Embed Size (px)
Citation preview

THE DARK AND BRIGHT SIDE OF
NETWORKING BEHAVIOR:
A RESOURCE-THEORETICAL COST-BENEFIT APPROACH
Inauguraldissertation
zur
Erlangung des Doktorgrades
der Humanwissenschaftlichen Fakultät
der Universität zu Köln
nach Promotionsordnung vom 10.05.2010
vorgelegt von
Laura Marie Wingender
aus Köln
Köln 2018

THE DARK AND BRIGHT SIDE OF NETWORKING BEHAVIOR
I
Diese Dissertation wurde von der Humanwissenschaftlichen Fakultät der Universität zu Köln im
April 2018 angenommen.
Erstgutachter: Prof. Dr. Hans-Georg Wolff (Köln)
Zweitgutachter: Prof. Dr. Birte Englich (Köln)
Tag der Disputation: 17.05.2018

THE DARK AND BRIGHT SIDE OF NETWORKING BEHAVIOR
II
Acknowledgements
I want to thank everyone, who made this dissertation possible. In preparing it, I have
elaborated on the significance of networking behavior as a means to gain support from others. And
indeed, this dissertation could not have been completed without great support over the past years.
First and foremost, I want to thank Hage Wolff for being the very model of an excellent
supervisor, guiding my work with professional advice and support, and providing me with freedom
and many opportunities to grow and develop. I also want to thank my friend and colleague Hadjira
Bendella for always having the best laugh with me, even and especially when I hit obstacles or
encountered challenges. Further, I want to thank Monica Forret for giving me the best time at St.
Ambrose University in Iowa, to discuss my research and work on joint projects. I also thank Birte
Englich who agreed to review and evaluate this work.
I also want to thank everyone, who made this dissertation possible by providing me with
emotional support. I thank my family, David, Sabine and Bernd, and Mira and Niklas, who helped
and supported me in so many invaluable ways throughout the past years. Of course, I also thank
my friends, Constanze, Helmut, Josefine, Nina, and Sarah for encouraging me all the way through
not to lose faith in my work. I am beyond excited to see what lies ahead of us!
Finally, I want to thank everyone, who made this doctoral thesis possible by investing their
time for my studies. Many thanks go to everyone, who helped me during data collection, as well
as everyone, who volunteered to participate in the studies or supported them in any other way.

THE DARK AND BRIGHT SIDE OF NETWORKING BEHAVIOR
III
List of Tables
Table 1. Abbreviations ................................................................................................................. VII
Table 2. Individual Antecedents of Networking Behavior ........................................................... 17
Table 3. Networking Resources from the Literature .................................................................... 22
Table 4. Sample Roles in the Networking Condition ................................................................... 56
Table 5. Descriptive Statistics, Reliabilities, and Correlations between Study Variables ............ 64
Table 6. Descriptive Statistics for Dependent Measures .............................................................. 65
Table 7. Regression of Self-Control Depletion on Condition....................................................... 67
Table 8. Regression of Self-Control Depletion on Condition and Extraversion .......................... 69
Table 9. Regression of Self-Control Depletion on Condition and Social Skills ........................... 71
Table 10. Regression of Self-Rated Self-Control on Condition. .................................................. 73
Table 11. Sample Roles in the Social Control Condition ............................................................. 86
Table 12. Descriptive Statistics, Reliabilities, and Correlations between Study Variables ......... 91
Table 13. Descriptive Statistics for Dependent Measures ............................................................ 92
Table 14. Regression of Self-Control Depletion on Condition and Impression Management ..... 94
Table 15. Regression of Self-Rated Self-Control on Condition ................................................... 95
Table 16. Regression of Positive Affect on Condition ................................................................. 96
Table 17. Sample Event Advertising .......................................................................................... 107
Table 18. Overview of Networking Events ................................................................................ 108
Table 19. Descriptive Statistics, Reliabilities, and Correlations between Study Variables ........ 117
Table 20. Multilevel Estimates for Models Predicting Self-Control (Handgrip), a .................... 119
Table 21. Multilevel Estimates for Models Predicting Self-Control (Handgrip), b ................... 121
Table 22. Multilevel Estimates for Models Predicting Self-Rated Depletion, a ........................ 124

THE DARK AND BRIGHT SIDE OF NETWORKING BEHAVIOR
IV
Table 23. Multilevel Estimates for Models Predicting Self-Rated Depletion, b ........................ 126
Table 24. Multilevel Estimates for Models Predicting Positive Affect ...................................... 129
Table 25. Participants’ Professional Sectors ............................................................................... 144
Table 26. Response Rates ........................................................................................................... 145
Table 27. Descriptive Statistics, Reliabilities, and Correlations between Person-Level Variables
............................................................................................................................................. 153
Table 28. Descriptive Statistics, Reliabilities, and Correlations between Day-Level Variables 154
Table 29. Multilevel Estimates for Models Predicting Day-Level Positive Affect .................... 156
Table 30 Multilevel Estimates for Models Predicting Day-Level Work-Life Conflict .............. 157
Table 31. Multilevel Estimates for Models Predicting Day-Level Work Satisfaction ............... 158
Table 32. Multilevel Estimates for Models Predicting Day-Level Emotional Exhaustion ........ 159
Table 33. Multilevel Estimates for Models Predicting Day-Level Work Engagement .............. 160
Table 34. Multilevel Estimates for Models Predicting Day-Level Work Performance ............. 161
Table C1. Regression of Self-Rated Self-Control on Condition and Extraversion in Study 1 .. 226
Table C2. Regression of Self-Rated Self-Control on Condition and Social Skills in Study 1 .. 227
Table D1. Regression of Self-Rated Self-Control on Condition and Impression Management in
Study 2 ………...……………………………………………………………………….... 231
Table E1. Multilevel Estimates for Models Predicting Day-Level Self-Control in Study 4 …. 240

THE DARK AND BRIGHT SIDE OF NETWORKING BEHAVIOR
V
List of Figures
Figure 1. Theoretical model of networking behavior and individual consequences and
antecedents. ........................................................................................................................... 10
Figure 2. Categorization of resources. .......................................................................................... 33
Figure 3. Theoretical model of networking behavior, energy resources, and outcomes. ............. 45
Figure 4. Overview of hypotheses in Study 1. .............................................................................. 50
Figure 5. Sample sequence of the Stroop task (HD Stroop condition). ........................................ 58
Figure 6. Differences between conditions in self-control depletion. ............................................ 67
Figure 7. Simple slopes for the interaction between condition and extraversion on self-control
depletion. ............................................................................................................................... 70
Figure 8. Simple slopes for the interaction between condition and social skills on self-control
depletion. ............................................................................................................................... 72
Figure 9. Overview of hypotheses in Study 2. .............................................................................. 81
Figure 10. Difference between conditions in self-control depletion............................................. 93
Figure 11. Mediating effect of impression management. ............................................................. 94
Figure 12. Difference between conditions in positive affect. ....................................................... 96
Figure 13. Overview of hypotheses in Study 3. .......................................................................... 101
Figure 14. Extraversion moderates the depleting effect of intense networking behavior when
attending a networking event. ............................................................................................. 103
Figure 15. Simple slopes for the interaction between pre-post change and networking intensity on
self-control depletion for introverts. ................................................................................... 122
Figure 16. Simple slopes for the interaction between pre-post change and networking intensity on
self-control depletion for extraverts. ................................................................................... 122

THE DARK AND BRIGHT SIDE OF NETWORKING BEHAVIOR
VI
Figure 17. Simple slopes for the interaction between pre-post change and networking intensity on
depletion for introverts. ....................................................................................................... 127
Figure 18. Simple slopes for the interaction between pre-post change and networking intensity on
depletion for extraverts. ...................................................................................................... 127
Figure 19. Overview of hypotheses in Study 4. .......................................................................... 134
Figure 20. Diary study design. .................................................................................................... 146
Figure 21. Overview of day-level relationships between networking behavior and energy
resource gain, attitudinal and productive outcomes. ........................................................... 162
Figure 22. Empirical tests of the theoretical model of networking behavior, energy resources, and
outcomes. ............................................................................................................................ 168

THE DARK AND BRIGHT SIDE OF NETWORKING BEHAVIOR
VII
Abbreviations
Table 1. Abbreviations
Abbreviations
cf. Compare
COR Conservation of resources
g Grams
ED Ego depletion
e.g. For example
etc. And so forth
HD Stroop High depletion Stroop
HR Human resources
i.e. That is
LD Stroop Low depletion Stroop
NW Networking
OCB Organizational citizenship behavior
UoC University of Cologne
s Seconds
vs. Versus

THE DARK AND BRIGHT SIDE OF NETWORKING BEHAVIOR
VIII
Table of Contents
Acknowledgements .......................................................................................................................... I
List of Tables ................................................................................................................................ III
List of Figures ................................................................................................................................ V
Abbreviations ............................................................................................................................... VII
Table of Contents ....................................................................................................................... VIII
Abstract ........................................................................................................................................... 1
Zusammenfassung........................................................................................................................... 2
Introduction ..................................................................................................................................... 3
Theoretical Background ................................................................................................................ 10
Networking Behavior ................................................................................................................ 10
What we know ...................................................................................................................... 10
Networking research ......................................................................................................... 11
Antecedents of networking behavior ................................................................................ 13
Consequences of networking behavior ............................................................................. 18
What we need to know .......................................................................................................... 27
Resource Theories ..................................................................................................................... 30
Conservation of resources theory .......................................................................................... 30
Ego depletion theory ............................................................................................................. 39
Theoretical Model of Networking Behavior, Energy Resources, and Outcomes ......................... 44
Overview of the Studies ................................................................................................................ 48
Study 1 .......................................................................................................................................... 50
Hypotheses ................................................................................................................................ 50

THE DARK AND BRIGHT SIDE OF NETWORKING BEHAVIOR
IX
Energy resource drain ........................................................................................................... 51
Method ...................................................................................................................................... 53
Participants ............................................................................................................................ 53
Procedure .............................................................................................................................. 53
Measures ............................................................................................................................... 54
Results ....................................................................................................................................... 63
Energy resource drain ........................................................................................................... 65
Discussion ................................................................................................................................. 74
Study 2 .......................................................................................................................................... 80
Hypotheses ................................................................................................................................ 81
Energy resource drain ........................................................................................................... 81
Energy resource gain............................................................................................................. 83
Method ...................................................................................................................................... 84
Participants ............................................................................................................................ 84
Procedure .............................................................................................................................. 84
Measures ............................................................................................................................... 85
Results ....................................................................................................................................... 90
Energy resource drain ........................................................................................................... 92
Energy resource gain............................................................................................................. 95
Discussion ................................................................................................................................. 97
Study 3 ........................................................................................................................................ 100
Hypotheses .............................................................................................................................. 101
Energy resource drain ......................................................................................................... 101

THE DARK AND BRIGHT SIDE OF NETWORKING BEHAVIOR
X
Energy resource gain........................................................................................................... 104
Method .................................................................................................................................... 105
Setting ................................................................................................................................. 105
Participants .......................................................................................................................... 106
Procedure ............................................................................................................................ 109
Measures ............................................................................................................................. 109
Analyses .............................................................................................................................. 113
Results ..................................................................................................................................... 116
Energy resource drain ......................................................................................................... 118
Energy resource gain........................................................................................................... 128
Discussion ............................................................................................................................... 130
Study 4 ........................................................................................................................................ 133
Hypotheses .............................................................................................................................. 134
Energy resource drain ......................................................................................................... 134
Energy resource gain........................................................................................................... 135
Attitudinal outcomes ........................................................................................................... 136
Productive outcomes ........................................................................................................... 142
Method .................................................................................................................................... 143
Participants .......................................................................................................................... 143
Procedure ............................................................................................................................ 145
Measures ............................................................................................................................. 146
Analyses .............................................................................................................................. 151
Results ..................................................................................................................................... 153

THE DARK AND BRIGHT SIDE OF NETWORKING BEHAVIOR
XI
Energy resource drain ......................................................................................................... 155
Energy resource gain........................................................................................................... 155
Attitudinal outcomes ........................................................................................................... 156
Productive outcome ............................................................................................................ 160
Discussion ............................................................................................................................... 163
General Discussion ..................................................................................................................... 167
Conclusion .................................................................................................................................. 181
References ................................................................................................................................... 182
Appendices .................................................................................................................................. 220

THE DARK AND BRIGHT SIDE OF NETWORKING BEHAVIOR
1
Abstract
Networking behavior leads to career success in the long term. However, networking
research has widely neglected to examine how people directly experience networking, particularly
with regard to short-term personal costs. Shedding light on potential costs, however, is important
because it allows individuals to make more informed decisions about whether and how to use
networking as a career strategy. Adopting a resource-theoretical approach, I build upon
conservation of resources and ego depletion theory to develop and test a model capable of
explaining how networking behavior has a dark and bright side. My central research question is:
How does networking behavior affect energy resources, defined as highly volatile resources
inherent in a person? Data from two laboratory (N = 334) and two field studies (N = 328) show
that networking simultaneously depletes and generates energy resources. On the dark side,
networking encompasses several processes (e.g., impression management) that deplete self-
regulatory energy resources. Extraversion serves as a buffer against the depleting effect of
networking behavior. On the bright side, networking behavior generates affective energy
resources, as manifested by positive affect. Taken together, following networking behavior, people
can be described as “depleted, but happy”. Furthermore, networking behavior and energy resource
processes are related to attitudinal (e.g., work-related well-being) and productive (e.g., work
performance) outcomes on a daily basis. Findings should be integrated into future human resources
practices and networking trainings to stimulate a critical reflection of networking behavior as a
universal career strategy.

THE DARK AND BRIGHT SIDE OF NETWORKING BEHAVIOR
2
Zusammenfassung
Networking-Verhalten führt langfristig zu Karriereerfolg. Hingegen kann die bisherige
Networking-Forschung nicht erklären, wie Menschen ihr Networking-Verhalten erleben,
insbesondere mit Blick auf kurzfristige persönliche Kosten. Die Berücksichtigung potenzieller
Kosten ist jedoch relevant, damit Menschen bessere Entscheidungen treffen können, ob und wann
sie Networking-Verhalten als Karrierestrategie einsetzen. Ich habe einen ressourcen-theoretischen
Ansatz gewählt, um vor dem Hintergrund der Conservation of Resources- und Ego Depletion-
Theorie ein Modell zu entwickeln und zu testen, das sowohl Kosten als auch Nutzen von
Networking integriert. Die zentrale Frage lautet: Wie wirkt sich Networking-Verhalten auf
Energie-Ressourcen aus, welche als schwankende personale Ressourcen definiert sind? Daten aus
zwei Laborstudien (N = 334) und zwei Feldstudien (N = 328) zeigen, dass Networking-Verhalten
einerseits Energie-Ressourcen erschöpft und andererseits Energie-Ressourcen generiert. Auf der
Kosten-Seite umfasst Networking-Verhalten verschiedene Prozesse, wie z.B. Impression
Management, die selbstregulatorische Energie-Ressourcen erschöpfen. Extraversion schwächt
Ressourcenerschöpfung durch Networking ab. Auf der Nutzen-Seite generiert Networking-
Verhalten Energie-Ressourcen, was sich in positivem Affekt manifestiert. Zusammenfassend
können Personen, die Networking betrieben haben als „erschöpft, aber glücklich“ beschrieben
werden. Darüber hinaus hängen Networking-Verhalten und damit verbundene Energie-
Ressourcen-Prozesse mit einstellungs- (z.B. arbeitsbezogenes Wohlbefinden) und
leistungsbezogenen (z.B. Arbeitsleistung) Auswirkungen auf Tagesebene zusammen. Die
Ergebnisse sollten in zukünftige Personal-Maßnahmen und Networking-Trainings integriert
werden, um eine kritische Betrachtung von Networking-Verhalten als universelle Karrierestrategie
anzustoßen.

THE DARK AND BRIGHT SIDE OF NETWORKING BEHAVIOR
3
Introduction
It is who you know... So, we are constantly told to network in order to succeed in our
careers. That is, to build, maintain, and use interpersonal relationships that provide access to
professional resources, which, in turn, might be leveraged for work and career success. In light of
the relevance of networking behavior for work and career advancement, it comes as no surprise
that networking piques the interest of practitioners and researchers alike.
Popular books (e.g., Liebermeister, 2015) and newspaper articles (e.g., Groll, 2017)
enthusiastically encourage people to create and foster professional ties to promote their careers.
Likewise, because networking is thought to improve work performance, organizations are advised
to foster their members’ networking behavior as a competitive edge (e.g., Kay, 2010).
Accordingly, companies, conferences, and professional associations increasingly hold special
networking events, and recently, online platforms (e.g., www.linkedin.de) through which
professionals can grow and organize their networks have gained significant followings. Recently,
a networking app (Grip) geared to matching and introducing the most relevant networking
contacts,1 like popular dating apps such as Tinder, was developed to further facilitate network
building (Google Inc., 2017). That is to say, there is no shortage of networking opportunities and
tools, and in order to successfully master these, people might consider enrolling in one of many
networking webinars or trainings (e.g., Schütte & Blickle, 2015).
Clearly, networking research supports the view that networking is beneficial. More
specifically, networking behavior facilitates access to interpersonal resources such as strategic
information, which might be used for professional success (cf. Gibson, Hardy, & Buckley, 2014).
1 Users are presented potential contacts and anonymously swipe their interest to establish
a “virtual handshake” that, in the best case, is the basis for future collaborations.

THE DARK AND BRIGHT SIDE OF NETWORKING BEHAVIOR
4
To name but a few empirical study findings, networking behavior is positively related to job search
success (e.g., van Hoye, van Hoft, & Lievens, 2009), work performance (e.g., Thompson, 2005)
and career success (e.g., Wolff & Moser, 2009). Thus, existing networking research emphasizes
that networking behavior leads to work and career benefits in the long term.
However, research generally remains silent about how people directly experience
networking. That is, how do people feel after they have engaged in networking behavior? Are they
lively, caring, and happy or rather jittery, uncomfortable and exhausted? Existing networking
studies provide no satisfactory answers, so scholarly understanding of networking behavior
remains limited in at least three ways. First, as networking research predominantly focuses on
long-term consequences, particularly career success, it remains unclear how networking behavior
affects outcomes, which take effect within relatively short-term intervals. Second, previous studies
have mainly focused on work-related consequences of networking behavior. However, outcomes
of networking behavior might also transcend the workplace and thus have an impact on people’s
private lives. Third, in recent years, scholars have begun to criticize the prevailing research focus
on positive consequences of networking behavior, instead suggesting that networking behavior
might also have a “dark side” (Wolff, Moser, & Grau, 2008, p. 114). For instance, a recent study
shows that instrumental networking behavior can make individuals feel dirty from a moral
standpoint (Casciaro, Gino, & Kouchaki, 2014). Taken together, these limitations show that, to
date, little research attention has been directed to short-term, personal, and negative consequences
of networking behavior. Filling these gaps, however, could help in several ways. For example,
addressing short-term effects might give insight into how people directly experience their
networking behavior, thus allowing for a finer-grained process approach towards networking.
Furthermore, by accounting for effects on people’s personal lives, networking can be embedded

THE DARK AND BRIGHT SIDE OF NETWORKING BEHAVIOR
5
into the broader context of people’s lives. Finally, integrating costs of networking behavior might
help explain why some people typically shy away from networking even when they recognize the
importance of being well connected (“knowing-doing gap”, Pfeffer & Sutton, 2013, p. 4).
Furthermore, knowledge about costs might help people to come to more informed decisions about
whether and how to use networking as a career management strategy.
I approach these questions by taking a resource-theoretical perspective. In the networking
literature, resources are described as central because networking behavior is considered a means
to gain professional resources. Yet, surprisingly, scholars in the field of networking behavior have
not drawn extensively on resource theories. In recent years, resource theories have become
increasingly popular in the organizational literature (Halbesleben, Neveu, Paustian-Underdahl, &
Westman, 2014; Hobfoll, 2011). Arguably, one of the most influential integrative resource theories
is the conservation of resources (COR) theory (Hobfoll, 1989, 2001). COR, originating from the
stress literature, emphasizes how resource loss and gain can influence individuals’ stress and well-
being. For example, COR theory has become fundamental in explaining how resource loss results
in burnout, which is characterized by exhaustion (Hobfoll, 2002; Hobfoll & Freedy, 1993; Maslach
& Leiter, 2008). In addition, COR links resource gains to improved well-being, for example in the
form of work engagement (cf. Halbesleben et al., 2014). Building on COR, I seek to develop and
test a theoretical model capable of explaining how networking behavior is a double-edged sword
regarding its effects on people’s personal resources in the short-term.
COR begins with the basic tenet that individuals strive to obtain, retain, foster, and protect
resources (Hobfoll, 1989, 2002). Resources are “those objects, personal characteristics, conditions,
or energies [emphasis added by the author] that are valued in their own right, or that are valued
because they act as conduits to the achievement or protection of valued resources” (Hobfoll, 2001,

THE DARK AND BRIGHT SIDE OF NETWORKING BEHAVIOR
6
p. 339). To date widely neglected in networking research, the developed model focuses on the
relationship between networking behavior and energies, which are characterized as volatile and
personal resources such as self-control or affect (ten Brummelhuis & Bakker, 2012). Along these
lines, my central research question is: How does networking behavior affect energy resources? As
an extension of the basic tenet, COR postulates the principle of resource investment. This principle
suggests that people must invest resources in order to gain resources and achieve goals (Hobfoll,
2001). Building on this principle, I consider networking behavior a resource investment behavior,
(cf. Halbesleben & Wheeler, 2015), igniting two main energy resource processes: an energy
resource drain process and an energy resource gain process.
On the dark side (energy resource drain), networking behavior requires initial resource
investments. If the invested resources, however, are finite and diminish with use, people will
probably end up with drained resource reservoirs. As illustrated by the ego depletion (ED) theory
(Baumeister, Bratslavsky, Muraven, & Tice, 1998), self-control resources are consumptive.
Networking behavior encompasses several processes that, according to the ED theory, consume
and thus deplete self-regulatory resources, such as goal-directedness, impression management, and
emotion regulation (cf. Baumeister, Vohs, & Tice, 2007). Therefore, applying ED theory to COR’s
resource investment principle, I propose that networking behavior depletes self-regulatory
resources. To further establish the energy resource drain process, I seek to identify boundary
conditions of the energy resource drain process. Building on COR’s argument that personality can
influence the process of resource loss (Hobfoll, 2002; Hobfoll, Freedy, Lane, & Geller, 1990), I
suggest that personality traits (e.g., extraversion) and skills (e.g., social skills) might be able to
mitigate the depleting effect of networking behavior.

THE DARK AND BRIGHT SIDE OF NETWORKING BEHAVIOR
7
On the bright side (energy resource gain), networking behavior is a means to gain work-
related resources (cf. Gibson et al., 2014; Porter & Woo, 2015). Thus, when people invest
resources into networking, they expect these investments to pay off, either immediately or in the
future. (Anticipated) gain of resources should also be manifested by enhanced resource states with
regard to affective energy resources. In other words, individuals might experience positive affect
after engaging in networking. Taken together, networking behavior should simultaneously deplete
(self-regulatory) energy resources and generate (affective) energy resources. Building on COR,
networking behavior and energy resource drain and gain should further lead to differentiated
attitudinal (e.g., work-related well-being) and productive (e.g., work performance) outcomes over
the course of a day (Hobfoll, 2001; ten Brummelhuis & Bakker, 2012). Therefore, I also integrate
attitudinal and productive outcomes of networking behavior.
To summarize, the main purpose of this dissertation is to develop and test a model of
networking behavior that explains short-term energy resource drain and gain integrally. To that
end, I first review and synthesize research and theory on networking behavior and its antecedents
and consequences. Based on the literature review, I identify several crucial questions that have not
yet been tackled in existing networking research. Second, I elaborate on two resource theories that
serve as guiding frameworks in developing the theoretical model: Conservation of resources
(Hobfoll, 1989, 2001) and ego depletion theory (Baumeister et al., 1998). At the core of this
dissertation, I integrate the networking and resources literature into a theoretical model of
networking behavior, energy resource processes, and attitudinal and productive outcomes. Next, I
test the proposed model in four studies. I present two experimental laboratory (Studies 1 and 2)
and two field studies (Studies 3 and 4). Finally, I discuss implications for theory, research, and
practice.

THE DARK AND BRIGHT SIDE OF NETWORKING BEHAVIOR
8
By developing and testing a model of networking behavior, energy resources, and
outcomes, I seek to make five important contributions to the networking literature. First, I pioneer
in taking a resource-theoretical perspective on networking behavior. Even though in the
networking literature, resources are described as central, networking has not yet been considered
in light of resource theories such as conservation of resources theory. Drawing upon COR, I seek
to predict and test how networking behavior depletes and generates a specific form of resources,
that is, energy resources.
Second, I pay heed to short-term effects of networking. Short-term effects have been
widely neglected in networking research, thus it remains unclear how people directly experience
networking behavior. Because energies are highly transient (ten Brummelhuis & Bakker, 2012),
they can only be adequately captured with a novel finer-grained process approach. To date,
networking studies mostly rely on cross-sectional data, whereas the few longitudinal studies have
relatively long periods between data collections (e.g., every 12 months over the course of 2 years;
Wolff & Moser, 2010). Typically, in these studies, networking behavior is conceptualized in a
rather static way by asking individuals to estimate how often they have shown networking
behaviors in the past months or year (e.g., Forret & Dougherty, 2001). Likewise, criteria are
typically measured statically (e.g., number of promotions received at a given point in time, cf.
Wolff & Moser, 2010). However, theoretical frameworks such as the conservation of resources
theory suggest that resource processes are more dynamic than static (Hobfoll, 1989; 2001).
Accordingly, scholars (e.g., Halbesleben et al., 2014) recently called for research designs that
“better match the dynamic nature of COR theory.” (p. 1356, see also Bolino, Harvey, & Bachrach,
2012). To address this criticism, I break new ground in terms of research designs, using
experimental and diary study designs.

THE DARK AND BRIGHT SIDE OF NETWORKING BEHAVIOR
9
Third, I integrate personal resources into networking research. This is highly relevant,
given that personal resources such as energies can have considerable downstream effects on
employees themselves, as well as on their organizations and families (Hobfoll, 2001; ten
Brummelhuis & Bakker, 2012). Therefore, I also integrate daily outcomes that have transcended
the workplace and entered into an employees’ private life (e.g., feelings of work-life conflict). By
doing this, I seek to embed networking behavior into the broader context of people’s lives.
Fourth, by adopting a cost-benefit approach, I suggest that networking is not exclusively
good, but cuts both ways. From a theoretical standpoint, the simultaneous examination of the
resource-consuming and resource-generating processes of networking behavior is crucial because
it provides a more comprehensive test of COR. From a practical perspective, shedding light on
potential costs of networking behavior is important for people to decide whether and how to use
networking as a career management strategy.
Fifth, I examined boundary conditions of the energy resource drain process. More
specifically, I identified personality traits and skills that act as buffers against the depleting effects
of networking. Integrating moderating effects of personality allows for determining more
accurately, who must be particularly aware of the resource costs inherent in networking. Of
practical significance, this might help explain why some people usually shy away from networking
even when they desire to obtain the long-term benefits of networking, such as effective networks
and career success (Ingram & Morris, 2007; Obukhova & Lan, 2013; see also Gallagher, Fleeson,
& Hoyle, 2011).

THE DARK AND BRIGHT SIDE OF NETWORKING BEHAVIOR
10
Theoretical Background
Networking Behavior
In the first part, I discuss what we know about networking behavior and its antecedents and
consequences. The literature review reveals that several crucial questions remain unsettled in
existing networking research. Therefore, in the second part, I discuss what we should seek to learn
in order to gain a deeper understanding of networking behavior.
What we know
In this literature review, I provide answers to several crucial questions. First, how is
networking behavior defined and measured in networking research? Second, what are antecedents
of networking behavior? And third, what are consequences of networking behavior? Figure 1
illustrates a theoretical model of networking behavior and its antecedents and consequences on
part of the individual.2
Figure 1. Theoretical model of networking behavior and individual consequences and antecedents.
Based on Gibson et al. (2014).
2 In reviewing the literature, I primarily focus on antecedents and consequences on part of
the individual as opposed to the organization.
THE DARK AND BRIGHT SIDE OF NETWORKING BEHAVIOR
11
Networking research
Networking research can be traced back at least to the early 1970’s sociological and
managerial works. In 1974, Granovetter emphasized the importance of an individuals’ “weak ties”
(p. 1460, i.e., less intimate and emotionally intense ties) for information flow, a topic that was
picked up about 20 years later by Burt (1992) with the idea of “structural holes” (p. 65). Regarding
managerial research, Mintzberg (1975) articulated the interpersonal role of managers as one of
building and maintaining organizational relationships at work in order to establish an effective
individual organizational information system. Later, empirical research identified networking as
crucial for the salary progression (Gould & Penley, 1984) and promotion (Luthans, Rosenkrantz,
& Hennessey, 1985) of managers, thereby shifting the focus toward networking as an individual
career strategy.
Defining networking behavior
Gould and Penley (1984) also provided one of the first definitions of networking,
describing it as “the practice of developing a system or ‘network’ of contacts inside and/or outside
the organization, thereby providing relevant career information and support for the individual”
(p. 246). Jumping forward in time, a recent definition stems from a theoretical networking paper
by Porter and Woo (2015), characterizing networking as “strategic processes by which one initiates
an instrumental relationship […] with a contact capable of providing interpersonal resources that
are beneficial for work-related activities” (p. 1485). Based on a review of historical definitions,
Gibson et al. (2014) recently presented an integrated consensus definition of networking:
“Networking is a form of goal-directed behavior which occurs both inside and outside of an
organization, focused on creating, cultivating, and utilizing interpersonal relationships” (p. 150).
THE DARK AND BRIGHT SIDE OF NETWORKING BEHAVIOR
12
Drawing from these definitions, networking can be characterized as a set of particular behaviors
(see also Wolff et al., 2008). These behaviors are focused on the short-term goal of building and
establishing interpersonal relationships (that in their entirety consolidate in a person’s network) to
obtain work-related resources. In the long term, these resources might be leveraged for work and
career success (cf. Consequences of networking behavior).
Measuring networking behavior
Early research by Mintzberg (1975), Kotter (1982) and Luthans et al. (1985) used
participant observation to assess managerial networking behavior. These days, most research relies
on some form of quantitative self-reports about the frequency of an individuals’ networking
behavior (for an overview, see Wingender & Wolff, 2016). In a recent study, Casciaro and
colleagues (2014) captured networking behavior one-dimensionally with a single item (“How
often do you engage in professional networking?”). In contrast, the most complex multi-
dimensional networking scales comprise five3 or six4 subscales and up to 44 items (Forret &
Dougherty, 2001; Wolff & Moser, 2006). In these surveys, respondents indicate how often they
have engaged in the listed behaviors in the past (e.g., within the past year, Forret & Dougherty,
2001). Examples of networking behaviors from networking surveys include: Introducing oneself
to people who can influence one’s career (Sturges, Guest, & Conway, 2002) and giving out
3 Forret and Dougherty (2001) used exploratory factor analysis to identify five networking
dimensions: 1) maintaining contacts, 2) socializing, 4) engaging in professional activities, 4)
participating in church and community, and 5) increasing internal visibility. 4 Wolff & Moser (2006, English version: Wolff, Schneider-Rahm, Forret, 2011; shortened
18-item versions: Wolff, Spurk, & Teeuwen, 2017 and Porter, Woo, & Campion, 2016) used a
theoretical approach to distinguish between two facets. The structural facet differentiates between
internal and external networking. The functional facet discerns building, maintaining, and using
contacts. Crossing the two facets results in six networking subscales.

THE DARK AND BRIGHT SIDE OF NETWORKING BEHAVIOR
13
business cards (Forret & Dougherty, 2001), going out for lunch, dinner or drinks with people from
other work units (Forret & Dougherty, 2001; Michael & Yukl, 1993) as well as exchanging gossip
or strategic information (Gould & Penley, 1984; Wolff & Moser, 2006) like advice or leads
regarding job search (Wanberg, Kanfer, & Banas, 2000).
Antecedents of networking behavior
Networking research has investigated numerous determinants of networking behavior. I
broadly group antecedents of networking behavior in individual, demographic and organizational
antecedents (cf. Wolff et al., 2008).
Individual antecedents
With regard to individual antecedents, I organize variables into three categories: a)
personality traits, b) skills, and, c) attitudes (see Table 2). First, in terms of personality traits,
several studies have investigated the relationship between networking behavior and complex
personality models. As such, agency and communion (the Big Two, Paulhus & Trappnell, 2008)
are two dimensions representing two fundamental challenges: getting ahead and getting along
(Helm, Abele, Müller-Kalthoff, & Möller, 2017; Bruckmüller & Abele, 2013). Agency comprises
characteristics that are aimed at pursuing goals and manifesting accomplishments (also referred to
as dominance or competence). Communion comprises characteristics that are related to forming
and maintaining social connections (also referred to as affiliation or warmth, Fiske, Cuddy, Glick,
& Xu, 2002; Wiggins, Trapnell & Phillips, 1988). Using the interpersonal circumplex, Wolff and
THE DARK AND BRIGHT SIDE OF NETWORKING BEHAVIOR
14
Muck (2009) showed that both dominance and affiliation are related to networking behavior, thus
emphasizing that networkers are friendly and determined at the same time.5
Further studies have investigated the relationship between networking behavior and
personality on the basis of the Big Five model (Costa & McCrae, 1995). Extraversion and
agreeableness are more closely related to interpersonal behavior than the remaining factors
(openness to experience, emotional stability and conscientiousness, Hurley, 1998). Extraversion
combines agentic and communal aspects (Hurley, 1998), with extraverts being characterized as
assertive and action-oriented as well as warm and person-oriented (Costa & McCrae, 1995).
Extraversion consistently shows positive relations to networking behavior (Forret & Dougherty,
2001; van Hoye et al., 2009; Wanberg et al., 2000; Wolff & Kim, 2012; Wolff & Moser, 2006).
Likewise, agreeableness, as pointing to communion, is related to networking behavior (Wanberg
et al., 2000; Forret & Dougherty, 2001). However, taking a more nuanced look, agreeableness is
related only to internal networking, but not external networking (Wolff & Kim, 2012). Several
studies show that openness to experience, emotional stability and conscientiousness show
heterogeneous relationships with networking behavior (e.g., Ferris et al., 2005; Wanberg et al.,
2005; Wolff & Kim, 2012).
Other studies have investigated relationships of networking behavior with single
personality traits. For example, people with high interpersonal trust expect their interaction
partners to have good intentions and fulfill the norms of reciprocal exchange, thus facilitating
networking behavior, particularly building new contacts (Wolff & Moser, 2006). Furthermore,
networking behavior is positively related to proactivity (Thompson, 2005). In general, proactivity
5 Similarly, building on McClelland’s (1987) implicit motives framework, networking
behavior is associated with high need for competence, need for affiliation, and need for power
(Wolff, Weikamp, & Batinic, 2014, see also Porter, Woo, Alonso, & Snyder, 2018).

THE DARK AND BRIGHT SIDE OF NETWORKING BEHAVIOR
15
reflects the extent to which individuals take action to influence their environments (Bateman &
Crant, 1993) and bring about goal-oriented action and accomplishment (Ferris et al., 2007). As
such, “proactive people are likely to seek ways to construct a social environment conducive to
their own success on the job” (Thompson, 2005, p. 1012). Likewise, self-esteem shows a positive
correlation with networking behavior (Forret & Dougherty, 2001). Self-esteem refers to how
favorably individuals evaluate themselves (Brockner, 1988). Individuals with low self-esteem
might be more likely to withdraw from esteem-threatening situations (Brockner, 1988; Campbell,
1990), such as engaging in networking behaviors (Forret & Dougherty, 2001). They might feel
they have nothing worth contributing to others, whereas individuals with high self-esteem tend to
believe that they have valuable resources to exchange with others and that they could satisfy the
norm of reciprocity needed for effective networking relationships (Forret & Dougherty, 2001).
Also, networking behavior is associated with high levels of self-monitoring (Ferris et al., 2008,
see also Fang, Landis, Zhang, Anderson, Shaw, & Kilduff, 2015). High self-monitorers tend to
“monitor or control the images of the self they project in social interaction to a great extent”
(Snyder, 1987, p. 5) in order to successfully reach interpersonal ends (Gangestad & Snyder, 2000).
Second, along with personality traits, social skills have been found to determine
networking behavior (Hager, 2015). That is, socially skilled individuals are able to “perceive
interpersonal or social cues, integrate these cues with current motivations, generate responses, and
enact responses that will satisfy motives and goals” (Norton & Hope, 2001, p. 59). People with
high social skills can encourage cooperation among others (Fligstein, 2001) and can influence the
actions of others through the effective use of persuasion (Argyle, 1969). A study with
entrepreneurs reveals that political skills, closely related to the construct of social skills, enhance
the construction and use of entrepreneurial networks (Fang, Chi, Chen, & Baron, 2015). Political

THE DARK AND BRIGHT SIDE OF NETWORKING BEHAVIOR
16
skills are a social competence that enables individuals to achieve goals due to their understanding
of and influence upon others at work (Gansen-Amman, Meurs, Wihler, & Blickle, 2017). More
specifically, political skills reflect personal competency in social interactions (i.e., social
astuteness and networking ability; Ferris et al., 2005, 2007) and refer to proficiency at applying
situationally appropriate behavior and tactics to influence others (i.e., apparent sincerity and
interpersonal influence; Ferris et al., 2005, 2007), especially in highly uncertain environments
(Fang, Chi, Chen, & Baron, 2015).
Third, attitudes influence individuals’ networking behaviors. For example, networking
comfort (attitudes toward using networking as a job-search method) is positively related to
networking intensity (Wanberg et al., 2000). In a similar vein, with regard to moral concerns, a
survey study of lawyers offers correlational evidence that professionals who do not experience
“feelings of dirtiness from instrumental networking” (Casciaro et al., 2014, p. 705), relative to
those who do, tend to engage in it more frequently. Likewise, favorable attitudes toward workplace
politics (i.e., evaluating politics as good, fair, and necessary means to reach their ends, Forret and
Dougherty, 2001) and positive attitudes towards professional networks (Kastenmüller et al., 2011)
show a positive relationship with networking behavior.
Taken together, research shows that people who frequently engage in networking have
certain personality traits (e.g., extraversion) and skills (e.g., social skills). Also, networking
behavior correlates with positive attitudes towards networking behavior and related constructs. It
seems likely that these factors determine networking behavior. However, strictly speaking, the
predominantly correlational study designs do not allow reliable causal conclusions. For example,
regarding proactivity, networking behavior might as well facilitate an employees’ initiative taking.
That is, professional contacts might serve as key sources for information and feedback that

THE DARK AND BRIGHT SIDE OF NETWORKING BEHAVIOR
17
ultimately bolster employees’ confidence in their ability to be proactive. Therefore, alternative
research designs, such as experimental or longitudinal studies, would allow for stronger causal
inferences regarding the role of individual differences in the context of networking behavior (cf.
Shadish, Cook, & Campbell, 2002). Also, it might be interesting if individual differences such as
personality factors moderate the relationship between networking behavior and its consequences.
Table 2. Individual Antecedents of Networking Behavior
Individual Antecedents of Networking Behavior
Personality traits Agency (e.g., Wolff & Muck, 2009)
Communion (e.g., Wolff & Muck, 2009)
Extraversion (e.g., Wolff & Kim, 2012)
Agreeableness (e.g., Wanberg et al., 2000)
Interpersonal trust (e.g., Wolff & Moser, 2006)
Proactivity (e.g., Thompson, 2005)
Self-Esteem (e.g., Forret & Dougherty, 2001)
Self-Monitoring (e.g., Ferris et al., 2008)
Skills Social skills (e.g., Hager, 2015)
Political skills (e.g., Fang, Chi, Chen, & Baron, 2015)
Attitudes Networking comfort (e.g., Wanberg et al., 2000)
Low moral concerns regarding instrumental networking
(e.g., Casciaro et al., 2014)
Positive attitudes towards workplace politics
(e.g., Forret & Dougherty, 2001)
Positive attitudes towards occupational networks
(e.g., Kastenmüller et al., 2011)

THE DARK AND BRIGHT SIDE OF NETWORKING BEHAVIOR
18
Demographic antecedents
Research on demographic variables reveals heterogeneous and mostly small relationships
with networking behavior (cf. Wolff et al., 2008). Several studies find no relationships between
networking behavior and gender (Forret & Dougherty, 2001; Sturges et al., 2002; Wanberg et al.,
2000; Wolff & Moser, 2006), age or education (Gould & Penley, 1984; Sturges et al., 2002;
Wanberg et al., 2000; Wolff & Moser, 2006).
Excursus on organizational antecedents
Research on relationships between networking and organizational antecedents is relatively
scarce, even though it is plausible that organizational factors determine networking behavior.
Wingender and Wolff (2016) argue that situational antecedents of networking might seem less
relevant to scholars due to the primary research focus on networking behavior as an individual
career strategy. Scholars implicitly assume that an individuals’ career is predominantly determined
by him or herself and not by his or her organizations. The few existing studies show that, for
example, networking behavior is positively related to higher hierarchical level and certain
functional positions (e.g., marketing and sales, e.g., Forret & Dougherty, 2001; Michael & Yukl,
1993).
Consequences of networking behavior
Networking relationships
In the first place, networking behavior is focused on interpersonal relationships (Gibson et
al., 2014). Building, maintaining, and using relationships represents a dynamic process of
consecutive stages of relationship development (Porter & Woo, 2015). In the literature, networking

THE DARK AND BRIGHT SIDE OF NETWORKING BEHAVIOR
19
relationships are characterized as follows: They can occur both inside and outside an individuals’
core organization (Michael & Yukl, 1993). They are typically considered to be informal, that is,
“other than the manager’s immediate superior and subordinates” (Orpen, 1996, p. 245), or to
exceed formal role expectations, for example, when playing golf with a colleague. Networking
contacts might be referred to as “business friend[s]” (Ingram & Zou, 2008, p. 167; see also Chua,
Ingram, & Morris, 2008). Along these lines, professional and personal aspects can overlap
significantly, with task goals and personal goals coexisting within the same social relationships
(Casciaro & Lobo, 2008). However, purely personal relationships that lack any instrumental goals
or functions are not considered networking ties (Ingram & Zou, 2008). Networking relationships
are typically governed by norms of reciprocity (Gouldner, 1960, e.g., the proverbial “owing a
favor”) and therefore based on trust (Coleman, 1988; Wolff & Moser, 2006) because favors do not
always occur simultaneously.
Network
Networks address the “structure of relationships” (Porter & Woo, 2015, p. 1478). That is,
professional networks comprise the entirety of an actor’s networking relationships. Research on
networks (e.g., Dobrow & Higgins, 2005) analyzes characteristics of networking relationships
(e.g., strength), network positions (e.g., centrality), and network size and structure (e.g., diversity).
The availability of resources engendered by structure and quality of an individuals’ network refers
to the concept of social capital (Adler & Kwon, 2002; Coleman, 1988). As for networking
relationships, strong ties are necessary for obtaining complex knowledge at work (Hansen, 1999).
On the other hand, weak ties provide helpful information regarding job search (Granovetter, 1974).
Likewise, positional advantages, such as broker positions (bridges between distinct groups within

THE DARK AND BRIGHT SIDE OF NETWORKING BEHAVIOR
20
the network, also known as structural holes) entail informational and strategic benefits (Burt,
1992). Regarding network size and structure, large and diverse networks allow access to
instrumental resources, such as task advice and strategic information (Podolny & Baron, 1997).
The relationship between networking behavior and network structure is presumably reciprocal.
Hence, networking behavior should lead to favorable network structures. Accordingly, Wolff and
Moser (2006) show that networking behavior is related to large and non-redundant professional
networks. This network structure, in turn, likely creates further networking opportunities (e.g., van
Hoye et al., 2009).
Networking resources
In their literature review, Porter and Woo (2015) suggest that “access to interpersonal
resources is a common reason ‘why’ people network” (p. 1490). As Dobos (2015) states: “People
network for all kinds of reasons. It might be to find business partners and collaborators. It might
be to gain industry knowledge. It might be to keep abreast of opportunities in the hidden (or poorly
advertised) job market” (p. 10). In an attempt to organize the volume of networking resources,
Volmer and Wolff (2017, based on Wolff et al., 2008) classify networking resources into proximal
and distal resources.6 Proximal resources (e.g., task advice) are mostly available from dyadic
relationships, whereas distal resources (e.g., career success) are available from a (large and
diverse) professional network rather than from a single relationship (cf. Wolff et al., 2008). The
relationship between networking behavior and distal resources is most likely mediated by proximal
resources, such that accumulated proximal resources eventually aggregate into distal resources.
For example, an employee might request information from different contacts that, later on, he or
6 Wolff et al. (2008) originally used the terms “primary and secondary resources” (p.110).

THE DARK AND BRIGHT SIDE OF NETWORKING BEHAVIOR
21
she uses when negotiating his or her salary or seeking a promotion. Accordingly, distal resources
should result rather in the long term than in short-term (Wingender & Wolff, 2016). In support of
this assumption, Wolff and Moser (2010) found that building and maintaining internal networking
contacts did not predict career success (i.e., being promoted) in the subsequent year, but one year
later. Table 3 displays an overview of proximal and distal networking resources that have been
mentioned in the networking literature, but not necessarily studied scientifically. Notably, this list
is not intended to be exhaustive.
Porter and Woo (2015) consider resources based on the particularistic-universalistic
dimension (Foa & Foa, 1980), ranging from friendship (particularistic) to money (universalistic),
with networking resources falling in between these ends. Due to Porter and Woo’s (2015) focus
on dyadic networking relationships, their understanding of networking resources corresponds
broadly to the above concept of proximal resources. Furthermore, in line with Volmer and Wolff’s
(2017, see also Wolff et al., 2008) idea of distal resources, they argue that networking resources
bolster one’s perceived and actual ability to attain desirable work and career outcomes (i.e., distal
resources). Upon reviewing existing networking research, Porter and Woo (2015) identify three
networking outcomes that have attracted major attention in networking research: job search, work
performance, and career success. Considering those outcomes in light of the classification into
proximal and distal resources, it is striking that all refer to distal resources. In contrast, relatively
little research attention has been directed towards proximal networking resources. In the following,
I describe the three resources emphasized by Porter and Woo (2015) in more detail. I also elaborate
on entrepreneurial success because a large part of the sample in Study 3 consists of entrepreneurs.
Furthermore, I undertake a short excursus on organizational success.

THE DARK AND BRIGHT SIDE OF NETWORKING BEHAVIOR
22
Table 3. Networking Resources from the Literature
Networking Resources from the Literature
Proximal resources Strategic information (e.g., Podolny & Baron, 1997)
Task advice (e.g., Michael & Yukl, 1993)
Coworker support (e.g., Burke, 1984)
Ideas (e.g., Burke, 1984)
Feedback (e.g., Burke, 1984)
Cut red tape (e.g., Burke, 1984)
Distal resources Job search success (e.g., Porter & Woo, 2015)
Work performance (e.g., Porter & Woo, 2015)
Salary (e.g., Wolff & Moser, 2009)
Promotion (e.g., Wolff & Moser, 2010)
Career satisfaction (e.g., Wolff & Moser, 2009)
Entrepreneurial success (e.g., Brüderl & Preisendörfer, 1998)
Visibility (e.g., Wolff et al., 2008)
Reputation (e.g., Wolff et al., 2008)
Influence (e.g., Michael & Yukl, 1993)
Power (e.g., Wolff et al., 2008)
Organizational success (e.g., Wolff et al., 2008)
Job search success. “A contact is worth 2000 résumés” (Burke, 1984, p. 299). In this vein,
networking behavior is considered a key to job search success (Forret, 2014). Scholars use a broad
range of operationalizations of job search success, including job search outcomes (e.g., number of

THE DARK AND BRIGHT SIDE OF NETWORKING BEHAVIOR
23
job interviews and offers), employment outcomes (e.g., employment status, speed of
reemployment), and quality of employment (e.g., job satisfaction, person-organization fit, see
Forret, 2014). One of the first studies on networking behavior and job search outcomes in a large
retail bank showed that individuals referred by personal contacts who were currently employed at
the bank were significantly more likely to obtain job interviews and subsequent job offers
(Fernandez & Weinberg, 1997).7 Likewise, in a study with unemployed job seekers, 36% reported
that they had found a job through networking or personal contacts (Wanberg et al., 2000; see also
Granovetter, 1995). Note, however, that in this study, networking behavior did not provide
incremental prediction of reemployment when considering use of other job-search methods. In a
longitudinal study with unemployed job seekers, time spent networking was positively related to
the number of job offers (above and beyond other job search methods), but not with employment
status (van Hoye et al., 2009, see also Wanberg et al., 2000). Therefore, networking behavior seems
to have a direct influence on proximal job search outcomes (e.g., job offers) whereas more distal
outcomes (e.g., actual employment) might be determined by many factors other than networking
behavior. Findings of a two-year prospective study showed that employees’ networking with
external contacts was positively associated with changing the employer in the second year (Wolff
& Moser, 2010, see also Porter et al., 2016). Several studies suggest that weak ties might be
particularly helpful in channeling job information (Bian, Huang & Zhang, 2015; Granovetter,
1974; van Hoye et al., 2009) whereas strong ties are best able to mobilize forms of favoritism (Bian
et al., 2015). In sum, networking behavior can be considered a helpful job search strategy (best
used as a complement to other job-search methods, cf. Wanberg et al., 2000).
7 However, their operationalization of “personal contacts” (p. 883) includes close friends
and relatives and is therefore not limited to networking contacts.

THE DARK AND BRIGHT SIDE OF NETWORKING BEHAVIOR
24
Work performance. Work performance is defined as behaviors or actions that are relevant
to the goals of an organization (McCloy, Campbell, & Cudeck, 1994). Research on work
performance broadly distinguishes task performance (directly related to the organization’s
technical core) from contextual performance (contributing to the social and psychological core of
the organization, Motowidlo & Van Scotter, 1994). According to Porter and Woo (2015), research
on the relationship between networking behavior and work performance conceptualizes
networking as a practice that enables access to interpersonal resources that are necessary and useful
for facilitating work performance. Indeed, studies reveal significant correlations between
networking behavior and supervisor-rated performance evaluations (Shi, Chen, & Chou, 2011;
Thompson, 2005). Likewise, networking behavior is positively related to self-reported task
performance as well as contextual performance (Nesheim, Olsen, & Sandvik, 2017; see also
Gevorkian, 2013). Also, a longitudinal study with salespersons in an insurance company shows
that networking behavior significantly predicts objective measures of performance (e.g., sales
volume, Blickle et al., 2012). Regarding boundary conditions, this study finds that networking
operates most effectively in enterprising job contexts characterized by high levels of
communication and interpersonal interactions.
Career success. Networking research has a very strong focus on career success, which is
defined as the accumulated positive work and psychological outcomes resulting from one’s work
experiences (Seibert & Kraimer, 2001). Scholars use various measures of career success, broadly
differentiating between objective and subjective career success (Ng, Eby, Sorensen, & Feldman,
2005). Objective career success includes indicators of career success that can be seen and evaluated
objectively by others such as salary attainment and the number of promotions in one’s career.
THE DARK AND BRIGHT SIDE OF NETWORKING BEHAVIOR
25
Measures of subjective career success capture individuals’ subjective judgments about their career
attainments such as job and career satisfaction. Networking is generally viewed as an essential
behavior for career success, because resources obtained from networking relationships are
assumed to leverage career success (Porter & Woo, 2015). Regarding objective career success, a
recent meta-analysis finds that networking behavior is positively related to salary attainment (k =
15, r = .17, Ng & Feldman, 2014a). In a longitudinal study, Wolff and Moser (2009) showed that
networking behavior is related to concurrent salary as well as to the growth rate of salary over
time. Likewise, several studies found positive relations between networking behavior and
promotions (Blickle, Witzki, & Schneider, 2009; Forret & Dougherty, 2004; Luthans et al., 1985).
Also, findings of a two-year prospective study showed that networking behavior predicted
promotions, both in the first and second year (Wolff & Moser, 2010). With regard to subjective
career success, meta-analytical findings indicate a positive correlation of networking behavior and
career satisfaction (k = 16, r = .24, Ng and Feldman, 2014b, see also Forret & Dougherty, 2004;
Wolff & Moser, 2009).
Entrepreneurial success. The network approach to entrepreneurship (Aldrich & Zimmer,
1986; see also Brüderl & Preisendörfer, 1998) is a prominent theoretical perspective within the
literature on entrepreneurship. According to the Network Founding Hypothesis, entrepreneurs rely
on networking activities and resources from networking contacts (e.g., information on market
conditions) in order to successfully establish new firms (Burt, 1992; Brüderl & Preisendörfer,
1998). Concerning processes after founding, there is a similar hypothesis (Network Success
Hypothesis), suggesting that entrepreneurs who engage in networking behaviors and can refer to
a broad and diverse social network are more successful (Brüderl & Preisendörfer, 1998). Empirical

THE DARK AND BRIGHT SIDE OF NETWORKING BEHAVIOR
26
research addressing the relationship between networking and entrepreneurial success, however,
has produced inconclusive results. Most studies find a positive effect (e.g., Baum, Calabrese, &
Silverman, 2000; Brüderl & Preisendorfer, 1998; Raz & Gloor, 2007; Semrau & Sigmund, 2012;
Stam & Elfring, 2008), but some studies indicate null effects (e.g., Aldrich & Reese, 1993). These
heterogeneous results might be traced back to the broad variety of networking measures (e.g., time
spent networking, frequency of communication with specific networking partners; Witt, 2004),
which differ from the typical assessment of networking behaviors (cf. Measuring networking
behavior). Also, scholars use diverse criteria for entrepreneurial success (e.g., company survival,
sales growth, profitability, return on investment; Witt, 2004). Furthermore, a study suggests that
for entrepreneurs, increasing network size and relationship quality results in diminishing marginal
returns in terms of access to financial capital, knowledge and information, and additional business
contacts (Semrau & Werner, 2013). In line with resource theories such as COR, this finding might
be explained by a general “threshold for some resources after which having more is not
advantageous but still requires energy and effort” (Hobfoll, 2002, p. 316).
Excursus on organizational success. Fandt and Ferris (1990) argue that some employee
behaviors that are mainly self-interested such as networking behavior might also have an impact
on organizations.8 Yet, research on organizational consequences of networking behavior is
relatively scarce. The few studies that exist suggest that, from an organizational perspective,
employees’ networking behaviors can be either beneficial or detrimental. For example, an
employees’ networking with internal contacts is positively related to his or her normative
8 For entrepreneurs, individual and organizational success are intrinsically tied to one
another (e.g., company survival).

THE DARK AND BRIGHT SIDE OF NETWORKING BEHAVIOR
27
commitment, whereas networking with contacts outside an employees’ organization shows
negative relations with normative commitment (McCallum, Forret, & Wolff, 2014). Similarly, a
longitudinal study suggests that an employees’ internal networking decreases his or her likelihood
to leave the organization, whereas an employees’ external networking behavior significantly
relates to turnover (Porter et al., 2016; see also Wolff & Moser, 2010). Taken together, from an
organizational perspective, an employees’ internal networking is beneficial in terms of employee
commitment, whereas external networking also comes at disadvantages for the core organization
(e.g., reduced commitment, increased turnover).
What we need to know
The literature review reveals that existing networking research provides answers to the
following questions: First, how is networking behavior defined and measured? In the networking
literature, networking behavior is defined as goal-directed behavior focused on building,
maintaining, and using informal relationships (Gibson et al., 2014). It is typically measured with
networking surveys, asking individuals how often they have engaged in networking behavior in
the past (e.g., Forret & Dougherty, 2001). Second, what are individual antecedents of networking
behavior? Research suggests that personality factors (e.g., extraversion, Forret & Dougherty,
2001) and skills (e.g., social skills, e.g., Hager, 2015) as well as attitudes (e.g., networking comfort,
Wanberg et al., 2000) determine networking behavior. And finally, what are consequences of
networking behavior? In general, networking behavior is considered to pay off by providing
instrumental resources such as task advice and strategic information (Podolny & Baron, 1997). In
the long term, these resources should translate into work and career benefits (cf. Wolff et al., 2008).
Indeed, studies find that networking behavior is related to criteria of job search success (e.g., job

THE DARK AND BRIGHT SIDE OF NETWORKING BEHAVIOR
28
offers, van Hoye et al., 2009), improved work performance (e.g., task performance, Nesheim et
al., 2017) and career success (e.g., Wolff & Moser, 2010).
Accordingly, research has a strong focus on consequences that are rather long-term, mostly
work-related and almost exclusively positive, particularly career success. That way, however,
scholarly understanding of networking behavior remains limited in at least three ways. First, as
networking research predominantly focuses on long-term consequences, it remains unclear how
networking behavior affects people in the short-term. That is, most studies rely on cross-sectional
data, whereas the few longitudinal studies have relatively long periods between data collections.
Typically, in these studies, networking behavior is conceptualized in a rather static way by asking
individuals to estimate how often they have shown networking behaviors in the past months or
year (e.g., Forret & Dougherty, 2001). Likewise, criteria are typically measured in a static and
aggregated manner (e.g., number of promotions received at a given point in time, cf. Wolff &
Moser, 2010). Second, previous studies have mainly focused on work-related outcomes of
networking behavior. However, networking might also affect personal outcomes, thus
transcending the workplace and entering into people’s private lives. Third, in recent years, scholars
have occasionally begun to criticize the prevailing research focus on positive consequences of
networking behavior, instead suggesting that it might also have negative consequences (e.g., Wolff
et al., 2008). However, thus far, little is known about potential costs of networking behavior. For
example, participants of a networking training reported in feedback sessions that they had realized
“that networking isn’t as easy as it looks [...] and that it requires [...] sincere effort” (de Janasz &
Forret, 2008, p. 640). This implies that people must “commit their emotional, mental, or physical
resources and energy toward networking” (Kuwabara, Hildebrand, & Zou, 2016, p. 9) which might
consequently leave people with depleted resource reservoirs.

THE DARK AND BRIGHT SIDE OF NETWORKING BEHAVIOR
29
Filling these gaps is crucial to understand how people directly experience their networking
behavior. That is, to get granular on processes of networking behavior. Further, integrating
personal as well as detrimental effects of networking behavior extends the scope of existing
networking research. Gaining knowledge about personal costs of networking behavior might help
people to come to more informed decisions about whether and how to use networking as a career
management strategy. Furthermore, it might help explain why some people typically shy away
from networking even while acknowledging how important effective networks are for career
success. I seek to tackle those research gaps by adopting a resource-theoretical approach toward
networking behavior in order to develop an integrated model of networking behavior and its effects
on energy resources and attitudinal and productive outcomes.
THE DARK AND BRIGHT SIDE OF NETWORKING BEHAVIOR
30
Resource Theories
Resources are described as central in the networking literature. Therefore, it is surprising
that scholars in the field of networking research have not yet drawn extensively on resource
theories. I seek to break new ground in networking research by taking a resource-theoretical
perspective on networking behavior. In developing a model of networking behavior, energy
resource processes, and outcomes, I build upon two well-established resource theories: That is,
conservation of resources (Hobfoll, 1989, 2001) and ego depletion (Baumeister et al., 1998)
theory.
Conservation of resources theory
The conservation of resources theory (Hobfoll, 1989, 2001) originates from the stress
literature and explains how resource loss and gain are linked to stress and well-being (Hobfoll,
2002). COR is one of the most influential integrative resource theories and has been applied
broadly in the organizational literature (cf. Halbesleben et al., 2014; Hobfoll, 2011), for instance,
to explain burnout (e.g., Hobfoll & Freedy, 1993; Lee & Ashfort, 1996). Despite its popularity,
several criticisms have emerged recently, primarily related to resources — the core concept of
COR (cf. Halbesleben et al., 2014). Addressing these critiques, in recent years several scholars
have provided new directions for COR (e.g., Halbesleben et al., 2014; ten Brummelhuis & Bakker,
2012).
In the following, I approach four aspects of COR that provide the basis for developing a
theoretical model of networking behavior, energy resource processes, and outcomes. First, I
address COR’s definition and classification of resources. Based on COR’s resource classification,
I specify the type of resources that I seek to bring into focus (i.e., energy resources). Second, I

THE DARK AND BRIGHT SIDE OF NETWORKING BEHAVIOR
31
depict COR’s principle of resource investment and how resource investments can implicate
processes of resource drain and resource gain. Drawing from this principle, I conceptualize
networking as a resource investment behavior, which should consequently lead to drain and gain
of energy resources. Third, I elaborate on outcomes of resource drain and gain in order to build a
basis for predicting outcomes of networking behavior and related energy resource processes. The
final aspect I address is the measurement and study of resource changes in the context of COR.
Thereby, I focus on a more recent innovative measurement strategy which I also adopted in the
present work.
Hobfoll (2002) loosely defines resources as “those entities that either are centrally valued
in their own right (e.g., […] health […]) or act as means to obtain centrally valued ends (e.g., […]
social support)” (p. 307). However, this definition has been criticized in several ways: First, though
Hobfoll (2001) expressly states that his definition attempts “to avoid the slippery slope of
devaluing resources until everything that is good is a resource” (p. 360), his resource definition is
broad (cf., Gorgievski, Halbesleben, & Bakker, 2011; Thompson & Cooper, 2001). Thus, nearly
anything “good” can be a resource. Second, using the term “value” implies that a resource must
lead to a positive outcome in order to be a resource, thus confounding the resource with its outcome
(Halbesleben et al., 2014). Addressing this critique, Halbesleben et al. (2014) recently refined
resources as “anything perceived by the individual to help attain his or her goals” (p. 1338).
Notably, in this goal-based definition, the emphasis is on the perception that a resource could help
an individual attain a goal, not on the perception that a resource was actually successful in
facilitating goal attainment. Therefore, resources are decoupled from their outcomes. In this vein,
the refined definition of resources helps to clarify the notion of value. However, the goal-based
definition “remains necessarily vague due to its dependence on understanding of an individuals’

THE DARK AND BRIGHT SIDE OF NETWORKING BEHAVIOR
32
goals” (Halbesleben et al., 2014, p. 1339). This still means that nearly anything could be a resource
if someone thinks it could help him or her meet a goal. As a result of these broad definitions,
resources have been interpreted in a wide variety of ways in the literature (for an overview, see
Halbesleben et al., 2014).
Organizing the volume of resources listed in the literature and deliberating on resource
processes is aided by distinguishing between different types of resources. Early on, Hobfoll (1988,
2002) classified resources into four superordinate categories: objects (e.g., a car), conditions (e.g.,
career success), personal characteristics (e.g., skills), and energies (e.g., cognitive energy). This
original four-fold categorization was then refined into a two-by-two grid based on two dimensions:
Source (contextual vs. personal resources) and transience (structural vs. volatile resources, ten
Brummelhuis and Bakker, 2012). In terms of source, contextual resources can be found in the
social environment of an individual, whereas personal resources include personal characteristics
and energies. Regarding transience, structural resources are relatively stable and tend to last for
longer, whereas volatile resources are more fleeting (ten Brummelhuis & Bakker, 2012). A
typology of resources, based on a combination of the two dimensions is presented in Figure 2.

THE DARK AND BRIGHT SIDE OF NETWORKING BEHAVIOR
33
Figure 2. Categorization of resources.
Based on ten Brummelhuis and Bakker (2012) and Hobfoll (1988, 2001).
First, conditions9 (e.g., network, career success) are positioned in the upper left quadrant
because they are durable resources found in social contexts. Research shows that networking
behavior is related to beneficial conditions, such as a large and diverse network or career success.
Second, the lower left quadrant, which is labeled “social support” represents volatile resources
offered by others. Such resources are found in the social context, but are more transient than
conditions. Networking behavior is focused on obtaining a specific form of social support, that is,
instrumental support (e.g., strategic information, task advice). Third, structural personal resources
can be found in the upper right quadrant. They are labeled constructive resources and comprise
personality traits and skills. Constructive resources (e.g., extraversion, social skills) have been
9 Note that the concept of conditions is comparable to Volmer and Wolff’s (2017) idea of
distal resources, whereas social support is similar to proximal resources (cf. Networking
resources).
THE DARK AND BRIGHT SIDE OF NETWORKING BEHAVIOR
34
mainly considered as determinants of networking behavior. Fourth, energies (e.g., self-control,10
affect) are placed in the lower right quadrant, reflecting the fact that they are highly volatile
resources inherent in a person. There are also qualitative differences between different types of
energy resources (ten Brummelhuis & Bakker, 2012): Some energies are finite in that, once they
are used, they cannot be re-used for other purposes (e.g., self-control). Other energies are temporal,
thus reflecting psychological states that come and go (e.g., affect). Scholarly understanding of
relationships between networking behavior and energies is relatively scarce. This is surprising
given that energies can have considerable downstream effects on various outcomes such as well-
being and performance (cf. Hobfoll, 2001; ten Brummelhuis & Bakker, 2012). Therefore, in the
present work, I focus on the energy effects of networking. More specifically, I investigate how
networking behavior simultaneously depletes and generates energy resources.
COR postulates the basic tenet that individuals strive to obtain, retain, foster, and protect
resources (Hobfoll, 1989, 2002). That is, people seek to protect their current resources and acquire
new resources. As an extension of the basic tenet, COR postulates the principle of resource
investment. This principle suggests that people invest resources in ways that they believe will
maximize their returns and help them achieve goals (Hobfoll, 2001). The concept of resource
investment was first put forth by Schönpflug (1985). In a series of experimental laboratory studies,
he illustrated that individuals have to expend resources to achieve goals and that such employment
often depletes these resources. Schönpflug (1985, see also Hobfoll, 1989) concluded that goal-
directed actions, although committed to taking advantage, might actually yield disadvantages in
10 Note that ten Brummelhuis and Bakker (2012) label the quadrant “energies”. A subform
of energies is physical and cognitive energy. To avoid confusion, I do not use the term energy for
cognitive energy, but refer to a specific form of cognitive energy, that is, self-control (cf.
Baumeister et al., 1998).
THE DARK AND BRIGHT SIDE OF NETWORKING BEHAVIOR
35
terms of depleted resources. In this vein, many resource investments probably involve both drain
and gain of resources (cf. Halbesleben et al., 2014; e.g., Ng & Feldman, 2012; Koopman, Lanaj,
& Scott, 2016).
I consider networking a “resource investment behavior” (Halbesleben & Wheeler, 2015, p.
1628), which consequently involves both drain and gain of energy resources. That is, people invest
energy resources in networking behavior in order to obtain resources (e.g., task advice) and achieve
long-term goals (e.g., career success). If the invested resources, however, are depletable, their
investment comes at a price (Hobfoll, 1989, 2002). One such depletable energy resource is self-
control (Baumeister et al., 1998) and networking potentially requires and thus depletes self-control
resources (cf. Ego depletion theory). Therefore, in the short-term, networking behavior might
result in a self-regulatory energy resource drain. Furthermore, COR emphasizes that personality
can serve as a resource, which influences the process of resource loss (Hobfoll, 2002; Hobfoll et
al., 1990). Hence, it seems likely that certain personality factors might buffer against the effect of
networking behavior on energy resource drain.
On the other hand, COR theory emphasizes the strategic nature of resource investment:
When individuals decide to invest resources, they believe that their resource investment yields
resource gain (Hobfoll, 2001).11 Thus, when people invest energy resources into networking, they
expect these investments to pay off, either immediately or in the future. This (anticipated) gain of
resources should also be manifested by enhanced affective energy resource states. In this vein,
11 Note that the value of a specific resource is defined as “the willingness of an individual
to invest current resources” (Halbesleben et al., 2014, p. 1344) to acquire this specific resource.
Thus, the resources individuals seek to gain should have more value to them than the resources
invested.

THE DARK AND BRIGHT SIDE OF NETWORKING BEHAVIOR
36
networking behavior might also result in an affective energy resource gain. Taken together,
networking behavior might simultaneously deplete and generate energy resources.
Outcomes of resource drain and gain processes can be distinguished as productive and
attitudinal outcomes (Cohen & Bailey, 1997; see also ten Brummelhuis & Bakker, 2012).
Productive outcomes refer to the efficient and effective creation of products and services, such as
efficiency or meeting targets. Attitudinal outcomes refer to feelings and beliefs that are valued by
the employee and the employer, such as low feelings of work-home conflicts or improved work-
related well-being (cf. ten Brummelhuis & Bakker, 2012). In general, COR theory has a strong
focus on linking resource changes to well-being (Halbesleben et al., 2014; Hobfoll, 2002; ten
Brummelhuis & Bakker, 2012). Well-being is commonly viewed as a broad umbrella term that
refers to all different forms of evaluating important aspects of one’s life (e.g., work) or emotional
experience such as emotional exhaustion or work satisfaction (Diener et al., 2017). Perceived or
actual resource loss results in impaired well-being (burnout, e.g., Lee & Ashforth, 1996). In
contrast, (perceived) resource gain leads to improved well-being because resources “facilitate
well-being indirectly by allowing individuals to pursue and attain important goals” (Diener, Suh,
Lucas, & Schmidt, 1999, p. 284). Assuming that networking behavior results in short-term energy
resource drain and gain, a crucial question is how networking behavior further influences
attitudinal (e.g., work-related well-being) as well as productive (e.g., work performance)
outcomes.
Early on, Hobfoll, Lilly, & Jackson (1992; see also Hobfoll, 1998) created an instrument
(COR-E) listing 74 resources. People rate whether they have experienced either actual loss or
threat of loss for each resource listed within a specified period of time. However, COR-E has been
utilized in very few studies (e.g., Davidson et al., 2010; Wells, Hobfoll, & Lavin, 1997): Its length,

THE DARK AND BRIGHT SIDE OF NETWORKING BEHAVIOR
37
repetitions, and the irrelevance of many of the resources to the focus of any given study have
limited its use (Halbesleben et al., 2014). A more common and efficient strategy has been to
determine and measure a small subset of resources that are most relevant to the study (Halbesleben
et al., 2014; e.g., networking resources, cf. Table 3). However, simply examining changes in a
specific resource might fall short because “the value of resources varies among individuals and is
tied to their personal experiences and situations“ (Halbesleben et al., 2014, p. 1335). Therefore,
the selection of any specific resources, particular across occupations, seems problematic. Instead,
Halbesleben et al. (2014) suggest that researchers should emphasize the subjective evaluation of
resources that is inherent in COR theory. Therefore, another strategy to address resource changes
has been to measure outcomes of resource loss or gain: Scholars have recently begun to treat
indicators of psychological well-being as markers for a change in resources (e.g., Halbesleben et
al., 2013; Janssen, Lam, & Huang, 2010; Lam, Huang, & Janssen, 2010). Research on intra-
individual well-being finds that employees are sensitive to changes in resources that can occur
over relatively short timeframes, such as over workdays or weekends (e.g., Halbesleben &
Wheeler, 2015; Binnewies, Sonnentag, & Mojza, 2010; Fritz & Sonnentag, 2005). For example, a
resource deficit finds expression in emotional exhaustion, whereas resource gain is reflected in
work engagement as the “positive antipode of burnout” (Gorgievski & Hobfoll, 2008, p. 8). In the
present work, by integrating outcomes of resource changes (e.g., well-being), I adopt this
innovative research strategy for measuring resource changes.
To recapitulate, COR categorizes resources into four broad categories: conditions, social
support, constructive resources, and energies. I focus on energy resources. I consider networking
a resource investment behavior, which should lead to a self-regulatory energy resource drain and
an affective energy resource gain. As COR states that personality influences resource loss,

THE DARK AND BRIGHT SIDE OF NETWORKING BEHAVIOR
38
personality factors might have an impact on energy resource drain through networking.
Furthermore, networking behavior will probably affect outcomes such as work-related well-being
and work performance.
THE DARK AND BRIGHT SIDE OF NETWORKING BEHAVIOR
39
Ego depletion theory
I seek to apply ego depletion theory to COR’s resource investment principle. To recall, the
resource investment principle suggests that people have to invest resources in order to gain
resources. If the invested resources, like some energy resources, are finite and diminish with use,
their investment might lead to resource depletion (Hobfoll, 2002). As illustrated by ego depletion
theory, one such depletable energy resource is self-control (Baumeister et al., 1998). In this vein,
it seems promising to apply a self-regulatory lens to COR’s resource investment principle.
Ego depletion theory is, arguably, the most popular approach to understanding self-control
and has gained considerable attention in the literature (cf. Hagger et al., 2016). Self-control refers
to the capacity for actively guiding one’s attention, emotions, impulses, and actions in order to
bring them into line with standards (e.g., social expectations) and support the pursuit of goals
(Baumeister et al., 2007). Self-control is required for all volitional behaviors demanding effortful
control over automatic responses. According to the classic strength model, self-control depends on
a generalized and finite resource (Baumeister et al., 1998, 2007). The major tenet of the strength
model is that any investment of self-control consumes and temporarily depletes people’s limited
self-control resources. This state is referred to as “ego depletion” (Baumeister et al., 1998, p.
1252).12
I argue that networking behavior requires and thus depletes self-control resources.
Networking is defined as goal-directed behavior (Gibson et al., 2014). Research shows that,
generally speaking, guiding one’s behavior towards a goal requires self-control resources (cf.
Baumeister et al., 2007; e.g., Hofmann, Friese, & Roefs, 2009; Schönpflug, 1985; Sun & Frese,
12 In line with the existing literature, I use the terms ego depletion, resource depletion, and
self-control depletion as well as self-control resources and self-regulatory resources
interchangeably.

THE DARK AND BRIGHT SIDE OF NETWORKING BEHAVIOR
40
2013; Wang, Tao, Fan, Gao, & Wie, 2015). More specifically, the goal of networking behavior is
to build, maintain, and use professional relationships. Interacting with networking contacts,
particularly when building new relationships, probably requires self-control because people have
to listen carefully to process and organize the information retrieved (cf. Baumeister et al., 2007).
In doing so, they might try to assess whether the networking partner has valuable resources to offer
and what they could provide in return. In general, socializing in a workplace context is
fundamentally different and much more effortful than socializing outside of work (Sonnentag,
2001; Trougakos, Hideg, Cheng, & Beal, 2014). Therefore, networking situations place high
demands on monitoring and altering one’s behavioral responses to conform to social norms in
professional contexts. For example, it seems likely that people actively manage their emotions
during networking interaction such as faking to enjoy a boring networking interaction or
suppressing negative emotional responses towards an unpleasant contact. Managing emotions,
however, depletes self-regulatory resources. For example, in one study, watching an emotionally
evocative film while trying either to amplify or to stifle one’s emotional response caused self-
control depletion, as compared to watching the same film without trying to control one’s emotions
(Muraven, Tice, & Baumeister, 1998). Furthermore, in professional situations such as networking
interactions (relative to friendship situations), people are particularly likely to present an
advantageous self-image (Le Barbenchon, Milhabet, & Bry, 2016). That is, people seek to actively
manage how they come across to their networking partners, also known as impression management
(Leary & Kowalski, 1990).13 Selecting the image one wants to present and choosing the strategic
behaviors by which one seeks to convey the desired impression also consumes self-regulatory
13 Following Leary and Kowalski (1990), I use the terms self-presentation and impression
management interchangeably.

THE DARK AND BRIGHT SIDE OF NETWORKING BEHAVIOR
41
resources (e.g., Karremans, Verwijmeren, Pronk, & Teitsma, 2009; cf. Leary & Kowalski, 1990;
Vohs, Baumeister, & Ciarocco, 2005). For example, an experimental study finds that self-control
is impaired for participants who are instructed to appear both “likable and competent” (Vohs et
al., 2005, p. 634) relative to those who are asked to present themselves naturally. Appearing likable
and competent could approximate to the impression many individuals seek to make in networking
situations in which “affect and instrumentality are deeply intertwined” (Bergemann, Iyengar,
Ingram, & Morris, 2017, p. 3). Taken together, networking behavior encompasses several
processes that consume self-regulatory resources, for example, managing one’s emotions and the
impression one makes. Hence, engaging in networking behavior should result in a short-term drain
of self-regulatory energy resources.
The basic approach to testing the ego depletion effect uses an experimental sequential-task
paradigm, in which participants are randomly assigned to perform an initial task that either requires
self-control or does not. After completing this first task, all participants complete a second
unrelated self-control task. Assuming that self-control is a limited and universal resource,
performing the first self-control task should deplete this resource — and therefore cause impaired
performance on the second task (Baumeister et al., 2007). Research on tasks requiring self-control
from the literature includes the following: overcoming automatic responses (e.g., Stroop task,
Bertrams, Unger & Dickhäuser, 2011), resisting temptations (e.g., candy, Hofmann et al., 2007),
and persevering at difficult or tiring tasks (e.g., squeezing a handgrip, Goto & Kusumi, 2014; for
an overview, see Baumeister et al., 2007). Furthermore, in line with the theorizing that people
experience subjective fatigue when mental resources are taxed (Cameron, 1973) several
questionnaire measures exist, employing varying conceptualizations of an individuals’ energy

THE DARK AND BRIGHT SIDE OF NETWORKING BEHAVIOR
42
state (e.g., state self-control capacity, energy, depletion, fatigue, exhaustion, etc.; for an overview,
see Trougakos et al., 2014).
Early laboratory evidence for depleted self-regulatory resources has been reported by
Baumeister and colleagues (1998) and Muraven and colleagues (1998). Likewise, a meta-analysis
of 198 independent tests (accounting for unpublished studies) found the overall effect significant
with a moderate to large average effect size (d = 0.62, Hagger, Wood, Stiff, & Chatzisarantis,
2010). However, although supported by many studies, the validity of the ego depletion paradigm
has recently become the subject of an ongoing, and unresolved, debate in the face of failed
replications and concerns about publication bias (e.g., Carter & McCullough, 2014; Carter, Kofler,
Forster, & McCullough, 2015; Hagger et al., 2016). Recently, a large-scaled multi-lab replication
study with a single protocol failed to find any evidence for the ego depletion effect. However, the
authors conclude that it “may be premature to reject the ego depletion effect altogether based on
these data alone” (Hagger et al., 2016, p. 558) and call for further research to explore the ego
depletion phenomenon (see also Baumeister & Vohs, 2016).
Another subject of debate in social psychology is the underlying mechanism of ego
depletion. That is, recent theorizing has challenged the strength model and its idea of a limited
self-control resource. In their process model of self-control, Inzlicht and Schmeichel (2012)
alternatively suggest that initial self-control might induce shifts in motivation (away from self-
regulation and toward self-gratification) and attention (away from cues signaling the need for
control and toward cues signaling reward) that temporarily undermine self-control. In a similar
vein, Kotabe and Hoffmann (2015) propose an integrative self-control theory, arguing that
depletion affects effort-related processes via three mechanisms: a) increasing desire strength, b)
decreasing control motivation, and c) decreasing control capacity. In this vein, both approaches

THE DARK AND BRIGHT SIDE OF NETWORKING BEHAVIOR
43
acknowledge that self-control at Time 1 reduces self-control at Time 2 but propose an alternative
explanation for what happens between Time 1 and Time 2. That is, they emphasize motivational
aspects relative to a lack of capacity, as suggested by the strength model of Baumeister et al (1998,
2007).
Generally speaking, the degree of specification of a theory should be adequate for its
application. For example, “it is finer in general psychology and less fine in work psychology”
(Frese & Zapf, 1994, p. 273). Based on this notion, I argue that in work and organizational
psychology, research has a stronger focus on the effect itself than on breaking down the processes.
Thus, I do not seek to shed further light on the underlying processes of ego depletion but instead
look at the effect itself in the context of networking behavior. In this vein, even though the
underlying mechanisms of the ego depletion effect have not yet been unraveled, I propose that
networking behavior results in short-term self-control depletion.

THE DARK AND BRIGHT SIDE OF NETWORKING BEHAVIOR
44
Theoretical Model of Networking Behavior, Energy Resources, and Outcomes
Integrating the networking and resources literature, I seek to develop a model capable of
explaining how networking behavior affects processes of energy resource drain (self-control
depletion) and energy resource gain (positive affect) integrally. In this vein, I primarily focus on
the question How does networking behavior affect energy resources? Additionally, the model
provides answers to the following questions: Who is more likely to experience resource drain
through networking? and, further, How do networking behavior and energy resource processes
affect attitudinal and productive outcomes? The developed model serves as a basic framework for
the ensuing empirical studies.
Considering networking research in the context of COR’s resource categorization reveals
that scholarly understanding of relationships between networking behavior and energies (e.g., self-
control, affect) is relatively scarce. This is surprising, given that energies can have considerable
downstream effects on various outcomes such as well-being and performance (Hobfoll, 2001; ten
Brummelhuis & Bakker, 2012). Therefore, I focus on energy effects of networking behavior.
Energies are defined as “highly volatile resources inherent in a person” (ten Brummelhuis &
Bakker, 2012, p. 548).
Figure 3 illustrates the developed model of networking behavior and energy resource drain
and gain, as well as attitudinal and productive outcomes. Networking behavior, which I depict as
“resource investment behavior” (Halbesleben & Wheeler, 2015, p. 1628) is at the center of the
model. Building on this, the model reflects two simultaneous main processes: The first is an energy
resource drain process, describing networking behavior as a process in which self-regulatory
energy resources are depleted. The resource drain process also explains how personality traits and
skills mitigate resource drain. The second main process represents an energy resource gain
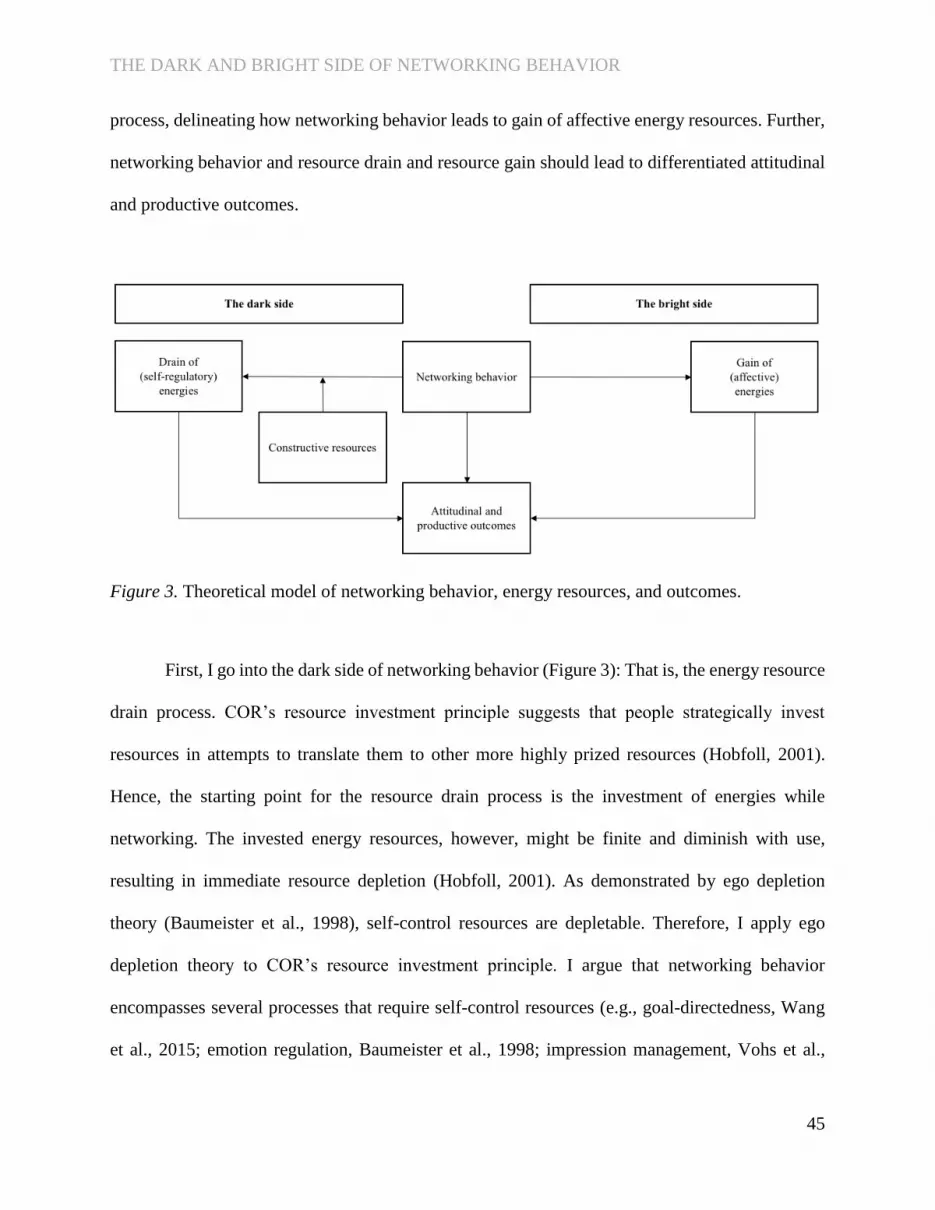
THE DARK AND BRIGHT SIDE OF NETWORKING BEHAVIOR
45
process, delineating how networking behavior leads to gain of affective energy resources. Further,
networking behavior and resource drain and resource gain should lead to differentiated attitudinal
and productive outcomes.
Figure 3. Theoretical model of networking behavior, energy resources, and outcomes.
First, I go into the dark side of networking behavior (Figure 3): That is, the energy resource
drain process. COR’s resource investment principle suggests that people strategically invest
resources in attempts to translate them to other more highly prized resources (Hobfoll, 2001).
Hence, the starting point for the resource drain process is the investment of energies while
networking. The invested energy resources, however, might be finite and diminish with use,
resulting in immediate resource depletion (Hobfoll, 2001). As demonstrated by ego depletion
theory (Baumeister et al., 1998), self-control resources are depletable. Therefore, I apply ego
depletion theory to COR’s resource investment principle. I argue that networking behavior
encompasses several processes that require self-control resources (e.g., goal-directedness, Wang
et al., 2015; emotion regulation, Baumeister et al., 1998; impression management, Vohs et al.,

THE DARK AND BRIGHT SIDE OF NETWORKING BEHAVIOR
46
2005). Consequently, networking behavior should deplete self-control resources. Furthermore, I
seek to identify boundary conditions of the proposed energy resource drain process. COR
emphasizes that personality can serve as a resource which buffers the process of resource drain
(Hobfoll, 2002; Hobfoll et al., 1990). Building on this, it seems likely that individual traits and
skills (i.e., constructive resources) determine the extent of self-control depletion.
Second, I elaborate on the bright side of networking behavior (Figure 3): That is, the energy
resource gain process. Energy resource gain processes likely begin with actual or anticipated gain
of resources (e.g., building a new networking relationship or receiving strategic information)
through networking. By definition, networking behavior is geared to building, maintaining, and
using relationships (Gibson et al., 2014). According to COR, networking relationships represent a
resource themselves (Hobfoll, 2002; ten Brummelhuis & Bakker, 2012, see also Granovetter,
1973). Additionally, using these relationships might provide further resources (e.g., strategic
information), either immediately or in the future. In this vein, building a new relationship or
utilizing a relationship means that a person gains a new resource or expects to gain a resource in
the future, whereas maintaining a relationship corresponds to fostering an established resource (cf.
Hobfoll, 2001). (Anticipated) gain of resources should also be manifested by enhanced affective
energy resource states (Halbesleben et al., 2014). Building on this, I argue that networking
behavior should lead to positive affect.
In line with COR, networking behavior and energy resource drain and gain should further
lead to differentiated attitudinal and productive outcomes (Hobfoll, 2001; ten Brummelhuis &
Bakker, 2012). Because I seek to emphasize how networking affects people’s personal lives, I
primarily focus on attitudinal outcomes (relative to productive outcomes such as work
performance). Examples of attitudinal outcomes are feelings of work-home conflict and work-
THE DARK AND BRIGHT SIDE OF NETWORKING BEHAVIOR
47
related well-being. Building on the assumption that networking behavior depletes self-regulatory
energy resources, it might further lead to increased feelings of work-life conflict (cf. ten
Brummelhuis & Bakker, 2012). In contrast, because networking behavior should lead to a gain of
affective energy resources, it should facilitate work-related well-being such as work engagement
(Diener et al., 1999). In this vein, networking behavior is likely to result in negative as well as
positive attitudinal outcomes.
To recapitulate, the proposed model emphasizes that networking behavior cuts both ways
in terms of energies, as reflected by two main processes: The first describes how networking
behavior drains self-regulatory energies and how this effect might be buffered by constructive
resources. The other main process depicts how networking behavior leads to gain of affective
energies, that is, positive affect. Further, networking behavior and energy resource drain and gain
should result in differentiated attitudinal and productive outcomes.

THE DARK AND BRIGHT SIDE OF NETWORKING BEHAVIOR
48
Overview of the Studies
The developed model of networking behavior, energy resource drain and gain and
attitudinal and productive outcomes is tested in four studies. That is, two experimental studies to
investigate in a controlled laboratory setting how networking behavior affects energy resource
drain and gain as well as two correlative field studies to replicate findings in the field and integrate
attitudinal and productive outcomes.
In Study 1, I seek to establish the energy resource drain process: That is, the postulated
self-control depleting effect of networking behavior. Further, I examine boundary conditions of
the energy resource drain process. More specifically, I seek to identify personality traits and skills,
which serve as buffers against the depleting effect of networking behavior. Therefore, I conducted
a laboratory experiment with student participants engaging in either the experimental networking
or one of two cognitive control tasks.
In the second study, I take a more nuanced look at the energy resource drain process. That
is, I consider a potential mechanism of the self-control depleting effect of networking behavior,
namely, impression management. In addition, I establish the energy resource gain process of
networking behavior, as manifested by enhanced affective states. Therefore, again, I conducted a
laboratory experiment with students, engaging in either the networking or a social control task.
Whereas the experimental designs used in Studies 1 and 2 provide high internal validity,
replicating results with a working sample in a natural networking situation strengthens external
validity.
Therefore, in Study 3, I pursue to replicate findings from the experimental studies in the
field. That is, I look at both the energy resource drain (and buffering effects of personality) and
energy resource gain process in real networking situations. Therefore, I conducted a study with

THE DARK AND BRIGHT SIDE OF NETWORKING BEHAVIOR
49
attendees of multiple networking events, performing a pre-test and a post-test (Shadish et al.,
2002).
Further, the developed model proposes that networking behavior and energy drain and gain
influence further outcomes. More specifically, networking behavior and related energy states are
assumed to affect attitudinal (e.g., work-related well-being) and productive (e.g., work
performance) outcomes throughout the day. Therefore, in Study 4, I extended the investigated time
frame to integrate outcomes that have an impact on employees’ after-work hours. In order to
investigate attitudinal and productive outcomes of networking behavior, I conducted a daily diary
study with employees who completed two online surveys per day (after work and before bedtime)
over the course of one working week.

THE DARK AND BRIGHT SIDE OF NETWORKING BEHAVIOR
50
Study 1
In Study 1, I focus on the dark side of networking behavior. That is, I seek to establish the
energy resource drain process, more specifically, the self-control depleting effect of networking
behavior. Further, I examine boundary conditions of the resource drain process. In this vein, I seek
to identify personality traits (i.e., extraversion) and skills (i.e., social skills) which serve as buffers
against the depleting effect of networking behavior.
Therefore, I conducted a controlled laboratory experiment with 206 students, engaging in
either the networking or one of two cognitive control tasks (Stroop test). I used the Stroop task as
a well-established manipulation in self-control research to validate the present experimental design
and provide reference values for high versus low depletion as a benchmark for depletion after
networking.
Hypotheses
Figure 4 depicts an overview of the hypotheses in Study 1.
Figure 4. Overview of hypotheses in Study 1.

THE DARK AND BRIGHT SIDE OF NETWORKING BEHAVIOR
51
Energy resource drain
According to the energy resource drain process, networking behavior requires and thus
depletes consumptive energy resources. This is in line with COR’s resource investment principle,
stating that individuals must invest resources in order to gain other resources (Hobfoll, 2001).
Because self-control has been found to be such a depletable energy resource (e.g., Baumeister et
al., 1998), I apply a self-regulatory lens to COR’s resource investment principle. As outlined
above, networking behavior encompasses several processes that consume self-regulatory
resources, for example, directing one’s behavior towards a goal (Wang et al., 2015) or managing
one’s emotions (e.g., Muraven et al., 1998) and impression (e.g., Vohs et al., 2005). Therefore, I
suggest that engaging in networking behavior should result in short-term depletion of self-
regulatory resources.
Hypothesis 1a: Networking behavior depletes self-control.
Furthermore, I seek to examine boundary conditions of the postulated energy resource
drain process. COR emphasizes that personality can influence the process of resource loss and gain
(Hobfoll, 2002; Hobfoll et al., 1990). In support of this notion, self-control research suggests that
dispositional behaviors (as opposed to counter-dispositional behaviors, such as introverted
behavior for extraverts, e.g., Gallagher et al., 2011; Zelenski, Santoro, & Whelan, 2012) and well-
learned behaviors (as opposed to unfamiliar and infrequently used behaviors, e.g., Vohs et al.,
2005) have less impairing effects on subsequent self-control success. Therefore, I seek to identify
personality traits and skills (i.e., constructive resources, Hobfoll, 2001; ten Brummelhuis &
Bakker, 2012), which might be able to buffer against the postulated depleting effect of networking.
First, with regard to the five-factor model of personality, studies have consistently found
that extraversion is an important predictor of networking (e.g., Forret & Dougherty, 2001; Wolff

THE DARK AND BRIGHT SIDE OF NETWORKING BEHAVIOR
52
& Moser, 2006, see antecedents). Extraverts prefer and enjoy the company of others (Mount &
Barrick, 1995) and do engage in a lot of social activities (e.g., Mehl, Gosling, & Pennebaker, 2006;
Paunonen, 2003). While introverts often experience discomfort in social situations and thus
actively try to avoid them, extraverts seek out social situations and can easily initiate contacts, also
in professional contexts (Forret & Dougherty, 2001). In this vein, I argue that, for extraverts,
networking behavior corresponds to their dispositional behavior, whereas for introverts, it
counteracts to their dispositional behavior. Consequently, extraverts should be better able to
conserve self-regulatory energy resources in networking situations.
Hypothesis 1b: Extraversion moderates the depleting effect of networking behavior.
Social skills, like extraversion, have a positive relationship with networking behavior
(Hager, 2015). Whereas extraversion taps into the quantity of people’s social activities, social
skills refer to the quality (i.e., effectiveness) of people’s social interactions (Kanning, 2009a).
Social skills enable individuals to effectively read, understand, and control social interactions
(Ferris, Witt, & Hochwarter, 2001). Socially skilled individuals have well learned to make a
positive first impression (Baron & Markman, 2000) and to establish rapport with others (Goleman,
1998). Furthermore, they are able to adjust their “behavior to different and changing situational
demands and to effectively influence and control the responses of others” (Witt & Ferris, 2003, p.
811). Hence, they feel comfortable in a wide range of social situations (Baron & Markman, 2000).
I suggest that socially skilled people (as opposed to people with low social skills) can draw on
their social skills in networking interactions. In this vein, like extraversion, social skills might
serve as a protective factor that helps mitigating depletion following networking.
Hypothesis 1c: Social skills moderate the depleting effect of networking behavior.

THE DARK AND BRIGHT SIDE OF NETWORKING BEHAVIOR
53
Method
Participants
The experiment took place at a laboratory at University of Cologne (UoC). I approached
students via various UoC mailing lists and UoC-related Facebook groups. Overall, 206 students
participated for monetary compensation (8 €) or course credit. The sample consisted of 149 (72%)
female and 57 (28%) male subjects (cf. Table 5). The average age was 24.81 years (SD = 4.47).
Participants came from a variety of fields of study; most frequent were psychology (25%),
geography (9%), and pedagogics (7%).
Procedure
One week before showing up at the laboratory, all participants filled in an online
background survey and chose a date for the experiment on site.14 Upon arrival at the laboratory,
all participants read and agreed to an informed consent. Those in the networking condition arrived
in groups of eight and were instructed to simulate a networking event with assigned roles for 20
minutes.15 Participants in the control conditions arrived in groups of up to five persons and were
seated in separate cubicles where they completed a PC-based Stroop task for 20 minutes.16 After
engaging in the respective task (Networking or Stroop), all subjects were seated or stayed in
14 Due to the different group sizes in the conditions, I had to assign dates for the respective
conditions beforehand. When choosing a date, participants had no idea which condition they
registered for and I made sure they did not enroll together with acquaintances. The experiment
took place from Monday till Friday between 12 am and 2.30 pm. I made sure that days of the week
and times of day randomly varied among the conditions.
15 The time frame of 20 minutes was based on a study using a 20-minutes group discussion
to test the effects of extraverted behavior on extraverts and introverts (Zelenski et al., 2012). 16 The laboratory was equipped with only five PCs able to run the Software required for
the Stroop tests.
THE DARK AND BRIGHT SIDE OF NETWORKING BEHAVIOR
54
separate cubicles to undertake an ostensible product test for five minutes, tasting and rating candy
as a measure of self-control depletion. Afterwards, participants self-rated their self-control and
filled out a brief post-questionnaire. Then all participants were thanked and paid. After data
collection was over, they were debriefed via email.
Measures
Experimental manipulation
Experimental condition
The networking (NW) manipulation was derived from a networking training task (de
Janasz & Forret, 2008), incorporating several behaviors relevant in networking situations (e.g.,
greeting one another with a handshake, articulating an elevator pitch, exchanging relevant
resources with others). These behaviors are also covered by items in networking scales (e.g., “At
company events or outings, I approach colleagues I haven’t met before“, “If I want to meet a
person who could be of professional importance to me, I take the initiative and introduce myself”,
and “At informal occasions, I exchange professional tips and hints with colleagues from other
departments”, Wolff et al., 2011).
Participants (N = 103)17 received written instructions (Appendix A) to simulate a
networking event with assigned roles. Role descriptions (see Table 4) specified their profession
(e.g., doctor, lawyer, etc.), two resources they were in need of (e.g., finding a job or a business
17 Because I had no comparable effect size that I could draw on for estimating the postulated
effect, I used a relatively large sample of NW participants to ensure adequate power. Using a post-
hoc power analysis in G*power (Faul, Erdfelder, Buchner, & Lang, 2009; d = 0.62, α = 0.05, one-
tailed), I determined a power of 98% for the difference between NW and LD Stroop participants
regarding self-control depletion (candy consumption).

THE DARK AND BRIGHT SIDE OF NETWORKING BEHAVIOR
55
partner etc.), and two resources they had to offer (e.g., the lawyer had judicial expertise and
navigation knowledge). As can be seen in the role descriptions, doctor and lawyer could help each
other reciprocally, but both needed to find another interaction partner to receive the second
resource needed. Furthermore, if they met people who did not provide relevant resources or
requested the resources offered, they could try to help by directing them to others who might be
able to help („If I can’t help a colleague from another department directly, I will keep an eye out
for him/her”, Wolff et al., 2011). The explicit task objective was to find the two unknown target
persons who had the resources needed and at the same time to make a reputable and favorable
impression. Participants were informed that the one person who successfully found both target
persons and was nominated by most of the seven interaction partners as the “best networker” would
receive a bonus of 10€ upon completion of the experiment. Thus, networking “successfully” during
the experimental situation was more relevant for participants. Also, the extrinsic reward is in line
with typical “networking events highlight[ing] extrinsic rather than intrinsic motivations of
participants, emphasizing the end goal” (Bergemann et al., 2017, p. 8). After reading the
instructions and preparing their roles for three minutes, participants started with the networking
group task.

THE DARK AND BRIGHT SIDE OF NETWORKING BEHAVIOR
56
Table 4. Sample Roles in the Networking Condition
Sample Roles in the Networking Condition
Doctor.
You are a successful surgeon, but currently you fear that a patient may sue you for medical
malpractice. This has never happened to you before and you may need an experienced lawyer.
Furthermore, you are an engaged SPD party member.
Lawyer.
You are an experienced lawyer pleading many influential and prosperous clients. You love
sailing and toy with the idea of buying a boat. You may need advice from an expert. By the way,
you do have an ingrown toenail, which most likely needs surgery, but you are a little
embarrassed talking about it.
Control conditions
Two control groups (Ntotal = 103)18 engaged in a modified version of the original Stroop
task (Stroop, 1935). In psychological testing, the Stroop test is widely used to assess an
individuals’ selective attention, cognitive flexibility and processing speed as well as executive
functions (e.g., Golden, 1978; MacLeod, 1991). Also, the Stroop task is a well-established
paradigm in ego depletion research and meta-analytical research has confirmed that the Stroop
task is a valid self-control manipulation (d = 0.40, Hagger et al., 2010). I used the control groups
for two reasons: First, I sought to validate the present experimental design by replicating findings
from prior ego depletion research. Second, I needed reference values for high versus low depletion
18 Using an a priori power analysis in G*power (Faul et al., 2009; d = 0.72, power: 95%,
one-tailed), I computed an intended sample size of 43 subjects per Stroop condition. The effect
size was based on a study by Imhoff et al. (2013), using the modified Stroop tasks to manipulate
depletion and candy consumption as dependent measure of self-control depletion.

THE DARK AND BRIGHT SIDE OF NETWORKING BEHAVIOR
57
in order to benchmark the level of depletion after networking. This is in line with self-control
research using experimental designs in which control participants engage in a task other than that
administered to the experimental depletion group (e.g., Burkley, 2008, Study 3; Muraven et al.,
1998, Study 3).
On a personal computer, using the software “Inquisit Lab”, participants were shown color
words written in colored fonts.19 They were instructed to indicate the color font of the presented
word by pressing the corresponding colored key as fast as they could without making many errors
(Appendix B). Stimuli were presented until participants responded; if they had not responded after
200 ms, they were requested to react faster (see Figure 5). In the low depletion condition (N = 52),
all color names were presented in the corresponding color font (e.g., ‘red’ appeared in red font).
In the high depletion condition (N = 51), the meaning of the word never matched the color font, so
that the automatic response to press the key corresponding to the meaning of the word had to be
inhibited (see Figure 5). In addition, participants were asked to press the key corresponding to the
meaning of the word if the word was presented in blue font (25% of the trials), thus preventing
them from strategically ignoring the meaning of the words. Participants were informed that the
program recorded their accuracy and reaction time and that, out of eight participants, the person
with the lowest error rate would receive a bonus of 10 €. In both conditions, participants had to
complete four practice trials correctly before starting the Stroop task.
19 On average, during the 20-minutes period, participants in the LD Stroop condition were
presented 463.27 stimuli (SD = 22.20) and in the HD Stroop condition, participants averaged out
at 422.22 presented stimuli (SD = 23.75).

THE DARK AND BRIGHT SIDE OF NETWORKING BEHAVIOR
58
Figure 5. Sample sequence of the Stroop task (HD Stroop condition).
Screening for univariate outliers regarding Stroop performance, I identified each one
participant in both Stroop conditions with an error rate that was more than three standard deviations
above the overall mean.20 All analyses reported were conducted both with and without those two
Stroop outliers. However, because results did not substantively differ, the analyses reported below
are based on the full sample. In general, this procedure is more conservative, because standard
deviations are higher and it is therefore more difficult to reach significance.
Dependent variables
Self-control depletion (candy consumption)
Food taste tests are „frequently used dependent tasks“ (Hagger et al., 2010, p. 513) in self-
control research. The consumption of unhealthy, high-calorie food (e.g., candy) serves as a prime
example of impulsive behavior and thus a failure of self-control to resist temptation. Based on
previous findings that people are particularly likely to grab snacks when self-control is depleted
20 LD Stroop error rate: M = 2.31%, SD = 1.85; HD Stroop error rate: M = 21.06%, SD =
9.65.

THE DARK AND BRIGHT SIDE OF NETWORKING BEHAVIOR
59
(e.g., Hofmann, Rauch, & Gawronski, 2007; Imhoff, Schmidt, & Gerstenberg, 2014; meta-
analysis: d = 0.50, Hagger et al., 2010), I used candy consumption as a measure of depletion. A
bowl containing 124 grams of chocolate coated peanuts (similar to M&M’s) was placed in front
of each participant. Participants were instructed to taste the product and rate it on a variety of
dimensions such as naturalness or sweetness. During the tasting process, participants listened to
“neutral” music (e.g., Beethoven’s Violin Concerto; see Mitterschiffthaler, Fu, Dalton, Andrew,
& Williams, 2007) to drown out chewing noises. After five minutes, the candy was taken out of
participants’ reach. Candy consumption was later determined by subtracting the amount left of the
pre-consumption weight. More candy consumption indicated higher levels of depletion of self-
control.
Two participants in the networking and one participant in the LD Stroop condition reported
to be allergic or vegan and therefore had to be excluded from all analyses on candy consumption.
Two participants in the Stroop conditions did not eat any candy without reporting a reason.
Screening for univariate outliers (SD > 3) regarding candy consumption, I identified four
participants in the networking condition who were more than three standard deviations above the
overall mean (M = 22.34, SD = 20.07, see Table 6). All analyses reported in the subsequent
discussions were conducted both with and without the six outliers regarding candy consumption
(.00 or > 82.55). However, because results did not substantively differ, I report results based on
the full sample.
Self-Control (self-rated)
I used the brief State Self-Control Capacity Scale (SSCCS; Ciarocco, Twenge, Muraven,
& Tice, 2004; German version: Bertrams et al., 2011) to assess participants’ subjective self-control

THE DARK AND BRIGHT SIDE OF NETWORKING BEHAVIOR
60
(Appendix C). Bertrams et al. (2011) found the scale to be one-dimensional and reliable (.85 < α
< .91). Furthermore, the scale showed the expected relations with behavioral measures of self-
control (e.g., Stroop test), thus supporting its validity. I used nine items from the original ten-item
scale; The item „If I were tempted by something right now, it would be very difficult to resist”
was removed because participants might connect it to their previous candy consumption and in
previous validation studies this item consistently showed the lowest discriminative power
(Bertrams et al., 2011). Sample items of the SSCCS include “I feel drained,” (reversed) “I feel like
my willpower is gone” (reversed), and “I would want to quit any difficult task I was given”
(reversed). Participants reported their self-control on a 7-point Likert-type scale ranging from 1
(strongly disagree) to 7 (strongly agree), α = .88.
Moderating variables
Extraversion
In the general online survey prior to the experiment on site, I measured extraversion with
twelve items derived from the NEO-FFI (Costa & McCrae, 1995; German version: Borkenau &
Ostendorf, 2008; Appendix D). The NEO-FFI is one of the most widely used self-report
instruments to assess the Five-Factor Model and multiple studies provide evidence for its validity
(e.g., Costa & McCrae, 1995; Kanning, 2009b). Sample items are “I like to have a lot of people
around me”, “I really enjoy talking to people”, and “I usually prefer to do things alone” (reversed).
Participants used a five-point Likert response format (1 = strongly disagree to 5 = strongly agree)
to rate their level of extraversion, α = .82.

THE DARK AND BRIGHT SIDE OF NETWORKING BEHAVIOR
61
Social Skills
In the general online survey, I measured social skills with a seven-item scale (Ferris et al.,
2001; Appendix E). Ferris et al. (2001) and Witt and Ferris (2003) report good reliabilities of the
scale (Cronbach’s Alphas: .79 - .89). Sample items are “In social situations, it is always clear to
me exactly what to say and do”, “I am able to adjust my behavior and become the type of person
dictated by any situation.”, and “I am particularly good at sensing the motivations and hidden
agendas of others”. Participants used a 5-point Likert scale ranging from 1 (strongly disagree) to
5 (strongly agree), α = .73.
Control variables
Regarding the use of control variables, scholars have identified several problems in existing
research, including a) „automatic or blind inclusion of control variables“ (Spector & Brannick,
2011, p. 287), b) “unclear descriptions of measures and methods, and c) incomplete reporting”
(Becker, 2005, p. 274). Following the author’s (Becker, 2005; Spector & Brannick, 2011)
recommendations, a) I use rational explanations based on theory and empirical results to drive the
inclusion of controls in the four studies. Furthermore, b) I describe how each control was measured
and how it was included in the statistical analysis and c) I report standard descriptive statistics,
reliabilities, and correlations as well as betas and significance levels of the included controls.
Following Becker (2005), I have run all analyses both with and without the assessed control
variables. If results did not differ with or without controlling for a certain control variable, I report
the final analyses without this variable.
THE DARK AND BRIGHT SIDE OF NETWORKING BEHAVIOR
62
In all analyses on behavioral self-control depletion, I included several control variables that
might affect candy consumption and have been included as controls in prior studies using candy
consumption as dependent measure (e.g., Hofmann et al., 2009; Imhoff et al., 2014).
Liking of the product
Liking of the product was assessed with the single-item measure (‘‘How much do you like
the product?”), which was embedded in a set of questions administered during the product test.
Hunger
In the post-test, participants were asked if they had been hungry before they entered the
experiment.
Body Mass Index
In the online survey, participants indicated their height and weight so that I could calculate
their BMI. However, because results did not substantively differ with or without including BMI
as a control variable, I report results without controlling for BMI.
Demographics
Furthermore, I assessed participants’ gender, age and field of study in the online survey.
However, because results did not substantively differ with or without controlling for demographic
variables, I report results without controlling for those variables.

THE DARK AND BRIGHT SIDE OF NETWORKING BEHAVIOR
63
Results
Table 5 displays the descriptive statistics, reliabilities, and correlations of all study
variables. Allocation of participants to the experimental conditions was independent of age, F(1,
204) = 0.45, p = .503. Also, gender distribution did not differ between the three conditions, χ2 =
.043, p = .337, and participants in the three conditions did not differ regarding social skills, F(1,
204) = 1.15, p = .285. In contrast, mean levels of extraversion significantly differed between the
groups, F(1, 204) = 4.84, p = .029. Participants in the LD Stroop condition (M = 3.18, SD = 0.61),
reported marginally lower extraversion than HD Stroop participants (M = 3.40, SD = 0.54), t(101)
= 1.94, p = .056, and significantly lower extraversion than networking participants, (M = 3.40, SD
= 0.52), t(153) = 2.35, p = .02. However, in the present context, it seems not problematic that
participants in the NW condition were slightly above the overall mean regarding their extraversion.
Assuming that extraversion buffers against depleting effects in the NW condition, comparing the
depletion group means is rather conservative when NW participants are more extraverted. Also,
controlling for extraversion did not substantively change the effects (see Table 8).
Importantly, the three experimental conditions did not significantly differ with regard to
BMI, F(1, 201) = 0.19, p = .892, reported hunger, F(1, 201) = 1.26, p = .263, and liking of the
product, F(1, 200) = 0.87, p = .353.
Contrasting expectations, depletion of self-control (candy consumption) and self-control
(self-rated) did not show a significant (negative) correlation, neither for the whole sample, r = .03,
p = .728 (see Table 5), nor when examining the conditions separately, networking: r = -.13, p =
.19, HD Stroop: r = .07, p = .608, LD Stroop: r = .05, p = .732.

64
Table 5. Descriptive Statistics, Reliabilities, and Correlations between Study Variables
Descriptive Statistics, Reliabilities, and Correlations between Study Variables
Variable M SD 1 2 3 4 5 6 7 8 9 10 11
1. Networkinga 0.50 0.50
2. HD Stroopa 0.25 0.43
3. LD Stroopa 0.25 0.44
4. Genderb 0.28 0.45 -.12† .17** .04
5. Age 24.81 4.40 -.09 .11 -.01 .21**
6. Extraversion 3.35 0.56 .10 .06 -.17** .03 -.07 (.82)
7. Social skills 3.51 0.49 .00 .14* -.14* .04 .03 .39*** (.73)
8. Hungerc 0.34 0.47 -.10 .09 .03 .04 .05 .01 .02
9. Product liking 5.36 1.24 -.08 .07 .03 .07 -.05 .23*** .23*** .20**
10. Self-controld 5.39 1.01 .31*** -.05 .31*** -.08 -.03 .39*** .12† -.17* -.00 (.88)
11. Self-control
depletione
22.34 20.07 .20** -.02 -.22** .31*** .08 .09 -.06 .23*** .23*** .03
Note. N = 206. Cronbach’s alphas are listed on the diagonal.
aReference groups: remaining conditions. bGender (0 =female, 1 = male). cHunger (0 = no, 1 = yes). dSelf-control (self-rated). eSelf-
control depletion (candy consumption in grams).
† p ≤ .10. * p ≤ .05. ** p ≤ .01.*** p .001.

THE DARK AND BRIGHT SIDE OF NETWORKING BEHAVIOR
65
Table 6 displays results for the experimental and control groups regarding the dependent
self-control measures. To examine the substantive hypotheses, I conducted hierarchical regression
analyses. As recommended by Cho and Abe (2013), all hypotheses were tested in a one-tailed way.
I report results separately for the two dependent measures of self-control.
Table 6. Descriptive Statistics for Dependent Measures
Descriptive Statistics for Dependent Measures
Variable Condition N M SD
Self-Control depletiona NW 101 26.38 23.00
Stroop HD 51 21.76 19.26
Stroop LD 51 14.90 10.49
Self-controlb NW 103 5.70 0.87
Stroop HD 51 5.31 0.92
Stroop LD 52 4.86 1.13
Note. aSelf-Control depletion (candy consumption in grams).
bSelf-control (self-rated).
Energy resource drain
Self-control depletion (candy consumption)
Hypothesis 1a predicted that networking behavior would deplete self-control resources. In
Step 1, I added the control variables hunger and liking of the product. Both control variables were
positively correlated with candy consumption (see Table 5), and had significant main effects on
candy consumption (see Table 7). In Step 2, I added the dummy-coded conditions of NW and HD
Stroop (with LD Stroop serving as reference category). Adding the conditions in Step 2

THE DARK AND BRIGHT SIDE OF NETWORKING BEHAVIOR
66
significantly increased the amount of variance explained, ΔR2 = .07, p .001. Testing HD Stroop
(vs. LD Stroop) was to test the validity of the Stroop paradigm, as participants in the HD Stroop
condition should consume more candy than participants in the LD Stroop condition. The regression
coefficient of HD Stroop was positive and significant, β = .14, p = .044, indicating that, as
expected, HD Stroop participants were more depleted than LD Stroop participants. As can be seen
in Table 7 and in line with expectations, the regression coefficient of networking was positive and
significant as well, β = .32, p .001, thus confirming that participants in the networking condition
were more depleted than participants in the LD Stroop21 condition (see Figure 6).22 Thus,
Hypothesis 1a received support.
21 I also tested if NW and HD Stroop participants differed regarding self-control depletion.
The regression coefficient of NW (with HD Stroop serving as reference category) was positive
and marginally significant, β = .16, p = .054. Thus, NW participants were marginally more depleted
than HD Stroop participants. 22 One-tailed tests.

THE DARK AND BRIGHT SIDE OF NETWORKING BEHAVIOR
67
Table 7. Regression of Self-Control Depletion on Condition
Regression of Self-control Depletion on Condition
Steps
Unstandardized
Coefficients
Standardized
Coefficients
R2
ΔR2
b SE β
1 - - - - .09***
Hungera 8.03 2.96 .19** - -
Product liking 3.19 1.13 .20** - -
2 - - - - .16*** .07***
Hunger 8.64 2.87 .20** - -
Product liking 3.43 1.09 .21** - -
Networking 12.84 3.24 .32*** - -
HD Stroop 6.43 3.75 .14* - -
Note. N = 203. Dependent variable: Candy consumption in grams.
aHunger (0 = no, 1 = yes).
** p .01. *** p .001.
Figure 6. Differences between conditions in self-control depletion.
Self-control depletion: Candy consumption in grams. * p ≤ .05. *** p .001.

THE DARK AND BRIGHT SIDE OF NETWORKING BEHAVIOR
68
Hypothesis 1b predicted a buffering effect of extraversion for the networking group; in
contrast, in the Stroop conditions, extraversion should not affect depletion of self-control through
networking. To test this hypothesis, I constituted a new dummy-coded variable (networking vs.
LD/HD Stroop combined). I used Model 2 (see Table 8), which included the main effects of
networking (vs. HD and LD Stroop combined)23 and extraversion as a baseline. Notably, the main
effect of networking on self-control depletion persisted to be significant after adding extraversion.
In the next step, I added the cross-product of Networking × Extraversion. Results showed that the
interaction term reached significance, β = -.24, p = .004, and significantly increased the amount
of variance explained, ΔR2 = .03, p = .007.
23 Note that the moderating effect of extraversion in the NW condition remained significant
when considering LD and HD Stroop conditions separately.
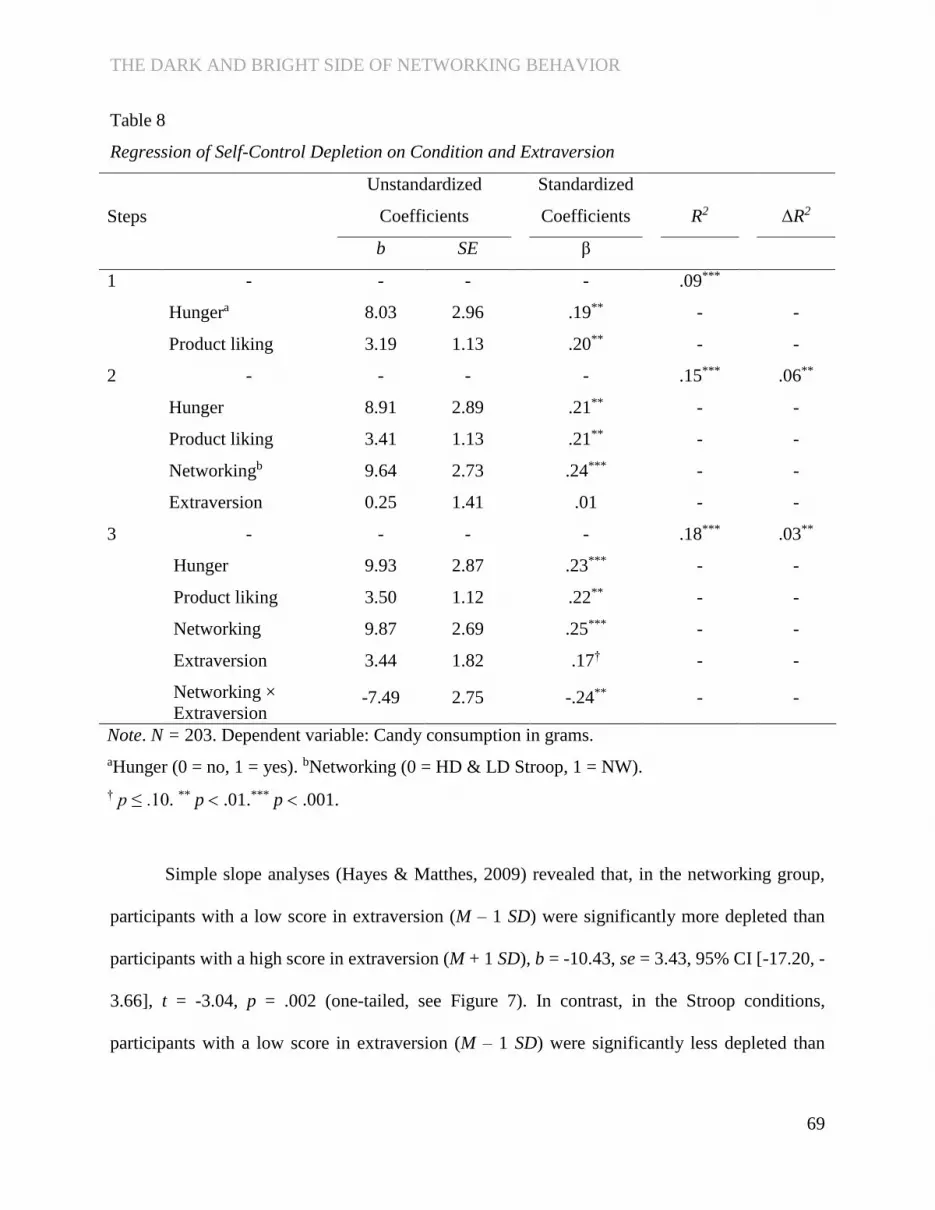
THE DARK AND BRIGHT SIDE OF NETWORKING BEHAVIOR
69
Table 8. Regression of Self-Control Depletion on Condition and Extraversion
Regression of Self-Control Depletion on Condition and Extraversion
Steps
Unstandardized
Coefficients
Standardized
Coefficients
R2
ΔR2
b SE β
1 - - - - .09***
Hungera 8.03 2.96 .19** - -
Product liking 3.19 1.13 .20** - -
2 - - - - .15*** .06**
Hunger 8.91 2.89 .21** - -
Product liking 3.41 1.13 .21** - -
Networkingb 9.64 2.73 .24*** - -
Extraversion 0.25 1.41 .01 - -
3 - - - - .18*** .03**
Hunger 9.93 2.87 .23*** - -
Product liking 3.50 1.12 .22** - -
Networking 9.87 2.69 .25*** - -
Extraversion 3.44 1.82 .17† - -
Networking ×
Extraversion -7.49 2.75 -.24** - -
Note. N = 203. Dependent variable: Candy consumption in grams.
aHunger (0 = no, 1 = yes). bNetworking (0 = HD & LD Stroop, 1 = NW).
† p ≤ .10. ** p .01.*** p .001.
Simple slope analyses (Hayes & Matthes, 2009) revealed that, in the networking group,
participants with a low score in extraversion (M – 1 SD) were significantly more depleted than
participants with a high score in extraversion (M + 1 SD), b = -10.43, se = 3.43, 95% CI [-17.20, -
3.66], t = -3.04, p = .002 (one-tailed, see Figure 7). In contrast, in the Stroop conditions,
participants with a low score in extraversion (M – 1 SD) were significantly less depleted than

THE DARK AND BRIGHT SIDE OF NETWORKING BEHAVIOR
70
participants with a high score in extraversion (M + 1 SD), b = 6.05, se = 2.91, 95% CI [0.30, 11.80],
t = 2.08, p = .020 (one-tailed). Thus, results confirmed Hypothesis 1b.
Figure 7. Simple slopes for the interaction between condition and extraversion on self-control
depletion.
Self-Control depletion: Candy consumption in grams.
I employed the same procedure to test Hypothesis 1c, suggesting that social skills buffer
against the depleting effect of networking. Again, I used a dummy-coded variable for condition
(networking vs. LD/HD Stroop combined).24 In support of Hypothesis 1b, I found a significant
increase in the amount of variance explained after adding the cross-product of social skills and
networking in Step 3, ΔR2 = .03, p = .007. In addition, the interaction term was significant, β = -
.24, p = .004 (see Table 9).
24 Note that the moderating effect of social skills in the NW condition remained significant
when considering LD and HD Stroop conditions separately.
0
5
10
15
20
25
30
35
40
Extraversion -1SD Extraversion M Extraversion + 1SD
Sel
f-C
on
tro
l D
eple
tio
n
Networking condition Stroop conditions

THE DARK AND BRIGHT SIDE OF NETWORKING BEHAVIOR
71
Table 9. Regression of Self-Control Depletion on Condition and Social Skills
Regression of Self-Control Depletion on Condition and Social Skills
Steps
Unstandardized
Coefficients
Standardized
Coefficients
R2
ΔR2
b SE β
1 - - - - .09***
Hungerb 8.03 2.96 .19** - -
Product liking 3.19 1.13 .20** - -
2 - - - - .16*** .07***
Hunger 8.68 2.87 .21** - -
Product liking 3.94 1.12 .24*** - -
Networking 9.87 2.68 .25*** - -
Social skills -2.45 1.40 -.12† - -
3 - - - - .19*** .03**
Hunger 8.55 2.82 .20** - -
Product liking 4.13 1.11 .26*** - -
Networking 10.17 2.64 .25*** - -
Social skills 0.71 1.79 .04 - -
Networking ×
Social Skills -7.37 2.69 -.24** - -
Notes. N = 203. Dependent variable: Candy consumption in grams.
aHunger (0 = no, 1 = yes). bNetworking (0 = HD & LD Stroop, 1 = NW).
† p ≤ .10. ** p .01.*** p .001.
As can be seen in Figure 8, participants in the networking group, participants with a low
score in extraversion (M – 1 SD) were significantly more depleted than participants with a high
score in extraversion (M + 1 SD), b = -13.68, se = 4.24, 95% CI [-22.04, -5.33], t = -3.23, p ≤ .001
(one-tailed, see Figure 8). In contrast, in the Stroop conditions, participants with a low score in
social skills (M – 1 SD) did not significantly differ from participants with a high score in social

THE DARK AND BRIGHT SIDE OF NETWORKING BEHAVIOR
72
skills (M + 1 SD), b = 1.46, se = 3.69, 95% CI [-5.81, 8.73], t = 0.40, p = .351 (one-tailed). Thus,
I found support for Hypothesis 1c.
Figure 8. Simple slopes for the interaction between condition and social skills on self-control
depletion.
Self-control depletion: Candy consumption in grams.
Self-Control (self-rated)
Hypothesis 1a predicted that networking behavior would deplete self-control. The
regression of self-control on condition resulted in a significant outcome, F(2,203) = 13.91, p
.001. However, as shown in Table 10, the regression coefficient of networking was positive and
significant, β = .42, p .001, showing that, contrasting the hypothesis, participants in the
networking condition reported higher levels of self-control than participants in the LD Stroop
condition. Likewise, the regression coefficient of HD Stroop was positive and significant, β = .19,
p = .009, showing that, also contrasting predictions, participants in the HD Stroop condition
reported higher levels of self-control than participants in the LD Stroop condition. Thus, in contrast
0
5
10
15
20
25
30
35
40
Social skills - 1 SD Social skills M Social skills + 1 SD
Sel
f-C
on
tro
l D
eple
tio
n
Networking condition Stroop conditions
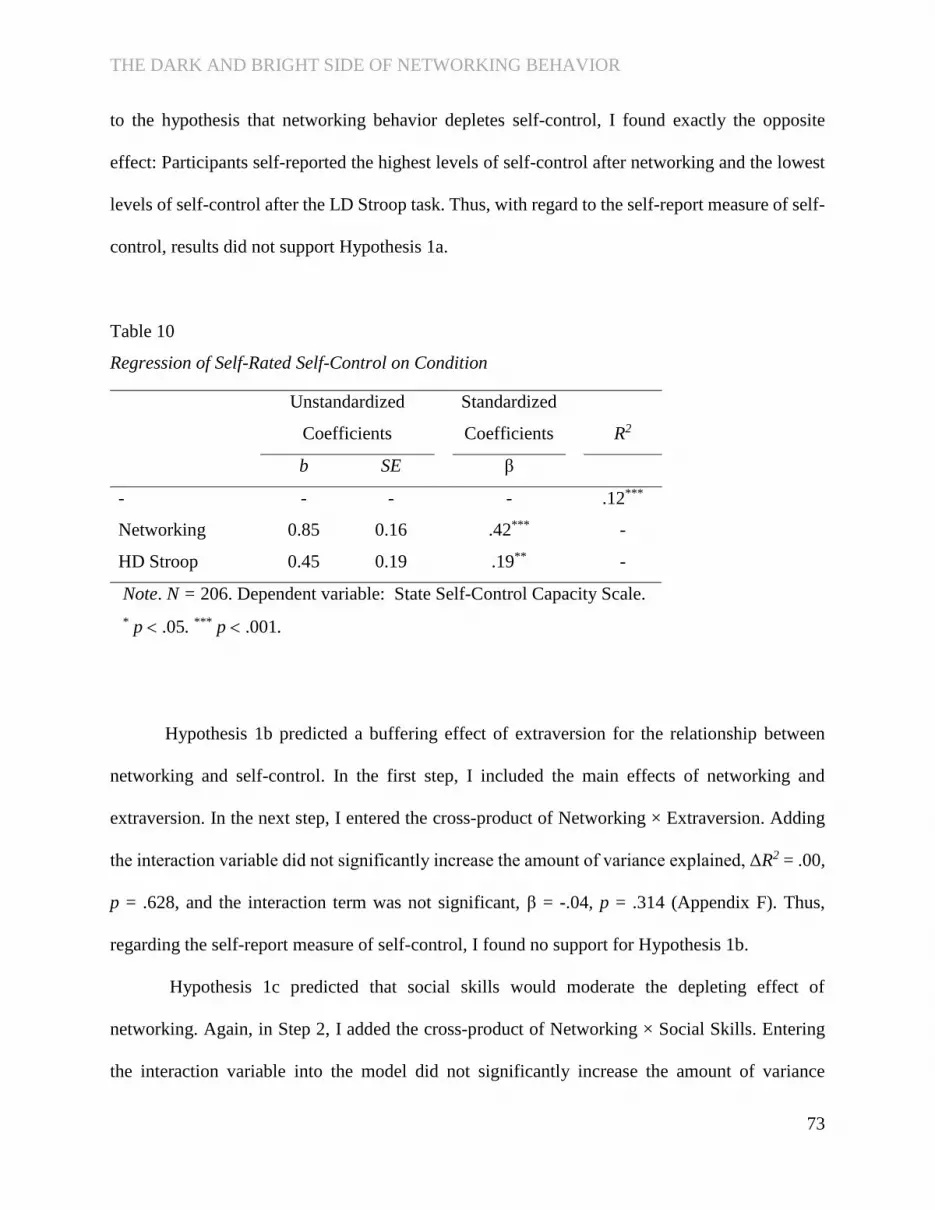
THE DARK AND BRIGHT SIDE OF NETWORKING BEHAVIOR
73
to the hypothesis that networking behavior depletes self-control, I found exactly the opposite
effect: Participants self-reported the highest levels of self-control after networking and the lowest
levels of self-control after the LD Stroop task. Thus, with regard to the self-report measure of self-
control, results did not support Hypothesis 1a.
Table 10. Regression of Self-Rated Self-Control on Condition.
Regression of Self-Rated Self-Control on Condition
Hypothesis 1b predicted a buffering effect of extraversion for the relationship between
networking and self-control. In the first step, I included the main effects of networking and
extraversion. In the next step, I entered the cross-product of Networking × Extraversion. Adding
the interaction variable did not significantly increase the amount of variance explained, ΔR2 = .00,
p = .628, and the interaction term was not significant, β = -.04, p = .314 (Appendix F). Thus,
regarding the self-report measure of self-control, I found no support for Hypothesis 1b.
Hypothesis 1c predicted that social skills would moderate the depleting effect of
networking. Again, in Step 2, I added the cross-product of Networking × Social Skills. Entering
the interaction variable into the model did not significantly increase the amount of variance
Unstandardized
Coefficients
Standardized
Coefficients
R2
b SE β
- - - - .12***
Networking 0.85 0.16 .42*** -
HD Stroop 0.45 0.19 .19** -
Note. N = 206. Dependent variable: State Self-Control Capacity Scale.
* p .05. *** p .001.

THE DARK AND BRIGHT SIDE OF NETWORKING BEHAVIOR
74
explained, ΔR2 = .00, p = .707, and the interaction term was not significant, β = -.05, p = .354
(Appendix F). Thus, with regard to the self-report measure of self-control, I found no support for
Hypothesis 1c.
Discussion
In Study 1, I focused on the dark side of networking. That is, I sought to establish the
energy resource drain process, more specifically, the self-control depleting effect of networking
behavior. Further, I examined boundary conditions of the energy resource drain process: That is, I
identified personality traits (i.e., extraversion) and skills (i.e., social skills) which serve as buffers
against the depleting effect of networking behavior. Therefore, I conducted a controlled laboratory
experiment with 206 students, engaging in either the networking or one of two control tasks.
I found initial support for the hypothesis that networking has a dark side in terms of energy
resource drain. That is, networking behavior depletes self-control resources (as benchmarked with
two well-established cognitive control conditions). More specifically, participants in the
networking condition consumed significantly more candy than participants in the low depletion
Stroop condition. Also, as predicted, extraversion and social skills moderated the depleting effect
of networking. That is, following networking, participants with high levels in extraversion or social
skills were less depleted (consumed less candy) than participants with low levels in extraversion
or social skills.
However, I found no support for the hypotheses regarding self-rated self-control: Opposing
expectations, participants in the networking condition reported the highest levels of self-control,
whereas LD Stroop participants reported the lowest levels of self-control. Furthermore, the two
measures of self-control did not show a significant correlation (cf. Table 5). Theoretically, non-

THE DARK AND BRIGHT SIDE OF NETWORKING BEHAVIOR
75
significant correlations and different outcomes on the two measures of self-control can be due to
several reasons, for example, (a) method-related characteristics, (b) motivational biases in self-
reports, (c) lack of introspective access, or (d) complete independence of the underlying constructs
(cf. Hofmann, Gawronski, Gschwender, Le, & Schmidt, 2005).
First, method-related factors might be rooted in the experimental procedure. After the
respective depletion manipulation (NW or Stroop task), participants first engaged in the product
test for five minutes. After that, they filled out the State Self-Control Capacity Scale. However,
prior studies show that even short periods of rest or relaxation might help restoring self-control
resources after depletion and thus minimize the deleterious effects of depletion (Baumeister &
Heatherton, 1996; Muraven & Baumeister, 2000). For example, “when depleted participants
received a 10-minute period between regulatory tasks, their subsequent performance equaled non-
depleted participants” (Tyler & Burns, 2008; see also Oaten, Williams, Jones, & Zadro, 2008).
Thus, participants might have been able to replenish their self-control resources during the product
test. However, a recovery effect cannot explain the reverse findings: Following networking,
participants first consumed the largest amount of candy (and LD Stroop participants ate least),
whereas they then reported the highest levels of self-control (LD Stroop participants the lowest).
That provokes the question if eating more candy might have had a positive effect on subsequent
self-control ratings. However, conversing this idea, I found no significant main effect of candy
consumption, β = .03, p = .728, on self-rated self-control, F(1, 201) = 1.21, p = .728. Thus, there
is little evidence that the product test that was inserted in between the depletion manipulation and
the self-control questionnaire allowed participants for replenishing their resources or that the
amount of consumed sweets had an impact on proximate self-control ratings.

THE DARK AND BRIGHT SIDE OF NETWORKING BEHAVIOR
76
Alternatively, the effects might be traced back to characteristics of the three initial
depletion manipulations (NW, HD & LD Stroop). In fact, the NW task was very different from the
Stroop tasks. Generally, the more differences between control and experimental group, the more
likely it is that the two groups rate the tasks fundamentally different (e.g., exciting vs. boring),
which might be reflected by self-reports. Particularly with regard to the LD Stroop condition,
participants might have experienced the task as very monotonous and boring. Referring to the non-
depleting control tasks in self-control research, Hagger et al. (2010) state that “some of the “easier”
versions of these tasks […] are tedious and boring” (p. 500). However, I can only speculate if, for
example, participants felt that the LD Stroop task was more boring than the NW task. If so, it might
be that the task did not actually deplete self-control resources, but, nonetheless, affected
participants’ subjective states, as reflected in their self-report of self-control. For example, after
the LD Stroop task, participants might have sensed that they needed something pleasant to make
them feel better or that they felt lazy (sample items from the State Self-Control Capacity Scale).
Therefore, in Study 2, I use a more similar control group.
Second, concerning motivational biases, explicit self-reports might be influenced by “the
tendency of respondents to provide socially desirable answers” (Fisher & Katz, 2000, p. 105, social
desirability bias). For example, studies suggest that people think highly of gregarious and outgoing
people (e.g., Anderson & Kilduff, 2009). That is, the ideal conceptions of both introverts and
extraverts tend to be extroverted (Brown & Hendrick, 1971), summarized as Extravert Ideal (Cain,
2013). Therefore, it might be that participants refused to admit that they felt depleted after
engaging in social interactions. In contrast, behavioral measures such as candy consumption might
be less biased because they should be less transparent to participants and thus less susceptible.
THE DARK AND BRIGHT SIDE OF NETWORKING BEHAVIOR
77
Third, self-control depletion might not be introspectively accessible for explicit self-
reports. Accordingly, Muraven (2012) suggested that depletion should not be necessarily
interpreted as a conscious process because people cannot usually report on subjective changes
indicative of having expended resources in self-regulation. Thus, there is only limited evidence
that people are aware of their self-control states (see also Baumeister & Vohs, 2016; Clarkson,
Hirt, Jia, & Alexander, 2010; Muraven & Slessareva, 2003; Schmeichel, Vohs, & Baumeister,
2003). In this vein, self-report measures might fall short.
Finally, as suggested by the zero-correlation between the two measures, the constructs
assessed by behavioral and self-report measures might be completely independent. However,
opposing this assumption, several studies have confirmed the validity of the State Self-Control
Capacity Scale: For example, Bertrams et al. (2010, Study 4) found that participants in the LD
Stroop condition reported more self-control than participants in the HD Stroop condition, which
is in line with theory and accords with empirical findings from other Stroop studies using other
self-control measures (e.g., handgrip, Goto & Kusumi, 2014).
Based on the above discussion, I attach more importance to behavioral measures of self-
control (relative to self-report measures) because they seem less prone to motivational biases and
do not necessarily require introspective access (cf. Hofmann et al., 2005).
In general, controlled experimental settings allow for strong causal inferences (Shadish et
al., 2002). In the context of the experimental setting of Study 1, I was able to manipulate
networking behavior by instructing a group of eight participants to network. Manipulating
networking behavior has an advantage over measuring a person’s habitual networking behavior,
as “studying manipulable agents allows a higher quality source of counterfactual inference through
such methods as random assignment” (Shadish et al., 2002, p. 8). Prior studies usually measured a

THE DARK AND BRIGHT SIDE OF NETWORKING BEHAVIOR
78
person’s typical networking behavior (either generally, e.g., “How often do you engage in
professional networking?” (Casciaro et al., 2014), or a mean score based on the frequency of
showing specific behaviors within a specified period, e.g., “Within the last year, how often have
you participated in social gatherings with people from work?” (Forret & Dougherty, 2001), cf.
Measuring networking behavior). However, this falls short because all employees, whether or not
they are practiced networkers, might engage in networking behavior eventually (e.g., at an
obligatory company event) and experience its consequences. In Study 1, I was able to examine
how networking affects people, irrespective of their typical behavior. In this vein, I go beyond the
dichotomous classification of people as “networkers” or “non-networkers”. Instead of testing
simple correlations of networking behavior with certain personality factors (that are typically
considered as determinants), I could test moderating effects of personality that might help explain
why certain people (e.g., introverts) typically shy away from networking.
I acknowledge that, despite the strengths of the experimental design, this study is not
without limitations. First, I used a post-test only design to measure depletion. This involves the
risk that the effects might be due to systematic pre-differences between the groups. However, as
described in the results section, other than extraversion25, none of the assessed variables
significantly differed between conditions. Furthermore, Shadish et al. (2002) state that the use of
a predicted interaction helps improving the post-test only design: “Sometimes substantive theory
is good enough to generate a highly differentiated causal hypothesis, that, if corollated would rule
out many internal validity threats because they are not capable of generating such complex
empirical implications” (p. 124).
25 As outlined above, with participants in the NW condition being slightly above the overall
mean in extraversion, hypothesis tests were rather conservative. Also, controlling for extraversion
did not affect the main effect of networking on depletion (see Table 8).

THE DARK AND BRIGHT SIDE OF NETWORKING BEHAVIOR
79
A second limitation might be the use of cognitive tasks as control conditions. Thus, an
alternative explanation for the findings regarding candy consumption might be that every social
interaction is per se depleting. To rule out such alternative explanations, it is suggested to select a
control group, which is as similar as possible to the treatment group (D’Agostino & Kwan, 1995).
Therefore, Study 2 replicates results with a control group engaging in a social task that is more
similar to the networking task.
Third, due to the controlled experimental setting, the study might also involve a weakness
regarding the extent to which these causal relationships generalize (Shadish et al., 2002). That is,
I used students engaging in simulated role-plays. Even though I am confident that the simulated
networking situation is highly representative for real networking situations, findings should be
replicated with a working sample in a real networking situation. Therefore, Study 3 replicates
results in the field.

THE DARK AND BRIGHT SIDE OF NETWORKING BEHAVIOR
80
Study 2
In Study 1, I focused on the dark side of networking behavior to establish the energy
resource drain process. That is, I found networking to deplete self-regulatory energy resources, as
benchmarked with two well-established cognitive control tasks. Furthermore, I examined
boundary conditions of the resource drain process: Extraversion and social skills served as buffers
against the self-control depleting effect of networking behavior.
In Study 2, I seek to shed light on both the dark and bright side of networking behavior.
On the dark side, I replicate findings from Study 1 with a social control condition that is more
similar to the networking condition than the control conditions used in Study 1. Additionally, I
examine a potential mechanism of the depleting effect of networking, namely impression
management. On the bright side, I investigate whether networking behavior generates energy
resources, as manifested by improved affect.
Therefore, I conducted a controlled laboratory experiment with 128 students, performing
either the networking or a control task. The control group engaged in a social task that was very
similar to the networking task, but did not challenge participants to reach for a specific goal during
the social interaction.

THE DARK AND BRIGHT SIDE OF NETWORKING BEHAVIOR
81
Hypotheses
Figure 9 depicts an overview of the hypotheses in Study 2.
Figure 9. Overview of hypotheses in Study 2.
Energy resource drain
According to the energy resource drain process, networking behavior depletes consumptive
energy resources. Supporting the proposed energy resource drain process, findings from Study 1
show that networking depletes self-control resources, as manifested by eating more candy.26
However, because the control groups engaged in non-social tasks, I cannot completely rule out
that it is not social interactions per se that exhausts self-control resources. Admittedly, Finkel et
al. (2006) suggest that most social interactions are “simple, […] because humans acquire […]
remarkable behavioral repertoires for bringing about social interaction. Furthermore, once these
repertoires are developed, humans generally apply them effortlessly and non-consciously” (p.
457). Yet, there are specific interpersonal situations (e.g., a job interview) that require more effort
26 With regard to self-rated self-control, as discussed, the surprising findings from Study 1
might be due to aspects of the depletion manipulations. Using a social control task that is very
similar to the NW task makes it less likely that the two groups perceive the tasks fundamentally
different (e.g., boring vs. exciting), which might then be reflected by self-reports of self-control.
Therefore, despite contrasting findings in Study 1, I expect networking interactions to be perceived
as more depleting than regular social interaction, which should be manifested by self-reports of
self-control.

THE DARK AND BRIGHT SIDE OF NETWORKING BEHAVIOR
82
and thus exhaust an individuals’ self-regulatory resources (cf. Vohs et al., 2005). For example,
Trougakos et al. (2014) argue that, generally, “socializing in a workplace context is fundamentally
different” (p. 408) and much more constrained than socializing outside of work (see also
Sonnentag, 2001). This should also apply to networking behavior as networking is focused on
relationships in professional contexts. Networking is a form of goal-directed behavior (Gibson et
al., 204). Therefore, people must select adequate strategies (e.g., impression management) to
achieve their interpersonal goals. Further, during the interaction, they must implement, monitor,
and, if necessary, adapt those strategies. In general, goal-directed behavior requires self-control
(e.g., Hofmann et al., 2009; Sun & Frese, 2013; Wang, et al., 2015). Hence, I propose that
networking behavior should require more self-control than other forms of social interaction.
Hypothesis 1a: Networking behavior depletes self-control.
Contrasting networking with other forms of social behavior might also help explaining the
underlying mechanisms of the depleting effect of networking behavior. Impression management,
sometimes referred to as self-presentation, is defined as the “process by which individuals control
the impressions others form of them” (Leary & Kowalski, 1990, p. 44). Impression management
plays a central role in social interactions and individuals are particularly likely to present an
advantageous self-image in professional situations (as compared to friendship situations, Le
Barbenchon et al., 2016). As such, impression management has been recognized as a crucial aspect
of career success (e.g., Feldman & Klich, 1991; Judge & Bretz, 1994; Judge, Cable, Boudreau, &
Bretz, 1995). Networking situations most likely evoke impression management to create a desired
image to the interaction partner and ultimately reach one’s interpersonal ends. In contrast, in
“normal” social interactions individuals should exert less impression management (cf. Le
Barbenchon et al., 2016). Selecting the image one wants to present and choosing the strategic

THE DARK AND BRIGHT SIDE OF NETWORKING BEHAVIOR
83
behaviors by which one seeks to get one’s message across requires volition and self-regulation (cf.
Leary & Kowalski, 1990). Studies show that more effortful forms of self-presentation drain more
self-regulatory resources compared with presenting oneself naturally or engaging in only minimal
self-presentation (Karremans et al., 2009; Vohs et al., 2005). I conclude that networking behavior
should be associated with higher levels of impression management (when compared with “normal”
social interaction), which, in turn, should be linked to subsequent self-control impairment.
Hypothesis 1b: Impression management behavior mediates the depleting effect of
networking behavior.
Energy resource gain
According to the energy resource gain process, networking behavior enhances affective
energy resources. When strategically investing resources in networking, people must believe that
these investments pay off (Hobfoll, 2001). Accordingly, Ingram and Morris (2007) argue that for
individuals participating in a networking event (mixer), “the tacit assumption is that these
investments pay off in terms of encounters that take place in the context of the mixer” (p. 558).
Networking behavior is focused on building, maintaining, and using networking relationships
(Gibson et al., 2014). In line with COR’s resource definitions, networking relationships represent
a resource themselves (cf. Halbesleben et al., 2014; Hobfoll, 2002; ten Brummelhuis & Bakker,
2012). Additionally, using these relationships might provide further resources (e.g., strategic
information). In this vein, building a new relationship or utilizing a relationship means that a
person gains a resource (cf. Hobfoll, 2001). Gain of resources such as instrumental relationships
or strategic information should also be reflected by enhanced affective energy resource states (cf.

THE DARK AND BRIGHT SIDE OF NETWORKING BEHAVIOR
84
Halbesleben et al., 2014; ten Brummelhuis & Bakker, 2012). In this vein, I argue that networking
behavior as a strategic resource investment behavior should improve positive affect.
Hypothesis 2: Networking behavior increases positive affect.
Method
Participants
The experiment took place at the same laboratory at University of Cologne as the first
experiment. I approached students via various UoC mailing lists and UoC-related Facebook
groups. Overall, 128 students (16 groups of 8 participants) participated for monetary compensation
(8 €) or course credit. The sample consisted of 89 (69%) female and 39 (31%) male subjects (see
Table 12). The average age was 24.41 years (SD = 5.19). Participants came from a variety of fields
of study; most frequent were psychology (47%), media sciences (14%), and biology (11%).
Procedure
One week in advance, all participants filled in an online background survey27 and chose a
date for the experiment on site.28 Upon arrival at the laboratory, all participants read and agreed to
an informed consent. In both conditions, participants arrived in groups of eight and were given
instructions to simulate a social event (networking vs. regular social event) with assigned roles for
27 Because this study was part of a larger research project, I also assessed the dark triad of
personality in the background survey with the 12-item “dirty dozen” questionnaire (Jonason &
Webster, 2010). Results were presented at the Congress of Society of Industrial and Organizational
Psychology (Wingender & Wolff, 2017). 28 The experiment took place from Monday till Friday between 12 am and 4 pm. I randomly
assigned dates to the conditions. When choosing a date, participants had no idea which condition
they registered for and I made sure they did not register in groups.

THE DARK AND BRIGHT SIDE OF NETWORKING BEHAVIOR
85
20 minutes. After engaging in the respective task, all subjects were led to another room where they
performed an ostensible product test for five minutes, tasting and rating candy as a measure of
self-control. Afterwards, all participants self-reported their State Self-Control Capacity29 and
Positive Affect30 and filled out a post-test survey. Then all participants were thanked and paid.
After data collection was over, they were debriefed via email.
Measures
Experimental manipulation
Experimental condition
The networking manipulation (N = 64)31 was the same as in Experiment 1 (Appendix A;
see also de Janasz & Forret, 2008). Participants were instructed to simulate a networking event
with assigned roles. Role descriptions were the same as in Study 1 (see Table 4). As in the first
experiment, participants were informed that the one person who successfully found both target
persons and was nominated by most of the seven interaction partners as the “best networker” would
29 I decided not to change the order of the dependent self-control measures as I attached
more importance to the behavioral measure of self-control because they seem less prone to
motivational biases and do not necessarily require introspective access (cf. Hofmann et al., 2005;
see Discussion of Study 1).
30 Because this study was part of a larger research project, I also assessed feelings of
dirtiness with five items that were integrated in the PANAS. Results were presented at the
Congress of Society of Industrial and Organizational Psychology (Wingender & Wolff, 2017). 31 To determine the adequate sample size, I a priori (as opposed to “unplanned optional
stopping rules”, Schönbrodt, Wagenmakers, Zehetleitner, & Perugini, 2017, p. 322) defined the
following procedure: First, I ran the experiment with two control groups, which I then compared
with two randomly selected NW groups from Experiment 1. Based on the calculated effect size (d
= 0.58) and with a power of 95% (one-tailed), G*power determined an intended total sample size
of 132 participants.

THE DARK AND BRIGHT SIDE OF NETWORKING BEHAVIOR
86
receive a bonus of 10 € upon completion of the experiment. After reading the instructions and
preparing their roles for three minutes, participants started to engage in the networking task.
Control condition
Social activities outside of work include activities such as going to a party arranged by an
acquaintance (Sonnentag, 2001). The proximal purpose of such events is not instrumental
networking, yet, all participants are aware of their own professional and private identity. Thus,
participants in the control group (N = 64) were instructed to simulate a social event with assigned
roles (Appendix G). Role descriptions (see Table 11), as in the networking condition, specified the
profession and a private interest. However, other than in the networking condition, the instructions
neither challenged participants to obtain specific resources nor to make a particularly favorable
impression to their interaction partners. Participants were informed that a bonus of 10 € would be
raffled at the end of the experiment, and that the lottery was completely irrespective of their
behavior in the social interaction.
Table 11. Sample Roles in the Social Control Condition
Sample Roles in the Social Control Condition
Doctor.
You are an engaged SPD party member. You are a surgeon.
Lawyer.
You love sailing and toy with the idea of buying a boat. You are a lawyer.

THE DARK AND BRIGHT SIDE OF NETWORKING BEHAVIOR
87
Dependent variables
Self-control depletion (candy consumption)
I used the same depletion measure as in Experiment 1 (see also Hofmann et al., 2007;
Imhoff et al., 2014). Again, participants were instructed to taste and rate candy. More candy
consumption indicated higher levels of depletion of self-control.
One participant in the networking group reported to be allergic and was therefore excluded
from all analyses on candy consumption. I screened for univariate outliers (SD > 3) and identified
three participants in the networking condition who were more than three standard deviations above
the overall mean (M = 15.28, SD = 13.67). One participant in the social interaction condition did
not eat any candy without reporting a reason. All analyses reported were conducted both with and
without these four outliers (.00 or > 56.29). However, because results did not substantively differ,
the analyses reported below are based on the full sample.
Self-control (self-rated)
I used the same nine items from the State Self-Control Capacity Scale as in Experiment 1
(Appendix C; Bertrams et al., 2011). Sample items of the SSCCS include “I feel drained”, “I feel
like my willpower is gone”, and “I would want to quit any difficult task I was given”. Again,
participants rated their self-control on a 7-point Likert-type scale ranging from 1 (strongly
disagree) to 7 (strongly agree), α = .86.
Positive Affect
I measured positive affect with ten items from the widely used Positive and Negative Affect
Schedule (PANAS, Watson, Clark, & Tellegen, 1988; German version: Krohne, Egloff,

THE DARK AND BRIGHT SIDE OF NETWORKING BEHAVIOR
88
Kohlmann, & Tausch, 1996; Appendix H). A number of studies confirm a high reliability (α = .86
- .90, Watson et al., 1988) and validity (e.g., Crawford & Henry, 2004, Krohne et al., 1996) of the
PANAS. Sample items include “active”, “determined”, and “proud”. Participants were asked to
indicate to what extent they felt this way at the present moment on a 5-point Likert scale (1 = not
at all, 5 = extremely), α = .89.
Mediating variable
Impression management
In the post-test, I used an adapted impression management scale that was originally
developed to assess impression management as a trait (Mummendey, & Eifler, 1994; Appendix I).
I adapted eight of the original 17 items to measure impression management behaviors during the
experimental interaction. Sample items were “During the social situation in the experiment, I did
not try to appeal to my interaction partners” (reversed), “During the social interaction in the
experiment, I did not try to make a favorable first impression” (reversed), and “During the social
situation in the experiment, I tried to attract interest by making qualified contributions”.
Participants reported their impression management behavior on a 7-point Likert-type scale ranging
from 1 (strongly disagree) to 7 (strongly agree), α = .68. The internal consistency of the scale is
relatively low. However, it almost meets the “alpha > .70 rule” (Guide Jr. & Ketokivi, 2015, p. 6).
Some scholars even suggest that .60 might be the acceptable lower bound of reliability for research
purposes (e.g., Loewenthal, 1996; Nunnally, 1978).
THE DARK AND BRIGHT SIDE OF NETWORKING BEHAVIOR
89
Control variables
Liking of the product
As part of the product rating test, participants reported how much they liked the product on
a 7-point Likert scale, ranging from 1 (not at all) to 7 (very much).
Hunger
In the post-test, participants were asked if they had been hungry before they entered the
experiment. Analyses were repeated including hunger as control variable, but results were
essentially identical. Therefore, following Becker (2005), I report results without controlling for
hunger.
Body Mass Index
Furthermore, participants indicated their height and weight in the online survey so that I
could calculate their BMI. However, because results did not substantively differ with or without
including BMI as a control variable, I report results without controlling for BMI.
Demographics
In the online survey, participants also indicated their gender, age, and field of study.
However, results did not substantively differ with or without including demographic variables as
controls. Thus, I report results without controlling for gender, age, or field of study.

THE DARK AND BRIGHT SIDE OF NETWORKING BEHAVIOR
90
Results
Table 12 displays the descriptive statistics, reliabilities, and correlations of the study
variables. As in Experiment 1, the behavioral measure of depletion of self-control and the self-
report measure of self-control were not correlated, neither for the whole sample, r = .07, p = .437
(see Table 12), nor within conditions, networking: r = .15, p = .255, social interaction: r = .03, p =
.843.
Allocation of participants to the two conditions was independent of age, t(126) = 0.65, p =
.520, d = 0.11, and gender, χ2 = 0.92, p = .337. Likewise, the experimental conditions did not
significantly differ with regard to hunger, t(126) = .21, p = .838, d = 0.05, and liking of the product,
t(122) = -1.66, p = .099, d = 0.29. However, for liking of the product, I found marginal differences
between the groups, with participants in the networking condition (M = 5.52, SD = 1.36) reporting
slightly more product liking than the social interaction group (M = 5.10, SD = 1.51). The effect
size (d = 0.29) according to Cohen (1988) is small. These marginal differences between the two
groups might be relevant in the context of results for positive affect (see Discussion of Study 2).

THE DARK AND BRIGHT SIDE OF NETWORKING BEHAVIOR
91
Table 12. Descriptive Statistics, Reliabilities, and Correlations between Study Variables
Descriptive Statistics, Reliabilities, and Correlations between Study Variables
Variable M SD 1 2 3 4 5 6 7 8
1. Networkinga 0.50 0.50
2. Genderb 0.30 0.46 .09
3. Age 24.41 5.19 -.06 .15
4. Hungerc 0.24 0.43 .02 .10 .04
5. Product liking 5.31 1.45 .15† -.01 -.06 .10
6. Impression
management
4.55 0.94 .32*** -.13 -.17 -.09 .25** (.68)
7. Positive affectd 3.27 0.72 .17† -.07 -.19* -.08 .28** .40** (.89)
8. Self-Controle 5.44 1.00 -.05 -.05 -.11 -.10 -.03 .16 .47** (.86)
9. Self-control
depletionf
15.28 13.67 .43*** .21* -.05 .01 .37** .34** .22* .07
Note. N = 128. Cronbach’s alphas are listed on the diagonal.
aNetworking (Reference group: Social interaction). bGender (0 =female, 1 = male). cHunger (0
= no, 1 = yes). dPositive affect (N = 127). eSelf-Control (self-rated, N = 127). fSelf-Control depletion
(candy consumption in grams, N = 127).
† p .10. * p .05, ** p .01.
Table 13 displays results for the two experimental conditions regarding the dependent
measures. In order to examine the substantive hypotheses, I conducted hierarchical regression
analyses. As recommended by Cho and Abe (2013), all hypotheses were tested in a one-tailed way.
I report results separately for the two measures of self-control.

THE DARK AND BRIGHT SIDE OF NETWORKING BEHAVIOR
92
Table 13. Descriptive Statistics for Dependent Measures
Descriptive Statistics for Dependent Measures
Variable Condition N M SD
Self-Control depletiona Networking 63 21.21 15.25
Social interaction 64 9.44 8.64
Self-controlb Networking 64 5.39 1.02
Social interaction 63 5.48 0.99
Positive affect Networking 64 3.39 0.78
Social interaction 63 3.14 0.65
Note. aSelf-Control depletion (candy consumption in grams). bSelf-
control (self-rated).
Energy resource drain
Self-control depletion (candy consumption)
Hypothesis 1a predicted that networking behavior would deplete self-control resources. In
Step 1, I controlled for liking of the product, which was significantly related to candy consumption,
β = .37, p ≤ .001 (see Table 14). Adding networking (dummy-coded condition, 1 = networking) in
Step 2 of the regression resulted in a significant increase in R2, ΔR² = .15, p ≤ .001, and the
regression coefficient turned out to be positive and significant, β = .39, p ≤ .001. Thus, participants
in the networking condition consumed significantly more candy than participants in the control
condition, indicating greater depletion in the networking group (see Figure 10). Therefore,
Hypothesis 1a received support.

THE DARK AND BRIGHT SIDE OF NETWORKING BEHAVIOR
93
Figure 10. Difference between conditions in self-control depletion.
Self-control depletion: Candy consumption in grams. *** p .001.
Hypothesis 1b predicted that impression management behavior would mediate the effect
of networking behavior on self-control depletion. Following the procedure suggested by Preacher
& Hayes (2004), I tested the indirect effect of impression management, β = .05, 95% CI [.008,
.115] (see Figure 11, see also Table 14). The bias-corrected bootstrap confidence interval for the
indirect effect was entirely above zero, indicating that the indirect effect of impression
management is significant. Thus, Hypothesis 1b received support, as the effect of networking
behavior on self-control depletion was partially mediated by impression management.

THE DARK AND BRIGHT SIDE OF NETWORKING BEHAVIOR
94
Table 14. Regression of Self-Control Depletion on Condition and Impression Management
Regression of Self-Control Depletion on Condition and Impression Management
Figure 11. Mediating effect of impression management. * p .05. ** p .01.*** p .001.
Steps
Unstandardized
Coefficients
Standardized
Coefficients
R2
ΔR2
b SE β
1 - - - - .14***
Product liking 3.51 0.80 .37*** - -
2 - - - - .29*** .15***
Product liking 2.96 0.74 .31*** - -
Networkinga 10.67 2.12 .39*** - -
3 - - - - .31*** .02†
Product liking 2.67 0.75 .28*** - -
Networking 9.36 2.22 .34*** - -
Impression
management 2.24 1.19 .16* - -
Note. N = 127. Dependent variable: Candy consumption in grams.
aNetworking (0 = social interaction, 1 = networking).
† p .10. * p .05. ** p .01.*** p .001.
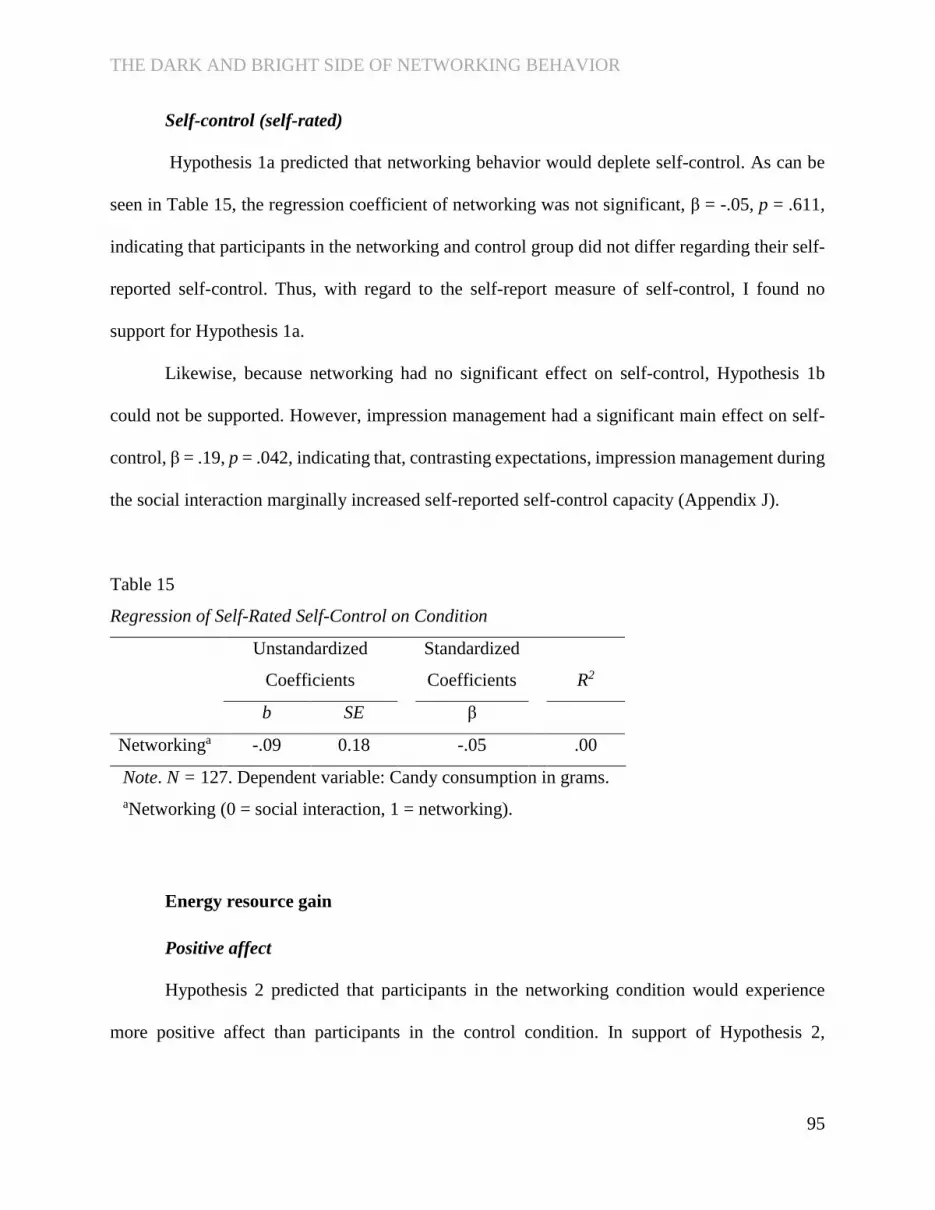
THE DARK AND BRIGHT SIDE OF NETWORKING BEHAVIOR
95
Self-control (self-rated)
Hypothesis 1a predicted that networking behavior would deplete self-control. As can be
seen in Table 15, the regression coefficient of networking was not significant, β = -.05, p = .611,
indicating that participants in the networking and control group did not differ regarding their self-
reported self-control. Thus, with regard to the self-report measure of self-control, I found no
support for Hypothesis 1a.
Likewise, because networking had no significant effect on self-control, Hypothesis 1b
could not be supported. However, impression management had a significant main effect on self-
control, β = .19, p = .042, indicating that, contrasting expectations, impression management during
the social interaction marginally increased self-reported self-control capacity (Appendix J).
Table 15. Regression of Self-Rated Self-Control on Condition
Regression of Self-Rated Self-Control on Condition
Unstandardized
Coefficients
Standardized
Coefficients
R2
b SE β
Networkinga -.09 0.18 -.05 .00
Note. N = 127. Dependent variable: Candy consumption in grams.
aNetworking (0 = social interaction, 1 = networking).
Energy resource gain
Positive affect
Hypothesis 2 predicted that participants in the networking condition would experience
more positive affect than participants in the control condition. In support of Hypothesis 2,

THE DARK AND BRIGHT SIDE OF NETWORKING BEHAVIOR
96
networking was significantly and positively related to positive affect, β = .25, p = .028 (see Table
16 and Figure 12).
Table 16. Regression of Positive Affect on Condition
Regression of Positive Affect on Condition
Unstandardized
Coefficients
Standardized
Coefficients
R2
b SE β
Networkinga .25 0.13 .17* .03
†
Note. N = 127. Dependent variable: Candy consumption in grams.
aNetworking (0 = social interaction, 1 = networking).
† p .10. * p .05.
Figure 12. Difference between conditions in positive affect. * p .05.

THE DARK AND BRIGHT SIDE OF NETWORKING BEHAVIOR
97
Discussion
Study 2 represents a conceptual replication of Study 1, focusing on both the dark and bright
side of networking behavior. On the dark side, I took a more nuanced look at the energy resource
drain process of networking behavior. Also, I considered a potential mechanism of the depleting
effect of networking behavior, namely impression management. On the bright side, I sought to
establish the energy resource gain process of networking behavior, as manifested by enhanced
affective states. Therefore, I conducted a laboratory experiment with 128 students, engaging in
either the networking or a social control task.
On the dark side, I found further support for the hypothesis that networking (relative to
“normal” social interaction) depletes self-control resources (as indicated by increased candy
consumption). Furthermore, I identified impression management as a mechanism of the depleting
effect of networking. Participants in the networking condition exerted more impression
management, which, in turn, depleted self-control resources (cf. Table 14 and Figure 11). This is
in line with self-control research, showing that impression management depletes self-control
resources (e.g., Karremans et al., 2009; Vohs et al., 2005). However, the effect of impression
management was rather small and can explain only part of self-control depletion following
networking. Therefore, networking behavior likely encompasses further processes that deplete
self-regulatory resources (e.g., goal-directedness, emotion regulation).
As in Experiment 1, I found no support for the hypothesis that networking behavior
decreases self-rated self-control. That is, participants in the networking and control conditions did
not significantly differ regarding their self-rated self-control. Explanations for this unexpected
finding are discussed below.

THE DARK AND BRIGHT SIDE OF NETWORKING BEHAVIOR
98
On the bright side, I found support for the hypothesis that networking behavior generates
resources, as manifested by augmented positive affect. That is, participants in the networking
condition reported significantly more positive affect than participants in the social control
condition.
Taken together, I found empirical support for both the energy resource drain and energy
resource gain process of networking behavior. Yet, despite the distinct strengths of the
experimental design (see also Discussion of Study 1 and General Discussion), Study 2 is not
without limitations. First, as in the first experiment, self-rated self-control was measured after the
product test. Thus, as discussed above, participants might have been able to replenish their self-
control resources during the product test.32 The same applied to positive affect, which was
measured at the end of the experiment. Also, participants in the networking and control condition
marginally differed regarding product liking. Therefore, I cannot completely rule out the
possibility that positive affect might have been affected by participants’ liking of the candy. In
fact, product liking and positive affect were significantly correlated (see Table 12). However,
networking still predicted positive affect when controlling for liking of the product, β = .17, p =
.03. Still, to exclude such alternative explanations, findings should be replicated without
participants tasting candy before self-reporting their positive affect. Therefore, in Study 3, I
replicate results with a different behavioral measure of self-control depletion.
Also, Study 2 might involve a weakness regarding external validity (cf. Shadish et al.,
2002). As in Study 1, I used student samples engaging in simulated role-plays. As discussed before,
32 I did not change the order of the two measures, because I attach more importance to the
behavioral measure of self-control (relative to the self-report measure). Behavioral measures are
suggested to be less prone to motivational biases in self-reports (e.g., social desirability bias), and
do not necessarily require introspective access (cf. Hofmann et al., 2005; see Discussion of Study
1 for a more detailed comparison of behavioral and self-report measures of self-control).

THE DARK AND BRIGHT SIDE OF NETWORKING BEHAVIOR
99
I am quite confident that the simulated networking situation is highly representative for real
networking situations. However, to ensure external validity, findings should be replicated with a
working sample in a real networking situation. Therefore, in Study 3, I collected data in the field
at real networking events.
THE DARK AND BRIGHT SIDE OF NETWORKING BEHAVIOR
100
Study 3
In Study 2, I examined both energy resource drain and energy resource gain following
networking behavior. On the dark side, I replicated results from Study 1, showing that networking
behavior leads to self-control depletion. Additionally, I identified impression management as a
mechanism of the depleting effect of networking. On the bright side, I found that networking
behavior generates resources, as manifested by improved affect.
Whereas the experimental designs used in Studies 1 and 2 provide high internal validity,
replicating results with a working sample in natural networking situations strengthens external
validity. Also, scholars recently called for greater use of field studies in order to test hypotheses
based on conservation of resources theory (e.g., Halbesleben et al., 2014).
Therefore, in Study 3, I seek to replicate results from Studies 1 and 2 in the field.
Networking events are defined as “forums for initiating acquaintanceships” (Ingram & Morris,
2007, p. 559) that are focused on the “proximal objective of cementing professional network
relationships” (Bergemann et al., 2017, p. 3). Hence, a networking event represents the prototype
of a networking situation. Therefore, I performed a field study with 162 attendees of multiple (k =
12) networking events, using a pre-test and post-test design (Shadish et al., 2002).

THE DARK AND BRIGHT SIDE OF NETWORKING BEHAVIOR
101
Hypotheses
Figure 13 depicts an overview of the hypotheses in Study 3.
Figure 13. Overview of hypotheses in Study 3.
Energy resource drain
According to the energy resource drain process, networking behavior depletes self-
regulatory energy resources. In Studies 1 and 2, I found support for self-regulatory energy resource
drain following networking, as manifested by increased candy consumption. However, both
studies were conducted in highly controlled experimental settings. In fact, most self-control
research has been run in laboratory settings (e.g., Baumeister et al., 1998; Vohs et al., 2005). This
raises the question if the findings can be effectively transferred to natural networking situations
like a real networking event. Recent studies conducted in employees’ natural work contexts show
that, on a daily basis, employees’ proactive, social, and helping behaviors at work are associated
with self-reported depletion (Lanaj, Johnson, & Wang, 2016), co-workers’ reports of end-of-
workday fatigue (Trougakos et al., 2014) and higher cortisol output (as a biological marker of
stress, Fay & Hüttges, 2016). As networking behavior is similar to proactive, social, and helping
behaviors at work, I hypothesize that attending a networking event depletes individuals’ self-

THE DARK AND BRIGHT SIDE OF NETWORKING BEHAVIOR
102
control resources. More specifically, attendees should have higher levels of self-control resources
before entering a networking event than after leaving the event.
Hypothesis 1a: Attending a networking event depletes self-control.
However, attending the same event might have different implications for attendees’ self-
control depletion, depending on the intensity of their networking behavior at the event. By way of
example: At a three hours networking event, two attendees spending the same time at the event
might likely put considerably different levels of effort in their networking activities at the event.
Whereas one attendee might speak for only 30 minutes with one single contact and walk around
solely for the rest of the time, the other participant might network for three full hours, thereby
introducing him or herself to multiple new contacts and reencountering acquaintances. I argue that
more intense networking, as characterized by more time spent networking and more unique
interactions with networking contacts, should consume more self-control resources. Thus, I
suggest that an individuals’ networking intensity at the event moderates the extent of self-control
depletion after the networking event.
Hypothesis 1b: Networking intensity moderates the depleting effect of attending a
networking event.
Furthermore, I seek to investigate boundary conditions of the postulated energy resource
drain process. COR theory proposes that the process of resource loss is dependent on an
individuals’ personality (Hobfoll et al., 1990). Supporting this notion, self-control research
suggests that behaviors that correspond to people’s disposition, such as extraverts behaving in an
extraverted manner have less impairing effects on subsequent self-control resource states (e.g.,
Gallagher et al., 2011; Zelenski et al., 2012; Vohs et al., 2005). Based on the proposed model of
networking behavior (cf. Figure 3), in Study 1, I sought to identify constructive resources (i.e.,

THE DARK AND BRIGHT SIDE OF NETWORKING BEHAVIOR
103
personality traits, Hobfoll, 2001; ten Brummelhuis & Bakker, 2012), which might be able to buffer
against the depleting effect of networking. More specifically, I examined extraversion as a
potential moderator as networking behavior should correspond to extraverts’ dispositional
behavior. In contrast, for introverts, networking behavior rather counteracts their dispositional
behavior. In line with the hypothesis, in Study 1, I found evidence for a buffering effect of
extraversion. In Study 3, I seek to replicate this finding. I argue that, when attending a networking
event, intense networking behavior is less depleting for extraverts relative to introverts (cf. Figure
14).
Hypothesis 1c: Extraversion moderates the depleting effect of networking intensity when
attending a networking event.
Figure 14. Extraversion moderates the depleting effect of intense networking behavior when
attending a networking event.

THE DARK AND BRIGHT SIDE OF NETWORKING BEHAVIOR
104
Energy resource gain
According to the energy resource gain process, networking behavior generates affective
energy resources. This is in line with COR theory, suggesting that people who strategically invest
resources expect their investments to pay off (Hobfoll, 2001). In a similar vein, Ingram and Morris
(2007) state that individuals who attend a networking event anticipate return on their investments
in terms of encounters that take place in the context of the event. This actual or anticipated resource
gain should be manifested by augmented affective energy resource states (cf. Halbesleben et al.,
2014; ten Brummelhuis & Bakker, 2012). Accordingly, in Study 2, I found that networking
behavior improves positive affect. In Study 3, I seek to replicate this finding, arguing that attending
a networking event should improve affect. That is, attendees’ should experience more positive
affect after leaving the event than before entering the event.
Hypothesis 2a: Attending a networking event increases positive affect.
COR conceptualizes networking relationships as resources (cf. Hobfoll, 2001). Building
on this notion, interacting with a networking contact at a networking event means to create or
foster a resource. Accordingly, more networking interactions at an event imply that a person gains
more resources. Likewise, spending more time networking should increase the likelihood of
attaining networking resources. In this vein, more intense networking (i.e., more networking
interactions and more time spent networking) should yield more resource gain and, hence,
reinforce the positive effect of attending a networking event on mood. Therefore, I argue that the
increase in positive affect after the event should be augmented by networking intensity.
Hypothesis 2b: Networking intensity moderates the effect of attending a networking event
on positive affect.

THE DARK AND BRIGHT SIDE OF NETWORKING BEHAVIOR
105
Method
Setting
I gathered data at twelve networking events taking place in North-Rhine-Westphalia (e.g.,
Cologne, Düsseldorf, and Dortmund). Bergemann and colleagues (2017) define networking events
as “planned meetings with a proximal objective of cementing professional network relationships.
They are planned by organizations, associations and clubs to help their members build network
relations” (p. 3). All events included in the present study were explicitly described as “networking
events” in the advertising (see Table 17) and covered a broad range of possible versions of
networking events (see Shadish et al., 2002, see Table 18). Out of the twelve events, four events
contained set networking tasks that explicitly instructed attendees to network with one another.
For example, participants were asked to perform a professional speed dating round or an elevator
pitch (short self-presentation, de Janasz & Forret, 2008). The events started at various times
between 8.30 am (“networking breakfast”) and 7.30 pm (“networking dinner”). The duration of
the events ranged between 1.5 and 8.5 hours (M = 3.25, SD = 1.96). Half of the events explicitly
addressed entrepreneurs, one event aimed at post-docs, whereas the other events were open for all
professional groups. Two of the events were for women only; at the mixed events, the percentage
of female attendees varied between 10% and 88% (M = 39.80, SD = 27.36). The largest events had
about 650 participants (based on participant registrations), whereas the smallest event was attended
by nine people (M = 134.83, SD = 241.33). The experimenter was able to gather usable data of six
to 28 study participants at the events (M = 13.50, SD = 6.29).

THE DARK AND BRIGHT SIDE OF NETWORKING BEHAVIOR
106
Participants
In total, 174 persons agreed to participate in the study in exchange for monetary
compensation/donations (5 €) or equivalent give-aways. Eleven of them did not return for the post-
test and one person did not complete the full post-test (dropout rate: 7%). These twelve participants
were therefore excluded from all analyses. Thus, the final sample included 162 participants, of
which 69 (42.6%) were female and 93 (57.4%) were male (see Table 19). The average age was
35.05 years (SD = 10.57). Out of the sample, 39.5% indicated to hold a supervisor position. The
sample consisted of 71 self-employed (43.8%), 52 employees (32.1%), 30 students (18.5%), and
nine job-seekers (5.6%). The great portion of self-employed persons in the sample highlights the
importance of networking behavior for entrepreneurs (cf. Entrepreneurial success), and reflects the
fact that half of the networking events explicitly addressed entrepreneurs (see Table 18).

THE DARK AND BRIGHT SIDE OF NETWORKING BEHAVIOR
107
Table 17. Sample Event Advertising
Sample Event Advertising Postdoc Networking Eventa
The Faculty and Academic Staff Development Department supports you in building your
network with other postdocs at the UoC as well as regionally, nationally and internationally. We
cordially invite you to take part in our interactive postdoc networking event. In the framework
of a “speed dating” session, there are ample opportunities to get to know one another and to
exchange interdisciplinary and international experiences.
Xing Business Dinnerb
We have organized another Business Dinner (also known as Cross-Table or Rotation Dinner) at
the Pullman Hotel. We will serve a three-course menu – and you will change tables for every
course. Thus, you will get to know at least 3 × 5 interesting people.
7 pm reception
7.45 – 10 pm Dinner with changing tables for every course
afterwards Networking at the bar.
Note. aUniversity of Cologne Administration. Academic Staff Development (2016). bXing
Ambassador Cologne (2016).

108
Table 18. Overview of Networking Events
Overview of Networking Events
Event No NW Task Start Time Durationa Target group Women
only
Percentage
Women
Event
Participants
Study
Participants
1 no 8.30 am 1.5 not specified no 58 12 10
2 no 10 am 2.0 not specified no 56 9 6
3 no 10 am 2.0 not specified no 71 24 10
4 yes 10 am 2.0 entrepreneurs yes 100 24 13
5 no 11 am 8.5 entrepreneurs no 12 60 14
6 yes 5 pm 2.5 academics no 88 16 6
7 no 6 pm 2.0 entrepreneurs no 20 60 14
8 no 6 pm 4.0 entrepreneurs no 20 650 28
9 no 7 pm 5.0 entrepreneurs no 20 650 12
10 no 7 pm 3.0 entrepreneurs no 10 50 19
11 yes 7 pm 4.0 not specified no 43 47 20
12 yes 7.30 pm 2.5 not specified yes 100 16 10
Note. aDuration (in hours).
THE DARK AND BRIGHT SIDE OF NETWORKING BEHAVIOR
109
Procedure
Upon arrival at the networking event, those who agreed to participate in the study
performed a pre-test that served as a baseline. They engaged in the handgrip task as a measure of
self-control and completed a brief survey. Before they left the event, participants engaged in a
post-test. Again, they performed the handgrip task and filled out a survey. Then, participants were
thanked and paid. Those who left their email address were debriefed after data collection was over.
Measures
Dependent Measures
The field setting and within-person (i.e., pre-post test) design in Study 3 was very different
from the laboratory setting and between-person designs in Studies 1 and 2. Therefore, I used
dependent measures that were more adequate for the setting and design in Study 3. That is, first, I
used a behavioral measure of self-control (i.e., handgrip performance) that has been typically
measured twice in a pre-test and post-test in prior studies (e.g., Martijn et al., 2007).33 Second, I
used survey measures for depletion34 and positive affect (i.e., Brief Mood Inspection Scale) that
are more economic than the SSCCS and PANAS used in Studies 1 and 2.
33 Also, as discussed above (see Discussion of Study 2), findings from Study 2 should be
replicated without participants tasting candy before self-reporting their positive affect. 34 By changing the measure of self-reported depletion, I also reacted to the surprising
findings of Studies 1 and 2 regarding the results of self-rated self-control, as measured with the
State Self-Control Capacity Scale (Bertrams et al., 2011).

THE DARK AND BRIGHT SIDE OF NETWORKING BEHAVIOR
110
Self-control (handgrip)
Squeezing a handgrip becomes tiring after a short period of time, and the person feels the
urge to stop squeezing (cf. Alberts, Martijn, Greb, Merckelbach, & de Vries 2007). Overcoming
this fatigue and overriding the urge to quit requires self-control. Accordingly, in a meta-analysis,
the handgrip task has been found to be a valid measure of self-control (d = 0.64, Hagger et al,
2010). Because most people think that a handgrip primarily depends on muscular strength, it is a
relatively unobtrusive measure of self-control (cf. Alberts et al., 2007). In most studies, as to being
able to control for individual differences in hand strength, handgrip stamina has been measured
twice, with a pre-test at the beginning and a post-test after the self-control manipulation (e.g.,
Martijn et al., 2007; Muraven et al., 1998; Tyler & Burns, 2008). Then, the difference between the
two measurements is computed; a greater decline indicates more self-control depletion. In the
present study, in order to minimize experimenter effects, the experimenter used a written protocol
throughout the whole procedure; that is, instructions were the same for all participants. To cover
the purpose of the study, participants were informed that the experimenter collected pilot data for
a sports psychology study and that two assessments would be taken at separate times and then
averaged to get the most accurate estimates. The experimenter then placed a pencil between the
grips and instructed participants to squeeze the handgrip for as long as they could. The
experimenter started a stopwatch when participants closed the grip and stopped when the pencil
fell out and noted the time in seconds.
Self-control depletion (self-rated)
Building on the theorizing that people experience subjective depletion when self-control
resources are taxed, there exist questionnaire measures with varying conceptualizations of an

THE DARK AND BRIGHT SIDE OF NETWORKING BEHAVIOR
111
individuals’ energy state (e.g., depletion, for an overview, see Hagger et al., 2010; Trougakos et
al., 2014; cf. Ego Depletion Theory). As a measure of depletion, I used a composite measure
consisting of six items: That is, four items referring to the energy (active, peppy) and tiredness
(tired, drowsy) components from the German translation of the Brief Mood Inspection Scale
(BMIS, Mayer, & Gaschke, 1988) as well as two additional items (fit and exhausted, based on
Alberts et al., 2007; Appendix I). Participants reported their depletion twice, in the pre-test and in
the post-test. They rated their level of depletion on a five-point Likert response format (1 = strongly
disagree to 5 = strongly agree), pre-test: α = .82, post-test: α = .88.
Positive affect
Positive affect was measured with six items referring to three positive mood states of the
Brief Mood Inspection Scale (BMIS, Mayer, & Gaschke, 1988; Appendix K): (1) happy (happy,
lively), (2) loving (loving, caring), and (3) calm (calm, content). Participants filled out the BMIS
in the pre-test as well as in the post-test. Participants used a five-point Likert response scale (1 =
strongly disagree to 5 = strongly agree) to rate their current level of positive affect, pre-test: α =
.81, post-test: α = .82.
Moderator variables
Networking intensity
In the post-test, I measured networking intensity with two items, asking participants to
estimate how much time they had spent networking at the event and to gauge the number of people
they had networked with at the event. This is in line with prior studies, measuring networking by
the time invested in networking (e.g., Aldrich, Elam & Reese, 1996) or by the volume of unique

THE DARK AND BRIGHT SIDE OF NETWORKING BEHAVIOR
112
interactions at a networking event (Bergemann et al., 2017). The two variables were standardized
within events and summed to form a scale of individuals’ networking intensity. Cronbach’s Alpha
was relatively low, α = .63. This can be attributed to the small number and breadth of the items
included. Yet, the reliability almost meets the “alpha > .70 rule” (Guide Jr. & Ketokivi, 2015, p.
6) and some scholars even suggest that .60 might be the acceptable lower bound of reliability for
research purposes (e.g., Loewenthal, 1996; Nunnally, 1978).
Extraversion
In the pre-test, extraversion was measured with twelve items derived from the NEO-FFI
(Costa & McCrae, 1995; German version: Borkenau & Ostendorf, 2008; Appendix D; see also
Study 1;). Sample items are “I like to have a lot of people around me”, “I really enjoy talking to
people”, and “I usually prefer to do things alone” (reversed). Participants used a five-point Likert
response format (1 = strongly disagree to 5 = strongly agree) to rate their level of extraversion, α
= .81.
Control variable
Time at the event
The experimenter noted the time of each individuals’ pre-test (upon arrival at the event)
and post-test (upon departure from the event). I later calculated the time passed in between pre-
test and post-test. All analyses were conducted both with and without controlling for time spent at
the event. However, because results were essentially identical, I report results without controlling
for individuals’ time at the event.

THE DARK AND BRIGHT SIDE OF NETWORKING BEHAVIOR
113
Demographics
Participants were asked to specify their gender and age in the post-test. Furthermore, they
indicated their occupational status (self-employed, employee, student, or unemployed) and
whether or not they held a supervisor’s position. Analyses were repeated controlling for all
demographic variables, but results were essentially identical. Therefore, I report results without
controlling for demographic variables.
Analyses
I analyzed the data with a multilevel random coefficient model using HLM (Version 7,
Raudenbush, Bryk, Cheong, Congdon, & du Toit, 2011), thereby accommodating the three-level
data structure with occasions (pre-test and post-test) nested within persons and with persons nested
within events. Thus, I considered nesting of persons within events. However, I did not specify any
event-level predictors, because I do not focus on differences between events and I relied on a
relatively small sample size of events.35
To test whether analyzing the data with HLM is appropriate, I examined the occasion-level
(within-person), the person-level (between-person) as well as the event-level (between-group)
variance for all occasion-level study variables (cf. Tables 20 to 24). For self-control (handgrip
performance), 43.49% of the overall variance was at the occasion-level (σ2 = 520.45, SDε = 57.83),
44.75% was at the person-level, and 11.76% was at the event-level. For self-rated depletion,
47.63% of the variance explained was at the occasion-level (σ2 = 0.26, SDε = 0.03), 42.14% was
at the person-level, and 10.23% was at the event-level. For positive affect, 24.52% of the overall
35 Also, as can be seen in the results section, the variance components on the event-level
are relatively low, thus implying to focus on occasion- and person-level differences.

THE DARK AND BRIGHT SIDE OF NETWORKING BEHAVIOR
114
variance was at the occasion-level (σ2 = 0.11, SDε = 0.01), 71.06% was at the person-level, and
4.42% was at the event-level. All occasion-level and person-level variance components are within
the range labelled as substantial by other scholars (e.g., Ilies, Schwind, & Heller, 2007: variances
between 21% and 71%). Thus, a substantive portion of the overall variance explained in all
dependent variables was due to variance at the occasion-level as well as person-level, making a
multilevel approach most appropriate for examining the research questions.36
As recommended by Cho and Abe (2013), all hypotheses were tested in a one-tailed way.
All dependent measures (handgrip, depletion, positive affect) were measured twice (pre- and post-
test). Therefore, I used a dummy-coded variable indicating the change from pre-test to post-test.
Networking intensity was centered at the respective event mean (group-mean centering, Enders &
Tofighi, 2007).37 Thereby, I was able to consider differences between attendees of the same event.
Extraversion was centered at the grand mean to account for deviances from the full sample’s
mean.38 I entered the respective variables into the models predicting self-control depletion
(handgrip performance, self-rated depletion) and positive affect in the following steps:
36 In contrast, the variance components on the event-level are relatively low. 37 Results did not substantially differ when centering networking intensity at the grand
mean. 38 Results did not substantially differ when centering extraversion at the respective event
mean.

THE DARK AND BRIGHT SIDE OF NETWORKING BEHAVIOR
115
Hypotheses 1a and 2a.
Step 1 (Model 0). In Step 1, the intercept was the only predictor.
Step 2 (Model 1). In Step 2, I added a dummy-coded variable indicating the change from
pre-test to post-test.
Hypotheses 1b and 2b.
Step 3 (Model 2). In Step 3, I added networking intensity.
Step 4 (Model 3). In Step 4, I added the cross-product of Pre-Post Change × Networking
Intensity.
Hypothesis 1c.
Step 1 (Model 0). In Step 1, the intercept was the only predictor.
Step 2 (Model 1). In Step 2, I added a dummy-coded variable indicating the change from
pre-test to post-test and all person-level variables.
Step 3 (Model 2). In Step 3, I added all cross-products.
Step 4 (Model 3). In Step 4, I added the three-way cross-product of Pre-Post Change ×
Networking Intensity × Extraversion.

THE DARK AND BRIGHT SIDE OF NETWORKING BEHAVIOR
116
Results
Table 19 displays the descriptive statistics, reliabilities, and correlations of the within- and
between person variables.39 Differences from pre-test to post-test in the two measures of self-
control (handgrip performance, self-rated depletion) showed the expected significant negative
correlation, r = -.23, p = .003. The effect size for the change in self-control is small, d = 0.26. Thus,
the effect size is lower than in the 2010 meta-analysis (d = 0.64, Hagger et al., 2010).
39 As recommended by Becker (2005), I report descriptive statistics for the control variable
Time at event, even though I did not include Time at event as a control variable, because results
are essentially identical with and without controlling for Time at event.

117
Table 19. Descriptive Statistics, Reliabilities, and Correlations between Study Variables
Descriptive Statistics, Reliabilities, and Correlations between Study Variables
Variable M SD 1 2 3 4 5 6 7 8 9 10
Level 2 (Person)
1. Gendera 0.57 0.50
2. Age 35.05 10.57 -.02
3. Employmentb 0.76 0.43 -.05 .35***
4. Supervisorc 0.40 0.49 .01 .27*** .34***
5. Extraversion 3.63 0.56 -.14† .00 .01 .20** (.81)
6. Timed at event 2.15 0.96 .11 .12 .11 -.06 .06
7. Timed networking 1.42 0.93 .11 .33*** .09 .23** .15† .39***
8. Networking contacts 8.45 5.58 .05 .32*** .17* .24** .04 .13 .47***
Level 1 (Occasion)e
9. Positive Affect 0.10 0.46 -.05 -.12 -.11 -.02 -.05 -.05 .01 .05 (.82)
10. Depletionf 0.13 0.71 .24** -.05 .09 -.09 -.11 .25*** .06 .03 -.35*** (.85)
11. Self-Controlg -8.84 31.13 -.15† -.04 .01 .01 .04 -.05 -.09 -.03 .16* -.23**
Note. N = 162. Cronbach’s alphas on the diagonal.
aGender (0 =female, 1 = male). bEmployment (0 = unemployed, 1 = employed). cSupervisor (0 = no; 1 = yes). dTime (hours).
eLevel 1 (Differences between pre- and post-test. Cronbach’s alphas are mean alphas of pre- and post-test). fDepletion (self-
rated). gSelf-Control (handgrip in seconds).
† p ≤ .10. * p .05. ** p .01.*** p .001.

THE DARK AND BRIGHT SIDE OF NETWORKING BEHAVIOR
118
Energy resource drain
Self-control (handgrip)
Hypothesis 1a predicted that attendees’ self-control (i.e., handgrip performance) would
decrease from pre-test to post-test. In the null model, the intercept was the only predictor (see
Table 20). In the second step, I entered pre-post change. Pre-post change was negatively and
significantly related to self-control, estimate = -8.84; SE = 1.82, t = -4.87, p ≤ .001, thus confirming
Hypothesis 1a.
Hypothesis 1b predicted that networking intensity would moderate depletion of self-control
from pre-test to post-test. In Model 2, I entered networking intensity, which had no significant
main effect on self-control, estimate = -0.31; SE = 0.83, t = -0.37, p = .709. In the last step, I
entered the cross-product of Pre-Post Change × Networking Intensity, which was negative, but did
not reach significance, estimate = -2.52; SE = 2.14, t = -1.18, p = .120 (see Table 20). Thus,
Hypothesis 1b was not supported.

119
Table 20. Multilevel Estimates for Models Predicting Self-Control (Handgrip), a
Multilevel Estimates for Models Predicting Self-Control (Handgrip), a
Model 0 Model 1 Model 2 Model 3
Variables Est. SE t Est. SE t Est. SE t Est. SE t
Level 2 (Person)a
Intercept 51.28 4.16 12.32*** 51.28 4.16 12.32*** 51.28 4.16 12.32*** 51.28 4.16 12.32***
Networking -0.31 0.83 -0.37 -0.31 0.82 -0.37
Level 1 (Occasion)b
Pre-post changec -8.84 1.82 -4.87*** -8.84 1.82 -4.87*** -8.84 1.82 -4.87***
Pre-Post × NW -2.52 2.14 -1.18
Deviance 3141.18 3128.54 3128.50 3125.91
Variance components
Occasion-level 520.45 481.42 481.42 473.76
Person-level 535.60*** 555.12*** 554.87*** 558.70***
Event-level 140.76*** 140.76*** 140.78*** 140.78***
Note. aN = 162. bN = 324. cPre-post change (0 = Pre-test; 1 = Post-test).
*** p ≤ .001.

THE DARK AND BRIGHT SIDE OF NETWORKING BEHAVIOR
120
Hypothesis 1c predicted that extraversion would act as a buffer against the depleting effect
of networking intensity when attending a networking event. Again, in Model 0, the intercept was
the only predictor (see Table 21). Next, I entered networking intensity, extraversion, and pre-post
change. As before, pre-post change was negatively and significantly related to self-control,
estimate = -8.84; SE = 1.82, t = -4.87, p ≤ .001, whereas networking intensity had no significant
main effect on self-control, estimate = -0.22; SE = 0.83, t = -0.27, p = .792. Likewise, extraversion
was not related to self-control, estimate = -0.92; SE = 1.30, t = -0.71, p = .480. In the next step, I
entered the cross-products of Pre-Post Change × Networking Intensity, estimate = -2.70; SE =
2.16, t = -1.25, p = .215, Pre-Post Change × Extraversion, estimate = 1.81; SE = 2.19, t = 0.83, p
= .409, as well as Networking Intensity × Extraversion, estimate = -0.17; SE = 0.63, t = -0.26, p =
.792. Finally, I entered the cross-product of Pre-Post Change × Networking Intensity ×
Extraversion, which turned out to be significant, estimate = 4.06; SE = 1.54, t = 2.63, p = .005.
I used online HLM calculators (Preacher, Curran, & Bauer, 2006) to conduct simple slope
tests of the three-way interaction effect (see Figure 15 and Figure 16): When engaging in little
networking behavior, neither introverts (M – 1 SD), estimate = -1.19, SD = 3.82, z = -0.31, p =
.755, nor extraverts (M + 1 SD), estimate = -11.68, SD = 7.77, z = -1.50, p = .133, showed
diminished self-control. In contrast, when engaging in intense networking behavior, introverts
showed a significant decrease in self-control, estimate = -20.45, SD = 3.42, z = -5.98, p ≤ .001,
whereas for extraverts, engaging in intense networking behavior only had a marginally significant
effect on self-control, estimate = -5.75, SD = 3.33, z = -1.73, p = .084. Thus, extraversion buffered
against the depleting effect of networking, thereby supporting Hypothesis 1c.

121
Table 21. Multilevel Estimates for Models Predicting Self-Control (Handgrip), b
Multilevel Estimates for Models Predicting Self-Control (Handgrip), b
Model 0 Model 1 Model 2 Model 3
Variables Est. SE t Est. SE t Est. SE t Est. SE t
Level 2 (Person)a
Intercept 51.28 4.16 12.32*** 51.25 4.17 12.28*** 51.29 4.19 12.25*** 51.29 4.19 12.25***
Networking -0.22 0.83 -0.27 -0.24 0.85 -0.28 -0.24 0.85 -0.28
Extraversion -0.92 1.30 -0.71 -0.89 1.33 -0.67 -0.89 1.33 -0.67
NW × Extra -0.17 0.63 -0.26 -0.17 0.63 -0.26
Level 1 (Occasion)b
Pre-post changec -8.84 1.82 -4.87*** -8.84 1.77 -5.01*** -9.77 1.91 -5.11***
Pre-Post × NW -2.70 2.16 -1.25 -2.15 2.02 -1.07
Pre-Post × Extra 1.81 2.19 0.83 1.05 2.30 0.46
P-P × NW × Extra 4.06 1.54 2.63**
Deviance 3141.18 3128.34 3125.18 3117.19
Variance component
Occasion-level 520.45 481.42 472.16 449.42
Person-level 535.60*** 553.50*** 557.86*** 569.23***
Event-level 140.76*** 142.65*** 143.31*** 143.31***
Note. aN = 162. bN = 324. cPre-post change (0 = Pre-test; 1 = Post-test). *** p ≤ .001. ** p ≤ .01.
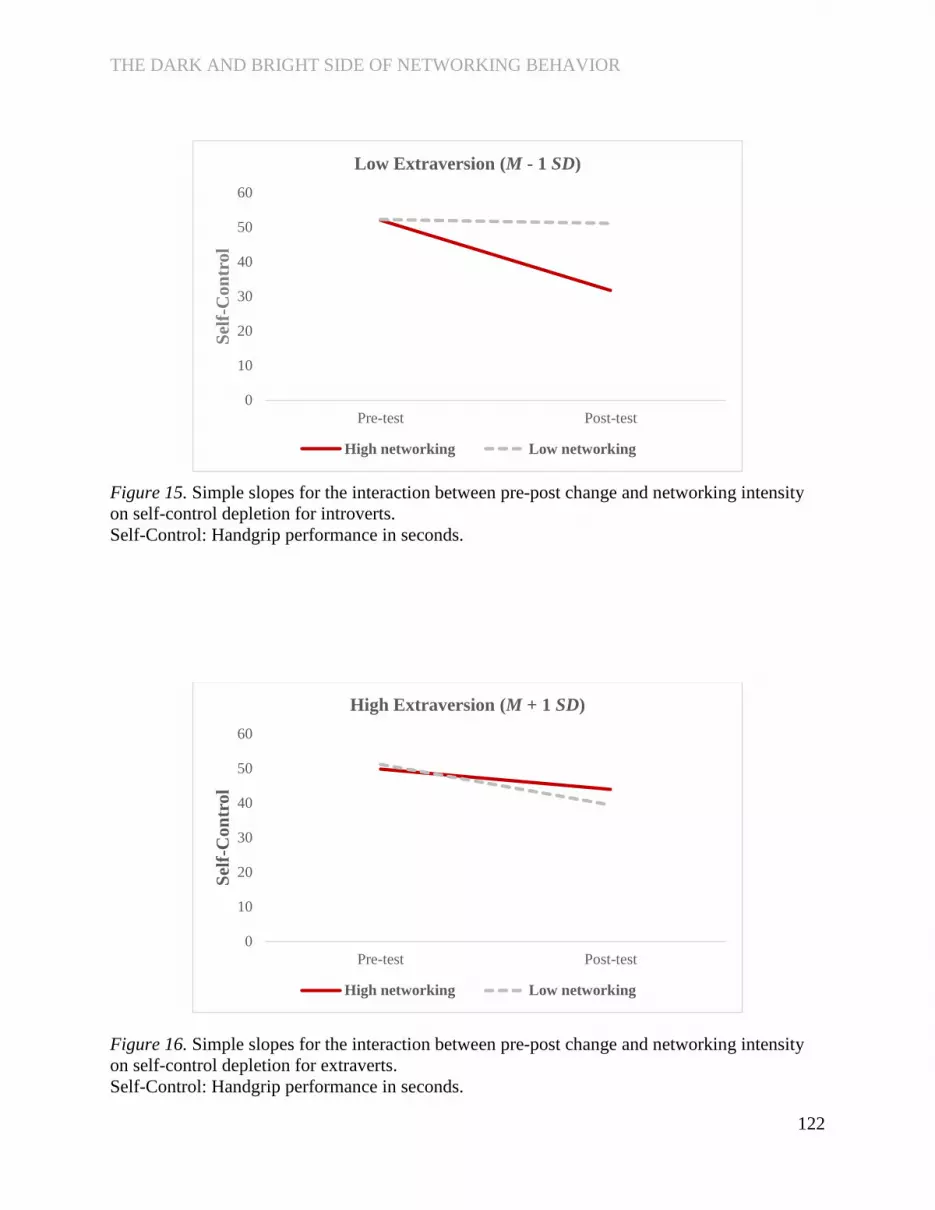
THE DARK AND BRIGHT SIDE OF NETWORKING BEHAVIOR
122
Figure 15. Simple slopes for the interaction between pre-post change and networking intensity
on self-control depletion for introverts.
Self-Control: Handgrip performance in seconds.
Figure 16. Simple slopes for the interaction between pre-post change and networking intensity
on self-control depletion for extraverts.
Self-Control: Handgrip performance in seconds.
0
10
20
30
40
50
60
Pre-test Post-test
Sel
f-C
on
trol
Low Extraversion (M - 1 SD)
High networking Low networking
0
10
20
30
40
50
60
Pre-test Post-test
Sel
f-C
on
trol
High Extraversion (M + 1 SD)
High networking Low networking

THE DARK AND BRIGHT SIDE OF NETWORKING BEHAVIOR
123
Depletion (self-rated)
Hypothesis 1a predicted that depletion would increase from pre-test to post-test. I
employed the same procedure as before: In the null model, the intercept was the only predictor
(see Table 22). In the second step, I entered pre-post change. Pre-post change was positively and
marginally significant related to depletion, estimate = 0.13; SE = 0.09, t = 1.36, p = .088. Thus,
Hypothesis 1a received limited support.
Hypothesis 1b predicted that networking intensity would moderate the increase in
depletion. In Model 2, I entered networking intensity, which had a marginally significant effect on
depletion, estimate = -0.05; SE = 0.03, t = -1.73, p = .086. In the last step, I entered the cross-
product of Pre-Post Change × Networking Intensity, which was not related to depletion, estimate
= 0.01; SE = 0.05, t = 0.12, p = .451. Thus, Hypothesis 1b was not supported.
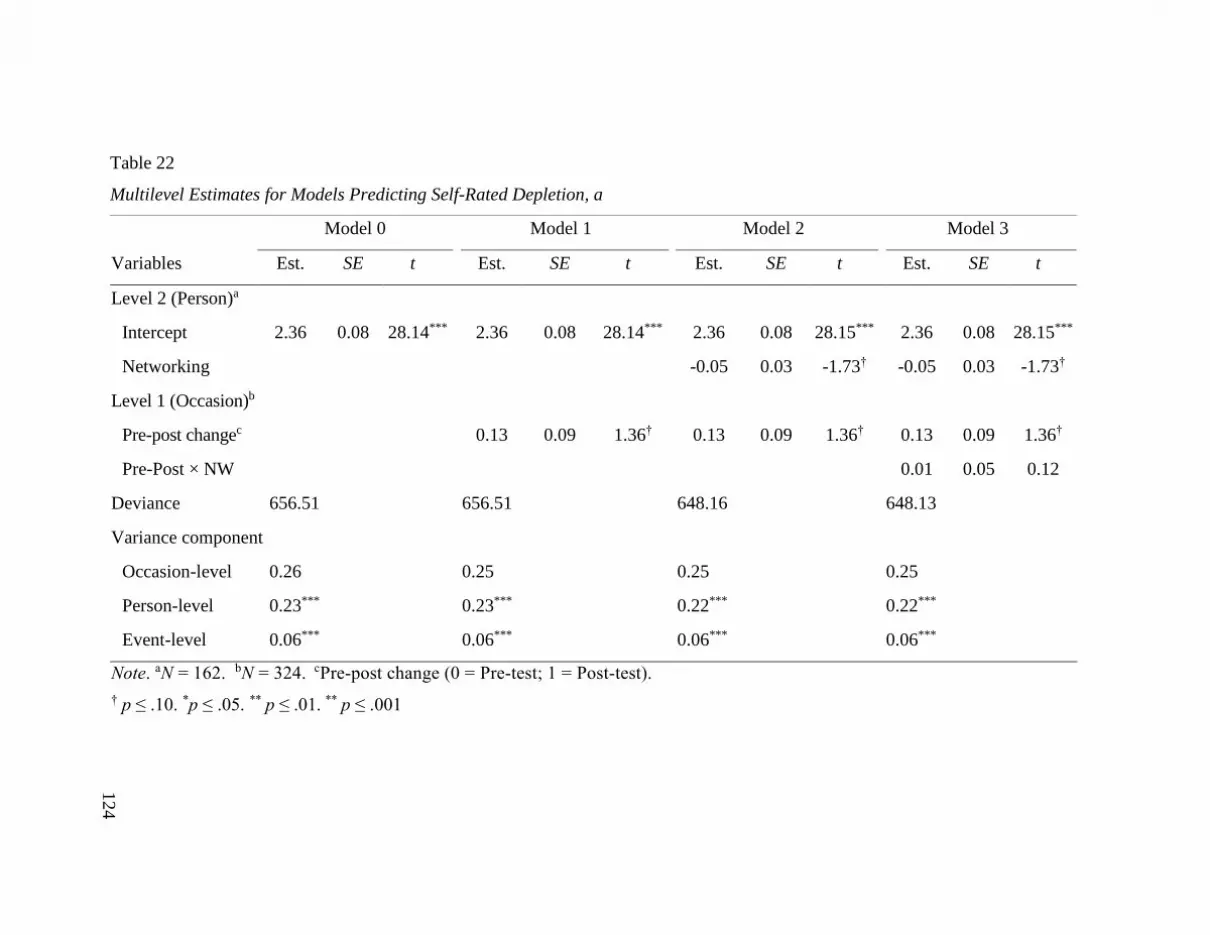
124
Table 22. Multilevel Estimates for Models Predicting Self-Rated Depletion, a
Multilevel Estimates for Models Predicting Self-Rated Depletion, a
Model 0 Model 1 Model 2 Model 3
Variables Est. SE t Est. SE t Est. SE t Est. SE t
Level 2 (Person)a
Intercept 2.36 0.08 28.14*** 2.36 0.08 28.14*** 2.36 0.08 28.15*** 2.36 0.08 28.15***
Networking -0.05 0.03 -1.73† -0.05 0.03 -1.73†
Level 1 (Occasion)b
Pre-post changec 0.13 0.09 1.36† 0.13 0.09 1.36† 0.13 0.09 1.36†
Pre-Post × NW 0.01 0.05 0.12
Deviance 656.51 656.51 648.16 648.13
Variance component
Occasion-level 0.26 0.25 0.25 0.25
Person-level 0.23*** 0.23*** 0.22*** 0.22***
Event-level 0.06*** 0.06*** 0.06*** 0.06***
Note. aN = 162. bN = 324. cPre-post change (0 = Pre-test; 1 = Post-test).
† p ≤ .10. *p ≤ .05. ** p ≤ .01. ** p ≤ .001

THE DARK AND BRIGHT SIDE OF NETWORKING BEHAVIOR
125
Hypothesis 1c predicted that extraversion would buffer against the depleting effect of
networking intensity when attending a networking event. In Model 1, I entered networking
intensity, extraversion, and pre-post change. Networking intensity was no longer related to
depletion, estimate = 0.03; SE = 0.03, t = -1.20, p = .231, after adding extraversion; neither was
pre-post change, estimate = 0.13; SE = 0.09, t = 1.36, p = .176. In contrast, extraversion was
significantly related to depletion, estimate = -0.21; SE = 0.04, t = -4.96, p ≤ .001. In the next step,
I entered the cross-products of Pre-Post Change × Networking Intensity, estimate = 0.01; SE =
0.05, t = 0.29, p = .776, Pre-Post Change × Extraversion, estimate = -0.08; SE = 0.08, t = -1.05, p
= .294, and Networking Intensity × Extraversion, estimate = 0.05; SE = 0.02, t = -2.71, p = .008.
Finally, in Step 5, I entered the cross-product of Pre-Post Change × Networking Intensity ×
Extraversion, estimate = -0.08; SE = 0.03, t = -2.63, p = .005, which was significant.
As before, I used online HLM calculators (Preacher et al., 2006) to conduct simple slope
tests of the three-way interaction effect (see Figure 17 and Figure 18): When engaging in little
networking behavior, neither introverts (M – 1 SD), estimate = 0.08, SD = 0.06, z = 1.49, p = .137,
nor extraverts (M + 1 SD), estimate = 0.20, SD = 0.17, z = 1.16, p = .246, reported increased
depletion. In contrast, when engaging in intense networking behavior, introverts reported
significantly more depletion in the post-test, estimate = 0.34, SD = 0.10, z = 3.25, p ≤ .001, whereas
for extraverts, engaging in intense networking behavior had no effect on depletion, estimate = -
0.03, SD = 0.20, z = -0.18, p = .861. Thus, extraversion buffered against the depleting effect of
networking, thereby confirming Hypothesis 1c.
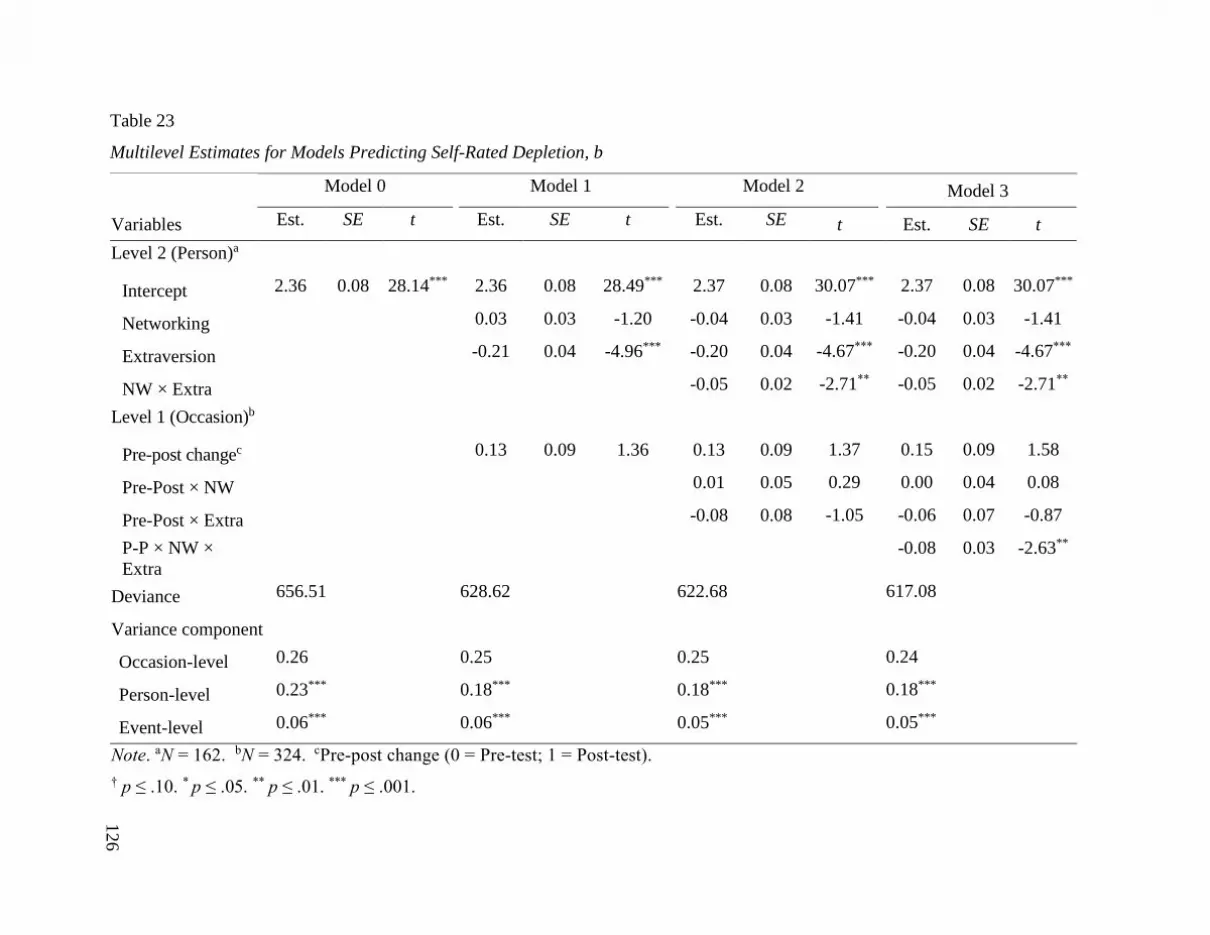
12
6
Table 23. Multilevel Estimates for Models Predicting Self-Rated Depletion, b
Multilevel Estimates for Models Predicting Self-Rated Depletion, b
Model 0 Model 1 Model 2 Model 3
Variables Est. SE t Est. SE t Est. SE t Est. SE t
Level 2 (Person)a
Intercept 2.36 0.08 28.14*** 2.36 0.08 28.49*** 2.37 0.08 30.07*** 2.37 0.08 30.07***
Networking 0.03 0.03 -1.20 -0.04 0.03 -1.41 -0.04 0.03 -1.41
Extraversion -0.21 0.04 -4.96*** -0.20 0.04 -4.67*** -0.20 0.04 -4.67***
NW × Extra -0.05 0.02 -2.71** -0.05 0.02 -2.71**
Level 1 (Occasion)b
Pre-post changec 0.13 0.09 1.36 0.13 0.09 1.37 0.15 0.09 1.58
Pre-Post × NW 0.01 0.05 0.29 0.00 0.04 0.08
Pre-Post × Extra -0.08 0.08 -1.05 -0.06 0.07 -0.87
P-P × NW ×
Extra
-0.08 0.03 -2.63**
Deviance 656.51 628.62 622.68 617.08
Variance component
Occasion-level 0.26 0.25 0.25 0.24
Person-level 0.23*** 0.18*** 0.18*** 0.18***
Event-level 0.06*** 0.06*** 0.05*** 0.05***
Note. aN = 162. bN = 324. cPre-post change (0 = Pre-test; 1 = Post-test).
† p ≤ .10. * p ≤ .05. ** p ≤ .01. *** p ≤ .001.

THE DARK AND BRIGHT SIDE OF NETWORKING BEHAVIOR
127
Figure 17. Simple slopes for the interaction between pre-post change and networking intensity
on depletion for introverts.
Depletion: BMIS.
Figure 18. Simple slopes for the interaction between pre-post change and networking intensity
on depletion for extraverts.
Depletion: BMIS.

THE DARK AND BRIGHT SIDE OF NETWORKING BEHAVIOR
128
Energy resource gain
Positive Affect
Hypothesis 2a predicted that positive affect would increase from pre-test to post-test. In
the null model, the intercept was the only predictor (see Table 24). In the second step, I entered
pre-post change. Pre-post change was positively and significantly related to positive affect,
estimate = 0.10; SE = 0.02, t = 3.01, p = .002, thus confirming Hypothesis 2a.
Hypothesis 2b predicted that networking intensity would moderate the increase in positive
affect. In Model 2, I entered networking intensity, which had no significant main effect on self-
control, estimate = 0.01; SE = 0.83, t = 0.62, p = .534. In the last step, I entered the cross-product
of Pre-Post Change × Networking Intensity, which, in contrast to the hypothesis, was not related
to positive affect, estimate = -0.00; SE = 0.02, t = -0.06, p = .951. Thus, Hypothesis 2b was not
supported.

129
Table 24. Multilevel Estimates for Models Predicting Positive Affect
Multilevel Estimates for Models Predicting Positive Affect
Model 0 Model 1 Model 2 Model 3
Variables Est. SE t Est. SE t Est. SE t Est. SE t
Level 2 (Person)a
Intercept 3.25 0.06 50.95*** 3.25 0.06 50.95*** 3.25 0.06 50.95*** 3.25 0.06 50.95***
Networking 0.01 0.02 0.62 0.01 0.02 0.62
Level 1 (Occasion)b
Pre-post changec 0.10 0.03 3.01** 0.10 0.03 3.01** 0.10 0.03 3.01**
Pre-Post × NW -0.00 0.02 -0.06
Deviance 515.96 508.96 508.77 508.77
Variance component
Occasion-level 0.11 0.10 0.10 0.10
Person-level 0.31*** 0.32*** 0.32*** 0.32***
Event-level 0.02* 0.02* 0.02* 0.02*
Note. aN = 162. bN = 324. cPre-post change (0 = Pre-test; 1 = Post-test).
*p ≤ .05. ** p ≤ .01. ** p ≤ .001

THE DARK AND BRIGHT SIDE OF NETWORKING BEHAVIOR
130
Discussion
In Study 3, I sought to replicate results from the two laboratory experiments in the field at
real networking events. As in Studies 1 and 2, I investigated the dark side of networking behavior.
That is, energy resource drain through networking behavior (i.e., self-control depletion) as well as
a buffering effect of extraversion. Further, as in Study 2, I also integrated the bright side of
networking, referring to the energy resource gain process, as manifested by positive affect.
Therefore, I performed a field study with 162 attendees of multiple networking events.
On the dark side, I found that networking behavior depletes self-control resources. More
specifically, participants showed significant decreases in handgrip performance (as a measure of
self-control) after participating in a networking event. Also, they reported marginally more
depletion after attending a networking event. However, contrasting expectations, I found no
moderating effect of networking intensity for the depleting effect of attending a networking event.
Hence, depletion following the event did not depend on time spent networking and the number of
networking interactions at the event. Yet, as predicted by the developed model of networking
behavior (cf. Figure 3) and in line with findings from Study 1, extraversion moderated the
depleting effect of networking intensity when attending a networking event. That is, when
engaging in intense networking at the event, introverts’ handgrip performance worsened and they
reported more depletion in the post-test. In contrast, intense networking had no such detrimental
effect on extraverts.
On the bright side, I found further support for energy resource gain following networking
behavior. Findings suggest that attending a networking event enhances energy resources, as
manifested by positive affect. However, contrary to expectations, the positive effect on mood
resources was not moderated by networking intensity. Hence, participants did not experience more
THE DARK AND BRIGHT SIDE OF NETWORKING BEHAVIOR
131
positive affect when they had spent more time networking and interacted with more networking
contacts at the event.
Networking events are planned meetings with the proximal objective of building,
maintaining, and using interpersonal relationships (cf. Bergemann et al., 2017; Ingram & Morris,
2007). Therefore, in order to gain a deeper understanding of networking behavior and its
consequences, it seems promising to collect data at networking events. Furthermore, replicating
findings with a working sample strengthens external validity. I used a broad sample with
participants from different occupational backgrounds. Prior networking studies typically focus on
either employees (e.g., Wolff & Moser, 2009), entrepreneurs (e.g., Ostgaard & Birley, 1996), job
seekers (e.g., Wanberg et al., 2000), or students (Schütte & Blickle, 2015), whereas I included all
of them. Yet, controlling for the respective status did not substantively change results, thus arguing
for generalizability of the findings. Nonetheless, interpretations should be handled with care, given
the small sample size of the subgroups (particularly job-seekers, N = 9, and students, N = 30). The
same applies to the event level. By including twelve events, I followed Shadish et al.’s (2002)
recommendation to use a sample of many possible versions of the examined situation. However,
the sample size of twelve events is still too small to examine event-level effects (cf. Ohly,
Sonnentag, & Niessen, 2010; Snijders, 2005).
Despite the distinct strengths of the present study, I recognize several limitations. First,
the within-person design with repeated measures yields potential threats to internal validity, for
example, fatigue or practice effects (cf. Shadish et al., 2002). However, I built my hypotheses on
theory as well as empirical findings from experimental laboratory studies that are characterized by
high internal validity. Furthermore, in Study 3, I relied on well-established measures that have
been typically measured twice in a pre-test and post-test in prior studies (e.g., Martijn et al., 2007).

THE DARK AND BRIGHT SIDE OF NETWORKING BEHAVIOR
132
Also, I did not rely on mere changes from pre-test to post-test, but rather examined quite complex
moderator effects, including a three-way Interaction of pre-post change, networking intensity, and
extraversion. As outlined above, Shadish and colleagues (2002) state that the use of predicted
interactions makes internal validity threats less plausible.
Second, I used no random sample, but participants who I encountered at networking events.
The tendency to participate in a networking event, however, might be influenced by personal
characteristics. If only certain types of people chose to attend networking events, results might
reflect those group tendencies (self-selection bias). Supporting this notion, with regard to
extraversion, the sample in Study 3 had a significantly higher mean (M = 3.63, SD =0.56) than the
sample in Study 1 (M = 3.35, SD = 0.56), t(366) = 4.81, p ≤ .001. This fits in with the
characterization of extraverts as actively seeking out social interactions with professional contacts
(cf. Forret & Dougherty, 2001). However, that makes results from Study 3 even more pivotal as
they also apply to individuals who deliberately pursued the networking situation. Also, it is
noteworthy that I still found a moderating effect of extraversion.
Lastly, even though in Study 3, I gathered data in a natural setting, a networking event
seems to be a rather particular situation. Therefore, networking behaviors should also be studied
in employees’ everyday working life. Therefore, in Study 4, I seek to investigate employees’
networking behavior in their natural work context.
THE DARK AND BRIGHT SIDE OF NETWORKING BEHAVIOR
133
Study 4
In Studies 1 – 3, I established energy resource drain and energy resource gain processes
through networking behavior. On the dark side, I found that networking behavior depletes self-
regulatory energy resources. On the bright side, I found that networking behavior generates
affective energy resources. Taken together, Studies 1 – 3 suggest that networking behavior
simultaneously depletes and generates energy resources.
Whereas the experimental designs used in Studies 1 and 2 provide high internal validity,
replicating results in real networking situations (Study 3) strengthens external validity. Yet,
because a networking event still is a rather particular situation, in Study 4, I seek to investigate
how networking behavior affects employees in their everyday working life. Although people’s
networking behavior appears to be relatively stable when aggregated over time (e.g., Meier &
O’Toole, 2005), as for other proactive behaviors at work (e.g., Sonnentag & Starzyk, 2015), there
might be considerable within-person variability. Therefore, I argue that networking behavior varies
from day to day and even those who rarely show networking behaviors do so at times and should
experience its consequences.
The proposed model (cf. Figure 3; see also Hobfoll, 2002; ten Brummelhuis & Bakker,
2012) suggests that people’s networking behavior not only yields immediate energy resource drain
and gain, but also leads to attitudinal and productive outcomes over the course of a day. Therefore,
in Study 4, I take a step forward and integrate day-level outcomes of networking behavior. For
example, networking behavior at work might likely have an impact on employees’ work-related
well-being (e.g., emotional exhaustion), not only at work but also after finishing work. In order to
assess the relationship between employees’ networking behavior at work with outcomes at work
as well as after work, I extended the investigated time frame. That is, I measured outcomes of

THE DARK AND BRIGHT SIDE OF NETWORKING BEHAVIOR
134
networking behavior twice, after work and before bedtime. More specifically, I conducted a daily
diary study with 166 employees, completing two online surveys per day over the course of one
working week.
Hypotheses
Figure 19 depicts an overview of the hypotheses in Study 4.
Figure 19. Overview of hypotheses in Study 4.
Energy resource drain
According to the energy resource drain process, networking behavior depletes self-
regulatory energy resources. In Studies 1 – 3, I found support for the proposed energy resource
drain process. That is, networking behavior depletes self-control resources, as manifested by
increased candy consumption (Studies 1 and 2) and decreased handgrip performance (Study 3)
following networking. With regard to self-report measures, Study 3 showed that networking

THE DARK AND BRIGHT SIDE OF NETWORKING BEHAVIOR
135
behavior increases depletion whereas findings of Studies 1 and 2 contradicted hypotheses. As
discussed, the unexpected findings in Studies 1 and 2 might be due to the relatively long period in
between the networking manipulation and the measurement of self-reported self-control (see
Discussion of Study 1; see also Tyler & Burns, 2008). In the present study, the period in between
the exertion of networking behavior (e.g., at lunch) and the assessment of self-control (i.e., after
work) might be even longer. Furthermore, the study design does not allow for assessing self-
control depletion with a behavioral self-control measure. Therefore, I do not specify any
hypotheses regarding self-control depletion. However, I briefly report results regarding self-
control depletion.
Energy resource gain
According to the proposed energy resource gain process, networking behavior generates
energy resources in the form of enhanced positive affect. This is in line with COR theory,
suggesting that people anticipate the strategic resource investments they make in networking
behavior to pay off (Hobfoll, 2001). Accordingly, Ingram and Morris (2007) state that attendees
of networking event expect to receive return on their investments. Hence, engaging in networking
behavior should result in immediate or anticipated resource gain (e.g., forming a new networking
relationship or obtaining strategic information). Actual or anticipated resource gain during
networking should also be manifested by augmented affective energy resource states (cf.
Halbesleben et al., 2014; ten Brummelhuis & Bakker, 2012). In line with this arguing, in Studies
2 and 3, I found that networking behavior improves positive affect. Therefore, tying in with
findings from Studies 2 and 3, I seek to replicate the finding that networking behavior positively

THE DARK AND BRIGHT SIDE OF NETWORKING BEHAVIOR
136
relates to positive affect. More specifically, I assume that on work days characterized by high
levels of networking behavior, employees should experience more positive affect after work.
Hypothesis 1: Day-level networking behavior is positively related to day-level positive
affect.
Attitudinal outcomes
Given that networking behavior results in short-term energy resource drain and gain, a
crucial question is how networking behavior and energy resource processes influence further
outcomes over the course of a day (cf. Figure 3 and Figure 19). Attitudinal outcomes refer to
feelings and beliefs that are valued by the employee and the employer (ten Brummelhuis & Bakker,
2012). Examples of attitudinal outcomes are feelings of work-home conflict and work-related well-
being.
Feelings of work-life40 conflict
The work–life literature is dominated by resource-theoretical approaches (Wiese, 2007)
such as models based on role theory (e.g., Greenhaus & Beutell, 1985; Pleck, 1977). The basic
notion of these models is that employees have limited resources such as time and energy for
fulfilling roles. Work–life conflict occurs when resource investments in one domain drain resource
reservoirs, leaving insufficient resources to function optimally in the other domain (ten
Brummelhuis & Bakker, 2012). According to the proposed model of networking behavior (cf.
40 I refer to the “life” instead of the “family” domain because the former label is not limited
to the family, but embraces the various life roles employees might possess beyond their work roles
(cf. Greenhaus & Powell, 2006).

THE DARK AND BRIGHT SIDE OF NETWORKING BEHAVIOR
137
Figure 3 and Figure 19), employees must invest self-regulatory energy resources when engaging
in networking behaviors at work, resulting in self-control depletion (see also Studies 1 – 3). As a
consequence, employees who have invested their self-control resources into networking behavior
at work might be too depleted to maintain private relationships or participate in family life after
finishing work. They might therefore experience feelings of work-life conflict. In a similar vein,
Wolff et al. (2008) argue that a strong focus on work-related contacts might go along with a neglect
of friends and family and, consequently, cause work-life conflicts. Therefore, I assume that higher
levels of networking behavior at work should lead to increased feelings of work-life conflict on a
daily basis.
Hypothesis 2: Day-level networking behavior is positively related to day-level feelings of
work-life conflict.
Work-related well-being
Well-being is commonly viewed as people’s subjective and emotional assessments of
important aspects of their lives (Diener, 1984),41 for example, their work (work-related well-being,
ten Brummelhuis & Bakker, 2012). In general, COR theory has a strong focus on linking resource
changes to well-being (cf. Halbesleben et al., 2014; Hobfoll, 2002; ten Brummelhuis & Bakker,
2012). Perceived or actual resource loss has been found to result in burnout (e.g., Lee & Ashforth,
1996), whereas (perceived) resource gains improve well-being (Diener et al., 1999). For example,
a resource deficit finds expression in emotional exhaustion, whereas resource gain is reflected by
41 This broad definition by Diener (1984; see also Diener et al., 2017) also encompasses
emotional assessments such as positive affect. However, based on COR’s resource typology, I
consider positive affect an energy resource whereas indicators of work-related well-being such as
work satisfaction, emotional exhaustion, and work engagement represent attitudinal outcomes (cf.
ten Brummelhuis and Bakker, 2012).

THE DARK AND BRIGHT SIDE OF NETWORKING BEHAVIOR
138
work engagement as the “positive antipode of burnout” (Gorgievski & Hobfoll, 2008, p. 8). In this
vein, a recent strategy to measure resource changes has been to use well-being as an indicator that
there has been a change in resources (cf. Halbesleben et al., 2014). Research on intra-individual
well-being finds that employees are sensitive to changes in resources that can occur over relatively
short timeframes such as over workdays or weekends (e.g., Halbesleben & Wheeler, 2015;
Binnewies et al., 2010; Fritz & Sonnentag, 2005). Building on this, I argue that networking
behavior should improve people’s subjective work-related well-being on a daily basis. That is,
networking behavior is a means to generate resources, either immediately (e.g., networking
relationships, strategic information) or in the future (e.g., job search or career success, cf. Gibson
et al., 2014). Those resources, in turn, might “facilitate well-being indirectly by allowing
individuals to pursue and attain important goals” (Diener et al., 1999, p. 284). I consider three
indicators of work-related well-being: work satisfaction, emotional exhaustion, and work
engagement.
Work satisfaction
Work satisfaction is the most commonly examined indicator of work-related well-being
(cf. Diener et al., 1999; Ilies et al., 2007). It reflects an evaluative state resulting from a positive
“appraisal of one’s job or job experiences” (Locke, 1976, p. 1300), for example, with regard to
evaluations of the social environment at work (Koopman et al., 2016).42 Work-related resources
such as instrumental support increase work satisfaction (e.g., Raby, 2010). As networking behavior
42 Thus, satisfaction is mostly treated as an attitude concept in survey studies (e.g., Warr,
Cook, & Wall, 1979). However, in diary studies work satisfaction can also be considered an
affective response to one’s job (e.g., Fisher, 2000; cf. Ohly et al., 2010).
THE DARK AND BRIGHT SIDE OF NETWORKING BEHAVIOR
139
is a means to generate such work-related resources (cf. Gibson et al., 2014), I argue that higher
levels of networking behavior should be related to increased work satisfaction on a daily basis.
Hypothesis 3a: Day-level networking behavior is positively related to day-level work
satisfaction.
The proposed model of networking behavior (cf. Figure 3 and Figure 19) suggests that
engaging in networking behavior should result in positive affect (see also Studies 2 and 3), which,
in turn, has an impact on attitudinal outcomes such as work satisfaction. This is in line with
research on mood congruence, arguing that the valence of experienced emotions (e.g., positive
affect) influences the valence of retrieved evaluations (e.g., work satisfaction; cf. Bower, 1981;
Forgas, 1995). Accordingly, meta-analytical research shows a significant relationship between
positive affect and work satisfaction (ρ = .34, Thoresen, Kaplan, Barsky, Warren, & Chermont,
2003). Also, Koopman and colleagues (2016) find that employees’ positive affect mediates the
effect of interpersonal OCB on work satisfaction (see also Dimotakis, Scott, & Koopman, 2011;
Judge & Ilies, 2004). Therefore, I propose a mediating effect of positive affect for the relationship
between networking behavior and work satisfaction.
Hypothesis 3b: Day-level positive affect mediates the relationship between day-level
networking behavior and day-level work satisfaction.
Emotional exhaustion
Emotional exhaustion is “an important marker of employee well-being” (Halbesleben &
Wheeler, 2011, p. 608). It represents the central strain dimension (Maslach & Leiter, 2008) and
key component of burnout (Demerouti, Bakker, Nachreiner, & Schaufeli, 2001; Halbesleben &
Bowler, 2007). According to COR, resource gain should reduce emotional exhaustion (cf.

THE DARK AND BRIGHT SIDE OF NETWORKING BEHAVIOR
140
Halbesleben et al., 2014). Accordingly, meta-analytical research (Halbesleben, 2006) as well as
several studies (e.g., Baeriswyl, Krause, Elfering, & Berset, 2017; Ducharme, Knudsen, & Roman,
2008; Hobfoll & Freedy, 1993; Ortiz-Bonnín, García-Buades, Caballer, & Zapf, 2016) confirm
that work-related resources such as instrumental support at work are negatively related to
emotional exhaustion. Networking behavior is a means to generate professional resources (cf.
Gibson et al., 2014). Hence, employees might draw upon networking behavior to accumulate
work-related resources in order to address exhaustion. Therefore, I argue that networking behavior
at work decreases emotional exhaustion on a daily basis.
Hypothesis 4a: Day-level networking behavior is positively related to day-level emotional
exhaustion.
As suggested by the developed model of networking behavior (cf. Figure 3 and Figure 19),
networking behavior leads to improved affect (see Studies 2 and 3), which can “undo” negative
states, inherent to emotional exhaustion (Fredrickson, 1998; Fredrickson & Levenson, 1998, Tice,
Baumeister, Shmueli, & Muraven, 2007). Accordingly, a meta-analysis showed a significant,
negative relationship between positive affect and emotional exhaustion (ρ = -.32, Thoresen et al.,
2003). Building on this arguing, improved affect following networking behavior should reduce
emotional exhaustion (cf. ten Brummelhuis & Bakker, 2012). In line with COR and proposed
model of networking behavior, I suggest that part of the relationship between networking behavior
and emotional exhaustion can be explained by the affective boost following networking.
Hypothesis 4b: Day-level positive affect mediates the relationship between day-level
networking behavior and day-level emotional exhaustion.
THE DARK AND BRIGHT SIDE OF NETWORKING BEHAVIOR
141
Work engagement
Contrasting emotional exhaustion, work engagement is considered the positive antipode of
burnout (Schaufeli, Bakker, & Salanova, 2006), representing a state of excess resources
(Gorgievski & Hobfoll, 2008). It is defined as a “positive, fulfilling work-related state of mind that
is characterized by vigor, dedication, and absorption” (Schaufeli & Bakker, 2004, p. 295). Vigor
is characterized by high levels of energy while working and the willingness to invest effort in one’s
work. Dedication refers to being strongly involved in one’s work and experiencing a sense of
enthusiasm and challenge. Finally, absorption is characterized by being fully concentrated in one’s
work (Schaufeli & Bakker, 2004). Work engagement generally shows positive relationships with
work-related resources such as instrumental support (e.g., Albrecht, 2010; Bakker, 2011; Bakker
& Demerouti, 2008; Schaufeli & Bakker, 2004; Schaufeli, Bakker, & Van Rhenen; 2009). As
networking behavior provides access to work-related resources (cf. Gibson et al., 2014) it should
be positively related to work engagement. Indeed, a recent diary study found that networking
behavior was positively associated with work engagement on a daily basis (Dubbelt, Rispens, &
Demerouti, 2016). Likewise, I hypothesize that networking behavior relates to work engagement.43
Hypothesis 5: Day-level networking behavior is positively related to day-level work
engagement.
43 Because I measured networking behavior, positive affect, and work engagement
concurrently after work, I could not test a mediating effect of positive affect on the relationship
between networking behavior and work engagement. However, in line with COR, it seems likely
that, as for work satisfaction and emotional exhaustion, the effect of networking behavior on work
engagement is mediated by positive affect following networking behavior.

THE DARK AND BRIGHT SIDE OF NETWORKING BEHAVIOR
142
Productive outcomes
Furthermore, the proposed model of networking behavior suggests that networking
behavior influences productive outcomes (cf. Figure 3 and Figure 19). Productive outcomes refer
to the efficient and effective creation of products and services (ten Brummelhuis & Bakker, 2012).
One such productive outcome is work performance.
Work performance
Work performance is defined as behaviors relevant to the goals of an organization, with
task performance directly relating to the organization’s technical core (McCloy et al., 1994).
Studies suggest that an individuals’ performance at work varies from day to day (e.g., Bakker,
2011), depending on the level of work-related resources (e.g., Xanthopoulou, Bakker, Demerouti,
& Schaufeli, 2009). Accordingly, previous studies show that networking behavior as a means to
generate work-related resources is positively associated with task performance (e.g., Blickle et al.,
2012; Nesheim et al., 2017; Shi et al., 2011; Thompson, 2005; cf. work performance). This might
be due to several mechanisms, such as “acquiring and having trustworthy sources of information,
identifying and communicating with potential customers, creating solutions to problems that have
a high degree of uniqueness and require input from several contributors, as well as influencing
decision outcomes at both the operative and strategic level” (Nesheim et al., 2017, p. 242).
Accordingly, I propose a positive relationship between networking behavior and task performance
on a daily basis.
Hypothesis 6: Day-level networking behavior is positively related to day-level work
performance.

THE DARK AND BRIGHT SIDE OF NETWORKING BEHAVIOR
143
Method
I used a daily diary study design. Upon registration, participants filled out a general
background survey. Starting the following Monday, they completed two daily online surveys (after
work and before bedtime) over the course of a working week.
Participants
I recruited study participants via university and company mailing lists as well as in various
Facebook groups throughout Germany. Participants were required to have secondary education
and to be employed for a minimum of 19 paid working hours per week. Participation was
motivated by promising feedback about study findings and raffling lottery prices (iPad, Amazon
vouchers). Lottery prizes were not contingent on participants’ compliance (e.g., one lot per daily
survey completed) as scholars warn that this might motivate participants to fake responses (e.g.,
Green, Rafaeli, Bolger, Shrout, & Reis, 2006).
A total of 180 employees agreed to participate in the study. Five participants had to be
excluded from the analyses because they did not complete the full background survey. Nine
participants were excluded because they did not respond to a single daily survey. Thus, the final
sample consisted of 166 employees (92.2% of the original sample). Due to the recruitment strategy,
I have no information on the number of individuals who initially received the request to participate.
Out of the final sample, 109 participants were female (65.7%) and 57 (34.3%) were male
(see Table 27). The average age was 30.28 years (SD = 5.49). Regarding education, 12.0% had
secondary education, 9.6% held a bachelor’s degree and 65.7% held a master’s degree; 12.7%
indicated to have a PhD. The average tenure was 3.20 years (SD = 3.31) and 22.9 % held a
supervisor position.

THE DARK AND BRIGHT SIDE OF NETWORKING BEHAVIOR
144
More than half of the sample worked in academia (55.8%), the remaining participants
worked across a wide range of industries (see Table 25). As academics are clearly overrepresented
in the sample, I repeated all analyses separately for academics (N = 92) and non-academics (N =
74). In both samples, all parameters showed the same tendencies and the differences between the
full and the constituent samples topped out at one position after the decimal point. Due to the
smaller sample sizes, some results did not reach significance in the constituent samples. However,
because I found no major or systematic differences between the full and the constituent samples,
I report results for the full sample only.
Table 25. Participants’ Professional Sectors
Participants’ Professional Sectors
Professional sector Frequency Percent
Academia 92 55.8%
Health Care and Welfare 16 9.6%
Education 9 5.4%
Building Industry 7 4.2%
Information and Communication Technology 6 3.6%
Automotive 4 2.4%
Finance and Insurance 3 1.8%
Energy Supply 2 1.2%
Logistics 1 0.6%
Other 25 15.1%
Missing 1 0.6%

THE DARK AND BRIGHT SIDE OF NETWORKING BEHAVIOR
145
From the 1660 daily surveys sent out, participants responded to 1279 surveys (699 after
work, 580 at bedtime), indicating an overall response rate of 77.1%. As displayed in Table 26, in
general, the after work survey (M = 84.2%, SD = 5.4) had a better response rate than the nightly
survey (M = 69.9%, SD = 9.9).
Table 26. Response Rates
Response Rates
Day After work At bedtime
1 88.6% 77.7%
2 85.5% 69.3%
3 88.0% 75.3%
4 83.7% 74.1%
5 75.3% 53.0%
Procedure
All data was collected online and via self-report. After participants registered, they read
and agreed to an informed consent and filled out a general background survey. Starting the
following Monday, participants completed two daily brief online surveys over five consecutive
working days (see Figure 20). Participants were instructed to answer the daily survey (sent out at
4.30 pm) after they finished work and to respond to the nightly survey (sent out at 9 pm) right
before they went to bed. Responding was possible during a specified time frame of five hours.

THE DARK AND BRIGHT SIDE OF NETWORKING BEHAVIOR
146
Figure 20. Diary study design.
Measures
General background survey
Networking behavior
In order to evaluate the validity of the day-level networking measure, I assessed
employees’ general person-level networking behavior in the background survey. I used a shortened
twelve-item version of Wolff and colleague’s (2017) brief 18-item networking scale (based on the
original 44-item scale, Wolff & Moser, 2006; Appendix L). Sample items are “In my company, I
approach employees I know by sight and start a conversation”, “I discuss problems with colleagues
from other departments that they are having with their work”, and “I exchange professional tips
and hints with acquaintances from other organizations”. Participants used a 5-point Likert scale (1
= never to 5 = very often/always), α = .86.

THE DARK AND BRIGHT SIDE OF NETWORKING BEHAVIOR
147
Demographic variables
Participants specified their gender, age, education, and tenure. Furthermore, they indicated
their professional sector and whether they held a supervisor position. I repeated all analyses,
controlling for demographic variables, but results were essentially identical. Therefore, as
recommended by Becker (2005), I report the findings without controlling for demographic
variables (see Study 1 for more details on dealing with control variables).
Daily after work survey
Networking behavior
I measured day-level networking behavior with five items based on Wolff and Moser’s
(2006) networking scale (Appendix M). I used more general items because the original items are
very specific and might thus produce floor effects on the daily level. Sample items for day-level
networking behavior are “Today at work, I built new contacts”, “Today at work, I maintained my
informal contacts”, and “Today at work, I approached my informal contacts to request support”.
Participants used a 6-point Likert scale, ranging from 1 (not at all) to 6 (very much). Cronbach’s
alphas ranged from .74 to .91 over the five days (mean α = .84). In order to evaluate the validity
of the day-level networking measure, I assessed the relationship between person-level networking
and day-level networking behavior. Using HLM, I entered person-level networking into the model
predicting day-level networking. I found the expected significant, positive relationship between
the two measures, estimate = 0.40, SE = 0.10, t = 3.85, p ≤ .001.

THE DARK AND BRIGHT SIDE OF NETWORKING BEHAVIOR
148
Self-Control
I assessed self-control with the brief ten-item German version of the State Self-Control
Capacity Scale (Bertrams et al., 2011; Appendix C; see also Studies 1 and 2).44 Cronbach’s Alphas
ranged between .84 and .90 from Day 1 to 5 (mean α = .88).
Positive affect
I measured positive affect with ten items from the PANAS (German version: Krohne et al.,
1996; Appendix H; see also Study 2). Sample items include “active”, “determined”, and “proud”.
Participants indicated to what extent they felt this way at the present moment on a 5-point Likert
scale (1 = not at all to 5 = extremely). Cronbach’s Alphas varied from .81 to .91 over the five days
(mean α = .87).
Work engagement
Work engagement was assessed with the short nine-item version of the Utrecht Work
Engagement Scale (UWES-9, Schaufeli et al., 2006; Appendix N). Sample items are “Today at
work, I felt bursting with energy”, “Today, I was enthusiastic about my work”, and “Today, I
immersed in my work”. The items were scored on a 5-point Likert-type scale ranging from 1
(strongly disagree) to 5 (strongly agree). Cronbach’s alphas for work engagement ranged from .92
to .94 over the five days (mean α = .93).
44 Note that I conducted Studies 3 and 4 in reverse order and changed the self-report
measure in Study 3.

THE DARK AND BRIGHT SIDE OF NETWORKING BEHAVIOR
149
Work performance
I measured work performance with five items of the subscale “Task Performance”, derived
from the Work Performance Behavior Questionnaire (Staufenbiel & Hartz, 2000; Appendix O).
Sample items include “Today at work, I fulfilled my obligations”, “Today at work, I met my
performance requirements”, and “Today at work, I neglected my responsibilities” (reversed).
Participants answered on a 5-point Likert-type scale ranging from 1 (strongly disagree) to 5
(strongly agree). Cronbach’s Alpha varied between .85 and .89 over the five days (mean α = .87).
Workload
I controlled for workload because it might affect networking behavior as well as other
criteria. For example, on work intense days, individuals might have no time or energy to network
and might be emotionally exhausted (e.g., Garrick et al., 2014; Luong & Rogelberg, 2005). I
measured workload with five items from the Work Intensity Questionnaire (Richter et al., 2000).
Sample items include “Today, I had a lot of work to do”, “Today at work, I felt a lot of time
pressure”, and “Today, my pace of work was very fast”. Participants answered on a 5-point Likert-
type scale ranging from 1 (strongly disagree) to 5 (strongly agree). Cronbach’s alphas of workload
varied between .73 and .81 from Day 1 to 5 (mean α = .77). I conducted all analyses both with and
without workload. However, because results were essentially identical, I report results without
controlling for workload.

THE DARK AND BRIGHT SIDE OF NETWORKING BEHAVIOR
150
Daily bedtime survey
Feelings of work-life conflict
I measured feelings of work-life conflict with four items of the subscale “strain-based
work-family conflict”, derived from the Work-Family Conflict Scale by Stephens and Sommer
(1996; Appendix P). Sample items are “Today, I felt the strain of attempting to balance my work
and private life responsibilities”, “Today, I felt irritable in my private life because my work was
so demanding”, and “Today, the demands of my job made it difficult for me to maintain the kind
of private relationships that I would have liked”. Participants used a 5-point Likert-type scale
ranging from 1 (strongly disagree) to 5 (strongly agree). Cronbach’s alpha ranged between .82
and .87 over the five days (mean α = .87).
Work satisfaction
I used a series of five faces showing feelings from very negative (1 = totally dissatisfied)
to very positive (5 = totally satisfied) to assess momentarily work satisfaction (Kunin, 1955;
Appendix Q). Studies showed that single-item scales are an adequate measure of overall work
satisfaction (e.g., Ironson, Smith, Brannick, Gibson, & Paul, 1989; Kaplan, Warren, Barsky, &
Thoresen, 2009; Wanous, Reichers, & Hudy, 1997).
Emotional exhaustion
Emotional exhaustion was measured with eight items from the Oldenburg Burnout
Inventory (OLBI, Demerouti, Bakker, Vardakou, & Kantas, 2003; Appendix R). Sample items
include “Today after work, I felt worn out and weary”, “Today after work, I needed more time
than usual to relax and feel better”, and “Today after work, I felt fit for my leisure activities”

THE DARK AND BRIGHT SIDE OF NETWORKING BEHAVIOR
151
(reversed). Participants indicated their agreement on a 5-point Likert-scales (1 = strongly disagree
to 5 = strongly agree). Cronbach’s Alpha ranged from .82. to .87 over the five days (mean α =
.85).
Analyses
I analyzed the data with a multilevel random coefficient model using HLM (Version 7,
Raudenbush et al., 2011), thereby accommodating the two-level data structure with days nested
within persons. In order to test whether HLM is appropriate to analyze the data, I examined the
day-level (within-person) and person-level (between-person) variance of all day-level study
variables (cf. Tables 29 – 34). For networking behavior, 62.98% of the overall variance explained
was at the day-level, suggesting that even though scholars depict networking as a rather stable
behavior syndrome (e.g., Meier & O’Toole, 2005), there is substantive within-person variation at
the day-level. For self-control, 57.95% and for positive affect, 55.07% of the overall variance
explained was at the day-level. For feelings of work-life conflict, 50.18% of the overall variance
was at the day-level. For work satisfaction, 37.05%, and for emotional exhaustion, 46.68% of the
overall variance explained was at the day-level. For work engagement, 40.40%, and for work
performance, 57.21%, of the overall variance explained was at the day-level. Regarding workload,
the day-level variance was 54.39%. All variance components are within the range labelled as
substantial by other scholars (e.g., Ilies et al., 2007: variances between 21% and 71%). Thus, a
substantive portion of the overall variance explained in networking as well as in all dependent
variables of the present study was due to variance at the day-level, suggesting that a multilevel
approach is most appropriate for examining the research questions.
THE DARK AND BRIGHT SIDE OF NETWORKING BEHAVIOR
152
As recommended by Enders and Tofighi (2007), all within-person predictors were centered
at the respective person mean. All hypotheses were tested in a one-tailed way (cf. Cho & Abe,
2013). I entered the variables into the models in the following three steps:
Step 1 (Model 0). In the first step, the intercept was the only predictor.
Step 2(Model 1). In Step 2, I entered day-level networking behavior.
Step 3 (Model 2). In the last step, I entered positive affect as a mediator of the relationship
between networking and the respective criterion (work satisfaction or emotional exhaustion).

THE DARK AND BRIGHT SIDE OF NETWORKING BEHAVIOR
153
Results
Table 27 displays the descriptive statistics, correlations, and reliabilities of the person-level
variables.
Table 27. Descriptive Statistics, Reliabilities, and Correlations between Person-Level Variables
Descriptive Statistics, Reliabilities, and Correlations between Person-Level Variables
Variable M SD 1 2 3 4 5 6 7
1 Networking 3.12 0.60 (.86)
2 Gendera 0.34 0.48 .04
3 Age 30.28 5.49 .02 .20**
4 Educationb 2.79 0.82 -.07 -.05 .17*
5 Tenure 3.20 3.31 .17* .16* .51*** .05
6 Supervisorc 0.23 0.42 .03 .27*** .32*** .12 .30***
7 Academiad 0.55 0.50 -.09 .09 -.07 .51*** -.02 .06
Note. N = 166. Cronbach’s alpha listed on the diagonal.
aGender (0 =female, 1 = male). bEducation (1 = secondary education, 2 = bachelor’s
degree, 3 = master’s degree, 4 = PhD). cLeadership (0 = no; 1 = yes). dAcademia (0 = no; 1 =
yes).
*p ≤ .05, **p ≤ .01. ***p ≤ .001.
Table 28 displays the descriptive statistics, correlations, and reliabilities of the day-level
variables.45
45 As recommended by Becker (2005), I report descriptive statistics for workload, even
though I did not include workload as a control variable, because results are essentially identical
with and without controlling for workload.

154
Table 28. Descriptive Statistics, Reliabilities, and Correlations between Day-Level Variables
Descriptive Statistics, Reliabilities, and Correlations between Day-Level Variables
Variable M SD 1 2 3 4 5 6 7 8 9
1 Networking 2.37 1.13 (.84)
2 Self-Control 3.43 0.66 .01 (.88)
3 Positive affect 2.57 1.13 .18*** .66*** (.87)
4 Work-Life Conflict 2.06 0.87 .06 -.44*** -.27*** (.87)
5 Work satisfaction 3.69 1.00 .14** .32*** .29*** -.33***
6 Emotional exhaustion 2.52 0.76 -.10* -.66*** -.54** .61*** -.45*** (.85)
7 Work engagement 2.95 0.77 .25*** .41*** .48*** -.18*** .64*** -.50*** (.93)
8 Work Performance 3.81 0.77 .12** .33*** .20*** -.18*** .28*** -.32*** .42*** (.87)
9 Workload 2.80 0.87 .06 -.25*** -.10** .45*** -.07 .38*** .01 -.05 (.77)
Note. N = 512 – 699. Cronbach’s alphas listed on the diagonal.
*p ≤ .05. **p ≤ .01. ***p ≤ .001.

THE DARK AND BRIGHT SIDE OF NETWORKING BEHAVIOR
155
Energy resource drain
Self-control depletion
Even though, I did not specify any hypotheses regarding self-control, I briefly report
results. In the null model, the intercept was the only predictor. In Step 2, I entered day-level
networking behavior, revealing that networking behavior was not related to day-level self-control,
estimate = 0.02; SE = 0.03, t = 0.76, p = .448 (Appendix S).
Energy resource gain
Positive affect
Hypothesis 1 predicted that day-level networking behavior would be positively related to
day-level positive affect after work. In the null model, the intercept was the only predictor (see
Table 29). In Model 1, I entered networking, revealing a positive relationship of networking
behavior and positive affect, estimate = 0.08, SE = 0.03, t = 2.61, p = .005. Thus, I found support
for Hypothesis 1.

THE DARK AND BRIGHT SIDE OF NETWORKING BEHAVIOR
156
Table 29. Multilevel Estimates for Models Predicting Day-Level Positive Affect
Multilevel Estimates for Models Predicting Day-Level Positive Affect
Model 0 Model 1
Variable Est. SE T Est. SE t
Intercept 2.58 0.04 58.13*** 2.58 0.04 58.12***
Networking 0.08 0.03 2.61**
Deviance 1396.04 1391.08
Level 1 Intercept 0.30 0.30
Level 2 Intercept 0.25*** 0.25***
Note. Level 1: N = 699. Level 2: N = 165.
** p ≤ .01. *** p ≤ .001.
Attitudinal outcomes
Feelings of work-life conflict
Hypothesis 2 predicted that employee networking behavior would be positively related to
feelings of work-life conflict on a daily basis. In the null model, the intercept was the only predictor
(see Table 30). In Model 1, I entered networking, revealing a marginally significant, positive
relationship of networking behavior and feelings of work-life conflict, estimate = 0.07, SE = 0.05,
t = 1.50, p = .067. Hence, I found limited support for Hypothesis 2.

THE DARK AND BRIGHT SIDE OF NETWORKING BEHAVIOR
157
Table 30 Multilevel Estimates for Models Predicting Day-Level Work-Life Conflict
Multilevel Estimates for Models Predicting Day-Level Feelings of Work-Life Conflict
Model 0 Model 1
Variable Est. SE T Est. SE t
Intercept 2.08 0.06 36.99*** 2.08 0.06 36.66***
Networking 0.07 0.05 1.50†
Deviance 1329.57 1265.53
Level 1 Intercept 0.38 0.39
Level 2 Intercept 0.38*** 0.37***
Note. Level 1: N = 546. Level 2: N = 154.
† p ≤ .10. *** p ≤ .001.
Work satisfaction
Hypothesis 3a predicted that networking behavior would be positively related to work
satisfaction on a daily basis. In Model 0, the intercept was the only predictor (see Table 31). In
Model 1, I entered networking, revealing a positive relationship between networking behavior and
work satisfaction, estimate = 0.09, SE = 0.04, t = 2.48, p = .007. Thus, results supported Hypothesis
3a.
Hypothesis 3b predicted that the relationship between networking behavior and work
satisfaction would be mediated by positive affect. I tested the mediating effect of positive affect
following the procedure suggested by Preacher & Hayes (2004). Therefore, in Model 2, I entered
positive affect (Table 31). Model 2 showed a positive relationship of positive affect and work
satisfaction, estimate = 0.25, SE = 0.06, t = 3.83, p ≤ .001, as well as a positive relationship of
networking and work satisfaction, estimate = 0.08, SE = 0.03, t = 2.28, p = .012. Thus, Hypothesis
3a received support, as positive affect partially mediated the relationship between networking and

THE DARK AND BRIGHT SIDE OF NETWORKING BEHAVIOR
158
work satisfaction. Notably, networking behavior had an effect on work satisfaction, which was
over and beyond positive affect.
Table 31. Multilevel Estimates for Models Predicting Day-Level Work Satisfaction
Multilevel Estimates for Models Predicting Day-Level Work Satisfaction
Model 0 Model 1 Model 2
Variable Est. SE t Est. SE t Est. SE t
Intercept 3.66 0.07 52.07*** 3.64 0.07 51.18*** 3.64 0.07 51.17***
Networking 0.09 0.04 2.48** 0.08 0.03 2.28**
Positive Affect 0.25 0.06 3.83***
Deviance 1232.08 1165.98 1151.16
Level 1 Intercept 0.37 0.37 0.35
Level 2 Intercept 0.63*** 0.63*** 0.63***
Note. Level 1: N = 512. Level 2: N = 154.
* p ≤ .05. ** p ≤ .01. *** p ≤ .001.
Emotional exhaustion
Hypothesis 4a predicted that networking behavior would be negatively related to emotional
exhaustion on a daily basis. In the null model, the intercept was the only predictor (see Table 32).
In Model 1, I added networking. Networking behavior and emotional exhaustion were significantly
and negatively related, estimate = -0.07, SE = 0.03, t = -2.23, p = .014. Thus, results supported
Hypothesis 4a.
Hypothesis 4b predicted a mediating effect of positive affect on the relationship between
networking behavior and emotional exhaustion. As before, I tested the mediation hypothesis
following the procedure suggested by Preacher & Hayes (2004). Model 2 showed a negative
relationship of positive affect and emotional exhaustion, estimate = -0.40, SE = 0.05, t = -8.76,

THE DARK AND BRIGHT SIDE OF NETWORKING BEHAVIOR
159
p ≤ .001 (Table 32). After adding positive affect in Model 2, the relationship between networking
behavior and emotional exhaustion was still significant, estimate = -0.05, SE = 0.03, t = -1.69, p =
.047. Thus, Hypothesis 4b received support, as positive affect partially mediated the relationship
between networking behavior and emotional exhaustion.
Table 32. Multilevel Estimates for Models Predicting Day-Level Emotional Exhaustion
Multilevel Estimates for Models Predicting Day-Level Emotional Exhaustion
Model 0 Model 1 Model 2
Variable Est. SE t Est. SE t Est. SE t
Intercept 2.54 0.05 51.22*** 2.53 0.05 50.44*** 2.53 0.05 50.49***
Networking -0.07 0.03 -2.23** -0.05 0.03 -1.69*
Positive Affect -0.40 0.05 -8.76***
Deviance 1139.43 1075.58 999.36
Level 1 Intercept 0.27 0.26 0.22
Level 2 Intercept 0.31*** 0.31*** 0.32***
Note. Level 1: N = 580. Level 2: N = 157.
* p ≤ .05. *** p ≤ .001.
Work engagement
Hypothesis 5 predicted that networking behavior would be positively related to work
engagement on a daily basis. In the null model, the intercept was the only predictor (see Table 33).
Entering networking behavior in Model 1 revealed a positive relationship between networking and
work engagement, estimate = 0.15, SE = 0.03, t = 5.12, p ≤ .001. Thus, results supported
Hypothesis 5.

THE DARK AND BRIGHT SIDE OF NETWORKING BEHAVIOR
160
Table 33. Multilevel Estimates for Models Predicting Day-Level Work Engagement
Multilevel Estimates for Models Predicting Day-Level Work Engagement Model 0 Model 1
Variable Est. SE t Est. SE t
Intercept 2.94 0.05 58.32*** 2.94 0.05 58.30***
Networking 0.15 0.03 5.12***
Deviance 1318.16 1282.54
Level 1 Intercept 0.24 0.23
Level 2 Intercept 0.36*** 0.36***
Note. Level 1: N = 699. Level 2: N = 165.
*** p ≤ .001.
Productive outcome
Work performance
Hypothesis 6 predicted that networking would be positively related to work performance.
Again, in Model 0, the intercept was the only predictor (see Table 34). I added networking behavior
in Model 1, showing that it was positively related to work performance, estimate = 0.08, SE = 0.03,
t = 2.75, p = .003. Thus, results supported Hypothesis 6.

THE DARK AND BRIGHT SIDE OF NETWORKING BEHAVIOR
161
Table 34. Multilevel Estimates for Models Predicting Day-Level Work Performance
Multilevel Estimates for Models Predicting Day-Level Work Performance
Model 0 Model 1
Variable Est. SE t Est. SE T
Intercept 3.80 0.05 84.20*** 3.80 0.05 84.19***
Networking 0.08 0.03 2.75**
Deviance 1458.52 1453.15
Level 1 Intercept 0.34 0.33
Level 2 Intercept 0.25*** 0.25***
Note. Level 1: N = 699. Level 2: N = 165.
** p ≤ .01. *** p ≤ .001.

THE DARK AND BRIGHT SIDE OF NETWORKING BEHAVIOR
162
Figure 21 depicts an overview of the day-level relationships of networking behavior and
energy resource gain (positive affect) as well as attitudinal and productive outcomes.46 47
Figure 21. Overview of day-level relationships between networking behavior and energy
resource gain, attitudinal and productive outcomes.
46 The overview does not represent a path model, but is composed of all variables
investigated in Study 4. 47 The depicted time course does not necessarily represent the measurement times, but the
assumed time course.

THE DARK AND BRIGHT SIDE OF NETWORKING BEHAVIOR
163
Discussion
In Study 4, I took a further step to test the proposed model of networking behavior (cf.
Figure 3 and Figure 19) by integrating negative and positive outcomes of employees’ networking
behavior. That is, in Study 4, I primarily focused on attitudinal (i.e., feelings of work-life conflict
and work-related well-being) as well as productive (i.e., work performance) outcomes of
networking behavior on a daily basis. I also integrated affective energy resource gain (positive
affect; see also Studies 2 and 3).48 Thus, in order to examine how networking behavior relates to
energy resources and attitudinal and productive outcomes over the course of a day, I conducted a
daily diary study with 166 employees.
On the dark side, networking behavior showed a marginally significant relationship with
feelings of work-life conflict on a daily basis. Therefore, findings provide further support that
networking behavior also comes at a cost. Future studies (e.g., experience sampling studies) should
take a more nuanced look at the relationship between networking behavior and feelings of work-
life conflict to examine the role of self-control depletion as a potential mechanism.
On the bright side, I found further support for affective energy resource gain following
networking behavior. That is, employees’ networking behavior at work was positively related to
positive affect after work. The affective boost associated with networking behavior might also help
explain how networking behavior related to improved work-related well-being on a daily basis.
That is, the relationship of networking behavior with work satisfaction as well as emotional
exhaustion was partially mediated by positive affect. Furthermore, the positive relationships of
48 I also assessed self-regulatory energy resource drain. However, due to the extended time
frame, self-control processes could not be adequately captured (Tyler & Burns, 2008; see also
Discussion of Studies 1 and 2). I found no relationship between networking behavior and self-
reported self-control depletion.

THE DARK AND BRIGHT SIDE OF NETWORKING BEHAVIOR
164
networking behavior with work engagement and work performance correspond to findings of prior
diary studies (Dubbelt et al., 2016; Nesheim et al., 2017).
Taken together, results support the proposed model of networking behavior, suggesting
that networking behavior leads to attitudinal and productive outcomes throughout the day.
Noteworthy, on a daily basis, the beneficial outcomes of networking behavior (i.e., positive affect,
work-related well-being, and work performance) seem to outweigh the detrimental outcomes (i.e.,
feelings of work-life conflict).
The diary study design utilizing frequent, repeated measurement is a good approach to
capture networking behavior and its outcomes in employees’ natural work contexts. Measuring
networking behavior on a daily basis reduces the recall bias that often flaws survey designs (Ohly
et al., 2010). When asking participants to report about their workday, they only have to think back
a few hours, which should increase the accuracy of their reports.
I acknowledge that despite making important contributions to test the developed model
(i.e., integrating attitudinal and productive outcomes), this study is not without limitations. For
instance, I did not measure energy resource states immediately after employees engaged in
networking behavior but after work. As discussed before, energy effects of networking behavior
might be too short-lived to stay in effect such a long time. However, whereas I first investigated
energy processes in controlled laboratory settings and then replicated results in the field, in Study
4, I primarily focused on attitudinal and productive outcomes of networking behavior on a daily
basis. This is based on scholar’s arguing that the day-level is an appropriate level of analysis to
examine the complex dynamics of interpersonal behavior and its outcomes (e.g., Halbesleben &
Wheeler, 2015).

THE DARK AND BRIGHT SIDE OF NETWORKING BEHAVIOR
165
Also concerning internal validity, some of the day-level variables were measured
concurrently (networking behavior, positive affect, work engagement and work performance),
which might involve the risk of common method variance. To reduce a potential bias, I applied
several methods recommended by scholars (e.g., Podsakoff, MacKenzie, Lee, & Podsakoff, 2003;
Conway & Lance, 2010): For instance, all measures were derived from established questionnaires
with good psychometric properties. Also, I sought to avoid overlap in items measuring different
constructs to rule out conceptual overlap. Furthermore, I placed predictor and criterion variables
on separate pages and used different scale formats. In addition, I guaranteed participants
anonymity to reduce evaluation apprehension.
Aside from common method bias, the concurrent measurement of networking behavior and
some other variables can also make it difficult to resolve causality. For example, with regard to
work engagement, Bakker and Demerouti (2008) suggest a reverse effect, such that engaged
employees would be better able to mobilize job resources (e.g., by engaging in networking
behavior). Due to the correlational design, I cannot completely rule out alternative explanations,
such as reciprocal or reverse causal effects. However, it should be noted that I also found
relationships between networking behavior at work (reported after work) and attitudinal outcomes
reported at bedtime (i.e., feelings of work-life conflict, work satisfaction, emotional exhaustion),
thus commending to the proposed causal direction. In order to help clarify causal directions, future
studies should ideally add a baseline measurement of the outcome variables, for example, in the
morning before employees start working.
Furthermore, regarding external validity, the sample was constrained to highly qualified
employees. Therefore, study findings should be replicated with blue-collar workers as well as self-
employed or unemployed. Also, academic staff was clearly overrepresented in the sample which

THE DARK AND BRIGHT SIDE OF NETWORKING BEHAVIOR
166
might restrict generalizability of the findings. However, as outlined above, I found no major
differences between academics and employees from other professional sectors.

THE DARK AND BRIGHT SIDE OF NETWORKING BEHAVIOR
167
General Discussion
In this dissertation, I explored the dark and bright sides of networking behavior. Therefore,
I adopted a resource-theoretical approach. Building on COR and ego depletion theory, I have
developed a theoretical model of networking behavior, energy resource drain and gain processes
as well as attitudinal and productive outcomes. In developing the model, my central research
question was: How does networking behavior affect energy resources? Additionally, the model
tackled the following questions: Who is more likely to experience energy resource drain through
networking? And, how do networking behavior and energy resource processes affect attitudinal
and productive outcomes? I tested the proposed model in two experimental laboratory studies with
student samples (Studies 1 and 2) and two correlational field studies with working samples
(Studies 3 and 4; cf. Figure 22). In light of the current debate about the ego depletion effect in the
face of failed replications (e.g., Carter & McCullough, 2014; Carter et al., 2015; Hagger et al.,
2016; cf. Ego depletion theory), I seek to emphasize the fact that, in the context of the present
dissertation project, I performed only the four studies reported.

THE DARK AND BRIGHT SIDE OF NETWORKING BEHAVIOR
168
Figure 22. Empirical tests of the theoretical model of networking behavior, energy resources, and
outcomes.
On the dark side, networking behavior is a considerable resource investment and
consequently drains an individuals’ resource reservoirs. As such, findings show that networking
depletes self-regulatory energy resources. A mechanism of the self-control depleting effect of
networking behavior is impression management. That is, in order to achieve interpersonal goals in
networking interactions, people seek to convey a desired image, which, in turn, depletes self-
control resources. Regarding boundary conditions, extraversion and social skills moderate the
depleting effect. Hence, introverts and people with low social skills are particularly likely to
experience self-control depletion following networking behavior, whereas extraverts and socially
skilled people experience less self-control depletion through networking. Furthermore, networking
behavior seems to result in negative attitudinal outcomes. More specifically, on a daily basis,
networking behavior relates to increased feelings of work-life conflict. This might be due to
employees’ depleted resource reservoirs preventing them from engaging in private activities after
work, such as meeting friends or participating in family life.
THE DARK AND BRIGHT SIDE OF NETWORKING BEHAVIOR
169
On the bright side, people anticipate that their resource investments during networking
behavior pay off, either immediately or in the future. This actual or anticipated resource gain is
reflected by enhanced affective energy resource states. In other words, networking behavior
increases positive affect. Furthermore, on a daily basis, networking behavior is associated with
positive attitudinal outcomes, such as improved work-related well-being. More specifically, on a
daily basis, high levels of employees’ networking behavior are positively related to work
satisfaction and work engagement. Also, on days that are characterized by high levels of
networking behavior, employees experience reduced emotional exhaustion. Part of the relationship
between networking behavior and indicators of well-being can be explained by the affective boost
following networking. Furthermore, work-related well-being might be facilitated by work-related
resources obtained through networking that help employees achieve goals. Likewise, networking
behavior positively relates to productive outcomes (i.e., work performance) on a daily basis. This
might also be due to gain of networking resources, such as strategic information and task advice
facilitating work activities.
By developing and testing a model of networking behavior, energy resource processes and
attitudinal and productive outcomes, the present research makes five important contributions to
the networking literature. First, it breaks new ground by adopting a resource-theoretical approach
to networking behavior. In the networking literature, resources are described as central. However,
networking behavior has not yet been considered in light of resource theories such as COR
(Hobfoll, 1989, 2001). COR originates from the stress literature and has become increasingly
popular in the organizational literature to explain how resource changes can predict burnout
(Hobfoll, 2002; Hobfoll & Freedy, 1993) and well-being (Halbesleben et al., 2014; Hobfoll, 2002,
2011). In a recent study on interpersonal organizational citizenship behavior (OCB), also known

THE DARK AND BRIGHT SIDE OF NETWORKING BEHAVIOR
170
as helping behavior, the authors used COR as a guiding framework to explain how employees’
daily OCB simultaneously involves negative and positive effects (Koopman et al., 2016). More
specifically, interpersonal OCB interfered with perceptions of work goal progress, but it was also
associated with positive affect. In this vein, COR seems to provide a promising framework to shed
light on potential resource costs and benefits of networking behavior. Building on COR, I focused
on several constructs – for example, networking behavior, extraversion, energies, or well-being –
that, in the COR literature, have generally all been argued to be “resources” (cf. Conservation of
Resources Theory). Building on COR’s resource typology, I took an initial step in clarifying the
role of these constructs in the context of networking behavior. That is, I delineated the complex
relationships between resource investment behavior (i.e., networking behavior, cf. Halbesleben &
Wheeler, 2015), moderating effects of constructive resources (i.e., extraversion), energy resource
drain (i.e., self-control depletion) and energy resource gain (i.e., positive affect) and attitudinal
(i.e., feelings of work-life conflict, work-related well-being) and productive outcomes (i.e.,
performance, cf. ten Brummelhuis & Bakker, 2012). Drawing on COR and ego depletion theory,
I developed and tested an integrative model of the dark and bright sides of networking behavior in
terms of energy resources and attitudinal and productive outcomes.
Second, by focusing on immediate energy effects and day-level outcomes, the present
research considered short-term consequences of networking. Short-term consequences have been
widely neglected in networking research, thus leaving it an open question as to how people directly
experience their networking behaviors. Because energies are highly transient (ten Brummelhuis &
Bakker, 2012), they can only be adequately captured with a novel, finer-grained process approach.
Prior networking studies have mostly relied on cross-sectional data, whereas the few longitudinal
studies have relatively long periods between data collections (e.g., every 12 months over the course

THE DARK AND BRIGHT SIDE OF NETWORKING BEHAVIOR
171
of 2 years, cf. Wolff & Moser, 2010). Typically, in these studies, networking behavior is
conceptualized in a rather static way by asking individuals to estimate how often they have shown
networking behaviors in the past months or year (e.g., Forret & Dougherty, 2001). Likewise,
criteria are typically measured statically (e.g., number of promotions received at a given point in
time, cf. Wolff & Moser, 2010). However, theoretical frameworks such as the COR theory suggest
that resource processes are more dynamic than static (Hobfoll, 1989, 2001). Accordingly, scholars
recently called for research designs that “better match the dynamic nature of COR theory.”
(Halbesleben et al., 2014, p. 1356; see also Bolino et al., 2012). To address this critique, I explored
widely uncharted waters in terms of study designs. The two experiments in this dissertation are
among the first studies examining networking behavior in the laboratory (see also Casciaro et al.,
2014). The experimental design allowed for manipulating networking behavior and analyzing
micro processes in a controlled setting. Additionally, in order to learn more about the dynamics of
networking behaviors and related outcomes on a daily basis, I used a daily diary study design.
Manipulating networking behavior as well as measuring networking behavior on a daily basis
allowed for examining how engaging in networking behavior affects people, irrespective of their
habitual behavior. Therefore, I went beyond the dichotomous classification of people into
“networkers” or “non-networkers,” but rather examined how networking affects people in the
short-term. Over the course of the four studies, I gradually extended the investigated time frame:
In the first three studies, I fathomed the immediate effects of networking, whereas in Study 4, I
examined networking behavior and its outcomes on a daily basis. Of course, extending the time
frame between the assessments naturally comes with less control, and hence, a decline in internal
validity. However, at the same time, external validity (generalizability, Cronbach, 1982) increased
over the course of the four studies. Defining external validity as “inference about whether the

THE DARK AND BRIGHT SIDE OF NETWORKING BEHAVIOR
172
causal relationship holds over variation in persons, settings, treatment, and measurement variable”
(Shadish et al., 2002, p.19), the robust findings of the four studies suggest a high external validity.
Therefore, the used multi-method approach advances networking research because it allows for
adequately capturing short-term effects of networking.
Third, by focusing on energies, I integrated personal resources into networking research.
This is highly relevant given that personal resources can have considerable downstream effects on
employees themselves, as well as on their organizations and families (cf. Hobfoll, 2001; ten
Brummelhuis & Bakker, 2012). As such, I showed that gain of affective energy resources through
networking influences indicators of employees’ work-related well-being (work satisfaction,
emotional exhaustion) over the course of the day. Hence, this research takes into account that
networking behavior might not only be relevant for employees’ work and careers, but that its
outcomes might also transcend the workplace and enter into employees’ private lives. By doing
this, I embedded networking behavior into the broader context of people’s lives.
Fourth, the present research adopted a cost-benefit approach. Considering the sheer volume
of research on networking, it is surprising how little attention has been paid on the potential costs
of networking behavior. Indeed, the present findings suggest that networking is not exclusively
“good,” but cuts both ways. That is, networking behavior depletes self-regulatory energy
resources, but also generates affective energy resources. Likewise, it seems that networking
behavior is associated with increased feelings of work-life conflicts, but it is also relates to
improved work-related well-being and work performance. From a theoretical standpoint, the
simultaneous examination of the resource-consuming and resource-generating processes of
networking behavior is important because it provides a more comprehensive test of COR. From a

THE DARK AND BRIGHT SIDE OF NETWORKING BEHAVIOR
173
practical perspective, shedding light on potential costs of networking behavior is important for
people to decide whether and how to use networking as a career management strategy.
Fifth, I examined boundary conditions of the energy resource drain process, thus
investigating for whom networking behavior is particularly costly. More specifically, I identified
personality factors (i.e., extraversion) and skills (i.e., social skills) that buffer against the depleting
effect of networking. Examining moderating effects allows for determining more accurately, who
must be particularly aware of the resource costs inherent in networking. Of practical significance,
these findings might help explain why introverts usually shy away from networking (e.g., Forret
& Dougherty, 2001), even when they desire to obtain long-term benefits of networking such as
effective networks and career success (Ingram & Morris, 2007; Obukhova & Lan, 2013; see also
Gallagher et al., 2011). Under the assumption that resource gains are the same for all individuals,49
introverts might indeed benefit from engaging in networking more often. However, because
resource depletion following networking behavior is stronger for introverts, the cost-benefit
calculation and hence the incentive structure of networking might be less positive for introverts.
For example, although engaging in networking makes introverts feel good, it might also make
them more likely to later show signs of ego depletion, such as breaking their diet rules, showing
less persistence in unpleasant tasks, or behaving in socially inappropriate ways (cf. Zelenski et al.,
2012). Buffering effects of personality also provide support for COR’s assumption that specific
traits (i.e., extraversion) might act as resources themselves and enable people to effectively invest
resources to maximize resource gains down the road (i.e., engaging in networking behavior, cf.
Hobfoll, 2001, 2002). In contrast, according to COR, those who lack resources (i.e., extraversion)
49 In Study 3, I found no moderating effect of extraversion on the relationship between
networking behavior and positive affect.

THE DARK AND BRIGHT SIDE OF NETWORKING BEHAVIOR
174
are likely to adopt a defensive posture to conserve their resources (i.e., disengaging from
networking behavior). This finding also supports COR’s notion that the value of resources can
vary among individuals: What is a resource to one person could be a demand to another
(Halbesleben et al, 2014; Hobfoll, 1988, 1989). Hence, for extraverts, networking might be
perceived as a resource because it represents an effective means to generate other resources and
achieve goals. In contrast, introverts might tend to perceive networking behavior as resource-
threatening. This theorizing is particularly relevant, given that, in general, resource loss is
disproportionally more salient than resource gain (Hobfoll, 1989, 2001).
I acknowledge that, despite making several important contributions to the networking
literature, the present research is not without limitations (for a more detailed discussion of
limitations see Discussions of Studies 1 – 4) and thus suggests several directions for future studies.
First, in Studies 1 and 2, the two measures of self-control (candy consumption, State Self-Control
Capacity Scale) did not show the expected correlation. Furthermore, in Studies 1 and 2 as well as
in Study 4, I did not find a significant effect of networking behavior on self-rated self-control, as
measured with the State Self-Control Capacity Scale (Bertrams et al., 2011). As discussed before,
this might be rooted in the study designs that might have allowed for replenishing self-control
resources in between the exertion of networking behavior and the assessment of self-rated self-
control. Despite the surprising findings of Study 1, I did not react by changing the order of the two
self-control measures in Study 2. As discussed, that is because I attached more importance to the
behavioral measure of self-control (relative to the self-report measure) because it should be less
prone to motivational biases in self-reports or lack of introspective access (cf. Hofmann et al.,
2005; see also Discussion of Study 1). Then, in Study 4, I primarily focused on day-level
relationships between networking behavior and attitudinal and productive outcomes, as predicted

THE DARK AND BRIGHT SIDE OF NETWORKING BEHAVIOR
175
by the developed networking model (cf. Figure 3). While focusing on day-level outcomes of
networking behavior, the daily diary study design was a promising approach. However, in order
to examine immediate effects of networking behavior on self-control in employees’ natural work
contexts, experience sampling methods might be better suited. Ideally, these methods might
integrate behavioral measures of self-control, for example, every networking interaction might be
followed by an online assessment of participants’ persistence on challenging anagrams (e.g.,
Gailliot, Plant, Butz, & Baumeister, 2007, Study 8; Gordijn, Hindriks, Koomen, Dijksterhuis &
Van Knippenberg, 2004, Study 5).50 Another alternative explanation for the contradicting findings
regarding behavioral and self-reported self-control might be complete independence of the
underlying constructs (cf. Hofmann et al., 2005), thus questioning validity of the measures.
Opposing this assumption, prior studies have confirmed the validity of the behavioral measures
(e.g., meta-analysis: Hagger et al., 2010) and the State Self-Control Capacity Scale (e.g., Bertrams
et al., 2011). I suggest, however, that future studies should take a closer look at the State Self-
Control Capacity Scale in the context of networking behavior to unravel the surprising findings of
the present research.
Another limitation refers to the samples used in the four studies. In Studies 1 and 2, I drew
on student samples, which might restrict generalizability. However, I was able to replicate results
with working samples in Studies 3 and 4. In Study 3, due to the study setting (real networking
events), I did not employ a random sampling method. The tendency to participate in a networking
event, however, might be influenced by personal characteristics. Therefore, the sample in Study 3
50 Also, these studies might use more “objective” measures of networking behavior. For
instance, participants could wear portable technology to track their networking encounters (see
also Bergemann et al., 2017).

THE DARK AND BRIGHT SIDE OF NETWORKING BEHAVIOR
176
likely includes more “habitual networkers” relative to the population as a whole.51 Notably, the
detrimental effect of networking behavior also applied to those who (presumably) had deliberately
sought out a networking situation. In Study 4, the sample was constrained to highly qualified
employees and included a great portion of academic staff. However, I found no major differences
between academics and employees from other professional sectors (see Participants in Study 4).
Future studies might replicate findings with blue-collar workers, self-employed, or job-seekers.
Finally, because all data in the present research were collected in Germany, future research should
examine if the findings can be replicated across different cultural contexts. For example, studies
suggest that networking behavior is as relevant in Chinese businesses as in western organizations
(e.g., Han, Wang, & Kakabadse, 2016). Also, as in western contexts, Chinese employees use
impression management strategies in networking situations. However, studies indicate that
impression management tactics used by Chinese employees might differ from the strategies
employed by employees in Western cultures52 (e.g., Bailey, Chen, & Dou, 1997; Han et al., 2016;
Hwang, 1987). This might have implications for the self-control depleting effect of networking
behavior as impression management has been identified as a mechanism of the self-control
depleting effect of networking behavior (see Study 2). Therefore, replicating and extending the
present research to different cultural contexts would be helpful to learn more about the robustness
of the finding that networking behavior carries two faces in terms of energy resources.
Furthermore, future research might enhance the dark side of the developed model by
identifying further costs of networking behavior. For instance, on a daily basis, networking
51 Supporting this assumption, the sample in Study 3 had a significantly higher mean
regarding extraversion than the sample in Study 1 (see Discussion Study 3). 52 For example, in Chinese organizations, impression management is more likely to involve
attempts to falsely underscore loyalty, selflessness, respect for authority, a strong work ethic, and
concern for the common good.

THE DARK AND BRIGHT SIDE OF NETWORKING BEHAVIOR
177
behavior might interfere with employees’ subjective perceptions of work goal progress. That is, to
some people, “it is a fine line between networking and not-working” (Kuwabara et al., 2016, p. 3)
and they might feel counterproductive when engaging in networking. COR conceptualizes time as
a crucial, yet scarce resource (Hobfoll, 1989). Accordingly, studies show that, when time is
limited, individuals face a trade-off between completing their core work and doing other things
(Barnes, Hollenbeck, Wagner, DeRue, Nahrgang, & Schwind, 2008; see also Koopman et al.,
2016). Employees might feel they could have accomplished more of their core duties had they not
spent their limited time engaging in networking behavior. Also, employees engaging in networking
behavior at work might experience more role overload and role ambiguity because they might feel
that other employees depend heavily on them (cf. Cullen, Gerbasi, & Chrobot-Mason, 2018).
Additionally, future studies should take a more nuanced look at the mechanisms of the positive
relationship of employees’ networking behavior and experienced feelings of work-life conflicts.
Hence, as put concisely by Koopman and colleagues (2016): “The future of “dark side” research
[…] appears to be bright indeed” (p. 427).
Also, future research should extend the developed model by showing how networking
behavior might trigger either resource loss or gain spirals, depending on its effectiveness.
Unfortunately, networking behavior might not always be effective, that is, at times people might
invest a substantial amount of time and energy without receiving the expected benefits. If
networking is that ineffective, individuals will probably experience stress (Hobfoll, 2002; ten
Brummelhuis & Bakker, 2012). This stress might ignite a resource loss spiral as COR theory
proposes that stressed (i.e., resource-poor) individuals adopt a defensive posture to conserve their
remaining resources. Accordingly, a recent study showed that stressed individuals were unable or
reluctant to invest resources in creating new communication ties (Kalish, Luria, Toker, &

THE DARK AND BRIGHT SIDE OF NETWORKING BEHAVIOR
178
Westman, 2015). That way, however, these stressed individuals might have missed out on
networking opportunities that had the potential to provide additional resources and enhance well-
being.
On the other hand, COR states that as individuals gain resources, they are in a better
position to invest and gain additional resources (a resource gain spiral). Hence, positive affective
states following networking behavior might ignite such gain spirals. For example, research with
Fredrickson’s (2001) broaden-and-build theory has shown that momentary experiences of positive
emotions can build enduring psychological resources (e.g., social support) and hence trigger
upward spirals toward emotional well-being (e.g., Viswesvaran, Sanchez, & Fisher, 1999).
Interestingly, when using positive affect as a marker of perceived resource gain (cf. Halbesleben
et al., 2014), findings from the two field studies (Study 3 and 4) indicate that individuals perceive
most networking interactions as profitable, as networking behavior positively relates to positive
affect.
Furthermore, findings of the present research suggest several practical implications. First,
employees should be aware of the dual effects of networking behavior. Knowledge on costs is
important because it allows individuals to make more informed decisions about whether and how
to use networking as a career strategy. As the stem “work” in networking suggests, networking
behavior should be considered an investment into one’s career. Considering self-regulatory energy
resource drain implicates setting time for resource replenishment when scheduling networking
occasions. In fact, many people use their lunch breaks to engage in various networking activities.
They should, however, ensure that they get the chance to recover afterwards; that is, taking a break
from their “break”. Studies suggest that a ten minutes break (might be a short walk or relaxing at
the desk) allows the self’s depleted resource reservoirs to adequately replenish (Tyler & Burns,

THE DARK AND BRIGHT SIDE OF NETWORKING BEHAVIOR
179
2008). In contrast, if there are no opportunities for replenishment, resource depletion is assumed
to continue or worsen (Baumeister et al., 2007). This assumption has been shown in research where
when self-control depleted, people were less effective at managing their social behavior so as to
make a good impression, and they sometimes even behaved in annoying or off-putting ways (Vohs
et al., 2005). At the workplace, however, this behavior might have severe consequences for
employees.
Also, findings are highly relevant for organizations implementing network building human
resources (HR) practices (cf. Collins & Clark, 2003) or arranging an event (e.g., a conference) that
involves networking opportunities. For instance, participants should always have the chance to get
away from such an event for several minutes to restore their resources (“escape rooms”). Another
means to alleviate depletion at networking events could be the option to switch to other (non-
social) tasks, for example, to study materials on display (e.g., posters, video screens, cf. Tyler &
Burns, 2008).
In addition, findings should be integrated in networking trainings to help individuals
establishing effective networking habits. Even though studies suggest that person-level networking
is relatively stable (e.g., Meier & O’Toole, 2005: r = .53 over two years; Sturges et al., 2002: r =
.56 over 12 months; Wolff & Moser, 2006: .65 < r < .80 over four months), findings of the daily
diary study (Study 4) show that there is substantive within-person variation at the day-level.
Likewise, networking training research suggests that networking behavior can be taught and
developed to some degree (Ferris et al., 2001, Schütte & Blickle, 2015). Most trainings to date
emphasize the importance of networking behavior, point out networking opportunities, and bring
people to practice and develop their networking behavior (e.g., de Janasz & Forret, 2008; Schütte
& Blickle, 2015; Wanberg, Van Hooft, Liu, & Csillag, 2018). However, simply understanding the

THE DARK AND BRIGHT SIDE OF NETWORKING BEHAVIOR
180
importance of networking and knowing when and how to network might not be enough to bring
people to actually network if they view networking as resource threatening (knowing-doing gap,
Kuwabara et al., 2016; Pfeffer & Sutton, 2013). Therefore, networking trainings might also benefit
from the inclusion of strategies for replenishing self-control resources.
Furthermore, the present research showed that individual differences (e.g., extraversion)
influence the extent of resource depletion following an individuals’ networking activities. Hence,
for introverts, it is clearly possible and sometimes desirable to engage in networking, but it costs
them more effort. Accordingly, results from Studies 1 and 3 suggest that introverts might not lack
networking skills, but rather experience incomparably high resource costs following networking
behavior (see also Gallagher et al., 2011). Thus, networking trainings should particularly address
and be tailored to introverts. In a recent study that supports this notion, the authors developed an
online intervention aimed at improving job seekers’ networking self-efficacy (job seeker
confidence about engaging in networking), networking use (amount of time spent in networking),
and networking utility (extent that networking conversations provide useful benefits, Wanberg et
al., 2018). Based on an experimental field study with two control groups, Wanberg et al. (2018)
found that the networking training intervention was particularly effective for introverts with regard
to improving their networking self-efficacy. Hence, networking trainings seem to be a promising
approach to counteract the detrimental effect of networking behavior, particularly for introverts.
Taken together, the present research sheds some light on the complexity of resource-
consuming and resource-generating processes inherent in networking behavior, thereby suggesting
a number of important implications for practice while also paving the way for future work.

THE DARK AND BRIGHT SIDE OF NETWORKING BEHAVIOR
181
Conclusion
Taking a resource-theoretical perspective, networking behavior has a dark and bright side
in terms of energy resources. In a nutshell, people’s energy resource state after engaging in
networking behavior can be described as “depleted, but happy”. Regarding resource costs of
networking behavior, introverts (relative to extraverts) pay a higher price in terms of self-
regulatory energy resources. Hence, for introverts, the cost-benefit ratio of networking behavior
seems less rewarding. With regard to attitudinal and productive outcomes of networking behavior
on a daily basis, the bottom line is relatively positive. For example, networking behavior relates to
improved work-related well-being. Overall, I hope that the present research contributes to a more
elaborated and balanced discussion of networking behavior among scholars and among
practitioners.

THE DARK AND BRIGHT SIDE OF NETWORKING BEHAVIOR
182
References
Adler, P. S., & Kwon, S. - W. (2002). Social capital: Prospects for a new concept. Academy of
Management Review, 27(1), 17-40. doi:10.5465/AMR.2002.5922314
Alberts, H. J. E. M., Martijn, C., Greb, J., Merckelbach, H., & de Vries, N. K. (2007). Carrying on
or giving in: The role of automatic processes in overcoming ego depletion. British Journal
of Social Psychology, 46(2), 383–399. doi:10.1348/014466606X130111
Albrecht, S. L. (Ed., 2010). Handbook of employee engagement: Perspectives, issues, research
and practice. Glos, UK: Edward Elgar.
Aldrich, H., Elam, A. B., & Reese, P. R. (1996). Strong ties, weak ties, and strangers: Do women
business owners differ from men in their use of networking to obtain assistance?
Entrepreneurship in a global context. In S. Birley & I. MacMillan (Hrsg.),
Entrepreneurship in a global context (pp. 1–25). London: Routledge.
Aldrich, H. E., & Reese, P. R., (1993). Does networking pay off? A panel study of entrepreneurs
in the research triangle. In N. S. Churchill, S. Birley, J. Doutriaux, E. J. Gatewood, F. S.
Hoy, & W. E. Wetzel (Eds.), Frontiers of Entrepreneurship Research (pp. 325-339).
Center for Entrepreneurial Studies: Babson Park.
Aldrich, H. E., & Zimmer, C. (1986). Entrepreneurship Through Social Networks. In D. Sexton &
R. Smilor (Eds.), The Art and Science of Entrepreneurship (pp. 3 – 23). New York:
Ballinger.
Anderson, C., & Kilduff, G. J. (2009). Why do dominant personalities attain influence in face-to-
face groups? The competence-signaling effects of trait dominance. Journal Of Personality
And Social Psychology, 96(2), 491-503. doi:10.1037/a0014201
Argyle, M. (1969). Social interaction. Chicago: Aldine.

THE DARK AND BRIGHT SIDE OF NETWORKING BEHAVIOR
183
Baeriswyl, S., Krause, A., Elfering, A., & Berset, M. (2017). How workload and coworker support
relate to emotional exhaustion: The mediating role of sickness presenteeism. International
Journal of Stress Management, 24(Suppl 1), 52-73. doi:10.1037/str0000018
Bailey, J., Chen, C. C. and Dou, S. G. (1997). Conceptions of self and performance-related
feedback in the US, Japan and China. (1997). Journal of International Business Studies,
28(3), 605-625. doi: 10.1057/palgrave.jibs.8490113
Bakker, A. B. (2011). An Evidence-Based Model of Work Engagement. Current Directions in
Psychological Science, 20(4), 265 – 269. doi:10.1177/0963721411414534
Bakker, A. B., & Demerouti, E. (2008). Towards a model of work engagement. The Career
Development International, 13(3), 209-223. doi:10.1108/13620430810870476
Baron, R. A., & Markman, G. D. (2000). Beyond social capital: How social skills can enhance
entrepreneurs’ success. Academy of Management Executive, 14, 106–116. doi:
10.5465/AME.2000.2909843
Barnes, C. M., Hollenbeck, J. R., Wagner, D. T., DeRue, D. S., Nahrgang, J. D., & Schwind, K.
M. (2008). Harmful help: The costs of backing-up behavior in teams. Journal Of Applied
Psychology, 93(3), 529-539. doi:10.1037/0021-9010.93.3.529
Bateman, T. S., & Crant, J. M. (1993). The proactive component of organizational behavior: A
measure and correlates. Journal Of Organizational Behavior, 14(2), 103-118.
doi:10.1002/job.4030140202
Baum, J. A. C., Calabrese, T., & Silverman, B. S. (2000). Don’t go it alone: Alliance network
composition and startups’ performance in Canadian biotechnology. Strategic Management
Journal, 21(3): 267–294. doi:10.1002/(SICI)10970266(200003)21:3≤ 267::AID-
SMJ89>3.0.CO;2-8

THE DARK AND BRIGHT SIDE OF NETWORKING BEHAVIOR
184
Baumeister, R. F., Bratslavsky, E., Muraven, M., & Tice, D. M. (1998). Ego depletion: Is the active
self a limited resource? Journal Of Personality And Social Psychology, 74(5), 1252-1265.
doi:10.1037/0022-3514.74.5.1252
Baumeister, R. F., & Heatherton, T. F. (1996). Self-regulation failure: An overview. Psychological
Inquiry, 7(1), 1-15. doi:10.1207/s15327965pli0701_1
Baumeister, R. F., & Vohs, K. D. (2016). Commentary: Misguided Effort with Elusive
Implications. Perspectives on Psychological Science, 11(4), 574-575.
doi:10.1177/1745691616652878.
Baumeister, R. F., Vohs, K. D., & Tice (2007). The Strength Model of Self-Control. Current
Directions in Psychological Science, 16(6): 351-355.
doi:10.1111/j.14678721.2007.00534.x
Becker, T. E. (2005). Potential Problems in the Statistical Control of Variables in Organizational
Research: A Qualitative Analysis With Recommendations. Organizational Research
Methods, 8(3), 274-289. doi:10.1177/1094428105278021
Bergemann, P., Iyengar, S., Ingram, P., & Morris, M. (2017, August). Of Human Bondage:
Autonomy and Tie Formation in Instrumental Settings. Paper presented at Congress of
Academy of Management in Atlanta, Georgia.
Bertrams, A., Unger, A., & Dickhäuser, O. (2011). Momentan verfügbare Selbstkontrollkraft -
Vorstellung eines Messinstruments und erste Befunde aus pädagogisch-psychologischen
Kontexten [Momentarily available self-control strength - Introduction of a measure and
first findings from educational-psychological contexts]. Zeitschrift Für Pädagogische
Psychologie, 25(3), 185-196. doi:10.1024/1010-0652/a000042

THE DARK AND BRIGHT SIDE OF NETWORKING BEHAVIOR
185
Bian, Y., Huang, X., & Zhang, L. (2015). Information and favoritism: The network effect on wage
income in China. Social Networks, 40, 129-138. doi:10.1016/j.socnet.2014.09.003
Binnewies, C., Sonnentag, S., & Mojza, E. J. (2009). Daily performance at work: Feeling
recovered in the morning as a predictor of day-level job performance. Journal Of
Organizational Behavior, 30(1), 67-93. doi:10.1002/job.541
Blickle, G., John, J., Ferris, G. R., Momm, T., Liu, Y., Haag, R., & ... Oerder, K. (2012). Fit of
political skill to the work context: A two‐study investigation. Applied Psychology: An
International Review, 61(2), 295-322. doi:10.1111/j.1464-0597.2011.00469.x
Blickle, G., Witzki, A. H., & Schneider, P. B. (2009). Mentoring support and power: A three year
predictive field study on protegé networking and career success. Journal Of Vocational
Behavior, 74(2), 181-189. doi:10.1016/j.jvb.2008.12.008
Bolino, M. C., Harvey, J., & Bachrach, D. G. (2012). A self-regulation approach to understanding
citizenship behavior in organizations. Organizational Behavior and Human Decision
Processes, 119(1), 126-139. doi:10.1016/j.obhdp.2012.05.006
Borkenau, P., & Ostendorf, F. (2008). NEO-Fünf-Faktoren Inventar nach Costa und McCrae
(NEO-FFI), Deutsche Fassung [Neo Five Factor Inventory (Costa, P.T. & McCrae, R.R.,
1985)]. Göttingen: Hogrefe.
Bower, G. H. (1981). Mood and memory. The American Psychologist, 36: 129–148.
doi:10.1037/0003-066X.36.2.129
Brockner, J. (1988). Self-esteem at work. Lexington, MA: Lexington Books.
Brown, S. R., & Hendrick, C. (1971). Introversion, extraversion and social perception. British
Journal Of Social & Clinical Psychology, 10(4), 313-319. doi:10.1111/j.2044-
8260.1971.tb00755.x

THE DARK AND BRIGHT SIDE OF NETWORKING BEHAVIOR
186
Bruckmüller, S., & Abele, A. E. (2013). The density of the Big Two. How are agency and
communion structurally represented?. Social Psychology, 44(2), 63-74. doi:10.1027/1864-
9335/a000145
Brüderl, J., & Preisendörfer, P. (1998). Network support and the success of newly founded
businesses. Small Business Economics, 10(3): 213–225. doi:10.1023/A:1007997102930
Burke, R. J. (1984). Relationships in and around organizations: It's both who you know and what
you know that counts. Psychological Reports, 55(1), 299-307.
doi:10.2466/pr0.1984.55.1.299
Burkley, E. (2008). The role of self-control in resistance to persuasion. Personality and Social
Psychology Bulletin, 34, 419–431. doi:10.1177/0146167207310458
Burt, R. S. (1992). Structural holes. The Social Structure of Competitions. Cambridge, MA:
Harvard University Press.
Cain, S. (2013). Quiet: The power of introverts in a world that can't stop talking. New York, NY,
US: Crown Publishers/Random House.
Cameron, C. (1973). A theory of fatigue. Ergonomics, 16(5), 633-648.
doi:10.1080/00140137308924554
Campbell, J. D. (1990). Self-esteem and clarity of the self-concept. Journal Of Personality And
Social Psychology, 59(3), 538-549. doi:10.1037/0022-3514.59.3.538
Carter, E. C., & McCullough, M. E. (2014). Publication bias and the limited strength model of
self-control: Has the evidence for ego depletion been overestimated?. Frontiers In
Psychology, 5.

THE DARK AND BRIGHT SIDE OF NETWORKING BEHAVIOR
187
Carter, E. C., Kofler, L. M., Forster, D. E., & McCullough, M. E. (2015). A series of meta-analytic
tests of the depletion effect: Self-control does not seem to rely on a limited resource.
Journal Of Experimental Psychology: General, 144(4), 796-815. doi:10.1037/xge0000083
Casciaro, T., Gino, F., & Kouchaki, M. (2014). The contaminating effects of building instrumental
ties: How networking can make us feel dirty. Administrative Science Quarterly, 59(4),
705-735. doi:10.1177/0001839214554990
Casciaro, T., & Lobo, M. S. (2008). When competence is irrelevant: The role of interpersonal
affect in task-related ties. Administrative Science Quarterly, 53(4), 655-684. doi.:
10.2189/asqu.53.4.655
Cho, H., & Abe, S. (2013). Is two-tailed testing for directional research hypotheses tests
legitimate? Journal Of Business Research, 66(9), 1261-1266.
doi:10.1016/j.jbusres.2012.02.023
Chua, R. J., Ingram, P., & Morris, M. W. (2008). From the head and the heart: Locating cognition-
and affect-based trust in managers' professional networks. Academy Of Management
Journal, 51(3), 436-452. doi:10.5465/AMJ.2008.32625956
Ciarocco, N. J., Twenge, J., Muraven, M., & Tice, D. (2004). The state self-control capacity scale:
Reliability, validity, and correlations with physical and psychological stress. Unpublished
manuscript, San Diego State University.
Clarkson, J. J., Hirt, E. R., Jia, L., & Alexander, M. B. (2010). When perception is more than
reality: the effects of perceived versus actual resource depletion on self-regulatory
behavior. Journal of Personality and Social Psychology, 98(1), 29-46.
doi:10.1037/a0017539.
Cohen, J. (1988). Statistical power analysis for the behavioral sciences. Hillsdale, NJ: Erlbaum.

THE DARK AND BRIGHT SIDE OF NETWORKING BEHAVIOR
188
Cohen, S. G., & Bailey, D. E. (1997). What makes teams work: Group effectiveness research from
the shop floor to the executive suite. Journal Of Management, 23(3), 239-290.
doi:10.1177/014920639702300303
Coleman, J. S. (1988). Social capital in the creation of human capital. American Journal of
Sociology, 94(Suppl.), 95-120. doi:/10.1086/228943
Collins, C. J., & Clark, K. D. (2003). Strategic human resource practices, top management team
social networks, and firm performance: The role of human resource practices in creating
organizational competitive advantage. Academy Of Management Journal, 46(6), 740-751.
doi:10.2307/30040665
Conway, J. M., & Lance, C. E. (2010). What reviewers should expect from authors regarding
common method bias in organizational research. Journal Of Business And Psychology,
25(3), 325-334. doi:10.1007/s10869-010-9181-6
Costa, P. T., & McCrae, R. R. (1995). Domains and facets: Hierarchical personality assessment
using the Revised NEO Personality Inventory. Journal Of Personality Assessment, 64(1),
21-50. doi:10.1207/s15327752jpa6401_2
Crawford, J. R., & Henry, J. D. (2004). The Positive and Negative Affect Schedule (PANAS):
Construct validity, measurement properties and normative data in a large non-clinical
sample. British Journal Of Clinical Psychology, 43(3), 245-265.
doi:10.1348/0144665031752934
Cronbach, L. J. (1982). Designing evaluations of educational and social programs. San Francisco:
Jossey-Bass.

THE DARK AND BRIGHT SIDE OF NETWORKING BEHAVIOR
189
Cullen, K. L., Gerbasi, A., & Chrobot-Mason, D. (2018). Thriving in Central Network Positions:
The Role of Political Skill. Journal of Management, 44(2), 682 - 706 doi:
10.1177/0149206315571154
D'Agostino, R. B., & Kwan, H. (1995). Measuring effectiveness: What to expect without a
randomized control group. Medical Care, 33(4, Suppl), 95-105.
Davidson, O. B., Eden, D., Westman, M., Cohen-Charash, Y., Hammer, L. B., Kluger, A. N., &
... Spector, P. E. (2010). Sabbatical leave: Who gains and how much?. Journal Of Applied
Psychology, 95(5), 953-964. doi:10.1037/a0020068
de Janasz, S. C., & Forret, M. L. (2008). Learning the art of networking: A critical skill for
enhancing social capital and career success. Journal of Management Education, 32(5),
629-650. doi:10.1177/1052562907307637
Demerouti, E., Bakker, A. B., Nachreiner, F., & Schaufeli, W. B. (2001). The job demands-
resources model of burnout. Journal of Applied Psychology, 86(3), 499–512.
doi:10.1037/0021-9010.86.3.499
Demerouti, E., Bakker, A. B., Vardakou, I., & Kantas, A. (2003). The convergent validity of two
burnout instruments. A multitrait-multimethod analysis. European Journal of
Psychological Assessment, 19(1), 12-23. doi:10.1027//1015-5759.19.1.12
Diener, E. (1984). Subjective well-being. Psychological Bulletin, 95(3), 542–575. doi:
10.1037/0033-2909.95.3.542
Diener, E., Suh, E. M., Lucas, R. E., & Smith, H. L. (1999). Subjective well-being: Three decades
of progress. Psychological Bulletin, 125(2), 276-302. doi:10.1037/0033-2909.125.2.276

THE DARK AND BRIGHT SIDE OF NETWORKING BEHAVIOR
190
Diener, E., Heintzelman, S. J., Kushlev, K., Tay, L., Wirtz, D., Lutes, L. D., & Oishi, S. (2017).
Findings all psychologists should know from the new science on subjective well-being.
Canadian Psychology/Psychologie Canadienne, 58(2), 87-104. doi:10.1037/cap0000063
Dimotakis, N., Scott, B. A., & Koopman, J. (2011). An experience sampling investigation of
workplace interactions, affective states, and employee well-being. Journal Of
Organizational Behavior, 32(4), 572-588. doi:10.1002/job.722
Dobos, N. (2015). Networking, corruption, and subversion. Journal Of Business Ethics, 144(3),
467–478. doi:10.1007/s10551-015-2853-4
Dobrow, S. R., & Higgins, M. C. (2005). Developmental networks and professional identity: A
longitudinal study. The Career Development International, 10(6-7), 567-583.
doi:10.1108/13620430510620629
Dubbelt, L., Rispens, S., & Demerouti, E. (2016). Work engagement and research output among
female and male scientists. A diary study. Journal Of Personnel Psychology, 15(2), 55-65.
doi: 10.1027/1866-5888/a000150.
Ducharme, L. J., Knudsen, H. K., & Roman, P. M. (2008). Emotional exhaustion and turnover
intention in human service occupations: The protective role of coworker
support. Sociological Spectrum, 28(1), 81-104. doi:10.1080/02732170701675268
Enders, C. K., & Tofighi, D. (2007). Centering predictor variables in cross-sectional multilevel
models: A new look at an old issue. Psychological Methods, 12(2), 121-138.
doi:10.1037/1082-989X.12.2.121
Fandt, P. M., & Ferris, G. R. (1990). The management of information and impressions: When
employees behave opportunistically. Organizational Behavior And Human Decision
Processes, 45(1), 140-158. doi:10.1016/0749-5978(90)90008-W

THE DARK AND BRIGHT SIDE OF NETWORKING BEHAVIOR
191
Fang, R., Chi, L., Chen, M., & Baron, R. A. (2015). Bringing political skill into social networks:
Findings from a field study of entrepreneurs. Journal Of Management Studies, 52(2), 175-
212. doi:10.1111/joms.12107
Fang, R., Landis, B., Zhang, Z., Anderson, M. H., Shaw, J. D., & Kilduff, M. (2015). Integrating
personality and social networks: A meta-analysis of personality, network position, and
work outcomes in organizations. Organization Science, 26(4), 1243-1260.
doi:10.1287/orsc.2015.0972
Faul, F., Erdfelder, E., Buchner, A., & Lang, A. (2009). Statistical power analyses using G*Power
3.1: Tests for correlation and regression analyses. Behavior Research Methods, 41(4),
1149-1160. doi:10.3758/BRM.41.4.1149
Fay, D., & Hüttges, A. (2016). Drawbacks of Proactivity: Effects of Daily Proactivity on Daily
Salivary Cortisol and Subjective Well-Being. Journal Of Occupational Health
Psychology, 22(4), 429 – 442. doi:10.1037/ocp0000042
Feldman, D. C., & Klich, N. R. (1991). Impression management and career strategies. In R. A.
Giacalone, P. Rosenfeld, R. A. Giacalone, & P. Rosenfeld (Eds.), Applied impression
management: How image-making affects managerial decisions (pp. 67-80). Thousand
Oaks, CA, US: Sage Publications, Inc.
Fernandez, R. M., & Weinberg, N. (1997). Sifting and sorting: Personal contacts and hiring in a
retail bank. American Sociological Review, 62(6): 883-902. doi:10.2307/2657345.
Ferris, G. R., Blickle, G., Schneider, P. B., Kramer, J., Zettler, I., Solga, J., & ... Meurs, J. A.
(2008). Political skill construct and criterion-related validation: A two-study
investigation. Journal Of Managerial Psychology, 23(7), 744-771.
doi:10.1108/02683940810896321

THE DARK AND BRIGHT SIDE OF NETWORKING BEHAVIOR
192
Ferris, G. R., Treadway, D. C., Kolodinsky, R. W., Hochwarter, W. A., Kacmar, C. J., Douglas,
C., & Frink, D. D. (2005). Development and Validation of the Political Skill
Inventory. Journal of Management, 31(1), 126-152. doi:10.1177/0149206304271386
Ferris, G. R., Treadway, D. C., Perrewé, P. L., Brouer, R. L., Douglas, C., & Lux, S. (2007).
Political skill in organizations. Journal Of Management, 33(3), 290-320.
doi:10.1177/0149206307300813
Ferris, G. R., Witt, L. A., & Hochwarter, W. A. (2001). Interaction of social skill and general
mental ability on job performance and salary. Journal of Applied Psychology, 86(6), 1075-
1082. doi:10.1037/0021-9010.86.6.1075
Finkel, E. J., Campbell, W. K., Brunell, A. B., Dalton, A. N., Scarbeck, S. J., & Chartrand, T. L.
(2006). High-maintenance interaction: Inefficient social coordination impairs self-
regulation. Journal Of Personality And Social Psychology, 91(3), 456-475.
doi:10.1037/0022-3514.91.3.456
Fisher, C. D. (2000). Mood and emotions while working: Missing pieces of job
satisfaction? Journal Of Organizational Behavior, 21(2), 185-202. doi:
10.1002/(SICI)1099-1379(200003)21:2≤ 185::AID-JOB34>3.0.CO;2-M
Fisher, R. J., & Katz, J. E. (2000). Social-desirability bias and the validity of self-reported values.
Psychology & Marketing, 17(2), 105-120. doi:10.1002/(SICI)1520-6793(200002)17:2≤
105::AID-MAR3>3.0.CO;2-9
Fiske, S. T., Cuddy, A. C., Glick, P., & Xu, J. (2002). A model of (often mixed) stereotype content:
Competence and warmth respectively follow from perceived status and
competition. Journal Of Personality And Social Psychology, 82(6), 878-902.
doi:10.1037/0022-3514.82.6.878

THE DARK AND BRIGHT SIDE OF NETWORKING BEHAVIOR
193
Fligstein, M. (2001). Social skill and the theory of fields. Sociological Theory, 19(2), 105-125.
doi: org/10.1111/0735-2751.00132
Foa, U. G., & Foa, E. B. (1980). Resource theory: Interpersonal behavior as exchange. In M. S.
Greenberg, K. J. Gergen, & R. H. Willis (Eds.), Social exchange: Advances in theory and
research (pp. 77-94). New York: Plenum.
Forgas, J. P. (1995). Mood and judgment: The affect infusion model (AIM). Psychological
Bulletin, 117(1), 39-66. doi:10.1037/0033-2909.117.1.39
Forret, M. L. (2014). Networking as a job search behavior and career management strategy. In U.-
C. Klehe, & E. A. J. v. Hooft (Eds.), The Oxford Handbook of Job Loss and Job Search.
Oxford: Oxford University Press. doi: 10.1093/oxfordhb/9780199764921.013.022
Forret, M. L., & Dougherty, T. W. (2001). Correlates of networking behavior for managerial and
professional employees. Group & Organization Management, 26(3), 283-311.
doi:10.1177/1059601101263004
Forret, M. L., & Dougherty, T. W. (2004). Networking behaviors and career outcomes: Differences
for men and women?. Journal of Organizational Behavior, 25(3), 419-437.
doi:10.1002/job.253
Fredrickson, B. L. (1998). What good are positive emotions?. Review Of General Psychology,
2(3), 300-319. doi:10.1037/1089-2680.2.3.300
Fredrickson, B. L. (2001). The role of positive emotions in positive psychology: The broaden-and-
build theory of positive emotions. American Psychologist, 56(3), 218-226. doi:
10.1037/0003-066X.56.3.218
THE DARK AND BRIGHT SIDE OF NETWORKING BEHAVIOR
194
Fredrickson, B. L., & Levenson, R. W. (1998). Positive emotions speed recovery from the
cardiovascular sequelae of negative emotions. Cognition And Emotion, 12(2), 191-220.
doi:10.1080/026999398379718
Frese, M., & Zapf, D. (1994). Action as the core of work psychology: A German approach. In H.
C. Triandis, M. D. Dunnette, L. M. Hough, H. C. Triandis, M. D. Dunnette, L. M. Hough
(Eds.) , Handbook of industrial and organizational psychology, Vol. 4, 2nd ed (pp. 271-
340). Palo Alto, CA, US: Consulting Psychologists Press.
Fritz, C., & Sonnentag, S. (2005). Recovery, health, and job performance: Effects of weekend
experiences. Journal Of Occupational Health Psychology, 10(3), 187-199.
Gallagher, P., Fleeson, W., & Hoyle, R. H. (2011). A self-regulatory mechanism for personality
trait stability: Contra-trait effort. Social Psychological And Personality Science, 2(4), 335-
342. doi:10.1177/1948550610390701
Gangestad, S. W., & Snyder, M. (2000). Self-monitoring: Appraisal and reappraisal. Psychological
Bulletin, 126(4), 530-555. doi:10.1037/0033-2909.126.4.530
Gailliot, M. T., Plant, E. A., Butz, D. A., & Baumeister, R. F. (2007). Increasing Self-Regulatory
Strength Can Reduce the Depleting Effect of Suppressing Stereotypes. Personality And
Social Psychology Bulletin, 33(2), 281-294. doi:10.1177/0146167206296101
Gansen-Ammann, D., Meurs, J.A., Wihler, A. & Blickle, G. (2017). Political Skill and Manager
Performance: Exponential and Asymptotic Relationships Due to Differing Levels of
Enterprising Job Demands. Group & Organization Management. doi:
10.1177/1059601117747487

THE DARK AND BRIGHT SIDE OF NETWORKING BEHAVIOR
195
Garrick, A., Mak, A. S., Cathcart, S., Winwood, P. C., Bakker, A. B., & Lushington, K. (2014).
Psychosocial safety climate moderating the effects of daily job demands and recovery on
fatigue and work engagement. Journal of Occupational and Organizational Psychology,
87(4), 694–714. doi: 10.1111/joop.12069
Gevorkian, M. (2013). Relationships between proactive personality, networking, career
satisfaction, and performance perceptions. Dissertation Abstracts International, 73.
Gibson, C., Hardy, J., & Buckley, M. R. (2014). Understanding the role of networking in
organizations. The Career Development International, 19(2), 146-161. doi:10.1108/CDI-
09-2013-0111
Golden, C. J. (1978). Stroop Color and Word Test: A Manual for Clinical and Experimental Uses.
Chicago, Illinois: Skoelting.
Google Inc. (2017). Grip – Professional networking. Retrieved from
https://play.google.com/store/apps/details?id=com.networkr&hl=de
Gordijn, E. H., Hindriks, I., Koomen, W., Dijksterhuis, A., & Van Knippenberg, A. (2004).
Consequences of stereotype suppression and internal suppression motivation: A self-
regulation approach. Personality and Social Psychology Bulletin, 30, 212–224.
doi:10.1177/0146167203259935
Gorgievski, M. J., Halbesleben, J. B., & Bakker, A. B. (2011). Expanding the boundaries of
psychological resource theories. Journal Of Occupational And Organizational
Psychology, 84(1), 1-7. doi:10.1111/j.2044-8325.2010.02015.x
Gorgievski, M. J., & Hobfoll, S. E. (2008). Work can burn us out or fire us up: Conservation of
resources in burnout and engagement. In J. R. B. Halbesleben (Ed.), Handbook of stress
and burnout in health care (pp. 7-22). Hauppauge, NY: Nova Science.

THE DARK AND BRIGHT SIDE OF NETWORKING BEHAVIOR
196
Gould, S., & Penley, L. E. (1984). Career strategies and salary progression: A study of their
relationships in a municipal bureaucracy. Organizational Behavior & Human
Performance, 34(2), 244-265. doi:10.1016/0030-5073(84)90006-0
Gouldner, A. W. (1960). The norm of reciprocity: A preliminary statement. American Sociological
Review, 25(2), 161-178.
Goto, T., & Kusumi, T. (2013). How can reward contribute to efficient self-control?
Reinforcement of task-defined responses diminishes ego-depletion. Motivation And
Emotion, 37(4), 726-732. doi:10.1007/s11031-013-9356-3
Granovetter, M. S. (1974). The strength of weak ties. American Journal of Sociology, 78(6): 1460-
1480. doi: 10.1086/225469
Granovetter, M. S. (1995). Getting a job (2nd ed.). Chicago: University of Chicago Press.
Green, A. S., Rafaeli, E., Bolger, N., Shrout, P. E., & Reis, H. T. (2006). Paper or plastic? Data
equivalence in paper and electronic diaries. Psychological Methods, 11(1), 87–105. doi:
10.1037/1082-989X.11.1.87
Greenhaus, J. H., & Beutell, N. J. (1985). Sources of Conflict Between Work and Family Roles.
Academy Of Management Review, 10(1), 76-88. doi:10.5465/AMR.1985.4277352
Greenhaus, J. H., & Powell, G. N. (2006). When work and family are allies: A theory of work–
family enrichment. Academy of Management Review, 31, 72–92.
doi:10.5465/AMR.2006.19379625

THE DARK AND BRIGHT SIDE OF NETWORKING BEHAVIOR
197
Groll, T. (2017, March). Klüngeln für die Karriere [Cliquing for Career]. Retrieved from
http://www.zeit.de/karriere/beruf/2017-02/netzwerken-karriere-vorteil-
frauen?utm_content=zeitde_redpost_zon_link_sf&utm_campaign=ref&utm_source=face
book_zonaudev_int&utm_term=facebook_zonaudev_int&utm_medium=sm&wt_zmc=s
m.int.zonaudev.facebook.ref.zeitde.redpo
Guide Jr., V. D. R., & Ketokivi, M. (2015). Notes from the Editors: Redefining some
methodological criteria for the journal. Journal of Operations Management, 37, 5 – 8. doi:
10.1016/S0272-6963(15)00056-X
Hager, M. A. (2015). An examination of social skills as a correlate and moderator of the
relationship between networking behaviors and career outcomes. Dissertation Abstracts
International Section A, 76.
Hagger, M. S., Wood, C., Stiff, C., & Chatzisarantis, N. L. D. (2010). Ego Depletion and the
Strength Model of Self-Control: A Meta-Analysis. Psychological Bulletin, 136(4), 495–
525. doi:10.1037/a0019486
Hagger, M. S., Chatzisarantis, N. D., Alberts, H., Anggono, C. O., Batailler, C., Birt, A. R., & ...
Zwienenberg, M. (2016). A multilab preregistered replication of the ego-depletion
effect. Perspectives On Psychological Science, 11(4), 546-573.
doi:10.1177/1745691616652873
Halbesleben, J. B. (2006). Sources of social support and burnout: A meta-analytic test of the
conservation of resources model. Journal Of Applied Psychology, 91(5), 1134-1145.
doi:10.1037/0021-9010.91.5.1134

THE DARK AND BRIGHT SIDE OF NETWORKING BEHAVIOR
198
Halbesleben, J. B., & Bowler, W. M. (2007). Emotional exhaustion and job performance: The
mediating role of motivation. Journal Of Applied Psychology, 92(1), 93-106.
doi:10.1037/0021-9010.92.1.93
Halbesleben, J. B., Neveu, J., Paustian-Underdahl, S. C., & Westman, M. (2014). Getting to the
'COR': Understanding the role of resources in conservation of resources theory. Journal Of
Management, 40(5), 1334-1364. doi:10.1177/0149206314527130
Halbesleben, J. B., & Wheeler, A. R. (2011). I owe you one: Coworker reciprocity as a moderator
of the day-level exhaustion–performance relationship. Journal of Organizational
Behavior, 32(4), 608–626. doi:10.1002/job.748
Halbesleben, J. B., & Wheeler, A. R. (2015). To invest or not? The role of coworker support and
trust in daily reciprocal gain spirals of helping behavior. Journal Of Management, 41(6),
1628-1650. doi:10.1177/0149206312455246
Han, Y., Wang, Z., Sheard, G., & Kakabadse, N. (2016). A grounded investigation of Chinese
office politics. Asia - Pacific Journal of Business Administration, 8(3), 281-297.
doi:10.1108/APJBA-12-2015-0108
Hansen, M. T. (1999). The search–transfer problem: The role of weak ties in sharing knowledge
across organization subunits. Administrative Science Quarterly, 44(1), 82-111.
doi:10.2307/2667032
Hayes, A. F., & Matthes, J. (2009). Computational procedures for probing interactions in OLS and
logistic regression: SPSS and SAS implementations. Behavior Research Methods, 41(3),
924-936. doi:10.3758/BRM.41.3.924
THE DARK AND BRIGHT SIDE OF NETWORKING BEHAVIOR
199
Helm, F., Abele, A. E., Müller-Kalthoff, H., & Möller, J. (2017). Applying dimensional
comparison theory to the fundamental dimensions of social judgment – agency and
communion. Learning and Individual Differences, 54116-125.
doi:10.1016/j.lindif.2017.01.011
Hobfoll, S. E. (1988). The ecology of stress. New York, NY, US: Hemisphere.
Hobfoll, S. E. (1989). Conservation of resources: A new attempt at conceptualizing
stress. American Psychologist, 44(3), 513-524. doi:10.1037/0003-066X.44.3.513
Hobfoll, S. E. (1998). Stress, culture, and community: The psychology and philosophy of stress.
New York, NY, US: Plenum Press. doi:10.1007/978-1-4899-0115-6
Hobfoll, S. E. (2001). The influence of culture, community, and the nested-self in the stress
process: Advancing Conservation of Resources theory. Applied Psychology: An
International Review, 50(3), 337-370. doi:10.1111/1464-0597.00062
Hobfoll, S. E. (2002). Social and Psychological Resources and Adaptation. Review of General
Psychology, 6(4), 307–324. doi: 10.1037//1089-2680.6.4.307
Hobfoll, S. E. (2011). Conservation of resource caravans and engaged settings. Journal Of
Occupational And Organizational Psychology, 84(1), 116-122. doi:10.1111/j.2044-
8325.2010.02016.x
Hobfoll, S. E., & Freedy, J. (1993). Conservation of resources: A general stress theory applied to
burnout. In W. B. Schaufeli, C. Maslach, T. Marek, W. B. Schaufeli, C. Maslach, T. Marek
(Eds.) , Professional burnout: Recent developments in theory and research (pp. 115-133).
Philadelphia, PA, US: Taylor & Francis.

THE DARK AND BRIGHT SIDE OF NETWORKING BEHAVIOR
200
Hobfoll, S. E., Freedy, J., Lane, C., & Geller, P. (1990). Conservation of social resources: Social
support resource theory. Journal Of Social And Personal Relationships, 7(4), 465-478.
doi:10.1177/0265407590074004
Hobfoll, S. E., Lilly, R. S., & Jackson, A. P. (1992). Conservation of social resources and the self.
In H. F. Veiel, U. Baumann, H. F. Veiel, U. Baumann (Eds.) , The meaning and
measurement of social support (pp. 125-141). Washington, DC, US: Hemisphere
Publishing Corp.
Hofmann, W., Friese, M., & Roefs, A. (2009). Three ways to resist temptation: The independent
contributions of executive attention, inhibitory control, and affect regulation to the impulse
control of eating behavior. Journal Of Experimental Social Psychology, 45(2), 431-435.
doi:10.1016/j.jesp.2008.09.013
Hofmann, W., Gawronski, B., Gschwendner, T., Le, H., & Schmitt, M. (2005). A Meta-Analysis
on the Correlation Between the Implicit Association Test and Explicit Self-Report
Measures. Personality And Social Psychology Bulletin, 31(10), 1369-1385.
doi:10.1177/0146167205275613
Hofmann, W., Rauch, W., & Gawronski, B. (2007). And deplete us not into temptation: Automatic
attitudes, dietary restraint, and self-regulatory resources as determinants of eating behavior.
Journal of Experimental Social Psychology, 43(3), 497–504.
doi:10.1016/j.jesp.2006.05.004
Hurley, J. R. (1998). Agency and communion as related to 'Big Five' self-representations and
subsequent behavior in small groups. The Journal Of Psychology: Interdisciplinary And
Applied, 132(3), 337-351. doi:10.1080/00223989809599172

THE DARK AND BRIGHT SIDE OF NETWORKING BEHAVIOR
201
Hwang, K. (1987). Face and Favor: The Chinese Power Game. American Journal of Sociology,
92(4), 944-974.
Ilies, R., Schwind, K. M., & Heller, D. (2007). Employee well-being: A multilevel model linking
work and nonwork domains. European Journal Of Work And Organizational
Psychology, 16(3), 326-341. doi:10.1080/13594320701363712
Imhoff, R., Schmidt, A. F., & Gerstenberg, F. (2014). Exploring the interplay of trait self-control
and ego depletion: Empirical evidence for ironic effects. European Journal Of
Personality, 28(5), 413-424. doi:10.1002/per.1899
Ingram, P., & Morris, M. W. (2007). Do people mix at mixers? Structure, homophily, and the 'life
of the party'. Administrative Science Quarterly, 52(4), 558-585. doi:10.2189/asqu.52.4.558
Ingram, P., & Zou, X. (2008). Business Friendships. Research in Organizational Behavior, 28,
167–184. doi: 10.1016/j.riob.2008.04.006
Inzlicht, M., & Schmeichel, B. J. (2012). What is ego depletion? Toward a mechanistic revision
of the resource model of self-control. Perspectives on Psychological Science, 7(5), 450–
463. doi:10.1177/1745691612454134
Ironson, G. H., Smith, P. C., Brannick, M. T., Gibson, W. M., & Paul, K. B. (1989). Construction
of a Job in General scale: A comparison of global, composite, and specific measures.
Journal of Applied Psychology, 74(2), 193-200. doi: 10.1037/0021-9010.74.2.193
Janssen, O., Lam, C. K., & Huang, X. (2010). Emotional exhaustion and job performance: The
moderating roles of distributive justice and positive affect. Journal Of Organizational
Behavior, 31(6), 787-809. doi:10.1002/job.614
Jonason, P. K. & Webster, G. D. (2010). The Dirty Dozen: A Concise Measure of the Dark Triad.
Psychological Assessment, 22, 420–432. doi: 10.1037/a0019265

THE DARK AND BRIGHT SIDE OF NETWORKING BEHAVIOR
202
Judge, T. A., & Bretz, R. D. (1994). Political influence behavior and career success. Journal Of
Management, 20(1), 43-65. doi:10.1177/014920639402000103
Judge, T. A., Cable, D. M., Boudreau, J. W., & Bretz, R. D. (1995). An empirical investigation of
the predictors of executive career success. Personnel Psychology, 48(3), 485-519.
doi:10.1111/j.1744-6570.1995.tb01767.x
Judge, T. A., & Ilies, R. (2004). Affect and Job Satisfaction: A Study of Their Relationship at
Work and at Home. Journal Of Applied Psychology, 89(4), 661-673. doi:10.1037/0021-
9010.89.4.661
Kalish, Y., Luria, G., Toker, S., & Westman, M. (2015). Till stress do us part: On the interplay
between perceived stress and communication network dynamics. Journal Of Applied
Psychology, 100(6), 1737-1751. doi:10.1037/apl0000023
Kanning, U. - P. (2009a). ISK. Inventar sozialer Kompetenzen [Social Skills Inventory]. Göttingen:
Hogrefe.
Kanning, U. P. (2009b). NEO-Fünf-Faktoren-Inventar nach Costa und McCrae (NEO-FFI) [Neo
Five Factor Inventory (Costa & McCrae)]. Zeitschrift Für Arbeits- Und
Organisationspsychologie, 53(4), 194-198. doi:10.1026/0932-4089.53.4.194
Kaplan, S. A., Warren, C. R., Barsky, A. P., & Thoresen, C. J. (2009). A note on the relationship
between affect(ivity) and differing conceptualizations of job satisfaction: Some unexpected
meta-analytic findings. European Journal Of Work And Organizational
Psychology, 18(1), 29-54. doi:10.1080/13594320701873264
Karremans, J. C., Verwijmeren, T., Pronk, T. M., & Reitsma, M. (2009). Interacting with women
can impair men’s cognitive functioning. Journal Of Experimental Social Psychology,
45(4), 1041-1044. doi:10.1016/j.jesp.2009.05.004
THE DARK AND BRIGHT SIDE OF NETWORKING BEHAVIOR
203
Kastenmüller, A., Greitemeyer, T., Aydin, N., Tattersall, A. J., Peus, C., Bussmann, P., & ...
Fischer, P. (2011). Terrorism threat and networking: Evidence that terrorism salience
decreases occupational networking. Journal Of Organizational Behavior, 32(7), 961-977.
doi:10.1002/job.745
Kay, F. (2010). Successful networking: How to build new networks for career and company
progression. Philadelphia: Kogan Page.
Koopman, J., Lanaj, K., & Scott, B. A. (2016). Integrating the bright and dark sides of OCB: A
daily investigation of the benefits and costs of helping others. Academy of Management
Journal, 59(2), 414-435. doi: 10.5465/amj.2014.0262
Kotabe, H. P., & Hofmann, W. (2015). On integrating the components of self-control. Perspectives
On Psychological Science, 10(5), 618-638.
Kotter, J. P. (1982). What effective managers really do. Harvard Business Review, 60(6), 156-167.
Krohne, H. W., Egloff, B., Kohlmann, C. - W., & Tausch, A. (1996). Untersuchung mit einer
deutschen Form der Positive and Negative Affect Schedule (PANAS) [Positive and
Negative Affect Schedule (PANAS; Watson, D., Clark, L.A. & Tellegen, A., 1988) -
German adaptation]. Diagnostica, 42(2), 139-156.
Kunin, T. (1955). The Construction of a New Type of Attitude Measure. Personnel Psychology,
g8(1), 65-77. doi: 10.1111/j.1744-6570.1955.tb01189.x
Kuwabara, K., Hildebrand, C., & Zou, X. (2016). Lay theories of networking: How laypeople’s
beliefs about networks affect their attitudes and engagement toward instrumental
networking. Academy of Management Review. doi: 10.5465/amr.2015.0076

THE DARK AND BRIGHT SIDE OF NETWORKING BEHAVIOR
204
Lam, C. K., Huang, X., & Janssen, O. (2010). Contextualizing emotional exhaustion and positive
emotional display: The signaling effects of supervisors’ emotional exhaustion and service
climate. Journal Of Applied Psychology, 95(2), 368-376. doi:10.1037/a0017869
Lanaj, K., Johnson, R. E., & Wang, M. (2016). When Lending a Hand Depletes the Will: The
Daily Costs and Benefits of Helping. Journal of Applied Psychology, 101(8), 1097-1110.
doi: 10.1037/apl0000118.
Leary, M. R., & Kowalski, R. M. (1990). Impression management: A literature review and two-
component model. Psychological Bulletin, 107(1), 34-47. doi:10.1037/0033-
2909.107.1.34
Le Barbenchon, E., Milhabet, I., & Bry, C. (2016). This Only Happens to Others. Different Self-
Presentations in Friendship and Professional Situations. Social Psychology, 47(5), 270–
280. doi: 10.1027/1864-9335/a000281
Lee, R. T., & Ashforth, B. E. (1996). A meta-analytic examination of the correlates of the three
dimensions of job burnout. Journal Of Applied Psychology, 81(2), 123-133.
doi:10.1037/0021-9010.81.2.123
Liebermeister, B. (2015). Effizientes Networking: Wie Sie aus einem Kontakt eine werthaltige
Geschäftsbeziehung entwickeln [Efficient Networking: How to develop a valuable business
relationship] (2nd edition). Frankfurt a. M.: Frankfurter Allgemeine Buch.
Locke, E. A. (1976). The nature and causes of job satisfaction. In M. D. Dunnette (Ed.), Handbook
of industrial and organizational psychology (pp. 1297–1349). Chicago, IL: Rand McNally.
Loewenthal, K. M. (1996). An introduction to psychological tests and scales. London, England:
UCL Press Limited.

THE DARK AND BRIGHT SIDE OF NETWORKING BEHAVIOR
205
Luong, A., & Rogelberg, S. G. (2005). Meetings and more meetings: The relationship between
meeting load and the daily well-being of employees. Group Dynamics, 9(1), 58–67. doi:
/10.1037/1089-2699.9.1.58
Luthans, F., Rosenkrantz, S. A., & Hennessey, H. W. (1985). What do successful managers really
do? An observation study of managerial activities. Journal Of Applied Behavioral
Science, 21(3), 255-270. doi:10.1177/002188638502100303
MacLeod, C. M. (1991). Half a century of research on the Stroop effect: An integrative
review. Psychological Bulletin, 109(2), 163-203. doi:10.1037/0033-2909.109.2.163
Martijn, C., Alberts, H. M., Merckelbach, H., Havermans, R., Huijts, A., & De Vries, N. K. (2007).
Overcoming ego-depletion: The influence of exemplar priming on self-control
performance. European Journal Of Social Psychology, 37(2), 231-238.
doi:10.1002/ejsp.350
Maslach, C., & Leiter, M. P. (2008). Early predictors of job burnout and engagement. Journal Of
Applied Psychology, 93(3), 498-512. doi:10.1037/0021-9010.93.3.498
Mayer, J. D., & Gaschke, Y. N. (1988). The experience and meta-experience of mood. Journal Of
Personality And Social Psychology, 55(1), 102-111. doi:10.1037/0022-3514.55.1.102
McCallum, S. Y., Forret, M. L., & Wolff, H. (2014). Internal and external networking behavior.
An investigation of relationships with affective, continuance, and normative
commitment. Career Development International, 19(5), 595-614. doi:10.1108/CDI-08-
2013-0101
McClelland, D. C. (1987). Human Motivation. Cambridge, UK: Cambridge University Press.

THE DARK AND BRIGHT SIDE OF NETWORKING BEHAVIOR
206
McCloy, R. A., Campbell, J. P., & Cudeck, R. (1994). A confirmatory test of a model of
performance determinants. Journal Of Applied Psychology, 79(4), 493-505.
doi:10.1037/0021-9010.79.4.493
Mehl, M. R., Gosling, S. D., & Pennebaker, J. W. (2006). Personality in its natural habitat:
Manifestations and implicit folk theories of personality in daily life. Journal Of Personality
And Social Psychology, 90(5), 862-877. doi:10.1037/0022-3514.90.5.862
Meier, K. J., & O' Toole, L. J. (2005). Managerial Networking: Issues of Measurement and
Research Design. Administration & Society, 37(5), 523-541.
doi:10.1177/0095399705277142
Michael, J., & Yukl, G. (1993). Managerial level and subunit function as determinants of
networking behavior in organizations. Group & Organization Management, 18(3), 328-
351. doi:10.1177/1059601193183005
Mintzberg, H. (1975). The manager´s job: Folklore and fact. Harvard Business Review, 54(4), 49-
61.
Mitterschiffthaler, M. T., Fu, C. Y., Dalton, J. A., Andrew, C. M., & Williams, S. R. (2007). A
functional MRI study of happy and sad affective states induced by classical music. Human
Brain Mapping, 28(11): 1150-1162. doi:10.1002/hbm.20337
Motowidlo, S. J., & Van Scotter, J. R. (1994). Evidence that task performance should be
distinguished from contextual performance. Journal Of Applied Psychology, 79(4), 475-
480. doi:10.1037/0021-9010.79.4.475

THE DARK AND BRIGHT SIDE OF NETWORKING BEHAVIOR
207
Mount, M. K., & Barrick, M. R. (1995). The Big Five personality dimensions: Implications for
research and practice in human resources management. In K. M. Rowland & G. Ferris
(Eds.), Research in personnel and human resources management, 13(3, pp. 153-200).
Greenwich, CT: JAI Press.
Mummendey, H. D., & Eifler, S. (1994). Ein Fragebogen zur Erfassung "positiver"
Selbstdarstellung (Impression-Management-Skala) [Impression management scale].
Bielefeld: Univ. Bielefeld, Fak. für Soziologie.
Muraven, M., & Baumeister, R. F. (2000). Self-regulation and depletion of limited resources: Does
self-control resemble a muscle?. Psychological Bulletin, 126(2), 247-259.
doi:10.1037/0033-2909.126.2.247
Muraven, M., & Slessareva, E. (2003). Mechanism of self-control failure: Motivation and limited
resources. Personality And Social Psychology Bulletin, 29(7), 894-906.
doi:10.1177/0146167203029007008
Muraven, M., Tice, D. M., & Baumeister, R. F. (1998). Self-control as a limited resource:
Regulatory depletion patterns. Journal Of Personality And Social Psychology, 74(3), 774-
789. doi:10.1037/0022-3514.74.3.774
Nesheim, T., Olsen, K. M., & Sandvik, A. M. (2017). Never walk alone: Achieving work
performance through networking ability and autonomy. Employee Relations, 39(2), 240-
253. doi:10.1108/ER-09-2016-0185
Ng, T. H., Eby, L. T., Sorensen, K. L., & Feldman, D. C. (2005). Predictors of objective and
subjective career success. A meta-analysis. Personnel Psychology, 58(2), 367-408.
doi:10.1111/j.1744-6570.2005.00515.x

THE DARK AND BRIGHT SIDE OF NETWORKING BEHAVIOR
208
Ng, T. H., & Feldman, D. C. (2012). Employee voice behavior: A meta‐analytic test of the
conservation of resources framework. Journal of Organizational Behavior, 33(2), 216-234.
doi:10.1002/job.754
Ng, T. W., & Feldman, D. C. (2014a). A conservation of resources perspective on career hurdles
and salary attainment. Journal Of Vocational Behavior, 85(1), 156-168.
doi:10.1016/j.jvb.2014.05.008
Ng, T. W., & Feldman, D. C. (2014b). Subjective career success: A meta-analytic review. Journal
Of Vocational Behavior, 85(2), 169-179. doi:10.1016/j.jvb.2014.06.001
Norton, P. J., & Hope, D. A. (2001). Analogue observational methods in the assessment of social
functioning in adults. Psychological Assessment, 13(1), 59-72. doi:10.1037/1040-
3590.13.1.59
Nunnally, J. C. (1978). Psychonzetric Theory (2nd ed). New York: McGraw-Hill.
Oaten, M., Williams, K. D., Jones, A. & Zadro, L. (2008). The Effects of Ostracism on Self–
Regulation in the Socially Anxious. Journal of Social and Clinical Psychology, 27(5), 471-
504. doi: org/10.1521/jscp.2008.27.5.471
Obukhova, E., & Lan, G. (2013). Do job seekers benefit from contacts? A direct test with
contemporaneous searches. Management Science, 59(10), 2204-2216.
doi:10.1287/mnsc.1120.1701
Ohly, S., Sonnentag, S., Niessen, C., & Zapf, D. (2010). Diary Studies in Organizational Research.
An Introduction and Some Practical Recommendations. Journal of Personnel Psychology,
9(2), 79–93. doi: 10.1027/1866-5888/a000009.
Ostgaard, T. A., & Birley, S. (1996). New venture growth and personal networks. Journal Of
Business Research, 36(1), 37-50. doi:10.1016/0148-2963(95)00161-1

THE DARK AND BRIGHT SIDE OF NETWORKING BEHAVIOR
209
Orpen, C. (1996). Dependency as a moderator of the effects of networking behavior on managerial
career success. The Journal Of Psychology: Interdisciplinary And Applied, 130(3), 245-
248. doi:10.1080/00223980.1996.9915006
Ortiz-Bonnín, S., García-Buades, M. E., Caballer, A., & Zapf, D. (2016). Supportive climate and
its protective role in the emotion rule dissonance - emotional exhaustion relationship. A
multilevel analysis. Journal Of Personnel Psychology, 15(3), 125-133. doi:10.1027/1866-
5888/a000160
Paulhus, D. L., & Trapnell, P. D. (2008). Self-presentation of personality: An agency-communion
framework. In O. P. John, R. W. Robins, & L. A. Pervin (Eds.), Handbook of personality
psychology: Theory and research (3rd ed., pp. 492–517). New York, NY: Guilford.
Paunonen, S. V. (2003). Big Five factors of personality and replicated predictions of
behavior. Journal Of Personality And Social Psychology, 84(2), 411-424.
doi:10.1037/0022-3514.84.2.411
Pfeffer, J. & Sutton, R. I. (2013). The Knowing-Doing Gap: How Smart Companies Turn
Knowledge into Action. Brighton, MA: Harvard Business Press.
Pleck, J. H. (1977). The work-family role system. Social Problems, 24(4), 417-427.
doi:10.1525/sp.1977.24.4.03a00040
Podolny, J. M., & Baron, J. N. (1997). Resources and relationships: Social networks and mobility
in the workplace. American Sociological Review, 62(5), 673-693. doi:10.2307/2657354
Podsakoff, P. M., MacKenzie, S. B., Lee, J., & Podsakoff, N. P. (2003). Common method biases
in behavioral research: A critical review of the literature and recommended remedies.
Journal Of Applied Psychology, 88(5), 879-903. doi:10.1037/0021-9010.88.5.879

THE DARK AND BRIGHT SIDE OF NETWORKING BEHAVIOR
210
Porter, C. M., & Woo, S. E. (2015). Untangling the networking phenomenon: A dynamic
psychological perspective on how and why people network. Journal Of
Management, 41(5), 1477-1500. doi:10.1177/0149206315582247
Porter, C. M., Woo, S. E., Alonso, N., & Snyder, G. (2018, April). Development and Validation
of the Professional Networking Motives Inventory. In C. M. Porter (Chair), New Frontiers
of Professional Networking Research. Symposium conducted at Congress of Society for
Industrial and Organizational Psychology, Chicago, USA.
Porter, C.M., Woo, S.E. & Campion, M.A. (2016). Internal and external networking differentially
predict turnover through job embeddedness and job offers. Personnel Psychology, 69, 635-
672. doi: 10.1111/peps.12121
Preacher, K. J., Curran, P. J., & Bauer, D. J. (2006). Computational tools for probing interactions
in multiple linear regression, multilevel modeling, and latent curve analysis. Journal Of
Educational And Behavioral Statistics, 31(4), 437-448. doi:10.3102/10769986031004437
Preacher, K. J., & Hayes, A. F. (2004). SPSS and SAS procedures for estimating indirect effects
in simple mediation models. Behavior Research Methods, Instruments &
Computers, 36(4), 717-731. doi:10.3758/BF03206553
Raby, C. W. (2010). The impact of social support as a source of job satisfaction on jobs with high
autonomy distributed doctoral program in management: A mixed methods study.
Dissertation Abstracts International Section A, 71, 1374.
Raudenbush, S. W., Bryk, A. S., & Congdon, R. (2011). HLM7 for Windows [Computer software].
Skokie, IL: Scientific Software International, Inc.
Raz, O., & Gloor, P. A. (2007). Size really matters--New insights for start-ups'
survival. Management Science, 53(2), 169-177. doi:10.1287/mnsc.1060.0609

THE DARK AND BRIGHT SIDE OF NETWORKING BEHAVIOR
211
Richter, P., Hemmann, E., Merboth, H., Fritz, S., Hänsgen, C., & Rudolf, M. (2000). Das Erleben
von Arbeitsintensität und Tätigkeitsspielraum - Entwicklung und Validierung eines
Fragebogens zur orientierenden Analyse (FIT) [Perceived work intensity and job
activity/decision latitude: Development and validation of a questionnaire (FIT)]. Zeitschrift
Für Arbeits- Und Organisationspsychologie, 44(3), 129-139. doi:10.1026//0932-
4089.44.3.129
Schaufeli, W. B., & Bakker, A. B. (2004). Job demands, job resources, and their relationship with
burnout and engagement: A multi-sample study. Journal Of Organizational
Behavior, 25(3), 293-315. doi:10.1002/job.248
Schaufeli, W. B., Bakker, A. B., & Salanova, M. (2006). The Measurement of Work Engagement
With a Short Questionnaire: A Cross-National Study. Educational And Psychological
Measurement, 66(4), 701-716. doi:10.1177/0013164405282471
Schaufeli, W. B., Bakker, A. B., & Van Rhenen, W. (2009). How changes in job demands and
resources predict burnout, work engagement and sickness absenteeism. Journal Of
Organizational Behavior, 30(7), 893-917. doi:10.1002/job.595
Schmeichel, B. J., Vohs, K. D., & Baumeister, R. F. (2003). Intellectual performance and ego
depletion: Role of the self in logical reasoning and other information processing. Journal
Of Personality And Social Psychology, 85(1), 33-46. doi:10.1037/0022-3514.85.1.33
Schönbrodt, F. D., Wagenmakers, E., Zehetleitner, M., & Perugini, M. (2017). Sequential
hypothesis testing with Bayes factors: Efficiently testing mean differences. Psychological
Methods, 22(2), 322-339. doi:10.1037/met0000061

THE DARK AND BRIGHT SIDE OF NETWORKING BEHAVIOR
212
Schönpflug, W. (1985). Goal directed behavior as a source of stress: Psychological origins and
consequences of inefficiency. In M. Frese, J. Sabini (Eds.), Goal directed behavior: The
concept of action in psychology (pp. 172-188). Hillsdale: Erlbaum.
Schütte, N., & Blickle, G. (2015). Validierung eines Trainings zum Aufbau eines Netzwerkes zur
Berufsfindung [Validating a training to build networks to promote career choice].
Zeitschrift für Arbeits- und Organisationspsychologie, 59(2), 57-69.
Seibert, S. E., & Kraimer, M. L. (2001). The five-factor model of personality and career
success. Journal Of Vocational Behavior, 58(1), 1-21. doi:10.1006/jvbe.2000.1757
Semrau, T., & Sigmund, S. (2012). Networking ability and the financial performance of new
ventures: A mediation analysis among younger and more mature firms. Strategic
Entrepreneurship Journal, 6(4), 335-354. doi: 10.1002/sej.1146
Semrau, T., & Werner, A. (2013). How exactly do network relationships pay off? The effects of
network size and relationship quality on access to start-up resources. Entrepreneuship
Theory and Practice, 38(3), 501-525. doi: 10.1111/etap.12011
Shadish, W. R., Cook, T. D., & Campbell, D.T. (2002). Experimental and Quasi-Experimental
Designs for Generalized Causal Inferences. Boston, MA: Houghton Mifflin Company.
Snijders, T. A. B. (2005). Power and sample size in multilevel modeling. In B. S. Everitt & D. C.
Howell (Eds.), Encyclopedia of statistics in behavioral science (pp. 1570–1573).
Chichester: Wiley.
Snyder, M. (1987). Public appearances, private realities: The psychology of self-monitoring. New
York:W. H. Freeman.
Sonnentag, S. (2001). Work, recovery activities, and individual well-being: A diary study. Journal
of Occupational Health Psychology 35(3-4) doi: 10.1037//1076-8998.6.3.196

THE DARK AND BRIGHT SIDE OF NETWORKING BEHAVIOR
213
Sonnentag, S., & Starzyk, A. (2015). Perceived prosocial impact, perceived situational constraints,
and proactive work behavior: Looking at two distinct affective pathways. Journal Of
Organizational Behavior, 36(6), 806-824. doi:10.1002/job.2005
Spector, P. E., & Brannick, M. T. (2011). Methodological urban legends: The misuse of statistical
control variables. Organizational Research Methods, 14(2), 287-305.
doi:10.1177/1094428110369842
Stam, W., & Elfring, T. (2008). Entrepreneurial orientation and new venture performance: The
moderating role of intra- and extraindustry social capital. Academy Of Management
Journal, 51(1), 97-111. doi:10.5465/AMJ.2008.30744031
Staufenbiel, T., & Hartz, C. (2000). Organizational Citizenship Behavior: Entwicklung und erste
Validierung eines Messinstruments Organizational Citizenship Behavior: Development
and validation of an assessment instrument. Diagnostica, 46(2), 73-83.
doi:10.1026//0012-1924.46.2.73
Stephens, G. K., & Sommer, S. M. (1996). The Measurement of Work to Family Conflict.
Educational and Psychological Measurement, 56(3), 475 – 486. doi:
10.1177/0013164496056003009
Stroop, J. R. (1935). Studies of interference in serial verbal reactions. Journal Of Experimental
Psychology, 18(6), 643-662. doi:10.1037/h0054651
Sturges, J., Guest, D., Conway, N., & Davey, K. M. (2002). A longitudinal study of the relationship
between career management and organizational commitment among graduates in the first
ten years at work. Journal Of Organizational Behavior, 23(6), 731-748.
doi:10.1002/job.164

THE DARK AND BRIGHT SIDE OF NETWORKING BEHAVIOR
214
Sun, S. H., & Frese, M. (2013). Multiple goal pursuit. In E. A. Locke, G. P. Latham, E. A. Locke,
G. P. Latham (Eds.) , New developments in goal setting and task performance (pp. 177-
194). New York, NY, US: Routledge/Taylor & Francis Group.
ten Brummelhuis, L. L., & Bakker, A. B. (2012). A resource perspective on the work–home
interface: The work–home resources model. American Psychologist, 67(7), 545-556.
doi:10.1037/a0027974
Thompson, J. A. (2005). Proactive Personality and Job Performance: A Social Capital
Perspective. Journal Of Applied Psychology, 90(5), 1011-1017. doi:10.1037/0021-
9010.90.5.1011
Thompson, M. S., & Cooper, C. L. (2001). A rose by any other name…: A commentary on
Hobfoll's Conservation of Resources theory. Applied Psychology: An International
Review, 50(3), 408-418.
Thoresen, C. J., Kaplan, S. A., Barsky, A. P., Warren, C. R., & de Chermont, K. (2003). The
Affective Underpinnings of Job Perceptions and Attitudes: A Meta-Analytic Review and
Integration. Psychological Bulletin, 129(6), 914-945. doi:10.1037/0033-2909.129.6.914
Tice, D. M., Baumeister, R. F., Shmueli, D., & Muraven, M. (2007). Restoring the self: Positive
affect helps improve self-regulation following ego depletion. Journal Of Experimental
Social Psychology, 43(3), 379-384. doi:10.1016/j.jesp.2006.05.007
Trougakos, J. P., Hideg, I., Cheng, B. H., & Beal, D. J. (2014). Lunch breaks unpacked: The role
of autonomy as a moderator of recovery during lunch. Academy Of Management
Journal, 57(2), 405-421. doi:10.5465/amj.2011.1072
Tyler, J. M., & Burns, K. C. (2008). After Depletion: The Replenishment of the Self’s Regulatory
Resources. Self and Identity, 7(3), 305 – 321. doi: 10.1080/15298860701799997

THE DARK AND BRIGHT SIDE OF NETWORKING BEHAVIOR
215
University of Cologne Administration. Academic Staff Development (2016). Networking for
Postdocs. 2nd Postdoc Meeting. Retrieved from http://verwaltung.uni-
koeln.de/abteilung43/content/career_development/postdoc_excellent/networking_amp_in
formation/index_eng.html
van Hoye, G., van Hoft, E. A. J., & Lievens, F. (2009). Networking as a job search behavior: A
social network perspective. Journal of Occupational and Organizational Psychology,
82(3): 661-682. doi:10.1108/09649420610643411
Viswesvaran, C., Sanchez, J.I. and Fisher, J. (1999) The Role of Social Support in the Process of
Work Stress: A Meta-Analysis. Journal of Vocational Behavior, 54, 314-334.
doi: 10.1006/jvbe.1998.1661
Vohs, K. D., Baumeister, R. F., & Ciarocco, N. J. (2005). Self-Regulation and Self-Presentation:
Regulatory Resource Depletion Impairs Impression Management and Effortful Self-
Presentation Depletes Regulatory Resources. Journal Of Personality And Social
Psychology, 88(4), 632-657. doi:10.1037/0022-3514.88.4.632
Wanberg, C. R., Kanfer, R., & Banas, J. T. (2000). Predictors and outcomes of networking
intensity among unemployed job seekers. Journal Of Applied Psychology, 85(4), 491-503.
doi:10.1037/0021-9010.85.4.491
Wanberg, Van Hooft, Liu, and Csillag (2018, April). Learning to Network during Job Search:
Effects of an Online Training Program. In C. M. Porter (Chair), New Frontiers of
Professional Networking Research. Symposium conducted at Congress of Society for
Industrial and Organizational Psychology, Chicago, USA.

THE DARK AND BRIGHT SIDE OF NETWORKING BEHAVIOR
216
Wang, L., Tao, T., Fan, C., Gao, W., & Wie, C. (2015). The Influence of Chronic Ego Depletion
on Goal Adherence: An Experience Sampling Study. PLOS ONE, 10(11). doi:
10.1371/journal.pone.0142220
Wanous, J. P., Reichers, A. E., & Hudy, M. J. (1997). Overall job satisfaction: How good are
single-item measures? Journal of Applied Psychology, 82(2): 247-252. doi: /10.1037/0021-
9010.82.2.247
Warr, P., Cook, J., & Wall, T. (1979). Scales for the measurement of some work attitudes and
aspects of psychological well-being. Journal Of Occupational Psychology, 52(2), 129-
148. doi:10.1111/j.2044-8325.1979.tb00448.x
Watson, D., Clark, L. A., & Tellegen, A. (1988). Development and validation of brief measures of
positive and negative affect: The PANAS scales. Journal Of Personality And Social
Psychology, 54(6), 1063-1070. doi:10.1037/0022-3514.54.6.1063
Wells, J. D., Hobfoll, S. E., & Lavin, J. (1997). Resource loss, resource gain, and communal coping
during pregnancy among women with multiple roles. Psychology Of Women Quarterly,
21(4), 645-662. doi:10.1111/j.1471-6402.1997.tb00136.x
Wiggins, J. S., Trapnell, P., & Phillips, N. (1988). Psychometric and geometric characteristics of
the Revised Interpersonal Adjective Scales (IAS-R). Multivariate Behavioral Research,
23(4), 517-530.
Wiese B. S. (2007) Work-Life-Balance. In K. Moser (Ed.) Wirtschaftspsychologie. Berlin:
Springer. doi: 10.1007/978-3-540-71637-2_13

THE DARK AND BRIGHT SIDE OF NETWORKING BEHAVIOR
217
Wingender, L. M. & Wolff, H. (2016). Die Rolle von Networking-Verhalten in der beruflichen
Entwicklung [The role of networking behavior for the professional career]. In S. Kauffeld
& D. Spurk (Eds.), Handbuch Laufbahnmanagement und Karriereplanung. Berlin:
Springer. doi: 10.1007/978-3-662-45855-6_8-1
Wingender, L. M. & Wolff, H. (2017). The dark side of networking – leaving individuals depleted
and dirty. Poster presented at Congress of Society for Industrial and Organizational
Psychology.
Witt, P. (2004). Entrepreneurs’ networks and the success of start-ups. Entrepreneurship and
Regional Development, 16(5): 391–412. doi:10.1080/0898562042000188423
Witt, L. A., & Ferris, G. R. (2003). Social skill as moderator of the conscientiousness-performance
relationship: Convergent results across four studies. Journal Of Applied Psychology, 88(5),
809-820. doi:10.1037/0021-9010.88.5.809
Wolff, H., & Kim, S. (2012). The relationship between networking behaviors and the big five
personality dimensions. The Career Development International, 17(1), 43-66.
doi:10.1108/13620431211201328
Wolff, H., & Moser, K. (2006). Entwicklung und Validierung einer Networkingskala
Development and validation of a networking scale. Diagnostica, 52(4), 161-180.
doi:10.1026/0012-1924.52.4.161
Wolff, H., & Moser, K. (2009). Effects of networking on career success: A longitudinal
study. Journal Of Applied Psychology, 94(1), 196-206. doi:10.1037/a0013350
Wolff, H., & Moser, K. (2010). Do specific types of networking predict specific mobility
outcomes? A two-year prospective study. Journal Of Vocational Behavior, 77(2), 238-245.
doi:10.1016/j.jvb.2010.03.001

THE DARK AND BRIGHT SIDE OF NETWORKING BEHAVIOR
218
Wolff, H., Moser, K., & Grau, A. (2008). Networking: Theoretical foundations and construct
validity. In J. Deller (Ed.), Readings in applied organizational behavior from the Lüneburg
Symposium (pp. 101-118). Mehring: Rainer Hampp.
Wolff, H., & Muck, P. M. (2009). Persönlichkeit und Networking: Eine Analyse mittels
Interpersonalem Circumplex [Personality and networking: An analysis based on the
interpersonal circumplex]. Zeitschrift Für Personalpsychologie, 8(3), 106-116.
doi:10.1026/1617-6391.8.3.106
Wolff, H., Schneider-Rahm, C. I., & Forret, M. L. (2011). Adaptation of a German
multidimensional networking scale into English. European Journal Of Psychological
Assessment, 27(4), 244-250. doi:10.1027/1015-5759/a000070
Wolff, H., Spurk, D., & Teeuwen, S. (2017, May). Development of short 18-Item Networking
scales from Wolff and Moser's (2006) multifaceted networking measure. Poster presented
at Congress of European Association of Work and Organizational Psychology in Dublin,
Ireland.
Wolff, H. & Volmer, J. (2017). The short-term consequences of networking: A daily diary study.
Unpublished manuscript, University of Cologne.
Wolff, H., Weikamp, J. G. & Batinic, B. (2014). Implicit motives as determinants of networking
behavior. Unpublished manuscript, University of Cologne.
Xanthopoulou, D., Bakker, A. B., Demerouti, E., & Schaufeli, W. B. (2009). Work engagement
and financial returns: A diary study on the role of job and personal resources. Journal of
Occupational And Organizational Psychology, 82(1), 183-200.
doi:10.1348/096317908X285633

THE DARK AND BRIGHT SIDE OF NETWORKING BEHAVIOR
219
Xing Ambassador Cologne (2016). Xing Business Dinner (Cross Table). Retrieved from
https://www.xing.com/events/xing-business-dinner-cross-table-
1658293?notification_id=2328124&cce=em61f5ab16.:2BG5L4mZAntJ7DUUZQs5AG
Zelenski, J. M., Santoro, M. S., & Whelan, D. C. (2012). Would introverts be better off if they
acted more like extraverts? Exploring emotional and cognitive consequences of
counterdispositional behavior. Emotion, 12(2), 290-303. doi:10.1037/a0025169

THE DARK AND BRIGHT SIDE OF NETWORKING BEHAVIOR
220
Appendices
Appendix A
Instruction Networking Task in Studies 1 and 2
Please read the brief role descriptions and consider ways to network and “market” yourself. Be
creative and do not limit yourself to slogans like “I can offer…, I am in need of…”. You might
pad your role with further details. You have 3 minutes to prepare your role.
Then, you will have 20 minutes to network. Please make sure to make a professional impression!
Shake hands with every person you will get to know, introduce yourself and your request and
address your interaction partners formally. Take time to make a positive impression to your
interaction partners, might be they can help you.
Your task will be to find the people who will be able to help you. At the same time, you can extend
your individual network and introduce your contacts to one another.
At the end of the experiment, the person who has successfully solved the task and has networked
most successfully will receive a bonus of 10€. Therefore, we will ask each participant who of the
seven interaction partners was the best networker during the experiment (e.g., particularly helpful
or likable). The one person who has successfully found the target persons who can help him or her
and was elected as the “best networker” by most of the interaction partners, will receive the bonus
(if more than one person wins, the bonus will be raffled amongst the winners). Please make use of
the whole 20 minutes. Imagine, you are at an event and cannot leave early. Keep talking to your
interaction partners and stay focused.
Role description

THE DARK AND BRIGHT SIDE OF NETWORKING BEHAVIOR
221
Appendix B
Instruction Stroop Tasks in Study 1
HD Stroop
In the following task, you will need the keyboard. Place it in front of you in a way that enables you
to press the marked keys.
In the center of the screen, you will be presented with a number of color words in different colors
of font. For each one, you will need to identify the FONT COLOR of the word (yellow, green, or
red). Then, press the key that corresponds to the FONT COLOR of the word.
Example: If the word “yellow” will be displayed in red font, you should press the yellow key. The
same holds true for words that are displayed in yellow or green font.
In contrast, if a word is displayed in blue font, you should press the key that corresponds the
MEANING of the word.
Example: If the word “yellow” will be displayed in blue font, you should press the yellow key.
Please respond as fast as possible without making many errors! The program will record your
accuracy and your reaction time.
In total, 48 participants will run through this test. The six participants with the lowest error rate
will receive a bonus of 10€. The winners will be named in the final report (if they agree).
First, you will respond to four test items. After successfully passing the test items, you can press
the space-bar to start the task. The task will take you about 20 minutes.
If you have any further questions, please address the experimenter.

THE DARK AND BRIGHT SIDE OF NETWORKING BEHAVIOR
222
LD Stroop
In the following task, you will need the keyboard. Place it in front of you in a way that enables you
to press the marked keys.
In the center of the screen, you will be presented with a number of words. For each one, you will
need to identify the FONT COLOR of the word (yellow, green, red, or blue). Then, press the key
that corresponds to the font color of the word.
Please respond as fast as possible without making many errors! The program will record your
accuracy and your reaction time.
In total, 48 participants will run through this test. The six participants with the lowest error rate
will receive a bonus of 10€. The winners (if they consent) will be named in the final report.
First, you will respond to four test items. After successfully passing the test items, you can press
the space-bar to start the task. The task will take you about 20 minutes.
If you have any further questions, please address the experimenter.

THE DARK AND BRIGHT SIDE OF NETWORKING BEHAVIOR
223
Appendix C
Table C1. Regression of Self-Rated Self-Control on Condition and Extraversion in Study 1
Regression of Self-Rated Self-Control on Condition and Extraversion in Study 1
Steps
Unstandardized
Coefficients
Standardized
Coefficients
R2
ΔR2
b SE β
1 - - - - .23***
Networkinga 0.55 0.13 .27*** - -
Extraversion 0.37 0.63 .37*** - -
2 - - - - .23*** .00
Networking 0.55 0.13 .27*** - -
Extraversion 0.40 0.09 .39*** - -
Networking ×
Extraversion -.06 0.13 -.04 - -
Notes. N = 206. Dependent variable: Self-control (self-rated, SSCCS).
aNetworking (0 = HD & LD Stroop, 1 = NW).
*** p .001.

THE DARK AND BRIGHT SIDE OF NETWORKING BEHAVIOR
224
Table C2 Regression of Self-Rated Self-Control on Condition and Social Skills in Study 1
Regression of Self-Rated Self-Control on Condition and Social Skills in Study 1
Steps
Unstandardized
Coefficients
Standardized
Coefficients
R2
ΔR2
b SE β
1 - - - - .11***
Networkinga 0.62 0.13 .31*** - -
Social skills 0.12 0.07 .12† - -
2 - - - - .11*** .00
Networking 0.62 0.13 .31*** - -
Social skills 0.14 0.09 .14 - -
Networking ×
Social skills -.05 0.14 -.03 - -
Notes. N = 206. Dependent variable: Self-control (self-rated, SSCCS).
aNetworking (0 = HD & LD Stroop, 1 = NW).
† p ≤ .10. ** p .01.*** p .001.

THE DARK AND BRIGHT SIDE OF NETWORKING BEHAVIOR
225
Appendix G
Instruction Social Control Task in Study 2
You have 20 minutes to talk to each other in a casual and informal manner.
Behave the way you like and feel most comfortable with. You do not need to pay heed to anything
specific.
At the end of the experiment, a bonus of 10€ will be raffled. The raffle is completely irrespective
of your behavior during the experiment.
Role description

THE DARK AND BRIGHT SIDE OF NETWORKING BEHAVIOR
226
Appendix D
Table D1 Regression of Self-Rated Self-Control on Condition and Impression Management in
Regression of Self-Rated Self-Control on Condition and Impression Management in Study 2
Steps
Unstandardized
Coefficients
Standardized
Coefficients
R2
ΔR2
b SE β
1 - - - - .00
Networkinga -.09 0.18 -.05 -
2 - - - - .24*** .24***
Networking 2.96 0.74 .31*** - -
Impression
management 10.67 2.12 .39*** - -
Notes. N = 127. Dependent variable: Self-control (self-rated, SSCCS).
aNetworking (0 = social interaction, 1 = NW).
† p .1. * p .05. ** p .01.*** p .001.
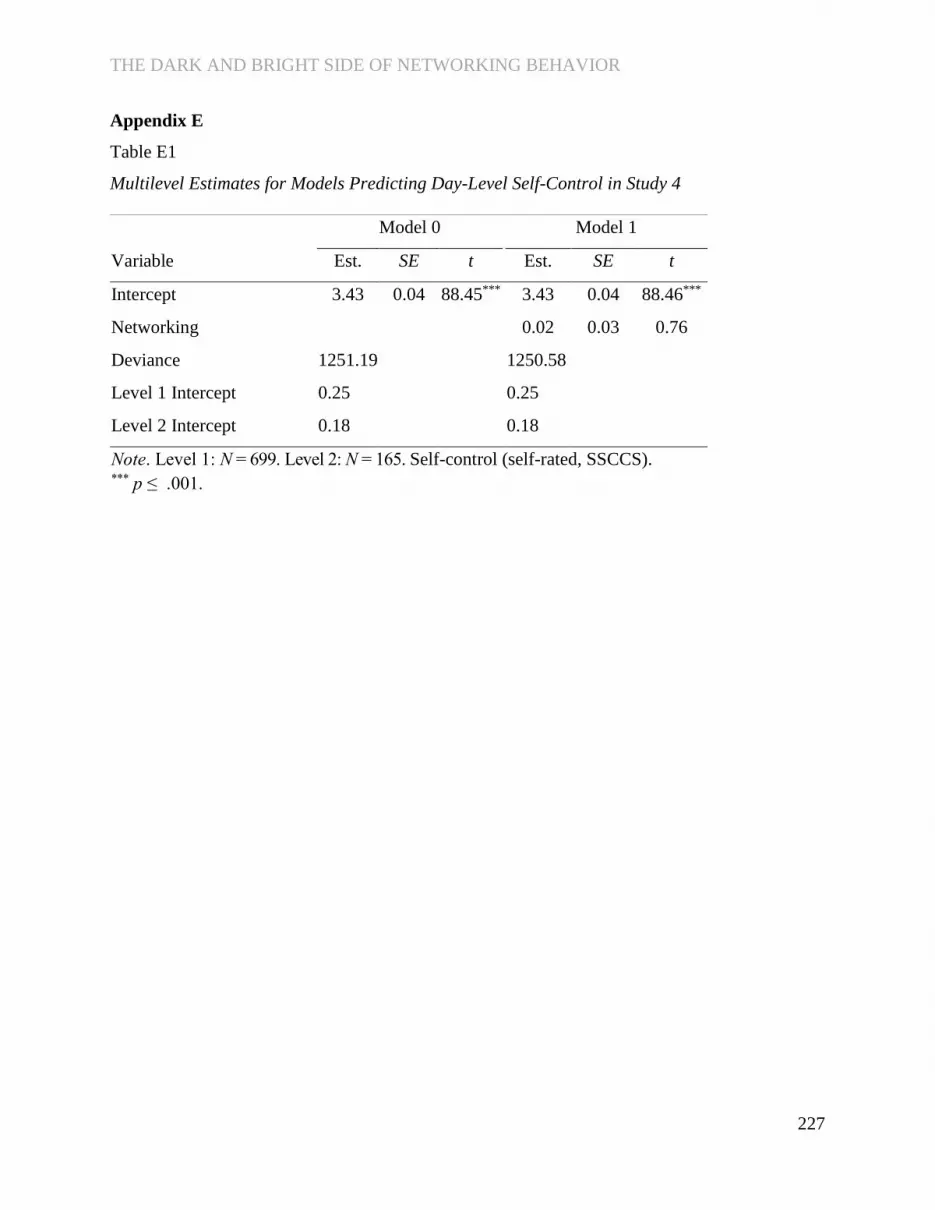
THE DARK AND BRIGHT SIDE OF NETWORKING BEHAVIOR
227
Appendix E
Table E1el
Multilevel Estimates for Models Predicting Day-Level Self-Control in Study 4
Model 0 Model 1
Variable Est. SE t Est. SE t
Intercept 3.43 0.04 88.45*** 3.43 0.04 88.46***
Networking 0.02 0.03 0.76
Deviance 1251.19 1250.58
Level 1 Intercept 0.25 0.25
Level 2 Intercept 0.18 0.18
Note. Level 1: N = 699. Level 2: N = 165. Self-control (self-rated, SSCCS). *** p ≤ .001.


