Embed Size (px)
Citation preview
The Development of Tonal Centres and Abstract Pitch asCategorisations of Pitch-Use.
Niall Griffith1,Department of Computer Science,
University of Exeter,Prince of Wales Road,
Exeter,EX4 4PT,England.
email: [email protected]
Running Head: Tonality and Pitch Use.
Keywords: music, induction, tonality, pitch use, interval use, sequence categorisation, ART2,Kohonen Feature Maps, Feedforward Networks.
1My thanks to the editor of Connection Science, Noel Sharkey, for organising the reviews for this paper and toPeter Todd and the two reviewers for their comments.
1
Abstract
Modelling how people establish a sense of tonality and encode pitch invariance areimportant elements of research into musical cognition. This paper2 describes simulations ofprocesses that induce classifications of pitch and interval use from a set of nursery rhymemelodies. The classifications are identified with keys and degrees of the scale. The extractiveprocess has been implemented in various forms of shunting, adding and tracking memory,and ART2 networks, Kohonen Feature Maps and Feedforward nets are used as classifiers,in modular combinations. In the model stable tonal centres emerge as general categories ofpitch use over the short to medium term, while degree categories emerge from classifyinginterval use over the longer term. The representations of degree reflect the similarity relationsbetween degrees.
Overall, this research is concerned with the problem of how to abstract representationsof sequences in a way that is both resilient and adaptive. It uses various extractive processesco-operatively to derive consistent representations from sequences of pitches, and shows thatby using information generated within one process it is possible to guide the developmentof another, in this case functional representation.
2The research presented in this paper is part of the author’s doctoral research, supervised by Noel Sharkey andHenry Shaffer and funded by a SERC studentship.
2
1 Introduction
The simulations described in this paper are concerned with modelling the abstraction of profilesof pitch use from music, and how statistical representations may contribute to the developmentof musical tonality. Musical tonality is a complex phenomenon. While not wishing to discussin detail all the processes that have been recognised as influencing tonal understanding, it isworthwhile to outline its four major aspects.
Firstly, there is a precedent stage of psychoacoustic transduction. It is unclear how theidentities and relations emerging from this transduction influence other tonal processes. Whilepsychoacoustics seems insufficient to account for tonality as a whole (Storr, 1992); (Griffith,1993a), it is obviously a necessary phenomenal basis (Terhardt, 1974); (Patterson, 1986). Thepsychophysical transduction of sound is assumed to be a psychological constant, i.e. it has beenacquired over evolutionary timescales.
Secondly, there are processes involving a dialogue between social conventions, top downschematic processes and psychoacoustic mechanisms. An example of this kind of process is theevolution of temperaments leading to the system of keys in Western music. This involved an un-derstanding of the mathematics underlying tuning, the development of keyboard instruments, andthe wish to resolve aesthetic problems inherent in previous tunings. The historical developmentof scales and temperaments suggests a multiplicity of processes; some as precedent as gestaltgrouping principles, others as tertiary as the formalisation of the properties and implications ofpitch sets. How these perceptual and conceptual processes interact is part of the ongoing researchagenda for cognitive musicology.
Thirdly, there is the coincidence of tonal with non-tonal musical dimensions (Bregman,1990); (Handel, 1973). These are considered to include phrasing (Narmour, 1984); (Page, 1993),rhythmic and metrical structures (Peretz & Kolinsky,1993) and expressive timing (Shaffer, Clarke& Todd, 1985). The influence between tonality and these structures seems to some extent to bemutual. However, very little is known for certain about the operation of coincidence betweenmusical dimensions, or how and when it takes place in auditory processing.
Fourthly, tonality involves functions that induce structure from the use that is made of pitches.These functions are concerned with structure that arises over time, i.e. they are sequential. Pitchuse has three aspects: i) the memorisation of sequences, ii) the abstraction of the attributesof pitch use within sequences, iii) the compositional relations - in the general sense of puttingtogether - between the first two aspects. The simulations reported focus on the second of theseaspects, the abstraction of patterns of pitch use.
2 Computational models of Key and Tonality
Over the last 30 or so years various programs have been written with the aim of identifying, froma stream of pitch information, the key of a piece of music. Most of these have been concernedwith the operation of a fully developed sense of key (Simon, 1968); (Winograd, 1968); (Longuet-Higgins & Steedman, 1970); (Holtzmann, 1977); (Ulrich, 1977); (Krumhansl, 1990a); (Huron& Parncutt, 1993). More recently, Artificial Neural Networks (ANN’s) have been used to model
3
some of the processes involved in learning about musical structure via simulated exposure topieces of music.
The idea that musical schemas emerge from broad perceptual processes classifying structuredsequences of sound, is prominent in the work of both Bharucha (Bharucha, 1987; Bharucha,1991), who stresses the chordal structure of tonality, and Leman (Leman, 1990; Leman, 1992),who stresses the harmonic (overtone) structure of tonality. Frances (1988) argues that there isnot enough information in melody by itself to serve as the basis for tonality. The simulationsdescribed below explore how much can be learned from a minimum of melodic information.
Leman’s model (Leman, 1992) involves the temporal integration of the harmonic constituentsof pitches, and is based on the virtual pitch theory of Terhardt, Stoll & Seewann (1982), anddeveloped by (Parncutt, 1988). Pitch representations integrated over a few seconds are related totonal centres previously developed from representations of chords. Tonal attribution is a functionof the distance between the current integrated pitch representation and tonal centres. The modelspecifies no mechanism to account for the emergence of abstract pitch.
MUSACT (Bharucha, 1987), is a spreading activation model of chord and key relations.Layers of units representing pitches, chords, and keys, are connected to each other by virtue ofmembership, i.e. a pitch is only linked to those chords it is a member of. When a set of pitchesis fed into the network, the connections propagate activation to chords and then to keys. Overall,the net settles into a vote for different chords and keys. MUSACT has been extended usingCompetitive Learning to simulate the acquisition of the chord and key schemas. The learningmodel proposes that chords are grouped in pools. The chords in a group are yoked togetherfor the purposes of learning. When a chord of a particular type, e.g. C major is mapped to anuncommitted node in a group the other nodes in the group are also adjusted so as to be predisposedto the same pattern of pitches at other points in the chromatic scale. Yoking chords in this wayis necessary because there is nothing to suggest, for example, that the chord c e g (C major) is ofthe same type as f a c (F major). The learning mechanism incorporates the pitch transformationsthrough the chromatic pitch set that relate chords of the same type built from different roots. Byusing this mechanism MUSACT eschews the use of interval information. However, it is arguablethat if it used interval information, then the chord pools could be developed in a simpler, andmore general way out of categorisations of the interval structure of chords. The issues that ariseout of whether pitch relations are encoded by mechanisms of the type proposed in MUSACTor whether pitch relations are previously encoded as intervals, allowing their subsequent use byother processes, is beyond the scope of this paper. The model described below proposes thatintervals are encoded, and that this information is used to establish abstract pitch identity.
MUSACT models the construction of tonality as the integration of pitches into chords andscales. It specifies only a black box gating model of the abstraction of pitch into an invariant formsuch as the tonic sol-fa, or scale degrees. Although the tonic sol-fa is primarily an aide-memoire,and the system of degrees is primarily an analytical device, both describe an abstract, singleoctave scale. These abstract scales play an important role in learning and remembering music.MUSACT uses pitch class and key identities to gate pitch into a form where the tonic of a scale isalways 0. An equivalent mechanism is described by (Scarborough, Miller & Jones, 1989). Howmight such a mechanism be learned? It is difficult to see how to establish a direct phenomenalbasis for abstract pitch in the overtone characteristics of pitches, as this does not vary by key -
4
yet the abstract function, and scale position, of pitches and chords depends upon the key they areplayed within. However, differentiation does arise in a representation of how pitches are relatedto other pitches over a period of time. These relationships can be thought of either in terms ofthe statistics of the pitch transitions (Griffith, 1993a), or in terms of the statistics of the intervaltransitions associated with sets of pitches.
The model described below investigates constructive mechanisms that extract and classify thestatistics associated with the use of pitch classes and their associated intervals. These mechanismsinduce outlines of tonal structure representing diatonic centres and degrees of the scale.
3 Pitch Use and the Development of Tonality
The music used in the simulations is a set of nursery rhymes. These are represented by vectorsthat identify the pitch classes and intervals used in Western music.
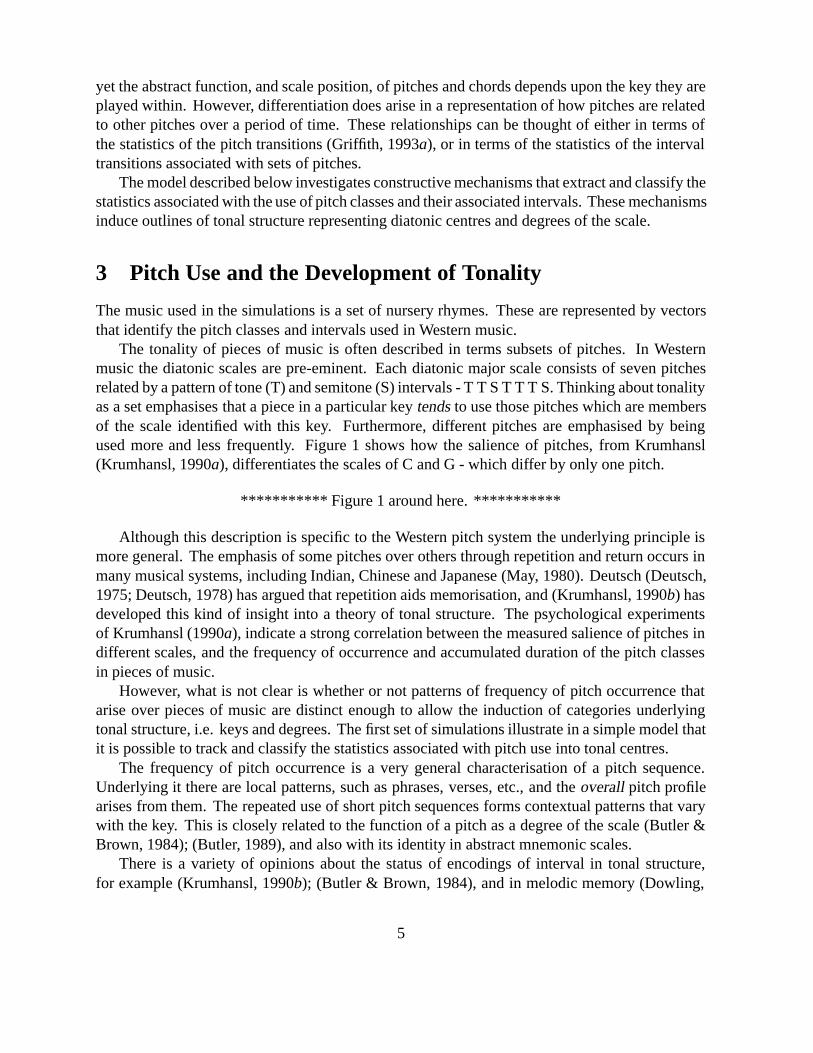
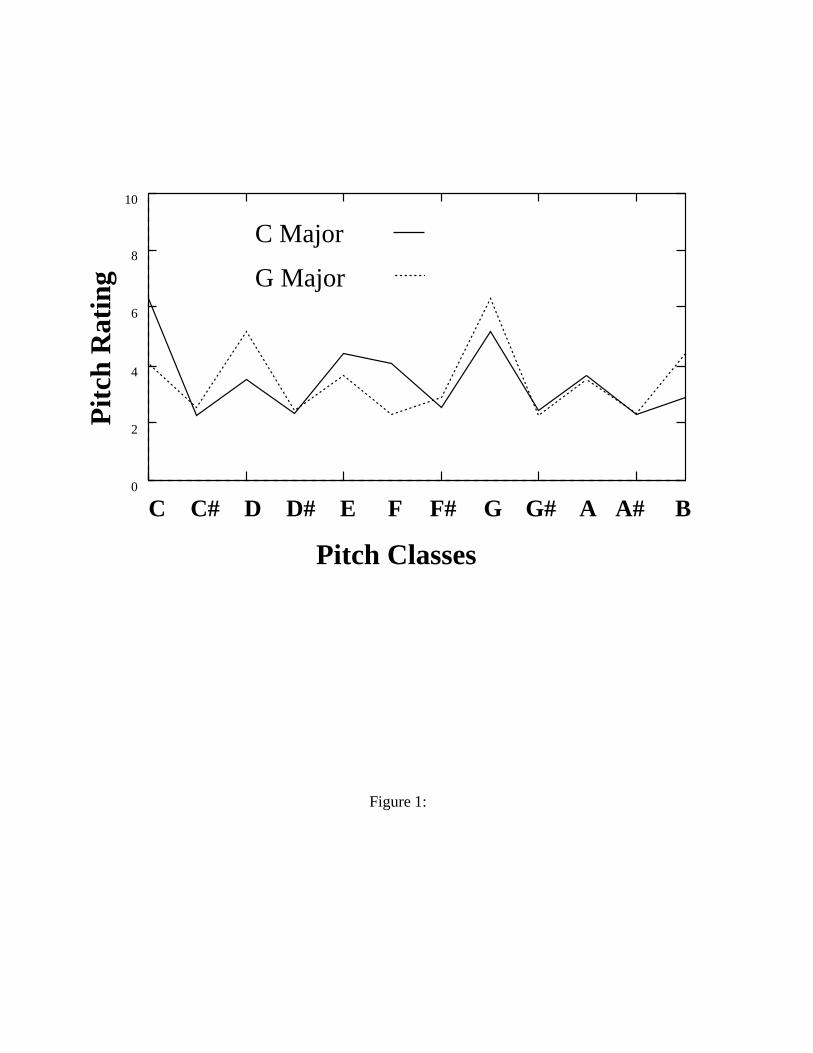
The tonality of pieces of music is often described in terms subsets of pitches. In Westernmusic the diatonic scales are pre-eminent. Each diatonic major scale consists of seven pitchesrelated by a pattern of tone (T) and semitone (S) intervals - T T S T T T S. Thinking about tonalityas a set emphasises that a piece in a particular key tends to use those pitches which are membersof the scale identified with this key. Furthermore, different pitches are emphasised by beingused more and less frequently. Figure 1 shows how the salience of pitches, from Krumhansl(Krumhansl, 1990a), differentiates the scales of C and G - which differ by only one pitch.
*********** Figure 1 around here. ***********
Although this description is specific to the Western pitch system the underlying principle ismore general. The emphasis of some pitches over others through repetition and return occurs inmany musical systems, including Indian, Chinese and Japanese (May, 1980). Deutsch (Deutsch,1975; Deutsch, 1978) has argued that repetition aids memorisation, and (Krumhansl, 1990b) hasdeveloped this kind of insight into a theory of tonal structure. The psychological experimentsof Krumhansl (1990a), indicate a strong correlation between the measured salience of pitches indifferent scales, and the frequency of occurrence and accumulated duration of the pitch classesin pieces of music.
However, what is not clear is whether or not patterns of frequency of pitch occurrence thatarise over pieces of music are distinct enough to allow the induction of categories underlyingtonal structure, i.e. keys and degrees. The first set of simulations illustrate in a simple model thatit is possible to track and classify the statistics associated with pitch use into tonal centres.
The frequency of pitch occurrence is a very general characterisation of a pitch sequence.Underlying it there are local patterns, such as phrases, verses, etc., and the overall pitch profilearises from them. The repeated use of short pitch sequences forms contextual patterns that varywith the key. This is closely related to the function of a pitch as a degree of the scale (Butler &Brown, 1984); (Butler, 1989), and also with its identity in abstract mnemonic scales.
There is a variety of opinions about the status of encodings of interval in tonal structure,for example (Krumhansl, 1990b); (Butler & Brown, 1984), and in melodic memory (Dowling,
5
1984; Dowling, 1988). However, the close relationship between the two is well established. Therepresentation of pitch use in terms of intervals allows comparison between pitch use in differentkeys.
The model focuses on the frequency of occurrence of pitches and intervals in diatonic majorscales. As such it can make no claim to be a complete model of tonal induction. It is a partialsynthesis of insights in the work of Krumhansl, Butler and Brown and others (Krumhansl, 1990a);(Butler & Brown, 1984); (Brown, 1988); (Butler, 1989)3. More generally Tonality is conceivedto arise from a diverse set of processes (Bharucha, 1987), (Terhardt, 1984), (Bregman, 1990),and (Balzano, 1980).
Several concerns have influenced the development of the model. Firstly, the idea that clas-sification is an adaptive process, concerned with developing stable, consistent representations ofaspects of experience. Secondly, that classification is focused at appropriate levels of granularity,both representationally and temporally, resulting in categorisations that are more or less general(Lakoff, 1987). Thirdly, that representations derived at one level of granularity may be usedas a source of attentional focus by processes making other classifications. These characteristics- adaptive stability, appropriate categorical granularity, and attentional structure are all viewedas desirable properties. In particular the simulations are interested in how categorical processeswhich attend to different dimensions of pitch use, over different representational and temporalspans can be used together.
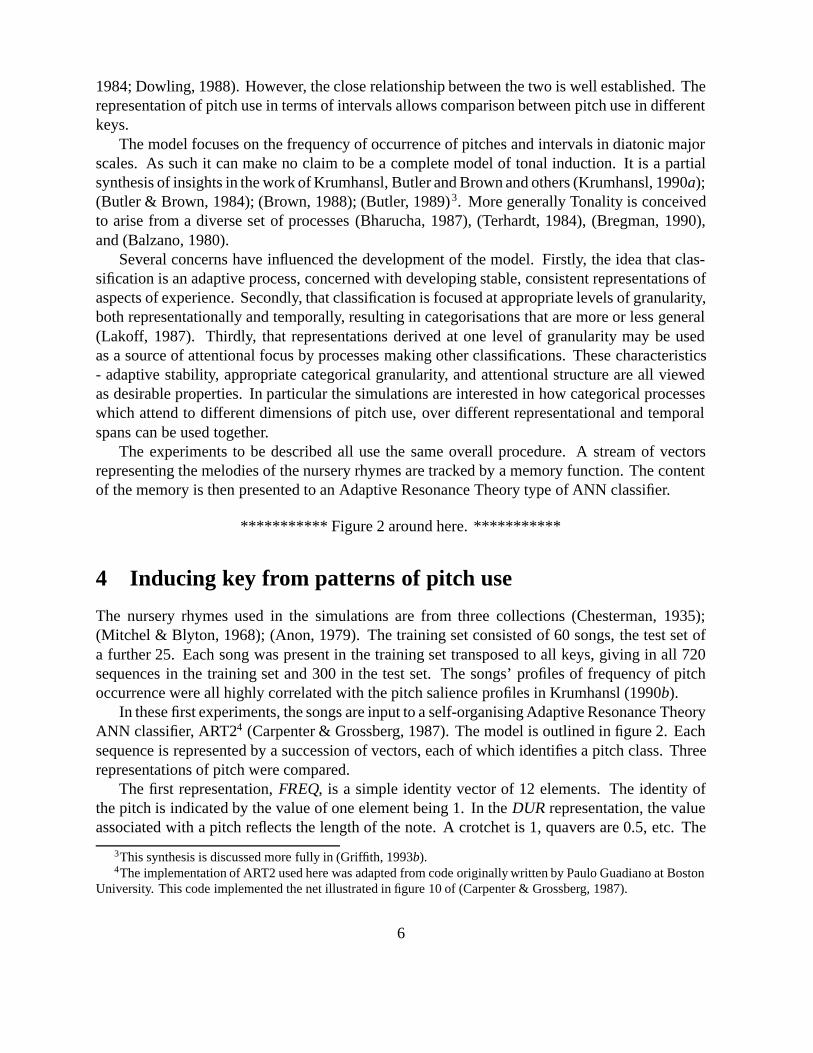
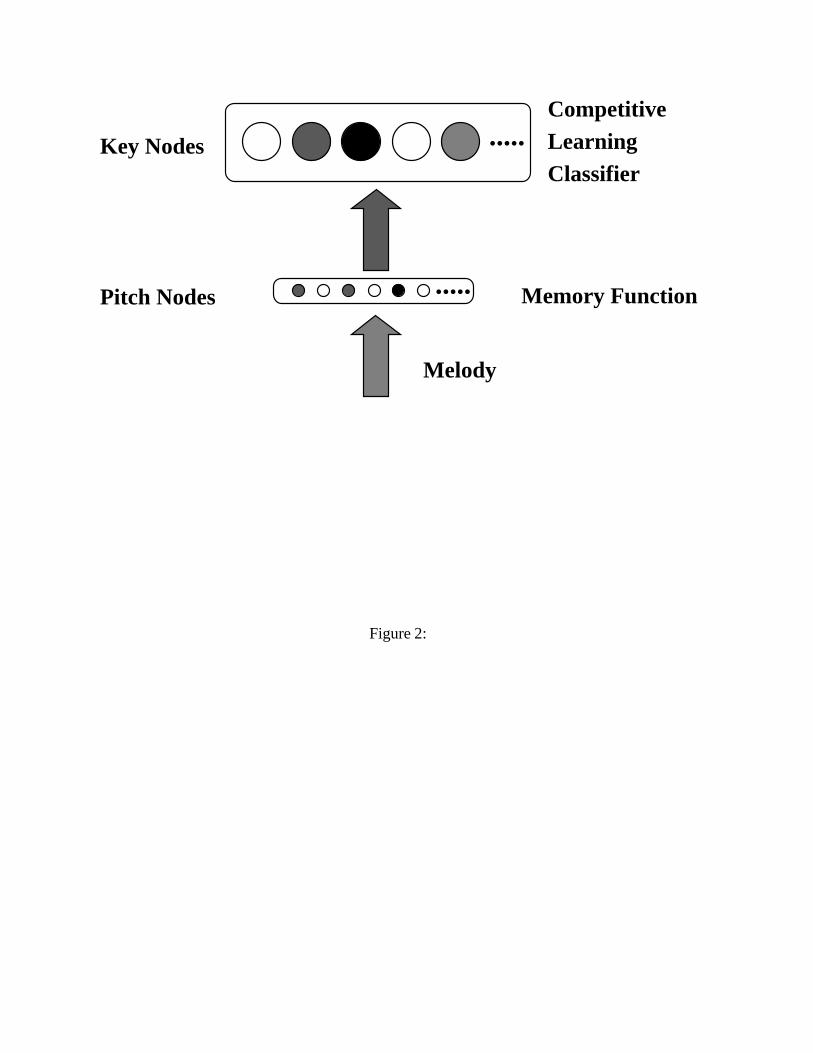
The experiments to be described all use the same overall procedure. A stream of vectorsrepresenting the melodies of the nursery rhymes are tracked by a memory function. The contentof the memory is then presented to an Adaptive Resonance Theory type of ANN classifier.
*********** Figure 2 around here. ***********
4 Inducing key from patterns of pitch use
The nursery rhymes used in the simulations are from three collections (Chesterman, 1935);(Mitchel & Blyton, 1968); (Anon, 1979). The training set consisted of 60 songs, the test set ofa further 25. Each song was present in the training set transposed to all keys, giving in all 720sequences in the training set and 300 in the test set. The songs’ profiles of frequency of pitchoccurrence were all highly correlated with the pitch salience profiles in Krumhansl (1990b).
In these first experiments, the songs are input to a self-organising Adaptive Resonance TheoryANN classifier, ART24 (Carpenter & Grossberg, 1987). The model is outlined in figure 2. Eachsequence is represented by a succession of vectors, each of which identifies a pitch class. Threerepresentations of pitch were compared.
The first representation, FREQ, is a simple identity vector of 12 elements. The identity ofthe pitch is indicated by the value of one element being 1. In the DUR representation, the valueassociated with a pitch reflects the length of the note. A crotchet is 1, quavers are 0.5, etc. The
3This synthesis is discussed more fully in (Griffith, 1993b).4The implementation of ART2 used here was adapted from code originally written by Paulo Guadiano at Boston
University. This code implemented the net illustrated in figure 10 of (Carpenter & Grossberg, 1987).
6
SLI, timesliced representation, involves the repetition of each FREQ vector a number of timesto reflect its duration. Semi-quavers are presented twice, quavers four times, etc. A similarrepresentation was used by Todd (1989).
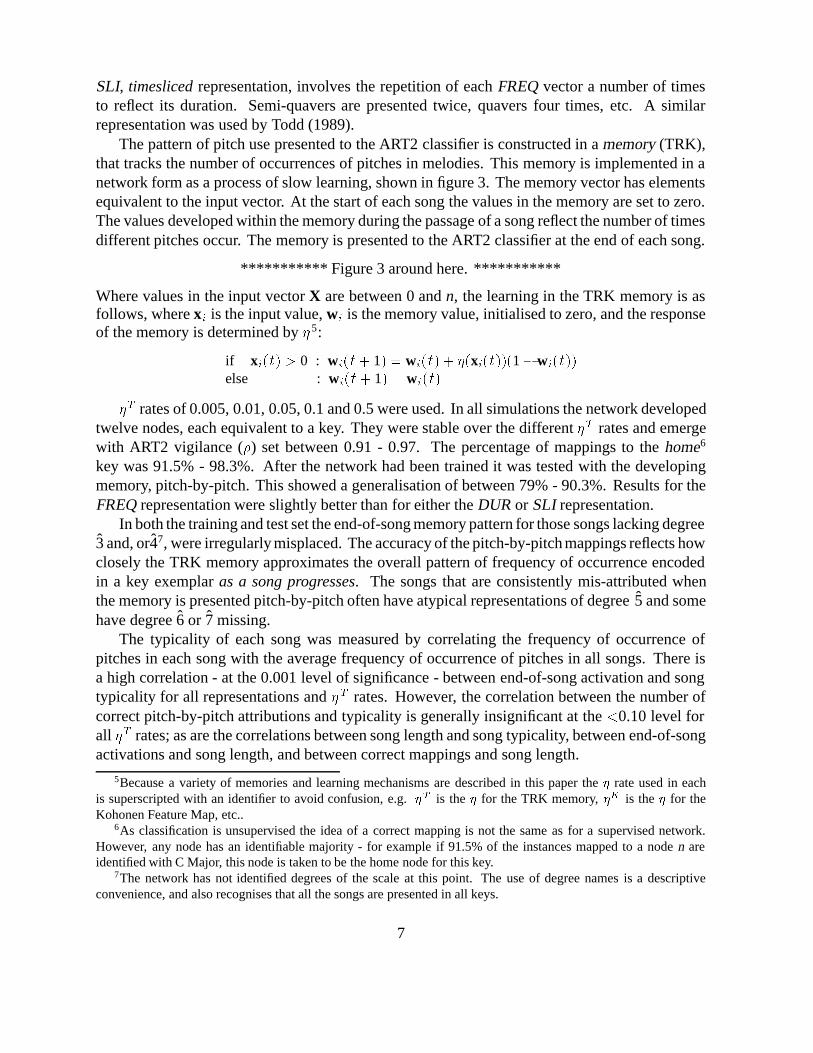
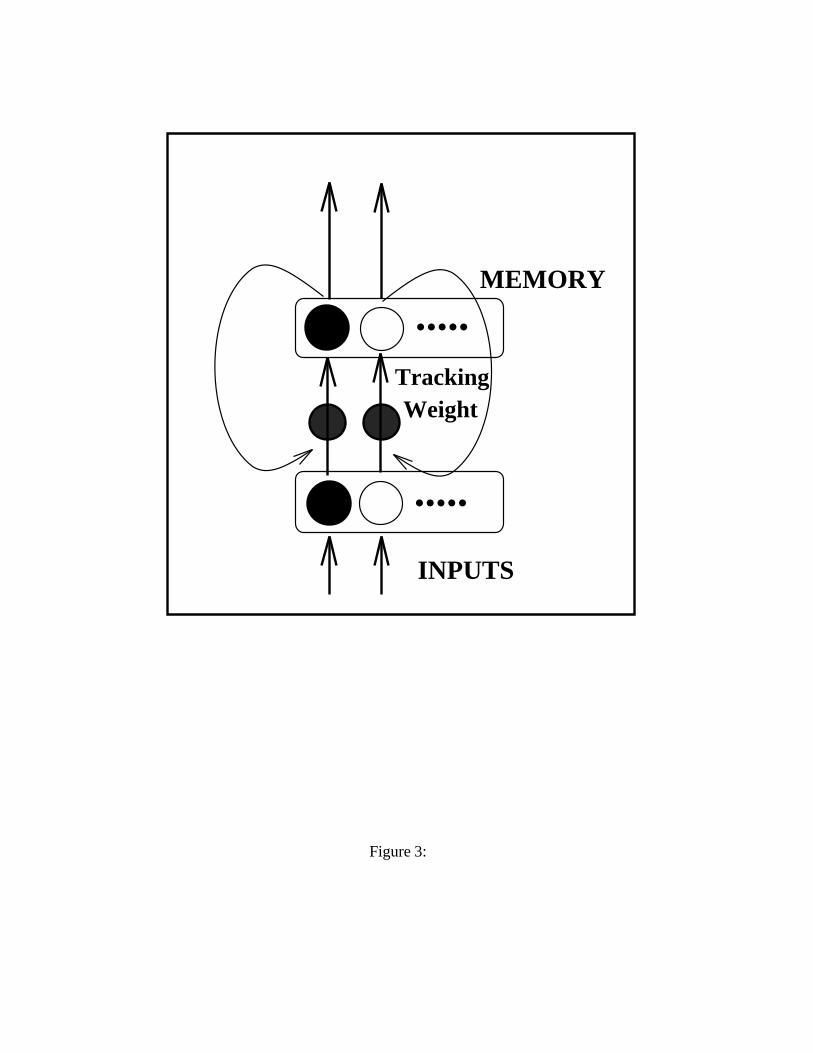
The pattern of pitch use presented to the ART2 classifier is constructed in a memory (TRK),that tracks the number of occurrences of pitches in melodies. This memory is implemented in anetwork form as a process of slow learning, shown in figure 3. The memory vector has elementsequivalent to the input vector. At the start of each song the values in the memory are set to zero.The values developed within the memory during the passage of a song reflect the number of timesdifferent pitches occur. The memory is presented to the ART2 classifier at the end of each song.
*********** Figure 3 around here. ***********
Where values in the input vector X are between 0 and n, the learning in the TRK memory is asfollows, where xi is the input value, wi is the memory value, initialised to zero, and the responseof the memory is determined by �5:
if xi(t) > 0 : wi(t + 1) = wi(t) + �(xi(t))(1� wi(t))else : wi(t + 1) = wi (t)
�T rates of 0.005, 0.01, 0.05, 0.1 and 0.5 were used. In all simulations the network developedtwelve nodes, each equivalent to a key. They were stable over the different �T rates and emergewith ART2 vigilance (�) set between 0.91 - 0.97. The percentage of mappings to the home6
key was 91.5% - 98.3%. After the network had been trained it was tested with the developingmemory, pitch-by-pitch. This showed a generalisation of between 79% - 90.3%. Results for theFREQ representation were slightly better than for either the DUR or SLI representation.
In both the training and test set the end-of-song memory pattern for those songs lacking degree3 and, or47, were irregularly misplaced. The accuracy of the pitch-by-pitch mappings reflects howclosely the TRK memory approximates the overall pattern of frequency of occurrence encodedin a key exemplar as a song progresses. The songs that are consistently mis-attributed whenthe memory is presented pitch-by-pitch often have atypical representations of degree 5 and somehave degree 6 or 7 missing.
The typicality of each song was measured by correlating the frequency of occurrence ofpitches in each song with the average frequency of occurrence of pitches in all songs. There isa high correlation - at the 0.001 level of significance - between end-of-song activation and songtypicality for all representations and �T rates. However, the correlation between the number ofcorrect pitch-by-pitch attributions and typicality is generally insignificant at the <0.10 level forall �T rates; as are the correlations between song length and song typicality, between end-of-songactivations and song length, and between correct mappings and song length.
5Because a variety of memories and learning mechanisms are described in this paper the � rate used in eachis superscripted with an identifier to avoid confusion, e.g. �
T is the � for the TRK memory, �K is the � for theKohonen Feature Map, etc..
6As classification is unsupervised the idea of a correct mapping is not the same as for a supervised network.However, any node has an identifiable majority - for example if 91.5% of the instances mapped to a node n areidentified with C Major, this node is taken to be the home node for this key.
7The network has not identified degrees of the scale at this point. The use of degree names is a descriptiveconvenience, and also recognises that all the songs are presented in all keys.
7
*********** Table I around here. ***********
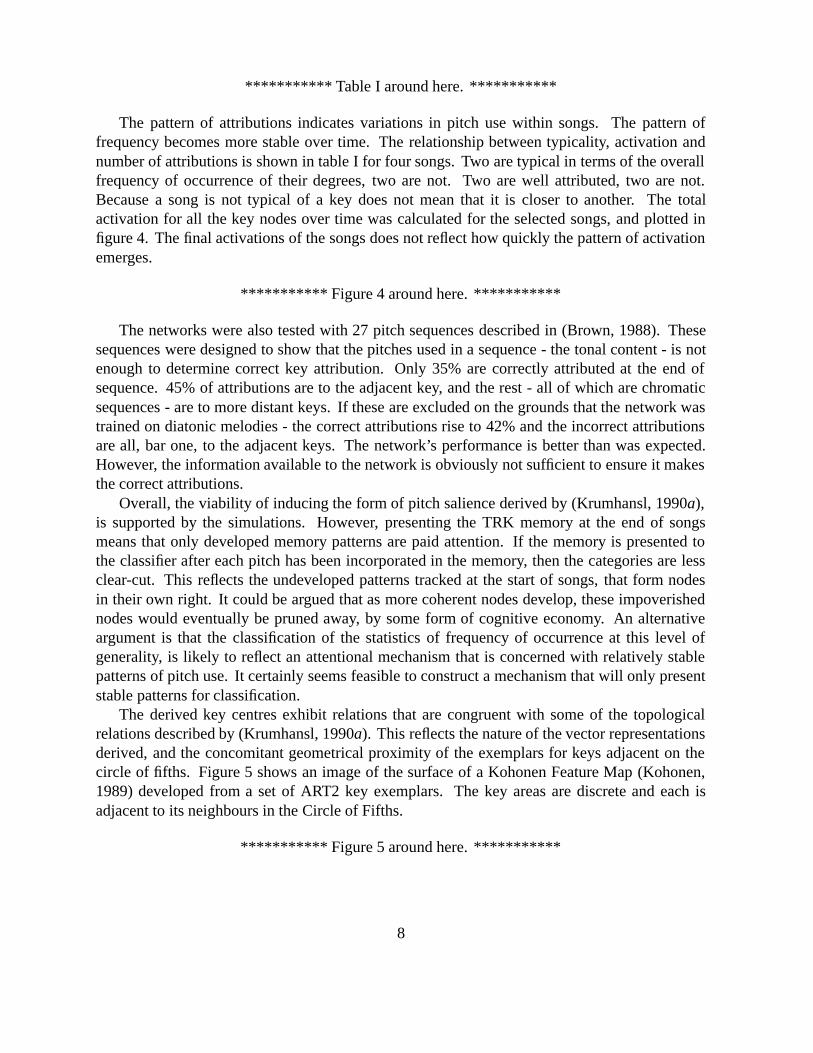
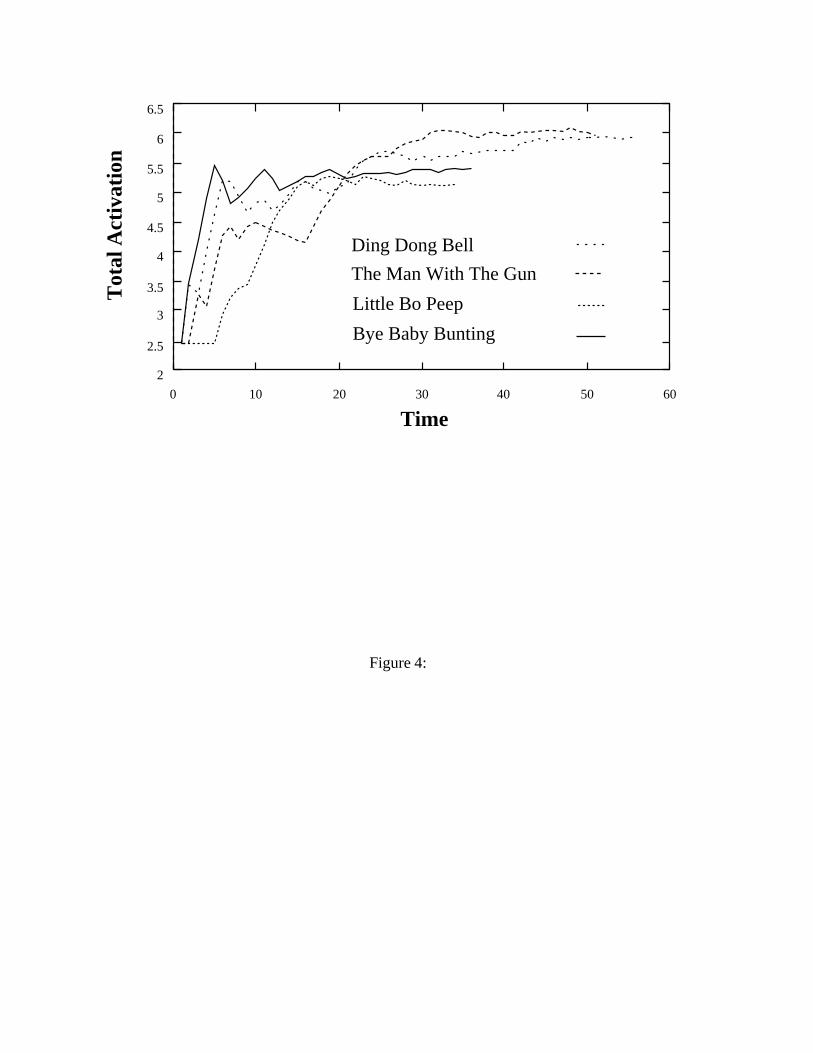
The pattern of attributions indicates variations in pitch use within songs. The pattern offrequency becomes more stable over time. The relationship between typicality, activation andnumber of attributions is shown in table I for four songs. Two are typical in terms of the overallfrequency of occurrence of their degrees, two are not. Two are well attributed, two are not.Because a song is not typical of a key does not mean that it is closer to another. The totalactivation for all the key nodes over time was calculated for the selected songs, and plotted infigure 4. The final activations of the songs does not reflect how quickly the pattern of activationemerges.
*********** Figure 4 around here. ***********
The networks were also tested with 27 pitch sequences described in (Brown, 1988). Thesesequences were designed to show that the pitches used in a sequence - the tonal content - is notenough to determine correct key attribution. Only 35% are correctly attributed at the end ofsequence. 45% of attributions are to the adjacent key, and the rest - all of which are chromaticsequences - are to more distant keys. If these are excluded on the grounds that the network wastrained on diatonic melodies - the correct attributions rise to 42% and the incorrect attributionsare all, bar one, to the adjacent keys. The network’s performance is better than was expected.However, the information available to the network is obviously not sufficient to ensure it makesthe correct attributions.
Overall, the viability of inducing the form of pitch salience derived by (Krumhansl, 1990a),is supported by the simulations. However, presenting the TRK memory at the end of songsmeans that only developed memory patterns are paid attention. If the memory is presented tothe classifier after each pitch has been incorporated in the memory, then the categories are lessclear-cut. This reflects the undeveloped patterns tracked at the start of songs, that form nodesin their own right. It could be argued that as more coherent nodes develop, these impoverishednodes would eventually be pruned away, by some form of cognitive economy. An alternativeargument is that the classification of the statistics of frequency of occurrence at this level ofgenerality, is likely to reflect an attentional mechanism that is concerned with relatively stablepatterns of pitch use. It certainly seems feasible to construct a mechanism that will only presentstable patterns for classification.
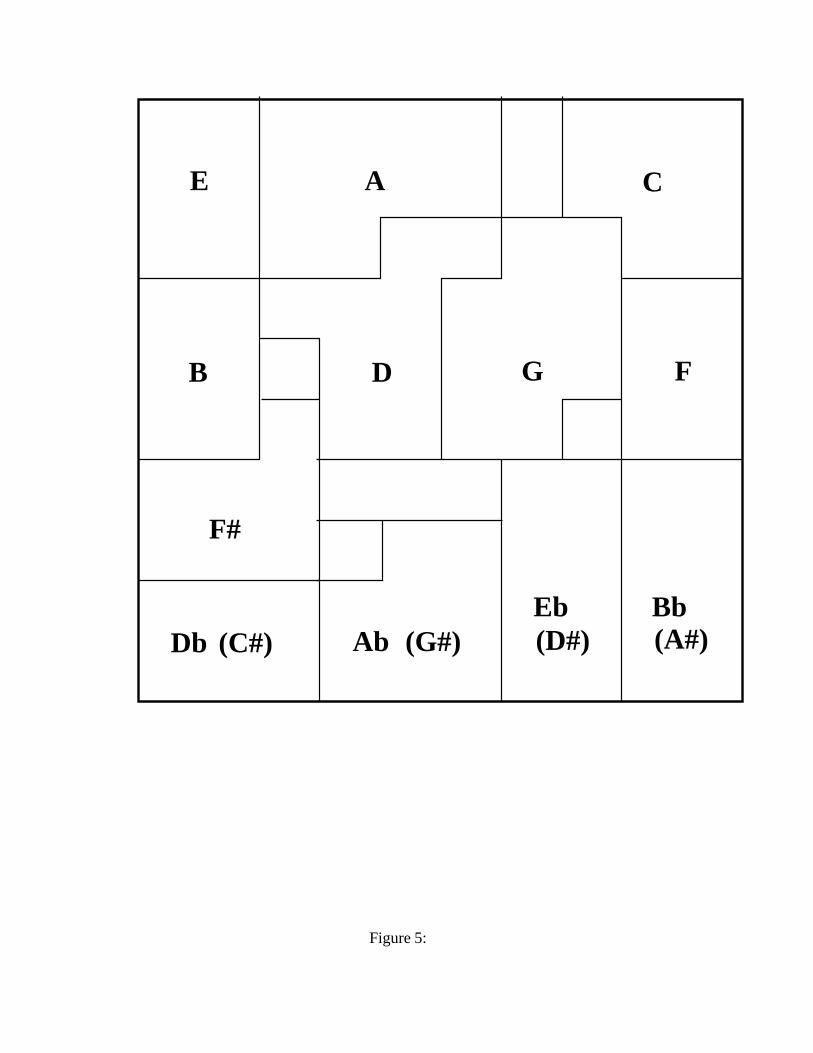
The derived key centres exhibit relations that are congruent with some of the topologicalrelations described by (Krumhansl, 1990a). This reflects the nature of the vector representationsderived, and the concomitant geometrical proximity of the exemplars for keys adjacent on thecircle of fifths. Figure 5 shows an image of the surface of a Kohonen Feature Map (Kohonen,1989) developed from a set of ART2 key exemplars. The key areas are discrete and each isadjacent to its neighbours in the Circle of Fifths.
*********** Figure 5 around here. ***********
8
5 Abstracting pitch from patterns of interval use
The encoding of abstract pitch (degree) is accepted as an important part of the mechanism thatmemorises melodies. The work of Dowling (Dowling, 1984; Dowling, 1988) indicates thatmelodic memory involves the encoding of abstract pitch and the pattern of intervals betweenpitches. These two components appear to be used with greater and lesser accuracy in differentsituations. The model that is outlined below investigates the relationship between the twoby suggesting that it is possible to derive representations of abstract pitches as classificationsof patterns of memorised interval use associated with pitches. The model assumes that thecategorical interval between two pitches in the chromatic scale has been identified. It is a verysimilar model to that used to derive key centres from frequency of pitch occurrence. However,it differs in two ways. First, the statistics of the use of pitch classes are separated, so that theuse of different pitches can be compared. Second, pitch use is specified in terms of the intervalrelationships between pitches. If pitch use is described directly in terms of other pitches itsrepresentation is limited by the positional specification of pitch within the input vector space8 -and by implication within actual pitch space. Interval on the other hand represents pitch relationsdirectly.
The model investigates whether different degrees of the scale are associated with differentpatterns of intervals, sufficiently distinct to delineate interval based categories of pitch use. Ifthey do, the representation will lend support to the intervallic model of pitch function advocatedby (Browne, 1981); (Butler & Brown, 1984). The model should reflect, for example, that thetonic 1 and the dominant 5 are functionally more similar than the tonic 1 and the leading tone 7.This kind of property is more interesting than the position or identity of the degree.
5.1 The intervals of the major scale
In these simulations intervals are identified in vectors in the same way as pitches - a vectorposition being associated with an interval. The sets of intervals within the diatonic major scaleare described in (Browne, 1981), and are shown in table II. The pattern of intervals associatedwith each degree of the scale is very similar, and will have limited discriminatory value.
*********** Table II around here. ***********
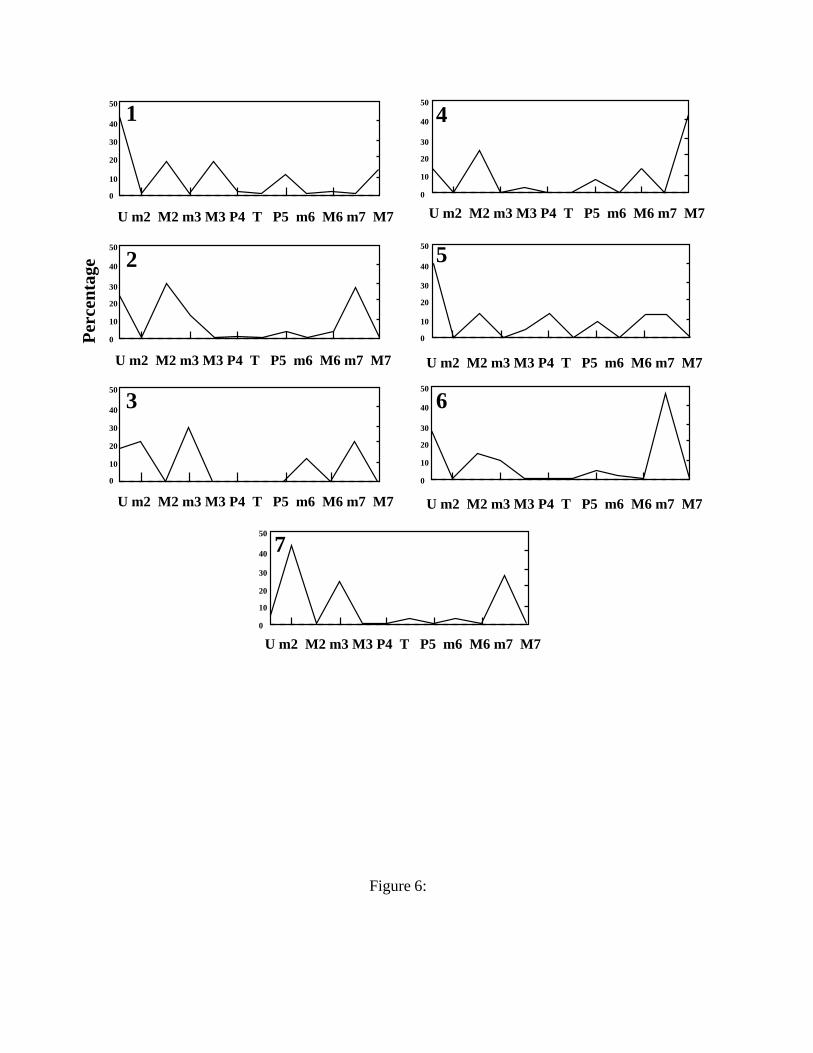
However, as with the frequency of occurrence of pitches, the way in which the sets of intervalsare used is quite different, as can be seen in figure 6. The values plotted are calculated by summingthe intervals that precede each pitch in the songs. The resulting counts of the different intervalsassociated with each pitch are then expressed as percentages. The overall pattern of intervaluse shows a marked preponderance of intervals between pitches that are near neighbours in thescale, as might be expected in a set of melodies. In the model the representation of the intervalliccontext of pitches is constructed in a set of memories similar to those used to extract frequencyof pitch occurrence, except that twelve memories are used - one for each pitch.
8In the pitch vector the equivalence of pitches in different keys can only be recovered by rotating the vectorsuntil the patterns coincide.
9
*********** Figure 6 around here. ***********
5.2 An outline model of pitch abstraction
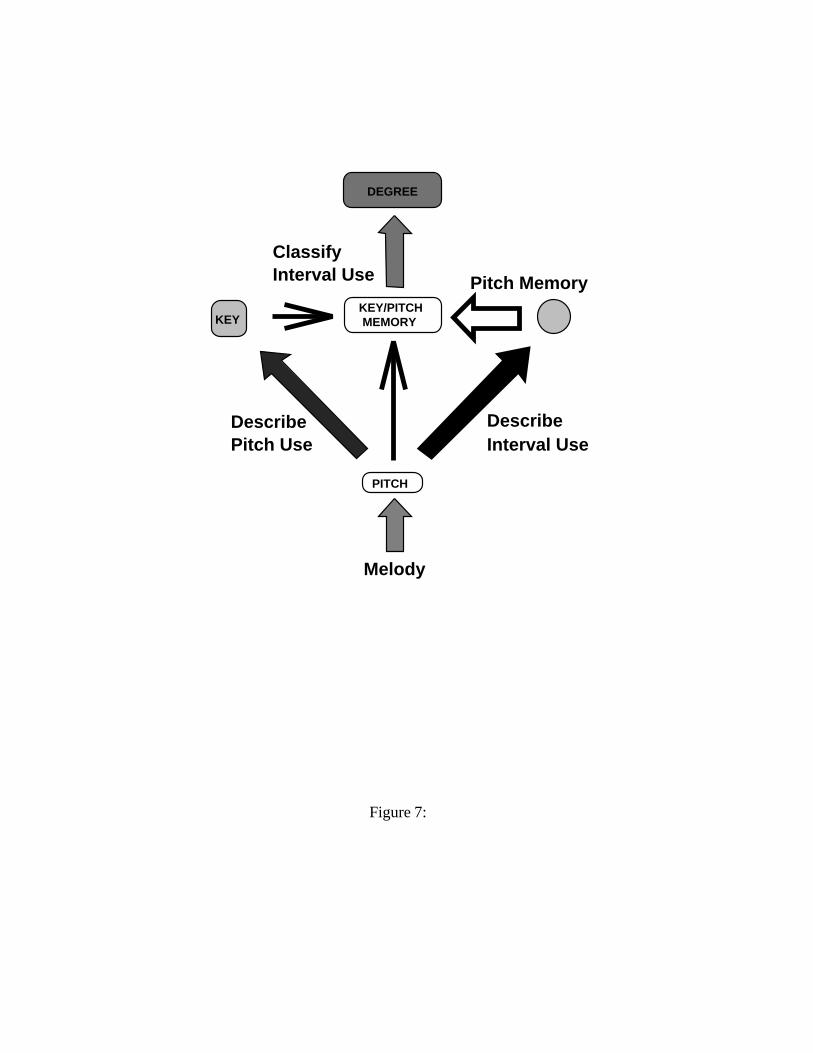
An outline of the model of pitch abstraction is shown in figure 7. The functions within the modelare bipartite. Firstly, a process of self-organising, bottom up statistical extraction using ART2,classifies patterns constructed in echoic and tracking memory models. The memory patterns areconsolidated in a set of discrete pitch-in-key representations guided by the key identified in theprocess described in section 4. These pitch-in-key representations, comprise the most generaldescription of interval use associated with pitch. When they are classified the result is a set ofnodes identified with degrees of the scale.
*********** Figure 7 around here. ***********
The second element of the model is concerned with acquiring associative mappings betweenpitch, key and degree. The degree identities, such as emerge from the self-organising statisticalextraction, are used as teaching patterns in a supervised learning model. Two kinds of associationare learned. The first are the associative mappings often taken to epitomise the abstract systemof degrees. This involves mappings between pitch, key and degree, to allow the recovery - froma combination of pairs of identities of the third identity. For example, if we know the identityof pitch and key, e.g. f] and G major then we know the degree - 7. Vice versa if we knowthe key and degree, G major and 7 then we know the pitch, f]. Similarly, the identification ofpitch and degree allows the extrapolation of key. The second kind of mapping is between thedeveloping interval memories and degree identities. This mapping allows the identification ofdegree directly from developing interval memories, as a song progresses, and encodes intervallicpatterns as tonal descriptors parallel to the identification of keys.
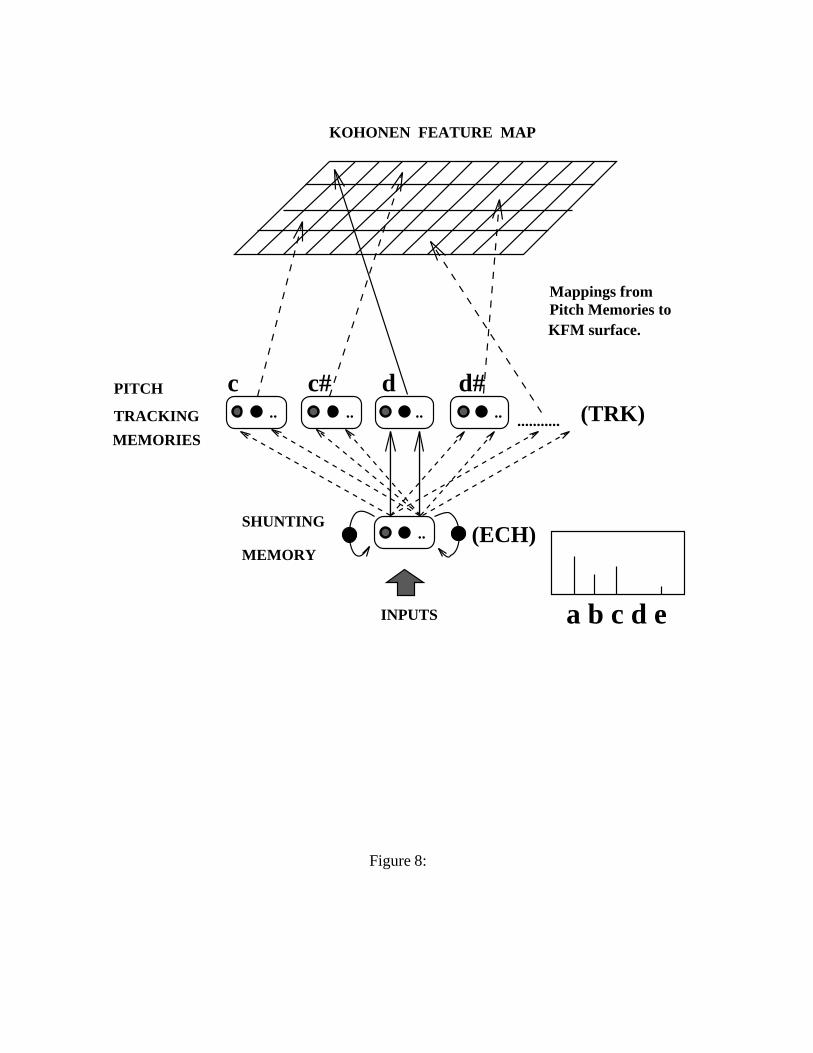
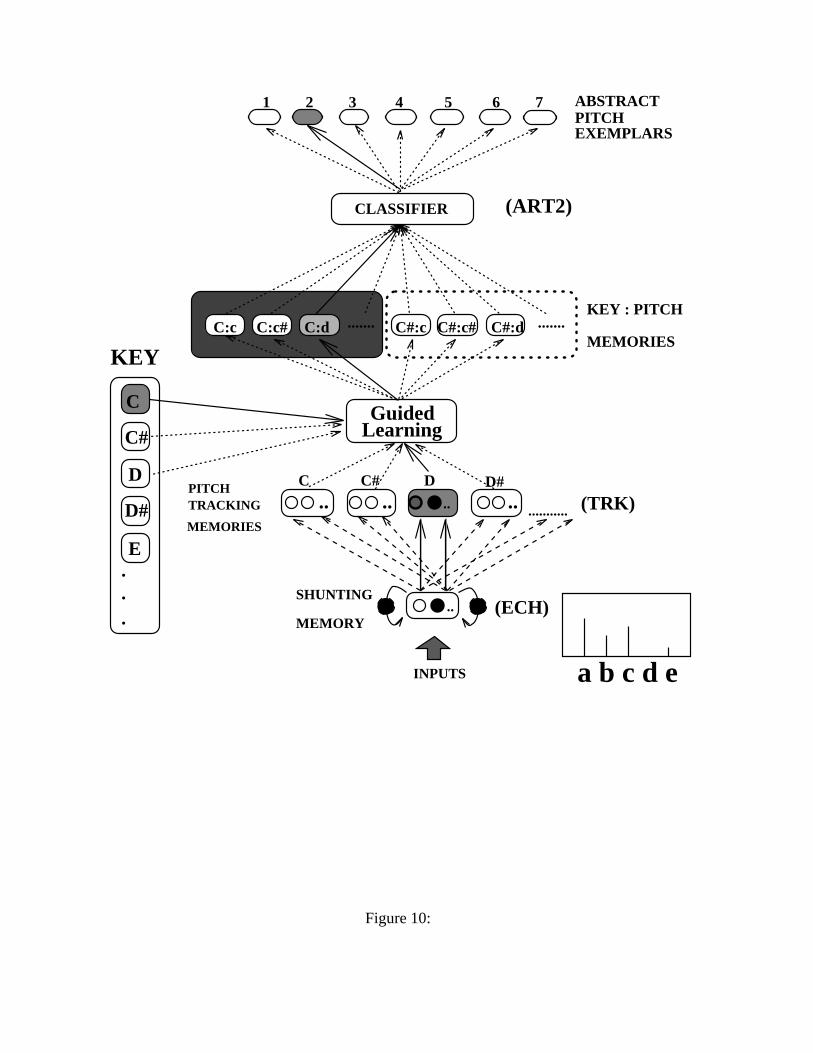
The self-organising part of the model was implemented using four similar memory models,that derive representations of the intervallic context of each pitch class. The general form of thememory is shown in the bottom of figures 8 and 10. It comprises two stages. The first stagetraces the occurrence of intervals over all the pitch classes. This echoic (ECH) or trace memory,is of the shunting (Multiplicative), adding type (Grossberg, 1978), and is similar to that used byGjerdingen (1990). The box in the figure 10 shows the trace values that might occur in such amemory using an �E rate of 0.5, applied to the sequence e ! b ! c ! a. Here one memorytype is described. The SAT memory is an shunting, adding, tracking memory. It is reset to zeroat the start of each song. Where values in the input vector X are either 0 or 1, xj is the input valueand wj is the echoic memory value, initialised to zero, and �E is the memory rate:
if xj(t) > 0 : wj(t) = (wj(t� 1) + (�Exj(t)))else : wj(t) = �Ewj(t� 1)
The ECH memory models used are straightforward and are easily implemented. They are describedin more detail in (Griffith, 1993b). They produce a trace of events in which the recency of each intervalis reflected by a value between 0 and 1. The results they produce are very similar.
The second stage is a set of TRK memories, like that used to track the frequency of occurrence ofpitch. One memory is dedicated to each pitch class and receives input from the initial ECH memory.
10
The tracking memory is identical in all four models and is the same as that used in the model of keyidentification described in section 4, except that the frequency of occurrence is tracked separately for thetwelve pitch classes. Learning takes place in the TRK memory associated with a pitch only when thatpitch occurs.
The two stage memory computes two things. Firstly, the ECH memory produces a vector that reflectsthe recency of intervals. The actual values reflect the �E rate and the configuration of the adding andshunting elements. Elements that are more prominent (recent) in the ECH memory have larger values.The second TRK memories are specific to pitch, the tracking only takes place in a pitch memory when thatpitch occurs. This memory tracks the pattern of intervals in the ECH memory, emphasising the intervalsthat are consistently prominent in a pitch’s context by scaling up the tracking of the more recent intervalsrelative to older, lower valued intervals.
As the TRK memory for a pitch is only activated when that pitch occurs, the intervals associated withless frequent pitches are tracked less often and the pattern that is tracked in the TRK memory is sensitiveto the idiosyncracies of pitch use in particular songs. This problem is intrinsic to the pattern of eventsbeing represented in this way and cannot be resolved by setting the �E memory rate of the initial ECHmemory to a high value. If it is the interval events will stay longer in the ECH memory, but the subsequentTRK memory tracking representations become less differentiated. The lower the �E rate the closer thecontents of the TRK memory should approximate the frequency of occurrences of intervals associatedwith each pitch.
5.3 Topological maps of pitch interval use
The representations developed within the pitch memories were initially investigated using a KohonenFeature Map (KFM) (Kohonen, 1989). These initial simulations looked specifically at how differentiatedthe representations developed in the two stage memories were. All four types of memory were used. TheKFM used was a two dimensional, 12 by 12 surface. The local update area was initialised to 11, andthe learning rate, �K rate was 0.3. The set of experiments covered four memory types, three �E rates -0.75, 0.5 and 0.25 and five �T rates - 0.005, 0.01, 0.05, 0.1 and 0.5, making a set of 60 simulations. Thesimulation is outlined in figure 8.
*********** Figure 8 around here. ***********
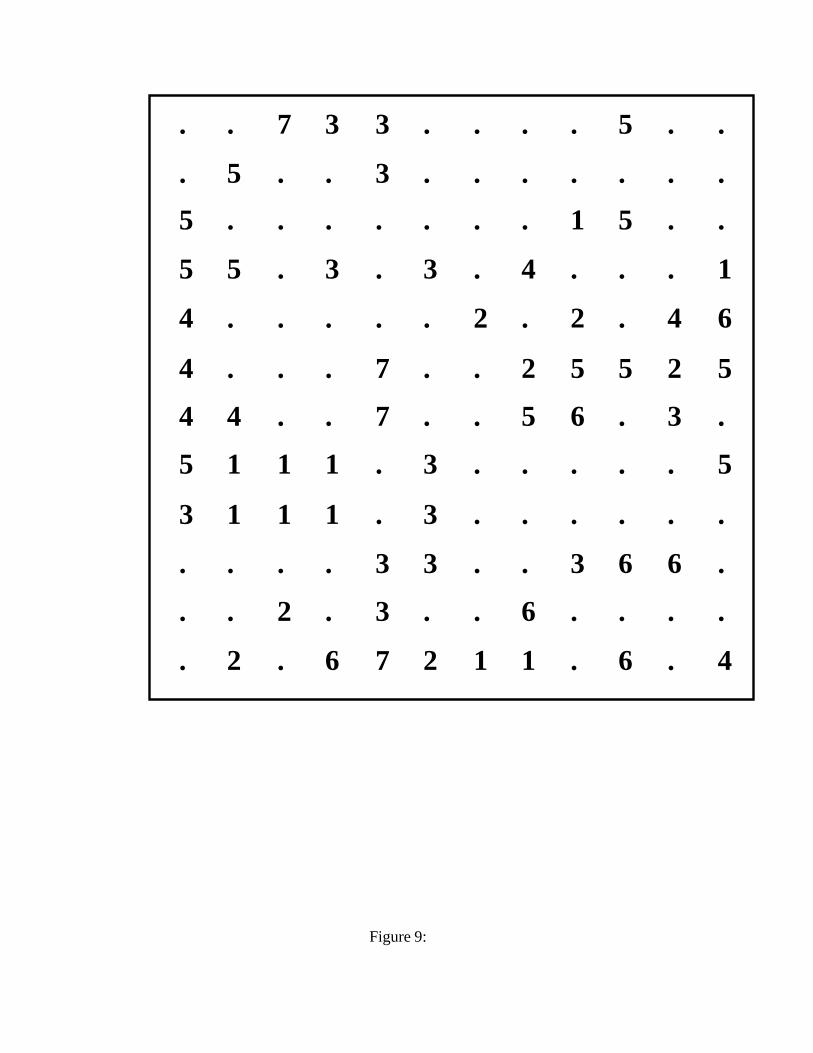
The memories were presented at the end of a song. The pattern of interval use in a pitch memory atthis point reflects the pattern of intervals associated with a particular pitch in a particular song and key.The degree identity associated with the pitch and the key, e.g. g in C Major being degree 5, is used totag the points plotted on the KFM. If the set of songs were homogeneous in their association of pitchesand intervals, then we would expect the KFM to develop discrete areas associated with specific degrees.However, we have already seen in section 4, figure 4 that pitch-by-pitch there is a variety of pitch use inthe different songs. In fact all the maps produced by these KFM simulations were highly fragmented, seefigure 9, with much intermixing of different degrees. The specific pitch memories represent the variabilityof pitch use within songs more accurately, but this makes the patterns more diffuse, and abstraction moredifficult.
*********** Figure 9 around here. ***********
11
How well these pitch memories reflect the variation in pitch use found among the songs, was assessedby comparing the contents of the memories with what was expected to be in them. The reference figuresfor intervallic context are those used to plot figure 6, for the association of degrees and intervals. The meanvectors for all the memories of each degree are calculated and compared to these figures. The correlationfor each degree are generally at the 0.001 level - a minority are significant at the 0.01 level. The range ofcorrelations confirms that the performance of the memories is influenced by the setting of �E in the initialtracking memory. The lowest �E rate of 0.25 gives the highest correlations over all memory types, whichconfirms the characteristics of the memory functions. With a lower �E rate, the ECH memory contains ashorter history and so the TRK memory approximates more closely the frequency of interval occurrence.The larger the �E rate the more the TRK memory is tracking sets of values that reflect a sequence ofintervals, and diverges from simply counting the associations between a pitch and its immediately priorintervals.
5.4 Integrating patterns of interval over pitch and key
The initial KFM simulation confirms that the variations in pitch use in different songs - represented aspatterns of intervals, is too great to allow the emergence of clear patterns of intervals that reflect thefunctional contexts of pitches identifiable with degrees. However, the network is not limited to learningthe pitch representations active during a song, in isolation. The key of each song, identified in the processoutlined in section 4, is available to guide the attention of a further process learning pitch representationsidentified with a key.
Figure 10 outlines the simulation. The representations developed in the two stage memories aretracked using the same slow learning as an ART2 network (Carpenter & Grossberg, 1987). This learningtakes place in a layer of memories in which the recipient node is determined by the current key and pitchclass9. The representations developed within these nodes can be used as the input to a self-organizingART2 network for classification.
*********** Figure 10 around here. ***********
In these simulations the association of pitch and key is implemented, for convenience, by the use ofindices. Another simulation established that this mapping can be acquired via a process of self-organisingclassification. Vectors identifying pitch and key were concatenated to form pitch-in-key identities e.g cin C or c in F. By setting the vigilance in an ART2 network high, only identical pitch-in-key identityvectors are mapped to the same node. Each node identified in this way can associated with a second setof memory weights to be used in learning pitch-in-key representations.
*********** Figure 11 around here. ***********
The integration of intervallic patterns over keys was simulated for the same set of � T rates and �E
rates as for the KFM experiments. Each interval was presented to the network and passed via the ECHmemory into the TRK memory identified with the current pitch. Then using the identity of the pitch andkey the contents of the TRK memory was learned by the appropriate pitch-in-key node. The weights forthis node learn in the same way as used within the ART2 network. The result is that the pitch-in-key nodesdevelop representations that lie at the centre of the cluster of memory vectors mapped to them (Hinton,
9This layer consists of 84 nodes. If the tunes were not diatonically limited the number would be 144.
12
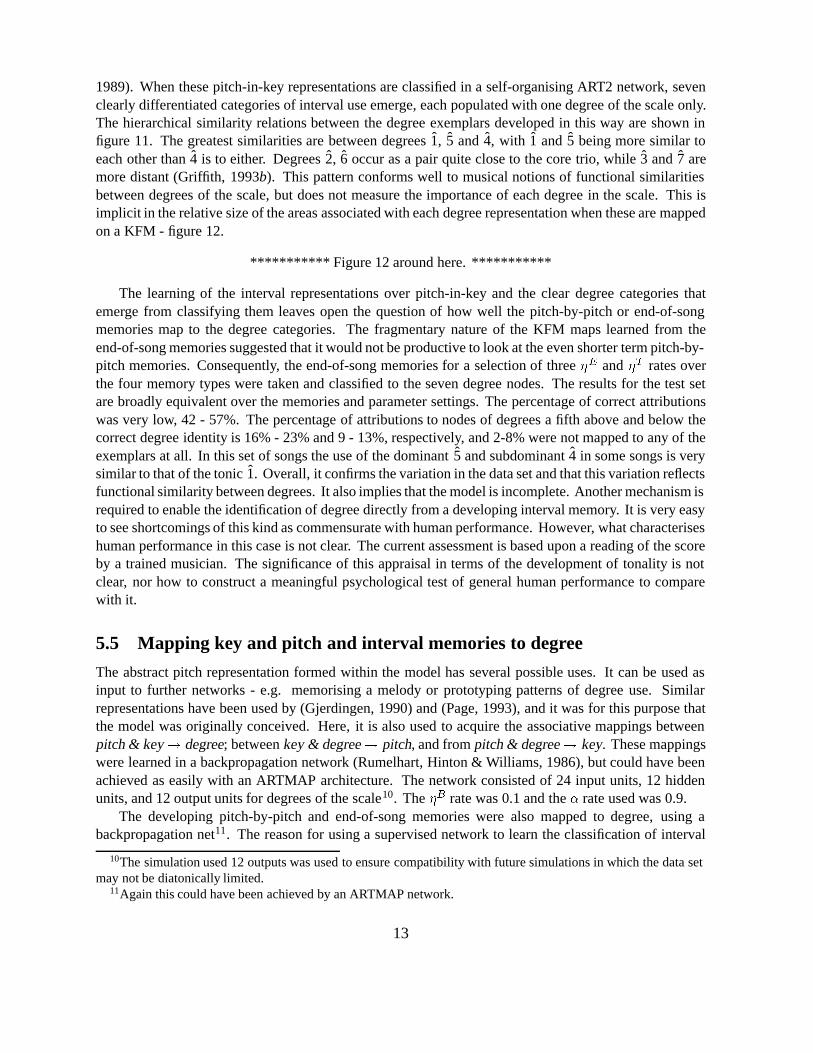
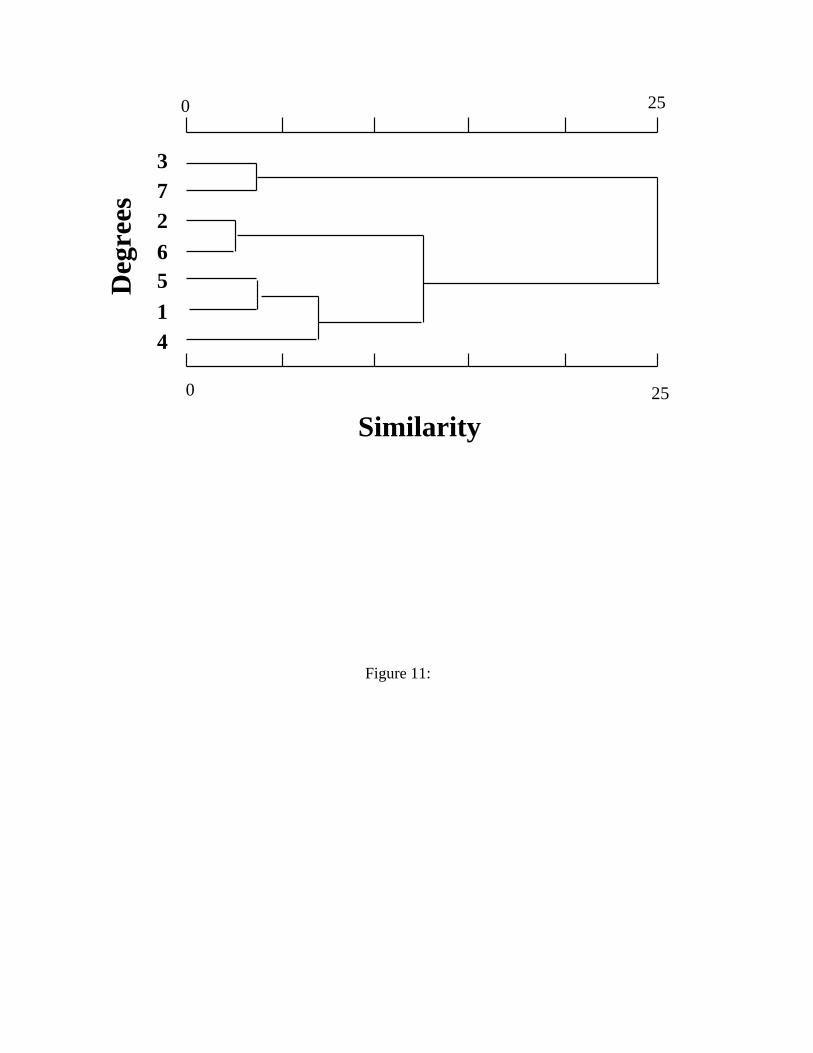
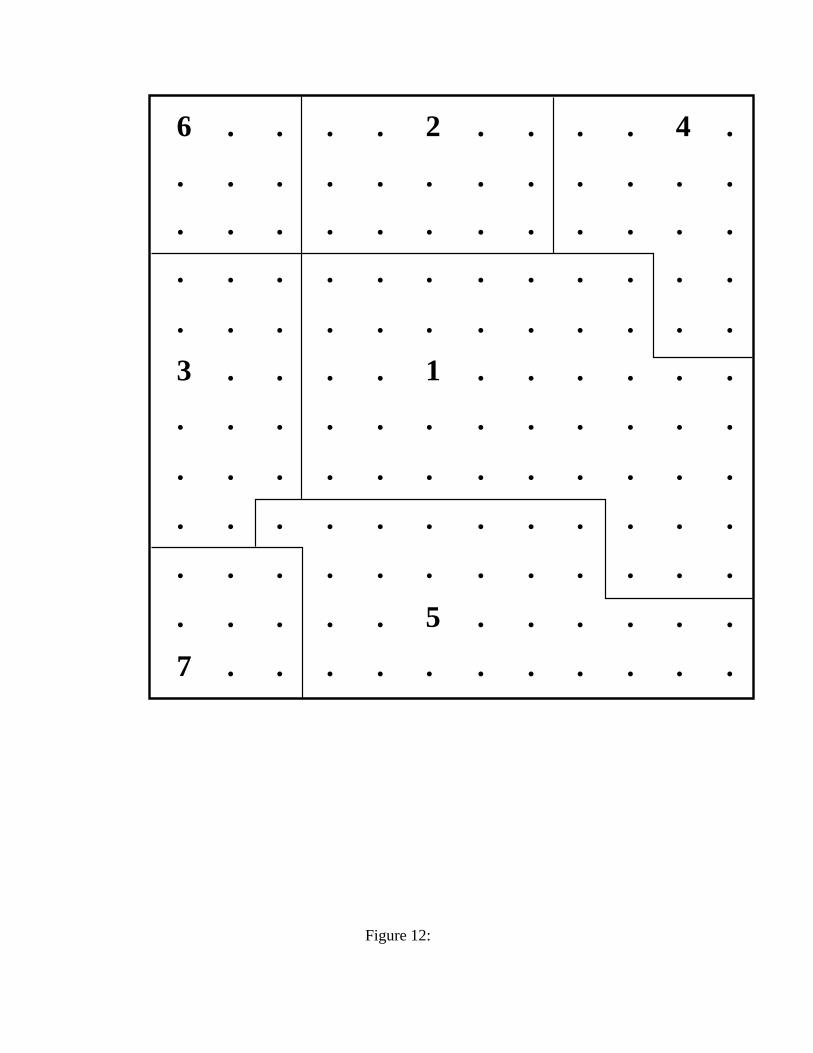
1989). When these pitch-in-key representations are classified in a self-organising ART2 network, sevenclearly differentiated categories of interval use emerge, each populated with one degree of the scale only.The hierarchical similarity relations between the degree exemplars developed in this way are shown infigure 11. The greatest similarities are between degrees 1, 5 and 4, with 1 and 5 being more similar toeach other than 4 is to either. Degrees 2, 6 occur as a pair quite close to the core trio, while 3 and 7 aremore distant (Griffith, 1993b). This pattern conforms well to musical notions of functional similaritiesbetween degrees of the scale, but does not measure the importance of each degree in the scale. This isimplicit in the relative size of the areas associated with each degree representation when these are mappedon a KFM - figure 12.
*********** Figure 12 around here. ***********
The learning of the interval representations over pitch-in-key and the clear degree categories thatemerge from classifying them leaves open the question of how well the pitch-by-pitch or end-of-songmemories map to the degree categories. The fragmentary nature of the KFM maps learned from theend-of-song memories suggested that it would not be productive to look at the even shorter term pitch-by-pitch memories. Consequently, the end-of-song memories for a selection of three �E and �T rates overthe four memory types were taken and classified to the seven degree nodes. The results for the test setare broadly equivalent over the memories and parameter settings. The percentage of correct attributionswas very low, 42 - 57%. The percentage of attributions to nodes of degrees a fifth above and below thecorrect degree identity is 16% - 23% and 9 - 13%, respectively, and 2-8% were not mapped to any of theexemplars at all. In this set of songs the use of the dominant 5 and subdominant 4 in some songs is verysimilar to that of the tonic 1. Overall, it confirms the variation in the data set and that this variation reflectsfunctional similarity between degrees. It also implies that the model is incomplete. Another mechanism isrequired to enable the identification of degree directly from a developing interval memory. It is very easyto see shortcomings of this kind as commensurate with human performance. However, what characteriseshuman performance in this case is not clear. The current assessment is based upon a reading of the scoreby a trained musician. The significance of this appraisal in terms of the development of tonality is notclear, nor how to construct a meaningful psychological test of general human performance to comparewith it.
5.5 Mapping key and pitch and interval memories to degree
The abstract pitch representation formed within the model has several possible uses. It can be used asinput to further networks - e.g. memorising a melody or prototyping patterns of degree use. Similarrepresentations have been used by (Gjerdingen, 1990) and (Page, 1993), and it was for this purpose thatthe model was originally conceived. Here, it is also used to acquire the associative mappings betweenpitch & key! degree; between key & degree! pitch, and from pitch & degree! key. These mappingswere learned in a backpropagation network (Rumelhart, Hinton & Williams, 1986), but could have beenachieved as easily with an ARTMAP architecture. The network consisted of 24 input units, 12 hiddenunits, and 12 output units for degrees of the scale10. The �B rate was 0.1 and the � rate used was 0.9.
The developing pitch-by-pitch and end-of-song memories were also mapped to degree, using abackpropagation net11. The reason for using a supervised network to learn the classification of interval
10The simulation used 12 outputs was used to ensure compatibility with future simulations in which the data setmay not be diatonically limited.
11Again this could have been achieved by an ARTMAP network.
13
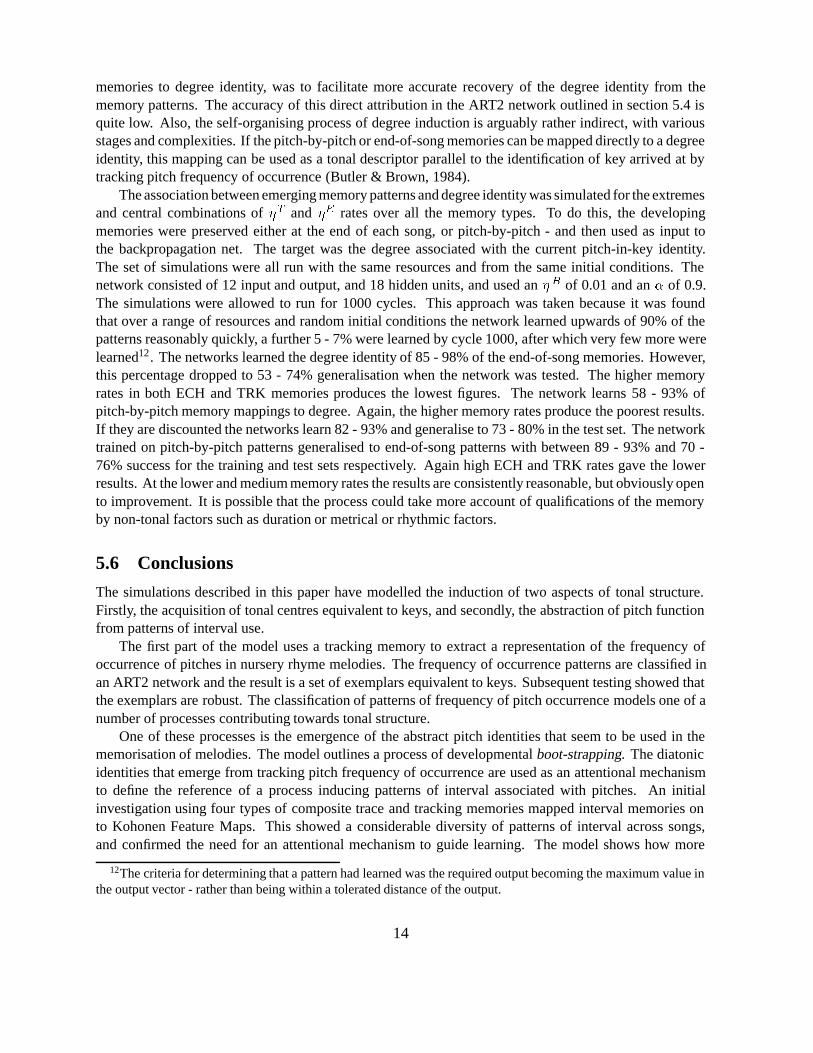
memories to degree identity, was to facilitate more accurate recovery of the degree identity from thememory patterns. The accuracy of this direct attribution in the ART2 network outlined in section 5.4 isquite low. Also, the self-organising process of degree induction is arguably rather indirect, with variousstages and complexities. If the pitch-by-pitch or end-of-song memories can be mapped directly to a degreeidentity, this mapping can be used as a tonal descriptor parallel to the identification of key arrived at bytracking pitch frequency of occurrence (Butler & Brown, 1984).
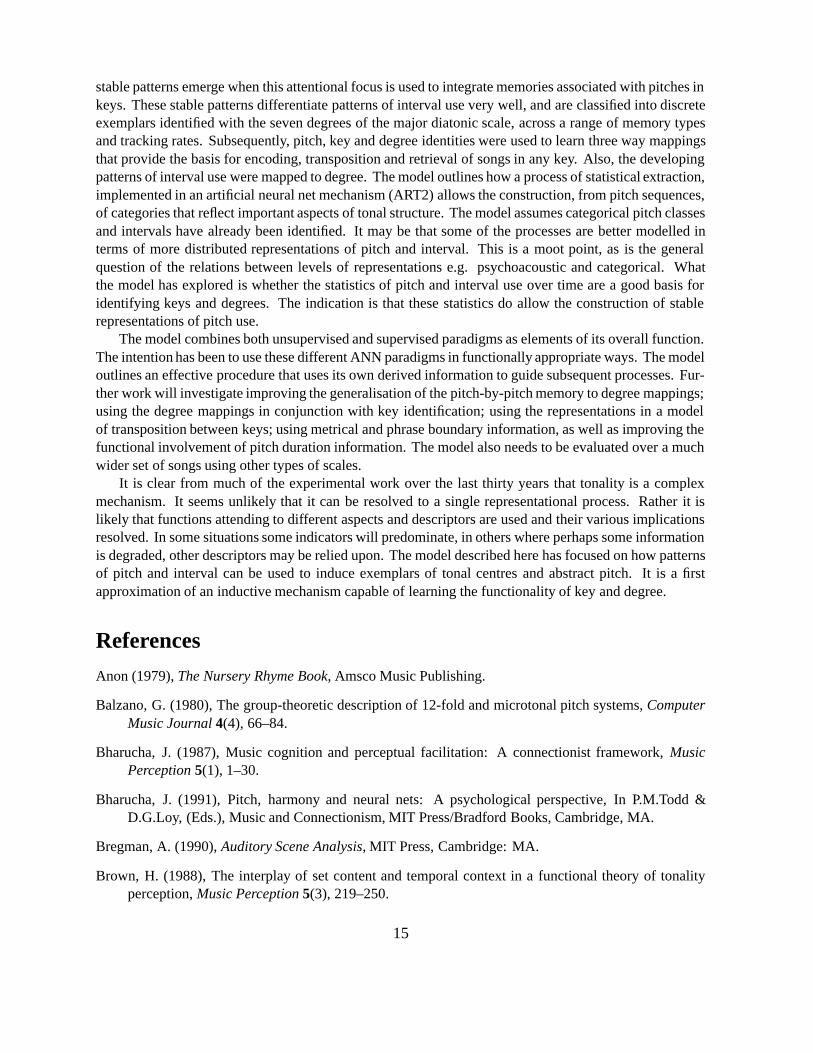
The association between emerging memory patterns and degree identity was simulated for the extremesand central combinations of �T and �E rates over all the memory types. To do this, the developingmemories were preserved either at the end of each song, or pitch-by-pitch - and then used as input tothe backpropagation net. The target was the degree associated with the current pitch-in-key identity.The set of simulations were all run with the same resources and from the same initial conditions. Thenetwork consisted of 12 input and output, and 18 hidden units, and used an �B of 0.01 and an � of 0.9.The simulations were allowed to run for 1000 cycles. This approach was taken because it was foundthat over a range of resources and random initial conditions the network learned upwards of 90% of thepatterns reasonably quickly, a further 5 - 7% were learned by cycle 1000, after which very few more werelearned12. The networks learned the degree identity of 85 - 98% of the end-of-song memories. However,this percentage dropped to 53 - 74% generalisation when the network was tested. The higher memoryrates in both ECH and TRK memories produces the lowest figures. The network learns 58 - 93% ofpitch-by-pitch memory mappings to degree. Again, the higher memory rates produce the poorest results.If they are discounted the networks learn 82 - 93% and generalise to 73 - 80% in the test set. The networktrained on pitch-by-pitch patterns generalised to end-of-song patterns with between 89 - 93% and 70 -76% success for the training and test sets respectively. Again high ECH and TRK rates gave the lowerresults. At the lower and medium memory rates the results are consistently reasonable, but obviously opento improvement. It is possible that the process could take more account of qualifications of the memoryby non-tonal factors such as duration or metrical or rhythmic factors.
5.6 Conclusions
The simulations described in this paper have modelled the induction of two aspects of tonal structure.Firstly, the acquisition of tonal centres equivalent to keys, and secondly, the abstraction of pitch functionfrom patterns of interval use.
The first part of the model uses a tracking memory to extract a representation of the frequency ofoccurrence of pitches in nursery rhyme melodies. The frequency of occurrence patterns are classified inan ART2 network and the result is a set of exemplars equivalent to keys. Subsequent testing showed thatthe exemplars are robust. The classification of patterns of frequency of pitch occurrence models one of anumber of processes contributing towards tonal structure.
One of these processes is the emergence of the abstract pitch identities that seem to be used in thememorisation of melodies. The model outlines a process of developmental boot-strapping. The diatonicidentities that emerge from tracking pitch frequency of occurrence are used as an attentional mechanismto define the reference of a process inducing patterns of interval associated with pitches. An initialinvestigation using four types of composite trace and tracking memories mapped interval memories onto Kohonen Feature Maps. This showed a considerable diversity of patterns of interval across songs,and confirmed the need for an attentional mechanism to guide learning. The model shows how more
12The criteria for determining that a pattern had learned was the required output becoming the maximum value inthe output vector - rather than being within a tolerated distance of the output.
14
stable patterns emerge when this attentional focus is used to integrate memories associated with pitches inkeys. These stable patterns differentiate patterns of interval use very well, and are classified into discreteexemplars identified with the seven degrees of the major diatonic scale, across a range of memory typesand tracking rates. Subsequently, pitch, key and degree identities were used to learn three way mappingsthat provide the basis for encoding, transposition and retrieval of songs in any key. Also, the developingpatterns of interval use were mapped to degree. The model outlines how a process of statistical extraction,implemented in an artificial neural net mechanism (ART2) allows the construction, from pitch sequences,of categories that reflect important aspects of tonal structure. The model assumes categorical pitch classesand intervals have already been identified. It may be that some of the processes are better modelled interms of more distributed representations of pitch and interval. This is a moot point, as is the generalquestion of the relations between levels of representations e.g. psychoacoustic and categorical. Whatthe model has explored is whether the statistics of pitch and interval use over time are a good basis foridentifying keys and degrees. The indication is that these statistics do allow the construction of stablerepresentations of pitch use.
The model combines both unsupervised and supervised paradigms as elements of its overall function.The intention has been to use these different ANN paradigms in functionally appropriate ways. The modeloutlines an effective procedure that uses its own derived information to guide subsequent processes. Fur-ther work will investigate improving the generalisation of the pitch-by-pitch memory to degree mappings;using the degree mappings in conjunction with key identification; using the representations in a modelof transposition between keys; using metrical and phrase boundary information, as well as improving thefunctional involvement of pitch duration information. The model also needs to be evaluated over a muchwider set of songs using other types of scales.
It is clear from much of the experimental work over the last thirty years that tonality is a complexmechanism. It seems unlikely that it can be resolved to a single representational process. Rather it islikely that functions attending to different aspects and descriptors are used and their various implicationsresolved. In some situations some indicators will predominate, in others where perhaps some informationis degraded, other descriptors may be relied upon. The model described here has focused on how patternsof pitch and interval can be used to induce exemplars of tonal centres and abstract pitch. It is a firstapproximation of an inductive mechanism capable of learning the functionality of key and degree.
References
Anon (1979), The Nursery Rhyme Book, Amsco Music Publishing.
Balzano, G. (1980), The group-theoretic description of 12-fold and microtonal pitch systems, ComputerMusic Journal 4(4), 66–84.
Bharucha, J. (1987), Music cognition and perceptual facilitation: A connectionist framework, MusicPerception 5(1), 1–30.
Bharucha, J. (1991), Pitch, harmony and neural nets: A psychological perspective, In P.M.Todd &D.G.Loy, (Eds.), Music and Connectionism, MIT Press/Bradford Books, Cambridge, MA.
Bregman, A. (1990), Auditory Scene Analysis, MIT Press, Cambridge: MA.
Brown, H. (1988), The interplay of set content and temporal context in a functional theory of tonalityperception, Music Perception 5(3), 219–250.
15
Browne, R. (1981), Tonal implications of the diatonic set, In Theory Only 5(6), 3–21.
Butler, D. (1989), Describing the perception of tonality in music: A critique of the tonal hierarchy theoryand a proposal for a theory of intervallic rivalry, Music Perception 6(3), 219–242.
Butler, D. & Brown, H. (1984), Tonal structure versus function: Studies of the recognition of harmonicmotion, Music Perception 2(1), 5–24.
Carpenter, G. & Grossberg, S. (1987), ART2: Self-organization of stable category recognition codes foranalog input patterns, Applied Optics 26(23), 4919–4930.
Chesterman, L. (1935), Music for the Nursery School, Harrap, London.
Deutsch, D. (1975), Facilitation by repetition in recognition memory for tonal pitch,Memory and Cognition3, 263–266.
Deutsch, D. (1978), Delayed pitch comparisons and the principle of proximity, Perception and Psy-chophysics 23, 227–230.
Dowling, W. (1984), Assimilation and tonal structure: Comment on Castellano, Bharucha, and Krumhansl,Journal of Experimental Psychology 113(3), 417–420.
Dowling, W. (1988), Tonal structure and childrens early learning of music, In J. Sloboda, (Ed.), GenerativeProcesses in Music, Oxford University Press.
Frances, R. (1988), La Perception de la Musique, Lawrence Erlbaum Associates, New Jersey. OriginallyPublished 1954. Libraire Philosophique J. Vrin, Paris. Translated by J. W Dowling.
Gjerdingen, R. (1990), Categorisation of musical patterns by self-organizing neuronlike networks, MusicPerception 7(4), 339–370.
Griffith, N. (1993a), Modelling the Acquisition and Representation of Musical Tonality as a Function OfPitch-Use through Self-Organising Artificial Neural Networks., PhD thesis, University of Exeter,Department of Computer Science. Unpublished.
Griffith, N. (1993b), Representing the tonality of musical sequences using neural nets, In Proceedings ofthe First International Conference on Cognitive Musicology, Jyvaskyla, Finland, pp. 109–132.
Grossberg, S. (1978), Behavioral contrast in short term memory: Serial binary memory models or parallelcontinuous memory models, Journal of Mathematical Psychology 17, 199–219.
Handel, S. (1973), Temporal segmentation of repeating auditory patterns, Journal of Experimental Psy-chology 101, 46–54.
Hinton, G. E. (1989), Connectionist learning procedures, Artificial Intelligence 40, 185–234.
Holtzmann, S. R. (1977), A program for key determination, Interface.
Huron, D. & Parncutt, R. (1993), An improved key-tracking method encorporating pitch salience andechoing memory, Psychomusicology.
Kohonen, T. (1989), Self-organization and Associative Memory, Springer Verlag, Berlin.
16
Krumhansl, C. (1990a), Cognitive Foundations of Musical Pitch, Oxford University Press, Oxford.
Krumhansl, C. (1990b), Tonal hierarchies and rare intervals in music cognition, Music Perception7(Spring), 309–324.
Lakoff, G. (1987), Women, Fire and Dangerous things: What Categories reveal about the Mind, Universityof Chicago Press, Chicago.
Leman, M. (1990), The ontogenesis of tonal semantics: Results of a computer study, Reports from theSeminar of Musicology SM-IPEM 18, Institute of Psychoacoustics and Electronic Music, Universityof Ghent.
Leman, M. (1992), The theory of tone semantics: Concept, foundation, and application, Minds andMachines 2(4), 345–363.
Longuet-Higgins, H. & Steedman, M. (1970), On interpreting bach, Machine Intelligence 6, 221–239.
May, E., (Ed.) (1980), Musics of Many Cultures: An Introduction, University of California Press, LA:CA.
Mitchel & Blyton (1968), The Faber Book of Nursery Songs, faber.
Narmour, E. (1984), Toward an analytical symbology: The melodic, harmonic and durational functions ofimplication and realization., In M. Baroni & L. Callegari, (Eds.),Musical grammars and computeranalysis, Olschki, Florence.
Page, M. P. A. (1993), Modelling Aspects of Music Perception using Self-Organizing Neural Networks,PhD thesis, University of Wales College of Cardiff.
Parncutt, R. (1988), Revision of Terhardt’s psychoacoustical model of the root(s) of a musical chord,Music Perception 6(1), 65–93.
Patterson, R. (1986), Spiral detection of periodicity and the spiral form of musical scales., Psychology ofMusic 14, 44–61.
Peretz, I. & Kolinsky, R. (1993), Boundaries of separability between melody and rhythm in music dis-crimination: A neuropsychological perspective, The Quarterly Journal of Experimental Psychology46A(2), 301–325.
Rumelhart, D., Hinton, G. & Williams, R. (1986), Learning internal representations by error propagation.,In D. Rumelhart & J. McClelland, (Eds.), Parallel Distributed Processing: Explorations in theMicrostructure of Cognition, Vol. 1:Foundations, MIT Press, Cambridge, MA.
Scarborough, D., Miller, O. & Jones, J. (1989), Connectionist models for tonal analysis, Computer MusicJournal 13(3), 49–55.
Shaffer, L., Clarke, E. & Todd, N. (1985), Meter and rhythm in piano playing, Cognition 20, 61–77.
Simon, H. A. (1968), Perception du pattern musical par auditeur, Science de lart V(2), 28–34.
Storr, A. (1992), Music and the Mind, Harper Collins, Glasgow.
17
Terhardt, E. (1974), Pitch, consonance, and harmony, The Journal of the Acoustical Society of America55(5), 1061–1069.
Terhardt, E. (1984), The concept of musical consonance: A link between music and psychoacoustics,Music Perception 1(3), 276–295.
Terhardt, E., Stoll, G. & Seewann, M. (1982), Algorithm for extraction of pitch and pitch salience fromcomplex tonal signals, The Journal of the Acoustical Society of America 71(3), 679–688.
Todd, P. (1989), A connectionist approach to algorithmic composition, Computer Music Journal 13(4), 27–43.
Ulrich, W. (1977), The analysis and synthesis of jazz by computer, In Proceedings of the 5th. IJCAI,pp. 865–872.
Winograd, T. (1968), Linguistics and the computer analysis of tonal harmony, Journal of Music Theory12(3), 2–49.
18

Table I The typicality and attribution of four songs from the training and test set, using the FREQrepresentation at an �T rate of 0.05.
Table II Intervals between the degrees of the major diatonic scale.

Set Song Typicality Activation AttributionTrain Bye Baby Bunting 0.6180 0.7850 2.75 - 22.2%Test Little Bo Peep 0.6684 0.9107 100.0%Train The Man With The Gun 0.8908 0.9469 50.98 - 74.51%Test Ding Dong Bell 0.8452 0.9691 100.0%
Table I:
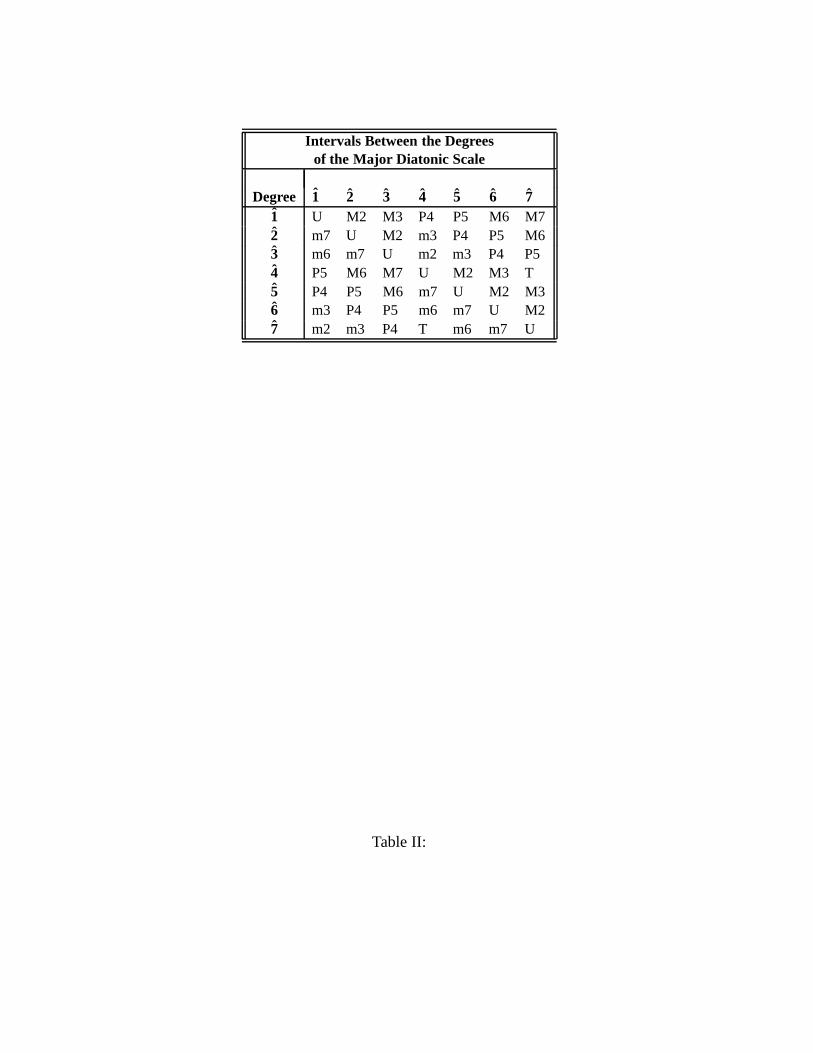
Intervals Between the Degreesof the Major Diatonic Scale
Degree 1 2 3 4 5 6 71 U M2 M3 P4 P5 M6 M72 m7 U M2 m3 P4 P5 M63 m6 m7 U m2 m3 P4 P54 P5 M6 M7 U M2 M3 T5 P4 P5 M6 m7 U M2 M36 m3 P4 P5 m6 m7 U M27 m2 m3 P4 T m6 m7 U
Table II:
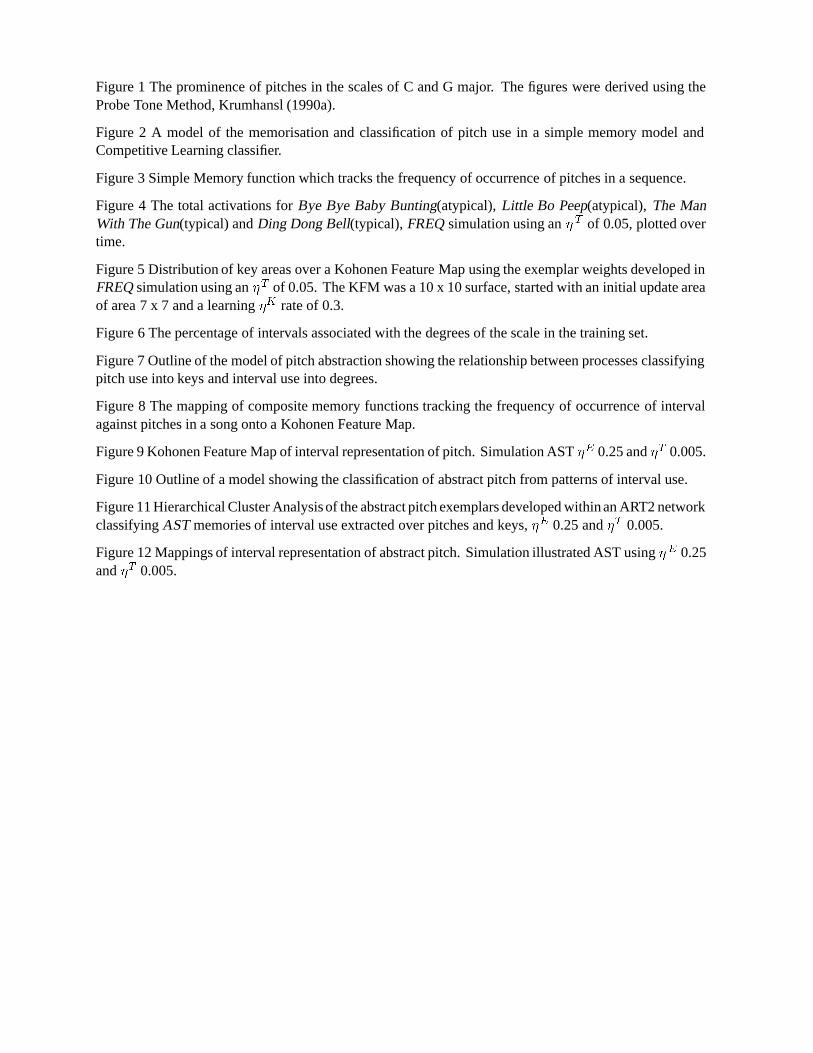
Figure 1 The prominence of pitches in the scales of C and G major. The figures were derived using theProbe Tone Method, Krumhansl (1990a).
Figure 2 A model of the memorisation and classification of pitch use in a simple memory model andCompetitive Learning classifier.
Figure 3 Simple Memory function which tracks the frequency of occurrence of pitches in a sequence.
Figure 4 The total activations for Bye Bye Baby Bunting(atypical), Little Bo Peep(atypical), The ManWith The Gun(typical) and Ding Dong Bell(typical), FREQ simulation using an � T of 0.05, plotted overtime.
Figure 5 Distribution of key areas over a Kohonen Feature Map using the exemplar weights developed inFREQ simulation using an �T of 0.05. The KFM was a 10 x 10 surface, started with an initial update areaof area 7 x 7 and a learning �K rate of 0.3.
Figure 6 The percentage of intervals associated with the degrees of the scale in the training set.
Figure 7 Outline of the model of pitch abstraction showing the relationship between processes classifyingpitch use into keys and interval use into degrees.
Figure 8 The mapping of composite memory functions tracking the frequency of occurrence of intervalagainst pitches in a song onto a Kohonen Feature Map.
Figure 9 Kohonen Feature Map of interval representation of pitch. Simulation AST �E 0.25 and �T 0.005.
Figure 10 Outline of a model showing the classification of abstract pitch from patterns of interval use.
Figure 11 Hierarchical Cluster Analysis of the abstract pitch exemplars developed within an ART2 networkclassifying AST memories of interval use extracted over pitches and keys, �E 0.25 and �T 0.005.
Figure 12 Mappings of interval representation of abstract pitch. Simulation illustrated AST using � E 0.25and �T 0.005.
C# D D# E F F# G G# A A# BC
Pit
ch R
atin
g
0
2
4
6
8
10
G Major
C Major
Pitch Classes
Figure 1:
..... Memory FunctionPitch Nodes
Melody
ClassifierLearningCompetitive
Key Nodes .....
Figure 2:
INPUTS
.....
.....MEMORY
TrackingWeight
Figure 3:
Tot
al A
ctiv
atio
n
2
2.5
3
3.5
4
4.5
5
5.5
6
6.5
0 10 20 30 40 50 60
Ding Dong Bell
The Man With The Gun
Little Bo Peep
Bye Baby Bunting
Time
Figure 4:
F#
Ab (G#)
AE C
DB G F
Db (C#) (D#)Eb
(A#)Bb
Figure 5:
7
20
30
40
50
0
10
U m2 M2 m3 M3 P4 T P5 m6 M6 m7 M7
U m2 M2 m3 M3 P4 T P5 m6 M6 m7 M7
U m2 M2 m3 M3 P4 T P5 m6 M6 m7 M7
1
20
30
40
50
0
10
U m2 M2 m3 M3 P4 T P5 m6 M6 m7 M7
4
20
30
40
50
0
10
U m2 M2 m3 M3 P4 T P5 m6 M6 m7 M7
U m2 M2 m3 M3 P4 T P5 m6 M6 m7 M7
U m2 M2 m3 M3 P4 T P5 m6 M6 m7 M7
6
20
30
40
50
0
10
2
20
30
40
50
0
10
5
20
30
40
50
0
10
3
20
30
40
50
0
10
Per
cent
age
Figure 6:
DescribeInterval Use
ClassifyInterval Use
Describe
DEGREE
Pitch Use
KEY MEMORYKEY/PITCH
PITCH
Melody
Pitch Memory
Figure 7:
.. .. .. ..
..
c c# d d#
a b c d eINPUTS
KOHONEN FEATURE MAP
...........
SHUNTING
MEMORY
Mappings fromPitch Memories toKFM surface.
(ECH)
(TRK)TRACKING
PITCH
MEMORIES
Figure 8:
.
.
.
.
5
5
4
4
4
5
3
.
5
.
5
.
.
4
1
1
.
.
2
7
.
.
.
.
.
.
1
1
.
2
.
3
.
.
3
.
.
.
1
1
.
.
6
3
3
.
.
.
7
7
.
.
3
3
7
.
.
.
3
.
.
.
3
3
3
.
2
.
.
.
.
.
2
.
.
.
.
.
.
1
.
.
.
4
.
2
5
.
.
.
6
1
.
.
1
.
2
5
6
.
.
3
.
.
5
.
5
.
.
5
.
.
.
6
.
6
.
.
.
.
4
2
3
.
.
6
.
.
.
.
.
1
6
5
.
5
.
.
.
4
Figure 9:
C
.
.
.
C#
D
D#
E
KEY
PITCH.... .. ..
a b c d e
..SHUNTING
MEMORY
INPUTS
(ECH)
........... (TRK)C C# D D#
MEMORIES
.......C:c C:c# C:d C#:c C#:c# C#:d .......KEY : PITCH
MEMORIES
GuidedLearning
1 3 4 5 6 7
EXEMPLARSPITCHABSTRACT2
CLASSIFIER (ART2)
TRACKING
Figure 10:
Deg
rees
0 25
0 25
372
65
14
Similarity
Figure 11:
.
.
.
.
3
.
.
.
.
.
7
.
.
.
.
.
.
.
.
.
.
.
.
.
.
.
.
.
.
.
.
.
.
.
.
.
.
.
.
.
.
.
.
.
.
.
.
.
.
.
.
.
.
.
.
.
.
.
.
.
.
.
.
.
.
.
.
.
.
.
.
.
.
.
6
.
.
.
.
.
.
.
.
.
.
.
.
.
.
.
.
.
.
.
.
.
.
.
.
.
.
.
.
.
.
.
.
.
.
.
.
.
.
.
.
.
.
.
.
.
2
.
.
.
.
1
.
.
.
.
5
.
4
.
.
.
.
.
.
.
.
.
.
.
Figure 12:


