Embed Size (px)
Citation preview
Strathmore University
SU+ @ Strathmore University Library
Electronic Theses and Dissertations
2017
The Drivers of audit report lag by listed companies
in Kenya
Fredrick J. Otieno Owino School of Management and Commerce (SMC) Strathmore University
Follow this and additional works at http://su-plus.strathmore.edu/handle/11071/5600
Recommended Citation
Owino, F. J. O. (2017). The Drivers of audit report lag by listed companies in Kenya. Retrieved from
http://su-plus.strathmore.edu/handle/11071/5600
This Thesis - Open Access is brought to you for free and open access by DSpace @Strathmore University. It has been accepted for inclusion in Electronic Theses and Dissertations by an authorized administrator of DSpace @Strathmore University. For more information, please contact [email protected]
The Drivers of Audit Report Lag by Listed Companies in Kenya
056633 Owino Fredrick J. Otieno
A Research Thesis Submitted to the School of Management and Commerce in Partial
Fulfillment for the award of a Master of Commerce Degree of Strathmore University
May, 2017
This thesis is available for Library use on the understanding that it is copyright material
and that no quotation from the thesis may be published without proper acknowledgement.
i
DECLARATION
I declare that this thesis is my original work and has not been presented to any other university for
the award of a degree. Any work done by other people has been duly acknowledged. To the best
of my knowledge and belief, the thesis contains no material previously published or written by
another person. It has been examined by a board of examiners of Strathmore University.
© No part of this thesis may be reproduced without the permission of the author and Strathmore
University.
Owino Fredrick J. Otieno (56633)
…………………………
…………………………
Approval
The thesis for Owino Fredrick J. Otieno was reviewed and approved by the following;
Dr. David Mathuva
Lecturer Accounting and Finance, Strathmore University Business School
Strathmore University
Dr. David Wangombe
Dean, School of Management and Commerce
Strathmore University
Professor Ruth Kiraka
Dean, School of Graduate Studies
Strathmore University
ii
ACKNOWLEDGEMENT
First and foremost I would like to express my profound gratitude to the Almighty God for the gift
of life and giving me the strength and good health to pursue this demanding but rewarding
program. Special and sincere thanks to my supervisor Dr Mathuva for patiently and selflessly
guiding me through all aspects of this study. I most sincerely acknowledge Dr Wang’ombe, Dean
School of Management and Commerce and Strathmore University for giving me the chance to
study this program.
Further acknowledgement goes to Emma Akinyi from ICPAK for allowing me to access some of
ICPAK members as my respondents as well as Lillian Kendi and Sam Njoroge from KPMG.
Words are inadequate in offering my thanks to my colleagues and good friends Albert Ochieng,
Noah Otinga, John Kamau, Jacob Amwayi, Sharon Wandili, Edna Maritim, Mercy Atieno,
Caroline Ger, Purity Maina, Tiberius Tabulu, Mary Aminga, Erastus Musembi, Moses Nzuki,
Diana Ominde and Mike Mbabu for their encouragement, advice and invaluable insights into this
study. I would like to also thank Purity Namasaka, Gillian Nduku and Kevin Otieno for generously
providing insights on the data analysis section of this study.
Finally, I would wish to express my heartfelt gratitude to my parents Mr. Michael T. Owino and
Mrs. Agnes Nafula, sister Mercy N. Akinyi and brother Newton Odhiambo for their understanding,
love, support, prayers and words of encouragement. I will always be indebted to you all.
iii
TABLE OF CONTENTS
DECLARATION ............................................................................................................................. i
ACKNOWLEDGEMENT .............................................................................................................. ii
TABLE OF CONTENTS ............................................................................................................... iii
LIST OF TABLES ........................................................................................................................ vii
LIST OF FIGURES ..................................................................................................................... viii
ABBREVIATIONS AND ACRONYMS ...................................................................................... ix
DEFINITION OF TERMS ............................................................................................................. x
ABSTRACT ................................................................................................................................... xi
CHAPTER ONE ............................................................................................................................. 1
INTRODUCTION .......................................................................................................................... 1
1.1 Background of the study ....................................................................................................... 1
1.1.1 ARL and the timeliness of financial reporting information ........................................... 1
1.1.2 ARL in Kenya and the regulatory provisions ................................................................. 3
1.2 Problem Statement ................................................................................................................ 5
1.3 Main Research Objective ...................................................................................................... 6
1.4 Research questions ................................................................................................................ 6
1.5 Scope of the Study................................................................................................................. 6
1.6 Significance of the study ....................................................................................................... 7
CHAPTER TWO ............................................................................................................................ 8
LITERATURE REVIEW ............................................................................................................... 8
2.1 Introduction ........................................................................................................................... 8
2.2 Extant theories on ARL and its determinants........................................................................ 8
2.2.1 Agency Theory ............................................................................................................... 8
2.2.2 Signaling theory ............................................................................................................ 10
iv
2.2.3 Stakeholder theory ........................................................................................................ 11
2.3 Empirical Review ................................................................................................................ 11
2.3.1 Background of ARL ..................................................................................................... 12
2.3.2 Determinants of ARL ................................................................................................... 13
2.4 Summary of literature.......................................................................................................... 27
2.5 Research Gap....................................................................................................................... 28
2.6 Conceptual framework ........................................................................................................ 28
2.7 Operationalization of variables ........................................................................................... 29
CHAPTER THREE ...................................................................................................................... 33
RESEARCH METHODOLOGY.................................................................................................. 33
3.1 Introduction ......................................................................................................................... 33
3.2 Research Philosophy ........................................................................................................... 33
3.3 Research Design .................................................................................................................. 33
3.4 Population and sample ........................................................................................................ 34
3.5 Data collection..................................................................................................................... 35
3.6 Data Analysis and presentation ........................................................................................... 36
3.7 Research quality .................................................................................................................. 37
3.8 Ethical considerations ......................................................................................................... 37
CHAPTER FOUR ......................................................................................................................... 38
PRESENTATION OF RESEARCH FINDINGS ......................................................................... 38
4.1 Introduction ......................................................................................................................... 38
4.2 Results from secondary data analysis.................................................................................. 38
4.3 Diagnostics tests .................................................................................................................. 38
4.3.1 Test for Heteroscedasticity ........................................................................................... 38
4.3.2 Test for Normality ........................................................................................................ 39
v
4.3.3 Test for Autocorrelation ............................................................................................... 39
4.3.4 Test for Multi-collinearity ............................................................................................ 40
4.3.5 Descriptive statistics ..................................................................................................... 41
4.4 Correlation matrix ............................................................................................................... 44
4.5 Selecting the significant determinants of ARL ................................................................... 46
4.6 Final model using the most significant variables ................................................................ 48
4.6.1 Robustness check using Fixed Effects.......................................................................... 50
4.7 Robustness check using all variables in one model ............................................................ 52
4.9 Results from questionnaire .................................................................................................. 54
4.9.1 Demographic characteristics ......................................................................................... 54
4.9.2 Practitioners’ perspectives on the determinants of ARL .............................................. 54
4.10 Chapter summary .............................................................................................................. 61
CHAPTER FIVE .......................................................................................................................... 62
DISCUSSION, CONCLUSION AND RECOMMENDATIONS ................................................ 62
5.1 Introduction ......................................................................................................................... 62
5.2 Discussion of findings ......................................................................................................... 62
5.2.1 Influence of auditor-related factors on ARL ................................................................ 62
5.2.2 Effect of company related factors on ARL ................................................................... 62
5.2.3 Influence of Corporate governance related factors on ARL ......................................... 63
5.2.4 Practitioners’ perspectives on ARL. ............................................................................. 64
5.3 Conclusion ........................................................................................................................... 65
5.4 Research implications ......................................................................................................... 65
5.4.1 Policy recommendations ............................................................................................... 65
5.4.2 Managerial recommendations ....................................................................................... 65
5.5 Contribution to knowledge .................................................................................................. 65
vi
5.6 Areas of further studies ....................................................................................................... 66
5.7 Limitations of the study....................................................................................................... 66
REFERENCES ............................................................................................................................. 67
APPENDICES .............................................................................................................................. 82
Appendix I: Letter of introduction ................................................................................................ 82
Appendix II: Questionnaire........................................................................................................... 83
Appendix III: Companies included in the study ........................................................................... 87
Appendix IV: Corporate governance quality index ...................................................................... 88
Appendix V: Audit committee quality index ................................................................................ 89
Appendix VI: Normal probability-probability plot for ARL ........................................................ 90
Appendix VII: Normal quantile-quantile plot for ARL ................................................................ 91
Appendix VIII: Histogram on ARL .............................................................................................. 92
Appendix IX: Regression standardized residual for ARL ............................................................ 93
vii
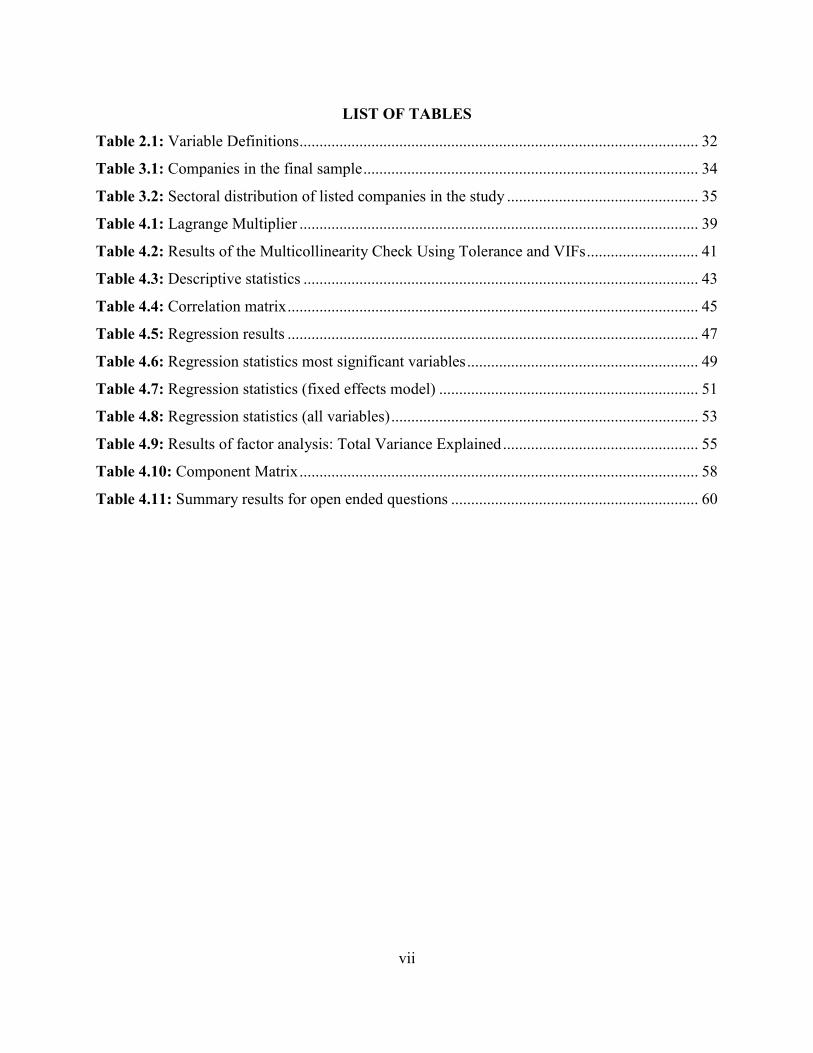
LIST OF TABLES
Table 2.1: Variable Definitions .................................................................................................... 32
Table 3.1: Companies in the final sample .................................................................................... 34
Table 3.2: Sectoral distribution of listed companies in the study ................................................ 35
Table 4.1: Lagrange Multiplier .................................................................................................... 39
Table 4.2: Results of the Multicollinearity Check Using Tolerance and VIFs ............................ 41
Table 4.3: Descriptive statistics ................................................................................................... 43
Table 4.4: Correlation matrix ....................................................................................................... 45
Table 4.5: Regression results ....................................................................................................... 47
Table 4.6: Regression statistics most significant variables .......................................................... 49
Table 4.7: Regression statistics (fixed effects model) ................................................................. 51
Table 4.8: Regression statistics (all variables) ............................................................................. 53
Table 4.9: Results of factor analysis: Total Variance Explained ................................................. 55
Table 4.10: Component Matrix .................................................................................................... 58
Table 4.11: Summary results for open ended questions .............................................................. 60

viii
LIST OF FIGURES
Figure 2.1: Conceptual Framework ............................................................................................. 29
Figure 4.1: Scree plot ................................................................................................................... 56
ix
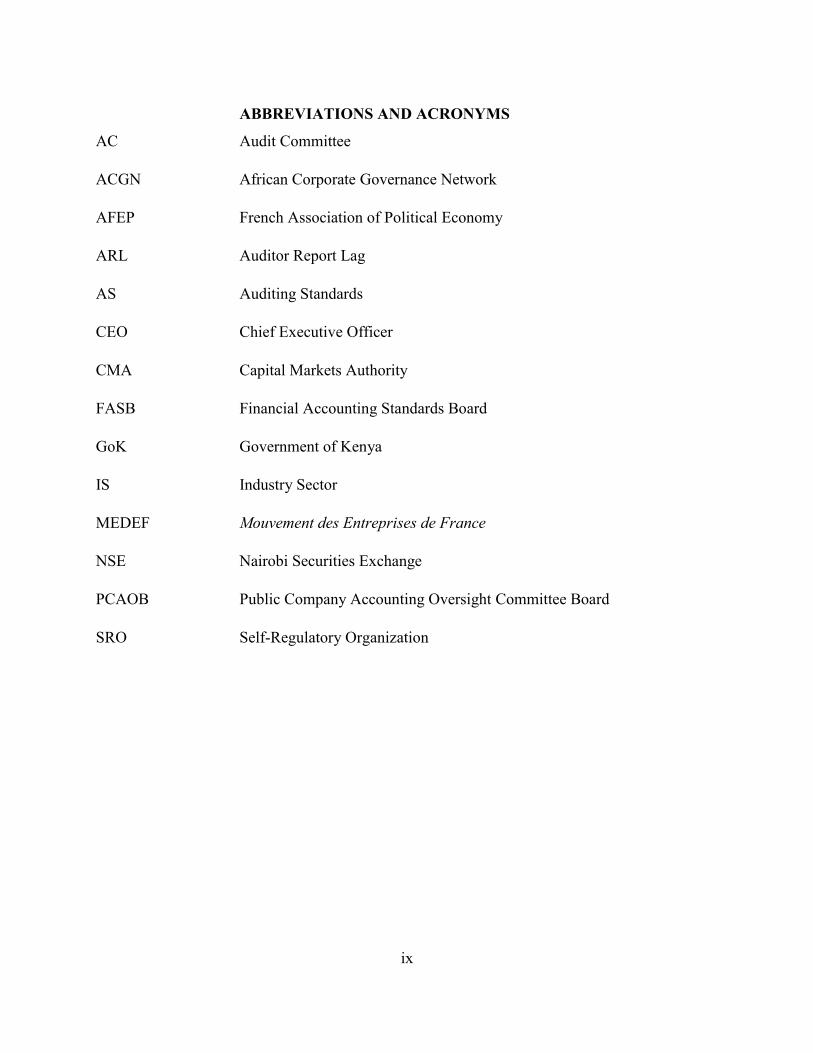
ABBREVIATIONS AND ACRONYMS
AC Audit Committee
ACGN African Corporate Governance Network
AFEP French Association of Political Economy
ARL Auditor Report Lag
AS Auditing Standards
CEO Chief Executive Officer
CMA Capital Markets Authority
FASB Financial Accounting Standards Board
GoK Government of Kenya
IS Industry Sector
MEDEF Mouvement des Entreprises de France
NSE Nairobi Securities Exchange
PCAOB Public Company Accounting Oversight Committee Board
SRO Self-Regulatory Organization
x
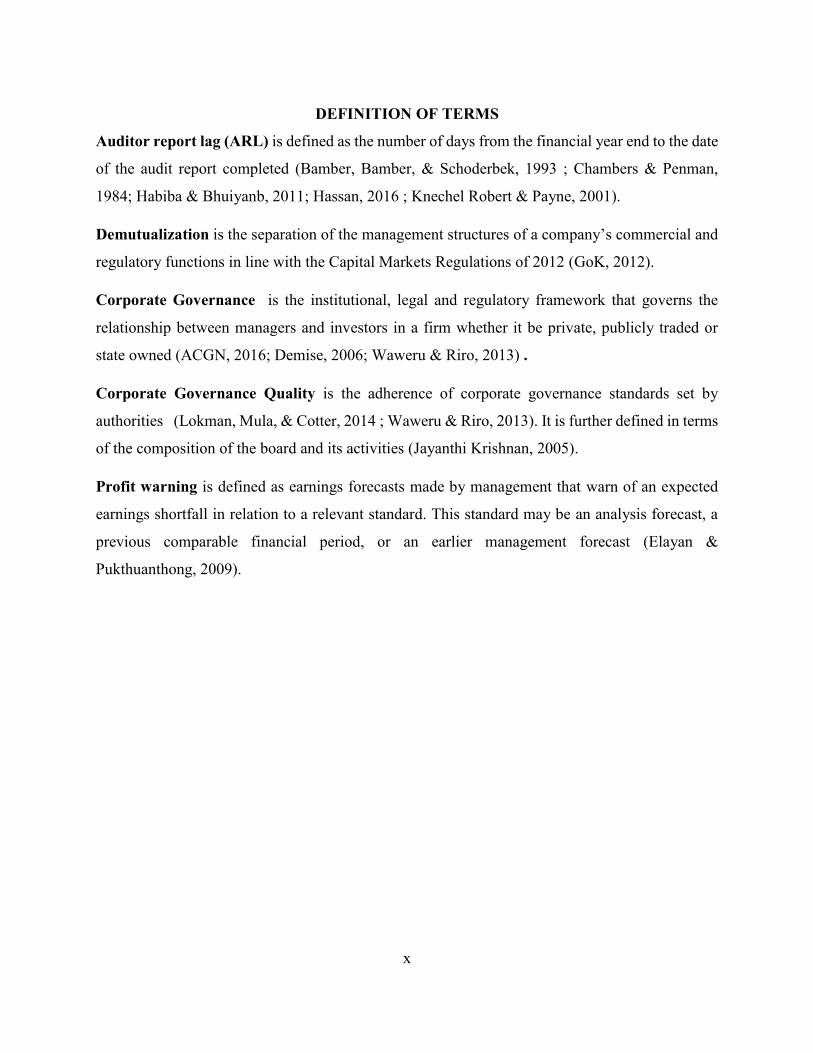
DEFINITION OF TERMS
Auditor report lag (ARL) is defined as the number of days from the financial year end to the date
of the audit report completed (Bamber, Bamber, & Schoderbek, 1993 ; Chambers & Penman,
1984; Habiba & Bhuiyanb, 2011; Hassan, 2016 ; Knechel Robert & Payne, 2001).
Demutualization is the separation of the management structures of a company’s commercial and
regulatory functions in line with the Capital Markets Regulations of 2012 (GoK, 2012).
Corporate Governance is the institutional, legal and regulatory framework that governs the
relationship between managers and investors in a firm whether it be private, publicly traded or
state owned (ACGN, 2016; Demise, 2006; Waweru & Riro, 2013) .
Corporate Governance Quality is the adherence of corporate governance standards set by
authorities (Lokman, Mula, & Cotter, 2014 ; Waweru & Riro, 2013). It is further defined in terms
of the composition of the board and its activities (Jayanthi Krishnan, 2005).
Profit warning is defined as earnings forecasts made by management that warn of an expected
earnings shortfall in relation to a relevant standard. This standard may be an analysis forecast, a
previous comparable financial period, or an earlier management forecast (Elayan &
Pukthuanthong, 2009).
xi
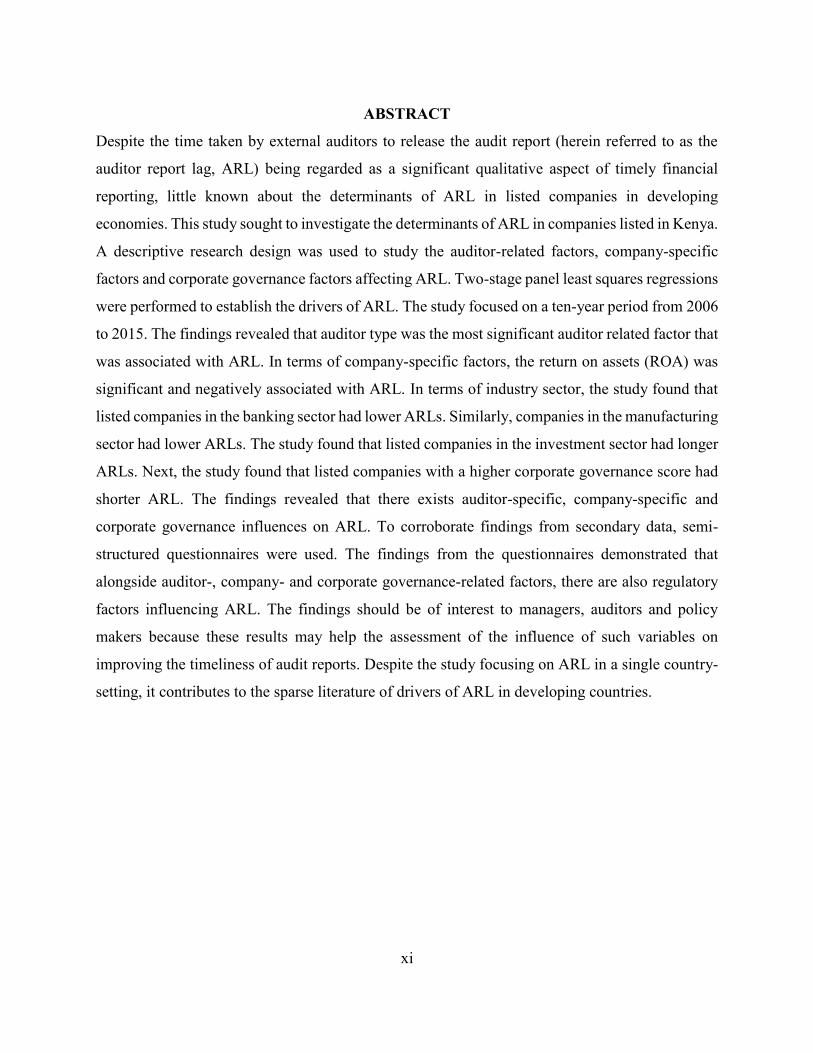
ABSTRACT
Despite the time taken by external auditors to release the audit report (herein referred to as the
auditor report lag, ARL) being regarded as a significant qualitative aspect of timely financial
reporting, little known about the determinants of ARL in listed companies in developing
economies. This study sought to investigate the determinants of ARL in companies listed in Kenya.
A descriptive research design was used to study the auditor-related factors, company-specific
factors and corporate governance factors affecting ARL. Two-stage panel least squares regressions
were performed to establish the drivers of ARL. The study focused on a ten-year period from 2006
to 2015. The findings revealed that auditor type was the most significant auditor related factor that
was associated with ARL. In terms of company-specific factors, the return on assets (ROA) was
significant and negatively associated with ARL. In terms of industry sector, the study found that
listed companies in the banking sector had lower ARLs. Similarly, companies in the manufacturing
sector had lower ARLs. The study found that listed companies in the investment sector had longer
ARLs. Next, the study found that listed companies with a higher corporate governance score had
shorter ARL. The findings revealed that there exists auditor-specific, company-specific and
corporate governance influences on ARL. To corroborate findings from secondary data, semi-
structured questionnaires were used. The findings from the questionnaires demonstrated that
alongside auditor-, company- and corporate governance-related factors, there are also regulatory
factors influencing ARL. The findings should be of interest to managers, auditors and policy
makers because these results may help the assessment of the influence of such variables on
improving the timeliness of audit reports. Despite the study focusing on ARL in a single country-
setting, it contributes to the sparse literature of drivers of ARL in developing countries.
1
CHAPTER ONE
INTRODUCTION
1.1 Background of the study
This chapter outlines the background of the study perspective by describing ARL and the
timeliness of financial reporting information, ARL in Kenya and the auditing and regulatory
framework in Kenya. It also outlined the problem statement and the research objectives. The
chapter concludes with the scope and significance of the study. For a well-functioning capital
market timely financial reports are a necessity and undue delay in releasing these reports
increases uncertainty in decision making for investors (Afify, 2009 ; Ashton, Willingham, &
Elliott, 1987). Changes in technology and business practices especially corporate governance
practices have propelled the need to have timely accounting information. Moreover, policy
makers such as the Financial Accounting Standards Board (FASB) have also raised concerns
about the timeliness of public information disclosures (FASB, 2008). Therefore, this study
examined the drivers of auditor report lag (ARL) in companies listed in the Nairobi Securities
Exchange (NSE).
1.1.1 ARL and the timeliness of financial reporting information
The Public Company Accounting Oversight Committee Board (PCAOB) defines an audit
report as an independent examination and expression of opinion on the financial statements of
a company’s annual report. The aim of an audit is to independently verify the content and
preparation of the company’s financial statements according to the standards, legislation,
regulations and requirements (PCAOB, 2016). The timeliness of audited annual reports is
important to investors because it influences the usefulness of information available to investors
for decision making (Alkhatib & Marji, 2012). Audit Report Lag (ARL) has been defined by
various authors as the number of days from the financial year end to the audit report date (Habib
& Bhuiyanb, 2011; Hassan, 2016; Knechel Robert & Payne, 2001). ARL is one of the few
external variables that allow stakeholders to gauge the efficiency of audit ( Habib & Bhuiyanb,
2011; Hassan, 2016).
The timeliness of audited financial reporting has been a concern for various stakeholders,
including shareholders, managers, and regulators, as well as internal and external auditors
(Abbott, Parker, & Peters, 2012; Krishnan & Yang, 2009). In the Kenyan perspective
timeliness of audited financial statements is prescribed by the Company Act, 2015 as six
months or approximately one hundred and eighty days. Furthermore, Kenyan banks are
2
required to submit annual reports within three months or approximately ninety days from
financial year end. ARL has elicited interest among researchers because timeliness is a critical
qualitative aspect of financial reporting (FASB, 2008) and also enhances decision making
quality (Afify, 2009; Al-Ajmi, 2008). Timely reporting serves to reduce unfavorable effects of
moral hazard and the implications of adverse selection (Leventis, Weetman, & Weetmann,
2004). Prior studies posit that delays in reporting present opportunities for insider trading and
misappropriation or misapplication of corporate assets (Leventis et al., 2004).
The Financial Accounting Standards Board (FASB) views timeliness as an “ancillary aspect”
of relevance and further suggests that a lack of timeliness can rob information of relevance it
might otherwise have had (FASB, 2008). Therefore, delayed disclosure of accounting
information allows a subset of investors to acquire costly private pre-disclosure information
that would lead to the “well informed” investors exploiting their private information at the
detriment of the less informed investors (Afify, 2009). The usefulness of Accounting
information is dependent on completeness, accuracy, reliability and timeliness of accounting
information (Wisna, 2013). Timeliness is a critical qualitative aspect of financial reporting
(FASB, 2008) and also enhances decision making quality (Hassan, 2016). Timely audited
financial information improves pricing of securities (Gul, Kim, & Qiu, 2010), and limits insider
trading and spread of rumors in the market (Owusu-Ansah, 2000).
ARL has been identified as the single most important determinant of timeliness in earnings
announcement (Leventis & Weetman, 2005 ; Owusu-Ansah, 2000), which in turn, determines
the market reaction to earnings announcement (Gul et al., 2010). Other researchers have argued
that the longer the ARL the higher the likelihood of unscrupulous behavior in the market
(Bamber et al., 1993). When the audit report is delayed it worsens the information asymmetry
between managers and stakeholders and increases the uncertainty in investment decisions.
Consequently, this may adversely affect investors' confidence in the capital market.
Unexpected reporting lag may be associated with lower quality information. Determinants that
cause the difference in timing of corporate disclosures have been an area of interest to
researchers for many years (Knechel Robert & Payne, 2001).
Given the importance of ARL to investors and stakeholders, identifying the determinants of
ARL continues to attract the attention of researchers as illustrated in recent studies (Bonson-
Ponte, Escobar-Rodriguez & Borrero-Dominguez, 2008; Ettredge, Li & Sun, 2006; Hassan,
2016). Due to the marked socio-economic, cultural and political differences between
3
developing and developed economies no one study on ARL that has had its findings
generalized for other countries (Bokpin & Isshaq, 2009; McGee, 2009; Waweru & Uliana,
2005). ARL is also expected to vary cross-sectionally because of firm and audit-specific
characteristics such as firm size, profitability, corporate governance, audit tenure, auditor
independence (Bédard & Gendron, 2010 ; Habib & Bhuiyanb, 2011). An understanding of the
possible determinants of the ARL likely would provide insights into audit efficiency. In
developing countries the most reliable source and reference of accounting information is
audited financial statements (Alkhatib & Marji, 2012). Prior research posits that there are
marked socio-economic, cultural and political differences between developing and developed
economies (Bokpin & Isshaq, 2009; McGee, 2009; Waweru & Uliana, 2005).
Prior research has focused on identifying and expanding variables that determine ARL and
their findings indicate that the ARL is affected by Corporate Governance characteristics for
instance, board independence, audit committee independence, number of meetings, size and
CEO duality (Apadore & Mohd Noor, 2013; Baatwah, Salleh, & Ahmad, 2015; Henderson &
Kaplan, 2000). Type of news such as audit opinion and profit warning (Ahmad & Kamarudin,
2003; Hossain & Taylor, 2008; Wermert et al., 2000). Auditor and firm characteristics such
as firm profitability, audit tenure and audit specialization (Apadore & Mohd Noor, 2013 ; Dao
& Pham, 2014; Waweru et al., 2015). However, studies have not incorporated the aspect of
corporate governance and audit committee quality as drivers of ARL. Therefore this study also
sought to investigate the influence of corporate governance and audit committee quality as
corporate governance-related factors on ARL.
1.1.2 ARL in Kenya and the regulatory provisions
Kenya being an emerging economy is characterized by weak institutions such as poorly
enforced governance systems, corruption and minimal democracy. This provides an ideal
setting to explore the importance of firm and country characteristics in corporate governance
because of their unique structures (Hugill & Siegel, 2014). Weak institutions can impact a
country’s growth and along with it the ability to compete globally (Acemoglu, Johnson, &
Robinson, 2001; Beck, Ross, & Loayza, 2000). Kenyans have witnessed numerous companies
struggle financially due to weak corporate governance the most recent being Uchumi
supermarkets, Imperial bank, Dubai bank (Ngugi, 2016; Wasuna, 2015, 2016). Weak corporate
governance structures may significantly affect the ARL (Afify, 2009). An involuntary change
of auditors may lead to longer audit lags as opposed to voluntary change (Tanyi, Raghunandan,
4
& Barua, 2010). This phenomenon has been seen in Uchumi supermarkets which has delayed
the release of its audit reports extending the lag to six months (Ngugi, 2016). The investor is
left assuming that there is bad news being concealed by managers of the company (Carslaw &
Kaplan, 1991) because one way of delaying bad news is delaying the audit report (Alkhatib &
Marji, 2012; Patrick & Benjamin, 1994).
The Kenyan education sector has experienced some radical reforms in 2016 which saw the
release of national examinations earlier than the norm (Ayiro, 2016 ; Wanzala, 2016). Some
stakeholders see this as a move that has brought back credibility because fraudulent individuals
have no time to alter results (Otieno, 2016). However, other stakeholders view this as
compromising on the quality of marking since it’s done within a very short period (Onsongo,
2017). Similarly, reducing the time taken to release audit reports improves the credibility of
financial statements (Owusu-Ansah, 2000), however, care must be taken not to compromise
audit quality (Robert Knechel, Krishnan, Pevzner, Shefchik, & Velury, 2013).
The Companies Act 2015 No. 17 of 2015 formerly Companies Act Chapter 486 and the Code
of Corporate Practices for Issuers of Securities for the Public formerly Corporate Governance
Guidelines were introduced in 2015 to regulated listed companies. The Act, under section 688,
lays out the framework for documents that publicly listed companies in Kenya are required to
file with the registrar of companies. The Companies Act Chapter 486 was amended and now
incorporates the duration required to submit audit reports to the registrar of companies, that is,
six months from fiscal year end, failure to which each director of the company who is in default
commits an offence and on conviction is liable to a fine not exceeding five hundred thousand
shillings (GoK, 2015).
The Code of Corporate Practices for Issuers of Securities for the Public 2015 sets out the
principles and specific recommendations on structure and processes, which listed companies
should adopt in making good corporate governance an integral part of their business dealings
and culture. The constitution of Kenya Chapter Four section 27 (8) promulgated in 2010 now
requires that in any elective or appointed body no more than two thirds shall be of one gender.
As of 31st December 2016, Kenya had sixty six public listed companies (NSE, 2016). Seven
are classified in the Agricultural sector, three in the Automobiles and Accessories sector,
eleven in the Banking sector, five in the Energy and Petroleum sector, twelve in the
Commercial and Services sector, six in the Insurance sector, one in the Real Estate Investment
5
Trust sector, five in the Construction and Allied sector, four in the Investment sector, one in
the Investment Services sector, ten in the Manufacturing and Allied sector, one in the
Telecommunication and Technology.
1.2 Problem Statement
The timely release of audited financial statements is important because it brings out two
qualitative characteristics of financial accounting information: relevance and reliability
(FASB, 2008). Today’s society is highly reactionary to information and this has been amplified
due to the advancements in technology where platforms have been created to ease access of
stakeholders to financial information (Sultana, Singh, & Mitchell Van der Zahn, 2015). These
technological advancements such as, online trading platforms have reduced capital flow
barriers and increased market integration; however, they have also contributed to greater
market volatility (Sultan, 2015). Consequently, the demand to timely release of audit reports is
ever more essential.
Some researchers posit that longer ARLs are perceived as bad news to investors because of the
likelihood of fraudulent behavior (Rezaei & Shahroodi, 2015) while other researchers argue
that a longer audit lag can be good news to investors when the effectiveness of fraud detection
is high (Yim, 2010). Therefore, this inconclusively in findings puts auditors and management
of listed companies under pressure to release audit reports without undue delay. Inconsistency
in findings has also been cited where bank size, a company specific characteristic is negatively
associated with ARL when using a cross-sectional approach but positively associated when
using a longitudinal approach (Henderson & Kaplan, 2000).
The delay in releasing audit reports is causing information asymmetry in the Kenyan market.
An example is the case of Uchumi Supermarkets Limited which has delayed the release of its
audit report for days which has seen its share price fall from in September 2016 (Ksh 3.35) to
in May 2017 (Ksh. 2.95) (NSE, 2017). From an investors’ perspective, a lengthy audit delay
could suggest there has been a deterioration in the quality of client-auditor interaction which
could translate into an auditor change, and a negative stock market reaction (Krishnamurthy,
Zhou, & Zhou, 2006). Developing countries have different institutional set-ups as compared to
developed countries (Che-Ahmad & Abidin, 2009). Kenya being a developing country is faced
with challenges of weak corporate governance structures hence, the need to conduct this study.
Furthermore, it is important to study drivers of ARL because it affects the timeliness of
financial reports which is one of the qualitative aspects of financial statements (Habib &
6
Bhuiyan, 2011; Hassan, 2016). Due to information asymmetry brought about by ARL in the
market the study analyzed a broad spectrum of auditor-, company- and corporate governance-
related characteristics to identify which variables influence the ARL.
1.3 Main Research Objective
The main objective of this study was to examine the drivers of ARL by listed companies in
Kenya.
1.3.1 Specific Objectives
The study sought to address the following objectives:
1. To analyze the influence of auditor-related factors on ARL by listed companies in Kenya.
2. To examine the effect of company-related factors on ARL by Kenyan listed companies.
3. To analyze the influence of corporate governance related factors by listed companies in
Kenya.
4. To obtain practitioners perspectives on the drivers of ARL by listed companies in Kenya.
1.4 Research questions
The study sought to answer the following research questions:
1. What is the influence of auditor-related factors on ARL by listed companies in Kenya?
2. What is the effect of company-related factors on ARL by Kenyan listed companies?
3. What is the influence of corporate governance-related factors on ARL by listed companies
in Kenya?
4. What do practitioners perceive of drivers of ARL among listed companies in Kenya?
1.5 Scope of the Study
The study seeks to examine the determinants of ARL among listed companies in Kenya. The
study was limited to 424 observations from 44 companies listed on the NSE that is, from 1st
January 2006 to 31st December 2015. The study also sought responses from external auditors
and internal auditors of the listed companies.
7
1.6 Significance of the study
The findings of this study are significant in the following ways:
1.6.1 To investors
The study examines the determinants of ARL in Kenyan listed companies. This information is
useful in guiding investors in adjusting their investment preferences, on companies listed in
the NSE, in good time (Dodd, Dopuch, Holthausen, & Leftwich, 1984). The findings of this
study will also improve investor confidence in the capital markets by the timeliness of earnings
information, which is affected by the ARL (Bamber et al., 1993; Ettredge, Li, & Sun, 2006).
1.6.2 To Auditors
Knowledge on the determinants of ARL is likely to provide more insights into audit efficiency
(Leventis, Weetman, & Caramanis, 2005; Walker & Hay, 2007). The findings of this study
will aid auditors in having a better understanding of what factors drive the ARL in Kenya.
1.6.3 To Researchers and academicians
The study is structured to examine the determinants of ARL in a Kenyan context which differ
cross-sectional from other countries due to firm and audit specific characteristics (Habib &
Bhuiyanb, 2011). Therefore, the findings of this study will extend literature on the knowledge
of determinants of ARL in the Kenyan perspective. Using mixed method of research the study
aims at providing information on the determinants of ARL in a developing country.
1.6.4 To Policy makers and regulators
Policy makers play an important role in ensuring companies adheres to timely financial
reporting. Knowledge on the drivers of ARL may help inform policy makers such as ICPAK
and CMA in formulating policies that may improve the timeliness of audit reports.
8
CHAPTER TWO
LITERATURE REVIEW
2.1 Introduction
This chapter discusses the theoretical and empirical literature on determinants of ARL of
Kenyan listed companies. The study considered agency theory, signaling theory and the
stakeholder theory. The relationship between theoretical and empirical literature was discussed
to establish the relationships among the variables. The chapter includes a conceptual
framework to further show the linkage between the variables. A summary of the literature will
highlight the literature gaps and form basis of this study.
2.2 Extant theories on ARL and its determinants
This study drew from agency theory, signaling theory and stakeholder theory. The theories
guided the formulation of dependent and independent variables. The agency theory and the
stakeholder theory informed the independent variables; auditor-related factors; corporate-
governance related factors and company specific factors because auditors are agents appointed
by shareholders, corporate governance practices are meant to protect stakeholders interests.
2.2.1 Agency Theory
Agency theory was developed as a result of researchers exploring risk-sharing among
cooperating individuals. It was found that an agency problem is one that arises as a result of
cooperating parties having different attitudes towards risk (Arrow, 1971; Eisenhardt, 1989 ;
Wilson, 1968) or one that occurs due to cooperating parties differ in terms of goals and division
of labor (Jensen & Meckling, 1976 ; Ross, 1973). An agency relationship has been defined as
the contractual relationship that arise when one or more persons (principles) engage another
(agents) to perform certain services on their behalf (Jensen & Meckling, 1976). Separation
between the owners and control leads to a potential conflict between the agents (managers) and
principles (agents) (Aboagye-Otchere, Bedi, & Kwakye, 2012; Hassan, 2016) . The theory
holds that agents (managers) will always act in their own self-interest and this is further
encouraged by the asymmetrical information between agents and principals (Urquiza, Navarro,
Trombetta, & Lara, 2010).
The agency theory is concerned with resolving two problems the first being the contention that
arises when the shareholders and managers have diverse desires. The second problem
addressed by the agency theory is the conflict that arises when the principal and agent have
9
different attitudes towards risk because of the different risk preferences (Eisenhardt, 1989). In
order to alleviate the self-interest actions of managers the agency theory posits that good
corporate governance should be implemented (Errunza & Miller, 2000). The agency theory
posits that the main role of financial reporting is to monitor the quality of management
emphasizing on the need for proper governance structures to ensure that managers act in the
best interest of shareholders (Jensen & Meckling, 1976).
The Agency theory posits that the principal-agent conflict can arise due to information
asymmetry caused by ARL, it further argues that reduction of ARL may help reduce
information asymmetry between the principal and agent thus reducing the principal-agent
conflict. The agency theory provides a unique, realistic and empirically testable perspective on
problems arising due to the principal-agent relationship (Eisenhardt, 1989). Agency theory has
been applied to the organizational phenomena positivist and principle-agent (Eisenhardt, 1989
; Jensen, 1983). The positivist researchers focused on identifying conflict situations between
principal and agent arising due to different goals and prescribing governance mechanisms the
limit the agent’s self-serving behavior (Eisenhardt, 1989). The principal-agent researcher
focused on determining the optimal contract, behavior versus outcome between principal and
agent (Eisenhardt, 1989). The principal-agent theory in comparison to the positivist theory is
abstract and mathematical, therefore, beyond the reach of organizations and scholars
(Eisenhardt, 1989). Therefore, this study employs a positivist approach of the agency theory
which will identify the corporate governance mechanisms that have been put in place to remedy
principal agent conflicts in a Kenyan perspective.
Prior studies on the determinants of ARL have employed the agency theory because it provides
unique, realistic and empirically testable perspective on principle agent problems (Bamber,
Bamber, & Schoderbek, 1993; Waweru et al., 2015). Agency theory is useful in this study in
that it informs the determinants of ARL: auditor-related factors such as auditor type, corporate
governance-related factors such as presence and size of audit committee and company-related
factors such as ownership concentration, firm size, profitability and industry. Afify (2009)
while utilising agency theory found that existance of an audit committee, size of the firm ,
industry and profitability significantly affected the ARL in Malaysia. Similary, Eghliaow
(2013) found that company size, industry and auditor type were significant. Apadore and Mohd
Noor (2013) found that audit committee size, ownership concentration, firm size and
profitability were significantly associated with ARL.
10
2.2.2 Signaling theory
Signaling theory was developed by Spence (1973) and advanced by Watts and Zimmerman
(1986) to explain behavior in labor markets but can also be used to explain the concept of
timely financial reporting. Signaling is a reaction to information asymmetry in financial
markets; in this case, companies have information that investors don’t have (Watson, Shrives,
& Marston, 2002). The signaling theory is mainly concerned with reducing information
asymmetry between two parties (Spence, 2002). Under the signaling theory, information
asymmetry can be reduced if one party signals the other. In this case, managers of higher
quality firms will want to distinguish themselves from lower quality through timely financial
reporting (Leventis et al., 2004). For the signaling effect to be successful the news needs to be
credible. If managers falsely try to signal news that they are of high quality when in fact they
are of low quality and it is eventually revealed, subsequent financial reporting will not be
viewed as credible (Watson et al., 2002). Managers must also decide whether or not to
communicate news that may either be positive or negative to stakeholders in a timely manner
(Connelly, Certo, Ireland, & Reutzel, 2011). Companies that reports profits communicate to
investors that they have a bright future ahead and are worth investing in.
Signaling theory has been used in prior studies in auditing and accounting because it is useful
in describing the behavior between two parties who have access to different information
(Rezaei & Shahroodi, 2015). The signaling theory posits that management may signal
something about the firm through various aspects of information disclosure such as the release
of audit reports. The timing of the release of audit reports may be viewed as a signal by
investors of how the firm is performing. Early release of audit reports may be viewed as good
news and may affect the firm’s value positively. Late release of audit reports may be viewed
as bad news and may negatively affect the firm’s value. The information signaling theory has
informed the selection of board independence, leverage, complexity, firm size and profitability.
Shamsul-Nahar (2007) using signaling theory investigated the role board of directors and audit
committee on the timeliness of reporting. The study found that board independence, leverage
and profitability were significantly associated with ARL. Similarly, Mukhtaruddin, Oktarina,
Relasari, and Abukosim (2015) examined the influence of firm size and complexity. The study
found that firm size was significant. However, complexity was not significant leaving room for
further studies on determinants of ARL in different countries and institutional set-up to
investigate its influence on ARL.
11
2.2.3 Stakeholder theory
Stakeholder theory was developed by Freeman (1984) who argued that organizations are
accountable to the shareholders as well as other stakeholders which is contrary to the traditional
view that shareholders were the only stakeholders of a company. Stakeholders are groups or
individuals who may benefit or be harmed by activities of a company. These stakeholders have
contrasting interests which have to be taken into account when releasing the audit reports. This
is important because their varying interests can affect the company’s ability to achieve its
objectives (Freeman, 2001). The stakeholder theory concerns itself with the trying to meet the
expectations of these different stakeholders by employing strategies that could help achieve
this problem such as good corporate governance practices. Therefore, it is implied that the
directors and auditors of a company have a duty of care to the stakeholders. Stakeholders may
bring action against the directors and auditors for failure of exercising due care.
The stakeholder theory can also be used to explain the effect of ARL on the share returns in
the sense that, ARL can be increased because managers have an incentive to delay release of
audit reports due to mandatory statutory disclosures that prevent them from hiding bad news
(Watts, 1992). Stakeholder theory suggests that the delay of audit reports sends a ‘silent signal’
for shareholder to divest their firms’ shares before the news reaches the market. On the other
hand, shorter ARLs imply that good news is released into the market before other source
discloses this news (Mahajan & Chander, 2008; Nor Izah Ku Ismail & Chandler, 2004). The
stakeholder theory argues that stakeholders such as regulator can influence the ARL by
implementing policies that reduce ARL so as to ensure timely financial reporting. This theory
was instrumental in identifying ARL as having a potential influence on the profitability,
growth, age, leverage, and audit firm size. Al-tahat (2015) employed stakeholder theory to
investigate the association of ARL firm size, profitability, leverage, and auditor type. The study
found a significant relationship between profitability, auditor type and ARL.
2.3 Empirical Review
This section will discuss prior literature on the key variables of this study that is, the ARL,
auditor-related factors, corporate governance related factors and stock returns and preparers’
perspective. Prior studies have identified drivers of ARL as auditor-related factors, company-
related factors and corporate governance related factors (Afify, 2009; Eghliaow, 2013; Hassan,
2016). These factors are different in different countries due to the different institutional set-up
in the different countries.
12
2.3.1 Background of ARL
Research on ARL commenced about 41 years ago and some of the earliest studies were done
by Courtis, (1976) and Gilling (1977) in New Zealand, by Davis & Whittred (1980) in Australia
, in the US by Garsombke (1981) and Canada by Ashton, Graul, & Newton (1989). Ashton,
Willingham, & Elliot (1987) conducted a research to determine the association between ARL
with corporate characteristics. Their findings indicated that ARL is positively associated with
the client's revenue and business complexity, but is negatively related with client status
(represented by one for companies traded on an organized exchange or over the counter, and
zero otherwise), quality of internal control (rated one if auditor judged the internal control
quality as "virtually none" and five if "excellent") and relative mix of audit job (rated one if all
audit work performed subsequent to year end and four if most work performed prior to year-
end).
Prior studies found that firms that report losses have a longer ARL (Carslaw & Kaplan, 1991 ;
Courtis, 1976). ARL is influenced by an auditor's business risk associated with the client and
audit specific events that are expected to require additional audit work such as extraordinary
items, net losses and qualified audit opinions (Bamber et al., 1993) and also found that large
clients have a shorter audit lag. Audit lag increased for companies that switched their auditor
late in the fiscal year (Schwartz & Soo, 1996). This result is consistent with their expectation
that companies change their auditor early in their fiscal year for positive reasons, whereas late
auditor switching is driven by extended auditor client negotiations or opinion shopping, which
leads to longer audit lag.
Studies on audit lag in the banking sector revealed that a financial institution takes less time to
issue an audit report because it operates in a highly regulated industry (Henderson & Kaplan,
2000). Some researchers suggest that any attempts to regulate more closely the timeliness of
audited financial reports should focus on audit-specific issues (e.g., audit fees or audit hours,
proxied by the presence of extraordinary items in the income statement, the number of remarks
in the subject to/except for audit opinions) rather than on the audit client's characteristics. They
find that the type of auditors, audit fees, number of remarks in audit report, extraordinary items
and uncertainty of opinion in the audit report are statistically significant in explaining
variations in audit timeliness (Leventis & Weetman, 2005).
13
2.3.2 Determinants of ARL
This section discusses prior literature on drivers of ARL. The drivers of ARL were grouped
into auditor-, company specific-, and corporate governance-related factors.
2.3.2.1 Influence of auditor-related characteristics on ARL
Simunic (1980) pioneered the study on determinants of audit fees. A meta-analysis of audit
fees classified audit fees into three categories, that is, firm (client), auditor and engagement
attributes (Hay, Knechel, & Wong, 2006). The rise of accounting scandals has seen an increase
in public interest in corporate governance seen by recent studies examining board and audit
committee characteristics as determinants of audit fees (Abbott, Parker, Peters, &
Raghunandan, 2003; Carcello, Hermanson, Neal, & Riley, 2002). Prior studies related to audit
fees have highlighted two schools of thought on audit pricing (Agus et al., 2015). One school
of thought views audit fees from the supply side perspective that links audit fees and audit risk.
Based on this perspective audit fees are seen as a proxy for audit efficiency (Masli, Peters,
Richardson, & Sanchez, 2010; Raghunandan & Rama, 2006). Audit fees are a result of a
production function where the existence of a strong internal control environment decreases the
amount of audit fees, consequentially reducing the time taken to release the audit report (Agus
et al., 2015; Simunic, 1980). This theoretical model however assumes a constant demand for
audit and does not take into account the different demand forces that determine audit fees (Agus
et al., 2015).
The second school of thought views audit pricing from the demand side where the demand
from audit services is a function of a set of risk factors that stakeholders with interest on the
outcome of the audit fee (Hay et al., 2006). The demand for audit services is expected to
increase as the number of stakeholders interested in the outcome of the audit increases; this is
evidenced by the level of stakeholder involvement in corporate governance decisions. The
demand for audit services increases because those charged with governance need to protect
their interests (Knechel & Willekens, 2006). This school of thought sees audit fees as a proxy
for audit quality. In conclusion, the discussion above shows the need to investigate the effect
of fee on the ARL in the Kenyan environment.
Auditor type refers to the size of the audit firm whether it can be classified under the big four
or not. Companies audited by big four audit firms tend to have shorter audit lags as compared
to non-big four audit firms (Carslaw & Kaplan, 1991). This is attributed to the vast resources
available to big four audit firms and they tend to develop audit specialization and expertise in
14
certain sectors that increases their efficiency (Carslaw & Kaplan, 1991). In Libya it was found
that firms audited by big audit firms have shorter lags (Eghliaow, 2013) contrary to a similar
study in Malaysia which concluded that the auditor type was an insignificant variable (Apadore
& Mohd Noor, 2013).
Prior studies show that once a risky client leave a Big 4 audit firm, that firm has to seek audit
services in a non-Big 4 audit firm. This is because Big 4 audit firms have more to lose from
litigation and may suffer a great blow to their reputation from an audit failure than non-Big 4
audit firms (Jones & Raghunandan, 1998; Mande & Son, 2011). Studies have shown that Big
4 audit firms are less dependent on one clients audit fees (Watkins, Hillison, & Morecroft,
2004). Therefore, clients dropped by one Big 4 audit firm are less likely to be accepted by
another Big 4 audit firm because of the client risks that all Big 4 audit firms try to avoid (Mande
& Son, 2011). From an investor perspective, when a Big 4 audit firm drops a company as a
client signals a possibility of auditor-client conflict that may lead to a lengthy audit delay that
leads to a negative stock price reaction (Krishnamurthy et al., 2006).
Big 4 audit firms dropping a risky client does not reflect positive from a social perspective
because non-Big 4 audit firms now have to audit these risky clients. Non-Big audit firms
provide lesser monitoring of the financial reporting process than Big audit firms (Cassell,
GirouxG., Myers, & Omer, 2007). This could lead to a reduction in the audit quality due to the
increase likelihood of audit failures (Mande & Son, 2011). Audit risk is also usually high when
an auditor is auditing a client for the first time because the auditor needs to incur extra effort
and time in learning the business processes and financial reporting systems (Flanigan, 2002;
Tanyi et al., 2010). This usually leads to a longer audit delay (Tanyi et al., 2010). Prior studies
measure audit risk as the ratio of current liabilities to current assets (Sultana et al., 2015). This
discussion motivated formulation of the following hypothesis.
H1: Auditor-related characteristics has a positive influence ARL (audit fees, audit risk and
auditor type).
2.3.2.2 Influence of company-specific factors on ARL
Prior researchers who have studied ARL have measured company size in terms of total assets
(Ashton et al., 1989; Courtis, 1976) while others have used revenue (Knechel Robert & Payne,
2001). This study will separately use both measurements and give a comparative outlook on
their effect on the ARL. Based on prior research company size could either be positively or
negatively associated with ARL (Carslaw & Kaplan, 1991). Some researchers found a negative
15
association between company size and ARL this may be attributed to the fact that large
companies may have stronger internal control systems, which reduce the likelihood of financial
reporting errors occurring. Additionally, large companies have the capability of exerting
greater time pressures to complete the audit in a timely fashion as compared to small companies
(Carslaw & Kaplan, 1991).
Profitability has been employed in prior studies on audit delay as a measure of a company’s
financial performance (Ahmad & Kamarudin, 2003; El-Banany, 2006). Profitability has been
defined as the rate of return of the company’s investment (Arshad & Gondal, 2013). Return on
Equity (ROE) have been used to measure profitability (Che-Ahmad & Abidin, 2009).
Studies show that auditors are likely to perform their audit task more cautiously and thoroughly
for companies with low profitability due to the high business risk involved in comparison to
companies with high profitability (Che-Ahmad & Abidin, 2009). Therefore, the audit lag is
expected to be longer for companies with low profitability in comparison to those with high
profitability. In Libya and Malaysia it was found that profitability doesn’t have a significant
effect on audit lag (Apadore & Mohd Noor, 2013; Eghliaow, 2013).
Complexity has been identified as the level of diversification of a company’s’ business
operations and is measured by the number of subsidiaries owned by a company (Che-Ahmad
& Abidin, 2009). Auditors are expected to take longer to complete his audit task for companies
with more business operations than those with few (Che-Ahmad & Abidin, 2009). Complexity
can also be measured using the ratio of inventory and receivables to total assets. It is expected
that a larger proportion of receivables and inventory requires more time to verify balances in
the financial statements and hence a longer lag (Che-Ahmad & Abidin, 2009). This study will
also employ the use ratio of inventory and receivables to total assets (Agus et al., 2015).
Prior studies show that audit firms that decide to focus on particular industries invest in
technologies, physical facilities, personnel, and organizational control systems which are
expected to improve audit quality thus improving of timely financial reporting (Balsam,
Krishnan, & Yang, 2003; Kwon, Lim, & Tan, 2007). Industry-specific auditors tend to develop
industry specific knowledge, and are consequently expected to complete an audit within a
shorter period than non-industry specific auditors. Other studies show that companies in the
financial sector for instance, banks tend to have shorter audit delays than companies in non-
financial sector because it is a highly regulated sector (Henderson & Kaplan, 2000). This study
will assess whether the type of industry a company belongs to affect the ARL.
16
Ceteris paribus, it is expected that all companies would disclose financial information as fast
as possible to avoid adverse selection (Grossman, 1981). Favorable news is usually expected
to be reported earlier than unfavorable news (Milgrorn, 1981). There may also be an agent’s
compensation effect in that favorable news is more likely to be rewarded. Verrecchia (1983 /
1990) found that the incentive to disclose information is a decreasing function of the
proprietary costs attached to a disclosure and an increasing function of the favorableness of the
news in a disclosure. Darrough and Stoughton (1990) posited that industry dynamics may also
influence the release of information, companies that have less fear of potential entrants will
respond to market demands for timely information. Companies that hold favorable news might
wish to delay disclosure, while companies with unfavorable news might want to release early
to prevent entry (Palepu & Healy, 2001).
According to Ettredge et al., (2011) compliance is negatively associated with bad news. Prior
research suggests that management has incentives to exercise discretion over the timeliness of
reporting(Chambers & Penman, 1984; Givoly & Palmon, 1982; Patell & Wolfson, 1982 ).
Komen (2014) identified bad news to be profit warning. According to Alves et al., (2011) profit
warning helps reduce the expectation gap and lowers market reactions to avoid large stock
price fluctuations. Profit warning is viewed by some investors as bad news but on the other
hand it helps reduce large stock price variations hence, perceived as good news by other
investors (Alves et al., 2011). Disclosure of profit warning also seeks to reduce information
asymmetry and keeping transparency (Tumurkhuu & Wang, 2010).This prevents insiders,
mainly managers, from misusing information thereby protecting unsuspecting investors.
Investor make decisions based on information perceived to be credible, if a firm gives
misleading information about future prospects of the firm especially that which is related to
profit, then investors have difficulty in relying on this information to make rational decisions
(Bodie, Kane, & Marcus, 2009). According to Bulkley and Herrerias (2004) profit warning is
classified into two categories : quantitative and qualitative profit warnings. Quantitative profit
warnings involve giving the actual figures of the profit estimates that are not met while
qualitative profit warnings involve the use of phrases such as “unlikely to meet desired profit
target”.
Market participants particularly the investors do not like to receive bad news especially one
that is related to profits. Prior studies have revealed that profit warnings are received as bad
news not only within the country where the company is listed but also in countries with
17
comparable foreign non-announcing firms (Alves et al., 2011). The norm is that profit warnings
are communicated just before the year end and this may affect the ARL because, on average ,
managers tend to delay bad news (Kothari, Shu, & Wysocki, 2009). In Kenya it is a regulatory
requirement for listed companies to disclose all material information and make public the
announcement of any profit warning where there is a material discrepancy between projected
earnings for current year and level of earnings in previous financial year (GoK, 2002).
Companies such as National Bank of Kenya and Centum Investment have been penalized for
violation of this requirement (Herbling, 2016a; Ngigi, 2013).
Managerial ownership serves to align the interests of shareholders and managers (Kelton &
Yang, 2008) and reconciles any agency conflicts between managers and shareholders thus
reducing principle-agent conflicts (Jensen & Meckling, 1976).Studies find that companies with
high level of manager ownership have longer ARLs which is attributed to less pressure to
release timely information since they have access to the information (Ashton et al., 1989;
Bamber et al., 1993). In line with the body of this research this study will classify the listed
companies as either owner controlled or manager controlled as was the case in previous studies
(Carslaw & Kaplan, 1991). A company will be considered owner controlled if thirty percent of
ordinary shared is owned by one individual and vice versa. Ownership concentration is treated
as a dummy variable where 1 represents owner controlled companies (Carslaw & Kaplan,
1991).
Studies show that companies with high leverage have longer audit lags this is due to the like
hood of bankruptcy (Che-Ahmad & Abidin, 2009). The amount of long term debt is also likely
to raise agency costs and is likely to increase audit efforts because of the high business risk
(Carslaw & Kaplan, 1991; Che-Ahmad & Abidin, 2009). Prior studies have measured leverage
as total liabilities divided by total assets (da Silveira Di Miceli, Leal, Barros, & Carvalhal-da-
Silva, 2009). A high leverage level may indicate poor financial health and the auditors may
raise concerns that the financial reporting process is flawed (Carslaw & Kaplan, 1991). He or
she may decide to take up additional procedures that would tend to increase the audit delay
because the audit of debt is more complicated than that of equity (Carslaw & Kaplan, 1991).
Leverage will be used as a control variable for this study.
Prior studies posit that timely reporting of financial information is important to stakeholders
because it is the only means of obtaining information on the company’s performance (Leventis
& Weetman, 2005). Longer ARLs create information asymmetry which enables investors with
18
information to take advantage of those without information, therefore investors will tend to
invest in companies with shorter ARLs because they reduce information asymmetry (Ahearne,
Griever, & Warnock, 2004; Portes & Rey, 2005). Therefore, companies with a significant
amount of foreign ownership have an incentive to timely release audit reports. The discussion
led to the following hypothesis.
H2: Company-specific factors are negatively associated with ARL (size, profitability,
complexity, industry sector, profit warning, ownership concentration, leverage, foreign
ownership).
2.3.2.3 Influence of corporate governance-related factors on ARL
This section discusses prior literature on corporate governance related factors that affect the
ARL that is, corporate governance quality and audit committee quality. Corporate governance
is an important determinant of the ARL, it involves mechanisms that govern actions of and
interactions between firm managers, shareholders, board members and stakeholders in an
attempt to address principal agent conflicts (Afify, 2009 ; Hugill & Siegel, 2014). Investors are
willing to offer valuable financing or pay higher equity price for firms with better governance
(Chen, Chen, & Wei, 2009) because high quality corporate governance controls the principal-
agent conflict through regulation or firm policy thus protecting investors (Hugill & Siegel,
2014). On the other hand Ettredge et al. (2011) found that non-compliant firms have lower
quality corporate governance .
The 20th Century has seen the emergence of new standards, principles and recommendations
that increasingly regulate corporate governance practices (Zitouni, 2016) . Kenya has not been
left behind as it has the Code of Corporate Practices for Issuers of Securities for the Public,
2015. Since the publication of the Cadbury’s report in 1992, regular publication of codes of
good conduct have enriched corporate governance quality all over the world. Prior research by
Charreaux (1997) shows that in France, the traditional corporate governance model is focused
on the manager who had absolute power; hence the disciplinary impact of market mechanisms
remained limited. This led to different working committee to make recommendations for
French companies wishing to strengthen their good governance practices. They issued the
Viénot I and Viénot II reports, the Bouton report and The Corporate Governance Principles for
listed companies.
The report Viénot I named after the CEO of Société Générale , highlights the importance of
corporate governance principals in France. The report Viénot II brought in a deeper reflection
19
on the dual functions of chairman and CEO, the executive compensation and shareholders right
to access information. The Bouton report focused on the corporate governance practices in the
composition of the board and independence of auditors and the accounting practices within the
company. The consolidation of joint reports from AFEP and MEDEF gave rise to corporate
governance principles which highlight ‘competence’ as an important quality of the director
more so than ‘independence’. In 2008 these principles were updated with recommendations on
the compensation of directors and in 2010 they were updated on the presence of women in the
Board of Directors.
The German system of governance is based on internal control mechanisms (Emmons &
Schmid, 1998). In this system the disciplinary power of the financial markets is particularly
restricted as opposed to the Anglo-American system characterized by more liquid markets and
more active institutional shareholders (Elmeskov, 1995; Easton & Walker, 1997). This internal
monitoring system is characterized by the power of banks and the formal separation between
management and regulatory bodies (Zitouni, 2016). The ‘German code of corporate
governance was first published in 2000 and subsequently revised ten times between the period
of 2002 and 2015. Similarly, in 2002 the ‘Swiss code of corporate governance for public
companies was published and revised on 2008 and 2014. In 1994 Canadians introduced the
“guidelines for better corporate governance in Canada” which mainly emphasized on the role
of Directors. It was later modified into “Guide to good disclosure; corporate governance”
which was revised in 2006 and 2013.
In the US, several reports by the Blue Ribbon Committee on Improving the Effectiveness of
Corporate Audit Committee (BRC, 1999) and the National Association of Corporate Directors
Blue Ribbon Committees (NACD, 2000) were published with recommendations on how to
improve the quality of audit committees. This led to the SEC publishing rules about the
communication on the composition and activities of audit committees (SEC, 1999). The
accounting fraud scandals of 2002 led to the introduction of Sarbanes-Oxley Act in addition to
the requirements of this act the New York Stock Exchange (NYSE) issued a report that required
listed companies to have a Board of Directors with majority being independent directors. Prior
literature on audit delay indicates that the association between corporate governance quality
and timeliness of financial reporting is rarely investigated (Bédard & Gendron, 2010).
Corporate governance is a central and dynamic aspect of business and its importance cannot
be overstated (Dibra, 2016). Prior studies find that developing countries are characterized by
20
weak governance structures, corruption and fraud (Ntayi, Ngoboka, & Kakooza, 2013; Osei-
Tutu, Badu, & Owusu-Manu, 2010).
In Kenya corporate governance started making head way in 1998 in a workshop for non-
executive directors which was organized by the Private Sector Initiative for Corporate
Governance. This led to the Capital Markets Authority publishing of Guidelines on Corporate
Governance Practices by Public Listed Companies in Kenya of 2002. This was later revised
into the Code of Corporate Practices for Issuers of Securities for the Public 2015. Waweru and
Uliana (2014) found that audit quality and firm performance are the main factors that influence
the quality of corporate governance in Kenya. Afify (2009) recommends that further studies
should be conducted on the relationship between ARL and corporate governance quality using
a corporate governance index. Due to the concerns raised on the quality of corporate
governance all over the world there is need to study it in relation to ARL.
Agency theory posits that principal-agent conflict in companies arise due to managers self-
interests (Jensen & Meckling, 1976). The board of directors is one of many mechanisms put in
place to monitor managers on behalf of dispersed shareholders (Abd-Elsalam & El-Masry,
2008). The Code of Corporate Governance Practices for issuers of Securities to the Public 2015
cites the board of directors as the single most important institution in corporate governance. It
further states that effective corporate governance requires a board of governance that is
composed of qualified and competent members. Prior studies show that a large board has
difficulty in communication and coordination making it a less efficient monitoring body than
a small board (Dimitropoulos & Asteriou, 2010). A large board also has higher ‘free rider
problem’ intensity than a small board (Jensen, 1993; Naimi Mohamad-Nor, Shafie, & Wan-
Hussin, 2010). In addition, large boards create less participation, are less organized and less
likely to quickly reach a compromise in decisions (Dalton, Daily, Johnson, & Ellstrand, 1999;
Mak & Li, 2001). An increase in board size is related to higher incidences of fraud cases
(Beasley & Salterio, 2001). On the other hand small boards exhibit greater in formativeness
(Vafeas, 2005).
Board size has been found to be positively related to earnings management in one study (Abdul-
Rahman & Mohamed-Ali, 2006) while it has been found to be negatively associated with
earnings management in another (Bradbury, Mak, & Tan, 2006) consequently having a mixed
effect on the ARL. The conflicting evidence warrants a study in a Kenyan perspective. In
conclusion, researchers have not prescribed the appropriate board size but their findings
21
suggest that the size will depend on the needs of a company. For instance, in Kenya the Code
of Corporate Governance Practices for issuers of Securities to the Public 2015 only
recommends that listed companies should be of sufficient size whereby it shall not be too large
to undermine interactive discussion during meetings or too small hindering the inclusion of
experts
The Code of Corporate Governance Practices for issuers of Securities to the Public 2015
recommends that the board should have policies and procedures in place to ensure
independence of its members which should be assessed annually by the board Code of
corporate governance, 2015). Industry practice and empirical review in finance find that the
degree of board independence is closely related to its composition (Afify, 2009). Corporate
governance has increasingly shifted towards having more directors who are not from the
company and with minimal shareholding in the company to increase independence (Afify,
2009; John & Senbet, 1998). Some researcher argue that directors from outside the company
rarely collude with company management for their own self-interests (Fama & Jensen, 1983).
Independent directors are a tool for keeping company’s management in check and have been
associated with more voluntary disclosure and timely financial reporting than companies with
less independent directors (Chen & Jaggi, 2000; Huafang & Jianguo, 2007; Patelli & Prencipe,
2007). However, some studies show that board independence does not enhance transparency
(Haniffa & Cooke, 2002). This inconsistency in findings necessitates an investigation of board
independence in the Kenyan environment.
CEO-duality is a term used to refer to when the CEO also serves as chairman of the board. This
implies that most of the decision making power lies with one individual barring board
independence reducing the boards oversight capacity (Afify, 2009). Corporate governance has
grown towards having a separation of the CEO and Chairman of the board positions to avoid
conflicts of self-interests (Agus et al., 2015). In Kenya the Code of Corporate Governance
Practices for issuers of Securities to the Public 2015 recommends that the positions of CEO
and chairperson of the board should not be held by the same individual.
The agency theory posits that CEO- duality creates a strong individual power base which could
impair board independence and the effectiveness of its governing functions (Abd-Elsalam &
El-Masry, 2008). A CEO with role duality is capable of selecting board member, selecting
agendas and controlling board meetings (Kelton & Yang, 2008). Agency theory supports the
separation of these two roles to provide checks and balances over management performance.
22
Studies have found that CEO-duality is associated with longer audit lags (Gul & Leung, 2004).
In line with this body of research the Cadbury Committee (1992) recommended that large
companies separate the role of the chairman and the CEO (Abdelsalam & Street, 2007).
Prior studies find that separation of CEO and chairman positions contributes to timely financial
reporting (Abdelsalam & Street, 2007; Cerbioni & Parbonetti, 2007; Gul & Leung, 2004;
Huafang & Jianguo, 2007; Sarkar, Sarkar, & Sen, 2008). However, other studies find no
evidence that CEO duality impairs timely financial reporting (Cheng & Courtenay, 2006; Petra,
2007). CEO duality adversely affects internet disclosures and an unfavorable effect on earnings
quality (Al-Arussi, Selamat, & Mohd-Hanefah, 2009). In contrast to these findings other
researcher have found that there is no association between CEO-duality and earnings
management (Abdul-Rahman & Mohamed-Ali, 2006; Abdullah, Mohamad-Yusof, &
Mohamad-Nor, 2010; Bradbury et al., 2006). In conclusion, these studies have contrasting
findings necessitating an investigation of CEO duality’s effect on the ARL in a Kenya
perspective.
Corporate governance quality is defined in terms of the composition of the board and its
activities (Jayanthi Krishnan, 2005). According to a company’s corporate governance quality
increases as additional corporate governance standards are met. The compatibility of corporate
governance practices with global standards has become integral to corporate success. Good
corporate governance practices have therefore become a necessary prerequisite for any
corporation to manage effectively in the globalized market. Researchers have developed and
improved indices to measure corporate governance quality such as Cornelius (2005) who
developed an index that made use of five major aspects of corporate governance. These aspects
were board composition and independence; executive and director compensation; the executive
and non-executive board members’ ownership; the auditory processes independence and
separability; and capital structure (Cornelius, 2005).
Prior literature on gender diversity shows that women are likely to be involved in monitoring-
related committees mostly the audit committees that increase transparency (Adams & Ferreira,
2009). Furthermore, it has been found that the participation of women in boards promotes more
effective and prompt information to investors (Baumgartner, & Schneider, 2010). Additionally,
prior researchers have found that boardroom gender diversity is positively related to audit effort
and may reduce the ARL (Srinidhi, Gul, & Tsui, 2011) . Some studies find that boards with
female directors tend to be associated with more accurate earning forecast thus, reducing
23
information asymmetry (Gul, Hutchinson, & Lai, 2013). However, results have not been
conclusive whether gender diversity reduces information asymmetry by reducing ARL (Cai,
Keasey, & Short, 2006).
Prior studies in the US show the following existence of the committee at sixty nine percent,
independence at fifty seven percent, competence at fifty one percent, number of meeting at
thirty percent and its size at twenty two percent. These characteristics are expected to different
in different countries due to the different environmental factors of companies for instance,
concentration of ownership (Bédard & Gendron, 2010). The Code of Corporate Governance
Practices for issuers of Securities to the Public 2015 recommends that the board of directors of
listed companies should appoint an audit committee of not less than three independent non-
executive members. Prior studies show that audit committee size influences financial
disclosures (Li, Pike, & Haniffa, 2008b; Persons, 2009) where large audit committee are
expected to solve financial reporting problems at a faster rate than smaller committee due to
the increased resources available to the committee (Naimi Mohamad-Nor et al., 2010).
However, other studies show that there is a weak relationship between audit committee size
and the quality of financial information disclosure (Ahmad-Zaluki & Wan-Hussin, 2010).
Studies have found audit committee characteristics to be the board size, independence, number
of meetings and relevant expertise (Abbott, Parker, & Peters, 2004; Apadore & Mohd Noor,
2013).
Prior studies posit that independent audit committees are likely to effective if the committees
are active. One way of describing their activeness is in terms of the number of meetings held
(Menon & William, 1994). The Treadway Commission (1987) also known as the National
Committee on Fraudulent Financial Reporting states that audit committee that intend to be
actively involved in oversight need to maintain a high level of activity. Their diligence is
measured by the number of meeting held (Naimi Mohamad-Nor et al., 2010). In Kenya the
Code of Corporate Governance Practices for issuers of Securities to the Public 2015
recommends that audit committee should meet regularly. Other jurisdictions like the US
through the Blue Ribbon Committee (BRC) (1999) on audit committees recommend that audit
committee meetings should be not less than four in a year. While in the UK the number of
meetings should be not less than three in a year in light of the fact that companies are required
to produce interim financial reports semi-annually (Naimi Mohamad-Nor et al., 2010).
24
Prior studies show that the number of times audit committees meet is positively associated with
the level of disclosure and discretionary accruals are lower (Li et al., 2008b; Xie, Davidson III,
& Dadalt, 2003). In addition, other studies have high level of audit committee activity is
significantly in lowering financial restatement and fraudulent financial reporting (Abbott et al.,
2004; Persons, 2009). However, other studies find no significant association between the
number audit committee meetings and financial reporting quality. This inconsistency in
findings has motivated this study to find out the association in a Kenyan perspective. The
auditing environment necessitates the need for audit committee members to have a high degree
of accounting comprehension (Naimi Mohamad-Nor et al., 2010). Possession of the relevant
expertise enables the audit committee members to understand auditing issues and risks. Audit
committee members have been classified as financial experts if they have had past employment
in finance and /or accounting, requisite professional certification in accounting and /or any
other financial oversight experience or background which result in financial prowess (Felo &
Solieri, 2009) .
Prior studies show having the relevant financial expertise and prior experience and knowledge
in financial reporting and audit minimizes fraudulent financial reporting (Bédard, Chtourou, &
Courteau, 2004; McMullen & Raghunandan, 1996) and the audit committee is likely to make
expert judgment than those without (DeZoort & Salterio, 2001). In addition, audit committees
with financial expertise reduce financial restatements or constrain contributing to the timely
release of audit reports (Abbott et al., 2004; Xie et al., 2003). Other studies show that the
appointment of audit committee members who are financial experts has a positive stock market
reaction because the market’s expectation is that their financial prowess will be useful in their
financial monitoring role (DeFond, Hann, & Hu, 2005). In conclusion, these studies show that
possession of the relevant expertise is necessary for an audit committee to be in a position to
prevent and detect financial reporting errors in a timely manner thus reducing the ARL.
In Kenya the Code of Corporate Governance Practices for issuers of Securities to the Public
2015 recommends that the board for listed companies should establish an audit committee of
not less than three independent and non-executive members. Prior studies show that large audit
committees are more likely to uncover and resolve potential problems in the financial reporting
process in comparison to small audit committees and may be due to the committee availing
resources (Naimi Mohamad-Nor et al., 2010). The audit committee size has an influence in
timely financial reporting (Li, Pike, & Haniffa, 2008a; Persons, 2009). Other studies however,
25
provide weak evidence that audit committee size is positively associated with timely financial
reporting (Ahmad-Zaluki & Wan-Hussin, 2010). In addition, other studies show that audit
committee size is not a significant driver of effectiveness (Bédard & Gendron, 2010). Despite
that advantage of having the capability of availing more resources a large audit committee may
face problems of incremental costs of poor communication, inability of reaching consensus in
a timely manner thus affecting the audit releasing period (Bédard & Gendron, 2010).
Javed and Iqbal (2006) proposed an index that would measure corporate governance quality
using twenty two factors. These factors were divided into three major groups the first group
being the composition of board independence autonomy that measures the structure and
effectiveness of the board of directors. The second being the company’s property and
shareholders and the third is clearness, disclosure and accountability. The maximum score is
100 (Javed and Iqbal, 2006). Shah, Butt, & Hasan (2009) suggested that corporate governance
is a function of board composition, ownership structure and audit committee independent. They
developed an index that gave weights to the factors based on their relative importance then
calculated the sum of the weights (Shah et al., 2009). da Silveira Di Miceli, Leal, Barros, &
Carvalhal-da-Silva (2009) created an index called the corporate governance practice index
which is computed from the responses of twenty four binary and objective questions .Each
positive answer adds one point so the final score for each firm ranges from 0 to 24 that is, worst
to best corporate governance quality (da Silveira Di Miceli et al., 2009)
Gompers, Ishii, & Metrick (2003) developed an index that comprised of five levels which
included twenty four different variables related to corporate governance systems of companies.
Companies that had scored five or less than five had stronger corporate governance
mechanisms and companies that scored fourteen and above had weak corporate governance
structures (Gompers et al., 2003). For the purpose of this study the researcher adopted an index
developed by Zitouni (2016). He used the Data Envelopment Analysis approach which
incorporates endogenous or exogenous relations between different mechanisms and corporate
governance mechanisms. Additionally, it has the ability to simultaneously integrate multiple
inputs and outputs without explicitly specifying priori functional form. It also determines a
“good practice” frontier a kind of benchmarking of firms whose combination of governance
standards. Units that operate efficiently have a score equal to one while less efficient have a
score of less than one (Zitouni, 2016).
26
Audit committee quality is defined in terms of the composition of the board and its activities
(Jayanthi Krishnan, 2005). The audit committee plays a vital role in not only monitoring of
internal controls to ensure the quality of financial reporting is not compromised, also but acts
as corporate governance mechanism (Carcello & Neal, 2000; Klein, 2002). The corporate
governance aspect of the audit committee comes about because of the potential litigation risk
and reputation impairment (Zhang, Zhou, & Zhou, 2007).Prior studies show that the audit
committee quality is associated with financial reporting outcomes that is timely release of audit
report is associated with high quality audit committees (Carcello & Neal, 2000; Klein, 2002).
The Blue Ribbon Committee (BRC), (1999) recommended that audit committees should have
at least one member with professional qualifications; this is because they can perform their role
in financial reporting more effectively (Raghunandan, Read, & Rama, 2001). Kenya has
adopted the Code of Corporate Governance Practices for issuers of Securities to the Public
2015 recommends that audit committee should have not less than three independent and non-
executive directors and have at least one director with a professional qualification in audit or
accounting. The discussions led to the following hypothesis.
H3: Corporate governance related factors have a positive effect on ARL (CGQS and ACQS).
2.3.2.4 Stakeholder perceptions on ARL and its determinants
It is paramount to understand the perceptions of auditors regarding ARL because any difference
that may arise may contribute to a longer or shorter ARL. Prior studies indicate that auditor
perceive the completion of an audit in good time as a significant contributor to audit efficiency
(Carcello, Hermanson, & McGrath, 1992). Auditors perceive that a lengthy interaction between
them and their clients implies high audit risk to their integrity, internal and the financial
reporting process (Mande & Son, 2011). Prior studies have found that auditor resignations
occur in the year following lengthy ARL (Mande & Son, 2011). Longer audit delays usually
occur due to disagreements between the auditor and client on accounting issues and general
deterioration in the quality of auditor- client interaction. Audit delays may also be caused by
problems in the audit, a client firm has high inherent and control risk requiring more work by
the auditor (Ireland, 2003). Big four audit firms are more likely than non-big four audit firms
to provide better monitoring of financial reporting process but a change in audit firm would
reduce the audit quality and increase the likelihood of audit delays (Cassell, Giroux, Myers, &
Omer, 2007).
27
Prior studies indicate that auditors take actions to mitigate their risk exposure when managing
their clients ‘portfolios. Clients in financial distress are more likely to be dropped by big four
audit firms in comparison to those not experiencing financial distress (Schwartz & Menon,
1985). Jones and Raghunandan (1998) also found that clients portfolio in the big 6 audit firms
comprised less of financially distressed companies during a period of increased litigation.
Krishnan and Krishnan (1997) argued that litigation risk proxied by Stice's (1991) litigation
score is positively associated with auditor resignations. Johnstone & Bedard (2004) posit that,
financial distress, audit risk factors relating to managements’ integrity, internal controls, and
financial reporting quality have a great impact on an auditors’ decision to retain or dismiss
clients.
The agency theory is an important tool in managing conflicts between managers and auditors
long ARL portrays a negative image of managers to the shareholders therefore managers
perceive that shorter ARL means good news to shareholders which could result in rewards
(Matos, 2001). From a managers perspective factors that may contribute to long ARL are weak
internal controls , lack of funds to seek Big 4 auditors and the incentive to delay “bad news”
(Kothari et al., 2009). From an investors’ perspective, a lengthy audit delay could suggest there
has been a deterioration in the quality of client-auditor interaction which could translate into
an auditor change, and a negative stock market reaction (Krishnamurthy et al., 2006).
2.4 Summary of literature
The chapter began by discussing the extant theories underpinning this study. The agency
signaling and stakeholder theories and informed the selection of the auditor, company specific
and corporate governance characteristics as drivers of ARL. These theories provided a
framework in which these variables could be associated and examined. Empirical literature
review revealed that the auditor related characteristics were audit fees, auditor type and audit
risk. The company specific characteristics were size of the company, profitability, complexity,
industry sector, profit warnings, ownership concentration, leverage and foreign ownership. The
corporate governance characteristics were board and audit committee characteristics. A review
of literature revealed that the examination of drivers of ARL was still an area of interest. The
variables of interest were then operationalized through a review of literature. The theoretical
and empirical review of literature revealed that drivers of ARL were an area suitable for further
research based on unique institutional and country characteristics. The chapter concluded with
the conceptual framework which depicted the association between the variables of interest.
28
2.5 Research Gap
While these studies on audit delay share many similarities, they also present peculiarities that
differentiate them. Prior studies show differences in respect of periods, methodology, variables
introduced and conclusions obtained. In this research the inevitable gap existing between the
close of the accounting period and the date of signing of the audit report is analyzed, taking the
view that minimizing this gap would improve the efficiency of the market (Leventis et al.,
2005). A review of literature has established that most studies on ARL have focused on the
components of corporate governance and less on the quality of corporate governance.
Moreover, studies have also focused on profitability of companies and few on profit warning.
It has also revealed that different countries have different institutional set-ups.
2.6 Conceptual framework
The conceptual framework is described as an elaborate network of associations between the
dependent independent and confounding variables considered as relevant to the problem being
addressed by the study (Kothari, 2009). The dependent variable is the variable of primary
interest (Sekaran & Bougie, 2013). The confounding variable is the variable that obscures the
effects of another variable or one that correlates with the independent and dependent variables
(Frank, 2000). The confounding variable in this study is the ARL in Kenyan listed companies.
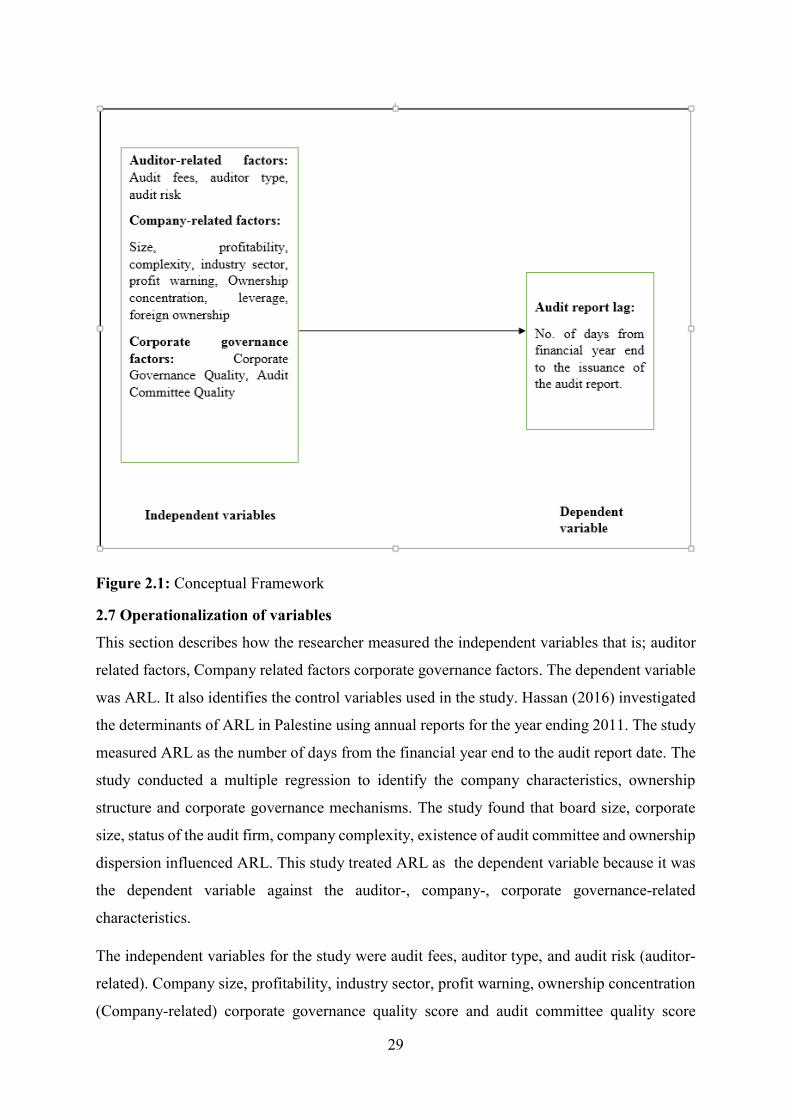
29
Figure 2.1: Conceptual Framework
2.7 Operationalization of variables
This section describes how the researcher measured the independent variables that is; auditor
related factors, Company related factors corporate governance factors. The dependent variable
was ARL. It also identifies the control variables used in the study. Hassan (2016) investigated
the determinants of ARL in Palestine using annual reports for the year ending 2011. The study
measured ARL as the number of days from the financial year end to the audit report date. The
study conducted a multiple regression to identify the company characteristics, ownership
structure and corporate governance mechanisms. The study found that board size, corporate
size, status of the audit firm, company complexity, existence of audit committee and ownership
dispersion influenced ARL. This study treated ARL as the dependent variable because it was
the dependent variable against the auditor-, company-, corporate governance-related
characteristics.
The independent variables for the study were audit fees, auditor type, and audit risk (auditor-
related). Company size, profitability, industry sector, profit warning, ownership concentration
(Company-related) corporate governance quality score and audit committee quality score
30
Corporate governance-related. Baatwah et al. (2015) investigated the CEO characteristics and
audit report timeliness. The study utilized the amount paid to external auditors for an audit
engagement. The audit fees were transformed into natural logarithm. Mohamad-Nor, Shafie
and Wan-Hussin (2010) investigated Corporate governance and audit report lag in Malaysia
following the implementation of the Malaysian Code on Corporate Governance in 2001. The
study treated auditor type as a dummy variable where if an audit firm was among the Big 4
audit firms 1 was scored and 0 if it was not among the Big 4. Consistent with the study, this
study also treated auditor type as a dummy variable.
Sultana et al. (2015) examined the audit committee characteristics and the ARL. The study
estimated audit risk as the ratio of current liabilities to current assets. Consistent with the study
this study measured audit risk as the ratio of current liabilities to current assets. Baatwah et al.
(2015) examined CEO characteristics and audit report timeliness using data from the Oman
capital market for a five year period from 2007-2011. The study measured company size using
the log of total assets. Similar to the study, this study utilized the log of total assets to measure
company size.
Apadore and Mohd Noor (2013) analyzed the relation between the characteristics of corporate
governance; board independence, ownership concentration, audit committee independence,
expertise, meeting, size, internal audit investment and audit report lag among companies listed
under Bursa Malaysia 2009 to 2010. The study estimated ROA as net income to total assets
ratio. Similarly, this study measured ROA as the profit after tax to total assets ratio.
Additionally, Puat Nelson and Norwahida Shukeri (2011) examined the impact of corporate
governance characteristics on ARL in Malaysia. The study treated firm performance as a
dummy variable where 1 was scored if company made profits and 0 otherwise. Similarly, this
study employed the dummy variable measure used by to measure firm performance.
Henderson and Kaplan (2000) investigated the determinants of ARL in the banking sector. The
study treated industry sector as a dichotomous variable where 1 was scored if the company was
in the banking sector and 0 otherwise. Similarly, this study treated the listed companies
belonging to the different sectors as dummy variables.1 was scored if firm was in the
agricultural sector and 0 otherwise. Similarly 1 was scored if firm was in the manufacturing
and allied and 0 otherwise. 1 was scored if firm was in the automobiles and accessories sector
and 0 otherwise. 1 was scored if firm was in the banking sector and 0 otherwise. 1 was scored
if firm was in the insurance sector and 0 otherwise. 1 was scored if firm was in the investment
31
sector and 0 otherwise. 1 was scored if firm was in the commercial and services sector and 0
otherwise. 1 was scored if firm was in the construction and allied sector and 0 otherwise. 1 was
scored if firm was in the energy and petroleum sector and 0 otherwise. 1 was scored if firm
was in the telecommunication and technology sector and 0 otherwise (Henderson & Kaplan,
2000).
Soltani (2002) investigated the timeliness of corporate and audit reports in the French context
over a ten year period. The study treated profit warning as a dichotomous variable where 1
was scored if company issued profit warning and 0 otherwise.as was the case in previous
studies this study also treated profit warning as a dummy variable (Soltani, 2002). Carslaw and
Kaplan (1991) examined audit delay in New Zealand using company (owner control and
manager control) explanatory variables. The study estimated ownership concentration as a
dummy variable where 1 was scored if owner or manager had 30% or more ownership and 0
otherwise. Similarly, this study treated ownership concentration as a dummy variable.
Mathuva, Mboya and Mcfie (2016) examined the association of the governance of credit unions
and their social environmental disclosure in a developing country. The study utilized a
corporate governance quality index to measure corporate governance quality and an audit
committee quality index to measure audit committee quality. Similary, Zitouni (2016)
developed an index that consituted governance mechanisms as inputs and governance
standards from the codes of good practices as the outputs. These studies treated the following
as dummy variables ; board size, independence, training of board members, board meetings,
audit committee presence, AC size, AC meetings, relevant expertise, presence of compensation
committee, CEO presence in compensation committee, gender diversity, presence of other
committees, financial expertise and supervisory experiencce.
Al-Ajmi (2008) investigated of the timeliness of annual reports of an unbalanced panel of 231
firm-years of financial and non-financial copanies listed on the Bahrain Stock Exchange. The
study measured leverage as total liabilities divided by total assets. Similarly, this study
employed the total liabilities to total assets ratio to estimate leverage. Baatwah et al. (2015)
examined CEO characteristics and audit report timeliness using data from the Oman capital
market for a five year period from 2007-2011. The study measured firm performance using
ROA calculated as the profit after tax divided by total assets. Similarly, this study estimated
firm performance using ROA. Table 2.1 presents the variables definitions used by this study.
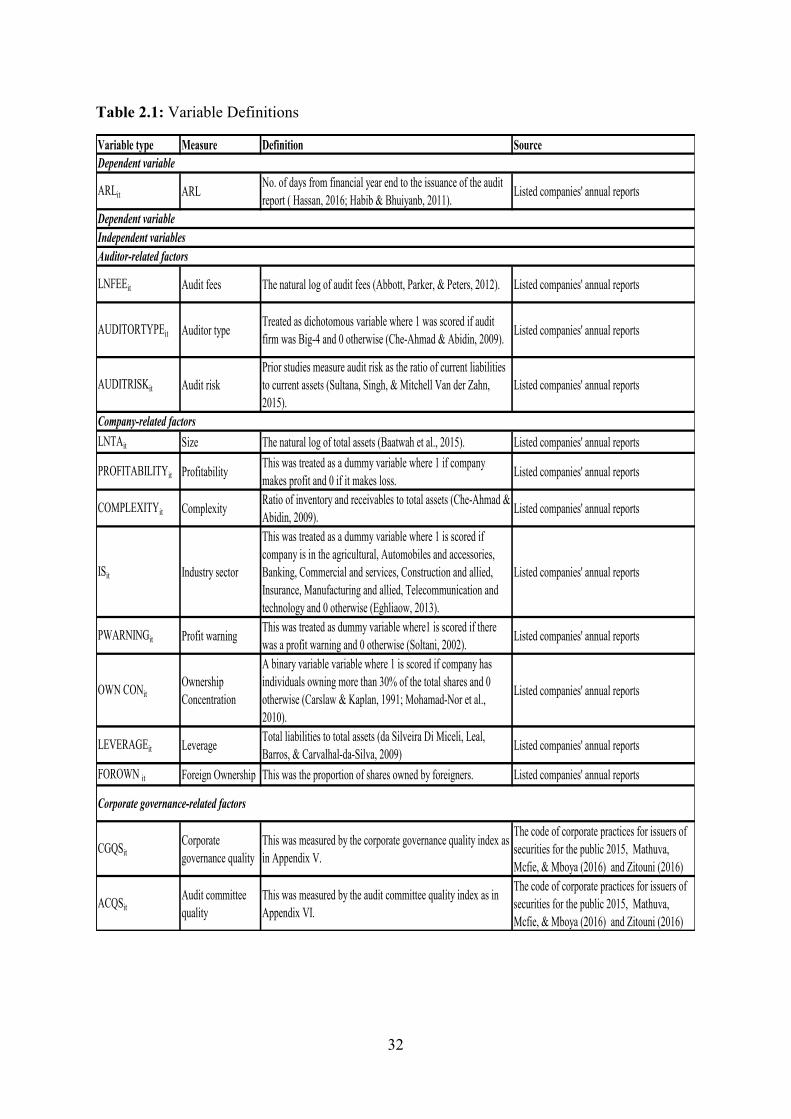
32
Table 2.1: Variable Definitions
Variable type Measure Definition Source
ARLit ARLNo. of days from financial year end to the issuance of the audit
report ( Hassan, 2016; Habib & Bhuiyanb, 2011).Listed companies' annual reports
LNFEEit Audit fees The natural log of audit fees (Abbott, Parker, & Peters, 2012). Listed companies' annual reports
AUDITORTYPEit Auditor typeTreated as dichotomous variable where 1 was scored if audit
firm was Big-4 and 0 otherwise (Che-Ahmad & Abidin, 2009). Listed companies' annual reports
AUDITRISKit Audit risk
Prior studies measure audit risk as the ratio of current liabilities
to current assets (Sultana, Singh, & Mitchell Van der Zahn,
2015).
Listed companies' annual reports
LNTAit Size The natural log of total assets (Baatwah et al., 2015). Listed companies' annual reports
PROFITABILITYit ProfitabilityThis was treated as a dummy variable where 1 if company
makes profit and 0 if it makes loss.Listed companies' annual reports
COMPLEXITYit ComplexityRatio of inventory and receivables to total assets (Che-Ahmad &
Abidin, 2009). Listed companies' annual reports
ISit Industry sector
This was treated as a dummy variable where 1 is scored if
company is in the agricultural, Automobiles and accessories,
Banking, Commercial and services, Construction and allied,
Insurance, Manufacturing and allied, Telecommunication and
technology and 0 otherwise (Eghliaow, 2013).
Listed companies' annual reports
PWARNINGit Profit warningThis was treated as dummy variable where1 is scored if there
was a profit warning and 0 otherwise (Soltani, 2002).Listed companies' annual reports
OWN CONit
Ownership
Concentration
A binary variable variable where 1 is scored if company has
individuals owning more than 30% of the total shares and 0
otherwise (Carslaw & Kaplan, 1991; Mohamad-Nor et al.,
2010).
Listed companies' annual reports
LEVERAGEit LeverageTotal liabilities to total assets (da Silveira Di Miceli, Leal,
Barros, & Carvalhal-da-Silva, 2009)Listed companies' annual reports
FOROWN it Foreign Ownership This was the proportion of shares owned by foreigners. Listed companies' annual reports
CGQSit
Corporate
governance quality
This was measured by the corporate governance quality index as
in Appendix V.
The code of corporate practices for issuers of
securities for the public 2015, Mathuva,
Mcfie, & Mboya (2016) and Zitouni (2016)
ACQSit
Audit committee
quality
This was measured by the audit committee quality index as in
Appendix VI.
The code of corporate practices for issuers of
securities for the public 2015, Mathuva,
Mcfie, & Mboya (2016) and Zitouni (2016)
Corporate governance-related factors
Dependent variable
Dependent variable
Independent variables
Auditor-related factors
Company-related factors
33
CHAPTER THREE
RESEARCH METHODOLOGY
3.1 Introduction
This chapter presents the methodology for collecting and analyzing the data for testing the
objectives of the study. It discussed the research design, research philosophy, population and
data collection techniques to be used. It began with a rationale for the broad research
philosophy underpinning the quantitative and qualitative approach taken by this study. It
discussed the primary and secondary data collection methods to be used and the methods used
to analyze data from both sources. This chapter also discussed the regression model to be used
in analyzing secondary data.
3.2 Research Philosophy
Various authors have argued on different research ideologies known as paradigm argument
that have shaped knowledge development over the years (Alzheimer Europe, 2009).This
research employed an ontological research philosophy paradigm which relates more to the
dynamics of human beings (Agyeman, 2010). A positivistic research is one that deals with
units that can be observed and tested (Agyeman, 2010; Remenyi, Williams, Money, & Swartz,
1998) stated “a positivist approach to research implies that the researcher is working with an
observable social reality, for which the end product of such reality should be the derivation of
laws or law like generalizations”.
Consistent with prior studies (Eghliaow, 2013) on audit delay in Libya, this study was guided
by the post positivism philosophical approach with the premise that the social reality exists
“out there” and can be scientifically measured. A nomothetic will be applied which enables the
researcher to apply statistical techniques to test hypotheses and analyze research data collated
using quantitative research techniques, such as questionnaire (Castro-Schilo & Ferrer, 2013).
Post positivism philosophical assumptions include causality determinism where cause
determines effect and reductionism where ideas are reduced and theories verified using
empirical methods (Creswell, 2003) .
3.3 Research Design
The development of a good research design permits us to obtain the best data possible
(Creswell, 2012). This study employed a descriptive research design because the study
involved an investigation of the drivers of ARL. Descriptive research design enabled the
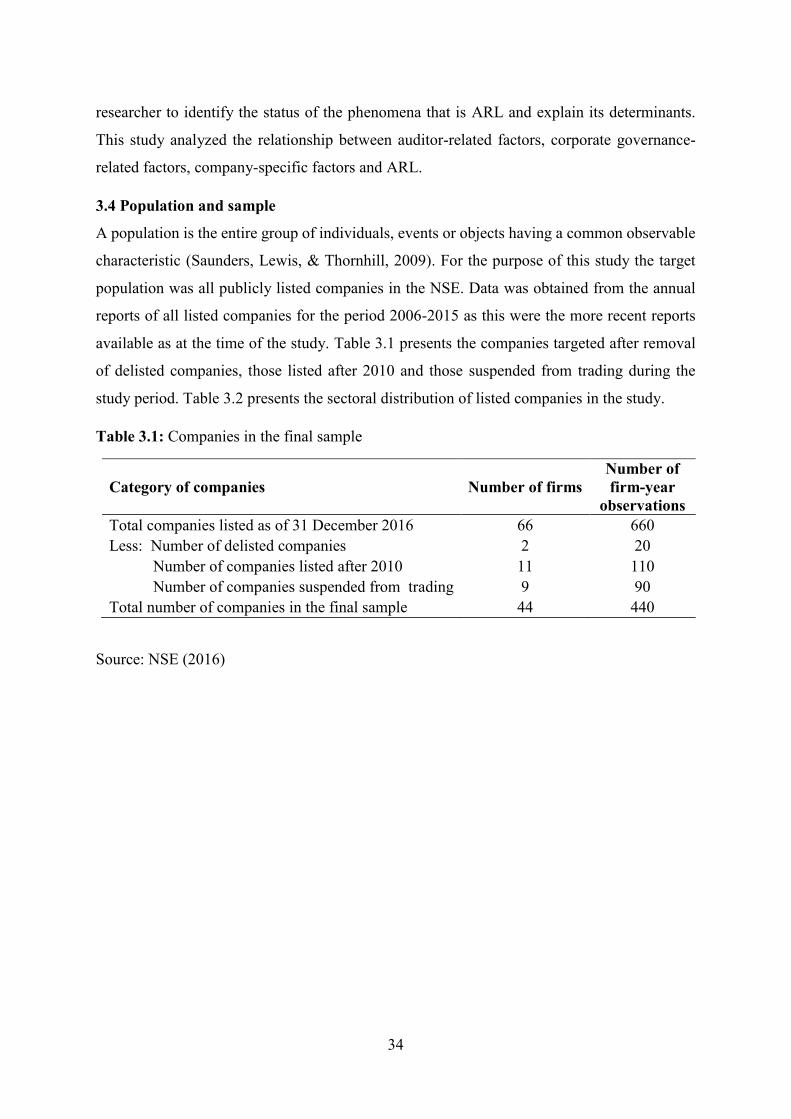
34
researcher to identify the status of the phenomena that is ARL and explain its determinants.
This study analyzed the relationship between auditor-related factors, corporate governance-
related factors, company-specific factors and ARL.
3.4 Population and sample
A population is the entire group of individuals, events or objects having a common observable
characteristic (Saunders, Lewis, & Thornhill, 2009). For the purpose of this study the target
population was all publicly listed companies in the NSE. Data was obtained from the annual
reports of all listed companies for the period 2006-2015 as this were the more recent reports
available as at the time of the study. Table 3.1 presents the companies targeted after removal
of delisted companies, those listed after 2010 and those suspended from trading during the
study period. Table 3.2 presents the sectoral distribution of listed companies in the study.
Table 3.1: Companies in the final sample
Category of companies Number of firms
Number of
firm-year
observations
Total companies listed as of 31 December 2016 66 660
Less: Number of delisted companies 2 20
Number of companies listed after 2010 11 110
Number of companies suspended from trading 9 90
Total number of companies in the final sample 44 440
Source: NSE (2016)
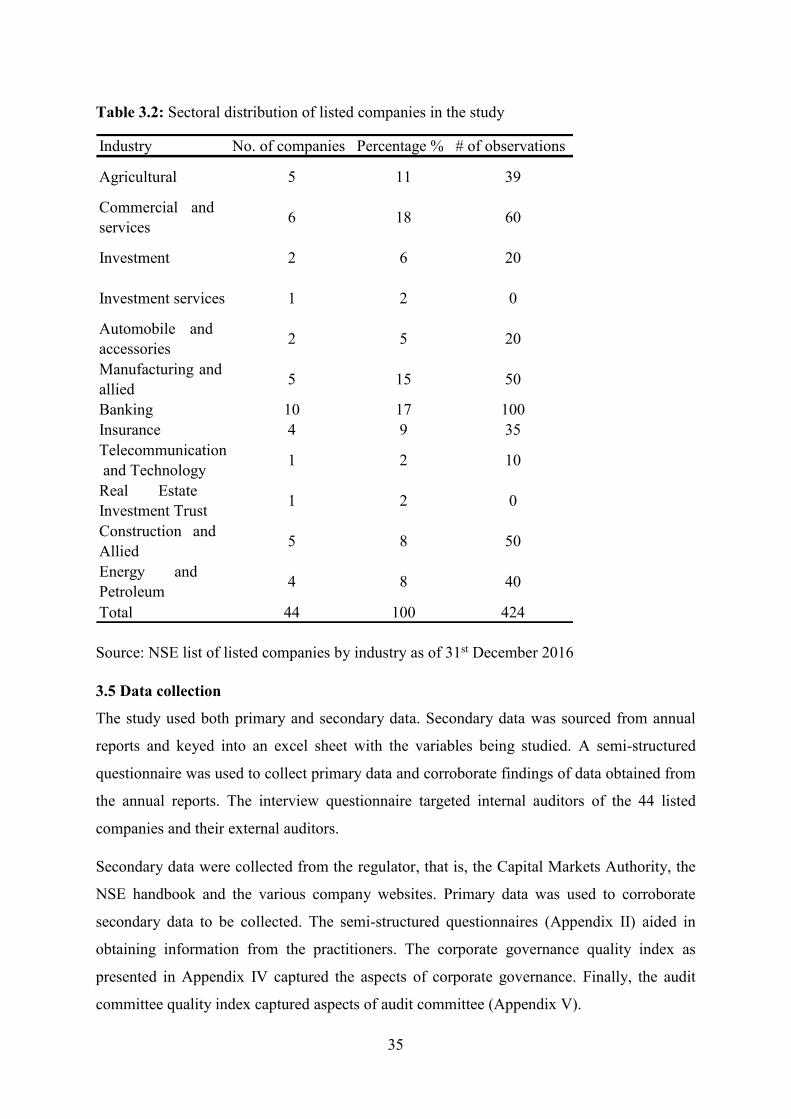
35
Table 3.2: Sectoral distribution of listed companies in the study
Source: NSE list of listed companies by industry as of 31st December 2016
3.5 Data collection
The study used both primary and secondary data. Secondary data was sourced from annual
reports and keyed into an excel sheet with the variables being studied. A semi-structured
questionnaire was used to collect primary data and corroborate findings of data obtained from
the annual reports. The interview questionnaire targeted internal auditors of the 44 listed
companies and their external auditors.
Secondary data were collected from the regulator, that is, the Capital Markets Authority, the
NSE handbook and the various company websites. Primary data was used to corroborate
secondary data to be collected. The semi-structured questionnaires (Appendix II) aided in
obtaining information from the practitioners. The corporate governance quality index as
presented in Appendix IV captured the aspects of corporate governance. Finally, the audit
committee quality index captured aspects of audit committee (Appendix V).
Industry No. of companies Percentage % # of observations
Agricultural 5 11 39
Commercial and
services6 18 60
Investment 2 6 20
Investment services 1 2 0
Automobile and
accessories2 5 20
Manufacturing and
allied5 15 50
Banking 10 17 100
Insurance 4 9 35
Telecommunication
and Technology1 2 10
Real Estate
Investment Trust1 2 0
Construction and
Allied5 8 50
Energy and
Petroleum4 8 40
Total 44 100 424
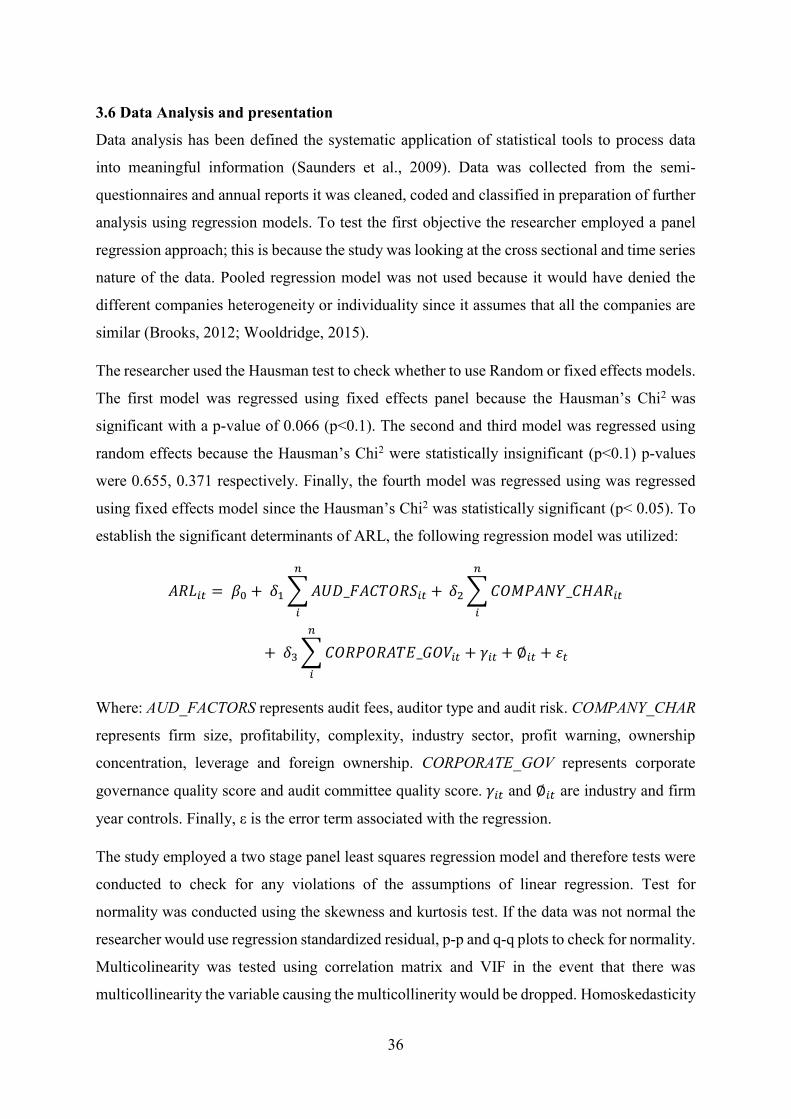
36
3.6 Data Analysis and presentation
Data analysis has been defined the systematic application of statistical tools to process data
into meaningful information (Saunders et al., 2009). Data was collected from the semi-
questionnaires and annual reports it was cleaned, coded and classified in preparation of further
analysis using regression models. To test the first objective the researcher employed a panel
regression approach; this is because the study was looking at the cross sectional and time series
nature of the data. Pooled regression model was not used because it would have denied the
different companies heterogeneity or individuality since it assumes that all the companies are
similar (Brooks, 2012; Wooldridge, 2015).
The researcher used the Hausman test to check whether to use Random or fixed effects models.
The first model was regressed using fixed effects panel because the Hausman’s Chi2 was
significant with a p-value of 0.066 (p<0.1). The second and third model was regressed using
random effects because the Hausman’s Chi2 were statistically insignificant (p<0.1) p-values
were 0.655, 0.371 respectively. Finally, the fourth model was regressed using was regressed
using fixed effects model since the Hausman’s Chi2 was statistically significant (p< 0.05). To
establish the significant determinants of ARL, the following regression model was utilized:
𝐴𝑅𝐿𝑖𝑡 = 𝛽0 + 𝛿1 ∑ 𝐴𝑈𝐷_𝐹𝐴𝐶𝑇𝑂𝑅𝑆𝑖𝑡 +
𝑛
𝑖
𝛿2 ∑ 𝐶𝑂𝑀𝑃𝐴𝑁𝑌_𝐶𝐻𝐴𝑅𝑖𝑡
𝑛
𝑖
+ 𝛿3 ∑ 𝐶𝑂𝑅𝑃𝑂𝑅𝐴𝑇𝐸_𝐺𝑂𝑉𝑖𝑡 + 𝛾𝑖𝑡 + ∅𝑖𝑡 + 휀𝑡
𝑛
𝑖
Where: AUD_FACTORS represents audit fees, auditor type and audit risk. COMPANY_CHAR
represents firm size, profitability, complexity, industry sector, profit warning, ownership
concentration, leverage and foreign ownership. CORPORATE_GOV represents corporate
governance quality score and audit committee quality score. 𝛾𝑖𝑡 and ∅𝑖𝑡 are industry and firm
year controls. Finally, ε is the error term associated with the regression.
The study employed a two stage panel least squares regression model and therefore tests were
conducted to check for any violations of the assumptions of linear regression. Test for
normality was conducted using the skewness and kurtosis test. If the data was not normal the
researcher would use regression standardized residual, p-p and q-q plots to check for normality.
Multicolinearity was tested using correlation matrix and VIF in the event that there was
multicollinearity the variable causing the multicollinerity would be dropped. Homoskedasticity
37
would be tested using Lagrange Multiplier (LM) test if the source of the heteroscedasticity is
known GLS would be employed for the regression. In the event the source of the
heteroscedasticy is not known the variables would be converted into logarithms.
Autocorrelation would be testes using the Durbin-Watson (DW) test. In the event there was
autocorrelation the study would use a general to specific model as done in prior studies (Mizon,
1995).
3.7 Research quality
3.7.1 Internal validity
Internal validity addresses whether or not an observed covariation should be considered a
causal relationship (Calder, Phillips, & Tybout, 1982). To ensure internal validity the
researcher conducted a pilot study before issuance of the questionnaire to the intended
respondents. The questionnaire was issued to five MCOM students specializing in forensic
accounting, three accounting lecturers and two external auditors. Feedback from the
respondents led to the deletion of some questions due to their repetitiveness.
3.7.2 External validity
External validity addresses the concern of whether or not a causal relationship should be
generalized (Calder et al., 1982). To ensure external validity the study ensured that majority of
the listed companies were included in the sample as can be seen in table 3.1.
3.8 Ethical considerations
Ethical considerations in research is important especially when it involves human beings
(Cooper & Schindler, 2010). Research ethics is defined as the appropriate behavior of research
relative to norms of the society (Zikmund, 2010). Research may have adverse consequences
and therefore research subjects have to be protected (Cooper & Schindler, 2010 ; Patton, 2002
; Sekaran & Bougie, 2013). This research considered ethical considerations in the following
ways. First, participation was voluntary and participants reserved the right to withdraw at any
time. Secondly, the participants were informed of the purpose of this study using a cover letter
approved by the university that accompanied the questionnaire. Thirdly, the cover letter assured
the participants of total confidentiality. Finally, the identities of the participants were kept
private and confidential.
38
CHAPTER FOUR
PRESENTATION OF RESEARCH FINDINGS
4.1 Introduction
This chapter presents the findings of analysis done on data derived from annual reports and
questionnaires. Data from questionnaires were collected from internal and external auditor of
companies listed in the Nairobi securities exchange. The section is organized into two parts.
Part A: results from secondary data analysis. Part B: results from primary data. Part A presents
the diagnostic tests, correlation matrix, selecting the significant determinants of ARL, final
model using most significant variables and robustness checks. Part B presents the demographic
characteristics, auditor and manager perspectives on the drivers of ARL.
4.2 Results from secondary data analysis
4.3 Diagnostics tests
This section entails the diagnostic tests carried out prior to the multiple-regression.
4.3.1 Test for Heteroscedasticity
Heteroscedasticity is a problem that exists if the errors do not have a constant variance, that is,
var(ut) = σ2 < ∞ (Brooks, 2012; Wooldridge, 2015). Consistent with prior studies the Lagrange
Multiplier was used to check for heteroscedasticity (Yaacob & Che-Ahmad, 2012). The
Lagrange Multiplier is calculated by using R2 from the auxiliary regression and multiplying it
by the number of observations, that is, TR2 ∼ χ2(m) where m is the number of regressors in
the auxiliary regression (Brooks, 2012; Wooldridge, 2015). The null hypothesis was H0=0,
there is no heteroscedasticity. Table 4.1 shows how the Lagrange Multiplier (LM) was arrived
at. According to these findings the calculated LM for model one was 270.297 and the 5%
critical value from the χ2 was 7.815 which lead to the conclusion that there was
heteroscedasticity since the researcher rejected the null hypothesis. Similarly, the calculated
LM for model two was 69.488 and the 5% critical value from the χ 2 was 21.026 which lead to
the conclusion that there was no heteroscedasticity since the researcher did not reject the null
hypothesis.
The calculated LM for model three was 5.936 and the 5% critical value from the χ2 was 5.991
which lead to the conclusion that there was no heteroscedasticity since the researcher did not
reject the null hypothesis. A possible solution is the use of generalized least squares (GLS)
however since the cause of the heteroscedasticity was not known GLS could not be used.
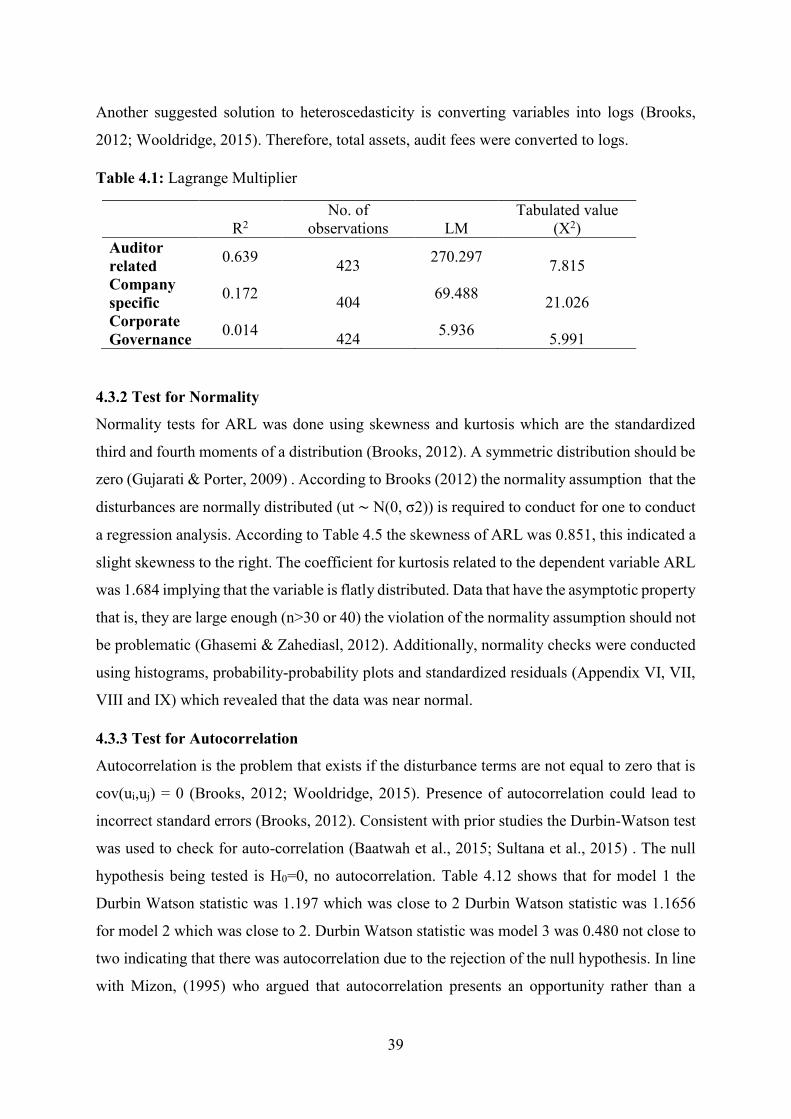
39
Another suggested solution to heteroscedasticity is converting variables into logs (Brooks,
2012; Wooldridge, 2015). Therefore, total assets, audit fees were converted to logs.
Table 4.1: Lagrange Multiplier
R2
No. of
observations LM
Tabulated value
(X2)
Auditor
related 0.639
423 270.297
7.815
Company
specific 0.172
404 69.488
21.026
Corporate
Governance 0.014
424 5.936
5.991
4.3.2 Test for Normality
Normality tests for ARL was done using skewness and kurtosis which are the standardized
third and fourth moments of a distribution (Brooks, 2012). A symmetric distribution should be
zero (Gujarati & Porter, 2009) . According to Brooks (2012) the normality assumption that the
disturbances are normally distributed (ut ∼ N(0, σ2)) is required to conduct for one to conduct
a regression analysis. According to Table 4.5 the skewness of ARL was 0.851, this indicated a
slight skewness to the right. The coefficient for kurtosis related to the dependent variable ARL
was 1.684 implying that the variable is flatly distributed. Data that have the asymptotic property
that is, they are large enough (n>30 or 40) the violation of the normality assumption should not
be problematic (Ghasemi & Zahediasl, 2012). Additionally, normality checks were conducted
using histograms, probability-probability plots and standardized residuals (Appendix VI, VII,
VIII and IX) which revealed that the data was near normal.
4.3.3 Test for Autocorrelation
Autocorrelation is the problem that exists if the disturbance terms are not equal to zero that is
cov(ui,uj) = 0 (Brooks, 2012; Wooldridge, 2015). Presence of autocorrelation could lead to
incorrect standard errors (Brooks, 2012). Consistent with prior studies the Durbin-Watson test
was used to check for auto-correlation (Baatwah et al., 2015; Sultana et al., 2015) . The null
hypothesis being tested is H0=0, no autocorrelation. Table 4.12 shows that for model 1 the
Durbin Watson statistic was 1.197 which was close to 2 Durbin Watson statistic was 1.1656
for model 2 which was close to 2. Durbin Watson statistic was model 3 was 0.480 not close to
two indicating that there was autocorrelation due to the rejection of the null hypothesis. In line
with Mizon, (1995) who argued that autocorrelation presents an opportunity rather than a
40
problem and can be avoided by a “general to specific strategy” this study used a two-stage
panel least squares regressions model (Mizon, 1995).
4.3.4 Test for Multi-collinearity
Multi-collinearity has been defined as the problem that arises when two or more independent
variables are highly correlated (Brooks, 2012). Consistent with prior studies related to ARL
multi-collinearity was tested using the correlation matrix (Mande & Son, 2011; Waweru et al.,
2015). Evidence from the correlation matrix shows that the highest coefficient correlation was
at 0.687 which was less than 0.8 meaning that multi-collinearity was not a problem. Therefore,
there was also no multi-collinearity. Additional tests were conducted using the Variance
Inflation Factor VIF). Prior studies show that a VIF geater than five (tolerance <0.20) implies
that the regression coefficients were poorly estimated (Hair, Ringle, & Sarstedt, 2013;
Mardikyan & Çetin, 2008). Table 4.2 presents the multicollinearity test using VIF. Prior studies
show that VIF that is less than ten implies no multi-collinearity (Dao & Pham, 2014).
According to the findings in table 4.2 the VIF of the independent variables ranged between
1.17 and 8.331. The tolerance values ranged between 0.12 and 0.851. Therefore both the
tolerance values and VIF values showed that there was no multi-collinearity since they were
below 10 (Brooks, 2012; Dao & Pham, 2014). In conclusion, since there is no relationship
between the independent variables in the ARL the relationship can be said to be orthogonal.
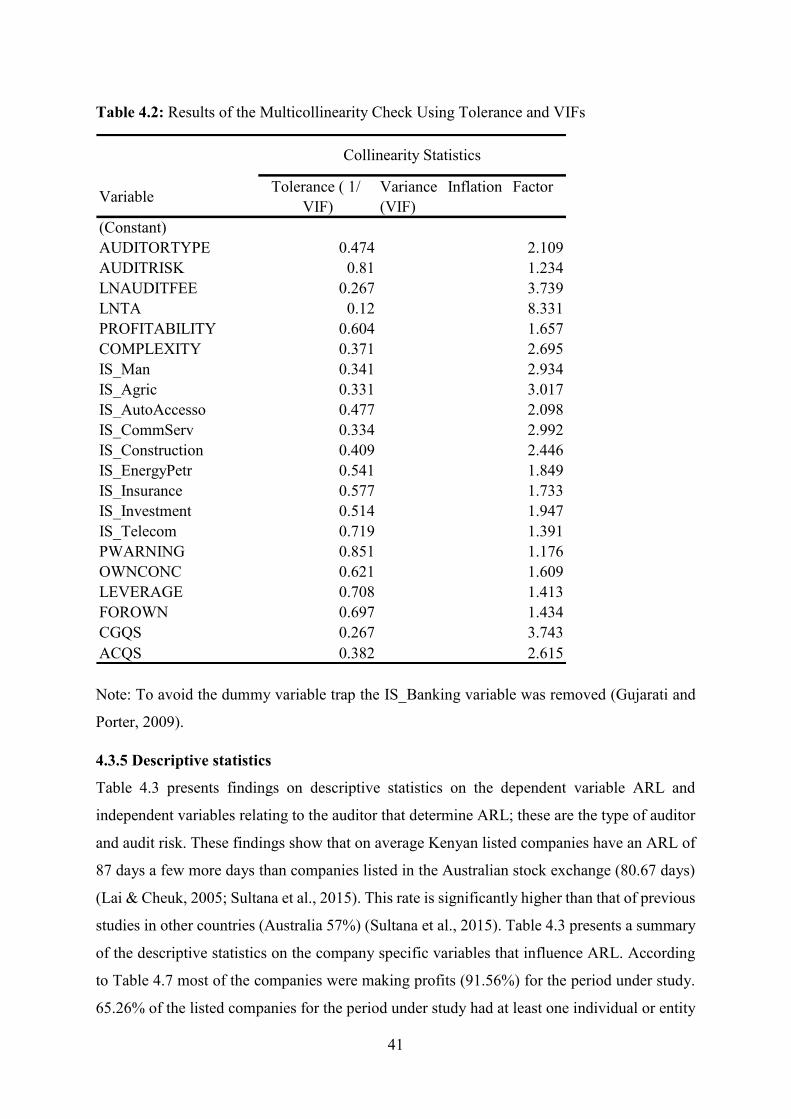
41
Table 4.2: Results of the Multicollinearity Check Using Tolerance and VIFs
Note: To avoid the dummy variable trap the IS_Banking variable was removed (Gujarati and
Porter, 2009).
4.3.5 Descriptive statistics
Table 4.3 presents findings on descriptive statistics on the dependent variable ARL and
independent variables relating to the auditor that determine ARL; these are the type of auditor
and audit risk. These findings show that on average Kenyan listed companies have an ARL of
87 days a few more days than companies listed in the Australian stock exchange (80.67 days)
(Lai & Cheuk, 2005; Sultana et al., 2015). This rate is significantly higher than that of previous
studies in other countries (Australia 57%) (Sultana et al., 2015). Table 4.3 presents a summary
of the descriptive statistics on the company specific variables that influence ARL. According
to Table 4.7 most of the companies were making profits (91.56%) for the period under study.
65.26% of the listed companies for the period under study had at least one individual or entity
VariableTolerance ( 1/
VIF)
Variance Inflation Factor
(VIF)
(Constant)
AUDITORTYPE 0.474 2.109
AUDITRISK 0.81 1.234
LNAUDITFEE 0.267 3.739
LNTA 0.12 8.331
PROFITABILITY 0.604 1.657
COMPLEXITY 0.371 2.695
IS_Man 0.341 2.934
IS_Agric 0.331 3.017
IS_AutoAccesso 0.477 2.098
IS_CommServ 0.334 2.992
IS_Construction 0.409 2.446
IS_EnergyPetr 0.541 1.849
IS_Insurance 0.577 1.733
IS_Investment 0.514 1.947
IS_Telecom 0.719 1.391
PWARNING 0.851 1.176
OWNCONC 0.621 1.609
LEVERAGE 0.708 1.413
FOROWN 0.697 1.434
CGQS 0.267 3.743
ACQS 0.382 2.615
Collinearity Statistics
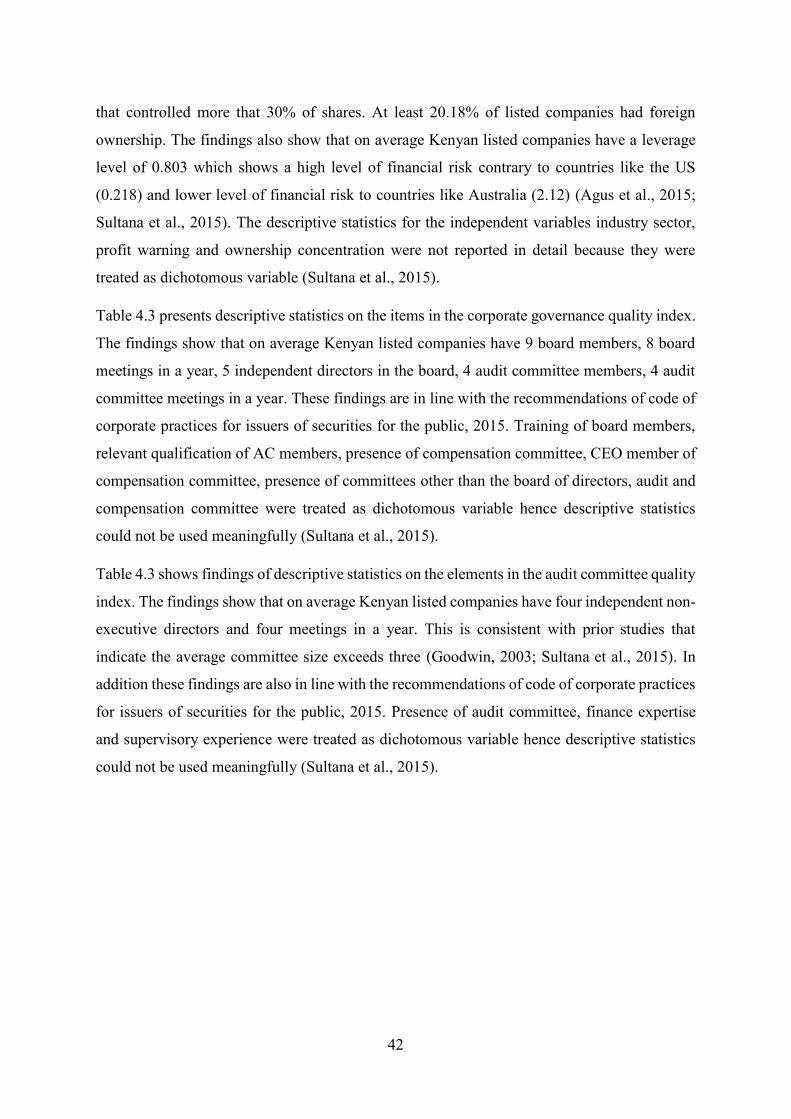
42
that controlled more that 30% of shares. At least 20.18% of listed companies had foreign
ownership. The findings also show that on average Kenyan listed companies have a leverage
level of 0.803 which shows a high level of financial risk contrary to countries like the US
(0.218) and lower level of financial risk to countries like Australia (2.12) (Agus et al., 2015;
Sultana et al., 2015). The descriptive statistics for the independent variables industry sector,
profit warning and ownership concentration were not reported in detail because they were
treated as dichotomous variable (Sultana et al., 2015).
Table 4.3 presents descriptive statistics on the items in the corporate governance quality index.
The findings show that on average Kenyan listed companies have 9 board members, 8 board
meetings in a year, 5 independent directors in the board, 4 audit committee members, 4 audit
committee meetings in a year. These findings are in line with the recommendations of code of
corporate practices for issuers of securities for the public, 2015. Training of board members,
relevant qualification of AC members, presence of compensation committee, CEO member of
compensation committee, presence of committees other than the board of directors, audit and
compensation committee were treated as dichotomous variable hence descriptive statistics
could not be used meaningfully (Sultana et al., 2015).
Table 4.3 shows findings of descriptive statistics on the elements in the audit committee quality
index. The findings show that on average Kenyan listed companies have four independent non-
executive directors and four meetings in a year. This is consistent with prior studies that
indicate the average committee size exceeds three (Goodwin, 2003; Sultana et al., 2015). In
addition these findings are also in line with the recommendations of code of corporate practices
for issuers of securities for the public, 2015. Presence of audit committee, finance expertise
and supervisory experience were treated as dichotomous variable hence descriptive statistics
could not be used meaningfully (Sultana et al., 2015).
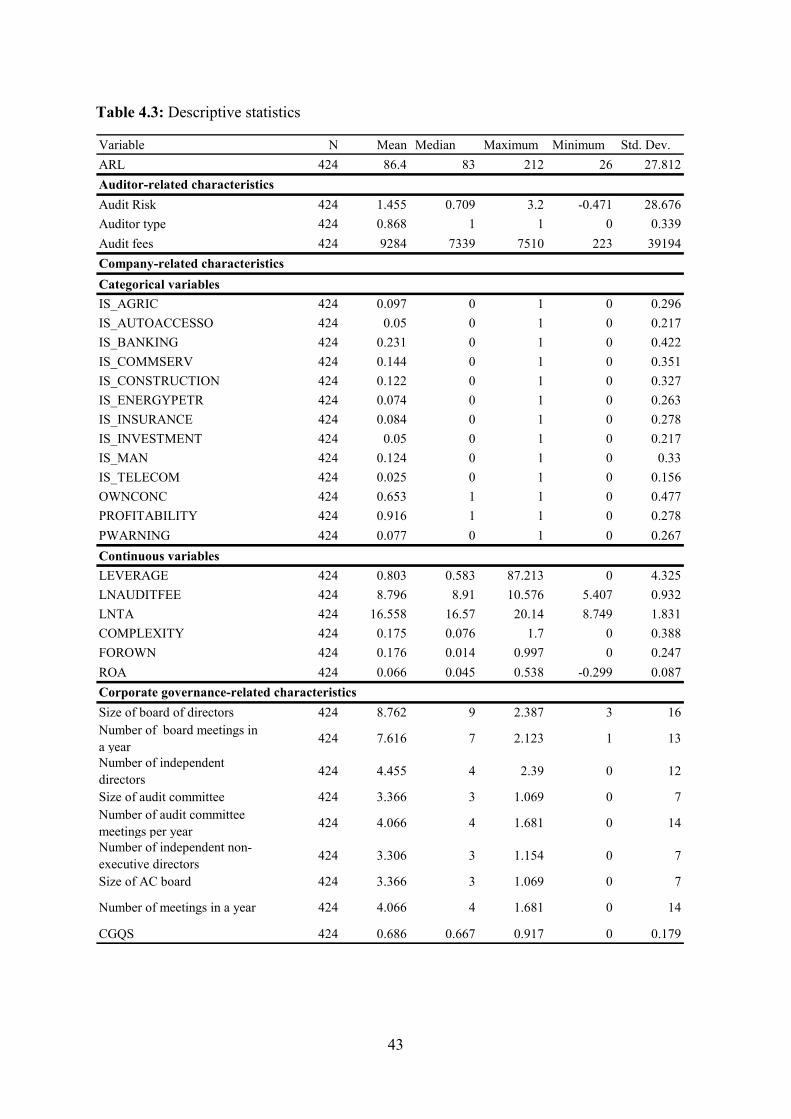
43
Table 4.3: Descriptive statistics
Variable N Mean Median Maximum Minimum Std. Dev.
ARL 424 86.4 83 212 26 27.812
Audit Risk 424 1.455 0.709 3.2 -0.471 28.676
Auditor type 424 0.868 1 1 0 0.339
Audit fees 424 9284 7339 7510 223 39194
Categorical variables
IS_AGRIC 424 0.097 0 1 0 0.296
IS_AUTOACCESSO 424 0.05 0 1 0 0.217
IS_BANKING 424 0.231 0 1 0 0.422
IS_COMMSERV 424 0.144 0 1 0 0.351
IS_CONSTRUCTION 424 0.122 0 1 0 0.327
IS_ENERGYPETR 424 0.074 0 1 0 0.263
IS_INSURANCE 424 0.084 0 1 0 0.278
IS_INVESTMENT 424 0.05 0 1 0 0.217
IS_MAN 424 0.124 0 1 0 0.33
IS_TELECOM 424 0.025 0 1 0 0.156
OWNCONC 424 0.653 1 1 0 0.477
PROFITABILITY 424 0.916 1 1 0 0.278
PWARNING 424 0.077 0 1 0 0.267
Continuous variables
LEVERAGE 424 0.803 0.583 87.213 0 4.325
LNAUDITFEE 424 8.796 8.91 10.576 5.407 0.932
LNTA 424 16.558 16.57 20.14 8.749 1.831
COMPLEXITY 424 0.175 0.076 1.7 0 0.388
FOROWN 424 0.176 0.014 0.997 0 0.247
ROA 424 0.066 0.045 0.538 -0.299 0.087
Size of board of directors 424 8.762 9 2.387 3 16
Number of board meetings in
a year 424 7.616 7 2.123 1 13
Number of independent
directors424 4.455 4 2.39 0 12
Size of audit committee 424 3.366 3 1.069 0 7
Number of audit committee
meetings per year424 4.066 4 1.681 0 14
Number of independent non-
executive directors424 3.306 3 1.154 0 7
Size of AC board 424 3.366 3 1.069 0 7
Number of meetings in a year 424 4.066 4 1.681 0 14
CGQS 424 0.686 0.667 0.917 0 0.179
Company-related characteristics
Corporate governance-related characteristics
Auditor-related characteristics
44
4.4 Correlation matrix
Pearson’s correlation coefficient is a parametric rank statistic that measures the strength of a
relationship between two variables (Piovani, 2008). The correlation matrix shows the highest
coefficient correlation was 0.681 which was less than 0.8 meaning that multi-collinearity was
not a problem. The variable profit warning had a positive relation with ARL however; it was
not significant implying that it may not be related to ARL. Table 4.4 presents a summary of
the Pearson’s correlation matrix. The full matrix can be availed on request.
The findings show that the correlation coefficients between ARL and auditor type was weak,
negative and significant (coefficient = -0.348, p = 0.000). This implies that there is some
relationship between audit fee and ARL. The correlation coefficient for audit fee was weak,
negative and p-value was significant (coefficient= -0.210, p-value = 0.000). The correlation
coefficient for total assets was weak, negative and p-value was significant (coefficient=-0.272,
p-value= 0.000). This implied that companies with large asset had shorter ARL. The correlation
coefficient for profitability was weak, negative and p-value was significant (coefficient= -
0.183, p-value=0.000). This meant that companies that were profitable had shorter ARL. The
correlation coefficient for FOROWN was weak, negative and p-value was significant
(coefficient=-0.112, p-value=0.021). The correlation coefficient for leverage was weak,
negative and p-value was significant (coefficient= -0.160, p-value=0.000). The correlation
coefficient for CGQS was weak, negative and p-value was significant (coefficient= -0.119, p-
value=0.014).
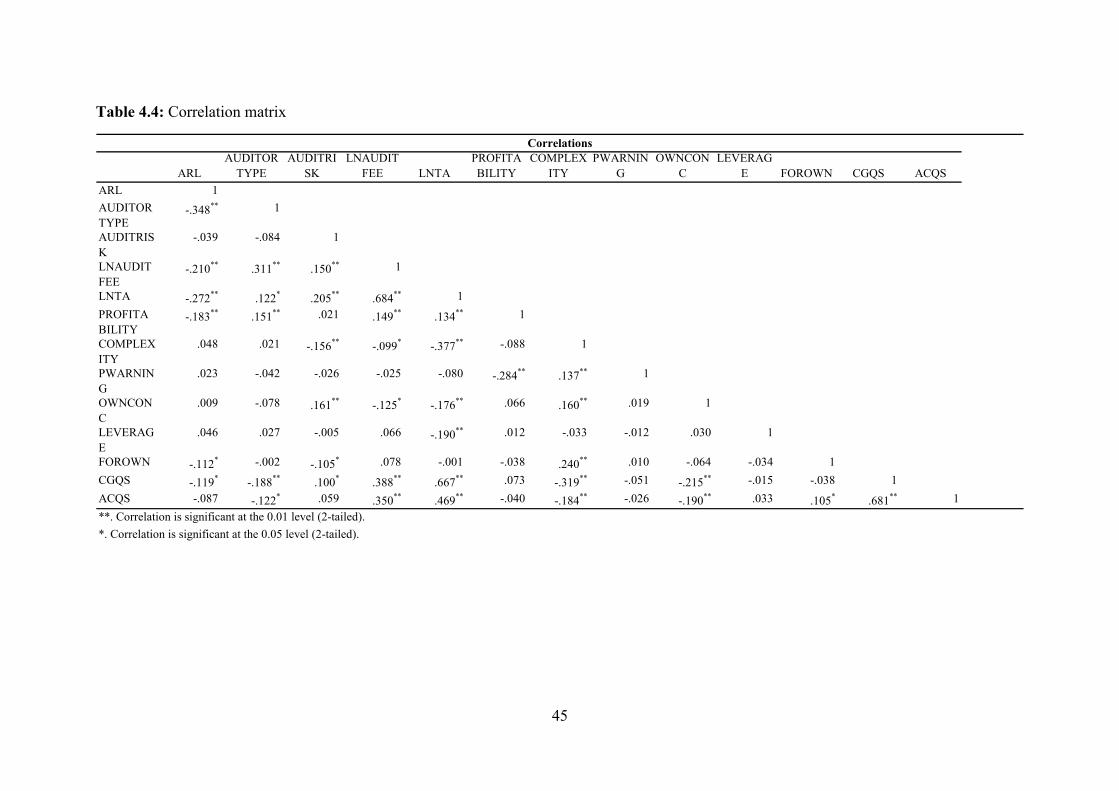
45
Table 4.4: Correlation matrix
ARL
AUDITOR
TYPE
AUDITRI
SK
LNAUDIT
FEE LNTA
PROFITA
BILITY
COMPLEX
ITY
PWARNIN
G
OWNCON
C
LEVERAG
E FOROWN CGQS ACQS
ARL 1
AUDITOR
TYPE-.348
** 1
AUDITRIS
K
-.039 -.084 1
LNAUDIT
FEE-.210
**.311
**.150
** 1
LNTA -.272**
.122*
.205**
.684** 1
PROFITA
BILITY-.183
**.151
** .021 .149**
.134** 1
COMPLEX
ITY
.048 .021 -.156**
-.099*
-.377** -.088 1
PWARNIN
G
.023 -.042 -.026 -.025 -.080 -.284**
.137** 1
OWNCON
C
.009 -.078 .161**
-.125*
-.176** .066 .160
** .019 1
LEVERAG
E
.046 .027 -.005 .066 -.190** .012 -.033 -.012 .030 1
FOROWN -.112* -.002 -.105
* .078 -.001 -.038 .240** .010 -.064 -.034 1
CGQS -.119*
-.188**
.100*
.388**
.667** .073 -.319
** -.051 -.215** -.015 -.038 1
ACQS -.087 -.122* .059 .350
**.469
** -.040 -.184** -.026 -.190
** .033 .105*
.681** 1
Correlations
**. Correlation is significant at the 0.01 level (2-tailed).
*. Correlation is significant at the 0.05 level (2-tailed).
46
4.5 Selecting the significant determinants of ARL
This study used panel regression method to select the determinants of ARL. Consistent with
prior studies this study used panel regression to identify the significant determinants of ARL
(Henderson & Kaplan, 2000; Yaacob & Che-Ahmad, 2012). Table 4.5 shows a summary of
the regression statistics for models 1, 2 and 3. According to the findings all the models were
significant since the F-statistic was significant (p<0.05). The most significant auditor related
variable influencing ARL is Auditor type that has a p-value of 0.003. The most significant
company specific variables are total assets, profitability, ROA, IS-Banking, IS-Investment, IS-
Manufacturing. Table 4.5 also shows that the corporate governance quality score is significant
(P<0.1). The study used panel data and therefore, it was necessary to carry out the Hausman
test. The Hausman test is used to determine whether to use a fixed or random effects model to
run the regression (Brooks, 2012). The study used model 1 to represent the auditor-related
characteristics (objective 1), model 2 to represent company specific characteristics (objective
2) and model 3 to represent the corporate governance characteristics (objective 3). Therefore,
the Hausman test was conducted for models 1, 2 and 3 to determine whether to use random
effects or fixed effects model. The null hypothesis was the random effects model was sufficient.
For Model 1 the Hausman chi2 (χ 2) (p-value=0.066) was significant, hence the null hypothesis
was rejected and the fixed effect model was selected. Model 2 the Hausman chi2(χ 2) p-value
(0.655) was not significant level hence the null hypothesis was not rejected; hence the random
effects model was selected. Model 3 the Hausman chi2 (χ 2) (p-value=0.371) was not significant
hence the null hypothesis was not rejected; hence the random effects model was selected.
Table 4.5 reveals that Model 1 had an adjusted R-squared of 58.5% indicating that the 58.5%
of the variability of the dependent variable (ARL) was explained by the independent variables
and 41.5% was explained by variables not in the model. Model 2 had an R-squared of 17.2%
implying that 17.2% of the variability in ARL was explained by the independent variables and
82.8% was explained by variables not in the model. Model 3 R-squared of 1.4% indicating that
only 1.4% of the variability in ARL was explained by the independent variables and 98.6%
was explained by variables not in the model. According to the findings in table 4.5 the most
significant variables were auditor type (t=-3.028, p-value=0.003). LNTA (t=-1.651, p-
value=0.099). PROFITABILITY (t=-1.790, p-value=0.074). ROA (t=-4.282, p-value=0.000).
DIV (t=-2.424, p-value=0.016), IS-BANKING (t=-2.028, p-value=0.043), IS-INVEST (t=-
1.700, p-value=0.090), IS-MAN (t=-1.775, p-value=0.076). CGQS = (t=-1.689, p-
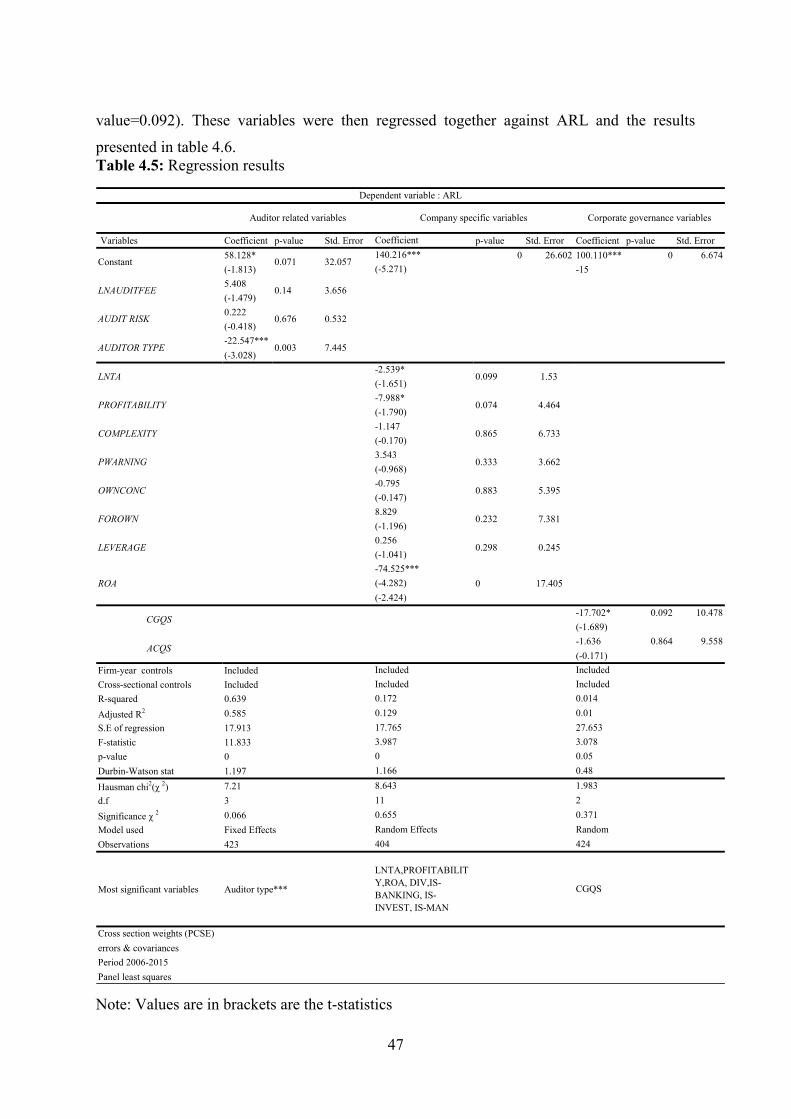
47
value=0.092). These variables were then regressed together against ARL and the results
presented in table 4.6.
Table 4.5: Regression results
Note: Values are in brackets are the t-statistics
Variables Coefficient p-value Std. Error p-value Std. Error Coefficient p-value Std. Error
58.128* 0 26.602 100.110*** 0 6.674
(-1.813) -15
5.408
(-1.479)
0.222
(-0.418)
-22.547***
(-3.028)
-17.702* 0.092 10.478
(-1.689)
-1.636 0.864 9.558
(-0.171)
Firm-year controls Included
Cross-sectional controls Included
R-squared 0.639
Adjusted R2 0.585
S.E of regression 17.913
F-statistic 11.833
p-value 0
Durbin-Watson stat 1.197
Hausman chi2(χ
2) 7.21
d.f 3
Significance χ 2 0.066
Model used Fixed Effects
Observations 423
Most significant variables Auditor type***
errors & covariances
Period 2006-2015
Panel least squares
404 424
LNTA,PROFITABILIT
Y,ROA, DIV,IS-
BANKING, IS-
INVEST, IS-MAN
CGQS
Cross section weights (PCSE)
11 2
0.655 0.371
Random Effects Random
0 0.05
1.166 0.48
8.643 1.983
0.129 0.01
17.765 27.653
3.987 3.078
Included Included
Included Included
0.172 0.014
CGQS
ACQS
0 17.405(-4.282)
(-2.424)
(-1.041)
ROA
-74.525***
0.232 7.381(-1.196)
LEVERAGE0.256
0.298 0.245
(-0.147)
FOROWN8.829
0.333 3.662(-0.968)
OWNCONC-0.795
0.883 5.395
(-0.170)
PWARNING3.543
0.074 4.464(-1.790)
COMPLEXITY-1.147
0.865 6.733
(-1.651)
PROFITABILITY-7.988*
LNTA-2.539*
0.099 1.53
AUDIT RISK 0.676 0.532
AUDITOR TYPE 0.003 7.445
Constant 0.071 32.057140.216***
(-5.271)
LNAUDITFEE 0.14 3.656
Dependent variable : ARL
Auditor related variables Company specific variables Corporate governance variables
Coefficient
48
4.6 Final model using the most significant variables
The final model was arrived at by selecting the most significant variables from the auditor
related variables company specific variables and corporate governance variables. Table 4.6
presents summary statistics of the regression using the most significant variables identified in
model 1, 2 and 3. The overall model was significant since the F-statistic was significant
(p<0.05). The Hausman test was conducted and found that the chi square statistic of 10.022
had a p-value of 0.348 which means that it was not significant (p > 0.1). The null hypothesis
tested was random effect model is appropriate, with a p-value of 0.348 was not significant
(p<0.05) we failed to reject it. Therefore, these variables were regressed using the random
effects model and the output is presented in table 4.6. The regression revealed that the most
significant variables were auditor type (t=-5.24, p-value=0.000) return on assets (t=-5.786, p-
value=0.000), IS-Banking (t=-6.253, p-value=0.000), IS-Investment (t=3.94, p-value=0.000),
IS-manufacturing (t=-4.66, p-value=0.000). The adjusted R-squared for the model was 37.1%.
This implies that 37.1% of the variability in ARL was explained by the independent variables
and 62.9% was explained by variables not in the model.
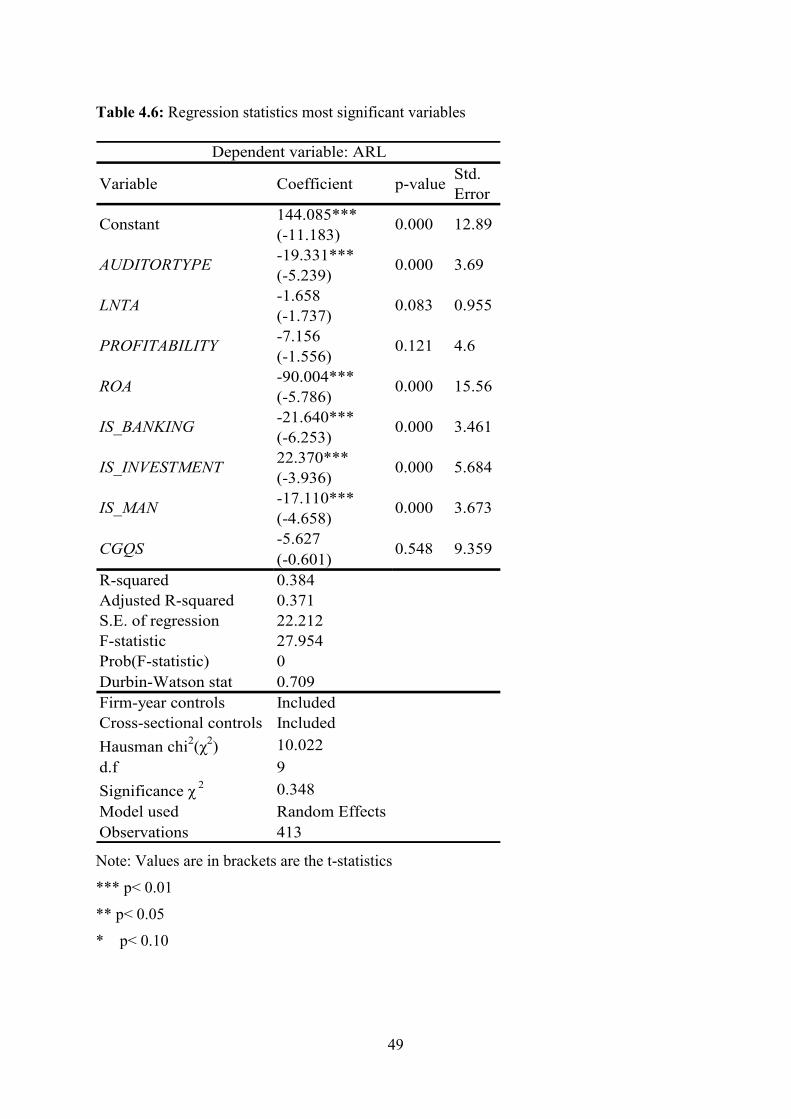
49
Table 4.6: Regression statistics most significant variables
Note: Values are in brackets are the t-statistics
*** p< 0.01
** p< 0.05
* p< 0.10
Variable Coefficient p-valueStd.
Error
144.085***
(-11.183)
-19.331***
(-5.239)
-1.658
(-1.737)
-7.156
(-1.556)
-90.004***
(-5.786)
-21.640***
(-6.253)
22.370***
(-3.936)
-17.110***
(-4.658)
-5.627
(-0.601)
R-squared 0.384
Adjusted R-squared 0.371
S.E. of regression 22.212
F-statistic 27.954
Prob(F-statistic) 0
Durbin-Watson stat 0.709
Firm-year controls Included
Cross-sectional controls Included
Hausman chi2(χ
2) 10.022
d.f 9
Significance χ 2 0.348
Model used Random Effects
Observations 413
CGQS 0.548 9.359
ROA
IS_INVESTMENT 0.000 5.684
IS_MAN 0.000 3.673
0.000 15.56
IS_BANKING 0.000 3.461
LNTA 0.083 0.955
PROFITABILITY 0.121 4.6
Dependent variable: ARL
Constant 0.000 12.89
AUDITORTYPE 0.000 3.69
50
4.6.1 Robustness check using Fixed Effects
This study further conducted a robustness check on the final model using the fixed effects
model and the output was presented in table 4.7. According to the findings the overall model
was significant since the F-statistic was significant (p<0.05). The findings reveal that the most
significant variables were Profitability consistent with (Khasharmeh & Aljifri, 2010), Return
on Assets (t=-5.804, p-value=0.000), IS-Banking (t=-5.924, p-value=0.000), IS-Investment
(t=3.775, p-value=0.000). The finding on profitability was consistent with that of Khasharmeh
and Aljifri (2010) . The fixed effects model contrasts the random effects model in that that the
auditor type and IS-Man are not significant. However, the adjusted R-squared increased to
37.2%. This implies that 37.2% of the variability in the ARL is can be predicted by the model
and 62.8% can be explained by variables not in the model.
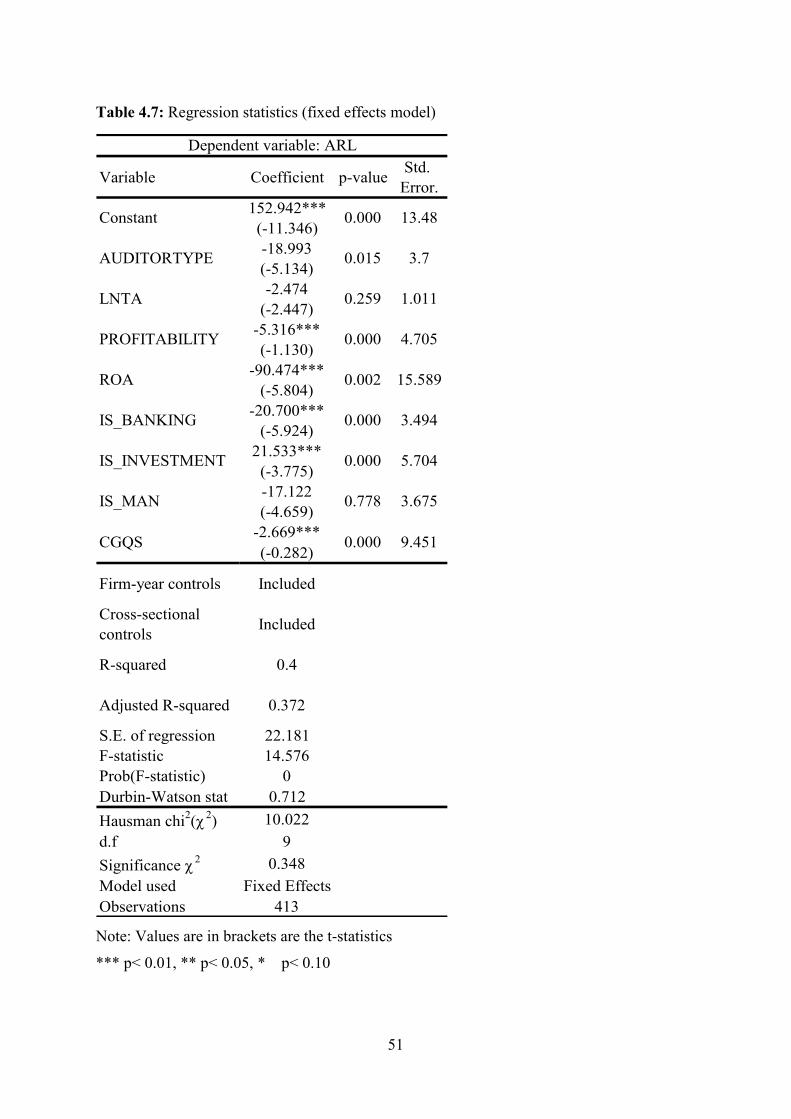
51
Table 4.7: Regression statistics (fixed effects model)
Note: Values are in brackets are the t-statistics
*** p< 0.01, ** p< 0.05, * p< 0.10
Variable Coefficient p-valueStd.
Error.
152.942***
(-11.346)
-18.993
(-5.134)
-2.474
(-2.447)
-5.316***
(-1.130)
-90.474***
(-5.804)
-20.700***
(-5.924)
21.533***
(-3.775)
-17.122
(-4.659)
-2.669***
(-0.282)
Firm-year controls Included
Cross-sectional
controlsIncluded
R-squared 0.4
Adjusted R-squared 0.372
S.E. of regression 22.181
F-statistic 14.576
Prob(F-statistic) 0
Durbin-Watson stat 0.712
Hausman chi2(χ
2) 10.022
d.f 9
Significance χ 2 0.348
Model used Fixed Effects
Observations 413
CGQS 0.000 9.451
IS_INVESTMENT 0.000 5.704
IS_MAN 0.778 3.675
ROA 0.002 15.589
IS_BANKING 0.000 3.494
LNTA 0.259 1.011
PROFITABILITY 0.000 4.705
Dependent variable: ARL
Constant 0.000 13.48
AUDITORTYPE 0.015 3.7
52
4.7 Robustness check using all variables in one model
The study also did robustness check by using one model to regress the auditor related variables,
company-specific variables, corporate governance variable and the output was presented in
table 4.8. The overall model was significant since the F-statistic was significant (p<0.05).
According to the findings the most significant variables were audit fees (t=-2.762, p-
value=0.006), auditor type (t=-3.981, p-value=0.000), CGQS(t=-2.094, p-value=0.004),
IS_banking (t=-3.374, p-value=0.001), IS_investment (t=3.368, p-value=0.001), IS_man (t=-
3.275, p-value=0.001), IS_telecom (t=-2.750, p-value=0.006), LNAUDITFEE (t=2.173, p-
value=0.030), LNTA (t=-2.100, p-value=0.040), ROA (t=-4.030, p-value=0.000). The R-
squared increased by 7.7% implying that this model could explain slightly more of the
variability of the ARL. However, the Durbin-Watson stat was 0.800 implying there was
autocorrelation. The previous model tends to take care of autocorrelation because it tends to
use a “general to specific” approach as recommended by Mizon (1995).
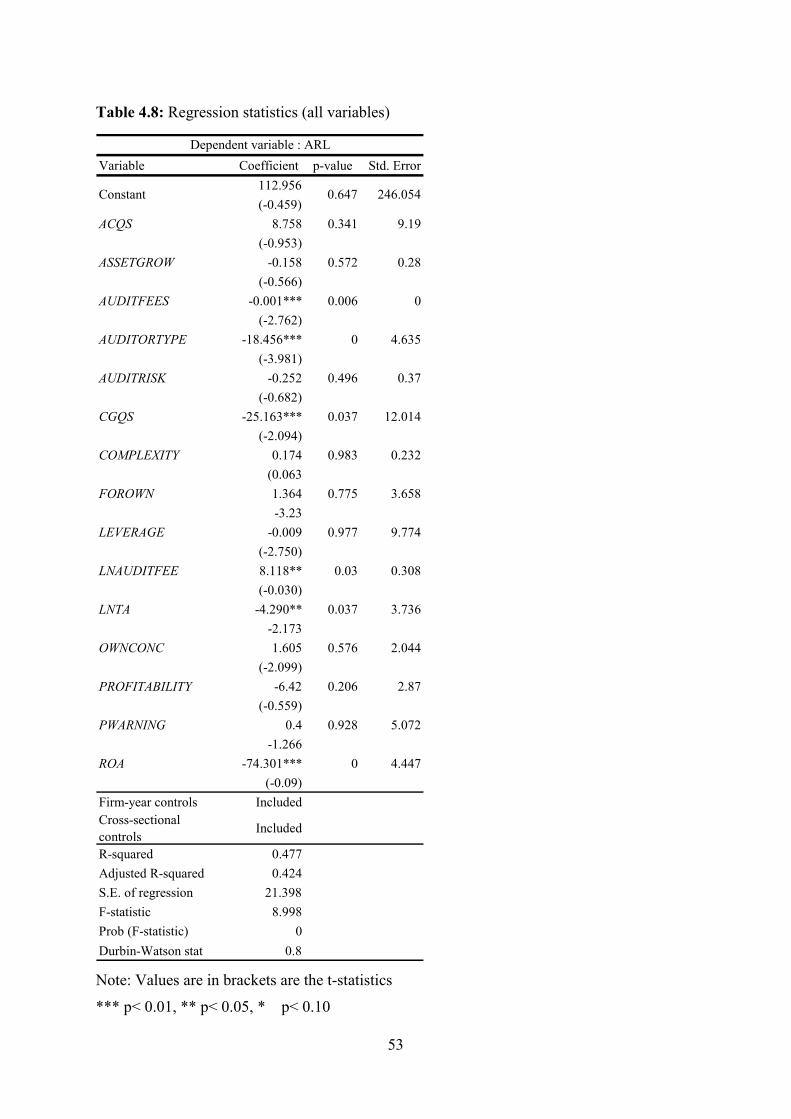
53
Table 4.8: Regression statistics (all variables)
Note: Values are in brackets are the t-statistics
*** p< 0.01, ** p< 0.05, * p< 0.10
Variable Coefficient p-value Std. Error
112.956
(-0.459)
ACQS 8.758 0.341 9.19
(-0.953)
ASSETGROW -0.158 0.572 0.28
(-0.566)
AUDITFEES -0.001*** 0.006 0
(-2.762)
AUDITORTYPE -18.456*** 0 4.635
(-3.981)
AUDITRISK -0.252 0.496 0.37
(-0.682)
CGQS -25.163*** 0.037 12.014
(-2.094)
COMPLEXITY 0.174 0.983 0.232
(0.063
FOROWN 1.364 0.775 3.658
-3.23
LEVERAGE -0.009 0.977 9.774
(-2.750)
LNAUDITFEE 8.118** 0.03 0.308
(-0.030)
LNTA -4.290** 0.037 3.736
-2.173
OWNCONC 1.605 0.576 2.044
(-2.099)
PROFITABILITY -6.42 0.206 2.87
(-0.559)
PWARNING 0.4 0.928 5.072
-1.266
ROA -74.301*** 0 4.447
(-0.09)
Firm-year controls Included
Cross-sectional
controlsIncluded
R-squared 0.477
Adjusted R-squared 0.424
S.E. of regression 21.398
F-statistic 8.998
Prob (F-statistic) 0
Durbin-Watson stat 0.8
Dependent variable : ARL
Constant 0.647 246.054
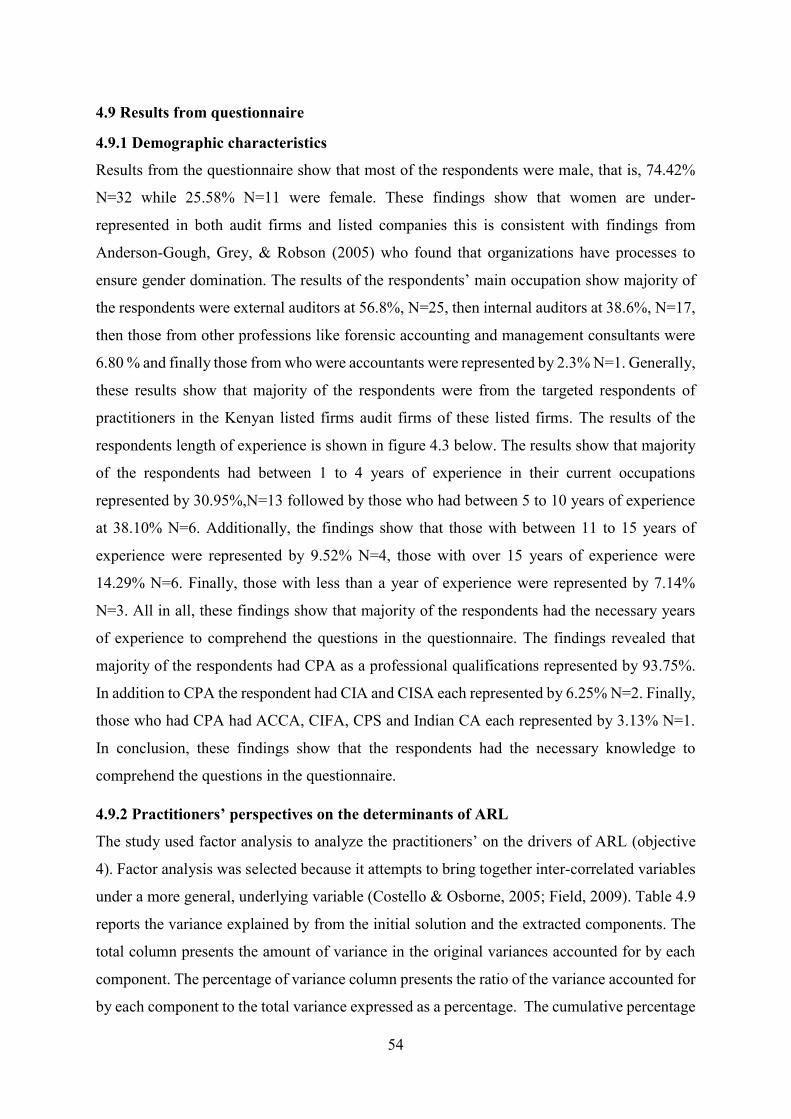
54
4.9 Results from questionnaire
4.9.1 Demographic characteristics
Results from the questionnaire show that most of the respondents were male, that is, 74.42%
N=32 while 25.58% N=11 were female. These findings show that women are under-
represented in both audit firms and listed companies this is consistent with findings from
Anderson-Gough, Grey, & Robson (2005) who found that organizations have processes to
ensure gender domination. The results of the respondents’ main occupation show majority of
the respondents were external auditors at 56.8%, N=25, then internal auditors at 38.6%, N=17,
then those from other professions like forensic accounting and management consultants were
6.80 % and finally those from who were accountants were represented by 2.3% N=1. Generally,
these results show that majority of the respondents were from the targeted respondents of
practitioners in the Kenyan listed firms audit firms of these listed firms. The results of the
respondents length of experience is shown in figure 4.3 below. The results show that majority
of the respondents had between 1 to 4 years of experience in their current occupations
represented by 30.95%,N=13 followed by those who had between 5 to 10 years of experience
at 38.10% N=6. Additionally, the findings show that those with between 11 to 15 years of
experience were represented by 9.52% N=4, those with over 15 years of experience were
14.29% N=6. Finally, those with less than a year of experience were represented by 7.14%
N=3. All in all, these findings show that majority of the respondents had the necessary years
of experience to comprehend the questions in the questionnaire. The findings revealed that
majority of the respondents had CPA as a professional qualifications represented by 93.75%.
In addition to CPA the respondent had CIA and CISA each represented by 6.25% N=2. Finally,
those who had CPA had ACCA, CIFA, CPS and Indian CA each represented by 3.13% N=1.
In conclusion, these findings show that the respondents had the necessary knowledge to
comprehend the questions in the questionnaire.
4.9.2 Practitioners’ perspectives on the determinants of ARL
The study used factor analysis to analyze the practitioners’ on the drivers of ARL (objective
4). Factor analysis was selected because it attempts to bring together inter-correlated variables
under a more general, underlying variable (Costello & Osborne, 2005; Field, 2009). Table 4.9
reports the variance explained by from the initial solution and the extracted components. The
total column presents the amount of variance in the original variances accounted for by each
component. The percentage of variance column presents the ratio of the variance accounted for
by each component to the total variance expressed as a percentage. The cumulative percentage
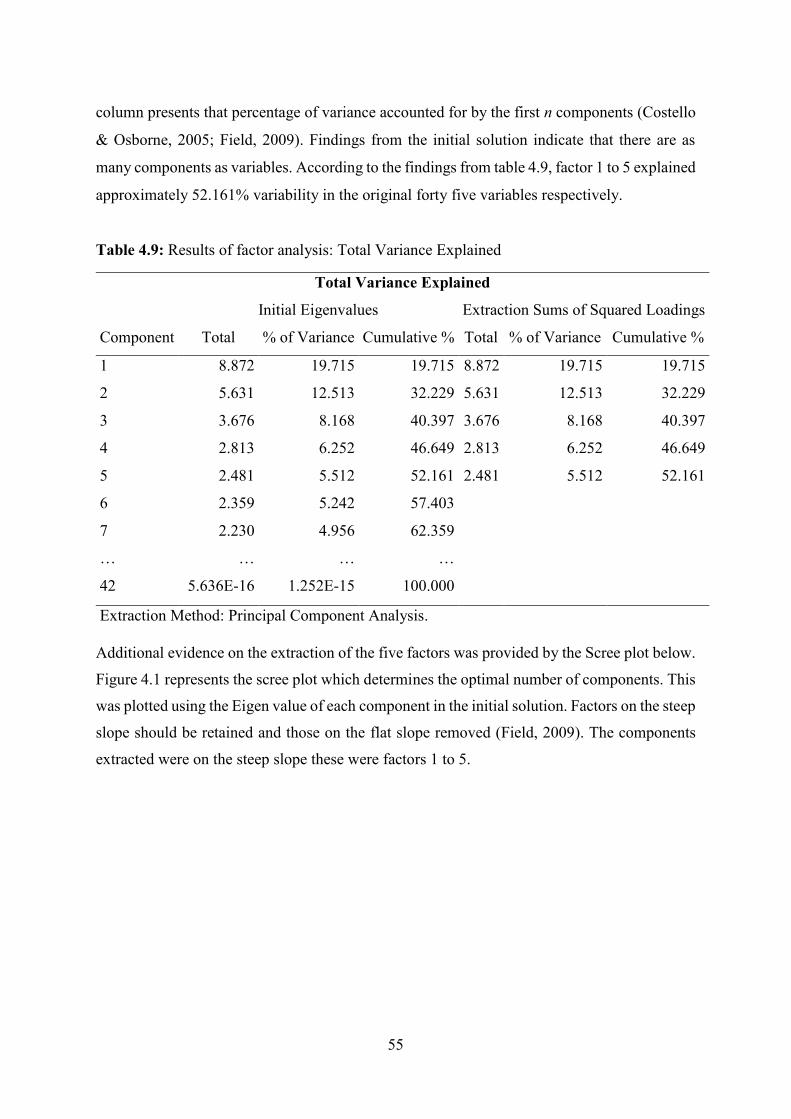
55
column presents that percentage of variance accounted for by the first n components (Costello
& Osborne, 2005; Field, 2009). Findings from the initial solution indicate that there are as
many components as variables. According to the findings from table 4.9, factor 1 to 5 explained
approximately 52.161% variability in the original forty five variables respectively.
Table 4.9: Results of factor analysis: Total Variance Explained
Total Variance Explained
Component
Initial Eigenvalues Extraction Sums of Squared Loadings
Total % of Variance Cumulative % Total % of Variance Cumulative %
1 8.872 19.715 19.715 8.872 19.715 19.715
2 5.631 12.513 32.229 5.631 12.513 32.229
3 3.676 8.168 40.397 3.676 8.168 40.397
4 2.813 6.252 46.649 2.813 6.252 46.649
5 2.481 5.512 52.161 2.481 5.512 52.161
6 2.359 5.242 57.403
7 2.230 4.956 62.359
… … … …
42 5.636E-16 1.252E-15 100.000
Extraction Method: Principal Component Analysis.
Additional evidence on the extraction of the five factors was provided by the Scree plot below.
Figure 4.1 represents the scree plot which determines the optimal number of components. This
was plotted using the Eigen value of each component in the initial solution. Factors on the steep
slope should be retained and those on the flat slope removed (Field, 2009). The components
extracted were on the steep slope these were factors 1 to 5.
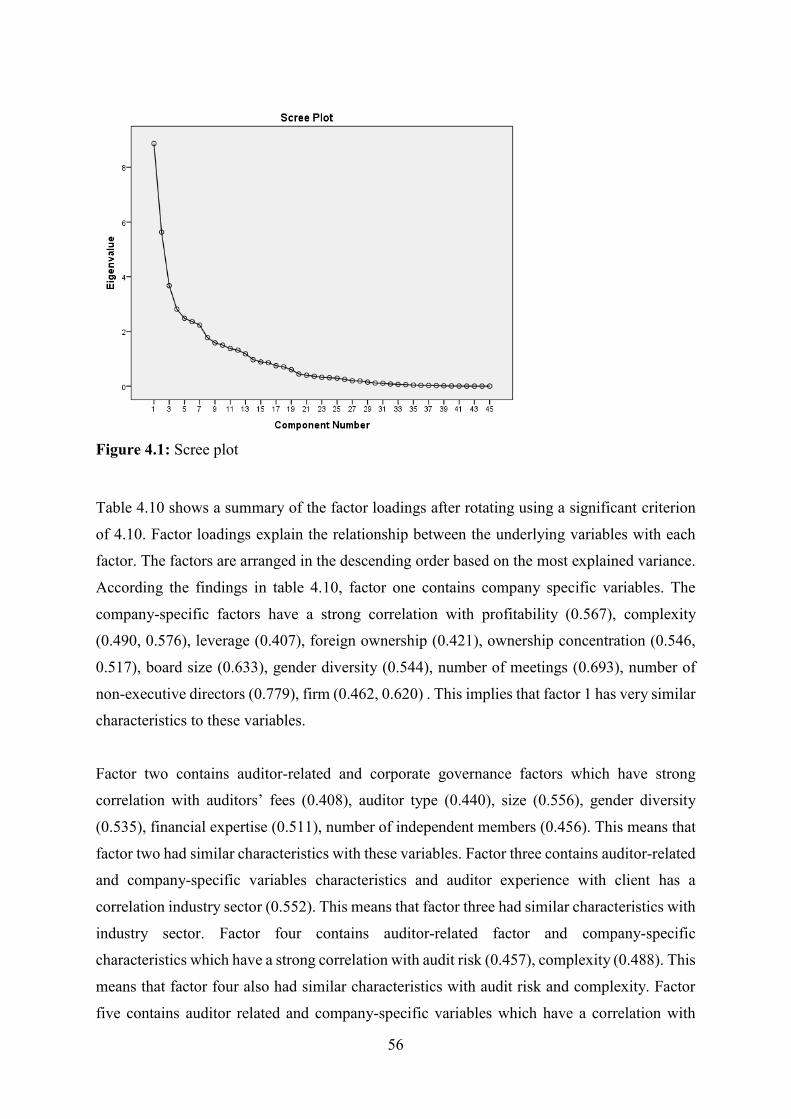
56
Figure 4.1: Scree plot
Table 4.10 shows a summary of the factor loadings after rotating using a significant criterion
of 4.10. Factor loadings explain the relationship between the underlying variables with each
factor. The factors are arranged in the descending order based on the most explained variance.
According the findings in table 4.10, factor one contains company specific variables. The
company-specific factors have a strong correlation with profitability (0.567), complexity
(0.490, 0.576), leverage (0.407), foreign ownership (0.421), ownership concentration (0.546,
0.517), board size (0.633), gender diversity (0.544), number of meetings (0.693), number of
non-executive directors (0.779), firm (0.462, 0.620) . This implies that factor 1 has very similar
characteristics to these variables.
Factor two contains auditor-related and corporate governance factors which have strong
correlation with auditors’ fees (0.408), auditor type (0.440), size (0.556), gender diversity
(0.535), financial expertise (0.511), number of independent members (0.456). This means that
factor two had similar characteristics with these variables. Factor three contains auditor-related
and company-specific variables characteristics and auditor experience with client has a
correlation industry sector (0.552). This means that factor three had similar characteristics with
industry sector. Factor four contains auditor-related factor and company-specific
characteristics which have a strong correlation with audit risk (0.457), complexity (0.488). This
means that factor four also had similar characteristics with audit risk and complexity. Factor
five contains auditor related and company-specific variables which have a correlation with

57
audit fees (0.504), industry sector (0.402), and number of independent members (0.430). This
means that factor five had similar characteristics with audit fees and industry-sector.
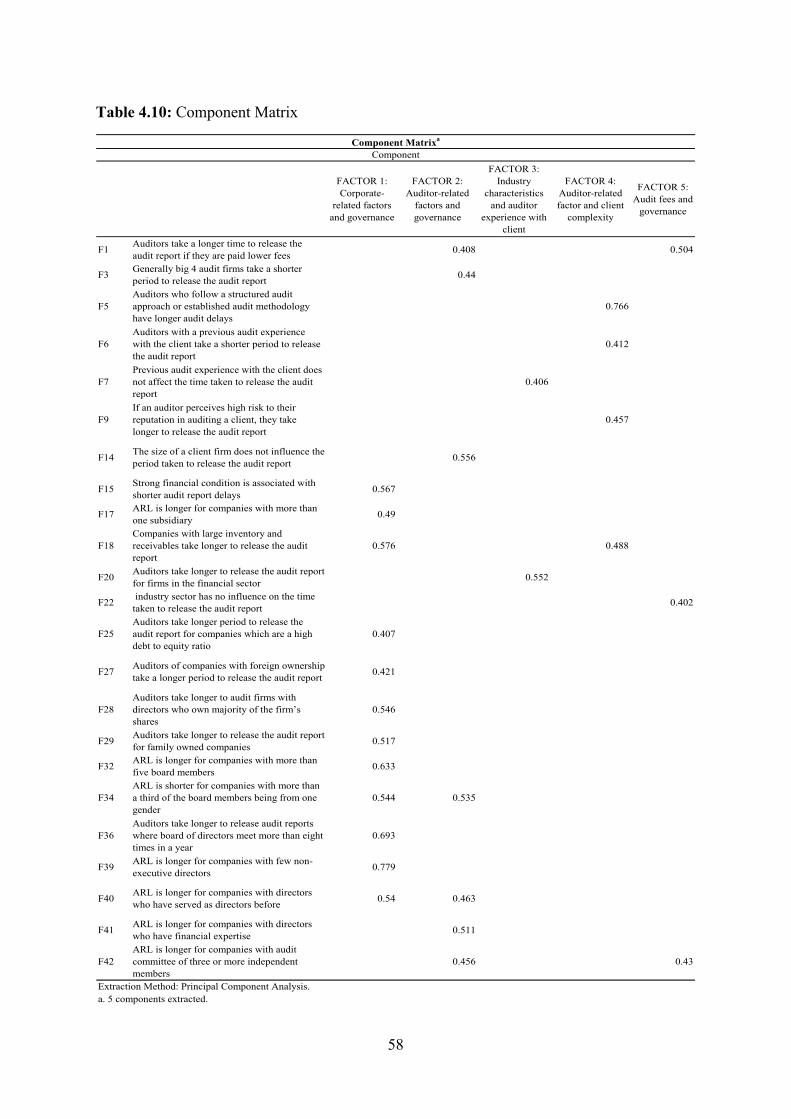
58
Table 4.10: Component Matrix
FACTOR 1:
Corporate-
related factors
and governance
FACTOR 2:
Auditor-related
factors and
governance
FACTOR 3:
Industry
characteristics
and auditor
experience with
client
FACTOR 4:
Auditor-related
factor and client
complexity
FACTOR 5:
Audit fees and
governance
F1Auditors take a longer time to release the
audit report if they are paid lower fees0.408 0.504
F3Generally big 4 audit firms take a shorter
period to release the audit report0.44
F5
Auditors who follow a structured audit
approach or established audit methodology
have longer audit delays
0.766
F6
Auditors with a previous audit experience
with the client take a shorter period to release
the audit report
0.412
F7
Previous audit experience with the client does
not affect the time taken to release the audit
report
0.406
F9
If an auditor perceives high risk to their
reputation in auditing a client, they take
longer to release the audit report
0.457
F14The size of a client firm does not influence the
period taken to release the audit report0.556
F15Strong financial condition is associated with
shorter audit report delays0.567
F17ARL is longer for companies with more than
one subsidiary0.49
F18
Companies with large inventory and
receivables take longer to release the audit
report
0.576 0.488
F20Auditors take longer to release the audit report
for firms in the financial sector0.552
F22 industry sector has no influence on the time
taken to release the audit report0.402
F25
Auditors take longer period to release the
audit report for companies which are a high
debt to equity ratio
0.407
F27Auditors of companies with foreign ownership
take a longer period to release the audit report0.421
F28
Auditors take longer to audit firms with
directors who own majority of the firm’s
shares
0.546
F29Auditors take longer to release the audit report
for family owned companies0.517
F32ARL is longer for companies with more than
five board members0.633
F34
ARL is shorter for companies with more than
a third of the board members being from one
gender
0.544 0.535
F36
Auditors take longer to release audit reports
where board of directors meet more than eight
times in a year
0.693
F39ARL is longer for companies with few non-
executive directors0.779
F40ARL is longer for companies with directors
who have served as directors before0.54 0.463
F41ARL is longer for companies with directors
who have financial expertise0.511
F42
ARL is longer for companies with audit
committee of three or more independent
members
0.456 0.43
Component Matrixa
Extraction Method: Principal Component Analysis.
a. 5 components extracted.
Component
59
Table 4.11 presents findings from the open ended questions. The findings in table 4.11 revealed
that some of the variables identified by the practitioners were similar to those identified by
literature of the study. The company specific variables were: complexity of the company (Che-
Ahmad & Abidin, 2009), size and financial stability (Baatwah et al., 2015). The auditor-related
factors were: audit risk (Sultana, Singh, & Mitchell Van der Zahn, 2015), financial expertise,
audit fees, industry sector, financial stability (Mathuva, Mboya, & Mcfie, 2016), industry
(Baatwah et al., 2015), audit fee (Abbott, Parker, & Peters, 2012). These findings are consistent
with that of the factor analysis that identified the main components explaining the
interrelationship among the variables in the questionnaire to be auditor-, company- and
corporate governance related.
However, there were variables identified by practitioners that were not identified by literature
of the study. The auditor related characteristics were: use of Computer-Assisted Audit
Techniques (CAATs), auditor expertise and experience, commitment of audit team,
disagreements with management over matters arising in management letter, auditing of
subsidiaries by a different auditor, audit planning and staffing, sample size, scope, audit
methodology. The company-specific characteristics were: maturity of the company,
geographical presence, management experience, client understanding of audit findings, speed
of information provision, speed of management response to audit queries, nature of company,
regulatory framework, business risk, organization of the client and management experience.
These findings are consistent with findings from factor analysis that implied that audit-,
company- and corporate governance-related factors.

60
Table 4.11: Summary results for open ended questions
Auditor-related factors = 38 Client-related factors = 57 Governance-related factors = 2 Regulatory-factors = 8
Computer-Assisted Audit
Techniques (CAATs)Size Corporate governance
Regulatory Requirements
and framework
Strength and effectiveness of
Internal ControlsCorporate governance
IndustryManagement Support and
Cooperation
Auditor Specialist Expertise in
the SectorComplexity of the Client
Number of Audit Staff
Members performing the AuditGeographical Presence
Commitment of the Audit
TeamManagement Experience
If Subsidiaries and Associates
are Audited by Different
Auditors not from the Network
Client Risk Rating by Auditor
Audit fees chargedSpeed of Information
Provision
61
4.10 Chapter summary
The chapter began with an analysis of secondary data then primary data. Diagnostics tests were
carried out to test for violation of OLS assumptions. The two-stage panel least squares
regressions. Factor analysis was conducted on the results from the questionnaire. The chapter
concluded with an analysis of the open ended questionnaire. Generally the findings showed a
negative relation between ARL and: the auditor type, ROA, IS_Banking, IS_manufacturing
and CGQS. The findings also show a positive association between ARL and IS_Investment.
This implies that managers of listed companies should take advantage of selecting the
appropriate auditor type given their resource capabilities and adopt strategies that would help
maintain stable ROA such as increasing their revenue without increasing their asset costs. The
Company’s Act 2015, the code of corporate practices for issuers of securities for the public
2015 and regulations by the Central Bank of Kenya have enabled companies in the banking
sector to have a favorable ARL. It is important for other sectors to adopt stringent regulation
to improve timeliness of audit reports. The findings illustrate the importance of examining the
influence of auditor-, company- and corporate governance-related characteristics as drivers of
ARL.
62
CHAPTER FIVE
DISCUSSION, CONCLUSION AND RECOMMENDATIONS
5.1 Introduction
This chapter provided a summary of findings, conclusions and recommendations based on the
research objectives and the existing empirical literature. The objectives were analyzing the
influence of company–related factors, auditor-related factors, and corporate governance-
related factors on ARL by listed companies in Kenya. Furthermore, the study sought to obtain
auditor and management perspectives on the drivers of ARL by listed companies in Kenya.
5.2 Discussion of findings
The purpose of the study was to examine the drivers of ARL in Kenyan listed companies. It
was carried out using two-stage panel regression on four hundred and forty four firm year
observations. The findings of the study were discussed below.
5.2.1 The influence of auditor-related factors on ARL
This study sought to establish the influence of auditor related variables on ARL of Kenyan
listed companies. Model 1 which used fixed effects model revealed that the auditor type had a
beta of -22.547 with p-value of 0.003 and significant implying that a change of auditor from a
non-Big 4 firm to Big 4 firm caused a decrease of ARL of approximately 23 days. The final
model using the random effects model selected auditor type as the most significant auditor
related variable. The significant negative association was consistent with that found by
Mohamad-Nor, Shafie and Wan-Hussin (2010). According to the findings auditor type had a
beta of -19.331 and a p-value of 0.000 implying that it was highly significant. This implied that
changing from a non-Big 4 audit firm to a Big 4 audit firm reduced the ARL by approximately
20 days. These findings are consistent with prior studies which found that companies audited
by big four audit firms tend to have shorter audit lags as compared to non-big four audit firms
(Carslaw & Kaplan, 1991). However, according to findings from the questionnaire majority of
the respondents indicated that the auditor type may not influence ARL. This implies that there
may be other reasons practitioners consider other than auditor type on ARL.
5.2.2 The effect of company related factors on ARL
This study sought to establish the effect of company related variables on ARL of Kenyan listed
companies. Model 2 using random effects model revealed that LNTA had a beta of -2.59 with
a p-value of 0.10 significant implying that a unit increase in total assets may lead to a decrease
63
in ARL of approximately 3 days. Profitability had a beta of -7.99 with a p-value of 0.07
significant implying that companies that make profit have lesser ARL by approximately 8 days
in comparison to los making companies. ROA had a beta of -74.525 with a p-value of 0.000
significant implying that a unit change in ROA caused a decrease in ARL of 75 days.
Companies in the banking sector had a beta -21.504 and p-value of 0.043 was significant
implying that companies in the banking sector have a shorter ARL of approximately 22 days
than other sectors. Companies in the Investment sector had a beta 26.005 with a p-value of 0.09
significant implying that they had a longer ARL of approximately 26 days than other sectors.
Companies in the manufacturing sector had a beta -20.393 with a p-value of 0.077 significant
implying that they had a shorter ARL of approximately 26 days than other sectors.
The final model used Panel regression, employing a random effects approach revealed ROA
had a beta of -90.004 with a p-value 0.000 significant implying that unit change in ROA caused
a decrease in ARL of 90 days. This was consistent with prior studies found a significant
negative relationship (Baatwah et al., 2015). Companies in the banking sector had a beta of -
21.640 with a p-value 0.000 implying that their ARL was 22 days shorter than other listed other
sectors. This is consistent with prior studies which found that banks tend to have shorter audit
delays than companies in other sectors (Henderson & Kaplan, 2000). This implies that due to
the heavy regulation in the banking sector banks are expected to have shorter ARL than other
listed sectors.
Companies in the investment sector had a beta of 22.370 with a p-value 0.000 significant
meaning that they their ARL were 23 days longer than other listed sectors. Companies in the
manufacturing sector had a beta of -17.11 with a p-value of 0.000 significant implying that
their ARL was approximately 17 days shorter that other listed sectors. Practitioners’
perspective from the questionnaire shows that majority find that ROA companies in the
banking, investment and manufacturing sector as having significant influence on ARL.
5.2.3 The influence of corporate governance related factors on ARL
This study sought to establish the influence of corporate governance related variables on ARL
of Kenyan listed companies. Model 3 using random effects model found that the CGQS had a
beta of -17.702 with p-value 0.092 significant this implies that a unit increase in corporate
governance quality results in a decrease in ARL of approximately 18 days. Using random
effects model the final model found that corporate governance quality was insignificant with a
beta of -5.626 and p-value of 0.548.This implies that a unit change in corporate governance
64
would result to a decrease in ARL of approximately 6 days. Findings from the questionnaire
show that majority of the respondents corporate governance quality is significant in
determining ARL. These findings show there is need for emphasis of corporate governance
quality in Kenyan listed companies.
5.2.4 Practitioners’ perspectives on ARL.
The study used semi-structured questionnaires to obtain auditor and management perspectives.
The findings from the questionnaire were analyzed using factor analysis. The findings from
factor analysis indicated that auditor-, company specific- and corporate governance-related
characteristics explained the interrelationship between the variables in the questionnaire.
Results from the open-ended questionnaire revealed that some of the variables identified by
the practitioners were similar to those identified by literature of the study. The company
specific variables were: complexity of the company (Che-Ahmad & Abidin, 2009), size and
financial stability (Baatwah et al., 2015). The auditor-related factors were: audit risk (Sultana,
Singh, & Mitchell Van der Zahn, 2015), financial expertise, audit fees, industry sector,
financial stability (Mathuva, Mboya, et al., 2016), industry (Baatwah et al., 2015), audit fee
(Abbott, Parker, & Peters, 2012). These findings are consistent with that of the factor analysis
that identified the main components explaining the interrelationship among the variables in the
questionnaire to be auditor-, company- and corporate governance related.
However, there were variables identified by practitioners that were not identified by literature
of the study. The auditor related characteristics were: use of Computer-Assisted Audit
Techniques (CAATs), auditor expertise and experience, commitment of audit team,
disagreements with management over matters arising in management letter, auditing of
subsidiaries by a different auditor, audit planning and staffing, sample size, scope, audit
methodology. The company-specific characteristics were: maturity of the company,
geographical presence, management experience, client understanding of audit findings, speed
of information provision, speed of management response to audit queries, nature of company,
regulatory framework, business risk, organization of the client and management experience.
These findings are consistent with findings from factor analysis that implied that audit-,
company- and corporate governance-related factors were the main drivers of ARL.
65
5.3 Conclusion
This study guided by the agency theory, signaling theory and stakeholder theory reviewed
literature on determinants of ARL and found auditor related variables, company specific
variables and corporate governance variables that influenced ARL. Additionally, the study
found interrelationships between the independent variables ARL and leverage. According to
the findings ARL was significantly influenced by auditor type, ROA, companies in the
banking, investment and manufacturing sectors and governance measured by corporate
governance quality score. According to the findings these variables were significant influence
on the ARL. This study finds that knowledge of the determinants of ARL is essential for Kenya
listed companies in promoting efficiency in the corporate sector.
5.4 Research implications
5.4.1 Policy recommendations
The findings of this study provide insights to policy makers and regulators interested in
increasing awareness of the importance of focusing on the type of auditor return on assets,
industry sector and corporate governance quality as significant drivers of ARL. These insights
may act as catalysts for economic growth because they may reduce information asymmetry
between managers and end users of audited financial reports.
5.4.2 Managerial recommendations
Given the importance of the auditor type managers need to ensure that they exercise caution in
selecting the appropriate auditor and not only focusing on audit fees which was found not to
be a significant driver of ARL. Additionally, given the significance of ROA managers should
maintain good and stable ROA by increasing revenue without increasing asset costs. The
findings imply managers should dedicate resources to continuous improvement of corporate
governance quality for example having a corporate governance committee so as to nurture and
enhance a culture of timely reporting of audited financial reports.
5.5 Contribution to knowledge
In advancement of the Agency theory, this study performed a comprehensive analysis of the
drivers of ARL in a developing country, Kenya. The study employed a two-stage panel least
squares regressions to determine the drivers of ARL in Kenya. Prior studies investigated the
individual characteristics of corporate governance. The study contributes to literature by
incorporating the corporate governance and audit committee quality indices as composite
measures of quality.
66
5.6 Areas of further studies
The study relied heavily on annual reports as the main source for the drivers of ARL. Further
studies can use other platforms for accessing drivers of ARL such as the internet, focus groups
and publications. In determining the drivers of ARL the study used a binary coding system.
Despite its popularity in prior studies it has its limitations. Future studies can consider other
coding system such as effects or contrast coding.
5.7 Limitations of the study
A number of limitations were encountered during the study. Due to unavailability of some
annual reports the study used unbalanced panel data. This provides an avenue for further
studies to investigate drivers of ARL using balanced panel data. The study removed some
companies from the study because they were delisted or suspended or listed quite late into the
period of study. However, this allows future research to investigate on these companies. The
study focused on the drivers of ARL in a developing country, Kenya. Due to the different
culture, regulatory frameworks, institutional set ups and country specific factors it may not
possible to generalize findings since it was constrained to Kenya and may differ with other
countries. Prior studies have measured ARL as the number of days from the financial year end
to when the audit report date is released this is not the most accurate measure of ARL since the
actual date that the audit work began may not be the financial year end. Future research can
use a different measure of ARL that captures the exact date the audit began to when the audit
report is released.
67
REFERENCES
Abbott, L. J., Parker, S., & Peters, G. F. (2004). Audit committee characteristics and
restatements. Auditing: A Journal of Practice & Theory, 23(1), 69–87.
Abbott, L. J., Parker, S., Peters, G. F., & Raghunandan, K. (2003). An empirical investigation
of audit fees, nonaudit fees, and audit committees. Contemporary Accounting Research,
20(2), 215–234.
Abbott, L., Parker, S., & Peters, G. (2012). Internal Audit Assistance and External Audit
Timeliness. A Journal of Practice & Theory, 34(4), 3–20.
Abd-Elsalam, O. H., & El-Masry, A. (2008). The impact of board independence and ownership
structure on the timeliness of corporate internet reporting of Irish-listed companies.
Emerald Insight, 34(12), 848–867. https://doi.org/10.1108/03074350810915842
Abdelsalam, O. H., & Street, D. L. (2007). Corporate governance and the timeliness of
corporate internet reporting by UK listed companies. Journal of International Accounting,
Auditing and Taxation, 16(2), 111–130.
Abdul-Rahman, R., & Mohamed-Ali, F. H. (2006). Board, audit committee, culture and
earnings management: Malaysian evidence. Managerial Auditing Journal, 21(7), 783–
804.
Abdullah, S. N., Mohamad-Yusof, N. Z., & Mohamad-Nor, M. N. (2010). Financial
restatement and corporate governance among Malaysian listed companies. Managerial
Auditing Journal, 25(6), 526–552.
Aboagye-Otchere, F., Bedi, I., & Kwakye, O. (2012). Corporate governance and disclosure
practices of Ghanaian listed companies. Journal of Accounting in Emerging Economies,
2(2), 140–161.
Acemoglu, D., Johnson, S., & Robinson, J. A. (2001). The Colonial Origins of Comparative
Development: An Empirical Investigation,. American Economic Review, 9, 1369–1401.
ACGN. (2016). State of Corporate Governance in Africa : An overview of 13 countries.
Retrieved from
http://www.iodkenya.co.ke/assets/resource/52a55520521edb893dc45a0af3c4197e.pdf
Adams, R. B., & Ferreira, D. (2009). Women in the boardroom and their impact on governance
and performance. Journal of Financial Economics, 94(2), 291–309.
Afify, H. a. E. (2009). Determinants of audit report lag. Journal of Applied Accounting
Research, 10(1), 56–86. https://doi.org/10.1108/09675420910963397
Afify, H. A. E. (2009). Determinants of audit report lag Does implementing corporate
governance have any impact? Empirical evidence from Egypt. Journal of Applied
Accounting Research, 10(1), 56–86.
Agus, M., Indrarini, H., Lee, L. R., Harjoto, M. A., Laksmana, I., & Lee, R. (2015). The impact
of demographic characteristics of CEOs and directors on audit fees and audit delay.
Managerial Auditing Journal, 309(8), 998–1022. https://doi.org/10.1108/MAJ-01-2015-
1147
Agyeman, S. K. (2010). Challenges facing venture capitalists in developing economies An
empirical study about venture capital industry in Ghana. Umeå University.
68
Ahearne, A. G., Griever, W. L., & Warnock, F. E. (2004). Information costs and home bias: an
analysis of US holdings of foreign equities. Journal of International Economics, 62(2),
13–336.
Ahmad-Zaluki, N. A., & Wan-Hussin, W. N. (2010). Corporate governance and earnings
forecasts accuracy. Asian Review of Accounting, 18(1), 50–67.
Ahmad, R. A. ., & Kamarudin, K. A. (2003). Audit delay and the timeliness of corporate
reporting: Malaysian evidence.
Al-Ajmi, J. (2008). Audit and reporting delays: Evidence from an emerging market. Advances
in Accounting, Incorporating Advances in International Accounting, 24, 217–226.
Al-Arussi, A. S., Selamat, M. H., & Mohd-Hanefah, M. (2009). Determinants of financial and
environmental disclosures through the internet by Malaysian companies. Asian Review of
Accounting, 17(1), 59–76.
Al-tahat, S. S. Y. (2015). Timeliness of Audited Financial Reports of Jordanian Listed
Companies. International Journal of Management, 3(2), 39–47.
Alkhatib, K., & Marji, Q. (2012). Audit Reports Timeliness: Empirical Evidence from Jordan.
Procedia - Social and Behavioral Sciences, 62, 1342–1349.
https://doi.org/10.1016/j.sbspro.2012.09.229
Alves, P., Peter, F., & Steven, Y. (2011). Cross-Border Information Transfers:Evidence from
Profit Warnings Issued by European Firms. Accounting and Business Research, 39(5),
449–472.
Alzheimer Europe. (2009). Philosophies guiding research. Retrieved December 25, 2016, from
http://www.alzheimer-europe.org/Research/Understanding-dementia-research/Types-of-
research/Philosophies-guiding-research
Anderson-Gough, F., Grey, C., & Robson, K. (2005). “Helping them to forget..”: the
organizational embedding of gender relations in public audit firms. Accounting,
Organizations and Society, 30(5), 469–490.
Apadore, K., & Mohd Noor, M. (2013). Determinants of Audit Report Lag and Corporate
Governance in Malaysia. International Journal of Business & Management, 8(15), 151–
163. https://doi.org/10.5539/ijbm.v8n15p151
Arrow, K. (1971). Essays in the theory of risk bearing. Chicago: Markham.
Arshad, Z., & Gondal, M. Y. (2013). Impact of working capital management on profitability a
case of the Pakistan cement industry. Interdisciplinary Journal of Contemporary
Research in Business, 5(2), 384–390.
Ashton, R. ., Willingham, J. ., & Elliott, R. K. (1987). An empirical analysis of audit delay.
Journal of Accounting Research, 25(2), 275–92.
Ashton, R. H., Graul, P. R., & Newton, J. D. (1989). Audit delay and the timeliness of corporate
reporting. Contemporary Accounting Research, 5(2), 657–673.
Ashton, R. H., Willingham, J. J., & Elliot, R. K. (1987). An empirical analysis of audit delay.
Journal of Accounting Research, 25, 275–292.
Ayiro, L. (2016, December 31). Matiang’i radical reforms were inevitable. Standard Digital.
69
Retrieved from https://www.standardmedia.co.ke/article/2000228425/matiang-i-radical-
reforms-were-inevitable
Baatwah, S., Salleh, Z., & Ahmad, N. (2015). CEO characteristics and audit report timeliness:
Do CEO tenure and financial expertise matter? Managerial Auditing Journal, 30(8/8),
998–1022. https://doi.org/http://dx.doi.org/10.1108/09564230910978511
Balsam, S., Krishnan, J., & Yang, J. S. (2003). Auditor industry specialization and earnings
quality. Auditing: A Journal of Practice & Theory, 22, 71–97.
Bamber, M., Bamber, L., & Schoderbek, M. (1993). Audit structure and other determinants of
audit report lag: an empirical analysis. Auditing: A Journal of Practice and Theory, 12(1),
1–23.
Baumgartner, M. S., & Schneider, D. E. (2010). Perceptions of women in management: A
thematic analysis of razing the glass ceiling. Journal of Career Development, 37(2), 559–
576.
Beasley, M. S., & Salterio, S. E. (2001). The relationship between board characteristics and
voluntary improvements in audit committee composition and experience. Contemporary
Accounting Research, 18(4), 539–570.
Beck, T., Ross, L., & Loayza, N. (2000). Financial Intermediation and Growth: Causality and
Causes. Journal of Monetary Economics, 46, 31–77.
Bédard, J., Chtourou, S. M., & Courteau, L. (2004). The effect of audit committee expertise,
independence, and activity on aggressive earnings management. Auditing: A Journal of
Practice & Theory, 23(2), 13–35.
Bédard, J., & Gendron, Y. (2010). Strengthening the financial reporting systems: Can audit
committees deliver? International Journal of Auditing, 14(2), 1–37.
Blue Ribbon Committee (BRC). (1999). Report and recommendation of the Blue Ribbon
Commission on improving the effectiveness of corporate audit committees. New York.
Bodie, Z., Kane, A., & Marcus, A. J. (2009). Investment. (8th ed.). Boston: McGraw-Hill.
Bokpin, A. G., & Isshaq, Z. (2009). Corporate governance, disclosure and foreign share
ownership on the Ghana Stock Exchange. Managerial Auditing Journal, 24(7), 688–703.
Bradbury, M., Mak, Y. T., & Tan, S. M. (2006). Board characteristics, audit committee
characteristics and abnormal accruals. Pacific Accounting Review, 18(2), 47–68.
Brooks, C. (2012). Introductory econometrics for finance. (3rd ed.). London: Cambridge
university press.
Bulkley, G., & Herrerias, R. (2004). Stock returns following profit warnings.
Cadbury Committee. (1992). The Financial Aspects of Corporate Governance: A Report of the
Committee on Corporate Governance. London.
Cai, C. X., Keasey, K., & Short, H. (2006). Corporate governance and information efficiency
in security markets. European Financial Management, 12(5), 763–787.
Calder, B. J., Phillips, L. W., & Tybout, A. M. (1982). The concept of external validity. Journal
of Consumer Research, 9(3), 240–244.
70
Carcello, J., Hermanson, D. R., Neal, T. Y., & Riley, R. A. J. (2002). Board characteristics and
audit fees. Contemporary Accounting Research, 19(3), 365–384.
Carcello, J. V., Hermanson, R. H., & McGrath, N. T. (1992). Audit quality attributes: The
perceptions of audit partners, preparers, and financial statement users. Auditing, 11(1), 1.
Carcello, J. V., & Neal, T. L. (2000). Audit committee composition and auditor reporting. The
Accounting Review, 75(4), 453–467.
Carslaw, C. A., & Kaplan, S. E. (1991). An examination of audit delay: further evidence from
New Zealand. Accounting & Business Research, 22(85), 21–32.
Cassell, C. A., Giroux, G., Myers, L. A., & Omer, T. C. (2007). The effect of the Sarbanes-
Oxley Act of 2002 on the relation between the strength of corporate governance and
auditor-client alignments. TX.
Cassell, C. A., GirouxG., Myers, L. A., & Omer, T. C. (2007). The effect of the Sarbanes-Oxley
Act of 2002 on the relation between the strength of corporate governance and auditor-
client alignments. Texas.
Castro-Schilo, L., & Ferrer, E. (2013). Comparison of Nomothetic Versus Idiographic-
Oriented Methods for Making Predictions About Distal Outcomes From Time Series
Data. Multivariate Behavioral Research, 48, 175–207.
Cerbioni, F., & Parbonetti, A. (2007). Exploring the effects of corporate governance on
intellectual capital disclosure: An analysis of European biotechnology companies.
European Accounting Review, 16(4), 791–826.
Chambers, A., & Penman, S. (1984). Timeliness of Reporting and the Stock Price Reaction to
Earnings Announcements. Journal of Accounting Research, 22(1), 21–47.
Charreaux, G. (1997). Vers une théorie du gouvernement des entreprises. Le Gouvernement
Des Entreprises : Corporate Governance, Théories et Faits, 421–469.
https://doi.org/10.3166/RFG.253.189-212
Che-Ahmad, A., & Abidin, S. (2009). Audit delay of listed companies: A case of Malaysia.
International Business Research, 1(4), 32.
Chen, C. J. P., & Jaggi, B. (2000). Association between independent non-executive directors,
family control and financial disclosures in Hong Kong. Journal of Accounting and Public
Policy, 19(4), 285–310.
Chen, K. C. W., Chen, Z., & Wei, K. C. J. (2009). Legal Protection of Investors, Corporate
Governance, and the Cost of Equity Capital. mmmJournal of Corporate Finance, 15(273–
289).
Cheng, E. C. M., & Courtenay, S. M. (2006). Board composition, regulatory regime and
voluntary disclosure. International Journal of Accounting, 41(3), 262–289.
Connelly, B. L., Certo, S. T., Ireland, D., & Reutzel, C. R. (2011). Signaling theory: A review
and assessment. Journal of Management, 37(1), 39–67.
https://doi.org/10.1177/0149206310388419
Cooper, D. R., & Schindler, P. S. (2010). Business Research Methods (11th ed.). New York:
McGraw - Hill.
71
Cornelius, P. (2005). Good corporate practices in poor corporate governance systems.
Corporate Governance: The International Journal of Business in Society, 5(3), 12–23.
https://doi.org/10.1108/14720700510604661
Costello, A. B., & Osborne, J. W. (2005). Best Practices in Exploratory Factor Analysis: Four
Recommendations for Getting the Most From Your Analysis. Practical Assessment,
Research and Evaluation, 10, 1–5.
Courtis, J. K. (1976). Relationships between timeliness in corporate reporting and corporate
attributes. Accounting and Business Research, 25, 45–56., 25, 45–56.
Creswell, J. (2003). Research Design: Qualitative. Quantitative and Mixed Methods
Approaches (Second). London and New Delhi: SAGE.
Creswell, J. (2012). Research design: Qualitative, Quantitative, and mixed methods
approaches. Journal of investigative surgery : the official journal of the Academy of
Surgical Research (Vol. 25). https://doi.org/10.3109/08941939.2012.723954
da Silveira Di Miceli, A., Leal, R. P. C., Barros, L. A. B. de C., & Carvalhal-da-Silva, A. L.
(2009). Evolution and determinants of firm-level corporate governance quality in Brazil.
Revista de Administração, 44(3), 173–189. Retrieved from
http://papers.ssrn.com/sol3/papers.cfm?abstract_id=995764
Dalton, D. R., Daily, C. M., Johnson, J., & Ellstrand, A. E. (1999). Number of directors and
financial performance: A meta-analysis. Academy of Management Journal, 42(6), 674–
687.
Dao, M., & Pham, T. (2014). Audit tenure , auditor specialization and audit report lag.
Managerial Auditing Journal, 29(6), 490–512. https://doi.org/10.1108/MAJ-07-2013-
0906
Darrough, M. N., & Stoughton, N. M. (1990). Financial disclosure policy in an entry game.
Journd of Accounting and Economics, 12(1–3), 219–243.
Davis, B., & Whittred, G. P. (1980). The association between selected corporate attributes and
timeliness in corporate reporting: Further analysis. Abacus, 16(1), 48–60., 16(1), 48–60.
DeFond, M. L., Hann, R. N., & Hu, X. (2005). Does the market value financial expertise on
audit committees of boards of directors? Journal of Accounting Research, 43(2), 153–93.
Demise, N. (2006). OECD principles of corporate governance. Corporate Governance in
Japan: From the Viewpoints of Management, Accounting, and the Market, 109–117.
https://doi.org/10.1007/978-4-431-30920-8_10
DeZoort, F. T., & Salterio, S. E. (2001). The effects of corporate governance experience and
financial reporting and audit knowledge on audit committee members’ judgments.
Auditing: A Journal of Practice and Theory, 20(2), 31–47.
Dibra, R. (2016). Corporate Governance Failure : The Case Of Enron And Parmalat, 12(16),
283–290. https://doi.org/10.19044/esj.2016.v12n16p283
Dimitropoulos, P. E., & Asteriou, D. (2010). The effect of board composition on the
informativeness and quality of annual earnings: Empirical evidence from Greece.
Research in International Business and Finance, 24(2), 773–784.
Dodd, P., Dopuch, N., Holthausen, R., & Leftwich, R. (1984). Qualified audit opinions and
72
stock prices: Information content, announcement dates, and concurrent disclosures.
Journal of Accounting and Economics, 6, 3–38.
Easton, B. S. T., & Walker, M. A. (1997). Income , Growth , and Economic Freedom. The
American Economic Review, 87(2). Retrieved from http://www.jstor.org/stable/2950940
Income , Growth , and Economic Freedom
Eghliaow, S. M. (2013). An Empirical Examination of the Determinants of Audit Report Delay
in Libya An Empirical Examination of the Determinants of Audit Report Delay in Libya,
(July).
Eisenhardt, K. M. (1989). Agency Theory: An Assessment and Review. The Academy of
Management Review, 14(1), 57–74. https://doi.org/10.2307/258191
El-Banany, M. (2006). A study of determinants of audit report lag in the Egyptian banks. The
Accounting Thought, 2, 56–78.
Elayan, F. A., & Pukthuanthong, K. (2009). Why warn? The impact of profit warnings on
shareholder’s equity. Investment Management and Financial Innovations. Massey
University.
Elmeskov, J. (1995). Germany: The structures of corporate governance. Organisation for
Economic Cooperation and Development., (196), 46.
Emmons, W. R., & Schmid, F. A. (1998). Universal Banking, Control Rights, and Corporate
Finance in Germany.
Errunza, V. R., & Miller, D. P. (2000). Market segmentation and the cost of the capital in
international equity markets. Journal of Financial and Quantitative Analysis, 35(4), 557–
600.
Ettredge, M., Johnstone, K., Stone, M., & Qian, W. (2011). The Effects of Firm Size ,
Corporate Governance Quality , and Bad News on Disclosure Compliance disclosure
compliance University of Kansas University of Wisconsin - Madison University of
Alabama.
Fagbemi, T. ., & Uadiale, O. M. (2011). An appraisal of the determinants of timeliness of audit
report in Nigeria: Evidence from selected quoted companies.
Fama, E. F., & Jensen, M. C. (1983). Separation of ownership and control. Journal of Law and
Economics, 26(2), 301–325.
FASB. (2008). Characteristics of Accounting Information, Statement of Financial Accounting
Concepts No. 2. Norwalk, CT. Retrieved from
http://www.fasb.org/cs/BlobServer?blobkey=id&blobwhere=1175820904484&blobhead
er=application/pdf&blobcol=urldata&blobtable=MungoBlobs
Felo, A. J., & Solieri, S. A. (2009). Are all audit committee financial experts created equally?
International Journal of Disclosure and Governance, 6(2), 150–166.
Field, A. (2009). Discovering Statistics using SPSS. London: SAGE.
Flanigan, J. (2002, March 24). Andersen’s pain will strengthen system. Los Angeles Times. Los
Angeles.
Frank, K. A. (2000). Impact of a confounding variable on a regression coefficient. Sociological
73
Methods & Research, 29(2), 147–194.
Freeman, R. E. (2001). A stakeholder theory of the modern corporation. Perspectives in
Business Ethics Sie, 3, 144.
Garsombke, H. P. (1981). The timeliness of corporate financial disclosure.
Ghasemi, A., & Zahediasl, S. (2012). Normality tests for statistical analysis: a guide for non-
statisticians. International Journal of Endocrinology and Metabolism, 10(2), 486–489.
Gilling, D. M. (1977). Timeliness in corporate reporting: some further comment. Accounting
and Business Research, 8(29), 34–36.
Givoly, D., & Palmon, D. (1982). Timeliness of Annual Earnings Announcements: Some
Empirical Evidence. The Accounting Review, 57(3), 486–508.
GoK. The Capital Markets (securities) (public offers, listing and disclosures) regulations, 2002
legal notice no. 60 (2002). Retrieved from
https://www.google.com/url?sa=t&rct=j&q=&esrc=s&source=web&cd=4&cad=rja&ua
ct=8&ved=0ahUKEwj2xeP_4r7RAhVEzRQKHdwzBDEQFggxMAM&url=https%3A
%2F%2Fwww.nse.co.ke%2Fregulatory-framework%2Fcapital-markets-
authority.html%3Fdownload%3D25%253Acapital-markets-securit
GoK. The Capital Markets (securities) (public offers, listings and disclosures) (amendment)
regulations, 2012 legal notice no. 61 (2012).
GoK. Companies Act,2015 (2015).
Gompers, P., Ishii, J., & Metrick, A. (2003). Corporate Governance and Equity Prices. The
Quarterly Journal of Economics, 118(1), 107–155.
https://doi.org/10.1162/00335530360535162
Goodwin, J. (2003). The relationship between the audit committee and the internal audit
function: Evidence from Australia and New Zealand. International Journal of Auditing,
7(3), 263–78.
Grossman, S. . J. (1981). The informational role of war- ranties and private disclosure about
product quality. The Journal of Law and Economics, 24(3), 461–489.
Gujarati, D. N., & Porter, D. C. (2009). Bsic Econometrics (4th ed.). New York: McGraw-Hill
Irwin.
Gul, F. A., Hutchinson, M., & Lai, K. M. (2013). Gender-diverse boards and properties of
analyst earnings forecasts. Accounting Horizons, 27(3), 511–538.
Gul, F. A., Kim, J. B., & Qiu, A. A. (2010). Ownership concentration, foreign shareholding,
audit quality, and stock price synchronicity: Evidence from China. Journal of Financial
Economics, 95(3), 425–442.
Gul, F. A., & Leung, S. (2004). Board leadership, outside directors’ expertise and voluntary
corporate disclosures. Journal of Accounting and Public Policy, 23(5), 351–379.
Habib, A., & Bhuiyan, M. B. U. (2011). Audit firm industry specialization and the audit report
lag. Journal of International Accounting, Auditing and Taxation, 20(1), 32–44.
https://doi.org/10.1016/j.intaccaudtax.2010.12.004
Habib, A., & Bhuiyanb, M. B. U. (2011). Audit firm industry specialization and the audit report
74
lag. Journal of International Accounting, Auditing and Taxation, 20, 32–44.
Habiba, A., & Bhuiyanb, M. B. U. (2011). Audit firm industry specialization and the audit
report lag. Journal of International Accounting, Auditing and Taxation, 20, 32–44.
Habiba Al-Shaer aly salama Steven Toms. (2017). Audit committees and financial reporting
quality: evidence from UK environmental accounting disclosures. Journal of Applied
Accounting Research, 18(1).
Hair, J. F., Ringle, C. M., & Sarstedt, M. (2013). Editorial - Partial Least Squares Structural
Equation Modeling: Rigorous Applications, Better Results and Higher Acceptance. Long
Range Planning, 46(1/2), 1–12.
Haniffa, R. M., & Cooke, T. E. (2002). Culture,corporate governance and disclosure in
Malaysian corporations. Abacus, 38(3), 317–349.
Hannan, M. T., & Freeman, J. (1984). Structural inertia and organizational change. Structural
Inertia and Organizational Change. American Sociological Review, 149–164.
Hassan, Y. (2016). Determinants of audit report lag: evidence from Palestine. Journal of
Accounting in Emerging Economies, 6(1), 13–32.
Hay, D. C., Knechel, W. R., & Wong, N. (2006). Audit fee: a meta-analysis of the effect of
supply and demand attributes. Contemporary Accounting Research, 23(1), 141–191.
Henderson, B. C., & Kaplan, S. E. (2000). An examination of audit report lag for banks: a panel
data approach. Auditing: A Journal of Practice & Theory, 19(2), 159–74.
Herbling, D. (2016, April 11). CMA punishes NBK for breach of profit alert rules. Business
Daily. Retrieved from http://www.businessdailyafrica.com/CMA-punishes-NBK-for-
breach-of-profit-alert-rules/539546-3155004-elwq2c/index.html
Hossain, M. A., & Taylor, P. J. (2008). Relationship between selected corporate attributes and
audit delay in developing countries: empirical evidence from Bangladesh. Retrieved from
www.mahossain.compdftimebanf.pdf
Huafang, X., & Jianguo, Y. (2007). Ownership structure, board composition and corporate
voluntary disclosure: Evidence from listed companies in China. Managerial Auditing
Journal, 22(6), 604–619.
Hugill, A., & Siegel, J. (2014). Which Does More to Determine the Quality of Corporate
Governance in Emerging Economies , Firms or Countries ? SSRN Electronic Journal.
Ireland, J. C. (2003). An empirical investigation of determinants of audit reports in the UK.
Journal of Business Finance & Accounting, 30(7–8), 975–1015.
Javed and Iqbal. (2006). Corporate Governance and Firm Performance : Evidence from
Karachi Stock Exchange, (Winter), 947–964.
Jensen, M. (1983). Organization theory and methodology. Accounting Review, 56, 319–338.
Jensen, M. C. (1993). The modern industrial revolution, exit and the failure of internal control
systems. Journal of Finance, 48(3), 831–880.
Jensen, M., & Meckling, W. (1976). Theory of the firm: managerial behaviour, agency costs
and ownership structure. Journal of Financial Economics, 3(4), 305–360.
75
John, K., & Senbet, L. W. (1998). Corporate governance and board effectiveness. Journal of
Banking & Finance, 22, 371–403.
Johnstone, K. M., & Bedard, J. C. (2004). Audit firm portfolio management decisions. Journal
of Accounting Research, 42(4), 659–690.
Jones, F. L., & Raghunandan, K. (1998). Client risk and recent changes in the market for audit
services. Journal of Accounting & Public Policy, 17, 169–181.
Kelton, A. S., & Yang, Y. (2008). The impact of corporate governance on internet financial
reporting. Journal of Accounting and Public Policy, 27(1), 62–87.
Khasharmeh, H. A., & Aljifri, K. (2010). The Timeliness of Annual Reports in Bahrain and
the United Arab Emirates: An emprical comparative stydy. The International Journal of
Business and Finance Research, 4(1), 51–72.
Klein, A. (2002). Audit committee, board of director characteristics, and earnings management.
Journal of Accounting & Economics, 33(3), 375–400.
Knechel, W. R., & Willekens, M. (2006). The role of risk management and governance in
determining audit demand. Journal of Business Finance and Accounting, 33(9/10), 1344–
1367.
Knechel Robert, W., & Payne, J. (2001). Additional Evidence on Audit Report Lag. A Journal
of Practice & Theory, 20(1), 137–146.
Komen, E. (2014). The Effect Of Financial Innovation On Stock Returns Of Firms. University
of Nairobi.
Kothari, C. R. (2009). Research Methodology: Methods and Techniques (2nd ed.). New Delhi:
New Age International.
Kothari, S., Shu, S., & Wysocki, P. D. (2009). Do managers withhold bad news?. Journal of
Accounting Research, 47(1), 241–276.
Krishnamurthy, S., Zhou, J., & Zhou, N. (2006). Auditor reputation, auditor independence, and
the stock market impact of Andersen’s indictment on its client firms. Contemporary
Accounting Research, 23(2), 465–90.
Krishnan, J. (2005). Audit Committee Quality and Internal Control: An Empirical Analysis.
The Accounting Review, 80(2), 649–675.
Krishnan, J., & Krishnan, J. (1997). Litigation risk and auditor resignations. The Accounting
Review, 72(539–560).
Krishnan, J., & Yang, J. (2009). Recent Trends in Audit Report and Earnings Announcement
Lags. Accounting Horizons, 23(3), 265–288.
Kwon, S. Y., Lim, C. Y., & Tan, P. M.-S. (2007). Legal systems and earnings quality: The role
of auditor industry specialization. Auditing: A Journal of Practice & Theory, 26(2), 25–
56.
Lai, K. W., & Cheuk, L. C. (2005). Audit report lag, audit partner rotation and audit firm
rotation: Evidence from Australia. Hong Kong.
Leventis, S., & Weetman, P. (2005). “Timeliness of financial reporting: applicability of
disclosure theories in an emerging capital market”, , Vol. 34 No. 1, pp. 43-56. Accounting
76
and Business Research, 34(1), 43–56.
Leventis, S., Weetman, P., & Weetmann, P. (2004). Timeliness of financial reporting:
applicability of disclosure theories in an emerging capital market. Accounting and
Business Research, 34(1), 43–56. https://doi.org/10.1080/00014788.2004.9729950
Li, J., Pike, R., & Haniffa, R. (2008a). Intellectual capital disclosure and corporate governance
structure in UK. Accounting and Business Research, 38(2), 136–159.
Li, J., Pike, R., & Haniffa, R. (2008b). Intellectual capital disclosure and corporate governance
structure in UK firms. Accounting and Business Research, 38(2), 137–159.
Lokman, N., Mula, J. M., & Cotter, J. (2014). Corporate governance quality and voluntary
disclosure of corporate governance information: Practices of listed Malaysian family
controlled business, (1), 1–5. https://doi.org/10.1007/s13398-014-0173-7.2
Mahajan, P., & Chander, S. (2008). Determinants of timeliness of corporate disclosure of
selected companies in India. The IUP. Journal of Accounting Research and Audit
Practices, 7(4), 28–63.
Mak, Y. T., & Li, Y. (2001). Determinants of corporate ownership and board structure:
Evidence from Singapore. Journal of Corporate Finance, 7(3), 236–256.
Mande, V., & Son, M. (2011). Do audit delays affect client retention? Managerial Auditing
Journal, 26(1), 32–50. https://doi.org/10.1108/02686901111090826
Mardikyan, S., & Çetin, E. (2008). Efficient Choice of Biasing Constant for Ridge Regression.
International Journal of Contemporary Mathematical Sciences, 3(11), 527–536.
Masli, A., Peters, G. F., Richardson, V. J., & Sanchez, J. M. (2010). Examining the potential
benefit of internal control monitoring technology. The Accounting Review, 85(3), 1001–
1034.
Mathuva, D., Mboya, J., & Mcfie, J. (2016). Achieving legitimacy through co-operative
governance and social and environmental disclosure by credit unions in a developing
country. Journal of Applied Accounting Research.
Mathuva, D., Mcfie, J., & Mboya, J. (2016). of Applied Accounting Research Achieving
legitimacy through co-operative governance and social and environmental disclosure by
credit unions in a developing country. Journal of Applied Accounting Research.
Matos, J. A. (2001). Theoretical foundations of corporate governance. Princeton University
Press.
McGee, R. W. (2009). Corporate Governance in Transition Economies. Miami, FL.: Springer.
McMullen, D. A., & Raghunandan, K. (1996). Enhancing audit committee effectiveness.
Journal of Accountancy, 182(2), 7–81.
Menon, K., & William, J. D. (1994). The usage of audit committees in monitoring. Journal of
Accounting and Public Policy, 13(2), 131–139.
Milgrorn, P. (1981). Good news and bad news representation theorems and applications. Bell
Journal of Economics, 12, 380–391.
Mizon, G. E. (1995). A simple message for autocorrelation correctors: Don’t. Journal of
Econometrics, 69(1), 267–288.
77
Mohamad-Nor, M., Shafie, R., & Wan-Hussin, W. (2010). Corporate Governance and audit
Report Lag in Malaysia. Asian Academy of Management Journal of Accounting and
Finance, 6(2), 57–87.
Mukhtaruddin, M., Oktarina, R., Relasari, R., & Abukosim, A. (2015). Firm and Auditor
Characteristics, and Audit Report Lag in Manufacturing Companies Listed on Indonesia
Stock Exchange during 2008-2012. Expert Journal of Business and Management, 3(1),
13–26.
Naimi Mohamad-Nor, M., Shafie, R., & Wan-Hussin, W. N. (2010). Corporate governance
and audit report lag in Malaysia. Asian Academy of Management Journal of Accounting
and Finance, 6(2), 57–84.
Ngigi, G. (2013, May 23). Centum penalised Sh50,000 for profit warning violation. Business
Daily. Retrieved from http://www.businessdailyafrica.com/Centum-penalised-Sh50000-
for-profit-warning-violation/539552-1860998-fn28vuz/index.html
Ngugi, B. (2016, January). Uchumi results release delayed over change of auditors. Business
Daily. Retrieved from http://www.businessdailyafrica.com/Uchumi-results-release-
delayed-over-change-of-auditors/539552-3438940-naivdqz/index.html
Nor Izah Ku Ismail, K., & Chandler, R. (2004). The timeliness of quarterly financial reports of
companies in Malaysia. Asian Review of Accounting, 12(1), 1–18.
NSE. (2016). History of NSE. Retrieved November 9, 2016, from
https://www.nse.co.ke/nse/history-of-nse.html
Ntayi, J. M., Ngoboka, P., & Kakooza, C. S. (2013). Moral schemas and corruption in Ugandan
public procurement. Journal of Business Ethics, 112(3), 417-436., 112(3), 417–436.
Oladipupo, A. O., & Izedomi, F. I. O. (2013). Relative Contributions of Audit and Management
Delays in Corporate Financial Reporting: Empirical Evidence from Nigeria. International
Journal of Business and Social Science, 4(10).
Onsongo, D. (2017, January 9). Sossion says 2016 KCSE results were manipulated. Daily
Nation. Retrieved from http://www.nation.co.ke/news/education/Sossion-says-2016--
KCSE-results-were-doctored/2643604-3510332-3c8b1i/
Osei-Tutu, E., Badu, E., & Owusu-Manu, D. (2010). Exploring corruption practices in public
procurement of infrastructural projects in Ghana. International Journal of Managing
Projects in Business, 3(2), 236–256. https://doi.org/10.1108/17538371011036563
Otieno, R. (2016, December 1). Uhuru praises Matiang’i on credible KCPE results. Standard
Digital. Retrieved from https://www.standardmedia.co.ke/article/2000225437/uhuru-
praises-matiang-i-on-credible-kcpe-results
Owusu-Ansah, S. (2000). Timeliness of corporate financial reporting in emerging capital
markets: empirical evidence from the Zimbabwe Stock Exchange. Accounting and
Business Research, 30(3), 241–254.
Palepu, K. G., & Healy, P. M. (2001). Information asymmetry, corporate disclosure, and the
capital markets: a review of the empirical disclosure literature. Journal of Accounting and
Economics, 31(405–440).
Patell, J. M., & Wolfson, M. A. (1982). Good News, Bad News, and the Intraday Timing of
Corporate EWsclosures 509-527. The Accounting Review, 509–527.
78
Patelli, L., & Prencipe, A. (2007). The relationship between voluntary disclosure and
independent directors in the presence of a dominant shareholder. European Accounting
Review, 16(1), 5–33.
Patrick, N., & Benjamin, T. (1994). An empirical examination of the determinats of audit delay
in Hong Kong. Business Accounting 1Review, 26, 43–59.
Patton, M. Q. (2002). Qualitative Research and Evaluation Methods (3rd ed.). California.:
Sage.
PCAOB. (2016). AS 1001: Responsibilities and Functions of the Independent Auditor.
Retrieved March 12, 2017, from
https://pcaobus.org/Standards/Auditing/Pages/AS1001.aspx
Persons, O. S. (2009). Audit committee characteristics and earlier voluntary ethics disclosure
among fraud and no-fraud firms. International Journal of Disclosure and Governance,
6(4), 284–297.
Petra, S. T. (2007). The effects of corporate governance on the informativeness of earnings.
Economics of Governance, 8(2), 129–152.
Piovani, J. I. (2008). The historical construction of correlation as a conceptual and operative
instrument for empirical research. Quality & Quantity, 42(6), 757–777.
Portes, R., & Rey, H. (2005). The determinants of cross-border equity flows. Journal of
International Economics, 65(2), 269–296.
Puat Nelson, S., & Norwahida Shukeri, S. (2011). Corporate governance and audit report
timeliness: evidence from Malaysia. Research in Accounting in Emerging Economies
(Vol. 11). Emerald Group Publishing Ltd. https://doi.org/10.1108/S1479-3563(2011)11
Raghunandan, K., & Rama, D. (2006). SOX section 404 material weakness disclosures and
audit fees. Auditing: A Journal of Practice and Theory, 25(1), 99–114.
Raghunandan, K., Read, W. J., & Rama, D. V. (2001). Audit Committee Composition, “Gray
Directors,” and Interaction with Internal Auditing. Accounting Horizons, 15(2), 105–118.
Remenyi, D., Williams, B., Money, A., & Swartz, E. (1998). Doing Research in Business and
Management. London: Sage Publications.
Rezaei, F., & Shahroodi, P. (2015). The relationship between audit opinion change and timing
of disclosure. International Journal of Innovation and Applied Studies, 10(3), 778–790.
Robert Knechel, W., Krishnan, G. V., Pevzner, M., Shefchik, L. B., & Velury, U. K. (2013).
Audit quality: Insights from the academic literature. Auditing, 32(SUPPL.1), 385–421.
https://doi.org/10.2308/ajpt-50350
Ross, S. (1973). The economic theory of agency: The principal’s problem. American Economic
Review, 63, 134–139.
Sarkar, J., Sarkar, S., & Sen, K. (2008). Board of directors and opportunistic earnings
management: Evidence from India. Journal of Accounting, Auditing and Finance, 23(4),
517–551., 23(4), 517–551.
Saunders, M., Lewis, P., & Thornhill, A. (2009). Research Methods for Business Students .
(5th ed.). Essex: Pearson Education Limited.
79
Schwartz, K. B., & Soo, B. S. (1996). The association between auditor changes and reporting
lags. Contemporary Accounting Research, 13(1), 357–70.
Schwartz, K., & Menon, K. (1985). Auditor switches by failing firms. The Accounting Review,
60(248–261).
Sekaran, U., & Bougie, R. (2013). Research Methods for Business: A Skill Building Approach
(6th ed.). New York: John Wiley and Sons Inc.
Shah, S. Z. A., Butt, S. A., & Hasan, A. (2009). Corporate governance and earnings
management an empirical evidence form Pakistani listed companies. European Journal
of Scientific Research, 26(4), 624–638. Retrieved from
http://www.eurojournals.com/ejsr.htm
Shamsul-Nahar, A. (2007). Board Composition, Audit Committee and timeliness of corporate
financial reports in Malaysia. Corporate Ownership & Control, 4(2), 33–45.
Simunic, D. (1980). The pricing of audit services: theory and evidence. Journal of Accounting
Research, 18(1), 161–190.
Soltani, B. (2002). Timeliness of corporate and audit reports: some empirical evidence in the
French context. The International Journal of Accounting, 37, 215–46.
Spence, M. (1973). Job market signaling. Quarterly Journal of Economics, 87(3), 355–374.
Spence, M. (2002). Signaling in retrospect and the informational structure of markets.
American Economic Review, 92, 434–459.
Srinidhi, B., Gul, F. A., & Tsui, J. (2011). Female directors and earnings quality. Contemporary
Accounting Research, 28(5), 1610–1644.
Stice, J. D. (1991). Using financial market information to identify pre-engagement factors
associated with lawsuits against public accountants. The Accounting Review, 66, 516–533.
Sultana, N., Singh, H., & Mitchell Van der Zahn, J.-L. (2015). Audit Committee Characteristics
and Audit Report Lag. International Journal of Auditing, 19, 72–87.
Tanyi, P., Raghunandan, K., & Barua, A. (2010). Audit Report Lags after Voluntary and
Involuntary Auditor Changes. Accounting Horizons, 24(4), 671–688.
Treadway Commission. (1987). Report of the National Commission on Fraudulent Financial
Reporting. Washington DC.
Tumurkhuu, T., & Wang, X. (2010). The relationship between the profit warning and stock
returns: Empirical evidence in EU markets. Sweden. Retrieved from http://umu.diva-
portal.org/smash/get/diva2:394405/FULLTEXT01.pdf
UNDP. (2010). Human Development Report 2010: The Real Wealth of Nations: Pathways to
Human Development. New York: Palgrave Macmillan. https://doi.org/10.2307/2137795
Urquiza, F. B., Navarro, M. C., Trombetta, M., & Lara, J. M. (2010). Disclosure theories and
disclosure measures. Spanish Journal of Accounting and Finance, 39(147), 393–420.
Vafeas, N. (2005). Audit committee, boards, and the quality of reported earnings.
Contemporary Accounting Research, 22(4), 1093–1122.
Verrecchia, R. E. (1983). Discretionary disclosure. Journal of Accounting and Economics, 5,
80
179–194.
Verrecchia, R. E. (1990). Endogenous proprietary costs through firm interdependence. Journal
of Accounting and Economics, 12(1–3), 245–250.
Wallace, R. S. O. (1990). Accounting in Developing Countries: A Review of the Literature.
Research in Third World Accounting, 2, 3–54.
Wanzala, O. (2016, May 19). Schools calendar overhauled in new war against exam cheating.
Daily Nation. Retrieved from http://www.nation.co.ke/news/Tough-rules-to-stop-exam-
cheats-unveiled/1056-3209416-1dxn99z/index.html
Wasuna, B. (2015). How Dubai Bank chief took billions from customers. Business Daily.
Retrieved from http://www.businessdailyafrica.com/How-Dubai-Bank-chief-took-
billions-from-customers/539546-2900102-4i4ebu/index.html
Wasuna, B. (2016). How Imperial Bank bosses stole billions from depositors. Daily Monitor.
Retrieved from http://www.monitor.co.ug/Business/Prosper/How-Imperial-Bank-bosses-
stole-billions-from-depositors/688616-3395520-6xve8rz/index.html
Watkins, A. L., Hillison, W., & Morecroft, S. E. (2004). Audit quality: a synthesis of theory
and empirical evidence. Journal of Accounting Literature, 23, 153–193.
Watson, A., Shrives, P., & Marston, C. (2002). Voluntary Disclosure of Accounting Ratios in
the UK. The British Accounting Review, 34(4), 289–313. https://doi.org/10.1006/S0890-
8389(02)00077-X
Watts, R. L., & Zimmerman, J. L. (1986). Positive Accounting Theory. Englewood Cliffs, NJ:
PrenticeHall.
Watts, R. L. (1992). Accounting choice theory and market-based research in accounting. The
British Accounting Review, 24(3), 235–267.
Waweru, N. M., & Riro, G. K. (2013). Corporate Governance , Firm Characteristics and
Earnings Management in an Emerging Economy, 11(1).
Waweru, N. M., & Uliana, E. (2005). Predictors of management accounting change in South
Africa: evidence from five retail companies. SA Journal of Accounting Research, 19(1),
37–71.
Waweru, N., Sultana, N., Singh, H., Mitchell Van der Zahn, J.-L., Outa, E. R., Waweru, N. M.,
… Lee, R. (2015). Audit tenure , auditor specialization and audit report lag. Managerial
Auditing Journal, 29(3), 292–316. https://doi.org/10.1108/MAJ-07-2013-0897
Waweru, N., & Uliana, E. (2014). Determinants of quality corporate governance in Sub-
Saharan AfricaEvidence from Kenya and South Africa. Managerial Auditing Journal,
29(5), 455–485. https://doi.org/10.1108/MAJ-07-2013-0897
Wermert, J.G., Dodd, J.L., & Doucet, T.A. (2000). An empirical examination of audit report
lag using client and audit firm cycle times. Retrieved from
www.cbpa.drake.edu/dodd/research/ mbaa/MBAA ARL Paper, 2000.doc (accessed
January 2008).
Wilson, K. (1968). On the theories of syndicates. Econometrica, 36, 119–132.
Wisna, N. (2013). The Effect of Information Technology on the Quality of Accounting
81
Information system and Its impact on the Quality of Accounting Information. Research
Journal of Finance and Accounting, 4(15), 2222–2847.
Wooldridge, J. M. (2015). Introductory Econometrics: A Modern Approach. (6th, Ed.).
Cengage Learning.
Xie, B., Davidson III, W. N., & Dadalt, P. J. (2003). Earnings management and corporate
governance: The role of the board and the audit committee. Journal of Corporate Finance,
9(3), 295–316.
Yaacob, N. M., & Che-Ahmad, A. (2012). Adoption of FRS 138 and Audit Delay in Malaysia.
International Journal of Economics and Finance, 4(1), 167–176.
https://doi.org/10.5539/ijef.v4n1p167
Yim, A. (2010). Fraud Detection and Financial Reporting and Audit Delay ∗. London.
Zhang, Y., Zhou, J., & Zhou, N. (2007). Audit committee quality, auditor independence, and
internal control weaknesses. Journal of Accounting and Public Policy, 26(3), 300–327.
https://doi.org/10.1016/j.jaccpubpol.2007.03.001
Zikmund, W. G. (2010). Business Research Methods (8th ed.). Mason, OH.: South - Western
Cengage Learning.
Zitouni, T. (2016). Index Approach of Corporate Governance. Journal of Business Studies
Quartely, 7(3).
82
APPENDICES
Appendix I: Letter of introduction
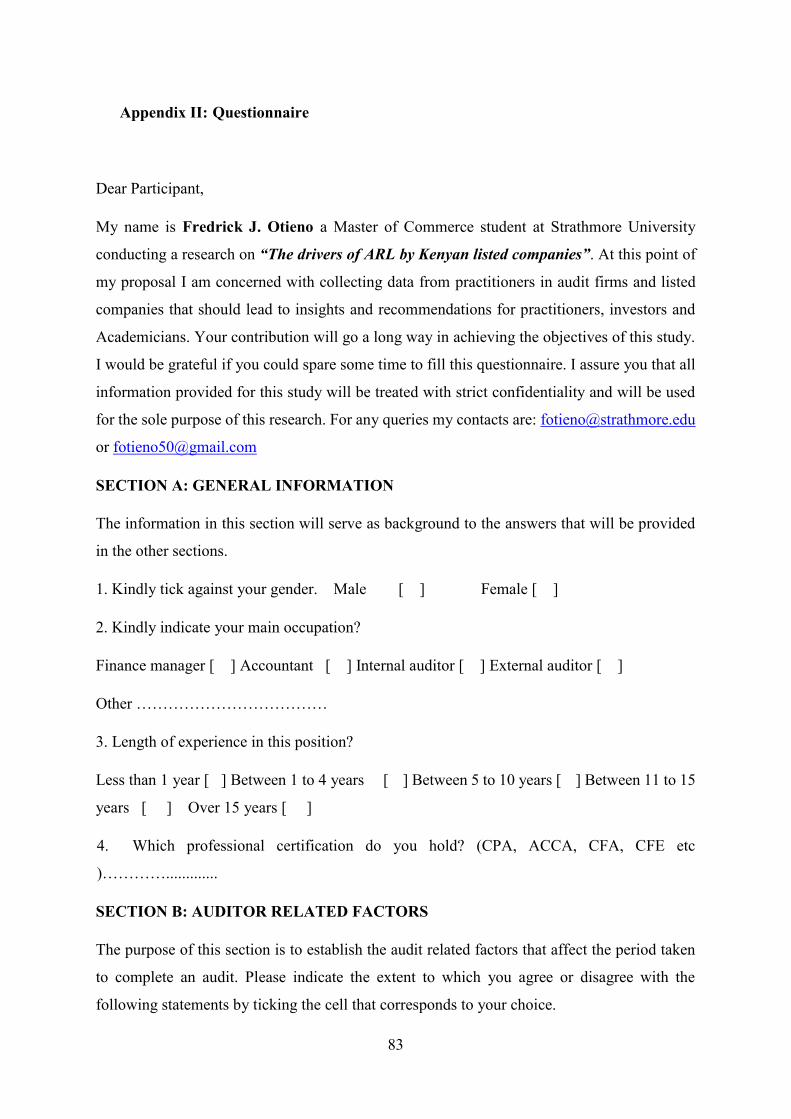
83
Appendix II: Questionnaire
Dear Participant,
My name is Fredrick J. Otieno a Master of Commerce student at Strathmore University
conducting a research on “The drivers of ARL by Kenyan listed companies”. At this point of
my proposal I am concerned with collecting data from practitioners in audit firms and listed
companies that should lead to insights and recommendations for practitioners, investors and
Academicians. Your contribution will go a long way in achieving the objectives of this study.
I would be grateful if you could spare some time to fill this questionnaire. I assure you that all
information provided for this study will be treated with strict confidentiality and will be used
for the sole purpose of this research. For any queries my contacts are: [email protected]
SECTION A: GENERAL INFORMATION
The information in this section will serve as background to the answers that will be provided
in the other sections.
1. Kindly tick against your gender. Male [ ] Female [ ]
2. Kindly indicate your main occupation?
Finance manager [ ] Accountant [ ] Internal auditor [ ] External auditor [ ]
Other ………………………………
3. Length of experience in this position?
Less than 1 year [ ] Between 1 to 4 years [ ] Between 5 to 10 years [ ] Between 11 to 15
years [ ] Over 15 years [ ]
4. Which professional certification do you hold? (CPA, ACCA, CFA, CFE etc
)………….............
SECTION B: AUDITOR RELATED FACTORS
The purpose of this section is to establish the audit related factors that affect the period taken
to complete an audit. Please indicate the extent to which you agree or disagree with the
following statements by ticking the cell that corresponds to your choice.
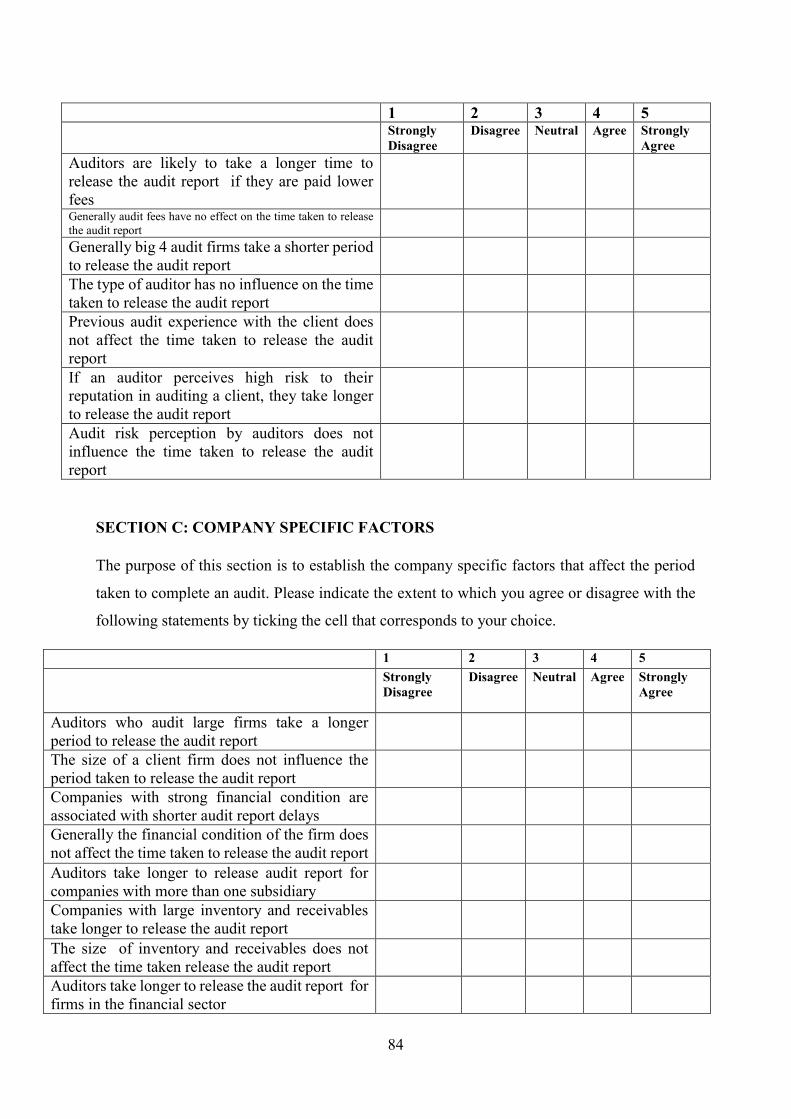
84
1 2 3 4 5
Strongly
Disagree
Disagree Neutral Agree Strongly
Agree
Auditors are likely to take a longer time to
release the audit report if they are paid lower
fees
Generally audit fees have no effect on the time taken to release
the audit report
Generally big 4 audit firms take a shorter period
to release the audit report
The type of auditor has no influence on the time
taken to release the audit report
Previous audit experience with the client does
not affect the time taken to release the audit
report
If an auditor perceives high risk to their
reputation in auditing a client, they take longer
to release the audit report
Audit risk perception by auditors does not
influence the time taken to release the audit
report
SECTION C: COMPANY SPECIFIC FACTORS
The purpose of this section is to establish the company specific factors that affect the period
taken to complete an audit. Please indicate the extent to which you agree or disagree with the
following statements by ticking the cell that corresponds to your choice.
1 2 3 4 5
Strongly
Disagree
Disagree Neutral Agree Strongly
Agree
Auditors who audit large firms take a longer
period to release the audit report
The size of a client firm does not influence the
period taken to release the audit report
Companies with strong financial condition are
associated with shorter audit report delays
Generally the financial condition of the firm does
not affect the time taken to release the audit report
Auditors take longer to release audit report for
companies with more than one subsidiary
Companies with large inventory and receivables
take longer to release the audit report
The size of inventory and receivables does not
affect the time taken release the audit report
Auditors take longer to release the audit report for
firms in the financial sector
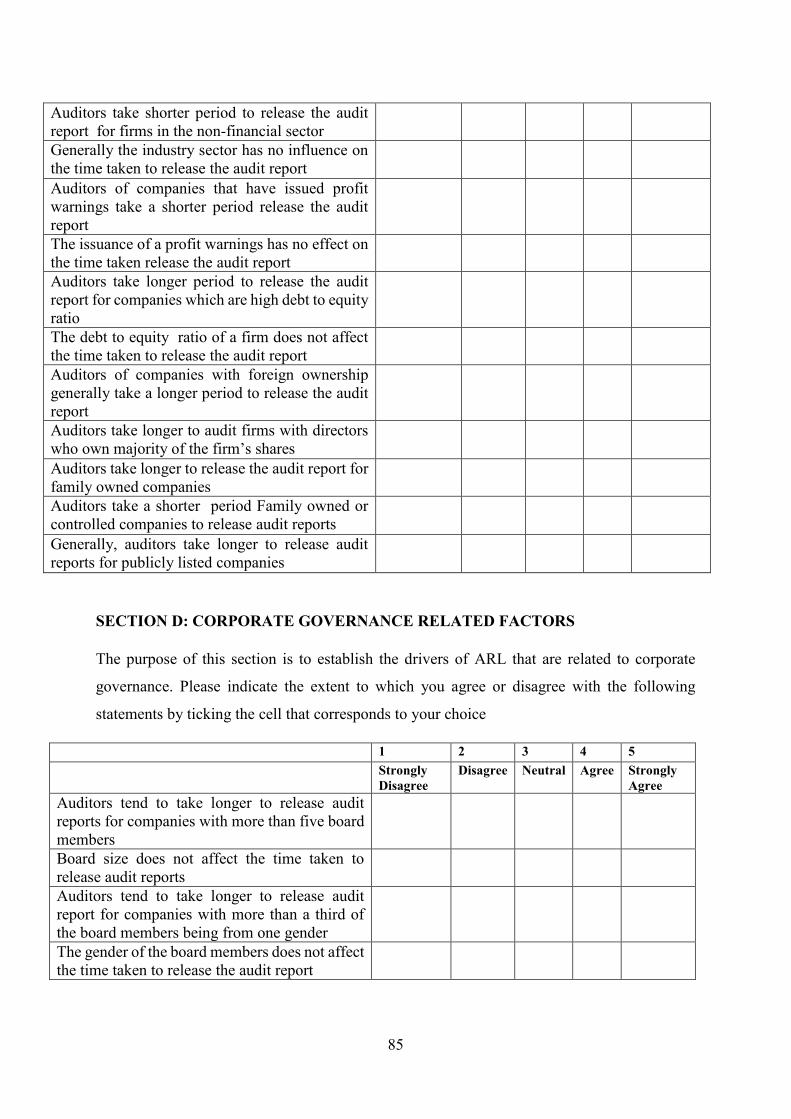
85
Auditors take shorter period to release the audit
report for firms in the non-financial sector
Generally the industry sector has no influence on
the time taken to release the audit report
Auditors of companies that have issued profit
warnings take a shorter period release the audit
report
The issuance of a profit warnings has no effect on
the time taken release the audit report
Auditors take longer period to release the audit
report for companies which are high debt to equity
ratio
The debt to equity ratio of a firm does not affect
the time taken to release the audit report
Auditors of companies with foreign ownership
generally take a longer period to release the audit
report
Auditors take longer to audit firms with directors
who own majority of the firm’s shares
Auditors take longer to release the audit report for
family owned companies
Auditors take a shorter period Family owned or
controlled companies to release audit reports
Generally, auditors take longer to release audit
reports for publicly listed companies
SECTION D: CORPORATE GOVERNANCE RELATED FACTORS
The purpose of this section is to establish the drivers of ARL that are related to corporate
governance. Please indicate the extent to which you agree or disagree with the following
statements by ticking the cell that corresponds to your choice
1 2 3 4 5
Strongly
Disagree
Disagree Neutral Agree Strongly
Agree
Auditors tend to take longer to release audit
reports for companies with more than five board
members
Board size does not affect the time taken to
release audit reports
Auditors tend to take longer to release audit
report for companies with more than a third of
the board members being from one gender
The gender of the board members does not affect
the time taken to release the audit report
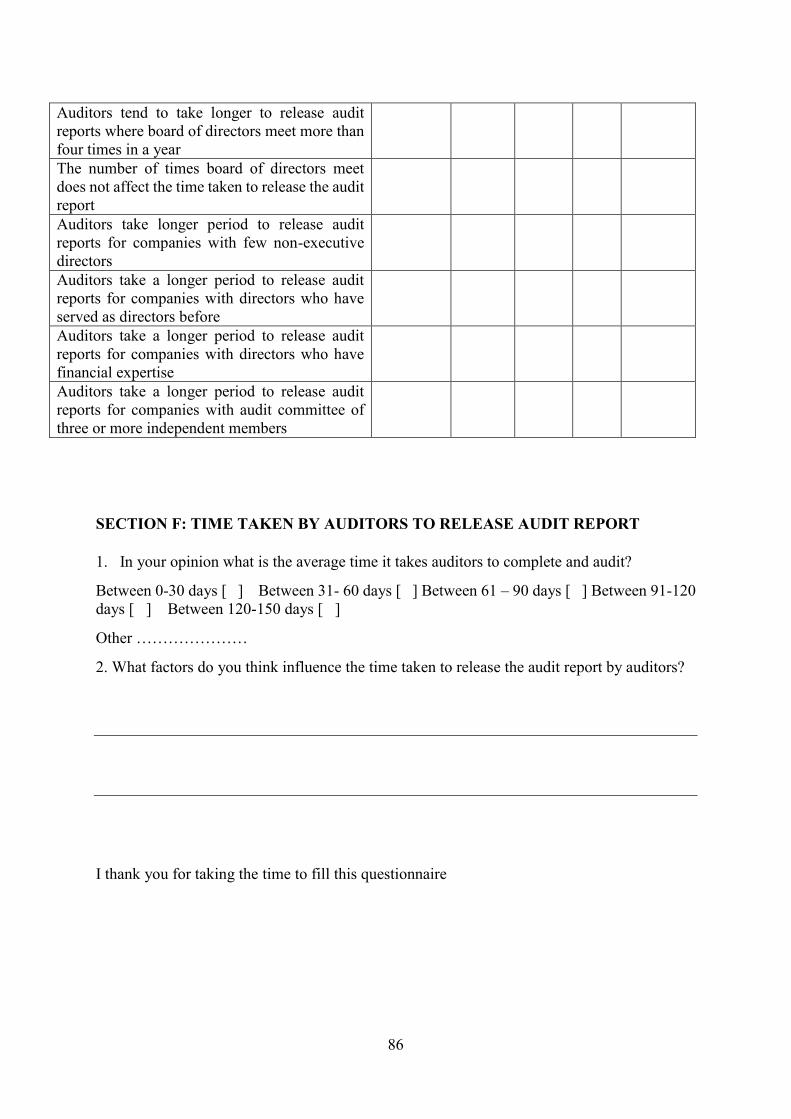
86
Auditors tend to take longer to release audit
reports where board of directors meet more than
four times in a year
The number of times board of directors meet
does not affect the time taken to release the audit
report
Auditors take longer period to release audit
reports for companies with few non-executive
directors
Auditors take a longer period to release audit
reports for companies with directors who have
served as directors before
Auditors take a longer period to release audit
reports for companies with directors who have
financial expertise
Auditors take a longer period to release audit
reports for companies with audit committee of
three or more independent members
SECTION F: TIME TAKEN BY AUDITORS TO RELEASE AUDIT REPORT
1. In your opinion what is the average time it takes auditors to complete and audit?
Between 0-30 days [ ] Between 31- 60 days [ ] Between 61 – 90 days [ ] Between 91-120
days [ ] Between 120-150 days [ ]
Other …………………
2. What factors do you think influence the time taken to release the audit report by auditors?
I thank you for taking the time to fill this questionnaire
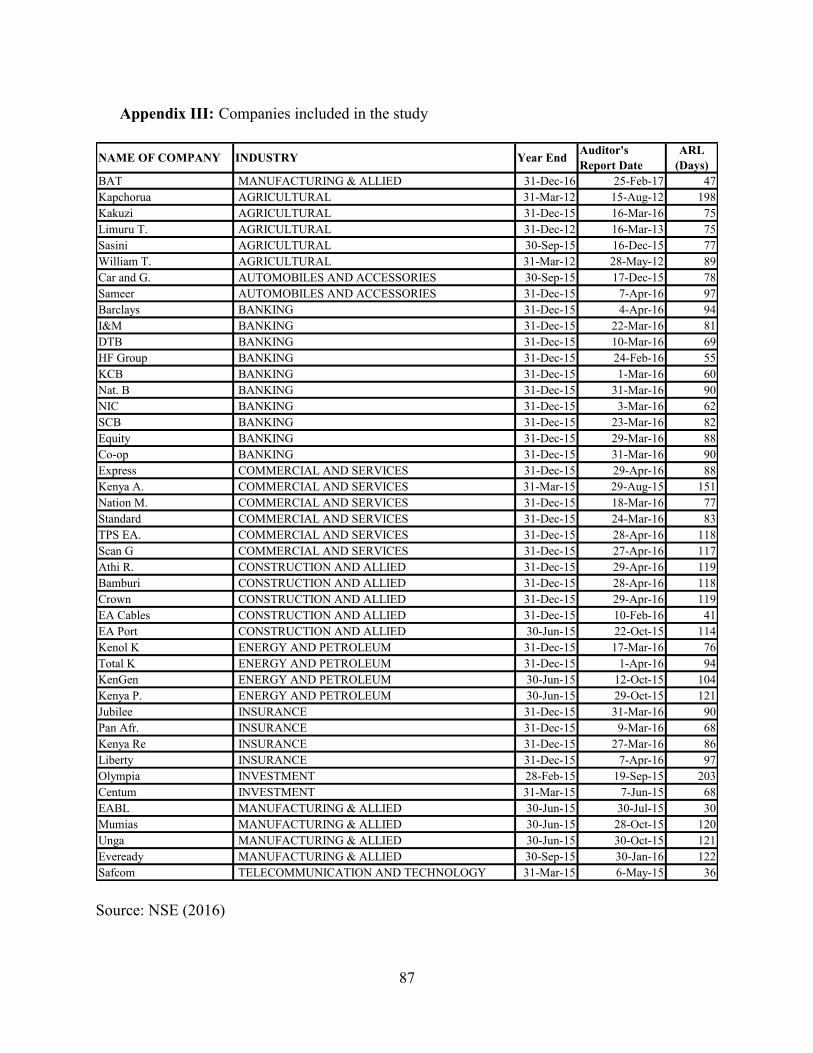
87
Appendix III: Companies included in the study
Source: NSE (2016)
BAT MANUFACTURING & ALLIED 31-Dec-16 25-Feb-17 47
Kapchorua AGRICULTURAL 31-Mar-12 15-Aug-12 198
Kakuzi AGRICULTURAL 31-Dec-15 16-Mar-16 75
Limuru T. AGRICULTURAL 31-Dec-12 16-Mar-13 75
Sasini AGRICULTURAL 30-Sep-15 16-Dec-15 77
William T. AGRICULTURAL 31-Mar-12 28-May-12 89
Car and G. AUTOMOBILES AND ACCESSORIES 30-Sep-15 17-Dec-15 78
Sameer AUTOMOBILES AND ACCESSORIES 31-Dec-15 7-Apr-16 97
Barclays BANKING 31-Dec-15 4-Apr-16 94
I&M BANKING 31-Dec-15 22-Mar-16 81
DTB BANKING 31-Dec-15 10-Mar-16 69
HF Group BANKING 31-Dec-15 24-Feb-16 55
KCB BANKING 31-Dec-15 1-Mar-16 60
Nat. B BANKING 31-Dec-15 31-Mar-16 90
NIC BANKING 31-Dec-15 3-Mar-16 62
SCB BANKING 31-Dec-15 23-Mar-16 82
Equity BANKING 31-Dec-15 29-Mar-16 88
Co-op BANKING 31-Dec-15 31-Mar-16 90
Express COMMERCIAL AND SERVICES 31-Dec-15 29-Apr-16 88
Kenya A. COMMERCIAL AND SERVICES 31-Mar-15 29-Aug-15 151
Nation M. COMMERCIAL AND SERVICES 31-Dec-15 18-Mar-16 77
Standard COMMERCIAL AND SERVICES 31-Dec-15 24-Mar-16 83
TPS EA. COMMERCIAL AND SERVICES 31-Dec-15 28-Apr-16 118
Scan G COMMERCIAL AND SERVICES 31-Dec-15 27-Apr-16 117
Athi R. CONSTRUCTION AND ALLIED 31-Dec-15 29-Apr-16 119
Bamburi CONSTRUCTION AND ALLIED 31-Dec-15 28-Apr-16 118
Crown CONSTRUCTION AND ALLIED 31-Dec-15 29-Apr-16 119
EA Cables CONSTRUCTION AND ALLIED 31-Dec-15 10-Feb-16 41
EA Port CONSTRUCTION AND ALLIED 30-Jun-15 22-Oct-15 114
Kenol K ENERGY AND PETROLEUM 31-Dec-15 17-Mar-16 76
Total K ENERGY AND PETROLEUM 31-Dec-15 1-Apr-16 94
KenGen ENERGY AND PETROLEUM 30-Jun-15 12-Oct-15 104
Kenya P. ENERGY AND PETROLEUM 30-Jun-15 29-Oct-15 121
Jubilee INSURANCE 31-Dec-15 31-Mar-16 90
Pan Afr. INSURANCE 31-Dec-15 9-Mar-16 68
Kenya Re INSURANCE 31-Dec-15 27-Mar-16 86
Liberty INSURANCE 31-Dec-15 7-Apr-16 97
Olympia INVESTMENT 28-Feb-15 19-Sep-15 203
Centum INVESTMENT 31-Mar-15 7-Jun-15 68
EABL MANUFACTURING & ALLIED 30-Jun-15 30-Jul-15 30
Mumias MANUFACTURING & ALLIED 30-Jun-15 28-Oct-15 120
Unga MANUFACTURING & ALLIED 30-Jun-15 30-Oct-15 121
Eveready MANUFACTURING & ALLIED 30-Sep-15 30-Jan-16 122
Safcom TELECOMMUNICATION AND TECHNOLOGY 31-Mar-15 6-May-15 36
NAME OF COMPANY INDUSTRY Year EndAuditor's
Report Date
ARL
(Days)
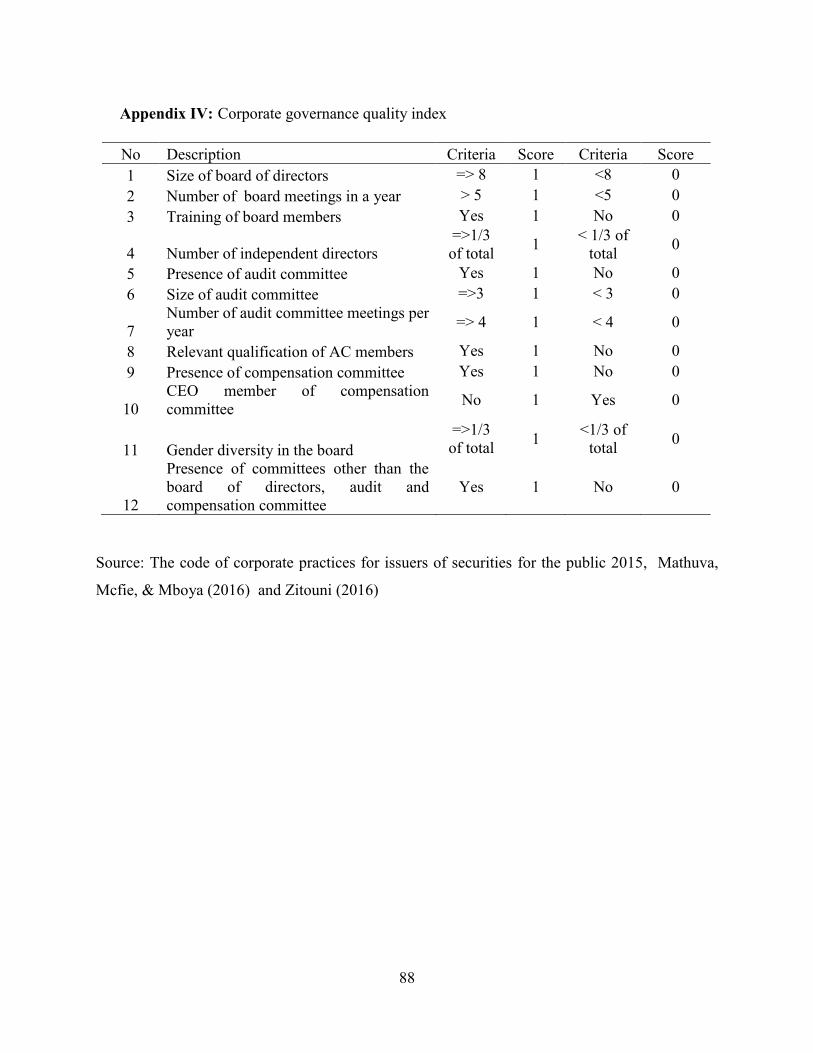
88
Appendix IV: Corporate governance quality index
No Description Criteria Score Criteria Score
1 Size of board of directors => 8 1 <8 0
2 Number of board meetings in a year > 5 1 <5 0
3 Training of board members Yes 1 No 0
4 Number of independent directors
=>1/3
of total 1
< 1/3 of
total 0
5 Presence of audit committee Yes 1 No 0
6 Size of audit committee =>3 1 < 3 0
7
Number of audit committee meetings per
year => 4 1 < 4 0
8 Relevant qualification of AC members Yes 1 No 0
9 Presence of compensation committee Yes 1 No 0
10
CEO member of compensation
committee No 1 Yes 0
11 Gender diversity in the board
=>1/3
of total 1
<1/3 of
total 0
12
Presence of committees other than the
board of directors, audit and
compensation committee
Yes 1 No 0
Source: The code of corporate practices for issuers of securities for the public 2015, Mathuva,
Mcfie, & Mboya (2016) and Zitouni (2016)
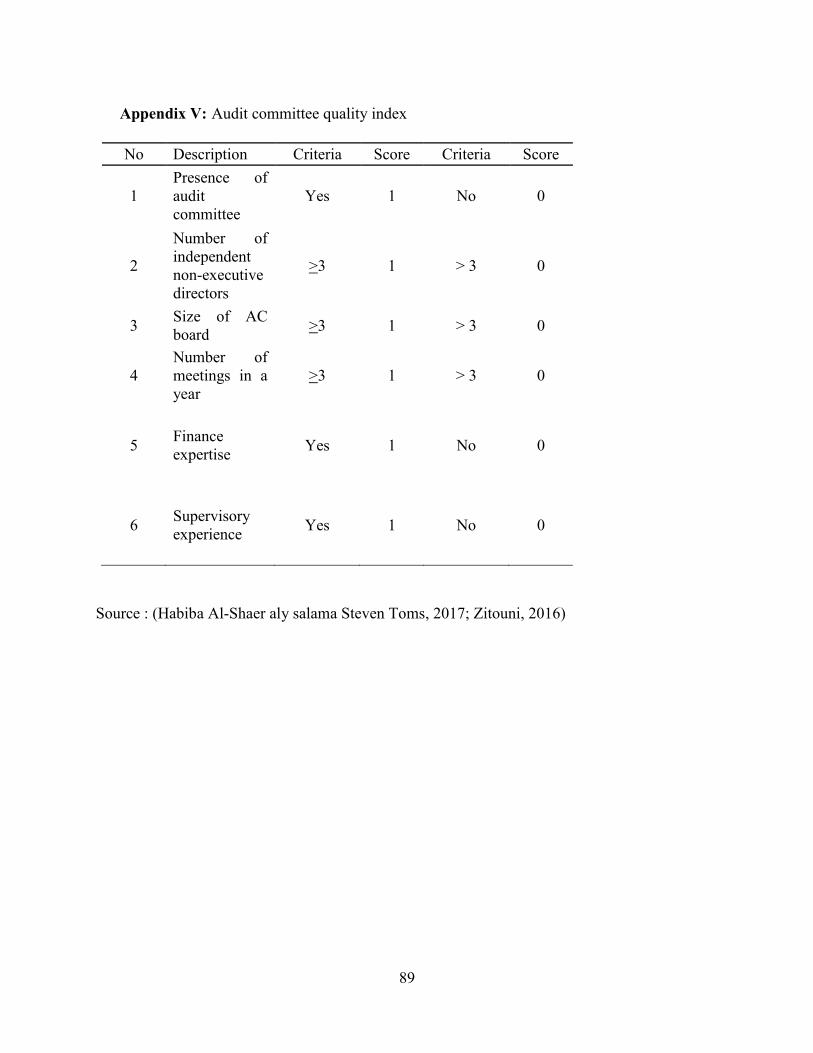
89
Appendix V: Audit committee quality index
No Description Criteria Score Criteria Score
1
Presence of
audit
committee
Yes 1 No 0
2
Number of
independent
non-executive
directors
>3 1 > 3 0
3 Size of AC
board >3 1 > 3 0
4
Number of
meetings in a
year
>3 1 > 3 0
5 Finance
expertise Yes 1 No 0
6 Supervisory
experience Yes 1 No 0
Source : (Habiba Al-Shaer aly salama Steven Toms, 2017; Zitouni, 2016)
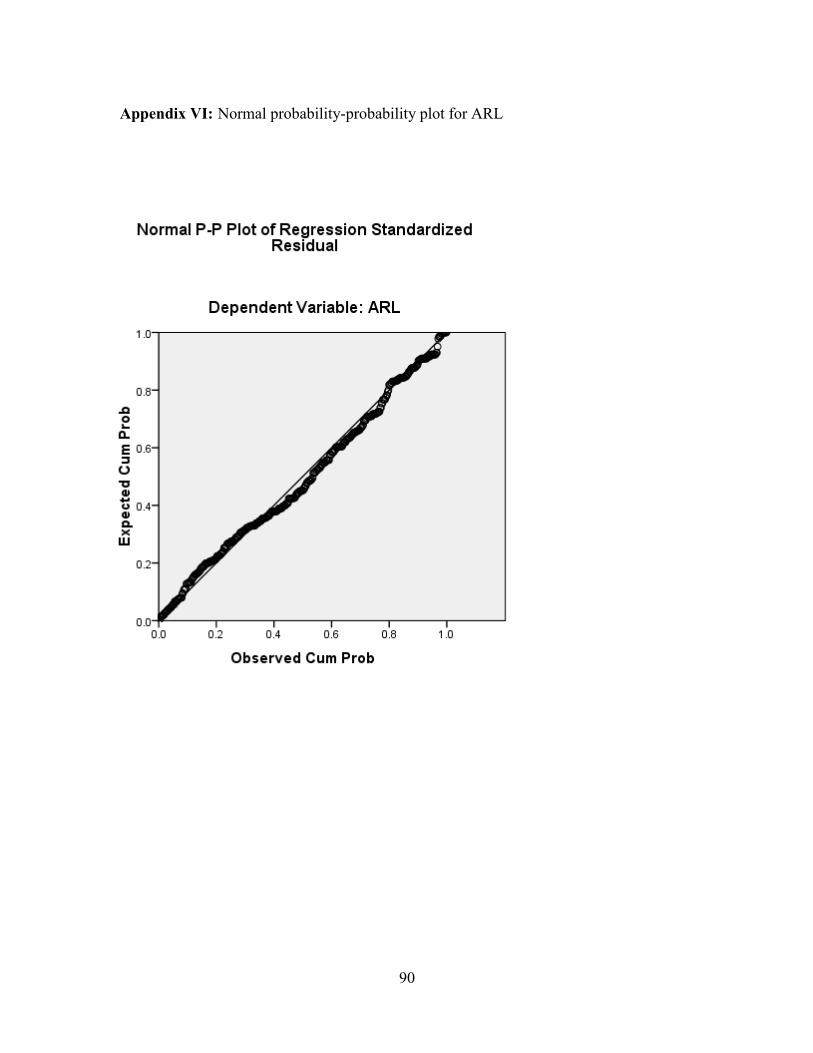
90
Appendix VI: Normal probability-probability plot for ARL
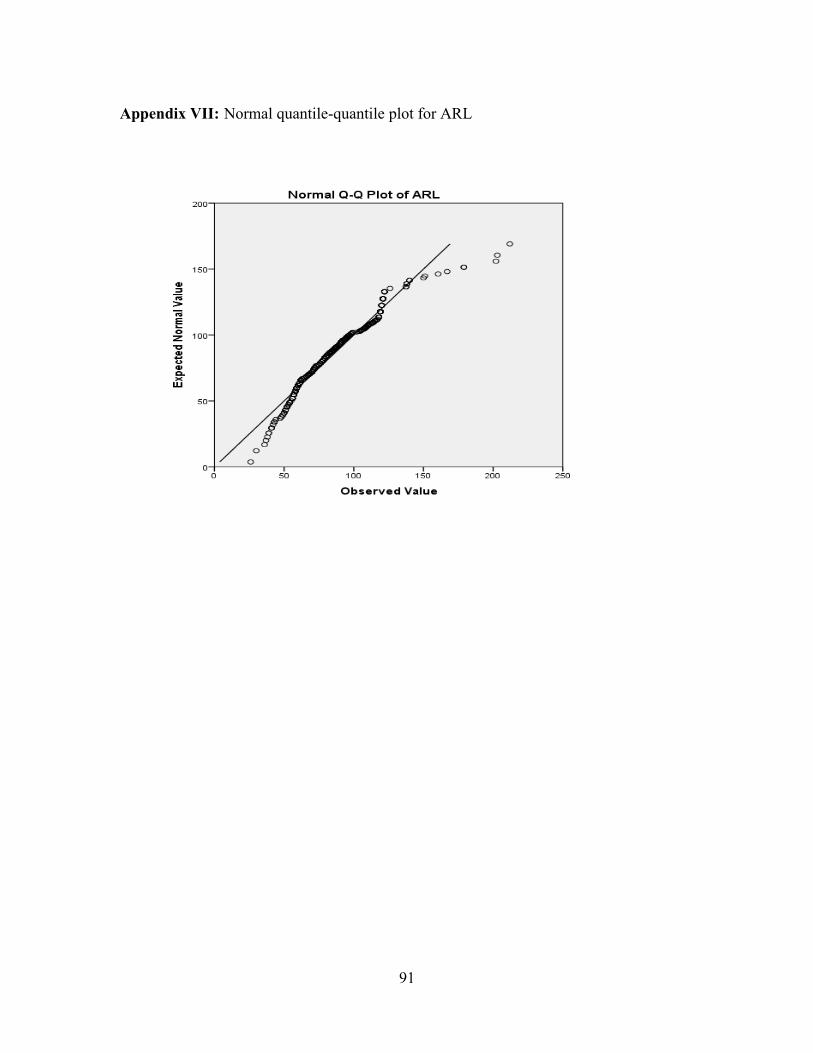
91
Appendix VII: Normal quantile-quantile plot for ARL
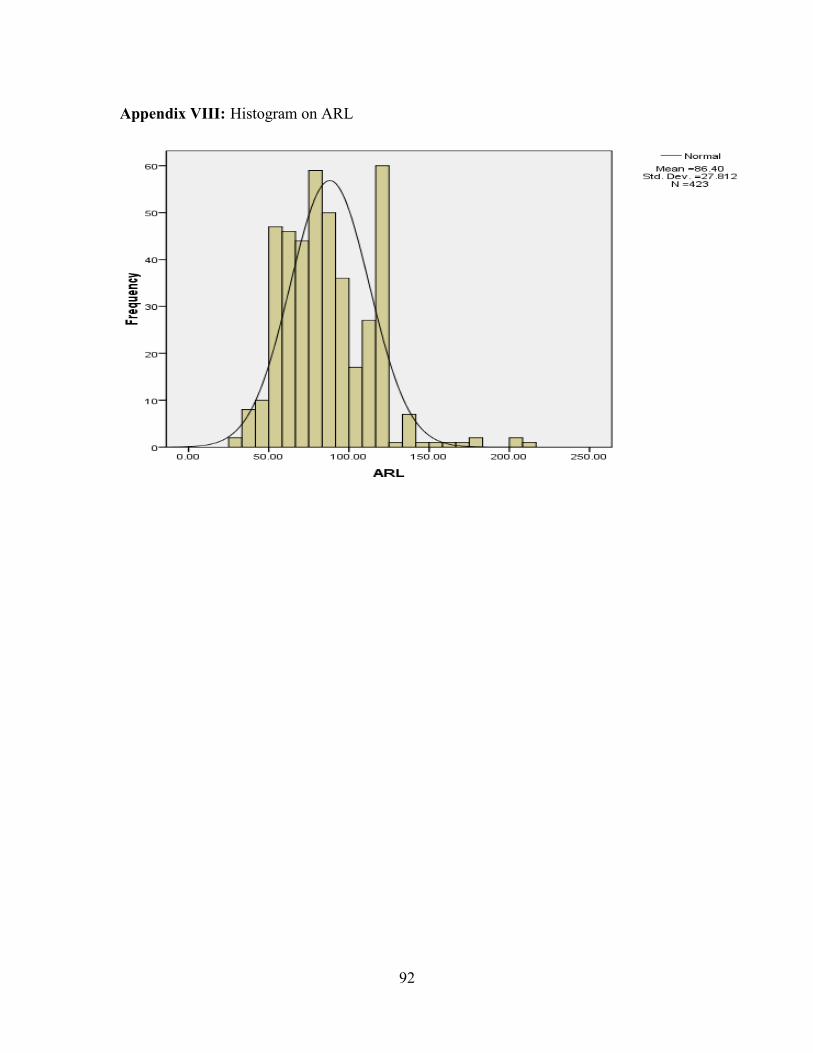
92
Appendix VIII: Histogram on ARL
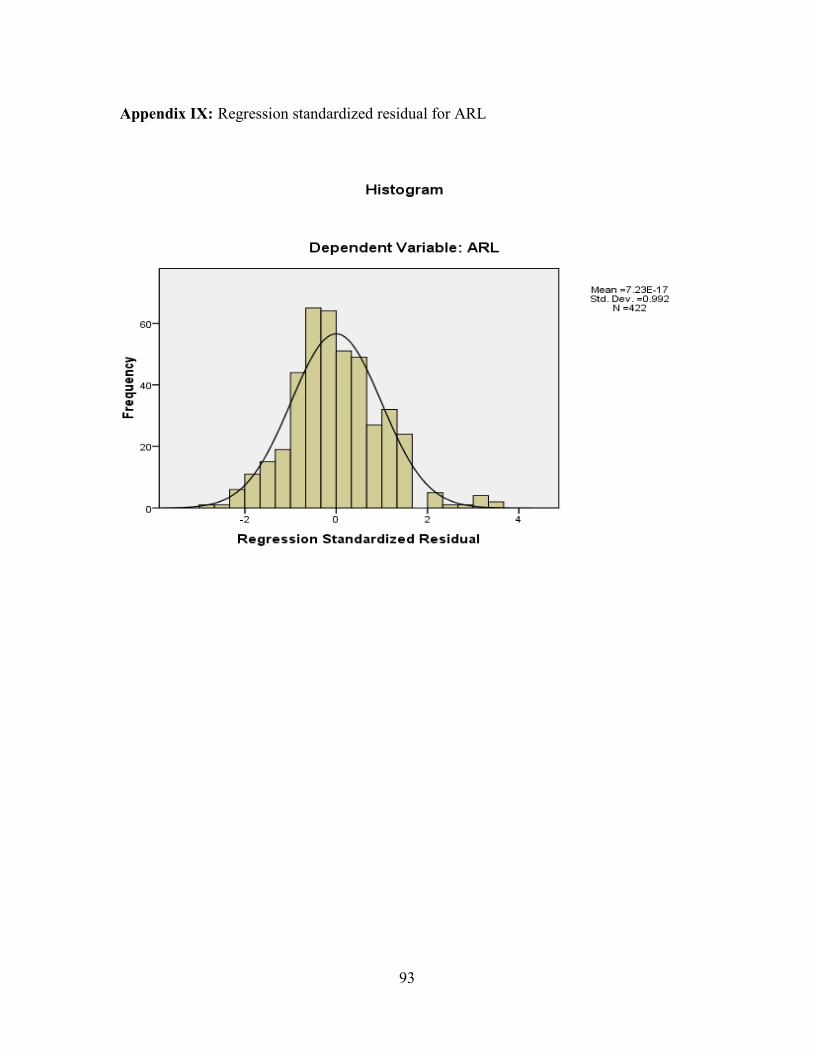
93
Appendix IX: Regression standardized residual for ARL


