Embed Size (px)
Citation preview

The Effect of School-Based Kindergarten Transition Policies andPractices on Child Academic Outcomes
Amy B. Schulting, Patrick S. Malone, and Kenneth A. DodgeCenter for Child and Family Policy, Duke University
AbstractThis study examined the effect of school-based kindergarten transition policies and practices on childoutcomes. The authors followed 17,212 children from 992 schools in the Early ChildhoodLongitudinal Study-Kindergarten sample (ECLS-K) across the kindergarten school year.Hierarchical linear modeling revealed that the number of school-based transition practices in the fallof kindergarten was associated with more positive academic achievement scores at the end ofkindergarten, even controlling for family socioeconomic status (SES) and other demographic factors.This effect was stronger for low- and middle-SES children than high-SES children. For low-SESchildren, 7 transition practices were associated with a .21 standard deviation increase in predictedachievement scores beyond 0 practices. The effect of transition practices was partially mediated byan intervening effect on parent-initiated involvement in school during the kindergarten year. Thefindings support education policies to target kindergarten transition efforts to increase parentinvolvement in low-SES families.
Keywordskindergarten transition; parent involvement; socioeconomic status; academic achievement
The importance a successful transition to kindergarten cannot be overstated. Kindergartenmarks a child’s entry into formal schooling, and performance in kindergarten paves the wayfor future academic success or failure. The relation between children’s performance duringearly elementary school and their later academic achievement has been well documented(Ensminger & Slusarcick, 1992; Entwisle & Alexander, 1998; Entwisle & Hayduck, 1988;Gutman, Sameroff, & Cole, 2003). Recognizing the importance of early school success, thevast majority of schools in the United States implement policies and practices to ease children’stransition to kindergarten, but in varying degrees. Commonly used transition practices includemeeting with parents, phoning or sending home information about the kindergarten program,and inviting parents and children to visit the kindergarten classroom prior to the start of theschool year (Pianta, Cox, Taylor, & Early, 1999). These policies are implicitly designed tonurture parental involvement, especially for disenfranchised families. However, despite thewidespread use of transition practices, at present, there is no empirical evidence linking suchpractices to improved child outcomes (Early, Pianta, Taylor, & Cox, 2001). Therefore, thepurposes of this study were to examine whether transition practices have an incremental effecton child outcomes during kindergarten; whether this effect varies across socioeconomicgroups; and how this effect is mediated.
Copyright 2005 by the American Psychological AssociationCorrespondence concerning this article should be addressed to Amy B. Schulting, Center for Child and Family Policy, Duke University,Durham, NC 27708. [email protected].
NIH Public AccessAuthor ManuscriptDev Psychol. Author manuscript; available in PMC 2009 October 5.
Published in final edited form as:Dev Psychol. 2005 November ; 41(6): 860–871. doi:10.1037/0012-1649.41.6.860.
NIH
-PA Author Manuscript
NIH
-PA Author Manuscript
NIH
-PA Author Manuscript

The transition to kindergarten can be challenging as it represents a shift on many fronts.Children are moving from a preschool, daycare center, or their own home, where different ratesof development had been acceptable, to an elementary school requiring mastery of specificacademic skills by predetermined deadlines. These deadlines are becoming increasinglyinflexible in this era of heightened school accountability. Under the recently adopted No ChildLeft Behind Act, children must meet the academic expectations of each grade level by the endof the school year or face sanctions that include summer school and retention (Neill, 2003).Furthermore, against the recommendations of early childhood educators, children are beingtested as early as kindergarten and preschool in preparation for the high-stakes testing requiredby the No Child Left Behind Act (Neill, Guisbond, Schaeffer, Maddon, & Legoros, 2004). Inaddition to the pressure of academic deadlines and future high-stakes testing, children mustalso adjust to the formal instruction and behavioral expectations of kindergarten, which oftendiffer from those in the preschool and home environments (Rimm-Kaufman & Pianta, 2000).
Not all children are successful in making the transition to formal schooling. Rimm-Kaufman,Pianta, and Cox’s (2000) national survey of problems identified by teachers during thetransition to kindergarten revealed that teachers reported that 48% of children had difficultyadjusting to school. Approximately one third (32%) of children were reported to have “someproblems” during the transition, and 16% of children were identified as having a “difficult orvery difficult” entry into kindergarten characterized by “serious concerns or manyproblems” (Rimm-Kaufman et al., 2000, p. 154). In addition, over one third of teachers reportedthat problems such as difficulty following directions, difficulty working independently, and alack of academic skills characterized over half the students in their class.
Although teachers in this study reported an alarmingly high rate of transition difficulties in thegeneral population of kindergartners, problems during the entry to kindergarten are even moreprevalent among children of low socioeconomic status (SES). Children from low SESbackgrounds have more difficult transitions to school characterized by early and persistentschool failure, behavior problems, low levels of parental involvement, and a widening gapbetween their academic achievement and that of their more affluent peers (Gutman et al.,2003; Rimm-Kaufman et al., 2000).
The Developmental Basis of Kindergarten Transition PoliciesThe transition to kindergarten has been characterized in a variety of ways in the literature, eachwith different theoretical under-pinnings leading to different intervention strategies. One wayof explaining children’s success or failure during the transition to kindergarten is as a functionof child-level factors, often collectively referred to as the child’s “readiness” for school. Theschool readiness construct gained national attention when the first of the National EducationGoals, or “Goals, 2000,” asserted that “all children in America will start school ready tolearn” (National Education Goals Panel, 1998, p. 1). This goal is predicated on the belief thatchildren’s abilities and skills at kindergarten entry determine their success or failure during thetransition to formal schooling (Meisels, 1999). Therefore, interventions based on the notion ofreadiness emphasize the importance of remediating skills deficits or other deficiencies inherentin the child.
Child factors, such as academic skills, behavior patterns, and maturity, have been found to playa role in children’s adjustment to kindergarten and in subsequent performance (Ensminger &Slusarcick, 1992; Gutman et al., 2003; Pallas, Entwisle, Alexander, & Cadigan, 1987).However, children’s academic and cognitive abilities measured in preschool have been foundto account for less than 25% of the variance in academic outcomes in kindergarten (LaParo &Pianta, 2000). The primary limitation of the readiness construct is that it lacks any considerationof the contextual factors that play an equally important role in children’s transition to and
Schulting et al. Page 2
Dev Psychol. Author manuscript; available in PMC 2009 October 5.
NIH
-PA Author Manuscript
NIH
-PA Author Manuscript
NIH
-PA Author Manuscript

success in kindergarten (Pianta, Rimm-Kaufman, & Cox, 1999). Consequently, the notion ofchild readiness as the primary determinant of kindergarten success has been replaced over timeby more dynamic, social-ecological approaches (Pianta & Walsh, 1996; C. T. Ramey & Ramey,1999). The developmental model of transition, which is based on Pianta and Walsh’s (1996)contextual systems model and Bronfenbrenner and Morris’s (1998) biecological model,emphasizes the importance of fostering positive relationships among the home, school,community, and peer group to support the child throughout the transition to kindergarten(Pianta & Kraft-Sayre, 2003). Transition practices based on this model are those that “facilitatean ongoing relationship process among all partners” (Pianta & Kraft-Sayre, 2003, p. 9). Thismodel recognizes that the child is embedded within a group of interacting systems. Successfultransitions are not considered solely contingent on the skills a child brings to kindergarten, butthey are believed to be the result of close, collaborative, and supportive relationships amongthe family, school, peers, and community (Pianta & Walsh, 1996; S. L. Ramey & Ramey,1994).
Consistent with a social-ecological approach, the National Education Goals Panel (1998) beganemphasizing the importance of “ready schools.” The first principle of ready schools states that“ready schools smooth the transition between home and school” (National Education GoalsPanel, 1998, p. 5). In recognition of the importance of contextual factors and the significanceof relationships across contexts during the transition to kindergarten, the National EducationGoals Panel encouraged schools to implement transition practices that create closerconnections with families, preschools, and the community. Pianta, Cox, et al. (1999) describedthe transition practices of ready schools as those that (a) reach out to establish links withfamilies and preschools, (b) reach backward in time to establish connections prior to the firstday of kindergarten, and (c) reach with appropriate intensity to establish personal connectionsto children and families through strategies such as home visiting.
In concordance with the National Education Goals Panel’s emphasis on ready schools, the vastmajority of schools in the United States now utilize at least some transition practices in anattempt to ease children’s transition to kindergarten. Pianta, Cox, et al.’s (1999) survey of anational sample of kindergarten teachers regarding their use of 21 transition practices revealedthat 95% of teachers talked with parents after school had started, 88% sent a letter home afterschool started, and the majority of teachers sent home a flyer about kindergarten before (69%)or after (77%) school had started. A majority of teachers also reported offering an open housebefore (62%) or after (82%) the beginning of the school year. Less commonly used transitionpractices involved making personal or phone contact with the family, child, or preschool priorto the beginning of school, with only 5%-17% of teachers reporting use of these practices. Itis interesting that teachers in high-poverty districts reported even fewer intensive orindividualized transition practices and higher rates of impersonal, low-intensity practices suchas sending a letter home or holding an open house. The only exception to this pattern was thatteachers in high-poverty districts conducted home visits more frequently than did teachers ofmore affluent students. It is important to note that low-income children, who are at highest riskof failure during the transition to kindergarten and therefore in need of higher levels ofintervention during this time, were found to receive more generic and lower intensity transitionpractices than their more affluent counterparts (Pianta, Cox, et al., 1999; C. T. Ramey & Ramey,1999).
The developmental model of transition and the ready schools construct provide theoreticalsupport for transition policies that reach out to families prior to the beginning of the schoolyear to support a positive home-school relationship in order to increase kindergarten success(National Education Goals Panel, 1998; Pianta & Kraft-Sayre, 2003). However, to ourknowledge, there is currently no empirical evidence linking transition policies to improvedchild outcomes during kindergarten. Given the widespread use of such practices, it is important
Schulting et al. Page 3
Dev Psychol. Author manuscript; available in PMC 2009 October 5.
NIH
-PA Author Manuscript
NIH
-PA Author Manuscript
NIH
-PA Author Manuscript

to determine whether the transition policies used by schools and teachers have a positive impacton kindergarten outcomes.
The Current StudyThe current study examined data from the Early Childhood Longitudinal Study, KindergartenClass of 1998-1999 (ECLS-K; National Center for Educational Statistics, 2001), which hasthe largest and most nationally representative body of information regarding kindergartentransition policies and practices available. Over 21,000 children in 992 schools participated inthis study, Three hypotheses were tested:
Hypothesis 1: Schools that implemented policies of active support to ease thetransition to kindergarten would have students who achieved at higher levels by theend of the kindergarten year.
Because selection biases are likely to lead economically advantaged children to populateschools with more transition practices, statistical controls are necessary to test the incrementaleffect of school transition policies on student outcomes. Even with these controls, a positiveeffect of transition policies was hypothesized.
Hypothesis 2: Given that transition policies have been implemented to help parentsand children become more familiar with the culture and practices of the school, weexpected that these policies would exert the strongest effects on those families thatwere least likely to be acculturated into school procedures initially.
SES is a reasonable proxy for this factor, given that children from low-SES groups are mostlikely to experience preschool backgrounds that differ from school culture (Gutman et al.,2003). These children also experience the greatest difficulty with the kindergarten transition,have parents who are least involved in school, and have the poorest academic outcomes (Rimm-Kaufman et al., 2000). Thus, we hypothesized that kindergarten transition practices wouldpartially close the socioeconomic achievement gap.
Hypothesis 3: We expected that kindergarten transition policies would have a positiveeffect on parent-initiated involvement at school and that this involvement wouldmediate the effect of transition policies on child academic outcomes.
In the current study, we sought to understand the mechanism of any effect of transition practiceson child outcomes through mediation analyses. A fundamental factor in a child’s academicsuccess is parental involvement in the child’s education through expression of interest inlearning, support for the teacher, and knowledge and monitoring of the child’s performance atschool to reinforce school achievement in the home environment (Hill, 2001). Parent-initiatedschool involvement has been positively associated with academic success and low behaviorproblems (Hill et al., 2004; Kohl, Lengua, McMahon, & the Conduct Problems PreventionResearch Group, 2000). In contrast, teacher-initiated parent involvement that occurs only afterthe child has displayed behavior problems is associated with negative outcomes (Kohl et al.,2000) because this involvement reflects the child’s problems rather than the parent’s initiationof preventive intercesson. Implicit in the design of kindergarten transition practices is theproximal goal of increasing parent-initiated involvement before any problems arise.
MethodParticipants
The current study used data from ECLS-K. The ECLS-K is a longitudinal study following anationally representative cohort of 21,260 children from kindergarten through Grade 5. Thefirst wave of data collection for the ECLS-K began in 1998-1999, when participating childrenentered kindergarten. Four additional waves of data were completed by the spring of 2004. The
Schulting et al. Page 4
Dev Psychol. Author manuscript; available in PMC 2009 October 5.
NIH
-PA Author Manuscript
NIH
-PA Author Manuscript
NIH
-PA Author Manuscript

current study used data from the first two waves collected during the fall of kindergarten in1998 (between September and December) and the spring of kindergarten in 1999 (betweenMarch and July).
Kindergarten students—Data for 17,212 children are included in the public-use data filesused in these analyses. The sample was 51% boys, 49% girls; 57% White, 14% Black, 17%Hispanic, 6% Asian, 1% Native Hawaiian or other Pacific Islander. 2% American Indian orAlaskan Native, and 3% more than one race; 20% of children were reported as living belowthe poverty line. On average, children in this sample were 5 years 7 months old when assessedduring the fall of their kindergarten year.
Kindergarten teachers of ECLS-K students—The ECLS-K includes data from 2,991teachers from 992 schools. Six percent of the teachers identified their race as Black, 4%Hispanic, 2% Asian, 1% Native American, 74% White, 5% identified more than one race, and8% of teachers did not respond. The sample was 98% women, and they had an average of 1.2years of experience teaching perkindergarten, 8.5 years of experience teaching kindergarten,and 3.1 years of experience teaching Grade 1-Grade 5. Teachers’ years of experience inkindergarten ranged from 1 year (16% of teachers) to 30 years (1.4%). Sixty-eight percent ofteachers had 10 or fewer years of experience teaching kindergarten, 23% had 10.5 to 20 yearsof experience, and 9% had over 20 years of experience as a kindergarten teacher.
Schools—The original ECLS-K sample included 914 public schools and 363 private schoolswith both religious and nonreligious affiliations (National Center for Educational Statistics,2001). Each of the four different geographic regions of the United States, the Northeast, South,West, and Midwest, had approximately 25% of schools in the original sample. Participatingschools enrolled students from a range of socioeconomic backgrounds as represented by thepercentage of the student population eligible for free lunch. Student eligibility for free lunchwas obtained only for students at public schools. Of the 914 public schools included in theoriginal sample, 29% had 25% or fewer students that qualified for free lunch, and 17% ofschools reported that 25% to 50% of students were eligible for free lunch. Over half of thestudent population was eligible for free lunch in a substantial number of schools. Fourteenpercent of schools had between 51% and 75% of students qualifying for free lunch. Schoolswith over 75% of students qualifying for free lunch made up 13% of the sample. Free lunchdata were missing for 27% of public schools. These data were available only for the originalsample of schools and were not included on the public-use dataset. A total of 992 schools wereincluded in the public-use dataset.
Procedure and MeasuresAcademic achievement—The ECLS-K used direct cognitive assessments to evaluatechildren’s academic achievement during the fall and spring of the kindergarten year. Thiscognitive assessment battery measures children’s competence in three subject areas: (a) reading(language use and literacy), (b) mathematics, and (c) general knowledge of the social andphysical world. These untimed assessments were administered in a one-on-one setting withcomputer-assisted interviewing technology. For each area of competence, assessments werecompleted in two stages. First, children completed a routing test that included items from eachability level. Then, children were given a level test commensurate with their performance onthe routing test in each subject area.
Achievement scores for each subject area are reported in the ECLS-K in a number of differentformats. The current study uses the standardized scores (T scores) calculated for each subjectarea. Standardized achievement scores included in the ECLS-K database were created bytransforming the item response theory estimates and then rescaling the scores to have a mean
Schulting et al. Page 5
Dev Psychol. Author manuscript; available in PMC 2009 October 5.
NIH
-PA Author Manuscript
NIH
-PA Author Manuscript
NIH
-PA Author Manuscript

of 50 and a standard deviation of 10. Standardized achievement scores for reading, math, andgeneral knowledge, collected in the spring of kindergarten, were averaged to create a compositeacademic achievement score for each child. Cronbach’s alpha coefficients indicated highinternal consistency (α = .85). This composite was then rescaled to a mean of 50 and a standarddeviation of 10 for ease of interpretation.
Parent involvement—Parents reported on parent-initiated involvement at school in thespring of the kindergarten year. Parents reported how often they participated in a range ofactivities and events at the school over the course of the full kindergarten year that includedopen-house or back-to-school night, Parent-Teacher Association meetings, parent-advisorygroup or policy council meetings, regularly scheduled parent-teacher conferences, school orclass events, volunteering at school, and fundraising activities. Responses to these sevenquestions were summed to produce a parent-initiated school-involvement score. Because ofthe skewed nature of such open-ended responses, the natural logarithm of this sum (rescaledto a minimum of I) was taken before further calculations. Cronbach’s alpha coefficients forthis scale indicated moderate internal consistency (α = .52).
Teachers reported about teacher-initiated parental involvement, including whether parentsparticipated in regularly scheduled conferences, attended informal meetings with the teacherto discuss the child’s progress, returned teacher’s phone calls, and volunteered in the classroomor school when asked. Responses to these four questions were summed to produce a teacher-initiated parent involvement score. Cronbach’s alpha coefficients for this scale indicatedmoderate internal consistency (α = .60). Both parent-initiated and teacher-initiated parentinvolvement scores were converted to Z scores.
School transition practices—Information regarding transition polices and practices wasreported by kindergarten teachers in the fall of 1998. kindergarten teachers were asked toidentify which of the following seven transition practices were implemented at their school toease children’s transition to kindergarten: (a) information about the kindergarten program isphoned or sent home to parents, (b) preschoolers spend time in the kindergarten classrooms,(c) school days are shortened at the beginning of the school year, (d) parents and children visitkindergarten prior to the start of the school year, (e) teachers visit students’ homes at thebeginning of the school year, (f) parents attend an orientation session prior to the school year,or (g) other transition activities are provided. We computed a score for each teacher by totalingthe number of transition practices that were endorsed. Cronbach’s alpha coefficients indicatedmoderate internal consistency on this index (α = .44). This level of internal consistency isadequate for an index of this kind because implementation of all seven transition practices byone teacher is unlikely. Teachers were reporting transition practices primarily implemented atthe school level; therefore, it was necessary to designate school transition scores as a school-level rather than a teacher-specific variable. Transition scores for each school were computedby averaging teacher-reported transition scores across all teachers at a particular school. Forschools for which two or more teachers reported scores, the intraclass correlation was .93.
Covariates—In the fall of the kindergarten year, parents completed a questionnaire in whichthey answered a variety of demographic questions. The current study includes informationregarding the child’s race, sex, and age (in months); mother’s age; home language; number ofpeople living in the household; family type; and the SES of the family.
Family type is a nominal variable indicating whether both parents are present in the home andwhether the kindergarten child has siblings living in the home. Parents indicated how manytotal people live in the household in a separate question. Parents also reported whether theirhome language was English.
Schulting et al. Page 6
Dev Psychol. Author manuscript; available in PMC 2009 October 5.
NIH
-PA Author Manuscript
NIH
-PA Author Manuscript
NIH
-PA Author Manuscript

SES is a continuous composite variable created by averaging the following components: (a)father or male guardian’s education, (b) mother or female guardian’s education, (c) father ormale guardian’s occupation, (d) mother of female guardian’s occupation, and (e) householdincome. Each of these measures was standardized to have a mean of 0 and a standard deviationof 1. Parents reported their education and occupation during the fall of the kindergarten year.Parent education level was coded as “1” if the parent completed Grade 8 or below, “2” forcompletion of Grades 9-12, “3” for a high school diploma or equivalent, “4” for participationin a vocational/technical program, “5” for some college, “6” for a bachelor’s degree, “7” forgraduate/professional school without obtaining a degree, “8” for completion of a master’sdegree, and “9” for a doctorate or professional degree. Occupational prestige was codedaccording to the General Social Survey prestige scores (National Center for EducationalStatistics, 2001).
Race for teachers, parents, and children was obtained in the fall of the kindergarten year.Teachers reported their race; parents reported both their race and their kindergarten child’srace. For this nominal variable, parents and teachers were presented with seven different racialgroups including Caucasian, Black/African American, Hispanic (of both specified andunspecified ethnicity), Asian, Native Hawaiian/Pacific Islander, and American Indian orAlaska Native. Respondents were given the opportunity to select each of the seven racialcategories to allow for the option of identifying membership in more than one racial group.
In addition to race, this study also included a number of other teacher-level variables. In thefall of the year, teachers completed a questionnaire in which they answered a variety ofdemographic questions, in addition to questions about their beliefs, their teaching practices,and their classrooms. The current study includes information regarding teachers’ age, sex, yearsof teaching experience, years teaching at their current school, type of certification, educationlevel, beliefs about teaching, and class size.
Teachers answered three questions about their certification. They identified whether they werecertified in elementary educaton and/or early childhood education and what type of certificationthey had earned. For type of certification, a nominal variable, teachers reported whether theyhad temporary/probational certification, alternative certification, regular certification (less thanthe highest), the highest certification available, or no certification. Teachers also indicated thehighest level of education they had completed. They reported whether they had completed highschool or had an associate’s or bachelor’s degree. 1year beyond a bachelor’s degree, a master’sdegree, an education specialist or professional diploma, or a doctorate.
Teachers were also asked to indicate the extent to which they agreed with certain statementsabout teaching using a 5-point scale: 1 (they strongly disagree), 2 (disagree), 3 (neither agreenor disagree), 4 (agree), and 5 (they strongly agree). The three statements teachers respondedto were (a) “I really enjoy my present teaching job” (b) “I am certain that I am making adifference in the lives of the children I teach” and (c) “If I could start over, I would chooseteaching again as my career.”
In the spring, school administrators answered questions about their school and the communityin which the school was located. Information regarding total school enrollment, the percentageof minority students, the percentage of students eligible for free and reduced lunch, and thepercentage of students scoring at or above the national average in reading and math wereincluded in this study. The percentage of minority students is a categorical variable that wascoded as follows: 1 (<10% minority), 2 (10%-24.9), 3 (25%-49.9%), 4 (50%-74.9), and 5(<75%), School enrollment responses were coded as follows: 1 (0-149 students), 2 (150-299students), 3 (300-499 students), 4 (500-749 students), and 5 (750 students and above).Administrators also indicated the extent to which certain problems were an issue in the
Schulting et al. Page 7
Dev Psychol. Author manuscript; available in PMC 2009 October 5.
NIH
-PA Author Manuscript
NIH
-PA Author Manuscript
NIH
-PA Author Manuscript

community where their school was located on a 4-point scale: 1 (the issue was a bigproblem), 2 (the issue was somewhat of a problem), 3 (the issue was not a problem), and 4 (theadministrator did not know if it was a problem in their community). Administrators rated thefollowing problems: (a) tensions based on racial, ethnic, or religious differences; (b) garbage,litter, or broken glass on the street, sidewalks, or yards; (c) selling and/or using drugs orexcessive drinking in public; (d) gangs; (e) heavy traffic; (f) violent crime like drive-byshootings; (g) vacant houses and buildings; and (h) crime in the neighborhood. Responses tothese eight problems were averaged to produce a total community problems score. TheCronbach’s alpha for this scale was .83.
ResultsMissing Data and Imputation
The rate of missing data ranged from 11.3%-16.4% for academic achievement scores and from10.1%-11.6% for transition activities. For the majority of child- and family-level covariates,the rate of missing data ranged from 0.1%-4.2%; however, three covariates, mother’s age, totalnumber in the household, and family type, were missing at rates between 13.5%-15.1%. Therewere missing data from teacher covariates at a rate of 6%-17%, and from 0.8%-16.2% forschool-level variables.
We addressed the problem of missing data by multiple imputation (MI). This simulation-basedapproach allows full use of the available data without introducing the biases that can be createdby ad hoc approaches such as listwise deletion (Schafer, 1997; Schafer & Graham, 2002). MIproduces unbiased parameter estimates under conditions of the data being missing at random(MAR), as opposed to the more restrictive assumption of missing completely at random thatis necessitated with listwise deletion. Under the assumption of MAR, the missingness in thedata is a probabilistic phenomenon whereby the fact of being missing produces associationsbetween the missing and the available data. Thus, the mechanisms of missingness are accountedfor by relations between the available data and the pattern of missing data. The MARassumption cannot be formally tested; however, even if the MAR assumption is not applicable,MI still outperforms listwise deletion, and a false MAR assumption may have only a minorinfluence on estimates and standard erros (Collins, Schafer, & Kam, 2001).
For each missing data point, a sample of values is generated from the simulation based on theestimated covariance matrix. The range of the imputed values represents the degree ofuncertainty about the correct value to be imputed. The multiple imputed data sets are thenanalyzed, and the results are combined to generate results that appropriately incorporate theuncertainty. The combination procedures result in parameter estimates and standard errors(Little & Rubin, 1987). The degrees of freedom in the combined results indicate the precisionof the imputation, as indicated by the relative magnitudes of the between- and within-imputation variances, and are not direct reflections of the sample size.
For this study, we imputed data separately by level of analysis: child-family, teacher-classroom, and school. The imputations at each level included only variables from that level;the multilevel aspect was not modeled. This is a violation of one of the assumptions of thecombination rules—the combinations of results assume that the imputation model is at leastas complex as the analysis model (for which we did incorporate the multilevel structure).Unfortunately, we could identify no tools for multiple imputation of a multilevel dataset withmissing values scattered among all variables at all levels; even compromise strategies (e.g.,dummy-coding indicators of membership in the nesting group) were impractical with a datasetof this size. We believe that the strategy applied here is the best available for accommodatingthe situation at hand. We discuss possible ramifications of this assumption violation later inthis article.
Schulting et al. Page 8
Dev Psychol. Author manuscript; available in PMC 2009 October 5.
NIH
-PA Author Manuscript
NIH
-PA Author Manuscript
NIH
-PA Author Manuscript

A total of 10 imputed data sets at each level were generated using PROC MI in SAS 9.1 (SASInstitute, 2004). With 10 imputations, MI is 95% efficient with 50% missing information.Because there was no cross-level information, our sample was restricted to those students forwhom there were some data at all three levels; this resulted in a sample of 15,529 students in2,862 classrooms in 905 schools. In addition to the study variables (school transition activities,SES, and achievement outcomes), we included student race/ethnicity (eight categories), studentsex, student age, and an array of additional variables at the three levels described above. Visualexamination of the diagnostic plots showed that there were difficulties in the imputation processfor two variables and their covariances (father’s age and age of the mother at the birth of herfirst child); there was not excess autocorrelation between statistics from consecutiveimputations. These variables were omitted from further analyses. With this exception, theinspection suggested that the imputations were independent, random draws from thedistributions. Analyses were completed across these 10 imputed data sets using PROCMIANALYZE in SAS.
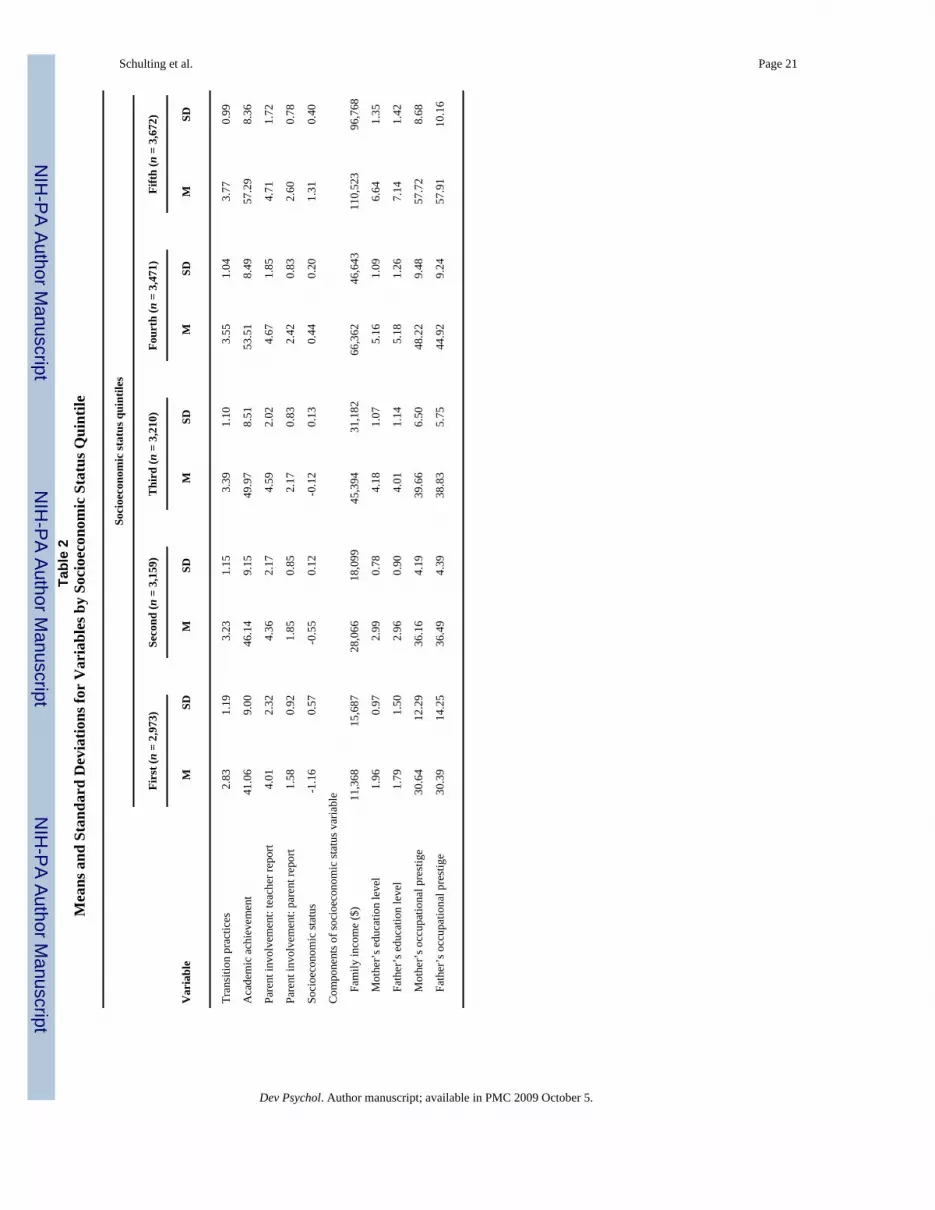
Descriptive StatisticsThe means and standard deviations of all variables are presented in Table 1. In addition to thecomposite variable of SES, descriptive statistics are reported for the variables used to createthis composite. As illustrated in Table 1, this sample included students with a broad range ofacademic achievement outcomes and SES levels. In addition, kindergarten teachers variedgreatly in their use of each transition practice. The most common transition practices reportedby teachers were to phone or send home information about the kindergarten program to parents(86%) and parent orientation at school (76%). The least commonly reported transition practiceswere home visits by the teacher (4%) and shortened school days (18%).
Table 2 lists the means and standard deviations for all variables by SES quintiles. Averageacademic achievement, parent involvement, and number of transition practices variedsignificantly across the SES quintiles. Increases in SES were associated with greater rates ofparent involvement at school, higher academic achievement, and a larger number of transitionpractices. Finally, Table 3 shows the correlations among the student and teacher variables takenat the student level.
Effect of Transition Policies on Achievement OutcomesBecause of the nesting of children within classrooms and classrooms within schools, and thelikelihood that children within a classroom are more alike than children across classrooms,analyses that take this nesting into account were necessary to determine the true relationbetween transition practices and child outcomes (Bijleveld & van der Kamp, 1998). A three-level hierarchical linear model (HLM) was used to account for the nesting of children withinteachers (i.e., classrooms) and within schools (Raudenbush & Bryk, 2002). All models wereestimated in PROC MIXED in SAS v.9.1, using sample weights provided with the ECLS-Kpublic-use data (specifically, the weight variable “BYCOMWO”). HLM is essentially similarto linear regression; however, the assumption that the residuals are independently distributedis not required. HLM, rather, assumes that residuals at one level (e.g., students) are independentand normally distributed within each higher level unit (e.g., classrooms). It is entirely possiblein HLM that the student-level residuals depend on the nesting unit, and the first step we takebelow is the examination of the partitioning of that variance. We first examined theunconditional model, which contains no predictors. The unconditional model partitions thevariance in academic achievement to each of the three levels: student, classroom, and school.Of the total variance in academic achievement, 0.1% (averaged across imputations) wasattributable to school effects, 0.2% to classroom effects, and the remainder was attributable tochild factors. To assess the impact of the imputation process on the clustering, we also estimatedthe variance components in achievement in the sample of 14,343 students who met the same
Schulting et al. Page 9
Dev Psychol. Author manuscript; available in PMC 2009 October 5.
NIH
-PA Author Manuscript
NIH
-PA Author Manuscript
NIH
-PA Author Manuscript

inclusion criteria (data at all levels) and had valid nonimputed data for achievement. In thisanalysis, 0.1% of the achievement variance was attributable to school effects, 0.2% toclassroom effects, and the remainder was attributable to child factors. The very low clustervariance indicates that clustering effects are minimal; the multilevel models are still needed tomodel appropriate precision for effects at different levels.
Models 1, 2, and 3 were used to address the first two research questions. Model 1 tested theeffect of transition practices on academic achievement, including covariantes of childdemographic factors, (age, gender, race, and linear and quadratic effects of SES). All nominalvariables were dummy coded. Two-way interaction terms of SES (linear and quadratic effect)× Transition Practices were included in Model 2 to test the second research question, whichwas a hypothesis that the effect of transition practices varies as a function of the linear and/orquadratic effect of SES. Two-way interactions between transition practices and thedemographic variables of race, gender, and age were also included. All covariates in Model 2were grand-mean centered (i.e., rescaled to sample-wide means of zero, within imputation)before the nonlinear terms (the square of SES and the interaction terms with transitionactivities) were calculated to reduce collinearity between the linear and nonlinear terms and toimprove interpretability of main effects for models including the interaction terms—that is,each main effect term is then interpretable as the effect when all other variables are at theirmeans, and the interaction terms can be ignored, as at least one of the components is at its meanof zero. Finally, Model 3 included an array of covariates at all three levels of the analysis toscreen for possible third-variable mechanisms accounting for the relations between transitionpractices and outcomes. The final model is indicated in the following equations:
(1)
(2)
(3)
(4)
(5)
(6)
(7)
Schulting et al. Page 10
Dev Psychol. Author manuscript; available in PMC 2009 October 5.
NIH
-PA Author Manuscript
NIH
-PA Author Manuscript
NIH
-PA Author Manuscript

Thus, in Model 3, student achievement is modeled as function of a random within-classroomintercept (Equation 2), fixed effects of transition practices (Equation 4), SES, SES2, ninestudent demographic variables, seven other student-level covariates, and a random residual(Equations 1, 3, and 7). The effects of SES, its square, and the demographic variables arepredicted by their respective school-level intercepts and transition practices (Equation 6). Thewithin-classroom intercept is a function of a random within-school intercept (Equation 4),transition practices (Equation 4), fixed effects of 24 teacher-level covariates, and a randomresidual (Equations 2 and 5). Finally, the within-school intercept is a function of an overallintercept, transition practices, fixed effects of six school-level covariates, and a random residual(Equation 4). Models 1 and 2 do not include the additional student-, teacher-, and school-levelcovariates (Equations 1, 2, and 4), and Model 1 does not include the effects of transitions onthe effects of the student-level predictors (Equation 6).
Results of Model 1 indicate that school-level transition practices were a significant predictorof academic achievement at the end of kindergarten, b = 0.51, SE = 0.12 t(20238) = 4.38, p < .0001. This finding indicates that individual academic achievement will increase by .051standard deviations with each additional school-level transition practice.
Model 2 incorporated interactions between transition practices and sociodemographiccovariates. We found the hypothesized interaction between transition practices and studentSES, both with SES2, b = -0.10, SE = 0.03, t(17936) = -3.06, p = .002, and overall with thetwo components of SES, F(2, 10859) = 5.93, p = .003. The interactions between transitionpractices and child age, race/ethnicity, and gender were not significant, ps > .19.
Finally, Model 3 tested the main and interactive effects of transition practices with additionalcovariates included. The key results (excluding those for covariates included only for statisticalcontrol) appear in Table 4. As hypothesized, SES was found to be a significant predictor ofacademic achievement. Although the strength of the relation between transition practices andachievement was reduced when SES was included in the model, transition practices remaineda significant predictor of academic achievement even after controlling for SES and the full setof covariates. These findings indicate that kindergarten achievement scores increased .03standard deviations with each additional transition practice at the school level. The averageschool’s 3.4 practices are associated with a .10 standard deviation increase in academicachievement scores beyond the effect for a school with no transition practices. Main effects ofrace, gender, and age were also significant, but the interactions were not.
As hypothesized, the interaction between SES and transition practices contributed significantunique prediction to achievement outcomes, F(2, 7251) = 4.00, p = .018. Figure 1 presents thepredicted academic achievement scores across different levels of SES by number of transitionactivities. The effect of transition practices (the spacing of the plotted curves) was greater atlower SES. There was also a significant interaction effect between transition activities and thequadratic component of SES in predicting academic achievement, with children of averageSES and one standard deviation below the mean of SES exhibiting the largest academic gainsfor each additional transition activity. The predicted achievement scores for children at themean SES level and one standard deviation below the mean SES increased by .21 standarddeviations between children offered zero transition activities and those offered seven transitionactivities. In contrast, for children at the highest SES level, predicted achievement scoresdecreased by .17 standard deviations between children offered zero versus seven transitionactivities.
We repeated Model 3 with each individual transition practice (rather than the sum) as apredictor to determine whether each transition practice was related to academic achievement.Of the six specific practices (excluding “other”), only the fourth transition practice, that parents
Schulting et al. Page 11
Dev Psychol. Author manuscript; available in PMC 2009 October 5.
NIH
-PA Author Manuscript
NIH
-PA Author Manuscript
NIH
-PA Author Manuscript

and children visit the kindergarten classroom prior to the beginning of the year, showed asignificant main effect on achievement, b = 1.26, SE = 0.48, t(2886) = 2.64, p = .009. The useof this transition practice also interacted significantly with SES, in a pattern similar to that ofthe sum of transition practices—interaction with linear SES: b = -0.58, SE = 0.35, t(1451) =-1.69, p = .091; interaction with SES2: b = -0.39, SE = 0.12, t(5639) = -3.34, p < .0008; overallinteraction: F(2, 3662) = 5.53, p = .004; none of the remaining tests of main effects of practicesor their interactions with SES were significant, ps > .12.
Mediation of the Effect of Transition PoliciesEffect of transition policies on parent-school involvement—We tested the finalresearch question with a third set of models used to examine the effect of transition practiceson parent-initiated school involvement and to determine whether this involvement mediatedthe relation between transition practices and academic achievement. As hypothesized, school-level transition practices were a significant predictor of parent-initiated school involvement,b = 0.08, SE = 0.01, t(814) = 6.00, p = .0001. Similar to academic achievement, there was asignificant interaction between transition activities and the curvilinear component of SES inpredicting parent-initiated school involvement, F(2, 338) = 9.31, p < .0001, with children ofaverage SES and one standard deviation below the mean of SES exhibiting the largest gainsin parent-initiated school involvement for each additional transition activity. Figure 2 presentsthe predicted parent-initiated school involvement scores across different SES groups bynumber of transition activities. The predicted parent-initiated school involvement scores forchildren at the mean SES level and one standard deviation below the mean SES increased by .59 and .56 standard deviations, respectively, between children offered zero transition activitiesand those offered seven transition activities. In contrast, predicted parent-initiated schoolinvolvement scores increased by only .30 standard deviations for children at the lowest SESlevels and decreased by .05 standard deviations for the most affluent children between childrenoffered zero versus seven transition activities.
The effect of transition practices on teacher-initiated parent involvement was also examined.Transition practices had a negative main effect on teacher-initiated parent involvement, b =-0.07, SE = 0.02, t(836) = -3.64, p = .0003; this effect did not interact with SES F(2, 184) < 1,ns.
Test of mediation—A final set of hierarchical linear models tested whether parent-initiatedschool involvement mediated the relation between transition practices and academic outcomes.We used Baron and Kenney’s (1986) principles for testing mediating variables, which requirethat criteria be met at each of four steps to establish full mediation and that criteria be met ateach of four steps to establish full mediation and that criteria be met at the first three steps toestablish partial mediation (Kenny, Kashy, & Bolger, 1998). The first step is to determinewhether the predictor variable is significantly correlated with the criterion variable. As reportedpreviously (see Table 4), transition practices were a statistically significant predictor ofacademic achievement. In Step 2, the predictor variable must also be significantly correlatedwith the potential mediating variable. As reported above, the transition practices variable wasfound to be a significant predictor of parent-initiated school involvement. In Step 3, the criterionvariable is regressed on both the potential mediating variable and the predictor variable. Criteriafor Step 3 were met, as the potential mediating variable, parent-initiated school involvement,was found to be a significant predictor of the criterion variable, academic achievement, b =0.89, SE. = 0.08, t(331) = 10.94, p < .0001; when controlling for transition practices. The finalstep is to determine whether the total effect of transition practices on academic achievementis reduced when parent-initiated school involvement is included in the model. Transitionpractices were a marginally statistically significant predictor of achievement with parent-initiated school involvement in the model, b = 0.22, SE = 0.12, t(4809) = 1.77, p = .08, but the
Schulting et al. Page 12
Dev Psychol. Author manuscript; available in PMC 2009 October 5.
NIH
-PA Author Manuscript
NIH
-PA Author Manuscript
NIH
-PA Author Manuscript

effect of transition practices was reduced from .29 to .22, indicating that parent-initiated schoolinvolvement accounted for 24% of the total effect of transition practices on academicachievement. It can be concluded that parent-initiated school involvement partially mediatedthe relation between transition practices and achievement.
DiscussionAlthough there is substantial theoretical and political support for school transition practices toease the transition to kindergarten (National Education Goals Panel, 1998; Pianta & Kraft-Sayre, 2003; Pianta & Walsh, 1996), there had been no empirical evidence supporting the useof such practices. The purpose of this study was to address this significant gap in the literatureby investigating the relation between school transition practices and kindergarten outcomes.Using a large, nationally representative sample and multilevel modeling that appropriatelynests students within classrooms and schools, we found that kindergarten transition policiesdo indeed have a modest positive effect on students’ academic achievement and on parent-initiated school involvement during the kindergarten year, even when we controlled for SESand other demographic factors related to these outcomes. This finding provides the strongestempirical support to date for school policies designed to facilitate the transition to kindergarten.
Another important finding of this study is that the relation between transition practices andachievement is moderated by SES. As hypothesized, the effect of transition practices onacademic achievement was stronger for children from average- or low-income families thanfor children from more affluent backgrounds. High-income children were more likely todemonstrate high academic achievement in kindergarten regardless of the transition practicesoffered at their school. In contrast, the predicted achievement scores of average- and low-income children receiving transition practices were substantially higher than they would havebeen had they attended schools that did not offer such practices. This finding is especiallynoteworthy in light of the finding that low-income children receive the fewest transitionpractices. Ironically, high-income children, who are least in need of support during thetransition to kindergarten and benefit least from transition practices, receive the largest numberof such practices, whereas the children who would benefit most from these practices are leastlikely to receive them.
Kindergarten transition practices were found to have a positive effect on parent-initiated schoolinvolvement, and this involvement was found to partially mediate the effect of transitionpractices on academic achievement. The link between parent involvement and improved schooloutcomes is well established (Hill et al., 2004; Izzo, Weissberg, Kasprow, & Fendrich, 1999;Kohl et al., 2000; Marcon, 1999), but the current findings represent the strongest evidence todate that schools’ effort to increase parent-initiated school involvement will have a positiveimpact on student academic outcomes. It is possible that transition practices help parents feelmore comfortable at school, better informed of school activities, and aware of the importanceof their involvement, which leads to increased parent-initiated school involvement and in turnto improved student achievement. In contrast, teacher-initiated parent involvement, as reportedby teachers, was negatively associated with child outcomes. This finding is consistent withother research that identified a link between teacher-initiated parent involvement and negativechild outcomes (Kohl et al., 2000). It is possible that teachers attempt to involve parents atschool and encourage them to attend meetings and conferences about their child’s progressprimarily after the child has displayed problems in school.
SES was also found to moderate the relation between transition practices and parent-initiatedschool involvement. Transition practices had a limited effect on the parent-initiated schoolinvolvement of both very rich and very poor parents, presumably for different reasons. Affluentparents had high levels of school involvement overall. It is unlikely that transition practices
Schulting et al. Page 13
Dev Psychol. Author manuscript; available in PMC 2009 October 5.
NIH
-PA Author Manuscript
NIH
-PA Author Manuscript
NIH
-PA Author Manuscript

would significantly increase school involvement among this population, as affluent parents arealready very involved at school. In contrast, impoverished parents demonstrated very low levelsof school involvement overall. Transition practices were related to a slight increase in theirinvolvement at school, perhaps by increasing parents’ comfort at school or their knowledge oropportunities to become involved. However, it is likely that current transition practices do notadequately address the needs of this high-risk population or reduce the substantial barriers totheir involvement, thus limiting the impact of transition practices on low-income parents’involvement. The strongest relation between transition practices and parent-initiated schoolinvolvement was found among parents with moderately low to moderately high incomes,indicating that current transition practices are most effective at encouraging involvementamong the middle-class population.
Limitations and Future DirectionsIt is important to note the limitations to this study. This study used correlational data, not arandomized design; therefore, it is unclear whether transition practices played a causal role inimproving the kindergarten outcomes identified in this study. It remains possible that anunmeasured third variable would have accounted for the effect of transition practices on bothachievement and parent involvement. It is also possible that a school’s use of transitionpractices is a proxy for other school factors such as good leadership, high-quality teachers,better home-school relations, or other practices that support student achievement and parentinvolvement. Future studies can address this limitation by measuring and accounting forrelevant school-level factors that may contribute to student achievement and parentinvolvement or through a randomized intervention trial.
Although we were able to determine which transition practices were offered to students andfamilies. it is not known whether families actually participated in the activities offered to them.It will be important for future studies to determine which transition practices were used byparents and children to measure the impact of individual practices on kindergarten outcomes.
The strongest test of the effect of kindergarten transition policies and practices would comefrom a randomized intervention design in which students are assigned to various combinationsof transition interventions or a control group. Such a design would allow researchers todetermine whether transition practices exert a causal impact, which transition practices havethe greatest impact on kindergarten outcomes, and whether the same practices are equallyefficacious for families from diverse socioeconomic or cultural backgrounds. It is possible thattransition practices designed to meet the needs of low-income students, in particular practicesthat serve to improve the home-school relationship, will lead to even better outcomes for thishigh-risk population (Pianta & Walsh, 1996).
ConclusionsThe findings of the current study have important implications for education policy and effortsto improve the transition to kindergarten. The findings are that school transition practices arerelated to improved academic achievement and increased parent-initiated school involvementduring kindergarten and that the impact of these practices is greatest for the low-incomechildren who are least likely to receive them. Low-income children are at the greatest risk ofschool failure at kindergarten entry. In addition, low-income children are more likely to haveparents who are not involved at school (Zill, 1999), and unfortunately, as demonstrated in thisstudy, they are also more likely to attend a school that offers fewer transition practices. Thefindings of this study indicate that offering transition practices to high-risk children andfamilies can have a substantial positive impact on academic achievement and parent-initiatedschool involvement during kindergarten. Furthermore, transition practices designedspecifically to meet the needs of high-risk families might have an even greater positive effect
Schulting et al. Page 14
Dev Psychol. Author manuscript; available in PMC 2009 October 5.
NIH
-PA Author Manuscript
NIH
-PA Author Manuscript
NIH
-PA Author Manuscript

on kindergarten outcomes, as current transition practices appear to be most effective withmiddle-class parents. This study supports the continued use of kindergarten transition practicesto ease children’s and families’ transition to kindergarten and suggests that school transitionpolicies should be expanded to focus on targeting low-income students and families.
AcknowledgmentsWe are grateful to the Miriam and Peter Haas Fund for support of this research.
ReferencesBaron RM, Kenny DA. The moderator-mediator variable distinction in social psychological research:
Conceptual, strategic, and statistical considerations. Journal of Personality and Social Psychology1986;51:1173–1182. [PubMed: 3806354]
Bijleveld, CCJH.; van der Kamp, LJT. Longitudinal data analysis: Designs, models and methods. Sage;Thousand Oaks, CA: 1998.
Bronfenbrenner, U.; Morris, PA. The ecology of developmental process. In: Damon, W.; Lerner, R.,editors. Handbook of child psychology: Vol. 1. Theoretical models of human development. Wiley;New York: 1998. p. 993-1028.
Collins LM, Schafer JL, Kam C-M. A comparison of inclusive and restrictive strategies in modern missingdata procedures. Psychological Methods 2001;6:330–351. [PubMed: 11778676]
Early DM, Pianta RC, Taylor LC, Cox MJ. Transition practices: Findings from a national survey ofkindergarten teachers. Early Childhood Education Journal 2001;28:199–206.
Ensminger ME, Slusarcick AL. Paths to high school graduation or dropout: A longitudinal study of afirst grade cohort. Sociology of Education 1992;65:95–113.
Entwisle DR, Alexander KL. Facilitating the transition to first grade: The nature of transition and researchon factors affecting it. The Elementary School Journal 1998;98:351–355.
Entwisle DR, Hayduck LA. Lasting effects of elementary school. Sociology of Education 1988;61:147–159.
Gutman LM, Sameroff AJ, Cole R. Academic growth curve trajectories from 1st grade to 12th grade:Effects of multiple social risk factors and preschool child factors. Developmental Psychology2003;39:777–790. [PubMed: 12859129]
Hill NE. Parenting and academic socialization as they relate to school readiness: The roles of ethnicityand family income. Journal of Educational Psychology 2001;93:686–697.
Hill NE, Castellino D, Lansford JE, Nowlin P, Dodge KA, Bates JE, Pettit GS. Parent-academicinvolvement as related to school behavior, achievement, and aspirations: Demographic variationsacross adolescence. Child Development 2004;75:1491–1509. [PubMed: 15369527]
Izzo CV, Weissberg RP, Kasprow WJ, Fendrich M. A longitudinal assessment of teacher perceptions ofparental involvement in children’s education and school performance. American Journal ofCommunity Psychology 1999;27:817–839. [PubMed: 10723536]
Kenny, DA.; Kashy, DA.; Bolger, N. Data analysis in social psychology. In: Gilbert, D.; Fiske, S.;Lindzey, G., editors. The handbook of social psychology. Vol. 4th ed.. Vol. 1. McGraw-Hill; Boston:1998. p. 233-265.
Kohl GO, Lengua LJ, McMahon RJ, the Conduct Problems Prevention Research Group. Parentinvolvement in school: Conceptualizing multiple dimensions and their relations with family anddemographic risk factors. Journal of School Psychology 2000;38:501–523.
LaParo KM, Pianta RC. Predicting children’s competence in the early school years: A meta-analyticreview. Review of Educational Research 2000;70:443–484.
Little, RJA.; Rubin, DB. Statistical analysis with missing data. Wiley; New York: 1987.Marcon RA. Positive relationships between parent school involvement and public school inner-city
preschoolers’ development and academic performance. School Psychology Review 1999;28:395–412.
Meisels, SJ. Assessing readiness. In: Pianta, RC.; Cox, MJ., editors. The transition to kindergarten.Brookes; Baltimore: 1999. p. 39-66.
Schulting et al. Page 15
Dev Psychol. Author manuscript; available in PMC 2009 October 5.
NIH
-PA Author Manuscript
NIH
-PA Author Manuscript
NIH
-PA Author Manuscript

National Center for Educational Statistics. User’s manual for the ECLS-K base year public-use data filesand electronic code book. U.S. National Center for Education Statistics; Washington, DC: 2001.(NCES Pub. No. 2001-029) [CD-ROM]
National Education Goals Panel. Ready schools. U.S. Government Printing Office; Washington, DC:1998.
Neill M. High-stakes, high-risk: The dangerous consequences of high-stakes testing. American SchoolBoard Journal February;2003 90(2)Retrived July 18, 2004 fromhttp://www.asbj.com/2003/02/0203/coverstory2.html
Neill, M.; Guisbond, L.; Schaeffer, M.; Maddon, J.; Legoros, L. Failing our children: How “no child leftbehind” undermines quality and equity in education, and an accountability model that supports schoolimprovement. 2004. Retrieved July 18, 2004, fromwww.fairtest.org/Failing_Our_Children_Report.html
Pallas AM, Entwisle DR, Alexander KL, Cadigan D. Children who do exceptionally well in first grade.Sociology of Education 1987;60:257–271.
Pianta RC, Cox MJ, Taylor L, Early D. Kindergarten teachers’ practices related to the transition to school:Results of a national survey. Elementary School Journal 1999;100:71–86.
Pianta, RC.; Kraft-Sayre, M. Successful kindergarten transition: Your guide to connecting children,families, and schools. Brookes; Baltimore: 2003.
Pianta, RC.; Rimm-Kaufman, SE.; Cox, MJ. Introduction: An ecological approach to kindergartentransition. In: Pianta, RC.; Cox, MJ., editors. The transition to kindergarten. Brookes; Baltimore:1999. p. 3-12.
Pianta, RC.; Walsh, DJ. High-risk children in schools: Creating sustaining relationships. Routledge; NewYork: 1996.
Ramey, CT.; Ramey, SL. Beginning school for children at risk. In: Pianta, RC.; Cox, MJ., editors. Thetransition to kindergarten. Brookes; Baltimore: 1999. p. 217-252.
Ramey SL, Ramey CT. The transition to school: Why the first few years matter for a lifetime. Phi DeltaKappan 1994;76:194–199.
Raudenbush, SW.; Bryk, AS. Hierarchical linear models: Applications and data analysis methods. Vol.2nd ed.. Sage; Thousand Oaks, CA: 2002.
Rimm-Kaufman SE, Pianta RC. An ecological perspective on the transition to kindergarten: A theoreticalframework to guide empirical research. Journal of Applied Developmental Psychology 2000;21:491–511.
Rimm-Kaufman SE, Pianta RC, Cox MJ. Teachers’ judgments of problems in the transition tokindergarten. Early Childhood Research Quarterly 2000;15:147–166.
SAS Institute. SAS 9.1 [Computer software]. Author; Cary, NC: 2004.Schafer, JL. Analysis of incomplete multivariate data. Chapman and Hall; New York: 1997.Schafer JL, Graham JW. Missing data: Our view of the state of the art. Psychological Methods
2002;7:147–177. [PubMed: 12090408]Zill, N. Promoting educational equity and excellence in kindergarten. In: Pianta, RC.; Cox, MJ., editors.
The transition to kindergarten. Brookes; Baltimore: 1999. p. 67-105.
Schulting et al. Page 16
Dev Psychol. Author manuscript; available in PMC 2009 October 5.
NIH
-PA Author Manuscript
NIH
-PA Author Manuscript
NIH
-PA Author Manuscript

Figure 1.Predicted kindergarten achievement by socioeconomic status and transition practices.
Schulting et al. Page 17
Dev Psychol. Author manuscript; available in PMC 2009 October 5.
NIH
-PA Author Manuscript
NIH
-PA Author Manuscript
NIH
-PA Author Manuscript
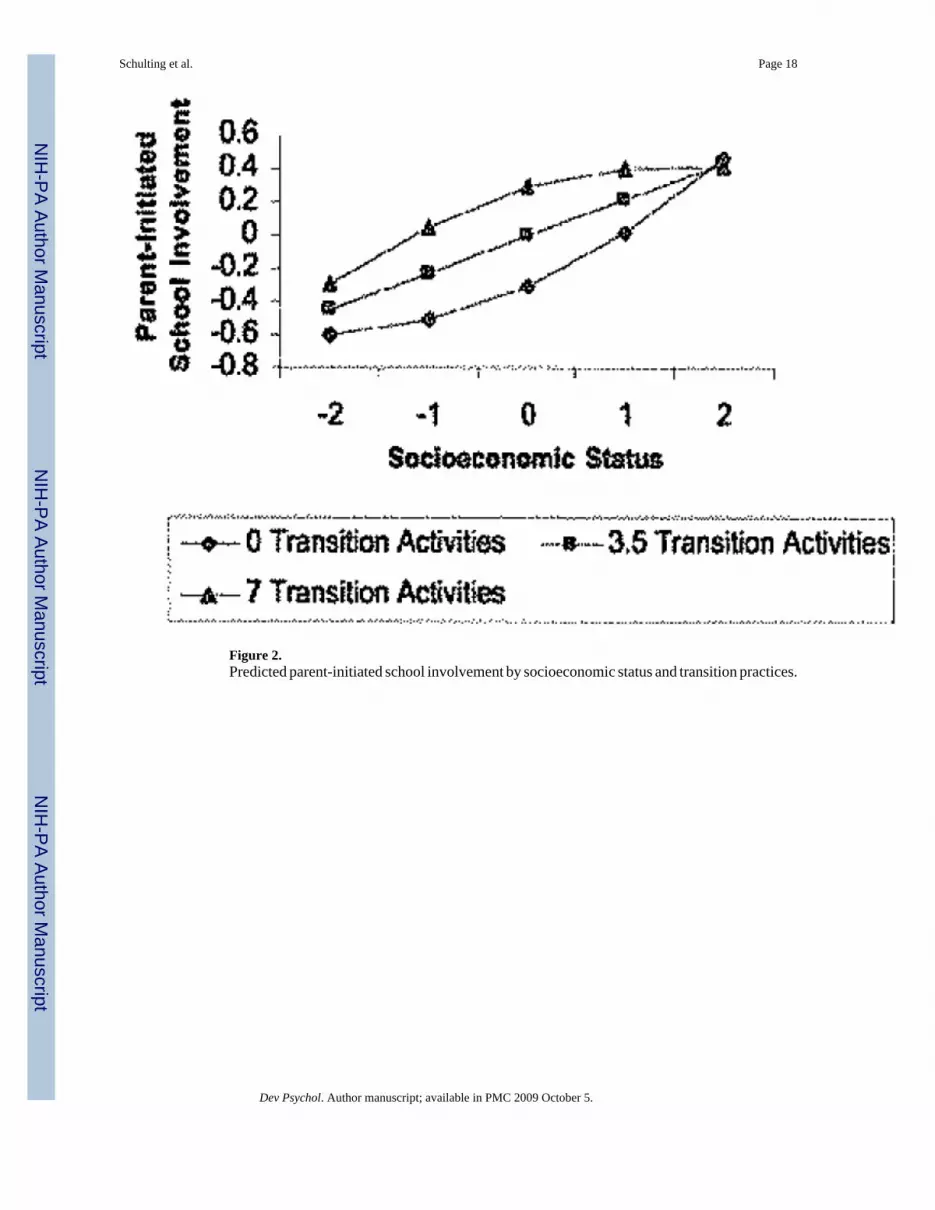
Figure 2.Predicted parent-initiated school involvement by socioeconomic status and transition practices.
Schulting et al. Page 18
Dev Psychol. Author manuscript; available in PMC 2009 October 5.
NIH
-PA Author Manuscript
NIH
-PA Author Manuscript
NIH
-PA Author Manuscript

NIH
-PA Author Manuscript
NIH
-PA Author Manuscript
NIH
-PA Author Manuscript
Schulting et al. Page 19Ta
ble
1D
escr
iptiv
e St
atis
tics f
or A
ll V
aria
bles
Var
iabl
eM
SDR
ange
Tea
cher
-re
port
ed u
se o
fea
ch p
ract
ice
%
Aca
dem
ic c
ovar
iate
s
Sc
hool
tran
sitio
n pr
actic
es3.
351.
140-
7,00
Tele
phon
e or
send
info
rmat
ion
0.96
0.19
0-1.
0086
Chi
ld v
isit
clas
sroo
m0.
610.
490-
1.00
39
Shor
tene
d sc
hool
day
s0.
270.
450-
1.00
18
Pare
nt v
isit
scho
ol0.
900.
300-
1.00
76
Hom
e vi
sit b
y te
ache
r0.
080.
280-
1.00
4
Pare
nt o
rient
atio
n at
scho
ol0.
870.
340-
1.00
76
Oth
er0.
500.
500-
1.00
26
A
cade
mic
ach
ieve
men
t50
.010
.00
36.7
7-62
.17
Pa
rent
invo
lvem
ent (
teac
her r
epor
t)4.
502.
022.
48-7
.02
Pa
rent
invo
lvem
ent (
pare
nt re
port)
2.15
0.90
1.10
-3.3
3
Chi
ld- a
nd fa
mily
-leve
l cov
aria
tes
Sc
ocio
econ
omic
stat
us0.
020.
80-0
.85-
1.09
Fam
ily in
com
e ($
)53
,219
57.2
620-
1,00
0,00
0
Mot
her’
s edu
catio
n le
vel
4.26
1.79
2.00
-6.0
0
Fath
er’s
edu
catio
n le
vel
4.27
2.03
2.00
-7.0
0
Mot
her’
s occ
upat
iona
l pre
stig
e42
.64
11.7
733
.42-
61.4
3
Fath
er’s
occ
upat
iona
l pre
stig
e41
.73
11.8
933
.42-
56.8
2
C
hild
age
(in
mon
ths)
68.4
44.
3163
.00-
74.1
3
C
hild
gen
der
1.49
0.50
1.00
-2.0
0
To
tal n
o. in
fam
ily4.
551.
403.
00-6
.00
M
othe
r’s a
ge (i
n ye
ars)
33.3
66.
5925
.00-
41.0
0
Scho
ol-le
vel c
ovar
iate
s
Pe
rcen
tage
of m
inor
ity st
uden
ts2.
761.
571.
00-5
.00
To
tal s
choo
l enr
ollm
ent
3.18
1.22
1.00
-5.0
0
C
omm
unity
pro
blem
s2.
680.
412.
12-3
.00
Pe
rcen
tage
≥ a
vera
ge in
mat
h62
.58
23.4
130
.00-
90.0
0
Pe
rcen
tage
≥ a
vera
ge in
read
ing
61.4
323
.89
28.1
1-90
.00
Dev Psychol. Author manuscript; available in PMC 2009 October 5.

NIH
-PA Author Manuscript
NIH
-PA Author Manuscript
NIH
-PA Author Manuscript
Schulting et al. Page 20
Var
iabl
eM
SDR
ange
Tea
cher
-re
port
ed u
se o
fea
ch p
ract
ice
%
Pe
rcen
tage
elig
ible
for f
ree
and
redu
ced
lunc
h38
.97
31.5
90-
84.1
5
Teac
her a
nd c
lass
room
-leve
l cov
aria
tes
C
lass
size
20.3
94.
3515
.00-
26.0
0
Te
aher
age
41.0
110
.10
27.0
0-54
.00
Te
ache
r gen
der
1.98
0.15
1.00
-2.0
0
Y
ears
teac
hing
pre
scho
ol1.
162.
690-
4.00
Y
ears
teac
hing
kin
derg
arte
n8.
477.
511.
00-2
0.00
Y
ears
teac
hing
Gra
de 1
1.58
3.08
0-5.
00
Y
ears
teac
hing
Gra
des 2
-51.
883.
280-
6.00
Y
ears
at c
urre
nt sc
hool
8.64
7.71
1.00
-21.
00
Ea
rly c
hild
hood
cer
tific
atio
n0.
540.
500-
1.00
El
emen
tary
cer
tific
atio
n0.
850.
350-
1.00
Te
ache
r enj
oys t
each
ing
4.51
0.70
4.00
-5.0
0
Te
ache
r wou
ld c
hoos
e te
achi
ng a
gain
4.35
0.93
3.00
-5.0
0
B
elie
ves t
each
ing
mak
es a
diff
eren
ce4.
580.
584.
00-5
.00
Dev Psychol. Author manuscript; available in PMC 2009 October 5.
NIH
-PA Author Manuscript
NIH
-PA Author Manuscript
NIH
-PA Author Manuscript
Schulting et al. Page 21Ta
ble
2M
eans
and
Sta
ndar
d D
evia
tions
for
Var
iabl
es b
y So
cioe
cono
mic
Sta
tus Q
uint
ile
Soci
oeco
nom
ic st
atus
qui
ntile
s
Firs
t (n
= 2,
973)
Seco
nd (n
= 3
,159
)T
hird
(n =
3,2
10)
Four
th (n
= 3
,471
)Fi
fth (n
= 3
,672
)
Var
iabl
eM
SDM
SDM
SDM
SDM
SD
Tran
sitio
n pr
actic
es2.
831.
193.
231.
153.
391.
103.
551.
043.
770.
99
Aca
dem
ic a
chie
vem
ent
41.0
69.
0046
.14
9.15
49.9
78.
5153
.51
8.49
57.2
98.
36
Pare
nt in
volv
emen
t: te
ache
r rep
ort
4.01
2.32
4.36
2.17
4.59
2.02
4.67
1.85
4.71
1.72
Pare
nt in
volv
emen
t: pa
rent
repo
rt1.
580.
921.
850.
852.
170.
832.
420.
832.
600.
78
Soci
oeco
nom
ic st
atus
-1.1
60.
57-0
.55
0.12
-0.1
20.
130.
440.
201.
310.
40
Com
pone
nts o
f soc
ioec
onom
ic st
atus
var
iabl
e
Fa
mily
inco
me
($)
11,3
6815
,687
28,0
6618
,099
45,3
9431
,182
66,3
6246
,643
110,
523
96,7
68
M
othe
r’s e
duca
tion
leve
l1.
960.
972.
990.
784.
181.
075.
161.
096.
641.
35
Fa
ther
’s e
duca
tion
leve
l1.
791.
502.
960.
904.
011.
145.
181.
267.
141.
42
M
othe
r’s o
ccup
atio
nal p
rest
ige
30.6
412
.29
36.1
64.
1939
.66
6.50
48.2
29.
4857
.72
8.68
Fa
ther
’s o
ccup
atio
nal p
rest
ige
30.3
914
.25
36.4
94.
3938
.83
5.75
44.9
29.
2457
.91
10.1
6
Dev Psychol. Author manuscript; available in PMC 2009 October 5.

NIH
-PA Author Manuscript
NIH
-PA Author Manuscript
NIH
-PA Author Manuscript
Schulting et al. Page 22Ta
ble
3In
terc
orre
latio
ns A
mon
g co
vari
ates
, Com
posi
te V
aria
bles
, and
The
ir C
ompo
nent
s
Var
iabl
e1
23
45
67
89
1011
1213
1415
1617
1819
2021
2223
2425
2627
2829
1. S
choo
l tra
nsiti
on p
ract
ices
—.0
5.0
0.0
4.0
9.0
5.0
5.0
4.0
5-.0
7.0
8.1
9.1
4-.0
4.1
7
2. S
ocio
econ
omic
stat
us.2
3.0
3-.0
2.0
5.0
7.0
1.0
6.0
5.0
3-.0
9.3
0.8
4.7
8.1
0.3
5
3. A
cade
mic
ach
ieve
men
t.2
1.4
8.0
3.0
0.0
2.0
5.0
2.0
2.0
4.0
3-.1
6.2
0.4
2.3
1.1
4.3
0
4. C
hild
age
.07
.01
.24
.03
.00
.00
.01
.02
.01
-.01
.03
.02
.04
.01
.01
-.03
.02
5. C
hild
gen
der
-.01
.00
.03
-.07
-.01
.00
.01
.00
.01
.00
.00
.00
.00
.00
.00
.00
.04
.01
6. F
ree
or re
duce
d lu
nch
-.28
-.40
-.34
-.05
-.01
.01
.03
-.03
-.08
-.05
-.07
-.05
-.03
.11
-.17
-.35
-.27
-.09
-.25
7. P
erce
ntag
e m
inor
ity-.4
3-.3
2-.3
4-.1
3.0
0.5
5.0
0-.0
2.0
1-.1
0-.1
0-.0
8-.0
4-.0
3.1
8-.1
0-.2
6-.2
0-.0
6-.2
2
8. S
choo
l enr
ollm
ent
-.20
-.13
-.12
-.05
.00
.20
.24
.10
.07
.01
-.04
.00
-.07
-.01
-.02
.07
-.05
-.10
-.07
-.07
-.10
9. C
omm
unity
pro
blem
s.2
6.2
5.2
3.0
2.0
0-.4
0-4
8-.1
6.0
1-.0
2.0
5.0
7.0
7.0
5.0
3.0
1-.0
8.1
0.2
2.1
6.0
5.1
3
10. A
t or a
bove
ave
rage
read
ing
.24
.33
.29
.06
.00
-.59
-.48
-.18
.38
.02
-.03
.02
.09
.05
.04.
02.0
4-.0
9.1
4.2
8.2
1.0
6.2
1
11. A
t or a
bove
ave
rage
mat
h.2
1.3
0.2
7.0
5.0
0-.5
3-.4
3-.1
5.3
6.9
4.0
3-.0
2.0
3.0
8.0
3.0
4.0
2.0
3-.0
9.1
3.2
6.1
9.0
5.1
9
12. C
lass
size
-.07
-.05
-.05
-.04
.01
.08
.16
.21
-.07
-.03
-.02
.00
.04
.04
-.04
.04
-.03
.05
-.03
.00
-.01
-.04
-.04
.00
-.04
13. Y
ears
teac
hing
Gra
des 2
-5-.0
2.0
1.0
1-.0
3.0
0.0
1.0
3.0
1-.0
2-.0
1-.0
2.0
6-.0
8.1
4.0
1.0
1.1
7-.0
1.2
9-.0
1-.0
1.0
0.0
2.0
1.0
1.0
0
14. Y
ears
teac
hing
Gra
de 1
-.03
-.01
.01
.00
.00
.01
.03
.01
-.01
-.02
-.02
.03
.17
-.04
.11
.01
.08
.19
.00
.25
.01
.03
.02
-.01
-.01
.01
.00
15. Y
ears
teac
hing
kin
derg
arte
n.0
6.0
4.0
4.0
3.0
0-.0
7-.1
1.0
2.0
8.0
7.0
6.0
7-.0
1.0
3.0
5.0
6.0
7.0
5.6
7-.0
3.6
1.0
8-.0
2.0
2.0
4.0
3-.0
2.0
1
16. E
arly
chi
ldho
od c
ertif
icat
ion
.05
.03
.03
.03
-.01
.01
.01
.10
.01
.02
.03
.00
-.08
-.04
.05
-.17
.02
.00
-.03
-.02
.06
-.02
.01
.03
.02
-.06
-.01
17. E
lem
enta
ry C
ertif
icat
ion
.00
-.02
-.01
.00
.00
.03
-.02
.07
-.02
-.03
-.02
.04
.14
.11
.06
.02
.04
.08
.01
.08
-.01
.02
-.01
-.01
-.01
-.02
.00
18. T
each
ing
Mak
es a
Diff
eren
ce.0
4.0
5.0
2.0
0.0
1-.0
4.0
1.0
1.0
5.0
2.0
3.0
4.0
1.0
1.0
7.5
0.0
3.4
0.0
2.0
1.0
0.0
2.0
5.0
4-.0
2.0
3
19. T
each
er E
njoy
s Tea
chin
g.0
9.0
7.0
5.0
1.0
0-.0
8-.1
0-.0
4.0
7.0
9.0
8-.0
4.0
1.0
8.0
5.0
5.5
2.0
5.0
4.0
0.0
3.0
6.0
5.0
1.0
5
20. Y
ears
at C
urre
nt S
choo
l.0
5.0
1.0
2.0
2.0
1-.0
5-.1
0.0
0.0
7.0
5.0
3.0
4.1
7.1
9.6
7-.0
4.5
5.0
8.0
0.0
1.0
1.0
1.0
0-.0
2
21. W
ould
Cho
ose
Teac
hing
.05
.06
.02
.01
.00
-.07
-.08
-.07
.05
.05
.04
-.03
.01
.00
-.03
-.04
.01
.00
.03
.05
.03
.02
.04
22. T
each
er A
ge.0
4.0
5.0
4.0
1.0
0-.0
5-.0
4.0
1.0
3.0
2.0
2.0
5.2
9.2
5.6
1.0
7.0
0.0
3.0
4.0
2.0
2.0
1
23. T
otal
no.
in fa
mily
-.07
-.09
-.16
.02
.00
.11
.12
.07
-.08
-.09
-.09
.00
.01
.03
-.02
.01
.01
.03
.01
.01
.03
24. M
othe
r’s A
ge.0
8.3
0.2
0.0
4.0
0-.1
7-.1
0-.0
5.1
0.1
4.1
3-.0
1.0
1.0
2.0
2.0
7-.0
7-.0
2-.0
4-.0
5
25. F
athe
r Edu
catio
n Le
vel
.19
.84
.42
.01
.01
-3.5
-.26
-.10
.22
.28
.26
-.04
.02
-.01
.04
.27
.19
.05
.16
26. F
athe
r Occ
upat
iona
l Pre
stig
e.1
4.7
8.3
1.0
1.0
0-.2
7-.2
0-.0
7.1
6.2
1.2
0-.0
4.0
1-.0
1.0
3.6
1.0
8.3
0
27. H
ome
Lang
uage
.21
.21
.24
.08
.00
-.19
-.35
-.18
.19
.19
.16
-.08
-.01
-.02
.06
.06
.22
28. P
aren
t Inv
olve
men
t (Te
ache
r Rep
ort)
-.04
.10
.14
-.03
.04
-.09
-.06
-.07
.05
.06
.05
.00
.01
.01
-.02
.09
29. P
aren
t Inv
olve
men
t (Pa
rent
Rep
ort)
.17
.35
.30
.02
.01
-.25
-.22
-.10
.13
.21
.19
-.04
.00
.00
.01
—N
ote.
Sig
nific
ance
val
ues o
n im
pute
d da
ta v
ary
to th
e ex
tent
of m
issi
ng d
ata.
Dev Psychol. Author manuscript; available in PMC 2009 October 5.

NIH
-PA Author Manuscript
NIH
-PA Author Manuscript
NIH
-PA Author Manuscript
Schulting et al. Page 23Ta
ble
4H
iera
rchi
cal
Lin
ear
Mod
el o
f K
inde
rgar
ten
Aca
dem
ic A
chie
vem
ent
on T
rans
ition
Pra
ctic
es,
Soci
oeco
nom
ic S
tatu
s, C
hild
Dem
ogra
phic
Var
iabl
es, a
nd In
tera
ctio
n T
erm
s, M
odel
3
Pred
icto
r C
oeffi
cien
t(S
E)t
Fdf
sp
Inte
rcep
t48
.70
(0.4
5)10
9.20
3556
.000
1
Tran
sitio
n pr
actic
es0.
29 (0
.13)
2.34
3656
.019
Soci
oeco
nom
ic st
atus
(SES
)63
.65
2, 6
845
.000
1
Li
near
(SES
)3.
2 (0
.29)
11.0
335
15.0
001
Q
uadr
atic
(SES
× S
ES)
0.52
(0.1
1)4.
5693
42.0
001
Chi
ld g
ende
r1.
34 (0
.42)
3.18
2982
1.0
015
Chi
ld a
ge0.
53 (0
.06)
9.61
533
.000
1
Chi
ld ra
ce2.
707,
394
15.0
09
SES
× Tr
ansi
tion
4.00
2, 7
251
.018
Chi
ld G
ende
r × T
rans
ition
-0.1
6 (0
.12)
-1.3
328
454
.18
Chi
ld A
ge ×
Tra
nsiti
on-0
.01
(0.0
2)-0
.69
831
.49
Rac
e ×
Tran
sitio
n0.
857,
594
78.5
4
SES
× SE
S ×
Tran
sitio
n-0
.09
(0.0
3)-2
.69
1606
3.0
07
Dev Psychol. Author manuscript; available in PMC 2009 October 5.


