Embed Size (px)
Citation preview
www.elsevier.com/locate/biocon
Biological Conservation 124 (2005) 519–526
BIOLOGICAL
CONSERVATION
The effects of aquaculture on bottlenose dolphin (Tursiops sp.)ranging in Shark Bay, Western Australia
Jana J. Watson-Capps a,*, Janet Mann a,b
a Department of Biology, Georgetown University, Washington, DC, United Statesb Department of Psychology, Georgetown University, Washington, DC, United States
Received 12 October 2004
Abstract
The increasing presence of aquaculture in coastal waters calls for a better understanding of its environmental effects. Currently
little information is available on the impact of shellfish farms on cetaceans. Here we compare long-term ranging patterns of adult
female bottlenose dolphins (Tursiops sp. in Shark Bay, Western Australia) before and during full-scale pearl oyster farming oper-
ations, to determine if they were displaced. When the exact location of the oyster farm was determined, the dolphins decreased their
use of that area after the farm was in place. Tracks of adult female dolphin movement near the oyster farm were compared to tracks
of dolphin movement near an ecologically similar area where no oyster farm existed. Tracks near the oyster farm were less likely to
enter the oyster farm itself than tracks near an ecologically similar location. This suggests that shellfish aquaculture could have a
large impact on small cetaceans. The analytical techniques discussed apply broadly to aquatic and terrestrial animals.
� 2005 Elsevier Ltd. All rights reserved.
Keywords: Ranging; Displacement; Aquaculture; Tursiops sp.; Oyster farm
1. Introduction
Aquaculture, the farming of finfish or shellfish, has
grown 11% in the last decade, becoming the fastest
growing industry in the world food economy (Newton,
2000). Aquaculture has the potential to reduce theamount of fish and shellfish taken from the ocean and
to bring substantial income to an area; it produced
37.8 million metric tons of fish and shellfish and $55.7
billion USD in 2002 (Food and Agriculture Organiza-
tion of the United Nations, 2003). However, farming
of carnivorous fish that require food from the ocean still
results in a net take of wild stocks (Naylor et al., 2000).
Furthermore, if finfish or shellfish are farmed in a natu-ral marine environment, concern arises over the effects
0006-3207/$ - see front matter � 2005 Elsevier Ltd. All rights reserved.
doi:10.1016/j.biocon.2005.03.001
* Corresponding author. Tel.: +1 202 687 5798; fax: +1 202 687 5662.
E-mail address: [email protected] (J.J. Watson-Capps).
of increased biodeposition from fecal and pseudofecal
matter, introduction of new species, genetic mingling
of wild and captive stock, antibiotics and medicines, as
well as competition with, displacement of and interac-
tion with other fauna (Fleming, 1994; Buschmann
et al., 1996; Wursig and Gailey, 2002). The described im-pacts of shellfish farming primarily involve competition
with local bivalves, deposition of organic matter, altered
benthic communities, and introduction of exotic species
(Mirto et al., 2000; Naylor et al., 2000, 2001; Henderson
et al., 2001; La Rosa et al., 2001).
Potential impacts on marine mammals as a result of
aquaculture interaction include death or injury through
entanglement in gear, displacement, altered food chain,disruption of migration pathways (for large cetaceans),
and human intervention (marine mammals killed or
relocated). Most of the literature to date has focused
on otters and pinnipeds that prey on finfish and some
520 J.J. Watson-Capps, J. Mann / Biological Conservation 124 (2005) 519–526
shellfish, but there is a paucity of information on ceta-
ceans and aquaculture (reviewed in Wursig and Gailey,
2002; Kemper et al., 2003). Unlike pinnipeds, cetaceans
have not been reported to consume fish or shellfish out
of farms, but have been known to get entangled in
equipment, resulting in the damage of gear, release offish, and self injury (Dans et al., 1997; Kemper and
Gibbs, 2001; Crespo and Hall, 2002; Hall and Donovan,
2002). Displacement of cetaceans by aquaculture may
also occur because they frequently share the same
coastal habitat (Crespo and Hall, 2002; Wursig and
Gailey, 2002; Markowitz et al., 2004).
Unlike finfish farms that are netted at the periphery,
shellfish farms typically have open areas that are largeenough to allow small cetaceans to swim through the
farm. Nevertheless, cetaceans may still avoid shellfish
farms because of ropes, equipment, human activities,
water clarity, prey availability, or other habitat factors.
In the last few years, several reports to management
agencies (Mann and Janik, in litt.; Slooten et al., in litt.;
Paton et al., in litt.) have highlighted the potential dis-
placement of dolphins by oyster and mussel farmingoperations. For example, dusky dolphins (Lagenorhyn-
chus obscurus) use a green-lipped mussel (Perna canalic-
ulus) farm area less than nearby areas in Marlborough
Sounds, New Zealand (Markowitz et al., 2004).
Bottlenose dolphins (Tursiops spp.) are appropriate
and useful study animals in this case because of their
world-wide distribution in tropical and temperate
coastal waters. Because of their cosmopolitan distribu-tion, the information gained in our study can be applied
to management of shellfish farms world-wide and,
because they share valuable coastal habitat with humans,
bottlenose dolphins may be particularly affected by aqua-
culture. Variable coastal habitats may provide niches
important for dolphin foraging or as a refuge from preda-
tors. For example, dolphins that specialize in habitat-
specific foraging strategies (Mann and Sargeant, 2003)may be seriously affected if they are displaced from that
area. Resident communities of dolphins are likely to be
most affected and displacement could result in a popula-
tion decline. Furthermore, the pressures of aquaculture
on the dolphin population may add to existing anthropo-
genic pressures, such as boat traffic (see Chilvers et al.,
2005 for an example of human impacts on marine mam-
mals in Moreton Bay, Australia).Even though these data are from only one bottlenose
dolphin study site, it is appropriate to extrapolate to
other areas. Shark Bay represents one of the longest run-
ning and extensive studies on small cetaceans; it is the
only site where ranging information prior to a pearl oys-
ter farm is available. Comparisons of Shark Bay to other
sites show similar bottlenose dolphin social structure
and behavior (Connor et al., 2000). Therefore, our studyoffers the best available test to date of the effects of an
oyster farm on small cetacean ranging.
Marine mammals, including cetaceans, not only at-
tract public interest, but are also protected in Australia
under the Environmental Protection and Biological
Conservation Act 1999. To manage a growing industry,
more information on the effects of aquaculture on ceta-
ceans is needed.The aim of this paper is to determine if ranging pat-
terns of bottlenose dolphins have been altered by an oys-
ter farm in Shark Bay, Western Australia. To do this we
analyzed their movements near the farm before and dur-
ing its operation. We addressed the following questions:
(1) do bottlenose dolphins change their use of an area
once farming begins there; (2) do they move away from
the farm; and (3) do they move around (but notthrough) the farm? We also make recommendations
for future research and management. The analytical
techniques discussed apply broadly to aquatic and ter-
restrial animals.
Shark Bay was designated in 1991 as a World Heri-
tage Area for its extensive seagrass beds and dugong
(Dugong dugon) population (United Nations Educa-
tional, Scientific, and Cultural Organization, 1991).Although Shark Bay is not a World Heritage Area be-
cause of the dolphins that inhabit it, the dolphins are
a significant tourist draw to the area; currently four dol-
phins are hand fed daily and attract more than 100,000
tourists per year (Mann and Kemps, 2003). Feeding is
regulated by the Western Australian Department of
Conservation and Land Management. These four, and
hundreds of other dolphins, have been part of a long-term research project since 1982 and have been continu-
ously studied since 1984 (Connor and Smolker, 1985;
Connor et al., 2000).
2. Methods
2.1. Study site
Mann has been researching mother and calf behav-
ioral ecology since 1988, collecting data on 99 calves
born to 67 females. Eleven females that regularly used
the bay (Red Cliff Bay) where the oyster farm is located
were the focus of this analysis. The study area is located
off the campground and resort of Monkey Mia (25�47 0S,
113�43 0E) on the eastern side of Peron Peninsula, whichbisects Shark Bay. Red Cliff Bay is adjacent to Monkey
Mia, with Whale Bight (also called Hell�s Gate) to the
north. These two areas represent the core of our
200 km2 study site.
2.2. Recent history of pearling in Shark Bay
In the late 1980s, a small oyster farm and shark bait-ing operation designed for tourists was established. In
1993, this operation changed into a full-scale oyster
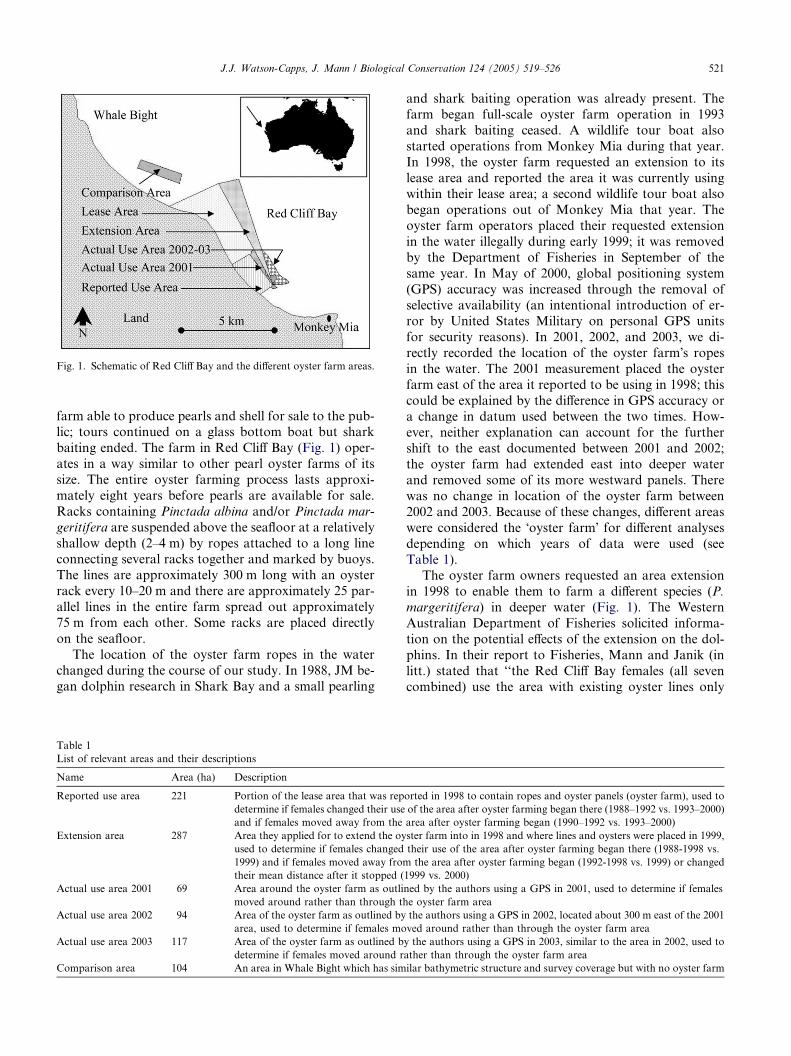
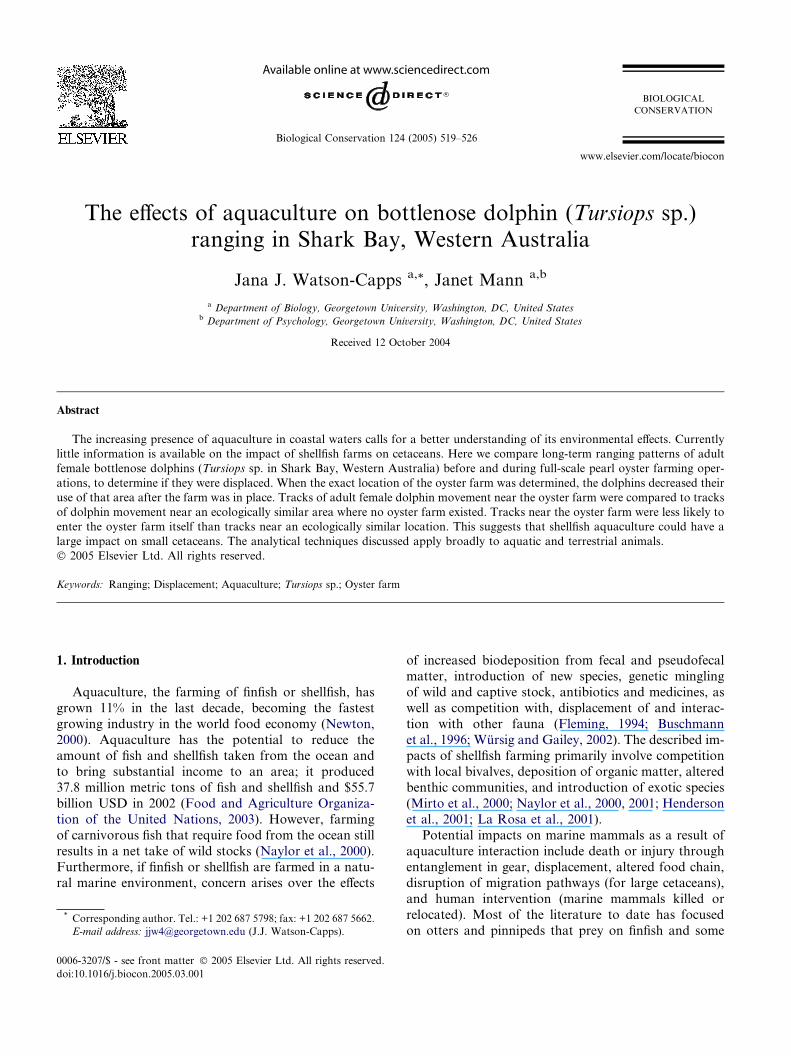
Fig. 1. Schematic of Red Cliff Bay and the different oyster farm areas.
J.J. Watson-Capps, J. Mann / Biological Conservation 124 (2005) 519–526 521
farm able to produce pearls and shell for sale to the pub-lic; tours continued on a glass bottom boat but shark
baiting ended. The farm in Red Cliff Bay (Fig. 1) oper-
ates in a way similar to other pearl oyster farms of its
size. The entire oyster farming process lasts approxi-
mately eight years before pearls are available for sale.
Racks containing Pinctada albina and/or Pinctada mar-
geritifera are suspended above the seafloor at a relatively
shallow depth (2–4 m) by ropes attached to a long lineconnecting several racks together and marked by buoys.
The lines are approximately 300 m long with an oyster
rack every 10–20 m and there are approximately 25 par-
allel lines in the entire farm spread out approximately
75 m from each other. Some racks are placed directly
on the seafloor.
The location of the oyster farm ropes in the water
changed during the course of our study. In 1988, JM be-gan dolphin research in Shark Bay and a small pearling
Table 1
List of relevant areas and their descriptions
Name Area (ha) Description
Reported use area 221 Portion of the lease area that was rep
determine if females changed their use
and if females moved away from the
Extension area 287 Area they applied for to extend the oy
used to determine if females changed
1999) and if females moved away from
their mean distance after it stopped (
Actual use area 2001 69 Area around the oyster farm as outli
moved around rather than through th
Actual use area 2002 94 Area of the oyster farm as outlined by
area, used to determine if females mo
Actual use area 2003 117 Area of the oyster farm as outlined b
determine if females moved around r
Comparison area 104 An area in Whale Bight which has sim
and shark baiting operation was already present. The
farm began full-scale oyster farm operation in 1993
and shark baiting ceased. A wildlife tour boat also
started operations from Monkey Mia during that year.
In 1998, the oyster farm requested an extension to its
lease area and reported the area it was currently usingwithin their lease area; a second wildlife tour boat also
began operations out of Monkey Mia that year. The
oyster farm operators placed their requested extension
in the water illegally during early 1999; it was removed
by the Department of Fisheries in September of the
same year. In May of 2000, global positioning system
(GPS) accuracy was increased through the removal of
selective availability (an intentional introduction of er-ror by United States Military on personal GPS units
for security reasons). In 2001, 2002, and 2003, we di-
rectly recorded the location of the oyster farm�s ropes
in the water. The 2001 measurement placed the oyster
farm east of the area it reported to be using in 1998; this
could be explained by the difference in GPS accuracy or
a change in datum used between the two times. How-
ever, neither explanation can account for the furthershift to the east documented between 2001 and 2002;
the oyster farm had extended east into deeper water
and removed some of its more westward panels. There
was no change in location of the oyster farm between
2002 and 2003. Because of these changes, different areas
were considered the �oyster farm� for different analyses
depending on which years of data were used (see
Table 1).The oyster farm owners requested an area extension
in 1998 to enable them to farm a different species (P.
margeritifera) in deeper water (Fig. 1). The Western
Australian Department of Fisheries solicited informa-
tion on the potential effects of the extension on the dol-
phins. In their report to Fisheries, Mann and Janik (in
litt.) stated that ‘‘the Red Cliff Bay females (all seven
combined) use the area with existing oyster lines only
orted in 1998 to contain ropes and oyster panels (oyster farm), used to
of the area after oyster farming began there (1988–1992 vs. 1993–2000)
area after oyster farming began (1990–1992 vs. 1993–2000)
ster farm into in 1998 and where lines and oysters were placed in 1999,
their use of the area after oyster farming began there (1988-1998 vs.
the area after oyster farming began (1992-1998 vs. 1999) or changed
1999 vs. 2000)
ned by the authors using a GPS in 2001, used to determine if females
e oyster farm area
the authors using a GPS in 2002, located about 300 m east of the 2001
ved around rather than through the oyster farm area
y the authors using a GPS in 2003, similar to the area in 2002, used to
ather than through the oyster farm area
ilar bathymetric structure and survey coverage but with no oyster farm
522 J.J. Watson-Capps, J. Mann / Biological Conservation 124 (2005) 519–526
0.36% of the time, but used the proposed extension area
10.58% of the time.’’ This was determined using focal
follows of adult females that spent most of their time
in Red Cliff Bay. Based primarily on this result and con-
cern for how the extension might affect the dolphin tour-
ism industry, the Western Australian Minister for theEnvironment delayed a decision on the application until
more information was available. We were unaware of
the illegal extension in 1999 until the Department of
Fisheries removed the illegal lines. Subsequently, the
extension was denied, but the farm owners were granted
a lease area in Herald Bight, 25 km north of Monkey
Mia. Furthermore, a pre-existing pearl oyster farm lease
area, located in nearby Whale Bight, became active in2000.
These events provided us with an opportunity to
compare ranging of female dolphins that frequently
used the area near the oyster farm before, during, and
after (in the case of the removal of the extension) a for-
mal operation was in place.
2.3. Data collection and analyses
From 1988 to 2003, with the exception of 1995, sur-
veys were conducted in Red Cliff Bay and surrounding
waters in our study area always starting from the Mon-
key Mia campground (Fig. 1). Surveys did not system-
atically cover our search area because our primary
research focus at the time was to find particular females.
The search area changed from year to year and tendedto get larger every year (from 1453 ha in 1988 to
13,281 ha in 2000). Because of this change, only data
from the smallest search area were used for comparison
of distance to the oyster farm, which is why the years
used changes slightly in the following analyses. All dol-
phins seen while searching for a particular focal animal
were surveyed. Surveys consisted of approaching the
animals in a small (4–5 m) boat and determining indi-vidual identification using photographs of their dorsal
fins as unique natural markers (Wursig and Wursig,
1977).
The location of the boat while near (within 10–20 m)
dolphins was recorded using either compass bearings to
prominent landmarks (1988–1994) or a GPS (1996–
2003). The compass bearings were converted through
triangulation to latitude and longitude using the LocateII computer program (Nams, 1990). This process had an
average error ± SE of 290 ± 49 m (mean distance be-
tween GPS measures and points plotted using compass
bearings, n = 32). The GPS locations were recorded
using the WGS84 datum and had a random error of
up to 200 m until May 2000, when the error decreased
to 30 m. The distances to the reported use area of the
oyster farm and the proposed extension area (positionsprovided by the Department of Fisheries report to Shire
of Shark Bay, 1998) were then calculated with ArcView
3.2 using a Universal Transverse Mercator projection
1983, zone 49.
To analyze the change in use of and the movement
away from the reported use area and the extension area,
we included only females that were sighted at least 10
times during the relevant time periods and had 50% ormore of their total sightings in Red Cliff Bay. Only
one sighting per day was considered independent be-
cause these dolphins were able to transverse their range
in this time. For the detailed analysis of tracks, all adult
females with focal follow data near the oyster farm were
used.
2.3.1. Change in use of an area
We plotted an outline of the oyster farm (reported
use area and the extension area) and overlaid indepen-
dent points for the individual adult female dolphins
(n = 10 or 11 depending on the time period). Next we
calculated the percentage of points inside the area out
of all the points for each individual. We then compared
the mean percentage of points in the area before, during
and after the oyster farm was present. The means werecompared using Fisher�s paired randomization tests be-
cause of the small sample sizes (Jadwiszczak, 2003).
2.3.2. Movement away from the oyster farm
A regression using general estimating equations was
employed to compare the average distance from the oys-
ter farm (reported use area and the extension area) be-
tween time periods while accounting for variationbetween individuals, year, month, and time of day
(Liang and Zeger, 1986; SAS v8). General estimating
equations are used to analyze longitudinal data by
accounting for repeated observations which may be cor-
related. Two different general estimating equation mod-
els were run, one comparing distance to the reported use
area (before full-scale operation: 1990–1992 vs. during
full-scale operation: 1993–2000) and one comparing dis-tance to the illegal extension area (pre-extension: 1992–
1998 vs. during extension: 1999 vs. post-extension:
2000). A common search area was needed to compare
ranging shifts between time periods. Data from 1988
and 1989 were excluded because our search area was
small compared to other years.
2.3.3. Movement around the oyster farm
To examine detailed movement around the oyster
farm we used years (2001–2003) when we had confirmed
the locations of oyster farming lines (ropes) and when
dolphin locations during focal follows were recorded
with high accuracy (<30 m error). Any follows that oc-
curred within 2 km of the oyster farm were plotted on
a map with an outline of the oyster farm (n = 17 females
from 36 follows). An ecologically similar area in WhaleBight, the neighboring bay, was also examined for com-
parison (n = 10 females from 16 follows). Because an
J.J. Watson-Capps, J. Mann / Biological Conservation 124 (2005) 519–526 523
oyster farm began operation in 2000 in the comparison
area, only follows before this time were used there.
For each follow we then calculated the percentage of
segments that went into the oyster farm out of the
number that had the potential to go into the oyster
farm based on their length and the starting point ofthe segment. A segment is a line between two consecu-
tive GPS points taken 30 min apart. Thirty-minute
intervals were chosen because it was the longest time
between points. All locations before 2001 were deter-
mined every 30 min. Location data collected in 2001
and later were collected every 5, 10, or 15 min. These
data were sub-sampled so that only 30 min segments
were used in this analysis. We used a Fisher�s random-ization test (Jadwiszczak, 2003) to compare the mean
percentage of segments that went into the oyster farm
out of all those that had the potential to do so, com-
pared to the mean percentage of segments that went
into the comparison area. Individuals were considered
the sampling unit. If more than one follow was ob-
served per individual in a category (oyster farm or com-
parison area), the mean percentage for that individualwas used.
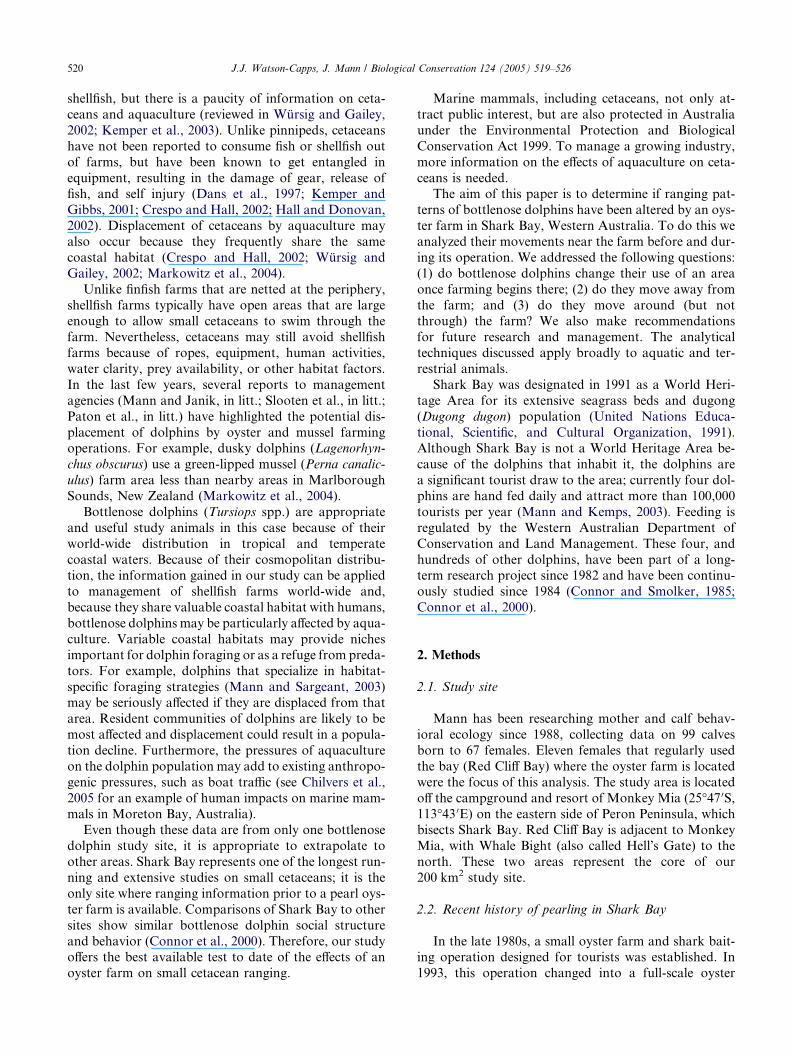
Distance from Reported Use Area
0
500
1000
1500
2000
2500
1990 1991 1992 1993 1994 1996 1997 1998 1999 2000
Dis
tanc
e (m
)
Pre-farming During Full-scale Farming
3. Results
3.1. Change in use of an area
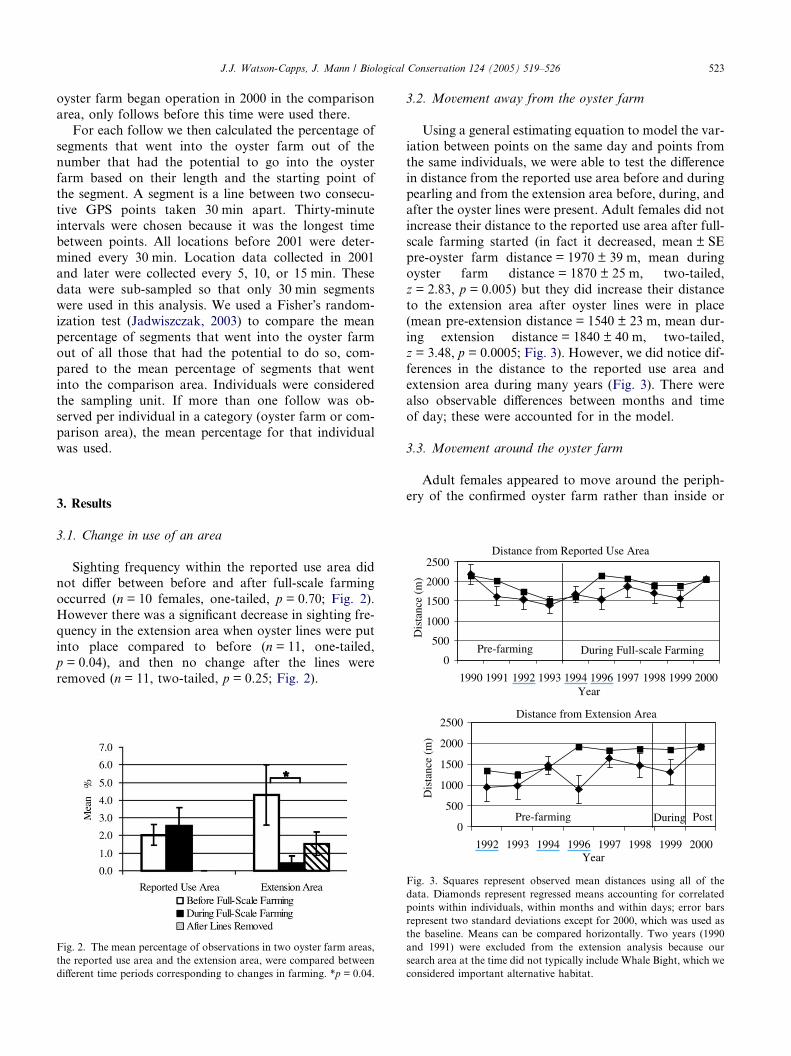
Sighting frequency within the reported use area didnot differ between before and after full-scale farming
occurred (n = 10 females, one-tailed, p = 0.70; Fig. 2).
However there was a significant decrease in sighting fre-
quency in the extension area when oyster lines were put
into place compared to before (n = 11, one-tailed,
p = 0.04), and then no change after the lines were
removed (n = 11, two-tailed, p = 0.25; Fig. 2).
Fig. 2. The mean percentage of observations in two oyster farm areas,
the reported use area and the extension area, were compared between
different time periods corresponding to changes in farming. *p = 0.04.
3.2. Movement away from the oyster farm
Using a general estimating equation to model the var-
iation between points on the same day and points from
the same individuals, we were able to test the difference
in distance from the reported use area before and duringpearling and from the extension area before, during, and
after the oyster lines were present. Adult females did not
increase their distance to the reported use area after full-
scale farming started (in fact it decreased, mean ± SE
pre-oyster farm distance = 1970 ± 39 m, mean during
oyster farm distance = 1870 ± 25 m, two-tailed,
z = 2.83, p = 0.005) but they did increase their distance
to the extension area after oyster lines were in place(mean pre-extension distance = 1540 ± 23 m, mean dur-
ing extension distance = 1840 ± 40 m, two-tailed,
z = 3.48, p = 0.0005; Fig. 3). However, we did notice dif-
ferences in the distance to the reported use area and
extension area during many years (Fig. 3). There were
also observable differences between months and time
of day; these were accounted for in the model.
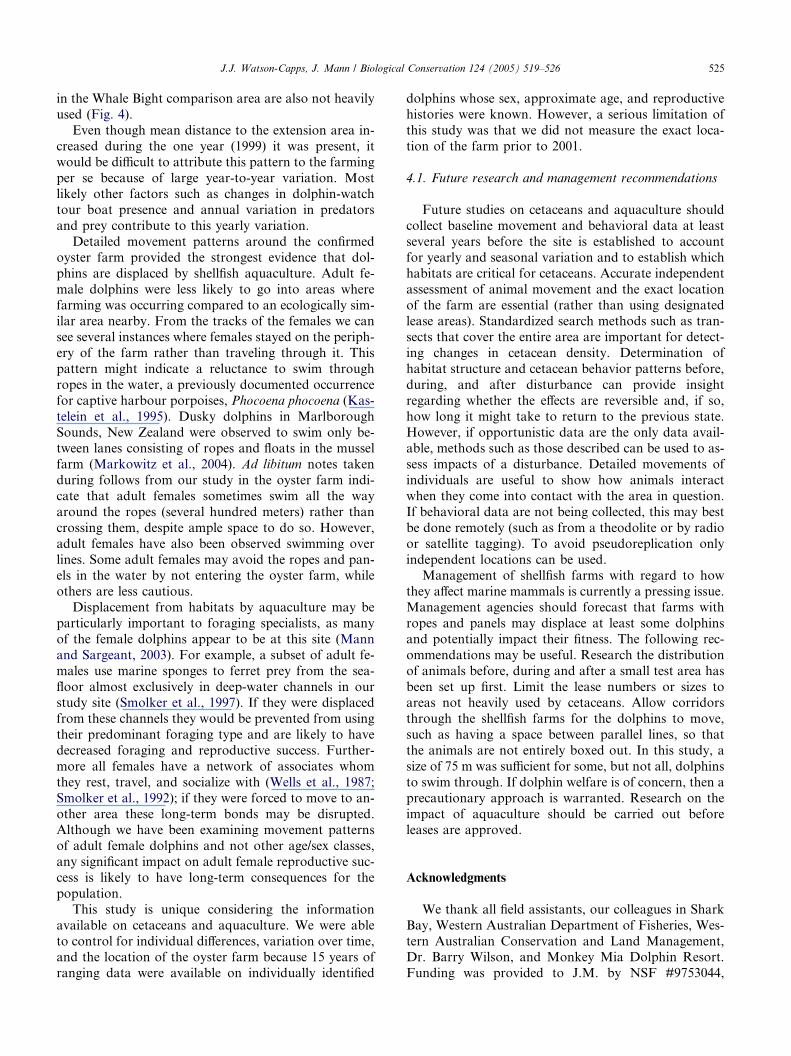
3.3. Movement around the oyster farm
Adult females appeared to move around the periph-
ery of the confirmed oyster farm rather than inside or
Year
Distance from Extension Area
0
500
1000
1500
2000
2500
1992 1993 1994 1996 1997 1998 1999 2000Year
Dis
tanc
e (m
)
Pre-farming During Post
Fig. 3. Squares represent observed mean distances using all of the
data. Diamonds represent regressed means accounting for correlated
points within individuals, within months and within days; error bars
represent two standard deviations except for 2000, which was used as
the baseline. Means can be compared horizontally. Two years (1990
and 1991) were excluded from the extension analysis because our
search area at the time did not typically include Whale Bight, which we
considered important alternative habitat.
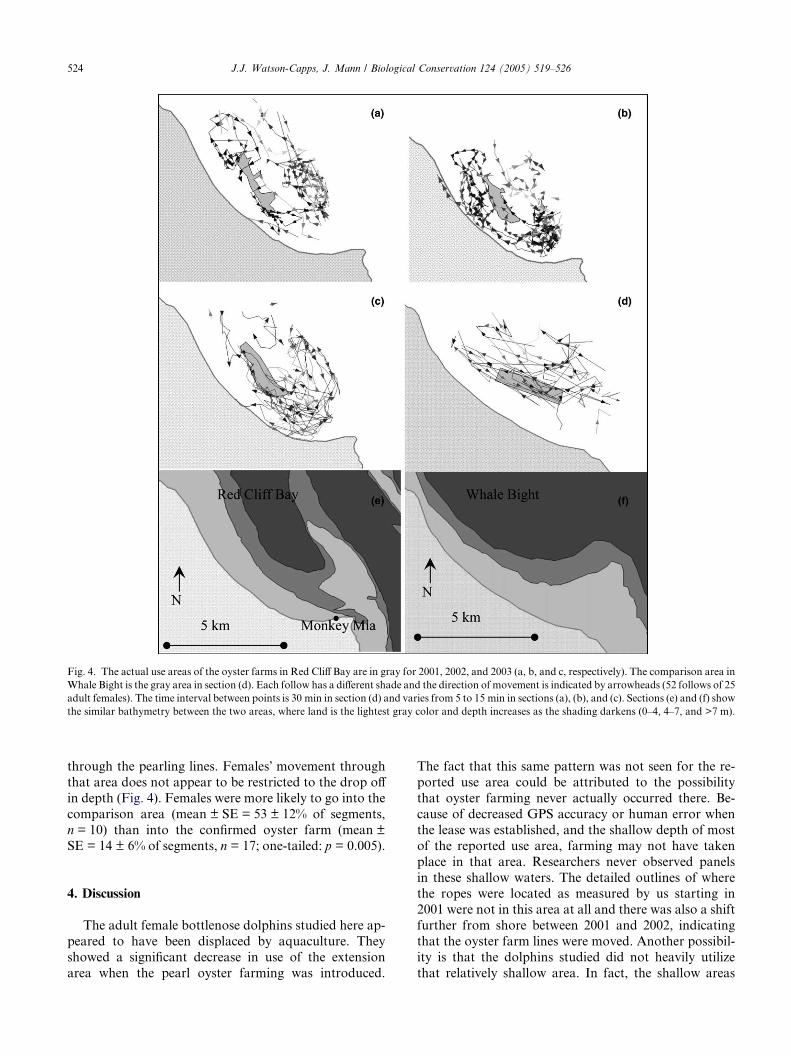
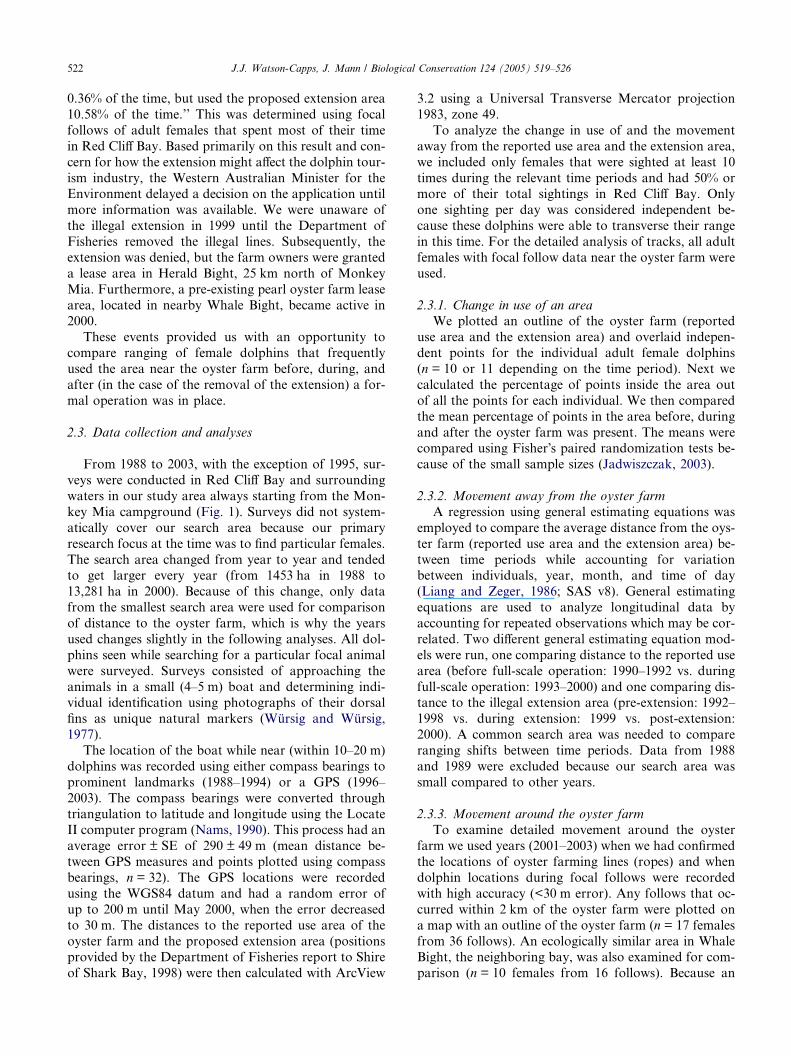
Fig. 4. The actual use areas of the oyster farms in Red Cliff Bay are in gray for 2001, 2002, and 2003 (a, b, and c, respectively). The comparison area in
Whale Bight is the gray area in section (d). Each follow has a different shade and the direction of movement is indicated by arrowheads (52 follows of 25
adult females). The time interval between points is 30 min in section (d) and varies from 5 to 15 min in sections (a), (b), and (c). Sections (e) and (f) show
the similar bathymetry between the two areas, where land is the lightest gray color and depth increases as the shading darkens (0–4, 4–7, and >7 m).
524 J.J. Watson-Capps, J. Mann / Biological Conservation 124 (2005) 519–526
through the pearling lines. Females� movement through
that area does not appear to be restricted to the drop off
in depth (Fig. 4). Females were more likely to go into the
comparison area (mean ± SE = 53 ± 12% of segments,
n = 10) than into the confirmed oyster farm (mean ±
SE = 14 ± 6% of segments, n = 17; one-tailed: p = 0.005).
4. Discussion
The adult female bottlenose dolphins studied here ap-
peared to have been displaced by aquaculture. They
showed a significant decrease in use of the extension
area when the pearl oyster farming was introduced.
The fact that this same pattern was not seen for the re-
ported use area could be attributed to the possibility
that oyster farming never actually occurred there. Be-
cause of decreased GPS accuracy or human error when
the lease was established, and the shallow depth of most
of the reported use area, farming may not have taken
place in that area. Researchers never observed panels
in these shallow waters. The detailed outlines of wherethe ropes were located as measured by us starting in
2001 were not in this area at all and there was also a shift
further from shore between 2001 and 2002, indicating
that the oyster farm lines were moved. Another possibil-
ity is that the dolphins studied did not heavily utilize
that relatively shallow area. In fact, the shallow areas
J.J. Watson-Capps, J. Mann / Biological Conservation 124 (2005) 519–526 525
in the Whale Bight comparison area are also not heavily
used (Fig. 4).
Even though mean distance to the extension area in-
creased during the one year (1999) it was present, it
would be difficult to attribute this pattern to the farming
per se because of large year-to-year variation. Mostlikely other factors such as changes in dolphin-watch
tour boat presence and annual variation in predators
and prey contribute to this yearly variation.
Detailed movement patterns around the confirmed
oyster farm provided the strongest evidence that dol-
phins are displaced by shellfish aquaculture. Adult fe-
male dolphins were less likely to go into areas where
farming was occurring compared to an ecologically sim-ilar area nearby. From the tracks of the females we can
see several instances where females stayed on the periph-
ery of the farm rather than traveling through it. This
pattern might indicate a reluctance to swim through
ropes in the water, a previously documented occurrence
for captive harbour porpoises, Phocoena phocoena (Kas-
telein et al., 1995). Dusky dolphins in Marlborough
Sounds, New Zealand were observed to swim only be-tween lanes consisting of ropes and floats in the mussel
farm (Markowitz et al., 2004). Ad libitum notes taken
during follows from our study in the oyster farm indi-
cate that adult females sometimes swim all the way
around the ropes (several hundred meters) rather than
crossing them, despite ample space to do so. However,
adult females have also been observed swimming over
lines. Some adult females may avoid the ropes and pan-els in the water by not entering the oyster farm, while
others are less cautious.
Displacement from habitats by aquaculture may be
particularly important to foraging specialists, as many
of the female dolphins appear to be at this site (Mann
and Sargeant, 2003). For example, a subset of adult fe-
males use marine sponges to ferret prey from the sea-
floor almost exclusively in deep-water channels in ourstudy site (Smolker et al., 1997). If they were displaced
from these channels they would be prevented from using
their predominant foraging type and are likely to have
decreased foraging and reproductive success. Further-
more all females have a network of associates whom
they rest, travel, and socialize with (Wells et al., 1987;
Smolker et al., 1992); if they were forced to move to an-
other area these long-term bonds may be disrupted.Although we have been examining movement patterns
of adult female dolphins and not other age/sex classes,
any significant impact on adult female reproductive suc-
cess is likely to have long-term consequences for the
population.
This study is unique considering the information
available on cetaceans and aquaculture. We were able
to control for individual differences, variation over time,and the location of the oyster farm because 15 years of
ranging data were available on individually identified
dolphins whose sex, approximate age, and reproductive
histories were known. However, a serious limitation of
this study was that we did not measure the exact loca-
tion of the farm prior to 2001.
4.1. Future research and management recommendations
Future studies on cetaceans and aquaculture should
collect baseline movement and behavioral data at least
several years before the site is established to account
for yearly and seasonal variation and to establish which
habitats are critical for cetaceans. Accurate independent
assessment of animal movement and the exact location
of the farm are essential (rather than using designatedlease areas). Standardized search methods such as tran-
sects that cover the entire area are important for detect-
ing changes in cetacean density. Determination of
habitat structure and cetacean behavior patterns before,
during, and after disturbance can provide insight
regarding whether the effects are reversible and, if so,
how long it might take to return to the previous state.
However, if opportunistic data are the only data avail-able, methods such as those described can be used to as-
sess impacts of a disturbance. Detailed movements of
individuals are useful to show how animals interact
when they come into contact with the area in question.
If behavioral data are not being collected, this may best
be done remotely (such as from a theodolite or by radio
or satellite tagging). To avoid pseudoreplication only
independent locations can be used.Management of shellfish farms with regard to how
they affect marine mammals is currently a pressing issue.
Management agencies should forecast that farms with
ropes and panels may displace at least some dolphins
and potentially impact their fitness. The following rec-
ommendations may be useful. Research the distribution
of animals before, during and after a small test area has
been set up first. Limit the lease numbers or sizes toareas not heavily used by cetaceans. Allow corridors
through the shellfish farms for the dolphins to move,
such as having a space between parallel lines, so that
the animals are not entirely boxed out. In this study, a
size of 75 m was sufficient for some, but not all, dolphins
to swim through. If dolphin welfare is of concern, then a
precautionary approach is warranted. Research on the
impact of aquaculture should be carried out beforeleases are approved.
Acknowledgments
We thank all field assistants, our colleagues in Shark
Bay, Western Australian Department of Fisheries, Wes-
tern Australian Conservation and Land Management,Dr. Barry Wilson, and Monkey Mia Dolphin Resort.
Funding was provided to J.M. by NSF #9753044,
526 J.J. Watson-Capps, J. Mann / Biological Conservation 124 (2005) 519–526
Eppley Foundation for Research, and the Brach Foun-
dation, the National Geographic Society to J.M. and
J.J.W., Georgetown University Graduate Student Re-
search Award to J.J.W. Thanks to Magellan of Austra-
lia for providing us with GPS units. Thanks to J. Pettis
and two anonymous reviewers for helpful comments onearlier drafts of the manuscript and to F. Barton for sta-
tistical consultation. This research was conducted under
Georgetown University Animal Care and Use Commit-
tee Protocol #02-035 and Western Australian Conserva-
tion and Land Management License SF004406.
References
Buschmann, A.H., Lopez, D.A., Medina, A., 1996. A review of the
environmental effects and alternative production strategies of
marine aquaculture in Chile. Aquacultural Engineering 15, 397–
421.
Chilvers, B.L., Lawler, I.R., Macknight, F., Marsh, H., Noad, M.,
Paterson, R., 2005. Moreton Bay, Queensland, Australia: an
example of the co-existence of significant marine mammal popu-
lations and large-scale coastal development. Biological Conserva-
tion 122, 559–571.
Connor, R.C., Smolker, R.A., 1985. Habituated dolphins (Tursiops
sp.) in Western Australia. Journal of Mammalogy 66, 703–706.
Connor, R.C., Wells, R.S., Mann, J., Read, A.J., 2000. The bottlenose
dolphin: social relationships in a fission–fusion society. In: Mann,
J., Connor, R.C., Tyack, P.L., Whitehead, H. (Eds.), Cetacean
Societies. University of Chicago Press, Chicago, pp. 91–126.
Crespo, E.A., Hall, M.A., 2002. Interactions between aquatic mam-
mals and humans in the context of ecosystem management. In:
Evans, P.G.H., Raga, J.A. (Eds.), Marine Mammals: Biology and
Conservation. Kluwer Academic/Plenum Publishers, New York,
pp. 463–490.
Dans, S.L., Crespo, E.A., Garcıa, N.A., Reyes, L.M., Pedraza, S.N.,
Alonso, M.K., 1997. Incidental mortality of Patagonian dusky
dolphins in mid-water trawling: retrospective effects from the early
1980s. Report of the International Whaling Commission 47, 699–
703.
Food and Agriculture Organization of the United Nations, 2003.
Review of the State of World Aquaculture. Food and Agriculture
Organization of the United Nations Fisheries Circular 882, pp. 1–
95.
Fleming, I.A., 1994. Captive breeding and the conservation of wild
salmon populations. Conservation Biology 8, 886–888.
Hall, M.A., Donovan, G.P., 2002. Environmentalists, fisherman,
cetaceans, and fish: is there a balance and can science help to find
it? In: Evans, P.G.H., Raga, J.A. (Eds.), Marine Mammals:
Biology and Conservation. Kluwer Academic/Plenum Publishers,
New York, pp. 491–521.
Henderson, A., Gamito, S., Karakassis, I., Pederson, P., Smaal, A.,
2001. Use of hydrodynamic and benthic models for managing
environmental impacts of marine aquaculture. Journal of Applied
Ichthyology 17, 163–172.
Jadwiszczak, P., 2003. Rundum Projects: an application for random-
ization and bootstrap testing, version 1.1. Available from: <http://
pjadw.tripod.com>.
Kastelein, R.A., Haan, D.D., Staal, C., 1995. Behaviour of harbour
porpoises (Phocoena phocoena) in response to ropes. In: Nachtigall,
P.E., Lien, J., Au, W.W.L., Read, A.J. (Eds.), Harbour Porpoises –
Laboratory Studies to Reduce Bycatch. De Spil Publishers,
Woerden, The Netherlands, pp. 69–90.
Kemper, C.M., Gibbs, S.E., 2001. Dolphin interactions with tuna
feedlots at Port Lincoln, South Australia and recommendations for
minimising entanglements. Journal of Cetacean Resource Man-
agement 3, 283–292.
Kemper, C.M., Pemberton, D., Cawthorn, M., Heinrich, S., Mann, J.,
Wursig, B., Shaughnessy, P., Gales, R., 2003. Aquaculture and
marine mammals: co-existence of conflict? In: Gales, N., Hindell,
M., Kirkwood, R. (Eds.), Marine Mammals: Fisheries, Tourism
and Management Issues. CSIRO Publishing, Collingwood, Vic.,
Australia, pp. 208–225.
La Rosa, T., Mirto, S., Marino, A., Alonzo, V., Maugeri, T.L.,
Mazzola, A., 2001. Heterotrophic bacteria community and pollu-
tion indicators of mussel-farm impact in the Gulf of Gaeta
(Tyrrhenian Sea). Marine Environmental Research 52, 301–321.
Liang, K., Zeger, S., 1986. Longitudinal data analysis using general-
ized linear models. Biometrika 73, 13–22.
Mann, J., Kemps, C., 2003. The effects of provisioning on maternal
care in bottlenose dolphins. In: Gales, N., Hindell, M., Kirkwood,
R. (Eds.), Marine Mammals: Fisheries, Tourism and Management
Issues. CSIRO Publishing, Collingwood, Vic., Australia, pp. 292–
305.
Mann, J., Sargeant, B., 2003. Like mother, like calf: the ontogeny of
foraging traditions in wild Indian Ocean bottlenose dolphins
(Tursiops sp.). In: Fragaszy, D., Perry, S. (Eds.), The Biology of
Traditions: Models and Evidence. Cambridge University Press,
Cambridge, pp. 236–266.
Markowitz, T.M., Harlin, A.D., Wursig, C., McFadden, C.J., 2004.
Dusky dolphin foraging habitat: overlap with aquaculture in New
Zealand. Aquatic Conservation Marine and Freshwater Ecosys-
tems 14, 133–149.
Mirto, S., La Rosa, T., Danovaro, R., Mazzola, A., 2000. Microbial
and meiofaunal response to intensive mussel-farm biodeposition in
coastal sediments of the western Mediterranean. Marine Pollution
Bulletin 40, 244–252.
Nams, V.O., 1990. Locate II: Computer Program Used to Triangulate
Locations. Available from: <http://www.nsac.ns.ca/envsci/staff/
vnams/Locate.htm>.
Naylor, R.L., Goldburg, R.J., Primavera, J.H., Kautsky, N., Beve-
ridge, M.C.M., Clay, J., Folke, C., Lubchenco, J., Mooney, H.,
Troell, M., 2000. Effect of aquaculture on world fish supplies.
Nature 405, 1017–1024.
Naylor, R.L., Williams, S.L., Strong, D.R., 2001. Aquaculture – a
gateway for exotic species. Science 294, 1655–1656.
Newton, G., 2000. Aquaculture update. Australian Marine Science
Association 152, 18–20.
Smolker, R.A., Richards, A.F., Connor, R.C., Mann, J., Berggren, P.,
1997. Sponge-carrying by Indian Ocean bottlenose dolphins:
possible tool-use by a delphinid. Ethology 103, 454–465.
Smolker, R.A., Richards, A.F., Connor, R.C., Pepper, J.W., 1992. Sex
differences in patterns of association among Indian Ocean bottle-
nose dolphins. Behaviour 123, 38–69.
United Nations Educational, Scientific, and Cultural Organization,
1991. Convention concerning the protection of the world cultural
and natural heritage. Report of the 15th Session of the World
Heritage Committee SC-91/conf.002/15.
Wells, R.S., Scott, M.D., Irvine, A.B., 1987. The social structure of
free-ranging bottlenose dolphins. In: Genoways, H.H. (Ed.),
Current Mammalogy. Plenum Press, New York, pp. 247–305.
Wursig, B., Gailey, G.A., 2002. Marine mammals and aquaculture:
conflicts and potential resolutions. In: Stickney, R.R., McVay, J.P.
(Eds.), Responsible Marine Aquaculture. CAP International Press,
New York, pp. 45–59.
Wursig, B., Wursig, M., 1977. The photographic determination of
group size, composition, and stability of coastal porpoises (Tursi-
ops truncatus). Science 198, 755–756.


