Embed Size (px)
Citation preview
Emerging Markets Review 12 (2011) 1–20
Contents lists available at ScienceDirect
Emerging Markets Review
j ourna l homepage: www.e lsev ie r.com/ locate /emr
The effects of bank regulations, competition, and financialreforms on banks' performance☆
Sami Ben Naceur a,⁎, Mohammed Omran b
a ESSEC Tunis, 4 Rue Abou Zakaria Al Hafsi, Tunis 1089, Tunisiab Cairo and Alexandria Stock Exchanges, 4 (A) El Sherifein St., Down Town, Postal Code 11513, P.O. Box 358 Mohammed Farid,Cairo, Egypt
a r t i c l e i n f o
☆ The views expressed herein are those of the aut(CASE), its board of directors, or its management. Th⁎ Corresponding author.
E-mail addresses: [email protected] (S.B. Nace
1566-0141/$ – see front matter © 2010 Published bdoi:10.1016/j.ememar.2010.08.002
a b s t r a c t
Article history:Received 20 June 2009Received in revised form 10 August 2010Accepted 31 August 2010Available online 9 September 2010
In this paper, we examine the influence of bank regulation, con-centration, and financial and institutional development on commercialbank margins and profitability across a broad selection of Middle Eastand North Africa (MENA) countries. The empirical results suggest thatbank-specific characteristics, in particular bank capitalization and creditrisk, have a positive and significant impact on banks' net interestmargin,cost efficiency, and profitability. Also we find that macroeconomic andfinancial development indicators have no significant impact on netinterest margins, except for inflation. Regulatory and institutionalvariables seem to have an impact on bank performance.
© 2010 Published by Elsevier B.V.
JEL classification:E44G21L51
Keywords:Bank interest marginBank profitabilityDynamic panel data and MENA region
1. Introduction
During the late 1980s and the 1990s, several Middle East and North Africa (MENA) countries (Tunisia,Morocco, Egypt, and Jordan, among others) underwent noteworthy financial reforms under the auspice ofthe International Monetary Fund (IMF). These reforms have significantly affected both the banking systemand the domestic stock market.
hor and should not be attributed to the Cairo and Alexandria Stock Exchangese paper has received a grant from the seven round of ERF/GDN project.
ur), [email protected] (M. Omran).
y Elsevier B.V.
2 S.B. Naceur, M. Omran / Emerging Markets Review 12 (2011) 1–20
While several research studies on bank performance have been conducted extensively for UScommercial banks and, to lesser extent, for financial institutions in Europe and in large emerging markets(Brazil, China, and others), relatively little is known about bank performance among banks in other regions,in particular, MENA countries.
The main contributions of the paper are as follows. Using bank level data from ten countries over theperiod 1989–2005 (Tunisia, Bahrain, Egypt, Jordan, Kuwait, Lebanon, Morocco, Oman, Saudi Arabia, andUnited Arab Emirates), our study aims at assessing the impact of financial development, bank regu-lations, market structure, and institutional factors on bank performance. In addition to the assessment ofthe above relationship, our study provides an insight into the characteristics and practices of successfulcommercial banks in terms of performance. In view of the findings, we should be able to draw somepolicy implications that may be useful for bank management, policymakers, and shareholders in theMENA region.
Estimating the source of bank performance using a dynamic system General Method of Moment(GMM) specification, we find that bank specific characteristics, in particular bank capitalization andcredit risk, are key determinants. We fail, however, to find any significant relationship betweenmacroeconomic variables and bank performance except for inflation. Also, the results suggest that banksenjoy lower operating costs in a well-developed banking sector environment. Furthermore, the stockmarket development variable is always positive and significant in all specifications, suggesting that banksoperating in a well-developed stock market environment tend to have greater profit opportunities. Theregulatory and institutional variables seem to have an impact on bank performance as the results suggestthat corruption increases the cost-efficiency and net-interest margins while an improvement in the lawand order variable decreases the cost efficiency without affecting performance. These results indicate theneed of MENA banks to operate in a more competitive environment, well-developed capital markets, anda better governance environment.
The rest of the paper is organized as follows. We document and discuss financial reform efforts in theMENA region in Section 2, concentrating on the banking sector compared with the security market. Aliterature review of the determinants of bank performance is given in Section 3, distinguishing betweensingle and cross-country studies. In Section 4, we provide a detailed description of data, methodology,and empirical models that includes measurements of our variable of interest. We then report our em-pirical results and findings in Section 5, while Section 6 concludes the paper and spells out some policyimplications.
2. Financial reform in MENA
Research on financial development and its relationshipwith growth is extensive and ongoing. Althoughthe relationship between financial development and growth continues to be debated, there is generalagreement that financial repression or government intervention impose on the financial sector restrictionsand price distortion that inhibit growth prospects. In addition there is a consensus that macroeconomicstability is critical for the growth of financial services.
Thus, countries should adopt appropriate macroeconomic policies, encourage competition within thefinancial sector, and develop a strong and transparent institutional and legal framework for financial sectoractivities. In particular, there is need for prudential regulations and supervision, strong creditor rights, andcontract enforcement. Therefore, government decision-makers should eliminate financial repression andsupport financial development as important elements of their policy package to stimulate and sustaineconomic growth (Creane et al., 2003).
In this context, MENA countries have perceived the importance of financial sector reform in allocatinginvestment and enhancing productivity by identifying promising projects and firms, mobilizing savings,encouraging good corporate governance, and enabling the trading, hedging, and diversifying of risk, as wellas facilitating the exchange of goods and services. Thus in the late 1990s a number of MENA countries haveadopted a financial reform agenda.
While the restructuring initiatives in the MENA region are less vibrant than those taking place inEastern Europe and parts of Asia, nevertheless, several MENA countries are witnessing a new era inprivatization, bank regulation, market-orientation, and integration of privately owned banks of different
3S.B. Naceur, M. Omran / Emerging Markets Review 12 (2011) 1–20
organizational structure, resulting in a well-developed, profitable, and efficient banking sector in somecountries, particularly the Gulf Cooperation Council (GCC) countries.
The economy of the entire MENA region is classified as a bank-based economy as banks are thedominant financial institutions, since they control most financial flows and possess most financial assets.However, economic reforms have directed more bank ownership and activity toward the private sectorand have activated the dormant securities market.
For decades many governments in the MENA region – apart from the Gulf Countries – adopted financialrepression policies that resulted in a nominal interest-rate ceiling that is below the prevailing inflation rateand the rate of currency depreciation. Under repressive regimes, monetary authorities impose high reserverequirements, bank-specific credit ceilings, and selective credit allocation. These measures result in a non-competitive and segmented financial system. Such polices allowed the authorities to control better themoney supply, serving some social goals, such as protecting lenders against usury practices by moderatingthe free determination of interest rates and keeping interest rates below market rates, which reduces thecost of servicing government debts.
As mentioned above, MENA region can be classified as a bank-based economy, therefore, manycountries havewitnessed a comprehensive financial reform agenda, concentrated on banking reform in thelate 1990s. Before this date, both Lebanon and Morocco had a more liberalized financial sector comparedwith the rest of the region, while other countries tended to have a state-dominated and excessivelyregulated financial sector, especially Algeria, Libya, and Syria.
The underlying argument is that the soundness of the banking system is important not only becauseit limits economic downturns related to financial panics, but also because it avoids adverse budgetaryconsequences for governments. Thus prudential regulation is meant to protect the banking system byinducing banks to invest wisely (Murinde and Yaseen, 2004).
There were and still ongoing reform in the banking sector in the MENA region. Most of countries in thisregion went through several bank laws, which contain provisions for disclosure and transparency in thecentral bank's activities. Central banks are focusing on many policies, including formulating monetary,credit, and banking policy, supervising policy implementation, managing the national gold and foreignexchange reserves, regulate the banking system, managing public debt, and advising the government onloans and credit facilities. The banks' minimum capital requirements vis-à-vis their risk-weighted assetswere increased to 8% in most countries in the region, along the lines of the recommendations of the BasleCommittee on Banking Supervision in 1995. Capital was defined to consist of two components, primarycapital, which includes paid-up capital and reserves, and other capital, which includes provisions forgeneral banking risks and subordinated long-term loans of at least five-year maturity (Murinde andYaseen, 2004).
Looking at the structure of banking sector in the non-oil countries, we can see that the state ownsaround 67% of banking assets in Egypt, while it owns only 29% in Morocco. However, there is no stateownership of banks in either Jordan or Lebanon. The same findings are true for both banking system loansand deposits. It is, however, worth mentioning that the number of government-owned banks in Egypt isstill highest among other MENA countries.1
As for the oil countries (GCC), we can observe that they have a fairly large number of banks with anextensive network of branches. Banks in the GCC countries are financially strong and well-capitalized (Jbiliet al., 1996). Most of banks in GCC are family-owned, with modest state ownership participation, althougha large number of specialized banks are fully state-owned.
The GCC has already set guidelines in an effort to put in placeminimum requirements for banks desiringto establish branches in other GCC countries. These requirements are intended to reduce incidents ofcrashes and sectoral failures. Guidelines and standards have been set with respect to licensing, capital, andcapital reserve, monitoring and inspection of licensed foreign banks, bank closures, minimum capitalretention requirements, and a minimum age for a bank (ten years), among other requirements (Jabsheh,2002).
1 According to World Bank database for bank regulation and supervision, by the end of 2005.
4 S.B. Naceur, M. Omran / Emerging Markets Review 12 (2011) 1–20
Looking at the other component of the financial sector (security markets), we can see that secu-rity markets in the MENA region attracted the attention of policymakers within the framework ofdeveloping and reforming the financial markets. Most countries in the region started reformingtheir security markets in the 1990s, and the reform agenda included plans to revitalize stockmarkets in some countries and to establish stock markets in others. Many of these countries issuednew capital laws, aimed at encouraging private investment, increasing investors' protection,and enhancing the banks' role in stimulating capital markets through the establishment of mutualfunds.
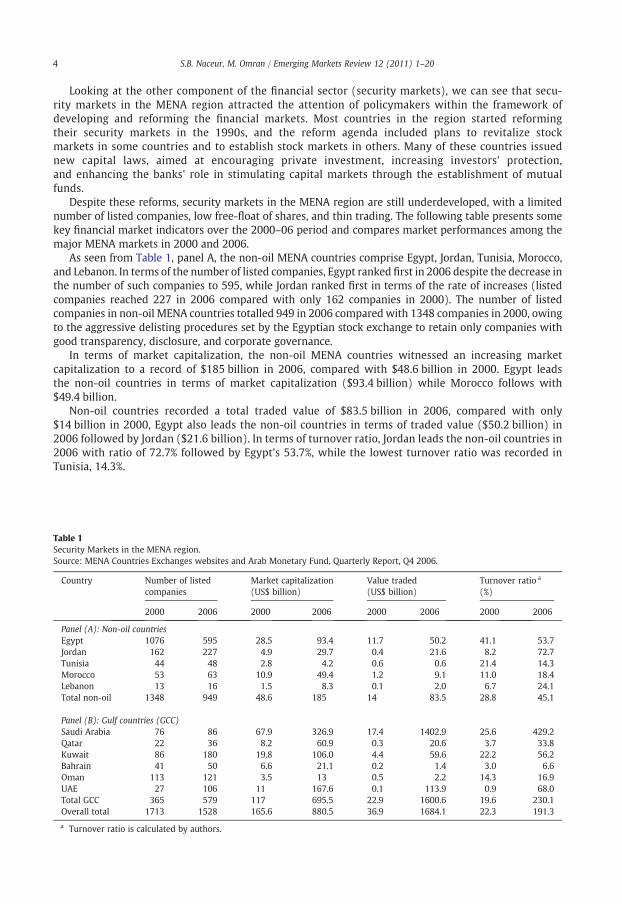
Despite these reforms, security markets in the MENA region are still underdeveloped, with a limitednumber of listed companies, low free-float of shares, and thin trading. The following table presents somekey financial market indicators over the 2000–06 period and compares market performances among themajor MENA markets in 2000 and 2006.
As seen from Table 1, panel A, the non-oil MENA countries comprise Egypt, Jordan, Tunisia, Morocco,and Lebanon. In terms of the number of listed companies, Egypt ranked first in 2006 despite the decrease inthe number of such companies to 595, while Jordan ranked first in terms of the rate of increases (listedcompanies reached 227 in 2006 compared with only 162 companies in 2000). The number of listedcompanies in non-oil MENA countries totalled 949 in 2006 compared with 1348 companies in 2000, owingto the aggressive delisting procedures set by the Egyptian stock exchange to retain only companies withgood transparency, disclosure, and corporate governance.
In terms of market capitalization, the non-oil MENA countries witnessed an increasing marketcapitalization to a record of $185 billion in 2006, compared with $48.6 billion in 2000. Egypt leadsthe non-oil countries in terms of market capitalization ($93.4 billion) while Morocco follows with$49.4 billion.
Non-oil countries recorded a total traded value of $83.5 billion in 2006, compared with only$14 billion in 2000, Egypt also leads the non-oil countries in terms of traded value ($50.2 billion) in2006 followed by Jordan ($21.6 billion). In terms of turnover ratio, Jordan leads the non-oil countries in2006 with ratio of 72.7% followed by Egypt's 53.7%, while the lowest turnover ratio was recorded inTunisia, 14.3%.
Table 1Security Markets in the MENA region.Source: MENA Countries Exchanges websites and Arab Monetary Fund, Quarterly Report, Q4 2006.
Country Number of listedcompanies
Market capitalization(US$ billion)
Value traded(US$ billion)
Turnover ratio a
(%)
2000 2006 2000 2006 2000 2006 2000 2006
Panel (A): Non-oil countriesEgypt 1076 595 28.5 93.4 11.7 50.2 41.1 53.7Jordan 162 227 4.9 29.7 0.4 21.6 8.2 72.7Tunisia 44 48 2.8 4.2 0.6 0.6 21.4 14.3Morocco 53 63 10.9 49.4 1.2 9.1 11.0 18.4Lebanon 13 16 1.5 8.3 0.1 2.0 6.7 24.1Total non-oil 1348 949 48.6 185 14 83.5 28.8 45.1
Panel (B): Gulf countries (GCC)Saudi Arabia 76 86 67.9 326.9 17.4 1402.9 25.6 429.2Qatar 22 36 8.2 60.9 0.3 20.6 3.7 33.8Kuwait 86 180 19.8 106.0 4.4 59.6 22.2 56.2Bahrain 41 50 6.6 21.1 0.2 1.4 3.0 6.6Oman 113 121 3.5 13 0.5 2.2 14.3 16.9UAE 27 106 11 167.6 0.1 113.9 0.9 68.0Total GCC 365 579 117 695.5 22.9 1600.6 19.6 230.1Overall total 1713 1528 165.6 880.5 36.9 1684.1 22.3 191.3
a Turnover ratio is calculated by authors.
5S.B. Naceur, M. Omran / Emerging Markets Review 12 (2011) 1–20
Panel B presents the development of the financialmarket in the GCC, where Saudi Arabia leads the GCCin terms of market capitalization ($326.9 billion) in 2006 followed by the United Arab Emirates (UAE).Total GCC market capitalization in 2006 was recorded at $695.5 billion compared with $117 billion in2000.
In terms of value traded, Saudi Arabia also leads the GCC ($1402.9 billion) in 2006, compared with only$ 17.4 billion in 2000, followed by UAE which recorded a total value traded of $113.9 billion in 2006,compared with only $0.1 billion in 2000.
Saudi Arabia also leads the GCC in terms of turnover ratio, which recorded 429.2% in 2006, comparedwith 25.6% in 2000, and was followed by the UAE (68% in 2006), compared with only 0.9% in 2002.
3. Related literature
Before embarking on our proposed research, we review the existing literature to identify how ourpaper could contribute to this already rich body of knowledge. The researches on bank performancewere initially devoted to the analysis of bank margins. The pioneering paper of Ho and Saunders (1981)has been the theoretical framework for all empirical studies on the determinants of bank margins. Thedealership model of Ho and Saunders indicates that the optimum bank interest margin depends on thebank's risk aversion, the size of bank transactions, the variance of the interest rate on deposits andloans, and the degree of market competition (see Hawtrey and Liang, 2008 and Kasma, 2010 for adetailed review of the results in both developed and developing countries). This model has beenextended by Allen (1988) who introduced different types of bank products, Angbazo (1996) whoaugmented the model with credit risk defaults, and Maudos and De Guevara (2004) who includedoperating costs.
An alternative approach adopted by our paper has focused on performance analysis using both netinterest margins and return on bank assets and equity with a more eclectic one-step estimation proce-dure based on a behavioral model of the banking firm. Bank performance is usually expressed in thisapproach as a function of internal and external determinants. The internal variables are commonly bankspecific determinants and the external variables are related to the economic, financial and institutionalenvironment.
The empirical papers on bank performance examine either cross-country or individual country bankingsystems. In most studies, variables such as bank size, credit risk, and equity are used as internal deter-minants of bank performance.
Size is included to assess the existence of economies or diseconomies of scale in the bankingsector. The empirical results provide conflicting evidence. Smirlock (1985), Short (1979), Bikker andHu (2002), and Ben Naceur and Goaied (2008) find a positive and significant relationship betweensize and bank performance. On the other hand, Kosmidou et al. (2005) find that small UK banksdisplay higher profitability to larger ones over the period in 1998. Kasman (2010) find that a size hasa negative and statistically significant impact on the net interest margin on a panel of 431 banks in 39countries.
The relationship between equity and profitability is also controversial. The first to examine closelythe capital–earning relationship is Berger (1995). The traditional view suggests a higher capital-assetratio (CAR) is linked with a lower Return on Equity (ROE) because a higher CAR decreases the risk onequity and the tax subsidy provided by interest deductibility. More recent view based on relaxation of thesymmetric information assumption claims that an increase in CAR raises ROE by reducing the expectedcosts for financial distress. Berger (1995) finds that an unexpected rise in capital tended to increaseearning in a sample of US banks in the 1980s. He related this result to two hypotheses: first, increasingcapital lower interest rate paid on unsecured debt and second, bank uses additional capital to signal thatfuture projects are better. In more recent studies, Angbazo (1996), Demirguc-Kunt and Huinzingua(1999), Saunders and Schumacher (2000), Drakos (2003), Maudos and De Guevara (2004), Pasiourasand Kosmidou (2007), and Ben Naceur and Goaied (2008) find a positive relationship between bankperformance and capitalization.
In the literature on bank margins and profitability, the bank loans over total assets ratio ismainly used as a measure of bank liquidity or as a proxy for credit risk when data do not permit thecalculation of the loan loss provision (Maudos and De Guevara, 2004). Miller and Noulas (1997) suggest
6 S.B. Naceur, M. Omran / Emerging Markets Review 12 (2011) 1–20
a negative relationship between credit risk and profitability because a higher loan to asset ratioincreases the exposure of banks to bad loans and hence lowers profit margins. On the other hand,standard asset pricing arguments imply a positive relationship between risk and earnings. Empiricalstudies find that a higher loan ratio is associated with higher interest margins, which suggest that risk-averse shareholders seek larger earnings to compensate higher credit risk (Demirguc-Kunt andHuizingua, 1999, Chirwa, 2003, Maudos and Guevara, 2004, Ben Naceur and Goaied, 2008, and Flaminiet al., 2009). However, Demirguc-Kunt and Huizingua (1999) find that the sign on loans to total assetsratio is negative in the before-tax profit over total assets equation, but when it is interacted with GDPbecomes positive, indicating that at higher income level banks' lending activities tend to be moreprofitable.
The impact of macroeconomic factors on bank performance has also been discussed in the literature.Revel (1979) was the first to suggest that the effect of inflation on bank profitability depends onwhether operating expenses increase at a higher rate than inflation. Perry (1992) adds that the impactof inflation on bank profitability depends on whether inflation is fully anticipated. This implies thatif inflation is totally anticipated then revenues increase faster than costs, improving in this wayprofitability. Most of the studies on the impact of inflation on profitability find a positive and significantrelationship (Claessens et al., 2001, Bourke, 1989, Molyneux and Thornton, 1992, Athanasoglou et al.,2006, and Pasiouoras and Kosmidou, 2007). However, Afanasieff et al. (2002) and Ben Naceur andKandil (2009) find that the inflation rate negatively affects interest margins. Afanasieff et al. suggest thatinflationmay be capturing the effect of seignorage collection on interest margins. Ben Naceur and Kandilexplain the negative coefficient by the fact that a higher inflation rate increases uncertainty and reducesdemand for credit. One could also argue that this negative relationship may be linked to sloweradjustment of revenues compared with costs for inflation (Wendell and Valderrama, 2006 and Abreuand Mendes, 2003).
GDP growth is also considered as a macro determinant of bank performance and allows for con-trolling business cycle fluctuations (Bernanke and Gertler, 1989; Kiyotaki and Moore, 1997). Accordingto Bernake and Gertler (1989), during recessions the quality of loans declines and therefore companiesborrow at higher margins, therefore a negative relationship between spread and economic growth isto be expected. Claeys and Vennet (2008) find that prevailing business cycle conditions affect netinterest margins. In the Western European countries, higher economic growth is associated withhigher margins, whereas in the Central Eastern European countries no link is found. The positiverelationship between growth and net interest margin is also found in Schwaiger and Liebig (2008),Claessens et al. (2001) and Flamini et al. (2009). Nevertheless, a negative relationship is found inDemirguc-Kunt et al. (2004) while Dietrich et al. (2010) confirm the contercyclicality of interestmargins. Using profitability indicators (returns on assets and equity), Goddard et al. (2004), Demirguc-Kunt and Huizinga (1998), Bikker and Hu (2002), and Flamini et al. (2009) find a positive relationshipwith real GDP growth.
Turning to market concentration and its impact on bank profitability, it should be noted that twoopposing hypotheses have been proposed: the structure-conduct-performance (SCP) hypothesis andthe efficient-structure (ES) hypothesis. The SCP hypothesis states that increased market power yieldsmonopoly powers (Short, 1979; Molyneux et al., 1996). The ES hypothesis asserts that marketconcentration is not the case of a bank's superior profitability and attributes the higher profit to superiorefficiency that enables efficient banks to gain market share and earn higher profits (Demsetz, 1973, andPeltzman, 1977). A number of studies confirm the SCP hypothesis (Rose and Fraser, 1976, Heggestad andMingo, 1974, Rhoades, 1977, Samad, 2005, and Chirwa, 2003). Other researches provide support to the EShypothesis in the banking sector (Gillini et al., 1984, Smirlock, 1985, and Evanoff and Fortier, 1988) andsome find no evidence to support the SCP hypothesis (Berger, 1995, Athanasoglou et al., 2008, and BenNaceur and Goaied, 2008).
The last group of profitability determinants deals with financial structure and institutional vari-ables. Demirguc-Kunt and Huizingua (1999) find a negative relationship between the size of thebanking sector and profitability measures that reflects the higher level of competition in developedbanking sector. Demirguc-Kunt and Huizingua (2001) also present evidence on the impact offinancial development and structure on bank performance for a large sample of countries over the1990–97 period. The paper finds that financial development has a significant impact on bank
7S.B. Naceur, M. Omran / Emerging Markets Review 12 (2011) 1–20
profitability. A developed banking system reduces profitability through higher competitivenesswhereas stock market development improves bank performance especially in a lower level offinancial development. The complementarity between stock market development and bankperformance is also found in Ben Naceur and Goaied (2008), and Kosmidou et al. (2005).
Regarding legal and institutional differences, Demirguc-Kunt and Huizingua (1999) find that bettercontract enforcement, an efficient legal system, and lack of corruption are associated with low profitabilityin a sample of 80 developed and developing countries. In the same vein, Demirguk-Kunt et al. (2004)examine the impact of bank regulation, market structure, and national institutions on bank interestmargins and overhead cost using 1400 banks across 72 countries. The paper finds that bank regulationbecome insignificant when controlling for national indicators of economic freedom or property rightsprotection. Institutional development explains cross-bank differences in net interest margins. In a study on92 countries over the period 1994–2008, Dietrich et al. (2010) find that country-level governance variablesare important determinants of the internet margins with significant differences between developed anddeveloping countries. Finally, Leaven and Majnoni (2005) investigate the effect of judicial efficiency onbank's lending spreads for a large cross-section of countries. The paper found that improvement in judicialefficiency and judicial enforcements of debt contracts are crucial for lowering the cost of financialintermediation.
4. Data and empirical model
4.1. Data
We use a sample of 173 banks from ten MENA countries over the 1988–2005 period. All bank balancesheet data and income statements are obtained from the BankScope database provided by Fitch/IBCA/Bureau Van Dijk. Since we focus on bank intermediation we use unconsolidated statements when availableand consolidated statements when the unconsolidated ones are not provided, making sure that each bankis included only once in the data set. Besides, because our sample includes only commercial banks, there ishomogeneity in the comparison over country groups. All bank-specific variables are calculated using thestandardized global accounting format available in the Bankscope. Data on inflation, economic growth andGDP per capita are taken from the world development indicators. Data on financial development, structure,and density are from Beck and others (2007) and IFS (IMF International Financial Statistics). TheInternational country risk guide (ICRG) database provides information on the quality of environment, suchlaw and order and corruption indexes.
As seen from Table 2, banks from non-oil countries dominate our sample banks, with Lebanon andEgypt representing 50% of the entire sample. Also, we can notice that the UAR, followed by Bahrain,dominates the banking sector in the GCC (above 50% of our sample banks). We were able to gather moredata on these banks in recent years comparedwith earlier years as Bankscope included a limited number ofbanks in the 1980s, but the number kept increasing in the 1990s, reflecting developments in the bankingsector in the MENA countries.
4.2. Methodology and empirical models
The empirical work on determinants of bank's profitability can potentially suffer from three sources ofinconsistency: highly persistent profit, omitted variables, and endogeneity bias (Poghosyan and Hesse,2009). We adopt the dynamic panel techniques in our empirical analysis to correct for these potentialproblems. The linear dynamic panel data equation is specified as follows:
Perfit = β1Perfit−1 + β2Bik;t + β3Ri;t + β4Mi;t + β5Fi;t + β6Ii;t + βCi;t + ηi + εit ð1Þ
Where Perfik,t is the performance of bank k in country i during the period t and is measured by threealternative measures (cost of intermediation, operating performance, and bank profitability), each
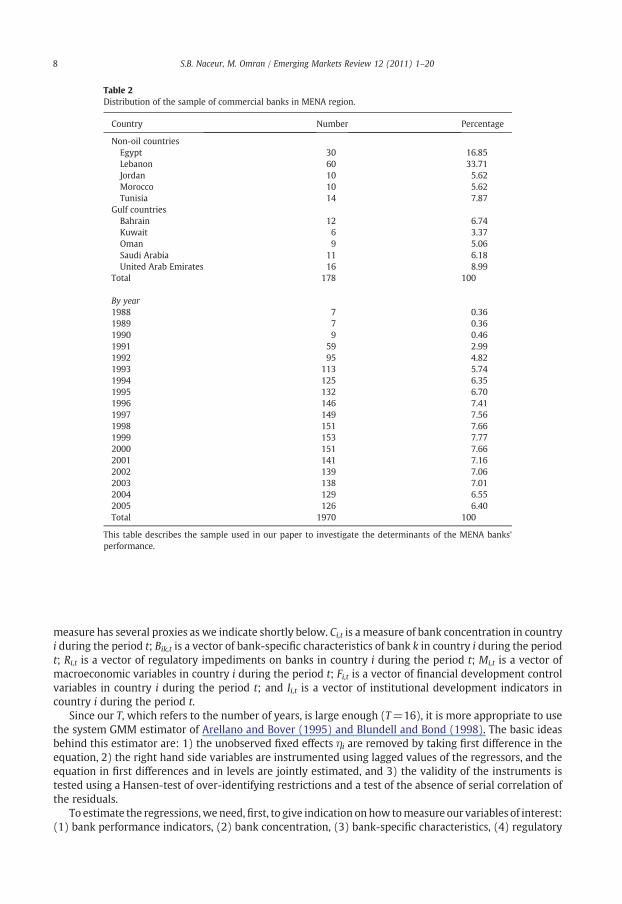
Table 2Distribution of the sample of commercial banks in MENA region.
Country Number Percentage
Non-oil countriesEgypt 30 16.85Lebanon 60 33.71Jordan 10 5.62Morocco 10 5.62Tunisia 14 7.87
Gulf countriesBahrain 12 6.74Kuwait 6 3.37Oman 9 5.06Saudi Arabia 11 6.18United Arab Emirates 16 8.99
Total 178 100
By year1988 7 0.361989 7 0.361990 9 0.461991 59 2.991992 95 4.821993 113 5.741994 125 6.351995 132 6.701996 146 7.411997 149 7.561998 151 7.661999 153 7.772000 151 7.662001 141 7.162002 139 7.062003 138 7.012004 129 6.552005 126 6.40Total 1970 100
This table describes the sample used in our paper to investigate the determinants of the MENA banks'performance.
8 S.B. Naceur, M. Omran / Emerging Markets Review 12 (2011) 1–20
measure has several proxies as we indicate shortly below. Ci,t is a measure of bank concentration in countryi during the period t; Bik,t is a vector of bank-specific characteristics of bank k in country i during the periodt; Ri,t is a vector of regulatory impediments on banks in country i during the period t; Mi,t is a vector ofmacroeconomic variables in country i during the period t; Fi,t is a vector of financial development controlvariables in country i during the period t; and Ii,t is a vector of institutional development indicators incountry i during the period t.
Since our T, which refers to the number of years, is large enough (T=16), it is more appropriate to usethe system GMM estimator of Arellano and Bover (1995) and Blundell and Bond (1998). The basic ideasbehind this estimator are: 1) the unobserved fixed effects ηi are removed by taking first difference in theequation, 2) the right hand side variables are instrumented using lagged values of the regressors, and theequation in first differences and in levels are jointly estimated, and 3) the validity of the instruments istested using a Hansen-test of over-identifying restrictions and a test of the absence of serial correlation ofthe residuals.
To estimate the regressions,weneed,first, to give indication onhow tomeasure our variables of interest:(1) bank performance indicators, (2) bank concentration, (3) bank-specific characteristics, (4) regulatory
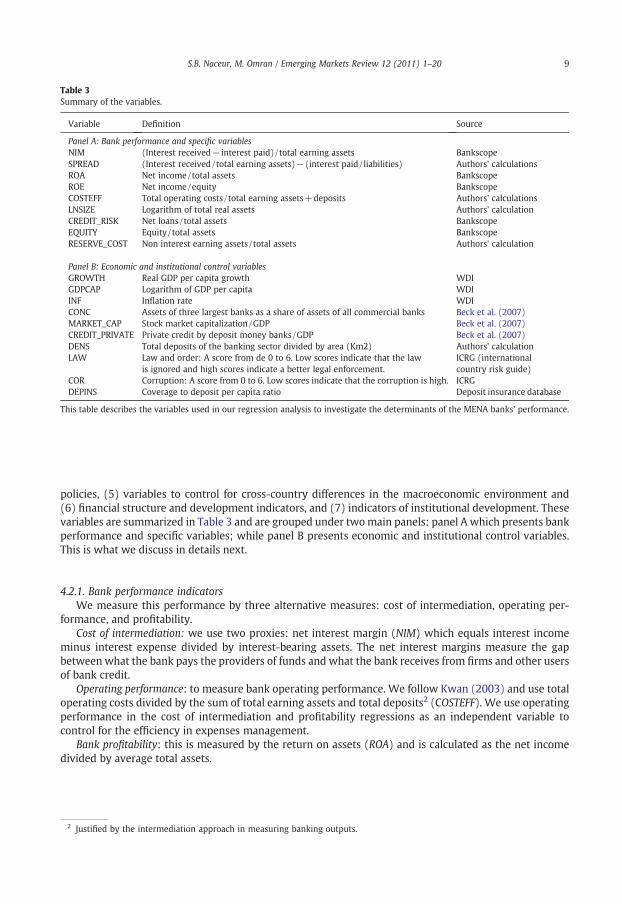
Table 3Summary of the variables.
Variable Definition Source
Panel A: Bank performance and specific variablesNIM (Interest received− interest paid)/ total earning assets BankscopeSPREAD (Interest received/total earning assets)−(interest paid/ liabilities) Authors' calculationsROA Net income/total assets BankscopeROE Net income/equity BankscopeCOSTEFF Total operating costs / total earning assets+deposits Authors' calculationsLNSIZE Logarithm of total real assets Authors' calculationCREDIT_RISK Net loans /total assets BankscopeEQUITY Equity/total assets BankscopeRESERVE_COST Non interest earning assets / total assets Authors' calculation
Panel B: Economic and institutional control variablesGROWTH Real GDP per capita growth WDIGDPCAP Logarithm of GDP per capita WDIINF Inflation rate WDICONC Assets of three largest banks as a share of assets of all commercial banks Beck et al. (2007)MARKET_CAP Stock market capitalization/GDP Beck et al. (2007)CREDIT_PRIVATE Private credit by deposit money banks/GDP Beck et al. (2007)DENS Total deposits of the banking sector divided by area (Km2) Authors' calculationLAW Law and order: A score from de 0 to 6. Low scores indicate that the law
is ignored and high scores indicate a better legal enforcement.ICRG (internationalcountry risk guide)
COR Corruption: A score from 0 to 6. Low scores indicate that the corruption is high. ICRGDEPINS Coverage to deposit per capita ratio Deposit insurance database
This table describes the variables used in our regression analysis to investigate the determinants of the MENA banks' performance.
9S.B. Naceur, M. Omran / Emerging Markets Review 12 (2011) 1–20
policies, (5) variables to control for cross-country differences in the macroeconomic environment and(6) financial structure and development indicators, and (7) indicators of institutional development. Thesevariables are summarized in Table 3 and are grouped under twomain panels: panel A which presents bankperformance and specific variables; while panel B presents economic and institutional control variables.This is what we discuss in details next.
4.2.1. Bank performance indicatorsWe measure this performance by three alternative measures: cost of intermediation, operating per-
formance, and profitability.Cost of intermediation: we use two proxies: net interest margin (NIM) which equals interest income
minus interest expense divided by interest-bearing assets. The net interest margins measure the gapbetween what the bank pays the providers of funds and what the bank receives from firms and other usersof bank credit.
Operating performance: to measure bank operating performance. We follow Kwan (2003) and use totaloperating costs divided by the sum of total earning assets and total deposits2 (COSTEFF). We use operatingperformance in the cost of intermediation and profitability regressions as an independent variable tocontrol for the efficiency in expenses management.
Bank profitability: this is measured by the return on assets (ROA) and is calculated as the net incomedivided by average total assets.
2 Justified by the intermediation approach in measuring banking outputs.
10 S.B. Naceur, M. Omran / Emerging Markets Review 12 (2011) 1–20
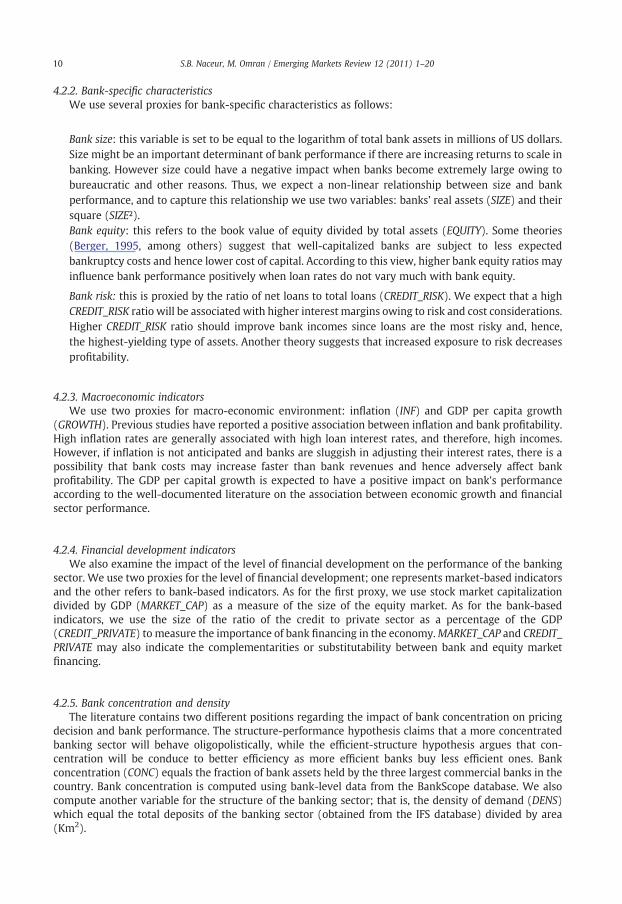
4.2.2. Bank-specific characteristicsWe use several proxies for bank-specific characteristics as follows:
Bank size: this variable is set to be equal to the logarithm of total bank assets in millions of US dollars.Size might be an important determinant of bank performance if there are increasing returns to scale inbanking. However size could have a negative impact when banks become extremely large owing tobureaucratic and other reasons. Thus, we expect a non-linear relationship between size and bankperformance, and to capture this relationship we use two variables: banks' real assets (SIZE) and theirsquare (SIZE²).Bank equity: this refers to the book value of equity divided by total assets (EQUITY). Some theories(Berger, 1995, among others) suggest that well-capitalized banks are subject to less expectedbankruptcy costs and hence lower cost of capital. According to this view, higher bank equity ratios mayinfluence bank performance positively when loan rates do not vary much with bank equity.
Bank risk: this is proxied by the ratio of net loans to total loans (CREDIT_RISK). We expect that a highCREDIT_RISK ratio will be associated with higher interest margins owing to risk and cost considerations.Higher CREDIT_RISK ratio should improve bank incomes since loans are the most risky and, hence,the highest-yielding type of assets. Another theory suggests that increased exposure to risk decreasesprofitability.
4.2.3. Macroeconomic indicatorsWe use two proxies for macro-economic environment: inflation (INF) and GDP per capita growth
(GROWTH). Previous studies have reported a positive association between inflation and bank profitability.High inflation rates are generally associated with high loan interest rates, and therefore, high incomes.However, if inflation is not anticipated and banks are sluggish in adjusting their interest rates, there is apossibility that bank costs may increase faster than bank revenues and hence adversely affect bankprofitability. The GDP per capital growth is expected to have a positive impact on bank's performanceaccording to the well-documented literature on the association between economic growth and financialsector performance.
4.2.4. Financial development indicatorsWe also examine the impact of the level of financial development on the performance of the banking
sector. We use two proxies for the level of financial development; one represents market-based indicatorsand the other refers to bank-based indicators. As for the first proxy, we use stock market capitalizationdivided by GDP (MARKET_CAP) as a measure of the size of the equity market. As for the bank-basedindicators, we use the size of the ratio of the credit to private sector as a percentage of the GDP(CREDIT_PRIVATE) to measure the importance of bank financing in the economy.MARKET_CAP and CREDIT_PRIVATE may also indicate the complementarities or substitutability between bank and equity marketfinancing.
4.2.5. Bank concentration and densityThe literature contains two different positions regarding the impact of bank concentration on pricing
decision and bank performance. The structure-performance hypothesis claims that a more concentratedbanking sector will behave oligopolistically, while the efficient-structure hypothesis argues that con-centration will be conduce to better efficiency as more efficient banks buy less efficient ones. Bankconcentration (CONC) equals the fraction of bank assets held by the three largest commercial banks in thecountry. Bank concentration is computed using bank-level data from the BankScope database. We alsocompute another variable for the structure of the banking sector; that is, the density of demand (DENS)which equal the total deposits of the banking sector (obtained from the IFS database) divided by area(Km2).
11S.B. Naceur, M. Omran / Emerging Markets Review 12 (2011) 1–20
4.2.6. Regulatory policiesTo the extent that reserve holdings are not remunerated or remunerated at less-than-market rates,
these regulations impose a burden on banks. Thus, we will test whether reserve requirements impactnegatively bank net interest margins and performance. Reserve requirement is proxied by the ratio of non-interest earning assets divided by total assets (COST_RESERVES).
Additionally, we use coverage-to-deposit per capita ratio (DEPINS) as another variable to control for theprotection provided by authorities for depositors. A better coverage will reduce the monitoring of bank-form depositors, which will contribute to a decrease of bank performance.
4.2.7. Institutional constraints to competitionBesides analyzing specific regulatory impediments on competition and the effect of bank concentration
on interest margins, we also consider three indicators as proxies for the overall institutional environment.In particular, we investigate whether bank regulation and concentration have an incidence on bank-interest margins beyond the overall institutional environment.
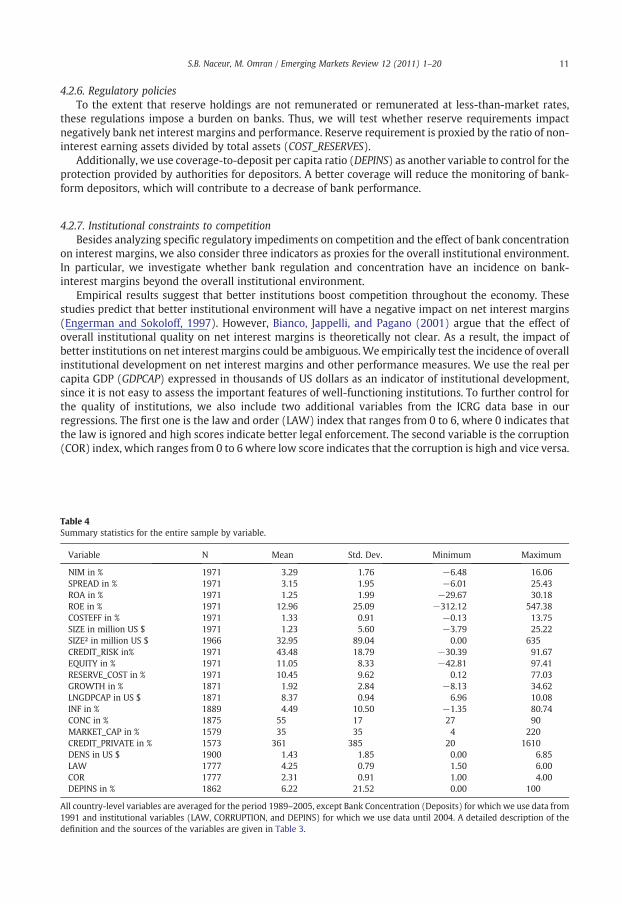
Empirical results suggest that better institutions boost competition throughout the economy. Thesestudies predict that better institutional environment will have a negative impact on net interest margins(Engerman and Sokoloff, 1997). However, Bianco, Jappelli, and Pagano (2001) argue that the effect ofoverall institutional quality on net interest margins is theoretically not clear. As a result, the impact ofbetter institutions on net interest margins could be ambiguous.We empirically test the incidence of overallinstitutional development on net interest margins and other performance measures. We use the real percapita GDP (GDPCAP) expressed in thousands of US dollars as an indicator of institutional development,since it is not easy to assess the important features of well-functioning institutions. To further control forthe quality of institutions, we also include two additional variables from the ICRG data base in ourregressions. The first one is the law and order (LAW) index that ranges from 0 to 6, where 0 indicates thatthe law is ignored and high scores indicate better legal enforcement. The second variable is the corruption(COR) index, which ranges from 0 to 6 where low score indicates that the corruption is high and vice versa.
Table 4Summary statistics for the entire sample by variable.
Variable N Mean Std. Dev. Minimum Maximum
NIM in % 1971 3.29 1.76 −6.48 16.06SPREAD in % 1971 3.15 1.95 −6.01 25.43ROA in % 1971 1.25 1.99 −29.67 30.18ROE in % 1971 12.96 25.09 −312.12 547.38COSTEFF in % 1971 1.33 0.91 −0.13 13.75SIZE in million US $ 1971 1.23 5.60 −3.79 25.22SIZE² in million US $ 1966 32.95 89.04 0.00 635CREDIT_RISK in% 1971 43.48 18.79 −30.39 91.67EQUITY in % 1971 11.05 8.33 −42.81 97.41RESERVE_COST in % 1971 10.45 9.62 0.12 77.03GROWTH in % 1871 1.92 2.84 −8.13 34.62LNGDPCAP in US $ 1871 8.37 0.94 6.96 10.08INF in % 1889 4.49 10.50 −1.35 80.74CONC in % 1875 55 17 27 90MARKET_CAP in % 1579 35 35 4 220CREDIT_PRIVATE in % 1573 361 385 20 1610DENS in US $ 1900 1.43 1.85 0.00 6.85LAW 1777 4.25 0.79 1.50 6.00COR 1777 2.31 0.91 1.00 4.00DEPINS in % 1862 6.22 21.52 0.00 100
All country-level variables are averaged for the period 1989–2005, except Bank Concentration (Deposits) for which we use data from1991 and institutional variables (LAW, CORRUPTION, and DEPINS) for which we use data until 2004. A detailed description of thedefinition and the sources of the variables are given in Table 3.
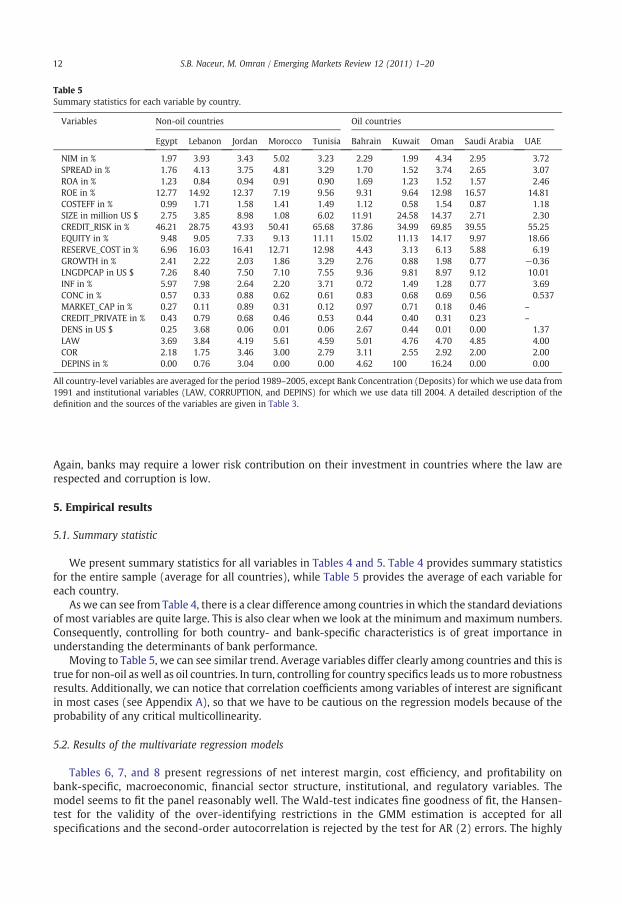
Table 5Summary statistics for each variable by country.
Variables Non-oil countries Oil countries
Egypt Lebanon Jordan Morocco Tunisia Bahrain Kuwait Oman Saudi Arabia UAE
NIM in % 1.97 3.93 3.43 5.02 3.23 2.29 1.99 4.34 2.95 3.72SPREAD in % 1.76 4.13 3.75 4.81 3.29 1.70 1.52 3.74 2.65 3.07ROA in % 1.23 0.84 0.94 0.91 0.90 1.69 1.23 1.52 1.57 2.46ROE in % 12.77 14.92 12.37 7.19 9.56 9.31 9.64 12.98 16.57 14.81COSTEFF in % 0.99 1.71 1.58 1.41 1.49 1.12 0.58 1.54 0.87 1.18SIZE in million US $ 2.75 3.85 8.98 1.08 6.02 11.91 24.58 14.37 2.71 2.30CREDIT_RISK in % 46.21 28.75 43.93 50.41 65.68 37.86 34.99 69.85 39.55 55.25EQUITY in % 9.48 9.05 7.33 9.13 11.11 15.02 11.13 14.17 9.97 18.66RESERVE_COST in % 6.96 16.03 16.41 12.71 12.98 4.43 3.13 6.13 5.88 6.19GROWTH in % 2.41 2.22 2.03 1.86 3.29 2.76 0.88 1.98 0.77 −0.36LNGDPCAP in US $ 7.26 8.40 7.50 7.10 7.55 9.36 9.81 8.97 9.12 10.01INF in % 5.97 7.98 2.64 2.20 3.71 0.72 1.49 1.28 0.77 3.69CONC in % 0.57 0.33 0.88 0.62 0.61 0.83 0.68 0.69 0.56 0.537MARKET_CAP in % 0.27 0.11 0.89 0.31 0.12 0.97 0.71 0.18 0.46 –
CREDIT_PRIVATE in % 0.43 0.79 0.68 0.46 0.53 0.44 0.40 0.31 0.23 –
DENS in US $ 0.25 3.68 0.06 0.01 0.06 2.67 0.44 0.01 0.00 1.37LAW 3.69 3.84 4.19 5.61 4.59 5.01 4.76 4.70 4.85 4.00COR 2.18 1.75 3.46 3.00 2.79 3.11 2.55 2.92 2.00 2.00DEPINS in % 0.00 0.76 3.04 0.00 0.00 4.62 100 16.24 0.00 0.00
All country-level variables are averaged for the period 1989–2005, except Bank Concentration (Deposits) for which we use data from1991 and institutional variables (LAW, CORRUPTION, and DEPINS) for which we use data till 2004. A detailed description of thedefinition and the sources of the variables are given in Table 3.
12 S.B. Naceur, M. Omran / Emerging Markets Review 12 (2011) 1–20
Again, banks may require a lower risk contribution on their investment in countries where the law arerespected and corruption is low.
5. Empirical results
5.1. Summary statistic
We present summary statistics for all variables in Tables 4 and 5. Table 4 provides summary statisticsfor the entire sample (average for all countries), while Table 5 provides the average of each variable foreach country.
As we can see from Table 4, there is a clear difference among countries in which the standard deviationsof most variables are quite large. This is also clear when we look at the minimum and maximum numbers.Consequently, controlling for both country- and bank-specific characteristics is of great importance inunderstanding the determinants of bank performance.
Moving to Table 5, we can see similar trend. Average variables differ clearly among countries and this istrue for non-oil as well as oil countries. In turn, controlling for country specifics leads us tomore robustnessresults. Additionally, we can notice that correlation coefficients among variables of interest are significantin most cases (see Appendix A), so that we have to be cautious on the regression models because of theprobability of any critical multicollinearity.
5.2. Results of the multivariate regression models
Tables 6, 7, and 8 present regressions of net interest margin, cost efficiency, and profitability onbank-specific, macroeconomic, financial sector structure, institutional, and regulatory variables. Themodel seems to fit the panel reasonably well. The Wald-test indicates fine goodness of fit, the Hansen-test for the validity of the over-identifying restrictions in the GMM estimation is accepted for allspecifications and the second-order autocorrelation is rejected by the test for AR (2) errors. The highly
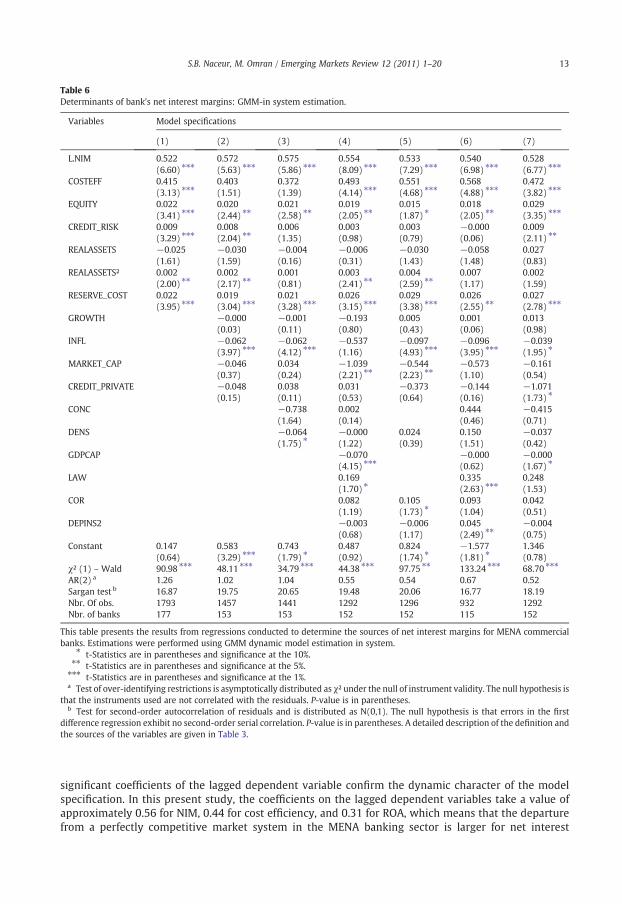
Table 6Determinants of bank's net interest margins: GMM-in system estimation.
Variables Model specifications
(1) (2) (3) (4) (5) (6) (7)
L.NIM 0.522 0.572 0.575 0.554 0.533 0.540 0.528(6.60) ⁎⁎⁎ (5.63) ⁎⁎⁎ (5.86) ⁎⁎⁎ (8.09) ⁎⁎⁎ (7.29) ⁎⁎⁎ (6.98) ⁎⁎⁎ (6.77) ⁎⁎⁎
COSTEFF 0.415 0.403 0.372 0.493 0.551 0.568 0.472(3.13) ⁎⁎⁎ (1.51) (1.39) (4.14) ⁎⁎⁎ (4.68) ⁎⁎⁎ (4.88) ⁎⁎⁎ (3.82) ⁎⁎⁎
EQUITY 0.022 0.020 0.021 0.019 0.015 0.018 0.029(3.41) ⁎⁎⁎ (2.44) ⁎⁎ (2.58) ⁎⁎ (2.05) ⁎⁎ (1.87) ⁎ (2.05) ⁎⁎ (3.35) ⁎⁎⁎
CREDIT_RISK 0.009 0.008 0.006 0.003 0.003 −0.000 0.009(3.29) ⁎⁎⁎ (2.04) ⁎⁎ (1.35) (0.98) (0.79) (0.06) (2.11) ⁎⁎
REALASSETS −0.025 −0.030 −0.004 −0.006 −0.030 −0.058 0.027(1.61) (1.59) (0.16) (0.31) (1.43) (1.48) (0.83)
REALASSETS² 0.002 0.002 0.001 0.003 0.004 0.007 0.002(2.00) ⁎⁎ (2.17) ⁎⁎ (0.81) (2.41) ⁎⁎ (2.59) ⁎⁎ (1.17) (1.59)
RESERVE_COST 0.022 0.019 0.021 0.026 0.029 0.026 0.027(3.95) ⁎⁎⁎ (3.04) ⁎⁎⁎ (3.28) ⁎⁎⁎ (3.15) ⁎⁎⁎ (3.38) ⁎⁎⁎ (2.55) ⁎⁎ (2.78) ⁎⁎⁎
GROWTH −0.000 −0.001 −0.193 0.005 0.001 0.013(0.03) (0.11) (0.80) (0.43) (0.06) (0.98)
INFL −0.062 −0.062 −0.537 −0.097 −0.096 −0.039(3.97) ⁎⁎⁎ (4.12) ⁎⁎⁎ (1.16) (4.93) ⁎⁎⁎ (3.95) ⁎⁎⁎ (1.95) ⁎
MARKET_CAP −0.046 0.034 −1.039 −0.544 −0.573 −0.161(0.37) (0.24) (2.21) ⁎⁎ (2.23) ⁎⁎ (1.10) (0.54)
CREDIT_PRIVATE −0.048 0.038 0.031 −0.373 −0.144 −1.071(0.15) (0.11) (0.53) (0.64) (0.16) (1.73) ⁎
CONC −0.738 0.002 0.444 −0.415(1.64) (0.14) (0.46) (0.71)
DENS −0.064 −0.000 0.024 0.150 −0.037(1.75) ⁎ (1.22) (0.39) (1.51) (0.42)
GDPCAP −0.070 −0.000 −0.000(4.15) ⁎⁎⁎ (0.62) (1.67) ⁎
LAW 0.169 0.335 0.248(1.70) ⁎ (2.63) ⁎⁎⁎ (1.53)
COR 0.082 0.105 0.093 0.042(1.19) (1.73) ⁎ (1.04) (0.51)
DEPINS2 −0.003 −0.006 0.045 −0.004(0.68) (1.17) (2.49) ⁎⁎ (0.75)
Constant 0.147 0.583 0.743 0.487 0.824 −1.577 1.346(0.64) (3.29) ⁎⁎⁎ (1.79) ⁎ (0.92) (1.74) ⁎ (1.81) ⁎ (0.78)
χ² (1) – Wald 90.98 ⁎⁎⁎ 48.11 ⁎⁎⁎ 34.79 ⁎⁎⁎ 44.38 ⁎⁎⁎ 97.75 ⁎⁎ 133.24 ⁎⁎⁎ 68.70 ⁎⁎⁎
AR(2) a 1.26 1.02 1.04 0.55 0.54 0.67 0.52Sargan test b 16.87 19.75 20.65 19.48 20.06 16.77 18.19Nbr. Of obs. 1793 1457 1441 1292 1296 932 1292Nbr. of banks 177 153 153 152 152 115 152
This table presents the results from regressions conducted to determine the sources of net interest margins for MENA commercialbanks. Estimations were performed using GMM dynamic model estimation in system.
⁎ t-Statistics are in parentheses and significance at the 10%.⁎⁎ t-Statistics are in parentheses and significance at the 5%.⁎⁎⁎ t-Statistics are in parentheses and significance at the 1%.a Test of over-identifying restrictions is asymptotically distributed as χ² under the null of instrument validity. The null hypothesis is
that the instruments used are not correlated with the residuals. P-value is in parentheses.b Test for second-order autocorrelation of residuals and is distributed as N(0,1). The null hypothesis is that errors in the first
difference regression exhibit no second-order serial correlation. P-value is in parentheses. A detailed description of the definition andthe sources of the variables are given in Table 3.
13S.B. Naceur, M. Omran / Emerging Markets Review 12 (2011) 1–20
significant coefficients of the lagged dependent variable confirm the dynamic character of the modelspecification. In this present study, the coefficients on the lagged dependent variables take a value ofapproximately 0.56 for NIM, 0.44 for cost efficiency, and 0.31 for ROA, which means that the departurefrom a perfectly competitive market system in the MENA banking sector is larger for net interest
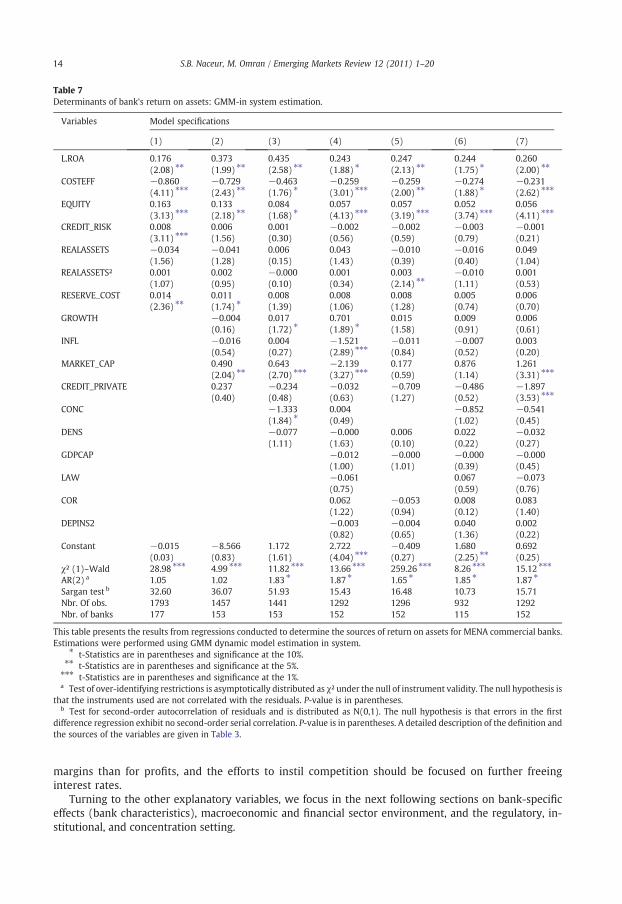
Table 7Determinants of bank's return on assets: GMM-in system estimation.
Variables Model specifications
(1) (2) (3) (4) (5) (6) (7)
L.ROA 0.176 0.373 0.435 0.243 0.247 0.244 0.260(2.08) ⁎⁎ (1.99) ⁎⁎ (2.58) ⁎⁎ (1.88) ⁎ (2.13) ⁎⁎ (1.75) ⁎ (2.00) ⁎⁎
COSTEFF −0.860 −0.729 −0.463 −0.259 −0.259 −0.274 −0.231(4.11) ⁎⁎⁎ (2.43) ⁎⁎ (1.76) ⁎ (3.01) ⁎⁎⁎ (2.00) ⁎⁎ (1.88) ⁎ (2.62) ⁎⁎⁎
EQUITY 0.163 0.133 0.084 0.057 0.057 0.052 0.056(3.13) ⁎⁎⁎ (2.18) ⁎⁎ (1.68) ⁎ (4.13) ⁎⁎⁎ (3.19) ⁎⁎⁎ (3.74) ⁎⁎⁎ (4.11) ⁎⁎⁎
CREDIT_RISK 0.008 0.006 0.001 −0.002 −0.002 −0.003 −0.001(3.11) ⁎⁎⁎ (1.56) (0.30) (0.56) (0.59) (0.79) (0.21)
REALASSETS −0.034 −0.041 0.006 0.043 −0.010 −0.016 0.049(1.56) (1.28) (0.15) (1.43) (0.39) (0.40) (1.04)
REALASSETS² 0.001 0.002 −0.000 0.001 0.003 −0.010 0.001(1.07) (0.95) (0.10) (0.34) (2.14) ⁎⁎ (1.11) (0.53)
RESERVE_COST 0.014 0.011 0.008 0.008 0.008 0.005 0.006(2.36) ⁎⁎ (1.74) ⁎ (1.39) (1.06) (1.28) (0.74) (0.70)
GROWTH −0.004 0.017 0.701 0.015 0.009 0.006(0.16) (1.72) ⁎ (1.89) ⁎ (1.58) (0.91) (0.61)
INFL −0.016 0.004 −1.521 −0.011 −0.007 0.003(0.54) (0.27) (2.89) ⁎⁎⁎ (0.84) (0.52) (0.20)
MARKET_CAP 0.490 0.643 −2.139 0.177 0.876 1.261(2.04) ⁎⁎ (2.70) ⁎⁎⁎ (3.27) ⁎⁎⁎ (0.59) (1.14) (3.31) ⁎⁎⁎
CREDIT_PRIVATE 0.237 −0.234 −0.032 −0.709 −0.486 −1.897(0.40) (0.48) (0.63) (1.27) (0.52) (3.53) ⁎⁎⁎
CONC −1.333 0.004 −0.852 −0.541(1.84) ⁎ (0.49) (1.02) (0.45)
DENS −0.077 −0.000 0.006 0.022 −0.032(1.11) (1.63) (0.10) (0.22) (0.27)
GDPCAP −0.012 −0.000 −0.000 −0.000(1.00) (1.01) (0.39) (0.45)
LAW −0.061 0.067 −0.073(0.75) (0.59) (0.76)
COR 0.062 −0.053 0.008 0.083(1.22) (0.94) (0.12) (1.40)
DEPINS2 −0.003 −0.004 0.040 0.002(0.82) (0.65) (1.36) (0.22)
Constant −0.015 −8.566 1.172 2.722 −0.409 1.680 0.692(0.03) (0.83) (1.61) (4.04) ⁎⁎⁎ (0.27) (2.25) ⁎⁎ (0.25)
χ² (1)–Wald 28.98 ⁎⁎⁎ 4.99 ⁎⁎⁎ 11.82 ⁎⁎⁎ 13.66 ⁎⁎⁎ 259.26 ⁎⁎⁎ 8.26 ⁎⁎⁎ 15.12 ⁎⁎⁎
AR(2) a 1.05 1.02 1.83 ⁎ 1.87 ⁎ 1.65 ⁎ 1.85 ⁎ 1.87 ⁎
Sargan test b 32.60 36.07 51.93 15.43 16.48 10.73 15.71Nbr. Of obs. 1793 1457 1441 1292 1296 932 1292Nbr. of banks 177 153 153 152 152 115 152
This table presents the results from regressions conducted to determine the sources of return on assets for MENA commercial banks.Estimations were performed using GMM dynamic model estimation in system.
⁎ t-Statistics are in parentheses and significance at the 10%.⁎⁎ t-Statistics are in parentheses and significance at the 5%.⁎⁎⁎ t-Statistics are in parentheses and significance at the 1%.a Test of over-identifying restrictions is asymptotically distributed as χ² under the null of instrument validity. The null hypothesis is
that the instruments used are not correlated with the residuals. P-value is in parentheses.b Test for second-order autocorrelation of residuals and is distributed as N(0,1). The null hypothesis is that errors in the first
difference regression exhibit no second-order serial correlation. P-value is in parentheses. A detailed description of the definition andthe sources of the variables are given in Table 3.
14 S.B. Naceur, M. Omran / Emerging Markets Review 12 (2011) 1–20
margins than for profits, and the efforts to instil competition should be focused on further freeinginterest rates.
Turning to the other explanatory variables, we focus in the next following sections on bank-specificeffects (bank characteristics), macroeconomic and financial sector environment, and the regulatory, in-stitutional, and concentration setting.
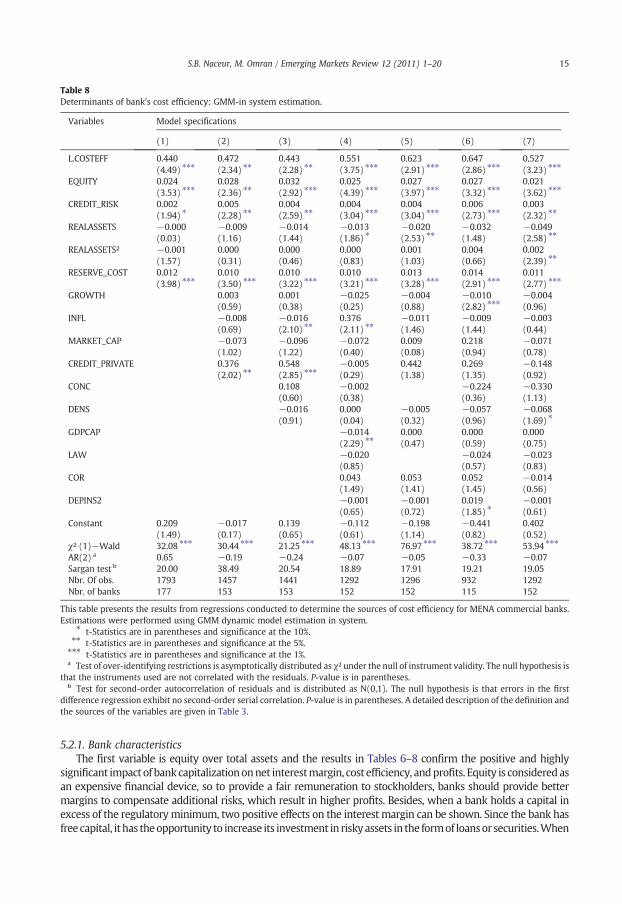
Table 8Determinants of bank's cost efficiency: GMM-in system estimation.
Variables Model specifications
(1) (2) (3) (4) (5) (6) (7)
L.COSTEFF 0.440 0.472 0.443 0.551 0.623 0.647 0.527(4.49) ⁎⁎⁎ (2.34) ⁎⁎ (2.28) ⁎⁎ (3.75) ⁎⁎⁎ (2.91) ⁎⁎⁎ (2.86) ⁎⁎⁎ (3.23) ⁎⁎⁎
EQUITY 0.024 0.028 0.032 0.025 0.027 0.027 0.021(3.53) ⁎⁎⁎ (2.36) ⁎⁎ (2.92) ⁎⁎⁎ (4.39) ⁎⁎⁎ (3.97) ⁎⁎⁎ (3.32) ⁎⁎⁎ (3.62) ⁎⁎⁎
CREDIT_RISK 0.002 0.005 0.004 0.004 0.004 0.006 0.003(1.94) ⁎ (2.28) ⁎⁎ (2.59) ⁎⁎ (3.04) ⁎⁎⁎ (3.04) ⁎⁎⁎ (2.73) ⁎⁎⁎ (2.32) ⁎⁎
REALASSETS −0.000 −0.009 −0.014 −0.013 −0.020 −0.032 −0.049(0.03) (1.16) (1.44) (1.86) ⁎ (2.53) ⁎⁎ (1.48) (2.58) ⁎⁎
REALASSETS² −0.001 0.000 0.000 0.000 0.001 0.004 0.002(1.57) (0.31) (0.46) (0.83) (1.03) (0.66) (2.39) ⁎⁎
RESERVE_COST 0.012 0.010 0.010 0.010 0.013 0.014 0.011(3.98) ⁎⁎⁎ (3.50) ⁎⁎⁎ (3.22) ⁎⁎⁎ (3.21) ⁎⁎⁎ (3.28) ⁎⁎⁎ (2.91) ⁎⁎⁎ (2.77) ⁎⁎⁎
GROWTH 0.003 0.001 −0.025 −0.004 −0.010 −0.004(0.59) (0.38) (0.25) (0.88) (2.82) ⁎⁎⁎ (0.96)
INFL −0.008 −0.016 0.376 −0.011 −0.009 −0.003(0.69) (2.10) ⁎⁎ (2.11) ⁎⁎ (1.46) (1.44) (0.44)
MARKET_CAP −0.073 −0.096 −0.072 0.009 0.218 −0.071(1.02) (1.22) (0.40) (0.08) (0.94) (0.78)
CREDIT_PRIVATE 0.376 0.548 −0.005 0.442 0.269 −0.148(2.02) ⁎⁎ (2.85) ⁎⁎⁎ (0.29) (1.38) (1.35) (0.92)
CONC 0.108 −0.002 −0.224 −0.330(0.60) (0.38) (0.36) (1.13)
DENS −0.016 0.000 −0.005 −0.057 −0.068(0.91) (0.04) (0.32) (0.96) (1.69) ⁎
GDPCAP −0.014 0.000 0.000 0.000(2.29) ⁎⁎ (0.47) (0.59) (0.75)
LAW −0.020 −0.024 −0.023(0.85) (0.57) (0.83)
COR 0.043 0.053 0.052 −0.014(1.49) (1.41) (1.45) (0.56)
DEPINS2 −0.001 −0.001 0.019 −0.001(0.65) (0.72) (1.85) ⁎ (0.61)
Constant 0.209 −0.017 0.139 −0.112 −0.198 −0.441 0.402(1.49) (0.17) (0.65) (0.61) (1.14) (0.82) (0.52)
χ² (1)−Wald 32.08 ⁎⁎⁎ 30.44 ⁎⁎⁎ 21.25 ⁎⁎⁎ 48.13 ⁎⁎⁎ 76.97 ⁎⁎⁎ 38.72 ⁎⁎⁎ 53.94 ⁎⁎⁎
AR(2) a 0.65 −0.19 −0.24 −0.07 −0.05 −0.33 −0.07Sargan test b 20.00 38.49 20.54 18.89 17.91 19.21 19.05Nbr. Of obs. 1793 1457 1441 1292 1296 932 1292Nbr. of banks 177 153 153 152 152 115 152
This table presents the results from regressions conducted to determine the sources of cost efficiency for MENA commercial banks.Estimations were performed using GMM dynamic model estimation in system.
⁎ t-Statistics are in parentheses and significance at the 10%.⁎⁎ t-Statistics are in parentheses and significance at the 5%.⁎⁎⁎ t-Statistics are in parentheses and significance at the 1%.a Test of over-identifying restrictions is asymptotically distributed as χ² under the null of instrument validity. The null hypothesis is
that the instruments used are not correlated with the residuals. P-value is in parentheses.b Test for second-order autocorrelation of residuals and is distributed as N(0,1). The null hypothesis is that errors in the first
difference regression exhibit no second-order serial correlation. P-value is in parentheses. A detailed description of the definition andthe sources of the variables are given in Table 3.
15S.B. Naceur, M. Omran / Emerging Markets Review 12 (2011) 1–20
5.2.1. Bank characteristicsThe first variable is equity over total assets and the results in Tables 6–8 confirm the positive and highly
significant impact of bankcapitalizationonnet interestmargin, cost efficiency, andprofits. Equity is consideredasan expensive financial device, so to provide a fair remuneration to stockholders, banks should provide bettermargins to compensate additional risks, which result in higher profits. Besides, when a bank holds a capital inexcess of the regulatoryminimum, two positive effects on the interest margin can be shown. Since the bank hasfreecapital, it has theopportunity to increase its investment in riskyassets in the formof loansor securities.When
16 S.B. Naceur, M. Omran / Emerging Markets Review 12 (2011) 1–20
market conditions enable the bank to provide additional loans with a profitable return/risk profile, this will,ceteris paribus, improve the interest margin. However, the positive impact of equity on cost efficiency issomewhatpuzzling since theexpectedassociationshouldbenegativebecausewell-capitalizedbanks reflectbothhigh- qualitymanagement and aversion to risk taking. An explanation given for this result could be attributed tothe incentives provided by indebtedness to control operating costs, so if bank increase its capital the incentivedisappears.
Now consider credit risk measured by loans over total assets. As shown in Tables 6 and 7, bank riskenters positively and significantly in all the net interest margin and cost efficiency regressions. Thepositive impact of credit risk on net interest margins could be explained by two factors: banks covertheir greater exposition to risk by increasing margins and the cost of loans since they need to beoriginated, serviced, and monitored (loans are the type of assets with the highest operational cost ina bank portfolio). As for the positive effect of credit risk on cost efficiency, it could be attributed bythe increased screening and monitoring required by a higher proportion of loans in the bank's assetsportfolio. On the profit side, the impact of credit risk is positive and significant only in the basic modelwith only the bank's characteristic variables, but the significance disappears when macroeconomic andfinancial variables are included. The positive sign on stock market capitalization in Table 8, equation 2,could be at the origin of this disappearance since stockmarket development contributes to a great extent tothe improvement of transparency and hence the reduction of the screening and monitoring process ofloans by banks.
With respect to the cost of reserves, the results in Tables 6 and 7 suggest that the higher the reservesthen the higher is the net interest margins and cost efficiency. The results also support the argument thatthe opportunity cost of keeping reserves, which can be considered as an implicit tax, seems to influencepositively bank interest margins and cost efficiency. Thereby, commercial banks try to reflect this tax thaterodes their profitability by increasing their explicit margins and passing it on to customers. Besides, theimpact of the cost of reserves on profit is positive, meaning that banks make customers pay a price abovethe opportunity cost of keeping reserves.
All estimated equations in Tables 7 and 8 show that the effect of bank size on profitability and costefficiency is not relevant. As with the effect of size on net interest margins, Table 6 shows that the impact ofsize on bankmargins is non-linearwhichmean that there is an optimum size to reach in theMENA bankingsector above which diseconomies of scale should show up.
The cost efficiency ratio is an important explanatory variable for interest rate margins in the MENAregion. Higher industry operating costs produce higher spreads. As the theoretical model predicts, banksthat support higher average operating expenses tend to generate higher margins in order to compensatetheir higher transformation costs and these banks pass it again on to borrowers. This behavior reflectssomehow the market power of banks and the lack of competition in the lending sector.
5.2.2. The macroeconomic and financial sector environmentWe now turn to the effects of macroeconomic and financial structure variables. As displayed in
Tables 6–8, the macroeconomic characteristics, inflation and economic growth, have differential impactson bank margins' efficiency and profits. While real output does not appear to influence a bank's incomestatement, inflation shocks seem to be passedmainly through the deposit rates (see Table 6), whichmeansthat banks do not adjust their lending rates accordingly to inflation and consequently they bear the entirenegative cost of inflation. In other words, banks respond to the upward adjustment in the discount rate byreducing margins, hence supporting the cost of refinancing their liquidity needs. On the other hand, inflationis associated negatively and significantlywith overheads and this association contributes to the cancelling outof the negative impact of inflation on profits.
The variables used as proxies for relative development of the banking sector and the stockmarket seem to have no impact on net interest margins in all specifications as displayed in Table 6.Next, we see in all specifications that themeasure of bank development has negative signs with statisticallysignificant coefficients in the cost efficiency regressions. This may suggest that in a well-developed bankingsector banks lower their operating costs. Also, the results in Table 7 suggest that the measure of stockmarket development has positive and significant signs in all specifications. This suggests that banks thatoperate in a well-developed stock market tend to have greater profit opportunities. A possible explanation
17S.B. Naceur, M. Omran / Emerging Markets Review 12 (2011) 1–20
is that the stock market contributes to the reinforcement of firm equity and thereby reduces loansproblems and leads to an increase of information available on traded firms, which enable banks to betterevaluate credit risk.
5.2.3. Regulatory, institutional and concentration settingFirst consider concentration inTables6–8.Bankconcentrationentersnegatively and significantly inall thenet
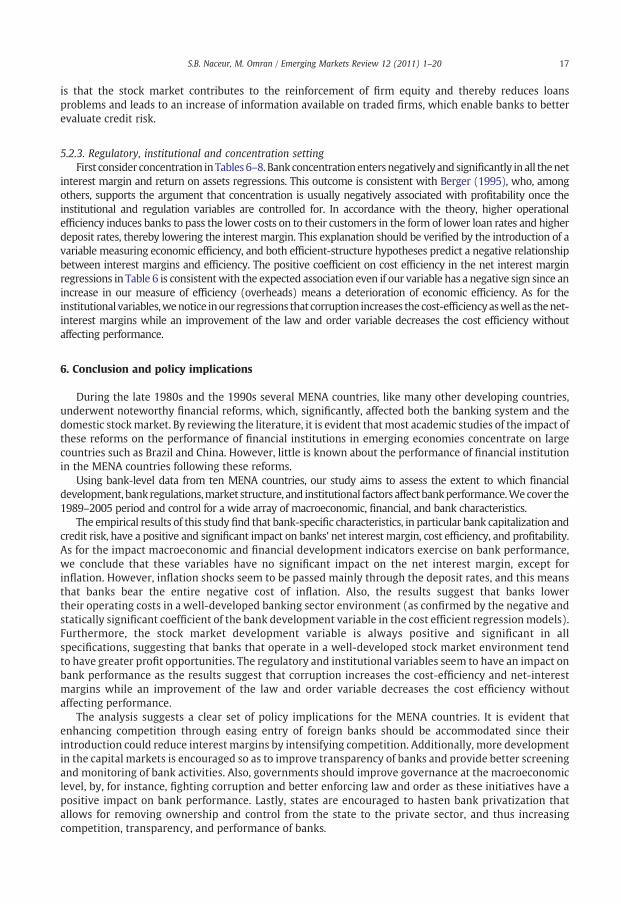
interest margin and return on assets regressions. This outcome is consistent with Berger (1995), who, amongothers, supports the argument that concentration is usually negatively associated with profitability once theinstitutional and regulation variables are controlled for. In accordance with the theory, higher operationalefficiency induces banks to pass the lower costs on to their customers in the form of lower loan rates and higherdeposit rates, thereby lowering the interest margin. This explanation should be verified by the introduction of avariable measuring economic efficiency, and both efficient-structure hypotheses predict a negative relationshipbetween interest margins and efficiency. The positive coefficient on cost efficiency in the net interest marginregressions in Table 6 is consistentwith the expected association even if our variable has a negative sign since anincrease in our measure of efficiency (overheads) means a deterioration of economic efficiency. As for theinstitutional variables,wenotice inour regressions that corruption increases the cost-efficiencyaswell as thenet-interest margins while an improvement of the law and order variable decreases the cost efficiency withoutaffecting performance.
6. Conclusion and policy implications
During the late 1980s and the 1990s several MENA countries, like many other developing countries,underwent noteworthy financial reforms, which, significantly, affected both the banking system and thedomestic stockmarket. By reviewing the literature, it is evident that most academic studies of the impact ofthese reforms on the performance of financial institutions in emerging economies concentrate on largecountries such as Brazil and China. However, little is known about the performance of financial institutionin the MENA countries following these reforms.
Using bank-level data from ten MENA countries, our study aims to assess the extent to which financialdevelopment, bank regulations,market structure, and institutional factors affect bankperformance.Wecover the1989–2005 period and control for a wide array of macroeconomic, financial, and bank characteristics.
The empirical results of this study find that bank-specific characteristics, in particular bank capitalization andcredit risk, have a positive and significant impact on banks' net interest margin, cost efficiency, and profitability.As for the impact macroeconomic and financial development indicators exercise on bank performance,we conclude that these variables have no significant impact on the net interest margin, except forinflation. However, inflation shocks seem to be passed mainly through the deposit rates, and this meansthat banks bear the entire negative cost of inflation. Also, the results suggest that banks lowertheir operating costs in a well-developed banking sector environment (as confirmed by the negative andstatically significant coefficient of the bank development variable in the cost efficient regression models).Furthermore, the stock market development variable is always positive and significant in allspecifications, suggesting that banks that operate in a well-developed stock market environment tendto have greater profit opportunities. The regulatory and institutional variables seem to have an impact onbank performance as the results suggest that corruption increases the cost-efficiency and net-interestmargins while an improvement of the law and order variable decreases the cost efficiency withoutaffecting performance.
The analysis suggests a clear set of policy implications for the MENA countries. It is evident thatenhancing competition through easing entry of foreign banks should be accommodated since theirintroduction could reduce interest margins by intensifying competition. Additionally, more developmentin the capital markets is encouraged so as to improve transparency of banks and provide better screeningand monitoring of bank activities. Also, governments should improve governance at the macroeconomiclevel, by, for instance, fighting corruption and better enforcing law and order as these initiatives have apositive impact on bank performance. Lastly, states are encouraged to hasten bank privatization thatallows for removing ownership and control from the state to the private sector, and thus increasingcompetition, transparency, and performance of banks.
18 S.B. Naceur, M. Omran / Emerging Markets Review 12 (2011) 1–20
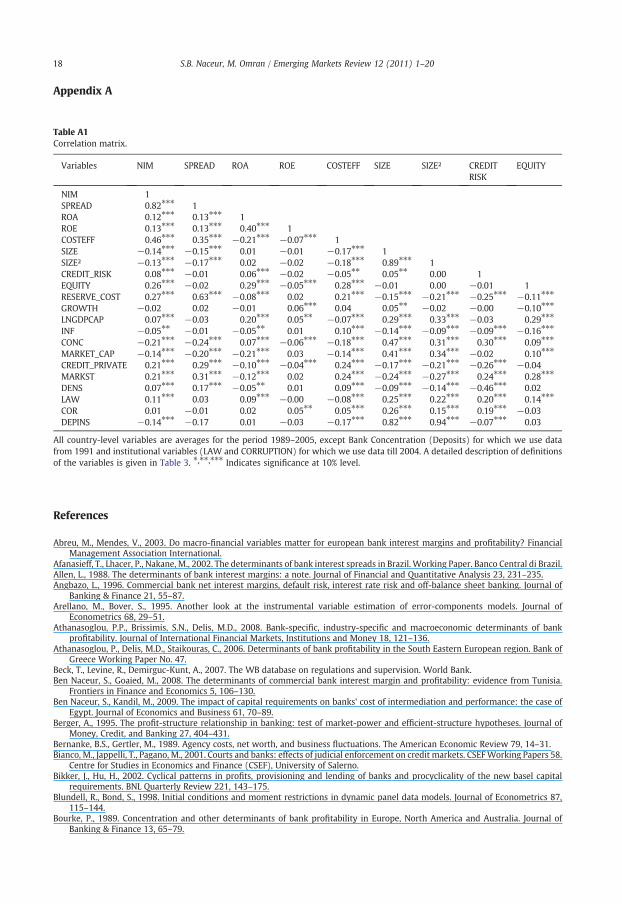
Appendix A
Table A1Correlation matrix.
Variables NIM SPREAD ROA ROE COSTEFF SIZE SIZE² CREDITRISK
EQUITY
NIM 1SPREAD 0.82⁎⁎⁎ 1ROA 0.12⁎⁎⁎ 0.13⁎⁎⁎ 1ROE 0.13⁎⁎⁎ 0.13⁎⁎⁎ 0.40⁎⁎⁎ 1COSTEFF 0.46⁎⁎⁎ 0.35⁎⁎⁎ −0.21⁎⁎⁎ −0.07⁎⁎⁎ 1SIZE −0.14⁎⁎⁎ −0.15⁎⁎⁎ 0.01 −0.01 −0.17⁎⁎⁎ 1SIZE² −0.13⁎⁎⁎ −0.17⁎⁎⁎ 0.02 −0.02 −0.18⁎⁎⁎ 0.89⁎⁎⁎ 1CREDIT_RISK 0.08⁎⁎⁎ −0.01 0.06⁎⁎⁎ −0.02 −0.05⁎⁎ 0.05⁎⁎ 0.00 1EQUITY 0.26⁎⁎⁎ −0.02 0.29⁎⁎⁎ −0.05⁎⁎⁎ 0.28⁎⁎⁎ −0.01 0.00 −0.01 1RESERVE_COST 0.27⁎⁎⁎ 0.63⁎⁎⁎ −0.08⁎⁎⁎ 0.02 0.21⁎⁎⁎ −0.15⁎⁎⁎ −0.21⁎⁎⁎ −0.25⁎⁎⁎ −0.11⁎⁎⁎
GROWTH −0.02 0.02 −0.01 0.06⁎⁎⁎ 0.04 0.05⁎⁎ −0.02 −0.00 −0.10⁎⁎⁎
LNGDPCAP 0.07⁎⁎⁎ −0.03 0.20⁎⁎⁎ 0.05⁎⁎ −0.07⁎⁎⁎ 0.29⁎⁎⁎ 0.33⁎⁎⁎ −0.03 0.29⁎⁎⁎
INF −0.05⁎⁎ −0.01 −0.05⁎⁎ 0.01 0.10⁎⁎⁎ −0.14⁎⁎⁎ −0.09⁎⁎⁎ −0.09⁎⁎⁎ −0.16⁎⁎⁎
CONC −0.21⁎⁎⁎ −0.24⁎⁎⁎ 0.07⁎⁎⁎ −0.06⁎⁎⁎ −0.18⁎⁎⁎ 0.47⁎⁎⁎ 0.31⁎⁎⁎ 0.30⁎⁎⁎ 0.09⁎⁎⁎
MARKET_CAP −0.14⁎⁎⁎ −0.20⁎⁎⁎ −0.21⁎⁎⁎ 0.03 −0.14⁎⁎⁎ 0.41⁎⁎⁎ 0.34⁎⁎⁎ −0.02 0.10⁎⁎⁎
CREDIT_PRIVATE 0.21⁎⁎⁎ 0.29⁎⁎⁎ −0.10⁎⁎⁎ −0.04⁎⁎⁎ 0.24⁎⁎⁎ −0.17⁎⁎⁎ −0.21⁎⁎⁎ −0.26⁎⁎⁎ −0.04MARKST 0.21⁎⁎⁎ 0.31⁎⁎⁎ −0.12⁎⁎⁎ 0.02 0.24⁎⁎⁎ −0.24⁎⁎⁎ −0.27⁎⁎⁎ 0.24⁎⁎⁎ 0.28⁎⁎⁎
DENS 0.07⁎⁎⁎ 0.17⁎⁎⁎ −0.05⁎⁎ 0.01 0.09⁎⁎⁎ −0.09⁎⁎⁎ −0.14⁎⁎⁎ −0.46⁎⁎⁎ 0.02LAW 0.11⁎⁎⁎ 0.03 0.09⁎⁎⁎ −0.00 −0.08⁎⁎⁎ 0.25⁎⁎⁎ 0.22⁎⁎⁎ 0.20⁎⁎⁎ 0.14⁎⁎⁎
COR 0.01 −0.01 0.02 0.05⁎⁎ 0.05⁎⁎⁎ 0.26⁎⁎⁎ 0.15⁎⁎⁎ 0.19⁎⁎⁎ −0.03DEPINS −0.14⁎⁎⁎ −0.17 0.01 −0.03 −0.17⁎⁎⁎ 0.82⁎⁎⁎ 0.94⁎⁎⁎ −0.07⁎⁎⁎ 0.03
All country-level variables are averages for the period 1989–2005, except Bank Concentration (Deposits) for which we use datafrom 1991 and institutional variables (LAW and CORRUPTION) for which we use data till 2004. A detailed description of definitions
of the variables is given in Table 3. ⁎,⁎⁎,⁎⁎⁎ Indicates significance at 10% level.References
Abreu, M., Mendes, V., 2003. Do macro-financial variables matter for european bank interest margins and profitability? FinancialManagement Association International.
Afanasieff, T., Lhacer, P., Nakane, M., 2002. The determinants of bank interest spreads in Brazil. Working Paper. Banco Central di Brazil.Allen, L., 1988. The determinants of bank interest margins: a note. Journal of Financial and Quantitative Analysis 23, 231–235.Angbazo, L., 1996. Commercial bank net interest margins, default risk, interest rate risk and off-balance sheet banking. Journal of
Banking & Finance 21, 55–87.Arellano, M., Bover, S., 1995. Another look at the instrumental variable estimation of error-components models. Journal of
Econometrics 68, 29–51.Athanasoglou, P.P., Brissimis, S.N., Delis, M.D., 2008. Bank-specific, industry-specific and macroeconomic determinants of bank
profitability. Journal of International Financial Markets, Institutions and Money 18, 121–136.Athanasoglou, P., Delis, M.D., Staikouras, C., 2006. Determinants of bank profitability in the South Eastern European region. Bank of
Greece Working Paper No. 47.Beck, T., Levine, R., Demirguc-Kunt, A., 2007. The WB database on regulations and supervision. World Bank.Ben Naceur, S., Goaied, M., 2008. The determinants of commercial bank interest margin and profitability: evidence from Tunisia.
Frontiers in Finance and Economics 5, 106–130.Ben Naceur, S., Kandil, M., 2009. The impact of capital requirements on banks' cost of intermediation and performance: the case of
Egypt. Journal of Economics and Business 61, 70–89.Berger, A., 1995. The profit-structure relationship in banking: test of market-power and efficient-structure hypotheses. Journal of
Money, Credit, and Banking 27, 404–431.Bernanke, B.S., Gertler, M., 1989. Agency costs, net worth, and business fluctuations. The American Economic Review 79, 14–31.Bianco, M., Jappelli, T., Pagano, M., 2001. Courts and banks: effects of judicial enforcement on credit markets. CSEFWorking Papers 58.
Centre for Studies in Economics and Finance (CSEF), University of Salerno.Bikker, J., Hu, H., 2002. Cyclical patterns in profits, provisioning and lending of banks and procyclicality of the new basel capital
requirements. BNL Quarterly Review 221, 143–175.Blundell, R., Bond, S., 1998. Initial conditions and moment restrictions in dynamic panel data models. Journal of Econometrics 87,
115–144.Bourke, P., 1989. Concentration and other determinants of bank profitability in Europe, North America and Australia. Journal of
Banking & Finance 13, 65–79.
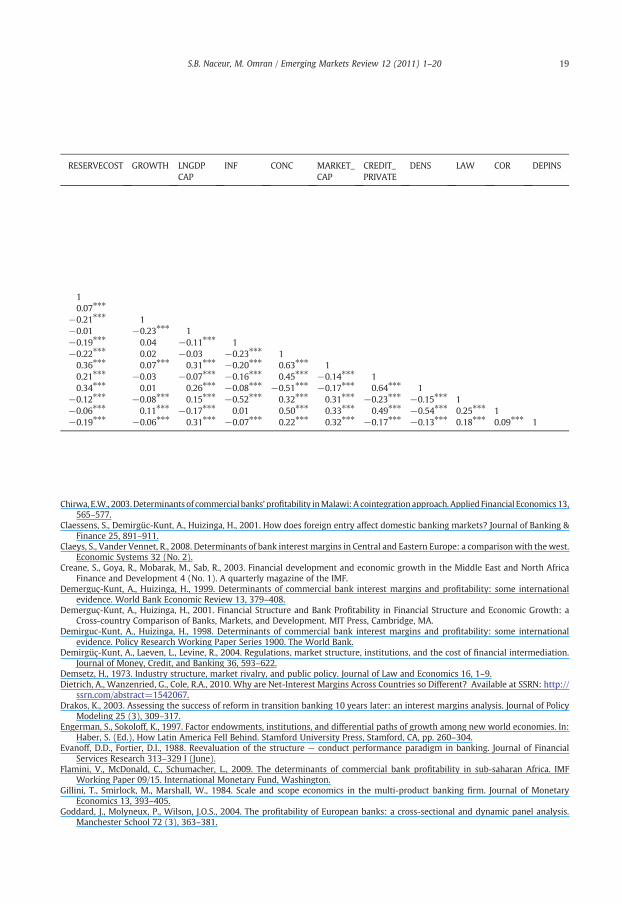
RESERVECOST GROWTH LNGDPCAP
INF CONC MARKET_CAP
CREDIT_PRIVATE
DENS LAW COR DEPINS
10.07⁎⁎⁎
−0.21⁎⁎⁎ 1−0.01 −0.23⁎⁎⁎ 1−0.19⁎⁎⁎ 0.04 −0.11⁎⁎⁎ 1−0.22⁎⁎⁎ 0.02 −0.03 −0.23⁎⁎⁎ 10.36⁎⁎⁎ 0.07⁎⁎⁎ 0.31⁎⁎⁎ −0.20⁎⁎⁎ 0.63⁎⁎⁎ 10.21⁎⁎⁎ −0.03 −0.07⁎⁎⁎ −0.16⁎⁎⁎ 0.45⁎⁎⁎ −0.14⁎⁎⁎ 10.34⁎⁎⁎ 0.01 0.26⁎⁎⁎ −0.08⁎⁎⁎ −0.51⁎⁎⁎ −0.17⁎⁎⁎ 0.64⁎⁎⁎ 1
−0.12⁎⁎⁎ −0.08⁎⁎⁎ 0.15⁎⁎⁎ −0.52⁎⁎⁎ 0.32⁎⁎⁎ 0.31⁎⁎⁎ −0.23⁎⁎⁎ −0.15⁎⁎⁎ 1−0.06⁎⁎⁎ 0.11⁎⁎⁎ −0.17⁎⁎⁎ 0.01 0.50⁎⁎⁎ 0.33⁎⁎⁎ 0.49⁎⁎⁎ −0.54⁎⁎⁎ 0.25⁎⁎⁎ 1−0.19⁎⁎⁎ −0.06⁎⁎⁎ 0.31⁎⁎⁎ −0.07⁎⁎⁎ 0.22⁎⁎⁎ 0.32⁎⁎⁎ −0.17⁎⁎⁎ −0.13⁎⁎⁎ 0.18⁎⁎⁎ 0.09⁎⁎⁎ 1
19S.B. Naceur, M. Omran / Emerging Markets Review 12 (2011) 1–20
Chirwa, E.W., 2003.Determinants of commercial banks' profitability inMalawi: A cointegrationapproach.Applied Financial Economics 13,565–577.
Claessens, S., Demirgüc-Kunt, A., Huizinga, H., 2001. How does foreign entry affect domestic banking markets? Journal of Banking &Finance 25, 891–911.
Claeys, S., Vander Vennet, R., 2008. Determinants of bank interest margins in Central and Eastern Europe: a comparisonwith the west.Economic Systems 32 (No. 2).
Creane, S., Goya, R., Mobarak, M., Sab, R., 2003. Financial development and economic growth in the Middle East and North AfricaFinance and Development 4 (No. 1). A quarterly magazine of the IMF.
Demerguç-Kunt, A., Huizinga, H., 1999. Determinants of commercial bank interest margins and profitability: some internationalevidence. World Bank Economic Review 13, 379–408.
Demerguç-Kunt, A., Huizinga, H., 2001. Financial Structure and Bank Profitability in Financial Structure and Economic Growth: aCross-country Comparison of Banks, Markets, and Development. MIT Press, Cambridge, MA.
Demirguc-Kunt, A., Huizinga, H., 1998. Determinants of commercial bank interest margins and profitability: some internationalevidence. Policy Research Working Paper Series 1900. The World Bank.
Demirgüç-Kunt, A., Laeven, L., Levine, R., 2004. Regulations, market structure, institutions, and the cost of financial intermediation.Journal of Money, Credit, and Banking 36, 593–622.
Demsetz, H., 1973. Industry structure, market rivalry, and public policy. Journal of Law and Economics 16, 1–9.Dietrich, A., Wanzenried, G., Cole, R.A., 2010. Why are Net-Interest Margins Across Countries so Different? Available at SSRN: http://
ssrn.com/abstract=1542067.Drakos, K., 2003. Assessing the success of reform in transition banking 10 years later: an interest margins analysis. Journal of Policy
Modeling 25 (3), 309–317.Engerman, S., Sokoloff, K., 1997. Factor endowments, institutions, and differential paths of growth among new world economies. In:
Haber, S. (Ed.), How Latin America Fell Behind. Stamford University Press, Stamford, CA, pp. 260–304.Evanoff, D.D., Fortier, D.I., 1988. Reevaluation of the structure — conduct performance paradigm in banking. Journal of Financial
Services Research 313–329 I (June).Flamini, V., McDonald, C., Schumacher, L., 2009. The determinants of commercial bank profitability in sub-saharan Africa. IMF
Working Paper 09/15. International Monetary Fund, Washington.Gillini, T., Smirlock, M., Marshall, W., 1984. Scale and scope economics in the multi-product banking firm. Journal of Monetary
Economics 13, 393–405.Goddard, J., Molyneux, P., Wilson, J.O.S., 2004. The profitability of European banks: a cross-sectional and dynamic panel analysis.
Manchester School 72 (3), 363–381.
20 S.B. Naceur, M. Omran / Emerging Markets Review 12 (2011) 1–20
Hawtrey, K., Liang, H., 2008. Bank interest rate margins in OECD countries. North American Journal of Economics and Finance 19,249–260.
Heggestad, A.A., Mingo, J.J., 1974. Prices, Nonprices, and Concentration in Selected Banking Markets. Proceedings of a Conference onBank Structure and Competition. Federal Reserve Bank of Chicago, Chicago, pp. 69–95.
Ho, T., Saunders, A., 1981. The determinants of bank interest margins: theory and empirical evidence. Journal of Financial andQuantitative Analysis 16, 581–600.
Jabsheh, F.Y., 2002. The GATS Agreement And Liberalizing The Kuwaiti Banking Sector. ERF, 8th Annual Conference, Egypt.Jbili, A., Galbis, V., Bisat, A., 1996. Financial Systems and Reform in the Gulf Cooperation Council Countries. Paper presented at the
Workshop on Financial Market Development, ArabMonetary Fund and the Economic Research Forum for the Arab Countries, Iranand Turkey, Abu Dhabi, UAE, 25–27 May.
Kasman, A., 2010. Consolidation and Commercial bank net interest margins: evidence from the old and new European unionmembers and candidate countries. Economic Modeling 27, 648–655.
Kiyotaki, N., Moore, J., 1997. Credit cycles. Journal of Political Economy 105, 211–248.Kosmidou, K., Pasiouras, F., Tsaklanganos, A., 2005. Factors Influencing the profits and size of Greek banks operating abroad: a pooled
time-series study. Applied Financial Economics 15, 731–738.Kwan, S.H., Liebig, D., 2008. Operating performance of banks among Asian economies: an international and time series comparison.
Journal of Banking & Finance 27 (3), 471–487.Leaven, L., Majnoni, G., 2005. Does judicial efficiency lower the cost of credit? Journal of Banking & Finance 29, 1791–1812.Maudos, J., Fernandez de Guevara, J., 2004. Factors explaining the interest margin in the banking sectors of the European union.
Journal of Banking & Finance 28, 2259–2281.Miller, S.M., Noulas, A.G., 1997. Portfolio mix and large-bank profitability in the USA. Applied Economics 29 (4), 505–512.Molyneux, P., Thorton, J., 1992. Determinants of European bank profitability: a note. Journal of Banking & Finance 16, 1173–1178.Molyneux, P., Thornton, J., Lloyd-Williams, D.M., 1996. Competition and market contestability in Japanese commercial banking.
Journal of Economics and Business 48, 33–45.Murinde, V., Yaseen, H., 2004. The Impact of Basle Accord regulations on bank capital and risk behaviour: Evidence from the Middle
East and North Africa (MENA) region. Third International Conference of the Centre for Regulation and Competition (CRC), on Pro-Poor Regulation & Competition: Issues, Policies and Practices. CapeTown, 7–9 September.
Pasiouras, F., Kosmidou, K., 2007. Factors influencing the profitability of domestic and foreign commercial banks in the Europeanunion. Research in International Business and Finance 21, 222–237.
Peltzman, S., 1977. The gains and losses from industrial concentration. Journal of Law and Economics 20, 229–263.Perry, P., 1992. Do banks gain or lose from inflation? Journal of Retail Banking 14, 25–40.Poghosyan, T., Hesse, H., 2009. Oil prices and bank profitability: evidence from major oil-exporting countries in the Middle East and
North Africa. IMF Working Paper 09/220. International Monetary Fund, Washington.Revell, J., 1979. Inflation and financial institutions. Financial Times, London.Rhoades, S.A., 1977. Structure-performance studies in banking: a summary and evaluation. Staff Economic Study No. 92. Board of
Governors of the Federal Reserve System, Washington, DC.Rose, S.A., Fraser, D.R., 1976. The relationship between stability and change in market structure: an analysis of bank prices. Journal of
Industrial Economics 24, 251–266.Samad, A., 2005. Banking structure and performance: evidence from Utah. Review of Business Research V (2), 151–156.Saunders, A., Schumacher, L., 2000. The determinants of bank interest rate margins: an international study. Journal of International
Money and Finance 19, 813–832.Schwaiger, M.S., Liebig, D., 2008. Determinants of bank interest margins in Central and Eastern Europe. Financial Stability Report 14,
68–87 (Österreichische Nationalbank).Short, B.K., 1979. The relation between commercial bank profit rates and banking concentration in Canada, Western Europe and
Japan. Journal of Banking & Finance 3, 209–219.Smirlock, M., 1985. Evidence on the (non) relationship between concentration and profitability in banking. Journal of Money, Credit,
and Banking 17, 69–83.Wendell, S., Valderrama, L., 2006. The monetary policy regime and banking spreads in Barbados. IMF Working Paper 06/211.
International Monetary Fund, Washington.
![BANGLADESH BANK PRUDENTIAL REGULATIONS FOR BANKS : SELECTED ISSUES [UPDATED TILL JUNE 2009] ii POLICY ON CAPITAL ADEQUACY OF BANKS CONSTITUTION OF THE BOARD OF DIRECTORS AND FIT AND](https://img.pdfslide.net/doc/110x75/631607793ed465f0570bd959/bangladesh-bank-prudential-regulations-for-banks-selected-issues-updated-till.jpg)