Embed Size (px)
Citation preview
The effects of ISO 9001 on firms’productive efficiency
Dimitris Tzelepis, Kostas Tsekouras, Dimitris Skuras andEfthalia Dimara
Department of Economics, University of Patras, Patras, Greece
Abstract
Purpose – This work sets out to explore the effects of ISO 9001 on productive efficiency of firms.
Design/methodology/approach – A sample of 1,572 firms from three Greek manufacturingindustries is used for empirical work. The firms are from the food and beverages industries, themachineries industries as well as from the electrical and electronics appliances manufacturingindustries and include both adopters and non-adopters of ISO 9001. A stochastic frontiermethodological approach is adopted and the effects of ISO 9001 can be modeled in four ways: as amanagerial input alongside the conventional inputs of capital and labor, as a factor affecting technicalinefficiency, as an input and a factor affecting technical inefficiency and as having no effect at all.
Findings – ISO 9001 operates as a factor affecting technical inefficiency with non-neutral effects oncapital and labor. The combined effect of ISO 9001 with capital increases the level of technicalinefficiency reflecting adjustment costs incurred when ISO 9001 is adopted. The combined effectof ISO 9001 with labor decreases the level of technical inefficiency reflecting the positive result ofISO 9001 on reducing x-inefficiency.
Research limitations/implications – The analysis isolates the effects of ISO 9001 on capital andlabor but specific case studies are necessary in order to reveal managerial best practices that confrontnegative and support positive effects of ISO 9001 adoption within firms.
Originality/value – The paper illustrates that ISO 9001 is a managerial factor reducing productiveinefficiency.
Keywords ISO 9000 series, Technology led strategy, Costs, Greece
Paper type Research paper
IntroductionA “quality system” consists of a set of fixed business procedures and rules aimingto ensure that a product, process or service meets a pre-determined and widelyacknowledged set of standards (Vloeberghs and Bellens, 1996). Quality assurance, anindustrial process designed to manage and update the quality system, is able tocontinuously guarantee and demonstrate that the system conforms to the agreed set ofspecific conditions and standards (Rothery, 1992). The ISO 9000 series or, more formally,“quality management and quality assurance standards,” outlines the requirements to bemet by a producer, illustrating the producer’s competence to design, produce and deliverproducts or services with a consistent and coherent level of quality.
In 2000, a wide range of modifications were introduced to the ISO 9000 seriesproducing the ISO 9001:2000 series which replaced ISO 9001, 9002 and 9003 that wereintroduced in 1994. Although ISO 9001:2000 is regarded as a cosmetic change to theolder 1994 series, some profound changes are evident. ISO 9001:2000 is structured in
The current issue and full text archive of this journal is available at
www.emeraldinsight.com/0144-3577.htm
The authors are grateful to two referees and the editors of this journal for their very usefulcomments on an earlier draft of this work.
IJOPM26,10
1146
International Journal of Operations &Production ManagementVol. 26 No. 10, 2006pp. 1146-1165q Emerald Group Publishing Limited0144-3577DOI 10.1108/01443570610691111
five sections instead of the old 20-part structure. The new standard is oriented towardsthe achievement of higher levels of customer satisfaction. Product realization, i.e. theinterconnected processes that are used to bring products into being, is central to theISO 9001:2000 approach. ISO 9001:2000 is made up of at least 21 processes gluedtogether by means of input-output relationships. These input-output relationshipsmake up a single large process, the quality management system. Finally, the newISO 9001:2000 series allows for greater flexibility because a producer may ignore orexclude some requirements, if certain conditions are met.
The importance of employing quality assurance schemes has been widely documented,not without criticism and controversy, in the academic management and economicsliterature. Supply and demand drivers may be behind the decision to adopt a qualityassurance scheme and are extensively documented in the relevant literature (Tsekouraset al., 2002). Basically, the decision to adopt a quality assurance scheme may be theoutcome of a complex push and pull process of simultaneously acting forces applied byexternal parties such as the final consumers, the intermediate consumers (other firmsdown the supply chain) or by internal agents, mainly a firm’s own management. Researchon the effects of adopting an ISO quality assurance scheme spans over a wide range ofbusiness performance indicators and frequently the results are contradictory (Tsekouraset al., 2002; Dimara et al., 2004). The early contributors (Deming, 1986; Juran, 1982;Inshikawa, 1986) viewed quality management as a holistic management strategy aimingto improve internal processes of companies and enhance the overall competitiveperformance (Yahya and Goh, 2001). Evidence shows that ISO 9000 registration can beleveraged into a competitive advantage when it is made consistent with a firm’s strategicdirection (Curkovic and Pagell, 1999) and is related to expectations about its contributionto improved quality and especially to those factors perceived by the management of thefirm as important to competitive success and competitive advantage (Escanciano et al.,2001; Withers and Ebrahimpour, 2000). For example, Forker et al. (1996) examined asample of strategic business units and individual firms in the furniture industry and foundthat high quality leads to improved business performance.
According to more moderate expectations regarding the effects of an ISO qualityassurance scheme, it as a factor reducing internal inefficiencies as well as a factorcontributing towards the reduction of development times for new products, of start-upproblems and of costs in general (Gotzamani and Tsiotras, 2002; Santos and Escanciano,2002). For example, Reincheld and Sasser (1990), argue that the adoption of an ISO qualityassurance scheme reduces the costs of scrap, rework or jammed machinery. Furthermore,certain studies argue that the ISO 9000 has the potential to reduce transaction costs byserving as the seller’s guarantee of quality (Holleran et al., 1999). In a world survey withdata collected from 977 business firms located in the major industrialized regions of theworld, Adam et al. (1997) found that although the quality improvement approachsuccessfully influenced quality, the impact on financial performance was somewhat weak.
On the other hand, a growing number of researchers argue that the ISO 9000 series,being a paper-driven process of limited value, does not really have an impact on firmperformance and that ISO 9000 certification is just another marketing cue (Curkovicand Pagell, 1999; Uzumeri, 1997; Terziovski et al., 1997; Curkovic and Handfield, 1996).Elsewhere empirical support for such a view is provided (Lima et al., 2000; Stashevskyand Elizur, 2000; Adams, 1999; Terziovski et al., 1997). Casadesus and Karapetrovic(2005) employ a longitudinal impact study and argue that ISO 9000 standards are
Effects of ISO9001
1147
limited in providing a set of concrete benefits over time. The authors argue that theirfinding may be partly explained by the large increase in ISO 9000 registrationsworldwide which reduces the ability to claim competitive advantage from ISOregistration.
To summarize, the literature identifies that the adoption of a quality assurancescheme by a firm may have three major types of impacts on the firm’s efficiency. The firsttype of impacts is generated when ISO 9001 is regarded as a completely new managerialtype of input that totally alters the operation and efficiency of a firm. The second type ofimpacts is generated when ISO 9001 is regarded as an integrated quality assuranceprocess that simply reduces inefficiencies without altering the whole operation of a firm.The third type of impacts refers to the absence of any positive impact or to the presenceof negative impacts on a firm’s efficiency. This type of impact is generated whenISO 9001 is regarded as a paper-driven process of limited value that does not really affectthe efficiency of a firm although, in some cases, may increase inefficiencies.
In this paper, we extend current research and examine the effects that adopting anISO 9001 quality assurance scheme may have on productive efficiency of firms, anissue that, to the best of our knowledge, has not been addressed in the relevantliterature up to the present. The methodology employed in this paper allows us todisentangle the three major types of possible impacts from the adoption of an ISO 9001quality assurance scheme on a firm’s efficiency. As such, we are able to test threealternative hypotheses. Firstly, that the adoption of an ISO 9001 quality assurancescheme is a new “managerial input” that expands a firm’s conventional bundle ofinputs. Secondly, that the adoption of an ISO 9001 is a process that reducesinefficiency. Thirdly, that the adoption of an ISO 9001 has no impacts on the firm’sefficiency. Alternative econometric models are constructed and are empirically testedon a large sample of firms in three industries of the Greek manufacturing sector.
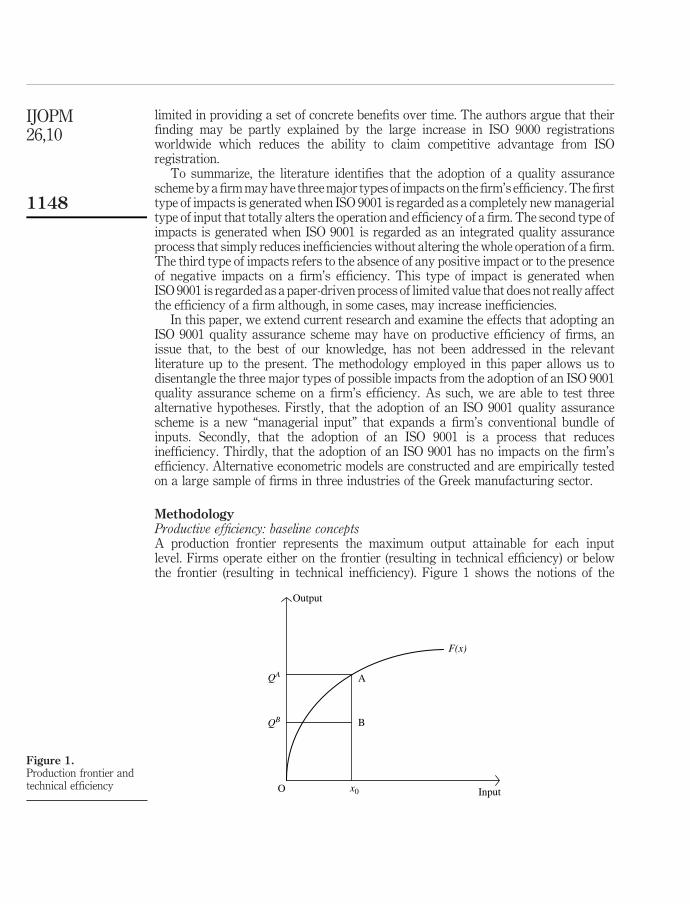
MethodologyProductive efficiency: baseline conceptsA production frontier represents the maximum output attainable for each inputlevel. Firms operate either on the frontier (resulting in technical efficiency) or belowthe frontier (resulting in technical inefficiency). Figure 1 shows the notions of the
Figure 1.Production frontier andtechnical efficiency
IJOPM26,10
1148
production frontier and technical efficiency. The production frontier is defined by theFðxÞ production function and depicts the process under which inputs are converted tooutput or, in other words, the production technology that permits the input x toproduce output Q. The firm operating at point A which lies on the production frontieris a technically efficient firm, while the firm operating at point B is a technicallyinefficient one. The efficiency score (EFF) for the technically efficient firms is equalto one (1), while the corresponding score for the technically inefficient firm isðQA=QBÞ , 1:
Production frontiers may be either deterministic or stochastic. In the case ofa deterministic frontier, the maximum output attainable for a given input level is ascalar, while in the case of a stochastic frontier the maximum potential output consistsof a distribution of outcomes or, in other words, is a random variable. In each of theseoutput levels a probability of occurrence is attributed and this probability is a prioriunknown since it depends on the state of the economic environment. The interestedreader may find a useful introduction to stochastic frontier analysis in Kumbhakar andLovell (2000).
The dominant approaches in the parametric efficiency measurement are the errorcomponent model (ECM) of Battese and Coelli (1992) and the technical efficiency effectsmodel (TEEM) defined in Huang and Liu (1994) and Battese and Coelli (1995). In thefollowing paragraphs, the theoretical underpinnings of these two models as well as anextension of the TEEM introduced by Battese and Broca (1997) are briefly presented.The latter allows the estimation of non-neutral technical efficiency effects. Let usconsider the stochastic frontier production function model:
Qi ¼ x0iaþ 1i ð1Þ
where Qi is the output of the i-th firm ði ¼ 1; 2; . . . ;N Þ; xi is a ðk £ 1Þ vector of values ofknown functions of production inputs and a is a ðk £ 1Þ vector of unknown parametersto be estimated. The error term is specified as:
1i ¼ vi 2 ui ð2Þ
The vi terms represent statistical noise, i.e. effects that cannot be controlled by theavailable observable variables, such as measurement errors, omitted variables, etc. andare assumed to be independently and identically distributed. The ui terms arenon-negative random variables which represent technical efficiency. Technicalefficiency reflects the entrepreneurial ability to combine resources, i.e. to producemaximum output given the bundle of available inputs and the technologicalcharacteristics of the firm. Thus, technical efficiency accounts for those factors that canbe controlled by the firm, and can be defined as the discrepancy between the actualoutput of the firm and its potential output as it is determined by the frontier. Whenui ¼ 0; a firm’s production lies on the stochastic frontier and the firm is fullytechnically efficient; when ui . 0; a firm’s production lies below the frontier and thefirm is technically inefficient. Given that the actual production level is x0
iaþ vi 2 ui;while the efficient level is x0
iaþ vi; the technical efficiency score for the i-th firm isgiven by Battese and Coelli (1992):
EFFi ¼ expð2uiÞ ð3Þ
Effects of ISO9001
1149
where the ui terms are assumed to be i.i.d as truncations at zero of the N mu;s2u
� �
distribution. Battese and Coelli (1992) show that the best predictor of exp (2ui) isobtained by using the conditional expectation of exp (2ui) given 1i, as E½expð2uiÞ=1i�:The imposition of one or more restrictions upon this model can provide a number ofspecial cases. Setting mu ¼ 0 reduces the distribution of the technical inefficiency term(ui) to the traditional half-normal model.
The approach employed in the TEEM for efficiency measurement is based on theextension of the ECM and assumes that the efficiency term ui is described by thefollowing linear relationship, the so-called inefficiency model:
ui ¼ d0 þ z0idþ wi ð4Þ
where Zi is an ð1 £M Þ vector of values of known functions of factors affecting EFFlevels, and (d0, d) is a ð1 þM Þ £ 1 vector of parameters to be estimated. In other wordsthe Zi vector reflects factors that, depending on their sign, reduce or increasemanagerial inefficiency and as a result a firm locates closer or further to the frontier.The wi is an i.i.d. random variable, defined as a truncation of the normal distributionwith mean zero and variance s2
w; and as a result, at the point of truncation holds thatwi $ 2d0 2 z0id: Combining equations (2) and (4), the efficiency level of the i-th firm inthe case of the TEEM is defined as:
EFFi ¼ expð2uiÞ ¼ exp 2 d0 þ z0idþ wi
� �ð5Þ
The stochastic frontier presented in equation (1) and the inefficiency model presentedin equation (4) are jointly estimated by maximum likelihood algorithms. It isworthwhile noting that we utilise the parameterization of Battese and Corra (1977),who replace s2
v and s2u with s 2 ¼ s2
v þ s2u and so:
g ¼s2u
s2v þ s2
u
� � :
The parameter g lies between 0 and 1. A value of g ¼ 0 indicates that the deviationfrom the frontier is due entirely to noise, while a value of g ¼ 1 indicates that alldeviations are due to technical inefficiency. This specification allows us to test the nullhypothesis that there are no technical inefficiency effects in the model H0 : g ¼ 0versus the alternative hypothesis H1 : g . 0: A similar hypothesis holds for the ECMmodel. The joint log-likelihood function of the stochastic frontier and inefficiencymodel, which is expressed in terms of the variance parameters s 2 ¼ s2
v þ s2u and
g ¼ s2u=s
2 and of the vector ða; d0; dÞ; along with the respective partial derivatives,are presented in Battese and Coelli (1995).
Regarding the nature of technical efficiency scores (EFF), the general stochasticfrontier model encompasses the following three sub-cases: In the first one, wheng ¼ d0 ¼ d1 ¼ . . . ¼ dM ¼ 0; there is no technical inefficiency (deterministic orstochastic), and the model collapses to the traditional average production function.In the second one, when only g ¼ 0; technical efficiency is deterministic and, theexplanatory variables in equation (4) must be included in equation (1) along withinputs and other relevant variables. In the third one, when all d parameters, apartfrom the intercept term, are zero, the z variables do not affect the EFF levels and themodel reduces to the kind of production function described in Stevenson (1980).
IJOPM26,10
1150
Hypotheses about the nature of technical inefficiencies can be tested using thegeneralized likelihood ratio statistic, l, given by
l ¼ 22½lnLðH 0Þ2 lnLðH 1Þ� ð6Þ
where LðH 0Þ and LðH 1Þ denote the values of the likelihood function under the null andthe alternative hypothesis, respectively. It should be noted that because g lies on theboundary of the parameter space, l has an asymptotic distribution which is a mixtureof chi-squared distributions 0:5x2
k21 þ 0:5x2k where k is the appropriate number of
degrees of freedom which is equal to the number of restrictions involved in the nullhypothesis. Theoretical values for a mixture of chi-squared distributions are providedin Kodde and Palm (1986).
If we consider that the best approximation of the production frontier is achieved bya translog function, the baseline model of the production frontier without inefficiencyfactors (IFs), i.e. the ECM, described in equations (1) and (2) may be written as:
lnQ ¼ a0 þi¼K;L
Xai ln xi þ
1
2i¼K;L
X
j¼K;L
Xaij ln xi ln xj þ v2 u ðModel AÞ ð7Þ
In the same way, the TEEM described by equation (4) may be written as:
lnQ ¼ a0 þi¼K;L
Xai ln xi þ
1
2i¼K;L
X
j¼K;L
Xaij ln xi ln xj þ v2 u
u ¼ d0 þX10
j¼1
djzj þ w
ðModel CÞ ð8Þ
In their extension of the aforementioned models, Battese and Broca (1997) introducednon-neutral specifications of the stochastic frontier which nest the TEEM(Battese and Coelli, 1995) which, in turn, nests the error components model (ECM)(Battese and Coelli, 1992). More specifically the inefficiency term, u, may beapproximated by:
lnQ ¼ a0 þi¼K;L
Xai ln xi þ
1
2i¼K;L
X
j¼K;L
Xaij ln xi ln xj þ v2 u
ui ¼ d0 þX7
j¼1
djzji þX7
j¼1
X3
k¼1
gkjzjixki þ wi
ð9Þ
which is called the non-neutral TEEM. The specific model explicitly adopts theassumption that the inefficiency effects are functions of all the input variables.All interactions between a specific technical inefficiency effect and all inputs show thefactor of production that is affected the most by the specific IF and the direction(negative or positive) in which this factor of production is affected.
ISO 9001 as an input of productionIf we consider ISO 9001 to be a managerial input of production, in the sense that theadoption of the ISO 9001 requirements enhances the bundle of inputs such as capital
Effects of ISO9001
1151
and labor with a “new” managerial input, the above described baseline models inequations (7), (8) and (9) are encompassing this new factor in their production function.The ECM becomes:
lnQ¼ a0 þi¼K;L
Xai lnxi þ
1
2i¼K;L
X
j¼K;L
Xaij lnxi lnxj þ aISOxISO þ u2 v ðModel BÞ ð10Þ
where xISO is a dummy variable which takes the value of 1 if the firm has adopted anISO 9001 quality assurance scheme. Correspondingly, the TEEM with ISO 9001 asan input of production becomes:
lnQ¼ a0 þi¼K;L
Xai lnxi þ
1
2i¼K;L
X
j¼K;L
Xaij lnxi lnxj þ aISOxISO þ u2 v
v¼ d0 þX10
j¼1
djzj þw
ðModel DÞ ð11Þ
and the non-neutral variant of the above model becomes:
lnQ¼ a0 þi¼K;L
Xai lnxi þ
1
2i¼K;L
X
j¼K;L
Xaij lnxi lnxj þ aISOxISO þ u2 v
v¼ d0 þX10
j¼2
djzj þX8
j¼1
dISO;jxISOzj þw
ðModel GÞ ð12Þ
ISO 9001 as a factor affecting inefficiencyIf ISO 9001 is not considered to be an input of production but is considered simply as aprocess that may assist firms to reduce production inefficiencies or, as its opponentsargue, a factor that aggravates inefficiencies by adding more paperwork, then theTEEM becomes:
lnQ ¼ a0 þi¼K;L
Xai ln xi þ
1
2i¼K;L
X
j¼K;L
Xaij ln xi ln xj þ u2 v
v ¼ d0 þ dISOzISO þX10
j¼1
djzj þ w
ðModel EÞ ð13Þ
and the non-neutral variant of the same model becomes:
lnQ ¼ a0 þi¼K;L
Xai ln xi þ
1
2i¼K;L
X
j¼K;L
Xaijln xiln xj þ u2 v
v ¼ d0 þ dISOzISO þX10
j¼2
djzj þj¼K;L
XdISO;jxjzISO þ w
ðModel FÞ ð14Þ
IJOPM26,10
1152
ISO 9001 as an input of production and a factor affecting inefficiencyIf the adoption of ISO 9001 process acts as both a new input of production and a factoraffecting production inefficiency the TEEM becomes:
lnQ¼ a0 þi¼K;L
Xai lnxi þ
1
2i¼K;L
X
j¼K;L
Xaij lnxi lnxj þ aISOxISO þ u2 v
v¼ d0 þ dISOxISO þX10
j¼2
djzj þw
ðModel HÞ ð15Þ
and its non-neutral variant becomes:
lnQ¼ a0 þi¼K;L
Xai lnxi þ
1
2i¼K;L
X
j¼K;L
Xaij lnxi lnxj þ aISOxISO þ u2 v
v¼ d0 þ dISOzISO þX10
j¼2
djzj þX8
j¼1
dISO;jxISOzj þj¼K;L
XdISO;jzISOxj þw
ðModel IÞ ð16Þ
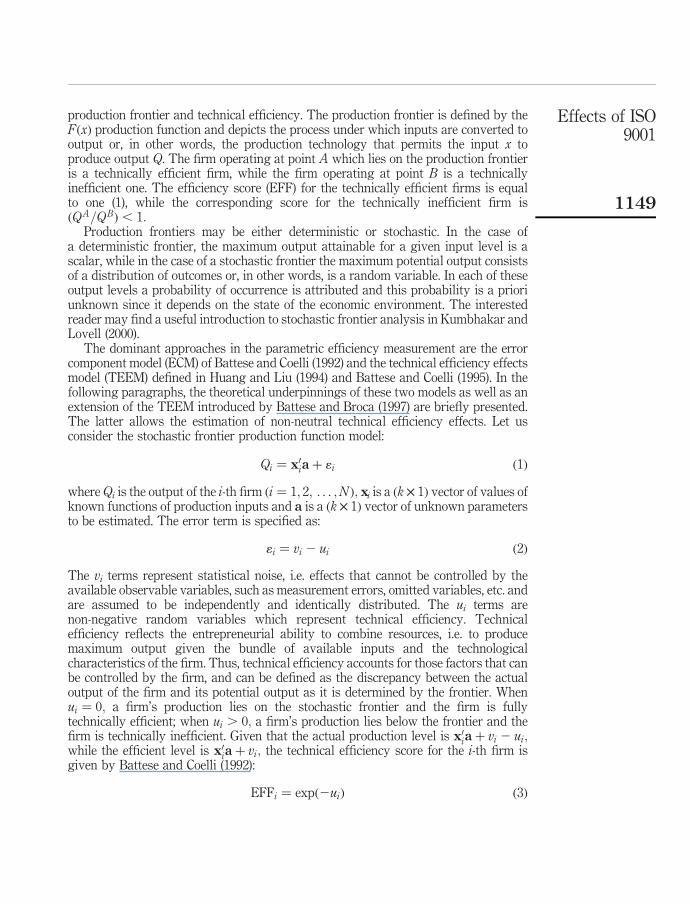
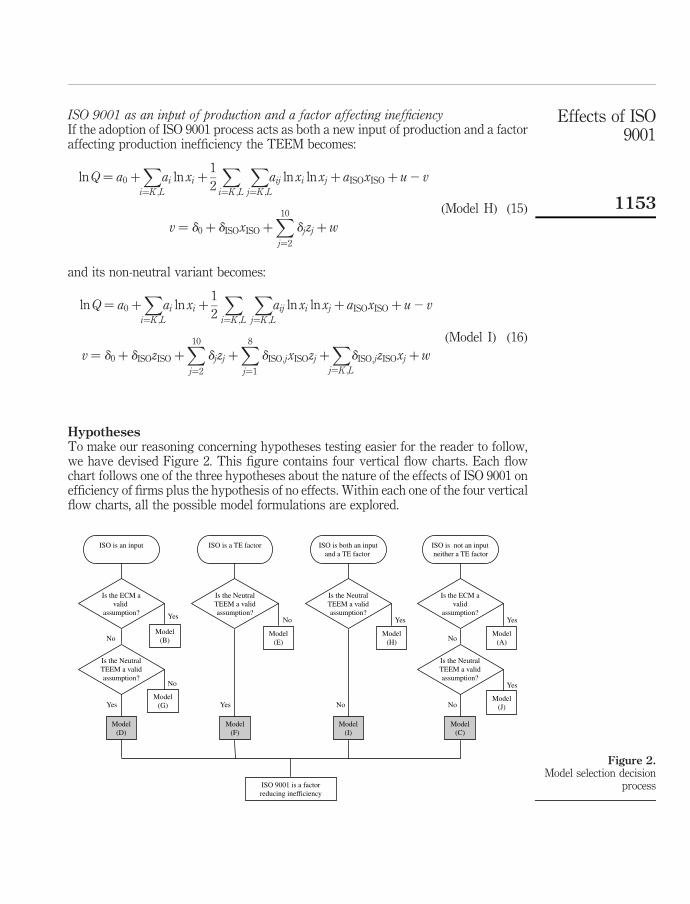
HypothesesTo make our reasoning concerning hypotheses testing easier for the reader to follow,we have devised Figure 2. This figure contains four vertical flow charts. Each flowchart follows one of the three hypotheses about the nature of the effects of ISO 9001 onefficiency of firms plus the hypothesis of no effects. Within each one of the four verticalflow charts, all the possible model formulations are explored.
Figure 2.Model selection decision
process
Effects of ISO9001
1153
More specifically, if ISO 9001 is considered to be an input (denoted as NI in Figure 2),the first vertical flow chart on the far left of Figure 2 shows that this may beapproximated under an ECM specification (model B) or under a TEEM specification.The latter may be modeled with neutral (model D) or non-neutral (model G) effects ofthe inefficiency terms. Accordingly, if ISO 9001 is considered as a simple IF (Figure 2),the second from the left vertical flow chart of Figure 2 shows that this may beapproximated only by a TEEM specification with neutral (model E) or non-neutral(model F) effects of the inefficiency terms. If ISO 9001 acts both as an input (NI) and anIF, the third from the left vertical flow chart of Figure 2 shows that this may beapproximated only by a TEEM specification with neutral (model H) or non-neutral(model I) effects of the inefficiency terms. Finally, if ISO 9001 has nothing to do withefficiency of firms and is, therefore, considered neither as an input nor as aninefficiency term of the production process, the ECM specification (model A) and theTEEM specification (model C) without non-neutral effects are estimated.
All the above models are nested and their differences are in the numberof restrictions employed in their estimation. Thus, hypotheses about the nature oftechnical inefficiencies can be tested using the generalized likelihood ratio statistic, l,given in equation (6). However, the possible combinations of the large number ofmodels estimated in this work, complicates the testing of hypotheses. For this reason,we identified the best four models, one for each of the four vertical flow charts shown inFigure 2. In other words, we find the best model under each one of the four majorassumptions concerning the effects of ISO 9001 on productive efficiency of firms. Thenwe compare these four models with each other in order to find the model that bestdescribes the effects of ISO 9001 on productive efficiency of firms and also shows theexact nature of the effects exercised by ISO 9001 on productive efficiency of firms.
DataData for this work came from the business database maintained by the privatefinancial and business information service company which in Greece is called ICAP.The annual ICAP directories provide key elements from the published balance sheetsof almost all Plc. and Ltd firms operating in all sectors of economic activity in Greece.From the annual directories of ICAP we devised a database of firms operating in threeindustries of the manufacturing sector, representing a low-tech industry (the food anddrinks industry), a medium-tech industry (the machineries industry) and a high-techindustry (the electrical and electronics industry) and for 1998-2000, the latest availableperiod of published data. Firms in these three industries have adopted the ISO 9001procedures from as early as 1989 and, as a result, the effects of adopting ISO 9001 havehad a considerable time (through 2000) to materialize.
As was discussed in the introduction of this work, it is very difficult to deduce a setof stylized facts concerning the effects of ISO 9001 adoption on firm efficiency.This difficulty should be attributed firstly, to the contradicting evidence provided byinternational literature and secondly, to the lack of an appropriate number of casestudies focusing on the effects of ISO 9001 on specific manufacturing industries.The food industry, however, is the only single manufacturing sector for which evidencefrom international literature reveals an overall positive effect of ISO’s adoption on firmefficiency (Efstratiadis et al., 2000; Grigg and McAlinden, 2001).
IJOPM26,10
1154
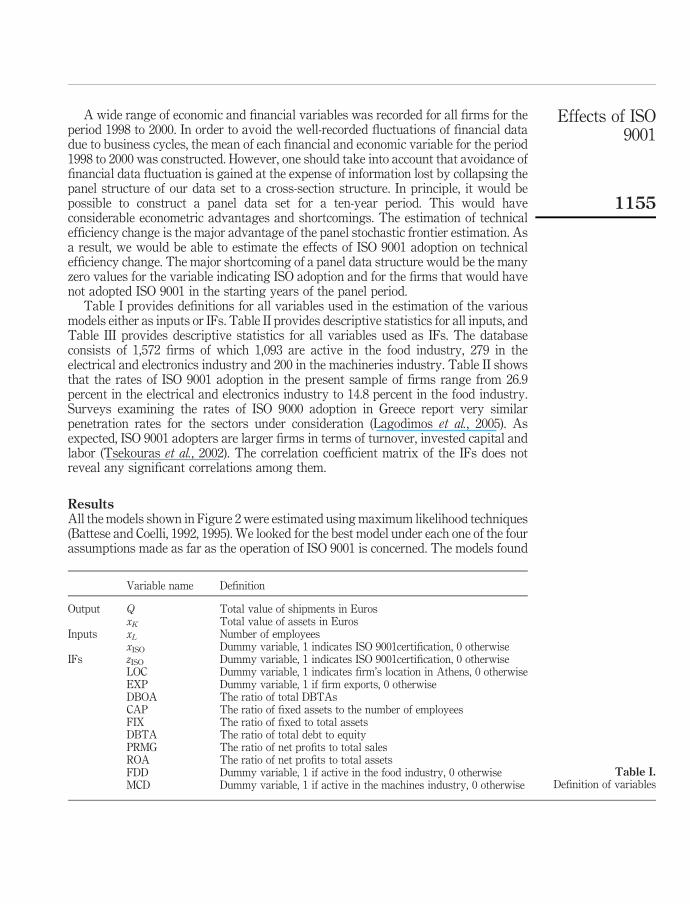
A wide range of economic and financial variables was recorded for all firms for theperiod 1998 to 2000. In order to avoid the well-recorded fluctuations of financial datadue to business cycles, the mean of each financial and economic variable for the period1998 to 2000 was constructed. However, one should take into account that avoidance offinancial data fluctuation is gained at the expense of information lost by collapsing thepanel structure of our data set to a cross-section structure. In principle, it would bepossible to construct a panel data set for a ten-year period. This would haveconsiderable econometric advantages and shortcomings. The estimation of technicalefficiency change is the major advantage of the panel stochastic frontier estimation. Asa result, we would be able to estimate the effects of ISO 9001 adoption on technicalefficiency change. The major shortcoming of a panel data structure would be the manyzero values for the variable indicating ISO adoption and for the firms that would havenot adopted ISO 9001 in the starting years of the panel period.
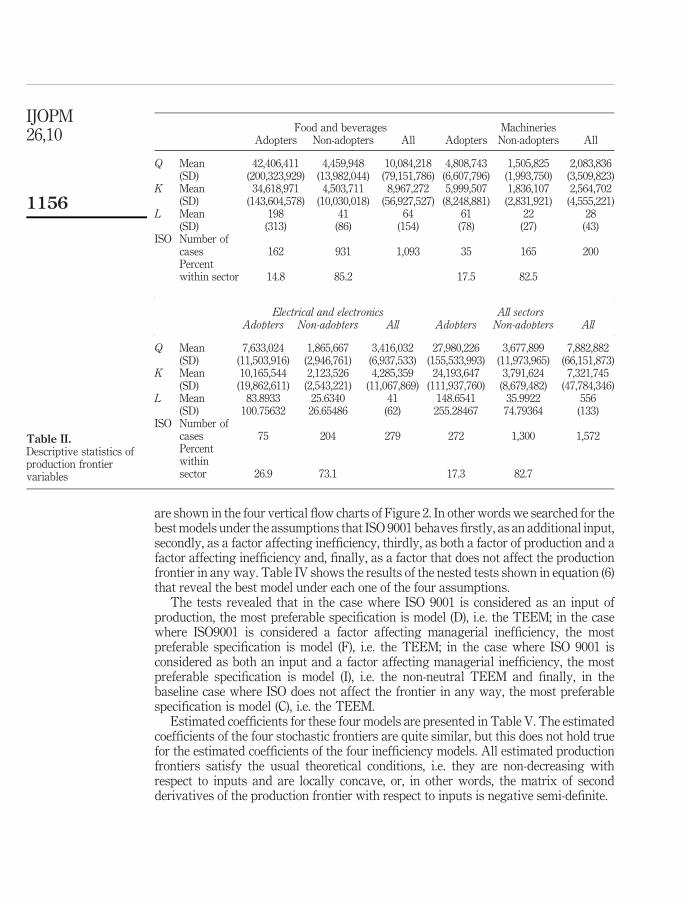
Table I provides definitions for all variables used in the estimation of the variousmodels either as inputs or IFs. Table II provides descriptive statistics for all inputs, andTable III provides descriptive statistics for all variables used as IFs. The databaseconsists of 1,572 firms of which 1,093 are active in the food industry, 279 in theelectrical and electronics industry and 200 in the machineries industry. Table II showsthat the rates of ISO 9001 adoption in the present sample of firms range from 26.9percent in the electrical and electronics industry to 14.8 percent in the food industry.Surveys examining the rates of ISO 9000 adoption in Greece report very similarpenetration rates for the sectors under consideration (Lagodimos et al., 2005). Asexpected, ISO 9001 adopters are larger firms in terms of turnover, invested capital andlabor (Tsekouras et al., 2002). The correlation coefficient matrix of the IFs does notreveal any significant correlations among them.
ResultsAll the models shown in Figure 2 were estimated using maximum likelihood techniques(Battese and Coelli, 1992, 1995). We looked for the best model under each one of the fourassumptions made as far as the operation of ISO 9001 is concerned. The models found
Variable name Definition
Output Q Total value of shipments in EurosxK Total value of assets in Euros
Inputs xL Number of employeesxISO Dummy variable, 1 indicates ISO 9001certification, 0 otherwise
IFs zISO Dummy variable, 1 indicates ISO 9001certification, 0 otherwiseLOC Dummy variable, 1 indicates firm’s location in Athens, 0 otherwiseEXP Dummy variable, 1 if firm exports, 0 otherwiseDBOA The ratio of total DBTAsCAP The ratio of fixed assets to the number of employeesFIX The ratio of fixed to total assetsDBTA The ratio of total debt to equityPRMG The ratio of net profits to total salesROA The ratio of net profits to total assetsFDD Dummy variable, 1 if active in the food industry, 0 otherwiseMCD Dummy variable, 1 if active in the machines industry, 0 otherwise
Table I.Definition of variables
Effects of ISO9001
1155
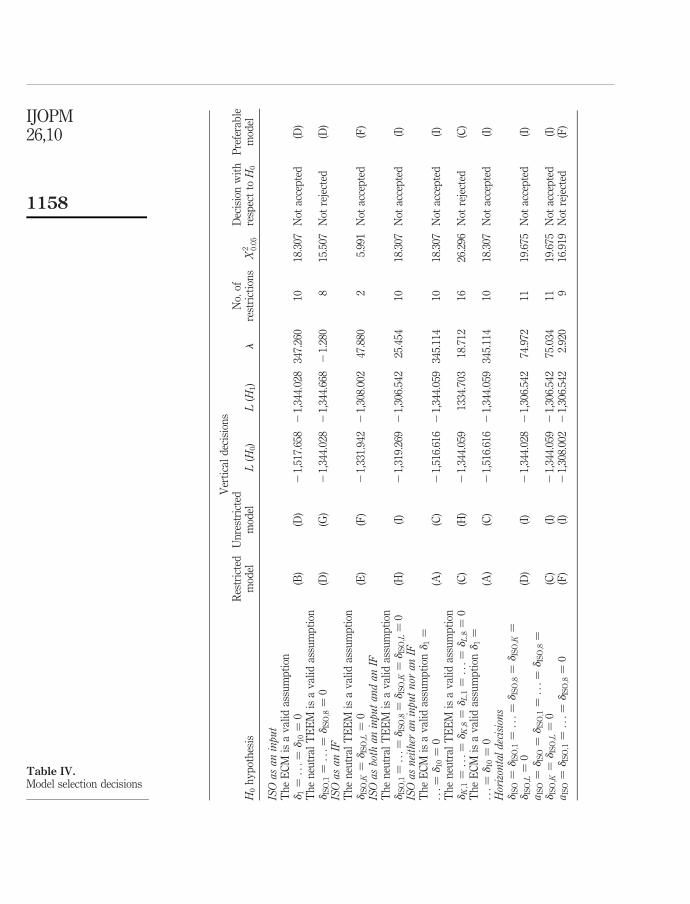
are shown in the four vertical flow charts of Figure 2. In other words we searched for thebest models under the assumptions that ISO 9001 behaves firstly, as an additional input,secondly, as a factor affecting inefficiency, thirdly, as both a factor of production and afactor affecting inefficiency and, finally, as a factor that does not affect the productionfrontier in any way. Table IV shows the results of the nested tests shown in equation (6)that reveal the best model under each one of the four assumptions.
The tests revealed that in the case where ISO 9001 is considered as an input ofproduction, the most preferable specification is model (D), i.e. the TEEM; in the casewhere ISO9001 is considered a factor affecting managerial inefficiency, the mostpreferable specification is model (F), i.e. the TEEM; in the case where ISO 9001 isconsidered as both an input and a factor affecting managerial inefficiency, the mostpreferable specification is model (I), i.e. the non-neutral TEEM and finally, in thebaseline case where ISO does not affect the frontier in any way, the most preferablespecification is model (C), i.e. the TEEM.
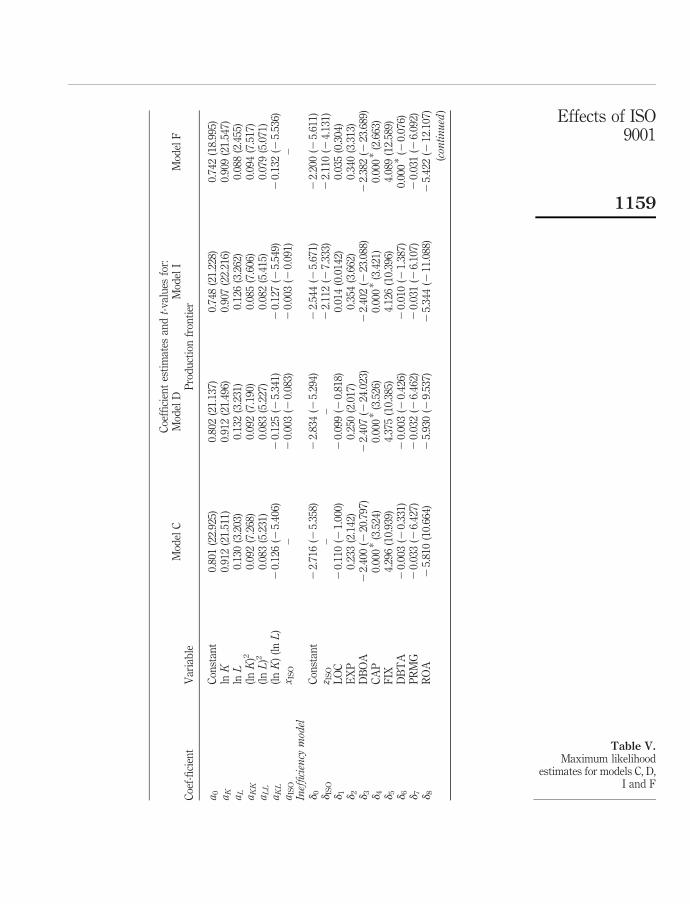
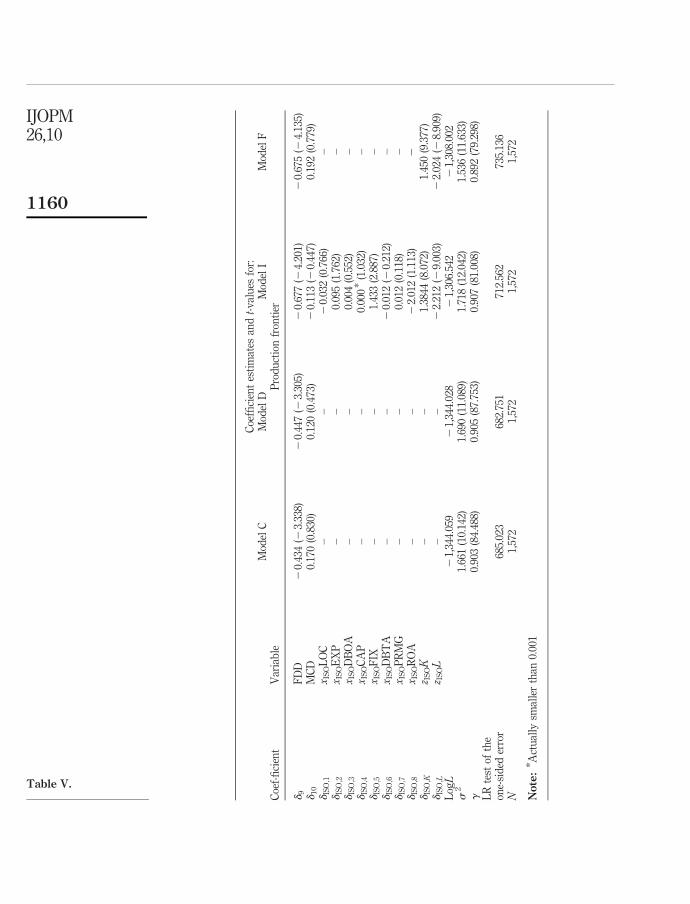
Estimated coefficients for these four models are presented in Table V. The estimatedcoefficients of the four stochastic frontiers are quite similar, but this does not hold truefor the estimated coefficients of the four inefficiency models. All estimated productionfrontiers satisfy the usual theoretical conditions, i.e. they are non-decreasing withrespect to inputs and are locally concave, or, in other words, the matrix of secondderivatives of the production frontier with respect to inputs is negative semi-definite.
Food and beverages MachineriesAdopters Non-adopters All Adopters Non-adopters All
Q Mean 42,406,411 4,459,948 10,084,218 4,808,743 1,505,825 2,083,836(SD) (200,323,929) (13,982,044) (79,151,786) (6,607,796) (1,993,750) (3,509,823)
K Mean 34,618,971 4,503,711 8,967,272 5,999,507 1,836,107 2,564,702(SD) (143,604,578) (10,030,018) (56,927,527) (8,248,881) (2,831,921) (4,555,221)
L Mean 198 41 64 61 22 28(SD) (313) (86) (154) (78) (27) (43)
ISO Number ofcases 162 931 1,093 35 165 200Percentwithin sector 14.8 85.2 17.5 82.5
Electrical and electronics All sectorsAdopters Non-adopters All Adopters Non-adopters All
Q Mean 7,633,024 1,865,667 3,416,032 27,980,226 3,677,899 7,882,882(SD) (11,503,916) (2,946,761) (6,937,533) (155,533,993) (11,973,965) (66,151,873)
K Mean 10,165,544 2,123,526 4,285,359 24,193,647 3,791,624 7,321,745(SD) (19,862,611) (2,543,221) (11,067,869) (111,937,760) (8,679,482) (47,784,346)
L Mean 83.8933 25.6340 41 148.6541 35.9922 556(SD) 100.75632 26.65486 (62) 255.28467 74.79364 (133)
ISO Number ofcases 75 204 279 272 1,300 1,572Percentwithinsector 26.9 73.1 17.3 82.7
Table II.Descriptive statistics ofproduction frontiervariables
IJOPM26,10
1156
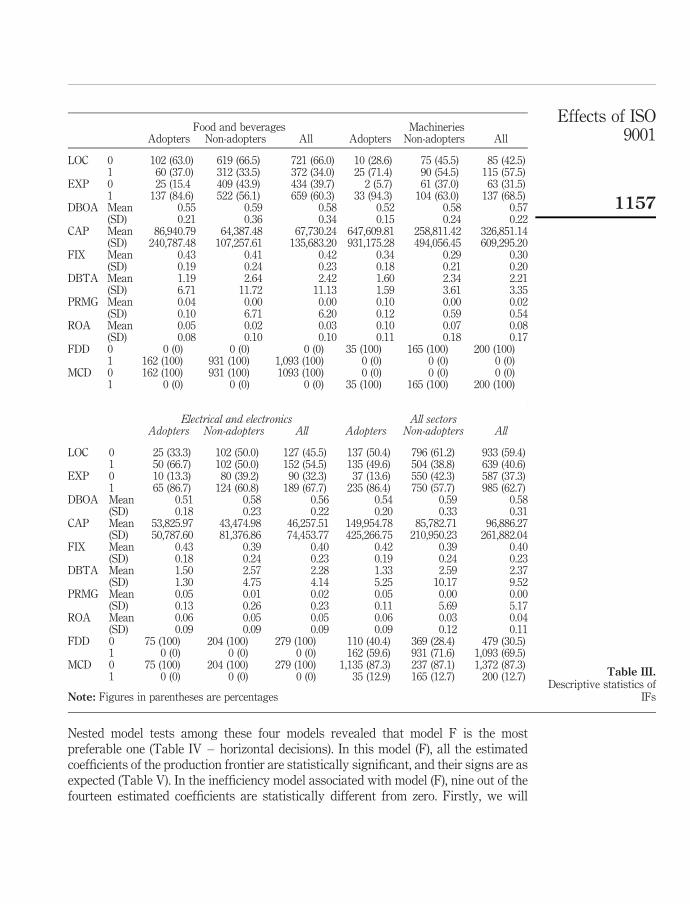
Nested model tests among these four models revealed that model F is the mostpreferable one (Table IV – horizontal decisions). In this model (F), all the estimatedcoefficients of the production frontier are statistically significant, and their signs are asexpected (Table V). In the inefficiency model associated with model (F), nine out of thefourteen estimated coefficients are statistically different from zero. Firstly, we will
Food and beverages MachineriesAdopters Non-adopters All Adopters Non-adopters All
LOC 0 102 (63.0) 619 (66.5) 721 (66.0) 10 (28.6) 75 (45.5) 85 (42.5)1 60 (37.0) 312 (33.5) 372 (34.0) 25 (71.4) 90 (54.5) 115 (57.5)
EXP 0 25 (15.4 409 (43.9) 434 (39.7) 2 (5.7) 61 (37.0) 63 (31.5)1 137 (84.6) 522 (56.1) 659 (60.3) 33 (94.3) 104 (63.0) 137 (68.5)
DBOA Mean 0.55 0.59 0.58 0.52 0.58 0.57(SD) 0.21 0.36 0.34 0.15 0.24 0.22
CAP Mean 86,940.79 64,387.48 67,730.24 647,609.81 258,811.42 326,851.14(SD) 240,787.48 107,257.61 135,683.20 931,175.28 494,056.45 609,295.20
FIX Mean 0.43 0.41 0.42 0.34 0.29 0.30(SD) 0.19 0.24 0.23 0.18 0.21 0.20
DBTA Mean 1.19 2.64 2.42 1.60 2.34 2.21(SD) 6.71 11.72 11.13 1.59 3.61 3.35
PRMG Mean 0.04 0.00 0.00 0.10 0.00 0.02(SD) 0.10 6.71 6.20 0.12 0.59 0.54
ROA Mean 0.05 0.02 0.03 0.10 0.07 0.08(SD) 0.08 0.10 0.10 0.11 0.18 0.17
FDD 0 0 (0) 0 (0) 0 (0) 35 (100) 165 (100) 200 (100)1 162 (100) 931 (100) 1,093 (100) 0 (0) 0 (0) 0 (0)
MCD 0 162 (100) 931 (100) 1093 (100) 0 (0) 0 (0) 0 (0)1 0 (0) 0 (0) 0 (0) 35 (100) 165 (100) 200 (100)
Electrical and electronics All sectorsAdopters Non-adopters All Adopters Non-adopters All
LOC 0 25 (33.3) 102 (50.0) 127 (45.5) 137 (50.4) 796 (61.2) 933 (59.4)1 50 (66.7) 102 (50.0) 152 (54.5) 135 (49.6) 504 (38.8) 639 (40.6)
EXP 0 10 (13.3) 80 (39.2) 90 (32.3) 37 (13.6) 550 (42.3) 587 (37.3)1 65 (86.7) 124 (60.8) 189 (67.7) 235 (86.4) 750 (57.7) 985 (62.7)
DBOA Mean 0.51 0.58 0.56 0.54 0.59 0.58(SD) 0.18 0.23 0.22 0.20 0.33 0.31
CAP Mean 53,825.97 43,474.98 46,257.51 149,954.78 85,782.71 96,886.27(SD) 50,787.60 81,376.86 74,453.77 425,266.75 210,950.23 261,882.04
FIX Mean 0.43 0.39 0.40 0.42 0.39 0.40(SD) 0.18 0.24 0.23 0.19 0.24 0.23
DBTA Mean 1.50 2.57 2.28 1.33 2.59 2.37(SD) 1.30 4.75 4.14 5.25 10.17 9.52
PRMG Mean 0.05 0.01 0.02 0.05 0.00 0.00(SD) 0.13 0.26 0.23 0.11 5.69 5.17
ROA Mean 0.06 0.05 0.05 0.06 0.03 0.04(SD) 0.09 0.09 0.09 0.09 0.12 0.11
FDD 0 75 (100) 204 (100) 279 (100) 110 (40.4) 369 (28.4) 479 (30.5)1 0 (0) 0 (0) 0 (0) 162 (59.6) 931 (71.6) 1,093 (69.5)
MCD 0 75 (100) 204 (100) 279 (100) 1,135 (87.3) 237 (87.1) 1,372 (87.3)1 0 (0) 0 (0) 0 (0) 35 (12.9) 165 (12.7) 200 (12.7)
Note: Figures in parentheses are percentages
Table III.Descriptive statistics of
IFs
Effects of ISO9001
1157
Ver
tica
ld
ecis
ion
s
H0
hy
pot
hes
isR
estr
icte
dm
odel
Un
rest
rict
edm
odel
L(H
0)
L(H
1)
lN
o.of
rest
rict
ion
sX
2 0:05
Dec
isio
nw
ith
resp
ect
toH
0
Pre
fera
ble
mod
el
ISOasaninput
Th
eE
CM
isa
val
idas
sum
pti
ond
1¼
...¼
d10¼
0(B
)(D
)2
1,51
7.65
82
1,34
4.02
834
7.26
010
18.3
07N
otac
cep
ted
(D)
Th
en
eutr
alT
EE
Mis
av
alid
assu
mp
tion
dIS
O;1¼
...¼
dIS
O;8¼
0(D
)(G
)2
1,34
4.02
82
1,34
4.66
82
1.28
08
15.5
07N
otre
ject
ed(D
)ISOasanIF
Th
en
eutr
alT
EE
Mis
av
alid
assu
mp
tion
dIS
O;K
¼d
ISO;L¼
0(E
)(F
)2
1,33
1.94
22
1,30
8.00
247
.880
25.
991
Not
acce
pte
d(F
)ISOasboth
aninputandanIF
Th
en
eutr
alT
EE
Mis
av
alid
assu
mp
tion
dIS
O;1¼
...¼
dIS
O;8¼
dIS
O;K
¼d
ISO;L¼
0(H
)(I
)2
1,31
9.26
92
1,30
6.54
225
.454
1018
.307
Not
acce
pte
d(I
)ISOasneither
aninputnor
anIF
Th
eE
CM
isa
val
idas
sum
pti
ond
1¼
...¼
d10¼
0(A
)(C
)2
1,51
6.61
62
1,34
4.05
934
5.11
410
18.3
07N
otac
cep
ted
(I)
Th
en
eutr
alT
EE
Mis
av
alid
assu
mp
tion
dK;1¼
...¼
dK;8¼
dL;1¼
...¼
dL;8¼
0(C
)(H
)2
1,34
4.05
913
34.7
0318
.712
1626
.296
Not
reje
cted
(C)
Th
eE
CM
isa
val
idas
sum
pti
ond
1¼
...¼
d10¼
0(A
)(C
)2
1,51
6.61
62
1,34
4.05
934
5.11
410
18.3
07N
otac
cep
ted
(I)
Horizontaldecisions
dIS
O¼
dIS
O;1¼
...¼
dIS
O;8¼
dIS
O;K
¼d
ISO;L¼
0(D
)(I
)2
1,34
4.02
82
1,30
6.54
274
.972
1119
.675
Not
acce
pte
d(I
)a
ISO¼
dIS
O¼
dIS
O;1¼
...¼
dIS
O;8¼
dIS
O;K
¼d
ISO;L¼
0(C
)(I
)2
1,34
4.05
92
1,30
6.54
275
.034
1119
.675
Not
acce
pte
d(I
)a
ISO¼
dIS
O;1¼
...¼
dIS
O;8¼
0(F
)(I
)2
1,30
8.00
22
1,30
6.54
22.
920
916
.919
Not
reje
cted
(F)
Table IV.Model selection decisions
IJOPM26,10
1158
Coe
ffici
ent
esti
mat
esan
dt-
val
ues
for:
Mod
elC
Mod
elD
Mod
elI
Mod
elF
Coe
f-fi
cien
tV
aria
ble
Pro
du
ctio
nfr
onti
er
a0
Con
stan
t0.
801
(22.
925)
0.80
2(2
1.13
7)0.
748
(21.
228)
0.74
2(1
8.99
5)aK
lnK
0.91
2(2
1.51
1)0.
912
(21.
496)
0.90
7(2
2.21
6)0.
909
(21.
547)
aL
lnL
0.13
0(3
.203
)0.
132
(3.2
31)
0.12
6(3
.262
)0.
088
(2.4
55)
aKK
(lnK
)20.
092
(7.2
68)
0.09
2(7
.190
)0.
085
(7.6
06)
0.09
4(7
.517
)aLL
(lnL
)20.
083
(5.2
31)
0.08
3(5
.227
)0.
082
(5.4
15)
0.07
9(5
.071
)aKL
(lnK
)(l
nL
)2
0.12
6(2
5.40
6)2
0.12
5(2
5.34
1)2
0.12
7(2
5.54
9)2
0.13
2(2
5.53
6)a
ISO
x IS
O–
20.
003
(20.
083)
20.
003
(20.
091)
–Inefficiency
model
d0
Con
stan
t2
2.71
6(2
5.35
8)2
2.83
4(2
5.29
4)2
2.54
4(2
5.67
1)2
2.20
0(2
5.61
1)d
ISO
z IS
O–
–2
2.11
2(2
7.33
3)2
2.11
0(2
4.13
1)d
1L
OC
20.
110
(21.
000)
20.
099
(20.
818)
0.01
4(0
.014
2)0.
035
(0.3
04)
d2
EX
P0.
233
(2.1
42)
0.25
0(2
.017
)0.
354
(3.6
62)
0.34
0(3
.313
)d
3D
BO
A2
2.40
0(2
20.7
97)
22.
407
(224
.023
)2
2.40
2(2
23.0
88)
22.
382
(223
.689
)d
4C
AP
0.00
0*
(3.5
24)
0.00
0*
(3.5
26)
0.00
0*
(3.4
21)
0.00
0*
(2.6
63)
d5
FIX
4.29
6(1
0.93
9)4.
375
(10.
385)
4.12
6(1
0.39
6)4.
089
(12.
589)
d6
DB
TA
20.
003
(20.
331)
20.
003
(20.
426)
20.
010
(21.
387)
0.00
0*
(20.
076)
d7
PR
MG
20.
033
(26.
427)
20.
032
(26.
462)
20.
031
(26.
107)
20.
031
(26.
092)
d8
RO
A2
5.81
0(1
0.66
4)2
5.93
0(2
9.53
7)2
5.34
4(2
11.0
88)
25.
422
(212
.107
)
(continued
)
Table V.Maximum likelihood
estimates for models C, D,I and F
Effects of ISO9001
1159
Coe
ffici
ent
esti
mat
esan
dt-
val
ues
for:
Mod
elC
Mod
elD
Mod
elI
Mod
elF
Coe
f-fi
cien
tV
aria
ble
Pro
du
ctio
nfr
onti
er
d9
FD
D2
0.43
4(2
3.33
8)2
0.44
7(2
3.30
5)2
0.67
7(2
4.20
1)2
0.67
5(2
4.13
5)d
10
MC
D0.
170
(0.8
30)
0.12
0(0
.473
)2
0.11
3(2
0.44
7)0.
192
(0.7
79)
dIS
O;1
x IS
OL
OC
––
20.
032
(0.7
66)
–d
ISO;2
x IS
OE
XP
––
0.09
5(1
.762
)–
dIS
O;3
x IS
OD
BO
A–
–0.
004
(0.5
52)
–d
ISO;4
x IS
OC
AP
––
0.00
0*
(1.0
32)
–d
ISO;5
x IS
OF
IX–
–1.
433
(2.8
87)
–d
ISO;6
x IS
OD
BT
A–
–2
0.01
2(2
0.21
2)–
dIS
O;7
x IS
OP
RM
G–
–0.
012
(0.1
18)
–d
ISO;8
x IS
OR
OA
––
22.
012
(1.1
13)
2d
ISO;K
z IS
OK
––
1.38
44(8
.072
)1.
450
(9.3
77)
dIS
O;L
z IS
OL
––
22.
212
(29.
003)
22.
024
(28.
909)
LogL
21,
344.
059
21,
344.
028
21,
306.
542
21,
308.
002
s2
1.66
1(1
0.14
2)1.
690
(11.
089)
1.71
8(1
2.04
2)1.
536
(11.
633)
g0.
903
(84.
488)
0.90
5(8
7.75
3)0.
907
(81.
008)
0.89
2(7
9.29
8)L
Rte
stof
the
one-
sid
eder
ror
685.
023
682.
751
712.
562
735.
136
N1,
572
1,57
21,
572
1,57
2
Note:
* Act
ual
lysm
alle
rth
an0.
001
Table V.
IJOPM26,10
1160
discuss briefly the effects of non-ISO-related IFs, and then we will provide a briefexposition of the ISO-related factor. Three variables capturing financial characteristicsof a firm, namely the ratio of debt to total assets (DBTA), the profit margins (PRMG),and the returns on assets (ROA) affect the inefficiency level. The influence of DBTA onthe technical inefficiency of firms is negative. The negative effect means that firmswhich use financial resources, increasing in this way the ratio of the DBTA, undertakehard or soft investment projects that improve the level of the firms’ technical efficiency.The positive influence of PRMG on technical efficiency scores may be attributed to theexistence of some form of market power that the firms possess and exert throughinnovation activities which, in turn, improve the firms’ technical efficiency. The ROAvariable exercises the same effects on technical inefficiency as the PRMG variable.
On the other hand, technical efficiency of firms is negatively affected by exportingactivities (EXP), capital intensity (CAP) and the ratio of fixed to total assets (FIX). Ithas been shown, especially for Greek manufacturing firms (Tsekouras and Skuras,2005), that firms which exhibit intensive exporting activities may be either highlyefficient or inefficient. In the present case study, inefficient firms attempt to reduceinefficiency by acquiring knowledge from foreign markets. The interpretation of thenegative influence of the capital to labor ratio (CAP) and of the fixed to total assetsratio (FIX) on technical efficiency firms may be explained by the fixed- or quasi-fixedinfluence of the inputs on flexibility of a firm to adjust its input mix in exogenouschanges. In other words, this effect captures the cost of adjustment, in terms of loss ofproduction, which the quasi-fixed inputs, such as the capital input, may impose on afirm’s efficiency level when exogenous changes take place (Coelli et al., 2002).
The adoption of ISO 9001 affects inefficiency autonomously (through the dISO
coefficient) and in combination with capital ðdISO;KÞ and labor ðdISO;LÞ separately. Thehighly significant and negative sign of the dISO coefficient implies an autonomousreduction of managerial inefficiency due to ISO 9001 adoption. In the same model, thepositive and statistically significant dISO;K coefficient implies that the effect of ISO 9001adoption combined with capital increases managerial inefficiency. Thus, the largerthe size of the firm in terms of capital, the larger the managerial inefficiencywhen ISO 9001 is adopted. This negative result may be due to the costs imposed by theISO 9001 norms and the concern with capital asset maintenance. In other words, theadoption of ISO 9001 demands that specific maintenance and repairing works takeplace more frequently than before the introduction of ISO 9001. More frequent capitalmaintenance increases the cost in terms of output loss and, in a sense, is directlyanalogous to adjustment costs when new processes are introduced in firms with largeinvested capital (Callan, 1987).
In contrast to the positive significant coefficient dISO;K ; the negative and statisticallysignificant coefficient dISO;L implies that the combined effect of ISO 9001 adoption inrelation to labor reduces managerial inefficiency. Thus, the larger the size of the firm interms of labor, the higher the reduction in terms of managerial inefficiency that isachieved when ISO 9001 is adopted. Leibenstein (1966) coined the term x-inefficiencyfor the situation in which more labor time is being used in a given production processthan is actually necessary. One of the greatest challenges for both employers andmanagers is to reduce x-inefficiency by making operations more efficient. Here, weprovide a clear indication of the adoption of ISO 9001 working towards reducing
Effects of ISO9001
1161
x-inefficiency by having significant non-neutral effects on labor, i.e. effects as a factorreducing managerial inefficiency when combined with labor of a firm.
Conclusions and managerial policy implicationsIn the present work we attempted to look into the exact effects of ISO 9001 adoption ina production frontier framework. The adoption of ISO 9001 as a form of managerialorganization can have either three distinct effects or no effect on the productionprocess. Firstly, the adoption of ISO 9001 may affect the production process as amanagerial input to the production process just like capital and labor. Secondly, theadoption of ISO 9001 may affect the production process as a factor reducingmanagerial inefficiency. Thirdly, the adoption of ISO 9001 may affect the productionprocess as a managerial input to the production process and, at the same time, as afactor reducing managerial inefficiency. When the adoption of ISO 9001 operates as afactor reducing inefficiency, our methodology allows ISO 9001 to exercise non-neutraleffects on the factors of production.
Our research results provide a clear rejection of the arguments put forth by ISO’sopponents. All models with ISO, i.e. ISO as a factor of production or as a factoraffecting inefficiency, are statistically superior to the models without ISO, leading us toaccept that the ISO/on position models the production process better than the ISO/offposition. Furthermore, we find that ISO is really a factor affecting managerialinefficiency and not a completely new managerial factor of production. Moreover, theoverall ISO’s effects on managerial inefficiency are negative indicating that theadoption of ISO reduces managerial inefficiency. Speaking in terms of a productionfrontier graph, the effects of ISO 9001 as a factor affecting inefficiency may be capturedby the re-position of a single firm closer to the frontier, if ISO reduces inefficiency, or,away from the frontier if ISO is a paper-driven process increasing inefficiency.
Going deeper into the exact effects of ISO’s adoption on managerial inefficiency wefind that ISO exerts differential effects on capital and labor. In firms depending largelyon capital assets, ISO’s adoption increases managerial inefficiency, a finding indicatingthat the adoption of the ISO process increases “adjustment costs.” In firms dependingmore on labour, ISO’s adoption reduces managerial inefficiency, a finding indicating, inthe most definitive way to date, that the adoption of ISO is a form of managerialorganization reducing x-inefficiencies. The work of Molina et al. (2004) stressed theimportance of ISO 9000 effects on knowledge transferability and knowledge transfers.A recent study by Naveh et al. (2004) revealed that learning is a more important factorthan timing in explaining ISO 9000 performance. High levels of firm performance aredue to learning from own experience or from the experience of others (Naveh et al.,2004). Thus, knowledge transfer and learning may be one very important factorreducing x-inefficiency and a very important path of future research.
If the adoption of ISO 9001 is considered as a new input, then the implications ofISO adoption are equivalent to the implications caused by reengineering a firm’soperation. Reengineering a firm’s operation would imply a different use of input mix,and the subsequent improvement of the firm’s production performance. Speaking interms of a production frontier graph, the adoption of ISO 9001 as a new productioninput, would cause the parallel outward movement of the frontier in the case ISO’sadoption had neutral effects (neutral technical change) and the non-parallel outwardmovement in the case ISO’s adoption had non-neutral effects (biased technical change).
IJOPM26,10
1162
In other words, total technical change may be decomposed in two parts from which oneowns to the adoption of ISO as a new production input.
Future research in the framework of the present work may examine two issues.Firstly, there is evidence that the adoption of ISO does not really operate as a factor ofproduction, i.e. a managerial input, because the processes of ISO are not a coherent andintegrated TQM form of organization. Secondly, future research should be directed intomapping the exact effects of ISO’s adoption as a factor increasing “adjustment costs”and reducing “x-inefficiencies.” In this respect we think that detailed case studyanalysis will provide best practice examples of firms and management which havesuccessfully confronted “adjustment costs” and have maximized the positive effects on“x-inefficiency.”
References
Adam, E., Corbett, L., Flores, B., Harrison, N., Lee, T., Rho, B-H., Ribera, J., Samson, D. andWestbrook, R. (1997), “An international study of quality improvement approach and firmperformance”, International Journal of Operations & Production Management, Vol. 17No. 9, pp. 842-73.
Adams, M. (1999), “Determinants of ISO accreditation in the New Zealand manufacturingsector”, OMEGA, Vol. 27 No. 2, pp. 285-92.
Battese, G.E. and Broca, S.S. (1997), “Functional forms of stochastic frontier production functionsand models for technical inefficiency effects: a comparative study for wheat farmers inPakistan”, Journal of Productivity Analysis, Vol. 8, pp. 395-414.
Battese, G. and Coelli, T. (1992), “Frontier production functions, technical efficiency and paneldata: with application to paddy farmers in India”, Journal of Productivity Analysis, Vol. 3Nos 1/2, pp. 153-69.
Battese, G.E. and Coelli, T. (1995), “A model for technical inefficiency effects in a stochasticfrontier production function for panel data”, Empirical Economics, Vol. 20, pp. 325-32.
Battese, G. and Corra, G. (1977), “Estimation of a production frontier model: with application tothe pastoral zone of Eastern Australia”, Australian Journal of Agricultural Economics,Vol. 21 No. 3, pp. 169-79.
Callan, S.J. (1987), “Productivity growth from total and variable cost functions: an application toelectric utilities”, in Moroney, J.R. (Ed.), Advances in the Economics of Energy andResources,Vol. 6, JAI Press, Greenwich, CT, pp. 1-16.
Casadesus, M. and Karapetrovic, S. (2005), “Has ISO 9000 lost some of its lustre? A longitudinalimpact study”, International Journal of Operations & Production Management, Vol. 25No. 6, pp. 580-96.
Coelli, T., Tatje, E. and Perelman, S. (2002), “Capacity utilisation and profitability: adecomposition of short-run profit efficiency”, International Journal of ProductionEconomics, Vol. 79 No. 3, pp. 261-78.
Curkovic, S. and Handfield, R.B. (1996), “Use of ISO 9000 and Baldrige Award criteria in supplierquality evaluation”, International Journal of Purchasing &Materials Management, Spring,pp. 2-11.
Curkovic, S. and Pagell, M. (1999), “A critical examination of the ability of ISO 9000 certificationto lead to a competitive advantage”, Journal of Quality Management, Vol. 4 No. 1, pp. 51-67.
Deming, W.E. (1986), Out of the Crisis, MIT Centre for Advanced Engineering Study, Cambridge,MA.
Effects of ISO9001
1163
Dimara, E., Tsekouras, K., Skuras, D. and Goutsos, S. (2004), “Strategic orientation and financialperformance of firms implementing ISO 9000”, International Journal of Quality &Reliability Management, Vol. 21 No. 1, pp. 72-89.
Efstratiadis, M., Karirti, A. and Arvanitoyannis, I. (2000), “Implementation of ISO 9000 to thefood industry: an overview”, International Journal of Food Sciences and Nutrition, Vol. 51,pp. 459-73.
Escanciano, C., Fernandez, E. and Vazquez, C. (2001), “Influence of ISO 9000 certification on theprogress of Spanish industry towards TQM”, International Journal of Reliability andQuality Management, Vol. 18 No. 5, pp. 481-94.
Forker, L., Vickery, S. and Droge, C. (1996), “The contribution of quality to businessperformance”, International Journal of Operations & Production Management, Vol. 16No. 8, pp. 44-62.
Gotzamani, K. and Tsiotras, G. (2002), “The true motives behind ISO 9000 certification”,International Journal of Quality & Reliability Management, Vol. 19 No. 2, pp. 151-69.
Grigg, N. and McAlinden, C. (2001), “A new role for ISO 9000 in the food industry? Indicative datafrom the UK and mainland Europe”, British Food Journal, Vol. 103 No. 9, pp. 644-56.
Holleran, E., Bredahl, M.E. and Zaibet, L. (1999), “Private incentives for adopting food safety andquality assurance”, Food Policy, Vol. 24 No. 6, pp. 669-83.
Huang, C.J. and Liu, J.T. (1994), “Estimation of a non neutral stochastic frontier function”, Journalof Productivity Analysis, Vol. 5, pp. 171-80.
Inshikawa, K. (1986), Guide to Quality Control, Kraus International Publications, New York, NY.
Juran, J. (1982), Upper Management and Quality, Juran Institute Inc., New York, NY.
Kodde, D.A. and Palm, F.C. (1986), “Wald criteria for jointly testing equality and inequalityrestrictions”, Econometrica, Vol. 54, pp. 1243-8.
Kumbhakar, S. and Lovell, C.A.K. (2000), Stochastic Frontier Analysis, Cambridge UniversityPress, Cambridge.
Lagodimos, A.G., Dervitsiotis, K.N. and Kirkagaslis, S.E. (2005), “The penetration of ISO 9000certification in Greek industries”, Total Quality Management, Vol. 16 No. 4, pp. 505-27.
Leibenstein, H. (1966), “Allocative efficiency vs. x-inefficiency”, The American Economic Review,Vol. 56 No. 3, pp. 392-415.
Lima, M.A.M., Resende, M. and Hasenclever, L. (2000), “Quality certification and performance ofBrazilian firms: an empirical study”, International Journal of Production Economics, Vol. 66No. 2, pp. 143-7.
Molina, L.M., Montes, F.J.L. and Fuentes, M. (2004), “TQM and ISO 9000 effects on knowledgetransferability and knowledge transfers”, Total Quality Management, Vol. 15 No. 7,pp. 1001-15.
Naveh, E., Marcus, A. and Moon, H.K. (2004), “Implementing ISO 9000: performanceimprovement by first or second movers”, International Journal of Production Research,Vol. 42 No. 9, pp. 1843-63.
Reincheld, F.F. and Sasser, J. (1990), “Zero defections: quality comes to services”, HarvardBusiness Review, September-October, pp. 105-11.
Rothery, B. (1992), ISO 9000, Gower, Aldershot.
Santos, L. and Escanciano, C. (2002), “Benefits of the ISO 9000:1994 system”, InternationalJournal of Reliability and Quality Management, Vol. 19 No. 3, pp. 321-34.
IJOPM26,10
1164
Stashevsky, S. and Elizur, D. (2000), “The effect of quality management and participation indecision-making on individual performance”, Journal of Quality Management, Vol. 5 No. 1,pp. 53-65.
Stevenson, R.E. (1980), “Likelihood functions for generalized stochastic frontier estimation”,Journal of Econometrics, Vol. 13 No. 1, pp. 57-66.
Terziovski, M., Samson, D. and Dow, D. (1997), “The business value of quality managementsystems certification evidence from Australia and New Zealand”, Journal of OperationsManagement, Vol. 15 No. 1, pp. 1-18.
Tsekouras, K., Dimara, E. and Skuras, D. (2002), “Adoption of a quality assurance scheme and itseffect on firm performance: a study of Greek firms implementing ISO 9000”, Total QualityManagement Journal, Vol. 13, pp. 827-41.
Tsekouras, K. and Skuras, D. (2005), “Productive efficiency and exports: an examination ofalternative hypotheses for the Greek cement industry”, Applied Economics, Vol. 37,pp. 279-91.
Uzumeri, M.V. (1997), “ISO 9000 and other metastrands: principles for management practice?”,Academy of Management Executive, Vol. 11 No. 1, pp. 21-36.
Vloeberghs, D. and Bellens, J. (1996), “ISO 9000 in Belgium: experience of Belgian qualitymanagers and HRM”, European Management Journal, Vol. 14, pp. 207-11.
Withers, B. and Ebrahimpour, M. (2000), “Does ISO 9000 certification affect the dimensions ofquality used for competitive advantage?”, European Management Journal, Vol. 18 No. 4,pp. 431-43.
Yahya, S. and Goh, W-K. (2001), “The implementation of an ISO 9000 quality system”,International Journal of Quality and Reliability, Vol. 18 No. 9, pp. 941-66.
Corresponding authorDimitris Skuras can be contacted at: [email protected]
Effects of ISO9001
1165
To purchase reprints of this article please e-mail: [email protected] visit our web site for further details: www.emeraldinsight.com/reprints


