Embed Size (px)
Citation preview
THE EFFECTS OF VARYING MATERNAL
DIETARY FAT QUANTITY AND COMPOSITION
ON DISEASE PROGRAMMING IN THE
OFFSPRING: A FOCUS ON ESSENTIAL FATTY
ACIDS
Sally A V Draycott
B.Sc. (Hons)
A thesis submitted jointly to the University of Nottingham and the
University of Adelaide in the fulfillment of the requirements for degree
of Doctor of Philosophy
Division of Food, Nutrition and Dietetics (University of Nottingham)
Division of Agriculture, Food and Wine (University of Adelaide)
September 2019
I
FOREWORD
This thesis contains original research in a style accepted for or suitable for publication.
As such, results chapters are in the format of a manuscript each containing their own
introduction, methods, results and discussion sections. Due to the succinctness of the
methods sections prepared for manuscripts, a detailed methods section has also been
included as a standalone chapter. Where applicable, manuscripts in their published or
accepted format have been included as an appendix.

II
ACKNOWLEDGEMENTS
It is only through hearing stories from others that I realise just how lucky I have been.
Bev, Simon and Matt, firstly I can’t thank you enough for taking a chance and giving
this PhD opportunity to someone fresh out of their undergraduate degree. Your support
over the years has been overwhelming. The support with animal work, meticulous
checking, constructive comments and advice on paper drafts, travel grants, conference
abstracts, data analysis and presentations have shaped me into a better scientist and
writer. The opportunities you have openly and generously supported to travel the world
and to see so much more of what is in it have shaped me as person. Working under
your supervision has only enhanced my desire to pursue a career in scientific research
and I can honestly say I have enjoyed every moment of this PhD. I know how fortunate
I have been to complete this PhD with that feeling.
A huge thanks is also owed to all of the staff and colleagues at both the University of
Nottingham and the University of Adelaide for creating such a supportive and
welcoming environment to work in, there are simply too many of you to name. I have
worked in two departments, both of which I have felt very lucky to have been a part
of and I can only hope that this continues to be the case wherever I may end up in the
future.
I would like to take this opportunity to particularly thank Grace George, Zoe Daniel
and Simon Welham. Grace, a rat wasn’t something I knew how to handle until you
showed me. Zoe, a PCR plate wasn’t something I knew how to load until you taught
me how. Simon, a PhD wasn’t something I ever thought I could achieve and I wouldn’t
have attempted it if it wasn’t for the encouragement and confidence you instilled in
me throughout a short summer placement.
Special gratitude will always go to my family. No matter what I do in my professional
career you will always provide me with laughter, perspective and purpose.
Finally, I would like to respectfully acknowledge the contribution made by the
laboratory rats for the completion of this research.
III
CONTENTS
FOREWORD........................................................................................................................... I
ACKNOWLEDGEMENTS ................................................................................................. II
CONTENTS.......................................................................................................................... III
TABLES AND FIGURES ................................................................................................. VII
PUBLICATIONS ARISING FROM THIS THESIS ...................................................... XII
RELATED PUBLICATIONS .......................................................................................... XIII
LIST OF ABBREVIATIONS .......................................................................................... XIV
ABSTRACT ....................................................................................................................... XVI
VISUAL ABSTRACT .................................................................................................... XVIII
1. INTRODUCTION .............................................................................................................. 1
1.1 Obesity ..................................................................................................................... 1
1.1.1 Definitions and classifications ......................................................................... 1
1.1.2 Prevalence of obesity and future projections ................................................... 1
1.1.3 Causes: a nutritional perspective ...................................................................... 2
1.1.4 Health consequences of overweight and obesity ............................................. 3
1.2 Developmental origins of health and disease (DOHaD) .......................................... 5
1.2.1 An introduction to the DOHaD hypothesis ...................................................... 5
1.3 Fetal origins of obesity ........................................................................................... 13
1.3.1 Placental influence on nutrient transfer.......................................................... 14
1.4 Adipose tissue development, maintenance and function ....................................... 15
1.4.1 Types of adipose tissue, function and morphology ........................................ 15
1.4.2 White adipose tissue (WAT) development .................................................... 17
1.4.3 Lipogenesis and lipolysis ............................................................................... 19
1.5 An introduction to dietary fatty acids .................................................................... 22
1.5.1 Types of dietary fatty acids ............................................................................ 22
1.5.2 Setting the scene for dietary PUFA ................................................................ 22
1.5.3 Current recommendations and intakes of dietary PUFA ............................... 23
1.5.4 Metabolism and function ............................................................................... 26
1.6 Fetal requirements for fatty acids and lipids .......................................................... 33
1.7 PUFA and associated disease risk .......................................................................... 34
1.7.1 Dietary PUFA and disease risk in adults........................................................ 34
1.7.2 Dietary PUFA and disease: A DOHaD perspective ....................................... 36
1.8 Objectives and hypotheses ..................................................................................... 39
IV
2. MATERIALS AND METHODS .................................................................................... 40
2.1 Animal Diets .......................................................................................................... 40
2.2 Animal Trial Designs ............................................................................................. 45
2.2.1 Trial I: Altered maternal diet and fetal outcomes .......................................... 45
2.2.2 Trial II: Altered maternal diet and offspring outcomes up to 8 weeks of age 47
2.3 Laboratory Methods ............................................................................................... 49
2.3.1 Lipid analysis ................................................................................................. 49
2.3.2 Gene expression analysis ............................................................................... 53
2.3.3 Assays ............................................................................................................ 58
3. MANUSCRIPT 1: THE ROLE OF MATERNAL DIETARY LA:ALA RATIO ON
FETAL AND PLACENTAL GROWTH ........................................................................... 66
3.1 Abstract .................................................................................................................. 67
3.2 Introduction ............................................................................................................ 68
3.3 Materials and Methods ........................................................................................... 70
3.3.1 Animals .......................................................................................................... 70
3.3.2 Diets ............................................................................................................... 70
3.3.3 Blood sample and tissue collection ................................................................ 71
3.3.4 Lipid extraction .............................................................................................. 71
3.3.5 Fatty acid methylation and analysis ............................................................... 72
3.3.6 Isolation of RNA, cDNA synthesis and reverse transcription quantitative real-
time PCR (RT-qPCR) .................................................................................... 72
3.3.7 Statistical analysis .......................................................................................... 73
3.4 Results .................................................................................................................... 74
3.4.1 Maternal food intake ...................................................................................... 74
3.4.2 Maternal fatty acid profile .............................................................................. 74
3.4.3 Maternal weight and body composition ......................................................... 75
3.4.4 Placental fatty acid profile ............................................................................. 75
3.4.5 Fetal whole blood fatty acid profile ............................................................... 76
3.4.6 Fetal and placental weight and hepatic gene expression ................................ 77
3.5 Discussion .............................................................................................................. 77
Tables and Figures ............................................................................................................. 82
4. MANUSCRIPT 2: THE EFFECT OF MATERNAL DIETARY FAT CONTENT
AND OMEGA-6 TO OMEGA-3 RATIO ON OFFSPRING GROWTH AND HEPATIC
GENE EXPRESSION IN THE RAT ................................................................................. 93
4.1 Abstract .................................................................................................................. 94
4.2 Introduction ............................................................................................................ 95
4.3 Materials and Methods ........................................................................................... 97
V
4.3.1 Animals .......................................................................................................... 97
4.3.2 Diets ............................................................................................................... 97
4.3.3 Blood sample and tissue collection ................................................................ 98
4.3.4 Fatty acid methylation and analysis ............................................................... 98
4.3.5 Isolation of RNA and cDNA synthesis and reverse transcription quantitative
real-time PCR (qRT-PCR) ............................................................................. 99
4.3.6 Determination of liver DNA, protein and glycogen content ........................ 100
4.3.7 Statistical analysis ........................................................................................ 100
4.4 Results .................................................................................................................. 100
4.4.1 Maternal dietary intakes ............................................................................... 100
4.4.2 Maternal fatty acid profile ............................................................................ 101
4.4.3 Maternal weight, body composition and gene expression ........................... 102
4.4.4 Birth outcomes and offspring bodyweights ................................................. 103
4.4.5 Offspring fatty acid profile .......................................................................... 103
4.4.6 Offspring organ weight and liver composition ............................................ 104
4.4.7 Hepatic gene expression ............................................................................... 104
4.5 Discussion ............................................................................................................ 105
4.6 Tables and Figures ............................................................................................... 111
5. MANUSCRIPT 3: OMEGA-6:OMEGA-3 FATTY ACID RATIO AND TOTAL FAT
CONTENT OF THE MATERNAL DIET ALTERS OFFSPRING GROWTH AND
FAT DEPOSITION IN THE RAT ................................................................................... 119
5.1 Abstract ................................................................................................................ 120
5.2 Introduction .......................................................................................................... 121
5.3 Materials and Methods ......................................................................................... 123
5.3.1 Animals ........................................................................................................ 123
5.3.2 Diets ............................................................................................................. 123
5.3.3 Tail cuff plethysmography ........................................................................... 124
5.3.4 Blood sample and tissue collection .............................................................. 124
5.3.5 Lipid extraction ............................................................................................ 125
5.3.6 Determination of circulating and hepatic lipids ........................................... 125
5.3.7 Fatty acid methylation and fatty acid analysis of whole blood and liver samples
...................................................................................................................... 125
5.3.8 Isolation of RNA and cDNA synthesis and reverse transcription quantitative
real-time PCR (qRT-PCR) ........................................................................... 125
5.3.9 Statistical analysis ........................................................................................ 126
5.4 Results .................................................................................................................. 127
5.4.1 Offspring bodyweight, body composition and blood pressure .................... 127
VI
5.4.2 Offspring whole blood and hepatic fatty acid profile .................................. 128
5.4.3 Circulating and hepatic lipid profile ............................................................ 129
5.4.4 Gene expression ........................................................................................... 129
5.5 Discussion ............................................................................................................ 130
5.6 Tables and Figures ............................................................................................... 136
6. MANUSCRIPT 4: EXPRESSION OF CHOLESTEROL PACKAGING AND
TRANSPORT GENES IN HUMAN AND RAT PLACENTA: IMPACT OF OBESITY
AND A HIGH FAT DIET ................................................................................................. 146
6.1 Abstract ................................................................................................................ 147
6.2 Introduction .......................................................................................................... 148
6.3 Materials and Methods ......................................................................................... 150
6.3.1 Animal Experiments and sample collection ................................................. 150
6.3.2 Human placental sample collection ............................................................. 151
6.3.3 Sample Preparation and PCR ....................................................................... 152
6.3.4 Statistical Analysis ....................................................................................... 153
6.4 Results .................................................................................................................. 153
6.4.1 Rat placenta .................................................................................................. 153
6.4.2 Human placenta............................................................................................ 154
6.5 Discussion ............................................................................................................ 154
6.6 Tables ................................................................................................................... 158
7. GENERAL DISCUSSION ............................................................................................ 162
8. REFERENCES ............................................................................................................... 171
Appendix A ......................................................................................................................... 204
Appendix B ......................................................................................................................... 205
Appendix C ......................................................................................................................... 206
Appendix D ......................................................................................................................... 207
Appendix E ......................................................................................................................... 208
Appendix F ......................................................................................................................... 209
VII
TABLES AND FIGURES
Figure 1.1 Diagrammatic representation of the thrifty phenotype hypothesis (Taken
from Hales and Barker (2001)) ............................................................................ 8
Figure 1.2 Summary of the predictive adaptive response hypothesis. Environmental
cues, such as maternal undernutrition, stimulate responses within the developing
offspring to ensure it is best suited for the postnatal environment. If the
postnatal environment matches the prenatal prediction then the individual is
well adapted and is at no greater disease risk. If there is a mismatch in the
predicted and actual postnatal environment then disease risk is increased in later
life (Adapted from Low et al. (2012)). .............................................................. 11
Figure 1.3 (Overleaf) Overview of de novo lipogenesis (DNL) which occurs in the
cytoplasm of most cells, particularly adipocytes and hepatocytes. Fatty acids are
produced via the synthesis of palmitic acid from metabolites produced in the
citric acid cycle. Dietary glucose and/or fatty acids are transported into cells via
their respective transporters where they can enter the citric acid cycle. Citrate is
converted in acetyl-CoA by ATP citrate lyase (ACLY). The two central
enzymes responsible for DNL, acetyl-CoA carboxylase (ACC) and fatty acid
synthase (FAS), then further synthesise palmitic acid (C16:0). A range of fatty
acids can then be made from palmitic acid through multi-step processes
requiring various different enzymes, one of which is the rate limiting enzyme
Stearoyl-CoA desaturase-1 (SCD1) which is responsible for the production of
monounsaturated fatty acids. The enzymes involved in DNL are under the
transcriptional control of sterol regulatory element-binding protein 1 (SREBP-
1c) due to the presence of SREBP response elements (SRE) in the promotor
regions of these genes. The biological activity of SREBP-1c relies on its
maturation and release from the membranes of the endoplasmic reticulum (ER)
and the Golgi apparatus. It is well understood that this process is inhibited by
sterols such as cholesterol, however, insulin (Soyal et al., 2015) as well as some
fatty acids (Xu et al., 2001) are also thought to regulate this process. (Adapted
from Song et al. (2018)). .................................................................................... 19
Figure 1.4 Temporal changes in (A) apparent consumption of linoleic acid in
Western countries and (B) linoleic acid (18:2n-6) and alpha-linolenic acid
VIII
(18:3n-3) content in mature breast milk of US women (taken from Ailhaud et al.
(2006)). ............................................................................................................... 25
Figure 1.5 (Overleaf) The metabolism of dietary linoleic acid (LA) and alpha-
linolenic acid (ALA) to long-chain fatty acid derivatives and eicosanoid
biosynthesis (adapted from Patterson et al. (2012) and Gibson et al. (2011))... 28
Figure 2.1 Schematic summary of animal trial I experimental design. *indicates
collection of a tail vein blood sample for measurement of circulating fatty acids.
............................................................................................................................ 46
Figure 2.2 Schematic summary of animal trial II experimental design. *indicates
collection of a tail vein blood sample for measurement of circulating fatty acids.
Where offspring were culled (at 1, 2, 4 and 8 weeks of age), one male and one
female were chosen at random from each litter. ................................................ 48
Figure 2.3 Example of dried blood spot (DBS) sample obtained from newborn rat
offspring on a PUFA-coat™ DBS collection card (Liu et al., 2014). ............... 51
Figure 2.4 Composite standard curve from four DNA assays. Data presented are
mean ± SD. ......................................................................................................... 59
Figure 2.5 Composite standard curve from four protein assays. Data presented are
mean ± SD. ......................................................................................................... 61
Figure 2.6 Composite standard curve from five glycogen assays. Data presented are
mean ± SD. ......................................................................................................... 63
Figure 2.7 Composite standard curve from eight cholesterol assays. Data presented
are mean ± SD. ................................................................................................... 64
Figure 2.8 Composite standard curve from eight triglyceride assays. Data presented
are mean ± SD. ................................................................................................... 65
Figure 3.1 Maternal average daily (A) food intake, (B) energy intake and (C) protein
intake before mating and up to day 20 of gestation fed on either a high LA (18%
fat) diet (closed circles), high LA (36% fat) diet (open circles), low LA (18%
fat) diet (closed squares) and a low LA (36% fat) diet (open squares). Values are
means ± SEM and n=5-7 per group. The effects of dietary fatty acid ratio and
dietary fat content were determined using a two-way repeated measures
ANOVA. * indicates a significant effect of dietary fat content (** P<0.01, ***
P<0.001). ............................................................................................................ 88
Figure 3.2 Maternal whole blood fatty acids profile at (A/B) baseline (C/D) after 4
weeks on experimental diet and (E/F) at day 20 of gestation. Values are means ±
IX
SEM and n=5-7 per group. The effects of dietary fatty acid ratio and dietary fat
content were determined using a two-way ANOVA (*P<0.05, **P<0.01,
***P<0.001). † indicates a significant interaction between dietary fat content
and LA:ALA ratio (P<0.05). .............................................................................. 88
Figure 3.3 Maternal weight gain of rats during pre-feeding and up to day 20 of
gestation fed on either a high LA (18% fat) diet (closed circles), high LA (36%
fat) diet (open circles), low LA (18% fat) diet (closed squares) and a low LA
(36% fat) diet (open squares). Values are means ± SEM and n=5-7 per group.
The effects of dietary fatty acid ratio and dietary fat content were determined
using a two-way repeated measures ANOVA and no significant differences
were found between groups. .............................................................................. 88
Figure 3.4 Placental (A/B) and fetal whole blood (C/D) fatty acid profile at
gestational day 20. Values are means ± SEM and n=10-14 per group. The
effects of maternal dietary fatty acid ratio and maternal dietary fat content were
determined using a two-way ANOVA (*P<0.05, **P<0.01, ***P<0.001). †
indicates a significant interaction between dietary fat content and LA:ALA ratio
(P<0.05). ............................................................................................................. 88
Figure 4.1 Maternal average daily (A) feed intake, (B) energy intake and (C) protein
intake during pre-feeding, pregnancy and lactation fed on either a high LA (18%
fat) diet (closed circles), high LA (36% fat) diet (open circles), low LA (18%
fat) diet (closed squares) and a low LA (36% fat) diet (open squares). Values are
means ± SEM and n=6-9 per group. The effects of dietary fatty acid ratio and
dietary fat content was determined using a two-way repeated measures
ANOVA. * indicates a significant effect of dietary fat content (** P<0.01, ***
P<0.001). † indicates a significant interaction between dietary fat content and
fatty acid ratio. ................................................................................................. 115
Figure 4.2 Maternal whole blood fatty acids profile at (A/B) baseline (C/D) after 4
weeks on experimental diet and (D/E) at the end of lactation (3 weeks post-
partum). Values are means ± SEM and n=6-9 per group. The effects of dietary
fatty acid ratio and dietary fat content were determined using a two-way
ANOVA (*P<0.05, **P<0.01, ***P<0.001). † indicates a significant interaction
effect (P<0.05). ................................................................................................ 115
Figure 4.3 Offspring whole blood fatty acids profile at (A/B) one week of age and
(C/D) at two weeks of age. Values are means ± SEM and n=11-17 per group.
X
The effects of maternal dietary fatty acid ratio, maternal dietary fat content and
sex were determined using a three-way ANOVA. No effect of sex was found for
any of the fatty acids measured and so male and female samples were combined
for further analysis. * Indicates significant difference (*P<0.05, **P<0.01,
***P<0.001). † indicates a significant interaction effect (P<0.05). ................. 115
Figure 5.1 Body weights of (A) male and (B) female offspring post-weaning up to 8
weeks of age exposed to either a high LA (18% fat) diet (closed circles), high
LA (36% fat) diet (open circles), low LA (18% fat) diet (closed squares) or a
low LA (36% fat) diet (open squares) during gestation and lactation. Offspring
weaned onto a chow diet. Values are means ± SEM and n =6–9 per group. The
effects of dietary fatty acid ratio and dietary fat content were determined using a
two-way repeated measures ANOVA and a significant effect of maternal dietary
fat content (P<0.0001) on body weight was observed for both male and female
offspring. .......................................................................................................... 141
Figure 5.2 Whole blood fatty acid profile in (A) male and (B) female offspring at 4
weeks of age. Values are means ± SEM and n=6-9 per group. The effects of
maternal dietary fatty acid ratio and maternal dietary fat content were
determined using a two-way ANOVA; all comparisons were made within sex
group. *Indicates significant difference (*P<0.05, **P<0.01, ***P<0.001). †
indicates a significant interaction effect (P<0.05). SFA, saturated fatty acid;
MUFA, monounsaturated fatty acid; LA, linoleic acid; AA, arachidonic acid;
ALA, alpha-linolenic acid; EPA, eicosapentaenoic acid; DPA,
docosapentaenoic acid; DHA, docosahexaenoic acid. ..................................... 141
Figure 5.3 Liver fatty acid profile in (A) male and (B) female offspring at 4 weeks of
age. Values are means ± SEM and n=6-9 per group. The effects of maternal
dietary fatty acid ratio and maternal dietary fat content were determined using a
two-way ANOVA; all comparisons were made within sex group. *Indicates
significant difference (*P<0.05, **P<0.01, ***P<0.001). SFA, saturated fatty
acid; MUFA, monounsaturated fatty acid; LA, linoleic acid; AA, arachidonic
acid; ALA, alpha-linolenic acid; EPA, eicosapentaenoic acid; DPA,
docosapentaenoic acid; DHA, docosahexaenoic acid. ..................................... 141
Figure 5.4 Offspring whole blood fatty acid profile in (A) male and (B) female
offspring at 8 weeks of age. Values are means ± SEM and n=6-9 per group. The
effects of maternal dietary fatty acid ratio and maternal dietary fat content were

XI
determined using a two-way ANOVA. All comparisons were made within sex
group. *Indicates significant difference (*P<0.05, **P<0.01, ***P<0.001).
SFA, saturated fatty acid; MUFA, monounsaturated fatty acid; LA, linoleic
acid; AA, arachidonic acid; ALA, alpha-linolenic acid; EPA, eicosapentaenoic
acid; DPA, docosapentaenoic acid; DHA, docosahexaenoic acid. .................. 141
Figure 7.1 Summary of main findings. ................................................................... 170
XII
PUBLICATIONS ARISING FROM THIS THESIS
Draycott, SAV, Liu, G, Daniel, ZC, Elmes, MJ, Muhlhausler, BS & Langley-Evans,
SC (2019). Maternal dietary ratio of linoleic acid to alpha-linolenic acid during
pregnancy has sex-specific effects on placental and fetal weights in the rat.
Nutrition & Metabolism, 16(1), 1.
Draycott, SAV, George, G, Elmes, MJ, Muhlhausler, BS & Langley-Evans, SC
(2020). The effect of maternal dietary fat content and omega-6 to omega-3 ratio on
offspring growth and hepatic gene expression in the rat. British Journal of
Nutrition, 1, 30.
Draycott, SAV, Daniel, Z, Khan, R, Muhlhausler, BS, Elmes, MJ & Langley-Evans,
SC (2019). Expression of cholesterol packaging and transport genes in human and
rat placenta: impact of obesity and a high-fat diet. J Dev Orig Health Dis, 1-6.
XIII
RELATED PUBLICATIONS
George, G, Draycott, SAV, Muir, R, Clifford, B, Elmes, MJ & Langley-Evans, SC
(2019). Exposure to maternal obesity during suckling outweighs in utero exposure
in programming for post-weaning adiposity and insulin resistance in rats. Scientific
Reports, 9(1), 10134.
George, G, Draycott, SAV, Muir, R, Clifford, B, Elmes, MJ & Langley-Evans, SC
(2019). The impact of exposure to cafeteria diet during pregnancy or lactation on
offspring growth and adiposity before weaning. Scientific Reports, (accepted
manuscript).
XIV
LIST OF ABBREVIATIONS
AA Arachidonic acid
ACC Acetyl-coA carboxylase
ALA Alpha-linolenic acid
BAT Brown adipose tissue
BMI Body mass index
C/EBP CCAAT/enhancer binding protein
CAD Coronary artery disease
cDNA Complementary deoxyribonucleic acid
CHD Coronary heart disease
COX Cyclooxygenases
CVD Cardiovascular disease
DBS Dried blood spot
DHA Docosahexaenoic acid
DNA Deoxyribonucleic acid
DNL De novo lipogenesis
DOHaD Developmental origins of health and disease
DPA Docosapentaenoic acid
ELOVL Elongation of very long chain fatty acids
EPA Eicosapentaenoic acid
FAME Fatty acid methyl ester
FAS/Fasn Fatty acid synthase
FID Flame ionisation detector
GC Gas chromatography
GH Growth hormone
GPDH Glycerol-3-phosphate dehydrogenase
HDL High-density lipoprotein
IGF Insulin-like growth factor
LA Linoleic acid
LCPUFA Long chain polyunsaturated fatty acid
LOX Lipoxygenases
LPL/Lpl Lipoprotein lipase
MetS Metabolic syndrome
XV
MUFA Monounsaturated fatty acid
NCD Non-communicable diseases
PAR Predictive adaptive response
PG Prostaglandin
PPAR Peroxisome proliferator activated receptor
PUFA Polyunsaturated fatty acid
qRT-PCR Quantitative real-time polymerase chain reaction
RNA Ribonucleic acid
RXR Retinoid X receptor
SCD Stearoyl-CoA desaturase
SFA Saturated fatty acid
SREBP-1c/Srebf1 Sterol regulatory element-binding protein (variant 1c)
TAG Triacylglycerol/triglyceride
TX Thromboxane
UCP1 Uncoupling protein 1
VPR Volume pressure recording
WAT White adipose tissue
WHO World Health Organisation
XVI
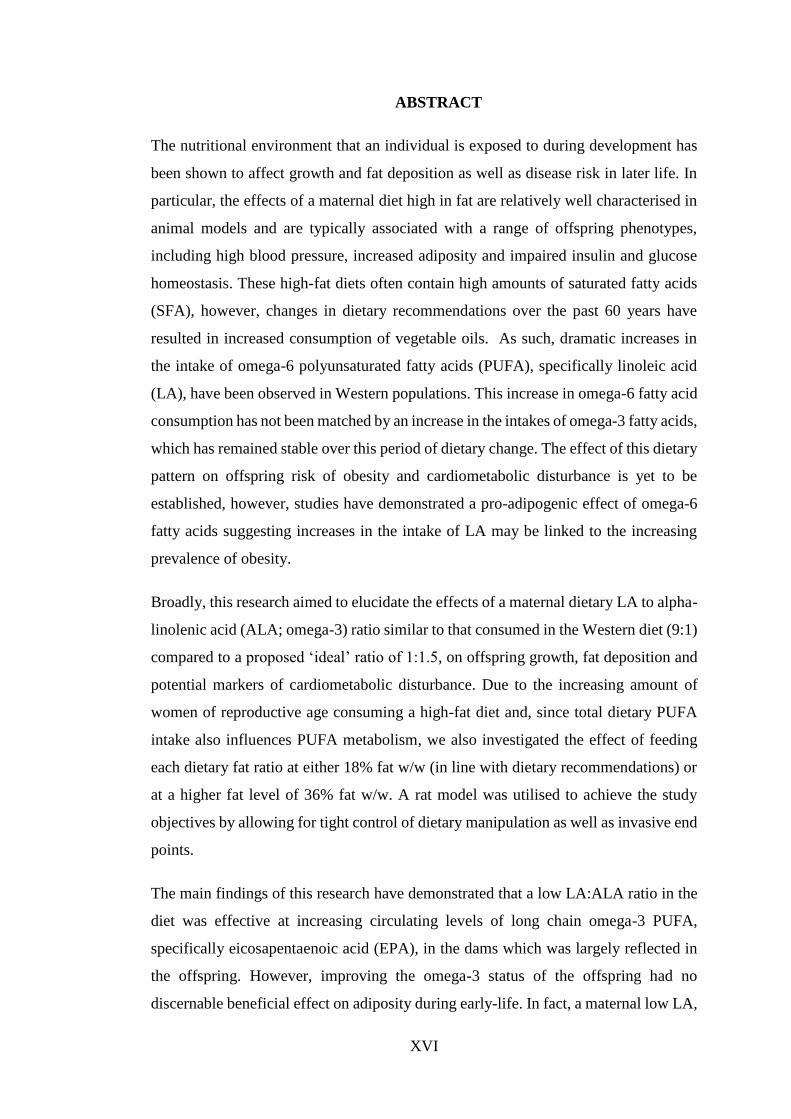
ABSTRACT
The nutritional environment that an individual is exposed to during development has
been shown to affect growth and fat deposition as well as disease risk in later life. In
particular, the effects of a maternal diet high in fat are relatively well characterised in
animal models and are typically associated with a range of offspring phenotypes,
including high blood pressure, increased adiposity and impaired insulin and glucose
homeostasis. These high-fat diets often contain high amounts of saturated fatty acids
(SFA), however, changes in dietary recommendations over the past 60 years have
resulted in increased consumption of vegetable oils. As such, dramatic increases in
the intake of omega-6 polyunsaturated fatty acids (PUFA), specifically linoleic acid
(LA), have been observed in Western populations. This increase in omega-6 fatty acid
consumption has not been matched by an increase in the intakes of omega-3 fatty acids,
which has remained stable over this period of dietary change. The effect of this dietary
pattern on offspring risk of obesity and cardiometabolic disturbance is yet to be
established, however, studies have demonstrated a pro-adipogenic effect of omega-6
fatty acids suggesting increases in the intake of LA may be linked to the increasing
prevalence of obesity.
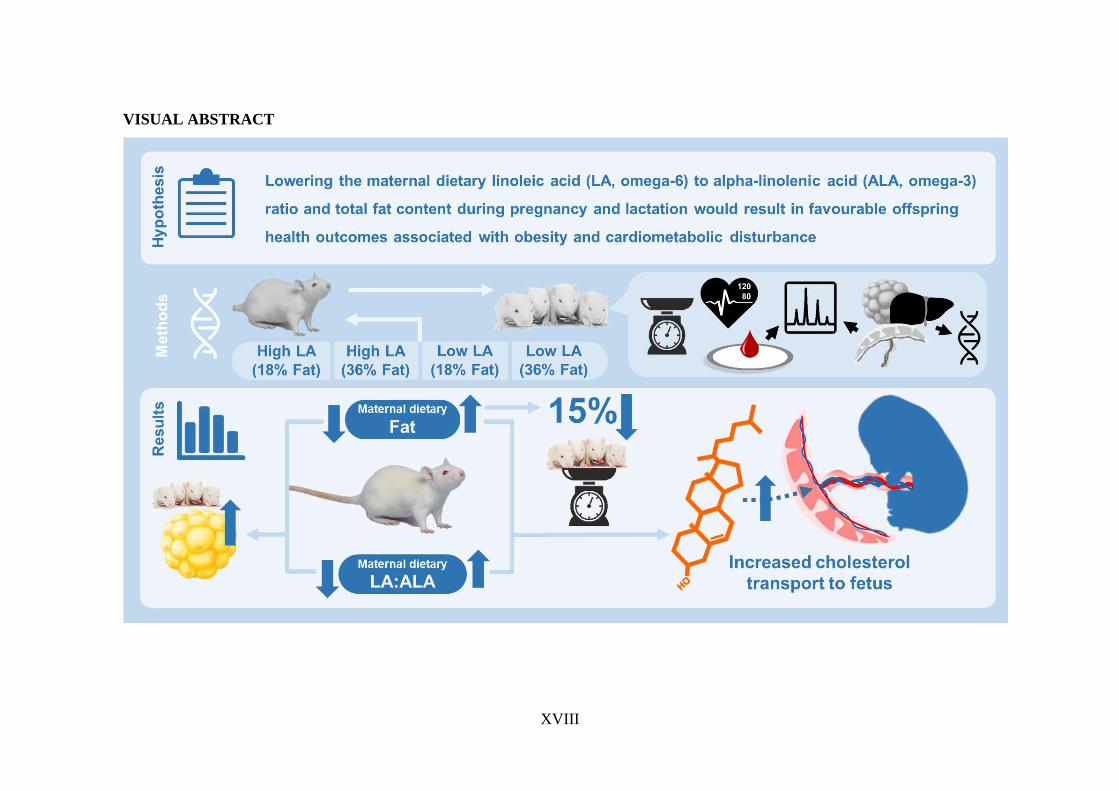
Broadly, this research aimed to elucidate the effects of a maternal dietary LA to alpha-
linolenic acid (ALA; omega-3) ratio similar to that consumed in the Western diet (9:1)
compared to a proposed ‘ideal’ ratio of 1:1.5, on offspring growth, fat deposition and
potential markers of cardiometabolic disturbance. Due to the increasing amount of
women of reproductive age consuming a high-fat diet and, since total dietary PUFA
intake also influences PUFA metabolism, we also investigated the effect of feeding
each dietary fat ratio at either 18% fat w/w (in line with dietary recommendations) or
at a higher fat level of 36% fat w/w. A rat model was utilised to achieve the study
objectives by allowing for tight control of dietary manipulation as well as invasive end
points.
The main findings of this research have demonstrated that a low LA:ALA ratio in the
diet was effective at increasing circulating levels of long chain omega-3 PUFA,
specifically eicosapentaenoic acid (EPA), in the dams which was largely reflected in
the offspring. However, improving the omega-3 status of the offspring had no
discernable beneficial effect on adiposity during early-life. In fact, a maternal low LA,
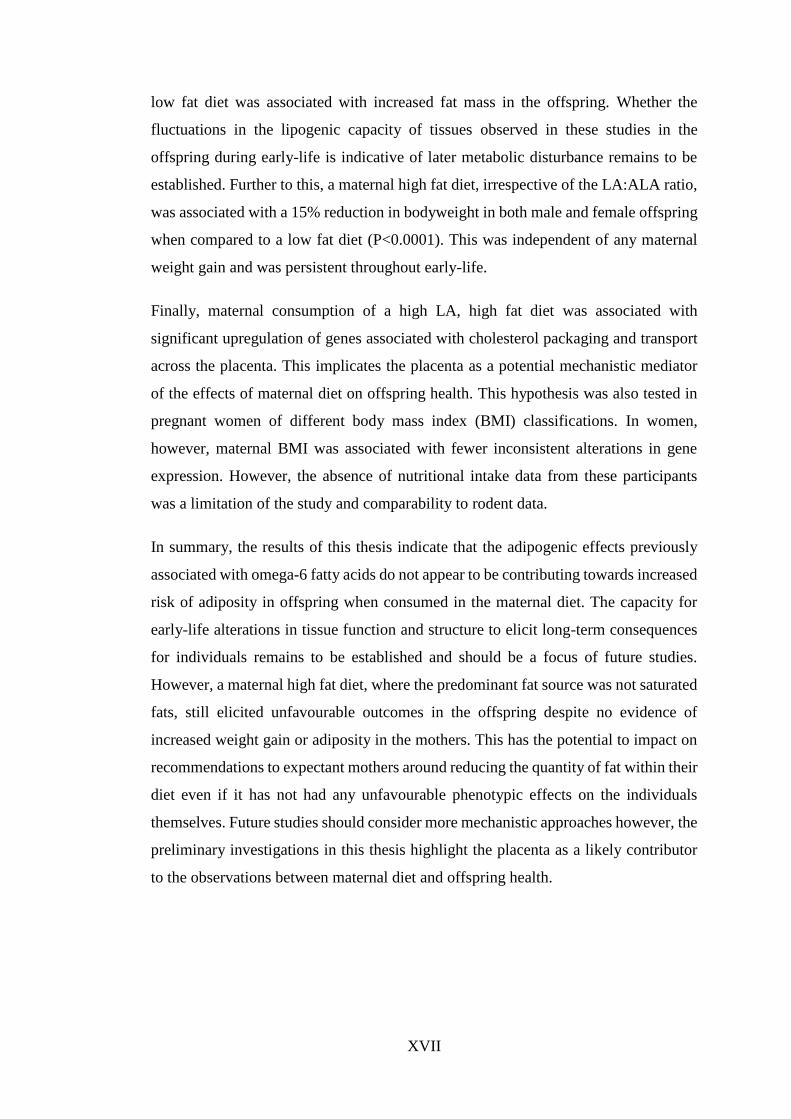
XVII
low fat diet was associated with increased fat mass in the offspring. Whether the
fluctuations in the lipogenic capacity of tissues observed in these studies in the
offspring during early-life is indicative of later metabolic disturbance remains to be
established. Further to this, a maternal high fat diet, irrespective of the LA:ALA ratio,
was associated with a 15% reduction in bodyweight in both male and female offspring
when compared to a low fat diet (P<0.0001). This was independent of any maternal
weight gain and was persistent throughout early-life.
Finally, maternal consumption of a high LA, high fat diet was associated with
significant upregulation of genes associated with cholesterol packaging and transport
across the placenta. This implicates the placenta as a potential mechanistic mediator
of the effects of maternal diet on offspring health. This hypothesis was also tested in
pregnant women of different body mass index (BMI) classifications. In women,
however, maternal BMI was associated with fewer inconsistent alterations in gene
expression. However, the absence of nutritional intake data from these participants
was a limitation of the study and comparability to rodent data.
In summary, the results of this thesis indicate that the adipogenic effects previously
associated with omega-6 fatty acids do not appear to be contributing towards increased
risk of adiposity in offspring when consumed in the maternal diet. The capacity for
early-life alterations in tissue function and structure to elicit long-term consequences
for individuals remains to be established and should be a focus of future studies.
However, a maternal high fat diet, where the predominant fat source was not saturated
fats, still elicited unfavourable outcomes in the offspring despite no evidence of
increased weight gain or adiposity in the mothers. This has the potential to impact on
recommendations to expectant mothers around reducing the quantity of fat within their
diet even if it has not had any unfavourable phenotypic effects on the individuals
themselves. Future studies should consider more mechanistic approaches however, the
preliminary investigations in this thesis highlight the placenta as a likely contributor
to the observations between maternal diet and offspring health.
XVIII
VISUAL ABSTRACT
1
1 INTRODUCTION
1.1 Obesity
1.1.1 Definitions and classifications
Overweight and obesity are defined by the World Health Organisation (WHO, 2017a)
as “abnormal or excessive fat accumulation that presents a risk to health”.
Measurement of a person’s body mass index (BMI), a formulation of weight divided
by height squared (kg/m2), remains the most common indicator of obesity in adults.
Current classifications state that an adult with a BMI 25-29.9 kg/m2 is considered
overweight and obese if their BMI ≥ 30 kg/m2 (WHO, 2017a). The use of BMI as an
inexpensive population measure is central to its widespread use, however, it does
possess limitations as a direct proxy for the estimation of obesity. BMI does not take
into account factors such as sex, age, ethnicity, all of which affect the balance of
muscle and fat in the body, or fat distribution. A study by Romero-Corral et al. (2008),
for example, showed that BMI underestimated obesity such that it failed to identify
50% of participants who were defined as obese through body fat percentage
measurements. The same study reported that BMI failed to discriminate between body
fat percentage and lean mass particularly in men and elderly participants, a common
criticism of the method (Frankenfield et al., 2001). As such, waist circumference and
body fat percentage are often used in conjunction with BMI for a more accurate
assessment of overweight or obesity in an individual (Burton, 2010). Due to the
confounding effect of developmental age on the relationship between weight and the
distribution of fat and muscle, and thus the accuracy of BMI measurements, they are
not used for the classification of overweight and obesity in children. Instead, reference
is made to population based measurements specific for age and sex and classification
is based on how many standard deviations an individual’s weight falls from the
population mean (WHO, 2017a).
1.1.2 Prevalence of obesity and future projections
Despite disagreements in the measurement criteria for the diagnosis of obesity, BMI
continues to be the gold-standard for adult diagnosis and the WHO estimated a
staggering 1.9 billion adults to be overweight or obese as of 2016 (WHO, 2017a). This
INTRODUCTION
2
largely preventable condition, previously considered an issue for high-income
countries, is now on the rise in low- and middle-income countries and is not only
affecting adults. Of increasing concern is that 41 million children under the age of 5
were estimated to be overweight or obese in 2016 (WHO, 2017a). Furthermore, the
prevalence of obesity worldwide continues to rise (Finucane et al., 2011) and, beyond
the individual health risks, places a huge social and economic burden on afflicted
countries.
Based on current trends, modelling estimates predict that over half of the UK
population could be overweight or obese by 2030, leading to an economic burden of
around £1.9-2 billion per year in healthcare costs associated with overweight and
obesity as well as its co-morbidities (Wang et al., 2011). More recent modelling
approaches have used available data from longitudinal studies in the US. Using these
data the researchers were able to simulate growth trajectories of children into
adulthood and predicted that, based on representative anthropometrics of the
population, the majority of children within the population (57.3%; based on 2016 data)
would be obese at the age of 35 years (Ward et al., 2017). Further to this, the same
study suggested that for roughly half of these individuals, the onset of obesity would
occur during childhood. Another study in the Australian population predicted that,
whilst the prevalence of overweight was likely to remain relatively steady until the
year 2025, the prevalence of obesity and severe obesity was predicted to rise to 35%
and 13% respectively during this time (Hayes et al., 2017). This equates to a respective
increase of 8% and 4% based on 2014-2015 data (Australian Institute of Health and
Welfare, 2017).
1.1.3 Causes: a nutritional perspective
The primary cause of obesity is an “energy imbalance between calories consumed and
calories expended” (WHO, 2017a). A positive energy balance is where energy intake
is greater than energy expenditure leading to increased energy storage within the body.
Prolonged exposure to a positive energy balance leads to weight gain and ultimately
to obesity. Whilst seemingly quite a simplistic explanation, it is important to note that
obesity is not merely a result of overindulgence and lack of physical activity. There
are many factors affecting an individual’s susceptibility to weight gain and obesity,
both biological (genetics, sex, age, and ethnicity) and environmental (e.g.
INTRODUCTION
3
socioeconomic status, stress), that should not be overlooked. Further to this, there
appears to be evidence to suggest that regulation of body weight is asymmetric (Müller
et al., 2010). Likely due to the more immediate threat to survival that undernutrition
possesses, stronger feedback mechanisms exist to restore normal energy balance in
states of undernutrition as opposed to overnutrition (Blundell and King, 1996).
Despite the complexity of obesity aetiology, prevention and treatment, nutritional
status and physical activity remain at the core of this issue and it is often through the
interference of nutritional status that other external factors associated with obesity act.
For example, many of the genes associated with a heritable predisposition to obesity
centre around hunger, satiety and food intake (O'Rahilly and Farooqi, 2008). Similarly,
the association between low socioeconomic status and increased incidence of obesity
appears to be due to unhealthier food choices driven by the cost of food items (Pechey
and Monsivais, 2016).
Whilst all macronutrients are essential to the diet and should not be excluded, excess
dietary fat has commonly been associated with weight gain and obesity (Bray et al.,
2002). Dietary fat has a higher energy density than protein and carbohydrate and,
whilst the storage of protein and carbohydrate is relatively limited, the capacity for fat
storage is virtually unlimited. Global increases in the incidence of overweight and
obesity can be attributed to many factors, although global shifts in dietary habits
tending towards an increased energy intake coupled with a decrease in physical activity
are often implicated as a primary cause.
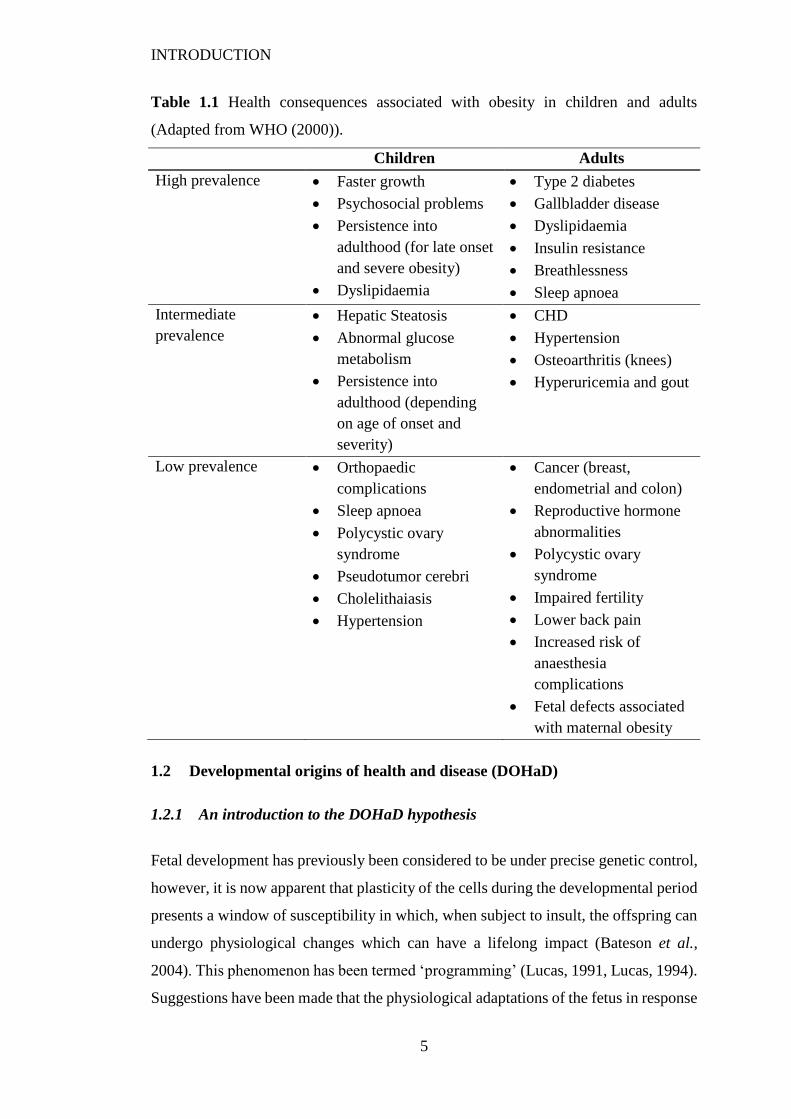
1.1.4 Health consequences of overweight and obesity
The health consequences associated with obesity are wide reaching, ranging from
increased risk of premature death to several non-fatal debilitating diseases and
psychological issues (Table 1.1). Whilst obesity is often considered a disease in its
own right, overweight and obesity are strongly associated with an increased risk of
type 2 diabetes (Resnick et al., 2000, Janssen, 2007), various cancers (Bianchini et al.,
2002) and the leading causes of death worldwide, coronary heart disease (CHD) and
stroke (Kenchaiah et al., 2002, WHO, 2017b). Obese individuals often present with
one or more co-morbidities including hypertension, glucose intolerance,
dyslipidaemia, hypertriglyceridemia and decreased high-density lipoprotein (HDL)
INTRODUCTION
4
cholesterol. The presence of at least three of these conditions in an individual is
referred to as the Metabolic Syndrome (MetS), and is associated with an increased risk
of type 2 diabetes (Galassi et al., 2006) and a 2-fold higher risk of a cardiovascular
event (Mottillo et al., 2010).
Several robust studies have reported a clear relationship between excessive body
weight and increased mortality (Adams et al., 2006, Berrington de Gonzalez et al.,
2010, Calle et al., 1999, Chen et al., 2013, Whitlock et al., 2009). A comprehensive
study by the Global Burden of Disease 2015 Obesity Collaborators systematically
investigated this association in 195 countries worldwide over a 25-year period (Afshin
et al., 2017). The authors of this study reported that over 4 million deaths worldwide
were accounted for by overweight and obesity in 2015, 70% of which were due to
cardiovascular disease (CVD).
Many of the co-morbidities associated with obesity in adults are now being observed
more commonly in children (Table 1.1). Further to this, it is estimated that 80% of
obese adolescents will continue to be obese in adulthood resulting in an increased risk
of the plethora of issues associated with adult obesity (Simmonds et al., 2016). Obesity
in adolescence has been directly linked to increased risk of death from CHD and
atherosclerosis, and this effect is independent of adult weight (Must et al., 1992).
However, more recent systematic reviews have highlighted that there is little evidence
to support childhood obesity as an independent risk factor for CVD (Lloyd et al., 2010)
and MetS (Lloyd et al., 2012) and, in fact, more adverse outcomes are observed when
individuals are of a normal, or even low, BMI during childhood and become obese in
adulthood. This highlights the complex relationship between early BMI and adult
disease risk and that targeting health management practices at overweight and obese
children only may result in the neglect of a high-risk group of individuals. Adult
obesity, however, is a major independent risk factor for an abundance of diseases and
childhood obesity is a major risk factor for adult obesity. As such, whilst it is important
to maintain interventions targeting weight loss and management in adults in order to
prevent the neglect of these high-risk groups, prevention in early life may be critical
to reducing this obesity epidemic.
INTRODUCTION
5
Table 1.1 Health consequences associated with obesity in children and adults
(Adapted from WHO (2000)).
Children Adults
High prevalence Faster growth
Psychosocial problems
Persistence into
adulthood (for late onset
and severe obesity)
Dyslipidaemia
Type 2 diabetes
Gallbladder disease
Dyslipidaemia
Insulin resistance
Breathlessness
Sleep apnoea
Intermediate
prevalence
Hepatic Steatosis
Abnormal glucose
metabolism
Persistence into
adulthood (depending
on age of onset and
severity)
CHD
Hypertension
Osteoarthritis (knees)
Hyperuricemia and gout
Low prevalence Orthopaedic
complications
Sleep apnoea
Polycystic ovary
syndrome
Pseudotumor cerebri
Cholelithaiasis
Hypertension
Cancer (breast,
endometrial and colon)
Reproductive hormone
abnormalities
Polycystic ovary
syndrome
Impaired fertility
Lower back pain
Increased risk of
anaesthesia
complications
Fetal defects associated
with maternal obesity
1.2 Developmental origins of health and disease (DOHaD)
1.2.1 An introduction to the DOHaD hypothesis
Fetal development has previously been considered to be under precise genetic control,
however, it is now apparent that plasticity of the cells during the developmental period
presents a window of susceptibility in which, when subject to insult, the offspring can
undergo physiological changes which can have a lifelong impact (Bateson et al.,
2004). This phenomenon has been termed ‘programming’ (Lucas, 1991, Lucas, 1994).
Suggestions have been made that the physiological adaptations of the fetus in response
INTRODUCTION
6
to changes in the intrauterine environment, such as alterations in the quality and
quantity of maternal nutrients, may result in changes in gene expression which can in
turn impact upon tissue structure. Owing to the fact that tissue structures are generally
in place at the time of birth, or shortly after, the impact of a relatively short period of
insult can potentially become permanent. This can in turn lead to a predisposition to
diseases in later life, and this concept forms the basis of the Developmental Origins of
Health and Disease (DOHaD) hypothesis, pioneered by the work of David Barker and
colleagues (Barker et al., 1990, Hales et al., 1991).
1.2.1.1 Evidence from epidemiological studies
Support for the DOHaD hypothesis was initially provided by epidemiological studies
investigating associations between early life factors and a range of diseases in later
life. Barker et al. (1989) found that in a group of men from Hertfordshire, all of whom
were born between 1911 and 1930, those with the lowest weights at birth and at one
year of age had the highest death rates from ischaemic heart disease. Further studies
in this population, as well as others, provided evidence of inverse associations between
birthweight and risk of hypertension (Barker et al., 1990), impaired glucose tolerance
(Hales et al., 1991) and type 2 diabetes (Barker et al., 1993). These findings were
supported by a series of studies on a group of men and women in Finland that also
found associations between low birthweight and increased risk of death from CHD
(Forsén et al., 1997, Forsen et al., 1999). In addition, the Finnish studies also
demonstrated that the highest risk of CHD was observed in those individuals who were
lighter at birth but had a greater body mass at 7 years of age (Eriksson et al., 1999).
As such, the theory emerged that a period of rapid ‘catch-up’ growth in early life
increased an individual’s risk of adverse outcomes.
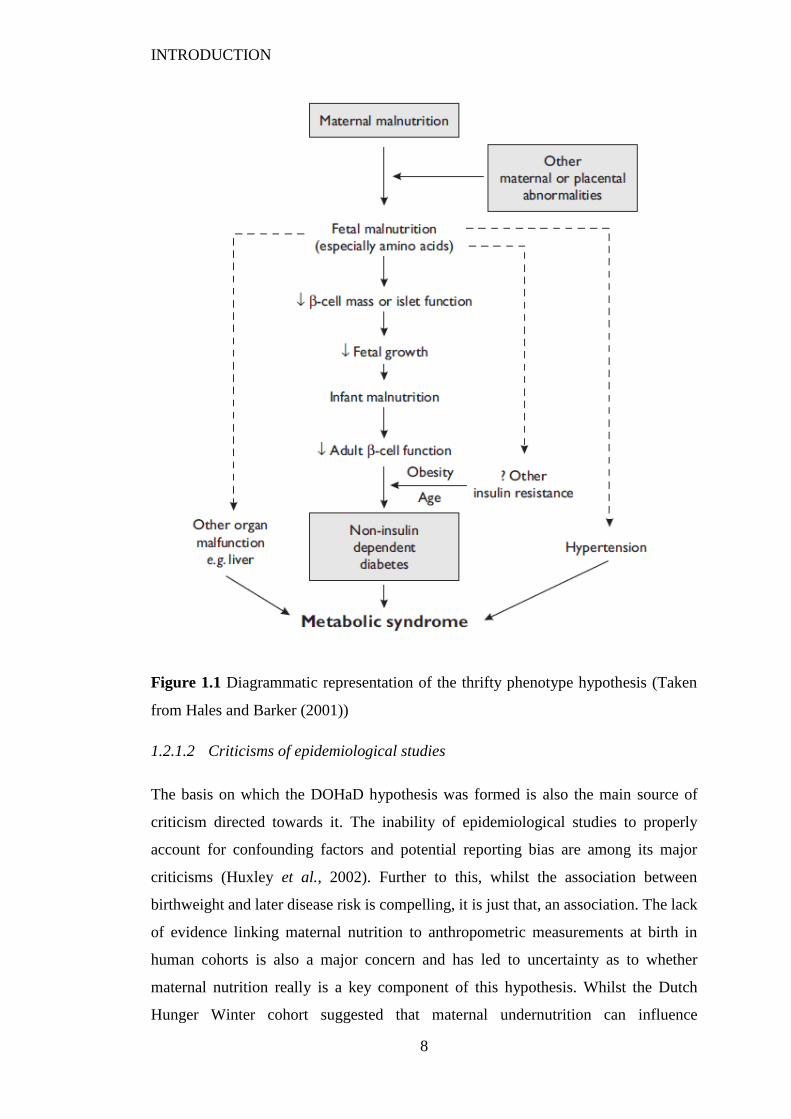
The emergence of further studies demonstrating this same association subsequently
led to ‘The Thrifty Phenotype’ hypothesis. Introduced by Hales and Barker (1992),
this hypothesis proposed that poor nutrition in early life was the driver for the
epidemiological association between poor fetal and infant growth and subsequent
development of type 2 diabetes. Essentially, poor nutrient supply from the mother
leads to adaptations within the fetus which protect the individual from the effects of a
low nutrient postnatal environment (Figure 1.1). It is naïve to think of this reduction
in birthweight as causal in the disease pathway as birthweight itself is a result of a
INTRODUCTION
7
combination of environmental and genetic factors during fetal life. Whilst reductions
in intrauterine growth can be attributed to many factors, including maternal stress
(Rice et al., 2010), smoking (Ward et al., 2007) and air pollution (Pedersen et al.,
2013), this hypothesis placed inadequate maternal nutrition as a key contributor.
The long-term effects of maternal malnutrition in humans are difficult to study
experimentally, however, a number of historical cohorts have provided important
‘natural’ experiments to demonstrate this phenomena. One of the most studied
populations is the Dutch Hunger Winter cohort. During the winter of 1944-1945,
western Holland was subject to severe food shortages for approximately 6 months, at
the height of which daily intake was reduced to just 400-800 calories. This ‘Dutch
Hunger Winter’ led to a cohort of offspring that had been exposed to severe maternal
undernutrition at different times in gestation. Retrospective studies of this cohort have
shown that men exposed to the famine in early gestation were more likely to become
obese in adulthood, whereas men exposed to the famine in late gestation were less
likely to become obese (Ravelli et al., 1976). Further studies of this cohort have
demonstrated that exposure to the famine in early gestation was also associated with
an atherogenic lipid profile (Roseboom et al., 2000). Several other famine cohorts have
been investigated and produced similar associations to those observed in the Dutch
Hunger Winter cohort (Hoffman et al., 2017). Taken together, these studies have
triggered a cascade of research investigating maternal dietary intake as a central driver
of the DOHaD hypothesis.
INTRODUCTION
8
Figure 1.1 Diagrammatic representation of the thrifty phenotype hypothesis (Taken
from Hales and Barker (2001))
1.2.1.2 Criticisms of epidemiological studies
The basis on which the DOHaD hypothesis was formed is also the main source of
criticism directed towards it. The inability of epidemiological studies to properly
account for confounding factors and potential reporting bias are among its major
criticisms (Huxley et al., 2002). Further to this, whilst the association between
birthweight and later disease risk is compelling, it is just that, an association. The lack
of evidence linking maternal nutrition to anthropometric measurements at birth in
human cohorts is also a major concern and has led to uncertainty as to whether
maternal nutrition really is a key component of this hypothesis. Whilst the Dutch
Hunger Winter cohort suggested that maternal undernutrition can influence
INTRODUCTION
9
birthweight, the dietary insult in these studies was severe whereas changes in
birthweight were not (Roseboom et al., 2001), raising questions as to how significant
an influence maternal nutrition actually has on fetal growth. Studies of well-nourished
populations have also shown that while changes in maternal dietary intakes are
associated with differences in birthweight, these differences are small and do not shift
birthweight outside the normal range (Englund-Ögge et al., 2018). It is important to
note, however, that the nature of DOHaD effects are inherently small, as large
perturbations in growth and metabolism are often lethal to the developing fetus. As
such small variations within the normal range may still be physiologically important.
Nonetheless, overcoming these criticisms required establishment of a direct link
between maternal nutrition and anthropometric birth measurements or to disease risk
in later life.
1.2.1.3 Evidence from animal models
Whilst epidemiological studies have highlighted a link between early life nutrition and
adverse health outcomes in humans, establishing causality is challenging as
experimental manipulation of the maternal diet during pregnancy is difficult and often
not ethically viable. As a result, animal models have been critical to our understanding
of the DOHaD hypothesis and provide significant advantages over epidemiological
studies. A range of animal models have been utilised, however, rodents are most
commonly used owing to their shorter lifespan and length of gestation, larger litter
size, the ability to test more specific hypotheses, and an increased degree of nutritional
and environmental control as well as the measurements of invasive end points
(McMullen and Mostyn, 2009b). To provide comparability with epidemiological
studies and in an attempt to establish a link between maternal nutrition and birthweight,
early studies investigated the effects of global nutrient restriction (Woodall et al.,
1996). These dietary interventions resulted in reduced offspring birthweight and were
associated with hypertension in later life, a key risk factor for CVD (Woodall et al.,
1996, Vickers et al., 2000). Studies investigating the impact of key nutrient
deficiencies, including protein (Langley and Jackson, 1994, Jackson et al., 2002) and
iron (Gambling et al., 2003), have also reported reductions in birthweights and
increased blood pressure in the offspring in later life.
INTRODUCTION
10
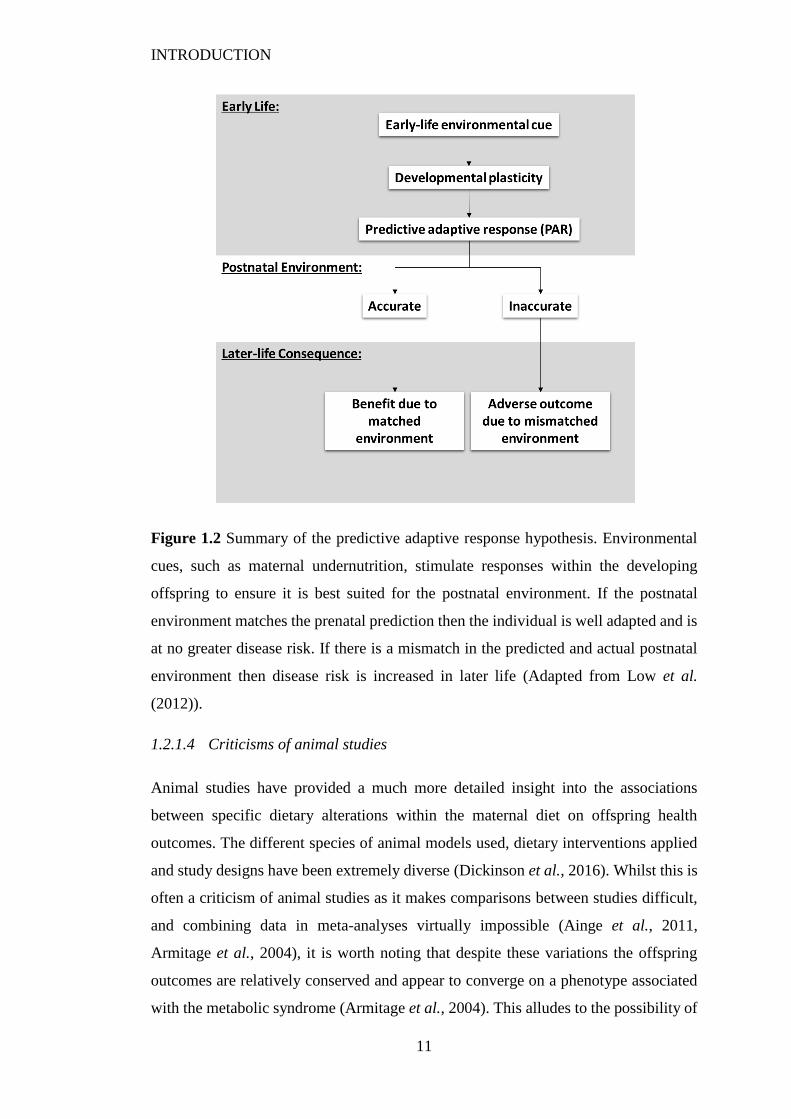
The additional evidence from animal studies led to the expansion of the thrifty
phenotype hypothesis. The predictive adaptive response (PAR) hypothesis, proposed
by Gluckman and Hanson (2004), suggested that an individual can make physiological
adaptations to environmental cues at a time of developmental plasticity. Plasticity is
highest during early development and so the hypothesis proposes that the fetus can
make physiological changes in utero to adapt to its predicted postnatal environment.
Whilst this level of adaptation could be considered an evolutionary advantage, the
hypothesis proposes that if the actual environment is different to that predicted by
maternal cues the physiological adaptations of the offspring place them at an increased
risk of disease (Figure 1.2).
INTRODUCTION
11
Figure 1.2 Summary of the predictive adaptive response hypothesis. Environmental
cues, such as maternal undernutrition, stimulate responses within the developing
offspring to ensure it is best suited for the postnatal environment. If the postnatal
environment matches the prenatal prediction then the individual is well adapted and is
at no greater disease risk. If there is a mismatch in the predicted and actual postnatal
environment then disease risk is increased in later life (Adapted from Low et al.
(2012)).
1.2.1.4 Criticisms of animal studies
Animal studies have provided a much more detailed insight into the associations
between specific dietary alterations within the maternal diet on offspring health
outcomes. The different species of animal models used, dietary interventions applied
and study designs have been extremely diverse (Dickinson et al., 2016). Whilst this is
often a criticism of animal studies as it makes comparisons between studies difficult,
and combining data in meta-analyses virtually impossible (Ainge et al., 2011,
Armitage et al., 2004), it is worth noting that despite these variations the offspring
outcomes are relatively conserved and appear to converge on a phenotype associated
with the metabolic syndrome (Armitage et al., 2004). This alludes to the possibility of
INTRODUCTION
12
a few key mechanisms being responsible for the association between the early life
nutritional environment and offspring health outcomes (McMullen et al., 2012). The
biggest criticism surrounding animal studies is that, like epidemiological studies, they
have failed to elucidate an underlying mechanism.
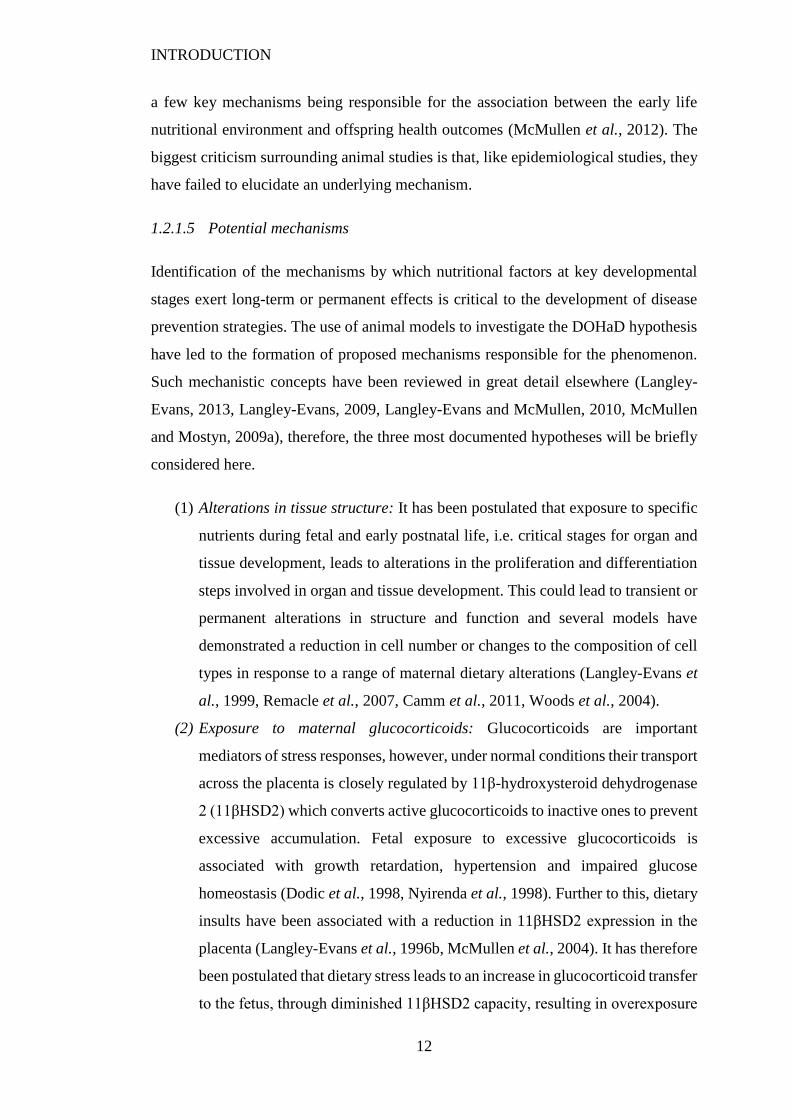
1.2.1.5 Potential mechanisms
Identification of the mechanisms by which nutritional factors at key developmental
stages exert long-term or permanent effects is critical to the development of disease
prevention strategies. The use of animal models to investigate the DOHaD hypothesis
have led to the formation of proposed mechanisms responsible for the phenomenon.
Such mechanistic concepts have been reviewed in great detail elsewhere (Langley-
Evans, 2013, Langley-Evans, 2009, Langley-Evans and McMullen, 2010, McMullen
and Mostyn, 2009a), therefore, the three most documented hypotheses will be briefly
considered here.
(1) Alterations in tissue structure: It has been postulated that exposure to specific
nutrients during fetal and early postnatal life, i.e. critical stages for organ and
tissue development, leads to alterations in the proliferation and differentiation
steps involved in organ and tissue development. This could lead to transient or
permanent alterations in structure and function and several models have
demonstrated a reduction in cell number or changes to the composition of cell
types in response to a range of maternal dietary alterations (Langley-Evans et
al., 1999, Remacle et al., 2007, Camm et al., 2011, Woods et al., 2004).
(2) Exposure to maternal glucocorticoids: Glucocorticoids are important
mediators of stress responses, however, under normal conditions their transport
across the placenta is closely regulated by 11β-hydroxysteroid dehydrogenase
2 (11βHSD2) which converts active glucocorticoids to inactive ones to prevent
excessive accumulation. Fetal exposure to excessive glucocorticoids is
associated with growth retardation, hypertension and impaired glucose
homeostasis (Dodic et al., 1998, Nyirenda et al., 1998). Further to this, dietary
insults have been associated with a reduction in 11βHSD2 expression in the
placenta (Langley-Evans et al., 1996b, McMullen et al., 2004). It has therefore
been postulated that dietary stress leads to an increase in glucocorticoid transfer
to the fetus, through diminished 11βHSD2 capacity, resulting in overexposure
INTRODUCTION
13
of fetal tissues. This can in turn lead to changes in the expression of the many
genes that contain glucocorticoid response elements and hence lead to the
alterations in tissue structure and function discussed above.
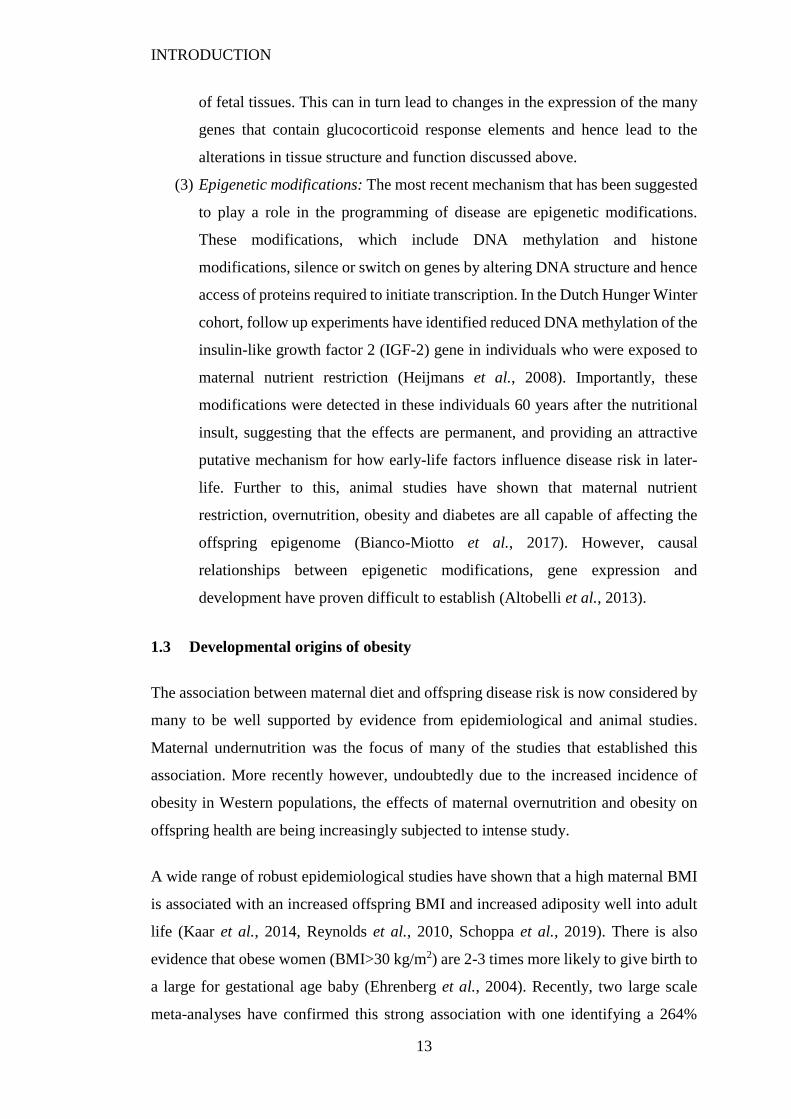
(3) Epigenetic modifications: The most recent mechanism that has been suggested
to play a role in the programming of disease are epigenetic modifications.
These modifications, which include DNA methylation and histone
modifications, silence or switch on genes by altering DNA structure and hence
access of proteins required to initiate transcription. In the Dutch Hunger Winter
cohort, follow up experiments have identified reduced DNA methylation of the
insulin-like growth factor 2 (IGF-2) gene in individuals who were exposed to
maternal nutrient restriction (Heijmans et al., 2008). Importantly, these
modifications were detected in these individuals 60 years after the nutritional
insult, suggesting that the effects are permanent, and providing an attractive
putative mechanism for how early-life factors influence disease risk in later-
life. Further to this, animal studies have shown that maternal nutrient
restriction, overnutrition, obesity and diabetes are all capable of affecting the
offspring epigenome (Bianco-Miotto et al., 2017). However, causal
relationships between epigenetic modifications, gene expression and
development have proven difficult to establish (Altobelli et al., 2013).
1.3 Developmental origins of obesity
The association between maternal diet and offspring disease risk is now considered by
many to be well supported by evidence from epidemiological and animal studies.
Maternal undernutrition was the focus of many of the studies that established this
association. More recently however, undoubtedly due to the increased incidence of
obesity in Western populations, the effects of maternal overnutrition and obesity on
offspring health are being increasingly subjected to intense study.
A wide range of robust epidemiological studies have shown that a high maternal BMI
is associated with an increased offspring BMI and increased adiposity well into adult
life (Kaar et al., 2014, Reynolds et al., 2010, Schoppa et al., 2019). There is also
evidence that obese women (BMI>30 kg/m2) are 2-3 times more likely to give birth to
a large for gestational age baby (Ehrenberg et al., 2004). Recently, two large scale
meta-analyses have confirmed this strong association with one identifying a 264%
INTRODUCTION
14
increased risk of childhood obesity if the mother was obese before conception
(Heslehurst et al., 2019, Voerman et al., 2019). It has been postulated that the positive
relationship between maternal BMI and offspring adiposity may, at least in part, be a
consequence of increased maternal nutrient intake. Thus, the developing fetus and
infant of the obese mother is exposed to an increased nutrient supply via the placenta
or through changes in breast milk composition, and this promotes overgrowth and
increased adiposity.
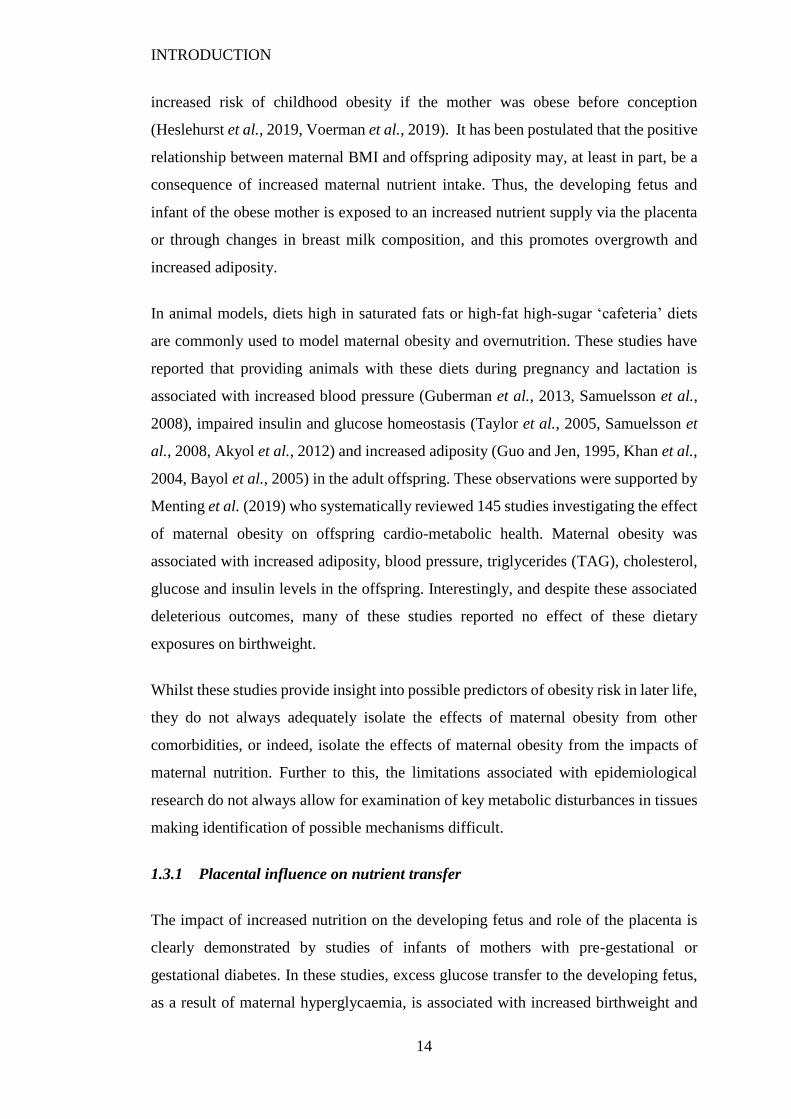
In animal models, diets high in saturated fats or high-fat high-sugar ‘cafeteria’ diets
are commonly used to model maternal obesity and overnutrition. These studies have
reported that providing animals with these diets during pregnancy and lactation is
associated with increased blood pressure (Guberman et al., 2013, Samuelsson et al.,
2008), impaired insulin and glucose homeostasis (Taylor et al., 2005, Samuelsson et
al., 2008, Akyol et al., 2012) and increased adiposity (Guo and Jen, 1995, Khan et al.,
2004, Bayol et al., 2005) in the adult offspring. These observations were supported by
Menting et al. (2019) who systematically reviewed 145 studies investigating the effect
of maternal obesity on offspring cardio-metabolic health. Maternal obesity was
associated with increased adiposity, blood pressure, triglycerides (TAG), cholesterol,
glucose and insulin levels in the offspring. Interestingly, and despite these associated
deleterious outcomes, many of these studies reported no effect of these dietary
exposures on birthweight.
Whilst these studies provide insight into possible predictors of obesity risk in later life,
they do not always adequately isolate the effects of maternal obesity from other
comorbidities, or indeed, isolate the effects of maternal obesity from the impacts of
maternal nutrition. Further to this, the limitations associated with epidemiological
research do not always allow for examination of key metabolic disturbances in tissues
making identification of possible mechanisms difficult.
1.3.1 Placental influence on nutrient transfer
The impact of increased nutrition on the developing fetus and role of the placenta is
clearly demonstrated by studies of infants of mothers with pre-gestational or
gestational diabetes. In these studies, excess glucose transfer to the developing fetus,
as a result of maternal hyperglycaemia, is associated with increased birthweight and
INTRODUCTION
15
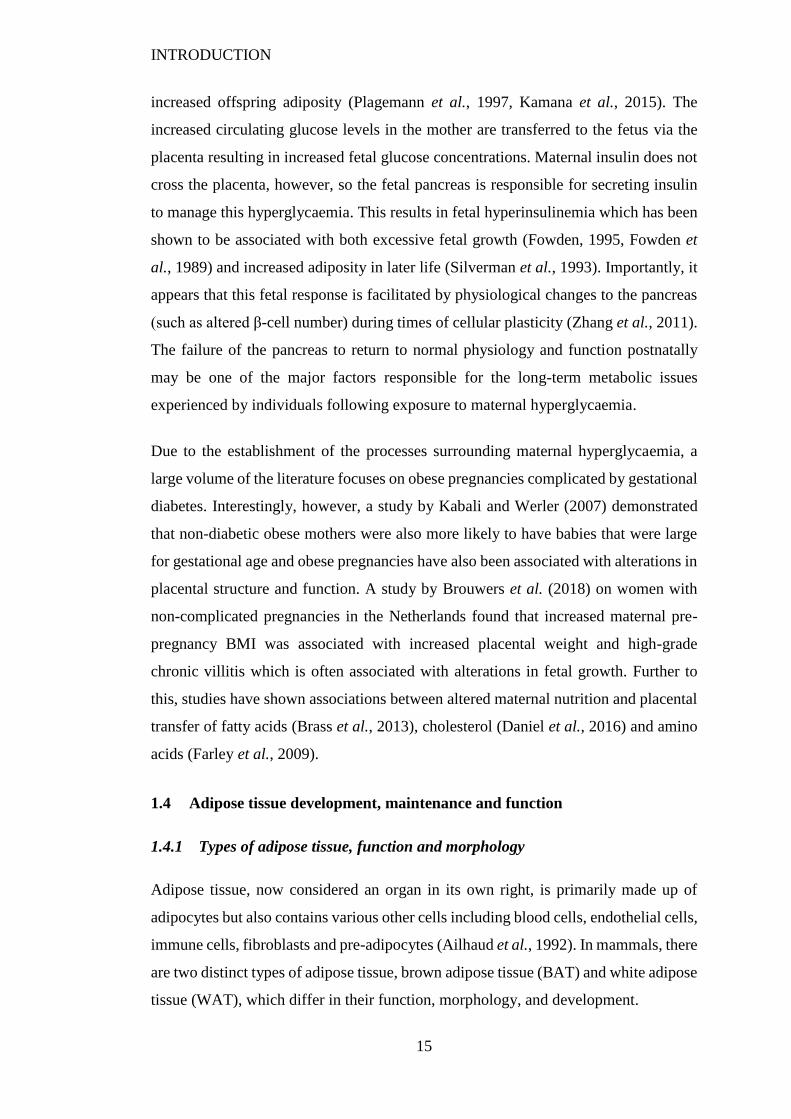
increased offspring adiposity (Plagemann et al., 1997, Kamana et al., 2015). The
increased circulating glucose levels in the mother are transferred to the fetus via the
placenta resulting in increased fetal glucose concentrations. Maternal insulin does not
cross the placenta, however, so the fetal pancreas is responsible for secreting insulin
to manage this hyperglycaemia. This results in fetal hyperinsulinemia which has been
shown to be associated with both excessive fetal growth (Fowden, 1995, Fowden et
al., 1989) and increased adiposity in later life (Silverman et al., 1993). Importantly, it
appears that this fetal response is facilitated by physiological changes to the pancreas
(such as altered β-cell number) during times of cellular plasticity (Zhang et al., 2011).
The failure of the pancreas to return to normal physiology and function postnatally
may be one of the major factors responsible for the long-term metabolic issues
experienced by individuals following exposure to maternal hyperglycaemia.
Due to the establishment of the processes surrounding maternal hyperglycaemia, a
large volume of the literature focuses on obese pregnancies complicated by gestational
diabetes. Interestingly, however, a study by Kabali and Werler (2007) demonstrated
that non-diabetic obese mothers were also more likely to have babies that were large
for gestational age and obese pregnancies have also been associated with alterations in
placental structure and function. A study by Brouwers et al. (2018) on women with
non-complicated pregnancies in the Netherlands found that increased maternal pre-
pregnancy BMI was associated with increased placental weight and high-grade
chronic villitis which is often associated with alterations in fetal growth. Further to
this, studies have shown associations between altered maternal nutrition and placental
transfer of fatty acids (Brass et al., 2013), cholesterol (Daniel et al., 2016) and amino
acids (Farley et al., 2009).
1.4 Adipose tissue development, maintenance and function
1.4.1 Types of adipose tissue, function and morphology
Adipose tissue, now considered an organ in its own right, is primarily made up of
adipocytes but also contains various other cells including blood cells, endothelial cells,
immune cells, fibroblasts and pre-adipocytes (Ailhaud et al., 1992). In mammals, there
are two distinct types of adipose tissue, brown adipose tissue (BAT) and white adipose
tissue (WAT), which differ in their function, morphology, and development.
INTRODUCTION
16
Exclusive to mammals, BAT is responsible for non-shivering thermogenesis and
contributes to maintenance of normal body temperature. Early studies in humans
identified that BAT was present in highest quantities during fetal and early life but
declined into adulthood (Heaton, 1972) where it is mainly confined to subcutaneous
regions (Sacks and Symonds, 2013). WAT is by far the most abundant adipose tissue
sub-type in humans and its major role is energy storage in the form of TAG. WAT
stores are utilised, and hence deplete, in times when energy expenditure exceeds intake
and increase under reverse conditions. More recently it has been demonstrated that
WAT has other important physiological roles in addition to energy storage. Thus,
WAT has been recognised as an organ capable of major endocrine and secretory
functions and has been demonstrated to play a central role in the regulation of
inflammatory processes and glucose homeostasis (Trayhurn, 2005, Trayhurn and
Beattie, 2001). In contrast to BAT adipocytes, which are around 10-25µm in diameter
and are considered multilocular (i.e. containing many fat vacuoles), WAT adipocytes
are larger (20-100µm in diameter) and contain one vacuole where TAG are stored as
a long-term fuel reserve (Stock and Cinti, 2003). BAT is highly vascularised and
contain many mitochondria. These mitochondria expresses a unique protein,
uncoupling protein 1 (UCP1), which actively transports protons into the mitochondrial
matrix. This process is not ‘coupled’ with synthesis of energy in the form of ATP and
instead produces heat as a bi-product (Cinti et al., 1997). These highly specialised
adaptations are conducive to its main function of heat production.
BAT has, in recent years, been investigated as therapeutic target for obesity. This is
primarily due to early studies in rodents that showed altered BAT activity in response
to obesity (Trayhurn, 2018). However, it is worth noting that rodent BAT development
is quite different to that observed in humans. Rodents possess considerable deposits of
BAT throughout their adult life due to its key role in maintaining body temperature
during times of hibernation where animals are exposed to prolonged periods of cold
(Cannon and Nedergaard, 2004). As such, human BAT may play a much less
significant role in obesity prevention in humans. For this reason, alongside the function
of WAT as a site of unlimited lipid storage and the observation of significant increases
in WAT stores in obese individuals, from here the focus will be on WAT rather than
BAT.
INTRODUCTION
17
1.4.2 White adipose tissue (WAT) development
Adipocytes have been detected before birth in many species including humans,
however, in rodents they are not detected until after birth (Ailhaud et al., 1992). The
development of white adipocytes begins during the second trimester of embryonic
development in humans where small adipocyte cell clusters begin to develop
(Poissonnet et al., 1984). These clusters aggregate in distinct locations and increase in
size as development progresses but the number of clusters remains the same (Ailhaud
et al., 1992). Adipocytes are of mesodermal origin and embryonic stem cells undergo
various differentiation steps resulting in cells becoming increasingly committed to the
adipocyte lineage. Cells committed to the adipocyte lineage are termed pre-adipocytes.
Differentiation to mature adipocytes (adipogenesis) occurs in several stages and is
regulated by a plethora of transcription factors and signals.
1.4.2.1 Transcriptional regulation of adipogenesis
WAT adipogenesis can occur at any stage during development and adulthood. Studies
have shown that cell cycle arrest of pre-adipocytes appears to be a requirement for
differentiation (Pairault and Green, 1979). Early markers of the commitment of cells
to the adipocyte lineage are members of the CCAAT/enhancer binding protein
(C/EBP) family. The beta and gamma subtypes (C/EBPβ and C/EBPγ) are expressed
before the cell cycle arrest phase and appear to stimulate the expression of genes
required for this pre-requisite (Hwang et al., 1997). In particular, in vivo experiments
have identified that C/EBPβ up-regulates the mRNA expression of peroxisome
proliferator activated receptor gamma (PPARγ) (Wu et al., 1995). Binding sites for
C/EBPβ have been identified in the promoter regions of PPARγ as well as C/EBPα
(Tang et al., 2004), which have both been shown to be involved with cell cycle arrest
(Umek et al., 1991, Altiok et al., 1997). Studies have shown that adipocyte
differentiation in the presence of C/EBPα does not occur if PPARγ is not also present
(Rosen et al., 2002). However, differentiation does occur in the presence of PPARγ
without C/EBPα, resulting in PPARγ being branded the master regulator of
adipogenesis. PPARγ, largely specific to adipose tissue, is a nuclear transcription
factor that is highly expressed in adipose cells early in development. It acts to promote
the expression of other adipogenic genes by forming heterodimeric complexes with
the retinoid X receptor (RXR) which interact directly with DNA regions. Another key
INTRODUCTION
18
adipogenic gene expressed during early adipogenesis is sterol regulatory element-
binding protein variant 1c (SREBP-1c) which stimulates the expression of many genes
required for lipogenesis (Horton et al., 2002). The ability of adipocytes to carry out
lipogenesis and accumulate lipid signifies the final phase of maturation. During this
time, the mRNA expression of genes involved in lipogenesis and fatty acid uptake,
including fatty acid synthase (FAS), lipoprotein lipase (LPL), glycerol-3-phosphate
dehydrogenase (GPDH), stearoyl-CoA desaturase (SCD) as well as others, increases
drastically (Gregoire et al., 1998). Mature adipocytes become increasingly sensitive to
insulin through up-regulation of glucose transporters and insulin receptors (Garcia de
Herreros and Birnbaum, 1989) and begin to synthesise adipokines such as leptin and
adiponectin (Gregoire et al., 1998).
1.4.2.2 Regulation of adipogenesis by hormones and growth factors
Studies have shown that the cascade of events that leads to the eventual maturation of
adipocyte cells is sensitive to signals from growth factors and hormones. Observational
studies in humans have shown an association between growth hormone (GH) and
increased body fat mass. This has led to the hypothesis that GH plays a key role in
adipogenesis which has been supported by studies that confirmed the ability of GH to
induce differentiation in vitro (Morikawa et al., 1982). GH is also known to stimulate
gene expression of insulin-like growth factor-1 (IGF-1) which is necessary for
adipocyte differentiation (Smith et al., 1988). IGF-1 receptors are found on pre-
adipocytes and their abundance increases during adipocyte maturation resulting in the
increased sensitivity of maturing adipocytes to insulin and IGF-1. Binding of insulin
and IGF-1 to their receptors triggers an intracellular signalling pathway which results
in adipocyte differentiation (Kamai et al., 1996). Many other factors have been
demonstrated to stimulate (glucocorticoids, PGE2 and PGI2) or suppress (EGF, TGFα,
TGFβ) differentiation (Gregoire et al., 1998) leading to a complex regulation of the
formation of new adipocytes. It is also important to note, however, that the aggregation
of large adipose tissue stores is not just as a result of increased adipocyte number
(hyperplasia), but is in fact primarily due to an increase in cell size (hypertrophy).
INTRODUCTION
19
1.4.3 Lipogenesis and lipolysis
Whilst the formation of new fat cells revolves around the differentiation of pre-
adipocytes, the amount of fat stored within a mature adipocyte is dependent on three
processes: (1) lipid synthesis or lipogenesis, (2) lipid breakdown or lipolysis and (3)
fatty acid uptake from the circulation. Fatty acids are essential cellular constituents
with critical roles in signalling, energy supply and cell structure. They are the
functional units of fat and are stored within adipocytes within TAG molecules, a
glycerol backbone bound to three fatty acids. Lipogenesis refers to the formation of
TAG from fatty acids consumed within the diet and/or produced endogenously. The
latter is more specifically termed de novo lipogenesis and utilises carbohydrates as a
source of glucose which is then converted into fatty acids in a multistep pathway
summarised in Figure 1.3. Lipolysis refers to the breakdown of TAG into glycerol and
free fatty acids which can then be further broken down to yield energy in the form of
ATP in a process termed β-oxidation. When the rate of lipogenesis exceeds the rate of
lipolysis then lipid storage, and hence fat mass, increases. Lipogenesis, predominantly
occurring in adipose tissue but also in the liver, skeletal muscle, heart and pancreas, is
under precise control by many metabolic and hormonal factors.
De novo lipogenesis is chiefly under the enzymatic control of acetyl-CoA carboxylase
(ACC) and fatty acid synthase (FAS) (Volpe and Vagelos, 1976, Bloch and Vance,
1977). These enzymes act on acetyl-CoA and malonyl-CoA respectively to produce
palmitic acid which can then be stored or used to produce other fatty acids. Many
enzymes involved in de novo lipogenesis are under the transcriptional control of sterol
regulatory element binding proteins (SREBP) of which there are three-subtypes:
SREBP-2, SREBP-1a and SREBP-1c. SREBP-1c has been shown to be the dominant
isoform associated with lipogenesis (Horton et al., 2002) and activates many lipogenic
genes (Figure 1.3).
Figure 1.3 (Overleaf) Overview of de novo lipogenesis (DNL) which occurs in the
cytoplasm of most cells, particularly adipocytes and hepatocytes. Fatty acids are
produced via the synthesis of palmitic acid from metabolites produced in the citric acid
cycle. Dietary glucose and/or fatty acids are transported into cells via their respective
transporters where they can enter the citric acid cycle. Citrate is converted in acetyl-
CoA by ATP citrate lyase (ACLY). The two central enzymes responsible for DNL,
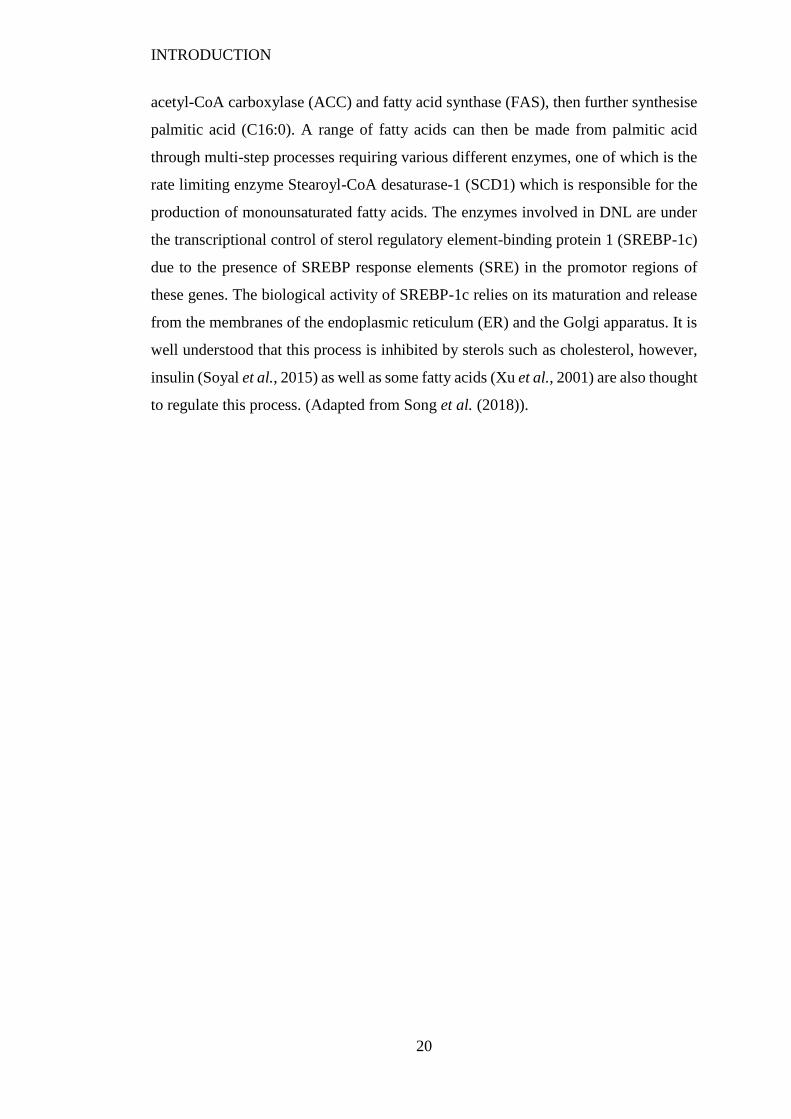
INTRODUCTION
20
acetyl-CoA carboxylase (ACC) and fatty acid synthase (FAS), then further synthesise
palmitic acid (C16:0). A range of fatty acids can then be made from palmitic acid
through multi-step processes requiring various different enzymes, one of which is the
rate limiting enzyme Stearoyl-CoA desaturase-1 (SCD1) which is responsible for the
production of monounsaturated fatty acids. The enzymes involved in DNL are under
the transcriptional control of sterol regulatory element-binding protein 1 (SREBP-1c)
due to the presence of SREBP response elements (SRE) in the promotor regions of
these genes. The biological activity of SREBP-1c relies on its maturation and release
from the membranes of the endoplasmic reticulum (ER) and the Golgi apparatus. It is
well understood that this process is inhibited by sterols such as cholesterol, however,
insulin (Soyal et al., 2015) as well as some fatty acids (Xu et al., 2001) are also thought
to regulate this process. (Adapted from Song et al. (2018)).
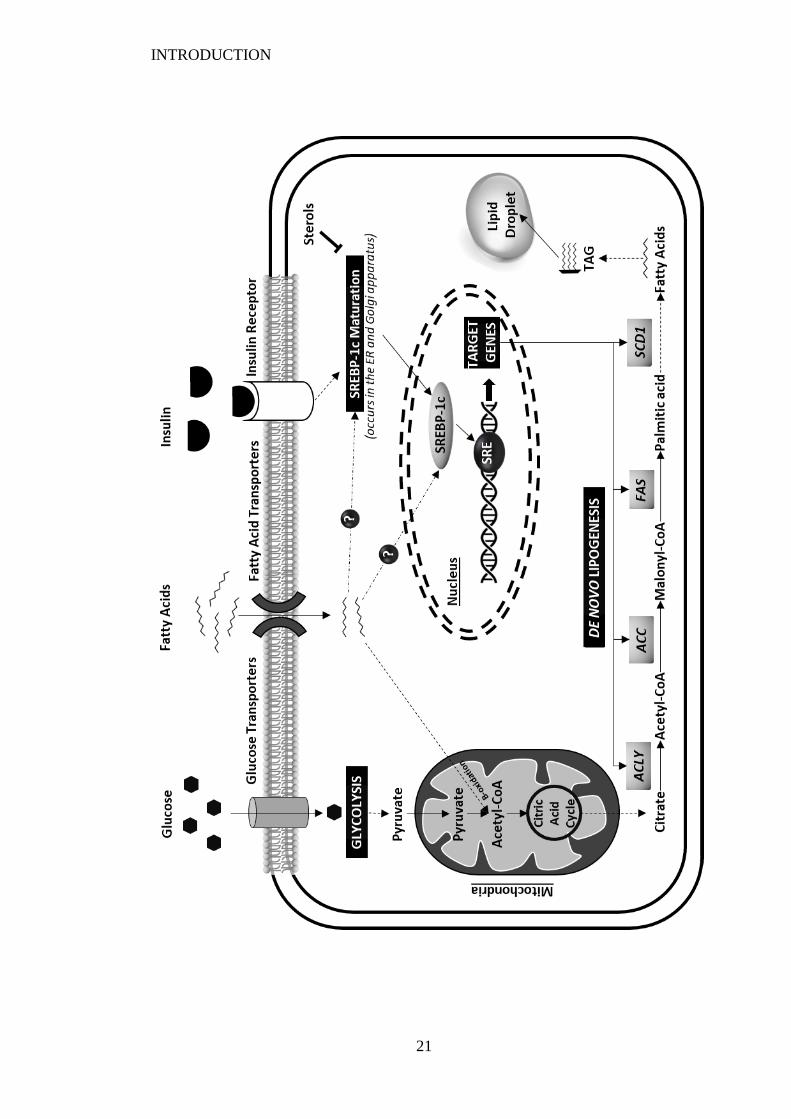
INTRODUCTION
21
INTRODUCTION
22
1.5 An introduction to dietary fatty acids
1.5.1 Types of dietary fatty acids
Fatty acids are carboxylic acids consisting of a hydrocarbon chain of varying length
and a terminal carboxyl group. Fatty acids mainly exist in an esterified form such as
those found in oils, animal fats and waxes and they can be classified based on the
number of double bonds within the hydrocarbon chain. Saturated fatty acids (SFA)
contain no double bonds and are found in animal products such as meat and dairy, as
well as some tropical oils (e.g. coconut and palm oil). Monounsaturated fatty acids
(MUFA) contain a single double bond and are found in high quantities in olive oil,
macadamia oil and a number of other nuts and seeds. Polyunsaturated fatty acids
(PUFA) contain more than one double bond. PUFA are further subcategorised into
omega-3, omega-6 and omega-9 families based on the location of the double bonds
and it is becoming increasingly clear that individual fatty acids within their broad
classifications carry unique biological characteristics and health effects.
Whilst all three PUFA families carry biological importance, it is the omega-3 and
omega-6 families that are of greatest interest to research as they are considered
essential fatty acids (Burr and Burr, 1930). Specifically the 18 carbon omega-6 family
precursor linoleic acid (LA), found in high amounts in soy, corn, safflower and
sunflower oils, and the omega-3 family precursor alpha-linolenic acid (ALA), found
in leafy green vegetables as well as flaxseed and canola oil, cannot be synthesised
within the human body and must be consumed in the diet and failure to do so is fatal
(Burr and Burr, 1930).
1.5.2 Setting the scene for dietary PUFA
It is well established that poor dietary habits result in excessive weight gain in children
and adults. A key characteristic of obesity is increased central and visceral adiposity,
and dietary fats are often implicated as a key driver. It is clear, however, that not all
dietary fats are equal in their biological structure and function and so some may
contribute to obesity and its associated health outcomes more than others. Efforts have
been made to identify those components in an attempt to address the obesity epidemic
on a population level.
INTRODUCTION
23
Obesity is a major risk factor for CVD (see section 1.1) and early studies found an
association between circulating cholesterol levels and risk of death from CHD. A study
by Keys (1970) also found a strong correlation between dietary intake of saturated fat
and blood cholesterol concentrations (Keys, 1970). At around the same time, dietary
PUFA were shown to reduce cholesterol levels (Keys et al., 1965). This resulted in the
hypothesis that SFA were a key driver of CVD and consequently governments
recommended that SFA in the diet, particularly animal fats, be replaced with PUFA
(vegetable oils) in order to decrease the risk of CHD. For the UK, as well as other
developed countries, this led to a substantial decrease in animal fat consumption in the
last 40 years (SACN, 2019). Interestingly, however, the dramatic reduction in the
consumption of SFA, and corresponding increase in the intakes of PUFA, at a
population level was not associated with any reduction in the deaths from CVD. In
fact, ischaemic heart disease still remains the leading cause of death worldwide,
particularly in middle- and high-income countries where such government level
recommendations were made (WHO, 2017b). Regardless of this, saturated fat
continues to be regarded as a potential cause of the increased rates of CVD in
populations worldwide, despite evidence that some SFA exert cardio-protective
effects. Dairy products such as cheese have been labelled as harmful due to their high
saturated fat content despite having relatively high levels of monounsaturated fats and
despite studies that show some level of cardio-protection associated with higher levels
of cheese consumption (Gholami et al., 2017). There is little doubt that cholesterol
levels can be reduced in some individuals by substituting saturated fats with PUFA,
however, this does not always translate to reductions in rates of death from CVD
(Ramsden et al., 2013c) and this topic needs to be continually reassessed. However,
despite these new insights and re-evaluation of the role of saturated fat within the diet,
dietary patterns over the past 60 years have shifted dramatically in Western countries
towards a reduction in saturated fat and an increase in dietary PUFA.
1.5.3 Current recommendations and intakes of dietary PUFA
1.5.3.1 Recommended intakes
Broad government recommendations to replace SFA with PUFA in the diet have led
to a population-level shift in the fatty acid composition of Western diets such as those
consumed in the UK, USA and Australia. Primarily this shift has been caused by the
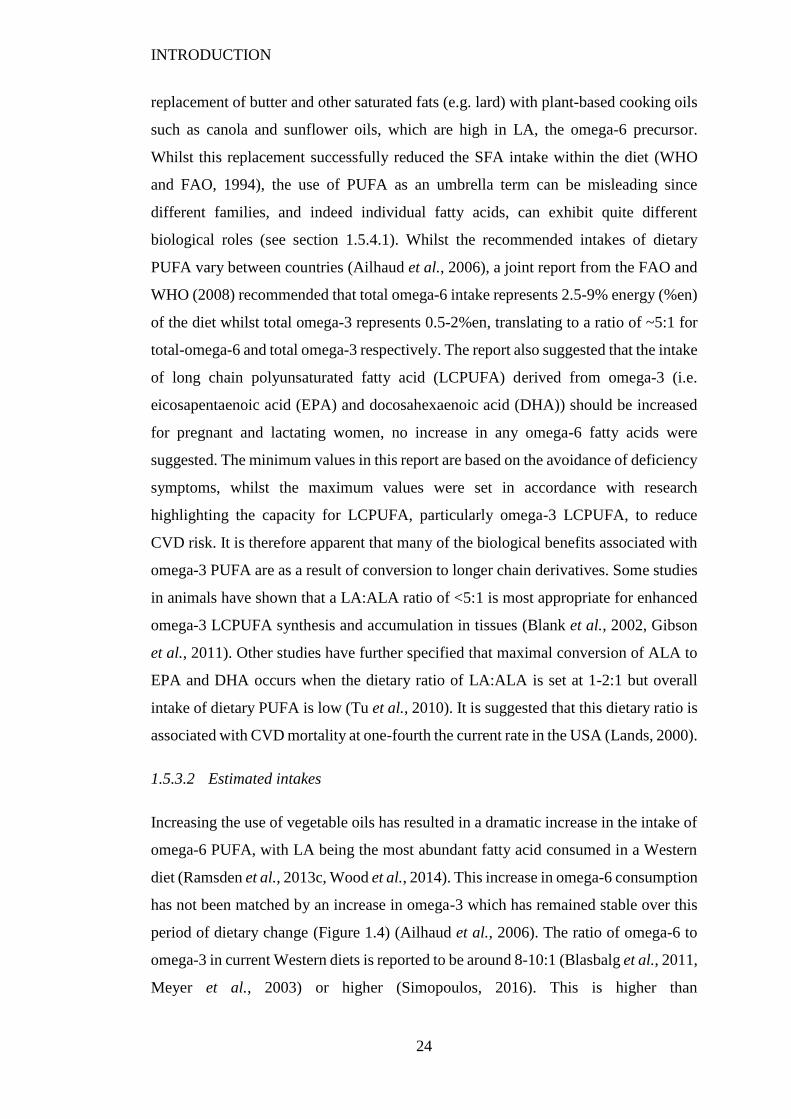
INTRODUCTION
24
replacement of butter and other saturated fats (e.g. lard) with plant-based cooking oils
such as canola and sunflower oils, which are high in LA, the omega-6 precursor.
Whilst this replacement successfully reduced the SFA intake within the diet (WHO
and FAO, 1994), the use of PUFA as an umbrella term can be misleading since
different families, and indeed individual fatty acids, can exhibit quite different
biological roles (see section 1.5.4.1). Whilst the recommended intakes of dietary
PUFA vary between countries (Ailhaud et al., 2006), a joint report from the FAO and
WHO (2008) recommended that total omega-6 intake represents 2.5-9% energy (%en)
of the diet whilst total omega-3 represents 0.5-2%en, translating to a ratio of ~5:1 for
total-omega-6 and total omega-3 respectively. The report also suggested that the intake
of long chain polyunsaturated fatty acid (LCPUFA) derived from omega-3 (i.e.
eicosapentaenoic acid (EPA) and docosahexaenoic acid (DHA)) should be increased
for pregnant and lactating women, no increase in any omega-6 fatty acids were
suggested. The minimum values in this report are based on the avoidance of deficiency
symptoms, whilst the maximum values were set in accordance with research
highlighting the capacity for LCPUFA, particularly omega-3 LCPUFA, to reduce
CVD risk. It is therefore apparent that many of the biological benefits associated with
omega-3 PUFA are as a result of conversion to longer chain derivatives. Some studies
in animals have shown that a LA:ALA ratio of <5:1 is most appropriate for enhanced
omega-3 LCPUFA synthesis and accumulation in tissues (Blank et al., 2002, Gibson
et al., 2011). Other studies have further specified that maximal conversion of ALA to
EPA and DHA occurs when the dietary ratio of LA:ALA is set at 1-2:1 but overall
intake of dietary PUFA is low (Tu et al., 2010). It is suggested that this dietary ratio is
associated with CVD mortality at one-fourth the current rate in the USA (Lands, 2000).
1.5.3.2 Estimated intakes
Increasing the use of vegetable oils has resulted in a dramatic increase in the intake of
omega-6 PUFA, with LA being the most abundant fatty acid consumed in a Western
diet (Ramsden et al., 2013c, Wood et al., 2014). This increase in omega-6 consumption
has not been matched by an increase in omega-3 which has remained stable over this
period of dietary change (Figure 1.4) (Ailhaud et al., 2006). The ratio of omega-6 to
omega-3 in current Western diets is reported to be around 8-10:1 (Blasbalg et al., 2011,
Meyer et al., 2003) or higher (Simopoulos, 2016). This is higher than
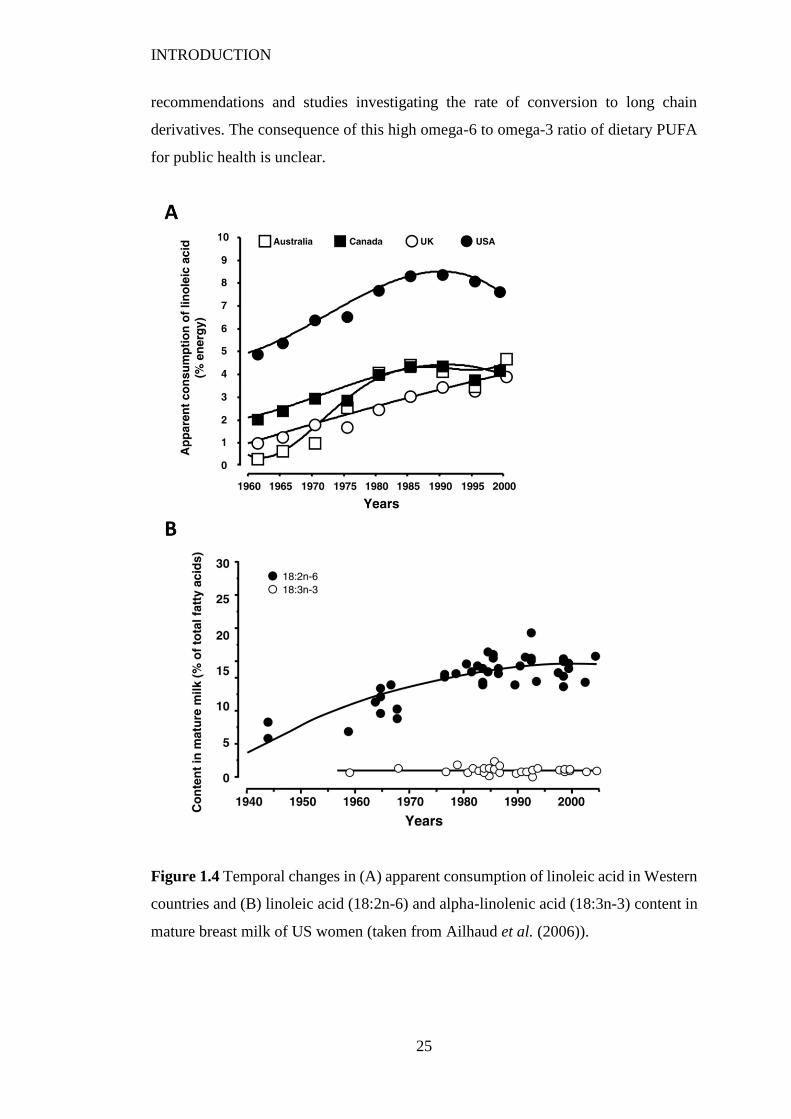
INTRODUCTION
25
recommendations and studies investigating the rate of conversion to long chain
derivatives. The consequence of this high omega-6 to omega-3 ratio of dietary PUFA
for public health is unclear.
Figure 1.4 Temporal changes in (A) apparent consumption of linoleic acid in Western
countries and (B) linoleic acid (18:2n-6) and alpha-linolenic acid (18:3n-3) content in
mature breast milk of US women (taken from Ailhaud et al. (2006)).
INTRODUCTION
26
1.5.4 Omega-6 and omega-3 PUFA
1.5.4.1 Metabolism and function
The biological functions of the omega-6 and omega-3 classes are primarily undertaken
by the long-chain derivatives of the parent compounds, LA and ALA, and so there is
a requirement for them to be converted to these derivatives in order to mediate many
of their biological effects. This multistep process, established by Holman (1986) and
further refined by Sprecher et al. (1995), relies on the addition of carbon molecules to
increase chain length (elongation) and the addition of double bonds within the carbon
chain (desaturation). As summarised in Figure 1.5, LA (18:2 n-6) and ALA (18:3 n-3)
are converted to 18:3 n-6 and 18:4 n-3 respectively by the enzyme Δ6 desaturase
encoded by the Fads2 gene. These desaturation products are further converted into
arachidonic acid (AA; 20:4 n-6) and eicosapentaenoic acid (EPA; 20:5 n-3)
respectively through the action of Δ5 desaturase, encoded by the Fads1 gene, and a
series of elongation steps. EPA is further converted into docosapentaenoic acid (DPA;
22:5 n-3) via elongation. A further desaturation, which utilises Δ6 desaturase once
more, and a final β-oxidation step produces docosahexaenoic acid (DHA; 22:6 n-3). It
is these longer chain fatty acids that carry important biological roles.
Both omega-3 and omega-6 PUFA are involved in many important biological
functions, demonstrated by the absolute requirement of LA and ALA in the diet. They
are an important constituent of cell membranes (Spector, 1999) and so influence cell
membrane fluidity as well as the behaviour of membrane bound enzymes and receptors
(Buettner et al., 2007). They also play a role in controlling blood pressure and are key
to proper brain and neural development (Wall et al., 2010). The long chain derivatives
of both families, AA in the omega-6 pathway and EPA and DHA in the omega-3
pathway, also have important roles in inflammation and immune regulation through
the actions of their own derivatives known as eicosanoids (Calder, 2006, Patterson et
al., 2012).
1.5.4.2 Eicosanoids and their role in inflammation
Eicosanoids are biologically active lipids and include a variety of molecules which
generally fall into the subcategory of prostaglandins (PG), thromboxanes (TX),
INTRODUCTION
27
leukotrienes, resolvins or lipoxins. Eicosanoids are derived from 20-carbon fatty acids
(such as AA and EPA) which are liberated from the plasma membrane by
phospholipases (Figure 1.5). Eicosanoids are then metabolised through the sequential
actions of various enzymes including cyclooxygenases (COX) and lipoxygenases
(LOX). Metabolism of AA by the COX enzymes results in the synthesis of 2-series
prostaglandins (PGE2, PGI2, PGD2 and PGF2α) and thromboxanes (TXA2 and TXB2)
and 4-series leukotrienes (Patterson et al., 2012). When EPA is used as a substrate for
COX and LOX enzymes, as opposed to AA, prostaglandins and thromboxanes of the
3-series and the 5-series of leukotrienes are produced (Patterson et al., 2012).
Eicosanoids play a critical role in many processes involved in inflammation, which in
healthy individuals facilitates a natural bodily defence against infection and injury
(Ricciotti and FitzGerald, 2011). Inflammation of this kind is caused by induction of
a pro-inflammatory signalling cascade that is rapidly mediated by a host of anti-
inflammatory mediators acting through a negative feedback mechanism resulting in an
acute inflammatory response, with relatively rapid resolution. However, when these
regulatory mechanisms falter, or there is an imbalance in pro-inflammatory and anti-
inflammatory signals, excessive and ongoing inflammation can occur (Calder, 2015).
As such, the dysregulation of eicosanoid production has been implicated in diseases
with an inflammatory component such as CVD, obesity, inflammatory bowel diseases,
rheumatoid arthritis and cancer (Patterson et al., 2012).
Eicosanoids derived from AA and EPA have varied properties, both pro-inflammatory
and anti-inflammatory in nature and all play an important role in the regulation of
inflammation. However, it is generally considered that eicosanoids derived from AA
are more pro-inflammatory in nature whilst those derived from EPA are more anti-
inflammatory. PGI2 and PGE2, generated from AA, have pro-arrhythmic effects
whereas PGI3 and PGE3 are anti-arrhythmic (Li et al., 1997). Similarly, AA derived
TBX2 is a potent vasoconstrictor and platelet activator whereas TBX3, derived from
EPA, has few physiological effects. AA derived eicosanoids also activate the
production of inflammatory cytokines, including TNFα, IL-1 and IL-6 (Schmitz and
Ecker, 2008). Resolvins derived from EPA (E-series) and DHA (D-series) also exert
anti-inflammatory effects by suppressing the activation of NFΚβ, resulting in
INTRODUCTION
28
decreased synthesis of inflammatory cytokines, a process that appears to be dependent
on PPARγ activation (Liao et al., 2012).
EPA, DHA and AA are competitive substrates for enzymes involved in the synthesis
of eicosanoids and diets high in omega-3 PUFA have been shown to decrease
production of PGE2, TXB2, TNFα and IL-1 in humans (Caughey et al., 1996). The
utilisation of either AA or EPA/DHA as a precursor for eicosanoid production relies
on their synthesis and incorporation into cell membranes. The formation of the
LCPUFA from LA and ALA utilises the same enzymes for elongation and desaturation
(Figure 1.5). This sharing of enzymes for this multistep process results in competition
between the two families for substrate binding and thus, a differing ratio of dietary
precursors can lead to an imbalanced production of long chain derivatives and hence
a more pro-inflammatory or anti-inflammatory eicosanoid profile.
Figure 1.5 (Overleaf) The metabolism of dietary linoleic acid (LA) and alpha-
linolenic acid (ALA) to long-chain fatty acid derivatives and eicosanoid biosynthesis
(adapted from Patterson et al. (2012) and Gibson et al. (2011)).
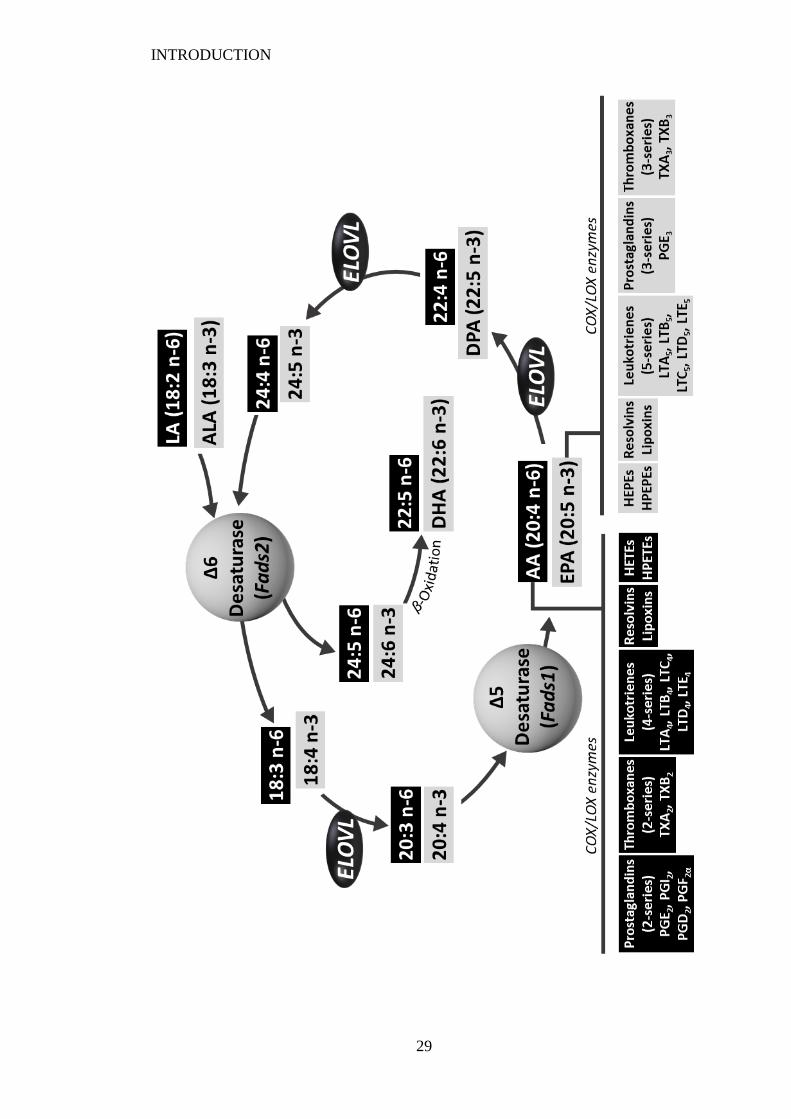
INTRODUCTION
29
INTRODUCTION
30
1.5.5 Enzymes and competition between families
1.5.5.1 Desaturase and elongase enzymes
Desaturase enzymes Fads1 and Fads2 are found in a variety of tissues but are present
at highest levels in the liver. They are responsible for the addition of double bonds to
fatty acids in the LCPUFA synthesis pathway (Figure 1.5). Fads2 is considered a key
regulatory enzyme in the synthesis of LCPUFA as it is used twice in the conversion of
ALA to DHA (Sprecher et al., 1995). The importance of the Fads2 gene in synthesis
of LCPUFA has been clearly demonstrated in mice as Fads2 knockout mice lack the
ability to carry out the initial step of LCPUFA synthesis which results in downstream
consequences for PUFA metabolites manifesting in sterility in both males and females
(Stoffel et al., 2008, Stroud et al., 2009). Stroud et al. (2009) also demonstrated the
importance of the Fads1 gene in LCPUFA synthesis with radiolabelled administration
of LA and ALA. Fads2 knockout mice accumulated levels of 20:3 n-6 and 20:4 n-3,
fatty acid metabolites produced from LA and ALA respectively. This suggests that
Fads1 has some desaturation capacity when expression of Fads2 is suppressed.
Fatty acid elongation is carried out by the elongation of very long chain fatty acids
proteins (ELOVL), of which 7 subtypes have been identified in humans and rodents.
ELOVL2 and ELOVL5 are the key elongase enzymes associated with LCPUFA
synthesis in mammals and are expressed in high amounts in the liver (Jakobsson et al.,
2006). Knockout experiments have highlighted that the initial elongation step is
dependent on ELOVL5 but increased activity of ELOVL2 in ELOVL5 knockout mice
also suggests a compensatory mechanism whereby ELOVL2 acts to ensure LCPUFA
synthesis (Moon et al., 2009). Interestingly, mRNA expression of SREBP-1c was up-
regulated in ELOVL5 knockout mice due to the decreases in cellular concentrations
of DHA and AA. This up-regulation led to the up-regulation of SREBP-1c target genes
responsible for lipogenesis which consequently resulted in hepatic steatosis i.e. fat
accumulation in the liver (Moon et al., 2009).
The expression of the desaturase and elongase enzymes have been shown to be
sensitive to dietary intakes. In vivo and in vitro studies have demonstrated that both
Fads1 and Fads2 mRNA expression and enzyme activity are suppressed in the
presence of adequate omega-3 and omega-6 dietary PUFA and elevated when dietary
INTRODUCTION
31
PUFA is low (Cho et al., 1999a, Cho et al., 1999b, Tu et al., 2010). Expression of
ELOVL5 is also sensitive to nutritional status such that high levels of omega-3
suppress mRNA expression, however, ELOVL2 expression does not appear to be
regulated by dietary fat intake (Wang et al., 2005).
1.5.5.2 Pathway competition
Animal studies have demonstrated that, if they are not directly consumed in the diet,
the abundance of the 20-carbon fatty acids (i.e. AA and EPA) is determined by the
ratio of their precursors, LA and ALA in the diet. Blank et al. (2002) demonstrated
that in piglets fed a varying LA:ALA ratio the predominant LCPUFA in plasma
phospholipids of those receiving a low LA:ALA ratio was EPA and in those receiving
a high LA:ALA ratio was AA. Similar observations were made in the livers of rats
receiving diets containing increasing amounts of ALA (%en) and thus a decreasing
LA:ALA ratio. A dose-response relationship was observed such that EPA levels
increased as the LA:ALA ratio in the diet decreased (Tu et al., 2010). This has also
been demonstrated in humans where decreasing dietary intakes of LA, with no changes
in omega-3 intake, resulted in an increase in omega-3 LCPUFA in plasma
phospholipids (Wood et al., 2014). These studies highlight that a LA dominant diet
results in AA as the major 20-carbon fatty acid in tissues and accumulation of EPA
can only occur when the LA:ALA ratio of diets is low.
This imbalance in LCPUFA synthesis can partially be explained by simple substrate
competition. Brenner and Peluffo (1966) demonstrated an inverse relationship
between the conversion of LA to 18:3 n-6 and the amount of ALA added, implying
that ALA and LA compete for the same desaturation enzyme and this is likely to be at
the initial step where LA and ALA utilise Fads2. This same study also demonstrated
that the Fads2 enzyme had a higher affinity for ALA compared to LA adding further
complication to the competition between these two substrates. This suggests that
conversion of omega-3 fatty acids to LCPUFA is preferential over conversion of
omega-6 fatty acids and by lowering the amount of omega-6 substrate, i.e. LA, the
amount of omega-3 LCPUFA being synthesised would increase. The competition
between LA and ALA for conversion to their longer-chain derivatives was also
demonstrated in a study by Clark et al. (1992), in which they lowered the LA:ALA
ratio of formula milk (19:1) by either increasing the amount of ALA (4:1) or
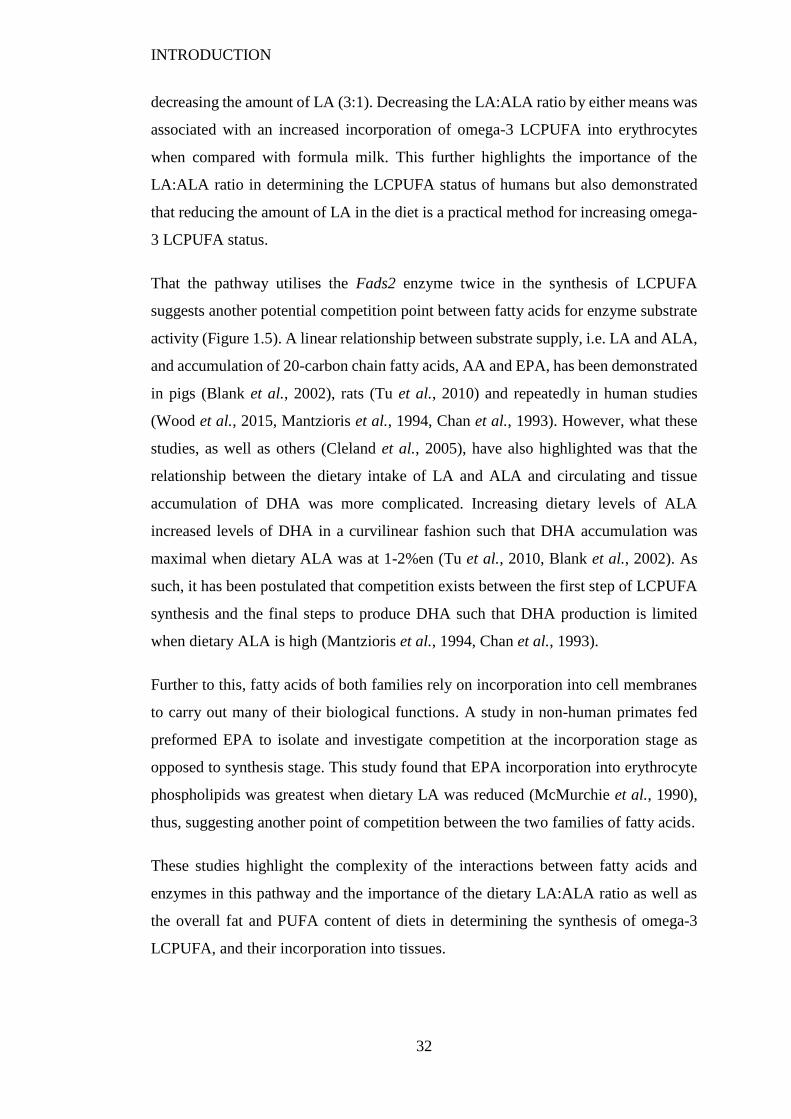
INTRODUCTION
32
decreasing the amount of LA (3:1). Decreasing the LA:ALA ratio by either means was
associated with an increased incorporation of omega-3 LCPUFA into erythrocytes
when compared with formula milk. This further highlights the importance of the
LA:ALA ratio in determining the LCPUFA status of humans but also demonstrated
that reducing the amount of LA in the diet is a practical method for increasing omega-
3 LCPUFA status.
That the pathway utilises the Fads2 enzyme twice in the synthesis of LCPUFA
suggests another potential competition point between fatty acids for enzyme substrate
activity (Figure 1.5). A linear relationship between substrate supply, i.e. LA and ALA,
and accumulation of 20-carbon chain fatty acids, AA and EPA, has been demonstrated
in pigs (Blank et al., 2002), rats (Tu et al., 2010) and repeatedly in human studies
(Wood et al., 2015, Mantzioris et al., 1994, Chan et al., 1993). However, what these
studies, as well as others (Cleland et al., 2005), have also highlighted was that the
relationship between the dietary intake of LA and ALA and circulating and tissue
accumulation of DHA was more complicated. Increasing dietary levels of ALA
increased levels of DHA in a curvilinear fashion such that DHA accumulation was
maximal when dietary ALA was at 1-2%en (Tu et al., 2010, Blank et al., 2002). As
such, it has been postulated that competition exists between the first step of LCPUFA
synthesis and the final steps to produce DHA such that DHA production is limited
when dietary ALA is high (Mantzioris et al., 1994, Chan et al., 1993).
Further to this, fatty acids of both families rely on incorporation into cell membranes
to carry out many of their biological functions. A study in non-human primates fed
preformed EPA to isolate and investigate competition at the incorporation stage as
opposed to synthesis stage. This study found that EPA incorporation into erythrocyte
phospholipids was greatest when dietary LA was reduced (McMurchie et al., 1990),
thus, suggesting another point of competition between the two families of fatty acids.
These studies highlight the complexity of the interactions between fatty acids and
enzymes in this pathway and the importance of the dietary LA:ALA ratio as well as
the overall fat and PUFA content of diets in determining the synthesis of omega-3
LCPUFA, and their incorporation into tissues.
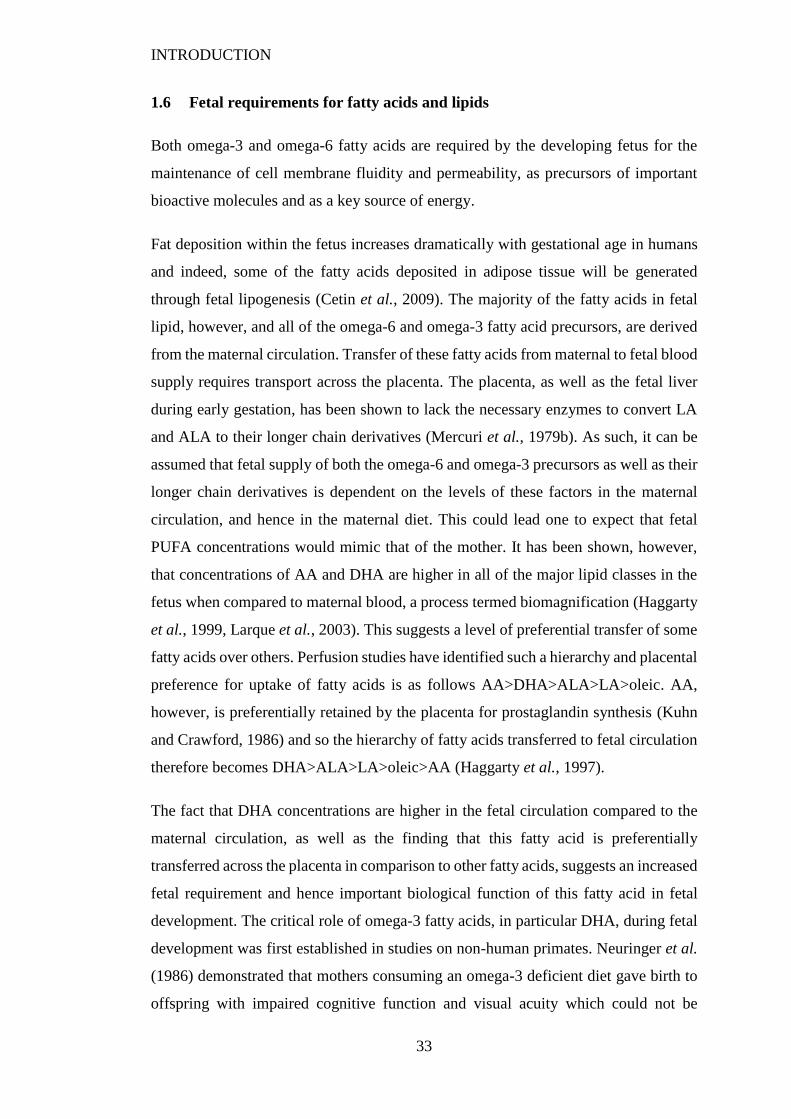
INTRODUCTION
33
1.6 Fetal requirements for fatty acids and lipids
Both omega-3 and omega-6 fatty acids are required by the developing fetus for the
maintenance of cell membrane fluidity and permeability, as precursors of important
bioactive molecules and as a key source of energy.
Fat deposition within the fetus increases dramatically with gestational age in humans
and indeed, some of the fatty acids deposited in adipose tissue will be generated
through fetal lipogenesis (Cetin et al., 2009). The majority of the fatty acids in fetal
lipid, however, and all of the omega-6 and omega-3 fatty acid precursors, are derived
from the maternal circulation. Transfer of these fatty acids from maternal to fetal blood
supply requires transport across the placenta. The placenta, as well as the fetal liver
during early gestation, has been shown to lack the necessary enzymes to convert LA
and ALA to their longer chain derivatives (Mercuri et al., 1979b). As such, it can be
assumed that fetal supply of both the omega-6 and omega-3 precursors as well as their
longer chain derivatives is dependent on the levels of these factors in the maternal
circulation, and hence in the maternal diet. This could lead one to expect that fetal
PUFA concentrations would mimic that of the mother. It has been shown, however,
that concentrations of AA and DHA are higher in all of the major lipid classes in the
fetus when compared to maternal blood, a process termed biomagnification (Haggarty
et al., 1999, Larque et al., 2003). This suggests a level of preferential transfer of some
fatty acids over others. Perfusion studies have identified such a hierarchy and placental
preference for uptake of fatty acids is as follows AA>DHA>ALA>LA>oleic. AA,
however, is preferentially retained by the placenta for prostaglandin synthesis (Kuhn
and Crawford, 1986) and so the hierarchy of fatty acids transferred to fetal circulation
therefore becomes DHA>ALA>LA>oleic>AA (Haggarty et al., 1997).
The fact that DHA concentrations are higher in the fetal circulation compared to the
maternal circulation, as well as the finding that this fatty acid is preferentially
transferred across the placenta in comparison to other fatty acids, suggests an increased
fetal requirement and hence important biological function of this fatty acid in fetal
development. The critical role of omega-3 fatty acids, in particular DHA, during fetal
development was first established in studies on non-human primates. Neuringer et al.
(1986) demonstrated that mothers consuming an omega-3 deficient diet gave birth to
offspring with impaired cognitive function and visual acuity which could not be
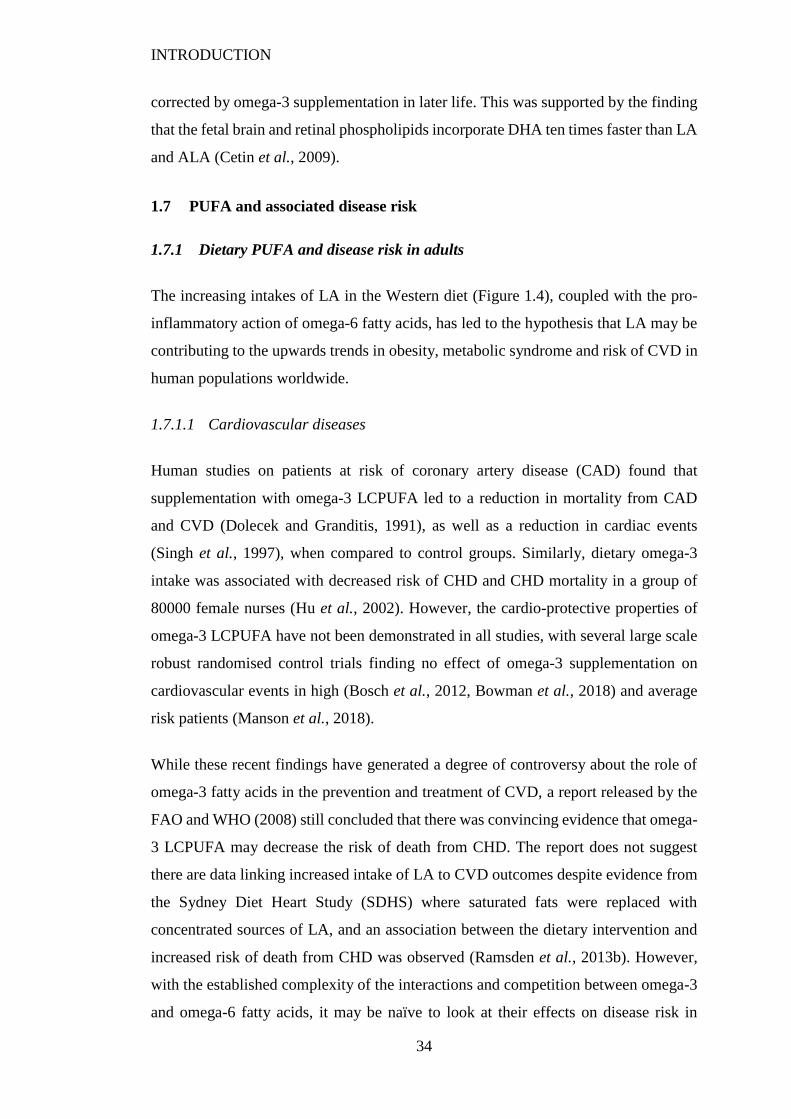
INTRODUCTION
34
corrected by omega-3 supplementation in later life. This was supported by the finding
that the fetal brain and retinal phospholipids incorporate DHA ten times faster than LA
and ALA (Cetin et al., 2009).
1.7 PUFA and associated disease risk
1.7.1 Dietary PUFA and disease risk in adults
The increasing intakes of LA in the Western diet (Figure 1.4), coupled with the pro-
inflammatory action of omega-6 fatty acids, has led to the hypothesis that LA may be
contributing to the upwards trends in obesity, metabolic syndrome and risk of CVD in
human populations worldwide.
1.7.1.1 Cardiovascular diseases
Human studies on patients at risk of coronary artery disease (CAD) found that
supplementation with omega-3 LCPUFA led to a reduction in mortality from CAD
and CVD (Dolecek and Granditis, 1991), as well as a reduction in cardiac events
(Singh et al., 1997), when compared to control groups. Similarly, dietary omega-3
intake was associated with decreased risk of CHD and CHD mortality in a group of
80000 female nurses (Hu et al., 2002). However, the cardio-protective properties of
omega-3 LCPUFA have not been demonstrated in all studies, with several large scale
robust randomised control trials finding no effect of omega-3 supplementation on
cardiovascular events in high (Bosch et al., 2012, Bowman et al., 2018) and average
risk patients (Manson et al., 2018).
While these recent findings have generated a degree of controversy about the role of
omega-3 fatty acids in the prevention and treatment of CVD, a report released by the
FAO and WHO (2008) still concluded that there was convincing evidence that omega-
3 LCPUFA may decrease the risk of death from CHD. The report does not suggest
there are data linking increased intake of LA to CVD outcomes despite evidence from
the Sydney Diet Heart Study (SDHS) where saturated fats were replaced with
concentrated sources of LA, and an association between the dietary intervention and
increased risk of death from CHD was observed (Ramsden et al., 2013b). However,
with the established complexity of the interactions and competition between omega-3
and omega-6 fatty acids, it may be naïve to look at their effects on disease risk in
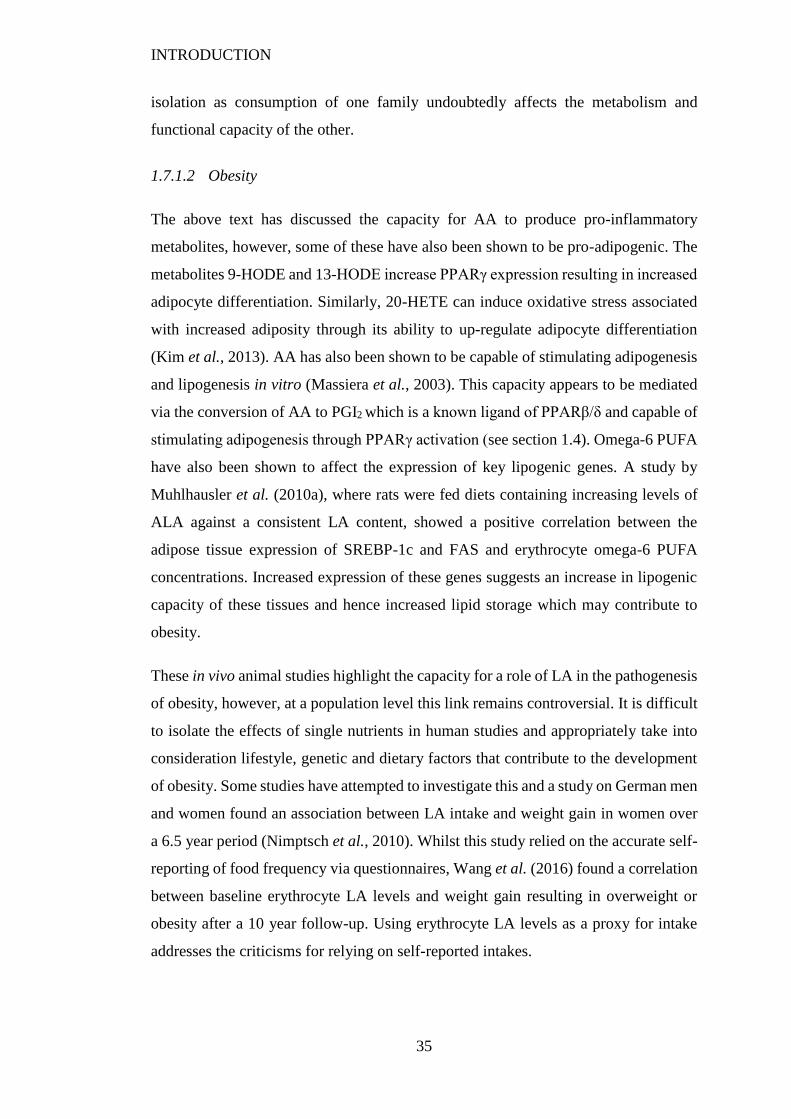
INTRODUCTION
35
isolation as consumption of one family undoubtedly affects the metabolism and
functional capacity of the other.
1.7.1.2 Obesity
The above text has discussed the capacity for AA to produce pro-inflammatory
metabolites, however, some of these have also been shown to be pro-adipogenic. The
metabolites 9-HODE and 13-HODE increase PPARγ expression resulting in increased
adipocyte differentiation. Similarly, 20-HETE can induce oxidative stress associated
with increased adiposity through its ability to up-regulate adipocyte differentiation
(Kim et al., 2013). AA has also been shown to be capable of stimulating adipogenesis
and lipogenesis in vitro (Massiera et al., 2003). This capacity appears to be mediated
via the conversion of AA to PGI2 which is a known ligand of PPARβ/δ and capable of
stimulating adipogenesis through PPARγ activation (see section 1.4). Omega-6 PUFA
have also been shown to affect the expression of key lipogenic genes. A study by
Muhlhausler et al. (2010a), where rats were fed diets containing increasing levels of
ALA against a consistent LA content, showed a positive correlation between the
adipose tissue expression of SREBP-1c and FAS and erythrocyte omega-6 PUFA
concentrations. Increased expression of these genes suggests an increase in lipogenic
capacity of these tissues and hence increased lipid storage which may contribute to
obesity.
These in vivo animal studies highlight the capacity for a role of LA in the pathogenesis
of obesity, however, at a population level this link remains controversial. It is difficult
to isolate the effects of single nutrients in human studies and appropriately take into
consideration lifestyle, genetic and dietary factors that contribute to the development
of obesity. Some studies have attempted to investigate this and a study on German men
and women found an association between LA intake and weight gain in women over
a 6.5 year period (Nimptsch et al., 2010). Whilst this study relied on the accurate self-
reporting of food frequency via questionnaires, Wang et al. (2016) found a correlation
between baseline erythrocyte LA levels and weight gain resulting in overweight or
obesity after a 10 year follow-up. Using erythrocyte LA levels as a proxy for intake
addresses the criticisms for relying on self-reported intakes.
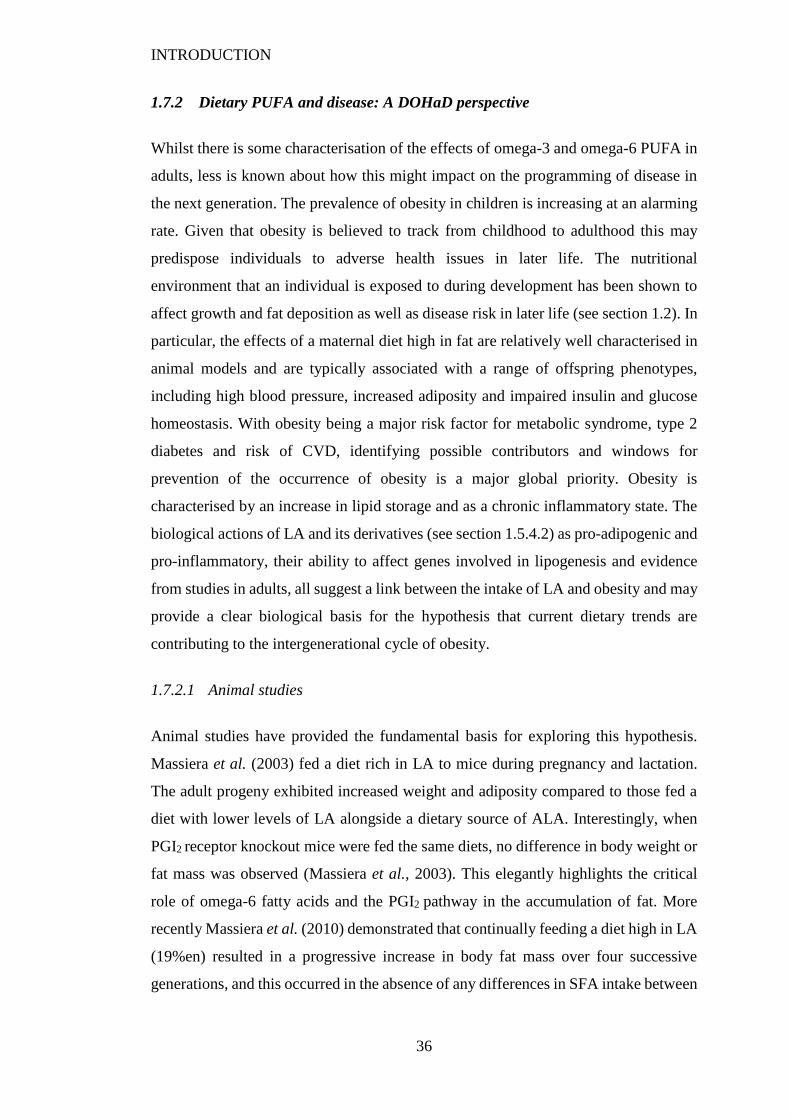
INTRODUCTION
36
1.7.2 Dietary PUFA and disease: A DOHaD perspective
Whilst there is some characterisation of the effects of omega-3 and omega-6 PUFA in
adults, less is known about how this might impact on the programming of disease in
the next generation. The prevalence of obesity in children is increasing at an alarming
rate. Given that obesity is believed to track from childhood to adulthood this may
predispose individuals to adverse health issues in later life. The nutritional
environment that an individual is exposed to during development has been shown to
affect growth and fat deposition as well as disease risk in later life (see section 1.2). In
particular, the effects of a maternal diet high in fat are relatively well characterised in
animal models and are typically associated with a range of offspring phenotypes,
including high blood pressure, increased adiposity and impaired insulin and glucose
homeostasis. With obesity being a major risk factor for metabolic syndrome, type 2
diabetes and risk of CVD, identifying possible contributors and windows for
prevention of the occurrence of obesity is a major global priority. Obesity is
characterised by an increase in lipid storage and as a chronic inflammatory state. The
biological actions of LA and its derivatives (see section 1.5.4.2) as pro-adipogenic and
pro-inflammatory, their ability to affect genes involved in lipogenesis and evidence
from studies in adults, all suggest a link between the intake of LA and obesity and may
provide a clear biological basis for the hypothesis that current dietary trends are
contributing to the intergenerational cycle of obesity.
1.7.2.1 Animal studies
Animal studies have provided the fundamental basis for exploring this hypothesis.
Massiera et al. (2003) fed a diet rich in LA to mice during pregnancy and lactation.
The adult progeny exhibited increased weight and adiposity compared to those fed a
diet with lower levels of LA alongside a dietary source of ALA. Interestingly, when
PGI2 receptor knockout mice were fed the same diets, no difference in body weight or
fat mass was observed (Massiera et al., 2003). This elegantly highlights the critical
role of omega-6 fatty acids and the PGI2 pathway in the accumulation of fat. More
recently Massiera et al. (2010) demonstrated that continually feeding a diet high in LA
(19%en) resulted in a progressive increase in body fat mass over four successive
generations, and this occurred in the absence of any differences in SFA intake between
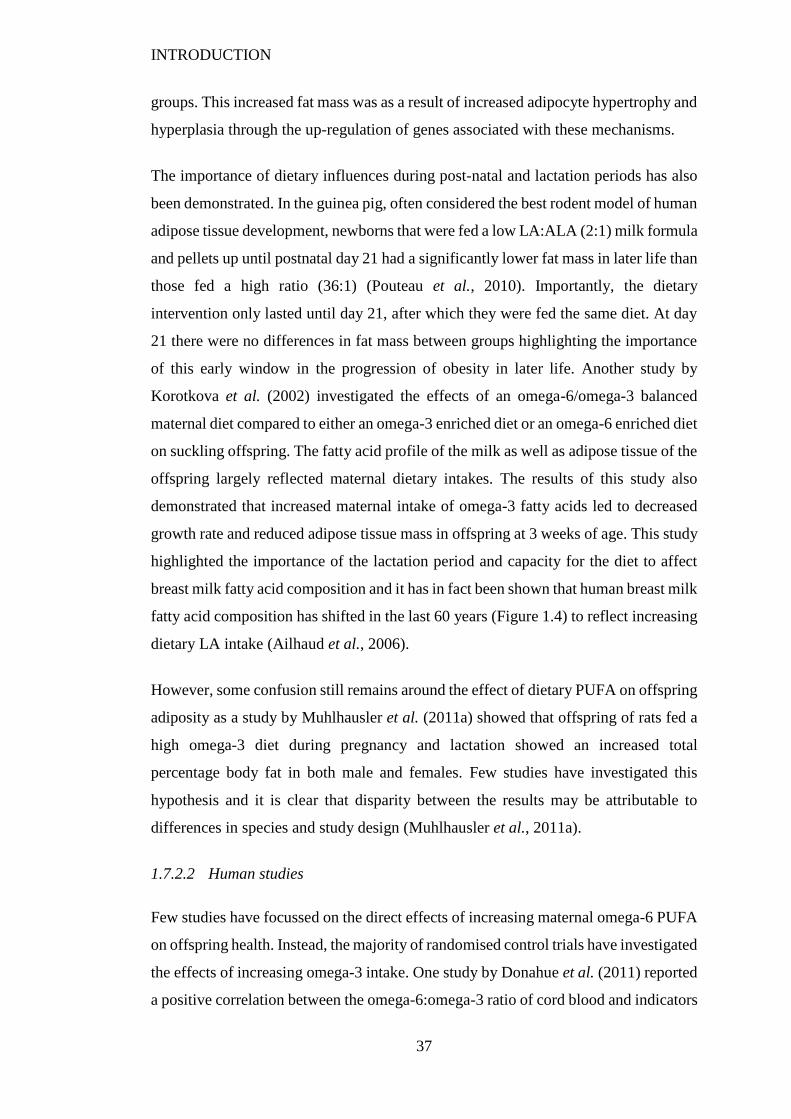
INTRODUCTION
37
groups. This increased fat mass was as a result of increased adipocyte hypertrophy and
hyperplasia through the up-regulation of genes associated with these mechanisms.
The importance of dietary influences during post-natal and lactation periods has also
been demonstrated. In the guinea pig, often considered the best rodent model of human
adipose tissue development, newborns that were fed a low LA:ALA (2:1) milk formula
and pellets up until postnatal day 21 had a significantly lower fat mass in later life than
those fed a high ratio (36:1) (Pouteau et al., 2010). Importantly, the dietary
intervention only lasted until day 21, after which they were fed the same diet. At day
21 there were no differences in fat mass between groups highlighting the importance
of this early window in the progression of obesity in later life. Another study by
Korotkova et al. (2002) investigated the effects of an omega-6/omega-3 balanced
maternal diet compared to either an omega-3 enriched diet or an omega-6 enriched diet
on suckling offspring. The fatty acid profile of the milk as well as adipose tissue of the
offspring largely reflected maternal dietary intakes. The results of this study also
demonstrated that increased maternal intake of omega-3 fatty acids led to decreased
growth rate and reduced adipose tissue mass in offspring at 3 weeks of age. This study
highlighted the importance of the lactation period and capacity for the diet to affect
breast milk fatty acid composition and it has in fact been shown that human breast milk
fatty acid composition has shifted in the last 60 years (Figure 1.4) to reflect increasing
dietary LA intake (Ailhaud et al., 2006).
However, some confusion still remains around the effect of dietary PUFA on offspring
adiposity as a study by Muhlhausler et al. (2011a) showed that offspring of rats fed a
high omega-3 diet during pregnancy and lactation showed an increased total
percentage body fat in both male and females. Few studies have investigated this
hypothesis and it is clear that disparity between the results may be attributable to
differences in species and study design (Muhlhausler et al., 2011a).
1.7.2.2 Human studies
Few studies have focussed on the direct effects of increasing maternal omega-6 PUFA
on offspring health. Instead, the majority of randomised control trials have investigated
the effects of increasing omega-3 intake. One study by Donahue et al. (2011) reported
a positive correlation between the omega-6:omega-3 ratio of cord blood and indicators
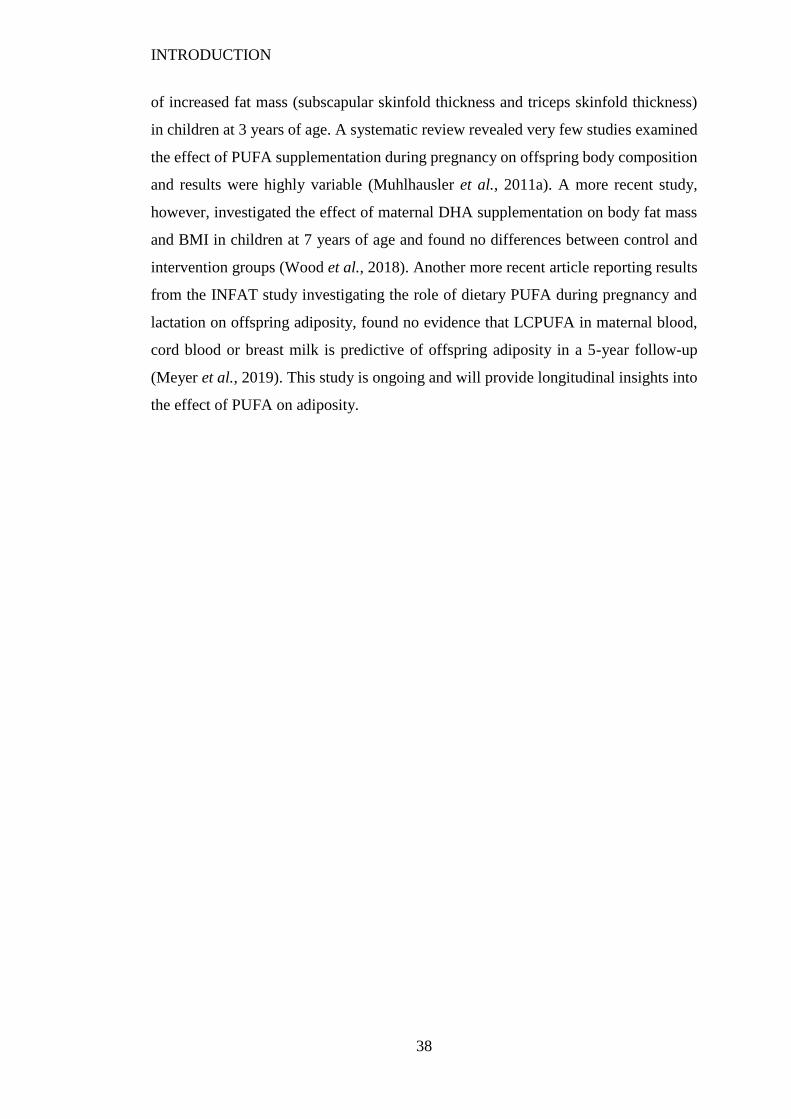
INTRODUCTION
38
of increased fat mass (subscapular skinfold thickness and triceps skinfold thickness)
in children at 3 years of age. A systematic review revealed very few studies examined
the effect of PUFA supplementation during pregnancy on offspring body composition
and results were highly variable (Muhlhausler et al., 2011a). A more recent study,
however, investigated the effect of maternal DHA supplementation on body fat mass
and BMI in children at 7 years of age and found no differences between control and
intervention groups (Wood et al., 2018). Another more recent article reporting results
from the INFAT study investigating the role of dietary PUFA during pregnancy and
lactation on offspring adiposity, found no evidence that LCPUFA in maternal blood,
cord blood or breast milk is predictive of offspring adiposity in a 5-year follow-up
(Meyer et al., 2019). This study is ongoing and will provide longitudinal insights into
the effect of PUFA on adiposity.
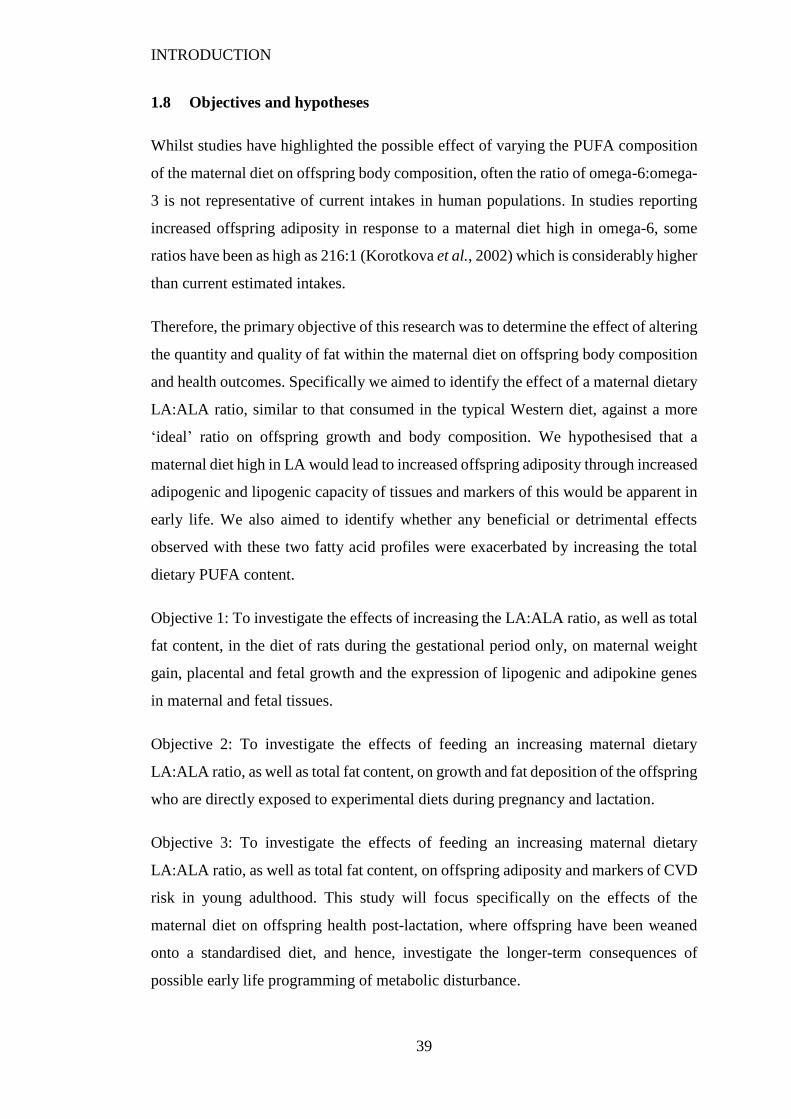
INTRODUCTION
39
1.8 Objectives and hypotheses
Whilst studies have highlighted the possible effect of varying the PUFA composition
of the maternal diet on offspring body composition, often the ratio of omega-6:omega-
3 is not representative of current intakes in human populations. In studies reporting
increased offspring adiposity in response to a maternal diet high in omega-6, some
ratios have been as high as 216:1 (Korotkova et al., 2002) which is considerably higher
than current estimated intakes.
Therefore, the primary objective of this research was to determine the effect of altering
the quantity and quality of fat within the maternal diet on offspring body composition
and health outcomes. Specifically we aimed to identify the effect of a maternal dietary
LA:ALA ratio, similar to that consumed in the typical Western diet, against a more
‘ideal’ ratio on offspring growth and body composition. We hypothesised that a
maternal diet high in LA would lead to increased offspring adiposity through increased
adipogenic and lipogenic capacity of tissues and markers of this would be apparent in
early life. We also aimed to identify whether any beneficial or detrimental effects
observed with these two fatty acid profiles were exacerbated by increasing the total
dietary PUFA content.
Objective 1: To investigate the effects of increasing the LA:ALA ratio, as well as total
fat content, in the diet of rats during the gestational period only, on maternal weight
gain, placental and fetal growth and the expression of lipogenic and adipokine genes
in maternal and fetal tissues.
Objective 2: To investigate the effects of feeding an increasing maternal dietary
LA:ALA ratio, as well as total fat content, on growth and fat deposition of the offspring
who are directly exposed to experimental diets during pregnancy and lactation.
Objective 3: To investigate the effects of feeding an increasing maternal dietary
LA:ALA ratio, as well as total fat content, on offspring adiposity and markers of CVD
risk in young adulthood. This study will focus specifically on the effects of the
maternal diet on offspring health post-lactation, where offspring have been weaned
onto a standardised diet, and hence, investigate the longer-term consequences of
possible early life programming of metabolic disturbance.
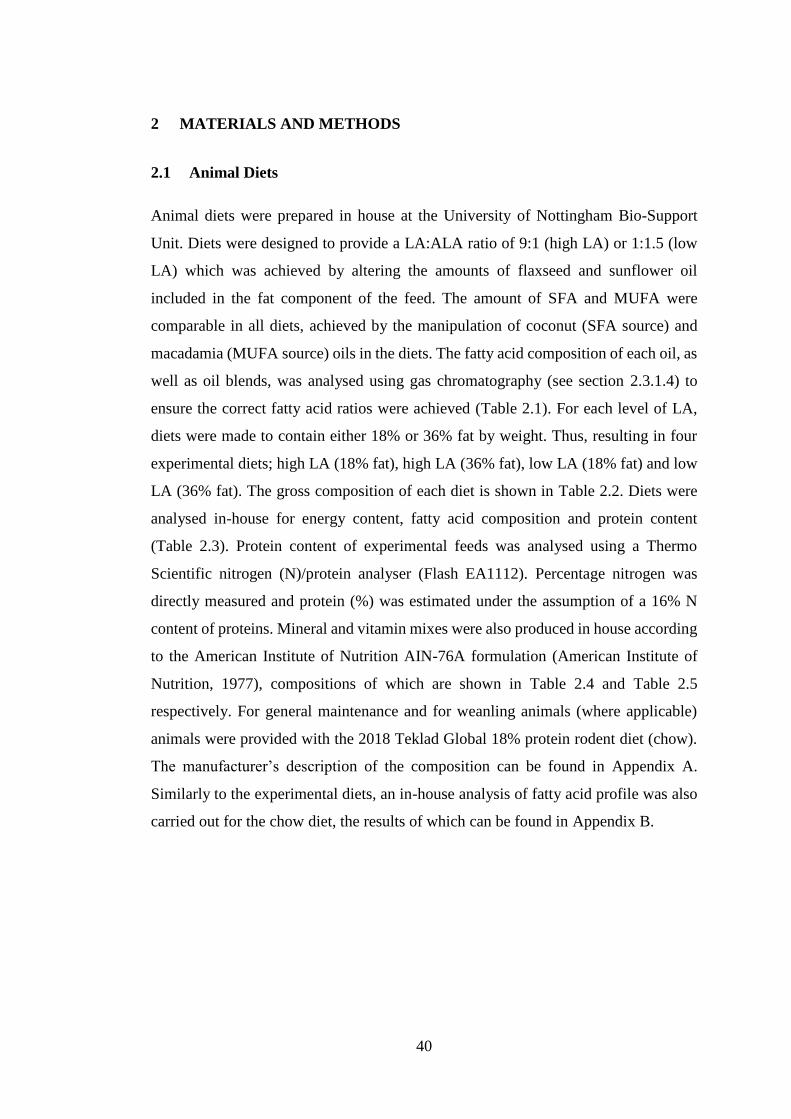
40
2 MATERIALS AND METHODS
2.1 Animal Diets
Animal diets were prepared in house at the University of Nottingham Bio-Support
Unit. Diets were designed to provide a LA:ALA ratio of 9:1 (high LA) or 1:1.5 (low
LA) which was achieved by altering the amounts of flaxseed and sunflower oil
included in the fat component of the feed. The amount of SFA and MUFA were
comparable in all diets, achieved by the manipulation of coconut (SFA source) and
macadamia (MUFA source) oils in the diets. The fatty acid composition of each oil, as
well as oil blends, was analysed using gas chromatography (see section 2.3.1.4) to
ensure the correct fatty acid ratios were achieved (Table 2.1). For each level of LA,
diets were made to contain either 18% or 36% fat by weight. Thus, resulting in four
experimental diets; high LA (18% fat), high LA (36% fat), low LA (18% fat) and low
LA (36% fat). The gross composition of each diet is shown in Table 2.2. Diets were
analysed in-house for energy content, fatty acid composition and protein content
(Table 2.3). Protein content of experimental feeds was analysed using a Thermo
Scientific nitrogen (N)/protein analyser (Flash EA1112). Percentage nitrogen was
directly measured and protein (%) was estimated under the assumption of a 16% N
content of proteins. Mineral and vitamin mixes were also produced in house according
to the American Institute of Nutrition AIN-76A formulation (American Institute of
Nutrition, 1977), compositions of which are shown in Table 2.4 and Table 2.5
respectively. For general maintenance and for weanling animals (where applicable)
animals were provided with the 2018 Teklad Global 18% protein rodent diet (chow).
The manufacturer’s description of the composition can be found in Appendix A.
Similarly to the experimental diets, an in-house analysis of fatty acid profile was also
carried out for the chow diet, the results of which can be found in Appendix B.
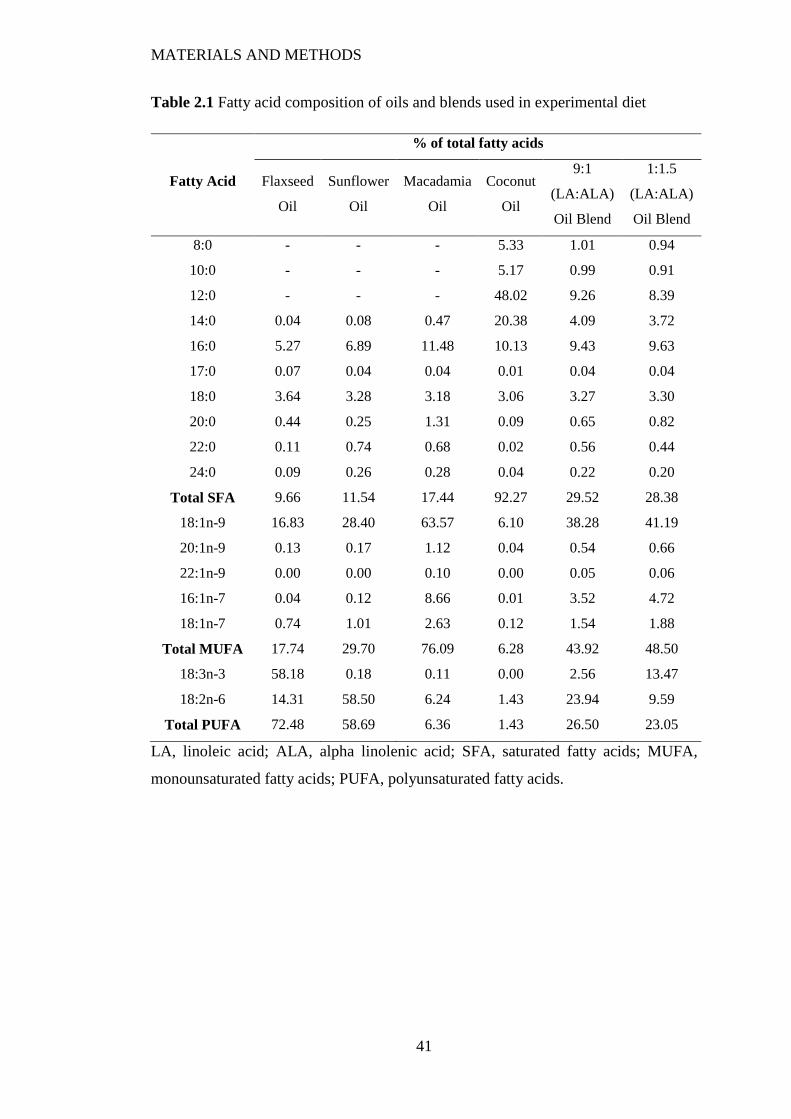
MATERIALS AND METHODS
41
Table 2.1 Fatty acid composition of oils and blends used in experimental diet
Fatty Acid
% of total fatty acids
Flaxseed
Oil
Sunflower
Oil
Macadamia
Oil
Coconut
Oil
9:1
(LA:ALA)
Oil Blend
1:1.5
(LA:ALA)
Oil Blend
8:0 - - - 5.33 1.01 0.94
10:0 - - - 5.17 0.99 0.91
12:0 - - - 48.02 9.26 8.39
14:0 0.04 0.08 0.47 20.38 4.09 3.72
16:0 5.27 6.89 11.48 10.13 9.43 9.63
17:0 0.07 0.04 0.04 0.01 0.04 0.04
18:0 3.64 3.28 3.18 3.06 3.27 3.30
20:0 0.44 0.25 1.31 0.09 0.65 0.82
22:0 0.11 0.74 0.68 0.02 0.56 0.44
24:0 0.09 0.26 0.28 0.04 0.22 0.20
Total SFA 9.66 11.54 17.44 92.27 29.52 28.38
18:1n-9 16.83 28.40 63.57 6.10 38.28 41.19
20:1n-9 0.13 0.17 1.12 0.04 0.54 0.66
22:1n-9 0.00 0.00 0.10 0.00 0.05 0.06
16:1n-7 0.04 0.12 8.66 0.01 3.52 4.72
18:1n-7 0.74 1.01 2.63 0.12 1.54 1.88
Total MUFA 17.74 29.70 76.09 6.28 43.92 48.50
18:3n-3 58.18 0.18 0.11 0.00 2.56 13.47
18:2n-6 14.31 58.50 6.24 1.43 23.94 9.59
Total PUFA 72.48 58.69 6.36 1.43 26.50 23.05
LA, linoleic acid; ALA, alpha linolenic acid; SFA, saturated fatty acids; MUFA,
monounsaturated fatty acids; PUFA, polyunsaturated fatty acids.
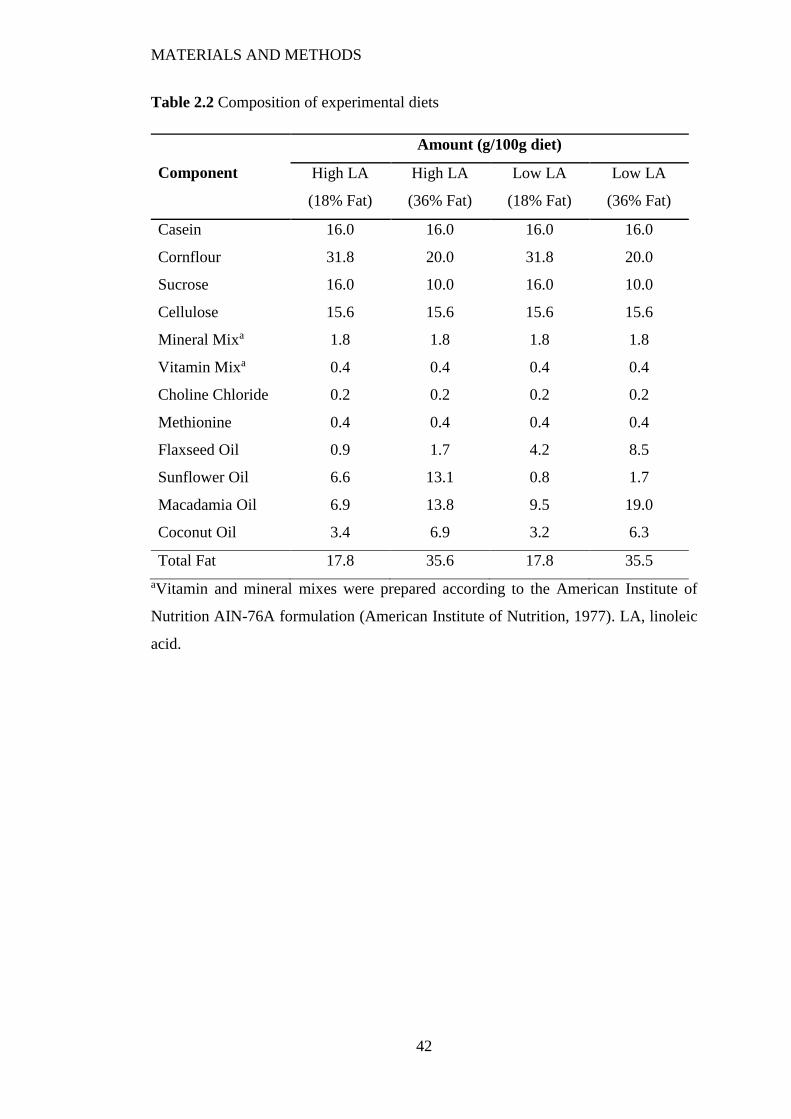
MATERIALS AND METHODS
42
Table 2.2 Composition of experimental diets
Component
Amount (g/100g diet)
High LA
(18% Fat)
High LA
(36% Fat)
Low LA
(18% Fat)
Low LA
(36% Fat)
Casein 16.0 16.0 16.0 16.0
Cornflour 31.8 20.0 31.8 20.0
Sucrose 16.0 10.0 16.0 10.0
Cellulose 15.6 15.6 15.6 15.6
Mineral Mixa 1.8 1.8 1.8 1.8
Vitamin Mixa 0.4 0.4 0.4 0.4
Choline Chloride 0.2 0.2 0.2 0.2
Methionine 0.4 0.4 0.4 0.4
Flaxseed Oil 0.9 1.7 4.2 8.5
Sunflower Oil 6.6 13.1 0.8 1.7
Macadamia Oil 6.9 13.8 9.5 19.0
Coconut Oil 3.4 6.9 3.2 6.3
Total Fat 17.8 35.6 17.8 35.5
aVitamin and mineral mixes were prepared according to the American Institute of
Nutrition AIN-76A formulation (American Institute of Nutrition, 1977). LA, linoleic
acid.
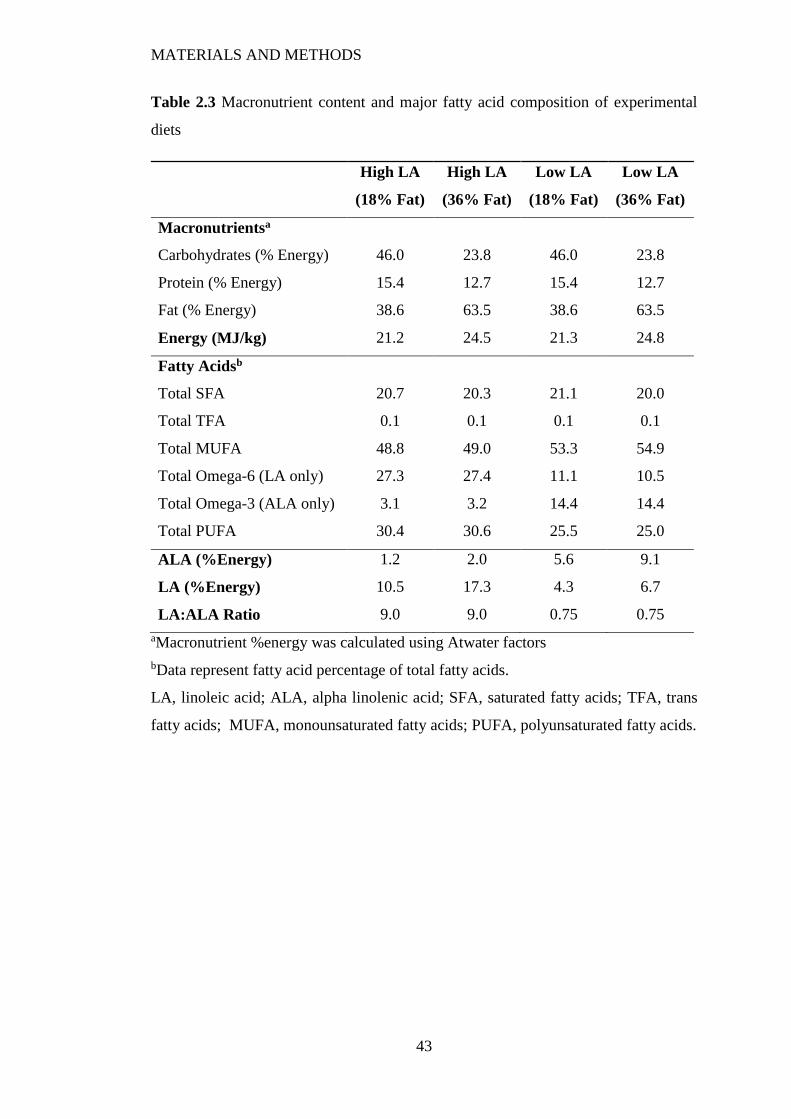
MATERIALS AND METHODS
43
Table 2.3 Macronutrient content and major fatty acid composition of experimental
diets
High LA
(18% Fat)
High LA
(36% Fat)
Low LA
(18% Fat)
Low LA
(36% Fat)
Macronutrientsa
Carbohydrates (% Energy) 46.0 23.8 46.0 23.8
Protein (% Energy) 15.4 12.7 15.4 12.7
Fat (% Energy) 38.6 63.5 38.6 63.5
Energy (MJ/kg) 21.2 24.5 21.3 24.8
Fatty Acidsb
Total SFA 20.7 20.3 21.1 20.0
Total TFA 0.1 0.1 0.1 0.1
Total MUFA 48.8 49.0 53.3 54.9
Total Omega-6 (LA only) 27.3 27.4 11.1 10.5
Total Omega-3 (ALA only) 3.1 3.2 14.4 14.4
Total PUFA 30.4 30.6 25.5 25.0
ALA (%Energy) 1.2 2.0 5.6 9.1
LA (%Energy) 10.5 17.3 4.3 6.7
LA:ALA Ratio 9.0 9.0 0.75 0.75
aMacronutrient %energy was calculated using Atwater factors
bData represent fatty acid percentage of total fatty acids.
LA, linoleic acid; ALA, alpha linolenic acid; SFA, saturated fatty acids; TFA, trans
fatty acids; MUFA, monounsaturated fatty acids; PUFA, polyunsaturated fatty acids.
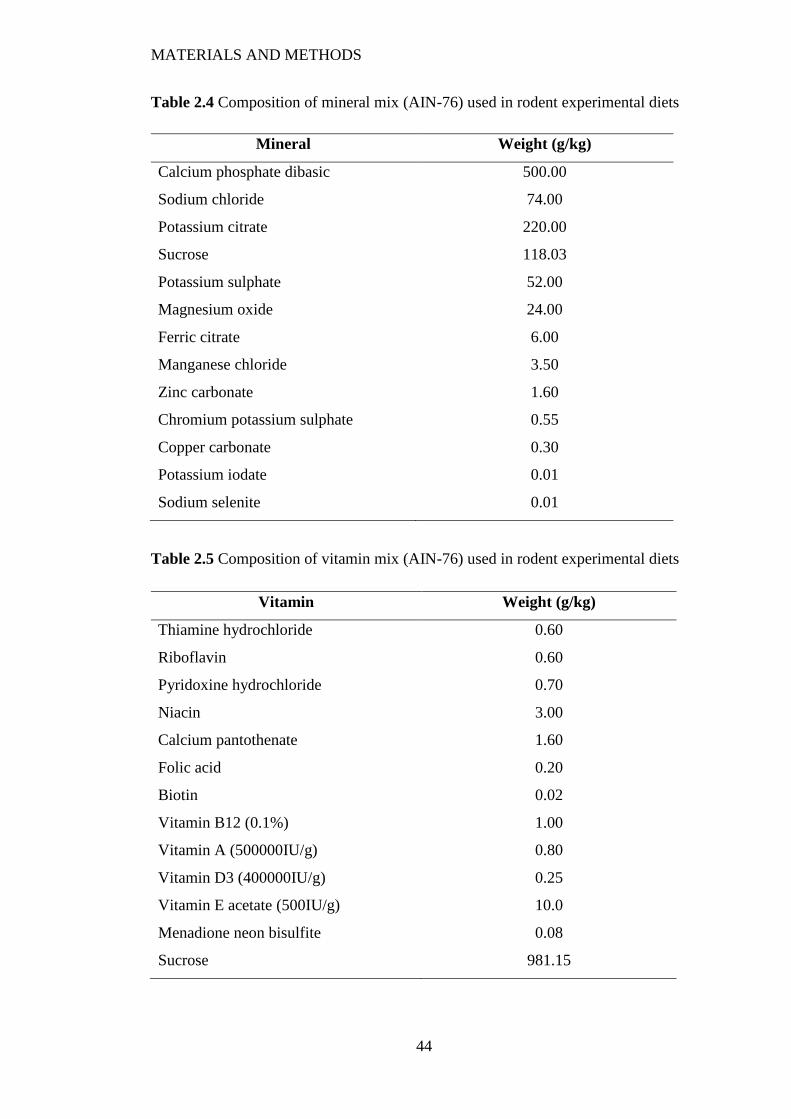
MATERIALS AND METHODS
44
Table 2.4 Composition of mineral mix (AIN-76) used in rodent experimental diets
Table 2.5 Composition of vitamin mix (AIN-76) used in rodent experimental diets
Mineral Weight (g/kg)
Calcium phosphate dibasic 500.00
Sodium chloride 74.00
Potassium citrate 220.00
Sucrose 118.03
Potassium sulphate 52.00
Magnesium oxide 24.00
Ferric citrate 6.00
Manganese chloride 3.50
Zinc carbonate 1.60
Chromium potassium sulphate 0.55
Copper carbonate 0.30
Potassium iodate 0.01
Sodium selenite 0.01
Vitamin Weight (g/kg)
Thiamine hydrochloride 0.60
Riboflavin 0.60
Pyridoxine hydrochloride 0.70
Niacin 3.00
Calcium pantothenate 1.60
Folic acid 0.20
Biotin 0.02
Vitamin B12 (0.1%) 1.00
Vitamin A (500000IU/g) 0.80
Vitamin D3 (400000IU/g) 0.25
Vitamin E acetate (500IU/g) 10.0
Menadione neon bisulfite 0.08
Sucrose 981.15
MATERIALS AND METHODS
45
2.2 Animal Trial Designs
All animal procedures were performed in accordance with the Animals (Scientific
Procedures) Act 1986 under Home Office licence and were approved by the Animal
Ethics Committee of the University of Nottingham, UK. Virgin female Wistar rats (75-
100g) were obtained from Charles River Laboratories (UK) and were housed in plastic
individually ventilated cages (IVC) and subjected to a 12 h light–12 h dark cycle at a
temperature of 20–22°C and 45-65% humidity. The animals were housed on wood
shavings and had ad libitum access to food and water at all times. All experiments
were performed within the University of Nottingham Bio-Support Unit (Sutton
Bonington Campus, UK).
Animals were allowed to acclimatise to the unit for 2 weeks after arrival; during this
time they were maintained on a standard laboratory chow diet (2018 Teklad Global
18% protein rodent diet). After two weeks, a tail vein blood sample was taken from rat
dams using a needle to pierce the skin. This was done 10 minutes after the application
of an anaesthetic cream. The initial blood drop was discarded and further drops were
placed onto dried blood spot (DBS) cards (see section 2.3.1.1) for further analysis.
Animals were then randomly allocated to their experimental diets and maintained on
these for 4 weeks, during which time animals were pair-housed. A second tail vein
blood sample was taken before animals were mated. After mating, animals followed
the design of either trial I (see section 2.2.1) or trial II (see section 2.2.2). The two
trials were run in parallel and four unrelated males were used for mating.
2.2.1 Trial I: Altered maternal diet and fetal outcomes
Trial I aimed to assess the effect of altered maternal fatty acid ratio and total fat content
on fetal development.
2.2.1.1 Animal breeding and maintenance
Conception was confirmed by the appearance of a semen plug and this was noted as
day 0 of pregnancy. Average time in mating pairs was 2.5 days and all but one female
conceived within their first oestrous cycle housed with the male. After conception,
animals were individually housed and remained on their respective diets until day 20
of gestation (full term = 22 days) where dams and fetuses were culled and tissues were
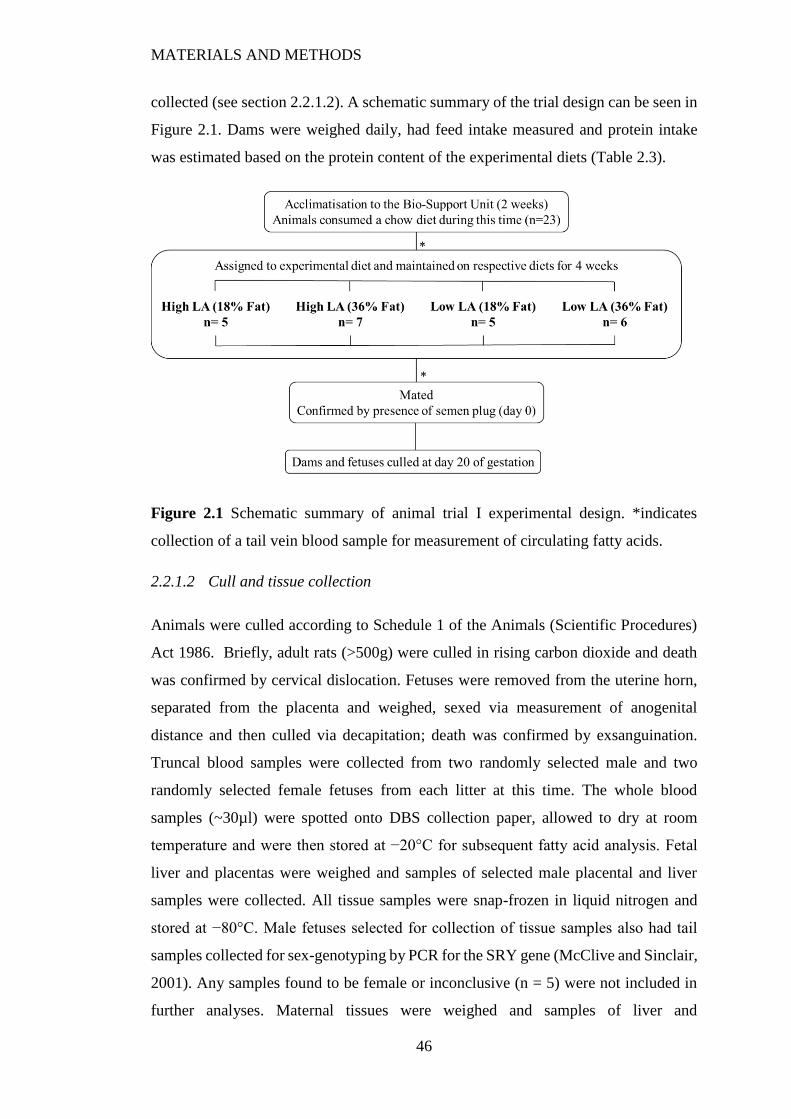
MATERIALS AND METHODS
46
collected (see section 2.2.1.2). A schematic summary of the trial design can be seen in
Figure 2.1. Dams were weighed daily, had feed intake measured and protein intake
was estimated based on the protein content of the experimental diets (Table 2.3).
Figure 2.1 Schematic summary of animal trial I experimental design. *indicates
collection of a tail vein blood sample for measurement of circulating fatty acids.
2.2.1.2 Cull and tissue collection
Animals were culled according to Schedule 1 of the Animals (Scientific Procedures)
Act 1986. Briefly, adult rats (>500g) were culled in rising carbon dioxide and death
was confirmed by cervical dislocation. Fetuses were removed from the uterine horn,
separated from the placenta and weighed, sexed via measurement of anogenital
distance and then culled via decapitation; death was confirmed by exsanguination.
Truncal blood samples were collected from two randomly selected male and two
randomly selected female fetuses from each litter at this time. The whole blood
samples (~30µl) were spotted onto DBS collection paper, allowed to dry at room
temperature and were then stored at −20°C for subsequent fatty acid analysis. Fetal
liver and placentas were weighed and samples of selected male placental and liver
samples were collected. All tissue samples were snap-frozen in liquid nitrogen and
stored at −80°C. Male fetuses selected for collection of tissue samples also had tail
samples collected for sex-genotyping by PCR for the SRY gene (McClive and Sinclair,
2001). Any samples found to be female or inconclusive (n = 5) were not included in
further analyses. Maternal tissues were weighed and samples of liver and
MATERIALS AND METHODS
47
retroperitoneal adipose tissue were collected. Blood was collected from dams via
cardiac puncture. Whole blood (~30µl) was spotted onto DBS cards and the rest was
placed into heparinised tubes (Sarstedt) and centrifuged at 13000 rpm for 10 minutes
at 4°C. The plasma was isolated from the whole blood samples and stored at -80°C
until further analysis. All harvested organs were weighed and snap frozen in liquid
nitrogen prior to storage at -80°C.
2.2.2 Trial II: Altered maternal diet and offspring outcomes up to 8 weeks of age
Trial II aimed to assess the effect of altered maternal fatty acid ratio and total fat
content on offspring development up to 8 weeks of age.
2.2.2.1 Animal breeding and maintenance
Conception was confirmed by the appearance of a semen plug and this was noted as
day 0 of pregnancy. Average time in mating pairs was 2.8 days and all but two females
conceived within their first oestrous cycle housed with the male. After conception,
animals were individually housed and remained on their respective diets until
completion of the experiment. Litters were standardised to 8 pups within 24 hours of
birth (4 males and 4 females where possible). At 1 and 2 weeks of age, one randomly
selected male and one randomly selected female from each litter was culled. At 3
weeks of age, offspring were weaned away from the mother onto a chow diet. Animals
were group housed with littermates according to sex. After the offspring were weaned
the dams were culled. All remaining animals had blood pressure measurements taken
at 4 weeks of age, after which one male and one female were randomly chosen and
culled. At 8 weeks of age, all remaining offspring had another blood pressure
measurement taken and were then culled. A schematic summary of the trial design can
be seen in Figure 2.2. Dams were weighed daily, had feed intake measured and protein
intake was estimated based on the protein content of the experimental diets (Table 2.3).
All neonates were weighed at birth and sex was determined by measurement of
anogenital distance. Offspring were then weighed weekly until the end of the
experiment.
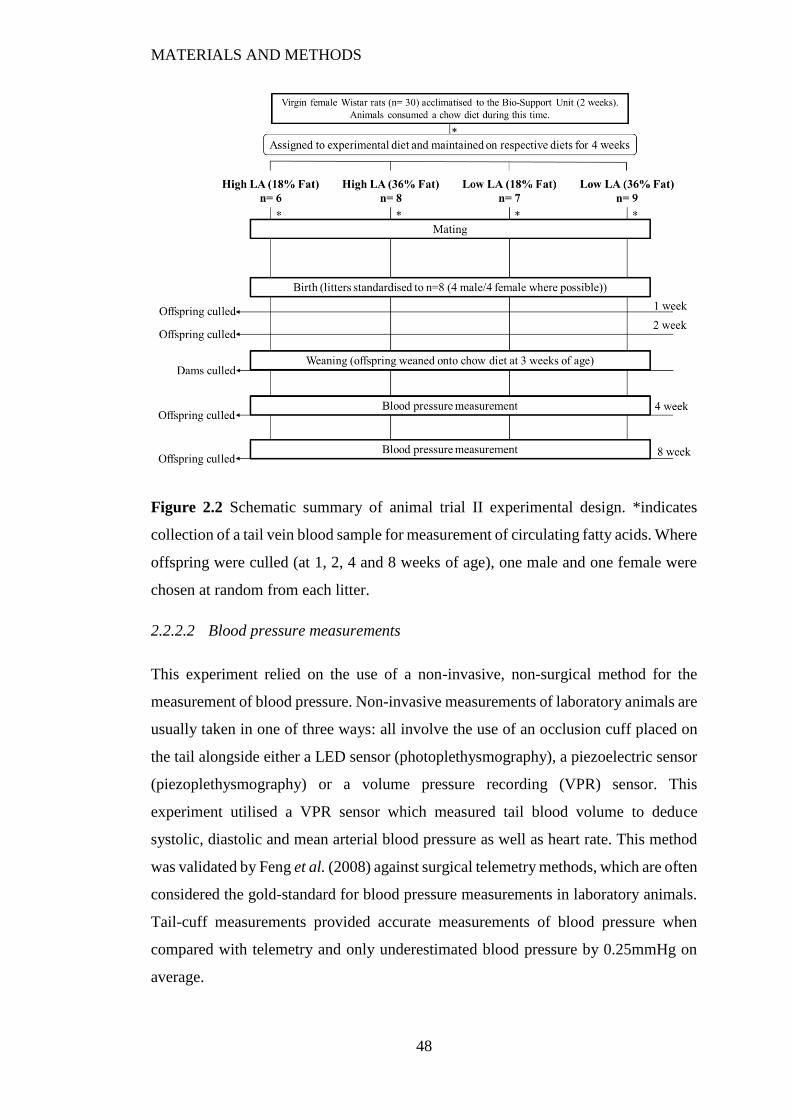
MATERIALS AND METHODS
48
Figure 2.2 Schematic summary of animal trial II experimental design. *indicates
collection of a tail vein blood sample for measurement of circulating fatty acids. Where
offspring were culled (at 1, 2, 4 and 8 weeks of age), one male and one female were
chosen at random from each litter.
2.2.2.2 Blood pressure measurements
This experiment relied on the use of a non-invasive, non-surgical method for the
measurement of blood pressure. Non-invasive measurements of laboratory animals are
usually taken in one of three ways: all involve the use of an occlusion cuff placed on
the tail alongside either a LED sensor (photoplethysmography), a piezoelectric sensor
(piezoplethysmography) or a volume pressure recording (VPR) sensor. This
experiment utilised a VPR sensor which measured tail blood volume to deduce
systolic, diastolic and mean arterial blood pressure as well as heart rate. This method
was validated by Feng et al. (2008) against surgical telemetry methods, which are often
considered the gold-standard for blood pressure measurements in laboratory animals.
Tail-cuff measurements provided accurate measurements of blood pressure when
compared with telemetry and only underestimated blood pressure by 0.25mmHg on
average.
MATERIALS AND METHODS
49
Prior to blood pressure measurements, animals were placed in a heat box set to 30°C
for 15 minutes to enhance blood flow to the tail. Animals were then restrained in
individual restraint tubes with adjustable nose cone, fitted with the deflated occlusion
and VPR cuff (CODA System, Kent Scientific, Torrington, CT) and left to acclimatise
to the restraint tube for 10 minutes to minimise the impact of stress before
measurements began. After acclimatisation, animals underwent 10 cycles of blood
pressure measurements. Of these 10 cycles, the first three were disregarded as
acclimatisation cycles and an average for each measurement was taken from the
remaining seven. Animals were restrained for no longer than 30 minutes and removed
if individuals presented with signs of stress.
2.2.2.3 Cull and tissue collection
Animals were culled according to Schedule 1 of the Animals (Scientific Procedures)
Act 1986. Briefly, adult rats (>500g) were culled in rising carbon dioxide and death
was confirmed by cervical dislocation. Adolescent rats (<500g) were culled via
cervical dislocation and death was confirmed by exsanguination. Truncal blood was
collected from offspring using glass capillary tubes and spotted onto DBS cards
(~30µl) at 1 and 2 weeks of age. Blood was collected from dams and offspring at 4
and 8 weeks of age via cardiac puncture. Whole blood (~30µl) was spotted onto DBS
cards and the remaining sample was placed in heparinised tubes (Sarstedt) and
centrifuged at 13000 rpm for 10 minutes at 4°C. The plasma was isolated from the
whole blood samples and stored at -80°C until further analysis. All harvested organs
were weighed and snap frozen in liquid nitrogen prior to storage at -80°C.
2.3 Laboratory Methods
2.3.1 Lipid analysis
2.3.1.1 The use and validation of dried blood spot (DBS) cards for the measurement
of fatty acids
The DBS technique is a sampling method where blood is spotted onto filter paper and
allowed to dry. This drying stabilises the blood sample for further analysis and the
technique has been in use since the 1960s where it was first used to screen for
phenylketonuria in infants (Guthrie and Susi, 1963). Since then it has been used as a
MATERIALS AND METHODS
50
screening method for biomarkers for a range of disorders such as HIV (Parker and
Cubitt, 1999), cystic fibrosis (Wilcken et al., 1983) and sickle-cell anaemia (Garrick
et al., 1973). Advances in the sensitivity and specificity of techniques associated with
analysing small volumes of blood have resulted in the DBS technique becoming a
significant tool, particularly in newborn screening.
When compared with conventional blood collection and measurement techniques, the
DBS technique has many advantages (Parker and Cubitt, 1999). One such advantage
is that the DBS technique only requires the collection of capillary blood, a significant
benefit especially in neonates and elderly patients where venous blood collection can
be very difficult. The technique also eliminates the need for immediate processing of
blood samples to separate blood fractions for long-term stability and storage. Because
of the immediate stability to samples that the DBS technique provides, blood samples
can be collected ‘in field’ and shipped, at room temperature, for analysis at a later time.
Most of the advantages that the DBS technique confers over traditional venepuncture
methods centre on the immediate stability of the blood samples, more specifically, the
stability of the metabolite of interest within the blood sample. The use of the DBS
technique to measure fatty acid status was first described by Nishio et al. (1986) but
required a relatively large volume (~100µl) of blood and was validated for specific
fatty acid biomarkers of adrenoleukodystrophy which are inherently stable in air
(C22:0, C24:0 and C26:0). Since then, improvements have been made in the technique,
however, the inability to measure fatty acids in all lipid fractions (Ichihar et al., 2002)
and significant variability in measurements of LCPUFA when compared to
conventional techniques (Marangoni et al., 2004), limited the application of this
method for the measurement of the complete fatty acid profile. The oxidation of fatty
acids, particularly LCPUFA, when exposed to air was postulated as a potential reason
for this high variability (Ichihar et al., 2002). As such, to stabilise the LCPUFA, studies
took the approach of either processing the samples immediately (Agostoni et al., 2008)
or storing them at -20°C (Bell et al., 2011), both of which negate the advantage of the
method as a convenient and stable technique.
Previous research in our laboratory by Liu et al. (2014) established and validated a
method for the measurement of the complete fatty acid profile in whole blood (PUFA
coat™). This work tested fatty acid stability on various commercially available filter
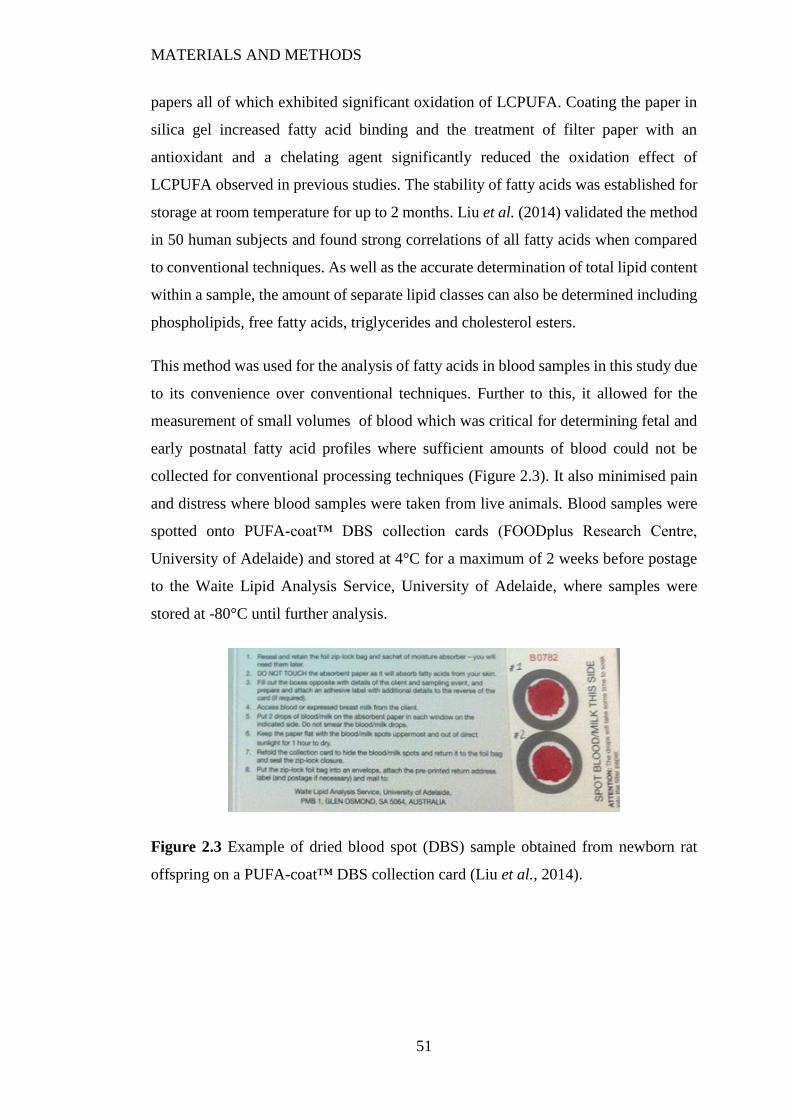
MATERIALS AND METHODS
51
papers all of which exhibited significant oxidation of LCPUFA. Coating the paper in
silica gel increased fatty acid binding and the treatment of filter paper with an
antioxidant and a chelating agent significantly reduced the oxidation effect of
LCPUFA observed in previous studies. The stability of fatty acids was established for
storage at room temperature for up to 2 months. Liu et al. (2014) validated the method
in 50 human subjects and found strong correlations of all fatty acids when compared
to conventional techniques. As well as the accurate determination of total lipid content
within a sample, the amount of separate lipid classes can also be determined including
phospholipids, free fatty acids, triglycerides and cholesterol esters.
This method was used for the analysis of fatty acids in blood samples in this study due
to its convenience over conventional techniques. Further to this, it allowed for the
measurement of small volumes of blood which was critical for determining fetal and
early postnatal fatty acid profiles where sufficient amounts of blood could not be
collected for conventional processing techniques (Figure 2.3). It also minimised pain
and distress where blood samples were taken from live animals. Blood samples were
spotted onto PUFA-coat™ DBS collection cards (FOODplus Research Centre,
University of Adelaide) and stored at 4°C for a maximum of 2 weeks before postage
to the Waite Lipid Analysis Service, University of Adelaide, where samples were
stored at -80°C until further analysis.
Figure 2.3 Example of dried blood spot (DBS) sample obtained from newborn rat
offspring on a PUFA-coat™ DBS collection card (Liu et al., 2014).
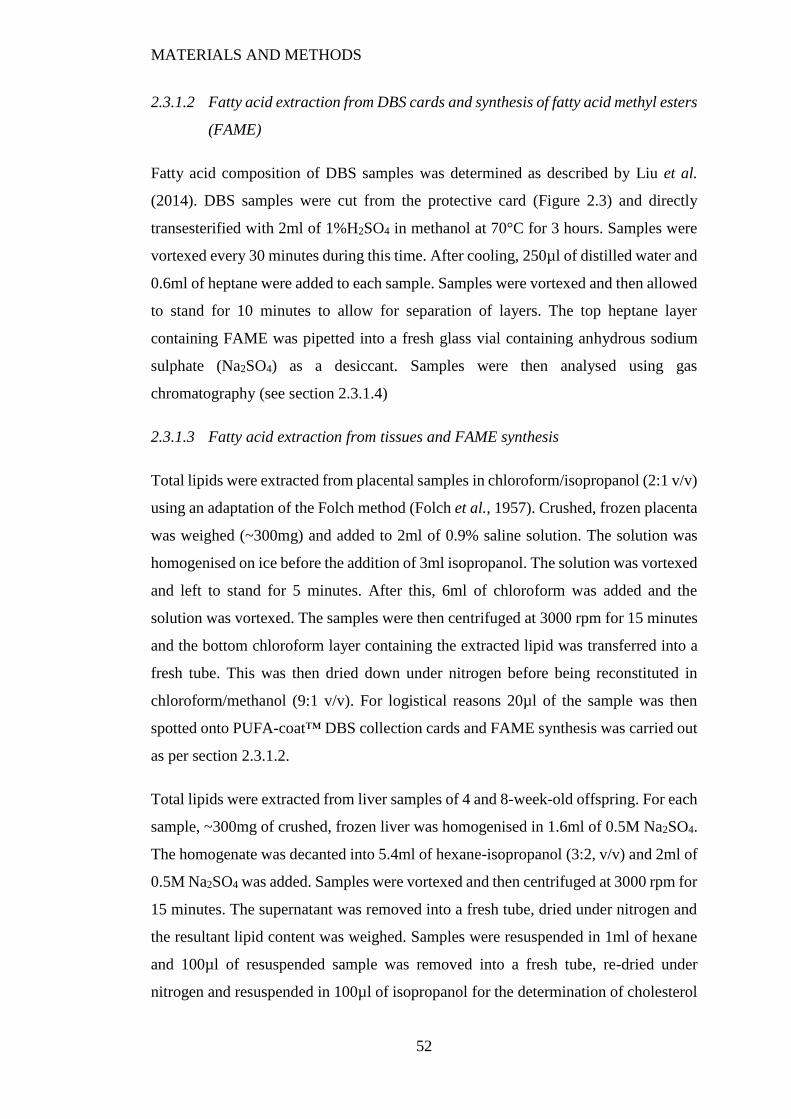
MATERIALS AND METHODS
52
2.3.1.2 Fatty acid extraction from DBS cards and synthesis of fatty acid methyl esters
(FAME)
Fatty acid composition of DBS samples was determined as described by Liu et al.
(2014). DBS samples were cut from the protective card (Figure 2.3) and directly
transesterified with 2ml of 1%H2SO4 in methanol at 70°C for 3 hours. Samples were
vortexed every 30 minutes during this time. After cooling, 250µl of distilled water and
0.6ml of heptane were added to each sample. Samples were vortexed and then allowed
to stand for 10 minutes to allow for separation of layers. The top heptane layer
containing FAME was pipetted into a fresh glass vial containing anhydrous sodium
sulphate (Na2SO4) as a desiccant. Samples were then analysed using gas
chromatography (see section 2.3.1.4)
2.3.1.3 Fatty acid extraction from tissues and FAME synthesis
Total lipids were extracted from placental samples in chloroform/isopropanol (2:1 v/v)
using an adaptation of the Folch method (Folch et al., 1957). Crushed, frozen placenta
was weighed (~300mg) and added to 2ml of 0.9% saline solution. The solution was
homogenised on ice before the addition of 3ml isopropanol. The solution was vortexed
and left to stand for 5 minutes. After this, 6ml of chloroform was added and the
solution was vortexed. The samples were then centrifuged at 3000 rpm for 15 minutes
and the bottom chloroform layer containing the extracted lipid was transferred into a
fresh tube. This was then dried down under nitrogen before being reconstituted in
chloroform/methanol (9:1 v/v). For logistical reasons 20µl of the sample was then
spotted onto PUFA-coat™ DBS collection cards and FAME synthesis was carried out
as per section 2.3.1.2.
Total lipids were extracted from liver samples of 4 and 8-week-old offspring. For each
sample, ~300mg of crushed, frozen liver was homogenised in 1.6ml of 0.5M Na2SO4.
The homogenate was decanted into 5.4ml of hexane-isopropanol (3:2, v/v) and 2ml of
0.5M Na2SO4 was added. Samples were vortexed and then centrifuged at 3000 rpm for
15 minutes. The supernatant was removed into a fresh tube, dried under nitrogen and
the resultant lipid content was weighed. Samples were resuspended in 1ml of hexane
and 100µl of resuspended sample was removed into a fresh tube, re-dried under
nitrogen and resuspended in 100µl of isopropanol for the determination of cholesterol
MATERIALS AND METHODS
53
and triglyceride content (see section 2.3.3.4 and 2.3.3.5). The remaining sample was
stored at -20°C for fatty acid analysis (see section 2.3.1.4).
2.3.1.4 Gas chromatography (GC) analysis of fatty acid methyl esters (FAME)
Samples containing FAME were analysed at the University of Adelaide. Samples were
separated and analysed by a Hewlett-Packard 6890 gas chromatograph (GC) equipped
with a capillary column (30m x 0.25mm) coated with 70% cyanopropyl
polysilphenylene-siloxane (BPX-70; 0.25µm film thickness) which was fitted with a
flame ionisation detector (FID). Helium was utilised as the carrier gas and a split ratio
was set at 20:1. Injector temperature was set at 250°C and FID temperature at 300°C.
FAME were identified in unknown samples based on the comparison of retention times
with an external lipid standard (Standard 463, Nu-check prep Inc. MN, USA) using
Agilent Chemstation software. Individual fatty acid content was calculated based on
peak area and response factors normalised to total fatty acid content and expressed as
a percentage of total fatty acids across lipid classes.
2.3.2 Gene expression analysis
2.3.2.1 Isolation and preparation of ribonucleic acid (RNA) from liver
RNA was isolated from liver using Roche High Pure Tissue kits (Roche Diagnostics
Ltd, UK). Lysis buffer (400µl) was added to ~25mg of crushed snap-frozen liver tissue
in a clean, autoclaved Eppendorf tube. Samples were further homogenised by passing
the tissue and buffer through a 21-gauge needle 5-10 times. The lysate was then
centrifuged for 2 minutes at 13000 rpm and the supernatant was removed and placed
into a fresh sterile Eppendorf tube with 200µl of absolute ethanol. A Roche high pure
filter tube was combined with the collection tube and the entire solution was pipetted
into the upper chamber of the filter/collection assembly. The samples were then
centrifuged for 30 seconds at 13000 rpm and the filtered flow-through was discarded.
For each sample, 90µl of DNase incubation buffer was mixed with 10µl DNase and
the solution was added to the upper chamber of the filter/collection assembly in order
to remove any contaminating genomic DNA. After an incubation step of 15 minutes
at room temperature, the assembly was sequentially washed with wash buffers I and
II. The upper chamber was then removed and placed in a fresh sterile Eppendorf tube
MATERIALS AND METHODS
54
and 100µl of elution buffer was passed through (centrifuged at 8000 rpm) and the
resultant solution in the Eppendorf contained the extracted RNA.
2.3.2.2 Isolation and preparation of RNA from adipose tissue
RNA was isolated from adipose tissue samples using a QIAGEN RNeasy Mini-kit
(QIAGEN Ltd., UK) alongside MagNA Lyser green beads and instrument (Roche
Diagnostics Ltd.). Lysis buffer (600µl; containing 1% beta-mercaptoethanol) was
added to ~100mg of crushed snap frozen adipose tissue in a sterile tube containing the
MagNA Lyser green beads. Samples were vortexed for 10 seconds and placed in the
MagNA Lyser instrument for 40 seconds at 6500 rpm. Samples were then centrifuged
at 8000 rpm for 3 minutes. After centrifugation, 400µl of the infranatant was removed
(carefully avoiding the top lipid layer) into a fresh sterile Eppendorf tube and kept on
ice. To increase RNA yield, the previous steps were repeated after adding 350µl of
lysis buffer to the remaining solution in the tube containing the MagNA Lyser green
beads. The resulting infranatant was then combined with that collected previously. The
sample was then centrifuged for 5 minutes at 13000 rpm and 700µl of the supernatant
removed and added to an equal volume of 70% ethanol. The resulting solution was
then incrementally passed through the RNeasy filter column (centrifuged at 800 rpm
for 15 seconds) and flow-through discarded. After a wash step, 70µl of buffer was
combined with 10µl of DNase and pipetted into the top chamber of the RNeasy column
where it was incubated for 15 minutes at room temperature. After multiple subsequent
wash steps, the upper chamber of the RNeasy column was placed in a fresh sterile
Eppendorf tube and 30µl of RNase-free water was added. The assembly was
centrifuged for 1 minute at 8000 rpm and the resulting solution in the Eppendorf
contained the eluted RNA.
2.3.2.3 Testing RNA concentration and purity
All RNA samples were tested for RNA concentration (ng/µl) using a Nanodrop 2000
spectrophotometer (Thermo Scientific). Samples were measured at 260nm for nucleic
acids and at 280nm for proteins. The 260/280 ratio gave an indication of any protein
contamination within the samples and those failing to achieve a ratio value between
1.8 and 2.0 and/or concentration lower than 50ng/µl were discarded and RNA
extraction was repeated as in section 2.3.2.1 or 2.3.2.2.
MATERIALS AND METHODS
55
2.3.2.4 Agarose gel electrophoresis
RNA quality was assessed by agarose gel electrophoresis. All samples were diluted to
a concentration of 50 ng/µl with RNAse free water based on the concentrations
measured in section 2.3.2.3. A 1% agarose gel was prepared by diluting 1.5g agarose
in 150ml 1xTris-acetate-EDTA (TAE) buffer. The solution was microwaved until the
agarose was completely dissolved, cooled briefly under running water, and
immediately poured into a gel tray with a 20 well comb inserted. Gels were left to set
for 45 minutes after which the comb was removed and the gel was placed in the gel
tank and submerged with 1xTAE buffer. Sample was loaded (10µl) alongside 2µl of
loading dye into each well. The gel was electrophoresed at 100v for approximately 30
minutes or until the bands were ~2cm from the bottom of the gel. The gel was then
stained in ethidium bromide for 20 minutes and imaged under UV light (Gel Doc 2000,
Bio-Rad Laboratories Inc.). After visual inspection of the gel, samples with two clear
bands were considered acceptable. Any samples presenting with bands that were
unclear, absent or smeared were discarded and RNA extraction was repeated as in
section 2.3.2.1 or 2.3.2.2.
2.3.2.5 Complementary DNA (cDNA) synthesis
Qualifying RNA samples were synthesised into first strand complementary DNA
(cDNA) using RevertAid™ Reverse Transcription kit (Thermo Fisher Scientific Inc.).
Reaction mixes were prepared according to manufacturer’s instructions. A master mix
containing random hexamer primers and nuclease free water was added to RNA into
a fresh 96 well plate (Table 2.6) and incubated at 65°C for 5 minutes (GeneAmp PCR
system 9700, Applied Biosystems). A ‘no template control’ was also added to each
plate where RNA was replaced with water to ensure there was no contamination of the
reagents. The plate was then immediately placed on ice to halt any further reactions.
A second master mix was prepared (Table 2.6) and 8µl was added to each well and the
plate was then incubated once more for 5 minutes at 25°C followed by 60 minutes at
42°C. The reaction was terminated by heating the plate to 70°C for 5 minutes. A further
80µl of RNase free water was added to each sample to make each well up to a 100µl
total volume. A further dilution of the cDNA (1:8) was made and the plate was stored
at -20°C until further analysis.
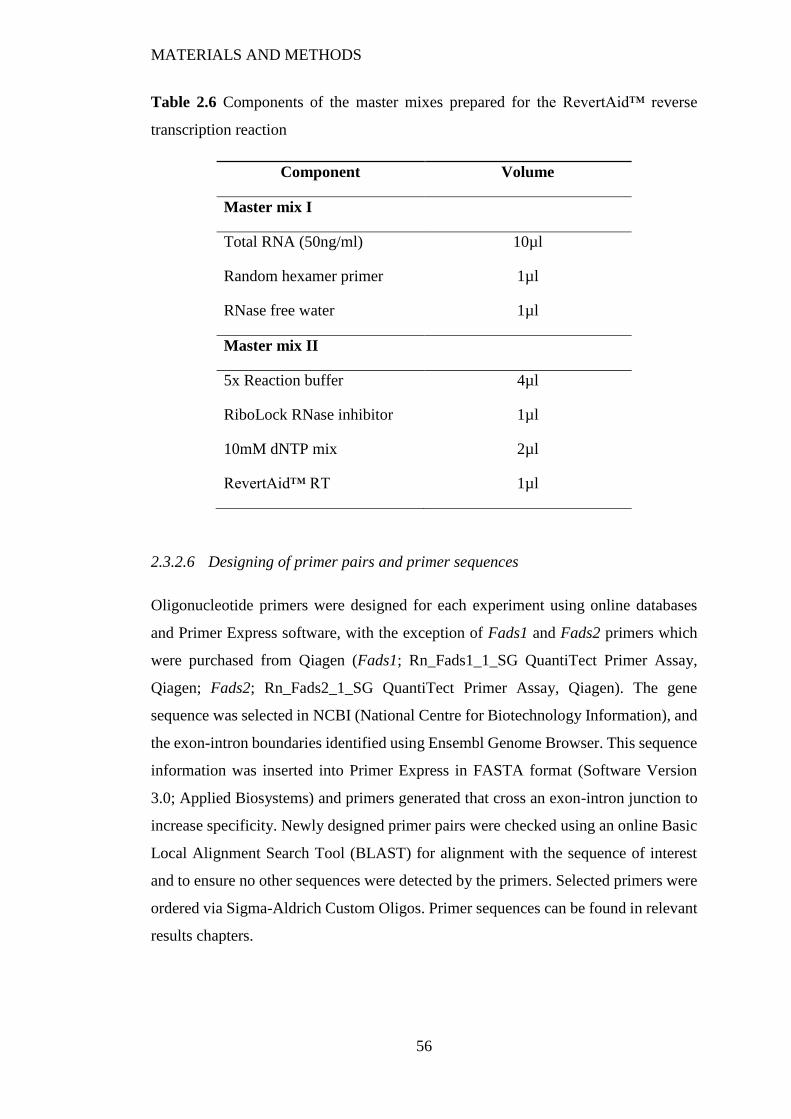
MATERIALS AND METHODS
56
Table 2.6 Components of the master mixes prepared for the RevertAid™ reverse
transcription reaction
Component Volume
Master mix I
Total RNA (50ng/ml) 10µl
Random hexamer primer 1µl
RNase free water 1µl
Master mix II
5x Reaction buffer 4µl
RiboLock RNase inhibitor 1µl
10mM dNTP mix 2µl
RevertAid™ RT 1µl
2.3.2.6 Designing of primer pairs and primer sequences
Oligonucleotide primers were designed for each experiment using online databases
and Primer Express software, with the exception of Fads1 and Fads2 primers which
were purchased from Qiagen (Fads1; Rn_Fads1_1_SG QuantiTect Primer Assay,
Qiagen; Fads2; Rn_Fads2_1_SG QuantiTect Primer Assay, Qiagen). The gene
sequence was selected in NCBI (National Centre for Biotechnology Information), and
the exon-intron boundaries identified using Ensembl Genome Browser. This sequence
information was inserted into Primer Express in FASTA format (Software Version
3.0; Applied Biosystems) and primers generated that cross an exon-intron junction to
increase specificity. Newly designed primer pairs were checked using an online Basic
Local Alignment Search Tool (BLAST) for alignment with the sequence of interest
and to ensure no other sequences were detected by the primers. Selected primers were
ordered via Sigma-Aldrich Custom Oligos. Primer sequences can be found in relevant
results chapters.
MATERIALS AND METHODS
57
2.3.2.7 Quantitative real-time polymerase chain reaction (qRT-PCR)
Although the basic principle is similar, the polymerase chain reaction (PCR) can be
performed in a variety of ways to measure gene expression in various biological
samples. Single stranded cDNA is heated with a specific primer pair, designed to bind
and amplify a target sequence i.e. the gene of interest. This amplification occurs over
a number of amplification cycles. During each cycle, each single stranded cDNA
sample is denatured by increasing the temperature. The temperature is then lowered
again to allow for primer annealing. Finally the temperature is raised again to allow a
thermally stable DNA polymerase to amplify the target sequence. The quantity of
amplification is relative to the amount of starting sequence within the sample giving
an indication of the overall abundance of the gene of interest.
This research relied on a specific method for the measurement of gene expression,
quantitative real-time PCR (qRT-PCR). This method utilises a fluorescent dye which
binds to double stranded nucleic acids. As PCR progresses, the fluorescent signal will
increase. With each cycle, the number of copies of the gene of interest doubles and so
in theory the fluorescent signal should double also. At the start of the reaction however,
as there are only a few template strands, the signal is not strong enough to be detected
(lag phase). After a few more cycles the gene of interested is amplified in a higher
quantity and the fluorescent signal can be detected above the background noise
(exponential phase). After a few more cycles, the reaction will then begin to slow down
as the reagents are used up (plateau phase). As such, it is important to ensure that
quantification of expression and any analysis performed is based upon data generated
during the exponential phase, measurements during the lag or plateau phase are not
entirely representative of starting quantities as they are limited by reagent quantity.
The cycle in the exponential phase where the fluorescent signal moves into the
detectable range is called the threshold cycle (CT). The amount of starting material
within each sample will dictate how long it takes for the reaction to enter its CT: a
lower amount of starting material would require more cycles and so the CT would be
higher.
For this research, a ‘master mix’ containing SYBR green fluorescent dye (Roche
Diagnostics), forward and reverse primers for the target gene and RNAse free water
were made. Exactly 10µl of the master mix and 5µl of the cDNA sample were pipetted
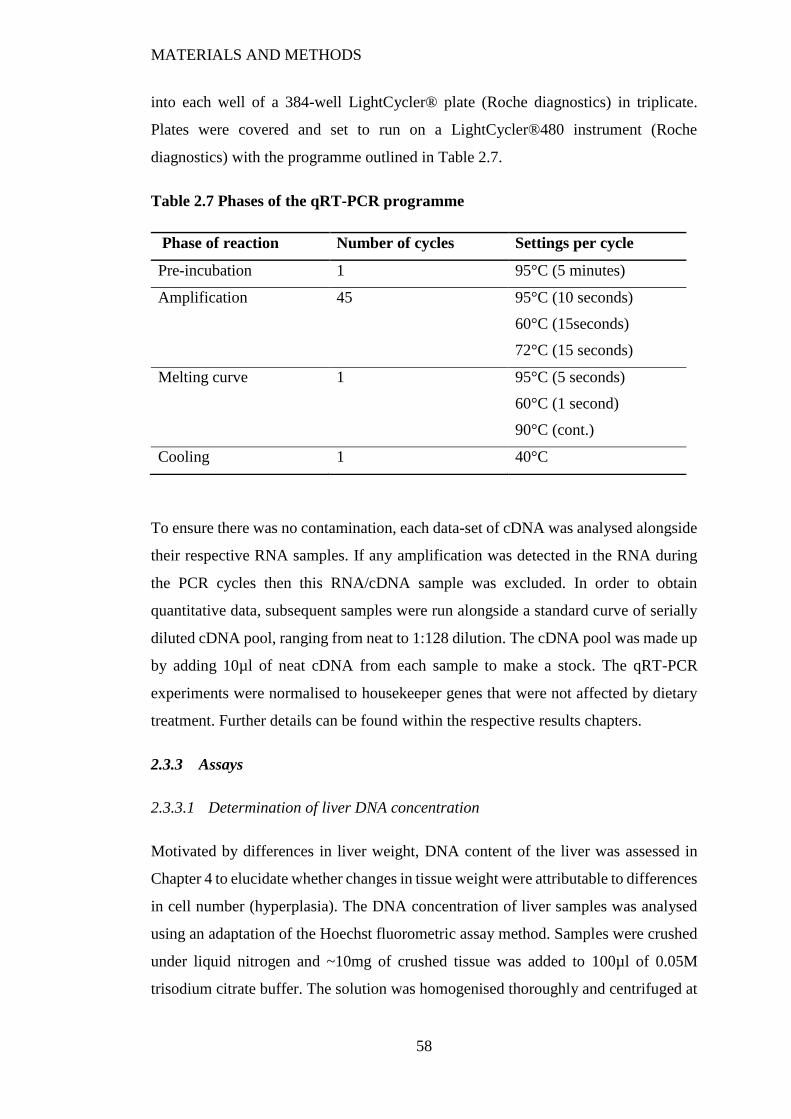
MATERIALS AND METHODS
58
into each well of a 384-well LightCycler® plate (Roche diagnostics) in triplicate.
Plates were covered and set to run on a LightCycler®480 instrument (Roche
diagnostics) with the programme outlined in Table 2.7.
Table 2.7 Phases of the qRT-PCR programme
Phase of reaction Number of cycles Settings per cycle
Pre-incubation 1 95°C (5 minutes)
Amplification 45 95°C (10 seconds)
60°C (15seconds)
72°C (15 seconds)
Melting curve 1 95°C (5 seconds)
60°C (1 second)
90°C (cont.)
Cooling 1 40°C
To ensure there was no contamination, each data-set of cDNA was analysed alongside
their respective RNA samples. If any amplification was detected in the RNA during
the PCR cycles then this RNA/cDNA sample was excluded. In order to obtain
quantitative data, subsequent samples were run alongside a standard curve of serially
diluted cDNA pool, ranging from neat to 1:128 dilution. The cDNA pool was made up
by adding 10µl of neat cDNA from each sample to make a stock. The qRT-PCR
experiments were normalised to housekeeper genes that were not affected by dietary
treatment. Further details can be found within the respective results chapters.
2.3.3 Assays
2.3.3.1 Determination of liver DNA concentration
Motivated by differences in liver weight, DNA content of the liver was assessed in
Chapter 4 to elucidate whether changes in tissue weight were attributable to differences
in cell number (hyperplasia). The DNA concentration of liver samples was analysed
using an adaptation of the Hoechst fluorometric assay method. Samples were crushed
under liquid nitrogen and ~10mg of crushed tissue was added to 100µl of 0.05M
trisodium citrate buffer. The solution was homogenised thoroughly and centrifuged at
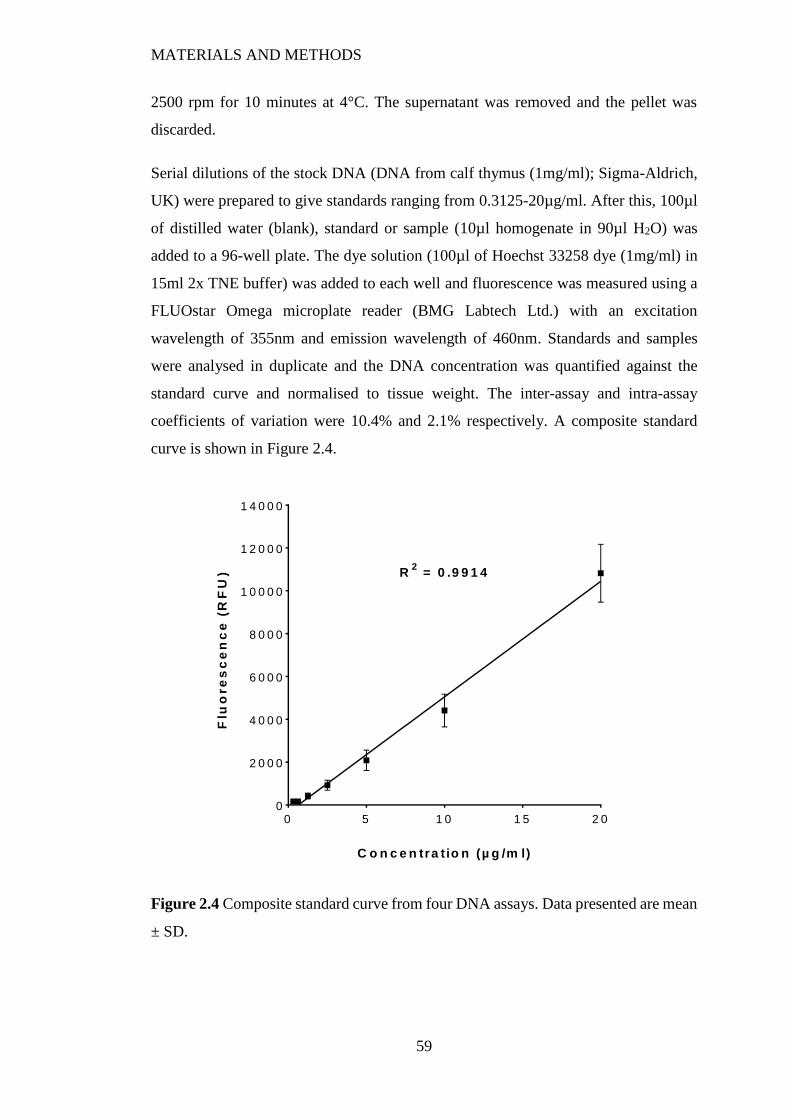
MATERIALS AND METHODS
59
2500 rpm for 10 minutes at 4°C. The supernatant was removed and the pellet was
discarded.
Serial dilutions of the stock DNA (DNA from calf thymus (1mg/ml); Sigma-Aldrich,
UK) were prepared to give standards ranging from 0.3125-20µg/ml. After this, 100µl
of distilled water (blank), standard or sample (10µl homogenate in 90µl H2O) was
added to a 96-well plate. The dye solution (100µl of Hoechst 33258 dye (1mg/ml) in
15ml 2x TNE buffer) was added to each well and fluorescence was measured using a
FLUOstar Omega microplate reader (BMG Labtech Ltd.) with an excitation
wavelength of 355nm and emission wavelength of 460nm. Standards and samples
were analysed in duplicate and the DNA concentration was quantified against the
standard curve and normalised to tissue weight. The inter-assay and intra-assay
coefficients of variation were 10.4% and 2.1% respectively. A composite standard
curve is shown in Figure 2.4.
0 5 1 0 1 5 2 00
2 0 0 0
4 0 0 0
6 0 0 0
8 0 0 0
1 0 0 0 0
1 2 0 0 0
1 4 0 0 0
C o n c e n tra t io n (µ g /m l)
Flu
ore
sc
en
ce
(R
FU
) R2 = 0 .9 9 1 4
Figure 2.4 Composite standard curve from four DNA assays. Data presented are mean
± SD.
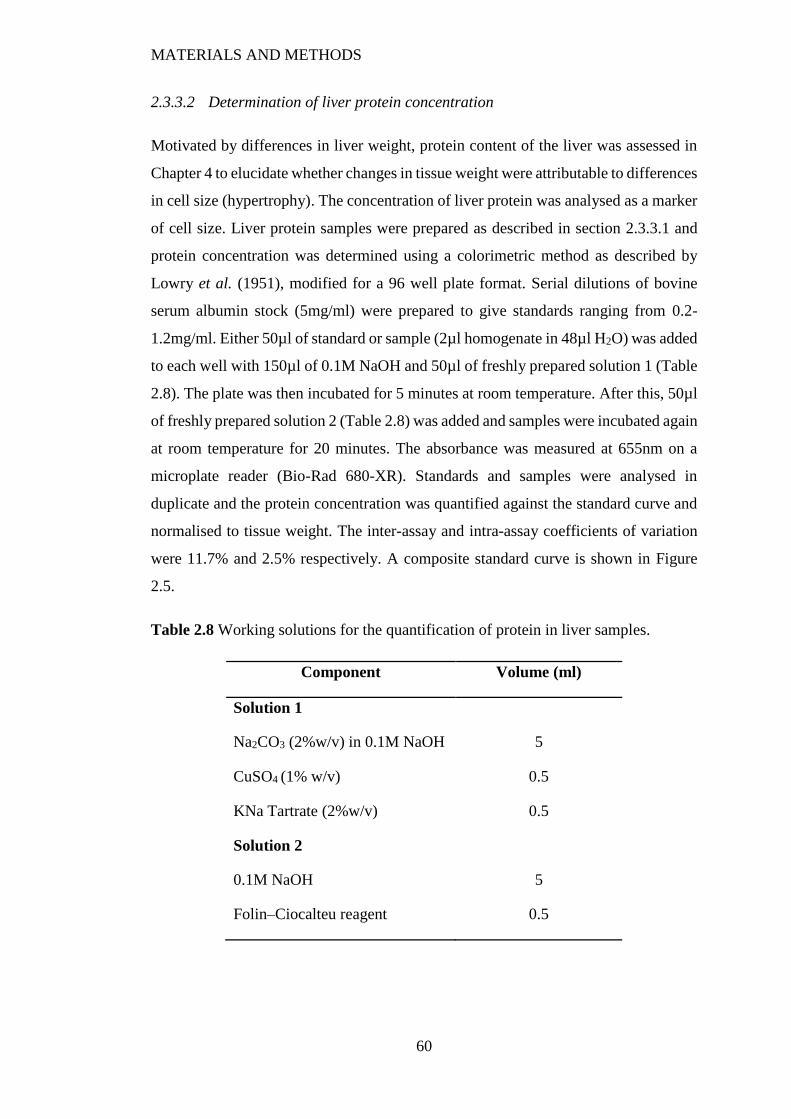
MATERIALS AND METHODS
60
2.3.3.2 Determination of liver protein concentration
Motivated by differences in liver weight, protein content of the liver was assessed in
Chapter 4 to elucidate whether changes in tissue weight were attributable to differences
in cell size (hypertrophy). The concentration of liver protein was analysed as a marker
of cell size. Liver protein samples were prepared as described in section 2.3.3.1 and
protein concentration was determined using a colorimetric method as described by
Lowry et al. (1951), modified for a 96 well plate format. Serial dilutions of bovine
serum albumin stock (5mg/ml) were prepared to give standards ranging from 0.2-
1.2mg/ml. Either 50µl of standard or sample (2µl homogenate in 48µl H2O) was added
to each well with 150µl of 0.1M NaOH and 50µl of freshly prepared solution 1 (Table
2.8). The plate was then incubated for 5 minutes at room temperature. After this, 50µl
of freshly prepared solution 2 (Table 2.8) was added and samples were incubated again
at room temperature for 20 minutes. The absorbance was measured at 655nm on a
microplate reader (Bio-Rad 680-XR). Standards and samples were analysed in
duplicate and the protein concentration was quantified against the standard curve and
normalised to tissue weight. The inter-assay and intra-assay coefficients of variation
were 11.7% and 2.5% respectively. A composite standard curve is shown in Figure
2.5.
Table 2.8 Working solutions for the quantification of protein in liver samples.
Component Volume (ml)
Solution 1
Na2CO3 (2%w/v) in 0.1M NaOH 5
CuSO4 (1% w/v) 0.5
KNa Tartrate (2%w/v) 0.5
Solution 2
0.1M NaOH 5
Folin–Ciocalteu reagent 0.5
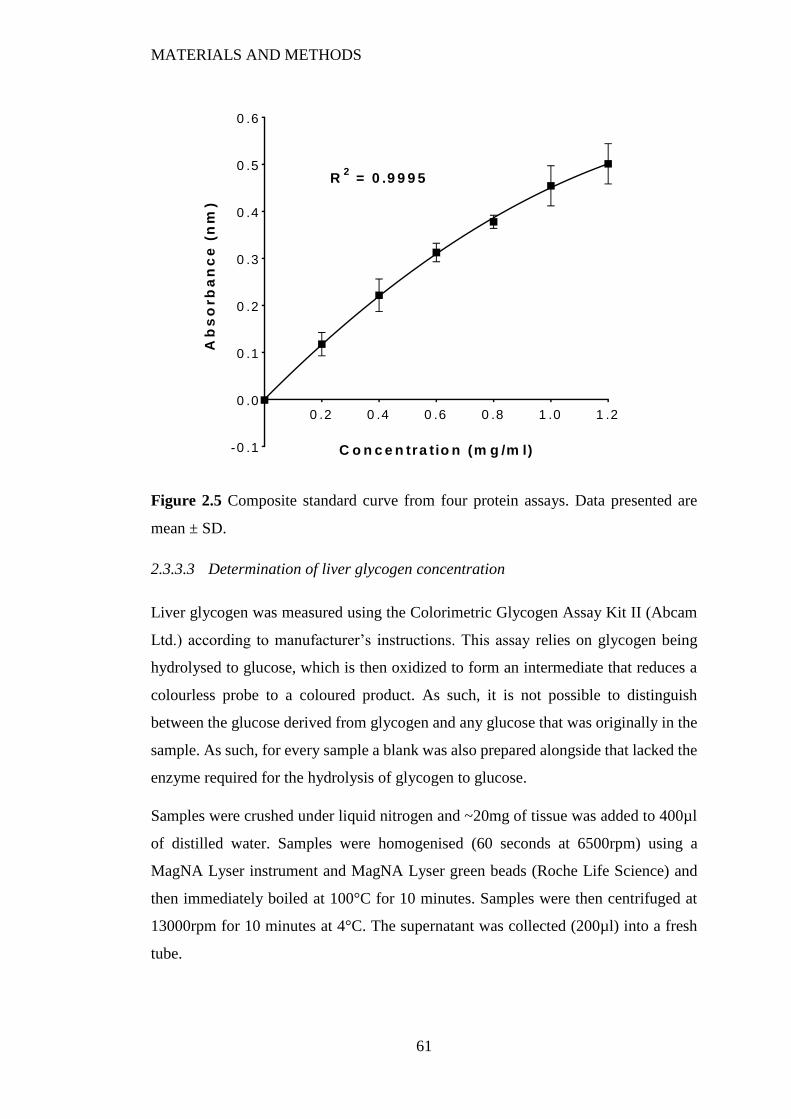
MATERIALS AND METHODS
61
0 .2 0 .4 0 .6 0 .8 1 .0 1 .2
-0 .1
0 .0
0 .1
0 .2
0 .3
0 .4
0 .5
0 .6
C o n c e n tra tio n (m g /m l)
Ab
so
rb
an
ce
(n
m)
R2 = 0 .9 9 9 5
Figure 2.5 Composite standard curve from four protein assays. Data presented are
mean ± SD.
2.3.3.3 Determination of liver glycogen concentration
Liver glycogen was measured using the Colorimetric Glycogen Assay Kit II (Abcam
Ltd.) according to manufacturer’s instructions. This assay relies on glycogen being
hydrolysed to glucose, which is then oxidized to form an intermediate that reduces a
colourless probe to a coloured product. As such, it is not possible to distinguish
between the glucose derived from glycogen and any glucose that was originally in the
sample. As such, for every sample a blank was also prepared alongside that lacked the
enzyme required for the hydrolysis of glycogen to glucose.
Samples were crushed under liquid nitrogen and ~20mg of tissue was added to 400µl
of distilled water. Samples were homogenised (60 seconds at 6500rpm) using a
MagNA Lyser instrument and MagNA Lyser green beads (Roche Life Science) and
then immediately boiled at 100°C for 10 minutes. Samples were then centrifuged at
13000rpm for 10 minutes at 4°C. The supernatant was collected (200µl) into a fresh
tube.

MATERIALS AND METHODS
62
Standards were prepared from a glycogen standard stock (2mg/ml). This stock was
diluted to 0.2mg/ml in water and then 0-10µl of the stock was added to each well (made
up to 50µl with glycogen hydrolysis buffer) to produce a standard curve ranging from
8-40µg/ml. The supernatant from homogenised tissue was diluted 1:10 and 10µl of
this dilution was used for the assay to give approximately 50µg/well and wells were
made up to 50µl with glycogen hydrolysis buffer. After this, 2µl of the hydrolysis
enzyme mix was added to all standard and sample wells but was not added to sample
blanks. The plate was then incubated at room temperature for 30 minutes.
During this time, a reaction mix was prepared for the standards and samples and a
background control mix was prepared for the sample blanks (Table 2.9). To all
standard and sample wells, 48µl of the reaction mix was added and 50µl of the
background control mix was added to all sample blanks. The assay was incubated at
room temperature for 30 minutes and then absorbance was measured using a
microplate reader (FLUOstar Omega, BMG Labtech Ltd.) at 450nm. Standards and
samples were analysed in duplicate and the glycogen concentration was quantified
against the standard curve and normalised to tissue weight. The inter-assay and intra-
assay coefficients of variation were 2.8% and 8.7% respectively. A composite standard
curve is shown in Figure 2.5.
Table 2.9 Glycogen assay reaction and background control mix working solutions
Reaction mix
(µl)
Background
control mix (µl)
Glycogen development buffer 44 46
Development enzyme mix 2 2
Probe 2 2
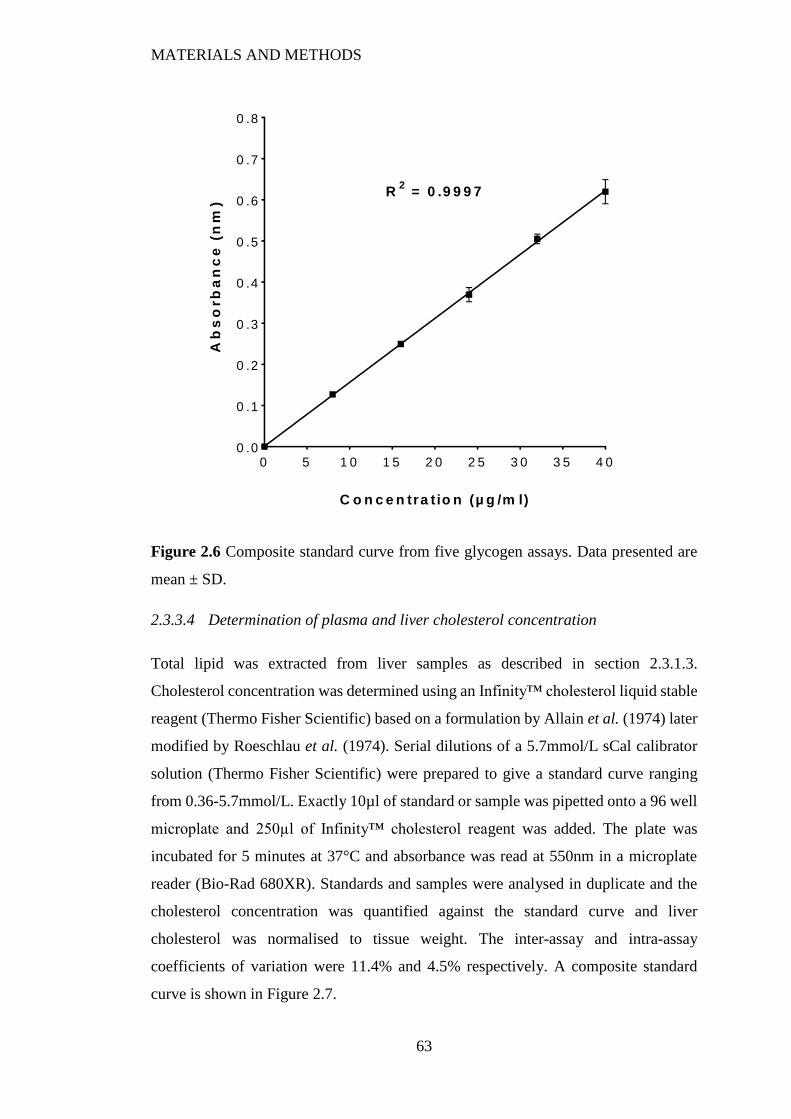
MATERIALS AND METHODS
63
0 5 1 0 1 5 2 0 2 5 3 0 3 5 4 00 .0
0 .1
0 .2
0 .3
0 .4
0 .5
0 .6
0 .7
0 .8
C o n c e n tra t io n (µ g /m l)
Ab
so
rb
an
ce
(n
m)
R2 = 0 .9 9 9 7
Figure 2.6 Composite standard curve from five glycogen assays. Data presented are
mean ± SD.
2.3.3.4 Determination of plasma and liver cholesterol concentration
Total lipid was extracted from liver samples as described in section 2.3.1.3.
Cholesterol concentration was determined using an Infinity™ cholesterol liquid stable
reagent (Thermo Fisher Scientific) based on a formulation by Allain et al. (1974) later
modified by Roeschlau et al. (1974). Serial dilutions of a 5.7mmol/L sCal calibrator
solution (Thermo Fisher Scientific) were prepared to give a standard curve ranging
from 0.36-5.7mmol/L. Exactly 10µl of standard or sample was pipetted onto a 96 well
microplate and 250µl of Infinity™ cholesterol reagent was added. The plate was
incubated for 5 minutes at 37°C and absorbance was read at 550nm in a microplate
reader (Bio-Rad 680XR). Standards and samples were analysed in duplicate and the
cholesterol concentration was quantified against the standard curve and liver
cholesterol was normalised to tissue weight. The inter-assay and intra-assay
coefficients of variation were 11.4% and 4.5% respectively. A composite standard
curve is shown in Figure 2.7.
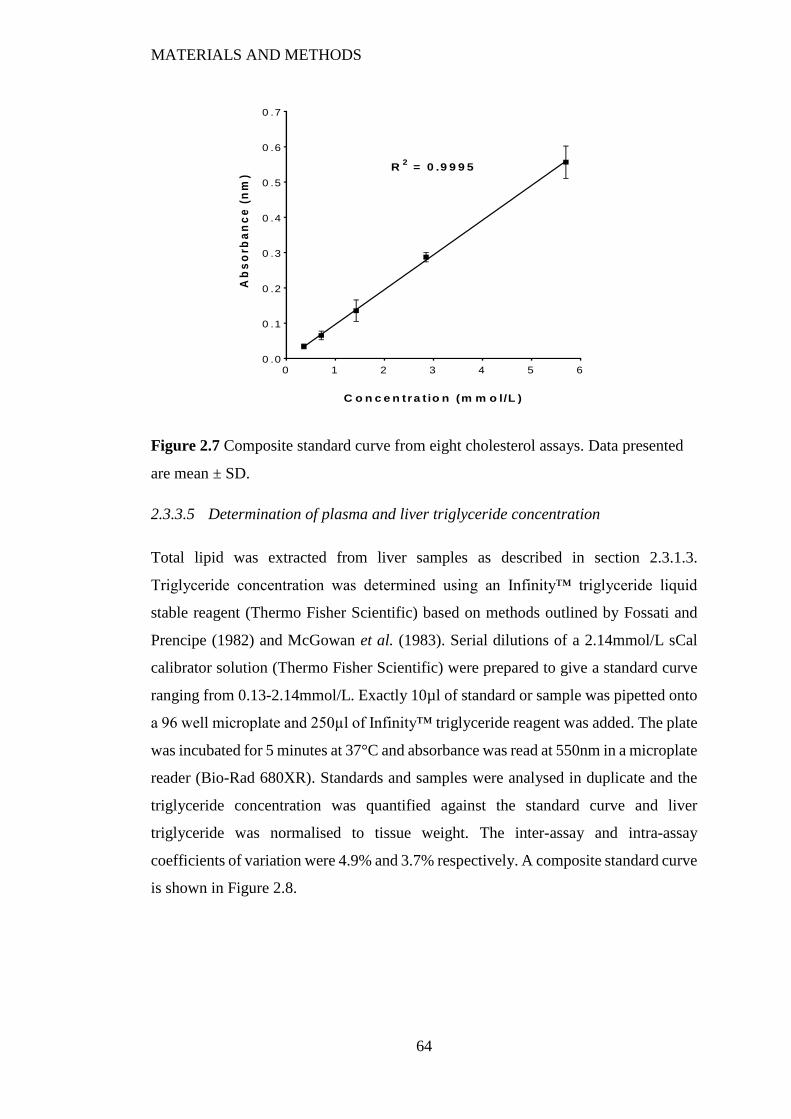
MATERIALS AND METHODS
64
0 1 2 3 4 5 60 .0
0 .1
0 .2
0 .3
0 .4
0 .5
0 .6
0 .7
C o n c e n tra t io n (m m o l/L )
Ab
so
rba
nc
e (
nm
)
R2 = 0 .9 9 9 5
Figure 2.7 Composite standard curve from eight cholesterol assays. Data presented
are mean ± SD.
2.3.3.5 Determination of plasma and liver triglyceride concentration
Total lipid was extracted from liver samples as described in section 2.3.1.3.
Triglyceride concentration was determined using an Infinity™ triglyceride liquid
stable reagent (Thermo Fisher Scientific) based on methods outlined by Fossati and
Prencipe (1982) and McGowan et al. (1983). Serial dilutions of a 2.14mmol/L sCal
calibrator solution (Thermo Fisher Scientific) were prepared to give a standard curve
ranging from 0.13-2.14mmol/L. Exactly 10µl of standard or sample was pipetted onto
a 96 well microplate and 250µl of Infinity™ triglyceride reagent was added. The plate
was incubated for 5 minutes at 37°C and absorbance was read at 550nm in a microplate
reader (Bio-Rad 680XR). Standards and samples were analysed in duplicate and the
triglyceride concentration was quantified against the standard curve and liver
triglyceride was normalised to tissue weight. The inter-assay and intra-assay
coefficients of variation were 4.9% and 3.7% respectively. A composite standard curve
is shown in Figure 2.8.
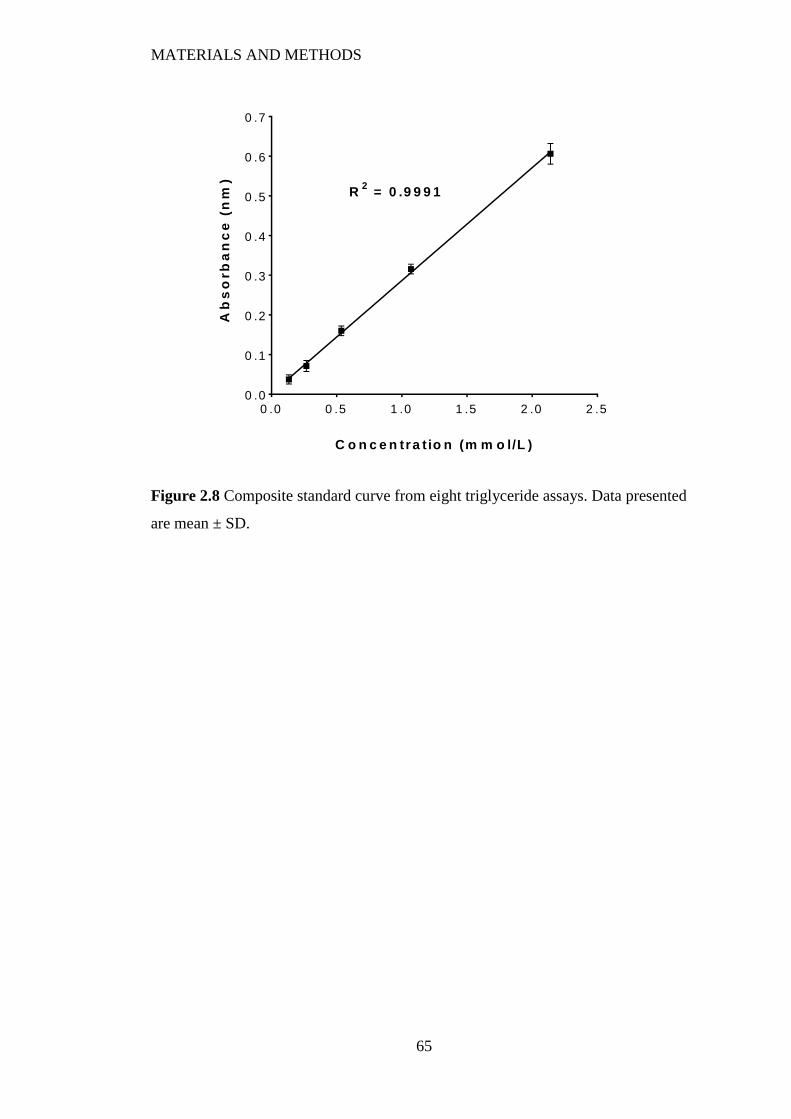
MATERIALS AND METHODS
65
0 .0 0 .5 1 .0 1 .5 2 .0 2 .50 .0
0 .1
0 .2
0 .3
0 .4
0 .5
0 .6
0 .7
C o n c e n tra t io n (m m o l/L )
Ab
so
rb
an
ce
(n
m)
R2 = 0 .9 9 9 1
Figure 2.8 Composite standard curve from eight triglyceride assays. Data presented
are mean ± SD.
66
3 MANUSCRIPT 1: THE ROLE OF MATERNAL DIETARY LA:ALA
RATIO ON FETAL AND PLACENTAL GROWTH
Draycott, SAV, Liu, G, Daniel, ZC, Elmes, MJ, Muhlhausler, BS & Langley-Evans,
SC (2019). Maternal dietary ratio of linoleic acid to alpha-linolenic acid during
pregnancy has sex-specific effects on placental and fetal weights in the rat.
Nutrition & Metabolism, 16(1), 1.
Author contributions can be found in Appendix C and the published article can be
found in Appendix D.
MANUSCRIPT 1
67
3.1 Abstract
Background: Increased consumption of linoleic acid (LA, omega-6) in Western diets
coupled with the pro-inflammatory and adipogenic properties of its derivatives has led
to suggestions that fetal exposure to this dietary pattern could be contributing to the
intergenerational cycle of obesity.
Method: This study aimed to evaluate the effects of maternal consumption of a LA to
alpha-linolenic acid (ALA) ratio similar to modern Western diets (9:1) compared to a
lower ratio (1:1.5) on placental and fetal growth, and to determine any cumulative
effects by feeding both diets at two total fat levels (18% vs 36% fat w/w). Female
Wistar rats (n=5-7/group) were assigned to one of the four experimental diets prior to
mating until 20d of gestation.
Results: Fatty acid profiles of maternal and fetal blood and placental tissue at 20d
gestation were different between dietary groups, and largely reflected dietary fatty acid
composition. Female fetuses were heavier (2.98±0.06g vs 3.36±0.07g, P<0.01) and
male placental weight was increased (0.51±0.02g vs 0.58±0.02g, P<0.05) in the low
LA:ALA groups. Female fetuses of dams exposed to a 36% fat diet had a reduced
relative liver weight irrespective of LA:ALA ratio (7.61±0.22% vs 6.93±0.19%,
P<0.05). These effects occurred in the absence of any effect of the dietary treatments
on maternal bodyweight, fat deposition or expression of key lipogenic genes in
maternal and fetal liver or maternal adipose tissue.
Conclusion: These findings suggest that both the total fat content as well as the
LA:ALA ratio of the maternal diet have sex-specific implications for the growth of the
developing fetus.
MANUSCRIPT 1
68
3.2 Introduction
The prevalence of obesity, a major risk factor for cardiovascular disease and type 2
diabetes, continues to rise in both low-, middle- and high-income countries, with 1.9
billion adults worldwide estimated to be overweight or obese as of 2016 (WHO,
2017a). Of particular concern is that 41 million children under the age of 5 were
estimated to be overweight or obese globally in 2016 (WHO, 2017a), and often present
with early onset of cardiometabolic diseases including type 2 diabetes and
hypertension (Owen et al., 2009, Mayer-Davis et al., 2017).
Exposure to either an inappropriately high or inappropriately low plane of nutrition
before birth and/or in early infancy is a major risk factor for the development of obesity
and type 2 diabetes through the life course (Gale et al., 2007, Catalano and Ehrenberg,
2006, Muhlhausler et al., 2006, Langley-Evans, 2015). Maternal high-fat diets have
consistently been associated with an increased risk of obesity and poor
cardiometabolic health in the offspring (Armitage et al., 2005). It is increasingly
recognised, however, that the impact of maternal fat consumption is dependent not
only on the amount of fat consumed but also the specific fat type. The ratio of omega-
6 and omega-3 polyunsaturated fatty acids (PUFA) in the diet appears to be of
particular importance, likely due to the opposing roles of these two classes of PUFA
on metabolic and inflammatory processes within the body (Schmitz and Ecker, 2008).
Thus, omega-3 PUFA, including alpha-linolenic acid (ALA) and its long chain PUFA
(LCPUFA) derivatives, eicosapentaenoic acid (EPA) and docosahexaenoic acid
(DHA) inhibit inflammation, adipogenesis and lipogenesis (Massiera et al., 2003,
Madsen et al., 2005). Conversely, the omega-6 PUFA, linoleic acid (LA) and its long
chain derivative, arachidonic acid (AA) have pro-inflammatory actions and promote
adipogenesis and lipogenesis in vitro and in vivo (Shillabeer et al., 1998, Ailhaud et
al., 2006). Consequently, excess consumption of omega-6 relative to omega-3 fatty
acids would be expected to be associated with increased incidence of inflammatory
conditions, increased adiposity and heightened risk of cardiometabolic diseases.
The opposing roles of the omega-3 and omega-6 fatty acids have particular relevance
due to a substantial increase in the intake of the omega-6 essential fatty acid, LA, in
the Western diet over the past few decades, with very little change in the intake of
omega-3 PUFA. The ratio of LA:ALA in typical Western diets has been reported at
MANUSCRIPT 1
69
~8-10:1 (Blasbalg et al., 2011, Meyer et al., 2003) or higher (Simopoulos, 2016),
which is substantially higher than the proposed ‘ideal’ ratio of ~1-2:1 based on levels
required to achieve maximal conversion of ALA to its longer chain derivatives (Lands,
2008, Tu et al., 2010, Gibson et al., 2011). Previous studies have shown that the high
omega-6:omega-3 ratio in the modern Western diets is reflected in the blood and tissue
fatty acid profiles of pregnant and lactating women, as well as breast milk (Ailhaud et
al., 2006), however, the effect of perinatal exposure to an increased omega-6:omega-
3 PUFA ratio remains unclear. Massiera et al. (2010) demonstrated that increasing
omega-6 PUFA intake induced a gradual enhancement in fat mass over generations.
However, the level of LA (~19% energy) and LA:ALA ratio (28:1) in their study were
much higher than those found in typical Western diets, and the impact of different
dietary fat levels was not evaluated. In addition, no studies to date have examined the
effects of an increased maternal omega-6:omega-3 ratio on maternal, placental and
fetal outcomes before birth.
The aim of the current study was to determine the effects of increasing the LA:ALA
ratio (9:1 vs 1:1.5) in the diet of rats, on maternal weight gain, placental and fetal
growth and the expression of lipogenic and adipokine genes in maternal and fetal liver
and maternal adipose tissue. To determine any additive effects of altering the maternal
dietary LA:ALA ratio, each diet was fed at either 18% fat w/w, to reflect dietary
recommendations of fat intake (SACN, 2018), or at a higher fat content of 36% fat
w/w.
MANUSCRIPT 1
70
3.3 Materials and Methods
3.3.1 Animals
All animal procedures were performed in accordance with the Animals (Scientific
Procedures) Act 1986 under Home Office licence and were approved by the Animal
Ethics Committee of the University of Nottingham, UK. Virgin female Wistar rats (n
= 24; 75-100g; Charles River, UK) were housed on wood shavings in individually
ventilated cages under a 12 hour light/12 hour dark cycle at a temperature of 20-22°C
and had ad libitum access to food and water throughout the experiment. Animals were
pair housed from the start of the experiment until mating; after confirmation of
conception, animals were individually housed until completion of the experiment.
Female rats were allowed to acclimatise to the unit for 1-2 weeks, during which time
they were fed on standard laboratory chow (2018 Teklad Global 18% Protein Rodent
Diet, Harlan Laboratories, UK). After acclimatisation, a tail vein blood sample was
taken from each animal for the determination of fatty acid status. The rats were then
randomly assigned to one of 4 dietary groups, details of which are provided below.
Animals were maintained on their allocated diet for a four week ‘feed-in’ period after
which they were mated. Conception was confirmed by the presence of a semen plug
and this was recorded as day 0 of pregnancy. Average time in mating pairs was 2.5
days and all but one female conceived within their first oestrous cycle housed with the
male. Female rats remained on their respective diets until day 20 of gestation (full term
= 22 days) at which time rat dams were euthanised by CO2 asphyxiation and cervical
dislocation and fetuses by cervical dislocation and exsanguination for collection of
maternal, fetal and placental tissues. All female rats were weighed and had feed intake
measured daily throughout the experiment and protein intake was estimated based on
the protein content of the experimental diets.
3.3.2 Diets
Diets were designed to provide either a high (9:1, high LA) or low (1:1.5 low LA) ratio
of LA to ALA, achieved by altering the amounts of flaxseed and sunflower oil included
in the fat component of the feed. The levels of saturated fatty acids (SFA) and
monounsaturated fatty acids (MUFA) were comparable in all diets, achieved by
adjusting the amounts of coconut (SFA source) and macadamia (MUFA source) oils
MANUSCRIPT 1
71
in the diets. For each level of LA, diets containing either 18% or 36% fat by weight
were developed. This resulted in four experimental diets; high LA (18% fat), high LA
(36% fat), low LA (18% fat) and low LA (36% fat; n=5-7 per dietary group). The lists
of ingredients and final fatty acid composition of the four experimental diets are
presented in Table 3.1 and Table 3.2 respectively. Protein content of experimental
feeds was analysed using a Thermo Scientific nitrogen (N)/protein analyser (Flash
EA1112). %N was directly measured and protein (%) was estimated under the
assumption of a 16% N content of proteins.
3.3.3 Blood sample and tissue collection
Blood samples were collected from dams prior to the start of the experiment and after
the 4 week ‘feed-in’ period (tail vein) and at day 20 of gestation (cardiac puncture
following CO2 asphyxiation and cervical dislocation). Truncal blood samples were
also collected from two randomly selected male and 2 randomly selected female
fetuses from each litter at this time. The whole blood samples (~30µl) were spotted
onto PUFAcoat™ dried blood spot (DBS) collection paper (Liu et al., 2014), allowed
to dry at room temperature and were then stored at -20°C for subsequent fatty acid
analysis. Maternal tissues were weighed and samples of liver and retroperitoneal
adipose tissue were collected. All fetuses were weighed and sexed via measurement of
anogenital distance. Fetal liver and placentas were weighed and samples of selected
male placental and liver samples were collected. All tissue samples were snap-frozen
in liquid nitrogen and stored at -80°C until determination of gene expression by reverse
transcriptase quantitative PCR (RT-qPCR). Male fetuses selected for collection of
tissue samples also had tail samples collected for sex-genotyping by PCR for the SRY
gene (McClive and Sinclair, 2001). Any samples found to be female or inconclusive
(n=5) were not included in hepatic gene expression analyses.
3.3.4 Lipid extraction
Total lipids were extracted from male placental tissue with chloroform/isopropanol
(2:1 v/v), an adapted method from Folch (Folch et al., 1957). Briefly, ~300mg of
crushed frozen placenta was weighed out and 2ml of 0.9% saline was added. The
solution was homogenised on ice; 3ml of isopropanol was added and vortexed and the
solution was left to stand for 5 minutes. After this, 6ml of chloroform was added and
MANUSCRIPT 1
72
the solution was shaken, centrifuged and the chloroform (bottom phase) containing the
lipid was transferred into a fresh tube. This was dried under nitrogen and resuspended
in chloroform/methanol (9:1 v/v) and 20µl of the sample was then spotted onto
PUFAcoat™ DBS collection paper (Liu et al., 2014), allowed to dry at room
temperature and stored at -20°C for subsequent fatty acid analysis.
3.3.5 Fatty acid methylation and analysis
Fatty acid composition in maternal and fetal DBS were determined as previously
described (Liu et al., 2014). Briefly, whole DBS samples were directly transesterified
with 2ml of 1%H2SO4 in methanol at 70°C for 3 hours. Samples were allowed to cool
and the fatty acid methyl esters (FAME) were then extracted with heptane and
transferred into a glass vial containing anhydrous sodium sulphate (Na2SO4) as a
desiccant. Samples were separated and analysed by a Hewlett-Packard 6890 gas
chromatograph (GC) equipped with a capillary column (30m x 0.25mm) coated with
70% cyanopropyl polysilphenylene-siloxane (BPX-70; 0.25µm film thickness) which
was fitted with a flame ionization detector (FID). Helium was utilised as the carrier
gas and the split ratio was set at 20:1. Injector temperature was set at 250°C and FID
temperature at 300°C. FAMEs were identified in unknown samples based on the
comparison of retention times with an external lipid standard (Standard 463, Nu-check
prep Inc., MN, USA) using Agilent Chemstation software. Individual fatty acid
content was calculated based on peak area and response factors, normalised to total
fatty acid content and expressed as a percentage of total fatty acids across lipid classes.
3.3.6 Isolation of RNA, cDNA synthesis and reverse transcription quantitative
real-time PCR (RT-qPCR)
RNA was isolated from crushed snap-frozen samples of ~25mg of liver using the
Roche High Pure Tissue kit (Roche Diagnostics Ltd., UK). Adipose RNA was
extracted using MagNA Lyser green beads and instrument (Roche Diagnostics Ltd.)
in combination with the RNeasy Mini Kit (QIAGEN Ltd., UK) with the following
modifications. Between 100-150mg of snap frozen tissue was homogenised using
green beads in 600µl Buffer RTL (including β-mercaptoethanol); the sample was
centrifuged for 3 minutes at 8000 rpm and the resulting infranatant was transferred
into a fresh tube. The remaining tissue sample was homogenised in a further 350µl of
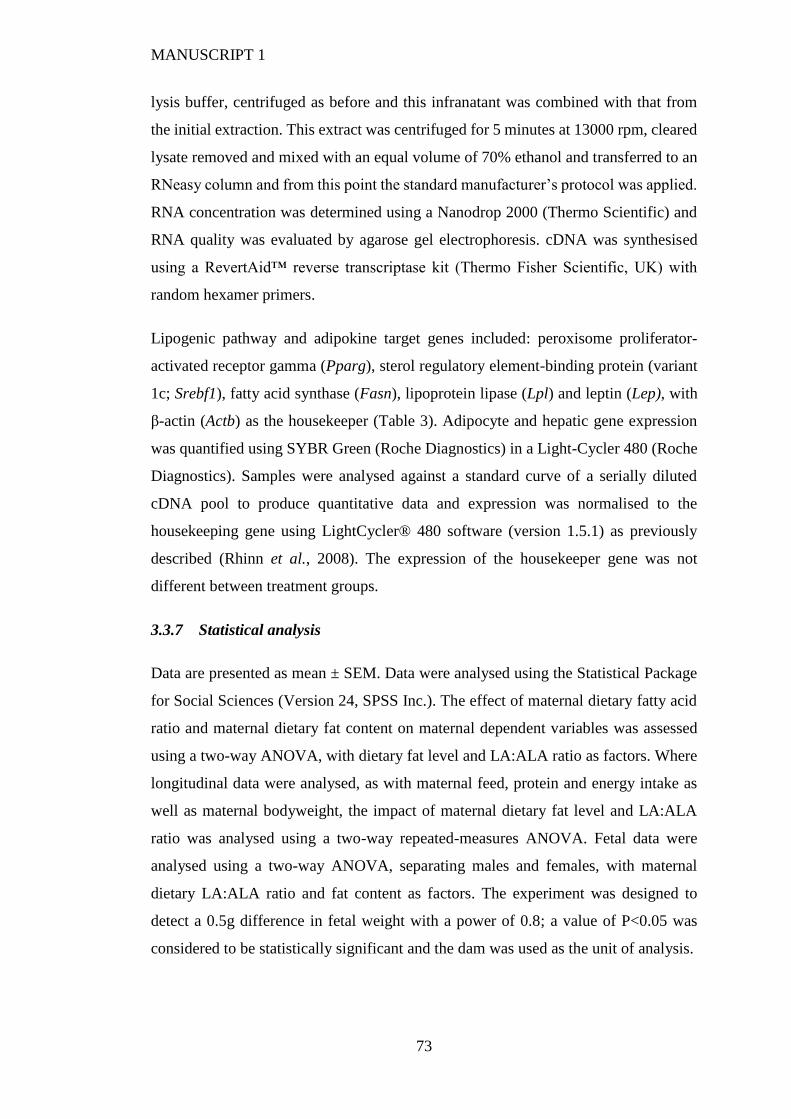
MANUSCRIPT 1
73
lysis buffer, centrifuged as before and this infranatant was combined with that from
the initial extraction. This extract was centrifuged for 5 minutes at 13000 rpm, cleared
lysate removed and mixed with an equal volume of 70% ethanol and transferred to an
RNeasy column and from this point the standard manufacturer’s protocol was applied.
RNA concentration was determined using a Nanodrop 2000 (Thermo Scientific) and
RNA quality was evaluated by agarose gel electrophoresis. cDNA was synthesised
using a RevertAid™ reverse transcriptase kit (Thermo Fisher Scientific, UK) with
random hexamer primers.
Lipogenic pathway and adipokine target genes included: peroxisome proliferator-
activated receptor gamma (Pparg), sterol regulatory element-binding protein (variant
1c; Srebf1), fatty acid synthase (Fasn), lipoprotein lipase (Lpl) and leptin (Lep), with
β-actin (Actb) as the housekeeper (Table 3). Adipocyte and hepatic gene expression
was quantified using SYBR Green (Roche Diagnostics) in a Light-Cycler 480 (Roche
Diagnostics). Samples were analysed against a standard curve of a serially diluted
cDNA pool to produce quantitative data and expression was normalised to the
housekeeping gene using LightCycler® 480 software (version 1.5.1) as previously
described (Rhinn et al., 2008). The expression of the housekeeper gene was not
different between treatment groups.
3.3.7 Statistical analysis
Data are presented as mean ± SEM. Data were analysed using the Statistical Package
for Social Sciences (Version 24, SPSS Inc.). The effect of maternal dietary fatty acid
ratio and maternal dietary fat content on maternal dependent variables was assessed
using a two-way ANOVA, with dietary fat level and LA:ALA ratio as factors. Where
longitudinal data were analysed, as with maternal feed, protein and energy intake as
well as maternal bodyweight, the impact of maternal dietary fat level and LA:ALA
ratio was analysed using a two-way repeated-measures ANOVA. Fetal data were
analysed using a two-way ANOVA, separating males and females, with maternal
dietary LA:ALA ratio and fat content as factors. The experiment was designed to
detect a 0.5g difference in fetal weight with a power of 0.8; a value of P<0.05 was
considered to be statistically significant and the dam was used as the unit of analysis.
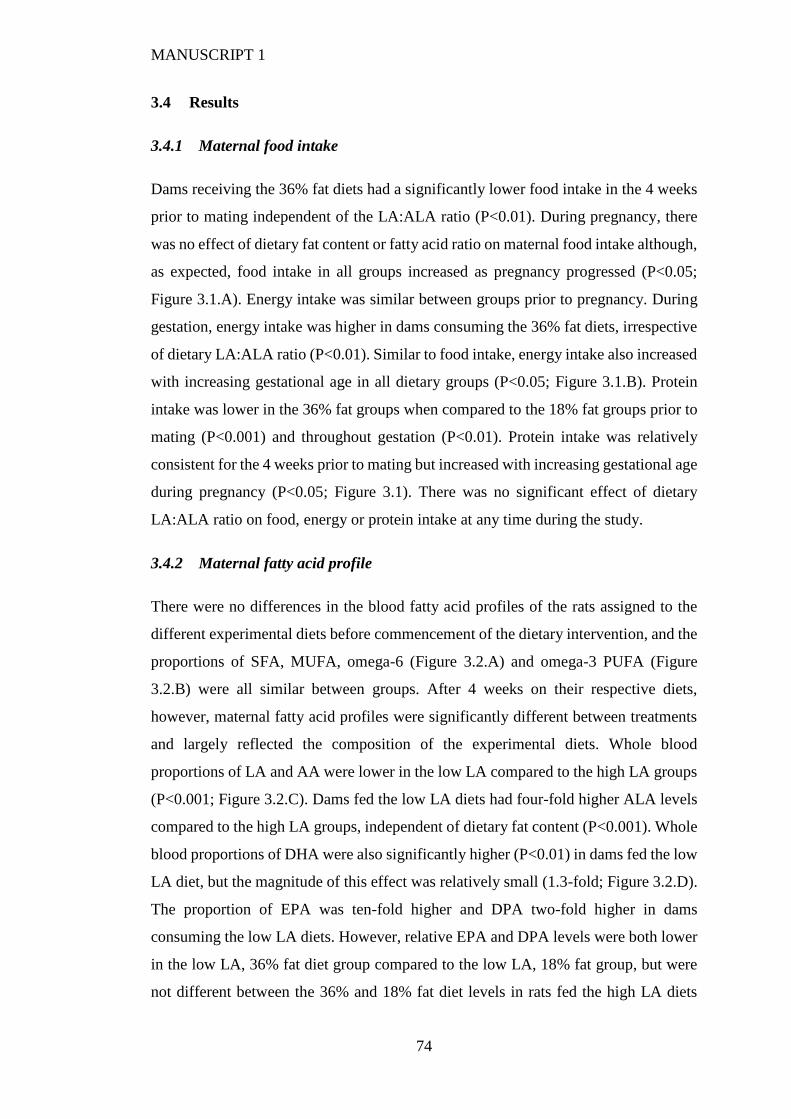
MANUSCRIPT 1
74
3.4 Results
3.4.1 Maternal food intake
Dams receiving the 36% fat diets had a significantly lower food intake in the 4 weeks
prior to mating independent of the LA:ALA ratio (P<0.01). During pregnancy, there
was no effect of dietary fat content or fatty acid ratio on maternal food intake although,
as expected, food intake in all groups increased as pregnancy progressed (P<0.05;
Figure 3.1.A). Energy intake was similar between groups prior to pregnancy. During
gestation, energy intake was higher in dams consuming the 36% fat diets, irrespective
of dietary LA:ALA ratio (P<0.01). Similar to food intake, energy intake also increased
with increasing gestational age in all dietary groups (P<0.05; Figure 3.1.B). Protein
intake was lower in the 36% fat groups when compared to the 18% fat groups prior to
mating (P<0.001) and throughout gestation (P<0.01). Protein intake was relatively
consistent for the 4 weeks prior to mating but increased with increasing gestational age
during pregnancy (P<0.05; Figure 3.1). There was no significant effect of dietary
LA:ALA ratio on food, energy or protein intake at any time during the study.
3.4.2 Maternal fatty acid profile
There were no differences in the blood fatty acid profiles of the rats assigned to the
different experimental diets before commencement of the dietary intervention, and the
proportions of SFA, MUFA, omega-6 (Figure 3.2.A) and omega-3 PUFA (Figure
3.2.B) were all similar between groups. After 4 weeks on their respective diets,
however, maternal fatty acid profiles were significantly different between treatments
and largely reflected the composition of the experimental diets. Whole blood
proportions of LA and AA were lower in the low LA compared to the high LA groups
(P<0.001; Figure 3.2.C). Dams fed the low LA diets had four-fold higher ALA levels
compared to the high LA groups, independent of dietary fat content (P<0.001). Whole
blood proportions of DHA were also significantly higher (P<0.01) in dams fed the low
LA diet, but the magnitude of this effect was relatively small (1.3-fold; Figure 3.2.D).
The proportion of EPA was ten-fold higher and DPA two-fold higher in dams
consuming the low LA diets. However, relative EPA and DPA levels were both lower
in the low LA, 36% fat diet group compared to the low LA, 18% fat group, but were
not different between the 36% and 18% fat diet levels in rats fed the high LA diets
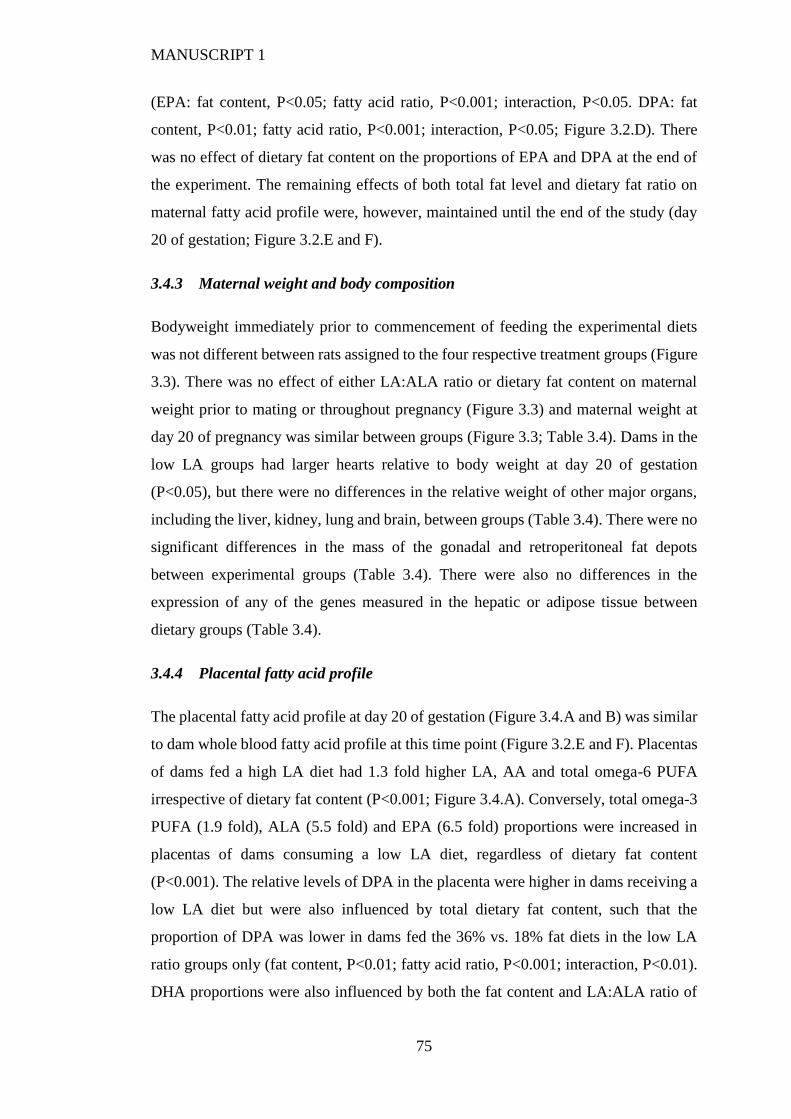
MANUSCRIPT 1
75
(EPA: fat content, P<0.05; fatty acid ratio, P<0.001; interaction, P<0.05. DPA: fat
content, P<0.01; fatty acid ratio, P<0.001; interaction, P<0.05; Figure 3.2.D). There
was no effect of dietary fat content on the proportions of EPA and DPA at the end of
the experiment. The remaining effects of both total fat level and dietary fat ratio on
maternal fatty acid profile were, however, maintained until the end of the study (day
20 of gestation; Figure 3.2.E and F).
3.4.3 Maternal weight and body composition
Bodyweight immediately prior to commencement of feeding the experimental diets
was not different between rats assigned to the four respective treatment groups (Figure
3.3). There was no effect of either LA:ALA ratio or dietary fat content on maternal
weight prior to mating or throughout pregnancy (Figure 3.3) and maternal weight at
day 20 of pregnancy was similar between groups (Figure 3.3; Table 3.4). Dams in the
low LA groups had larger hearts relative to body weight at day 20 of gestation
(P<0.05), but there were no differences in the relative weight of other major organs,
including the liver, kidney, lung and brain, between groups (Table 3.4). There were no
significant differences in the mass of the gonadal and retroperitoneal fat depots
between experimental groups (Table 3.4). There were also no differences in the
expression of any of the genes measured in the hepatic or adipose tissue between
dietary groups (Table 3.4).
3.4.4 Placental fatty acid profile
The placental fatty acid profile at day 20 of gestation (Figure 3.4.A and B) was similar
to dam whole blood fatty acid profile at this time point (Figure 3.2.E and F). Placentas
of dams fed a high LA diet had 1.3 fold higher LA, AA and total omega-6 PUFA
irrespective of dietary fat content (P<0.001; Figure 3.4.A). Conversely, total omega-3
PUFA (1.9 fold), ALA (5.5 fold) and EPA (6.5 fold) proportions were increased in
placentas of dams consuming a low LA diet, regardless of dietary fat content
(P<0.001). The relative levels of DPA in the placenta were higher in dams receiving a
low LA diet but were also influenced by total dietary fat content, such that the
proportion of DPA was lower in dams fed the 36% vs. 18% fat diets in the low LA
ratio groups only (fat content, P<0.01; fatty acid ratio, P<0.001; interaction, P<0.01).
DHA proportions were also influenced by both the fat content and LA:ALA ratio of

MANUSCRIPT 1
76
the diet, such that dams exposed to the low LA diets had higher placental DHA
compared to those fed on high LA diets (P<0.001) and dams fed the 36% fat diet had
higher relative levels of placental DHA compared to dams consuming either of the
18% fat diets (P<0.05; Figure 3.4.B). Placental total MUFA proportions were higher
in the low LA compared to the high LA groups (P<0.001) but were not affected by
dietary fat content. Placental SFA were lower in dams exposed to a low LA diet
(P<0.05) as well as in dams exposed to a high (36%) fat diet (P<0.05), however the
magnitude of this difference was very small (Figure 3.4.A).
3.4.5 Fetal whole blood fatty acid profile
There was no effect of sex on fetal fatty acid profile and so male and female samples
were combined for subsequent analysis. Blood ALA (five-fold) and EPA (seven-fold)
were higher in fetuses of dams exposed to the low LA diets. However, there was a
significant interaction between maternal dietary LA:ALA ratio and maternal dietary
fat content for these fatty acids, such that increasing dietary fat content from 18% to
36% fat was associated with relatively higher ALA (fat content, P<0.001; fatty acid
ratio, P<0.001; interaction, P<0.001) and lower EPA levels (fat content, P=0.721; fatty
acid ratio, P<0.001; interaction, P<0.05) in the low LA groups only. DPA (three-fold)
and DHA (1.3-fold) blood proportions were also increased in fetuses of dams exposed
to the low LA diets, independent of dietary fat content (P<0.001; Figure 3.4.D).
Conversely, fetuses of dams consuming the low LA diets had relatively lower
circulating LA (1.2-fold) and AA (1.4-fold) compared to fetuses of dams fed high LA
diets (P<0.001; Figure 3.4.C). Interestingly, fetal LA proportions were also influenced
by dietary fat content, such that fetuses of dams consuming the 36% fat diets had
higher relative circulating LA (P<0.001) levels compared to fetuses of dams fed the
18% fat diet. Fetal blood MUFA were influenced by both maternal dietary LA:ALA
ratio and dietary fat content. Thus, fetuses of dams exposed to a low LA diet exhibited
elevated MUFA proportions compared to high LA groups (P<0.001) and fetuses of
dams exposed to a 36% fat diet had proportionately lower circulating MUFA levels
compared to fetuses of dams fed the 18% fat diets (P<0.001; Figure 3.4.C).
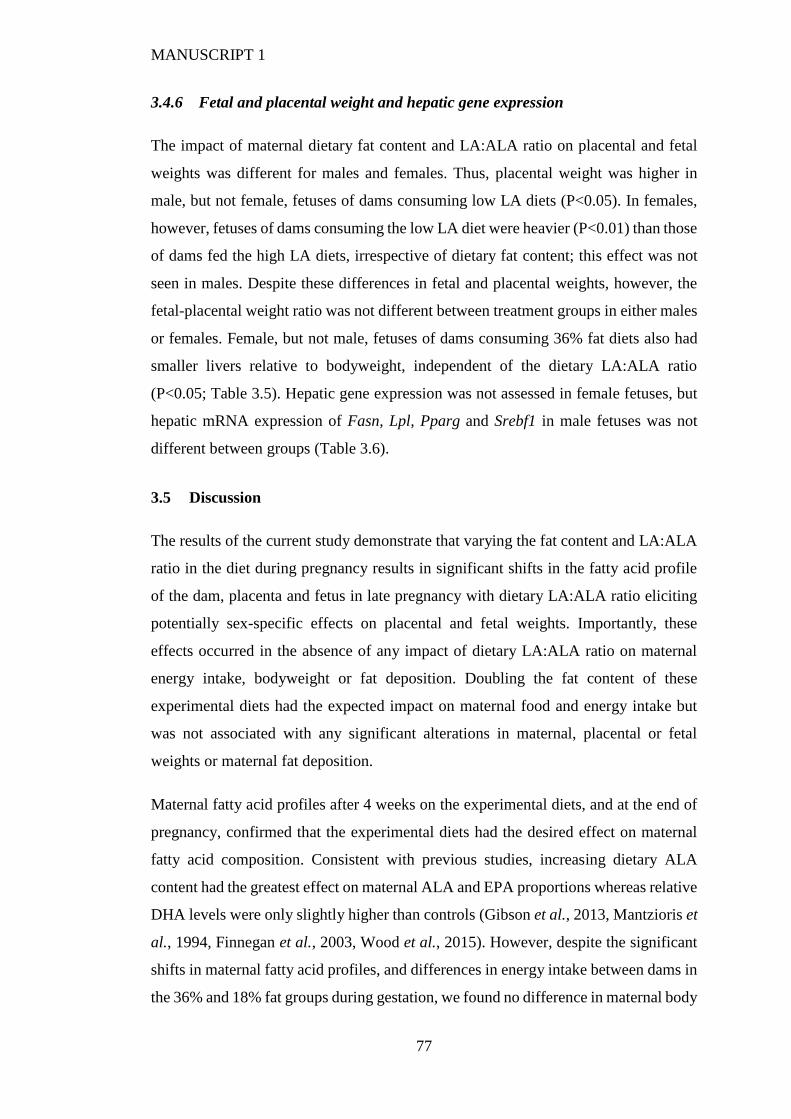
MANUSCRIPT 1
77
3.4.6 Fetal and placental weight and hepatic gene expression
The impact of maternal dietary fat content and LA:ALA ratio on placental and fetal
weights was different for males and females. Thus, placental weight was higher in
male, but not female, fetuses of dams consuming low LA diets (P<0.05). In females,
however, fetuses of dams consuming the low LA diet were heavier (P<0.01) than those
of dams fed the high LA diets, irrespective of dietary fat content; this effect was not
seen in males. Despite these differences in fetal and placental weights, however, the
fetal-placental weight ratio was not different between treatment groups in either males
or females. Female, but not male, fetuses of dams consuming 36% fat diets also had
smaller livers relative to bodyweight, independent of the dietary LA:ALA ratio
(P<0.05; Table 3.5). Hepatic gene expression was not assessed in female fetuses, but
hepatic mRNA expression of Fasn, Lpl, Pparg and Srebf1 in male fetuses was not
different between groups (Table 3.6).
3.5 Discussion
The results of the current study demonstrate that varying the fat content and LA:ALA
ratio in the diet during pregnancy results in significant shifts in the fatty acid profile
of the dam, placenta and fetus in late pregnancy with dietary LA:ALA ratio eliciting
potentially sex-specific effects on placental and fetal weights. Importantly, these
effects occurred in the absence of any impact of dietary LA:ALA ratio on maternal
energy intake, bodyweight or fat deposition. Doubling the fat content of these
experimental diets had the expected impact on maternal food and energy intake but
was not associated with any significant alterations in maternal, placental or fetal
weights or maternal fat deposition.
Maternal fatty acid profiles after 4 weeks on the experimental diets, and at the end of
pregnancy, confirmed that the experimental diets had the desired effect on maternal
fatty acid composition. Consistent with previous studies, increasing dietary ALA
content had the greatest effect on maternal ALA and EPA proportions whereas relative
DHA levels were only slightly higher than controls (Gibson et al., 2013, Mantzioris et
al., 1994, Finnegan et al., 2003, Wood et al., 2015). However, despite the significant
shifts in maternal fatty acid profiles, and differences in energy intake between dams in
the 36% and 18% fat groups during gestation, we found no difference in maternal body
MANUSCRIPT 1
78
weight or fat deposition between these groups. This was unexpected as previous
studies with comparable fat contents have reported significant increases in maternal
bodyweight and fat mass in dams fed on diets containing higher amounts of total fat
(Chalkley et al., 2002, Buettner et al., 2007). Consistent with previous studies (Keesey
and Hirvonen, 1997), dams fed on the 36% fat diets in this study reduced their feed
intake to compensate for the higher energy density of the feed and it may be that this
adaptive response was sufficient to prevent excessive weight gain and fat deposition
in dams fed the higher fat diet.
Our finding that placental and fetal fatty acid profiles were similar to those in the dams
was consistent with our hypothesis that variations in maternal fatty acid profile would
be reflected in the fetal compartment. Thus, our results confirm that shifts in maternal
dietary fatty acid intake are associated with corresponding shifts in fetal fatty acid
supply. It is, however, important to note that the relative proportions of some fatty
acids, most notably LA and MUFA, in the fetal compartment also appeared to be
influenced by total dietary fat content, independent of the dietary fat ratio. This effect
was not observed to the same extent for maternal and placental fatty acid profiles and
implies that not only the ratio, but also absolute amounts of fatty acids is a key
determinant of placental fatty acid transfer. Our finding that fetal, but not maternal or
placental, LA proportions were higher in the 36% fat vs 18% fat groups implies that
placental LA transfer is favoured as dietary fat content increases. Placental capacity to
store fatty acids as triglycerides has been well documented (Lewis and Desoye, 2017),
and placental triglyceride levels are increased in conditions where maternal circulating
triglyceride and fatty acid concentrations are high (Diamant et al., 1982). However,
this storage capacity is limited and, in cases of excess maternal dietary fat, has the
potential to result in a greater proportion of fatty acids being transferred from maternal
to fetal circulation. One possibility, therefore, is that the capacity of the placenta for
LA storage is exceeded in the 36% fat groups in our current study and that this resulted
in a greater amount of this fatty acid being transferred to the fetal compartment. In
contrast to LA, however, fetal MUFA proportions in the current study were lower in
the 36% fat compared to the 18% fat groups. Thus, the results of our study indicate
that the effect of increased dietary fat content on placental fatty acid transfer varies
substantially between individual fatty acids.
MANUSCRIPT 1
79
That the human placenta preferentially transfer specific fatty acids over others,
following the hierarchy of AA>DHA>ALA>LA>oleic acid, has been previously
demonstrated (Haggarty et al., 1997). The findings from the present study suggest that
this selective transfer effect may be exacerbated in the presence of an increased dietary
fat load, such that the higher total amounts of LA and ALA in the 36% fat diets lead
to greater transfer of LA and ALA to the fetal compartment, at the expense of MUFA,
particularly oleic acid. If this is the case, it would imply that the quality of dietary fat
intake during pregnancy may be more important, and thus have a greater potential to
influence fetal growth and development, at higher levels of total dietary fat intakes.
The fatty acid data in our study are expressed as a proportion of total lipids rather than
absolute concentrations, and the relatively small proportionate change in fetal LA
could translate into a much greater, and physiologically relevant, change in absolute
concentrations.
In contrast to previous studies, we found no effect of maternal total fat intake on
placental or fetal bodyweight, and our results in fact suggest that maternal LA:ALA
ratio had a greater effect on these measures. The increased placental weight of male
fetuses in the low LA groups suggests that an increase in maternal omega-3 status may
potentially increase placental growth. One possibility for this increase in weight is that
omega-3 fatty acids are preferentially deposited in the placenta. This, however, seems
unlikely given that previous studies have suggested that while there is preferential
placental uptake of DHA from the maternal circulation, the majority is transferred
across the placenta to the fetal circulation (Ferchaud-Roucher et al., 2017, Haggarty et
al., 1997). In addition, a considerable amount of omega-3 fatty acids (~75mg) would
have to accumulate in the placenta to solely account for the difference in placental
weight between high and low LA groups, making it unlikely that this mechanism could
fully account for the observed increase in placental weight. An alternative possibility
is that omega-3 PUFA, in particular DHA, acted to promote placental growth. Why
the increased placental weight in our study was only seen in male placentas is not
completely clear, however, female placental weight appeared to follow the same
trajectory but did not reach statistical significance. Differences in gene expression
between male and female placentas have been documented (Rosenfeld, 2015).
MANUSCRIPT 1
80
Given that the effects on placental weight only reached significance in males, it is
interesting that maternal consumption of the low LA diet was associated with increased
fetal weight only in females. Maternal omega-3 LCPUFA supplementation during
pregnancy has been associated with increases in birth weight in human randomised
controlled trials (Makrides et al., 2006). However, this is generally considered to be
secondary to an increase in the duration of gestation and therefore cannot explain the
higher fetal weights observed in this study, since all fetuses were weighed at the same
gestational age. There are, however, previous reports indicating that upregulation of
omega-3 LCPUFA-responsive genes following maternal omega-3 LCPUFA
supplementation is more pronounced in female compared to male placentas in humans,
and is associated with increases in infant birth weight, but not placental weight
(Sedlmeier et al., 2014). Our finding of lower female fetal liver weight in the 36% fat
groups is consistent with some (Krasnow et al., 2011), but not all (Guo and Jen, 1995,
McCurdy et al., 2009), studies that have previously reported the effects of maternal
high fat diets on neonatal liver weight. Whether the reduced liver weight in fetuses of
dams consuming the high fat diet persists after birth, and whether it has functional
consequences for hepatic metabolism, remain to be determined.
It was interesting that despite the significant changes in the fatty acid profiles of both
dams and fetuses, no changes in maternal (hepatic and adipose tissue) or fetal (hepatic)
expression of lipogenic genes were observed in this study. This was despite evidence
from previous studies that omega-3 PUFA can suppress, while omega-6 PUFA can
promote, expression of Srebf1 and downstream lipogenic genes (Al-Hasani and Joost,
2005, Muhlhausler et al., 2010a). It is possible, however, that any changes in maternal
gene expression and corresponding increases in lipogenesis could be masked by the
normal physiological adaptations that occur during pregnancy, particularly between
day 19 and 20 of gestation when the pregnant rat experiences a marked increase in
total body fat mass (Lopez-Luna et al., 1991). Similarly, due to the immaturity of
hepatic signalling pathways within the fetus, changes in gene expression occurring as
a result of altered maternal dietary LA:ALA ratio may be too subtle to be detected.
In conclusion, we have demonstrated that both the total amount of fat and the ratio of
LA and ALA in the maternal diet have significant effects on placental and fetal weight,
supporting the hypothesis that the quality, as well as the quantity, of fat in the maternal
MANUSCRIPT 1
81
diet can impact on fetal growth and development. Importantly, the LA:ALA ratio in
the current study was designed to reflect that of typical Western diets of many
countries, and our results show that consuming this high LA diet was associated with
alterations in placental and fetal weight in comparison to a LA:ALA ratio considered
to be ‘optimal’ for human nutrition (Blasbalg et al., 2011). The observed changes in
placental and fetal weight may contribute to future metabolic and physiological
function of the offspring, given the established association between reduced fetal and
placental growth and increased future risk of obesity and poor metabolic health
(Parsons et al., 2001, Murtaugh et al., 2003, Tian et al., 2006). However, further
studies are required in order to determine the longer-term impacts of maternal dietary
LA:ALA ratio and total fat load on the growth, body composition and cardiometabolic
health of the offspring. Human studies that have assessed the potential implication of
a higher omega-6:omega-3 ratio and/or elevated maternal omega-6 intakes on growth,
body composition or metabolic health of the children are also limited (Much et al.,
2013) and further studies (or re-evaluation of existing studies) are needed. The results
of the current study have also demonstrated that at least some of the effects of maternal
dietary fat load/LA:ALA ratio elicited sex-specific responses, which may in part be
due to differences in the placental response to omega-3 LCPUFA between male and
female placentas. Further research is required to assess the placental responses to shifts
in maternal dietary fat content and composition in both males and females and the “sex
of the placenta” should be considered in future studies.
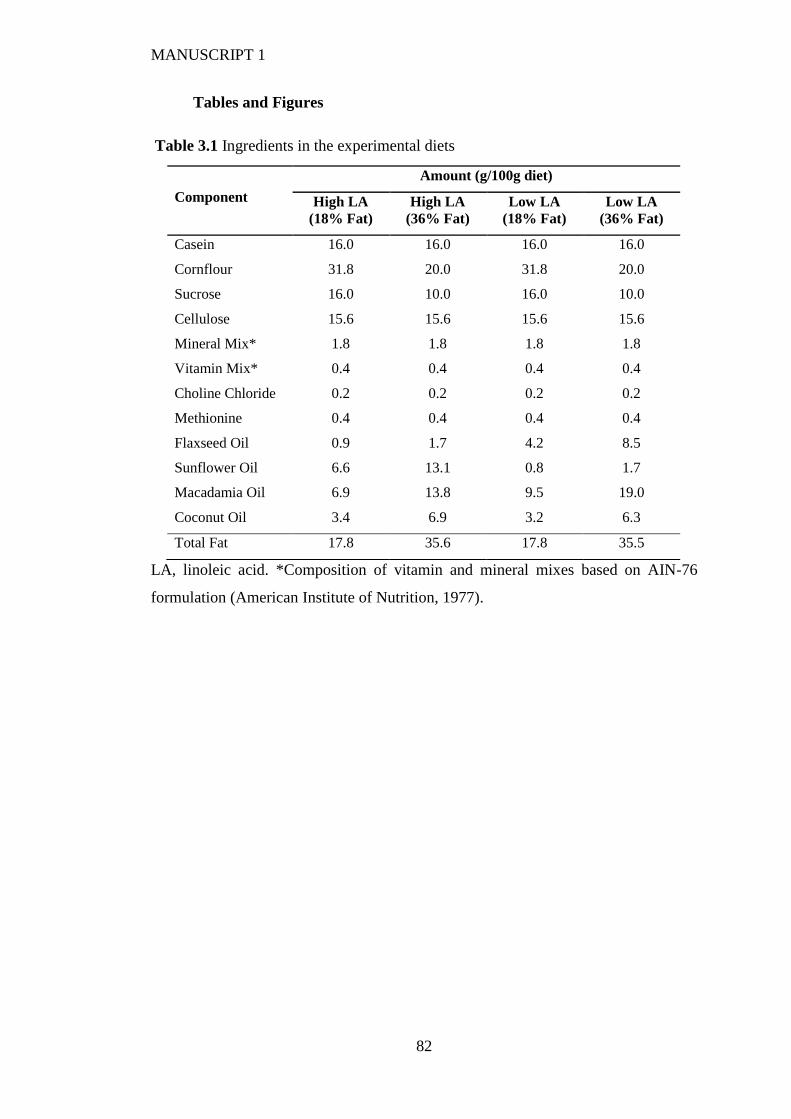
MANUSCRIPT 1
82
Tables and Figures
Table 3.1 Ingredients in the experimental diets
LA, linoleic acid. *Composition of vitamin and mineral mixes based on AIN-76
formulation (American Institute of Nutrition, 1977).
Component
Amount (g/100g diet)
High LA
(18% Fat)
High LA
(36% Fat)
Low LA
(18% Fat)
Low LA
(36% Fat)
Casein 16.0 16.0 16.0 16.0
Cornflour 31.8 20.0 31.8 20.0
Sucrose 16.0 10.0 16.0 10.0
Cellulose 15.6 15.6 15.6 15.6
Mineral Mix* 1.8 1.8 1.8 1.8
Vitamin Mix* 0.4 0.4 0.4 0.4
Choline Chloride 0.2 0.2 0.2 0.2
Methionine 0.4 0.4 0.4 0.4
Flaxseed Oil 0.9 1.7 4.2 8.5
Sunflower Oil 6.6 13.1 0.8 1.7
Macadamia Oil 6.9 13.8 9.5 19.0
Coconut Oil 3.4 6.9 3.2 6.3
Total Fat 17.8 35.6 17.8 35.5
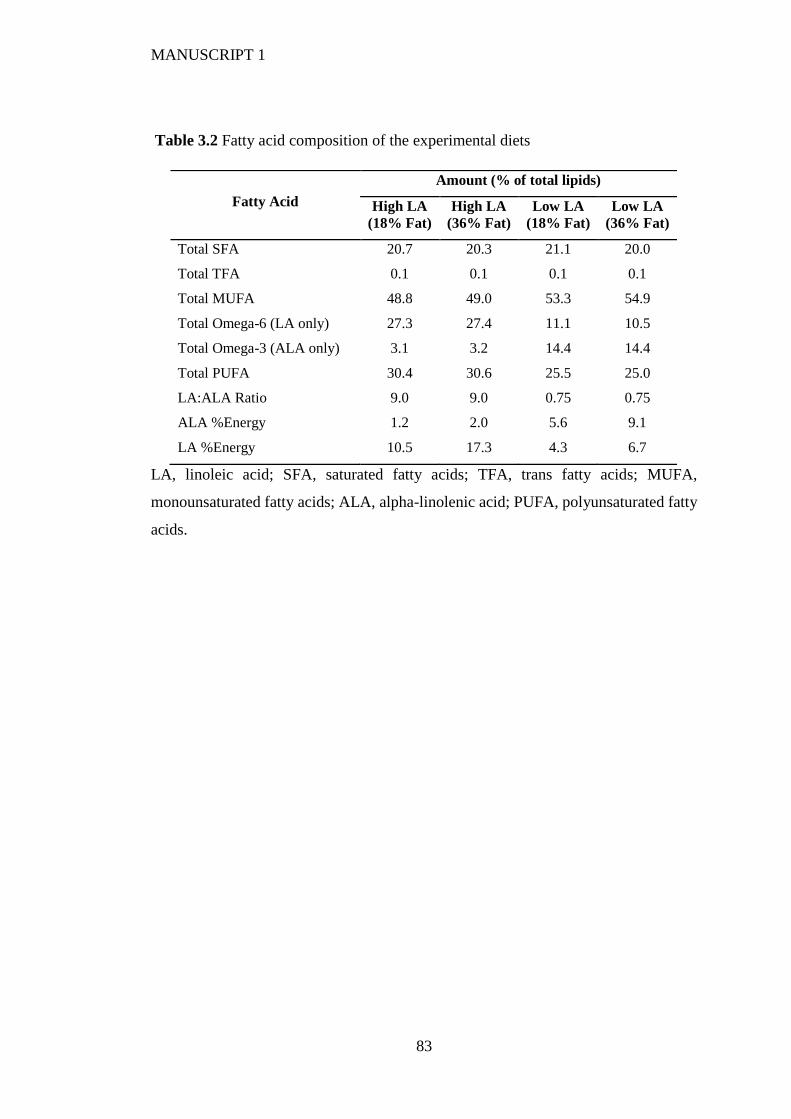
MANUSCRIPT 1
83
Table 3.2 Fatty acid composition of the experimental diets
LA, linoleic acid; SFA, saturated fatty acids; TFA, trans fatty acids; MUFA,
monounsaturated fatty acids; ALA, alpha-linolenic acid; PUFA, polyunsaturated fatty
acids.
Fatty Acid
Amount (% of total lipids)
High LA
(18% Fat)
High LA
(36% Fat)
Low LA
(18% Fat)
Low LA
(36% Fat)
Total SFA 20.7 20.3 21.1 20.0
Total TFA 0.1 0.1 0.1 0.1
Total MUFA 48.8 49.0 53.3 54.9
Total Omega-6 (LA only) 27.3 27.4 11.1 10.5
Total Omega-3 (ALA only) 3.1 3.2 14.4 14.4
Total PUFA 30.4 30.6 25.5 25.0
LA:ALA Ratio 9.0 9.0 0.75 0.75
ALA %Energy 1.2 2.0 5.6 9.1
LA %Energy 10.5 17.3 4.3 6.7
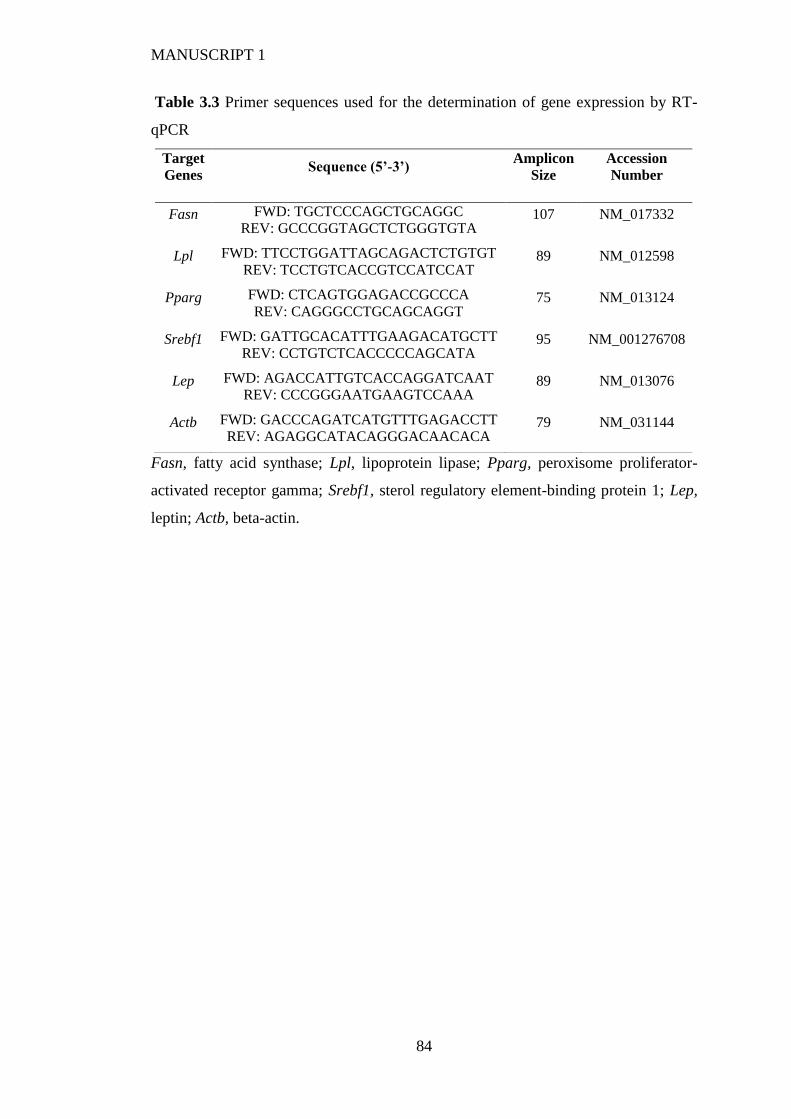
MANUSCRIPT 1
84
Table 3.3 Primer sequences used for the determination of gene expression by RT-
qPCR
Fasn, fatty acid synthase; Lpl, lipoprotein lipase; Pparg, peroxisome proliferator-
activated receptor gamma; Srebf1, sterol regulatory element-binding protein 1; Lep,
leptin; Actb, beta-actin.
Target
Genes Sequence (5’-3’)
Amplicon
Size
Accession
Number
Fasn FWD: TGCTCCCAGCTGCAGGC
REV: GCCCGGTAGCTCTGGGTGTA 107 NM_017332
Lpl FWD: TTCCTGGATTAGCAGACTCTGTGT
REV: TCCTGTCACCGTCCATCCAT 89 NM_012598
Pparg FWD: CTCAGTGGAGACCGCCCA
REV: CAGGGCCTGCAGCAGGT 75 NM_013124
Srebf1 FWD: GATTGCACATTTGAAGACATGCTT
REV: CCTGTCTCACCCCCAGCATA 95 NM_001276708
Lep FWD: AGACCATTGTCACCAGGATCAAT
REV: CCCGGGAATGAAGTCCAAA 89 NM_013076
Actb FWD: GACCCAGATCATGTTTGAGACCTT
REV: AGAGGCATACAGGGACAACACA 79 NM_031144
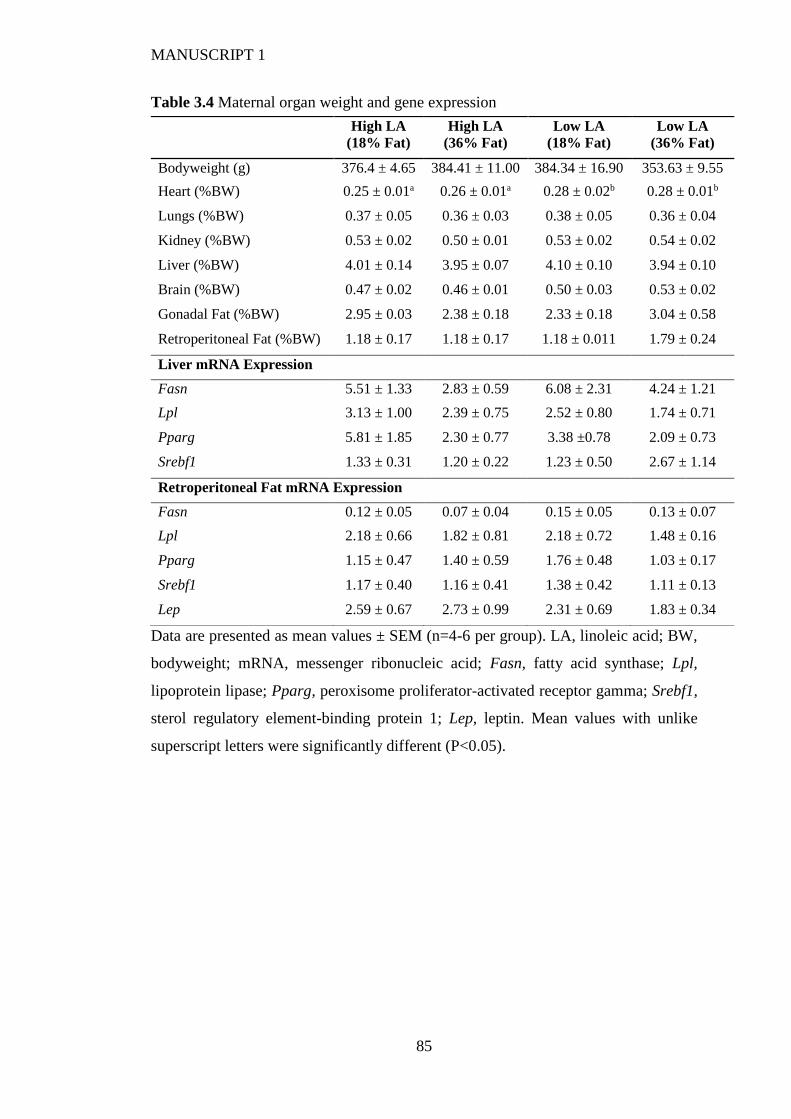
MANUSCRIPT 1
85
Table 3.4 Maternal organ weight and gene expression
Data are presented as mean values ± SEM (n=4-6 per group). LA, linoleic acid; BW,
bodyweight; mRNA, messenger ribonucleic acid; Fasn, fatty acid synthase; Lpl,
lipoprotein lipase; Pparg, peroxisome proliferator-activated receptor gamma; Srebf1,
sterol regulatory element-binding protein 1; Lep, leptin. Mean values with unlike
superscript letters were significantly different (P<0.05).
High LA
(18% Fat)
High LA
(36% Fat)
Low LA
(18% Fat)
Low LA
(36% Fat)
Bodyweight (g) 376.4 ± 4.65 384.41 ± 11.00 384.34 ± 16.90 353.63 ± 9.55
Heart (%BW) 0.25 ± 0.01a 0.26 ± 0.01a 0.28 ± 0.02b 0.28 ± 0.01b
Lungs (%BW) 0.37 ± 0.05 0.36 ± 0.03 0.38 ± 0.05 0.36 ± 0.04
Kidney (%BW) 0.53 ± 0.02 0.50 ± 0.01 0.53 ± 0.02 0.54 ± 0.02
Liver (%BW) 4.01 ± 0.14 3.95 ± 0.07 4.10 ± 0.10 3.94 ± 0.10
Brain (%BW) 0.47 ± 0.02 0.46 ± 0.01 0.50 ± 0.03 0.53 ± 0.02
Gonadal Fat (%BW) 2.95 ± 0.03 2.38 ± 0.18 2.33 ± 0.18 3.04 ± 0.58
Retroperitoneal Fat (%BW) 1.18 ± 0.17 1.18 ± 0.17 1.18 ± 0.011 1.79 ± 0.24
Liver mRNA Expression
Fasn 5.51 ± 1.33 2.83 ± 0.59 6.08 ± 2.31 4.24 ± 1.21
Lpl 3.13 ± 1.00 2.39 ± 0.75 2.52 ± 0.80 1.74 ± 0.71
Pparg 5.81 ± 1.85 2.30 ± 0.77 3.38 ±0.78 2.09 ± 0.73
Srebf1 1.33 ± 0.31 1.20 ± 0.22 1.23 ± 0.50 2.67 ± 1.14
Retroperitoneal Fat mRNA Expression
Fasn 0.12 ± 0.05 0.07 ± 0.04 0.15 ± 0.05 0.13 ± 0.07
Lpl 2.18 ± 0.66 1.82 ± 0.81 2.18 ± 0.72 1.48 ± 0.16
Pparg 1.15 ± 0.47 1.40 ± 0.59 1.76 ± 0.48 1.03 ± 0.17
Srebf1 1.17 ± 0.40 1.16 ± 0.41 1.38 ± 0.42 1.11 ± 0.13
Lep 2.59 ± 0.67 2.73 ± 0.99 2.31 ± 0.69 1.83 ± 0.34
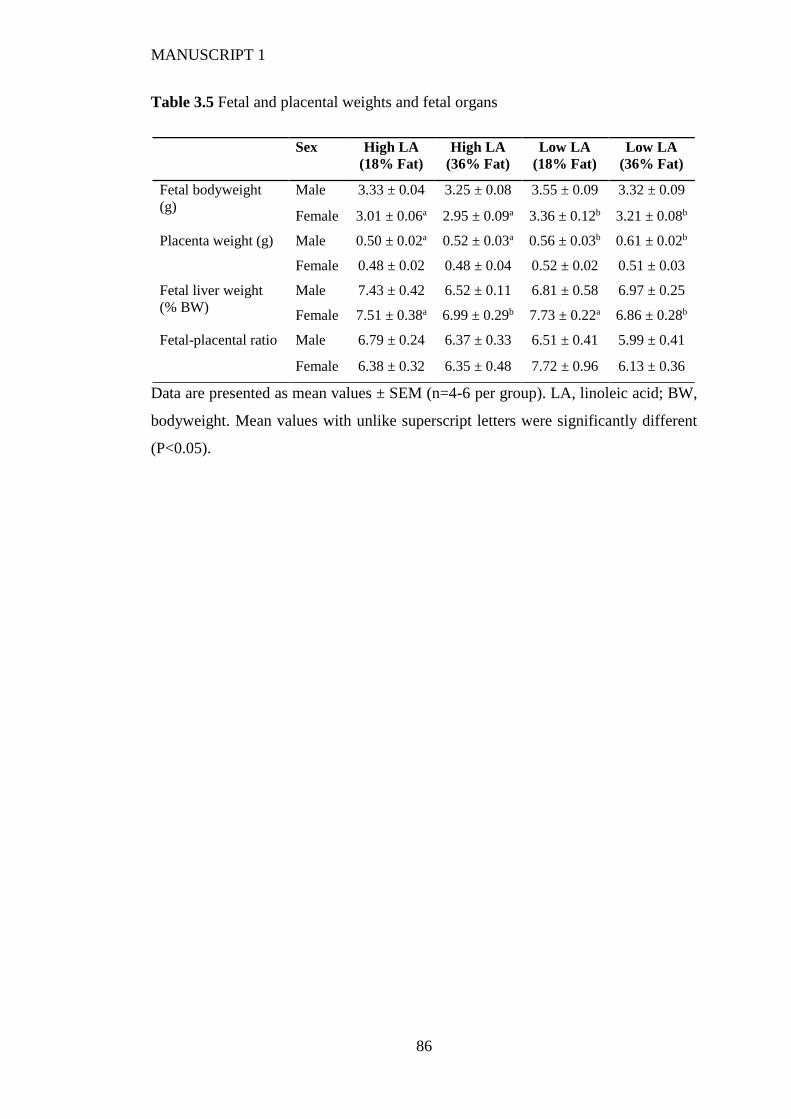
MANUSCRIPT 1
86
Table 3.5 Fetal and placental weights and fetal organs
Data are presented as mean values ± SEM (n=4-6 per group). LA, linoleic acid; BW,
bodyweight. Mean values with unlike superscript letters were significantly different
(P<0.05).
Sex High LA
(18% Fat)
High LA
(36% Fat)
Low LA
(18% Fat)
Low LA
(36% Fat)
Fetal bodyweight
(g)
Male 3.33 ± 0.04 3.25 ± 0.08 3.55 ± 0.09 3.32 ± 0.09
Female 3.01 ± 0.06a 2.95 ± 0.09a 3.36 ± 0.12b 3.21 ± 0.08b
Placenta weight (g) Male 0.50 ± 0.02a 0.52 ± 0.03a 0.56 ± 0.03b 0.61 ± 0.02b
Female 0.48 ± 0.02 0.48 ± 0.04 0.52 ± 0.02 0.51 ± 0.03
Fetal liver weight
(% BW)
Male 7.43 ± 0.42 6.52 ± 0.11 6.81 ± 0.58 6.97 ± 0.25
Female 7.51 ± 0.38a 6.99 ± 0.29b 7.73 ± 0.22a 6.86 ± 0.28b
Fetal-placental ratio Male 6.79 ± 0.24 6.37 ± 0.33 6.51 ± 0.41 5.99 ± 0.41
Female 6.38 ± 0.32 6.35 ± 0.48 7.72 ± 0.96 6.13 ± 0.36
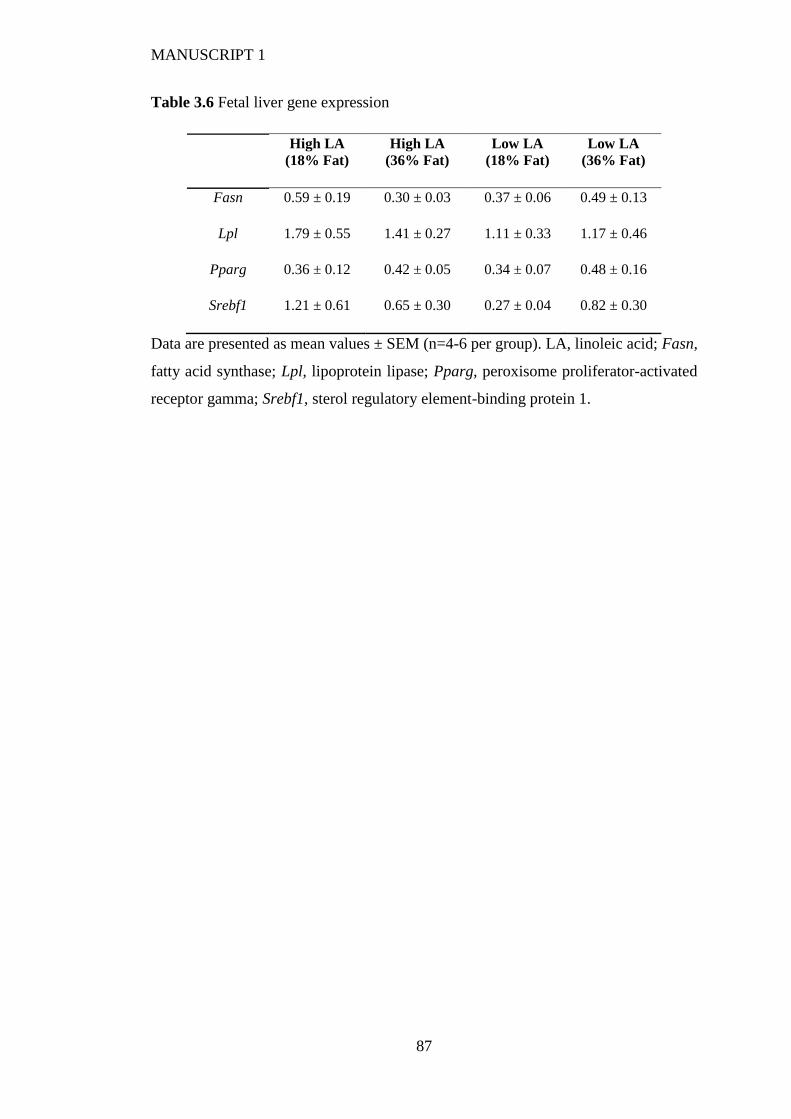
MANUSCRIPT 1
87
Table 3.6 Fetal liver gene expression
High LA
(18% Fat)
High LA
(36% Fat)
Low LA
(18% Fat)
Low LA
(36% Fat)
Fasn 0.59 ± 0.19 0.30 ± 0.03 0.37 ± 0.06 0.49 ± 0.13
Lpl 1.79 ± 0.55 1.41 ± 0.27 1.11 ± 0.33 1.17 ± 0.46
Pparg 0.36 ± 0.12 0.42 ± 0.05 0.34 ± 0.07 0.48 ± 0.16
Srebf1 1.21 ± 0.61 0.65 ± 0.30 0.27 ± 0.04 0.82 ± 0.30
Data are presented as mean values ± SEM (n=4-6 per group). LA, linoleic acid; Fasn,
fatty acid synthase; Lpl, lipoprotein lipase; Pparg, peroxisome proliferator-activated
receptor gamma; Srebf1, sterol regulatory element-binding protein 1.
MANUSCRIPT 1
88
Figure 3.1 Maternal average daily (A) food intake, (B) energy intake and (C) protein
intake before mating and up to day 20 of gestation fed on either a high LA (18% fat)
diet (closed circles), high LA (36% fat) diet (open circles), low LA (18% fat) diet
(closed squares) and a low LA (36% fat) diet (open squares). Values are means ± SEM
and n=5-7 per group. The effects of dietary fatty acid ratio and dietary fat content were
determined using a two-way repeated measures ANOVA. * indicates a significant
effect of dietary fat content (** P<0.01, *** P<0.001).
Figure 3.2 Maternal whole blood fatty acids profile at (A/B) baseline (C/D) after 4
weeks on experimental diet and (E/F) at day 20 of gestation. Values are means ± SEM
and n=5-7 per group. The effects of dietary fatty acid ratio and dietary fat content were
determined using a two-way ANOVA (*P<0.05, **P<0.01, ***P<0.001). † indicates
a significant interaction between dietary fat content and LA:ALA ratio (P<0.05).
Figure 3.3 Maternal weight gain of rats during pre-feeding and up to day 20 of
gestation fed on either a high LA (18% fat) diet (closed circles), high LA (36% fat)
diet (open circles), low LA (18% fat) diet (closed squares) and a low LA (36% fat) diet
(open squares). Values are means ± SEM and n=5-7 per group. The effects of dietary
fatty acid ratio and dietary fat content were determined using a two-way repeated
measures ANOVA and no significant differences were found between groups.
Figure 3.4 Placental (A/B) and fetal whole blood (C/D) fatty acid profile at gestational
day 20. Values are means ± SEM and n=10-14 per group. The effects of maternal
dietary fatty acid ratio and maternal dietary fat content were determined using a two-
way ANOVA (*P<0.05, **P<0.01, ***P<0.001). † indicates a significant interaction
between dietary fat content and LA:ALA ratio (P<0.05).
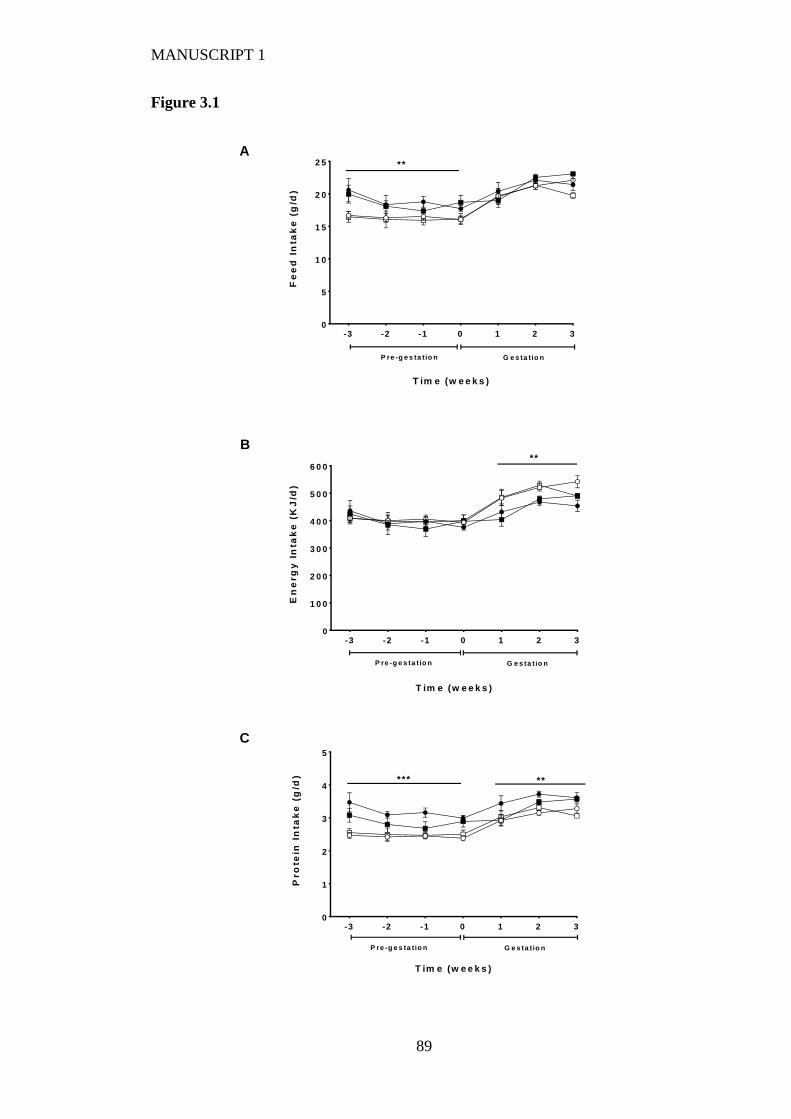
MANUSCRIPT 1
89
Figure 3.1
-3 -2 -1 0 1 2 30
5
1 0
1 5
2 0
2 5
T im e (w e e k s )
Fe
ed
In
tak
e (
g/d
)
* *
P re -g e s ta tio n G e s ta tio n
-3 -2 -1 0 1 2 30
1 0 0
2 0 0
3 0 0
4 0 0
5 0 0
6 0 0
T im e (w e e k s )
En
erg
y I
nta
ke
(K
J/d
)
* *
P re -g e s ta tio n G e s ta tio n
-3 -2 -1 0 1 2 30
1
2
3
4
5
T im e (w e e k s )
Pro
tein
In
tak
e (
g/d
) * * * **
P re -g e s ta tio n G e s ta tio n
A
B
C
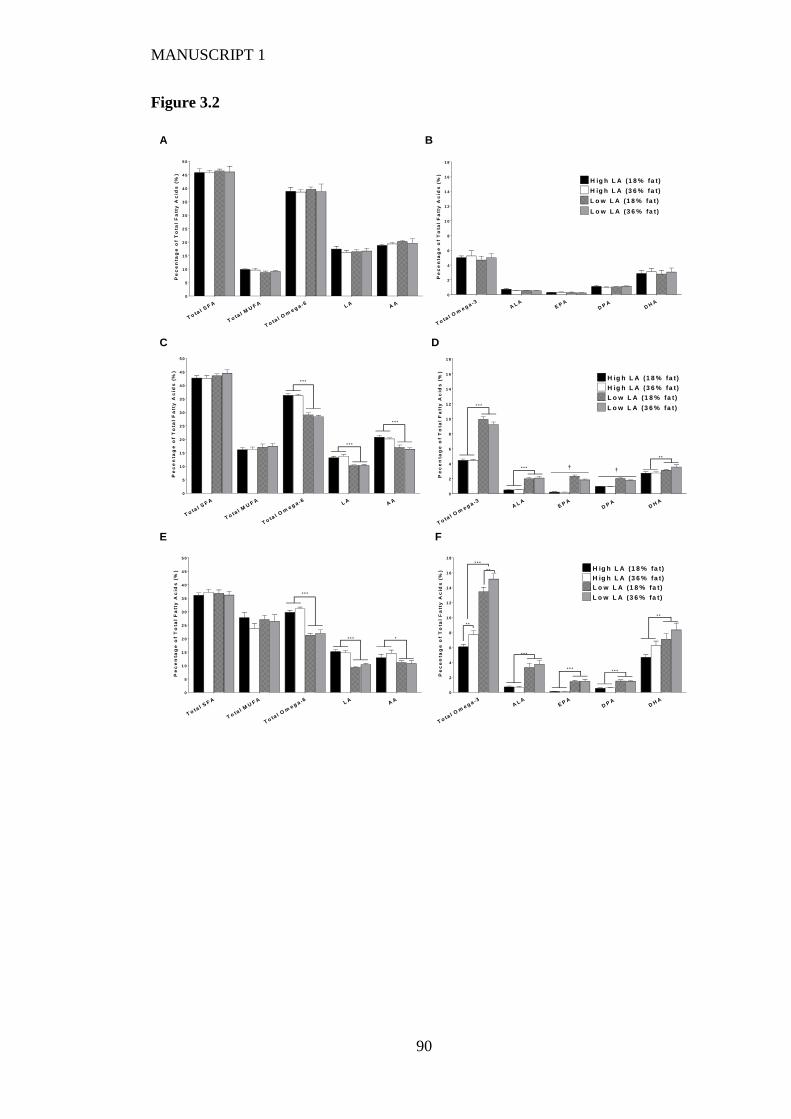
MANUSCRIPT 1
90
Figure 3.2
T o tal S
F A
T o tal M
UF A
T o tal O
me g a -6 L A
AA
0
5
1 0
1 5
2 0
2 5
3 0
3 5
4 0
4 5
5 0
Pe
ce
nta
ge
of
To
tal
Fa
tty
Ac
ids
(%
)
T o tal S
F A
T o tal M
UF A
T o tal O
me g a -6 L A
AA
0
5
1 0
1 5
2 0
2 5
3 0
3 5
4 0
4 5
5 0
Pe
ce
nta
ge
of
To
tal
Fa
tty
Ac
ids
(%
)
* * *
* * *
* * *
T o tal O
me g a -3
AL A
E P AD
P A
DH
A
0
2
4
6
8
1 0
1 2
1 4
1 6
1 8
Pe
ce
nta
ge
of
To
tal
Fa
tty
Ac
ids
(%
)
* * *
* * * ††
* *
H ig h L A (3 6 % fa t )
H ig h L A (1 8 % fa t )
L o w L A (1 8 % fa t )
L o w L A (3 6 % fa t )
T o tal S
F A
T o tal M
UF A
T o tal O
me g a -6 L A
AA
0
5
1 0
1 5
2 0
2 5
3 0
3 5
4 0
4 5
5 0
Pe
ce
nta
ge
of
To
tal
Fa
tty
Ac
ids
(%
)
* * *
* * * *
T o tal O
me g a -3
AL A
E P AD
P A
DH
A
0
2
4
6
8
1 0
1 2
1 4
1 6
1 8
Pe
ce
nta
ge
of
To
tal
Fa
tty
Ac
ids
(%
) H ig h L A (1 8 % fa t )
H ig h L A (3 6 % fa t )
L o w L A (1 8 % fa t )
L o w L A (3 6 % fa t )
* * *
* * *
* * ** * *
* *
* *
* *
T o tal O
me g a -3
AL A
E P AD
P A
DH
A
0
2
4
6
8
1 0
1 2
1 4
1 6
1 8
Pe
ce
nta
ge
of
To
tal
Fa
tty
Ac
ids
(%
)
H ig h L A (1 8 % fa t )
H ig h L A (3 6 % fa t )
L o w L A (1 8 % fa t )
L o w L A (3 6 % fa t )
A B
C D
E F
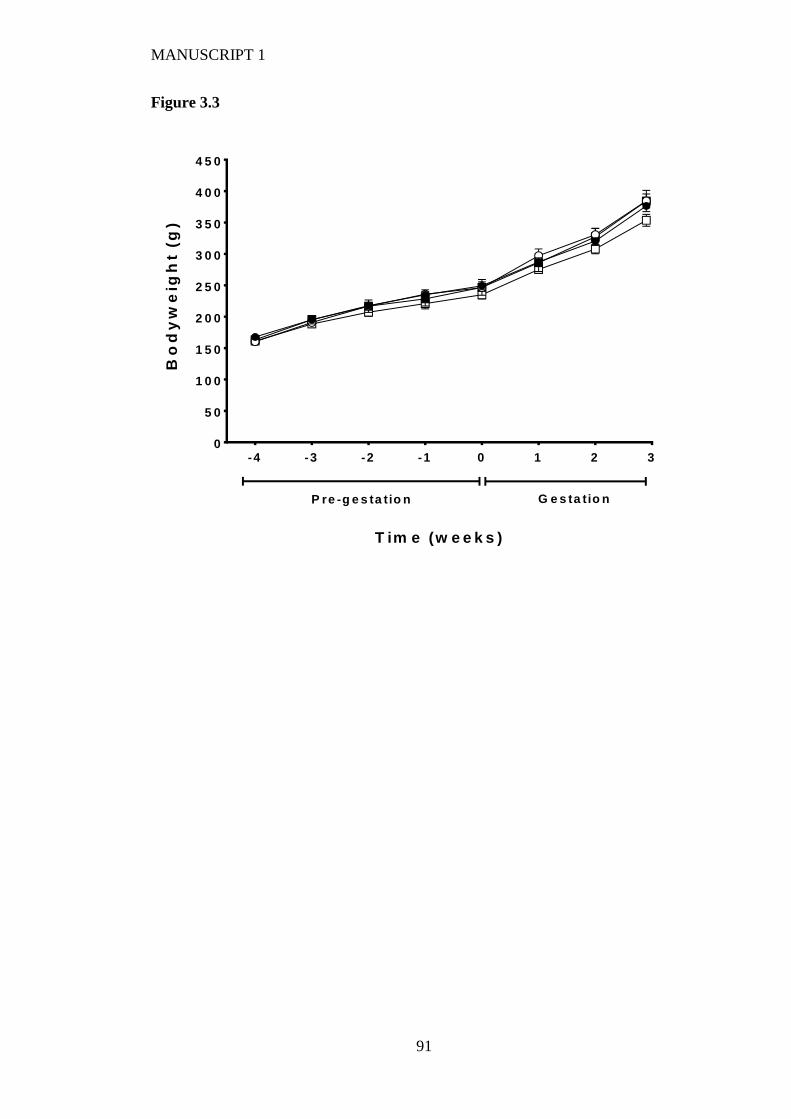
MANUSCRIPT 1
91
Figure 3.3
-4 -3 -2 -1 0 1 2 30
5 0
1 0 0
1 5 0
2 0 0
2 5 0
3 0 0
3 5 0
4 0 0
4 5 0
T im e (w e e k s )
Bo
dy
we
igh
t (g
)
P re -g e s ta tio n G e s ta tio n
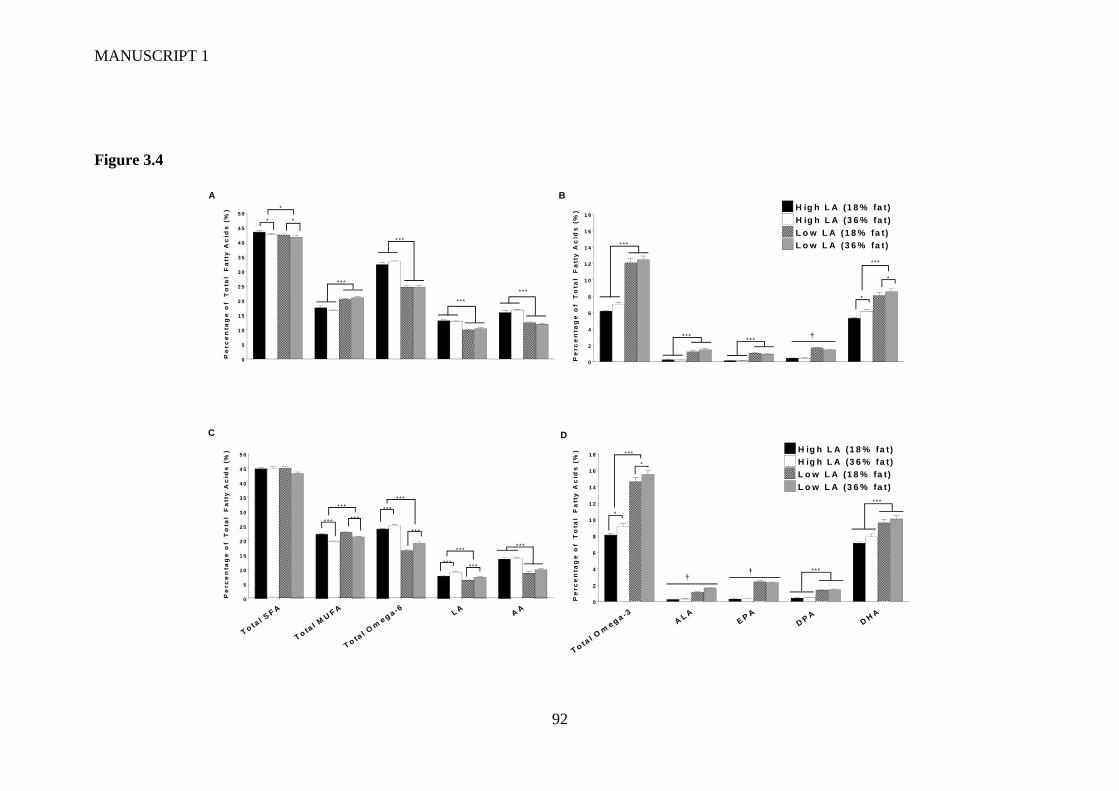
MANUSCRIPT 1
92
Figure 3.4
0
5
1 0
1 5
2 0
2 5
3 0
3 5
4 0
4 5
5 0
Pe
rc
en
tag
e o
f T
ota
l F
att
y A
cid
s (
%)
* * *
* * *
* * *
* * *
* *
*
0
2
4
6
8
1 0
1 2
1 4
1 6
1 8
Pe
rc
en
tag
e o
f T
ota
l F
att
y A
cid
s (
%)
* * *
* * ** * *
†
*
*
* * *
H ig h L A (1 8 % fa t )
H ig h L A (3 6 % fa t )
L o w L A (1 8 % fa t )
L o w L A (3 6 % fa t )
T o tal S
F A
T o tal M
UF A
T o tal O
me g a -6 L A
AA
0
5
1 0
1 5
2 0
2 5
3 0
3 5
4 0
4 5
5 0
Pe
rc
en
tag
e o
f T
ota
l F
att
y A
cid
s (
%)
* * *
* * ** * *
* * *
* * *
* * *
* * *
* * * * * *
* * *
T o tal O
me g a -3
AL A
EP
A
DP
A
DH
A
0
2
4
6
8
1 0
1 2
1 4
1 6
1 8
Pe
rc
en
tag
e o
f T
ota
l F
att
y A
cid
s (
%)
*
*
* * *
* * *
* * *
††
H ig h L A (1 8 % fa t )
H ig h L A (3 6 % fa t )
L o w L A (1 8 % fa t )
L o w L A (3 6 % fa t )
A B
C D
93
4 MANUSCRIPT 2: THE EFFECT OF MATERNAL DIETARY FAT
CONTENT AND OMEGA-6 TO OMEGA-3 RATIO ON OFFSPRING
GROWTH AND HEPATIC GENE EXPRESSION IN THE RAT
Draycott, SAV, George, G, Elmes, MJ, Muhlhausler, BS & Langley-Evans, SC
(2019). The effect of maternal dietary fat content and omega-6 to omega-3 ratio on
offspring growth and hepatic gene expression in the rat. British Journal of Nutrition
(accepted manuscript).
Author contributions can be found in Appendix C and the submitted article PDF can
be found in Appendix E.
MANUSCRIPT 2
94
4.1 Abstract
Abstract
Omega-6 fatty acids have been shown to exert pro-adipogenic effects whereas omega-
3 fatty acids appear to work in opposition. Increasing intakes of LA (linoleic acid;
omega-6) vs ALA (alpha-linolenic acid; omega-3) in Western diets has led to the
hypothesis that consumption of this diet during pregnancy may be contributing to
adverse offspring health. This study investigated the effects of feeding a maternal
dietary LA:ALA ratio similar to that of the Western diet (9:1) compared to a proposed
‘ideal’ ratio (~1:1.5), at two total fat levels (18% vs 36% fat w/w), on growth and
lipogenic gene expression in the offspring. Female Wistar rats were assigned to one of
the four experimental groups throughout gestation and lactation. Offspring were culled
at 1 and 2 weeks of age for blood and tissue sample collection. Offspring of dams
consuming a 36% fat diet were ~20% lighter than those exposed to an 18% fat diet
(P<0.001). Male, but not female, liver weight at 1 week was ~13% heavier, and had
increased glycogen (P<0.05), in offspring exposed to high LA (P<0.01). Hepatic
expression of lipogenic genes suggested an increase in lipogenesis in male offspring
exposed to a 36% fat maternal diet and in female offspring exposed to a low LA diet,
via increases in the expression of Fasn and Srebf1. Sexually dimorphic responses to
altered maternal diet appeared to persist until two weeks-of-age. In conclusion, whilst
maternal total fat content predominantly affected offspring growth, fatty acid ratio and
total fat content had sexually dimorphic effects on offspring liver weight and
composition.
MANUSCRIPT 2
95
4.2 Introduction
Accumulating evidence suggests that the nutritional environment experienced by an
individual during fetal and early infant development has long-lasting impacts on their
metabolic health (Langley-Evans, 2015). In the context of the global epidemic of
obesity and nutritional excess, there has been considerable interest in determining the
effects of maternal overnutrition on the metabolic health of the offspring. The majority
of these studies have utilised animal models and have consistently reported that
maternal high-fat feeding during pregnancy has detrimental effects on the metabolic
health of both the mother and her offspring (Ribaroff et al., 2017, Ainge et al., 2011).
As a result, excess maternal fat consumption has been implicated as a key contributor
to metabolic programming of long-term health and disease risk.
There is increasing evidence, however, that the impact of a high-fat diet on the
metabolic health of the offspring depends not only on the amount of fat in the diet, but
also on the fatty acid composition (Muhlhausler and Ailhaud, 2013, Draycott et al.,
2019). There has been particular interest in the role of two classes of polyunsaturated
fatty acids (PUFA), due to the substantive increase in the amounts of omega-6 PUFA,
predominately linoleic acid (LA), being consumed in the diets of many Western
countries over the past few decades (Blasbalg et al., 2011, Sioen et al., 2017). This
increase in the intake of LA has not been accompanied by substantial changes in the
consumption of omega-3 PUFA such as alpha-linolenic acid (ALA) and has therefore
resulted in increases in the ratio of omega-6:omega-3 PUFA consumed in the diets of
many Western countries (Ailhaud et al., 2006, Blasbalg et al., 2011).
The increasing dominance of omega-6 over omega-3 PUFA in modern Western diets
has considerable biological significance, since the omega-6 and omega-3 fatty acid
families utilise the same enzymes for production of longer chain bioactive derivatives
such as arachidonic acid (AA; omega-6), eicosapentaenoic acid (EPA; omega-3),
docosapentaenoic acid (DPA; omega-3) and docosahexaenoic acid (DHA; omega-3),
and also compete for incorporation into cell membranes. As a result, excess
consumption of LA leads to a decrease in the production and incorporation of omega-
3 fatty acids through simple substrate competition, and this effect is exacerbated when
total dietary PUFA is high (Tu et al., 2010, Gibson et al., 2013). The omega-3 and
omega-6 long-chain polyunsaturated fatty acids (LCPUFA) derivatives also have
MANUSCRIPT 2
96
opposing physiological actions, with those from the omega-3 family predominately
exhibiting anti-inflammatory properties (for example via the suppression of the pro-
inflammatory transcription factor nuclear factor kappa B and activation of the anti-
inflammatory transcription factor peroxisome proliferator activated receptor γ (Calder,
2015)) and those from the omega-6 family exhibiting more pro-inflammatory and pro-
adipogenic properties (Massiera et al., 2003). This has led to the hypothesis that the
increasing ratio of omega-6 to omega-3 fatty acids in modern Western diets may have
negative effects on conditions characterised by low-grade inflammation, including
obesity and the metabolic syndrome, and may potentially be contributing to an
intergenerational cycle of obesity (Ailhaud et al., 2006).
Data from observational studies in humans and animal models provide supporting
evidence that suggests high intakes of omega-6 PUFA during pregnancy could have
negative effects on metabolic health of the progeny (Massiera et al., 2010, Korotkova
et al., 2002, Much et al., 2013). However, the results of these studies have not been
consistent. The results of pre-clinical studies are also limited by the use of diets with
much higher omega-6:omega-3 PUFA ratios and/or absolute PUFA contents than
those encountered in typical human diets. Furthermore, offspring often continue to
have access to the same diet as their mother so that any effects observed cannot be
clearly attributed to dietary fatty acid exposure during the gestation and lactation
periods (Muhlhausler et al., 2011b, Ibrahim et al., 2009, Muhlhausler et al., 2011a).
The aim of this study, therefore, was to investigate the effects of feeding a maternal
dietary LA:ALA ratio similar to that of the Western diet (9:1) (Blasbalg et al., 2011),
compared to a proposed ‘ideal’ ratio of ~1:1.5 (Gibson et al., 2011, Lands, 2000) on
growth and lipogenic gene expression in the offspring. Since total dietary PUFA intake
also influences PUFA metabolism (Tu et al., 2010, Gibson et al., 2013), we also
investigated the effect of feeding each dietary fat ratio at either 18% fat w/w (in line
with dietary recommendations (SACN, 2018)) or at a higher fat level of 36% fat w/w.
A rat model was utilised to achieve the study objectives by allowing for tight control
of dietary manipulation as well as invasive end points.
MANUSCRIPT 2
97
4.3 Materials and Methods
4.3.1 Animals
All animal procedures were performed in accordance with the Animals (Scientific
Procedures) Act 1986 under Home Office licence and were approved by the Animal
Ethics Committee of the University of Nottingham, UK. Virgin female Wistar rats
(n=30; 75-100g; Charles River, UK) were housed on wood shavings in individually
ventilated cages under a 12 hour light/12 hour dark cycle at a temperature of 20-22°C
and had ad libitum access to food and water throughout the experiment. Female rats
were allowed to acclimatise to the unit for 1-2 weeks, during which time they were fed
standard laboratory chow (2018 Teklad Global 18% Protein Rodent Diet, Harlan
Laboratories, UK). After acclimatisation, a tail vein blood sample was taken from each
animal for the determination of fatty acid status. The rats were then randomly assigned
to one of 4 dietary groups (details provided below). Animals were maintained on their
allocated diet for a four week ‘pre-feeding’ period, after which they were mated.
Conception was confirmed by the presence of a semen plug and this was recorded as
day 0 of pregnancy. Animals were housed in individual cages and remained on their
respective diets throughout pregnancy and lactation.
Litters were standardised to 8 pups within 24 hours of birth (4 males and 4 females,
where possible). At 1 and 2 weeks of age, one randomly selected male and one
randomly selected female from each litter were culled via cervical dislocation and
exsanguination for blood and tissue collection. At 3 weeks of age, the remaining
offspring were weaned and dams were then euthanised by CO2 asphyxiation and
cervical dislocation for collection of maternal blood and tissues. All dams were
weighed and had feed intake measured daily throughout the experiment and offspring
bodyweight was measured weekly.
4.3.2 Diets
Diets were designed to provide either a high (9:1, high LA) or low (1:1.5, low LA)
ratio of LA (cis/cis isomer) to ALA, achieved by altering the amounts of flaxseed and
sunflower oil included in the fat component of the feed. The levels of saturated and
monounsaturated fatty acids were comparable in all diets, achieved by adjusting the
amounts of coconut (saturated fat source) and macadamia (monounsaturated fat
MANUSCRIPT 2
98
source) oils in the diets. For each level of LA, diets were developed to contain either
18% fat (w/w), in line with government recommendations (SACN, 2018), or 36% fat
(w/w) to highlight any additive effects (38.6 vs 63.5% of dietary energy respectively).
This resulted in four experimental diets; high LA (18% fat), high LA (36% fat), low
LA (18% fat) and low LA (36% fat; n=6-9 per dietary group). The list of ingredients
and final fatty acid composition of the four experimental diets have been reported
previously (Draycott et al., 2019).
4.3.3 Blood sample and tissue collection
Blood samples were collected from dams prior to the start of the experiment and after
the 4 week ‘feed-in’ period (tail vein sample) and at the end of lactation (via cardiac
puncture following CO2 asphyxiation and cervical dislocation). Truncal blood samples
were also collected from one randomly selected male and one randomly selected
female at 1 and 2 weeks of age. In all cases, samples of whole blood (~30µl) from non-
fasted animals were spotted onto PUFAcoat™ dried blood spot (DBS) collection paper
(Liu et al., 2014), allowed to dry at room temperature and stored at -20°C for
subsequent fatty acid analysis. Maternal tissues were weighed and samples of whole
liver, retroperitoneal and gonadal adipose tissues collected. Offspring body and organ
weights were measured and whole liver samples were collected from one randomly
selected male and female pup at both time points. At 2 weeks of age, samples of
gonadal and retroperitoneal fat were also collected from one male and one female pup
per litter. All tissue samples were snap-frozen in liquid nitrogen and stored at -80°C
until determination of gene expression by quantitative reverse transcriptase PCR
(qRT-PCR).
4.3.4 Fatty acid methylation and analysis
Fatty acid composition in maternal and fetal blood was determined as previously
described (Liu et al., 2014). Briefly, whole DBS samples were directly transesterified
with 2ml of 1% H2SO4 in methanol and the fatty acid methyl esters (FAME) were
extracted with heptane. Samples were separated and analysed by a Hewlett-Packard
6890 gas chromatograph (GC) equipped with a capillary column (30m x 0.25mm)
coated with 70% cyanopropyl polysilphenylene-siloxane (BPX-70; 0.25µm film
thickness) which was fitted with a flame ionization detector (FID). FAMEs were
MANUSCRIPT 2
99
identified in unknown samples based on the comparison of retention times with an
external lipid standard (Standard 463, Nu-check prep Inc., MN, USA) using Agilent
Chemstation software (Agilent Technologies Australia Pty Ltd). Individual fatty acid
content was calculated based on peak area and response factors normalised to total
fatty acid content and expressed as a percentage of total fatty acids.
4.3.5 Isolation of RNA and cDNA synthesis and reverse transcription quantitative
real-time PCR (qRT-PCR)
RNA was isolated from crushed snap-frozen samples of ~25mg of liver using the
Roche High Pure Tissue kit (Roche Diagnostics Ltd., UK). Adipose RNA was
extracted, after homogenisation of ~100mg of tissue with MagNA Lyser green beads
and instrument (Roche Diagnostics Ltd.), using the RNeasy Mini Kit (QIAGEN Ltd.,
UK). RNA concentration was determined using a Nanodrop 2000 (Thermo Scientific)
and RNA quality was evaluated by agarose gel electrophoresis. cDNA was synthesised
using a RevertAid™ reverse transcriptase kit (Thermo Fisher Scientific, UK) with
random hexamer primers.
Lipogenic pathway and adipokine target genes included were chosen based on
previous data from our laboratory that indicated that these genes were sensitive to
changes in the maternal diet (Erhuma et al., 2007b) and included; peroxisome
proliferator-activated receptor gamma (Pparg), sterol regulatory element-binding
protein (variant 1c; Srebf1), fatty acid synthase (Fasn), lipoprotein lipase (Lpl) and
leptin (Lep), with β-actin (Actb) as the housekeeper. Primer efficiency ranged from
85%-108% and sequences have previously been published elsewhere (Draycott et al.,
2019). Adipocyte and hepatic gene expression was quantified using SYBR Green
(Roche Diagnostics) in a Light-Cycler 480 (Roche Diagnostics). Samples were
analysed against a standard curve of a serially diluted cDNA pool to produce
quantitative data and expression was normalised to the housekeeping gene using
LightCycler® 480 software (version 1.5.1) as previously described (Rhinn et al.,
2008). The expression of the housekeeper gene was not different between treatment
groups.
MANUSCRIPT 2
100
4.3.6 Determination of liver DNA, protein and glycogen content
For determination of DNA and protein content of liver samples, approximately 100mg
of frozen crushed sample was added to 1ml of 0.05M trisodium citrate buffer. Samples
were homogenised and centrifuged at 2500rpm for 10 minutes at 4°C. Supernatant was
used for further analyses. DNA concentration (µg/ml) was measured using a Hoechst
fluorometric method and protein concentration (mg/ml), modified for a 96 well plate
format, was measured as described by Lowry et al. (1951). Measurements were
normalised to the exact amount of tissue used for measurements. Liver glycogen was
measured using the Colorimetric Glycogen Assay Kit II (Abcam Ltd.) according to
manufacturer’s instructions.
4.3.7 Statistical analysis
Data are presented as mean ± SEM. Data were analysed using the Statistical Package
for Social Sciences (Version 24, SPSS Inc.). The effect of maternal dietary fatty acid
ratio and maternal dietary fat content on maternal dependent variables was assessed
using a two-way ANOVA, with dietary LA:ALA ratio and dietary fat content as factors
and dams were used as the unit of analysis. Where longitudinal data were analysed, as
with maternal feed, protein and energy intakes, the impact of maternal dietary
LA:ALA ratio and maternal dietary fat content was analysed using a two-way
repeated-measures ANOVA. Offspring data were analysed using a two-way ANOVA,
with maternal dietary LA:ALA ratio and fat content as factors; where there was no
overall effect of sex, male and female offspring data were combined. Where data were
not normally distributed, analyses were performed on log10 transformed data. A value
of P<0.05 was considered to be statistically significant.
4.4 Results
4.4.1 Maternal dietary intakes
There were no differences in feed intake of dams between treatment groups before or
during pregnancy. During lactation, dams receiving the 36% fat diets had a lower
average daily feed intake than those receiving the 18% fat diets, irrespective of dietary
LA:ALA ratio (P<0.001; Figure 4.1.A). Energy intake was similar between groups
throughout the experiment (Figure 4.1.B). Protein intake prior to and during pregnancy
MANUSCRIPT 2
101
was affected by both dietary LA:ALA ratio and fat content (P<0.05; Figure 4.1.C),
however, these effects were small and inconsistent. During lactation, protein intake
was affected by dietary fat content only (P<0.001; Figure 4.1.C), such that mothers
receiving 36% fat diets consumed 24% less protein on average compared to those
consuming 18% fat diets, irrespective of dietary LA:ALA ratio. As expected, all dams
consumed more food, energy and protein during lactation than before and during
pregnancy regardless of dietary group (P<0.001).
4.4.2 Maternal fatty acid profile
There were no differences in the proportions of either saturated fatty acids (SFA),
monounsaturated fatty acids (MUFA), omega-6 (Figure 4.2.A) or omega-3 PUFA
(Figure 4.2.B) in whole blood samples collected from the dams prior to the
commencement of dietary intervention. After 4 weeks on their respective diets, the
blood fatty acid profiles were significantly different between treatment groups and
largely reflected the composition of the experimental diets. Thus, dams fed on high
LA diets had higher proportions of LA (1.2 fold) and AA (1.4 fold) compared to those
consuming a low LA diet (P<0.001; Figure 4.2.C). Conversely, dams fed the low LA
diets had a 5.5 fold higher proportion of ALA and an 8.5 fold higher proportion of
EPA compared to those consuming a high LA diet (P<0.001; Figure 4.2.D). These
changes were independent of the total fat content of the diet. DPA and DHA levels
after the 4 week pre-feeding period were influenced by both dietary LA:ALA ratio and
total fat content. Thus, the relative proportions of DPA were higher in dams fed the
low LA compared to high LA diets (P<0.001), and marginally higher in dams
consuming the 18% vs 36% fat diets (P<0.05). DHA proportions were also higher in
the low LA group (P<0.001) but, unlike DPA, were modestly but significantly higher
in dams consuming the 36% fat vs 18% fat diets (P<0.05; Figure 4.2.D). Total blood
MUFA proportions were higher (1.3-fold) in dams consuming the low LA diet,
irrespective of dietary fat content (P<0.001; Figure 4.2.D).
The blood fatty acid profile of the dams at the end of lactation, after a further 6 weeks
on their respective experimental diets, were similar to those observed after the first 4
weeks of dietary intervention. A notable difference, however, was that at this time
point, relative proportions of DHA, as a percentage of total lipids, were not different
between dietary groups (Figure 4.2.F). LA (1.5-fold), AA (1.8-fold) and total omega-
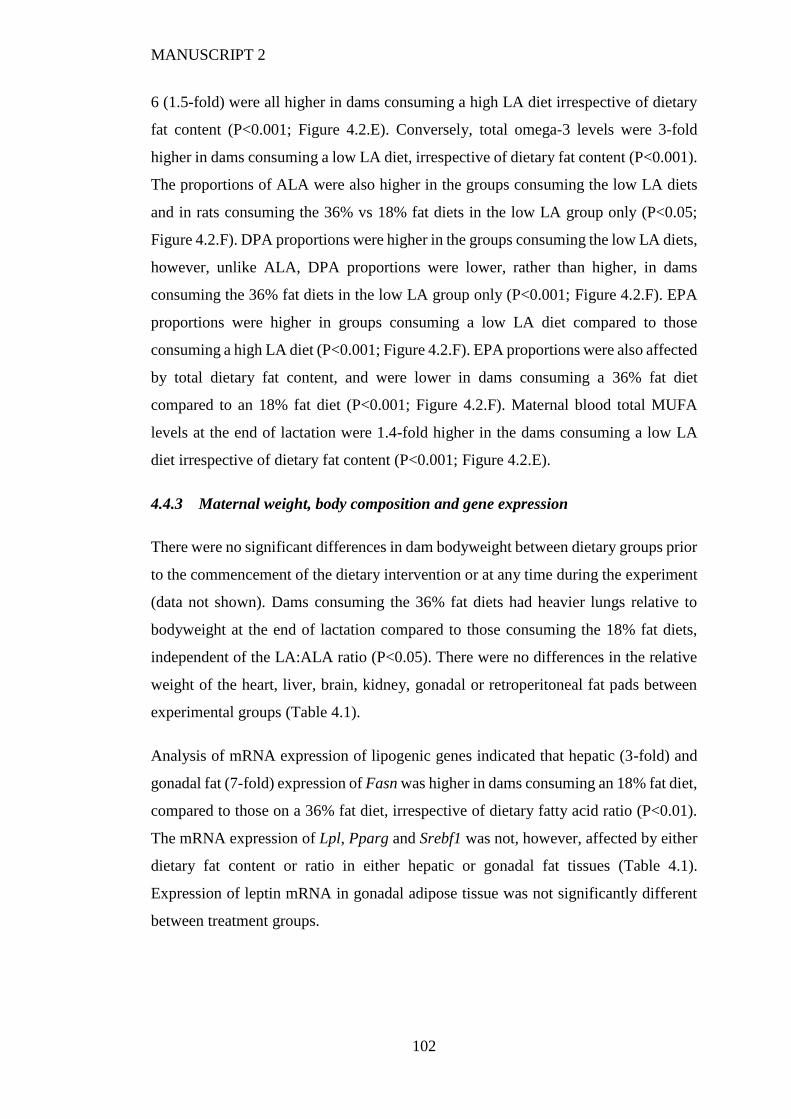
MANUSCRIPT 2
102
6 (1.5-fold) were all higher in dams consuming a high LA diet irrespective of dietary
fat content (P<0.001; Figure 4.2.E). Conversely, total omega-3 levels were 3-fold
higher in dams consuming a low LA diet, irrespective of dietary fat content (P<0.001).
The proportions of ALA were also higher in the groups consuming the low LA diets
and in rats consuming the 36% vs 18% fat diets in the low LA group only (P<0.05;
Figure 4.2.F). DPA proportions were higher in the groups consuming the low LA diets,
however, unlike ALA, DPA proportions were lower, rather than higher, in dams
consuming the 36% fat diets in the low LA group only (P<0.001; Figure 4.2.F). EPA
proportions were higher in groups consuming a low LA diet compared to those
consuming a high LA diet (P<0.001; Figure 4.2.F). EPA proportions were also affected
by total dietary fat content, and were lower in dams consuming a 36% fat diet
compared to an 18% fat diet (P<0.001; Figure 4.2.F). Maternal blood total MUFA
levels at the end of lactation were 1.4-fold higher in the dams consuming a low LA
diet irrespective of dietary fat content (P<0.001; Figure 4.2.E).
4.4.3 Maternal weight, body composition and gene expression
There were no significant differences in dam bodyweight between dietary groups prior
to the commencement of the dietary intervention or at any time during the experiment
(data not shown). Dams consuming the 36% fat diets had heavier lungs relative to
bodyweight at the end of lactation compared to those consuming the 18% fat diets,
independent of the LA:ALA ratio (P<0.05). There were no differences in the relative
weight of the heart, liver, brain, kidney, gonadal or retroperitoneal fat pads between
experimental groups (Table 4.1).
Analysis of mRNA expression of lipogenic genes indicated that hepatic (3-fold) and
gonadal fat (7-fold) expression of Fasn was higher in dams consuming an 18% fat diet,
compared to those on a 36% fat diet, irrespective of dietary fatty acid ratio (P<0.01).
The mRNA expression of Lpl, Pparg and Srebf1 was not, however, affected by either
dietary fat content or ratio in either hepatic or gonadal fat tissues (Table 4.1).
Expression of leptin mRNA in gonadal adipose tissue was not significantly different
between treatment groups.
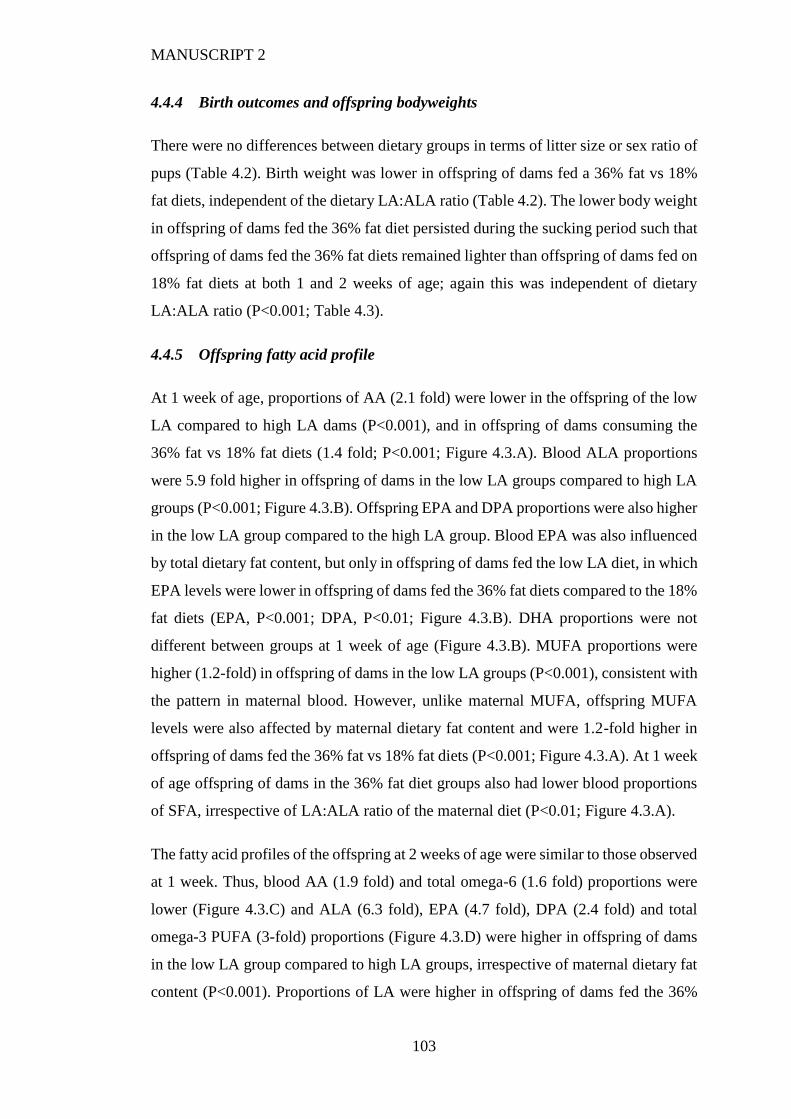
MANUSCRIPT 2
103
4.4.4 Birth outcomes and offspring bodyweights
There were no differences between dietary groups in terms of litter size or sex ratio of
pups (Table 4.2). Birth weight was lower in offspring of dams fed a 36% fat vs 18%
fat diets, independent of the dietary LA:ALA ratio (Table 4.2). The lower body weight
in offspring of dams fed the 36% fat diet persisted during the sucking period such that
offspring of dams fed the 36% fat diets remained lighter than offspring of dams fed on
18% fat diets at both 1 and 2 weeks of age; again this was independent of dietary
LA:ALA ratio (P<0.001; Table 4.3).
4.4.5 Offspring fatty acid profile
At 1 week of age, proportions of AA (2.1 fold) were lower in the offspring of the low
LA compared to high LA dams (P<0.001), and in offspring of dams consuming the
36% fat vs 18% fat diets (1.4 fold; P<0.001; Figure 4.3.A). Blood ALA proportions
were 5.9 fold higher in offspring of dams in the low LA groups compared to high LA
groups (P<0.001; Figure 4.3.B). Offspring EPA and DPA proportions were also higher
in the low LA group compared to the high LA group. Blood EPA was also influenced
by total dietary fat content, but only in offspring of dams fed the low LA diet, in which
EPA levels were lower in offspring of dams fed the 36% fat diets compared to the 18%
fat diets (EPA, P<0.001; DPA, P<0.01; Figure 4.3.B). DHA proportions were not
different between groups at 1 week of age (Figure 4.3.B). MUFA proportions were
higher (1.2-fold) in offspring of dams in the low LA groups (P<0.001), consistent with
the pattern in maternal blood. However, unlike maternal MUFA, offspring MUFA
levels were also affected by maternal dietary fat content and were 1.2-fold higher in
offspring of dams fed the 36% fat vs 18% fat diets (P<0.001; Figure 4.3.A). At 1 week
of age offspring of dams in the 36% fat diet groups also had lower blood proportions
of SFA, irrespective of LA:ALA ratio of the maternal diet (P<0.01; Figure 4.3.A).
The fatty acid profiles of the offspring at 2 weeks of age were similar to those observed
at 1 week. Thus, blood AA (1.9 fold) and total omega-6 (1.6 fold) proportions were
lower (Figure 4.3.C) and ALA (6.3 fold), EPA (4.7 fold), DPA (2.4 fold) and total
omega-3 PUFA (3-fold) proportions (Figure 4.3.D) were higher in offspring of dams
in the low LA group compared to high LA groups, irrespective of maternal dietary fat
content (P<0.001). Proportions of LA were higher in offspring of dams fed the 36%
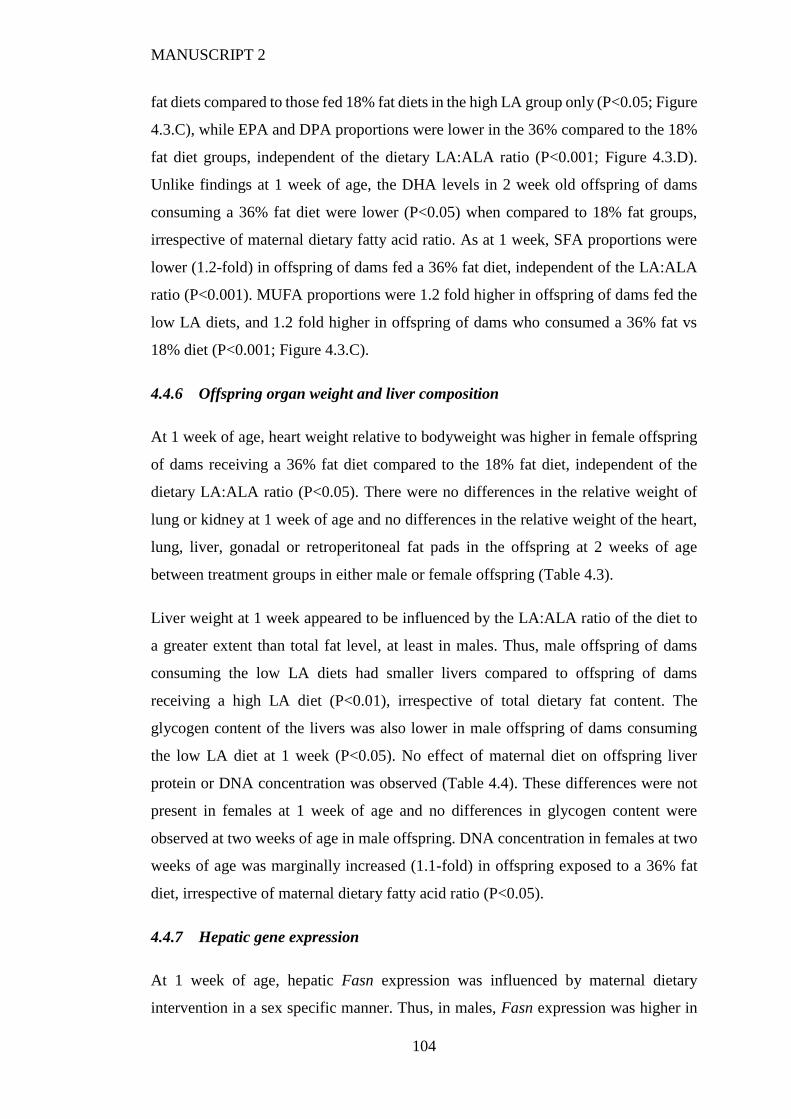
MANUSCRIPT 2
104
fat diets compared to those fed 18% fat diets in the high LA group only (P<0.05; Figure
4.3.C), while EPA and DPA proportions were lower in the 36% compared to the 18%
fat diet groups, independent of the dietary LA:ALA ratio (P<0.001; Figure 4.3.D).
Unlike findings at 1 week of age, the DHA levels in 2 week old offspring of dams
consuming a 36% fat diet were lower (P<0.05) when compared to 18% fat groups,
irrespective of maternal dietary fatty acid ratio. As at 1 week, SFA proportions were
lower (1.2-fold) in offspring of dams fed a 36% fat diet, independent of the LA:ALA
ratio (P<0.001). MUFA proportions were 1.2 fold higher in offspring of dams fed the
low LA diets, and 1.2 fold higher in offspring of dams who consumed a 36% fat vs
18% diet (P<0.001; Figure 4.3.C).
4.4.6 Offspring organ weight and liver composition
At 1 week of age, heart weight relative to bodyweight was higher in female offspring
of dams receiving a 36% fat diet compared to the 18% fat diet, independent of the
dietary LA:ALA ratio (P<0.05). There were no differences in the relative weight of
lung or kidney at 1 week of age and no differences in the relative weight of the heart,
lung, liver, gonadal or retroperitoneal fat pads in the offspring at 2 weeks of age
between treatment groups in either male or female offspring (Table 4.3).
Liver weight at 1 week appeared to be influenced by the LA:ALA ratio of the diet to
a greater extent than total fat level, at least in males. Thus, male offspring of dams
consuming the low LA diets had smaller livers compared to offspring of dams
receiving a high LA diet (P<0.01), irrespective of total dietary fat content. The
glycogen content of the livers was also lower in male offspring of dams consuming
the low LA diet at 1 week (P<0.05). No effect of maternal diet on offspring liver
protein or DNA concentration was observed (Table 4.4). These differences were not
present in females at 1 week of age and no differences in glycogen content were
observed at two weeks of age in male offspring. DNA concentration in females at two
weeks of age was marginally increased (1.1-fold) in offspring exposed to a 36% fat
diet, irrespective of maternal dietary fatty acid ratio (P<0.05).
4.4.7 Hepatic gene expression
At 1 week of age, hepatic Fasn expression was influenced by maternal dietary
intervention in a sex specific manner. Thus, in males, Fasn expression was higher in
MANUSCRIPT 2
105
offspring of dams consuming a 36% fat diet irrespective of maternal LA:ALA ratio
(P<0.05). In female offspring, however, Fasn expression was higher in offspring of
dams consuming a low LA diet, independent of dietary fat content (P<0.05). Hepatic
Lpl mRNA expression in male offspring at 1 week of age was also influenced by
maternal dietary fat content, with higher expression in offspring of dams consuming a
36% fat diet vs 18% fat diet (P<0.05). In female offspring, hepatic Srebf1 expression,
similar to that of Fasn, was higher in offspring of dams consuming a low LA diet at 1
and 2 weeks of age (P<0.01). Female hepatic expression of Pparg was lower in
offspring of dams consuming a low LA diet at 2 weeks of age (P<0.05). There were
no differences in the expression of Fasn or Lpl in female offspring, or expression of
any hepatic genes in male offspring at this time point (Table 4.3).
4.5 Discussion
This study has demonstrated that altering the fat content and/or LA:ALA ratio of the
maternal diet during pregnancy and lactation resulted in significant alteration in the
circulating fatty acid profile of dams in the absence of any significant effects on
maternal bodyweight or body composition. Exposure to a 36% fat diet during gestation
and lactation was, however, associated with lower offspring bodyweight from birth,
which persisted to 2 weeks of age. This suggests that increased dietary fat intake during
pregnancy and lactation can compromise growth of the progeny, irrespective of the
type of fat consumed. In addition, alterations in the fat content and/or composition of
the maternal diet had transient effects on offspring body composition and hepatic gene
expression, effects which were also sex-specific.
Maternal fatty acid profiles after 4 weeks on the experimental diets largely reflected
dietary composition, confirming that the dietary intervention had the desired effect on
maternal circulating fatty acid composition. These changes persisted after a further 6
weeks of exposure to the diets and, as expected, the dietary LA:ALA ratio had a greater
impact on the maternal blood omega-6 and omega-3 status than total dietary fat
content. Consistent with previous studies (Tu et al., 2010, Blank et al., 2002, Brenna
et al., 2009, Draycott et al., 2019), decreasing the dietary LA:ALA ratio resulted in
substantial increases in relative maternal ALA and EPA levels but only a very modest
increase in DHA proportions after a 4-week exposure, and no difference compared to
the higher LA:ALA ratio after 10 weeks. Interestingly, and independent of dietary
MANUSCRIPT 2
106
LA:ALA ratio, dams appeared to be more efficient at converting DPA to DHA when
total dietary fat load was higher. One possibility could be that this is simply a result of
the higher amount of substrate (i.e. ALA) available for conversion to the longer chain
derivatives such as DPA and DHA in diets containing higher total fat levels. This effect
did not, however, persist after a further 6 weeks of dietary exposure, at which point
EPA and DPA were lower in dams consuming a low LA 36% fat diet compared to a
low LA 18%. This may be a result of saturation of the PUFA metabolic pathway when
total fat, and therefore PUFA, levels were higher (Tu et al., 2013, Gibson et al., 2013).
This apparent decrease in capacity to convert ALA through to EPA and DHA during
consumption of a 36% fat diet coincides with the decreased protein intake observed in
these groups. It is possible that the lower consumption of protein in rats fed on the 36%
fat diets may have contributed to reduced conversion of ALA, since previous studies
have shown reduced desaturase, particularly Δ6-desaturase, expression in the
mammary gland (Bautista et al., 2013) and liver (Mercuri et al., 1979a) of rats exposed
to a low protein diet. Maternal whole blood MUFA proportions appeared to be
influenced by dietary LA:ALA ratio, however, this is most likely a result of the slightly
higher MUFA content of the low LA diets.
Offspring fatty acid profiles at 1 and 2 weeks of age largely reflected maternal profiles
with maternal dietary LA:ALA ratio exhibiting the strongest effect on offspring
circulating fatty acid proportions. However, the total fat content of the maternal diet
appeared to have a greater influence on the blood fatty acid composition of the
offspring as opposed to that observed in the dams. Of particular interest was the finding
that the proportion of both EPA and DPA in offspring at 1 week of age were higher in
the low LA (18% fat) vs the low LA (36% fat) group, and that this effect persisted at
2 weeks of age despite ALA levels being increased in the low LA (36% fat) group at
this time point. DHA was not different between groups at 1 week of age but was lower
in offspring exposed to a 36% fat diet at 2 weeks of age. As with the maternal fatty
acid profiles, this again may be a result of saturation of the PUFA metabolic pathway
at higher total PUFA intakes, and is in line with findings from numerous studies, both
human and animal, that indicate that simply increasing the quantity of substrate, i.e.
ALA, is not an effective strategy for increasing concentrations of its long-chain
derivatives, in particular DHA (Mantzioris et al., 1994, Blank et al., 2002, Brenna et
al., 2009, Chan et al., 1993).
MANUSCRIPT 2
107
The total dietary fat content of the maternal diet also had an influence on the proportion
of SFA in the offspring, such that offspring of dams consuming 36% fat diets exhibited
lower SFA proportions than offspring of dams consuming the 18% fat diets. Unlike
the fetus, where fatty acid composition is largely related to maternal dietary intake,
during suckling, offspring fatty acid composition is largely determined by the
composition of the milk, which may not fully reflect maternal fatty acid intakes. In a
study by Mohammad et al. (2014), for example, women consuming diets with a higher
total fat content (55%en vs. 25%en) exhibited reduced SFA concentrations (C6:0-
C14:0) in breast milk but not in maternal plasma. While milk composition was not
assessed in the current study, this raises the possibility that SFA content of the milk
may have been lower in those dams consuming the 36% fat diets, which could in turn
explain the lower SFA status of the offspring. Alternatively, it may be that increasing
the fat content of the diets resulted in an increased conversion of SFA to MUFA, since
high-fat feeding has been associated with increased expression of the enzyme
responsible for conversion of SFA to MUFA, stearoyl-CoA desaturase 1 (SCD-1) (Hu
et al., 2004) and could therefore be the reason for the observed effect of fat content on
offspring MUFA levels in this study. It is important to note, however, that circulating
fatty acid profiles are a product of both dietary fatty acid intake as well as tissue fatty
acid production and release. Whilst the collection of blood samples from animals in
the fed state suggests that the dietary fraction of fatty acids would provide a greater
contribution to the fatty acid profile of both dams and offspring, the influence of
hepatic synthesis of fatty acids should not be overlooked as a contributor to the
observed differences.
Despite significant shifts in maternal fatty acid profiles and increased fat content of
the 36% fat diets, we saw no differences in maternal bodyweight or fat deposition.
This is consistent with our previous study (Draycott et al., 2019) and is likely a result
of the reduced feed intakes of the dams to compensate for the increased energy density
of the higher fat diets, a phenomenon consistently seen with dietary intervention trials
using rodents (Keesey and Hirvonen, 1997). Despite the lack of an effect on maternal
weight gain and fat deposition, bodyweight was reduced in offspring of dams receiving
a 36% fat diet, irrespective of maternal dietary LA:ALA ratio. This phenotype was
consistent across sexes and persisted from birth to 2 weeks of age. Variable results
have been reported in this regard with some studies reporting no effects (Khan et al.,
MANUSCRIPT 2
108
2002, Khan et al., 2005, Dyrskog et al., 2005) or increased weight (Samuelsson et al.,
2008). This finding was, however, consistent with many other studies that reported
decreased fetal (Taylor et al., 2003, Mark et al., 2011), birth (Howie et al., 2009) and
weaning weight (Cerf et al., 2006) in offspring of dams exposed to a 36% fat diet
during gestation and lactation periods. The differential effects of different high-fat
diets on offspring growth is likely due to differences in composition of the diet as well
as periods of exposure between studies (Ainge et al., 2011). In those studies that have
reported lower offspring weights in offspring fed a high-fat diet, lower protein intakes
in dams consuming a high-fat diet have been cited as a likely contributing factor.
Further to this, protein restricted diets have been associated with impaired mammary
gland development (Bautista et al., 2013, Moretto et al., 2011) leading to impaired
milk synthesis (Moretto et al., 2011), and this may also have contributed to reduced
offspring growth observed during the suckling period. It is important to note however,
that the reduction in protein intake in dams consuming a 36% fat diet in the current
study were more modest (10-25%) than those typically used in low-protein diet studies
(~50% reduction) (Langley and Jackson, 1994, Langley-Evans and Nwagwu, 1998,
Ozanne et al., 1998, Malandro et al., 1996).
The lower Fasn expression in the liver and adipose tissue of dams exposed to a 36%
fat diet is consistent with the established role of this enzyme in suppressing lipogenesis
in times of energy excess (Geelen et al., 2001). Surprisingly, this change did not appear
to be mediated through changes in maternal Srebf1 mRNA expression, a known
regulator of Fasn expression (Griffin and Sul, 2004). It is important to note that since
only mRNA expression was measured, we cannot comment on any differences in
protein expression or activity of this transcription factor although mRNA and protein
levels have been shown to be closely correlated (Erhuma et al., 2007b). Following this
up at the protein level is a major priority for future study. In the offspring, however,
hepatic Fasn expression was not downregulated by exposure to a maternal 36% fat
diet but was actually higher in male offspring of dams consuming the 36% fat
compared to the 18% fat diets at 1 week of age and was accompanied by an increase
in Lpl expression. In female offspring, however, hepatic Fasn and Sbrepf1 expression
at 1 week were influenced by maternal dietary fatty acid ratio, rather than total fat
content, with both genes upregulated in offspring of dams fed the low LA diets. In
both cases, the upregulation of Sbref1, Fasn and Lpl genes would be expected to be
MANUSCRIPT 2
109
associated with an upregulation of both lipogenesis and fatty acid uptake. It is worth
mentioning that differences in hepatic expression of lipogenic genes in male offspring
were consistently associated with maternal dietary fat content whereas differences in
female hepatic expression were consistently associated with maternal dietary fatty acid
ratio. This suggests that female offspring are more sensitive to changes in the types of
maternal dietary fat whereas male offspring are more sensitive to gross maternal fat
consumption. Sex specific effects associated with the programming of disease
hypothesis have been frequently reported (Gabory et al., 2013). The mechanism by
which sex influences these effects, however, remains to be elucidated within a larger
perspective, as well as within the context of this study.
We found no evidence that these alterations in hepatic gene expression translated to
increases in liver weight, however whether there was any effect on hepatic fat content
remains to be determined. In both male and female offspring, relative liver weight was
increased in offspring of dams fed the high LA diet. In an aim to further elucidate the
source of this increased weight, we measured liver DNA, protein and glycogen
composition. Similar to liver weight, glycogen levels were increased in offspring of
dams fed the high LA diets. This increase in glycogen, however, was not sufficient
enough to completely account for the differences observed in liver weight but may be
a contributing factor. Consideration of DNA and protein content of the tissue did not
indicate significant changes to cell size or number. More detailed analysis is required
to further elucidate the mechanism by which high maternal dietary omega-6 may
impact upon offspring liver physiology.
The majority of the hepatic mRNA expression differences, as well as gross differences
in liver weight and composition, appeared to be transient and were no longer present
at 2 weeks of age. A notable exception was the lower expression of Srebf1 mRNA and
higher expression of Pparg in females of dams exposed to a high LA diet compared to
the low LA diet, with a similar trend observed in males. Although found in relatively
low concentrations in the liver, activation of Pparg has been shown to increase hepatic
lipid storage and is elevated in models of hepatic steatosis (Inoue et al., 2005). As
such, decreased Pparg expression can alleviate some of the symptoms of hepatic
steatosis leading to a reduced liver weight in conjunction with a reduction in hepatic
triglyceride content (Gavrilova et al., 2003). Thus, our finding that female offspring
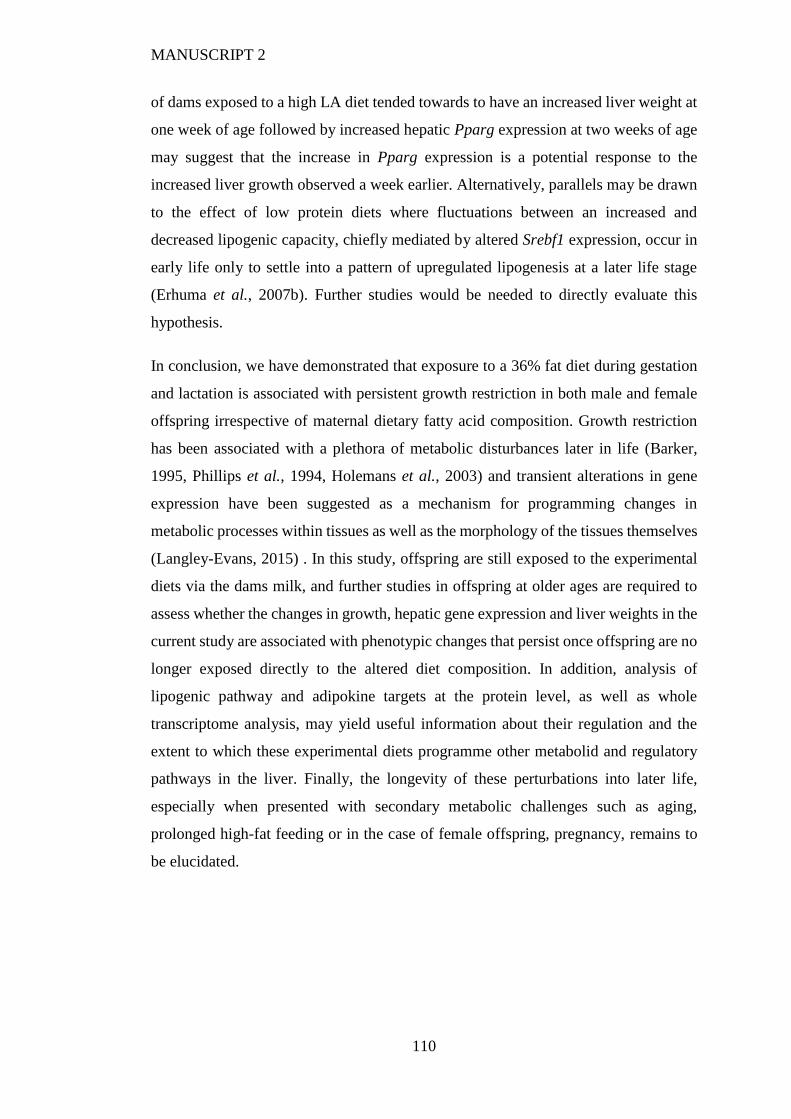
MANUSCRIPT 2
110
of dams exposed to a high LA diet tended towards to have an increased liver weight at
one week of age followed by increased hepatic Pparg expression at two weeks of age
may suggest that the increase in Pparg expression is a potential response to the
increased liver growth observed a week earlier. Alternatively, parallels may be drawn
to the effect of low protein diets where fluctuations between an increased and
decreased lipogenic capacity, chiefly mediated by altered Srebf1 expression, occur in
early life only to settle into a pattern of upregulated lipogenesis at a later life stage
(Erhuma et al., 2007b). Further studies would be needed to directly evaluate this
hypothesis.
In conclusion, we have demonstrated that exposure to a 36% fat diet during gestation
and lactation is associated with persistent growth restriction in both male and female
offspring irrespective of maternal dietary fatty acid composition. Growth restriction
has been associated with a plethora of metabolic disturbances later in life (Barker,
1995, Phillips et al., 1994, Holemans et al., 2003) and transient alterations in gene
expression have been suggested as a mechanism for programming changes in
metabolic processes within tissues as well as the morphology of the tissues themselves
(Langley-Evans, 2015) . In this study, offspring are still exposed to the experimental
diets via the dams milk, and further studies in offspring at older ages are required to
assess whether the changes in growth, hepatic gene expression and liver weights in the
current study are associated with phenotypic changes that persist once offspring are no
longer exposed directly to the altered diet composition. In addition, analysis of
lipogenic pathway and adipokine targets at the protein level, as well as whole
transcriptome analysis, may yield useful information about their regulation and the
extent to which these experimental diets programme other metabolid and regulatory
pathways in the liver. Finally, the longevity of these perturbations into later life,
especially when presented with secondary metabolic challenges such as aging,
prolonged high-fat feeding or in the case of female offspring, pregnancy, remains to
be elucidated.
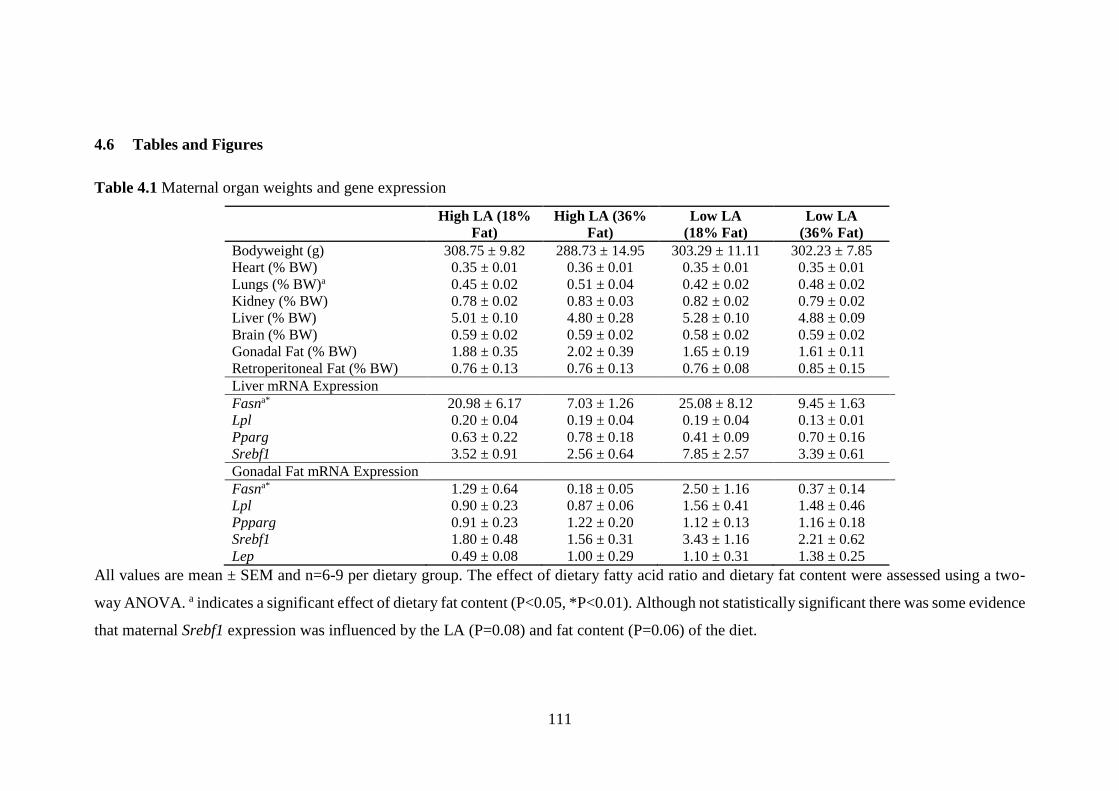
111
4.6 Tables and Figures
Table 4.1 Maternal organ weights and gene expression
High LA (18%
Fat)
High LA (36%
Fat)
Low LA
(18% Fat)
Low LA
(36% Fat)
Bodyweight (g) 308.75 ± 9.82 288.73 ± 14.95 303.29 ± 11.11 302.23 ± 7.85
Heart (% BW) 0.35 ± 0.01 0.36 ± 0.01 0.35 ± 0.01 0.35 ± 0.01
Lungs (% BW)a 0.45 ± 0.02 0.51 ± 0.04 0.42 ± 0.02 0.48 ± 0.02
Kidney (% BW) 0.78 ± 0.02 0.83 ± 0.03 0.82 ± 0.02 0.79 ± 0.02
Liver (% BW) 5.01 ± 0.10 4.80 ± 0.28 5.28 ± 0.10 4.88 ± 0.09
Brain (% BW) 0.59 ± 0.02 0.59 ± 0.02 0.58 ± 0.02 0.59 ± 0.02
Gonadal Fat (% BW) 1.88 ± 0.35 2.02 ± 0.39 1.65 ± 0.19 1.61 ± 0.11
Retroperitoneal Fat (% BW) 0.76 ± 0.13 0.76 ± 0.13 0.76 ± 0.08 0.85 ± 0.15
Liver mRNA Expression
Fasna* 20.98 ± 6.17 7.03 ± 1.26 25.08 ± 8.12 9.45 ± 1.63
Lpl 0.20 ± 0.04 0.19 ± 0.04 0.19 ± 0.04 0.13 ± 0.01
Pparg 0.63 ± 0.22 0.78 ± 0.18 0.41 ± 0.09 0.70 ± 0.16
Srebf1 3.52 ± 0.91 2.56 ± 0.64 7.85 ± 2.57 3.39 ± 0.61
Gonadal Fat mRNA Expression
Fasna* 1.29 ± 0.64 0.18 ± 0.05 2.50 ± 1.16 0.37 ± 0.14
Lpl 0.90 ± 0.23 0.87 ± 0.06 1.56 ± 0.41 1.48 ± 0.46
Ppparg 0.91 ± 0.23 1.22 ± 0.20 1.12 ± 0.13 1.16 ± 0.18
Srebf1 1.80 ± 0.48 1.56 ± 0.31 3.43 ± 1.16 2.21 ± 0.62
Lep 0.49 ± 0.08 1.00 ± 0.29 1.10 ± 0.31 1.38 ± 0.25
All values are mean ± SEM and n=6-9 per dietary group. The effect of dietary fatty acid ratio and dietary fat content were assessed using a two-
way ANOVA. a indicates a significant effect of dietary fat content (P<0.05, *P<0.01). Although not statistically significant there was some evidence
that maternal Srebf1 expression was influenced by the LA (P=0.08) and fat content (P=0.06) of the diet.
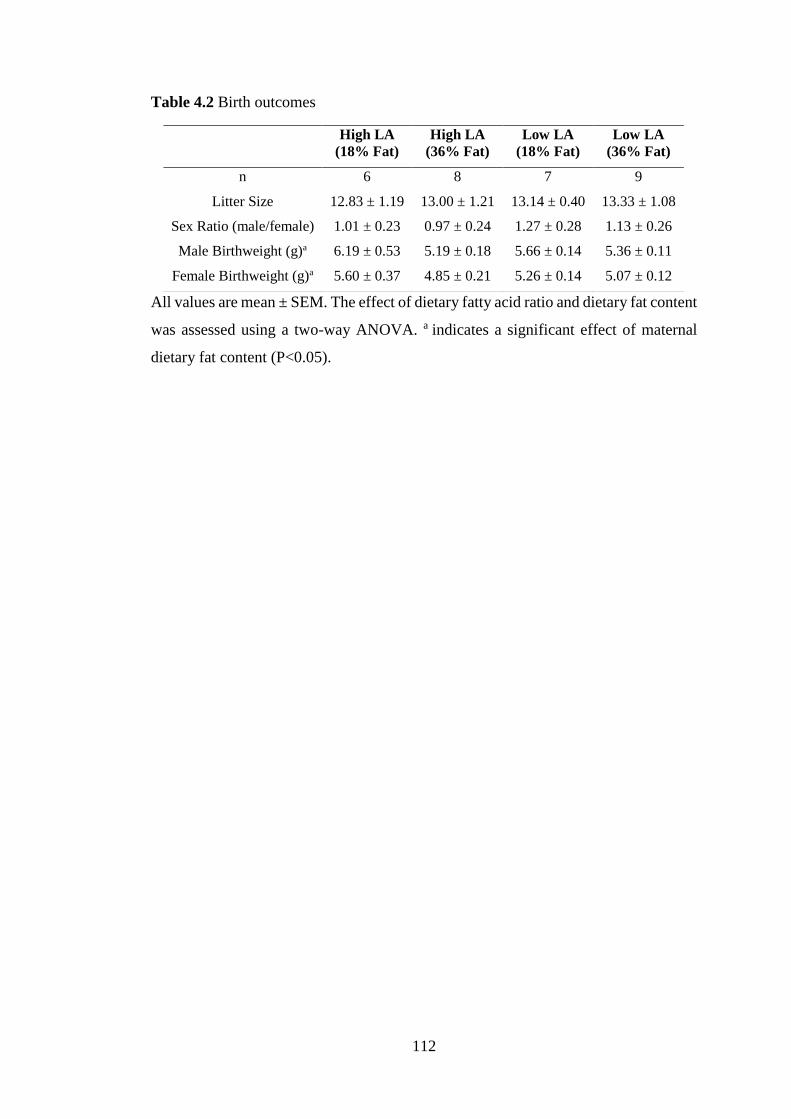
112
Table 4.2 Birth outcomes
All values are mean ± SEM. The effect of dietary fatty acid ratio and dietary fat content
was assessed using a two-way ANOVA. a indicates a significant effect of maternal
dietary fat content (P<0.05).
High LA
(18% Fat)
High LA
(36% Fat)
Low LA
(18% Fat)
Low LA
(36% Fat)
n 6 8 7 9
Litter Size 12.83 ± 1.19 13.00 ± 1.21 13.14 ± 0.40 13.33 ± 1.08
Sex Ratio (male/female) 1.01 ± 0.23 0.97 ± 0.24 1.27 ± 0.28 1.13 ± 0.26
Male Birthweight (g)a 6.19 ± 0.53 5.19 ± 0.18 5.66 ± 0.14 5.36 ± 0.11
Female Birthweight (g)a 5.60 ± 0.37 4.85 ± 0.21 5.26 ± 0.14 5.07 ± 0.12
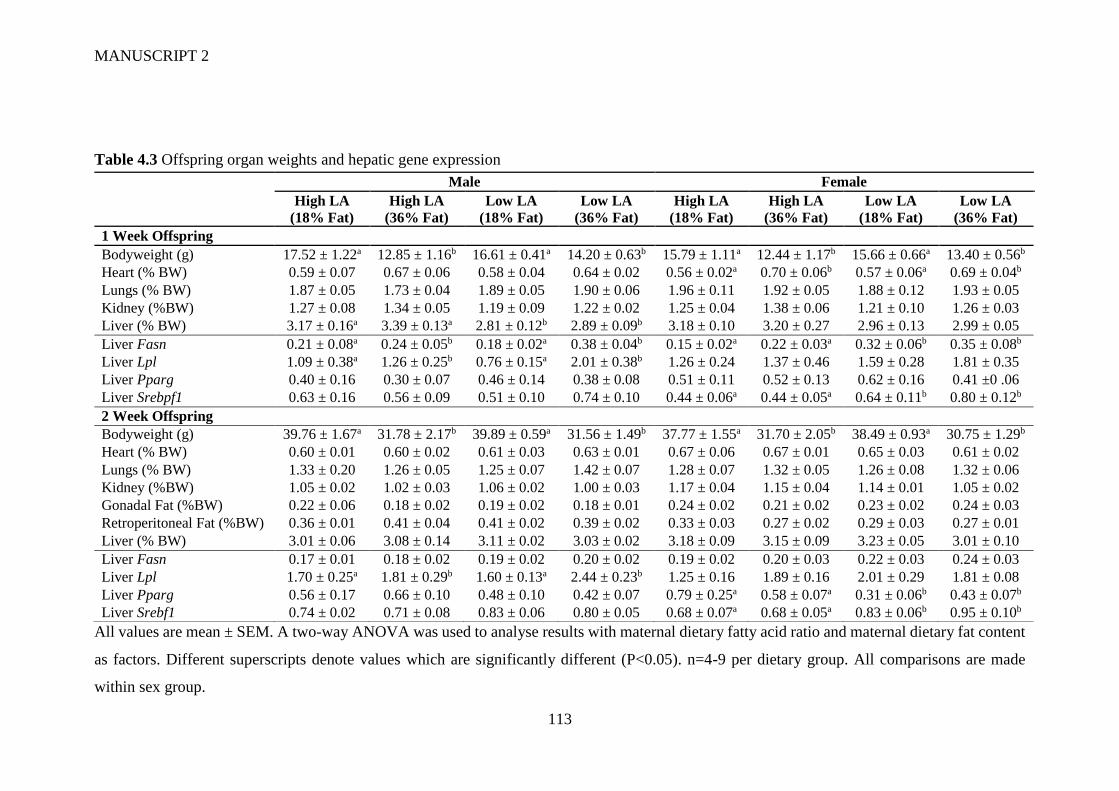
MANUSCRIPT 2
113
Table 4.3 Offspring organ weights and hepatic gene expression
All values are mean ± SEM. A two-way ANOVA was used to analyse results with maternal dietary fatty acid ratio and maternal dietary fat content
as factors. Different superscripts denote values which are significantly different (P<0.05). n=4-9 per dietary group. All comparisons are made
within sex group.
Male Female
High LA
(18% Fat)
High LA
(36% Fat)
Low LA
(18% Fat)
Low LA
(36% Fat)
High LA
(18% Fat)
High LA
(36% Fat)
Low LA
(18% Fat)
Low LA
(36% Fat)
1 Week Offspring
Bodyweight (g) 17.52 ± 1.22a 12.85 ± 1.16b 16.61 ± 0.41a 14.20 ± 0.63b 15.79 ± 1.11a 12.44 ± 1.17b 15.66 ± 0.66a 13.40 ± 0.56b
Heart (% BW) 0.59 ± 0.07 0.67 ± 0.06 0.58 ± 0.04 0.64 ± 0.02 0.56 ± 0.02a 0.70 ± 0.06b 0.57 ± 0.06a 0.69 ± 0.04b
Lungs (% BW) 1.87 ± 0.05 1.73 ± 0.04 1.89 ± 0.05 1.90 ± 0.06 1.96 ± 0.11 1.92 ± 0.05 1.88 ± 0.12 1.93 ± 0.05
Kidney (%BW) 1.27 ± 0.08 1.34 ± 0.05 1.19 ± 0.09 1.22 ± 0.02 1.25 ± 0.04 1.38 ± 0.06 1.21 ± 0.10 1.26 ± 0.03
Liver (% BW) 3.17 ± 0.16a 3.39 ± 0.13a 2.81 ± 0.12b 2.89 ± 0.09b 3.18 ± 0.10 3.20 ± 0.27 2.96 ± 0.13 2.99 ± 0.05
Liver Fasn 0.21 ± 0.08a 0.24 ± 0.05b 0.18 ± 0.02a 0.38 ± 0.04b 0.15 ± 0.02a 0.22 ± 0.03a 0.32 ± 0.06b 0.35 ± 0.08b
Liver Lpl 1.09 ± 0.38a 1.26 ± 0.25b 0.76 ± 0.15a 2.01 ± 0.38b 1.26 ± 0.24 1.37 ± 0.46 1.59 ± 0.28 1.81 ± 0.35
Liver Pparg 0.40 ± 0.16 0.30 ± 0.07 0.46 ± 0.14 0.38 ± 0.08 0.51 ± 0.11 0.52 ± 0.13 0.62 ± 0.16 0.41 ±0 .06
Liver Srebpf1 0.63 ± 0.16 0.56 ± 0.09 0.51 ± 0.10 0.74 ± 0.10 0.44 ± 0.06a 0.44 ± 0.05a 0.64 ± 0.11b 0.80 ± 0.12b
2 Week Offspring
Bodyweight (g) 39.76 ± 1.67a 31.78 ± 2.17b 39.89 ± 0.59a 31.56 ± 1.49b 37.77 ± 1.55a 31.70 ± 2.05b 38.49 ± 0.93a 30.75 ± 1.29b
Heart (% BW) 0.60 ± 0.01 0.60 ± 0.02 0.61 ± 0.03 0.63 ± 0.01 0.67 ± 0.06 0.67 ± 0.01 0.65 ± 0.03 0.61 ± 0.02
Lungs (% BW) 1.33 ± 0.20 1.26 ± 0.05 1.25 ± 0.07 1.42 ± 0.07 1.28 ± 0.07 1.32 ± 0.05 1.26 ± 0.08 1.32 ± 0.06
Kidney (%BW) 1.05 ± 0.02 1.02 ± 0.03 1.06 ± 0.02 1.00 ± 0.03 1.17 ± 0.04 1.15 ± 0.04 1.14 ± 0.01 1.05 ± 0.02
Gonadal Fat (%BW) 0.22 ± 0.06 0.18 ± 0.02 0.19 ± 0.02 0.18 ± 0.01 0.24 ± 0.02 0.21 ± 0.02 0.23 ± 0.02 0.24 ± 0.03
Retroperitoneal Fat (%BW) 0.36 ± 0.01 0.41 ± 0.04 0.41 ± 0.02 0.39 ± 0.02 0.33 ± 0.03 0.27 ± 0.02 0.29 ± 0.03 0.27 ± 0.01
Liver (% BW) 3.01 ± 0.06 3.08 ± 0.14 3.11 ± 0.02 3.03 ± 0.02 3.18 ± 0.09 3.15 ± 0.09 3.23 ± 0.05 3.01 ± 0.10
Liver Fasn 0.17 ± 0.01 0.18 ± 0.02 0.19 ± 0.02 0.20 ± 0.02 0.19 ± 0.02 0.20 ± 0.03 0.22 ± 0.03 0.24 ± 0.03
Liver Lpl 1.70 ± 0.25a 1.81 ± 0.29b 1.60 ± 0.13a 2.44 ± 0.23b 1.25 ± 0.16 1.89 ± 0.16 2.01 ± 0.29 1.81 ± 0.08
Liver Pparg 0.56 ± 0.17 0.66 ± 0.10 0.48 ± 0.10 0.42 ± 0.07 0.79 ± 0.25a 0.58 ± 0.07a 0.31 ± 0.06b 0.43 ± 0.07b
Liver Srebf1 0.74 ± 0.02 0.71 ± 0.08 0.83 ± 0.06 0.80 ± 0.05 0.68 ± 0.07a 0.68 ± 0.05a 0.83 ± 0.06b 0.95 ± 0.10b
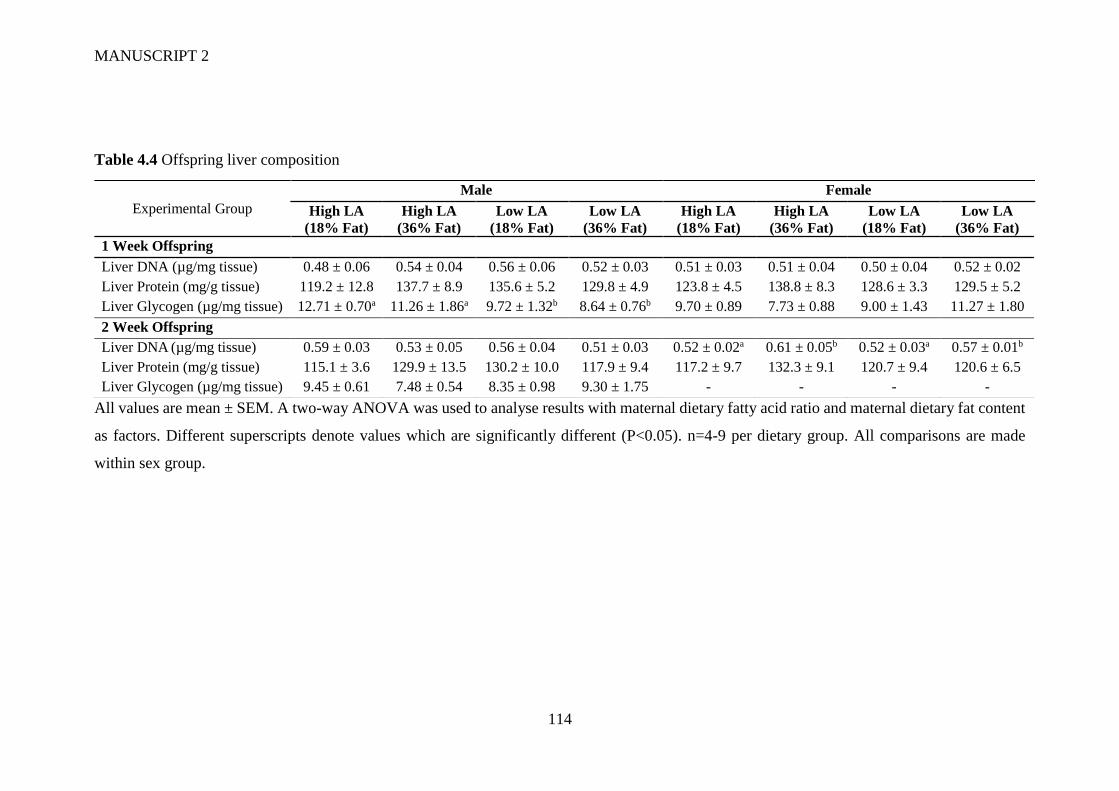
MANUSCRIPT 2
114
Table 4.4 Offspring liver composition
All values are mean ± SEM. A two-way ANOVA was used to analyse results with maternal dietary fatty acid ratio and maternal dietary fat content
as factors. Different superscripts denote values which are significantly different (P<0.05). n=4-9 per dietary group. All comparisons are made
within sex group.
Experimental Group
Male Female
High LA
(18% Fat)
High LA
(36% Fat)
Low LA
(18% Fat)
Low LA
(36% Fat)
High LA
(18% Fat)
High LA
(36% Fat)
Low LA
(18% Fat)
Low LA
(36% Fat)
1 Week Offspring
Liver DNA (µg/mg tissue) 0.48 ± 0.06 0.54 ± 0.04 0.56 ± 0.06 0.52 ± 0.03 0.51 ± 0.03 0.51 ± 0.04 0.50 ± 0.04 0.52 ± 0.02
Liver Protein (mg/g tissue) 119.2 ± 12.8 137.7 ± 8.9 135.6 ± 5.2 129.8 ± 4.9 123.8 ± 4.5 138.8 ± 8.3 128.6 ± 3.3 129.5 ± 5.2
Liver Glycogen (µg/mg tissue) 12.71 ± 0.70a 11.26 ± 1.86a 9.72 ± 1.32b 8.64 ± 0.76b 9.70 ± 0.89 7.73 ± 0.88 9.00 ± 1.43 11.27 ± 1.80
2 Week Offspring
Liver DNA (µg/mg tissue) 0.59 ± 0.03 0.53 ± 0.05 0.56 ± 0.04 0.51 ± 0.03 0.52 ± 0.02a 0.61 ± 0.05b 0.52 ± 0.03a 0.57 ± 0.01b
Liver Protein (mg/g tissue) 115.1 ± 3.6 129.9 ± 13.5 130.2 ± 10.0 117.9 ± 9.4 117.2 ± 9.7 132.3 ± 9.1 120.7 ± 9.4 120.6 ± 6.5
Liver Glycogen (µg/mg tissue) 9.45 ± 0.61 7.48 ± 0.54 8.35 ± 0.98 9.30 ± 1.75 - - - -
MANUSCRIPT 2
115
Figure 4.1 Maternal average daily (A) feed intake, (B) energy intake and (C) protein
intake during pre-feeding, pregnancy and lactation fed on either a high LA (18% fat)
diet (closed circles), high LA (36% fat) diet (open circles), low LA (18% fat) diet
(closed squares) and a low LA (36% fat) diet (open squares). Values are means ± SEM
and n=6-9 per group. The effects of dietary fatty acid ratio and dietary fat content was
determined using a two-way repeated measures ANOVA. * indicates a significant
effect of dietary fat content (** P<0.01, *** P<0.001). † indicates a significant
interaction between dietary fat content and fatty acid ratio.
Figure 4.2 Maternal whole blood fatty acids profile at (A/B) baseline (C/D) after 4
weeks on experimental diet and (D/E) at the end of lactation (3 weeks post-partum).
Values are means ± SEM and n=6-9 per group. The effects of dietary fatty acid ratio
and dietary fat content were determined using a two-way ANOVA (*P<0.05,
**P<0.01, ***P<0.001). † indicates a significant interaction effect (P<0.05).
Figure 4.3 Offspring whole blood fatty acids profile at (A/B) one week of age and
(C/D) at two weeks of age. Values are means ± SEM and n=11-17 per group. The
effects of maternal dietary fatty acid ratio, maternal dietary fat content and sex were
determined using a three-way ANOVA. No effect of sex was found for any of the fatty
acids measured and so male and female samples were combined for further analysis.
* Indicates significant difference (*P<0.05, **P<0.01, ***P<0.001). † indicates a
significant interaction effect (P<0.05).
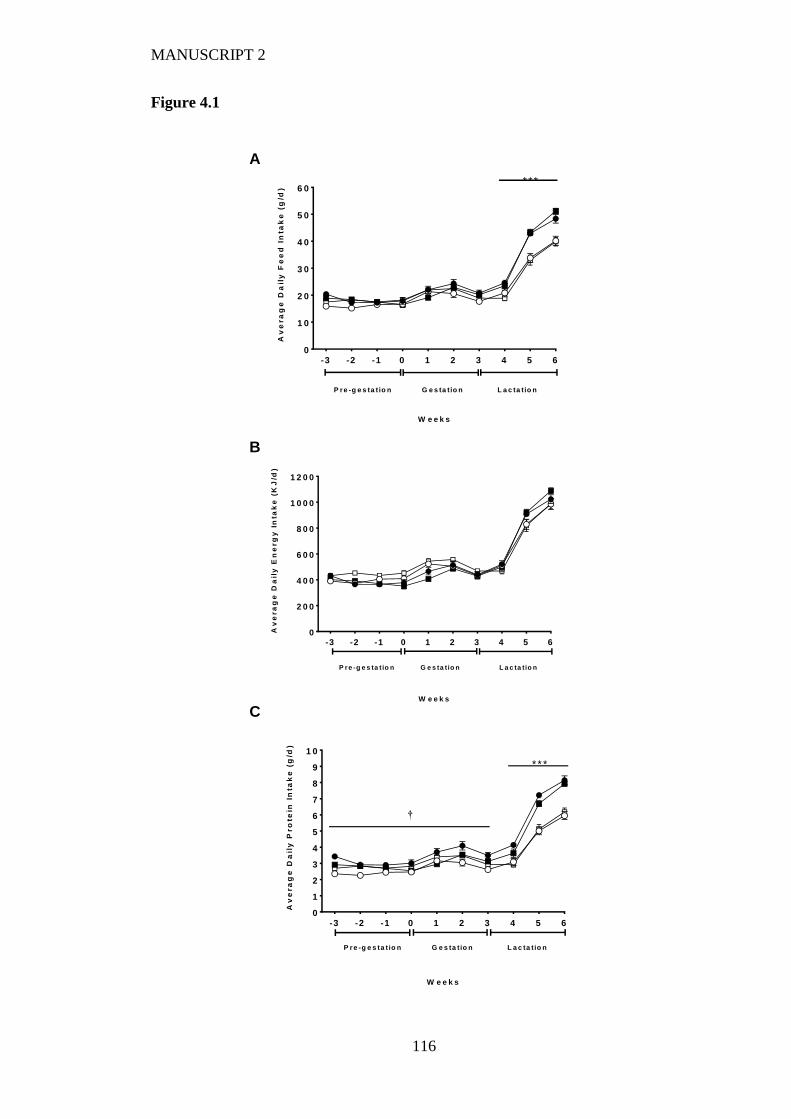
MANUSCRIPT 2
116
Figure 4.1
-3 -2 -1 0 1 2 3 4 5 60
1 0
2 0
3 0
4 0
5 0
6 0
W e e k s
Av
era
ge
Da
ily
Fe
ed
In
tak
e (
g/d
)
P re -g e s ta t io n G e s ta tio n L a c ta tio n
* * *
-3 -2 -1 0 1 2 3 4 5 60
2 0 0
4 0 0
6 0 0
8 0 0
1 0 0 0
1 2 0 0
W e e k s
Av
era
ge
Da
ily
En
erg
y I
nta
ke
(K
J/d
)
P re -g e s ta t io n G e s ta tio n L a c ta tio n
-3 -2 -1 0 1 2 3 4 5 60
1
2
3
4
5
6
7
8
9
1 0
W e e k s
Av
era
ge
Da
ily
Pro
tein
In
tak
e (
g/d
)
†
* * *
P re -g e s ta t io n G e s ta tio n L a c ta tio n
A
B
C
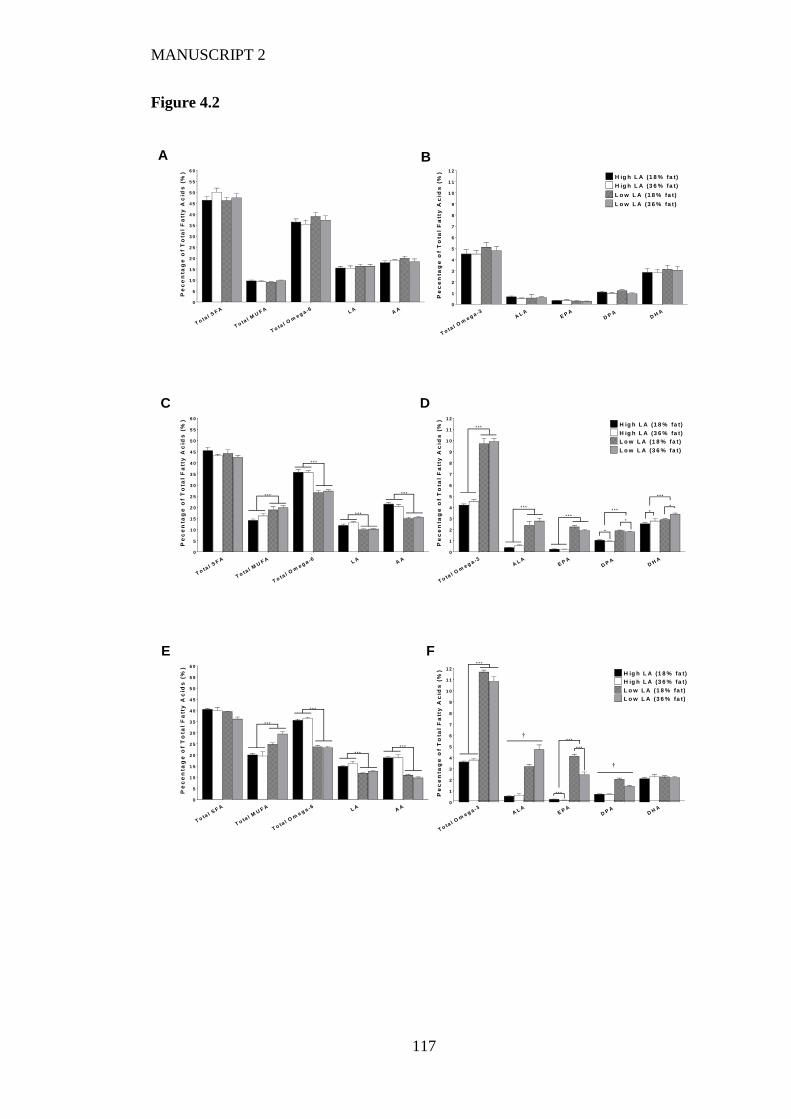
MANUSCRIPT 2
117
Figure 4.2
T o tal S
F A
T o tal M
UF A
T o tal O
me g a -6 L A
AA
0
5
1 0
1 5
2 0
2 5
3 0
3 5
4 0
4 5
5 0
5 5
6 0
Pe
ce
nta
ge
of
To
tal
Fa
tty
Ac
ids
(%
)
T o tal O
me g a -3
AL A
E P AD
P A
DH
A
0
1
2
3
4
5
6
7
8
9
1 0
1 1
1 2
Pe
ce
nta
ge
of
To
tal
Fa
tty
Ac
ids
(%
)
H ig h L A (1 8 % fa t)
H ig h L A (3 6 % fa t)
L o w L A (1 8 % fa t )
L o w L A (3 6 % fa t )
T o tal S
F A
T o tal M
UF A
T o tal O
me g a -6 L A
AA
0
5
1 0
1 5
2 0
2 5
3 0
3 5
4 0
4 5
5 0
5 5
6 0
Pe
ce
nta
ge
of
To
tal
Fa
tty
Ac
ids
(%
)
* * *
* * *
* * *
* * *
T o tal O
me g a -3
AL A
E P AD
P A
DH
A
0
1
2
3
4
5
6
7
8
9
1 0
1 1
1 2
Pe
ce
nta
ge
of
To
tal
Fa
tty
Ac
ids
(%
)
H ig h L A (1 8 % fa t)
H ig h L A (3 6 % fa t)
L o w L A (1 8 % fa t )
L o w L A (3 6 % fa t )
* * *
* * *
* * *
* * *
*
*
* * *
*
*
T o tal S
F A
T o tal M
UF A
T o tal O
me g a -6 L A
AA
0
5
1 0
1 5
2 0
2 5
3 0
3 5
4 0
4 5
5 0
5 5
6 0
Pe
ce
nta
ge
of
To
tal
Fa
tty
Ac
ids
(%
)
* * *
* * *
* * *
* * *
T o tal O
me g a -3
AL A
E P AD
P A
DH
A
0
1
2
3
4
5
6
7
8
9
1 0
1 1
1 2
Pe
ce
nta
ge
of
To
tal
Fa
tty
Ac
ids
(%
)
H ig h L A (1 8 % fa t)
H ig h L A (3 6 % fa t)
L o w L A (1 8 % fa t )
L o w L A (3 6 % fa t )
* * *
* * *
* * *
* * *†
†
A
FE
DC
B
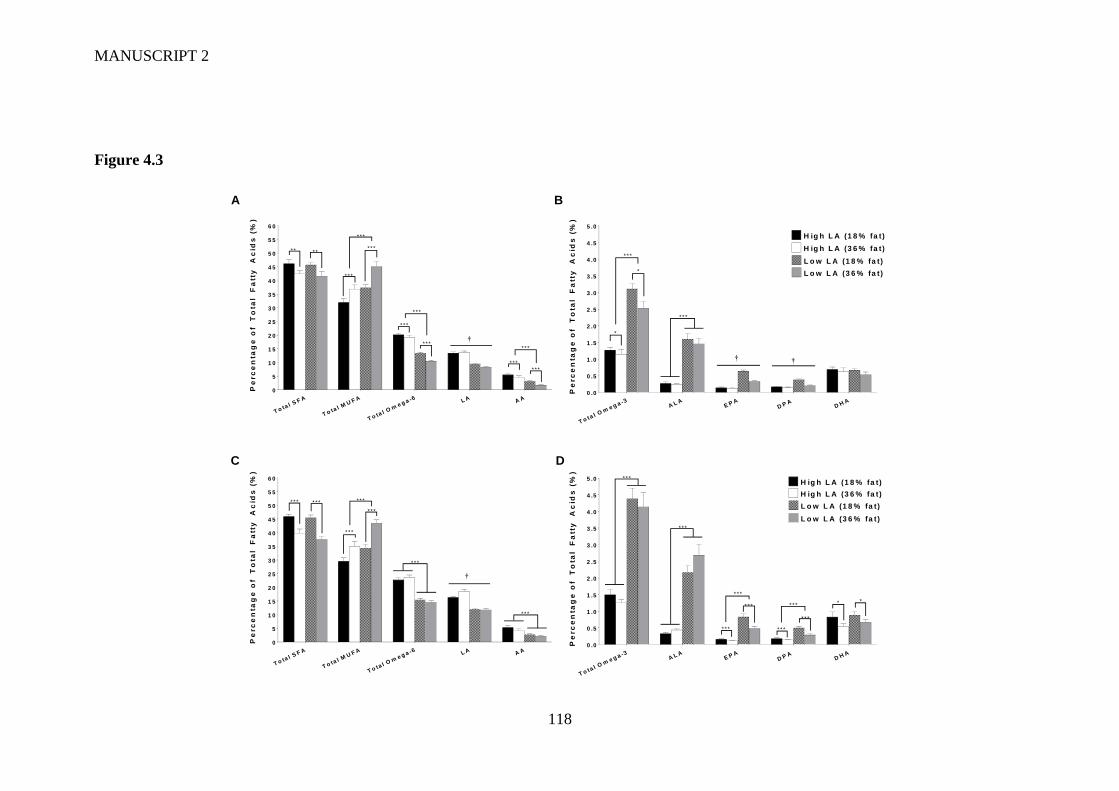
MANUSCRIPT 2
118
Figure 4.3
T o tal S
F A
T o tal M
U F A
T o tal O
me g a -6 L A A A
0
5
1 0
1 5
2 0
2 5
3 0
3 5
4 0
4 5
5 0
5 5
6 0
Pe
rc
en
tag
e o
f T
ota
l F
att
y
Ac
ids
(%
)* * * *
* * *
* * *
* * *
* * *
* * *
* * *
* * *
* * *
* * *
†
T o tal O
me g a -3
A L AE P A
D P A D H A
0 .0
0 .5
1 .0
1 .5
2 .0
2 .5
3 .0
3 .5
4 .0
4 .5
5 .0
Pe
rc
en
tag
e o
f T
ota
l F
att
y
Ac
ids
(%
)
H ig h L A (1 8 % fa t)
H ig h L A (3 6 % fa t)
L o w L A (1 8 % fa t )
L o w L A (3 6 % fa t )*
*
* * *
* * *
† †
T o tal S
F A
T o tal M
U F A
T o tal O
me g a -6 L A A A
0
5
1 0
1 5
2 0
2 5
3 0
3 5
4 0
4 5
5 0
5 5
6 0
Pe
rc
en
tag
e o
f T
ota
l F
att
y
Ac
ids
(%
)
* * * * * *
* * *
* * *
* * *
* * *
* * *
†
T o tal O
me g a -3
A L AE P A
D P A D H A
0 .0
0 .5
1 .0
1 .5
2 .0
2 .5
3 .0
3 .5
4 .0
4 .5
5 .0
Pe
rc
en
tag
e o
f T
ota
l F
att
y
Ac
ids
(%
)
H ig h L A (1 8 % fa t)
H ig h L A (3 6 % fa t)
L o w L A (1 8 % fa t )
L o w L A (3 6 % fa t )
* * *
* * *
* * *
* * *
* * *
* * *
* * *
* * * * *
A B
DC
119
5 MANUSCRIPT 3: OMEGA-6:OMEGA-3 FATTY ACID RATIO AND
TOTAL FAT CONTENT OF THE MATERNAL DIET ALTERS
OFFSPRING GROWTH AND FAT DEPOSITION IN THE RAT
Draycott, SAV, Daniel, Z, Elmes, MJ, Muhlhausler, BS & Langley-Evans, SC (2019).
Omega-6:omega-3 fatty acid ratio and total fat content of the maternal diet alters
offspring growth and fat deposition in the rat (prepared manuscript).
Author contributions can be found in Appendix C.
MANUSCRIPT 3
120
5.1 Abstract
Omega-3 long-chain polyunsaturated fatty acids (LCPUFA) have been shown to
inhibit lipogenesis and adipogenesis in adult rats. Their possible early life effects on
offspring fat deposition, and whether these effects could persist beyond the immediate
post-natal period, remains to be established. This study aimed to evaluate the effects
of maternal consumption of a linoleic acid (LA) to alpha-linolenic acid (ALA) ratio
similar to modern Western diets (9:1) compared to a lower ratio (1:1.5) on offspring
adiposity and other health indicators in the post-weaning rat, and to determine any
cumulative effects by feeding both diets at two total fat levels (18% vs 36% fat
w/w). Female Wistar rats (n=6-9 per group) were fed one of four diets during
pregnancy and lactation. Offspring were weaned onto standard laboratory chow.
Offspring of dams consuming a high-fat diet, irrespective of maternal dietary LA:ALA
ratio, were lighter (male, 27g lighter; female 19g lighter; P<0.0001) than offspring of
dams fed on an 18% fat diet from 3-8 weeks of age. Offspring exposed to a low LA
(18% fat) diet had higher proportions of circulating omega-3 LCPUFA and increased
gonadal fat mass at 4 weeks of age (P<0.05). Reduced mRNA expression of hepatic
(P<0.01), gonadal (P<0.05) and retroperitoneal (P<0.05) Srebf1 was observed in
offspring exposed to a 36% fat diet at 4 weeks of age and in male liver at 8 weeks of
age (P<0.05). Whilst offspring fat deposition appeared to be sensitive to both maternal
dietary LA:ALA ratio and total fat content, offspring growth and lipogenic capacity of
tissues was more sensitive to maternal dietary fat content.
MANUSCRIPT 3
121
5.2 Introduction
Risk of obesity may be partially attributed to the nutritional environment encountered
during early life (McMillen and Robinson, 2005). Interventions that target these
critical life stages exert a greater preventative effect than those applied later in life
(Blake-Lamb et al., 2016). Epidemiological as well as experimental animal studies
have shown that exposure to a hypercaloric or high fat diet during early development
is associated with increased adiposity in the offspring in later life (Armitage et al.,
2005, Hanson and Gluckman, 2014, Wang et al., 2017). Emerging evidence, however,
suggests that the type of fat an individual is exposed to during development may also
play a key role in determining their future metabolic health. Of increasing interest, due
to the significant increase in their consumption over the past 60 years, is the role of
dietary omega-6 polyunsaturated fatty acids (PUFA) (Ailhaud et al., 2006, Blasbalg et
al., 2011).
The biological effects of omega-6 fatty acids (which have pro-adipogenic and pro-
inflammatory properties), as well as the evidence suggesting that increased maternal
omega-6 PUFA intake is associated with offspring adiposity (Massiera et al., 2010,
Massiera et al., 2003), has led to the hypothesis that a diet high in omega-6 PUFA may
be contributing to the increased incidence of obesity (Ailhaud and Guesnet, 2004).
Furthermore, due to the opposing anti-inflammatory effects the omega-3 PUFA alpha
linolenic acid (ALA) and its derivatives, which are primarily anti-inflammatory in
nature, it has been hypothesised that a diet high in these fatty acids may reduce fat
deposition (Ruzickova et al., 2004, Hill et al., 2007). The substantial increases in
population level intakes of omega-6 PUFA, in particular linoleic acid (LA; precursor
to longer omega-6 derivatives) has not coincided with any increases in omega-3
consumption (Blasbalg et al., 2011), resulting in a significant increase in the ratio of
omega-6 to omega-3 fatty acids in typical Western diets over this time. Formation of
longer chain PUFA, such as arachidonic acid (AA; omega-6), eicosapentaenoic acid
(EPA; omega-3) and docosahexaenoic acid (DHA; omega-3), relies on a common set
of enzymes utilised by both families of PUFA. As such, competition exists between
the two families such that the levels of omega-6 PUFA within the body can directly
affect the levels of omega-3 PUFA, therefore, implying that alterations in the ratio of
these two families of PUFA, as well as their overall amount, may impact on fat
deposition and lipogenesis.
MANUSCRIPT 3
122
The potential mechanism through which variation in the omega-6:omega-3 ratio in
early life may programme metabolic health is unknown. It is possible that early
changes in the patterns of expression of key genes involved in lipogenesis within the
liver and adipose tissue have a long-term impact on fat deposition and accumulation.
These genes include sterol regulatory element-binding protein 1c (Srebf1), peroxisome
proliferator-activated receptor gamma (Pparg), fatty acid synthase (Fasn), lipoprotein
lipase (Lpl), and leptin (Lep). Previous studies in adult animals have also demonstrated
that increased omega-3 PUFA intake can reduce lipid accumulation resulting in an
overall reduction in body fat (Hill et al., 2007, Ruzickova et al., 2004, Couet et al.,
1997), and that this is mediated through modulation of the expression of Srebf1 (Xu et
al., 1999) and Pparg (Forman et al., 1997, Kliewer et al., 1997). There have been few
studies, however, investigating whether these anti-lipogenic effects are observed in
offspring exposed to a maternal diet that is high in omega-3 fats. Conflicting results
have been reported in this regard, with some studies reporting decreased (Ibrahim et
al., 2009, Massiera et al., 2003, Wyrwoll et al., 2006) and others reporting increased
(Muhlhausler et al., 2011b) offspring adiposity.
The aim of this study was to investigate the effects of feeding a maternal dietary
LA:ALA ratio similar to that of the Western diet (9:1) (Blasbalg et al., 2011),
compared to a proposed ‘ideal’ ratio of ~1:1.5 (Gibson et al., 2011, Lands, 2000) on
offspring adiposity and other health indicators. To elucidate any additive effects of
altering the maternal dietary LA:ALA ratio, each diet was fed at either 18% fat w/w
or at a higher fat content of 36% fat w/w. This paper focusses specifically on the effects
of pre- and early post-natal exposure to altered dietary fat content and fatty acid ratio
on offspring that have been weaned onto a standard laboratory diet. As such, offspring
are no longer directly exposed to the maternal dietary interventions. We hypothesised
that exposure to a high LA diet during pregnancy and lactation would lead to increased
adiposity in the offspring, marked by increased expression of lipogenic genes, and that
this effect may be exacerbated with exposure to a high-fat diet.
MANUSCRIPT 3
123
5.3 Materials and Methods
5.3.1 Animals
All animal procedures were performed in accordance with the Animals (Scientific
Procedures) Act 1986 under Home Office licence and were approved by the Animal
Ethics Committee of the University of Nottingham, UK. Virgin female Wistar rats
(n=30; 75-100g; Charles River, UK) were maintained as previously described
(Draycott et al., 2019). After acclimatisation, a tail vein blood sample was taken from
each animal for the determination of fatty acid status and individuals were then
randomly allocated to experimental groups. Animals were maintained on their
allocated diet for a four week ‘pre-feeding’ period, after which they were mated.
Conception was confirmed by the presence of a semen plug and this was recorded as
day 0 of pregnancy. Animals were housed in individual cages and remained on their
respective diets throughout pregnancy and lactation. All maternal data are reported
elsewhere (Draycott et al., 2019).
Litters were standardised to 8 pups within 24 hours of birth (4 males and 4 females,
where possible). At 1 and 2 weeks of age, one male and one female from each litter
were euthanised and tissues collected for analyses, the results of which are published
elsewhere (Draycott et al., 2019). At 3 weeks of age, the remaining offspring were
weaned and dams were euthanised by CO2 asphyxiation and cervical dislocation for
collection of maternal blood and tissues. Offspring were weaned onto a standard
laboratory chow diet (2018 Teklad Global 18% Protein Rodent Diet, Harlan
Laboratories, UK) and pair housed with the remaining same sex littermate. Offspring
bodyweight was measured weekly and all animals had blood pressure measured at 4
weeks of age. At this time, one male and one female were euthanised by CO2
asphyxiation and cervical dislocation. Blood pressure was measured again at 8 weeks
of age on all remaining animals after which the experiment ended and all remaining
animals were euthanised by CO2 asphyxiation and cervical dislocation.
5.3.2 Diets
Diets were designed to provide either a high (9:1, high LA) or low (1:1.5, low LA)
ratio of LA to ALA. For each level of LA, diets containing either 18% or 36% fat
(w/w) were developed. This resulted in four experimental diets; high LA (18% fat),
MANUSCRIPT 3
124
high LA (36% fat), low LA (18% fat) and low LA (36% fat; n=6-9 per dietary group).
The list of ingredients and final fatty acid composition of the four experimental diets
are as reported elsewhere (Draycott et al., 2019).
5.3.3 Tail cuff plethysmography
This experiment utilised a non-invasive method for measuring blood pressure
validated by Feng et al. (2008). A volume pressure recording (VPR) sensor was used
to measure tail blood volume to deduce systolic, diastolic and mean arterial blood
pressure as well as heart rate. Prior to blood pressure measurements, animals were
placed in a heat box set to 30°C for 15 minutes to enhance blood flow to the tail.
Animals were then restrained in individual restraint tubes with adjustable nose cone,
fitted with the deflated occlusion and VPR cuff (CODA System, Kent Scientific,
Torrington, CT) and left to acclimatise to the restraint tube for 10 minutes to minimise
the impact of stress before measurements began. After acclimatisation, animals
underwent 10 cycles of blood pressure measurements; of these 10 cycles, the first three
were disregarded as acclimatisation cycles and an average for each measurement was
taken from the remaining seven. Animals were restrained for no longer than 30 minutes
and removed if individuals presented with signs of stress.
5.3.4 Blood sample and tissue collection
Blood samples were collected from the offspring at 4 and 8 weeks of age via cardiac
puncture and ~30µl was spotted onto PUFAcoat™ dried blood spot (DBS) collection
paper (Liu et al., 2014), allowed to dry at room temperature and stored at -20°C for
subsequent fatty acid analysis. The remainder of the blood sample was centrifuged at
13000 rpm for 10 minutes at 4°C. The plasma was isolated from the whole blood
sample and stored at -80°C until further analysis. Offspring body and organ weights
were measured and samples of liver, gonadal fat and retroperitoneal fat were collected
at each time point. All tissue samples were snap-frozen in liquid nitrogen and stored
at -80°C until determination of gene expression by quantitative reverse transcriptase
PCR (q-RTPCR).
MANUSCRIPT 3
125
5.3.5 Lipid extraction
Total lipids were extracted from liver samples of 4 and 8-week-old offspring. For each
sample, ~300mg of crushed, frozen liver was homogenised in 1.6ml of 0.5M Na2SO4.
The homogenate was decanted into 5.4ml of hexane-isopropanol (3:2, v/v) and 2ml of
0.5M Na2SO4 was added. Samples were vortexed and then centrifuged at 3000 rpm for
15 minutes. The supernatant was removed into a fresh tube, dried under nitrogen and
the resultant lipid content was weighed. Samples were resuspended in 1ml of hexane
and 100µl of resuspended sample was removed into a fresh tube, re-dried under
nitrogen and resuspended in 100µl of isopropanol for the determination of cholesterol
and triglyceride content. The remaining sample was stored at -20°C for fatty acid
analysis.
5.3.6 Determination of circulating and hepatic lipids
Plasma and liver cholesterol and triacylglycerol (TAG) content was determined by a
quantitative enzymatic colorimetric assay as per manufacturers protocol (Infinity™
cholesterol and Infinity™ triglyceride reagent; Thermo Scientific UK).
5.3.7 Fatty acid methylation and fatty acid analysis of whole blood and liver
samples
Fatty acid composition in maternal and fetal whole blood, and in lipids extracted from
liver samples from offspring at 4 weeks of age, was determined by Gas
Chromatography (GC) on a Hewlett-Packard 6890 gas chromatograph using methods
that have previously been described in detail (Liu et al., 2014, Draycott et al., 2019).
Individual fatty acid content was calculated based on peak area and response factors
normalised to total fatty acid content and expressed as a percentage of total fatty acids.
5.3.8 Isolation of RNA and cDNA synthesis and reverse transcription quantitative
real-time PCR (qRT-PCR)
RNA was isolated from crushed snap-frozen samples of ~25mg of liver using the
Roche High Pure Tissue kit (Roche Diagnostics Ltd., UK). Adipose RNA was
extracted, after homogenisation of ~100mg of tissue with MagNA Lyser green beads
and instrument (Roche Diagnostics Ltd.), using the RNeasy Mini Kit (QIAGEN Ltd.,
UK). RNA concentration was determined using a Nanodrop 2000 (Thermo Scientific)
MANUSCRIPT 3
126
and RNA quality was evaluated by agarose gel electrophoresis. cDNA was synthesised
using a RevertAid™ reverse transcriptase kit (Thermo Fisher Scientific, UK) with
random hexamer primers.
Lipogenic pathway and adipokine target genes included; peroxisome proliferator-
activated receptor gamma (Pparg), sterol regulatory element-binding protein (variant
1c) (Srebf1), fatty acid synthase (Fasn), lipoprotein lipase (Lpl) and leptin (Lep).
Primer sequences for these gene targets have previously been published elsewhere
(Draycott et al., 2019). Hepatic expression of delta-5 (Fads1; Rn_Fads1_1_SG
QuantiTect Primer Assay, Qiagen) and delta-6 (Fads2; Rn_Fads2_1_SG QuantiTect
Primer Assay, Qiagen) desaturase enzymes were also determined. Cyclophilin A
(PPIA) and β-actin (Actb) were used as housekeeper genes. Adipocyte and hepatic
gene expression was quantified using SYBR Green (Roche Diagnostics) in a Light-
Cycler 480 (Roche Diagnostics). Samples were analysed against a standard curve of a
serially diluted cDNA pool to produce quantitative data and expression was
normalised to the housekeeping gene using LightCycler® 480 software (version 1.5.1)
as previously described (Rhinn et al., 2008). The expression of the housekeeper genes
was not different between treatment groups.
5.3.9 Statistical analysis
Data are presented as mean ± SEM. Data were analysed using the Statistical Package
for Social Sciences (Version 24, SPSS Inc.). The effect of maternal dietary fatty acid
ratio, maternal dietary fat content and sex on dependent variables was assessed using
a three-way ANOVA. Where sex had a main effect on variables but no interaction with
maternal dietary factors, data were split for male and female offspring and a two-way
ANOVA was used to assess the effect of maternal dietary fat content and fatty acid
ratio on male and female offspring separately. Where longitudinal data were analysed,
as with bodyweight, the impact of maternal dietary LA:ALA ratio and maternal dietary
fat content was analysed using a two-way repeated-measures ANOVA. A value of
P<0.05 was considered to be statistically significant and dams were used as the unit of
analysis.
MANUSCRIPT 3
127
5.4 Results
5.4.1 Offspring bodyweight, body composition and blood pressure
Offspring bodyweights were measured weekly from birth until the end of the
experiment. Figure 5.1 shows bodyweights of offspring from 3-8 weeks of age.
Offspring birthweight and bodyweight prior to this are reported elsewhere (Draycott
et al., 2019) (see Chapter 4). Offspring of dams consuming a 36% fat diet, irrespective
of maternal dietary LA:ALA ratio, were lighter than offspring of dams fed on an 18%
fat diet from 3-8 weeks of age in both male (on average 27g lighter) and female (on
average 19g lighter) offspring (P<0.0001).
Table 5.1 shows the organ and fat depot weights of male and female offspring at 4 and
8 weeks of age. At 4 weeks of age, relative heart weight was 5% higher and relative
liver weight was 4% lower in female offspring of dams exposed to a 36% fat diet
compared to those exposed to an 18% fat diet, irrespective of maternal dietary
LA:ALA ratio (P<0.05). Relative liver weight at 4 weeks also tended (P=0.075) to be
lower in male offspring of dams provided the 36% vs 18% fat diet. A significant
interaction between maternal dietary fatty acid ratio and maternal dietary fat content
on relative gonadal fat weight was observed for both male and female offspring at 4
weeks of age, manifesting as ~30% lower weight of the gonadal fat depots in the low
LA group, but only if exposed to 36% fat in early life. There were no differences in
the relative weight of lungs, kidney or retroperitoneal fat pad between experimental
groups at 4 weeks of age. Differences in relative organ and fat weights measured in
offspring at 4 weeks of age appeared to be transient as no differences were observed
at 8 weeks of age for any of these organs or fat depots.
Blood pressure at 4 weeks of age was not influenced by maternal diet. At 8 weeks of
age, female offspring exposed to a 36% diet during gestation and lactation had
significantly lower systolic (16 mmHg; P=0.024) and tended to have lower diastolic
(11 mmHg; P=0.068) blood pressure than offspring exposed to an 18% fat diet (Table
5.1). Blood pressure in males was not influenced by either LA:ALA ratio or fat content
of the maternal diet.
MANUSCRIPT 3
128
5.4.2 Offspring whole blood and hepatic fatty acid profile
A significant effect of sex was observed for some of the fatty acids measured in whole
blood and liver at 4 and 8 weeks of age. No interactions were observed between sex
and maternal dietary treatment, so male and female data were split for further analysis.
Figure 5.2 shows the fatty acid profile of whole blood in offspring at 4 weeks of age.
In male offspring, exposure to a 36% fat diet was associated with increased proportions
of saturated fatty acid (SFA; P<0.05) and monounsaturated fatty acid (MUFA; P<0.05)
as well as decreased proportions of LA (P<0.05) and AA (P<0.05), resulting in lower
overall total omega-6 in response to a maternal 36% fat diet. Proportions of MUFA
and AA were also influenced by maternal dietary fatty acid ratio such that a low LA
diet was associated with increased MUFA (P<0.01) and decreased AA (P<0.01) levels.
A similar pattern was observed for the proportions of SFA, MUFA and omega-6 fatty
acids in whole blood of female offspring. In females, a significant interaction was
observed for the proportions of long chain omega-3 fatty acids (EPA, P<0.05; DPA,
P<0.01 and DHA; P<0.05). Interestingly, female offspring exposed to a low LA (18%
fat) diet had higher proportions of these fatty acids and as a result, higher total omega-
3 proportions. Similar patterns were observed in male offspring, however, only a
significant main effect of maternal dietary LA:ALA ratio was observed.
The elevated omega-3 proportions in offspring of dams exposed to a low LA (18% fat)
diet at 4 weeks of age, prompted investigation into the liver fatty acid profile at this
time point (Figure 5.3). Interestingly, the composition of fatty acids in the liver did not
completely reflect that of the whole blood, and were only influenced by maternal
dietary fatty acid ratio. In male offspring, exposure to a low LA diet during pregnancy
and lactation was associated with lower proportions of total omega-6, LA and AA and
higher proportions of total omega-3, ALA, EPA, DHA and total SFA (Figure 5.3.A).
Similar observations were made for the fatty acid composition of the liver in female
offspring at this time point. A key difference, however, was that maternal diet appeared
to have no effect on total SFA in the female offspring (Figure 5.3.B).
At 8 weeks of age, whole blood fatty acid profile was reassessed (Figure 5.4). In male
offspring, there were no longer any differences in proportions of SFA, MUFA, total
omega-6, LA, AA or ALA between experimental groups. Total omega-3 (P<0.001),
EPA (P<0.01), DPA (P<0.05) and DHA (P=0.052) proportions all remained elevated
MANUSCRIPT 3
129
in male offspring of dams exposed to a low LA diet during pregnancy and lactation.
Similar observations were made for the fatty acid composition of female whole blood
at 8 weeks of age. Proportions of AA, and consequently levels of total omega-6, were,
however, higher in female offspring exposed to a high LA diet, irrespective of maternal
dietary fat content. In both male and female whole blood, DPA proportions appeared
to be influenced by maternal dietary fat content such that a 36% fat diet was associated
with lower proportions of this fatty acid. This was significant in female offspring
(P<0.05) and tended towards significance in male offspring (P=0.057). Unlike in male
offspring, DHA proportions in female offspring whole blood at 8 weeks of age were
not associated with maternal dietary intake.
5.4.3 Circulating and hepatic lipid profile
At 4 weeks of age, male offspring exposed to a 36% fat diet had lower circulating
plasma TAG concentrations (P=0.01) and reduced liver cholesterol concentrations
(P<0.05) when compared to offspring exposed to an 18% fat diet (Table 5.2). In the
female liver, however, TAG concentrations were affected by maternal dietary ratio
such that female offspring exposed to a low LA diet had lower concentrations of liver
TAG (P<0.05), irrespective of maternal dietary fat level. There was no effect of
maternal diet on plasma cholesterol or total liver lipid at 4 weeks of age. By 8 weeks
of age, there were no significant differences in any of the variables measured in female
offspring. In males, however, there was a significant interaction of maternal dietary fat
content and fatty acid ratio such that exposure to a high LA (36% fat) diet resulted in
increased circulating cholesterol (P<0.05) but reduced liver TAG concentrations in 8
week old male offspring (Table 5.2).
5.4.4 Gene expression
An interaction between maternal dietary fatty acid ratio and fat content on hepatic
expression of Fads1 and Fads2 was observed in female offspring (Table 5.2). This
resulted in increased expression of both genes in female offspring of dams exposed to
a high LA (36% fat) diet suggesting an increased capacity for synthesis of long chain
fatty acids in this group. There were no differences in the expression of these genes in
male offspring. Expression of key lipogenic genes (Fasn, Lpl, Pparg, Srebf1 and Lep)
was measured in the liver as well as gonadal and retroperitoneal fat depots (Lep was
MANUSCRIPT 3
130
only measured in the fat depots due to limited hepatic expression). At 4 weeks of age
(Table 5.3), a consistent effect of maternal dietary fat content on expression of Srebf1
mRNA was observed. Offspring of dams exposed to a 36% fat diet had lower
expression of hepatic (P<0.01), gonadal fat (P<0.05; significant in female offspring
only) and retroperitoneal fat (P<0.05) Srebf1 mRNA compared to offspring of dams
consuming an 18% fat diet. A similar pattern was observed for other genes in the
retroperitoneal fat depot, such that offspring of dams exposed to a 36% fat diet
exhibited lower mRNA expression of Fasn (P<0.01; male offspring only), Lpl
(P<0.05; male and female offspring) and Lep (P<0.05; male offspring only). At 4
weeks of age, hepatic Lpl expression was higher in offspring of dams consuming a low
LA 36% fat diet compared to other groups in both male and female offspring (P<0.05).
In female offspring at 4 weeks of age, a significant interaction between maternal
dietary fatty acid ratio and maternal dietary fat content was observed in gonadal fat
expression of Fasn (P<0.05) and Lep (P<0.05) as well as retroperitoneal fat expression
of Pparg (P<0.05) and Lep (P<0.01). This interaction manifested as increased
expression of these genes in offspring exposed to 36% fat with a high LA:ALA ratio,
but decreased expression when the diet consisted of a low LA:ALA ratio. As such,
offspring exposed to a low LA (18% fat) diet consistently exhibited the highest
expression of these genes.
Table 5.4 summarises the mRNA expression at 8 weeks of age. Male offspring
exposed to a 36% fat diet during gestation and lactation showed lower hepatic Srebf1
and gonadal fat Lep mRNA expression (P<0.05) when compared to an 18% fat diet,
irrespective of maternal dietary fatty acid ratio. In females, and other tissues measured
in male offspring, the differences in Srebf1 expression observed at 4 weeks of age
appeared to be transient as no differences were observed between groups at 8 weeks
of age. Fasn mRNA at 8 weeks of age was significantly higher in female offspring of
dams consuming a 36% fat diet in both the gonadal (P<0.05) and retroperitoneal
(P<0.01) fat depots, irrespective of maternal dietary ratio.
5.5 Discussion
This study aimed to investigate the effect of an altered maternal dietary LA:ALA ratio,
as well as total dietary fat content, on offspring growth, adiposity, lipid profiles and
expression of key genes associated with lipogenesis. We have shown that the maternal
MANUSCRIPT 3
131
dietary LA:ALA ratio is a key driver of the fatty acid profile in offspring whole blood
and liver. Additionally, we found that exposure to a high fat diet, irrespective of dietary
LA:ALA ratio, was associated with a persistent reduction in offspring bodyweight
even after the offspring were weaned onto a standard, nutritionally balanced rodent
diet. Differences in adipose tissue weight were determined by maternal dietary
LA:ALA ratio as well as total fat content, whilst the expression of key lipogenic genes
was predominantly affected by the latter. These data suggest that a maternal diet high
in fat can have detrimental effects on offspring growth whilst an interaction between
total fat intake and maternal dietary PUFA ratio appears to affect offspring adiposity
via alterations in the expression of lipogenic genes.
We have previously shown that exposure to a varying LA:ALA ratio and fat content
in the diet influences the circulating fatty acid profile of dams (Draycott et al., 2019)
as well as offspring directly exposed to the maternal diet (see Chapter 4). In the present
study, we have demonstrated that the circulating and hepatic fatty acid profiles of
offspring at 4 weeks of age, as well as the circulating fatty acid profile at 8 weeks of
age, are still influenced by maternal dietary factors despite the offspring no longer
being directly exposed to dietary interventions. Of particular interest is the elevated
proportions of long chain omega-3 PUFA in whole blood samples of offspring exposed
to a low LA (18% fat) diet but not in those exposed to a low LA (36% fat) diet. The
experimental diet, as well as the chow diet that offspring were weaned onto, only
contained the omega-6 and omega-3 precursors, LA and ALA. This implies, therefore,
that the increased levels of long-chain omega-3 PUFA (LCPUFA) are due to an
increased capacity of these offspring for conversion of ALA to its longer-chain
derivatives through elongation and desaturation and/or remnants of preferential
transfer of these fatty acids from the mother during pregnancy and/or lactation. We are
inclined to believe this is a result of the latter as our previous study indicated a similar
fatty acid profile in the dams during the lactation period (see Chapter 4). Further to
this, studies in other species have provided no evidence of increased desaturation and
elongation capacity of offspring exposed to higher omega-3 levels (Kanakri et al.,
2017). However, a combination of both of these factors, as well as the possible
influence of fatty acid release from adipose tissue, is conceivable and should not be
completely ruled out.
MANUSCRIPT 3
132
This interesting finding in the offspring whole blood fatty acid profile at 4 weeks of
age encouraged investigation into the hepatic fatty acid profile and capacity for long
chain PUFA synthesis. Interestingly, and despite evidence of strong correlations
between circulating and hepatic liver fatty acid profiles (Tu et al., 2013), we found that
the increased omega-3 LCPUFA observed in whole blood of offspring exposed to a
low LA (18% fat) diet was not apparent in the liver. Investigation into the desaturation
and elongation capacity of the liver in these animals revealed some sex-specific
interactions of maternal diet and key genes associated with this pathway. The
observation that female offspring exposed to a high LA (36% fat) diet exhibited
increased levels of Fads1 and Fads2, does in fact suggest that these individuals may
have an increased capacity for LCPUFA synthesis. This did not, however, appear to
translate into any physiological differences in the composition of fatty acids in the liver
between experimental groups and the mRNA levels measured in this study may not be
reflective of protein levels and/or activity of these enzymes. These findings highlight
the potential for prolonged biological effects of fatty acids incorporated into
phospholipid membranes and/or stored in tissues during gestation and lactation.
Further experiments investigating the longevity of changes in offspring fatty acid
profile would confirm if there is a programmed effect of increased capacity for
LCPUFA synthesis or if this is an artefact of direct exposure to the maternal dietary
intervention. Even if transient, the effects of altered fatty acid composition of tissues,
restriction of growth and greater adiposity that we have observed are likely to
potentiate long-term metabolic consequences.
Offspring of dams exposed to a 36% fat diet exhibited consistently lower bodyweights
than offspring exposed to an 18% fat diet during gestation and lactation. Importantly,
this effect was apparent from birth (see Chapter 4) and persisted after the offspring had
been weaned onto a standard laboratory diet, suggesting a long-term effect of exposure
to a maternal high-fat diet that is persistent beyond direct dietary exposure. This is
consistent with many studies reporting decreased fetal (Taylor et al., 2003, Mark et
al., 2011), birth (Howie et al., 2009) and weaning weight (Cerf et al., 2006) in
offspring of dams exposed to a high-fat diet during gestation and lactation periods.
Early life growth restriction is often proceeded by a period of “catch-up” growth in
which offspring gain weight rapidly and is often associated with increased adiposity
(Ong et al., 2000) and increased risk of metabolic disease and hypertension in the
MANUSCRIPT 3
133
offspring (Morrison et al., 2010). Surprisingly, further to a reduced bodyweight in
response to a maternal high-fat diet, female offspring at 8 weeks of age also had
reduced blood pressure. This apparent increased sensitivity of female rather than male
offspring to maternal dietary treatments has been noted previously (Khan et al., 2002),
although, as in a number of other studies (Samuelsson et al., 2008, Guberman et al.,
2013), maternal high-fat diets resulted in increased as opposed to decreased blood
pressure. It is important to note, however, that many of these studies utilised a maternal
diet high in saturated fat and studies using diets high in polyunsaturated fats, as with
this study, have shown reductions in blood pressure when compared to a maternal diet
high in saturated fats (Langley-Evans et al., 1996a). In support of this, we have
previously noted that offspring hypertension associated with low protein feeding
during rat pregnancy is modified by other components of the experimental diet,
including the source of fat (Langley-Evans, 2000, Langley-Evans, 1996).
An unexpected finding of the study was that offspring exposed to a low LA (18% fat)
diet had the highest relative gonadal fat mass at 4 weeks of age, in conjunction with
higher Lep mRNA expression in the gonadal fat adipose tissue. This was consistent
across sexes and conflicted with our hypothesis as well as the evidence linking
increased omega-3 intake with reduced fat deposition and accumulation in in vitro and
rodent models (Massiera et al., 2003, Wyrwoll et al., 2006). This finding was,
however, in line with other rodent studies in which the higher omega-3 exposure was
restricted to the gestation and lactation periods (Muhlhausler et al., 2011b) and adds
to the disparity observed in reports of human (Muhlhausler et al., 2010b) as well as
animal studies (Muhlhausler et al., 2011a) investigating the role of increased maternal
dietary omega-3 on offspring body composition. The increased gonadal fat weight of
the low LA (18% fat) group at 4 weeks of age coincided with increased Fasn
expression in this tissue, suggesting that the higher gonadal fat deposition may have
been driven by an increased capacity for de novo lipogenesis in this group.
Interestingly, however, this increased Fasn expression was only observed in females,
raising the possibility of different underlying mechanisms for increased gonadal fat
accumulation between males and females which has also been suggested by previous
work (Vithayathil et al., 2018).
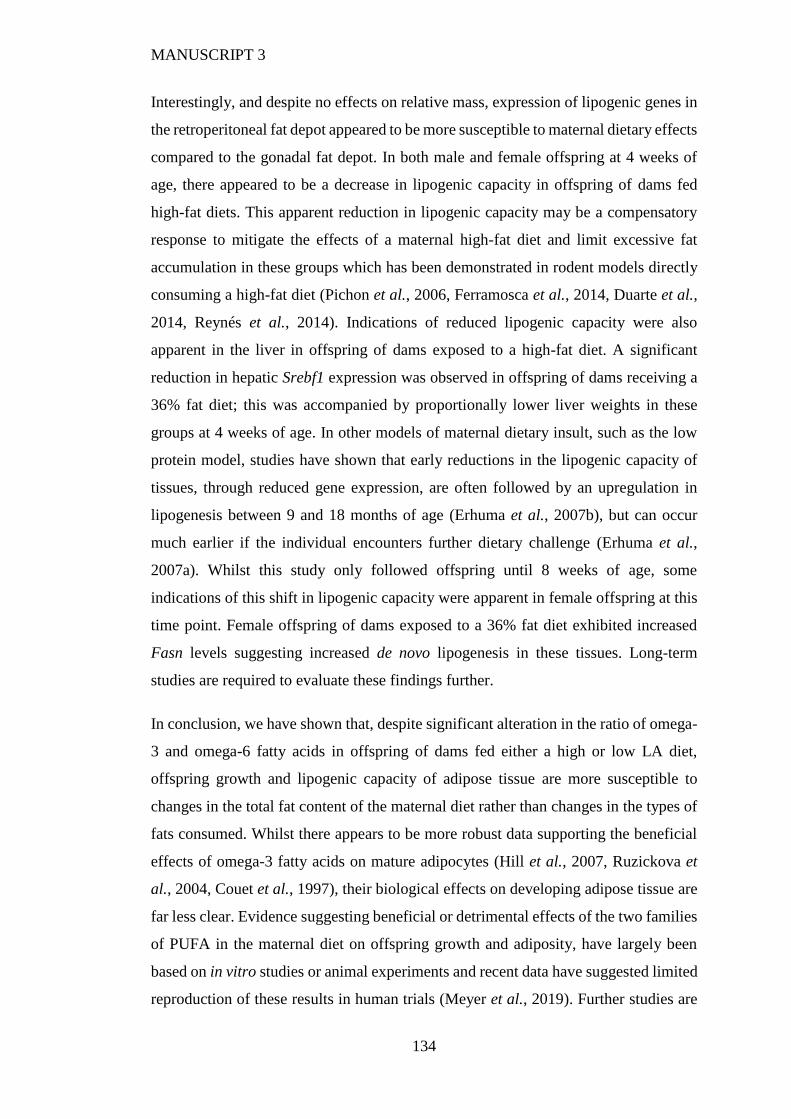
MANUSCRIPT 3
134
Interestingly, and despite no effects on relative mass, expression of lipogenic genes in
the retroperitoneal fat depot appeared to be more susceptible to maternal dietary effects
compared to the gonadal fat depot. In both male and female offspring at 4 weeks of
age, there appeared to be a decrease in lipogenic capacity in offspring of dams fed
high-fat diets. This apparent reduction in lipogenic capacity may be a compensatory
response to mitigate the effects of a maternal high-fat diet and limit excessive fat
accumulation in these groups which has been demonstrated in rodent models directly
consuming a high-fat diet (Pichon et al., 2006, Ferramosca et al., 2014, Duarte et al.,
2014, Reynés et al., 2014). Indications of reduced lipogenic capacity were also
apparent in the liver in offspring of dams exposed to a high-fat diet. A significant
reduction in hepatic Srebf1 expression was observed in offspring of dams receiving a
36% fat diet; this was accompanied by proportionally lower liver weights in these
groups at 4 weeks of age. In other models of maternal dietary insult, such as the low
protein model, studies have shown that early reductions in the lipogenic capacity of
tissues, through reduced gene expression, are often followed by an upregulation in
lipogenesis between 9 and 18 months of age (Erhuma et al., 2007b), but can occur
much earlier if the individual encounters further dietary challenge (Erhuma et al.,
2007a). Whilst this study only followed offspring until 8 weeks of age, some
indications of this shift in lipogenic capacity were apparent in female offspring at this
time point. Female offspring of dams exposed to a 36% fat diet exhibited increased
Fasn levels suggesting increased de novo lipogenesis in these tissues. Long-term
studies are required to evaluate these findings further.
In conclusion, we have shown that, despite significant alteration in the ratio of omega-
3 and omega-6 fatty acids in offspring of dams fed either a high or low LA diet,
offspring growth and lipogenic capacity of adipose tissue are more susceptible to
changes in the total fat content of the maternal diet rather than changes in the types of
fats consumed. Whilst there appears to be more robust data supporting the beneficial
effects of omega-3 fatty acids on mature adipocytes (Hill et al., 2007, Ruzickova et
al., 2004, Couet et al., 1997), their biological effects on developing adipose tissue are
far less clear. Evidence suggesting beneficial or detrimental effects of the two families
of PUFA in the maternal diet on offspring growth and adiposity, have largely been
based on in vitro studies or animal experiments and recent data have suggested limited
reproduction of these results in human trials (Meyer et al., 2019). Further studies are

MANUSCRIPT 3
135
required to investigate the effects of maternal dietary PUFA on developing tissues but
caution should be exercised in the meantime not to extrapolate from data on mature
tissues and to highlight the detrimental effects of a maternal high-fat intake regardless
of the types of fats consumed.

MANUSCRIPT 3
136
5.6 Tables and Figures
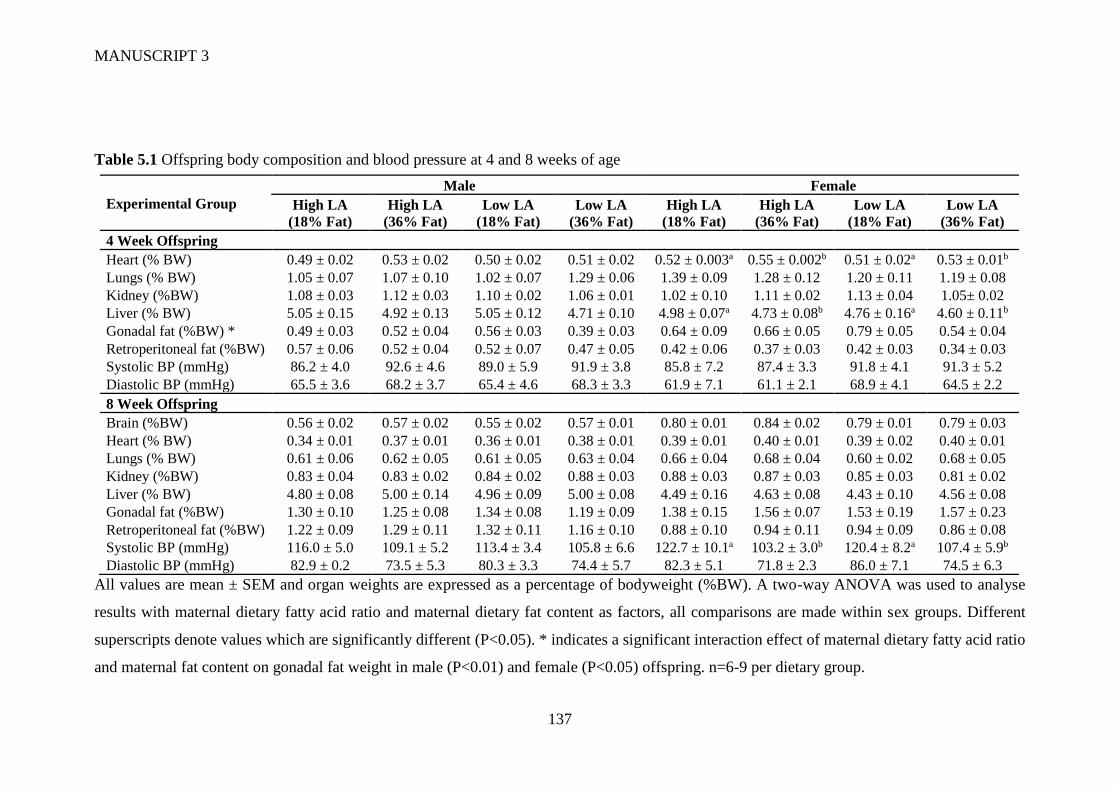
MANUSCRIPT 3
137
Table 5.1 Offspring body composition and blood pressure at 4 and 8 weeks of age
All values are mean ± SEM and organ weights are expressed as a percentage of bodyweight (%BW). A two-way ANOVA was used to analyse
results with maternal dietary fatty acid ratio and maternal dietary fat content as factors, all comparisons are made within sex groups. Different
superscripts denote values which are significantly different (P<0.05). * indicates a significant interaction effect of maternal dietary fatty acid ratio
and maternal fat content on gonadal fat weight in male (P<0.01) and female (P<0.05) offspring. n=6-9 per dietary group.
Experimental Group
Male Female
High LA
(18% Fat)
High LA
(36% Fat)
Low LA
(18% Fat)
Low LA
(36% Fat)
High LA
(18% Fat)
High LA
(36% Fat)
Low LA
(18% Fat)
Low LA
(36% Fat)
4 Week Offspring
Heart (% BW) 0.49 ± 0.02 0.53 ± 0.02 0.50 ± 0.02 0.51 ± 0.02 0.52 ± 0.003a 0.55 ± 0.002b 0.51 ± 0.02a 0.53 ± 0.01b
Lungs (% BW) 1.05 ± 0.07 1.07 ± 0.10 1.02 ± 0.07 1.29 ± 0.06 1.39 ± 0.09 1.28 ± 0.12 1.20 ± 0.11 1.19 ± 0.08
Kidney (%BW) 1.08 ± 0.03 1.12 ± 0.03 1.10 ± 0.02 1.06 ± 0.01 1.02 ± 0.10 1.11 ± 0.02 1.13 ± 0.04 1.05± 0.02
Liver (% BW) 5.05 ± 0.15 4.92 ± 0.13 5.05 ± 0.12 4.71 ± 0.10 4.98 ± 0.07a 4.73 ± 0.08b 4.76 ± 0.16a 4.60 ± 0.11b
Gonadal fat (%BW) * 0.49 ± 0.03 0.52 ± 0.04 0.56 ± 0.03 0.39 ± 0.03 0.64 ± 0.09 0.66 ± 0.05 0.79 ± 0.05 0.54 ± 0.04
Retroperitoneal fat (%BW) 0.57 ± 0.06 0.52 ± 0.04 0.52 ± 0.07 0.47 ± 0.05 0.42 ± 0.06 0.37 ± 0.03 0.42 ± 0.03 0.34 ± 0.03
Systolic BP (mmHg) 86.2 ± 4.0 92.6 ± 4.6 89.0 ± 5.9 91.9 ± 3.8 85.8 ± 7.2 87.4 ± 3.3 91.8 ± 4.1 91.3 ± 5.2
Diastolic BP (mmHg) 65.5 ± 3.6 68.2 ± 3.7 65.4 ± 4.6 68.3 ± 3.3 61.9 ± 7.1 61.1 ± 2.1 68.9 ± 4.1 64.5 ± 2.2
8 Week Offspring
Brain (%BW) 0.56 ± 0.02 0.57 ± 0.02 0.55 ± 0.02 0.57 ± 0.01 0.80 ± 0.01 0.84 ± 0.02 0.79 ± 0.01 0.79 ± 0.03
Heart (% BW) 0.34 ± 0.01 0.37 ± 0.01 0.36 ± 0.01 0.38 ± 0.01 0.39 ± 0.01 0.40 ± 0.01 0.39 ± 0.02 0.40 ± 0.01
Lungs (% BW) 0.61 ± 0.06 0.62 ± 0.05 0.61 ± 0.05 0.63 ± 0.04 0.66 ± 0.04 0.68 ± 0.04 0.60 ± 0.02 0.68 ± 0.05
Kidney (%BW) 0.83 ± 0.04 0.83 ± 0.02 0.84 ± 0.02 0.88 ± 0.03 0.88 ± 0.03 0.87 ± 0.03 0.85 ± 0.03 0.81 ± 0.02
Liver (% BW) 4.80 ± 0.08 5.00 ± 0.14 4.96 ± 0.09 5.00 ± 0.08 4.49 ± 0.16 4.63 ± 0.08 4.43 ± 0.10 4.56 ± 0.08
Gonadal fat (%BW) 1.30 ± 0.10 1.25 ± 0.08 1.34 ± 0.08 1.19 ± 0.09 1.38 ± 0.15 1.56 ± 0.07 1.53 ± 0.19 1.57 ± 0.23
Retroperitoneal fat (%BW) 1.22 ± 0.09 1.29 ± 0.11 1.32 ± 0.11 1.16 ± 0.10 0.88 ± 0.10 0.94 ± 0.11 0.94 ± 0.09 0.86 ± 0.08
Systolic BP (mmHg) 116.0 ± 5.0 109.1 ± 5.2 113.4 ± 3.4 105.8 ± 6.6 122.7 ± 10.1a 103.2 ± 3.0b 120.4 ± 8.2a 107.4 ± 5.9b
Diastolic BP (mmHg) 82.9 ± 0.2 73.5 ± 5.3 80.3 ± 3.3 74.4 ± 5.7 82.3 ± 5.1 71.8 ± 2.3 86.0 ± 7.1 74.5 ± 6.3
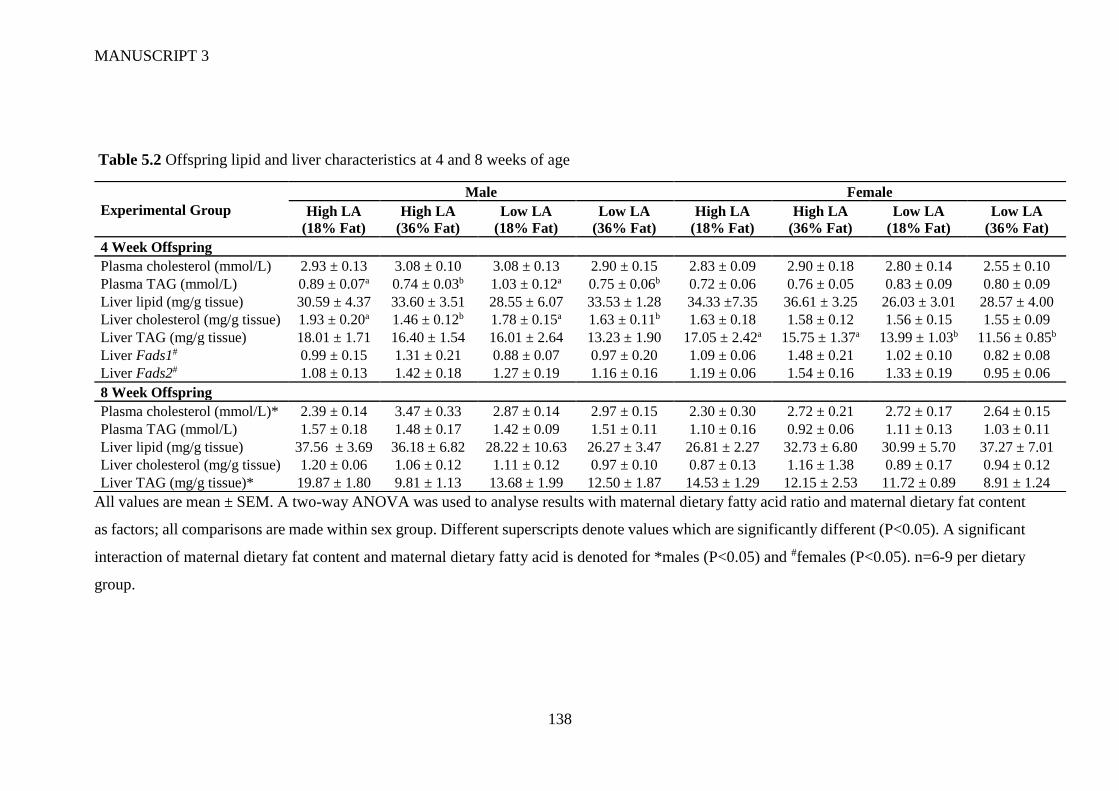
MANUSCRIPT 3
138
Table 5.2 Offspring lipid and liver characteristics at 4 and 8 weeks of age
All values are mean ± SEM. A two-way ANOVA was used to analyse results with maternal dietary fatty acid ratio and maternal dietary fat content
as factors; all comparisons are made within sex group. Different superscripts denote values which are significantly different (P<0.05). A significant
interaction of maternal dietary fat content and maternal dietary fatty acid is denoted for *males (P<0.05) and #females (P<0.05). n=6-9 per dietary
group.
Experimental Group
Male Female
High LA
(18% Fat)
High LA
(36% Fat)
Low LA
(18% Fat)
Low LA
(36% Fat)
High LA
(18% Fat)
High LA
(36% Fat)
Low LA
(18% Fat)
Low LA
(36% Fat)
4 Week Offspring
Plasma cholesterol (mmol/L) 2.93 ± 0.13 3.08 ± 0.10 3.08 ± 0.13 2.90 ± 0.15 2.83 ± 0.09 2.90 ± 0.18 2.80 ± 0.14 2.55 ± 0.10
Plasma TAG (mmol/L) 0.89 ± 0.07a 0.74 ± 0.03b 1.03 ± 0.12a 0.75 ± 0.06b 0.72 ± 0.06 0.76 ± 0.05 0.83 ± 0.09 0.80 ± 0.09
Liver lipid (mg/g tissue) 30.59 ± 4.37 33.60 ± 3.51 28.55 ± 6.07 33.53 ± 1.28 34.33 ±7.35 36.61 ± 3.25 26.03 ± 3.01 28.57 ± 4.00
Liver cholesterol (mg/g tissue) 1.93 ± 0.20a 1.46 ± 0.12b 1.78 ± 0.15a 1.63 ± 0.11b 1.63 ± 0.18 1.58 ± 0.12 1.56 ± 0.15 1.55 ± 0.09
Liver TAG (mg/g tissue) 18.01 ± 1.71 16.40 ± 1.54 16.01 ± 2.64 13.23 ± 1.90 17.05 ± 2.42a 15.75 ± 1.37a 13.99 ± 1.03b 11.56 ± 0.85b
Liver Fads1# 0.99 ± 0.15 1.31 ± 0.21 0.88 ± 0.07 0.97 ± 0.20 1.09 ± 0.06 1.48 ± 0.21 1.02 ± 0.10 0.82 ± 0.08
Liver Fads2# 1.08 ± 0.13 1.42 ± 0.18 1.27 ± 0.19 1.16 ± 0.16 1.19 ± 0.06 1.54 ± 0.16 1.33 ± 0.19 0.95 ± 0.06
8 Week Offspring
Plasma cholesterol (mmol/L)* 2.39 ± 0.14 3.47 ± 0.33 2.87 ± 0.14 2.97 ± 0.15 2.30 ± 0.30 2.72 ± 0.21 2.72 ± 0.17 2.64 ± 0.15
Plasma TAG (mmol/L) 1.57 ± 0.18 1.48 ± 0.17 1.42 ± 0.09 1.51 ± 0.11 1.10 ± 0.16 0.92 ± 0.06 1.11 ± 0.13 1.03 ± 0.11
Liver lipid (mg/g tissue) 37.56 ± 3.69 36.18 ± 6.82 28.22 ± 10.63 26.27 ± 3.47 26.81 ± 2.27 32.73 ± 6.80 30.99 ± 5.70 37.27 ± 7.01
Liver cholesterol (mg/g tissue) 1.20 ± 0.06 1.06 ± 0.12 1.11 ± 0.12 0.97 ± 0.10 0.87 ± 0.13 1.16 ± 1.38 0.89 ± 0.17 0.94 ± 0.12
Liver TAG (mg/g tissue)* 19.87 ± 1.80 9.81 ± 1.13 13.68 ± 1.99 12.50 ± 1.87 14.53 ± 1.29 12.15 ± 2.53 11.72 ± 0.89 8.91 ± 1.24
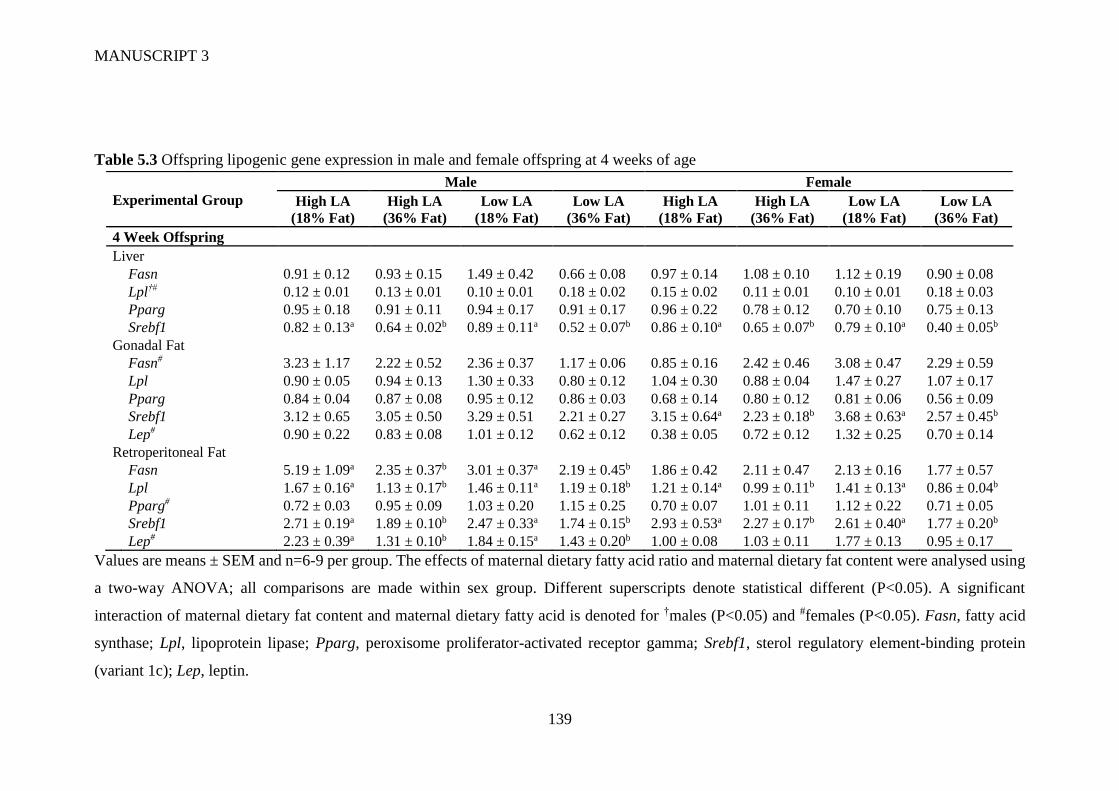
MANUSCRIPT 3
139
Table 5.3 Offspring lipogenic gene expression in male and female offspring at 4 weeks of age
Values are means ± SEM and n=6-9 per group. The effects of maternal dietary fatty acid ratio and maternal dietary fat content were analysed using
a two-way ANOVA; all comparisons are made within sex group. Different superscripts denote statistical different (P<0.05). A significant
interaction of maternal dietary fat content and maternal dietary fatty acid is denoted for †males (P<0.05) and #females (P<0.05). Fasn, fatty acid
synthase; Lpl, lipoprotein lipase; Pparg, peroxisome proliferator-activated receptor gamma; Srebf1, sterol regulatory element-binding protein
(variant 1c); Lep, leptin.
Experimental Group
Male Female
High LA
(18% Fat)
High LA
(36% Fat)
Low LA
(18% Fat)
Low LA
(36% Fat)
High LA
(18% Fat)
High LA
(36% Fat)
Low LA
(18% Fat)
Low LA
(36% Fat)
4 Week Offspring
Liver Fasn 0.91 ± 0.12 0.93 ± 0.15 1.49 ± 0.42 0.66 ± 0.08 0.97 ± 0.14 1.08 ± 0.10 1.12 ± 0.19 0.90 ± 0.08 Lpl†# 0.12 ± 0.01 0.13 ± 0.01 0.10 ± 0.01 0.18 ± 0.02 0.15 ± 0.02 0.11 ± 0.01 0.10 ± 0.01 0.18 ± 0.03 Pparg 0.95 ± 0.18 0.91 ± 0.11 0.94 ± 0.17 0.91 ± 0.17 0.96 ± 0.22 0.78 ± 0.12 0.70 ± 0.10 0.75 ± 0.13 Srebf1 0.82 ± 0.13a 0.64 ± 0.02b 0.89 ± 0.11a 0.52 ± 0.07b 0.86 ± 0.10a 0.65 ± 0.07b 0.79 ± 0.10a 0.40 ± 0.05b
Gonadal Fat Fasn# 3.23 ± 1.17 2.22 ± 0.52 2.36 ± 0.37 1.17 ± 0.06 0.85 ± 0.16 2.42 ± 0.46 3.08 ± 0.47 2.29 ± 0.59 Lpl 0.90 ± 0.05 0.94 ± 0.13 1.30 ± 0.33 0.80 ± 0.12 1.04 ± 0.30 0.88 ± 0.04 1.47 ± 0.27 1.07 ± 0.17 Pparg 0.84 ± 0.04 0.87 ± 0.08 0.95 ± 0.12 0.86 ± 0.03 0.68 ± 0.14 0.80 ± 0.12 0.81 ± 0.06 0.56 ± 0.09 Srebf1 3.12 ± 0.65 3.05 ± 0.50 3.29 ± 0.51 2.21 ± 0.27 3.15 ± 0.64a 2.23 ± 0.18b 3.68 ± 0.63a 2.57 ± 0.45b Lep# 0.90 ± 0.22 0.83 ± 0.08 1.01 ± 0.12 0.62 ± 0.12 0.38 ± 0.05 0.72 ± 0.12 1.32 ± 0.25 0.70 ± 0.14
Retroperitoneal Fat
Fasn 5.19 ± 1.09a 2.35 ± 0.37b 3.01 ± 0.37a 2.19 ± 0.45b 1.86 ± 0.42 2.11 ± 0.47 2.13 ± 0.16 1.77 ± 0.57 Lpl 1.67 ± 0.16a 1.13 ± 0.17b 1.46 ± 0.11a 1.19 ± 0.18b 1.21 ± 0.14a 0.99 ± 0.11b 1.41 ± 0.13a 0.86 ± 0.04b Pparg# 0.72 ± 0.03 0.95 ± 0.09 1.03 ± 0.20 1.15 ± 0.25 0.70 ± 0.07 1.01 ± 0.11 1.12 ± 0.22 0.71 ± 0.05 Srebf1 2.71 ± 0.19a 1.89 ± 0.10b 2.47 ± 0.33a 1.74 ± 0.15b 2.93 ± 0.53a 2.27 ± 0.17b 2.61 ± 0.40a 1.77 ± 0.20b Lep# 2.23 ± 0.39a 1.31 ± 0.10b 1.84 ± 0.15a 1.43 ± 0.20b 1.00 ± 0.08 1.03 ± 0.11 1.77 ± 0.13 0.95 ± 0.17
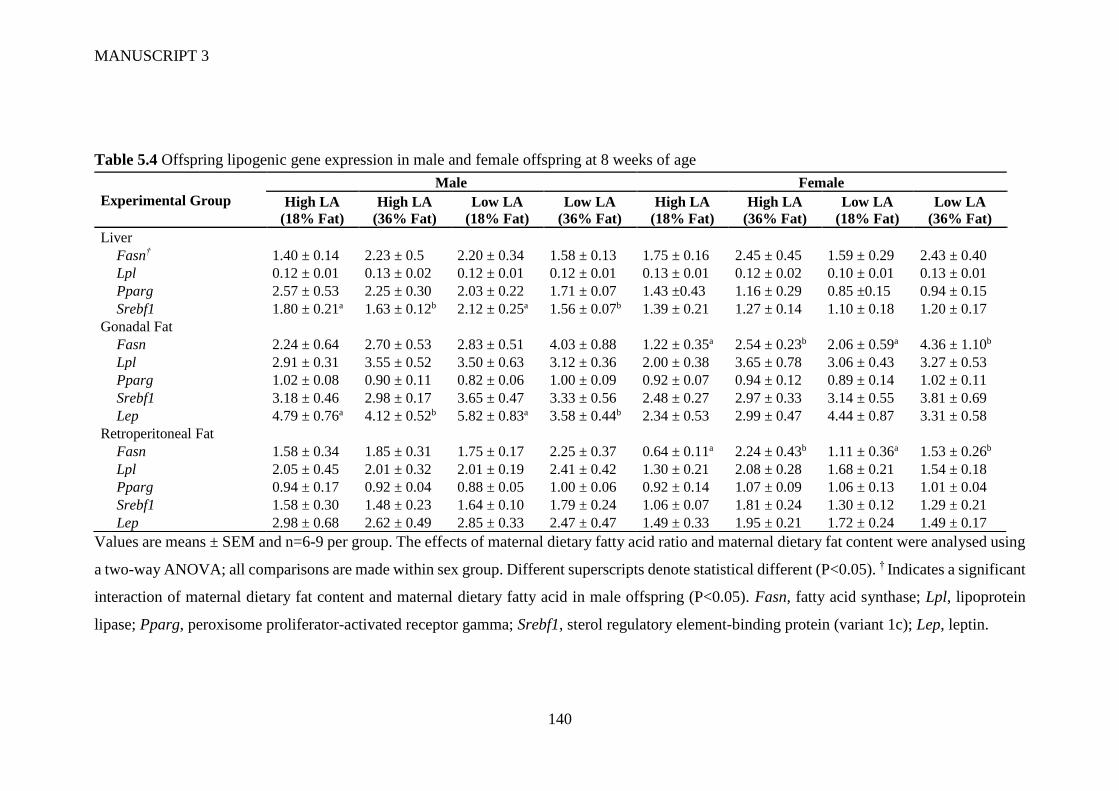
MANUSCRIPT 3
140
Table 5.4 Offspring lipogenic gene expression in male and female offspring at 8 weeks of age
Values are means ± SEM and n=6-9 per group. The effects of maternal dietary fatty acid ratio and maternal dietary fat content were analysed using
a two-way ANOVA; all comparisons are made within sex group. Different superscripts denote statistical different (P<0.05). † Indicates a significant
interaction of maternal dietary fat content and maternal dietary fatty acid in male offspring (P<0.05). Fasn, fatty acid synthase; Lpl, lipoprotein
lipase; Pparg, peroxisome proliferator-activated receptor gamma; Srebf1, sterol regulatory element-binding protein (variant 1c); Lep, leptin.
Experimental Group
Male Female
High LA
(18% Fat)
High LA
(36% Fat)
Low LA
(18% Fat)
Low LA
(36% Fat)
High LA
(18% Fat)
High LA
(36% Fat)
Low LA
(18% Fat)
Low LA
(36% Fat)
Liver Fasn† 1.40 ± 0.14 2.23 ± 0.5 2.20 ± 0.34 1.58 ± 0.13 1.75 ± 0.16 2.45 ± 0.45 1.59 ± 0.29 2.43 ± 0.40 Lpl 0.12 ± 0.01 0.13 ± 0.02 0.12 ± 0.01 0.12 ± 0.01 0.13 ± 0.01 0.12 ± 0.02 0.10 ± 0.01 0.13 ± 0.01 Pparg 2.57 ± 0.53 2.25 ± 0.30 2.03 ± 0.22 1.71 ± 0.07 1.43 ±0.43 1.16 ± 0.29 0.85 ±0.15 0.94 ± 0.15 Srebf1 1.80 ± 0.21a 1.63 ± 0.12b 2.12 ± 0.25a 1.56 ± 0.07b 1.39 ± 0.21 1.27 ± 0.14 1.10 ± 0.18 1.20 ± 0.17
Gonadal Fat Fasn 2.24 ± 0.64 2.70 ± 0.53 2.83 ± 0.51 4.03 ± 0.88 1.22 ± 0.35a 2.54 ± 0.23b 2.06 ± 0.59a 4.36 ± 1.10b Lpl 2.91 ± 0.31 3.55 ± 0.52 3.50 ± 0.63 3.12 ± 0.36 2.00 ± 0.38 3.65 ± 0.78 3.06 ± 0.43 3.27 ± 0.53 Pparg 1.02 ± 0.08 0.90 ± 0.11 0.82 ± 0.06 1.00 ± 0.09 0.92 ± 0.07 0.94 ± 0.12 0.89 ± 0.14 1.02 ± 0.11 Srebf1 3.18 ± 0.46 2.98 ± 0.17 3.65 ± 0.47 3.33 ± 0.56 2.48 ± 0.27 2.97 ± 0.33 3.14 ± 0.55 3.81 ± 0.69 Lep 4.79 ± 0.76a 4.12 ± 0.52b 5.82 ± 0.83a 3.58 ± 0.44b 2.34 ± 0.53 2.99 ± 0.47 4.44 ± 0.87 3.31 ± 0.58
Retroperitoneal Fat Fasn 1.58 ± 0.34 1.85 ± 0.31 1.75 ± 0.17 2.25 ± 0.37 0.64 ± 0.11a 2.24 ± 0.43b 1.11 ± 0.36a 1.53 ± 0.26b Lpl 2.05 ± 0.45 2.01 ± 0.32 2.01 ± 0.19 2.41 ± 0.42 1.30 ± 0.21 2.08 ± 0.28 1.68 ± 0.21 1.54 ± 0.18 Pparg 0.94 ± 0.17 0.92 ± 0.04 0.88 ± 0.05 1.00 ± 0.06 0.92 ± 0.14 1.07 ± 0.09 1.06 ± 0.13 1.01 ± 0.04 Srebf1 1.58 ± 0.30 1.48 ± 0.23 1.64 ± 0.10 1.79 ± 0.24 1.06 ± 0.07 1.81 ± 0.24 1.30 ± 0.12 1.29 ± 0.21 Lep 2.98 ± 0.68 2.62 ± 0.49 2.85 ± 0.33 2.47 ± 0.47 1.49 ± 0.33 1.95 ± 0.21 1.72 ± 0.24 1.49 ± 0.17
MANUSCRIPT 3
141
Figure 5.1 Body weights of (A) male and (B) female offspring post-weaning up to 8
weeks of age exposed to either a high LA (18% fat) diet (closed circles), high LA (36%
fat) diet (open circles), low LA (18% fat) diet (closed squares) or a low LA (36% fat)
diet (open squares) during gestation and lactation. Offspring weaned onto a chow diet.
Values are means ± SEM and n =6–9 per group. The effects of dietary fatty acid ratio
and dietary fat content were determined using a two-way repeated measures ANOVA
and a significant effect of maternal dietary fat content (P<0.0001) on body weight was
observed for both male and female offspring.
Figure 5.2 Whole blood fatty acid profile in (A) male and (B) female offspring at 4
weeks of age. Values are means ± SEM and n=6-9 per group. The effects of maternal
dietary fatty acid ratio and maternal dietary fat content were determined using a two-
way ANOVA; all comparisons were made within sex group. *Indicates significant
difference (*P<0.05, **P<0.01, ***P<0.001). † indicates a significant interaction
effect (P<0.05). SFA, saturated fatty acid; MUFA, monounsaturated fatty acid; LA,
linoleic acid; AA, arachidonic acid; ALA, alpha-linolenic acid; EPA, eicosapentaenoic
acid; DPA, docosapentaenoic acid; DHA, docosahexaenoic acid.
Figure 5.3 Liver fatty acid profile in (A) male and (B) female offspring at 4 weeks of
age. Values are means ± SEM and n=6-9 per group. The effects of maternal dietary
fatty acid ratio and maternal dietary fat content were determined using a two-way
ANOVA; all comparisons were made within sex group. *Indicates significant
difference (*P<0.05, **P<0.01, ***P<0.001). SFA, saturated fatty acid; MUFA,
monounsaturated fatty acid; LA, linoleic acid; AA, arachidonic acid; ALA, alpha-
linolenic acid; EPA, eicosapentaenoic acid; DPA, docosapentaenoic acid; DHA,
docosahexaenoic acid.
Figure 5.4 Offspring whole blood fatty acid profile in (A) male and (B) female
offspring at 8 weeks of age. Values are means ± SEM and n=6-9 per group. The effects
of maternal dietary fatty acid ratio and maternal dietary fat content were determined
using a two-way ANOVA. All comparisons were made within sex group. *Indicates
significant difference (*P<0.05, **P<0.01, ***P<0.001). SFA, saturated fatty acid;
MUFA, monounsaturated fatty acid; LA, linoleic acid; AA, arachidonic acid; ALA,
alpha-linolenic acid; EPA, eicosapentaenoic acid; DPA, docosapentaenoic acid; DHA,
docosahexaenoic acid.
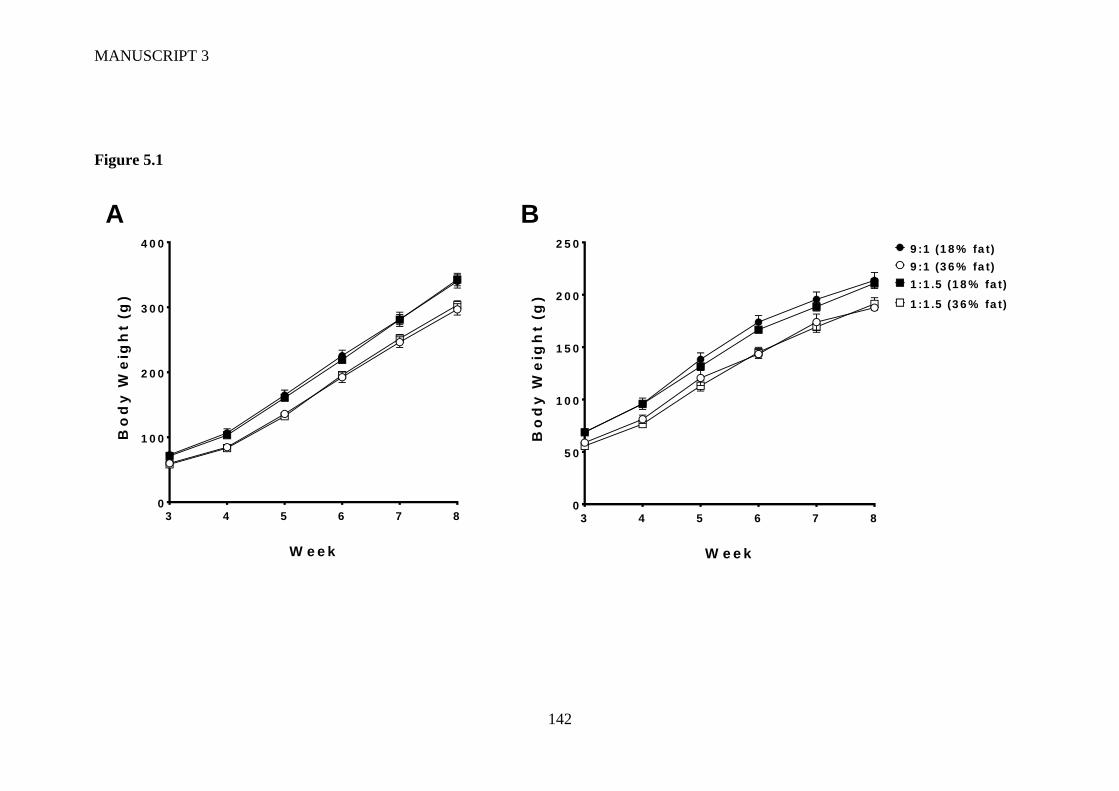
MANUSCRIPT 3
142
Figure 5.1
3 4 5 6 7 80
1 0 0
2 0 0
3 0 0
4 0 0
W e e k
Bo
dy
We
igh
t (g
)
3 4 5 6 7 80
5 0
1 0 0
1 5 0
2 0 0
2 5 0
W e e k
Bo
dy
We
igh
t (g
)
9 :1 (1 8 % fa t)
9 :1 (3 6 % fa t)
1 :1 .5 (1 8 % fa t)
1 :1 .5 (3 6 % fa t)
A B
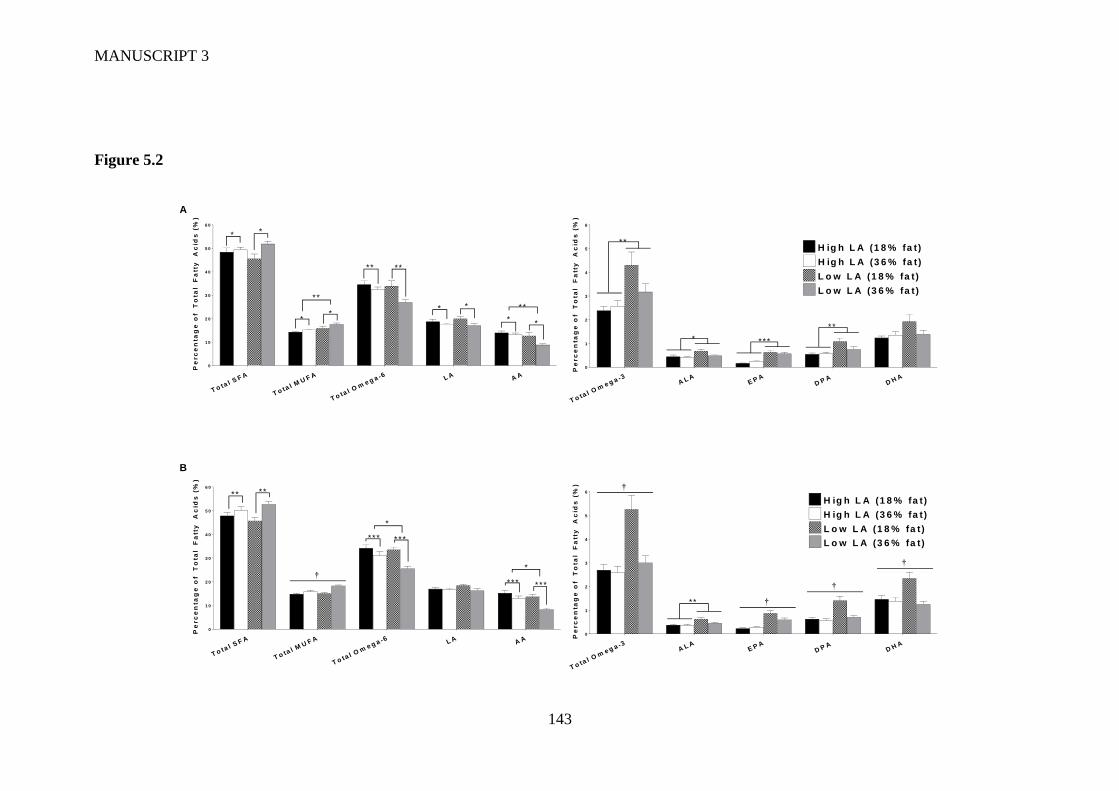
MANUSCRIPT 3
143
Figure 5.2
T o tal S
F A
T o tal M
U F A
T o tal O
me g a -6 L A A A
0
1 0
2 0
3 0
4 0
5 0
6 0
Pe
rc
en
tag
e o
f T
ota
l F
att
y
Ac
ids
(%
)
* *
**
**
** **
* *
* *
**
T o tal O
me g a -3
A L AE P A
D P A D H A
0
1
2
3
4
5
6
Pe
rc
en
tag
e o
f T
ota
l F
att
y
Ac
ids
(%
)
**
* ***
**
H ig h L A (1 8 % fa t )
H ig h L A (3 6 % fa t )
L o w L A (1 8 % fa t )
L o w L A (3 6 % fa t )
T o tal S
F A
T o tal M
U F A
T o tal O
me g a -6 L A A A
0
1 0
2 0
3 0
4 0
5 0
6 0
Pe
rc
en
tag
e o
f T
ota
l F
att
y
Ac
ids
(%
)
** **
†
*** ***
*
*** ***
*
T o tal O
me g a -3
A L AE P A
D P A D H A
0
1
2
3
4
5
6
Pe
rc
en
tag
e o
f T
ota
l F
att
y
Ac
ids
(%
) †
†
†
†
**
H ig h L A (1 8 % fa t )
H ig h L A (3 6 % fa t )
L o w L A (1 8 % fa t )
L o w L A (3 6 % fa t )
A
B
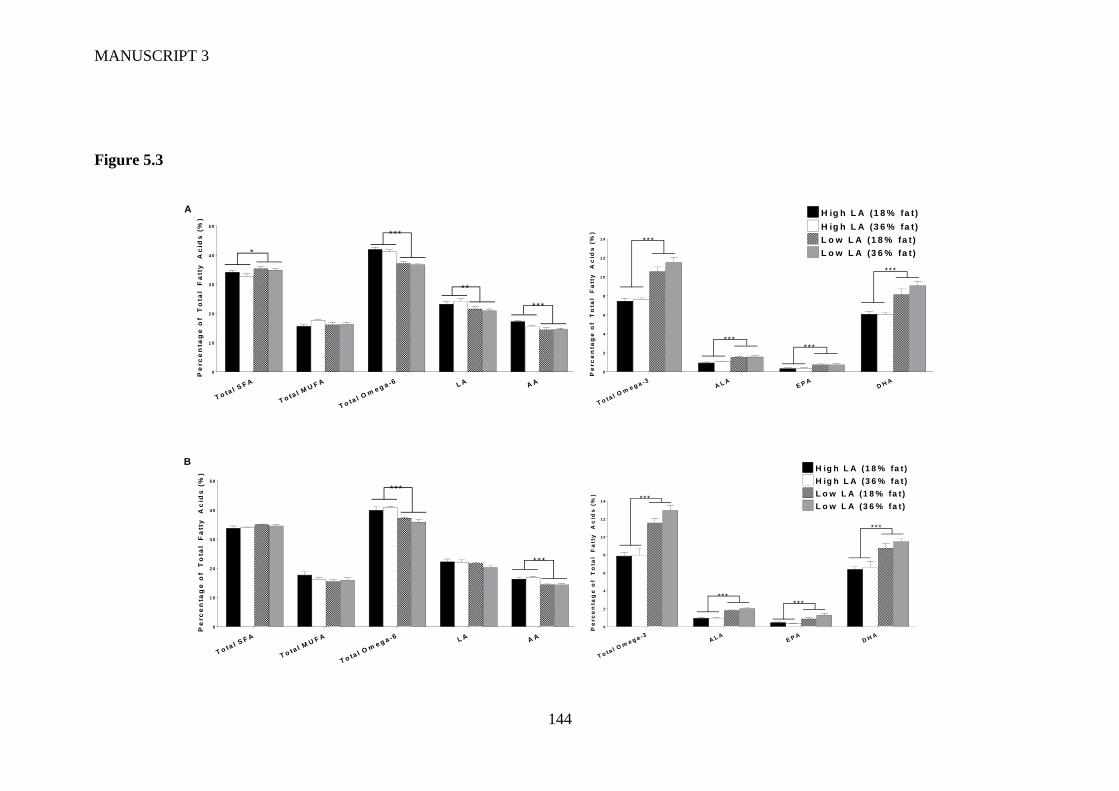
MANUSCRIPT 3
144
Figure 5.3
T o tal S
F A
T o tal M
U F A
T o tal O
me g a -6 L A A A
0
1 0
2 0
3 0
4 0
5 0
Pe
rc
en
tag
e o
f T
ota
l F
att
y
Ac
ids
(%
)
*
***
**
***
T o tal O
me g a -3
A L AE P A
D H A
0
2
4
6
8
1 0
1 2
1 4
Pe
rc
en
tag
e o
f T
ota
l F
att
y
Ac
ids
(%
)
H ig h L A (1 8 % fa t )
H ig h L A (3 6 % fa t )
L o w L A (1 8 % fa t )
L o w L A (3 6 % fa t )
***
******
***
T o tal S
F A
T o tal M
U F A
T o tal O
me g a -6 L A A A
0
1 0
2 0
3 0
4 0
5 0
Pe
rc
en
tag
e o
f T
ota
l F
att
y
Ac
ids
(%
)
***
***
T o tal O
me g a -3
A L AE P A
D H A
0
2
4
6
8
1 0
1 2
1 4
Pe
rc
en
tag
e o
f T
ota
l F
att
y
Ac
ids
(%
)
H ig h L A (1 8 % fa t )
H ig h L A (3 6 % fa t )
L o w L A (1 8 % fa t )
L o w L A (3 6 % fa t )***
******
***
A
B
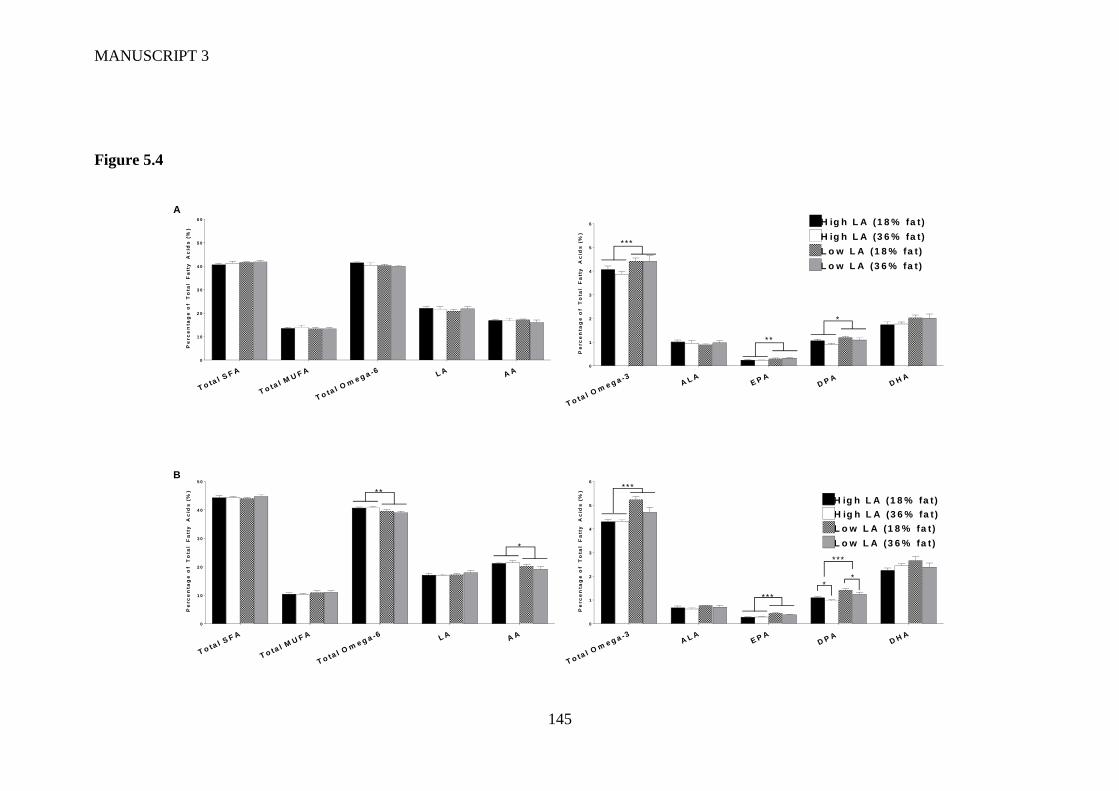
MANUSCRIPT 3
145
Figure 5.4
T o tal S
F A
T o tal M
U F A
T o tal O
me g a -6 L A A A
0
1 0
2 0
3 0
4 0
5 0
6 0
Pe
rc
en
tag
e o
f T
ota
l F
att
y
Ac
ids
(%
)
T o tal O
me g a -3
A L AE P A
D P A D H A
0
1
2
3
4
5
6
Pe
rc
en
tag
e o
f T
ota
l F
att
y
Ac
ids
(%
)
***
**
*
H ig h L A (1 8 % fa t )
H ig h L A (3 6 % fa t )
L o w L A (1 8 % fa t )
L o w L A (3 6 % fa t )
T o tal S
F A
T o tal M
U F A
T o tal O
me g a -6 L A A A
0
1 0
2 0
3 0
4 0
5 0
Pe
rc
en
tag
e o
f T
ota
l F
att
y
Ac
ids
(%
) **
*
T o tal O
me g a -3
A L AE P A
D P A D H A
0
1
2
3
4
5
6
Pe
rc
en
tag
e o
f T
ota
l F
att
y
Ac
ids
(%
)
***
***
*
***
*
H ig h L A (3 6 % fa t )
H ig h L A (1 8 % fa t )
L o w L A (1 8 % fa t )
L o w L A (3 6 % fa t )
A
B
146
6 MANUSCRIPT 4: EXPRESSION OF CHOLESTEROL PACKAGING
AND TRANSPORT GENES IN HUMAN AND RAT PLACENTA:
IMPACT OF OBESITY AND A HIGH FAT DIET
Draycott, SAV, Daniel, Z, Khan, R, Elmes, MJ, Muhlhausler, BS & Langley-Evans,
SC (2019). Expression of cholesterol packaging and transport genes in human and
rat placenta: impact of obesity and a high-fat diet. J. Dev. Orig. Health Dis
(accepted manuscript).
Author contributions can be found in Appendix C and accepted manuscript PDF can
be found in Appendix F.
This paper has been accepted for publication and will appear in a revised form in the
Journal of Developmental Origins of Health and Disease published by Cambridge
University Press.
The copyright in the material on these pages is owned by or licensed to Cambridge
University Press, or reproduced with permission from other third-party copyright
owners. It may be downloaded and printed for personal reference, but not otherwise
copied, altered in any way or transmitted to others (unless explicitly stated otherwise)
without the written permission of Cambridge University Press.
MANUSCRIPT 4
147
6.1 Abstract
Evidence suggests that sub-optimal maternal nutrition has implications for the
developing offspring. We have previously shown that exposure to a low-protein diet
during gestation was associated with upregulation of genes associated with cholesterol
transport and packaging within the placenta. This study aimed to elucidate the effect
of altering maternal dietary linoleic acid (LA; omega-6):alpha-linolenic acid (ALA;
omega-6) ratios as well as total fat content on placental expression of genes associated
with cholesterol transport. The potential for maternal BMI to be associated with
expression of these genes in human placental samples was also evaluated. Placentas
were collected from 24 Wistar rats at 20d gestation (term=21-22d gestation) that had
been fed one of four diets containing varying fatty acid compositions during
pregnancy, and from 62 women at the time of delivery. Expression of 14 placental
genes associated with cholesterol packaging and transfer were assessed in rodent and
human samples by qRT-PCR. In rats, placental mRNA expression of ApoA2, ApoC2,
Cubn, Fgg, Mttp and Ttr was significantly elevated (3-30 fold) in animals fed a high
LA (36% fat) diet, suggesting increased cholesterol transport across the placenta in
this group. In women, maternal BMI was associated with fewer inconsistent alterations
in gene expression. In summary, sub-optimal maternal nutrition is associated with
alterations in the expression of genes associated with cholesterol transport in a rat
model. This may contribute to altered fetal development and potentially programme
disease risk in later life. Further investigation of human placenta in response to specific
dietary interventions is required.
MANUSCRIPT 4
148
6.2 Introduction
Maternal nutrition can have a profound impact on fetal development and future
physiological function and metabolic health (Langley-Evans, 2015). A number of
dietary perturbations, including maternal undernutrition and low protein diets, have
been associated with increased risk of obesity and cardiovascular disease in the adult
offspring (Le Clair et al., 2009, Langley-Evans, 2013). In the context of the growing
epidemic of obesity, focus has shifted towards understanding the effects of nutritional
excess and obesity on offspring programming of disease. Studies have consistently
demonstrated that these exposures are associated with a substantial increase in the risk
of poor metabolic health in the offspring in both humans (Godfrey et al., 2017) and
animal models (Ribaroff et al., 2017). There is emerging evidence from animal studies,
however, that maternal high-fat diets also have the potential to program metabolic
outcomes in the offspring independent of the effects of maternal obesity. In addition,
these effects appear to depend not only on the amount of fat in the diet (Ainge et al.,
2011), but also on the fatty acid composition (Muhlhausler and Ailhaud, 2013,
Ramsden et al., 2013a). The majority of studies to date that have investigated the
effects of a maternal high fat diet have utilised diets high in saturated fat. However,
due to changes in population level patterns in dietary consumption (Blasbalg et al.,
2011, Sioen et al., 2017), attention has now shifted toward the roles of polyunsaturated
fats within the diet.
The mechanisms underlying this early life programming of obesity and metabolic
disease are not completely understood. However, as the sole interface between the
mother and the fetus, structural and functional changes within the placenta have been
implicated as playing a key role (Tarrade et al., 2015). Cholesterol is present in every
cell of the human body and an adequate supply is therefore critical for supporting
normal fetal development. As the precursor for all steroid hormone synthesis,
cholesterol also plays an important role in placental function. During pregnancy, the
fetus obtains cholesterol via endogenous synthesis as well as transfer across the
placenta from the maternal circulation, disturbances to either of these processes have
negative impacts on fetal growth, cell proliferation, metabolism and the organisation
of tissues (Singh et al., 2013, Fernandez et al., 2005). The endogenous synthesis of
cholesterol appears to be most critical for the developing fetus, as defects in this
MANUSCRIPT 4
149
pathway are known to be lethal (Porter, 2002). Sub-optimal maternal contribution of
cholesterol across the placenta, however, has been associated with lower birthweight
(Maymunah et al., 2014, Edison et al., 2007) and microcephaly (Edison et al., 2007)
in humans, highlighting the importance of this exogenous cholesterol supply.
Transport of cholesterol across the placenta is a complex process in both humans and
rodents (Baardman et al., 2013, Woollett, 2011). Briefly, the majority of cholesterol
circulates the body in the form of HDL, LDL and VLDL cholesterol, which are
associated with specific structural apolipoproteins (ApoA2, ApoB and ApoC2
respectively). The layer of trophoblast cells, located closest to maternal circulation,
take in LDL and VLDL through their respective receptors. HDL cholesterol can be
taken up via a specific receptor (scavenger receptor class B type 1; SR-B1) or by
binding to proteins such as megalin and cubilin (Cubn). Once within the cell,
cholesterol is hydrolysed into free cholesterol, bound to sterol carrier proteins and then
transferred to the basolateral membrane where it passes through the fetoplacental
endothelium. The processes governing cholesterol efflux from the endothelial layer
are poorly understood, although it has been shown that exogenous cholesterol is
secreted into fetal circulation, through association with various transporters (Stefulj et
al., 2009), where it is repackaged into fetal lipoproteins. This process is facilitated by
microsomal triglyceride transfer protein (Mttp). The finding that the placenta expresses
and secretes its own apolipoproteins such as ApoB (Madsen et al., 2004) also raises
the possibility that cholesterol is repackaged into HDL, LDL and VLDL cholesterol
within the placenta itself.
In addition to its critical role in fetal growth and development, there is emerging
evidence that alterations in placental cholesterol transfer capacity may also be a
contributing factor to metabolic programming. In a previous study (Daniel et al.,
2016), we showed providing rats with a low protein diet until day 13 of gestation, a
dietary treatment previously associated with programming of obesity, hypertension
and glucose intolerance in adult offspring (Langley and Jackson, 1994, Erhuma et al.,
2007b), resulted in increased placental expression of a number of genes associated
with cholesterol and lipoprotein transport and metabolism in the rat.
Given the similarity in the metabolic phenotype induced by maternal
obesity/nutritional excess and low protein diets, we hypothesised that programming of
MANUSCRIPT 4
150
health and disease is driven by perturbations of a small set of common ‘gatekeeper’
processes (Swali et al., 2011, McMullen et al., 2012) and changes in placental
cholesterol transfer and metabolism may be common mechanisms underlying
metabolic programming by different dietary exposures. Therefore, the aim of this
current study was to investigate the effect of a high maternal dietary omega-6:omega-
3 fatty acid ratio, associated with decreased placental weight (Draycott et al., 2019),
against a lower ratio as well as total fat intake, on the expression of genes associated
with cholesterol and lipoprotein transport, known to be affected by maternal diet, in
the mature placenta of the rat. We also aimed to investigate whether placental
expression of these same genes differed according to maternal body mass index (BMI)
in a cohort of pregnant women.
6.3 Materials and Methods
6.3.1 Animal experiments and sample collection
This paper reports data from the analysis of placentas that were collected as part of a
previous study (Draycott et al., 2019). Virgin female Wistar rats (n = 24; 75-100 g;
Charles River, UK) were housed on wood shavings in individually ventilated cages
under a 12 h light/12 h dark cycle at a temperature of 20–22 °C and had ad libitum
access to food and water throughout the experiment. Female rats were allowed to
acclimatise to the unit for 1–2 weeks, during which time they were fed on standard
laboratory chow (2018 Teklad Global 18% Protein Rodent Diet, Harlan Laboratories,
UK). After acclimatisation, a tail vein blood sample was taken from each animal for
the determination of fatty acid status. The rats were then randomly assigned to one of
4 dietary groups designed to provide either a high (9:1, high LA) or low (1:1.5 low
LA) ratio of linoleic acid (LA) to alpha-linolenic acid (ALA), achieved by altering the
amounts of flaxseed and sunflower oil included in the fat component of the feed. The
levels of saturated fatty acids (SFA) and monounsaturated fatty acids (MUFA) were
comparable in all diets, achieved by adjusting the amounts of coconut (SFA source)
and macadamia (MUFA source) oils in the diets. For each level of LA, diets containing
either 18% or 36% fat by weight were developed. This resulted in four experimental
diets; high LA (18% fat), high LA (36% fat), low LA (18% fat) and low LA (36% fat;
n =5–7 per dietary group). The list of ingredients and final fatty acid composition of
the four experimental diets have been published previously (Draycott et al., 2019).
MANUSCRIPT 4
151
All animal procedures were performed in accordance with the Animals (Scientific
Procedures) Act 1986 under Home Office licence and were approved by the Animal
Ethics Committee of the University of Nottingham, UK. Animals were pair housed
from the start of the experiment until mating, after confirmation of conception animals
were individually housed until completion of the experiment. Animals were
maintained on their allocated diet for a four week ‘feed-in’ period after which they
were mated. Conception was confirmed by the presence of a semen plug and this was
recorded as day 0 of pregnancy. Female rats remained on their respective diets until
day 20 of gestation (full term = 22 days) at which time rat dams were euthanised by
CO2 asphyxiation and cervical dislocation and fetuses by cervical dislocation and
exsanguination. All fetuses were weighed and sexed via measurement of anogenital
distance. Placentas from male fetuses were collected for analysis and a tail sample
from the fetus was collected for sex-genotyping by PCR for the SRY gene (McClive
and Sinclair, 2001). Any samples found to be female or inconclusive (n = 5) were not
included in placental gene expression analysis. Full details of maternal weight gain,
food intake and the effect of the diets on fetal and placental weight are published
elsewhere (Draycott et al., 2019).
6.3.2 Human placental sample collection
Ethical approval for the study was obtained from the Derbyshire Research Ethics
Committee (Ref: 09/H0401/90). Placental samples were obtained from patients
attending the Department of Obstetrics and Gynaecology, Royal Derby Hospital,
Derby, UK. Patients provided informed, written consent prior to undergoing elective
caesarean section at term gestation (>37 weeks), indications for which were maternal
request, previous elective section or breech presentation while cases with diabetes,
hypertension, pre-eclampsia were excluded. Placentae, once checked by the midwife
and with the cord clamped, were transported to the lab within 20 minutes of delivery,
where placental villous samples were taken midway between the cord insertion site
and placental periphery and frozen at -80°C prior to extraction of RNA. Participants
were stratified based on a BMI measurement taken during an antenatal clinic
appointment, resulting in 3 groups of women; BMI <25 kg/m2 (n=20), BMI 25-35
kg/m2 (n=21) and BMI >35 kg/m2 (n=21).
MANUSCRIPT 4
152
6.3.3 Sample preparation and PCR
RNA was isolated from 20-25mg of crushed snap-frozen human or rat placental tissue
using the Roche High Pure Tissue kit (Roche Diagnostics Ltd., UK) according to
manufacturer’s instructions. RNA concentration was determined using a Nanodrop
2000 (Thermo Scientific) and RNA quality was evaluated by agarose gel
electrophoresis. cDNA was synthesised using a RevertAid™ reverse transcriptase kit
(Thermo Fisher Scientific, UK) with random hexamer primers.
Gene targets were chosen based on our previous data (Daniel et al., 2016) where
RNASeq analysis of day 13 rat placentas revealed differential expression of 91 genes
in response to maternal protein restriction. Ingenuity pathway analysis identified 8
pathways that were significantly affected (P<0.001), 6 of which were closely related
functionally with a strong emphasis of cholesterol uptake and efflux across the
placenta. Genes were selected based upon the ingenuity analysis (ApoA2, ApoB,
ApoC2, Ttr, Fgg, serpin G1 and Rbp4). Additional genes were chosen that were shown
to be differentially expressed in the protein restricted condition (Vil1, Gpc3, Prf1,
Cubn, Mttp) but not associated with pathways identified by Ingenuity analysis. Tagln
and Tbp gene targets were also chosen as preliminary RNASeq analysis suggested that
they may be sensitive to maternal dietary factors, resulting in 14 target genes for
analysis. Real-time PCR primers were designed using Primer Express software
(version 1.5; Applied Biosystems) from the RNA sequence, checked using BLAST
(National Centre for Biotechnology Information) and were purchased from Sigma
(UK). The primer sequences can be found in Supplementary Table 6.4. Real-time PCR
was performed on a LightCycler 480 (Roche, Burgess Hill, UK) using the 384 well
format. Each reaction contained 5μl of cDNA with the following reagents: 7.5μl SYBR
green master mix (Roche), 0.45μl forward and reverse primers (final concentration
0.3μM each) and 1.6μl RNase-free H2O. Samples were pre-incubated at 95°C for 5
min followed by 45 PCR amplification cycles (denaturation, 95°C for 10 seconds;
annealing, 60°C for 15 seconds; elongation, 72°C for 15 seconds). Transcript
abundance was determined using a standard curve generated from serial dilutions of a
pool of cDNA made from all samples. Expression was normalised against the
expression of cyclophilin A, which was not significantly different between
experimental groups.
MANUSCRIPT 4
153
6.3.4 Statistical Analysis
Data are presented as mean ± SEM. Data were analysed using the Statistical Package
for Social Sciences (Version 24, SPSS Inc.). For animal data, the effect of maternal
dietary fatty acid ratio and maternal dietary fat content on placental expression of
target genes was assessed using a two-way ANOVA, with dietary fat level and
LA:ALA ratio as factors. Human data were analysed using a one-way ANOVA with
maternal BMI as a factor. Possible co-variates were identified and corrected for within
the analysis. A value of P<0.05 was considered statistically significant.
6.4 Results
6.4.1 Rat placenta
The results of the gene expression analyses in the rodent placentas are shown in Table
6.1. Expression was measured for 13 genes (ApoB excluded), however, Tbp expression
was not detectable in any of the samples (data not shown) and so could not be included
in the analysis.
Placental Mttp mRNA expression was significantly increased (3 fold; P<0.01) in dams
consuming a high LA compared to a low LA diet, independent of total dietary fat
content (Table 6.1). There was a significant interaction between the effects of maternal
total dietary fat and LA content in relation to mRNA expression of ApoA2, ApoC2,
Cubn, Fgg, Rbp4 and Ttr (P<0.05), such that expression of these genes was
significantly increased in rats consuming the high LA diets, but only when dietary fat
content was also high (36% fat w/w). The magnitude of this effect was greatest for
Cubn (30-fold increase in the high LA (36% fat) group when compared to the low LA
(36% fat) group). A similar pattern was observed for other key cholesterol-transport
and metabolism genes in the placenta (Gpc3, P=0.072; Vil1, P=0.054), with 1.5-7 fold
higher expression in placentas of dams exposed to a high LA diet, but only when
dietary fat content was also high. Placental expression of Prf1, SerpinG1 and Tagln
was not affected by either maternal dietary fatty acid ratio or fat content.
MANUSCRIPT 4
154
6.4.2 Human placenta
The sociodemographic and clinical characteristics of the women who provided
placental samples for this study are summarised in Table 6.2. The average age, parity
and gestation length of women within this study were similar between women in the
three BMI groups, however the birth weights of infants born to women with a BMI
>25 kg/m2 were significantly greater than those of women in the normal BMI range.
The results of the gene expression analyses in the human placentas are shown in Table
6.3. All 14 genes were measured and detected in these samples. Women with a BMI
in the 25-35 kg/m2 range (overweight to obese) exhibited a 2-6 fold higher mRNA
expression of ApoB in their placental samples compared to women with a BMI either
<25 or >35 kg/m2. The expression of Rbp4 was significantly lower in placentas
obtained from women with a BMI >25 kg/m2 compared to those with a BMI <25 kg/m2
(85% down-regulation, P=0.001). A similar pattern was also observed for Ttr, with 71-
88% down-regulation of expression in women with a BMI >25 kg/m2, although this
was not statistically significant (P=0.053). The mRNA of other placental genes was
not different between BMI groups.
6.5 Discussion
This experiment aimed to test the hypothesis that maternal diet, specifically, fatty acid
composition and quantity, and obesity would influence the expression of genes
associated with cholesterol uptake and transport in rat and human placenta. The results
of the rat studies suggested clear effects of maternal dietary fat content and
composition, such that maternal consumption of a higher-fat, high LA maternal diet
was associated with increased expression of key genes associated with these pathways,
suggesting enhanced cholesterol transport to the fetus in this group. In the human
study, however, only two of these genes were differentially expressed in placentas
from women in different BMI categories, suggesting that maternal obesity had a
limited impact on placental cholesterol transport at the level of gene expression.
Within this study, we have shown that exposure to a high LA, high-fat diet resulted in
increased expression of genes involved in the formation of apolipoproteins, cholesterol
uptake and cholesterol repackaging. These differences were not observed when either
the fat content and/or the fatty acid ratio was altered, suggesting a strong interaction
MANUSCRIPT 4
155
between these variables. Importantly, the effects observed on the placental gene
expression profiles show striking resemblances to our previous findings (Daniel et al.,
2016) where upregulation of these genes was observed in the placentas of dams
exposed to a low protein diet. These data suggest that, not only do these differences
persist to a late stage placenta (day 20), but, despite different dietary interventions, the
similarities in results suggest a common mechanism of action. The upregulation of key
genes in the rat placenta observed in this study suggests a state of increased cholesterol
uptake and efflux. While the potential impacts of this in the current study are not clear,
it has been demonstrated in previous studies that exposure to excess cholesterol during
fetal development can be associated with adverse outcomes. In rodent models,
maternal hypercholesterolemia has been associated with growth restriction (Bhasin et
al., 2009), altered liver development (El-Sayyad et al., 2014) and atherosclerosis
(Napoli et al., 2002, Goharkhay et al., 2007). In humans, maternal
hypercholesterolaemia has been associated with the development of fatty streaks in
fetal arteries and cholestasis during pregnancy is associated with programming of an
overweight, insulin resistant phenotype in the child (Papacleovoulou et al., 2013,
Napoli et al., 1997). It will therefore be important in future studies to determine the
longer term consequence of the changes in placental gene expression for the postnatal
offspring.
Based on the substantial impact of maternal high-fat high LA feeding, a dietary pattern
commonly observed in the modern Western diet, we extended our study to determine
if there was any evidence to suggest an effect of maternal obesity on cholesterol
transfer in the human. There were, however, relatively few differences in the
expression of key genes associated with different BMI categories in human placental
samples, although there were some subtle differences in the expression of 3 genes
(ApoB, Rbp4 and Ttr) between BMI categories. Ttr is a protein that binds to and
transports Rbp4. In the bound state, Rbp4 is protected from glomerular filtration and
so levels of these two proteins are often correlated. As such, the similar patterns of
expression across these two genes observed in this study was anticipated. What was
surprising, however, was our finding that women with a BMI above the normal range
(>25 kg/m2, overweight or obese) exhibited decreased placental expression of these
genes since elevated levels of circulating Rbp4 have been associated with many of the
co-morbidities linked to obesity including hypertension (Solini et al., 2009), insulin
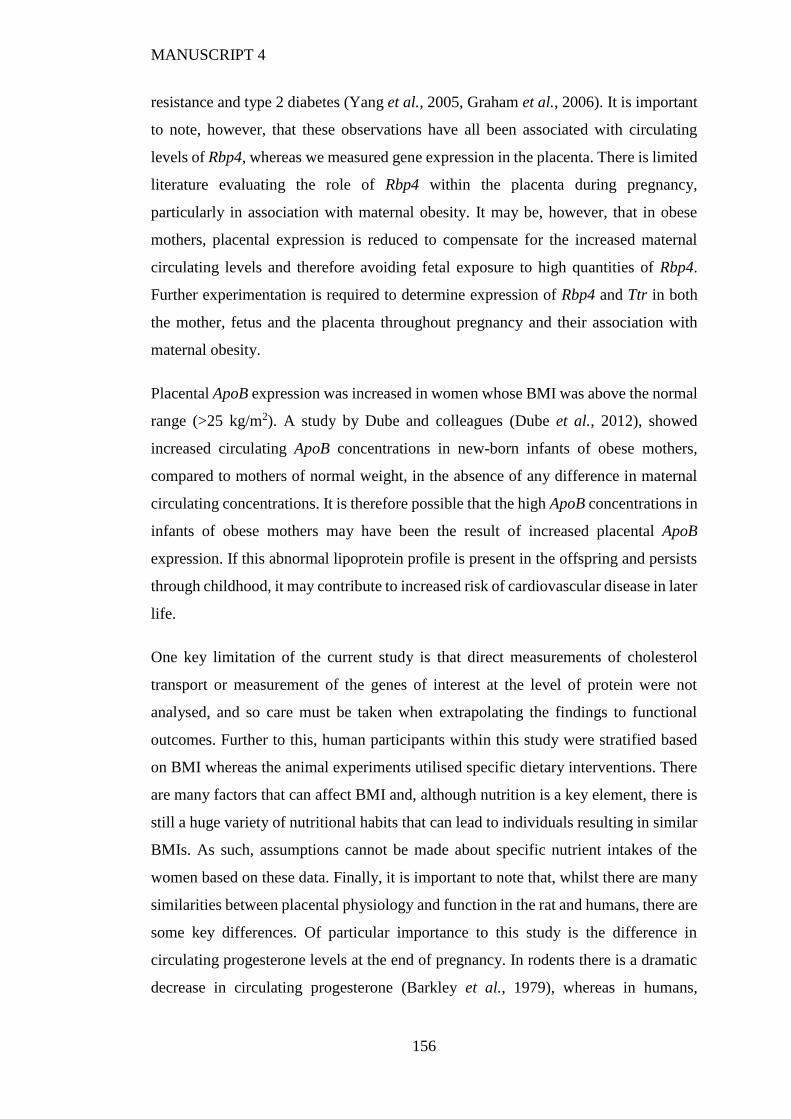
MANUSCRIPT 4
156
resistance and type 2 diabetes (Yang et al., 2005, Graham et al., 2006). It is important
to note, however, that these observations have all been associated with circulating
levels of Rbp4, whereas we measured gene expression in the placenta. There is limited
literature evaluating the role of Rbp4 within the placenta during pregnancy,
particularly in association with maternal obesity. It may be, however, that in obese
mothers, placental expression is reduced to compensate for the increased maternal
circulating levels and therefore avoiding fetal exposure to high quantities of Rbp4.
Further experimentation is required to determine expression of Rbp4 and Ttr in both
the mother, fetus and the placenta throughout pregnancy and their association with
maternal obesity.
Placental ApoB expression was increased in women whose BMI was above the normal
range (>25 kg/m2). A study by Dube and colleagues (Dube et al., 2012), showed
increased circulating ApoB concentrations in new-born infants of obese mothers,
compared to mothers of normal weight, in the absence of any difference in maternal
circulating concentrations. It is therefore possible that the high ApoB concentrations in
infants of obese mothers may have been the result of increased placental ApoB
expression. If this abnormal lipoprotein profile is present in the offspring and persists
through childhood, it may contribute to increased risk of cardiovascular disease in later
life.
One key limitation of the current study is that direct measurements of cholesterol
transport or measurement of the genes of interest at the level of protein were not
analysed, and so care must be taken when extrapolating the findings to functional
outcomes. Further to this, human participants within this study were stratified based
on BMI whereas the animal experiments utilised specific dietary interventions. There
are many factors that can affect BMI and, although nutrition is a key element, there is
still a huge variety of nutritional habits that can lead to individuals resulting in similar
BMIs. As such, assumptions cannot be made about specific nutrient intakes of the
women based on these data. Finally, it is important to note that, whilst there are many
similarities between placental physiology and function in the rat and humans, there are
some key differences. Of particular importance to this study is the difference in
circulating progesterone levels at the end of pregnancy. In rodents there is a dramatic
decrease in circulating progesterone (Barkley et al., 1979), whereas in humans,
MANUSCRIPT 4
157
progesterone levels are increased or at least maintained at the time of parturition (Tal
et al., 2000). Progesterone is a key steroid produced from cholesterol within the
placenta and has been shown to regulate the expression of some genes including Rbp4
in other tissues (Mullen et al., 2012). As such, careful consideration of the differences
in placental hormone production, particularly steroid hormones, between the two
species should be made when drawing comparisons.
In conclusion, this study aimed to elucidate whether differences in placental expression
of genes involved in cholesterol transport and efflux were associated with altered
maternal nutrition in a manner similar to our previous observations in the low-protein
model. We demonstrated that exposure to high levels of omega-6 as part of a high-fat
diet elicited a similar pattern of placental gene expression, suggesting an increase in
cholesterol transport across the placenta. This highlights the potential for a common
mechanism by which sub-optimal maternal nutrition during pregnancy alters placental
function, and potentially fetal development, resulting in increased risk of disease in
later life. We then carried out a preliminary study which aimed to establish if similar
alterations were observed in human placentas. Although BMI was associated with
some changes in expression, these observations were not consistent and further
experimentation is required on placental samples where the specific nutrient intake of
the participants are known.
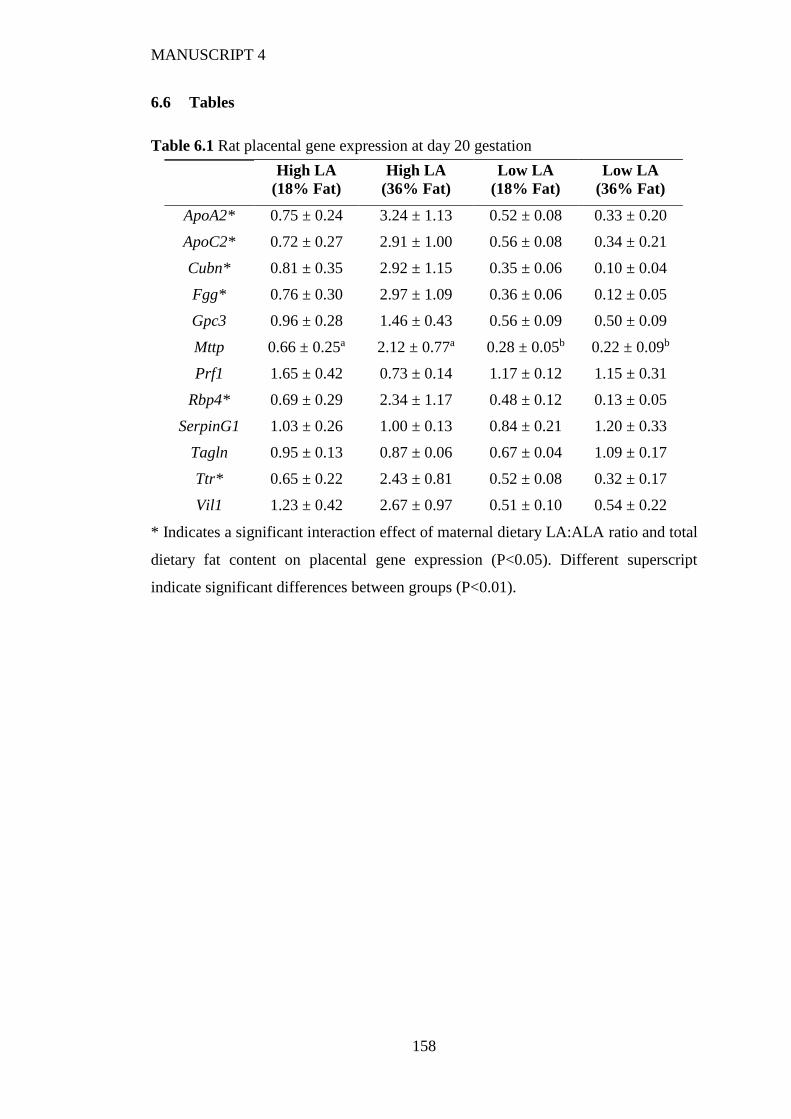
MANUSCRIPT 4
158
6.6 Tables
Table 6.1 Rat placental gene expression at day 20 gestation
* Indicates a significant interaction effect of maternal dietary LA:ALA ratio and total
dietary fat content on placental gene expression (P<0.05). Different superscript
indicate significant differences between groups (P<0.01).
High LA
(18% Fat)
High LA
(36% Fat)
Low LA
(18% Fat)
Low LA
(36% Fat)
ApoA2* 0.75 ± 0.24 3.24 ± 1.13 0.52 ± 0.08 0.33 ± 0.20
ApoC2* 0.72 ± 0.27 2.91 ± 1.00 0.56 ± 0.08 0.34 ± 0.21
Cubn* 0.81 ± 0.35 2.92 ± 1.15 0.35 ± 0.06 0.10 ± 0.04
Fgg* 0.76 ± 0.30 2.97 ± 1.09 0.36 ± 0.06 0.12 ± 0.05
Gpc3 0.96 ± 0.28 1.46 ± 0.43 0.56 ± 0.09 0.50 ± 0.09
Mttp 0.66 ± 0.25a 2.12 ± 0.77a 0.28 ± 0.05b 0.22 ± 0.09b
Prf1 1.65 ± 0.42 0.73 ± 0.14 1.17 ± 0.12 1.15 ± 0.31
Rbp4* 0.69 ± 0.29 2.34 ± 1.17 0.48 ± 0.12 0.13 ± 0.05
SerpinG1 1.03 ± 0.26 1.00 ± 0.13 0.84 ± 0.21 1.20 ± 0.33
Tagln 0.95 ± 0.13 0.87 ± 0.06 0.67 ± 0.04 1.09 ± 0.17
Ttr* 0.65 ± 0.22 2.43 ± 0.81 0.52 ± 0.08 0.32 ± 0.17
Vil1 1.23 ± 0.42 2.67 ± 0.97 0.51 ± 0.10 0.54 ± 0.22
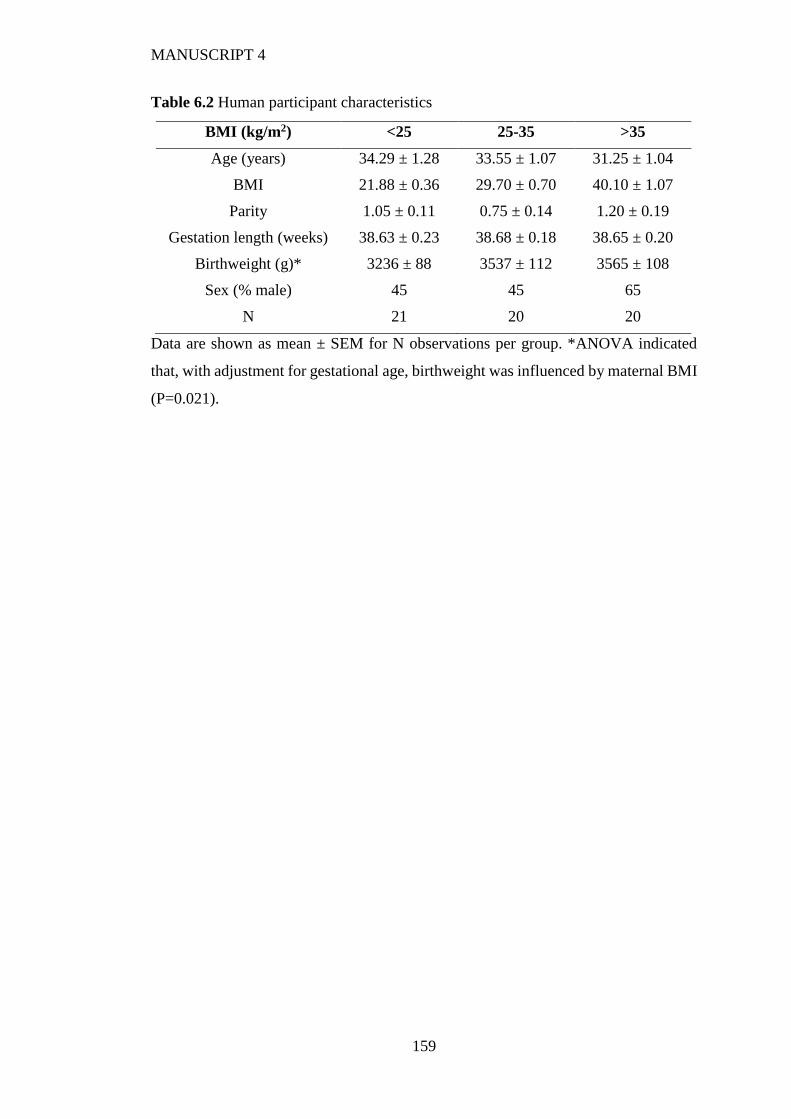
MANUSCRIPT 4
159
Table 6.2 Human participant characteristics
Data are shown as mean ± SEM for N observations per group. *ANOVA indicated
that, with adjustment for gestational age, birthweight was influenced by maternal BMI
(P=0.021).
BMI (kg/m2) <25 25-35 >35
Age (years) 34.29 ± 1.28 33.55 ± 1.07 31.25 ± 1.04
BMI 21.88 ± 0.36 29.70 ± 0.70 40.10 ± 1.07
Parity 1.05 ± 0.11 0.75 ± 0.14 1.20 ± 0.19
Gestation length (weeks) 38.63 ± 0.23 38.68 ± 0.18 38.65 ± 0.20
Birthweight (g)* 3236 ± 88 3537 ± 112 3565 ± 108
Sex (% male) 45 45 65
N 21 20 20
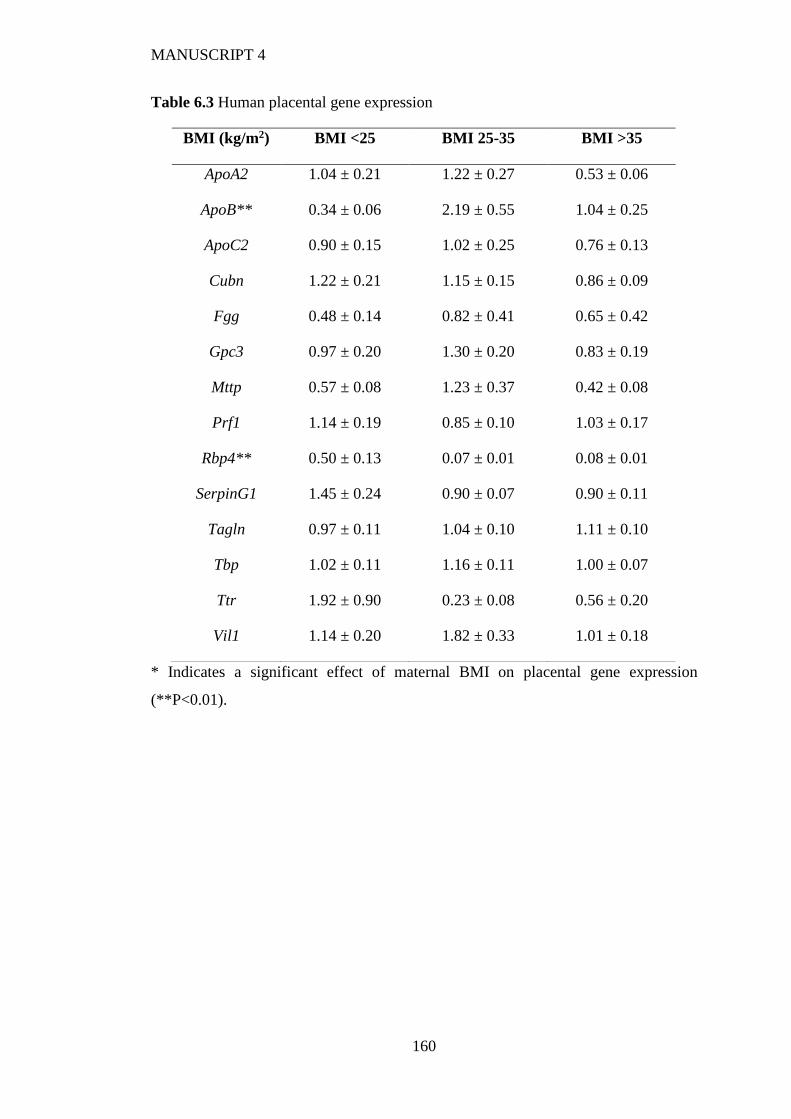
MANUSCRIPT 4
160
Table 6.3 Human placental gene expression
* Indicates a significant effect of maternal BMI on placental gene expression
(**P<0.01).
BMI (kg/m2) BMI <25 BMI 25-35 BMI >35
ApoA2 1.04 ± 0.21 1.22 ± 0.27 0.53 ± 0.06
ApoB** 0.34 ± 0.06 2.19 ± 0.55 1.04 ± 0.25
ApoC2 0.90 ± 0.15 1.02 ± 0.25 0.76 ± 0.13
Cubn 1.22 ± 0.21 1.15 ± 0.15 0.86 ± 0.09
Fgg 0.48 ± 0.14 0.82 ± 0.41 0.65 ± 0.42
Gpc3 0.97 ± 0.20 1.30 ± 0.20 0.83 ± 0.19
Mttp 0.57 ± 0.08 1.23 ± 0.37 0.42 ± 0.08
Prf1 1.14 ± 0.19 0.85 ± 0.10 1.03 ± 0.17
Rbp4** 0.50 ± 0.13 0.07 ± 0.01 0.08 ± 0.01
SerpinG1 1.45 ± 0.24 0.90 ± 0.07 0.90 ± 0.11
Tagln 0.97 ± 0.11 1.04 ± 0.10 1.11 ± 0.10
Tbp 1.02 ± 0.11 1.16 ± 0.11 1.00 ± 0.07
Ttr 1.92 ± 0.90 0.23 ± 0.08 0.56 ± 0.20
Vil1 1.14 ± 0.20 1.82 ± 0.33 1.01 ± 0.18
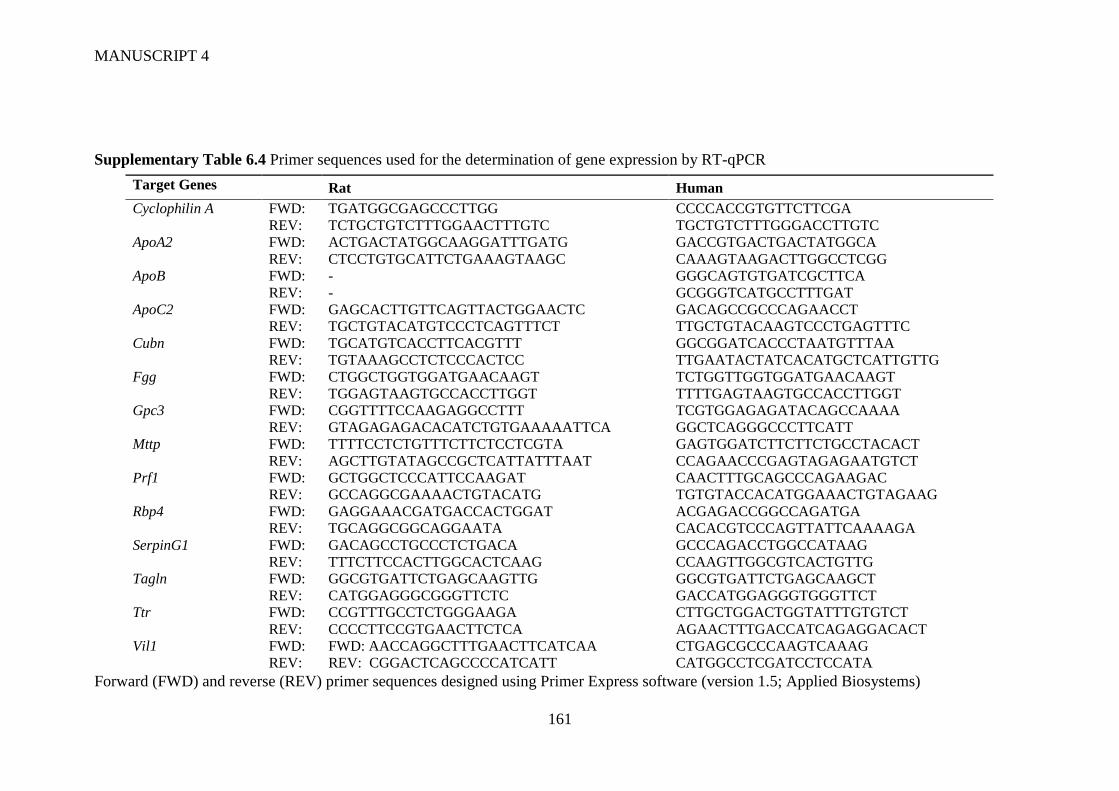
MANUSCRIPT 4
161
Supplementary Table 6.4 Primer sequences used for the determination of gene expression by RT-qPCR
Forward (FWD) and reverse (REV) primer sequences designed using Primer Express software (version 1.5; Applied Biosystems)
Target Genes Rat Human
Cyclophilin A FWD:
REV:
TGATGGCGAGCCCTTGG
TCTGCTGTCTTTGGAACTTTGTC
CCCCACCGTGTTCTTCGA
TGCTGTCTTTGGGACCTTGTC
ApoA2 FWD:
REV:
ACTGACTATGGCAAGGATTTGATG
CTCCTGTGCATTCTGAAAGTAAGC
GACCGTGACTGACTATGGCA
CAAAGTAAGACTTGGCCTCGG
ApoB FWD:
REV:
-
-
GGGCAGTGTGATCGCTTCA
GCGGGTCATGCCTTTGAT
ApoC2 FWD:
REV:
GAGCACTTGTTCAGTTACTGGAACTC
TGCTGTACATGTCCCTCAGTTTCT
GACAGCCGCCCAGAACCT
TTGCTGTACAAGTCCCTGAGTTTC
Cubn FWD:
REV:
TGCATGTCACCTTCACGTTT
TGTAAAGCCTCTCCCACTCC
GGCGGATCACCCTAATGTTTAA
TTGAATACTATCACATGCTCATTGTTG
Fgg FWD:
REV:
CTGGCTGGTGGATGAACAAGT
TGGAGTAAGTGCCACCTTGGT
TCTGGTTGGTGGATGAACAAGT
TTTTGAGTAAGTGCCACCTTGGT
Gpc3 FWD:
REV:
CGGTTTTCCAAGAGGCCTTT
GTAGAGAGACACATCTGTGAAAAATTCA
TCGTGGAGAGATACAGCCAAAA
GGCTCAGGGCCCTTCATT
Mttp FWD:
REV:
TTTTCCTCTGTTTCTTCTCCTCGTA
AGCTTGTATAGCCGCTCATTATTTAAT
GAGTGGATCTTCTTCTGCCTACACT
CCAGAACCCGAGTAGAGAATGTCT
Prf1 FWD:
REV:
GCTGGCTCCCATTCCAAGAT
GCCAGGCGAAAACTGTACATG
CAACTTTGCAGCCCAGAAGAC
TGTGTACCACATGGAAACTGTAGAAG
Rbp4 FWD:
REV:
GAGGAAACGATGACCACTGGAT
TGCAGGCGGCAGGAATA
ACGAGACCGGCCAGATGA
CACACGTCCCAGTTATTCAAAAGA
SerpinG1 FWD:
REV:
GACAGCCTGCCCTCTGACA
TTTCTTCCACTTGGCACTCAAG
GCCCAGACCTGGCCATAAG
CCAAGTTGGCGTCACTGTTG
Tagln FWD:
REV:
GGCGTGATTCTGAGCAAGTTG
CATGGAGGGCGGGTTCTC
GGCGTGATTCTGAGCAAGCT
GACCATGGAGGGTGGGTTCT
Ttr FWD:
REV:
CCGTTTGCCTCTGGGAAGA
CCCCTTCCGTGAACTTCTCA
CTTGCTGGACTGGTATTTGTGTCT
AGAACTTTGACCATCAGAGGACACT
Vil1 FWD:
REV:
FWD: AACCAGGCTTTGAACTTCATCAA
REV: CGGACTCAGCCCCATCATT
CTGAGCGCCCAAGTCAAAG
CATGGCCTCGATCCTCCATA
162
7 GENERAL DISCUSSION
As discussed in Chapter 1, the well-established phenomenon that changes in the
maternal diet can have a lasting impact on the offspring has resulted in the
investigation into the role of a wide range of dietary insults (caloric restriction, low
protein diets, cafeteria diets, high-fat diets) on offspring disease risk in later life.
Animal models have been critical in establishing biological feasibility of the DOHaD
hypothesis due to the ability to precisely control dietary intakes in experimental animal
studies in a way that is not possible in human trials, and also offer the means to
investigate mechanistic drivers. The reproducibility of common offspring phenotypes
associated with the MetS, as a result of a wide variety of nutritional insults during early
development, provides a strong evidence base to support the role of these dietary
influences in early-life programming of metabolic disturbance. It also alludes to the
potential of a common underlying mechanism linking different maternal dietary
perturbations to increased lifelong risk of obesity and metabolic disease in the
offspring (McMullen et al., 2012).
Increases in the intake of LA in Western populations has been documented in several
large scale studies (Blasbalg et al., 2011, Ailhaud et al., 2006) and has coincided with
large increases in the prevalence of obesity (WHO, 2017a). As such, the number of
women of reproductive age who are consuming a high omega-6:omega-3 ratio, in the
context of an obesogenic dietary pattern, has increased drastically over the last 60 years
and this coincides with increases in the levels of LA in breast milk (Ailhaud et al.,
2006). The pro-inflammatory and pro-adipogenic effects of omega-6 fatty acids and
their eicosanoid derivatives have been characterized through in vitro and experimental
animal studies (Massiera et al., 2003, Massiera et al., 2010). This has led to the
hypothesis that increased consumption of omega-6 PUFA, relative to omega-3 PUFA,
in many Western countries, including the UK, Australia and the US, is contributing to
the intergenerational cycle of obesity and prevalence of inflammatory conditions
including diabetes as CVD.
Observational studies in humans and experimental animal studies that have attempted
to elucidate the role of high omega-6 intakes during pregnancy on the offspring
provide some evidence to suggest that this dietary pattern is associated with negative
effects on the metabolic health of the progeny (Massiera et al., 2010, Korotkova et al.,
GENERAL DISCUSSION
163
2002, Much et al., 2013). However, the number of studies investigating the effect of
altering the maternal omega-6:omega-3 ratio on offspring body composition has been
limited. Animal studies specifically investigating the impact of increased maternal
dietary omega-3 intake on offspring adiposity, however, have produced conflicting
results, with some studies reporting decreased (Massiera et al., 2003, Wyrwoll et al.,
2006, Donahue et al., 2011) and others reporting increased (Muhlhausler et al., 2011b)
offspring fat mass.
The lack of studies in this area and inconsistencies between study designs (including
dose and timing of dietary interventions) and reported outcomes has been highlighted
as a key issue for drawing clear conclusions regarding the potential role of omega-3
and omega-6 PUFA, and the ratio between them, in cardiometabolic programming
(Muhlhausler et al., 2011a). One of the key limitations of most existing animal studies
in this area is the use of diets with much higher omega-6:omega-3 PUFA (>200:1;
Korotkova et al. (2002)) than that encountered in typical human diets. These diets are
often also fed in the context of a low overall fat content (~5% energy), owing to the
composition of most commercially available rodent diets, making translation of
findings to humans difficult. In addition, in most studies, offspring continued to have
access to the same diet as their mother after weaning, so that any effects observed
cannot be clearly attributed to dietary fatty acid exposure during the gestation and
lactation periods (Muhlhausler et al., 2011b, Ibrahim et al., 2009, Muhlhausler et al.,
2011a). Finally, no studies prior to this thesis had examined the effects of an increased
maternal omega-6:omega-3 ratio on maternal, placental and fetal outcomes before
birth. The central aim of this thesis, therefore, was to investigate the role of the omega-
6:omega-3 ratio in the maternal diet on offspring health outcomes (such as growth, fat
deposition, tissue composition and blood pressure) taking into consideration these
limitations and addressing the identified gaps in knowledge.
A key feature of the work described in this thesis was that the diets designed for the
experiments were novel and overcame many of the limitations of diets used in previous
studies as they were designed to reflect current intakes and recommendations typical
of human diets. The LA:ALA ratio of 9:1 was comparable with current estimations of
population intakes in the US (Blasbalg et al., 2011) and the ratio of 1:1.5 was selected
to represent an ‘ideal’ ratio and was based on maximal conversion of precursor fatty
GENERAL DISCUSSION
164
acids to biologically active long-chain derivatives (Gibson et al., 2011, Lands, 2000,
Gibson et al., 2013). The total fat, as well as the composition of SFA, MUFA and total
PUFA in the 18% fat w/w diets, was in line with recommended intakes for a healthy
diet (FAO and WHO, 2008) and the high-fat diet used in the experiments represented
a doubling of this amount, which is more consistent with the higher fat diets in the
human context than semi-synthetic high-fat rodent diets.
Taken together the results from maternal whole blood fatty acid analysis in
experimental Chapters 3 and 4 confirmed that manipulation of the fatty acid
composition of the diet was reflected in the circulating fatty acid profile of the dams.
Consistent with previous studies (Tu et al., 2010, Blank et al., 2002, Brenna et al.,
2009), we demonstrated that lowering the LA:ALA ratio was not sufficient to produce
sustained increases in DHA synthesis at either levels of total PUFA tested. A possible
reason for this was that the amount of ALA in the low LA:ALA ratio groups (5-9%en)
was sufficient to saturate the Δ6-desaturase enzyme that is utilised for both the
conversion of ALA to EPA and DPA to DHA (Figure 1.5). In support of this, the level
was notably higher than ALA levels in a number of previous studies that had achieved
increases in DHA synthesis (Tu et al., 2010, Gibson et al., 2013, Gibson et al., 2011)
where increases in DHA production were only observed when ALA was <2% energy.
This adds to the hypothesis that, despite achieving a low LA:ALA ratio in the diet, the
conversion of ALA to DHA is inhibited when total ALA (%en) is high (Chan et al.,
1993, Mantzioris et al., 1994, Cleland et al., 1992). Despite a maintained increase in
the production of EPA in response to a low LA:ALA ratio in these studies, the inability
of the diets to increase levels of DHA may help to explain some of the findings as
DHA has been shown to be central to many of the beneficial effects observed with
respect to omega-3 fatty acids. In future experiments, diets would be designed with the
aim to maintain a low LA:ALA ratio, but also to ensure that the overall ALA (%
energy) was low.
The finding that diets containing 36% w/w fat did not lead to increases in bodyweight
and fat mass in the dams was surprising and may be cause for criticism as to whether
these studies are representative of the human population, where consumption of a high-
fat diet is often coupled with obesity. However, since maternal obesity has been shown
to exert effects independent of the maternal diet (White et al., 2009), the animal model
GENERAL DISCUSSION
165
in this thesis provides an opportunity to examine the effects of dietary manipulation
independent of the effects associated with maternal obesity. Therefore, it was possible
investigate hypotheses under the assumption that any observed responses were results
of the specific changes in dietary composition applied, rather than mediated via the
effects on maternal bodyweight and metabolism.
Whilst establishing the maternal state in response to the dietary interventions was
important due to the novelty of the formulated diets, assessing the fetal and offspring
response was the primary aim of this research. Taken together, the results of Chapters
3 and 6 characterised the fetal and placental response to in utero exposure to the
experimental diets. To our knowledge this was the first time that the effects of an
increased LA:ALA ratio on offspring outcomes before birth had been investigated.
When taken in the context of the complete works of this thesis, it appears that the
increased fetal weight in response to exposure to a low LA:ALA ratio in utero was
transient, and that the total fat content of the diet is a much more potent influencer of
postnatal growth than the changes in dietary fatty acid ratio investigated in this thesis.
This growth restriction of offspring exposed to a high-fat diet was prevalent at all post-
natal life stages and a novel finding of this research. The majority of existing studies
reporting decreases in offspring weight in response to a maternal high-fat diet in
rodents, utilise diets predominantly rich in SFA which are successful in producing
animal models of maternal obesity. What we have shown here is that maternal diets in
which SFA is not the predominant fat source, which are a recommendation of UK and
Australian governments, still elicit unfavourable outcomes in the offspring that are
independent of any maternal weight gain. This is important and could potentially
impact on recommendations to expectant mothers around reducing the quantity of fat
within their diet even if it has not had any unfavourable phenotypic effects on the
individuals themselves.
It is important to note that, before any extrapolations of this research can be made to
human populations, comparable studies must first be undertaken in a human cohort. A
potential limitation of this study is that reductions in offspring weight in response to a
high-fat diet is not a typical feature of human pregnancies. In fact, and as was shown
in experimental Chapter 6, exposure to a high-fat diet during gestation and lactation
often, but not always (Knudsen et al., 2008), leads to increased offspring weight in
GENERAL DISCUSSION
166
human studies. The observational nature and limitations associated with human studies
have resulted in very few, if any, studies that have reliably separated the effects of
high-fat diets with maternal obesity. Further to this, accurate information on dietary
intakes is difficult to collect and assess. As such, the translation of findings between
animal and human studies is difficult.
It is notable that studies focussed on metabolic programming have indicated that the
same phenotypes, including hypertension, insulin resistance and/or obesity can be
produced by a range of different nutritional insults, raising the possibility of a common
underlying mechanism. In addition, these phenotypes can be observed in the adult
offspring independent of whether the nutritional treatment results in changes in
offspring birthweight. In this thesis, as in most pre-clinical studies in the programming
field, the measured endpoints (fat mass, blood pressure etc.) are important indicators
of an altered metabolic phenotype but cannot alone indicate whether these changes
manifest into a disease state in later life. As such, another limitation of this research
was the short duration of the experiment and lack of establishment of an overt
phenotype in the offspring. We measured indicators of obesity and hypertension in the
offspring, however, in human populations these phenotypes, particularly hypertension,
do not often develop until later life. At 8 weeks of age, the oldest offspring in these
experiments were equivalent in development to a human teenager. Therefore, in future,
these hypotheses should be tested in offspring preferably up to 24 months in age to be
able to confidently determine whether a disease state would be established as the
animals age.
Whilst maternal dietary fat content was clearly a key determinant of offspring post-
natal growth, an altered maternal dietary LA:ALA ratio appeared to have some
transient effects on offspring liver weight, hepatic and adipose tissue lipogenesis as
well as more long-lasting effects on circulating fatty acid profiles. Many of these
observed differences, however, were no longer apparent at 8 weeks of age suggesting
that the maternal dietary influence was only capable of exerting a transient effect on
all variables measured besides post-natal growth. Whether the prolonged effect of
maternal diet on offspring growth, or indeed the transient effects of fat deposition,
lipogenesis and liver composition, have repercussions later in life remains to be
established. In addition, and despite evidence of the potential effects of increased
GENERAL DISCUSSION
167
omega-3 consumption for weight loss in adult populations, this research established
no lasting benefit to decreasing the maternal LA:ALA ratio on offspring adiposity. It
was in fact the low LA, low fat diet that resulted in increased fat mass in the offspring.
This was consistent with another animal study investigating the effect of maternal
DHA supplementation that reported increased fat mass in the offspring (Muhlhausler
et al., 2011b). Further to this, recent studies investigating the effects of maternal
omega-3 supplementation in human populations, have mostly reported no association
between maternal omega-3 intake and early-life adiposity (Li et al., 2018, Vahdaninia
et al., 2018). Studies in human populations currently only have the scope to investigate
early life indicators of adiposity and later disease risk. As such, whilst there appears to
be little advantage to increasing the omega-3 status of pregnant women with respect
to offspring risk of obesity and disease at this current time, long-term follow-up of
these human cohorts already exposed to alterations in maternal dietary fatty acid
composition is key to establishing whether this dietary pattern has any associations
with disease in later life. However, the results of this thesis, as well as other studies
(Muhlhausler et al., 2011b), suggest this is unlikely to be true.
That many of the observations at 4 weeks of age, such as changes in lipogenic capacity
and offspring adiposity, were seemingly ‘corrected’ for by 8 weeks of age may result
in them being regarded as inconsequential. However, other long-term studies
investigating maternal dietary insults, such as the well-established low-protein model,
have demonstrated that early transient alterations in tissue structure and function,
particularly alterations in the expression of lipogenic genes, can be greatly exacerbated
in later life and have been shown to be associated with hepatic steatosis in adult rats
(Erhuma et al., 2007b). This further reiterates the importance of long-term follow-up
studies to test this hypothesis in the context of this research, as well as in the larger
perspective of the field. It is important to note that throughout this research many
similarities have been drawn to other maternal dietary insults, but particularly to a low
protein maternal diet. To assume that the results of this thesis are solely attributable to
the total PUFA content and fatty acid composition of the maternal diet may be naïve.
As demonstrated by Chapter 3, and particularly 4, alteration in the fat content of the
maternal diet led to alterations in the protein intake of dams. Although not measured
in this study, this could have resulted in reduced fetal exposure to protein as well as
changes in milk composition which could have contributed to the observed differences.
GENERAL DISCUSSION
168
Formulating a diet that only changes a single nutrient component is near impossible
and, although useful for examining specific responses, is not representative of normal
situations. As such, interpretation of the results of nutritional intervention studies
should be open minded as changes in one dietary variable will inevitably affect
another.
The extrapolation of rodent data to human cohorts should be carefully considered and
the conclusions drawn from the data presented in this thesis may not be true of human
populations. However, a significant advantage of utilising an animal model is the
ability to investigate the potential mechanisms underlying the observed outcomes. The
uniformity of outcomes and considerable conservation of many metabolic processes
across mammals suggests that the mechanisms underlying the DOHaD hypothesis
would be similar between species. Epigenetic modifications of the fetal genome have
been well explored whilst the role of the placenta in fetal programming has been
somewhat overlooked. Experimental Chapter 6 highlighted that placental function was
sensitive to changes in the maternal diet and adds weight to the concept that
dysregulation of nutrient transfer across the placenta may be contributing to fetal
programming and long-term health. Human placentas were also examined in an
attempt to examine comparability between animal and human studies. Limitations in
the retrospective data available from the human participants, however, made
comparisons difficult. Despite this, Chapter 6 did highlight that changes in the
maternal diet, as inferred from differences in maternal BMI, is associated with altered
transcriptome in the human placenta which may lead to altered fetal development and
increased disease risk in later life.
In conclusion, previous data supporting the beneficial effects of omega-3 fatty acids
on adipocytes have largely been based on in vitro studies and have used mature, as
opposed to developing, adipocytes (Couet et al., 1997, Hill et al., 2007, Ruzickova et
al., 2004). These, as well as studies in animals and humans, often focus on omega-3
dietary supplementation rather than trying to improve the omega-3 status by reducing
the amount of omega-6 in the diet (Middleton et al., 2018, Wood et al., 2018, Meyer
et al., 2019, Hauner et al., 2009). As such, the findings of this thesis demonstrated for
the first time that improving the omega-3 status of offspring, through manipulation of
the LA:ALA ratio in the mother, had no lasting beneficial effect on offspring adiposity

GENERAL DISCUSSION
169
in the time-frame of this research. However, whether early-life alterations in tissue
function and structure elicit long-term consequences for individuals remains to be
established and should be a focus of future studies. Further to this we have identified
that a maternal high-fat diet, where saturated fats were not the predominant fat source,
leads to restricted offspring growth throughout early life which may impact upon
disease risk in later life. Finally, the mechanistic investigations provide a platform for
further examination of the placenta and the processes within it that may lead to the
identification of potential biomarkers that indicate nutritional programming of disease.
A summary of the main results observed in this thesis are summarised in Figure 7.1.
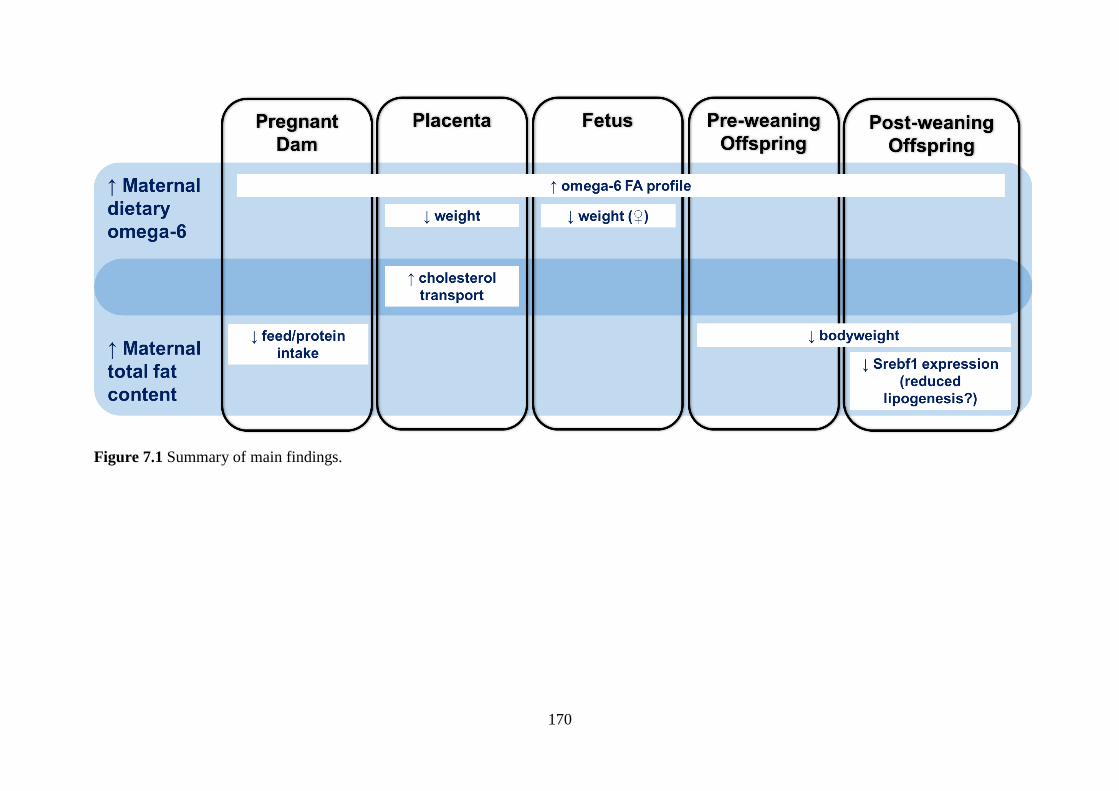
170
Figure 7.1 Summary of main findings.
171
8 REFERENCES
Adams, KF, Schatzkin, A, Harris, TB, Kipnis, V, Mouw, T, Ballard-Barbash, R,
Hollenbeck, A & Leitzmann, MF (2006). Overweight, obesity, and mortality
in a large prospective cohort of persons 50 to 71 years old. N Engl J Med,
355(8), 763-78.
Afshin, A, Forouzanfar, MH, Reitsma, MB, Sur, P, Estep, K, Lee, A, Marczak, L,
Mokdad, AH, et al. (2017). Health effects of overweight and obesity in 195
countries over 25 years. N Engl J Med, 377(1), 13-27.
Agostoni, C, Marangoni, F, Stival, G, Gatelli, I, Pinto, F, Rise, P, Giovannini, M, Galli,
C & Riva, E (2008). Whole blood fatty acid composition differs in term versus
mildly preterm infants: Small versus matched appropriate for gestational age.
Pediatr Res, 64(3), 298-302.
Ailhaud, G, Grimaldi, P & Negrel, R (1992). Cellular and molecular aspects of adipose
tissue development. Annu Rev Nutr, 12(207-33.
Ailhaud, G & Guesnet, P (2004). Fatty acid composition of fats is an early determinant
of childhood obesity: A short review and an opinion. Obes Rev, 5(1), 21-6.
Ailhaud, G, Massiera, F, Weill, P, Legrand, P, Alessandri, JM & Guesnet, P (2006).
Temporal changes in dietary fats: Role of n-6 polyunsaturated fatty acids in
excessive adipose tissue development and relationship to obesity. Prog Lipid
Res, 45(3), 203-36.
Ainge, H, Thompson, C, Ozanne, SE & Rooney, KB (2011). A systematic review on
animal models of maternal high fat feeding and offspring glycaemic control.
Int J Obes (Lond), 35(3), 325-35.
Akyol, A, Mcmullen, S & Langley-Evans, SC (2012). Glucose intolerance associated
with early-life exposure to maternal cafeteria feeding is dependent upon post-
weaning diet. Br J Nutr, 107(7), 964-78.
Al-Hasani, H & Joost, H-G (2005). Nutrition-/diet-induced changes in gene expression
in white adipose tissue. Best Prac Res Clin Endocrinol Metab, 19(4), 589-603.
Allain, CC, Poon, LS, Chan, CS, Richmond, W & Fu, PC (1974). Enzymatic
determination of total serum cholesterol. Clin Chem, 20(4), 470-5.
REFERENCES
172
Altiok, S, Xu, M & Spiegelman, BM (1997). Ppargamma induces cell cycle
withdrawal: Inhibition of e2f/dp DNA-binding activity via down-regulation of
pp2a. Genes Dev, 11(15), 1987-98.
Altobelli, G, Bogdarina, IG, Stupka, E, Clark, AJ & Langley-Evans, S (2013).
Genome-wide methylation and gene expression changes in newborn rats
following maternal protein restriction and reversal by folic acid. PLoS One,
8(12), e82989.
American Institute of Nutrition (1977). Report of the american institute of nurtition ad
hoc committee on standards for nutritional studies. J Nutr, 107(7), 1340-8.
Armitage, JA, Khan, IY, Taylor, PD, Nathanielsz, PW & Poston, L (2004).
Developmental programming of the metabolic syndrome by maternal
nutritional imbalance: How strong is the evidence from experimental models
in mammals? J Physiol, 561(Pt 2), 355-77.
Armitage, JA, Taylor, PD & Poston, L (2005). Experimental models of developmental
programming: Consequences of exposure to an energy rich diet during
development. J Physiol, 565(Pt 1), 3-8.
Australian Institute of Health and Welfare (2017). A picture of overweight and obesity
in australia. Canberra: AIHW.
Baardman, ME, Kerstjens-Frederikse, WS, Berger, RM, Bakker, MK, Hofstra, RM &
Plosch, T (2013). The role of maternal-fetal cholesterol transport in early fetal
life: Current insights. Biol Reprod, 88(1), 24.
Barker, DJ (1995). Fetal origins of coronary heart disease. BMJ, 311(6998), 171-4.
Barker, DJ, Bull, AR, Osmond, C & Simmonds, SJ (1990). Fetal and placental size
and risk of hypertension in adult life. British Medical Journal, 301(6746), 259-
262.
Barker, DJ, Hales, CN, Fall, CH, Osmond, C, Phipps, K & Clark, PM (1993). Type 2
(non-insulin-dependent) diabetes mellitus, hypertension and hyperlipidaemia
(syndrome x): Relation to reduced fetal growth. Diabetologia, 36(1), 62-7.
Barker, DJ, Winter, PD, Osmond, C, Margetts, B & Simmonds, SJ (1989). Weight in
infancy and death from ischaemic heart disease. Lancet, 2(8663), 577-80.
Barkley, MS, Geschwind, Ii & Bradford, GE (1979). The gestational pattern of
estradiol, testosterone and progesterone secretion in selected strains of mice.
Biol Reprod, 20(4), 733-8.
REFERENCES
173
Bateson, P, Barker, D, Clutton-Brock, T, Deb, D, D'udine, B, Foley, RA, Gluckman,
P, Godfrey, K, et al. (2004). Developmental plasticity and human health.
Nature, 430(6998), 419-21.
Bautista, CJ, Rodriguez-Gonzalez, GL, Torres, N, Hernandez-Pando, R, Ramirez, V,
Rodriguez-Cruz, M, Nathanielsz, PW & Zambrano, E (2013). Protein
restriction in the rat negatively impacts long-chain polyunsaturated fatty acid
composition and mammary gland development at the end of gestation. Arch
Med Res, 44(6), 429-36.
Bayol, SA, Simbi, BH & Stickland, NC (2005). A maternal cafeteria diet during
gestation and lactation promotes adiposity and impairs skeletal muscle
development and metabolism in rat offspring at weaning. J Physiol, 567(Pt 3),
951-61.
Bell, JG, Mackinlay, EE, Dick, JR, Younger, I, Lands, B & Gilhooly, T (2011). Using
a fingertip whole blood sample for rapid fatty acid measurement: Method
validation and correlation with erythrocyte polar lipid compositions in uk
subjects. Br J Nutr, 106(9), 1408-15.
Berrington De Gonzalez, A, Hartge, P, Cerhan, JR, Flint, AJ, Hannan, L, Macinnis,
RJ, Moore, SC, Tobias, GS, et al. (2010). Body-mass index and mortality
among 1.46 million white adults. N Engl J Med, 363(23), 2211-9.
Bhasin, KK, Van Nas, A, Martin, LJ, Davis, RC, Devaskar, SU & Lusis, AJ (2009).
Maternal low-protein diet or hypercholesterolemia reduces circulating
essential amino acids and leads to intrauterine growth restriction. Diabetes,
58(3), 559-66.
Bianchini, F, Kaaks, R & Vainio, H (2002). Overweight, obesity, and cancer risk. The
Lancet Oncology, 3(9), 565-574.
Bianco-Miotto, T, Craig, JM, Gasser, YP, Van Dijk, SJ & Ozanne, SE (2017).
Epigenetics and dohad: From basics to birth and beyond. J Dev Orig Health
Dis, 8(5), 513-519.
Blake-Lamb, TL, Locks, LM, Perkins, ME, Woo Baidal, JA, Cheng, ER & Taveras,
EM (2016). Interventions for childhood obesity in the first 1,000 days a
systematic review. Am J Prev Med, 50(6), 780-789.
Blank, C, Neumann, MA, Makrides, M & Gibson, RA (2002). Optimizing dha levels
in piglets by lowering the linoleic acid to alpha-linolenic acid ratio. J Lipid Res,
43(9), 1537-43.
REFERENCES
174
Blasbalg, TL, Hibbeln, JR, Ramsden, CE, Majchrzak, SF & Rawlings, RR (2011).
Changes in consumption of omega-3 and omega-6 fatty acids in the united
states during the 20th century. The American Journal of Clinical Nutrition,
93(5), 950-962.
Bloch, K & Vance, D (1977). Control mechanisms in the synthesis of saturated fatty
acids. Annu Rev Biochem, 46(263-98.
Blundell, JE & King, NA (1996). Overconsumption as a cause of weight gain:
Behavioural-physiological interactions in the control of food intake (appetite).
Ciba Found Symp, 201(138-54; discussion 154-8, 188-93.
Bosch, J, Gerstein, HC, Dagenais, GR, Diaz, R, Dyal, L, Jung, H, Maggiono, AP,
Probstfield, J, et al. (2012). N-3 fatty acids and cardiovascular outcomes in
patients with dysglycemia. N Engl J Med, 367(4), 309-18.
Bowman, L, Mafham, M, Wallendszus, K, Stevens, W, Buck, G, Barton, J, Murphy,
K, Aung, T, et al. (2018). Effects of n-3 fatty acid supplements in diabetes
mellitus. N Engl J Med, 379(16), 1540-1550.
Brass, E, Hanson, E & O’tierney-Ginn, PF (2013). Placental oleic acid uptake is lower
in male offspring of obese women. Placenta, 34(6), 503-509.
Bray, GA, Lovejoy, JC, Smith, SR, Delany, JP, Lefevre, M, Hwang, D, Ryan, DH &
York, DA (2002). The influence of different fats and fatty acids on obesity,
insulin resistance and inflammation. J Nutr, 132(9), 2488-91.
Brenna, JT, Salem, N, Sinclair, AJ & Cunnane, SC (2009). Α-linolenic acid
supplementation and conversion to n-3 long-chain polyunsaturated fatty acids
in humans. Prostaglandins, Leukotrienes and Essential Fatty Acids, 80(2), 85-
91.
Brenner, RR & Peluffo, RO (1966). Effect of saturated and unsaturated fatty acids on
the desaturation in vitro of palmitic, stearic, oleic, linoleic, and linolenic acids.
J Biol Chem, 241(22), 5213-9.
Brouwers, L, Franx, A, Vogelvang, TE, Houben, ML, Van Rijn, BB & Nikkels, PGJ
(2018). Association of maternal prepregnancy body mass index with placental
histopathological characteristics in uncomplicated term pregnancies. Pediatric
and Developmental Pathology, 22(1), 45-52.
Buettner, R, Scholmerich, J & Bollheimer, LC (2007). High-fat diets: Modeling the
metabolic disorders of human obesity in rodents. Obesity (Silver Spring),
15(4), 798-808.
REFERENCES
175
Burr, GO & Burr, MM (1930). On the nature and role of fatty acids essential nutrition.
The Journal of Biological Chemistry, 86(587-622.
Burton, RF (2010). Waist circumference as an indicator of adiposity and the relevance
of body height. Med Hypotheses, 75(1), 115-9.
Calder, PC (2006). Polyunsaturated fatty acids and inflammation. Prostaglandins
Leukot Essent Fatty Acids, 75(3), 197-202.
Calder, PC (2015). Marine omega-3 fatty acids and inflammatory processes: Effects,
mechanisms and clinical relevance. Biochimica et Biophysica Acta (BBA) -
Molecular and Cell Biology of Lipids, 1851(4), 469-484.
Calle, EE, Thun, MJ, Petrelli, JM, Rodriguez, C & Heath, CW, Jr. (1999). Body-mass
index and mortality in a prospective cohort of u.S. Adults. N Engl J Med,
341(15), 1097-105.
Camm, EJ, Martin-Gronert, MS, Wright, NL, Hansell, JA, Ozanne, SE & Giussani,
DA (2011). Prenatal hypoxia independent of undernutrition promotes
molecular markers of insulin resistance in adult offspring. FASEB J, 25(1),
420-7.
Cannon, B & Nedergaard, J (2004). Brown adipose tissue: Function and physiological
significance. Physiol Rev, 84(1), 277-359.
Catalano, PM & Ehrenberg, HM (2006). The short- and long-term implications of
maternal obesity on the mother and her offspring. BJOG, 113(10), 1126-33.
Caughey, GE, Mantzioris, E, Gibson, RA, Cleland, LG & James, MJ (1996). The effect
on human tumor necrosis factor alpha and interleukin 1 beta production of diets
enriched in n-3 fatty acids from vegetable oil or fish oil. Am J Clin Nutr, 63(1),
116-22.
Cerf, ME, Muller, CJ, Du Toit, DF, Louw, J & Wolfe-Coote, SA (2006).
Hyperglycaemia and reduced glucokinase expression in weanling offspring
from dams maintained on a high-fat diet. Br J Nutr, 95(2), 391-6.
Cetin, I, Alvino, G & Cardellicchio, M (2009). Long chain fatty acids and dietary fats
in fetal nutrition. J Physiol, 587(Pt 14), 3441-51.
Chalkley, SM, Hettiarachchi, M, Chisholm, DJ & Kraegen, EW (2002). Long-term
high-fat feeding leads to severe insulin resistance but not diabetes in wistar
rats. Am J Physiol Endocrinol Metab, 282(6), E1231-8.
REFERENCES
176
Chan, JK, Mcdonald, BE, Gerrard, JM, Bruce, VM, Weaver, BJ & Holub, BJ (1993).
Effect of dietary alpha-linolenic acid and its ratio to linoleic acid on platelet
and plasma fatty acids and thrombogenesis. Lipids, 28(9), 811-7.
Chen, Y, Copeland, WK, Vedanthan, R, Grant, E, Lee, JE, Gu, D, Gupta, PC,
Ramadas, K, et al. (2013). Association between body mass index and
cardiovascular disease mortality in east asians and south asians: Pooled
analysis of prospective data from the asia cohort consortium. Bmj, 347(f5446.
Cho, HP, Nakamura, M & Clarke, SD (1999a). Cloning, expression, and fatty acid
regulation of the human delta-5 desaturase. J Biol Chem, 274(52), 37335-9.
Cho, HP, Nakamura, MT & Clarke, SD (1999b). Cloning, expression, and nutritional
regulation of the mammalian delta-6 desaturase. J Biol Chem, 274(1), 471-7.
Cinti, S, Frederich, RC, Zingaretti, MC, De Matteis, R, Flier, JS & Lowell, BB (1997).
Immunohistochemical localization of leptin and uncoupling protein in white
and brown adipose tissue. Endocrinology, 138(2), 797-804.
Clark, KJ, Makrides, M, Neumann, MA & Gibson, RA (1992). Determination of the
optimal ratio of linoleic acid to α-linolenic acid in infant formulas. The Journal
of Pediatrics, 120(4, Part 2), S151-S158.
Cleland, LG, Gibson, RA, Pedler, J & James, MJ (2005). Paradoxical effect of n-3-
containing vegetable oils on long-chain n-3 fatty acids in rat heart. Lipids,
40(10), 995-8.
Cleland, LG, James, MJ, Neumann, MA, D'angelo, M & Gibson, RA (1992). Linoleate
inhibits epa incorporation from dietary fish-oil supplements in human subjects.
Am J Clin Nutr, 55(2), 395-9.
Couet, C, Delarue, J, Ritz, P, Antoine, JM & Lamisse, F (1997). Effect of dietary fish
oil on body fat mass and basal fat oxidation in healthy adults. Int J Obes Relat
Metab Disord, 21(8), 637-43.
Daniel, Z, Swali, A, Emes, R & Langley-Evans, SC (2016). The effect of maternal
undernutrition on the rat placental transcriptome: Protein restriction up-
regulates cholesterol transport. Genes & Nutrition, 11(1), 27.
Diamant, YZ, Metzger, BE, Freinkel, N & Shafrir, E (1982). Placental lipid and
glycogen content in human and experimental diabetes mellitus. Am J Obstet
Gynecol, 144(1), 5-11.
Dickinson, H, Moss, TJ, Gatford, KL, Moritz, KM, Akison, L, Fullston, T, Hryciw,
DH, Maloney, CA, et al. (2016). A review of fundamental principles for animal
REFERENCES
177
models of dohad research: An australian perspective. J Dev Orig Health Dis,
7(5), 449-472.
Dodic, M, May, CN, Wintour, EM & Coghlan, JP (1998). An early prenatal exposure
to excess glucocorticoid leads to hypertensive offspring in sheep. Clin Sci
(Lond), 94(2), 149-55.
Dolecek, TA & Granditis, G (1991). Dietary polyunsaturated fatty acids and mortality
in the multiple risk factor intervention trial (mrfit). World Rev Nutr Diet,
66(205-16.
Donahue, SM, Rifas-Shiman, SL, Gold, DR, Jouni, ZE, Gillman, MW & Oken, E
(2011). Prenatal fatty acid status and child adiposity at age 3 y: Results from a
us pregnancy cohort. Am J Clin Nutr, 93(4), 780-8.
Draycott, SAV, Liu, G, Daniel, ZC, Elmes, MJ, Muhlhausler, BS & Langley-Evans,
SC (2019). Maternal dietary ratio of linoleic acid to alpha-linolenic acid during
pregnancy has sex-specific effects on placental and fetal weights in the rat.
Nutrition & Metabolism, 16(1), 1.
Duarte, JA, Carvalho, F, Pearson, M, Horton, JD, Browning, JD, Jones, JG & Burgess,
SC (2014). A high-fat diet suppresses de novo lipogenesis and desaturation but
not elongation and triglyceride synthesis in mice. J Lipid Res, 55(12), 2541-
53.
Dube, E, Gravel, A, Martin, C, Desparois, G, Moussa, I, Ethier-Chiasson, M, Forest,
JC, Giguere, Y, et al. (2012). Modulation of fatty acid transport and
metabolism by maternal obesity in the human full-term placenta. Biol Reprod,
87(1), 14, 1-11.
Dyrskog, SE, Gregersen, S & Hermansen, K (2005). High-fat feeding during gestation
and nursing period have differential effects on the insulin secretory capacity in
offspring from normal wistar rats. Rev Diabet Stud, 2(3), 136-45.
Edison, RJ, Berg, K, Remaley, A, Kelley, R, Rotimi, C, Stevenson, RE & Muenke, M
(2007). Adverse birth outcome among mothers with low serum cholesterol.
Pediatrics, 120(4), 723-33.
Ehrenberg, HM, Mercer, BM & Catalano, PM (2004). The influence of obesity and
diabetes on the prevalence of macrosomia. Am J Obstet Gynecol, 191(3), 964-
8.
REFERENCES
178
El-Sayyad, HIH, Al-Haggar, MMS, El-Ghawet, HA & Bakr, IHM (2014). Effect of
maternal diabetes and hypercholesterolemia on fetal liver of albino wistar rats.
Nutrition, 30(3), 326-336.
Englund-Ögge, L, Brantsæter, AL, Juodakis, J, Haugen, M, Meltzer, HM, Jacobsson,
B & Sengpiel, V (2018). Associations between maternal dietary patterns and
infant birth weight, small and large for gestational age in the norwegian mother
and child cohort study. European Journal of Clinical Nutrition.
Erhuma, A, Bellinger, L, Langley-Evans, SC & Bennett, AJ (2007a). Prenatal
exposure to undernutrition and programming of responses to high-fat feeding
in the rat. British Journal of Nutrition, 98(3), 517-524.
Erhuma, A, Salter, AM, Sculley, DV, Langley-Evans, SC & Bennett, AJ (2007b).
Prenatal exposure to a low-protein diet programs disordered regulation of lipid
metabolism in the aging rat. Am J Physiol Endocrinol Metab, 292(6), E1702-
14.
Eriksson, JG, Forsen, T, Tuomilehto, J, Winter, PD, Osmond, C & Barker, DJ (1999).
Catch-up growth in childhood and death from coronary heart disease:
Longitudinal study. BMJ, 318(7181), 427-31.
Fao & Who (2008). Joint fao/who expert consultation on fats and fatty acids in human
nutrition.
Farley, D, Tejero, ME, Comuzzie, AG, Higgins, PB, Cox, L, Werner, SL, Jenkins, SL,
Li, C, et al. (2009). Feto-placental adaptations to maternal obesity in the
baboon. Placenta, 30(9), 752-760.
Feng, M, Whitesall, S, Zhang, Y, Beibel, M, D'alecy, L & Dipetrillo, K (2008).
Validation of volume-pressure recording tail-cuff blood pressure
measurements. Am J Hypertens, 21(12), 1288-91.
Ferchaud-Roucher, V, Rudolph, MC, Jansson, T & Powell, TL (2017). Fatty acid and
lipid profiles in primary human trophoblast over 90h in culture. Prostaglandins
Leukot Essent Fatty Acids, 121(14-20.
Fernandez, C, Martin, M, Gomez-Coronado, D & Lasuncion, MA (2005). Effects of
distal cholesterol biosynthesis inhibitors on cell proliferation and cell cycle
progression. J Lipid Res, 46(5), 920-9.
Ferramosca, A, Conte, A, Damiano, F, Siculella, L & Zara, V (2014). Differential
effects of high-carbohydrate and high-fat diets on hepatic lipogenesis in rats.
Eur J Nutr, 53(4), 1103-14.
REFERENCES
179
Finnegan, YE, Minihane, AM, Leigh-Firbank, EC, Kew, S, Meijer, GW, Muggli, R,
Calder, PC & Williams, CM (2003). Plant- and marine-derived n-3
polyunsaturated fatty acids have differential effects on fasting and postprandial
blood lipid concentrations and on the susceptibility of ldl to oxidative
modification in moderately hyperlipidemic subjects. Am J Clin Nutr, 77(4),
783-95.
Finucane, MM, Stevens, GA, Cowan, MJ, Danaei, G, Lin, JK, Paciorek, CJ, Singh,
GM, Gutierrez, HR, et al. (2011). National, regional, and global trends in body-
mass index since 1980: Systematic analysis of health examination surveys and
epidemiological studies with 960 country-years and 9.1 million participants.
Lancet, 377(9765), 557-67.
Folch, J, Lees, M & Sloane Stanley, GH (1957). A simple method for the isolation and
purification of total lipides from animal tissues. Journal of Biological
Chemistry, 226(1), 497-509.
Forman, BM, Chen, J & Evans, RM (1997). Hypolipidemic drugs, polyunsaturated
fatty acids, and eicosanoids are ligands for peroxisome proliferator-activated
receptors alpha and delta. Proc Natl Acad Sci U S A, 94(9), 4312-7.
Forsen, T, Eriksson, JG, Tuomilehto, J, Osmond, C & Barker, DJ (1999). Growth in
utero and during childhood among women who develop coronary heart
disease: Longitudinal study. Bmj, 319(7222), 1403-7.
Forsén, T, Eriksson, JG, Tuomilehto, J, Teramo, K, Osmond, C & Barker, DJP (1997).
Mother's weight in pregnancy and coronary heart disease in a cohort of finnish
men: Follow up study. BMJ, 315(7112), 837.
Fossati, P & Prencipe, L (1982). Serum triglycerides determined colorimetrically with
an enzyme that produces hydrogen peroxide. Clin Chem, 28(10), 2077-80.
Fowden, AL (1995). Endocrine regulation of fetal growth. Reprod Fertil Dev, 7(3),
351-63.
Fowden, AL, Hughes, P & Comline, RS (1989). The effects of insulin on the growth
rate of the sheep fetus during late gestation. Q J Exp Physiol, 74(5), 703-14.
Frankenfield, DC, Rowe, WA, Cooney, RN, Smith, JS & Becker, D (2001). Limits of
body mass index to detect obesity and predict body composition. Nutrition,
17(1), 26-30.
REFERENCES
180
Gabory, A, Roseboom, TJ, Moore, T, Moore, LG & Junien, C (2013). Placental
contribution to the origins of sexual dimorphism in health and diseases: Sex
chromosomes and epigenetics. Biology of Sex Differences, 4(1), 5.
Galassi, A, Reynolds, K & He, J (2006). Metabolic syndrome and risk of
cardiovascular disease: A meta-analysis. The American Journal of Medicine,
119(10), 812-819.
Gale, CR, Javaid, MK, Robinson, SM, Law, CM, Godfrey, KM & Cooper, C (2007).
Maternal size in pregnancy and body composition in children. J Clin
Endocrinol Metab, 92(10), 3904-3911.
Gambling, L, Dunford, S, Wallace, DI, Zuur, G, Solanky, N, Srai, SK & Mcardle , HJ
(2003). Iron deficiency during pregnancy affects postnatal blood pressure in
the rat. J Physiol, 552(2), 603-610.
Garcia De Herreros, A & Birnbaum, MJ (1989). The acquisition of increased insulin-
responsive hexose transport in 3t3-l1 adipocytes correlates with expression of
a novel transporter gene. J Biol Chem, 264(33), 19994-9.
Garrick, MD, Dembure, P & Guthrie, R (1973). Sickle-cell anemia and other
hemoglobinopathies. New England Journal of Medicine, 288(24), 1265-1268.
Gavrilova, O, Haluzik, M, Matsusue, K, Cutson, JJ, Johnson, L, Dietz, KR, Nicol, CJ,
Vinson, C, et al. (2003). Liver peroxisome proliferator-activated receptor
gamma contributes to hepatic steatosis, triglyceride clearance, and regulation
of body fat mass. J Biol Chem, 278(36), 34268-76.
Geelen, SN, Blazquez, C, Geelen, MJ, Sloet Van Oldruitenborgh-Oosterbaan, MM &
Beynen, AC (2001). High fat intake lowers hepatic fatty acid synthesis and
raises fatty acid oxidation in aerobic muscle in shetland ponies. Br J Nutr,
86(1), 31-6.
Gholami, F, Khoramdad, M, Esmailnasab, N, Moradi, G, Nouri, B, Safiri, S &
Alimohamadi, Y (2017). The effect of dairy consumption on the prevention of
cardiovascular diseases: A meta-analysis of prospective studies. J Cardiovasc
Thorac Res, 9(1), 1-11.
Gibson, RA, Muhlhausler, B & Makrides, M (2011). Conversion of linoleic acid and
alpha-linolenic acid to long-chain polyunsaturated fatty acids (lcpufas), with a
focus on pregnancy, lactation and the first 2 years of life. Matern Child Nutr,
7 Suppl 2(17-26.
REFERENCES
181
Gibson, RA, Neumann, MA, Lien, EL, Boyd, KA & Tu, WC (2013). Docosahexaenoic
acid synthesis from alpha-linolenic acid is inhibited by diets high in
polyunsaturated fatty acids. Prostaglandins Leukot Essent Fatty Acids, 88(1),
139-46.
Gluckman, PD & Hanson, MA (2004). The developmental origins of the metabolic
syndrome. Trends in Endocrinology & Metabolism, 15(4), 183-187.
Godfrey, KM, Reynolds, RM, Prescott, SL, Nyirenda, M, Jaddoe, VWV, Eriksson, JG
& Broekman, BFP (2017). Influence of maternal obesity on the long-term
health of offspring. Lancet Diabetes Endocrinol, 5(1), 53-64.
Goharkhay, N, Sbrana, E, Gamble, PK, Tamayo, EH, Betancourt, A, Villarreal, K,
Hankins, GD, Saade, GR & Longo, M (2007). Characterization of a murine
model of fetal programming of atherosclerosis. Am J Obstet Gynecol, 197(4),
416.e1-5.
Graham, TE, Yang, Q, Blüher, M, Hammarstedt, A, Ciaraldi, TP, Henry, RR, Wason,
CJ, Oberbach, A, et al. (2006). Retinol-binding protein 4 and insulin resistance
in lean, obese, and diabetic subjects. New England Journal of Medicine,
354(24), 2552-2563.
Gregoire, FM, Smas, CM & Sul, HS (1998). Understanding adipocyte differentiation.
Physiol Rev, 78(3), 783-809.
Griffin, MJ & Sul, HS (2004). Insulin regulation of fatty acid synthase gene
transcription: Roles of usf and srebp-1c. IUBMB Life, 56(10), 595-600.
Guberman, C, Jellyman, JK, Han, G, Ross, MG & Desai, M (2013). Maternal high-fat
diet programs rat offspring hypertension and activates the adipose renin-
angiotensin system. American journal of obstetrics and gynecology, 209(3),
262.e1-262.e2628.
Guo, F & Jen, KL (1995). High-fat feeding during pregnancy and lactation affects
offspring metabolism in rats. Physiol Behav, 57(4), 681-6.
Guthrie, R & Susi, A (1963). A simple phenylalanine method for detecting
phenylketonuria in large populations of newborn infants. Pediatrics, 32(338-
43.
Haggarty, P, Ashton, J, Joynson, M, Abramovich, DR & Page, K (1999). Effect of
maternal polyunsaturated fatty acid concentration on transport by the human
placenta. Biol Neonate, 75(6), 350-9.
REFERENCES
182
Haggarty, P, Page, K, Abramovich, DR, Ashton, J & Brown, D (1997). Long-chain
polyunsaturated fatty acid transport across the perfused human placenta.
Placenta, 18(8), 635-42.
Hales, CN & Barker, DJ (1992). Type 2 (non-insulin-dependent) diabetes mellitus:
The thrifty phenotype hypothesis. Diabetologia, 35(7), 595-601.
Hales, CN & Barker, DJ (2001). The thrifty phenotype hypothesis. Br Med Bull, 60(5-
20.
Hales, CN, Barker, DJ, Clark, PM, Cox, LJ, Fall, C, Osmond, C & Winter, PD (1991).
Fetal and infant growth and impaired glucose tolerance at age 64. British
Medical Journal, 303(6809), 1019-1022.
Hanson, MA & Gluckman, PD (2014). Early developmental conditioning of later
health and disease: Physiology or pathophysiology? Physiol Rev, 94(4), 1027-
76.
Hauner, H, Vollhardt, C, Schneider, KT, Zimmermann, A, Schuster, T & Amann-
Gassner, U (2009). The impact of nutritional fatty acids during pregnancy and
lactation on early human adipose tissue development. Rationale and design of
the infat study. Ann Nutr Metab, 54(2), 97-103.
Hayes, AJ, Lung, TWC, Bauman, A & Howard, K (2017). Modelling obesity trends
in australia: Unravelling the past and predicting the future. International
Journal Of Obesity, 41(178.
Heaton, JM (1972). The distribution of brown adipose tissue in the human. J Anat,
112(Pt 1), 35-39.
Heijmans, BT, Tobi, EW, Stein, AD, Putter, H, Blauw, GJ, Susser, ES, Slagboom, PE
& Lumey, LH (2008). Persistent epigenetic differences associated with
prenatal exposure to famine in humans. Proceedings of the National Academy
of Sciences of the United States of America, 105(44), 17046-17049.
Heslehurst, N, Vieira, R, Akhter, Z, Bailey, H, Slack, E, Ngongalah, L, Pemu, A &
Rankin, J (2019). The association between maternal body mass index and child
obesity: A systematic review and meta-analysis. PLOS Medicine, 16(6),
e1002817.
Hill, AM, Buckley, JD, Murphy, KJ & Howe, PR (2007). Combining fish-oil
supplements with regular aerobic exercise improves body composition and
cardiovascular disease risk factors. Am J Clin Nutr, 85(5), 1267-74.
REFERENCES
183
Hoffman, DJ, Reynolds, RM & Hardy, DB (2017). Developmental origins of health
and disease: Current knowledge and potential mechanisms. Nutr Rev, 75(12),
951-970.
Holemans, K, Aerts, L & Van Assche, FA (2003). Fetal growth restriction and
consequences for the offspring in animal models. J Soc Gynecol Investig,
10(7), 392-9.
Holman, RT (1986). Control of polyunsaturated acids in tissue lipids. J Am Coll Nutr,
5(2), 183-211.
Horton, JD, Goldstein, JL & Brown, MS (2002). Srebps: Activators of the complete
program of cholesterol and fatty acid synthesis in the liver. J Clin Invest,
109(9), 1125-1131.
Howie, GJ, Sloboda, DM, Kamal, T & Vickers, MH (2009). Maternal nutritional
history predicts obesity in adult offspring independent of postnatal diet. J
Physiol, 587(Pt 4), 905-15.
Hu, CC, Qing, K & Chen, Y (2004). Diet-induced changes in stearoyl-coa desaturase
1 expression in obesity-prone and -resistant mice. Obes Res, 12(8), 1264-70.
Hu, FB, Bronner, L, Willett, WC, Stampfer, MJ, Rexrode, KM, Albert, CM, Hunter,
D & Manson, JE (2002). Fish and omega-3 fatty acid intake and risk of
coronary heart disease in women. JAMA, 287(14), 1815-21.
Huxley, R, Neil, A & Collins, R (2002). Unravelling the fetal origins hypothesis: Is
there really an inverse association between birthweight and subsequent blood
pressure? The Lancet, 360(9334), 659-665.
Hwang, CS, Loftus, TM, Mandrup, S & Lane, MD (1997). Adipocyte differentiation
and leptin expression. Annu Rev Cell Dev Biol, 13(231-59.
Ibrahim, A, Basak, S & Ehtesham, NZ (2009). Impact of maternal dietary fatty acid
composition on glucose and lipid metabolism in male rat offspring aged 105 d.
British Journal of Nutrition, 102(2), 233-241.
Ichihar, K, Waku, K, Yamaguchi, C, Saito, K, Shibahara, A, Miyatani, S &
Yamamoto, K (2002). A convenient method for determination of the c20-22
pufa composition of glycerolipids in blood and breast milk. Lipids, 37(5), 523-
6.
Inoue, M, Ohtake, T, Motomura, W, Takahashi, N, Hosoki, Y, Miyoshi, S, Suzuki, Y,
Saito, H, et al. (2005). Increased expression of pparγ in high fat diet-induced
REFERENCES
184
liver steatosis in mice. Biochemical and Biophysical Research
Communications, 336(1), 215-222.
Jackson, AA, Dunn, RL, Marchand, MC & Langley-Evans, SC (2002). Increased
systolic blood pressure in rats induced by a maternal low-protein diet is
reversed by dietary supplementation with glycine. Clin Sci (Lond), 103(6),
633-9.
Jakobsson, A, Westerberg, R & Jacobsson, A (2006). Fatty acid elongases in
mammals: Their regulation and roles in metabolism. Prog Lipid Res, 45(3),
237-49.
Janssen, I (2007). Morbidity and mortality risk associated with an overweight bmi in
older men and women. Obesity (Silver Spring), 15(7), 1827-40.
Kaar, JL, Crume, T, Brinton, JT, Bischoff, KJ, Mcduffie, R & Dabelea, D (2014).
Maternal obesity, gestational weight gain, and offspring adiposity: The
exploring perinatal outcomes among children study. J Pediatr, 165(3), 509-15.
Kabali, C & Werler, MM (2007). Pre-pregnant body mass index, weight gain and the
risk of delivering large babies among non-diabetic mothers. International
Journal of Gynecology & Obstetrics, 97(2), 100-104.
Kamai, Y, Mikawa, S, Endo, K, Sakai, H & Komano, T (1996). Regulation of insulin-
like growth factor-i expression in mouse preadipocyte ob1771 cells. J Biol
Chem, 271(17), 9883-6.
Kamana, KC, Shakya, S & Zhang, H (2015). Gestational diabetes mellitus and
macrosomia: A literature review. Annals of Nutrition and Metabolism,
66(suppl 2)(14-20.
Kanakri, K, Carragher, J, Muhlhausler, B, Hughes, R & Gibson, R (2017). In ovo
exposure to omega-3 fatty acids does not enhance omega-3 long-chain
polyunsaturated fatty acid metabolism in broiler chickens. Journal of
Developmental Origins of Health and Disease, 8(5), 520-528.
Keesey, RE & Hirvonen, MD (1997). Body weight set-points: Determination and
adjustment. J Nutr, 127(9), 1875S-1883S.
Kenchaiah, S, Evans, JC, Levy, D, Wilson, PW, Benjamin, EJ, Larson, MG, Kannel,
WB & Vasan, RS (2002). Obesity and the risk of heart failure. N Engl J Med,
347(5), 305-13.
Keys, A (1970). Coronary heart disease in seven countries. Circulation, 41(1), 186-
195.
REFERENCES
185
Keys, A, Anderson, JT & Grande, F (1965). Serum cholesterol response to changes in
the diet: I. Iodine value of dietary fat versus 2s-p. Metabolism, 14(7), 747-58.
Khan, I, Dekou, V, Hanson, M, Poston, L & Taylor, P (2004). Predictive adaptive
responses to maternal high-fat diet prevent endothelial dysfunction but not
hypertension in adult rat offspring. Circulation, 110(9), 1097-102.
Khan, IY, Dekou, V, Douglas, G, Jensen, R, Hanson, MA, Poston, L & Taylor, PD
(2005). A high-fat diet during rat pregnancy or suckling induces cardiovascular
dysfunction in adult offspring. Am J Physiol Regul Integr Comp Physiol,
288(1), R127-33.
Khan, IY, Taylor, PD, Dekou, V, Seed, PT, Lakasing, L, Graham, D, Dominiczak, AF,
Hanson, MA & Poston, L (2002). Gender-linked hypertension in offspring of
lard-fed pregnant rats. Hypertension, 41(1), 168-175.
Kim, DH, Puri, N, Sodhi, K, Falck, JR, Abraham, NG, Shapiro, J & Schwartzman, ML
(2013). Cyclooxygenase-2 dependent metabolism of 20-hete increases
adiposity and adipocyte enlargement in mesenchymal stem cell-derived
adipocytes. J Lipid Res, 54(3), 786-793.
Kliewer, SA, Sundseth, SS, Jones, SA, Brown, PJ, Wisely, GB, Koble, CS, Devchand,
P, Wahli, W, et al. (1997). Fatty acids and eicosanoids regulate gene expression
through direct interactions with peroxisome proliferator-activated receptors
alpha and gamma. Proc Natl Acad Sci U S A, 94(9), 4318-23.
Knudsen, VK, Orozova-Bekkevold, IM, Mikkelsen, TB, Wolff, S & Olsen, SF (2008).
Major dietary patterns in pregnancy and fetal growth. Eur J Clin Nutr, 62(4),
463-70.
Korotkova, M, Gabrielsson, B, Lonn, M, Hanson, LA & Strandvik, B (2002). Leptin
levels in rat offspring are modified by the ratio of linoleic to alpha-linolenic
acid in the maternal diet. J Lipid Res, 43(10), 1743-9.
Krasnow, SM, Nguyen, MLT & Marks, DL (2011). Increased maternal fat
consumption during pregnancy alters body composition in neonatal mice.
American Journal of Physiology - Endocrinology and Metabolism, 301(6),
E1243-E1253.
Kuhn, DC & Crawford, M (1986). Placental essential fatty acid transport and
prostaglandin synthesis. Prog Lipid Res, 25(1-4), 345-53.
Lands, B (2008). A critique of paradoxes in current advice on dietary lipids. Prog Lipid
Res, 47(2), 77-106.
REFERENCES
186
Lands, WEM (2000). Commentary on the workshop statement. Prostaglandins,
Leukotrienes and Essential Fatty Acids (PLEFA), 63(3), 125-126.
Langley-Evans, SC (1996). Intrauterine programming of hypertension in the rat:
Nutrient interactions. Comp Biochem Physiol A Physiol, 114(4), 327-33.
Langley-Evans, SC (2000). Critical differences between two low protein diet protocols
in the programming of hypertension in the rat. Int J Food Sci Nutr, 51(1), 11-
7.
Langley-Evans, SC (2009). Nutritional programming of disease: Unravelling the
mechanism. J Anat, 215(1), 36-51.
Langley-Evans, SC (2013). Fetal programming of cvd and renal disease: Animal
models and mechanistic considerations. Proc Nutr Soc, 72(3), 317-25.
Langley-Evans, SC (2015). Nutrition in early life and the programming of adult
disease: A review. J Hum Nutr Diet, 28 Suppl 1(1-14.
Langley-Evans, SC, Clamp, AG, Grimble, RF & Jackson, AA (1996a). Influence of
dietary fats upon systolic blood pressure in the rat. Int J Food Sci Nutr, 47(5),
417-25.
Langley-Evans, SC & Mcmullen, S (2010). Developmental origins of adult disease.
Med Princ Pract, 19(2), 87-98.
Langley-Evans, SC & Nwagwu, M (1998). Impaired growth and increased
glucocorticoid-sensitive enzyme activities in tissues of rat fetuses exposed to
maternal low protein diets. Life Sciences, 63(7), 605-615.
Langley-Evans, SC, Phillips, GJ, Benediktsson, R, Gardner, DS, Edwards, CR,
Jackson, AA & Seckl, JR (1996b). Protein intake in pregnancy, placental
glucocorticoid metabolism and the programming of hypertension in the rat.
Placenta, 17(2-3), 169-72.
Langley-Evans, SC, Welham, SJ & Jackson, AA (1999). Fetal exposure to a maternal
low protein diet impairs nephrogenesis and promotes hypertension in the rat.
Life Sci, 64(11), 965-74.
Langley, SC & Jackson, AA (1994). Increased systolic blood pressure in adult rats
induced by fetal exposure to maternal low protein diets. Clin Sci (Lond), 86(2),
217-22; discussion 121.
Larque, E, Demmelmair, H, Berger, B, Hasbargen, U & Koletzko, B (2003). In vivo
investigation of the placental transfer of (13)c-labeled fatty acids in humans. J
Lipid Res, 44(1), 49-55.
REFERENCES
187
Le Clair, C, Abbi, T, Sandhu, H & Tappia, PS (2009). Impact of maternal
undernutrition on diabetes and cardiovascular disease risk in adult offspring.
Can J Physiol Pharmacol, 87(3), 161-79.
Lewis, RM & Desoye, G (2017). Placental lipid and fatty acid transfer in maternal
overnutrition. Ann Nutr Metab, 70(3), 228-231.
Li, G-L, Chen, H-J, Zhang, W-X, Tong, Q & Yan, Y-E (2018). Effects of maternal
omega-3 fatty acids supplementation during pregnancy/lactation on body
composition of the offspring: A systematic review and meta-analysis. Clinical
Nutrition, 37(5), 1462-1473.
Li, Y, Kang, JX & Leaf, A (1997). Differential effects of various eicosanoids on the
production or prevention of arrhythmias in cultured neonatal rat cardiac
myocytes. Prostaglandins, 54(2), 511-530.
Liao, Z, Dong, J, Wu, W, Yang, T, Wang, T, Guo, L, Chen, L, Xu, D & Wen, F (2012).
Resolvin d1 attenuates inflammation in lipopolysaccharide-induced acute lung
injury through a process involving the ppargamma/nf-kappab pathway. Respir
Res, 13(110.
Liu, G, Muhlhausler, BS & Gibson, RA (2014). A method for long term stabilisation
of long chain polyunsaturated fatty acids in dried blood spots and its clinical
application. Prostaglandins Leukot Essent Fatty Acids, 91(6), 251-60.
Lloyd, LJ, Langley-Evans, SC & Mcmullen, S (2010). Childhood obesity and adult
cardiovascular disease risk: A systematic review. Int J Obes (Lond), 34(1), 18-
28.
Lloyd, LJ, Langley-Evans, SC & Mcmullen, S (2012). Childhood obesity and risk of
the adult metabolic syndrome: A systematic review. Int J Obes (Lond), 36(1),
1-11.
Lopez-Luna, P, Maier, I & Herrera, E (1991). Carcass and tissue fat content in the
pregnant rat. Biol Neonate, 60(1), 29-38.
Low, FM, Gluckman, PD & Hanson, MA (2012). Developmental plasticity,
epigenetics and human health. Evolutionary Biology, 39(4), 650-665.
Lowry, OH, Rosebrough, NJ, Farr, AL & Randall, RJ (1951). Protein measurement
with the folin phenol reagent. J Biol Chem, 193(1), 265-75.
Lucas, A (1991). Programming by early nutrition in man. In: BOCK, J. R. &
WHELEN, J. (eds.) The childhood environment and adult disease. Chichester:
Wiley.
REFERENCES
188
Lucas, A (1994). Role of nutritional programming in determining adult morbidity.
Archives of Disease in Childhood, 71(4), 288-90.
Madsen, EM, Lindegaard, ML, Andersen, CB, Damm, P & Nielsen, LB (2004).
Human placenta secretes apolipoprotein b-100-containing lipoproteins. J Biol
Chem, 279(53), 55271-6.
Madsen, L, Petersen, RK & Kristiansen, K (2005). Regulation of adipocyte
differentiation and function by polyunsaturated fatty acids. Biochim Biophys
Acta, 1740(2), 266-86.
Makrides, M, Duley, L & Olsen, SF (2006). Marine oil, and other prostaglandin
precursor, supplementation for pregnancy uncomplicated by pre-eclampsia or
intrauterine growth restriction. Cochrane Database Syst Rev, 3), CD003402.
Malandro, MS, Beveridge, MJ, Kilberg, MS & Novak, DA (1996). Effect of low-
protein diet-induced intrauterine growth retardation on rat placental amino acid
transport. Am J Physiol, 271(1 Pt 1), C295-303.
Manson, JE, Cook, NR, Lee, IM, Christen, W, Bassuk, SS, Mora, S, Gibson, H, Albert,
CM, et al. (2018). Marine n−3 fatty acids and prevention of cardiovascular
disease and cancer. New England Journal of Medicine, 380(1), 23-32.
Mantzioris, E, James, MJ, Gibson, RA & Cleland, LG (1994). Dietary substitution
with an alpha-linolenic acid-rich vegetable oil increases eicosapentaenoic acid
concentrations in tissues. Am J Clin Nutr, 59(6), 1304-9.
Marangoni, F, Colombo, C & Galli, C (2004). A method for the direct evaluation of
the fatty acid status in a drop of blood from a fingertip in humans: Applicability
to nutritional and epidemiological studies. Analytical Biochemistry, 326(2),
267-272.
Mark, PJ, Sisala, C, Connor, K, Patel, R, Lewis, JL, Vickers, MH, Waddell, BJ &
Sloboda, DM (2011). A maternal high-fat diet in rat pregnancy reduces growth
of the fetus and the placental junctional zone, but not placental labyrinth zone
growth. Journal of Developmental Origins of Health and Disease, 2(1), 63-70.
Massiera, F, Barbry, P, Guesnet, P, Joly, A, Luquet, S, Moreilhon-Brest, C, Mohsen-
Kanson, T, Amri, EZ & Ailhaud, G (2010). A western-like fat diet is sufficient
to induce a gradual enhancement in fat mass over generations. J Lipid Res,
51(8), 2352-61.
Massiera, F, Saint-Marc, P, Seydoux, J, Murata, T, Kobayashi, T, Narumiya, S,
Guesnet, P, Amri, EZ, et al. (2003). Arachidonic acid and prostacyclin
REFERENCES
189
signaling promote adipose tissue development: A human health concern? J
Lipid Res, 44(2), 271-9.
Mayer-Davis, EJ, Lawrence, JM, Dabelea, D, Divers, J, Isom, S, Dolan, L, Imperatore,
G, Linder, B, et al. (2017). Incidence trends of type 1 and type 2 diabetes
among youths, 2002-2012. N Engl J Med, 376(15), 1419-1429.
Maymunah, A-O, Kehinde, O, Abidoye, G & Oluwatosin, A (2014).
Hypercholesterolaemia in pregnancy as a predictor of adverse pregnancy
outcome. Afr Health Sci, 14(4), 967-973.
Mcclive, PJ & Sinclair, AH (2001). Rapid DNA extraction and pcr-sexing of mouse
embryos. Mol Reprod Dev, 60(2), 225-6.
Mccurdy, CE, Bishop, JM, Williams, SM, Grayson, BE, Smith, MS, Friedman, JE &
Grove, KL (2009). Maternal high-fat diet triggers lipotoxicity in the fetal livers
of nonhuman primates. J Clin Invest, 119(2), 323-35.
Mcgowan, MW, Artiss, JD, Strandbergh, DR & Zak, B (1983). A peroxidase-coupled
method for the colorimetric determination of serum triglycerides. Clin Chem,
29(3), 538-42.
Mcmillen, IC & Robinson, JS (2005). Developmental origins of the metabolic
syndrome: Prediction, plasticity, and programming. Physiol Rev, 85(2), 571-
633.
Mcmullen, S, Langley-Evans, SC, Gambling, L, Lang, C, Swali, A & Mcardle, HJ
(2012). A common cause for a common phenotype: The gatekeeper hypothesis
in fetal programming. Med Hypotheses, 78(1), 88-94.
Mcmullen, S & Mostyn, A (2009a). Animal models for the study of the developmental
origins of health and disease. Proc Nutr Soc, 68(3), 306-20.
Mcmullen, S & Mostyn, A (2009b). Animal models for the study of the developmental
origins of health and disease. The Proceedings of the Nutrition Society, 68(3),
306-20.
Mcmullen, S, Osgerby, JC, Thurston, LM, Gadd, TS, Wood, PJ, Wathes, DC &
Michael, AE (2004). Alterations in placental 11 beta-hydroxysteroid
dehydrogenase (11 betahsd) activities and fetal cortisol:Cortisone ratios
induced by nutritional restriction prior to conception and at defined stages of
gestation in ewes. Reproduction, 127(6), 717-25.
Mcmurchie, EJ, Rinaldi, JA, Burnard, SL, Patten, GS, Neumann, M, Mcintosh, GH,
Abbey, M & Gibson, RA (1990). Incorporation and effects of dietary
REFERENCES
190
eicosapentaenoate (20 : 5(n − 3)) on plasma and erythrocyte lipids of the
marmoset following dietary supplementation with differing levels of linoleic
acid. Biochimica et Biophysica Acta (BBA) - Lipids and Lipid Metabolism,
1045(2), 164-173.
Menting, MD, Mintjens, S, Van De Beek, C, Frick, CJ, Ozanne, SE, Limpens, J,
Roseboom, TJ, Hooijmans, CR, et al. (2019). Maternal obesity in pregnancy
impacts offspring cardiometabolic health: Systematic review and meta-
analysis of animal studies. Obesity Reviews, 20(5), 675-685.
Mercuri, O, De Tomas, ME & Itarte, H (1979a). Prenatal protein depletion and delta9,
delta6 and delta5 desaturases in the rat. Lipids, 14(9), 822-5.
Mercuri, O, De Tomás, ME & Itarte, H (1979b). Prenatal protein depletion and δ9, δ6
and δ5 desaturases in the rat. Lipids, 14(9), 822-825.
Meyer, BJ, Mann, NJ, Lewis, JL, Milligan, GC, Sinclair, AJ & Howe, PRC (2003).
Dietary intakes and food sources of omega-6 and omega-3 polyunsaturated
fatty acids. Lipids, 38(4), 391-398.
Meyer, DM, Brei, C, Stecher, L, Much, D, Brunner, S & Hauner, H (2019).
Associations between long-chain pufas in maternal blood, cord blood, and
breast milk and offspring body composition up to 5 years: Follow-up from the
infat study. Eur J Clin Nutr, 73(3), 458-464.
Middleton, P, Gomersall, JC, Gould, JF, Shepherd, E, Olsen, SF & Makrides, M
(2018). Omega‐3 fatty acid addition during pregnancy. Cochrane Database of
Systematic Reviews, 11).
Mohammad, MA, Sunehag, AL & Haymond, MW (2014). De novo synthesis of milk
triglycerides in humans. Am J Physiol Endocrinol Metab, 306(7), E838-E847.
Moon, YA, Hammer, RE & Horton, JD (2009). Deletion of elovl5 leads to fatty liver
through activation of srebp-1c in mice. J Lipid Res, 50(3), 412-23.
Moretto, VL, Ballen, MO, Goncalves, TS, Kawashita, NH, Stoppiglia, LF, Veloso,
RV, Latorraca, MQ, Martins, MS & Gomes-Da-Silva, MH (2011). Low-
protein diet during lactation and maternal metabolism in rats. ISRN Obstet
Gynecol, 2011(876502.
Morikawa, M, Nixon, T & Green, H (1982). Growth hormone and the adipose
conversion of 3t3 cells. Cell, 29(3), 783-9.
REFERENCES
191
Morrison, JL, Duffield, JA, Muhlhausler, BS, Gentili, S & Mcmillen, IC (2010). Fetal
growth restriction, catch-up growth and the early origins of insulin resistance
and visceral obesity. Pediatric Nephrology, 25(4), 669-677.
Mottillo, S, Filion, KB, Genest, J, Joseph, L, Pilote, L, Poirier, P, Rinfret, S, Schiffrin,
EL & Eisenberg, MJ (2010). The metabolic syndrome and cardiovascular risk
a systematic review and meta-analysis. J Am Coll Cardiol, 56(14), 1113-32.
Much, D, Brunner, S, Vollhardt, C, Schmid, D, Sedlmeier, EM, Bruderl, M, Heimberg,
E, Bartke, N, et al. (2013). Effect of dietary intervention to reduce the n-6/n-3
fatty acid ratio on maternal and fetal fatty acid profile and its relation to
offspring growth and body composition at 1 year of age. Eur J Clin Nutr, 67(3),
282-8.
Muhlhausler, BS, Adam, CL, Findlay, PA, Duffield, JA & Mcmillen, IC (2006).
Increased maternal nutrition alters development of the appetite-regulating
network in the brain. FASEB J, 20(8), 1257-9.
Muhlhausler, BS & Ailhaud, GP (2013). Omega-6 polyunsaturated fatty acids and the
early origins of obesity. Curr Opin Endocrinol Diabetes Obes, 20(1), 56-61.
Muhlhausler, BS, Cook-Johnson, R, James, M, Miljkovic, D, Duthoit, E & Gibson, R
(2010a). Opposing effects of omega-3 and omega-6 long chain polyunsaturated
fatty acids on the expression of lipogenic genes in omental and retroperitoneal
adipose depots in the rat. J Nutr Metab, 2010(
Muhlhausler, BS, Gibson, RA & Makrides, M (2010b). Effect of long-chain
polyunsaturated fatty acid supplementation during pregnancy or lactation on
infant and child body composition: A systematic review. Am J Clin Nutr, 92(4),
857-63.
Muhlhausler, BS, Gibson, RA & Makrides, M (2011a). The effect of maternal omega-
3 long-chain polyunsaturated fatty acid (n-3 lcpufa) supplementation during
pregnancy and/or lactation on body fat mass in the offspring: A systematic
review of animal studies. Prostaglandins Leukot Essent Fatty Acids, 85(2), 83-
8.
Muhlhausler, BS, Miljkovic, D, Fong, L, Xian, CJ, Duthoit, E & Gibson, RA (2011b).
Maternal omega-3 supplementation increases fat mass in male and female rat
offspring. Frontiers in Genetics, 2(48.
Mullen, MP, Forde, N, Parr, MH, Diskin, MG, Morris, DG, Nally, JE, Evans, AC &
Crowe, MA (2012). Alterations in systemic concentrations of progesterone
REFERENCES
192
during the early luteal phase affect rbp4 expression in the bovine uterus.
Reprod Fertil Dev, 24(5), 715-22.
Müller, MJ, Bosy-Westphal, A & Heymsfield, SB (2010). Is there evidence for a set
point that regulates human body weight? F1000 medicine reports, 2(59-59.
Murtaugh, MA, Jacobs, DR, Moran, A, Steinberger, J & Sinaiko, AR (2003). Relation
of birth weight to fasting insulin, insulin resistance, and body size in
adolescence. Diabetes Care, 26(1), 187.
Must, A, Jacques, PF, Dallal, GE, Bajema, CJ & Dietz, WH (1992). Long-term
morbidity and mortality of overweight adolescents. A follow-up of the harvard
growth study of 1922 to 1935. N Engl J Med, 327(19), 1350-5.
Napoli, C, D'armiento, FP, Mancini, FP, Postiglione, A, Witztum, JL, Palumbo, G &
Palinski, W (1997). Fatty streak formation occurs in human fetal aortas and is
greatly enhanced by maternal hypercholesterolemia. Intimal accumulation of
low density lipoprotein and its oxidation precede monocyte recruitment into
early atherosclerotic lesions. J Clin Invest, 100(11), 2680-90.
Napoli, C, De Nigris, F, Welch John, S, Calara Federico, B, Stuart Robert, O, Glass
Christopher, K & Palinski, W (2002). Maternal hypercholesterolemia during
pregnancy promotes early atherogenesis in ldl receptor-deficient mice and
alters aortic gene expression determined by microarray. Circulation, 105(11),
1360-1367.
Neuringer, M, Connor, WE, Lin, DS, Barstad, L & Luck, S (1986). Biochemical and
functional effects of prenatal and postnatal omega 3 fatty acid deficiency on
retina and brain in rhesus monkeys. Proceedings of the National Academy of
Sciences of the United States of America, 83(11), 4021-4025.
Nimptsch, K, Berg-Beckhoff, G & Linseisen, J (2010). Effect of dietary fatty acid
intake on prospective weight change in the heidelberg cohort of the european
prospective investigation into cancer and nutrition. Public Health Nutrition,
13(10), 1636-1646.
Nishio, H, Kodama, S, Yokoyama, S, Matsuo, T, Mio, T & Sumino, K (1986). A
simple method to diagnose adrenoleukodystrophy using a dried blood spot on
filter paper. Clin Chim Acta, 159(1), 77-82.
Nyirenda, MJ, Lindsay, RS, Kenyon, CJ, Burchell, A & Seckl, JR (1998).
Glucocorticoid exposure in late gestation permanently programs rat hepatic
phosphoenolpyruvate carboxykinase and glucocorticoid receptor expression
REFERENCES
193
and causes glucose intolerance in adult offspring. The Journal of clinical
investigation, 101(10), 2174-2181.
O'rahilly, S & Farooqi, IS (2008). Human obesity as a heritable disorder of the central
control of energy balance. Int J Obes (Lond), 32 Suppl 7(S55-61.
Ong, KK, Ahmed, ML, Emmett, PM, Preece, MA & Dunger, DB (2000). Association
between postnatal catch-up growth and obesity in childhood: Prospective
cohort study. Bmj, 320(7240), 967-71.
Owen, CG, Whincup, PH, Orfei, L, Chou, QA, Rudnicka, AR, Wathern, AK, Kaye,
SJ, Eriksson, JG, et al. (2009). Is body mass index before middle age related
to coronary heart disease risk in later life? Evidence from observational studies.
Int J Obes (Lond), 33(8), 866-77.
Ozanne, SE, Martensz, ND, Petry, CJ, Loizou, CL & Hales, CN (1998). Maternal low
protein diet in rats programmes fatty acid desaturase activities in the offspring.
Diabetologia, 41(11), 1337-42.
Pairault, J & Green, H (1979). A study of the adipose conversion of suspended 3t3
cells by using glycerophosphate dehydrogenase as differentiation marker.
Proceedings of the National Academy of Sciences of the United States of
America, 76(10), 5138-5142.
Papacleovoulou, G, Abu-Hayyeh, S, Nikolopoulou, E, Briz, O, Owen, BM, Nikolova,
V, Ovadia, C, Huang, X, et al. (2013). Maternal cholestasis during pregnancy
programs metabolic disease in offspring. The Journal of Clinical Investigation,
123(7), 3172-3181.
Parker, SP & Cubitt, WD (1999). The use of the dried blood spot sample in
epidemiological studies. J Clin Pathol, 52(9), 633-639.
Parsons, TJ, Power, C & Manor, O (2001). Fetal and early life growth and body mass
index from birth to early adulthood in 1958 british cohort: Longitudinal study.
BMJ : British Medical Journal, 323(7325), 1331-1335.
Patterson, E, Wall, R, Fitzgerald, GF, Ross, RP & Stanton, C (2012). Health
implications of high dietary omega-6 polyunsaturated fatty acids. J Nutr
Metab, 2012(539426.
Pechey, R & Monsivais, P (2016). Socioeconomic inequalities in the healthiness of
food choices: Exploring the contributions of food expenditures. Prev Med,
88(203-209.
REFERENCES
194
Pedersen, M, Giorgis-Allemand, L, Bernard, C, Aguilera, I, Andersen, A-MN,
Ballester, F, Beelen, RMJ, Chatzi, L, et al. (2013). Ambient air pollution and
low birthweight: A european cohort study (escape). The Lancet Respiratory
Medicine, 1(9), 695-704.
Phillips, DI, Barker, DJ, Hales, CN, Hirst, S & Osmond, C (1994). Thinness at birth
and insulin resistance in adult life. Diabetologia, 37(2), 150-4.
Pichon, L, Huneau, JF, Fromentin, G & Tome, D (2006). A high-protein, high-fat,
carbohydrate-free diet reduces energy intake, hepatic lipogenesis, and
adiposity in rats. J Nutr, 136(5), 1256-60.
Plagemann, A, Harder, T, Kohlhoff, R, Rohde, W & Dorner, G (1997). Overweight
and obesity in infants of mothers with long-term insulin-dependent diabetes or
gestational diabetes. Int J Obes Relat Metab Disord, 21(6), 451-6.
Poissonnet, CM, Burdi, AR & Garn, SM (1984). The chronology of adipose tissue
appearance and distribution in the human fetus. Early Hum Dev, 10(1-2), 1-11.
Porter, FD (2002). Malformation syndromes due to inborn errors of cholesterol
synthesis. J Clin Invest, 110(6), 715-724.
Pouteau, E, Aprikian, O, Grenot, C, Reynaud, D, Pace-Asciak, C, Cuilleron, CY,
Castañeda-Gutiérrez, E, Moulin, J, et al. (2010). A low alpha-linolenic intake
during early life increases adiposity in the adult guinea pig. Nutrition &
metabolism, 7(8-8.
Ramsden, CE, Faurot, KR, Zamora, D, Suchindran, CM, Macintosh, BA, Gaylord, S,
Ringel, A, Hibbeln, JR, et al. (2013a). Targeted alteration of dietary n-3 and n-
6 fatty acids for the treatment of chronic headaches: A randomized trial. Pain,
154(11), 2441-51.
Ramsden, CE, Zamora, D, Leelarthaepin, B, Majchrzak-Hong, SF, Faurot, KR,
Suchindran, CM, Ringel, A, Davis, JM & Hibbeln, JR (2013b). Use of dietary
linoleic acid for secondary prevention of coronary heart disease and death:
Evaluation of recovered data from the sydney diet heart study and updated
meta-analysis. BMJ, 4(346.
Ramsden, CE, Zamora, D, Leelarthaepin, B, Majchrzak-Hong, SF, Faurot, KR,
Suchindran, CM, Ringel, A, Davis, JM & Hibbeln, JR (2013c). Use of dietary
linoleic acid for secondary prevention of coronary heart disease and death:
Evaluation of recovered data from the sydney diet heart study and updated
meta-analysis. BMJ : British Medical Journal, 346(
REFERENCES
195
Ravelli, GP, Stein, ZA & Susser , MW (1976). Obesity in young men after famine
exposure in utero and early infancy. New Eng J Med, 295(7), 349-53.
Remacle, C, Dumortier, O, Bol, V, Goosse, K, Romanus, P, Theys, N, Bouckenooghe,
T & Reusens, B (2007). Intrauterine programming of the endocrine pancreas.
Diabetes Obes Metab, 9 Suppl 2(196-209.
Resnick, HE, Valsania, P, Halter, JB & Lin, X (2000). Relation of weight gain and
weight loss on subsequent diabetes risk in overweight adults. J Epidemiol
Community Health, 54(8), 596-602.
Reynés, B, García-Ruiz, E, Díaz-Rúa, R, Palou, A & Oliver, P (2014). Reversion to a
control balanced diet is able to restore body weight and to recover altered
metabolic parameters in adult rats long-term fed on a cafeteria diet. Food
Research International, 64(839-848.
Reynolds, RM, Osmond, C, Phillips, DIW & Godfrey, KM (2010). Maternal bmi,
parity, and pregnancy weight gain: Influences on offspring adiposity in young
adulthood. The Journal of Clinical Endocrinology & Metabolism, 95(12),
5365-5369.
Rhinn, H, Scherman, D & Escriou, V (2008). One-step quantification of single-
stranded DNA in the presence of rna using oligreen in a real-time polymerase
chain reaction thermocycler. Anal Biochem, 372(1), 116-8.
Ribaroff, GA, Wastnedge, E, Drake, AJ, Sharpe, RM & Chambers, TJG (2017).
Animal models of maternal high fat diet exposure and effects on metabolism
in offspring: A meta-regression analysis. Obes Rev, 18(6), 673-686.
Ricciotti, E & Fitzgerald, GA (2011). Prostaglandins and inflammation.
Arteriosclerosis, Thrombosis, and Vascular Biology, 31(5), 986-1000.
Rice, F, Harold, GT, Boivin, J, Van Den Bree, M, Hay, DF & Thapar, A (2010). The
links between prenatal stress and offspring development and psychopathology:
Disentangling environmental and inherited influences. Psychological
Medicine, 40(2), 335-345.
Roeschlau, P, Bernt, E & Gruber, W (1974). Enzymatic determination of total
cholesterol in serum. Z Klin Chem Klin Biochem, 12(5), 226.
Romero-Corral, A, Somers, VK, Sierra-Johnson, J, Thomas, RJ, Collazo-Clavell, ML,
Korinek, J, Allison, TG, Batsis, JA, et al. (2008). Accuracy of body mass index
in diagnosing obesity in the adult general population. Int J Obes (Lond), 32(6),
959-66.
REFERENCES
196
Roseboom, TJ, Van Der Meulen, JH, Osmond, C, Barker, DJ, Ravelli, AC & Bleker,
OP (2000). Plasma lipid profiles in adults after prenatal exposure to the dutch
famine. American Journal of Clinical Nutrition, 72(5), 1101-6.
Roseboom, TJ, Van Der Meulen, JH, Ravelli, AC, Osmond, C, Barker, DJ & Bleker,
OP (2001). Effects of prenatal exposure to the dutch famine on adult disease in
later life: An overview. Mol Cell Endocrinol, 185(1-2), 93-8.
Rosen, ED, Hsu, CH, Wang, X, Sakai, S, Freeman, MW, Gonzalez, FJ & Spiegelman,
BM (2002). C/ebpalpha induces adipogenesis through ppargamma: A unified
pathway. Genes Dev, 16(1), 22-6.
Rosenfeld, CS (2015). Sex-specific placental responses in fetal development.
Endocrinology, 156(10), 3422-3434.
Ruzickova, J, Rossmeisl, M, Prazak, T, Flachs, P, Sponarova, J, Veck, M, Tvrzicka,
E, Bryhn, M & Kopecky, J (2004). Omega-3 pufa of marine origin limit diet-
induced obesity in mice by reducing cellularity of adipose tissue. Lipids,
39(12), 1177-85.
Sacks, H & Symonds, ME (2013). Anatomical locations of human brown adipose
tissue: Functional relevance and implications in obesity and type 2 diabetes.
Diabetes, 62(6), 1783-1790.
Sacn. (2018). Draft report: Saturated fats and health [Online]. Available:
https://www.gov.uk/government/consultations/saturated-fats-and-health-
draft-sacn-report [Accessed 03/12/2018 2018].
Sacn (2019). Saturated fats and health: Sacn report.
Samuelsson, AM, Matthews, PA, Argenton, M, Christie, MR, Mcconnell, JM, Jansen,
EH, Piersma, AH, Ozanne, SE, et al. (2008). Diet-induced obesity in female
mice leads to offspring hyperphagia, adiposity, hypertension, and insulin
resistance: A novel murine model of developmental programming.
Hypertension, 51(2), 383-92.
Schmitz, G & Ecker, J (2008). The opposing effects of n−3 and n−6 fatty acids.
Progress in Lipid Research, 47(2), 147-155.
Schoppa, I, Lyass, A, Heard-Costa, N, De Ferranti, SD, Fox, C, Gillman, MW,
D’agostino Sr, R, Levy, D & Mendelson, MM (2019). Association of maternal
prepregnancy weight with offspring adiposity throughout adulthood over 37
years of follow-up. Obesity, 27(1), 137-144.
REFERENCES
197
Sedlmeier, EM, Brunner, S, Much, D, Pagel, P, Ulbrich, SE, Meyer, HH, Amann-
Gassner, U, Hauner, H & Bader, BL (2014). Human placental transcriptome
shows sexually dimorphic gene expression and responsiveness to maternal
dietary n-3 long-chain polyunsaturated fatty acid intervention during
pregnancy. BMC Genomics, 15(941.
Shillabeer, G, Kumar, V, Tibbo, E & Lau, DC (1998). Arachidonic acid metabolites
of the lipoxygenase as well as the cyclooxygenase pathway may be involved
in regulating preadipocyte differentiation. Metabolism, 47(4), 461-6.
Silverman, BL, Landsberg, L & Metzger, BE (1993). Fetal hyperinsulinism in
offspring of diabetic mothers. Association with the subsequent development of
childhood obesity. Ann N Y Acad Sci, 699(36-45.
Simmonds, M, Llewellyn, A, Owen, CG & Woolacott, N (2016). Predicting adult
obesity from childhood obesity: A systematic review and meta-analysis. Obes
Rev, 17(2), 95-107.
Simopoulos, AP (2016). An increase in the omega-6/omega-3 fatty acid ratio increases
the risk for obesity. Nutrients, 8(3), 128.
Singh, P, Saxena, R, Srinivas, G, Pande, G & Chattopadhyay, A (2013). Cholesterol
biosynthesis and homeostasis in regulation of the cell cycle. PLoS One, 8(3),
e58833.
Singh, RB, Niaz, MA, Sharma, JP, Kumar, R, Rastogi, V & Moshiri, M (1997).
Randomized, double-blind, placebo-controlled trial of fish oil and mustard oil
in patients with suspected acute myocardial infarction: The indian experiment
of infarct survival--4. Cardiovasc Drugs Ther, 11(3), 485-91.
Sioen, I, Van Lieshout, L, Eilander, A, Fleith, M, Lohner, S, Szommer, A, Petisca, C,
Eussen, S, et al. (2017). Systematic review on n-3 and n-6 polyunsaturated
fatty acid intake in european countries in light of the current recommendations
- focus on specific population groups. Ann Nutr Metab, 70(1), 39-50.
Smith, PJ, Wise, LS, Berkowitz, R, Wan, C & Rubin, CS (1988). Insulin-like growth
factor-i is an essential regulator of the differentiation of 3t3-l1 adipocytes. J
Biol Chem, 263(19), 9402-8.
Solini, A, Santini, E, Madec, S, Rossi, C & Muscelli, E (2009). Retinol-binding
protein-4 in women with untreated essential hypertension. Am J Hypertens,
22(9), 1001-6.
REFERENCES
198
Song, Z, Xiaoli, AM & Yang, F (2018). Regulation and metabolic significance of de
novo lipogenesis in adipose tissues. Nutrients, 10(10).
Soyal, SM, Nofziger, C, Dossena, S, Paulmichl, M & Patsch, W (2015). Targeting
srebps for treatment of the metabolic syndrome. Trends in Pharmacological
Sciences, 36(6), 406-416.
Spector, AA (1999). Essentiality of fatty acids. Lipids, 34(S1-S3.
Sprecher, H, Luthria, DL, Mohammed, BS & Baykousheva, SP (1995). Reevaluation
of the pathways for the biosynthesis of polyunsaturated fatty acids. J Lipid Res,
36(12), 2471-7.
Stefulj, J, Panzenboeck, U, Becker, T, Hirschmugl, B, Schweinzer, C, Lang, I,
Marsche, G, Sadjak, A, et al. (2009). Human endothelial cells of the placental
barrier efficiently deliver cholesterol to the fetal circulation via abca1 and
abcg1. Circ Res, 104(5), 600-8.
Stock, MJ & Cinti, S (2003). Adipose tissue | structure and function of brown adipose
tissue. In: CABALLERO, B. (ed.) Encyclopedia of food sciences and nutrition
(second edition). Oxford: Academic Press.
Stoffel, W, Holz, B, Jenke, B, Binczek, E, Günter, RH, Kiss, C, Karakesisoglou, I,
Thevis, M, et al. (2008). Delta6-desaturase (fads2) deficiency unveils the role
of omega3- and omega6-polyunsaturated fatty acids. The EMBO journal,
27(17), 2281-2292.
Stroud, CK, Nara, TY, Roqueta-Rivera, M, Radlowski, EC, Lawrence, P, Zhang, Y,
Cho, BH, Segre, M, et al. (2009). Disruption of fads2 gene in mice impairs
male reproduction and causes dermal and intestinal ulceration. J Lipid Res,
50(9), 1870-80.
Swali, A, Mcmullen, S, Hayes, H, Gambling, L, Mcardle, HJ & Langley-Evans, SC
(2011). Cell cycle regulation and cytoskeletal remodelling are critical
processes in the nutritional programming of embryonic development. PLOS
ONE, 6(8), e23189.
Tal, R, Taylor, HS, Burney, RO, Mooney, SB & Giudice, LC (2000). Endocrinology
of pregnancy. In: FEINGOLD, K. R., ANAWALT, B., BOYCE, A.,
CHROUSOS, G., DUNGAN, K., GROSSMAN, A., HERSHMAN, J. M.,
KALTSAS, G., KOCH, C., KOPP, P., KORBONITS, M., MCLACHLAN, R.,
MORLEY, J. E., NEW, M., PERREAULT, L., PURNELL, J., REBAR, R.,
REFERENCES
199
SINGER, F., TRENCE, D. L., VINIK, A. & WILSON, D. P. (eds.) Endotext.
South Dartmouth (MA): MDText.com, Inc.
Tang, Q-Q, Zhang, J-W & Daniel Lane, M (2004). Sequential gene promoter
interactions of c/ebpβ, c/ebpα, and pparγ during adipogenesis. Biochemical and
Biophysical Research Communications, 319(1), 235-239.
Tarrade, A, Panchenko, P, Junien, C & Gabory, A (2015). Placental contribution to
nutritional programming of health and diseases: Epigenetics and sexual
dimorphism. J Exp Biol, 218(Pt 1), 50-8.
Taylor, PD, Khan, IY, Lakasing, L, Dekou, V, O'brien-Coker, I, Mallet, AI, Hanson,
MA & Poston, L (2003). Uterine artery function in pregnant rats fed a diet
supplemented with animal lard. Exp Physiol, 88(3), 389-98.
Taylor, PD, Mcconnell, J, Khan, IY, Holemans, K, Lawrence, KM, Asare-Anane, H,
Persaud, SJ, Jones, PM, et al. (2005). Impaired glucose homeostasis and
mitochondrial abnormalities in offspring of rats fed a fat-rich diet in pregnancy.
Am J Physiol Regul Integr Comp Physiol, 288(1), R134-9.
Tian, JY, Cheng, Q, Song, XM, Li, G, Jiang, GX, Gu, YY & Luo, M (2006). Birth
weight and risk of type 2 diabetes, abdominal obesity and hypertension among
chinese adults. Eur J Endocrinol, 155(4), 601-7.
Trayhurn, P (2005). Endocrine and signalling role of adipose tissue: New perspectives
on fat. Acta Physiol Scand, 184(4), 285-93.
Trayhurn, P (2018). Brown adipose tissue-a therapeutic target in obesity? Front
Physiol, 9(1672-1672.
Trayhurn, P & Beattie, JH (2001). Physiological role of adipose tissue: White adipose
tissue as an endocrine and secretory organ. Proceedings of the Nutrition
Society, 60(3), 329-339.
Tu, WC, Cook-Johnson, RJ, James, MJ, Muhlhausler, BS & Gibson, RA (2010).
Omega-3 long chain fatty acid synthesis is regulated more by substrate levels
than gene expression. Prostaglandins Leukot Essent Fatty Acids, 83(2), 61-8.
Tu, WC, Muhlhausler, BS, Yelland, LN & Gibson, RA (2013). Correlations between
blood and tissue omega-3 lcpufa status following dietary ala intervention in
rats. Prostaglandins Leukot Essent Fatty Acids, 88(1), 53-60.
Umek, RM, Friedman, AD & Mcknight, SL (1991). Ccaat-enhancer binding protein:
A component of a differentiation switch. Science, 251(4991), 288-92.
REFERENCES
200
Vahdaninia, M, Mackenzie, H, Dean, T & Helps, S (2018). The effectiveness of
omega-3 polyunsaturated fatty acid interventions during pregnancy on obesity
measures in the offspring: An up-to-date systematic review and meta-analysis.
Eur J Nutr.
Vickers, MH, Breier, BH, Cutfield, WS, Hofman, PL & Gluckman, PD (2000). Fetal
origins of hyperphagia, obesity, and hypertension and postnatal amplification
by hypercaloric nutrition. Am J Physiol Endocrinol Metab, 279(1), E83-7.
Vithayathil, MA, Gugusheff, JR, Ong, ZY, Langley-Evans, SC, Gibson, RA &
Muhlhausler, BS (2018). Exposure to maternal cafeteria diets during the
suckling period has greater effects on fat deposition and sterol regulatory
element binding protein-1c (srebp-1c) gene expression in rodent offspring
compared to exposure before birth. Nutr Metab (Lond), 15(17.
Voerman, E, Santos, S, Patro Golab, B, Amiano, P, Ballester, F, Barros, H, Bergström,
A, Charles, M-A, et al. (2019). Maternal body mass index, gestational weight
gain, and the risk of overweight and obesity across childhood: An individual
participant data meta-analysis. PLoS medicine, 16(2), e1002744-e1002744.
Volpe, JJ & Vagelos, PR (1976). Mechanisms and regulation of biosynthesis of
saturated fatty acids. Physiol Rev, 56(2), 339-417.
Wall, R, Ross, RP, Fitzgerald, GF & Stanton, C (2010). Fatty acids from fish: The
anti-inflammatory potential of long-chain omega-3 fatty acids. Nutr Rev, 68(5),
280-9.
Wang, L, Manson, JE, Rautiainen, S, Gaziano, JM, Buring, JE, Tsai, MY & Sesso, HD
(2016). A prospective study of erythrocyte polyunsaturated fatty acid, weight
gain, and risk of becoming overweight or obese in middle-aged and older
women. Eur J Nutr, 55(2), 687-697.
Wang, Y, Botolin, D, Christian, B, Busik, J, Xu, J & Jump, DB (2005). Tissue-specific,
nutritional, and developmental regulation of rat fatty acid elongases. J Lipid
Res, 46(4), 706-15.
Wang, Y, Min, J, Khuri, J & Li, M (2017). A systematic examination of the association
between parental and child obesity across countries. Adv Nutr, 8(3), 436-448.
Wang, YC, Mcpherson, K, Marsh, T, Gortmaker, SL & Brown, M (2011). Health and
economic burden of the projected obesity trends in the USA and the uk. Lancet,
378(9793), 815-25.
REFERENCES
201
Ward, C, Lewis, S & Coleman, T (2007). Prevalence of maternal smoking and
environmental tobacco smoke exposure during pregnancy and impact on birth
weight: Retrospective study using millennium cohort. BMC Public Health,
7(81.
Ward, ZJ, Long, MW, Resch, SC, Giles, CM, Cradock, AL & Gortmaker, SL (2017).
Simulation of growth trajectories of childhood obesity into adulthood. New
England Journal of Medicine, 377(22), 2145-2153.
White, CL, Purpera, MN & Morrison, CD (2009). Maternal obesity is necessary for
programming effect of high-fat diet on offspring. Am J Physiol Regul Integr
Comp Physiol, 296(5), R1464-72.
Whitlock, G, Lewington, S, Sherliker, P, Clarke, R, Emberson, J, Halsey, J, Qizilbash,
N, Collins, R & Peto, R (2009). Body-mass index and cause-specific mortality
in 900 000 adults: Collaborative analyses of 57 prospective studies. Lancet,
373(9669), 1083-96.
Who (2000). Obesity: Preventing and managing the global epidemic. Report of a who
consultation. WHO Technical Report Series 894(1-253.
Who. (2017a). Obesity and overweight [Online]. Available:
http://www.who.int/mediacentre/factsheets/fs311/en/ [Accessed 27/10/2017
2017].
Who. (2017b). The top 10 casues of death [Online]. Available:
http://www.who.int/mediacentre/factsheets/fs310/en/ [Accessed 27/10/2017
2017].
Who & Fao (1994). Fats and oils in human nutrition: Report of a joint fao/who expert
consultation. Rome: FAO.
Wilcken, B, Brown, ARD, Urwin, R & Brown, DA (1983). Cystic fibrosis screening
by dried blood spot trypsin assay: Results in 75,000 newborn infants. The
Journal of Pediatrics, 102(3), 383-387.
Wood, K, Mantzioris, E, Lingwood, B, Couper, J, Makrides, M, Gibson, RA &
Muhlhausler, BS (2018). The effect of maternal dha supplementation on body
fat mass in children at 7 years: Follow-up of the domino randomized controlled
trial. Prostaglandins Leukot Essent Fatty Acids, 139(49-54.
Wood, KE, Lau, A, Mantzioris, E, Gibson, RA, Ramsden, CE & Muhlhausler, BS
(2014). A low omega-6 polyunsaturated fatty acid (n-6 pufa) diet increases
REFERENCES
202
omega-3 (n-3) long chain pufa status in plasma phospholipids in humans.
Prostaglandins Leukot Essent Fatty Acids, 90(4), 133-8.
Wood, KE, Mantzioris, E, Gibson, RA, Ramsden, CE & Muhlhausler, BS (2015). The
effect of modifying dietary la and ala intakes on omega-3 long chain
polyunsaturated fatty acid (n-3 lcpufa) status in human adults: A systematic
review and commentary. Prostaglandins Leukot Essent Fatty Acids, 95(47-55.
Woodall, SM, Johnston, BM, Breier, BH & Gluckman, PD (1996). Chronic maternal
undernutrition in the rat leads to delayed postnatal growth and elevated blood
pressure of offspring. Pediatr Res, 40(3), 438-43.
Woods, LL, Weeks, DA & Rasch, R (2004). Programming of adult blood pressure by
maternal protein restriction: Role of nephrogenesis. Kidney Int, 65(4), 1339-
48.
Woollett, LA (2011). Review: Transport of maternal cholesterol to the fetal
circulation. Placenta, 32 Suppl 2(S218-21.
Wu, Z, Xie, Y, Bucher, NL & Farmer, SR (1995). Conditional ectopic expression of
c/ebp beta in nih-3t3 cells induces ppar gamma and stimulates adipogenesis.
Genes Dev, 9(19), 2350-63.
Wyrwoll, CS, Mark, PJ, Mori, TA, Puddey, IB & Waddell, BJ (2006). Prevention of
programmed hyperleptinemia and hypertension by postnatal dietary omega-3
fatty acids. Endocrinology, 147(1), 599-606.
Xu, J, Nakamura, MT, Cho, HP & Clarke, SD (1999). Sterol regulatory element
binding protein-1 expression is suppressed by dietary polyunsaturated fatty
acids. A mechanism for the coordinate suppression of lipogenic genes by
polyunsaturated fats. J Biol Chem, 274(33), 23577-83.
Xu, J, Teran-Garcia, M, Park, JH, Nakamura, MT & Clarke, SD (2001).
Polyunsaturated fatty acids suppress hepatic sterol regulatory element-binding
protein-1 expression by accelerating transcript decay. J Biol Chem, 276(13),
9800-7.
Yang, Q, Graham, TE, Mody, N, Preitner, F, Peroni, OD, Zabolotny, JM, Kotani, K,
Quadro, L & Kahn, BB (2005). Serum retinol binding protein 4 contributes to
insulin resistance in obesity and type 2 diabetes. Nature, 436(7049), 356-62.
Zhang, L, Long, NM, Hein, SM, Ma, Y, Nathanielsz, PW & Ford, SP (2011). Maternal
obesity in ewes results in reduced fetal pancreatic beta-cell numbers in late

REFERENCES
203
gestation and decreased circulating insulin concentration at term. Domest Anim
Endocrinol, 40(1), 30-9.

204
Appendix A
Tecklad Global 18% Protein Rodent Diet (Harlan Laboratories)
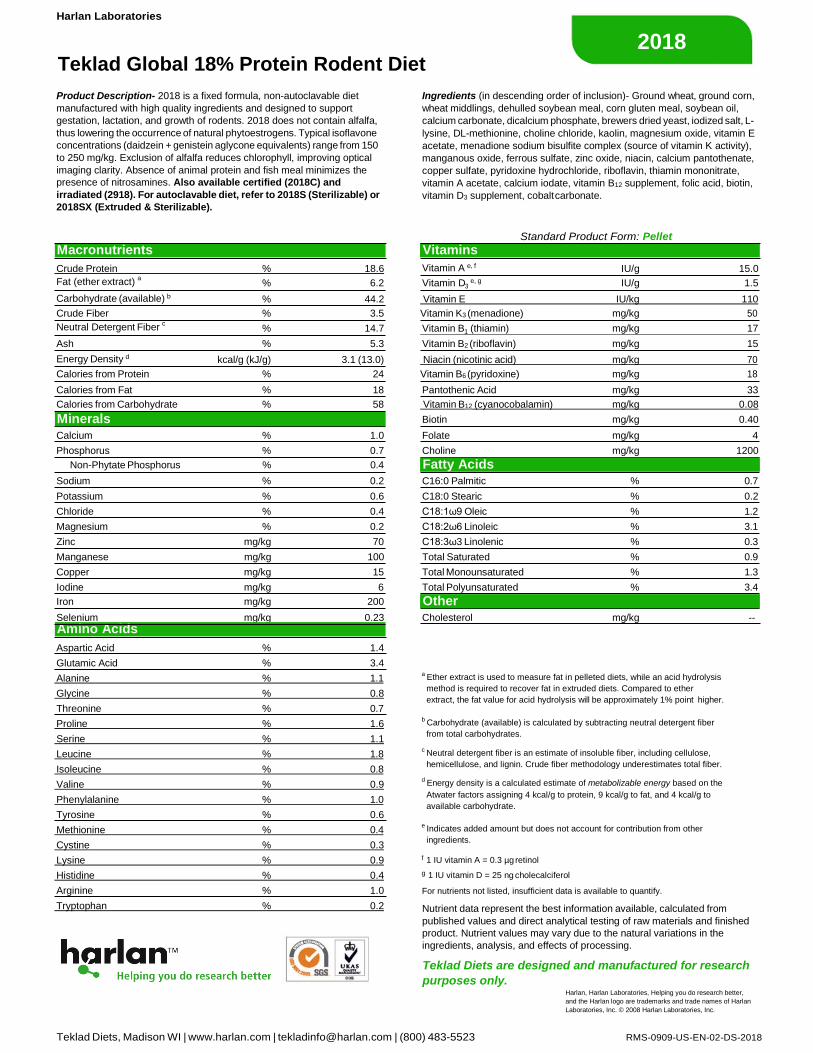
2018 2018
3
1
Harlan Laboratories
Teklad Global 18% Protein Rodent Diet
Product Description- 2018 is a fixed formula, non-autoclavable diet
manufactured with high quality ingredients and designed to support
gestation, lactation, and growth of rodents. 2018 does not contain alfalfa,
thus lowering the occurrence of natural phytoestrogens. Typical isoflavone
concentrations (daidzein + genistein aglycone equivalents) range from 150
to 250 mg/kg. Exclusion of alfalfa reduces chlorophyll, improving optical
imaging clarity. Absence of animal protein and fish meal minimizes the
presence of nitrosamines. Also available certified (2018C) and
irradiated (2918). For autoclavable diet, refer to 2018S (Sterilizable) or
2018SX (Extruded & Sterilizable).
Ingredients (in descending order of inclusion)- Ground wheat, ground corn,
wheat middlings, dehulled soybean meal, corn gluten meal, soybean oil,
calcium carbonate, dicalcium phosphate, brewers dried yeast, iodized salt, L-
lysine, DL-methionine, choline chloride, kaolin, magnesium oxide, vitamin E
acetate, menadione sodium bisulfite complex (source of vitamin K activity),
manganous oxide, ferrous sulfate, zinc oxide, niacin, calcium pantothenate,
copper sulfate, pyridoxine hydrochloride, riboflavin, thiamin mononitrate,
vitamin A acetate, calcium iodate, vitamin B12 supplement, folic acid, biotin,
vitamin D3 supplement, cobalt carbonate.
Standard Product Form: Pellet
Crude Protein % 18.6 Vitamin A e, f IU/g 15.0
Fat (ether extract) a
% 6.2 Vitamin D e, g IU/g 1.5
Carbohydrate (available) b % 44.2 Vitamin E IU/kg 110
Crude Fiber % 3.5 Vitamin K3 (menadione) mg/kg 50
Neutral Detergent Fiber c
% 14.7 Vitamin B (thiamin) mg/kg 17
Ash % 5.3 Vitamin B2 (riboflavin) mg/kg 15
Energy Density d kcal/g (kJ/g) 3.1 (13.0) Niacin (nicotinic acid) mg/kg 70
Calories from Protein % 24 Vitamin B6 (pyridoxine) mg/kg 18
Calories from Fat % 18 Pantothenic Acid mg/kg 33
Calories from Carbohydrate % 58 Vitamin B12 (cyanocobalamin) mg/kg 0.08
Biotin mg/kg 0.40
Calcium % 1.0 Folate mg/kg 4
Phosphorus % 0.7 Choline mg/kg 1200
Non-Phytate Phosphorus % 0.4
Sodium % 0.2 C16:0 Palmitic % 0.7
Potassium % 0.6 C18:0 Stearic % 0.2
Chloride % 0.4 C18:1ω9 Oleic % 1.2
Magnesium % 0.2 C18:2ω6 Linoleic % 3.1
Zinc mg/kg 70 C18:3ω3 Linolenic % 0.3
Manganese mg/kg 100 Total Saturated % 0.9
Copper mg/kg 15 Total Monounsaturated % 1.3
Iodine mg/kg 6 Total Polyunsaturated % 3.4
Iron mg/kg 200
Selenium mg/kg 0.23 Cholesterol mg/kg --
Aspartic Acid % 1.4
Glutamic Acid % 3.4
Alanine % 1.1
Glycine % 0.8
Threonine % 0.7
Proline % 1.6
Serine % 1.1
Leucine % 1.8
Isoleucine % 0.8
Valine % 0.9
Phenylalanine % 1.0
Tyrosine % 0.6
Methionine % 0.4
Cystine % 0.3
a Ether extract is used to measure fat in pelleted diets, while an acid hydrolysis
method is required to recover fat in extruded diets. Compared to ether
extract, the fat value for acid hydrolysis will be approximately 1% point higher.
b Carbohydrate (available) is calculated by subtracting neutral detergent fiber
from total carbohydrates.
c Neutral detergent fiber is an estimate of insoluble fiber, including cellulose,
hemicellulose, and lignin. Crude fiber methodology underestimates total fiber.
d Energy density is a calculated estimate of metabolizable energy based on the
Atwater factors assigning 4 kcal/g to protein, 9 kcal/g to fat, and 4 kcal/g to
available carbohydrate.
e Indicates added amount but does not account for contribution from other
ingredients.
Lysine % 0.9 f 1 IU vitamin A = 0.3 µg retinol
Histidine % 0.4 g 1 IU vitamin D = 25 ng cholecalciferol
Arginine % 1.0 For nutrients not listed, insufficient data is available to quantify.
Tryptophan % 0.2 Nutrient data represent the best information available, calculated from
published values and direct analytical testing of raw materials and finished
product. Nutrient values may vary due to the natural variations in the
ingredients, analysis, and effects of processing.
Teklad Diets are designed and manufactured for research
purposes only. Harlan, Harlan Laboratories, Helping you do research better,
and the Harlan logo are trademarks and trade names of Harlan
Laboratories, Inc. © 2008 Harlan Laboratories, Inc.
Teklad Diets, Madison WI | www.harlan.com | [email protected] | (800) 483-5523 RMS-0909-US-EN-02-DS-2018
Amino Acids
Vitamins Macronutrients
2018
Other
Fatty Acids
Minerals
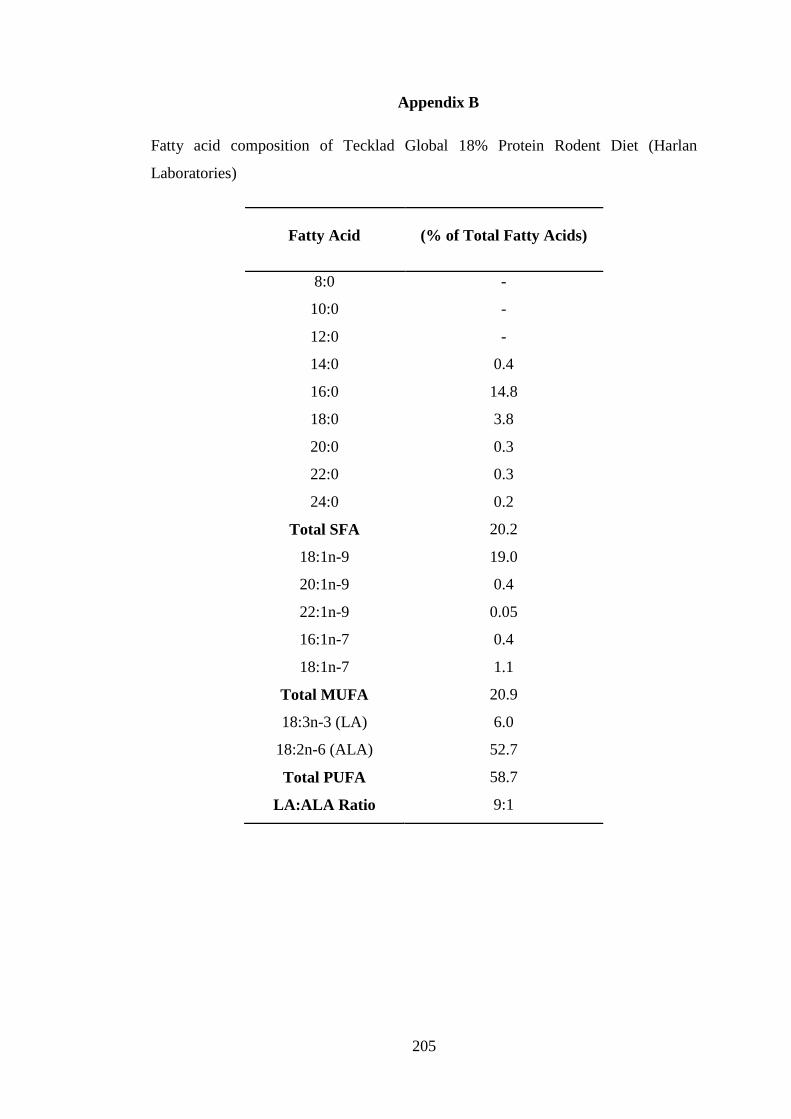
205
Appendix B
Fatty acid composition of Tecklad Global 18% Protein Rodent Diet (Harlan
Laboratories)
Fatty Acid (% of Total Fatty Acids)
8:0 -
10:0 -
12:0 -
14:0 0.4
16:0 14.8
18:0 3.8
20:0 0.3
22:0 0.3
24:0 0.2
Total SFA 20.2
18:1n-9 19.0
20:1n-9 0.4
22:1n-9 0.05
16:1n-7 0.4
18:1n-7 1.1
Total MUFA 20.9
18:3n-3 (LA) 6.0
18:2n-6 (ALA) 52.7
Total PUFA 58.7
LA:ALA Ratio 9:1
206
Appendix C
STATEMENT OF AUTHORSHIP OF PUBLICATIONS
This statement confirms the contribution made by Sally Draycott to jointly authored
work
I confirm that Sally Draycott contributed 80% to the publication:
Draycott, SAV, Liu, G, Daniel, ZC, Elmes, MJ, Muhlhausler, BS & Langley-
Evans, SC (2019). Maternal dietary ratio of linoleic acid to alpha-linolenic acid
during pregnancy has sex-specific effects on placental and fetal weights in the
rat. Nutrition & Metabolism, 16, 1.
I confirm that Sally Draycott contributed 80% to the publication:
Draycott, SAV, George, G, Elmes, MJ, Muhlhausler, BS & Langley-Evans,
SC (2020). The effect of maternal dietary fat content and omega-6 to omega-3
ratio on offspring growth and hepatic gene expression in the rat. British Journal
of Nutrition, 1, 30.
I confirm that Sally Draycott contributed 80% to the publication:
Draycott, SAV, Daniel, Z, Elmes, MJ, Muhlhausler, BS & Langley-Evans, SC
(2019). Omega-6:omega-3 fatty acid ratio and total fat content of the maternal
diet alters offspring growth and fat deposition in the rat (prepared manuscript).
I confirm that Sally Draycott contributed 60% to the publication:
Draycott, SAV, Daniel, Z, Khan, R, Muhlhausler, BS, Elmes, MJ & Langley-
Evans, SC (2019). Expression of cholesterol packaging and transport genes in
human and rat placenta: impact of obesity and a high-fat diet. J Dev Orig
Health Dis, 1-6.
Signature:
Date: 24/02/2020

207
Appendix D
Published article in the journal of Nutrition and Metabolism:
Draycott, SAV, Liu, G, Daniel, ZC, Elmes, MJ, Muhlhausler, BS & Langley-
Evans, SC (2019). Maternal dietary ratio of linoleic acid to alpha-linolenic acid
during pregnancy has sex-specific effects on placental and fetal weights in the
rat. Nutrition & Metabolism, 16, 1.
208
Appendix E
This article has been accepted for publication and will appear in a revised form,
subsequent to editorial input by Cambridge University Press, in British Journal of
Nutrition published by Cambridge University Press.
Copyright © 2019 Cambridge University Press. All Rights Reserved.
Draycott, SAV, George, G, Elmes, MJ, Muhlhausler, BS & Langley-Evans,
SC (2020). The effect of maternal dietary fat content and omega-6 to omega-3
ratio on offspring growth and hepatic gene expression in the rat. British Journal
of Nutrition, 1, 30. https://doi.org/10.1017/S000711452000046X
Accepted manuscript
This peer-reviewed article has been accepted for publication but not yet copyedited or
typeset, and so may be subject to change during the production process. The article is
considered published and may be cited using its DOI
10.1017/S000711452000046X
The British Journal of Nutrition is published by Cambridge University Press on behalf of The
Nutrition Society
The effect of maternal dietary fat content and omega-6 to omega-3 ratio on offspring
growth and hepatic gene expression in the rat
Sally A V Draycott 1,2
, Grace George, Matthew J Elmes1, Beverly S Muhlhausler
2,3 and
Simon C Langley-Evans1*
1 School of Biosciences, University of Nottingham, Sutton Bonington Campus,
Loughborough, UK
2 Food and Nutrition Research Group, Department of Food and Wine Science, School of
Agriculture Food and Wine, University of Adelaide, Adelaide, Australia
3Commonwealth Scientific and Industrial Research Organisation, Adelaide, Australia
*Corresponding author
Simon Langley-Evans
Sutton Bonington Campus
Sutton Bonington
Leicestershire
LE12 5RD
UK
Short title: Maternal diet, offspring gene expression.
Key words: Maternal nutrition, omega-6, omega-3, pregnancy, growth restriction
Dow
nloaded from https://w
ww
.cambridge.org/core . Bodleian Libraries of the U
niversity of Oxford , on 25 Feb 2020 at 14:05:11 , subject to the Cam
bridge Core terms of use, available at https://w
ww
.cambridge.org/core/term
s . https://doi.org/10.1017/S000711452000046X
Accepted manuscript
Abstract
Omega-6 fatty acids have been shown to exert pro-adipogenic effects whereas omega-3 fatty
acids work in opposition. Increasing intakes of LA (linoleic acid; omega-6) vs ALA (alpha-
linolenic acid; omega-3) in Western diets has led to the hypothesis that consumption of this
diet during pregnancy may be contributing to adverse offspring health. This study
investigated the effects of feeding a maternal dietary LA:ALA ratio similar to that of the
Western diet (9:1) compared to a proposed ‘ideal’ ratio (~1:1.5), at two total fat levels (18%
vs 36% fat w/w), on growth and lipogenic gene expression in the offspring. Female Wistar
rats were assigned to one of the four experimental groups throughout gestation and lactation.
Offspring were culled at 1 and 2 weeks of age for sample collection. Offspring of dams
consuming a -36% fat diet were ~20% lighter than those exposed to a 18% fat diet (P<0.001).
Male, but not female, liver weight at 1 week was ~13% heavier, and had increased glycogen
(P<0.05), in offspring exposed to high LA (P<0.01). Hepatic expression of lipogenic genes
suggested an increase in lipogenesis in male offspring exposed to a 36% fat maternal diet and
in female offspring exposed to a low LA diet, via increases in the expression of Fasn and
Srebf1. Sexually dimorphic responses to altered maternal diet appeared to persist until two
weeks-of-age. In conclusion, whilst maternal total fat content predominantly affected
offspring growth, fatty acid ratio and total fat content had sexually dimorphic effects on
offspring liver weight and composition.
Dow
nloaded from https://w
ww
.cambridge.org/core . Bodleian Libraries of the U
niversity of Oxford , on 25 Feb 2020 at 14:05:11 , subject to the Cam
bridge Core terms of use, available at https://w
ww
.cambridge.org/core/term
s . https://doi.org/10.1017/S000711452000046X
Accepted manuscript
Introduction
Accumulating evidence suggests that the nutritional environment experienced by an
individual during fetal and early infant development has long-lasting impacts on their
metabolic health (1)
. In the context of the global epidemic of obesity and nutritional excess,
there has been considerable interest in determining the effects of maternal overnutrition on
the metabolic health of the offspring. The majority of these studies have utilised animal
models and have consistently reported that maternal high-fat feeding during pregnancy has
detrimental effects on the metabolic health of both the mother and her offspring (2,3)
. As a
result, excess maternal fat consumption has been implicated as a key contributor to metabolic
programming of long-term health and disease risk.
There is increasing evidence, however, that the impact of a high-fat diet on the metabolic
health of the offspring depends not only on the amount of fat in the diet, but also on the fatty
acid composition (4,5)
. There has been particular interest in the role of two classes of
polyunsaturated fatty acids (PUFA), due to the substantive increase in the amounts of omega-
6 PUFA, predominately linoleic acid (LA), being consumed in the diets of many Western
countries over the past few decades (6,7)
. This increase in the intake of LA has not been
accompanied by substantial changes in the consumption of omega-3 PUFA such as alpha-
linolenic acid (ALA) and has therefore resulted in increases in the ratio of omega-6:omega-3
PUFA consumed in the diets of many Western countries (6,8)
.
The increasing dominance of omega-6 over omega-3 PUFA in modern Western diets has
considerable biological significance, since the omega-6 and omega-3 fatty acid families
utilise the same enzymes for production of longer chain bioactive derivatives such as
arachidonic acid (AA; omega-6), eicosapentaenoic acid (EPA; omega-3), docosapentaenoic
acid (DPA; omega-3) and docosahexaenoic acid (DHA; omega-3), and also compete for
incorporation into cell membranes. As a result, excess consumption of LA leads to a decrease
in the production and incorporation of omega-3 fatty acids through simple substrate
competition, and this effect is exacerbated when total dietary PUFA is high (9,10)
. The omega-
3 and omega-6 long-chain polyunsaturated fatty acids (LCPUFA) derivatives also have
opposing physiological actions, with those from the omega-3 family predominately
exhibiting anti-inflammatory properties (for example via the suppression of the pro-
inflammatory transcription factor nuclear factor kappa B and activation of the anti-
inflammatory transcription factor peroxisome proliferator activated receptor γ (11)
) and those
Dow
nloaded from https://w
ww
.cambridge.org/core . Bodleian Libraries of the U
niversity of Oxford , on 25 Feb 2020 at 14:05:11 , subject to the Cam
bridge Core terms of use, available at https://w
ww
.cambridge.org/core/term
s . https://doi.org/10.1017/S000711452000046X
Accepted manuscript
from the omega-6 family exhibiting more pro-inflammatory and pro-adipogenic properties
(12). This has led to the hypothesis that the increasing ratio of omega-6 to omega-3 fatty acids
in modern Western diets may have negative effects on conditions characterised by low-grade
inflammation, including obesity and the metabolic syndrome, and may potentially be
contributing to an intergenerational cycle of obesity (8)
.
Data from observational studies in humans and animal models provide supporting evidence
that suggests high intakes of omega-6 PUFA during pregnancy could have negative effects on
metabolic health of the progeny (13,14,15)
. However, the results of these studies have not been
consistent. The results of pre-clinical studies are also limited by the use of diets with much
higher omega-6:omega-3 PUFA ratios and/or absolute PUFA contents than those encountered
in typical human diets. Furthermore, offspring often continue to have access to the same diet
as their mother so that any effects observed cannot be clearly attributed to dietary fatty acid
exposure during the gestation and lactation periods (16,17,18)
. The aim of this study, therefore,
was to investigate the effects of feeding a maternal dietary LA:ALA ratio similar to that of
the Western diet (9:1) (6)
, compared to a proposed ‘ideal’ ratio of 1:1.5 (19,20)
on growth and
lipogenic gene expression in the offspring. Since total dietary PUFA intake also influences
PUFA metabolism (9,10)
, we also investigated the effect of feeding each dietary fat ratio at
either 18% fat w/w (in line with dietary recommendations (21)
) or at a higher fat level of 36%
fat w/w. A rat model was utilised to achieve the study objectives by allowing for tight control
of dietary manipulation as well as invasive end points.
Materials and Methods
Animals
All animal procedures were performed in accordance with the Animals (Scientific
Procedures) Act 1986 under Home Office licence and were approved by the Animal Ethics
Committee of the University of Nottingham, UK. Virgin female Wistar rats (n=30; 75-100g;
Charles River, UK) were housed on wood shavings in individually ventilated cages under a
12 hour light/12 hour dark cycle at a temperature of 20-22°C and had ad libitum access to
food and water throughout the experiment. Female rats were allowed to acclimatise to the
unit for 1-2 weeks, during which time they were fed standard laboratory chow (2018 Teklad
Global 18% Protein Rodent Diet, Harlan Laboratories, UK). After acclimatisation, a tail vein
blood sample was taken from each animal for the determination of fatty acid status. The rats
Dow
nloaded from https://w
ww
.cambridge.org/core . Bodleian Libraries of the U
niversity of Oxford , on 25 Feb 2020 at 14:05:11 , subject to the Cam
bridge Core terms of use, available at https://w
ww
.cambridge.org/core/term
s . https://doi.org/10.1017/S000711452000046X
Accepted manuscript
were then randomly assigned to one of 4 dietary groups (details provided below). Animals
were maintained on their allocated diet for a four week ‘pre-feeding’ period, after which they
were mated. Conception was confirmed by the presence of a semen plug and this was
recorded as day 0 of pregnancy. Animals were housed in individual cages and remained on
their respective diets throughout pregnancy and lactation.
Litters were standardised to 8 pups within 24 hours of birth (4 males and 4 females, where
possible). At 1 and 2 weeks of age, one randomly selected male and one randomly selected
female from each litter were culled via cervical dislocation and exsanguination for blood and
tissue collection. At 3 weeks of age, the remaining offspring were weaned and dams were
then euthanised by CO2 asphyxiation and cervical dislocation for collection of maternal blood
and tissues. All dams were weighed and had feed intake measured daily throughout the
experiment and offspring bodyweight was measured weekly.
Diets
Diets were designed to provide either a high (9:1, high LA) or low (1:1.5, low LA) ratio of
LA (cis/cis isomer) to ALA, achieved by altering the amounts of flaxseed and sunflower oil
included in the fat component of the feed. The levels of saturated and monounsaturated fatty
acids were comparable in all diets, achieved by adjusting the amounts of coconut (saturated
fat source) and macadamia (monounsaturated fat source) oils in the diets. For each level of
LA, diets were developed to contain either 18% fat (w/w), in line with government
recommendations (21)
, or 36% fat (w/w) to highlight any additive effects (38.6 vs 63.5% of
dietary energy respectively). This resulted in four experimental diets (n=6-9 per dietary
group); high LA (18% fat), high LA (36% fat), low LA (18% fat) and low LA (36% fat). The
list of ingredients and final fatty acid composition of the four experimental diets have been
reported previously (5)
.
Blood sample and tissue collection
Blood samples were collected from dams prior to the start of the experiment and after the 4
week ‘feed-in’ period (tail vein sample) and at the end of lactation (via cardiac puncture
following CO2 asphyxiation and cervical dislocation). Truncal blood samples were also
collected from one randomly selected male and one randomly selected female at 1 and 2
weeks of age. In all cases, samples of whole blood (~30µl) from non-fasted animals were
spotted onto PUFAcoat™ dried blood spot (DBS) collection paper (22)
, allowed to dry at
Dow
nloaded from https://w
ww
.cambridge.org/core . Bodleian Libraries of the U
niversity of Oxford , on 25 Feb 2020 at 14:05:11 , subject to the Cam
bridge Core terms of use, available at https://w
ww
.cambridge.org/core/term
s . https://doi.org/10.1017/S000711452000046X
Accepted manuscript
room temperature and stored at -20°C for subsequent fatty acid analysis. Maternal tissues
were weighed and samples of whole liver, retroperitoneal and gonadal adipose tissues
collected. Offspring body and organ weights were measured and whole liver samples were
collected from one randomly selected male and female pup at both time points. At 2 weeks of
age, samples of gonadal and retroperitoneal fat were also collected from one male and one
female pup per litter. All tissue samples were snap-frozen in liquid nitrogen and stored at -
80°C until determination of gene expression by quantitative reverse transcriptase PCR (qRT-
PCR).
Fatty acid methylation and analysis
Fatty acid composition in maternal and fetal blood was determined as previously described
(22). Briefly, whole DBS samples were directly transesterified with 2ml of 1% H2SO4 in
methanol and the fatty acid methyl esters (FAME) were extracted with heptane. Samples
were separated and analysed by a Hewlett-Packard 6890 gas chromatograph (GC) equipped
with a capillary column (30m x 0.25mm) coated with 70% cyanopropyl polysilphenylene-
siloxane (BPX-70; 0.25µm film thickness) which was fitted with a flame ionization detector
(FID). FAMEs were identified in unknown samples based on the comparison of retention
times with an external lipid standard (Standard 463, Nu-check prep Inc., MN, USA) using
Agilent Chemstation software (Agilent Technologies Australia Pty Ltd). Individual fatty acid
content was calculated based on peak area and response factors normalised to total fatty acid
content and expressed as a percentage of total fatty acids.
Isolation of RNA and cDNA synthesis and quantitative reverse transcription real-time PCR
(qRT-PCR)
RNA was isolated from crushed snap-frozen samples of ~25mg of liver using the Roche High
Pure Tissue kit (Roche Diagnostics Ltd., UK). Adipose RNA was extracted, after
homogenisation of ~100mg of tissue with MagNA lyser green beads and instrument (Roche
Diagnostics Ltd.), using the RNeasy Mini Kit (QIAGEN Ltd., UK). RNA concentration was
determined using a Nanodrop 2000 (Thermo Scientific) and RNA quality was evaluated by
agarose gel electrophoresis. cDNA was synthesised using a RevertAid™ reverse transcriptase
kit (Thermo Fisher Scientific, UK) with random hexamer primers.
Lipogenic pathway and adipokine target genes were chosen based on previous data from our
laboratory that indicated that these genes were sensitive to changes in the maternal diet(23)
and
Dow
nloaded from https://w
ww
.cambridge.org/core . Bodleian Libraries of the U
niversity of Oxford , on 25 Feb 2020 at 14:05:11 , subject to the Cam
bridge Core terms of use, available at https://w
ww
.cambridge.org/core/term
s . https://doi.org/10.1017/S000711452000046X
Accepted manuscript
included; peroxisome proliferator-activated receptor gamma (Pparg), sterol regulatory
element-binding protein (variant 1c; Srebf1), fatty acid synthase (Fasn), lipoprotein lipase
(Lpl) and leptin (Lep), with β-actin (Actb) as the housekeeper. Primer efficiency ranged from
85%-108% and sequences have previously been published elsewhere (5)
. Adipocyte and
hepatic gene expression was quantified using SYBR Green (Roche Diagnostics) in a Light-
Cycler 480 (Roche Diagnostics). Samples were analysed against a standard curve of a serially
diluted cDNA pool to produce quantitative data and expression was normalised to the
housekeeping gene using LightCycler® 480 software (version 1.5.1) as previously described
(24). The expression of the housekeeper gene was not different between treatment groups.
Determination of liver DNA, protein and glycogen content
For determination of DNA and protein content of liver samples, approximately 100mg of
frozen crushed sample was added to 1ml of 0.05M trisodium citrate buffer. Samples were
homogenised and centrifuged at 2500rpm for 10 minutes at 4°C. Supernatant was used for
further analyses. DNA concentration (ug/ml) was measured using a Hoechst fluorimetric
method and protein content (ug/well), modified for a 96 well plate format, was measured as
described by Lowry et al. (25)
. Measurements were normalised to the exact amount of tissue
used for measurements. Liver glycogen was measured using the Colorimetric Glycogen
Assay Kit II (Abcam Ltd.) according to manufacturer’s instructions.
Statistical analysis
Data are presented as mean ± SEM. Data were analysed using the Statistical Package for
Social Sciences (Version 24, SPSS Inc.). The effect of maternal dietary fatty acid ratio and
maternal dietary fat content on maternal dependent variables was assessed using a two-way
ANOVA, with dietary LA:ALA ratio and dietary fat content as factors and dams were used as
the unit of analysis. Where longitudinal data were analysed, as with maternal feed, protein
and energy intakes, the impact of maternal dietary LA:ALA ratio and maternal dietary fat
content was analysed using a two-way repeated-measures ANOVA. Offspring data were
analysed using a two-way ANOVA, with maternal dietary LA:ALA ratio and fat content as
factors; where there was no overall effect of sex, male and female offspring data were
combined. Where data were not normally distributed, analyses were performed on log10
transformed data. A value of P<0.05 was considered to be statistically significant.
Dow
nloaded from https://w
ww
.cambridge.org/core . Bodleian Libraries of the U
niversity of Oxford , on 25 Feb 2020 at 14:05:11 , subject to the Cam
bridge Core terms of use, available at https://w
ww
.cambridge.org/core/term
s . https://doi.org/10.1017/S000711452000046X
Accepted manuscript
Results
Maternal dietary intakes
There were no differences in feed intake of dams between treatment groups before or during
pregnancy. During lactation, dams receiving the 36% fat diets had a lower average daily feed
intake than those receiving the 18% fat diets, irrespective of dietary LA:ALA ratio (P<0.001;
Fig 1a). Energy intake was similar between groups throughout the experiment (Fig. 1b).
Protein intake prior to and during pregnancy was affected by both dietary LA:ALA ratio and
fat content (P<0.05; Fig. 1c), however, these effects were small and inconsistent. During
lactation, protein intake was affected by dietary fat content only (P<0.001; Fig. 1c), such that
mothers receiving 36% fat diets consumed 24% less protein on average compared to those
consuming 18% fat diets, irrespective of dietary LA:ALA ratio. As expected, all dams
consumed more food, energy and protein during lactation than before and during pregnancy
regardless of dietary group (P<0.001).
Maternal fatty acid profile
There were no differences in the proportions of either saturated fatty acids (SFA),
monounsaturated fatty acids (MUFA), omega-6 (Fig. 2a) or omega-3 PUFA (Fig. 2b) in
whole blood samples collected from the dams prior to the commencement of dietary
intervention. After 4 weeks on their respective diets, the blood fatty acid profiles were
significantly different between treatment groups and largely reflected the composition of the
experimental diets. Thus, dams fed on high LA diets had higher proportions of LA (1.2 fold)
and AA (1.4 fold) compared to those consuming a low LA diet (P<0.001; Fig. 2c).
Conversely, dams fed the low LA diets had a 5.5 fold higher proportion of ALA and an 8.5
fold higher proportion of EPA compared to those consuming a high LA diet (P<0.001; Fig.
2D). These changes were independent of the total fat content of the diet. DPA and DHA
levels after the 4 week pre-feeding period were influenced by both dietary LA:ALA ratio and
total fat content. Thus, the relative proportions of DPA were higher in dams fed the low LA
compared to high LA diets (P<0.001), and marginally higher in dams consuming the 18% vs
36% fat diets (P<0.05). DHA proportions were also higher in the low LA group (P<0.001)
but, unlike DPA, were modestly but significantly higher in dams consuming the 36% fat vs
18% fat diets (P<0.05; Fig. 2D). Total blood MUFA proportions were higher (1.3-fold) in
dams consuming the low LA diet, irrespective of dietary fat content (P<0.001; Fig. 2C).
Dow
nloaded from https://w
ww
.cambridge.org/core . Bodleian Libraries of the U
niversity of Oxford , on 25 Feb 2020 at 14:05:11 , subject to the Cam
bridge Core terms of use, available at https://w
ww
.cambridge.org/core/term
s . https://doi.org/10.1017/S000711452000046X
Accepted manuscript
The blood fatty acid profile of the dams at the end of lactation, after a further 6 weeks on
their respective experimental diets, were similar to those observed after the first 4 weeks of
dietary intervention. A notable difference, however, was that at this time point, relative
proportions of DHA, as a percentage of total lipids, were not different between dietary groups
(Fig. 2F). LA (1.5-fold), AA (1.8-fold) and total omega-6 (1.5-fold) were all higher in dams
consuming a high LA diet irrespective of dietary fat content (P<0.001; Fig. 2E). Conversely,
total omega-3 levels were 3-fold higher in dams consuming a low LA diet, irrespective of
dietary fat content (P<0.001). The proportions of ALA were also higher in the groups
consuming the low LA diets and in rats consuming the 36% vs 18% fat diets in the low LA
group only (P<0.05; Fig 2F). DPA proportions were higher in the groups consuming the low
LA diets, however, unlike ALA, DPA proportions were lower, rather than higher, in dams
consuming the 36% fat diets in the low LA group only (P<0.001; Fig. 2F). EPA proportions
were higher in groups consuming a low LA diet compared to those consuming a high LA diet
(P<0.001; Fig. 2F). EPA proportions were also affected by total dietary fat content, and were
lower in dams consuming a 36% fat diet compared to an 18% fat diet (P<0.001; Fig. 2F).
Maternal blood total MUFA levels at the end of lactation were 1.4-fold higher in the dams
consuming a low LA diet irrespective of dietary fat content (P<0.001; Fig. 2E).
Maternal weight, body composition and gene expression
There were no significant differences in dam bodyweight between dietary groups prior to the
commencement of the dietary intervention or at any time during the experiment (data not
shown). Dams consuming the 36% fat diets had heavier lungs relative to bodyweight at the
end of lactation compared to those consuming the 18% fat diets, independent of the LA:ALA
ratio (P<0.05). There were no differences in the relative weight of the heart, liver, brain,
kidney, gonadal or retroperitoneal fat pads between experimental groups (Table 1).
Analysis of mRNA expression of lipogenic genes indicated that hepatic (3-fold) and gonadal
fat (7-fold) expression of Fasn was higher in dams consuming an 18% fat diet, compared to
those on a 36% fat diet, irrespective of dietary fatty acid ratio (P<0.01). The mRNA
expression of Lpl, Pparg and Srebf1 was not, however, affected by either dietary fat content
or ratio in either hepatic or gonadal fat tissues (Table 1). Expression of leptin mRNA in
gonadal adipose tissue was not significantly different between treatment groups.
Dow
nloaded from https://w
ww
.cambridge.org/core . Bodleian Libraries of the U
niversity of Oxford , on 25 Feb 2020 at 14:05:11 , subject to the Cam
bridge Core terms of use, available at https://w
ww
.cambridge.org/core/term
s . https://doi.org/10.1017/S000711452000046X
Accepted manuscript
Birth outcomes and offspring bodyweights
There were no differences between dietary groups in terms of litter size or sex ratio of pups
(Table 2). Birth weight was lower in offspring of dams fed a 36% fat vs 18% fat diets,
independent of the dietary LA:ALA ratio (Table 2). The lower body weight in offspring of
dams fed the 36% fat diet persisted during the sucking period such that offspring of dams fed
the 36% fat diets remained lighter than offspring of dams fed on 18% fat diets at both 1 and 2
weeks of age; again this was independent of dietary LA:ALA ratio (P<0.001; Table 3).
Offspring fatty acid profile
At 1 week of age, proportions of AA (2.1 fold) were lower in the offspring of the low LA
compared to high LA dams (P<0.001), and in offspring of dams consuming the 36% fat vs
18% fat diets (1.4 fold; P<0.001; Fig. 3A). Blood ALA proportions were 5.9 fold higher in
offspring of dams in the low LA groups compared to high LA groups (P<0.001; Fig. 3B).
Offspring EPA and DPA proportions were also higher in the low LA group compared to the
high LA group. Blood EPA was also influenced by total dietary fat content, but only in
offspring of dams fed the low LA diet, in which EPA levels were lower in offspring of dams
fed the 36% fat diets compared to the 18% fat diets (EPA, P<0.001; DPA, P<0.01; Fig. 3B).
DHA proportions were not different between groups at 1 week of age (Fig. 3B). MUFA
proportions were higher (1.2-fold) in offspring of dams in the low LA groups (P<0.001),
consistent with the pattern in maternal blood. However, unlike maternal MUFA, offspring
MUFA levels were also affected by maternal dietary fat content and were 1.2-fold higher in
offspring of dams fed the 36% fat vs 18% fat diets (P<0.001; Fig. 3A). At 1 week of age
offspring of dams in the 36% fat diet groups also had lower blood proportions of SFA,
irrespective of LA:ALA ratio of the maternal diet (P<0.01; Fig. 3A).
The fatty acid profiles of the offspring at 2 weeks of age were similar to those observed at 1
week. Thus, blood AA (1.9 fold) and total omega-6 (1.6 fold) proportions were lower (Fig.
3C) and ALA (6.3 fold), EPA (4.7 fold), DPA (2.4 fold) and total omega-3 PUFA (3-fold)
proportions (Fig. 3D) were higher in offspring of dams in the low LA group compared to
high LA groups, irrespective of maternal dietary fat content (P<0.001). Proportions of LA
were higher in offspring of dams fed the 36% fat diets compared to those fed 18% fat diets in
the high LA group only (P<0.05; Fig 3C), while EPA and DPA proportions were lower in the
36% compared to the 18% fat diet groups, independent of the dietary LA:ALA ratio
(P<0.001; Fig. 3D). Unlike findings at 1 week of age, the DHA levels in 2 week old offspring
Dow
nloaded from https://w
ww
.cambridge.org/core . Bodleian Libraries of the U
niversity of Oxford , on 25 Feb 2020 at 14:05:11 , subject to the Cam
bridge Core terms of use, available at https://w
ww
.cambridge.org/core/term
s . https://doi.org/10.1017/S000711452000046X
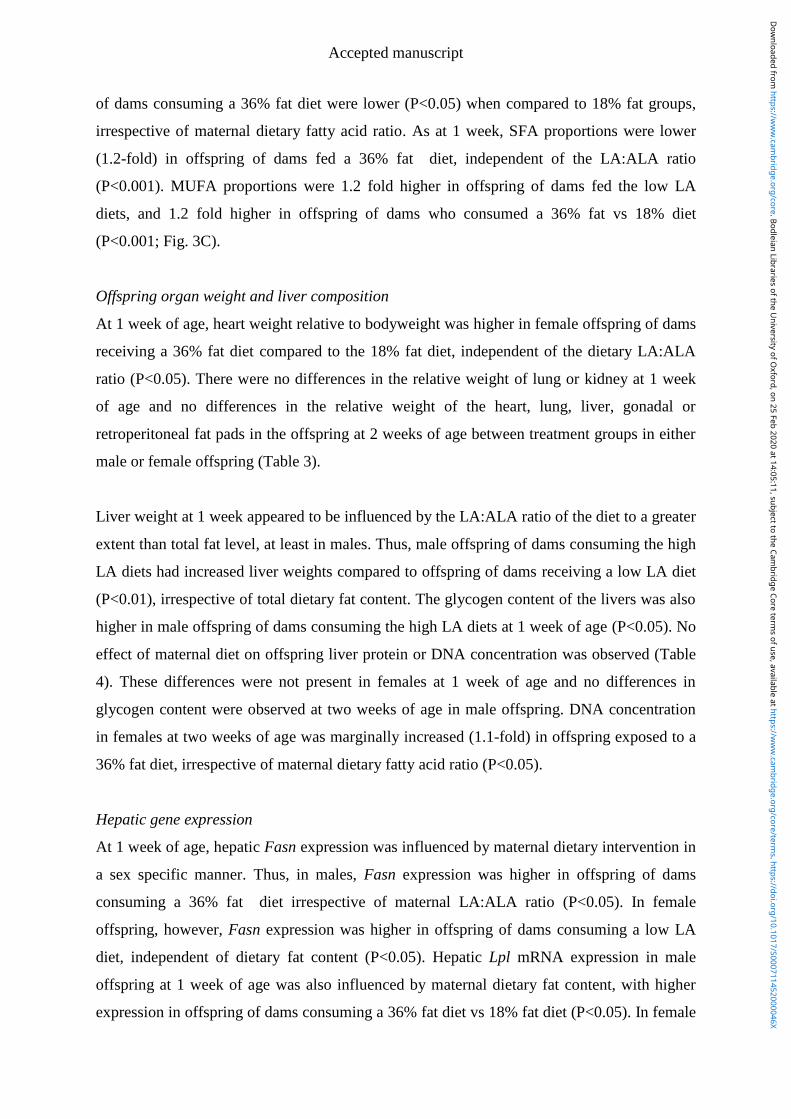
Accepted manuscript
of dams consuming a 36% fat diet were lower (P<0.05) when compared to 18% fat groups,
irrespective of maternal dietary fatty acid ratio. As at 1 week, SFA proportions were lower
(1.2-fold) in offspring of dams fed a 36% fat diet, independent of the LA:ALA ratio
(P<0.001). MUFA proportions were 1.2 fold higher in offspring of dams fed the low LA
diets, and 1.2 fold higher in offspring of dams who consumed a 36% fat vs 18% diet
(P<0.001; Fig. 3C).
Offspring organ weight and liver composition
At 1 week of age, heart weight relative to bodyweight was higher in female offspring of dams
receiving a 36% fat diet compared to the 18% fat diet, independent of the dietary LA:ALA
ratio (P<0.05). There were no differences in the relative weight of lung or kidney at 1 week
of age and no differences in the relative weight of the heart, lung, liver, gonadal or
retroperitoneal fat pads in the offspring at 2 weeks of age between treatment groups in either
male or female offspring (Table 3).
Liver weight at 1 week appeared to be influenced by the LA:ALA ratio of the diet to a greater
extent than total fat level, at least in males. Thus, male offspring of dams consuming the high
LA diets had increased liver weights compared to offspring of dams receiving a low LA diet
(P<0.01), irrespective of total dietary fat content. The glycogen content of the livers was also
higher in male offspring of dams consuming the high LA diets at 1 week of age (P<0.05). No
effect of maternal diet on offspring liver protein or DNA concentration was observed (Table
4). These differences were not present in females at 1 week of age and no differences in
glycogen content were observed at two weeks of age in male offspring. DNA concentration
in females at two weeks of age was marginally increased (1.1-fold) in offspring exposed to a
36% fat diet, irrespective of maternal dietary fatty acid ratio (P<0.05).
Hepatic gene expression
At 1 week of age, hepatic Fasn expression was influenced by maternal dietary intervention in
a sex specific manner. Thus, in males, Fasn expression was higher in offspring of dams
consuming a 36% fat diet irrespective of maternal LA:ALA ratio (P<0.05). In female
offspring, however, Fasn expression was higher in offspring of dams consuming a low LA
diet, independent of dietary fat content (P<0.05). Hepatic Lpl mRNA expression in male
offspring at 1 week of age was also influenced by maternal dietary fat content, with higher
expression in offspring of dams consuming a 36% fat diet vs 18% fat diet (P<0.05). In female
Dow
nloaded from https://w
ww
.cambridge.org/core . Bodleian Libraries of the U
niversity of Oxford , on 25 Feb 2020 at 14:05:11 , subject to the Cam
bridge Core terms of use, available at https://w
ww
.cambridge.org/core/term
s . https://doi.org/10.1017/S000711452000046X
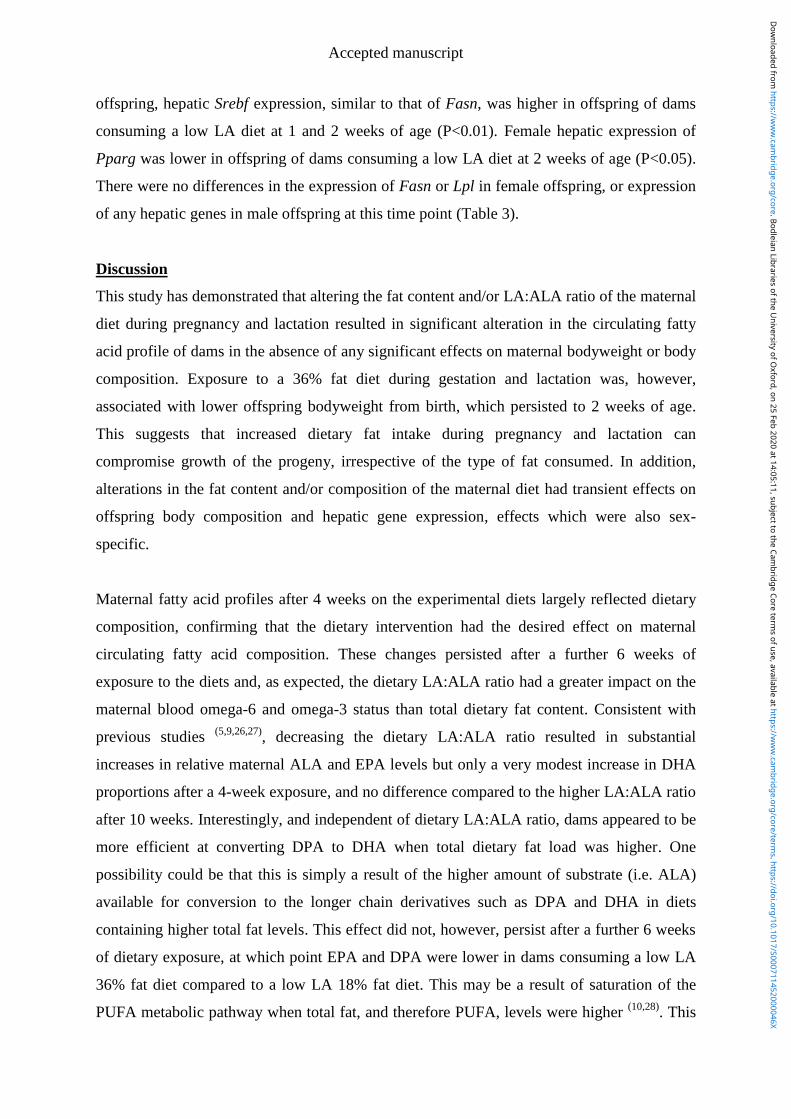
Accepted manuscript
offspring, hepatic Srebf expression, similar to that of Fasn, was higher in offspring of dams
consuming a low LA diet at 1 and 2 weeks of age (P<0.01). Female hepatic expression of
Pparg was lower in offspring of dams consuming a low LA diet at 2 weeks of age (P<0.05).
There were no differences in the expression of Fasn or Lpl in female offspring, or expression
of any hepatic genes in male offspring at this time point (Table 3).
Discussion
This study has demonstrated that altering the fat content and/or LA:ALA ratio of the maternal
diet during pregnancy and lactation resulted in significant alteration in the circulating fatty
acid profile of dams in the absence of any significant effects on maternal bodyweight or body
composition. Exposure to a 36% fat diet during gestation and lactation was, however,
associated with lower offspring bodyweight from birth, which persisted to 2 weeks of age.
This suggests that increased dietary fat intake during pregnancy and lactation can
compromise growth of the progeny, irrespective of the type of fat consumed. In addition,
alterations in the fat content and/or composition of the maternal diet had transient effects on
offspring body composition and hepatic gene expression, effects which were also sex-
specific.
Maternal fatty acid profiles after 4 weeks on the experimental diets largely reflected dietary
composition, confirming that the dietary intervention had the desired effect on maternal
circulating fatty acid composition. These changes persisted after a further 6 weeks of
exposure to the diets and, as expected, the dietary LA:ALA ratio had a greater impact on the
maternal blood omega-6 and omega-3 status than total dietary fat content. Consistent with
previous studies (5,9,26,27)
, decreasing the dietary LA:ALA ratio resulted in substantial
increases in relative maternal ALA and EPA levels but only a very modest increase in DHA
proportions after a 4-week exposure, and no difference compared to the higher LA:ALA ratio
after 10 weeks. Interestingly, and independent of dietary LA:ALA ratio, dams appeared to be
more efficient at converting DPA to DHA when total dietary fat load was higher. One
possibility could be that this is simply a result of the higher amount of substrate (i.e. ALA)
available for conversion to the longer chain derivatives such as DPA and DHA in diets
containing higher total fat levels. This effect did not, however, persist after a further 6 weeks
of dietary exposure, at which point EPA and DPA were lower in dams consuming a low LA
36% fat diet compared to a low LA 18% fat diet. This may be a result of saturation of the
PUFA metabolic pathway when total fat, and therefore PUFA, levels were higher (10,28)
. This
Dow
nloaded from https://w
ww
.cambridge.org/core . Bodleian Libraries of the U
niversity of Oxford , on 25 Feb 2020 at 14:05:11 , subject to the Cam
bridge Core terms of use, available at https://w
ww
.cambridge.org/core/term
s . https://doi.org/10.1017/S000711452000046X
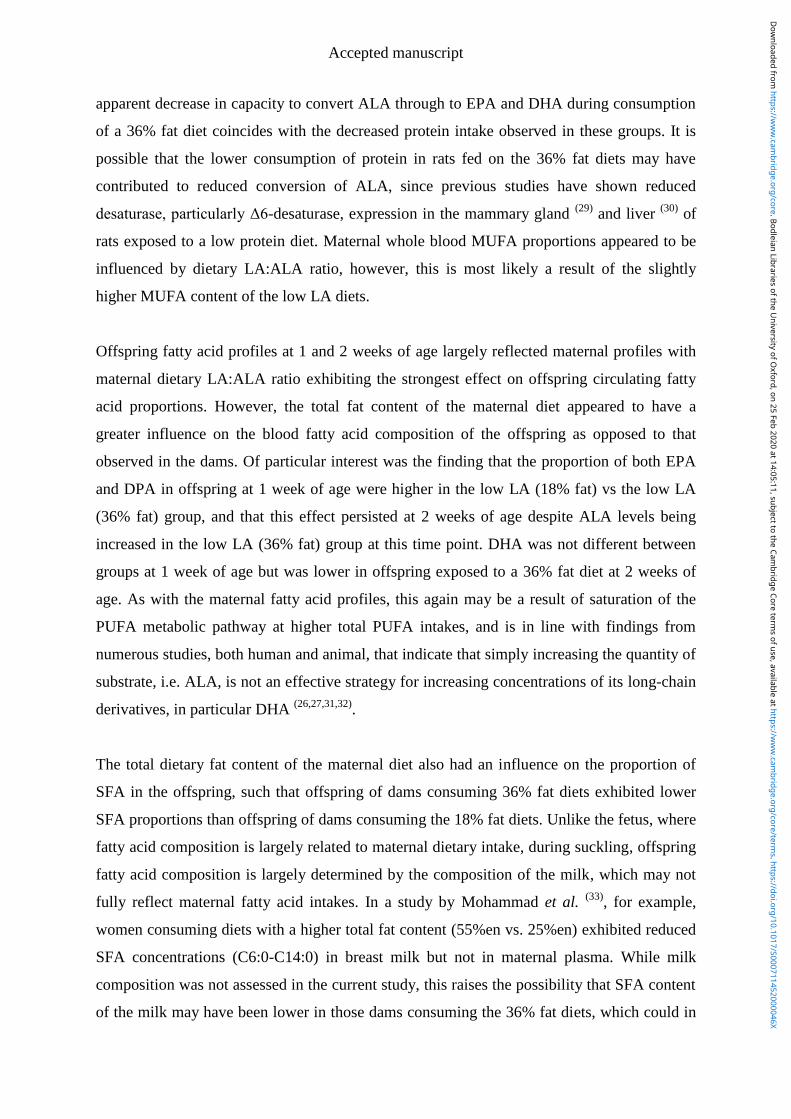
Accepted manuscript
apparent decrease in capacity to convert ALA through to EPA and DHA during consumption
of a 36% fat diet coincides with the decreased protein intake observed in these groups. It is
possible that the lower consumption of protein in rats fed on the 36% fat diets may have
contributed to reduced conversion of ALA, since previous studies have shown reduced
desaturase, particularly Δ6-desaturase, expression in the mammary gland (29)
and liver (30)
of
rats exposed to a low protein diet. Maternal whole blood MUFA proportions appeared to be
influenced by dietary LA:ALA ratio, however, this is most likely a result of the slightly
higher MUFA content of the low LA diets.
Offspring fatty acid profiles at 1 and 2 weeks of age largely reflected maternal profiles with
maternal dietary LA:ALA ratio exhibiting the strongest effect on offspring circulating fatty
acid proportions. However, the total fat content of the maternal diet appeared to have a
greater influence on the blood fatty acid composition of the offspring as opposed to that
observed in the dams. Of particular interest was the finding that the proportion of both EPA
and DPA in offspring at 1 week of age were higher in the low LA (18% fat) vs the low LA
(36% fat) group, and that this effect persisted at 2 weeks of age despite ALA levels being
increased in the low LA (36% fat) group at this time point. DHA was not different between
groups at 1 week of age but was lower in offspring exposed to a 36% fat diet at 2 weeks of
age. As with the maternal fatty acid profiles, this again may be a result of saturation of the
PUFA metabolic pathway at higher total PUFA intakes, and is in line with findings from
numerous studies, both human and animal, that indicate that simply increasing the quantity of
substrate, i.e. ALA, is not an effective strategy for increasing concentrations of its long-chain
derivatives, in particular DHA (26,27,31,32)
.
The total dietary fat content of the maternal diet also had an influence on the proportion of
SFA in the offspring, such that offspring of dams consuming 36% fat diets exhibited lower
SFA proportions than offspring of dams consuming the 18% fat diets. Unlike the fetus, where
fatty acid composition is largely related to maternal dietary intake, during suckling, offspring
fatty acid composition is largely determined by the composition of the milk, which may not
fully reflect maternal fatty acid intakes. In a study by Mohammad et al. (33)
, for example,
women consuming diets with a higher total fat content (55%en vs. 25%en) exhibited reduced
SFA concentrations (C6:0-C14:0) in breast milk but not in maternal plasma. While milk
composition was not assessed in the current study, this raises the possibility that SFA content
of the milk may have been lower in those dams consuming the 36% fat diets, which could in
Dow
nloaded from https://w
ww
.cambridge.org/core . Bodleian Libraries of the U
niversity of Oxford , on 25 Feb 2020 at 14:05:11 , subject to the Cam
bridge Core terms of use, available at https://w
ww
.cambridge.org/core/term
s . https://doi.org/10.1017/S000711452000046X
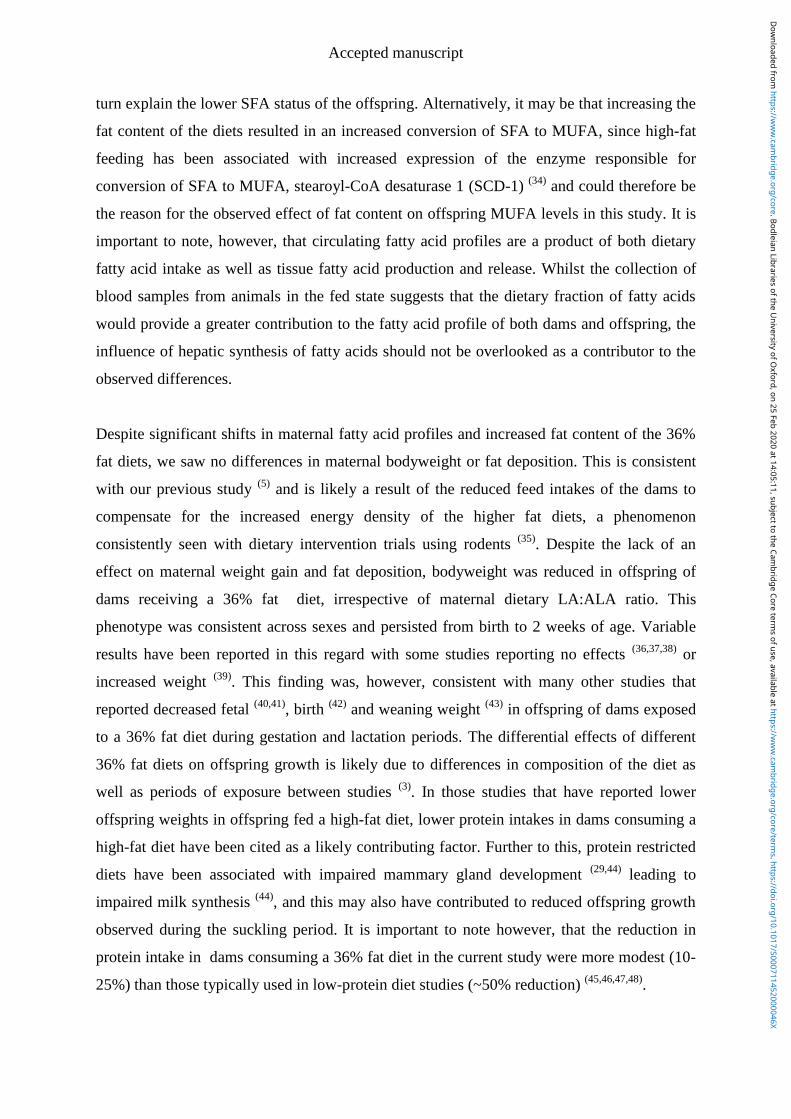
Accepted manuscript
turn explain the lower SFA status of the offspring. Alternatively, it may be that increasing the
fat content of the diets resulted in an increased conversion of SFA to MUFA, since high-fat
feeding has been associated with increased expression of the enzyme responsible for
conversion of SFA to MUFA, stearoyl-CoA desaturase 1 (SCD-1) (34)
and could therefore be
the reason for the observed effect of fat content on offspring MUFA levels in this study. It is
important to note, however, that circulating fatty acid profiles are a product of both dietary
fatty acid intake as well as tissue fatty acid production and release. Whilst the collection of
blood samples from animals in the fed state suggests that the dietary fraction of fatty acids
would provide a greater contribution to the fatty acid profile of both dams and offspring, the
influence of hepatic synthesis of fatty acids should not be overlooked as a contributor to the
observed differences.
Despite significant shifts in maternal fatty acid profiles and increased fat content of the 36%
fat diets, we saw no differences in maternal bodyweight or fat deposition. This is consistent
with our previous study (5)
and is likely a result of the reduced feed intakes of the dams to
compensate for the increased energy density of the higher fat diets, a phenomenon
consistently seen with dietary intervention trials using rodents (35)
. Despite the lack of an
effect on maternal weight gain and fat deposition, bodyweight was reduced in offspring of
dams receiving a 36% fat diet, irrespective of maternal dietary LA:ALA ratio. This
phenotype was consistent across sexes and persisted from birth to 2 weeks of age. Variable
results have been reported in this regard with some studies reporting no effects (36,37,38)
or
increased weight (39)
. This finding was, however, consistent with many other studies that
reported decreased fetal (40,41)
, birth (42)
and weaning weight (43)
in offspring of dams exposed
to a 36% fat diet during gestation and lactation periods. The differential effects of different
36% fat diets on offspring growth is likely due to differences in composition of the diet as
well as periods of exposure between studies (3)
. In those studies that have reported lower
offspring weights in offspring fed a high-fat diet, lower protein intakes in dams consuming a
high-fat diet have been cited as a likely contributing factor. Further to this, protein restricted
diets have been associated with impaired mammary gland development (29,44)
leading to
impaired milk synthesis (44)
, and this may also have contributed to reduced offspring growth
observed during the suckling period. It is important to note however, that the reduction in
protein intake in dams consuming a 36% fat diet in the current study were more modest (10-
25%) than those typically used in low-protein diet studies (~50% reduction) (45,46,47,48)
.
Dow
nloaded from https://w
ww
.cambridge.org/core . Bodleian Libraries of the U
niversity of Oxford , on 25 Feb 2020 at 14:05:11 , subject to the Cam
bridge Core terms of use, available at https://w
ww
.cambridge.org/core/term
s . https://doi.org/10.1017/S000711452000046X
Accepted manuscript
The lower Fasn expression in the liver and adipose tissue of dams exposed to a 36% fat diet
is consistent with the established role of this enzyme in suppressing lipogenesis in times of
energy excess (49)
. Surprisingly, this change did not appear to be mediated through changes in
maternal Srebf1 mRNA expression, a known regulator of Fasn expression (50)
. It is important
to note that since only mRNA expression was measured, we cannot comment on any
differences in protein expression or activity of this transcription factor although mRNA and
protein levels have been shown to be closely correlated (23)
. Following this up at the protein
level is a major priority for future study. In the offspring, however, hepatic Fasn expression
was not downregulated by exposure to a maternal 36% fat diet but was actually higher in
male offspring of dams consuming the 36% fat compared to the 18% fat diets at 1 week of
age and was accompanied by an increase in Lpl expression. In female offspring, however,
hepatic Fasn and Sbrepf1 expression at 1 week were influenced by maternal dietary fatty acid
ratio, rather than total fat content, with both genes upregulated in offspring of dams fed the
low LA diets. In both cases, the upregulation of Sbref1, Fasn and Lpl genes would be
expected to be associated with an upregulation of both lipogenesis and fatty acid uptake. It is
worth mentioning that differences in hepatic expression of lipogenic genes in male offspring
were consistently associated with maternal dietary fat content whereas differences in female
hepatic expression were consistently associated with maternal dietary fatty acid ratio. This
suggests that female offspring are more sensitive to changes in the types of maternal dietary
fat whereas male offspring are more sensitive to gross maternal fat consumption. Sex specific
effects associated with the programming of disease hypothesis have been frequently reported
(51). The mechanism by which sex influences these effects, however, remains to be elucidated
within a larger perspective, as well as within the context of this study.
We found no evidence that these alterations in hepatic gene expression translated to increases
in liver weight, however whether there was any effect on hepatic fat content remains to be
determined. In both male and female offspring, relative liver weight was increased in
offspring of dams fed the high LA diet. In an aim to further elucidate the source of this
increased weight, we measured liver DNA, protein and glycogen composition. Similar to
liver weight, glycogen levels were increased in offspring of dams fed the high LA diets. This
increase in glycogen, however, was not sufficient enough to completely account for the
differences observed in liver weight but may be a contributing factor. Consideration of DNA
and protein content of the tissue did not indicate significant changes to cell size or number.
Dow
nloaded from https://w
ww
.cambridge.org/core . Bodleian Libraries of the U
niversity of Oxford , on 25 Feb 2020 at 14:05:11 , subject to the Cam
bridge Core terms of use, available at https://w
ww
.cambridge.org/core/term
s . https://doi.org/10.1017/S000711452000046X
Accepted manuscript
More detailed analysis is required to further elucidate the mechanism by which high maternal
dietary omega-6 may impact upon offspring liver physiology.
The majority of the hepatic mRNA expression differences, as well as gross differences in
liver weight and composition, appeared to be transient and were no longer present at 2 weeks
of age. A notable exception was the lower expression of Srebf1 mRNA and higher expression
of Pparg in females of dams exposed to a high LA diet compared to the low LA diet, with a
similar trend observed in males. Although found in relatively low concentrations in the liver,
activation of Pparg has been shown to increase hepatic lipid storage and is elevated in
models of hepatic steatosis (52)
. As such, decreased Pparg expression can alleviate some of
the symptoms of hepatic steatosis leading to a reduced liver weight in conjunction with a
reduction in hepatic triglyceride content (53)
. Thus, our finding that female offspring of dams
exposed to a high LA diet tended towards to have an increased liver weight at one week of
age followed by increased hepatic Pparg expression at two weeks of age may suggest that the
increase in Pparg expression is a potential response to the increased liver growth observed a
week earlier. Alternatively, parallels may be drawn to the effect of low protein diets where
fluctuations between an increased and decreased lipogenic capacity, chiefly mediated by
altered Srebf1 expression, occur in early life only to settle into a pattern of upregulated
lipogenesis at a later life stage (23)
. Further studies would be needed to directly evaluate this
hypothesis.
In conclusion, we have demonstrated that exposure to a 36% fat diet during gestation and
lactation is associated with persistent growth restriction in both male and female offspring
irrespective of maternal dietary fatty acid composition. Growth restriction has been
associated with a plethora of metabolic disturbances later in life (54,55,56)
and transient
alterations in gene expression have been suggested as a mechanism for programming changes
in metabolic processes within tissues as well as the morphology of the tissues themselves (1)
.
In this study, offspring are still exposed to the experimental diets via the dams milk, and
further studies in offspring at older ages are required to assess whether the changes in growth,
hepatic gene expression and liver weights in the current study are associated with phenotypic
changes that persist once offspring are no longer exposed directly to the altered diet
composition. In addition, analysis of lipogenic pathway and adipokines targets at the protein
level, as well as whole transcriptome analysis, may yield useful information about their
regulation and the extent to which these experimental diets programme other metabolic and
regulatory pathways in the liver. Finally, the longevity of these perturbations into later life,
especially when presented with secondary metabolic challenges such as aging, prolonged
high-fat feeding or in the case of female offspring, pregnancy, remains to be elucidated.
Dow
nloaded from https://w
ww
.cambridge.org/core . Bodleian Libraries of the U
niversity of Oxford , on 25 Feb 2020 at 14:05:11 , subject to the Cam
bridge Core terms of use, available at https://w
ww
.cambridge.org/core/term
s . https://doi.org/10.1017/S000711452000046X
Accepted manuscript
Acknowledgements
The authors gratefully acknowledge the staff at the Bio-Support Unit (University of
Nottingham) for help and advice with animal procedures and Zoe Daniel for assistance with
molecular analyses.
Financial Support
BSM is supported by a Career Development Fellowship from the National Health and
Medical Research Council of Australia (APP1083009)
Conflicts of Interest
None
Author Contributions
SCL-E, BSM and MJE participated in study design. SAVD carried out the study (assisted by
GG), data analysis and preparation of the manuscript which was revised and approved by
SCL-E, BSM, MJE and GG.
Dow
nloaded from https://w
ww
.cambridge.org/core . Bodleian Libraries of the U
niversity of Oxford , on 25 Feb 2020 at 14:05:11 , subject to the Cam
bridge Core terms of use, available at https://w
ww
.cambridge.org/core/term
s . https://doi.org/10.1017/S000711452000046X
Accepted manuscript
References
1. Langley-Evans SC (2015) Nutrition in early life and the programming of adult disease: a
review. J Hum Nutr Diet 28 Suppl 1, 1-14.
2. Ribaroff GA, Wastnedge E, Drake AJ et al. (2017) Animal models of maternal high fat
diet exposure and effects on metabolism in offspring: a meta-regression analysis. Obes Rev
18, 673-686.
3. Ainge H, Thompson C, Ozanne SE et al. (2011) A systematic review on animal models of
maternal high fat feeding and offspring glycaemic control. Int J Obes (Lond) 35, 325-335.
4. Muhlhausler BS, Ailhaud GP (2013) Omega-6 polyunsaturated fatty acids and the early
origins of obesity. Curr Opin Endocrinol Diabetes Obes 20, 56-61.
5. Draycott SAV, Liu G, Daniel ZC et al. (2019) Maternal dietary ratio of linoleic acid to
alpha-linolenic acid during pregnancy has sex-specific effects on placental and fetal weights
in the rat. Nutrition & Metabolism 16, 1.
6. Blasbalg TL, Hibbeln JR, Ramsden CE et al. (2011) Changes in consumption of omega-3
and omega-6 fatty acids in the United States during the 20th century. The American Journal
of Clinical Nutrition 93, 950-962.
7. Sioen I, van Lieshout L, Eilander A et al. (2017) Systematic Review on N-3 and N-6
Polyunsaturated Fatty Acid Intake in European Countries in Light of the Current
Recommendations - Focus on Specific Population Groups. Ann Nutr Metab 70, 39-50.
8. Ailhaud G, Massiera F, Weill P et al. (2006) Temporal changes in dietary fats: role of n-6
polyunsaturated fatty acids in excessive adipose tissue development and relationship to
obesity. Prog Lipid Res 45, 203-236.
9. Tu WC, Cook-Johnson RJ, James MJ et al. (2010) Omega-3 long chain fatty acid synthesis
is regulated more by substrate levels than gene expression. Prostaglandins Leukot Essent
Fatty Acids 83, 61-68.
Dow
nloaded from https://w
ww
.cambridge.org/core . Bodleian Libraries of the U
niversity of Oxford , on 25 Feb 2020 at 14:05:11 , subject to the Cam
bridge Core terms of use, available at https://w
ww
.cambridge.org/core/term
s . https://doi.org/10.1017/S000711452000046X
Accepted manuscript
10. Gibson RA, Neumann MA, Lien EL et al. (2013) Docosahexaenoic acid synthesis from
alpha-linolenic acid is inhibited by diets high in polyunsaturated fatty acids. Prostaglandins
Leukot Essent Fatty Acids 88, 139-146.
11. Calder PC (2015) Marine omega-3 fatty acids and inflammatory processes: Effects,
mechanisms and clinical relevance. Biochimica et Biophysica Acta (BBA) - Molecular and
Cell Biology of Lipids 1851, 469-484.
12. Massiera F, Saint-Marc P, Seydoux J et al. (2003) Arachidonic acid and prostacyclin
signaling promote adipose tissue development: a human health concern? J Lipid Res 44, 271-
279.
13. Massiera F, Barbry P, Guesnet P et al. (2010) A Western-like fat diet is sufficient to
induce a gradual enhancement in fat mass over generations. J Lipid Res 51, 2352-2361.
14. Korotkova M, Gabrielsson B, Lonn M et al. (2002) Leptin levels in rat offspring are
modified by the ratio of linoleic to alpha-linolenic acid in the maternal diet. J Lipid Res 43,
1743-1749.
15. Much D, Brunner S, Vollhardt C et al. (2013) Effect of dietary intervention to reduce the
n-6/n-3 fatty acid ratio on maternal and fetal fatty acid profile and its relation to offspring
growth and body composition at 1 year of age. Eur J Clin Nutr 67, 282-288.
16. Muhlhausler BS, Miljkovic D, Fong L et al. (2011) Maternal Omega-3 Supplementation
Increases Fat Mass in Male and Female Rat Offspring. Frontiers in Genetics 2, 48.
17. Ibrahim A, Basak S, Ehtesham NZ (2009) Impact of maternal dietary fatty acid
composition on glucose and lipid metabolism in male rat offspring aged 105 d. British
Journal of Nutrition 102, 233-241.
18. Muhlhausler BS, Gibson RA, Makrides M (2011) The effect of maternal omega-3 long-
chain polyunsaturated fatty acid (n-3 LCPUFA) supplementation during pregnancy and/or
Dow
nloaded from https://w
ww
.cambridge.org/core . Bodleian Libraries of the U
niversity of Oxford , on 25 Feb 2020 at 14:05:11 , subject to the Cam
bridge Core terms of use, available at https://w
ww
.cambridge.org/core/term
s . https://doi.org/10.1017/S000711452000046X
Accepted manuscript
lactation on body fat mass in the offspring: a systematic review of animal studies.
Prostaglandins Leukot Essent Fatty Acids 85, 83-88.
19. Gibson RA, Muhlhausler B, Makrides M (2011) Conversion of linoleic acid and alpha-
linolenic acid to long-chain polyunsaturated fatty acids (LCPUFAs), with a focus on
pregnancy, lactation and the first 2 years of life. Matern Child Nutr 7 Suppl 2, 17-26.
20. Lands WEM (2000) Commentary on the Workshop Statement. Prostaglandins,
Leukotrienes and Essential Fatty Acids (PLEFA) 63, 125-126.
21. SACN (2018) Draft Report: Saturated fats and health.
https://www.gov.uk/government/consultations/saturated-fats-and-health-draft-sacn-report
(accessed 03/12/2018 2018)
22. Liu G, Muhlhausler BS, Gibson RA (2014) A method for long term stabilisation of long
chain polyunsaturated fatty acids in dried blood spots and its clinical application.
Prostaglandins Leukot Essent Fatty Acids 91, 251-260.
23. Erhuma A, Salter AM, Sculley DV et al. (2007) Prenatal exposure to a low-protein diet
programs disordered regulation of lipid metabolism in the aging rat. Am J Physiol Endocrinol
Metab 292, E1702-1714.
24. Rhinn H, Scherman D, Escriou V (2008) One-step quantification of single-stranded DNA
in the presence of RNA using Oligreen in a real-time polymerase chain reaction
thermocycler. Anal Biochem 372, 116-118.
25. Lowry OH, Rosebrough NJ, Farr AL et al. (1951) Protein measurement with the Folin
phenol reagent. The Journal of biological chemistry 193, 265-275.
26. Blank C, Neumann MA, Makrides M et al. (2002) Optimizing DHA levels in piglets by
lowering the linoleic acid to alpha-linolenic acid ratio. J Lipid Res 43, 1537-1543.
Dow
nloaded from https://w
ww
.cambridge.org/core . Bodleian Libraries of the U
niversity of Oxford , on 25 Feb 2020 at 14:05:11 , subject to the Cam
bridge Core terms of use, available at https://w
ww
.cambridge.org/core/term
s . https://doi.org/10.1017/S000711452000046X
Accepted manuscript
27. Brenna JT, Salem N, Sinclair AJ et al. (2009) α-Linolenic acid supplementation and
conversion to n-3 long-chain polyunsaturated fatty acids in humans. Prostaglandins,
Leukotrienes and Essential Fatty Acids 80, 85-91.
28. Tu WC, Muhlhausler BS, Yelland LN et al. (2013) Correlations between blood and tissue
omega-3 LCPUFA status following dietary ALA intervention in rats. Prostaglandins Leukot
Essent Fatty Acids 88, 53-60.
29. Bautista CJ, Rodriguez-Gonzalez GL, Torres N et al. (2013) Protein restriction in the rat
negatively impacts long-chain polyunsaturated fatty acid composition and mammary gland
development at the end of gestation. Archives of medical research 44, 429-436.
30. Mercuri O, de Tomas ME, Itarte H (1979) Prenatal protein depletion and Delta9, Delta6
and Delta5 desaturases in the rat. Lipids 14, 822-825.
31. Mantzioris E, James MJ, Gibson RA et al. (1994) Dietary substitution with an alpha-
linolenic acid-rich vegetable oil increases eicosapentaenoic acid concentrations in tissues. Am
J Clin Nutr 59, 1304-1309.
32. Chan JK, McDonald BE, Gerrard JM et al. (1993) Effect of dietary alpha-linolenic acid
and its ratio to linoleic acid on platelet and plasma fatty acids and thrombogenesis. Lipids 28,
811-817.
33. Mohammad MA, Sunehag AL, Haymond MW (2014) De novo synthesis of milk
triglycerides in humans. American journal of physiology Endocrinology and metabolism 306,
E838-E847.
34. Hu CC, Qing K, Chen Y (2004) Diet-induced changes in stearoyl-CoA desaturase 1
expression in obesity-prone and -resistant mice. Obesity research 12, 1264-1270.
35. Keesey RE, Hirvonen MD (1997) Body weight set-points: determination and adjustment.
J Nutr 127, 1875S-1883S.
Dow
nloaded from https://w
ww
.cambridge.org/core . Bodleian Libraries of the U
niversity of Oxford , on 25 Feb 2020 at 14:05:11 , subject to the Cam
bridge Core terms of use, available at https://w
ww
.cambridge.org/core/term
s . https://doi.org/10.1017/S000711452000046X
Accepted manuscript
36. Khan IY, Taylor PD, Dekou V et al. (2002) Gender-Linked Hypertension in Offspring of
Lard-Fed Pregnant Rats. Hypertension 41, 168-175.
37. Khan IY, Dekou V, Douglas G et al. (2005) A high-fat diet during rat pregnancy or
suckling induces cardiovascular dysfunction in adult offspring. Am J Physiol Regul Integr
Comp Physiol 288, R127-133.
38. Dyrskog SE, Gregersen S, Hermansen K (2005) High-fat feeding during gestation and
nursing period have differential effects on the insulin secretory capacity in offspring from
normal Wistar rats. Rev Diabet Stud 2, 136-145.
39. Samuelsson AM, Matthews PA, Argenton M et al. (2008) Diet-induced obesity in female
mice leads to offspring hyperphagia, adiposity, hypertension, and insulin resistance: a novel
murine model of developmental programming. Hypertension 51, 383-392.
40. Taylor PD, Khan IY, Lakasing L et al. (2003) Uterine artery function in pregnant rats fed
a diet supplemented with animal lard. Exp Physiol 88, 389-398.
41. Mark PJ, Sisala C, Connor K et al. (2011) A maternal high-fat diet in rat pregnancy
reduces growth of the fetus and the placental junctional zone, but not placental labyrinth zone
growth. Journal of Developmental Origins of Health and Disease 2, 63-70.
42. Howie GJ, Sloboda DM, Kamal T et al. (2009) Maternal nutritional history predicts
obesity in adult offspring independent of postnatal diet. J Physiol 587, 905-915.
43. Cerf ME, Muller CJ, Du Toit DF et al. (2006) Hyperglycaemia and reduced glucokinase
expression in weanling offspring from dams maintained on a high-fat diet. Br J Nutr 95, 391-
396.
44. Moretto VL, Ballen MO, Goncalves TS et al. (2011) Low-Protein Diet during Lactation
and Maternal Metabolism in Rats. ISRN obstetrics and gynecology 2011, 876502.
45. Langley SC, Jackson AA (1994) Increased systolic blood pressure in adult rats induced
by fetal exposure to maternal low protein diets. Clinical science (London, England : 1979)
86, 217-222; discussion 121.
Dow
nloaded from https://w
ww
.cambridge.org/core . Bodleian Libraries of the U
niversity of Oxford , on 25 Feb 2020 at 14:05:11 , subject to the Cam
bridge Core terms of use, available at https://w
ww
.cambridge.org/core/term
s . https://doi.org/10.1017/S000711452000046X
Accepted manuscript
46. Langley-Evans SC, Nwagwu M (1998) Impaired growth and increased glucocorticoid-
sensitive enzyme activities in tissues of rat fetuses exposed to maternal low protein diets. Life
Sciences 63, 605-615.
47. Ozanne SE, Martensz ND, Petry CJ et al. (1998) Maternal low protein diet in rats
programmes fatty acid desaturase activities in the offspring. Diabetologia 41, 1337-1342.
48. Malandro MS, Beveridge MJ, Kilberg MS et al. (1996) Effect of low-protein diet-induced
intrauterine growth retardation on rat placental amino acid transport. The American journal of
physiology 271, C295-303.
49. Geelen SN, Blazquez C, Geelen MJ et al. (2001) High fat intake lowers hepatic fatty acid
synthesis and raises fatty acid oxidation in aerobic muscle in Shetland ponies. Br J Nutr 86,
31-36.
50. Griffin MJ, Sul HS (2004) Insulin regulation of fatty acid synthase gene transcription:
roles of USF and SREBP-1c. IUBMB Life 56, 595-600.
51. Gabory A, Roseboom TJ, Moore T et al. (2013) Placental contribution to the origins of
sexual dimorphism in health and diseases: sex chromosomes and epigenetics. Biology of Sex
Differences 4, 5.
52. Inoue M, Ohtake T, Motomura W et al. (2005) Increased expression of PPARγ in high fat
diet-induced liver steatosis in mice. Biochemical and Biophysical Research Communications
336, 215-222.
53. Gavrilova O, Haluzik M, Matsusue K et al. (2003) Liver peroxisome proliferator-
activated receptor gamma contributes to hepatic steatosis, triglyceride clearance, and
regulation of body fat mass. The Journal of biological chemistry 278, 34268-34276.
54. Barker DJ (1995) Fetal origins of coronary heart disease. BMJ 311, 171-174.
55. Phillips DI, Barker DJ, Hales CN et al. (1994) Thinness at birth and insulin resistance in
adult life. Diabetologia 37, 150-154.
56. Holemans K, Aerts L, Van Assche FA (2003) Fetal growth restriction and consequences
for the offspring in animal models. J Soc Gynecol Investig 10, 392-399.
Dow
nloaded from https://w
ww
.cambridge.org/core . Bodleian Libraries of the U
niversity of Oxford , on 25 Feb 2020 at 14:05:11 , subject to the Cam
bridge Core terms of use, available at https://w
ww
.cambridge.org/core/term
s . https://doi.org/10.1017/S000711452000046X
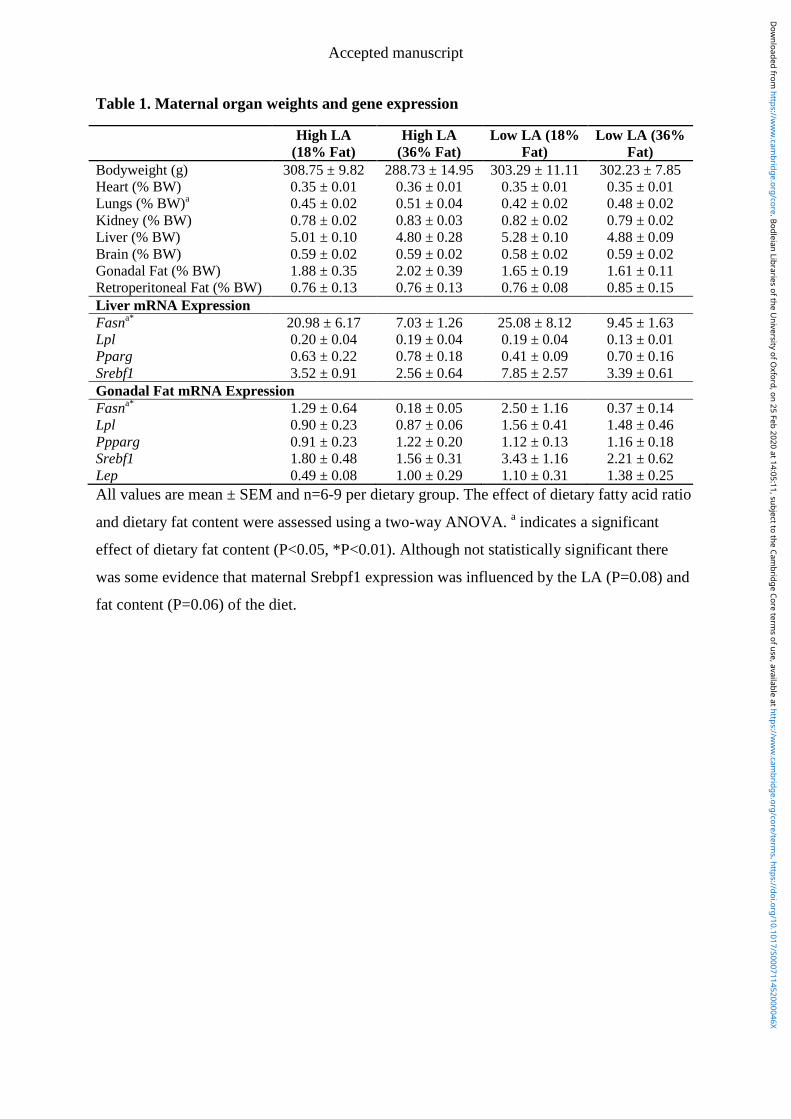
Accepted manuscript
Table 1. Maternal organ weights and gene expression
All values are mean ± SEM and n=6-9 per dietary group. The effect of dietary fatty acid ratio
and dietary fat content were assessed using a two-way ANOVA. a indicates a significant
effect of dietary fat content (P<0.05, *P<0.01). Although not statistically significant there
was some evidence that maternal Srebpf1 expression was influenced by the LA (P=0.08) and
fat content (P=0.06) of the diet.
High LA
(18% Fat)
High LA
(36% Fat)
Low LA (18%
Fat)
Low LA (36%
Fat)
Bodyweight (g) 308.75 ± 9.82 288.73 ± 14.95 303.29 ± 11.11 302.23 ± 7.85
Heart (% BW) 0.35 ± 0.01 0.36 ± 0.01 0.35 ± 0.01 0.35 ± 0.01
Lungs (% BW)a
0.45 ± 0.02
0.51 ± 0.04
0.42 ± 0.02
0.48 ± 0.02
Kidney (% BW) 0.78 ± 0.02 0.83 ± 0.03 0.82 ± 0.02 0.79 ± 0.02
Liver (% BW)
5.01 ± 0.10 4.80 ± 0.28 5.28 ± 0.10 4.88 ± 0.09
Brain (% BW) 0.59 ± 0.02 0.59 ± 0.02 0.58 ± 0.02 0.59 ± 0.02
Gonadal Fat (% BW) 1.88 ± 0.35 2.02 ± 0.39 1.65 ± 0.19 1.61 ± 0.11
Retroperitoneal Fat (% BW) 0.76 ± 0.13 0.76 ± 0.13 0.76 ± 0.08 0.85 ± 0.15
Liver mRNA Expression
Fasna*
20.98 ± 6.17
7.03 ± 1.26
25.08 ± 8.12
9.45 ± 1.63
Lpl 0.20 ± 0.04 0.19 ± 0.04 0.19 ± 0.04 0.13 ± 0.01
Pparg 0.63 ± 0.22 0.78 ± 0.18 0.41 ± 0.09 0.70 ± 0.16
Srebf1 3.52 ± 0.91 2.56 ± 0.64 7.85 ± 2.57 3.39 ± 0.61
Gonadal Fat mRNA Expression
Fasna*
1.29 ± 0.64
0.18 ± 0.05
2.50 ± 1.16
0.37 ± 0.14
Lpl 0.90 ± 0.23 0.87 ± 0.06 1.56 ± 0.41 1.48 ± 0.46
Ppparg 0.91 ± 0.23 1.22 ± 0.20 1.12 ± 0.13 1.16 ± 0.18
Srebf1 1.80 ± 0.48 1.56 ± 0.31 3.43 ± 1.16 2.21 ± 0.62
Lep 0.49 ± 0.08 1.00 ± 0.29 1.10 ± 0.31 1.38 ± 0.25
Dow
nloaded from https://w
ww
.cambridge.org/core . Bodleian Libraries of the U
niversity of Oxford , on 25 Feb 2020 at 14:05:11 , subject to the Cam
bridge Core terms of use, available at https://w
ww
.cambridge.org/core/term
s . https://doi.org/10.1017/S000711452000046X
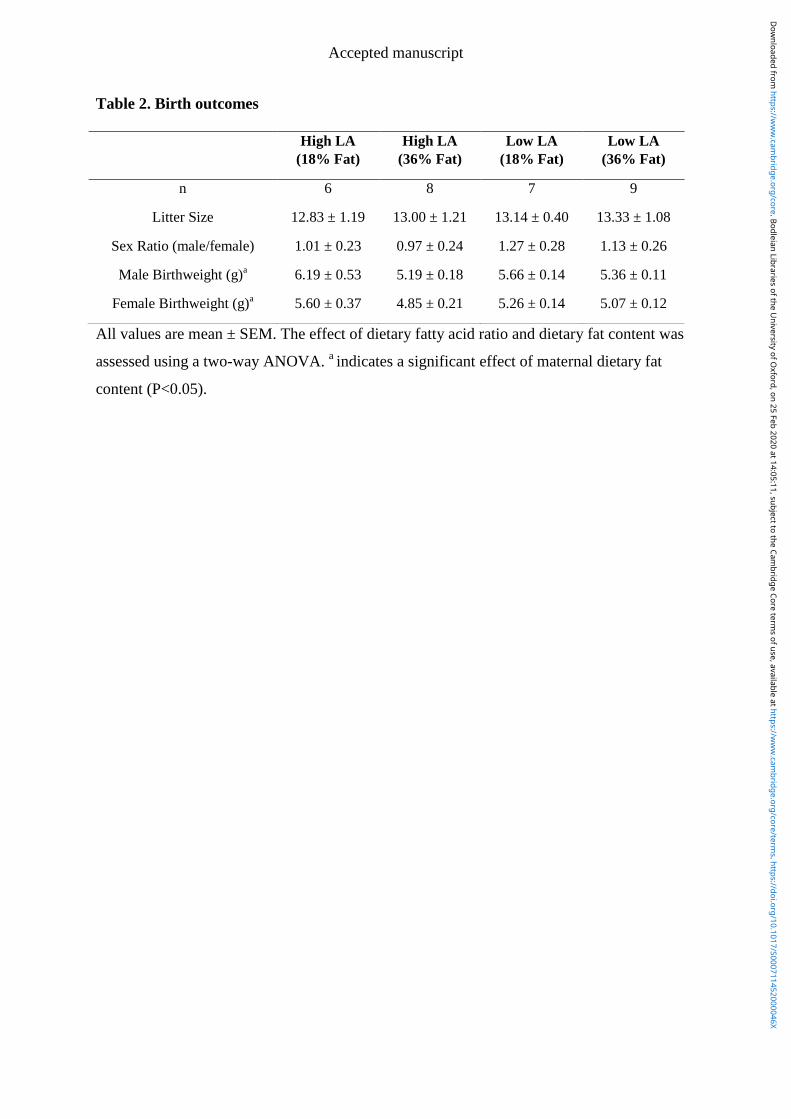
Accepted manuscript
Table 2. Birth outcomes
All values are mean ± SEM. The effect of dietary fatty acid ratio and dietary fat content was
assessed using a two-way ANOVA. a indicates a significant effect of maternal dietary fat
content (P<0.05).
High LA
(18% Fat)
High LA
(36% Fat)
Low LA
(18% Fat)
Low LA
(36% Fat)
n 6 8 7 9
Litter Size 12.83 ± 1.19 13.00 ± 1.21 13.14 ± 0.40 13.33 ± 1.08
Sex Ratio (male/female) 1.01 ± 0.23 0.97 ± 0.24 1.27 ± 0.28 1.13 ± 0.26
Male Birthweight (g)a
6.19 ± 0.53 5.19 ± 0.18 5.66 ± 0.14 5.36 ± 0.11
Female Birthweight (g)a
5.60 ± 0.37 4.85 ± 0.21 5.26 ± 0.14 5.07 ± 0.12
Dow
nloaded from https://w
ww
.cambridge.org/core . Bodleian Libraries of the U
niversity of Oxford , on 25 Feb 2020 at 14:05:11 , subject to the Cam
bridge Core terms of use, available at https://w
ww
.cambridge.org/core/term
s . https://doi.org/10.1017/S000711452000046X
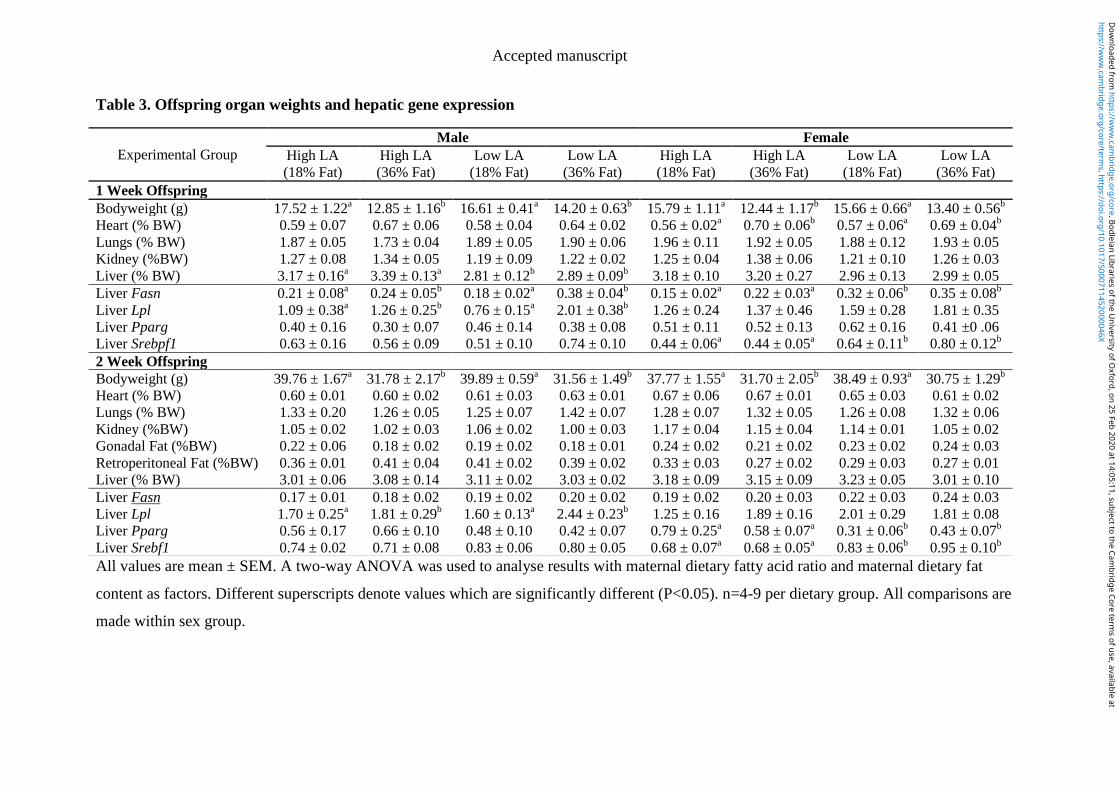
Accepted manuscript
Table 3. Offspring organ weights and hepatic gene expression
All values are mean ± SEM. A two-way ANOVA was used to analyse results with maternal dietary fatty acid ratio and maternal dietary fat
content as factors. Different superscripts denote values which are significantly different (P<0.05). n=4-9 per dietary group. All comparisons are
made within sex group.
Experimental Group
Male Female
High LA
(18% Fat)
High LA
(36% Fat)
Low LA
(18% Fat)
Low LA
(36% Fat)
High LA
(18% Fat)
High LA
(36% Fat)
Low LA
(18% Fat)
Low LA
(36% Fat)
1 Week Offspring
Bodyweight (g) 17.52 ± 1.22a
12.85 ± 1.16b
16.61 ± 0.41a
14.20 ± 0.63b
15.79 ± 1.11a 12.44 ± 1.17
b 15.66 ± 0.66
a 13.40 ± 0.56
b
Heart (% BW) 0.59 ± 0.07
0.67 ± 0.06
0.58 ± 0.04
0.64 ± 0.02
0.56 ± 0.02a 0.70 ± 0.06
b 0.57 ± 0.06
a 0.69 ± 0.04
b
Lungs (% BW) 1.87 ± 0.05 1.73 ± 0.04 1.89 ± 0.05 1.90 ± 0.06 1.96 ± 0.11 1.92 ± 0.05 1.88 ± 0.12 1.93 ± 0.05
Kidney (%BW) 1.27 ± 0.08 1.34 ± 0.05 1.19 ± 0.09 1.22 ± 0.02 1.25 ± 0.04 1.38 ± 0.06 1.21 ± 0.10 1.26 ± 0.03
Liver (% BW) 3.17 ± 0.16a 3.39 ± 0.13
a 2.81 ± 0.12
b 2.89 ± 0.09
b 3.18 ± 0.10
3.20 ± 0.27
2.96 ± 0.13
2.99 ± 0.05
Liver Fasn 0.21 ± 0.08a
0.24 ± 0.05b
0.18 ± 0.02a
0.38 ± 0.04b
0.15 ± 0.02a
0.22 ± 0.03a
0.32 ± 0.06b
0.35 ± 0.08b
Liver Lpl 1.09 ± 0.38a
1.26 ± 0.25b
0.76 ± 0.15a
2.01 ± 0.38b
1.26 ± 0.24 1.37 ± 0.46 1.59 ± 0.28 1.81 ± 0.35
Liver Pparg 0.40 ± 0.16 0.30 ± 0.07 0.46 ± 0.14
0.38 ± 0.08
0.51 ± 0.11 0.52 ± 0.13 0.62 ± 0.16 0.41 ±0 .06
Liver Srebpf1 0.63 ± 0.16
0.56 ± 0.09
0.51 ± 0.10 0.74 ± 0.10 0.44 ± 0.06a
0.44 ± 0.05a
0.64 ± 0.11b
0.80 ± 0.12b
2 Week Offspring
Bodyweight (g) 39.76 ± 1.67a 31.78 ± 2.17
b 39.89 ± 0.59
a 31.56 ± 1.49
b 37.77 ± 1.55
a 31.70 ± 2.05
b 38.49 ± 0.93
a 30.75 ± 1.29
b
Heart (% BW) 0.60 ± 0.01 0.60 ± 0.02 0.61 ± 0.03 0.63 ± 0.01 0.67 ± 0.06 0.67 ± 0.01 0.65 ± 0.03 0.61 ± 0.02
Lungs (% BW) 1.33 ± 0.20 1.26 ± 0.05 1.25 ± 0.07 1.42 ± 0.07 1.28 ± 0.07 1.32 ± 0.05 1.26 ± 0.08 1.32 ± 0.06
Kidney (%BW) 1.05 ± 0.02 1.02 ± 0.03 1.06 ± 0.02 1.00 ± 0.03 1.17 ± 0.04 1.15 ± 0.04 1.14 ± 0.01 1.05 ± 0.02
Gonadal Fat (%BW) 0.22 ± 0.06
0.18 ± 0.02
0.19 ± 0.02
0.18 ± 0.01
0.24 ± 0.02
0.21 ± 0.02
0.23 ± 0.02
0.24 ± 0.03
Retroperitoneal Fat (%BW) 0.36 ± 0.01
0.41 ± 0.04
0.41 ± 0.02
0.39 ± 0.02
0.33 ± 0.03
0.27 ± 0.02
0.29 ± 0.03
0.27 ± 0.01
Liver (% BW) 3.01 ± 0.06 3.08 ± 0.14 3.11 ± 0.02 3.03 ± 0.02 3.18 ± 0.09 3.15 ± 0.09 3.23 ± 0.05 3.01 ± 0.10
Liver Fasn 0.17 ± 0.01 0.18 ± 0.02 0.19 ± 0.02 0.20 ± 0.02 0.19 ± 0.02 0.20 ± 0.03 0.22 ± 0.03 0.24 ± 0.03
Liver Lpl 1.70 ± 0.25a
1.81 ± 0.29b
1.60 ± 0.13a
2.44 ± 0.23b
1.25 ± 0.16 1.89 ± 0.16 2.01 ± 0.29 1.81 ± 0.08
Liver Pparg 0.56 ± 0.17
0.66 ± 0.10
0.48 ± 0.10
0.42 ± 0.07
0.79 ± 0.25a
0.58 ± 0.07a
0.31 ± 0.06b
0.43 ± 0.07b
Liver Srebf1 0.74 ± 0.02
0.71 ± 0.08
0.83 ± 0.06
0.80 ± 0.05
0.68 ± 0.07a
0.68 ± 0.05a
0.83 ± 0.06b
0.95 ± 0.10b
https://ww
w.cam
bridge.org/core/terms . https://doi.org/10.1017/S000711452000046X
Dow
nloaded from https://w
ww
.cambridge.org/core . Bodleian Libraries of the U
niversity of Oxford , on 25 Feb 2020 at 14:05:11 , subject to the Cam
bridge Core terms of use, available at
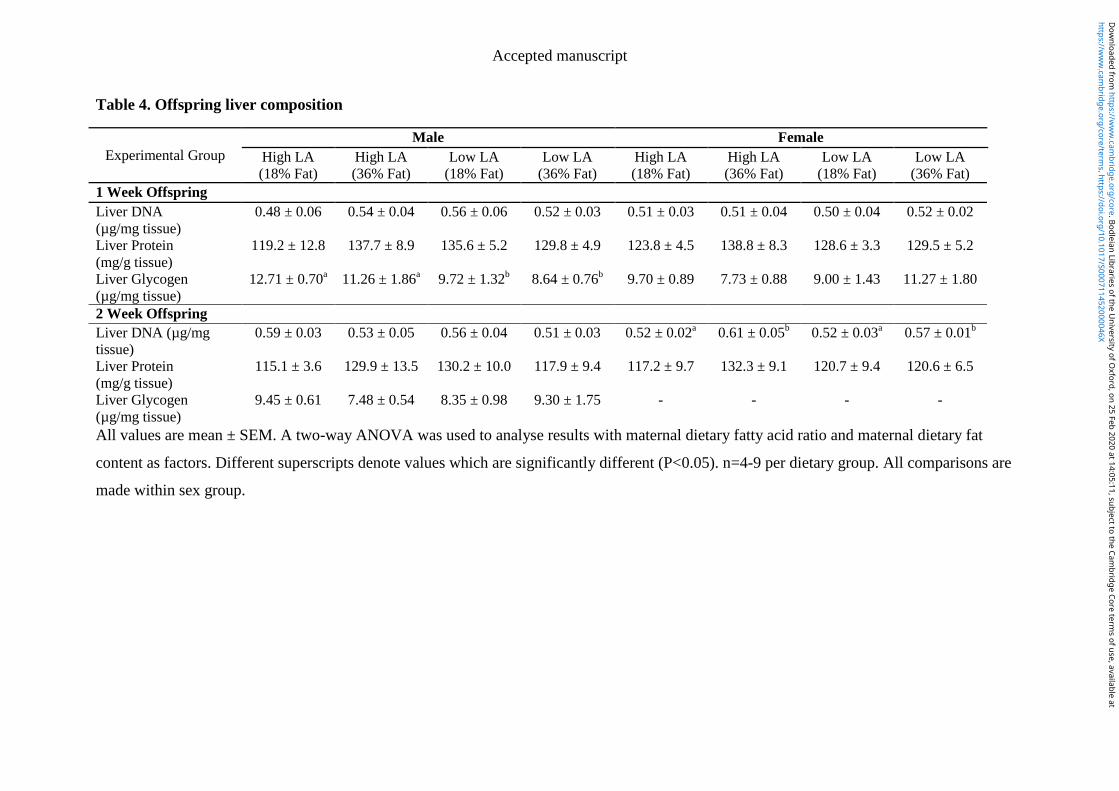
Accepted manuscript
Table 4. Offspring liver composition
All values are mean ± SEM. A two-way ANOVA was used to analyse results with maternal dietary fatty acid ratio and maternal dietary fat
content as factors. Different superscripts denote values which are significantly different (P<0.05). n=4-9 per dietary group. All comparisons are
made within sex group.
Experimental Group
Male Female
High LA
(18% Fat)
High LA
(36% Fat)
Low LA
(18% Fat)
Low LA
(36% Fat)
High LA
(18% Fat)
High LA
(36% Fat)
Low LA
(18% Fat)
Low LA
(36% Fat)
1 Week Offspring
Liver DNA
(µg/mg tissue)
0.48 ± 0.06 0.54 ± 0.04 0.56 ± 0.06 0.52 ± 0.03 0.51 ± 0.03 0.51 ± 0.04 0.50 ± 0.04 0.52 ± 0.02
Liver Protein
(mg/g tissue)
119.2 ± 12.8 137.7 ± 8.9 135.6 ± 5.2 129.8 ± 4.9 123.8 ± 4.5 138.8 ± 8.3 128.6 ± 3.3 129.5 ± 5.2
Liver Glycogen
(µg/mg tissue)
12.71 ± 0.70a
11.26 ± 1.86a
9.72 ± 1.32b
8.64 ± 0.76b
9.70 ± 0.89 7.73 ± 0.88 9.00 ± 1.43 11.27 ± 1.80
2 Week Offspring
Liver DNA (µg/mg
tissue)
0.59 ± 0.03 0.53 ± 0.05 0.56 ± 0.04 0.51 ± 0.03 0.52 ± 0.02a
0.61 ± 0.05b
0.52 ± 0.03a
0.57 ± 0.01b
Liver Protein
(mg/g tissue)
115.1 ± 3.6 129.9 ± 13.5 130.2 ± 10.0 117.9 ± 9.4 117.2 ± 9.7 132.3 ± 9.1 120.7 ± 9.4 120.6 ± 6.5
Liver Glycogen
(µg/mg tissue)
9.45 ± 0.61 7.48 ± 0.54 8.35 ± 0.98 9.30 ± 1.75 - - - -
https://ww
w.cam
bridge.org/core/terms . https://doi.org/10.1017/S000711452000046X
Dow
nloaded from https://w
ww
.cambridge.org/core . Bodleian Libraries of the U
niversity of Oxford , on 25 Feb 2020 at 14:05:11 , subject to the Cam
bridge Core terms of use, available at
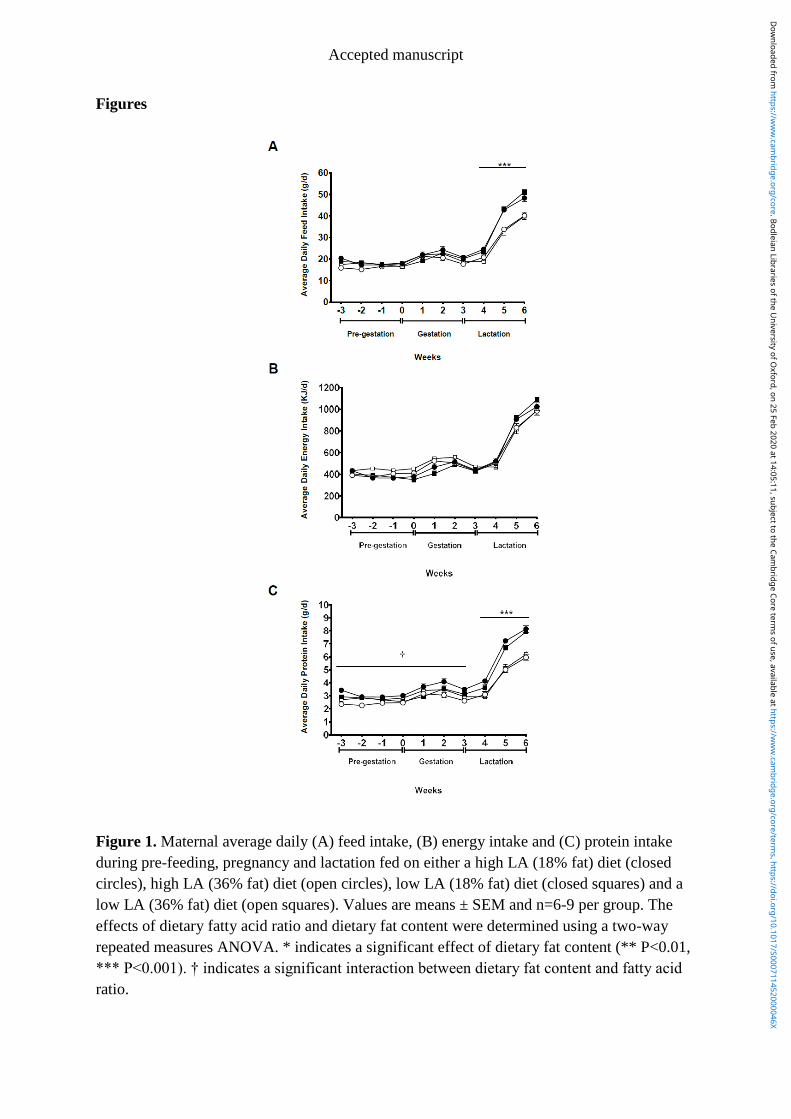
Accepted manuscript
Figures
Figure 1. Maternal average daily (A) feed intake, (B) energy intake and (C) protein intake
during pre-feeding, pregnancy and lactation fed on either a high LA (18% fat) diet (closed
circles), high LA (36% fat) diet (open circles), low LA (18% fat) diet (closed squares) and a
low LA (36% fat) diet (open squares). Values are means ± SEM and n=6-9 per group. The
effects of dietary fatty acid ratio and dietary fat content were determined using a two-way
repeated measures ANOVA. * indicates a significant effect of dietary fat content (** P<0.01,
*** P<0.001). † indicates a significant interaction between dietary fat content and fatty acid
ratio.
Dow
nloaded from https://w
ww
.cambridge.org/core . Bodleian Libraries of the U
niversity of Oxford , on 25 Feb 2020 at 14:05:11 , subject to the Cam
bridge Core terms of use, available at https://w
ww
.cambridge.org/core/term
s . https://doi.org/10.1017/S000711452000046X
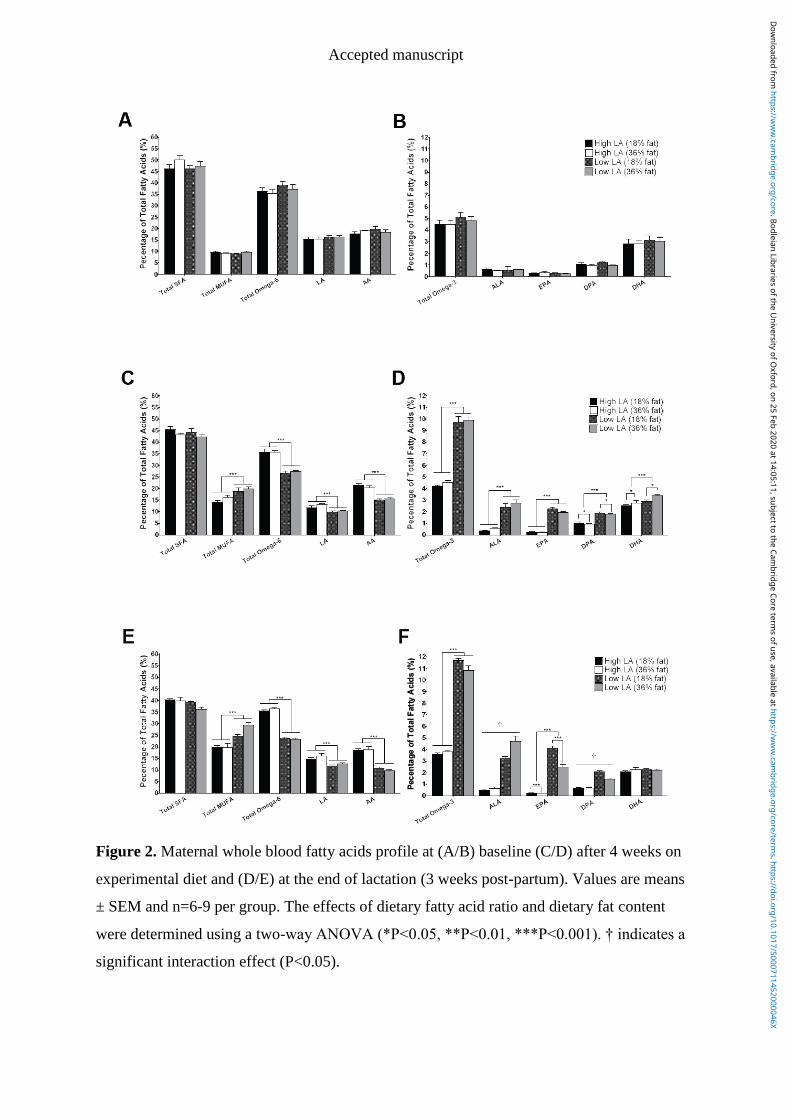
Accepted manuscript
Figure 2. Maternal whole blood fatty acids profile at (A/B) baseline (C/D) after 4 weeks on
experimental diet and (D/E) at the end of lactation (3 weeks post-partum). Values are means
± SEM and n=6-9 per group. The effects of dietary fatty acid ratio and dietary fat content
were determined using a two-way ANOVA (*P<0.05, **P<0.01, ***P<0.001). † indicates a
significant interaction effect (P<0.05).
Dow
nloaded from https://w
ww
.cambridge.org/core . Bodleian Libraries of the U
niversity of Oxford , on 25 Feb 2020 at 14:05:11 , subject to the Cam
bridge Core terms of use, available at https://w
ww
.cambridge.org/core/term
s . https://doi.org/10.1017/S000711452000046X
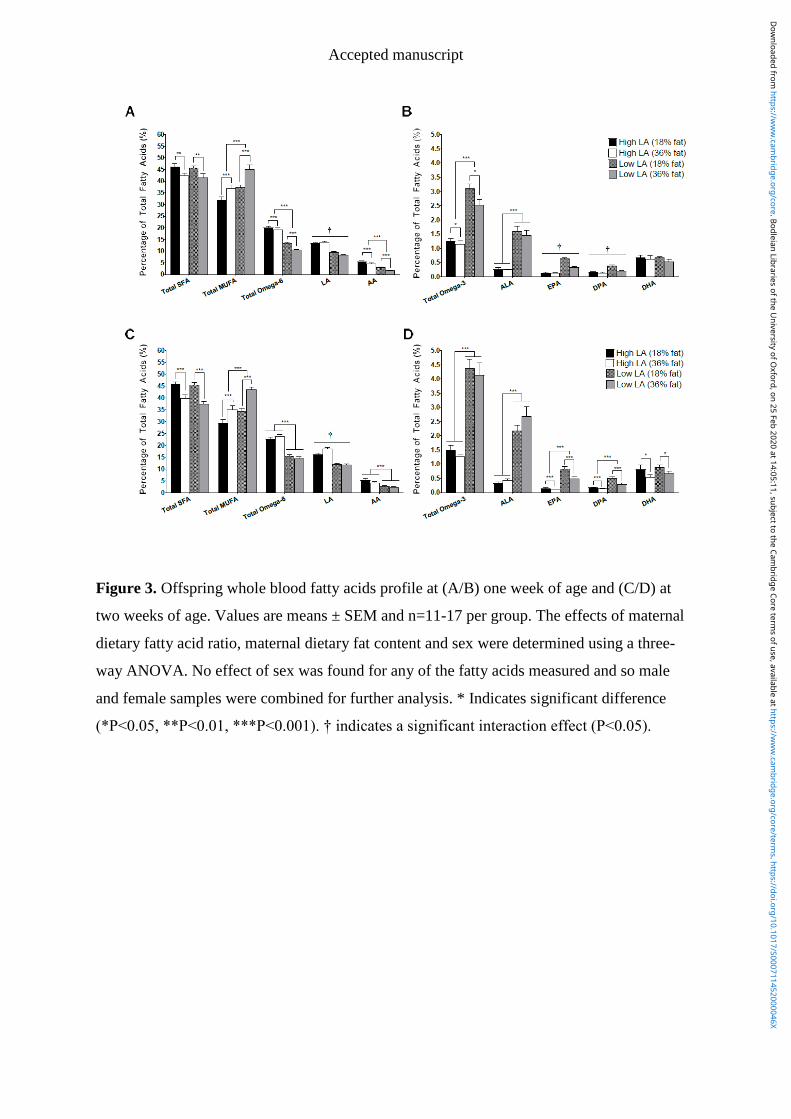
Accepted manuscript
Figure 3. Offspring whole blood fatty acids profile at (A/B) one week of age and (C/D) at
two weeks of age. Values are means ± SEM and n=11-17 per group. The effects of maternal
dietary fatty acid ratio, maternal dietary fat content and sex were determined using a three-
way ANOVA. No effect of sex was found for any of the fatty acids measured and so male
and female samples were combined for further analysis. * Indicates significant difference
(*P<0.05, **P<0.01, ***P<0.001). † indicates a significant interaction effect (P<0.05).
Dow
nloaded from https://w
ww
.cambridge.org/core . Bodleian Libraries of the U
niversity of Oxford , on 25 Feb 2020 at 14:05:11 , subject to the Cam
bridge Core terms of use, available at https://w
ww
.cambridge.org/core/term
s . https://doi.org/10.1017/S000711452000046X
209
Appendix F
This paper has been accepted for publication and will appear in a revised form,
subsequent to editorial input by Cambridge University Press, in Journal of
Developmental Origins of Health and Disease published by Cambridge University
press.
Copyright © 2019 Cambridge University Press. All Rights Reserved.
Draycott, SAV, Daniel, Z, Khan, R, Muhlhausler, BS, Elmes, MJ & Langley-
Evans, SC (2019). Expression of cholesterol packaging and transport genes in
human and rat placenta: impact of obesity and a high-fat diet. J Dev Orig
Health Dis, 1-6. https://doi.org/10.1017/S2040174419000606
Page 1 of 22
Expression of cholesterol packaging and transport genes in human and rat placenta: 1
impact of obesity and a high-fat diet 2
Sally AV Draycott1,2*, Zoe Daniel1, Raheela Khan3, Beverly S Muhlhausler2,4, Matthew J 3
Elmes1, Simon C Langley-Evans1 4
5
1School of Biosciences, University of Nottingham, Sutton Bonington Campus, 6
Loughborough, UK 7
2 Food and Nutrition Research Group, Department of Food and Wine Science, School of 8
Agriculture Food and Wine, University of Adelaide, Adelaide, Australia 9
3 Division of Medical Sciences and Graduate Entry Medicine, School of Medicine, The Royal 10
Derby Hospital, University of Nottingham, Derby, UK 11
4Commonwealth Scientific and Industrial Research Organisation, Adelaide, Australia 12
13
* Corresponding author: [email protected] 14
15
Short Title: High-fat diet and placental CHO transport 16
Draycott et al. High-fat diet and placental CHO transport
Abstract 17
Evidence suggests that sub-optimal maternal nutrition has implications for the developing 18
offspring. We have previously shown that exposure to a low-protein diet during gestation was 19
associated with upregulation of genes associated with cholesterol transport and packaging 20
within the placenta. This study aimed to elucidate the effect of altering maternal dietary linoleic 21
acid (LA; omega-6):alpha-linolenic acid (ALA; omega-6) ratios as well as total fat content on 22
placental expression of genes associated with cholesterol transport. The potential for maternal 23
BMI to be associated with expression of these genes in human placental samples was also 24
evaluated. Placentas were collected from 24 Wistar rats at 20d gestation (term=21-22d 25
gestation) that had been fed one of four diets containing varying fatty acid compositions during 26
pregnancy, and from 62 women at the time of delivery. Expression of 14 placental genes 27
associated with cholesterol packaging and transfer were assessed in rodent and human samples 28
by qRT-PCR. In rats, placental mRNA expression of ApoA2, ApoC2, Cubn, Fgg, Mttp and Ttr 29
was significantly elevated (3-30 fold) in animals fed a high LA (36% fat) diet, suggesting 30
increased cholesterol transport across the placenta in this group. In women, maternal BMI was 31
associated with fewer inconsistent alterations in gene expression. In summary, sub-optimal 32
maternal nutrition is associated with alterations in the expression of genes associated with 33
cholesterol transport in a rat model. This may contribute to altered fetal development and 34
potentially programme disease risk in later life. Further investigation of human placenta in 35
response to specific dietary interventions is required. 36
Key Words: Cholesterol, maternal nutrition, omega, placenta, pregnancy 37
Draycott et al. High-fat diet and placental CHO transport
Introduction 38
Maternal nutrition can have a profound impact on fetal development and future physiological 39
function and metabolic health (1). A number of dietary perturbations, including maternal 40
undernutrition and low protein diets, have been associated with increased risk of obesity and 41
cardiovascular disease in the adult offspring (2). In the context of the growing epidemic of 42
obesity, focus has shifted towards understanding the effects of nutritional excess and obesity 43
on offspring programming of disease. Studies have consistently demonstrated that these 44
exposures are associated with a substantial increase in the risk of poor metabolic health in the 45
offspring in both humans (3) and animal models (4). There is emerging evidence from animal 46
studies, however, that maternal high-fat diets also have the potential to program metabolic 47
outcomes in the offspring independent of the effects of maternal obesity. In addition, these 48
effects appear to depend not only on the amount of fat in the diet (5), but also on the fatty acid 49
composition (6). The majority of studies to date that have investigated the effects of a maternal 50
high fat diet have utilised diets high in saturated fat. However, due to changes in population 51
level patterns in dietary consumption (7), attention has now shifted toward the roles of 52
polyunsaturated fats within the diet. 53
The mechanisms underlying this early life programming of obesity and metabolic disease are 54
not completely understood. However, as the sole interface between the mother and the fetus, 55
structural and functional changes within the placenta have been implicated as playing a key 56
role (8). Cholesterol is present in every cell of the human body and an adequate supply is 57
therefore critical for supporting normal fetal development. As the precursor for all steroid 58
hormone synthesis, cholesterol also plays an important role in placental function. During 59
pregnancy, the fetus obtains cholesterol via endogenous synthesis as well as transfer across 60
the placenta from the maternal circulation, disturbances to either of these processes have 61
negative impacts on fetal growth, cell proliferation, metabolism and the organisation of 62
Draycott et al. High-fat diet and placental CHO transport
tissues (9). The endogenous synthesis of cholesterol appears to be most critical for the 63
developing fetus, as defects in this pathway are known to be lethal (10). Sub-optimal maternal 64
contribution of cholesterol across the placenta, however, has been associated with lower 65
birthweight (11, 12) and microcephaly (12) in humans, highlighting the importance of this 66
exogenous cholesterol supply. 67
Transport of cholesterol across the placenta is a complex process in both humans and rodents 68
(13). Briefly, the majority of cholesterol circulates the body in the form of HDL, LDL and 69
VLDL cholesterol, which are associated with specific structural apolipoproteins (ApoA2, 70
ApoB and ApoC2 respectively). The layer of trophoblast cells, located closest to maternal 71
circulation, take in LDL and VLDL through their respective receptors. HDL cholesterol can 72
be taken up via a specific receptor (scavenger receptor class B type 1; SR-B1) or by binding 73
to proteins such as megalin and cubilin (Cubn). Once within the cell, cholesterol is 74
hydrolysed into free cholesterol, bound to sterol carrier proteins and then transferred to the 75
basolateral membrane where it passes through the fetoplacental endothelium. The processes 76
governing cholesterol efflux from the endothelial layer are poorly understood, although it has 77
been shown that exogenous cholesterol is secreted into fetal circulation, through association 78
with various transporters (14), where it is repackaged into fetal lipoproteins. This process is 79
facilitated by microsomal triglyceride transfer protein (Mttp). The finding that the placenta 80
expresses and secretes its own apolipoproteins such as ApoB (15) also raises the possibility that 81
cholesterol is repackaged into HDL, LDL and VLDL cholesterol within the placenta itself. 82
83
In addition to its critical role in fetal growth and development, there is emerging evidence 84
that alterations in placental cholesterol transfer capacity may also be a contributing factor to 85
metabolic programming. In a previous study(16), we showed providing rats with a low protein 86
Draycott et al. High-fat diet and placental CHO transport
diet until day 13 of gestation, a dietary treatment previously associated with programming of 87
obesity, hypertension and glucose intolerance in adult offspring (17), resulted in increased 88
placental expression of a number of genes associated with cholesterol and lipoprotein 89
transport and metabolism in the rat. 90
Given the similarity in the metabolic phenotype induced by maternal obesity/nutritional 91
excess and low protein diets, we hypothesised that programming of health and disease is 92
driven by perturbations of a small set of common ‘gatekeeper’ processes (18) and changes in 93
placental cholesterol transfer and metabolism may be common mechanisms underlying 94
metabolic programming by different dietary exposures. Therefore, the aim of this current 95
study was to investigate the effect of a high maternal dietary omega-6:omega-3 fatty acid 96
ratio, associated with decreased placental weight (19), against a lower ratio as well as total fat 97
intake, on the expression of genes associated with cholesterol and lipoprotein transport, 98
known to be affected by maternal diet, in the mature placenta of the rat. We also aimed to 99
investigate whether placental expression of these same genes differed according to maternal 100
body mass index (BMI) in a cohort of pregnant women. 101
Materials and Methods 102
Animal Experiments and sample collection 103
This paper reports data from the analysis of placentas that were collected as part of a previous 104
study (19). Virgin female Wistar rats (n = 24; 75-100 g; Charles River, UK) were housed on 105
wood shavings in individually ventilated cages under a 12 h light/12 h dark cycle at a 106
temperature of 20–22 °C and had ad libitum access to food and water throughout the 107
experiment. Female rats were allowed to acclimatise to the unit for 1–2 weeks, during which 108
time they were fed on standard laboratory chow (2018 Teklad Global 18% Protein Rodent 109
Diet, Harlan Laboratories, UK). After acclimatisation, a tail vein blood sample was taken 110
Draycott et al. High-fat diet and placental CHO transport
from each animal for the determination of fatty acid status. The rats were then randomly 111
assigned to one of 4 dietary groups designed to provide either a high (9:1, high LA) or low 112
(1:1.5 low LA) ratio of linoleic acid (LA) to alpha-linolenic acid (ALA), achieved by altering 113
the amounts of flaxseed and sunflower oil included in the fat component of the feed. The 114
levels of saturated fatty acids (SFA) and monounsaturated fatty acids (MUFA) were 115
comparable in all diets, achieved by adjusting the amounts of coconut (SFA source) and 116
macadamia (MUFA source) oils in the diets. For each level of LA, diets containing either 117
18% or 36% fat by weight were developed. This resulted in four experimental diets; high LA 118
(18% fat), high LA (36% fat), low LA (18% fat) and low LA (36% fat) (n =5–7 per dietary 119
group). The list of ingredients and final fatty acid composition of the four experimental diets 120
have been published previously (19). 121
All animal procedures were performed in accordance with the Animals (Scientific 122
Procedures) Act 1986 under Home Office licence and were approved by the Animal Ethics 123
Committee of the University of Nottingham, UK. Animals were pair housed from the start of 124
the experiment until mating, after confirmation of conception animals were individually 125
housed until completion of the experiment. Animals were maintained on their allocated diet 126
for a four week ‘feed-in’ period after which they were mated. Conception was confirmed by 127
the presence of a semen plug and this was recorded as day 0 of pregnancy. Female rats 128
remained on their respective diets until day 20 of gestation (full term = 22 days) at which 129
time rat dams were euthanised by CO2 asphyxiation and cervical dislocation and fetuses by 130
cervical dislocation and exsanguination. All fetuses were weighed and sexed via 131
measurement of anogenital distance. Placentas from male fetuses were collected for analysis 132
and a tail sample from the fetus was collected for sex-genotyping by PCR for the SRY gene 133
(20). Any samples found to be female or inconclusive (n = 5) were not included in placental 134
Draycott et al. High-fat diet and placental CHO transport
gene expression analysis. Full details of maternal weight gain, food intake and the effect of 135
the diets on fetal and placental weight are published elsewhere (19). 136
Human placental sample collection 137
Ethical approval for the study was obtained from the Derbyshire Research Ethics Committee 138
(Ref: 09/H0401/90). Placental samples were obtained from patients attending the Department 139
of Obstetrics and Gynaecology, Royal Derby Hospital, Derby, UK. Patients provided 140
informed, written consent prior to undergoing elective caesarean section at term gestation 141
(>37 weeks), indications for which were maternal request, previous elective section or breech 142
presentation while cases with diabetes, hypertension, pre-eclampsia, were excluded. 143
Placentae, once checked by the midwife and with the cord clamped, were transported to the 144
lab within 20 minutes of delivery, where placental villous samples were taken midway 145
between the cord insertion site and placental periphery and frozen at -80°C prior to extraction 146
of RNA. Participants were stratified based on a BMI measurement taken during an antenatal 147
clinic appointment, resulting in 3 groups of women; BMI <25 kg/m2 (n=20), BMI 25-35 148
kg/m2 (n=21) and BMI >35 kg/m2 (n=21). 149
Sample Preparation and PCR 150
RNA was isolated from 20-25mg of crushed snap-frozen human or rat placental tissue using 151
the Roche High Pure Tissue kit (Roche Diagnostics Ltd., UK) according to manufacturer’s 152
instructions. RNA concentration was determined using a Nanodrop 2000 (Thermo Scientific) 153
and RNA quality was evaluated by agarose gel electrophoresis. cDNA was synthesised using 154
a RevertAid™ reverse transcriptase kit (Thermo Fisher Scientific, UK) with random hexamer 155
primers. 156
Gene targets were chosen based on our previous data (16) where RNASeq analysis of day 13 157
rat placentas revealed differential expression of 91 genes in response to maternal protein 158
Draycott et al. High-fat diet and placental CHO transport
restriction. Ingenuity pathway analysis identified 8 pathways that were significantly affected 159
(P<0.001), 6 of which were closely related functionally with a strong emphasis of cholesterol 160
uptake and efflux across the placenta. Genes were selected based upon the ingenuity analysis 161
(ApoA2, ApoB, ApoC2, Ttr, Fgg, serpin G1 and Rbp4). Additional genes were chosen that 162
were shown to be differentially expressed in the protein restricted condition (Vil1, Gpc3, 163
Prf1, Cubn, Mttp) but not associated with pathways identified by Ingenuity analysis. Tagln 164
and Tbp gene targets were also chosen as preliminary RNASeq analysis suggested that they 165
may be sensitive to maternal dietary factors, resulting in 14 target genes for analysis. Real-166
time PCR primers were designed using Primer Express software (version 1.5; Applied 167
Biosystems) from the RNA sequence, checked using BLAST (National Centre for 168
Biotechnology Information) and were purchased from Sigma (UK). The primer sequences 169
can be found in supplementary table S1. Real-time PCR was performed on a Lightcycler 480 170
(Roche, Burgess Hill, UK) using the 384 well format. Each reaction contained 5μl of cDNA 171
with the following reagents: 7.5μl SYBR green master mix (Roche), 0.45μl forward and 172
reverse primers (final concentration 0.3μM each) and 1.6μl RNase-free H2O. Samples were 173
pre-incubated at 95°C for 5 min followed by 45 PCR amplification cycles (denaturation, 174
95°C for 10 seconds; annealing, 60°C for 15 seconds; elongation, 72°C for 15 seconds). 175
Transcript abundance was determined using a standard curve generated from serial dilutions 176
of a pool of cDNA made from all samples. Expression was normalised against the expression 177
of cyclophilin A, which was not significantly different between experimental groups. 178
Statistical Analysis 179
Data are presented as mean ± SEM. Data were analysed using the Statistical Package for 180
Social Sciences (Version 24, SPSS Inc.). For animal data the effect of maternal dietary fatty 181
acid ratio and maternal dietary fat content on placental expression of target genes was 182
assessed using a two-way ANOVA, with dietary fat level and LA:ALA ratio as factors. 183
Draycott et al. High-fat diet and placental CHO transport
Human data were analysed using a one-way ANOVA with maternal BMI as a factor. Possible 184
co-variates were identified and corrected for within the analysis. A value of P<0.05 was 185
considered statistically significant. 186
Results 187
Rat placenta 188
The results of the gene expression analyses in the rodent placentas is shown in Table 1. 189
Expression was measured for 13 genes (ApoB excluded), however, Tbp expression was not 190
detectable in any of the samples (data not shown) and so could not be included in the 191
analysis. 192
Placental Mttp mRNA expression was significantly increased (3 fold; P<0.01) in dams 193
consuming a high LA compared to a low LA diet, independent of total dietary fat content 194
(Table 1). There was a significant interaction between the effects of maternal total dietary fat 195
and LA content in relation to mRNA expression of ApoA2, ApoC2, Cubn, Fgg, Rbp4 and Ttr 196
(P<0.05), such that expression of these genes was significantly increased in rats consuming 197
the high LA diets, but only when dietary fat content was also high (36% fat w/w). The 198
magnitude of this effect was greatest for Cubn (30-fold increase in the high LA (36% fat) 199
group when compared to the low LA (36% fat) group). A similar pattern was observed for 200
other key cholesterol-transport and metabolism genes in the placenta (Gpc3, P=0.072; Vil1, 201
P=0.054), with 1.5-7 fold higher expression in placentas of dams exposed to a high LA diet, 202
but only when dietary fat content was also high. Placental expression of Prf1, SerpinG1 and 203
Tagln was not affected by wither maternal dietary fatty acid ratio or fat content. 204
Human placenta 205
The sociodemographic and clinical characteristics of the women who provided placental 206
samples for this study are summarised in Table 2. The average age, parity and gestation 207
Draycott et al. High-fat diet and placental CHO transport
length of women within this study was similar between women in the three BMI groups, 208
however the birth weights of infants born to women with a BMI >25 kg/m2 were significantly 209
greater than those of women in the normal BMI range. 210
The results of the gene expression analyses in the human placentas is shown in Table 3. All 211
14 genes were measured and detected in these samples. Women with a BMI in the 25-35 212
kg/m2 range (overweight to obese) exhibited a 2-6 fold higher mRNA expression of ApoB in 213
their placental samples compared to women with a BMI either <25 or >35 kg/m2. The 214
expression of Rbp4 was significantly lower in placentas obtained from women with a BMI 215
>25 kg/m2 compared to those with a BMI <25 kg/m2 (85% down-regulation, P=0.001). A 216
similar pattern was also observed for Ttr, with 71-88% down-regulation of expression in 217
women with a BMI >25 kg/m2, although this did was not statistically significant (P=0.053). 218
The mRNA of other placental genes was not different between BMI groups. 219
Discussion 220
This experiment aimed to test the hypothesis that maternal diet, specifically, fatty acid 221
composition and quantity, and obesity would influence the expression of genes associated 222
with cholesterol uptake and transport in rat and human placenta. The results of the rat studies 223
suggested clear effects of maternal dietary fat content and composition, such that maternal 224
consumption of a higher-fat, high LA maternal diet was associated with increased expression 225
of key genes associated with these pathways, suggesting enhanced cholesterol transport to the 226
fetus in this group. In the human study, however, only two of these genes were differentially 227
expressed in placentas from women in different BMI categories, suggesting that maternal 228
obesity had a limited impact on placental cholesterol transport at the level of gene expression. 229
Within this study we have shown that exposure to a high LA, high-fat diet resulted in 230
increased expression of genes involved in the formation of apolipoproteins, cholesterol 231
Draycott et al. High-fat diet and placental CHO transport
uptake and cholesterol repackaging. These differences were not observed when either the fat 232
content and/or the fatty acid ratio was altered, suggesting a strong interaction between these 233
variables. Importantly, the effects observed on the placental gene expression profiles show 234
striking resemblances to our previous findings (16) where upregulation of these genes was 235
observed in the placentas of dams exposed to a low protein diet. These data suggest that, not 236
only do these differences persist to a late stage placenta (day 20), but, despite different 237
dietary interventions, the similarities in results suggest a common mechanism of action. The 238
upregulation of key genes in the rat placenta observed in this study suggests a state of 239
increased cholesterol uptake and efflux. While the potential impacts of this in the current 240
study are not clear, it has been demonstrated in previous studies that, exposure to excess 241
cholesterol during fetal development can be associated with adverse outcomes. In rodent 242
models, maternal hypercholesterolemia has been associated with growth restriction (21), 243
altered liver development (22) and atherosclerosis (23). In humans, maternal 244
hypercholesterolaemia has been associated with the development of fatty streaks in fetal 245
arteries and cholestasis during pregnancy is associated with programming of an overweight, 246
insulin resistant phenotype in the child (24). It will therefore be important in future studies to 247
determine the longer term consequence of the changes in placental gene expression for the 248
postnatal offspring. 249
Based on the substantial impact of maternal high-fat high LA feeding, a dietary pattern 250
commonly observed in the modern Western diet, we extended our study to determine if there 251
was any evidence to suggest an effect of maternal obesity on cholesterol transfer in the 252
human. There were, however, relatively few differences in the expression of key genes 253
associated with different BMI categories in human placental samples, although there were 254
some subtle differences in the expression of 3 genes (ApoB, Rbp4 and Ttr) between BMI 255
categories. Ttr is a protein that binds to and transports Rbp4. In the bound state, Rbp4 is 256
Draycott et al. High-fat diet and placental CHO transport
protected from glomerular filtration and so levels of these two proteins are often correlated. 257
As such, the similar patterns of expression across these two genes observed in this study was 258
anticipated. What was surprising, however, was our finding that women with a BMI above 259
the normal range (>25 kg/m2, overweight or obese) exhibited decreased placental expression 260
of these genes since elevated levels of circulating Rbp4 have been associated with many of 261
the co-morbidities linked to obesity including hypertension (25), insulin resistance and type 2 262
diabetes (26). It is important to note, however, that these observations have all been associated 263
with circulating levels of Rbp4, whereas we measured gene expression in the placenta. There 264
is limited literature evaluating the role of Rbp4 within the placenta during pregnancy, 265
particularly in association with maternal obesity. It may be, however, that in obese mothers, 266
placental expression is reduced to compensate for the increased maternal circulating levels 267
and therefore avoiding fetal exposure to high quantities of Rbp4. Further experimentation, is 268
required to determine expression of Rbp4 and Ttr in both the mother, fetus and the placenta 269
throughout pregnancy and their association with maternal obesity. 270
Placental ApoB expression was increased in women whose BMI was above the normal range 271
(>25 kg/m2 ). A study by Dube and colleagues (27), showed increased circulating ApoB 272
concentrations in new-born infants of obese mothers, compared to mothers of normal weight, 273
in the absence of any difference in maternal circulating concentrations. It is therefore possible 274
that the high ApoB concentrations in infants of obese mothers may have been the result of 275
increased placental ApoB expression. If this abnormal lipoprotein profile is present in the 276
offspring and persists through childhood it may contribute to increased risk of cardiovascular 277
disease in later life. 278
One key limitation of the current study is that direct measurements of cholesterol transport or 279
measurement of the genes of interest at the level of protein were not analysed, and so care 280
must be taken when extrapolating the findings to functional outcomes. Further to this, human 281
Draycott et al. High-fat diet and placental CHO transport
participants within this study were stratified based on BMI whereas the animal experiments 282
utilised specific dietary interventions. There are many factors that can affect BMI and, 283
although nutrition is a key element, there is still a huge variety of nutritional habits that can 284
lead to individuals resulting in similar BMIs. As such, assumptions cannot be made about 285
specific nutrient intakes of the women based on this data. Finally, it is important to note that, 286
whilst there are many similarities between placental physiology and function in the rat and 287
humans, there are some key differences. Of particular importance to this study is the 288
difference in circulating progesterone levels at the end of pregnancy. In rodents there is a 289
dramatic decrease in circulating progesterone (28), whereas in humans, progesterone levels are 290
increased or at least maintained at the time of parturition (29). Progesterone is a key steroid 291
produced from cholesterol within the placenta and has been shown to regulate the expression 292
of some genes including Rbp4 in other tissues (30). As such, careful consideration of the 293
differences in placental hormone production, particularly steroid hormones, between the two 294
species should be made when drawing comparisons. 295
In conclusion, this study aimed to elucidate whether differences in placental expression of 296
genes involved in cholesterol transport and efflux were associated with altered maternal 297
nutrition in a manner similar to our previous observations in the low-protein model. We 298
demonstrated that exposure to high levels of omega-6 as part of a high-fat diet elicited a 299
similar pattern of placental gene expression, suggesting an increase in cholesterol transport 300
across the placenta. This highlights the potential for a common mechanism by which sub-301
optimal maternal nutrition during pregnancy alters placental function, and potentially fetal 302
development, resulting in increased risk of disease in later life. We then carried out a 303
preliminary study which aimed to establish if similar alterations were observed in human 304
placentas. Although BMI was associated with some changes in expression, these observations 305

Draycott et al. High-fat diet and placental CHO transport
were not consistent and further experimentation is required on placental samples where the 306
specific nutrient intake of the participants are known. 307
308
Draycott et al. High-fat diet and placental CHO transport
Acknowledgements 309
The authors gratefully acknowledge Grace George and BSU staff at the University of 310
Nottingham for assistance with animal work and Rebecca Tarbox for assistance with sample 311
preparation. 312
Financial Support 313
This study was supported by a grant from the Rosetrees Trust (grant number M475). BSM 314
was supported by a Career Development Fellowship from the National Health and Medical 315
Research Council of Australia (APP 1083009). 316
Conflicts of interest 317
None 318
Ethical Standards 319
The authors assert that all procedures contributing to this work comply with the ethical 320
standards of the relevant national guidelines on human experimentation and with the Helsinki 321
Declaration of 1975, as revised in 2008, and has been approved by the Derbyshire Research 322
Ethics Committee (Ref. 09/H0401/90). 323
The authors assert that all animal procedures were performed in accordance with the Animals 324
(Scientific Procedures) Act 1986 under Home Office licence and were approved by the 325
Animal Ethics Committee of the University of Nottingham, UK. 326
327
Draycott et al. High-fat diet and placental CHO transport
References 328
1. Langley-Evans, S.C., Nutrition in early life and the programming of adult disease: 329
a review. J Hum Nutr Diet, 2015. 28 Suppl 1: p. 1-14. 330
2. Le Clair, C., T. Abbi, H. Sandhu, and P.S. Tappia, Impact of maternal 331
undernutrition on diabetes and cardiovascular disease risk in adult offspring. Can 332
J Physiol Pharmacol, 2009. 87(3): p. 161-79,Langley-Evans, S.C., Fetal 333
programming of CVD and renal disease: animal models and mechanistic 334
considerations. Proc Nutr Soc, 2013. 72(3): p. 317-25. 335
3. Godfrey, K.M., R.M. Reynolds, S.L. Prescott, et al., Influence of maternal obesity 336
on the long-term health of offspring. The lancet. Diabetes & endocrinology, 2017. 337
5(1): p. 53-64. 338
4. Ribaroff, G.A., E. Wastnedge, A.J. Drake, R.M. Sharpe, and T.J.G. Chambers, 339
Animal models of maternal high fat diet exposure and effects on metabolism in 340
offspring: a meta-regression analysis. Obesity reviews : an official journal of the 341
International Association for the Study of Obesity, 2017. 18(6): p. 673-686. 342
5. Ainge, H., C. Thompson, S.E. Ozanne, and K.B. Rooney, A systematic review on 343
animal models of maternal high fat feeding and offspring glycaemic control. Int J 344
Obes (Lond), 2011. 35(3): p. 325-35. 345
6. Muhlhausler, B.S. and G.P. Ailhaud, Omega-6 polyunsaturated fatty acids and the 346
early origins of obesity. Curr Opin Endocrinol Diabetes Obes, 2013. 20(1): p. 56-347
61,Ramsden, C.E., K.R. Faurot, D. Zamora, et al., Targeted alteration of dietary 348
n-3 and n-6 fatty acids for the treatment of chronic headaches: a randomized 349
trial. Pain, 2013. 154(11): p. 2441-51. 350
7. Blasbalg, T.L., J.R. Hibbeln, C.E. Ramsden, S.F. Majchrzak, and R.R. Rawlings, 351
Changes in consumption of omega-3 and omega-6 fatty acids in the United States 352
during the 20th century. The American Journal of Clinical Nutrition, 2011. 93(5): 353
p. 950-962,Sioen, I., L. van Lieshout, A. Eilander, et al., Systematic Review on N-354
3 and N-6 Polyunsaturated Fatty Acid Intake in European Countries in Light of the 355
Current Recommendations - Focus on Specific Population Groups. Ann Nutr 356
Metab, 2017. 70(1): p. 39-50. 357
8. Tarrade, A., P. Panchenko, C. Junien, and A. Gabory, Placental contribution to 358
nutritional programming of health and diseases: epigenetics and sexual 359
dimorphism. J Exp Biol, 2015. 218(Pt 1): p. 50-8. 360
9. Singh, P., R. Saxena, G. Srinivas, G. Pande, and A. Chattopadhyay, Cholesterol 361
biosynthesis and homeostasis in regulation of the cell cycle. PLoS One, 2013. 362
8(3): p. e58833,Fernandez, C., M. Martin, D. Gomez-Coronado, and M.A. 363
Lasuncion, Effects of distal cholesterol biosynthesis inhibitors on cell proliferation 364
and cell cycle progression. J Lipid Res, 2005. 46(5): p. 920-9. 365
10. Porter, F.D., Malformation syndromes due to inborn errors of cholesterol 366
synthesis. The Journal of clinical investigation, 2002. 110(6): p. 715-724. 367
11. Maymunah, A.-O., O. Kehinde, G. Abidoye, and A. Oluwatosin, 368
Hypercholesterolaemia in pregnancy as a predictor of adverse pregnancy 369
outcome. African health sciences, 2014. 14(4): p. 967-973. 370
12. Edison, R.J., K. Berg, A. Remaley, et al., Adverse birth outcome among mothers 371
with low serum cholesterol. Pediatrics, 2007. 120(4): p. 723-33. 372
13. Baardman, M.E., W.S. Kerstjens-Frederikse, R.M. Berger, et al., The role of 373
maternal-fetal cholesterol transport in early fetal life: current insights. Biol 374
Reprod, 2013. 88(1): p. 24,Woollett, L.A., Review: Transport of maternal 375
cholesterol to the fetal circulation. Placenta, 2011. 32 Suppl 2: p. S218-21. 376
14. Stefulj, J., U. Panzenboeck, T. Becker, et al., Human endothelial cells of the 377
placental barrier efficiently deliver cholesterol to the fetal circulation via ABCA1 378
and ABCG1. Circ Res, 2009. 104(5): p. 600-8. 379
15. Madsen, E.M., M.L. Lindegaard, C.B. Andersen, P. Damm, and L.B. Nielsen, 380
Human placenta secretes apolipoprotein B-100-containing lipoproteins. J Biol 381
Chem, 2004. 279(53): p. 55271-6. 382
Draycott et al. High-fat diet and placental CHO transport
16. Daniel, Z., A. Swali, R. Emes, and S.C. Langley-Evans, The effect of maternal 383
undernutrition on the rat placental transcriptome: protein restriction up-regulates 384
cholesterol transport. Genes & Nutrition, 2016. 11(1): p. 27. 385
17. Langley, S.C. and A.A. Jackson, Increased systolic blood pressure in adult rats 386
induced by fetal exposure to maternal low protein diets. Clin Sci (Lond), 1994. 387
86(2): p. 217-22; discussion 121,Erhuma, A., A.M. Salter, D.V. Sculley, S.C. 388
Langley-Evans, and A.J. Bennett, Prenatal exposure to a low-protein diet 389
programs disordered regulation of lipid metabolism in the aging rat. Am J Physiol 390
Endocrinol Metab, 2007. 292(6): p. E1702-14. 391
18. Swali, A., S. McMullen, H. Hayes, et al., Cell Cycle Regulation and Cytoskeletal 392
Remodelling Are Critical Processes in the Nutritional Programming of Embryonic 393
Development. PLOS ONE, 2011. 6(8): p. e23189,McMullen, S., S.C. Langley-394
Evans, L. Gambling, et al., A common cause for a common phenotype: the 395
gatekeeper hypothesis in fetal programming. Med Hypotheses, 2012. 78(1): p. 396
88-94. 397
19. Draycott, S.A.V., G. Liu, Z.C. Daniel, et al., Maternal dietary ratio of linoleic acid 398
to alpha-linolenic acid during pregnancy has sex-specific effects on placental and 399
fetal weights in the rat. Nutrition & Metabolism, 2019. 16(1): p. 1. 400
20. McClive, P.J. and A.H. Sinclair, Rapid DNA extraction and PCR-sexing of mouse 401
embryos. Mol Reprod Dev, 2001. 60(2): p. 225-6. 402
21. Bhasin, K.K., A. van Nas, L.J. Martin, et al., Maternal low-protein diet or 403
hypercholesterolemia reduces circulating essential amino acids and leads to 404
intrauterine growth restriction. Diabetes, 2009. 58(3): p. 559-66. 405
22. El-Sayyad, H.I.H., M.M.S. Al-Haggar, H.A. El-Ghawet, and I.H.M. Bakr, Effect of 406
maternal diabetes and hypercholesterolemia on fetal liver of albino Wistar rats. 407
Nutrition, 2014. 30(3): p. 326-336. 408
23. Napoli, C., F. de Nigris, S. Welch John, et al., Maternal Hypercholesterolemia 409
During Pregnancy Promotes Early Atherogenesis in LDL Receptor-Deficient Mice 410
and Alters Aortic Gene Expression Determined by Microarray. Circulation, 2002. 411
105(11): p. 1360-1367,Goharkhay, N., E. Sbrana, P.K. Gamble, et al., 412
Characterization of a murine model of fetal programming of atherosclerosis. Am J 413
Obstet Gynecol, 2007. 197(4): p. 416.e1-5. 414
24. Papacleovoulou, G., S. Abu-Hayyeh, E. Nikolopoulou, et al., Maternal cholestasis 415
during pregnancy programs metabolic disease in offspring. The Journal of Clinical 416
Investigation, 2013. 123(7): p. 3172-3181,Napoli, C., F.P. D'Armiento, F.P. 417
Mancini, et al., Fatty streak formation occurs in human fetal aortas and is greatly 418
enhanced by maternal hypercholesterolemia. Intimal accumulation of low density 419
lipoprotein and its oxidation precede monocyte recruitment into early 420
atherosclerotic lesions. J Clin Invest, 1997. 100(11): p. 2680-90. 421
25. Solini, A., E. Santini, S. Madec, C. Rossi, and E. Muscelli, Retinol-binding protein-422
4 in women with untreated essential hypertension. Am J Hypertens, 2009. 22(9): 423
p. 1001-6. 424
26. Yang, Q., T.E. Graham, N. Mody, et al., Serum retinol binding protein 4 425
contributes to insulin resistance in obesity and type 2 diabetes. Nature, 2005. 426
436(7049): p. 356-62,Graham, T.E., Q. Yang, M. Blüher, et al., Retinol-Binding 427
Protein 4 and Insulin Resistance in Lean, Obese, and Diabetic Subjects. New 428
England Journal of Medicine, 2006. 354(24): p. 2552-2563. 429
27. Dube, E., A. Gravel, C. Martin, et al., Modulation of fatty acid transport and 430
metabolism by maternal obesity in the human full-term placenta. Biol Reprod, 431
2012. 87(1): p. 14, 1-11. 432
28. Barkley, M.S., Geschwind, II, and G.E. Bradford, The gestational pattern of 433
estradiol, testosterone and progesterone secretion in selected strains of mice. Biol 434
Reprod, 1979. 20(4): p. 733-8. 435
29. Tal, R., H.S. Taylor, R.O. Burney, S.B. Mooney, and L.C. Giudice, Endocrinology of 436
Pregnancy, in Endotext, K.R. Feingold, et al., Editors. 2000, MDText.com, Inc.: 437
South Dartmouth (MA). 438

Draycott et al. High-fat diet and placental CHO transport
30. Mullen, M.P., N. Forde, M.H. Parr, et al., Alterations in systemic concentrations of 439
progesterone during the early luteal phase affect RBP4 expression in the bovine 440
uterus. Reprod Fertil Dev, 2012. 24(5): p. 715-22. 441
442
443
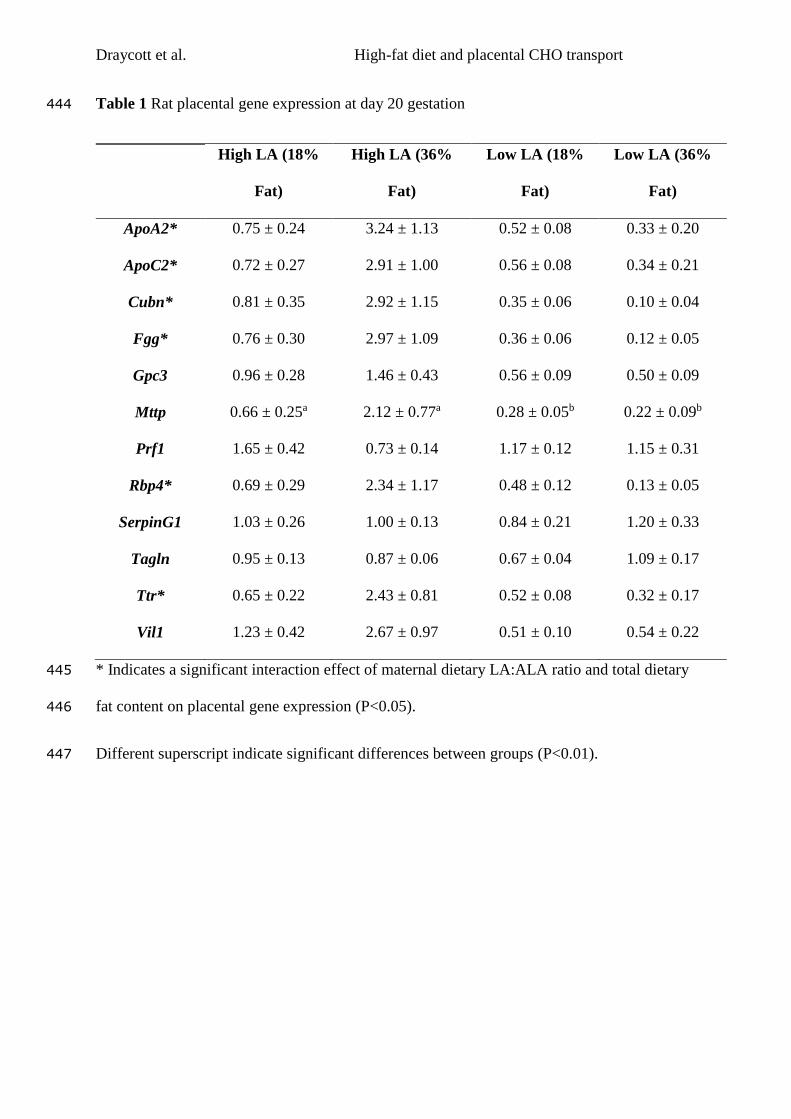
Draycott et al. High-fat diet and placental CHO transport
Table 1 Rat placental gene expression at day 20 gestation 444
* Indicates a significant interaction effect of maternal dietary LA:ALA ratio and total dietary 445
fat content on placental gene expression (P<0.05). 446
Different superscript indicate significant differences between groups (P<0.01). 447
High LA (18%
Fat)
High LA (36%
Fat)
Low LA (18%
Fat)
Low LA (36%
Fat)
ApoA2* 0.75 ± 0.24 3.24 ± 1.13 0.52 ± 0.08 0.33 ± 0.20
ApoC2* 0.72 ± 0.27 2.91 ± 1.00 0.56 ± 0.08 0.34 ± 0.21
Cubn* 0.81 ± 0.35 2.92 ± 1.15 0.35 ± 0.06 0.10 ± 0.04
Fgg* 0.76 ± 0.30 2.97 ± 1.09 0.36 ± 0.06 0.12 ± 0.05
Gpc3 0.96 ± 0.28 1.46 ± 0.43 0.56 ± 0.09 0.50 ± 0.09
Mttp 0.66 ± 0.25a 2.12 ± 0.77a 0.28 ± 0.05b 0.22 ± 0.09b
Prf1 1.65 ± 0.42 0.73 ± 0.14 1.17 ± 0.12 1.15 ± 0.31
Rbp4* 0.69 ± 0.29 2.34 ± 1.17 0.48 ± 0.12 0.13 ± 0.05
SerpinG1 1.03 ± 0.26 1.00 ± 0.13 0.84 ± 0.21 1.20 ± 0.33
Tagln 0.95 ± 0.13 0.87 ± 0.06 0.67 ± 0.04 1.09 ± 0.17
Ttr* 0.65 ± 0.22 2.43 ± 0.81 0.52 ± 0.08 0.32 ± 0.17
Vil1 1.23 ± 0.42 2.67 ± 0.97 0.51 ± 0.10 0.54 ± 0.22
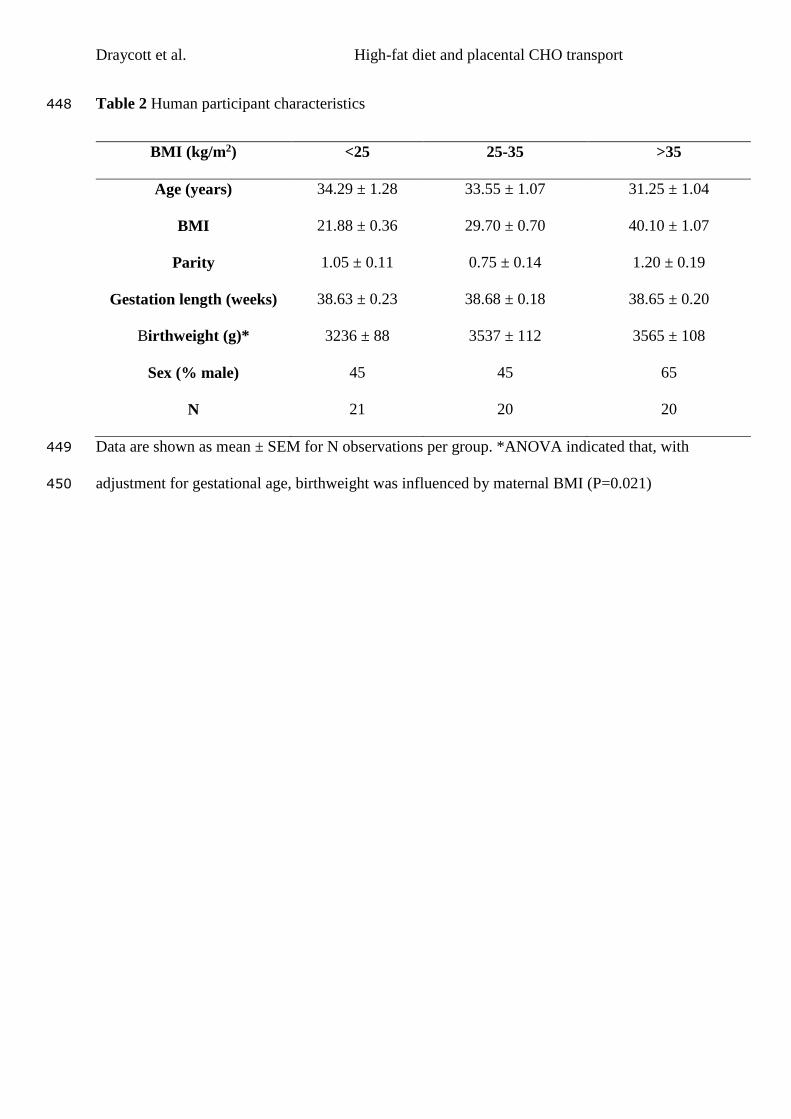
Draycott et al. High-fat diet and placental CHO transport
Table 2 Human participant characteristics 448
BMI (kg/m2) <25 25-35 >35
Age (years) 34.29 ± 1.28 33.55 ± 1.07 31.25 ± 1.04
BMI 21.88 ± 0.36 29.70 ± 0.70 40.10 ± 1.07
Parity 1.05 ± 0.11 0.75 ± 0.14 1.20 ± 0.19
Gestation length (weeks) 38.63 ± 0.23 38.68 ± 0.18 38.65 ± 0.20
Birthweight (g)* 3236 ± 88 3537 ± 112 3565 ± 108
Sex (% male) 45 45 65
N 21 20 20
Data are shown as mean ± SEM for N observations per group. *ANOVA indicated that, with 449
adjustment for gestational age, birthweight was influenced by maternal BMI (P=0.021) 450
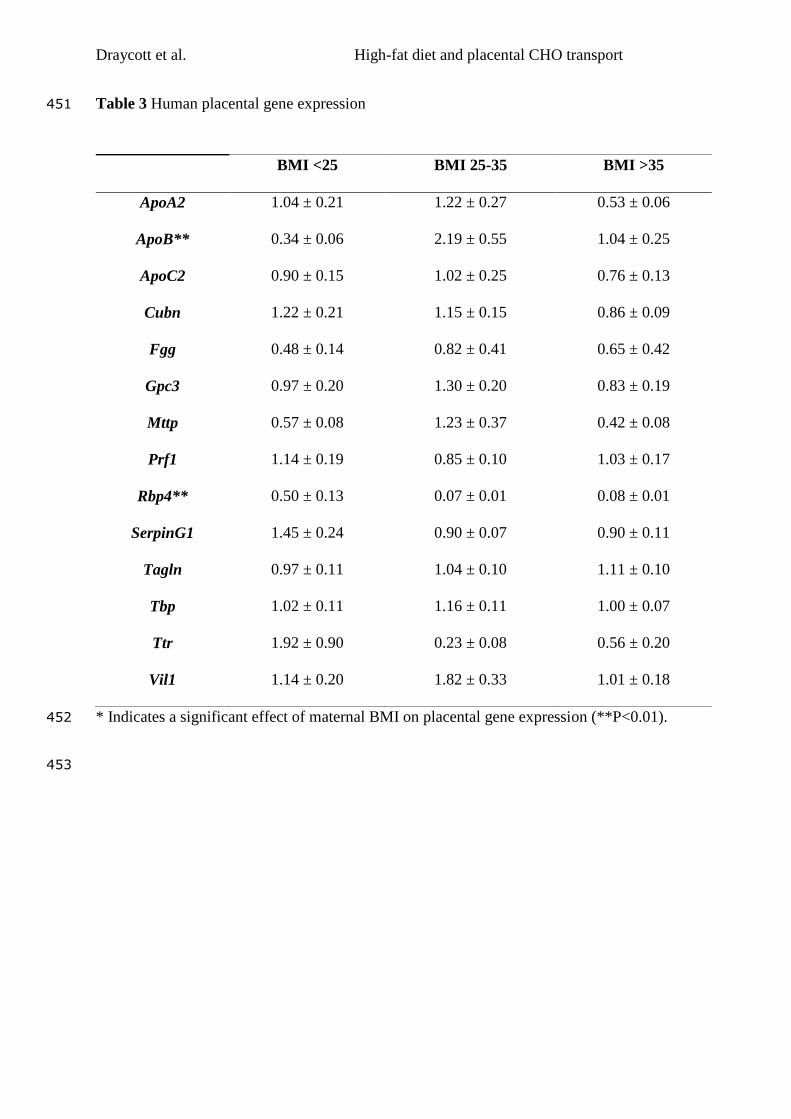
Draycott et al. High-fat diet and placental CHO transport
Table 3 Human placental gene expression 451
* Indicates a significant effect of maternal BMI on placental gene expression (**P<0.01). 452
453
BMI <25 BMI 25-35 BMI >35
ApoA2 1.04 ± 0.21 1.22 ± 0.27 0.53 ± 0.06
ApoB** 0.34 ± 0.06 2.19 ± 0.55 1.04 ± 0.25
ApoC2 0.90 ± 0.15 1.02 ± 0.25 0.76 ± 0.13
Cubn 1.22 ± 0.21 1.15 ± 0.15 0.86 ± 0.09
Fgg 0.48 ± 0.14 0.82 ± 0.41 0.65 ± 0.42
Gpc3 0.97 ± 0.20 1.30 ± 0.20 0.83 ± 0.19
Mttp 0.57 ± 0.08 1.23 ± 0.37 0.42 ± 0.08
Prf1 1.14 ± 0.19 0.85 ± 0.10 1.03 ± 0.17
Rbp4** 0.50 ± 0.13 0.07 ± 0.01 0.08 ± 0.01
SerpinG1 1.45 ± 0.24 0.90 ± 0.07 0.90 ± 0.11
Tagln 0.97 ± 0.11 1.04 ± 0.10 1.11 ± 0.10
Tbp 1.02 ± 0.11 1.16 ± 0.11 1.00 ± 0.07
Ttr 1.92 ± 0.90 0.23 ± 0.08 0.56 ± 0.20
Vil1 1.14 ± 0.20 1.82 ± 0.33 1.01 ± 0.18
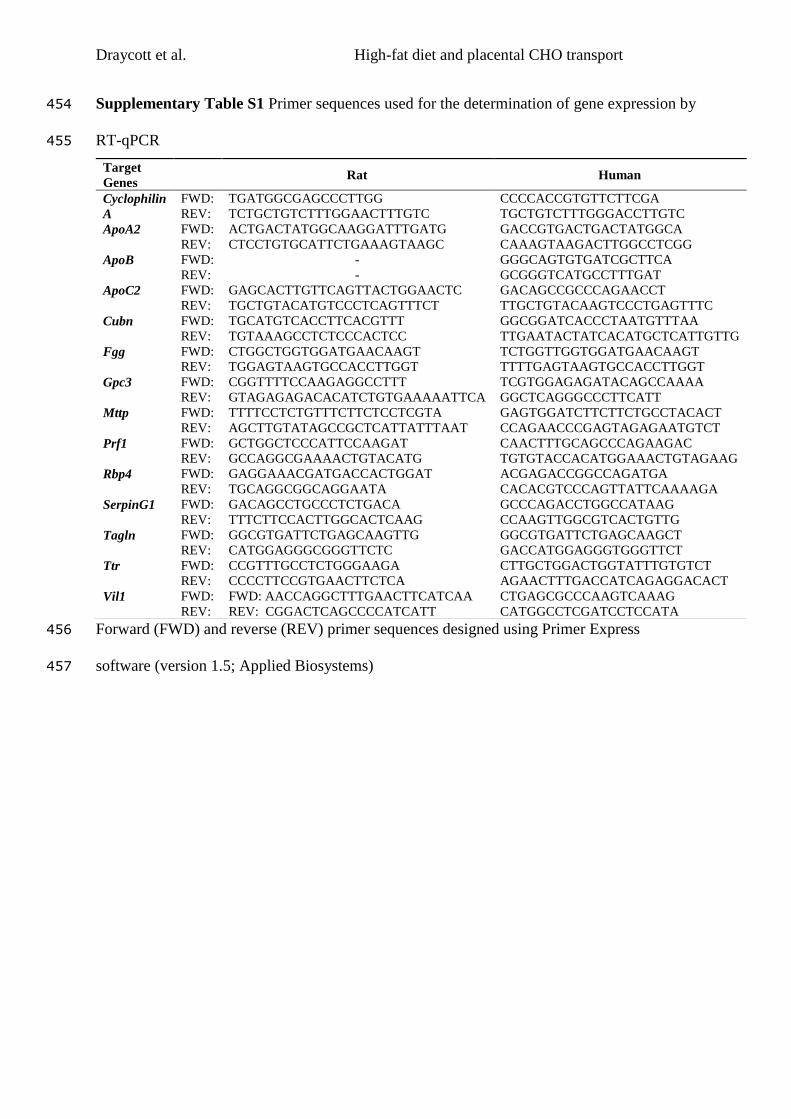
Draycott et al. High-fat diet and placental CHO transport
Supplementary Table S1 Primer sequences used for the determination of gene expression by 454
RT-qPCR 455
Forward (FWD) and reverse (REV) primer sequences designed using Primer Express 456
software (version 1.5; Applied Biosystems) 457
Target
Genes
Rat Human
Cyclophilin
A
FWD:
REV:
TGATGGCGAGCCCTTGG
TCTGCTGTCTTTGGAACTTTGTC
CCCCACCGTGTTCTTCGA
TGCTGTCTTTGGGACCTTGTC
ApoA2 FWD:
REV:
ACTGACTATGGCAAGGATTTGATG
CTCCTGTGCATTCTGAAAGTAAGC
GACCGTGACTGACTATGGCA
CAAAGTAAGACTTGGCCTCGG
ApoB FWD:
REV:
-
-
GGGCAGTGTGATCGCTTCA
GCGGGTCATGCCTTTGAT
ApoC2 FWD:
REV:
GAGCACTTGTTCAGTTACTGGAACTC
TGCTGTACATGTCCCTCAGTTTCT
GACAGCCGCCCAGAACCT
TTGCTGTACAAGTCCCTGAGTTTC
Cubn FWD:
REV:
TGCATGTCACCTTCACGTTT
TGTAAAGCCTCTCCCACTCC
GGCGGATCACCCTAATGTTTAA
TTGAATACTATCACATGCTCATTGTTG
Fgg FWD:
REV:
CTGGCTGGTGGATGAACAAGT
TGGAGTAAGTGCCACCTTGGT
TCTGGTTGGTGGATGAACAAGT
TTTTGAGTAAGTGCCACCTTGGT
Gpc3 FWD:
REV:
CGGTTTTCCAAGAGGCCTTT
GTAGAGAGACACATCTGTGAAAAATTCA
TCGTGGAGAGATACAGCCAAAA
GGCTCAGGGCCCTTCATT
Mttp FWD:
REV:
TTTTCCTCTGTTTCTTCTCCTCGTA
AGCTTGTATAGCCGCTCATTATTTAAT
GAGTGGATCTTCTTCTGCCTACACT
CCAGAACCCGAGTAGAGAATGTCT
Prf1 FWD:
REV:
GCTGGCTCCCATTCCAAGAT
GCCAGGCGAAAACTGTACATG
CAACTTTGCAGCCCAGAAGAC
TGTGTACCACATGGAAACTGTAGAAG
Rbp4 FWD:
REV:
GAGGAAACGATGACCACTGGAT
TGCAGGCGGCAGGAATA
ACGAGACCGGCCAGATGA
CACACGTCCCAGTTATTCAAAAGA
SerpinG1 FWD:
REV:
GACAGCCTGCCCTCTGACA
TTTCTTCCACTTGGCACTCAAG
GCCCAGACCTGGCCATAAG
CCAAGTTGGCGTCACTGTTG
Tagln FWD:
REV:
GGCGTGATTCTGAGCAAGTTG
CATGGAGGGCGGGTTCTC
GGCGTGATTCTGAGCAAGCT
GACCATGGAGGGTGGGTTCT
Ttr FWD:
REV:
CCGTTTGCCTCTGGGAAGA
CCCCTTCCGTGAACTTCTCA
CTTGCTGGACTGGTATTTGTGTCT
AGAACTTTGACCATCAGAGGACACT
Vil1 FWD:
REV:
FWD: AACCAGGCTTTGAACTTCATCAA
REV: CGGACTCAGCCCCATCATT
CTGAGCGCCCAAGTCAAAG
CATGGCCTCGATCCTCCATA


