Embed Size (px)
Citation preview

THE EPIDEMIOLOGY OF
MALIGNANT CATARRHAL FEVER VIRUSES IN BISON
A Thesis Submitted to the College of
Graduate Studies and Research
in Partial Fulfillment of the Requirements
for the Degree of Doctor of Philosophy
in the Department of Large Animal Clinical Sciences
Western College of Veterinary Medicine
University of Saskatchewan
Saskatoon
By
John Andrew Berezowski
© Copyright John Andrew Berezowski, November 2003. All rights reserved

PERMISSION TO USE
In presenting this thesis in partial fulfillment of the requirements for a
Postgraduate degree from the University of Saskatchewan, I agree that the Libraries of
this University may make it freely available for inspection. I further agree that
permission for copying of this thesis in any nlanner, in whole or in part, for scholarly
purposes may be granted by the professor or professors who supervised my thesis work
or, in their absence, by the Head of the department or the Dean of the College in which
my thesis work was done. It is understood that any copying or publication or use of this
thesis or parts thereof for financial gain shall not be allowed without my written
permission. It is also understood that due recognition shall be given to me and to the
University of Saskatchewan in any scholarly use which may be made of any material in
my thesis.
Requests for permission to copy or make other use of material in this thesis in
whole or in part should be addressed to:
Head of the Department of Large Animal Clinical Sciences
Western College of Veterinary Medicine
University of Saskatchewan
Saskatoon, Sask S7N 5B4

ABSTRACT
A competitive inhibition enzyme linked immunosorbent assay was validated and
used to estimate the prevalence of MCF-group virus infections in a sample of Alberta
farmed bison. Prevalence among 995 slaughterhouse specimens was 21.8%. Among 953
samples from a serum bank the prevalence was 23.9%, and among 646 samples from
five bison herds the prevalence was 23.4%. Test results from samples from one isolated
bison herd collected over a period of six years provided evidence that an MCF-group
virus was being transmitted across generations in the absence of exposure to any other
ruminant sources of MCF-group viruses. Study of an outbreak of MCF in bison
following a brief exposure to sheep provided very strong evidence that transmission of
MCF among bison does not occur. Culturing lymphocytes from 12 healthy adult bison in
the presence of the phorbol ester, 12-0-tetradecanoyl phorbol-13-acetate and testing of
DNA extracted from these cultures with consensus herpesvirus PCR allowed the
identification of viruses very similar to ovine herpesvirus two in five of the bison
samples.
11

ACKNOWLEDGEMENTS
This body of work could not have been completed without the help and support
of many people, most notably the supervisors of my work Murray Woodbury and Jerry
Haigh. Others who provided technical support as well as patience and guidance include
Keith West, Greg Appleyard, John Campbell, Brendan O'Connor and Dorothy
Middleton. Hong Li and Tim Crawford not only provided me with nluch needed
information about the biology of malignant catarrhal fever viruses, but also analyzed
several thousand bison serum samples at no cost to this project. John Nishi, Brent Elkin,
Damien Joly and Lorie Forbes were kind enough to provide serum samples from
Northern Canadian bison herds. Most important of all I'd like to acknowledge Linda.
Without her understanding, support and motivation I would probably still be fishing
calves out of the back ends of cows. I am indebted to you all.
iii

TABLE OF CONTENTS
PERMISSION TO USE .
ABSTRACT ii
ACKNOWLEDGMENTS iii
TABLE OF CONTENTS IV
LIST OF TABLES x
LIST OF FIGURES xi
LIST OF ABBREVIATIONS xu
I.INTRODUCTION 1
2. LITERATURE REVIEW 5
2.1 Introduction 5
2.2 General overview of MCF . . . . . . . . . . . . . . . . . . . . . . . . . . . . . . . . . . . . . . . 5
IV
2.3 Etiologies of MCF . . . . . . . . . . . . . . . . . . . . . . . . . . . . . . . . . . . . . . . . . . . . . 8
2.4 Transmission of MCF viruses 16
2.4.1 Transmission of AIHV-lin cattle 16
2.4.2 Transmission of AIHV-1 from wildebeest to cattle 19
2.4.3 Transmission of OvHV-2 among cattle, deer and bison 21
2.4.4 Transmission of OvHV-2 from sheep to cattle, deer and bison .. 22
2.5 Epidemiology of MCF viruses in their natural host populations 24
2.5.1 A1HV-1 and wildebeest 24
2.5.2 OvHV-2 and sheep 28
2.5.3 CpHV-2 and goats 32
2.5.4 Other MCF viruses 33
2.6 MCF in Bison 34
2.7 Diagnostic tests for MCF and MCF viruses 39
2.7.1 WD-MCF and infection with A1HV-l 39
2.7.1.1 Virus isolation 40
2.7.1.2 Virus neutralizing antibody test 41
2.7.1.3 ELISA tests 43
2.7.1.4 Other serology tests 43
2.7.1.5 PCR tests 44
2.7.2 SA-MCF and infection with OvHV-2 51
2.7.2.1 Indirect immunoflourescent antibody test 53
2.7.2.2 ELISA tests 54
v
2.7.2.3 PCR tests 57
2.8 Which test to use? 63
3. CUT-OFF ESTIMATION AND RELIABILITY OF THE CI-ELISA 67
3.1 Introduction 67
3.2 Materials and methods 72
3.2.1 Validation study 72
3.2.2 Reliability study 73
3.2.3 Analysis 74
3.3 Results 75
3.3.1 Validation study 75
3.3.2 Reliability study 81
3.4 Discussion 84
3.4.1 Validation study 84
3.4.2 Reliability study 90
3.4.3 Summary 93
4. SERO-SURVEY OF FARMED BISON IN ALBERTA 94
4.1 Introduction 94
4.2 Materials and methods 96
4.2.1 Fairview serum bank 96
4.2.2 Slaughter survey 101
VI

4.2.3 Cow-calf study 101
4.2.4 Analysis 102
4.3 Results 103
4.4 Discussion 112
4.4.1 Summary 117
5. SERO-SURVEY OF NORTHERN CANADIAN BISON 119
5.1 Introduction 119
5.2 Materials and methods 121
5.2.1 Wood Buffalo National Park 122
5.2.2 Hanging Ice/Edjericon 123
5.2.3 Mackenzie Bison Sanctuary 123
5.2.4 Hook Lake Captive Herd 124
5.2.5 Analysis 125
5.3 Results 125
5.4 Discussion 130
5.4.1 Summary 132
6. TRANSMISSION OF MCF IN BISON 133
6.1 Introduction 133
6.2 Outbreak history 136
6.3 Materials and methods 144
Vll

6.4 Results 146
6.5 Discussion 148
6.5.1 Summary 158
7. PCR ASSAY FOR MCF VIRUSES IN BISON 160
7.1 Introduction 160
7.2 Materials and methods . . . . . . . . . . . . . . . . . . . . . . . . . . . . . . . . . . . . . . . . 162
7.2.1 Samples . . . . . . . . . . . . . . . . . . . . . . . . . . . . . . . . . . . . . . . . . . . . 162
7.2.1.1 Bison associated with MCF outbreaks 162
7.2.1.2 Bison not associated with MCF outbreaks or sheep .. 162
7.2.1.3 Bison sampled for lymphocyte culture 163
7.2.1.4 Controls for PCR assays 163
7.2.2 Sample analysis 163
7.2.2.1 Extraction ofDNA 163
7.2.2.2 PCR assays . . . . . . . . . . . . . . . . . . . . . . . . . . . . . . . . . . 164
7.2.2.3 Lymphocyte cultures 166
7.2.2.4 MCF virus antibody detection 167
7.2.2.5 DNA sequencing 167
7.2.3 Data analysis 168
7.2.3.1 Sequence alignments 168
7.3 Results 168
7.3.1 Bison associated with MCF outbreaks 168
viii

7.3.2 Bison not associated with MCF outbreaks or sheep 169
7.3.3 Bison sampled for lymphocyte culture 169
7.4 Discussion 172
7.4.1 Summary . . . . . . . . . . . . . . . . . . . . . . . . . . . . . . . . . . . . . . . . . .. 173
8. DISCUSSION 174
BIBLIOGRAPHY 178
IX

LIST OF TABLES
2.1 Studies associating OvHV-2 and MCF in cattle and bison 13
2.2 Studies validating Baxter's PCR in pathology specimens 61
3.1 Percent inhibition of feedlot, Hooklake and reliability study bison 77
4.1 Prevalence in Fairview serum bank and slaughter survey bison 109
4.2 Prevalence in bison from 5 cow-calf herds 110
4.3 Comparison of prevalence between cows and calves from 5 cow-calf herds 111
5.1 Prevalence in Northern Canadian bison herds 126
5.2 Prevalence in Hanging IcelEdjericon and Hooklake herds 129
6.1 Nunlber of bison sold at the auction sale 138
6.2 Moralities among bison purchased at the auction sale . . . . . . . . . . . . . . . . . . . . . . 140
6.3 Number of bison exposed to bison sold at the auction sale 141
x

LIST OF FIGURES
3.1 Histogram of percent inhibition of Hooklake bison 76
3.2 Histogram of the percent inhibition of infected and un-infected bison 79
3.3 Two graph receiver operating characteristic curve for the CI-ELISA 80
3.4 Scatterplot of the first versus second sample percent inhibition 82
3.5 Scatterplot of the mean versus half the differences 84
4.1 Histogram of the number of samples in each pod of the Fairview serum bank 98
4.2 Histogram of the number sampled per pod from the Fairview serum bank. . . . . . 100
4.3 Histogram of the prevalence among pods in the Fairivew serum bank 104
4.4 Scatterplot of the prevalence in pods versus pod size in the Fairview serum bank 106
4.5 Scatterplot of prevalence versus number sampled per day in the slaughter survey 107
5.1 Map of the locations of Northern Canadian bison herds 121
6.1 Bar chart of the occurrence of mortalities over time the MCF outbreak . . . . . . . . 143
7.1 Gel electrophoresis of PCR products from bison lymphocyte cultures . . . . . . . . . 170
7.2 DNA sequences from 5 bison lymphocyte cultures 171
Xl

LIST OF ABBREVIATIONS
AIRV-1 Alcelaphine herpesvirus-1
AIRV-2 Alcelaphine herpesvirus-2
ACD Acid citrate dextrose
BRV-1 Bovine herpesvirus-1
BHV-4 Bovine herpesvirus-4
BIV
BLHV
BSV
BVDV
cDNA
CFIA
CI-ELISA
CpHV-2
dATP
dCTP
dGTP
dTTP
DMSO
DNA
EHV-2
ELISA
Bovine immunodeficiency virus
Bovine lymphotrophic herpesvirus
Bovine syncitial virus
Bovine virus diarrhea virus
Complin1entary DNA
Canadian Food Inspection Agency
Competitive inhibition enzyme linked immunosorbent assay
Caprine herpesvirus-2
Deoxyadenosine triphosphate
Deoxycytidine triphosphate
Deoxyguanidine triphosphate
Deoxythymidine triphosphate
Dimethyl sulfoxide
Deoxyribonucleic acid
Equine herpesvirus-2
Enzyme linked immunosorbent assay
Xll

HHV-8
lll/EJ
HiHV-l
HLCH
HVS
IIF
Mab-15-A
Max
MBS
MCF
MCFV-WTD
MHV-68
Min
N
OD
OR
OvHV-2
PBS
PCR
PI
Prg
r
Human herpesvirus-8
Hanging Ice/Edjericon
Hippotragine herpesvrius-l
Hook Lake Captive Herd
Herpesvirus sanliri
Indirect immunoflourescent assay
Monoclonal antibody against antigenic epitope 15A
Maximum
Mackenzie Bison Sanctuary
Malignant catarrhal fever
Malignant catarrhal fever virus of white-tailed deer
Murine herpesvirus-68
Minimum
Number
Optical density
Odds ratio
Ovine herpesvirus-2
Phosphate buffered saline
Polymerase chain reaction
Percent inhibition
Rogan Gladden prevalence
Pearson's product moment correlation coefficient
xiii

ROC
RRV
SA-MCF
Se
Sp
Taq
TO-ROC
TPA
WBNP
WD-MCF
Receiver operating characteristic
Rhesus monkey rhadinovirus
Sheep associated malignant catarrhal fever
Sensitivity
Specificity
Thermus aquaticus
Two graph receiver operating characterisitc
12-0-tetradecanoyl phorbol-13-acetate
Wood Buffalo National Park
Wildebeest derived malignant catarrhal fever
xiv
1
1. INTRODUCTION
Malignant catarrhal fever (MCF) is a highly fatal disease syndrome of many
ruminant species throughout the world. Five gamma herpesviruses of the rhadinovirus
genus have been causally associated with MCF. These viruses, which include
alcelaphine herpesvirus-1 (A1HV-1) (Plowright, Ferris et ai. 1960), alcelaphine
herpesvirus-2 (A1HV-2) (Klieforth, Maalouf et al. 2002), ovine herpesviruse-2 (OvHV
2) (Collins, Bruns et ai. 2000) , caprine herpesvirus-2 (CpHV-2) (Li, Keller et ai. 2001)
and an as yet unnamed virus that causes MCF in white-tailed deer (MCFV-WTD) (Li,
Dyer et ai. 2000) have recently been placed into the tentatively named MCF group of
gamma herpesviruses (Li, Keller et ai. 2001)
Although MCF is a sporadic disease in most ruminant species, it is an important
cause of mortality in farmed American bison (Bison bison). Reported mortalities in
bison have ranged from sporadic to as high as 100% in small herds (Schultheiss, Collins
et al. 2000). In one large herd of 900 bison 300 MCF mortalities were reported
(Schultheiss, Collins et ai. 2000). Mortalities have not been restricted to cow calf
operations. One bison feedlot reported mortality rates as high as 9.4% per year (O'Toole,
Li et ai. 2002). In a survey of bison farmers in Canada, MCF was the most common
cause of infectious mortality (Berezowski, Haigh et ai. 2000). In a survey of submissions
to veterinary diagnostic pathology laboratories in Western Canada and the Western
United States during the period from 1990 to 2000, MCF was the most common
infectious cause of submissions (Berezowski, Haigh et ai. 2000).

2
In Canada the population of farnled bison has been estimated to be expanding at
the rate of 26% per year since 1996 (Armstrong, Ayars et al. 1998). Although the
Canadian bison industry is small compared to other livestock industries, as it expands,
it's economic importance will also expand. Diseases such as MCF, which can cause
significant mortalities in farmed bison populations have the potential to dramatically
impact the bison industry in the future. It is therefore in the bison industry's best interest
to institute research with the goal of understanding the epidemiology of MCF-group
viruses in Canadian farmed bison populations. The purpose of this thesis is to begin that
process.
In the broadest sense this thesis is concerned with answering the questions: how
many healthy bison are infected with MCF-group viruses and are MCF-group viruses
being maintained within healthy bison populations? These questions initially seems
counter intuitive, since mortalities due to MCF in North American bison are generally
considered to be the result of transnlission of an MCF-group virus, ovine herpesvirus-2
(OvHV-2), from sheep to bison (Collins, Bruns et al. 2000). It seems unlikely that a
virus which causes a highly fatal disease, often occurring in large outbreaks in bison
would also be maintained within bison populations. A virus with these characteristics
would be expected to leave few survivors. This however may not be the case for the
relationship between bison and MCF-group viruses. Personal communications with other
researchers has suggested that in a few very small preliminary studies, there were a
significant proportion of healthy bison that had antibodies to MCF-group viruses
(Crawford 2000; Li 2000; O'Toole 2000). An initial explanation for these findings might

3
be that bison which are exposed to OvHV-2 don't all die from the infection. Some
infected bison may clear the virus from their body, and it is these bison that are being
identified by these preliminary studies. OvHV-2, however is a herpesvirus.
Herpesviruses, and especially those herpesviruses closely related to OvHV-2, tend to
produce life long infections (Murphy, Gibbs et ai. 1999; Timoney, Gillespie et ai. 1999),
making it unlikely that bison with MCF-group virus antibod.ies would have cleared their
MCF-group virus infections. If the prevalence of MCF-group virus infections in farmed
bison populations is high, are these infections all a direct result of the exposure of bison
to sheep, or is it possible that MCF-group virus infections are being maintained in
farmed bison populations by some form of bison to bison transmission?
Clearly the first step in studying MCF-group viruses in bison is to establish the
proportion of farmed bison that are infected with MCF-group viruses. Before this can be
done a test must be selected that correctly identifies those bison which are infected. In
this thesis, this selection process was initiated by conducting an "armchair" evaluation of
candidate tests through a critical review of the literature. The second chapter of this
thesis contains a review of the literature relating to diagnostic tests. Chapter two also
presents a review of the literature relating to the epidemiology of other MCF-group
viruses in their host species populations, as well as a short review of the literature
relating to MCF in bison. The test selected for this thesis project was a direct
competitive inhibition immunosorbent enzyme linked antibody test (CI-ELISA). This
test detects a monoclonal antibody specific for an antigenic epitope, 15-A, which is
conserved among all known viruses in the MCF-group of viruses (Li, Mcguire et ai.

4
2001). Since this test has been poorly validated in bison, the third chapter of this thesis
presents the results of studies that evaluated the performance of this CI-ELISA in bison.
The fourth chapter estimates the prevalence of MCF virus infections in bison from sero
surveys using the CI-ELISA in populations of farmed bison in Alberta. The fifth chapter
lookes at the prevalence of CI-ELISA positive bison in isolated bison populations in
Northern Canada, where there is no exposure to sheep. The sixth chapter presents results
from a study demonstrating that MCF was not transnlitted among bison in a naturally
occurring outbreak of MCF. The seventh chapter presents the results of surveys of small
populations of bison for the presence of MCF-group viruses using PCR assays.

5
2. LITERATURE REVIEW
2.1 Introduction.
The purpose of this review is to provide the reader with a broad understanding of
malignant catarrhal fever and the epidemiology of MCF-group viruses in animal
populations. Since this thesis is concerned with the epidemiology of MCF-group viruses,
there will only be a minor discussion of the clinical signs and pathology associated with
MCF, except with respect to bison. The bulk of this review will be concerned with the
transmission and epidemiology of MCF-group viruses as well as the diagnostic tests
used to diagnose infection with MCF-group viruses and clinical MCF.
2.2 General overview of malignant catarrhal fever.
Malignant catarrhal fever is a sporadic, highly fatal disease syndrome of many
ungulate species. The syndrome has a world wide distribution and has been reported in
33 species of ungulates including cattle, bison, buffalo, swine and many deer species
(Loken, Aleksandersen et al. 1998; Metzler 1991; Reid 1992). In susceptible species,
MCF is characterized clinically by high fever, profuse nasal discharge, leukopenia,
opthalmitis, corneal opacity, generalized lymphadenopathy, erosions of the upper
respiratory tract and alinlentary tract, and occasionally diarrhea and neurologic signs
(Heuschele 1988; Metzler 1991; Mushi Rurangira 1981; Plowright 1990). Histologically
the disease is characterized by hyperplasia of lymphoid organs, accumulation of

6
lymphocytes in many tissues, and generalized lymphocytic vasculitis (Liggitt, DeMartini
1980; Plowright 1990; Schultheiss, Collins et al. 2000).
There are two very similar, well known forms of MCF. They are differentiated
not by clinical signs or pathology, but rather by epidemiological and etiological
differences. The first is wildebeest derived malignant catarrhal fever (WD-MCF), so
named because of the association between exposure to wildebeest (Connochaetes spp.)
and the occurrence of MCF in cattle in Africa (Daubney, Hudson 1936). The second was
named sheep-associated malignant catarrhal fever (SA-MCF) because of the association
between MCF in cattle and their exposure to sheep (Goetze, Liess 1929; Goetze, Liess
1930). SA-MCF is considered to be the form of MCF that occurs most frequently
throughout the world, excluding Africa (Plowright 1990).
A third, less well known form of MCF has recently been reported in white-tailed
deer (Odocoileus virginianus) (Li, Dyer et ai. 2000). This form of MCF is similar
clinically and pathologically to the SA-MCF and WD-MCF (Li, Dyer et ai. 2000). Other
forms of MCF with varying clinical presentations and pathology have been reported in
white-tailed deer (Li, Wunschmann et ai. 2003), sika deer (Cervus nippon) (Crawford, Li
et al. 2002; Keel, Patterson et ai. 2003) and barbary red deer (Cervus eiaphus barbarus)
(Klieforth, Maalouf et ai. 2002). At the present time little is known about these
syndromes.
The association between blue wildebeest (Connochaetes taurinus) and WD-MCF
in cattle was known to Maasai pastoralists of East Africa since early times (Mushi,
Rurangira 1981; Plowright, Ferris et ai. 1960). They named the disease "Ngati" or

7
"Ugonjwa wa nyumbu" which translates as "disease of wildebeest" in Kiswahili (Mushi,
Rurangira 1981). The Maasai believed cattle contracted WD-MCF by grazing over
ground contaminated by the after-birth of calving wildebeest or by grazing over ground
on which wildebeest calves had lain and shed their neonatal hair coats (Daubney,
Hudson 1936). These beliefs may have arisen from their observation that most WD
MCF mOltalities occurred in cattle during, and for a few months following the
wildebeest calving season (Mushi, Rurangira 1981). The Maasai also recognized that
WD-MCF is a fatal disease and routinely slaughtered any cattle that developed clinical
signs that were suggestive of WD-MCF early in the course of the disease (Mirangi,
Kang'ee 1999). Timely slaughter allowed them to salvage the meat from affected cattle.
Early European travelers in Africa encountered WD-MCF when they grazed trek oxen
over ground that was frequented by wildebeest (Mushi, Rurangira 1981). They called the
disease "snot sickness" or "snottsiekte" in Africaans because of the copious nasal
discharge produced by oxen with WD-MCF (Mushi, Rurangira 1981).
Sheep associated malignant catarrhal fever has been recognized in Europe since
the late 1800's (Goetze, Liess 1929; Goetze, Liess 1930). The association between sheep
and SA-MCF in cattle was suggested by early epidemiological studies in Germany,
where it was found that a high proportion of cattle that died of MCF were pastured or
stabled closely to sheep (Goetze, Liess 1929; Goetze, Liess 1930).
WD-MCF and SA-MCF were initially considered to be two separate, distinct
diseases (Daubney, Hudson 1936; Goetze, Liess 1929; Goetze, Liess 1930). In 1930,
Goetze suggested that since the African (WD-MCF) and the European (SA-MCF) forms

8
of the disease were very similar, they should be classified as one disease caused by an
infectious agent that was present in both wildebeest and sheep (Goetze, Liess 1929;
Goetze, Liess 1930). Although it has since been accepted that the two diseases are one
syndrome, considerable debate has remained about the etiology of MCF. In 1936,
Daubney suggested that the infectious cause of MCF was a virus (Daubney, Hudson
1936). It was not until the 1960's when Plowright cultured the virus that causes WD
MCF (Plowright, Ferris et al. 1960) and the advent of DNA base sequencing in the
1990's, that it was determined that the causative agents of SA-MCF and WD-MCF are
closely related but separate viruses (Bridgen, Herring et al. 1989; Bridgen, Reid 1991;
Coulter, Wright et al. 2001; Ensser, Pfanz et al. 1997).
2.3 Etiologies of MCF
There are five gamma herpesvirus belonging to the genus rhadinovirus that have
been causally associated with MCF. These viruses are alcelaphine herpesvirus-l (AIHV
1) (Plowright, Ferris et al. 1960), alcelaphine herpesvirus-2 (AIHV-2) (Klieforth,
Maalouf et al. 2002), ovine herpesviruse-2 (OvHV-2) (Collins, Bruns et al. 2000; Li,
Shen et al. 1996b; Li, Shen et al. 1995) (Muller Doblies, Li et al. 1998), caprine
herpesvirus-2 (CpHV-2) (Crawford, Li et al. 2002; Keel, Patterson et ai. 2003; Li, Keller
et ai. 2001; Li, Wunschmann et ai. 2003) and an as yet unnamed virus which causes
MCF in white-tailed deer (MCFV-WTD) (Li, Dyer et ai. 2000). Some other members of
the rhadinovirus genus include herpesvirus san1iri (HVS), human herpesvirus-8 (HHV
8), murine herpesvirus-68 (MHV-68), rhesus monkey rhadinovirus (RRV), equine

9
herpesvirus-2 (EHV-2), bovine herpesvirus-4 (BHV-4) and hippotragine herpesvirus-1
(HiHV-1) (Coulter, Wright et al. 2001; Li, Keller et aI. 2001; Mushi, Rossiter et aI.
1981; Reid Bridgen 1991). Pathogenic members of this group are characterized by their
ability to cause lymphoproliferative diseases, establish latent infections in lymphoid
tissue and to replicate in vitro in lymphoblastoid cells (Coulter, Wright et aI. 2001).
Many of these viruses are well adapted to their natural host species populations, and as is
the case with A1HV-1, A1HV-2, CpHV-2 and OvHV-2, only produce disease when they
infect hosts which belong to less well adapted species (Imai, Nishimori et aI. 2001;
Mushi Rurangira 1981; Plowright, Ferris et aI. 1960, Klieforth, Maalouf et aI. 2002,
Crawford, Li et aI. 2002).
Viruses in the genus are classified as rhadinoviruses by their shared properties as
well as similarities in their genomic structure (Coulter, Wright et aI. 2001). OvHV-2,
CpHV-2 and MCFV-WTD, however, have been classified as rhadinoviruses based only
on their DNA base sequence homology to other viruses in this group, since none of these
three viruses have been isolated or cultured in tissue culture (Bridgen Reid 1991; Li,
Dyer et aI. 2000; Li, Keller et aI. 2001). Li has proposed, based on their genomic
similarity, that A1HV-1, A1HV-2, OvHV-2, CpHV-2, HiHV-l and MCFV-WTD be
classified as a separate subgroup of gamma herpesviruses called the MCF subgroup (Li,
Keller et aI. 2001).
Alcelaphine herpesvirus-I, which sub-clinically infects wildebeest, causes WD
MCF in cattle in Africa (Plowright, Ferris et aI. 1960) and susceptible ungulate species
in zoos and wildlife parks worldwide (Heuschele, Swansen et aI. 1983; Whitenack,

10
Castro 1981). The causal link between AIHV-l and WD-MCF has been firmly
established through epidemiological studies and transmission experiments. AIHV-1 has
been isolated and characterized from bovine cell cultures (Castro, Heuschele et al. 1985;
Plowright, Macadam et al. 1963), and recently the complete genomic sequence of
AIHV-l has been reported (Ensser, Pfanz et al. 1997). Plowright and others were able to
transmit WD-MCF to healthy cattle by parenteral injection of cellular suspensions from
AIHV-l infected bovine cell cultures and injection of cell free AIHV-l from cell
culture supernatants (Kalunda, Dardiri et al. 1981; Plowright 1963; Plowright, Ferris et
al. 1960). These studies firmly established that, at least in the laboratory, AIHV-1 alone
is sufficient to cause WD-MCF. Studies of naturally occurring WD-MCF mortalities in
which AIHV-l has been found by isolation of AIHV-l in tissue culture and
identification of AIHV-l DNA by PCR, suggest that AIHV-l is also a necessary cause
of naturally occurring WD-MCF (Barnard, Van De Pypekamp et al. 1989; Mirangi,
Kang'ee 1999; Murphy, Klieforth et al. 1994; Plowright 1963; Plowright, Ferris et al.
1960).
Several different viruses have been isolated from SA-MCF mortalities in cattle.
These include a bovine syncytial virus, a morbillivirus, a parvovirus, a toga virus, an
enterovirus, and several herpesviruses (Reid, Buxton et al. 1984). Even though these
viruses have been isolated from SA-MCF mortalities, some of these viruses have failed
to experimentally reproduce MCF, and all are considered to have no causal relationship
to the disease (Reid, Buxton et al. 1984). There have been several viruses, including a
reovirus, an adenovirus and sonle unclassified viruses, which have been isolated from

11
sheep incriminated in outbreaks of SA-MCF (Hoffman, Young 1989). Researchers have
not experimentally produced MCF with any of them, and they are not considered to be
causally associated with SA-MCF (Hoffman, Young 1989). OvHV-2 has remained the
only candidate for the causal agent of SA-MCF (Bridgen, Reid 1991; Collins, Bruns et
ai. 2000; Crawford, Li et al. 1999; Ensser, Pfanz et ai. 1997; Li, Shen et ai. 1995; Muller
Doblies, Li et ai. 1998; O'Toole, Li et ai. 1997; Plowright 1990; Schuller, Cerny et ai.
1990; Schultheiss, Collins et ai. 2000). Since OvHV-2 has resisted culture in tissue
culture, cell free OvHV-2 has been unavailable, making transmission experiments using
infectious virus particles impossible. The association between OvHV-2 and SA-MCF
has therefore been established by less direct methods.
Support for a causal association between sheep and SA-MCF initially came from
epidemiological reports of mortalities in cattle that were exposed to sheep (Aleska. 1935;
Bindel 1937; Goetze, Liess 1929; Goetze, Liess 1930; Magnusson 1940; Piercy 1954). In
many of these studies, sheep were penned closely with healthy cattle and deer over
various periods of time and in some cases sheep exposed cattle and deer developed MCF
(Goetze, Liess 1930; Magnusson 1940; McAllum, Mavor et ai. 1982). Although these
studies provided the first indication that sheep may be a risk factor for MCF in cattle and
deer, they must be considered with some caution since transmission was not consistent
and the researchers failed to include unexposed control cattle or deer in their studies. In a
recent study, Japanese deer (Cervus nippon) that died of MCF after exposure to sheep
were found to have OvHV-2 DNA fragments that were identical to those found in the
sheep they were exposed to (Imai, Nishimori et ai. 2001). Although this study does

12
provide more compelling evidence that sheep and OvHV-2 are causally linked to MCF,
these authors failed to use unexposed controls in their study. By failing to use unexposed
controls in the study, the authors failed to demonstrate that Japanese deer which don't
have SA-MCF did not have OvHV-2 DNA in their tissues.
The strongest support for a causal link between sheep, OvHV-2 and MCF comes
from PCR studies in which OvHV-2 DNA is found in a large proportion of healthy
sheep worldwide (Baxter, Pow et al. 1993; Li, Shen et al. 1994; Li, Shen et al. 1996; Li,
Shen et al. 1995; Li, Snowder et al. 1998), as well as in cattle and bison that died of
MCF, but not, or rarely in cattle or bison that died of other causes (Baxter, Pow et al.
1993; Collins, Bruns et al. 2000; Crawford, Li et al. 1999; Dunowska, Letchworth et al.
2001; Hussy, Stauber et al. 2001; Li, Shen et al. 1995; Muller Doblies, Li et al. 1998;
Tham 1997; Wiyono, Baxter et al. 1994). Although the authors did not do so, the data
presented in 4 of these studies can be used to calculate odds ratios for the strength of the
association between OvHV-2 and mortalities due to MCF. The odds ratios calculated
from these 4 studies (table 2.1) are very large, ranging from 110 to 3984, which indicates
that the association between OvHV-2 and MCF in these studies, is very strong. The
number of subjects in each study however is quite small, ranging from 19 to 140. This
has resulted in very broad 95% confidence intervals around each odds ratio estimate.
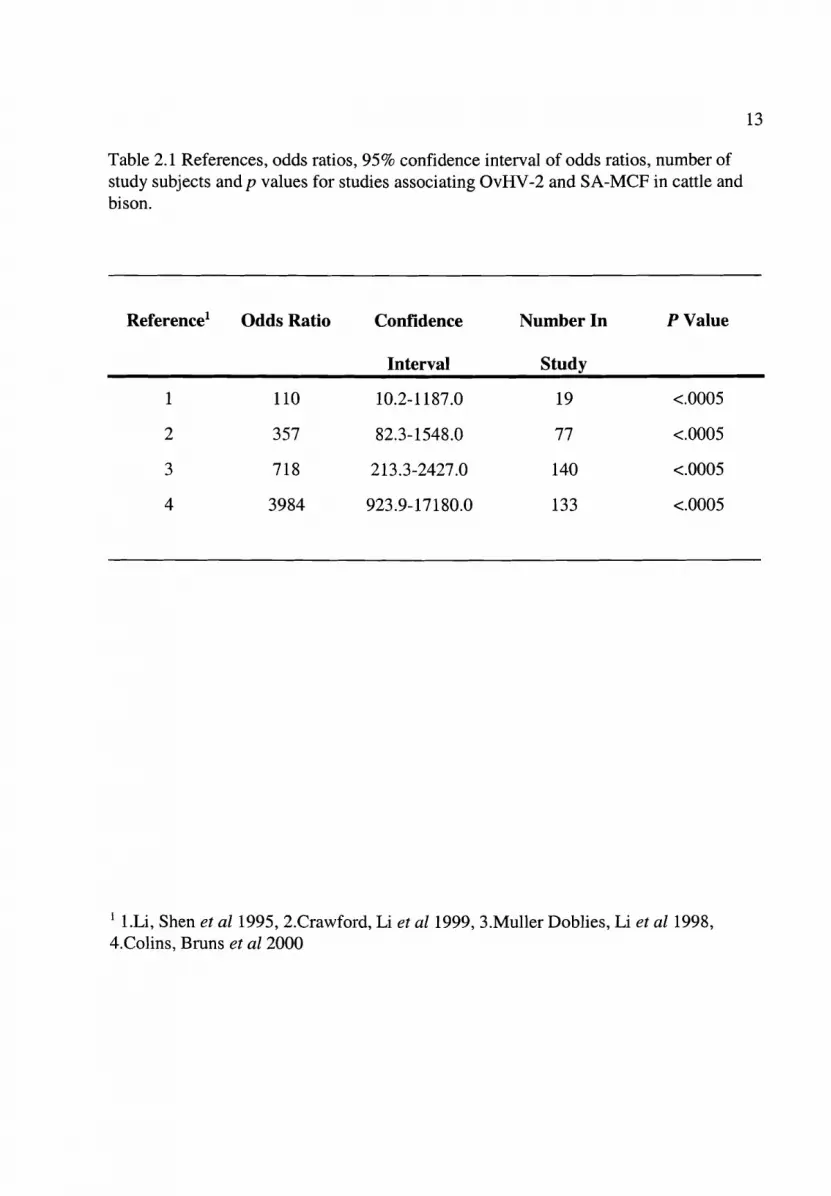
Table 2.1 References, odds ratios, 95% confidence interval of odds ratios, number ofstudy subjects and p values for studies associating OvHV-2 and SA-MCF in cattle andbison.
Reference! Odds Ratio Confidence Number In PValue
Interval Study
1 110 10.2-1187.0 19 <.0005
2 357 82.3-1548.0 77 <.0005
3 718 213.3-2427.0 140 <.0005
4 3984 923.9-17180.0 133 <.0005
1 l.Li, Shen et al1995, 2.Crawford, Li et al1999, 3.Muller Doblies, Li et al1998,4.Colins, Bruns et a12000
13

14
None of the 95% confidence intervals encompasses one, nor do any of the p values
approach or exceed 0.05. This suggests that although the sample sizes were small, the
association between OvHV-2 and MCF was statistically significant in these studies.
Calculating odds ratios from the data presented in these studies assumes that the
authors of the original studies used case-control study designs for determining the
association between OvHV-2 and MCF. Although all of the authors were interested in
this association, none of them discussed the use of case-control study designs, nor did
they address the potential sources of bias which case-control studies are prone. Since
these authors did not design their studies to reduce potential sources of bias, using their
data for inferences for which their data was not originally intended may result in biased
inferences. The odds ratios calculated from these studies are, however, quite large and
would require equally large flaws in study design to have produced spurious odds ratios
of the magnitude seen here. It is unlikely that such flaws would have existed in all four
of these studies.
Defining the relationship between OvHV-2 and SA-MCF has been very difficult.
Since there have been no transmission experiments performed with cell free OvHV-2
virus particles, it's relationship to SA-MCF must only be considered to be an association.
Although the association is a strong one, it cannot be defined as a causal association. At
best it can be stated that OvHV-2 is necessary for the production of SA-MCF, but
lacking transmission experiments with cell free OvHV-2, it must also be stated that
OvHV-2 alone may not be sufficient for the production of SA-MCF.
In 2000, Li (Li, Dyer et ai. 2000) described an outbreak of MCF that caused 5

15
white-tailed deer (Odocoileus virginianus) mortalities in a zoo in the United States. The
deer exhibited clinical signs that were similar to those observed in deer with SA-MCF
(Li, Dyer et al. 2000; Li, Westover et al. 1999; Reid 1992), as well as gross pathology
and histopathology that was similar to that seen in cattle and deer with SA-MCF or WD
MCF (Li, Dyer et al. 2000). Li was unable to detect the presence of AIHV-l or OvHV-2
DNA fragments in tissues from any of the dead deer. Using consensus primers directed
at a region of the herpesviral DNA polymerase gene, Li was able to amplify a 230 base
pair DNA fragment from peripheral blood lymphocytes of the affected deer. This
fragment was sequenced and found to be 82% identical to OvHV-2 and 72% identical to
AIHV-l. Based on these observations Li concluded that this virus was a newly
discovered pathogenic MCF virus that was similar to, but distinct from AIHV-l and
OvHV-2. Since a prinlary host for this new virus was not identified, the virus has been
given the temporary name of MCF virus of white-tailed deer (MCFV-WTD). The causal
association between MCFV-WTD and MCF is tenuous at this time. Li suggested that
MCFV-WTD had a causal association with MCF in white-tailed deer, based on detecting
this new virus in white-tailed deer that died of a disease similar to MCF, in the absence
of other known pathogenic MCF viruses. In addition, the new virus had genetic
similarities to other pathogenic MCF viruses. In order to strengthen this association Li
looked for, but was unable to find MCFV-WTD, in the peripheral blood leukocytes of
three healthy white-tailed deer. Since a sample of three could not possibly be
representative of the general population of white-tailed deer, firm acceptance of a causal
link between MCFV-WTD and MCF in white-tailed deer will await the results of further

16
studies that look for the presence of this virus in healthy white-tailed deer populations
and MCF mortalities.
Alcelaphine herpesvirus-2 which sub-clinically infects Jackson's hartebeest
(Alceiaphus buseiaphus jacksoni) (Klieforth, Maalouf et ai. 2002) and CpHV-2 which
sub-clinically infects domestic goats (Li, Keller et ai. 2001) have recently been
associated with MCF like syndromes in sika deer (Crawford, Li et al. 2002; Keel,
Patterson et ai. 2003), white-tailed deer (Li, Wunschmann et al. 2003) and barbary red
deer (Klieforth, Maalouf et al. 2002). Causal associations between these two viruses and
MCF should be considered tentative at this time since there are few studies reported and
none of them have critically examined causal associations.
2.4 Transmission of malignant catarrhal fever viruses
2.4.1 Transmission of AIHV-1 among cattle
Early MCF transmission studies demonstrated that WD-MCF could be
transmitted horizontally through transfusion of whole blood, or by parenteral injection of
tissue homogenates from cattle with WD-MCF to other susceptible cattle (Daubney,
Hudson 1936; Piercy 1952; Piercy 1952; Plowright 1963; Plowright, Ferris et al. 1960;
Rinjard 1935). Although these early studies clearly demonstrated that WD-MCF was
experimentally transmissible between cattle, these studies failed to demonstrate the
transmission of WD-MCF horizontally among cattle by any but iatrogenic means. In
these studies many cattle with experimentally induced WD-MCF were stabled closely to
susceptible cattle. In all instances, WD-MCF failed to be transmitted from cattle with
17
WD-MCF to susceptible cattle. In addition, cattle which were stabled next to cattle with
WD-MCF, failed to produce antibodies to AIHV-l (Kalunda, Dardili et al. 1981). From
these studies it has been concluded that cattle with WD-MCF do not transmit this
disease, or AIHV-l to other cattle (Plowright 1990).
AIHV-l has consistently been found in leukocyte fractions from cattle with WD
MCF (Plowright 1963; Plowright, Ferris et al. 1960). Transmission studies, in which
leukocytes from pelipheral blood buffy coats were successful at transmitting WD-MCF,
failed to demonstrate transmission through parenteral injections of serum or cell free
supernatants of tissue suspensions (Piercy 1953; Plowlight 1982). This suggests that
cattle with WD-MCF produce AIHV-l only in a leukocyte bound form. Kalunda found
AIHV-l in nasal and salivary secretions of cattle with WD-MCF by virus isolation, but
not in fecal, urinary, vulvar or ocular secretions (Kalunda, Dardiri et al. 1981). However,
Kalunda did not determine whether the AIHV-1 found in the nasal and ocular secretions
of the cattle in his study was in a cell free or leukocyte bound form.
Culturing AIHV-1 in tissue culture allowed researchers to study the stability of
AIHV-l in both a cell free and cell bound form. Although AIHV-l rapidly lost
infectivity in cellular suspensions, it was found to be very stable in a cell free form
(Mushi, Rossiter et al. 1980). Cell free AIHV-l retained infectivity for at least 30 days
on filter paper at 22 degrees C in relative humidity of 100% (Mushi, Rossiter et al.
1980). These studies suggest that in a natural setting, effective transmission of WD-MCF
is most likely to occur when AIHV-l is in a cell free form (Plowright 1990). Since cattle
infected with AIHV-l were found to contain AIHV-l only in a cell bound form (Piercy

18
1953; Plowright 1963; Plowright 1982; Plowright, Ferris et ai. 1960), and cellular
suspensions were found to be unstable (Mushi, Rossiter et ai. 1980), it has been
postulated that cattle fail to transmit MCF horizontally because cattle infected with
AIHV-l produce and excrete little or no cell free AIRV-1(Plowright 1982; Plowright
1990).
Although horizontal transmission of A1HV-1 has not been demonstrated in cattle
there is some evidence to suggest that adult cattle may become persistently infected with
AIRV-1 and possibly transmit the virus vertically to their calves. Plowright studied a
dairy cow that had been experimentally infected with AIHV-1 (Plowright, Kalunda et ai.
1972). The cow was viraemic for 15 weeks following infection, but did not develop WD
MCF. When it was killed 84 months after infection, virulent AIRV-l was cultured from
its tissues. During its lifetime the cow produced 6 calves, 4 of which were shown to be
infected with AIRV-l at birth or shortly after birth. In a study of an outbreak of WD
MCF in cattle, Barnard was able to show an association between cows that died of WD
MCF and calves that died of WD-MCF (Barnard 1990). In this outbreak calves that died
of WD-MCF were 79.5 times more likely to have mothers that died of WD-MCF than
calves that didn't die of WD-MCF (95% CI = 29.5 - 214.5, p<.OOOI). This association
may not, however, have been due to vertical transmission of AIRV-l, but rather to the
close spatial relationship, and thus shared potential exposure of cows and their calves to
infectious wildebeest that were in the area.

19
2.4.2 Transmission of AIHV-l from wildebeest to cattle
In 1936, Daubney and Hudson reported the experimental induction of WD-MCF
in cattle by stabling them in close proximity to a wildebeest calf (Daubney Hudson
1936). In 1965, Plowright repeated the same study and found the incubation period
following exposure to wildebeest calves, ranged from 30 to 81 days (Plowright 1965).
Plowright's work indicated that by the time wildebeest calves were 3 months of age very
few of them were viraemic, and he suggested that after that age wildebeest calves rarely
transmitted AIHV-l to cattle (Plowright 1965). Mushi was able to isolate cell free
AIHV-1 in nasal and ocular secretions of wildebeest calves by filtering nasal mucus
through a 450nm millipore membrane filter and from explant cell cultures of nasal
mucosa and cornea (Mushi, Rossiter et at. 1980). Barnard demonstrated that the peak age
of shedding of AIHV-l in nasal and ocular secretions occurred in wildebeest calves aged
1 to 2 months (Barnard, Bengis et at. 1989). By the time wildebeest calves reached the
age of 6 months there was very little virus in their nasal and ocular secretions (Barnard,
Bengis et at. 1989). AIHV-l infected free ranging adult wildebeest were rarely found to
shed AIHV-1 in their nasal or ocular secretions unless they were stressed by captivity or
treated with corticosteroids (Barnard, Bengis et al. 1989; Rweyemamu, Karstad et al.
1974). The inability to detect AIHV-l in nasal and ocular secretions of unstressed adult
wildebeest, as well as the failure to detect AIHV-1 in wildebeest fetal fluids or placentas
(Rossiter, Jessett et at. 1983) combined with the observation that WD-MCF mortalities
occur in cattle during the time when wildebeest calves are secreting the most virus in
their nasal and ocular secretions has led to the acceptance that wildebeest calves are the

20
main source of A1HV-1 that infects cattle in Africa (Mushi, Rurangira 1981; Plowright
1982).
The exact mechanism of transmission of A1HV-1 from wildebeest calves to
cattle is not known. Blood sucking external parasites were rejected as a vector of
transmission by the observation that the quantity of AIHV-1 in infected wildebeest
blood was much lower than that of other viruses which are known to be transmitted by
blood sucking parasites (Plowright 1965). Attempts to experimentally transmit AIHV-l
with African face flies (Musca xanthomeias) have failed, as have attempts to isolate
AIHV-1 from African face flies exposed to wildebeest calves (Barnard, Bengis et ai.
1990). Attempts to transmit MCF to cattle by lice found on wildebeest have been
unsuccessful (Mushi, Rurangira 1981). Since cell free AIHV-l is known to retain it's
infectivity for extended periods of time, in conditions of high relative humidity (Mushi,
Rossiter et al. 1980), and cell free A1HV-l is found in wildebeest calf nasal secretions
(Mushi, Rossiter et ai. 1980), it has been suggested that A1HV-1 is most likely spread to
cattle by wildebeest calves that aerosolize droplets containing infectious virus particles
(Mushi, Rurangira 1981; Plowright 1982).
A1HV-l DNA has been detected in the urine of 3 month old wildebeest calves by
DNA hybridization (Michel 1993), raising the possibility that urine may be a source of
AIHV-1 for infection of cattle. Even though AIHV-1 is stable in environments of high
humidity, there have been no reports that wildebeest urine is infectious to cattle.

21
2.4.3 Transmission of OvHV-2 among cattle, deer and bison
Horizontal transmission of SA-MCF has been sporadically successful by
intravenous, subcutaneous, intraperitoneal and intradermal injection, as well as oral
administration of large quantities of whole blood in cattle (Blood, Rowsell et al. 1961;
Goetze 1930; Goetze, Liess 1929; Goetze, Liess 1930; Homer, Oliver et al. 1975;
Magnusson 1940; Selman, Wiseman et al. 1974; Selman, Wiseman et al. 1978), red deer
(Cervus elaphus) (Huck, Shand et al. 1961; Oliver, Beatson et al. 1983), water buffalo
(Bubalus bubalus) (Wiyono, Baxter et al. 1994) and bison (Bison bison) (Liggitt,
McChesney et al. 1980). However, there have also been numerous unsuccessful attempts
at transmission (Blood, Rowsell et al. 1961; Duncan 1956; Homer, Oliver et al. 1975;
Pierson, Storz et al. 1974; Reid, Buxton et al. 1979). Lymphocyte cell lines have been
successfully cultured from cattle, red deer and Pere David's deer (Elaphurus davidianus)
with SA-MCF (Reid, Buxton et al. 1989). In one instance lymphocytes from cell culture
have been infectious to rabbits, but they have not been infectious to cattle or deer (Reid,
Buxton et al. 1989). Attempts to transmit the disease with nasal or ocular secretions have
failed (Imai, Nishimori et al. 2001; Schofield Bainf 1941). Natural transmission of SA
MCF to healthy cattle stabled closely to cattle with SA-MCF has invariably been
unsuccessful (Goetze 1930; Goetze, Liess 1929; Goetze, Liess 1930; Piercy 1954;
Pierson, Thake et al. 1973). This has not always been the case with red deer. In 1986,
Reid reported horizontal transmission of SA-MCF in one healthy red deer penned with a
red deer that had SA-MCF (Reid, Buxton et al. 1986). Reid suggested that horizontal
transmission among red deer was not the main method by which SA-MCF was

22
transmitted in red deer, since this happened to only one of seven red deer,. The
observation of horizontal transmission among red deer has not subsequently been
reported.
Failure of natural transmission of OvHV-2 among cattle is thought to be due to
the cell bound nature of OvHV-2 in cattle with SA-MCF, and the inability of cattle with
SA-MCF to produce and shed cell free OvHV-2 in a large enough quantity to be
infectious to other cattle (Michel, Aspeling 1994; Plowtight 1990). It has been postulated
that OvHV-2 is cell bound because the viral DNA of OvHV-2 becomes incorporated in
the cellular genome of infected cells or exists as an episome in infected cells (Metzler
1991; Reid, Buxton et ai. 1986; Westbury, Denholm 1982). This may explain why
attempts at transmission of SA-MCF among cattle were successful only when methods
of transmission ensured the integrity of the donor cells used for transmission (Westbury,
Denholm 1982). Understanding the mechanism of transmission of OvHV-2 has been
difficult because of the inability to isolate the virus or culture it in cell culture. Tests to
detect OvHV-2 in tissues and secretions have all been PCR based tests (Baxter, Pow et
ai. 1993; Bridgen, Reid 1991; Li, Shen et ai. 1995). These tests can detect the presence
of defined segments of OvHV-2 viral DNA, but can make no inferences about whether
these DNA segments are associated with viable infectious virus particles.
2.4.4 Transmission of OvHV-2 from sheep to cattle, deer and bison.
The mechanism by which OvHV-2 is transmitted from sheep to animals of other
species has not been determined. The inability of researchers to isolate or culture OvHV-

23
2 has prevented them from performing transmission experiments with cell free OvHV-2.
MCF has not been successfully transmitted to animals of any species by the inoculation
of adult sheep blood, tissues, secretions (Blood, Rowsell et ai. 1961; Goetze 1930;
Goetze, Liess 1929; Goetze, Liess 1930; Hoffman, Young 1989; Metzler 1991; Pierson,
Storz et ai. 1974; Plowright 1990), or external parasites (Goetze 1930; Goetze, Liess
1929; Goetze, Liess 1930). MCF has, however, been transmitted from healthy adult
sheep to cattle and deer by stabling them in close proximity to sheep (Aleska. 1935;
Bindel 1937; Goetze, Liess 1929; Goetze, Liess 1930; Imai, Nishimori et ai. 2001;
Magnusson 1940; Piercy 1954).
Through the use of PCR technology it has been shown that adult sheep and lambs
older than 5 months have OvHV-2 DNA in their nasal secretions (Baxter, Pow et ai.
1993; Baxter, Wiyono et ai. 1997; Imai, Nishimori et al. 2001; Li, Hua et ai. 2001; Li,
Snowder et al. 1998; Li, Snowder et ai. 2000). Li found the number of copies of OvHV
2 DNA in lamb nasal secretions to be highest in lambs aged 6 to 8 months of age (Li,
Hua et al. 2001). The copy numbers in nasal secretions of this age group exceeded the
copy numbers in their peripheral blood leukocytes by as much as 100,000 fold (Li, Hua
et al. 2001). Li found that over the course of one year the number of copies of OvHV-2
viral DNA in nasal secretions of most adult sheep remained constant and low (Li, Hua et
al. 2001). Sonle individual sheep within the flock, however, sporadically produced high
DNA copy nurnbers in their nasal secretions (Li, Hua et al. 2001). These sporadic
increases in copy nunlbers did not follow a seasonal pattern (Li, Hua et al. 2001). Based
on these findings, Li suggested that it was unlikely that the high number of copies of

24
OvHV-2 DNA found in nasal secretions of 6 to 8 month old lambs and occasional adult
sheep was due to the presence of latently infected lymphocytes, but rather was due to
viral replication of OvHV-2 in the epithelium of the sheep's naso-pharynx (Li, Hua et
al. 2001). Li proposed that nasal secretions of lambs and adult sheep could be a source of
virus for transmission of OvHV-2 to other species. Adult sheep could be sporadically
infective at any time of the year, but lambs were only infective once they reached the age
of 5 to 6 months (Li, Hua et al. 2001).
There is no direct evidence that there is cell free, or infectious OvHV-2 in sheep
nasal secretions, nor is there evidence that sheep nasal secretions are infectious to other
animals (Imai, Nishimori et al. 2001; Li, Hua et ai. 2001). In one study, nasal swabs
from sheep known to be infected with OvHV-2 failed to produce SA-MCF in Japanese
deer when the swabs were repeatedly rubbed in the nasal passages of the Japanese deer
(Imai, Nishimori et al. 2001). The only conclusion that can be made about the
transmission of OvHV-2 by sheep is that sheep are infected with OvHV-2, OvHV-2
DNA can be detected in their nasal secretions, and sheep can transmit OvHV-2 to
animals of other species, when they are stabled or penned closely to them (Imai,
Nishimori et ai. 2001; Li, Snowder et al. 2000).
2.5 Epidemiology of MCF viruses in their natural host populations.
2.5.1 Alcelaphine herpesvirus-l and wildebeest.
Although few adult wildebeest are viremic with AIHV-1 (Barnard, Bengis et ai.
1989; Plowright 1965), almost all of them have been shown to be latently infected with

25
AIHV-l through detection of AIHV-l virus neutralizing antibodies in their serum
(Plowright 1967; Rossiter, Jessett et al. 1983). A proportion of wildebeest calves are
born infected with AIHV-l. This was demonstrated by Plowright who found AIHV-l in
the spleen of a wildebeest fetus and in the blood of 3 of 7 recently born wildebeest calves
(Plowright 1965; Plowright 1965) as well as by Mushi et al who found AIHV-l in the
nasal secretions of a 4 day old wildebeest calf (Mushi Rurangira 1981). Barnard was
unable to demonstrate AIHV-l viremia, or virus in the nasal secretions of near term
pregnant free ranging wildebeest cows or in near term pregnant wildebeest cows that
were stressed by recent capture (Barnard, Bengis et al. 1989). Barnard suggested that
recrudescence of AIHV-1 in wildebeest cows was unlikely, except under extreme
conditions, and wildebeest cows were not a common source of infection for wildebeest
calves under field conditions (Barnard, Bengis et al. 1989). Based on Barnard's, Mushi's
and Plowright's findings it is likely that, under natural conditions, wildebeest cows do
not, or only rarely, infect their calves post calving. Rather, they initiate infection in the
population of wildebeest calves by producing a small number of in utero infections.
In free ranging wildebeest populations, Plowright found the proportion of
wildebeest calves that were viremic with AIHV-1 was highest at 31% in 3 month old
calves, and then dropped to less than 2% in calves 6 months old (Plowright 1965). In
Plowright's study only one wildebeest calf among 44 calves aged 13 to 18 months, and
none of 106 wildebeest over 18 months of age, were viremic (Plowright 1965). Barnard
repeated Plowright's study in 1989. His observations were similar to those of Plowright
except the highest prevalence of viremia was found to occur in slightly younger calves;

26
aged 1 to 2 months (Barnard, Bengis et ai. 1989). Plowright suggested the mechanism of
transmission of A IHV-1 in wildebeest populations was by spread of the virus in utero to
a proportion of wildebeest calves and then by horizontal spread among wildebeest calves
within the herd. The culmination of this process resulted in the infection of most
wildebeest calves by the time they reached the age of 4 to 5 months (Plowright 1965). In
order to verify this theory Plowright studied a group of neonatal wildebeest calves. In
this group of calves he observed that one congenitally infected calf spread AIHV-l
horizontally to 8 pen mates over a period of 15 weeks (Plowright 1965). Plowright's
theory gained further support by the finding that wildebeest calves had cell free AIHV-l
in their nasal and ocular secretions until they reached the age of 3 or 4 months (Barnard,
Bengis et ai. 1989; Mushi, Rossiter et ai. 1980). The cessation of cell free virus shedding
in wildebeest calf nasal secretions was found to coincide with the appearance of virus
neutralizing antibodies in their nasal secretions (Barnard, Bengis et ai. 1989; Mushi
Rurangira 1981). It was therefore suggested that transmission of AIHV-l among
wildebeest calves occurs through production of aerosolized droplets containing cell free
AIHV-l and that wildebeest calves produce infectious aerosols only dUling the short
period from infection until they produce their own virus neutralizing antibodies
(Plowright 1990). An alternative, or additional source of virus may be wildebeest calf
urine. Michel was able to detect AIHV-l viral DNA in 3 month old wildebeest calf urine
by DNA hybridization (Michel 1993).
The infection of wildebeest calves does not seem to be hindered by the presence
of circulating maternal antibodies. Mushi et ai demonstrated the presence of virus
27
neutralizing antibody within the colostrum of wildebeest cows (Mushi Rurangira 1981).
Maternally derived virus neutralizing antibody titers were found to be high in neonatal
wildebeest calves after colostrum consumption and then to decline over the first 4
months of their life, the time during which they were becoming infected with AIRV-l
from their herd mates (Plowright 1967; Plowright 1990).
Serum neutralizing antibody titers follow a biphasic pattern in wildebeest calves.
Plowright found titers to be low at birth and then, as expected, they rose and peaked
shortly after colostrum consumption (Plowright 1967; Plowright 1990). This peak was
followed by a steady decline in titers until calves reached 4 months of age (Plowright
1967; Plowright 1990). After 4 months of age mean virus neutralizing antibody titers
were found to increase steadily, presumably in response to of infection with AIRV-l,
until calves reached 18 months of age (Plowright 1967; Plowright 1990; Rossiter, Jessett
et aI. 1983). Barnard observed a similar pattern of antibody titers in wildebeest calves,
but found the second peak of antibody titers to occur when wildebeest calves were 6 to 7
months of age (Barnard, Bengis et aI. 1989). In both studies the second peak of antibody
titers was followed by a slight decline to amounts that were similar to those found in
adult wildebeest (Barnard, Bengis et aI. 1989; Plowright 1967; Plowright 1990; Rossiter,
Jessett et aI. 1983).
Barnard observed a seasonal variation in mean virus neutralizing antibody titers
in adult wildebeest. AIRV-l virus neutralizing antibody titers were found to peak in
adult wildebeest at the same time of the year that they peaked in wildebeest calves.
Barnard suggested this rise in antibody titers was due to exposure of adult wildebeest to

28
the large quantities of AIHV-l that was being produced by wildebeest calves, rather
than recrudescence of latent infection in adult wildebeest (Barnard, Bengis et ai. 1989).
2.5.2 Ovine herpesvirus-2 and sheep
The pattern of transmission of OvHV-2 among sheep is markedly different from
that of AIHV-1 in wildebeest. Nearly all of the adult populations of both species are
infected with their respective MCF viruses (Baxter, Wiyono et ai. 1997; Li, Mcguire et
ai. 2001; Li, Shen et al. 1995; Li, Shen et ai. 1995; Metzler 1991; Mirangi, Kang'ee
1997; Muluneh, Liebermann 1992; Plowright 1968; Plowright 1990; Plowright, Ferris et
ai. 1960; Rossiter 1981). The prevalence of viremia varies between the two species. Only
a few adult wildebeest are viremic with AIHV-l, as determined by cell culture, but
almost all adult sheep have OvHV-2 DNA in their peripheral blood leukocytes, as
determined by PCR assay (Baxter, Pow et ai. 1993; Li, Mcguire et ai. 2001; Li, Shen et
ai. 1995; Mirangi, Kang'ee 1997; Wiyono, Baxter et ai. 1994). PCR assay may be a more
sensitive test, but it can only detect the presence of specific segments of viral DNA and
cannot differentiate between infectious virus particles and noninfectious fragments of
viral DNA. It may not be appropriate to compare the PCR studies in sheep to virus
isolation studies in wildebeest. However, there have been no PCR studies of large
populations of wildebeest reported.
In contrast to wildebeest, pregnant ewes rarely transmit OvHV-2 to their lambs
in utero, nor do lambs become infected with OvHV-2 within the first few months of life
(Li, Snowder et ai. 1998). Li examined 4 sheep fetuses and demonstrated that they did

29
not have OvHV-2 antibodies in their serum, nor did they have OvHV-2 viral DNA in
their lymph nodes or peripheral blood leukocytes (Li, Snowder et al. 1998). Even though
OvHV-2 viral DNA is present in the colostrum and milk of ewes, Li was able to
determine that OvHV-2 infections were not established in lambs until they reached the
age of 3 to 3.5 months (Li, Snowder et al. 1998). Li suspected the OvHV-2 DNA which
was present in ewe colostrum and milk was present in lymphocytes, not in a cell free
infectious form (Li, Snowder et al. 1998). Alternatively the OvHV-2 in colostrum may
have been in an infectious form, but inactivated by the presence of antibodies within the
colostrum. Some OvHV-2 infected lymphocytes may have been transferred passively to
lambs when they suckled, resulting in Li' s and Baxter's separate observations of a few
weak OvHV-2 PCR positive test results from peripheral blood leukocytes of lambs that
had consumed colostrum (Baxter, Wiyono et al. 1997; Li, Snowder et al. 1998). These
lymphocytes although they contained OvHV-2 DNA were probably not infective, since
they did not establish OvHV-2 infection in lambs. Li determined in a subsequent study
that transfusion of peripheral blood leukocytes from latently infected sheep that were
PCR positive for OvHV-2 DNA was relatively inefficient for transmitting OvHV-2 in
sheep (Li, Snowder et al. 2000). Li firmly established that OvHV-2 was not transmitted
in utero or by the consumption of colostrum and milk in lambs, by demonstrating that
lambs weaned at 2 to 2.5 months of age and reared in isolation from other sheep,
remained uninfected with OvHV-2, even though their dams were determined to be
infected by demonstrating the presence of OvHV-2 DNA in their peripheral blood
leukocytes (Li, Snowder et al. 1998).

30
It remains unclear why larrlbs under the age of 2 months are impervious to
OvHV-2 infection. It is likely that the environment, at least within large OvHV-2
infected sheep flocks is constantly infective over time. In Li's study, lambs that were
weaned at 2 to 2.5 months of age and returned to an OvHV-2 infected sheep flock after
10 to 14 days rapidly became infected with OvHV-2 (Li, Snowder et ai. 1998). Li also
observed that all 20 uninfected 1 and 2 year old sheep that were introduced into an
OvHV-2 infected flock became infected with OvHV-2 (Li, Snowder et ai. 2000). Some
of the uninfected sheep became infected as early as one month after their introduction
into the infected flock (Li, Snowder et al. 2000). This latter study suggests that once
lambs which have consumed colostrum gain the age of 3 months they become
susceptible to OvHV-2 infection and remain susceptible until 2 years of age and possibly
for life. The inability of very young lambs to become infected with OvHV-2 may be
related to passively acquired immune components, age specific susceptibility to infection
or other unknown factors.
In Li's study, lambs in a sheep flock rapidly became infected with OvHV-2 after
the age of 3 months. Eighty seven percent of lambs in the flock had OvHV-2 DNA in
their peripheral blood leukocytes at 3.5 nl0nths and 1000/0 of lambs by 5.5 months of age
(Li, Hua et ai. 2001; Li, Snowder et al. 1998). Li observed a lag between the age that
OvHV-2 was detected in peripheral blood leukocytes and the age that OvHV-2 was
detected in nasal secretions of the lambs. There were only 5% of lambs with OvHV-2
DNA in their nasal secretions at 3.5 months of age, when 87% of the lambs had
detectable OvHV-2 DNA in their peripheral blood leukocytes (Li, Snowder et al. 1998).
31
The prevalence of lambs with OvHV-2 DNA in their nasal secretions increased to 33%
at 5.5 months, and peaked at 88% at 7.5 months, which was well after the age when
100% of the lambs in the flock had detectable OvHV-2 DNA in their peripheral blood
leukocytes (Li, Snowder et ai. 1998). There is no good explanation for this time lag. It
does, however, suggest that most lambs become infected with OvHV-2, or at least have
OvHV-2 DNA in their peripheral blood leukocytes, before the age when the virus is
replicating in their nasal mucosa and therefore before the age when they would
potentially be shedding the virus in large quantities in their nasal secretions.
The mechanism by which lambs become infected with OvHV-2 is not known. It
is probable that, similar to wildebeest and AIHV-l, the mechanism of spread of OvHV-2
is through aerosolized cell free virus particles, but the source of the virus is not known. It
may originate from sporadically shedding adult sheep within the flock; from a few lambs
in which virus replication occurs in the nasal passages early in the course of their
infection or it may originate from cell free virus that is made available to lambs by some
other, as yet unknown, means.
OvHV-2 antibodies follow a biphasic pattern in larnbs that is similar to that seen
in wildebeest calves. Lambs are born without OvHV-2 antibodies, but become
seropositive as soon as they suckle colostrum (Li, Snowder et ai. 1998). Maternal
antibodies ren1ain detectable until lambs reach about 2.5 months (Li, Snowder et ai.
1998). After 2.5 months of age lambs gradually become seropositive, with 50%
becoming seropositive at 7 to 8 months of age and 80 to 90 % becoming seropositive at 1
year of age (Li, Snowder et ai. 1998).

32
2.5.3 Caprine herpesvirus 2 and goats
Little is known about the transmission of CpHV-2 in goats. A large proportion of
adult goat populations are considered to be infected with an MCF virus, since antibodies
to MCF viruses can be found in their sera (Li, Shen et al. 1996a). With the development
of PCR primers specific to CpHV-2 it has been determined that most goats are infected
with CpHV-2 rather than other MCF viruses (Li, Keller et al. 2001). Li found that 87%
of 142 goats, had CpHV-2 DNA in their peripheral blood leukocytes (Li, Keller et al.
2001). Goats can be infected with OvHV-2 as well as CpHV-2. Wiyono found that 17%
of Indonesian goats had OvHV-2 DNA (Wiyono, Baxter et al. 1994), and Li found that
9% of 124 goats had OvHV-2 DNA, in their peripheral blood leukocytes (Li, Keller et al.
2001). In addition, a small proportion of the goats in Li's study were found to be co
infected with both CpHV-2 and OvHV-2 (Li, Keller et al. 2001). Although it is highly
likely that CpHV-2 infections are maintained in goat populations by some form of
transmission between goats, it remains a matter of speculation whether OvHV-2
infections in goats are maintained by transmission of OvHV-2 from other goats or from
sheep.
Prevalence of antibodies to CpHV-2 follows a biphasic pattern in goat kids,
which is similar to that observed in wildebeest calves and lambs. Kids are born without
CpHV-2 antibodies, but become seropositive after colostrum consumption (Li, Keller et
al. 2001). Maternal antibodies degrade until they are undetectable in kids 3 month of age,
after which the percentage of seropositive kids increases to 40% at 9 months and 100%
at 12 months (Li, Keller et al. 2001). This biphasic pattern suggests that, similar to lambs

33
and wildebeest calves, few or no kids are born infected with CpHV-2, and most of them
gain infection at some time after birth. The exact mechanism of transnlission has not
been determined.
2.5.4 Other MCF viruses.
The mechanism of transmission of Hippotragine herpesvirus-2 and AIRV-2 is
not known. Since the natural host of MCFV-WTD remains to be elucidated, studying it's
transmission is impossible. AIRV-2 has been isolated from the hartebeest (Aiceiaphus
buseIaphus cokei) and topi (DamaIiscus korrigum) (Mushi, Rossiter et ai. 1981; Reid,
Rowe 1973; Seal, Heuschele et ai. 1989). Forty to sixty percent of hartebeest and topi
populations have been found to have antibodies to MCF viruses in their sera (Reid,
Plowright et aI. 1975; Seal, Heuschele et ai. 1989). HiHV-l has been isolated from the
roan antelope (Hippotragus equinus) (Reid Bridgen 1991), of which 45 percent have
antibodies to MCF viruses (Mushi, Rossiter et aI. 1981; Seal, Heuschele et ai. 1989).
The high prevalence of antibodies to MCF viruses in all three of these host species
suggests that a large proportion of each population is infected with their respective MCF
virus. The mechanism by which MCF virus infections are maintained in each of these
populations has not been determined.
The prevalence and titer of virus neutralizing antibodies to MCF viruses has been
determined in the sera of captive fringe-eared oryx (Oryx beisa callotis) from one game
farm in Africa (Mushi Karstad 1981). All of the 50 adults tested were found to have
antibodies to MCF viruses. Calves had high antibody titers following colostrum

34
consumption. After this time titers began to decline until calves reached 6 to 8 months of
age, when titers began to rise again. This biphasic pattern of antibody levels is similar to
that seen in lambs, goats and wildebeest calves. It suggests that this fringe-eared oryx
population was maintaining an ongoing infection with an MCF virus by transmission of
the virus to neonates, or among neonates, at some time before they reached adult age.
However, there has never been an MCF virus identified from this, or any other fringe
eared oryx population. This failure may have been due to difficulties associated with
virus isolation and culture, or it may have been a result of the fringe-eared oryx in this
study having been infected with an MCF virus which, similar to OvHV-2, is refractory to
isolation and culture.
2.6 MCF in bison.
MCF is a disease of economic importance to the bison industry. MCF mortalities
have been reported in bison herds in Colorado, Wyoming, Kansas, New Mexico,
Minnesota, Nevada, Utah, North Dakota, South Dakota, Alberta, Saskatchewan and in a
bison feedlot in the American Midwest (Collins, Bruns et ala 2000; O'Toole, Li et ala
2002; Berezowski, Haigh et ala 2000 ; Berezowski, Middleton et ala 2000; Liggitt,
McChesney et ala 1980; Ruth, Reed et ala 1977; Schultheiss, Collins et al. 2000).
Mortality rates have ranged from sporadic single mortalities to rates as high as 100
percent. In one feedlot the mortality rates ranged from 0.87% to 9.4% during the period
from 1996 to 1999 (O'Toole, Li et ala 2002). Mortalities have been evenly distributed
through all age groups, with the exception that only rare mortalities have occurred in pre-

35
weaned bison calves (Collins, Bruns et al. 2000; O'Toole, Li et al. 2002; Schultheiss,
Collins et al. 1998; Schultheiss, Collins et al. 2000). Mortalities have not been limited to
one gender (Collins, Bruns et al. 2000). Although occasional MCF mortalities have
occurred in bison during any month of the year, the vast majority have occurred during
the months of November through May (Collins, Bruns et al. 2000). The reason for this
seasonal distribution of mortalities is unclear. Mortalities have been temporally
associated with handling of bison, occurring 3 to 14 days following handling of bison for
any reason (O'Toole, Li et al. 2002). It has been suggested that the stress associated with
handling of bison may precipitate disease, but this theory has not been explored, and
should be considered speculative at this time.
The clinical course of MCF in bison is very short. Most bison that die of MCF
are either found dead, or die within 8 to 48 hours of the onset of illness (Schultheiss,
Collins et al. 1998). In rare cases, bison with MCF have survived for longer periods. In
one report a bison cow survived for 80 days following an acute episode of MCF
(Schultheiss, Collins et al. 1998).
The earliest clinical signs of MCF are separation fron1 the herd, epiphora,
listlessness and refusal of food. This rapidly progresses to severe depression, recumbency
and death. Other clinical signs, which include diarrhea, melena, hematuria, stranguria,
corneal opacity, severe ocular and nasal discharge, blindness, convulsions and coughing
may be observed, but not consistently in all cases. The clinical presentation of bison with
MCF is of little or no diagnostic value to veterinarians, since the clinical signs are both
highly variable, and common to many other bison diseases (Collins, Bruns et al. 2000;
36
Liggitt, McChesney et ai. 1980; O'Toole, Li et ai. 2002; Ruth, Reed et ai. 1977;
Schultheiss, Collins et aI. 1998; Schultheiss, Collins et ai. 2000).
The most common gross pathological changes associated with MCF in bison are
corneal opacity, erosions throughout the gastrointestinal tract, and hemorrhagic cystitis.
Other gross changes include congestion and edema of the lungs, erosions of the tracheal
and bronchial mucosa, conjunctivitis, focal white lesions in the kidney, erythema of the
turbinate mucosa, and lymphnode enlargement. The gross pathology is often subtle and
inconsistent among cases, making confirmation of a diagnosis of MCF in bison difficult
based on gross pathology alone (Liggitt, McChesney et al. 1980; O'Toole, Li et aI. 2002;
Ruth, Reed et ai. 1977; Schultheiss, Collins et aI. 1998; Schultheiss, Collins et al. 2000).
In bison and other species, MCF is defined microscopically, by the presence of
lymphocytic infiltrations and lymphocytic vasculitis throughout many tissues and organs
in the body as well as erosions or ulcerations of the mucosa of the gastrointestinal and
urinary tracts. Lymphocytes infiltrate the adventitia and media of both arterioles and
venules. Mucosal erosions are often associated with lymphocytic infiltration of the
adjacent mucosa and submucosa, but mayor may not be associated with underlying or
adjacent vasculitis. Diffuse accumulations of lymphocytes may be observed within many
tissues; commonly hepatic portal triads and renal cortices. Although mortality rates are
higher, and outbreaks more common in bison than in cattle, the lesions which are found
in bison are often more subtle than those found in cattle with MCF. In bison there is less
widespread lymphocytic vasculitis and less severe lymphocytic infiltration. Mucosal
erosions are often not associated with underlying vasculitis, lymphocytic infiltration or

37
inflammation. Although the defining lesions are always present, in many cases a wide
range of tissues must be examined before characteristic lesions are observed (Liggitt,
McChesney et ai. 1980; O'Toole, Li et ai. 2002; Ruth, Reed et ai. 1977; Schultheiss,
Collins et ai. 1998; Schultheiss, Collins et ai. 2000).
MCF mortalities in farmed North American bison are considered to be associated
with exposure to sheep, and infection with OvHV-2 (Collins, Bruns et al. 2000; O'Toole,
Li et ai. 2002; Schultheiss, Collins et ai. 1998; Schultheiss, Collins et ai. 2000).
Although the reports are minimal, the association between OvHV-2 and MCF in bison is
reasonably well supported. The association between exposure to sheep and outbreaks of
MCF in bison is not as well documented.
OvHV-2 DNA has been detected, by PCR analysis of tissues, in 27 of 29
(Schultheiss, Collins et ai. 2000), 12 of 14 (O'Toole, Li et ai. 2002), 15 of 15 (O'Toole,
Li et ai. 2002) and 52 of 53 (Collins, Bruns et ai. 2000) bison that have died of MCF.
OvHV-2 DNA was not detected in 10 of 10 (Collins, Bruns et ai. 2000),4 of 4
(Schultheiss, Collins et ai. 1998) and 4 of 4 (O'Toole, Li et ai. 2002) bison that died of
other causes. There has been no association demonstrated between MCF mortalities in
bison and bovine herpesvirus 4 (BHV-4), bovine lymphotrophic herpesvirus (BLHV),
bovine syncitial virus (BSV), bovine immunodeficiency virus (BIV), and bovine virus
diarrhea virus (BVDV) in 26 bison that died of MCF (Collins, Bruns et ai. 2000). The
weakness in these reports lies with the small number of non-MCF mortalities that were
tested and the failure of the authors to look for OvHV-2 DNA in a representative sample
of normal healthy bison. These studies demonstrate fairly convincingly that OvHV-2

38
DNA is present in bison that die of MCF, but they do not adequately demonstrate that
OvHV-2 DNA is not present in bison that are healthy or bison that die of other causes.
Demonstrating a clear and consistent link between exposure to sheep and MCF
mortalities in bison is difficult. There have been 4 outbreaks reported in which there is
well documented exposure to sheep (Ruth, Reed et al. 1977; Schultheiss, Collins et ai.
2000), 2 with an equivocal exposure (O'Toole, Li et aI. 2002; Ruth, Reed et ai. 1977),
and 8 which failed to report whether there was or was not exposure to sheep (Collins,
Bruns et aI. 2000; Ruth, Reed et aI. 1977; Schultheiss, Collins et aI. 1998). In many of
these studies, the main focus was to describe the lesions associated with MCF in bison or
the association between OvHV-2 and MCF in bison. The failure to firmly establish an
association with sheep may simply have been the result of researchers failing to
investigate the existence of an association. Alternatively, the association may not have
been there. None of the authors of these studies, however, unequivocally stated that they
investigated and found no association between sheep and their reported outbreaks of
MCF in bison.
Since the association between sheep, OvHV-2 and MCF in cattle is well
established (Baxter, Pow et ai. 1993; Collins, Bruns et ai. 2000; Crawford, Li et aI.
1999; Li, Shen et aI. 1994; Li, Shen et aI. 1996b; Li, Shen et aI. 1995; Li, Snowder et ai.
1998; Muller Doblies, Li et aI. 1998; Wiyono, Baxter et aI. 1994), and OvHV-2 is
consistently found in bison with MCF (Collins, Bruns et aI. 2000; O'Toole, Li et aI.
2002; Schultheiss, Collins et aI. 2000), it is seems likely that, similar to cattle, sheep are
associated with MCF outbreaks in bison. Firm establishment of this association must,
39
however, await more detailed bison MCF outbreak investigations or controlled sheep
exposure trials.
2.7 Diagnostic tests for MCF and MCF viruses
MCF is a disease syndrome, which is defined by the observation of characteristic
histopathological changes in carcasses on postmortem examination. It is only when
researchers attempt to establish causal associations between MCF and MCF-group
viruses, or try to understand the epidemiology of MCF-group viruses in natural and
susceptible host populations that difficulties mise. These difficulties are mainly due to
the latent nature of herpesvirus infections. Even though infections with herpesviruses,
such as those belonging to the MCF-group of viruses, are considered to be lifelong, these
viruses are often difficult to find in animals that are infected with them (Michel,
Buchholz et al. 1995). The sensitivity of tests that are designed to isolate or identify
herpesviruses in latently infected animals are often low. Tests that detect antibodies to
herpesviruses may perform poorly because antibody levels in animals infected with
herpesviruses are often not specific to one herpesvirus and antibody levels in latently
infected ruminants are often variable over time.
2.7.1 WD-MCF and Infection with AIHV-l
The first method used to confirm WD-MCF in cattle was through the use of
transmission experiments. Blood or tissue from animals suspected of having WD-MCF
were injected into healthy cattle and rabbits. Induction of disease, having the

40
characteristic clinical signs and pathological changes of MCF in the recipients was
considered to be diagnostic for WD-MCF. Successful transmission of the disease,
however, was not always consistent and transnlission studies were mostly performed
during experiments to study the disease and not for routine diagnostic testing (Daubney,
Hudson 1936; Piercy 1952; Piercy 1952).
2.7.1.1 Virus isolation
Once methods for culturing AIHV-l in tissue culture were established and
AIHV-l was accepted as the causative agent ofWD-MCF, a diagnosis ofWD-MCF
could be confirmed by culturing the virus in bovine tissue culture (Plowright, Ferris et ai.
1960; Seal, Klieforth et ai. 1988). Tissue cultures infected with AIHV-l demonstrated a
cytopathic effect, consisting of multinucleate cellular focii, which was characteristic of
AlHV-1. Intranuclear, cytoplasmic and extracellular herpes-like particles could be
demonstrated by electron microscopy in AIHV-1 infected tissue cultures (Plowright,
Macadam et al. 1963). AIHV-l could be cultured from the blood of cattle with WD
MCF as well as from lymphnodes of cattle that died of WD-MCF (Plowright 1968).
Culturing AIHV-1 however, was a very cumbersome and often unsuccessful diagnostic
procedure. Tissue cultures were difficult to maintain and samples were required to be
taken from suspect animals shortly after death in order for the virus to be cultured
successfully (Plowright 1968).

41
2.7.1.2 Virus neutralizing antibody test
The first test to detect the presence of antibodies against A1HV-1 was a virus
neutralization or virus neutralizing antibody test. Virus neutralizing antibody tests were
conducted by inoculating tissue cultures with a mixture of serum from a test animal and
live A1HV-1. Serum was considered to contain antibodies against A1HV-l and was
classified as positive if it inhibited growth of AIHV-l in tissue culture (Plowright,
Macadam et ai. 1963). The test was not very sensitive for diagnosing WD-MCF since
only a portion of the cattle that died of WD-MCF produced serum neutralizing
antibodies to AIHV-l prior to death (Plowright 1968; Rossiter, Jessett et ai. 1980).Virus
neutralizing antibody tests have therefore been used mainly for the detection of latent
infections of ruminants of various species with MCF viruses (Hamblin, Hedger 1984;
Rossiter, Jessett et al. 1980; Seal, Heuschele et ai. 1989).
The virus neutralizing antibody test is considered to be specific to A1HV-1. It
does not detect antibodies produced against other bovine herpes viruses or OvHV-2
(Muluneh, Liebermann 1992; Plowright, Macadam et ai. 1963; Rossiter 1983; Seal,
Heuschele et ai. 1989). An AIHV-l cDNA clone has been identified and shown to
express a protein which has been recognized by A1HV-1 neutralizing sera (Lahijani,
Sutton et ai. 1995). Even though the virus neutralizing antibody test has gained
acceptance as a good test for detecting latent AIRV-1 infections, and has been used as a
gold standard for validating other tests, there have been no reports of studies aimed
directly at validating it (Seal, Heuschele et ai. 1989; Wan, Castro et ai. 1988). There is
one small study of wildebeest, that although not directly aimed at validating the virus

42
neutralizing antibody test, can be used to nlake inferences about the validity of the test
(Lahijani, Sutton et al. 1994). In this study, the virus neutralizing antibody test was
applied to serum samples taken from a population of 33 wildebeest. The sensitivity and
specificity of the test were 68.4 (95% CI = 47.5-89.3, N = 19) and 100.0 (95% CI = 73.2
100, N =14) respectively. A PCR assay which amplified a piece of A1HV-1 DNA in
peripheral blood leukocytes was used as the gold standard. A kappa statistic for
comparing the agreement between the two tests was 0.648 (95% CI =0.308-0.967, N =
33) indicating a good degree of statistical agreement, beyond chance, between the two
tests.
Although laboratory studies suggest that the virus neutralizing antibody test is
specific for detecting A1HV-1 antibodies, without adequate studies to evaluate the test's
ability to correctly classify the latent infection status of ruminants, the validity of the
virus neutralizing antibody test for the detection of latent A1HV-1 infections must
remain unknown.
Virus neutralizing antibody tests are very expensive, and labor intensive
procedures. In order to conduct virus neutralizing antibody tests, tissue cultures and cell
free A1HV-1 must be maintained in the laboratory (Plowright 1990). The difficulty,
expense and time required to perform these tests in the laboratory has compelled
researchers to search for alternative tests, which are more easily adapted to diagnostic
laboratory environments (Wan, Castro et al. 1988).
43
2.7.1.3 ELISA test
An whole virus enzyme linked immunosorbent assay (ELISA) has been
developed that detects multivalent antibody responses to AIRV-l (Wan, Castro et al.
1988). This test d.id not detect antibodies produced against bovine herpesviruses 1, 2 or
4. The sensitivity and specificity for detecting AIRV-1 antibodies were 85.3 (95% CI =
79.1-91.4, N = 129), and 83.9 (95% CI= 76.2-91.6, N = 87), in a diverse population of
ruminants. An AIHV-1 virus neutralizing antibody test was used as the gold standard.
Agreement between the two tests was good (Kappa = 0.69, 95% CI = 0.55-0.82). This
suggests that the two tests were probably detecting the same antibodies in serum, but
since the virus neutralizing antibody test has never been validated for detecting latent
AIRV-l infections, it's suitability for use as a gold standard is questionable, and
therefore the validity of this ELISA for detecting latent AIRV-1 infections also remains
in question.
2.7.1.4 Other serology tests
There have been several other tests developed for detecting antibodies to AIRV
1, including immunoflourescence (Rossiter 1981; Rossiter, Mushi et al. 1977),
immunoperoxidase(Rossiter 1981; Rossiter 1982), imn1unodiffusion (Rossiter 1980),
counter-immunoelectrophoresis (Rossiter 1980), compliment fixation (Rossiter lessett
1980), and flourescent antibody tests (Ferris, Hamdy et al. 1976). All of these test have
been either very poorly validated or not validated at all. Those for which validation
studies have been reported have performed very poorly. For these reasons, this review

44
will not provide any further discussion of these tests.
2.7.1.5 PCR tests
DNA base sequencing of portions of the A1HV-1 viral genome has allowed
several researchers to develop diagnostic tests which use PCR technology to amplify,
and gel electrophoresis to identify, segments of A1HV-1 DNA found in tissue or
peripheral blood leukocytes of animals infected with A1HV-1 (Bridgen 1991; Bridgen,
Herring et al. 1989; Hsu, Shih et al. 1990; Seal, Klieforth et al. 1990).
The first report of a PCR test for amplifying A1HV-1 DNA was a test that used
two, 20 base primers to amplify a 1028 base pair segment of a tissue culture strain (WC
11) of A1HV-1 (Hsu, Shih et al. 1990). The sequence of the primers and the amplified
segment of A1HV-1 DNA were determined from a previous report of the base sequence
of a 3389 base pair segment of the genome of the WC11 strain of A1HV-1 (Hsu, Shih et
al. 1990). The amplified DNA fragment was cleaved, with restriction endonuclease
enzyme xbaI, into two fragments which were determined by gel electrophoresis to
contain the number of base pairs predicted from the previously known sequence of the
amplified DNA fragment. The authors reported that the test performed well, but only
reported using the test on DNA derived from small numbers of infected cell cultures. In a
subsequent report the same primers from this test were used to identify A1HV-1 DNA in
peripheral blood leukocytes of 6 bovine calves that were experimentally infected with
A1HV-1 (Michel, Buchholz et al. 1995). In this study, the results of the PCR test were
compared to those of a hybridization test in which a 2.0 Kb DNA probe (SW15) (Michel

45
1993), specific to AIRV-I DNA, was used to detect AIRV-I DNA by hybridization in
samples from peripheral blood leukocytes. Both tests positively identified AIRV-I DNA
in the peripheral blood leukocytes of three infected calves that developed WD-MCF and
three infected calves that did not. The authors reported both PCR and hybridization test
results from multiple testings of all of the calves throughout the course of this study.
Although both tests yielded positive results for all 6 calves, the results were not
consistently positive over the 142 day period of the study. The authors assumed that all
of the calves in the study were truly infected with AIRV-I, even though 3 of them didn't
develop WD-MCF. Based on this assumption they made the recommendation that, in
order to firmly establish a diagnosis of latent infection with A IRV-1, nlultiple testings of
suspect animals would be required. If the assumption that all 6 calves were truly infected
with AIRV-1 can be accepted, then a crude estimate of the sensitivity of both of these
tests can be calculated form the data presented in the report. The sensitivity for the PCR
and DNA hybridization test are 65.5 (95% CI =56.0-74.2) and 40.2 (95% CI =33.8
46.8) respectively. From these calculations it would appear that both of these tests
performed poorly when used to diagnose latent infections with AIHV-1. The sample size
in this study was, however, very small. Establishing the true validity of these two tests
would require studies with much larger numbers of known AIRV-1 infected and
uninfected animals. There have been no subsequent reports of studies aimed at validating
either of these two tests.
A two stage nested PCR amplification test was developed (Katz, Seal et ai. 1991)
using two sets of primers, which were selected from the base sequence of a DNA clone

46
(clone B25) representing the Hindlli fragment D of the WCII strain of AIHV-l (Seal,
Klieforth et ai. 1990). The 2 outer primers anlplified a 487 base pair DNA fragment and
the two inner pairs a 172 base pair fragment. From the known base sequence of the
amplified fragments, restriction endonucleases PVU II and STU were used to cleave the
amplified fragments into segments which were determined to be of the predicted number
of base pairs by gel electrophosesis. The test did not amplify DNA from bovine
herpesviruses 1, 2, and 4, but did amplify DNA from 5 different strains of AIHV-I.
Although studies to validate this PCR test were not reported, the authors did report that
the test amplified DNA from both AIHV-2 and AIHV-l, suggesting that the test may
not be specific for A IHV-1.
In another study, a pair of PCR primers were developed from the base sequence
of the B25 clone of genomic DNA of the WCII strain of AIHV-I (Murphy, Klieforth et
ai. 1994).These two 30 base primers were used to design a diagnostic PCR test which
successfully amplified a 201 base pair segment of AIHV-I DNA. In addition to PCR
amplification of a specific segment of AIHV-1 DNA, the authors designed a 27 base
DNA probe that successfully hybridized to the PCR amplified segment of DNA. The
PCR successfully amplified DNA from 4 strains of AIHV-I, but not DNA from other
herpesviruses including; human cytonlegalovirus, Epstein-Barr virus, bovine
herpesvirus-I, and bovine herpesvirus-2. The test positively amplified and identified
AIHV-I DNA in 6 of 8 tissues taken at postmortem from an Indian gaur (Bos gaurus
gaurus) that died ofWD-MCF. In a second study, this test as well as an AIHV-I virus
neutralizing antibody test, were used to identify latent AIHV-1 infections in blood

47
samples from 86 ruminants belonging to 31 species of Bovidae and Cervidae (Lahijani,
Sutton et al. 1995). As expected, an10ng wildebeest, which are known to be infected
with AIHV-l, the agreement between the two tests was good (Kappa =0.648,95% CI =
0.328 - 0.967). Of the 33 wildebeest in the study, 13 were classified as positive by both
tests,14 were negative by both tests, and 6 were positive by peR, but negative for virus
neutralizing antibody. Among other species of ruminants, for which the MCF virus
infection status is not known, the agreement between the two tests was very poor (Kappa
-0.1124, 95% CI =-0.650-0.425). The agreement between samples with negative PCR
test results and their virus neutralizing test results was fairly good. The virus neutralizing
test yielded 25 negative test results from the group of 28 samples which had negative
PCR results. The virus neutralizing test however, yielded no positive test results from the
group of 25 ruminants that had positive PCR results. Since the AIHV-l virus
neutralizing antibody test is considered to be specific for AIHV-1 antibodies (Muluneh,
Liebermann 1992; Plowright, Macadam et ai. 1963; Rossiter 1983; Seal, Heuschele et al.
1989), this latter finding suggests that this PCR test may be capable of detecting DNA
from other viruses that do not stimulate their hosts to produce AIHV-1 virus neutralizing
antibodies. Obvious candidates would be other MCF group viruses such as AIRV-2,
HiHV-l, or OvHV-2, but may also include other as yet unidentified viruses. An
alternative explanation would be that those ruminants that are positive by PCR for
AIHV-l DNA, but negative for AIHV-l neutralizing antibodies, may be capable of
being infected with AIHV-1 without producing antibodies. Either alternative suggests
that one or both of these tests may not be a good test for correctly classifying ruminants

48
as being latently infected or non-infected with AIRV-1. Further studies are required to
validate both of these tests.
Tham developed a PCR assay using a pair of 20 base primers from the published
base sequence of gene A of the WC 11 strain of AIHV-l (Hsu, Shih et al. 1990), which
amplified a 413 base pair fragment of AIHV-l DNA (Tham, Ng et al. 1994). The
amplified DNA fragment was cleaved with restriction endonuclease XbaI into two
segments each with the number of base pairs predicted from the known base sequence of
the amplified fragment. In addition, a 25 base DNA probe was developed which
hybridized to the amplified DNA fragment. The test did not amplify DNA from bovine
herpesvirus-I, caprine herpesvirus-I, suid herpesvirus-I, gallid herpesvirus-lor canine
herpesvirus-I. The test was used to identify AIRV-l DNA in rabbits and red deer that
were infected with blood from a red deer which had clinical SA-MCF. The PCR test
successfully amplified the expected 413 base pair fragments of DNA from the infected
rabbits. This result would suggest that the genome of OvHV-2 contains a segment of
DNA that is homologous to the segment of DNA of gene A, of the AIHV-1 genome. It
would not be unreasonable to assume that these two viruses have homologous sections of
their respective genonlic DNAs, since these two viruses are known to be antigenically
related (Li, Shen et aI. 1994). The PCR test did not, however, amplify the expected 413
base pair fragment of DNA from the OVHV-2 infected red deer. Rather, it consistently
amplified a 600 base pair fragment. The authors of this study failed to put forward any
theories as to why a fragment of 600 base pairs was amplified in these deer with SA
MCF, nor did they discuss any attempts made to sequence the fragment, or identify it's

49
origin. The identity of this fragment might possibly be determined if the nucleotide
sequence of OvHV-2 was known. At the very least this report suggests that the set of
primers used in this peR amplification may amplify DNA segments from OvRV-2 and
possibly other unknown viruses, as well as those of AIRV-I. In a subsequent study
which compared this PCR assay to a PCR assay which used OvRV-2 specific primers
(Baxter, Pow et aI. 1993), it was shown that there was almost complete agreement
between the two tests (Kappa = 89.43, 95% CI = 83.00-95.80), when they were used on
blood and tissue samples from cattle, red deer and buffalo that were either normal, had
died of SA-MCF or had died of other diseases (Tham 1997). Since the base sequence of
the PCR primers used in Tham's PCR amplification were developed from the known
base sequence of gene A of the WC 11 strain of AIRV-l, this study provides further
support for hypothesis that both OvHV-2 and AIHV-l share this same fragment of DNA
in their genomes. It also suggests that Tham's PCR assay was unable to differentiate
between OvRV-2 and AIRV-l viral DNA.
There have been two reports of AIHV-l DNA probes being used to hybridize to
AIHV-l viral DNA found in tissue samples, blood, urine, nasal mucus, and ocular
secretions of animals infected, or suspected of being infected with AIHV-I. In the first
report a 950 base pair clone of the hindII sequence of genomic DNA of the WC 11 strain
of AIRV-l was used in an attempt to identify AIRV-l DNA in the tissue of rabbits
experimentally infected with AIHV-l (Bridgen, Munro et aI. 1992). The DNA clone
hybridized with only a small number of tissues from the infected rabbits. The authors
suggested that the poor hybridization observed in this study was a result of their being
50
little or no AIRV-1 viral DNA in tissues of rabbits dying of WD-MCF. This suggestion
was based on their observation that the clone was successful at hybridizing with AIHV-I
DNA from tissue cultures that were infected with AIRV-I. There have been no further
reports of this hybridization test being used in any experimental or field studies. The
validity of this hybridization test for detecting AIHV-l in the tissues of ruminants must
await the reporting of further studies.
An AIHV-l specific DNA probe was developed that used two DNA fragments;
a 2.0 Kb (SW 15) fragment and a 3.0 Kb fragment (SW 2) (Michel 1993). The probes
were developed from the WC 11 strain of AIHV-1 , and hybridized successfully with it.
Neither of these two fragments hybridized with infectious bovine rhinotracheitis virus,
bovine herpesvirus 2 or bovine herpesvirus 4. The SW 2, SW15 probe successfully
detected AIRV-1 DNA in the peripheral blood leukocytes of 7 of 10, three month old,
free ranging wildebeest calves. Although it is likely that these calves were infected with
AIRV-I, the cell cultures which were used to demonstrate the cytopathic effect
characteristic of AIRV-1 failed to do so. The failure was due to death of the cultures and
the results were considered to be inconclusive. The SW 15 probe failed to detect AIHV
1 DNA in the peripheral blood leukocytes of 40 cattle from a herd which had no contact
with wildebeest or sheep and no previous MCF mortalities. Even though it is likely that
these cattle were not infected with AIRV-I, their true infection status can only be
suggested, since the cell cultures used to confirm the presence of AIHV-l in this study
provided inconclusive results. If, however, the wildebeest in this study were truly
infected with AIHV-I and the cattle were not, then the performance of this test for

51
detecting latent A1RV-1 infection would be reasonable (sensitivity =70.0%,95% CI
35.4-91.9, specificity = 100.0%, 95% CI 89.1-100.0). Establishing the true validity of
this test will require further studies with known infected and uninfected animals.
There have been many tests developed for the detection of latent infections of
ruminants with AIHV-1. All of these tests either performed poorly or their performances
have not been adequately evaluated. This is surprising, since A1RV-l has been
successfully cultured and identified from infected animals for over 40 years (Plowright,
Ferris et ai. 1960). The major difficulty encountered when assessing the validity of newly
developed tests is finding or producing study subjects of known infection status. The
infection status of AIRV-1 uninfected ruminants could be established by virus isolation,
multiple testing with different tests, or the production of specific pathogen free
ruminants. The negative status of these ruminants could be strengthened by selection of
study subjects frolll populations that are not exposed to other known MCF virus carrying
ruminants. Since cell free strains of AIHV-1 exist, it would be possible to infect some of
these ruminants with AIRV-I, thereby positively establishing the infection in these
ruminants. Gold standard positive and negative blood, sera, and tissue samples could be
collected from these known infected and uninfected ruminants and used to validate
newly developed serology, PCR and other tests.
2.7.2 SA-MCF, and infection with OvHV-2
SA-MCF is a syndrome that is defined by the same histopathological
observations that define WD-MCF (Plowright 1990; Schultheiss, Collins et ai. 2000).

52
Classifying mortalities as being due to SA-MCF is therefore no more difficult than
classifying mortalities as being due to WD-MCF. However, since the two diseases are
pathologically the same, differentiating between SA-MCF and WD-MCF can be
difficult. In the past, the two syndromes have often been differentiated by documenting
the exposure of ruminants that die of MCF to latently infected hosts. MCF mortalities
that have occurred in East Africa or in zoos where there has been exposure to wildebeest
have been considered to be the result ofWD-MCF (Plowright 1990). MCF mortalities
that have occurred in other parts of the world, or where there has been exposure to sheep
have been considered to be due to SA-MCF (Goetze 1930; Goetze, Liess 1929; Goetze,
Liess 1930). Geographical location and exposure to sheep or wildebeest have not always
been good predictors of the causative agent of MCF mortalities. An outbreak of MCF
mortalities in Minnesota, in which there was an association with sheep, turned out to be
caused by AIHV-l(Li, Shen et aI. 1994; Li, Shen et aI. 1996b). Both OvHV-2 and
AIHV-l have been independently identified from African MCF mortalities (Michel,
Aspeling 1994; Plowright, Ferris et aI. 1960). The identification of a novel MCF virus
which was associated with MCF nlortalities in white-tailed deer raises the possibility that
in addition to SA-MCF and WD-MCF, there may be other fonns of MCF (Li, Dyer et aI.
2000). Since the syndromes of MCF cannot reliably be differentiated by pathology or
epidemiological associations with MCF virus infected host species, their classification
can only be achieved by demonstrating the presence of AIHV-l, OvHV-2, or some other
MCF virus in the carcasses of MCF mortalities.
Developing diagnostic tests to detect infection with OvHV-2 has been severely

53
hindered by the resistance of OvHV-2 to propagation in tissue culture. Since OvHV-2
has not been propagated, cell free OvHV-2 has been unavailable for infecting study
subjects. Failing to culture OvHV-2 has also made it difficult to positively establish the
infection status of study subjects. Culturing OvHV-2 from a study subject would provide
strong evidence of infection. Since OvHV-2 resists culture, failure to culture the virus
from a study subject cannot be considered evidence that a subject is free from infection.
Therefore gold standards for developing new diagnostic tests and establishing their
validity have been difficult to obtain, and infection status of study subjects has been
determined by other means.
The inability to propagate OvHV-2 in tissue culture, has made it in1possible to
conduct virus neutralizing antibody tests directly against OvHV-2. Although OvHV-2
shares some antigenic properties with AIHV-I (Li, Shen et al. 1995), antibodies from
sheep infected with OvHV-2, and cattle with SA-MCF have not neutralized AIHV-l
growth in tissue culture (Muluneh, Liebermann 1992; Rossiter 1981; Rossiter 1983). As
a result, virus neutralizing antibody tests using AIHV-1 tissue cultures have been
unsuccessful at detecting OvHV-2 antibodies.
2.7.2.1 Indirect immunofluorescent antibody test
The antigenic similarity between OvHV-2 and AIHV-l has prompted the use of
other AIHV-l antibody detecting tests to detect antibodies to OvHV-2. The test 1110st
commonly used has been an indirect immunofluorescent antibody test (IIF). This test has
been used to detect OvHV-2 antibodies in sheep (Li, Shen et ai. 1994; Muluneh,

54
Liebermann 1992; Rossiter 1981), healthy cattle (Rossiter 1983), and cattle with SA
MCF (Rossiter 1983). The specificity of this test is considered to be poor since the test
detects antibodies to other herpesviruses such as bovine herpesvirus 1, 2 and 4, as well as
OvHV-2 and AIHV-l (Li, Shen et al. 1994; Muluneh Liebermann 1992). Interpretation
of this test's results must therefore be done with caution.
2.7.2.2 ELISA tests
Li (Li, Shen et ai. 1995; Li, Shen et al. 1994) developed an indirect competitive
inhibition enzyme linked immunosorbent assay (CI-ELISA) that detected an
immunoglobulin G2b (monoclonal antibody IS-A) which binds to a carbohydrate
dependent epitope (epitope IS-A) of MCF viruses. The antigenic epitope IS-A, was
demonstrated to be conserved among 3 isolates of AIHV-l, as well as OvHV-2 and
MCFV-WTD (Li, Shen et al. 1994). The authors concluded that antigenic epitope 15-A
was an immunodominant epitope conserved among all known isolates of MCF viruses,
and most ruminants would produce immunoglobulin G2b in response infection with an
MCF virus. It was their opinion that the indirect CI-ELISA test would detect antibodies
in most ruminants to infection with any MCF virus (Li, Shen et al. 1995; Li, Shen et al.
1994). The test did not detect antibodies to 13 other common sheep and cattle viruses
including: ovine herpesvirus 1, caprine herpesvirus 1, OPPV, caprine arthritis
encephalitis vuris, ovine adenoviruses 5 and 6, ovine respiratory syncytial virus, ovine
parainfluenza virus 3, bovine herpesviruses 1, 2,and 4, bovine virus diarrhea virus, and
bovine respiratory syncytial virus (Li, Shen et ai. 1994). A cut-off value for the test was

55
established using sera from 5 to 6 month old lambs that were defined as being antibody
negative by their age and by having negative indirect immunofIourecence (IIF) and
immunoprecipitation (IPP) tests. Test sera were considered to be positive when the
percent inhibition of the test sera was greater than three standard deviations above the
mean percent inhibition of the negative sheep sera. The performance of the CI-ELISA
test was compared to the IIF test in a sample of 149 sheep. The agreement between the
two tests was good (Kappa = 73.83, 95% CI = 58.30 - 89.30). All of the CI-ELISA
positive samples (N =88) were positive when tested with the IIF test. Of the 61 sera that
tested negative with the CI-ELISA test, 43 were negative, but 18 were positive when
tested with the llF test. The authors suggested a possible reason for the IIF test
classifying 18 of the CI-ELISA negative sera as positive might be the llF test's ability to
detect antibodies to other herpesviruses which may have been infecting the study sheep
(Li, Shen et ai. 1994). In a subsequent study 136 of 143 sheep, which had OvHV-2 DNA
in their peripheral blood leukocytes as determined by PCR assay, were CI-ELISA
positive for OvHV-2 antibodies (Li, Shen et ai. 1995). If PCR detection of OvHV-2
DNA in peripheral blood leukocytes can be considered an indication of true infection
with OvHV-2, then the sensitivity of the CI-ELISA was 95.11 (95% CI =89.79 - 97.84)
in sheep. In the same study all serum samples from 59 pre-suckling lambs were CI
ELISA negative for OvHV-2 antibody. If pre-colostral lambs can be considered to have
no OvHV-2 antibodies in their serum, then in this study, the specificity of the CI-ELISA
test to detect latently infected sheep was 100.00 (95% CI = 92.13 - 100.00). These
studies, although small, indicate that the indirect CI-ELISA performs well as a test for

56
classifying sheep with respect to their latent OvHV-2 infection status.
The indirect CI-ELISA test has never been validated as a test for classifying the
latent OvHV-2 infection status of ruminants other than sheep. It has, however, been
validated as a test for diagnosing SA-MCF mortalities in cattle (Muller Doblies, Li et ai.
1998). The test was found to have a sensitivity of 59.46% (95% CI = 43.64 - 75.28) and
a specificity of 100.00% (95% CI =94.18 - 100.00) in a sample that included 75 healthy
cattle, 37 cattle that died of MCF and 3 cattle that died of other diseases. The low
sensitivity of the test was attributed to the rapid progression of MCF in cattle. It was
suggested that some of the cattle with MCF died before they had time to mount an
immune response (Muller Doblies, Li et ai. 1998).
The indirect CI-ELISA was modified to a direct CI-ELISA by conjugating the
monoclonal antibody15-A directly to horseradish peroxidase and by producing precoated
dried antigen plates (Li, Mcguire et ai. 2001). The new direct test had increased
sensitivity when compared to the indirect CI-ELISA. The cut off value for the test was
established using sera from a flock of sheep that had been weaned at 2 to 2.5 months of
age and then maintained in isolation. The negative status of the sheep was confirmed by
monthly PCR assays for OvHV-2 DNA. Serum samples were classified as positive when
their percent inhibition was greater than 25%, which was three standard deviations above
the mean percent inhibition of the uninfected sheep sera. The specificity of the test was
99.33% (95% CI =97.35 - 99.89) in a sample of 300 sera, drawn by multiple samplings,
from a flock of 19 OvHV-2 uninfected sheep. In a sample of 20 healthy bison, cattle and
deer that were determined to be OvHV-2 antibody negative by IIF test; the direct CI-

57
ELISA had a specificity of 95.00% (95% CI =85.18 - 98.70). In a sample of 48 adult
sheep determined to be infected with OvHV-2 by PCR assay for OvHV-2 DNA; the
sensitivity of the test was 100.00% (95% CI =90.77 - 100.00). In a sanlple of 17
mouflon sheep determined to be OvHV-2 infected by PCR assay for OvHV-2 DNA; the
sensitivity was 94.12% (95% CI =69.24 - 99.69). The sensitivity of the test as a
diagnostic test for SA-MCF was 98.25% (95% CI- 89.37 -99.91) in a sample of 57 cattle
mortalities that were confirmed to be SA-MCF mortalities by histopathology and PCR
assay for OvHV-2. From these limited data, it can be concluded that the direct CI-ELISA
performs well as an instrument to correctly classify sheep with respect to their latent
OvHV-2 virus infection status. The test also performs well as a test to detect OvHV-2
virus antibodies in cattle that died of SA-MCF. The ability of this test to correctly
classify the latent MCF virus infection status of other ruminants cannot be established
from this study, since the number of ruminants other than sheep in the study was very
small.
2.7.2.3 PCR tests
Although OvHV-2 has not been cultured in tissue culture, infected lymphocytes
from ruminants that have died from SA-MCF have been propagated in vitro (Reid,
Buxton et ai. 1983). Segments of OvHV-2 genomic DNA have been cloned from
infected lymphocytes, and their base sequences determined (Bridgen Reid 1991).
Although there was a great deal of similarity between the genomic DNA of A1HV-1 and
OvHV-2, the authors were able to find DNA fragments in which there were base

58
sequence differences between the two viruses. From the A8a subclone of a 5.2 Kb Hind
ill insert from lymphocyte line MF629, Baxter (Baxter, Pow et ai. 1993) developed two
sets of primers for a nested OvHV-2 PCR assay. The primers were considered to be
unique to OvHV-2. The outer set of primers (556 and 755) amplified a 422 base pair
fragment of OvHV-2 DNA. The nested primers (556 and 555) amplified a 238 base pair
fragment. Both of the fragments could be cleaved with restriction endonuclease RsaI into
fragments that were consistent with their predicted size from the known base sequence of
the A8a subclone. The primers did not amplify DNA from BHV-l, BHV-2, BHV-4, or
AIHV-I.
Baxter's PCR assay has been used in many studies to detect latent OvHV-2
infections in sheep. The assay has detected OvHV-2 DNA in the peripheral blood
leukocytes of 83% of 7 (Wiyono, Baxter et ai. 1994),99% of 144 (Li, Shen et ai. 1995),
60% of 10 (Baxter, Wiyono et ai. 1997),90% of 178 (Mirangi, Kang'ee 1997), and 100%
of 20 (Frolich, Li et ai. 1998) healthy adult sheep. It consistently amplified OvHV-2
DNA in peripheral blood leukocytes drawn monthly from 10 adult ewes over a 12 month
period (Li, Hua et ai. 2001). These studies would suggest that the sensitivity of this PCR
assay for detecting latent infections of sheep with OvHV-2 may be high. If it can be
assumed that all of the sheep in these studies were infected with OvHV-2, then the
sensitivity of the PCR ranged from 60% to 100% in these studies. However none of these
studies attempted to establish the true prevalence of OvHV-2 infections in their study
subjects. The true sensitivity of this PCR assay for detecting latent OvHV-2 infections in
sheep cannot be established from these studies.

59
Baxter's PCR assay amplified OvHV-2 DNA in the peripheral blood leukocytes
of 6.3% of 16 (Li, Shen et al. 1995), and 5.2% of 77 (Li, Snowder et al. 1998) pre
suckling lambs, as well as 0% of 4 lamb fetuses (Li, Snowder et al. 1998). If these lambs
were truly uninfected with OvHV-2, then the specificity of Baxter's PCR was high in
this study. It was 100% for lamb fetuses and ranged from 93.7% to 94.8% for lambs. The
assumption that these lambs were not infected with OvHV-2 is a reasonable assumption.
Larnbs weaned younger than 2.5 months of age and raised in isolation from other sheep
have been shown to remain uninfected with OvHV-2 as long as they are kept separate
from other sheep (Li, Snowder et al. 1999; Li, Snowder et al. 2000). In one flock of 19
OvHV-2 uninfected sheep, raised under these conditions and sampled monthly for 18
months, all of the samples were negative for OvHV-2 DNA, when tested with Baxter's
PCR (Li, Mcguire et al. 2001). Although the number of subjects were small, these
studies suggest that the specificity of this PCR assay is quite high in sheep.
There have been no studies reported which validate Baxter's PCR assay for
detecting latent OvHV-2 infections in other species of ruminants.
Baxter's PCR assay has proven to be a useful test for detecting OvHV-2 DNA in
ruminants that died of SA-MCF. There have been several studies reported, which
validated the PCR for this purpose. In all of these studies ruminant mortalities were
classified as being SA-MCF mortalities by histopathology. Ruminants were classified as
not being SA-MCF mortalities by routine diagnostic tests, or not having SA-MCF if they
were alive and healthy. The results from these studies are presented in table 2.2.
The majority of the studies reported were conducted in cattle. There was only one

60
study of bison and one of red deer. The sensitivities ranged from 91.7% to 100.0%, with
an over all sensitivity of 97.6% (95% CI =95.2 - 99.1) and a median of 100%. The
specificities ranged from 40.0% to 100.0%, with an over all mean of 90.7%(95% CI =
86.9 - 93.6) and a median of 100.0%.
Baxter's PCR assay performed very well as a test to detect OvHV-2 DNA in
cattle and bison SA-MCF mortalities. The overall sensitivity of 97.6% suggests that the
test produced on average only 2.4% false negative results. A comment should not be
made on the test's ability to detect OvHV-2 DNA in red deer, since there was only one
red deer SA-MCF mortality present in these studies. In most of the studies, the PCR
produced very few false positive results. This was especially evident for cattle. In 5 of 7
studies that reported using the PCR on non-SA-MCF mortalities or healthy cattle, the test
did not detect OvHV-2 DNA in any of the study subjects. This was not the case with red
deer, where the test detected OvHV-2 DNA in 60% of the healthy red deer. There are
several reasons why the PCR may have had poor sensitivity in red deer. The most
probable is that there was some form of laboratory error that occurred during the
performance of the assay. Altenlatively the test may have been detecting some other
MCF virus, or the red deer in the study may have actually been latently infected with
OvHV-2. There is some support for this last hypothesis. It has been shown that 45% of
weaned red deer fawns, (N =40) and 45% of yearling red deer fawns (N =40) had
OvHV-2 DNA in their peripheral blood leukocytes, as detected by Baxter's PCR
(Mackintosh, Tham 1998). In another study, PCR primers, developed from the base
sequence of the WC11 strain of AIHV-l, amplified a 600 base pair fragment of DNA

61
Table.2.2 Reference number (Ref), species of study subjects, sensitivity (Se), specificity(Sp), 95% confidence intervals (95% CI), and number of study subjects (N) from studiesthat validated Baxter's peR assay for OvHV-2 DNA in pathology specimens.
Refl Species Se 95% CI N Spe 95% CI N
1 Bovine 100.0 56.1 - 100.0 7 100.0 62.9 - 100.0 9
2 Bovine 91.7 59.8 - 99.6 12 100.0 71.7 - 100.0 13
3 Bovine 100.0 62.9 - 100.0 9 N/A
4 Bovine 100.0 84.5 - 100.0 27 62.8 46.7 -76.6 43
8 Bovine 96.7 81.5 - 99.8 31 100.0 88.6 - 100.0 38
5 Bovine 97.4 84.6 - 99.7 38 96.9 90.7 - 99.2 98
6 Bovine 91.9 72.0 - 97.9 37 100.0 89.3 - 100.0 41
7 Bovine 100.0 31.0 - 100.0 3 N/A
9 Bovine 100.0 92.8 - 100.0 63 100.0 89.9 - 100.0 43
4 Red deer 100.0 5.5 - 100.0 1 40.0 17.6-67.1 15
8 Bison 100.0 91.6 - 100.0 53 90.9 57.1 -99.5 11
Total All 97.6 95.2 - 99.1 281 90.7 86.8 - 93.6 311
1 1. Baxter, Pow et ai. 1993, 2. Wyono, Baxter et ai. 1994,3. Li, Shen et ai.1995, 4.Tham 1997,5. Muler Doblies, Li et ai. 1998,6. Crawford, Li et ai. 1999, 7.Hua, Li etai.1999, 8. Collins, Bruns et aI. 2000, 9.Hussy, Stauber et aI. 2000.

62
from red deer peripheral blood leukocytes (Tham, Ng et al. 1994). The red deer in this
study were infected with leukocytes originating from red deer that died of SA-MCF. The
amplified 600 base pair fragment was of unknown origin, since the primers from this
assay were shown to amplify a 413 base pair fragment from both A1HV-1 and OvHV-2
genomic DNA. These studies suggest that red deer may be latently infected with some
other, as yet unknown, MCF virus.
A PCR assay has been reported that amplified a 274 base pair fragment of
OvHV-2 genomic DNA (Schenz, Paernthaner et al. 2000). The assay successfully
amplified OvHV-2 DNA fragments in 18 SA-MCF cattle mortalities. The mortalities
were confirmed to be SA-MCF mortalities by histopathology. There have been no
subsequent validation studies reported for this PCR assay.
Hussy et al (Hussy, Stauber et al. 2001) developed a quantitative flourogenic
PCR assay that successfully amplified a 131 base pair segment of OvHV-2 genomic
DNA. In peripheral blood leukocytes from a sample of 20 known OvHV-2 infected and
20 known OvHV-2 uninfected sheep, the sensitivity and specificity of this PCR assay for
classifying sheep with respect to their latent OvHV-2 infection were both100% (95% CI
= 80.0 - 100.0). The PCR assay amplified OvHV-2 DNA in the peripheral blood
leukocytes of all 63 cattle that were confirmed by histopathology to have died of SA
MCF. From this sample the sensitivity of the assay for detecting OvHV-2 in SA-MCF
mortalities was 100.0% (95% CI =92.8 -100.0). The PCR assay failed to amplify OvHV
2 DNA in all of the peripheral blood leukocyte samples of 43 healthy cattle. The
specificity of the PCR for detecting OvHV-2 infection in healthy cattle in this study was

63
100.0% (95% CI = 89.8 - 100.0).The performance of Hussey's PCR assay was compared
to that of Baxter's PCR assay (Hussy, Stauber et ai. 2001). In both the sheep and cattle
populations cited above there was complete agreement between these two tests.
Although the number of study subjects was small, this study suggests that Hussey's PCR
assay is a good test for classifying cattle SA-MCF mortalities with respect to their
OvHV-2 infection status, and sheep with respect to their latent OvHV-2 infection status.
The assay has not been validated as a test for classifying the latent OvHV-2 infection
status of other ruminants
2.8 Which test to use.
Selection of a diagnostic test to classify bison with respect to their latent OvHV-2
infection status, has been difficult. An ideal test would be one that is both sensitive and
specific for OvHV-2 infection. If the validity of the selected test had not been established
for bison, it should at least have been established for other ruminants. If such validation
studies were available they could be used to make inferences about the potential
performance of the test in bison. In addition to being valid, the selected test should be
readily available, easy to perform, reliable and economical for large scale use.
All of the diagnostic tests that have been developed to detect both latent AIHV-l
infections of ruminants, and AIHV-l infections of WD-MCF ruminant mortalities have
been poorly validated. This alone would be enough to reject these tests for use in this
study. Although OvHV-2 and AIHV-l are closely related viruses (Bridgen, Reid 1991;
Li, Shen et ai. 1995), there are differences in both their genomic DNA base sequences

64
(Bridgen, Reid 1991) and their antigenic characteristics (Mulune, Liebermann 1992;
Rossiter 1981; Rossiter 1983). These differences ensure that before any of these tests
could be justifiably used to detect latent infections of bison with OvHV-2, their complete
validation would be required.
There have been two types of diagnostic tests developed for detecting MCF virus
infections. These are PCR assays and CI-ELISA tests. Baxter's peR assay for OvHV-2
DNA is the most likely of the PCR candidates (Baxter, Pow et al. 1993). It is the most
extensively validated PCR test and is the test that is used for most routine diagnostic
procedures (O'Toole, Li et al. 2002). In addition this test has been validated, in one small
study, as a test for detecting OvHV-2 DNA in bison that have died of SA-MCF (Collins,
Bruns et al. 2000). The assay was very good for detecting OvHV-2 infections in sheep
(Baxter, Wiyono et al. 1997; Li, Shen et al. 1994; Li, Shen et al. 1995), but has not been
validated as a test for detecting latent OvHV-2 infections in bison, or any other
ruminants.
It may be inappropriate to use the studies that validated Baxter's PCR assay in
sheep to estimate the validity of the test in bison. Where as most adult sheep are both CI
ELISA positive for OvHV-2 antibodies in their serum and PCR positive for OvHV-2
DNA in their peripheral blood leukocytes (Li, Shen et al. 1994; Li, Snowder et al. 2000),
this may not be the case with bison. In one bison feedlot study, only 8 of 71 bison that
were CI-ELISA positive for MCF virus antibodies were PCR positive for OvHV-2 DNA
in their peripheral blood leukocytes (O'Toole, Li et al. 2002). There may be several
explanations for these findings. The PCR may have failed to detect OvHV-2 DNA that

65
was present in bison peripheral blood leukocytes, or bison that were latently infected
with OvHV-2 did not have OvHV-2 DNA in their peripheral blood leukocytes. The PCR
products from the 8 PCR positive bison were not sequenced, so it is possible that the
PCR assay, although using primers specific for OvHV-2, may not have detected OvHV
2, but rather some other closely related virus that infected the PCR positive bison.
Conversely the CI-ELISA may have detected antibodies produced by infection with some
other closely related virus in the 71 CI-ELISA positive bison.
A biologically plausible hypothesis for the difference in the performance of these
two tests is that those bison which were CI-ELISA positive were truly infected with an
MCF virus, and that Baxter's PCR assay failed to detect OvHV-2 DNA in their
peripheral blood leukocytes. Baxter's PCR may have failed to detect OvHV-2 DNA in
these bison because they were either infected with another MCF virus, which was
stimulating MCF virus antibody production, or they were infected with OvHV-2, but
were not viremic at the time they were sampled. It would not necessarily be
uncharacteristic of a host species population that was latently infected with an MCF virus
to have few viraemic individuals in the population at anyone time. Of the two host
species for which most of the research has been reported, adult sheep are viremic all of
the time, as determined by PCR (Li, Snowder et al. 2000), where as adult wildebeest are
rarely viremic as determined by virus isolation (Plowright 1990). However, there have
been no reports published that assayed the peripheral blood leukocytes of a large
population of wildebeest for the presence of A1HV-1 DNA using a PCR test. Although
this hypothesis cannot be- directly supported by any experimental or observational

66
studies, if it were accepted, it would suggest that the CI-ELISA was a nluch more
sensitive test for detecting latent MCF virus infections than Baxter's PCR assay. It was
for this potential lack of sensitivity that Baxter's PCR assay was not selected for use in
this study.
Since OvHV-2 is a herpesvirus, it should, like other herpesviruses, produce life
long infections in bison that survive infection. Although antibody levels can change over
time in animals infected with herpesviruses, their infections should provide reasonably
wide, repeated windows of opportunity for antibody detection. Cross sectional studies
provide the best estimate of infection prevalence if the infecting agent is present in the
study subjects for long periods of time, or if antibodies are repeatedly or continually
detectable. Since the direct CI-ELISA detects antibodies, it was thought that it would
provide greater opportunity to detect bison that were latently infected with OvHV-2 than
would a PCR assay.
The final reason for selecting the CI-ELISA for this study was the availability and
low cost of the test. Both of which allowed for testing of a large number of bison. In
addition to looking at the prevalence of OvHV-2 infection of bison, the low cost of the
test enabled the performance of validity studies on this test in bison
The challenges associated with the use of the CI-ELISA in this study will be
those relating to the interpretation of the test results. Since the CI-ELISA detects
antibodies produced in response to infection with any MCF virus, it will be difficult to
draw conclusions as to which virus is infecting those bison which have positive test
results.

67
3. CUT-OFF ESTIMATION AND RELIABILITY OF THE CI-ELISA
3.1 Introduction
In order for livestock disease surveys to be meaningful to farmers, veterinarians,
animal health officials and researchers, survey instruments must provide reliable
estimates of the disease or infection status of the animals being tested. The performance
of a diagnostic test is characterized by two independent properties; accuracy and
precision. Accuracy is a measure of the agreement between a test result and the true
value being measured by the test. Precision, also called repeatability or reliability, is a
measure of the amount of agreement between test results when the test is repeatedly
applied to the same animal, or the same sample (Greiner, Gardner 2000). Precision and
accuracy can be further subdivided into analytical precision and accuracy, and field or
diagnostic precision and accuracy.
The analytical precision and accuracy of a test are concerned with the test's
ability to correctly measure the specific antibody or analyte it is designed to measure,
over repeated measurenlents, within an acceptable margin of error. Analytical precision
and accuracy are performed in the laboratory with samples of known concentrations of
the target analyte or antibody. They are usually the first studies carried out to evaluate a
test's performance. If a test performs well in the laboratory it is further evaluated to
establish the test's diagnostic precision and accuracy (Jacobson 1998).
The analytical accuracy of a test is measured by estimating it's analytical
sensitivity and specificity. Analytical sensitivity relates to the ability of the test to detect

68
the target analyte at varying concentrations in test solutions. Analytical specificity relates
to the tests failure to detect other closely related analytes and provides an estimate of the
test's propensity to generate false positive results (Saah, Hoover 1997).
The analytical sensitivity and specificity of the CI-ELISA for detecting antibodies
to an antigenic epitope (epitope 15-A) conserved among MCF viruses have been
reported (Li, Mcguire et ai. 2001; Li, Shen et ai. 1994; Li, Shen et ai. 1996b). Briefly,
the test was able to detect antibodies produced against the15A antigenic epitope in sera
from rabbits that were infected with 4 strains of MCF viruses, a calf infected with
AIHV-l and sheep infected with AIHV-l, over dilutions up to 1:640. The test did not
react to 8 other common sheep and 5 other common bovine viruses. Readers are directed
to the original reports for a more complete description of the analytical accuracy of the
CI-ELISA (Li, Mcguire et ai. 2001; Li, Shen et at. 1994; Li, Shen et at. 1996b). No
studies of the CI-ELISA's analytical precision have been reported.
Diagnostic accuracy and precision are measures of the ability of a test to correctly
classify anin1als with respect to their true infection or disease status, over repeated
measurements (Jacobson 1998). Studies have been reported which assess the CI
ELISA's accuracy as a test for classifying the OvHV-2 infection status of cattle and
bison that have died of SA-MCF (Li, Mcguire et al. 2001; Li, Shen et at. 1994; Li, Shen
et al. 1996b; Muller Doblies, Li et ai. 1998) and sheep that are latently infected with
OvHV-2 (Li, Mcguire et aI. 2001; Li, Shen et at. 1994; Li, Shen et aI. 1996b). There
have been no reported stud.ies evaluating the accuracy of the CI-ELISA as a test for
classifying bison with respect to their latent MCF virus infection status.

69
The diagnostic accuracy, (also called validity) of a test is evaluated by estimating
the diagnostic sensitivity and specificity of the test in populations of study subjects with
known infection status. Diagnostic sensitivity is an estimate of the probability that the
test will yield a positive result when applied to a known infected animal. Diagnostic
specificity is an estinlate of the probability that the test will yield a negative result when
applied to a known uninfected animal (Greiner, Gardner 2000).
The diagnostic accuracy of a test will be directly dependant on the tests ability to
correctly classify animals as being positive or negative with respect to their disease or
infection status based on their test results. Test results for many tests including ELISA
tests are not binary, positive/negative distributions, they are continuous distributions. A
value within the distribution must be selected in order to change the continuous
distribution to a binary distribution. This value, called the cut-off value, splits the
distribution into two groups, positive and negative. The diagnostic accuracy of a test with
continuously distributed results will be heavily dependant on the cut-off value (Greiner,
Gardner 2000).
ELISA test results are expressed as absorbance on a single serum dilution, the
optical density (OD) of which will be a reflection of the antibody activity in the serum. In
order to allow comparisons of the optical density of serum samples between test plates,
the optical density of each sample is compared to that of negative or positive control sera
that are included in each plate of test sera. The CI-ELISA for MAb 15-A uses uninfected
sheep sera as a negative control and the comparison is expressed as a ratio or percent
inhibition (PI) of the negative control sera. Since the OD of each sample is compared to a

70
control which is constant across all plates, the PI is used to calculate a cut-off value,
which can be used on all test plates (Wright, Nilsson et al. 1993). The cut-off value is
used to classify serum samples as either containing or not containing the test antibody
based on the sample PI and ultimately to classify animals as having or not having the test
antibody in their serum. Since PI values are continuously distributed, the cut-off value
that is selected will directly affect the diagnostic sensitivity and specificity of the test
(Barajas-Rojas, Riemann et al. 1993).
A cut-off of 25 PI of uninfected sheep control sera has been established for the
CI-ELISA as a test to classify latent OvHV-2 infections in sheep and a small population
of cattle and bison (N = 20) (Li, Mcguire et at. 2001). In this study the CI-ELISA
performed reasonably well. Using a 25 PI cut-off, the CI-ELISA had a diagnostic
sensitivity of 100% (95% CI =90.77 - 100.00) and a diagnostic specificity of 99.33%
(95% CI =97.35 - 99.89) in sheep. In 20 healthy bison the test had a diagnostic
specificity of 95.00% (95% CI =85.18 - 98.70), and in bison that died of SA-MCF the
test had a diagnostic sensitivity of 98.25% (95% CI = 89.37 - 99.91).
When known infected subjects are unavailable, cut-off values for ELISA tests
have been calculated from the distribution of test results from populations of uninfected
animals. The cut-off value is estimated by adding 2 or 3 standard deviations to the mean
of the distribution of test results. An alternative method using the percentiles of the
distribution has been suggested for cut-off estimation if the test results are not normally
distributed (Jacobson 1998). This method of validation is not the preferred method since
it provides no information about the diagnostic sensitivity of the ELISA and it is

71
recommended that when possible known infected animals should be included in the
validation study (Oreiner, Sohr et ai. 1995). Two graph receiver operating characteristics
(TG-ROC) curve analysis has been reported as a method for estimating the most efficient
cut-off value from samples of known infected and un-infected study subjects. TO-ROC
curve analysis estimates the cut-off value which maximizes the sensitivity and specificity
at a point on the graph at which the sensitivity and specificity are equal (Greiner, Sohr et
ai. 1995)
Reported here are two studies. The first is a validity study which established a
cut-off value for the CI-ELISA test when the test was used to classify bison with respect
to their latent MCF virus infection status. The cut-off value was estimated from sera
collected from two bison populations. One was a population of bison determined to be
uninfected with OvHV-2 by biological means and the other a very small population of
healthy bison that were determined to be infected by detecting OvHV-2 DNA in their
peripheral blood leukocytes by PCR assay. A cut-off value was estimated using the mean
plus standard deviations method as well as with TO-ROC analysis. Since the populations
were very small, a boot strapping method was used to estimate confidence intervals for
the cut-off value. Bootstrapping is a computer simulation method that can be used to
estimate confidence intervals for population parameters, such as a population mean or in
this case a cut-off value. In this study a large number of hypothetical data sets (10,000)
were created by randomly drawing values, with replacement, from the original study
population data set. Cut-off values were calculated from each hypothetical data set, and
bootstrapped confidence intervals were estimated from the distribution of these cut-off

72
values (Efron, Tibshirani 1993).
This chapter also reports a reliability study which estimated the precision of the
CI-ELISA test in paired bison sera. The precision was estimated from both the
distlibutions of PI in the paired samples and the classifications of the paired sera using a
25 PI cut-off.
3.2 Materials and Methods
3.2.1 Validation study
Bison sera used in this study came from two sources. Uninfected sera were
obtained from captive bison held in the Hook Lake bison recovery project isolation
facility at Fort Resolution, North West Territolies. This bison herd was established by
capturing bison calves with a net gun from a helicopter shortly after calves were born.
Calves were captured from free ranging bison cows belonging to the Hook Lake free
ranging bison herd, which is a sub-population of the Wood Buffalo National Park bison
herd. The herd is located in Northern Alberta and the North West Territories of Canada.
A total of 62 calves were captured during the period from 1996 to1998. Four calves died
shortly after capture, leaving 58 bison as the foundation stock for the herd. Since the
study began there have been 28 calves born in the herd. The herd has been maintained in
confinement since it's inception in 1996, with no contact being allowed between captive
bison and any other ruminants. There were no domestic or free ranging sheep within
hundreds of kilometers of the facility, nor has there ever been reported cases of MCF in
the Hook Lake captive herd or it's parent herd. A total of 132 serum samples were

73
obtained for CI-ELISA analysis from sampling's during the years, 1998,2000, and 2001.
In October of 2001, samples of peripheral blood leukocytes were obtained from the Hook
Lake captive herd for PCR analysis for OvHV-2 DNA.
Sera from known infected bison were obtained from a bison feedlot in the
American Midwest. At capacity the feedlot held 4,600 bison and 5,000 cattle. From 300
bison enrolled in a previously reported study of MCF in this feedlot (O'Toole, Li et al.
2002), 11 male bison aged 12 to 24 months were identified as being infected with
OvHV-2 by detecting OvHV-2 DNA in their peripheral blood leukocytes. Sera from
these 11 bison were obtained for CI-ELISA analysis.
3.2.2 Reliability study
Sera for the reliability study came from 47 adult male, and 230 adult female bison
on 15 farms. The number of bison sampled on each farm ranged from 8 to 42. The mean
nUITlber of bison sampled per farm was 18. Bison were blood sampled by a Canadian
Food Inspection Agency (CFIA) veterinarian during routine brucellosis and tuberculosis
surveillance. Each bison was sampled on two occasions, with approximately 72 hours
between the first and second sampling. Farms that were selected for this study included
all those farms from which farm owners requested to have their bison tested for
brucellosis and tuberculosis in one veterinary district in North Western Alberta, during
the winter of 1999 and 2000. The bison selected on each farm were a convenience
sample, selected by individual farm owners. Each sample was labeled with a nUITlber that
was coded in such a way as to blind the laboratory to the identity of the sample.

74
3.2.3 Analysis
CI-ELISA tests were performed, as previously repol1ed (Li, Mcguire et ai. 2001;
Li, Shen et ai. 1994) at the Department of Veterinary Microbiology and Pathology at the
Washington State University in Pullman, Washington. PCR analysis was performed at
Prairie Diagnostic Services, Western College of Veterinary Medicine, University of
Saskatchewan, Saskatoon, SK, using previously reported methods (Baxter, Pow et ai.
1993; Muller Doblies, Li et al. 1998).
Descriptive statistics and Pearson's correlation coefficients were calculated with
SPSS®10.0 (SPSS® Inc, Chicago Illinois, USA) statistical software. Confidence intervals
for the mean percent inhibition of the feedlot, Hooklake and reliability samples were
95% confidence intervals estimated from the 2.5th and 97.5th percentiles of the
distribution of the means of 10,000 non-parametric bootstrapped samples drawn from
each original sample, using the bootstrapping module of MlwiN® software (Institiue of
Education, London England) (Effron, Tibshirani 1993). Differences between the percent
inhibition of the Hooklake and feedlot bison were tested for statistical significance at the
5% significance level using Kruskal-Wallis one way analysis of variance with
SPSS®10.0 software. An optimal cut-off value for the CI-ELISA was estimated with two
graph receiver operating characteristic curve analysis using CMDT software (Jens
Briesofsky, Institute for Parasitology and Tropical Medicine, Berlin, Germany) (Greiner,
Sohr et ai. 1995). The confidence intervals for the cut-off value was a 95% confidence
intervals estimated from 2.5th and 97.5th percentiles of the distribution of the cut-off
values calculated for each of 10,000 bootstrapped samples of the feedlot and Hooklake

75
samples using CMDT software. The area under the receiver operating characteristic
curve was also estimated using CMDT software. Confidence intervals for sensitivities
and specificities were exact binomial 95% intervals for proportions calculated with Epi
Info® 6 version 6.04 software (Centers for Disease Control and Prevention (CDC), USA
and World Health Organization (WHO), geneva, Switzerland). Lin's concordance
correlation coefficient for agreement between the percent inhibition of the first and
second samples of the reliability study was calculated as previously reported (Shourkri,
Pause. 1999).
3.3 Results
3.3.1 Validation study
For the purposes of this study the Hook Lake bison were considered to be truly
uninfected with MCF viruses. PCR assays of peripheral blood leukocytes of these bison
failed to detect OvHV-2 viral DNA. The distribution of the PI values (figure 3.1) in the
Hook Lake population were significantly lower than those of both the feedlot bison and
the reliability study bison (Kurskal-Wallis p < 0.001). In addition the Hook Lake bison
were removed from their dams at a very early age, and were subsequently raised in
isolation from any other ruminant sources of MCF viruses.
In order to allow easy visualization of the PI data distributions, the PI's were
converted from percentages to decimals and value of one was added to each PI value. As
a result of this transformation, samples with a PI =1 had antibody activity that was the
same as that of the negative control serum. Samples with PI < 1 had antibody activity

76
that was less than that of the control sera and those with PI > 1 had antibody activity that
was greater than that of the control sera. The distribution of the percent inhibitions of the
Hook Lake bison sera are presented in figure 3.1, and the descriptive statistics are
presented in table 3.1.
I
-
-I
I--
~
-I
-
-r-- -
r-- nM r I I I I I n- - - - - - - - - - - - -
20
30
10
o.675 .726 .777 .828 .879 .930 .981 1.032 1.083 1.134 1.185 1.236 1.287
Jo...Q).cE~
z
Percent Inhibition
Figure 3.1 Histogram of the percent inhibition of sera from the Hook Lake bison.
Table 3.1 Number in group, mean, 95% confidence interval of the mean, standard

77
deviation(SD), minimum(Min) and maxin1um(Max) of the distributions of the percentinhibition of the feedlot (infected), Hook Lake(uninfected) bison and the first and secondsampling's of bison for the reliability study (Reliability 1 and Reliability 2).
Feedlot Hook Lake Reliability 1 Reliability 2
N 11
Mean 1.470
95% Clofmean1 1.392-1.554
Median 1.460
SD 0.143
Min 1.263
Max 1.741
132
0.925
0.910-0.941
0.910
0.091
0.663
1.281
277
1.135
1.108-1.163
1.095
0.237
0.345
1.820
277
1.112
1.082-1.141
1.064
0.253
.13
1.79
1 95% confidence intervals were calculated by bootstrapping with MLwiN, using 10,000non-parametric iterations. Confidence intervals were chosen from the 2.5 and 97.5percentiles

78
The distribution resembled a normal distribution, with a skew to the right. The
mean of the distribution was 0.925 and the standard deviation was 0.091. The mean plus
three standard deviations was 1.20, or 20 PI., which was on the 97.5 percentile of the
distlibution. If this value was used as a cut-off, the estimated specificity of the CI-ELISA
in this population would be 97.727 (95% CI = 93.502 - 99.529). In normally distributed
populations the mean plus three standard deviations should be close to the 99.9
percentile, which in this distribution was 1.269. If 1.25 were used as a cut-off, the
estimated specificity of the CI-ELISA from the distribution of PI's in this population
would be 99.242 (95% CI = 95.851 - 99.981).
For TO-ROC analysis, the Hook Lake population of bison were considered to be
the uninfected or "gold standard" negative population and the 11 feedlot bison, by virtue
of having OvHV-2 DNA in their peripheral blood leukocytes, were considered to be the
infected or "gold standard positive" population. Figure 3.2 is a histogram of the
combined distributions of the percent inhibition of the two populations. It can be seen
from figure 3.2 that there is little overlap between the two distributions. There is wide
separation between the means of the two populations and the 95% confidence intervals
of the two means do not overlap. The two distributions were significantly different
(Mann-Whitney Up < .001). The TO-ROC curve is presented in figure 3.3. The area
under the ROC curve, although not evident from figure 3.3 was 0.999. The cut-off value
which optimized both the sensitivity and specificity was estimated to be 1.256. Using
this cut-off value the sensitivity and specificity estimates from these two populations are
100% (95% CI = 71.50 - 100.00) and 99.242 (95% CI =95.851 - 99.981)

79
48
44
40 Un-infected• Infected
36
32
28~
Q)
.0 24E~
z 20
16
12
8
4
O~,,----,,----""-=--'--------~~--~"""";:::o::::II1.-
0.663 0.771 0.879 0.986 1.094 1.202 1.310 1.418 1.525 1.633 1.741
Percent Inhibition
Figure 3.2 Combined histograms of the PI of infected (feedlot) and uninfected (HookLake) bison. Included are the estimated normal curves for the two distributions.

80
100
0.00
080
070
I
0.00IrIIrrI
C.III
CrJ II
050I
Q) III
(J) II
0.40 I iOJ)
~II
O~II
L0.10
0.70 0.80 0.00 1.00 1.10 1.20 130 140 160 110PI
Figure 3.3 Two graph receiver operating characteristics curve of the sensitivity (Se) andspecificity (Sp) of the CI-ELISA (Y axis) for all PI cut-off points (X axis). Included inthe graph is the vertical line at the optimal cut-off PI value of 1.256 PI. The sensitivitycurve begins on the lower left of the graph and rises to the right and the specificity curvebegins on the lower right and rises to the left.

81
respectively. The cut-off estimated from 10,000 random samples drawn with
bootstrapping was 1.257. The 95% confidence intervals from the distribution of 10,000
bootstrapped cut-off values was 1.186 - 1.301.
3.3.2 Reliability study
The descriptive statistics for the distlibutions of the two samples of the reliability
study are presented in table 3.1 The mean PI of the two distributions are similar and
there is overlap of the 95% confidence intervals of the means. To illustrate the
agreement between the PI of paired samples, the PI of the first sample was plotted
against the PI of the second sample for each pair of samples. Figure 3.4 presents this
scatterplot with an estin1ated regression line. It can be seen from this graph that except
for a few outliers, most of the points are well clustered around the regression line
indicating a good deal of agreen1ent between the paired PI's. Figure 3.5 presents a plot
of the mean of the PI of the paired samples versus one half of the difference between
paired sample PI, with the accompanying estimated regression line. From this plot it can
be seen that most of the differences in PI between the paired samples cluster around the
regression line regardless of the size of the mean PI, except for very low mean PI's. The
smallest mean PI values had the largest difference between paired PI values. This gives
the plot an arrow shaped appearance with the tip pointing in the direction of the largest
PI values, and gives the estimated regression line a negative slope (slope =-0.038,
intercept =0.054, r =-0.118, p =0.05).
Linn's concordance coefficient for agreement between the PI of the first and

82
second of the paired samples was 0.811 (95% CI = 0.772 - 0.851), which indicated a
good deal of agreement between the paired PI.
2.0
1.8
c: 1.60:e..0~ 1.4 ac: a
- ac: 1.2(])
~(1) a a aa.. 1.0(1)
0-.8E a
COCJ)
"'0 .6 ac: a aD0()
.4(1)CJ)
a.2
0.0
0.0 .2 .4 .6 .8 1.0 1.2 1.4 1.6 1.8 2.0
First Sample Percent Inhibition
Figure 3.4 Scatterplot of the PI of the first sample against the PI of the second sample forpaired serum samples from bison in the reliability study, with estimated regression line.

83
.6
aC0 a
+:i;g .4.cc..... aC(]) aa a(.)"- .2(])
c.."'0 a aaQ)"-om
11. 0.0a-0
(])(.)CQ)"- a(])
-.2--(5 a
-COI a
-.4.2 .4 .6 .8 1.0 1.2 1.4 1.6 1.8 2.0
Mean Percent Inhibition
Figure.3.5 Scatterplot of the mean percent inhibition of paired bison serum samples (Xaxis) versus one half the difference of the percent inhibition of the same paired samples(Y axis), for the reliability study, with estimated regression line.
3.4 Discussion
3.4.1 Validity Study
Estimating the sensitivity and specificity of diagnostic tests for classifying

84
the infection status of aninlals requires the tests to be applied to populations of known
infected and uninfected animals. Establishing the true infection status of animals is often
difficult or impossible. In many cases the only methods available for verifying infection
status require the use of other less than perfect tests (Jacobson 1998). It is possible in
some situations however, to establish through biological or other means that animal
populations are not infected with infectious agents. When this can be accomplished, the
population of uninfected animals can be used to establish a test cut-off value. From the
distribution of test results from this population a cut-off value is selected which is either
2 or 3 standard deviations away from the mean for normal distributions. If the
distribution is skewed a cut-off value is selected that lies on a high percentile, usually the
99.9th percentile of the distribution (Jacobson 1998).
In order for this method to meaningfully classify animals with respect to their
infection status, it is imperative that the test's ability to detect it's target antibody or
analyte has been firmly established in previous studies (Jacobson 1998). Bison which die
of SA-MCF are considered to be truly infected with OvHV-2 (Collins, Bruns et ai. 2000;
Dunowska, Letchworth et ai. 2001; O'Toole, Li et ai. 2002; Schultheiss, Collins et ai.
1998; Schultheiss, Collins et ai. 2000). These bison elicit CI-ELISA positive test results
from their serum, indicating that the CI-ELISA does detect MAb 15-A in sera of bison
that are known to be infected with OvHV-2 (Li, Mcguire et ai. 2001; Muller Doblies, Li
et ai. 1998).
Populations can be classified as being uninfected by a number of methods. They
can be selected from geographical regions where there is no infection, and from herds

85
with no history of infection. The population may be further defined as uninfected by
testing with multiple tests, or by using biological criteria, such as lack of vectors for
vector transmitted diseases (Jacobson 1998). The Hook Lake captive bison herd can be
considered to be uninfected with OvHV-2 for a number of reasons. The bison which
were initially captured to form the herd were removed from their dams very shortly after
they were born. Removing lambs from their parent flock before they reach the age of 2.5
months, and raising them in isolation from other sheep successfully blocks the
transmission of OvHV-2 from the sheep flock to the lambs (Li, Snowder et al. 1999).
Even if the parent herd of the Hook Lake captive herd were infected with OvHV-2, it is
probable that in a manner similar to lambs, removing the calves from the herd at a very
early age effectively blocked transmission of OvHV-2 from the parent herd to the calves
that formed the Hook Lake captive herd. Once the calves were captured, they were raised
in complete isolation from any ruminants includ.ing sheep and other bison for the
duration of the study. Maintaining the Hook Lake captive herd in isolation from other
ruminants would have prevented infection of this herd with MCF viruses after their
capture. The negative infection status of the herd was further confirmed by the failure of
PCR assays to detect OvHV-2 DNA in the peripheral blood leukocytes of the bison in
this herd.
Using the Hook Lake captive bison herd as a population of MCF virus uninfected
bison allows the estimation of a cut-off value for the CI-ELISA test that should have a
very high specificity. The distribution of PI in this population has a skew to the right.
This is not unique to MCF viruses and this CI-ELISA test. ELISA's for other antibodies

86
commonly produce similar distributions when they are applied to sera from other
uninfected populations (Jacobson 1998). Since the study subjects in these populations
were uninfected, the mean PI for the population is always low. Using the mean plus three
standard deviations as a method for calculating a cut-off value from populations such as
these will result in the test producing a higher than predicted number of false positive
results when the test is applied to other populations. The preferred alternative is to use
percentiles to estimate the cut-off value (Jacobson 1998). The 99.9th percentile of the
Hook Lake captive herd was 26.912 PI (1.26912), which is close to the cut-off of 25 PI
established from studies of sheep (Li, Mcguire et aI. 2001). With 25 PI as the cut-off, the
estimated specificity of the CI-ELISA test in the Hook Lake captive herd was still quite
high at 99.242% (95% CI = 95.851 - 99.981).
Every population of test positive animals is made up of two sub-populations. The
first is a sub-population of animals that are truly infected, and the second is a sub
population of animals that are not infected, but produce false positive test results.
Maximizing the specificity of a test minimizes the proportion of uninfected animals that
are classified as being positive by the test. In other words, it maximizes the probability
that an animal which tests positive is truly infected. The drawback to using only known
uninfected animals to establish a test cut-off is that since there are no known infected
animals available for test validation, the proportion of all infected animals that the test is
able to detect remains unknown. Using a population of known uninfected animals to
establish a cut-off maximizes the predictive value of a positive test result, but provides
no information about the predictive value of a negative test result (Greiner, Sohr et al.

87
1995).
Identifying healthy live bison that are infected with MCF viruses is very difficult.
Bison that die of MCF can be readily classified as being infected with OvHV-2 by
demonstrating the presence of OvHV-2 DNA in their tissues (Collins, Bruns et al. 2000~
Muller Doblies, Li et al. 1998). Since this study was aimed at classifying healthy bison
with respect to their MCF virus infection status, as opposed to detecting the presence of
OvHV-2 antibodies in bison that died of MCF, it was considered inappropriate to use
bison that died of MCF as truly infected animals for the validity analysis. It is very
difficult to identify bison that are truly infected with OvHV-2 in populations of healthy
bison, since few healthy bison have been shown to have OvHV-2 DNA in their
peripheral blood leukocytes (O'Toole, Li et al. 2002). This study was able to identify
only 11 healthy bison that could be considered to be infected with OvHV-2, using PCR
assays.
Although the sample of infected bison in this study was very small, the results of
the TG-ROC analysis support the use of a 25 PI cut-off for classifying bison with respect
to their MCF virus infection status.
Analysis of ROC curves and TG-ROC curves are methods which examine the
covariance of sensitivity and specificity over various cut-off values (Greiner, Sohr et al.
1995). ROC curves are plots of the sensitivity versus one minus the specificity for all
cut-off values. Measuring the area under the ROC curve provides an estimate of the tests
efficiency or ability to discriminate between the infected and uninfected study subjects.
The area under the curve for tests which have perfect sensitivity and specificity is one.

88
Tests with less than perfect sensitivity and specificity have steadily decreasing areas
under the curve as the efficiency of the test decreases. ROC curves, while providing a
good way of estimating the efficiency of a test, provide no easy method for estinlating
the most efficient cut-off value (Greiner, Sohr et ai. 1995).
TG-ROC curve analysis provides an easier method for selecting cut-off values.
With TG-ROC analysis the sensitivity and specificity are plotted as separate variables for
each cut-off value. The point at which the two curves cross is the most efficient cut-off
value, since it is the cut-off value at which the specificity and sensitivity are equal. In
this study the most efficient cut-off value was estimated to be 1.256 (25.6 PI) (figure
3.3).
It is evident from figure 3.2 that the distributions of PIs from infected and
uninfected bison populations in this study were separated. The normal curves of the two
populations were distinct and there was little overlapping of the two curves. A cut-off
value, selected in the area of the histogram where the two population distribution curves
overlap should be very efficient, since the two curves cross at a point close to zero on the
Y axis. The area under the ROC curve from this small validation study of the CI-ELISA
test was 0.999. This value is very close to one, which indicates that in this study the CI
ELISA performed very well at discriminating between infected and uninfected bison.
This is further retlected by the high sensitivity (100.0%) and specificity (99.242%) of the
test when a cut-off value of 1.25 was used. Bootstrapping was used to assess the effect
which randonl variation may have had on the selection of a cut-off value. In a population
of 10,000 random samples drawn with replacement from this population, the mean cut-

89
off value (1.254 ) was very close to that which was calculated from the study population
(1.256). The 95% confidence interval from the bootstrapping population (1.186 - 1.301)
provides a estimate of where the mean cut-off value would lie, 95% of the time in
studies of the same size. The large spread of the confidence interval is a direct reflection
of the small sample sizes used in this study. Since the number of infected subjects was
much smaller than the nUlTlber of uninfected subjects in this study, mis-classifications
are more likely to occur with negative test results than with positive. This is evident form
the much larger confidence intervals estimated for the sensitivity of the test (71.50
100.00) as compared to those for the specificity (95.851 - 99.981).
The large confidence interval around the sensitivity estimate for the CI-ELISA
suggests that negative test results may have poor predictive value when prevalence in the
population under study is high. For example if the sensitivity of the CI-ELISA was 70%
and the prevalence in the population was 75% the predictive value for a negative test
result would be 52.43%, just slightly better than tossing a coin. Having low negative
predictive value is unlikely to severely bias prevalence estimates from surveys unless the
prevalence in the population was extremely high. However low negative predictive value
would severely reduce the utility of this test for ruling out an MCF virus infection in a
single bison in which a diagnostician had other evidence to suggest may be infected with
an MCF virus. In this case the test would provide no additional information if the test
result was negative.
Selecting 25 PI as the cut-off value for the CI-ELISA will ensure that test
positive bison have a very high probability of being infected with an MCF virus. Since

90
there is less confidence in negative than positive test results, the CI-ELISA is more likely
to under estimate the prevalence of MCF virus infections in bison populations than it is
to over estimate it.
3.4.2 Reliability Study
Precision, or reliability is a very important property of a diagnostic test. The
reliability of a test is a measure of the amount of random variation, or error that is
inherent in a tests measurement. Tests which have poor reliability are tests which have a
large amount of variation in test results when the test is applied repeatedly to the same
study subject. A test with poor reliability will always perform poorly as a diagnostic test,
since a test that demonstrates a large amount of variation when applied repeatedly to the
same individual, will have a large amount of variation inherent within single
measurements on one individual (Streiner, Normal 1995).
If there were complete agreement between paired test results from study subjects
in a population, the scatter plot of the first result against the second result would produce
a straight line with a 45 degree angle, which passes through the origin (Shourkri, Pause
1999). The scatter plot of the first versus the second of the paired PI's of the reliability
study (figure 3.4) suggests that there is a good deal of agreement between the paired test
results. The points cluster tightly around the estimated regression line and the regression
line passes through the origin. The amount of agreement between the paired PI's could
be assessed by calculating a Pearson product moment correlation coefficient. Pearson's
coefficient measures a linear relationship, but fails to detect any departure of pairs from

91
the 45 degree line which passes through the origin. Lin's concordance coefficient
provides a better measure of the agreement between pairs of test results, since it
evaluates the degree to which paired results fall on the 45 degree line though the origin
(Shourkri, Pause 1999). Lin's concordance coefficient for the paired PI test results from
this study was 0.817, indicating a high degree of agreement between the pairs.
A scatter plot of one half of the difference between the paired PI's versus the
mean of the paired PI's provides an indication of whether the precision of the test was
uniform over the conlplete range of test values. In figure 3.5 it can be seen that in
general the precision did not vary greatly over the complete range of mean test values
except for the very lowest mean values. This indicates that the CI-ELISA had more
variation or did not perform as well when the test results were at the low range of
possible results. Since the extreme low values are far from the cut-off value, poor
reliability in this range of test results should not significantly compromise the tests's
ability to correctly classify bison with respect to their latent MCF virus infection status.
In addition to providing information about the performance of the CI-ELISA test,
the reliability study also provides some information about the variability of the levels of
antibody produced against antigenic epitope 15-A of MCF viruses in bison sera over
short periods of time. Since the bison in this study were sampled at 72 hour intervals, the
high degree of agreement between paired CI-ELISA test results, suggests that antibody
levels did not vary significantly in bison over this time period. Establishing that there is
little variation in test results over time provides some confidence in test results from
bison sampled on only one occasion. The tinle interval, however is very short and

92
provides no information about long term fluctuations of antibody levels in bison sera.
There is some evidence from a previous study that levels of antibody in bison
sera, produced against antigenic epitope 15-A of MCF viruses, may fluctuate over long
periods of time (O'Toole, Li et al. 2002). In this feedlot study bison were classified with
respect to their latent MCF virus infection status with the direct CI-ELISA using a cut
off of 25 PI. From three samplings of 256 bison over a 13 month period, 93 (36.4%)
were classified as being positive on at least one of the three tests. Of these 93 bison, 34
(36.5%) were positive on only one test, 26 (28.0%) were positive on two tests and 33
(35.5%) were positive on all three tests. Viruses belonging to the MCF group of viruses
are known to produce long term latent infections in their hosts (Coulter, Wright et al.
2001). If infection with MCF viruses in bison can be considered to be long term, at least
of a longer duration than the time span of the feedlot study, and the specificity of the CI
ELISA can be accepted as being high, then the results of this study suggest that there
may be considerable variation in antibody levels against antigenic epitope 15-A of MCF
viruses within the sera of bison over long time periods. These results also suggest that
the CI-ELISA will probably under estimate the prevalence of MCF virus infections in
bison populations.
3.4.3 Summary
The CI-ELISA has been demonstrated to be a reliable test. A cut-off of 25 PI for
the direct CI-ELISA, previously established for sheep, has been demonstrated to be an
appropriate cut-off value for classifying bison with respect to their latent MCF virus

93
infection status. The long term variation of antibody levels against antigenic epitope 15-
A in bison, and the wide confidence interval of the diagnostic sensitivity estimate
suggest that this test may under estimate the prevalence of latent MCF virus infections in
bison populations.

94
4. SERO·SURVEY OF FARMED BISON IN ALBERTA
4.1 Introduction
In North America it has been accepted that MCF is most commonly caused by a
virus which infects large proportions of domestic sheep populations (Collins, Bruns et
ai. 2000; Muller Doblies, Li et al. 1998). This virus, although not as yet isolated or
propagated in tissue culture has been named ovine herpes virus-2 (OvHV-2) (Coulter,
Wright et al. 2001). In Europe and North America, MCF has been called sheep
associated malignant catarrhal fever (SA-MCF) because of the observed association
between sheep and MCF mortalities (Daubney, Hudson 1936; Goetze, Liess 1929;
Goetze, Liess 1930). Although the association between OvHV-2 and MCF has been well
documented in bison, there has been little support for an association between sheep and
MCF in bison (Collins, Bruns et al. 200; O'Toole, Li et ai. 2002; Schultheiss, Collins et
ai. 1998; Schultheiss, Collins et ai. 2000).
OvHV-2 is a gamma herpesvirus which is genetically closely related to a group
of viruses called the MCF-group (Li, Mcguire et ai. 2001). Within this group are
pathogenic viruses such as Alcelaphine herpesvirus-1 (A1HV-1) and an un-named virus
which causes MCF in white tailed deer (MCFV-WTD), as well as other viruses such as
Hippotragine herpesvirus-1 (HiHV-1) which have not been shown to be pathogenic
(Coulter, Wright et al. 2001; Li, Keller et al. 2001). Viruses within this group are well
adapted to certain host species with which they are thought to have co-evolved (Coulter,
95
Wright et al. 2001; Dunowska, Letchworth et al. 2001). Large proportions of the
populations of these species are sub-clinically infected, and it is only when the virus is
transmitted to other less well adapted host species that MCF is produced (Dunowska,
Letchworth et al. 2001). AIHV-l sub-clinically infects large proportions of wildebeest
populations, and produces MCF when the virus infects cattle (Plowright, Ferris et al.
1960). PCR studies have indicated that OvHV-2 sub-clinically infects large proportions
of domestic sheep populations and produces MCF when it infects cattle, bison and deer
(Collins, Bruns et al. 2000; Imai, Nishimori et al. 2001; Li, Snowder et al. 2000; Muller
Doblies, Li et al. 1998). Large proportions of both adult sheep and adult wildebeest
populations have been shown to have antibodies to their respective MCF viruses (Li,
Shen et al. 1996a; Li, Shen et al. 1994; Plowright 1967). Sero-surveys of other ruminant
species have demonstrated that only small proportions of the populations of susceptible
species have antibodies to MCF viruses (Frolich, Li et al. 1998; Heuschele 1988; Li,
Shen et al. 1996a). Bison, having mortalities ranging from sporadic to 100% in small
herds (Collins, Bruns et al. 2000; Ruth, Reed et al. 1977; Schultheiss, Collins et al.
2000), can be considered to be a species that is highly susceptible to MCF.
A previous survey of bison using an indirect CI-ELISA (Li, Shen et al. 1994)
indicated that only 2% of 103 bison had antibodies to MCF viruses (Li, Shen et al.
1996a). A more recent serological survey of a small group of bison in Alberta and the
United states, using a more sensitive direct CI-ELISA (Li, Mcguire et al. 2001),
demonstrated that 18% of 270 bison had antibodies to MCF viruses (Li, Mcguire et al.
2001). A prevalence of 18% in healthy bison suggests that a large proportion of the

96
bison in this study were exposed to MCF viruses without developing clinical MCF. This
study, however was based on a small sample size and may not be representative of the
entire bison population.
The purpose of chapter 4 of this thesis will be to establish the prevalence of
latent MCF virus infections in a large sample of farmed bison in Alberta. Bison serum
samples were collected from a bison serum bank located at Fairview Alberta, two
Alberta slaughter plants and five bison herds. Bison were classified as being latently
infected using a direct CI-ELISA test which detects an antibody response to antigenic
epitope 15-A in the serum of bison. Antigenic epitope 15-A is conserved among all
viruses belonging to the MCF group. A cut-off of 25 PI of negative control sheep senlm
was used to classify bison with respect to their infection status. Prevalence estimates
with confidence intervals were calculated with a Rogan-Gladen prevalence estimator.
Rogan-Gladen prevalence estimates and confidence intervals are sensitive not only to
the size of the population under study, but also to the size of the populations used to
establish the test's sensitivity and specificity (Greiner, Gardner 2000).
4.2 Materials and methods
4.2.1 Fairview senlm bank
Beginning in November 1996, Canadian Food Inspection Agency (CFIA)
veterinarians established a bank of bison sera located at the Alberta Agriculture Animal
Health Laboratory in Fairview Alberta. Sera for the serum bank were the extra aliquots
of serum from those bison tested during routine brucellosis surveillance in the Peace

97
River district of Northwestern Alberta. The farms sampled were self selected by those
farm owners who requested their bison be tested in order to maintain their negative herd
status, or to allow the movement of bison off the farm. Bison sampled were all 18
months of age or older. Samples collected from individual farms could have included the
entire population of bison on the farm which were over 18 months of age, or only a part
of that population. If a part of the on farm population was sampled, the sample was
selected as a convenience sample by the farm owner.
Within the serum bank, sera were organized into pods. Pods were labeled with a
pod number and the date of collection. Each pod could contain sera collected from one
or more farms. Information as to the number of farms in each pod or the number of
bison belonging to each farm within each pod was not available to this study. At the
time of the study there were 115 pods containing 4384 serum samples available for
sampling. The mean, median and mode of the distribution of the number of samples per
pod were 38, 19, and 10 respectively. A histogram of the distribution of pods by their
size is presented in figure 4.1
A sample size calculation for a population of 4384 with a prevalence of 25% and
a precision of 2.5% estimated the sampling fraction for the serum bank to be 913, if
random sampling procedures were used. This sampling fraction would provide an exact
binomial 95% confidence interval of 22.57 - 27.43 if there was an apparent prevalence
of 25% in the population and 0.44 - 1.56 if there were an apparent prevalence of 1%.

40-60 120-140 160-180 200-220 240-260 80-100
Number of samples per pod
o-..---'-----'--.-.....I.--""---lr--"'-.......L....--r-...L--~--I..-"""'"'-_.__...I...---'__r--
1-20
98
Figure 4.1 Histogram of the number of serum samples in each pod of the Fairview serumbank
99
Individual identification numbers were not available for each sample, so the pods were
sampled proportional to their size. In general every 5th sample was selected from each
pod until the required number of samples were collected. There were 953 samples
collected from 115 pods. The mean, median and mode of the distribution of the number
of samples per pod were 8, 5 and 1. A histogram of the distribution of pods by the
nUITlber of samples collected per pod is presented in figure 4.2.

100
1 - 6 11 - 16 21 - 26 31 - 36 41 - 46 51 - 56
Number sampled per pod
Figure 4.2 Histogram of the number sampled per pod from the Fairview serum bank.

101
4.2.2 Slaughter survey
During the period from April 7th, to September 8th of 2000, serum samples were
collected from bison that were slaughtered at two slaughter plants in Alberta. The age
and sex of the slaughtered bison was unknown. However, it has been reported that
almost all bison commercially slaughtered in Canada are males between the ages of 18
and 30 months, with an average live weight of 950 pounds (Armstrong, Ayars et al.
1998; Nixdorf, Barber et al. 1998). Information about the origin of the bison prior to
reaching the slaughter houses was not available to the study.
Collections were made on all days in which bison were being slaughtered during
the period of the study. On each slaughter day, all bison submitted for slaughter were
collected. Free flowing blood from severed jugular veins was collected into glass tubes
at the time of slaughter. In total 995 blood samples were collected on 24 slaughter dates.
The number of bison sampled per slaughtered date ranged from 8 to 71 samples. The
mean median and mode of the number of samples collected on each slaughter date were
41.4,44.0 and 31.1 respectively.
4.2.3 Cow-calf study
During the period from October 17, 2000 to February 20, 2001, serum samples
were obtained from 5 bison herds. Four of the herds were located within a 100 kIn radius
of the city of Edmonton, Alberta, and one herd was located in the Peace River district of
North Eastern British Columbia. Herds selected for the study were restricted to those
herds from which the herd owners allowed the principle investigator to collect samples.

102
Herds were also selected to provide a more or less even distribution of collection dates
over the course of the winter. Herds 2 and 5 had never experienced mortalities due to
MCF. Herds 1, 3 and 4 had reported mortalities due to MCF within the last 6 months
prior to sampling. An attempt was made to collect serum from all of the cows and calves
on each farm. Mechanical failure of equipment due to cold weather, escape of bison, and
other logistical problems prevented the complete collection of all bison cows and calves
in herds 2, and 3. Samples were collected into glass tubes by coccygeal or jugular
venipuncture.
4.2.4 Analysis
CI-ELISA tests were performed, as previously reported (Li, Mcguire et al. 2001;
Li, Shen et ai. 1994) at the Department of Veterinary Microbiology and Pathology at the
Washington State University in Pullman, Washington. In order to control for potential
effects of pod and slaughter day clustering on odds ratios, the odds ratio and confidence
interval for the comparison of the CI-ELISA positive prevalence between slaughter
survey bison and Fairview serum bank bison were calculated in a mixed-effect
generalized linear model with slaughter day/pod as a random effect using
PROC.GLIMMIX, SAS® version 8.1 software (SAS Institute Inc, Cary, NC.). In order to
control for the potential effect of clustering by herd, the odds ratio and confidence
interval for the comparison of the CI-ELISA positive prevalence between cow and calf
bison were also calculated in a mixed-effects generalized linear model with herd as a
random effect using PROC.GLIMMIX, SAS® version 8.1 software (SAS Institute Inc,

103
Cary, NC.). All other odds ratios, p values (Chi-square approximations) and confidence
intervals were calculated with Epi Info® 6 version 6.04 software (Centers for Disease
Control and Prevention (CDC), USA and World Health Organization (WHO), Geneva,
Switzerland). A 5% significance level was used for hypothesis testing. Descriptive
statistics were calculated with SPSS® 10.0 (SPSS Inc, Chicago Illinois, USA) software.
Sample size calculations were for estimating prevalence and were performed with Win
Episcope® 2.0 software (Ignacio de BIas, Carmelo Ortega, University of Zaragoza Spain;
Klaas Frankena, Wageningen University, The Netherlands; Jos Noordhuizen, Utrecht
University, The Netherlands; Michael Thrusfield, University of Edinburgh, United
Kingdom). Rogan-Gladen prevalence estimates and confidence intervals were calculated
as previously reported (Greiner, Gardener 2000).
4.3 Results
A histogram of the distribution of the CI-ELISA positive apparent prevalence
among the pods of the Fairview serum bank is presented in figure 4.3. It is evident from
this distribution that zero prevalence was the predominant prevalence among the
Fairview pods. Many of the pods were small and since pods were sampled proportional
to size, the median and mode number of samples per pod was 5 and 1.

104
0
0
10
:0
0
a I. . . . . . . . .
4
2
1
5
0.00 .13 .25 .38 .50 .63 .75 .88 1.00
Apparent prevalence
Figure 4.3 Histogram of the apparent prevalence of CI-ELISA positive bison sera amongthe pods in the Fairview serum bank

105
The relationship between sample size and prevalence is presented in figure 4.4,
which is a scatterplot of the pod sample size versus the apparent prevalence of the pods
in the Fairview serum bank. Figure 4.4 demonstrates that most of the variation in
apparent prevalence occurred among those pods whose samples sizes were small,
especially those pods with less than 10 samples per pod. Variation in prevalence was
much less among pods with larger sample sizes. Pods with zero prevalence were
predominantly found among those pods with small sample sizes. Since many pod sample
sizes were small, and there was considerable variation in prevalence among small pods,
the prevalence estimates for the Fairview serum bank were made using the entire sample
population as the denominator, rather than combining the prevalence estinlates from
individual pods.
The CI-ELISA positive apparent prevalence among the slaughter dates of the
slaughter survey ranged from 10.0 to 40.0. The mean, median and mode of apparent
prevalence among slaughter dates were 23.8, 22.4 and 29.0 respectively. Figure 4.5
presents a scatterplot of the apparent prevalence among slaughter dates versus the
number of samples collected (sanlple size) on each date. From this scatterplot it can be
seen that there was a considerable amount of variation in the apparent prevalence among
slaughter dates. The variation, however was relatively uniform over all slaughter dates,
regardless of the slaughter date sample size. Since there was a considerable range in
sample size and apparent prevalence for individual slaughter dates, prevalence estimates
for the slaughter survey were made using the entire slaughter population as the

106
o
oo
oo ~
o
0 0 0o CO 0
o 0
8 <0 \000001 0
I00 0 0
0 0 0 00 0
0 0 0-.1 -.0 .1 .2 .3 .4 .5 .6 .7 .8 .9 1.0 1.1
Apparent prevalence
oN.....C/'.i
o
1en
denominator, rather than combining prevalence estimates from each slaughter date.
Figure 4.4 Scatterplot of the CI-ELISA positive apparent prevalence of pods versus thesample size of pods in the Fairview serum bank

107
oo
oo
~ 0N 50..-;
0CZl0
~ 00%
..... 0
~ 0 0tf) 40 0 0
30 0 0 00
0
20 0
10 oo
5040302010o......- -.-- ~----..,.....----__._----_,
oApparent prevalence
Figure 4.5 Scatterplot of the CI-ELISA positive apparent prevalence for each slaughterday (X axis) versus the number of samples collected (sample size) on each slaughter day(Yaxis).

108
The apparent prevalence and Rogan-Gladen prevalence (Prg) estimates with
accompanying Rogan-Gladen confidence intervals for the Fairview serum bank and the
slaughter survey are presented in table 4.1. The overall Prg was 22.9% and there was no
d.ifference in apparent prevalence between the Fairview and samples (OR = 1.162,950/0
CI = 0.908 - 1.483).
The apparent prevalence, Prg estimates and Rogan-Gladen confidence intervals
for the 5 herds of bison in the cow-calf study are presented in table 4.2. The over all Prg
of CI-ELISA positive bison in these 5 herds was 16.2, with a 95% confidence interval of
13.7 - 18.7. There was no difference in the apparent prevalence of CI-ELISA positive
bison among the total populations of all 5 herds, nor was there a difference in apparent
prevalence among the cows in these herds. There was a significant difference between
the apparent prevalence in cows (22.8) of all herds combined, compared to the calves
(8.7) of all herds combined (OR = 3.176, 95% CI = 2.226 - 4.532). This was not true for
individual herds in the cow-calf study. In table 4.3 it can be seen that the cows in herds
one to four were more likely to be CI-ELISA positive than were the calves in those herds
(OR's 3.437 to 21.083, confidence intervals all >1). In herd five, however there was no
difference between the apparent prevalence in cows versus calves (OR =1.458, 95% CI
= 0.905 - 2.348). This is not due to the cows in herd five having a higher prevalence than
the cows in the other four herds, rather it is due to the higher prevalence of CI-ELISA
positive calves in herd five.

109
Table 4.1 CI-ELISA positive prevalence in sera from the Fairview serum bank and theslaughter survey. Included in the table are the number of samples tested in each group,the number CI-ELISA positive, the apparent prevalence, the Rogan-Gladen prevalenceestimate and the Rogan-Gladen 95% confidence interval for both groups and thecombined groups (Total).
Number tested
Number positive
Apparent prevalence
Rogan-Gladen Prevalence
95 % Confidence Interval
Fairview
953
209
22.0
21.8
19.0-24.5
Slaughter
995
240
24.1
23.9
21.1-26.7
Total
1948
449
23.1
22.9
20.8-24.9

110
Table 4.2 Cl-ELlSA positive prevalence estimates for bison cows and their calves from5 bison herds. The table includes the date sampled (Date), The herd identificationnumber (Herd), the number of bison sampled from each herd (No), the apparentprevalence (AP), the Rogan-Gladen prevalence (Prg) and the Rogan-Gladen 95%confidence interval (Cl). Totals are included for each class of bison, each farm and anover all total for the 5 herds.
Date
Date
Herd
Cows
Oct 17
1
Nov 20
2
Dec 3
3
Feb 2
4
Feb 20
5
Total
No 141 119 79 17 290 646
Ap 23.4 24.4 31.7 29.4 20.3 23.4
Prg 22.8 23.8 31.1 31.1 19.7 22.8
Cl 15.7-30.0 15.9-31.7 20.7-41.5 7.0-50.7 14.9-24.6 19.3-26.3
Calves
-0.01-3.1 0.03-13.4 -0.01-11.1 -0.01-0.01 9.2-19.3
No
AP
Prg
Cl
Total
140
1.4
0.7
105
8.6
7.8
46
6.5
4.5
18
oo
208
14.9
14.3
517
8.7
8.7
8.4-9.0
No
AP
Prg
Cl
281
12.5
11.8
7.7-15.9
224 125
17.0 22.4
16.3 21.8
11.2-21.4 14.4-29.3
35
14.3
13.6
0-25.4
498 1163
18.1 16.9
17.5 16.2
13.8-21.1 13.7-18.7

III
Table 4.3 Comparisons of the prevalence of CI-ELISA positive bison between cows andcalves for all 5 herds combined; comparison of the prevalence of CI-ELISA positivebison between cows and calves for individual herds, and the comparison of theprevalence of CI-ELISA calves in herd 5 to the calves in the rest of the herds combined.Included are the odds ratios (OR), 95% confidence intervals (CI) and p values.
Comparison OR CI P value
Cows vs calves all herds combined 3.176 2.226 - 4.532 < 0.001
Herd 1 cows vs calves 21.083 4.949 - 89.817 < 0.001
Herd 2 cows vs calves 3.437 1.542 - 7.658 0.003
Herd 3 cows vs calves 6.634 1.877 - 23.449 0.003
Herd 4 cows vs calvesl 8.769 1.194 - 64.420 0.044
Herd 5 cows vs calves 1.458 0.905 - 2.348 0.121
Herd 5 calves versus calves of 3.690 1.911 - 7.126 < 0.001
herds 1 to 4 combined
lOne of the cells of the two by two table for the comparison of the cows and calves forherd 4 contained a zero. For this comparison a value of one was added to each cell forthe calculation of the odds ratio, confidence interval and p value. The p value wascalculated with a Fisher's exact test.

112
The calves in herd five had a significantly higher apparent prevalence than the calves in
the other four herds combined (OR =3.690, 95% CI =1.911 - 7.126). In addition, the
confidence intervals for the estimates of the Prg of CI-ELISA positive calves included
zero, or were very close to zero for all herds except herd number five, indicating that the
Prg for calves in herds one through four may have been zero.
There were no differences in the apparent prevalence of CI-ELISA positive cows
or calves between the herds which repol1ed MCF mortalities and those which did not.
There was very little variation in the combined apparent prevalence or Prg among
the adult bison in the slaughter, Fairview serum bank and cow-calf studies. The Fairview
bison had the lowest Prg (21.8%), and the Slaughter bison had the highest (23.9%). The
apparent prevalence and Prg among all bison over the age of 1 year, in the slaughter,
Fairview and cow-calf studies combined were 23.17% and 22.94 (95% CI =21.14
24.73) respectively.
4.4 Discussion
Generalization of the results of this study to the bison population in Alberta musf
be done with caution. None of the sampling procedures employed in this study were
random, nor were sources for sampling a random or even representative sample of the
bison farmed in Alberta. Bison are not as amenable to handling as cattle are. Injuries are
more often associated with handling bison than cattle. Bison producers are in general
reluctant to handle their bison, or allow extra procedures to be performed on them,
unless the procedures are deemed absolutely necessary. As a result, this study obtained

113
samples only from those sources that were readily available. The number of samples
collected for this study however, was large and came from diverse groups of bison.
The Fairview serum bank contained samples that were collected over a period of
five years. Although samples came from only one area of Alberta; the Peace River
district, it is the area of Canada having the largest bison population. This geographical
region is estimated to be home to more than half of all Canadian bison (Armstrong,
Ayars et aI. 1998). The average size of bison herds in Alberta was estimated to be 68 in
1996, with breeding females making up 50% of the herd (Nixdorf, Barber et aI. 1998). In
that same year it was estimated that there were 22,782 bison in Alberta. The Canadian
bison population has been estimated to be growing at a rate of 26% per year since 1996
(Armstrong, Ayars et al. 1998). From this estimated rate of growth the population in
Alberta may have been as high as 55,000 in the year 2000. The number of bison farms in
Alberta was estimated to be 334 in 1996 (Armstrong, Ayars et aI. 1998). If the number
of farms increased at the same rate which the Canadian bison population increased, then
there may have been as many as 800 bison farms in Alberta in 2001. Bison were sampled
for the serum bank over a continuous period of time, during which the Alberta bison
population was rapidly expanding. It is therefore not possible to estimate the fraction of
the Alberta bison population which the Fairview serological survey represented.
However, the serum bank contained sera from at least 115 farms, which ranges from
34% of farms in 1996 to an estimated 14% of farms in 2001.
It is not known how many farms the slaughter plant samples came from. It has
been estimated that there were 2,854 bison slaughtered in Canada in 1998 (Hobbs,

114
Sanderson 2000). If the number of bison slaughtered in Canada has increased at the same
rate as the Canadian bison herd, the number of bison slaughtered in Canada may have
been as high as 4,500 in the year 2000. If this were the case, the slaughter survey
sampled a potential 22% of all bison slaughtered in Canada during the 2000 slaughter
year.
The accuracy of prevalence estimates from serological surveys are heavily
dependant on the validity of the tests used to classify the infection status of study
subjects. Validity studies are seldom conducted on the same study subjects that are the
object of serological surveys. They are most often conducted on known infected and
uninfected study subjects that may not be a sub-population of the population that is the
focus of the serological study. Selection of infected and un-infected sub-populations
may introduce bias into the prevalence estimates (Greiner, Gardener 2000). The Rogan
Gladen prevalence estimator provides an unbiased estimate of the prevalence in the
survey populations if the sensitivity and specificity of the test have been previously
established. Confidence intervals can be calculated for the Rogan-Gladen prevalence
estimate which include the effect on the Rogan-Gladen variance of not only the size of
the survey sample, but also the size of the samples which were used to establish both the
sensitivity and specificity of the diagnostic test. Although this method results in a
decrease in test precision, reflected as a widening of the confidence interval, it provides a
more valid estimate of the prevalence and confidence intervals in the survey populations
(Greiner, Gardener 2000).
The CI-ELISA test has been validated as a test to classify bison with respect to
115
their latent MCF virus infection status (see chapter 3). Although the validity studies were
small, the effect of their size on prevalence estimates has been accounted for by using a
Rogan-Gladen estimator to calculate prevalence estimates and their confidence intervals
(Greiner, Gardner 2000). The prevalence estimates generated by this study can therefore
be considered to be the result of valid classifications of the infection status of the bison
in this study, at the time of the study, within their respective confidence intervals.
However, since it has been shown that the level of antibody response to antigenic
epitope 15-A may vary in bison sera over time (O'Toole, Li et ai. 2002), it is possible
that these prevalence estimates may be low compared to the true prevalence of latent
MCF virus infections in these populations.
The Rogan-Gladen estimates of the prevalence of CI-ELISA positive bison in
this study indicate that a large proportion (>20%) of the study bison were latently
infected with MCF viruses. This is especially true of those study bison which were older
than one year of age. The Prg of all the three groups was similar and ranged from 21.8 to
23.9 percent. Although it can be stated with reasonable confidence that a large
proportion of these bison were infected with an MCF virus, the identity of the virus they
were latently infected with remains unknown, since the CI-ELISA was based on an
monoclonal antibody (MAb IS-A) which was produced against an epitope conserved
among all MCF viruses.
The prevalence of antibodies to MCF viruses is reported to be low in those
species that are susceptible to MCF (Frolich, Li et ai. 1998; Heuschele 1988; Li, Shen et
ai. 1996a). Although the reason for this has never been clearly established, there are

116
some hypotheses that may be put forward. Since susceptible hosts are not well adapted
to MCF viruses, it may be that most or all of those susceptible hosts in which an
infection becomes established die of MCF, leaving only a few latently infected
survivors. Alternatively, it may be that many susceptible hosts become infected, some of
which die, but most clear the infection. The latter suggestion seems unlikely since
viruses in the MCF group are known to produce long term, frequently life long, latent
infections in their host species (Coulter, Wright et al. 2001; Murphy, Gibbs et al. 1999;
Plowright 1990).
It has become accepted that MCF viruses are not transmitted between members
of susceptible host species (Heuschele 1988; Plowright 1990). This would suggest that
animals of susceptible host species attain their infections only through exposure to other
host species in which MCF viruses have co-evolved. MCF viruses which are well
adapted to a host species become highly infectious within that species (Dunowska,
LetchW011h et al. 2001). Both the MCF virus and the co-evolved host species develop
methods for transmitting the MCF virus quickly and effectively among most or all of the
members of host species populations (Barnard, Bengis et al. 1989; Li, Snowder et al.
2000). OvHV-2 should not be considered to be well adapted to bison since it produces
significant MCF mortalities in bison populations. Bison, however do not fit the pattenl
of a susceptible host species, since the prevalence of antibodies in bison populations as
demonstrated by this study, is relatively high. These infections must either come directly
from exposure to adapted host species, the most likely candidate in Canada being
domestic sheep, or through the maintenance of MCF virus infections within bison

117
populations via some form of bison to bison transmission. In a survey of bison farmers
in the year 2000, only 5.6% of 479 bison farmers reported having any contact between
sheep and their bison (Berezowski, Haigh et ai. 2000). The demonstration by this study
that a large proportion of farmed bison have antibodies to an MCF virus suggests that
bison may be maintaining MCF virus infections within their populations by bison to
bison transmission. Since the CI-ELISA test used in this study does not differentiate
between MCF virus species, the identity of the MCF virus infecting bison remains
uncertain.
Unlike the older bison in this study, the prevalence of CI-ELISA positive bison
calves was not uniform among all the populations of calves in this study. Within the first
four herds sampled the prevalence of CI-ELISA positive bison calves was low, or non
existent. In contrast, the last herd sampled, herd number five, had a much higher
prevalence. This difference is hard to explain. It may have been due to the effect of
chance, since the number of herds sampled for this study was small. Furthermore, the
number of herds sampled for each age class of calves was only one. Both of these sample
sizes is far to small to draw any firm conclusions.
4.4.1 Summary
The prevalence of CI-ELISA positive bison in three large samples of farmed
Alberta bison older than one year of age, ranged from 21.8 to 23.9 percent. In five herds
of farmed bison the prevalence of CI-ELISA positive bison calves ranged from zero to
14.3%. Since the CI-ELISA test used in this study detects an antibody produced against
an antigenic epitope which is conserved among MCF viruses, it is likely that positive

bison were exposed to and possibly latently infected with an MCF virus of unknown
identity.
118

119
5. SERO-SURVEY OF NORTHERN CANADIAN BISON
5.1 Introduction
The MCF group of viruses are a group of closely related gamma herpes viruses in
the genus Rhadinovirinae. Viruses within this group share many properties including
antigenic similarity and base sequence homology (Li, Keller et at. 2001). The most
studied viruses within this group are OvHV-2 and AIHV-l. OvHV-2 has co-evolved
with sheep and inapparently infects large proportions of adult domestic sheep
populations (Li, Snowder et at. 2000). AIHV-l has co-evolved with wildebeest and
inapparently infects large proportions of adult wildebeest populations (Plowright, Ferris
et ai. 1960). Latent infections in the adult populations of either of these two species can
be demonstrated by detecting antibodies to MCF viruses in their sera (Li, Shen et ai.
1996a; Plowright 1967). In both of these species the prevalence of antibody positive
animals is high (Li, Shen et ai. 1996a; Plowright 1967). These viruses are maintained
over generations in their respective host populations by transmission from the adults in
the herd to neonates and then by horizontal transmission from infected to uninfected
neonates (Li, Snowder et at. 1998; Plowright 1965). Viral transmission to neonates is
very rapid in both species. By the time neonates reach the age of one year most or all of
them have become infected (Li, Snowder et ai. 1998; Plowright 1965). Transplacental
transmission of AIHV-l occurs in wildebeest (Plowright 1965), but not in sheep with
OvHV-2. Lambs which are removed from their flock at less than 2.5 months of age and

120
raised in isolation from other sheep remain un-infected with OvHV-2, even though they
are susceptible to OvHV-2 infection for the remainder of their life (Li, Snowder et aI.
1999).
In the previous chapter it was demonstrated that 21.8 to 23.9 percent of bison in a
large sample of Alberta bison had antibodies to MCF viruses. Since MCF-group viruses
produce life long sub-clinical infections in other species (Li, Snowder et aI. 2000;
Plowright, Ferris et aI. 1960) it is probable that many of the bison tested were sub
clinically infected with an MCF virus. These infections may have originated directly
from exposure to sheep, or an alternative as yet unexplored hypothesis suggests that a
significant proportion of bison may be infected with an MCF virus that is being
maintained within bison populations by bison to bison transmission. The purpose of this
chapter is to investigate whether MCF virus infections are being maintained in bison
populations, independent of exposure to sheep. Four bison populations that were either
partially or completely isolated from other ruminants including sheep and other bison
were tested to determine their CI-ELISA positive prevalence. The CI-ELISA used in this
study nleasures an antibody produced against antigenic epitope 15-A which is conserved
among all MCF viruses (Li, Shen et aI. 1994). Two of these herds were maintained in
isolation for a long enough period to give birth to subsequent generations of bison. These
two herds formed the basis of a natural experiment that tested whether there was cross
generational transmission of MCF viruses in bison that were isolated from other known
ruminant sources of MCF viruses.

121
5.2 Materials and methods
Figure 5.1 presents a map of the geographical location of the 4 herds of bison
tested in this study.
M ....P
o SOkm, ,
Figure 5.1 Map of the location of the bison herds tested for chapter 5. (Adapted from S.Tessaro 1990, Northern diseased bison. Report of the environmental assessn1ent panel,Federal Environmental Assessment Review Office, Ottawa, Canada.)

122
5.2.1 Wood Buffalo National Park
Wood Buffalo National Park is a large tract of wilderness located in Northern
Alberta and the Northwest territories. The park was created in 1922 to protect the few
remaining wood bison (Bison bison athabascae) in Northern Canada from extinction.
During the years from 1925 to 1928, however 6,673 plains bison (Bison bison bison)
were translocated to the park from the National Buffalo Park in Wainwright Alberta. The
translocated plains bison interbred with woods bison in the park and the population grew
to reach 12,000 bison by 1934. For a number of reasons including disease, drowning and
predation, the bison population within the park has since declined to 2,137 bison,
estimated in the year 2000 (Nishi, Elkin et al. 2000). From a study which was
commissioned to assess the affect of brucellosis and tuberculosis on the growth of the
bison population in Wood Buffalo National Park (Joly 2001), 104 bison serum samples
were obtained for the present study. These samples were collected fronl free ranging
bison which were blood sampled after capture by net gun or darting with carfentanil and
xylazine hydrochloride from a helicopter. Capture methods were designed to provide a
sample representative of the geographical distribution of bison in the park (Joly 2001).
Bison were captured from February 24, 1998 to March 15, 1998. The sample population
consisted of female bison. The mean, median and mode of the distribution of ages of
sampled bison were 5.2, 4.0 and 2.0 years of age respectively. Bison in the park were
exposed to other free ranging ruminants, such as moose (Alces alces). The park is
isolated from commercial agriculture, but it is possible that since the park was
established, bison may have ranged into farming areas and been exposed to sheep and

123
cattle. Mortalities due to MCF have never been reported in the Park herd.
5.2.2 Hanging IcelEdjericon
The Hanging Ice ranch was a private bison ranch, first established in 1990 and
1991 with surplus bison of various ages from Elk Island National Park. The ranch was
located 30 km north of Fort Smith in the North West Territories of Canada, on the east
side of Slave Lake. In 1992 most of the bison of reproductive age were moved to a new
location, the Edjericon ranch which was located near Fort Resolution in the North West
Territories. Bison were maintained in confinement on both ranches and there were no
additions to this herds since it's inception. The bison at both ranches have had no contact
with other domestic ruminants from the time they left Elk Island National Park. Since
Elk Island National Park is located in the midst of a farming community east of
Edmonton, Alberta, it is possible that bison in the park were exposed to sheep in the
past. Removals from the Hanging Ice and Edjericon ranches were due to mortalities, sale
of bison and slaughter for meat production. One hundred twenty eight serunl samples
were obtained from a blood collection in 1994 and another 65 samples were obtained
from a collection in 2000. In both cases the collections were complete herd tests.
Mortalities due to MCF have never been reported in this herd.
5.2.3 Mackenzie Bison Sanctuary
The Mackenzie Bison Sanctuary bison herd is a free ranging herd, located on
8000 square kilometers of wilderness north of Great Slave Lake and the Mackenzie

124
River in the Northwest Territories of Canada. The herd was established in 1963 by
translocating 18 bison from Wood Buffalo National Park to an area northeast of Fort
Providence. In 1998 the herd was estimated to contain 1908 +/- 200 bison (Gates,
Stephenson et al. 2000). The range of the herd is confluent with the range of other
northern free ranging ruminants, most commonly moose (Alces alces). Due to the
northern geographical location of the sanctuary, the herd has never been in contact with
any other northern bison herds nor has their been contact with any farmed ruminants.
Fifty eight archived serum samples collected from bison in the sanctuary during the
years 1984 to 1987 were obtained for CI-ELISA analysis. The bison were sampled for
disease monitoring purposes. Information about sampling procedures and techniques
were unavailable to this study. Mortalities due to MCF have never been reported in this
herd.
5.2.4 Hook Lake Captive Herd
The Hook Lake captive bison herd is located at the Hook Lake bison recovery
project isolation facility at Fort Resolution, North West Territories. This bison herd was
established by capturing bison calves with a net gun from a helicopter shortly after they
were born. Captured calves were from free ranging bison cows belonging to the Hook
Lake free ranging bison herd, which is a sub-population of the greater Wood Buffalo
National Park bison herd. A total of 62 calves were captured during the period from
1996 to1998. Four calves died shortly after capture, leaving 58 bison as the foundation
stock for the herd. Since the study began there have been 28 calves born in the herd. The
125
herd has been maintained in confinement since its inception in 1996, with no contact
having occurred between captive bison and any other ruminants. For the duration of the
study there were no domestic or free ranging sheep within hundreds of kilometers of the
facility, nor has there ever been reported cases of MCF in the parent herd. Serum
samples were obtained from all 86 of the bison in this herd in the year 2000.
5.2.5 Analysis
CI-ELISA tests were perfomled, as previously reported (Li, Mcguire et ai. 2001;
Li, Shen et ai. 1994) at the Department of Veterinary Microbiology and Pathology,
Washington State University in Pullman, Washington. Rogan-Gladen prevalence
estimates and confidence intervals were calculated as previously reported (Greiner,
Gardener 2000). Odds ratios, p values (Chi-square approximations) and confidence
intervals for odds ratios were calculated with Epi Info® 6 version 6.04 software (Centers
for Disease Control and Prevention (CDC), USA and World Health Organization
(WHO), Geneva, Switzerland). A 5% significance level was used for hypothesis testing.
5.3 Results
Table 5.1 presents the overall prevalence and confidence intervals for all four of
the bison herds sampled for this study. The Mackenzie Bison Sanctuary (MBS) herd and
the Hook Lake Captive herd (HLCH) samples both had very low Rogan-Gladen
prevalence (Prg). The accompanying confidence intervals of the Prg for the MBS and
HLCH both included zero. The HLCH sample was a complete census of the HLCH,

126
Table 5.1 CI-ELISA positive prevalence in four northern bison herds. Herds included arethe Wood Buffalo National Park herd (WBNP), Hanging Ice/Edjericon herd (HIlEJ),Mackenzie Bison Sanctuary Herd (MBS), and the Hook Lake captive herd (HLCH). Thetable presents the size of each population, number of bison tested from each population(Sample size), apparent prevalence, Rogan-Gladen prevalence estimate and 95%confidence intervals of the Rogan-Gladen prevalence estimate.
WBNP HIlEJ MBS HLCH
Population size
Sample size
Apparent prevalence
Rogan-Gladen prevalence
95% Confidence interval
104
6.7
6.4
1.5 - 11.3
160 19081
160 58
38.8 5.2
38.6 4.9
31.0 - 46.2 -0.9 - 10.7
86
86
1.2
0.9
-1.6-3.4
1 The sizes of the Wood Buffalo National Park and Mackenzie Bison Sanctuary bisonherds are both approximations.

127
making it possible to conclude with some degree of confidence from the Prg and its
accompanying confidence interval that the HLCH had a CI-ELISA positive prevalence
of zero and therefore was uninfected with an MCF virus. Since the MBS prevalence
estimate was based on a relatively small sample of the parent herd, it may not be correct
to assume the MBS herd was uninfected with an MCF virus even though the confidence
interval of the Prg included zero. Information about sampling procedures was
unavailable for this herd and therefore sampling methods may have affected the
prevalence estimate.
The Prg estimate for the Wood Buffalo National Park (WBNP) herd was also
low. Although the Prg confidence interval did not include zero, it approached zero,
making it difficult to assume that WBNP herd was free from infection with an MCF
Vlrus.
The prevalence estimates for the Hanging IcelEdjericon (HIlEJ) sample were
high. The CI-ELISA positive Prg was 38.6 with a confidence interval well above zero
(31.0 - 46.2).
Both the HLCH and the HI/EJ herds were formed from bison that originated
from other herds. The HLCH came from neonatal bison calves that were captured form
the WBNP herd and the HIlEJ herd from surplus bison of various ages from the Elk
Island National Park herd (herd number 2 in chapter 4). Once these two herds were
established, they were maintained in captivity, free from exposure to other ruminants for
a period of time sufficient to allow the cows within these herds to give birth to
subsequent generations of calves. There were 28 calves born into the HLCH and 92
128
calves born into the lllJEJ herd (table 5.2). The Prg estimates for these two herds are
widely divergent. The translocated HIlEJ bison had a much higher Prg than did the
HLCH bison (OR =38.2, 95% CI =9.5 - 153.5). Among bison born after translocation,
the HIlEJ bison also had a much higher Prg than did the HLCH (OR =18.0, 95% CI =
3.8 - 85.7). It is difficult to firmly establish whether the herd of origin of the HLCH was
infected with an MCF virus, since the Prg and confidence interval of the herd of origin
were low. Among translocated HLCH bison the Prg was close to zero (Prg =1.7,950/0
CI =-2.1 - 4.9) and among HLCH bison born after translocation the Prg was zero (95%
CI = -1.3 - 0.7).
The Prg of the herd of origin of the lllJEJ herd was similar to that of other
farmed bison (Prg =23.8, 95% CI 15.9 - 30.0) and the Prg of the translocated bison was
high (Prg =39.5, 95% CI =27.8 - 51.2). The Prg of the bison born after translocation
was high (Prg =37.8, 95% CI =27.8 - 47.8).

129
Table 5.2 CI-ELISA positive prevalence for the Hanging Ice/Edjericon and Hook Lakecaptive bison herds. Included in the table are the number of bison tested (N), the RoganGladden prevalence, and the 95% confidence intervals of the Rgoan-Gladen prevalencefor the herd of origin, the bison that were translocated and the bison that were born aftertranslocation.
Hanging IcelEdjericon Hook Lake Captive Herd
Herd of origin
Rogan-Gladen prevalence
Confidence interval
Translocated bison
Rogan-Gladen prevalence
Confidence iterval
Born after translocation
Rogan-Gladen prevalence
confidence interval
N = 1191
23.8
15.9 - 30.0
N=68
39.5
27.8 - 51.2
N=92
37.8
27.8 - 47.8
N =1042
6.4
1.5 - 11.3
N=58
1.7
-2.1 - 4.9
N=28
o-1.3 - 0.7
1 The herd of origin of the Hanging Ice/Edjericon herd was herd number 2 in chapter 4.
2 The herd of origin of the Hook Lake captive herd was the Wood Buffalo National Parkherd

130
5.4 Discussion
It is difficult to firmly establish the CI-ELISA positive prevalence within the
WBNP and MBS bison populations from the results of this study. This is mainly due to
inadequacies in the study design. The sampling fractions of both herds were low. In
addition, the prevalence estimates from the samples of these two herds were low
compared to those expected in MCF virus infected bison populations (Chapter 4). Small
sample sizes and low numbers of test positive animals have the combined effect of
generating low prevalence estimates with wide confidence intervals that can easily
approach or encompass zero. Both the WBNP and MBS herds are populations of free
ranging bison that exist on large tracts of wilderness in remote areas of Canada. It is very
difficult to sample bison in either of these herds, and this study was forced to use only
those samples which were available from previous studies.
The CI-ELISA positive prevalence estimates for the fILCH and the HI/EJ herds
in this study can be considered to be more valid estimates of the CI-ELISA positive
prevalence within these two populations, since both of the herd samples were a complete
census of the populations alive at the time of sampling. The CI-ELISA positive
prevalence estimates for these two populations suggest that two different processes were
occurring within these populations.
The prevalence of CI-ELISA positive bison in the parent herd of the HI/EJ herd
was similar to that found in other farmed bison herds (table 5.2). Bison of various ages
were translocated to form the HI/EJ herd, and it is likely that the translocated bison
carried MCF viruses into the newly formed HI/EJ herd. The bison in this herd were

131
isolated from other ruminant sources of MCF viruses for the duration of the study. The
high CI-ELISA positive prevalence in second generation bison suggests that MCF
viruses were transmitted from translocated bison to subsequent generations of bison in
the HI/EJ herd.
The bison which formed the HLCH were uninfected when the herd was formed
and have remained uninfected into the next generation of bison (table 5.2). The bison
which formed the HLCH were captured as neonatal calves, but it is not known whether
removing these calves from their parent herd at an early age actually blocked
transmission of MCF viruses to these calves, since the prevalence estimates from their
parent herd were equivocal. The parent herd may not have been infected with MCF
viruses.
The HLCH and HI/EJ herds can be considered to be parts of a natural experiment
in which the HLCH serves as a control herd or herd with which the HI/EJ herd can be
compared. Both herds were maintained in Northern Canada, under similar conditions,
during the same period of time. Both herds were kept in confinement, unexposed to
other ruminants for a long enough period to produce subsequent generations of bison.
The major difference between the two herds was the HIJEJ herd was infected with MCF
viruses at its inception and the HLCH was not. The HIJEJ herd has maintained MCF
virus infections in subsequent generations of bison, in the absence of other ruminant
sources of MCF viruses. This suggests that MCF virus infections have been transmitted
from the translocated bison of the HI/EJ herd to subsequent generations of bison within
this herd. The HLCH, however has maintained it's uninfected status across generations

132
in the absence of other sources of MCF viruses. It is likely that both herds were
effectively isolated from other ruminant sources of MCF viruses for the duration of the
study.
It has been clearly established that herpesviruses belonging to the MCF group are
transmitted from adults within their co-evolved species populations to the next
generation of neonates. A1HV-1 is transmitted from adult wildebeest to neonatal
wildebeest (Plowright 1965), and OvHV-2 is transnlitted from adult sheep to lambs (Li,
Snowder et ai. 1998). The findings of this study suggest that a similar phenomenon may
have occurred among the lllJEJ bison. The mechanism of cross generational
transmission of MCF viruses in HI/EJ bison remains unknown. The CI-ELISA test used
in this study detects an antibody produced against an epitope which is conserved among
all known MCF group viruses (Li, Shen et ai. 1994). It is therefore not possible from the
results of this study to determine the identity of the virus which was transmitted among
the bison in the lllJEJ herd.
5.4.1 Summary
Using a CI-ELISA test, this study denlonstrated that MCF virus infections were
being maintained and transmitted across generations in one isolated bison herd, in the
absence of other ruminant sources of MCF viruses. Since the CI-ELISA detects
antibodies produced against an antigenic epitope which is conserved among all MCF
viruses, the identity of the virus infecting this bison herd could not be determined.

133
6. TRANSMISSION OF MCF IN BISON
6.1 Introduction
Malignant catarrhal fever(MCF) is a fatal disease of many ruminants including
cattle, bison, buffalo, swine and deer (Castro, Daley et al. 1982; Heuschele, Fletcher et
ai. 1984; Liggitt, McChesney et ai. 1980; Loken, Aleksandersen et ai. 1998; Metzler
1991; Reid, Buxton et ai. 1984). There are two commonly recognized forms of MCF,
wildebeest associated MCF (WD-MCF ) and sheep associated MCF (SA-MCF).
Wildebeest associated MCF is so named because wildebeest, most of whom are latently
infected with a herpesvirus named Alcelaphine herpesvirus 1 (AIHV-l), produce
outbreaks of WD-MCF when they transmit AIHV-l to cattle or other susceptible
ruminant species (Plowright, Ferris et ai. 1960). AIHV-l has been isolated in tissue
culture and the complete DNA base sequence of its genome has been reported (Ensser,
Pfanz et al. 1997; Plowright, Ferris et ai. 1960). Sheep associated malignant catarrhal
fever was originally named because of the observed association between exposure to
sheep and the occurrence of malignant catarrhal fever in susceptible ruminant species,
especially cattle (Goetze 1930; Goetze, Liess 1929; Goetze, Liess 1930). Ovine
herpesvirus-2 (OvHV-2), a gamma herpesvirus closely related to AIHV-l, has become
accepted as the causal agent of SA-MCF even though it has never been isolated in tissue
culture or observed by electron microscopy (Bridgen, Reid 1991; Dunowska, Letchworth
et ai. 2001; Heuschele, Reid 2001). OvHV-2 has been identified only from it's DNA
base sequences (Baxter, Pow et al. 1993; Bridgen, Reid 1991; Coulter, Reid 2002;
134
Dunowska, Letchworth et ai. 2001). PCR studies have demonstrated that a large
proportion of sheep are latently infected with OvHV-2, or at least have OvHV-2 DNA
base sequences in their peripheral blood leukocytes (Baxter, Pow et ai. 1993; Li, Shen et
ai. 1995; Li, Snowder et ai. 1998). PCR studies have also demonstrated a strong
association between the presence of OvHV-2 DNA base sequences and mortalities
attributed to SA-MCF in ruminants (Baxter, Pow et ai. 1993; Collins, Bruns et ai. 2000;
Crawford, Li et ai. 1999; Li, Shen et ai. 1995; Muller Doblies, Li et al. 1998; Tham
1997; Wiyono, Baxter et ai. 1994).
A third, less well known form of MCF, has been reported in one herd of white
tailed deer (Odocoeieus) virginianus) from a zoo in the United States (Li, Dyer et ai.
2000). Deer suspected of dying from MCF had gross pathology and histopathology
typical of malignant catarrhal fever, but evidence of neither A1HV-1 or OvHV-2 could
be found in their carcasses. However, a 230 base pair DNA fragment with homology to
other MCF virus DNA was identified in peripheral blood leukocytes of affected deer. It
had 82% similarity to the corresponding region of OvHV-2 DNA polymerase and 72%
similarity to A1HV-1 DNA polymerase, suggesting that there may be another
herpesvirus similar to AIHV-1 and OvHV-2 which is capable of producing MCF in
white-tailed deer. Further studies of the base sequence of this virus's DNA polymerase
and DNA packaging genes have supported it's close relationship to OvHV-2 and A1HV
1 (Kleiboeker, Miller et ai. 2002). The virus has been putatively named MCF virus of
white-tailed deer (MCFV-WTD). The reservoir host for this virus has not been reported.
Although SA-MCF is the most common form of malignant catarrhal fever world

135
wide, little is known about the epidemiology of the disease (Heuschele, Reid 2001). The
resistance of OvHV-2 to propagation in vitro has been a major impediment to
researchers studying MCF. Prior to the advent of PCR technology there was no method
available for positively identifying animals infected with OvHV-2 (Baxter, Pow et al.
1993). The inability to replicate OvHV-2 in vitro has made it difficult to study the
virus's stability in the environment, it's incubation period, or the mechanisms by which
it is transmitted from sheep to cattle or other susceptible species.
PCR and antibody prevalence studies have demonstrated that most sheep are
infected with OvHV-2, and that OvHV-2 is highly infectious within sheep populations
(Baxter, Wiyono et al. 1997; Li, Mcguire et al. 2001; Li, Shen et al. 1995; Li, Snowder
et al. 1998; Li, Snowder et al. 2000; Metzler 1991; Mirangi, Kang'ee 1997; Muluneh,
Liebermann 1992; Rossiter 1981; Wiyono, Baxter et al. 1994). OvHV-2 or at least SA
MCF is probably not transmitted directly from ruminants with SA-MCF to other healthy
susceptible ruminants. Transmission of SA-MCF has been sporadically successful by
injection of blood or tissue from affected cattle or bison to healthy cattle or bison
(Blood, Rowsell et al. 1961; Goetze 1930; Goetze, Liess 1929; Goetze, Liess 1930;
Homer, Oliver et al. 1975; Liggitt, McChesney et al. 1980; Magnusson 1940; Selman,
Wiseman et al. 1974; Selman, Wiseman et al. 1978). In contrast, horizontal transmission
of SA-MCF from affected cattle to healthy cattle stabled next to them has invariably
failed (Goetze 1930; Goetze, Liess 1929; Goetze, Liess 1930; Piercy 1954; Pierson,
Storz et al. 1974). Attempts to transmit SA-MCF with nasal and ocular secretions from
affected cattle or deer with SA-MCF to healthy cattle or deer has also failed (Imai,

136
Nishimori et al. 2001; Schofield, Bainf 1941).
There are several published reports of MCF outbreaks in bison (Collins, Bruns et
al. 2000; Liggitt, McChesney et al. 1980; O'Toole, Li et al. 2002; Ruth, Reed et ai.
1977; Schultheiss, Collins et ai. 1998; Schultheiss, Collins et al. 2000). In these reports
sources of OvHV-2 and details relating to the exposure of bison to sheep have been
either unreported or poorly defined, making it difficult to infer the mechanism of
transmission of OvHV-2 from sheep to bison.
This study reports the results of a natural experiment in which bison were
exposed to sheep for a period of less than one day at a public auction sale in
Saskatchewan. Following the auction sale, bison attendant at the sale were transported to
11 different farms where they were mixed with 1010 other bison. There were no sheep
on or near any of the destination farms. Over the next 220 days, 45 bison died of SA
MCF on the destination farms. Only those bison exposed to sheep at the auction sale
died of SA-MCF.
The purpose of this chapter is to demonstrate that in this natural outbreak of SA
MCF, there was no horizontal transmission of SA-MCF among bison.
6.2 Outbreak History
On November 7th, 2000, 163 bison, originating from 8 different Saskatchewan
farms were assembled for sale at an auction market in Saskatchewan. The number of
bison on each submitting farm ranged from 4 to 170 bison, with a mean herd size of 72.3
bison. The proportion of bison sold from each farm ranged from 5.8 to 100.0 percent of

137
each herd. The crude percent sold over all farms was 28.2 percent of all bison on the
submitting farms. Following the removal of sale bison to the auction market there were
415 bison remaining on the farms of origin. Table 6.1 presents the nUlnber of bison
submitted from each farm to the November 7th auction sale and the number of bison
remaining on each farm after the sale bison were removed. Buyer 10 is listed as a seller
because he not only sold bison at the auction sale on November 7th, but also bought other
bison at the sale and transported them to his farm. None of the farms of origin reported
any previous cases of MCF, nor were any of the sale bison exposed to sheep on their
farnlS of origin. The farms were widely separated geographically and there was no
exchange of bison between submitting farms prior to the November 7th sale. Most of the
bison were brought to the auction market on Sunday Noverrlber 5th• The renlainder were
brought to the auction market on Monday, November 6th• Bison at the sale consisted of
87 calves, 57 yearlings and 19 adults.
During the morning of November 6th, 216 sheep from several different
Saskatchewan sheep farms were assembled at the auction market for transport to Alberta
for slaughter. The sheep remained in the auction market until late in the afternoon of
November 6th• In addition, the method by which bison at the auction market were
exposed to the sheep has not been clearly established. However, since the sale was held
during the winter, both sale bison and sheep were housed within the same building
during their stay at the auction market. Sheep were not housed in the same room as sale
bison, but were housed in an adjoining room. The two rooms were connected by two
large openings that did not restrict air movement.

138
Table 6.1 The number of bison sold from each farm that submitted bison to theNovember 7th auction sale, percent of the total herd that was sold, number of mortalitiesin each group of bison submitted to the sale that were suspected to be MCF mortalities,number of mortalities in each group of bison submitted to the sale that were confirmedto be MCF mortalities and the number of bison left on each submitting farm after thesale bison were transported to the sale. There were no mortalities reported among bisonleft at home during the study period.
Bison Sold At Auction Sale Bison Left OnFarm
Percent Suspect ConfirmedSeller ID Number Sold MCF MCF Number
Buyer 10 30 29.7 3 1 71
Seller 1 20 34.5 4 6 38
Seller 2 2 5.6 1 0 34
Seller 3 38 32.8 5 5 78
Seller 4 24 41.3 4 5 34
Seller 5 5 14.3 1 0 30
Seller 6 40 23.6 4 4 130
Seller 7 4 100.0 2 0 0
Total 163 28.2 24 21 415

139
During the day of the sale there was movement of people and equipment through
these two openings. It is unlikely that bison and sheep would have been in direct contact
since bison were confined to pens within the auction market until the time they were
sold. No other livestock were present at the auction market during the time the sale bison
were there. This auction market has held many bison sales in the past. No sheep were
present at any of the previous sales nor were any of the previous sales associated with
MCF outbreaks.
After the sale, the bison were transported to 11 different bison farms. The
number of bison on these farms ranged from 0 to 270 bison, with a mean herd size of
91.2 bison. The number of sale bison transported to each destination farm ranged from 2
to 37 bison. On destination farms sale bison were mixed with resident bison of the same
age to form new groups of bison. Sale bison ranged from 3.3 to 100.0 (mean =31.7)
percent of the bison in each newly formed group. In total, sale bison were mixed with
1010 other bison on destination farms. Table 6.2 presents the number of sale bison
purchased by each buyer. There were no sheep within 2 miles of any of the destination
farms prior to the arrival of sale bison or during the term of the study. There were no
cases of MCF reported on any of the destination farms prior to the November 7th sale.
The destination farms were very widely dispersed geographically. Table 6.3 presents the
number of other bison that sale bison were mixed with on their destination farms. Buyer
11 did not purchase any bison at the November 7th auction sale. The sale bison purchased
by buyers number 4 and 9 spent one month at buyer 11 's farm mixed with his bison
before being moved to the farms of buyers 4 and 9.

140
Table 6.2 NUlnber of bison purchased by each buyer, number of suspected MCFmortalities, nunlber of MCF mortalities confirmed by postmortem examination, crudeMCF mortality rate, including both suspect and confirmed MCF mortalities, and thenumber of mortalities by other causes. There were no nlo1talities for reasons other thanMCF reported in these bison.
Number of Confirmed MCFBison SuspectMCF MCF Mortality
Buyer ID Purchased Mortalities Mortalities Rate
Buyer 1 33 3 6 27.3%
Buyer 2 5 0 1 20.0%
Buyer 3 16 5 2 43.8%
Buyer 4 7 0 0 0.0%
Buyer 5 2 0 0 0.00/0
Buyer 6 23 3 3 26.1%
Buyer 7 37 6 4 27.0%
Buyer 8 31 6 5 35.5%
Buyer 9 5 0 0 0.0%
Buyer 10 4 1 0 25.0%
Total 163 24 21 27.6%

141
Table 6.3 Number of bison on destination farms that were exposed to bison purchased atthe November 7th auction sale, number of mortalities due to all causes and the crudemortality rate.
Buyer ID Exposed Bison Mortalities Mortality Rate
Buyer 1 22 0 0.0%
Buyer 2 30 0 0.0%
Buyer 3 105 0 0.0%
Buyer 4 198 0 0.0%
Buyer 5 20 0 0.0%
Buyer 6 107 1 0.9%
Buyer 7 270 3 1.1%
Buyer 8 7 0 0.0%
Buyer 9 0 0 0.0%
Buyer 10 74 0 0.0%
Buyer 11 177 0 0.0%
Total 1010 4 0.4%
142
On December 28,2000 one of the bison that had been purchased at the auction
market on November 7th died. Subsequently a total of 45 bison purchased at the
November 7th sale died on 7 destination farms. Twenty one were confirmed as being
MCF mortalities by postmortem examination, and 24 were suspected of being MCF
mortalities based on descriptions of clinical signs provided by farmers.
The outbreak began quite suddenly on the 50th day following the sale. The peak
of the outbreak occurred during the 60th to 70th days or January 6th to 16th (mean =81
days, median =65 days, mode =60 days). The rate of occurrence of mortalities slowed
by the 100th day or February 12th, and then were sporadic until the last mortality on the
220th day or June 14th• Figure 6.1 compares the number of mortalities that occurred in
each 10 day period on destination farms following the auction sale.
There were no MCF mortalities in any of the 1010 bison that were mixed with
sale bison on destination farms. However, two bison died as a result of handling trauma
and 2 died from pneumonia as determined by postmortem examination. There were no
mortalities among the 415 bison remaining on the farms of origin for the duration of the
study.

10
8
6ena>E(ijt::0:2
4't-0L-a>.cE::JZ
2
o
143
- r-
- .---
~
-
-
..--
- .--
..-- .--- ..-- - - r--
I I I I I I I I I I I I I I I I I I I
40 60 80 100 120 140 160Days Following Auction Sale
180 200 220
Figure 6.1 Bar chart of the number of mortalities that occurred in the MCF outbreak foreach 10 day period following the auction sale. Day zero is the day of the auction sale,November 7th .The first mortality occurred on December 28th
, the 50th day following theauction sale. The last mortality occurred on June 14th
, the 220th day following the auctionsale.
6.3 Materials and methods

144
Names of farmers submitting bison to the November 7th action sale as well as
names of farmers buying bison at the sale were obtained from information supplied by
the auction market. Information about bison herds from both submitting and purchasing
farms was collected by directly interviewing farm owners. Once contact was established
with farmers, all farms involved were monitored by telephone consultation for a period
of 18 months following the November 7th auction sale. During this period farmers were
encouraged to immediately report any mortalities that occurred in their bison herds.
Dead bison were transported to the Prairie Diagnostic Services veterinary diagnostic
pathology laboratory at Saskatoon, Saskatchewan for postmortem examinations.
Bison mortalities were classified as confirmed MCF mortalities by postmortem
examination and positive PCR tests for the presence of OvHV-2 DNA. Gross pathology
included erosions and ulcerations in any part of the gastro-intestinal tract or bladder,
conjuntivitis, and keratitis. Histopathology included multisystemic mononuclear
vasculitis, erosions and ulcerations in the gastro-intestinal tract or bladder,
conjunctivitis, keratitis and uveitis. PCR tests were performed as previously reported
«Li, Shen et ai. 1995)) at Prairie Diagnostic Services.
Bison mortalities were classified as suspect MCF mortalities from clinical signs
provided by farm owners. Clinical signs included sudden death, diarrhea, ocular
discharge, nasal discharge, anorexia and severe depression.
From February 9th to March 6th, 2001, 145 bison were blood tested on 4 farms
that received bison from the Novernber 7th auction sale. Bison sampled included all of
the sale bison on each farm (N= 37) that were alive at the time of sampling and a random
145
sample of 108 of their penmates.
Peripheral blood leukocytes from all bison were tested for the presence of
OvHV-2 DNA with a PCR assay as previously reported (Li, Shen et ai. 1995) at Prairie
Diagnostic Services. Serum was tested for the presence of antibodies to MCF viruses
with a CI-ELISA test, as previously reported (Li, Mcguire et al. 2001), at the Department
of Veterinary Microbiology and Pathology at the Washington State University in
Pullman, Washington. Serum samples were classified as being positive for MCF virus
antibodies when they had a percent inhibition greater than 25 percent. Rogan-Gladen
prevalence estimates and confidence intervals were calculated as previously reported
(Greiner, Gardener 2000).
In order to control for the potential effect of clustering by herd, the odds ratio and
confidence interval for comparisons of the CI-ELISA positive prevalence between sale
bison and bison they were mixed with on destination farms were calculated in a mixed
effects generalized linear model with herd as a random effect using PROC.GLIMMIX,
SAS® version 8.1 software (SAS Institute Inc, Cary, NC.).
Two by Two tables for all other comparisons of groups had cells with values of
zero or less than 5 and produced unstable odds ratios when estimated with PROC
GLIMMIX. Odds ratios with accompanying confidence intervals for these comparison
were calculated as crude odds ratios, unadjusted for clustering. For two by two tables
with cells values of zero a value of one was added to each cell. Confidence intervals for
these comparisons were exact binomial confidence intervals and p values were Fischer's
exact p values. A 5% level of significance was used for hypothesis testing.

146
6.4. Results
The overall SA-MCF mortality rate in this outbreak was 27.6 percent of bison
that were sold at the November 7th auction sale. SA-MCF mortalities occurred among all
groups of bison submitted to the sale. Mortality rates ranged from 13.3 percent to 50.0
percent for bison from each farm submitting bison to the sale (table 6.1). There were SA
MCF mortalities on 7 of the 11 farms that purchased bison following the sale. Mortality
rates on destination farms ranged from 0.0 percent to 43.8 of bison purchased at the
November 7th sale (table 6.2).
Following the removal of sale bison to the November 7th sale there were 415
bison remaining on submitting farms. During the 18 month period of observation there
were no mortalities reported among these 415 bison.
Bison sold at the November 7th auction sale were mixed with 1010 bison on 11
destination farms. There were 4 mortalities among these bison, none of which were
attributed to SA-MCF. Sale bison were 95.5 (95% CI = 55.0 - 167.1, p < 0.001) times
more likely to die from any cause than bison they were mixed with on their destination
farms. A comparison of the rate of confirmed SA-MCF mortalities among sale bison to
the rate of SA-MCF mortalities among bison they were mixed with, estimated that sale
bison were 155.5 (95% CI = 65.2 - 370.9, p <0.001) times more likely to die of SA-MCF
than bison they were mixed with after the sale. When both confim1ed and suspect SA
MCF mortalities were cOITlbined, sale bison were 390.0 (95% CI = 195.5 -781.1,p <
0.001) times more likely to die of SA-MCF than bison they were mixed with on

147
destination fanns.
Among the 37 sampled sale bison and 108 sampled bison they were mixed with
on their destination farms, the overall prevalence of bison that were CI-ELISA positive
for MCF virus antibodies was 20.0 percent (Rogan Gladen prevalence = 19.8%, 95% CI
=13.2 - 26.3). The difference in prevalence between sale bison and bison they were
mixed with was not statistically significant. Sale bison had a CI-ELISA positive
prevalence of 24.3 percent (Rogan Gladen prevalence = 24.1 %, 950/0 CI = 10.2 - 38.0)
and bison they were mixed with had a CI-ELISA positive prevalence of 18.5 percent
(Rogan Gladen prevalence =18.3,95% CI =10.9 - 25.6) The 95% confidence intervals
for the two prevalences overlapped and the odds ratio for the comparison of the two
prevalences was 1.9, with a 95% confidence interval that encompassed one (950/0 CI =
0.73 - 5.0, p = 0.19).
The prevalence of bison that were PCR positive for OvHV-2 DNA anlong the 37
bison sampled on destination fanns and a random sample of 108 of their penmates was
similar and low. The overall PCR positive prevalence for both groups combined was
2.10 percent (95% CI = 0.4 - 5.9). The prevalence among sale bison was 2.70 percent
(1/37) (95% CI =0.1 - 15.8) and among their penmates the prevalence was 1.85 percent
(2/108) (95% CI =0.2 - 6.5). The odds ratio estimate of 1.5 for the comparison of the
two prevalences was not statistically significant (95% CI = 0.13 - 16.63, p = 1.00).
When the confirmed SA-MCF moralities among the sale bison were included
with the 37 sale bison tested 011 destination fanns, the OvHV-2 PCR positive prevalence
was 37.93 percent (95% CI = 25.51- 51.62). The odds ratio for the comparison of the

148
PCR positive prevalence in this group of bison to the PCR prevalence in the group of
108 bison on destination farms was statistically significant at 32.3 (95% CI 1 = 0.95
95.80, p < 0.001).
6.5 Discussion
The events that led to this outbreak of SA-MCF, namely the transport of 163
bison originating from 8 geographically separated farms transported to one location
where they were exposed to sheep and then transported to 11 other widely separated
farms where they were mixed with 1010 bison, can be considered a natural experiment
with three cohorts. Bison sold at the auction sale were a cohort exposed to sheep. Those
bison remaining on originating farms following removal of sale bison formed a second
cohort. This cohort served to demonstrate that bison sold at the November 7th auction
sale did not become infected with the agent causing this outbreak of SA-MCF while on
their fam1s of origin. The third cohort were bison that were mixed with sale bison on
destination farms. This cohort served to demonstrate that bison sold at the November 7th
auction sale did not become infected with the agent causing this outbreak of SA-MCF on
their destination farms, and that exposed bison did not transmit SA-MCF to any of the
bison they were mixed with following the sale. It is highly unlikely that this outbreak of
SA-MCF was precipitated by any means other than the exposure of bison to sheep for a
short period at the November 7th auction sale.
Even though the study of this outbreak was not begun until well into the outbreak
it should still be considered a prospective observational study. The period of observation

149
commenced on the day bison farmers selected and transported bison from their farms to
the auction sale and ended 18 months after the sale. From the time of the sale to the end
of the observation period, all bison on both submitting and purchasing farms were
accounted for.
The bison fam1s involved in this outbreak were not a random selection of
Saskatchewan bison farms, nor were bison sold at the auction market a random selection
of the bison on each farm. However, failing to randomize was unlikely to have affected
this outbreak. There is no reason to believe that bison sold at the auction mart were not
representative of other Saskatchewan bison. Nor is there any reason to believe that bison
sold at the auction sale were more predisposed to developing MCF than their pen-mates
on their farms of origin. It is unlikely that on the 8 farms submitting bison to the sale,
farm owners would have purposely selected for sale only those bison that were in some
way predisposed to developing MCF. It is more probable that the outbreak was caused
by exposure of bison to sheep at the auction sale. The probability of this having occurred
by chance alone was extremely low (odds ratio 160.8, 95% CI 62.2 - 396.6, p value <
0.001)
Although feeding and management of bison on the farms involved in this
outbreak was not under the direct control of the author, it is unlikely that bison sold at
the auction sale were managed differently from unexposed bison. In all but one
destination farm, sale bison were mixed in pens with bison of the same age. All bison
within each pen were provided the same feed and were maintained under the same
environmental conditions. If differential treatment of sale bison and un-exposed bison

150
had occurred, it did not have an effect on the relative risks estimated from the outbreak,
since there were no SA-MCF mortalities recorded in either the bison remaining on the
farms of origin or the bison mixed with sale bison on destination farms ..
Performing stressful procedures on bison such as processing them in handling
facilities has been associated with the occurrence of SA-MCF mortalities in one bison
feedlot (O'Toole, Li et al. 2002). Selling bison through an auction sale is a stressful
experience for bison. However, it is unlikely that the sole act of selling bison through an
auction sale caused this outbreak. Many bison are sold through auction sales every year
in North America. There have been no outbreaks of MCF reported in association with
other auction sales. In addition, the auction market that was central to this outbreak of
SA-MCF has held previous bison sales, none of which were associated with SA-MCF
outbreaks.
The criteria used for classifying bison mortalities as being due to SA-MCF was
not rigorous for all bison mortalities that occurred in this outbreak. By the time the
author was made aware of the outbreak, over half of the bison mortalities had already
occurred. Any subsequent mortalities that occurred were collected and subjected to
complete postmortem examinations. Mortalities were classified as being MCF
mortalities by gross pathology, histopathology and positive PCR assays for OvHV-2
DNA. However, postmortem examinations were performed on only 21 of 45 MCF
(mortalities. The other 24 mortalities were classified as SA-MCF mortalities based only
on clinical histories provided by farmers. Although the method of classification for these
latter mortalities, based on history alone, 111ay not have been as rigorous as the former, it

151
is likely that most, if not all of them were SA-MCF mortalities. The rate of non-SA
MCF mortality among bison remaining on the farms of origin following removal of the
November 7th sale bison was zero. Since sale bison originated from these farms it is
unlikely that they would have experienced mortalities due to causes other than SA-MCF
at a much higher rate than those bison remaining on the farms of origin. Likewise, the
rate of non-SA-MCF mortality among the 1010 bison that sale bison were mixed with
following the sale was low and it is unlikely that the sale bison would have had a much
higher non-SA-MCF mortality rate than their penmates on destination farms.
Failing to accurately classify 24 of the 45 mortalities that occurred within the
group of sale bison would have had little effect on the associations inferred from this
outbreak. Excluding the suspect SA-MCF mortalities from the relative risk calculations
would have reduced the magnitude of the relative lisk estinlates for comparisons of SA
MCF mortality rates among sale bison and un-exposed bison, but would not have
changed their direction or made them statistically insignificant. It is also unlikely that
there was mis-classification of mortalities among the un-exposed bison. The number of
mortalities among the un-exposed bison was very low (4 mortalities among 1425 bison).
Two of the mortalities were due to trauma and the other two were classified as being due
to pneumonia by post mortem examinations. Besides there were only a small number of
mortalities within the un-exposed bison, their mis-classification would not have
significantly changed the strength or direction of the relative risks estimated from the
outbreak.
The association between sheep and MCF in cattle has been recognized since the

152
late 1700's (Heuschele, Reid 2001). Barly epidemiological studies demonstrated that
cattle stabled next to sheep were often at lisk of developing MCF (Aleska. 1935; Bindel
1937; Goetze 1930; Goetze, Liess 1929; Goetze, Liess 1930; Magnusson 1940; Piercy
1954). There have been several viruses isolated from SA-MCF mortalities, however,
none of them have reproduced MCF (Reid, Buxton et ai. 1984). OvHV-2, although
never isolated in tissue culture, has remained the only candidate as a causal agent for
SA-MCF (Bridgen, Reid 1991; Collins, Bruns et ai. 2000; Crawford, Li et ai. 1999;
Bnsser, Pfanz et ai. 1997; Li, Shen et ai. 1995; Muller Doblies, Li et ai. 1998; O'Toole,
Li et ai. 1997; Plowright 1990; Schuller, Cerny Reiterer et ai. 1990; Schultheiss, Collins
et ai. 2000). Large proportions of sheep populations are infected with OvHV-2 (Baxter,
Pow et ai. 1993; Li, Shen et ai. 1996a; Li, Shen et al. 1994; Li, Shen et ai. 1996; Li,
Shen et al. 1995; Mirangi, Kang'ee 1997). Support for OvHV-2 as the causal agent for
SA-MCF comes from studies demonstrating that most cattle and bison that die of MCF
have OvHV-2 DNA in their carcasses, but healthy cattle and bison or cattle and bison
that die of other causes rarely have OvHV-2 in their blood or carcasses (Baxter, Pow et
ai. 1993; Collins, Bruns et ai. 2000; Crawford, Li et ai. 1999; Dunowska, Letchworth et
ai. 2001; Hussy, Stauber et ai. 2001; Li, Shen et ai. 1995; Li, Snowder et al. 1998;
Muller Doblies, Li et ai. 1998; Tham 1997; Wiyono, Baxter et al. 1994).
The outbreak reported here provides further support for sheep being a common
source of OvHV-2 in outbreaks of SA-MCF. The presence of OvHV-2 DNA was
demonstrated in all MCF mortalities that were examined. The measured associations
between exposure of bison to sheep for a short period of time and the occurrence of SA-

153
MCF mortalities in bison were very strong in this outbreak. Among all of the 1588 bison
included in this study it was only those bison exposed to sheep at the November 7th
auction sale that experienced SA-MCF mortalities. It is highly unlikely that bison sold at
the November 7th sale were infected with OvHV-2 on their farms of origin, since there
were no SA-MCF mortalities among bison remaining on these farms before and during
the study period. It is also highly unlikely that bison sold at the auction sale were
infected with OvHV-2 at their destination farms since there were no SA-MCF
mortalities among any of the bison they were mixed with on their destination farms for
the duration of the study.
The mechanism by which SA-MCF is transmitted fronl sheep to cattle or other
susceptible species has never been clearly demonstrated. Attempts to transmit MCF to
cattle and deer by inoculating them with sheep's blood, tissues, nasal secretions and
external parasites have failed (Blood, Rowsell et al. 1961; Goetze 1930; Goetze, Liess
1929; Goetze, Liess 1930; Hoffman, Young 1989; Metzler 1991; Pierson, Storz et al.
1974; Plowright 1990). However, there are many reports of MCF being transmitted from
sheep to cattle and deer by housing sheep in their close proximity (Aleska. 1935; Bindel
1937; Goetze, Liess 1929; Goetze, Liess 1930; Imai, Nishimori et al. 2001; Magnusson
1940; Piercy 1954). Goetze reported the close stabling of sheep to cattle in 37 of 40
farms on which MCF occurred (Goetze, Liess 1930). In this outbreak the exact
mechanism by which OvHV-2 was transmitted from sheep to bison is unknown. Because
of the wild and dangerous nature of farmed Saskatchewan bison, the bison at the
November 7th auction sale were confined to stout pens for the duration of their stay at the

154
auction market. Auction market workers were unlikely to be in direct contact with bison
since enteling pens containing unrestrained bison would have been very dangerous.
Confining sale bison in such a manner would have precluded any direct physical contact
between bison and sheep at the sale. Furthermore, sheep present at the auction market
were penned in a room adjacent to the room where bison were penned. A possible
mechanism for transmission of OvHV-2 from sheep to bison at the auction market
would have been via air movement from sheep pens to bison pens through two large
openings that connected the two rooms. OvHV-2 DNA has been shown to be present in
the nasal secretions of many sheep (Li, Hua et al. 2001; Li, Snowder et ai. 1998; Li,
Snowder et ai. 2000). Although the presence of OvHV-2 DNA in nasal secretions cannot
be considered unequivocal evidence for the presence of infectious OvHV-2 virus
particles, aerosolized water droplets containing OvHV-2 virus particles from air exhaled
by sheep has been speculated as a mechanism by which sheep transmit OvHV-2 to
susceptible ruminants (Li, Hua et ai. 2001).
Susceptible hosts that develop SA-MCF are thought to be unable to transmit
OvHV-2 to other susceptible hosts (Heuschele 1988; Heuschele, Reid 2001; Plowright
1990). The reason for this remains unclear. It has been speculated that OvHV-2 has only
limited viral replication within susceptible hosts resulting in little or no cell free
infectious virus being produced on epithelial surfaces (Heuschele, Reid 2001).
Horizontal transmission of SA-MCF has been sporadically successful by intravenous,
subcutaneous, intraperitoneal, and intradermal injection as well as oral administration of
large quantities of blood in cattle (Blood, Rowsell et ai. 1961; Goetze 1930; Goetze,

155
Liess 1929; Goetze, Liess 1930; Horner, Oliver et al. 1975; Magnusson 1940; Selman,
Wiseman et ai. 1974; Selman, Wiseman et ai. 1978), red deer (Cervus eiaphus) (Huck,
Shand et ai. 1961; Oliver, Beatson et ai. 1983), water buffalo (Bubaius bubaius)
(Wiyono, Baxter et ai. 1994) and bison (Bison bison) (Liggitt, McChesney et ai. 1980).
However, horizontal transmission of SA-MCF from cattle with SA-MCF to healthy
cattle stabled next to them has always failed (Goetze 1930; Goetze, Liess 1929; Goetze,
Liess 1930; Piercy 1954; Pierson, Thake et ai. 1973).
The outbreak reported here provides strong evidence that bison with SA-MCF do
not transmit SA-MCF to other susceptible bison. In this outbreak 45 bison that died of
SA-MCF failed to transmit SA-MCF to any of 1010 bison they were penned with on 11
different farms.
Although this outbreak provides strong evidence against horizontal transmission
of SA-MCF, evidence against horizontal transmission of OvHV-2 is less persuasive.
Prevalence of OvHV-2 PCR positive bison in a group of 37 surviving auction sale bison
and a random sample of 108 of their penmates provided inconclusive evidence for
horizontal transmission of OvHV-2 having occurred among the bison tested. The
presence of OvHV-2 DNA in peripheral blood leukocytes was demonstrated by PCR in
only one surviving sale bison and two of their penmates. The pre-sale PCR status of the
bison tested could not be determined. Therefore those bison that were positive may have
been positive before the sale. The low PCR positive prevalence among surviving sale
bison may have resulted from most OvHV-2 infected sale bison having died of SA-MCF
prior to being tested. If horizontal transmission of OvHV-2 had occurred it was expected

156
that some of those bison that were mixed with sale bison would have died of MCF, or
that the PCR positive prevalence among these bison would have been higher, possibly in
the range of the prevalence of SA-MCF mortalities among sale bison. This was not
observed.
Although the OvHV-2 PCR prevalence results provide no evidence supporting
the occurrence of horizontal transmission of OvHV-2 in bison, they cannot be
considered definitive proof that horizontal transmission of OvHV-2 did not occur. There
are no reports of studies establishing the sensitivity of PCR assays for detecting OvHV-2
infections in healthy bison. It may very well be that the analytical sensitivity of the PCR
assay for detecting OvHV-2 infected bison is very low in populations of healthy OvHV
2 infected bison. For this reason the assay may have failed to detect healthy bison that
were infected with OvHV-2 as a result of horizontal transmission.
The CI-ELISA prevalence of bison with MCF antibodies among 37 surviving
sale bison and 108 of their penmates provided no direct evidence for or against the
occurrence of horizontal transmission of OvHV-2 among the bison in this outbreak. The
CI-ELISA positive prevalence was slightly higher among surviving sale bison, being
24.3 percent, as cODlpared to 18.5 percent among their penmates . Surviving sale bison
were expected to have a higher CI-ELISA positive prevalence than their penmates since
they were known to have been exposed to OvHV-2 at the auction market. Their
penmates were not. However the difference between the two groups was not statistically
significant, possibly due to their small sample sizes. The pre-sale CI-ELISA status of the
bison could not be determined. The CI-ELISA positive prevalence of both groups of

157
bison were within the range expected for bison herds that had no SA-MCF mortalities
(see chapter 4). It cannot be concluded from these CI-ELISA test results that OvHV-2
was or was not horizontally transmitted among the bison tested following this outbreak
There has been some suggestion that bison may be latently infected with OvHV
2 for long periods before developing SA-MCF (O'Toole, Li et ai. 2002). However, there
is little support for this theory in the literature. Liggit (Liggitt, McChesney et ai. 1980)
reported an incubation period of 24 days for the occurrence of SA-MCF following
transfusion of blood from an infected bovine calf into a single yearling bison.
Schultheiss (Schultheiss, Collins et ai. 1998) reported one bison that survived for 80
days following an acute episode of SA-MCF before going on to die of a recrudescence of
SA-MCF. There have been no reports of the length of time bison may be latently
infected with OvHV-2 before developing SA-MCF following exposure to sheep. In this
outbreak the earliest time that SA-MCF occurred in bison was 50 days following a single
short exposure to sheep. The median time was 65 days and the mean was 81 days. The
last bison to die in the outbreak died 220 days following the auction sale, suggesting that
bison can be latently infected with OvHV-2 for a period of at least 220 days before
developing SA-MCF. Since the sensitivity of the PCR assay for detecting OvHV-2
infection in healthy bison is not known, it is possible that not all of the bison infected
with OvHV-2 at the auction sale died of SA-MCF during the observation period. Some
of the bison infected with OvHV-2 at the auction sale may have remained alive and
healthy through the study period without developing SA-MCF.
It has been previously established that at least 20 percent of farmed bison have
antibodies to MCF viruses (chapter 4), suggesting that a relatively large proportion of
farmed bison carry MCF virus infections. Since the CI-ELISA test used to detect

158
antibodies to MCF viruses is sensitive to all known MCF viruses (Li, Shen et ai. 1994),
the identity of the MCF virus infecting these bison is unknown. But it is possible that
this un-identified virus may be OvHV-2. However, OvHV-2 has been shown to be
closely associated with MCF mortalities in bison (Collins, Bruns et ai. 2000; O'Toole, Li
et al. 2002; Schultheiss, Collins et ai. 1998; Schultheiss, Collins et ai. 2000). In this
outbreak 27.6 percent of the bison exposed to sheep died from MCF. Those MCF
mortalities tested were all positive for OvHV-2 DNA. It has also been shown that MCF
virus antibodies can be maintained in bison across generations in the absence of
exposure to sheep or any other ruminant sources of MCF virus infection (chapter 5).
This latter finding provides some support for the theory that the MCF virus infections
observed in healthy farmed bison may be the result of bison to bison transmission of an
unidentified MCF virus. In the outbreak reported here, bison were infected with OvHV-2
for as long as 220 days before they died of MCF. During that time none of the 45 bison
that died of MCF successfully transmitted MCF to any of the 1010 bison they were in
close association with. If OvHV-2 was transmitted among the bison in this outbreak, it
did not produce MCF in any bison. Since the MCF virus infecting farmed bison is
unidentified, it can only be speculated that if OvHV-2 is in fact the un-identified MCF
virus, it must lose it's pathogenicity when it passes through bison.
6.5.1 Summary
This outbreak provides strong evidence for a causal association between
exposure to sheep and the subsequent occurrence of MCF in bison. It also provides
strong evidence that SA-MCF is not transmitted among bison and that bison can be
infected with OvHV-2 for up to 220 days before developing MCF. However it provides

159
no evidence for or against the horizontal transmission of OvHV-2 among the bison. At
best, it can be speculated that either OvHV-2 was not horizontally transmitted among the
bison in this outbreak or if it was, it was at a low frequency and the virus was no longer
pathogenic once it was transmitted from one bison to other bison.

160
7. PCR ASSAYS FOR MCF VIRUSES IN BISON
7.1 Introduction
Malignant catarrhal fever is a fatal disease of many ungulates including cattle,
bison, water buffalo and deer (Heuschele Reid 2001; Plowright 1990). It is most
commonly caused by one of two distinct but closely related gamma herpesviruses
belonging to the provisionally named MCF sub-group of ruminant rhadinoviruses
(Heuschele Reid 2001; Li, Keller et aI. 2001). Wildebeest (Connochaetes species), most
of which are sub-clinically infected with Alcelaphine herpesvirus-I (AIHV-l), produce
wildebeest-associated MCF (WD-MCF) when they transmit AIHV-1 to susceptible
ruminants in Africa and zoos or game farms where wildebeest are penned (Heuschele
Reid 2001). Similarly sheep, most of which are sub-clinically infected with ovine
herpesvirus-2 (OvHV-2), produce sheep-associated MCF (SA-MCF) when they transmit
OvHV-2 to susceptible ruminants worldwide (Heuschele Reid 2001; Li, Westover et aI.
1999). Recent reports suggest that other MCF group viruses may be causally associated
with MCF. White-tailed deer (OdocoeIeus virginianus) that died of MCF were shown to
have viral DNA in their tissues belonging to a previously unreported MCF group virus
(Kleiboeker, Miller et aI. 2002~ Li, Dyer et aI. 2000). Caprine herpesvirus-2 (CpHV-2), a
virus that sub-clinically infects domestic goats, caused chronic disease in a sika deer
(Cervus nippon) and Alcelaphine herpesvirus-2 (AIHV-2), demonstrated to sub
clinically infect Jackson's hartebeest (AIceIaphus buseIaphus jacksoni) has been reported
to cause MCF in barbary red deer (Cervus eIaphus barbarus) (Crawford, Li et aI. 2002;

161
Klieforth, Maalouf et al. 2002).
Ovine herpesvirus-2, the most common cause of MCF among farmed ruminants
throughout the world (Heuschele Reid 2001; Plowright 1990) has been reported to cause
MCF in North American farmed bison (Bison bison) (Collins, Bruns et al. 2000;
O'Toole, Li et al. 2002; Schultheiss, Collins et al. 1998; Schultheiss, Collins et al.
2000). Susceptible hosts, such as bison, that develop SA-MCF are generally considered
to be unable to transmit OvHV-2 to other susceptible hosts (Heuschele 1988; Heuschele
Reid 2001; Plowright 1990) (also see chapter 6). Since MCF virus infections are often
fatal to susceptible hosts it is logical that relatively few members of susceptible host
species populations would be infected with MCF viruses. Only 4% of 232 reindeer
(Rangifer tarandus), which are susceptible to MCF, were seropositive for antibodies to
MCF viruses (Zamke, Li et al. 2002). Similarly, only 3% of 63 white-tailed deer were
demonstrated seropositive for MCF virus antibodies (Li, Shen et al. 1996a). In contrast
to white-tailed deer and reindeer, recent sero-surveys have reported that 17% of 197,
23.7% of 300 and 22.9% of 2594 healthy bison had antibodies to MCF viruses (O'Toole,
Li et al. 2002; Zarnke, Li et al. 2002) (also see chapter 4). In addition, it has been
reported that an MCF virus was being transmitted among bison in one confined bison
population in the absence of any known ruminant sources of MCF viruses (chapter 5).
These studies demonstrated MCF viral infections by detecting a serum antibody that is
conserved among all known MCF viruses (Li, Mcguire et al. 2001), making it
impossible to be certain of the identify of the MCF virus infecting healthy bison. Studies
reporting the use of more specific tests are sparse. In one study, PCR assays detected
OvHV-2 DNA in the peripheral blood leukocytes of only 8 out of 111 healthy bison
from a feedlot during an outbreak of MCF (O'Toole, Li et al. 2002).

162
The purpose of this report is to present the results of three studies aimed at
establishing the identity of MCF group viruses that infect healthy farmed bison. In the
first study, PCR assays specific for OvHV-2 were used to assay the peripheral blood of
127 healthy bison involved in an outbreak of MCF for the presence of OvHV-2 DNA. In
the second study PCR assays specific for OvHV-2 were used to assay the peripheral
blood, kidneys and livers of 99 healthy adult bison for the presence of OvHV-2 DNA. In
the third study peripheral blood lymphocytes from 12 healthy adult bison were cultured
in vitro in the presence of the phorbol ester, 12-0-tetradecanoyl phorbol-13-acetate
(TPA), which has been shown to induce lytic growth of gamma herpesviruses in cell
cultures (Rolf, Zhong et aI. 1996). DNA was extracted from the lymphocyte cell cultures
and assayed for the presence of herpesvirus DNA with PCR assays using consensus
herpesvirus DNA polymerase primers and primers specific for OvHV-2.
7.2 Materials and methods
7.2.1 Samples
7.2.1.1 Bison associated with MCF outbreaks
Whole blood and serum were collected from 52 female and 75 male bison aged
8 to 20 months. Bison were selected as a convenience sample from three herds that had
confirmed cases of MCF in the last three months prior to testing. Herds contained 115,
200 and 307 bison. Whole blood was tested with OvHV-2 specific PCR assays and
serum was tested with a CI-ELISA specific for MCF viruses.
7.2.1.2 Bison not associated with MCF outbreaks or sheep
Whole blood and serum as well as kidney and liver samples were collected from

163
99 adult female bison during a complete herd depopulation. MCF was never reported in
this herd and there were no sheep within 2 miles of the herd. DNA extracted from whole
blood, kidney and liver were tested with OvHV-2 specific PCR assays and serum was
tested with a CI-ELISA specific for MCF virus antibodies.
7.2.1.3 Bison sampled for lymphocyte culture
Approximately 24 ml of whole blood was collected into ACD (22.0 gIL
trisodium acetate, 8.0 gIL citric acid, 22.0 gIL dextrose) anticoagulant vacutainer tubes
by venipuncture from12 adult female bison from two different bison herds. Blood
samples were maintained at room temperature and processed within 4 hours for cell
culture. DNA was extracted from lymphocytes prior to culturing and after culture for 72
to 144 hours and then tested by PCR with primers specific for OvHV-2 as well as
consensus herpes DNA polymerase primers.
7.2.1.4 Controls for PCR assays
Both positive and negative controls were included with each batch of samples
that were assayed. Positive controls came from whole blood from sheep that were
demonstrated to have OvHV-2 DNA in their blood by PCR assays. Negative controls
were PCR reaction mixtures with sterile water added instead of sample DNA.
7.2.2 Sample Analysis
7.2.2.1 Extraction of DNA
Two hundred microliters of whole blood or lymphocyte cell culture suspension
was mixed with 400 JlL of D solution (4M GITC, 25mM sodium citrate (pH 7.0), 0.1 M

164
2-mercapto-ethanol, 0.5% sacrosyl) and vortexed for 1 minute. Three hundred
microliters of phenol-chloroform (1: v/v) was added, the mixture was vortexed for 30
seconds and then centrifuged at 10,000 G at 4°C for 5 minutes. Three hundred
microliters of the supernatant was transferred to 200 JlL of phenol-chloroform, vortexed
for 30 seconds and centrifuged at 10,000 G at 4°C for 5 minutes. Two hundred
microliters of the supernatant was added to 500~ of 95% ethanol and centrifuged at
10,000 G at 4° C for 10 minutes. The supernatant was poured off, the DNA pellet dried
and re-suspended in 25 to 50~ of water prior to PCR amplification
Kidney and liver samples were macerated with a scalpel, suspended in 500 JlL of
Lysis solution (100mM sodium chloride, 500mM Tris (pH 8) and 10% SDS) with 5 JlL
of proteinase K (1/100 dilution) and incubated for 2 hours at 65° C. Following
incubation 500 JlL of phenol chloroform was added to the mixture. The mixture was
vortexed for 30 seconds and centrifuged at 15,000 G for 5 minutes. The upper aqueous
layer was removed and mixed with 500 JlL of phenol chloroform and centrifuged at
15,000 G for 5 minutes. The upper aqueous layer was removed, mixed with 1000 JlL of
ice-cold salted 95% ethanol and incubated at minus 20° C for 10 minutes. Following
incubation the mixture was centrifuged at 15,000 G at 4° C for 15 minutes. The
supernatant was poured off, 200 JlL of 80% ethanol was added and the mixture
centrifuged at 15,000 G at 4°C for 5 minutes. The ethanol was drained off, the DNA
pellet dried and then re-suspended in 25 to 100 JlL of water prior to PCR amplification.
7.2.2.2 PCR assays
PCR protocols for amplifying OvHV-2 DNA were adapted from Baxter et

165
al.(Baxter, Pow et al. 1993). For the primary reaction 5 J.tL of extracted DNA
suspensions were added to a mixture of 35.7 ilL water, 5 ilL lOX PCR buffer (Qiagen),
2.5 ilL (50 mM) MgCI2, 0.5 ilL (25 mM) each of dATP, dGTP, dCTP, and dTTP, 1.0 ilL
(20 pmol) each of primer 556 (AGTCTGGGTATATGAATCCAGATGGCTCTC) and
primer 755 (AAGATAAGCACCAGTTATGCATCTGATAAA), 0.3 ilL (5 U/IlL) Tag
DNA polymerase (Qiagen) and 1 drop of mineral oil. For the secondary reaction 5 ilL of
the primary reaction mixture was added to 35.2 ilL water, 5 ilL lOX PCR buffer
(Qiagen), 2 JlL (50 mM) MgC~, 0.5 ilL (25 rriM) each of dATP, dGTP, dCTP and
dTTP, 1.0 ilL (20 pmol) each of primers 556 and 555
(TTCTGGGGTAGTGGCGAGCGAAGGCTTC), 0.3 ilL (5 U/JlL) Tag DNA polymerase
(Qiagen) and 1 drop of mineral oil. Thermal cycling protocols for both the primary and
secondary reactions were 95° C for 5 minutes followed by 35 cycles of 94°C for 60
seconds, 55° C for 60 seconds and 72° C for 60 seconds. After cycling the mixture was
incubated at 72° C for 5 minutes and then held at 4° C. PCR assays for OvHV-2 DNA
were classified as positive when the reaction produced a PCR product of approximately
238 base pairs.
Consensus herpes virus PCR protocols were adapted from VanDevanter et
al.(VanDevanter, Warrener et al. 1996). For the primary reaction 5 ilL of each sample
with 0.1 to 2.0 Ilg total DNA was added to a mixture of 27.25 JlL water, 5 ilL lOX PCR
buffer (Qiagen), 4 ilL (25 mM) MgCL2, 1.25 ilL DMSO (for a final concentration of
2.50/0),0.5 JlL (25 mM) each of dATP, dGTP, dCTP and dTTP, 1 ilL (5 U/IlL) Tag DNA
polymerase (Qiagen) and 2 JlL (20 pM) each of upstream primers ILK
(TCCTGGACAAGCAGCARNYSGCNMTNAA), DFA

166
(GAYTTYGCNAGYYTNTAYCC) and downstream primer KG1
(GTCTTGCTCACCAGNTCNACNCCYTT). One drop of light mineral oil was added to
the mixture. For the secondary reaction 5 J.lL of the primary reaction was added to a
mixture of 29.25 J.lL water, 5 J.lL lOX PCR buffer (Qiagen), 4 J-lL (25 mM) MgC~, 1.25
JlL DMSO (for a final concentration of 2.5%),0.5 J-lL (25 mM) each of dATP, dGTP,
dCTP and dTTP, 1 J-lL (5 U/J.lL) Taq DNA polymerase (Qiagen) and 2 J-lL (20 pM) each
of primers TGV (TGTAACTCGGTGTAYGGNTTYACNGGNGT) and 1YG
(CACAGAGTCCGTRTCNCCRTADAT). One drop of light mineral oil was added to
the mixture. Thermal cycling settings for both the primary and secondary reactions were
94° C for 5 minutes followed by 45 cycles of 94° C for 30 seconds, 46° C for 60 seconds
and 72° C for 60 seconds. After cycling the reaction mixture was incubated at 72° C for 7
minutes and held at 4° C. Consensus PCR DNA polymerase assays were classified as
positive when the PCR reaction produced a PCR product of approximately 230 base
pairs.
For PCR product visualization 10 ilL of amplified PCR products were analyzed
by 1.5% agarose gel electrophoresis and ethidium bromide staining.
7.2.2.3 Lymphocyte cultures
Vacutainer tubes containing whole blood were centrifuged at 2000 rpm for
twenty minutes. Buffy coats were aspirated and mixed with equal volumes of PBS and
Elseviers solution (2 parts PBS to 1 part Elseviers solution). Five mls of this mixture was
layered over 5 mls of 70 % percol and centrifuged for 25 minutes at 2500 rpm.
167
Lymphocytes were aspirated from percol gradients and suspended in equal volumes of
PBS and Elsevier's solution (2 parts PBS to 1 part Elseviers solution). Lymphocytes
were cultured in concentrations ranging from 106 to 107 cellshnl in 2rrJl volumes in 24
well tissue culture plates (Falcon, Becton Dickenson) and 5ml volumes in Falcon T-25
25cm2 tissue culture flasks (Becton Dickenson). Culture media consisted of RPMI media
(Invitrogen) plus 10% (VN) fetal calf serum, 100units/ml penicillin G, 100 J.tgjml
streptomycin 0.3ngjml L-glutamine, 0.5 mM 2-mercaptoethanol, 20mM Hepes solution
with 5ugjml Concovalin A and 20 or 50 ngjmI12-0-tetradecanoyl phorbol-13-acetate.
Cultures were incubated at 37°C in 97% humidity with 5% CO2, Lymphocytes were
harvested for DNA extraction after 72 and 144 hours in culture.
7.2.2.4 MCF virus antibody detection
MCF viruses antibodies were detected using a recently reformatted direct
competitive inhibition enzyme linked immunosorbent assay (CI-ELISA), as previously
reported (Li, Mcguire et aI. 2001) at the Animal Disease Research Unit, USDA-ARS,
and the Department of Veterinary Microbiology and Pathology, Washington State
University, Pullman, Washington. The assay detects an antibody produced against an
antigenic epitope (15A) conserved among all known MCF group herpesviruses. Sera
were classified positive when they inhibited binding of a monoclonal antibody against
the 15A antigenic epitope by 25% more than the inhibition of negative control sera.
7.2.2.5 DNA sequencing
Consensus herpesvirus secondary PCR product bands (approximately 230 base

168
pairs) were sliced out of ethidium bromide stained gels and purified using an agarose gel
DNA extraction kit (QIAquick gel extraction kit, Qiagen, Washington, USA). Purified
PCR products were sequenced directly with both TGV and IYG primers with fluorescent
dye terminators and Taq DNA polymerase on an automated DNA sequencer (ABI Prism
3700 capillary electrophoresis DNA analyzer, Applied Biosystems Foster City
California) at the Plant Biotechnology Institute, National Research Council, Saskatoon,
SK.
7.2.3 Data analysis
7.2.3.1 Sequence alignments
DNA sequences were aligned by the clustal-w method using Editseq and
MegAlign® (DNA star, Madison, Wisc.) (Higgins Sharp 1989). Sense and anti-sense
DNA base sequences for each DNA polymerase consensus positive sample were aligned
in Editseq and those portions at either ends of each strand which contained errors were
removed from the final sequence for the sample.
7.3 Results
7.3.1 Bison associated with MCF outbreaks.
Sera from 26 of the 127 bison tested were positive for MCF virus antibodies
when tested with the CI-ELISA (prevalence =20.5%, 95% CI =13.8-28.5). OvHV-2
PCR assays of whole blood samples were positive for 3 bison (prevalence =2.3%, 95%
CI =0.5-6.7), one of which was CI-ELISA positive.

169
7.3.2 Bison not associated with MCF outbreaks or sheep.
Sera from 22 of 99 bison tested were positive for MCF virus antibodies
(prevalence =22.2%,95% CI =14.8-31.7). PCR assays detected OvHV-2 DNA in one
kidney sample from a bison that was CI-ELISA negative, all other samples were PCR
negative (prevalence =1.0%, 95% CI =0.0-5.4).
7.3.3 Bison sampled for lymphocyte culture.
Prior to culture, DNA extracted from lymphocytes of all bison were negative
when tested with PCR assays for OvHV-2 DNA and when tested with herpes consensus
DNA polYmerase PCR assays. Following culture for 72 to 144 hours, only one
lymphocyte culture, bison number 8, was positive for OvHV-2DNA. Seven of the
cultures including bison number 8 and the sheep whole blood sample, produced PCR
products of approximately 230 base pairs when amplified with herpes DNA polYmerase
consensus primers (figure 7.1). Sequences from 2 of the bison lYmphocyte cultures
contained many errors and were excluded from further analysis. Following alignment and
trimming of sequences, the remaining 5 bison lymphocyte cultures and one sheep whole
blood sample yielded sequences ranging from 133 to 162 base pairs. These 5 bison
lymphocyte culture DNA sequences were 99.2 to 100.0 percent similar (figure 7.2). They
were 99.2 to 100.0 percent similar to the DNA sequence fronl sheep whole blood and
99.2 to 100.0 percent similar to a previously reported OvHV-2 DNA polYmerase gene
sequence (Chmielewicz, Goltz et al. 2001)(Genbank accession number AF327831).
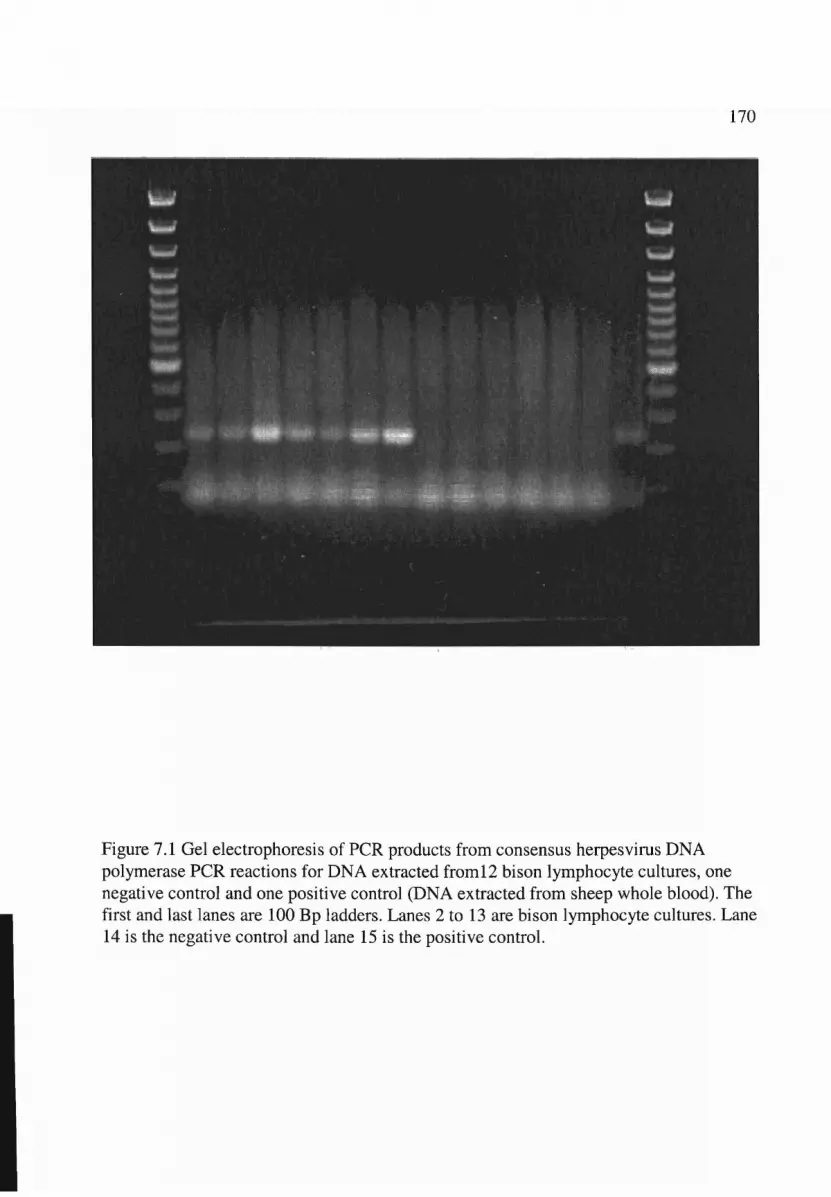
170
Figure 7.1 Gel electrophoresis of PCR products from consensus herpesvirus DNApolymerase PCR reactions for DNA extracted from12 bison lymphocyte cultures, onenegative control and one positive control (DNA extracted from sheep whole blood). Thefirst and last lanes are 100 Bp ladders. Lanes 2 to 13 are bison lymphocyte cultures. Lane14 is the negative control and lane 15 is the positive control.

171
10 20, ,7 C T C G G G G T C G G G T G C T G C G C Bison II C T C G G G G T C G G G T G C T G C G C Bison 27 C T C G G G G T C G G G T G C T G C G C Bison 3I C T C G G G G T C G G G T G C T G C G C Bison 4I Bison 5I Sheep1059 C T C G G G G T C G G G T G C T G C G C OvHV-2
30 40, ,27 G T G A A T T T T T A G A G T C T G G G Bison I21 G T G A A T T T T T A G A G T C T G G G Bison 227 G T G A A T T T T T A G A G T C T G G G Bison 321 G T G A A T T T T T A G A G T C T G G G Biron 4I A A T T T T T A G A G T C T G G G Bison 5I A A T T T T T A G A G T C T G G G Sheep1039 G T G A A T T T T T A G A G T C T G G G OvHV·2
50 60, .47 T T G G A C A T A T C T G C T G T A G G Bison I41 T T G G A C A T A T C T G C T G T A G G Bison 247 T T G G A C A T A T C T G C T G T A G G Bison 341 T T G G A C A T A T C T G C T G T A G G Bison 418 T T G G A C A T A T C T G C T G T A G G Bison 518 T T G G A C A T A T C T G C T G T A G G Sheep1019 T T G G A C A T A T C T G C T G T A G G OvHV·2
70 80, ,67 C T C T G G A C G T C C A G A T T T T C Bison I61 C T C T G G A C G T C C A G A T T T T C Bison 267 C T C T G G A C G T C C A G A T T T T C Bison 361 C T C T G G A C G T C C A G A T T T T C Bison 438 C T C T G G A C G T C C A G A T T T T C Bison 538 C T C T G G A C G T C C A G A T T T T C Sheep999 C T C T G G A C G T C C A G A T T T T C OvHV-2
90 100. ,87 C A C A A A C T G T T T T G T C T T C T Bison 181 C A C A A A C T G T T T T G T C T T C T Bison 287 C A C A A A C T G T T T T G T C T T C T Bison 381 C A C A A A C T G T T T T G T C T T C T Bison 458 C A C A A A C T G T T T T G T C T T C T Bison 558 C A C A A A C T G T T T T G T C T T C T Sheep979 C A C A A A C T G T T T T G T C T T C T OvHV-2
110 120, .107 C C A A C A T G G T T C G G C C C T G G Bison I101 C C A A C A T G G T T C G G C C C T G G Bison 2107 C C A A C A T G G T T C G G C C C T G G Bison 3101 C C A A C A T G G T T C G G C C C T G G Bison 478 C C A A C A T G G T T C G G C C C T G G Bison 578 C C A A C A T G G T T C G G C C C T G G Sheep959 C C A A C A T G G T T C G G C C C T G G OvHV-2
130 140, ,127 A G A G T C A C G G T C T C G G C T A T Bison I121 A G A G T C A C G G T C T C G G C T A T Bison 2127 A G A G T C A C G G T C T C G G C T A T Bison 3121 A G A G T C A C G G T C T C G G C T A T Bison 498 A G A G T C A C G G T C T C G G C T A T Bison 598 A G A G T C A C G G T C T C G G C T A T Sheep939 A G A G T C A C G G T C T C G G C T A T OvHV·2
ISO,147 C A T G A G G C A G G G C A G C Bison 1141 C A T G A G G C A G G A C A G C Bison 2147 C A T G A G G C A G G G C A G C Bison 3141 C A T G A G G C A G G A C A G C Bison 4118 C A T G A G G C A G G A C A G C Bison 5118 C A T G A G G C A G G A C A G C Sheep919 C A T G A G G C A G G G C A G C OvHV-2
Figure 7.2 Sequences of DNA extracted from the lymphocytes of 5 bison following 50 to60 hours of cell culture, sheep whole blood and OvHV-2 DNA polymerase gene(Genbank accession number AF327831)

172
7.4 Discussion
The prevalence of MCF virus antibody positive bison among the 226 bison tested
in this study is similar to the prevalence reported for bison in previous studies. Although
48 of these bison had antibodies to MCF viruses, OvHV-2 specific PCR assays were
able to detect OvHV-2 DNA in only 2 of them. The reason for this ren1ains unclear. It
might be speculated that in bison that are MCF virus antibody positive, the proportion of
circulating lymphocytes that are infected with MCF viruses is low, possibly too low for
PCR assays to detect.
The phorbol ester 12-0-tetradecanoyl phorbol-13-acetate has been demonstrated
to induce gamma herpesvuses infecting lymphocytes in cell cultures to switch from
latent to lytic growth cycles (Rolf, Zhong et aI. 1996). Induction of lytic cycles would
result in the production of large numbers of copies of herpes viral DNA that should be
easily detected with appropriate PCR assays. Although there is no direct evidence, it can
be sum1ised that a herpesvirus resembling OvHV-2 was induced into lytic cycles in 5 of
the lymphocyte cultures in this study. Both OvHV-2 specific PCR assays and
herpesvirus consensus DNA polymerase PCR assays were unable to detect herpesvirus
DNA in pre-culture lymphocytes. However, following growth in cell culture with 12-0
tetradecanoyl phorbol-13-acetate, 5 lymphocyte cultures were demonstrated by PCR
assay and sequence analysis to contain DNA sequences very similar to a sequence
reported for the DNA polymerase gene of OvHV-2.
It is difficult to explain why OvHV-2 specific prin1ers were able to amplify DNA
from only one of the lymphocyte cultures in this study, when consensus herpesvirus
DNA polymerase primers were able to amplify DNA from 7 of them. It may be possible
that OvHV-2 specific primers were less sensitive than consensus herpesvirus DNA

173
polymerase primers. It may also be speculated that the DNA base sequences of the MCF
virus infecting the bison in this study may be sufficiently different from those of OvHV
2 to prevent annealing of OvHV-2 specific primers.
This study was based on only a small nurnber of bison and the results although
preliminary, suggest that culturing bison lymphocytes in the presence of 12-0
tetradecanoyl phorbol-13-acetate has the potential of becoming a useful method for
identifying MCF viruses that sub-clinically infect bison.
7.4.1 Summary
Tissues and blood from 226 healthy bison tested with OvHV-2 specific PCR
primers were able to identify OvHV-2 in two bison. Cultuling lymphocytes from 12
healthy bison in the presence of the phorbol ester 12-0-tetradecanoyl phorbol-13-acetate
allowed the identification of MCF viruses that were very similar to OvHV-2 in 5 bison
using consensus herpesvirus PCR primers

174
8. DISCUSSION
The two major objectives of this thesis were to estimate the prevalence of latent
MCF virus infections in farmed bison populations in Alberta and to establish wether
MCF viruses are being maintained within bison populations, independent from exposure
to other MCF virus carrying host species. Both of theses objectives could only be met by
using a diagnostic test that could correctly classify healthy bison with respect to their
latent MCF virus infection status. The direct CI-ELISA test which detects antibodies
against an epitope conserved among known MCF viruses was shown to meet the needs
of this study.
The validity of the direct CI-ELISA test was initially established by estimating
the test's diagnostic specificity in a group of bison that were determined by biological
means to be free from infection with MCF viruses. Test results from the uninfected
bison population indicated that the diagnostic specificity of the test was high. Tests with
high diagnostic specificity are likely to produce few false positive results, and therefore
provide a considerable amount of confidence in the validity of positive test results.
Diagnostic specificity, however only provides half of the analysis required to
adequately evaluate the performance of a diagnostic test. The other half is diagnostic
sensitivity. Establishing the diagnostic sensitivity of a test requires application of the test
to known infected study subjects. Known healthy MCF virus infected bison were very
hard to obtain for this study, and only a very small number were tested. Although they
were few, when included in the evaluation of the CI-ELISA, they supported a similar
cut-off value to that which was established from the specificity estimation. This small

175
number of known MCF virus infected bison, therefore provided further support for the
CI-ELISA having high diagnostic specificity. Although vigorous attempts were made to
obtain a larger sample of MCF virus infected bison, the sample of infected bison
remained small, and sensitivity estimates from this study will remain both subject to
question and a weakness of this work.
The CI-ELISA test was demonstrated to be a reliable test when the test was
applied to paired serum samples drawn from bison at 72 hour intervals. These results
indicated that the CI-ELISA had both high analytical and diagnostic precision. They
suggest that anti-MCF antibody levels as detected by the CI-ELISA varied little in bison
over a 72 hour period. Results of a previous study however, suggest that anti-MCF virus
antibody levels as measured by the CI-ELISA may vary in bison over periods of months
(O'Toole, Li et al. 2002). It has been well established that herpesviruses belonging to the
MCF group of viruses produce life-long infections in their hosts (Coulter, Wright et al.
2001). If this is the case, and anti-MCF virus antibody levels can vary above and below
the CI-ELISA cut-off value in bison that are infected with MCF viruses, then it is likely
that the CI-ELISA will have true diagnostic sensitivity that is lower than estimated by
this study. This will have a direct effect on prevalence estimates from cross sectional
sero-surveys that use the CI-ELISA to identify MCF virus infected bison. CI-ELISA
positive prevalence studies such as those conducted for this thesis are likely to
underestimate the true prevalence of MCF virus infections in bison populations.
CI-ELISA positive prevalence estimates from san1ples of farmed Alberta bison
were higher than expected for a species which is very susceptible to MCF. Although
information about the origin of the serum samples from the Fairview serum bank and the
slaughter plants were unknown, the sample sizes were large. Within these 1,948 samples

176
and the 646 adult bison from the cow-calf herds, the prevalence of MCF virus infections
ranged from 21.8 to 23.9 percent. Since the true diagnostic sensitivity of the CI-ELISA
may be lower than estimated by this study, it is possible that these prevalence estimates
are under estimates of the true prevalence.
It is not possible to state with certainty the mechanisms by which the bison
within this study were infected with MCF viruses. It might be speculated that these MCF
virus infections were the result of bison to bison transmission. Demonstrating the
presence of MCF virus antibodies in bison born in isolation from all other ruminants
except their MCF virus infected parents as was the case with the Edjericon herd provides
some support for this speculation. It might also be speculated that these infections were
OvHV-2 infections resulting from transmission of OvHV-2 during exposures to sheep.
Although the PCR studies reported in chapter seven were based on a very small number
of bison they demonstrated that at least some healthy bison are infected with either
OvHV-2 or a virus very similar to it. However, the auction market outbreak
demonstrated that many bison infected with OvHV-2 of sheep origin die of MCF and are
unable to transmit MCF to other bison. Auction market bison that died of SA-MCF or
that were sub-clinically infected with OvHV-2 were either unable to transmit OvHV-2 to
other bison, or if transmission did occur, the virus became attenuated during it's initial
passage through a bison.
This study has fulfilled it's objectives. The prevalence of MCF virus infections
within farmed bison populations in Alberta was established, and estin1ated to range from
21.8 to 23.9 percent in adult bison. This study demonstrated that MCF virus infections
can be maintained within bison populations independent from exposure to other
ruminants by cross generational transmission and provided some preliminary evidence

that OvHV-2 or a very close relative may be infecting some of these bison
177

178
BIBLIOGRAPHY
Aleska. (1935). "Le coryza gangreneux en Lithuanie. Abstr. in Vet Bull, 1935.5: p.
837." Rec Med Vet Ill: 274-278.
Armstrong, J., M. Ayars, et al. (1998). Bison Production: economic and production
information for Saskatchewan producers. Regina, Saskatchewan Agriculture and
Food: l.
Barajas-Rojas, J. A., H. P. Riemann, et al. (1993). "Notes about determining the cut-off
value in enzyme linked immunsorbent assay (ELISA)." Prev Vet Med 15:231
233.
Barnard, B. J. H. (1990). "Epizootology of wildebeest-derived malignant catarrhal fever:
possible transmission among cows and their calves in the north-western
Transvaal." Onderstepoort J Vet Res 57: 201-204.
Barnard, B. J. H., R. G. Bengis, et al. (1989). "Excretion of alcelaphine herpes virus 1 by
captive and free-living wildebeest (Connachaetes taurinus)." Onderstepoort J
Vet Res 56: 131-134.
Barnard, B. J. H., R. G. Bengis, et al. (1990). "Epidemiology of wildebeest-derived
malignant catarrhal fever in South Africa: inability to transfer the disease with an
African face fly Musca xanthomelas (Diptera: Muscidae)." Onderstepoort J Vet
Res 57: 89-93.
Barnard, B. J. H., H. E. Van De Pypekamp, et al. (1989). "Epizootology of wildebeest
derived malignant catarrhal fever in an outbreak in the north-western transvaal:

179
indications of an intermediate host." Onderstepoort J Vet Res 56: 135-139.
Baxter, S. I. F., I. Pow, et al. (1993). "PCR detection of the sheep-associated agent of
malignant catarrhal fever." Arch Viro1132: 145-159.
Baxter, S. I. F., A. Wiyono, et al. (1997). "Identification of ovine herpesvirus-2 infection
in sheep." Arch Viro1142: 823-831.
Berezowski, J., J. C. Haigh, et al. (2000). Survey of Bison submissions to veterinary
diagnostic pathology laboratories in Canada and the Western United States.
Unpublished. Saskatoon, Western College of Veterinary Medicine.
Berezowski, J., J. C. Haigh, et al. (2000). Survey of Canadian bison farmers for causes
of morbidity and mortality in Canadian bison by a self administered postal
questionnaire. Unpublished. Saskatoon, Western College of Veterinary Medcine.
Berezowski, J., D. M. Middleton, et al. (2001). Epidemiology of a large outbreak of
malignant catarrhal fever in bison (Bison bison) following brief exposure to
sheep at an auction sale. Am Assoc Vet Lab Diag 44th Ann Meeting, Hershey,
PA, Am Assoc Vet Lab Diag.
Bindel, L. (1937). "Rola owcy w patogenezie glowicy bydla. Abstr. in Vet. Bull 1938.8:
p. 381-382." Przegl Wet. 52: 476- 488 and 536-541.
Blood, D. C., H. C. Rowsell, et al. (1961). "An outbreak of bovine malignant catarrh in a
dairy herd 2. Transmission experiments." Can Vet J 9(2): 319-325.
Bridgen, A. (1991). "The derivation of a restriction endonuclease map for A1celaphine
herpesvirus 1 DNA." Arch Viroll17: 183-192.
Bridgen, A., A. J. Herring, et al. (1989). "Preliminary characterization of the a1celaphine
herpes virus 1 genome." J. Gen Virol 70: 1141-1150.
Bridgen, A., R. Munro, et al. (1992). "The detection of a1celaphine herpesvirus-l DNA

180
by in situ hybridization of tissues from rabbits affected with malignant catarrhal
fever." J Comp Patholl06: 351-359.
Bridgen, A., H. W. Reid (1991). "Derivation of a DNA clone corresponding to the viral
agent of sheep-associated malignant catarrhal fever." Res Vet Sci 50: 38-44.
Castro, A. E., G. G. Daley, et al. (1982). "Malignant catarrhal fever in an Indian gaur and
greater kudu: experimental transmission, isolation, and identification of a
herpesvirus." Am J Vet Res 43: 5-11.
Castro, A. E., W. P. Heuschele, et al. (1985). "lTltrastructure of cellular changes in the
replication of the alcelaphine herpesvirus-l of malignant catarrhal fever." Am J
Vet Res 46: 1231-1237.
Chmielewicz, B., M. Goltz, et al. (2001). "Detection and multigenic characterization of a
novel gammaherpesvirus in goats." Virus Res. 75(1): 87-94.
Collins, J. K., C. Bruns, et al. (2000). "Malignant catarrhal fever: polymerase chain
reaction survey for ovine herpesvirus 2 and other persistent herpesvirus and
retrovirus infections of dairy cattle and bison." J Vet Diagn Invest 11: 406-411.
Coulter, G. R., H. Reid (2002). "Isolation and expression of three open reading frames
from ovine herpesvirus-2." J Gen Virol 83: 533-543.
Coulter, L. J., H. Wright, et al. (2001). "Molecular genomic characterization of the
viruses of malignant catarrhal fever." J. Compo Pathol. 124: 2-19.
Crawford, T. (2000). Personal communication. Pullman Washington.
Crawford, T., H. Li, et al. (2002). "Mural folliculitis and alopecia caused by infection
with goat-associated malignant catarrhal fever virus in two sika deer." J Am Vet
Med Assoc 221(6): 843 - 847.
Crawford, T. B., H. Li, et al. (1999). "Diagnosis of malignant catarrhal fever by PCR

181
using formalin-fixed, paraffin-embedded tissues." J Vet Diagn Invest 10: 111
116.
Daubney, R., J. R. Hudson (1936). "Transmission experiments with bovine malignant
catarrh." J Comp Pathol49: 63-89.
Duncan, D. W. (1956). "Bovine malignant catarrh." Aust Vet J 32: 156-160.
Dunowska, M., G. J. Letchworth, et al. (2001). "Ovine herpesvirus-2 glycoprotein B
sequences from tissues of ruminant malignant catarrhal fever cases and healthy
sheep are highly conserved." J Gen Virol. 82: 2785-2790.
Efron, B., R. J. Tibshirani (1993). An introduction to the bootstrap. New York, Chapman
and Hall.
Ensser, A., R. Pfanz, et al. (1997). "Primary structure of the alcelaphine herpesvirus 1
genome." J Virol 71(9): 6517-6525.
Ferris, D. H., F. M. Hamdy, et al. (1976). "Detection of African nlalignant catarrhal
fever virus antigens in cell cultures by immunofluorescence [Cattle, buffalo, and
other ruminants]." Vet Microbioll(4): 437-448.
Frolich, K., H. Li, et al. (1998). "Serosurvey for antibodies to malignant catarrhal fever
associated viruses in free-living and captive cervids in Germany." J Wildl Dis
34(4): 777-782.
Gates, C. C., R. O. Stephenson, et al. (2000). National recovery plan for the wood bison.,
Committe for the recovery of nationally endangered wildlife.
Goetze, R. (1930). "Untersuchungen uber das bosartige Katarrhalfieber des Rindes."
Deutsch Tier Woch 38: 487-491.
Goetze, R., J. Liess (1929). "Erfolgreiche Uebertragungsversuche des bosartigen
Katarrhalfiebers von Rindzu Rind." Duetsch Tier Woch. 37: 433-437.
182
Goetze, R., J. Liess (1930). "Untersuchen uber das bosartgige Katarrhalfieber des
Rindes. Schafe als Uebertrager." Deutsch Tier Woch 38: 194-200.
Greiner, M., I. A. Gardener (2000). "Application of diagnostic tests in veterinary
epidemiological studies." Prev Vet Med 45: 43-59.
Greiner, M., 1. A. Gardner (2000). "Epidemiological issues in the validation of
veterinary diagnostic tests." Prev Vet Med 45: 3-22.
Greiner, M., D. Sohr, et al. (1995). "A modified ROC analysis for the selection of cut
off values and the definition of intermediate results of serodiagnostic tests." J
Immunol Meth 185: 123-132.
Hamblin, C., R. S. Hedger (1984). "Neutralizing antibodies to wildebeest-derived
malignant catarrhal fever virus in African wildlife." Compo Immunol Microbiol
Infect Dis 7: 195-199.
Heuschele, W. P. (1988). "Malignant catarrhal fever-A review of a selious disease
hazard for exotic and domestic ruminants." Zool Garten 58: 123-133.
Heuschele, W. P., H. R. Fletcher, et al. (1984). Epidemiological aspects of malignant
catarrhal fever in the USA. Proc of the 88th An Meeting US Anim Health Assoc,
Fort Worth, Texas: 640 - 651.
Heuschele, W. P., H. Reid (2001). Malignant Catarrhal Fever. Infectious Diseases of
Wild Mammals. E. Williams and 1. Barker. Ames, Iowa., Iowa State University
Press.: 157 - 164.
Heuschele, W. P., M. Swansen, et al. (1983). Malignant catarrhal fever in U.S. zoos
[Virus isolations]. Ann Proc Am Assoc Zoo Vet. Topeka, Kan. 83: 67-72.
Higgins, D. G., P. M. Sharp (1989). "Fast and sensitive multiple sequence alignments on
a microcomputer." CABIOS 5(4): 151 - 153.

183
Hobbs, J. E., K. Sanderson (2000). Partnership and profitability in the bison industry-.
Bison are Back 2000, Edmonton, Ab.
Hoffman, D., M. P. Young (1989). "Malignant catarrhal fever." Aust Vet J 66: 405-406.
Homer, G. W., R. E. Oliver, et al. (1975). "An epizootic of malignant catarrhal fever. 2.
Laboratory investigations [Cattle]." N Z Vet J 23(3): 35-38.
Hsu, D., L. M. Shih, et al. (1990). "A diagnostic method to detect alcelaphine
herpesvirus-1 of malignant catarrhal fever using the polymerase chain reaction."
Arch Viro1114: 259-263.
Hsu, D., L. M. Shih, et al. (1990). "Nucleotide sequence of a 3.5 kilobase fragment of
malignant catarrhal fever virus strain WC1l." Arch Virol 113: 53-60.
Huck, R. A., A. Shand, et al. (1961). "Malignant catarrh of deer." Vet Rec 73(19): 457
465.
Hussy, D., N. Stauber, et al. (2001). "Quantitative flourogenic PCR assay for measuring
ovine herpesvirus 2 replication in sheep." Clin Diag Lab Immunol 8(1): 123-128.
Imai, K., T. Nishimori, et al. (2001). "Experimental transmission of sheep-associated
malignant catarrhal fever from sheep to Japanese deer (Cervus nippon) and
cattle." Vet Microbiol 79: 83-90.
Jacobson, R. H. (1998). "Validation of serological assays for diagnosis of infectious
diseases." Rev Sci Tec Off Int Epiz. 17(2): 469-486.
Joly, D. O. (2001). Brucellosis and tuberculosis as factors limiting population growth of
northenl bison. Phd Thesis, Dept. of Biology. Saskatoon, University of
Saskatchewan.
Kalunda, M., A. H. Dardiri, et al. (1981). "Malignant catarrhal fever. 1. Response of
American cattle to malignant catarrhal virus isolated in Kenya." Can J Comp

184
Med 45: 70-76.
Katz, J., B. Seal, et al. (1991). "Molecular diagnosis of alcelaphine herpesvirus
(malignant catarrhal fever) infections by nested amplification of viral DNA in
bovine blood buffy coat specimens." J Vet Diagn Invest 3: 193-198.
Keel, M., J. Patterson, et al. (2003). "Caprine herpesvirus-2 in association with naturally
occuring malignant catarrhal fever in captive sika deer (Cervus nippon)." J Vet
Diagn Invest 15(2): 179-183.
Kleiboeker, S. B., M. A. Miller, et al. (2002). "Detection and multigenic characterization
of a herpesvirus assocaited with malignant catarrhal fever in white-tailed deer
(Odecoileus virginianus) from Missouri." J Clin MicrobioI40(4): 1311-1318.
Klieforth, R. B., R. Maalouf, et al. (2002). "Malignant catarrhal fever-like disease in
barbary red deer (Cervus elaphus barbarus) naturally infected with a virus
resembling Alcelaphine herpesvirus 2." J Clin Microbiol 40(9): 3381 - 3390.
Lahijani, R. S., S. M. Sutton, et al. (1995). "Identification and analysis of an alcelaphine
herpesvirus 1 (AHV-l) cDNA clone expressing a fusion protein recognized by
AHV-l neutralizing sera." Arch Viro1140: 547-561.
Lahijani, R. S., S. M. Sutton, et al. (1994). "Application of polymerase chain reaction to
detect animals latently infected with agents of malignant catarrhal fever." J Vet
Diagn Invest 6: 403-409.
Li, H. (2000). Personal communication. Pullman, Washington.
Li, H., N. Dyer, et al. (2000). "Newly recognized herpesvirus causing malignant
catarrhal fever in white-tailed deer (Odocoileus virginianus)." J Clin Microbiol
38: 1313-1318.
Li, H., Y. P. Hua, et al. (2001). "Levels of ovine herpesvirus 2 DNA in nasal secretions

185
and blood of sheep: Implications for transmission." Vet Microbiol 79: 301-310.
Li, H., J. Keller, et al. (2001). "Recognition of another member of the malignant
catarrhal fever virus group:An endemic gammaherpesvirus in domestic goats." J
Gen Virol 82: 227-232.
Li, H., T. C. Mcguire, et al. (2001). "A simpler more sensitive competitive inhibition
ELISA for detection of antibody to malignant catarrhal fever viruses." J Vet
Diagn Invest In press.
Li, H., D. T. Shen, et al. (1995). "Identification and characterization of the major
proteins of malignant catarrhal fever virus." J Gen Virol 76: 123-129.
Li, H., D. T. Shen, et al. (l996a). "Prevalence of antibody to nlalignant catarrhal fever
virus in wild and domestic ruminants by competitive-inhibition ELISA." J Wildl
Dis 32: 437-443.
Li, H., D. T. Shen, et al. (1994). "Competitive inhibition enzyme-linked immunosorbent
assay for antibody in sheep and other ruminants to a conserved epitope of
malignant catarrhal fever virus." J Clin Microbiol(32): 1674-1679.
Li, H., D. T. Shen, et al. (1996b). "Malignant catarrhal fever virus: characterization of a
United States isolate and development of diagnostic assays." Vector borne
pathogens in international trade and tropical animal diseases. New York, N.Y. :
New York Academy of Sciences 1996: 198-210.
Li, H., D. T. Shen, et al. (1995). "Investigation of sheep-associated malignant catarrhal
fever virus infection in ruminants by PCR and competitive inhibition enzyme
linked immunosorbent assay." J Clin Microbiol33: 2048-2053.
Li, H., G. Snowder, et al. (1999). "Production of malignant catarrhal virus-free sheep."
Vet Microbiol 65: 167-172.

186
Li, H., G. Snowder, et al. (1998). "Transmission of ovine herpesvirus 2 in lambs." J Clin
Microbiol 36(1): 223-226.
Li, H., G. Snowder, et al. (2000). "Transmission of ovine herpesvirus 2 among adult
sheep." Vet Microbiol 71: 27-35.
Li, H., W. C. Westover, et al. (1999). "Sheep-associated malignant catarrhal fever in a
petting zoo." J Zoo Wildl Med 30(3): 408-412.
Li, H., A. Wunschmann, et al. (2003). "Caprine herpesvirus-2-associated malignant
catarrhal fever in white-tailed deer (Odocoileus virginianus)." J Vet Diagn Invest
15(1): 46-49.
Liggitt, H. D., J. C. DeMartini (1980). "The pathomorphology of malignant catarrhal
fever 1. Gnerealized lymphoid vasculitis." Vet Pathol 17: 58-72.
Liggitt, H. D., A. E. McChesney, et al. (1980). "Experimental transmission of bovine
malignant catarrhal fever to a bison (Bison bison)." J Wildl Dis 16: 299-304.
Loken, T., M. Aleksandersen, et al. (1998). "Malignant catarrhal fever caused by ovine
herpesvirus-2 in pigs in Norway." Vet Rec 143: 464-467.
Mackintosh, C. G., K. M. Tham (1998). Preliminary findings on the use of PCR assay
for MCF in red deer. Proceedings of a deer course for veterinarians, # 15
Dunedin, New Zealand, Deer Branch of the New Zealand Veterinary
Association:207 - 211.
Maclure, M., W. C. Willett (1987). "Misinterpretation and misuse of the kappa statistic."
Am J Epidem 126(2): 161-169.
Magnusson, H. (1940). "Om elekartad katarralfeber. Nagra forosk att experimentellt
overfora sjukdomen." Beretn. 5 Nord. Vet-med: 369-391.
McAllum, H. F. J., N. M. Mavor, et al. (1982). "A malignant catarrhal fever-like disease

187
in red deer (Cervus elaphus) in New Zealand." N Z Vet J 30: 99-101.
Metzler, A. E. (1991). "The malignant catarrhal fever complex." Comp Immunol
Microbiol Infect Dis 14: 107-124.
Michel, A. L. (1993). "Generation of a nucleic acid probe specific for the alcelaphine
herpesvirus 1 and its use for the detection of malignant catarrhal fever virus DNA
in blue wildebeest calves (Connochaetes taurinus)." Onderstepoort J Vet Res 60:
87-93.
Michel, A. L., I. A. Aspeling (1994). "Evidence of persistent malignant catarrhal fever
infection in a cow obtained by nucleic acid hybridisation." J S Afr Vet Assoc 65:
26-27.
Michel, A. L., G. S. Buchholz, et al. (1995). "Monitoring experimental alcelaphine
herpesvirus-1 infection in cattle by nucleic-acid hybridization and PCR."
Onderspoort J Vet Res 62: 109-115.
Mirangi, P. K., F. M. Kang'ee (1997). "Detection of ovine herpesvirus 2 in Kenyan
sheep by polymerase chain reaction." Vet Rec 141: 176-177.
Mirangi, P. K., F. M. Kang'ee (1999). "Diagnosis of malignant catarrhal fever using the
polymerase chain reaction." Vet Rec 145: 558-559.
Muller Doblies, D. D., H. Li, et al. (1998). "Field validation of laboratory tests for
clinical diagnosis of sheep-associated malignant catarrhal fever." J Clin
Microbiol 36: 2970-2972.
Muluneh, A., H. Liebermann (1992). "Studies concerning etiology of sheep-associated
malignant catarrhal fever in Europe." Deutsch Tier Woch 99: 384-386.
Murphy, F. A., E. P. J. Gibbs, et al. (1999). Veterinary Virology 3rd ed. San Diego, CA,
Academic press.

188
Murphy, M. F., R. B. Klieforth, et al. (1994). "Diagnosis of malignant catarrhal fever by
polymerase chain reaction amplification of alcelaphine herpesvirus-l sequence."
J Wildl Dis 30(3): 377-382.
Mushi, E. Z., L. Karstad (1981). "Prevalence of virus neutralising antibodies to
malignant catarrhal fever virus in oryx (Oryx beisa callotis)." J Wildl Dis 17:
467-470.
Mushi, E. Z., P. B. Rossiter, et al. (1981). "Isolation and characterization of a
herpesvirus from topi (Damaliscus korrigum, ogilby)." J Comp Pathol 91: 63-68.
Mushi, E. Z., P. B. Rossiter, et al. (1980). "The demonstration of cell-free malignant
catarrhal fever herpesvirus in wildebeest nasal secretions." J Hyg 85: 175-179.
Mushi, E. Z., F. R. Rurangira (1981). "Epidenliology of bovine malignant catarrhal
fevers, a review." Vet Res Comnlun 5: 127-142.
Nishi, J. S., B. T. Elkin, et al. (2000). An overview of the Hook Lake Wood Bison
Recovery Project; where have we come from, where are we now, and where
would we like to go. International Bison conference 2000, Edmonton, Ab.:215
233.
Nixdorf, R., D. Barber, et al. (1998). Bison Feedlot. Regina, SK., Saskatchewan
Agriculture and Food.
Oliver, R. E., N. S. Beatson, et al. (1983). "Experimental transmission of malignant
catarrhal fever to red deer (Cervus elaphus)." N Z Vet J 31: 209-213.
Oliver, R. E., N. S. Beatson, et al. (1983). Transmission of malignant catarrhal fever
from red deer to rabbits. Biology of Deer Production, Dunedin, New Zealand,
The Royal Society of New Zealand.
O'Toole, D. (2000). Personal communication. Laramie, Wyoming.

189
O'Toole, D., H. Li, et al. (1997). "Chronic and recovered cases of sheep-associated
malignant catarrhal fever in cattle." Vet Rec 140: 519-524.
O'Toole, D., H. Li, et al. (2002). "Malignant catarrhal fever in a bison (Bison bison)
feedlot, 1993-2000." J Vet Diagn Invest 14: 183-193.
Piercy, S. E. (1952). "Studies in bovine malignant catarrh 1. Experimental infection in
cattle." Br Vet J 108: 35-47.
Piercy, S. E. (1952). "Studies in bovine malignant catarrh 2. Experimental infection in
cattle continued." Br Vet J 108: 214-220.
Piercy, S. E. (1953). Investigation into infectious bovine malignant catarrh. 15th
International Veterinary Congress, Stockholm, Sweden.
Piercy, S. E. (1954). "Studies in bovine malignant catarrh 5. The role of sheep in the
transmission of the disease." Br Vet J 110: 508-516.
Pierson, R. E., J. Storz, et al. (1974). "Experimental transmission of malignant catarrhal
fever." Am J Vet Res 35(4): 523-525.
Pierson, R. E., D. Thake, et al. (1973). "An epizootic of malignant catarrhal fever in
feedlot cattle." J Am Vet Med Assoc 163(4): 349-350.
Plowright, W. (1963). Studies on the virus of malignant catarrhal fever in Africa. 17th
World Veterinary Congress, Hanover, Germany.
Plowright, W. (1965). "Malignant catarrhal fever in East Africa 1. Behavior of the virus
in free-living populations of blue wildebeest." Res Vet Sci 6: 56-68.
Plowright, W. (1965). "Malignant catarrhal fever in East Africa 2. Observations on
wildebeest calves at the laboratory and contact tranSll1ission of the infection to
cattle." Res Vet Sci 6: 69-83.
Plowright, W. (1967). "Malignant catarrhal fever in East Africa 3. Neutralizing antibody

190
in free-living wildebeest." Res Vet Sci 8: 129-136.
Plowright, W. (1968). "Malignant catarrhal fever." J Am Vet Med Assoc 152(6): 795
806.
Plowright, W. (1982). Malignant catarhal fever virus: A lymphotrophic herpesvirus of
ruminants. Latent herpes virus infections in veterinary Medicine. G. Wittman, R.
M. Gaskell and G. Rziha. Boston, Martinus Nijhoff Publishers: 279-305.
Plowright, W. (1990). Malignant catarrhal fever. Virus infections of Vertebrates. Z.
Dinter and B. Morein. Amsterdam, Elsevier. 3:Virus infections of ruminants.:
123-150.
Plowright, W., R. D. Ferris, et al. (1960). "Blue wildebeest and the etiological agent of
bovine malignant catarrhal fever." Nature 188: 1167-1169.
Plowright, W., M. Kalunda, et al. (1972). "Congenital infection of cattle with the
herpesvirus causing malignant catarrhal fever." Res Vet Sci 13(1): 37-45.
Plowright, W., R. F. Macadam, et al. (1963). "Growth and characterization of the virus
of bovine malignant catarrhal fever in East Africa." J Gen Microbiol 39: 253
266.
Reid, H. W. (1992). The biology of a fatal herpesvirus infection of deer (malignant
catarrhal fever). The Biology of Deer. R. D. Brown. New York, Springer-Verlag:
93-100.
Reid, H. W., A. Bridgen (1991). "Recovery of a herpesvirus from a roan antelope
(Hippotragus equinus)." Vet Microbiol 28: 269-278.
Reid, H. W., D. Buxton, et al. (1984). "Malignant catarrhal fever." Vet Rec 116: 581
583.
Reid, H. W., D. Buxton, et al. (1979). "An outbreak of malignant catarrhal fever in red

191
deer (Cervus elephus)." Vet Rec 104: 120-123.
Reid, H. W., p. Buxton, et al. (1986). "Malignant catarrhal fever: experimental
transmission of the 'sheep-associated' form of the disease from cattle and deer to
cattle, deer, rabbits and hamsters." Res Vet Sci 41: 76-81.
Reid, H. W., D. Buxton, et al. (1989). "Isolation and characterisation of lymphoblastoid
cells from cattle and deer affected with 'sheep-associated' malignant catarrhal
fever." Res Vet Sci 47: 90-96.
Reid, H. W., D. Buxton, et al. (1983). "A cytotoxic T-lymphocyte line propagated from a
rabbit infected with sheep associated malignant catarrhal fever Herpesvirus." Res
Vet Sci 34: 109-113.
Reid, H. W., W. Plowright, et al. (1975). "Neutralising antibody to herpesviruses derived
from wildebeest and hartebeest in wild animals in East Africa." Res Vet Sci
18(3): 269-273.
Reid, H. W., L. Rowe (1973). "The attenuation of a herpes virus (malignant catarrhal
fever virus) isolated from hartebeest (Alcelaphus buselaphus cokei Gunther).
[Cattle]." Res Vet Sci 15(1): 144-146.
Rinjard, P. (1935). "Contribution a l'etude de l'etiologie du coryza gangreneux.
Conditions de conservation du virus. Abstr. in Vet Bull, 1936. 6: p 65." Rec Med
Vet Ill: 391-406.
Rolf, R., W. Zhong, et al. (1996). "Lytic growth of Karposi's sarcoma-associated
herpesvirus (human herpevirus 8) in culture." Nature Med. 2(3): 342 -346.
Rossiter, P. B. (1980). "Antigens and antibodies of malignant catarrhal fever herpesvirus
detected by imnlunodiffusion and counter-immunodiffusion." Vet Microbiol5:
205-213.

192
Rossiter, P. B. (1981). "Antibodies to malignant catarrhal fever virus in sheep." J Comp
Pathol 91: 303-311.
Rossiter, P. B. (1981). "Immunoflouresence and immunoperoxidase techniques for
detecting antibodies to malignant catarrhal fever in infected cattle." Trop Anim
Health Prod 13: 189-192.
Rossiter, P. B. (1982). "Immunoglobulin response of rabbits infected with malignant
catarrhal fever virus." Res Vet Sci 33: 120-122.
Rossiter, P. B. (1983). "Antibodies to malignant catarrhal fever virus in cattle with non
wildebeest associated malignant catarrhal fever." J Comp Pathol 93: 93-97.
Rossiter, P. B., D. M. Jessett (1980). "A complement fixation test for antigens of and
antibodies to malignant catarrhal fever virus." Res Vet Sci 28: 228-233.
Rossiter, P. B., D. M. Jessett, et al. (1983). "Role of wildebeest fetal membranes and
fluids in the transmission of malignant catarrhal fever virus [Kenya]." Vet Rec
113: 150-152.
Rossiter, P. B., D. M. Jessett, et al. (1983). "Antibodies in carrier wildebeest to the
lymphoproliferative herpesvirus of malignant catarrhal fever." Comp Immunol
Microbiol Infect Dis 6: 39-43.
Rossiter, P. B., D. M. Jessett, et al. (1980). "Antibodies to malignant catarrhal fever
virus antigens in the sera of normal and naturally infected cattle in Kenya." Res
Vet Sci 28: 235-239.
Rossiter, P. B., E. Z. Mushi, et al. (1977). "The development of antibodies in rabbits and
cattle infected experimentally with an African strain of malignant catarrhal fever
virus." Vet Microbiol 2(1): 57-66.
Ruth, G. R., D. E. Reed, et al. (1977). "Malignant catarrhal fever in bison." J Am Vet

193
Med Assoc 171(9): 913-917.
Rweyemamu, M. M., L. Karstad, et al. (1974). "Malignant catarrhal fever virus in nasal
secretions of wildebeest: A probable mechanism for virus transmission." J Wildl
Dis 10(4): 478-487.
Saah, A. J., D. R. Hoover (1997). "Sensitivity and specificity reconsidered: the meaning
of these terms in analytical and diagnostic settings." Ann Int Med 126: 91-94.
Schenz, C., A. Paernthaner, et al. (2000). "In vivo diagnose der schaf-assoziierten form
des bosartigen katarrhalfiebers(SA-BKF) mittels PCR im vergleich mit
klinischen und pathologischen untersuchungsergebnissen." Wein Tierarztl Mschr
87: 350-358.
Schofield, F. W., A. F. Bainf (1941). "Malignant catarrhal fever of cattle." Can J Comp
Med 5(10): 294-297.
Schuller, W., S. Cerny Reiterer, et al. (1990). "Evidence that the sheep associated form
of malignant catarrhal fever is caused by a herpes virus." J Vet Med Series B
37(6): 442-447.
Schultheiss, P. C., J. K. Collins, et al. (1998). "Malignant catarrhal fever in bison, acute
and chronic cases." J Vet Diagn Invest 10: 255-262.
Schultheiss, P. C., J. K. Collins, et al. (2000). "Epizootic of malignant catarrhal fever in
three bison herds:differences from cattle and association with ovine herpesvirus
2." J Vet Diagn Invest 12: 497-502.
Seal, B., W. P. Heuschele, et al. (1989). "Prevalence of antibodies to alcelaphine
herpesvirus-1 and nucleic acid hybridization of viruses isolkated from captive
and exotic ruminants." Am J Vet Res 50: 1447-1453.
Seal, B., R. B. Klieforth, et al. (1988). "Replication of alcelaphine herpesviruses in

194
various culture systems and subsequent purification of virus." J Tissue Cult
Methods 11: 49-56.
Seal, B., R. B. Klieforth, et al. (1990). "Restriction endonuclease analysis of alcelaphine
herpesvirus 1 DNA and molecular cloning of virus genomic DNA for potwntial
diagnostic use." J Vet Diagn Invest 2: 92-102.
Selman, I. E., A. Wiseman, et al. (1974). "A clinico-pathological study of bovine
malignant catarrhal fever in Great Britain." Vet Rec 94(21): 483-490.
Selman, I. E., A. Wiseman, et al. (1978). "Transmission studies with bovine malignant
catarrhal fever." Vet Rec 102(12): 252-257.
Shourkri, M. M., C. A. Pause (1999). Statistical methods for health sciences. Boca
Raton, CRC Press.
Streiner, D. L., G. R. Normal (1995). Health Measurment Scales. Oxford, Oxford
University Press.
Tham, K. M. (1997). "Molecular and clinicopathological diagnosis of malignant
catarrhal fever in cattle, deer and buffalo in New Zealand." Vet Rec 141: 303
306.
Tham, K. M., K. Ng, et al. (1994). "Polymerase chain reaction amplification of
wildebeest-associated and cervine-derived malignant catarrhal fever virus DNA."
Arch Viro1135: 355-364.
Timoney, J. F., J. H. Gillespie, et al. (1999). Hagan's and Bruners Microbiology and
Infectious Diseases of Domestic Animals 8th ed. Ithaca, New York, Compteck
publishing associates.
VanDevanter, D. R., P. Warrener, et al. (1996). "Detection and analysis of diverse
herpesviral species by consensus primer PCR." J Clin Microbiol 34(7): 1666-
195
1671.
Wan, S. K., A. E. Castro, et al. (1988). "Enzyme-linked immunosorbent assay for the
detection of antibodies to the alcelaphine herpesvirus of malignant catarrhal fever
in exotic ruminants." Am J Vet Res 49: 164-168.
Westbury, H. A., L. J. Denholm (1982). "Malignant catarrhal fever in farmed Rusa deer
(Cervus timorensis). 2. Animal transmission and virological studies." Aust Vet J
58: 88-92.
Whitenack, D. L., A. E. Castro (1981). "Experimental malignant catarrhal fever (African
from) in white-tailed deer." J Wildl Dis 17(3): 443-451.
Wiyono, A., S. I. F. Baxter, et al. (1994). "PCR detection of ovine herpesvirus-2 DNA in
Indonesian ruminants-normal sheep and clinical cases of malignant catarrhal
fever." Vet Microbiol42: 45-52.
Wright, P. F., E. Nilsson, et al. (1993). "Standardization and validation of enzyme-linked
immunosorbent assay techniques for the detection of antibody in infectious
disease diagnosis." Rev Sci Tec Off Int Epiz 12(2): 435-450.
Zamke, R., H. Li, et al. (2002). "Serum antibody prevalence of malignant catarrhal fever
viruses in seven wildlife species from Alaska." J Wildl Dis 38(3): 500 - 504.