Embed Size (px)
Citation preview

The European Banking System
Total number of credit institutions in the EU
Number of Credit Institutions as part of the Monetary Financial Institutions in Europe (excluding central banks, money market funds and other institutions)
"Monetary financial institutions" (MFIs) are resident credit institutions as defined in European Union law, and other resident financial institutions whose business is to receive deposits and/or close substitutes for deposits from entities other than MFIs and, for their own account (at least in economic terms), to grant credits and/or make investments in securities.
Banking System
Universal banks Specialized banksCommercial banks Mortage banksSavings banks Building savings banksCooperative banks Direct banks
Investment fundsCentral securities dispositoryDevelopment banks
Universal Banks German Universal Banks offer a major part of the banking activities mentioned in §1 KWG (German Banking Act). The main banking activities are taking deposits and providing loans and mortgages. But some of universal banks are also underwriting securities and invest directly in securities including equities.
Commercial banksGerman Commercial Banks consist of Major Banks, Regional Banks, other Commercial Banks and Branches of foreign Banks. All Commercial Banks are private-sector companies like public limited companies or commercial partnerships limited by shares. The main target of their business is the generation of returns. The distinctions to Savings and Cooperative Banks is the stronger engagement in the issue of securities, the buying and selling of securities and Investment Banking activites. The most important Commercial Banks are the four Major Banks Deutsche Bank, Commerzbank, UniCredit Bank and Deutsche Postbank.
Savings banksSavings banks are owned by an entity under public law (municipalities, rural districts, special purpose associations) and consist of Local Savings Banks and State Savings Banks. In contrast to the commercial banks, the savings banks are not profit-maximization institutions, but are operated in the public interest. According to taken

deposits and provided loans, the 416 Local Savings Banks and 9 State Savings Banks are the most important part of the German Universal Bank System.
Cooperative banksCooperative Banks are owned by their depositors. The main target of Cooperative Banks is the support of their shareholders. The main banking activity is the providing of loans, which are primarily refinanced by taken deposits. This Sector of the German Banking System consists of 1.047 Local Cooperative Banks and 2 Cooperative Central Banks.
Banking Supervision in Europe
The Single Supervisory Mechanism (SSM) The SSM places significant banks in participating countries under the direct supervision of the ECB. The SSM compromises the ECB and the national supervisory authorities of the euro countries.
Since 04.11.2014 120 Institutions, including 21 institutions from Germany, the so called significant institutions are subject to supervision by the ECB. Significant banks with total assets in excess of 30 billion EUR or 20% of the GDP of the member state in which they are located fall under the direct supervision of the ECB. In countries where none of the credit institutions meets the mentioned criteria at least the three most significant credit institutions will be subject to direct supervision by the ECB.
In the direct supervison of the significant institutions, the ECB will receive assistance by the local supervisory authorities. The national supervisory authorities will remain responsible for the supervision of the less significant institutions, although the ECB may issue general requirements and will receive regular reports.
Deposit guarantee schemes in Europe
The new European Directive on Deposit Guarantee Schemes entered into force on 2 July 2014. The Directive adopts a maximum harmonization approach, i.e. statutory deposit protection in the member states may not go beyond its provisions.
The Directive on Deposit Guarantee Schemes is designed to improve depositor protection in Europe. The aim is for the institutions themselves to bear the risk of having to compensate depositors and to avoid the need for Government aid. In line with this, the Directive specifies that all deposit guarantee schemes must be financed ex ante. To date, these schemes have only been financed ex post in many EU countries. Under the ex post model, the deposit-taking credit institutions assigned to the guarantee schemes only have to pay contributions if a compensation event occurs. By contrast, the deposit-taking credit institution that causes the compensation event is not required to make any contributions at all because it has become insolvent.

The member states must reduce the payment deadline for depositor compensation – currently 20 days – to seven days from the determination of the compensation event by 31 December 2023 at the latest.
In future, all depositors – including larger companies – will have a legal right to compensation of up to €100,000 for their covered deposits. In future, depositors will also have a legal right to compensation for deposits of over €100,000 made in connection with specific life events – such as the sale of private real estate, marriage, or a severance payment – for at least three months after the date of deposit.
The Subprime Crisis
The US Real Estate Market
Homeownership is a very important measurement of wealth in the US The US homeownership rate is high (roughly 68%) compared to other
developed countries e.g. Germany with 41% Classification of mortgages: prime mortgages vs. near-prime / sub-prime
mortgages (The FICO Score model)
Creation of Mortgage-Backed Securities (MBS)
Banks have constraints concerning their increase in risk-weighted assets (i.e. loans etc.) but also loanable funds are limited
Lending is limited With Securitization banks sell some of their risk-weighted assets by
securitization Lending is unlimited
Causes of the Sub-prime Crisis
According to the report of The President’s Working Group on Financial Markets these are the causes leading to the emergence of the Sub-prime Crisis:

Breakdown in underwriting standards for sub-prime mortgages; Significant erosion of market discipline by those involved in the
securitization process, including originators, underwriters, credit rating agencies,
flaws in credit rating agencies assessments of sub-prime mortgage-backed securities (MBS) and other complex structured credit products
risk management weaknesses at some large U.S. and European financial institutions; and
regulatory policies, including capital and disclosure requirements, that failed to mitigate risk management weaknesses.
Expanded View
After the burst of the dot.com bubble the FED tried to support economic growth by a low Federal Funds Target Rate
The low rate was kept too long and therefore letting mortgages interest rates decline as well – see red circle
This lead to an enormous amount of cheap credit within the economy which was mostly invested in the real estate market, fostering a bubble there
US: Development of Federal Funds Target Rate and mortgages interest rates
The indebtness of private households rose up to 180% of the disposable income This development was fostered by a drastic increase in mortgages Due to the relaxed lending requirements this encourages sub-prime lending as
well, giving rise to an increasing share of the total mortgage market However the actual danger of the sub- prime lending was within the increased
default rates that were not accounted for in the risk models
Transmission – systemic risk in the financial sector
Strong interdependencies in the financial sector
We distinguish between direct and indirect interdependencies

The higher the interdependencies among financial institutions, no matter if direct or indirect, the higher the risk of simultaneous losses
Poor public disclosure
Prevents investors from assessing the risk they take on in their investments, leading to a mis-pricing of risk
Further enables firms to neglect market discipline
The under priced financial safety net
In the US the safety net consists of deposit insurance and the ability to borrow at reduced cost from the FED
If under priced it can support „moral hazard behavior“ at the firms
Highly leveraged financial institutions
The IMF (1998) finds that leverage significantly increases before a financial crisis
Due to expansionary monetary and fiscal policies - fostering willingness to lend and borrow money (increase of indebtness)
Leading to heightened equity, asset and real estate prices that are not sustainable in the long run
Lack of market discipline
Market discipline is “...the ability of investors [...] to track [...] the changing financial condition and risk of firms and securities, to price securities accordingly, and, through pricing, to influence the actions of management.” (OFHEO, 2003, p. 21)
Bubbles in prices of real and financial assets
are recognized by the rise in prices to such an extent that they are unsustainable in the long run (OFHEO, 2003)
Several theories try to explain how these price bubbles can occur in the first place (speculation, the phenomena of euphoria, disaster myopia as well as herding)
From Sub-prime to the financial crisis
The liberalized financial structure-Increased use of securities and derivatives-The banks‘ strategy of „originate and distribute“

-The establishment of conduits and SIVs The rating agencies -The agencies failed to predict the default risk for MBS1. Because they were biased2. Their risk models were flawed The malfunctioning of the market Declining market value of MBS underscoring the expected cash flows from these
MBS Accounting methods -Introduction of fair value accounting = valuing financial assets according to their
market values -Question: How effective is fair value accounting if the market is not functioning
well?
The banks‘ equity cushion
-Over the years equity reserves have declined in banks
-Leaving them vulnerable to any adverse shock
-The Capital adequacy requirement demanded by the Basel Accord is not really a buffer to draw from
Conclusion
It is always difficult to identify where, when and how a crisis emerged Usually it is a chain reaction that triggers the crisis Same is true for the transformation of a crisis But given all the arguments on the systemic risk and what happened in reality
this transformation should have not been a surprise. Although the spread of the same was fast and intense around the globe.
Implications on Regulations
Capital requirements
-higher requirements for trading books and securities
-higher requirements for crucial banks and financial institutions
Leverage Ratio
-dicussions focusing on the introduction of comparable international ratios
Derivates

-regulation of the over-the-counter market (OTC)
Securitization
-more transparency
-higher capital requirements
Alternative Investments
-concerning Hedge Funds, Private Equity
Tighter regulations on registration, reporting,
Implications on Banks More Transparency
for investors and business partners especially concerning risk positions Stronger emphasize on risk management
reducing the dependencies from the rating agencies to assess risks Improving liquidity management
increasing the liquidity buffer to better absorb shocks Lower leverage
higher capital requirements Usage of less complex financial products
to better determine the associated risks of such products Compensation packages
will be based now on long-term profitability
Summary The financial crisis was triggered by a chain of events- there is no single
event to be blamed Futher everybody was involved: mortages brokers, lender, borrowers, rating
agencies, banks,financial institutions, investors The crisis is a sum of mistakes as well as fals incentives on the macro and
micro-economic level Concequences were not only visible in the financial markets but also came
along with the recession of the real economy worldwide Sustainable solutions must included tighter regulations as well as more
thourough monitoring However the challenge will be to find the balance between free markets and
the political involvment Concerning the economy there will be a stronger demand for responsible
behavior and ethics in order to restore the confidence into the economic

system
Basel III
Occasion and Aims of Basel III
Basel 3
Introduction of new equity- and liquidity provisions in December 2010 in response to the financial crisis
Execution of Basel III in Europe since January 2014 Step by step introduction of the new rules until January 2019 Mainly equal standards worldwide Strengthening of quality, quantity and flexibility of equity, as well as stricter
capital requirements for risk weighted assets (RWA) and worldwide standards for liquidity observation
Decrease in the probability and the dimension of future crises and therefore a support of sustainable economic growth
The Way from Basel I to Basel III
1974-Establishment of the Basel Committee through the G10 countries, in response to the bankruptcies of Bankhaus Herstatt (Germany) and Franklin National Bank (USA) – Establishment of the international cooperation
1988-Announcement of Basel I: Introduction of international standards and improvement of the international cooperation – Focus on default risk
2004-Announcement of Basel II : Introduction of the three-pillar-approach – Additional consideration of market- and operational risk – Promotion of dialogue between banks and supervisory authority– Promotion of transparency
2014-Implementation of Basel III : Phasing-in of new liquidity and capital standards until January 2019
3-Pillar-Approach of Basel II
Pillar 1 «Quantity»
Minimum Capital Requirements Regulates the equity backing of credit default risk, market price risks and
operational risks for financial institutions
Pillar 2 «Quality»
Monitoring activity through supervisory authorities Provisions on the periodic review of the credit institutions through the

supervisory authority regarding the company-internal risk management
Pillar 3 «Transparency»
Market transparency and disclosure Directions on disclosure and market discipline
The three-pillar-approach remains within Basel III.
Equity Structure according to Basel III
Common Equity Tier 1 Capital
4,5%
Solely pure equity
This includes:
Common shares Agio from the emission of common shares Retained earnings Other open reserves Partly third-party minority interests from CET 1
capital exhaustive list of adjustment items
Additional Tier 1 capital
1,5%
Non-innovative hybrid equitye.g. preferred shares, if they meet the criteria catalogue
Agio from the emission of the equity instrument
Partly third-party minority interests from Additional Tier 1 capital
Tier 2 Capital 2% Highly reduced importance of Tier 2 capital in comparison to Basel II
Restriction of the loss-bearing capacity of Tier 2 capital in case of a bankruptcy (gone-concern)
e.g. long-term subordinary debt or equivalent designed preferred shares incl. agio
Introduction of Capital Buffers
Capital Conversion Buffer
2,5%
Introduction of a capital conversion buffer in „good times“

Can be melt-off in loss making years (Attention: Restrictions in terms of payout blocs,e.g. for dividends and bonuses)
Countercyclical Buffer
0-2,5%
Introduction of an countercyclical buffer in times of „excessive credit growth”
Provision for possible credit bubble
Details not finally cleared
SIFI-Buffer
0-3,5%
Additional capital requirements for Systemically Important Institutes (SIFIs) planned
Individually defined according to systemic relevance of the institution
Details not finally cleared
All mentioned capital buffers have to be formed out of Common Equity Tier 1 (CET1) capital, that means mainly out of common shares + agio and retained earnings!

Capital Requirements Preliminary conclusion
The adjustment from Basel II to Basel III occurs step by step until 2019 The minimum equity ratio of banksin comparison to the RWA increases
drastically through the new provisions The focus is on CET1 Capital,that could account for more than 75% of the
whole equity (Basel 2(25%)) The new implemented capital buffers should increase the flexibility to act in

different situations


Minimum Requirements for Risk Management
Purpose and Content

The MaRisk are the Circular 10/2012 (BA) of the Federal Financial Supervisory Authority (BaFin), that provides a framework for structuring risk management. The legal basis is §25a KWG (German Banking Act), that demands a proper business organization from the institutions. The qualitative requirements of the second basel pillar are implemented trough the MaRisk.
The MaRisk are obligatory for german banks. They even apply to the branches of German institutions located outside Germany. Financial services institutions and securities trading banks shall comply with the requirements of this Circular insofar as this appears necessary, given the institution’s size as well as the nature, scale, complexity and riskiness of its business activities.
According to the MaRisk an appropriate and effective risk management encompasses defining strategies and establishing internal control mechanisms considering maintaining internal capital adequacy.
Internal control mechanisms shall consist of an internal control system and an internal audit function. The internal control system shall comprise, in particular,
rules on the organisational and operational structure, processes for identifying, assessing, managing, monitoring and reporting risks
(risk management and risk control processes), and a risk control function and a compliance function.


Steering of a Bank
The credit institution
Banking services:
Payment transaction services Investment services Financing services Other banking services
Credit Institutions are service providers, who create Banking Services and offer them to others. They process payments and provide a compensation between the need for investment and financing of different economic operators.
Credit Institutions perform transformation tasks regarding payment transaction, investments and financing:
Transformation of amounts: Money in small amounts is taken in and issued in larger amounts, or large amounts taken in and smaller amounts issued.
Maturity transformation: The Credit Institution lends money with a maturity

differing from the maturity of money taken in. Risk transformation: Latent default risks of the depositors are compensated
through risk distribution and credit selection in the process of lending the take in


Economic Value Added
Financial service managers need to take complex decisions

Traditional indicators like RoE or RAROC are not always optimal EVA was developed in the mid 80s by Joel M. Stern and G. Bennett Stewart III Today used by most financial service providers
The EVA concept
A company‘s EVA is positive if it outperforms the minimal return of an alternative investment with the same risk
EVA = after-tax-profit - CoC * RC
EVA = (RoE - CoC) * RC with
CoC = cost of capital (shareholders‘ return expectations)
RC = risk capital (capital tied up in business activities)
RoE = return on equity (after-tax return relative to risk capital employed)
Transfer of the formula to financial services
Calculating after-tax profit – conversions
Accounting profit does not always correspond to economic profit
Modifications are necessary:
Risk provisions if they are not allocated according to risk-oriented criteria Non-recurring events like big restructuring projects Goodwill amortization Non-operative income
Determining cost of capital (opportunity cost of capital)
Entity principle (industrial companies) we take into account only the equity part and we do not consider to the debt part
Industrial companies Equity and debt as alternative sources of financing Calculation: WACC (Weighted Average Cost of Capital)
Equity principle (financial services providers)
Financial service providers Debt is used as a basis for generating income Only cost of equity is considered Calculation: CAPM (Capital Asset Pricing Model)

Is calculated with a risk free rate of return plus the beta factor times a risk premium,because we invest in the equity market, not only in a risk free environmentThe beta factor inside the capm represents the marcet risk anindividual company has .The beta(market risk) is different depending on the business field a bank is acting. It is important to calculate our cost of equity.
Definition of risk capital(economic capital)
Equity capital does not reflect risk of single affairs in a differentiated way
Risk capital (=economic capital) measures the capital needed to cover the risk of a business.
Enables comparison and appropriate controlling of business units with different risk profiles. It can only be done internaly,it can not be done by external controler. It is also used for internal controlling meusures.
Other characteristics
Financial service providers tend to have many different business activities(for each u have to define the risk capital)
They are organized in profit centers and jointly use the resources of service centers to attain economies of scale
A method to account for service center costs is necessary, e. g. internal transfer pricing

EVA and Shareholder Value
Total shareholder return (TSR) = dividends + increase in market value
Market value =company capital(on balance sheet) + market value added (MVA)
MVA =
Reflects a company‘s capacity to create additional value with its capital, from point of view of the capital market
A high MVA shows that shareholders expect a high future value increase of the company
MVA = present value of all future EVAs (s. graph next page)
Relation between EVA and market value
The EVA concept takes in to account minimum interest expectance of market participants in the form of CoC
As current share prices reflect this expectance, the share price and the market value can only rise if a company outperforms the expectance Just positive EVA will not result in arrising the share prise, we have to increase positive EVA and to deliver delta EVA

EVA targets for a special companies are derived from capital market expectations
Top stearing measure for a company is expected total shareholder return
TSR=dividends+increase in market value of the stock
From TSR you derrive EVA for the company, which has to be delivered absolutely from the company to deliver a certain total shareholder return,this is than the EVA target on banking group level.
In a further development of the above model, MVA is divided into two components:
Current Operations Value (COV) =present value of a perpetuity of the EVAs achieved by the company today + company capital
Future Growth Value (FGV) =present value of EVAs achieved from growth
This concept helps to transfer implicitly contained growth expectances in market value into growth targets
We need the future growth value because we have to outperform the growth expectations of the market,we have to deliver the a positive delta EVA, we need growth targets for EVA and growth target for our company, both are derived from capital market expectations.
Applying the EVA concept
Approaches to EVA controlling

From the EVA formula, one can derive four essential ways to improve value creation:
(1) Increase profitablity= EVA ↑ without extending capital basis e. g. by
Centralizing service functions to realize economies of scale(higher profitability due to the lower costs)
Internal process improvements Cost management programs
(2) Profitable growthinvestment in activities with positive EVA (RoE > CoC) e. g.
Acquisitions Extending existing business activities to other customer segments, regions or
product areas
(3) Concentration on core businessbusiness activities that continue having a negative EVA (RoE < CoC) after considering all restructuring options are divested
(4) Reducing Cost of CapitalOn corporate level the CoC can be positively influenced reducing the beta factor, e. g. by
Optimizing capital structure and rating Appropriate capital market communication
The following graph illustrates measures (1) and (2):
Fields of application of EVA controlling
Value-oriented controlling concepts have to be consistently implemented and exercised
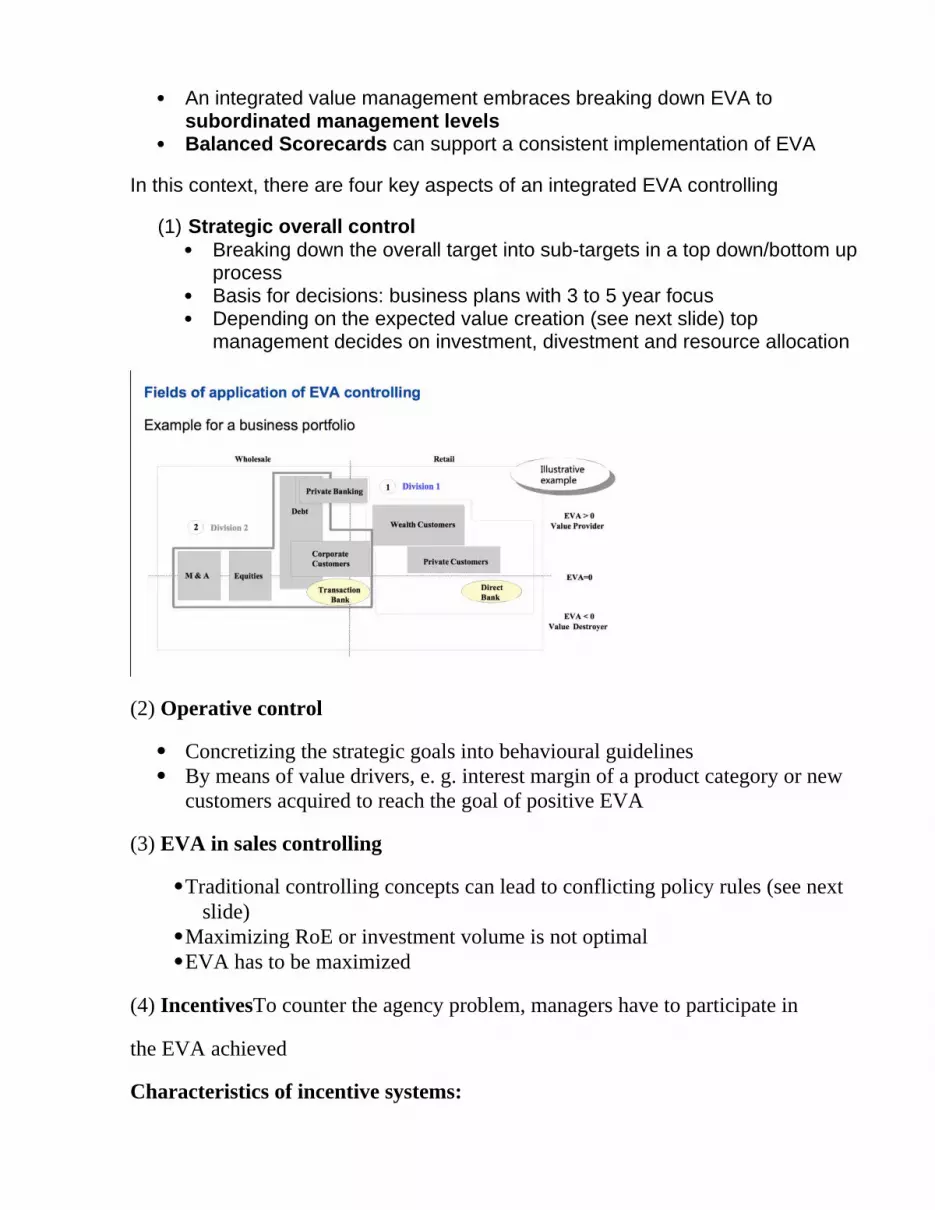
An integrated value management embraces breaking down EVA to subordinated management levels
Balanced Scorecards can support a consistent implementation of EVA
In this context, there are four key aspects of an integrated EVA controlling
(1) Strategic overall control Breaking down the overall target into sub-targets in a top down/bottom up
process Basis for decisions: business plans with 3 to 5 year focus Depending on the expected value creation (see next slide) top
management decides on investment, divestment and resource allocation
(2) Operative control
Concretizing the strategic goals into behavioural guidelines By means of value drivers, e. g. interest margin of a product category or new
customers acquired to reach the goal of positive EVA
(3) EVA in sales controlling
Traditional controlling concepts can lead to conflicting policy rules (see next slide)
Maximizing RoE or investment volume is not optimal EVA has to be maximized
(4) IncentivesTo counter the agency problem, managers have to participate in
the EVA achieved
Characteristics of incentive systems:

Managers up from the lowest level earn a significant share of their income dependent on EVA
No upper or lower limits for EVA bonuses Medium or long-term components e. g. payment by shares or options Synergies between departments can be reinforced by a participation in the EVA
of other departments or in global EVA

Prerequisites for successfuk EVA implementation
Commitment of top-management to concept Communication of value-orientation towards analysts and capital market Professional value reporting Willingness to change on all levels Training and internal communication Clear responsibilities through profit centers
Advantages of EVA concept:
Connects capital market expectances and internal management decisionspromotes shareholder value thinking
Comprehensive and integrated - embraces e. g Choice of strategyPlanning/budgeting/reportingOperative control and incentives
Can be used for all substantial decisions

Valuation of Banks
Valuation: Art or Science?
What triggers the need for a valuation analysis? Sale or acquisition of a bank, or parts of a financial institution, or a mergerBook-building prior to an IPOEntry of a shareholder into an existing firm, or departure of a former shareholder
Why banks are special
Treatment of debt: is debt a raw material or rather a source of capital? o Both equity and debt are taken into consideration when a corporate is
valued. o Banks view debt as a "raw material".o Therefore, capital at financial institutions only includes equity.
The regulatory overlayo The financial sector is an intensely regulated industry, whereby
regulations can take three basic forms:o (i) Minimum capital ratios, (ii) investment and growth restrictions, (iii)
Market entry can often be restricted The implications for valuation are two-fold:
Underlying assumption of growth through reinvestment has to be scrutinised as banks may face investment constraints.
Potential regulatory changes add a layer of uncertainty with a potentially negative value.
Treatment of reinvestments in the financial institutions enviroment o Reinvestments differently treated by banks and by corporateso Capex of corporates: investments in plant, equipment, other fixed assetso Operating expenses of banks: investments in brand name, human capital,
other intangible assets o Therefore capex and depreciation are relatively low for banks
Fair stand-alone value+Takeover premium=Transaction price paidIssues Takeover premium
Lower HighType of
transactionFriendly hostile
Stake at offer minority majority

Buyer competition exclusive auctionSynergie potential low highForm of payment
(liquidity)cash shares
Valuation methods for banks
Net Asset Value Multiples Sum-of-the Parts Divident discount DM/ Equity DCashFlow
+ Easy to calculate
+ Lower limit of the fair value
+ Simple and easy to calculate
+ Enable a quick calculation of a firm’s value
+ use of appropriate value methods in the different parts
+ Could be helpful for the identification of potential strengths/ weaknesses of particular divisions
+ Ensures the highest proximity to the „real“ company value
+ Simple identification of value drivers
- Considers historical figures
- Uncertainty about the estimation of hidden reserves
-Very dependent on market developments
- Easy to misuse and manipulate when firms are not very alike
- Requirement of working markets
- Necessity for a detailed understanding of the business model
- Uncertainty in the forecast of future company cf
- terminal value is a large component of the present value of the firm

Net Asset Value (NAV) (стоимость чистых активов) Все активы организации за вычетом всех обязательств и всех начислений на счет фирмы (включая разные формы долговых обязательств и преференциальные акции) . Это и есть акционерный капитал компании (shareholders equity) или чистая стоимость компании/ бизнеса (net worth).
Banking operations:
o reported book value of equity(expert opinion); o in practice often 1 year forward looking
Hidden reserves in security portfolio:
o mark-to-market quoted participations; o valuation of non-listed companies; o liquidity discount when necessary;o partial taxation of hidden reserves; o value above book value = hidden reserves (gross)
Hidden reserves in real estate portfolio:
o approximation fair market value; o taxation;o liquidity discount when necessary;
other hidden reserves/debts:
o over-financing of both risk provisions and pension accruals; o goodwill, o other.
Multiple Valuation
Мультипликатор - коэффициент или показатель, на который умножается оборот или доход компании, для расчета ее стоимости при использовании методов оценки с использованием повышающих/понижающих коэффициентов
Analyzing the company to be valued =>
Selecting relevant companies for the peer group =>
Peer group - is a set of companies or assets which are selected as being sufficiently comparable to the company or assets being valued. It can be chosen by different factors:

Industrial / business environment factors: Business model, industry, geography, seasonality, inflation
Accounting factors: Accounting policies, financial year end
Financial: Capital structure
Empirical factors: Size
Calculating and applying peer group multiples=>
Trading Multiples: Determination of the relation between market price and most important parameters for comparable companies.
Assignment of this relation to the company
Price-Earnings-Ratio (P/E) = Current Stock Price / (Net Profit / Weighted average number of shares)
EPS = net income-preferred dividends/weighted average no of shares in issue
(Cannot be used if earnings are negative)
Shows how much investors are willing to pay per $ of earnings
o Price-Book-Ratio (P/B) = the current closing price of the stock/ the latest quarter's book value per share = stock/total asset s- intangible assets (patents, goodwill) and liabilities
o Shows the market value in relation to the shareholder‘s equity in the balance sheet
o Price / Sales ratio = Share price / sales per share
Transaction Multiples:
Formation and application of price relations based on comparable transactions
Enterprise value / Earnings before Interest, Tax, Depreciation & Amortization. Also excludes movements in non-cash provisions and exceptional items
Enterprise Value- the value of the target company after the forecast period can be calculated by:
Average corrected P/E ratio * net profit at the end of the forecast period.
Sum-of-the Parts

Business unit Reference value
Personal Banking Adjusted book value. “Adjusted” means that the book value of assets and liabilities are adjusted to their fair market values, or marked to market. The difference between the adjusted assets less the adjusted liabilities is the assumed market value of the stockholder equity.
Adjusted book value considers the fair market value of assets owned by the business as well as any off balance sheet calculations.
Private banking Adjusted profit
Asset Management Funds under Management
Corporate banking Profit
Investment Banking Profit
Transaction banking Number of Transactions / Profit
Corporate Investments Revenues


