Embed Size (px)
Citation preview
arX
iv:a
stro
-ph/
0005
171v
1 8
May
200
0
Revised version February 1, 2008
The evolution of the galactic morphological types in clusters
Giovanni Fasano,1 Bianca M. Poggianti,1 Warrick J. Couch,2 Daniela Bettoni,1 Per Kjærgaard,3
Mariano Moles4
1) Osservatorio Astronomico di Padova, vicolo dell’Osservatorio 5, 35122 Padova, Italy.
2) School of Physics, University of New South Wales, Sydney 2052, Australia.
3) Astronomical Observatory of Copenhagen University, Juliane Maries Vej 30, 2100 Copenhagen, DK
4) Instituto de Matematicas y Fisica Fundamental, CSIC, C/ Serrano 123, 28006 Madrid, Spain.
ABSTRACT
The morphological types of galaxies in nine clusters in the redshift range 0.1 <∼
z <∼
0.25 are
derived from very good seeing images taken at the NOT and the La Silla–Danish telescopes,
with all galaxies at MV < −20 and within the central ∼1 Mpc2 area being classified. With
the purpose of investigating the evolution of the fraction of different morphological types with
redshift, we compare our results with the morphological content of nine distant clusters studied
by the MORPHS group (Dressler et al. 1997), five clusters observed with HST-WFPC2 at
redshift z = 0.2− 0.3 (Couch et al. 1998), and Dressler’s (1980) large sample of nearby clusters.
After having checked the reliability of our morphological classification both in an absolute sense
and relative to the MORPHS scheme (Smail et al. 1997), we analyze the relative occurrence of
elliptical, S0 and spiral galaxies as a function of the cluster properties and redshift. We find a
large intrinsic scatter in the S0/E ratio, mostly related to the cluster morphology. In particular,
in our cluster sample, clusters with a high concentration of ellipticals display a low S0/E ratio
and, vice-versa, low concentration clusters have a high S0/E. At the same time, the trend of
the morphological fractions (%Es, %S0s, %Sp) and of the S0/E and S0/Sp ratios with redshift
clearly points to a morphological evolution: as the redshift decreases, the S0 population tends
to grow at the expense of the spiral population, whereas the frequency of Es remains almost
constant. We also analyze the morphology-density (MD) relation in our clusters and find that
– similarly to higher redshift clusters – a good MD relation exists in the high-concentration
clusters, while it is absent in the less concentrated clusters. Finally, the comparison of the MD
relation in our clusters with that of the D97 sample suggests that the transformation of spirals
into S0 galaxies becomes more efficient with decreasing local density.
Subject headings: galaxies: clusters – galaxies: evolution – galaxies: structure
Received ; accepted
– 2 –
1. Introduction
When Butcher & Oemler (1978, 1984) discovered an excess of galaxies bluer than the elliptical sequence
in clusters at z ≥ 0.2, nothing was known about the galactic morphologies at such large distances. The first
evidence of the disky/spiral nature of the Butcher-Oemler galaxies came from high-resolution ground-based
imagery which also found several cases of galaxies with disturbed morphologies and/or close neighbors
(Thompson 1986, 1988, Lavery & Henry 1988, 1994, Lavery, Pierce & McClure 1992).
Over the past five years, thanks to the high spatial resolution imaging achieved with the Hubble Space
Telescope (HST), it has been established that the morphological properties of galaxies in rich clusters at
intermediate redshift differ dramatically from those in nearby clusters. The most obvious difference is
the overabundance of spirals in the cluster cores at z = 0.3 − 0.5 (Couch et al. 1994, 1998, Dressler et
al. 1994, Wirth et al. 1994, Dressler et al. 1997 [D97, MORPHS collaboration], Oemler et al. 1997, Smail
et al. 1997 [S97, MORPHS]). The spiral population in the distant clusters consist of the great majority
of the blue galaxies responsible for the Butcher-Oemler effect, as well as a sizeable fraction of the red
population (Dressler et al. 1999 [MORPHS], Poggianti et al. 1999 [MORPHS]). A considerable proportion
of these spirals have disturbed morphologies, in some cases quite clearly as the result of an ongoing
merger/interaction while in others possibly connected to some other dynamical mechanism (e.g. interaction
with the hot intracluster medium or the cluster tidal field, Moore et al. 1996, 1998, Abadi et al. 1999).
The second major piece of evidence for morphological evolution in clusters was uncovered only from
post-refurbishment data: Coupled to the increase in the spiral fraction, the S0 galaxies at intermediate
redshifts are proportionately (x2–3) less abundant than in nearby clusters, while the fraction of ellipticals is
already as large or larger (D97, S97). This result strongly suggests that a large number of the cluster spirals
observed at z ∼ 0.4 have evolved into the S0’s that dominate the cores of rich clusters today (D97, Couch
et al. 1998, van Dokkum et al. 1998, but see Andreon 1998 for a different view). Thus the disk galaxy
populations appear to be greatly affected by the cluster environment, while the ellipticals in dense regions
seem to have changed little since z ∼ 0.5 as far as both their abundance and their stellar populations are
concerned (van Dokkum & Franx 1996, Andreon, Davoust & Heim 1997, D97, Ellis et al. 1997 (MORPHS),
Kelson et al. 1997, S97, Barger et al. 1998 (MORPHS), van Dokkum et al. 1998, Kelson et al. 1999).
Morphological studies at redshift greater than 0.6 have been limited to three clusters so far, pointing to a
low fraction of early-type galaxies in two clusters at z ∼ 0.8 (Lubin et al. 1998, van Dokkum et al. 2000),
a high early-type galaxy fraction in a cluster at z=0.9 (Lubin et al. 1998) and a surprisingly high rate of
mergers in a cluster at z=0.83 (van Dokkum et al. 1999).
Further proof of the changes occurring in clusters is the observed evolution of the morphology-density
(MD) relation – the correlation between galaxy morphology and local projected density of galaxies that
Dressler (1980a, D80a) found in all types of clusters at low redshift, whereby the elliptical fraction increases
and the spiral fraction decreases with increasing local galaxy density. An MD relation qualitatively similar
to that found by D80a was discovered by D97 to be present in regular clusters and absent in irregular ones
at z ∼ 0.5. Interestingly, the incidence of ellipticals is already very high in all the distant clusters regardless
of their dynamical status, therefore the formation of the ellipticals must occur independently of and before
cluster virialization (D97).
Overall, the available data seem to require a strong morphological evolution in clusters between
z = 0.4 and z = 0. Still, it is worth keeping in mind that these conclusions, although grounded on
high-quality data obtained with a monumental observational effort, are based on a “small” sample of distant
– 3 –
clusters and on the comparison of a limited redshift range around z ∼ 0.4 with the present-day cluster
populations (Dressler 1980b, D80b). Clearly the z ∼ 0.1 − 0.2 regime - which up until now has remained
largely unexplored - is crucial for a better understanding of the progression of galaxy evolution in dense
environments. At these moderate redshifts, performing an analysis comparable to that of the MORPHS
requires either ground-based CCD imaging taken over quite a large field under excellent seeing conditions,
or a time-consuming mosaic coverage with HST.
The goal of this paper is to begin to fill in the observational gap between the distant clusters observed
with HST and the nearby clusters, and hence trace, for the first time, the evolution of the morphological
mix at a look-back time of 2 − 4 Gyr. In addition, by enlarging the sample of clusters whose galactic
morphologies have been studied in detail, we hope to shed some light on the dependence of the observed
evolutionary trends on the cluster properties. We present ground-based, good-seeing images of the central
regions of 9 clusters at z = 0.09 − 0.25 (§2) and we perform a detailed morphological analysis of the
galaxies in these clusters (§3). We study the relative occurrence of ellipticals, S0’s and spirals as a
function of the cluster properties and we compare them with similar studies at lower and higher redshift
(§4). Finally, we examine the morphology-density relation of the total sample and of the high- and
low-concentration clusters separately (§5) and we present our conclusions in §6. Throughout this paper we
use H0 = 50 km sec−1 Mpc−1 and q0 = 0.5.
2. Observations and sample selection
The data presented here we taken as part of a long term project, involving four of us (GF,DB,PK,MM),
aimed at analysing the scaling relations of early–type galaxies in 25 clusters spanning the redshift range
0.03 − 0.25 (Fasano et al. 2000). Only Abell clusters having Bautz and Morgan (1970) types II or larger,
Rood and Sastry (1971) types C or F, and galactic latitude |b| > 40◦ were included in the original sample.
Moreover, very poor clusters (Abell richness class = 0) were excluded from the selection.
The observations, taken in two or three bands (B, V , Gunn r), were collected at the NOT (STAN–CAM
or ALFOSC) and 1.5 Danish (DFOSC) telescopes during four different observing runs from May 1995 to
Feb 1997. A log of the observations pertinent to the clusters discussed in this paper, together with the main
properties of the CCDs used, are presented in Table 1. The seeing at the NOT telescope ranged from 0.5 to
0.82 arcsec, except during run (4) when it was 1.1 arcsec; at the 1.5 Danish telescope (run 3) the seeing was
∼ 1.5 arcsec. However, the rest-frame resolution in kpc does not vary much within the sample (see Table 2).
Several standard star fields (Landolt 1992) were observed during each night in the three bands in order to
set the proper photometric calibrations as a function of the zenith distance and of the B − Gr (or V − Gr)
colors. Bias subtraction and flat–fielding, together with the removal of bad columns and cosmic ray events,
Table 1
Run Date Instrument Pixelsize Field gain r.o.n.
(arcseconds) (pixels)
1 1995 May STAN-CAM 0.176 10242 1.69 6.36
2 1995 Jun STAN-CAM 0.176 10242 1.69 6.36
3 1997 Jan DFOSC 0.420 20522 1.31 4.90
4 1997 Feb ALFOSC 0.187 20482 1.02 5.60
– 4 –
were performed using the CCDPROC tool in IRAF. A more detailed description of the observations and
data reduction procedures can be found in Fasano et al. (2000).
To be consistent with previous morphological studies (D97), we should only consider clusters for
which at least the central 1 Mpc2 has been imaged. Due to the limited angular size of our CCD frames,
we have excluded from the present sample those clusters with z < 0.09, for which the coverage turned
out to be inadequate. Moreover, since our observations were not conceived in order to satisfy the above
mentioned criterion, even for clusters with z > 0.1 the sampled area is sometimes less than 1 Mpc2 and it
often turns out to be shifted with respect to the geometrical center of the cluster. Hence, among the 25
clusters observed as part of the scaling-relation program, we have selected 9 clusters in the redshift range
0.1 <∼
z <∼
0.25 for which an acceptable coverage of the central region has been secured.
The basic information concerning the selected clusters and the parameters relevant for our analysis
are reported in Table 2. For two clusters, A2658 and A1878, the available frames cover about half of the
requested area: in the following we will explain how we have tried to account for the partial coverage. For
Abell 2192 we list two different entries in Table 2: the first one (run 1) refers to four contiguous Gunn r
images covering a quite large area, the second one (run 2) relates to a smaller part of the cluster, for
which (B-r) colors of galaxies are available, thus allowing a more accurate photometric calibration. When
comparing with the other clusters, we will refer to the large area image of A2192, while we will make use of
the smaller area to assess how strongly the different coverage can affect the results.
3. Galaxy catalogs and morphological classification
Catalogs of galaxies for each frame have been obtained using SExtractor (Bertin and Arnouts 1996).
The galaxy magnitudes have been corrected for a well known bias affecting SExtractor magnitudes of
galaxies having an r1/4 profile (Franceschini et al. 1998).
As in D97, the analysis of the morphological types has been done for galaxies down to a visual absolute
magnitude MV ∼ −20.0. The corresponding r-band magnitude limits were derived using standard Gunn-r
and Cousins/Johnson (V ) filter transmission, first adopting the conversion between Gunn-r and Cousins
R given by Jorgensen (1994) and then applying the K-corrections of an intermediate energy distribution
Table 2
Cluster z RA DEC E(B-V) Run area seeing seeing Mlim
(J2000) (J2000) Mpc2 arcsec kpc (Gunn r)
A3330 0.091 05h 14m 47s -49◦ 04′ 19′′ 0.00 3 1.0 1.53 3.46 18.36
A389 0.116 02h 51m 31s -24◦ 56′ 05′′ 0.00 3 1.2 1.45 4.04 18.85
A951 0.143 10h 13m 55s +34◦ 43′ 06′′ 0.01 4 1.0 1.10 3.65 19.34
A2658 0.185 23h 44m 59s -12◦ 18′ 20′′ 0.10 2 0.4 0.70 2.78 20.46
A2192(l) 0.187 16h 26m 37s +42◦ 40′ 20′′ 0.01 1 1.8 0.55 2.22 20.21
A2192(s) 0.187 16h 26m 37s +42◦ 40′ 20′′ 0.01 2 0.4 0.82 3.31 20.21
A1643 0.198 12h 55m 54s +44◦ 04′ 46′′ 0.00 1 0.9 0.50 2.10 20.33
A2111 0.229 15h 39m 38s +34◦ 24′ 21′′ 0.06 1 0.9 0.70 3.22 20.80
A1952 0.248 14h41m 04s +28◦ 38′ 12′′ 0.00 2 1.2 0.60 2.93 20.92
A1878 0.254 14h 12m 49s +29◦ 12′ 59′′ 0.00 1 0.6 0.50 2.47 20.92
– 5 –
(Sab) for H0 = 50 km sec−1 Mpc−1 and q0 = 0.5. Examples of K-corrections for various galactic types can
be found in Poggianti (1997). The magnitude limits were corrected for the foreground Galactic extinction
(see Table 2) according to the standard Galactic extinction law (Mathis 1990).
Column 8 of Table 2 reports the seeing in arcseconds, whereas column 9 shows the rest-frame resolution
that ranges between 2 and 4 kpc. Even though the seeing quality of our imagery was often excellent, the
spatial resolution is poorer than that secured by the HST imaging of the clusters in D97 (∼ 0.7 kpc at z ∼
0.5), making the merely visual classification less reliable with respect to that given by the MORPHS. In
order to improve the morphological type estimates we have produced luminosity and geometrical (ellipticity
and position angle) profiles of all selected galaxies using the automatic surface photometry tool GASPHOT
(Pignatelli and Fasano 1999). In this way, in addition to the appearance of the galaxies on the images and to
the surface and isophotal plots, we took advantage of the typical indications coming from the morphological
profiles. For instance, S0 galaxies, even if poorly resolved, are usually characterized by increasing ellipticity
profiles (indicating an extended disk superimposed upon an inner, round bulge), composite luminosity
profiles (with r1/4 inner part and exponential outer part) and almost constant position angle profiles in
the outer part (disk). In contrast, constant (or even decreasing) ellipticity profiles and outer isophotal
twisting (together with ‘pure’ r1/4 luminosity profile) are highly suggestive of an elliptical morphology. An
exponential luminosity profile, with almost constant (or fluctuating) position angle and ellipticity profiles
are good hints of spiral morphology. A break-down in ellipticity, coupled with a sharp (and large) change
of position angle, usually indicates the presence of a bar, thus suggesting a spiral (or S0) classification.
Clearly, the above indications cannot be considered as unfailing rules, but certainly they contributed to
make the classifications more robust. Table 3 (available on CD-ROM form) reports the positions and the
morphological classifications of all galaxies in our sample.
The morphological classification of the selected galaxies was done by GF on the r-band images relying
on both the visual appearance and the profiles. Galaxies whose broad classification (E/S0/Sp) was judged
uncertain have been recorded with a question mark (eg: E?, S0?, Sp?) in Table 3. The transition objects
(E/S0, S0/E, S0/a, Sa/0) have been ‘arbitrarily’ assigned to some broad class (E/S0/Sp) on the basis of
the experience and of the opinion of the classifier (GF). However, the relative number of galaxies with
uncertain and/or transition morphology turns out to add a negligible contribution to the errorbars of the
morphological frequencies which are dominated by the Poissonian uncertainties.
It is obviously crucial for our purposes to assess the reliability of our classification scheme both in an
absolute sense and relative to the MORPHS scheme. To this end we have devised four different ‘blind’
tests. The absolute accuracy of our classification has been checked in two ways:
a) Using the MKOBJECTS tool in IRAF, we have produced a set of ‘toy’ galaxies with different
bulge/disk luminosity and size ratios and varying inclination, trying to reproduce E, S0, Sa and Sbc galaxies
according to the typical ratios given by Simien and de Vaucouleurs (1986). The proper values of noise,
seeing, pixel size and redshift have been used in the simulations to mimic, at best, the observing conditions
of the cluster A2111 at z=0.23 which represents an average case for its seeing and rest-frame resolution (0.7
arcsec, 3.22 kpc). The toy galaxies have been then classified using the same tools and the same classification
scheme used for real galaxies.
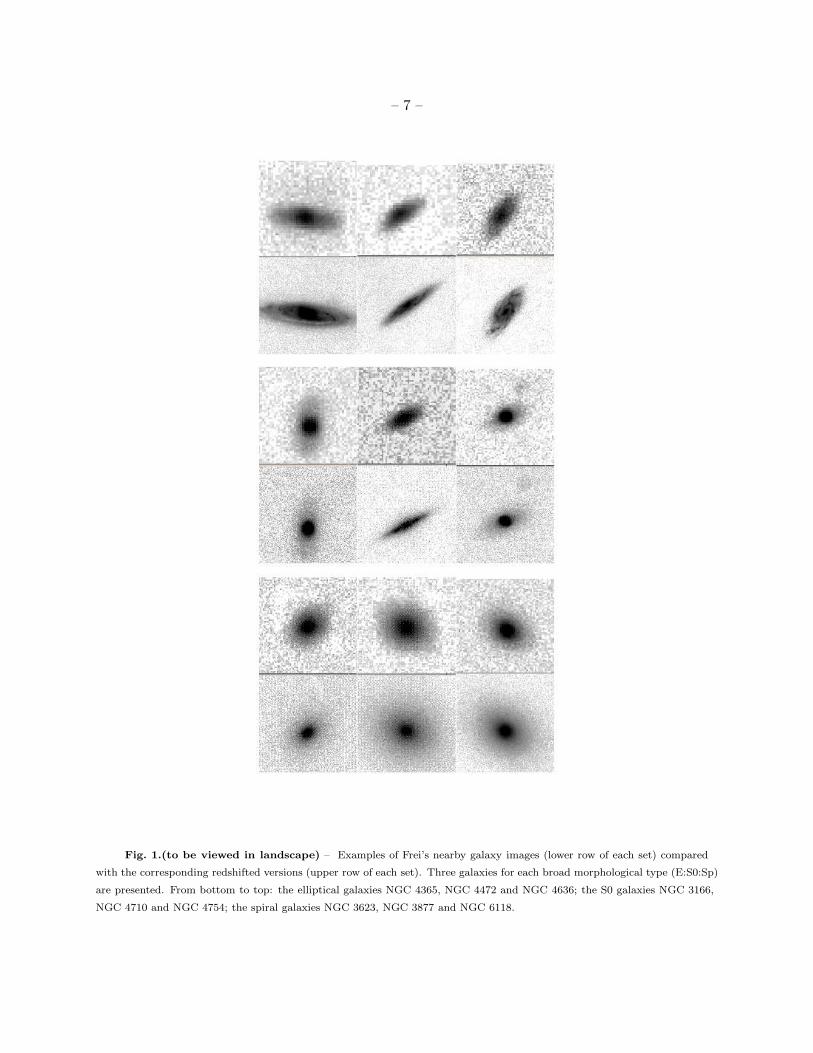
b) The nearby galaxy imaging collection of Frei et al. (1996) has been used to produce redshifted
versions (with the ∼ (1 + z)4 surface brightness dimming taken into account) of 34 galaxies of different
morphological types, including all the galaxies listed by Frei et al. to have types E to Sa (T=-5 to 1) and
eight later-type galaxies (T=2 to 6). In this way we intended to verify the capacity to discriminate between
– 6 –
ellipticals, S0s and early-type spirals and to recognize later-type galaxies, the latter being an easier task
than the former. Again the proper values of the observing parameters have been used to mimic our A2111
images and the resulting galaxies have been classified following the procedure and the rules used for our
cluster galaxies.
– 7 –
Fig. 1.(to be viewed in landscape) – Examples of Frei’s nearby galaxy images (lower row of each set) compared
with the corresponding redshifted versions (upper row of each set). Three galaxies for each broad morphological type (E:S0:Sp)
are presented. From bottom to top: the elliptical galaxies NGC 4365, NGC 4472 and NGC 4636; the S0 galaxies NGC 3166,
NGC 4710 and NGC 4754; the spiral galaxies NGC 3623, NGC 3877 and NGC 6118.
– 8 –
In Figure 1 three examples of Frei’s nearby galaxy images for each broad class (E:S0:Sp) are shown,
together with the corresponding redshifted versions.
The main goal of these tests is to determine whether the quality of our images is sufficient to recognize,
at the cluster redshifts, the salient features of the galactic morphologies, enabling us to broadly classify
galaxies into ellipticals (E,E?,E/S0), S0s (S0,S0?,S0/E,S0/a) and spirals (Sa/0 and later) as we would do
for nearby galaxies. These tests show that in the great majority of cases (89% in test [a] and 73% in test
[b]) the broad morphological types (E, S0 and spirals) assigned by GF at z=0 are also recovered at z ∼ 0.23
with no systematic shift among the types. The only exception is represented by those galaxies from Frei’s
catalog that were classified as S0/a at z=0. In fact, half of them enter the “spiral class” as early spirals
when viewed at z=0.23, while in our classification the S0/a galaxies belongs to the S0 class. Excluding these
S0/a galaxies, low-z ellipticals, S0s and spirals were recovered at z=0.23 in the 92% (11/12), 71% (5/7) and
100% (8/8) of the cases, respectively. Test a) shows that, regardless of the redshift, the seeing conditions,
etc, S0 galaxies viewed face-on are classified ellipticals, while the inclination of S0 and Sa galaxies influences
the assignment to one class or the other as edge-on S0s are easily mistaken for Sa’s, while Sa’s at small
inclinations are classified S0’s.
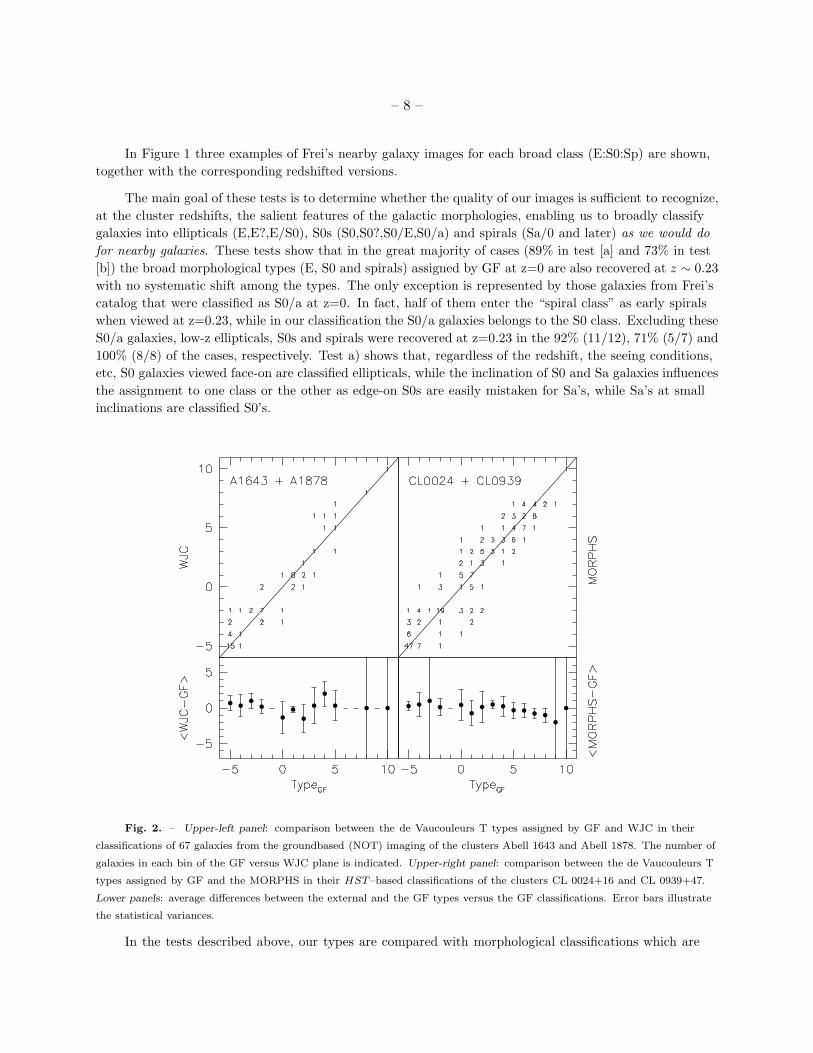
Fig. 2. – Upper-left panel: comparison between the de Vaucouleurs T types assigned by GF and WJC in their
classifications of 67 galaxies from the groundbased (NOT) imaging of the clusters Abell 1643 and Abell 1878. The number of
galaxies in each bin of the GF versus WJC plane is indicated. Upper-right panel: comparison between the de Vaucouleurs T
types assigned by GF and the MORPHS in their HST–based classifications of the clusters CL 0024+16 and CL 0939+47.
Lower panels: average differences between the external and the GF types versus the GF classifications. Error bars illustrate
the statistical variances.
In the tests described above, our types are compared with morphological classifications which are
– 9 –
considered correct a priori, since they refer to toy or nearby galaxies. However, in order to be able to
compare our results with higher redshift clusters, besides an absolute check, we need to test the consistency
between our classifications and those of the MORPHS group. This has been done in two ways:
c) GF undertook independent visual classifications of galaxies in the MORPHS HST images of the
clusters CL 0024+16 and CL 0939+47.
d) WJC (one of the classifiers of the MORPHS collaboration) has provided independent visual
classifications of 67 galaxies in two clusters of the present sample (Abell 1643 and Abell 1878).
The results of tests c) and d) are summarized in Figure 2. At first sight the agreement between GF
and the external classifiers seems to be quite good. However, after counting the total number of galaxies
which, according to the different classifiers, fall in the different broad morphological types (E/S0/Sp), it was
found that GF had classified a smaller number of galaxies as S0 in comparison to WJC and the MORPHS
(57 versus 73). Twelve of these galaxies GF had classified as ellipticals, while the remaining 4 had been
classified as spirals.
We stress that these differences are actually not statistically significant as far as the counts are
concerned. In the worst case – the S0 galaxies – the Poissonian uncertainties are such that the difference in
numbers between GF and the other classifiers (57 cf. 73) represents only a 1.5σ marging. Nevertheless, to be
conservative, we have assumed the above difference in assignment between the classifiers to be systematic.
In section 5, where an overall discussion of all available data will be presented, in order to consistently
compare our data with those from the MORPHS sample, we will introduce a statistical correction to
account for these differences in the morphological classification.
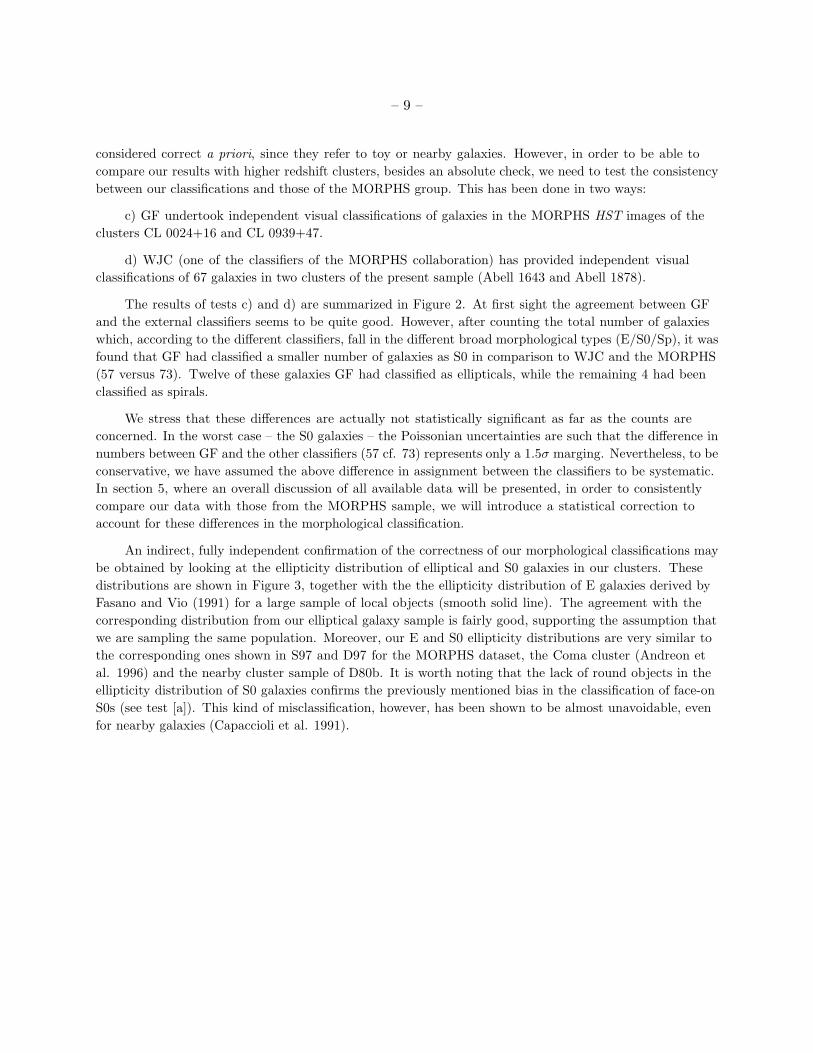
An indirect, fully independent confirmation of the correctness of our morphological classifications may
be obtained by looking at the ellipticity distribution of elliptical and S0 galaxies in our clusters. These
distributions are shown in Figure 3, together with the the ellipticity distribution of E galaxies derived by
Fasano and Vio (1991) for a large sample of local objects (smooth solid line). The agreement with the
corresponding distribution from our elliptical galaxy sample is fairly good, supporting the assumption that
we are sampling the same population. Moreover, our E and S0 ellipticity distributions are very similar to
the corresponding ones shown in S97 and D97 for the MORPHS dataset, the Coma cluster (Andreon et
al. 1996) and the nearby cluster sample of D80b. It is worth noting that the lack of round objects in the
ellipticity distribution of S0 galaxies confirms the previously mentioned bias in the classification of face-on
S0s (see test [a]). This kind of misclassification, however, has been shown to be almost unavoidable, even
for nearby galaxies (Capaccioli et al. 1991).
– 10 –
Fig. 3. Ellipticity distributions of elliptical and S0 galaxies in our clusters. The smooth solid line represents the ellipticity
distribution of Es derived by Fasano and Vio (1991) for a large sample of local objects.
4. Results and comparison with other samples
In Table 4 we list, for each cluster, the observed numbers of Es, S0s and spirals and the observed
S0/E ratio, together with the Poissonian error. The clusters appear to be grouped in two different families,
according to their S0/E ratios: a low S0/E family (4 clusters) with S0/E∼0.5, and a high S0/E family (5
clusters) with S0/E>∼1.1. We note that if we apply to our counts a statistical correction to compensate
for the excess of Es and the lack of S0s we have found in our classifications with respect to the MORPHS
(see §3), the S0/E ratios of the above mentioned families both shift upwards, but the dichotomy remains
(see Figure 10a). We have investigated whether this S0/E dichotomy could be driven by the small
Table 4: morphological counts of our clusters
Cluster z E S0 Sp S0/E
1) A3330 0.091 18 18 11 1.00±0.33
2) A 389 0.116 17 18 3 1.06±0.36
3) A951 0.143 10 12 2 1.20±0.50
4) A2658 0.185 11 6 3 0.54±0.29
5) A2192(l) 0.187 17 18 14 1.06±0.36
5) A2192(s) 0.187 9 12 5 1.33±0.59
6) A1643 0.198 15 17 15 1.13±0.40
7) A2111 0.229 34 17 16 0.50±0.14
8) A1952 0.248 25 14 14 0.56±0.20
9) A1878 0.254 15 8 15 0.53±0.23
– 11 –
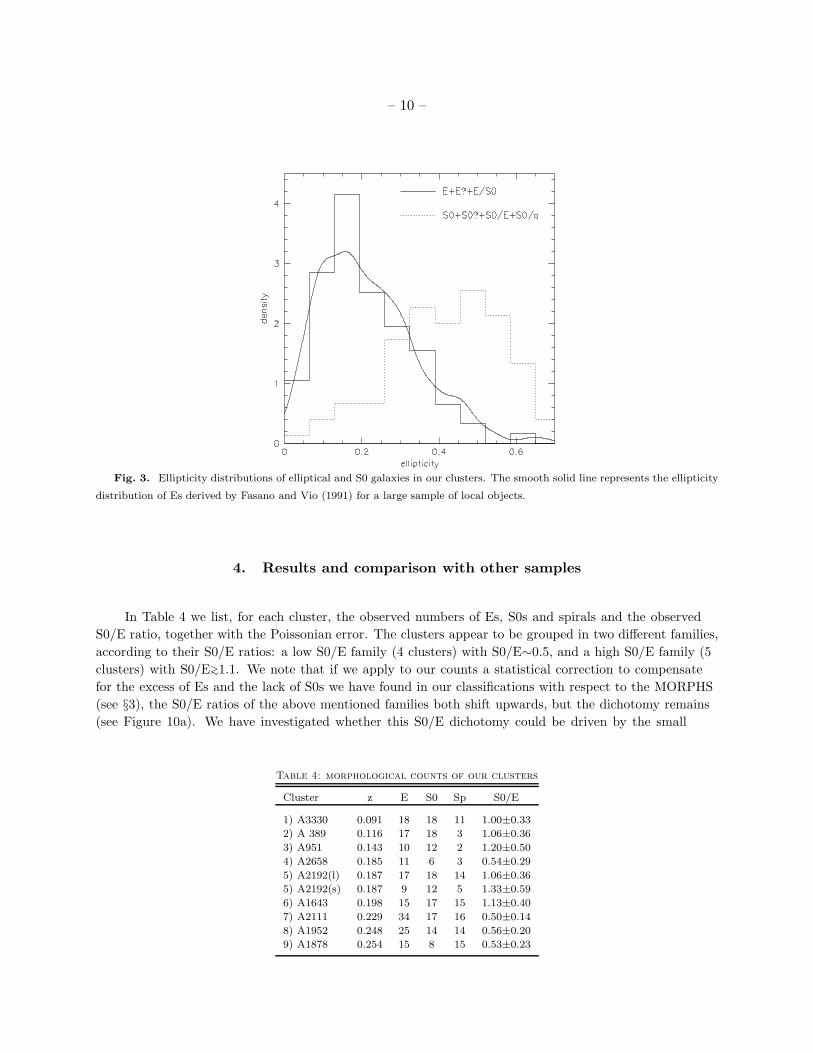
cluster-to-cluster variations in the rest-frame characteristics of the images, but the observed S0/E ratio is
found to be uncorrelated with the resolution and with the area surveyed as shown in Fig. 4a,b. 1 Hence,
the S0/E dichotomy seems to reflect an intrinsic difference in the relative proportions of these types of
galaxies in the two subsets of clusters.
2 2.5 3 3.5 40
0.5
1
1.5
2
0 0.5 1 1.5 2 20 40 60 80
Fig. 4. The S0/E ratio versus the rest-frame resolution (in kpc), the area (in Mpc2) and the mean galaxy density (in
numbers of galaxies per Mpc2). The open circles refer to A2192, where both the smallest area (0.4 Mpc2) and the largest area
(1.8 Mpc2) values are plotted. Errorbars are not displayed for the sake of clarity and can be found in Table 4.
The low S0/E and the high S0/E clusters are at z ≥ 0.19 and z ≤ 0.2, respectively, but this step-like
behaviour of the S0/E ratio at z ∼ 0.2 is unlikely to be an abrupt evolutionary effect: rather, it could be
related to different characteristics of the two families of clusters. Searching for correlations between the
S0/E ratio and the global cluster properties, we have found no relation with the mean projected galaxy
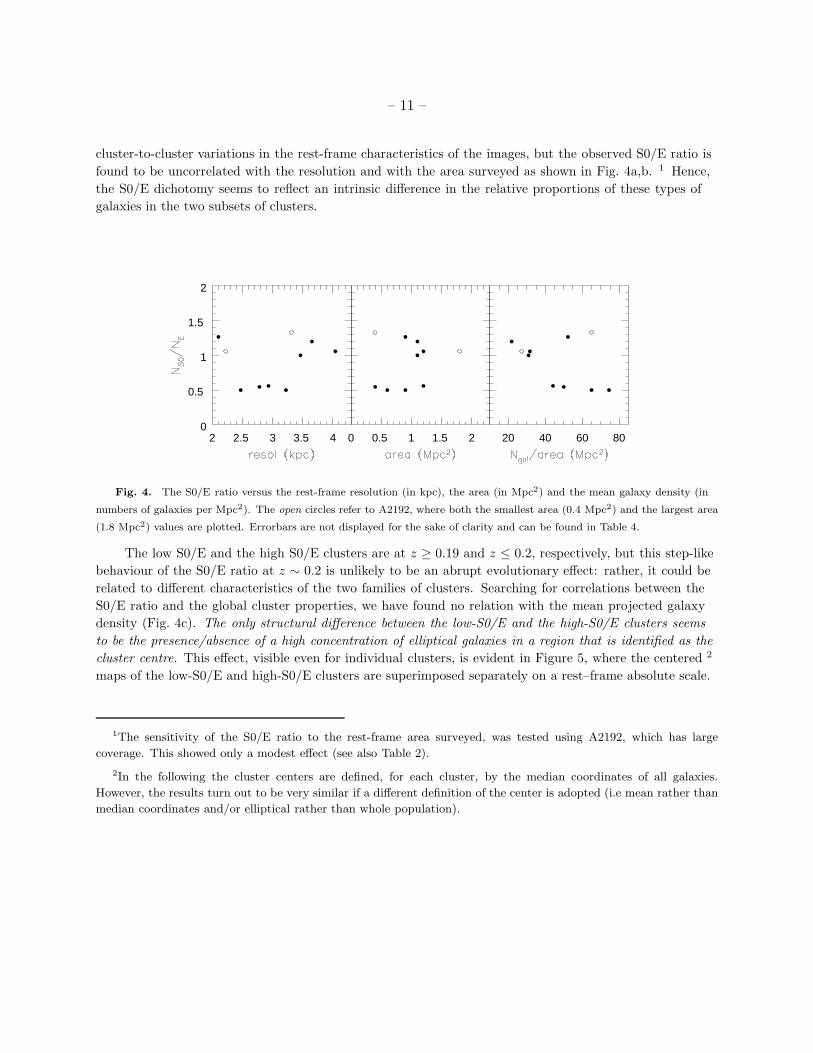
density (Fig. 4c). The only structural difference between the low-S0/E and the high-S0/E clusters seems
to be the presence/absence of a high concentration of elliptical galaxies in a region that is identified as the
cluster centre. This effect, visible even for individual clusters, is evident in Figure 5, where the centered 2
maps of the low-S0/E and high-S0/E clusters are superimposed separately on a rest–frame absolute scale.
1The sensitivity of the S0/E ratio to the rest-frame area surveyed, was tested using A2192, which has large
coverage. This showed only a modest effect (see also Table 2).
2In the following the cluster centers are defined, for each cluster, by the median coordinates of all galaxies.
However, the results turn out to be very similar if a different definition of the center is adopted (i.e mean rather than
median coordinates and/or elliptical rather than whole population).
– 12 –
Fig. 5. Overlapping of the centered maps of the low-S0/E and high-S0/E clusters. Filled dots, open dots and crosses
refer to ellipticals, S0s and spirals, respectively.
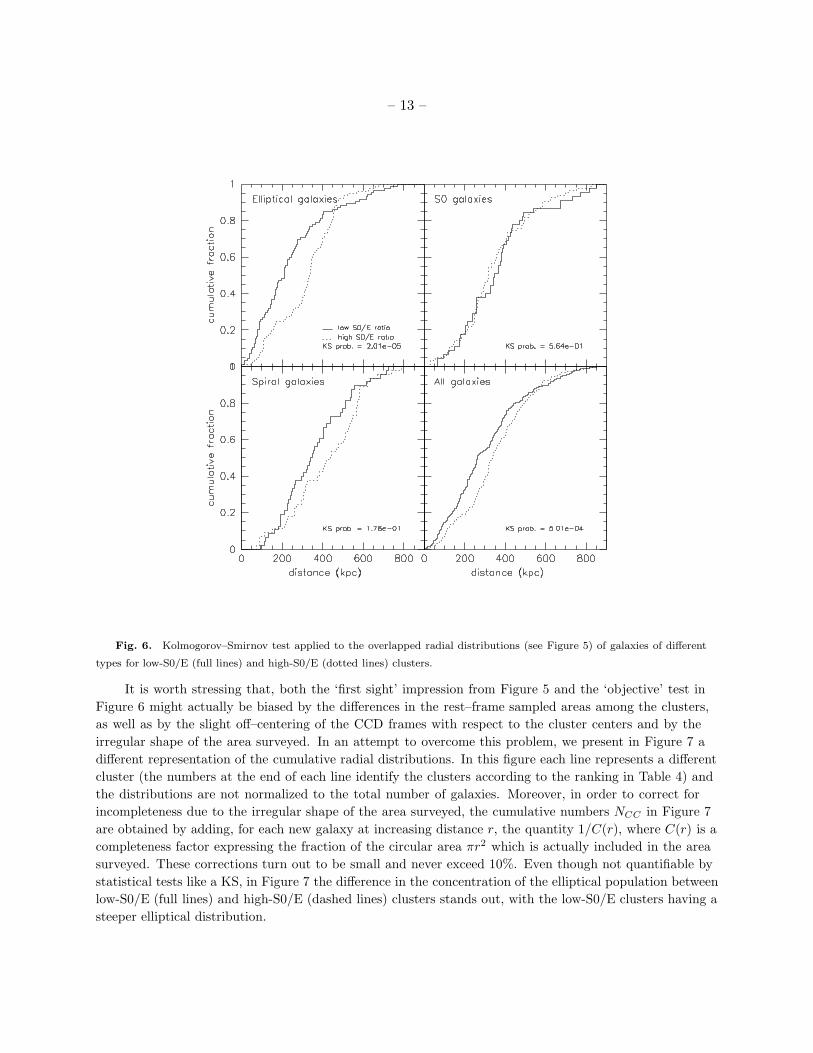
A more quantitative illustration of the difference in the galaxy spatial distribution between the
low-S0/E and the high-S0/E clusters is given in Fig. 6 using the Kolmogorov–Smirnov (KS) test. The
cumulative radial distribution of the ellipticals in the low-S0/E clusters is significantly steeper (i.e. more
concentrated) than that of the high S0/E clusters. The two S0 distributions are practically indistinguishable
and those of the spirals do not differ significantly, while the two total distributions of all types of galaxies
are dominated by the ellipticals and are statistically different.
– 13 –
Fig. 6. Kolmogorov–Smirnov test applied to the overlapped radial distributions (see Figure 5) of galaxies of different
types for low-S0/E (full lines) and high-S0/E (dotted lines) clusters.
It is worth stressing that, both the ‘first sight’ impression from Figure 5 and the ‘objective’ test in
Figure 6 might actually be biased by the differences in the rest–frame sampled areas among the clusters,
as well as by the slight off–centering of the CCD frames with respect to the cluster centers and by the
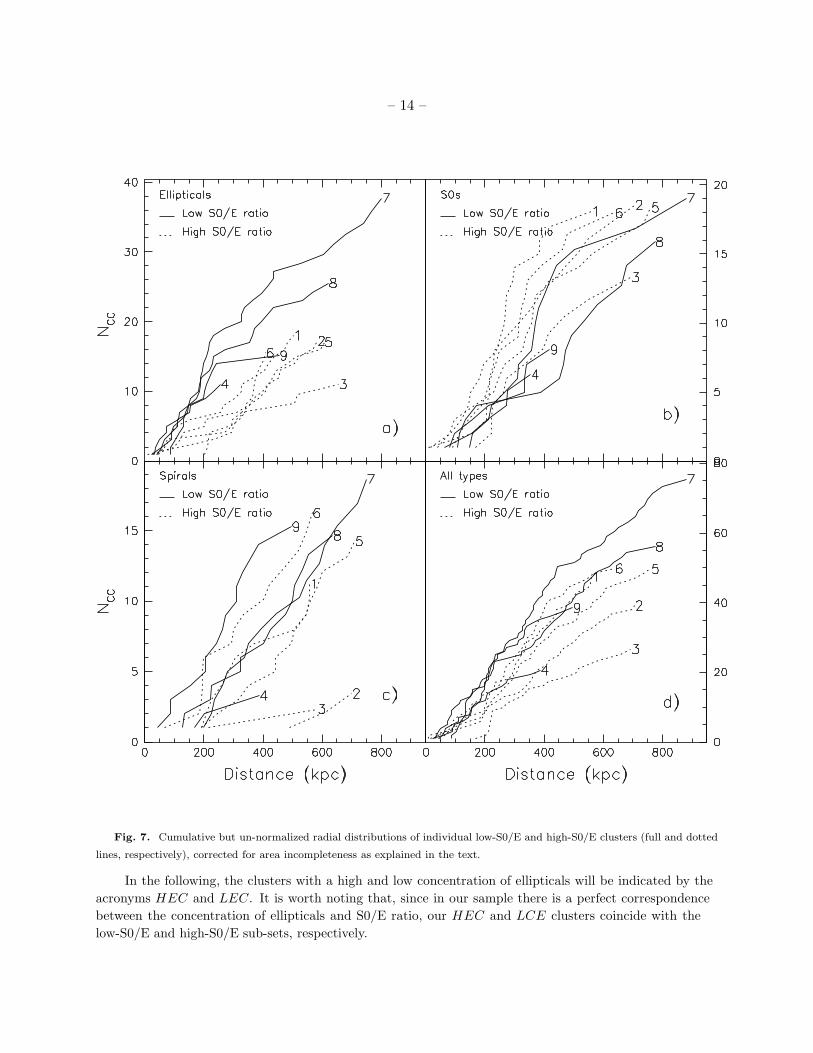
irregular shape of the area surveyed. In an attempt to overcome this problem, we present in Figure 7 a
different representation of the cumulative radial distributions. In this figure each line represents a different
cluster (the numbers at the end of each line identify the clusters according to the ranking in Table 4) and
the distributions are not normalized to the total number of galaxies. Moreover, in order to correct for
incompleteness due to the irregular shape of the area surveyed, the cumulative numbers NCC in Figure 7
are obtained by adding, for each new galaxy at increasing distance r, the quantity 1/C(r), where C(r) is a
completeness factor expressing the fraction of the circular area πr2 which is actually included in the area
surveyed. These corrections turn out to be small and never exceed 10%. Even though not quantifiable by
statistical tests like a KS, in Figure 7 the difference in the concentration of the elliptical population between
low-S0/E (full lines) and high-S0/E (dashed lines) clusters stands out, with the low-S0/E clusters having a
steeper elliptical distribution.
– 14 –
Fig. 7. Cumulative but un-normalized radial distributions of individual low-S0/E and high-S0/E clusters (full and dotted
lines, respectively), corrected for area incompleteness as explained in the text.
In the following, the clusters with a high and low concentration of ellipticals will be indicated by the
acronyms HEC and LEC. It is worth noting that, since in our sample there is a perfect correspondence
between the concentration of ellipticals and S0/E ratio, our HEC and LCE clusters coincide with the
low-S0/E and high-S0/E sub-sets, respectively.
– 15 –
4.1. Evolution in morphological content
We will now investigate the evolution of the galactic morphologies by comparing our results with other
studies at lower and higher redshift.
Before performing this comparison, we have applied 3 different statistical corrections to our raw
counts in Table 4: (i) The correction for incompleteness due to the irregular shape of the area surveyed
was computed according to the procedure outlined in the previous section (see caption of Fig.7). (ii) The
systematic differences in the morphological classifications between WJC+MORPHS and GF (see §3), were
corrected for my making the appropriate adjustments to GF’s morphological counts. Specifically, we have
multiplied GF’s S0 counts by 73/57 and, in order to preserve the total counts, we have taken the differential
counts from both the E and Sp populations according to the relative percentages given in section 3 (75%
and 25% , respectively). (iii) The field contamination was determined from the galaxy number counts given
by Metcalfe et al. (1995) and the breakdown into morphological classes (E/S0/Sp=18:27:56) was computed
for our limiting magnitudes at z ∼ 0.2 from the fits to the differential number counts of the Medium
Deep Survey (S97). The background assumed is listed for each cluster in Table 5 which is available in
CD-ROM form. The number of contaminating early-type galaxies was found to agree with the number of
probable background galaxies redder than the elliptical sequence in the color-magnitude plots, hence local
background variations should not be dramatic towards the clusters in this sample. As it will be clear in the
following discussion, the uncertainty introduced by the field contamination has negligible consequences on
our results.
At higher redshifts, we consider the MORPHS distant cluster sample plus five additional clusters in
the range z = 0.2 − 0.3. The latter include the 3 clusters at z ∼ 0.3 from the HST -based morphological
study of Couch et al. (1998), together with A2218 and A1689 (both at z = 0.18) for which archival
HST/WFPC-2 images were available. These images were used by WJC to morphologically classify the
galaxies in A2218 and A1689, in the same way as was done for the Couch et al. and MORPHS studies.
Details of all 5 clusters are given in Table 6; hereafter we shall refer to them as the C98+ sample.
As for our clusters, the morphological number counts of the MORPHS and the C98+ samples have
been computed down to MV = −20 and the raw counts have been corrected for incompleteness due
to the irregular shape of the area surveyed, (according to the procedure outlined earlier) and for field
contamination. The latter were determined from the morphological galaxy number counts of the Medium
Deep Survey as in S97. The magnitude limits adopted for the C98+ clusters are listed in Table 6. The
limits for the MORPHS dataset are MD97
lim −1 mag, where MD97
lim is given in Table 1 of D97.3 The magnitude
limits were derived adopting the transformations between the HST and standard photometric bands given
by Holtzman et al. (1995). The Cousins I-band calibration of the HST A1689 image was kindly provided
by I. Smail.
3In fact, due to a transcription error in D97, MD97
lim corresponds to MV = −19.
– 16 –
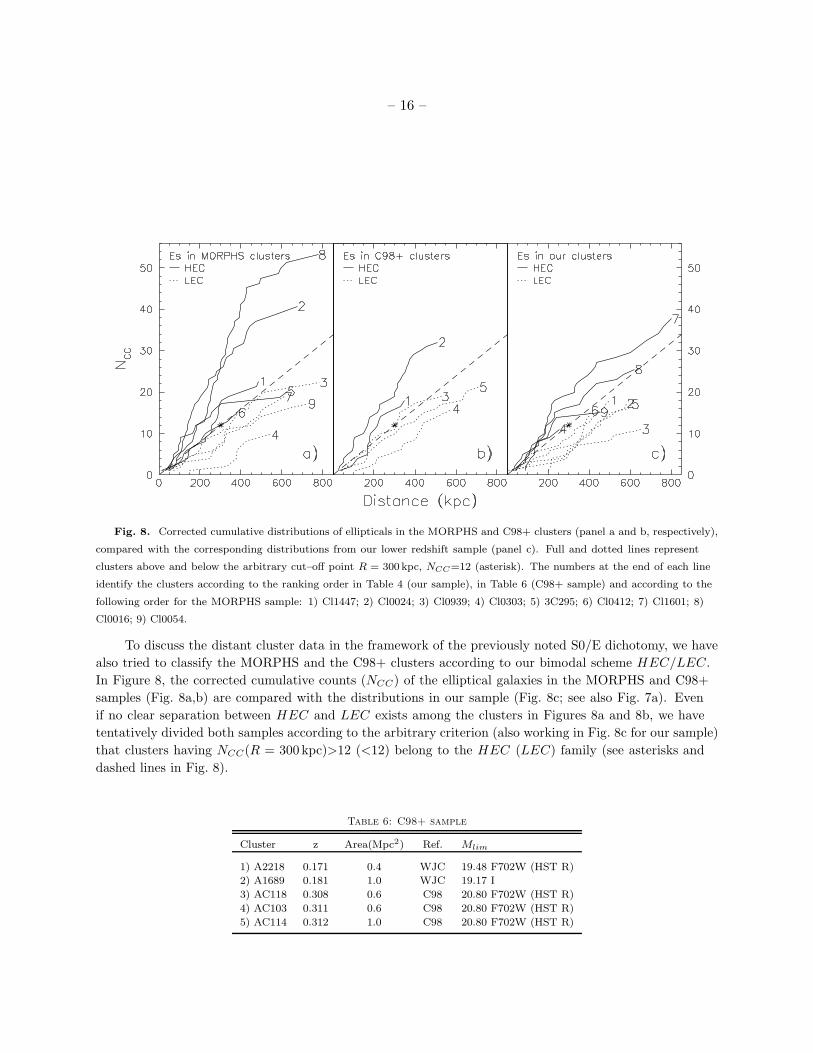
Fig. 8. Corrected cumulative distributions of ellipticals in the MORPHS and C98+ clusters (panel a and b, respectively),
compared with the corresponding distributions from our lower redshift sample (panel c). Full and dotted lines represent
clusters above and below the arbitrary cut–off point R = 300 kpc, NCC=12 (asterisk). The numbers at the end of each line
identify the clusters according to the ranking order in Table 4 (our sample), in Table 6 (C98+ sample) and according to the
following order for the MORPHS sample: 1) Cl1447; 2) Cl0024; 3) Cl0939; 4) Cl0303; 5) 3C295; 6) Cl0412; 7) Cl1601; 8)
Cl0016; 9) Cl0054.
To discuss the distant cluster data in the framework of the previously noted S0/E dichotomy, we have
also tried to classify the MORPHS and the C98+ clusters according to our bimodal scheme HEC/LEC.
In Figure 8, the corrected cumulative counts (NCC) of the elliptical galaxies in the MORPHS and C98+
samples (Fig. 8a,b) are compared with the distributions in our sample (Fig. 8c; see also Fig. 7a). Even
if no clear separation between HEC and LEC exists among the clusters in Figures 8a and 8b, we have
tentatively divided both samples according to the arbitrary criterion (also working in Fig. 8c for our sample)
that clusters having NCC(R = 300 kpc)>12 (<12) belong to the HEC (LEC) family (see asterisks and
dashed lines in Fig. 8).
Table 6: C98+ sample
Cluster z Area(Mpc2) Ref. Mlim
1) A2218 0.171 0.4 WJC 19.48 F702W (HST R)
2) A1689 0.181 1.0 WJC 19.17 I
3) AC118 0.308 0.6 C98 20.80 F702W (HST R)
4) AC103 0.311 0.6 C98 20.80 F702W (HST R)
5) AC114 0.312 1.0 C98 20.80 F702W (HST R)
– 17 –
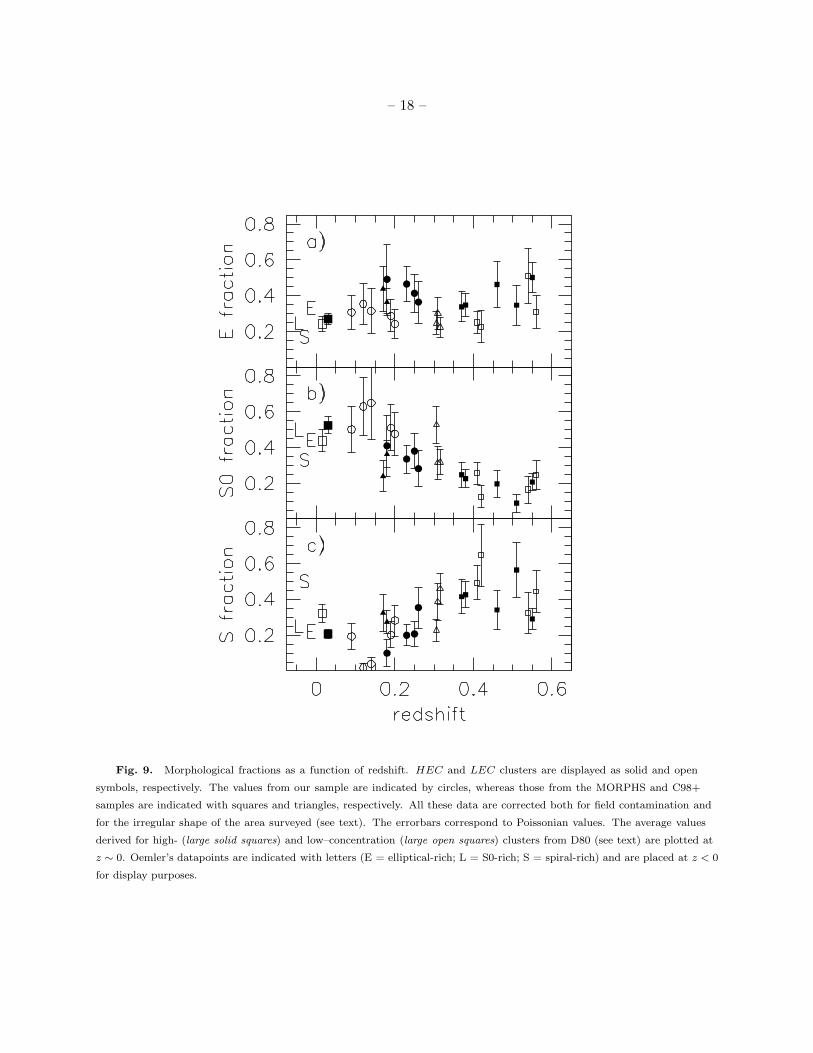
At low redshift, we refer to D80a and Oemler (1974; hereafter O74) as local benchmarks. The
morphological fractions and ratios of the high- and low–concentration nearby clusters (with a 1Mpc2 area
cut) of D80a were obtained from Table 2 and Fig. 3 in D97. In the following figures we also plot the values
quoted by Oemler (1974, O74) for different cluster types. Oemler divided clusters at low redshift into three
groups: spiral-rich (SR), elliptical-rich (ER) and S0-rich (S0R, named spiral-poor by O74) according to
their galaxy content (ER: E:S0:Sp=3:4:2; SR: E:S0:Sp=1:2:3; S0R: E:S0:Sp=1:2:1). We will come back
to this point in §6; here we want to stress that Oemler’s low redshift points should be considered only as
indicative because they were not found applying the same magnitude and area limits used in this work
and have been taken from the approximate ratios given by O74. Moreover, it is also worth stressing that
the correspondence between the D80a high(low)–concentration clusters and our HEC(LEC) clusters is far
from being demonstrated.
The fully-corrected morphological fractions and ratios of all the clusters as a function of redshift
are presented in Figs. 9 and 10, highlighting the HEC/LEC dichotomy (filled/open symbols represent
HEC/LEC clusters respectively). In order to evaluate the errors associated with background subtraction,
we have computed the changes in the morphological fractions that occur if the field correction for each
cluster and galactic type is varied by an amount equal to the correction itself (100% error, see Table 5
available in CD-ROM form). The variation in the morphological fractions is on average 0.03, ranging
between 0.01 and 0.08. In Figs. 9 and 10 the errorbars represent the Poissonian errors due to the small
numbers of galaxies and are typically greater than 0.1. Therefore the Poissonian errors always dominate
over the errors due to field subtraction.
In spite of the large errors, it is clear from these figures that there are systematic trends with z:
the spiral fraction declines and the S0 fraction rises in going towards lower redshifts. The morphological
fractions in our clusters are intermediate between the high and the low redshift values and seem to trace
a continuous change of the abundance of S0 and spiral galaxies. In contrast, the elliptical fraction (top
panel in Fig. 9) shows no particular trend with redshift, but rather a large scatter from cluster to cluster at
any epoch. The mirror-like trends of the S0 and spiral fractions (Figures 9b,c) are well represented by the
behaviour of the S0/Sp ratio in Fig. 10b. From this, we can confidently argue that, as the redshift becomes
lower, the S0 population tends to grow at the expense of the spiral population. 4
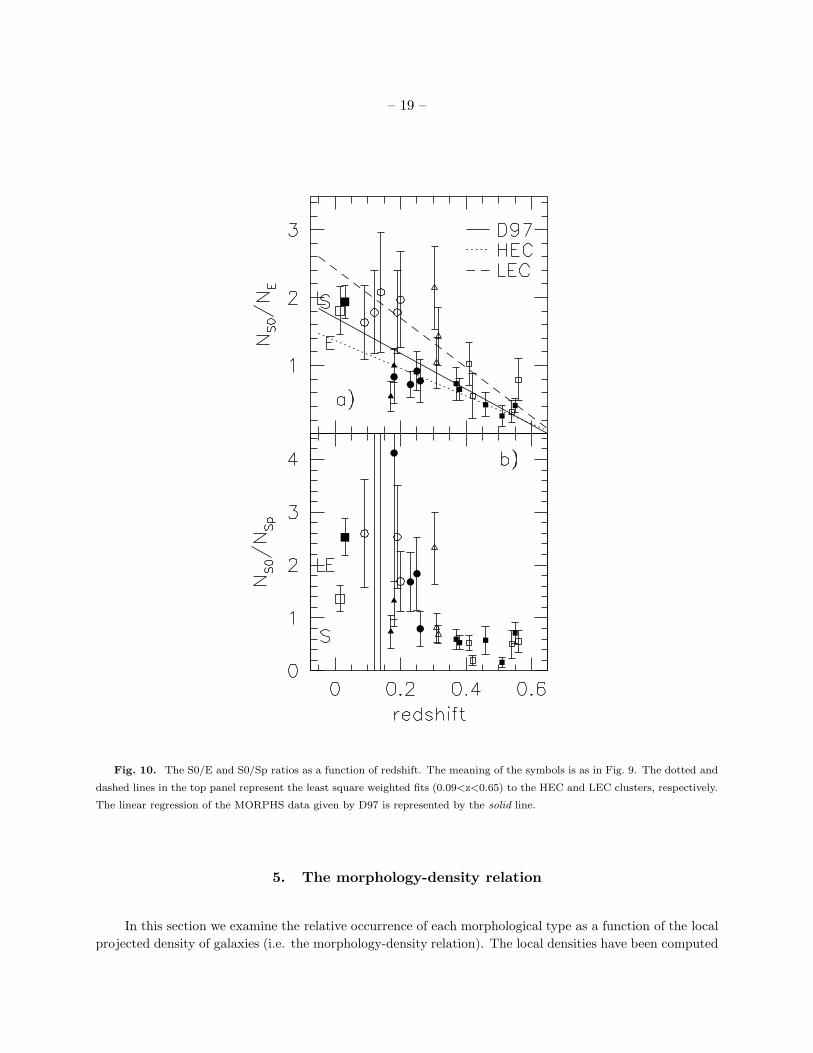
Figure 10a suggests the existence of a large intrinsic scatter in the S0/E ratio, which, at least within
our sample, can be mostly ascribed to the different cluster morphologies: clusters showing a marked
concentration of ellipticals in the central region have lower S0/E ratios with respect to the clusters in which
E galaxies are more or less uniformly distributed inside the cluster area. A similar tendency is possibly seen
at higher redshift as well and at low redshift comparing elliptical-rich and S0-rich clusters. The dotted and
dashed straight lines in Figure 10a represent the formal least–square weighted fits (0.09<z<0.65) to the
HEC and LEC clusters, respectively. In spite of the scatter, likely due to the intrinsic dependency of the
S0/E ratio on the cluster morphology, the trend with redshift found by D97 (full line in Figure 10a) turns
out to be confirmed.
4While this paper was being refereed, a morphological study of the cluster CL1358+62 at z=0.33 appeared as a
preprint (Fabricant, Franx & van Dokkum 2000). The area covered in this study is bigger than the area considered
here; neverthless, the morphological fractions – as independently classified by the authors and by A. Dressler – fall
in both cases within the typical values observed at that redshift in Fig. 9.
– 18 –
Fig. 9. Morphological fractions as a function of redshift. HEC and LEC clusters are displayed as solid and open
symbols, respectively. The values from our sample are indicated by circles, whereas those from the MORPHS and C98+
samples are indicated with squares and triangles, respectively. All these data are corrected both for field contamination and
for the irregular shape of the area surveyed (see text). The errorbars correspond to Poissonian values. The average values
derived for high- (large solid squares) and low–concentration (large open squares) clusters from D80 (see text) are plotted at
z ∼ 0. Oemler’s datapoints are indicated with letters (E = elliptical-rich; L = S0-rich; S = spiral-rich) and are placed at z < 0
for display purposes.
– 19 –
Fig. 10. The S0/E and S0/Sp ratios as a function of redshift. The meaning of the symbols is as in Fig. 9. The dotted and
dashed lines in the top panel represent the least square weighted fits (0.09<z<0.65) to the HEC and LEC clusters, respectively.
The linear regression of the MORPHS data given by D97 is represented by the solid line.
5. The morphology-density relation
In this section we examine the relative occurrence of each morphological type as a function of the local
projected density of galaxies (i.e. the morphology-density relation). The local densities have been computed
– 20 –
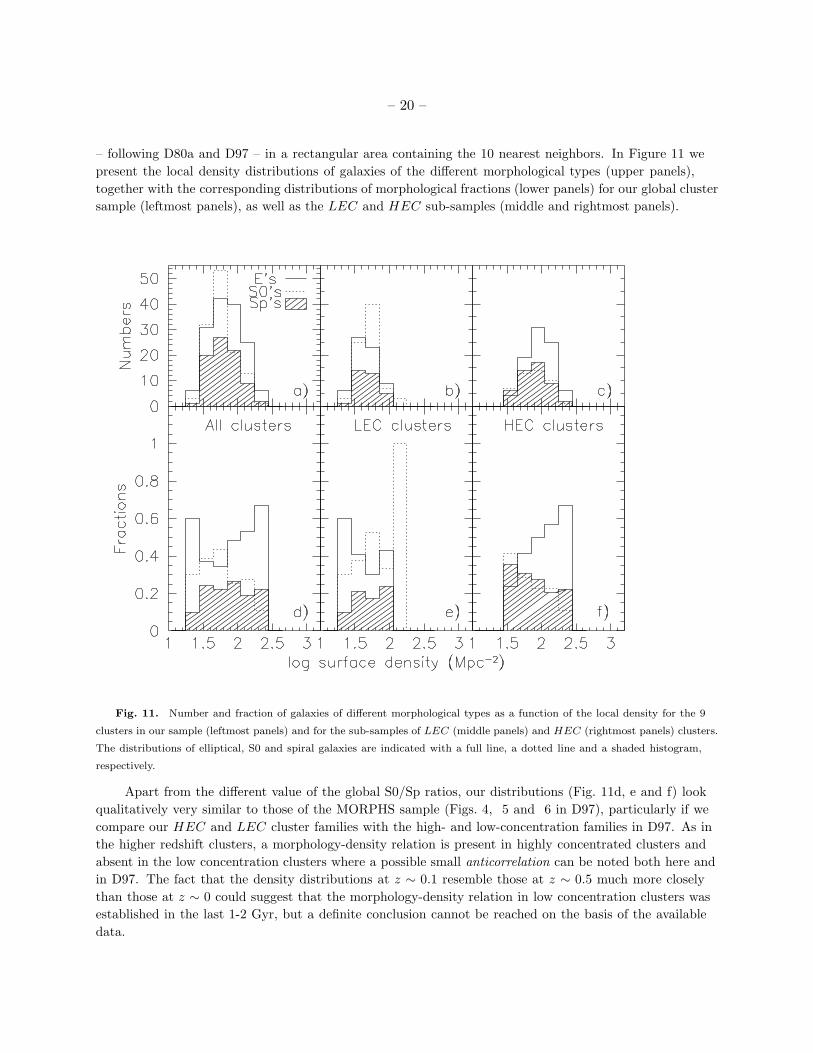
– following D80a and D97 – in a rectangular area containing the 10 nearest neighbors. In Figure 11 we
present the local density distributions of galaxies of the different morphological types (upper panels),
together with the corresponding distributions of morphological fractions (lower panels) for our global cluster
sample (leftmost panels), as well as the LEC and HEC sub-samples (middle and rightmost panels).
Fig. 11. Number and fraction of galaxies of different morphological types as a function of the local density for the 9
clusters in our sample (leftmost panels) and for the sub-samples of LEC (middle panels) and HEC (rightmost panels) clusters.
The distributions of elliptical, S0 and spiral galaxies are indicated with a full line, a dotted line and a shaded histogram,
respectively.
Apart from the different value of the global S0/Sp ratios, our distributions (Fig. 11d, e and f) look
qualitatively very similar to those of the MORPHS sample (Figs. 4, 5 and 6 in D97), particularly if we
compare our HEC and LEC cluster families with the high- and low-concentration families in D97. As in
the higher redshift clusters, a morphology-density relation is present in highly concentrated clusters and
absent in the low concentration clusters where a possible small anticorrelation can be noted both here and
in D97. The fact that the density distributions at z ∼ 0.1 resemble those at z ∼ 0.5 much more closely
than those at z ∼ 0 could suggest that the morphology-density relation in low concentration clusters was
established in the last 1-2 Gyr, but a definite conclusion cannot be reached on the basis of the available
data.
– 21 –
Another remarkable feature of the MD distributions is that, moving from high redshift to the
intermediate redshift regime, the fraction of Es as a function of the local density appears to be practically
unchanged for both HEC and LEC clusters, i.e. the elliptical-density relations at z = 0.2 are also
quantitatively similar to that of the MORPHS sample at z = 0.5. We also note that the LEC distributions
remain relatively flat over this redshift interval, while a strong increase in the S0/Sp fraction takes
place (compare our Fig. 12e with Fig. 8 in D97). This suggests that in the LEC clusters the Sp→S0
transformation process is highly efficient and that the efficiency is largely independent of local density. In
contrast, the S0– and spiral–density distributions in HEC clusters at the two different redshifts (compare
our Fig. 11f with Fig. 6 in D97), have quite different slopes, suggesting that the process of transfer from
spirals to S0s is more efficient in low density regions than in high density ones. The above analysis is based
on the comparison of two rather small cluster samples and, therefore, it needs to be confirmed by the
morphological study of more sizeable samples. Nevertheless, there is the suggestion that, at least in our
range of observed local densities (1.3<∼
log ρ <∼2.4), the efficiency of the possible transition from spiral to S0
morphology seems to increase with decreasing local density.
Finally, the fact that no MD relation is found in our LEC clusters demonstrates that the dichotomy
in the S0/E ratio discussed in the previous section cannot merely be ascribed to a universal MD relation
at z = 0.2 combined with different density ranges for the HEC and LEC clusters: the two types of
clusters are intrinsically different both in their global morphological content and in the arrangement of the
morphological types as a function of the local density.
6. Conclusions
1) The morphological properties of the galaxy populations in nine clusters at z = 0.1 − 0.25 are found
to be intermediate between those at z ∼ 0.4 − 0.5 and those at low-z, with a moderate spiral content and a
moderate “deficiency” (as compared to lower redshifts) of S0 galaxies. Our results support the evolutionary
scenario, inferred from higher redshift studies (D97, S97, Couch et al. 1998), involving the disk galaxy
populations in which there is a progressive morphological conversion in clusters, from spirals into S0’s.
2) At z ∼ 0.2, we find a dichotomy in the relative occurrence of S0 and elliptical galaxies: four of our
clusters display a low S0/E ratio (∼ 0.8) while two of our clusters have a significantly higher ratio (∼ 1.9)
similar to the other clusters in our sample at z = 0.1. The most likely interpretation of this dichotomy and
of the large scatter in the S0/E ratio at z ∼ 0.2 is that such a ratio is both a function of the redshift and
of the cluster “type”, being significantly lower in clusters with a strong central concentration of elliptical
galaxies.
3) At z ∼ 0.1 − 0.2 a morphology-density relation exists only for the high-concentration clusters and
is absent in the low-concentration ones. The same result was found at z ∼ 0.5 (D97), while at low redshift
the correlation between galaxy morphology and local density is present in all types of clusters of the D80a
sample. Although the number of galaxies is too small to draw definite conclusions, these results seem
to suggest that the morphology-density relation in low-concentration clusters was established only in the
last 1-2 Gyr, but only additional data and a homogeneous systematic analysis both at low and moderate
redshifts will clarify this matter. Moreover, comparing our MD relations with the corresponding ones at
z ∼ 0.5 (D97), we suggest that the efficiency of the Sp→S0 transformation process anticorrelates with the
local density.
– 22 –
The relation between the S0/E ratio and the spatial concentration of the ellipticals is not surprising
in the light of the well-known correlations between the galaxy content and the cluster type in low-redshift
clusters. As mentioned in §4, Oemler (1974) grouped clusters in three classes: spiral-rich (SR), elliptical-rich
(ER, the most spherical in shape and concentrated) and S0-rich (S0R, named “spiral-poor” by O74, “not
quite as centrally concentrated as the ER class, but more regular than the SR class”). Interestingly, O74
suggested that S0-rich clusters are dynamically evolved clusters (they already show segregation by mass and
morphological type) representing a later evolutionary stage of spiral-rich clusters, following the evolution of
a significant fraction of the spiral galaxies into S0’s. In contrast, in the scenario proposed by O74, E-rich
clusters are well evolved but intrinsically different from the S0R clusters: although possibly the dynamically
oldest type of clusters, their high elliptical content implies that they did not evolve from the spiral-rich
clusters and is likely due to an enhanced formation rate of ellipticals in regions that began as the densest
fluctuations in the early universe.
We speculate that in our sample at z ∼ 0.2, the four clusters with a strong central concentration of
ellipticals (and the lowest S0/E ratios) are presumably the analogues (and progenitors) of the low-z E-rich
clusters (see the extrapolation at low redshift of dotted line in Figure 10a), while the low-concentration
clusters (with the highest S0/E ratio) seem to be the analogues of the “S0-rich” clusters.
The effects of redshift (evolution) and cluster type are expected to mingle in various proportions at the
different epochs. Following O74, we suggest that the relative occurrence of S0’s and spirals is mostly linked
with the “maturity” of the cluster with spirals progressively evolving into S0’s, while the ellipticals are well
in place at redshifts greater than those considered here and their abundance and concentration reflect an
“original imprinting” (see also D97). Then, the S0/Sp ratio should be related to the evolutionary epoch of
the cluster and the S0/E value should be determined both by the epoch and the cluster type (nurture and
nature, in a way), with the redshift being the dominant effect at early epochs. 5
Acknowledgements
Based on observations made with the Nordic Optical Telescope, La Palma, and the Danish 1.5-m
telescope at ESO, La Silla, Chile. The Nordic Optical Telescope is operated jointly by Denmark, Finland,
Iceland, Norway, and Sweden, in the Spanish Observatorio del Roque de los Muchachos of the Instituto de
Astrofisica de Canarias.
The authors are grateful to the anonymous referee for the prompt refereeing that helped us to improve
the rigor and clarity of this paper. BMP and WJC warmly thank Ian Smail for providing the images
and the photometric catalog of A1689, for his valuable assistance in this project, for carefully reading the
manuscript and suggesting a number of changes that improved the paper. They are also thankful to their
collegues of the MORPHS group for many interesting discussions and useful advice.
5If the ER and S0R clusters are the endpoints of the evolution of two originally-different types of clusters and
both types experienced the accretion of large numbers of spirals that with time turned into S0’s, then when looking
further back in time, the difference in the S0/E ratio between the precursors of the ER and of the S0R clusters should
become smaller and smaller: at z ∼ 0.4 − 0.5 all types of clusters are expected to display a low S0/E ratio (with
smaller fluctuations among the different types of clusters), as indeed is observed in the MORPHS dataset, simply
because many of the S0’s have not yet formed.
– 23 –
This work was supported by the Formation and Evolution of Galaxies network set up by the European
Commission under contract ERB FMRX-CT96-086 of its TMR program and by the Danish Natural Science
Research Council through its Centre for Ground-Based Observational Astronomy. WJC acknowledges the
Schools of Physics at Bristol and St Andrews Universities and the European Southern Observatory for their
hospitality during the course of this work. This research has made use of the NASA/IPAC Extragalactic
Database (NED) which is operated by the Jet Propulsion Laboratory, Caltech, under contract with the
National Aeronautics and Space Administration.
– 24 –
REFERENCES
Abadi, M. G., Moore, B., Bower, R. G., 1999, MNRAS, 308, 947
Andreon, S., Davoust, E., Heim, T., 1997, A&A, 323, 337
Andreon, S., 1998, ApJ, 501, 533
Barger, A. J., Aragon-Salamanca, A., Smail, I., Ellis, R. S., Couch, W. J., Dressler, A., Oemler, A. Jr,
Poggianti, B. M, Sharples, R. M., 1998, ApJ, 501, 522
Bautz, L.P., Morgan, W.W, 1970, ApJ, 162, L149
Bertin, A., Arnouts, S., 1996, A&AS, 117,393
Butcher, H., Oemler, A. Jr. 1978, ApJ, 226, 559
Butcher, H., Oemler, A. Jr. 1984, ApJ, 285, 426
Capaccioli, M., Vietri, M., Held, E.V., Lorenz, H., 1991, ApJ, 371, 535
Couch, W. J., Barger, A. J., Smail, I., Ellis, R. S., Sharples, R. M., 1998, ApJ, 497, 188
Couch, W. J., Ellis, R. S., Sharples, R. M., Smail, I., 1994, ApJ, 430, 121
Dressler, A., 1980a, ApJ, 236, 351 (D80)
Dressler, A., 1980b, ApJS, 424, 565 (DCAT80)
Dressler, A., Oemler, A. Jr., Butcher, H., Gunn, J.E., 1994, ApJ, 430, 107
Dressler, A., Oemler, A. Jr., Couch, W. J., Smail, I., Ellis, R. S., Barger, A., Butcher, H., Poggianti, B. M.,
Sharples, R. M., 1997, ApJ, 490, 577 (D97)
Dressler, A., Smail, I., Poggianti, B.M., Butcher, H., Couch, W. J., Ellis, R. S., Oemler, A. Jr., 1999, ApJS,
122, 51
Ebeling, H., Edge, A., Bohringer, H., Allen, S., Crawford, C., Fabian, A., Voges, W., Huchra, J., 1998,
MNRAS, 301, 881
Ellis, R. S., Smail, I., Dressler, A., Couch. W. J., Oemler, A. Jr., Butcher, H., Sharples, R. M., 1997, ApJ,
483, 582
Fabricant, D., Franx, M., van Dokkum, P., 2000, ApJ, in press (astro-ph 0003360)
Fasano, G., Bettoni, D., D’Onofrio, M., Kjærgaard, P., Moles, M., 2000, in preparation
Fasano, G., Vio, R., 1991, MNRAS, 249, 629
Franceschini, A., Silva, L., Fasano, G., Granato, G.L., Bressan, A., Arnouts, S., Danese, L., 1998, ApJ, 506,
600
Frei, Z., Guhathakurta, P., Gunn, J. E., Tyson, J.A., 1996, AnJ, 111, 174
Holtzman, J.A., Burrows, C. J., Casertano, S., Hester, J. J., Trauger, J.T., Watson, A. M., Worthey, G.,
1995, PASP, 107, 1065
Jones, C., Forman, W., 1999, ApJ, 511, 65
Jorgensen, I., 1994, PASP, 106, 967
Kelson, D. D., van Dokkum, P. G., Franx, M., Illingworth, G. D., Fabricant, D., 1997, ApJ, 478, L13
Kelson, D. D., Illingworth, G. D., van Dokkum, P. G., Franx, M., 1999, ApJ, in press (astro-ph 9906152)
Landolt, A.U., 1992, AJ, 104,340
Lavery, R. J., Henry, J.P., 1988, ApJ, 330, 596
– 25 –
Lavery, R. J., Pierce, M. J., McClure, R. D., 1992, AJ, 104, 2067
Lavery, R. J., Henry, J.P., 1994, ApJ, 426, 524
Lubin, L. M., Postman, M., Oke, J.B., Ratnatunga, K.U., Gunn, J. E., Hoessel, J. G., Schneider, D. P.,
1998, ApJ, 116, 584
Mathis, J. S., 1990, ARAA, 28, 37
Metcalfe, N., Shanks, T., Fong, R., Roche, N., 1995, MNRAS, 273, 257
Moore, B., Katz, N., Lake, G., Dressler, A., Oemler, A. Jr. 1996, Nature, 379, 613
Moore, B., Lake, G., Katz, N., 1998, ApJ, 495, 139
Oemler, A. Jr., 1974, ApJ, 194, 1
Oemler, A. Jr., Dressler, A., Butcher, H., 1997, ApJ, 474, 561
Poggianti, B. M., 1997, A&AS, 122, 399
Poggianti, B.M., Smail, I., Dressler, A., Couch, W. J., Barger, A. J., Butcher, H., Ellis, R. S., Oemler, A. Jr.,
1999, ApJ, 518, 576
Pignatelli, E.,Fasano, G., 1999, Proceedings: First Italian Workshop of the ”Network sulla formazione ed
evoluzione delle galassie”, http://www.brera.mi.astro.it/docB/galaxy/news.html
Rood, H.J., Sastry, G.N., 1971, PASP, 83, 313
Simien, F., de Vaucouleurs, G., 1986, ApJ, 302, 564
Smail, I., Dressler, A., Couch, W. J., Ellis, R. S., Oemler, A. Jr, Butcher, H., Sharples, R. M., 1997, ApJS,
110, 213 (S97)
Smail, I., Edge, A. C., Ellis, R. E., Blandford, R. D., 1998, MNRAS, 293 124
Thompson, L. A., 1986, ApJ, 300, 639
Thompson, L. A., 1988, ApJ, 324, 112
van Dokkum, P. G., Franx, M., 1996, MNRAS, 281, 985
van Dokkum, P.G., Franx, M., Kelson, D. D., Illingworth, G. D., Fisher, D., Fabricant, D., 1998, ApJ, 500,
714
van Dokkum, P.G., Franx, M., Fabricant, D., Kelson, D. D., Illingworth, G. D., 1999, ApJ, 520, L95
van Dokkum, P.G., Franx, M., Fabricant, D., Illingworth, G.D., Kelson, D. D., 2000, ApJ, in press (astro-ph
0002507)
Wirth, G. D., Koo, D. C., Kron, R. G., 1994, ApJ, 435, L105
This preprint was prepared with the AAS LATEX macros v3.0.


![Properties of galactic B[e] supergiants](https://img.pdfslide.net/doc/110x75/634896762cd4c1a3540d11c8/properties-of-galactic-be-supergiants.jpg)


