Embed Size (px)
Citation preview
The Factors Driving Continuance Intention to Online Shopping (e-Loyalty): Behaviour Differences In The Case of Saudi Arabia
A thesis submitted in fulfilment of the requirements for
the degree of Doctor of Philosophy (PhD)
by
Talal Ahmed Abdullah Al-maghrabi
Brunel Business School, Brunel University United Kingdom
2010

In The Name Of Allah Most Gracious Most Merciful
ABSTRACT
III
ABSTRACT
This study proposes a model of e-shopping continuance intentions that incorporate the
revised technology acceptance model and expectation confirmation theory to measure
continuance online shopping intentions within Saudi Arabia. Using structural equation
modelling to confirm the model fit, and a 463-person sample, the author finds that perceived
usefulness, enjoyment, and subjective norms determine online shopping continuance
intentions, across male (30% of the sample) and female (70%) respondents. The structural
weights are largely equivalent, yet the regression paths from site quality to perceived
usefulness and perceived usefulness to continuation intentions are not invariant across the
research sample. This research thus moves beyond consideration of online shopping
intentions to include factors that may affect online shopping continuance. The research model
is able to explain 61% of the variance in intentions to continue shopping online. Therefore,
online strategies cannot ignore either direct or indirect differences in continuance intentions
due to behaviour differences among shoppers in Saudi Arabia. With the high percentages of
participants from the main populated regions in Saudi Arabia, the research model can be
generalized across Saudi Arabia. Thus, the research has added to the limited literature on
online repurchase intention or continuance intention by testing the proposed model in a
context that has never before been tested. Furthermore, few prior studies use SEM as their
methodological approach, and even fewer apply invariance analysis to verify behavioural
differences based on gender, regional, education, e-shopping experience, and e-shopping
spending with a sample obtained from Saudi Arabia. This study addresses these various
knowledge gaps. Moreover, this thesis provides managers with useful and important
information they can use to plan their Web sites and marketing strategies. The findings will
help e-retailers to identify which web site attributes influence consumers’ e-shopping
intentions, and thus improve the effectiveness of their e-shopping sites. A more thorough
understanding of e-shopping continuance intention helps e-retailers to entice e-shoppers to
shop online more, and entice non-online shoppers to shop online.
Keywords: Internet shopping, e-shopping, technology acceptance, behavioural differences,
continuance intentions, online shopping, Saudi Arabia.

IV
ACKNOWLEDGEMENTS
Praise be to Allah, the Lord of the worlds. And the blessings and the peace be upon the last
messenger of Allah, Mohammed (Peace Be Upon Him and All Other Prophets and
Messengers).
First and foremost, thanks and praise to Allah, the most gracious and most merciful, for his
directions and guidance throughout my entire life.
The author is very grateful to Dr. Charles Dennis for his enthusiastic supervision,
enlightening inspiration, continuing encouragement and invaluable technical suggestions
throughout the course of this investigation. The author also appreciates the guidance given to
improve his research skills.
Deep thanks also go to all Doctors, Professors, academic, administrative staff and students at
Brunel University for their assistance and support during my study.
Special thanks are due to all the questionnaire respondents and case study participants who
made this research possible.
The author is grateful to the Government of Saudi Arabia represented by the Minister of
Higher Education for providing the necessary financial support, which allowed this research
to continue.
My deep appreciation goes to my colleagues in Saudi Arabian Airlines for their help, support
and encouragement during my academy leave, and for providing me with everything possible
to enable my research.
I also would like to extend my sincere thanks and appreciation to my colleagues and the staff
of the Brunel Business School and Brunel University for supporting me throughout my
research and providing me with their knowledge, co-operation and uncomplaining support.
I am also deeply grateful also to all the companies and colleges who participated in this
research, particularly their managers who provided me with valuable information and were
V
generous with their time in interviews. Their generosity in helping me in my data collection is
much appreciated.
I am also deeply grateful to all friends whose support and unforgettable companionship I
really value.
My deepest thanks and special gratitude go to my dear parents; my mother for her ceaseless
prayers and support, and my father for his continuing encouragement and for building a
strong belief in my abilities since I was a boy. My deepest thanks to my brothers Wajdi, Naif
and Fadi and all my relatives for their support and encouragement during my different
research stages.
Finally, I gratefully acknowledge the care, patience, support, and encouragement of my wife
who has supported me throughout all my studies abroad including 11 years in USA and 5
years in UK and managing to stay all these years away from home in Saudi Arabia. My
thanks to my lovely children Tala and Trad for supporting me throughout my academic
research.
VI
COPYRIGHT
Attention is drawn to the fact that copyright of this research rests with its author. This copy
has been supplied on the condition that anyone who consults it is understood to recognize that
its copyright rests with its author under the terms of the United Kingdom Copyright Acts, and
that no quotation from the research and no information derived from it may be published
without the prior consent of the author.
VII
RESTRICTIONS ON USE
This research may be made available for consultation within the University Library and/or
with any other National Library e.g. in UK or Saudi Arabia, and may be photocopied or lent
to other libraries for the purpose of consultation.

VIII
DEDICATION
My Father
Who always teaches me to be committed to learning as a basis for success and a better future
My Mother
Who brought me up and stood by me throughout my life. Without her support, her prayers,
and her blessings, I would never have been able to finish this work. May God bless her.
My Wife
Who supported me in all my education abroad since 1992 in USA for my Diploma, Bachelor,
and my Master, and now for my PhD. Her understanding, support, encouragement,
acceptance of being away from home, love, and prayers were the fuel and light that drove me
to the end of this higher degree journey
My Lovely Two Children
(Tala and Trad)
I love you from the bottom of my heart.
IX
LIST OF PUBLICATIONS, CONFERENCES, AND WORKING
PAPERS
Working Papers published at University Research Archive (BURA):
• The driving factors of continuance intention of e-shopping: Gender differences in
behaviour - the case of Saudi Arabia - Brunel University Research Archive (BURA)
• The driving factors of continuance online shopping: Gender differences in behaviour
among students in Saudi Arabia - Brunel University Research Archive (BURA)
• Driving online shopping: Spending and behavioural differences among women in
Saudi Arabia - Brunel University Research Archive (BURA)
• The factors driving online shopping in Saudi Arabia: Regional and behavioural
differences among women - Brunel University Research Archive (BURA)
• Understanding the factors that derive continuance intention of e-shopping in Saudi
Arabia: Age group differences in behaviour - Brunel University Research Archive (BURA)
Accepted and Presented Conference Papers:
• European and Mediterranean Conference on Information Systems 2010 (EMCIS10), 12-13/4/2010 Abu Dhabi, United Arab Emirate. “Adapting TAM and ECT: Continuance Intention of e-Shopping in Saudi Arabia”,
• British Academy of Management 2009 (BAM 2009) 15/9/2009 Brighton, UK. “The Factors Driving Online Shopping in Saudi Arabia: Gender Differences and Behaviour”, Version 3.
• European and Mediterranean Conference on Information Systems 2009 (EMCIS09), 13-14/7/2009 Izmir, Turkey. “The Factors Driving Online Shopping in Saudi Arabia: Gender Differences and Behaviour”, Version 2.
• 4th Saudi International Conference 2010 (SIC2010) 30-31/7/2010 Manchester
University, UK. “The factors driving e-loyalty of online shopping in Saudi Arabia”.
• 3rd Saudi International Conference 2009 (SIC2009) 5-6/6/2009 Surrey University, UK. “The Factors Driving Online Shopping in Saudi Arabia: Gender Differences and Behaviour”, Version 1.
Published Journal Papers:
• International Journal of Customer Relationship Marketing and Management
(IJCRMM) “The Factors Driving Online Shopping in Saudi Arabia: Regional and Behavioural Differences among Women” Vol. 1, Issue 2, 2010.
X
• International Journal of Business Science & Applied Management (IJBSAM) “Driving Online Shopping: Spending and Behavioural Differences among Women in Saudi Arabia” Vol. 5, Issue 1, 2010.
• International Journal of Business Information Systems (IJBIS), Special Issue [Web
Services and e Commerce] “The Driving Factors of Continuance Online Shopping: Gender Differences in Behaviour among students in Saudi Arabia”, Forthcoming.
Journal Paper under peer-review:
• International Journal of Business Science & Applied Management (IJBSAM)
“Determinants of Customer Continuance Intention of Online Shopping”, Authors (Talal Al-maghrabi, Charles Dennis, Brunel University & Sue Vaux Halliday, University of Surrey).
• International Journal of Retail & Distribution Management (IJRDM) “The Factors Driving Online Shopping in Saudi Arabia: Gender Differences and Behaviour”, Authors (Talal Al-maghrabi & Charles Dennis).
• Journal of Enterprise Information Management (JEIM) “Antecedents of Continuance Intention to e-Shop: the Case of Saudi Arabia”, (Talal Al-maghrabi, Charles Dennis, Brunel University & Sue Vaux Halliday, University of Surrey).
Award:
• PhD Conference Prize for paper that has the potential for publication ‘PhD Doctoral
Symposium 2008’ – “Understanding the Driving Factors that Influence Continuance
Online Shopping The Case of Saudi Arabia - Paper 65”, Brunel Business School, Brunel University, UK
Conference and Journal Peer-Review:
• Telecommunications Policy 2010
• European and Mediterranean Conference on Information Systems (EMCIS 2010)
• British Academy of Management (BAM 2009)
• European and Mediterranean Conference on Information (EMCIS 2009)
XI
TABLE OF CONTENTS
ABSTRACT -------------------------------------------------------------------------------------------------------------------------------- III
LIST OF PUBLICATIONS, CONFERENCES, AND WORKING PAPERS ----------------------------------------------------------- IX
CHAPTER 1: INTRODUCTION ---------------------------------------------------------------------------------------------------- 1
1.1. INTRODUCTION TO RESEARCH SUBJECT -------------------------------------------------------------------- 1
1.2. TECHNOLOGY AND NEW SHOPPING CHANNELS --------------------------------------------------------- 2
1.3. RESEARCH PROBLEM --------------------------------------------------------------------------------------------------- 4
1.4. RESEARCH AIMS ----------------------------------------------------------------------------------------------------------- 7
1.5. RESEARCH OBJECTIVES ----------------------------------------------------------------------------------------------- 8
1.6. THEORETICAL BACKGROUND ------------------------------------------------------------------------------------- 9
1.7. METHODOLOGY ---------------------------------------------------------------------------------------------------------- 12
1.7.1. MEASURES----------------------------------------------------------------------------------------------------------------------- 13
1.7.2. ANALYSIS ------------------------------------------------------------------------------------------------------------------------ 13
1.7.3. STRUCTURAL EQUATION MODELLING------------------------------------------------------------------------------------ 13
1.7.4. INVARIANCE ANALYSIS ------------------------------------------------------------------------------------------------------ 14
1.8. THESIS OUTLINE --------------------------------------------------------------------------------------------------------- 14
CHAPTER 2: ORIGIN AND DEVELOPMENT OF THE INTERNET, E-COMMERCE, AND E-
SHOPPING IN SAUDI ARABIA -------------------------------------------------------------------------------------------------- 15
2.1. INTRODUCTION TO COUNTRY AND REGIONAL BACKGROUND ------------------------------- 15
2.2. E-COMMERCE AND ONLINE SHOPPING --------------------------------------------------------------------- 17
2.3. E-COMMERCE AND SAUDI ARABIA ---------------------------------------------------------------------------- 22
2.3.1. THE INTERNET IN SAUDI ARABIA ------------------------------------------------------------------------------------------ 22
2.3.2. E-COMMERCE IN SAUDI ARABIA ------------------------------------------------------------------------------------------- 25
2.3.3. E-COMMERCE CHALLENGES IN SAUDI ARABIA ------------------------------------------------------------------------ 26
2.4. WEBSITE CLASSIFICATIONS IN SAUDI ARABIA --------------------------------------------------------- 29
2.4.1 USING WEBSITES AS AN INFORMATION DELIVERY TOOL -------------------------------------------------------------- 29
2.4.2 USING WEBSITES TO IMPROVE CUSTOMER RELATIONSHIPS----------------------------------------------------------- 29
2.4.3 USING WEBSITES AS A VEHICLE FOR COMMON COMMUNICATION METHODS ------------------------------------- 29
2.5. ONLINE CUSTOMER RELATIONSHIP CHARACTERISTICS ----------------------------------------------- 31
2.5.1. GETTING TO KNOW THE CUSTOMER -------------------------------------------------------------------------------------- 31
2.5.2. THE REASON FOR ADAPTING AND MAINTAINING CUSTOMER RELATIONSHIPS -------------------------------- 31
2.5.3. E-SHOPPING AND CUSTOMER SATISFACTION --------------------------------------------------------------------------- 34
2.5.4. E-BUSINESSES AND CUSTOMER SEGMENTATION ---------------------------------------------------------------------- 37
2.5.5. E-SHOPPING AND RELATIONSHIP MARKETING ------------------------------------------------------------------------- 37
2.5.6. E-SHOPPING TO CREATE A CUSTOMER-CENTRIC CULTURE -------------------------------------------------------- 38
XII
2.6. SUMMARY ---------------------------------------------------------------------------------------------------------------------- 41
CHAPTER 3: LITERATURE REVIEW ---------------------------------------------------------------------------------------- 43
3.1 INTRODUCTION ------------------------------------------------------------------------------------------------------------------ 43
3.2. E-COMMERCE DEVELOPMENT FOR B2C -------------------------------------------------------------------------- 43
3.3. ONLINE SHOPPING AND PURCHASING ----------------------------------------------------------------------------- 45
3.4. ONLINE PURCHASING INTENTION ----------------------------------------------------------------------------------- 48
3.5. THE IMPORTANCE OF TRUST IN ELECTRONIC COMMERCE ------------------------------------------ 52
3.6. CONTINUANCE ONLINE SHOPPING AND SATISFACTION ------------------------------------------------ 53
3.6.1. RESEARCH ON CUSTOMER LOYALTY ------------------------------------------------------------------------------------- 55
3.7. THEORETICAL BACKGROUND ------------------------------------------------------------------------------------------ 57
TABLE 3.5: MOST COMMON THEORIES IN ONLINE SHOPPING -------------------------------------------------------------- 59
3.8. THEORY OF REASONED ACTION -------------------------------------------------------------------------------------- 61
3.8.1 LIMITATIONS OF TRA --------------------------------------------------------------------------------------------------------- 63
3.9. THE TECHNOLOGY ACCEPTANCE MODEL (TAM) ----------------------------------------------------------- 64
TABLE 3.6: OVERVIEW OF PREVIOUS RESEARCH ON E-SHOPPING INTENTIONS AND ADOPTION ---------------- 70
3.9.1 LIMITATION OF TAM ---------------------------------------------------------------------------------------------------------- 73
3.10. EXTENSION OF THE TECHNOLOGY ACCEPTANCE MODEL (TAM2) ------------------------------ 74
3.11. EXPECTATION CONFIRMATION THEORY (ECT) ------------------------------------------------------------ 76
3.11.1. LIMITATIONS OF ECT ------------------------------------------------------------------------------------------------------- 79
3.12. RESEARCH CONSTRUCTS ------------------------------------------------------------------------------------------------ 79
3.12.1. TRUST --------------------------------------------------------------------------------------------------------------------------- 79
3.12.1.1. Conceptual and Theoretical Description of Trust ----------------------------------83
3.12.2. ENJOYMENT ------------------------------------------------------------------------------------------------------------------- 84
3.12.3. SITE QUALITY ----------------------------------------------------------------------------------------------------------------- 86
3.12.4. SUBJECTIVE NORM ---------------------------------------------------------------------------------------------------------- 87
3.13. HOFSTEDE’S CULTURAL DIMENSIONS --------------------------------------------------------------------------- 89
3.14. SUMMARY ------------------------------------------------------------------------------------------------------------------------ 91
CHAPTER 4: CONCEPTUAL RESEARCH MODEL AND HYPOTHESES ------------------------------------- 93
4.1. INTRODUCTION ----------------------------------------------------------------------------------------------------------- 93
4.2. WEAKNESSES OF THE THEORIES ------------------------------------------------------------------------------- 93
4.3. RESEARCH QUESTION ------------------------------------------------------------------------------------------------- 98
4.4. RESEARCH AIMS AND OBJECTIVES --------------------------------------------------------------------------- 99
4.5. PROPOSED MODEL AND HYPOTHESIS ---------------------------------------------------------------------- 100
4.5. SUMMARY ------------------------------------------------------------------------------------------------------------------------- 113
CHAPTER 5: RESEARCH DESIGN AND METHODOLOGY ------------------------------------------------------- 114
5.1. INTRODUCTION ---------------------------------------------------------------------------------------------------------------- 114
XIII
5.2. RESEARCH DESIGN AND METHODOLOGY ---------------------------------------------------------------------- 114
5.3. RESEARCH PURPOSE AND TYPE -------------------------------------------------------------------------------------- 115
5.3.1 EXPLORATORY RESEARCH -------------------------------------------------------------------------------------------------- 115
5.3.2 DESCRIPTIVE RESEARCH ----------------------------------------------------------------------------------------------------- 116
5.3.3 EXPLANATORY RESEARCH -------------------------------------------------------------------------------------------------- 116
5.4. RESEARCH APPROACH ---------------------------------------------------------------------------------------------------- 116
5.4.1 POSITIVISM VS. PHENOMENOLOGY ---------------------------------------------------------------------------------------- 117
5.4.2 QUANTITATIVE VS. QUALITATIVE RESEARCH -------------------------------------------------------------------------- 120
5.4.3 INDUCTIVE VS. DEDUCTIVE RESEARCH ---------------------------------------------------------------------------------- 123
5.5 RESEARCH STRATEGY ------------------------------------------------------------------------------------------------------ 124
5.5.1. SURVEY ------------------------------------------------------------------------------------------------------------------------- 125
5.5.2. CASE STUDY ------------------------------------------------------------------------------------------------------------------- 126
5.5.3. DATA COLLECTION METHODS -------------------------------------------------------------------------------------------- 127
5.6. MULTIPLE METHODS AS AN APPROACH ------------------------------------------------------------------------- 128
5.7. QUALITATIVE METHODS (AS A COMPLEMENTARY METHOD) -------------------------------------- 130
5.7.1. QUALITATIVE SAMPLE ------------------------------------------------------------------------------------------------------ 130
5.7.2. QUALITATIVE DATA COLLECTION---------------------------------------------------------------------------------------- 131
5.8. QUANTITATIVE METHOD (PRINCIPLE METHOD) ----------------------------------------------------------- 132
5.8.1 VARIABLE MEASUREMENT -------------------------------------------------------------------------------------------------- 133
5.8.2. CONVERGENT AND DISCRIMINANT VALIDITY ------------------------------------------------------------------------- 135
5.8.3. STRUCTURAL EQUATION MODELLING----------------------------------------------------------------------------------- 136
5.8.4. INVARIANCE ANALYSIS ------------------------------------------------------------------------------------------------------ 138
5.9. QUESTIONNAIRE DESIGN ------------------------------------------------------------------------------------------------- 141
5.9.1. MEASURES---------------------------------------------------------------------------------------------------------------------- 142
5.10. PILOT STUDY------------------------------------------------------------------------------------------------------------------- 145
5.11. QUESTIONNAIRE TRANSLATION ----------------------------------------------------------------------------------- 147
5.12. SURVEY POPULATION ---------------------------------------------------------------------------------------------------- 148
5.12.1. SELECTING THE RESEARCH SAMPLING -------------------------------------------------------------------------------- 148
5.12.2. SAMPLE SIZE, METHODS, AND QUESTIONNAIRE DISTRIBUTION ------------------------------------------------ 149
5.12.3. ONLINE SURVEY ------------------------------------------------------------------------------------------------------------- 151
5.12.4. LIMITATIONS OF THE ONLINE QUESTIONNAIRE --------------------------------------------------------------------- 152
5.13 RESEARCH PLAN ------------------------------------------------------------------------------------------------------------- 153
5.14. SUMMARY ----------------------------------------------------------------------------------------------------------------------- 154
CHAPTER 6: DESCRIPTIVE STATISTICS AND RELIABILITY ------------------------------------------------- 156
6.1. INTRODUCTION ---------------------------------------------------------------------------------------------------------- 156
6.2. DATA PREPARATION -------------------------------------------------------------------------------------------------- 156
XIV
6.3. SAMPLE PROFILE ------------------------------------------------------------------------------------------------------- 156
6.4. RELIABILITY ASSESSMENT --------------------------------------------------------------------------------------- 159
6.5. INDIVIDUAL CONSTRUCT ANALYSES RELIABILITY ASSESSMENT -------------------------- 162
6.5.1. USEFULNESS ------------------------------------------------------------------------------------------------------------------- 162
6.5.2. SUBJECTIVE NORM ----------------------------------------------------------------------------------------------------------- 162
6.5.3. TRUST --------------------------------------------------------------------------------------------------------------------------- 163
6.5.4. PERCEIVED ENJOYMENT ---------------------------------------------------------------------------------------------------- 163
6.5.5. PERCEIVED SITE QUALITY -------------------------------------------------------------------------------------------------- 163
6.5.6. CONTINUANCE INTENTIONS ------------------------------------------------------------------------------------------------ 163
6.6. SPLIT-HALF MODEL RELIABILITY STATISTICS -------------------------------------------------------- 163
6.7. EXPLORATORY FACTOR ANALYSIS -------------------------------------------------------------------------- 164
6.7.1. VALIDITY OF FACTOR ANALYSIS ----------------------------------------------------------------------------------------- 165
6.8. SUMMARY ------------------------------------------------------------------------------------------------------------------------- 169
CHAPTER 7: QUANTITATIVE ANALYSIS -------------------------------------------------------------------------------- 171
7.1. INTRODUCTION ---------------------------------------------------------------------------------------------------------- 171
7.2. CONVERGENT AND DISCRIMINANT VALIDITY --------------------------------------------------------------- 171
7.3. TESTING THE HYPOTHESES WITH STRUCTURAL EQUATION MODEL ANALYSIS -- 173
7.4. CONFIRMATORY FACTOR ANALYSIS (CFA) -------------------------------------------------------------------- 175
7.5. RE-TEST THE RESEARCH MODEL WITH THE REMAINING SAMPLE ------------------------ 181
7.6. DIRECT AND INDIRECT EFFECT ANALYSIS -------------------------------------------------------------------- 185
7.7. INVARIANCE ANALYSIS --------------------------------------------------------------------------------------------------- 187
7.7.1. INVARIANCE ANALYSIS FOR GENDER (MALE AND FEMALE) -------------------------------------------------- 188
7.7.1.1. Decomposition of Effects (Gender Analysis) -------------------------------------- 190
7.7.2. INVARIANCE ANALYSIS FOR REGIONS (WEST – EAST – CENTRE) -------------------------------------------- 191
7.7.2.1. Latent Mean ----------------------------------------------------------------------------- 194
7.7.2.2. Decomposition of Effects (Region Analysis) ------------------------------------- 195
7.7.3. INVARIANCE ANALYSIS FOR AGE (YOUNGER THAN 35 – OLDER THAN 35) ---------------------------------- 196
7.7.3.1. Decomposition of Effects (Age Analysis) ----------------------------------------- 199
7.7.4. INVARIANCE ANALYSIS FOR THE EDUCATION LEVEL (BELOW BACHELOR AND BACHELOR AND
ABOVE) 199
7.7.4.1. Decomposition of Effects (Educational Analysis) --------------------------------- 202
7.7.5. INVARIANCE ANALYSIS FOR THE ONLINE SPENDING ----------------------------------------------------------------- 202
7.7.5.1. Decomposition of Effects (Spending Analysis) ------------------------------------ 204
7.7.6 INVARIANCE ANALYSIS FOR THE FREQUENCY OF USING THE INTERNET FOR SHOPPING ACTIVITIES ---- 205
7.7.6.1. Decomposition of Effects (Experience Analysis)---------------------------------- 209
7.8. HYPOTHESES TESTING ---------------------------------------------------------------------------------------------- 209
XV
7.9. SUMMARY ------------------------------------------------------------------------------------------------------------------------- 211
CHAPTER 8: QUALITATIVE ILLUSTRATION CASE - E-RETAILING: THE CASE OF SAUDI
ARABIA ----------------------------------------------------------------------------------------------------------------------------------- 213
8.1. INTRODUCTION ---------------------------------------------------------------------------------------------------------------- 213
8.2. PARTICIPATING COMPANIES ------------------------------------------------------------------------------------------ 214
8.2.1. COMMUNICATIONS AND INFORMATION TECHNOLOGY COMMISSION -------------------------------------------- 214
8.2.2. SAUDI ARABIAN AIRLINES ------------------------------------------------------------------------------------------------- 216
8.2.3. SAUDI TELECOMMUNICATION --------------------------------------------------------------------------------------------- 217
8.2.4. JARIR BOOKSTORE ------------------------------------------------------------------------------------------------------------ 219
8.2.5. BUDGET CAR HIRE, SAUDI ARABIA -------------------------------------------------------------------------------------- 221
8.3. INTERVIEW AND CASE ANALYSIS ----------------------------------------------------------------------------------- 222
8.3.1. MAIN INTERVIEW QUESTIONS ---------------------------------------------------------------------------------------------- 223
8.4. COMPANY DOCUMENTATION ANALYSIS ------------------------------------------------------------------------ 230
8.5. INTERNET USAGE IN SAUDI ARABIA ------------------------------------------------------------------------------- 236
8.5.1. MAIN REASON FOR USING COMPUTERS AND INTERNET ------------------------------------------------------------ 238
8.5.2. INTERNET SATISFACTION AND FILTERING ------------------------------------------------------------------------------ 240
8.5.3. AWARENESS OF E-COMMERCE -------------------------------------------------------------------------------------------- 240
8.5.4. USAGE OF E-COMMERCE ---------------------------------------------------------------------------------------------------- 241
8.6. SUMMARY ------------------------------------------------------------------------------------------------------------------------- 242
CHAPTER 9: DISCUSSION AND CONCLUSION ------------------------------------------------------------------------ 244
9.1. INTRODUCTION ---------------------------------------------------------------------------------------------------------- 244
9.2. DISCUSSION OF FINDINGS IN RELATION TO RESEARCH QUESTION ----------------------- 246
9.3. GENERAL DISCUSSION OF RESEARCH FINDINGS ----------------------------------------------------- 247
9.4. DIFFERENCES BETWEEN SHOPPERS ------------------------------------------------------------------------- 253
9.4.1. GENDER DIFFERENCES ------------------------------------------------------------------------------------------------------ 254
9.4.2. EXPERIENCE AND INEXPERIENCE E-SHOPPERS DIFFERENCES ----------------------------------------------------- 256
9.4.3. ONLINE SPENDING DIFFERENCES ----------------------------------------------------------------------------------------- 257
9.4.4. EDUCATIONAL LEVEL DIFFERENCES------------------------------------------------------------------------------------- 258
9.4.5. AGE DIFFERENCES ------------------------------------------------------------------------------------------------------------ 259
9.4.6. REGIONAL DIFFERENCES---------------------------------------------------------------------------------------------------- 261
9.5. RELEVANT FINDINGS OF THE QUALITATIVE ILLUSTRATIVE CASE STUDIES -------- 262
9.6. CONCLUSION AND CONTRIBUTIONS ------------------------------------------------------------------------- 267
9.6.1. RESEARCH MODEL GENERALIZABILITY -------------------------------------------------------------------------------- 274
9.7. RESEARCH LIMITATIONS AND FURTHER RESEARCH ---------------------------------------------- 276
9.7.1. THE SIGNIFICANCE OF USEFULNESS AND SATISFACTION ON CONTINUANCE INTENTION ------------------- 279
9.8. MANAGERIAL IMPLICATIONS ----------------------------------------------------------------------------------- 280
XVI
9.9. IMPLICATIONS FOR POLICY MAKER OF E-SHOPPING IN SAUDI ARABIA --------------- 284
9.10. THE ROLE OF E-COMMERCE AND ONLINE SHOPPING FOR WOMEN ---------------------- 291
9.11. SUMMARY ------------------------------------------------------------------------------------------------------------------- 291
9.12. PHD RESEARCH EXPERIENCE ----------------------------------------------------------------------------------- 292
9.13. CLOSING REMARKS --------------------------------------------------------------------------------------------------- 293
REFERENCES -------------------------------------------------------------------------------------------------------------------------- 295
APPENDIXES ------------------------------------------------------------------------------------------------------------------------------ 345
APPENDIX A: MOST COMMON THEORIES IN ONLINE SHOPPING --------------------------------------------------------- 345
APPENDIX B: OVERVIEW OF PREVIOUS RESEARCH ON E-SHOPPING INTENTIONS AND ADOPTION ------------ 351
APPENDIX C: COMPARISON AND ANALYSIS BETWEEN THREE MAJOR RESEARCH PARADIGMS ----------------- 361
APPENDIX D: QUESTIONNAIRE (MEASUREMENT INDICATORS)------------------------------------------------------------ 365
APPENDIX E: PILOT STUDY SURVEY QUESTIONNAIRES (ENGLISH AND ARABIC LANGUAGES) - 368
APPENDIX F: PILOT STUDY ------------------------------------------------------------------------------------------------------------ 383
APPENDIX G: ONLINE SURVEY ------------------------------------------------------------------------------------------------- 402
APPENDIX I: INTERVIEW QUESTIONS ---------------------------------------------------------------------------------------------- 418
XVII
LIST OF TABLES
TABLE 2.1: E-COMMERCE AND INTERNET APPLICATIONS ----------------------------------------------------- 18
TABLE 2.2: ESTIMATED VALUE OF E-COMMERCE TRANSACTIONS IN THE MIDDLE EAST IN 2002
AND 2005 (MILLIONS OF DOLLARS) ------------------------------------------------------------------------------ 19
TABLE 2.3: WEBSITE CLASSIFICATIONS ------------------------------------------------------------------------------- 30
TABLE 2.4: TARGETED PROMOTION TECHNIQUES FOR INTERNET RETAILERS ------------------------- 40
TABLE 3.5: MOST COMMON THEORIES IN ONLINE SHOPPING ------------------------------------------------- 59
TABLE 3.6: OVERVIEW OF PREVIOUS RESEARCH ON E-SHOPPING INTENTIONS AND ADOPTION 70
TABLE 4.7: PROPOSED HYPOTHESES --------------------------------------------------------------------------------- 112
TABLE 5.8: ADVANTAGES AND DISADVANTAGES OF POSITIVIST AND PHENOMENOLOGICAL 118
TABLE 5.9 : SUMMARY OF EPISTEMOLOGICAL STANCES ---------------------------------------------- 120
TABLE 5.10: DIFFERENCES BETWEEN QUANTITATIVE AND QUALITATIVE RESEARCH
APPROACHES ---------------------------------------------------------------------------------------------------------- 122
TABLE 5.11: ADVANTAGES AND DISADVANTAGES OF QUANTITATIVE AND QUALITATIVE
RESEARCH -------------------------------------------------------------------------------------------------------------- 122
TABLE 5.12: SUMMARY OF METHODOLOGICAL DICHOTOMIES -------------------------------------------- 124
TABLE 5.13: DIFFERENT RESEARCH STRATEGIES --------------------------------------------------------------- 125
TABLE 5.14: QUALITATIVE STRENGTHS AND WEAKNESSES OF SOURCES OF EVIDENCE --------- 132
TABLE 5.15: ACCEPTABLE GOODNESS-OF-FIT INDICES ------------------------------------------------------- 138
TABLE 5.16: QUESTIONNAIRE VARIABLES ------------------------------------------------------------------------- 142
TABLE 5.17: PILOT STUDY RELIABILITY ANALYSIS------------------------------------------------------------- 147
TABLE 6.18: SAMPLE STATISTICS -------------------------------------------------------------------------------------- 158
TABLE 6.19: SUMMARY OF MEASUREMENT SCALES ----------------------------------------------------------- 161
TABLE 6.20: RELIABILITY STATISTICS ------------------------------------------------------------------------------- 164
TABLE 6.21: KMO AND BARTLETT'S TEST --------------------------------------------------------------------------- 167
TABLE 6.22: TOTAL VARIANCE EXPLAINED ----------------------------------------------------------------------- 167
TABLE 6.23: EXPLORATORY FACTOR LOADING (PATTERN MATRIX) ------------------------------------ 167
TABLE 6.24: COMMUNALITIES ------------------------------------------------------------------------------------------ 168
TABLE 7.25: MEASUREMENT MODEL (CONFIRMATORY FACTOR ANALYSIS) ------------------------- 172
TABLE 7.26: FINAL SCALE PROPERTIES AND CORRELATIONS ---------------------------------------------- 173
TABLE 7.27: ASSESSMENT OF NORMALITY (FINAL MODEL) ------------------------------------------------- 176
TABLE 7.28: REGRESSION WEIGHTS FOR ORIGINAL MODEL ------------------------------------------------- 177
TABLE 7.29: GOODNESS-OF-FIT INDICES FOR ORIGINAL MODEL ------------------------------------------ 177
TABLE 7.30: MODIFICATION INDICES (MI) (REGRESSION WEIGHTS) -------------------------------------- 179
TABLE 7.31: REGRESSION WEIGHTS CALIBRATION SAMPLE (463 PARTICIPANTS) ------------------ 180
TABLE 7.32: GOODNESS-OF-FIT INDICES FOR THE CALIBRATION SAMPLE (463 PARTICIPANTS)180
TABLE 7.33: REGRESSION WEIGHTS FOR THE VALIDATION SAMPLE (465 PARTICIPANTS) ------- 182
TABLE 7.34: GOODNESS-OF-FIT INDICES FOR THE VALIDATION SAMPLE (465 PARTICIPANTS) 182
XVIII
TABLE 7.35: REGRESSION WEIGHTS FOR THE WHOLE SAMPLE (928 PARTICIPANTS) --------------- 183
TABLE 7.36: GOODNESS-OF-FIT INDICES FOR THE WHOLE SAMPLE (928 PARTICIPANTS) -------- 183
TABLE 7.37: COMPARING GOODNESS-OF-FIT INDICES FOR THE CALIBRATION SAMPLE, THE
VALIDATION SAMPLE, AND THE TOTAL SAMPLE -------------------------------------------------------- 184
TABLE 7.38: DECOMPOSITION OF EFFECTS ON CONTINUANCE INTENTIONS -------------------------- 186
TABLE 7.39: STANDARDIZED DIRECT EFFECTS ------------------------------------------------------------------- 186
TABLE 7.40: STANDARDIZED INDIRECT EFFECTS---------------------------------------------------------------- 186
TABLE 7.41: STANDARDIZED TOTAL EFFECTS -------------------------------------------------------------------- 187
TABLE 7.42: GOODNESS-OF-FIT INDICES FOR THE CALIBRATION AND VALIDATION SAMPLE - 187
TABLE 7.43: INVARIANCE ANALYSIS (CALIBRATION SAMPLE AND VALIDATION SAMPLE) ---- 188
TABLE 7.44: GOODNESS-OF-FIT INDICES FOR THE GENDER SAMPLE ------------------------------------- 188
TABLE 7.45: INVARIANCE ANALYSIS (GENDER ANALYSIS) -------------------------------------------------- 189
TABLE 7.46: STRUCTURAL WEIGHTS DIFFERENCES FOR THE GENDER SAMPLE (MALE – FEMALE) ------------------------------------------------------------------------------------------------------------------------------ 189
TABLE 7.47: MEANS: (MALE - DEFAULT MODEL) - FOR THE GENDER SAMPLE (MALE – FEMALE) ------------------------------------------------------------------------------------------------------------------------------ 190
TABLE 7.48: DECOMPOSITION OF EFFECTS ON CONTINUANCE INTENTIONS -------------------------- 190
TABLE 7.49: GOODNESS-OF-FIT INDICES FOR THE REGION SAMPLES ------------------------------------ 191
TABLE 7.50: INVARIANCE ANALYSIS (REGIONS ANALYSIS) ------------------------------------------------- 191
TABLE 7.51: INVARIANCE ANALYSIS (REGIONS) ----------------------------------------------------------------- 193
TABLE 7.52: STRUCTURAL WEIGHTS DIFFERENCES FOR THE GENDER SAMPLE (EAST - WEST) 193
TABLE 7.53: STRUCTURAL WEIGHTS DIFFERENCES FOR THE GENDER SAMPLE (EAST - CENTRE) ------------------------------------------------------------------------------------------------------------------------------ 193
TABLE 7.54: STRUCTURAL WEIGHTS DIFFERENCES FOR THE GENDER SAMPLE (WEST – CENTRE) ------------------------------------------------------------------------------------------------------------------------------ 193
TABLE 7.55: MEANS: (WEST REGION - DEFAULT MODEL) - FOR REGIONS (WEST – EAST) ---------- 195
TABLE 7.56: MEANS: (WEST REGION - DEFAULT MODEL) - FOR REGIONS (WEST – CENTRE)------ 195
TABLE 7.57: MEANS: (CENTRE REGION - DEFAULT MODEL) - FOR REGIONS (CENTRE - EAST) --- 195
TABLE 7.58: DECOMPOSITION OF EFFECTS ON CONTINUANCE INTENTIONS (EAST – WEST) ---- 196
TABLE 7.59: DECOMPOSITION OF EFFECTS ON CONTINUANCE INTENTIONS (EAST – CENTRE)- 196
TABLE 7.60: DECOMPOSITION OF EFFECTS ON CONTINUANCE INTENTIONS (WEST - CENTRE) 196
TABLE 7.61: GOODNESS-OF-FIT INDICES FOR YOUNGER THAN 35 – 35 AND OLDER ----------------- 197
TABLE 7.62: INVARIANCE ANALYSIS (YOUNGER THAN 35 – 35 AND OLDER) -------------------------- 197
TABLE 7.63: STRUCTURAL WEIGHTS DIFFERENCES FOR THE GENDER SAMPLE (YOUNGER THAN
35 – 35 AND OLDER) -------------------------------------------------------------------------------------------------- 198
TABLE 7.64: MEANS: (YOUNGER THAN 35 - DEFAULT MODEL) - FOR THE GENDER SAMPLE
(YOUNGER THAN 35 – 35 AND OLDER) ------------------------------------------------------------------------ 199
TABLE 7.65: DECOMPOSITION OF EFFECTS ON CONTINUANCE INTENTIONS (YOUNGER THAN 35
– 35 AND OLDER) ----------------------------------------------------------------------------------------------------- 199
TABLE 7.66: GOODNESS-OF-FIT INDICES FOR BELOW BACHELOR AND BACHELOR AND ABOVE ------------------------------------------------------------------------------------------------------------------------------ 200
XIX
TABLE 7.67: INVARIANCE ANALYSIS (BELOW BACHELOR AND BACHELOR AND ABOVE) ------- 200
TABLE 7.68: EDUCATIONAL STRUCTURE INVARIANT – REGRESSION FOR THE SIGNIFICANT
INVARIANT EDUCATIONS ---------------------------------------------------------------------------------------- 201
TABLE 7.69: MEANS: (BELOW BACHELOR - DEFAULT MODEL) - FOR THE EDUCATIONAL LEVEL ------------------------------------------------------------------------------------------------------------------------------ 201
TABLE 7.70: DECOMPOSITION OF EFFECTS ON CONTINUANCE INTENTIONS (BELOW BACHELOR
AND BACHELOR AND ABOVE) ---------------------------------------------------------------------------------- 202
TABLE 7.71: GOODNESS-OF-FIT INDICES FOR THE LOW ANNUAL ONLINE SPENDERS – HIGH
ANNUAL ONLINE SPENDERS SAMPLE ------------------------------------------------------------------------ 203
TABLE 7.72: INVARIANCE ANALYSIS (LOW ANNUAL ONLINE SPENDERS – HIGH ANNUAL ONLINE
SPENDERS) ------------------------------------------------------------------------------------------------------------- 203
TABLE 7.73: ASSUMING DEFAULT MODEL TO BE CORRECT ------------------------------------------------- 204
TABLE 7.74: MEANS: (LOW ANNUAL ONLINE SPENDERS - DEFAULT MODEL) - FOR THE RANDOM
SAMPLE AND HOLD-OUT SAMPLE ----------------------------------------------------------------------------- 204
TABLE 7.75: DECOMPOSITION OF EFFECTS ON CONTINUANCE INTENTIONS (LOW ANNUAL
ONLINE SPENDERS – HIGH ANNUAL ONLINE SPENDERS) --------------------------------------------- 205
TABLE 7.76: GOODNESS-OF-FIT INDICES FOR THE INTERNET SHOPPING ACTIVITIES (LOW AND
HIGH FREQUENCY SAMPLE) ------------------------------------------------------------------------------------- 206
TABLE 7.77: INVARIANCE ANALYSIS (LOW AND HIGH FREQUENCY OF USING THE INTERNET
FOR SHOPPING ACTIVITIES) -------------------------------------------------------------------------------------- 206
TABLE 7.78: STRUCTURAL FACTORIAL OF THEORETICAL CONSTRUCT (STRUCTURE INVARIANT
– REGRESSION) FOR THE FREQUENCY OF USING THE INTERNET FOR SHOPPING ACTIVITIES ------------------------------------------------------------------------------------------------------------------------------ 207
TABLE 7.79: MEANS: (LOW ONLINE FREQUENCY SHOPPING - DEFAULT MODEL) - FREQUENCY OF
USING THE INTERNET FOR SHOPPING ACTIVITIES ------------------------------------------------------ 208
TABLE 7.80: DECOMPOSITION OF EFFECTS ON CONTINUANCE INTENTIONS (LOW AND HIGH E-SHOPPING FREQUENCY) ------------------------------------------------------------------------------------------- 209
TABLE 7.81: PROPOSED HYPOTHESES -------------------------------------------------------------------------------- 210
TABLE 8.82: QUESTION 1 - LOCATION OF INTERVIEWED COMPANY HEADQUARTERS ------------ 223
TABLE 8.83: QUESTION 2 - SPENDING ON E-BUSINESS IMPLEMENTATION ----------------------------- 223
TABLE 8.84: QUESTION 3 - PRIMARY CHANNELS FOR REACHING CUSTOMERS----------------------- 224
TABLE 8.85: QUESTION 4 - WHY ADOPT THE E-BUSINESS SYSTEM ---------------------------------------- 224
TABLE 8.86: QUESTION 5 - CHANGES IN BUSINESS PROCESSES DUE TO IMPLEMENTATION ----- 226
TABLE 8.87: QUESTION 6 - PRIMARY RESPONSIBILITY FOR E-BUSINESS PROJECT MANAGEMENT ------------------------------------------------------------------------------------------------------------------------------ 226
TABLE 8.88: QUESTION 7 - BENEFITS RESULTING FROM E-BUSINESS PROJECT IMPLEMENTATION ------------------------------------------------------------------------------------------------------------------------------ 227
TABLE 8.89: QUESTION 8 - CONTRIBUTORS TO THE SUCCESS OF AN E-BUSINESS PROJECT ------ 228
TABLE 8.90: QUESTION 9 - IMPORTANT FACTORS FOR DEVELOPING E-BUSINESS PROJECT
IMPLEMENTATION -------------------------------------------------------------------------------------------------- 229
TABLE 8.91: SAUDI AIRLINES’ 2003 SURVEY ----------------------------------------------------------------------- 231
TABLE 9.92: SUMMARY OF THE FINDINGS -------------------------------------------------------------------------- 245
XX
LIST OF FIGURES
FIGURE 2.1: FORMS OF E-COMMERCE ---------------------------------------------------------------------------------- 18
FIGURE 2.2: AN E-COMMERCE WEBSITE (E-MALL) TARGETING SAUDI CUSTOMERS. ---------------- 20
FIGURE 2.3: E-COMMERCE WEBSITE (TAUFEER AND SOUQ) TARGETING YOUNG GENERATION
SAUDI CUSTOMERS.--------------------------------------------------------------------------------------------------- 21
FIGURE 2.4: INTERNET MARKET EVOLUTION IN SAUDI ARABIA (2001 – 2008), THE
COMMUNICATIONS AND INFORMATION TECHNOLOGY COMMISSION ANNUAL REPORT, 2009. ------------------------------------------------------------------------------------------------------------------------- 24
FIGURE 2. 5: CUSTOMER PROFIT CONTRIBUTIONS OVER TIME ----------------------------------------------- 32
FIGURE 2.6: ONLINE SERVICES TO SATISFY AND UNDERSTAND CUSTOMERS: SAUDI TELECOM
COMMUTATION (STC) ------------------------------------------------------------------------------------------------ 34
FIGURE 2.7: SAUDI AIRLINES WEBSITE IN FEBRUARY 2007 ---------------------------------------------------- 35
FIGURE 2.8: MOBILY TELECOMMUNICATIONS’ SITE PROVIDES SERVICES TO SATISFY AND
RETAIN CUSTOMERS. ------------------------------------------------------------------------------------------------- 38
FIGURE 2.9: ZAIN SAUDI ARABIA ---------------------------------------------------------------------------------------- 39
FIGURE 3.10: THEORY OF REASONED ACTION ---------------------------------------------------------------------- 62
FIGURE 3.11: TECHNOLOGY ACCEPTANCE MODEL (TAM) ------------------------------------------------------ 65
FIGURE 3.12: DROPPING ATTITUDE FROM TAM -------------------------------------------------------------------- 65
FIGURE 3.13: EXTENDED TECHNOLOGY ACCEPTANCE MODEL (TAM2) ----------------------------------- 76
FIGURE 3.14: EXPECTATION CONFIRMATION THEORY (ECT) ------------------------------------------------- 77
FIGURE 4.15: PROPOSED CONCEPTUAL FRAMEWORK --------------------------------------------------------- 112
FIGURE 5.16: EPISTEMOLOGICAL ASSUMPTION FOR QUALITATIVE AND QUANTITATIVE
RESEARCH -------------------------------------------------------------------------------------------------------------- 119
FIGURE 5.17: DEDUCTIVE APPROACH -------------------------------------------------------------------------------- 123
FIGURE 5.18: INDUCTIVE APPROACH --------------------------------------------------------------------------------- 123
FIGURE 5.19: SCREEN SHOTS: BOOKSTORE WEBSITE WITH ONLINE RESEARCH SURVEY LINK 150
FIGURE 5.20: ONLINE RESEARCH SURVEY (ENGLISH AND ARABIC VERSIONS) ---------------------- 152
FIGURE 5.21: RESEARCH PLAN ------------------------------------------------------------------------------------------ 154
FIGURE 7.22: THE INITIAL PROPOSED STRUCTURAL MODEL ------------------------------------------------ 178
FIGURE 7.23: FINAL RESEARCH MODEL ----------------------------------------------------------------------------- 181
FIGURE 7.24: SUMMARY OF FINAL REVISED RESEARCH MODEL ------------------------------------------ 185
FIGURE 8.25: SAUDI COMMUNICATIONS AND INFORMATION TECHNOLOGY COMMISSION
WEBSITE, 15 MAY 2009 --------------------------------------------------------------------------------------------- 215
FIGURE 8.26: SAUDI ARABIAN AIRLINES LOYALTY PROGRAM (ALFURSAN) WEBSITE, 15 MAY
2009 ------------------------------------------------------------------------------------------------------------------------ 216
FIGURE 8.27: SAUDI ARABIAN AIRLINES WEBSITE, 15 MAY 2009 ------------------------------------------- 217
FIGURE 8.28: SAUDI TELECOMMUNICATION (STC) WEBSITE, 15 MAY 2009 ----------------------------- 218
FIGURE 8.29: JARIR BOOKSTORE WEBSITE, 15 MAY 2009 ------------------------------------------------------ 220
FIGURE 8.30: BUDGET CAR HIRE SAUDI ARABIA WEBSITE, 15 MAY 2009 -------------------------------- 222
XXI
FIGURE 8.31: INFLUENCE OF FFP MEMBERSHIP ------------------------------------------------------------------ 231
FIGURE 8.32: RESERVATION METHODS ------------------------------------------------------------------------------ 232
FIGURE 8.33: ONLINE RESERVATION --------------------------------------------------------------------------------- 232
FIGURE 8.34: REASONS FOR NOT USING ONLINE RESERVATION ------------------------------------------- 233
FIGURE 8.35: ALTERNATIVE FFP PROFILES ------------------------------------------------------------------------- 234
FIGURE 8.36: PURPOSE OF USING THE WEBSITE ------------------------------------------------------------------ 234
FIGURE 8.37: SATISFACTION WITH RESERVATION METHODS ---------------------------------------------- 235
FIGURE 8.38: ONLINE RESERVATION STATISTICS --------------------------------------------------------------- 236
FIGURE 8.39: SAMPLE COMPOSITION BY AGE GROUPS -------------------------------------------------------- 237
FIGURE 8.40: FREQUENCY OF USAGE BY PROVINCES ---------------------------------------------------------- 238
FIGURE 8.41: COMPUTER USE ------------------------------------------------------------------------------------------- 239
FIGURE 8.42: USE OF INTERNET ----------------------------------------------------------------------------------------- 239
FIGURE 8.43: FILTERING CONCERNS ---------------------------------------------------------------------------------- 240
FIGURE 9.44: SUMMARY OF FINAL REVISED RESEARCH MODEL ------------------------------------------ 245
XXII
LIST OF ABBREVIATIONS
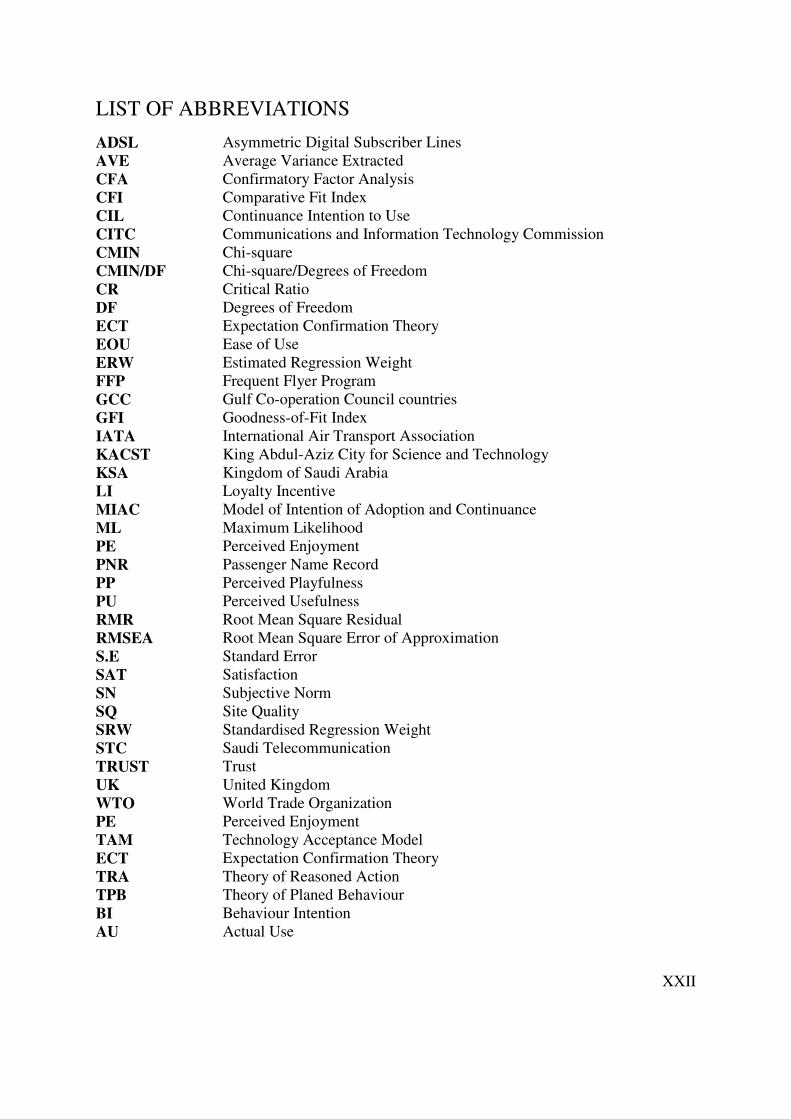
ADSL Asymmetric Digital Subscriber Lines AVE Average Variance Extracted CFA Confirmatory Factor Analysis CFI Comparative Fit Index CIL Continuance Intention to Use CITC Communications and Information Technology Commission CMIN Chi-square CMIN/DF Chi-square/Degrees of Freedom CR Critical Ratio DF Degrees of Freedom ECT Expectation Confirmation Theory EOU Ease of Use ERW Estimated Regression Weight FFP Frequent Flyer Program GCC Gulf Co-operation Council countries GFI Goodness-of-Fit Index IATA International Air Transport Association KACST King Abdul-Aziz City for Science and Technology KSA Kingdom of Saudi Arabia LI Loyalty Incentive MIAC Model of Intention of Adoption and Continuance ML Maximum Likelihood PE Perceived Enjoyment PNR Passenger Name Record PP Perceived Playfulness PU Perceived Usefulness RMR Root Mean Square Residual RMSEA Root Mean Square Error of Approximation S.E Standard Error SAT Satisfaction SN Subjective Norm SQ Site Quality SRW Standardised Regression Weight STC Saudi Telecommunication TRUST Trust UK United Kingdom WTO World Trade Organization PE Perceived Enjoyment TAM Technology Acceptance Model ECT Expectation Confirmation Theory TRA Theory of Reasoned Action TPB Theory of Planed Behaviour BI Behaviour Intention AU Actual Use
XXIII
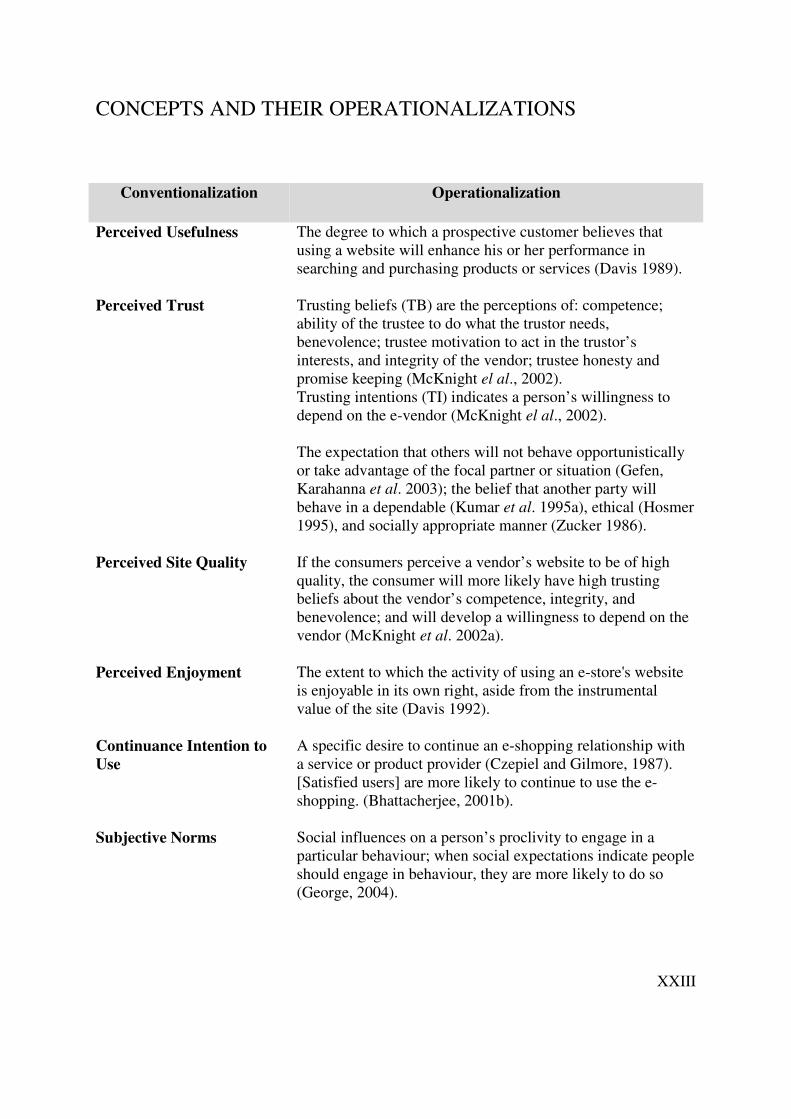
CONCEPTS AND THEIR OPERATIONALIZATIONS
Conventionalization Operationalization
Perceived Usefulness The degree to which a prospective customer believes that using a website will enhance his or her performance in searching and purchasing products or services (Davis 1989).
Perceived Trust Trusting beliefs (TB) are the perceptions of: competence; ability of the trustee to do what the trustor needs, benevolence; trustee motivation to act in the trustor’s interests, and integrity of the vendor; trustee honesty and promise keeping (McKnight el al., 2002). Trusting intentions (TI) indicates a person’s willingness to depend on the e-vendor (McKnight el al., 2002). The expectation that others will not behave opportunistically or take advantage of the focal partner or situation (Gefen, Karahanna et al. 2003); the belief that another party will behave in a dependable (Kumar et al. 1995a), ethical (Hosmer 1995), and socially appropriate manner (Zucker 1986).
Perceived Site Quality If the consumers perceive a vendor’s website to be of high quality, the consumer will more likely have high trusting beliefs about the vendor’s competence, integrity, and benevolence; and will develop a willingness to depend on the vendor (McKnight et al. 2002a).
Perceived Enjoyment The extent to which the activity of using an e-store's website is enjoyable in its own right, aside from the instrumental value of the site (Davis 1992).
Continuance Intention to
Use
A specific desire to continue an e-shopping relationship with a service or product provider (Czepiel and Gilmore, 1987). [Satisfied users] are more likely to continue to use the e-shopping. (Bhattacherjee, 2001b).
Subjective Norms Social influences on a person’s proclivity to engage in a particular behaviour; when social expectations indicate people should engage in behaviour, they are more likely to do so (George, 2004).
CHAPTER 1: INTRODUCTION
P a g e | 1
CHAPTER 1: INTRODUCTION
1.1. INTRODUCTION TO RESEARCH SUBJECT
Globalization continues to drive the rapid growth of international trade, worldwide
corporations, and non-local consumption alternatives (Alden et al., 2006; Holt, Quelch, and
Taylor, 2004), even as advances to the Internet and e-commerce have diminished trade
boundaries. Both e-commerce and e-shopping create opportunities for businesses to reach out
to consumers globally and directly; in turn, business and social science research now focuses
specifically on cross-national and cross-cultural Internet marketing (Griffith, Matthew, and
Harvey, 2006).
The Internet also has changed how businesses and customers customize, distribute, and
consume products. The advantage of low cost gives both businesses and consumers a new
and powerful channel for trading information and communication. In 1991, the Internet had
less than 3 million users worldwide and no e-commerce applications; by 1999, about 250
million users appeared online, with 63 million of them engaged in online transactions, which
produced a total value of $110 billion (Coppel, 2000). Business-to-consumer online sales in
the United States grew by 120% between 1998 and 1999 (Shop.org and Boston Consulting
Group, 2000). According to a U.K. payment association, the number of consumers who shop
online has increased by more than 150%, from 11 million in 2001 to more than 28 million in
2006 (cited in Alsajjan and Dennis, 2009). E-commerce transactions also are growing in the
Middle East (19.5 million Internet users) and in the Gulf States. In Saudi Arabia, online
transactions have increased by 100%, from $278 million in 2002 to $556 million in 2005 (Al
Riyadh, 2006). In 2007, Internet sales increased to more than $1.2 billion worldwide and are
expected to continue to rise (World Internet Users and Population Stats, 2007).
Despite these impressive online purchasing growth rates in the previous decade, compelling
evidence indicates that many consumers, searching different online retail sites, abandon their
purchases, which make the e-commerce market is still small. Likewise, how to persuade
customer repurchase remains a concern for e-commerce vendors (Johnson and Hult, 2008). It
is stated that only a small minority of website visitors (about 1%) proceeds to make purchases
(Gupta and Kim, 2007). This trend, along with the proliferation of business-to-consumer e-
CHAPTER 1: INTRODUCTION
P a g e | 2
shopping activities, necessitates a better understanding among online businesses of the factors
that encourage consumers to complete their e-shopping behaviour by purchasing. Such
continuance actions are critical, given the reasonably high cost of acquiring new customers
and the economic value of reliable customers (Reichheld and Schefter, 2000). Acquiring new
customers, penetrating them and initiating transactions may cost up to five times as much
maintaining existing ones (Bhattacherjee, 2001b; Crego and Schiffrin, 1995; Petrissans,
1999). Raising the number of reliable costumers by as slight as 5% can raise profitability by
30-85%, depending upon the business (Reicheld and Schefter, 2000).
Online customer retention is particularly difficult. Currently, consumers have various online
and offline options from which to choose. Modern customers demand that their needs be met
immediately, perfectly, and for free, and they are empowered with more information to make
decisions (Bhattacherjee, 2001b; Crego and Schiffrin, 1995). Given the inconsistent nature of
customer behaviour, the growth in global web-stores, the increasing product and service
availability and fairly low switching costs, consumers, without a compelling reason to choose
one retailer over another, will experiment or rotate purchases among multiple firms
(Bhattacherjee, 2001b; Crego and Schiffrin, 1995). All these promote to believe that it is
more important than ever to identify the main drivers of online customers’ continuance
shopping intention.
1.2. TECHNOLOGY AND NEW SHOPPING CHANNELS
Consumers largely find out more about goods and services due to their own experiences. The
process of trial and error forms an important part of customer experience and significantly
determines consumer choice and preferences (Bettman and Park, 1980; Foxall, 2003).
However, experience remains an indefinite concept that contains elements of both the service
and the delivery channels. Consumers, therefore, develop experiences by assessing the
channels through which they received the service, including the perceived richness of those
channels (Carlson and Zmud, 1999). Determining which experience is most important for
satisfying customers can be challenging. This research resolves the issue by focusing on a
single channel, namely Internet shopping as a method for delivering goods and services, and
thereby aims to clarify the drivers and important predictors of consumer continuance use
experiences.
CHAPTER 1: INTRODUCTION
P a g e | 3
Electronic commerce is changing the way people do business in unprecedented ways. In the
business-to-consumer (B2C) segment, many customers from developing countries continue to
discover this new shopping channel as a means to make purchases, track orders, search, and
obtain customer information. Consequently, use of the Internet as a shopping channel in
developing countries has increased dramatically in recent years (Cheung, 2005).
Consumer use of this new channel should help reduce consumer uncertainty, build new
consumer habits (Sheth and Parvatiyar, 1995), and increase understanding through social
exchange processes (Kelley and Thibaut, 1978). For e-retailers, the ultimate goal is to
become part of customers’ lives, resulting from their need for the seller's product or service,
and creating a continuance relationship. According to relational marketing, a series of
transactions can form a relationship (Cook and Emerson, 1978; Grönroos, 2001), and
according to e-shopping research, duration and interaction frequency provide good predictors
of relationship development (Levinthal and Fichman, 1988). In other words, time spent
online plays an important role in shopping online; people who spend more time online are
more likely to shop online (Lohse, Bellman, and Johnson, 2000). Likewise, theories of social
practice indicate that greater use of Internet shopping encourages automatic behaviour, such
as continuance usage (Brown and Duguid, 2001).
Unlike traditional shopping, the main interface for e-business or e-commerce is based on
information technology, the website, and how the customer and e-retailer interact. In e-
commerce, an e-retailer’s website replaces the salesperson’s functionalities: to represent the
company, introduce products, attract customers, provide services, and complete transactions
(Kim and Lim, 2003; Li and Zhang, 2005). Customer adaptation to and acceptance of e-
shopping is only the first step to overall success; companies that hope to succeed in their e-
business initiatives must also work toward creating and maintaining a long-term, sustainable
relationship with their customers.
In this sense, the frequency of technology usage (Lang and Colgate, 2003; Ricard,
Préfontaine, and Sioufi, 2001) and duration of the experience with the technology (Ricard et
al., 2001) offer valid representations of technology use. The features, benefits, and values of
a technology should influence how consumers make sense of e-shopping services, which also
influences use (Griffith, 1999; Carlell, 2001). As Carlson and Zmud (1999) indicate, a new
CHAPTER 1: INTRODUCTION
P a g e | 4
channel must be easy to use to encourage customers to start using the service, but the
importance of this aspect decreases as customers become more accustomed to the service.
Once they find the service easy to use, they start to look for more benefits and values from
using that service. The same study notes the importance of communicating with customers to
explain these benefits and values as an aspect of usefulness perceptions.
Most studies in e-commerce make two assumptions about customers and websites. First,
customers usually spend at least a few minutes to determine whether the website offers
desirable attributes, such as ease of use, usefulness, enjoyment, or loyalty incentives (Li and
Zhang, 2005), regardless of whether they actually like the site. Second, a good website with
strong traits receives affirmative cognitive evaluations (Li and Zhang, 2005).
Yet these two assumptions might not hold in the modern business reality. Intense competition
among e-companies encourages better product displays and greater customer satisfaction
efforts. Customers also have gained more power, with their ability to visit thousands of
Websites with ease, greatly increasing their choices and options when shopping. The
multitudes of sites that are available allow customers to realize that they can exit any
particular website quickly and easily if he or she does not like it for any reason. In this
climate, the first impression is very important. It conveys the message that the site is
trustworthy, high-quality, and easy to use and, thus, influences the customer to spend more
time on the site and enjoy all its features.
1.3. RESEARCH PROBLEM
Despite their widespread popularity, some common theories, such as the technology
acceptance model (TAM) and expectation confirmation theory (ECT) have not been tested in
some developing countries, such as Saudi Arabia. This gap becomes especially problematic
in the context of research question regarding what factors drive consumers’ continuance
intentions toward e-shopping. These include: Which forces drive customer continuance e-
shopping intentions in Saudi Arabia? Do they differ from the drivers in developed countries?
That is, do well-established theories from developed (mostly Western) countries also apply in
less developed (often non-Western) cultures; in the case of this research is Saudi Arabia?
CHAPTER 1: INTRODUCTION
P a g e | 5
Theoretical explanations of online shopping intentions consider several factors. Rogers
(1995) suggests that consumers re-evaluate acceptance decisions during a final confirmation
stage and decide to continue or discontinue. Continuance may be an extension of acceptance
behaviour that covaries with acceptance (e.g., Bhattercherjee, 2001a; Davis, Bagozzi, and
Warshaw, 1989; Karahanna, Straub, and Chervany, 1999). Researchers are confronted with a
multitude of models, and find that they can choose constructs, or choose a favoured model
and largely ignore the contributions from alternative models (Venkatesh et al, 2003). Given
the complementary nature of TAM and ECT, we adopt the extended expectation confirmation
theory (ECT; Bhattacherjee, 2001b) and the technology acceptance model (TAM; Davis,
Bagozzi, and Warshaw, 1989) as a theoretical basis, to propose a model of e-shopping
continuance intentions. This is similar to the way in which the TAM adapts the theory of
reasoned action (TRA) from social psychology to postulate a model of technology
acceptance.
The TAM, as expanded by Davis et al. (1992) and Gefen, Karahanna, and Straub (2003), and
the ECT (Bhattacherjee, 2001a; Oliver, 1980) have been used widely in research in the
industrialized world but they are less commonly applied to Saudi Arabia, which is part of the
developing countries. Moreover, the TAM stops at intention and does not investigate
continuance intentions or behaviour. Therefore, we consider that there is a need for more
research into e-shopping continuance intentions, particularly in non-western contexts.
Another issue that this thesis attempts to address pertains to the lack of a widely accepted,
cross-cultural definition of e-commerce. In recent years, the Internet has grown to include a
wider range of commercial activities and information exchanges, including the transaction
and exchange of information between government agencies, governments and businesses,
businesses and consumers, and among consumers. Coppel (2000) considers it business over
the Internet, which includes both business-to-business and business-to-consumer markets.
This study focuses mainly on the B2C arena, which provides the source of the most online
progress and development. Increasingly, commercial websites seek to provide useful product
information in order to attract potential online shoppers (Totty, 2001). Keeney (1999) pointed
out that measuring only actual purchases may be too narrow a scope when assessing the
online shopping activity of consumers. Based on previous research, this thesis will propose a
CHAPTER 1: INTRODUCTION
P a g e | 6
comprehensive definition as the following: e-shopping, electronic shopping, online shopping,
and Internet shopping, which are the same and include the activities of searching for, buying,
and selling products and services through the Internet. The author generalizes the definition;
rather than evaluating shopping at a particular site (as in Chen, Gillenson, and Sherrell,
2002); respondents were asked to generalize all online shopping activities.
In this field, which obviously relates closely to new technology decision-making processes,
prior research suggests some key gender differences (Van Slyke, Comunale, and Belanger,
2002; Venkatesh and Morris, 2000). Venkatesh et al. (2000) report that women tend to accept
information technology mainly when they know that others have high opinions of it and that
they are more influenced by ease of use. Men rely more on their own evaluations of the
usefulness of the technology. Yet in many cultures, women represent the primary decision
makers in families and the households’ main shoppers, so a cultural comparison of these
trends seems pertinent. Greater exposure to e-commerce and more decision-making power
also may grant women greater satisfaction from online shopping (Alreck and Settle, 2002).
Finally, as noted previously, existing research largely ignores Internet shopping in Saudi
Arabia and other Arabic countries, many of which can be considered to be developing
nations. This thesis focuses on Saudi Arabia and, specifically, continuance intentions toward
online shopping in Saudi Arabia. It goes further by explicitly addressing potential differences
in the online shopping behaviour of Saudi Arabians. In working to fill all these gaps, this
research offers a validated, conceptual model that integrates a variety of factors, including
gender and regions’ differences, and clarifies the theoretical problems of continuance
intentions in the unique context of Saudi Arabia.
The issues outlined above prompt the overarching research question, what factors drive
consumers’ continuance intentions toward e-shopping in Saudi Arabia?
More specifically, the research reported in this thesis aims to explore:
• Which forces drive customer continuance e-shopping intentions in Saudi Arabia?
• Do they differ from the drivers in developed countries?
• That is, do well-established theories from developed (mostly Western) countries also
apply in a less developed non-Western culture, i.e. Saudi Arabia?
CHAPTER 1: INTRODUCTION
P a g e | 7
• What impact do enjoyment, usefulness, and subjective norms have on continuance
intention in Saudi Arabia?
• Are gender, education, age, experience, spending, and geographic regions of Saudi
Arabia associated with any behaviour differences among online shoppers?
• Do e-retailers in Saudi Arabia recognize the value and cost effectiveness of
implementing e-commerce and e-shopping strategy?
1.4. RESEARCH AIMS
In line with the gaps in previous research and the resulting key research question, this thesis
adopts an information acceptance point of view. Consumers in Saudi Arabia are increasing
their use of online shopping, and a greater understanding of the factors that affect their
acceptance and continuance intentions is desperately needed. Online shopping offers e-
retailers many advantages. It is a cost effective option that has helped e-retailers to increase
their profitability. Part of these cost savings are passed on to customers. Furthermore, by
addressing behavioural differences in the development of this understanding, this thesis offers
insight into broad ranging issues with wider applications and differing degrees of importance.
The conceptual framework proposed herein attempts to describe continuance online shopping
intentions in the e-commerce world of Saudi Arabia as a result of the combined influences of
Site Quality (McKnight, and Chervany, 2002), Trust (McKnight, 2002), Usefulness (Gefen et
al., 2003), Enjoyment (Childers et al., 2001), Subjective Norms (Ya-Yueh, 2004), and Usage
Continuance Intentions (Yang and Peterson, 2004). The framework works to explain the
relationship among the factors that may attract a customer to use a website and their effects
on continuance intentions toward e-shopping in a unique cultural setting, while
acknowledging the potential behavioural online shopping differences between gender, age,
education, regions, experience, and online spending. Thus, the research aim is to enhance
knowledge and understanding in the area of online shopping continuance intention
(theoretically and practically) while proposing and validating a model of e-shopping
continuance intentions that incorporates different constructs from the modified TAM and
ECT, and considers variance of continuance intentions in the context of e-shopping in Saudi
Arabia.
CHAPTER 1: INTRODUCTION
P a g e | 8
1.5. RESEARCH OBJECTIVES
As an overriding objective, this research offers a novel perspective for establishing
overarching patterns of e-shopping that drive customer continuance intentions and, thereby,
enrich understanding of the factors that influence online shopping in Saudi Arabia. To
achieve these objectives, this research relies on TAM and ECT and their extensions to
explicate consumer online shopping continuance intentions due to the technological attributes
of the website (Davis, Bagozzi, and Warshaw, 1989; Bhattacherjee, 2001b). The subsequent
initial actions by consumers represent only a first step toward the creation and maintenance of
long-term, sustainable relationships with customers (Bhattacherjee, 2001b).
The TAM can reveal e-shopping intentions (Davis 1989; Davis et al. 1989), and many
empirical tests confirm it as a parsimonious, robust model of technology acceptance
behaviours in various IT categories, including e-commerce (Gefen and Straub 2000; Lee,
Park, and Ahn, 2001; Lederer et al., 2000), across levels of expertise (Taylor and Todd,
1995), and across countries (Rose and Straub, 1998; Straub, Keil, and Brennan, 1997). The
ECT, in turn, suggests that customer satisfaction develops from a customer’s evaluation of
the difference between expectations about the product or service before purchase and the
level to which the purchase meets those expectations (Kristensen, Martensen, and Gronholdt,
1999). Other studies address different e-commerce factors that are important to online
shopping such as trust and site quality (Ba, Whinston, and Zhang, 1999; Beatty et al., 1996;
Bhattacherjee, 2002; Brynjolfsson and Smith, 2000; Czepiel, 1990; Gefen, 2002; Hoffman,
Novak, and Perlta, 1999; Jarvenpaa et al., 1999; McKnight, Choudhury, and Kacmar, 2002b;
Ratnasingham 1998a; Urban, Sultan, and Qualls, 2000). As they reveal, customers must
experience a new channel before they can assess it, especially when they cannot see or touch
the product or service, or lack experience with the e-retailer. To strengthen the relationship
between e-shoppers and e-retailers, site quality and trust have important role to play.
Additionally, the e-retailing industry is interested in stimulating the interest of online
shoppers to build on continuance intention towards the online channel, away from the
traditional routine shopping, since it is more cost-effective for both parties. Correspondingly,
e-retailers would benefit from this research in assessing their websites’ quality perceptions as
a whole by actual online shoppers, as it provides insight for areas of improvement or different
positioning. As a result, the proposed model introduces a new model that predicts and
CHAPTER 1: INTRODUCTION
P a g e | 9
assesses online continuance intention shopping by determining the determinant factors of
continuance intention in the context of Saudi Arabia. This is done by conducting a
comprehensive analysis that includes Exploratory Factor Analysis (EFA), Structural Equation
Modelling (SEM) and invariance analysis for the data collected for study purposes to
examine research model generalizability. Additionally, it is very important to investigate and
understand how businesses recognize e-commerce in general and e-shopping in particular.
This is done by analysing the semi-structured interview, analysing the documents received
from selected companies participated in the research, Finally, the research would provide a
base for future research to build on with respect to the proposed model and its application to
other contexts.
Therefore, the research blueprint, with the procedural steps for selecting the research design
and research methodology, is as follows:
Phase 1. Define the research problem and objectives.
Phase 2. Review previous literature.
Phase 3. Develop the theoretical conceptual framework.
Phase 4. Design the research (i.e., survey questionnaire, pilot study, translation of
questionnaires).
Phase 5. Collect and analyze data (i.e., online survey, structured interview, content
analysis, descriptive analysis, factor analysis, discriminant validity,
structural equation modelling, hypotheses testing).
Phase 6. Discuss research findings.
1.6. THEORETICAL BACKGROUND
This section outlines the key elements involved in the proposed model. First, the TAM
(Davis, 1989) reflects an adaptation of the TRA, specifically tailored to users’ acceptance of
information systems. It helps explain the determinants of computer acceptance and can
explicate user behaviours across a broad range of computing technologies and populations. It
also is parsimonious and theoretically justified (Davis et al., 1989). The major determinants
CHAPTER 1: INTRODUCTION
P a g e | 10
are attitude toward, perceived usefulness of, and ease of use of the technology. Perceived
usefulness significantly influences attitude formation in prior research (Agarwal and Prasad,
1999; Davis, 1989; Dishaw and Strong, 1999; Gefen and Keil, 1998; Igbaria, Parasuraman,
and Baroudi, 1996; Moon and Kim, 2001; Taylor and Todd, 1995; Venkatesh, 2000;
Venkatesh and Davis, 2000), but evidence regarding perceived ease of use remains
inconsistent. Furthermore, other researches (e.g., Bhattachergee, 2001a; Ma and Liu, 2004;
van der Heijden, Verhagen, and Creemers, 2003) indicate that ease of use has a greater effect
on acceptance up to a certain threshold. That is, with more experience, the impact of ease of
use on intention declines. Because our research focuses on continuance intentions, we assume
all participants already have e-shopping experience, implying that other factors may be more
important than ease of use. Moreover, many studies simplify TAM by dropping attitude and
studying just the effect of perceived usefulness and ease of use on intention to use (Venkatesh
and Davis, 2000; Venkatesh et al., 2003; Gefen and Straub, 2000; Lederer et al., 2000; Teo,
Lim, and Lai, 1999; Premkumar and Bhattacherjee, 2008).
Updates to the TAM have added antecedents to perceived usefulness and ease of use
(Venkatesh and Davis, 2000), such as subjective norms, experience, trust, and output quality.
Ample evidence confirms that both usefulness (i.e., external motivation) and intrinsic
enjoyment (i.e., internal motivation) offer direct determinants of user acceptance (Davis,
Bagozzi, and Warshaw, 1992; Lederer et al., 2000; Moon and Kim, 2001; Teo et al., 1999;
Venkatesh, 1999).
Second, expectation confirmation theory (ECT) helps predict consumer behaviour before,
during, and after a purchase in various contexts and for both products and services (Anderson
and Sullivan, 1993; Dabholkar, Shepard, and Thorpe, 2000; Oliver, 1980, 1993; Patterson,
Johnson, and Spreng, 1997; Spreng, MacKenzie, and Olshavsky, 1996; Swan and Trawick,
1981; Tse and Wilton, 1988). According to the ECT, consumers define their repurchase
intentions by determining whether the product or service meets their initial expectations.
Thus, the comparison of the usefulness they actually perceive against their original
expectation of usefulness influences their continuance intentions (Bhattacherjee 2001a;
Oliver, 1980). For example, expectations might derive from knowledge and information
collected from mass media or other sources that predict the performance of products or
services. As the consumer uses the product, he or she confirms these expectations about the
CHAPTER 1: INTRODUCTION
P a g e | 11
value and benefits of the product/service. If it meets his or her initial expectation and leaves
the consumer happy and satisfied, this consumer experiences positive intentions to
repurchase. That is, repurchase intentions depend on satisfaction with the product or service
(Anderson and Sullivan, 1993; Oliver, 1980).
However, the ECT ignores potential changes in initial expectations after a consumption
experience and also the effect of those changes on subsequent cognitive processes
(Bhattacherjee 2001a). Pre-purchase expectations typically rely on others’ opinions or
information from mass media, whereas post-purchase expectations derive from first-hand
experience, which appears more realistic (Fazio and Zanna, 1981). After such first-hand
experience, expectations may increase if consumers believe the product or service is useful or
contains new benefits and features that were not part their initial expectation.
Venkatesh et al. (2003) suggest that continuing usage may also depend on cognitive beliefs
about perceived usefulness. Gefen et al. (2003) indicates that perceived usefulness reinforces
an online shopper’s intention to continue using a website, as happens when a person accepts a
new information system and is more willing to alter practices and expend time and effort to
use it (Succi and Walter, 1999). However, consumers may continue using an e-commerce
service if they consider it useful, even if they are dissatisfied with its prior use (Bhattacherjee,
2001a).
The dominant influence of perceived usefulness has led Bhattacherjee (2001) to include this
in his revised ECT. In a recent study by Premkumar and Bhattacherjee (2008) it was found
that just as perceived usefulness is the strongest predictor of intention in TAM, it continues to
be a stronger predictor of continuance intention than satisfaction when TAM is combined
with ECT (whereas satisfaction was dominant in the original ECT) (Premkumar and
Bhattacherjee, 2008). The relative dominance of usefulness explains its role as a critical
driver in continuance decisions, particularly in comparisons of utilitarian value over hedonic
value (Premkumar and Bhattacherjee, 2008).
Third, site quality and good interface design enhance the formation of consumer trust
(McKnight, Choudhury, and Kacmar, 2002a). If a consumer perceives a vendor’s website to
be of high quality, he or she is likely to trust that vendor’s competence, integrity, and
benevolence (McKnight et al., 2002a). Gefen et al. (2003), therefore, integrate trust into the
CHAPTER 1: INTRODUCTION
P a g e | 12
TAM in a B2C e-shopping context, finding that trust positively affects consumers’ intention
to use a website. In this sense, building trust with consumers becomes an essential mission
for e-retailers, because purchasing decisions represent trust-related behaviours (Jarvenpaa,
Tractinsky, and Vitale, 2000; McKnight et al., 2002b; Urban et al., 2000).
Fourth, a person’s beliefs about what other influential people (e.g., family, friends, and in-
group) think about the behaviour should directly influence their subjective norms. Therefore,
if e-shopping appears to represent a socially desirable behaviour, a person is more likely to e-
shop (George, 2002).
Fifth, Childers et al. (2001) argue that enjoyment can predict attitude toward e-shopping,
even as much as usefulness can. They also note that usefulness offers a better predictor for
grocery items, which tend to be mostly utilitarian, whereas enjoyment provides stronger
results for hedonic purchases. When it comes to e-shopping, the hedonic enjoyment
constructs in the TAM may entail the pleasure that users obtain from shopping online, which
in turn could reinforce their continuance intentions.
1.7. METHODOLOGY
To validate the conceptual model and the proposed research hypotheses, this thesis employs
an online survey, developed by the author, which is suitable for collecting data from large
geographical areas. In addition, compared with traditional surveys, online surveys offer lower
costs, faster responses, and less data entry effort. Chapter 5 describes the methodology in
greater details. This thesis pursues the benefits of a multiple method approach by employing
questionnaire surveys, measures from previous research, and case study. The research
population, defined as Internet users, includes 944 participants who receive the online
questionnaires (the research uses 928 of these respondents). This methodological approach is
justified on the basis of the reliability and validity of the questionnaires. Because this thesis
attempts to determine what drives continuance online shopping intentions, according to a
conceptual framework, the research relies on factor analysis, discriminant validity
assessments, and structural equation modelling. These tactics are appropriate for ensuring the
research can proceed and support the finding derived from the proposed conceptual model.
CHAPTER 1: INTRODUCTION
P a g e | 13
1.7.1. Measures
The measures of the various constructs come from existing literature, adapted to the context
of online shopping, where necessary. All online survey items use a Likert scale, on which 1
indicates strongly disagree and 7 is strongly agree. The site quality and trust items come from
McKnight et al. (2002a, 2002b). The perceived usefulness items derive from Gefen et al
(2003). Perceived enjoyment is a measure from Childers et al. (2001). Shih and Fang (2004)
provide the subjective norm items. The continuance intention items were adapted from Yang
and Peterson (2004).
1.7.2. Analysis
The measure analysis relies on the Cronbach’s alphas, which all should be greater than 0.7
(Bagozzi and Yi 1988), as well as a squared multiple correlation cut-off point of 0.7 and an
average variance extracted (AVE) cut-off point of 0.5 (Bagozzi, 1994; Byrne, 2001; Hair et
al., 2006). The measures should reveal convergent reliability and discriminant validity. This
section is described in more detail in Chapter 6 and 7.
1.7.3. Structural Equation Modelling
The tests of the proposed model, which operationalizes the hypotheses and the factors
involved in continuance e-shopping intentions, rely on goodness-of-fit indices. These include
Bentler and Bonnett’s (1980) chi-square/degrees-of-freedom (CMIN/DF) ratio, which should
not exceed five (Bentler, 1989).
A structural equation model (SEM), using AMOS 5.0 software, determines additional
goodness-of-fit indices, including the critical ratio (CR), chi-square (CMIN), degrees of
freedom (df), root mean square residual (RMR), root mean square error of approximation
(RMSEA), goodness-of-fit index (GFI), comparative fit index (CFI), normed fit index (NFI),
incremental fit index (NFI), and relative fit index (RFI).
Finally, the analysis examines the regression weights (path significance) of each relationship
in the proposed research model and the variance explained (R2 value) by each path. The
AMOS software reports standardized regression weights, standard errors, and CRs for each
path.
CHAPTER 1: INTRODUCTION
P a g e | 14
1.7.4. Invariance Analysis
When comparing cultures or groups, research participants may not recognize the same
meaning and understanding of survey items. Scholars, thus, have emphasized the importance
of minimizing possible research biases in cross-national and cross-cultural research derived
from the data collection (Yi, Merz, and Alden, 2008). To minimize the bias, this thesis
undertook a pilot study to test the questionnaire and applied careful back-translation methods
(Brislin, 1986). In addition, the testing assesses measurement invariance (equivalence) across
groups to determine the constructs’ factorial invariance (Cheung and Rensvold, 1999).
1.8. THESIS OUTLINE
This thesis contains eight chapters and proceeds as follows: Chapter 1 is the introduction.
Chapter 2 presents a background of IT and e-commerce in Saudi Arabia, and Chapter 3 offer
a literature review pertaining to online shopping, TAM, and ECT. Chapters 4 and 5 provide
the research question and hypotheses; and describe the methodology, respectively. The data
analysis is split between Chapters 6 and 7. Chapter 8 covers the current situation of
companies in Saudi Arabia as a case study. Finally, Chapter 9 is the discussion and
conclusion, which outlines some practical implications of this thesis.
CHAPTER 2: ORIGIN AND DEVELOPMENT OF THE INTERNET, E-COMMERCE, AND E-SHOPPING IN SAUDI ARABIA
P a g e | 15
CHAPTER 2: ORIGIN AND DEVELOPMENT OF THE INTERNET, E-COMMERCE, AND E-SHOPPING IN SAUDI ARABIA
2.1. INTRODUCTION TO COUNTRY AND REGIONAL
BACKGROUND
Saudi Arabia is a fascinating country that is often misunderstood and frequently
misrepresented. As the powerhouse of the Arab world, it enjoys the single largest economy,
is the world’s top oil exporter, and, despite its relative youth, has achieved rapid growth rates.
It ranks as the 14th largest country in the world, covering more than 2 million square
kilometres (Nations Online, 2008).
In addition, its population is young and growing 60% of the total population of 24,069,943 is
younger than 30 years (The Middle East Statistics, 2007), with a population growth rate of
approximately 2–3%. Its high gross domestic product (GDP) puts it 25th in the world on this
measure, and, consequently, investment opportunities are particularly attractive. The
demographics of the country also influence the political and economical circumstances that
determine the acceptance, development, and spread of technology in the country, which is
crucial for the success of e-commerce (Ein-Dor, Segev, and Orgad, 1992; Haley, 2002; Png,
Tan and Wee, 2001). In particular, the young population, which is split almost equally in
terms of gender (51% male, 49% female), appears more likely to accept the risk of
experimenting with new technology and new ideas (Straughn and Alere-Miller, 2001).
More than twenty years ago, Saudis lived in a very restricted environment that forbade most
advanced technologies. Only one governmental TV channel was available, satellite was
illegal, and women rarely appeared in public alone. Even the use of cordless phones was
prohibited!
However, after the first Gulf War, in the early 1990s to 2001, dramatic changes occurred in
the country. Saudis began to look to different sources for the latest information about the war,
opening the window to satellite imports and also provoking hundreds of new Arabic
channels, 60–75% of them targeting the Saudi market. In addition, as Saudi women began
working in the media, many other changes resulted. Greater exposure to the external world
induced significant changes, including the empowerment of the individual Saudi.

CHAPTER 2: ORIGIN AND DEVELOPMENT OF THE INTERNET, E-COMMERCE, AND E-SHOPPING IN SAUDI ARABIA
P a g e | 16
After 9/11/2001 incident in USA, the Saudi government felt pressured to implement even
further changes. One of them, especially notable in the traditionally conservative Saudi
culture and crucial for this thesis, involved the opening of communication and information
exchanged by Saudi youth, both male and female.
From the introduction of Internet services in 1998 to the beginning of 2007, 4.45 million
Internet users and more than 10 million mobile technology users appeared in Saudi Arabia.
Approximately half of the Internet users represent the younger generation of 30 year olds or
younger, who themselves represent 60% of the Saudi population (Okaz newspaper, 2007).
These remarkable developments raise a pertinent question: What impact do such changes
have on e-commerce in Saudi Arabia, especially among the young generation born after the
digital revolution?
Despite global advancements in retailing and marketing communication, retailers throughout
Saudi Arabia remain handicapped by several factors. Amazing progress certainly has
occurred in terms of creating electronic communication, and storing and processing
information, yet few Saudi marketers or retailers have access to modern communication
networks that can facilitate and enhance their customer communication (Tuqan, 2004). The
King Abdulaziz City for Science and Technology (KACST) is an independent scientific
organization whose main functions involve science and technology policy-making, data
collection, funding of external research, and services such as the patent office. Also, it
operates the Internet backbone in Saudi Arabia, as well as the local registry address space.
All Saudi Arabian web traffic will come from the IP block registered to KACST. In 2001,
KACST undertook a study to determine the penetration of IT into medium and small
companies in Saudi Arabia. It found that all companies had personal computers, 82% of
possessed servers, and 94% of the companies used local area networks, yet 64% had no
independent computer department. In addition, the percentage of Saudi nationals working in
the IT field in those companies reached only 12.5%.
It is not clear whether marketers and retailers in Saudi Arabia understand how to employ the
principle of sustainable relationships in their practices or the impact of relationships on their
consumers. The lack of understanding of the capabilities of the digital revolution may have
been prevented the Saudi market from expanding in this sense, which may, in turn, have
pushed customers to defect to international competitors. As a member of the World Trade
Organization (WTO), Saudi Arabia has gained a great opportunity for attracting foreign
CHAPTER 2: ORIGIN AND DEVELOPMENT OF THE INTERNET, E-COMMERCE, AND E-SHOPPING IN SAUDI ARABIA
P a g e | 17
businesses, with their advantages of capital and experience in innovation. Retailers in Saudi
Arabia thus face dual competitive pressure, internationally and within their borders, in several
areas, including service/product quality, administrative efficiency, and building ongoing
relationships.
Yet e-commerce firms may also serve as forerunners in product and service development,
financial advances, innovation, and quality improvements. Local businesses, therefore, must
react in these same areas.
2.2. E-COMMERCE AND ONLINE SHOPPING
Coppel (2000) defines e-commerce as doing business over the Internet by selling goods and
services that might be delivered more traditionally and products that can be digitized and
delivered online. E-commerce, or online business, can occur between businesses or between
businesses and consumers. In recent years, the Internet has grown to encompass a wider
range of potential commercial activities and information exchange. This includes the
transaction and exchange of information across government agencies, governments and
businesses, businesses and consumers, and among consumers (e.g., auctions), as Table 2.1
outlines.
Business to business e-Commerce (B2B) is sometimes called buy-side e-Commerce and
involves supporting the supply chain with Information and Communications Technologies
(ICT) (Beynon-Davies, 2007). B2B commerce is clearly between organizational actors -
public and/or private sector organizations. Business to consumer e-Commerce (B2C) is
sometimes called sell-side e-Commerce and concerns the enablement of the customer chain
with ICT (Beynon-Davies, 2007). Customers or consumers will typically be individuals, or
sometimes might be other organizations. Consumer to Consumer e-Commerce (C2C) is a
developing form of e-Commerce and is considered the most radical form of e-Commerce
since it overlaps with non-commercial activity in the area of community (Beynon-Davies,
2007). C2C e-Commerce exists in the ‘community’ and a new range of business opportunities
emerge within the social communities and virtual networking as a phenomenon driving new
levels of content and services(e.g., auctions, ebay). Figure 2.1 illustrates the traditional view
of e-Commerce. This research focuses mainly on the business-to-consumer (B2C) context,
where most of the progress and development in this area has taken place.
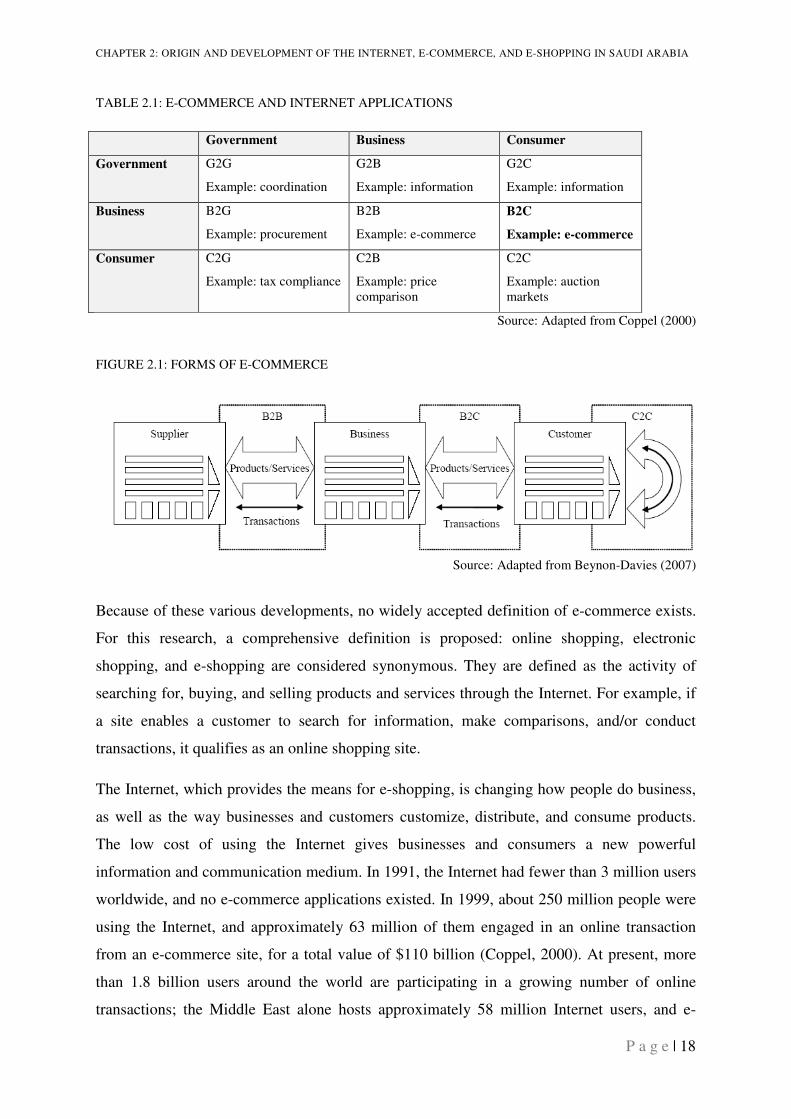
CHAPTER 2: ORIGIN AND DEVELOPMENT OF THE INTERNET, E-COMMERCE, AND E-SHOPPING IN SAUDI ARABIA
P a g e | 18
TABLE 2.1: E-COMMERCE AND INTERNET APPLICATIONS
Government Business Consumer
Government G2G
Example: coordination
G2B
Example: information
G2C
Example: information
Business B2G
Example: procurement
B2B
Example: e-commerce
B2C
Example: e-commerce
Consumer C2G
Example: tax compliance
C2B
Example: price comparison
C2C
Example: auction markets
Source: Adapted from Coppel (2000)
FIGURE 2.1: FORMS OF E-COMMERCE
Source: Adapted from Beynon-Davies (2007)
Because of these various developments, no widely accepted definition of e-commerce exists.
For this research, a comprehensive definition is proposed: online shopping, electronic
shopping, and e-shopping are considered synonymous. They are defined as the activity of
searching for, buying, and selling products and services through the Internet. For example, if
a site enables a customer to search for information, make comparisons, and/or conduct
transactions, it qualifies as an online shopping site.
The Internet, which provides the means for e-shopping, is changing how people do business,
as well as the way businesses and customers customize, distribute, and consume products.
The low cost of using the Internet gives businesses and consumers a new powerful
information and communication medium. In 1991, the Internet had fewer than 3 million users
worldwide, and no e-commerce applications existed. In 1999, about 250 million people were
using the Internet, and approximately 63 million of them engaged in an online transaction
from an e-commerce site, for a total value of $110 billion (Coppel, 2000). At present, more
than 1.8 billion users around the world are participating in a growing number of online
transactions; the Middle East alone hosts approximately 58 million Internet users, and e-
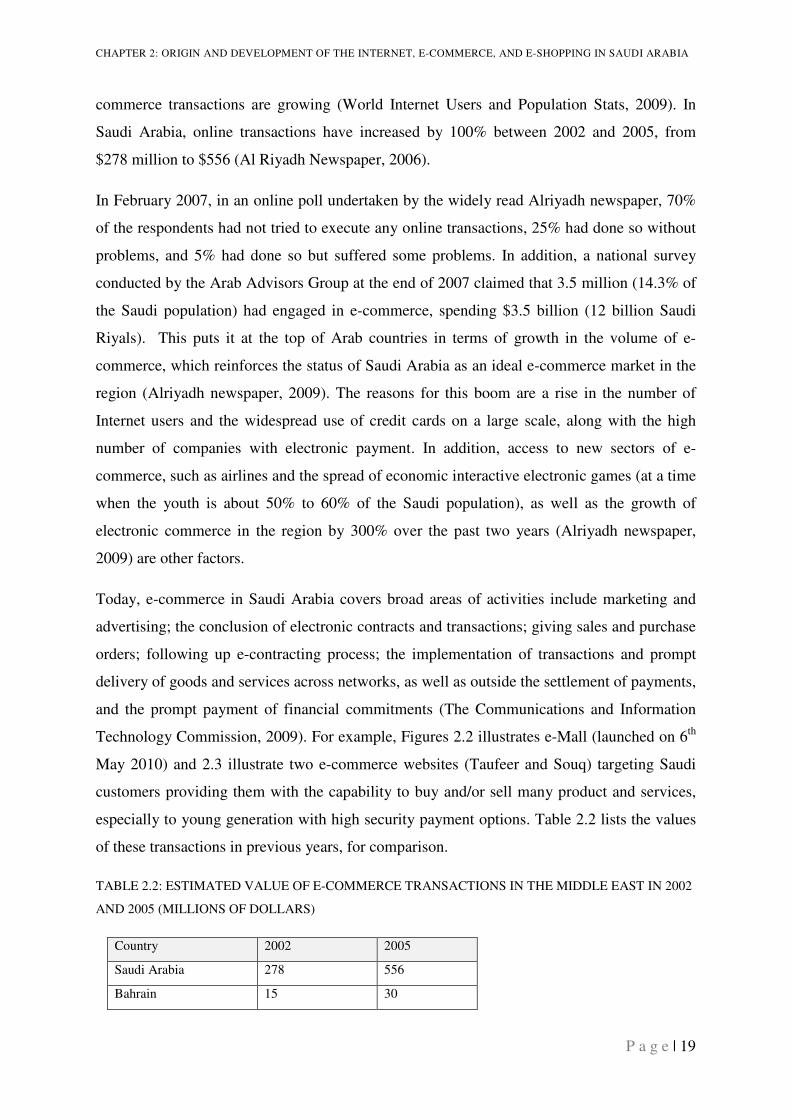
CHAPTER 2: ORIGIN AND DEVELOPMENT OF THE INTERNET, E-COMMERCE, AND E-SHOPPING IN SAUDI ARABIA
P a g e | 19
commerce transactions are growing (World Internet Users and Population Stats, 2009). In
Saudi Arabia, online transactions have increased by 100% between 2002 and 2005, from
$278 million to $556 (Al Riyadh Newspaper, 2006).
In February 2007, in an online poll undertaken by the widely read Alriyadh newspaper, 70%
of the respondents had not tried to execute any online transactions, 25% had done so without
problems, and 5% had done so but suffered some problems. In addition, a national survey
conducted by the Arab Advisors Group at the end of 2007 claimed that 3.5 million (14.3% of
the Saudi population) had engaged in e-commerce, spending $3.5 billion (12 billion Saudi
Riyals). This puts it at the top of Arab countries in terms of growth in the volume of e-
commerce, which reinforces the status of Saudi Arabia as an ideal e-commerce market in the
region (Alriyadh newspaper, 2009). The reasons for this boom are a rise in the number of
Internet users and the widespread use of credit cards on a large scale, along with the high
number of companies with electronic payment. In addition, access to new sectors of e-
commerce, such as airlines and the spread of economic interactive electronic games (at a time
when the youth is about 50% to 60% of the Saudi population), as well as the growth of
electronic commerce in the region by 300% over the past two years (Alriyadh newspaper,
2009) are other factors.
Today, e-commerce in Saudi Arabia covers broad areas of activities include marketing and
advertising; the conclusion of electronic contracts and transactions; giving sales and purchase
orders; following up e-contracting process; the implementation of transactions and prompt
delivery of goods and services across networks, as well as outside the settlement of payments,
and the prompt payment of financial commitments (The Communications and Information
Technology Commission, 2009). For example, Figures 2.2 illustrates e-Mall (launched on 6th
May 2010) and 2.3 illustrate two e-commerce websites (Taufeer and Souq) targeting Saudi
customers providing them with the capability to buy and/or sell many product and services,
especially to young generation with high security payment options. Table 2.2 lists the values
of these transactions in previous years, for comparison.
TABLE 2.2: ESTIMATED VALUE OF E-COMMERCE TRANSACTIONS IN THE MIDDLE EAST IN 2002
AND 2005 (MILLIONS OF DOLLARS)
Country 2002 2005
Saudi Arabia 278 556
Bahrain 15 30
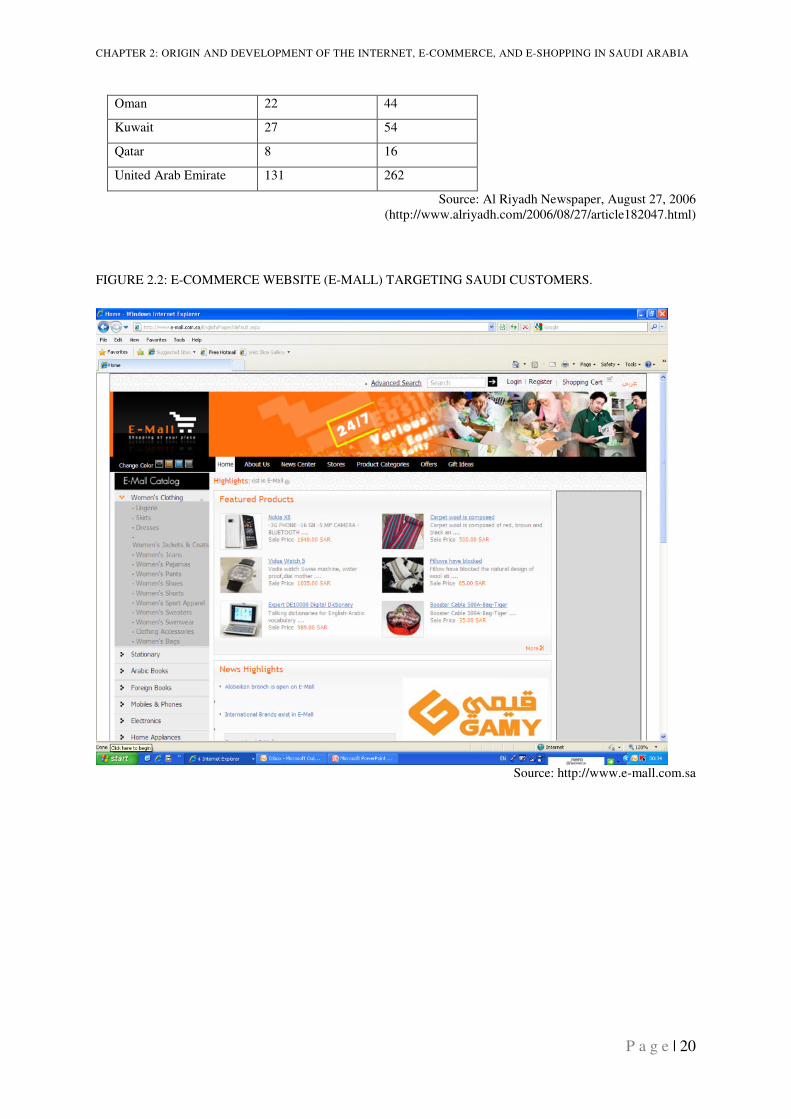
CHAPTER 2: ORIGIN AND DEVELOPMENT OF THE INTERNET, E-COMMERCE, AND E-SHOPPING IN SAUDI ARABIA
P a g e | 20
Oman 22 44
Kuwait 27 54
Qatar 8 16
United Arab Emirate 131 262
Source: Al Riyadh Newspaper, August 27, 2006 (http://www.alriyadh.com/2006/08/27/article182047.html)
FIGURE 2.2: E-COMMERCE WEBSITE (E-MALL) TARGETING SAUDI CUSTOMERS.
Source: http://www.e-mall.com.sa
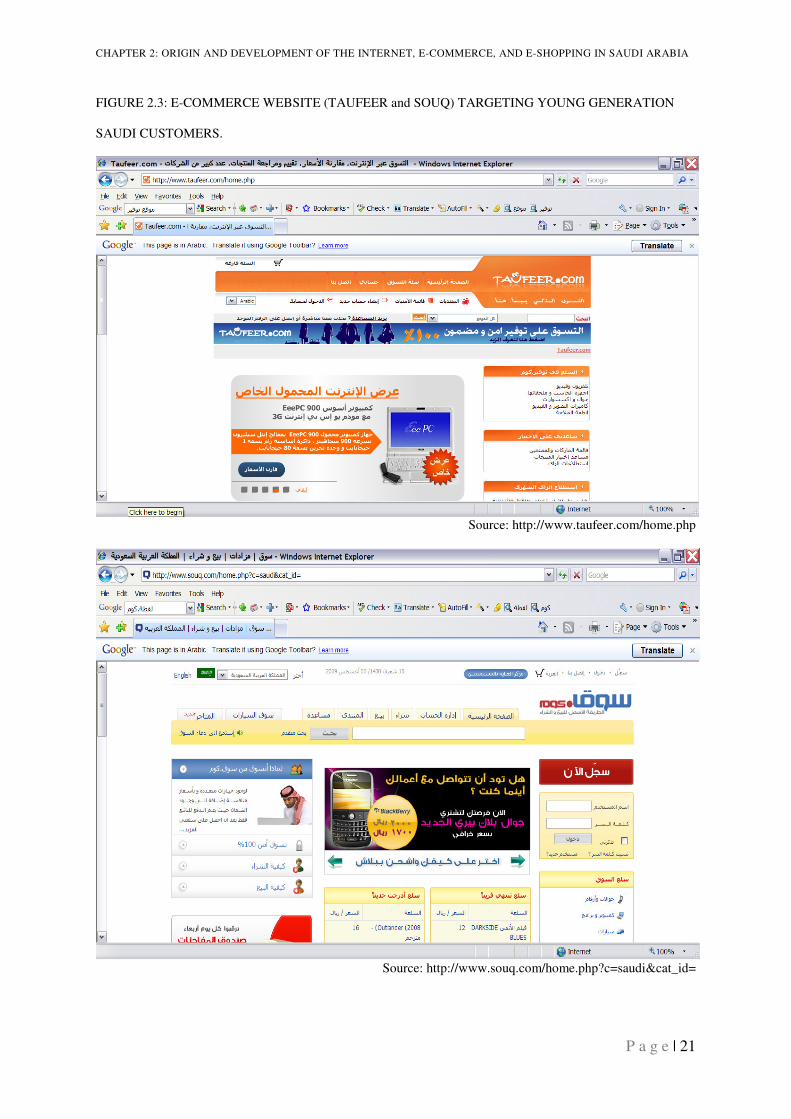
CHAPTER 2: ORIGIN AND DEVELOPMENT OF THE INTERNET, E-COMMERCE, AND E-SHOPPING IN SAUDI ARABIA
P a g e | 21
FIGURE 2.3: E-COMMERCE WEBSITE (TAUFEER and SOUQ) TARGETING YOUNG GENERATION
SAUDI CUSTOMERS.
Source: http://www.taufeer.com/home.php
Source: http://www.souq.com/home.php?c=saudi&cat_id=
CHAPTER 2: ORIGIN AND DEVELOPMENT OF THE INTERNET, E-COMMERCE, AND E-SHOPPING IN SAUDI ARABIA
P a g e | 22
2.3. E-COMMERCE AND SAUDI ARABIA
2.3.1. The Internet in Saudi Arabia
Saudi Arabia began allowing public access to the Internet through local service providers in
January 1999. However, it was also determined to block the flow of "undesirable" data into
the region.
Saudi Arabia has had Internet connectivity since 1994, but its access was restricted to use by
academic, medical, and research institutions. Saudi citizens could purchase computers and
modems, connect using foreign dial-up Internet service providers (ISPs), and launch sites on
foreign servers. However, international calls to the ISPs were expensive; for example, a dial-
up call to Bahrain cost U.S. $0.60 - 0.80 per minute; those to the United States and Europe
ran $1.70 - $2.10 per minute. Still, according to one estimate, some 30,000 Saudis accessed
the Internet in this fashion (Agence France-Presse, 1998).
Although public Internet access was approved in 1997, it was not until January 1999 that
local ISPs began connecting ordinary citizens. This delay resulted from authorities’ efforts to
establish a system that could control the flow of online information. The objective of this
monitoring process was to protect society from material on the Internet that would violate the
dictates of Islam or encroach on Saudi Arabian traditions and culture (FBIS, 1998).
Saudi Arabia's Council of Ministers endorsed a firewall to keep the public from accessing
"inappropriate" information (The Mosaic Group, 1998, p. 216). In addition, the council
prepared a wide set of restrictions on Internet content and usage. Decision number 163, made
public in May 1998, requires ISPs and users to refrain from:
“… using the network for illegitimate purposes such as, for example, immoral sites,
which include pornography, gambling, drug use, religious conversion of Muslims,
carrying out any activities violating the social, cultural, political, media, economic,
and religious values of the Kingdom of Saudi Arabia; sending or receiving coded
information unless after obtaining the necessary licenses from the administration of
the network in question; [and] introducing others into the usage accounts or briefing
them on the secret number of the user”.
(Al-Jazira newspaper, May 6, 1998).
CHAPTER 2: ORIGIN AND DEVELOPMENT OF THE INTERNET, E-COMMERCE, AND E-SHOPPING IN SAUDI ARABIA
P a g e | 23
As another interesting feature, this system encouraged citizens to report "immoral" sites to be
blocked, using a provided Web form.
In November 1998, the government approved private ISPs. However, all ISPs must link to a
main server at the KACST, which owns the country's sole gateway to the World Wide Web
(Al-Jazira Daily, May 6, 1998). More than 95% of the approximately 400,000 blocked
websites, according to authorities, deal with pornography; the rest reportedly contain political
and social subjects that violate the Saudi Arabia’s laws and regulations (Arab News Sunday,
July 6, 2003)
The pricing structure for Internet accounts announced by the KACST appears generally
moderate to high, depending on whether the ISPs choose to offer rates closer to the low or
high end of the permissible range set by the KACST. A light user, who spends approximately
five hours online per month, would pay a monthly rate of $36–$44.
Saudi Arabia also has worked hard to promote an IT culture, and, perhaps due to these
efforts, the country accounts for 40% of all computer and IT application sales in the Gulf
region’s booming $5 billion IT market (Riyadh Exhibition Co. Ltd., 2007). In 1998, the
number of personal computers in the country was 860,000, which represented 4.3% of the
population. By 2002, the number of PCs had increased to 1,425,000, at a growth rate of 6.5%
and a household penetration of 39.4% (The Middle East Statistics, 2007). Internet
connectivity, usage of e-commerce and e-banking services, sales of related software and
hardware, and sales of computers and laptops all are growing rapidly, stimulated especially
by the expansion of the Saudi’s young population with its ever increasing interest in
technology. Within the next few years, the population of just the Saudi capital, Riyadh, is
expected to increase by several million persons, which would likely increase IT demands as
well (Riyadh Exhibition Co. Ltd., 2007). Thus, Saudi Arabia has the potential to become the
region’s communication gateway, if it plans appropriately.
The Global E-readiness Index was developed by UN-DESA/ASPA, and it integrates
infrastructure, online presence, e-government, and other indicators in a weighted
benchmarking. Saudi Arabia has an index of 1.86, sitting comfortably above the average
global index of 1.62 (Anon, 2003). There is no doubt that Saudis are ready for e-commerce
and its usage. Internet users in Saudi Arabia in 2000 reached 200,000 (The Middle East
Statistics, 2007), then jumped dramatically to 3 million users in December 2005, and 4.7
million users as of December 2006 rising to 7.7 million users by September 2009, with a
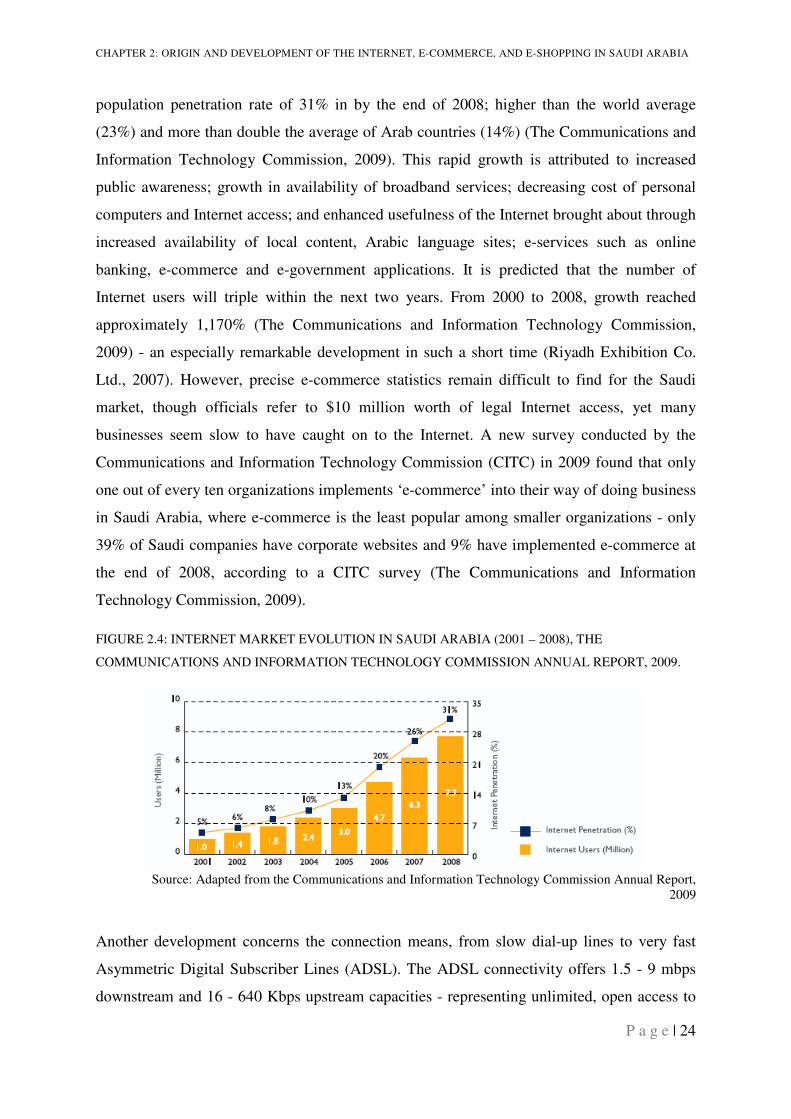
CHAPTER 2: ORIGIN AND DEVELOPMENT OF THE INTERNET, E-COMMERCE, AND E-SHOPPING IN SAUDI ARABIA
P a g e | 24
population penetration rate of 31% in by the end of 2008; higher than the world average
(23%) and more than double the average of Arab countries (14%) (The Communications and
Information Technology Commission, 2009). This rapid growth is attributed to increased
public awareness; growth in availability of broadband services; decreasing cost of personal
computers and Internet access; and enhanced usefulness of the Internet brought about through
increased availability of local content, Arabic language sites; e-services such as online
banking, e-commerce and e-government applications. It is predicted that the number of
Internet users will triple within the next two years. From 2000 to 2008, growth reached
approximately 1,170% (The Communications and Information Technology Commission,
2009) - an especially remarkable development in such a short time (Riyadh Exhibition Co.
Ltd., 2007). However, precise e-commerce statistics remain difficult to find for the Saudi
market, though officials refer to $10 million worth of legal Internet access, yet many
businesses seem slow to have caught on to the Internet. A new survey conducted by the
Communications and Information Technology Commission (CITC) in 2009 found that only
one out of every ten organizations implements ‘e-commerce’ into their way of doing business
in Saudi Arabia, where e-commerce is the least popular among smaller organizations - only
39% of Saudi companies have corporate websites and 9% have implemented e-commerce at
the end of 2008, according to a CITC survey (The Communications and Information
Technology Commission, 2009).
FIGURE 2.4: INTERNET MARKET EVOLUTION IN SAUDI ARABIA (2001 – 2008), THE
COMMUNICATIONS AND INFORMATION TECHNOLOGY COMMISSION ANNUAL REPORT, 2009.
Source: Adapted from the Communications and Information Technology Commission Annual Report,
2009
Another development concerns the connection means, from slow dial-up lines to very fast
Asymmetric Digital Subscriber Lines (ADSL). The ADSL connectivity offers 1.5 - 9 mbps
downstream and 16 - 640 Kbps upstream capacities - representing unlimited, open access to
CHAPTER 2: ORIGIN AND DEVELOPMENT OF THE INTERNET, E-COMMERCE, AND E-SHOPPING IN SAUDI ARABIA
P a g e | 25
the Internet at ten times the speed of ordinary telephone lines (Anon, 2001). The Arab
Advisors Group, in its study of available bandwidth and Internet subscriber numbers in
several Arab countries including Saudi Arabia, found that available Internet bandwidth in the
Middle East grew by 154% to 1.9 Gbps between August 2001 and January 2002. In 2007, it
had reached 750 Mbps of bandwidth.
2.3.2. E-commerce in Saudi Arabia
Radical developments in IT have affected Saudi Arabian economic and social life in many
ways. The world has experienced a revolution in informatics, with effects that may even
outweigh those of the Industrial Revolution. Communications technology and the
proliferation of computer networks and the Internet, as well as the integration between IT and
communications, have turned the world into a global village in which people can engage in
commercial transactions and access information on any subject from anywhere in the world,
promptly and cost effectively (Ministry of Communications and Information Technology,
Saudi Arabia, 2003).
Since the mid-1990s, developed countries have provided the entire infrastructure needed to
expand IT, using the economic, social, and service sectors of their own economic settings.
These well-developed infrastructures have had great impacts on IT, enhancing corporate
productivity and increasing corporate capacity to reach new markets and transcend
geographical and political barriers. They have also allocated essential money and adopted
appropriate policies and incentives, together with national programs, to encourage the
industry and strengthen research institutions. Consequently, institutions have restructured to
cope with the new realities in the regional and international arena, created job opportunities,
and improved social services (e.g., education and health care) (Ministry of Communications
and Information Technology, Saudi Arabia, 2003). All these efforts have encouraged the
development and prosperity of their people.
At the same time, Saudi Arabia, as part of the developing world, has invested in information
and telecommunication technologies to the maximum extent possible, considering its
financial means and level of development. In general, Saudi Arabia has tried to apply two
parallel strategies: using IT to develop basic services, such as education, health, and
government institutions, and developing modern industries in the fields of computer hardware
and software with assistance from local and foreign investors. Saudi Arabia also has made
great efforts to meet the demands of its local markets to match international e-business

CHAPTER 2: ORIGIN AND DEVELOPMENT OF THE INTERNET, E-COMMERCE, AND E-SHOPPING IN SAUDI ARABIA
P a g e | 26
trends, including the development and application of IT to national planning, and new
initiatives that progress toward an information-based society. The Saudi government has
approved a huge budget of $2.7 billion since 2007 to complete all e-transaction projects by
2010 and thus exhibit its full commitment to e-commerce (Okaz Newspaper, 2007).
This brief description of e-commerce–related activities by the government provides an
overview. For further information, readers might follow the following links:
• The e-Government Program–Yesser at http://www.yesser.gov.sa/english/default.asp
• Saudi Government Electronic Portal at http://www.saudi.gov.sa/wps/portal/espp
• Ministerial Agency of Civil Affairs at
http://www.moi.gov.sa/wps/portal/civilaffairs/home
• Minister of Commerce and Industry at http://www.commerce.gov.sa/english/
• Ministry of Communications and Information Technology at
http://www.mcit.gov.sa/english
• Saudi Post at http://www.sp.com.sa/English
• National Center for Digital Certification (NCDC) at
http://www.pki.gov.sa/index_english.htm
2.3.3. E-Commerce Challenges in Saudi Arabia
One of the major barriers to the growth of e-commerce in Saudi Arabia is the lack of
government support for digital security in online transactions. The Saudi Arabian government
has proposed several digital security initiatives and introduced legislation to advance the e-
commerce sector. This movement and involvement may be able to address many of the
challenges, such that the influence of the government can offer a positive factor that finds the
delicate balance between localization and globalization in international e-business standards.
To move forward and demonstrate its commitment to the e-commerce and technology sector,
Saudi Arabia created the Ministry of Communications and Information Technology (2003),
with the intention of benefiting from the rapid and integrated expansion of the country’s
social, economic, and administrative life, as well as enhances the development of an
information society. This process also may contribute to the increasing diversification of
sources of country revenue, the optimum use of available resources, and the achievement of
medium- and long-term savings. In addition, it could have a great impact on and contribution
to the well-being of the Saudi people, enhancing the country’s competitive advantage both

CHAPTER 2: ORIGIN AND DEVELOPMENT OF THE INTERNET, E-COMMERCE, AND E-SHOPPING IN SAUDI ARABIA
P a g e | 27
regionally and internationally. Thus, the government support in Saudi Arabia has had the
greatest impact in promoting the growth of the e-commerce sector in Saudi Arabia, especially
after the Saudi Arabian Monetary Agency has adopted and integrated solutions to the
SADAD system "payment system", the central system for the presentation of the various
payments electronically, which reflects the keenness of Saudi Arabia to create a special
system of financial transactions in a secure electronic environment through the Internet,
telephone or ATM systems.
Saudi Arabia has adopted a privatization strategy aimed at improving the efficiency and
competitiveness of the national economy by providing incentives for both domestic and
foreign capital investment and production, and encouraging participation in the
telecommunications sector. To develop the e-commerce industry and establish a legal
framework that will provide a competitive edge, the country established the Saudi
Communications and Information Technology Commission (CITC) on June 27, 2001, and
adopted several telecommunications legislations and regulations.
As a self-directed entity, the Saudi Communications Commission enjoys financial and
administrative independence. Its responsibilities include regulating the telecommunication
sector; securing the provision of advanced communication services; creating a favourable
environment for fair competition; protecting public interests and the rights of
telecommunications employees; securing the confidentiality and security of communications;
ensuring that the sector adapts to new technologies and developments; and securing the right
to access to public network at affordable prices.
Telecommunication regulations specifically define the duties and responsibilities of the Saudi
Communications Commission as maintaining the provision of quality telecommunication
services at affordable prices. To encourage further and rapid developments, the Commission
has opened up the data and mobile markets to competition. By 2007, three mobile phone
companies functioned in the Saudi market; a second landline company gained a license in the
same year. This movement contributed dramatically to the fast and flexible approach to
dealing with changes in domestic, regional, and international environments. This relates to
matters not only of economy and competition but also international standards and regulatory
rules that would extend the e-commerce and communication sector to the international realm.
Privatization in the telecommunication sector and more foreign investors, with their greater
expertise, has generated particular economic interest in this sector. Demand has increased for
CHAPTER 2: ORIGIN AND DEVELOPMENT OF THE INTERNET, E-COMMERCE, AND E-SHOPPING IN SAUDI ARABIA
P a g e | 28
Internet services and all their features, as has demand for fixed lines increased by 73% since
1997. The number of subscribers reached 3.4 million by the end of 2002, with a penetration
rate of 15% of the total population, such that 84.5% of households have access to a landline
(Economist Intelligence Unit, 2007). Mobile service also has grown quickly. The number of
subscribers rose from 316,000 in 1997 to more than 5 million in 2002, and 7.24 million in
2003. Penetration rates jumped from around 1.7% in 1997 to 11.8% in 2001, to 22.7% in
2002, and to 29.9% in 2003 (Economist Intelligence Unit, 2007).
Prior to 2006, the Saudi Telecommunication Company (STC) was the only service provider
for all communications (telephone, Internet, and mobile). After the Saudi Arabia joined the
WTO in 2006, the STC kept reducing its prices as a competitive strategy to maintain its
domination over this massive market and to discourage competitors from entering the market.
For example, it reduced the cost of connecting to ISPs through the national network by 30%,
and installation charges dropped by 70% (Anon, 2001). Yet the telecommunication industry
in Saudi Arabia still grew to include three additional communication service providers:
Mobily Telecommunications (Ithad Emirate telecommunications company), Zain
Telecommunications (a Kuwaiti telecommunications company), and Atheeb (new Saudi
landline, communication, and Internet provider)
With these developments the security of information remains a critical issue, so the Saudi
Arabian Council of Ministers put forward Decision 163 on March 4, 1997, that authorizes a
security information committee, supervised by the Ministry of Interior, with membership for
several agencies. The main responsibility of the committee is to increase trust among Internet
users by managing the security of information transmitted online. In response, the committee
has issued regulations governing the use of the Internet in the country (Ministry of
Communications and Information Technology, Saudi Arabia, 2003).
Finally, the government of Saudi Arabia has attempted to build the required environment for
technology acceptance by aiming for a better understanding of e-commerce. Programs with
the Ministry of Education, the Ministry of Higher Education, and the General Organization
for Technical Education and Vocational Training work to increase such understanding among
citizens (Ministry of Communications and Information Technology, Saudi Arabia, 2003).
These ministries work closely together to improve educational facilities and provide training
in IT-related activities in Saudi schools and universities in order to meet both regional and
international standards. The main aims are to build knowledge and acceptance of IT and to
CHAPTER 2: ORIGIN AND DEVELOPMENT OF THE INTERNET, E-COMMERCE, AND E-SHOPPING IN SAUDI ARABIA
P a g e | 29
provide younger generations with the skills they can use to exploit and benefit from IT and
the Internet, thereby moving the country forward as a leader in building an information-based
society in the region.
2.4. WEBSITE CLASSIFICATIONS IN SAUDI ARABIA
Since the establishment of the Internet in 1999, companies, both public and private, have
established a presence online. Websites are becoming the most common vehicle for
communication between companies and customers; they provide digitized versions of
companies’ brochures, organizational and promotional information for customers and online
visitors, financial reports, recruitment details, general information, contacts, and so forth.
Most sites also feature both Arabic and English language material. Diniz (1998) suggests
three categories of website content (see Table 2.3):
1. Information delivery tool.
2. Customer relationship management tool.
3. Communication.
2.4.1 Using websites as an information delivery tool
At a basic interactivity level, websites act like electronic brochures, providing institutional
and promotional information, and contacting and providing customers with special offers or
announcements. At an intermediary level, they also provide search engines, download of
reports, and links to other sites. Finally, the advanced level in this category uses customized
resources, subscription options, advertisements, and discussion groups.
2.4.2 Using websites to improve customer relationships
E-mails and forms provide a method of communication that enables customers to offer
suggestions and complaints. Alternatively, websites might provide advising tools that assist
customers in making decisions. The advanced level for this usage type involves gathering
information from customers to help improve the product, such as through videoconferencing.
2.4.3 Using websites as a vehicle for common communication methods
Customers can use the website to view their accounts and request products or services. At the
intermediary interactivity level, customers might access specific information about their
accounts, such as bank statements. Finally, at the advanced level, customers can use the site
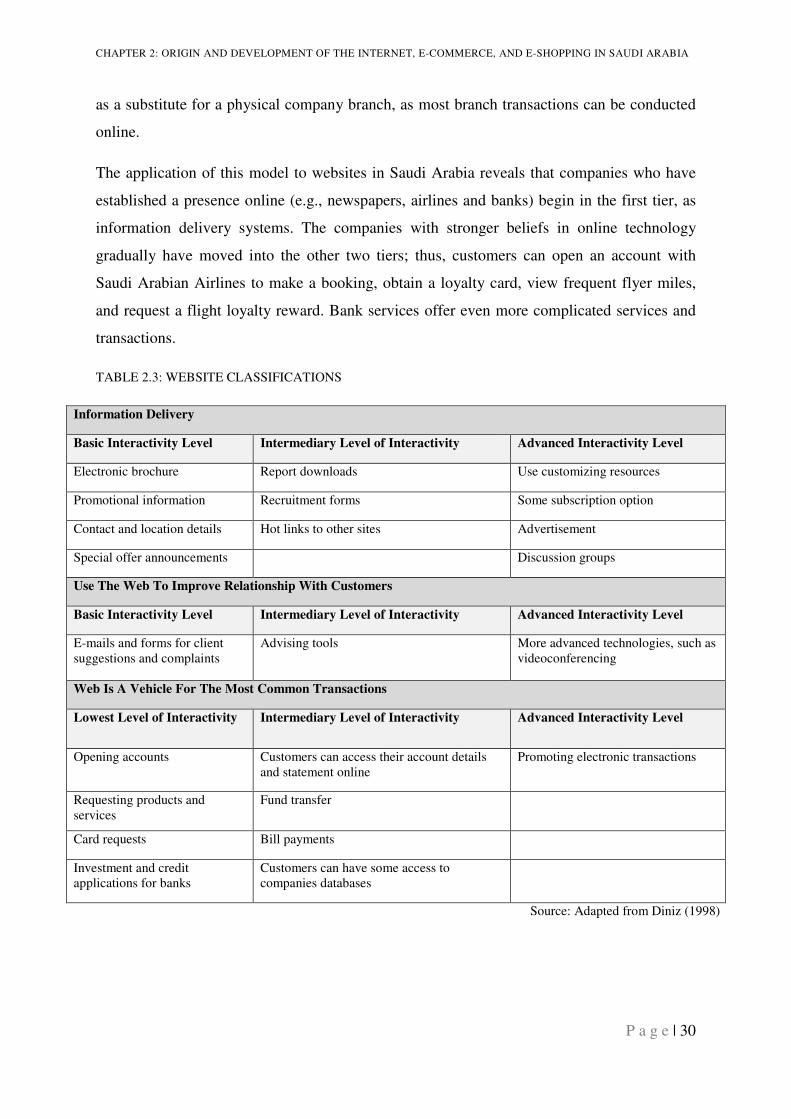
CHAPTER 2: ORIGIN AND DEVELOPMENT OF THE INTERNET, E-COMMERCE, AND E-SHOPPING IN SAUDI ARABIA
P a g e | 30
as a substitute for a physical company branch, as most branch transactions can be conducted
online.
The application of this model to websites in Saudi Arabia reveals that companies who have
established a presence online (e.g., newspapers, airlines and banks) begin in the first tier, as
information delivery systems. The companies with stronger beliefs in online technology
gradually have moved into the other two tiers; thus, customers can open an account with
Saudi Arabian Airlines to make a booking, obtain a loyalty card, view frequent flyer miles,
and request a flight loyalty reward. Bank services offer even more complicated services and
transactions.
TABLE 2.3: WEBSITE CLASSIFICATIONS
Information Delivery
Basic Interactivity Level Intermediary Level of Interactivity Advanced Interactivity Level
Electronic brochure Report downloads Use customizing resources
Promotional information Recruitment forms Some subscription option
Contact and location details Hot links to other sites Advertisement
Special offer announcements Discussion groups
Use The Web To Improve Relationship With Customers
Basic Interactivity Level Intermediary Level of Interactivity Advanced Interactivity Level
E-mails and forms for client suggestions and complaints
Advising tools More advanced technologies, such as videoconferencing
Web Is A Vehicle For The Most Common Transactions
Lowest Level of Interactivity Intermediary Level of Interactivity Advanced Interactivity Level
Opening accounts Customers can access their account details and statement online
Promoting electronic transactions
Requesting products and services
Fund transfer
Card requests Bill payments
Investment and credit applications for banks
Customers can have some access to companies databases
Source: Adapted from Diniz (1998)
CHAPTER 2: ORIGIN AND DEVELOPMENT OF THE INTERNET, E-COMMERCE, AND E-SHOPPING IN SAUDI ARABIA
P a g e | 31
2.5. ONLINE CUSTOMER RELATIONSHIP CHARACTERISTICS
2.5.1. Getting to Know the Customer
In recent years, many companies have come to recognize the need for customer relationship
to build and sustain ongoing relationships with customers that will satisfy them and make
them loyal. Online capabilities can support the company’s efforts to understand the customer
preferences and behaviours, and thereby segment customers accurately and precisely. Thus,
collecting, storing and using customer data becomes of critical significance and is considered
a core function for online businesses (Bourlakis 2009). According to theHarvard Business
School (2002), companies must encompass different angles of a customer’s buying life and
concentrate on the point at which the customer becomes exposed to the company. For
example, one customer may buy a product for personal use, whereas another could purchase
it as a gift. These two customers have different approaches to the product or service; so
different sales efforts would entice and motivate them.
To focus on and retain the most valuable customers, companies require the effective use of
technology and information resources (Galbreath and Rogers, 1999; Lee, 2006). Having
access to such technology and information can help an organization reach a position from
which to create products and services that will satisfy customers, especially if the
organization can identify segments within the customer base and understand the needs of
these specific groups according to their histories and behaviours (Directors and Corporation,
1999).
2.5.2. The Reason for Adapting and Maintaining Customer Relationships
Companies should not consider customers from the perspective of a single transaction.
Purchase volumes increase as customers sense greater satisfaction with, and are more hooked
by, the firm’s products or services (Ang and Buttle, 2002).
The primary goal of companies, hoping to take advantage of online business strategy, is to
build a long-term customer relationship that will improve the value for both parties (Krueger,
2000). Companies that adopt a customer relationship strategy may do so for various reasons,
most of which entail improving customer retention and customer satisfaction. Because of the
high costs of acquisition, increasing customer retention rates by 5% can increase company
profits by 25% to 95% (Reached and Teal, 2001). Hildebrand (1999) argues that it is 5 to 10
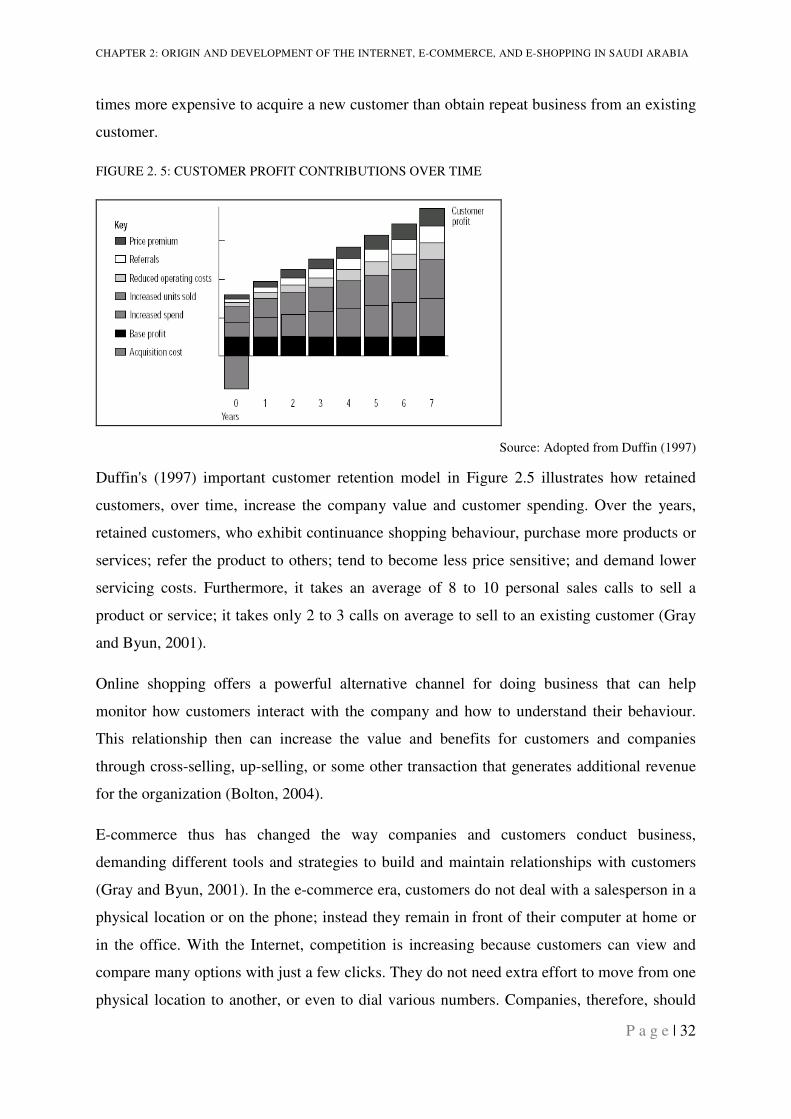
CHAPTER 2: ORIGIN AND DEVELOPMENT OF THE INTERNET, E-COMMERCE, AND E-SHOPPING IN SAUDI ARABIA
P a g e | 32
times more expensive to acquire a new customer than obtain repeat business from an existing
customer.
FIGURE 2. 5: CUSTOMER PROFIT CONTRIBUTIONS OVER TIME
Source: Adopted from Duffin (1997)
Duffin's (1997) important customer retention model in Figure 2.5 illustrates how retained
customers, over time, increase the company value and customer spending. Over the years,
retained customers, who exhibit continuance shopping behaviour, purchase more products or
services; refer the product to others; tend to become less price sensitive; and demand lower
servicing costs. Furthermore, it takes an average of 8 to 10 personal sales calls to sell a
product or service; it takes only 2 to 3 calls on average to sell to an existing customer (Gray
and Byun, 2001).
Online shopping offers a powerful alternative channel for doing business that can help
monitor how customers interact with the company and how to understand their behaviour.
This relationship then can increase the value and benefits for customers and companies
through cross-selling, up-selling, or some other transaction that generates additional revenue
for the organization (Bolton, 2004).
E-commerce thus has changed the way companies and customers conduct business,
demanding different tools and strategies to build and maintain relationships with customers
(Gray and Byun, 2001). In the e-commerce era, customers do not deal with a salesperson in a
physical location or on the phone; instead they remain in front of their computer at home or
in the office. With the Internet, competition is increasing because customers can view and
compare many options with just a few clicks. They do not need extra effort to move from one
physical location to another, or even to dial various numbers. Companies, therefore, should
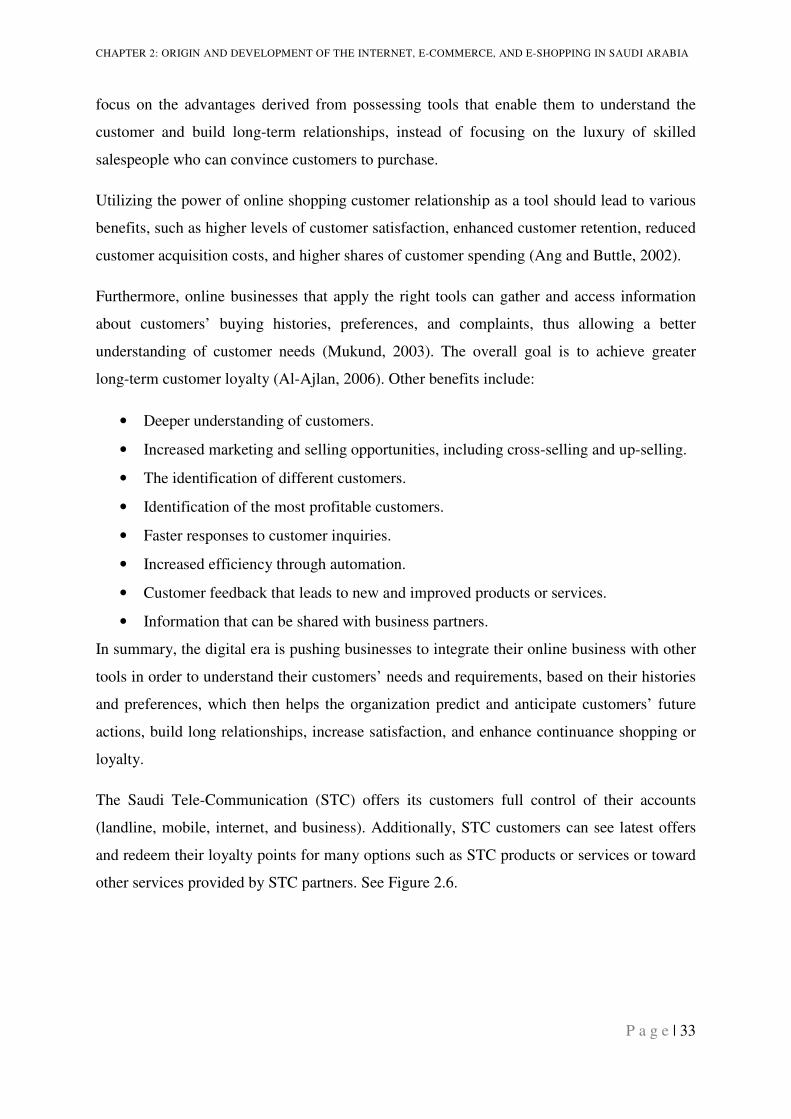
CHAPTER 2: ORIGIN AND DEVELOPMENT OF THE INTERNET, E-COMMERCE, AND E-SHOPPING IN SAUDI ARABIA
P a g e | 33
focus on the advantages derived from possessing tools that enable them to understand the
customer and build long-term relationships, instead of focusing on the luxury of skilled
salespeople who can convince customers to purchase.
Utilizing the power of online shopping customer relationship as a tool should lead to various
benefits, such as higher levels of customer satisfaction, enhanced customer retention, reduced
customer acquisition costs, and higher shares of customer spending (Ang and Buttle, 2002).
Furthermore, online businesses that apply the right tools can gather and access information
about customers’ buying histories, preferences, and complaints, thus allowing a better
understanding of customer needs (Mukund, 2003). The overall goal is to achieve greater
long-term customer loyalty (Al-Ajlan, 2006). Other benefits include:
• Deeper understanding of customers.
• Increased marketing and selling opportunities, including cross-selling and up-selling.
• The identification of different customers.
• Identification of the most profitable customers.
• Faster responses to customer inquiries.
• Increased efficiency through automation.
• Customer feedback that leads to new and improved products or services.
• Information that can be shared with business partners.
In summary, the digital era is pushing businesses to integrate their online business with other
tools in order to understand their customers’ needs and requirements, based on their histories
and preferences, which then helps the organization predict and anticipate customers’ future
actions, build long relationships, increase satisfaction, and enhance continuance shopping or
loyalty.
The Saudi Tele-Communication (STC) offers its customers full control of their accounts
(landline, mobile, internet, and business). Additionally, STC customers can see latest offers
and redeem their loyalty points for many options such as STC products or services or toward
other services provided by STC partners. See Figure 2.6.
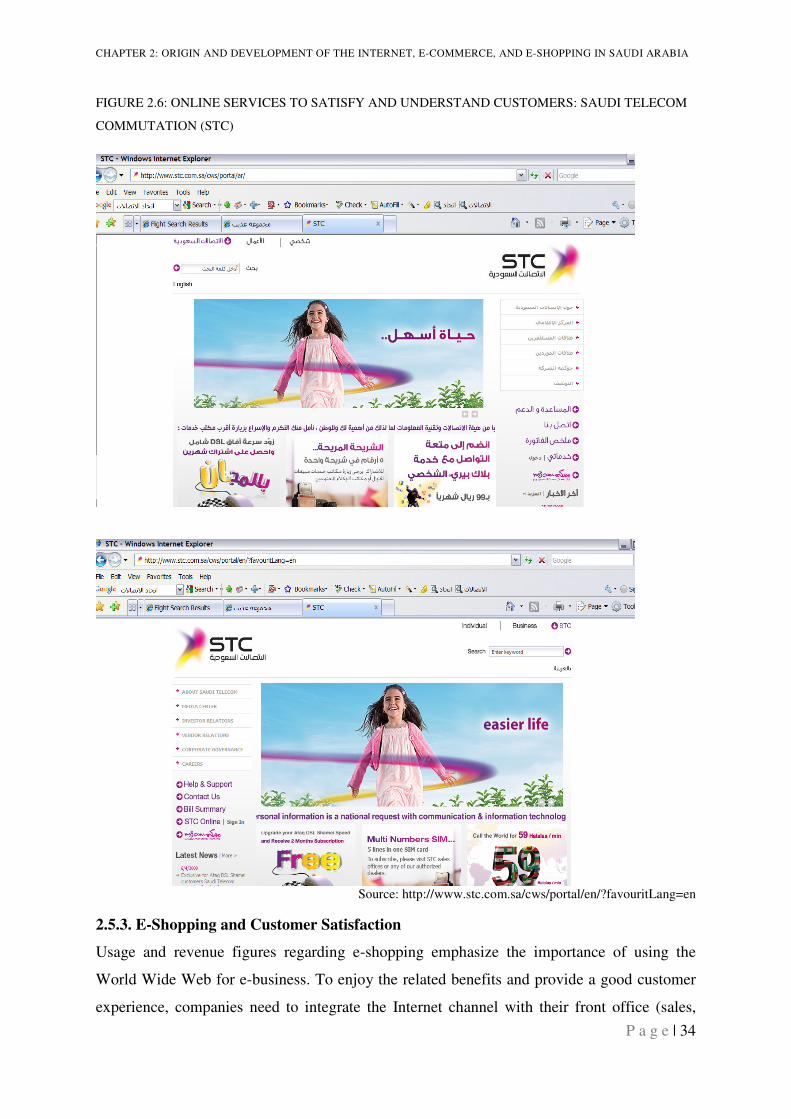
CHAPTER 2: ORIGIN AND DEVELOPMENT OF THE INTERNET, E-COMMERCE, AND E-SHOPPING IN SAUDI ARABIA
P a g e | 34
FIGURE 2.6: ONLINE SERVICES TO SATISFY AND UNDERSTAND CUSTOMERS: SAUDI TELECOM
COMMUTATION (STC)
Source: http://www.stc.com.sa/cws/portal/en/?favouritLang=en
2.5.3. E-Shopping and Customer Satisfaction
Usage and revenue figures regarding e-shopping emphasize the importance of using the
World Wide Web for e-business. To enjoy the related benefits and provide a good customer
experience, companies need to integrate the Internet channel with their front office (sales,
CHAPTER 2: ORIGIN AND DEVELOPMENT OF THE INTERNET, E-COMMERCE, AND E-SHOPPING IN SAUDI ARABIA
P a g e | 35
marketing, and service) efforts. Therefore, e-shopping management tools should consistently
help organizations keep closer contact with their customers (Gurau, 2003) as part of a
comprehensive customer relationship strategy. According to Sterne (1996), Internet-based
business consists of three general areas: pre-sales information, e-commerce services, and
post-sales support. These three areas play important roles in building trust, depending on
whether customers perceive the site as easy and useful, and confirming their expectations, all
of which will lead to customer satisfaction.
An unpublished study by the Centre for Customer Driven Quality also highlights that
managing customer relationships online offers significant potential savings. The main goal
for companies, when using the Internet to launch their services is to cut marketing costs and
reduce the price of their services and products. For example, for one particular retailer the
estimated cost of an in-store customer contact was $10, a phone contact was $5, and the cost
of a web contact was just $0.01 (Feinberg, et al., 2002) . In the airline industry, the savings
appear similar as, according to the International Air Transport Association (IATA), airlines
issue 300 million paper tickets per year that each cost $10 (Arab News Newspaper, 2007). An
e-ticket instead costs the company $1 - a massive savings of $9 per e-ticket transaction (Arab
News Newspaper, 2007).
FIGURE 2.7: SAUDI AIRLINES WEBSITE IN FEBRUARY 2007
Source: www.saudiairlines.com
CHAPTER 2: ORIGIN AND DEVELOPMENT OF THE INTERNET, E-COMMERCE, AND E-SHOPPING IN SAUDI ARABIA
P a g e | 36
In the past few years, the economic recession has caused many people to modify their
spending habits. Many traditional retail stores have seen a marked decline in sales. Massive
layoffs and home foreclosures have also affected the retail sales industry. The low operation
cost of online shopping compared to store shopping appears to make online shopping the
thriving for retailer during these tough economic recessions (Penn, Schoen and Berland
Associates, Inc., 2009).
Many traditional stores face problems with the decline in total sales due to the affect of the
economic downturn forcing consumers to modify their spending habits. A recent study
carried out by Penn, Schoen and Berland Associates, Inc. (2009), a marketing network,
proved that online consumers have become concerned about their purchasing decisions and
spend more time browsing the Internet, looking for the best deals before they decide to
purchase. Best prices, discounts and coupons, free shipping, and other special promotions
influence their decision. This group of consumers is marked as ‘recession shoppers’. Results
from the study also reported that 68% of recession shoppers purchased items they would not
have otherwise chosen because of discount offers, whereas 64% of recession shoppers said
they purchased items from a specific retailer they would not have otherwise used because of
coupons or discounts.
The Internet is providing shoppers with the tools to compare similar products in order to find
the best price. Also, shoppers do not have the fuel expenses associated with travelling to and
from traditional retail stores. The results of the study indicate that today's consumer is
becoming less of an impulse buyer and more of a careful shopper.
The expanding reach of the Internet not only enables companies to cross borders and reach
international customers easily, but also to give more and more consumers web access. The
number of Internet users worldwide will just continue to increase, especially among those
who have experimented with web access but not purchased online. The growth and
importance of online shopping and the management of the needs of current online shoppers
seem virtually guaranteed (Reda, 2000). Therefore, most companies should rely on managing
the e-business customer relationship to lower their costs and serve their customers more
effectively and efficiently, just as Saudi Airlines has moved to offer more online booking and
e-ticketing services. See Figure 2.7.
CHAPTER 2: ORIGIN AND DEVELOPMENT OF THE INTERNET, E-COMMERCE, AND E-SHOPPING IN SAUDI ARABIA
P a g e | 37
2.5.4. E-Businesses and Customer Segmentation
In the era of one-to-one marketing, many companies neglect market segmentation. However,
the power of e-business and customer relationship begins with segmentation, and ends with
the individual customer (Crosby, 2002). As Bull (2003) points out, targeting profitable
customers reflects a key characteristics of effective long relationship.
Internet shopping can open the door for companies to develop and manage electronic
customer relationship as a strategy that identifies, attracts, and retains profitable customers,
tying them to the company’s products or services through professional relationship
marketing, which encourages profitable growth (Kracklauer, Passenheim, and Seifert, 2001).
The core of any customer relationship strategy is customer segmentation; some of the world’s
pickiest companies actually enjoy the successful customer relationship that enable them to
pursue selective relationships with only the most profitable customers (Gillies and Rigby,
2002; Newell, 2000).
2.5.5. E-Shopping and Relationship Marketing
Some firms attempt to monitor customers’ online purchasing behaviours and habits, but
customers demand valuable returns in exchange for providing such personal information. In
this context, the meaning of relationship marketing may not be completely clear. For
example, Grönroos (1997) defines relationship marketing: “to establish, maintain and
enhance relationships with customers and other partners, at a profit, so that the objectives of
the parties involved are met. This is done by a mutual exchange and fulfilment of promises”.
Curry and Curry (2000) reinforce the idea of the customer as king, because all of an
organization’s revenues, profits, market share, and salaries come from one source: the
customer. Therefore, the core of relationship marketing must be to put the customer at the
heart of the organization.
The proliferation of B2C e-shopping activities challenges the role and influence of various
factors on e-shopping continuance behaviours. This thesis distinguishes between continuance
and acceptance; the former is more important as acquiring new customers may cost as much
as five times more than retaining existing ones due to the expenses related to searching for
new customers, setting up new accounts, and familiarizing new customers with the firm’s
services (Crego and Schiffrin, 1995; Petrissans, 1999; Bhattacherjee, 2001a).
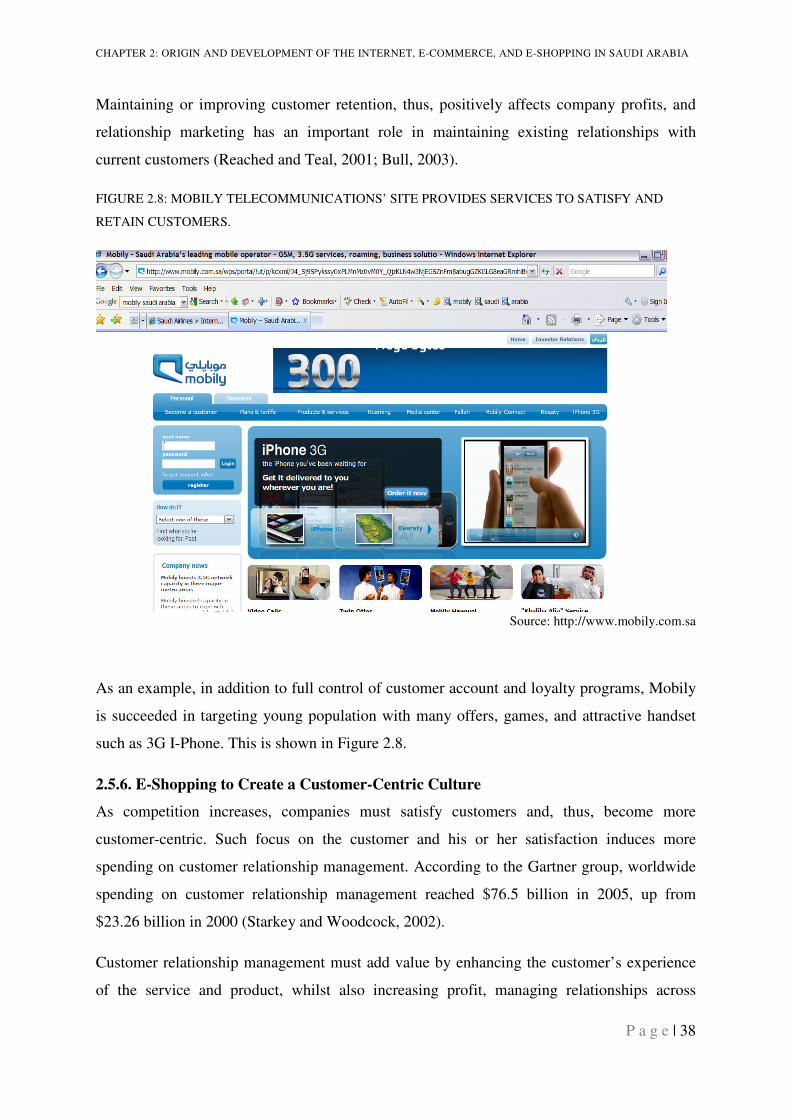
CHAPTER 2: ORIGIN AND DEVELOPMENT OF THE INTERNET, E-COMMERCE, AND E-SHOPPING IN SAUDI ARABIA
P a g e | 38
Maintaining or improving customer retention, thus, positively affects company profits, and
relationship marketing has an important role in maintaining existing relationships with
current customers (Reached and Teal, 2001; Bull, 2003).
FIGURE 2.8: MOBILY TELECOMMUNICATIONS’ SITE PROVIDES SERVICES TO SATISFY AND
RETAIN CUSTOMERS.
Source: http://www.mobily.com.sa
As an example, in addition to full control of customer account and loyalty programs, Mobily
is succeeded in targeting young population with many offers, games, and attractive handset
such as 3G I-Phone. This is shown in Figure 2.8.
2.5.6. E-Shopping to Create a Customer-Centric Culture
As competition increases, companies must satisfy customers and, thus, become more
customer-centric. Such focus on the customer and his or her satisfaction induces more
spending on customer relationship management. According to the Gartner group, worldwide
spending on customer relationship management reached $76.5 billion in 2005, up from
$23.26 billion in 2000 (Starkey and Woodcock, 2002).
Customer relationship management must add value by enhancing the customer’s experience
of the service and product, whilst also increasing profit, managing relationships across
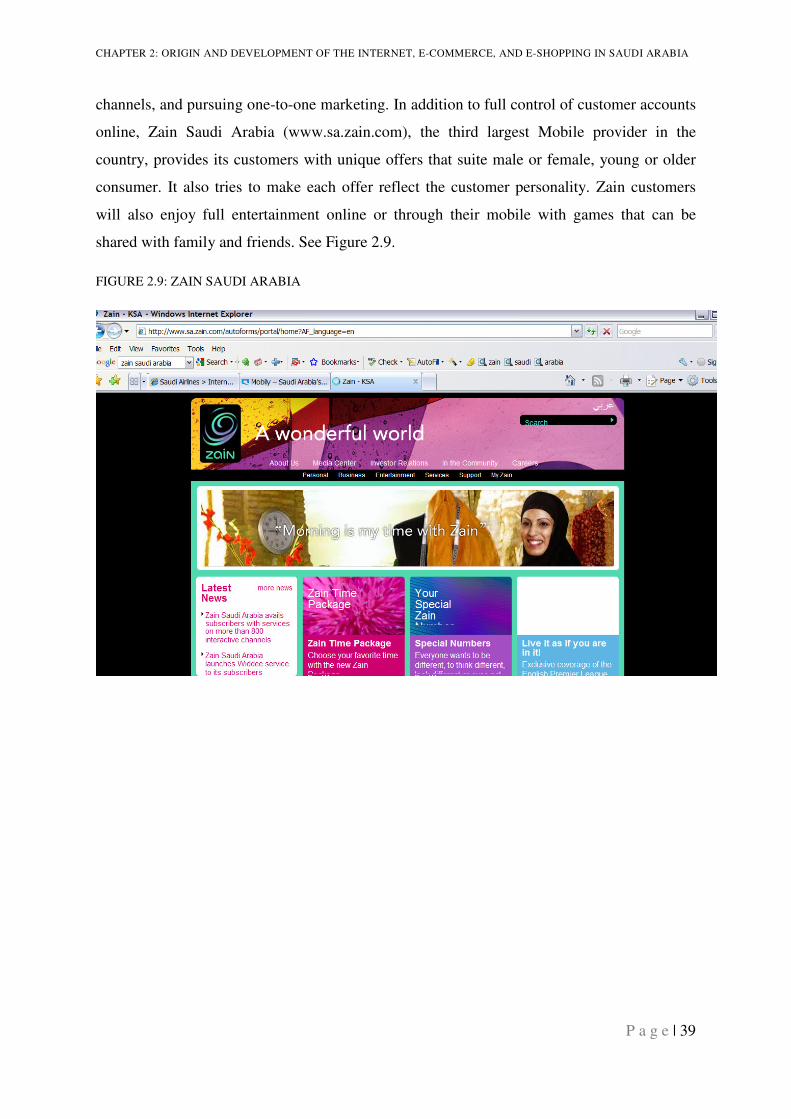
CHAPTER 2: ORIGIN AND DEVELOPMENT OF THE INTERNET, E-COMMERCE, AND E-SHOPPING IN SAUDI ARABIA
P a g e | 39
channels, and pursuing one-to-one marketing. In addition to full control of customer accounts
online, Zain Saudi Arabia (www.sa.zain.com), the third largest Mobile provider in the
country, provides its customers with unique offers that suite male or female, young or older
consumer. It also tries to make each offer reflect the customer personality. Zain customers
will also enjoy full entertainment online or through their mobile with games that can be
shared with family and friends. See Figure 2.9.
FIGURE 2.9: ZAIN SAUDI ARABIA
CHAPTER 2: ORIGIN AND DEVELOPMENT OF THE INTERNET, E-COMMERCE, AND E-SHOPPING IN SAUDI ARABIA
P a g e | 40
Source: www.sa.zain.com
To conclude, e-retailers in Saudi Arabia need to be creative and innovative with new
technologies in order to gain competitive advantages to attract and retain online consumers.
Collecting, storing and using customers’ data as well as tracking their shopping habits can
help e-retailers to increase the continuity of online shopping and capitalize on repeat
purchasing situations. The new sophisticated technologies that are used by e-retailers will
help further on the cross-selling and up-selling opportunities offered by the online shopping
medium. A number of techniques can be used that vary in their effectiveness depending on
situation and purpose in mind. For example, Amazon, by looking at their customers’ group
profiles, offer its customer with the most famous cross-selling and up-selling techniques
‘users who bought this item were interested in this item as well’ (Van Amstel et al., 2000).
Table 2.4 illustrates an idea of possible targeted promotion techniques that would increase the
continuity of online shopping and increase customer satisfaction.
TABLE 2.4: TARGETED PROMOTION TECHNIQUES FOR INTERNET RETAILERS
Targeted Promotion Techniques Example
Rules-Based Matching Club members, frequent visitors, etc. (e.g. Tesco.com)
Matching Agents Established profile can be matched with other profiles displaying similar purchasing behaviour (e.g. Amazon)
Collaborative Filtering Feedback on products and services defines groups of individuals with similar interests (e.g. Amazon)
Community Ratings Others help define good from bad (e.g. Like those used on E-bay)

CHAPTER 2: ORIGIN AND DEVELOPMENT OF THE INTERNET, E-COMMERCE, AND E-SHOPPING IN SAUDI ARABIA
P a g e | 41
Feedback and Learning Fields of interest
Attribute Searches e.g. All books with reduced prices
Full-Text Search Keywords provided by the user
Source: Adapted from Van Amstel et al (2000)
2.6. SUMMARY
Saudi Arabia is a fascinating country that is often misunderstood and frequently
misrepresented. This chapter covered prior research investigating the development of e-
commerce in the Saudi Arabian market. It focused on the changes that took place since 1991.
It also focused on the introduction of the Internet to the local citizens and the growth of
Internet usage, and the impact of this to e-commerce. Today, e-commerce in Saudi Arabia
covers broad areas of activities, which include marketing and advertising; the conclusion of
electronic contracts and transactions; giving sales and purchase orders; following up e-
contracting processes; the implementation of transactions and prompt delivery of goods and
services across networks, as well as the settlement of payments, and the prompt payment of
financial commitments (The Communications and Information Technology Commission,
2009).
The chapter then highlighted the steps taken by the Saudi Government towards improving the
Saudi Arabian IT infrastructure, including e-commerce, internet usages, and removal of any
obstacles which may be faced by private investors. The Saudi government has approved a
huge budget of $2.7 billion since 2007 to complete all e-transaction projects by 2010, and
thus exhibit its full commitment to e-commerce (Okaz Newspaper, 2007). The reasons for
this boom are a rise in the number of Internet users and the widespread use of credit cards on
a large scale, along with the high number of companies using electronic payment.
The proliferation of B2C e-shopping activities challenges the role and influence of various
factors on e-shopping continuance behaviours. This thesis distinguishes between continuance
and acceptance; the former is more important as acquiring new customers may cost as much
as five times more than retaining existing ones due to the expenses incurred in searching for
new customers, setting up new accounts, and familiarizing new customers with the firm’s
services (Crego and Schiffrin, 1995; Petrissans, 1999; Bhattacherjee, 2001a). The main goal
for companies, when using the Internet to launch their services is to cut marketing costs and
reduce the price of their services and products. For example, for one particular retailer the
CHAPTER 2: ORIGIN AND DEVELOPMENT OF THE INTERNET, E-COMMERCE, AND E-SHOPPING IN SAUDI ARABIA
P a g e | 42
estimated cost of an in-store customer contact was $10, a phone contact was $5, and the cost
of a web contact was just $0.01 (Feinberg, et al., 2002).
In summary, the field of online shopping is broad, fragmented and relatively new. This
chapter has investigated topical issues related to online shopping, such as knowing and
maintaining customers. The next chapter will provide a more in depth review of related
theories in the context of online shopping, and the factors that affect continuance intention.
CHAPTER 3: EVALUATION OF LITERATURE REVIEW
P a g e | 43
CHAPTER 3: LITERATURE REVIEW
3.1 INTRODUCTION
This chapter reviews relevant literature on the subject of established theories in the area of
online consumer behaviour. By identifying and evaluating these theories, the researcher is
able to make an informed judgement as to which is most suitable for this study.
Consequently, the aim is to provide a conceptual and theoretical framework that will inform
the subsequent analysis of the empirical data.
Research on consumer behaviour basically depends upon a number of theories that predict
and explain human behaviour in several domains. A body of theories recognized in social
science - Information System, and Management Information System (MIS) studies - provides
researchers with the tools to increase the insight into how consumers react with computing
technologies, and at the same time to generate the relationship between the human being and
the technology. According to Krauter and Kalucsha (2003), the majority of recognized
models in consumer behaviour studies come from three principle theories: the Theory of
Reasoned Action (TRA) (Fishbein and Ajzen, 1975); the Technology Acceptance Model
(TAM) (Davis, 1989); and the Expectation Confirmation Theory (ECT) proposed by Oliver,
(1980) and Bhattacherjee (2001).
Based on the authors’ knowledge, no previous research has been done on Internet Shopping
in Saudi Arabia, or Continuance Intention for Online Shopping in Saudi Arabia, or measuring
demographical differences in online shopping behaviour in Saudi Arabia.
The objective of this research is to provide a validated conceptual model that integrates the
different factors and clarifies the theoretical problems of continuance intention.
3.2. E-COMMERCE DEVELOPMENT FOR B2C
The rapid development of technology and e-marketing has been an indication of the growing
importance of e-commerce, which offers many opportunities for business and consequently
influences the development of future economy and international competitiveness of many
countries. Forecasts in the past have predicted that the value of goods and services purchased
online would increase rapidly. In the last ten years, a significant development and rapid
changes have been seen in B2C e-commerce. For this reason, there are opportunities for
CHAPTER 3: EVALUATION OF LITERATURE REVIEW
P a g e | 44
marketers, retailers and researchers to better understand how and why people participate and
continue to participate in e-commerce. Online shopping is a growing phenomenon all over
the world, and Saudi Arabia is no exception since online shopping is a very easy and
convenient way to interact and buy.
Until now there has been no single widely acceptable definition for e-commerce. Coppel
defined e-commerce as doing business over the Internet by selling goods and services that
might be delivered in the traditional way and products that can be digitized and delivered
online (Coppel, 2000). E-commerce or online business can be within businesses or between
businesses and consumers. In recent years, the Internet has encompassed a wider range of
potential commercial activities and information exchange, which includes transaction and
exchange of information between government agencies, governments and businesses,
businesses and consumers, and among consumers such as auctions. This research will focus
mainly on business to consumer (B2C) interaction, where most of the progress and
development in this area take place.
E-Commerce includes different forms of activities that cover important fields, such as
marketing, electronic negotiations, services and contracting taking place over the Internet and
through others channels (Coppel, 2000). In this environment, Chen (2009) indicated that the
quick development of B2C e-commerce in its early stage stimulated researchers and scholars
to investigate consumer behaviour in cyberspace. Alongside the development of e-retailing,
researchers continue to explain online shopping behaviour from different perspectives
(Shergill and Chen, 2005). Many previous studies have put forward assumptions depending
on conventional models when examining consumer behaviour in different contexts (Butler
and Peppard, 1998). However, different researchers propose that online shopping behaviour
may be basically different from physical shopping behaviour (Alba et al., 1997). There are
obvious differences between traditional shopping and shopping through the Internet; the most
important being that shopping through an online retailer provides availability and
transparency of information (Chen, 2009). Consequently, there are conflicting opinions in
this area among authorities on the subject.
Most studies in e-commerce have focused on two assumptions when visiting a website. The
first assumption is that customers usually spend at least a few minutes finding out if the
website has desirable attributes (Li and Zhang, 2005), such as ease of use, usefulness,
enjoyable, loyalty and incentives, regardless of whether they like the website or not. The
CHAPTER 3: EVALUATION OF LITERATURE REVIEW
P a g e | 45
other assumption is that good website traits usually obtain affirmative cognitive evaluations
and shopping experience (Li and Zhang, 2005). As described by Cambell and Pisterman,
people mainly try to base their website judgment on their first impression, based on the
stimuli that they get. Thus, if further information is required, customers are likely to be biased
in their search in favour of seeking confirmatory evidence, while avoiding contradictory
evidence (Campbell and Pisterman, 1996; Lindgaard, et al, 2006). Customers might display
avoidance behaviour even if the website has excellent products at reasonable prices if the
appropriate website message is not conveyed in the first place. The main interface with e-
commerce is the Information Technology (IT); the website, which is how customers and e-
retailers conduct business. This has been reflected in the empirical research into the
nomological network leading to consumer behaviours, such as making a purchase, which lead
to the two related antecedents: the technological attributes of the website, and consumer trust
in the e-business (Gefen et al., 2003). Because of the absence of proven guarantees that the e-
retailer will not engage in harmful opportunistic behaviours, trust is also a critical aspect of e-
commerce (Gefen, 2000; Kollock, 1999; Reichheld and Schefter, 2000). Other important
behaviours include unfair pricing, conveying inaccurate information, violations of privacy,
unauthorized use of credit card information, and unauthorized tracking transactions (Gefen et
al., 2003). Brashear et al. (2009) comment that ‘as e-commerce has grown, so have concerns
of online consumer privacy, the protection of consumer information and the intrusive nature
of online communications’, and these are considered later in section 3.5.
3.3. ONLINE SHOPPING AND PURCHASING
The definition of a consumer, according to Rostow (1963 cited in Diaz de Rada, 1998) is one
who has access to the consumption of goods and services throughout the society. If the needs
are socially created, and in line with these needs products are immediately produced to satisfy
those needs, the freedom of the consumer is reduced to a choice between the existing
products available. The idea of self-controlled consumers has disappeared (Castillo, 1991
cited in de Rada 1998) and nowadays the consumer, who is influenced by publicity, fashion-
trend, and the media, is accepted. Hirschman and Holbrook (1982) describe consumers as
either “problem solvers” or consumers seeking “fun, fantasy, arousal, sensory stimulation,
and enjoyment”.
The self-reliant consumer has gone and in his place there is a normalized and hetero-reliant
individual whose greatest wish is to be accepted and received by others without standing out
CHAPTER 3: EVALUATION OF LITERATURE REVIEW
P a g e | 46
too much, i.e. ‘that consumer eager to be lead by others without creating a scandal by his
behaviour’ (Riesman, 1950, cited in Diaz de Rada, 1998).
All these elements imply a rite in the in the act of shopping. Shields (1992, cited in Diaz de
Rada, 1998) feels that this shopping behaviour, which combines shopping and recreation,
generates a revaluation of the concept of oneself and of the personal relations within the
group and at the same time modifies the use and the distribution of the urban social spaces in
the long term. Thus, from the perspective of Hetherington (1992; cited in de Rada 1998, p.
328), as the comment appears in de Rada, the consumerism process should be considered as
“something more” than a simple shopping activity given that on some occasions it acquires a
basic role in social behaviour.
For over a decade, IT acceptance and usage have received much consideration from different
researchers and practitioners (Venkatesh, 2000). Using the Internet for shopping and
purchasing products is considered to be innovative, yet this phenomenon is not fully
understood. Like most phenomena in the formative stage, there is a perceived requirement to
understand what drives and encourage consumers to shop online. Several studies in this field
have focused on identifying the information-oriented shopping behaviour of online
consumers in the e-commerce environment (Chen, 2009).
Several reasons contribute to the increasing growth of online shopping; for instance,
development of more advanced technology has facilitated smoother surfing on the Internet.
This facility allows consumers to browse the Internet looking for services and products
without leaving their homes. They can further access the Internet, not only from their PC but
also from the web TV and mobile phones, maximising the advantage of improved navigation
software and search engines. Furthermore, the significance changes in lifestyles offer
opportunities for people to shop online at their convenience.
The development of online shopping makes many retailers consider adopting or launching
their products or services over the Internet. These considerations are due to a number of
different factors that include the need to increase competitiveness, and to improve service for
their current and potential customers. Today, the market around the world is dynamic due to
increasing competitive power, often coming from multinational corporations. Similarly,
organisations are able to take advantage of significant improvement in logistics and
information availability, which help create opportunities from global sourcing. Furthermore,
increasing information availability gives the perception that the commercial world is
CHAPTER 3: EVALUATION OF LITERATURE REVIEW
P a g e | 47
becoming smaller and more accessible. The investment in IT plays an important role in
productivity if the technology has been accepted and then used (Venkatesh, 1999).
Online shopping is one of the fastest growing trends all over the world, and it is considered as
one of the most successful applications of e-commerce. The Internet has changed the way
consumers buy products and services, and has rapidly evolved as a global phenomenon. At
the same time, when organisations use the Internet for launching their services the main goal
is to cut marketing costs and reduce the prices of their services and products. In addition,
organisations use the Internet as a channel to sell their products, to communicate and
distribute information, to get feedback about what they sell, and to measure customer
satisfaction. In order to offer better services, organisations should enhance their products and
services, which is possible only after identifying customers’ requirements. This is achieved
by investigating existing and potential consumers, and determining what they expect in terms
of service quality. In e-commerce, the concept of existing customers is defined as those
people dealing with Internet channels for the purpose of purchasing products; whereas
potential customers are those people who browse the Internet to search for information
regarding products and services they intend to purchase. Customers, therefore, use the
Internet to browse, searching for their needs and desires, and to compare prices of brands and
reliability, as well as valuing customer service facilities that they may receive after
purchasing.
Brashear et al. (2009) studied Internet shopping in six countries (the United States, England,
New Zealand, China, Brazil and Bulgaria) in order to compare the Internet shopper’s profile.
Their research findings show that online shoppers around the world share similar beliefs and
have favourable attitudes towards direct marketing and advertising.
Khalifa and Limayem (2003) present theoretical explanations of the intention and behaviour
of online shopping and proposed different factors (e.g. perceived consequences, attitude, and
social influences). For example, their results indicate that the intention of the Internet shopper
is significantly affected by the perceived consequences of online shopping (e.g. cheaper
prices, convenience, saving time, improved customer service, ability to do comparative
shopping, risks of security breach, and privacy violation).
However, consumers’ attitudes to e-purchasing are not necessarily universal. Whitcomb
(1998, cited in Atchariyachanvanich, 2001) comments in his study of business ethical values
in China that the Chinese are more motivated by profit than consumers in the US. Thus, there
CHAPTER 3: EVALUATION OF LITERATURE REVIEW
P a g e | 48
may be a greater perceived incentive for Chinese consumers. Similarly, Synodinos (2001,
cited in Atchariyachanvanich, 2001) notes that the consumption behaviour of consumers in
Japan is notably different from that of other societies. Such studies of differences between the
e-purchasing behaviour of consumers in different world market segments provide valuable
insight for e-retailers to help them retain customers.
An important strength of e-retailers is that they are able to convey detailed information to
customers. However, there is an associated risk that customers will face an information
overload, which will lead to the perception of less, rather than more, quality within the
subjective state leading to purchasing intentions (Chen, Shang, and Kao, 2009). The results of
their research suggest that there are significant differences between the perceptions of
experienced consumers and inexperienced consumers when faced with abundant information
when purchasing online. Therefore, e-retailers need to consider the volume of information
provided and determine how appropriate it is for facilitating the pleasure emotion for
different categories of e-purchasers.
Lu and Su (2009) remark that the growth in the use of mobile phones by consumers has had a
marked effect on their e-purchasing behaviour, resulting in several managerial implications.
Customers’ intentions are influenced by three infrastructural elements of perception: Internet
accessibility (ease of usage), purpose-oriented functionality (usefulness), and procedure-
oriented functionality (enjoyment).
3.4. ONLINE PURCHASING INTENTION
An increasing number and diversity of organisations are exploiting and generating many new
business opportunities through the Internet. At the same time, extensive research has been
published on business to consumer (B2C) electronic e-commerce about the Internet and
virtual shopping. Researchers continue to explain e-commerce behaviour from different
perspectives. The recent literature on consumer online purchasing decisions is primarily
concerned with investigations of the factors influencing customers engaging in internet
shopping.
Numerous studies have distinguished the factors that may affect traditional consumer
behaviour and therefore affect purchasing decisions in the context of internet shopping; for
instance, the effect of sales promotions (Degeratu, Rangaswamy, and Wu, 2000), the role of
brand names and the relationship between involvement and atmosphere and shoppers'
CHAPTER 3: EVALUATION OF LITERATURE REVIEW
P a g e | 49
affective and cognitive reactions (Eroglu, Machleit, and Davis, 2001), and the presence of
shopping plans before shopping (Dahlén and Lange, 2002). Some findings are specific to the
Internet environment. For example, Internet shopping intentions are affected by web search
behaviour and web-shopping adoption decisions. Furthermore, decisions are also indirectly
affected by web shopping attitude and past/post web shopping experiences (So, Wong, and
Sculli, 2005).
Website layout design and information content are important in order to stimulate initial
consumer interest to further explore a site (Menon and Kahn, 2002), and the role of brand
names, sensory search attributes and price influence their intention to purchase (Degeratu et
al., 2000). Matching channel characteristics and retail information displays for consumer
shopping orientation are also important factors (Mathwick, Malhotra, and Rigdon, 2002).
Perceived usefulness and ease of use (O'Cass and Fenech, 2003), previous adoption,
perceived risk, Internet use and perceived financial benefits (Eastin, 2002) may also affect
web-shopping adoption. Finally, the position trust plays and the influence and force of
security and privacy issues on web purchase intentions and decisions are crucial (Salisbury et
al., 2000; Liao and Cheung, 2001). The Internet has empowered consumers who now access
virtually unlimited selections of products, brands and sellers, and at the same time they can
swap between brands, trying different types of products at just a click. However, the truth is
that the consumer has infinite choices with limited time (Bhattacherjee 2001b; Crego and
Schiffrin, 1995; Cheung, Christy, and lee, 2005).
Many studies have concentrated on identifying the characteristics of the online shopper and
the differences between Internet buyers and non-buyers. For example, Jarvenpaa, et al.
(2000) argue that the consumer can recognize the differences in the size and reputation of
Internet stores, which correspondingly influence their evaluation of the level of stores’
trustworthiness and related perception of risk. They hypothesize that the perceived reputation
and perceived effect of trust on the consumer will produce a positive attitude to their
purchasing intention.
Internet usage and e-commerce applications are expected to continue increasing across the
world. Certainly, in each part of the world there are differences in cultures, social customs,
and infrastructures, and these differences lead to significant variations in the profiles of
shoppers and non-shoppers. Also, it is important to understand the similarities and differences
between consumers in all regions of the world. Chen and Chang (2003) proposed a
descriptive model of the online shopping process with some empirical research that showed
CHAPTER 3: EVALUATION OF LITERATURE REVIEW
P a g e | 50
that the online shopping experience is influenced by different factors relating to interactivity,
transactions and fulfilment. These factors are considered to be good indictors of overall
satisfaction with online shopping.
In the last decade, much research has been conducted on the user evaluation of e-retailers’
websites, and how this evaluation could impact customers’ attitudes, shopping intentions,
behaviour, and satisfaction (Li and Zhang, 2005). Constructs, such as perceived usefulness
(PU), perceived ease of use (PEOU), trust, perceived security, perceived convenience, and
perceived firmness have received a tremendous amount of attention from many researchers,
such as Bhattacherjee (2001), Chen, et al. (2002), Liang and Lai (2002), and Liao and
Cheung (2002). For example, in the B2C e-commerce context, Gefen and Straub (2000)
investigated how the PU and PEOU constructs influence e-shopping websites. They found
that PU and PEOU affect the customer intention of product information inquiry. Additionally,
PU influences the intention of purchase, and PEOU has significant impact on PU. Later,
Gefen et al (2003) integrated trust into the Technology Acceptance Model (TAM), finding
positive impacts on customers’ intention to use e-shopping by PU, PEOU, and trust.
Nowadays, technologies are advancing rapidly, leading to the maturity of e-commerce in
terms of satisfactory web design, functionality, and usability. In such case, e-shopping
retailers are striving to stand out by achieving favourable customer experience and effects
(Tractinsky 2004). In the same context, Kim, Ferrin, and Rao, (2003) determine that customer
satisfaction has a positive impact on the way that customers perceive the e-commerce
interface. Huang (2003) expresses the importance of emotion towards the e-shopping
environment and its relation to the intention to explore or shop online.
The adoption process of e-shopping has been extensively studied by the attitudinal theoretical
models, including TRA and TAM, through investigating the antecedent factors of adoption,
such as intention, ease of use, usefulness, attitude, subjective norm, and perceived behaviour
control (Bobbitt and Dabholkar, 2001; Chau, Au, and Tam, 2000; Goldsmith and Bridges,
2000; Koufaris, Kambil, and Labarbera, 2001; Vellido, Lisboa, and Meehan, 2000; Raijas
and Tuunainen, 2001; Limayem et al., 2000). Appendix A provides a summary of the most
common theories in online shopping.
Most of the international studies have taken into consideration the importance of the
differences in culture and demographics (Hofstede, 1984). Many researchers have
investigated the demographic factors like age, gender, income, and education as determinants
CHAPTER 3: EVALUATION OF LITERATURE REVIEW
P a g e | 51
of e-shopping adoption behaviour (Bellman, Lohse, and Johnson, 1999; Bhatnagar, Misra,
and Rao, 2000; Li, Kuo, and Russell, 1999; Phau and Poon, 2000; Ramaswami, Strader, and
Brett, 2000). Such factors play an important role and are considered as leading indicators of
who prefers to shop online (Lohse, et al., 2000). In political and economical situations, they
determine how the technology can be accepted, developed, and spread in the country, and this
is very important for the success of e-commerce (Ein-Dor, Segev, and Orgad, 1992; Haley,
2002; Png, Tan and Wee, 2001).
Previous research finds that gender differences are instrumental in the decision making
process for the use of new technology, and in determining the technology acceptance decision
for different individuals (Van Slyke et al., 2002; Venkatesh, Morris and Ackerman, 2000).
Venkatesh et al. (2000) reported that women tend to accept information technology based on
the opinion of others. This is often the result of more familiar ease of use. Conversely, men
are more influenced by the evaluation of the usefulness of the technology. However, women
are the main buying power for families and the traditional households’ shoppers in most
cultures. With the great increase of the amount of e-commerce exposure, and with women
having the potential to be decision makers with regards to shopping in many of the
households in different cultures, women would be more likely to find greater satisfaction in
online shopping (Alreck and Settle, 2001).
In their paper on cultural influences, Stafford, Turan, and Raisinghani, (2004) draw important
links between the works of Hofstede (1984) and Venkatesh (2000) with regard to the
understanding of key demographic variables in gender and the use of technology. Bush et al.
(2005) refer to the power of social influence, particularly within young female age groups
and the significance of role models in consumer behaviour within the sports market, both of
which are relevant to Saudi Arabian context.
Hofstede, however, found that most of the Arab countries, including Saudi Arabia, are
perceived as masculine societies. He found that in masculine societies, men tend to be early
adopters of Internet technology and, therefore, men are more active online shoppers. His
findings imply that masculine dominated cultures are likely to have more online shopping
activities. Nevertheless, most of the literature on consumer behaviour and Internet use
(Alreck and Settle, 2002; Otnes and McGrath, 2001; Van Slyke et al., 2002) tempers such
gender anticipation for online activity based on Hofsted’s (1984) masculinity findings. This
finds that busy women who conduct online shopping are in more need of the conveniences of
online shopping especially, where shopping has been (and continues to be) more positively
CHAPTER 3: EVALUATION OF LITERATURE REVIEW
P a g e | 52
linked with females in most modern households (Stafford, Turan, and Raisinghani, 2004).
Stafford et al. (2004), found no differences between men and women in relation to online
shopping connection.
Other researchers have argued that the types of products and services, as well as prices, are
important factors when examining the intention of Internet consumer behaviour (Bobbitt and
Dabholkar, 2001; Sohn, 1999; Degeratu et al., 2000; Liang and Lai 2002). For example,
many researches support this argument with products that do not need physical examination
before purchase and are not expensive so that they are easier to sell online, such as books and
CDs (Sohn, 1999). Service quality and brand reputation have important effects on intentions
of e-shoppers (Jarvenpaa et al., 2000; Ruyter, Wetzels, and Kleijnen, 2001; Song and Zahedi,
2001). Additionally, trust, as a crucial factor in online purchasing intention, and perceived
risk have been widely investigated by many researchers as an effective factor in Internet
shopping intention (Pavlou, 2001; Ruyter et al., 2001; Jarvenpaa et al., 2000).
3.5. THE IMPORTANCE OF TRUST IN ELECTRONIC COMMERCE
Researchers have identified factors that have been shown to have a relationship with the
acceptance of shopping online. Although the key factor is recognised to be trust, other factors
have been frequently examined by researchers, including privacy and security online (Kim
and Lim, 2001; Lee, 2002; Goldsmith, 2001), brand reputation (Ruyter et al., 2001; Ward and
Lee, 2000), navigation (Chau et al., 2000; Liang and Lai, 2002), interface (Schoenbachler
and Gordon, 2002), and accessibility (Chen and Sukpanich, 1998; Lee, 2002).
Trust has been defined in several ways, and varies from study to study, but there is a general
definition that has prevailed, originally provided by Mayer et al. (1995). This states that trust
is ‘the willingness of a party to be vulnerable to the actions of another party based on the
expectation that the other will perform a particular action important to the trustor, irrespective
of the ability to monitor or control that other party.’ There are several studies that mention the
role of trust in e-commerce and they have identified that trust affects consumers’ intention to
engage in online activities, both directly and indirectly. In the context of online shopping,
trust has been identified as an important factor and it is most cited as the reason for
consumers failing to purchase over the Internet (Lee and Turban, 2001). Kräuter and
Kaluscha (2003) suggest that due to the open nature of the Internet as a global infrastructure,
where online transactions are characterized by uncertainty and mystery, lack of control makes
CHAPTER 3: EVALUATION OF LITERATURE REVIEW
P a g e | 53
trust a vital element in e-commerce. Trust can occur when there is a state of dependence
between trustor and trustee, and also when acting on this dependence involves risk. In
general, trust is an important factor in different social interactions where uncertainty and
dependency appear (Kräuter and Kaluscha, 2003).
3.6. CONTINUANCE ONLINE SHOPPING AND SATISFACTION
The ability to retain customers remains an essential requirement for any business. In terms of
online shopping, this is even more the case. Customers can easily be influenced to move their
interest to other websites simply as a result of better offerings or information provision.
Atchariyachanvanich et al. (2007) state that ‘since keeping the customer repurchasing a
product/service is essential to maintain the profitability of any business, the continuance of
purchasing through the Internet is vital to businesses’.
The development and maintenance of customer satisfaction is the keystone of online
shopping success for e-businesses, and will eventually lead to increasing customer loyalty
intentions. Such loyalty is essential to the ongoing success of online sellers, and can only be
achieved through an understanding of the importance of fairness and trust. This is identified
by the use of the TAM, described in section 3.8. By combining these elements, e-retailers are
able to gain a better understanding of their customers’ underlying beliefs and, thus, their
loyalty intentions (Chiu et al., 2009). Further to this, Chiu et al (2009) showed that the
average customer is likely to shop four times at an online store before the e-store itself profits
from that customer. This reinforces the importance of customer continuance shopping
intentions. It is, therefore, essential that there is effective interaction between the e-store, the
customer, the website, and the environment in order to optimise the online shopping
behaviour of the customer.
Since customer satisfaction acts as the main driver to gain customer loyalty, it is impossible
to gain such loyal customers without satisfying them. However, consumers may continue
using an e-commerce service if they consider it useful, even if they are dissatisfied with its
prior use (Bhattacherjee, 2001a). In many industries, a loyal customer is considered as more
profitable than the non-loyal customer; the loyal customers cost less to serve and retain
because they know the product or service and require less information.
Raman (1999) states that loyal customer’s even serve as part-time employees; they can
provide strong word-of-mouth, create business referrals, provide references, help promote
CHAPTER 3: EVALUATION OF LITERATURE REVIEW
P a g e | 54
products, and serve on advisory boards (Bowen and Chen, 2001). Additionally, loyal
customers do make more attempts to purchase than non-loyal customers and are less likely to
defect to other competitors. Therefore, customers with more intention to continue e-business
with the organization will increase the sales, reduce the operational cost, reduce marketing
cost and lead to increase in profit (Gurau, 2003).
E-business enables companies to gather and access information about customers’ buying
histories, preferences, complaints, and other data, so that companies can better predict what it
are the customer’s needs and wants. The aim is to encourage deeper relationships with
customers and greater customer loyalty. Quinn (1996) states that ‘Customer Relationship
Management helps to build customer loyalty by serving the customer’s needs properly; at a
price that offers value. If we do that successfully, we can create not only loyal customers but
also customers who will become enthusiastic missionaries for the business and, indeed,
become more effective salespersons for the organization than their employees’. Realizing the
value of strengthening relationships will enable companies to increase profitability, reduce
defection and improve retention and growth rate (Young and Stepankek, 2003).
Satisfaction, building sustainable relationships and loyalty incentive play the main role in
keeping and retaining the customers. Many studies found that customers might stop doing
businesses with the organization for reasons other than satisfaction with the product or
service. One study conducted by Griffin (1995) found that 68% of the customers left with no
special reason, only that they felt neglected. This finding goes with research on customer
loyalty in the service industry conducted by Jobber (2001), who points out that only 14 % of
customers who stopped doing businesses did so because they were dissatisfied with the
quality of what they had bought, whereas more than two-thirds stopped purchasing because
they found service staff uncaring or unhelpful.
However, Rigby, Reichheld, and Schefter, (2002) argue that many companies are striving to
increase the percentage of customer loyalty through huge investment in loyalty programmes.
The issue is whether customers will value relationships. The answer depends on the kind of
relationships that the company wants to have with the customer. When companies try to
establish such relationships and provide loyalty incentives, they often end up trying to build
relationships with the wrong customers, or trying to build relationships with the right
customers but in the wrong way. There are many such examples of failing to get the full
advantage of e-business (Internet shopping) through gathering and accessing information
about customers’ buying histories, preferences, complaints, and other data. Companies have
CHAPTER 3: EVALUATION OF LITERATURE REVIEW
P a g e | 55
to build relationships that are valued by the customers, and thus ensure that the relationships
are two-way.
Research on continuance is in its infancy. Bhattacherjee (2001a) is one of the very first
attempts to explain consumer online repurchasing behaviour using (Oliver, 1980) ECT that
focuses on the post purchase. Bhattacherjee proposed model was formulated on the basis of
ECT and postulated satisfaction, confirmation, and loyalty incentives as salient factors
affecting consumer online repurchasing.
Bhattacherjee (2001b) examines the key drivers of consumers' intention to continue using
business-to-consumer e-commerce services. He concludes that consumers' continuance
intention is determined by their satisfaction with initial service use, their perceived usefulness
of service use, and the interaction between perceived usefulness and loyalty incentives for
service use. He also notes that satisfaction and perceived usefulness are both predicted by
consumers' confirmation of expectations from initial service use.
Shun and Yunjie (2006) demonstrate that customer value includes both outcome and process
components in online shopping. Their results show that while the outcome component is
generally assumed to be the most significant dimension, the process component has a
particular impact on satisfaction, and thus should not be overlooked in the development of
marketing strategy.
Ahn, Ryu, and Han (2007) introduce the concept of playfulness as a reason for consumer
continuance in online shopping. They find a strong relationship between user belief and
website quality, and describe this as being closely related to perceived ease of use and
usefulness. However, they point out that other factors, such as loyalty incentives, perceived
control, technology experience and trust all have significant parts to play.
3.6.1. Research on Customer Loyalty
Oliver (1996) defined customer loyalty as “a deeply held commitment to re-buy or re-
support a preferred product or service consistently in the future, despite situational influences
and marketing efforts having the potential to cause switching behaviour”. Customer loyalty is
a recurring research issue for both marketing and IT-related businesses (Chiou, 2004; Chung
and Lee, 2003; Oliver, 1996; 1999). An organisation sees loyalty among its customers as a
great benefit. Over time, they will increase profitability for the business, increase their
purchases, become less price sensitive, cost less to provide the service to, and often help to
generate new customers (Reichheld, 1993). Researchers have looked at what represents true
CHAPTER 3: EVALUATION OF LITERATURE REVIEW
P a g e | 56
customer loyalty, in some cases using behavioural data as a measure, and exploring attitude
and behaviour together as measures of loyalty. This is useful because collecting data is easy
and cheap; however it has the disadvantage of tending to overvalue the impact of loyalty,
which can lead therefore to an oversimplification.
Loyalty, as a process, involves the evaluation of alternative criteria. Jacoby and Chestnut
(1978) state that ‘if brand loyalty is ever to be managed, not just measured, it will have to be
elaborated in a much more detailed description of cognitive activities rather than focusing
only on behavioural aspects of brand loyalty’. Loyalty should be considered to be made up of
two distinct dimensions: behaviour and attitude (Day, 1969; Jacoby and Kyner, 1973). To
understand the difference between the two dimensions, Beerli, Martin, and Quintana, (2004)
differentiate between loyalty based on inertia and behavioural loyalty, where a product or
service is used out of habit as it requires less effort. In the latter case, behavioural loyalty can
result purely from the presence of convenience, and they emphasize that customers will
readily switch brands if another brand becomes more convenient. Attitudinal loyalty arises
through repeat purchasing behaviour, showing a conscious decision to continue purchasing
the product or service.
A model to predict online customers’ loyalty has been developed by Wa, Hom, and Kolwoon
(2003), which incorporates variables from TAM to improve loyalty prediction. In other
studies, perceived value and trust (Harris and Goode, 2004), and satisfaction (Shankar, Smith,
and Rangaswamy, 2003) have been proposed as loyalty determinants, with service quality as
an external factor that influences perceived value. Much research has been done to investigate
attitudinal loyalty in the loyalty context (e.g. Sirdeshm, Singh, and Sabol, 2002; Henard and
Szymanski, 2001; Rust and Oliver, 2000).
The Internet has played a significant role in building customer loyalty and maximizing sales
to existing customers (Griffin, 1996). The business value becomes zero if no customer is
willing to revisit an Internet shop, regardless of its technical or managerial assets (Lee, Kim,
and Moon, 2000). Customer loyalty is crucial because the value of a shop and the growth of
its business are mainly determined by the number of continued (loyal) customers in the
context of e-commerce (Lee et al., 2000), and the number of retained customers in the
context of any business (Crosby and Johnson, 2005).
The role played by website quality has been identified as a factor in both loyalty and
technology acceptance research. The literature on information systems success has long
established system quality as an important antecedent of system use (DeLone and McLean,
1992). In the e-commerce context, previous research has generally supported the link
CHAPTER 3: EVALUATION OF LITERATURE REVIEW
P a g e | 57
between perceived online system quality and system usage. If a customer perceives a
vendor’s website to be of high quality he will be more likely to generate a favourable attitude
towards it, demonstrate behavioural control over it, which in turn, translates into a higher
intention to reuse it (Pavlou and Fygenson, 2006; Jahng, Jain and Ramamurthy, 2007). Ha
and Stoel (2009) suggest that website quality is composed of four factors closely related to
service quality: website design, customer service, privacy and security, and atmosphere and
experience. Additionally, Chakraborty, Lala, and Warren (2002) Chung and Tan (2004)
indicated that perceived website quality is a multi-dimensional latent construct that includes
dimensions of playfulness, usefulness, user friendliness, informativeness, technology,
organization, and navigability. In this context, website quality has been seen to offer a
competitive advantage in the electronic market place in the form of delivering value added
services, and offering real time online services (Ruyter et al., 2001). Since quality is a
fundamental assessment of a product or service (Olshavsky, 1985; Luarn and Lin, 2003), it is
viewed by Snoj, Korda, and Mumel (2004) as a driver of perceived value. Customers will be
prepared to give time and effort online to interact with a website in order to locate the desired
product or service, to checkout quickly, and to receive detailed information about the product
or service and its delivery. Interactivity on the Internet refers to the degree to which
customers and retailers can communicate directly with one another anywhere, any time
(Blattberg and Deighton, 1991). Ghose and Dou (1998) observe that, for e-retailers, the
degree of interactivity influences the perceived quality of the website.
3.7. THEORETICAL BACKGROUND
Of the Socio-Cognitive models that predict and explain consumer behaviour; e.g., acceptance
of technology and/or continuance intention, the most common is the Theory of Reasoned
Action (TRA; Fishbein and Ajzen 1975), and its derivative, the Technology Acceptance
Model (TAM; Davis 1989). TAM is a more technology-oriented model, and many empirical
tests confirm TAM as a parsimonious, robust model of technology acceptance behaviours in
various IT categories, including e-commerce (Gefen and Straub 2000; Lee, Park, and Ahn,
2001; Lederer et al., 2000), across levels of expertise (Taylor and Todd, 1995), and across
countries (Rose and Straub, 1998; Straub, Keil, and Brennan, 1997). TAM is reported to be
valid in both organizational and non-organizational contexts including e-commerce (Gefen et
al., 2003). The ECT, in turn, suggests that customer satisfaction develops from a customer’s
evaluation of the difference between expectations about the product or service before
CHAPTER 3: EVALUATION OF LITERATURE REVIEW
P a g e | 58
purchase and the level to which the purchase meets those expectations (Kristensen,
Martensen, and Gronholdt, 1999). Other studies address different e-commerce issues, such as
trust (Ba, Whinston, and Zhang, 1999; Beatty et al., 1996; Bhattacherjee, 2002; Brynjolfsson
and Smith, 2000; Czepiel, 1990; Gefen, 2002; Hoffman, Novak, and Perlta, 1999; Jarvenpaa
et al., 1999; McKnight, Choudhury, and Kacmar, 2002b; Ratnasingham 1998a; Urban,
Sultan, and Qualls, 2000). These reveal that customers must experience a new channel before
they can assess it, especially when they cannot see or touch the product or service, or when
they lack experience with the e-retailer. Findings show that TRA and its family theories
including TAM and TPB are the dominant theories in online consumer behaviour (Cheung,
Chan, and Limayem, 2005). ECT and Innovation Diffusion Theory (IDT) also have been
examined in different online consumer behaviour studies. Cheung et al (2005) claimed that
most studies depend heavily on TRA and its family theories (TAM and TPB), while other
theories, such as ECT, are less frequently applied in online consumer behaviour studies. As a
result, researchers are encouraged to explore new theories, develop new frameworks and
investigate online consumer behaviour from different perspectives, angles, and cultural
contexts. Table 3.5 lists a summary of the five most frequently used theories and their
corresponding references.
From a theoretical point of view, consumers’ continuance online shopping intention can be
explained by taking into account different factors. Rogers (1995) suggested that adopters re-
evaluate their acceptance decision during a final confirmation stage and decide whether to
continue or discontinue an innovation. Additionally, previous researchers view continuance
as an extension of acceptance behaviour (i.e., they employ the same set of pre-acceptance
variables to explain both acceptance and continuance decisions), implicitly assuming that
continuance co-varies with acceptance (e.g., Davis et al., 1989, Karahanna, Straub, and
Chervany, 1999; Bhattacherjee, 2001).
The theoretical research model used in our study is based on the extended Expectation
Confirmation Theory (ECT) of Bhattacherjee (2001a) and the Technology Acceptance Model
(TAM) of Davis et al., (1989). This theoretical research lens is parallel in spirit to Davis et
al.’s formulation of the Technology Acceptance Model (TAM) in that it integrates
expectation confirmation theory (ECT) from the consumer behaviour literature to propose a
model of e-shopping continuance intention, similar to the manner in which TAM adapted the
Theory of Reasoned Action (TRA) from the social psychology literature to postulate a model
of technology acceptance.
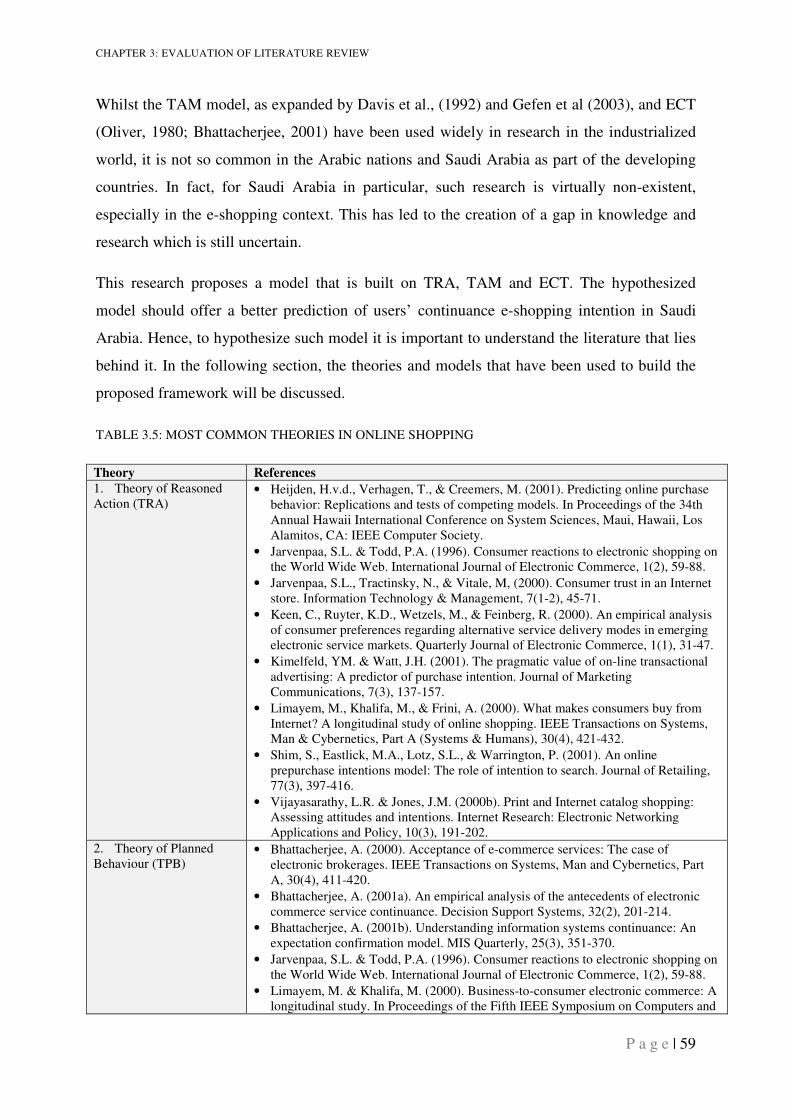
CHAPTER 3: EVALUATION OF LITERATURE REVIEW
P a g e | 59
Whilst the TAM model, as expanded by Davis et al., (1992) and Gefen et al (2003), and ECT
(Oliver, 1980; Bhattacherjee, 2001) have been used widely in research in the industrialized
world, it is not so common in the Arabic nations and Saudi Arabia as part of the developing
countries. In fact, for Saudi Arabia in particular, such research is virtually non-existent,
especially in the e-shopping context. This has led to the creation of a gap in knowledge and
research which is still uncertain.
This research proposes a model that is built on TRA, TAM and ECT. The hypothesized
model should offer a better prediction of users’ continuance e-shopping intention in Saudi
Arabia. Hence, to hypothesize such model it is important to understand the literature that lies
behind it. In the following section, the theories and models that have been used to build the
proposed framework will be discussed.
TABLE 3.5: MOST COMMON THEORIES IN ONLINE SHOPPING
Theory References
1. Theory of Reasoned Action (TRA)
• Heijden, H.v.d., Verhagen, T., & Creemers, M. (2001). Predicting online purchase behavior: Replications and tests of competing models. In Proceedings of the 34th Annual Hawaii International Conference on System Sciences, Maui, Hawaii, Los Alamitos, CA: IEEE Computer Society.
• Jarvenpaa, S.L. & Todd, P.A. (1996). Consumer reactions to electronic shopping on the World Wide Web. International Journal of Electronic Commerce, 1(2), 59-88.
• Jarvenpaa, S.L., Tractinsky, N., & Vitale, M, (2000). Consumer trust in an Internet store. Information Technology & Management, 7(1-2), 45-71.
• Keen, C., Ruyter, K.D., Wetzels, M., & Feinberg, R. (2000). An empirical analysis of consumer preferences regarding alternative service delivery modes in emerging electronic service markets. Quarterly Journal of Electronic Commerce, 1(1), 31-47.
• Kimelfeld, YM. & Watt, J.H. (2001). The pragmatic value of on-line transactional advertising: A predictor of purchase intention. Journal of Marketing Communications, 7(3), 137-157.
• Limayem, M., Khalifa, M., & Frini, A. (2000). What makes consumers buy from Internet? A longitudinal study of online shopping. IEEE Transactions on Systems, Man & Cybernetics, Part A (Systems & Humans), 30(4), 421-432.
• Shim, S., Eastlick, M.A., Lotz, S.L., & Warrington, P. (2001). An online prepurchase intentions model: The role of intention to search. Journal of Retailing, 77(3), 397-416.
• Vijayasarathy, L.R. & Jones, J.M. (2000b). Print and Internet catalog shopping: Assessing attitudes and intentions. Internet Research: Electronic Networking Applications and Policy, 10(3), 191-202.
2. Theory of Planned Behaviour (TPB)
• Bhattacherjee, A. (2000). Acceptance of e-commerce services: The case of electronic brokerages. IEEE Transactions on Systems, Man and Cybernetics, Part A, 30(4), 411-420.
• Bhattacherjee, A. (2001a). An empirical analysis of the antecedents of electronic commerce service continuance. Decision Support Systems, 32(2), 201-214.
• Bhattacherjee, A. (2001b). Understanding information systems continuance: An expectation confirmation model. MIS Quarterly, 25(3), 351-370.
• Jarvenpaa, S.L. & Todd, P.A. (1996). Consumer reactions to electronic shopping on the World Wide Web. International Journal of Electronic Commerce, 1(2), 59-88.
• Limayem, M. & Khalifa, M. (2000). Business-to-consumer electronic commerce: A longitudinal study. In Proceedings of the Fifth IEEE Symposium on Computers and
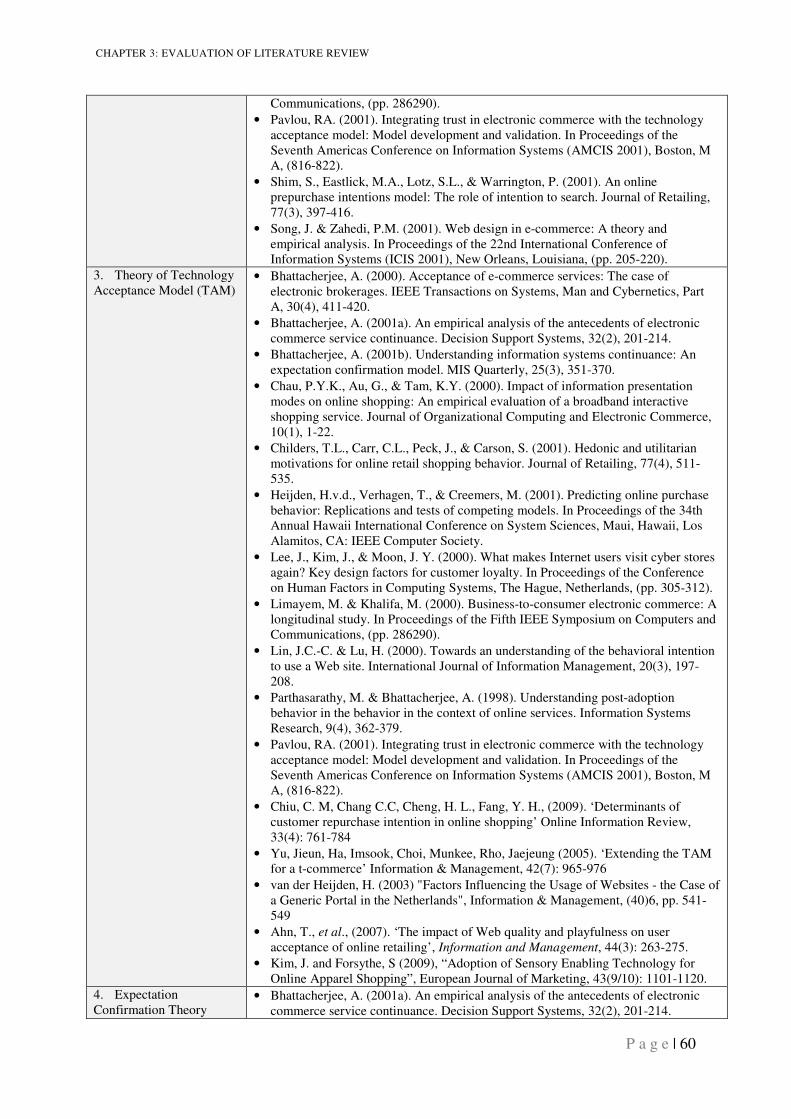
CHAPTER 3: EVALUATION OF LITERATURE REVIEW
P a g e | 60
Communications, (pp. 286290).
• Pavlou, RA. (2001). Integrating trust in electronic commerce with the technology acceptance model: Model development and validation. In Proceedings of the Seventh Americas Conference on Information Systems (AMCIS 2001), Boston, M A, (816-822).
• Shim, S., Eastlick, M.A., Lotz, S.L., & Warrington, P. (2001). An online prepurchase intentions model: The role of intention to search. Journal of Retailing, 77(3), 397-416.
• Song, J. & Zahedi, P.M. (2001). Web design in e-commerce: A theory and empirical analysis. In Proceedings of the 22nd International Conference of Information Systems (ICIS 2001), New Orleans, Louisiana, (pp. 205-220).
3. Theory of Technology Acceptance Model (TAM)
• Bhattacherjee, A. (2000). Acceptance of e-commerce services: The case of electronic brokerages. IEEE Transactions on Systems, Man and Cybernetics, Part A, 30(4), 411-420.
• Bhattacherjee, A. (2001a). An empirical analysis of the antecedents of electronic commerce service continuance. Decision Support Systems, 32(2), 201-214.
• Bhattacherjee, A. (2001b). Understanding information systems continuance: An expectation confirmation model. MIS Quarterly, 25(3), 351-370.
• Chau, P.Y.K., Au, G., & Tam, K.Y. (2000). Impact of information presentation modes on online shopping: An empirical evaluation of a broadband interactive shopping service. Journal of Organizational Computing and Electronic Commerce, 10(1), 1-22.
• Childers, T.L., Carr, C.L., Peck, J., & Carson, S. (2001). Hedonic and utilitarian motivations for online retail shopping behavior. Journal of Retailing, 77(4), 511-535.
• Heijden, H.v.d., Verhagen, T., & Creemers, M. (2001). Predicting online purchase behavior: Replications and tests of competing models. In Proceedings of the 34th Annual Hawaii International Conference on System Sciences, Maui, Hawaii, Los Alamitos, CA: IEEE Computer Society.
• Lee, J., Kim, J., & Moon, J. Y. (2000). What makes Internet users visit cyber stores again? Key design factors for customer loyalty. In Proceedings of the Conference on Human Factors in Computing Systems, The Hague, Netherlands, (pp. 305-312).
• Limayem, M. & Khalifa, M. (2000). Business-to-consumer electronic commerce: A longitudinal study. In Proceedings of the Fifth IEEE Symposium on Computers and Communications, (pp. 286290).
• Lin, J.C.-C. & Lu, H. (2000). Towards an understanding of the behavioral intention to use a Web site. International Journal of Information Management, 20(3), 197-208.
• Parthasarathy, M. & Bhattacherjee, A. (1998). Understanding post-adoption behavior in the behavior in the context of online services. Information Systems Research, 9(4), 362-379.
• Pavlou, RA. (2001). Integrating trust in electronic commerce with the technology acceptance model: Model development and validation. In Proceedings of the Seventh Americas Conference on Information Systems (AMCIS 2001), Boston, M A, (816-822).
• Chiu, C. M, Chang C.C, Cheng, H. L., Fang, Y. H., (2009). ‘Determinants of customer repurchase intention in online shopping’ Online Information Review, 33(4): 761-784
• Yu, Jieun, Ha, Imsook, Choi, Munkee, Rho, Jaejeung (2005). ‘Extending the TAM for a t-commerce’ Information & Management, 42(7): 965-976
• van der Heijden, H. (2003) "Factors Influencing the Usage of Websites - the Case of a Generic Portal in the Netherlands", Information & Management, (40)6, pp. 541-549
• Ahn, T., et al., (2007). ‘The impact of Web quality and playfulness on user acceptance of online retailing’, Information and Management, 44(3): 263-275.
• Kim, J. and Forsythe, S (2009), “Adoption of Sensory Enabling Technology for Online Apparel Shopping”, European Journal of Marketing, 43(9/10): 1101-1120.
4. Expectation Confirmation Theory
• Bhattacherjee, A. (2001a). An empirical analysis of the antecedents of electronic commerce service continuance. Decision Support Systems, 32(2), 201-214.
CHAPTER 3: EVALUATION OF LITERATURE REVIEW
P a g e | 61
(ECT) • Bhattacherjee, A. (2001b). Understanding information systems continuance: An expectation confirmation model. MIS Quarterly, 25(3), 351-370.
• Khalifa, M. & Liu, V. (2001). Satisfaction with Internet-based services: A longitudinal study. In Proceedings of the 22nd International Conference of Information Systems (ICIS 2001), New Orleans, Louisiana, (pp. 601-606).
• Thong, J. Y. L., Hong, S.-J., & Tam, K. Y. (2006). ‘The effects of post-adoption beliefs on the expectation–confirmation model for information technology continuance’, International Journal of Human-Computer Studies, 64(9), 799–810
• Lin, C. S., Wu, S., & Tsai, R. J. (2005). ‘Integrating perceived playfulness into expectation–confirmation model for web portal context’, Information and Management, 42(5), 683–693.
• Kang, Young Sik, Hong, Soongeun, and Lee, Heeseok (2009). ‘Exploring continued online service usage behavior: The roles of self-image congruity and regret’, Computers in Human Behavior, 25(1): 111-122
• Hong, S.-J., Thong, J. Y. L., & Tam, K. Y. (2006). ‘Understanding continued information technology usage behavior: A comparison of three models in the context of mobile internet’, Decision Support Systems, 42(3), 1819–1834.
• Liao, C., Chen, J.-L., & Yen, D. C. (2007). ‘Theory of planning behavior (TPB) and customer satisfaction in the continued use of e-service. An integrated model’, Computers in Human Behavior, 23(6), 2804–2822
• Limayem, M., Hirt, S. G., & Cheung, C. M. K. (2007). ‘How habit limits the predictive power of intention: The case of information systems continuance’, MIS Quarterly, 31(4), 705–737.
5. Innovation Diffusion Theory (IDT)
• Bhattacherjee, A. (2001a). An empirical analysis of the antecedents of electronic commerce service continuance. Decision Support Systems, 32(2), 201-214.
• Goldsmith, R.E. (2000). How innovativeness differentiates online buyers. Quarterly Journal of Electronic Commerce, 1(4), 323-333.
• Parthasarathy, M. & Bhattacherjee, A. (1998). Understanding post-adoption behavior in the behavior in the context of online services. Information Systems Research, 9(4), 362-379.
• Senecal, S. (2000). Stopping variables in online buying processes: An innovation diffusion approach. In Proceedings of the Sixth Americas Conference on Information Systems (AMCIS 2000), Long Beach, California, (pp. 1380-1385).
• Siu, N.Y.M. & Cheng, M.M.-S. (2001). A study of the expected adoption of online shopping: The case of Hong Kong. Journal of International Consumer Marketing, 75(3), 87-106.
3.8. THEORY OF REASONED ACTION
Liska (1984) declares that during the late 1960s and early 1970s a number of attitude-
behaviour theories appeared that specified theoretical and operational definitions of attitude.
The most prominent and influential of these theories is the Fishbein and Ajzen Theory of
Reasoned Action (TRA), which differentiates between the three components of attitude:
cognition (belief), affect (feeling), and conation (behavioural intention). The TRA is very
general and is ‘designed to explain virtually any human behaviour’ (Ajzen and Fishbein
1980). It attempts to predict and explain a person’s behaviour, and states that behavioural
intention plays an important part in determining the individual’s behaviour, and at the same
time the intentional behaviour and subjective norm determined by attitudes of the individual.
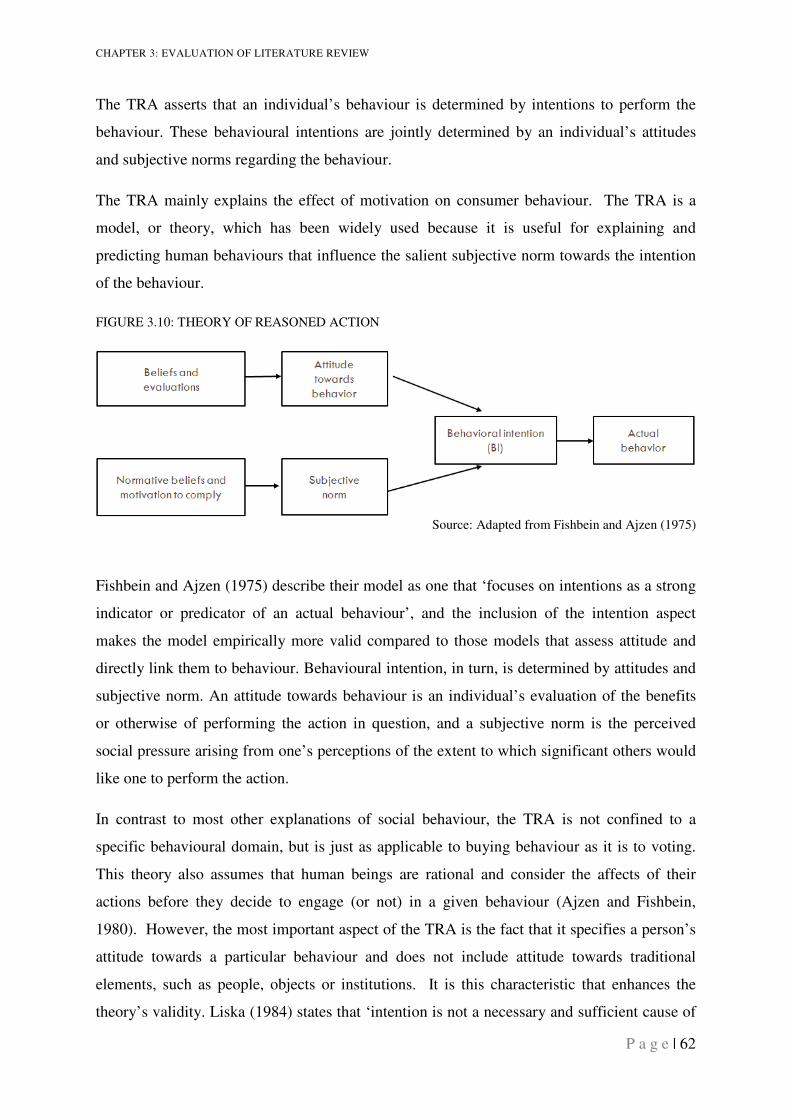
CHAPTER 3: EVALUATION OF LITERATURE REVIEW
P a g e | 62
The TRA asserts that an individual’s behaviour is determined by intentions to perform the
behaviour. These behavioural intentions are jointly determined by an individual’s attitudes
and subjective norms regarding the behaviour.
The TRA mainly explains the effect of motivation on consumer behaviour. The TRA is a
model, or theory, which has been widely used because it is useful for explaining and
predicting human behaviours that influence the salient subjective norm towards the intention
of the behaviour.
FIGURE 3.10: THEORY OF REASONED ACTION
Source: Adapted from Fishbein and Ajzen (1975)
Fishbein and Ajzen (1975) describe their model as one that ‘focuses on intentions as a strong
indicator or predicator of an actual behaviour’, and the inclusion of the intention aspect
makes the model empirically more valid compared to those models that assess attitude and
directly link them to behaviour. Behavioural intention, in turn, is determined by attitudes and
subjective norm. An attitude towards behaviour is an individual’s evaluation of the benefits
or otherwise of performing the action in question, and a subjective norm is the perceived
social pressure arising from one’s perceptions of the extent to which significant others would
like one to perform the action.
In contrast to most other explanations of social behaviour, the TRA is not confined to a
specific behavioural domain, but is just as applicable to buying behaviour as it is to voting.
This theory also assumes that human beings are rational and consider the affects of their
actions before they decide to engage (or not) in a given behaviour (Ajzen and Fishbein,
1980). However, the most important aspect of the TRA is the fact that it specifies a person’s
attitude towards a particular behaviour and does not include attitude towards traditional
elements, such as people, objects or institutions. It is this characteristic that enhances the
theory’s validity. Liska (1984) states that ‘intention is not a necessary and sufficient cause of
CHAPTER 3: EVALUATION OF LITERATURE REVIEW
P a g e | 63
behaviour, people do not do what they intend to do, but are constrained by the lack of
resources’ and opportunities’.
Liska (1984, p 72) states that the TRA specifies a causal structure, which underlies the
relationship between behaviour, intention and attitude, yet ‘various theoretical traditions and
considerable research suggest that behaviour affects both intentions and attitudes’. Therefore,
it appears that the hierarchical nature of the TRA is too simple to explain the complex
relationship between attitudes, intentions and behaviour.
Ajzen and Fishbein (1980) later refined the TRA with empirical evidence to support its
validity and reliability. They proposed that an individual’s behavioural intention is the
immediate determinant of behaviour; their attitude and subjective norm are mediated through
behavioural intention; and their behavioural and normative beliefs are mediated through
attitude and subjective norm.
To gain certain competitive advantages marketers need to achieve better understanding of the
factors that determine individual’s behaviour (Ajzen and Fishbein, 1980). Ajzen and Fishbein
relate their theory to the factors that determine consumer’s preferences for certain products
and individual brands, attitudes and brand preference. In one of their first studies, Ajzen and
Fishbein (1975) analysed consumers’ attitudes and intentions toward buying Millers beer and
found attitudes and subjective norms to be highly accurate predictors of intentions, as long as
correspondence was maintained. Ajzen and Fishbein restricted the application of their theory
to brand and product attitudes. This represents a single aspect of marketing, and could explain
why major academic texts employing the theory also focus on brand and product preference
(Peter and Olson, 2005; Foxall and Pallister, 1998). Therefore, it is possible that the use of
the TRA in marketing has not been fully utilized.
The TRA and its family of theories have postulated many factors to be the determinants of
online intention behaviour, such as attitude, subjective norm, and perceived control
(Bhattacherjee, 2000; Keen et al., 2000; Limayem et al., 2000).
3.8.1 Limitations of TRA
As indicated by Ajzen (1985), TRA theory was limited by what is called correspondence; that
is, attitude and intention must agree on action, target, context, and time frame in order for the
theory to predict specific behaviour (Sheppared et al., 1988). The greatest limitation of the
theory stems from the assumption that behaviour is under volitional control; that is, the
CHAPTER 3: EVALUATION OF LITERATURE REVIEW
P a g e | 64
theory only applies to behaviour that is knowingly thought out beforehand. Unreasonable
decisions, habitual actions or any behaviour that is not intentionally considered cannot be
explained by this theory.
Furthermore, Manski (1990) citied in Bemmaor (1995), identifies a limitation of the TRA,
explaining that, even if individuals have rational expectations, and given that stated intentions
are best predictors of behaviour, intentions and behaviour need not necessarily coincide.
Thus, an individual may have the intention to perform an act but they may not follow through
with an actual response. There may be outside influences that actually prevent them from
performing the behaviour.
3.9. THE TECHNOLOGY ACCEPTANCE MODEL (TAM)
There are many theoretical models employed to study the usage and behaviour in information
technology that attempt to explain the relationship between the attitudes, perceptions, beliefs
and final system use, i.e. the TRA, the Theory of planed Behaviour (TPB), and the
Technology Acceptance Model (TAM). Based on the TRA, Davis (1989) developed the
TAM with its main goal to forecast IT behaviours, in particular to explain and predict
computer acceptance, whilst on the other hand the TRA concentrates on human behaviour.
The TAM is a theoretical model that evaluates the effects of factors, such as system
characteristics, on user acceptance (Davis, 1986). In a similar fashion to the TRA, TAM
assumes that a computer user generally acts quite rationally, using information in a
systematic manner to decide whether or not to adopt this technology in the workplace. Davis
identifies three major determinants of technology acceptance related to cognition and
effectiveness, which had been suggested by previous research studies. He began with the
TRA and adapted this as a basis for causal links between perceived usefulness, perceived
ease of use, attitude towards using technology and behavioural intention to explain
technology adoption. Appendix B provides an overview of previous research on e-shopping
intentions and adoption.
Researchers have empirically validated the original TAM in a variety of settings, including
technology acceptance in internet usage and website usage. TAM, through its empirical
assessment, has been validated by Davis (1989) and further validated by several replications
and applications (Davis, 1993; Davis et al., 1989; Mathieson, 1991; Taylor and Todd, 1995).
The result of these studies demonstrates that usefulness is the primary determinant of
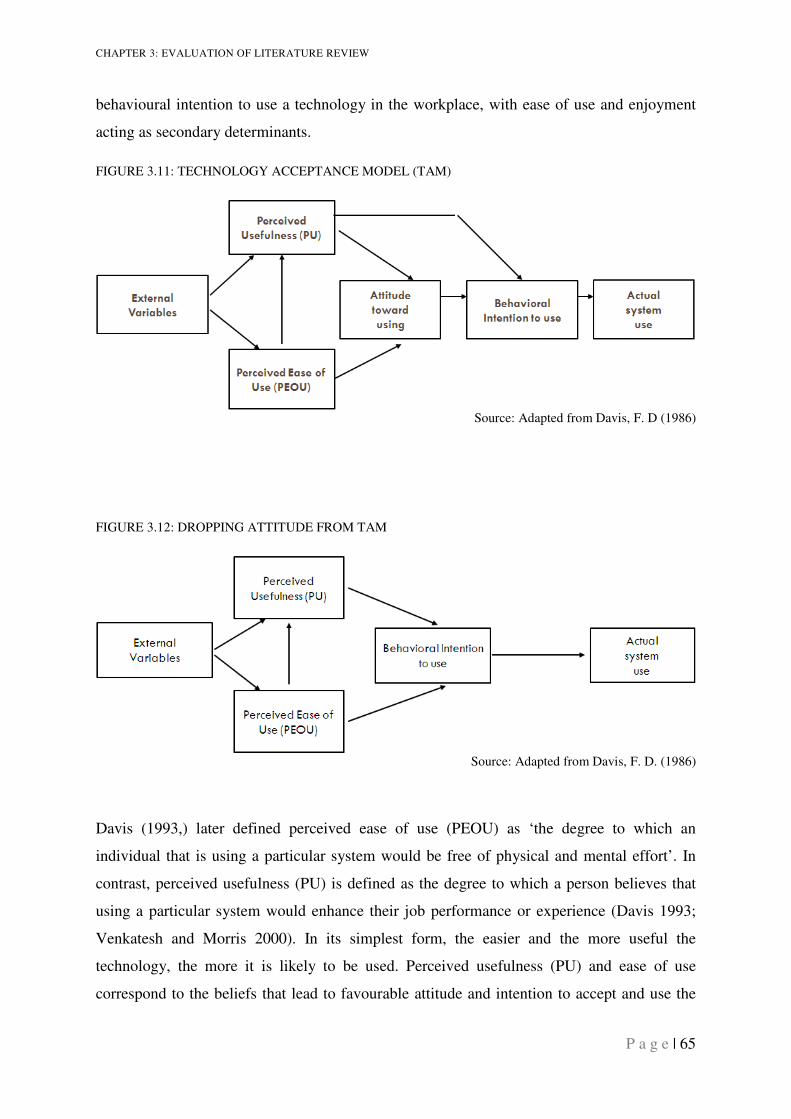
CHAPTER 3: EVALUATION OF LITERATURE REVIEW
P a g e | 65
behavioural intention to use a technology in the workplace, with ease of use and enjoyment
acting as secondary determinants.
FIGURE 3.11: TECHNOLOGY ACCEPTANCE MODEL (TAM)
Source: Adapted from Davis, F. D (1986)
FIGURE 3.12: DROPPING ATTITUDE FROM TAM
Source: Adapted from Davis, F. D. (1986)
Davis (1993,) later defined perceived ease of use (PEOU) as ‘the degree to which an
individual that is using a particular system would be free of physical and mental effort’. In
contrast, perceived usefulness (PU) is defined as the degree to which a person believes that
using a particular system would enhance their job performance or experience (Davis 1993;
Venkatesh and Morris 2000). In its simplest form, the easier and the more useful the
technology, the more it is likely to be used. Perceived usefulness (PU) and ease of use
correspond to the beliefs that lead to favourable attitude and intention to accept and use the
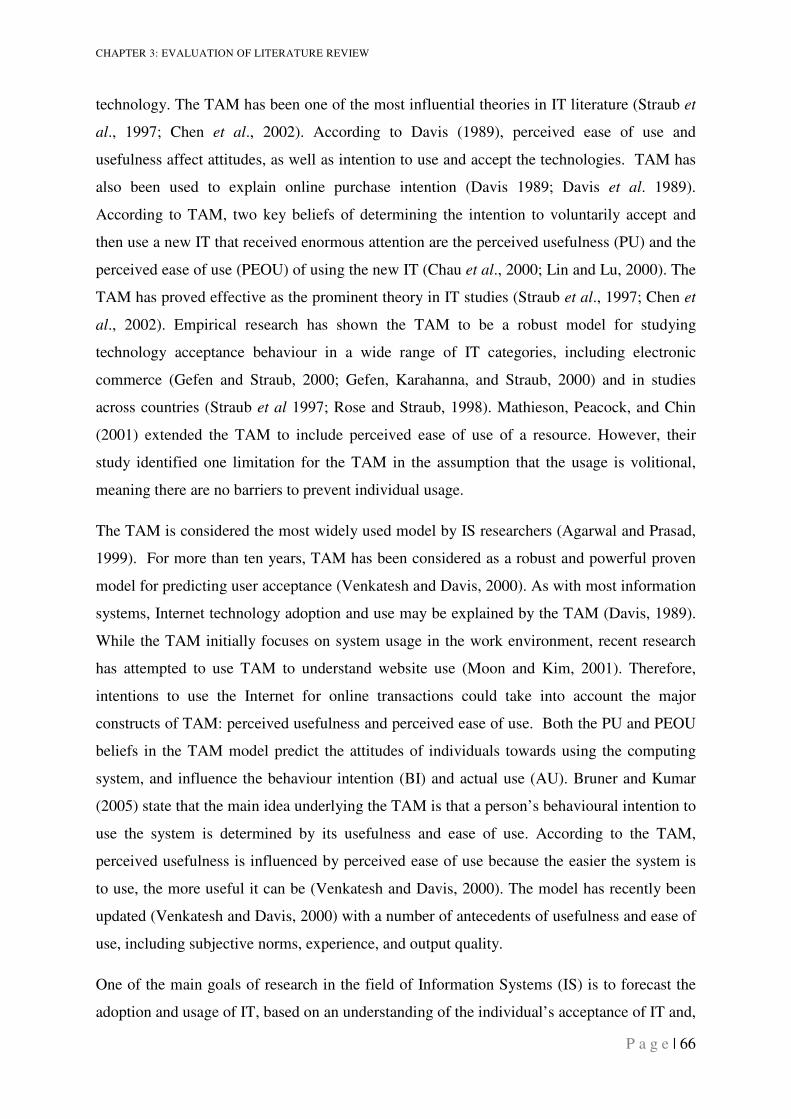
CHAPTER 3: EVALUATION OF LITERATURE REVIEW
P a g e | 66
technology. The TAM has been one of the most influential theories in IT literature (Straub et
al., 1997; Chen et al., 2002). According to Davis (1989), perceived ease of use and
usefulness affect attitudes, as well as intention to use and accept the technologies. TAM has
also been used to explain online purchase intention (Davis 1989; Davis et al. 1989).
According to TAM, two key beliefs of determining the intention to voluntarily accept and
then use a new IT that received enormous attention are the perceived usefulness (PU) and the
perceived ease of use (PEOU) of using the new IT (Chau et al., 2000; Lin and Lu, 2000). The
TAM has proved effective as the prominent theory in IT studies (Straub et al., 1997; Chen et
al., 2002). Empirical research has shown the TAM to be a robust model for studying
technology acceptance behaviour in a wide range of IT categories, including electronic
commerce (Gefen and Straub, 2000; Gefen, Karahanna, and Straub, 2000) and in studies
across countries (Straub et al 1997; Rose and Straub, 1998). Mathieson, Peacock, and Chin
(2001) extended the TAM to include perceived ease of use of a resource. However, their
study identified one limitation for the TAM in the assumption that the usage is volitional,
meaning there are no barriers to prevent individual usage.
The TAM is considered the most widely used model by IS researchers (Agarwal and Prasad,
1999). For more than ten years, TAM has been considered as a robust and powerful proven
model for predicting user acceptance (Venkatesh and Davis, 2000). As with most information
systems, Internet technology adoption and use may be explained by the TAM (Davis, 1989).
While the TAM initially focuses on system usage in the work environment, recent research
has attempted to use TAM to understand website use (Moon and Kim, 2001). Therefore,
intentions to use the Internet for online transactions could take into account the major
constructs of TAM: perceived usefulness and perceived ease of use. Both the PU and PEOU
beliefs in the TAM model predict the attitudes of individuals towards using the computing
system, and influence the behaviour intention (BI) and actual use (AU). Bruner and Kumar
(2005) state that the main idea underlying the TAM is that a person’s behavioural intention to
use the system is determined by its usefulness and ease of use. According to the TAM,
perceived usefulness is influenced by perceived ease of use because the easier the system is
to use, the more useful it can be (Venkatesh and Davis, 2000). The model has recently been
updated (Venkatesh and Davis, 2000) with a number of antecedents of usefulness and ease of
use, including subjective norms, experience, and output quality.
One of the main goals of research in the field of Information Systems (IS) is to forecast the
adoption and usage of IT, based on an understanding of the individual’s acceptance of IT and,
CHAPTER 3: EVALUATION OF LITERATURE REVIEW
P a g e | 67
in particular, the consideration of usage (Melone, 1990; Davis, 1989). At the same time,
researchers have made significant efforts to build theories that can be used to examine and
predict the factors responsible in determining the acceptance of IT (Agarwal and Prasad,
1999). Within TAM framework, usefulness of the interactive media can be thought of as
reflecting the more instrumental aspects of shopping, while enjoyment embodies the hedonic
aspect of shopping.
The TAM has gained considerable support and its use in different fields of research has
demonstrated its ability to explain behaviour. Davis suggests that future technology
acceptance research needs to address how other variables affect usefulness, ease of use, and
user acceptance (Moon and. Kim, 2001).
In 1989, Davis proposed a revised model of the TAM. Known as TAM2, see section 3.10.
TAM2 has advantages that include pre- and post-implementation beliefs and behaviours, and
is more concise and easier to understand and use. Szajna (1996) suggests that the original
TAM may be more appropriate than the revised version of the TAM, and that adding the
experience construct to the original TAM makes significant improvements. The addition to
the TAM model of the enjoyment construct, or the extent to which the activity of using the
technology is perceived to provide reinforcement in its own right, is separate from any
performance consequences that may be anticipated (Davis et al., 1989).
Since Davis et al (1989) proposed the TAM; the importance of technology acceptance has
increased and gained the attention of different researchers and practitioners (Venkatesh,
Morris, Davis, 2003). McFarland and Hamilton (2006) propose that the model is influenced
by contextual specificity, such as computer anxiety and prior experience, other use,
organizational support, task structure, system quality and perceived usefulness. The TAM has
been examined in several studies, confirming that TAM consistently explains a substantial
proportion of variance in usage intentions and behaviour among a variety of technologies.
Amoroso and Hunsinger et al. (2009), extending Burton-Jones and Hubona’s (2006) study,
assume that the external variables have direct effect on the usage behaviour, over and above
the indirect effect, and that TAM is significantly and consistently better at predicting
frequency than volume of usage. They also tested the relationship between the individual
differences of external variables, such as system experience, education and age, with the two
beliefs of TAM and IS usage. They found that the individual differences are fully mediated
by TAM beliefs, and that there is direct influence for individual variables on usage.
CHAPTER 3: EVALUATION OF LITERATURE REVIEW
P a g e | 68
Gefen et al. (2003) propose an integrated model for trust and TAM in online shopping with
the underlying premise that online customers are influenced by trust in e-vendors and
technology aspects of website interface. Consumer trust increases as a result of features of
interaction, some of which increase customers’ assessments of the ease of use of the e-
vendor’s website. The major finding of this study is that the intention of consumer
experience, resulting from the last transaction with the e-vendor from whom they purchased,
depends on trust and the two beliefs of perceived ease of use and usefulness.
Chiu et al. (2009) find the extended TAM useful in gaining a better understanding of
customers’ repurchase intentions. In particular, they identify the importance of the interaction
between the online vendor, the customer, the website and the environment, which leads to a
method for explaining online shopping behaviour. They stress the subsequent importance of
this version of TAM in the post-consumption decision-making processes of customers.
In both studies, enjoyment is a consistent and strong predictor of attitude toward interactive
shopping. Similarly, usefulness and ease of use were also significant predictors of attitude
across both studies. When comparing the relative effects of the TAM variables, within both
studies usefulness and enjoyment are equally predictive of interactive shopping attitude.
However, in the hedonic environment of web shopping, enjoyment is a stronger predictor of
attitude relative to ease of use.
Not all constructs are included in the original TAM, and Amoroso and Hunsinger (2009)
draw attention to the potential role played by institution-based trust and structural assurances
in influencing consumer attitudes towards purchasing. Subsequently, Porter and Donthu
(2006) developed and extended the TAM to include perceived access barriers, which help to
explain the demographic differences in the context of Internet use. They extended it in two
ways: including perceived access barriers among key beliefs about technology influence use,
and adding four demographic construct keys as external variables (age, education, income
and race). These additions suggested that the TAM belief variables are differentially relevant
to consumers with different demographic variables. No previous study has collectively
included age, education, income and race in a single TAM-based model. The TAM has been
functional in the context of the online consumer behaviour (Lai and Li, 2005) and has
received empirical support from several studies (Venkatesh and Davis, 2000).
CHAPTER 3: EVALUATION OF LITERATURE REVIEW
P a g e | 69
Consumers will not be happy with a product or service that does not meet their expectations.
Srinivasan, Anderson, and Ponnavolu (2002) defines e-loyalty as a customer’s favourable
attitude toward the e-retailer that results in repeat buying behaviour, and Shun and Yunjie
(2006) use this concept to demonstrate the usefulness of the customer value on the bottom
line of e-commerce performance.
Product value, shopping value and customer value in e-commerce are closely linked with
utilitarian and hedonic value. Utilitarian value is seen as an accumulation of functional
benefits and sacrifices, and is appropriate for task-specific uses related to online shopping.
These include purchase deliberation, whereby consumers consider the product, service and
price features before making a purchase (Hoffman and Novak, 1996). Utilitarian value
combines different cognitive aspects of attitude, including economic ‘value for money’
(Zeithaml, 1988) and judgements of convenience and time saving (Jarvenpaa and Todd,
1997; Teo, 2001). The concept bears some similarity to the active source of extrinsic value
for Internet shopping (Mathwick, Malhotra, and Rigdon, 2002), but it is important to
understand it as being distinctly different to hedonic value, i.e., online shopping may be
popular as a result of the ease of location of products or retailers, evaluation of price/quality
ratios, and conservation of temporal and psychological resources (Grewal et al., 2003;
Mathwick et al., 2002).
Hedonic value, however, is concerned with experiential beliefs and sacrifices, such as
entertainment and escapism. In this case, consumers often shop with the intention of gaining
an appreciation of the experience rather than simply for task completion (Babin, Darden, and
Griffen, 1994). Much research has been carried out on in-store shopping literature (Babin and
Attaway, 2000; Darden and Reynolds, 1971) and has identified hedonic value as an element
of online shopping (Hoffman and Novak, 1996). Online and offline shoppers also shop for
entertainment and for other non-routine experiences that absorb the users and allow them to
escape momentarily from reality (Kim, 2002; Mathwick et al., 2002).
Childers et al. (2001) found enjoyment to be a strong predictor of attitude towards e-
shopping. In that study, ‘usefulness’ and ‘enjoyment’ were equally predictive of attitude
overall. Usefulness was the better predictor for grocery shopping; enjoyment more so for the
examples that the authors described as ‘hedonic’ (Amazon, Hot Hot Hot (sauces), Wal-mart,
K Mart and Bookstore). In discussing the enjoyment constructs of the TAM model with
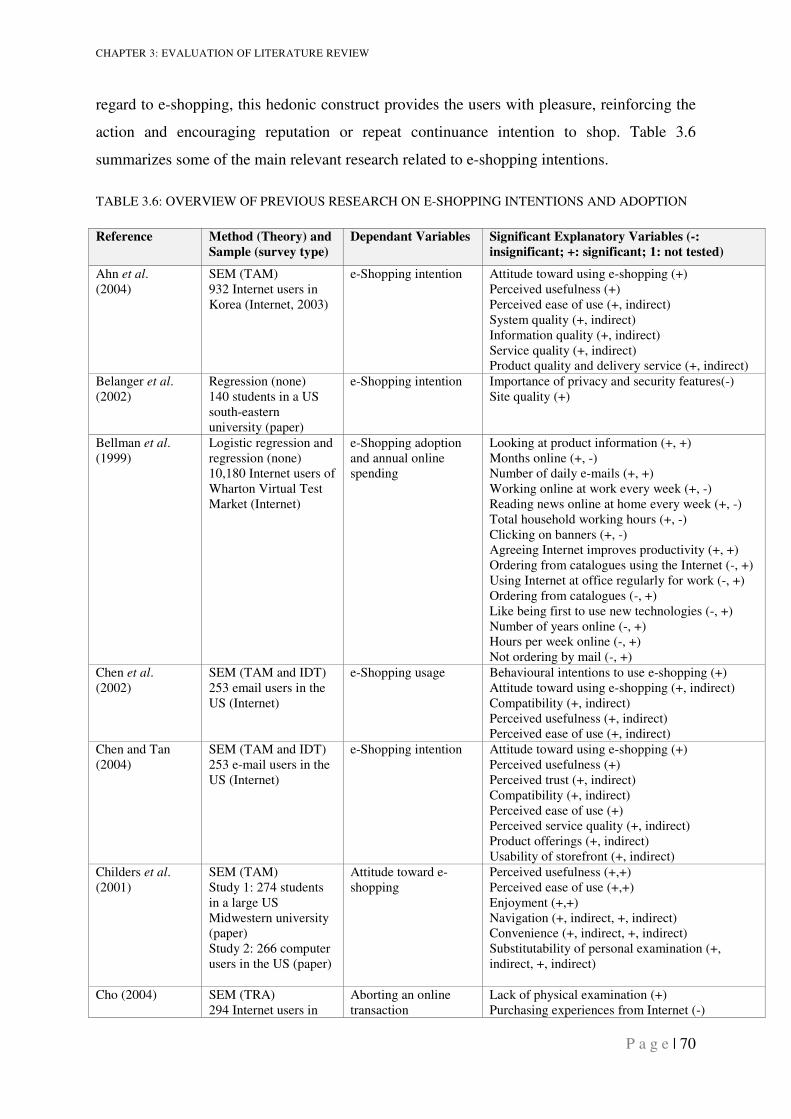
CHAPTER 3: EVALUATION OF LITERATURE REVIEW
P a g e | 70
regard to e-shopping, this hedonic construct provides the users with pleasure, reinforcing the
action and encouraging reputation or repeat continuance intention to shop. Table 3.6
summarizes some of the main relevant research related to e-shopping intentions.
TABLE 3.6: OVERVIEW OF PREVIOUS RESEARCH ON E-SHOPPING INTENTIONS AND ADOPTION
Reference Method (Theory) and
Sample (survey type)
Dependant Variables Significant Explanatory Variables (-:
insignificant; +: significant; 1: not tested)
Ahn et al. (2004)
SEM (TAM) 932 Internet users in Korea (Internet, 2003)
e-Shopping intention Attitude toward using e-shopping (+) Perceived usefulness (+) Perceived ease of use (+, indirect) System quality (+, indirect) Information quality (+, indirect) Service quality (+, indirect) Product quality and delivery service (+, indirect)
Belanger et al. (2002)
Regression (none) 140 students in a US south-eastern university (paper)
e-Shopping intention Importance of privacy and security features(-) Site quality (+)
Bellman et al. (1999)
Logistic regression and regression (none) 10,180 Internet users of Wharton Virtual Test Market (Internet)
e-Shopping adoption and annual online spending
Looking at product information (+, +) Months online (+, -) Number of daily e-mails (+, +) Working online at work every week (+, -) Reading news online at home every week (+, -) Total household working hours (+, -) Clicking on banners (+, -) Agreeing Internet improves productivity (+, +) Ordering from catalogues using the Internet (-, +) Using Internet at office regularly for work (-, +) Ordering from catalogues (-, +) Like being first to use new technologies (-, +) Number of years online (-, +) Hours per week online (-, +) Not ordering by mail (-, +)
Chen et al. (2002)
SEM (TAM and IDT) 253 email users in the US (Internet)
e-Shopping usage Behavioural intentions to use e-shopping (+) Attitude toward using e-shopping (+, indirect) Compatibility (+, indirect) Perceived usefulness (+, indirect) Perceived ease of use (+, indirect)
Chen and Tan (2004)
SEM (TAM and IDT) 253 e-mail users in the US (Internet)
e-Shopping intention Attitude toward using e-shopping (+) Perceived usefulness (+) Perceived trust (+, indirect) Compatibility (+, indirect) Perceived ease of use (+) Perceived service quality (+, indirect) Product offerings (+, indirect) Usability of storefront (+, indirect)
Childers et al. (2001)
SEM (TAM) Study 1: 274 students in a large US Midwestern university (paper) Study 2: 266 computer users in the US (paper)
Attitude toward e-shopping
Perceived usefulness (+,+) Perceived ease of use (+,+) Enjoyment (+,+) Navigation (+, indirect, +, indirect) Convenience (+, indirect, +, indirect) Substitutability of personal examination (+, indirect, +, indirect)
Cho (2004) SEM (TRA) 294 Internet users in
Aborting an online transaction
Lack of physical examination (+) Purchasing experiences from Internet (-)
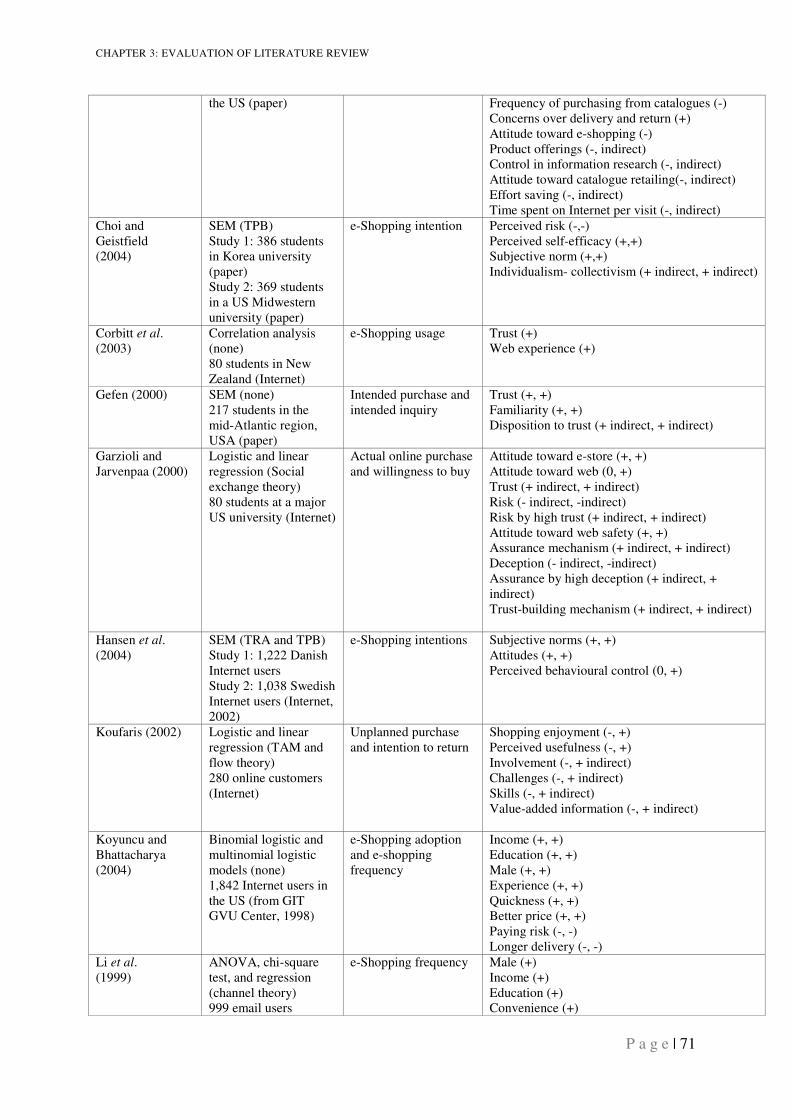
CHAPTER 3: EVALUATION OF LITERATURE REVIEW
P a g e | 71
the US (paper) Frequency of purchasing from catalogues (-) Concerns over delivery and return (+) Attitude toward e-shopping (-) Product offerings (-, indirect) Control in information research (-, indirect) Attitude toward catalogue retailing(-, indirect) Effort saving (-, indirect) Time spent on Internet per visit (-, indirect)
Choi and Geistfield (2004)
SEM (TPB) Study 1: 386 students in Korea university (paper) Study 2: 369 students in a US Midwestern university (paper)
e-Shopping intention Perceived risk (-,-) Perceived self-efficacy (+,+) Subjective norm (+,+) Individualism- collectivism (+ indirect, + indirect)
Corbitt et al. (2003)
Correlation analysis (none) 80 students in New Zealand (Internet)
e-Shopping usage Trust (+) Web experience (+)
Gefen (2000) SEM (none) 217 students in the mid-Atlantic region, USA (paper)
Intended purchase and intended inquiry
Trust (+, +) Familiarity (+, +) Disposition to trust (+ indirect, + indirect)
Garzioli and Jarvenpaa (2000)
Logistic and linear regression (Social exchange theory) 80 students at a major US university (Internet)
Actual online purchase and willingness to buy
Attitude toward e-store (+, +) Attitude toward web (0, +) Trust (+ indirect, + indirect) Risk (- indirect, -indirect) Risk by high trust (+ indirect, + indirect) Attitude toward web safety (+, +) Assurance mechanism (+ indirect, + indirect) Deception (- indirect, -indirect) Assurance by high deception (+ indirect, + indirect) Trust-building mechanism (+ indirect, + indirect)
Hansen et al. (2004)
SEM (TRA and TPB) Study 1: 1,222 Danish Internet users Study 2: 1,038 Swedish Internet users (Internet, 2002)
e-Shopping intentions Subjective norms (+, +) Attitudes (+, +) Perceived behavioural control (0, +)
Koufaris (2002) Logistic and linear regression (TAM and flow theory) 280 online customers (Internet)
Unplanned purchase and intention to return
Shopping enjoyment (-, +) Perceived usefulness (-, +) Involvement (-, + indirect) Challenges (-, + indirect) Skills (-, + indirect) Value-added information (-, + indirect)
Koyuncu and Bhattacharya (2004)
Binomial logistic and multinomial logistic models (none) 1,842 Internet users in the US (from GIT GVU Center, 1998)
e-Shopping adoption and e-shopping frequency
Income (+, +) Education (+, +) Male (+, +) Experience (+, +) Quickness (+, +) Better price (+, +) Paying risk (-, -) Longer delivery (-, -)
Li et al. (1999)
ANOVA, chi-square test, and regression (channel theory) 999 email users
e-Shopping frequency Male (+) Income (+) Education (+) Convenience (+)
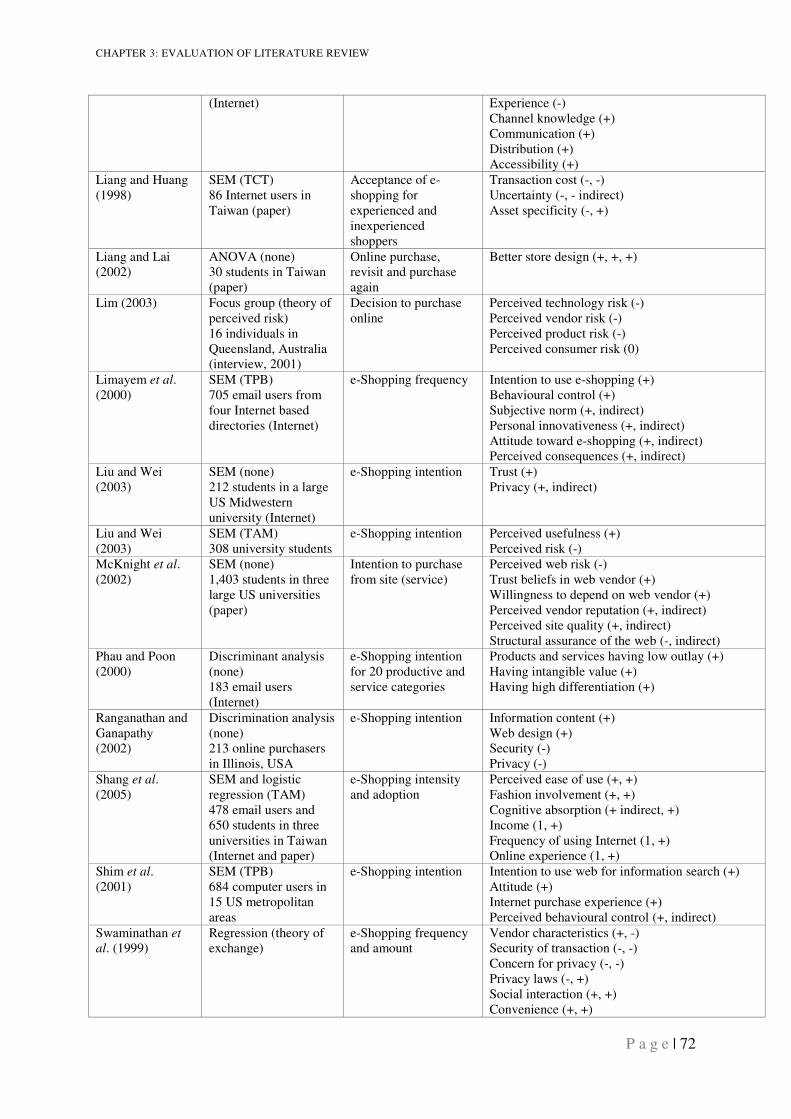
CHAPTER 3: EVALUATION OF LITERATURE REVIEW
P a g e | 72
(Internet) Experience (-) Channel knowledge (+) Communication (+) Distribution (+) Accessibility (+)
Liang and Huang (1998)
SEM (TCT) 86 Internet users in Taiwan (paper)
Acceptance of e-shopping for experienced and inexperienced shoppers
Transaction cost (-, -) Uncertainty (-, - indirect) Asset specificity (-, +)
Liang and Lai (2002)
ANOVA (none) 30 students in Taiwan (paper)
Online purchase, revisit and purchase again
Better store design (+, +, +)
Lim (2003) Focus group (theory of perceived risk) 16 individuals in Queensland, Australia (interview, 2001)
Decision to purchase online
Perceived technology risk (-) Perceived vendor risk (-) Perceived product risk (-) Perceived consumer risk (0)
Limayem et al. (2000)
SEM (TPB) 705 email users from four Internet based directories (Internet)
e-Shopping frequency Intention to use e-shopping (+) Behavioural control (+) Subjective norm (+, indirect) Personal innovativeness (+, indirect) Attitude toward e-shopping (+, indirect) Perceived consequences (+, indirect)
Liu and Wei (2003)
SEM (none) 212 students in a large US Midwestern university (Internet)
e-Shopping intention Trust (+) Privacy (+, indirect)
Liu and Wei (2003)
SEM (TAM) 308 university students
e-Shopping intention Perceived usefulness (+) Perceived risk (-)
McKnight et al. (2002)
SEM (none) 1,403 students in three large US universities (paper)
Intention to purchase from site (service)
Perceived web risk (-) Trust beliefs in web vendor (+) Willingness to depend on web vendor (+) Perceived vendor reputation (+, indirect) Perceived site quality (+, indirect) Structural assurance of the web (-, indirect)
Phau and Poon (2000)
Discriminant analysis (none) 183 email users (Internet)
e-Shopping intention for 20 productive and service categories
Products and services having low outlay (+) Having intangible value (+) Having high differentiation (+)
Ranganathan and Ganapathy (2002)
Discrimination analysis (none) 213 online purchasers in Illinois, USA
e-Shopping intention Information content (+) Web design (+) Security (-) Privacy (-)
Shang et al. (2005)
SEM and logistic regression (TAM) 478 email users and 650 students in three universities in Taiwan (Internet and paper)
e-Shopping intensity and adoption
Perceived ease of use (+, +) Fashion involvement (+, +) Cognitive absorption (+ indirect, +) Income (1, +) Frequency of using Internet (1, +) Online experience (1, +)
Shim et al. (2001)
SEM (TPB) 684 computer users in 15 US metropolitan areas
e-Shopping intention Intention to use web for information search (+) Attitude (+) Internet purchase experience (+) Perceived behavioural control (+, indirect)
Swaminathan et
al. (1999) Regression (theory of exchange)
e-Shopping frequency and amount
Vendor characteristics (+, -) Security of transaction (-, -) Concern for privacy (-, -) Privacy laws (-, +) Social interaction (+, +) Convenience (+, +)
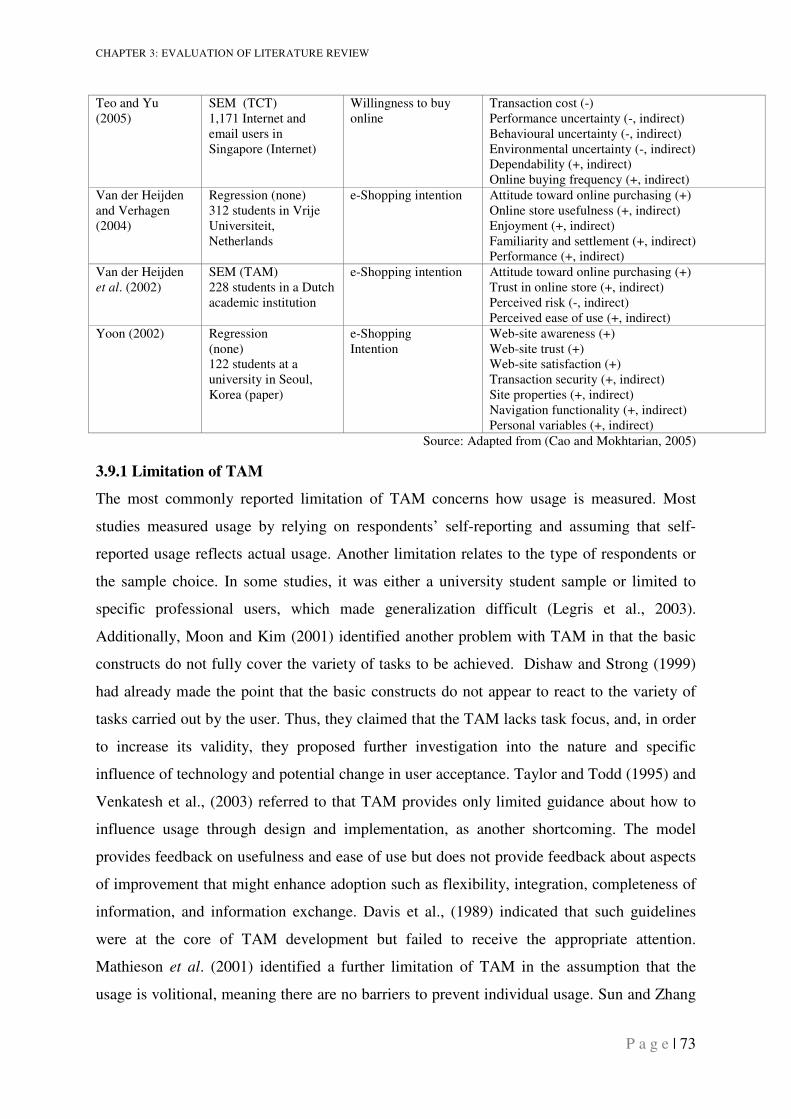
CHAPTER 3: EVALUATION OF LITERATURE REVIEW
P a g e | 73
Teo and Yu (2005)
SEM (TCT) 1,171 Internet and email users in Singapore (Internet)
Willingness to buy online
Transaction cost (-) Performance uncertainty (-, indirect) Behavioural uncertainty (-, indirect) Environmental uncertainty (-, indirect) Dependability (+, indirect) Online buying frequency (+, indirect)
Van der Heijden and Verhagen (2004)
Regression (none) 312 students in Vrije Universiteit, Netherlands
e-Shopping intention Attitude toward online purchasing (+) Online store usefulness (+, indirect) Enjoyment (+, indirect) Familiarity and settlement (+, indirect) Performance (+, indirect)
Van der Heijden et al. (2002)
SEM (TAM) 228 students in a Dutch academic institution
e-Shopping intention Attitude toward online purchasing (+) Trust in online store (+, indirect) Perceived risk (-, indirect) Perceived ease of use (+, indirect)
Yoon (2002) Regression (none) 122 students at a university in Seoul, Korea (paper)
e-Shopping Intention
Web-site awareness (+) Web-site trust (+) Web-site satisfaction (+) Transaction security (+, indirect) Site properties (+, indirect) Navigation functionality (+, indirect) Personal variables (+, indirect)
Source: Adapted from (Cao and Mokhtarian, 2005)
3.9.1 Limitation of TAM
The most commonly reported limitation of TAM concerns how usage is measured. Most
studies measured usage by relying on respondents’ self-reporting and assuming that self-
reported usage reflects actual usage. Another limitation relates to the type of respondents or
the sample choice. In some studies, it was either a university student sample or limited to
specific professional users, which made generalization difficult (Legris et al., 2003).
Additionally, Moon and Kim (2001) identified another problem with TAM in that the basic
constructs do not fully cover the variety of tasks to be achieved. Dishaw and Strong (1999)
had already made the point that the basic constructs do not appear to react to the variety of
tasks carried out by the user. Thus, they claimed that the TAM lacks task focus, and, in order
to increase its validity, they proposed further investigation into the nature and specific
influence of technology and potential change in user acceptance. Taylor and Todd (1995) and
Venkatesh et al., (2003) referred to that TAM provides only limited guidance about how to
influence usage through design and implementation, as another shortcoming. The model
provides feedback on usefulness and ease of use but does not provide feedback about aspects
of improvement that might enhance adoption such as flexibility, integration, completeness of
information, and information exchange. Davis et al., (1989) indicated that such guidelines
were at the core of TAM development but failed to receive the appropriate attention.
Mathieson et al. (2001) identified a further limitation of TAM in the assumption that the
usage is volitional, meaning there are no barriers to prevent individual usage. Sun and Zhang
CHAPTER 3: EVALUATION OF LITERATURE REVIEW
P a g e | 74
(2006) stated other two major shortcomings of TAM studies: first, the relatively low
explanatory power of the model (40 per cent on average) and second, the inconsistent
relationships among constructs. The relationships between the major constructs of TAM
showed an inconsistent pattern; in some studies the relations were statistically significant
indicating TAM as a robust model, while other studies showed the opposite, for example,
PEOU effects on attitude, behaviour intentions and usage were inconsistent. In addition, the
relationship between PEOU and PU was significant in most studies; however, there were
exceptions to that relationship and reasons were attributable to the type of users or their
experience (professional users have different intellectual capacities, and the more
experienced the users are the less likely the effect of PEOU on PU).
In an attempt to overcome these limitations, TAM2 was developed to cover for the absence of
moderators in the original TAM.
3.10. EXTENSION OF THE TECHNOLOGY ACCEPTANCE MODEL
(TAM2)
Venkatesh and Davis (2000) extended the original TAM model to explain perceived
usefulness and usage intentions in terms of social influence and cognitive instrumental
processes. As mentioned earlier, the original TAM model was based on Aizen’s TRA model
but did not originally include the subjective norms construct. Since TAM’s introduction,
many additional studies have built on TAM’s promising robustness, trying to compare TAM
to its origins and with other models used in explaining technology acceptance such as
Diffusion of Innovation Theory. Previous studies agreed upon the need for adding other
variables to serve as determinants of the major construct, in addition to the original model
determinants of PU and PEOU. TAM2, an extension of TAM, includes additional key
determinants of perceived usefulness and usage intention constructs aiming to explain the
changes in technology acceptance over time as individuals gain experience in using the
targeted technology (see Figure 3.13). The new model incorporates additional theoretical
constructs covering social influence processes (subjective norm, voluntariness, and image)
and cognitive instrumental processes (job relevance, output quality, result demonstrability,
and perceived ease of use).
Venkatesh and Davis (2000) explained the role of social influences in computer usage
contexts. According to them, TAM2 theorizes that the direct effect of subjective norms on
CHAPTER 3: EVALUATION OF LITERATURE REVIEW
P a g e | 75
intention over PU and PEOU will occur in mandatory system usage settings. The model
posits voluntariness as a moderating variable to distinguish between mandatory versus
voluntary compliance with organizational settings. Nevertheless, subjective norms can
influence intention through PU. In addition, TAM2 theorizes that internalization rather than
compliance will occur no matter whether the usage context is voluntary or mandatory. That
is, even when usage is mandated by the organization, it is the user’s perception of a system’s
usefulness through persuasive social information that will increase his/her intention towards
adoption or usage of the system.
On the other hand, through identification subjective norms will positively influence image.
An individual will have stronger intentions to use a target system if important members
within his/her social group believe he/she should. Experience is theorized to mediate the
relations between subjective norms and intentions on one hand and subjective norms-PU on
the other. As mentioned previously, the relation between SN and intention would be stronger
in a mandatory usage context and prior to implementation or at early stages of use.
Correspondingly, the relationship is expected to weaken with experience gained during
system usage. In contrast, TAM2 does not theorize that experience affects the image-PU
relation or that such relation might weaken over time.
As for the cognitive instrumental process, TAM2 proposes that individuals rely on the match
between their job goals and the outcomes of using the system (job relevance) as a basis for
their evaluation of the system usefulness (usefulness perceptions). The same is valid when it
comes to result demonstrability and output quality; if both are effective then the system used
is perceived as useful. Such relation does not change with increased experience. The results
of Venkatesh and Davis’ (2000) four longitudinal studies carried out on four different
systems at four organizations at three points in time showed that the new model, TAM2,
explained 34-52 per cent of the variance in usage intention and up to 60 per cent of the
variance in perceived usefulness.
The new model was tested and adopted by other disciplines. For instance, in the health sector
field, Chismar and Wiley-Patton (2003) tested the applicability of TAM2 to the acceptance of
Internet and Internet-based health applications within 89 paediatric physicians. Results
partially confirmed the model; however, a core construct of the model, perceived ease of use,
was not supported by the findings. PEOU did not predict intention to use while PU was a
strong determinant of intention to use. In their explanation of these findings the authors stated
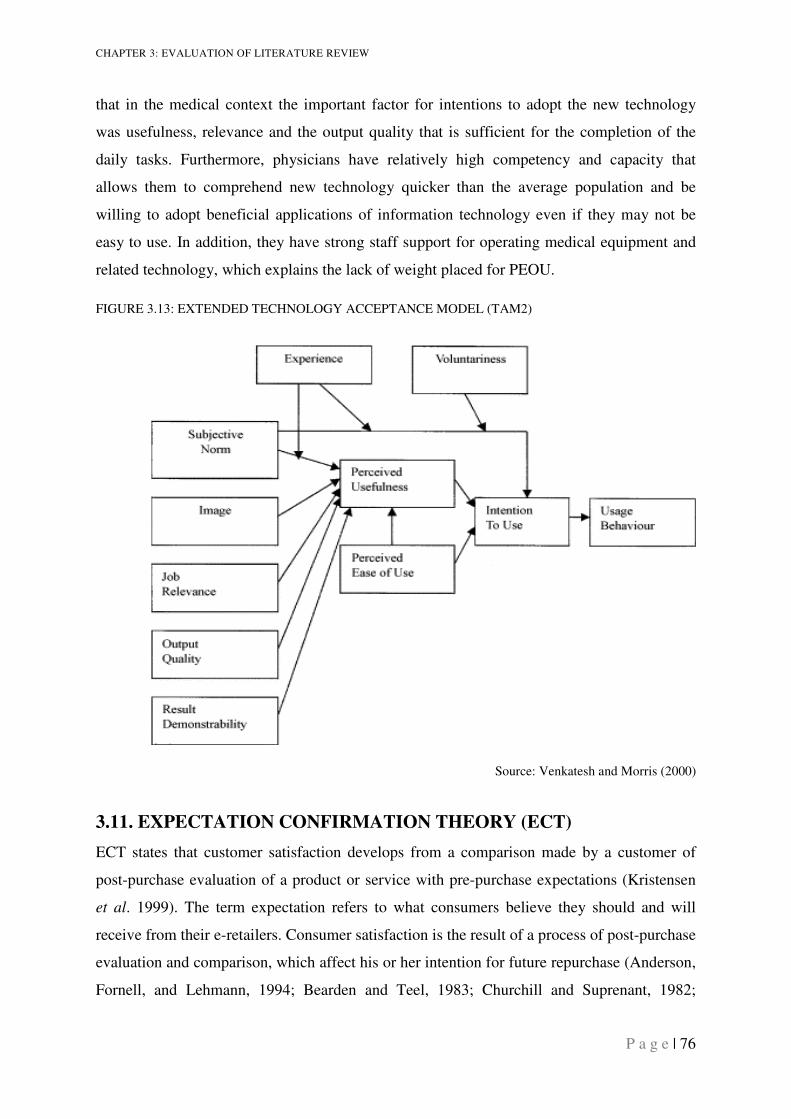
CHAPTER 3: EVALUATION OF LITERATURE REVIEW
P a g e | 76
that in the medical context the important factor for intentions to adopt the new technology
was usefulness, relevance and the output quality that is sufficient for the completion of the
daily tasks. Furthermore, physicians have relatively high competency and capacity that
allows them to comprehend new technology quicker than the average population and be
willing to adopt beneficial applications of information technology even if they may not be
easy to use. In addition, they have strong staff support for operating medical equipment and
related technology, which explains the lack of weight placed for PEOU.
FIGURE 3.13: EXTENDED TECHNOLOGY ACCEPTANCE MODEL (TAM2)
Source: Venkatesh and Morris (2000)
3.11. EXPECTATION CONFIRMATION THEORY (ECT)
ECT states that customer satisfaction develops from a comparison made by a customer of
post-purchase evaluation of a product or service with pre-purchase expectations (Kristensen
et al. 1999). The term expectation refers to what consumers believe they should and will
receive from their e-retailers. Consumer satisfaction is the result of a process of post-purchase
evaluation and comparison, which affect his or her intention for future repurchase (Anderson,
Fornell, and Lehmann, 1994; Bearden and Teel, 1983; Churchill and Suprenant, 1982;
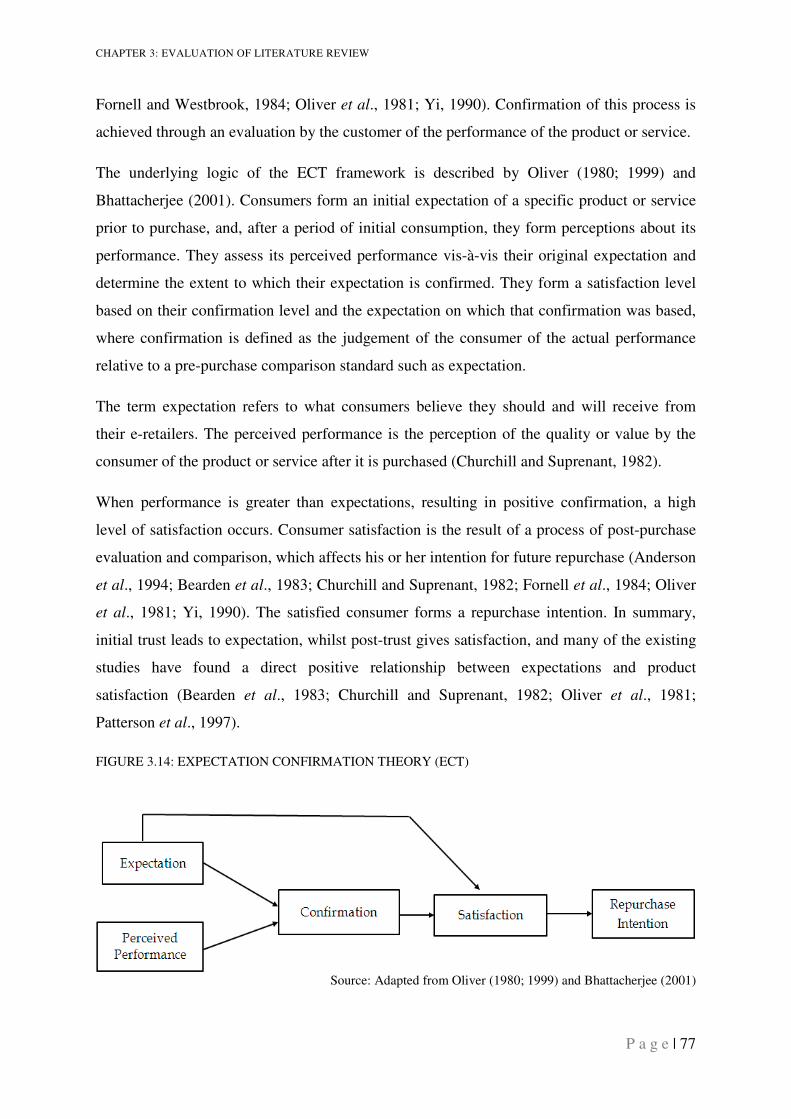
CHAPTER 3: EVALUATION OF LITERATURE REVIEW
P a g e | 77
Fornell and Westbrook, 1984; Oliver et al., 1981; Yi, 1990). Confirmation of this process is
achieved through an evaluation by the customer of the performance of the product or service.
The underlying logic of the ECT framework is described by Oliver (1980; 1999) and
Bhattacherjee (2001). Consumers form an initial expectation of a specific product or service
prior to purchase, and, after a period of initial consumption, they form perceptions about its
performance. They assess its perceived performance vis-à-vis their original expectation and
determine the extent to which their expectation is confirmed. They form a satisfaction level
based on their confirmation level and the expectation on which that confirmation was based,
where confirmation is defined as the judgement of the consumer of the actual performance
relative to a pre-purchase comparison standard such as expectation.
The term expectation refers to what consumers believe they should and will receive from
their e-retailers. The perceived performance is the perception of the quality or value by the
consumer of the product or service after it is purchased (Churchill and Suprenant, 1982).
When performance is greater than expectations, resulting in positive confirmation, a high
level of satisfaction occurs. Consumer satisfaction is the result of a process of post-purchase
evaluation and comparison, which affects his or her intention for future repurchase (Anderson
et al., 1994; Bearden et al., 1983; Churchill and Suprenant, 1982; Fornell et al., 1984; Oliver
et al., 1981; Yi, 1990). The satisfied consumer forms a repurchase intention. In summary,
initial trust leads to expectation, whilst post-trust gives satisfaction, and many of the existing
studies have found a direct positive relationship between expectations and product
satisfaction (Bearden et al., 1983; Churchill and Suprenant, 1982; Oliver et al., 1981;
Patterson et al., 1997).
FIGURE 3.14: EXPECTATION CONFIRMATION THEORY (ECT)
Source: Adapted from Oliver (1980; 1999) and Bhattacherjee (2001)
CHAPTER 3: EVALUATION OF LITERATURE REVIEW
P a g e | 78
The ECT has also postulated satisfaction, confirmation, and loyalty incentives to explain
consumer online repurchasing behaviour (Bhattacherjee, 2001a). Through the literature
review it can be seen that more emphasis of online repurchase was placed on factors coming
from the psychological discipline. In the context of online consumer behaviour, for example,
trust has been given great attention (Fung and Lee, 1999; Lee, Kim, and Moon, 2000) and
satisfaction formation (Khalifa and Liu, 2001). Other studies have examined different factors
of consumer online purchase continuance intention, such as web page design, navigation,
security, shopping aids (Liang and Lai, 2002), and service quality (Gefen and Devine, 2001).
Atchariyachanvanich, Okada, and Sonehara (2007) propose a theoretical model of purchase
and repurchase in Internet shopping that integrates the previously introduced models (the
Technology Acceptance Model (TAM) and the Expectation Confirmation Theory (ECT))
with the Model of Intention of Adoption and Continuance (MIAC). They tested their model
among Japanese consumers and the results of their study indicate that online consumer
purchasing intentions are positively related to the adoption of online shopping and directly
influenced by the continuance of the Internet shopping processes.
The ECT is particularly useful because it includes post-acceptance behaviour, which is
commonly used in consumer behaviour literature. However, the use of ECT theory within the
information systems field is important as the information systems are generally programmed
in the web environment. Refinement for use within the web context is, therefore, necessary
(Atchariyachanvanich et al., 2007). Important links exist between ECT and factors
surrounding customer loyalty. In particular, perceived incentives are found to have a
profound effect on repurchase intention, which is in contrast to the findings of Bhattacherjee
(2001b). Lin, Wub, and Tsaic, (2005) state that the extended model of ECT shows that
confirmation is a stronger predictor of satisfaction than perceived playfulness, but did not
have a significant effect on satisfaction.
Kim et al.’s (2003) research supports ECT’s proposition that satisfaction is a strong predictor
of consumer continuance intention. They also identified the close link between satisfaction
and confirmation, indicating the fulfilment of consumers’ expectations. They also cite the
work of Hart and Johnson (1999) regarding the trust-satisfaction relationship, stating that it
‘can easily be broken when a trust defect is committed’, and lead to ‘an erosion in a
company’s trust equity’.
CHAPTER 3: EVALUATION OF LITERATURE REVIEW
P a g e | 79
Thong, Hong, and Tam (2006) find strong support for including post-adoption beliefs, such
as perceived ease of use and perceived enjoyment, in the expanded model. This contributes to
the development of improved IT continuance behaviour. They specifically refer to mobile
Internet services as a complex consumer-oriented technology, and suggest the formulation of
a richer model.
3.11.1. Limitations of ECT
ECT ignores potential changes in initial expectations following the consumption experience
and the effect of these expectation changes on subsequent cognitive processes (Bhattacherjee
2001a). Pre-purchase expectations typically are based on others’ opinions or information
from mass media, whereas post-purchase expectations derive from first-hand experience,
which appears more realistic (Fazio and Zanna, 1981; Lin et al., 2005). After such
experience, expectations may increase if consumers believe the product or service is useful or
contains new benefits and features that were not part of their initial expectation. Thus,
consumers keep updating expectation toward using a technology as they gain more
experience from using it. Therefore, after assimilation of this experience, a user’s
expectations toward using a technology might be very different from the initial experience
before usage (Fazio and Zanna, 1981; Karahanna et al., 1999; Bhattacherjee, 2001b). Other
researchers (e.g., Thong et al, 2006) have concluded that expectations coming from
consumers’ direct experiences (post-adoption expectations) are the main predictors of
consumer satisfaction. In the expectation confirmation paradigm, expectation is commonly
defined as individual beliefs about the level of attributes possessed by a product or service
(Oliver and Linda, 1981; Churchill and Surprenant, 1982, Bearden and Teel, 1983). Based on
the previous researches (e.g., Davis et al., 1989; Karahanna et al., 1999; Venkatesh, 2000),
perceived usefulness is the most consistent antecedent of consumer’s intention to use IT.
Thong (2006) therefore indicated that it is more logical to have usefulness as a surrogate for
post-adoption expectations in future research when measuring intention.
3.12. RESEARCH CONSTRUCTS
3.12.1. Trust
Trust is accepted as an important factor in almost all social interactions, especially those
involving uncertainty and dependency. Uncertainty, anonymity, lack of control and potential
opportunism are essential characteristics of online transactions and exchange relationships,
CHAPTER 3: EVALUATION OF LITERATURE REVIEW
P a g e | 80
making risk and trust crucial elements of e-commerce. The process of purchasing on the
Internet presents numerous risks for consumers over and above the transaction process itself
being perceived as risky (Einwiller, Geissler, and Will, 2000), particularly where there is not
a simultaneous exchange of goods and money.
As part of the purchasing process, consumers may well need to share confidential information
about themselves, such as address and telephone numbers, as well as financial data in the
form of credit card details since a growing number of e-businesses are situated distant from
their customers and have a limited history of prior on-line transactions (Bhattacherjee, 2002).
The competitive nature of the market means that consumers are often faced with a wide range
of similar products or services to choose from, and are often confused by the vast array of
marketing messages directed at them. Consumers, however, are unaware of what e-retailers
might do with the sensitive information held about them as a result of shopping. Indeed, there
appears to be little certainty attached to the process in terms of delivery time, for example.
Therefore, consumers seek to reduce uncertainty and complexity of transactions in electronic
markets by applying mental shortcuts. One effective mental shortcut is trust, which can serve
as mechanism to reduce the complexity of human conduct in situations where people have to
cope with uncertainty (Luhmann, 1979).
Lack of consumer trust in e-retailers is one of the most common reasons for failure to
purchase from internet vendors (e.g. Lee and Turban, 2001). “In essence, consumers simply
do not trust most web providers enough to engage in relationship exchanges with them”
(Hoffman et al., 1999). This, the relevance of initiating, building, and maintaining trust
between buyers and sellers is of significance to successful trading, and is increasingly
recognized.
People develop trust in the web store through a number of factors. One is the perceived size
of the company; another is their reputation (Jarvenpaa et al., 2000). Thus, the larger the
perceived reputation, the greater the trust in the company. Reputation is closely related to
familiarity with the store, which researchers have also identified as an antecedent of trust, and
familiarity deals with as understanding of current actions of the store, while trust deals with
beliefs about the future actions of other people (Gefen, 2000). Therefore, it is conceivable
that trust can be considered a ‘threshold’ variable, along with ease of use, and usefulness.
The intention to behave is the prime determinant of the actual behaviour. This means that
once a certain evaluation level is reached, the variable no longer contributes to a favourable
CHAPTER 3: EVALUATION OF LITERATURE REVIEW
P a g e | 81
attitude. A shopper may or may not purchase at a trustworthy website, but he or she will
definitely not purchase at an untrustworthy site.
The importance of trust and the search for information are alternative mechanisms to absorb
uncertainty (Luhmann, 1979; Wicks, Berman, and Jones, 1999). In simple terms, the more a
person trusts in a given situation, the less additional information she or he needs to make a
certain decision. Conversely, where little trust exists, there will be a need for greater
completeness of information so that system-dependent and transaction-specific uncertainty is
reduced and to establish better trust. The fear of potential outcomes, resulting from an action
in terms of trust and information, creates the need to deal with uncertainty (Tomkins, 2001).
In the initial stages of the introduction of new technologies such as the Internet, it is
necessary to provide information about both the basic functioning and security of the e-
commerce system. This will have the effect of reducing any system-dependent uncertainty
and information-concerning characteristics and processes of the e-retailer so that transaction-
specific uncertainty can be reduced.
Trust has been the centre of interest in research for many years in a variety of different
contexts. As many types and views of trust as there are, there are also many fields which
study the phenomenon (Marsh, 1994). The significance of the importance of trust has been
analysed in relation to human affairs, but there also appears to be equally widespread lack of
agreement on a suitable definition of the concept (Hosmer, 1995; Rousseau et al., 1998;
Bhattacharya and Devinney, 1998; Husted, 1998).
Psychologists have viewed trust as a belief, an expectancy, or a feeling that is deeply rooted
in the personality and has its origins in the individual's early psychological development
(Rotter, 1967; 1971). They also define trust as an expectation about the behaviour of others in
transactions, focusing on the contextual factors that serve either to enhance or inhibit the
development and maintenance of trust (Lewicki and Bunker, 1995), whilst economists and
sociologists have been interested in how institutions and incentives are created to reduce the
anxiety and uncertainty associated with transactions (Granovetter, 1985; Zucker, 1986;
Williamson, 1993). Other studies have adopted different approaches, including finance (e.g.
Güth, 2001; Ferrary, 2002), marketing (e.g. Ganesan, 1994; Morgan and Hunt, 1994; Doney
and Cannon, 1997; Geyskens, Steenkamp, and Kumar, 1997; Swan, Bowers, and Richardson,
1999), and management (e.g. Mayer, Davis, and Schoorman, 1995; Gill and Butler, 1996;
Inkpen and Currall, 1998; McKnight, Cummings, and Chervany, 1998; Wicks et al., Berman,
CHAPTER 3: EVALUATION OF LITERATURE REVIEW
P a g e | 82
and Jones, 1999; Luo, 2002). Therefore, trust has been defined in different ways according to
the related discipline in question, and a consequent lack of clarity has arisen.
The importance of trust is related to the context of an action and its complexity. An analysis
of market transactions shows that different types of trust have to be identified. Trust can be
conceptualized on different levels of analysis, reflecting the array of entities, individuals,
dyads, groups, networks, systems, firms and inter-firm alliances in which trust and related
processes play a role (Rousseau et al., 1998). It can also focus on relationships between
individuals, but the analysis of trust in the context of electronic commerce should consider
impersonal forms of trust as well, because in electronic markets personal trust is a rather
limited mechanism to reduce uncertainty. The technology itself, in this case the Internet, has
to be considered as an object of trust (Shankar et al., 2002). Luhmann (1979) discusses
system trust, whereby a system is assumed to be operating in a predictable way; for example,
an e-commerce system is expected to function as it supposes to be. Such impersonal trust
helps to reduce system-dependent uncertainty, but it can also influence the perception of
transaction-specific risks.
One of the most frequently cited definitions in the literature on trust in e-commerce is the one
worked out by Mayer et al. (1995), who define trust as ‘the willingness of a party to be
vulnerable to the actions of another party based on the expectation that the other will perform
a particular action important to the trustor, irrespective of the ability to monitor or control that
other party’. This can be applied particularly to the personal relationship between at least two
parties, such as can be seen between a trustor and a trustee. The object of trust, in this case, is
another person or a group of persons, but not an abstract or technical system. In e-commerce,
usually the consumer is seen as the party who places him or herself in a vulnerable situation,
whilst the Internet merchant is the trustee, in whom trust is placed and who has the
opportunity to take advantage of the trustor's vulnerability. Husted (1998) and Mayer et al.
(1995) have both identified that ability; benevolence and integrity explain a major portion of
a trustee's trustworthiness.
McKnight and Chervany (2002) , in proposing a trust typology that comprises different forms
of interpersonal trust, distinguish in the context of e-commerce between the constructs of
trusting beliefs and trusting intentions. Trusting beliefs include the online consumer's beliefs
and expectancies about trust-related characteristics of the Internet merchant (McKnight and
Chervany, 2002), whereas trusting intention is the extent to which the online consumer is
CHAPTER 3: EVALUATION OF LITERATURE REVIEW
P a g e | 83
willing to depend on, or intends to depend on, the selling party in a given situation even
though she/he cannot control the vendor.
Mayer et al. (1995) as well as McKnight and Chervany (2002) emphasize the difference
between trust and trusting behaviours. “Trust is the willingness to assume risk; behavioural
trust is the assuming of risk” (Mayer et al., 1995). Whether or not the trustor will take a
specific risk is influenced by trusting beliefs, trusting intentions and by the perceived risk of
the trusting behaviour.
Thus, trust has been treated as a situational construct, but it can also be conceptualized as a
cross-situational, cross-personal construct, encompassing individual characteristics of the
trustor. This type of trust is called dispositional trust. Mayer et al. (1995) include a very
similar construct of propensity to trust in their trust model. Rotter (1967) recognizes that
people develop, over the course of their lives, generalized expectations about the
trustworthiness of other people, and has established a Trust Index that focuses on a
generalized trust in others.
3.12.1.1. Conceptual and Theoretical Description of Trust
Some sources find it difficult to define an appropriate type of trust for a particular context.
McKnight et al (2002) use the idea of characteristics, suggesting that there are 16 categories
of trust, which can be grouped as into five conceptual characteristics. These are competence,
predictability, benevolence, integrity and others.
McKnight et al. (2002) also argue that in the IT context the most suitable trust
conceptualization is trust as a set of beliefs and intentions. Trusting intention is the
willingness to depend on, or intention to depend on, another party even though one cannot
control that party. They argue that most trusting intentions definitions contain three elements:
a readiness to depend or rely on another; trusting intentions which are person-specific; and
trusting intentions that involve willingness without having control or power over the other
party. Willingness to depend is a trust dimension, such that it reflects volitional vulnerability,
a concept commonly used to define trust (Mayer et al., 1995). If a buyer is willing to depend
on a vendor, and thus accept general vulnerability, then the buyer is more likely to be willing
to accept the specific vulnerabilities associated with using the vendor’s site. Trusting belief is
the belief of one party that the other party has one or more characteristics beneficial to that
party (Mayer et al., 1995; McKnight and Chervany, 2002; Mishra, Kramer, and Tyler, 1996).
CHAPTER 3: EVALUATION OF LITERATURE REVIEW
P a g e | 84
Despite the fact that the parties may have little knowledge and information about each other,
trusting beliefs can form quickly; the customer may want the e-vendor to be willing and able
to act in the customer’s interest, honest in transactions, and both capable of, and predictable
in, delivering as promised (McKnight and Chervany, 2002). Looking at characteristics,
trusting beliefs are generally cognitive in nature, and are therefore similar to the conceptual
beliefs structure of TAM. They are, thus, perceptions of the trustworthiness, often developed
from research that has considered the trust fundamentals to be perceptions about the ethical
character (Ring and Van de Ven, 1994), ability (Gabarro, 1978), predictability (Rempel et al.,
1985) of the other party, or combinations of such attributes (McKnight et al., 2002). These
researchers have viewed them as focused on four concepts: integrity (trustee honesty and
promise keeping); benevolence (trustee caring and motivation to act in the trustor’s interests);
competence (ability of the trustee to do what the trustor needs); and predictability
(consistency of trustee behaviour) (McKnight et al., 1998).
Technology and trust issues are important in understanding online consumer behaviour, yet
their inclusion in traditional consumer behaviour is inconsistent. A greater degree of trust is
required in online shopping, for example, than in a physical branch of a retailer. Trust can
support and promote interaction between a consumer and an e-vendor when the latter is
unknown and the quality of a product or service is uncertain (Tan and Thoen, 2001).
According to Keen et al., (1999) it is now accepted that trust is an important issue for all
those who engage in e-commerce.
3.12.2. Enjoyment
Perceived enjoyment (PE) refers to the extent to which the activity of using an e-commerce
website is enjoyable in its own right aside from the instrumental value of the site (Davis, et
al. 1992). Additionally, Childers et al. (2001) stated that “shopping enjoyment is the extent to
which one believes that shopping will provide reinforcement in its own right, going beyond
performance consequences” and such enjoyment extends to the online channel (Bauer, Falk,
and Hammerschmidt, 2006). Perceived enjoyment occurs after at least some exploration of
the website. Attractiveness, which is part of the site quality, is found to have significant
positive impact on perceived enjoyment (Van der Heijden, 2003).
There is some evidence that online consumers not only care for the instrumental value of the
technology, but also the more immersive, hedonic value (Childers et al., 2001; Van der
Heijden, 2000). There is ample evidence that not only usefulness (external motivation) but
also enjoyment (internal motivation) is a direct determinant of user acceptance of technology
CHAPTER 3: EVALUATION OF LITERATURE REVIEW
P a g e | 85
(Davis et al., 1992; Venkatesh, 1999). This is in line with a more recent evaluation of the
TRA, in recognition of the evidence that attitudes are not only based on cognition, but also on
affection (Ajzen, 1991). Consumers may, in general, expect to find more enjoyment in
interactive environments than they do when shopping in physical environment.
These studies confirm the relevance and appropriateness of ease of use and usefulness in an
online context, and find substantial evidence for the intrinsic enjoyment that many consumers
have when surfing the web (Teo et al., 1999; Lederer et al., 2000; Moon and Kim, 2001).
Perceived enjoyment or playfulness is a significant antecedent of Internet use (Teo et al.,
1999).
Childers et al., (2001) went on to describe the term ‘enjoyment’ to embody the hedonic
aspects, while usefulness and ease of use denoted the utilitarian ones. However, enjoyment
has often been reported as a motivator for ‘bricks’ shopping, and is thus an important
dimension for e-shopping. Childers et al. (2001) found enjoyment to be more important for e-
shopping that is described as hedonic as opposed to utilitarian. Moreover, Parsons (2003)
pointed out that customers could be drawn in by appealing to hedonic motivations, and then
switched to buying through the use of utilitarian ones (e.g. price based). Like conventional
shoppers, e-shoppers should prefer experience that creates positive feelings. Past research
suggests that entertainment-related factors are positively related to attitude to a website (Chen
and Wells, 1999; Coyle and Thorson, 2001; Donthu, 2001; Kwon, Kim, and Lee, 2002;
McMillan, Hwang, and Lee, 2003). A shopper may or may not purchase at a user-friendly
website, but he or she will definitely not purchase at user-unfriendly website.
Entertainment involves all website elements that promote enjoyment while using the site.
These include sensory and hedonic stimuli, like colour, music, action, and interactivity. In
addition, site designs that promote fantasy or suspense can also provide entertainment, as
might games, puzzles, streaming video, and virtual tours. Entertainment also appears to
increase attitude to online shopping (Jarvenpaa and Todd, 1997; Vijayasarathy and Jones,
2000), intention to shop online (Lynch, Kent, and Srinivasan, 2001), frequency of online
purchases (Korgaonkar and Wolin, 1999), and e-loyalty (Childers et al., 2001). They
recommended including ‘images, video, colour, humour, sound, music, games, animations,
and all other aspects of interactive, networked multimedia that make it enjoyable’ – i.e. web
atmospherics.
CHAPTER 3: EVALUATION OF LITERATURE REVIEW
P a g e | 86
3.12.3. Site Quality
An e-vendor’s web presence is the main source upon which a customer can judge its
trustworthiness in the absence of other ‘real world’ tangible cues. Website quality is unique
to the online context and is unanimously seen as a vital factor during the online initial
purchase stage (Yoon, 2002; Koufaris and Hampton-Sosa, 2004). For the first-time buyer
with no previous experience with the seller, the initial trust, from the consumers' perspective,
is formed by indirect experience such as reputation, recommendation, effective
communication, and information quality of the seller website (Kim et al., 2003). Website
quality has been found as a trust-building lever in the first-time online purchase context
(McKnight et al., 2002). Wirtz and Lihotzky (2003) argue that online experiences differ from
those found in traditional brick-and-mortar shopping, suggesting that consumer evaluation of
the quality of online shopping may differ in achieving initial trust, which makes it more
complicated than in the traditional (physical) business environment. In any online shopping
situation, consumers may face difficulties attributed to: (1) the lack of information available
to the online buyer to assess the trustworthiness of the seller; (2) the lack of guidance on how
to assess the economic viability or credentials of the online seller; and (3) the fact that usually
the online customer has to pay upfront before exchange takes place (Qureshi et al., 2009).
E-shopping web site quality refers to “overall consumer perceptions of the excellence and
effectiveness of an e-retailer's product and/or service offering through its virtual store” (Ha
and Stoel, 2009). Additionally, shopping online includes a number of experiences such as
information search, web site browsing/navigation, ordering, payment, customer service
interactions, delivery, post-purchase problem resolution, and satisfaction with one's purchases
(Ha and Stoel, 2009). Chakraborty, Lala, and Warren (2002) and Chung and Tan (2004)
indicated that perceived website quality is a multi-dimensional latent construct that includes
dimensions of playfulness, usefulness, user friendliness, informativeness, technology,
organization, and navigability. Both the quality of web site features/interface performance
and the quality of features going beyond web site interface influences a consumer's
perception of Internet shopping (Ahn, Ryu and Han, 2003; Wolfinbarger and Gilly, 2003).
Evidence shows that online consumers appear to pay attention to the contents of the website
quality of product or service information through which consumers reach their purchase and
re-purchase decisions (Pavlou and Fygenson, 2006; Jahng et al., 2007).
An e-vendors’ site with user-friendly search and navigation functions provides users with a
better sense of control over their online shopping experience, which in turn may translate into
positive feelings about the competence of the vendor, its overall operational efficiency and
CHAPTER 3: EVALUATION OF LITERATURE REVIEW
P a g e | 87
the speed with which navigation is conducted online. Thus, a well-designed and organized
web interface, such as layout design and information content, can stimulate initial consumer
interest to further explore a site (Menon and Kahn, 2002) and reduce customers’ cost and the
time required when searching for product information. This can increase the customer’s
belief that the vendor running the website has high integrity, and will behave in a competent,
benevolent and therefore trustworthy manner (Flavian, Guinaliu and Gurrea, 2006).
Similarly, research has identified that the accuracy of product descriptions on websites leads
to initial customer trust in the online vendor (Yoon, 2002).
Interactivity on the Internet refers to the degree to which customers and retailers can
communicate directly with one another anywhere, any time (Blattberg and Deighton, 1991).
Customers prefer two-way communication rather than merely being passive recipients of
information (Ghose and Dou, 1998). Ghose and Dou (1998) observe that, for e-retailers, the
degree of interactivity influences the perceived quality of the website. In a physical store,
customers interact with sales personnel, whose friendliness and knowledge can affect
consumers' purchasing decision (Berry, 1969; Lindquist, 1974; McDaniel and Burnett, 1990;
Tigert, 1983). On the other hand, e-retailers provide several types of online service that can
increase this interactivity with customers, such as a toll-free phone number, e-mail addresses,
frequent asked questions (FAQs), software downloading, e-form inquiry, order status
tracking, customer comment, and customer feedback. Research has found that having FAQ
sections and feedback increases e-store visits and sales (Lohse and Spiller, 1998). Such
characteristics have been proven to contribute to the enhancement of initial trust in the online
vendor (Gefen et al., 2003a; van der Heijden and Verhagen, 2004).
3.12.4. Subjective Norm
The research literature shows support for the role of subjective norm on behavioural
intentions. For example, in a cross-sectional comparison of pre- and post-adoption of
information technology use, Karahanna, Straub, and Chervany (1999) found that top
management, supervisors, and peers significantly influenced adoption intention for both
potential technology adopters and actual users. In addition, they found that MIS staff and
friends were important influences for potential adopters, while computer specialists played a
significant role for actual users. In a study of decision support system adoption for health
planning, Chiasson and Lovato (2001) also report that subjective norm is a significant
antecedent of information system adoption intention. In addition, Morris and Venkatesh
(2000) investigated age differences in adoption intentions and continued use of information
CHAPTER 3: EVALUATION OF LITERATURE REVIEW
P a g e | 88
technology using the theory of planned behaviour. They found that workers were strongly
influenced by subjective norm, although age and length of exposure moderated the effects.
Based on the TPB, it is expected that subjective norm will have an influence on the intentions
of consumers to engage in online transactions.
Courneya and McAuley (1995a, 1995b) and Courneya et al. (2000) found little or no
significance of SN on intention, and argued with others that social support might provide for
a greater understanding of the exercise of motivation and behaviour. This can raise the
question of SN value and relevance for IS adoption behaviour. As a result, nowadays,
scattered research exists about it. When Davis (1989) introduced TAM, he did not find SN to
be significant in adopting IS in the organizational context. The reason behind the insignificant
relation was not rigorously investigated. This is a serious limitation since SN is in the core of
social psychology that has been used widely in IS acceptance research. After going back to
the psychology literature, a highly relative human behaviour phenomena may be the reason
behind the insignificance; ‘the power of situation’. Because using IS in an organization is
obligatory, then the situation leaves the users with no option but to comply, regardless what
important others think or feel. This is not the case in the e-commerce. For this reason, Davis
emphasized the need for more research. His later study in 2000, along with Venkatesh
demonstrated the significance of SN in IS adoption.
Courneya et al., (2000) argued that social support is more representative for normative
beliefs. Social support is the perception of assistance in performing the behaviour. Few
studies have examined the social support variable as a part of SN. This is because social
pressure can be practised as a way of supporting others in their behaviour.
Subjective norm can be thought of as composed of two components: (a) societal norm and (b)
social influence (Pavlou and Chai, 2002). Societal norm refers to the process of adherence to
the larger societal fashion, i.e., a large circle of influence. Collectivism, however, refers to the
extent to which individuals are integrated into groups, forming their judgments based on
group norms (Hofstede and Bond, 1988). Hofstede (1980) has noted that members of
individualistic societies prefer self-sufficiency, whereas those in collectivistic cultures
acknowledge their interdependent natures and obligations to the group. Other studies have
replicated Hofstede’s cultural dimension of collectivism, finding that it places greater relative
importance on the group's needs and norms than individualism (Triandis, 1989). Social
influence refers to the extent to which people accept a hierarchical system with an unequal
CHAPTER 3: EVALUATION OF LITERATURE REVIEW
P a g e | 89
power distribution (Pavlou and Chai, 2002), and here is seen to reflect adherence to opinions
from family, friends, and peers, i.e., a smaller circle of influence. Large differences in power
lead to less powerful individuals accepting large status differences. Furthermore, superiors
tend to be autocratic and paternalistic, whilst subordinates willingly do as they are told
(Hofstede and Bond, 1988).
Courneya et al.’s, (2000) and other researchers’ views of SN are rather ambiguous.
Accordingly, in the research reported here, SN is recognized as an important variable that
worth more investigation, especially in collectivist cultures, such as the Arabic countries in
general and Saudi Arabia in particular, where it is rarely examined.
3.13. HOFSTEDE’S CULTURAL DIMENSIONS
In order for managers to optimise the benefits of globalization of markets and corporate
multi-nationalism (Straub et al., 1997), it is necessary to gain a sound knowledge of cross-
cultural adoption and use of IT (Couger, 1986; Kumar and Bjorn-Anderson, 1990). However,
there have only been a small number of studies carried out that examine the possible cultural
effects on the adoption and diffusion of new IT (e.g. Ho, Raman, and Watson, 1989; Lim,
Raman, and Wei, 1990; Raman and Wei, 1992; Straub et al., 1997; Pavlou and Chai, 2002;
Jarvenpaa et al., 1999; McCoy, Galletta, and King, 2007).
One of the most important studies in social science research is Hofstede’s (1980) cultural
dimension theory (Pavlou and Chai 2002), which has gained widespread empirical support
(Sondergaard, 1994). His research, involving about 116,000 respondents and in 66 countries,
led to the development of the theoretical foundation for the exploration of the impact of
cultural differences on the adoption and diffusion of Internet banking.
Hofstede (1980) suggests that culture can be viewed as a collective programming of the
mind, whilst Kluckhohn (1951; cited by McCoy et al., 2007) defines culture as ‘patterned
ways of thinking, feeling and reacting, acquired and transmitted by symbols, constituting the
distinctive achievements of human groups, including their embodiments in artefacts; the
essential core of culture consists of traditional ideas and especially their attached values’.
Culture is sometimes referred to as a national character and has, therefore, been thought of as
a pattern of personality characteristics found among people within the same nation (Clark,
1990). Hoecklin’s (1995) definition of culture contains reference to a shared system of
meaning, which is relative, learned and about groups.
CHAPTER 3: EVALUATION OF LITERATURE REVIEW
P a g e | 90
Culture is widely believed to shape individual values and to affect behaviour (Hofstede,
1980). Hofstede argues that differentiation between cultures should be based on four main
dimensions: uncertainty avoidance, power distance, individualism and collectivism, and
masculinity and femininity. In 1998, he added a fifth dimension; short-term and long-term
orientation, which was initially driven from culture research in China.
Because of its relevance to the research constructs and to the Saudi Arabian culture, the
author will consider the Individualism/Collectivism dimension. This dimension refers to the
basic level of behaviour regulation, whether by individuals or groups. People high on the
individualism scale view themselves as relatively more important as those on the collective
scale (Pavlou and Chai, 2002). In individualistic societies, ties between individuals are loose.
If individualism is low, there is likely to be a predisposition against computer-based
communications because different media mute the group effect, by facilitating individuality
(Ho et al., 1989). In contrast, in collectivist societies there tends to be stronger integration.
Collectivist cultures, such as the Arab Countries (Egypt, Lebanon, Libya, Kuwait, Iraq,
Saudi-Arabia, UAE), show that people cannot pick up cues about the social situation as
readily from computer-based media and, therefore, would favour, overall, media, such as
face-to-face communication, and trusting each other more than trusting someone who is not
part of the circle. On the other hand, individualist cultures generally trust others unless they
are given the reason not to.
Previous studies suggest that individuals place more trust in people similar to themselves and
assess trustworthiness based on second-hand information and on stereotypes (Zucker 1986;
Morgan and Hunt, 1994; McKnight et al., 1998). Additionally, a highly collectivistic
cultures, such as the Arab World, is dominated by high collectivism, i.e., an individual’s
beliefs and actions depend on the social norms of the group and are typically influenced by
the expectations of people around him/her (Kluckhorn and Strodtbeck, 1961). Therefore, if e-
shopping is a socially desirable behaviour, a person is more likely to e-shop (George, 2002).
However, one criticism of Hofstede’s work is that the measures used for assessing these
dimensions do not exhibit statistical validity and reliability (Spector, Cooper, and Sparks,
2001). Other research has shown that the dimensions do not represent a sufficiently broad
cultural spectrum. Hofstede used only IBM employees and managers in his study and, as a
result, it is felt that his sample is not fully representative of the nations investigated.
However, Hofstede (1998) contends that in order to compare cultures across nations the
CHAPTER 3: EVALUATION OF LITERATURE REVIEW
P a g e | 91
groups examined must be as similar as possible in order for differences to be attributed to the
national cultural context.
A further weakness is that assigning the same cultural values to all people within a nation-
state may be overly simplistic, given the cultural diversity within many nations, and the
unique cultural values held by individuals regardless of national ethnicity (McCoy et al.,
2005). Nevertheless, as there are relatively few alternative ways of easily conceptualizing
culture, Hofstede’s work has continued to be used (Brown and Buys, 2005).
3.14. SUMMARY
E-Commerce includes different forms of activities that cover important fields, such as
marketing, electronic negotiations, services and contracting taking place over the Internet and
through other channels (Coppel, 2000). In this environment, Chen (2009) indicated that the
rapid development of B2C e-commerce, in its early stages, stimulated researchers and
scholars to investigate consumer behaviour in cyberspace. Additionally, Atchariyachanvanich
et al. (2007) state that ‘since keeping the customer repurchasing a product/service is essential
to maintain the profitability of any business, the continuance of purchasing through the
Internet is vital to businesses’. This chapter has identified that the study of consumer
behaviour is fundamentally dependent on a numbers of theories. These predict and explain
human behaviour in several domains, and are derived from basic models and theories. For
example, the TRA and the TPB, as the main body of these theories, are recognized by IS
researchers as helpful in providing them with an insight into how consumers react with
computing technologies, and, at the same time, examine relationships between humans and
the technology. The extended TAM and ECT have been adopted as a basis in this research
because, across the years, numerous empirical tests have shown them as strong models of
technology acceptance intention behaviours and continuance intention in a wide variety of IT
and country contexts.
Rogers (1995) suggested that adopters re-evaluate their acceptance decision during a final
confirmation stage and decide whether to continue or discontinue an innovation.
Additionally, previous researchers view continuance as an extension of acceptance behaviour
(i.e., they employ the same set of pre-acceptance variables to explain both acceptance and
continuance decisions), implicitly assuming that continuance co-varies with acceptance (e.g.,
Davis et al., 1989, Karahanna, Straub, and Chervany, 1999; Bhattacherjee, 2001). This
CHAPTER 3: EVALUATION OF LITERATURE REVIEW
P a g e | 92
chapter has also investigated Hofstede (1980) cultural dimensions. Hofstede indicated that in
collectivist cultures, such as the Arab Countries, people cannot pick up cues about the social
situation as readily from computer-based media and, therefore, would favour, overall, media,
such as face-to-face communication, trusting each other more than trusting someone who is
not part of the circle.
Hence, to hypothesize such a model it is important to understand the literature that lies behind
it. The next chapter will discuss further the research model built on TRA, TAM and ECT, and
then hypothesize a model that is expected to offer a better prediction of users’ continuance e-
shopping intention in Saudi Arabia.
CHAPTER 4: CONCEPTUAL RESEARCH MODEL AND HYPOTHESES
P a g e | 93
CHAPTER 4: CONCEPTUAL RESEARCH MODEL AND
HYPOTHESES
4.1. INTRODUCTION
The previous chapters have intensively discussed the development of the Internet and
e-commerce in Saudi Arabia, online shopping in Saudi Arabia, and the development of
different theories used in the context of online shopping.
This chapter presents the research conceptual model and the development of the hypotheses.
The focus of the first part is an overview of previous research, which then forms the research
question. Then, the remainder of this chapter proceeds as follows: the researcher presents the
key research question, and then details the proposed conceptual framework, model, and
hypotheses. The chapter concludes with a summary of these hypotheses and framework.
4.2. WEAKNESSES OF THE THEORIES
The popularity of the Internet worldwide has increased researchers’ interest in studying
electronic commerce and consumers’ behaviour. Most studies in the literature review in
Chapter 3 focused on constructs that affect customers’ intention to use and adopt online
shopping. These studies have explored how consumers view e-shopping, with more emphasis
on the antecedents of such consumer intentions and adoption.
Because most consumers now consider the technology standard, companies have begun to
realize the power of the Internet for expanding their businesses worldwide. Online shopping
as a new channel for doing business in B2C segments is becoming popular across all
countries. With the digital economy, companies have also become vulnerable to competitors
that are just a click away (see Cheung, Chan, and Limayem, 2005).
The popularity of Internet shopping is not limited to any particular business sector but rather
is apparent in all types of businesses. Consider the airline industry in general as an example:
e-ticketing is becoming the norm for travellers throughout the world. Furthermore, e-ticketing
helps airlines meet the requirements of the International Air Transportation Association
(IATA), which demanded that by January 1, 2008, all airlines and travellers would be able to
enjoy the usefulness and convenience of online ticketing for easier and hassle-free travel
(Arab News Newspaper, 2007).
CHAPTER 4: CONCEPTUAL RESEARCH MODEL AND HYPOTHESES
P a g e | 94
As described in Chapter 1, one e-ticket produces a saving of $9 per transaction compared
with a paper ticket. For example, considering that Saudi Arabian Airlines carries
approximately 16 million passengers annually, the airlines would be able to save $17 million
per year and provide better and convenient services to its customers (Alwatan Newspaper,
2006).
New regulations and factors emphasize what Cheung et al. (2005) call environmental factors
or structural influences, including market-related issues such as uncertainty, competition, and
concentration, as well as national and international issues such as legal structure, trade
restrictions, and culture. Markus and Soh (2002) also define structural influences as the
‘physical, social, and electronic arrangements that shape e-commerce business models and
influence individual and organizational use of the Internet.’
Local government regulations, national and international legal issues, and youthful and
demanding customers combine to force businesses to use e-business. Therefore, companies
should work to build long, sustainable relationships with their online consumers and focus
beyond the first step of online adoption. However, the lack of research into’ and
understanding of, the capabilities of the digital revolution in the Saudi market might prevent
e-businesses from promoting e-shopping, thus causing customers to defect.
Most theories emphasize aspects that affect the intention and adoption of online shopping,
ignoring the important aspects that lead to continuance, particular for Saudi Arabia where
such research is virtually non-existent, especially in the e-shopping context. Previous
research suggests that many factors can build a foundation for constructing a framework of
online consumer behaviour. Douglas, Morrin, and Craig (1994) suggest researchers should
develop theoretical and conceptual frameworks by integrating different constructs that come
from varied research traditions and disciplines. However, few studies attempt to investigate
the impact of the key characteristics on e-shopping continuance intentions. Thus, factors such
as web site quality, subjective norms, usefulness, trust, enjoyment, online loyalty incentives,
and satisfaction are under-researched and demand more investigation.
Furthermore, globalization continues to drive the rapid growth of international trade, global
corporations, and non-local consumption alternatives (Alden et al., 2006; Holt et al., 2004),
and advances in e-commerce diminish trade boundaries. E-commerce and e-shopping create
opportunities for businesses to reach out to consumers globally and directly. In turn, business
CHAPTER 4: CONCEPTUAL RESEARCH MODEL AND HYPOTHESES
P a g e | 95
and social science research now focuses specifically on cross-national and cross-cultural
Internet marketing (Griffith et al., 2006).
The Internet has changed how businesses and customers customize, distribute, and consume
products. Its low cost gives both businesses and consumers a new and powerful channel for
information and communication. Business-to-consumer online sales in the United States grew
by 120% between 1998 and 1999 (Shop.org and Boston Consulting Group, 2000). According
to a UK payment association, the number of consumers who shop online has increased by
more than 157%, from 11 million in 2001 to more than 28 million in 2006 (cited in Alsajjan
and Dennis, 2009). E-commerce transactions also are growing in the Middle East (19.5
million Internet users) and the Gulf States. In 2007, Internet sales increased to more than $1.2
billion worldwide and are expected to continue to rise (World Internet Users and Population
Stats, 2007).
Online customer retention is particularly difficult. Modern customers demand that their needs
be met immediately, perfectly, and for free, and they are empowered with more information
to make decisions (Bhattacherjee, 2001b; Crego and Schiffrin, 1995). Generally, of course,
consumers now have various online and offline options from which to choose, and without a
compelling reason to choose one retailer over another, they experiment or rotate purchases
among multiple firms (Bhattacherjee, 2001b; Crego and Schiffrin, 1995). Within this growing
marketplace we focus this research on a single issue. Despite impressive online purchasing
growth rates, compelling evidence indicates that many consumers who search different online
retail sites abandon their purchase intentions. How to persuade customer repurchase remains
a concern for e-commerce vendors (Johnson and Hult, 2008). It is stated that only a small
minority of website visitors (about 1%) proceeds to make purchases (Gupta and Kim, 2007).
This research is aimed to help online businesses understand which factors encourage
consumers to have continuance intention behaviour toward e-shopping. Such continuance is
critical, because acquiring new customers may cost as much as five times more than retaining
existing ones (Bhattacherjee, 2001b; Crego and Schiffrin, 1995; Petrissans, 1999), given the
reasonably high cost of acquiring new customers and the economic value of reliable
customers (Reichheld and Schefter, 2000). Raising the number of reliable costumers by as
slight as 5% can raise profitability by 30-85%, depending upon the business (Reicheld and
Schefter, 2000). Therefore, research into online continuance shopping has recently emerged
as an important issue (e.g., Bhattacherjee, 2001a; Kim and Malhotra, 2005; Kim, Malhotra,
and Narasimhan, 2005; Liao, Chen, and Yen, 2007; Limayem, Hirt, and Cheung, 2007).
CHAPTER 4: CONCEPTUAL RESEARCH MODEL AND HYPOTHESES
P a g e | 96
Companies should think strategically and use the savings they earn through their e-business
efficiently, while also raising the switching costs to retain customers. E-retailers can either
remember details about the customer that reduce the effort customers must exert in future
transactions or learn more about the customer to tailor the future interactions to the
customer’s specific needs (Straub and Watson, 2001). Better product quality, lower prices,
better services, and outcome value all help build sustainable relationships with online
customers.
Theoretical explanations of online shopping intentions consider several factors. Rogers
(1995) suggests that consumers re-evaluate their acceptance decisions during the final
confirmation stage and decide whether to continue. Continuance may be an extension of
acceptance behaviour that co-varies with acceptance (e.g., Bhattercherjee, 2001a; Davis et
al., 1989; Karahanna et al., 1999). We adopt the extended expectation confirmation theory
(ECT; Bhattacherjee, 2001b) and the extended technology acceptance model (TAM; Davis et
al. 1989) as a theoretical basis, integrating ECT from consumer behaviour literature to
propose a model of e-shopping continuance intentions, similar to the way that the TAM
adapts the theory of reasoned action (TRA) from social psychology to postulate a model of
technology acceptance.
The TAM, as explicated by Davis et al. (1992) and Gefen et al. (2003), and the ECT
(Bhattacherjee, 2001a; Oliver 1980) both have been used widely in research in the
industrialized world, but they are less commonly applied to Saudi context, which is part of
the developing countries. Moreover, the research contribution is potentially valuable, as the
TAM stops at intention and does not investigate continuance intentions or behaviour.
Moreover, the cross-cultural aspect to our contribution is also relevant, as both models have
been used widely in research in the industrialized world.
Furthermore, no widely acceptable definition for e-commerce exists. Coppel (2000) considers
it business over the Internet, which includes both business-to-business and business-to-
consumer markets. Increasingly, commercial websites seek to provide useful product
information in order to attract potential online shoppers (Totty, 2001). Keeney (1999) pointed
out that measuring only actual purchases may be too narrow a scope when assessing the
online shopping activity of consumers. He contended that gathering product information is a
second aspect of the online shopping activity. One recent e-commerce study (Chen et al.,
2002) adopted this two-fold definition. The author of this research also employs a similar
CHAPTER 4: CONCEPTUAL RESEARCH MODEL AND HYPOTHESES
P a g e | 97
definition of online shopping in order to get a more complete picture of continuance intention
to online shopping. Online shopping in this study is a combination of both the purchase and
the product information search activities. For the purpose of this research, we study the
following terms which are frequently used interchangeably: E-shopping, electronic shopping,
online shopping, and Internet shopping. We propose a new, comprehensive definition: “All
these activities include searching, buying, and selling products and services through the
Internet”. Additionally, continuance intention in this study means “a specific desire to
continue an e-shopping relationship with a service or product provider”.
In recent years, the Internet has grown to include a wider range of potential commercial
activities and information exchanges, such as the transaction and exchange of information
between government agencies, governments and businesses, businesses and consumers, and
among consumers. The author focuses mainly on the business-to-consumer (B2C) arena,
which has been the source of most online progress and development. The author generalizes
the two-fold definition; rather than evaluating shopping at a particular site (as in Chen et al.,
2002); respondents were asked to generalize all online shopping activities.
In Saudi Arabia approximately 60% of the 24,069,943 people are younger than 30 years of
age, and they are almost equally split between men (51%) and women (49%) (The Middle
East Statistics, 2007). Therefore, the nearly equal gender split in the population and regional
influence could be a key contributor to behavioural differences in online shopping across
Saudi culture and determine whether e-shopping intentions will lead to continuance
acceptance.
Previous research finds, in particular, that gender differences significantly affect new
technology decision-making processes (Van Slyke et al., 2002; Venkatesh et al., 2000).
Venkatesh et al. (2000) report that women tend to accept information technology when others
have high opinions of it and are more influenced by ease of use. Men rely more on their
evaluations of the usefulness of the technology. However, in many cultures, women represent
the primary decision makers in families and households’. Greater e-commerce exposure and
decision-making power may imply that males and females can attain greater satisfaction from
online shopping, especially as the Internet is one of the main environments for young people
to play, work, learn and communicate (Alreck and Settle 2002; Spero and Stone 2004). Saudi
Arabia has a population of 25 million. Clearly young people’s behaviour is of special
importance to Saudi trade.
CHAPTER 4: CONCEPTUAL RESEARCH MODEL AND HYPOTHESES
P a g e | 98
The dearth of literature regarding Arabic countries in general and Saudi Arabia in particular
prompted us to pursue this investigation in a country with a young and growing population.
Looking to Saudi Arabia, no previous research considers Internet shopping or, specifically,
continuance intentions toward online shopping, nor do studies address differences in online
shopping behaviour in Saudi Arabia according to gender, education, geographical locations,
high and low online spending, and experienced and inexperienced online shoppers. The aim
of this study is to fill this research gap. The main objective, therefore, is to establish any
overarching patterns of the e-shopping process, as a whole, that drives customer continuance
intention.
4.3. RESEARCH QUESTION
The growing body of research still does not appear to address the research questions that e-
retailers in this extremely competitive environment now face in the context of Saudi Arabia,
as an example of a developing country in the Arabic World. For Saudi Arabia in particular,
such research is virtually non-existent, especially in the e-shopping context. Despite the
proliferation of research concerning online shopping, to the best of the authors’ knowledge,
no single study has attempted to examine what factors drive consumers’ continuance
intentions toward e-shopping? As mentioned in the ‘Introduction’ chapter, Chapter 1, above,
factors to be considered include:
• Which forces drive customer continuance e-shopping intentions in Saudi
Arabia?
• Do they differ from the drivers in developed countries? That is, do well-
established theories from developed (mostly Western) countries also apply in
less developed (often non-Western) cultures; in the case of this research is
Saudi Arabia?
• What impact do enjoyment, usefulness, and subjective norms have on
continuance intention in Saudi Arabia?
• Are gender, education, age, experience, spending, and regions of Saudi Arabia
associated with any behaviour differences among online shoppers?
• Do e-retailers in Saudi Arabia recognize the value and cost effectiveness of
implementing e-commerce and e-shopping strategy?
CHAPTER 4: CONCEPTUAL RESEARCH MODEL AND HYPOTHESES
P a g e | 99
4.4. RESEARCH AIMS AND OBJECTIVES
In line with the gaps in previous research and the resulting key research question, this thesis
adopts an information acceptance point of view. Consumers in Saudi Arabia are increasing
their use of online shopping, and a greater understanding of the factors that affect their
acceptance and continuance intentions is desperately needed.
As explained in chapter 1, section 1.6 and 1.7, our study is aimed at enhancing knowledge
and understanding in the area of online shopping continuance intention while proposing and
validating a model of e-shopping continuance intentions that incorporate different constructs
from the modified TAM and ECT. It and considers variance of continuance intentions in the
context of e-shopping in Saudi Arabia. No previous research considers Internet shopping in
Saudi Arabia or, specifically, continuance intentions for online shopping in Saudi Arabia, nor
do studies address differences in online shopping behaviour in Saudi Arabia. Furthermore, by
addressing differences in online shopping behaviour towards the development and
understanding of this research model, this thesis offers insight into broad-ranging issues with
wider applications and differing degrees of importance.
Practically, the research will help online businesses to understand which factors stimulate
online shopping continuance intention in Saudi Arabia. Such continuance is critical because
acquiring new customers may cost as much as five times more than retaining existing ones
(Bhattacherjee 2001b; Crego and Schiffrin 1995; Petrissans 1999). Increasing the number of
repeated customers by as little as 5% can increase profitability by 30–85%, depending upon
the industry type (Reichheld and Schefter, 2000). As a result, the objective of the proposed
model introduces a new model that predicts and assesses online continuance intention
shopping by determining the determinant factors of continuance intention in the context of
Saudi Arabia. This is done by conducting a comprehensive analysis that includes Exploratory
Factor Analysis (EFA), Structural Equation Modelling (SEM) and invariance analysis for the
data collected for study purposes to examine research model generalizability. Furthermore,
the research will contribute to knowledge of continuance intention and provide a base for
future research to build on with respect to the proposed model and its application to other
contexts. As for managerial implications, the model will draw conclusions that should help
practitioners utilize the research results and improve customers’ continuance usage of the
virtual channel, specifically in online shopping and more generally e-commerce. Finally, it is
the objective of this thesis to conduct research with the highest possible standards and
CHAPTER 4: CONCEPTUAL RESEARCH MODEL AND HYPOTHESES
P a g e | 100
produce the best quality results.
4.5. PROPOSED MODEL AND HYPOTHESIS
The focus of this study is on Internet users with similar backgrounds but who come from
different geographic areas in Saudi Arabia. The intensive literature review (Chapter 3)
indicated appropriate scales, including Likert-type scales. These ask respondents to indicate a
number that corresponds to their level of agreement or disagreement with questionnaire
items.
The TAM (Davis, 1989) represents an adaptation of the TRA, tailored to users’ acceptance of
information systems. It helps explain determinants of computer acceptance and can explicate
user behaviours across a broad range of computing technologies and populations; it also is
parsimonious and theoretically justified (Davis et al., 1989). Previous research predicting
intentions to use online shopping behaviour has also used TAM (Vijayasarathy, 2004). The
major determinants are perceived usefulness and ease of use. Perceived usefulness
significantly influences attitude formation (Agarwal and Prasad, 1999; Davis, 1989; Dishaw
and Strong, 1999; Gefen and Keil, 1998; Igbaria et al., 1996; Moon and Kim, 2001; Taylor
and Todd, 1995; Venkatesh, 2000; Venkatesh and Davis, 2000), but evidence regarding
perceived ease of use remains inconsistent. Furthermore, other researchers (e.g.,
Bhattachergee, 2001a; Ma and Liu, 2004; van der Heijden, et al. 2003) indicate that ease of
use has the single most effect on acceptance after a certain threshold. That is, with more
experience, the impact of ease of use on intention declines. Because this research focuses on
continuance intentions, we assume all participants already have e-shopping experience,
implying that other factors may be more important than ease of use. Moreover, many studies
simplify TAM by dropping attitude and studying just the effect of perceived usefulness and
ease of use on intention to use (Venkatesh and Davis, 2000; Venkatesh et al., 2003; Gefen
and Straub, 2000; Lederer et al., 2000; Teo et al., 1999; Premkumar and Bhattacherjee,
2008).
Customers use cognitive judgment when using an e-commerce web site as they consider both
perceived usefulness and perceived ease of use (Li and Zhang, 2005). Behavioural intentions
and usage are often enhanced by e-shoppers’ extrinsic and intrinsic motivations (Li and
Zhang, 2005); perceived usefulness is an extrinsic motivation (Davis et al., 1992), and ease of
use is an intrinsic motivation in this context (Atkinson and Kydd, 1997). Updates to the TAM
CHAPTER 4: CONCEPTUAL RESEARCH MODEL AND HYPOTHESES
P a g e | 101
add antecedents of perceived usefulness and ease of use (Venkatesh and Davis, 2000), such
as subjective norms, experience, trust, and output quality. Moreover, the enjoyment construct
was added to TAM to explain the role of intrinsic motivation in the adoption of new
technology (Davis et al., 1992; Van der Heijden, 2004). Applying this into a website context,
Van der Heijden (2000) identified the concepts of perceived usefulness and perceived
enjoyment as strong influential variables to usage. Furthermore, ample evidence confirms
that both usefulness (i.e., external motivation) and intrinsic enjoyment (i.e., internal
motivation) offer direct determinants of user acceptance online (Davis et al., 1992; Lederer et
al., 2000; Moon and Kim, 2001; Teo et al. 1999; Venkatesh, 1999).
Expectation confirmation theory (ECT), in turn, helps predict consumer behaviour before,
during, and after a purchase in various contexts, in terms of both product and service
repurchases (Anderson and Sullivan, 1993; Dabholkar et al. 2000; Oliver, 1980, 1993;
Patterson et al., 1997; Spreng et al., 1996; Swan and Trawick, 1981; Tse and Wilton, 1988).
According to ECT, consumers define their repurchase intentions by determining whether the
product or service meets their initial expectations. Their comparison of perceived usefulness
versus their original expectation influences their continuance intentions (Bhattacherjee,
2001a; Oliver, 1980). For example, expectations might derive from knowledge and
information collected from mass media or other sources that predict products or services will
perform in a certain way. As the consumer uses the product, he or she confirms these
expectations about the value and benefits of the product/service. If it meets his/her initial
expectation and leaves the consumer satisfied, the consumer experiences positive intentions
to repurchase. Thus, repurchase intentions depend on satisfaction with the product or service
(Anderson and Sullivan, 1993; Oliver, 1980).
Nevertheless, ECT ignores potential changes in initial expectations following the
consumption experience and the effect of these expectation changes on subsequent cognitive
processes (Bhattacherjee 2001a). Pre-purchase expectations typically are based on others’
opinions or information from mass media, whereas post-purchase expectations derive from
first-hand experience, which appears more realistic (Fazio and Zanna, 1981; Lin et al., 2005).
Other researcher (e.g., Thong et al, 2006) has concluded that expectations coming from
consumers’ direct experiences (post-adoption expectations) are the main predictors of
consumer satisfaction. After such experience, expectations may increase if consumers believe
the product or service is useful or contains new benefits and features that were not part of
their initial expectation. In the expectation confirmation paradigm, expectation is commonly
CHAPTER 4: CONCEPTUAL RESEARCH MODEL AND HYPOTHESES
P a g e | 102
defined as individual beliefs about the level of attributes possessed by a product or service
(Oliver and Linda, 1981; Churchill and Surprenant, 1982, Bearden and Teel, 1983). Based on
the previous researches, including TAM (e.g., Davis et al., 1989; Karahanna et al., 1999;
Venkatesh, 2000), perceived usefulness is the most consistent antecedent of consumer’s
intention to use IT. Thong (2006) therefore indicated that it is more logical to have usefulness
to be surrogate for post-adoption expectations in future research when measuring intention.
Therefore, the research model developed in this thesis focuses only on post-acceptance
variables and the model assumes e-shopping retailers target users and heighten their loyalty
to the site. Hence, the post-expectation in the original ECT is represented by usefulness in our
model.
Venkatesh et al. (2003) suggest that usage and intentions to continue usage may depend on
cognitive beliefs about perceived usefulness. Gefen et al. (2003) also indicates that perceived
usefulness reinforces an online shopper’s intention to continue using a website, such that
when a person accepts a new information system, he or she is more willing to alter practices
and expend time and effort to use it (Succi and Walter, 1999). However, consumers may
continue using an e-commerce service if they consider it useful, even if they are dissatisfied
with its prior use (Bhattacherjee, 2001a).
The dominant influence of perceived usefulness has led Bhattacherjee (2001a) to include
usefulness in his revised ECT. In their recent study, Premkumar and Bhattacherjee (2008)
observed that whilst perceived usefulness is the strongest predictor of intention in TAM, it
continues to be a stronger predictor of continuance intention than satisfaction when TAM
combines with ECT (whereas satisfaction was dominant in the original ECT) (Premkumar
and Bhattacherjee, 2008). The relative dominance of usefulness explains its role as critical
driver in continuance decisions, particularly in comparisons of utilitarian value over hedonic
value (Premkumar and Bhattacherjee, 2008). Other researchers have found that both
perceived usefulness and perceived enjoyment are two evaluation criteria for functional
attributes of the target online service in terms of utilitarian and hedonic benefits
(Bhattacherjee, 2001b; Lin et al., 2005; Thong et al., 2006).
Site quality and good interface design enhance the formation of consumer trust (McKnight et
al., 2002a), and if a consumer perceives a vendor’s website to be of high quality, he/she
would be more prepared to trust that vendor’s competence, integrity, and benevolence
(McKnight et al., 2002a). Gefen et al. (2003) integrate trust into the TAM in a B2C e-
CHAPTER 4: CONCEPTUAL RESEARCH MODEL AND HYPOTHESES
P a g e | 103
shopping context and find trust positively affects consumers’ intention to use a website.
Building trust with consumers is an essential mission for e-retailers, because purchasing
decisions represent trust-related behaviours (Jarvenpaa et al., 2000; McKnight et al., 2002b;
Urban et al., 2000).
Subjective norm can be thought of as composed of two components: (a) societal norm and (b)
social influence (Pavlou and Chai, 2002). Societal norm refers to the process of adherence to
the larger societal fashion, i.e., a large circle of influence. Collectivism, however, refers to the
extent to which individuals are integrated into groups, forming their judgments based on
group norms (Hofstede and Bond, 1988). Hofstede (1980) has noted that members of
individualistic societies prefer self-sufficiency, whereas those in collectivistic cultures
acknowledge their interdependent natures and obligations to the group. Other studies have
replicated Hofstede’s cultural dimension of collectivism, finding that it places greater relative
importance on the group's needs and norms than individualism (Triandis, 1989). Social
influence refers to the extent to which people accept a hierarchical system with an unequal
power distribution (Pavlou and Chai, 2002), and here is seen to reflect adherence to opinions
from family, friends, and peers, i.e., a smaller circle of influence. Large differences in power
lead to less powerful individuals accepting large status differences. Furthermore, superiors
tend to be autocratic and paternalistic, whilst subordinates willingly do as they are told
(Hofstede and Bond, 1988).
Culture in the Arab World countries, such as Saudi Arabia, is dominated by high
collectivism, i.e., an individual’s beliefs depend on the social norms of the group (Kluckhorn
and Strodtbeck, 1961).
Additionally, other studies suggest that individuals place more trust in people similar to
themselves and assess trustworthiness based on second-hand information and on stereotypes
(Zucker, 1986; Morgan and Hunt, 1994; McKnight et al., 1998). In highly collectivistic
cultures, such as the Arab World, an individual’s actions are typically influenced by the
expectations of people around him/her, especially the group he/she identifies with. Therefore,
if e-shopping is a socially desirable behaviour, a person is more likely to e-shop (George,
2002).
In today’s online shopping, thousands of websites provide similar services in terms of
usefulness and benefits. Increasingly, online shoppers are becoming more sophisticated and
more experienced at shopping online. They are now looking for enjoyment (Koufaris,
CHAPTER 4: CONCEPTUAL RESEARCH MODEL AND HYPOTHESES
P a g e | 104
Kambil, and Labarbera, 2001) and excitement (Jayawardhena, 2004) in their shopping
experience. Previous researches indicated that individuals who experience pleasure and joy
from using a computer and perceive any activity involving the use of online shopping as
inherently enjoyable, regardless of any anticipated improvement in performance, are likely to
use it more extensively than others (Davis, 1992; Malone, 1981; Webster, 1989). Hedonic
motivations exert powerful influences on shopping behaviour in both traditional and online
shopping environments (Menon and Kahn, 2002). In traditional shopping channels, fulfilling
hedonic shopping motives increase both shopping time and purchases (Forsythe and Bailey,
1996). Childers et al. (2001) have confirmed that hedonic motives are important predictors of
attitudes toward online shopping, along with usefulness. Davis et al. (1989) found that while
perceived usefulness emerged as the major determinant of computer acceptance in the
workplace, enjoyment and fun had a significant effect beyond perceived usefulness. With
regard to e-shopping, the enhanced shopping hedonic enjoyment constructs in the extended
TAM (Davis, Bagozzi and Warshaw, 1992) and ECT (Lin, Wu and Tsai, 2005) are likely to
fulfil the hedonic shopping motives of shoppers and influence their online shopping,
reinforcing continuance intentions. Additionally, work by Donovan and Rossiter (1982)
found that enjoyment of a retail experience results in more time being spent shopping and
return patronage. Therefore, to the extent that a consumer associates enjoyment with an e-
retailer, intent to return should increase.
A satisfactory result of the post-purchase evaluation and comparison process in terms of
enjoyment, usefulness, and the expectations of social pressure of people around him/her, is
likely to affect intentions toward future repurchases (Anderson, Fornell, and Lehmann, 1994;
Bearden and Teel, 1983; Churchill and Suprenant, 1982; Fornell and Westbrook, 1984;
Oliver et al., 1981; Yi, 1990). Continuance intentions toward online shopping suggest that
users with satisfactory results of the post-purchase evaluation and comparison process are
more likely to continue to use e-shopping (Bhattacherjee, 2001b). In this setting, a
continuance intention toward online shopping (e-loyalty) refers to a specific desire to
continue a relationship with a service provider (Czepiel and Gilmore, 1987).
To conclude, theoretical explanations of online shopping intentions consider several factors.
Rogers’ theory of innovation (1995) suggests that consumers re-evaluate acceptance
decisions during a final confirmation stage and decide to continue or discontinue, and this is a
clear stage in the purchasing process on-line. As a result, we are looking to understand
continuance behaviour of online customers within Saudi Arabia. Ajzen and Fishbein (1975)
CHAPTER 4: CONCEPTUAL RESEARCH MODEL AND HYPOTHESES
P a g e | 105
and Kim and Hunter (1993) indicated that there is a strong correlation between behavioural
intentions and actual behaviour. This supports the use of behavioural intention as a substitute
for actual behaviour. This substitute is common in information systems research (Agarwal
and Prasad, 1998). The decision to continue may be an extension of acceptance behaviour
that co-varies with acceptance (e.g., Bhattercherjee 2001a; Davis et al. 1989; Karahanna et al.
1999). We therefore use continuance intention as a substitute for repurchase behaviour,
meaning that continuance intention will lead to repurchase behaviour (loyalty).
Our contribution is potentially valuable, as the TAM stops at intention and does not
investigate continuance intentions or behaviour. Moreover, the analysis of the group
behavioural differences aspect to our contribution is also relevant, as both models (TAM and
ECT) have been used widely in research in the industrialized world, but they are less
commonly applied to other Arabic countries, such as Saudi Arabia in particular in this
research, which is part of the developing countries.
Finally, researchers are confronted with a multitude of models, and find that they can “pick
and choose” constructs, or choose a “favoured model” and largely ignore the contributions
from alternative models (Venkatesh et al, 2003). Additionally, previous research suggests
that many factors can build a foundation for constructing a framework of online behavioural
shopping intention (Thong et al., 2006; Taylor and Todd, 1995; Venkatesh and Morris, 2000).
As indicated by Douglas et al. (1994), researchers should develop theoretical and conceptual
frameworks by integrating different constructs that come from varied research traditions and
disciplines. The TAM, as expanded by Davis et al. (1992) and Gefen (2003), and the ECT
(Bhattacherjee, 2001a; Oliver, 1980) have been widely used in research in the industrialized
world, but they are less commonly applied to other Arabic countries, such as Saudi Arabia in
particular in this research, which is part of the developing countries. Given the
complementary nature of TAM and ECT, our research aims to propose a model of e-shopping
continuance intentions. This adapts different constructs from the modified TAM and ECT,
and considers variance of continuance intentions in the context of e-shopping in Saudi
Arabia. The integrated model is depicted in Figure 4.15., where it can be seen that the effect
on Continuance Intention, which is adapted from ECT, comes from three constructs:
Perceived Usefulness, Enjoyment, and Subjective Norm. The topic of this research was
operationalised and its dimensions identified. The dimensions are Site Quality, Trust,
Usefulness, Subjective Norms, Enjoyment, and Continuance Intention. In addition, several
CHAPTER 4: CONCEPTUAL RESEARCH MODEL AND HYPOTHESES
P a g e | 106
indicators were selected and transformed into hypotheses. The research hypotheses and
model are summarised in Table 4.7 and Figure 4.15.
4.4.1. Site Quality
E-shopping web site quality refers to “overall consumer perceptions of the excellence and
effectiveness of an e-retailer's product and/or service offering through its virtual store” (Ha
and Stoel, 2009). In the online context, website quality is unique and unanimously seen as
vital factor during the initial online purchase stage (Yoon, 2002; Koufaris and Hampton-Sosa,
2004). For the first-time buyer with no previous experience with the seller, the initial trust,
from the consumers' perspective, is formed quickly by indirect experience on the basis of
available information such as reputation, recommendation, effective communication, and
information quality of the seller website (Meyerson et al., 1996; Kim et al., 2003). Website
quality has been found as a trust-building lever in the e-purchase context for the first-time
consumers (McKnight et al., 2002). Wirtz and Lihotzky (2003) argue that online experiences
differ from those found in traditional (physical) shopping, suggesting that consumer
evaluation of the quality of online shopping may differ in achieving initial trust, which make
it more complicated. This is due to the lack of information available to the online buyer to
assess the trustworthiness of the seller , the lack of guidance on how to assess the economic
viability or credentials of the online seller; and the upfront payment before exchange takes
place (Qureshi et al., 2009).
Additionally, shopping online include a number of experiences such as information search,
web site browsing/navigation, ordering, payment, customer service interactions, delivery,
post-purchase problem resolution, and satisfaction with one's purchases (Ha and Stoel, 2009).
E-retailers provide several types of online service that enhance initial trust in the online
vendor, such as a toll-free phone number, e-mail addresses, frequent asked questions (FAQs),
software downloading, e-form inquiry, order status tracking, customer comment, and
customer feedback (Gefen et al., 2003a; van der Heijden and Verhagen, 2004). Previous
researches find a significant relationship and a direct link between consumer perceptions of
quality and trust (Janda, Trocchia, and Gwinner, 2002; Zeithaml et al., 2000; Sultan and
Mooraj, 2001). Other researchers produce similar results in various retail settings (Anderson
and Sullivan, 1993; Sultan and Mooraj, 2001; Harris and Goode, 2004).
Website quality helps predict behaviour (Business Wire, 1999; Carl 1995; Meltzer, 1999); if
the vendor’s website is perceived to be of high quality, the consumer is more likely to depend
on the vendor (McKnight et al., 2002). Furthermore, an e-vendors’ site with user-friendly
CHAPTER 4: CONCEPTUAL RESEARCH MODEL AND HYPOTHESES
P a g e | 107
search and navigation functions provide users with a better sense of control over their online
shopping experience which in turn may translate into positive feelings about the competence
of the vendor, its overall operational efficiency and the speed with which navigation is
conducted online. Thus, a well-designed and organized web interface, such as layout design
and information content, can stimulate initial consumer interest to further explore a site
(Menon and Kahn, 2002) and reduce customers’ cost and the time required when searching
for product information. This can increase the customer’s belief that the vendor running the
website has high integrity, and will behave in a competent, benevolent and therefore
trustworthy manner (Flavian, Guinaliu and Gurrea, 2006). Similarly, if a customer perceives
a vendor’s website to be of high quality with enough product descriptions on websites leads
to initial customer trust in the online vendor (Yoon, 2002), and he/she will be more likely to
generate a favourable attitude towards it, demonstrate behavioural control over it (Pavlou and
Fygenson, 2006; Jahng, Jain and Ramamurthy, 2007), which in turn, translates into an easier
experience for consumers to release the product or service value and feature.
Researchers have also found that the perceived attractiveness of someone might influence
people’s perception of that person’s attributes (Dion, et al., 1972; Eagly, et al., 1991);
similarly, better looking university instructors perhaps receive higher teaching evaluations
(Hamermesh and Parker, 2005). Applying these finding to e-commerce, e-shoppers might
tend to perceive a website as more trustworthy and useful if it seems more attractive due to its
friendliness, organization, informativeness, and navigability (Chakraborty et al., (2002). On
the basis of this research, we therefore predict:
H1a: Perceived Site Quality relates positively to Perceived Usefulness.
H1b: Perceived Site Quality relates positively to customer Trust to use online shopping.
4.4.2. Trust
In general, trust is viewed as a set of specific beliefs dealing primarily with the benevolence,
competence and integrity of another party. Benevolence is the belief that the trustee will not
act against the trustor, even given the opportunity. Competence is the belief in the trustee’s
ability to fulfil its obligations, as expected by the trustor. Integrity is the belief that the trustee
will be honest and will honour its commitments (McKnight et al., 2002a). Also, trust refers to
an expectation that others will not behave opportunistically and/or take advantage of a
situation (Gefen, 2003). It is the belief that the other party will behave in a dependable
(Kumar, Scheer, and Steenkamp, 1995), ethical (Hosmer, 1995; Pavlou and Fygenson, 2006),
and socially appropriate manner (Zucker, 1986). Trust, therefore, implies a belief that the
CHAPTER 4: CONCEPTUAL RESEARCH MODEL AND HYPOTHESES
P a g e | 108
vendor will provide what has been promised (Ganesan, 1994). Some researchers determined
that perceived usefulness influences trust (Suh and Han, 2002), while others demonstrated
that trust influences usefulness (Gefen, 2004). However, if the e-vendor cannot be trusted to
behave in accordance with the consumers’ expectations, then there is no reason why
consumers should expect to gain any utility or benefit from using the interface (Pavlou, 2003;
Gefen, 2004; Chiu, 2009). A lack of trust will, therefore, prevent buyers from engaging in
online shopping (Hoffman et al., 1999). When consumers initially trust their online retailers,
and have a perception that online shopping is beneficial, they will eventually accept that
online shopping is useful (Gefen et al., 2003). In turn, perceived usefulness should occur only
for an e-vendor that can be trusted (Festinger, 1975). Indeed, prior research shows that trust
plays a pivotal role in driving perceived usefulness (Gefen et al., 2003; Pavlou, 2003) Thus:
H2: Perceived Trust relates positively to Perceived Usefulness.
4.4.3. Perceived Usefulness
Perceived usefulness is defined as the extent to which a consumer believes that online
shopping will enhance his or her transaction performance (Chiu, 2009). According to Burke
(1997), perceived usefulness is the primary prerequisite for mass market technology
acceptance. This depends on consumers’ expectations about how technology can improve and
benefit their lives (Peterson et al., 1997). A website is useful if it delivers services to a
customer, but not if the customers’ delivery expectations are not met (Barnes and Vidgen,
2000). The usefulness and accuracy of the site also influence customer attitudes. The
importance of perceived usefulness as a key motivating factor derives from the TRA and
TAM models, which propose that perceived usefulness affects computer usage due to
reinforcement values of outcomes (Adams, Nelson, and Todd, 1992). User acceptance of
computer systems is driven to a large extent by perceived usefulness (Adams et al., 1992;
Davis et al., 1989). In a robust TAM, perceived usefulness predicts IT use and intention to
use (e.g., Adams et al., 1992; Agarwal and Prasad, 1999; Gefen and Keil, 1998; Gefen and
Straub, 1997; Hendrickson, Massey, and Cronan, 1993; Igbaria et al., 1995; Subramanian,
1994), as well as e-commerce adoption (Gefen and Straub, 2000). In addition, Davis et al.
(1989) found that perceived usefulness exhibited a stronger and more consistent relationship
with usage than did other variables reported in the literature, including various attitudes,
satisfaction and perceptions measures. Furthermore, Davis et al. (1989) indicate that
individuals shape behavioural intentions towards online shopping based largely on a
CHAPTER 4: CONCEPTUAL RESEARCH MODEL AND HYPOTHESES
P a g e | 109
cognitive evaluation of how it will improve their shopping performance. According to
Bhattacherjee (2001), an individual is more likely to undertake continued intention to use
when such usage is perceived to be beneficial. Customers who have accomplished the task of
product acquisition in an efficient manner will be more likely to exhibit stronger repurchase
intentions (Babin and Babin, 2001). However, users may continue using an e-commerce
service if they consider it useful, even if they are dissatisfied with their prior use
(Bhattacherjee, 2001a).
Consumers are likely to evaluate and consider product-related information prior to purchase,
and perceived usefulness may, therefore, be more important than the enjoyment (hedonic
aspect) of the shopping experience (Babin et al., 1994). Additionally, Davis et al. (1992)
identified a positive relationship between perceived usefulness and enjoyment (Chung and
Tan, 2004). Furthermore, we, posit that a useful product or service online could make people
more likely to use and recommend it to their peers. That is, usefulness will act as persuasive
tools that will increase social influences on his/her intention towards continuance usage.
Although it does not affect the importance of friends, perceived usefulness is likely to
encourage peers to spread recommendations by word-of-mouth, thereby increases enjoyment
and continuance intentions. Therefore:
H3a: Perceived Usefulness relates positively to increased customer Subjective Norms.
H3b: Perceived Usefulness relates positively to Enjoyment.
H3c: Perceived Usefulness relates positively to Continuance Intentions.
4.4.4. Subjective Norms
Subjective norms influence a person’s proclivity to engage in certain behaviour. If social
expectations state that people should engage in the behaviour in question, then the person
should be more likely to do so (George, 2004).
According to Venkatesh et al. (2003), social influences result from subjective norms, which
relate to individual consumers’ perceptions about the beliefs of other consumers. Shim et al.
(2001) consider subjective norms only marginally significant for e-shopping intentions,
whereas Foucault et al. (2005) confirm a significant link between talking about e-shopping
with friends and intention to e-shop.
Ajzen, (1985) uses the term “subjective norms” to refer to the person's perception of the
social pressures that put on him or her to perform the behaviour in question. Social pressure
CHAPTER 4: CONCEPTUAL RESEARCH MODEL AND HYPOTHESES
P a g e | 110
can affect the attitudes and behaviour of individuals in varying degrees in different societies
depending on the culture.
Researchers, such as Hofstede (1994) and Adler (1995), maintain that the individualism-
collectivism dimension is an important means of understanding the motives of human action
and behaviour (Ali, 1988). This perspective refers to an understanding of people's needs to
either satisfy personal aspirations or attend to group needs. In highly collectivistic cultures,
such as the Arab World, an individual’s actions are typically influenced by the expectations
of people around him or her, especially the group he or she identifies with. Such in-group
identification is typically carried over to the e-shopping environment, where social pressure
from family and friends influences the attitudes and behaviour of the individual.
Therefore, in terms of the underlying motivation to accept technology or online shopping,
individuals from a collectivistic culture may use online shopping not because of their
potential usefulness or the enjoyment to be derived, but because of the perceived social
pressure from their family and friends. These individuals will conform to the accepted social
norm by using the technology to perform online shopping because of their belief that they
will be perceived as being technologically sophisticated by those whom they consider
important to their future well-being. Childerset et al., (2001), Joines, Scherer, and Scheufele
(2003), and Parsons (2002) indicated that social experiences also affect one's shopping
activities. Thus, one's tendency to seek enjoyment experiences while shopping online as a
means for product shopping might be influenced by surrounded people. Taking that into
consideration, social norms is then relevant to enjoyment, because involving consumers in the
web sites facilitate e-friendship, discussing experience with friends (Foucault et al., 2005),
and enforce e-shopping, which produce similar result of greater enjoyable experience. Thus,
H4a: Perceived Subjective Norms relate positively to increased customer Enjoyment.
H4b: Perceived Subjective Norms relate positively to Continuance Intentions.
4.4.5. Enjoyment
Perceived enjoyment (PE) refers to the extent to which the activity of using an e-commerce
website is enjoyable in its own right, and beyond the instrumental value of the site (Davis et
al., 1992). It is also defined as the extent to which online shopping is perceived to be
personally enjoyable and fun (Chiu et al., 2009). Attractiveness, which is part of site quality,
also has a significant positive impact on perceived enjoyment (Van Der Heijden, 2003).
CHAPTER 4: CONCEPTUAL RESEARCH MODEL AND HYPOTHESES
P a g e | 111
According to self-determination theory, customers are self-determining and intrinsically
motivated in online shopping when they are interested in it or enjoy doing it (Chiu et al.,
2009). In other words, users who have lower perceived enjoyment may feel that the website
requires more effort to use (Venkatesh et al., 2002). Other researchers indicate that
enjoyment has positive effects on the way customers perceive the ease of use of a website
mainly in studies focused on information system usage (Venkatesh, 2000; Venkatesh et al.,
2002; Yi and Hwang, 2003). Because Internet shopping is usually voluntary, and searching
and buying are impulsive behaviours, it seems likely that shoppers’ intentions become
stronger if they perceive higher enjoyment from the website (Li and Zhang, 2005). Along the
same lines, Atkinson and Kydd (1997) find that perceived enjoyment is important when
predicting the use of the Internet for entertainment purposes.
The use of online shopping may also be motivated by intrinsic psychological rewards.
Perceived enjoyment and fun represent intrinsic motivations for the use of online shopping. It
represents a type of intellectual playfulness and is defined as an individual characteristic that
described an individual's tendency to interact spontaneously, inventively, and imaginatively
with the computer. Empirical research indicates that the general characteristics of enjoyment
and fun relate positively to creativity and an exploratory type of behaviour during interaction
with computers (Webster, 1992). Research indicates that individuals who experience pleasure
and joy from using a computer, and perceive any activity involving use of online shopping as
inherently enjoyable apart from any anticipated improvement in performance, are likely to
use it more extensively than others (Davis, 1992; Malone, 1981; Webster, 1989). Davis et al.
(1989) found that while perceived usefulness emerged as the major determinant of computer
acceptance in the workplace, enjoyment and fun had a significant effect beyond perceived
usefulness.
Enjoyment in using a website significantly affects intentions to use (Davis et al., 1992;
Igbaria et al., 1995; Teo et al., 1999; Venkatesh et al., 2002). Additionally, Triandis (1980)
argued that emotions associated with such an affect (e.g. the feelings of joy, elation and
pleasure) have an impact on an individual’s behaviour. Shopping enjoyment (Koufaris,
2002), entertainment value of the website (O’Keefe, O’Connor, and Kung, 1998), and
perceived visual attractiveness all have positive impacts on perceived enjoyment and
continuance intentions (van der Heijden, 2003). Furthermore, Hirschman and Holbrook
(1982) suggested that positive consumption, related to emotions in a hedonic context, is
likely to lead to very high levels of commitment and repurchase intention. Davis et al. (1989)
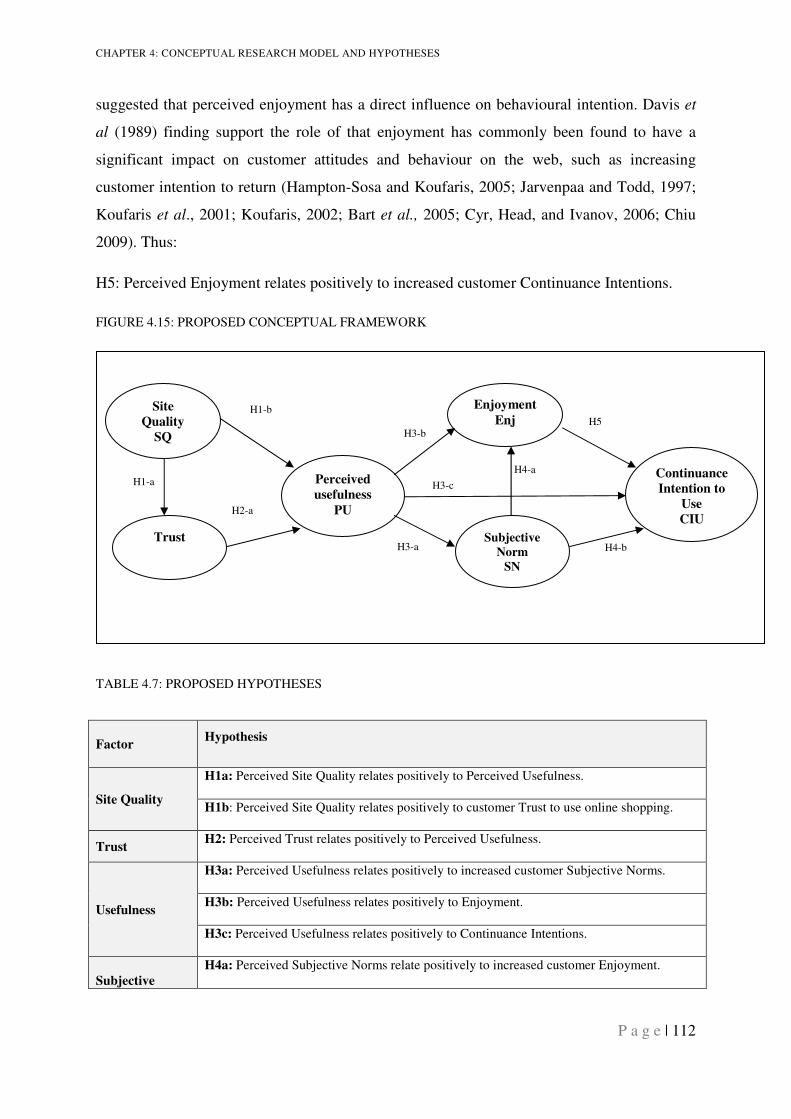
CHAPTER 4: CONCEPTUAL RESEARCH MODEL AND HYPOTHESES
P a g e | 112
suggested that perceived enjoyment has a direct influence on behavioural intention. Davis et
al (1989) finding support the role of that enjoyment has commonly been found to have a
significant impact on customer attitudes and behaviour on the web, such as increasing
customer intention to return (Hampton-Sosa and Koufaris, 2005; Jarvenpaa and Todd, 1997;
Koufaris et al., 2001; Koufaris, 2002; Bart et al., 2005; Cyr, Head, and Ivanov, 2006; Chiu
2009). Thus:
H5: Perceived Enjoyment relates positively to increased customer Continuance Intentions.
FIGURE 4.15: PROPOSED CONCEPTUAL FRAMEWORK
TABLE 4.7: PROPOSED HYPOTHESES
Factor Hypothesis
Site Quality
H1a: Perceived Site Quality relates positively to Perceived Usefulness.
H1b: Perceived Site Quality relates positively to customer Trust to use online shopping.
Trust H2: Perceived Trust relates positively to Perceived Usefulness.
Usefulness
H3a: Perceived Usefulness relates positively to increased customer Subjective Norms.
H3b: Perceived Usefulness relates positively to Enjoyment.
H3c: Perceived Usefulness relates positively to Continuance Intentions.
Subjective
H4a: Perceived Subjective Norms relate positively to increased customer Enjoyment.
Site
Quality
SQ
Subjective
Norm
SN
Enjoyment
Enj
Perceived
usefulness
PU
Trust
Continuance
Intention to
Use
CIU H2-a
H1-b
H3-a
H3-b
H3-c
H4-a
H5
H4-b
H1-a
CHAPTER 4: CONCEPTUAL RESEARCH MODEL AND HYPOTHESES
P a g e | 113
Norm H4b: Perceived Subjective Norms relate positively to Continuance Intentions.
Enjoyment H5: Perceived Enjoyment relates positively to increased customer Continuance Intentions.
4.5. SUMMARY
Online shopping as a new channel for doing business in B2C segments is becoming popular
across all countries. With the digital economy, companies have also become vulnerable to
competitors that are just a click away (see Cheung, Chan, and Limayem, 2005). Previous
research suggests that many factors can build a foundation for constructing a framework of
online consumer behaviour. Douglas et al. (1994) suggest researchers should develop
theoretical and conceptual frameworks by integrating different constructs that come from
varied research traditions and disciplines. However, few studies attempt to investigate the
impact of the key characteristics on e-shopping continuance intentions in Saudi Arabia. Many
researchers have attempted to extend TAM and ECT by integrating variables from other
models, theories and contexts to provide a better explanation of users’ intention or
continuance intention toward online shopping. TAM and ECT were originally applied mostly
in developed countries. The generalizability of previous studies across different cultures, such
as Saudi Arabia, is questionable. As a result, this research aims to help online businesses
understand which factors encourage consumers to have continuance intention behaviour
towards e-shopping.
In the proposed model, the author postulates that the effect on continuance intention, which is
adapted from ECT, comes from three constructs: perceived usefulness, enjoyment, and
subjective norm. The topic of this research was operationalised and its dimensions identified.
The dimensions are site quality, trust, usefulness, subjective norms, enjoyment, and
continuance intention. In addition, several indicators were selected and transformed into
hypotheses.
In the next chapter, the research design and methodology used to examine the model of
measurement of online shopping continuance intention, in the context of Saudi Arabia, will
be discussed in detail.
CHAPTER 5: RESEARCH DESIGN AND METHODOLOGY
P a g e | 114
CHAPTER 5: RESEARCH DESIGN AND METHODOLOGY
5.1. INTRODUCTION
This chapter presents the research methodology with a focus on the main approaches, types
of research, and research design. It also details quantitative and qualitative methods and
related processes, along with data collection and sampling approaches, as well as other
different techniques used in this research.
To select the right research method to investigate a problem, the chosen method must be
appropriate for achieving the objective. The selection process must avoid implementing a
method that might look ideal but in reality be inappropriate. The process itself must be
precise; that is, “each design and method should be taken on its merits as a means of
facilitating (or obscuring) the understanding of particular research problems” (Bryman, 1992:
255).
5.2. RESEARCH DESIGN AND METHODOLOGY
In any research, there are two commonly used terms that must be clearly defined and
distinguished: research design and research methodology.
Yin (2008) states that research design is the blueprint for any research which enables possible
solutions to be found for the research problems, and it act as guidelines for various stages of
the research. Additionally, the research design is the programme that is followed in the
process of collecting, analysing, and interpreting the research observations (Nachmias and
Nachmias, 2000). Yin (2008) states that research design deals with at least four key
problems, which if conducted right will lead to successful research: what questions to study,
what data are relevant, what data to collect, and how to analyse the results. Consequently, the
research design procedures cover some strategic decisions concerning the choice of data
collection methods, as well as more tactical decisions such as measurement and scaling
procedures, questionnaire, samples, and data analysis (Zikmund, 2003).
By contrast, research methodology is a system of specific rules and procedures on which
research is based and against which claims for knowledge are evaluated. Methodology entails
the whole process of carrying out a study or doing research (Creswell, 2003) aimed at
capturing or understanding a social phenomenon. Saunders (1997: 3) argues that research
CHAPTER 5: RESEARCH DESIGN AND METHODOLOGY
P a g e | 115
involves a multistage process which is followed in order to undertake and complete a
research project or study. The research methodology should contain topic formulation,
review of literature, strategy and design, data collection, data analysis, a report of the
findings, and details of any limitations or constraints that the researcher faced (Cooper and
Schindler, 2003).
To summarise, research design provides a conceptual framework for the study, while research
methodology is concerned with the tools that were used to achieve the research aims. Thus,
research design is more holistic and it includes research methodology, which is related to
strategic issues.
5.3. RESEARCH PURPOSE AND TYPE
Many research experts agree on three main purposes of carrying out research: exploratory,
descriptive, and explanatory (Robson, 1993; Saunders et al., 2009; Yin, 2003). In fact,
Robson (1993) points out that the purpose of the research enquiry may change over time.
Depending on the research nature and problem, the research investigation might include more
than one purpose of exploratory, descriptive, or explanatory (Babbie, 2004).
5.3.1 Exploratory Research
Exploratory research tries to build descriptions of complex circumstances or phenomena that
are unexplored in the literature (Marshall and Rossman, 1999). Yin (2003) considers
exploratory research to mean a study of new phenomenon. Thus, exploratory research is often
performed in order to clarify the nature of unclear problems. It represents the first stage of
investigation of a topic, with the objective of developing hypotheses (Neuman, 2000).
Saunders et al. (2009) explain that exploratory research as tends “to start with a wide research
area, and narrow down as the research develops”. Robson (1993) argues that exploratory
research is a valuable means of finding out “what is happening; to seek new insights; to ask
questions and to assess phenomena in a new light”.
Exploratory research always takes place during literature reviews and works to gain a better
understanding of the nature of the research problem (Trochim and Donnelly, 2001), as well as
gathering background information about the problem to develop research hypotheses
(Churchill, 1999). Saunders et al. (2009) suggest three ways of conducting exploratory
research: (a) researching the literature, (b) talking to experts in the subject or the research
area, and (c) conducting focus group interviews and case studies.
CHAPTER 5: RESEARCH DESIGN AND METHODOLOGY
P a g e | 116
5.3.2 Descriptive Research
The aim of descriptive research is to “portray an accurate profile of persons, events or
situations” (Robson, 1993:4). It is necessary to have a clear picture and definition of the
phenomena on which the researcher wishes to collect data prior to its collection (Dane, 1990).
Descriptive research entails the development of the hypothesis, and relies on the information
gained through exploratory research and the literature review (Malhotra, 2004). It uses
structured survey questionnaires, which involve sufficient participants to minimize errors and
maximize reliability (Malhotra, 2004). Therefore, descriptive research should define
questions, people surveyed, and method of analysis prior to beginning data collection. It also
describes the required variables within a population in relation to person, place, and time
(who, what, where, when, and why should be defined) (Zikmund, 2003). It also clarifies
previous studies and discusses relevant theories.
5.3.3 Explanatory Research
However, descriptive research does not explain the cause-and-effect relationships between
the research variables and the hypotheses (Zikmund, 2003). Explanatory research, therefore,
builds on gathered information and seeks to develop an explanation of variable relations
(Marshall and Rossman, 1999; Saunders et al., 2009; Yin, 2003; Babbie, 2004). It also
examines developed hypotheses and attempts to understand the reasons for observed
phenomena (Neuman, 2000). Miles and Huberman (1994), implies that understanding the
reasons for observed phenomena means “making complicated things understandable by
showing how their component parts fit together according to some rule”. It is important,
therefore, to note that conducting an explanatory research requires a well-defined research
problem, and the hypotheses need to be stated. Additionally, explanatory research is regularly
used within areas where extensive research has already been done.
5.4. RESEARCH APPROACH
The design of a research study begins with the selection of a topic and a paradigm. A
paradigm is essentially a worldview - a whole framework of beliefs, values and methods
within which research takes place. It is this worldview within which researchers works.
Henning, Van Rensburg, and Smit (2004) define a paradigm as “a theory or hypothesis”, i.e.,
a framework within which theories are built that fundamentally influences how you see the
world, determine your perspective, and shape your understanding of how things are
connected. Holding a particular worldview influences your personal behaviour, your
CHAPTER 5: RESEARCH DESIGN AND METHODOLOGY
P a g e | 117
professional practice, and ultimately the stance you take with regard to the subject of your
research. In very simple terms, a paradigm is a way to ‘see’ the world and organise it into a
coherent whole (MacNaughton, Rolfe, and Siraj-Blatchford, 2007). Just as a picture frame
‘frames’ a picture, a paradigm frames a research topic; and just as our choice of picture frame
influences how we see the picture within it, so our choice of paradigm influences how we see
our research topic.
Guba and Lincoln (1994) state that the basic beliefs that define a particular research paradigm
may be summarised by the responses given to three fundamental questions: (a) the
ontological question, i.e., what is the form and nature of reality; (b) the epistemological
question, i.e., what is the basic belief about knowledge (i.e. what can be known); and (c) the
methodological question, i.e., how can the researcher go about finding out whatever he or she
believes can be known. Appendix C provides more details on the comparison and analysis of
the three major research paradigms.
Selecting an appropriate research approach is one of the most critical phases a researcher
faces when seeking answers to a problem. Easterby-Smith, Thorpe, and Lowe (1991: p. 21)
insist that gaining knowledge about the research approaches is very important for three
reasons. First, it enables the researcher to take more informed decisions about the research
design. Second, it will help the researcher to think about those research approaches that will
work for conducted research and those that will not. Third, understanding the different
research approaches enables the researcher to adapt the research design to cater for
constraints.
A number of theoretical paradigms are discussed in the literature. Orlikowski and Baroudi
(1991), Irani et al., (1999) and Straub, Gefen and Boudreau (2005) all specify that researches
related to information systems, such as technology acceptance and continuance intention, are
not covered in one theoretical perspective. According to Easterby-Smith et al (1991), there
are two opposing philosophical/methodical approaches in research: positivism and
phenomenology.
5.4.1 Positivism vs. Phenomenology
The positivistic approach to research is based on research methodology commonly used in
science. It is characterised by a detached approach to research and seeks out the facts or
causes of any social phenomenon in a systematic way. Collis and Hussey (2003) state that the
“positivistic approach is founded on a belief that the study of human behaviour should be
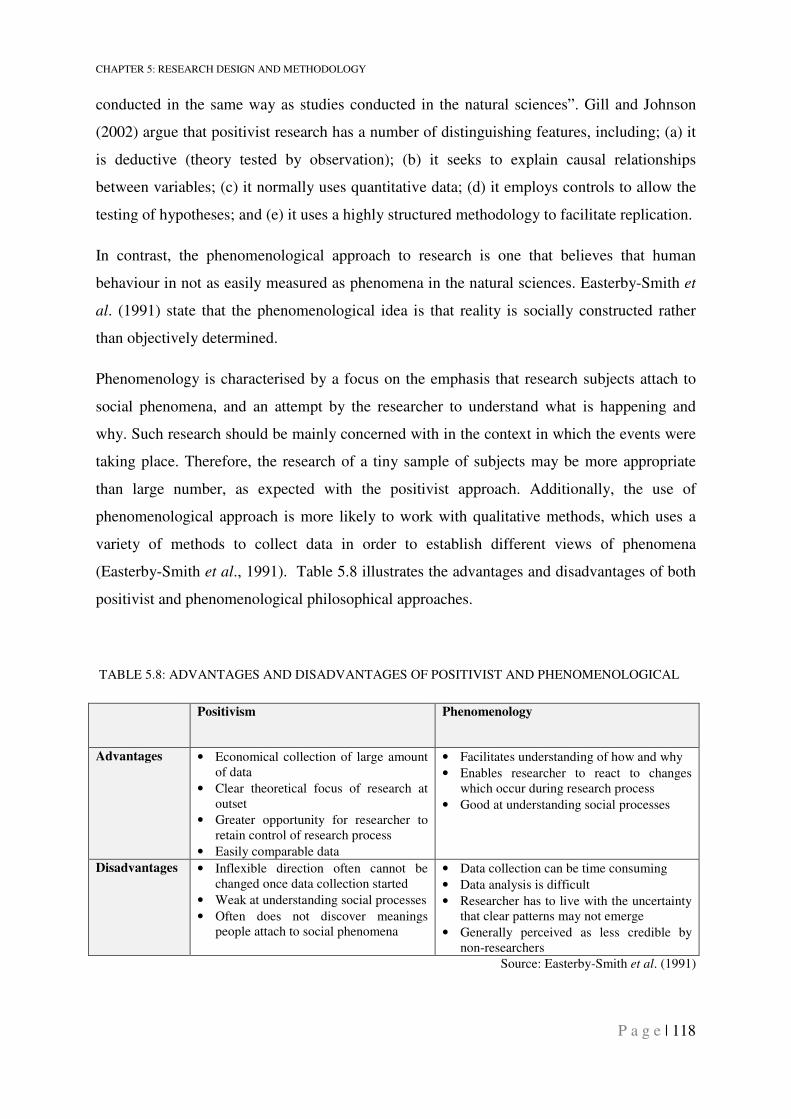
CHAPTER 5: RESEARCH DESIGN AND METHODOLOGY
P a g e | 118
conducted in the same way as studies conducted in the natural sciences”. Gill and Johnson
(2002) argue that positivist research has a number of distinguishing features, including; (a) it
is deductive (theory tested by observation); (b) it seeks to explain causal relationships
between variables; (c) it normally uses quantitative data; (d) it employs controls to allow the
testing of hypotheses; and (e) it uses a highly structured methodology to facilitate replication.
In contrast, the phenomenological approach to research is one that believes that human
behaviour in not as easily measured as phenomena in the natural sciences. Easterby-Smith et
al. (1991) state that the phenomenological idea is that reality is socially constructed rather
than objectively determined.
Phenomenology is characterised by a focus on the emphasis that research subjects attach to
social phenomena, and an attempt by the researcher to understand what is happening and
why. Such research should be mainly concerned with in the context in which the events were
taking place. Therefore, the research of a tiny sample of subjects may be more appropriate
than large number, as expected with the positivist approach. Additionally, the use of
phenomenological approach is more likely to work with qualitative methods, which uses a
variety of methods to collect data in order to establish different views of phenomena
(Easterby-Smith et al., 1991). Table 5.8 illustrates the advantages and disadvantages of both
positivist and phenomenological philosophical approaches.
TABLE 5.8: ADVANTAGES AND DISADVANTAGES OF POSITIVIST AND PHENOMENOLOGICAL
Positivism Phenomenology
Advantages • Economical collection of large amount of data
• Clear theoretical focus of research at outset
• Greater opportunity for researcher to retain control of research process
• Easily comparable data
• Facilitates understanding of how and why
• Enables researcher to react to changes which occur during research process
• Good at understanding social processes
Disadvantages • Inflexible direction often cannot be changed once data collection started
• Weak at understanding social processes
• Often does not discover meanings people attach to social phenomena
• Data collection can be time consuming
• Data analysis is difficult
• Researcher has to live with the uncertainty that clear patterns may not emerge
• Generally perceived as less credible by non-researchers
Source: Easterby-Smith et al. (1991)
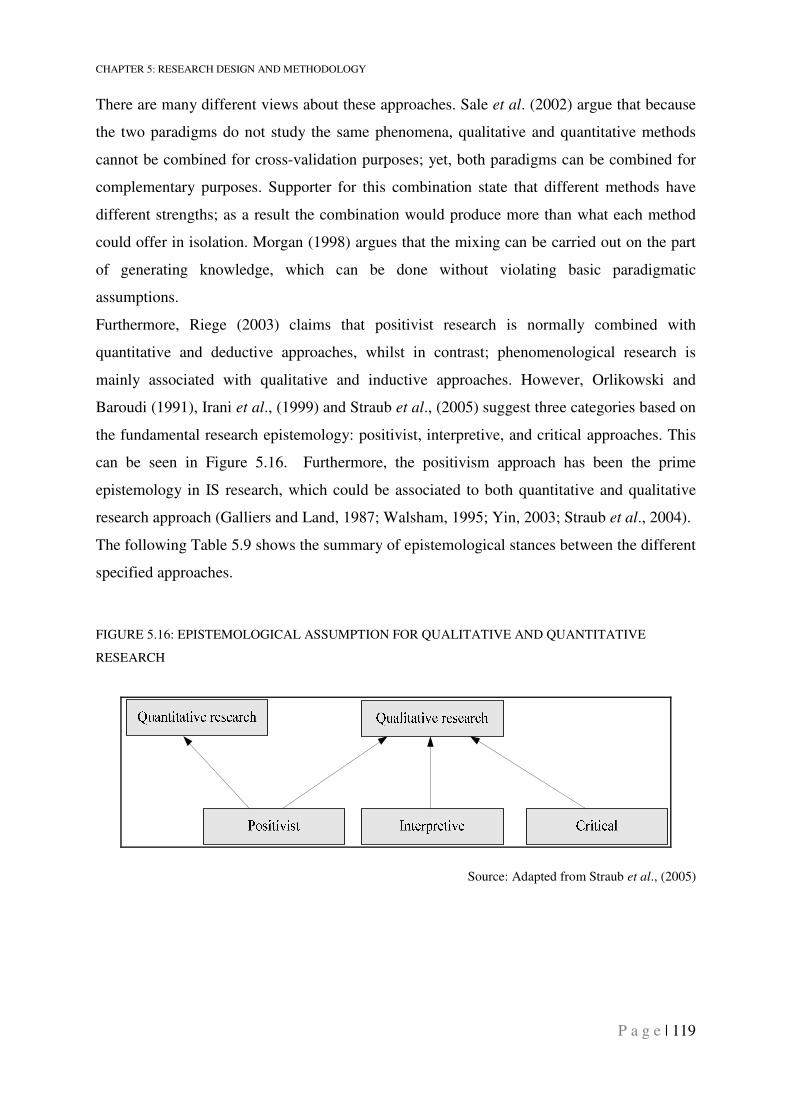
CHAPTER 5: RESEARCH DESIGN AND METHODOLOGY
P a g e | 119
There are many different views about these approaches. Sale et al. (2002) argue that because
the two paradigms do not study the same phenomena, qualitative and quantitative methods
cannot be combined for cross-validation purposes; yet, both paradigms can be combined for
complementary purposes. Supporter for this combination state that different methods have
different strengths; as a result the combination would produce more than what each method
could offer in isolation. Morgan (1998) argues that the mixing can be carried out on the part
of generating knowledge, which can be done without violating basic paradigmatic
assumptions.
Furthermore, Riege (2003) claims that positivist research is normally combined with
quantitative and deductive approaches, whilst in contrast; phenomenological research is
mainly associated with qualitative and inductive approaches. However, Orlikowski and
Baroudi (1991), Irani et al., (1999) and Straub et al., (2005) suggest three categories based on
the fundamental research epistemology: positivist, interpretive, and critical approaches. This
can be seen in Figure 5.16. Furthermore, the positivism approach has been the prime
epistemology in IS research, which could be associated to both quantitative and qualitative
research approach (Galliers and Land, 1987; Walsham, 1995; Yin, 2003; Straub et al., 2004).
The following Table 5.9 shows the summary of epistemological stances between the different
specified approaches.
FIGURE 5.16: EPISTEMOLOGICAL ASSUMPTION FOR QUALITATIVE AND QUANTITATIVE
RESEARCH
Source: Adapted from Straub et al., (2005)
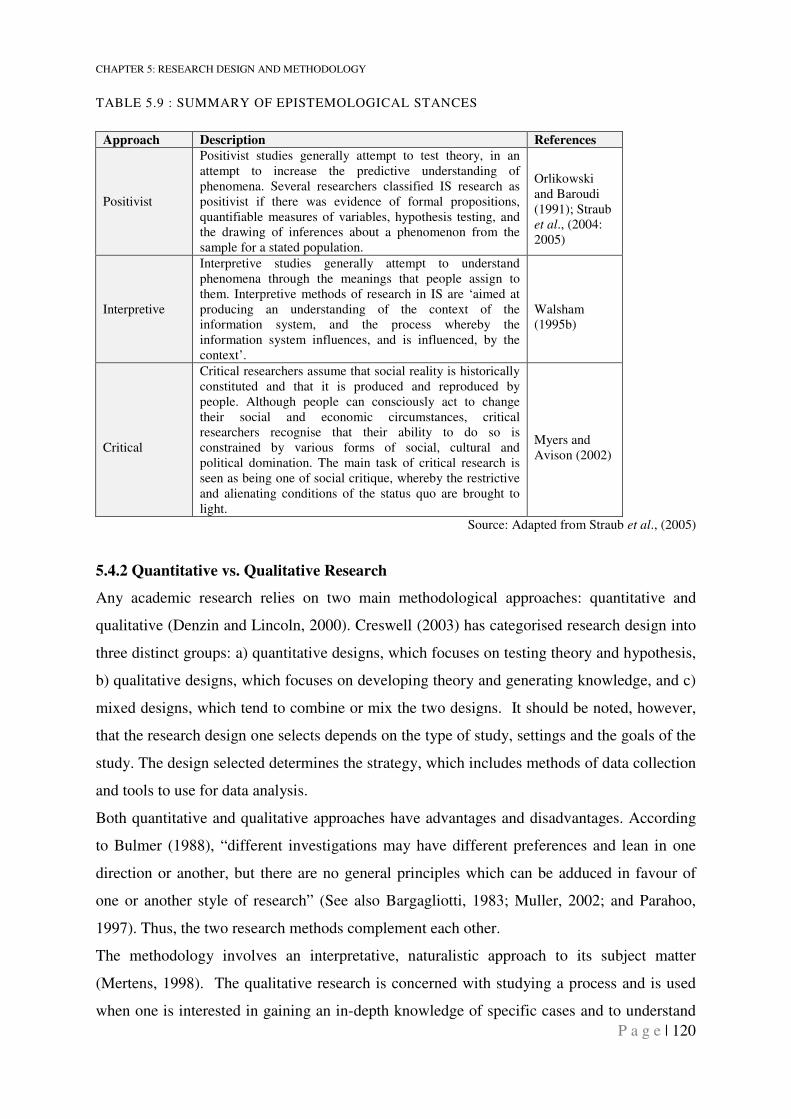
CHAPTER 5: RESEARCH DESIGN AND METHODOLOGY
P a g e | 120
TABLE 5.9 : SUMMARY OF EPISTEMOLOGICAL STANCES
Approach Description References
Positivist
Positivist studies generally attempt to test theory, in an attempt to increase the predictive understanding of phenomena. Several researchers classified IS research as positivist if there was evidence of formal propositions, quantifiable measures of variables, hypothesis testing, and the drawing of inferences about a phenomenon from the sample for a stated population.
Orlikowski and Baroudi (1991); Straub et al., (2004: 2005)
Interpretive
Interpretive studies generally attempt to understand phenomena through the meanings that people assign to them. Interpretive methods of research in IS are ‘aimed at producing an understanding of the context of the information system, and the process whereby the information system influences, and is influenced, by the context’.
Walsham (1995b)
Critical
Critical researchers assume that social reality is historically constituted and that it is produced and reproduced by people. Although people can consciously act to change their social and economic circumstances, critical researchers recognise that their ability to do so is constrained by various forms of social, cultural and political domination. The main task of critical research is seen as being one of social critique, whereby the restrictive and alienating conditions of the status quo are brought to light.
Myers and Avison (2002)
Source: Adapted from Straub et al., (2005)
5.4.2 Quantitative vs. Qualitative Research
Any academic research relies on two main methodological approaches: quantitative and
qualitative (Denzin and Lincoln, 2000). Creswell (2003) has categorised research design into
three distinct groups: a) quantitative designs, which focuses on testing theory and hypothesis,
b) qualitative designs, which focuses on developing theory and generating knowledge, and c)
mixed designs, which tend to combine or mix the two designs. It should be noted, however,
that the research design one selects depends on the type of study, settings and the goals of the
study. The design selected determines the strategy, which includes methods of data collection
and tools to use for data analysis.
Both quantitative and qualitative approaches have advantages and disadvantages. According
to Bulmer (1988), “different investigations may have different preferences and lean in one
direction or another, but there are no general principles which can be adduced in favour of
one or another style of research” (See also Bargagliotti, 1983; Muller, 2002; and Parahoo,
1997). Thus, the two research methods complement each other.
The methodology involves an interpretative, naturalistic approach to its subject matter
(Mertens, 1998). The qualitative research is concerned with studying a process and is used
when one is interested in gaining an in-depth knowledge of specific cases and to understand
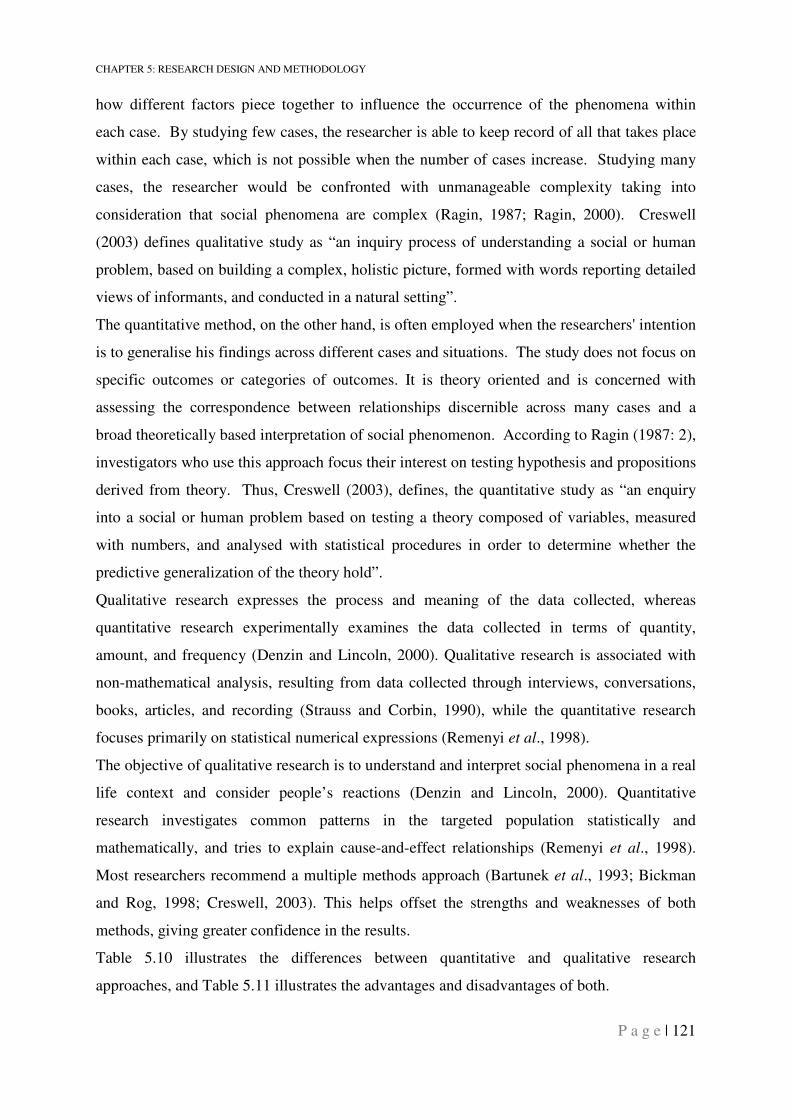
CHAPTER 5: RESEARCH DESIGN AND METHODOLOGY
P a g e | 121
how different factors piece together to influence the occurrence of the phenomena within
each case. By studying few cases, the researcher is able to keep record of all that takes place
within each case, which is not possible when the number of cases increase. Studying many
cases, the researcher would be confronted with unmanageable complexity taking into
consideration that social phenomena are complex (Ragin, 1987; Ragin, 2000). Creswell
(2003) defines qualitative study as “an inquiry process of understanding a social or human
problem, based on building a complex, holistic picture, formed with words reporting detailed
views of informants, and conducted in a natural setting”.
The quantitative method, on the other hand, is often employed when the researchers' intention
is to generalise his findings across different cases and situations. The study does not focus on
specific outcomes or categories of outcomes. It is theory oriented and is concerned with
assessing the correspondence between relationships discernible across many cases and a
broad theoretically based interpretation of social phenomenon. According to Ragin (1987: 2),
investigators who use this approach focus their interest on testing hypothesis and propositions
derived from theory. Thus, Creswell (2003), defines, the quantitative study as “an enquiry
into a social or human problem based on testing a theory composed of variables, measured
with numbers, and analysed with statistical procedures in order to determine whether the
predictive generalization of the theory hold”.
Qualitative research expresses the process and meaning of the data collected, whereas
quantitative research experimentally examines the data collected in terms of quantity,
amount, and frequency (Denzin and Lincoln, 2000). Qualitative research is associated with
non-mathematical analysis, resulting from data collected through interviews, conversations,
books, articles, and recording (Strauss and Corbin, 1990), while the quantitative research
focuses primarily on statistical numerical expressions (Remenyi et al., 1998).
The objective of qualitative research is to understand and interpret social phenomena in a real
life context and consider people’s reactions (Denzin and Lincoln, 2000). Quantitative
research investigates common patterns in the targeted population statistically and
mathematically, and tries to explain cause-and-effect relationships (Remenyi et al., 1998).
Most researchers recommend a multiple methods approach (Bartunek et al., 1993; Bickman
and Rog, 1998; Creswell, 2003). This helps offset the strengths and weaknesses of both
methods, giving greater confidence in the results.
Table 5.10 illustrates the differences between quantitative and qualitative research
approaches, and Table 5.11 illustrates the advantages and disadvantages of both.
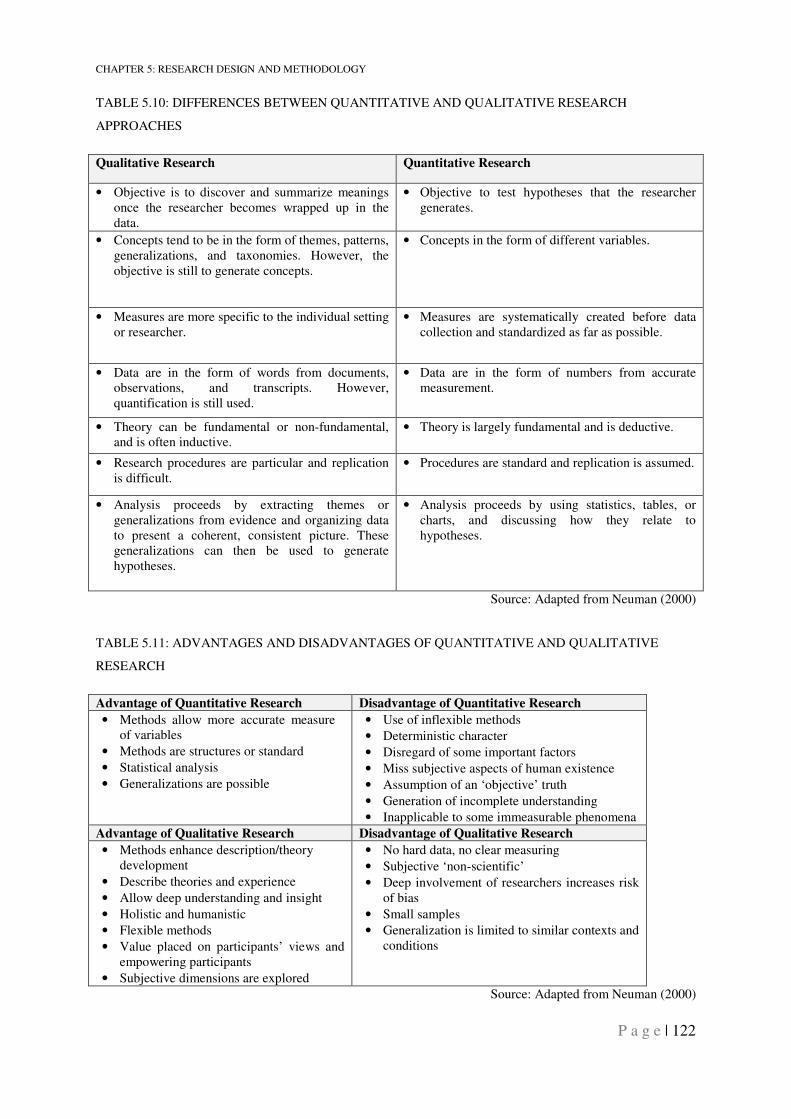
CHAPTER 5: RESEARCH DESIGN AND METHODOLOGY
P a g e | 122
TABLE 5.10: DIFFERENCES BETWEEN QUANTITATIVE AND QUALITATIVE RESEARCH
APPROACHES
Qualitative Research Quantitative Research
• Objective is to discover and summarize meanings once the researcher becomes wrapped up in the data.
• Objective to test hypotheses that the researcher generates.
• Concepts tend to be in the form of themes, patterns, generalizations, and taxonomies. However, the objective is still to generate concepts.
• Concepts in the form of different variables.
• Measures are more specific to the individual setting or researcher.
• Measures are systematically created before data collection and standardized as far as possible.
• Data are in the form of words from documents, observations, and transcripts. However, quantification is still used.
• Data are in the form of numbers from accurate measurement.
• Theory can be fundamental or non-fundamental, and is often inductive.
• Theory is largely fundamental and is deductive.
• Research procedures are particular and replication is difficult.
• Procedures are standard and replication is assumed.
• Analysis proceeds by extracting themes or generalizations from evidence and organizing data to present a coherent, consistent picture. These generalizations can then be used to generate hypotheses.
• Analysis proceeds by using statistics, tables, or charts, and discussing how they relate to hypotheses.
Source: Adapted from Neuman (2000)
TABLE 5.11: ADVANTAGES AND DISADVANTAGES OF QUANTITATIVE AND QUALITATIVE
RESEARCH
Advantage of Quantitative Research Disadvantage of Quantitative Research
• Methods allow more accurate measure of variables
• Methods are structures or standard
• Statistical analysis
• Generalizations are possible
• Use of inflexible methods
• Deterministic character
• Disregard of some important factors
• Miss subjective aspects of human existence
• Assumption of an ‘objective’ truth
• Generation of incomplete understanding
• Inapplicable to some immeasurable phenomena
Advantage of Qualitative Research Disadvantage of Qualitative Research
• Methods enhance description/theory development
• Describe theories and experience
• Allow deep understanding and insight
• Holistic and humanistic
• Flexible methods
• Value placed on participants’ views and empowering participants
• Subjective dimensions are explored
• No hard data, no clear measuring
• Subjective ‘non-scientific’
• Deep involvement of researchers increases risk of bias
• Small samples
• Generalization is limited to similar contexts and conditions
Source: Adapted from Neuman (2000)
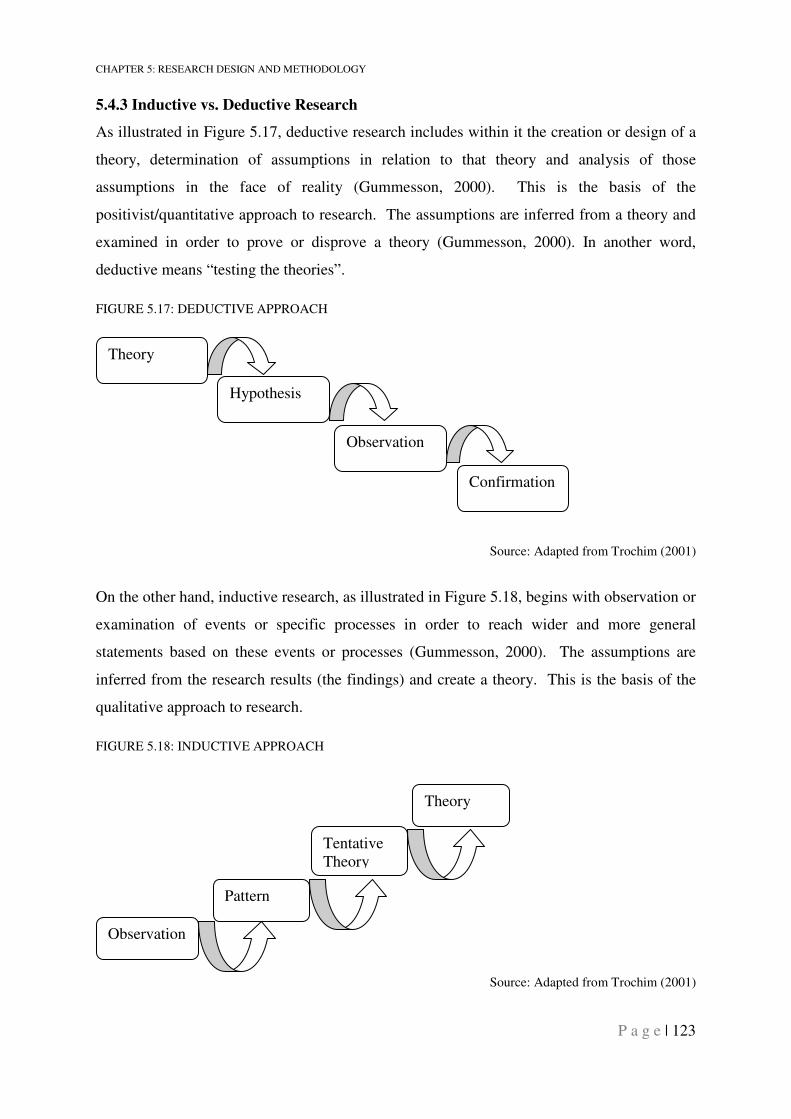
CHAPTER 5: RESEARCH DESIGN AND METHODOLOGY
P a g e | 123
5.4.3 Inductive vs. Deductive Research
As illustrated in Figure 5.17, deductive research includes within it the creation or design of a
theory, determination of assumptions in relation to that theory and analysis of those
assumptions in the face of reality (Gummesson, 2000). This is the basis of the
positivist/quantitative approach to research. The assumptions are inferred from a theory and
examined in order to prove or disprove a theory (Gummesson, 2000). In another word,
deductive means “testing the theories”.
FIGURE 5.17: DEDUCTIVE APPROACH
Source: Adapted from Trochim (2001)
On the other hand, inductive research, as illustrated in Figure 5.18, begins with observation or
examination of events or specific processes in order to reach wider and more general
statements based on these events or processes (Gummesson, 2000). The assumptions are
inferred from the research results (the findings) and create a theory. This is the basis of the
qualitative approach to research.
FIGURE 5.18: INDUCTIVE APPROACH
Source: Adapted from Trochim (2001)
Theory
Hypothesis
Observation
Confirmation
Observation
Pattern
Tentative Theory
Theory
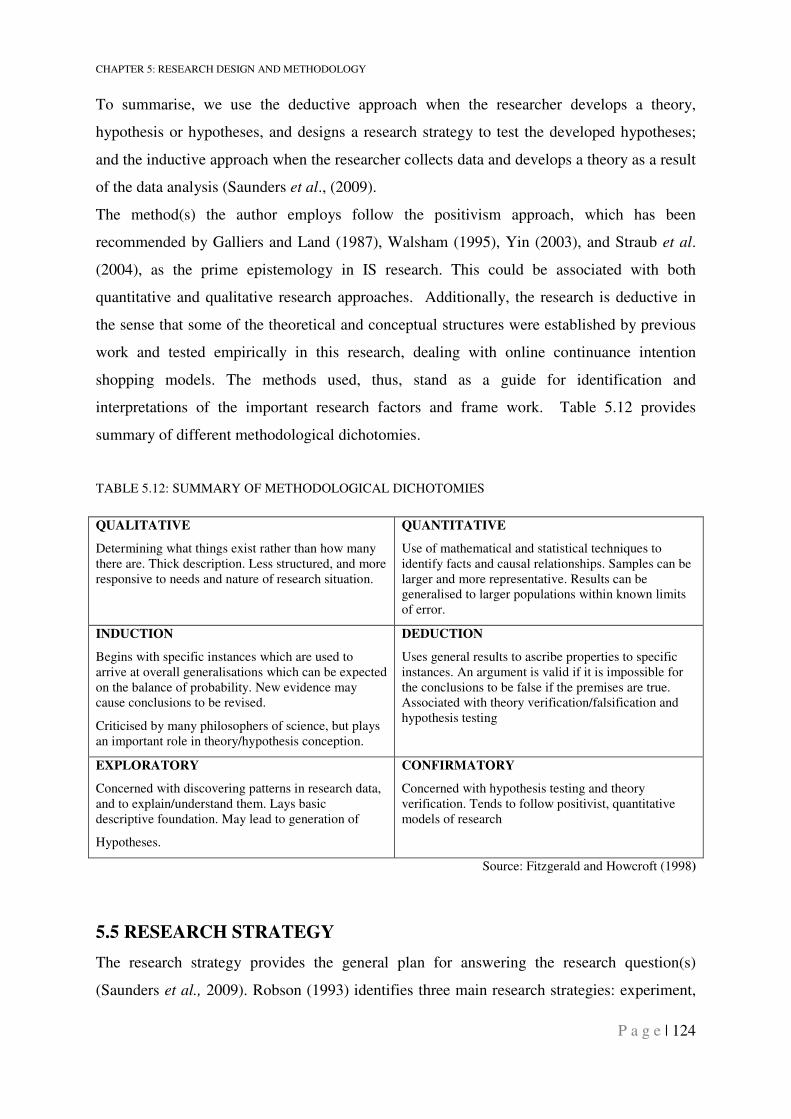
CHAPTER 5: RESEARCH DESIGN AND METHODOLOGY
P a g e | 124
To summarise, we use the deductive approach when the researcher develops a theory,
hypothesis or hypotheses, and designs a research strategy to test the developed hypotheses;
and the inductive approach when the researcher collects data and develops a theory as a result
of the data analysis (Saunders et al., (2009).
The method(s) the author employs follow the positivism approach, which has been
recommended by Galliers and Land (1987), Walsham (1995), Yin (2003), and Straub et al.
(2004), as the prime epistemology in IS research. This could be associated with both
quantitative and qualitative research approaches. Additionally, the research is deductive in
the sense that some of the theoretical and conceptual structures were established by previous
work and tested empirically in this research, dealing with online continuance intention
shopping models. The methods used, thus, stand as a guide for identification and
interpretations of the important research factors and frame work. Table 5.12 provides
summary of different methodological dichotomies.
TABLE 5.12: SUMMARY OF METHODOLOGICAL DICHOTOMIES
QUALITATIVE
Determining what things exist rather than how many there are. Thick description. Less structured, and more responsive to needs and nature of research situation.
QUANTITATIVE
Use of mathematical and statistical techniques to identify facts and causal relationships. Samples can be larger and more representative. Results can be generalised to larger populations within known limits of error.
INDUCTION
Begins with specific instances which are used to arrive at overall generalisations which can be expected on the balance of probability. New evidence may cause conclusions to be revised.
Criticised by many philosophers of science, but plays an important role in theory/hypothesis conception.
DEDUCTION
Uses general results to ascribe properties to specific instances. An argument is valid if it is impossible for the conclusions to be false if the premises are true. Associated with theory verification/falsification and hypothesis testing
EXPLORATORY
Concerned with discovering patterns in research data, and to explain/understand them. Lays basic descriptive foundation. May lead to generation of
Hypotheses.
CONFIRMATORY
Concerned with hypothesis testing and theory verification. Tends to follow positivist, quantitative models of research
Source: Fitzgerald and Howcroft (1998)
5.5 RESEARCH STRATEGY
The research strategy provides the general plan for answering the research question(s)
(Saunders et al., 2009). Robson (1993) identifies three main research strategies: experiment,
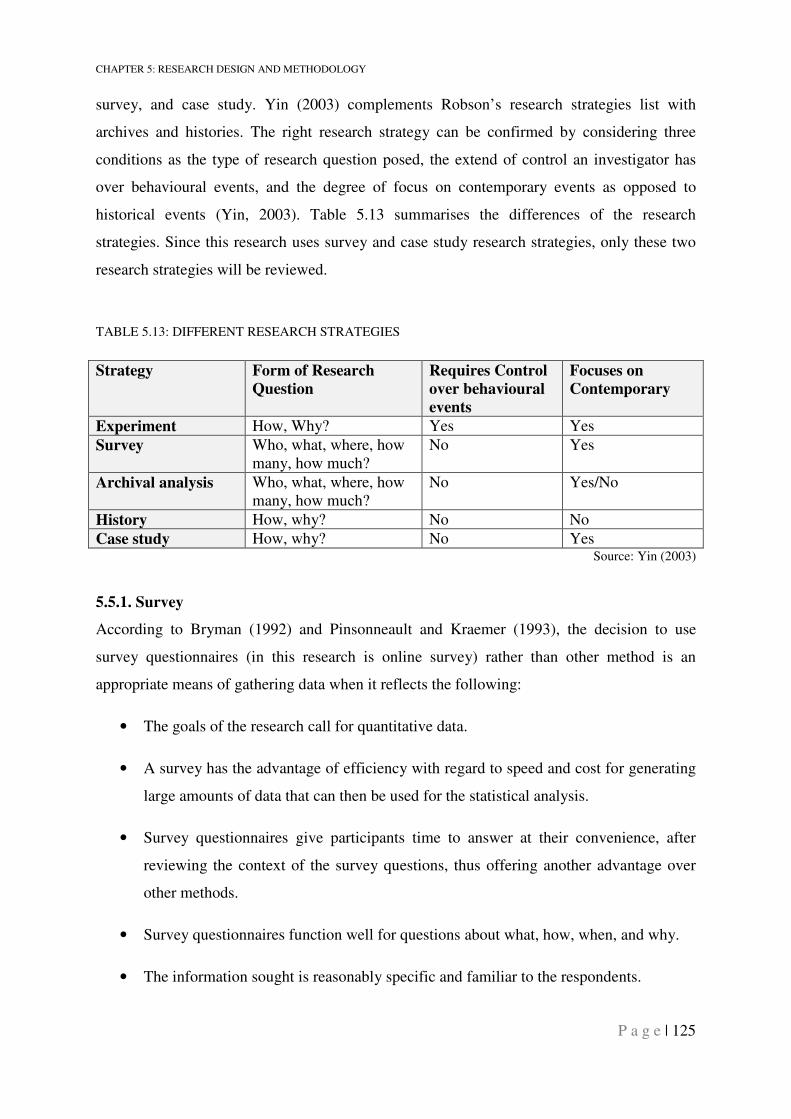
CHAPTER 5: RESEARCH DESIGN AND METHODOLOGY
P a g e | 125
survey, and case study. Yin (2003) complements Robson’s research strategies list with
archives and histories. The right research strategy can be confirmed by considering three
conditions as the type of research question posed, the extend of control an investigator has
over behavioural events, and the degree of focus on contemporary events as opposed to
historical events (Yin, 2003). Table 5.13 summarises the differences of the research
strategies. Since this research uses survey and case study research strategies, only these two
research strategies will be reviewed.
TABLE 5.13: DIFFERENT RESEARCH STRATEGIES
Strategy Form of Research
Question
Requires Control
over behavioural
events
Focuses on
Contemporary
Experiment How, Why? Yes Yes
Survey Who, what, where, how many, how much?
No Yes
Archival analysis Who, what, where, how many, how much?
No Yes/No
History How, why? No No
Case study How, why? No Yes Source: Yin (2003)
5.5.1. Survey
According to Bryman (1992) and Pinsonneault and Kraemer (1993), the decision to use
survey questionnaires (in this research is online survey) rather than other method is an
appropriate means of gathering data when it reflects the following:
• The goals of the research call for quantitative data.
• A survey has the advantage of efficiency with regard to speed and cost for generating
large amounts of data that can then be used for the statistical analysis.
• Survey questionnaires give participants time to answer at their convenience, after
reviewing the context of the survey questions, thus offering another advantage over
other methods.
• Survey questionnaires function well for questions about what, how, when, and why.
• The information sought is reasonably specific and familiar to the respondents.
CHAPTER 5: RESEARCH DESIGN AND METHODOLOGY
P a g e | 126
• The researcher has considerable prior knowledge of particular problems and the range
of responses likely to emerge.
This is the most efficient strategy when collecting data from a large group of people or a
population. It is more often used with quantitative research. According to Remenyi et al.
(1998), it can be used for description, explanation, and/or hypotheses testing.
The questionnaire method has the following advantages: economical, efficient, much larger
sample of respondents, ability of generalisation, versatility, standardisation, ease of
administration, and suitability for statistical analysis (McClintock et al., 1979; Hammersley,
1987). Furthermore, Saudi society is conservative with gender segregation in education and
work. Thus, the online survey in this research will help the researcher to reach more people,
who otherwise cannot be reached with traditional paper based surveys. See section 5.9.3 for
more information about the online survey.
Surveys can be conducted in several ways, ranging from face-to-face interviews to a postal
questionnaire (Bourque and Fielder, 1995), as well as online surveys (Bhattacherjee 2001). A
questionnaire survey is defined by McDaniel and Gates (2002) as a set of questions designed
to generate the evidence necessary to accomplish the objective of the research.
5.5.2. Case Study
As stated by Bell (2005), a case study is an umbrella term for a family of research methods
having in common the decision to focus on an enquiry around a specific instance or event.
Additionally, qualitative research or case study is synonymous terms, often fundamentally
associated together. The use of a case study is an appropriate methodology when the aim is to
gain a better understanding of complex social phenomena. Furthermore, it is an empirical
inquiry that investigates a contemporary phenomenon within its real-life context (Bell, 2005),
when the preferred research strategy questions of ‘who’, ‘why’, and ‘how’ are being
examined (Remenyi et al., 1998). Also, case study methodology is particularly useful if the
boundaries between phenomenon and context are not clearly evident (Yin, 2003).
The case study method can be used for exploratory, descriptive or explanatory purposes (Yin,
2003). Exploratory case study is a starting point for other research questions, and defines the
questions and hypotheses of a subsequent study, and determines the feasibility of the desired
research procedures. A descriptive case study provides narrative accounts and presents a
complete description of phenomenon within its context. An explanatory case study is used
CHAPTER 5: RESEARCH DESIGN AND METHODOLOGY
P a g e | 127
when testing theories, it always presents data regarding relationships and explaining which
causes produced which effects (Yin, 2003).
Case studies have a number of advantages that make them attractive to researchers. Case
study data is strong in reality and has the ability to facilitate the recognition of the complexity
and the embeddedness of social relationships (Adelman, Kemmis, and Jenkins 1980).
Furthermore, it is a means to obtain a more holistic context-based approach that provides an
analytic, not a statistical, generalisation (Yin, 2003).
However, several limitations to the case study methodology have been noted. There may be
bias in writing the description, which could influence the considerations or emphasise a
particular viewpoint. Researchers also question and criticise the case study due to its
tendency to generalise from a single case, to be very time-consuming and to generate a
massive amount of data, often resulting in unreadable documents (Yin, 2003).
5.5.3. Data Collection Methods
It is important to decide how the empirical data will be collected after having determined the
most suitable research strategy (Yin, 2003). Also, it is important to distinguish between the
two main types of data: primary data and secondary data. Primary data is the data that a
researcher gathers with a specific purpose in mind. Secondary data is the data that has already
been gathered by other researchers with different purposes in mind, such as government
databases, academic publications, public databases, Internet, and documents provided by
companies.
Having established what type of data is required, it is necessary, within the scope of the
selected research procedure and the theoretical framework, to decide the most suitable way of
collecting the required information. As stated by Roger and Victor (2006), “there is no single
best way of collecting data; the method chosen depends on the nature of the research question
posed and the specific questions you want to ask respondents. The aim of all methods is to
obtain a valid and reliable data”.
The method the author employs for research strategy is the positivism approach (Galliers and
Land, 1987; Walsham, 1995; Yin, 2003; Straub et al., 2004), which is associated with both
quantitative (survey method) and qualitative (case study) research approaches. The survey
method is used to collect the primary data for the research constructs. The case study method
is used as a complementary method to collect primary data through semi-structured
CHAPTER 5: RESEARCH DESIGN AND METHODOLOGY
P a g e | 128
interviews and secondary data from companies’ documents. Thus, the research strategy
stands as a guide for identification and interpretation of the data, which is important for the
research constructs and framework.
5.6. MULTIPLE METHODS AS AN APPROACH
Establishing a research design is a critical task in any study, since there are various
influencing factors associated with the research. Evidently, research approaches, strategies,
and data collection methods do not exist in isolation. The call for multi-method research on
the methodological level is one solution to the incommensurability of the paradigms. As
mentioned above, Sale et al. (2002) argue that because the two paradigms do not study the
same phenomena, qualitative and quantitative methods cannot be combined for cross-
validation purposes or multi-method purposes; however, both paradigms can be combined for
complementary purposes. Advocates for this combination state that different methods have
different strengths; thus the combination would produce more than what each method could
offer in isolation. Morgan (1998) argues that the mixing can be carried out on the technical
aspect (means of generating knowledge), which can be done without violating basic
paradigmatic assumptions. Therefore, they can be ‘mixed and matched’ with other
approaches. In theory, either quantitative or qualitative methods are the most widely used, but
a multiple methods (triangulation) strategy is also recommended in many authoritative
studies as a means of applying multiple and complementary methods (Eid, Trueman, and
Ahmed, 2002; Teo and Tan, 2000; Tigre and Dedrick, 2004). Furthermore, it is often
beneficial to mix approaches, and it is quite usual for a single study to combine quantitative
and qualitative methods, using both primary and secondary data (Saunders et al., 2009). Ott
(1989) argues that each method has its advantages and disadvantages. Reichers and Schneider
(1990) claim that such a step may yield the most valid measure; whilst Flick (1992) and
Lucchini (1996) state that multiple methods (triangulation) of data collection allow the
researcher to obtain a complex picture of the phenomena being researched, which might
otherwise be unavailable if only a single method is used.
Denzin (1978) defines multiple methods as the combination of methodologies in the study of
the same phenomenon. Their use helps overcome limitations of any particular single method,
because any limitation or weakness gets compensated for by the strengths of another method
(Brannen, 1992). Using a multiple methods improves internal and external validity (Denzin,
CHAPTER 5: RESEARCH DESIGN AND METHODOLOGY
P a g e | 129
1978), and “the use of multiple methods, or triangulation, reflects an attempt to secure an in-
depth understanding of the phenomenon in question” (Denzin and Lincoln, 2000).
Patton (2002) suggests four types of multiple methods (triangulation):
• Method: Comparing data generated by different methods (e.g., qualitative and
quantitative).
• Source: Comparing data from different qualitative and quantitative methods (e.g.,
observations, interviews, questionnaires).
• Analyst: Using different analysis techniques.
• Theory: Looking at data from different theoretical perspectives.
A multiple methods strategy has been adopted in this research, following frequent
recommendations from authoritative researchers to use multiple, complementary methods. In
this research, multiple methods (triangulation or mixed method) of multiple data collection in
Saudi Arabia are used in a combination of online survey, semi-structured interview, and
documentation analysis.
To give an example of how these two approaches have been utilized and complemented each
other in this research, the author began a survey research project with a focus group during
the pilot study (qualitative method) to develop/check the content of the questionnaire. During
the pilot study phase, a few interviews were conducted to explain the developed model and
research questionnaire (method triangulation). This approach would use the strengths of
qualitative methods for exploratory work to help ensure that the survey is covering the
important topics appropriately. Additionally, the semi-structured interview and the
documentation analysis of the selected Saudi companies provide a relative understanding of
the big picture of the research. Personal, semi-structured interviews with five Saudi Arabian
companies and authorities were conducted, including the director of the Internet Division in
the Communications and Information Technology Commission, Saudi Arabian Airlines;
Saudi Telecommunication; Saudi Budget car hire; and Jarir Bookstore. The interviews
enriched the research by revealing phenomena related to continuance Internet shopping in
Saudi Arabia from a perspective other than that of the customers. Here, the qualitative
methods serve as a follow-up to the main research method, which is the quantitative method.
Finally, at the survey data analysis stage, which is a quantitative approach, the collected
qualitative data (semi-structured interview and the documentation analysis) can play an
CHAPTER 5: RESEARCH DESIGN AND METHODOLOGY
P a g e | 130
important role and resources in interpreting, clarifying, describing and enabling a richer
understanding of the results from the quantitative research. Such benefits include, for
example, providing an interesting insight into patterns of association of the research construct
and hypotheses clarifying the why and how these patterns exist. The interviewees clarified
how the Saudi Communications and Information Technology Commission intends to advance
e-commerce in Saudi Arabia, the changes to e-commerce regulations, and advances in e-
commerce after Saudi Arabia joined the World Trade Organization (WTO), as well as how
companies see themselves in the current state of e-commerce and e-shopping.
5.7. QUALITATIVE METHODS (as a complementary method)
When conducting quantitative research, the researcher must determine the important
variables to measure, which may lead to some answers integrated into other variable
measures. The qualitative method also gives participants more freedom to describe what is
important to them (Patton, 1987). Moreover, researchers can use quantitative findings to
achieve a better and deeper understanding, especially through case studies that rely on
qualitative research methods. Patton (1987) states that “case studies become particularly
useful where one needs to understand some particular problem or situation in great depth, and
where one can identify cases rich in information, rich in sense that a great deal can be learned
from a few exemplars of phenomenon in question”
A case study, therefore, serves to assess and examine the applicability of the studied variables
and explore any potential benefits and obstacles of e-shopping in Saudi Arabia. Because e-
shopping represents a new and modern way of shopping, a case study is an effective
methodological approach (Yin, 2003) to explore the related “how” and “why” questions,
5.7.1. Qualitative Sample
The five Saudi companies that participated in this research, under the case study strategy,
were selected mainly on their relative proximity and willingness to participate, rather than
randomly. The five selected companies demonstrated appropriate knowledge and experience
relating to this research for the case study.
The process for employee selection for interview was carefully considered to ensure that the
selected interviewees represented the companies efficiently. Only senior managers and above
were allowed to participate in this interview so that a deeper discussion could be achieved.
Furthermore, each manager was encouraged to bring at least one participant from another
CHAPTER 5: RESEARCH DESIGN AND METHODOLOGY
P a g e | 131
related department (i.e. marketing, e-commerce, online business unit) so that a wider picture
of the company and the purpose of the research could be obtained.
Key personnel in the selected companies were approached through personal contacts to
establish interview dates and times. As the case study and interviews complement the main
qualitative research, the size of the sample remained small and limited to the selected
companies (Ritchie and Lewis, 2003).
The criteria for selection of the companies were as follows:
• The level of Internet services provided by the company’s shopping website.
• Current and future vision of the online shopping.
• The interest of the companies to participate in this research and future related
research.
The five Saudi Arabian companies that met these criteria were: Internet Division in the
Communications and Information Technology Commission, Saudi Arabian Airlines; Saudi
Telecommunication; Saudi Budget car hire; and Jarir Bookstore.
5.7.2. Qualitative Data Collection
Data collection for qualitative data (case study) was mainly obtained from six different
sources: documents, interviews, direct observation, participant observation, physical
artefacts, and/or archived records (Merriam, 1998; Yin 2003). Each of these sources carried
equal importance and weight. (See Table 5.14) In some cases, only one method of data
collection was used. However, Yin (2003) argues that research methods should be considered
complementary, and therefore, a good qualitative data (case study) will rely on as many
sources as possible. Appendix I illustrate the interview questionnaires, which was adapted
from Al-Ajlan (2006), and then the selected questions were re-written to reflect the
requirement of the research investigations, which cover wide range of the variables derived
from the literature review.
Using multiple sources of evidence is appropriate and will increase the reliability and validity
of the data, which, in turn, will have a valuable impact on the research findings as there is no
single correct way to conduct a case study (Merriam, 1998; Roger and Victor 2006). The
companies provided access to their documents, observations, and structured interviews with
employees, including managers of marketing, e-marketing, and IT. In each interview, the
relevant managers discussed points related to e-commerce and e-shopping in Saudi Arabia,
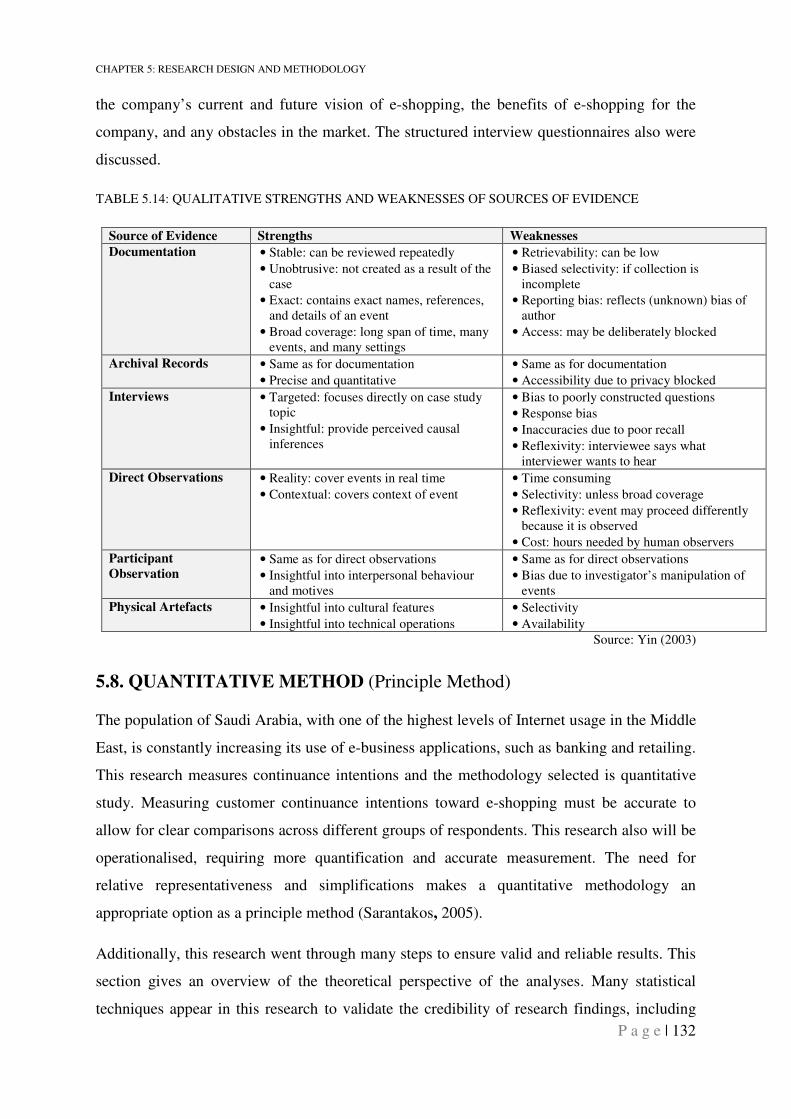
CHAPTER 5: RESEARCH DESIGN AND METHODOLOGY
P a g e | 132
the company’s current and future vision of e-shopping, the benefits of e-shopping for the
company, and any obstacles in the market. The structured interview questionnaires also were
discussed.
TABLE 5.14: QUALITATIVE STRENGTHS AND WEAKNESSES OF SOURCES OF EVIDENCE
Source of Evidence Strengths Weaknesses
Documentation • Stable: can be reviewed repeatedly
• Unobtrusive: not created as a result of the case
• Exact: contains exact names, references, and details of an event
• Broad coverage: long span of time, many events, and many settings
• Retrievability: can be low
• Biased selectivity: if collection is incomplete
• Reporting bias: reflects (unknown) bias of author
• Access: may be deliberately blocked
Archival Records • Same as for documentation
• Precise and quantitative
• Same as for documentation
• Accessibility due to privacy blocked
Interviews • Targeted: focuses directly on case study topic
• Insightful: provide perceived causal inferences
• Bias to poorly constructed questions
• Response bias
• Inaccuracies due to poor recall
• Reflexivity: interviewee says what interviewer wants to hear
Direct Observations • Reality: cover events in real time
• Contextual: covers context of event
• Time consuming
• Selectivity: unless broad coverage
• Reflexivity: event may proceed differently because it is observed
• Cost: hours needed by human observers
Participant
Observation • Same as for direct observations
• Insightful into interpersonal behaviour and motives
• Same as for direct observations
• Bias due to investigator’s manipulation of events
Physical Artefacts • Insightful into cultural features
• Insightful into technical operations
• Selectivity
• Availability
Source: Yin (2003)
5.8. QUANTITATIVE METHOD (Principle Method)
The population of Saudi Arabia, with one of the highest levels of Internet usage in the Middle
East, is constantly increasing its use of e-business applications, such as banking and retailing.
This research measures continuance intentions and the methodology selected is quantitative
study. Measuring customer continuance intentions toward e-shopping must be accurate to
allow for clear comparisons across different groups of respondents. This research also will be
operationalised, requiring more quantification and accurate measurement. The need for
relative representativeness and simplifications makes a quantitative methodology an
appropriate option as a principle method (Sarantakos, 2005).
Additionally, this research went through many steps to ensure valid and reliable results. This
section gives an overview of the theoretical perspective of the analyses. Many statistical
techniques appear in this research to validate the credibility of research findings, including
CHAPTER 5: RESEARCH DESIGN AND METHODOLOGY
P a g e | 133
coefficient α, factor analysis, and structure equation modelling (SEM) analysis using
(AMOS) software. Most of the data analysis was conducted using the well-known statistical
software, Statistical Package for Social Science (SPSS) (Norusis and Inc., 2000; Field, 2000).
5.8.1 Variable Measurement
The researcher started by encoding the collected data from Saudi Arabia using SPSS 13.0.
Then, an assessment of the internal reliability was conducted, in order to assess the quality of
the research constructs’ measurements. Reliability means that two or more researchers,
studying the same phenomenon with similar purposes should reach approximately the same
results (Gummesson, 2000). This necessitates keeping a thorough protocol of the study so
that others, who might want to execute the same study, following the same protocol, could
reach the same findings and conclusions (Yin, 2003). Therefore, a research with high
reliability could be replicated by others (Gummesson, 2000). Additionally, descriptive
statistics summarize the large data set to provide more meaningful values of the variables and
items being measured (Nachmias and Nachmias, 2000). To support the research findings and
offer a better and more meaningful understanding of the total measurable items, the
descriptive statistics with averages and percentages appear in the form of simple figures and
tables throughout the research.
When conducting an assessment of the internal consistency, and examining the reliability of
multiple items for the measured variables, coefficient α is the first and quickest recommended
test (Nunnally, 1978). Passing this test is a prerequisite for further analysis. Coefficient α
provides the average of the correlations of all variables and their measures that define a
variable (Norusis and Inc, 2000; Field, 2000). Nunnally (1978) suggested a criterion for a
desirable minimum range of 0.6 - 0.7 for coefficient α (reliability coefficient or composite
reliability) to be retained. If there are enough items to measure each variable, and if the
coefficient α is low, to improve the coefficient α, some items must not share the common
value for measuring the variable and, thus, could be eliminated (Field, 2000). The easiest and
recommended method to find items that demand elimination is to calculate the correlation of
each item with the total score. Items with correlations of less than 0.3 should be eliminated;
the same rule applies to any items that produce a sudden drop in the variable α or items
correlation (Field, 2000).
Factor analysis is a helpful tool when testing the correlation of a large number of variables in
a quantitative method and then combining them to provide a few but more meaningful
CHAPTER 5: RESEARCH DESIGN AND METHODOLOGY
P a g e | 134
factors. Some variables, called latent variables, cannot be observed directly. The measures of
observable variables in this research allow for intensive data analysis to explain the other and
the latent variables (Hair et al., 2006). In the factor analysis process, the researcher looks for
rational items that can be distinguished from one another and examines the correlation among
the observable items in the tested model.
The main objective of factor analysis is to find a way of representing the information
contained in a number of original variables into a smaller set of factors, with minimal loss of
information. Using factor analysis is essential to ensure that the items used in each variable
load mainly on a single factor to establish convergent validity. To eliminate any concerns
regarding the data normality and unique variances, the Maximum Likelihood method of
estimation was employed (Hair et al., 2006). Maximum Likelihood analysis is part of the
factor extraction method. This procedure is widely used by researchers and considered part of
factor analysis (Tabachnick and Fidell, 2007). It is known to be fairly robust to the violation
of a normality assumption (Hair et al., 2006). Since the factors are expected to be moderately
correlated, the Direct Oblimin rotation is employed.
Validity in social science research tries to measure intangibles, such as intentions,
behaviours, satisfaction, and trust. This process is carried out to establish whether surveys
measure what they are designed to measure. Therefore, social scientists have developed their
own means to measure such concepts.
The purpose of validation is to give researchers, their peers, and society as a whole a high
degree of confidence that the methods selected are useful in the quest for scientific truth
(Nunnally, 1978). Validity refers to the capacity of a model to indicate what researchers want
to know (Bannister and Mair, 1968). For example, face validity reveals whether participants
believe that the questions represent the actual purpose of the study, as described in the cover
letter. All participants in the pilot study agreed that the questions represented the stated
purpose of the study. Content validity assesses the research constructs that have been adopted
from existing literatures and previous researches. Content validity is an issue of
representation. The essential question asked by this validity is: Do the questionnaire items
pull in a representative manner from all the ways that could be used to measure the content of
a given construct (Straub et al., 2004). Content validity is verified through literature reviews
and expert judges or panels (Straub et al., 2004). Even though the constructs of this research
are adapted from exiting previous research that have been validated, several faculty members
CHAPTER 5: RESEARCH DESIGN AND METHODOLOGY
P a g e | 135
in Brunel University, doctoral students, and members of research and statistic departments in
Saudi Arabia considered whether the questionnaire items represented the study adequately for
both English and Arabic languages. All of them agreed that they did.
5.8.2. Convergent and Discriminant Validity
Reliability tests the stability of individual measurement items across replications from the
same source of information (Straub, 1989). Cronbach’s α examines the reliability of each
construct. Convergent validity indicates the extent to which the measures for a variable act as
if they measure the underlying theoretical construct because they share its variance (Schwab,
1980). Internal consistency reliability is generally considered a necessary but not sufficient
condition for convergent validity (Schwab, 1980).
Convergent validity examines whether individual indicators are indeed measuring the
constructs they are purported to measure. In other words, convergent validity helps verify that
different approaches to construct measurements reach the same results (Anderson and
Gerbing, 1988). Anderson and Gerbing suggest convergent validity indicates the extent to
which indicator items measuring a construct convergence and measure a single construct.
In determining the appropriate minimum loading required to retain items for inclusion within
a scale, Fornell and Lacker’s (1981) recommended a loading of 0.70 is considered high. They
also recommended construct reliability should exceed 0.80, and average variance extracted
(AVE) for all constructs should be 0.50 or higher. However, Hair et al.’s (2006) guidelines
are somewhat less harsh as they recommended factor loading greater than 0.30 to be
considered significant; loadings greater than 0.40 are considered important; and loadings of
0.50 or greater are considered to be very significant when determining the relative importance
and significance of factor loading of each item. Furthermore, when applying SEM, the
standard factor loading of observed variables on latent variables can be used to determine the
validity of observed variables (Hulland, Chow, and Lam, 1996). A value of 0.3 or more is
considered satisfactory (Hulland et al., 1996).
Discriminant validity is the degree to which components of the theoretically distinct concepts
are unique (Hulland et al., 1996). Nunnally also states that discriminant validity is normally
established through factor analysis. Fornell and Lacker (1981) said that discriminant validity
assess whether individual indicators can adequately distinguish between different constructs,
and it is assured if the square root of AVE for each construct is greater than the correlation
between that and all other constructs in the CFA model. If the items include an instrument
CHAPTER 5: RESEARCH DESIGN AND METHODOLOGY
P a g e | 136
that measures a construct correlate more highly with each other than with items measuring
other constructs in the model, the measure is then determined to have adequate discriminant
validity (Grant, 1989).
To summarise, the convergent validity indicates if the theorized components converge
together on the appropriate constructs, and discriminant validity reveals the cross-loading of
the components on multiple factors (Premkumar, Ramamurthy, and Crum, 1997). The factor
analysis of all items should indicate if the items load on the predetermined, theoretically
defined constructs, as well as whether there are any cross-loadings of items on other
constructs (Premkumar et al., 1997).
The split-half testing is another traditional form of reliability assessment. In this procedure,
the research sample is split into equal sub-samples, and scores of the halves correlated. In this
correlation, a reliability coefficient can be obtained (Nunnally, 1978; Field, 2005) by using
the average correlation between items, as in all reliability estimating. The split will result in
an approximate Cronback’s coefficient alpha (Nunnally, 1978). The Cronbach’s α for the two
parts should be between >0.60 and <0.95 (Straub et al., 2004). Additionally, the Kline’s
criterion for Spearman-Brown reliability coefficient is 0.7 (Kline, 2005).
5.8.3. Structural Equation Modelling
Structural equation modelling (SEM) using AMOS software further confirms and clarifies
variables and the model (Arbuckle, 2003). The objective of SEM in this research is to
understand the structure between several variables and then test paths hypothesized in the
conceptual model (Hoyle, 1995). In addition, SEM provides a comprehensive, flexible
approach to conducting the research design and performing data analysis, better than any
other single statistical model (Hoyle, 1995). It is recommended as a confirmatory method to
support the proposed hypotheses in the conceptual research model (Hoyle, 1995). Moreover,
SEM allows for multiple simultaneous directions of causality, and distinguishes the direct
effect from the indirect effect, as well as the total effect of an explanatory variable on each
dependent variable (Jöreskog and Sörbom, 2001; Cao and Mokhtarian, 2005). A total effect
consists of a direct and one or more indirect effects. The variance-covariance matrix is used
because it provides valid comparisons between different populations (Hair at el., 2006).
When assessing the proposed model with goodness-of-fit indices, several criteria should be
used, such as chi-square, which does not require an alternative model for comparison. The
obtained and implied covariance matrices and the maximum likelihood function drive the fit.
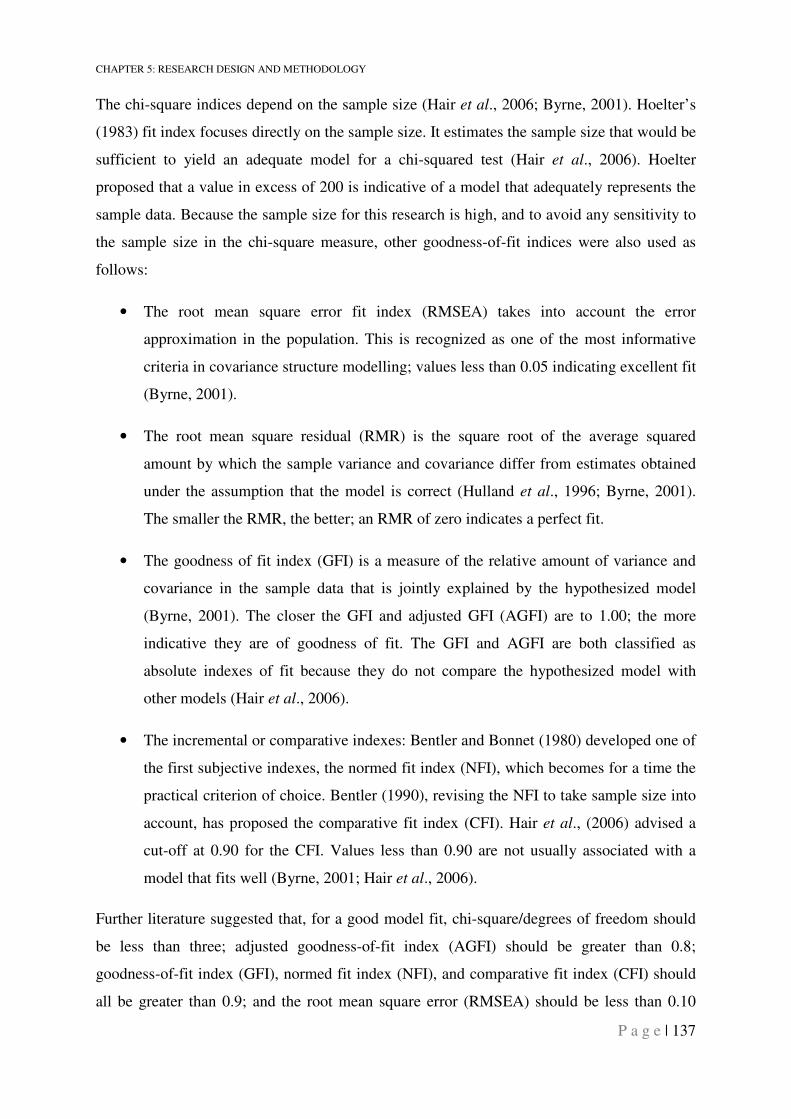
CHAPTER 5: RESEARCH DESIGN AND METHODOLOGY
P a g e | 137
The chi-square indices depend on the sample size (Hair et al., 2006; Byrne, 2001). Hoelter’s
(1983) fit index focuses directly on the sample size. It estimates the sample size that would be
sufficient to yield an adequate model for a chi-squared test (Hair et al., 2006). Hoelter
proposed that a value in excess of 200 is indicative of a model that adequately represents the
sample data. Because the sample size for this research is high, and to avoid any sensitivity to
the sample size in the chi-square measure, other goodness-of-fit indices were also used as
follows:
• The root mean square error fit index (RMSEA) takes into account the error
approximation in the population. This is recognized as one of the most informative
criteria in covariance structure modelling; values less than 0.05 indicating excellent fit
(Byrne, 2001).
• The root mean square residual (RMR) is the square root of the average squared
amount by which the sample variance and covariance differ from estimates obtained
under the assumption that the model is correct (Hulland et al., 1996; Byrne, 2001).
The smaller the RMR, the better; an RMR of zero indicates a perfect fit.
• The goodness of fit index (GFI) is a measure of the relative amount of variance and
covariance in the sample data that is jointly explained by the hypothesized model
(Byrne, 2001). The closer the GFI and adjusted GFI (AGFI) are to 1.00; the more
indicative they are of goodness of fit. The GFI and AGFI are both classified as
absolute indexes of fit because they do not compare the hypothesized model with
other models (Hair et al., 2006).
• The incremental or comparative indexes: Bentler and Bonnet (1980) developed one of
the first subjective indexes, the normed fit index (NFI), which becomes for a time the
practical criterion of choice. Bentler (1990), revising the NFI to take sample size into
account, has proposed the comparative fit index (CFI). Hair et al., (2006) advised a
cut-off at 0.90 for the CFI. Values less than 0.90 are not usually associated with a
model that fits well (Byrne, 2001; Hair et al., 2006).
Further literature suggested that, for a good model fit, chi-square/degrees of freedom should
be less than three; adjusted goodness-of-fit index (AGFI) should be greater than 0.8;
goodness-of-fit index (GFI), normed fit index (NFI), and comparative fit index (CFI) should
all be greater than 0.9; and the root mean square error (RMSEA) should be less than 0.10
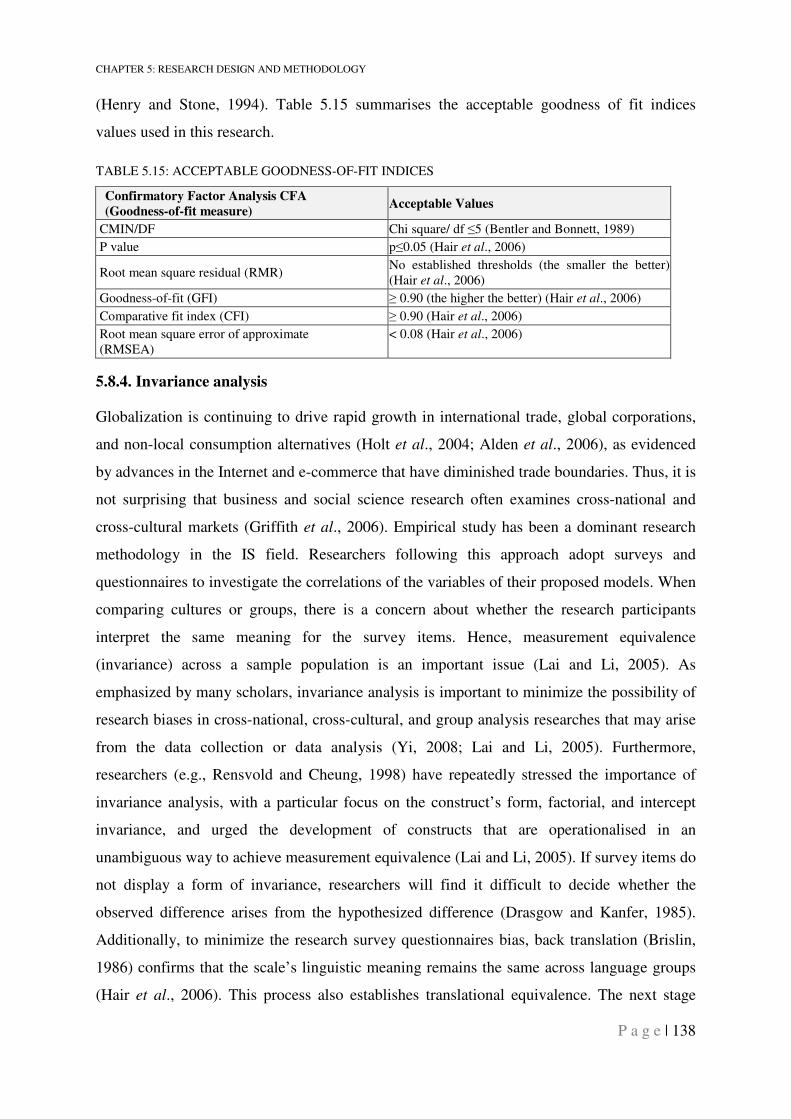
CHAPTER 5: RESEARCH DESIGN AND METHODOLOGY
P a g e | 138
(Henry and Stone, 1994). Table 5.15 summarises the acceptable goodness of fit indices
values used in this research.
TABLE 5.15: ACCEPTABLE GOODNESS-OF-FIT INDICES
Confirmatory Factor Analysis CFA
(Goodness-of-fit measure) Acceptable Values
CMIN/DF Chi square/ df ≤5 (Bentler and Bonnett, 1989)
P value p≤0.05 (Hair et al., 2006)
Root mean square residual (RMR) No established thresholds (the smaller the better) (Hair et al., 2006)
Goodness-of-fit (GFI) ≥ 0.90 (the higher the better) (Hair et al., 2006)
Comparative fit index (CFI) ≥ 0.90 (Hair et al., 2006)
Root mean square error of approximate (RMSEA)
< 0.08 (Hair et al., 2006)
5.8.4. Invariance analysis
Globalization is continuing to drive rapid growth in international trade, global corporations,
and non-local consumption alternatives (Holt et al., 2004; Alden et al., 2006), as evidenced
by advances in the Internet and e-commerce that have diminished trade boundaries. Thus, it is
not surprising that business and social science research often examines cross-national and
cross-cultural markets (Griffith et al., 2006). Empirical study has been a dominant research
methodology in the IS field. Researchers following this approach adopt surveys and
questionnaires to investigate the correlations of the variables of their proposed models. When
comparing cultures or groups, there is a concern about whether the research participants
interpret the same meaning for the survey items. Hence, measurement equivalence
(invariance) across a sample population is an important issue (Lai and Li, 2005). As
emphasized by many scholars, invariance analysis is important to minimize the possibility of
research biases in cross-national, cross-cultural, and group analysis researches that may arise
from the data collection or data analysis (Yi, 2008; Lai and Li, 2005). Furthermore,
researchers (e.g., Rensvold and Cheung, 1998) have repeatedly stressed the importance of
invariance analysis, with a particular focus on the construct’s form, factorial, and intercept
invariance, and urged the development of constructs that are operationalised in an
unambiguous way to achieve measurement equivalence (Lai and Li, 2005). If survey items do
not display a form of invariance, researchers will find it difficult to decide whether the
observed difference arises from the hypothesized difference (Drasgow and Kanfer, 1985).
Additionally, to minimize the research survey questionnaires bias, back translation (Brislin,
1986) confirms that the scale’s linguistic meaning remains the same across language groups
(Hair et al., 2006). This process also establishes translational equivalence. The next stage
CHAPTER 5: RESEARCH DESIGN AND METHODOLOGY
P a g e | 139
assesses measurement invariance (equivalence) across the groups (Rensvold and Cheung,
1998).
Several scholars question the validity of cross-national, cross-cultural, or group data analysis
if measurement invariance is not reported (Hui, 1985; Singh, 1995; Van de Vijver and
Harsveld, 1994). Survey participants may not interpret a construct in the same way across
cultures (Myers et al., 2000), or they may vary in their tendency to respond to certain scales
items (Hui, 1989). As a result, Steenkamp and Baumgartner (1998) and Hair (2006)
recommend a multi-group confirmatory factor analysis (CFA) approach to measurement
invariance in different cultures:
• Configural invariance: Determine if the basic meanings and structure of the research
model constructs are understood and conceptualized similarly in the different groups
(e.g., culture, age, gender, geographical region).
• Factorial metric invariance: Determine whether the ratings scales are perceived
similarly across different groups.
• Scalar invariance: Determine whether the quantifiable meanings of the scale are the
same compared with the means from different groups.
Factorial invariance is a prerequisite for any further analysis of invariance. When conducting
group comparisons (e.g., age, gender, geographic location), the construct can be described as
factorial or measurement equivalence if the item response factor parameter coefficients are
not significantly different between groups. Several methods test invariance analysis. Van de
Vijver and Harsveld (1994) propose looking for the factor parameters of the unconstrained
model. Items with the largest between-group differences are considered non-invariant. Marsh
and Hocevar (1985) propose examining the modification indexes in the fully constrained
model to highlight non-invariance. Items with large modification indexes are considered non-
invariant. However, the most accepted and widely used approach, due to its justifiability and
precision (Cheung et al., 1999, 2000) for invariance analysis, was introduced by Byrne et al
(1989). This approach uses CFA to obtain and compare the fit indices, including the chi-
square of unconstrained measurement models, estimated without any conditions, and a series
of constrained measurement models, estimated with the condition that one or more factor
parameters must have the same value for both compared groups (Byrne, 2001).
CHAPTER 5: RESEARCH DESIGN AND METHODOLOGY
P a g e | 140
Byrne et al.’s (1989) approach starts with the unconstrained model to examine configural and
factorial invariance. If the measurement weights differ significantly between groups, it is
unnecessary to move to the next step of the invariance analysis. However, if the measurement
weights do not differ significantly between groups, the invariance analysis continues to
estimate the invariance of the structural weights. The researcher should then compare the chi-
square and fit statistics of the fully constrained model with the unconstrained model and look
for differences. If the difference is significant, then at least one of the research model
parameters would have at least one non-invariant item. To find the non-invariant item,
several tests need to be conducted, with a partially constrained model, to examine the changes
in the chi-square statistics between the model’s constructs for significance. When comparing
the partially constrained model with the fully constrained model, if the chi-square difference
is significant, the constraint that is associated with this partially constrained model becomes a
source of non-invariance (Lai and Li, 2005). In addition, higher levels of invariance
measurement can be considered in order to examine the construct’s structural weights and
latent means, following a similar process.
Latent means enable the researcher to explore whether the quantifiable meanings of the scales
are similar across cultures or compared groups, involving scalar invariance by comparing the
mean between the two populations. The latent mean can then be interpreted with regard to
how much higher or lower the latent mean constructs are in one group relative to another
group (Hair et al., 2006).
Byrne (2001) suggests several steps for testing latent mean differences using AMOS, as
follows:
• The variance of the six research factors is freely estimated in each group, as are their
covariance’s.
• Except for those fixed to 1.00, all factor loadings are constrained to be equal across
groups.
• All intercepts for the observed measures are constrained to be equal across groups.
• The six factor means are freely estimated for one group, then constrained to be equal
to 0 for the other group. The latter group is regarded as the “reference” group.
This invariance measurement analysis examines if the research model achieves measurement
invariance. It searches for meaningful differences when validating the calibration sample with
CHAPTER 5: RESEARCH DESIGN AND METHODOLOGY
P a g e | 141
the validation sample, as well as across different genders, ages, education levels,
geographical locations, online spending levels, shopping frequencies, and times spent
shopping online.
5.9. QUESTIONNAIRE DESIGN
Designing the research questionnaire is important because a poor questionnaire collects data
that may not be relevant to the research question and may produce an unwanted output during
the analysis stage. Likert scales are the most common and widely used measurement scales
(Teo and Tan, 2000; Tigre and Dedrick, 2004). They appear in the survey questionnaire as an
instrument to provide quantitative data. The seven-point Likert scale measures participants’
perceptions of a wide range of variable relationships. In this research, it ranges from 1
(strongly disagree) to 7 (strongly agree).
Most of the variables and their related questions measure different aspects of the online
shopping experience. Some questions may seem repetitive to respondents, so the cover letter
of the survey states that the research is about e-shopping. It defines the term, and offers
alternative words for e-shopping, such as electronic shopping, online shopping, and Internet
shopping. These words appear interchangeably across the questions in both the Arabic and
English versions.
In addition to background questions, the survey contains questions about customers'
experience with computers, their uses of the Internet, and factors that have convinced them to
use e-retailers. The survey examines statistically some of the driving factors that have
influenced customers' intentions to continue their use of Internet shopping.
The survey questionnaire includes a cover letter, in both languages (Arabic and English),
stating the aim of the research, definition of online shopping, and the different terminology
used. Participants were invited to complete the survey with regard to an e-retailer from which
they had recently shopped or purchased. The participants were then asked to indicate the
degree to which each statement in the survey characterized their thoughts and feelings. The
cover letter also emphasizes the voluntary nature of the survey and ensures the complete
confidentiality of all responses. The questionnaires consisted of three main areas:
1. Questions related to variables that entice users to increase their intention to use
online shopping.
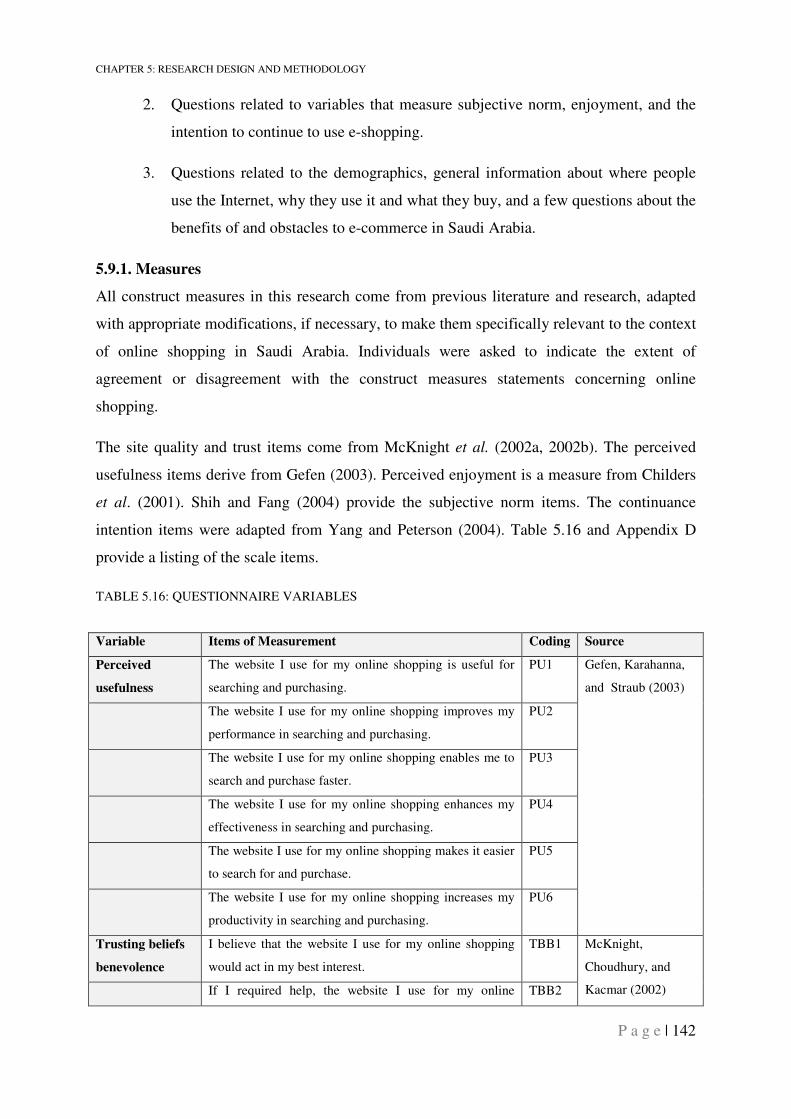
CHAPTER 5: RESEARCH DESIGN AND METHODOLOGY
P a g e | 142
2. Questions related to variables that measure subjective norm, enjoyment, and the
intention to continue to use e-shopping.
3. Questions related to the demographics, general information about where people
use the Internet, why they use it and what they buy, and a few questions about the
benefits of and obstacles to e-commerce in Saudi Arabia.
5.9.1. Measures
All construct measures in this research come from previous literature and research, adapted
with appropriate modifications, if necessary, to make them specifically relevant to the context
of online shopping in Saudi Arabia. Individuals were asked to indicate the extent of
agreement or disagreement with the construct measures statements concerning online
shopping.
The site quality and trust items come from McKnight et al. (2002a, 2002b). The perceived
usefulness items derive from Gefen (2003). Perceived enjoyment is a measure from Childers
et al. (2001). Shih and Fang (2004) provide the subjective norm items. The continuance
intention items were adapted from Yang and Peterson (2004). Table 5.16 and Appendix D
provide a listing of the scale items.
TABLE 5.16: QUESTIONNAIRE VARIABLES
Variable Items of Measurement Coding Source
Perceived
usefulness
The website I use for my online shopping is useful for
searching and purchasing.
PU1 Gefen, Karahanna,
and Straub (2003)
The website I use for my online shopping improves my
performance in searching and purchasing.
PU2
The website I use for my online shopping enables me to
search and purchase faster.
PU3
The website I use for my online shopping enhances my
effectiveness in searching and purchasing.
PU4
The website I use for my online shopping makes it easier
to search for and purchase.
PU5
The website I use for my online shopping increases my
productivity in searching and purchasing.
PU6
Trusting beliefs
benevolence
I believe that the website I use for my online shopping
would act in my best interest.
TBB1 McKnight,
Choudhury, and
Kacmar (2002) If I required help, the website I use for my online TBB2
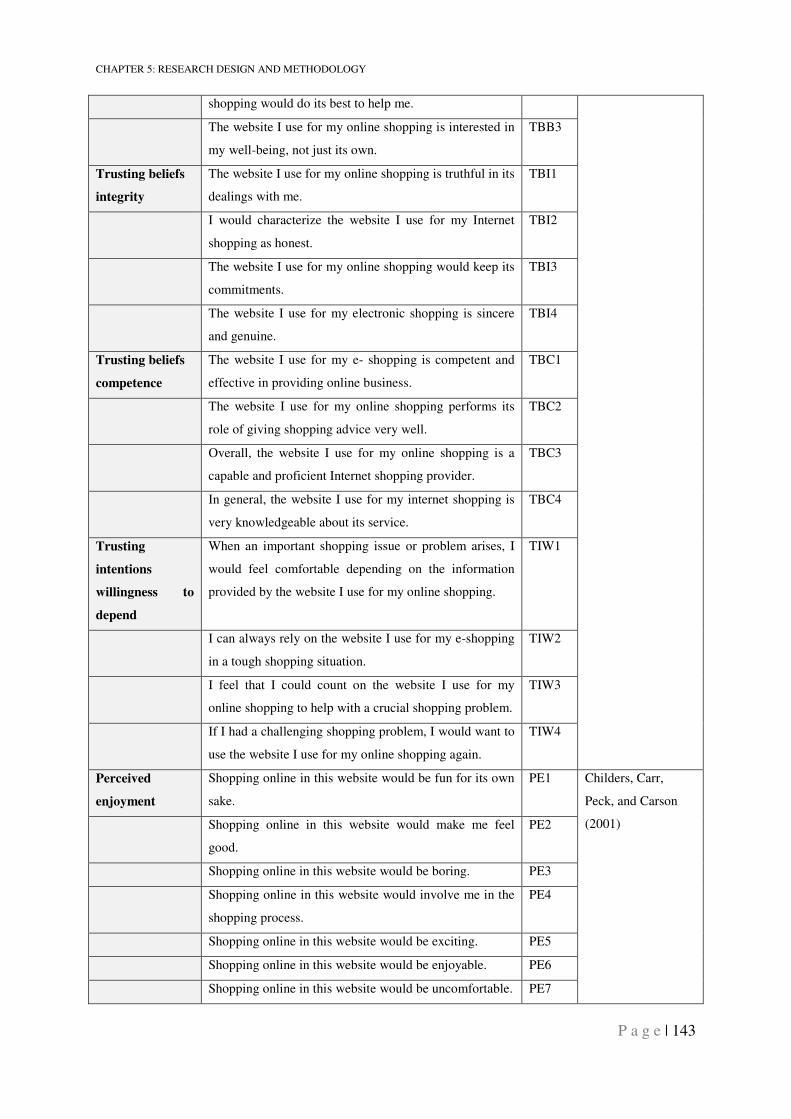
CHAPTER 5: RESEARCH DESIGN AND METHODOLOGY
P a g e | 143
shopping would do its best to help me.
The website I use for my online shopping is interested in
my well-being, not just its own.
TBB3
Trusting beliefs
integrity
The website I use for my online shopping is truthful in its
dealings with me.
TBI1
I would characterize the website I use for my Internet
shopping as honest.
TBI2
The website I use for my online shopping would keep its
commitments.
TBI3
The website I use for my electronic shopping is sincere
and genuine.
TBI4
Trusting beliefs
competence
The website I use for my e- shopping is competent and
effective in providing online business.
TBC1
The website I use for my online shopping performs its
role of giving shopping advice very well.
TBC2
Overall, the website I use for my online shopping is a
capable and proficient Internet shopping provider.
TBC3
In general, the website I use for my internet shopping is
very knowledgeable about its service.
TBC4
Trusting
intentions
willingness to
depend
When an important shopping issue or problem arises, I
would feel comfortable depending on the information
provided by the website I use for my online shopping.
TIW1
I can always rely on the website I use for my e-shopping
in a tough shopping situation.
TIW2
I feel that I could count on the website I use for my
online shopping to help with a crucial shopping problem.
TIW3
If I had a challenging shopping problem, I would want to
use the website I use for my online shopping again.
TIW4
Perceived
enjoyment
Shopping online in this website would be fun for its own
sake.
PE1 Childers, Carr,
Peck, and Carson
(2001) Shopping online in this website would make me feel
good.
PE2
Shopping online in this website would be boring. PE3
Shopping online in this website would involve me in the
shopping process.
PE4
Shopping online in this website would be exciting. PE5
Shopping online in this website would be enjoyable. PE6
Shopping online in this website would be uncomfortable. PE7
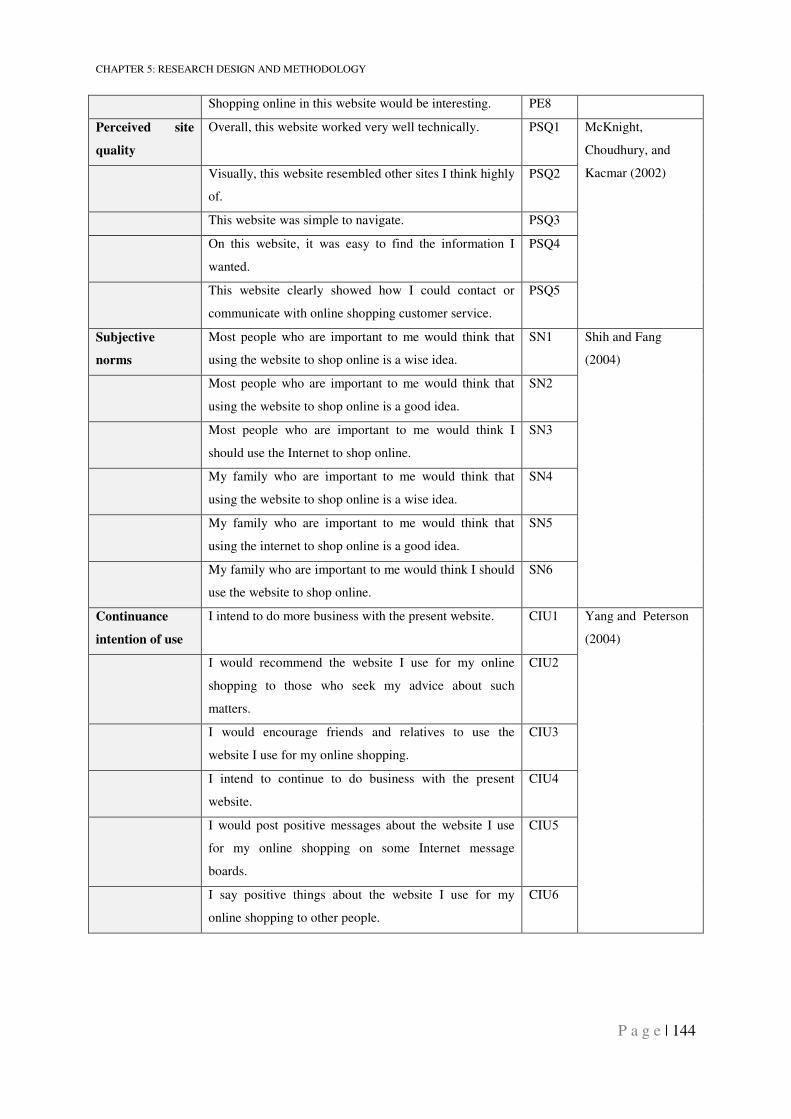
CHAPTER 5: RESEARCH DESIGN AND METHODOLOGY
P a g e | 144
Shopping online in this website would be interesting. PE8
Perceived site
quality
Overall, this website worked very well technically. PSQ1 McKnight,
Choudhury, and
Kacmar (2002) Visually, this website resembled other sites I think highly
of.
PSQ2
This website was simple to navigate. PSQ3
On this website, it was easy to find the information I
wanted.
PSQ4
This website clearly showed how I could contact or
communicate with online shopping customer service.
PSQ5
Subjective
norms
Most people who are important to me would think that
using the website to shop online is a wise idea.
SN1 Shih and Fang
(2004)
Most people who are important to me would think that
using the website to shop online is a good idea.
SN2
Most people who are important to me would think I
should use the Internet to shop online.
SN3
My family who are important to me would think that
using the website to shop online is a wise idea.
SN4
My family who are important to me would think that
using the internet to shop online is a good idea.
SN5
My family who are important to me would think I should
use the website to shop online.
SN6
Continuance
intention of use
I intend to do more business with the present website. CIU1 Yang and Peterson
(2004)
I would recommend the website I use for my online
shopping to those who seek my advice about such
matters.
CIU2
I would encourage friends and relatives to use the
website I use for my online shopping.
CIU3
I intend to continue to do business with the present
website.
CIU4
I would post positive messages about the website I use
for my online shopping on some Internet message
boards.
CIU5
I say positive things about the website I use for my
online shopping to other people.
CIU6
CHAPTER 5: RESEARCH DESIGN AND METHODOLOGY
P a g e | 145
5.10. PILOT STUDY
A preliminary questionnaire for this research was prepared. The reasons for conducting a
pilot study are as follows:
• To detect any problems in the research design and instrumentation.
• To delete any irrelevant items from the questionnaire.
• To test the applicability of the measurement scales.
• To discover any error and confusing questions that needs clarification.
The aim of this pilot study is to ensure that the items in the survey used for each construct are
understood by the respondents, and thus obtain a high level of content validity (Churchill,
1979). It is important to discover any errors or confusion in the questionnaires beforehand,
instead of during the real data collection (Blankenship, Breen, and Dutka, 1999). The
participants identified any questions or items that were not clear to them, and provided advice
about modifying those items.
The data collection for the pilot study took place between December 24, 2006, and January
24, 2007 in Saudi Arabia and London. A draft of a paper survey was pre-tested by two people
to confirm its clarity and layout. After the revision, an informal pre-test group of 35 people
produced 22 valid surveys (data were pooled from the 22 respondents, 11 in Saudi Arabia and
11 in London). Six were returned incomplete but with good feedback, and seven were not
received.
Participants were asked to apply the questions to the websites that they used mostly for their
e-shopping when they considered buying products or services or searching for information.
Furthermore, rather than evaluating online shopping continuance intention at a particular site
(as in Chen et al., 2002), the author asked respondents to generalize on all online shopping
activities. Likewise, they examined the survey instrument and commented on its format and
length, as well as the wording of each item. The participants on the pilot study were asked to
give feedback about the clarity of the questionnaire wording, ambiguity, question
consistency, survey layout and presentation, and any difficulty in completing the survey in
time. Ambiguous items would be considered for rewording in the final study based on
participant feedback. The participant feedback was collected through face-to-face meetings,
or e-mail.
CHAPTER 5: RESEARCH DESIGN AND METHODOLOGY
P a g e | 146
Classification and demographic data, such as age, gender, Internet usage, purchase intention,
income, issues online, and online spending are an important part of the questionnaire. The
demographic section helps measure the online shopping context of Saudi Arabia, which helps
reveal differences that might arise in consumers’ online shopping activities based on their
demographic factors. The demographic data were collected at the beginning of the session in
the pilot study. This process reverses for the final data collection, for which is at the end of
the session to ensure participants concentrate on the main construct items. Appendix E
illustrates the pilot study survey questionnaires in English and Arabic languages.
The 22 people gave their opinion of the survey. The following details represent the findings
from the feedback to the pilot survey:
• The survey was slightly long.
• It was hard to keep participants’ commitment to participate.
• Layout, length, language, and time are very important items when doing the
survey.
• Only the English version was used in the pilot study, even in Saudi Arabia.
• Some questions seem less important, and others were not clear and caused
confusion, such as “wise to use” and “good to use.”
• Some very similar questions might cause confusion, especially in the final survey
where two versions exist (Arabic and English) due to the difficulty of translating
closely related concepts.
The pilot study respondents represent online users, including undergraduate and postgraduate
students, professionals and experts. The UK samples include some postgraduate Saudi
students studying abroad, as well as non-Saudi students. Eighty two percent of the
participants were men. Most respondents were in their late 20s (n = 18), with 13.6% between
the ages of 18 and 25 years, 68.2% 26–35 years, 13.6% 36–45 years, and 4.5% older than 46
years. Exploratory analysis was performed, and the results were satisfactory. Most
Cronbach's alpha values surpassed the commonly adopted threshold value of 0.7. Table 5.17
reports the reliability analysis results. Appendix F provides more details about the pilot study
analysis results.
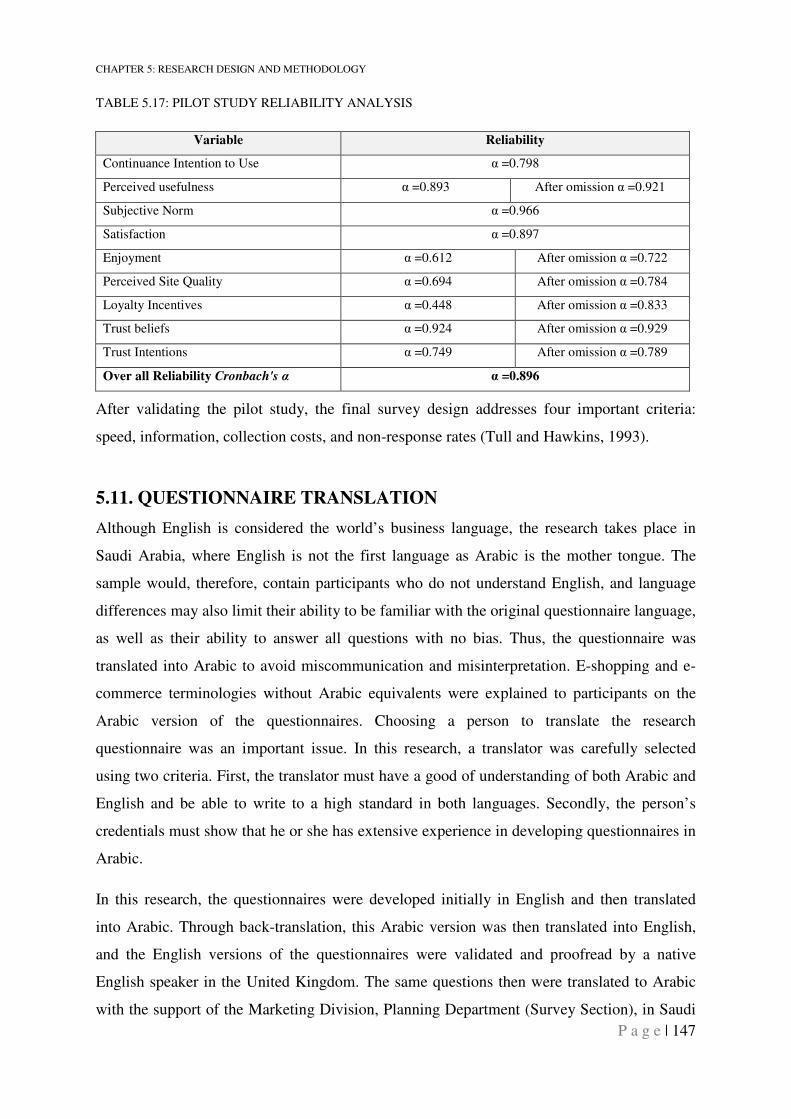
CHAPTER 5: RESEARCH DESIGN AND METHODOLOGY
P a g e | 147
TABLE 5.17: PILOT STUDY RELIABILITY ANALYSIS
Variable Reliability
Continuance Intention to Use α =0.798
Perceived usefulness α =0.893 After omission α =0.921
Subjective Norm α =0.966
Satisfaction α =0.897
Enjoyment α =0.612 After omission α =0.722
Perceived Site Quality α =0.694 After omission α =0.784
Loyalty Incentives α =0.448 After omission α =0.833
Trust beliefs α =0.924 After omission α =0.929
Trust Intentions α =0.749 After omission α =0.789
Over all Reliability Cronbach's α α =0.896
After validating the pilot study, the final survey design addresses four important criteria:
speed, information, collection costs, and non-response rates (Tull and Hawkins, 1993).
5.11. QUESTIONNAIRE TRANSLATION
Although English is considered the world’s business language, the research takes place in
Saudi Arabia, where English is not the first language as Arabic is the mother tongue. The
sample would, therefore, contain participants who do not understand English, and language
differences may also limit their ability to be familiar with the original questionnaire language,
as well as their ability to answer all questions with no bias. Thus, the questionnaire was
translated into Arabic to avoid miscommunication and misinterpretation. E-shopping and e-
commerce terminologies without Arabic equivalents were explained to participants on the
Arabic version of the questionnaires. Choosing a person to translate the research
questionnaire was an important issue. In this research, a translator was carefully selected
using two criteria. First, the translator must have a good of understanding of both Arabic and
English and be able to write to a high standard in both languages. Secondly, the person’s
credentials must show that he or she has extensive experience in developing questionnaires in
Arabic.
In this research, the questionnaires were developed initially in English and then translated
into Arabic. Through back-translation, this Arabic version was then translated into English,
and the English versions of the questionnaires were validated and proofread by a native
English speaker in the United Kingdom. The same questions then were translated to Arabic
with the support of the Marketing Division, Planning Department (Survey Section), in Saudi
CHAPTER 5: RESEARCH DESIGN AND METHODOLOGY
P a g e | 148
Arabia for final approval of the content, wording, and clarity of the questions. By translating
the Arabic questions back to English, Brislin’s (1986) back-translation method ensures they
have the same meaning. To avoid any bias, this back-translation step was performed by a
different person, namely, the Chief Editor of a private college in Saudi Arabia.
5.12. SURVEY POPULATION
Mark (1996) defines population as “the collection of all individuals, families, groups,
organizations, communities, and events that researchers are interested in finding out more
about.” For the purpose of this research, the target population consists of Internet users who
engage in online shopping in Saudi Arabia.
Although the research focuses on e-shopping in Saudi Arabia, the research cannot exclude
foreigners who live in Saudi Arabia, because it is an online survey. Selecting and defining the
topic and methodology helped gear the focus of the study to young Internet users, who have
experience of shopping online, as well as people with similar backgrounds from different
geographic areas within Saudi Arabia. Additionally, earlier studies have shown that data
collected directly from users, rather than from service providers, offer more accurate
information about service characteristics and how they lead to higher quality evaluation in the
context of e-shopping, especially given that customers’ continuance intentions are best
assessed through information obtained from the users themselves (Cao and Mokhtarian,
2005).
5.12.1. Selecting the Research Sampling
The population of interest in this study is Internet users in Saudi Arabia over 18 years old
who have previous experience of online shopping. However, since this research cannot cover
such a massive population, a sample was used for the data collection process. One
conventional sampling approach is to randomly distribute surveys to members of the general
population, since such a sample is frequently a good representation of the population at large.
Additionally, the researcher makes attempt to insure that this sample is an accurate
representation of some larger group or population by covering the main five regions in Saudi
Arabia. However, non-response bias and non-participants of one of the member of the
targeted group are concern. In addition, since online shopping is considered new phenomena
in Saudi Arabia, only a minority of the population makes online shopping; and therefore,
CHAPTER 5: RESEARCH DESIGN AND METHODOLOGY
P a g e | 149
such a sample may not contain a substantial number of e-shopping behaviour occurrence
(Cao and Mokhtarian, 2005), as a result, the statistical strength of the research results tends to
be limited. A convenience choice-based sampling approach is preferred, given that a small
proportion of all customers undertake online shopping.
Students are a natural sample, but caution is required when generalizing the results to the
larger population due to their homogeneity (Cao and Mokhtarian, 2005). Student samples
were added to the research because online customers commonly are younger and more highly
educated than conventional customers, making a student sample more representative of the
online customer population (OECD, 1998; Al-Diri, Hobbs, and Qahwaji, 2006; Williamson,
2006). Furthermore, adding a student sample may represent the future e-shopping patterns of
the population at large. Student samples were extracted from seven universities and colleges,
including the five regions of Saudi Arabia.
5.12.2. Sample Size, Methods, and Questionnaire Distribution
Correlation coefficients fluctuate across sample sizes, with much more fluctuation in small
samples than in large ones. Therefore, the reliability of the factor analysis depends on sample
size. A common rule of thumb suggests 10–15 participants per variable. Nunnally (1978)
recommends 10 times as many participants as variables. Field (2000) suggests 5–10
participants per variable, up to 300. Tabachnick and Fidell (2007) agree that “it is comforting
to have at least 300 cases for factor analysis,” as this is considered a good sample size
whereas 100 seems poor. For structural equation modelling (SEM), the sample should range
in size from 150 to 400, depending on the number of variables (Hair et al., 2006).
To achieve an appropriate sample size for this research, the researcher contacted various
Saudi colleges and universities, as well as some Saudi firms, prior to distributing the survey.
All of them accepted the research effort taking place at their campuses. Starting with 600
personalized e-mails, the links to the online survey also contained a cover letter that stated the
research objective, the definition of online shopping, and the alternative terms for online
shopping. The letter also confirms the voluntary and anonymous nature of the survey.
Visitors to the online survey were invited to complete the survey in relation to an e-retailer
from which they had recently shopped or purchased. The participants were then asked to
indicate the degree to which each statement in the survey was characteristic of their thoughts
and feelings. The cover letter appeared in both languages, and the link to the survey was
posted on seven forums, one for each of the seven Saudi state universities.
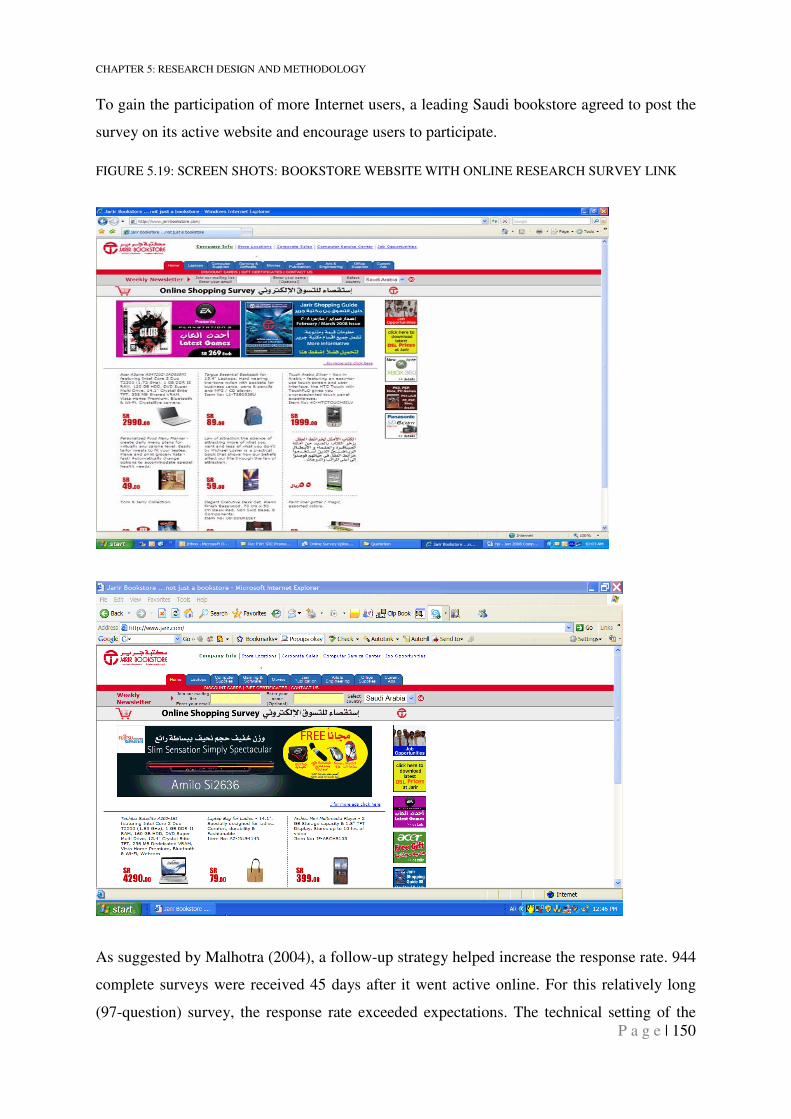
CHAPTER 5: RESEARCH DESIGN AND METHODOLOGY
P a g e | 150
To gain the participation of more Internet users, a leading Saudi bookstore agreed to post the
survey on its active website and encourage users to participate.
FIGURE 5.19: SCREEN SHOTS: BOOKSTORE WEBSITE WITH ONLINE RESEARCH SURVEY LINK
As suggested by Malhotra (2004), a follow-up strategy helped increase the response rate. 944
complete surveys were received 45 days after it went active online. For this relatively long
(97-question) survey, the response rate exceeded expectations. The technical setting of the
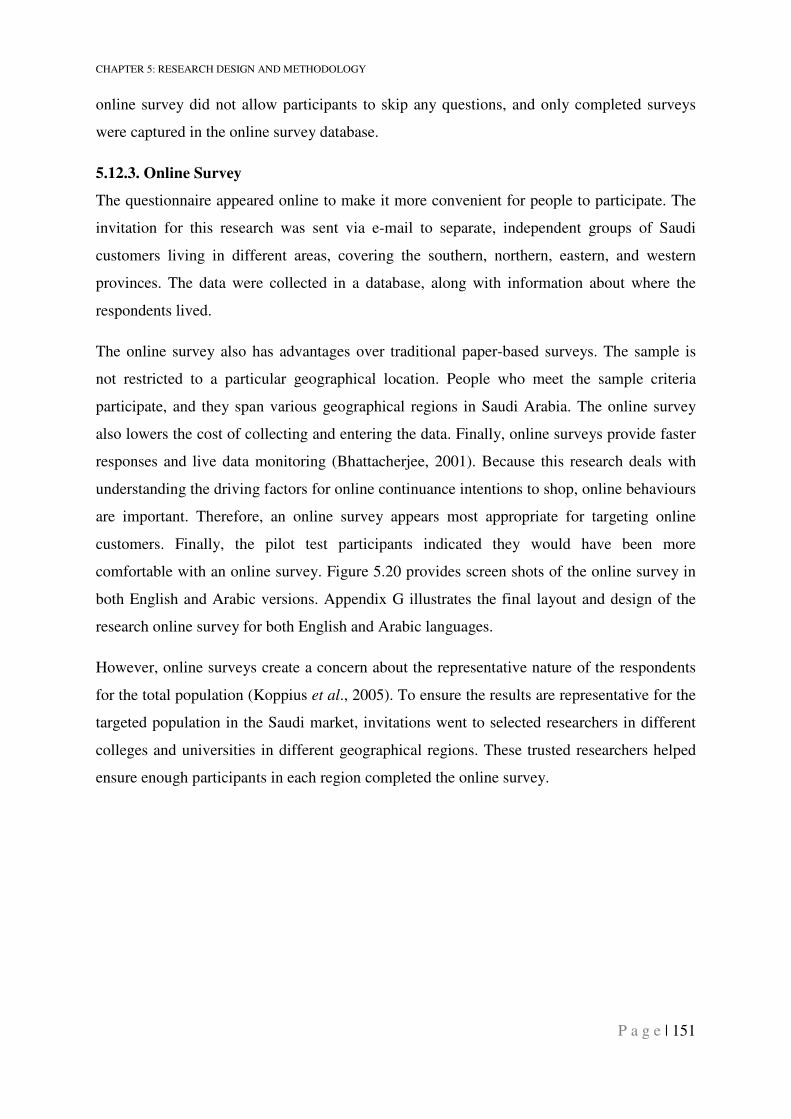
CHAPTER 5: RESEARCH DESIGN AND METHODOLOGY
P a g e | 151
online survey did not allow participants to skip any questions, and only completed surveys
were captured in the online survey database.
5.12.3. Online Survey
The questionnaire appeared online to make it more convenient for people to participate. The
invitation for this research was sent via e-mail to separate, independent groups of Saudi
customers living in different areas, covering the southern, northern, eastern, and western
provinces. The data were collected in a database, along with information about where the
respondents lived.
The online survey also has advantages over traditional paper-based surveys. The sample is
not restricted to a particular geographical location. People who meet the sample criteria
participate, and they span various geographical regions in Saudi Arabia. The online survey
also lowers the cost of collecting and entering the data. Finally, online surveys provide faster
responses and live data monitoring (Bhattacherjee, 2001). Because this research deals with
understanding the driving factors for online continuance intentions to shop, online behaviours
are important. Therefore, an online survey appears most appropriate for targeting online
customers. Finally, the pilot test participants indicated they would have been more
comfortable with an online survey. Figure 5.20 provides screen shots of the online survey in
both English and Arabic versions. Appendix G illustrates the final layout and design of the
research online survey for both English and Arabic languages.
However, online surveys create a concern about the representative nature of the respondents
for the total population (Koppius et al., 2005). To ensure the results are representative for the
targeted population in the Saudi market, invitations went to selected researchers in different
colleges and universities in different geographical regions. These trusted researchers helped
ensure enough participants in each region completed the online survey.
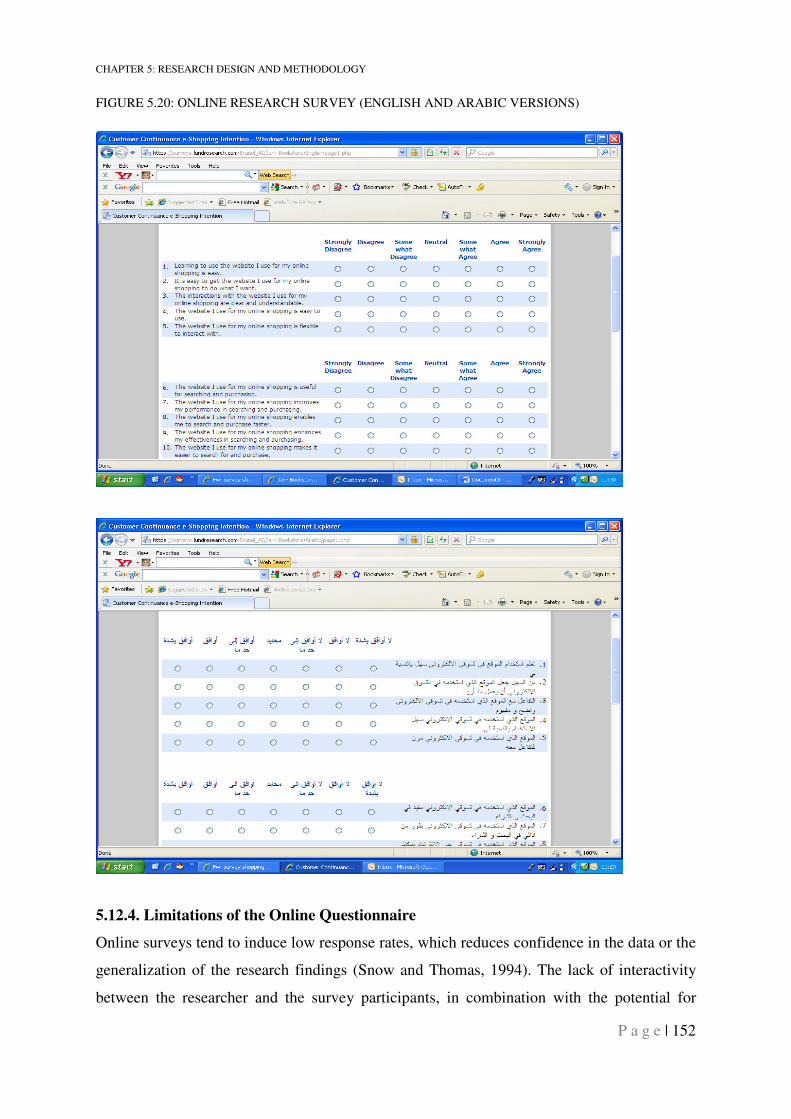
CHAPTER 5: RESEARCH DESIGN AND METHODOLOGY
P a g e | 152
FIGURE 5.20: ONLINE RESEARCH SURVEY (ENGLISH AND ARABIC VERSIONS)
5.12.4. Limitations of the Online Questionnaire
Online surveys tend to induce low response rates, which reduces confidence in the data or the
generalization of the research findings (Snow and Thomas, 1994). The lack of interactivity
between the researcher and the survey participants, in combination with the potential for
CHAPTER 5: RESEARCH DESIGN AND METHODOLOGY
P a g e | 153
unclear survey wording, may cause other problems and response errors (Pinsonneault and
Kraemer, 1993).
5.13 RESEARCH PLAN
The research design process acts as a blueprint for the conceptual framework and determines
the proper methodology to evaluate the research aim. Yin (2008) defines research design as
“the logic that links data to be collected and the conclusions to be drawn to the initial
questions of the study.” The research design involves four main issues: what questions to
study; what data are relevant; what data to collect; and how to analyze the data to derive
results (Yin, 2008).
The initial phase starts with a strategic decision to select the proper data collection method, as
well as tactical decisions regarding the measurement and scaling procedures, questionnaire
development, sample selection, and data analysis (Zikmund, 2003). The research
methodology pertains to the procedures used to develop the research framework. It describes
the approaches to be put into practice. The research problem can then be defined formally as
an operational framework, in which facts are placed to reveal their meaning more clearly
(Cooper and Schindler, 2003).
The research blueprint for this study proceeds through the following steps:
Phase 1: Define the research problem and objectives.
Phase 2: Literature review.
Phase 3: Develop the theoretical and conceptual framework.
Phase 4: Research design (design survey questionnaire, pilot study, and translation of
questionnaires).
Phase 5: Data collection and analysis (online survey, structured interview, content
analysis, descriptive analysis, factor analysis, discriminant validity, structural
equation modelling, and hypotheses testing).
Phase 6: Research findings (discussions, conclusion, and future research).
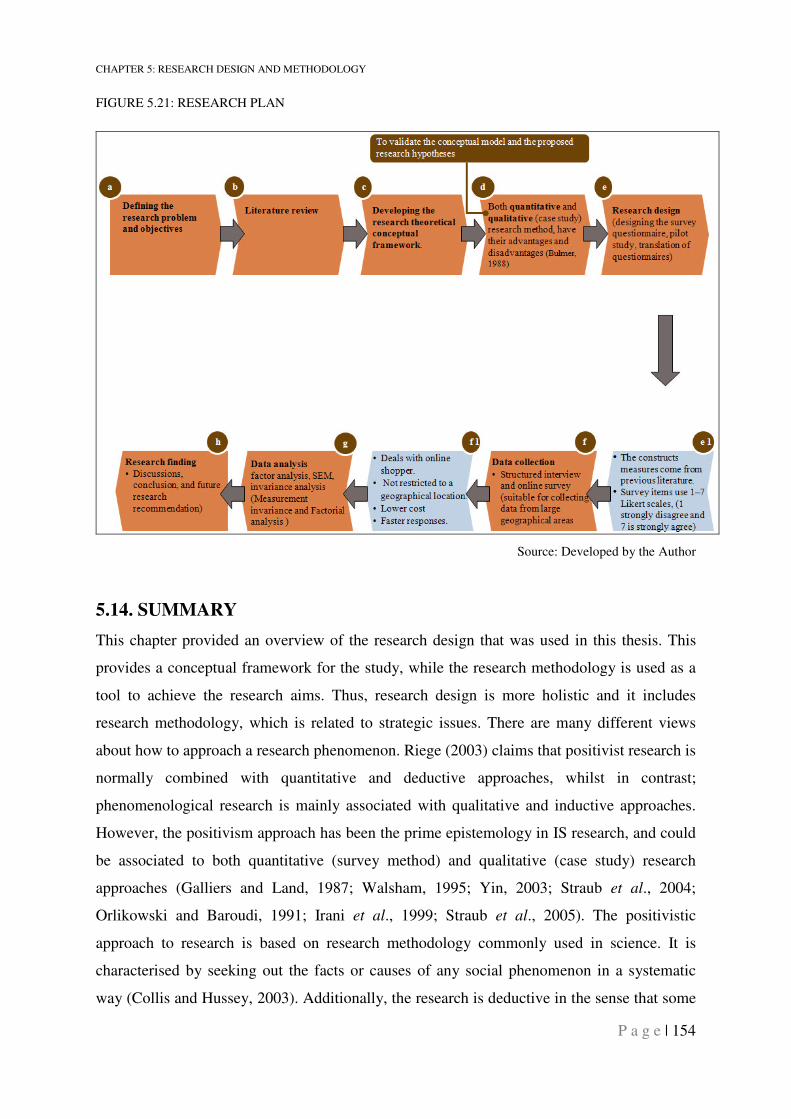
CHAPTER 5: RESEARCH DESIGN AND METHODOLOGY
P a g e | 154
FIGURE 5.21: RESEARCH PLAN
Source: Developed by the Author
5.14. SUMMARY
This chapter provided an overview of the research design that was used in this thesis. This
provides a conceptual framework for the study, while the research methodology is used as a
tool to achieve the research aims. Thus, research design is more holistic and it includes
research methodology, which is related to strategic issues. There are many different views
about how to approach a research phenomenon. Riege (2003) claims that positivist research is
normally combined with quantitative and deductive approaches, whilst in contrast;
phenomenological research is mainly associated with qualitative and inductive approaches.
However, the positivism approach has been the prime epistemology in IS research, and could
be associated to both quantitative (survey method) and qualitative (case study) research
approaches (Galliers and Land, 1987; Walsham, 1995; Yin, 2003; Straub et al., 2004;
Orlikowski and Baroudi, 1991; Irani et al., 1999; Straub et al., 2005). The positivistic
approach to research is based on research methodology commonly used in science. It is
characterised by seeking out the facts or causes of any social phenomenon in a systematic
way (Collis and Hussey, 2003). Additionally, the research is deductive in the sense that some
CHAPTER 5: RESEARCH DESIGN AND METHODOLOGY
P a g e | 155
of the theoretical and conceptual structures were established by previous work and tested
empirically in this research, dealing with online continuance intention shopping models. To
benefit from the multi-method approach (Mixed Approach), this research uses both
questionnaire-based surveys, containing measures used in previous research, and case studies
of Saudi companies. The survey method is used to collect the primary data for the research
constructs. The case study method is used as a complementary method to collect primary data
through semi-structured interviews and secondary data from companies’ documents. The
research pertains to online shopping, so the research population includes Internet users and
online questionnaires. The process for the methodological approach is justified for examining
questionnaire reliability and validity. Because this research aims to determine factors that
influence continuance online shopping intentions and develop an appropriate conceptual
framework, factor analysis, discriminant validity, and structural equation modelling are used
throughout. The methods used stand as a guide for identification and interpretations of the
important research factors and frame work. Thus, all these methods are appropriate and
indicate the research path is ready to proceed into the actual data and findings derived from
the proposed conceptual model, which are explored in details in chapter 6.
CHAPTER 6: DESCRIPTIVE STATISTICS AND RELIABILITY
P a g e | 156
CHAPTER 6: DESCRIPTIVE STATISTICS AND RELIABILITY
6.1. INTRODUCTION
To collect the research data and highlight the online shopping trends in Saudi Arabia, this
research study uses online survey distributed by direct personal e-mail to 600 Internet users in
Saudi Arabia as well as a survey posted on the website forums of seven local Universities and
Colleges in Saudi Arabia, covering most of the targeted geographical areas. This chapter
examines the descriptive statistics, looking particularly at frequencies, means, and
percentages.
As a first test of the internal consistency of the multiple-item variable reliability, the
coefficient α, or Cronbach’s α, is applied (Nunnally, 1978). With Cronbach’s α as an
indicator, all variable scales were tested using the reliability. This chapter further investigates
the Individual Construct Analyses, tests the research scales and variables by Exploratory
Factor Analysis (EFA) using SPSS, and the Validity of Factor Analysis.
6.2. DATA PREPARATION
Data preparation is an important step for the survey, influencing the outcome quality of the
data analysis produced. The data preparation can be structured, according to Richardson
(2005), as follows:
• Questionnaire editing before data entry: Although the research occurs online,
with systematic rules that leave no questions unanswered, all collected data were
double checked for completeness.
• Coding and data entry: All variables and related items are coded for faster
analysis and grouping, using a computer-based program, SPSS.
A few questions offer the option of “other” or to allow participants to add in an answer. The
coding of the questionnaire helped transfer the data from the online Excel database to the
SPSS statistical software.
6.3. SAMPLE PROFILE
This research targets people actively engaged in Internet and online shopping in Saudi
Arabia, including undergraduate and postgraduate students, and professionals (government
CHAPTER 6: DESCRIPTIVE STATISTICS AND RELIABILITY
P a g e | 157
employee, Private sector, Business people). Only native participants (Saudi nationals) were
used in the analysis of this research to ensure country sample. The five participated regions,
including the most populated cities (Riyadh, Jeddah, and Dammam), in addition to the seven
universities and colleges, that were chosen to extract the sample ensure representation in the
sample of the main population centres in Saudi Arabia.
As a convenience sample, this cannot be considered as representative of the population as a
whole. Nevertheless, the profile is examined to ensure that sufficient numbers of gender, age,
education, and region are included, as detailed below. The survey collects data from 928
participants in Saudi Arabia, of which 70% were women and 30% were men. Most of the
participants (92.8%) come from three main regions in Saudi Arabia: 26.2% from the East,
26.4% from the Central (Middle) region, 40.2% from the West, and 7.2 from North and South
regions. This was unsurprising because information technology is concentrated in three major
areas of the country, the most advanced regions major cities: Riyadh, the capital; Jeddah on
the West Coast (known as the gateway to the two holy Mosques); and Dammam on the East
Coast. Moreover, 25.2% of the overall participants were students, 31% of them work in the
public sector (government employees), 36.7% in the private sector, 7% consider themselves
business people, and less than 1% selected others which indicate house-wife. Since Saudi
Arabia is a big country with multiple traditions and subcultures, the developed online survey
is suitable for collecting data from large geographical areas. See the sample statistics in Table
6.18.
Education levels are as follows: 1.6% never attended high school, 10.7% had some high
school education, 12.4% earned a high schools diploma, 53.4% had bachelor degrees, and
21.9% were postgraduates. Almost half (45.8%) earned an income between £1,000 and
£4,000. Most respondents were in their late 20s: 3% younger than 18 years old, 29.5%
between the ages of 18 and 25 years, 40.8% aged 26–35 years, 19.9% aged 36–45, and 6.7%
older than 46 years. Similarly, 60% of the Saudi population is younger than 30 years of age.
A good portion of respondents (32.7%) visited at least five different shopping sites to
purchase online per month, and 46.2% had used the Internet for actual shopping, spending
£100–£500 (35.5%) or £501–£1,000 (32%) per year. For example, 66.1% of the respondents
used the Internet to make flight booking and purchase airline tickets, 58.1% bought books,
and 43.9% purchased music, DVDs or games. Online booking for airlines tickets, hotel
rooms, and buying books, for instance, is increasing in popularity despite the notion that
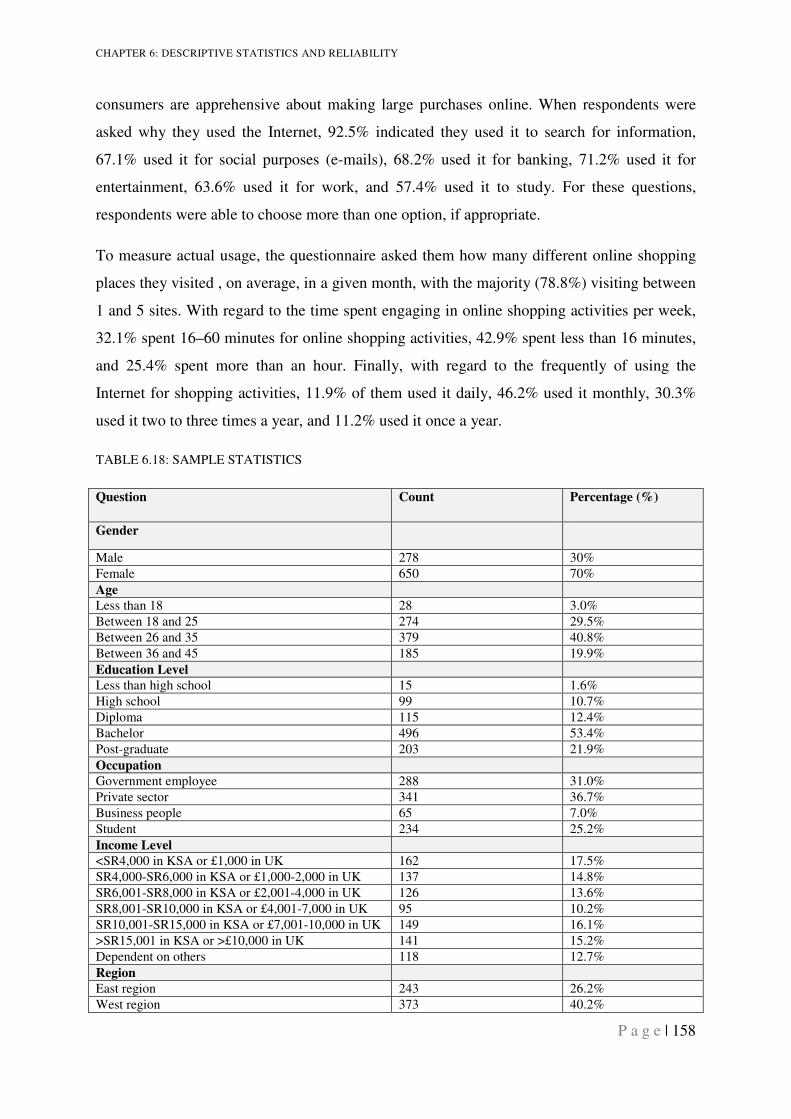
CHAPTER 6: DESCRIPTIVE STATISTICS AND RELIABILITY
P a g e | 158
consumers are apprehensive about making large purchases online. When respondents were
asked why they used the Internet, 92.5% indicated they used it to search for information,
67.1% used it for social purposes (e-mails), 68.2% used it for banking, 71.2% used it for
entertainment, 63.6% used it for work, and 57.4% used it to study. For these questions,
respondents were able to choose more than one option, if appropriate.
To measure actual usage, the questionnaire asked them how many different online shopping
places they visited , on average, in a given month, with the majority (78.8%) visiting between
1 and 5 sites. With regard to the time spent engaging in online shopping activities per week,
32.1% spent 16–60 minutes for online shopping activities, 42.9% spent less than 16 minutes,
and 25.4% spent more than an hour. Finally, with regard to the frequently of using the
Internet for shopping activities, 11.9% of them used it daily, 46.2% used it monthly, 30.3%
used it two to three times a year, and 11.2% used it once a year.
TABLE 6.18: SAMPLE STATISTICS
Question Count Percentage (%)
Gender
Male 278 30%
Female 650 70%
Age
Less than 18 28 3.0%
Between 18 and 25 274 29.5%
Between 26 and 35 379 40.8%
Between 36 and 45 185 19.9%
Education Level
Less than high school 15 1.6%
High school 99 10.7%
Diploma 115 12.4%
Bachelor 496 53.4%
Post-graduate 203 21.9%
Occupation
Government employee 288 31.0%
Private sector 341 36.7%
Business people 65 7.0%
Student 234 25.2%
Income Level
<SR4,000 in KSA or £1,000 in UK 162 17.5%
SR4,000-SR6,000 in KSA or £1,000-2,000 in UK 137 14.8%
SR6,001-SR8,000 in KSA or £2,001-4,000 in UK 126 13.6%
SR8,001-SR10,000 in KSA or £4,001-7,000 in UK 95 10.2%
SR10,001-SR15,000 in KSA or £7,001-10,000 in UK 149 16.1%
>SR15,001 in KSA or >£10,000 in UK 141 15.2%
Dependent on others 118 12.7%
Region
East region 243 26.2%
West region 373 40.2%
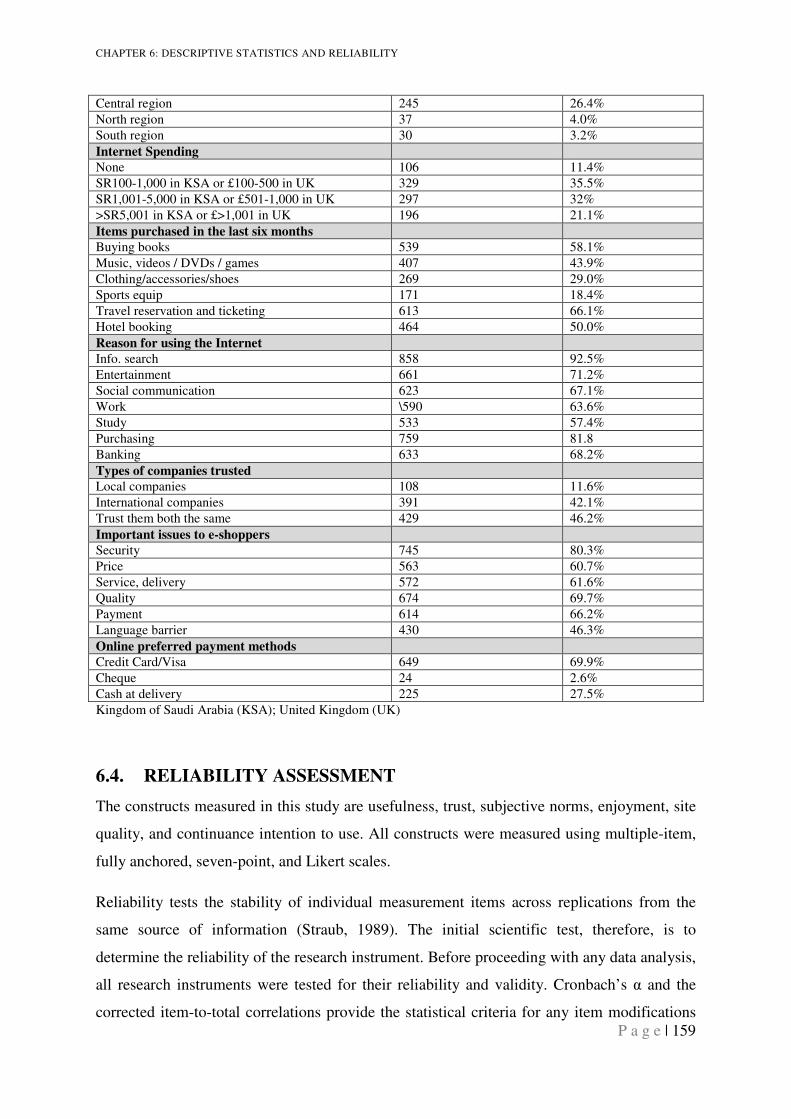
CHAPTER 6: DESCRIPTIVE STATISTICS AND RELIABILITY
P a g e | 159
Central region 245 26.4%
North region 37 4.0%
South region 30 3.2%
Internet Spending
None 106 11.4%
SR100-1,000 in KSA or £100-500 in UK 329 35.5%
SR1,001-5,000 in KSA or £501-1,000 in UK 297 32%
>SR5,001 in KSA or £>1,001 in UK 196 21.1%
Items purchased in the last six months
Buying books 539 58.1%
Music, videos / DVDs / games 407 43.9%
Clothing/accessories/shoes 269 29.0%
Sports equip 171 18.4%
Travel reservation and ticketing 613 66.1%
Hotel booking 464 50.0%
Reason for using the Internet
Info. search 858 92.5%
Entertainment 661 71.2%
Social communication 623 67.1%
Work \590 63.6%
Study 533 57.4%
Purchasing 759 81.8
Banking 633 68.2%
Types of companies trusted
Local companies 108 11.6%
International companies 391 42.1%
Trust them both the same 429 46.2%
Important issues to e-shoppers
Security 745 80.3%
Price 563 60.7%
Service, delivery 572 61.6%
Quality 674 69.7%
Payment 614 66.2%
Language barrier 430 46.3%
Online preferred payment methods
Credit Card/Visa 649 69.9%
Cheque 24 2.6%
Cash at delivery 225 27.5%
Kingdom of Saudi Arabia (KSA); United Kingdom (UK)
6.4. RELIABILITY ASSESSMENT
The constructs measured in this study are usefulness, trust, subjective norms, enjoyment, site
quality, and continuance intention to use. All constructs were measured using multiple-item,
fully anchored, seven-point, and Likert scales.
Reliability tests the stability of individual measurement items across replications from the
same source of information (Straub, 1989). The initial scientific test, therefore, is to
determine the reliability of the research instrument. Before proceeding with any data analysis,
all research instruments were tested for their reliability and validity. Cronbach’s α and the
corrected item-to-total correlations provide the statistical criteria for any item modifications
CHAPTER 6: DESCRIPTIVE STATISTICS AND RELIABILITY
P a g e | 160
or eliminations (Nunnally and Bernstein, 1994). Cronbach’s α is used to examine the
reliability of each construct; passing this test is a prerequisite for further analysis. All initial
scale items were taken from previously validated measures in IS literature or TAM and ECT
research. Scale items were reworded to relate to the e-shopping continuance usage context.
Whenever possible, at least three items were included per construct to ensure adequate
reliability, as recommended by Nunnally (1978).
The cut-off for acceptable corrected item-to-total correlations is 0.3 (Nunnally and Bernstein,
1994). Any item with negative corrected correlations is eliminated from any further
consideration. The Cronbach’s α measures the internal consistency and reflects how each
item correlates with other items or with the entire scale; the acceptable cut-off point is 0.8
(Fornell and Larcker, 1981), though a value of greater than 0.7 (Hair et al, 2006) or even 0.6
(Nunnally, 1978) are considered satisfactory. The criteria suggested by Hair et al (2006),
Nunnally (1978) and Fornell and Larcker (1981) were applied to determine the adequacy of
the reliability coefficients (composite reliability or The Cronbach’s α) obtained for each
measure.
The reliability assessment considers the responses to the online shopping survey from Saudi
Arabians, which contained 35 items for measuring internal consistency and item correlations.
All items used Likert scales.
The Cronbach’s α scores of the variables are high, ranging from 0.928 to 0.961. This is well
above the accepted lower limit of 0.7 (Hair et al, 2006). In addition, all item-to-total
correlation values are significantly greater than 0.3 (Nunnally and Bernstein, 1994). The
Cronbach’s α values in Table 6.19 are all greater than 0.7 (Hair et al., 2006; Bagozzi and Yi,
1988). Furthermore, each variable indicates good reliability. Therefore, the initial reliability
assessment indicates that all variables have sufficient reliability. This is a prerequisite for the
next analysis stage.
Because social science research often tries to measure intangibles, such as intention,
behaviour, satisfaction, enjoyment, and trust, it is hard to know for certain whether items
measure variables accurately. Validity indicates the capacity of a test to indicate what is
already known (Bannister and Mair, 1968).
As noted in Chapter 5, the face validity measure asks participants if they feel that the
questions represented the purpose of the study. Participants in the pilot study phase agreed
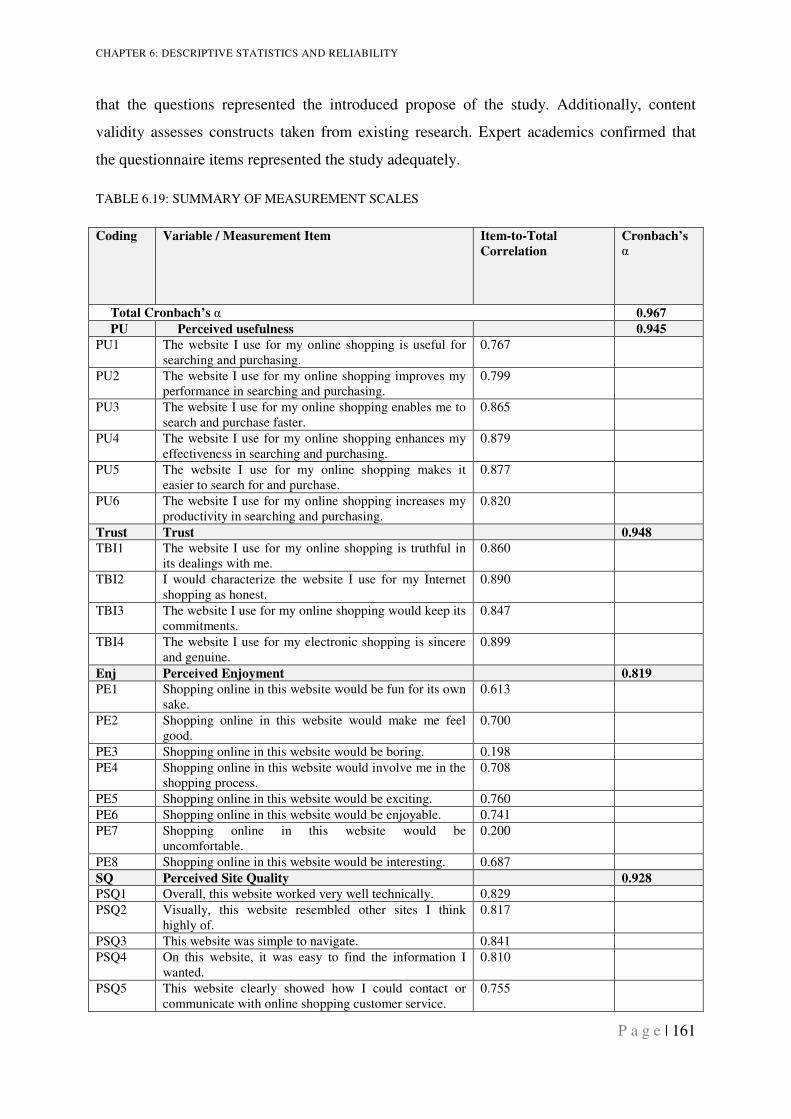
CHAPTER 6: DESCRIPTIVE STATISTICS AND RELIABILITY
P a g e | 161
that the questions represented the introduced propose of the study. Additionally, content
validity assesses constructs taken from existing research. Expert academics confirmed that
the questionnaire items represented the study adequately.
TABLE 6.19: SUMMARY OF MEASUREMENT SCALES
Coding Variable / Measurement Item Item-to-Total
Correlation
Cronbach’s
α
Total Cronbach’s α 0.967
PU Perceived usefulness 0.945
PU1 The website I use for my online shopping is useful for searching and purchasing.
0.767
PU2 The website I use for my online shopping improves my performance in searching and purchasing.
0.799
PU3 The website I use for my online shopping enables me to search and purchase faster.
0.865
PU4 The website I use for my online shopping enhances my effectiveness in searching and purchasing.
0.879
PU5 The website I use for my online shopping makes it easier to search for and purchase.
0.877
PU6 The website I use for my online shopping increases my productivity in searching and purchasing.
0.820
Trust Trust 0.948
TBI1 The website I use for my online shopping is truthful in its dealings with me.
0.860
TBI2 I would characterize the website I use for my Internet shopping as honest.
0.890
TBI3 The website I use for my online shopping would keep its commitments.
0.847
TBI4 The website I use for my electronic shopping is sincere and genuine.
0.899
Enj Perceived Enjoyment 0.819
PE1 Shopping online in this website would be fun for its own sake.
0.613
PE2 Shopping online in this website would make me feel good.
0.700
PE3 Shopping online in this website would be boring. 0.198
PE4 Shopping online in this website would involve me in the shopping process.
0.708
PE5 Shopping online in this website would be exciting. 0.760
PE6 Shopping online in this website would be enjoyable. 0.741
PE7 Shopping online in this website would be uncomfortable.
0.200
PE8 Shopping online in this website would be interesting. 0.687
SQ Perceived Site Quality 0.928
PSQ1 Overall, this website worked very well technically. 0.829
PSQ2 Visually, this website resembled other sites I think highly of.
0.817
PSQ3 This website was simple to navigate. 0.841
PSQ4 On this website, it was easy to find the information I wanted.
0.810
PSQ5 This website clearly showed how I could contact or communicate with online shopping customer service.
0.755
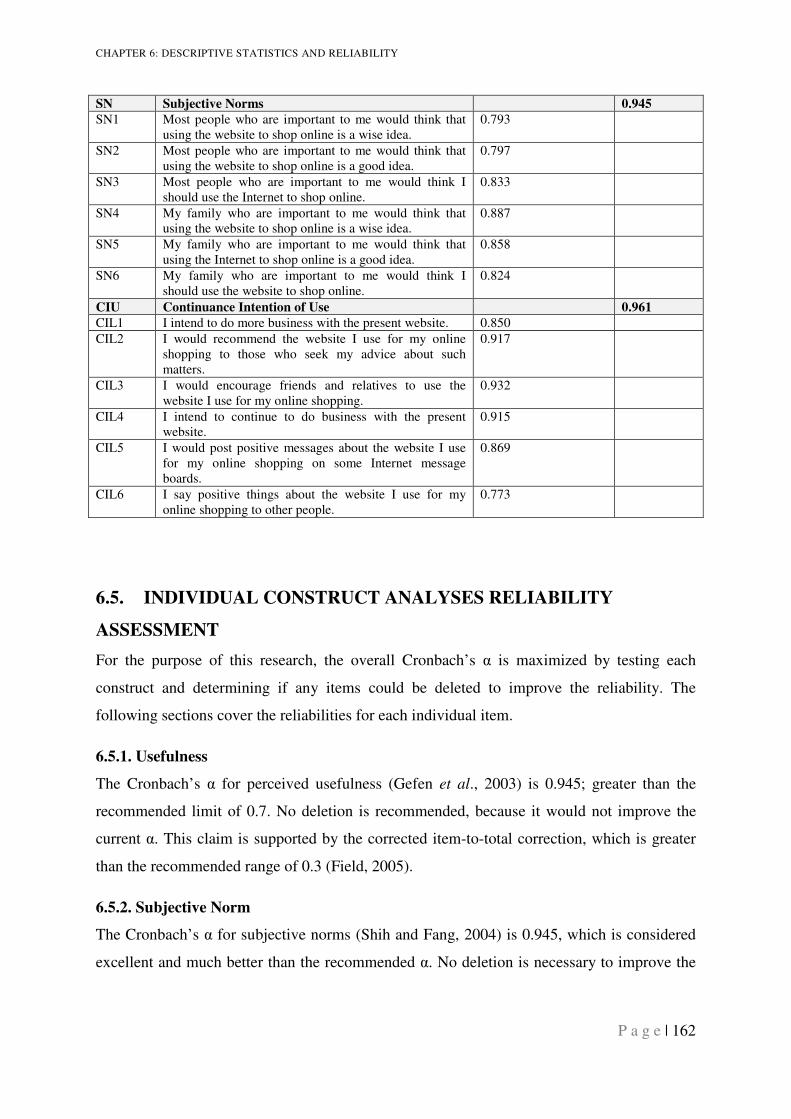
CHAPTER 6: DESCRIPTIVE STATISTICS AND RELIABILITY
P a g e | 162
SN Subjective Norms 0.945
SN1 Most people who are important to me would think that using the website to shop online is a wise idea.
0.793
SN2 Most people who are important to me would think that using the website to shop online is a good idea.
0.797
SN3 Most people who are important to me would think I should use the Internet to shop online.
0.833
SN4 My family who are important to me would think that using the website to shop online is a wise idea.
0.887
SN5 My family who are important to me would think that using the Internet to shop online is a good idea.
0.858
SN6 My family who are important to me would think I should use the website to shop online.
0.824
CIU Continuance Intention of Use 0.961
CIL1 I intend to do more business with the present website. 0.850
CIL2 I would recommend the website I use for my online shopping to those who seek my advice about such matters.
0.917
CIL3 I would encourage friends and relatives to use the website I use for my online shopping.
0.932
CIL4 I intend to continue to do business with the present website.
0.915
CIL5 I would post positive messages about the website I use for my online shopping on some Internet message boards.
0.869
CIL6 I say positive things about the website I use for my online shopping to other people.
0.773
6.5. INDIVIDUAL CONSTRUCT ANALYSES RELIABILITY
ASSESSMENT
For the purpose of this research, the overall Cronbach’s α is maximized by testing each
construct and determining if any items could be deleted to improve the reliability. The
following sections cover the reliabilities for each individual item.
6.5.1. Usefulness
The Cronbach’s α for perceived usefulness (Gefen et al., 2003) is 0.945; greater than the
recommended limit of 0.7. No deletion is recommended, because it would not improve the
current α. This claim is supported by the corrected item-to-total correction, which is greater
than the recommended range of 0.3 (Field, 2005).
6.5.2. Subjective Norm
The Cronbach’s α for subjective norms (Shih and Fang, 2004) is 0.945, which is considered
excellent and much better than the recommended α. No deletion is necessary to improve the
CHAPTER 6: DESCRIPTIVE STATISTICS AND RELIABILITY
P a g e | 163
current α. The corrected item-to-total corrections are all greater than the recommended level
(Field, 2005).
6.5.3. Trust
The Cronbach’s α for trust (McKnight et al., 2002) is 0.948; greater than 0.7. No deletion is
recommended. The corrected item-to-total correction is greater than 0.3 (Field, 2005).
6.5.4. Perceived Enjoyment
The Cronbach’s α for enjoyment (Childers et al., 2001) is 0.819; above the recommended α
level. However, the overall item statistics indicate that the deletion of items 3 and 7 would
improve reliability and, therefore, improve the Cronbach’s α to 0.934. This deletion receives
support from the corrected item-to-total corrections of 0.198 and 0.200, which are less than
the recommended level (Field, 2005).
6.5.5. Perceived Site Quality
The Cronbach’s α for perceived site quality (McKnight et al., 2002) is 0.928; well above the
recommended level. No deletion is recommended, as supported by the corrected item-to-total
corrections, which are greater than the recommended range of 0.3 (Field, 2005).
6.5.6. Continuance Intentions
The Cronbach’s α for continuance intentions (Yang and Peterson, 2004) is 0.961; again above
the recommended α of 0.7. No deletion is recommended or necessary. The corrected item-to-
total corrections are all greater than 0.3 (Field, 2005).
6.6. SPLIT-HALF MODEL RELIABILITY STATISTICS
The split-half model divides a scale into two parts and examines the correlation between them
(Nunnally 1979; Field, 2005). The split-half model shows a value of 0.867 for the Spearman-
Brown reliability coefficient, which is better than the 0.7 value required by Kline’s criterion
and most other researchers. The Cronbach’s α for the two parts also is very close (0.947 and
0.947), which meets Straub et al.’s (2004) requirement of Cronbach’s α > 0.60/0.70 and <
0.95, see Table 6.20.
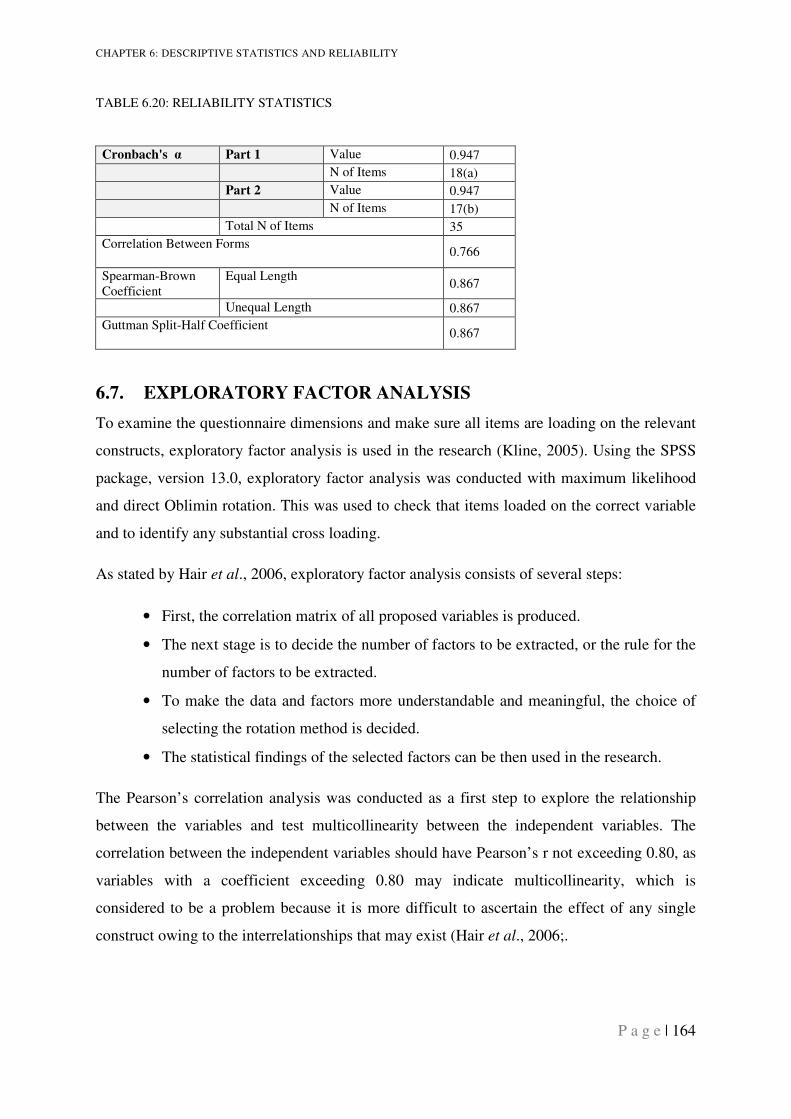
CHAPTER 6: DESCRIPTIVE STATISTICS AND RELIABILITY
P a g e | 164
TABLE 6.20: RELIABILITY STATISTICS
Cronbach's α Part 1 Value 0.947
N of Items 18(a)
Part 2 Value 0.947
N of Items 17(b)
Total N of Items 35
Correlation Between Forms 0.766
Spearman-Brown Coefficient
Equal Length 0.867
Unequal Length 0.867
Guttman Split-Half Coefficient 0.867
6.7. EXPLORATORY FACTOR ANALYSIS
To examine the questionnaire dimensions and make sure all items are loading on the relevant
constructs, exploratory factor analysis is used in the research (Kline, 2005). Using the SPSS
package, version 13.0, exploratory factor analysis was conducted with maximum likelihood
and direct Oblimin rotation. This was used to check that items loaded on the correct variable
and to identify any substantial cross loading.
As stated by Hair et al., 2006, exploratory factor analysis consists of several steps:
• First, the correlation matrix of all proposed variables is produced.
• The next stage is to decide the number of factors to be extracted, or the rule for the
number of factors to be extracted.
• To make the data and factors more understandable and meaningful, the choice of
selecting the rotation method is decided.
• The statistical findings of the selected factors can be then used in the research.
The Pearson’s correlation analysis was conducted as a first step to explore the relationship
between the variables and test multicollinearity between the independent variables. The
correlation between the independent variables should have Pearson’s r not exceeding 0.80, as
variables with a coefficient exceeding 0.80 may indicate multicollinearity, which is
considered to be a problem because it is more difficult to ascertain the effect of any single
construct owing to the interrelationships that may exist (Hair et al., 2006;.
CHAPTER 6: DESCRIPTIVE STATISTICS AND RELIABILITY
P a g e | 165
6.7.1. Validity of Factor Analysis
Using SPSS 13.0 statistical software, Kaiser-Myer-Oklin’s (KMO) Measure of Sampling
Adequacy and Barlett’s Test of Sphericity were used to test the collected research data in
order to determine whether a factor analysis should be carried out (Field, 2005). KMO is
known as one of the best measures for discovering the suitability of a set of data for factor
analysis (Field, 2000). The value of KMO should be greater than or equal to 0.5 (Field,
2000).
The next stage is to determine the number of factors extracted by using the eigenvalues
method (Hair et al, 2006). In addition, communalities for all the items and factor analysis
extraction with maximum likelihood (ML) procedure with direct Oblimin rotation were
tested. The purpose of using ML procedure in all cases was because it continues to be the
most widely used approach and is the default in most Structural Equation Modelling (SEM)
programs. Actually, ML has proven fairly robust to violations of the normality assumption
(Hair et al., 2006). Other researchers compare ML with other techniques and it produces
reliable results under many circumstances (Olsson et al., 2000; Olsson, Foss, and Breivik,
2004). Additionally, ML provides a simple structure that is needed for easy interpretation.
Direct Oblimin is used in this research as factor rotation method. No specific rules or
compelling analytical reasons have been developed to guide researchers when choosing one
rotational method over another (Hair et al., 2006). The choice of selecting the rotational
method should be made on the basis of the particular research problem need. Oblique rotation
methods, which include direct Oblimin, are “best suited to the goal of obtaining several
theoretically meaningful factors or constructs because, realistically, few constructs in the real
world are uncorrelated” (Hair et al., 2006). Furthermore, the oblique rotation was used as it
represents the clustering of variables more accurately (Tabachnick and Fidell, 2007).
It is very important to decide how the factors will be effectively extracted. Researchers are
always faced with the dilemma of how to decide the correct number of indicators needed per
construct. By default, SPSS 13.0 uses Kaiser’s criterion, which states that factors with
eigenvalues greater than 1 are retained. This rule applies provided that the sample size
exceeds 250 observations, there are less than 30 variables and the average communalities
exceed 0.5. Jolliffe’s (2002) criterion calls for factors with eigenvalues greater than 0.7 to be
retained, but there is little reason to recommend it over Kaiser’s (Field, 2005). As suggested
by Hair et al. (2006), only factors with eigenvalues greater than 1 were maintained in the
proposed model. Additionally, Hair indicated that to determine the minimum acceptable
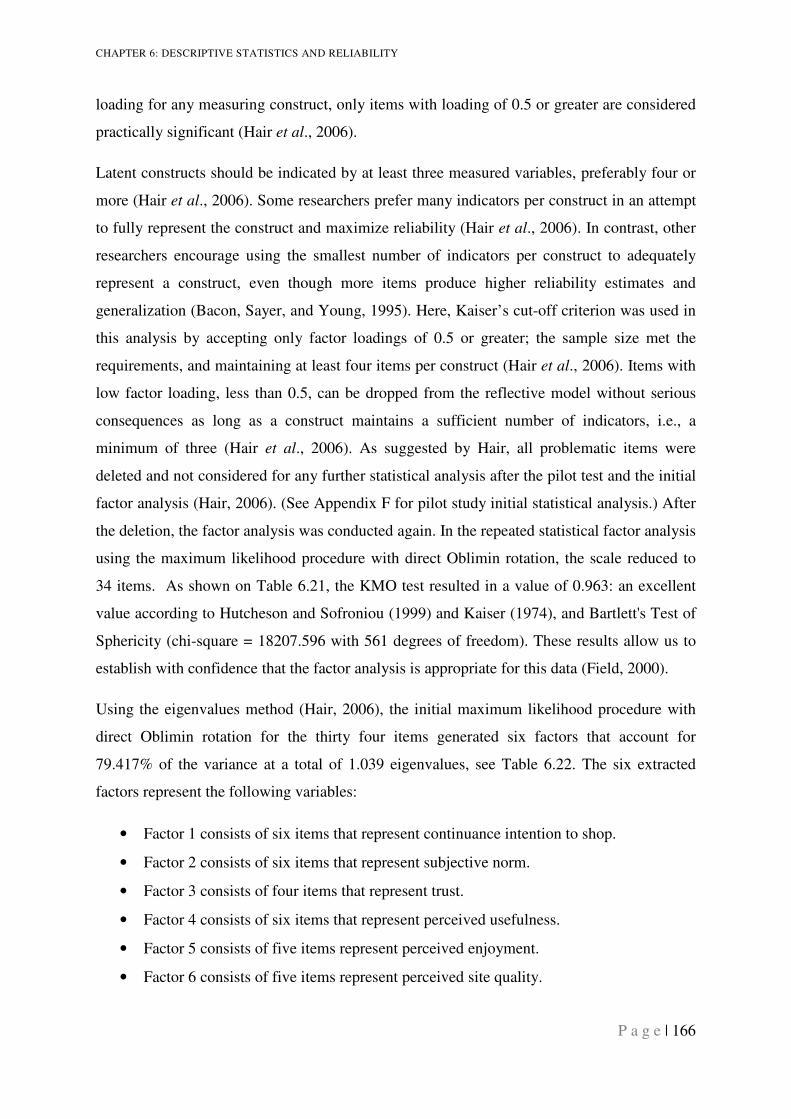
CHAPTER 6: DESCRIPTIVE STATISTICS AND RELIABILITY
P a g e | 166
loading for any measuring construct, only items with loading of 0.5 or greater are considered
practically significant (Hair et al., 2006).
Latent constructs should be indicated by at least three measured variables, preferably four or
more (Hair et al., 2006). Some researchers prefer many indicators per construct in an attempt
to fully represent the construct and maximize reliability (Hair et al., 2006). In contrast, other
researchers encourage using the smallest number of indicators per construct to adequately
represent a construct, even though more items produce higher reliability estimates and
generalization (Bacon, Sayer, and Young, 1995). Here, Kaiser’s cut-off criterion was used in
this analysis by accepting only factor loadings of 0.5 or greater; the sample size met the
requirements, and maintaining at least four items per construct (Hair et al., 2006). Items with
low factor loading, less than 0.5, can be dropped from the reflective model without serious
consequences as long as a construct maintains a sufficient number of indicators, i.e., a
minimum of three (Hair et al., 2006). As suggested by Hair, all problematic items were
deleted and not considered for any further statistical analysis after the pilot test and the initial
factor analysis (Hair, 2006). (See Appendix F for pilot study initial statistical analysis.) After
the deletion, the factor analysis was conducted again. In the repeated statistical factor analysis
using the maximum likelihood procedure with direct Oblimin rotation, the scale reduced to
34 items. As shown on Table 6.21, the KMO test resulted in a value of 0.963: an excellent
value according to Hutcheson and Sofroniou (1999) and Kaiser (1974), and Bartlett's Test of
Sphericity (chi-square = 18207.596 with 561 degrees of freedom). These results allow us to
establish with confidence that the factor analysis is appropriate for this data (Field, 2000).
Using the eigenvalues method (Hair, 2006), the initial maximum likelihood procedure with
direct Oblimin rotation for the thirty four items generated six factors that account for
79.417% of the variance at a total of 1.039 eigenvalues, see Table 6.22. The six extracted
factors represent the following variables:
• Factor 1 consists of six items that represent continuance intention to shop.
• Factor 2 consists of six items that represent subjective norm.
• Factor 3 consists of four items that represent trust.
• Factor 4 consists of six items that represent perceived usefulness.
• Factor 5 consists of five items represent perceived enjoyment.
• Factor 6 consists of five items represent perceived site quality.
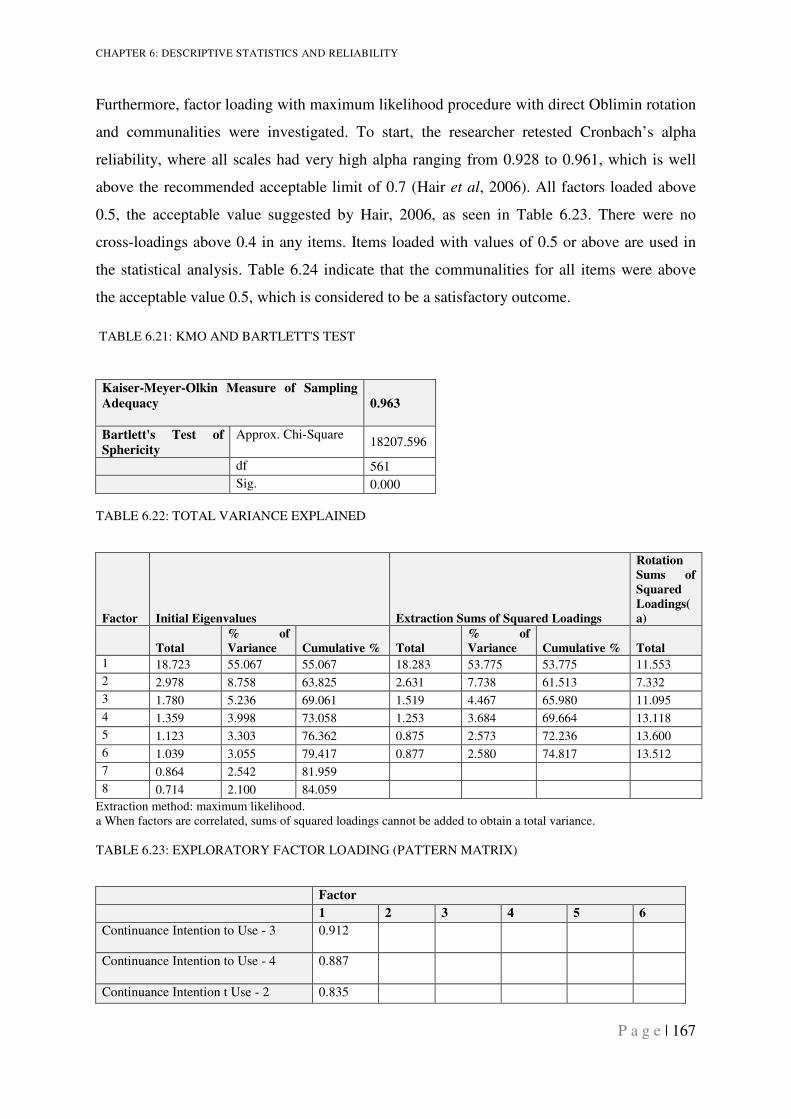
CHAPTER 6: DESCRIPTIVE STATISTICS AND RELIABILITY
P a g e | 167
Furthermore, factor loading with maximum likelihood procedure with direct Oblimin rotation
and communalities were investigated. To start, the researcher retested Cronbach’s alpha
reliability, where all scales had very high alpha ranging from 0.928 to 0.961, which is well
above the recommended acceptable limit of 0.7 (Hair et al, 2006). All factors loaded above
0.5, the acceptable value suggested by Hair, 2006, as seen in Table 6.23. There were no
cross-loadings above 0.4 in any items. Items loaded with values of 0.5 or above are used in
the statistical analysis. Table 6.24 indicate that the communalities for all items were above
the acceptable value 0.5, which is considered to be a satisfactory outcome.
TABLE 6.21: KMO AND BARTLETT'S TEST
Kaiser-Meyer-Olkin Measure of Sampling
Adequacy 0.963
Bartlett's Test of
Sphericity
Approx. Chi-Square 18207.596
df 561
Sig. 0.000
TABLE 6.22: TOTAL VARIANCE EXPLAINED
Factor Initial Eigenvalues Extraction Sums of Squared Loadings
Rotation
Sums of
Squared
Loadings(
a)
Total
% of
Variance Cumulative % Total
% of
Variance Cumulative % Total
1 18.723 55.067 55.067 18.283 53.775 53.775 11.553
2 2.978 8.758 63.825 2.631 7.738 61.513 7.332
3 1.780 5.236 69.061 1.519 4.467 65.980 11.095
4 1.359 3.998 73.058 1.253 3.684 69.664 13.118
5 1.123 3.303 76.362 0.875 2.573 72.236 13.600
6 1.039 3.055 79.417 0.877 2.580 74.817 13.512
7 0.864 2.542 81.959
8 0.714 2.100 84.059
Extraction method: maximum likelihood. a When factors are correlated, sums of squared loadings cannot be added to obtain a total variance.
TABLE 6.23: EXPLORATORY FACTOR LOADING (PATTERN MATRIX)
Factor
1 2 3 4 5 6
Continuance Intention to Use - 3 0.912
Continuance Intention to Use - 4 0.887
Continuance Intention t Use - 2 0.835
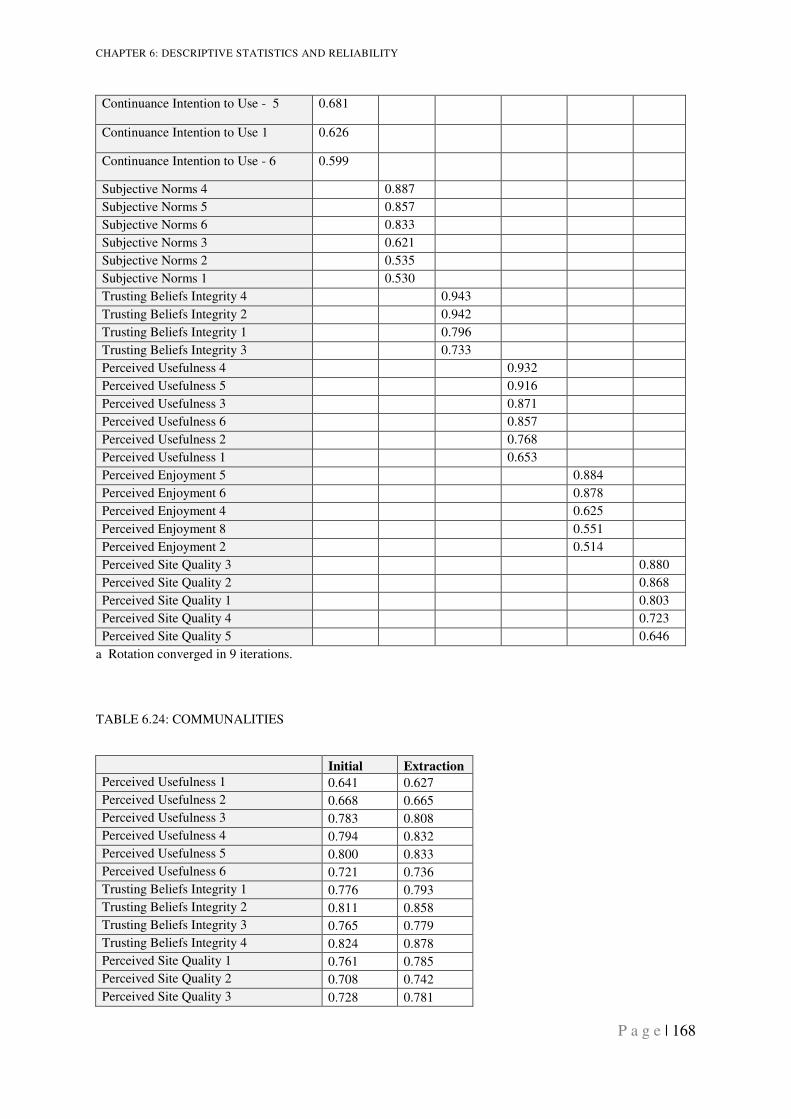
CHAPTER 6: DESCRIPTIVE STATISTICS AND RELIABILITY
P a g e | 168
Continuance Intention to Use - 5 0.681
Continuance Intention to Use 1 0.626
Continuance Intention to Use - 6 0.599
Subjective Norms 4 0.887
Subjective Norms 5 0.857
Subjective Norms 6 0.833
Subjective Norms 3 0.621
Subjective Norms 2 0.535
Subjective Norms 1 0.530
Trusting Beliefs Integrity 4 0.943
Trusting Beliefs Integrity 2 0.942
Trusting Beliefs Integrity 1 0.796
Trusting Beliefs Integrity 3 0.733
Perceived Usefulness 4 0.932
Perceived Usefulness 5 0.916
Perceived Usefulness 3 0.871
Perceived Usefulness 6 0.857
Perceived Usefulness 2 0.768
Perceived Usefulness 1 0.653
Perceived Enjoyment 5 0.884
Perceived Enjoyment 6 0.878
Perceived Enjoyment 4 0.625
Perceived Enjoyment 8 0.551
Perceived Enjoyment 2 0.514
Perceived Site Quality 3 0.880
Perceived Site Quality 2 0.868
Perceived Site Quality 1 0.803
Perceived Site Quality 4 0.723
Perceived Site Quality 5 0.646
a Rotation converged in 9 iterations.
TABLE 6.24: COMMUNALITIES
Initial Extraction
Perceived Usefulness 1 0.641 0.627
Perceived Usefulness 2 0.668 0.665
Perceived Usefulness 3 0.783 0.808
Perceived Usefulness 4 0.794 0.832
Perceived Usefulness 5 0.800 0.833
Perceived Usefulness 6 0.721 0.736
Trusting Beliefs Integrity 1 0.776 0.793
Trusting Beliefs Integrity 2 0.811 0.858
Trusting Beliefs Integrity 3 0.765 0.779
Trusting Beliefs Integrity 4 0.824 0.878
Perceived Site Quality 1 0.761 0.785
Perceived Site Quality 2 0.708 0.742
Perceived Site Quality 3 0.728 0.781
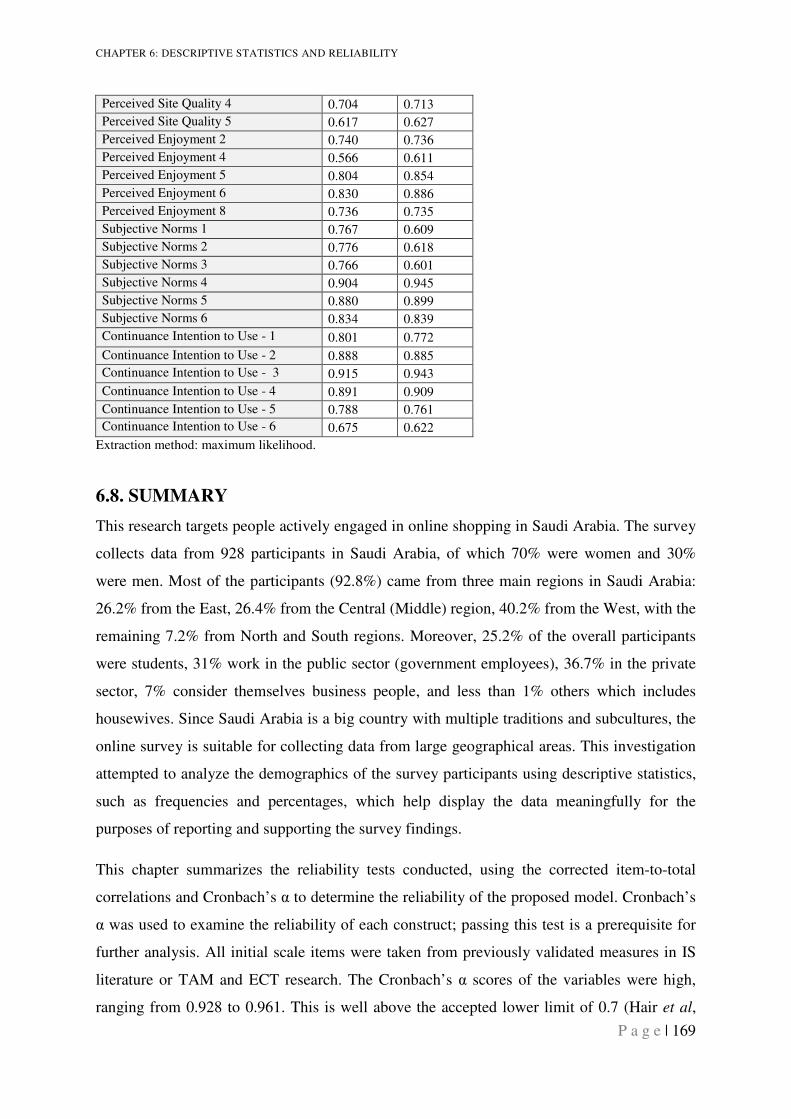
CHAPTER 6: DESCRIPTIVE STATISTICS AND RELIABILITY
P a g e | 169
Perceived Site Quality 4 0.704 0.713
Perceived Site Quality 5 0.617 0.627
Perceived Enjoyment 2 0.740 0.736
Perceived Enjoyment 4 0.566 0.611
Perceived Enjoyment 5 0.804 0.854
Perceived Enjoyment 6 0.830 0.886
Perceived Enjoyment 8 0.736 0.735
Subjective Norms 1 0.767 0.609
Subjective Norms 2 0.776 0.618
Subjective Norms 3 0.766 0.601
Subjective Norms 4 0.904 0.945
Subjective Norms 5 0.880 0.899
Subjective Norms 6 0.834 0.839
Continuance Intention to Use - 1 0.801 0.772
Continuance Intention to Use - 2 0.888 0.885
Continuance Intention to Use - 3 0.915 0.943
Continuance Intention to Use - 4 0.891 0.909
Continuance Intention to Use - 5 0.788 0.761
Continuance Intention to Use - 6 0.675 0.622
Extraction method: maximum likelihood.
6.8. SUMMARY
This research targets people actively engaged in online shopping in Saudi Arabia. The survey
collects data from 928 participants in Saudi Arabia, of which 70% were women and 30%
were men. Most of the participants (92.8%) came from three main regions in Saudi Arabia:
26.2% from the East, 26.4% from the Central (Middle) region, 40.2% from the West, with the
remaining 7.2% from North and South regions. Moreover, 25.2% of the overall participants
were students, 31% work in the public sector (government employees), 36.7% in the private
sector, 7% consider themselves business people, and less than 1% others which includes
housewives. Since Saudi Arabia is a big country with multiple traditions and subcultures, the
online survey is suitable for collecting data from large geographical areas. This investigation
attempted to analyze the demographics of the survey participants using descriptive statistics,
such as frequencies and percentages, which help display the data meaningfully for the
purposes of reporting and supporting the survey findings.
This chapter summarizes the reliability tests conducted, using the corrected item-to-total
correlations and Cronbach’s α to determine the reliability of the proposed model. Cronbach’s
α was used to examine the reliability of each construct; passing this test is a prerequisite for
further analysis. All initial scale items were taken from previously validated measures in IS
literature or TAM and ECT research. The Cronbach’s α scores of the variables were high,
ranging from 0.928 to 0.961. This is well above the accepted lower limit of 0.7 (Hair et al,
CHAPTER 6: DESCRIPTIVE STATISTICS AND RELIABILITY
P a g e | 170
2006). As suggested by Hair et al. (2006), only factors with eigenvalues greater than 1 were
maintained in the proposed model. Additionally, Hair indicated that to determine the
minimum acceptable loading for any measuring construct, only items with loading of 0.5 or
greater were considered practically significant (Hair et al., 2006). Moreover, the researcher
used Kaiser’s cut-off criterion in this analysis by accepting only factor loadings of 0.5 or
greater; the sample size met the requirements, maintaining at least four items per construct
(Hair et al., 2006).
The next chapter reports further quantitative data analysis, including factor analysis,
discriminant validity, and structural equation modelling (SEM) using AMOS software, in
order to test the hypotheses.
CHAPTER 7: QUANTITATIVE ANALYSIS
P a g e | 171
CHAPTER 7: QUANTITATIVE ANALYSIS
7.1. INTRODUCTION
It is crucial in any research or data analysis to make sure that the measurement tools are able
to clarify and illustrate the research constructs. In the previous chapter, a reliability test was
conducted using the corrected item-total correlations and Cronbach’s α to test the reliability
of the proposed model. The findings indicate that the variable instruments used in the survey
contain good content and construct reliability for the items measured in the survey. Also,
descriptive results of the questionnaires were outlined.
In this chapter, deeper quantitative analysis will be conducted to test the research variables
Convergent and Discriminant validity by Confirmatory Factor Analysis (CFA) using AMOS.
Furthermore, this chapter will validate the research model using Structural Equation
Modelling (SEM) using AMOS software and then will illustrate the modified model after
taking into consideration the recommendation from the modification indices (MI). Finally,
several invariance analyses will be conducted using group comparisons, such as gender, age,
geographical locations, and online shopping spending. The coming sections will illustrate the
results of each analysis in more detail and then present the final research constructs.
7.2. CONVERGENT AND DISCRIMINANT VALIDITY
Convergent validity reveals the extent to which the measures for a variable act as if they
measure the underlying theoretical construct because they share variance (Schwab, 1980). In
other words, convergent validity examines whether individual indicators are indeed
measuring the constructs they are purported to measure (Premkumar and Bhattacherjee,
2008). Internal consistency reliability is generally considered a necessary, but not sufficient,
condition for convergent validity (Schwab, 1980). Hair et al. (2006) suggest that variables
with factor loadings greater than 0.5 exhibit evidence of convergent validity. Table 7.25 and
Table 7.26 show that all exploratory and confirmatory factor loadings for all selected
constructs are greater than 0.50 (Hair et al., 2006).
The average variance extracted (AVE) is the average measure of convergence among a set of
items representing a latent construct; that is, the average percentage of variation explained by
the items (Hair et al., 2006). It can be calculated by summing the squared factor loadings.
Fornell and Larcker’s (1981) and Hair et al.’s (2006) criterion that an average variance
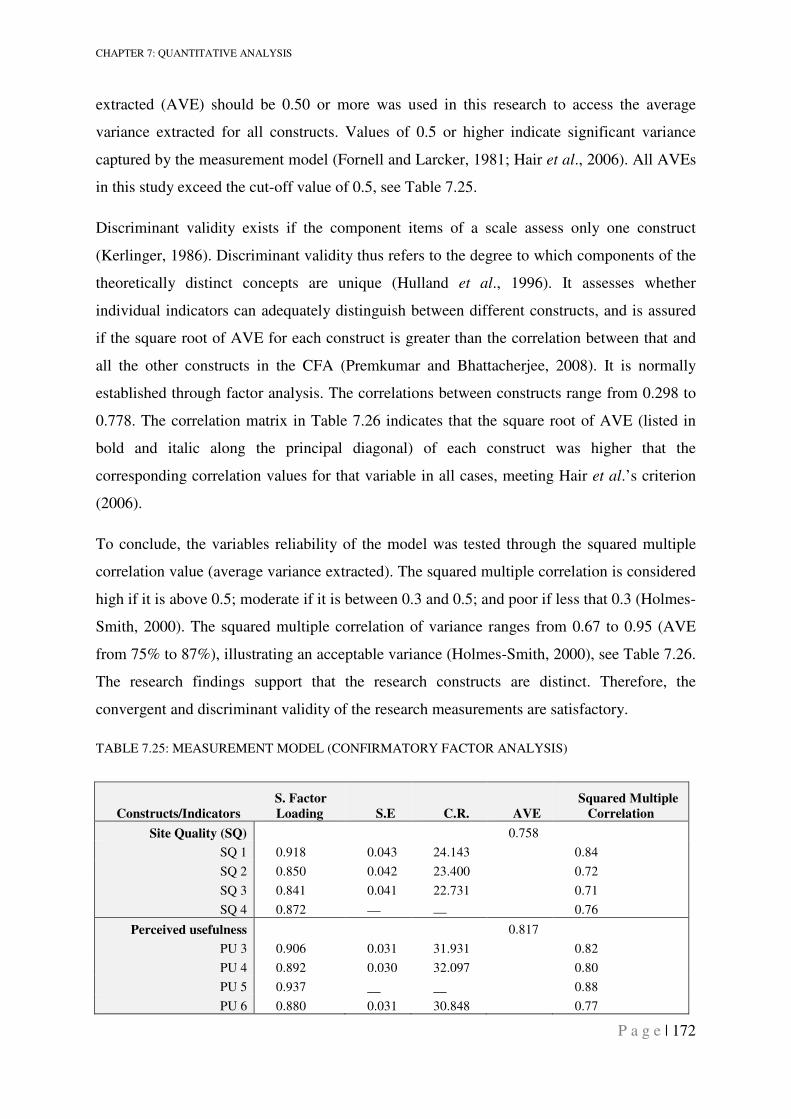
CHAPTER 7: QUANTITATIVE ANALYSIS
P a g e | 172
extracted (AVE) should be 0.50 or more was used in this research to access the average
variance extracted for all constructs. Values of 0.5 or higher indicate significant variance
captured by the measurement model (Fornell and Larcker, 1981; Hair et al., 2006). All AVEs
in this study exceed the cut-off value of 0.5, see Table 7.25.
Discriminant validity exists if the component items of a scale assess only one construct
(Kerlinger, 1986). Discriminant validity thus refers to the degree to which components of the
theoretically distinct concepts are unique (Hulland et al., 1996). It assesses whether
individual indicators can adequately distinguish between different constructs, and is assured
if the square root of AVE for each construct is greater than the correlation between that and
all the other constructs in the CFA (Premkumar and Bhattacherjee, 2008). It is normally
established through factor analysis. The correlations between constructs range from 0.298 to
0.778. The correlation matrix in Table 7.26 indicates that the square root of AVE (listed in
bold and italic along the principal diagonal) of each construct was higher that the
corresponding correlation values for that variable in all cases, meeting Hair et al.’s criterion
(2006).
To conclude, the variables reliability of the model was tested through the squared multiple
correlation value (average variance extracted). The squared multiple correlation is considered
high if it is above 0.5; moderate if it is between 0.3 and 0.5; and poor if less that 0.3 (Holmes-
Smith, 2000). The squared multiple correlation of variance ranges from 0.67 to 0.95 (AVE
from 75% to 87%), illustrating an acceptable variance (Holmes-Smith, 2000), see Table 7.26.
The research findings support that the research constructs are distinct. Therefore, the
convergent and discriminant validity of the research measurements are satisfactory.
TABLE 7.25: MEASUREMENT MODEL (CONFIRMATORY FACTOR ANALYSIS)
Constructs/Indicators
S. Factor
Loading S.E C.R. AVE
Squared Multiple
Correlation
Site Quality (SQ) 0.758
SQ 1 0.918 0.043 24.143 0.84
SQ 2 0.850 0.042 23.400 0.72
SQ 3 0.841 0.041 22.731 0.71
SQ 4 0.872 __ __ 0.76
Perceived usefulness 0.817
PU 3 0.906 0.031 31.931 0.82
PU 4 0.892 0.030 32.097 0.80
PU 5 0.937 __ __ 0.88
PU 6 0.880 0.031 30.848 0.77
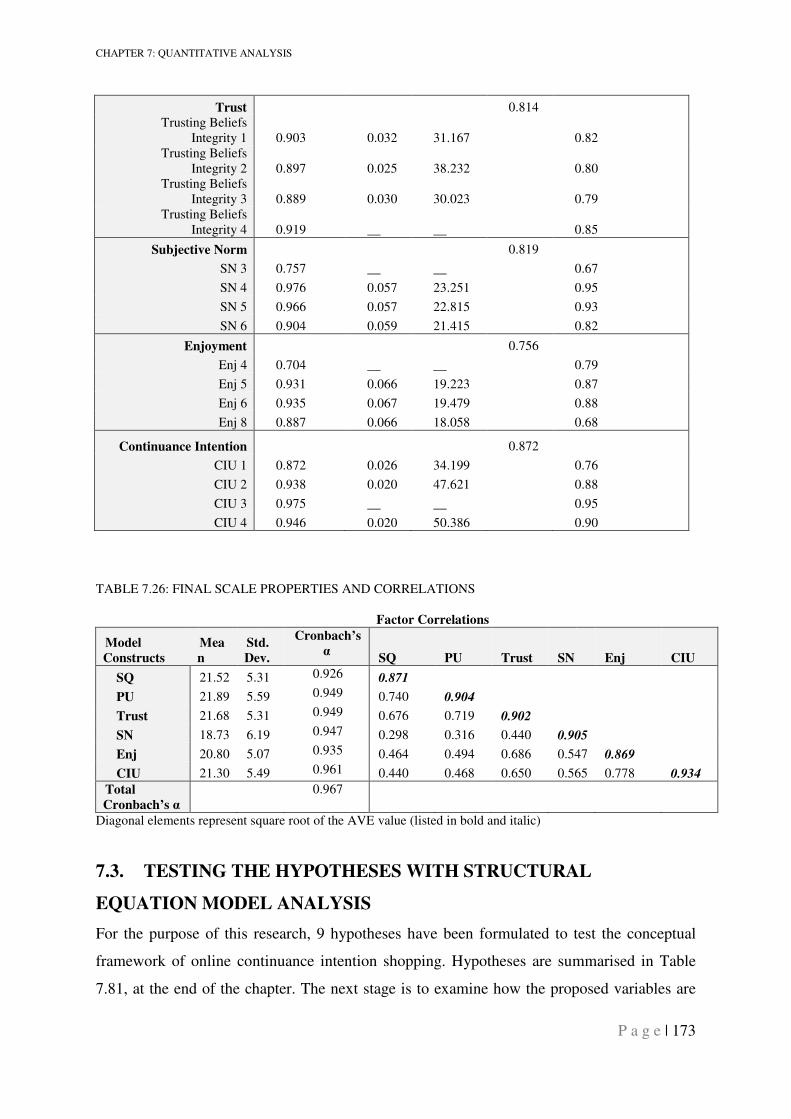
CHAPTER 7: QUANTITATIVE ANALYSIS
P a g e | 173
Trust 0.814 Trusting Beliefs
Integrity 1 0.903 0.032 31.167 0.82 Trusting Beliefs
Integrity 2 0.897 0.025 38.232 0.80 Trusting Beliefs
Integrity 3 0.889 0.030 30.023 0.79 Trusting Beliefs
Integrity 4 0.919 __ __ 0.85
Subjective Norm 0.819
SN 3 0.757 __ __ 0.67
SN 4 0.976 0.057 23.251 0.95
SN 5 0.966 0.057 22.815 0.93
SN 6 0.904 0.059 21.415 0.82
Enjoyment 0.756
Enj 4 0.704 __ __ 0.79
Enj 5 0.931 0.066 19.223 0.87
Enj 6 0.935 0.067 19.479 0.88
Enj 8 0.887 0.066 18.058 0.68
Continuance Intention 0.872
CIU 1 0.872 0.026 34.199 0.76
CIU 2 0.938 0.020 47.621 0.88
CIU 3 0.975 __ __ 0.95
CIU 4 0.946 0.020 50.386 0.90
TABLE 7.26: FINAL SCALE PROPERTIES AND CORRELATIONS
Factor Correlations
Model
Constructs
Mea
n
Std.
Dev.
Cronbach’s
α SQ PU Trust SN Enj CIU
SQ 21.52 5.31 0.926 0.871
PU 21.89 5.59 0.949 0.740 0.904
Trust 21.68 5.31 0.949 0.676 0.719 0.902
SN 18.73 6.19 0.947 0.298 0.316 0.440 0.905
Enj 20.80 5.07 0.935 0.464 0.494 0.686 0.547 0.869
CIU 21.30 5.49 0.961 0.440 0.468 0.650 0.565 0.778 0.934
Total
Cronbach’s α 0.967
Diagonal elements represent square root of the AVE value (listed in bold and italic)
7.3. TESTING THE HYPOTHESES WITH STRUCTURAL
EQUATION MODEL ANALYSIS
For the purpose of this research, 9 hypotheses have been formulated to test the conceptual
framework of online continuance intention shopping. Hypotheses are summarised in Table
7.81, at the end of the chapter. The next stage is to examine how the proposed variables are
CHAPTER 7: QUANTITATIVE ANALYSIS
P a g e | 174
related. The Structural Equation Model (SEM) is used with AMOS 5.0 software (Arbuckle,
2003). SEM has an advantage over other statistical methods in its capability to include
several observed and latent variables at the same time when predicting paths (Sharma, 1996).
Additionally, SEM focuses more on the pattern of relationships across the samples than on
individual observations (Hair et al., 2006). Since latent variables cannot be observed or
measured directly, unobserved variables are linked to indicators that are observable.
Therefore, SEM can facilitate their measurement (Byrne, 2001).
The research then takes a further step is to explain how well the observed indicators serve as
a measurement instrument for the proposed model latent variables. The model was evaluated
with the use of CFA on the basis of maximum likelihood (ML). Before conducting the
Confirmatory Factor Analysis (CFA), Cronbach’s alpha was used to examine the reliability
of the measures. All scales had very high alpha, ranging from 0.928 to 0.961, well above the
recommended acceptable limit of 0.7 (Hair et al, 2006). The goodness-of-fit for the proposed
model was assessed using various criteria, as recommended by Hair (Hair et al, 2006). Chi-
square (CMIN) is used in the model assessment to test the closeness of fit between the
unrestricted sample covariance and the restricted covariance matrix (Byrne, 2001; Hair et al.,
2006). Having a larger value for chi-square compared to the degrees of freedom suggests that
the observed matrices and estimated matrices are significantly different. On the other hand,
an insignificant chi-square (CMIN) (p>0.05) indicates a satisfactory fit of the model
(Holmes-Smith, 2000). In other words, the higher the probability, the closer the model to a
great fit (Byrne, 2001). When working with large research samples, like this research with
928 participants, it is rare to find a non-significant chi-square, which makes it preferable to
examine a range of other fit indices before a model is rejected (Anderson and Gerbing, 1988).
As chi-square is sensitive to sample size and model size, it is not considered a very good
measure of fit (Hair et al., 2006). Other goodness-of-fit indices were therefore considered in
this research. These included chi-square/degrees-of-freedom (CMIN/DF), root mean square
residual (RMR), root mean square error of approximation (RMSEA), goodness-of-fit index
(GFI), comparative fit index (CFI), normal fit index (NFI), incremental fit index (NFI) and
relative fit index (RFI).
The CFI is a measure of the covariance in the data; values close to one indicate good fit (Hair
et al., 2006). The goodness-of-fit (GFI) is another measure of absolute fit that used in this
research. It is a measure of the relative amount of variance and covariance in the sample that
CHAPTER 7: QUANTITATIVE ANALYSIS
P a g e | 175
are explained by the model (Hair et al., 2006). As with the CFI, the GFI index ranges from
zero to one, with values closes to one indicating a good fit (Hair et al., 2006).
The root mean square residual (RMR) is the average value of all standardised residuals. It
ranges from zero to one, where a value less than or equal to 0.08 indicates that the model fits
the data well (Hair et al., 2006; Hulland et al., 1996). Furthermore, the root mean square error
of approximation (RMSEA) takes into account the error of approximation in the research
population. It represents how well the collected data from the surveyed sample fits the
population covariance matrix (Hair et al., 2006). The limiting value of RMSEA for a good
model is debatable, but values that are below 0.10 are acceptable (Hair et al., 2006). Byrne
suggested that RMSEA values less than 0.05 indicate a good fit, whilst values as high as 0.08
indicate a reasonable fit (Byrne, 2001).
Finally, the critical ratio (CR) for standardised estimates of regression weight measures of the
model was used in this research. It (CR) is the estimate divided by its standard error, and
should be greater than 1.96 for the factor loading (Hair et al., 2006). Thus, if the CR of a
regression weight is greater that 1.96 (CR>1.96), then that proposed path parameter
covariance is significant at the 0.05 level (Hair et al., 2006).
Structural Equation Modelling (SEM) requires a larger sample size compared to other
multivariate approaches because some of the statistical algorithms used by SEM programs are
unreliable with small sample sizes (Hair et al., 2006). On the other hand, sample sizes greater
than 400 make SEM more sensitive to goodness-of-fit measures that suggest poor fit
(Quinones, Ford, and Teachout, 1995). Therefore, when the number of variables in the model
is six or more, sample size in the range of 150 to 500 is suggested when using SEM with
AMOS software (Hair et al., 2006). Taking this into consideration, the research collected data
will be split randomly into two halves. First, a model will be fitted to a calibration sample
(one random half of 463 participants) using SEM with AMOS as discussed later in this
chapter. Then, the model fit is checked on the validation sample (the other half of the sample
465 participants) for the purpose of validation.
7.4. CONFIRMATORY FACTOR ANALYSIS (CFA)
The purpose of the questionnaire was to test the proposed model, which describes the
relationship between the proposed critical e-shopping factors and the continuance e-shopping
intention in Saudi Arabia. The questionnaires reflect the proposed research model and its
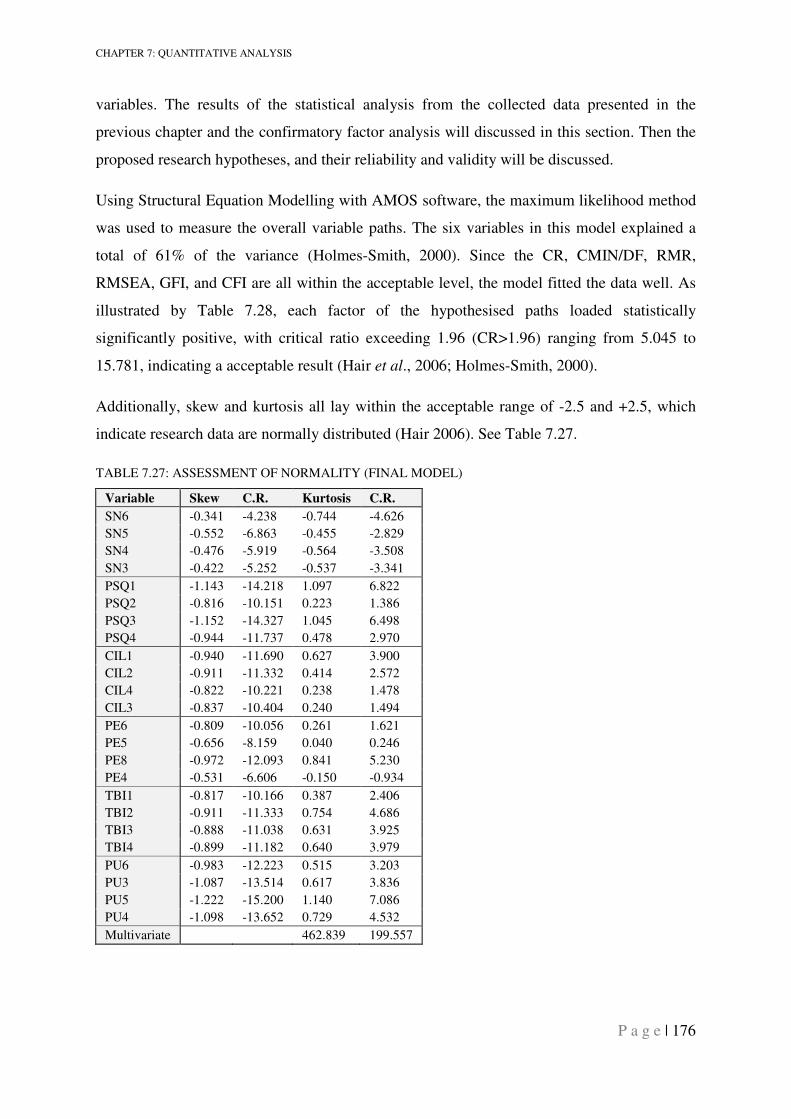
CHAPTER 7: QUANTITATIVE ANALYSIS
P a g e | 176
variables. The results of the statistical analysis from the collected data presented in the
previous chapter and the confirmatory factor analysis will discussed in this section. Then the
proposed research hypotheses, and their reliability and validity will be discussed.
Using Structural Equation Modelling with AMOS software, the maximum likelihood method
was used to measure the overall variable paths. The six variables in this model explained a
total of 61% of the variance (Holmes-Smith, 2000). Since the CR, CMIN/DF, RMR,
RMSEA, GFI, and CFI are all within the acceptable level, the model fitted the data well. As
illustrated by Table 7.28, each factor of the hypothesised paths loaded statistically
significantly positive, with critical ratio exceeding 1.96 (CR>1.96) ranging from 5.045 to
15.781, indicating a acceptable result (Hair et al., 2006; Holmes-Smith, 2000).
Additionally, skew and kurtosis all lay within the acceptable range of -2.5 and +2.5, which
indicate research data are normally distributed (Hair 2006). See Table 7.27.
TABLE 7.27: ASSESSMENT OF NORMALITY (FINAL MODEL)
Variable Skew C.R. Kurtosis C.R.
SN6 -0.341 -4.238 -0.744 -4.626
SN5 -0.552 -6.863 -0.455 -2.829
SN4 -0.476 -5.919 -0.564 -3.508
SN3 -0.422 -5.252 -0.537 -3.341
PSQ1 -1.143 -14.218 1.097 6.822
PSQ2 -0.816 -10.151 0.223 1.386
PSQ3 -1.152 -14.327 1.045 6.498
PSQ4 -0.944 -11.737 0.478 2.970
CIL1 -0.940 -11.690 0.627 3.900
CIL2 -0.911 -11.332 0.414 2.572
CIL4 -0.822 -10.221 0.238 1.478
CIL3 -0.837 -10.404 0.240 1.494
PE6 -0.809 -10.056 0.261 1.621
PE5 -0.656 -8.159 0.040 0.246
PE8 -0.972 -12.093 0.841 5.230
PE4 -0.531 -6.606 -0.150 -0.934
TBI1 -0.817 -10.166 0.387 2.406
TBI2 -0.911 -11.333 0.754 4.686
TBI3 -0.888 -11.038 0.631 3.925
TBI4 -0.899 -11.182 0.640 3.979
PU6 -0.983 -12.223 0.515 3.203
PU3 -1.087 -13.514 0.617 3.836
PU5 -1.222 -15.200 1.140 7.086
PU4 -1.098 -13.652 0.729 4.532
Multivariate 462.839 199.557
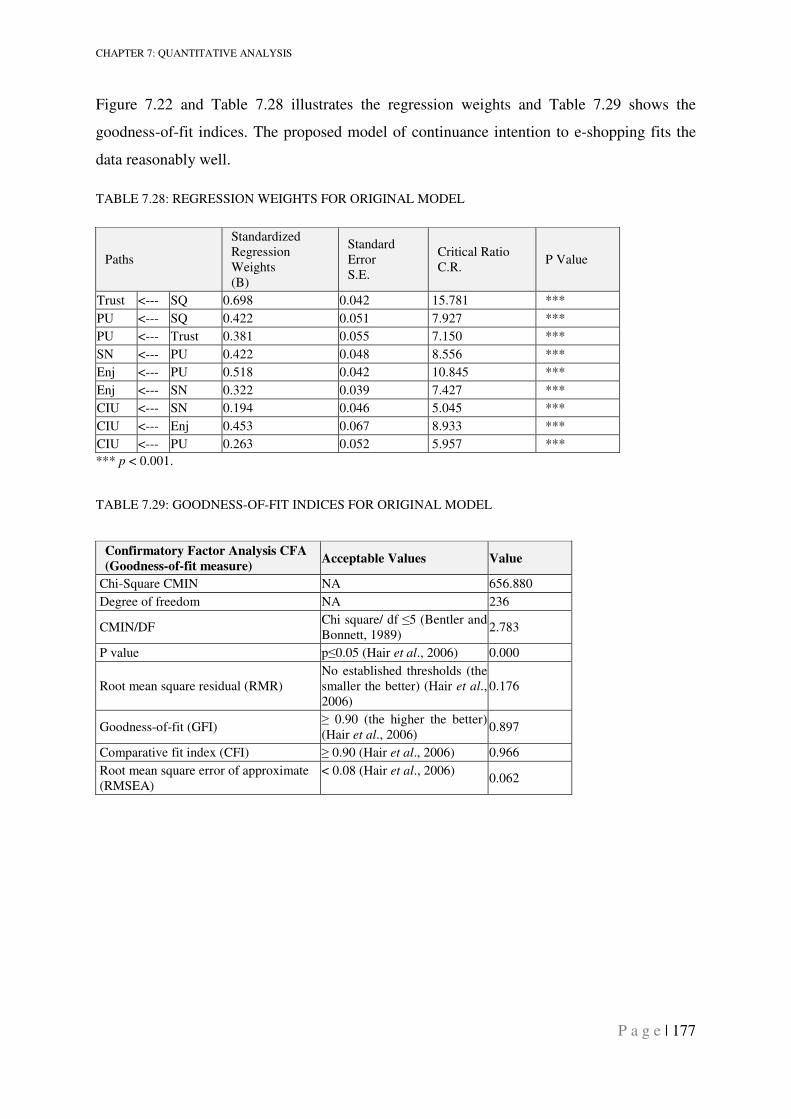
CHAPTER 7: QUANTITATIVE ANALYSIS
P a g e | 177
Figure 7.22 and Table 7.28 illustrates the regression weights and Table 7.29 shows the
goodness-of-fit indices. The proposed model of continuance intention to e-shopping fits the
data reasonably well.
TABLE 7.28: REGRESSION WEIGHTS FOR ORIGINAL MODEL
Paths
Standardized Regression Weights (B)
Standard Error S.E.
Critical Ratio C.R.
P Value
Trust <--- SQ 0.698 0.042 15.781 ***
PU <--- SQ 0.422 0.051 7.927 ***
PU <--- Trust 0.381 0.055 7.150 ***
SN <--- PU 0.422 0.048 8.556 ***
Enj <--- PU 0.518 0.042 10.845 ***
Enj <--- SN 0.322 0.039 7.427 ***
CIU <--- SN 0.194 0.046 5.045 ***
CIU <--- Enj 0.453 0.067 8.933 ***
CIU <--- PU 0.263 0.052 5.957 ***
*** p < 0.001.
TABLE 7.29: GOODNESS-OF-FIT INDICES FOR ORIGINAL MODEL
Confirmatory Factor Analysis CFA
(Goodness-of-fit measure) Acceptable Values Value
Chi-Square CMIN NA 656.880
Degree of freedom NA 236
CMIN/DF Chi square/ df ≤5 (Bentler and Bonnett, 1989)
2.783
P value p≤0.05 (Hair et al., 2006) 0.000
Root mean square residual (RMR) No established thresholds (the smaller the better) (Hair et al., 2006)
0.176
Goodness-of-fit (GFI) ≥ 0.90 (the higher the better) (Hair et al., 2006)
0.897
Comparative fit index (CFI) ≥ 0.90 (Hair et al., 2006) 0.966
Root mean square error of approximate (RMSEA)
< 0.08 (Hair et al., 2006) 0.062
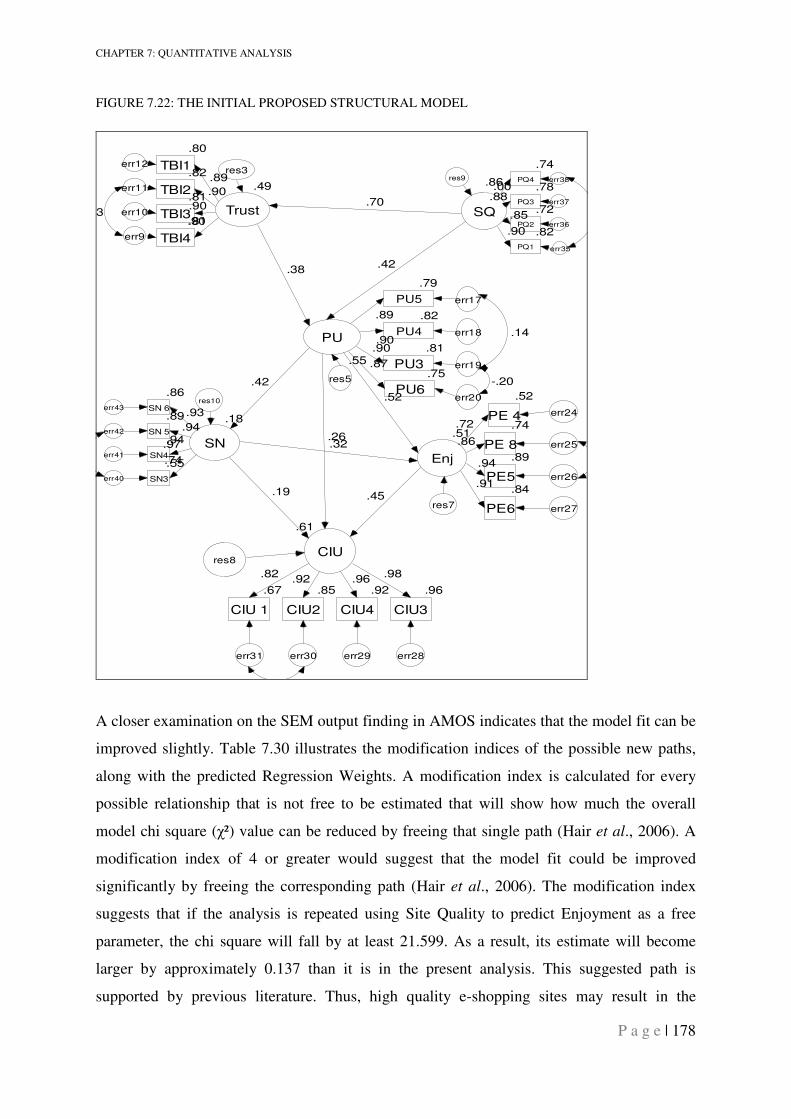
CHAPTER 7: QUANTITATIVE ANALYSIS
P a g e | 178
FIGURE 7.22: THE INITIAL PROPOSED STRUCTURAL MODEL
.79
PU5
.82
PU4
.55
PU
err17
err18.90
.89
res5
.81
PU3 err19
.90
.75
PU6err20
.87
.49
Trust.81
TBI4err9
.90
.81
TBI3err10.90
.82
TBI2err11 .90
.80
TBI1err12
.89
.51
Enj
.52
PE 4 err24
.72 .74
PE 8 err25.86
.89
PE5 err26
.94
.84
PE6 err27
.91
.61
CIU
.96
CIU3
err28
.98
.92
CIU4
err29
.96.85
CIU2
err30
.92.67
CIU 1
err31
.82
res3
res7
res8
.00
SQ
.74
PQ4 err38.86 .78
PQ3 err37.88
.72
PQ2 err36
.85
.82
PQ1 err35
.18
SN
.55
SN3err40
.74
.94
SN4err41
.97
.89
SN 5err42 .94
.86
SN 6err43.93
res9
res10
.90
.14
.70
.42.38
.42
.19 .45
.52
.32
-.20
.23
.26
A closer examination on the SEM output finding in AMOS indicates that the model fit can be
improved slightly. Table 7.30 illustrates the modification indices of the possible new paths,
along with the predicted Regression Weights. A modification index is calculated for every
possible relationship that is not free to be estimated that will show how much the overall
model chi square (χ²) value can be reduced by freeing that single path (Hair et al., 2006). A
modification index of 4 or greater would suggest that the model fit could be improved
significantly by freeing the corresponding path (Hair et al., 2006). The modification index
suggests that if the analysis is repeated using Site Quality to predict Enjoyment as a free
parameter, the chi square will fall by at least 21.599. As a result, its estimate will become
larger by approximately 0.137 than it is in the present analysis. This suggested path is
supported by previous literature. Thus, high quality e-shopping sites may result in the
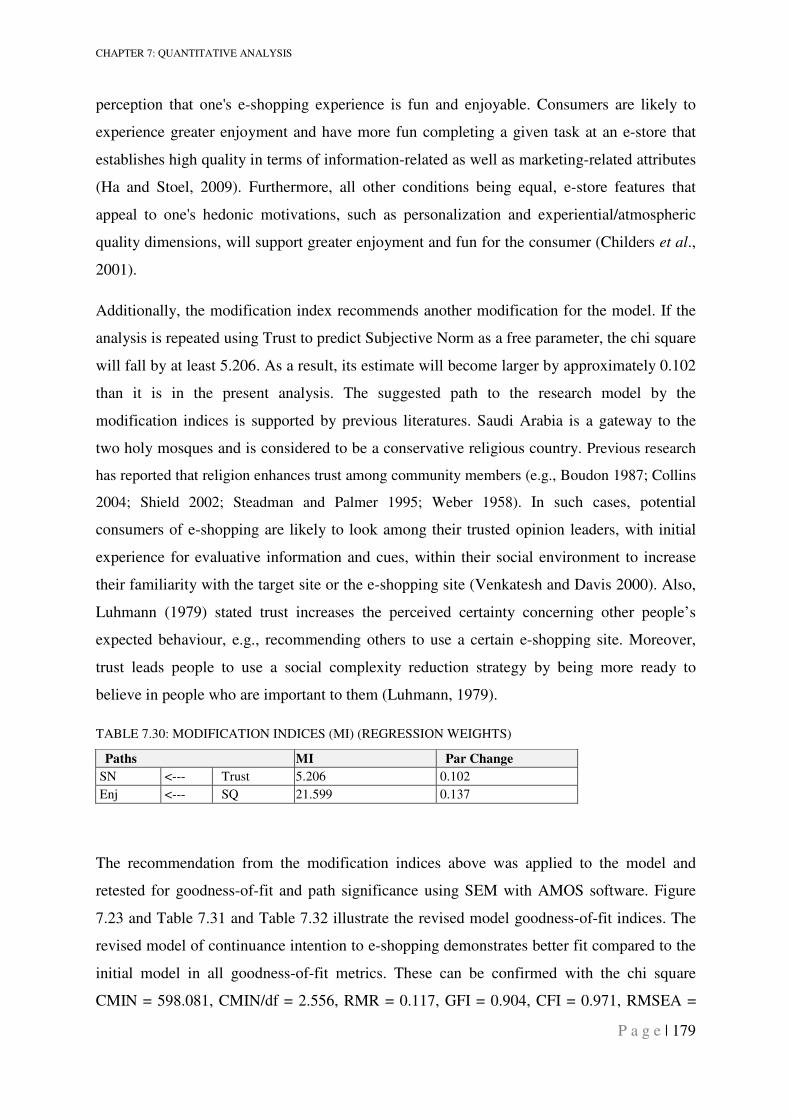
CHAPTER 7: QUANTITATIVE ANALYSIS
P a g e | 179
perception that one's e-shopping experience is fun and enjoyable. Consumers are likely to
experience greater enjoyment and have more fun completing a given task at an e-store that
establishes high quality in terms of information-related as well as marketing-related attributes
(Ha and Stoel, 2009). Furthermore, all other conditions being equal, e-store features that
appeal to one's hedonic motivations, such as personalization and experiential/atmospheric
quality dimensions, will support greater enjoyment and fun for the consumer (Childers et al.,
2001).
Additionally, the modification index recommends another modification for the model. If the
analysis is repeated using Trust to predict Subjective Norm as a free parameter, the chi square
will fall by at least 5.206. As a result, its estimate will become larger by approximately 0.102
than it is in the present analysis. The suggested path to the research model by the
modification indices is supported by previous literatures. Saudi Arabia is a gateway to the
two holy mosques and is considered to be a conservative religious country. Previous research
has reported that religion enhances trust among community members (e.g., Boudon 1987; Collins
2004; Shield 2002; Steadman and Palmer 1995; Weber 1958). In such cases, potential
consumers of e-shopping are likely to look among their trusted opinion leaders, with initial
experience for evaluative information and cues, within their social environment to increase
their familiarity with the target site or the e-shopping site (Venkatesh and Davis 2000). Also,
Luhmann (1979) stated trust increases the perceived certainty concerning other people’s
expected behaviour, e.g., recommending others to use a certain e-shopping site. Moreover,
trust leads people to use a social complexity reduction strategy by being more ready to
believe in people who are important to them (Luhmann, 1979).
TABLE 7.30: MODIFICATION INDICES (MI) (REGRESSION WEIGHTS)
Paths MI Par Change
SN <--- Trust 5.206 0.102
Enj <--- SQ 21.599 0.137
The recommendation from the modification indices above was applied to the model and
retested for goodness-of-fit and path significance using SEM with AMOS software. Figure
7.23 and Table 7.31 and Table 7.32 illustrate the revised model goodness-of-fit indices. The
revised model of continuance intention to e-shopping demonstrates better fit compared to the
initial model in all goodness-of-fit metrics. These can be confirmed with the chi square
CMIN = 598.081, CMIN/df = 2.556, RMR = 0.117, GFI = 0.904, CFI = 0.971, RMSEA =
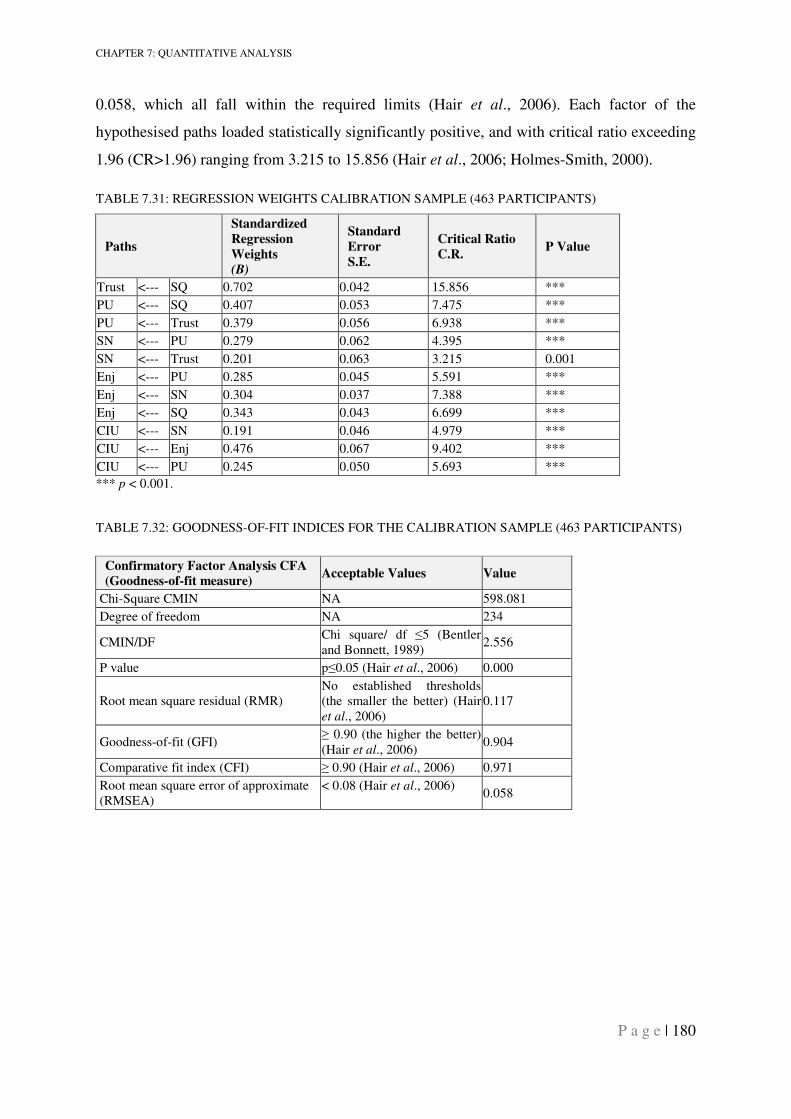
CHAPTER 7: QUANTITATIVE ANALYSIS
P a g e | 180
0.058, which all fall within the required limits (Hair et al., 2006). Each factor of the
hypothesised paths loaded statistically significantly positive, and with critical ratio exceeding
1.96 (CR>1.96) ranging from 3.215 to 15.856 (Hair et al., 2006; Holmes-Smith, 2000).
TABLE 7.31: REGRESSION WEIGHTS CALIBRATION SAMPLE (463 PARTICIPANTS)
Paths
Standardized
Regression
Weights
(B)
Standard
Error
S.E.
Critical Ratio
C.R. P Value
Trust <--- SQ 0.702 0.042 15.856 ***
PU <--- SQ 0.407 0.053 7.475 ***
PU <--- Trust 0.379 0.056 6.938 ***
SN <--- PU 0.279 0.062 4.395 ***
SN <--- Trust 0.201 0.063 3.215 0.001
Enj <--- PU 0.285 0.045 5.591 ***
Enj <--- SN 0.304 0.037 7.388 ***
Enj <--- SQ 0.343 0.043 6.699 ***
CIU <--- SN 0.191 0.046 4.979 ***
CIU <--- Enj 0.476 0.067 9.402 ***
CIU <--- PU 0.245 0.050 5.693 ***
*** p < 0.001.
TABLE 7.32: GOODNESS-OF-FIT INDICES FOR THE CALIBRATION SAMPLE (463 PARTICIPANTS)
Confirmatory Factor Analysis CFA
(Goodness-of-fit measure) Acceptable Values Value
Chi-Square CMIN NA 598.081
Degree of freedom NA 234
CMIN/DF Chi square/ df ≤5 (Bentler and Bonnett, 1989)
2.556
P value p≤0.05 (Hair et al., 2006) 0.000
Root mean square residual (RMR) No established thresholds (the smaller the better) (Hair et al., 2006)
0.117
Goodness-of-fit (GFI) ≥ 0.90 (the higher the better) (Hair et al., 2006)
0.904
Comparative fit index (CFI) ≥ 0.90 (Hair et al., 2006) 0.971
Root mean square error of approximate (RMSEA)
< 0.08 (Hair et al., 2006) 0.058
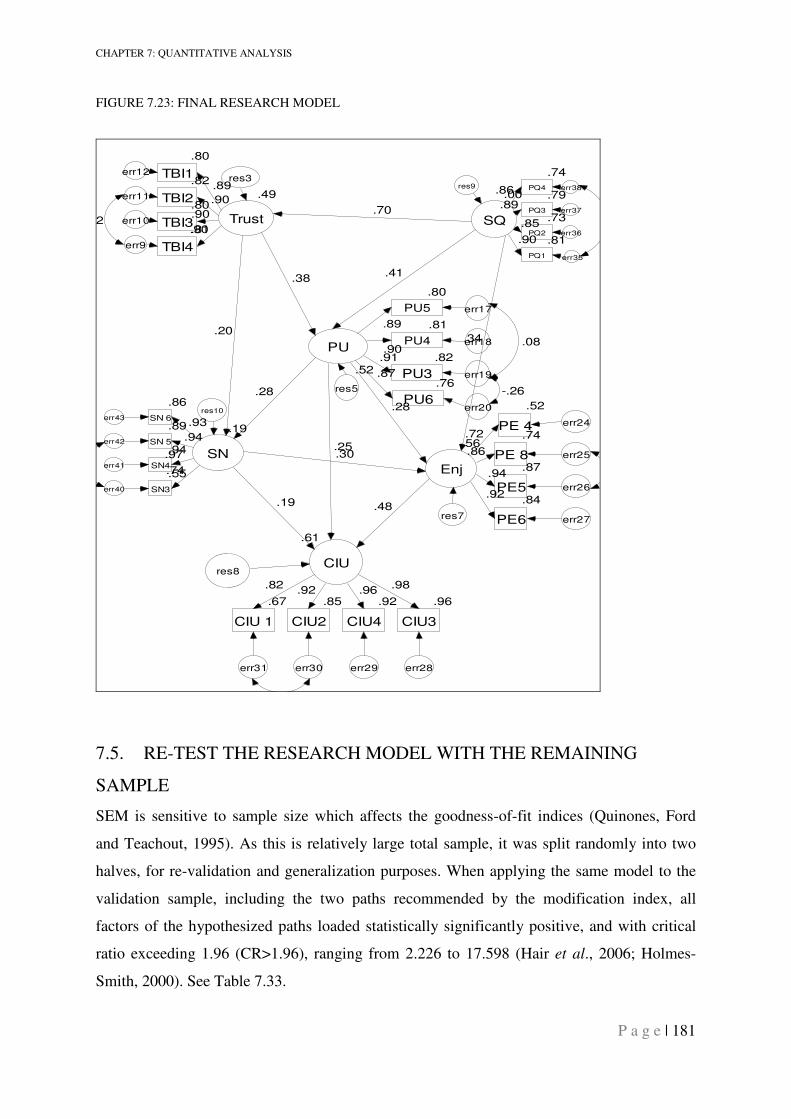
CHAPTER 7: QUANTITATIVE ANALYSIS
P a g e | 181
FIGURE 7.23: FINAL RESEARCH MODEL
.80
PU5
.81
PU4
.52
PU
err17
err18.90
.89
res5
.82
PU3 err19
.91
.76
PU6err20
.87
.49
Trust.81
TBI4err9
.90
.80
TBI3err10.90
.82
TBI2err11 .90
.80
TBI1err12
.89
.56
Enj
.52
PE 4 err24
.72 .74
PE 8 err25.86
.87
PE5 err26
.94
.84
PE6 err27
.92
.61
CIU
.96
CIU3
err28
.98
.92
CIU4
err29
.96.85
CIU2
err30
.92.67
CIU 1
err31
.82
res3
res7
res8
.00
SQ
.74
PQ4 err38.86 .79
PQ3 err37.89
.73
PQ2 err36
.85
.81
PQ1 err35
.19
SN
.55
SN3err40
.74
.94
SN4err41
.97
.89
SN 5err42 .94
.86
SN 6err43.93
res9
res10
.90
.08
.70
.41.38
.28
.19 .48
.28
.30
-.26
.22
.25
.34.20
7.5. RE-TEST THE RESEARCH MODEL WITH THE REMAINING
SAMPLE
SEM is sensitive to sample size which affects the goodness-of-fit indices (Quinones, Ford
and Teachout, 1995). As this is relatively large total sample, it was split randomly into two
halves, for re-validation and generalization purposes. When applying the same model to the
validation sample, including the two paths recommended by the modification index, all
factors of the hypothesized paths loaded statistically significantly positive, and with critical
ratio exceeding 1.96 (CR>1.96), ranging from 2.226 to 17.598 (Hair et al., 2006; Holmes-
Smith, 2000). See Table 7.33.
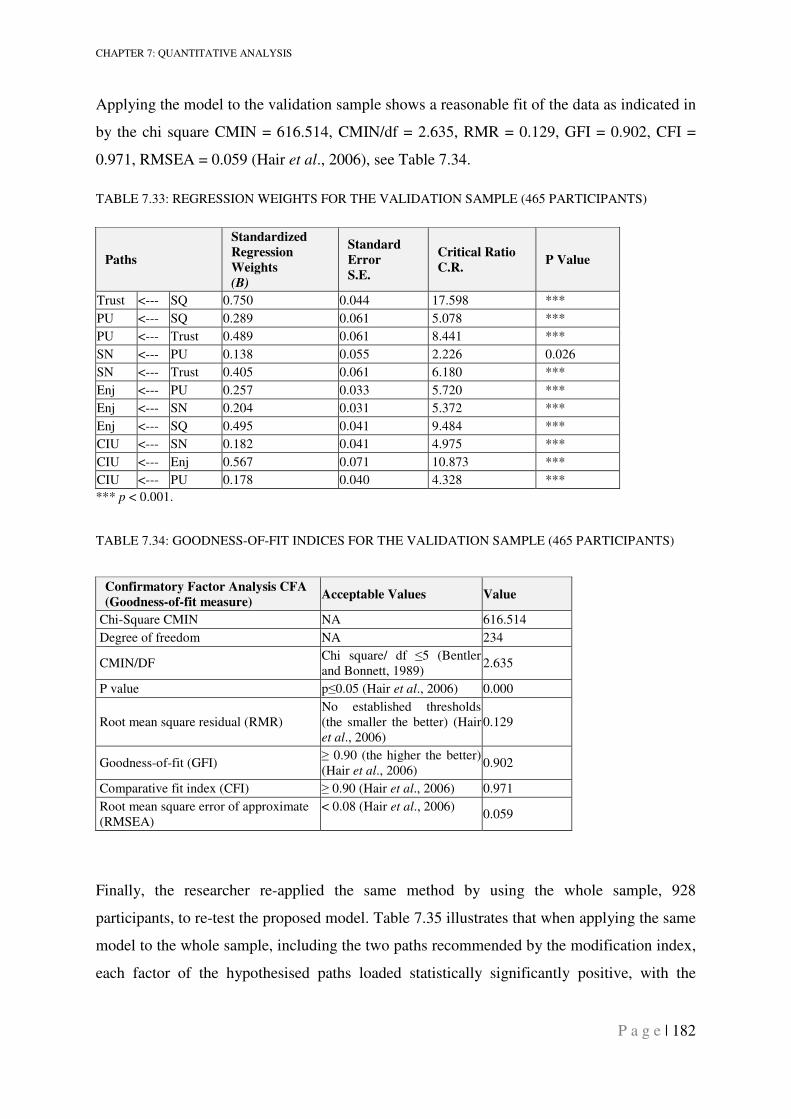
CHAPTER 7: QUANTITATIVE ANALYSIS
P a g e | 182
Applying the model to the validation sample shows a reasonable fit of the data as indicated in
by the chi square CMIN = 616.514, CMIN/df = 2.635, RMR = 0.129, GFI = 0.902, CFI =
0.971, RMSEA = 0.059 (Hair et al., 2006), see Table 7.34.
TABLE 7.33: REGRESSION WEIGHTS FOR THE VALIDATION SAMPLE (465 PARTICIPANTS)
Paths
Standardized
Regression
Weights
(B)
Standard
Error
S.E.
Critical Ratio
C.R. P Value
Trust <--- SQ 0.750 0.044 17.598 ***
PU <--- SQ 0.289 0.061 5.078 ***
PU <--- Trust 0.489 0.061 8.441 ***
SN <--- PU 0.138 0.055 2.226 0.026
SN <--- Trust 0.405 0.061 6.180 ***
Enj <--- PU 0.257 0.033 5.720 ***
Enj <--- SN 0.204 0.031 5.372 ***
Enj <--- SQ 0.495 0.041 9.484 ***
CIU <--- SN 0.182 0.041 4.975 ***
CIU <--- Enj 0.567 0.071 10.873 ***
CIU <--- PU 0.178 0.040 4.328 ***
*** p < 0.001.
TABLE 7.34: GOODNESS-OF-FIT INDICES FOR THE VALIDATION SAMPLE (465 PARTICIPANTS)
Confirmatory Factor Analysis CFA
(Goodness-of-fit measure) Acceptable Values Value
Chi-Square CMIN NA 616.514
Degree of freedom NA 234
CMIN/DF Chi square/ df ≤5 (Bentler and Bonnett, 1989)
2.635
P value p≤0.05 (Hair et al., 2006) 0.000
Root mean square residual (RMR) No established thresholds (the smaller the better) (Hair et al., 2006)
0.129
Goodness-of-fit (GFI) ≥ 0.90 (the higher the better) (Hair et al., 2006)
0.902
Comparative fit index (CFI) ≥ 0.90 (Hair et al., 2006) 0.971
Root mean square error of approximate (RMSEA)
< 0.08 (Hair et al., 2006) 0.059
Finally, the researcher re-applied the same method by using the whole sample, 928
participants, to re-test the proposed model. Table 7.35 illustrates that when applying the same
model to the whole sample, including the two paths recommended by the modification index,
each factor of the hypothesised paths loaded statistically significantly positive, with the
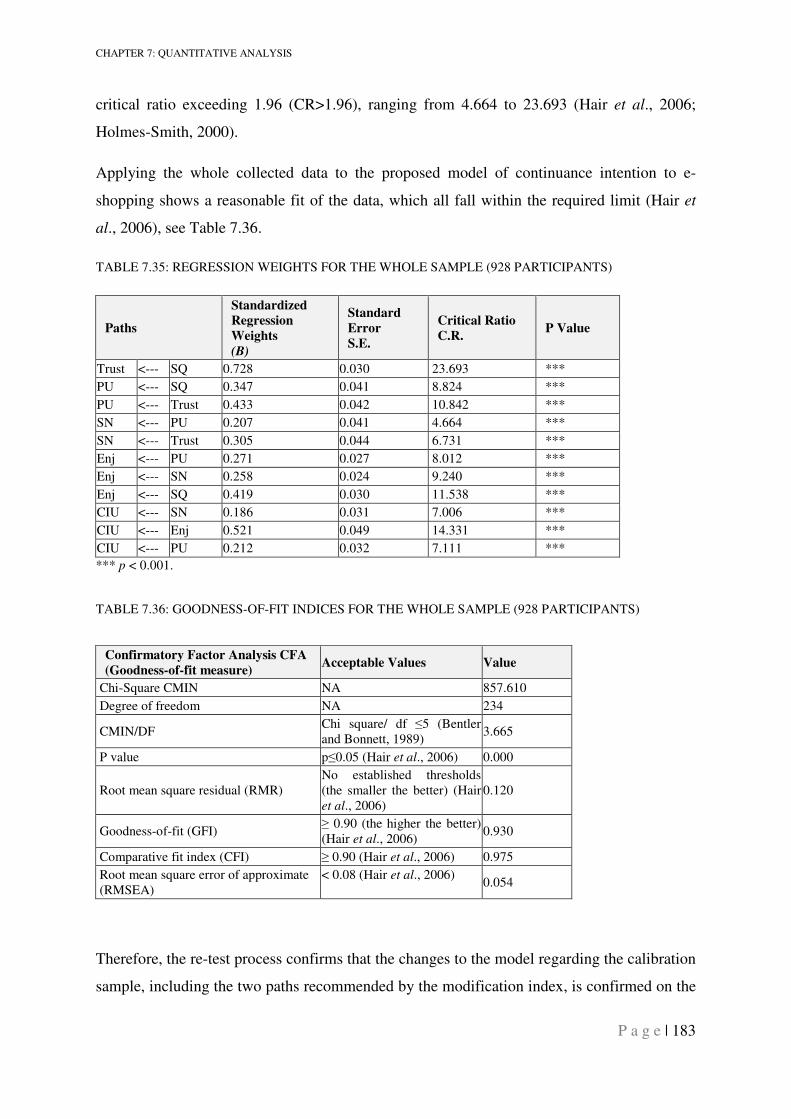
CHAPTER 7: QUANTITATIVE ANALYSIS
P a g e | 183
critical ratio exceeding 1.96 (CR>1.96), ranging from 4.664 to 23.693 (Hair et al., 2006;
Holmes-Smith, 2000).
Applying the whole collected data to the proposed model of continuance intention to e-
shopping shows a reasonable fit of the data, which all fall within the required limit (Hair et
al., 2006), see Table 7.36.
TABLE 7.35: REGRESSION WEIGHTS FOR THE WHOLE SAMPLE (928 PARTICIPANTS)
Paths
Standardized
Regression
Weights
(B)
Standard
Error
S.E.
Critical Ratio
C.R. P Value
Trust <--- SQ 0.728 0.030 23.693 ***
PU <--- SQ 0.347 0.041 8.824 ***
PU <--- Trust 0.433 0.042 10.842 ***
SN <--- PU 0.207 0.041 4.664 ***
SN <--- Trust 0.305 0.044 6.731 ***
Enj <--- PU 0.271 0.027 8.012 ***
Enj <--- SN 0.258 0.024 9.240 ***
Enj <--- SQ 0.419 0.030 11.538 ***
CIU <--- SN 0.186 0.031 7.006 ***
CIU <--- Enj 0.521 0.049 14.331 ***
CIU <--- PU 0.212 0.032 7.111 ***
*** p < 0.001.
TABLE 7.36: GOODNESS-OF-FIT INDICES FOR THE WHOLE SAMPLE (928 PARTICIPANTS)
Confirmatory Factor Analysis CFA
(Goodness-of-fit measure) Acceptable Values Value
Chi-Square CMIN NA 857.610
Degree of freedom NA 234
CMIN/DF Chi square/ df ≤5 (Bentler and Bonnett, 1989)
3.665
P value p≤0.05 (Hair et al., 2006) 0.000
Root mean square residual (RMR) No established thresholds (the smaller the better) (Hair et al., 2006)
0.120
Goodness-of-fit (GFI) ≥ 0.90 (the higher the better) (Hair et al., 2006)
0.930
Comparative fit index (CFI) ≥ 0.90 (Hair et al., 2006) 0.975
Root mean square error of approximate (RMSEA)
< 0.08 (Hair et al., 2006) 0.054
Therefore, the re-test process confirms that the changes to the model regarding the calibration
sample, including the two paths recommended by the modification index, is confirmed on the
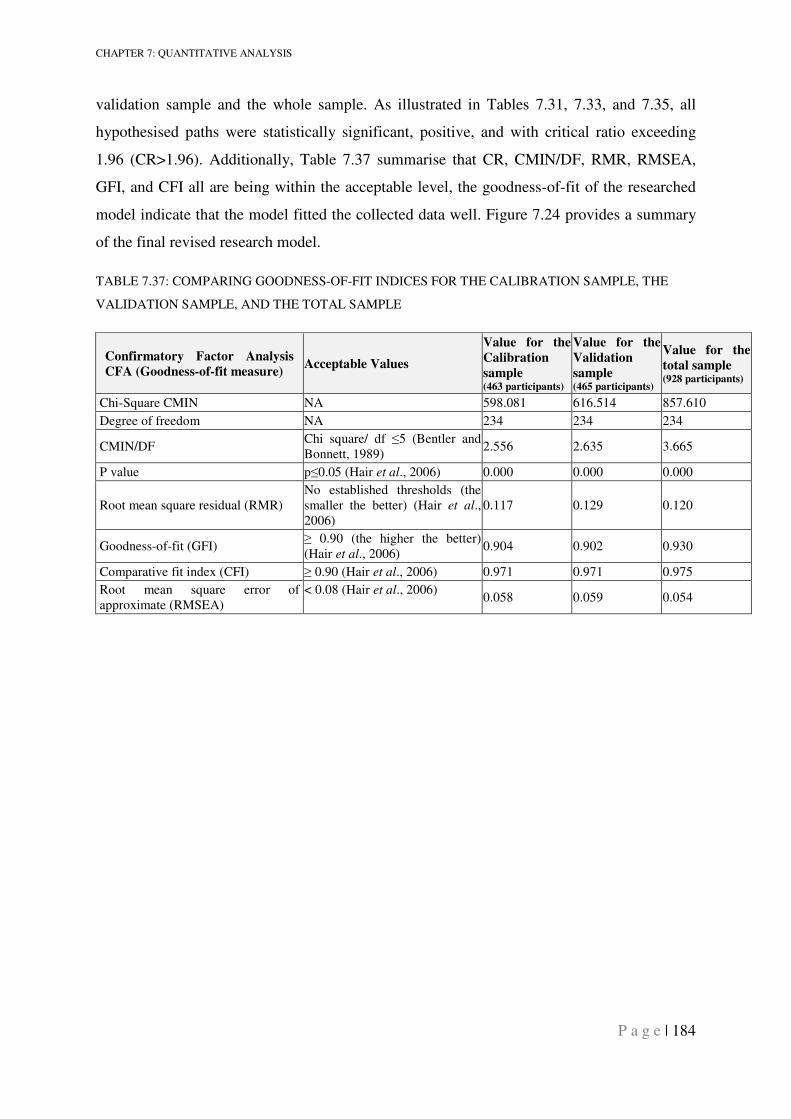
CHAPTER 7: QUANTITATIVE ANALYSIS
P a g e | 184
validation sample and the whole sample. As illustrated in Tables 7.31, 7.33, and 7.35, all
hypothesised paths were statistically significant, positive, and with critical ratio exceeding
1.96 (CR>1.96). Additionally, Table 7.37 summarise that CR, CMIN/DF, RMR, RMSEA,
GFI, and CFI all are being within the acceptable level, the goodness-of-fit of the researched
model indicate that the model fitted the collected data well. Figure 7.24 provides a summary
of the final revised research model.
TABLE 7.37: COMPARING GOODNESS-OF-FIT INDICES FOR THE CALIBRATION SAMPLE, THE
VALIDATION SAMPLE, AND THE TOTAL SAMPLE
Confirmatory Factor Analysis
CFA (Goodness-of-fit measure) Acceptable Values
Value for the
Calibration
sample (463 participants)
Value for the
Validation
sample (465 participants)
Value for the
total sample (928 participants)
Chi-Square CMIN NA 598.081 616.514 857.610
Degree of freedom NA 234 234 234
CMIN/DF Chi square/ df ≤5 (Bentler and Bonnett, 1989)
2.556 2.635 3.665
P value p≤0.05 (Hair et al., 2006) 0.000 0.000 0.000
Root mean square residual (RMR) No established thresholds (the smaller the better) (Hair et al., 2006)
0.117 0.129 0.120
Goodness-of-fit (GFI) ≥ 0.90 (the higher the better) (Hair et al., 2006)
0.904 0.902 0.930
Comparative fit index (CFI) ≥ 0.90 (Hair et al., 2006) 0.971 0.971 0.975
Root mean square error of approximate (RMSEA)
< 0.08 (Hair et al., 2006) 0.058 0.059 0.054
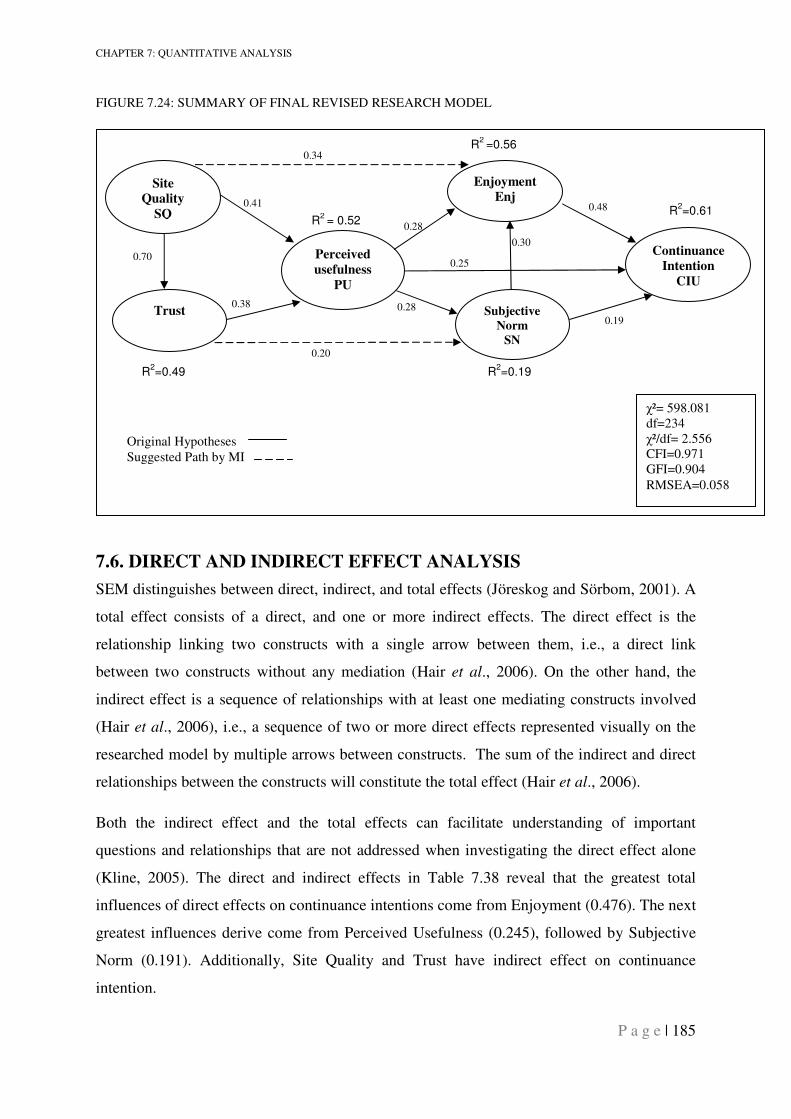
CHAPTER 7: QUANTITATIVE ANALYSIS
P a g e | 185
FIGURE 7.24: SUMMARY OF FINAL REVISED RESEARCH MODEL
7.6. DIRECT AND INDIRECT EFFECT ANALYSIS
SEM distinguishes between direct, indirect, and total effects (Jöreskog and Sörbom, 2001). A
total effect consists of a direct, and one or more indirect effects. The direct effect is the
relationship linking two constructs with a single arrow between them, i.e., a direct link
between two constructs without any mediation (Hair et al., 2006). On the other hand, the
indirect effect is a sequence of relationships with at least one mediating constructs involved
(Hair et al., 2006), i.e., a sequence of two or more direct effects represented visually on the
researched model by multiple arrows between constructs. The sum of the indirect and direct
relationships between the constructs will constitute the total effect (Hair et al., 2006).
Both the indirect effect and the total effects can facilitate understanding of important
questions and relationships that are not addressed when investigating the direct effect alone
(Kline, 2005). The direct and indirect effects in Table 7.38 reveal that the greatest total
influences of direct effects on continuance intentions come from Enjoyment (0.476). The next
greatest influences derive come from Perceived Usefulness (0.245), followed by Subjective
Norm (0.191). Additionally, Site Quality and Trust have indirect effect on continuance
intention.
Site
Quality
SQ
Subjective
Norm
SN
Enjoyment
Enj
Perceived
usefulness
PU
Trust
Continuance
Intention
CIU
χ²= 598.081 df=234 χ²/df= 2.556 CFI=0.971 GFI=0.904
RMSEA=0.058
0.38
0.41
R2=0.49
R2
= 0.52
R2
=0.56
0.28
0.28
0.25
0.30
0.48
0.19
0.70
R2=0.19
R2=0.61
Original Hypotheses Suggested Path by MI
0.34
0.20
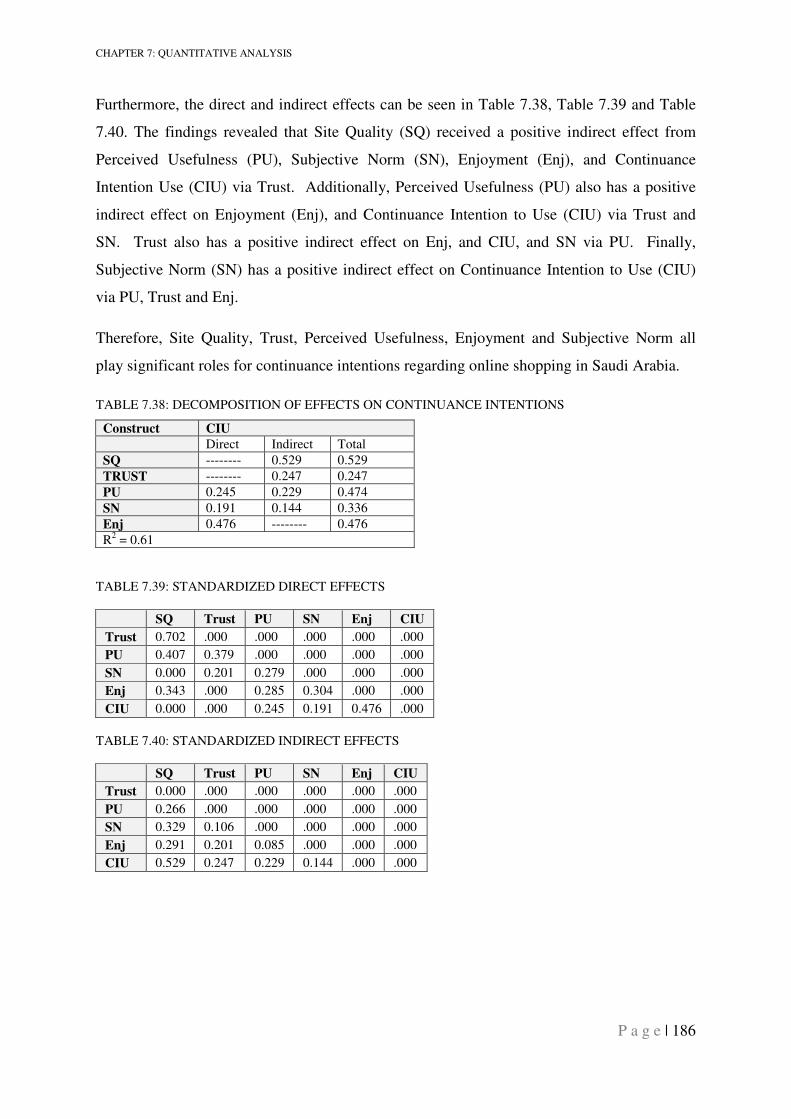
CHAPTER 7: QUANTITATIVE ANALYSIS
P a g e | 186
Furthermore, the direct and indirect effects can be seen in Table 7.38, Table 7.39 and Table
7.40. The findings revealed that Site Quality (SQ) received a positive indirect effect from
Perceived Usefulness (PU), Subjective Norm (SN), Enjoyment (Enj), and Continuance
Intention Use (CIU) via Trust. Additionally, Perceived Usefulness (PU) also has a positive
indirect effect on Enjoyment (Enj), and Continuance Intention to Use (CIU) via Trust and
SN. Trust also has a positive indirect effect on Enj, and CIU, and SN via PU. Finally,
Subjective Norm (SN) has a positive indirect effect on Continuance Intention to Use (CIU)
via PU, Trust and Enj.
Therefore, Site Quality, Trust, Perceived Usefulness, Enjoyment and Subjective Norm all
play significant roles for continuance intentions regarding online shopping in Saudi Arabia.
TABLE 7.38: DECOMPOSITION OF EFFECTS ON CONTINUANCE INTENTIONS
Construct CIU
Direct Indirect Total
SQ -------- 0.529 0.529
TRUST -------- 0.247 0.247
PU 0.245 0.229 0.474
SN 0.191 0.144 0.336
Enj 0.476 -------- 0.476
R2 = 0.61
TABLE 7.39: STANDARDIZED DIRECT EFFECTS
SQ Trust PU SN Enj CIU
Trust 0.702 .000 .000 .000 .000 .000
PU 0.407 0.379 .000 .000 .000 .000
SN 0.000 0.201 0.279 .000 .000 .000
Enj 0.343 .000 0.285 0.304 .000 .000
CIU 0.000 .000 0.245 0.191 0.476 .000
TABLE 7.40: STANDARDIZED INDIRECT EFFECTS
SQ Trust PU SN Enj CIU
Trust 0.000 .000 .000 .000 .000 .000
PU 0.266 .000 .000 .000 .000 .000
SN 0.329 0.106 .000 .000 .000 .000
Enj 0.291 0.201 0.085 .000 .000 .000
CIU 0.529 0.247 0.229 0.144 .000 .000
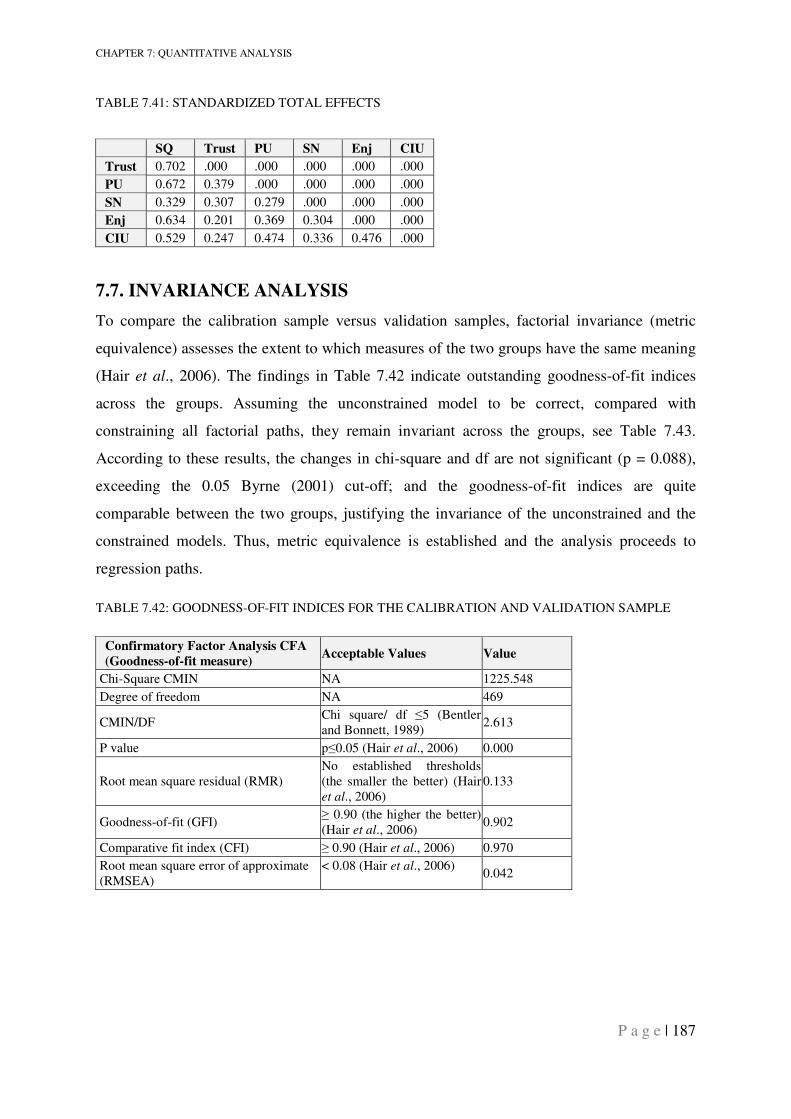
CHAPTER 7: QUANTITATIVE ANALYSIS
P a g e | 187
TABLE 7.41: STANDARDIZED TOTAL EFFECTS
SQ Trust PU SN Enj CIU
Trust 0.702 .000 .000 .000 .000 .000
PU 0.672 0.379 .000 .000 .000 .000
SN 0.329 0.307 0.279 .000 .000 .000
Enj 0.634 0.201 0.369 0.304 .000 .000
CIU 0.529 0.247 0.474 0.336 0.476 .000
7.7. INVARIANCE ANALYSIS
To compare the calibration sample versus validation samples, factorial invariance (metric
equivalence) assesses the extent to which measures of the two groups have the same meaning
(Hair et al., 2006). The findings in Table 7.42 indicate outstanding goodness-of-fit indices
across the groups. Assuming the unconstrained model to be correct, compared with
constraining all factorial paths, they remain invariant across the groups, see Table 7.43.
According to these results, the changes in chi-square and df are not significant (p = 0.088),
exceeding the 0.05 Byrne (2001) cut-off; and the goodness-of-fit indices are quite
comparable between the two groups, justifying the invariance of the unconstrained and the
constrained models. Thus, metric equivalence is established and the analysis proceeds to
regression paths.
TABLE 7.42: GOODNESS-OF-FIT INDICES FOR THE CALIBRATION AND VALIDATION SAMPLE
Confirmatory Factor Analysis CFA
(Goodness-of-fit measure) Acceptable Values Value
Chi-Square CMIN NA 1225.548
Degree of freedom NA 469
CMIN/DF Chi square/ df ≤5 (Bentler and Bonnett, 1989)
2.613
P value p≤0.05 (Hair et al., 2006) 0.000
Root mean square residual (RMR) No established thresholds (the smaller the better) (Hair et al., 2006)
0.133
Goodness-of-fit (GFI) ≥ 0.90 (the higher the better) (Hair et al., 2006)
0.902
Comparative fit index (CFI) ≥ 0.90 (Hair et al., 2006) 0.970
Root mean square error of approximate (RMSEA)
< 0.08 (Hair et al., 2006) 0.042
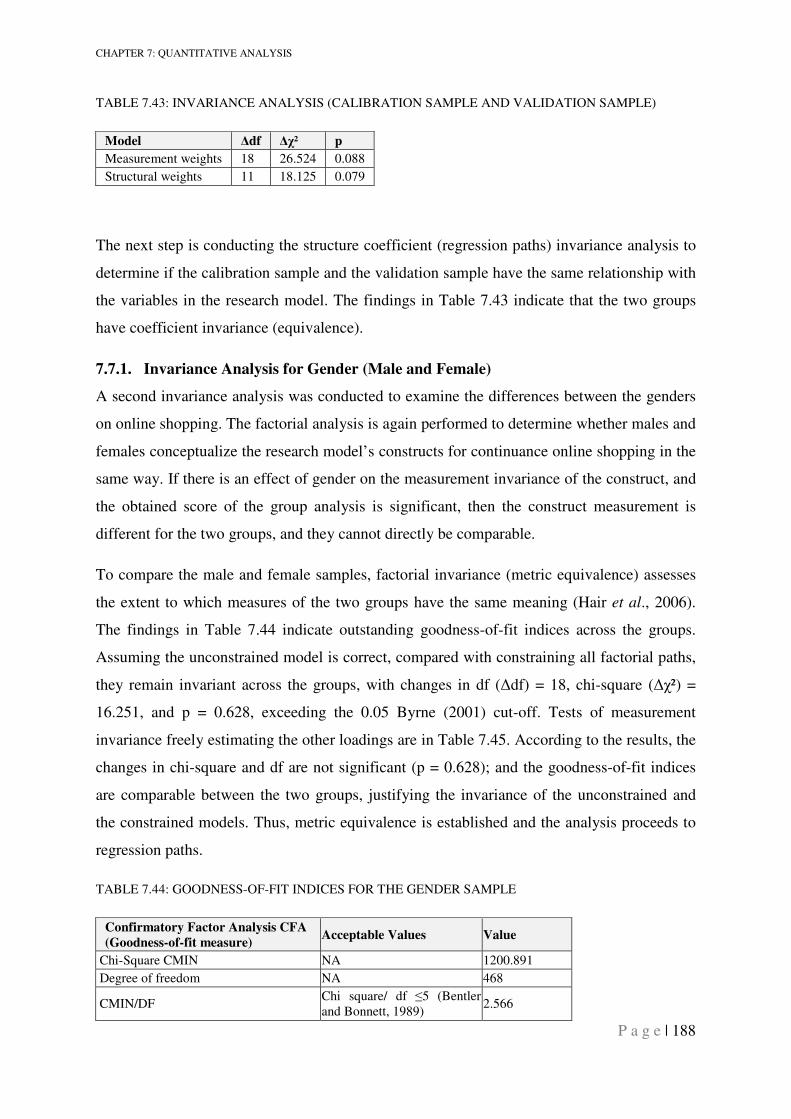
CHAPTER 7: QUANTITATIVE ANALYSIS
P a g e | 188
TABLE 7.43: INVARIANCE ANALYSIS (CALIBRATION SAMPLE AND VALIDATION SAMPLE)
Model ∆df ∆χ² p
Measurement weights 18 26.524 0.088
Structural weights 11 18.125 0.079
The next step is conducting the structure coefficient (regression paths) invariance analysis to
determine if the calibration sample and the validation sample have the same relationship with
the variables in the research model. The findings in Table 7.43 indicate that the two groups
have coefficient invariance (equivalence).
7.7.1. Invariance Analysis for Gender (Male and Female)
A second invariance analysis was conducted to examine the differences between the genders
on online shopping. The factorial analysis is again performed to determine whether males and
females conceptualize the research model’s constructs for continuance online shopping in the
same way. If there is an effect of gender on the measurement invariance of the construct, and
the obtained score of the group analysis is significant, then the construct measurement is
different for the two groups, and they cannot directly be comparable.
To compare the male and female samples, factorial invariance (metric equivalence) assesses
the extent to which measures of the two groups have the same meaning (Hair et al., 2006).
The findings in Table 7.44 indicate outstanding goodness-of-fit indices across the groups.
Assuming the unconstrained model is correct, compared with constraining all factorial paths,
they remain invariant across the groups, with changes in df (∆df) = 18, chi-square (∆χ²) =
16.251, and p = 0.628, exceeding the 0.05 Byrne (2001) cut-off. Tests of measurement
invariance freely estimating the other loadings are in Table 7.45. According to the results, the
changes in chi-square and df are not significant (p = 0.628); and the goodness-of-fit indices
are comparable between the two groups, justifying the invariance of the unconstrained and
the constrained models. Thus, metric equivalence is established and the analysis proceeds to
regression paths.
TABLE 7.44: GOODNESS-OF-FIT INDICES FOR THE GENDER SAMPLE
Confirmatory Factor Analysis CFA
(Goodness-of-fit measure) Acceptable Values Value
Chi-Square CMIN NA 1200.891
Degree of freedom NA 468
CMIN/DF Chi square/ df ≤5 (Bentler and Bonnett, 1989)
2.566
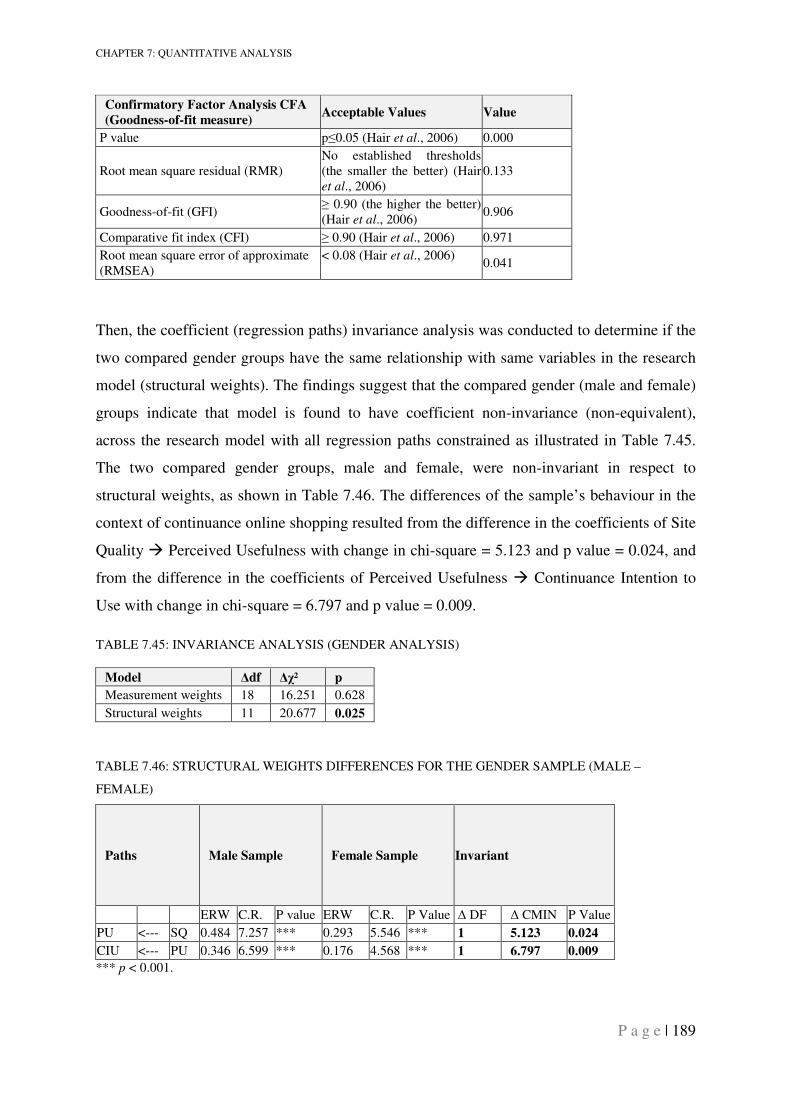
CHAPTER 7: QUANTITATIVE ANALYSIS
P a g e | 189
Confirmatory Factor Analysis CFA
(Goodness-of-fit measure) Acceptable Values Value
P value p≤0.05 (Hair et al., 2006) 0.000
Root mean square residual (RMR) No established thresholds (the smaller the better) (Hair et al., 2006)
0.133
Goodness-of-fit (GFI) ≥ 0.90 (the higher the better) (Hair et al., 2006)
0.906
Comparative fit index (CFI) ≥ 0.90 (Hair et al., 2006) 0.971
Root mean square error of approximate (RMSEA)
< 0.08 (Hair et al., 2006) 0.041
Then, the coefficient (regression paths) invariance analysis was conducted to determine if the
two compared gender groups have the same relationship with same variables in the research
model (structural weights). The findings suggest that the compared gender (male and female)
groups indicate that model is found to have coefficient non-invariance (non-equivalent),
across the research model with all regression paths constrained as illustrated in Table 7.45.
The two compared gender groups, male and female, were non-invariant in respect to
structural weights, as shown in Table 7.46. The differences of the sample’s behaviour in the
context of continuance online shopping resulted from the difference in the coefficients of Site
Quality � Perceived Usefulness with change in chi-square = 5.123 and p value = 0.024, and
from the difference in the coefficients of Perceived Usefulness � Continuance Intention to
Use with change in chi-square = 6.797 and p value = 0.009.
TABLE 7.45: INVARIANCE ANALYSIS (GENDER ANALYSIS)
Model ∆df ∆χ² p
Measurement weights 18 16.251 0.628
Structural weights 11 20.677 0.025
TABLE 7.46: STRUCTURAL WEIGHTS DIFFERENCES FOR THE GENDER SAMPLE (MALE –
FEMALE)
Paths Male Sample Female Sample Invariant
ERW C.R. P value ERW C.R. P Value ∆ DF ∆ CMIN P Value
PU <--- SQ 0.484 7.257 *** 0.293 5.546 *** 1 5.123 0.024
CIU <--- PU 0.346 6.599 *** 0.176 4.568 *** 1 6.797 0.009
*** p < 0.001.
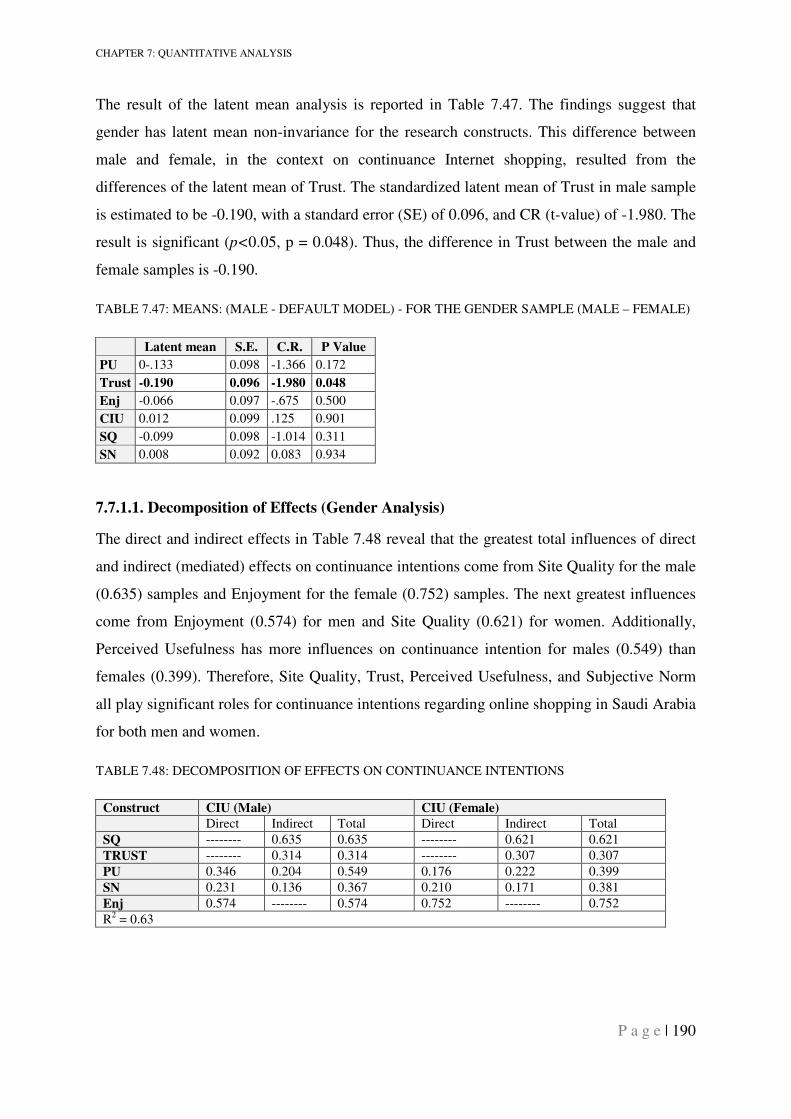
CHAPTER 7: QUANTITATIVE ANALYSIS
P a g e | 190
The result of the latent mean analysis is reported in Table 7.47. The findings suggest that
gender has latent mean non-invariance for the research constructs. This difference between
male and female, in the context on continuance Internet shopping, resulted from the
differences of the latent mean of Trust. The standardized latent mean of Trust in male sample
is estimated to be -0.190, with a standard error (SE) of 0.096, and CR (t-value) of -1.980. The
result is significant (p<0.05, p = 0.048). Thus, the difference in Trust between the male and
female samples is -0.190.
TABLE 7.47: MEANS: (MALE - DEFAULT MODEL) - FOR THE GENDER SAMPLE (MALE – FEMALE)
Latent mean S.E. C.R. P Value
PU 0-.133 0.098 -1.366 0.172
Trust -0.190 0.096 -1.980 0.048
Enj -0.066 0.097 -.675 0.500
CIU 0.012 0.099 .125 0.901
SQ -0.099 0.098 -1.014 0.311
SN 0.008 0.092 0.083 0.934
7.7.1.1. Decomposition of Effects (Gender Analysis)
The direct and indirect effects in Table 7.48 reveal that the greatest total influences of direct
and indirect (mediated) effects on continuance intentions come from Site Quality for the male
(0.635) samples and Enjoyment for the female (0.752) samples. The next greatest influences
come from Enjoyment (0.574) for men and Site Quality (0.621) for women. Additionally,
Perceived Usefulness has more influences on continuance intention for males (0.549) than
females (0.399). Therefore, Site Quality, Trust, Perceived Usefulness, and Subjective Norm
all play significant roles for continuance intentions regarding online shopping in Saudi Arabia
for both men and women.
TABLE 7.48: DECOMPOSITION OF EFFECTS ON CONTINUANCE INTENTIONS
Construct CIU (Male) CIU (Female)
Direct Indirect Total Direct Indirect Total
SQ -------- 0.635 0.635 -------- 0.621 0.621
TRUST -------- 0.314 0.314 -------- 0.307 0.307
PU 0.346 0.204 0.549 0.176 0.222 0.399
SN 0.231 0.136 0.367 0.210 0.171 0.381
Enj 0.574 -------- 0.574 0.752 -------- 0.752
R2 = 0.63
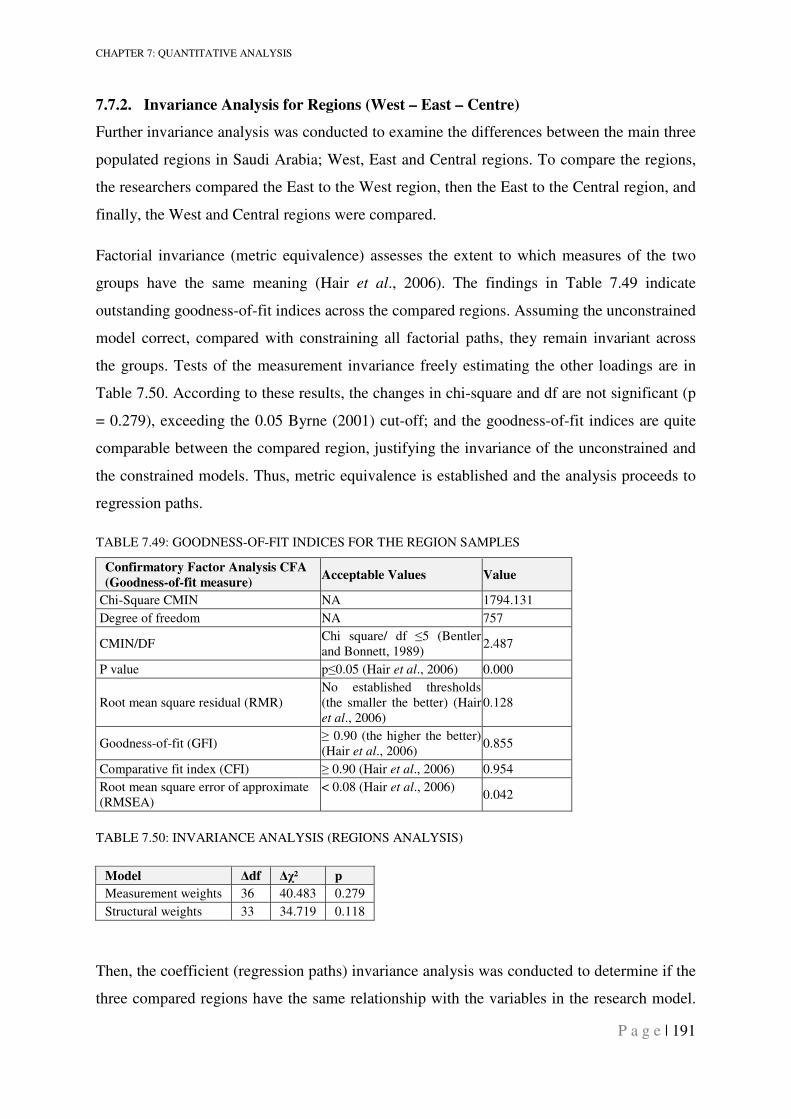
CHAPTER 7: QUANTITATIVE ANALYSIS
P a g e | 191
7.7.2. Invariance Analysis for Regions (West – East – Centre)
Further invariance analysis was conducted to examine the differences between the main three
populated regions in Saudi Arabia; West, East and Central regions. To compare the regions,
the researchers compared the East to the West region, then the East to the Central region, and
finally, the West and Central regions were compared.
Factorial invariance (metric equivalence) assesses the extent to which measures of the two
groups have the same meaning (Hair et al., 2006). The findings in Table 7.49 indicate
outstanding goodness-of-fit indices across the compared regions. Assuming the unconstrained
model correct, compared with constraining all factorial paths, they remain invariant across
the groups. Tests of the measurement invariance freely estimating the other loadings are in
Table 7.50. According to these results, the changes in chi-square and df are not significant (p
= 0.279), exceeding the 0.05 Byrne (2001) cut-off; and the goodness-of-fit indices are quite
comparable between the compared region, justifying the invariance of the unconstrained and
the constrained models. Thus, metric equivalence is established and the analysis proceeds to
regression paths.
TABLE 7.49: GOODNESS-OF-FIT INDICES FOR THE REGION SAMPLES
Confirmatory Factor Analysis CFA
(Goodness-of-fit measure) Acceptable Values Value
Chi-Square CMIN NA 1794.131
Degree of freedom NA 757
CMIN/DF Chi square/ df ≤5 (Bentler and Bonnett, 1989)
2.487
P value p≤0.05 (Hair et al., 2006) 0.000
Root mean square residual (RMR) No established thresholds (the smaller the better) (Hair et al., 2006)
0.128
Goodness-of-fit (GFI) ≥ 0.90 (the higher the better) (Hair et al., 2006)
0.855
Comparative fit index (CFI) ≥ 0.90 (Hair et al., 2006) 0.954
Root mean square error of approximate (RMSEA)
< 0.08 (Hair et al., 2006) 0.042
TABLE 7.50: INVARIANCE ANALYSIS (REGIONS ANALYSIS)
Model ∆df ∆χ² p
Measurement weights 36 40.483 0.279
Structural weights 33 34.719 0.118
Then, the coefficient (regression paths) invariance analysis was conducted to determine if the
three compared regions have the same relationship with the variables in the research model.
CHAPTER 7: QUANTITATIVE ANALYSIS
P a g e | 192
The findings shown in Table 7.50 suggest that the model has over whole coefficient
invariance (equivalent), with all regression paths constrained. However, with such a big
research sample, and even though the structural weight shows invariance among the three
regions, the author realised the need to minimize the possibility of research biases in cross-
national, cross-cultural, and group analysis among constructs relationship (path) that may
arise from the data strength and weakness when applied to every constructs’ path. Therefore,
to look for significant path differences, the author decided to test each factorial path
separately while the rest of the paths are freely estimated across the compared regions, to
look for any non-invariance path. In Table 7.52, 7.53, and 7.54, it could be seen that non-
invariance is found in the individual path, even though it was not so over whole. Therefore, in
this case testing the individual path has demonstrated to be a more rigorous test for non-
invariance.
The findings in Table 7.52 suggest that West and East were non-invariant in certain structural
paths. The differences between the West and East samples’ behaviour resulted from the
different in the coefficients of Perceived Usefulness � Enjoyment with change in chi-square
= 6.060 and p value = 0.014.
When comparing the East and Central regions (Table 7.53), the differences of East and
Central samples’ behaviour resulted from the difference in the coefficients of Perceived
Usefulness � Enjoyment with change in chi-square = 13.437 and p value = 0.000.
Additionally, there are differences in the coefficients of Site Quality � Enjoyment with
change in chi-square = 6.207 and p value = 0.013.
The last regional comparison in this stage was between the sample of the Western and
Central regions. The only differences between the West and Central samples’ behaviour
resulted from the different in the coefficients of Site Quality � Enjoyment with change in
chi-square = 5.643 and p value = 0.018, see Table 54. These differences in the structural
weights are considered further in the discussion chapter (chapter 9.3.6).
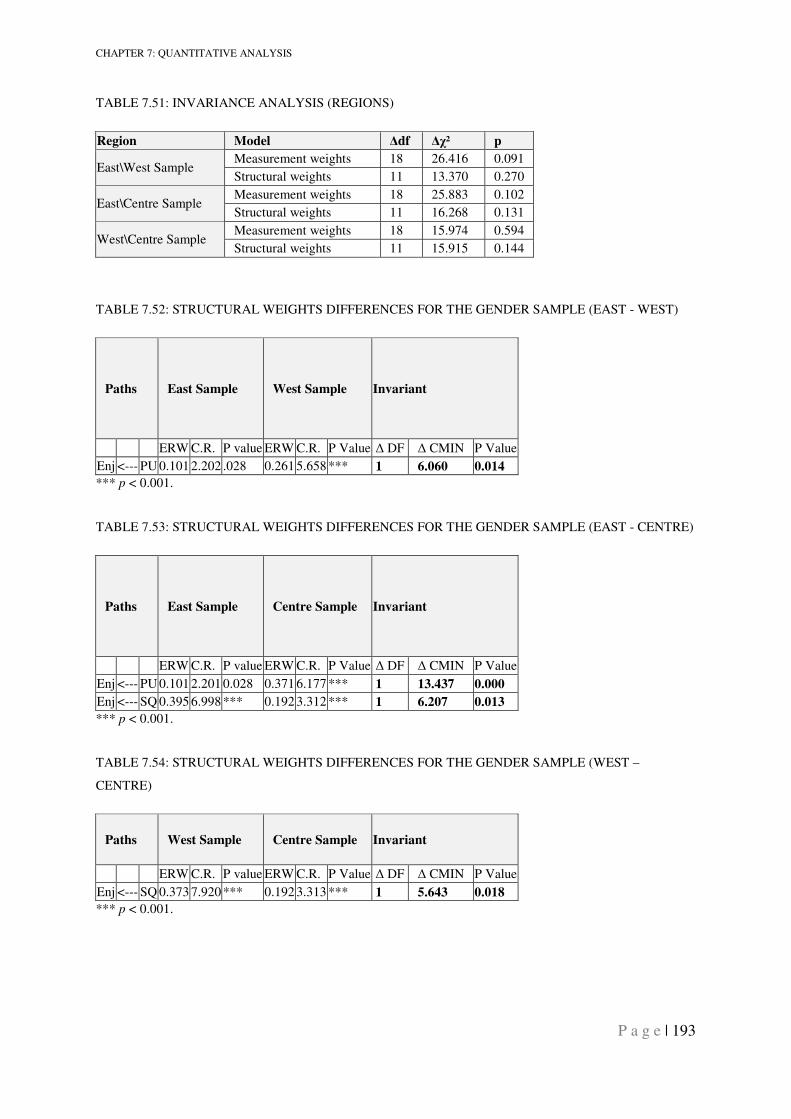
CHAPTER 7: QUANTITATIVE ANALYSIS
P a g e | 193
TABLE 7.51: INVARIANCE ANALYSIS (REGIONS)
Region Model ∆df ∆χ² p
East\West Sample Measurement weights 18 26.416 0.091
Structural weights 11 13.370 0.270
East\Centre Sample Measurement weights 18 25.883 0.102
Structural weights 11 16.268 0.131
West\Centre Sample Measurement weights 18 15.974 0.594
Structural weights 11 15.915 0.144
TABLE 7.52: STRUCTURAL WEIGHTS DIFFERENCES FOR THE GENDER SAMPLE (EAST - WEST)
Paths East Sample West Sample Invariant
ERW C.R. P value ERW C.R. P Value ∆ DF ∆ CMIN P Value
Enj <--- PU 0.101 2.202 .028 0.261 5.658 *** 1 6.060 0.014
*** p < 0.001.
TABLE 7.53: STRUCTURAL WEIGHTS DIFFERENCES FOR THE GENDER SAMPLE (EAST - CENTRE)
Paths East Sample Centre Sample Invariant
ERW C.R. P value ERW C.R. P Value ∆ DF ∆ CMIN P Value
Enj <--- PU 0.101 2.201 0.028 0.371 6.177 *** 1 13.437 0.000
Enj <--- SQ 0.395 6.998 *** 0.192 3.312 *** 1 6.207 0.013
*** p < 0.001.
TABLE 7.54: STRUCTURAL WEIGHTS DIFFERENCES FOR THE GENDER SAMPLE (WEST –
CENTRE)
Paths West Sample Centre Sample Invariant
ERW C.R. P value ERW C.R. P Value ∆ DF ∆ CMIN P Value
Enj <--- SQ 0.373 7.920 *** 0.192 3.313 *** 1 5.643 0.018
*** p < 0.001.
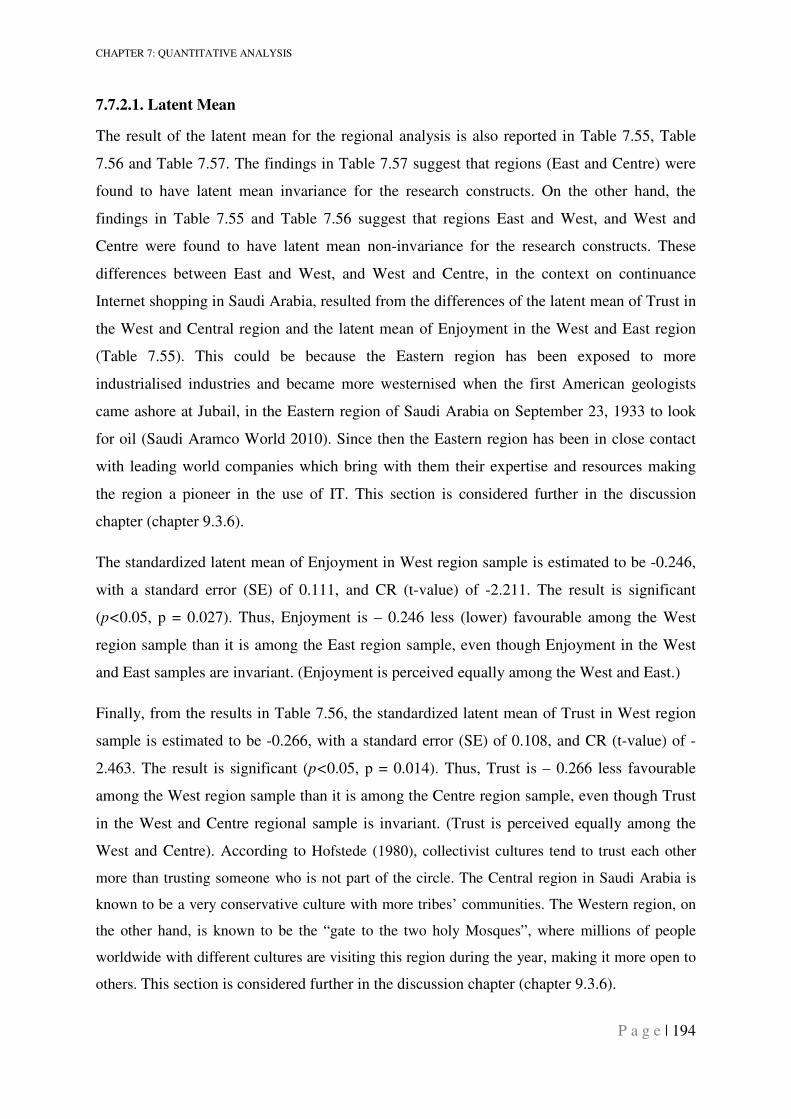
CHAPTER 7: QUANTITATIVE ANALYSIS
P a g e | 194
7.7.2.1. Latent Mean
The result of the latent mean for the regional analysis is also reported in Table 7.55, Table
7.56 and Table 7.57. The findings in Table 7.57 suggest that regions (East and Centre) were
found to have latent mean invariance for the research constructs. On the other hand, the
findings in Table 7.55 and Table 7.56 suggest that regions East and West, and West and
Centre were found to have latent mean non-invariance for the research constructs. These
differences between East and West, and West and Centre, in the context on continuance
Internet shopping in Saudi Arabia, resulted from the differences of the latent mean of Trust in
the West and Central region and the latent mean of Enjoyment in the West and East region
(Table 7.55). This could be because the Eastern region has been exposed to more
industrialised industries and became more westernised when the first American geologists
came ashore at Jubail, in the Eastern region of Saudi Arabia on September 23, 1933 to look
for oil (Saudi Aramco World 2010). Since then the Eastern region has been in close contact
with leading world companies which bring with them their expertise and resources making
the region a pioneer in the use of IT. This section is considered further in the discussion
chapter (chapter 9.3.6).
The standardized latent mean of Enjoyment in West region sample is estimated to be -0.246,
with a standard error (SE) of 0.111, and CR (t-value) of -2.211. The result is significant
(p<0.05, p = 0.027). Thus, Enjoyment is – 0.246 less (lower) favourable among the West
region sample than it is among the East region sample, even though Enjoyment in the West
and East samples are invariant. (Enjoyment is perceived equally among the West and East.)
Finally, from the results in Table 7.56, the standardized latent mean of Trust in West region
sample is estimated to be -0.266, with a standard error (SE) of 0.108, and CR (t-value) of -
2.463. The result is significant (p<0.05, p = 0.014). Thus, Trust is – 0.266 less favourable
among the West region sample than it is among the Centre region sample, even though Trust
in the West and Centre regional sample is invariant. (Trust is perceived equally among the
West and Centre). According to Hofstede (1980), collectivist cultures tend to trust each other
more than trusting someone who is not part of the circle. The Central region in Saudi Arabia is
known to be a very conservative culture with more tribes’ communities. The Western region, on
the other hand, is known to be the “gate to the two holy Mosques”, where millions of people
worldwide with different cultures are visiting this region during the year, making it more open to
others. This section is considered further in the discussion chapter (chapter 9.3.6).
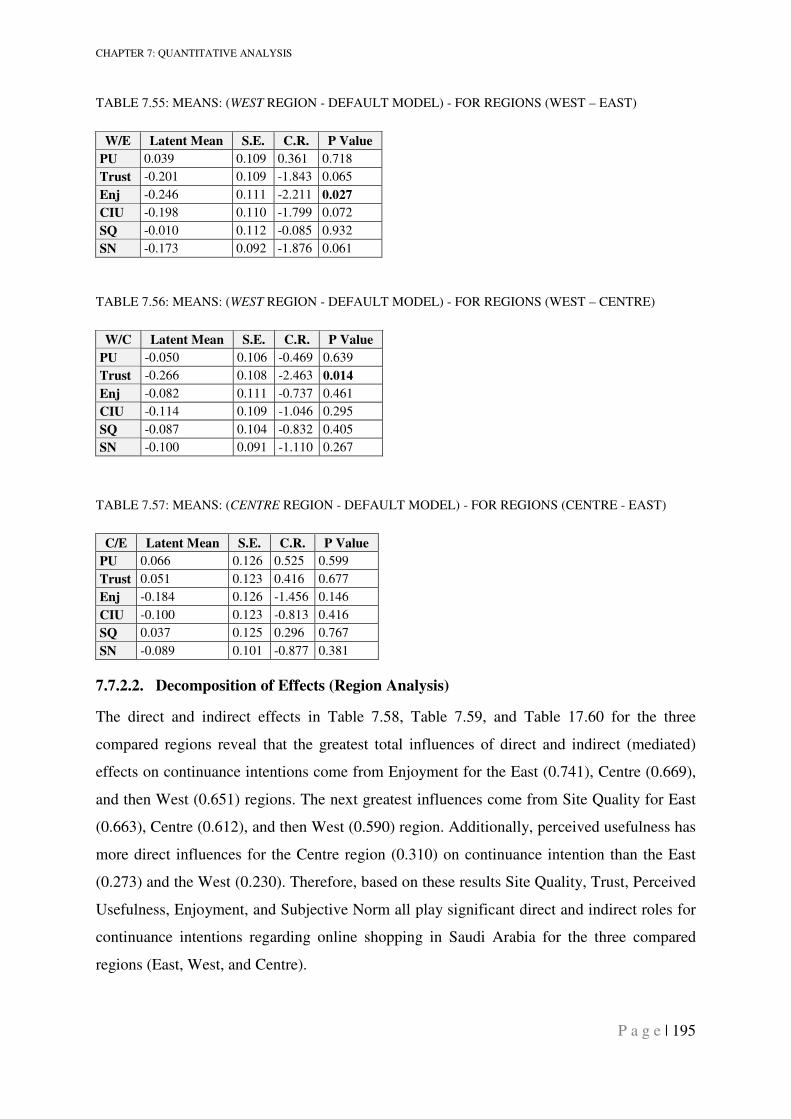
CHAPTER 7: QUANTITATIVE ANALYSIS
P a g e | 195
TABLE 7.55: MEANS: (WEST REGION - DEFAULT MODEL) - FOR REGIONS (WEST – EAST)
W/E Latent Mean S.E. C.R. P Value
PU 0.039 0.109 0.361 0.718
Trust -0.201 0.109 -1.843 0.065
Enj -0.246 0.111 -2.211 0.027
CIU -0.198 0.110 -1.799 0.072
SQ -0.010 0.112 -0.085 0.932
SN -0.173 0.092 -1.876 0.061
TABLE 7.56: MEANS: (WEST REGION - DEFAULT MODEL) - FOR REGIONS (WEST – CENTRE)
W/C Latent Mean S.E. C.R. P Value
PU -0.050 0.106 -0.469 0.639
Trust -0.266 0.108 -2.463 0.014
Enj -0.082 0.111 -0.737 0.461
CIU -0.114 0.109 -1.046 0.295
SQ -0.087 0.104 -0.832 0.405
SN -0.100 0.091 -1.110 0.267
TABLE 7.57: MEANS: (CENTRE REGION - DEFAULT MODEL) - FOR REGIONS (CENTRE - EAST)
C/E Latent Mean S.E. C.R. P Value
PU 0.066 0.126 0.525 0.599
Trust 0.051 0.123 0.416 0.677
Enj -0.184 0.126 -1.456 0.146
CIU -0.100 0.123 -0.813 0.416
SQ 0.037 0.125 0.296 0.767
SN -0.089 0.101 -0.877 0.381
7.7.2.2. Decomposition of Effects (Region Analysis)
The direct and indirect effects in Table 7.58, Table 7.59, and Table 17.60 for the three
compared regions reveal that the greatest total influences of direct and indirect (mediated)
effects on continuance intentions come from Enjoyment for the East (0.741), Centre (0.669),
and then West (0.651) regions. The next greatest influences come from Site Quality for East
(0.663), Centre (0.612), and then West (0.590) region. Additionally, perceived usefulness has
more direct influences for the Centre region (0.310) on continuance intention than the East
(0.273) and the West (0.230). Therefore, based on these results Site Quality, Trust, Perceived
Usefulness, Enjoyment, and Subjective Norm all play significant direct and indirect roles for
continuance intentions regarding online shopping in Saudi Arabia for the three compared
regions (East, West, and Centre).
CHAPTER 7: QUANTITATIVE ANALYSIS
P a g e | 196
TABLE 7.58: DECOMPOSITION OF EFFECTS ON CONTINUANCE INTENTIONS (EAST – WEST)
Construct CIU (East) CIU (West)
Direct Indirect Total Direct Indirect Total
SQ -------- 0.663 0.663 -------- 0.590 0.590
TRUST -------- 0.278 0.278 -------- 0.290 0.290
PU 0.273 0.140 0.413 0.230 0.255 0.485
SN 0.167 0.128 0.295 0.219 0.144 0.363
Enj 0.741 -------- 0.741 0.651 -------- 0.651
R2 = 0.67
TABLE 7.59: DECOMPOSITION OF EFFECTS ON CONTINUANCE INTENTIONS (EAST – CENTRE)
Construct CIU (East) CIU (Centre)
Direct Indirect Total Direct Indirect Total
SQ -------- 0.663 0.663 -------- 0.612 0.612
TRUST -------- 0.278 0.278 -------- 0.376 0.376
PU 0.273 0.140 0.413 0.291 0.310 0.600
SN 0.167 0.128 0.295 0.220 0.137 0.357
Enj 0.741 -------- 0.741 0.669 -------- 0.669
R2 = 0.65
TABLE 7.60: DECOMPOSITION OF EFFECTS ON CONTINUANCE INTENTIONS (WEST - CENTRE)
Construct CIU (West) CIU (Centre)
Direct Indirect Total Direct Indirect Total
SQ -------- 0.590 0.590 -------- 0.612 0.612
TRUST -------- 0.290 0.290 -------- 0.376 0.376
PU 0.230 0.255 0.485 0.291 0.310 0.600
SN 0.219 0.144 0.363 0.220 0.137 0.357
Enj 0.651 -------- 0.651 0.669 -------- 0.669
R2 = 0.59
7.7.3. Invariance Analysis for Age (Younger than 35 – Older than 35)
Participants’ ages ranged from 18 years to over 46 years, but most respondents (40.8%) were
aged between 26 and 35 years. The researcher used 35 years of age as a separation line, 379
(73.4%) participants were categorized as ‘young’ while the remaining 26.6% were ‘old’.
Factorial invariance (metric equivalence) assesses the extent to which measures of the two
groups (young and old sample) have the same meaning (Hair et al., 2006). The results in
Table 7.61 indicate outstanding goodness-of-fit indices across the two compared groups.
Assuming the unconstrained model is correct, compared with constraining all factorial paths,
they remain invariant across the groups. Tests of measurement invariance freely estimating
the other loadings are in Table 7.62. According to these results, the changes in chi-square and
df are not significant (p = 0.115), exceeding the 0.05 Byrne (2001) cut-off; and the goodness-
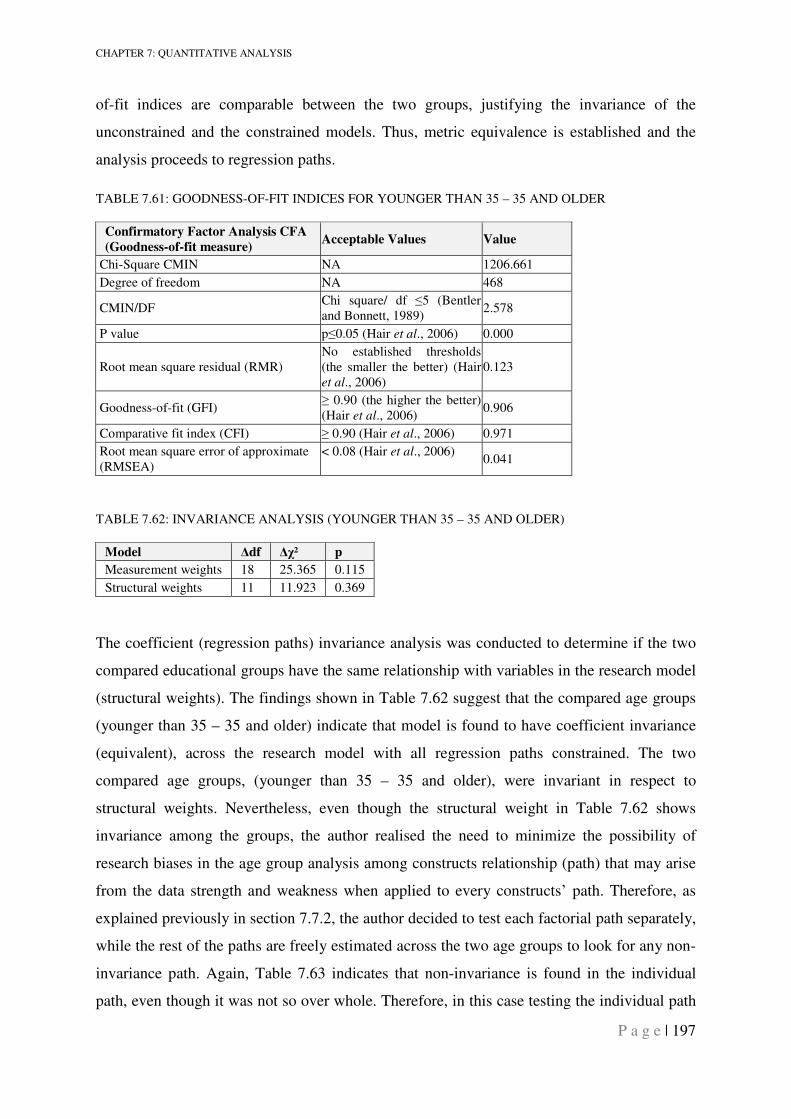
CHAPTER 7: QUANTITATIVE ANALYSIS
P a g e | 197
of-fit indices are comparable between the two groups, justifying the invariance of the
unconstrained and the constrained models. Thus, metric equivalence is established and the
analysis proceeds to regression paths.
TABLE 7.61: GOODNESS-OF-FIT INDICES FOR YOUNGER THAN 35 – 35 AND OLDER
Confirmatory Factor Analysis CFA
(Goodness-of-fit measure) Acceptable Values Value
Chi-Square CMIN NA 1206.661
Degree of freedom NA 468
CMIN/DF Chi square/ df ≤5 (Bentler and Bonnett, 1989)
2.578
P value p≤0.05 (Hair et al., 2006) 0.000
Root mean square residual (RMR) No established thresholds (the smaller the better) (Hair et al., 2006)
0.123
Goodness-of-fit (GFI) ≥ 0.90 (the higher the better) (Hair et al., 2006)
0.906
Comparative fit index (CFI) ≥ 0.90 (Hair et al., 2006) 0.971
Root mean square error of approximate (RMSEA)
< 0.08 (Hair et al., 2006) 0.041
TABLE 7.62: INVARIANCE ANALYSIS (YOUNGER THAN 35 – 35 AND OLDER)
Model ∆df ∆χ² p
Measurement weights 18 25.365 0.115
Structural weights 11 11.923 0.369
The coefficient (regression paths) invariance analysis was conducted to determine if the two
compared educational groups have the same relationship with variables in the research model
(structural weights). The findings shown in Table 7.62 suggest that the compared age groups
(younger than 35 – 35 and older) indicate that model is found to have coefficient invariance
(equivalent), across the research model with all regression paths constrained. The two
compared age groups, (younger than 35 – 35 and older), were invariant in respect to
structural weights. Nevertheless, even though the structural weight in Table 7.62 shows
invariance among the groups, the author realised the need to minimize the possibility of
research biases in the age group analysis among constructs relationship (path) that may arise
from the data strength and weakness when applied to every constructs’ path. Therefore, as
explained previously in section 7.7.2, the author decided to test each factorial path separately,
while the rest of the paths are freely estimated across the two age groups to look for any non-
invariance path. Again, Table 7.63 indicates that non-invariance is found in the individual
path, even though it was not so over whole. Therefore, in this case testing the individual path
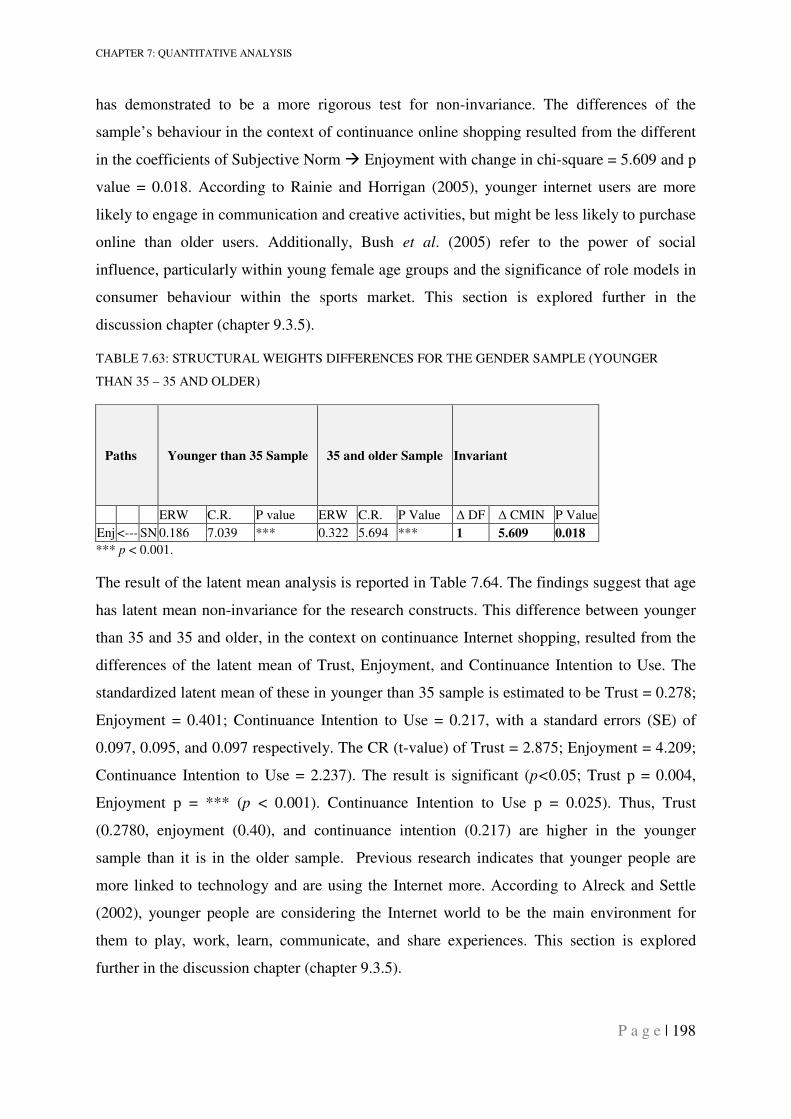
CHAPTER 7: QUANTITATIVE ANALYSIS
P a g e | 198
has demonstrated to be a more rigorous test for non-invariance. The differences of the
sample’s behaviour in the context of continuance online shopping resulted from the different
in the coefficients of Subjective Norm � Enjoyment with change in chi-square = 5.609 and p
value = 0.018. According to Rainie and Horrigan (2005), younger internet users are more
likely to engage in communication and creative activities, but might be less likely to purchase
online than older users. Additionally, Bush et al. (2005) refer to the power of social
influence, particularly within young female age groups and the significance of role models in
consumer behaviour within the sports market. This section is explored further in the
discussion chapter (chapter 9.3.5).
TABLE 7.63: STRUCTURAL WEIGHTS DIFFERENCES FOR THE GENDER SAMPLE (YOUNGER
THAN 35 – 35 AND OLDER)
Paths Younger than 35 Sample 35 and older Sample Invariant
ERW C.R. P value ERW C.R. P Value ∆ DF ∆ CMIN P Value
Enj <--- SN 0.186 7.039 *** 0.322 5.694 *** 1 5.609 0.018
*** p < 0.001.
The result of the latent mean analysis is reported in Table 7.64. The findings suggest that age
has latent mean non-invariance for the research constructs. This difference between younger
than 35 and 35 and older, in the context on continuance Internet shopping, resulted from the
differences of the latent mean of Trust, Enjoyment, and Continuance Intention to Use. The
standardized latent mean of these in younger than 35 sample is estimated to be Trust = 0.278;
Enjoyment = 0.401; Continuance Intention to Use = 0.217, with a standard errors (SE) of
0.097, 0.095, and 0.097 respectively. The CR (t-value) of Trust = 2.875; Enjoyment = 4.209;
Continuance Intention to Use = 2.237). The result is significant (p<0.05; Trust p = 0.004,
Enjoyment p = *** (p < 0.001). Continuance Intention to Use p = 0.025). Thus, Trust
(0.2780, enjoyment (0.40), and continuance intention (0.217) are higher in the younger
sample than it is in the older sample. Previous research indicates that younger people are
more linked to technology and are using the Internet more. According to Alreck and Settle
(2002), younger people are considering the Internet world to be the main environment for
them to play, work, learn, communicate, and share experiences. This section is explored
further in the discussion chapter (chapter 9.3.5).
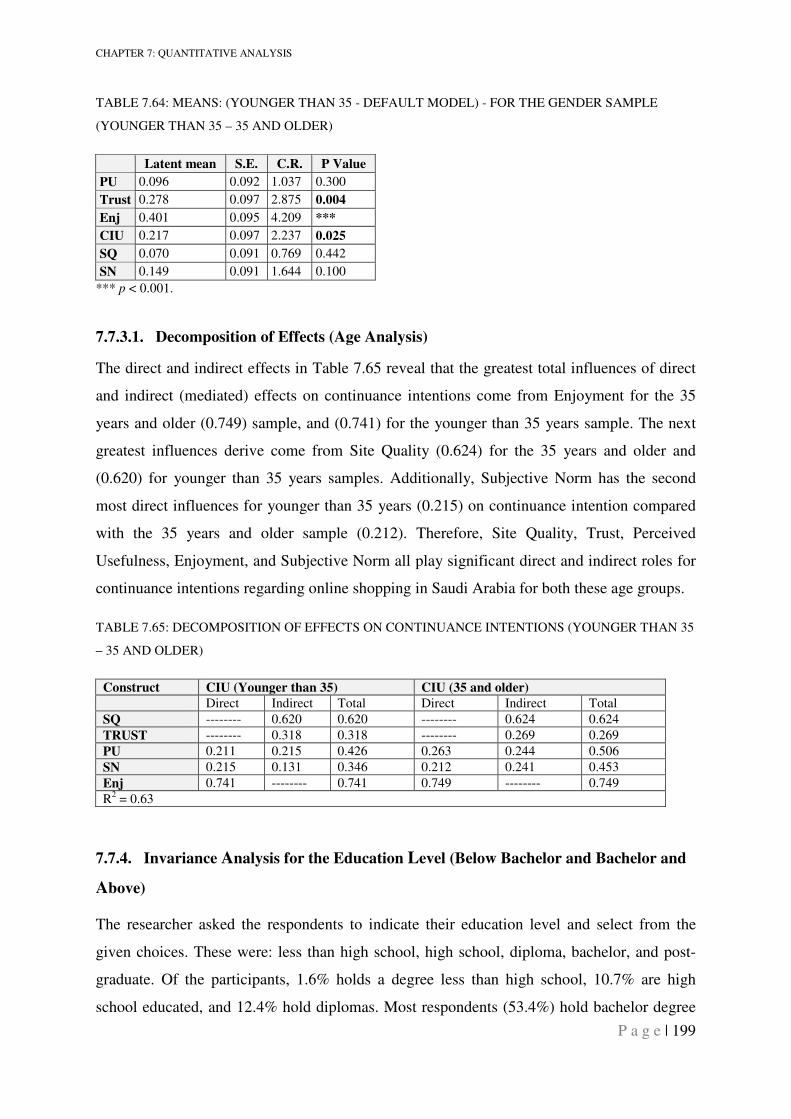
CHAPTER 7: QUANTITATIVE ANALYSIS
P a g e | 199
TABLE 7.64: MEANS: (YOUNGER THAN 35 - DEFAULT MODEL) - FOR THE GENDER SAMPLE
(YOUNGER THAN 35 – 35 AND OLDER)
Latent mean S.E. C.R. P Value
PU 0.096 0.092 1.037 0.300
Trust 0.278 0.097 2.875 0.004
Enj 0.401 0.095 4.209 ***
CIU 0.217 0.097 2.237 0.025
SQ 0.070 0.091 0.769 0.442
SN 0.149 0.091 1.644 0.100
*** p < 0.001.
7.7.3.1. Decomposition of Effects (Age Analysis)
The direct and indirect effects in Table 7.65 reveal that the greatest total influences of direct
and indirect (mediated) effects on continuance intentions come from Enjoyment for the 35
years and older (0.749) sample, and (0.741) for the younger than 35 years sample. The next
greatest influences derive come from Site Quality (0.624) for the 35 years and older and
(0.620) for younger than 35 years samples. Additionally, Subjective Norm has the second
most direct influences for younger than 35 years (0.215) on continuance intention compared
with the 35 years and older sample (0.212). Therefore, Site Quality, Trust, Perceived
Usefulness, Enjoyment, and Subjective Norm all play significant direct and indirect roles for
continuance intentions regarding online shopping in Saudi Arabia for both these age groups.
TABLE 7.65: DECOMPOSITION OF EFFECTS ON CONTINUANCE INTENTIONS (YOUNGER THAN 35
– 35 AND OLDER)
Construct CIU (Younger than 35) CIU (35 and older)
Direct Indirect Total Direct Indirect Total
SQ -------- 0.620 0.620 -------- 0.624 0.624
TRUST -------- 0.318 0.318 -------- 0.269 0.269
PU 0.211 0.215 0.426 0.263 0.244 0.506
SN 0.215 0.131 0.346 0.212 0.241 0.453
Enj 0.741 -------- 0.741 0.749 -------- 0.749
R2 = 0.63
7.7.4. Invariance Analysis for the Education Level (Below Bachelor and Bachelor and
Above)
The researcher asked the respondents to indicate their education level and select from the
given choices. These were: less than high school, high school, diploma, bachelor, and post-
graduate. Of the participants, 1.6% holds a degree less than high school, 10.7% are high
school educated, and 12.4% hold diplomas. Most respondents (53.4%) hold bachelor degree
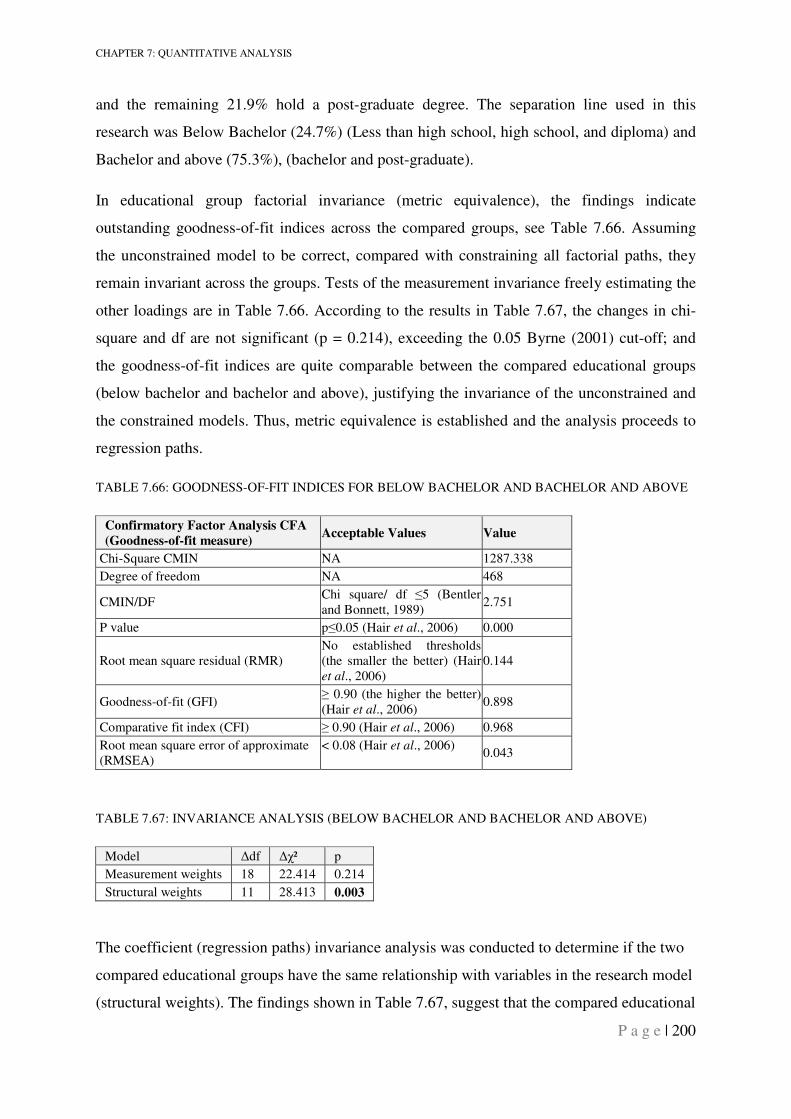
CHAPTER 7: QUANTITATIVE ANALYSIS
P a g e | 200
and the remaining 21.9% hold a post-graduate degree. The separation line used in this
research was Below Bachelor (24.7%) (Less than high school, high school, and diploma) and
Bachelor and above (75.3%), (bachelor and post-graduate).
In educational group factorial invariance (metric equivalence), the findings indicate
outstanding goodness-of-fit indices across the compared groups, see Table 7.66. Assuming
the unconstrained model to be correct, compared with constraining all factorial paths, they
remain invariant across the groups. Tests of the measurement invariance freely estimating the
other loadings are in Table 7.66. According to the results in Table 7.67, the changes in chi-
square and df are not significant (p = 0.214), exceeding the 0.05 Byrne (2001) cut-off; and
the goodness-of-fit indices are quite comparable between the compared educational groups
(below bachelor and bachelor and above), justifying the invariance of the unconstrained and
the constrained models. Thus, metric equivalence is established and the analysis proceeds to
regression paths.
TABLE 7.66: GOODNESS-OF-FIT INDICES FOR BELOW BACHELOR AND BACHELOR AND ABOVE
Confirmatory Factor Analysis CFA
(Goodness-of-fit measure) Acceptable Values Value
Chi-Square CMIN NA 1287.338
Degree of freedom NA 468
CMIN/DF Chi square/ df ≤5 (Bentler and Bonnett, 1989)
2.751
P value p≤0.05 (Hair et al., 2006) 0.000
Root mean square residual (RMR) No established thresholds (the smaller the better) (Hair et al., 2006)
0.144
Goodness-of-fit (GFI) ≥ 0.90 (the higher the better) (Hair et al., 2006)
0.898
Comparative fit index (CFI) ≥ 0.90 (Hair et al., 2006) 0.968
Root mean square error of approximate (RMSEA)
< 0.08 (Hair et al., 2006) 0.043
TABLE 7.67: INVARIANCE ANALYSIS (BELOW BACHELOR AND BACHELOR AND ABOVE)
Model ∆df ∆χ² p
Measurement weights 18 22.414 0.214
Structural weights 11 28.413 0.003
The coefficient (regression paths) invariance analysis was conducted to determine if the two
compared educational groups have the same relationship with variables in the research model
(structural weights). The findings shown in Table 7.67, suggest that the compared educational
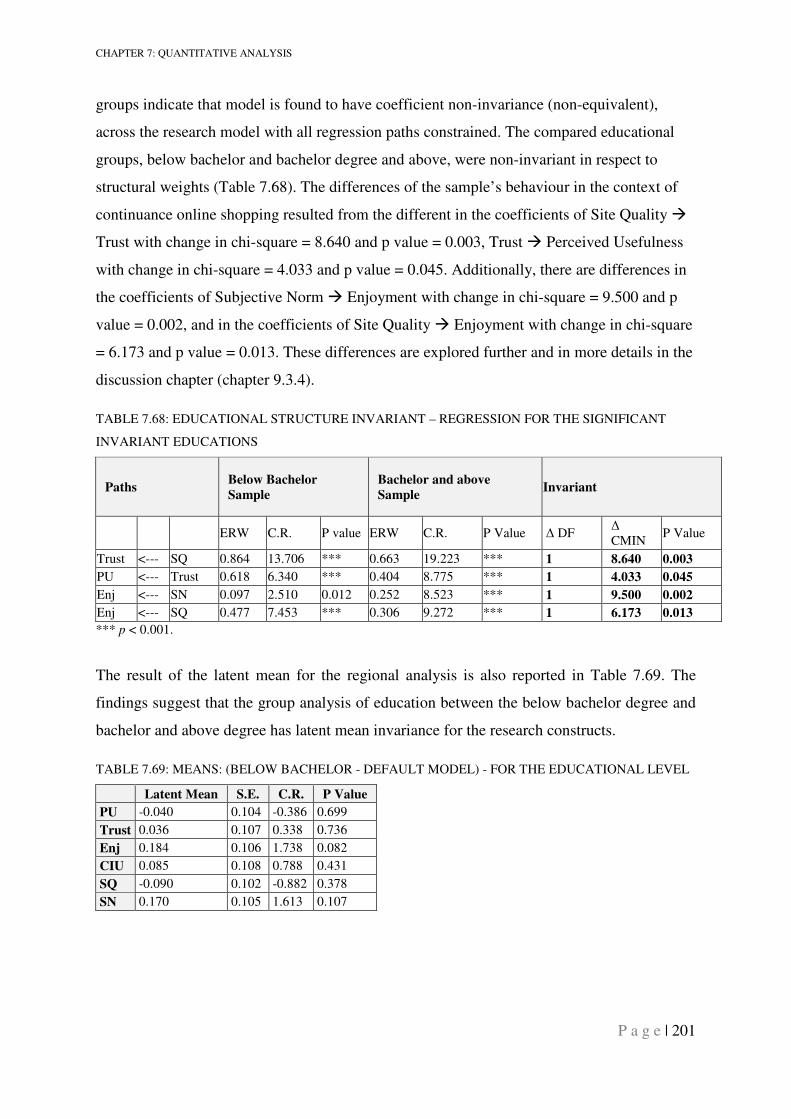
CHAPTER 7: QUANTITATIVE ANALYSIS
P a g e | 201
groups indicate that model is found to have coefficient non-invariance (non-equivalent),
across the research model with all regression paths constrained. The compared educational
groups, below bachelor and bachelor degree and above, were non-invariant in respect to
structural weights (Table 7.68). The differences of the sample’s behaviour in the context of
continuance online shopping resulted from the different in the coefficients of Site Quality �
Trust with change in chi-square = 8.640 and p value = 0.003, Trust � Perceived Usefulness
with change in chi-square = 4.033 and p value = 0.045. Additionally, there are differences in
the coefficients of Subjective Norm � Enjoyment with change in chi-square = 9.500 and p
value = 0.002, and in the coefficients of Site Quality � Enjoyment with change in chi-square
= 6.173 and p value = 0.013. These differences are explored further and in more details in the
discussion chapter (chapter 9.3.4).
TABLE 7.68: EDUCATIONAL STRUCTURE INVARIANT – REGRESSION FOR THE SIGNIFICANT
INVARIANT EDUCATIONS
Paths Below Bachelor
Sample
Bachelor and above
Sample Invariant
ERW C.R. P value ERW C.R. P Value ∆ DF ∆ CMIN
P Value
Trust <--- SQ 0.864 13.706 *** 0.663 19.223 *** 1 8.640 0.003
PU <--- Trust 0.618 6.340 *** 0.404 8.775 *** 1 4.033 0.045
Enj <--- SN 0.097 2.510 0.012 0.252 8.523 *** 1 9.500 0.002
Enj <--- SQ 0.477 7.453 *** 0.306 9.272 *** 1 6.173 0.013
*** p < 0.001.
The result of the latent mean for the regional analysis is also reported in Table 7.69. The
findings suggest that the group analysis of education between the below bachelor degree and
bachelor and above degree has latent mean invariance for the research constructs.
TABLE 7.69: MEANS: (BELOW BACHELOR - DEFAULT MODEL) - FOR THE EDUCATIONAL LEVEL
Latent Mean S.E. C.R. P Value
PU -0.040 0.104 -0.386 0.699
Trust 0.036 0.107 0.338 0.736
Enj 0.184 0.106 1.738 0.082
CIU 0.085 0.108 0.788 0.431
SQ -0.090 0.102 -0.882 0.378
SN 0.170 0.105 1.613 0.107
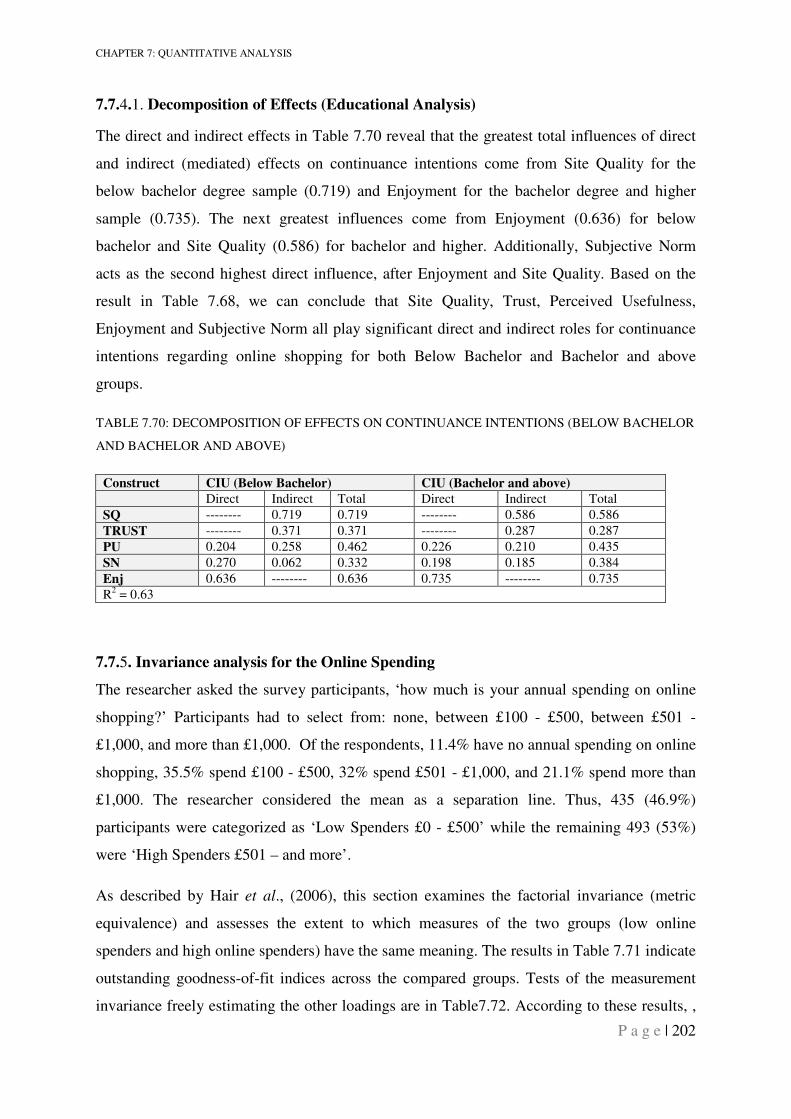
CHAPTER 7: QUANTITATIVE ANALYSIS
P a g e | 202
7.7.4.1. Decomposition of Effects (Educational Analysis)
The direct and indirect effects in Table 7.70 reveal that the greatest total influences of direct
and indirect (mediated) effects on continuance intentions come from Site Quality for the
below bachelor degree sample (0.719) and Enjoyment for the bachelor degree and higher
sample (0.735). The next greatest influences come from Enjoyment (0.636) for below
bachelor and Site Quality (0.586) for bachelor and higher. Additionally, Subjective Norm
acts as the second highest direct influence, after Enjoyment and Site Quality. Based on the
result in Table 7.68, we can conclude that Site Quality, Trust, Perceived Usefulness,
Enjoyment and Subjective Norm all play significant direct and indirect roles for continuance
intentions regarding online shopping for both Below Bachelor and Bachelor and above
groups.
TABLE 7.70: DECOMPOSITION OF EFFECTS ON CONTINUANCE INTENTIONS (BELOW BACHELOR
AND BACHELOR AND ABOVE)
Construct CIU (Below Bachelor) CIU (Bachelor and above)
Direct Indirect Total Direct Indirect Total
SQ -------- 0.719 0.719 -------- 0.586 0.586
TRUST -------- 0.371 0.371 -------- 0.287 0.287
PU 0.204 0.258 0.462 0.226 0.210 0.435
SN 0.270 0.062 0.332 0.198 0.185 0.384
Enj 0.636 -------- 0.636 0.735 -------- 0.735
R2 = 0.63
7.7.5. Invariance analysis for the Online Spending
The researcher asked the survey participants, ‘how much is your annual spending on online
shopping?’ Participants had to select from: none, between £100 - £500, between £501 -
£1,000, and more than £1,000. Of the respondents, 11.4% have no annual spending on online
shopping, 35.5% spend £100 - £500, 32% spend £501 - £1,000, and 21.1% spend more than
£1,000. The researcher considered the mean as a separation line. Thus, 435 (46.9%)
participants were categorized as ‘Low Spenders £0 - £500’ while the remaining 493 (53%)
were ‘High Spenders £501 – and more’.
As described by Hair et al., (2006), this section examines the factorial invariance (metric
equivalence) and assesses the extent to which measures of the two groups (low online
spenders and high online spenders) have the same meaning. The results in Table 7.71 indicate
outstanding goodness-of-fit indices across the compared groups. Tests of the measurement
invariance freely estimating the other loadings are in Table7.72. According to these results, ,
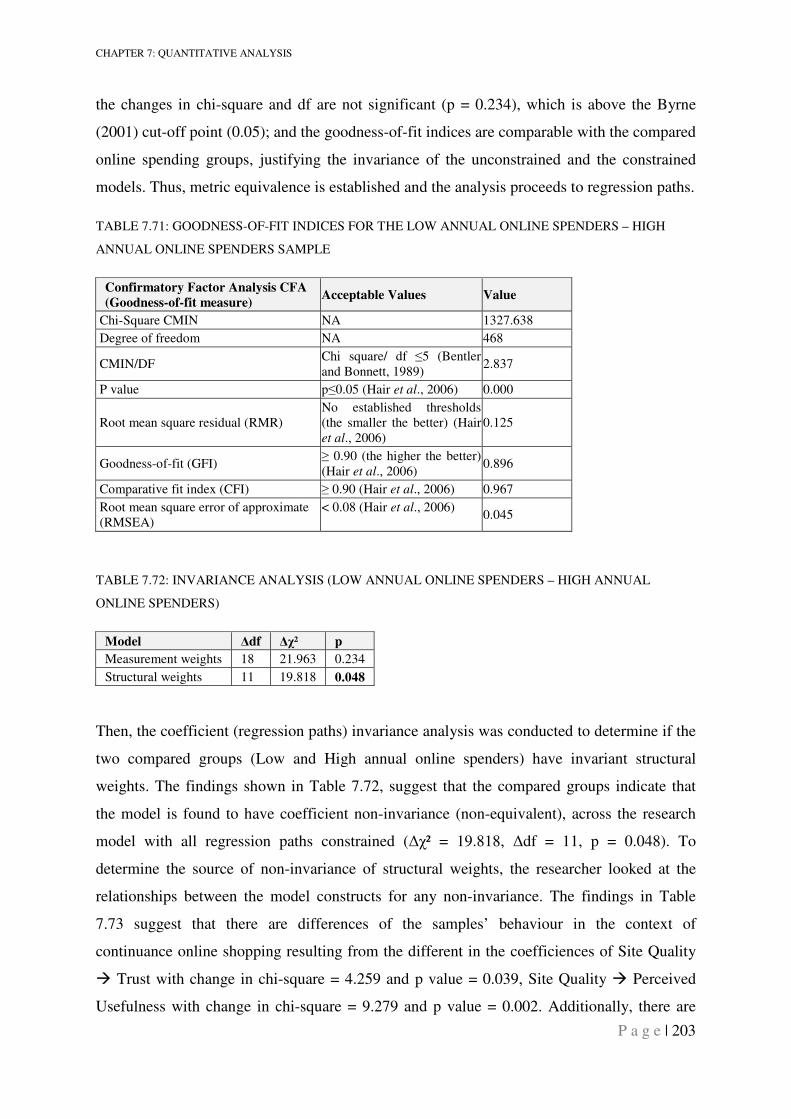
CHAPTER 7: QUANTITATIVE ANALYSIS
P a g e | 203
the changes in chi-square and df are not significant (p = 0.234), which is above the Byrne
(2001) cut-off point (0.05); and the goodness-of-fit indices are comparable with the compared
online spending groups, justifying the invariance of the unconstrained and the constrained
models. Thus, metric equivalence is established and the analysis proceeds to regression paths.
TABLE 7.71: GOODNESS-OF-FIT INDICES FOR THE LOW ANNUAL ONLINE SPENDERS – HIGH
ANNUAL ONLINE SPENDERS SAMPLE
Confirmatory Factor Analysis CFA
(Goodness-of-fit measure) Acceptable Values Value
Chi-Square CMIN NA 1327.638
Degree of freedom NA 468
CMIN/DF Chi square/ df ≤5 (Bentler and Bonnett, 1989)
2.837
P value p≤0.05 (Hair et al., 2006) 0.000
Root mean square residual (RMR) No established thresholds (the smaller the better) (Hair et al., 2006)
0.125
Goodness-of-fit (GFI) ≥ 0.90 (the higher the better) (Hair et al., 2006)
0.896
Comparative fit index (CFI) ≥ 0.90 (Hair et al., 2006) 0.967
Root mean square error of approximate (RMSEA)
< 0.08 (Hair et al., 2006) 0.045
TABLE 7.72: INVARIANCE ANALYSIS (LOW ANNUAL ONLINE SPENDERS – HIGH ANNUAL
ONLINE SPENDERS)
Model ∆df ∆χ² p
Measurement weights 18 21.963 0.234
Structural weights 11 19.818 0.048
Then, the coefficient (regression paths) invariance analysis was conducted to determine if the
two compared groups (Low and High annual online spenders) have invariant structural
weights. The findings shown in Table 7.72, suggest that the compared groups indicate that
the model is found to have coefficient non-invariance (non-equivalent), across the research
model with all regression paths constrained (∆χ² = 19.818, ∆df = 11, p = 0.048). To
determine the source of non-invariance of structural weights, the researcher looked at the
relationships between the model constructs for any non-invariance. The findings in Table
7.73 suggest that there are differences of the samples’ behaviour in the context of
continuance online shopping resulting from the different in the coefficiences of Site Quality
� Trust with change in chi-square = 4.259 and p value = 0.039, Site Quality � Perceived
Usefulness with change in chi-square = 9.279 and p value = 0.002. Additionally, there are
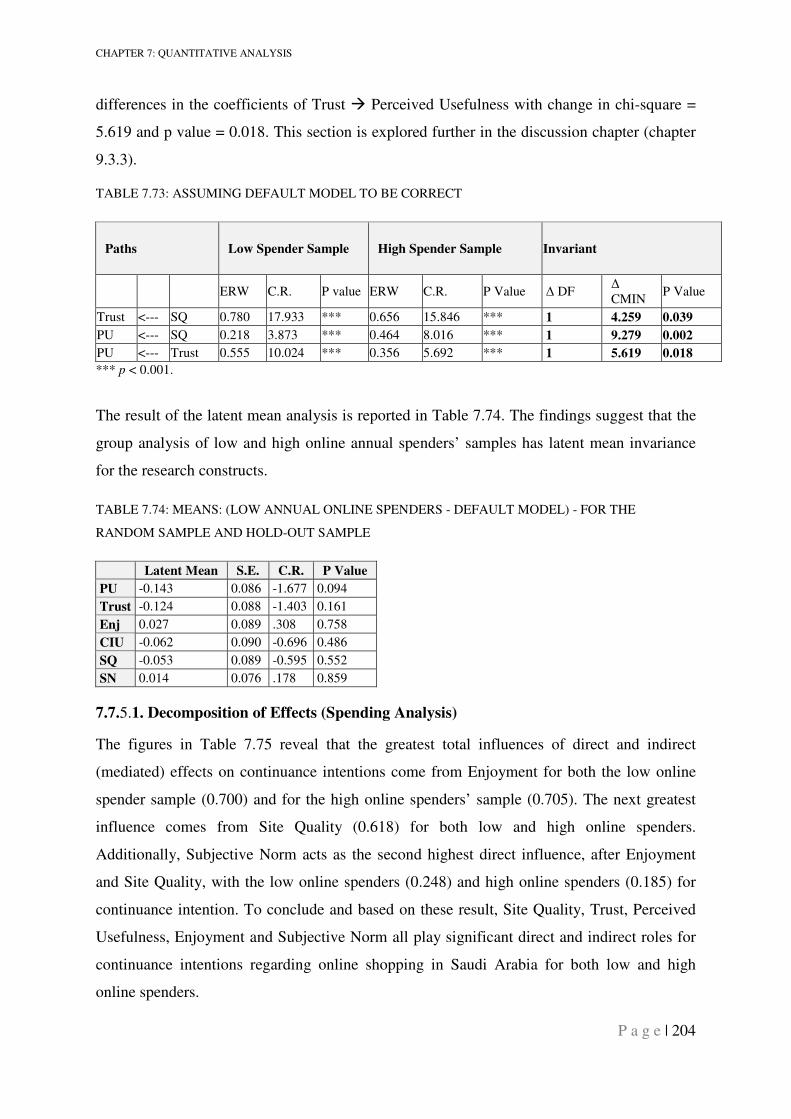
CHAPTER 7: QUANTITATIVE ANALYSIS
P a g e | 204
differences in the coefficients of Trust � Perceived Usefulness with change in chi-square =
5.619 and p value = 0.018. This section is explored further in the discussion chapter (chapter
9.3.3).
TABLE 7.73: ASSUMING DEFAULT MODEL TO BE CORRECT
Paths Low Spender Sample High Spender Sample Invariant
ERW C.R. P value ERW C.R. P Value ∆ DF ∆ CMIN
P Value
Trust <--- SQ 0.780 17.933 *** 0.656 15.846 *** 1 4.259 0.039
PU <--- SQ 0.218 3.873 *** 0.464 8.016 *** 1 9.279 0.002
PU <--- Trust 0.555 10.024 *** 0.356 5.692 *** 1 5.619 0.018
*** p < 0.001.
The result of the latent mean analysis is reported in Table 7.74. The findings suggest that the
group analysis of low and high online annual spenders’ samples has latent mean invariance
for the research constructs.
TABLE 7.74: MEANS: (LOW ANNUAL ONLINE SPENDERS - DEFAULT MODEL) - FOR THE
RANDOM SAMPLE AND HOLD-OUT SAMPLE
Latent Mean S.E. C.R. P Value
PU -0.143 0.086 -1.677 0.094
Trust -0.124 0.088 -1.403 0.161
Enj 0.027 0.089 .308 0.758
CIU -0.062 0.090 -0.696 0.486
SQ -0.053 0.089 -0.595 0.552
SN 0.014 0.076 .178 0.859
7.7.5.1. Decomposition of Effects (Spending Analysis)
The figures in Table 7.75 reveal that the greatest total influences of direct and indirect
(mediated) effects on continuance intentions come from Enjoyment for both the low online
spender sample (0.700) and for the high online spenders’ sample (0.705). The next greatest
influence comes from Site Quality (0.618) for both low and high online spenders.
Additionally, Subjective Norm acts as the second highest direct influence, after Enjoyment
and Site Quality, with the low online spenders (0.248) and high online spenders (0.185) for
continuance intention. To conclude and based on these result, Site Quality, Trust, Perceived
Usefulness, Enjoyment and Subjective Norm all play significant direct and indirect roles for
continuance intentions regarding online shopping in Saudi Arabia for both low and high
online spenders.
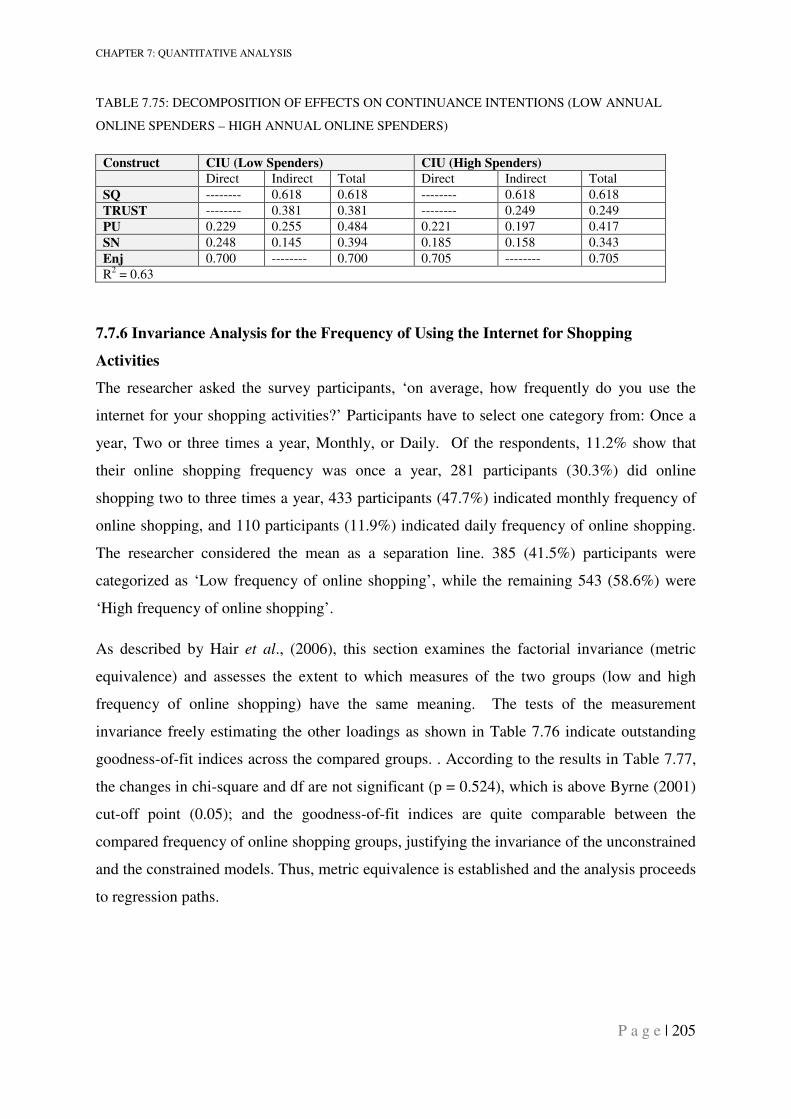
CHAPTER 7: QUANTITATIVE ANALYSIS
P a g e | 205
TABLE 7.75: DECOMPOSITION OF EFFECTS ON CONTINUANCE INTENTIONS (LOW ANNUAL
ONLINE SPENDERS – HIGH ANNUAL ONLINE SPENDERS)
Construct CIU (Low Spenders) CIU (High Spenders)
Direct Indirect Total Direct Indirect Total
SQ -------- 0.618 0.618 -------- 0.618 0.618
TRUST -------- 0.381 0.381 -------- 0.249 0.249
PU 0.229 0.255 0.484 0.221 0.197 0.417
SN 0.248 0.145 0.394 0.185 0.158 0.343
Enj 0.700 -------- 0.700 0.705 -------- 0.705
R2 = 0.63
7.7.6 Invariance Analysis for the Frequency of Using the Internet for Shopping
Activities
The researcher asked the survey participants, ‘on average, how frequently do you use the
internet for your shopping activities?’ Participants have to select one category from: Once a
year, Two or three times a year, Monthly, or Daily. Of the respondents, 11.2% show that
their online shopping frequency was once a year, 281 participants (30.3%) did online
shopping two to three times a year, 433 participants (47.7%) indicated monthly frequency of
online shopping, and 110 participants (11.9%) indicated daily frequency of online shopping.
The researcher considered the mean as a separation line. 385 (41.5%) participants were
categorized as ‘Low frequency of online shopping’, while the remaining 543 (58.6%) were
‘High frequency of online shopping’.
As described by Hair et al., (2006), this section examines the factorial invariance (metric
equivalence) and assesses the extent to which measures of the two groups (low and high
frequency of online shopping) have the same meaning. The tests of the measurement
invariance freely estimating the other loadings as shown in Table 7.76 indicate outstanding
goodness-of-fit indices across the compared groups. . According to the results in Table 7.77,
the changes in chi-square and df are not significant (p = 0.524), which is above Byrne (2001)
cut-off point (0.05); and the goodness-of-fit indices are quite comparable between the
compared frequency of online shopping groups, justifying the invariance of the unconstrained
and the constrained models. Thus, metric equivalence is established and the analysis proceeds
to regression paths.
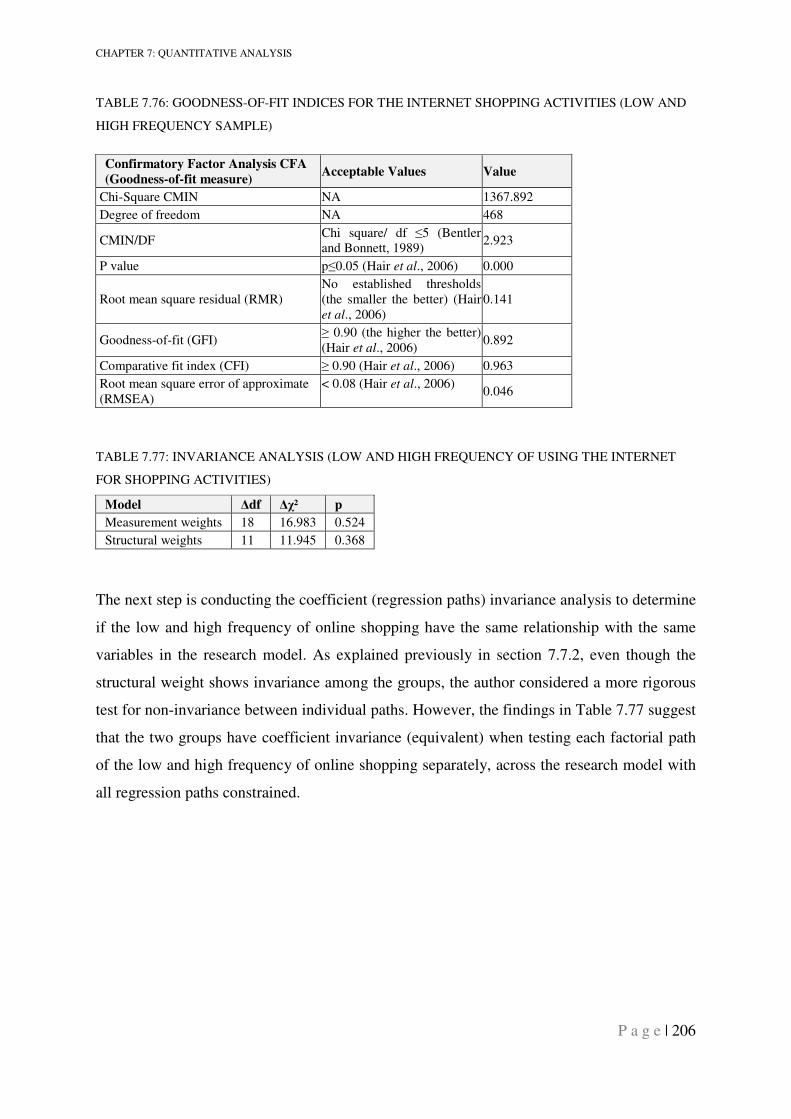
CHAPTER 7: QUANTITATIVE ANALYSIS
P a g e | 206
TABLE 7.76: GOODNESS-OF-FIT INDICES FOR THE INTERNET SHOPPING ACTIVITIES (LOW AND
HIGH FREQUENCY SAMPLE)
Confirmatory Factor Analysis CFA
(Goodness-of-fit measure) Acceptable Values Value
Chi-Square CMIN NA 1367.892
Degree of freedom NA 468
CMIN/DF Chi square/ df ≤5 (Bentler and Bonnett, 1989)
2.923
P value p≤0.05 (Hair et al., 2006) 0.000
Root mean square residual (RMR) No established thresholds (the smaller the better) (Hair et al., 2006)
0.141
Goodness-of-fit (GFI) ≥ 0.90 (the higher the better) (Hair et al., 2006)
0.892
Comparative fit index (CFI) ≥ 0.90 (Hair et al., 2006) 0.963
Root mean square error of approximate (RMSEA)
< 0.08 (Hair et al., 2006) 0.046
TABLE 7.77: INVARIANCE ANALYSIS (LOW AND HIGH FREQUENCY OF USING THE INTERNET
FOR SHOPPING ACTIVITIES)
Model ∆df ∆χ² p
Measurement weights 18 16.983 0.524
Structural weights 11 11.945 0.368
The next step is conducting the coefficient (regression paths) invariance analysis to determine
if the low and high frequency of online shopping have the same relationship with the same
variables in the research model. As explained previously in section 7.7.2, even though the
structural weight shows invariance among the groups, the author considered a more rigorous
test for non-invariance between individual paths. However, the findings in Table 7.77 suggest
that the two groups have coefficient invariance (equivalent) when testing each factorial path
of the low and high frequency of online shopping separately, across the research model with
all regression paths constrained.
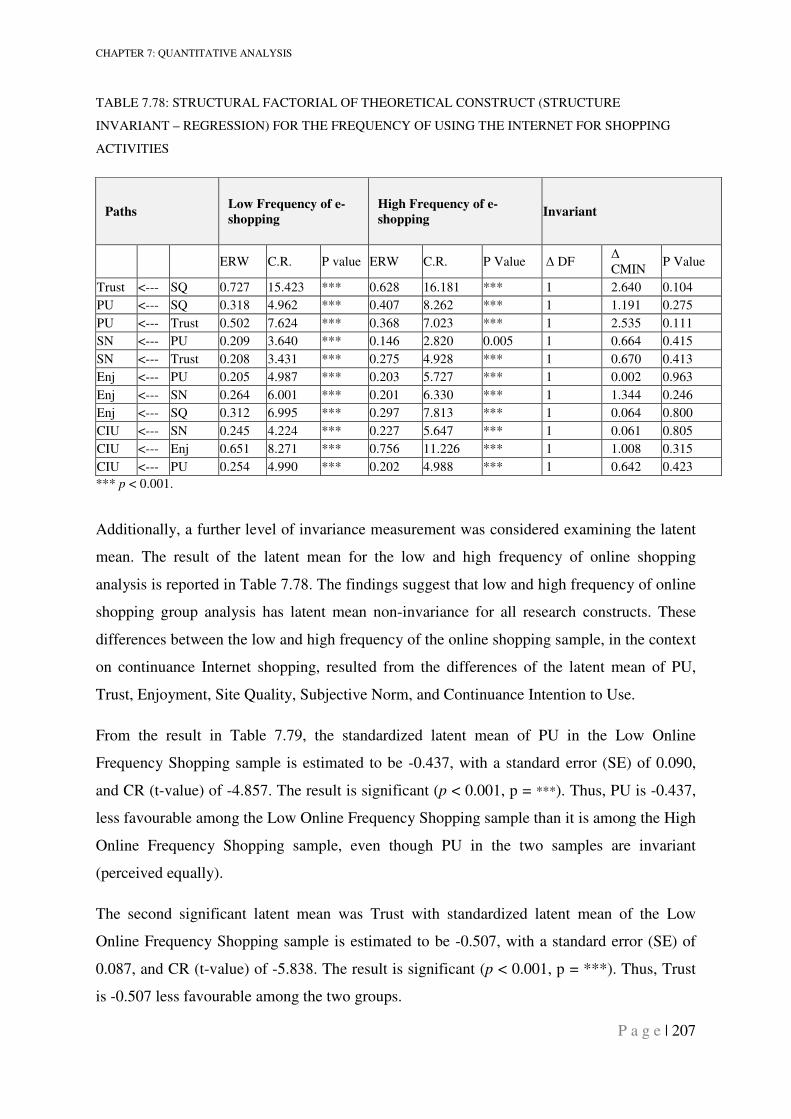
CHAPTER 7: QUANTITATIVE ANALYSIS
P a g e | 207
TABLE 7.78: STRUCTURAL FACTORIAL OF THEORETICAL CONSTRUCT (STRUCTURE
INVARIANT – REGRESSION) FOR THE FREQUENCY OF USING THE INTERNET FOR SHOPPING
ACTIVITIES
Paths Low Frequency of e-
shopping
High Frequency of e-
shopping Invariant
ERW C.R. P value ERW C.R. P Value ∆ DF ∆ CMIN
P Value
Trust <--- SQ 0.727 15.423 *** 0.628 16.181 *** 1 2.640 0.104
PU <--- SQ 0.318 4.962 *** 0.407 8.262 *** 1 1.191 0.275
PU <--- Trust 0.502 7.624 *** 0.368 7.023 *** 1 2.535 0.111
SN <--- PU 0.209 3.640 *** 0.146 2.820 0.005 1 0.664 0.415
SN <--- Trust 0.208 3.431 *** 0.275 4.928 *** 1 0.670 0.413
Enj <--- PU 0.205 4.987 *** 0.203 5.727 *** 1 0.002 0.963
Enj <--- SN 0.264 6.001 *** 0.201 6.330 *** 1 1.344 0.246
Enj <--- SQ 0.312 6.995 *** 0.297 7.813 *** 1 0.064 0.800
CIU <--- SN 0.245 4.224 *** 0.227 5.647 *** 1 0.061 0.805
CIU <--- Enj 0.651 8.271 *** 0.756 11.226 *** 1 1.008 0.315
CIU <--- PU 0.254 4.990 *** 0.202 4.988 *** 1 0.642 0.423
*** p < 0.001.
Additionally, a further level of invariance measurement was considered examining the latent
mean. The result of the latent mean for the low and high frequency of online shopping
analysis is reported in Table 7.78. The findings suggest that low and high frequency of online
shopping group analysis has latent mean non-invariance for all research constructs. These
differences between the low and high frequency of the online shopping sample, in the context
on continuance Internet shopping, resulted from the differences of the latent mean of PU,
Trust, Enjoyment, Site Quality, Subjective Norm, and Continuance Intention to Use.
From the result in Table 7.79, the standardized latent mean of PU in the Low Online
Frequency Shopping sample is estimated to be -0.437, with a standard error (SE) of 0.090,
and CR (t-value) of -4.857. The result is significant (p < 0.001, p = ***). Thus, PU is -0.437,
less favourable among the Low Online Frequency Shopping sample than it is among the High
Online Frequency Shopping sample, even though PU in the two samples are invariant
(perceived equally).
The second significant latent mean was Trust with standardized latent mean of the Low
Online Frequency Shopping sample is estimated to be -0.507, with a standard error (SE) of
0.087, and CR (t-value) of -5.838. The result is significant (p < 0.001, p = ***). Thus, Trust
is -0.507 less favourable among the two groups.
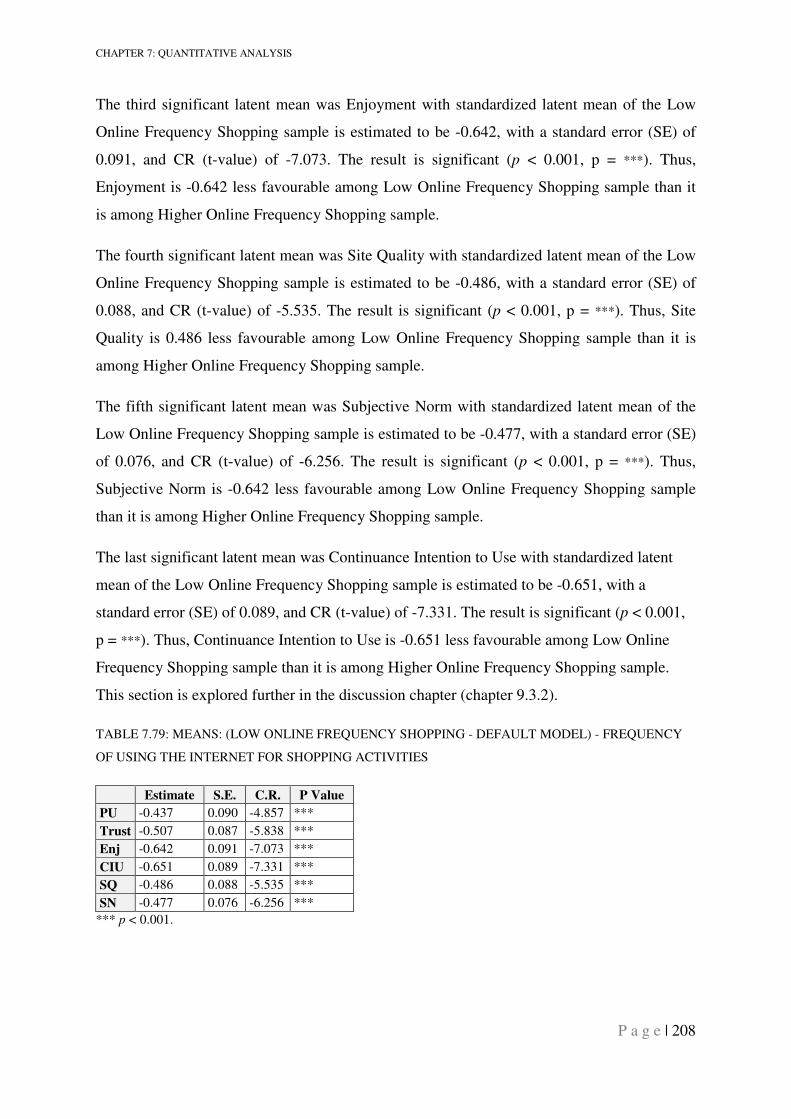
CHAPTER 7: QUANTITATIVE ANALYSIS
P a g e | 208
The third significant latent mean was Enjoyment with standardized latent mean of the Low
Online Frequency Shopping sample is estimated to be -0.642, with a standard error (SE) of
0.091, and CR (t-value) of -7.073. The result is significant (p < 0.001, p = ***). Thus,
Enjoyment is -0.642 less favourable among Low Online Frequency Shopping sample than it
is among Higher Online Frequency Shopping sample.
The fourth significant latent mean was Site Quality with standardized latent mean of the Low
Online Frequency Shopping sample is estimated to be -0.486, with a standard error (SE) of
0.088, and CR (t-value) of -5.535. The result is significant (p < 0.001, p = ***). Thus, Site
Quality is 0.486 less favourable among Low Online Frequency Shopping sample than it is
among Higher Online Frequency Shopping sample.
The fifth significant latent mean was Subjective Norm with standardized latent mean of the
Low Online Frequency Shopping sample is estimated to be -0.477, with a standard error (SE)
of 0.076, and CR (t-value) of -6.256. The result is significant (p < 0.001, p = ***). Thus,
Subjective Norm is -0.642 less favourable among Low Online Frequency Shopping sample
than it is among Higher Online Frequency Shopping sample.
The last significant latent mean was Continuance Intention to Use with standardized latent
mean of the Low Online Frequency Shopping sample is estimated to be -0.651, with a
standard error (SE) of 0.089, and CR (t-value) of -7.331. The result is significant (p < 0.001,
p = ***). Thus, Continuance Intention to Use is -0.651 less favourable among Low Online
Frequency Shopping sample than it is among Higher Online Frequency Shopping sample.
This section is explored further in the discussion chapter (chapter 9.3.2).
TABLE 7.79: MEANS: (LOW ONLINE FREQUENCY SHOPPING - DEFAULT MODEL) - FREQUENCY
OF USING THE INTERNET FOR SHOPPING ACTIVITIES
Estimate S.E. C.R. P Value
PU -0.437 0.090 -4.857 ***
Trust -0.507 0.087 -5.838 ***
Enj -0.642 0.091 -7.073 ***
CIU -0.651 0.089 -7.331 ***
SQ -0.486 0.088 -5.535 ***
SN -0.477 0.076 -6.256 ***
*** p < 0.001.
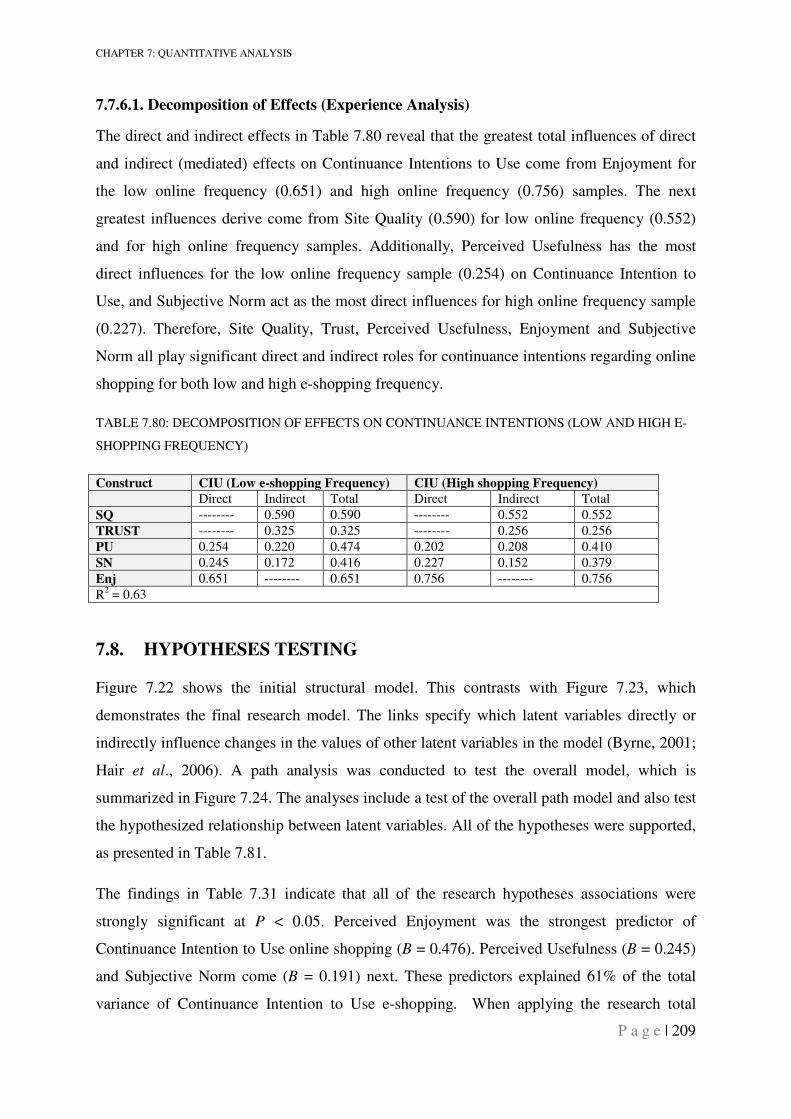
CHAPTER 7: QUANTITATIVE ANALYSIS
P a g e | 209
7.7.6.1. Decomposition of Effects (Experience Analysis)
The direct and indirect effects in Table 7.80 reveal that the greatest total influences of direct
and indirect (mediated) effects on Continuance Intentions to Use come from Enjoyment for
the low online frequency (0.651) and high online frequency (0.756) samples. The next
greatest influences derive come from Site Quality (0.590) for low online frequency (0.552)
and for high online frequency samples. Additionally, Perceived Usefulness has the most
direct influences for the low online frequency sample (0.254) on Continuance Intention to
Use, and Subjective Norm act as the most direct influences for high online frequency sample
(0.227). Therefore, Site Quality, Trust, Perceived Usefulness, Enjoyment and Subjective
Norm all play significant direct and indirect roles for continuance intentions regarding online
shopping for both low and high e-shopping frequency.
TABLE 7.80: DECOMPOSITION OF EFFECTS ON CONTINUANCE INTENTIONS (LOW AND HIGH E-
SHOPPING FREQUENCY)
Construct CIU (Low e-shopping Frequency) CIU (High shopping Frequency)
Direct Indirect Total Direct Indirect Total
SQ -------- 0.590 0.590 -------- 0.552 0.552
TRUST -------- 0.325 0.325 -------- 0.256 0.256
PU 0.254 0.220 0.474 0.202 0.208 0.410
SN 0.245 0.172 0.416 0.227 0.152 0.379
Enj 0.651 -------- 0.651 0.756 -------- 0.756
R2 = 0.63
7.8. HYPOTHESES TESTING
Figure 7.22 shows the initial structural model. This contrasts with Figure 7.23, which
demonstrates the final research model. The links specify which latent variables directly or
indirectly influence changes in the values of other latent variables in the model (Byrne, 2001;
Hair et al., 2006). A path analysis was conducted to test the overall model, which is
summarized in Figure 7.24. The analyses include a test of the overall path model and also test
the hypothesized relationship between latent variables. All of the hypotheses were supported,
as presented in Table 7.81.
The findings in Table 7.31 indicate that all of the research hypotheses associations were
strongly significant at P < 0.05. Perceived Enjoyment was the strongest predictor of
Continuance Intention to Use online shopping (B = 0.476). Perceived Usefulness (B = 0.245)
and Subjective Norm come (B = 0.191) next. These predictors explained 61% of the total
variance of Continuance Intention to Use e-shopping. When applying the research total
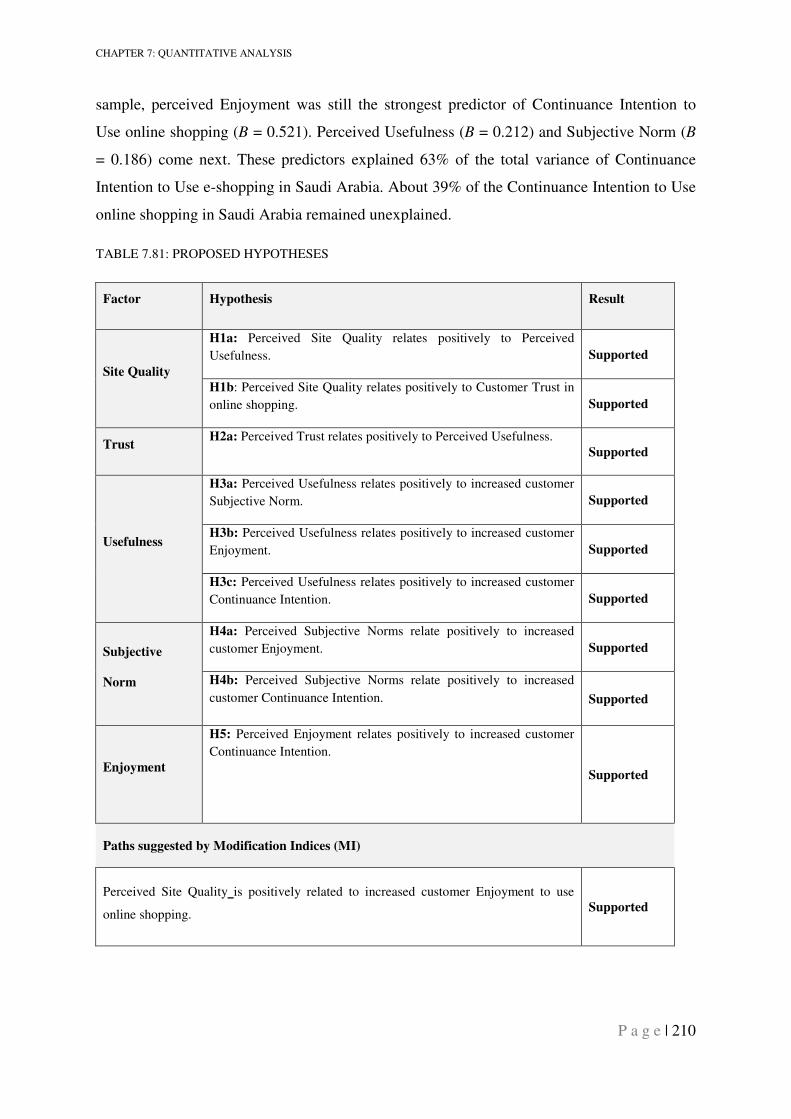
CHAPTER 7: QUANTITATIVE ANALYSIS
P a g e | 210
sample, perceived Enjoyment was still the strongest predictor of Continuance Intention to
Use online shopping (B = 0.521). Perceived Usefulness (B = 0.212) and Subjective Norm (B
= 0.186) come next. These predictors explained 63% of the total variance of Continuance
Intention to Use e-shopping in Saudi Arabia. About 39% of the Continuance Intention to Use
online shopping in Saudi Arabia remained unexplained.
TABLE 7.81: PROPOSED HYPOTHESES
Factor Hypothesis Result
Site Quality
H1a: Perceived Site Quality relates positively to Perceived
Usefulness. Supported
H1b: Perceived Site Quality relates positively to Customer Trust in
online shopping. Supported
Trust H2a: Perceived Trust relates positively to Perceived Usefulness.
Supported
Usefulness
H3a: Perceived Usefulness relates positively to increased customer
Subjective Norm. Supported
H3b: Perceived Usefulness relates positively to increased customer
Enjoyment. Supported
H3c: Perceived Usefulness relates positively to increased customer
Continuance Intention. Supported
Subjective
Norm
H4a: Perceived Subjective Norms relate positively to increased
customer Enjoyment. Supported
H4b: Perceived Subjective Norms relate positively to increased
customer Continuance Intention. Supported
Enjoyment
H5: Perceived Enjoyment relates positively to increased customer
Continuance Intention.
Supported
Paths suggested by Modification Indices (MI)
Perceived Site Quality is positively related to increased customer Enjoyment to use
online shopping. Supported
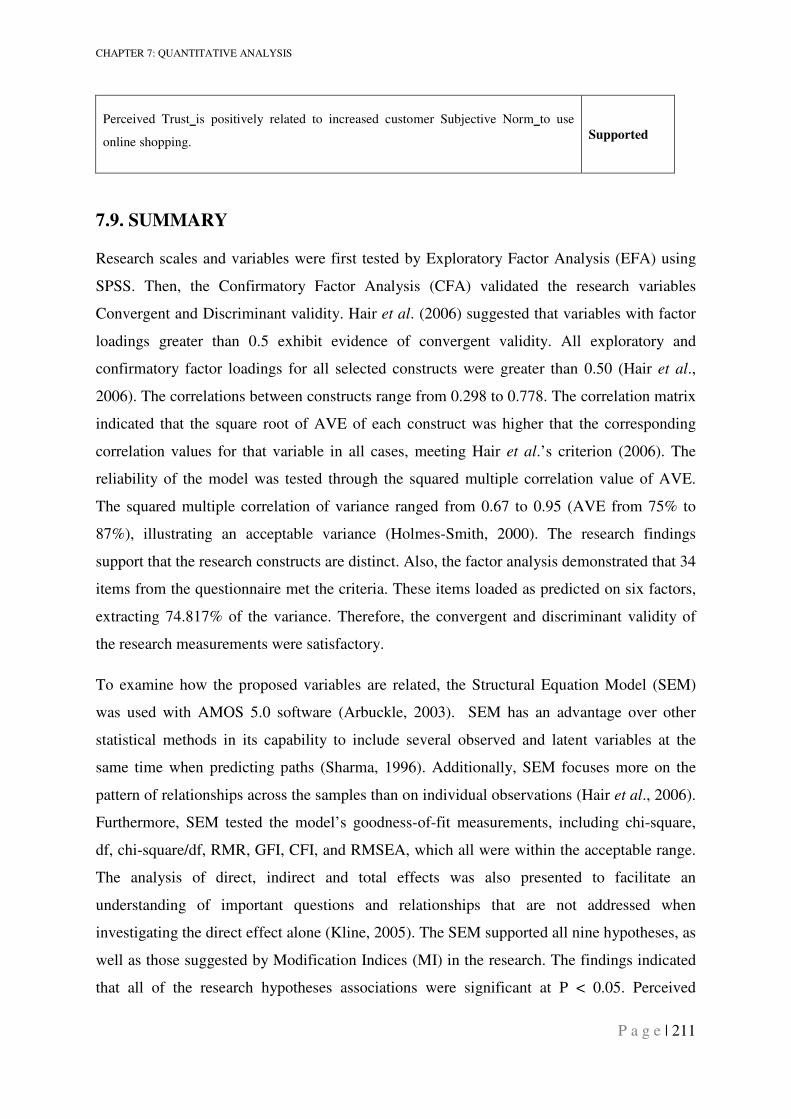
CHAPTER 7: QUANTITATIVE ANALYSIS
P a g e | 211
Perceived Trust is positively related to increased customer Subjective Norm to use
online shopping. Supported
7.9. SUMMARY
Research scales and variables were first tested by Exploratory Factor Analysis (EFA) using
SPSS. Then, the Confirmatory Factor Analysis (CFA) validated the research variables
Convergent and Discriminant validity. Hair et al. (2006) suggested that variables with factor
loadings greater than 0.5 exhibit evidence of convergent validity. All exploratory and
confirmatory factor loadings for all selected constructs were greater than 0.50 (Hair et al.,
2006). The correlations between constructs range from 0.298 to 0.778. The correlation matrix
indicated that the square root of AVE of each construct was higher that the corresponding
correlation values for that variable in all cases, meeting Hair et al.’s criterion (2006). The
reliability of the model was tested through the squared multiple correlation value of AVE.
The squared multiple correlation of variance ranged from 0.67 to 0.95 (AVE from 75% to
87%), illustrating an acceptable variance (Holmes-Smith, 2000). The research findings
support that the research constructs are distinct. Also, the factor analysis demonstrated that 34
items from the questionnaire met the criteria. These items loaded as predicted on six factors,
extracting 74.817% of the variance. Therefore, the convergent and discriminant validity of
the research measurements were satisfactory.
To examine how the proposed variables are related, the Structural Equation Model (SEM)
was used with AMOS 5.0 software (Arbuckle, 2003). SEM has an advantage over other
statistical methods in its capability to include several observed and latent variables at the
same time when predicting paths (Sharma, 1996). Additionally, SEM focuses more on the
pattern of relationships across the samples than on individual observations (Hair et al., 2006).
Furthermore, SEM tested the model’s goodness-of-fit measurements, including chi-square,
df, chi-square/df, RMR, GFI, CFI, and RMSEA, which all were within the acceptable range.
The analysis of direct, indirect and total effects was also presented to facilitate an
understanding of important questions and relationships that are not addressed when
investigating the direct effect alone (Kline, 2005). The SEM supported all nine hypotheses, as
well as those suggested by Modification Indices (MI) in the research. The findings indicated
that all of the research hypotheses associations were significant at P < 0.05. Perceived
CHAPTER 7: QUANTITATIVE ANALYSIS
P a g e | 212
Enjoyment was the strongest predictor of Continuance Intention to Use online shopping (B =
0.476). Perceived Usefulness (B = 0.245) and Subjective Norm come (B = 0.191) next. These
predictors explained 61% of the total variance of Continuance Intention to Use e-shopping.
Finally, to minimize the possibility of research biases in cross-national, cross-cultural, and
group analysis among constructs relationships (paths) that may arise from the data strength
and weakness when applied to every construct’s path, intensive invariance analysis was
conducted to compare behaviour among gender, age, education, regions, experience and
spending among internet shopping in Saudi Arabia.
The next chapter will explain the findings of informal interviews, supported by semi-
structured questionnaires, illustrating how businesses view online shopping in Saudi Arabia.
CHAPTER 8: QUALITATIVE ILLUSTRATION CASE - E-RETAILING: THE CASE OF SAUDI ARABIA
P a g e | 213
CHAPTER 8: QUALITATIVE ILLUSTRATION CASE - E-
RETAILING: THE CASE OF SAUDI ARABIA
8.1. INTRODUCTION
This research uses a combination of both quantitative method, as main research method, and
qualitative method, as a complimentary method. The goal in applying both methods is to
overcome any weaknesses and maximize the strengths of the quantitative and qualitative
methods, as described by Merriam (1998) as the best way to conduct a research and case
study.
When conducting a quantitative method, the participants have more freedom to describe what
is important to their organizations or themselves (Patton, 1987). Patton encourages
researchers to determine quantitative findings at a better and deeper understanding by
conducting a case study using qualitative research methods, because “case studies become
particularly useful where one needs to understand some particular problem or situation in
great depth, and where one can identify cases rich in information (rich in the sense that a
great deal can be learned from a few exemplars of phenomenon in question)” (Patton, 1987).
As an additional approach in this research, the case study allows for a means to assess and
examine the applicability of the studied variables and explore any potential benefits of and
obstacles to e-shopping in the Saudi Market. Because e-shopping is considered a new and
modern way of shopping, case studies are appropriate; they are effective methodological
approaches when the researcher wants to explore the “how” and “why” questions (Yin,
2003b). This approach will help clarify the meaning of the research question from the
provider prospective.
Managers and staff from relevant marketing and IT departments, whose knowledge and
experience relate to this research, were selected as key informants. They represent four
leading companies and one government authority of e-commence and Internet in Saudi
Arabia. In addition, key personnel in a small number of selected companies were approached
through personal contacts for interview dates and times (Ritchie and Lewis, 2003).
Companies’ documents, observations, and structured interviews with related employees -
including managers of marketing, e-marketing, and IT - provide information for the case
studies. It is worth mentioning that the interviews were conducted to collect information
CHAPTER 8: QUALITATIVE ILLUSTRATION CASE - E-RETAILING: THE CASE OF SAUDI ARABIA
P a g e | 214
about e-commerce and e-shopping in Saudi Arabia; the company’s current and future e-
shopping vision; the benefits of e-shopping to the company; and obstacles in the market.
Subject to the participants’ time restraints, the qualitative research covered the information
collected from the semi-structured interview, face-to-face discussions, and companies’
previous surveys and documents.
The criteria used when selecting the five Saudi Arabian participated companies are:
• The level of Internet services provided by the company’s Internet shopping Website.
• Current and future vision of the company for online shopping.
• The interest of the company in participating in this research and any future related
research.
This chapter starts with brief background information about the companies, followed by the
results gained from the semi-structured interview questionnaires. Next, the key points arising
from the face-to-face interview are outlined. The chapter concludes with a brief summary of
the findings.
8.2. PARTICIPATING COMPANIES
8.2.1. Communications and Information Technology Commission
The Communications and Information Technology Commission (CITC) in Saudi Arabia
(www.citc.gov.sa) was established as the Saudi Communications Commission in 2002. The
name changed after the Commission was entrusted with new tasks relating to information
technology, becoming the Communications and Information Technology Commission
(CITC) in 2005.
The vision statement of the Commission is to provide "universally available, high quality and
affordable communications and information technology services". Thus, it is very important
for the organization to keep pace with the major developments in the field of
telecommunications on the international level, which often lead to regulatory changes in the
competitive and investment environment of this sector, as well as recognize how these
developments create fundamental changes in the infrastructure and regulation of the
telecommunications sector in Saudi Arabia.
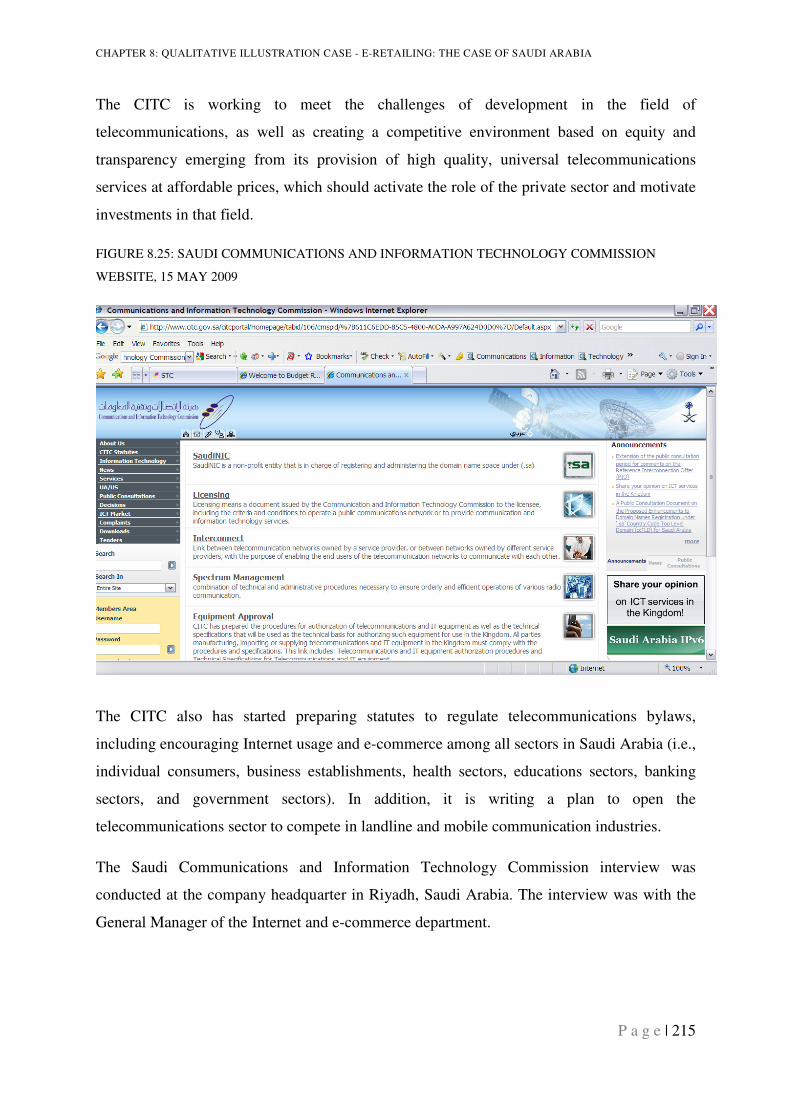
CHAPTER 8: QUALITATIVE ILLUSTRATION CASE - E-RETAILING: THE CASE OF SAUDI ARABIA
P a g e | 215
The CITC is working to meet the challenges of development in the field of
telecommunications, as well as creating a competitive environment based on equity and
transparency emerging from its provision of high quality, universal telecommunications
services at affordable prices, which should activate the role of the private sector and motivate
investments in that field.
FIGURE 8.25: SAUDI COMMUNICATIONS AND INFORMATION TECHNOLOGY COMMISSION
WEBSITE, 15 MAY 2009
The CITC also has started preparing statutes to regulate telecommunications bylaws,
including encouraging Internet usage and e-commerce among all sectors in Saudi Arabia (i.e.,
individual consumers, business establishments, health sectors, educations sectors, banking
sectors, and government sectors). In addition, it is writing a plan to open the
telecommunications sector to compete in landline and mobile communication industries.
The Saudi Communications and Information Technology Commission interview was
conducted at the company headquarter in Riyadh, Saudi Arabia. The interview was with the
General Manager of the Internet and e-commerce department.
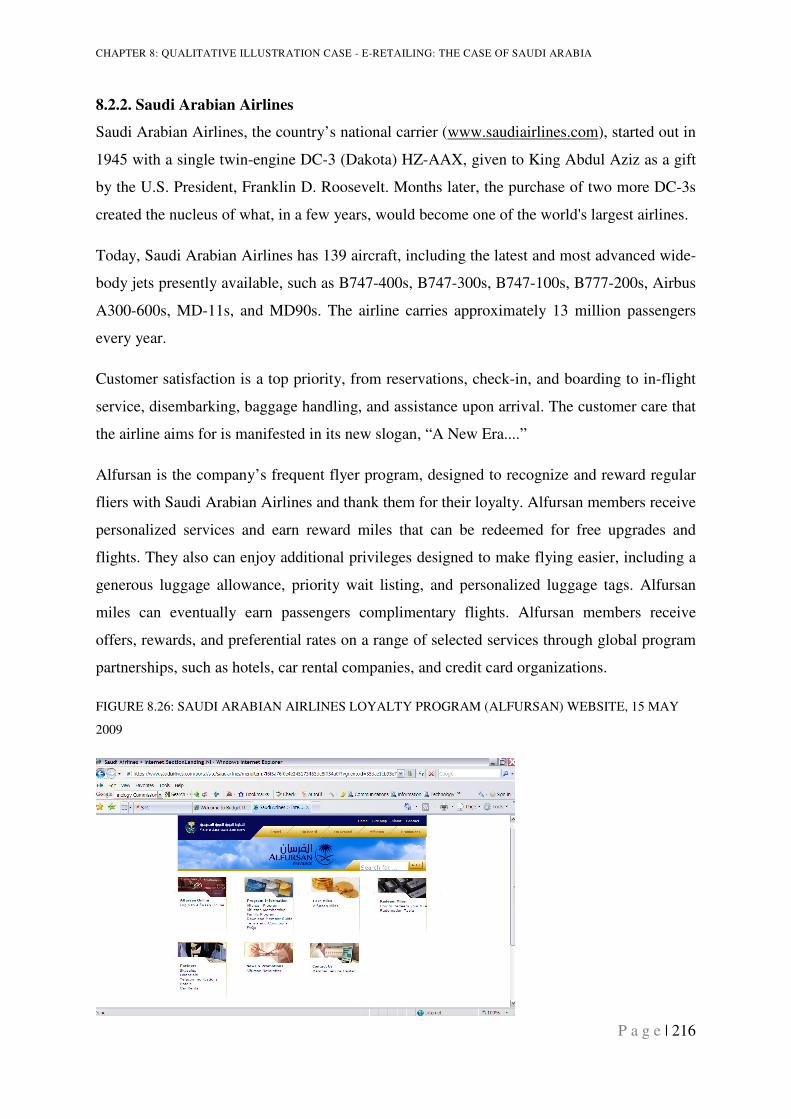
CHAPTER 8: QUALITATIVE ILLUSTRATION CASE - E-RETAILING: THE CASE OF SAUDI ARABIA
P a g e | 216
8.2.2. Saudi Arabian Airlines
Saudi Arabian Airlines, the country’s national carrier (www.saudiairlines.com), started out in
1945 with a single twin-engine DC-3 (Dakota) HZ-AAX, given to King Abdul Aziz as a gift
by the U.S. President, Franklin D. Roosevelt. Months later, the purchase of two more DC-3s
created the nucleus of what, in a few years, would become one of the world's largest airlines.
Today, Saudi Arabian Airlines has 139 aircraft, including the latest and most advanced wide-
body jets presently available, such as B747-400s, B747-300s, B747-100s, B777-200s, Airbus
A300-600s, MD-11s, and MD90s. The airline carries approximately 13 million passengers
every year.
Customer satisfaction is a top priority, from reservations, check-in, and boarding to in-flight
service, disembarking, baggage handling, and assistance upon arrival. The customer care that
the airline aims for is manifested in its new slogan, “A New Era....”
Alfursan is the company’s frequent flyer program, designed to recognize and reward regular
fliers with Saudi Arabian Airlines and thank them for their loyalty. Alfursan members receive
personalized services and earn reward miles that can be redeemed for free upgrades and
flights. They also can enjoy additional privileges designed to make flying easier, including a
generous luggage allowance, priority wait listing, and personalized luggage tags. Alfursan
miles can eventually earn passengers complimentary flights. Alfursan members receive
offers, rewards, and preferential rates on a range of selected services through global program
partnerships, such as hotels, car rental companies, and credit card organizations.
FIGURE 8.26: SAUDI ARABIAN AIRLINES LOYALTY PROGRAM (ALFURSAN) WEBSITE, 15 MAY
2009
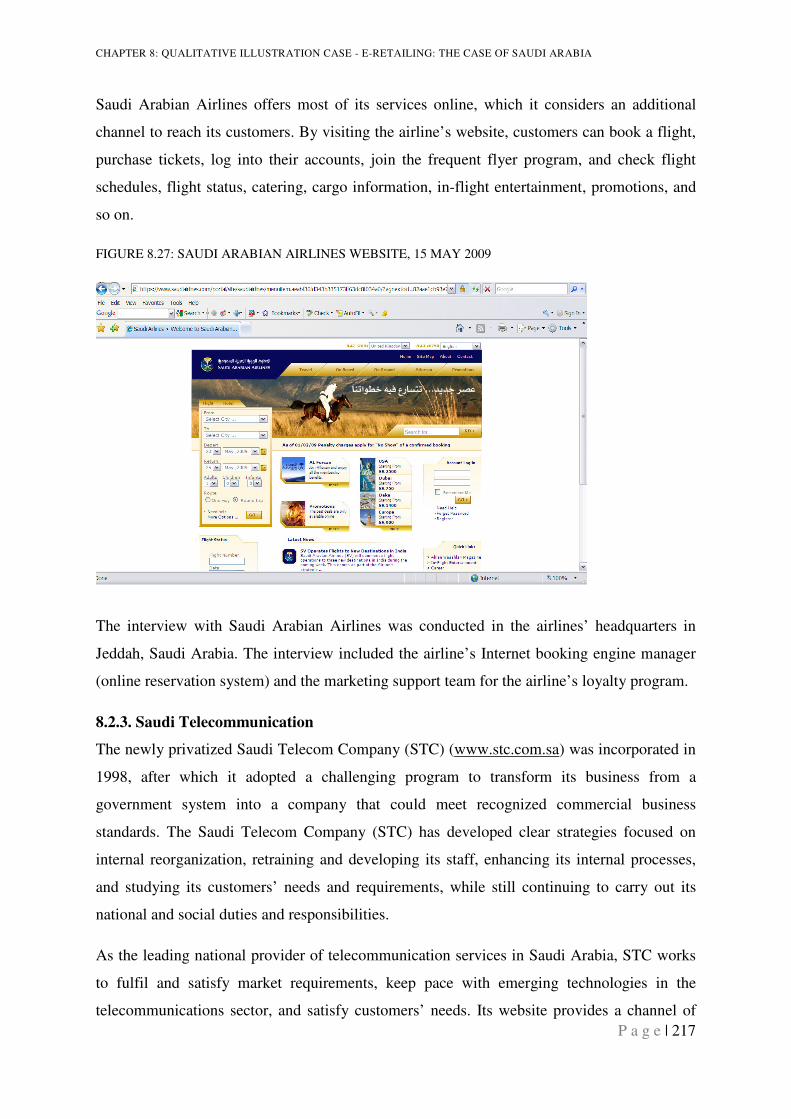
CHAPTER 8: QUALITATIVE ILLUSTRATION CASE - E-RETAILING: THE CASE OF SAUDI ARABIA
P a g e | 217
Saudi Arabian Airlines offers most of its services online, which it considers an additional
channel to reach its customers. By visiting the airline’s website, customers can book a flight,
purchase tickets, log into their accounts, join the frequent flyer program, and check flight
schedules, flight status, catering, cargo information, in-flight entertainment, promotions, and
so on.
FIGURE 8.27: SAUDI ARABIAN AIRLINES WEBSITE, 15 MAY 2009
The interview with Saudi Arabian Airlines was conducted in the airlines’ headquarters in
Jeddah, Saudi Arabia. The interview included the airline’s Internet booking engine manager
(online reservation system) and the marketing support team for the airline’s loyalty program.
8.2.3. Saudi Telecommunication
The newly privatized Saudi Telecom Company (STC) (www.stc.com.sa) was incorporated in
1998, after which it adopted a challenging program to transform its business from a
government system into a company that could meet recognized commercial business
standards. The Saudi Telecom Company (STC) has developed clear strategies focused on
internal reorganization, retraining and developing its staff, enhancing its internal processes,
and studying its customers’ needs and requirements, while still continuing to carry out its
national and social duties and responsibilities.
As the leading national provider of telecommunication services in Saudi Arabia, STC works
to fulfil and satisfy market requirements, keep pace with emerging technologies in the
telecommunications sector, and satisfy customers’ needs. Its website provides a channel of
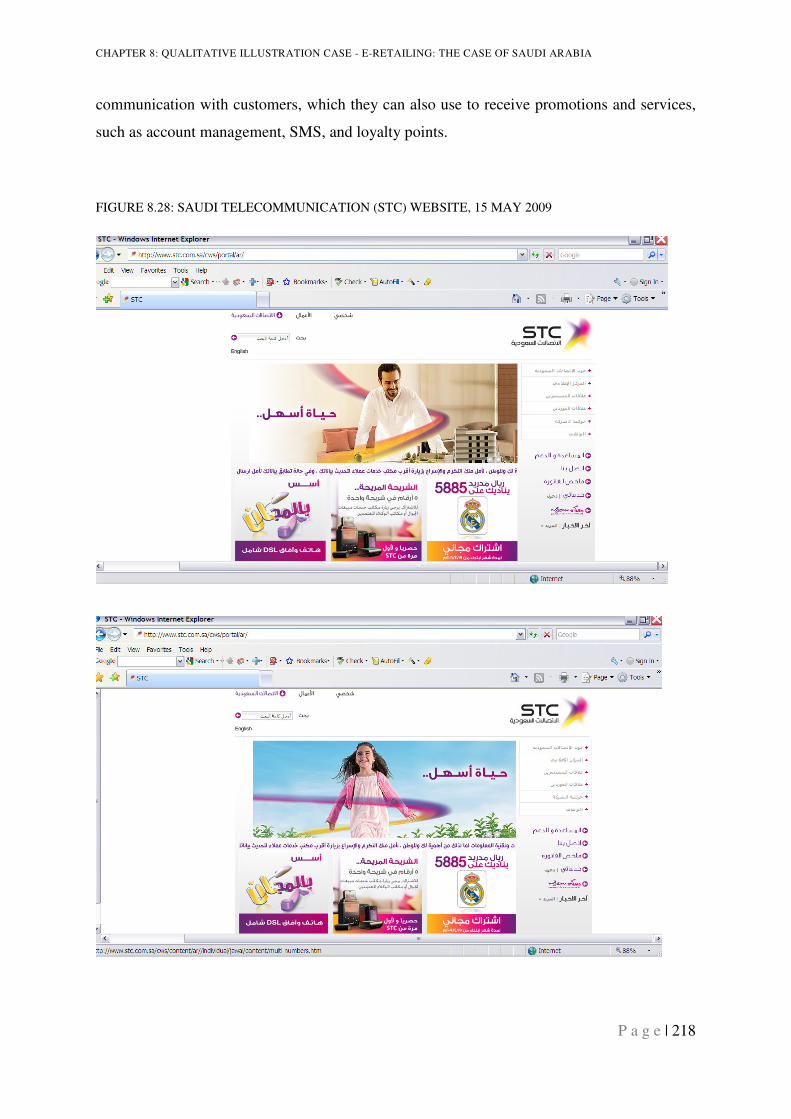
CHAPTER 8: QUALITATIVE ILLUSTRATION CASE - E-RETAILING: THE CASE OF SAUDI ARABIA
P a g e | 218
communication with customers, which they can also use to receive promotions and services,
such as account management, SMS, and loyalty points.
FIGURE 8.28: SAUDI TELECOMMUNICATION (STC) WEBSITE, 15 MAY 2009

CHAPTER 8: QUALITATIVE ILLUSTRATION CASE - E-RETAILING: THE CASE OF SAUDI ARABIA
P a g e | 219
In addition, STC recently adopted its FORWARD Strategy, which aims to support and
reinforce its competitive position. With this strategy, STC hopes to enhance its customer-
centric culture in all its business fields. This culture has been reflected in the organizational
design of the company, which comprises a Corporate Centre, multiple Functional Units, and
four Key Business Units focused on the Key STC Customer Categories:
• Personal BU
• Home BU
• Enterprise BU
• Wholesale BU
In the last few years, STC has extended beyond its local borders into international markets,
forming a network of businesses and investments with various Gulf Cooperation Council
countries (Bahrain, Kuwait, Oman, Qatar, and the United Arab Emirates), Asia, and Africa.
The company has footprints in Kuwait, India, Indonesia, Malaysia, Turkey, and South Africa.
Therefore, STC serves more customers, and seeks to expand further internationally through
potential investments in line with its FORWARD Strategy.
The STC interview, conducted at the company headquarters in Riyadh, Saudi Arabia,
included the marketing loyalty manager and the customer satisfaction support team.
8.2.4. Jarir Bookstore
The Jarir Bookstore chain (www.jarirbookstore.com) is the result of the effort and
commitment of the visionary Al-Agil brothers, who started the project in 1979 with a small
store located on Jarir Street, in Riyadh, Saudi Arabia. This single store specialized in the
supply of office and school products to meet customers' demand with high levels of
satisfaction. Today Jarir, with its 22 stores, three of which are international (Qatar, UAE, and
Kuwait), is recognized as the market leader in office and school supplies, IT products, and
books. The Jarir Bookstore chain is highly respected in Saudi Arabia, among both customers
and the wider business community. The company is led by a strong management team with
effective leadership skills, which respects individual initiative and provides opportunities for
personal growth to employees. The company achieves this position through the dedication,
commitment, and professionalism of its employees.
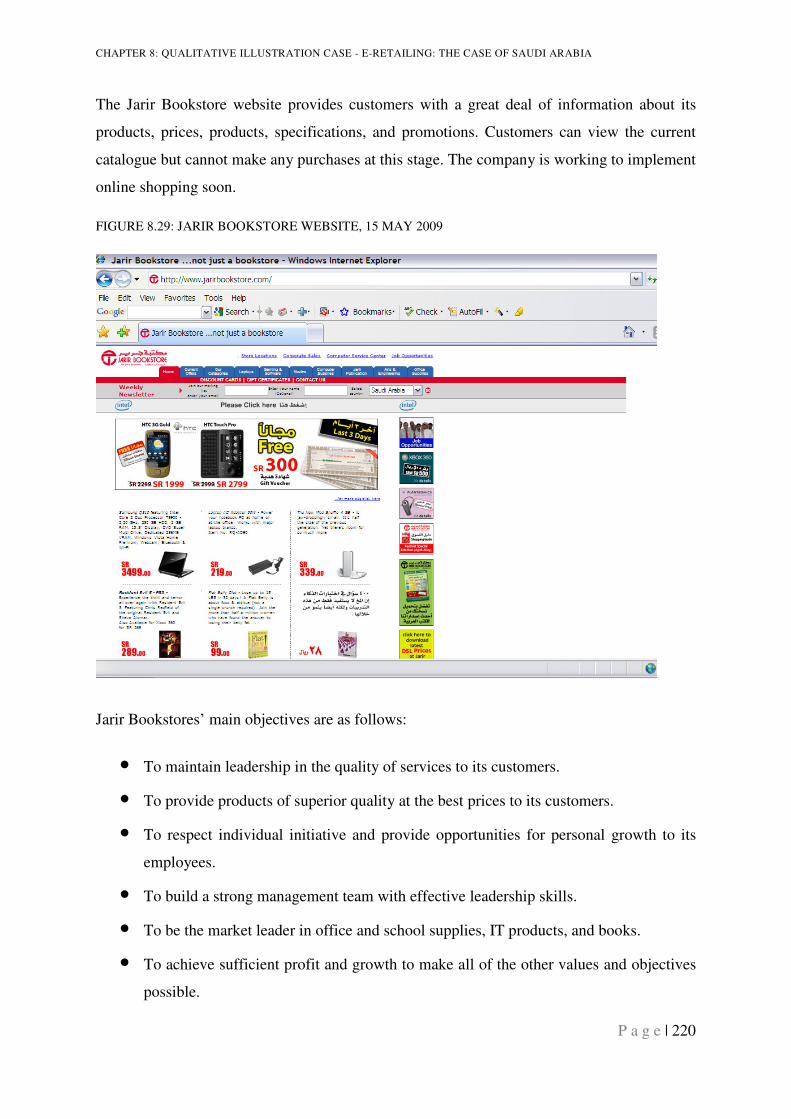
CHAPTER 8: QUALITATIVE ILLUSTRATION CASE - E-RETAILING: THE CASE OF SAUDI ARABIA
P a g e | 220
The Jarir Bookstore website provides customers with a great deal of information about its
products, prices, products, specifications, and promotions. Customers can view the current
catalogue but cannot make any purchases at this stage. The company is working to implement
online shopping soon.
FIGURE 8.29: JARIR BOOKSTORE WEBSITE, 15 MAY 2009
Jarir Bookstores’ main objectives are as follows:
• To maintain leadership in the quality of services to its customers.
• To provide products of superior quality at the best prices to its customers.
• To respect individual initiative and provide opportunities for personal growth to its
employees.
• To build a strong management team with effective leadership skills.
• To be the market leader in office and school supplies, IT products, and books.
• To achieve sufficient profit and growth to make all of the other values and objectives
possible.

CHAPTER 8: QUALITATIVE ILLUSTRATION CASE - E-RETAILING: THE CASE OF SAUDI ARABIA
P a g e | 221
The interview with Jarir Bookstore was conducted at the company headquarters in Riyadh,
Saudi Arabia. The interviewees were the general manager, marketing manager, and e-
marketing support team.
8.2.5. Budget Car Hire, Saudi Arabia
Unitrans Budget (www.budgetsaudi.com) is the sole Saudi franchisee of Budget
International, one of the largest car rental companies in the world, with more than 3200 rental
offices and a well-established brand that operates throughout the world. Unitrans Budget has
been operating since 1978 and is the largest car rental company in the Middle East, South
East Asia, and Africa. Its complete transportation solutions rely on a fleet of more than
14,500 vehicles, accessed through 80 rental offices in Saudi Arabia, which employ
approximately 1000 people. The company head office is in Jeddah, with regional offices in
Riyadh and Dammam, and branches in Jubail, Qassim, Buraidah, Yanbu, Makkah, Medinah
Munawarah, Abha, Taif, Rabigh, and Tabuk.
Unitrans Budget operates with the largest and the most modern fleet of luxury, 4x4, full size,
intermediate, compact, and economy cars. The fleet hosts vehicles of many different makes,
such as Mercedes, BMW, Ford, GM, Mercury, Volvo, Nissan, Toyota, Honda, and Mazda,
making it the most diverse fleet in Saudi Arabia.
Services provided by Budget include short-term rentals, long-term rentals, car sales,
chauffeurs, crop rates, Hajj and Umrah services, lodging and driving, premier limousine
services, cross-border services, and so on. In addition, Budget Express, the company’s loyalty
program, offers members quicker processing times, preferential rates, priority reservation,
and tailor-made customer programs.
The Budget Saudi Arabia website provides customers with information about the cars, car
types, prices, locations, details, specifications, and promotions. Customers can book and pay
for cars though the website. The company is working to enhance its online services to provide
better support and, thus, satisfy its online customers.
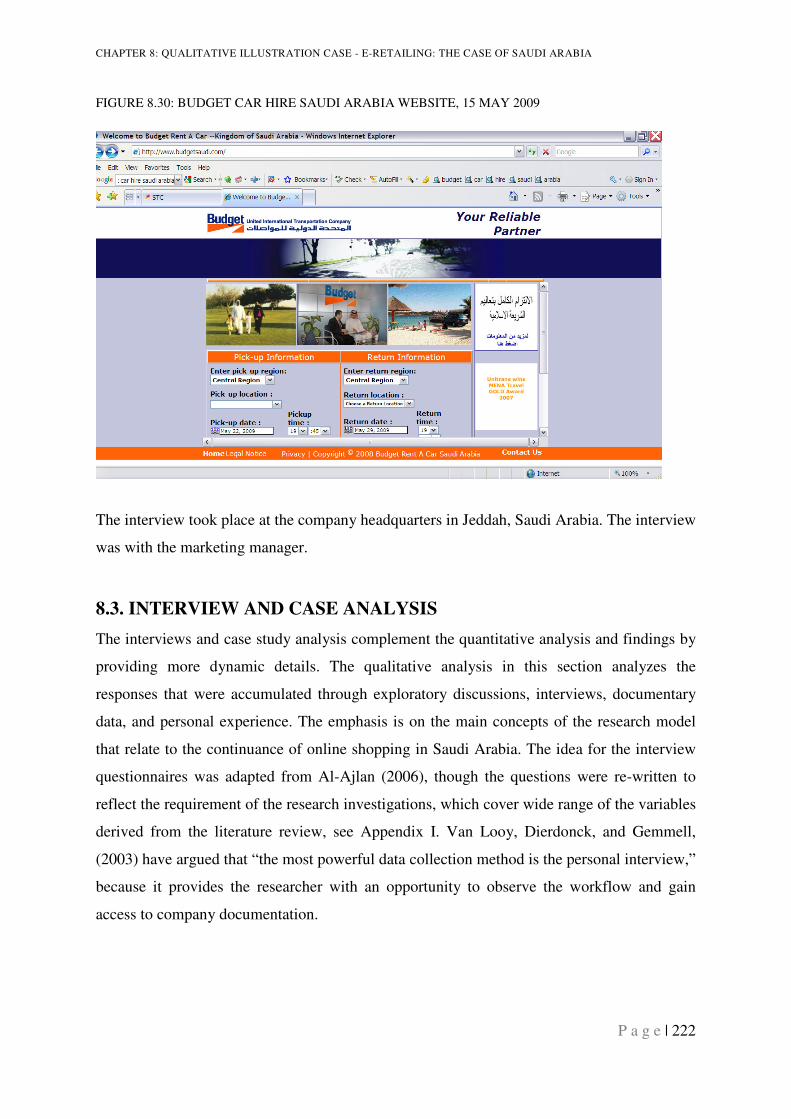
CHAPTER 8: QUALITATIVE ILLUSTRATION CASE - E-RETAILING: THE CASE OF SAUDI ARABIA
P a g e | 222
FIGURE 8.30: BUDGET CAR HIRE SAUDI ARABIA WEBSITE, 15 MAY 2009
The interview took place at the company headquarters in Jeddah, Saudi Arabia. The interview
was with the marketing manager.
8.3. INTERVIEW AND CASE ANALYSIS
The interviews and case study analysis complement the quantitative analysis and findings by
providing more dynamic details. The qualitative analysis in this section analyzes the
responses that were accumulated through exploratory discussions, interviews, documentary
data, and personal experience. The emphasis is on the main concepts of the research model
that relate to the continuance of online shopping in Saudi Arabia. The idea for the interview
questionnaires was adapted from Al-Ajlan (2006), though the questions were re-written to
reflect the requirement of the research investigations, which cover wide range of the variables
derived from the literature review, see Appendix I. Van Looy, Dierdonck, and Gemmell,
(2003) have argued that “the most powerful data collection method is the personal interview,”
because it provides the researcher with an opportunity to observe the workflow and gain
access to company documentation.
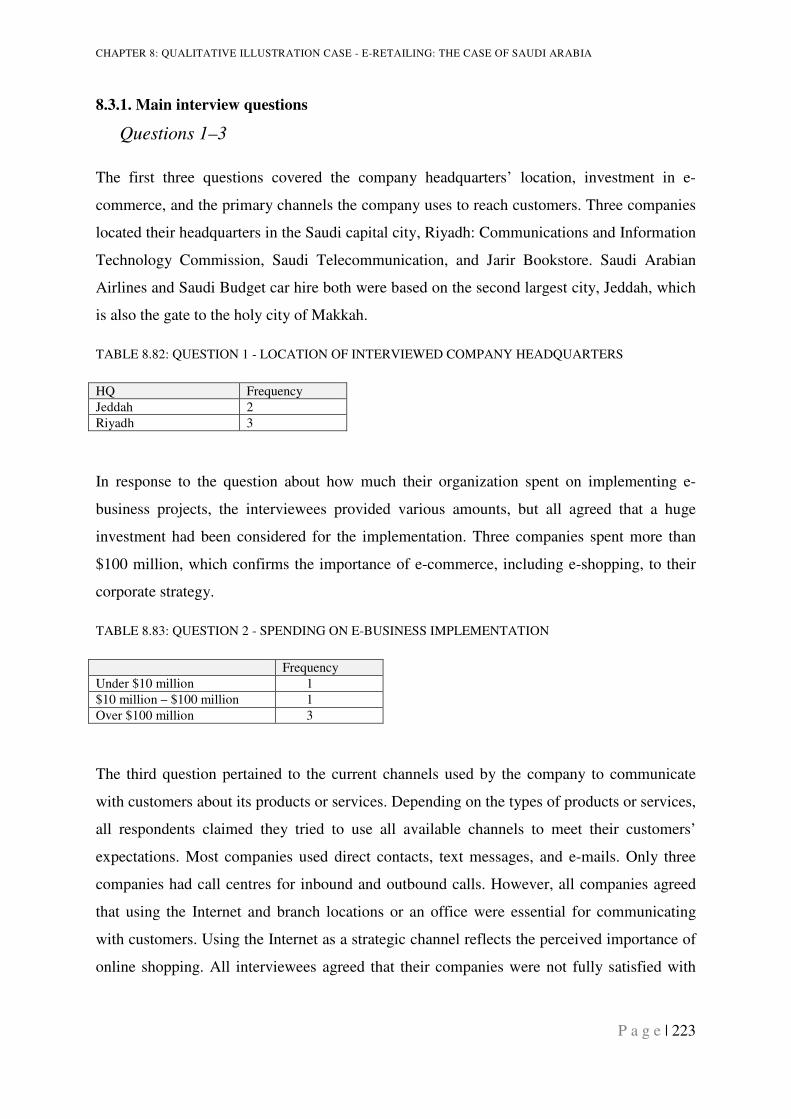
CHAPTER 8: QUALITATIVE ILLUSTRATION CASE - E-RETAILING: THE CASE OF SAUDI ARABIA
P a g e | 223
8.3.1. Main interview questions
Questions 1–3
The first three questions covered the company headquarters’ location, investment in e-
commerce, and the primary channels the company uses to reach customers. Three companies
located their headquarters in the Saudi capital city, Riyadh: Communications and Information
Technology Commission, Saudi Telecommunication, and Jarir Bookstore. Saudi Arabian
Airlines and Saudi Budget car hire both were based on the second largest city, Jeddah, which
is also the gate to the holy city of Makkah.
TABLE 8.82: QUESTION 1 - LOCATION OF INTERVIEWED COMPANY HEADQUARTERS
HQ Frequency
Jeddah 2
Riyadh 3
In response to the question about how much their organization spent on implementing e-
business projects, the interviewees provided various amounts, but all agreed that a huge
investment had been considered for the implementation. Three companies spent more than
$100 million, which confirms the importance of e-commerce, including e-shopping, to their
corporate strategy.
TABLE 8.83: QUESTION 2 - SPENDING ON E-BUSINESS IMPLEMENTATION
Frequency
Under $10 million 1
$10 million – $100 million 1
Over $100 million 3
The third question pertained to the current channels used by the company to communicate
with customers about its products or services. Depending on the types of products or services,
all respondents claimed they tried to use all available channels to meet their customers’
expectations. Most companies used direct contacts, text messages, and e-mails. Only three
companies had call centres for inbound and outbound calls. However, all companies agreed
that using the Internet and branch locations or an office were essential for communicating
with customers. Using the Internet as a strategic channel reflects the perceived importance of
online shopping. All interviewees agreed that their companies were not fully satisfied with
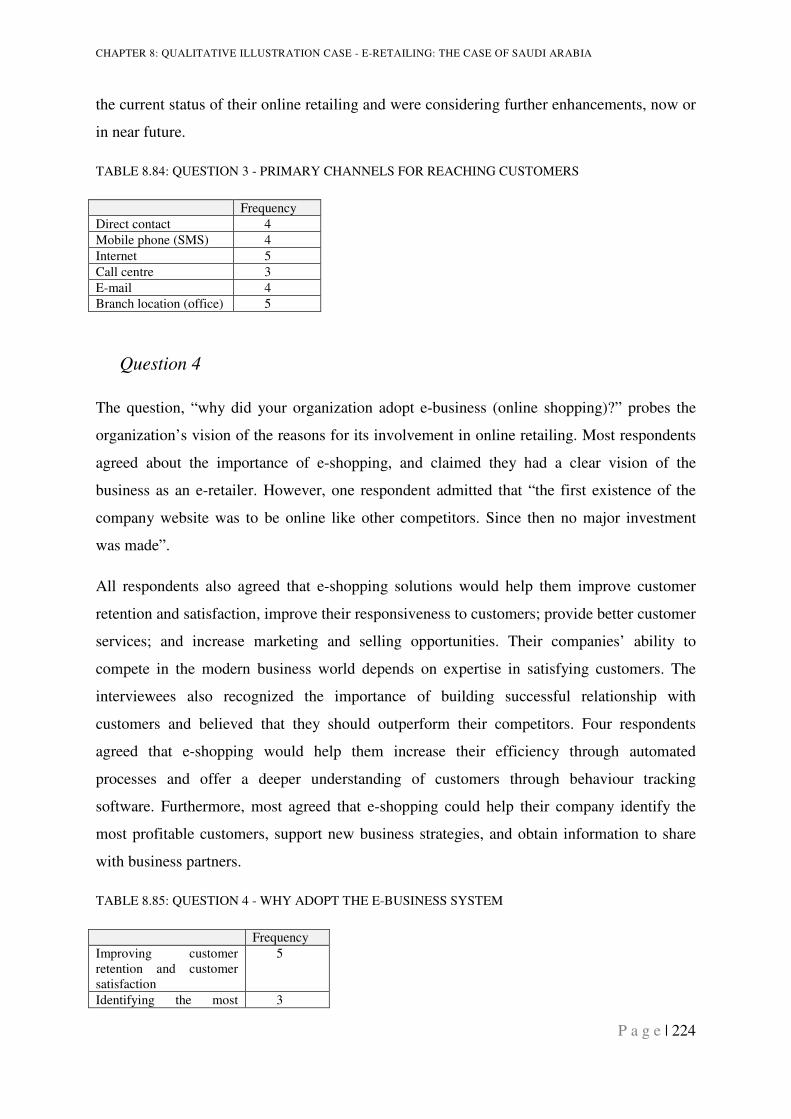
CHAPTER 8: QUALITATIVE ILLUSTRATION CASE - E-RETAILING: THE CASE OF SAUDI ARABIA
P a g e | 224
the current status of their online retailing and were considering further enhancements, now or
in near future.
TABLE 8.84: QUESTION 3 - PRIMARY CHANNELS FOR REACHING CUSTOMERS
Frequency
Direct contact 4
Mobile phone (SMS) 4
Internet 5
Call centre 3
E-mail 4
Branch location (office) 5
Question 4
The question, “why did your organization adopt e-business (online shopping)?” probes the
organization’s vision of the reasons for its involvement in online retailing. Most respondents
agreed about the importance of e-shopping, and claimed they had a clear vision of the
business as an e-retailer. However, one respondent admitted that “the first existence of the
company website was to be online like other competitors. Since then no major investment
was made”.
All respondents also agreed that e-shopping solutions would help them improve customer
retention and satisfaction, improve their responsiveness to customers; provide better customer
services; and increase marketing and selling opportunities. Their companies’ ability to
compete in the modern business world depends on expertise in satisfying customers. The
interviewees also recognized the importance of building successful relationship with
customers and believed that they should outperform their competitors. Four respondents
agreed that e-shopping would help them increase their efficiency through automated
processes and offer a deeper understanding of customers through behaviour tracking
software. Furthermore, most agreed that e-shopping could help their company identify the
most profitable customers, support new business strategies, and obtain information to share
with business partners.
TABLE 8.85: QUESTION 4 - WHY ADOPT THE E-BUSINESS SYSTEM
Frequency
Improving customer retention and customer satisfaction
5
Identifying the most 3
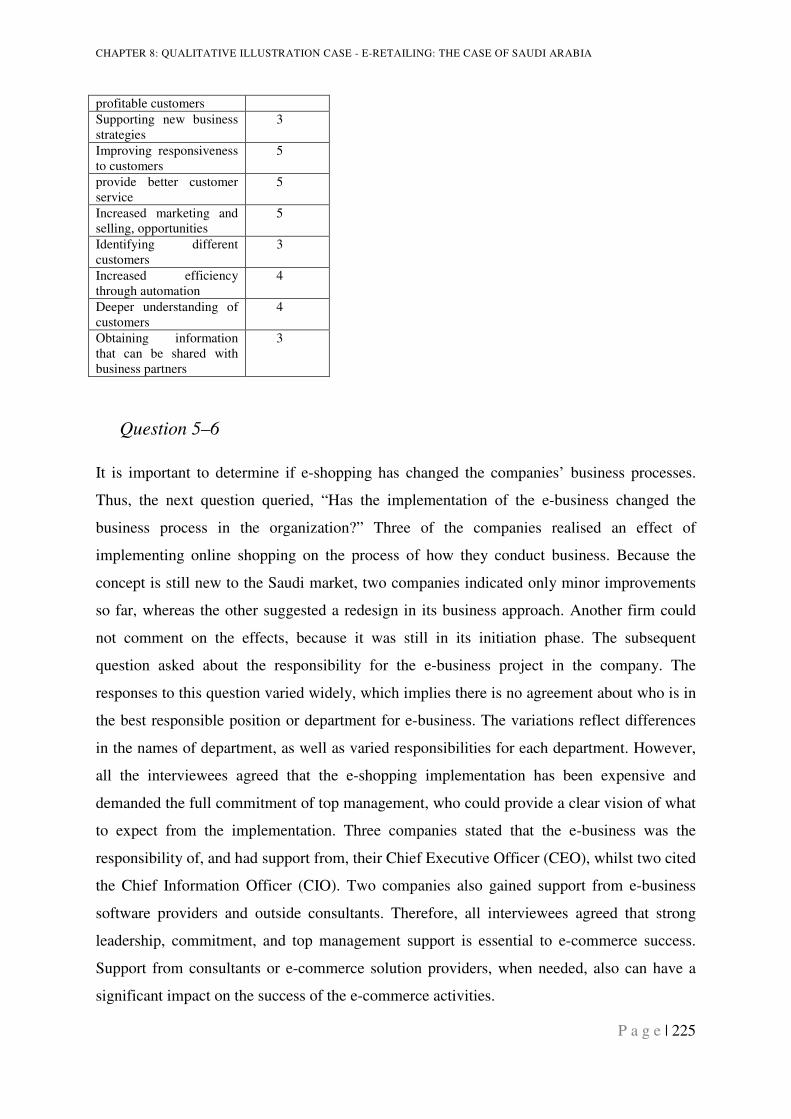
CHAPTER 8: QUALITATIVE ILLUSTRATION CASE - E-RETAILING: THE CASE OF SAUDI ARABIA
P a g e | 225
profitable customers
Supporting new business strategies
3
Improving responsiveness to customers
5
provide better customer service
5
Increased marketing and selling, opportunities
5
Identifying different customers
3
Increased efficiency through automation
4
Deeper understanding of customers
4
Obtaining information that can be shared with business partners
3
Question 5–6
It is important to determine if e-shopping has changed the companies’ business processes.
Thus, the next question queried, “Has the implementation of the e-business changed the
business process in the organization?” Three of the companies realised an effect of
implementing online shopping on the process of how they conduct business. Because the
concept is still new to the Saudi market, two companies indicated only minor improvements
so far, whereas the other suggested a redesign in its business approach. Another firm could
not comment on the effects, because it was still in its initiation phase. The subsequent
question asked about the responsibility for the e-business project in the company. The
responses to this question varied widely, which implies there is no agreement about who is in
the best responsible position or department for e-business. The variations reflect differences
in the names of department, as well as varied responsibilities for each department. However,
all the interviewees agreed that the e-shopping implementation has been expensive and
demanded the full commitment of top management, who could provide a clear vision of what
to expect from the implementation. Three companies stated that the e-business was the
responsibility of, and had support from, their Chief Executive Officer (CEO), whilst two cited
the Chief Information Officer (CIO). Two companies also gained support from e-business
software providers and outside consultants. Therefore, all interviewees agreed that strong
leadership, commitment, and top management support is essential to e-commerce success.
Support from consultants or e-commerce solution providers, when needed, also can have a
significant impact on the success of the e-commerce activities.
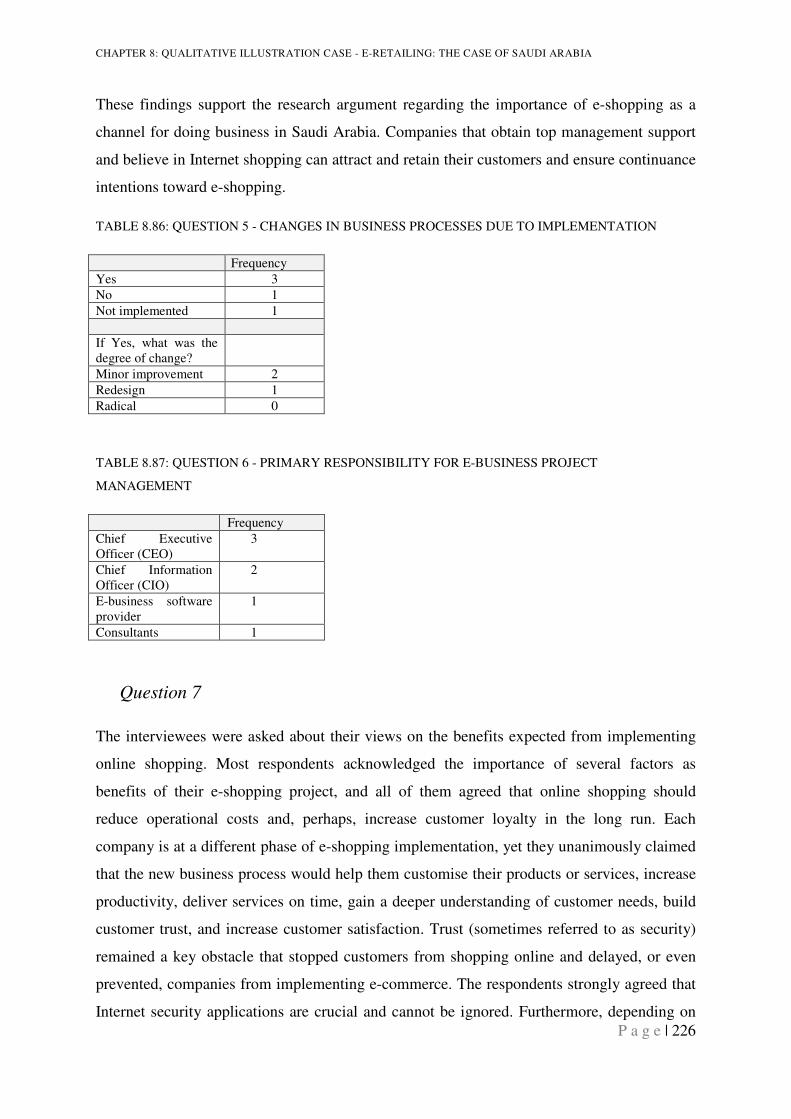
CHAPTER 8: QUALITATIVE ILLUSTRATION CASE - E-RETAILING: THE CASE OF SAUDI ARABIA
P a g e | 226
These findings support the research argument regarding the importance of e-shopping as a
channel for doing business in Saudi Arabia. Companies that obtain top management support
and believe in Internet shopping can attract and retain their customers and ensure continuance
intentions toward e-shopping.
TABLE 8.86: QUESTION 5 - CHANGES IN BUSINESS PROCESSES DUE TO IMPLEMENTATION
Frequency
Yes 3
No 1
Not implemented 1
If Yes, what was the degree of change?
Minor improvement 2
Redesign 1
Radical 0
TABLE 8.87: QUESTION 6 - PRIMARY RESPONSIBILITY FOR E-BUSINESS PROJECT
MANAGEMENT
Frequency
Chief Executive Officer (CEO)
3
Chief Information Officer (CIO)
2
E-business software provider
1
Consultants 1
Question 7
The interviewees were asked about their views on the benefits expected from implementing
online shopping. Most respondents acknowledged the importance of several factors as
benefits of their e-shopping project, and all of them agreed that online shopping should
reduce operational costs and, perhaps, increase customer loyalty in the long run. Each
company is at a different phase of e-shopping implementation, yet they unanimously claimed
that the new business process would help them customise their products or services, increase
productivity, deliver services on time, gain a deeper understanding of customer needs, build
customer trust, and increase customer satisfaction. Trust (sometimes referred to as security)
remained a key obstacle that stopped customers from shopping online and delayed, or even
prevented, companies from implementing e-commerce. The respondents strongly agreed that
Internet security applications are crucial and cannot be ignored. Furthermore, depending on
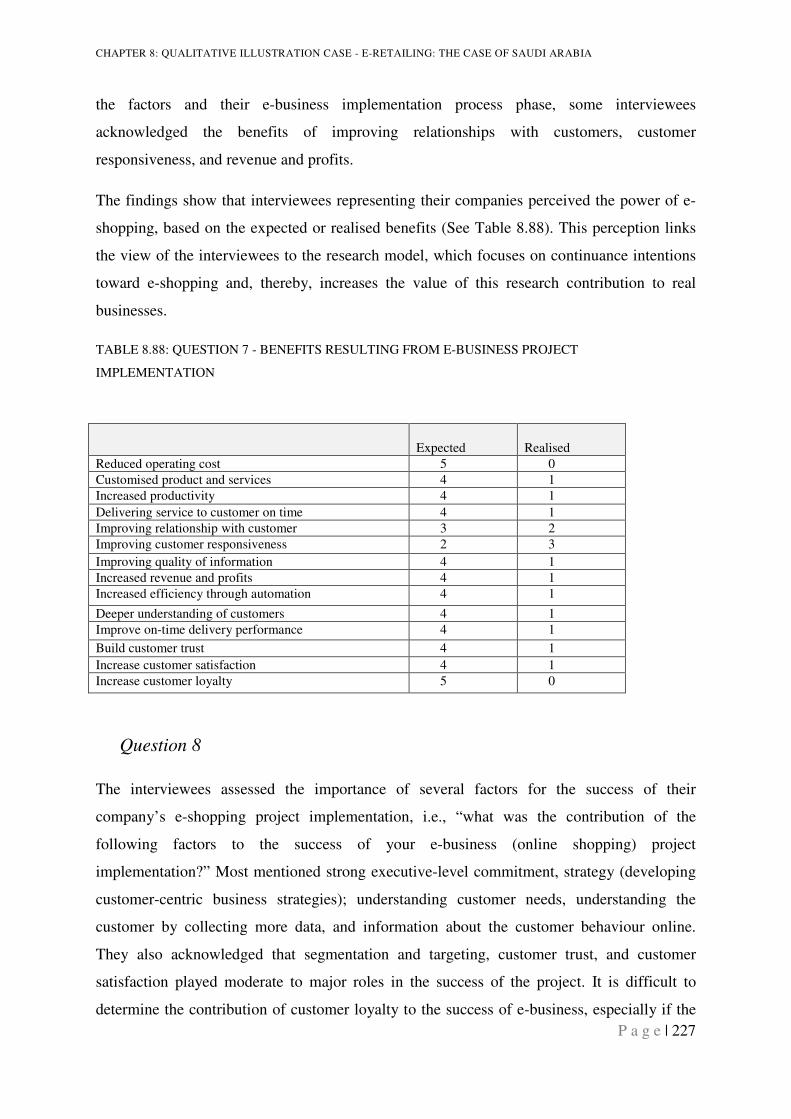
CHAPTER 8: QUALITATIVE ILLUSTRATION CASE - E-RETAILING: THE CASE OF SAUDI ARABIA
P a g e | 227
the factors and their e-business implementation process phase, some interviewees
acknowledged the benefits of improving relationships with customers, customer
responsiveness, and revenue and profits.
The findings show that interviewees representing their companies perceived the power of e-
shopping, based on the expected or realised benefits (See Table 8.88). This perception links
the view of the interviewees to the research model, which focuses on continuance intentions
toward e-shopping and, thereby, increases the value of this research contribution to real
businesses.
TABLE 8.88: QUESTION 7 - BENEFITS RESULTING FROM E-BUSINESS PROJECT
IMPLEMENTATION
Expected Realised
Reduced operating cost 5 0
Customised product and services 4 1
Increased productivity 4 1
Delivering service to customer on time 4 1
Improving relationship with customer 3 2
Improving customer responsiveness 2 3
Improving quality of information 4 1
Increased revenue and profits 4 1
Increased efficiency through automation 4 1
Deeper understanding of customers 4 1
Improve on-time delivery performance 4 1
Build customer trust 4 1
Increase customer satisfaction 4 1
Increase customer loyalty 5 0
Question 8
The interviewees assessed the importance of several factors for the success of their
company’s e-shopping project implementation, i.e., “what was the contribution of the
following factors to the success of your e-business (online shopping) project
implementation?” Most mentioned strong executive-level commitment, strategy (developing
customer-centric business strategies); understanding customer needs, understanding the
customer by collecting more data, and information about the customer behaviour online.
They also acknowledged that segmentation and targeting, customer trust, and customer
satisfaction played moderate to major roles in the success of the project. It is difficult to
determine the contribution of customer loyalty to the success of e-business, especially if the
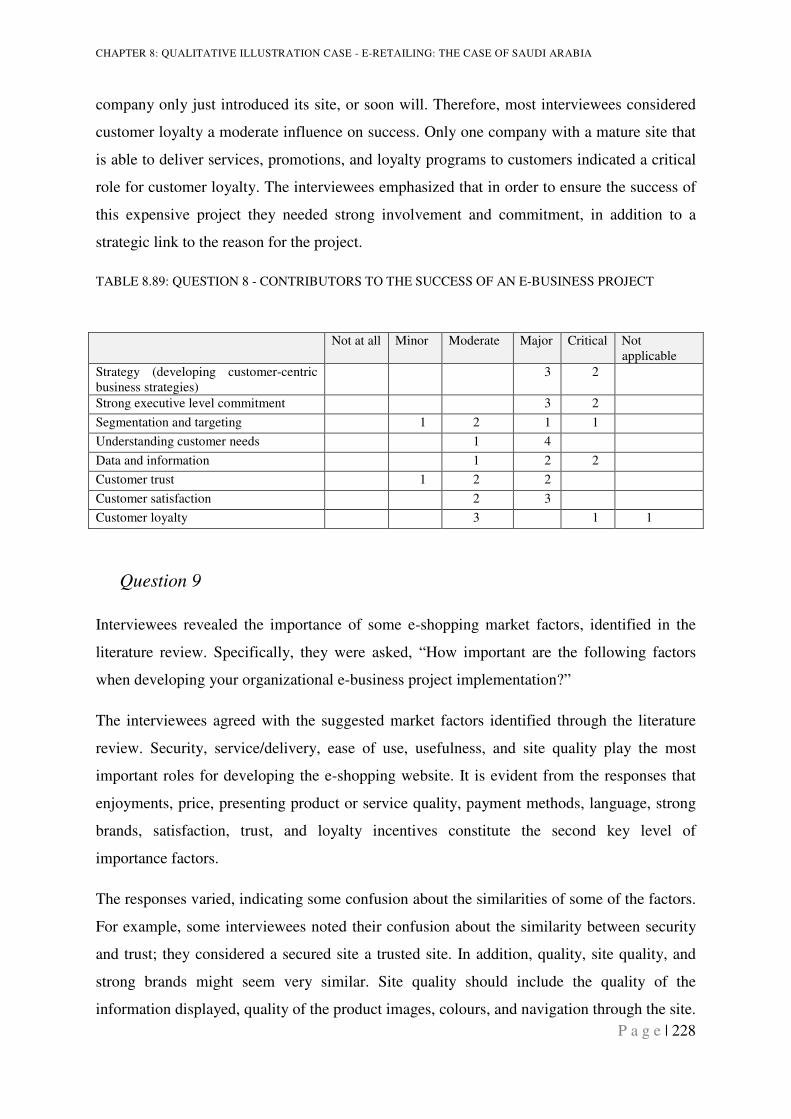
CHAPTER 8: QUALITATIVE ILLUSTRATION CASE - E-RETAILING: THE CASE OF SAUDI ARABIA
P a g e | 228
company only just introduced its site, or soon will. Therefore, most interviewees considered
customer loyalty a moderate influence on success. Only one company with a mature site that
is able to deliver services, promotions, and loyalty programs to customers indicated a critical
role for customer loyalty. The interviewees emphasized that in order to ensure the success of
this expensive project they needed strong involvement and commitment, in addition to a
strategic link to the reason for the project.
TABLE 8.89: QUESTION 8 - CONTRIBUTORS TO THE SUCCESS OF AN E-BUSINESS PROJECT
Not at all Minor Moderate Major Critical Not applicable
Strategy (developing customer-centric business strategies)
3 2
Strong executive level commitment 3 2
Segmentation and targeting 1 2 1 1
Understanding customer needs 1 4
Data and information 1 2 2
Customer trust 1 2 2
Customer satisfaction 2 3
Customer loyalty 3 1 1
Question 9
Interviewees revealed the importance of some e-shopping market factors, identified in the
literature review. Specifically, they were asked, “How important are the following factors
when developing your organizational e-business project implementation?”
The interviewees agreed with the suggested market factors identified through the literature
review. Security, service/delivery, ease of use, usefulness, and site quality play the most
important roles for developing the e-shopping website. It is evident from the responses that
enjoyments, price, presenting product or service quality, payment methods, language, strong
brands, satisfaction, trust, and loyalty incentives constitute the second key level of
importance factors.
The responses varied, indicating some confusion about the similarities of some of the factors.
For example, some interviewees noted their confusion about the similarity between security
and trust; they considered a secured site a trusted site. In addition, quality, site quality, and
strong brands might seem very similar. Site quality should include the quality of the
information displayed, quality of the product images, colours, and navigation through the site.
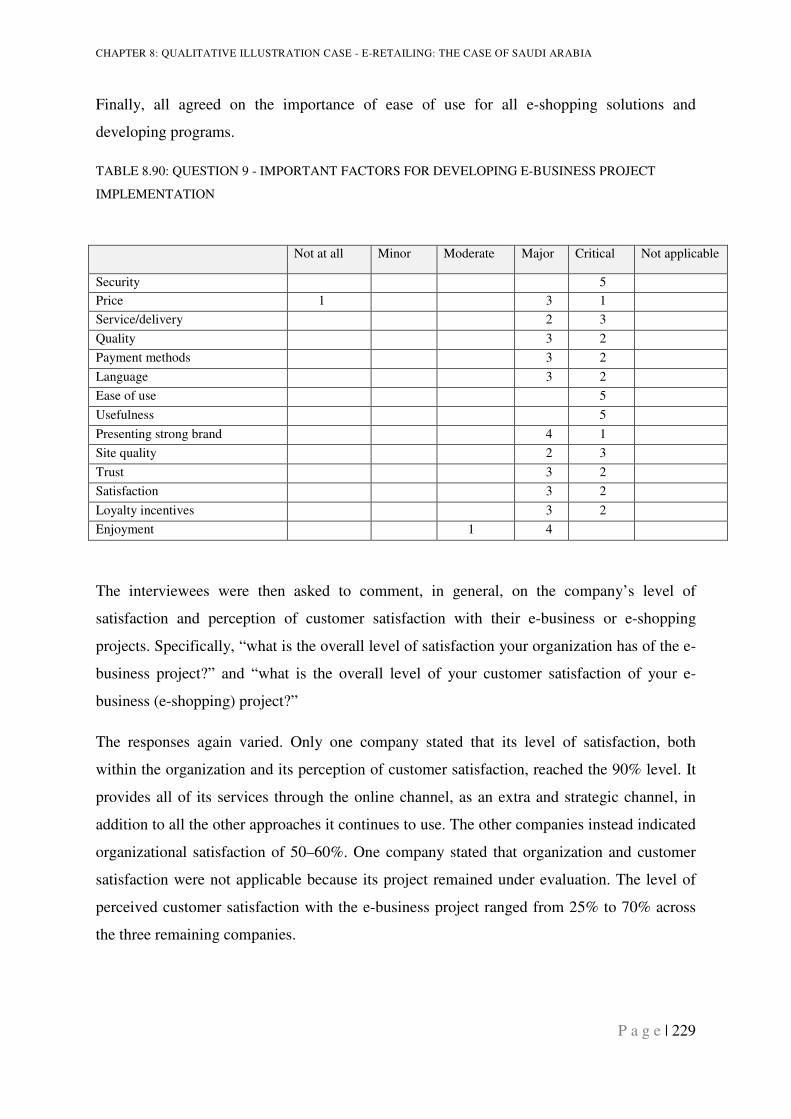
CHAPTER 8: QUALITATIVE ILLUSTRATION CASE - E-RETAILING: THE CASE OF SAUDI ARABIA
P a g e | 229
Finally, all agreed on the importance of ease of use for all e-shopping solutions and
developing programs.
TABLE 8.90: QUESTION 9 - IMPORTANT FACTORS FOR DEVELOPING E-BUSINESS PROJECT
IMPLEMENTATION
Not at all Minor Moderate Major Critical Not applicable
Security 5
Price 1 3 1
Service/delivery 2 3
Quality 3 2
Payment methods 3 2
Language 3 2
Ease of use 5
Usefulness 5
Presenting strong brand 4 1
Site quality 2 3
Trust 3 2
Satisfaction 3 2
Loyalty incentives 3 2
Enjoyment 1 4
The interviewees were then asked to comment, in general, on the company’s level of
satisfaction and perception of customer satisfaction with their e-business or e-shopping
projects. Specifically, “what is the overall level of satisfaction your organization has of the e-
business project?” and “what is the overall level of your customer satisfaction of your e-
business (e-shopping) project?”
The responses again varied. Only one company stated that its level of satisfaction, both
within the organization and its perception of customer satisfaction, reached the 90% level. It
provides all of its services through the online channel, as an extra and strategic channel, in
addition to all the other approaches it continues to use. The other companies instead indicated
organizational satisfaction of 50–60%. One company stated that organization and customer
satisfaction were not applicable because its project remained under evaluation. The level of
perceived customer satisfaction with the e-business project ranged from 25% to 70% across
the three remaining companies.
CHAPTER 8: QUALITATIVE ILLUSTRATION CASE - E-RETAILING: THE CASE OF SAUDI ARABIA
P a g e | 230
8.4. COMPANY DOCUMENTATION ANALYSIS
To enrich this section, the research includes available documentary data from the
Communications and Information Technology Commission, which conducts surveys in the
Saudi market, and documents obtained from Saudi Arabian Airlines, which expressed great
willingness to co-operate and participate in this research.
Saudi Arabian Airlines conducted customer satisfaction surveys pertaining to its electronic
services in 2003 and 2007. The results demonstrate that these Internet users wish to take
advantage of the online electronic services provided by the airline. The participants included
airline customers and members of its frequent flyer program (Alfursan).
The 2003 survey aimed to measure their satisfaction with the current services and their
anticipation of future services. Among the available documents and survey questionnaires
that relate to this research project, one survey question asked customers to rank the factors
that influenced their choice when they selected airlines. The Frequent Flyer Program (FFP)
was ranked fifth in terms of importance when selecting an airline carrier. The top four factors
were safety reputation, price, seat comfort, and convenient schedule. This finding mirrored
the 2001 and 2002 surveys. When safety, price, schedule, and seat comfort ratings are equal,
FFP provides a competitive advantage, in support of Bhattacherjee (2001a), who states that
loyalty incentives did not have any significant effect on continuance intention. That is,
loyalty incentive programs, such as frequent flyer miles, cash back, and loyalty points
programs, cannot be continuously effective customer retention strategies, though loyalty
programs can be effective if consumers find the company’s other services useful
(Bhattacherjee, 2001a). Therefore, this finding is important for companies that want to
maximize the effect of their loyalty incentives and retain customers. Companies dealing with
B2C e-commerce need not depend on loyalty programs to satisfy and retain their customers;
instead, they should exercise a thoughtful mix of factors.
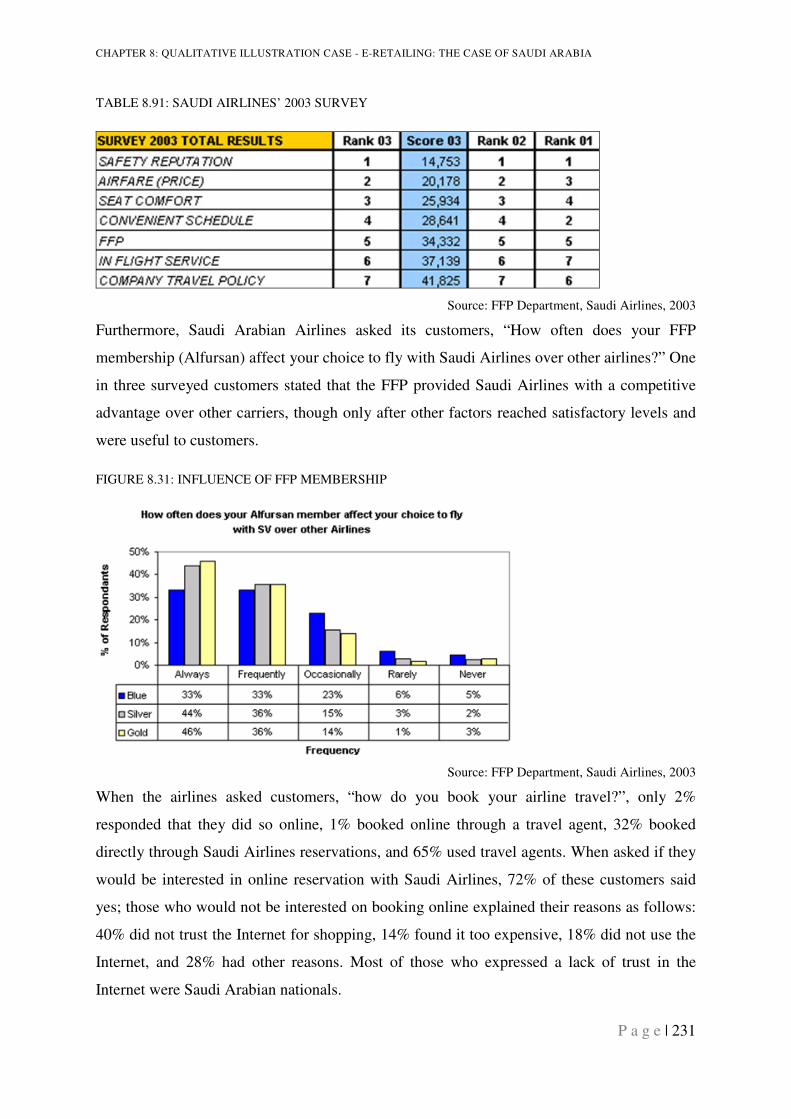
CHAPTER 8: QUALITATIVE ILLUSTRATION CASE - E-RETAILING: THE CASE OF SAUDI ARABIA
P a g e | 231
TABLE 8.91: SAUDI AIRLINES’ 2003 SURVEY
Source: FFP Department, Saudi Airlines, 2003
Furthermore, Saudi Arabian Airlines asked its customers, “How often does your FFP
membership (Alfursan) affect your choice to fly with Saudi Airlines over other airlines?” One
in three surveyed customers stated that the FFP provided Saudi Airlines with a competitive
advantage over other carriers, though only after other factors reached satisfactory levels and
were useful to customers.
FIGURE 8.31: INFLUENCE OF FFP MEMBERSHIP
Source: FFP Department, Saudi Airlines, 2003
When the airlines asked customers, “how do you book your airline travel?”, only 2%
responded that they did so online, 1% booked online through a travel agent, 32% booked
directly through Saudi Airlines reservations, and 65% used travel agents. When asked if they
would be interested in online reservation with Saudi Airlines, 72% of these customers said
yes; those who would not be interested on booking online explained their reasons as follows:
40% did not trust the Internet for shopping, 14% found it too expensive, 18% did not use the
Internet, and 28% had other reasons. Most of those who expressed a lack of trust in the
Internet were Saudi Arabian nationals.
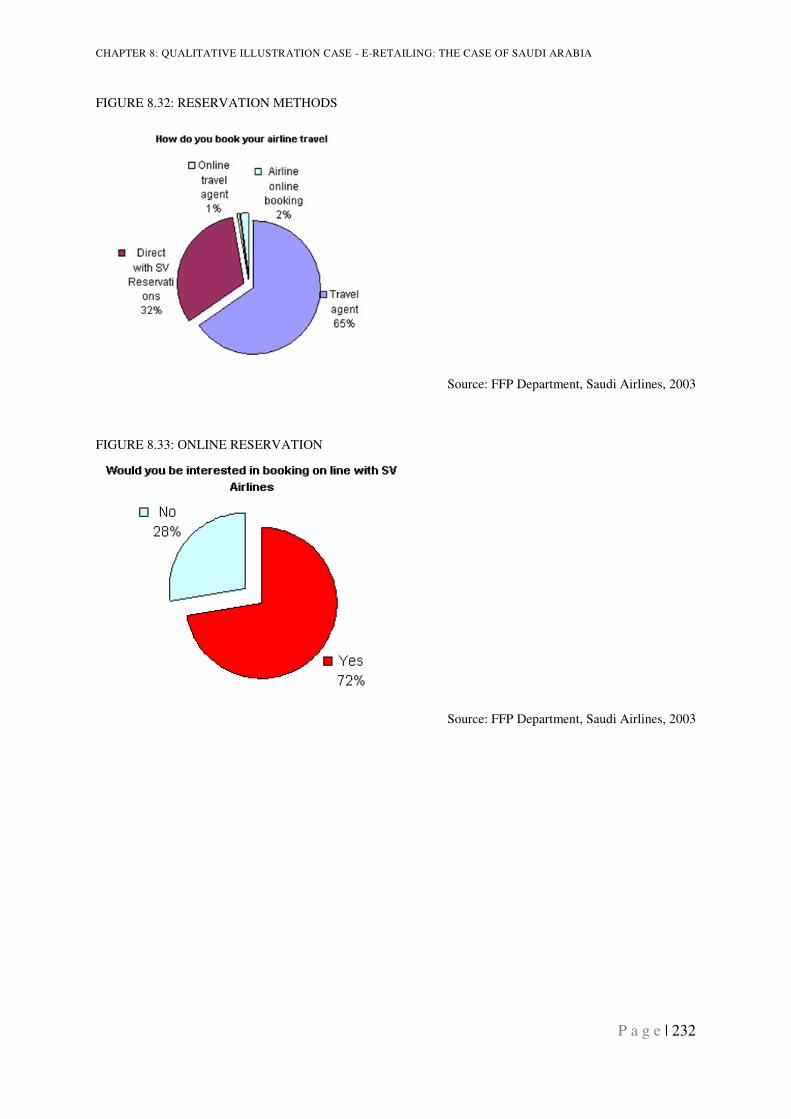
CHAPTER 8: QUALITATIVE ILLUSTRATION CASE - E-RETAILING: THE CASE OF SAUDI ARABIA
P a g e | 232
FIGURE 8.32: RESERVATION METHODS
Source: FFP Department, Saudi Airlines, 2003
FIGURE 8.33: ONLINE RESERVATION
Source: FFP Department, Saudi Airlines, 2003
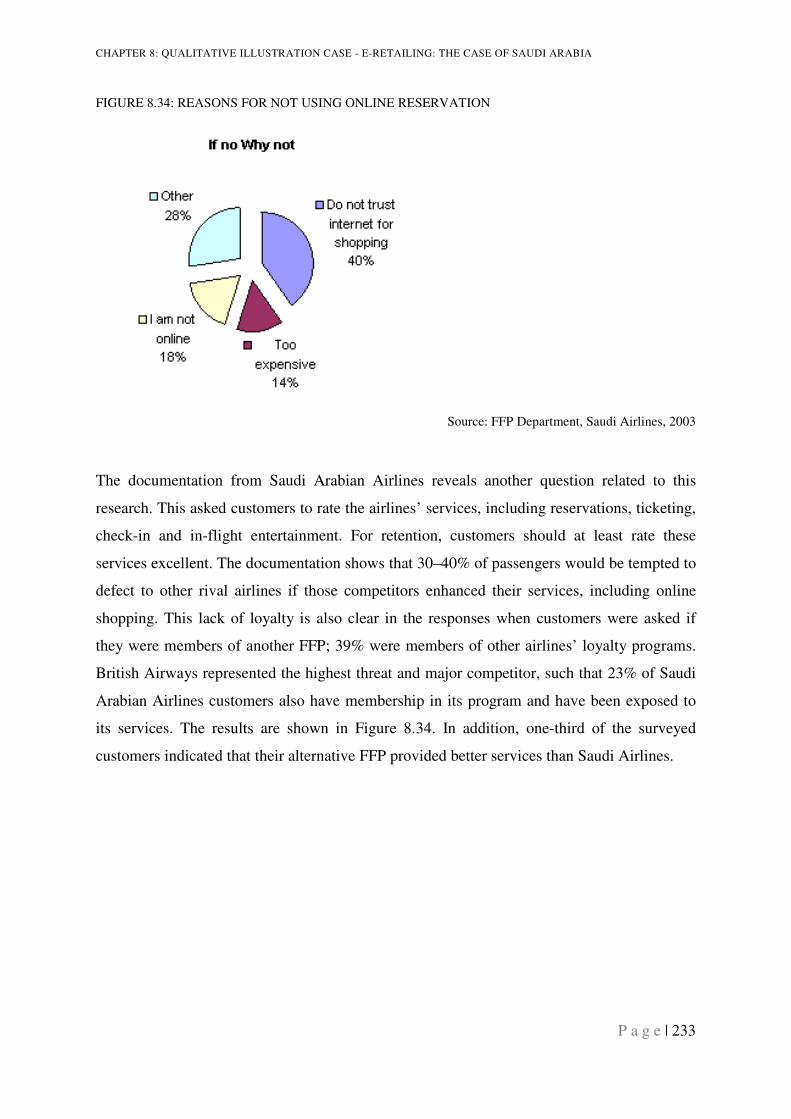
CHAPTER 8: QUALITATIVE ILLUSTRATION CASE - E-RETAILING: THE CASE OF SAUDI ARABIA
P a g e | 233
FIGURE 8.34: REASONS FOR NOT USING ONLINE RESERVATION
Source: FFP Department, Saudi Airlines, 2003
The documentation from Saudi Arabian Airlines reveals another question related to this
research. This asked customers to rate the airlines’ services, including reservations, ticketing,
check-in and in-flight entertainment. For retention, customers should at least rate these
services excellent. The documentation shows that 30–40% of passengers would be tempted to
defect to other rival airlines if those competitors enhanced their services, including online
shopping. This lack of loyalty is also clear in the responses when customers were asked if
they were members of another FFP; 39% were members of other airlines’ loyalty programs.
British Airways represented the highest threat and major competitor, such that 23% of Saudi
Arabian Airlines customers also have membership in its program and have been exposed to
its services. The results are shown in Figure 8.34. In addition, one-third of the surveyed
customers indicated that their alternative FFP provided better services than Saudi Airlines.
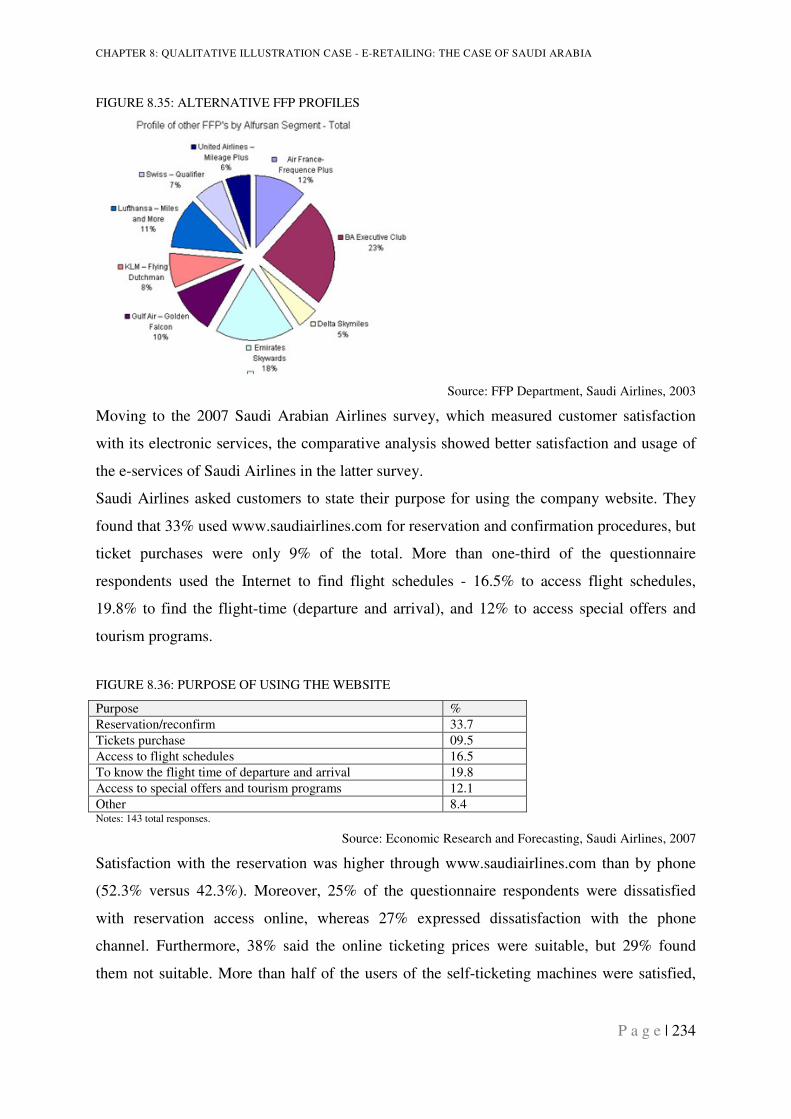
CHAPTER 8: QUALITATIVE ILLUSTRATION CASE - E-RETAILING: THE CASE OF SAUDI ARABIA
P a g e | 234
FIGURE 8.35: ALTERNATIVE FFP PROFILES
Source: FFP Department, Saudi Airlines, 2003
Moving to the 2007 Saudi Arabian Airlines survey, which measured customer satisfaction
with its electronic services, the comparative analysis showed better satisfaction and usage of
the e-services of Saudi Airlines in the latter survey.
Saudi Airlines asked customers to state their purpose for using the company website. They
found that 33% used www.saudiairlines.com for reservation and confirmation procedures, but
ticket purchases were only 9% of the total. More than one-third of the questionnaire
respondents used the Internet to find flight schedules - 16.5% to access flight schedules,
19.8% to find the flight-time (departure and arrival), and 12% to access special offers and
tourism programs.
FIGURE 8.36: PURPOSE OF USING THE WEBSITE
Purpose %
Reservation/reconfirm 33.7
Tickets purchase 09.5
Access to flight schedules 16.5
To know the flight time of departure and arrival 19.8
Access to special offers and tourism programs 12.1
Other 8.4 Notes: 143 total responses.
Source: Economic Research and Forecasting, Saudi Airlines, 2007
Satisfaction with the reservation was higher through www.saudiairlines.com than by phone
(52.3% versus 42.3%). Moreover, 25% of the questionnaire respondents were dissatisfied
with reservation access online, whereas 27% expressed dissatisfaction with the phone
channel. Furthermore, 38% said the online ticketing prices were suitable, but 29% found
them not suitable. More than half of the users of the self-ticketing machines were satisfied,
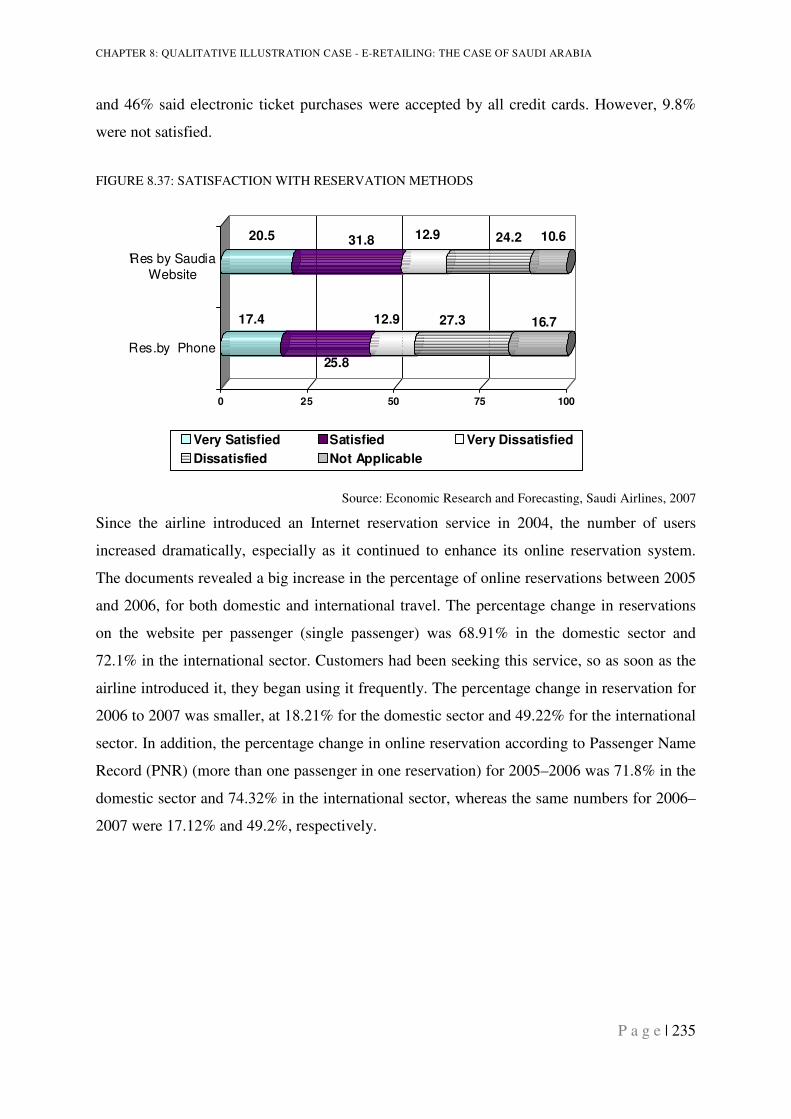
CHAPTER 8: QUALITATIVE ILLUSTRATION CASE - E-RETAILING: THE CASE OF SAUDI ARABIA
P a g e | 235
and 46% said electronic ticket purchases were accepted by all credit cards. However, 9.8%
were not satisfied.
FIGURE 8.37: SATISFACTION WITH RESERVATION METHODS
17.4
25.8
12.9 27.3 16.7
20.5 31.8 12.9 24.2 10.6
0 25 50 75 100
Res.by Phone
\Res by Saudia
Website
Very Satisfied Satisfied Very Dissatisfied
Dissatisfied Not Applicable
Source: Economic Research and Forecasting, Saudi Airlines, 2007
Since the airline introduced an Internet reservation service in 2004, the number of users
increased dramatically, especially as it continued to enhance its online reservation system.
The documents revealed a big increase in the percentage of online reservations between 2005
and 2006, for both domestic and international travel. The percentage change in reservations
on the website per passenger (single passenger) was 68.91% in the domestic sector and
72.1% in the international sector. Customers had been seeking this service, so as soon as the
airline introduced it, they began using it frequently. The percentage change in reservation for
2006 to 2007 was smaller, at 18.21% for the domestic sector and 49.22% for the international
sector. In addition, the percentage change in online reservation according to Passenger Name
Record (PNR) (more than one passenger in one reservation) for 2005–2006 was 71.8% in the
domestic sector and 74.32% in the international sector, whereas the same numbers for 2006–
2007 were 17.12% and 49.2%, respectively.
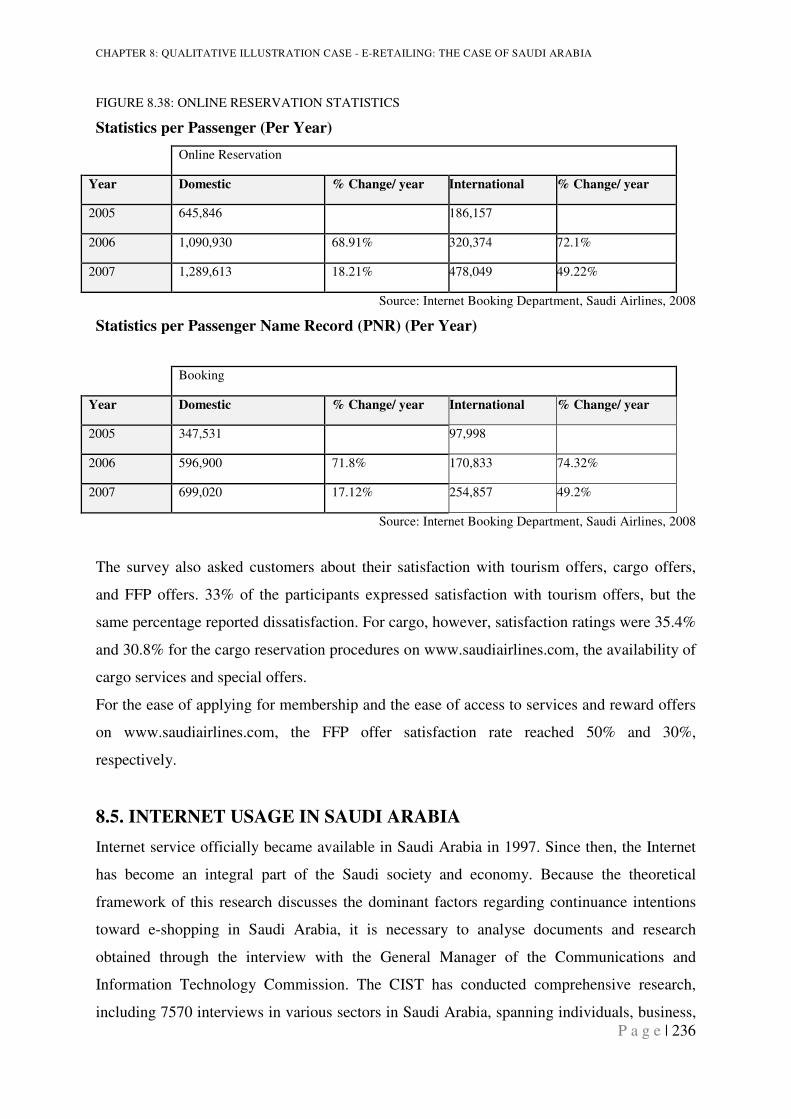
CHAPTER 8: QUALITATIVE ILLUSTRATION CASE - E-RETAILING: THE CASE OF SAUDI ARABIA
P a g e | 236
FIGURE 8.38: ONLINE RESERVATION STATISTICS
Statistics per Passenger (Per Year)
Online Reservation
Year Domestic % Change/ year International % Change/ year
2005 645,846 186,157
2006 1,090,930 68.91% 320,374 72.1%
2007 1,289,613 18.21% 478,049 49.22%
Source: Internet Booking Department, Saudi Airlines, 2008
Statistics per Passenger Name Record (PNR) (Per Year)
Booking
Year Domestic % Change/ year International % Change/ year
2005 347,531 97,998
2006 596,900 71.8% 170,833 74.32%
2007 699,020 17.12% 254,857 49.2%
Source: Internet Booking Department, Saudi Airlines, 2008
The survey also asked customers about their satisfaction with tourism offers, cargo offers,
and FFP offers. 33% of the participants expressed satisfaction with tourism offers, but the
same percentage reported dissatisfaction. For cargo, however, satisfaction ratings were 35.4%
and 30.8% for the cargo reservation procedures on www.saudiairlines.com, the availability of
cargo services and special offers.
For the ease of applying for membership and the ease of access to services and reward offers
on www.saudiairlines.com, the FFP offer satisfaction rate reached 50% and 30%,
respectively.
8.5. INTERNET USAGE IN SAUDI ARABIA
Internet service officially became available in Saudi Arabia in 1997. Since then, the Internet
has become an integral part of the Saudi society and economy. Because the theoretical
framework of this research discusses the dominant factors regarding continuance intentions
toward e-shopping in Saudi Arabia, it is necessary to analyse documents and research
obtained through the interview with the General Manager of the Communications and
Information Technology Commission. The CIST has conducted comprehensive research,
including 7570 interviews in various sectors in Saudi Arabia, spanning individuals, business,
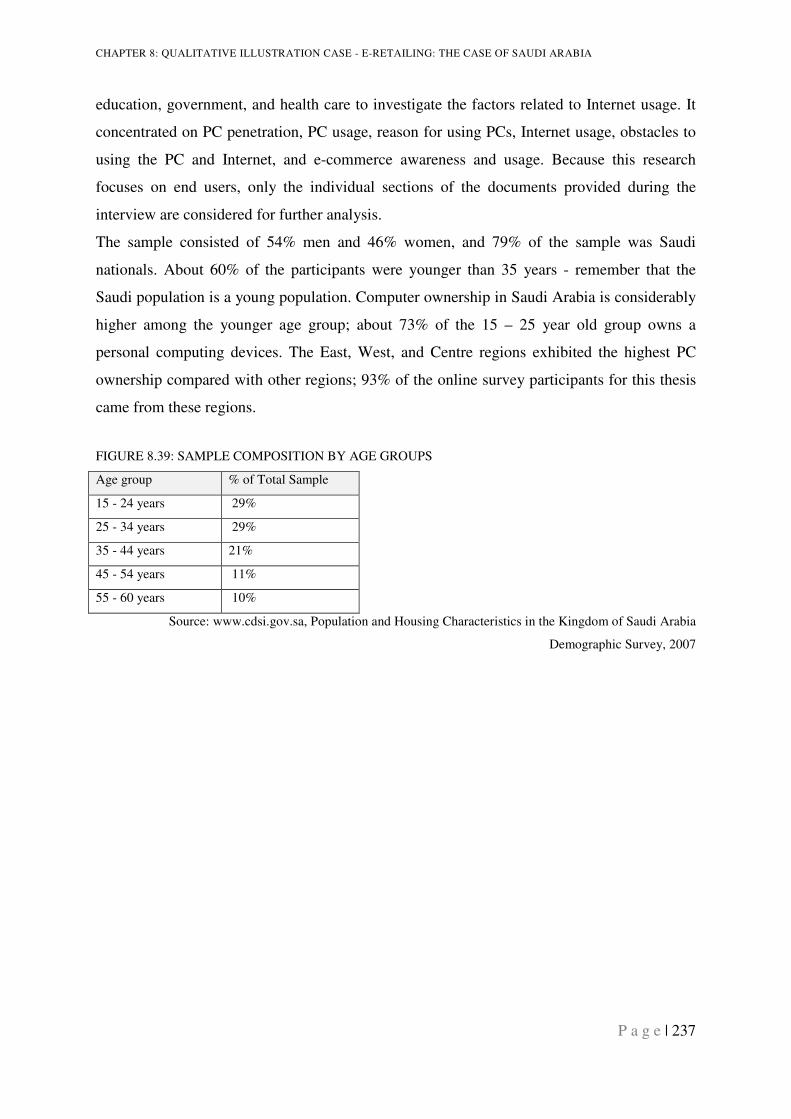
CHAPTER 8: QUALITATIVE ILLUSTRATION CASE - E-RETAILING: THE CASE OF SAUDI ARABIA
P a g e | 237
education, government, and health care to investigate the factors related to Internet usage. It
concentrated on PC penetration, PC usage, reason for using PCs, Internet usage, obstacles to
using the PC and Internet, and e-commerce awareness and usage. Because this research
focuses on end users, only the individual sections of the documents provided during the
interview are considered for further analysis.
The sample consisted of 54% men and 46% women, and 79% of the sample was Saudi
nationals. About 60% of the participants were younger than 35 years - remember that the
Saudi population is a young population. Computer ownership in Saudi Arabia is considerably
higher among the younger age group; about 73% of the 15 – 25 year old group owns a
personal computing devices. The East, West, and Centre regions exhibited the highest PC
ownership compared with other regions; 93% of the online survey participants for this thesis
came from these regions.
FIGURE 8.39: SAMPLE COMPOSITION BY AGE GROUPS
Age group % of Total Sample
15 - 24 years 29%
25 - 34 years 29%
35 - 44 years 21%
45 - 54 years 11%
55 - 60 years 10%
Source: www.cdsi.gov.sa, Population and Housing Characteristics in the Kingdom of Saudi Arabia
Demographic Survey, 2007
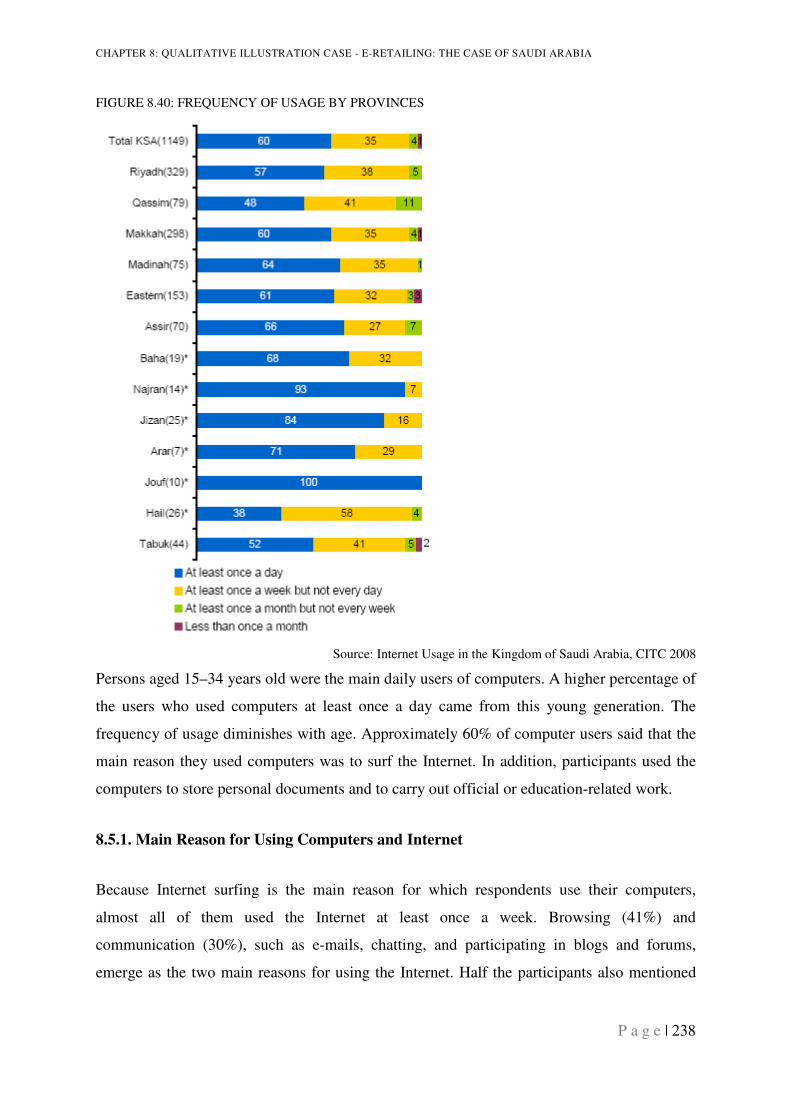
CHAPTER 8: QUALITATIVE ILLUSTRATION CASE - E-RETAILING: THE CASE OF SAUDI ARABIA
P a g e | 238
FIGURE 8.40: FREQUENCY OF USAGE BY PROVINCES
Source: Internet Usage in the Kingdom of Saudi Arabia, CITC 2008
Persons aged 15–34 years old were the main daily users of computers. A higher percentage of
the users who used computers at least once a day came from this young generation. The
frequency of usage diminishes with age. Approximately 60% of computer users said that the
main reason they used computers was to surf the Internet. In addition, participants used the
computers to store personal documents and to carry out official or education-related work.
8.5.1. Main Reason for Using Computers and Internet
Because Internet surfing is the main reason for which respondents use their computers,
almost all of them used the Internet at least once a week. Browsing (41%) and
communication (30%), such as e-mails, chatting, and participating in blogs and forums,
emerge as the two main reasons for using the Internet. Half the participants also mentioned
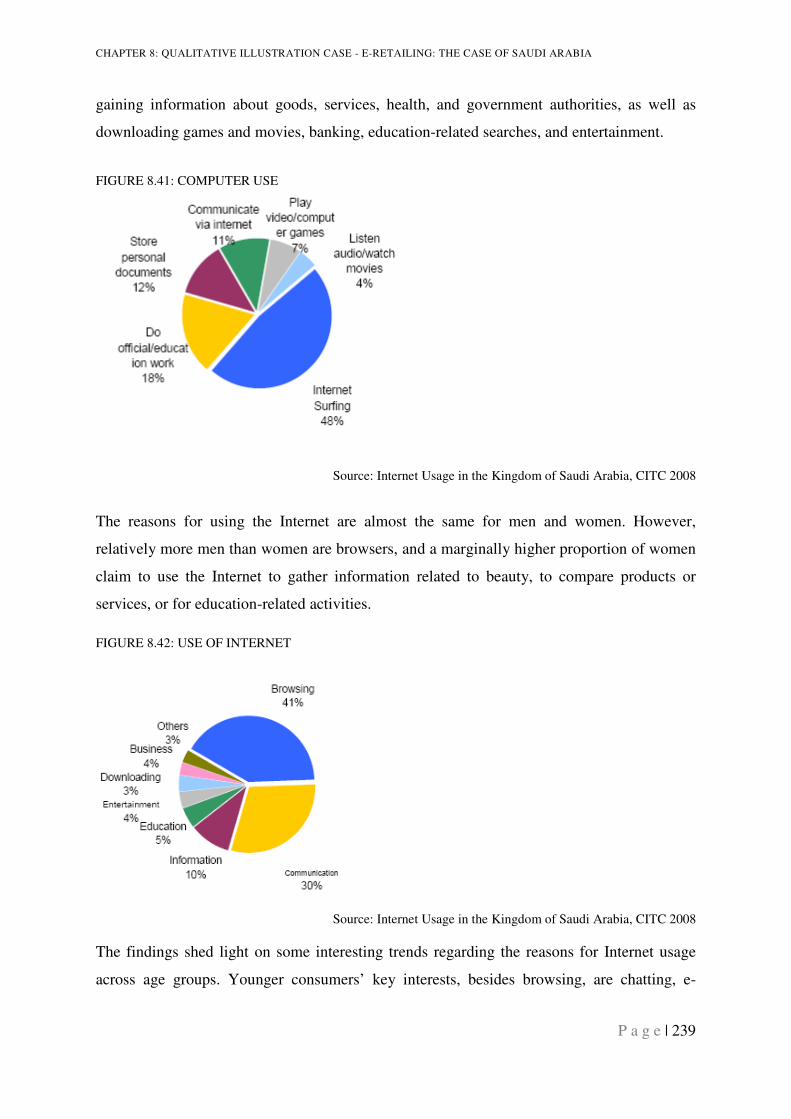
CHAPTER 8: QUALITATIVE ILLUSTRATION CASE - E-RETAILING: THE CASE OF SAUDI ARABIA
P a g e | 239
gaining information about goods, services, health, and government authorities, as well as
downloading games and movies, banking, education-related searches, and entertainment.
FIGURE 8.41: COMPUTER USE
Source: Internet Usage in the Kingdom of Saudi Arabia, CITC 2008
The reasons for using the Internet are almost the same for men and women. However,
relatively more men than women are browsers, and a marginally higher proportion of women
claim to use the Internet to gather information related to beauty, to compare products or
services, or for education-related activities.
FIGURE 8.42: USE OF INTERNET
Source: Internet Usage in the Kingdom of Saudi Arabia, CITC 2008
The findings shed light on some interesting trends regarding the reasons for Internet usage
across age groups. Younger consumers’ key interests, besides browsing, are chatting, e-
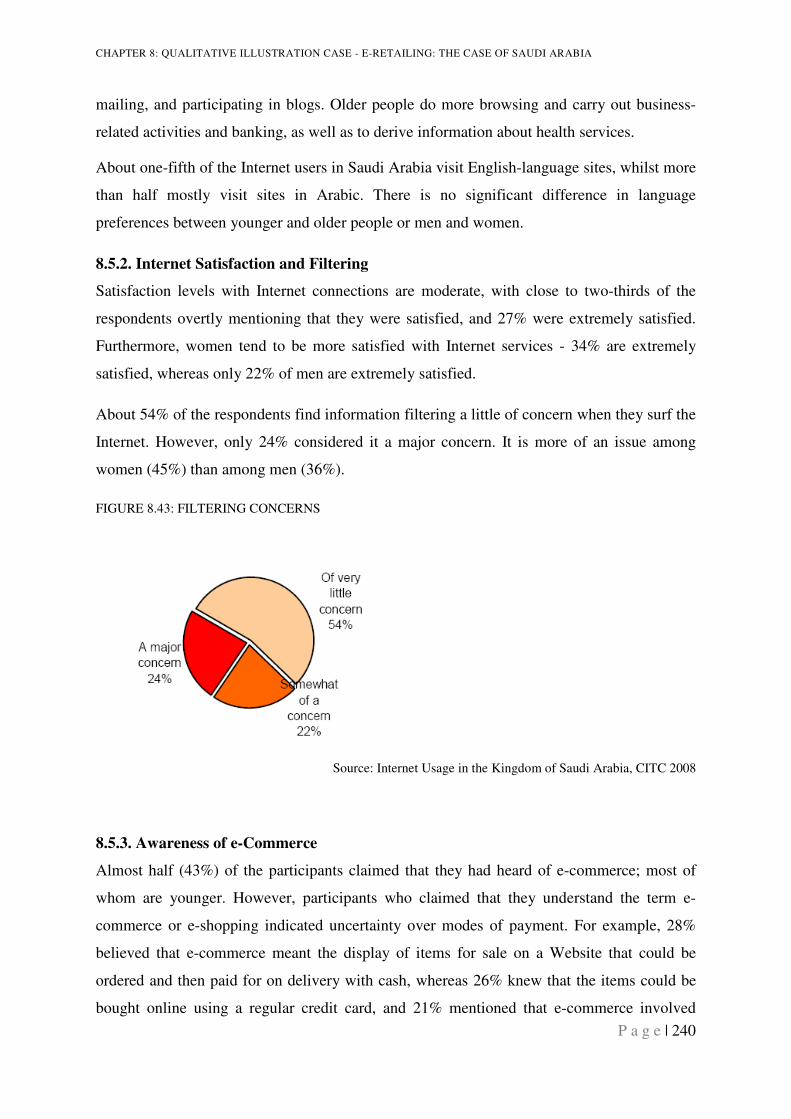
CHAPTER 8: QUALITATIVE ILLUSTRATION CASE - E-RETAILING: THE CASE OF SAUDI ARABIA
P a g e | 240
mailing, and participating in blogs. Older people do more browsing and carry out business-
related activities and banking, as well as to derive information about health services.
About one-fifth of the Internet users in Saudi Arabia visit English-language sites, whilst more
than half mostly visit sites in Arabic. There is no significant difference in language
preferences between younger and older people or men and women.
8.5.2. Internet Satisfaction and Filtering
Satisfaction levels with Internet connections are moderate, with close to two-thirds of the
respondents overtly mentioning that they were satisfied, and 27% were extremely satisfied.
Furthermore, women tend to be more satisfied with Internet services - 34% are extremely
satisfied, whereas only 22% of men are extremely satisfied.
About 54% of the respondents find information filtering a little of concern when they surf the
Internet. However, only 24% considered it a major concern. It is more of an issue among
women (45%) than among men (36%).
FIGURE 8.43: FILTERING CONCERNS
Source: Internet Usage in the Kingdom of Saudi Arabia, CITC 2008
8.5.3. Awareness of e-Commerce
Almost half (43%) of the participants claimed that they had heard of e-commerce; most of
whom are younger. However, participants who claimed that they understand the term e-
commerce or e-shopping indicated uncertainty over modes of payment. For example, 28%
believed that e-commerce meant the display of items for sale on a Website that could be
ordered and then paid for on delivery with cash, whereas 26% knew that the items could be
bought online using a regular credit card, and 21% mentioned that e-commerce involved
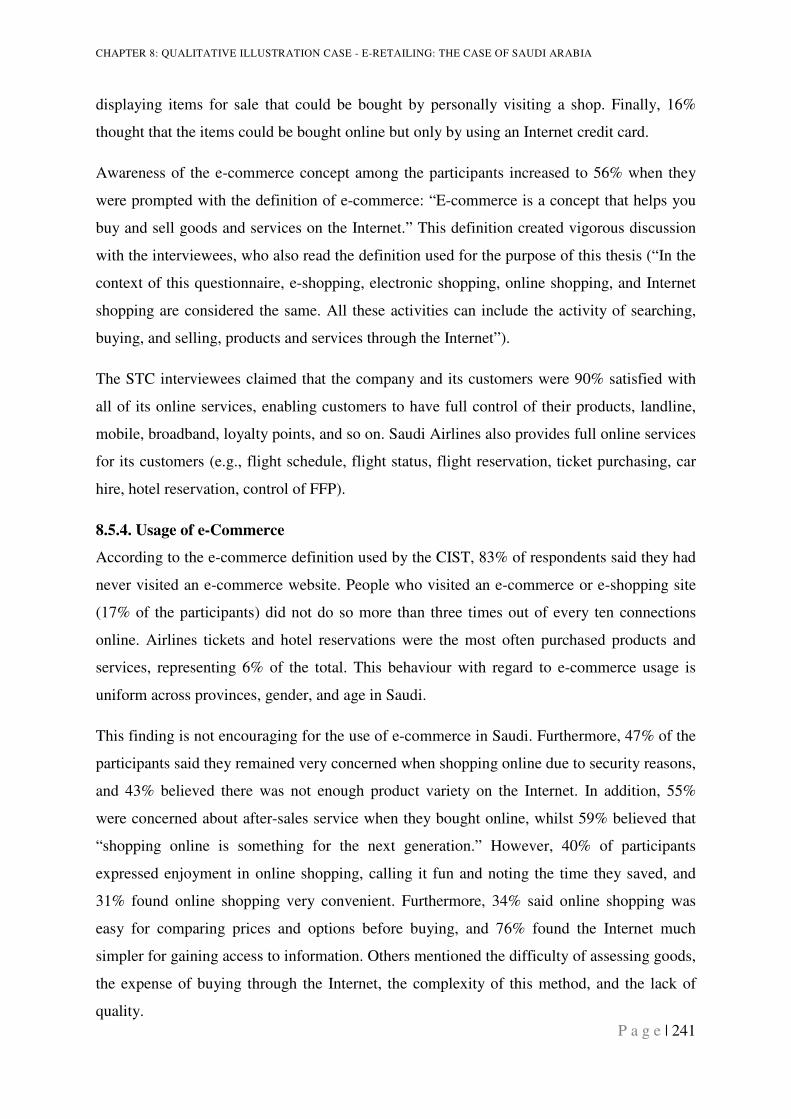
CHAPTER 8: QUALITATIVE ILLUSTRATION CASE - E-RETAILING: THE CASE OF SAUDI ARABIA
P a g e | 241
displaying items for sale that could be bought by personally visiting a shop. Finally, 16%
thought that the items could be bought online but only by using an Internet credit card.
Awareness of the e-commerce concept among the participants increased to 56% when they
were prompted with the definition of e-commerce: “E-commerce is a concept that helps you
buy and sell goods and services on the Internet.” This definition created vigorous discussion
with the interviewees, who also read the definition used for the purpose of this thesis (“In the
context of this questionnaire, e-shopping, electronic shopping, online shopping, and Internet
shopping are considered the same. All these activities can include the activity of searching,
buying, and selling, products and services through the Internet”).
The STC interviewees claimed that the company and its customers were 90% satisfied with
all of its online services, enabling customers to have full control of their products, landline,
mobile, broadband, loyalty points, and so on. Saudi Airlines also provides full online services
for its customers (e.g., flight schedule, flight status, flight reservation, ticket purchasing, car
hire, hotel reservation, control of FFP).
8.5.4. Usage of e-Commerce
According to the e-commerce definition used by the CIST, 83% of respondents said they had
never visited an e-commerce website. People who visited an e-commerce or e-shopping site
(17% of the participants) did not do so more than three times out of every ten connections
online. Airlines tickets and hotel reservations were the most often purchased products and
services, representing 6% of the total. This behaviour with regard to e-commerce usage is
uniform across provinces, gender, and age in Saudi.
This finding is not encouraging for the use of e-commerce in Saudi. Furthermore, 47% of the
participants said they remained very concerned when shopping online due to security reasons,
and 43% believed there was not enough product variety on the Internet. In addition, 55%
were concerned about after-sales service when they bought online, whilst 59% believed that
“shopping online is something for the next generation.” However, 40% of participants
expressed enjoyment in online shopping, calling it fun and noting the time they saved, and
31% found online shopping very convenient. Furthermore, 34% said online shopping was
easy for comparing prices and options before buying, and 76% found the Internet much
simpler for gaining access to information. Others mentioned the difficulty of assessing goods,
the expense of buying through the Internet, the complexity of this method, and the lack of
quality.
CHAPTER 8: QUALITATIVE ILLUSTRATION CASE - E-RETAILING: THE CASE OF SAUDI ARABIA
P a g e | 242
Unlike e-commerce, approximately 49% of the respondents were aware of e-learning and
fairly confident about this concept. E-Learning was very well accepted by most people,
across Saudi Arabia. In particular, 74% believed that the Internet makes information access
easier and more convenient, as well as providing the most up-to-date information.
Furthermore, 70% considered e-learning via the Internet a medium of the modern generation.
However, about 45% felt that the Internet was dangerous for children, and 25% mentioned
that the Internet may provide access to immoral content. These concerns were more common
among older people.
8.6. SUMMARY
This chapter has presented a qualitative analysis of complementary research, structured
around interviews and documentary analysis. Most of the interviewees agree that e-commerce
is a powerful concept for reaching customers and serving them better. The findings show that
companies link e-shopping to the opportunity to retain and satisfy customers, to generate
more profits, to identify new customers, to offer better responses and services, and so on. The
interviewed companies realised the benefits of implementing e-commerce solutions for
themselves and their customers. However, to ensure the success of e-commerce, top
management involvement is essential.
In addition to the structured interviews, the other analysed documents provide a better
understanding of e-shopping in Saudi Arabia. The analyzed documents from Saudi Airlines
show greater potential for e-commerce services: 72% of the surveyed customers said they
would be interested in online reservation, and 52.3% of its customers who participated in the
airline survey were satisfied with the airline online reservation.
Other documents from the Communications and Information Technology Commission
showed a link between the PC penetration in Saudi Arabia and Internet usage. The level of
PC penetration in Saudi Arabia is good; about two-thirds of the population claims to own a
computer of some type. Their main objective in using the Internet is to surf and
communicate, or perform educational or office-related work. Youngsters are relatively more
frequent users, using the Internet more, mostly for browsing, e-mailing, and chatting.
Approximately 54% of the people in Saudi Arabia have an Internet connection. The main
reason for not having an Internet connection is a lack of awareness of its benefits. The
CHAPTER 8: QUALITATIVE ILLUSTRATION CASE - E-RETAILING: THE CASE OF SAUDI ARABIA
P a g e | 243
majority of the users browse, chat, or e-mail, though young users also are interested in
participating in forums and blogs, and older respondents conduct banking activities and
gather information.
A significant proportion of people (40%) are concerned about information filtering,
especially the youngsters. They believed such filtering caused them to lack some crucial
information, and they wanted full freedom to surf. E-commerce, as a concept, was not very
clear to these respondents, though nearly half of them claimed to be aware of it. Perhaps
because they think of it as something for the next generation, not even one-fifth of the
respondents had ever visited or used any e-commerce sites. Of the present users, most of
whom have never bought anything online, safety considerations and a lack of necessity
stopped them from purchasing. Many also cite their concerns about the after-sales service if
they buy online. The definition they use differs from the e-shopping definition applied in this
thesis though.
The views about e-learning are much more positive. Most people believe the Internet makes
information access easier, more convenient, and more up-to-date. Furthermore, participants
considered e-learning through the Internet as the medium of today’s generation.
The following chapter, therefore, addresses the data findings and discussion, with the aim of
gaining a better understanding of the research model.
CHAPTER 9: DISCUSSION AND CONCLUSION
P a g e | 244
CHAPTER 9: DISCUSSION AND CONCLUSION
9.1. INTRODUCTION
In today’s businesses, e-commerce is characterised by very high competition (Belanger et al.,
2002). It is an essential strategy for practitioners and academics alike to understand what
makes customers loyal and have the intention to revisit and continue doing business. Current
online shoppers are becoming more sophisticated, more demanding for value, and more
experienced at shopping online. Current literature demonstrates the growing stream of
research, examining the factors that influence e-shopping attitude, intention to use, intention
to purchase, online satisfaction, and online continuance intention. However, much of this
research examines the factors that influence e-shopping intention in western and non-western
countries, with little or non-existent studies for Saudi Arabia in particular. Despite the
proliferation of research concerning online shopping, to the best of the researcher’s
knowledge, no single research has attempted to examine the continuance intention of online
shopping in context of the unique young population, to be found in Saudi Arabia.
The aim and purpose of this study is to address this gap and provide a validated conceptual
model that integrates different factors, clarifying the theoretical problems of continuance e-
shopping intentions and conducting invariance analysis among different groups to measure
behavioural differences in Saudi Arabia.
This chapter provides an overview of the discussion of the research findings of the
quantitative data presented in Chapter 6 and Chapter 7, supported with a case study from
Chapter 8. Additionally, this chapter provides the research conclusions, recommendations,
research limitation, future research, and managerial implications. To achieve the overall
objective, a research framework was developed. The discussion and conclusion in this
chapter is supported by the research literature review and in accordance with the research
hypotheses.
Table 9.92 provides a summary of the research hypotheses and findings. Figure 9.44 provides
the revised final research model. The online field survey validates the hypothesized model,
and the model findings confirm that Perceived Enjoyment, Perceived Usefulness, and
Subjective Norms are the main determinants of continuance intentions in Saudi Arabia,
accounting for 61% of continuance e-shopping intentions. As shown in Figure 9.44, this
model illustrates the research findings, which identify a model of continuance online
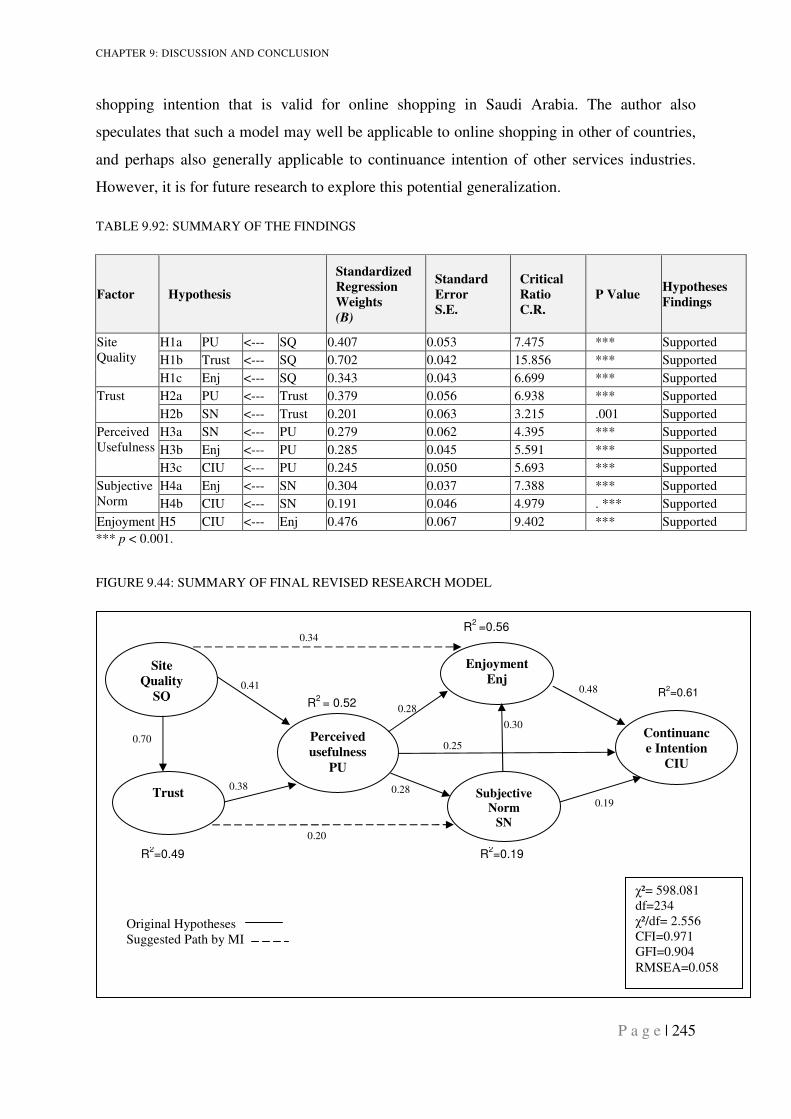
CHAPTER 9: DISCUSSION AND CONCLUSION
P a g e | 245
shopping intention that is valid for online shopping in Saudi Arabia. The author also
speculates that such a model may well be applicable to online shopping in other of countries,
and perhaps also generally applicable to continuance intention of other services industries.
However, it is for future research to explore this potential generalization.
TABLE 9.92: SUMMARY OF THE FINDINGS
Factor Hypothesis
Standardized
Regression
Weights
(B)
Standard
Error
S.E.
Critical
Ratio
C.R.
P Value Hypotheses
Findings
Site Quality
H1a PU <--- SQ 0.407 0.053 7.475 *** Supported
H1b Trust <--- SQ 0.702 0.042 15.856 *** Supported
H1c Enj <--- SQ 0.343 0.043 6.699 *** Supported
Trust H2a PU <--- Trust 0.379 0.056 6.938 *** Supported
H2b SN <--- Trust 0.201 0.063 3.215 .001 Supported
Perceived Usefulness
H3a SN <--- PU 0.279 0.062 4.395 *** Supported
H3b Enj <--- PU 0.285 0.045 5.591 *** Supported
H3c CIU <--- PU 0.245 0.050 5.693 *** Supported
Subjective Norm
H4a Enj <--- SN 0.304 0.037 7.388 *** Supported
H4b CIU <--- SN 0.191 0.046 4.979 . *** Supported
Enjoyment H5 CIU <--- Enj 0.476 0.067 9.402 *** Supported
*** p < 0.001.
FIGURE 9.44: SUMMARY OF FINAL REVISED RESEARCH MODEL
Site
Quality
SQ
Subjective
Norm
SN
Enjoyment
Enj
Perceived
usefulness
PU
Trust
Continuanc
e Intention
CIU
χ²= 598.081 df=234 χ²/df= 2.556 CFI=0.971 GFI=0.904
RMSEA=0.058
0.38
0.41
R2=0.49
R2
= 0.52
R2
=0.56
0.28
0.28
0.25
0.30
0.48
0.19
0.70
R2=0.19
R2=0.61
Original Hypotheses Suggested Path by MI
0.34
0.20
CHAPTER 9: DISCUSSION AND CONCLUSION
P a g e | 246
9.2. DISCUSSION OF FINDINGS IN RELATION TO RESEARCH
QUESTION
Despite these impressive online purchasing growth rates in the previous decade,
compelling evidence indicates that many consumers, searching different online retail
sites, abandon their purchases, which make the e-commerce market is still small.
Likewise, how to persuade customer repurchase remains a concern for e-commerce
vendors (Johnson and Hult, 2008). It is stated that only a small minority of website
visitors (about 1%) proceeds to make purchases (Gupta and Kim, 2007). Retaining
customers is a financial imperative for e-shopping business (e-vendors), especially as
attracting new customers is considerably more expensive than in the case of comparable
traditional bricks-and-mortar stores (Reichheld and Schefter, 2000). Given the
inconsistent nature of customer behaviour, the growth in global web-stores, the increasing
product and service availability and fairly low switching costs, consumers, without a
compelling reason to choose one retailer over another, will experiment or rotate purchases
among multiple firms (Bhattacherjee, 2001b; Crego and Schiffrin, 1995). Raising the
number of reliable costumers by as slight as 5% can raise profitability by 30-85%,
depending upon the business (Reicheld and Schefter, 2000). All these promote to believe
that it is more important than ever to identify the main drivers of online customers’
continuance shopping intention. Thus, what, then, makes customers return to an e-
vendor? The author of this research attempts to provide a validated conceptual model that
integrates different factors and clarifies the theoretical problems of continuance e-
shopping intentions. Furthermore, the developed research model is expected to answer the
research questions: “What factors drive consumers’ continuance intentions toward e-
shopping?”, which also include: Which forces drive customer continuance e-shopping
intentions in Saudi Arabia?; Do they differ from the drivers in developed countries?; That
is, do well-established theories from developed (mostly Western) countries also apply in
less developed (often non-Western) cultures; in the case of this research is Saudi Arabia?;
What impact do enjoyment, usefulness, and subjective norms have on continuance
intention in Saudi Arabia?; Are gender, education, age, experience, spending, and regions
of Saudi Arabia associated with any behaviour differences among online shoppers?.
Additionally, the developed research model is expected to provide a better explanation of
behavioural differences of continuance e-shopping intentions. Moreover, the model
CHAPTER 9: DISCUSSION AND CONCLUSION
P a g e | 247
contributes to an understanding of the factors that encourage consumers to increase their
e-shopping continuance intention. The online field survey validates the hypothesized
model, and the model findings confirm that Perceived Enjoyment, Perceived Usefulness,
and Subjective Norms are the main determinants in Saudi Arabia, explaining 61% of
continuance e-shopping intentions. However, Enjoyment is more influential (see Table
9.92; SRW = 0. 476, CR = 9.402), followed by Perceived Usefulness (SRW = 0.245, CR
= 5.693), and then Subjective Norms (SRW = 0.191, CR= 4.979). These findings are
consistent with previous research (e.g., Bhattacherjee, 2001a; Childers et al., 2001; Davis
et al. 1989; George, 2002; Shih and Fang, 2004; Taylor and Todd, 1995; Teo et al., 1999;
Venkatesh et al., 2003). Enjoyment, Perceived Usefulness, and Subjective Norms have
positive influences (direct or indirect) on consumers’ continuance e-shopping intentions.
Furthermore, the findings reveal the important role of the perception of e-shopping
quality in e-shopping continuance intention, which is in agreement with previous research
(Ahn et al., 2003)
9.3. GENERAL DISCUSSION OF RESEARCH FINDINGS
Globalization continues to drive the rapid growth of international trade, global corporations,
and non-local consumption alternatives (Alden et al., 2006; Holt et al., 2004), and advances
of the Internet and e-commerce have diminished trade boundaries. E-Commerce and e-
shopping create opportunities for businesses to reach to consumers globally and directly, and
in turn, business and social science research now focuses specifically on cross-national and
cross-cultural Internet marketing (Griffith et al., 2006). The Internet has changed how
businesses and customers customize, distribute, and consume products. Its low cost gives
both businesses and consumers a new and powerful channel for information and
communication. According to the latest Nielsen Global Online Survey on Internet shopping
habits (Nielsen.com, 2008); more than 85% of the world’s online population has used the
Internet to make a purchase - increasing the market for online shopping by 40% in the past
two years.
Childers et al., (2001) went on to describe the term ‘enjoyment’ to embody the hedonic
aspects, while usefulness denoted the utilitarian ones. This research found that online
shoppers in Saudi Arabia do, indeed, perceive utilitarian value and hedonic value to be
important in their future intentions. The research model provides some other interesting
results. Unlike findings from developed countries that show perceived usefulness and
CHAPTER 9: DISCUSSION AND CONCLUSION
P a g e | 248
satisfaction to be the dominant predictor of intention or continuance intention (Agarwal and
Prasad, 1999; Davis, 1989; Dishaw and Strong, 1999; Gefen and Keil, 1998; Igbaria et al.,
1996; Moon and Kim, 2001; Taylor and Todd, 1995; Venkatesh, 2000; Venkatesh and Davis,
2000; Premkumar and Bhattacherjee, 2008), the results of this study indicate that perceived
Enjoyment is the strongest predictor that motivates individuals to continuance intention to use
e-shopping. Perceived Usefulness and Subjective Norm (social pressure) are shown to be the
next factors, which influence continuance intention usage. In addition, Trust and Site Quality
have strong indirect influence on continuance intention for e-shopping usage. The dominance
of Enjoyment over Perceived Usefulness in predicting continuance intention to use e-
shopping in the context of Saudi Arabia could be due to the fact that thousands of websites
provide similar services in terms of usefulness and benefits. It appears that consumers turn to
online vendors primarily for hedonic reasons. Therefore, attracting and retaining users by
providing an enjoyable and playful e-shopping site has become very important.
Second, since its introduction to the public in 1999, e-commerce is in its introductory stage in
Saudi Arabia. E-Shoppers are becoming more engaged in the enjoyment of e-shopping.
Third, Saudi Arabia has a population of 25 million, highly skewed in terms of age
distribution, with 60% under the age of 30 (Middle East Statistics, 2007). This age profile is
relevant to our findings, as in countries that are further advanced in Internet shopping; much
of the growth has been driven by young people. For example, in the UK, teenagers spend on
average £3 billion a year (Datamonitor, cited by Spero and Stone, 2004). Clearly, young
people’s behaviour is of special importance to Saudi trade. Taking that into consideration, the
Internet is one of the main environments for young people to play, work, learn and
communicate (Alreck and Settle, 2002; Spero and Stone, 2004), which suggests that
enjoyment is the strongest predictor in this research finding. Notwithstanding that the results
indicate that more males were influenced by utilitarian considerations (see Table 7.46), the
female and male respondents were both influenced by hedonic aspects (Table 7.46). Finally,
with particular relevance to the female e-shoppers, this is in line with previous research
findings that women tend to accept technology based on their hedonic experiences and the
opinions of others (Teo et al., 1999; Venkatesh et al., 2000).
Research indicates that consumers in all shopping media shop for both utilitarian and hedonic
outcomes (Childers et al., 2001). Consistent with previous research, the results of this study
demonstrate the hedonic and utilitarian roles in continuance online shopping. The enjoyment
and usefulness constructs are, respectively, strong hedonic and utilitarian influential
CHAPTER 9: DISCUSSION AND CONCLUSION
P a g e | 249
indicators to usage intention (Davis et al., 1992; Van der Heijden, 2004) and revisit intention
(Lin, Wu and Tsai, 2005; Donovan and Rossiter 1982). Additionally, the results are similar to
Childers et al.’s (2001) findings that enjoyment can predict attitude towards e-shopping, just
as much as usefulness can. With regard to e-shopping, the hedonic enjoyment constructs in
the research model may reflect the pleasure that users obtain from shopping online, which
reinforces continuance intentions.
The findings of this study and those conducted in North America can be viewed in the light
of national culture. Hofstede's studies have shown that North American countries are
characterized by low collectivism and low uncertainty avoidance. In other words, individuals
in this region are highly self-reliant (Hofstede, 1984) and thus have little concern for status
and formality; they often bypass their superiors to perform their tasks (Adler, 1995). In
addition, these countries are dominated by individuals with “doing-oriented cultures”
(Maznevski and DiStefano, 1995). Individuals from doing-oriented cultures typically stress
accomplishments, work hard to achieve goals, and maximize work effort. Therefore,
individuals in developed countries will be influenced to use technology as a tool for efficient
and effective work practices as well a tool required for self-advancement.
In contrast, the Arab World culture, including Saudi Arabia, is dominated by high
collectivism and high uncertainty avoidance, i.e., an individual’s beliefs depend on the social
norms of the group (Kluckhorn and Strodtbeck, 1961) as well as expecting managers to set
the standards to be followed. Individuals in this region are also being-oriented, meaning that
they work only as much as needed to be able to live, and minimize work (Adler, 1995).
Individuals follow their managers’ directives and use technology regardless of accrued
benefits. Additionally, other studies suggest that individuals place more trust in people
similar to themselves and assess trustworthiness based on second-hand information and on
stereotypes (McKnigh et al., 1998; Morgan and Hunt, 1994; Zucker, 1986). In a similar vein,
recent studies in the marketing literature have also confirmed the importance and dynamics of
social pressure on consumer behaviour. For instance, Takada and Jain (1991) have found that
the diffusion of consumer goods in South Korea and Taiwan is directly influenced by social
value.
There is a distinction between intrinsic and extrinsic behavioural motivation. The motivation
to use a technology might arise because of derived intrinsic rewards (enjoyment and fun),
perceived benefits (usefulness) or extrinsic pressure (social pressure) (Deci, 1975). Intrinsic
CHAPTER 9: DISCUSSION AND CONCLUSION
P a g e | 250
and extrinsic behavioural motivation could be applied to the individualistic and collectivist
cultures in many ways. For example, while emphasis on intrinsic motivation (enjoyment, fun,
and usefulness) is typical of individualistic cultures, emphasis on extrinsic pressure (social
pressure) is more typical of collectivist cultures such as Saudi Arabia. Moreover, Ajzen
(1985) uses the term “subjective norms” to refer to the person's perception of the social
pressures that put on him or her to perform the behaviour in question. Depending on the
culture, social pressure can affect the individual behaviour in varying degrees in different
societies.
Researchers such as Hofstede (1994) and Adler (1995) maintain that the individualism-
collectivism dimension is an important means of understanding the motives of human action
and behaviour (Ali, 1988). This perspective refers to the cultural dispositions to understand
people's needs to either satisfy personal aspirations or attend to group needs. In highly
collectivistic cultures such as the Arab World, an individual’s actions are typically influenced
by the expectations of people around him/her, especially the group he/she identifies with.
Thus, individuals from a collectivistic culture may use online shopping not because of their
potential usefulness or the enjoyment to be derived but because of the perceived social
pressure from their family and friends. In addition, they may wish to be perceived as being
technologically sophisticated by those whom they consider important to their future well-
being. Therefore, the research finding of subjective norm (social pressure) towards
continuance intention is consistent with Gelb and Johnson (1995), who conclude that positive
or negative social pressure, such as word-of-mouth, is more effective than advertising in
persuading customers to increase or reduce their intention or action.
The use of online shopping may also be motivated by intrinsic psychological rewards.
Perceived enjoyment and fun represent an intrinsic motivation for the use of online shopping.
It represents a type of intellectual playfulness and is defined as an individual characteristic
that describes an individual's tendency to interact spontaneously, inventively, and
imaginatively with the computer. Empirical research indicates that the general characteristics
of enjoyment and fun relate positively to creativity and an exploratory type of behaviour
during interaction with computers (Webster, 1992). It also shows that individuals who
experience pleasure and joy from using the computer and perceive any activity involving use
of online shopping as inherently enjoyable, apart from any anticipated improvement in
performance, are likely to use it more extensively than others (Davis, 1992; Malone, 1981;
Webster, 1989). Davis et al. (1989) found that while perceived usefulness emerged as the
CHAPTER 9: DISCUSSION AND CONCLUSION
P a g e | 251
major determinant of computer acceptance in the workplace, enjoyment and fun had a
significant effect beyond it.
A cultural dimension that was not related to Hofstede's dimensions of culture, but has
enormous management implications is the abstractive versus associative character in cultures
(Kedia and Bhagat, 1991). This dimension examines patterns of thinking and perception that
affects various aspects of employee behaviour. In abstractive cultures, which are found in
regions such as North America and Europe, people think and behave in a linear fashion using
a rational cause-and-effect paradigm to create perceptions. In associative cultures, which are
typically found among Africans, Asians and Arabs, including Saudi Arabia, perceptions and
behaviour are often diffuse, i.e., they utilise associations among events that may not have a
logical basis (Micheal, 1997). Previous studies involving subjects from abstractive cultures
have shown that perceived usefulness is positively related with system usage (Robey, 1979;
Thompson et al., 1991). These could also justify the findings in the research model including
enjoyment as the dominant predictor of continuance intention along with subjective norm.
Site Quality and Trust are strong antecedents of Perceived Usefulness (Site Quality SRW =
0.407, CR = 7.475; Trust SRW = 0.379, CR = 6.938). Both Site Quality (0.529) and Trust
(0.247) have large indirect effects on Continuance Intentions (see Table 7.31). These findings
match the collectivist culture of Saudi Arabia, where people tend to trust only members of
their in-group (Yamagishi and Yamagishi 1994).
Site Quality has a direct effect on Trust (SRW = 0.702, CR = 15.856). Trust and Site Quality
do not have direct effects on Continuance Intentions toward the online retailer. Rather,
significant indirect effects from Trust (0.247) and Site Quality (0.529) move through
Perceived Usefulness, Subjective Norms, and Enjoyment. This model refers to post-purchase
behaviour after a first-hand experience in online shopping. It appears that consumer initial
trust and usefulness expectations can be confirmed, leading to increased usefulness that puts
more pressure on social contacts to use and enjoy the site.
Web practitioners are also concerned with quality factors that appear to have an impact on
user acceptance. That is because web quality factors are under the control of the company and
are ways of influencing user beliefs and behavioural intention. Site Quality, which in this
research represents engineering-oriented performance characteristics (interface and visual
design, functionality, response time, easy to use), and availability and clarity of
communication, interaction and navigation mechanisms with customer service (accepting
CHAPTER 9: DISCUSSION AND CONCLUSION
P a g e | 252
consumer complaints and timely resolution of them with responsiveness, assurance, and
follow up services), which enhance the formation of consumer trust (McKnight et al., 2002a).
Consumers trust a vendor’s competence, integrity, and benevolence when they perceive a
vendor’s website to be of high quality (McKnight et al., 2002a).
Studies have shown that information quality has a positive impact on perceived ease of use
and usefulness of a website. The research confirms Lederer et al.’s (2000) finding that
information quality had a significant relationship with perceived usefulness. Building trust
with consumers is an essential mission for e-retailers because purchasing decisions represent
trust-related behaviours (Jarvenpaa et al. 2000; McKnight et al. 2002b; Urban et al. 2000).
Additionally, trustworthiness in the e-retailer is an essential element in the decision to place
trust with that person (Halliday 2004).
In the e-shopping context, trust implies a belief that the vendor will provide what has been
promised (Ganesan, 1994). As a result, perceived usefulness should occur only for an e-
vendor that can be trusted (Festinger, 1975).
The modification indices (MI) in Table 7.30 suggest two significant relations. The first
suggested relation by modification indices (MI) is Site Quality which has positive direct
effect on Enjoyment (SRW = 0.343, CR = 6.699), as shown in Table 7.31. This finding is in
line with Chung and Tan (2004), who suggested that website characteristics, such as quality,
were the antecedents of perceived playfulness and that they had a dominant role in
influencing a user’s feeling of playfulness. Chakraborty et al., (2002) indicated that perceived
website quality is a multi-dimensional latent construct that includes dimensions of
playfulness, usefulness, user friendliness, informativeness, technology, organization, and
navigability. Additionally, high quality e-shopping sites may result in the perception that the
consumer’s e-shopping experience is fun and enjoyable. Consumers are likely to experience
greater enjoyment and have more fun completing a given task at an e-store that establishes
high quality in terms of information-related as well as marketing-related attributes (Ha and
Stoel, 2009). Furthermore, all other conditions being equal, e-store features that appeal to
hedonic motivations, such as personalization and experiential/atmospheric quality
dimensions, will support greater enjoyment and fun for the consumer (Childers et al., 2001).
Koufaris (2002) showed that the use of value-added search mechanisms could make the
shopping experience more fulfilling and enjoyable. His findings are also consistent with the
research conclusion that the more enriched and satisfying shopping information could be
CHAPTER 9: DISCUSSION AND CONCLUSION
P a g e | 253
interesting and helpful. High levels of information quality on the website (various, complete,
detailed, accurate, timely, relevant, and reliable) are also likely to provide users with
convenience, enhanced enjoyment, and better purchase decisions. Furthermore, the findings
confirm Tractinsky et al.’s (2000) ideas that people will associate visual attractiveness of a
website with the positive beliefs that are common in TAM research, i.e., usefulness,
enjoyment, and ease-of-use.
The second suggested relation by MI, as illustrated in Table 7.30, is the positive direct effect
of Trust on Subjective Norm (SRW = 0.201, CR = 3.215), see Table 7.31. Saudi Arabia is
gateway to the two holy mosques and considered a conservative religious country. Previous
researches reported that religion enhances trust among community members (e.g., Boudon, 1987;
Collins, 2004; Shield, 2002; Steadman and Palmer, 1995; Weber, 1958). Additionally, according
to Hofstede (1980), collectivist cultures, such as Saudi Arabia, tend to trust each other more than
trusting someone who is not part of the circle. Their actions are typically influenced by the
expectations of trusted people around them, such as family, friends, or the larger circle of the
community.
Unlike Karahanna et al (1999) who suggested that as consumers gain e-shopping experience,
cognitive considerations based on first-hand experience gain prominence and social
normative considerations lose significance, the research findings indicate that the effect of
Trust for consumers with high experience on Subjective Norm (ERW = 0.275) is higher than
for consumers with less e-shopping experience (ERW = 0.208), see Table 7.78. However, the
regression weight of Subjective Norm on Continuance Intention is less on consumers with
higher e-shopping experience (ERW = 0.227) than consumers with less experience (ERW =
0.245), see Table 7.78. Similarly, the total effect of Subjective Norm on Continuance
Intention is higher with consumers who have less e-shopping experience (0.416) than
consumers with higher e-shopping experience (0.379), see Table 7.78.
9.4. DIFFERENCES BETWEEN SHOPPERS
As typical “innovators” (Donthu and Garcia, 1999), previous researches indicated that online
shoppers tended to be more educated (Li et al., 1999), younger than average and more likely
to be male (Korgaonkar and Wolin, 1999). This research is unique in the sense that it is the
first attempt, within the researcher’s knowledge, to conduct invariance analysis among
different groups in the context of e-shopping in Saudi Arabia. The research provides valuable
CHAPTER 9: DISCUSSION AND CONCLUSION
P a g e | 254
insights and is considered key contribution to understanding the continuance behavioural
intention differences in online shopping by looking at eighteen invariance analyses which
include: gender differences, experience and inexperience differences, online spending
differences, age differences, education differences, and geographical regions differences.
When comparing cultures or groups, research participants may not recognise the same
meaning and understanding of survey items. Scholars thus have emphasized the importance
of minimizing possible research biases in cross-national, cross-cultural, and group analysis
researches derived from the data collection (Lai and Li, 2005; Yi et al., 2008). To do this, we
applied back-translation (Brislin, 1986), as well as assessing the measurement invariance
(equivalence) across the groups to consider the constructs’ factorial invariance (Cheung et al.
1999; Lai and Li, 2005).
The invariance analysis indicates whether any differences occur between the compared
groups. The factorial analysis reveals if the compared group, e.g. men and women,
conceptualize the model constructs in the same way and with the same meaning (Hair et al.,
2006). If we find a group effect on the measurement invariance of the construct and the score
of the group analysis is significant, the construct measurement differs for the two groups, and
they cannot be compared directly.
Hence, the invariance analysis of the coefficient regression paths was conducted to determine
if the two compared groups have the same relationship with same variables in the research
model (structural weights).
9.4.1. Gender Differences
As has been previously demonstrated in 7.7.1, the differences in the sample’s behaviour in
the context of continuance online shopping in Saudi Arabia resulted from the difference in
the coefficients of Site Quality � Perceived Usefulness with change in chi-square = 5.123
and p value = 0.024, and from the difference in the coefficients of Perceived Usefulness �
Continuance Intention to use with change in chi-square = 6.797 and p value = 0.009.
Moreover, the findings of the latent mean analysis suggest that gender was found to have
latent mean non-invariance for the research constructs. This difference between male and
female, in the context on continuance Internet shopping, resulted from the differences of the
latent mean of Trust. The standardized latent mean of Trust is less among the male sample
than it is among female sample.
CHAPTER 9: DISCUSSION AND CONCLUSION
P a g e | 255
Additionally, the direct and indirect effects reveal that the greatest total influences of direct
and indirect (mediated) effects on Continuance Intentions come from Site Quality for the
male (0.635) and Enjoyment for the female (0.752) samples. The next greatest influences
come from Enjoyment (0.574) for men; and Site Quality (0.621) for women. Additionally,
Perceived Usefulness has more influences for males (0.549) on Continuance Intention than
females (0.399). Therefore, Site Quality, Trust, Perceived Usefulness, and Subjective Norm
all play significant roles for Continuance Intentions regarding online shopping in Saudi
Arabia for both men and women.
The differences in gender demonstrate that men and women have significant differences in
their reactions to the site quality and visual stimuli that, in turn, affect their recognition of the
product value and benefit, thus affecting their continuance intention. Furthermore, men are
more influenced by evaluations of the utilitarian usefulness of technology, whereas women
tend to accept technology based on their hedonic experiences and the opinions of others (Teo
et al., 1999; Venkatesh et al., 2000; Venkatesh and Morris, 2000). Furthermore, the findings
support previous research, which shows that males tend to engage in processing of available
information (Meyers-Levy, 1989; Meyers-Levy and Maheswaran, 1991; Meyers-Levy and
Sternthal, 1991). The use of this selective processing strategy implies that men focus on
highly available cues. Additionally, men are significantly more “quick shoppers” when
compared to women (Hansen and Jensen, 2008). On the other hand, women tend to try to
understand all available signs revealed from the site quality (Simon and Peppas, 2005),
though information overload may prevent women from understanding the intended value and
benefit from the e-retailer. Thus, extending these finding to online shopping continuance
intention, websites that fail to provide sufficient information for women might lead to poor
understanding of the product value or usefulness resulting less favourable intention toward
the websites. Finally, site quality, e.g. Internet design, is male dominated and mostly
designed with an associated mindset, which may explain why men are more affected by site
quality in this research than women (Rommes et al., 1999). Thus, the outcomes of this study
suggest the need to explore new ways to enhance to attract more female consumers.
More recent surveys, such as the Pew Internet conducted in 2002 and Sky News conducted in
2002, indicated that women are more dominant than men when it comes to e-commerce,
(cited in Cha 2009). According to comScore focusing on expenditures online, women
accounted for 58% of online shopping, whereas men were responsible for 42% between April
2004 and March 2005 (Maguire 2006). In this research, women are the most dominant in
CHAPTER 9: DISCUSSION AND CONCLUSION
P a g e | 256
terms of online purchasing in all categories. In terms of fashion, 17.7% of women have
purchased clothing, accessories or shoes, thus confirming previous studies. Statistics reveal
that clothing is one of very few categories with more women than men purchasing online
(Statistics Denmark, 2007). Previous research finds evidence that women are more involved
in fashion and clothing than men (O’Cass, 2004).
9.4.2. Experience and Inexperience e-Shoppers Differences
As has been previously demonstrated in 7.7.6, the result reveals that all research constructs
are less favourable among the inexperienced online shoppers than they are among the
experience online shoppers, even though constructs in the two groups sample are invariant
(perceived equally).
The findings of the direct and indirect effects provide more valuable insights than the greatest
total influences of direct and indirect (mediated) effects on Continuance Intentions coming
from Enjoyment for the low online frequency (0.651) and high online frequency (0.756)
samples. The next greatest influences come from Site Quality for low online frequency
(0.590) and for high online frequency (0.552) sample. Additionally, Perceived Usefulness has
the most direct influences for low online frequency sample (0.254) on Continuance Intention,
and Subjective Norm acts as the most direct influence for high online frequency sample
(0.227). Therefore, Site Quality, Trust, Perceived Usefulness, Enjoyment and Subjective
Norm all play significant direct and indirect roles for Continuance Intentions regarding online
shopping in Saudi Arabia for both low and high e-shopping frequency.
The findings indicate that Enjoyment remains an important predictor of Continuance
Intentions for e-shopping, as many past studies have shown. In terms of the significant
standardized beta coefficients, Subjective Norm is 0.245 for inexperienced shoppers and
0.227 for experienced shoppers; Perceived Usefulness is 0.254 for inexperienced shoppers
and 0.202 for experienced shoppers; and Enjoyment is 0.651 for inexperienced shoppers and
0.756 for experienced shoppers. These indicate that both utilitarian value and hedonic value
are relevant for both frequent (experienced) and infrequent (inexperienced) online shoppers,
whilst hedonic value appears to play a significant role for frequent (experienced) online
shoppers. Rogers (1995) stated that people are more likely to adopt an innovation they are
comfortable with and that is compatible with other technologies they already use. Also,
people who have not purchased online tend to continue to buy goods or services offline (Cha,
2009). Thus, the findings could be interpreted as experienced online shoppers are going to
CHAPTER 9: DISCUSSION AND CONCLUSION
P a g e | 257
continue shopping and purchasing online. Additionally, the latent mean indicates that
frequent (experienced) online shoppers have more favourable evaluations of the research
constructs than infrequent (inexperienced) shoppers. Such findings might hold a number of
implications for online retailers. It might be that the more experience Internet shopper gains,
the more trust and confidence he/she is going to gain, though, experienced shoppers look for
enjoyment. Taylor and Todd (1995) stated that experience users place less weight on PU
because they employ the knowledge gained from their prior experiences. Furthermore, Yu et
al. (2005) found that subjective norm, PU, and enjoyment to have positive influence in
intention for both experience and inexperience users. That is subjective norm, PU, and
enjoyment are common factors amongst the two groups. What this suggests is that while all
are important, Enjoyment is a stronger direct predictor than PU and Subjective Norm, at least
for experienced repeat consumers of online shopping.
9.4.3. Online Spending Differences
As has been previously demonstrated in 7.7.5, the source of non-invariance of structural
weights in the context of continuance online shopping resulted from the difference in the
coefficients of Site Quality � Trust with change in chi-square = 4.259 and p value = 0.039,
and Site Quality � Perceived Usefulness with change in chi-square = 9.279 and p value =
0.002. Additionally, there are differences in the coefficients of Trust � Perceived Usefulness
with change in chi-square = 5.619 and p value = 0.018.
The results demonstrate that 78.8% of the respondents have visited 1 - 5 websites in a given
month; 75% of them spend 60 minutes for online shopping activities per week; 11.9% of
them used the Internet daily for shopping activities; 46.2% of them used it monthly; 30.3%
used it two to three times a year; and 11.2% used it once a year. Thus, it could be argued that
the more time spent doing online shopping activities, the more experience they gain and the
expectation to spend on purchasing becomes more. As a result, the coefficient of non-
invariance could be interpreted as inexperience consumers might spend more time evaluating
the e-retailers’ website quality to build the proper trust, and then develop criteria for the value
or benefit from the product, than consumers with more knowledge and experience (Bettman
and Park, 1980). The low online spenders (inexperienced shoppers) might need to spend
some time to develop the required knowledge. Furthermore, according to additional results
not part of this research, see Appendix K, there is even spending differences in the path of
Site Quality to Perceived Usefulness among females themselves in the Saudi market, which
marketers need to pay attention to it when appealing to females shoppers.
CHAPTER 9: DISCUSSION AND CONCLUSION
P a g e | 258
The findings of the latent mean analysis suggest that the group analysis of low and high
online spenders’ samples had latent mean invariance for the research constructs.
The direct and indirect effects reveal that the greatest total influences on Continuance
Intentions come from Enjoyment for both the low online spending sample (0.700) and for the
high online spending sample (0.705). The next greatest influences come from Site Quality
(0.618) for both low and high online spenders. Additionally, Subjective Norm acts as the
third highest direct influences, after Enjoyment and Site Quality, with the low online spender
(0.248) greater on Continuance Intention than high online spender (0.185). Based on this
result, Trust, Perceived Usefulness, Enjoyment and Subjective Norm all play significant
direct and indirect roles for Continuance Intentions regarding online shopping in Saudi
Arabia for both low and high online spenders.
The findings indicate that enjoyment remains an important predictor of continuance
intentions among the e-shopping in Saudi Arabia. In terms of the significant standardized
beta coefficients on Continuance Intentions, Subjective Norm is 0.248 for low spender
shoppers and 0.185 for high spender shoppers; PU is 0.229 for low spender shoppers and
0.221 for high spender shoppers; and Enjoyment is 0.700 for low spender shoppers and 0.705
for high spender shoppers. What this suggests is that while all are important, Enjoyment is a
stronger direct predictor than PU and Subjective Norm, for both low and high consumers of
online shopping.
9.4.4. Educational Level Differences
As has been previously demonstrated in 7.7.4., again, the findings indicate that Enjoyment
remains an important predictor of Continuance Intentions among the education level in terms
of e-shopping in Saudi Arabia. In terms of the significant standardized beta coefficients on
Continuance Intentions, Subjective Norm (0.270); PU is (0.204); and Enjoyment is (0.636)
for shoppers holding less than bachelor degree, and Subjective Norm (0.198); PU (0.226);
and Enjoyment (0.735) for bachelor and higher. What this suggests is that while all are
important, Enjoyment is a stronger direct predictor than PU and Subjective Norm, for both
shoppers with less than bachelor degree and bachelor degree and higher consumers of online
shopping.
The non-invariance coefficient (regression paths) invariance analysis findings suggest that the
less educated group are affected more with Site Quality and Trust in e-shopping because the
less educated group assumed to be young with less online shopping experience. This is
CHAPTER 9: DISCUSSION AND CONCLUSION
P a g e | 259
consistent with previous research that indicates building trust with consumers is an essential
mission for purchasing decisions (Jarvenpaa et al., 2000; McKnight et al., 2002b; Urban et
al., 2000). It is also in line with McKnight et al. (2002a) , who state that site quality and good
interface design enhance the formation of consumer trust, and consumers trust the vendor’s
competence, integrity, and benevolence when they perceives the vendor’s website to be of
high quality (McKnight et al., 2002a).
On the other hand, the findings could be interpreted such that online shoppers tend to be more
educated (Li et al, 1999), with high income (Dennis et al., 2009), who rely on cognitive cues
when making buying decision; while less educated and less fortunate individuals rely on their
perceptions of website quality and on satisfaction cues. Thus, it is assumed that individuals
who are also highly educated have the knowledge and experience of online shopping. This
makes them involved in social communities and e-friendship, sharing their experiences
(Foucault et al., 2005), which leads to promoting the enjoyment.
9.4.5. Age Differences
As has been previously demonstrated in 7.7.3., due to a higher-than-average percentage of
young consumers, 35 years old and younger, (73.4%) participated in this research; it is
considered important to conduct age invariance analysis. Online customers commonly are
younger and more highly educated than conventional customers, making a young consumer
more representative of the online customer population (OECD, 1998; Al-Diri, Hobbs, and
Qahwaji, 2006). Additionally, Users who range in age from their teens through their 30s are
particularly attractive targets for sellers of goods and services; they also are more likely to
purchase products or services online than are older consumers (Akhter, 2003; He and
Mykytyn, 2007).
The two compared age groups, (younger than 35, and 35 and older), were invariant in respect
to structural weights. The researcher went one step further to find if there is difference in the
coefficient paths. The differences of the sample’s behaviour in the context of continuance
online shopping resulted from the different in the coefficients of Subjective Norm �
Enjoyment with change in chi-square = 5.609 and p value = 0.018. The findings could be
interpreted as online shoppers tended to be more educated (Li et al., 1999), with higher
income levels (Dennis et al., 2009), and assumed to be older with better jobs. Likewise,
older individuals tend to shop online more compared to lower income consumers. As stated
by Taylor and Todd (1995) and Yu et al. (2005), experience users (in this case older group)
CHAPTER 9: DISCUSSION AND CONCLUSION
P a g e | 260
place less weight on PU. That is perhaps, because older group tend to be more experienced or
knowledgeable about websites allowing information exchange, interaction, sharing reviews,
rating of travel, holidays, accommodations, and cult brands between consumers to meet their
needs. On the other hand, Bush et al. (2005) refer to the power of social influence,
particularly within young female age groups and the significance of role models in consumer
behaviour within the sports market. Additionally, youth populations are motivated by status
and peer pressure, and making the Internet is one of the main environments for them to play,
work, learn and communicate (Alreck and Settle 2002; Spero and Stone 2004), thereby,
increasing enjoyment.
The latent mean findings provide valuable insights and understanding for practitioners and
researchers alike on how young and old consumers perceive the research constructs. The
result of the latent mean analysis suggests that age was found to have latent mean non-
invariance for the research constructs. This difference between younger than 35, and 35 and
older, in the context on continuance internet shopping in Saudi Arabia, resulted from the
differences of the latent mean of Trust, Enjoyment, and Continuance Intention to use. The
standardized latent mean of Trust, Enjoyment, and Continuance Intention to use in the
younger than 35 samples is higher among the younger sample than it is among the older
sample. The latent mean findings reveal that younger consumers have higher intention to
continue. Akhter (2003) suggests that younger people are more likely than older consumers to
purchase products or services using the Internet. Also, these contributions are in line with
previous research that the Internet is one of the main environments for young people to play,
work, learn, communicate, and share experiences (Alreck and Settle, 2002; Spero and Stone,
2004). Additionally, previous research demonstrated that consumers who experience pleasure
and joy from using e-shopping and perceive any activity involving use of online shopping as
inherently enjoyable, are likely to use it more extensively than others (Davis, 1992; Malone,
1981; Webster, 1989). Therefore, managers should work to increase the level of Trust,
Enjoyment, and Continuance Intention among older consumers.
The direct and indirect effects reveal that the greatest total influences on Continuance
Intentions come from Enjoyment for the 35 years and older (0.749) and for younger than 35
years (0.705) samples. The next greatest influences come from Site Quality (0.624) for the 35
years and older and (0.620) for younger than 35 years samples. Additionally, Subjective
Norm has the second most direct influences for younger than 35 years (0.215) on
Continuance Intention over the 35 years and older samples (0.212). Therefore, Site Quality,
CHAPTER 9: DISCUSSION AND CONCLUSION
P a g e | 261
Trust, Perceived Usefulness, Enjoyment, and Subjective Norm all play significant direct and
indirect roles for Continuance Intentions regarding online shopping for both compared age
group, younger than 35, and 35 years and older.
Again, the findings indicate that Enjoyment remains an important predictor of continuance
intentions among the age groups for e-shopping in Saudi Arabia. The significant standardized
beta coefficients on Continuance Intentions, Subjective Norm (0.211); PU is (0.215); and
Enjoyment is (0.741) for shoppers aged less than 35 years old; and Subjective Norm (0.263);
PU (0.212); and Enjoyment (0.749) for shoppers aged 35 years and older. What this suggests
is that while all are important, Enjoyment is a stronger direct predictor than PU and
Subjective Norm, for both young and old shoppers using online shopping.
9.4.6. Regional Differences
Saudi Arabia is ranked as the 14th largest country in the world, covering more than 2 million
square kilometres (Nations Online, 2008). In addition, its population is young and growing -
60% of the total population of 24,069,943 is younger than 30 years (The Middle East
Statistics, 2007), with a population growth rate of approximately 2–3%. Thus, the researcher
attempted to determine whether the cross-national and cross-cultural factors among regions
have any effect on e-shopping continuance intention. The regional invariance analysis
focused on the three most populated regions, where most participants come from, West
(40.2%), East (26.2%), and Centre (26.4%).
As has been previously demonstrated in 7.7.2, again, the findings indicate that Enjoyment
remains an important predictor of Continuance Intentions among the most populated regions
in terms of e-shopping in Saudi Arabia. In terms of the significant standardized beta
coefficients on Continuance Intentions in the West Region, Subjective Norm (0.219); PU is
(0.230); and Enjoyment is (0.651); in the East Region, Subjective Norm (0.167); PU is
(0.273); and Enjoyment is (0.741); and in the Centre Region, Subjective Norm (0.220); PU is
(0.291); and Enjoyment is (0.669) for online shoppers. What this suggests is that while all are
important, Enjoyment is a stronger direct predictor than PU and Subjective Norm, for
consumers of online shopping in all regions. The findings of indicate regions are non-
invariant in e-shopping context in Saudi Arabia. In additional result not related to this study,
see Appendix J, the author found regional differences in continuance intention among
women. Based on the author’s knowledge, no previous research has studied the differences
between different regions in one country. The author has no obvious justification for these
CHAPTER 9: DISCUSSION AND CONCLUSION
P a g e | 262
differences. However, when we look at Saudi Arabia we notice that information technology
is concentrated in the three most advanced areas of the country. These three areas happen to
be also the major cities; Riyadh, the capital of Central region; Jeddah on the West Coast; and
Dammam on the East Coast. Riyadh is by far most the largest and most important IT
incubator in the country, mainly because it is the capital and most of the government agencies
that sponsor research and development (R&D) are located there. Riyadh is also regarded as
the business centre of the country and, therefore, many of the businesses are located there.
Another importance is Economic Balance Program, which acts as a host for several important
joint ventures, many of which are with large global firms operating in the IT field. Dammam,
in the Eastern region, was once considered the major IT centre in the country because of the
presence of King Fahad University of Petroleum and Minerals (KFUPM) and Aramco, the
largest Oil Company in the world. Both of these organizations have been considered to be
pioneers in the use of IT in Saudi Arabia, and they fostered most of the early R&D efforts in
the country. Jeddah has the least IT concentration among the three. However, one of the earth
satellite hub stations are located in Jeddah at King Fahad Satellite City, which link up with
the Intelsat Satellite System, allowing subscribers to dial over 200 countries directly. This is a
major access point, identifying Jeddah as the communication hub of the country, which in
turn led to the concentration of IT organizations in the area (Saudi Telecom. Website, 2009).
However, as a citizen of Saudi Arabia, the author believes that the populations in the Central
regions are mostly conservative and religious people, whereas people on the Western and
Eastern coasts tend to be more liberal and open to other cultures and religions. This may
indicate that people in the Central region could be more utilitarian in their approach to using
the Internet for shopping, whilst, on the other hand, the Western and Eastern people are more
open to use the Internet for utilitarian and hedonic approaches. However, these regions’ non-
invariance introduces a series of interesting questions that are beyond the scope of this thesis
but important for future investigation and research.
9.5. RELEVANT FINDINGS OF THE QUALITATIVE
ILLUSTRATIVE CASE STUDIES
As discussed in chapter 5, section 4.1, 4.6 and chapter 8, Sale et al. (2002) argue that the
result of the combination of the different methods would have different strengths; and would
produce more than what each method could offer in isolation. Morgan (1998) indicated the
CHAPTER 9: DISCUSSION AND CONCLUSION
P a g e | 263
mixing of qualitative and quantitative can be carried out on the part of generating knowledge,
which can be done without violating basic paradigmatic assumptions. The qualitative data
was mainly obtained from different sources such as company documents, semi-structured
interviews, direct observation, and/or archived records. Each of these sources carried equal
importance and weight (Merriam, 1998; Yin 2003). However, as emphasised by Yin (2003)
that research methods should be considered complementary, and therefore, a good qualitative
data rely on as many sources as possible to generate knowledge and better understanding of
online shopping continuance intention in Saudi Arabia.
The qualitative result from the semi-structured interview and the documentation analysis of
the selected Saudi companies (the director of the Internet Division in the Communications
and Information Technology Commission, Saudi Arabian Airlines; STC; Saudi Budget car
hire; and Jarir Bookstore) enriched the research by revealing phenomena related to
continuance Internet shopping in Saudi Arabia from a perspective other than that of the
customers; and provided a relative understanding of the big picture of the research.
Moreover, the interviewees clarified how the Saudi companies see themselves in the current
state of e-commerce and online shopping and advances in e-commerce after Saudi Arabia
joined the World Trade Organization (WTO).
The qualitative findings show that interviewees representing their companies perceived the
power of e-commerce and online shopping, based on the expected or realised benefits to their
company (See Table 8.88). This perception links the view of the interviewees to the research
model, which focuses on continuance intentions toward online shopping and, thereby,
increases the value of this research contribution to real businesses. Additionally, the findings
support the argument that companies are aware that online shopping not only helps customers
find products or services quickly and conveniently, but also provides technology that benefits
the company’s efforts to enter other markets, understand customers better, and share gathered
information with partners to promote, modify, and distribute products and services.
Both Saudi Arabian Airlines and STC exemplify the online shopping definition used in this
thesis in section 4.2. The Saudi banks also offer excellent services to their customers.
However, even though the interviewees agreed that e-shopping, electronic shopping, online
shopping, and Internet shopping were the same, a few remained confused. One significant
observation about understanding e-commerce is that more awareness is needed among both
companies and consumers.
CHAPTER 9: DISCUSSION AND CONCLUSION
P a g e | 264
The interviewees agreed with the suggested market factors identified through the literature
review. Security, service/delivery, ease of use, usefulness, and site quality play the most
important roles for developing the online shopping website. It is evident from the responses
that enjoyments, price, presenting product or service quality, payment methods, language,
strong brands, satisfaction, trust, and loyalty incentives constitute the second key level of
importance factors. These findings further support the argument about the need to develop a
research model to understand the factors that affect continuance intentions toward online
shopping in Saudi Arabia. The findings show a strong link across beliefs about online
shopping among the interviewed companies, the documents analyzed, and both current and
potential customers.
All of the interviewed companies in this research agree on investing and using the Internet as
a channel to communicate with customers, in additional to using branch offices. All
interviewees agreed that their companies are not fully satisfied with the current status of their
online retailing and are considering further enhancement, either now or in near future. For
example, Jarir Bookstore indicated that it exists online just to keep up with others. They
ensure, however, that their website displays current products, information and prices. It
would be highly advisable for Jarir bookstore and other Saudi retailers to respond and meet
market needs to increase sales and retain existing customers. However, using the Internet as a
strategic channel reflects the importance companies perceive place on online shopping to
Saudi companies. According to Kimber (2001), shopper loyalty in-store and online are
linked. For example, the supermarket Tesco’s customers who use both on- and offline
shopping channels spend 20% more on average than customers who use only the traditional
store (cited in Dennis et al., 2009). Also, consumers who shop across multiple channels
provide higher revenues, higher share of wallet, have higher past customer value, and have a
higher likelihood of being active than other customers.
Furthermore, after analysing companies’ documentations, 47% of the participants said they
remained very concerned when shopping online due to security reasons, and 43% believed
there was not enough product variety on the Internet. In addition, 55% were concerned about
after-sales service when they bought online, whilst 59% believed that “shopping online is
something for the next generation.” However, 40% of participants expressed enjoyment in
online shopping, calling it fun and noting the time they saved, and 31% found online
shopping very convenient. Furthermore, 34% said online shopping was easy for comparing
prices and options before buying, and 76% found the Internet much simpler for gaining
CHAPTER 9: DISCUSSION AND CONCLUSION
P a g e | 265
access to information. Others mentioned the difficulty of assessing goods, the expense of
buying through the Internet, the complexity of this method, and the lack of quality.
The respondents strongly agreed that Internet security applications are crucial and cannot be
ignored. Therefore, adopting security for the website should help increase customer trust. The
Internet reservation manager at Saudi Arabian Airlines noted that “security is very important
factor for our customers, and because of that we implement strong security standards to
restrict access to customers’ information and secure e-ticket purchasing”. As indicated in
section 8.4, those who would not be interested on booking flight online explained their
reasons as follows: 40% did not trust the Internet for shopping, 14% found it too expensive,
18% did not use the Internet, and 28% had other reasons. Most of those who expressed a lack
of trust in the Internet were Saudi Arabian nationals. Similarly, the thesis survey findings
indicate that 42.1% of participants have trust toward international e-retailers compared to
11.6% for local e-retailers. This is a big concern for local Saudi e-retailers who should focus
on increasing the level of consumers’ trust of online shopping.
According to the interviewee from Saudi Arabian Airlines, the company is not satisfied with
these figures, especially considering the vast number of passengers carried each year. To
address those customers who would not book travel online because they did not trust the
Internet for shopping, the company has signed a huge contract to improve its e-services.
According to the interviewee, Saudi Airlines “can make big reductions in its operational cost
by the expected saving from the new e-services, including flight reservation.” Saudi Arabian
Airlines also needs to emphasise trust to increase the number of customers who will reserve
online by purchasing e-tickets online. An unpublished study by the Centre for Customer
Driven Quality highlights the potential savings, as noted in previous chapters (Feinberg, et al.
2002). That is, paper tickets cost $10 per ticket to process; e-tickets cost $1. Therefore, most
companies should rely on e-business and e-customer relationship management to lower their
costs and serve their customers more effectively and efficiently.
Saudi Airlines offered its online services in 2004, but this was only for booking a seat. Based
on the information gathered during the interview, less than two million online bookings were
made in 2007 for both domestic and international flights. Full online e-ticket purchasing was
introduced in 2008. Now, there are three airlines operating in Saudi Arabia, one national
carrier and two low cost airlines, which are providing booking and buying tickets online.
At this stage, interviewees find it difficult to determine the contribution of customer loyalty
CHAPTER 9: DISCUSSION AND CONCLUSION
P a g e | 266
to the success of e-business or online shopping solution, especially if the company only just
introduced its site, or soon will. Therefore, most interviewees considered customer loyalty a
moderate influence on success. However, analysing the provided documentation illustrated
that 39% of the survived airlines customers were members of other airlines’ loyalty
programs. British Airways represented the highest threat and major competitor, such that
23% of Saudi Arabian Airlines customers also have membership in its program and have
been exposed to its services. As a result, as indicated in section 4.4, building a specific desire
or intention to continue an online shopping relationship with a service or product provider is
critical because acquiring new customers may cost as much as five times more than retaining
existing ones (Bhattacherjee 2001b; Crego and Schiffrin 1995; Petrissans 1999).
The four telecommunications companies operating in Saudi Arabia were offering their
products and services online. Today, they strive to attract and retain their customers by
providing other entertainment such as games, sponsoring sport events and football clubs, and
offering customised packages to young customers, both male, and female. For example, in an
effort to attract, retain and be engaged with Saudi consumers’ worldwide, especially young
members of the population who are fully linked with sports, Saudi Telecoms (STC) has
signed a five-year agreement with six of the top Saudi football teams and two leading
European teams, Manchester United Football Club and Real Madrid Football Club. As
sponsor, STC will have a presence inside the stadiums, and will be featured on the clubs’
website. Furthermore, under the terms of the agreement, each year 70 Saudi students will
have the opportunity to go for a period of training at the Manchester United and Real Madrid
Academies. As part of the agreement, all STC's business units will have full use of the
Manchester United and Real Madrid logos in marketing campaigns as well as usage of the
clubs’ logo, players' photographs, club news, and music in STC retail centres, its website, and
sent via text to their subscribed customers (AMEInfo.com, 2009).
The research results and e-commerce growth potential indicate that retailers in Saudi Arabia
need to reconsider their current marketing strategy and take more steps to respond to the
needs and attitudes of their target users. First, retailers need to create online retailing stores as
new channels for growing numbers of customers. Then, they need to adjust their online
storefronts as well as the various channels through which their products and services are
delivered. Unfortunately, the Saudi consumers in this research have expressed several
concerns over the current online shopping situation, which have acted as a barrier and
dissuaded Internet users in Saudi Arabia from using the online shopping.
CHAPTER 9: DISCUSSION AND CONCLUSION
P a g e | 267
During the company interviews, all interviewees realised the external pressures initiated by
competitors that already had adopted (or were in the process of adopting) e-commerce, as
well as from customers who had experienced other services. Most of these managers said that
customer pressure would lead to either greater implementation or an enhanced e-commerce
project. The Director General of Jarir Bookstore noted that “we existed online because of the
market, and follow with competitors. Now, to keep our relationship with our customers, we
need again to follow the market and enhance our online business.” However, the Saudi
Airlines Internet booking manager stated that “the pressure we get from customer is the input
that makes the market to follow.” He added, “Customers do not want only one channel, they
want flexibility in reservation, buying, managing their account, etc. through more than one
channel.”
The participants of the online research survey and interviewees consider that the fact that
Saudi Arabia is behind in the area of IT can be attributed to several factors. These may
include computer illiteracy, lack of government incentives to attract businesses (free-trade
zones and subsidies), absence of adequate infrastructure to support the e-commerce industry,
poor enforcement of e-commerce laws, intellectual property and copyright laws, and lack of
resources. Therefore, the research sample profile indicates these concerns as the main reasons
preventing the full adoption of e-commerce. Finally, the interviewees emphasized that in
order to ensure the success of this expensive project they needed strong involvement and
commitment, in addition to a strategic link to the reason for the project. The connection
between company commitment and strategy to the other factors contributes to the success of
the online shopping project.
9.6. CONCLUSION AND CONTRIBUTIONS
Whilst the TAM model, as expanded by Davis et al., (1992) and Gefen et al (2003), and ECT
(Oliver, 1980; Bhattacherjee, 2001) have been used widely in research in the industrialized
world, it is not so common in the Arabic nations and Saudi Arabia as part of the developing
countries. To the best of the author’s knowledge, this study is the first attempt to investigate
the online shopping continuance intention in Saudi Arabia. In fact, such research is virtually
non-existent, especially in the e-shopping context. Therefore, this study adds to the
understudied area of online shopping continuance intention in the western and in non-western
countries in general; and the Arab World in particular, and Saudi Arabia specifically, by
examining the effects of usefulness, enjoyment, and subjective norms on continuance
CHAPTER 9: DISCUSSION AND CONCLUSION
P a g e | 268
intention. Consumers will form intentions to continue online shopping if they find it to be
useful and enjoyable. This study addresses this knowledge gap for a unique culture.
To the same extent, the research contribution is potentially valuable, as the TAM stops at
intention and does not investigate continuance intentions or behaviour. Moreover, the cross-
cultural and the intensive group behavioural differences aspects to our contribution are also
relevant, as both models have been used widely in research in the industrialized world. Such
differences between shoppers (invariance analysis) introduce series of interesting questions
that are beyond the scope of this thesis but important for future investigation and research.
The shortage of research in the Arabic countries and as well as the intensive invariance
analysis conducted in this thesis would generate a debate and stimulate research in the Arab
world context in general and in Saudi Arabia in particular, specially that Saudi Arabia has
been ranked 5th in 2009 and 4th in 2010 in the Kearney Global Retail Development Index for
retail attractiveness (Kearney GRDI, 2010).
As shown in Figure 9.44, the proposed model considered TAM and ECT, with the inclusion
of other variables associated with online shopping. Empirical testing of the proposed model
found the model to be strongly supported, with all paths are significant in the hypothesised
directions. The result suggests that enjoyment, subjective norms, and perceived usefulness are
the main determinants of online shopping continuance intention. One interesting findings of
this research is that, among the three determinants of online shopping continuance intention,
the influence of enjoyment is the strongest predictor; it was even stronger than usefulness and
subjective norms. As indicated by the results of this research, the importance of subjective
norms contradicts with Davis et al. (1989) claimed that subjective norms are not significant in
explaining behavioural intentions, which can be assumed to be related to cultural factors.
Additionally, another key conclusion from this study is the importance of both the direct and
indirect effects of behavioural differences in Saudi Arabia, which should be take into
consideration when developing any website and marketing strategy for e-retailing. The author
also speculates that such a model may well be generally applicable to online shopping in
other countries, and perhaps also generally applicable to continuance intention in other
service industries. However, it is for future research to explore this potential generalization.
From a theoretical standpoint, these results contribute to existing literature in several ways.
First, we enhance e-shopping literature by providing insights into the factors that seem to
affect online shopping continuance intentions in Saudi Arabia. The author also posits that
CHAPTER 9: DISCUSSION AND CONCLUSION
P a g e | 269
enjoyment, subjective norms, and perceived usefulness have direct and indirect effects on
continuance intention. Notwithstanding that TAM omits subjective norms, primarily because
Davis claimed that they are not significant in explaining behavioural intentions (Davis et al.,
1989), our research finding of subjective norm (social pressure) towards continuance
intention is consistent with Gelb and Johnson (1995), who conclude that positive or negative
social pressure, such as word-of-mouth, is more effective than advertising in persuading
customers to increase or reduce their intention or action. As indicated by the results of this
research, the importance of subjective norms can be assumed to be related to cultural factors
leading to the interesting question of to what extent the TAM and ECT may be valid in more
collective societies than developed countries.
A key conclusion from this study is the importance of both the direct and indirect effects
differences in Saudi Arabia, which should be taken into consideration when developing
marketing strategy for e-retailing. The research findings imply that usefulness, enjoyment,
and subjective norms are not the only contributor to online shopping continuance intention,
but it is trust and site quality that lead to a higher level of customers’ continuance intention.
Additionally, the greater positive indirect effects of Site Quality on Perceived Usefulness,
Subjective Norms, and Enjoyment, and that of Trust on Enjoyment and Subjective Norms
suggest that online retailers should increase the positive perceptions of site quality and trust
to make their e-shopping environment more useful and enjoyable. Unlike the relationship in
traditional business settings with customers, the role of site quality and trust is important
because the primary interface with an e-vendor is a website, through the use of information
technology (IT). For instance, if new customers are more likely to judge a website by its
appeal conveying its quality and trustworthiness rather than its usability, then companies
need to pay attention to increasing the appeal of their sites. Furthermore, e-retailers should
endorse their trustworthiness by marketing their robust security measures, privacy policy
statements, seals of approval and including statements such as “secure servers” can increase
confidence among current and potential customers (McKnight et al., 2000; Palmer et al.,
2000; Gehrke and Turban, 1999). Offering guarantees, warranties or adding a Frequently
Asked Questions (FAQ) section to the website services should lower users’ uncertainty
perceptions.
Today, the use of the technology, such as online shopping, is determined not only by
subjective norms but also by the user’s need for relationships with others and social
communities (Schau and Gilly, 2003). According to Wilska (2003, p. 459), the role of
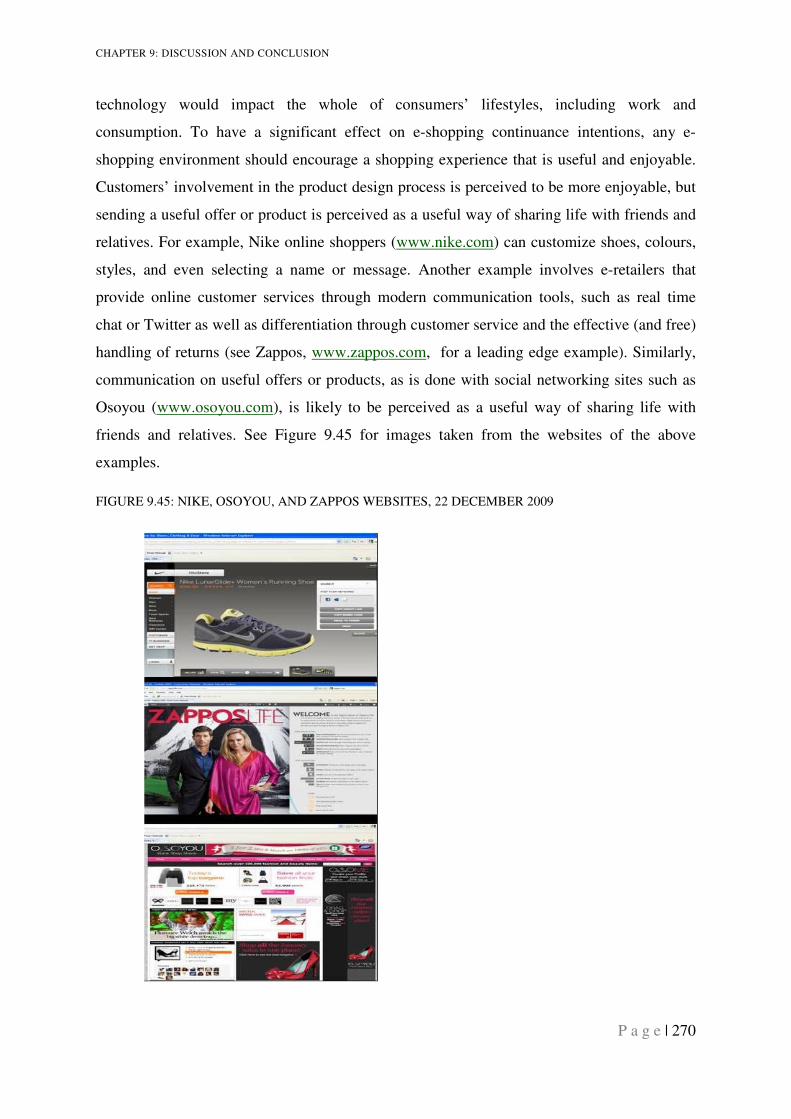
CHAPTER 9: DISCUSSION AND CONCLUSION
P a g e | 270
technology would impact the whole of consumers’ lifestyles, including work and
consumption. To have a significant effect on e-shopping continuance intentions, any e-
shopping environment should encourage a shopping experience that is useful and enjoyable.
Customers’ involvement in the product design process is perceived to be more enjoyable, but
sending a useful offer or product is perceived as a useful way of sharing life with friends and
relatives. For example, Nike online shoppers (www.nike.com) can customize shoes, colours,
styles, and even selecting a name or message. Another example involves e-retailers that
provide online customer services through modern communication tools, such as real time
chat or Twitter as well as differentiation through customer service and the effective (and free)
handling of returns (see Zappos, www.zappos.com, for a leading edge example). Similarly,
communication on useful offers or products, as is done with social networking sites such as
Osoyou (www.osoyou.com), is likely to be perceived as a useful way of sharing life with
friends and relatives. See Figure 9.45 for images taken from the websites of the above
examples.
FIGURE 9.45: NIKE, OSOYOU, AND ZAPPOS WEBSITES, 22 DECEMBER 2009
CHAPTER 9: DISCUSSION AND CONCLUSION
P a g e | 271
Second, the results support previous research that perceived usefulness reflects the utilitarian
aspects of online shopping, whereas perceived enjoyment reflects its hedonic aspects. In our
study, enjoyment has the strongest direct effect on e-shopping continuance intentions. In our
study, enjoyment has the strongest effect on e-shopping continuance intentions, which
confirms that enjoyment in an online shopping environment is important and has a direct
effect. Some consumers may primarily shop online for utilitarian or functional purpose, such
as improved multidimensional examination of a product, while other consumers may shop
online for hedonic purposes, such as enhancing the shopping enjoyment experience by
creating a virtual model of the product. Also, if an individual ‘‘feels good’’ about an online
activity, and it is intrinsically motivating, the individual is more likely to engage in it.
Individuals using online shopping and experiencing enjoyment and playfulness are more
absorbed and interested in the interaction. Such interaction shapes the individual intention to
visit online shopping again later (Lin et al., 2005). Conversely, website with low enjoyment
level may lead to lower intention to return and less likelihood that consumers will make that
e-retailer part of their online shopping routine (Jayawardhena and Wright, 2009).
Nevertheless, the result demonstrates that combining the direct and indirect effects indicates
that perceived usefulness had an equal strong total effect on e-shopping continuance
intentions similar to enjoyment, in support of previous findings that usefulness has strong
links to intentions. The benefits of using an e-shopping website can be classified as current e-
shopping activities, such as the usefulness of using the technology itself in shopping,
searching, and visualizing the products, or the benefits relating to future activities, such as
getting the items that have been ordered. When e-shoppers view a retailer’s website as
trustworthy, it makes the website more beneficial as customers are willing to pay a premium
price for just that added special relationship with an e-shopping site that they trust and
perceive as useful and beneficial (Reichheld and Schefter, 2000). Usefulness is an important
criterion for consumers when they select online stores and it can increase their satisfaction.
However, consumers may continue using an e-commerce service they consider useful, even if
they are dissatisfied with it (Bhattacherjee, 2001a).
This study also contributes to a better understanding of the impact of the behavioural
differences of continuance intention in the context of Saudi Arabia. This should be taken into
consideration when developing any website and marketing strategy. An invariance analysis
was conducted to examine the differences between the different groups for online shopping to
determine if the compared groups conceptualize the research model’s constructs for
CHAPTER 9: DISCUSSION AND CONCLUSION
P a g e | 272
continuance online shopping in the same way. The findings provide valuable new insights
into the differences in the continuance e-shopping intention among gender, education, age,
geographical location, experienced and inexperienced e-shoppers, and low and high online
spenders. The findings revealed that there are gender differences among male and female
groups.
Additionally, when comparing the three main regions, West, Centre, and East, the findings
demonstrate that there are differences between the consumers among the three regions.
According to another result not part of this research, see Appendix J, the author finds that
there are even regional differences among females themselves in the Saudi market in the path
of Perceived Usefulness to Enjoyment in the Eastern vs. Western region, as well as in Eastern
and Central region. Furthermore, the findings reveal further differences between younger and
older generations, as well as among consumers with less than bachelor degree and consumers
who have bachelor degree and higher degree.
The findings of this research contribute to a better understanding when comparing the low
and high online spending among e-consumers. Even though there are no indicated differences
between experienced and inexperienced e-shoppers, the results indicate important findings in
regard to the latent mean for marketing managers and researchers. Latent means make it
possible to explore whether the quantifiable meanings of the scales are similar across cultures
or the compared groups, which involves scalar invariance when comparing the mean between
two populations. The latent mean, therefore, can be interpreted as the difference between the
latent mean construct means in one group relative to the other (Hair et al., 2006).
The research findings imply that, although obtaining shopping and gratification value are
important purchase goal and are vital to experienced repeat customers’ continuance
intentions, site quality and trust still play extremely influential role in continuance intention
in the less experienced online shoppers. Specifically, site quality and trust are essential for
creating customer loyalty and managing customer continuance online shopping intention. The
differences between the experienced and inexperienced online shopping sample, in the
context of continuance online shopping intention, resulted from the differences of the latent
mean of PU, Trust, Enjoyment, Site Quality, Subjective Norm, and continuance intention to
use. Thus, these constructs are less favourable among the inexperienced online shopping
sample than it is among the experienced online shopping sample.
CHAPTER 9: DISCUSSION AND CONCLUSION
P a g e | 273
Therefore, it is important to fully understand these comparison differences. For example, e-
retailers should emphasise the usefulness (utilitarian values) of their websites in their
marketing strategy when communicating with men, whilst emphasising their enjoyment
(hedonic values) when designing their marketing mix for women. e-Retailers targeting Saudi
customers should not use the same web design and/or marketing mix to stimulate usefulness
and enjoyment perceptions among consumers in the compared groups and regions.
Third, this study is unique in its methodological approach. Within Saudi Arabia, few prior
studies have used SEM as their methodological approach, and even fewer applied invariance
analysis to verify behavioural differences. This approach allows the author to examine and
compare details of different groups that were not otherwise possible. The research-gathered
data that made it possible to analyse group invariance, and gain a better understanding of the
effect of behavioural differences in continuance intention among gender, geographical
regions (West, Centre, and East), experienced and inexperienced e-shoppers, age, education,
and high and low online spenders. To conclude, despite the three structural weights (gender,
education, and online spending) and three latent means (gender, age, and experience online
shopping) were non-invariant, this study conducted sixteen invariance analyses which
confirms that the research model and the findings of this research are free from gender,
geographical regions (West, Centre, and East), experienced and inexperienced e-shoppers,
age, education, and high and low online spenders biases, in the continuance intention of
online shopping context. However, with such a big research sample, and even though the
structural weight shows invariance among few group analysis, the author realised the need to
minimize the possibility of research biases in cross-national, cross-cultural, and group
analysis among constructs relationship (path) that may arise from the data strength and
weakness when applied to every constructs’ path. Therefore, to look for significant path
differences, the author decided to test each factorial path separately while the rest of the paths
are freely estimated across the compared groups, to look for any non-invariance path. It could
be seen in the age and region invariance analysis, see section 7.7.2; and 7.7.3, that non-
invariance were found in the individual paths, even though there were not so over whole.
Therefore, the author’s approach in this case of testing the individual path has demonstrated a
more rigorous test for non-invariance than that normally employed (e.g. Byron, 2001), as
detailed in Section 5.8.4. Finally, to date, few research studies in the context of Saudi Arabia
have validated their constructs with invariance analysis. This study addresses this knowledge
CHAPTER 9: DISCUSSION AND CONCLUSION
P a g e | 274
gap in the online shopping context for the unique culture of Saudi Arabia, and is the first
attempt to do so.
9.6.1. Research Model Generalizability
The research model in this study confirms that online shopping involves hedonic as well as
utilitarian value. Additionally, subjective norms and social influence play an important role in
Saudi Arabia. As expected based on current IS literature, perceived usefulness (utilitarian)
and perceived enjoyment (hedonic) value are influential indicators of intention and revisit
intention (Davis et al., 1992; Van der Heijden, 2004; Lin, Wu and Tsai, 2005; Donovan and
Rossiter 1982). As mentioned earlier, Shim et al. (2001) consider subjective norms only
marginally significant for e-shopping intentions, whereas Foucault et al. (2005) confirm a
significant link between talking about e-shopping with friends and intention to e-shop.
However, TAM omits subjective norms, primarily because Davis claimed that they are not
significant in explaining behavioural intentions (Davis et al., 1989). The similarity and
distinction in the findings between this research and literatures could be attributed to cultures,
which suggest that information technology and management practices should be modified for
different cultural contexts.
The Arab World culture, including Saudi Arabia, is dominated by high collectivism, i.e., an
individual’s beliefs depend on the social norms of the group (Kluckhorn and Strodtbeck,
1961) as well as expecting managers to set the standards to be followed. Additionally, other
studies suggest that individuals place more trust in people similar to themselves and assess
trustworthiness based on second-hand information and on stereotypes (McKnigh et al., 1998;
Morgan and Hunt, 1994; Zucker, 1986). In a similar vein, recent studies in the marketing
literature have also confirmed the importance and dynamics of social pressure on consumer
behaviour. For instance, Takada and Jain (1991) have found that the diffusion of consumer
goods in South Korea and Taiwan is directly influenced by social value.
However, contrary to findings based in North America and in this research, Anandarajan
(2002) noted that individuals in Nigeria are more affected by normative and social values on
usage, whereas usefulness and enjoyment had no effect on usage, even though Nigeria is
classified as collectivist culture by Hofstede (1984).
Prior research indicates that consumers in all shopping channels shop for both utilitarian and
hedonic outcomes (Childers et al., 2001), which is also consistent with previous research that
CHAPTER 9: DISCUSSION AND CONCLUSION
P a g e | 275
social influence plays an important role in collectivist cultures (Foucault et al. 2005;
Anandarajan, 2002). The author of this research suggests that the research model and the
results of this study could be generalized into other contexts in general, Arab countries in
particular, and Gulf Cooperation Council countries (GCC) in specific. This is because Arab
countries are classified by Hofstede (1984) as collectivist culture. The generalization of the
research model to the Gulf Cooperation Council countries (Bahrain, Kuwait, Oman, Qatar,
and the United Arab Emirates) is more likely to be applicable because of having parallels
with Saudi Arabia in sharing similar values, tribes, relatively young population, and rapid
economic growth rates (Nations Online, 2008).
Additionally, the growth of disposable family income in and distribution of the spending
within families in GCC countries are similar. Shopping is done by good value of the
economic potential available, on the experience of each person, on the social scale of the
individual and on the peer groups and sub-groups that individual mixed in, specially that
most of the GCC countries have been ranked in the top 30 in the 2010 Kearney Global Retail
Development Index for retail attractiveness (Kearney GRDI, 2010)..
The methodology used in this research is useful in indicating the potential generalizability of
the study findings’ across different cultures and contexts. This research is theory oriented and
is concerned with assessing the correspondence between relationships discernible across
cases and a broad theoretically based interpretation of social phenomenon. According to
Ragin (1987) and Creswell (2003), investigators who use such approach focus their interest
on testing hypothesis and propositions derived from theory to determine whether the
predictive generalization of the theory hold. This is achieved by conducting a comprehensive
analysis that includes Exploratory Factor Analysis (EFA), Structural Equation Modelling
(SEM) and invariance analysis for the data collected for the purpose of examining research
model generalizability.
However, the author in this thesis suggests that the external validity (generalizability) of
TAM and ECT in other cultures is questionable, see section 9.7. The author recommends that
the research model should be further tested in other cultural contexts to show the potential
generalizability, particularly cultures that may have similarities with Saudi Arabia.
CHAPTER 9: DISCUSSION AND CONCLUSION
P a g e | 276
9.7. RESEARCH LIMITATIONS AND FURTHER RESEARCH
Typical of most field surveys, this study suffers some limitations. First, the novelty associated
with using an online survey in the Saudi Arabian market indicates that the empirical data may
be biased. Second, the online survey was posted with permission on Saudi universities’
online forums. The survey may suffer a non-response bias, but there is no systematic way to
determine the response rate in an online survey. Thus, notwithstanding that the survey
attracted a large sample of participants and covers all main geographical regions in Saudi
Arabia, it still may suffer from the biases that are inherent to such studies.
The adoption of online shopping and online intention or revisit intention might also be
influenced by the product or service itself (Klein, 2003). Since this study has not focused
specifically on any particular products or e-retailers, it is not known to what extent our
research results may be extended to specific products or services. Without referring to the
nature of the product, participants in this research have used their Internet and e-shopping
preferences to answer the questionnaires. Certain products or services on a website may be
relatively simple, low-touch products that require relatively less trust, have some unique
features (e.g., web-based, graphics-rich, interactive interface), purpose (e.g., learning new
concepts), or more complex high-touch products for which trust issues are expected to be
more dominant. Therefore, future research needs to assess the generalizability of the model
for the purchase of relatively simple low-touch products or for more complex high-touch
products, including applicability to other related online industries, such as financial services
and airlines industries.
Furthermore, Girard, Korgaonka, and Silverblatt (2003) find that online shopping preferences
depend on product types. Men are more likely to shop online for books, computers, and other
"utilitarian experience" goods (e.g., cell phones, televisions), whereas women instead shop
online for hedonic experience goods, such as perfume and clothing. Our study focuses on
consumers who had experience and had previously purchased from an e-vendor's website,
without any preferences of any particular industry or product or service categories. The
relative importance of the research results may be at variance with inexperienced consumers
or with experienced consumers who have never purchased from a site other than his/her
preferred one. Thus, the generalizability of results to potential consumers of an e-vendor that
have never visited and e-shopped on the e-vendor's website and/or have never purchased
from the e-vendor is not immediately obvious and, therefore, warrants further investigation.
CHAPTER 9: DISCUSSION AND CONCLUSION
P a g e | 277
Also, additional research is required into whether the results can be generalised to non-
customers or to disaffected customers.
This research attempts to adopt the extended TAM and extended ECT as a theoretical basis
from consumer behaviour literature to propose a model of e-shopping continuance intentions.
Even though this research found that consumers perceive utilitarian and hedonic value to be
important in their online shopping future intentions, additional research should address the
online shopping continuance intentions context that incorporates product type and website
purpose. For example, some online shoppers might expect that certain types of products are
simply more experiential and thus more likely to invoke hedonic value; others might not.
Users in our study had different experiences and concerns when shopping online. Based on
research demographic findings and other related issues, participants raised a concern about
whether they trust local or international e-retailers when shopping online. The findings
indicate that 42.1% of participants trust international e-retailers compared to 11.6% for local
retailers. This is a big concern for local Saudi e-retailers who should focus on increasing the
level of consumers’ trust of online shopping. Online shoppers in Saudi Arabia also have
issues and concerns over online security, quality, payment methods, and language barriers.
Though not discussed in this research, the type of e-retailer (local or international), the mode
of payment, online security, and language barriers may constrain the research model
constructs on continuance e-shopping intention. Since prior research in the context of e-
shopping in Saudi Arabia has not distinguished between these constraints, such distinction
may be another way of extending the current research.
Most of the respondents in this research responded in terms of what he/she purchased online:
books (58.1%), music (43.9%), travel reservation and e-ticketing (66.1%), hotel booking
(50%), fashion (29%), and sports equipment (18.4%). Future research should examine which
products or services are marketed and purchased most successfully via the Internet for Saudi
consumers. For example, some researchers have argued that the current state of Internet
technologies prevent the delivery of the sensory aspects of shopping, such as taste, smell, and
touch (Stewart and Zhao, 2000). Researchers should also examine ways to either overcome
such difficulties with existing technology or enable the Internet to actually provide such
sensory experiences. This is particularly relevant for products such as clothes, fabrics,
perfumes cosmetics, sports equipment, and fresh foods.
CHAPTER 9: DISCUSSION AND CONCLUSION
P a g e | 278
Hofstede (1984) argues in several contexts that the popular theories are culture bound. The
theoretical basis of this study is the extended technology acceptance model (TAM), which is
derived from the theory of reasoned action (TRA) model, and the extended expectation
confirmation theory (ECT). Both extended TAM and ECT have adapted other constructs,
such as usefulness, enjoyment, and trust, to measure continuance intention (Agarwal and
Prasad, 1999; Davis, 1989; Dishaw and Strong, 1999; Gefen and Keil, 1998; Igbaria et al.,
1996; Moon and Kim, 2001; Taylor and Todd, 1995; Venkatesh, 2000; Venkatesh and Davis,
2000; Premkumar and Bhattacherjee, 2008; Lin, Wu and Tsai, 2005). However, TAM omits
subjective norms, primarily because Davis claimed that they are not significant in explaining
behavioural intentions (Davis et al., 1989). As indicated by the results of this research, the
importance of subjective norms can be assumed to be related to cultural factors leading to the
interesting question of to what extent the TAM and ECT may be valid in more collective
societies than developed countries. In line with the current interest in cross-cultural research,
this thesis suggests that the external validity (generalizability) of TAM and ECT in other
cultures is questionable. The author recommends that the research model should be tested in
other cultures to show the potential generalization of the research model, particularly those
that may have parallels with Saudi Arabia, such as the Gulf Regions.
The results of this research have far reaching implications for developed countries as well.
Globalization of the Internet, e-commerce, and joining the World Trade Organization have
significantly increased the understanding of the local culture of Saudi Arabia. Thus,
researchers, international and/or Saudi companies’ who are developing e-shopping site and
targeting customers in Saudi Arabia, should invest in more research to understand the local
culture, if, unfavourable results are to be avoided.
Even though this study can be considered to be the first attempt to address the knowledge gap
in the online shopping context for the unique culture of Saudi Arabia, as far as the author is
aware, through its comprehensive group invariance analysis, it has opened the door for
researchers to conduct more intensive research to deeply understand the effect of behavioural
differences in continuance intention among gender, geographical regions, experience and
inexperience, age, education, and high and low online spenders. Additionally, the
continuance intention antecedents reveal the direct and indirect effects. The impact of
additional factors, such as satisfaction, loyalty incentives, and interactivity should be
considered in future research investigations.
CHAPTER 9: DISCUSSION AND CONCLUSION
P a g e | 279
9.7.1. The Significance of Usefulness and Satisfaction on Continuance Intention
In prior TAM research, attitude is an effect-based variable that has exhibited inconsistent
results on its effect on intention (Karahanna et al., 1999). Many studies simplify TAM by
dropping attitude and studying just the effect of perceived usefulness and ease of use on
intention to use (Venkatesh and Davis, 2000; Venkatesh et al., 2003; Gefen and Straub, 2000;
Lederer et al., 2000; Teo et al., 1999; Premkumar and Bhattacherjee, 2008). Dropping
attitude from the original TAM model is entirely consistent with most TAM-based research.
Attitude, in fact, is not part of Davis’ (1989) own, more concise, version of TAM (Gefen,
2003).
In a recent study by Premkumar and Bhattacherjee (2008), an interesting finding was made.
Just as perceived usefulness is the strongest predictor of intention in TAM, it continues to be
a stronger predictor of continuance intention than satisfaction when TAM combined with
ECT (whereas satisfaction was dominant in the original ECT) (Premkumar and
Bhattacherjee, 2008). Satisfaction, another affect-based variable, has exhibited inconsistent
results in its effect on continuance intention in the presence of TAM variables. An
explanation of the inconsistency of satisfaction would be that satisfaction is typically defined
as a transaction-oriented effect based on first-hand experience with the product/service, and
therefore may be more appropriate for short-term usage decisions (Premkumar and
Bhattacherjee, 2008). Satisfaction may, therefore, be more important for impulsive purchases
where there are competing products and the user’s first experience has to be satisfying in
order for he/she to continue buying or using the service. While most e-shopping or
purchasing of products online typically involves considerable time and effort for the user in
comparing and contrasting, newer web-based application services, such as e-Bay versus
Amazon auctions, may be more akin to impulsive purchases. In such circumstances,
satisfaction with transaction experiences may be critical for retaining user loyalty and
continuance intention to use that service.
The common construct on these researches is the dominant influence of perceived usefulness
on intention or continuance intention, which has led Bhattacherjee (2001) to include
usefulness in his revised ECT. The findings of this research indicate the relative dominance
of enjoyment and usefulness in explaining their role as critical drivers in continuance
decisions, particularly in hedonic and utilitarian value. Since satisfaction was omitted in the
initial testing in this research, more research is required to explain which factor is leading and
CHAPTER 9: DISCUSSION AND CONCLUSION
P a g e | 280
has the most dominant effect on measuring continuance intention, satisfaction or usefulness,
in collectivist cultures, such as the Arabic World in general and Saudi Arabia in particular.
This is particularly the case with those countries that may have parallels with Saudi Arabia,
such as the Gulf Regions before any definitive conclusions can be derived.
9.8. MANAGERIAL IMPLICATIONS
This study provides managers with useful and important information about planning their
websites and marketing strategies. Limayem et al. (2000) argued that providing and
managing accurate information with clear and brief text attached to the appropriate images is
essential, and comprises the primary role of web designers and marketers. Website quality
will build positive first impression, which increase trust. This is especially true when an
activity involves social uncertainty and risk when involving online activities (Fukuyama,
1995; Luhmann, 1979). Social uncertainty and risk with an e-vendor are typically high
because the behaviour of an e-retailer cannot be guaranteed or monitored (Reichheld and
Schefter, 2000). The quality of the website and trust could act as reducers of risk and social
uncertainty among online customers (e.g., Gefen, 2000; Jarvenpaa et al., 1999; Jarvenpaa et
al., 2000), and increase familiarity and affiliations with respectable companies (e.g., Stewart,
1999; Gefen, 2000). As a result, direct contributions build consumer trust.
Moreover, nowadays, computer applications, such as online shopping, are ubiquitous in all
aspects of our life, and are no longer fads or image enhancers but utilitarian tools without
which businesses may come to a halt. Therefore, e-shoppers are increasingly going to
demand usefulness, particularly in the long run, for customers to be successfully retained.
Thus, managers and site developers should focus on quality, informative content, and trust,
which reflect an increase in usefulness, and lead to increased enjoyment of the e-shopping
process. The Nielsen.com report on online shoppers (2008) indicated that around 60% of
online shoppers tend to stick to the shopping sites they are familiar with, and would buy
mostly from the same site. This shows the importance of capturing the tens of millions of
new online shoppers as they make their first purchases on the Internet. If shopping sites can
capture them early, and create a positive shopping experience, they will be more likely to
capture their loyalty and their money. For example, companies can increase familiarity
through advertising; through articles in the popular press; through linkages with well known
websites; and through providing incentives to use the e-vendor's website. Applying this to the
interviewed companies, Saudi Airlines and Saudi Telecom can provide incentives to use their
CHAPTER 9: DISCUSSION AND CONCLUSION
P a g e | 281
website services, such as additional frequent flyer miles for Saudi Airlines customers when
booking travel reservations and purchasing e-tickets online. Otherwise, customers might
move to competitors, and customers who never return reduce the firm’s customer base and
revenues, requiring substantial expenditures to attract them back again.
System developers and marketing managers must be aware of e-shoppers’ requirements while
developing the e-retailer website, and provide ongoing adaptive system maintenance to
continually match e-business features to the evolving needs of the market and consumers. In
contrast to the challenges traditional retailers might face such as stock management issues,
the daily face-to-face interaction with customers, and the queues in front of the cashier, e-
retailers have to deal with the constant security threats, the challenges of delivering on time,
the need to always look ahead for the latest innovations and technological trends, and get the
right ‘atmosphere’ for their digitally connected customers (Bourlakis et al., 2009).
Additionally, the business solutions should be underpinned by a creative, innovative and
open-minded senior management that encourages experimentation with new technologies and
will not hesitate to use them in order to gain competitive advantages (Bourlakis et al., 2009).
However, implementing e-business technology solutions and dealing with such e- challenges
are expensive and require additional management costs (Wagner, 2007). During the research
interviews, the interviewed companies in Saudi Arabia demonstrated their concerns about the
high cost of e-business or e-commerce solutions. Thus, managers must know which
technology is most effective to achieve their goals. Furthermore, to enhance user enjoyment,
improve the value and features of the product or service, and socially involve as a means of
ensuring their continued use and loyalty, practitioners should consider various
implementation strategies, such as user involvement in the design process, virtual model,
interactivity, and user education to ensure that users build realistic expectations of the product
or service, confirm their initial expectations, improve the value and benefit, and are satisfied
with their e-shopping journey.
Based on the current research findings, understanding the utilitarian and/or hedonic roles on
online shopping would enable marketing managers to increase their online shopping and
purchasing by providing more effective product information, better online product evaluation,
reduce perceived risk and increase trust, achieve a more engaging e-shopping experience, and
enhance consumers’ enjoyment of the e-shopping journey or process. For example,
interactive activities such as looking at products or an inside look at an airplane in a 360˚
view and trying-on clothing or selecting your travel seat using virtual model technology can
CHAPTER 9: DISCUSSION AND CONCLUSION
P a g e | 282
provide enjoyment in addition to facilitating product evaluation. Additionally, as illustrated in
Table 2.4, the sophisticated technologies used in online shopping can provide e-retailers with
many techniques that will increase the online shopping usefulness and enjoyment resulting to
the continuity of loyal online shopping. An example of such technique is Amazon technique,
‘users who bought this item were interested in this item as well’, probably being the most
famous example by looking at customer group profiles. Thus, given the current research
findings, e-retailers should ensure that they are providing sufficient hedonic value to online
shoppers before attempting to focus on other aspects of their website development.
To build sustainable e-shopping relationships, managers cannot ignore either direct
(perceived usefulness, enjoyment, subjective norms) or indirect (site quality, trust, perceived
usefulness, subjective norms) influences on continuance intentions. For example, in the e-
shopping context, trust is considered a social antecedent, whilst site quality and perceived
usefulness are considered technological antecedents. These two distinct sets of antecedents
are intertwined in this case. As the supported research hypotheses indicate, site quality is
associated with increased trust, and increased trust is, in turn, associated with increased
perceived usefulness above and beyond the increase in perceived usefulness caused by site
quality. These suggest to e-vendors that managers who invest in increased consumer trust
may achieve increased customer continuance intention from their website directly, or
indirectly, through perceived usefulness.
Moreover, the results reveal the significant effects of subjective norms on enjoyment and
continuance intention, and suggest that recommendations from other people still play a major
role in an individual’s e-commerce intention behaviour, despite Davis’s (1989) claim to the
contrary. The reduced possibility of personal advice from people surrounding consumers
when shopping online might make it difficult for consumers to make their decision, which
subsequently might prevent them from continuing shopping online. To the same extent, the
strength of relationship ties increases when consumers interact and share their experience
with other consumers or e-retailers. Marketers now have to balance traditional media, online
media, and content that is generated by experts, bloggers and consumers themselves. An
astonishing 70% of Americans now say they consult product reviews or consumer ratings
before they make their buying decisions and 62% say they spend at least 30 minutes online
every week to help them decide what and whether to buy (Penn, Schoen and Berland
Associates, Inc., 2009). Furthermore, women may be less likely to shop online because the
environment does not offer emotional involvement or social interaction. Social interaction
CHAPTER 9: DISCUSSION AND CONCLUSION
P a g e | 283
during online shopping for women tends to enable female shoppers to interact with their
friends. Therefore, managers should endorse personal advice and facilitate positive word of
mouth advice, through social networks such as Blogger, Delicious, Facebook, Google
Bookmarks, MySpace, Twitter, and many more, to enhance the perceptions of family,
friends, potential customers, and customers’ perceptions about their websites’ usefulness,
enjoyment, and trustworthiness. For example, Facebook's shopping application allows users
to rate and discuss with their friends products they want to purchase. Therefore, users of
social networks can obtain their online friends' opinions about the products they want to buy.
The research emphasises the importance of taking the result of the group invariance analysis
and the direct and indirect decomposition of effects into account when investigating
consumers’ continuance intention to shop and purchase online in Saudi Arabia when
developing any website and marketing strategy. E-Retailers in Saudi Arabia should
emphasise the usefulness (utilitarian values) of their websites in their marketing strategy
when communicating with men, whilst emphasising their enjoyment (hedonic values) when
designing their marketing mix for women. E-Retailers targeting Saudi customers should not
use the same web design and/or marketing mix to stimulate usefulness and enjoyment
perceptions among male and female consumers. For example, understanding the differences
between male and female consumers can help managers shift consumers from single visits to
ongoing, trusted, useful, and enjoyable relationships, which should produce more stable,
long-run business for online firms.
Furthermore, since enjoyment has the strongest influence among females in Saudi Arabia,
managers should consider ways to induce positive feeling of enjoyment, fun, and leisure
experience when conducting e-shopping. Consumers compare a range of product or service
benefits to be obtained when buying a product versus the perceived costs of that product to
deduce overall obtained perceived usefulness or benefits. In the long run, consumers might
look again to the perceived benefits of continuing a business relationship with an e-vendor
versus the perceived benefits and the switching cost to another e-vendor. Therefore, managers
should remain competitive and continuously work to enhance the perceived usefulness and
benefits of the product or services to discourage switching to other competitors.
CHAPTER 9: DISCUSSION AND CONCLUSION
P a g e | 284
9.9. IMPLICATIONS FOR POLICY MAKER OF E-SHOPPING IN
SAUDI ARABIA
The development of online shopping makes many retailers consider adopting or launching
their products or services over the Internet. These considerations are due to a number of
different factors that include the need to increase competitiveness, and to improve service for
their current and potential customers. Today, the market around the world is dynamic due to
increasing competitive power, often coming from multinational corporations. Similarly,
organisations are able to take advantage of significant improvements in logistics and
information availability, which help create opportunities from global sourcing. Furthermore,
increasing information availability gives the perception that the commercial world is
becoming smaller and more accessible. The investment in IT plays an important role in
productivity if the technology has been accepted and then used (Venkatesh, 1999).
Despite global advancements in e-retailing and marketing communication and in addition to
the many steps taken by the Saudi Government to improve IT and e-commerce environment,
few retailers throughout Saudi Arabia have an online presence. Those that do generally only
display company information or products and prices. Online banking is the only predominant
e-business in Saudi Arabia (Guru et al., 2003). Internet banking was introduced in Saudi
Arabia in 2001, and by 2006 all 16 banks operating in the country were offering Internet
services. The Saudi population has accepted not only the banking system, but also the modern
electronic revolution in banking (Abdul-Muhmin, 1998).
Despite the e-commerce spending growth, according to a report by Madar Research (2004),
the purchasing of products and services via the Internet is still practised by only limited
numbers of Internet users in Gulf Co-operation Council (GCC) countries. However, the
growth in the number of online customers, the number of online transactions and the value of
purchases made, particularly in 2004, is creating a culture of B2C e-commerce in the region.
For example, in 2009 alone, five million electronic purchase transactions took place in Saudi
Arabia (Okaz newspaper, 2009). Furthermore, it is mentioned that the number of visitors
since the launching of the new e-Mall in 6th May, 2010 were 80000 visitors from 77
countries in the world, and the purchasing process in the market have reached 50 electronic
shopping carts for more than 120 products provided by the participating stores, which shows
the increasing demand on products and growing the culture of E-commerce (Okaz
newspaper, 2009).
CHAPTER 9: DISCUSSION AND CONCLUSION
P a g e | 285
As internet usage has increased due to its efficiencies of new technological developments and
the greater provision of online commerce, the increased interchange of personal consumer
information will enable marketers to gain greater expertise in the evaluation of consumer
purchase behaviours. However, breaches in privacy and security will likely hold back online
retailing in long run, due either to consumer distrust or legislative permission. In the long run,
having continuance usage is the goal of policy makers and businesses. It is known that
acquiring new customers, penetrating them and initiating transactions may cost up to five
times as much maintaining existing ones (Bhattacherjee, 2001b; Crego and Schiffrin, 1995;
Petrissans, 1999). Raising the number of reliable customers by as little as 5% can raise
profitability by 30-85%, depending upon the business (Reicheld and Schefter, 2000).
The research findings indicate that the increased Internet experience alone does not appear to
diminish online security and privacy concerns. It is evident that protected and responsible
handling of consumer information will be a strategic tool for promoting online transactions
and two-way communications with potential customers. The lack of trust in Saudi online
retailers is a big concern. Only 11.6% of Saudi consumers trust local retailers with online
shopping, compared to 42.1% for international e-retailers. This lack of trust can be
considered as a critical obstacle that could prevent the success of online transactions because
many consumers still do not trust the vendor when shopping online.
Saudi Arabia, as part of the developing world, has invested in information and
telecommunication technologies to the maximum extent possible, considering its financial
means and level of development. The Saudi government has approved a huge budget of $2.7
billion since 2007 to complete all e-transaction projects by 2010 and thus exhibit its full
commitment to e-commerce (Okaz Newspaper, 2007). In general, the Saudi Arabian
government needs to focus more on two parallel strategies: using IT to develop basic
services, such as e-government, e-commerce, education, health, and government institutions;
and developing modern industries in the fields of computer hardware and software with
assistance from local and foreign investors. The Saudi Arabian government also should make
great effort to meet the demands of its local markets to match international e-business trends,
including the development and application of IT to national planning, and new initiatives that
progress toward an information-based society.
To develop the e-commerce industry and establish a legal framework that will provide a
competitive edge, the Saudi government established the Saudi Communications and

CHAPTER 9: DISCUSSION AND CONCLUSION
P a g e | 286
Information Technology Commission (CITC) on June 27, 2001, and adopted several
telecommunications legislations and regulations. The responsibilities of the Saudi
Communications Commission should emphasise and enforce regulating the
telecommunication sector; securing the provision of advanced communication services;
creating a favourable environment for fair competition; protecting public interests; securing
the confidentiality and security of communications; ensuring that the sector adapts to new
technologies and developments; and securing the right to access to public network at
affordable prices.
Additionally, with these developments, the security of information remains a critical issue, so
the Saudi Arabian Council of Ministers put forward Decision 163 on March 4, 1997, that
authorizes a security information committee, supervised by the Ministry of Interior, with
membership by several agencies. The main responsibility of the committee is to increase trust
among Internet users by managing the security of information transmitted online. In response,
the committee has issued regulations governing the use of the Internet in the country
(Ministry of Communications and Information Technology, Saudi Arabia, 2003).
In recognition of the important role of e-commerce for the Saudi economy and to attract
foreign investors and compete in the international arena, a royal directive issued on February
14, 1999, established the Standing Committee of e-Commerce. This committee is responsible
for identifying infrastructure requirements for e-commerce in Saudi Arabia; promoting
awareness of e-commerce, with its unique benefits and possible positive outcomes; instituting
the legal and legislative frameworks necessary for electronic transactions and related
contracts; improving the postal delivery of parcels; identifying the addresses of government
agencies, trading companies, and individuals; enabling national companies and factories to
market and sell their products within and outside Saudi Arabia through the Internet; and
increasing confidence in the efficiency and safety of electronic transactions. The aim of the
committee is to enable Saudis to access the Internet easily and conveniently, in accordance
with the greater frequency and time spent online, which should encourage positive behaviour
in relation to e-commerce (Lohse et al., 2000).
However, since its establishment, the strategic aim has not been realized by retailers or
consumers in Saudi Arabia. The research findings and analysis of documentary evidence
indicate that 67.8% expressed the desire for government support to improve the mailing
system, implementing policy and procedures for e-shopping in Saudi Arabia and encouraging
CHAPTER 9: DISCUSSION AND CONCLUSION
P a g e | 287
lower costs for Internet services, which therefore will provide access and availability at a
reasonable cost in order to create a readiness for citizens, residents, and businesses to use the
Internet more.. In addition, 80.3% of the participants said they remained very concerned
when shopping online due to security reasons, and 43% believed there was not enough
product variety on the Internet. Also, 54.7% feel e-shopping in Saudi Arabia will be ideal in
the near future; 55% were concerned about after-sales service when they bought online,
whilst 59% believed that “shopping online is something for the next generation”. Others
mentioned the difficulty of assessing goods, the expense of buying through the Internet, the
complexity of this method, and the lack of quality.
Additionally, consumers have raised other concerns when shopping online. These include
payment methods (66.2%), language barriers, such as no Arabic language (46.3%), quality of
products or services (69.7%), consumers believe online prices are still high (60.7%), and
delivery of service or products (61.6%) (e.g. the national mailing system in Saudi Arabia has
no door-to-door delivery). Moreover, only 17.2% of the Saudi consumers feel that e-shopping
in Saudi Arabia is well developed. Another 85.2% feels e-shopping in the Saudi market needs
improvement and still does not meeting citizens’ expectations, as they demand more efficient
and effective services. Government information filtering is another issue when shopping or
surfing the Internet. About 54% of the respondents find government information filtering a
little of concern when they surf the Internet but 24% considered it to be a major concern.
Nevertheless, 40% of participants expressed enjoyment in online shopping, calling it fun and
noting the time they saved, and 31% found online shopping very convenient. Furthermore,
34% said online shopping was easy for comparing prices and options before buying, and 76%
found the Internet much simpler for gaining access to information.
In this regard and to activate the e-commerce role, the Saudi government and the e-commerce
associations should involve the private sector in the process of developing e-commerce in
Saudi Arabia. An advisory team of businesspeople should be selected to include experienced
persons interested in e-commerce, who will interact with potential e-commerce investors,
help guarantee the environment needed to initiate e-commerce transactions, and provide
incentives for investing in e-commerce technologies.
Since security, privacy and trust are big concern for the Saudi consumers, the future research
by policy makers in this area should include investigations into what factors affect consumer
perceptions of their privacy and security with online firms. The research findings suggest that

CHAPTER 9: DISCUSSION AND CONCLUSION
P a g e | 288
individual perceptions’ of online risk and security should continue to be a primary
consideration in Saudi Arabia. However, e-retailers should endorse their trustworthiness by
marketing their robust security measures, privacy policy statements, and seals of approval
that can increase confidence among current and potential customers (McKnight et al., 2000;
Palmer et al., 2000; Gehrke and Turban, 1999). Consumers are likely to believe that a site
maintains a higher privacy standard when that site participates in an Internet seal of approval
program.
The participation in the seal approval programs should have favourable effects on consumer
perceptions toward online trust, security and privacy. Also, it is anticipated that such
favourable effects will not continue if participation by licensees is inconsistent and seal of
approval program sponsors do not regulate licensees as promised.
If Internet seal of approval programs are to continue, there appear to be several issues that the
Saudi government and e-commerce associations in Saudi Arabia must take into consideration
for such security programs are to be successful in (1) maintaining a certain level of
performance with respect to online retailer privacy policies and (2) acting as valid indicators
of such performance levels to online consumers. That is, the Saudi government and e-
commerce associations must have sufficient resources to cover both initial approval costs and
ongoing monitoring cost of seal approval programs. Obviously, these costs can be reflected in
periodic registration fees. However, the potential for such fees to escalate to unreasonably
high levels could eliminate the participation of smaller companies, thus reducing the validity
of the seal approval programs as an indicator of privacy policy performance standards.
Another concern is that if seal programs are having difficulty in governing their relatively
small numbers of online licensee firm in Saudi Arabia, it seems unlikely that such programs
could accommodate the type of substantial growth common to e-commerce. If such seal
programs were to fail to remain effective as their member base grows, it would appear likely
that government intervention would be necessary as expressed by 67.8% of the survey
participants.
Saudi Arabia has been ranked 5th in 2009 and 4th in 2010 in the Kearney Global Retail
Development Index for retail attractiveness (Kearney GRDI, 2010). The Saudi government
support has had the greatest impact in promoting the growth of the e-commerce sector,
especially after the Saudi Arabian Monetary Agency has adopted and integrated payment
solutions to the SADAD system "payment system", which reflects the keenness of Saudi
CHAPTER 9: DISCUSSION AND CONCLUSION
P a g e | 289
Arabia to create a special system of financial transactions in a secure electronic environment
through the Internet, telephone or ATM systems.
The research findings indicate that the most popular online purchases in Saudi Arabia are
books (58.1%), fashion (clothing/accessories/shoes) (29%), videos / DVDs / games (43.9%),
airline tickets (66.1%), hotel bookings (50%), and sports equipment (18.4%). Credit cards are
by far the most common method of payment for online purchases in Saudi Arabia (69.9%),
next comes cash on delivery (27.5%), and finally cheque payments (2.6%).
Furthermore, Internet users in Saudi Arabia used the Internet to make online travel booking,
hotel room reservations, and buy books, making them the most popular categories of
purchase via the Internet. The increase in popularity of online shopping search (92.5%),
banking (68.2%), and online purchasing (81.8%) make it apparent that Saudi consumers are
open to e-commerce use (Anon, 2003), despite the notion that they are apprehensive of
making large purchases online (Madar Research, 2004).
The research findings are consistent with the world’s most popular online purchases.
Globally, the most popular and purchased items over the Internet are books (41% purchased
in the past three months), clothing/accessories/shoes (36%), videos / DVDs / Games (24%),
airline tickets (24%) and electronic equipment (23%) (Nielsen.com, 2008). Credit cards are
by far the most common method of payment for online purchases: 60% of global online
consumers used their credit card for a recent online purchase, while one in four online
consumers chose PayPal. Of those paying with a credit card, more than half (53%) used Visa
(Nielsen.com, 2008). As a result, the overall findings indicate the potential for significant
growth for online retailers. It is important for businesses and firms exist online and attract
new users to their website and create a positive experience for them.
The e-commerce associations should generate more training and awareness of e-commerce
among retailers and consumers in Saudi Arabia. Almost half (43%) of the participants
claimed that they had heard of e-commerce; most of whom are younger. However,
participants who claimed that they understand the term e-commerce or e-shopping indicated
uncertainty over modes of payment. For example, 28% believed that e-commerce meant the
display of items for sale on a Website that could be ordered and then paid for on delivery
with cash, whereas 26% knew that the items could be bought online using a regular credit
card, and 21% mentioned that e-commerce involved displaying items for sale that could be
bought by personally visiting a shop. Finally, 16% thought that the items could be bought
CHAPTER 9: DISCUSSION AND CONCLUSION
P a g e | 290
online but only by using an Internet credit card, a credit card introduced by banks in Saudi
Arabia to be used exclusively for online purchasing.
The government of Saudi Arabia should attempt greater effort to build the required
environment for technology acceptance by aiming for a better understanding of e-commerce.
Programs with the Ministry of Education, the Ministry of Higher Education, and the General
Organization for Technical Education and Vocational Training work to increase such
understanding among businesses and citizens. These ministries work closely together to
improve educational facilities and provide training in IT-related activities in Saudi schools
and universities in order to meet both regional and international standards. The main aims are
to build knowledge and acceptance of IT and to provide younger generations with the skills
they can use to exploit and benefit from IT and the Internet, thereby moving the country
forward as a leader in building an information-based society in the region.
The research results and e-commerce growth potential indicate that e-commerce associations
in Saudi Arabia need to reconsider their current marketing strategy and take more steps to
respond to the needs and attitudes of their target users. First, they need to create online
retailing stores as new channels for growing numbers of customers. Second, they need to
amend their online storefronts as well as the various channels through which their products
and services are delivered. Unfortunately, the Saudi consumers in this research have
expressed several concerns over the current online shopping situation, which have acted as a
barrier and dissuaded Internet users in Saudi Arabia from using the online shopping.
The participants of the online research survey and interviewees consider that the fact that
Saudi Arabia is behind in the area of IT can be attributed to several factors. These may
include computer illiteracy, lack of government incentives to attract businesses (e.g. free-
trade zones and subsidies), absence of adequate infrastructure to support the e-commerce
industry, poor enforcement of e-commerce laws, intellectual property and copyright laws, and
lack of resources. Therefore, the research sample profile indicates these concerns as the main
reasons preventing the full adoption of e-commerce.
Finally, the invariance analysis and latent mean have introduced wealth of information to
policy makers and e-commerce associations in Saudi Arabia to look, evaluate, and compare
behaviour differences in term of gender, age, education, experience, spending, and regions
among consumers across the country.
CHAPTER 9: DISCUSSION AND CONCLUSION
P a g e | 291
9.10. THE ROLE OF E-COMMERCE AND ONLINE SHOPPING FOR
WOMEN
The revolution in information and communication technology (ICT) and e-commerce
applications (online shopping) has broadened the work of members of the community
particularly that carried out by women, at administrative, social and economic levels.
Therefore, information and communication technology and online shopping offer many
opportunities for jobs, investment, and a new way of shopping for women in Islamic
societies, such as Saudi Arabia. However, its importance to Muslim women may outweigh
the importance level for women living in non-Muslim societies for a number of reasons.
Despite the fact that women comprise 70% of the participants in this research, women in
Islamic countries are facing several social and cultural obstacles preventing them from
engaging in work. One of the most important effects of the information revolution for women
is the potential for the development of small business projects in various fields, such as arts,
handicrafts, online gifts shop, and food products or other domestic business activities. Also,
women can utilize e-commerce for product development and marketing. In addition, the
possibility exists for women to be employed in IT sectors without having to work in offices,
as well as exploring online shopping from home. Working over the Internet and online
shopping allow women to avoid falling into the forbidden areas of Islam, such as going out
and mixing with men in the workplace, which is still the case in a few conservative cities in
Saudi Arabia. However, for Saudi Arabia societies, as well as countries with similar culture
and religions, to allow women to utilise this technology, several stages of development
should be introduced to facilitate computer literacy and information technology, and then
increase the level of education and training programs among women to fully exploit the
principles of the Internet and online shopping.
9.11. SUMMARY
This chapter examines and discusses the research findings. The results indicate that utilitarian
(usefulness), social pressure (subjective norm), and hedonic (enjoyment) factors are
important to consumers when shopping or purchasing online. The results reveal that
enjoyment is the strongest predictor of continuance intention. The next section covered some
group invariance analyses, and highlighting their effects on the research model, moving on to
summarize the main research the main key contributions and conclusions that address the
research gap by providing better explanation of behavioural differences of continuance e-
CHAPTER 9: DISCUSSION AND CONCLUSION
P a g e | 292
shopping intentions in Saudi Arabia, and a better understanding of the factors that encourage
consumers to increase their e-shopping continuance intention. This chapter, also, provided
many valuable ideas for academics for future research, as well as some of the research
limitations. To gain the value of the research findings, the author linked the findings of the
research to many valuable managerial implications. Finally, this chapter concluded with
common benefits and obstacles that have been found from the interviews, participants’
profiles, and current e-shopping status in Saudi Arabia. To conclude, it is important to
emphasize that the participants in this study were shoppers who had shopped or purchased
online. In reality, many online shoppers might shop online (information search) but do not
purchase. One likely reason for this situation may be that many Internet retailers simply have
not found a way to create superior value and enjoyment for shoppers that visit their websites.
Obviously, the potential is great, and to realize this potential, it is necessary for Internet
retailers to determine the core value sought by e-customers and to deliver extremely core
value well.
9.12. PHD RESEARCH EXPERIENCE
I really enjoyed my PhD research experience at Brunel University. It is a ‘dream come true’.
It was a wonderful opportunity to engage myself in a subject, about which I was passionate
during my previous study, work experience in the Airlines industry, and through my part-
time academic teaching. Although writing a PhD thesis could be one of the greatest
challenges any student might face, the researcher has gained many benefits from this research
experience:
• The researcher was able to meet a range of professional people, professors, and
lecturers from different parts of the world.
• The researcher had the opportunity to enjoy publishing successfully many papers in
different journals and has presented research papers in various national and
international conferences.
• The researcher gained a valuable experience learning why, what, where, and how to
conduct a research.
• The PhD process provided reliable problem solving experience.
CHAPTER 9: DISCUSSION AND CONCLUSION
P a g e | 293
• This research journey is not the end; rather it is the start for more research that may
contribute to the discipline and to benefit my country, Saudi Arabia.
• The final good lesson during the PhD journey is patience.
9.13. CLOSING REMARKS
To conclude, most e-commerce research has focused on understanding the initial purchasing
intention, purchase intention, and willingness to transact or transaction intention. However,
research on online repurchase, e-loyalty or continuance intention is still scant. Furthermore,
based on the author’s knowledge, no prior research neither on online purchasing intention nor
online continuance intention has been conducted in the context of Saudi Arabia. Thus, this
research has added to the limited literature on online repurchase intention or continuance
intention by testing the proposed model in a context in which it has never previously been
tested. This study has developed a model of e-shopping continuance intentions that
incorporates the revised technology acceptance model and expectation confirmation theory,
as a theoretical basis, to measure continuance online shopping intentions. The author finds
that enjoyment, perceived usefulness, and subjective norms determine online shopping
continuance intentions in Saudi Arabia. This research thus moves beyond consideration of
online shopping intentions and includes factors that may affect online shopping continuance.
The model explains 61% of the variance in intentions to continue shopping online. Online
strategies cannot ignore either direct or indirect differences in continuance intentions among
shoppers in Saudi Arabia. With the high percentages of participants from the three main
populated regions, the research model can be generalized across the country with reasonable
confidence. The research contributes to the literature on Internet shopping and continuance
intentions to e-shop in Saudi Arabia.
Few prior studies in Saudi Arabia use SEM as their methodological approach, and even fewer
have applied invariance analysis to verify behavioural differences based on gender, regional,
education, e-shopping experience, and e-shopping spending with a sample obtained from
Saudi Arabia. This study addresses these various knowledge gaps.
The finding of this thesis is useful to both research scholars and practitioners. This thesis
provides managers with useful and important information they can use to plan their websites
and marketing strategies. For e-retailers, the findings help them to know which web site
attributes influence consumers’ beliefs about e-shopping, and then improve their e-shopping
CHAPTER 9: DISCUSSION AND CONCLUSION
P a g e | 294
sites. Also, a more thorough understanding of the impact of latent mean of consumer beliefs
about e-shopping on continuance intention help e-retailers learn more about how to entice e-
shoppers to shop online more, and entice non-online shoppers to start online shopping.
Furthermore, the findings help e-commerce scholars and practitioners understand why
customers in the Saudi Arabian context might want to continue e-shopping, thus suggesting
improvements to website quality and informative content, which determine usefulness and
enjoyment perceptions, enhancing customers’ e-shopping experience, and encouraging both
purchase and repurchase. Additionally, this research serves as a basis for understanding e-
shopping acceptance, usage, and continuance intentions across the less-studied context of the
Gulf Region.
Finally, the significant effect of subjective norm on enjoyment and continuance intention
suggests that recommendations from other people still play a major role in an individual’s e-
commerce behaviour intention. Therefore, managers should endorse and facilitate positive
word-of-mouth, using social networks such as Blogger, Delicious, Facebook, Google
Bookmarks, MySpace, Twitter, and many more, to enhance the perceptions of family,
friends, potential customers, and customers of their websites’ usefulness, enjoyment and
trustworthiness.
REFERENCE
P a g e | 295
REFERENCES
Abdul-Muhmin, A.G. (1998) ‘Demographic differences in usage and attitudes toward the
Saudi Arabian EFTPoS system’, International Journal of Bank Marketing, 16 (3) pp.
117-128.
Adams D. A., Nelson P. R., and Todd P. A. (1992) ‘Perceived usefulness, ease of use and
usage of information technology: a replication’, MIS Quarterly, 16 (2) pp. 227-47.
Adler, N.J. (1995) International dimensions of organizational behaviour. Cincinnati:
South-Western Publishing.
Agarwal, R. and Prasad, J. (1999) ‘Are individual differences germane to the acceptance of
new information technologies?’, Decision Sciences, 30 (2) pp. 61-391.
Agence France-Presse (1998) ‘Saudi Arabia ready to cruise the information superhighway’,
July 15.
Ahn T, Ryu S,and Han I. (2003) ‘The impact of the online and offline features on the user
acceptance of internet shopping malls’, Electronic Commerce Research and
Applications, 3(4) pp. 405–20.
Ahn T., Ryu, S. and Han, I. (2004) ‘The impact of the online and offline features on the user
acceptance of internet shopping malls’, Electronic Commerce Research and
Applications, 3 (4) pp.405-420.
Ahn T., Ryu, S. and Han, I. (2007) ‘The impact of Web quality and playfulness on user
acceptance of online retailing’, Information and Management, 44 (3) pp.263-275.
Ajzen I, and Fishbein M. (1980) Understanding Attitudes and Predicting Social Behavior.
Englewood Cliffs, NJ: Prentice-Hall.
Ajzen I. (1985) ‘From intentions to actions: A theory of planned behavior.’ In: Kuhl J. and
Beckmann J. (ed) Action control: From cognition to behaviour. New York:
Springer, pp. 11–39.
Ajzen I. (1991) ‘The Theory of Planned Behavior’, Organizational Behavior and Human
Decision Processes, 50 (2) pp.179-211.
Ajzen I. and Fishbein, M. (1975) Belief, Attitude, Intention, and Behavior: An
Introduction to Theory and Research, Reading, MA: Addison-Wesley pp 45.
Akhter S. H. (2003) ‘Digital Divide and Purchase Intention: Why Demographic Psychology
Matters’, Journal of Economic Psychology, 24 (3) 321-327.
REFERENCE
P a g e | 296
Al Riyadh, (2006) ‘Challenge bad the future of e-com in Saudi Arabia’, Saudi Arabia.
[Online] Available at: http://www.alriyadh.com/2006/08/27/article182047.html; issue
13943, year 43, 27\8\2006, [Accessed on 4 April 2007].
Al-Ajlan, M. B. (2006) CRM implementation an empirical study of best practice and a
proposed model of implementation. TQM, PhD Thesis, Bradford University.
Alba, J., Lynch, J., Weitz, B., Janiszewski, C., Lutz, R., Saywer, A. and Wood, S. (1997)
‘Interactive Home Shopping: Consumer, Retailer, and Manufacturers Incentives to
Participate in Electronic Marketplaces’, Journal of Marketing, 61(3): 38-53.
Alden, D. L., Jan-Benedict E. M. Steenkamp, and Batra, R. (2006) ‘Consumer attitudes
toward marketing globalization: antecedent, consequent and structural factors,’
International of Research in Marketing, 23 (3) pp. 227-39.
Al-Diri, K., Hobbs, D., and Qahwaji, R., (2006) ‘Effects of Social Presence and Cultural
Representation on Websites for Promoting Trust In B2C E-Commerce - A Saudi
Arabian Study’. In Proceedings of the IADIS International Conference e-
Commerce, Barcelona, Spain.
Ali, A., (1988) ‘A cross-national perspective of managerial work value systems’. Advances in
International Comparative Management 3 pp. 151–169.
Al-Jazira Daily (1998) ‘The regulations on ISPs forbid them from establishing any linkage to
the Internet except via the KACST’, Al-Jazira Daily, May 6.
Al-Jazira newspaper (1998) May 6, 1998, as reported in FBIS, May 12, 1998.
Alreck, P., and Settle, R.A. (2002) ‘Gender effects on Internet, Catalog and Store Shopping’,
Journal of Database Marketing, 9 (2) pp.150-162.
Alsajjan, B. and Dennis, C. (2009) ‘Internet banking acceptance model: cross-market
examination’, Journal of Business Research, forthcoming.
Alwatan Newspaper (2006) ‘Saudi Arabian Airlines sign a contract to supply the airlines with
e-ticketing system’, issue 2012, date Monday, 3, April, 2006. Available at:
http://www.alwatan.com.sa/daily/2006-04-03/economy/economy08.htm
AMEinfo.com, (2009) ‘Saudi Telecom Company signs partnership agreement’, Avaialable at:
http://www.ameinfo.com/215875.html [Accessed Nov 2009].
Amoroso D.L. and Hunsinger, S. (2009) ‘Analysis of the Factors that Influence Online
Purchasing’ Journal of Information Systems Applied Research. 2 (1)
http://jisar.org/2/1/ May 18, 2009.
REFERENCE
P a g e | 297
Anandarajan, M., Igbaria, M., Anakwe, U.P. (2002) ‘IT acceptance in a less-developed
country: a motivational factor perspective’, International Journal of Information
Man-agement, 22(1), pp. 47-65
Anderson, E. W. and Sullivan, M. W. (1993) ‘The Antecedents and Consequences of
Customer Satisfaction for Firms’, Marketing Science, 12 (2), pp. 125-143.
Anderson, E. W., Fornell, C., and Lehmann, D. (1994) ‘Customer Satisfaction, Market Share,
and Profitability: Findings from Sweden’, Journal of Marketing, 72, pp. 53-66.
Anderson, J. C., and Gerbing, D. W. (1988) ‘Structural equation modeling in practice: A
review and recommended two-step approach’, Psychological Bulletin 103, pp. 411–
423
Ang, L. and Buttle, F. A. (2002) ‘ROI on CRM: a customer-journey approach’ IMP-
conference, Perth, Australia, Industrial Marketing & Purchasing.
Anon (2001) ‘Saudi Telecom cuts Internet charges’
http://saudiembassy.net/2001News/News/TraDetail.asp?cIndex=3072 edn. Royal
Embassy of Saudi Arabia in Washington D.C.
Anon (2003) ‘Development of e-Commerce Sectors in the Arabic Regions’, paper presented
at the Western Asia Preparatory Conference for the World Summit on the Information
Society (WSIS), Beirut, 4-6 February 2003.
Arab Advisors Group (2007) ‘A Survey of Internet Use and Online Advertising Consumption
and Effectiveness in Saudi Arabia and the UAE’ [report].
Arab Advisors Group (2008) ‘A Survey of Internet Use and Online Advertising Consumption
and Effectiveness in Saudi Arabia’ [report].
Arab News (2003) ‘Internet Regulations Tightened’ Raid Qusti, Riyadh Bureau Chief , Arab
News Sunday, 6, July, 2003.
Arab News Newspaper (2007) ‘Airlines Initiate E-Ticketing Process to Meet Deadline’,
Saudi Arabia, Available at:
http://www.arabnews.com/?page=9§ion=0&article=96844&d=30&m=5&y=2007
, [Accessed on 10 July 2007].
Arab News Newspaper (2007) ‘Saudia to Issue E-Boarding Pass by Mid-August’, date
Wednesday, 24, May. Available at:
http://www.arabnews.com/?page=1§ion=0&article=96567&d=24&m=5&y=2007
[Accessed on 10 July 2007].
REFERENCE
P a g e | 298
Arbuckle, J.L. (2003) Amos 5.0 User’s Guide, Marketing Department, SPSS Inc.,
SmallWaters Corp., Chicago, IL.
Atchariyachanvanich, K, Okada, H, Sonehara, N, (2007) ‘What keeps online customers
repurchasing through the internet?’, ACM SIGecom Exchanges, 6(2) pp.47-57.
Atkinson, M. A. and Kydd, C. (1997) ‘Individual Characteristics Associated with World
Wide Web Use: An Empirical Study of Playfulness and Motivation’, The Database
for Advances in Information Systems, 28 (2) pp. 53-62.
Ba, S., Whinston, A. B., and Zhang, H. (1999) ‘Building Trust in the Electronic Market using
an Economic Incentive Mechanism,’ The 1999 International Conference on
Information Systems, Charlotte, NC.
Babbie, E., (2004) The Practice of Social Research, 10th edition. Wadsworth Pub. Co
Belmont Calif.
Babin, B. J., Darden, W. R., and Griffen, M., (1994) ‘Work and/or fun: measuring hedonic
and utilitarian shopping value’, Journal of Consumer Research, 49 (2) pp. 91-99.
Babin, B.J, Attaway, J.S. (2000) ‘Atmospheric affect as a tool for creating value and gaining
share of customer’, Journal of Business Research, 49(2), pp.91-109.
Babin, B.J. and Babin, L. (2001) ‘Seeking something different? A model of schema
typicality, consumer affect, purchase intentions and perceived shopping value’,
Journal of Business Research, 54 (4) pp. 89-96.
Bacon, D. R.., Sauer, P. L., and Young, M. (1995) ‘Composite reliability in structural
equations modeling.’ Educational and Psychological Measurement, 55 pp.394−406.
Bagozzi, R. Davis, F. and Warshaw, P. (1992) ‘Development and test of a theory of
technological learning and usage’, Human Relations, 45 pp. 659-686.
Bagozzi, R. P., (1982), “A Field Investigation of Causal Relationships Among Cognitions,
Affect, Intentions, and Behaviour”, Journal of Marketing Research. 19, pp. 562-584.
Bagozzi, R. P., and Fornell, C., (1982) Theoretical Concepts, Measurements and
Meaning. In A Second Generation of Multivariate Analysis, ed. C. Fornell. New
York: Praeger.
Bagozzi, R., (1994), Principles of Marketing Research, Massachusetts: Blackwell
Publishers Inc.
Bagozzi, R.and Yi, Y., (1988) ‘On the evaluation of structural equation models’, Journal of
the Academy of Marketing Science, 16 pp. 74-94.
REFERENCE
P a g e | 299
Bannister, D., J. and Mair, M.M. (1968) The Evaluation of Personal Constructs. Academic
Press, Inc., New York
Bargagliotti, L. (1983) ‘Qualitative modes of inquiry’, Western Journal of Nursing Research,
10 pp.138-149.
Barnes, S. J. and Vidgen, R. (2000) ‘Information and Interaction quality: Evaluating Internet
Bookshop Web sites with SERVQUAL’, In Proceedings of the 13th International E-
Commerce Conference, BLED.
Bart, Y., Shankar, V., Sultan, F. and Urban, G.L. (2005) ‘Are the drivers and role of online
trust the same for all web sites and consumers? A large-scale exploratory empirical
study’, Journal of Marketing, 69 (4) pp.133-52.
Bartunek, J. M., Bobko, P., Venkatraman, N. (1993) ‘Toward Innovation and Diversity in
Management Research Methods’, The Academy of Management Journal, Vol. 36(6),
pp. 1362-1373
Bauer, H. H, Falk, T., and Hammerschmidt, M. (2006) ‘e-TransQual: a transaction process-
based approach for capturing service quality in online shopping’, Journal of Business
Research, 59(7), pp. 866–75.
Bearden, W. O. and Teel, J. E., (1983) ‘Selected Determinants of Consumer Satisfaction and
Complaint Reports’, Journal of Marketing Research, 20, pp. 21-28.
Beatty, S.E.., Mayer, M., Coleman, J.E.., Reynolds, K.E., and Lee, J. (1996) ‘Customer-Sales
Associate Retail Relationships’ Journal of Retailing 72 (3) pp 223-247.
Beerli, A., Martin, J.D., and Quintana, A., (2004), ‘A Model of Consumer Loyalty in the
Retail Banking Market’, The Journal of European Marketing, 38(1), pp. 253-275.
Belanger, F., Hiller, J.S. and Smith, W.J. (2002) ‘Trustworthiness in electronic commerce:
the role of privacy, security, and site attributes’, The Journal of Strategic Information
Systems, 11 (3/4) pp. 245-70.
Bell, J. (2005) Doing your research project: A guide to first-time researchers in
education and social science (4th ed.), Open University Press, Buckingham.
Bellman, S., Lohse, G.L., and Johnson, E.J. (1999) ‘Predictors of online buying behavior’.
Communications of the ACM, 42(12) pp.32-38.
Bemmaor, A., (1995) ‘Predicting behavior from intention-to-buy measures: the parametric
case’, Journal of Marketing Research, 32, pp. 176–191
Bentler, P. M. (1990) Comparative fit indexes in structural models. Psychological Bulletin,
107, pp. 238-246.
REFERENCE
P a g e | 300
Bentler, P.M. and Bonett D.G. (1980) ‘Significance tests and goodness of fit in the analysis
of covariance structures’, Psychological Bulletin, 88 (3) pp.588-606.
Bentler, P.M., (1989) EQS Structural Equations Program Manual, BMDP Statistical
Software, Los Angeles.
Berry, L.L. (1969) ‘The components of department store image: a theoretical and empirical
analysis’, Journal of Retailing, 45(1), pp. 3-20
Bettman, J.R. and Whan Park, C. (1980) ‘Effects of Prior Knowledge and Experience and
Phase of the Choice Process on Consumer Decision Processes: A Protocol Analysis’
Journal of Consumer Research, 7, pp. 234–48.
Beynon-Davies, P., (2007) ‘eBusiness Maturity and Regional Development’ International
Journal of Business Science and Applied Management, 2(1), 9-20
Bhatnagar, A., Misra, S. and Rao, H.R. (2000). ‘On risk, convenience, and Internet shopping
behavior: Why some consumers are online shoppers while others are not’
Communications of the ACM, 43(11), 98-105.
Bhattacharya, R. and Devinney, T.M., (1998) ‘A formal model of trust based on outcomes’,
Academy of Management Review, 23(3), pp. 459–474
Bhattacherjee, A. (2000). ‘Acceptance of e-commerce services: The case of electronic
brokerages’. IEEE Transactions on Systems, Man and Cybernetics, Part A, 30(4)
pp.411-420.
Bhattacherjee, A. (2001a) ‘Understanding Information Systems Continuance: An
Expectation-Confirmation Model’, MIS Quarterly, 25(3) pp.351-370.
Bhattacherjee, A. (2001b) ‘An empirical analysis of the antecedents of electronic commerce
service continuance’, Decision Support Systems, 32(2) pp.201-214.
Bhattacherjee, A. (2002) ‘Individual Trust in Online Firms: Scale Development and Initial
Test’ Journal of Management Information Systems, 19 (1) pp 213-243.
Bickman L., Rog D. J. (1998) Handbook of Applied Social Research Methods. Sage:
Thousand Oaks
Blankenship, A. B., Breen, G. E. and Dutka, A. F. (1999) State of the Art Marketing
Research, (2nd ed) Linconwood: NTC Business.
Blattberg, R.C., Deighton, J. (1991) ‘Interactive marketing: exploring the age of
addressability’, Sloan Management Review, 31(1) pp. 5-14.
Bless, C. and Higson-Smith, C. (1995), Fundamentals of Social Research Methods: An
African Perspective, (2nd) Kenwyn, South Africa: Juta.
REFERENCE
P a g e | 301
Bobbitt, L.M. and Dabholkar, RA. (2001). ‘Integrating attitudinal theories to understand and
predict use of technologybased self-service: The Internet as an illustration’
International Journal of Service Industry Management, 12(5) pp.423-450.
Bolton, M. (2004). ‘Customer centric business processing’ International Journal of
Productivity and Performance Management, 53(1) pp. 44-51.
Booz Allen Hamilton, (2007), ‘The ICT e-volution, brining information to communications’
Available at:
http://www.booz.com/media/file/The_ICT_Evolution_Bringing_Information_To_Co
mmunications_FINAL.pdf [Accessed Nov 2009].
Bose, R. (2002) ‘Customer relationship management: key components for IT success.’
Industrial Management and Data Systems 102(2) pp. 89–97.
Boudon, R. (1987) ‘The individualistic tradition in sociology’. In The Micro-Macro Link, J.
Alexander, B. Geisen, R. Munch, N. Smelser, eds., pp. 45-70. Berkeley, CA: University
of California Press.
Bourlakis, M., Papagiannidis, S. and Li, F. (2009) ‘Retail spatial evolution: paving the way
from traditional to metaverse retailing’ Electronic Commerce Research, 9 (1) pp.135-
148.
Bourque, L.B., Fielder, E.P. (1995) How to Conduct Self-Administered and Mail Surveys,
Thousand Oaks, CA: Sage.
Bowen, J. T. and Chen, S-L. (2001) ‘The relationship between customer loyalty and customer
satisfaction’ International Journal of Contemporary Hospitality Management, 13(5).
Bowernman, B. L. and O’Connel, R. T. (1990) Linear statistical models: an applied
approach (2nd edition). Belmont, CA: Duxbury.
Bradshaw, D. and Brash, C. (2001) ‘Managing customer relationships in the e-business
world: how to personalise computer relationships for increased profitability’
International Journal of Retail and Data Systems, 29(12) pp: 520-530
Brannen, J. (1992) Mixing Methods: Qualitative and Quanti-tative Research. Avebury,
Aldershot, Brookfield, USA.
Brashear, T. G., Kashyap, V., Musante, M. D, Donthu, N. (2009). ‘A Profile of the Internet
Shopper: Evidence from Six Countries’, Journal of Marketing Theory and Practice,
17 (3) pp. 267 - 282
Brislin R., (1986) The Wording and Translation of Research Instruments, in: Field Methods
in Cross-Cultural Research, Beverly Hills: W. Lonner and J. Berry, eds, Sage.
REFERENCE
P a g e | 302
Brown, I. and Buys, M., (2005) ‘A cross-cultural investigation into customer satisfaction with
internet banking security’, Proceedings of the 2005 annual research conference of the
South African institute of computer scientists and information technologists on IT
research in developing countries, pp. 200-207.
Brown, J.S., and Duguid, P. (2001) ‘Knowledge and organization: a social-practice
perspective’, Organization Science, 12 (2) pp.198-213.
Bruner, G.C., and Kumar, A. (2005) ‘Explaining consumer acceptance of handheld Internet
devices’, Journal of Business Research, 58 (5) pp.553-558.
Bryman, A. (1992) Quality and Quantity in Social Research, London: Routledge
Bryman, A. (2004) Social Research Methods, (2nd) Oxford: Oxford University Press.
Brynjolfsson, E., and Smith, M. (2000) ‘Frictionless Commerce? A Comparison of Internet
and Conventional Retailers’ Management Science 46 (4) pp 563-585.
Bull, C. (2003) ‘Strategic issues in customer relationship management (CRM)
implementation.’ Business Process Management Journal, 9 (5) pp. 592-602.
Bulmer, M. (1988) The Chicago school of sociology: Institutionalization, Diversity and
the Rise of Sociological Research, Chicago University Press
Burke, R. R. (1996) ‘Virtual shopping breakthrough in marketing research’ Harvard Business
Review, 74 (2) pp.120-131.
Burke, R. R. (1997) ‘Do you see what I see? The future of virtual shopping’ Journal of the
Academy of Science, 25 (4) pp.352-60.
Burstein, B., Bank, L. and Jarvik, L. (1980) ‘Sex differences in cognitive functioning:
evidence, determinants, implications’ Human Development, 23 pp. 289–313.
Burton-Jones and Hubona, G.S. (2006) ‘The mediation of external variables in the
technology acceptance model’, Information & Management, 43 (6), pp. 706–717
Bush, V.D., Bush A.J., Clark, P. and Bush, R.P. (2005) ‘Girl power and word-of-mouth
behavior in the flourishing sports market’ Journal of Consumer Marketing. 22 (5), pp.
257-264.
Business Wire (1999) ‘Online Investing Market Grows by 37% in 1998; online Investors
Expect Impact to be felt by Full Service and Discount Firms’, Available at:
http://www.businesswire.com/webbox/bw.021199/1100662.html, [Accessed Feb.
2009].
Butler, P. and Peppard, J. (1998) ‘Consumer purchasing on the Internet: Process and
Prospects’, European Management Journal, 16 (5) pp.600-610.
REFERENCE
P a g e | 303
Byrne, B. M. (2001), Structure Equation Modelling with AMOS: Basic Concepts,
Applications and Programming, Mahwah, N.J. and London: Lawrence Erlbaum
Associations.
Byrne, B. M., Shavelson, R. J., and Muthén, B. (1989). ‘Testing for the equivalence of factor
covariance and mean structures: The issue of partial measurement invariance.’
Psychological Bulletin, 105 pp.456-466.
Byrne, B., (1995) SEM with AMOS: Basic concepts, applications, and programming,
Routledge.
Campbell, A. and Pisterman S. (1996) ‘A Fitting Approach to Interactive Service Design, the
Importance of Emotional Needs, Design Management Journal, 7 (4), pp.10-14
Cao X., and Mokhtarian P. L. (2005) ‘The intended and actual adoption of online purchasing:
a brief review of recent literature’, Institute of Transportation Studies (ITS),
Department of Civil and Environmental Engineering, University of California, Davis,
Available at: http://www.its.ucdavis.edu/publications/2005/UCD-ITS-RR-05-26.pdf
Carl, J., (1995) ‘Online service users: loyal as alley cats?’ Web Week, 1 (7)
Carlson, J.R. and Zmud, R.W. (1999), ‘Channel expansion theory and the experiential nature
of media richness perceptions’, Academy of Management Journal, 42 (2) pp.153-70.
Cathy S. Lin, S. Wu and Tsai, R.J. (2005), ‘Integrating perceived playfulness into
expectation-confirmation model for web portal context’ Information & Management,
42 (5) pp. 683–693.
Cha, J, (2009). ‘Shopping on Social Networking Web Sites: Attitudes toward Real versus
Virtual Items’, Journal of Interactive Advertising, 10 (1) pp.77-93.
Chakraborty, G., Lala, V., and Warren, D., (2002) ‘An empirical investigation of antecedents
of B2B websites’ effectiveness’, Journal of Interactive Marketing, 16(4), pp. 51–72.
Chang, M. K, Cheung W, and Lai V. S. (2005).‘Literature derived reference models for the
adoption of online shopping’ Information & Management, 42 pp.543-559.
Chau, P.Y.K., Au, G. and Tam, K.Y. (2000) ‘Impact of information presentation modes on
online shopping: An empirical evaluation of a broadband interactive shopping
service.’ Journal of Organizational Computing and Electronic Commerce, 10(1) pp.1-
22.
Chen Q, Wells WD. (1999) ‘Attitude toward the site’, Journal of Advertising Research,
39(5), pp. 27–37.
REFERENCE
P a g e | 304
Chen, C. A, (2009). ‘Information-oriented Online Shopping Behavior in Electronic
Commerce Environment’, Journal of Software, 4 (4) pp.307-314.
Chen, L D. and Sukpanich, N. (1998) ‘Assessing consumers' involvement in Internet
purchasing’. In Proceedings of the 4th Americas Conference on Information
Systems (AMCIS), Baltimore, Maryland.
Chen, L. D., and Tan, J. (2004) ‘Technology adaptation in e-commerce: key determinants of
virtual stores acceptance’, European Management Journal, 22 (1) pp. 74-86.
Chen, L., Gillenson, M., and Sherrell, D. (2002) ‘Enticing online consumers: An extended
technology acceptance perspective’, Information & Management, 39(8) pp.705-719.
Chen, S. J. and Chang, T. Z. (2003) ‘A descriptive model of online shopping process: some
empirical results’. International Journal of Service Industry Management, 14 (5)
pp.556–569
Chen, Y-C., Shang, R-A. and Kao, C-Y. (2009) ‘The effects of information overload on
consumers’ subjective state towards buying decision in the internet shopping
environment’ Electronic Commerce Research and Applications 8 pp.48–58.
Cheung, C. M. K., Chan G. W. W. and Limayem, M. (2005) ‘A Critical Review of Online
Consumer Behavior: Empirical Research’, Journal of Electronic Commerce in
Organizations, 3 (4) pp. 1-19.
Cheung, G. W. and Rensvold, R. B. (1999) ‘Testing factorial invariance across groups: a
reconceptualization and proposed new method’, Journal of Management 25 (1) pp. 1–
27.
Cheung, G. W. and Rensvold, R. B. (2000) ‘Assessing extreme and acquiescence response
sets in cross-cultural research using structural equation modeling’, Journal of Cross-
Cultural Psychology, 31 (2) pp.187–212.
Cheung, G.W., Christy M. K., and Lee M. K. O. (2005) ‘Consumer satisfaction with internet
shopping: a research framework and propositions for future research’, In Proceedings
of the 7th International Conference on Electronic Commerce, Xi'an, China
Chiasson, M.W. and Lovato C.Y. (2001) ‘Factors Influencing the Formation of a User's
Perceptions and Use of a DSS Software Innovation’ Database for Advances in
Information Systems, 32 (3) pp.16-35.
Childers, T., Carr, C., Peck, J. and Carson, S. (2001) ‘Hedonic and utilitarian motivations for
online retail shopping behavior’, Journal of Retailing, 77 (4) pp. 511-535.
Chiou, J.-S. (2004) ‘The antecedents of consumers loyalty toward Internet Service
Providers’, Information and Management, 41, pp. 685-695.
REFERENCE
P a g e | 305
Chiu, C. M., Chang C.C., Cheng, H. L. and Fang, Y. H. (2009) ‘Determinants of customer
repurchase intention in online shopping’ Online Information Review, 33(4) pp.761-
784.
Chiu, C.M., Lin, H.Y., Sun, S.Y. and Hsu, M.H. (2009) 'Understanding customers' loyalty
intentions towards online shopping: an integration of technology acceptance model
and fairness theory', Behaviour & Information Technology, 28 (4) pp.347-360
Cho, J. (2004) ‘Likelihood to abort an online transaction: Influences from cognitive
evaluations, attitudes, and behavioral variables’ Information & Management, 41 (7)
pp.827-838.
Chrchill, G. A. Jr. (1979) ‘A Paradigm for Developing Better Measures of Marketing
Constructs’, Journal of Marketing Research, 16 Feb. pp.64-73.
Chung, I. K., and Lee, M. M. (2003) ‘A study of influencing factors for repurchase intention
in Internet shopping malls’, In Proceeding of the International Parallel and
Distributed Processing Symposium, Nice, France, 243a.
Chung, J., and F.B. Tan (2004) ‘Antecedents of playfulness: an exploratory study on user
acceptance of general information-searching websites’, Information & Management,
41 pp. 869–881.
Churchill, G. A, and Suprenant, C. (1982) ‘An investigation into the determinants of
consumer satisfaction’, Journal of Marketing Research, 19, pp. 491–504.
Churchill, G. A. (1999) Marketing Research: Methodological Foundations. Chicago:
Dryden.
Clark, T., (1990) ‘International marketing and national character: a review and proposal for
an integrative theory’, Journal of Marketing, 54(4), pp. 66-79.
Coles, S. and Gokey, T. (2002) ‘Customer Retention is Not Enough’ Journal of Consumer
Marketing, 22 (2/3) pp.1-7.
Collins, R. (2004) Interaction Ritual Chains. Princeton: Princeton University Press.
Collis, J. and Hussey, R. (2003) Business research: A practical guide for undergraduate
and postgraduate students. New York: Palgrave Macmillan.
Cook, K.S., Emerson, R.M. (1978) ‘Power, equity, and commitment in exchange networks’,
American Sociological Review, 43 pp.721-38.
Cooper D. R., and Schindler. P. S. (2003) Business research methods, eighth edition,
McGraw-Hill Higher Education, ISBN 0-07-249870-6.
REFERENCE
P a g e | 306
Coppel, J. (2000) ‘E-commerce: impacts and policy challenges’, OECD Economics
Department Working Papers, No. 252, OECD Publishing. Doi:
10.1787\801315684632
Couger, J.D., (1986) ‘Effect of Cultural Differences on Motivation of Analysts and
Programmers: Singapore vs. the United States’, MIS Quarterly, 10(2), pp. 189-196.
Coyle, J.R., and Thorson, E. (2001) ‘The effects of progressive levels of interactivity and
vividness in web mariceting sites’, Journal of Advertising, 41(3), 65-77
Crego, E. T. and Schiffrin, P. D. (1995) Customer-Centered Reengineering: Remapping
for Total Customer Value. Burr Ridge, IL: Irwin.
Creswell, W. J. (2003) Research Design, Qualitative, Quantitative and Mixed Methods
Approaches. London: Sage.
Crosby, L. A. (2002). ‘Exploding some myths about customer relationship management’,
Managing Service Quality, 12 (5) pp. 271-277.
Crosby, L. A. and Johnson, S. L. (2005), ‘Growing up’, Marketing Management, 14, (2), pp.
12-13.
Curry, J. and Curry A. (2000). The customer marketing method: how to implement and
profit from customer relationship management. New York, London: Free Press.
Cyr, D., Head, M. and Ivanov, A. (2006) ‘Design aesthetics leading to m-loyalty in mobile
commerce’, Information and Management, 43 (8) pp. 950-63.
Czepiel, J.A. (1990) ‘Service Encounters and Service Relationships: Implications for
Research’ Journal of Business Research 20 (1) pp. 13-21.
Czepiel, John A. and Robert Gilmore (1987) ‘Exploring the Concept of Loyalty in The
Services Marketing Challenge: Integrating for Competitive Advantage, J. A. Czepiel,
C. A. Congram, and J. Shanahan, eds. Chicago, IL: AMA, 91-94
Dabholkar, P. A., Shepard, C. D. and Thorpe, D. I. (2000) ‘A Comprehensive Framework for
Service Quality: an investigation of critical conceptual and measurement issues
through a longitudinal study’, Journal of Retailing, 76 (2) pp. 139-173.
Daft, R. and Lengel, R. (1986) ‘Organizational information requirements, media richness,
and structural design’, Management Science, 32 (5), pp. 554–571.
Dahlén, M. and Lange, F. (2002) ‘Real consumers in the virtual store’, Scandinavian Journal
of Management, 18 (3) pp.341-63
Dane, F. C. (1990) Research methods. Pacific Cole, CA, USA: Brooks/Cole.
REFERENCE
P a g e | 307
Darden, William R. and Reynolds, Fred D., (1971) ‘Shopping Orientations and Product
Usage Rates’, Journal of Marketing Research, 8, pp. 505–508
Davis, F. D., (1989) ‘Perceived Usefulness, Perceived Ease of Use and User Acceptance of
Information Technology’, MIS Quarterly, 13 (3) pp. 319-340.
Davis, F. D., Bagozzi, R. P. and Warshaw, P. R. (1992) ‘Extrinsic and Intrinsic Motivation to
Use Computers in the Workplace’ Journal of Applied Social Psychology, 22 pp.
1111-1132.
Davis, F. D., Bagozzi, R. P., and Warshaw, P. R., (1989) ‘User Acceptance of Computer
Technology: A Comparison of Two Theoretical Models’, Management Science, 35
(8) pp. 982-1003.
Davis, F.D., (1986) ‘A technology acceptance model for empirically testing new end-user
information systems: theory and results’. Ph.D. Thesis, Sloan School of Management,
Massachusetts institute of Technology.
Davis, F.D., (1993) ‘User acceptance of information technology: system characteristics, user
perceptions and behavioural impacts’, International Journal of Man-Machine Studies,
38, pp. 475-487.
Day, G. (1994). ‘The capabilities of market-driven organizations’, Journal of Marketing,
58(4) pp. 37-52.
de Rada, V. D. (1998) ‘A single consumer or different types of consumer: an analysis of
social types according to their consumer habits’, British Food Journal, 100 (7)
pp.326–336.
Deci, E.L. (1975) Intrinsic Motivation, Plenum Press, New York.
Degeratu, A., Rangaswamy, A. and Wu, J. (2000) ‘Consumer choice behavior in online and
traditional supermarkets: the effects of brand name, price, and other search attributes’,
International Journal of Research in Marketing, 17 (1) pp.55-78.
DeLone, W.H. and McLean, E.R., (1992) ‘Information systems success: The quest for the
dependent variable’, Information Systems Research, 3 (1) pp. 60–95.
Dennis, C., Merrilees, B., Jayawardhena, C. and Wright, L. (2009) ‘e-Consumer Behaviour’
European Journal of Marketing, 43 (9/10) pp. 1121-1139.
Denzin, N. K. (1978) The Research Act, (2nd ed) New York: McGraw Hill.
Denzin, N. K. and Lincoln, Y. S. (2000) The Handbook of Qualitative Research, (2nd ed)
Thousand Okas, Calif and London: Sage Publications.
REFERENCE
P a g e | 308
Diniz E. (1998) ‘Web Banking in USA’ Journal of Internet Banking and Finance, 3 (2) pp.
1-7.
Dion, K., Berscheid E. and Walster E. (1972) ‘What Is Beautiful Is Good’ Journal of
Personality and Social Psychology, 24 (3) pp. 285-290
Directors Publication Ltd. (1999). Customer relationship management how directors can
build business through improved customer relations. London: Published for the
Institute of Directors and Oracle Corporation UK Ltd by Director Publications.
Dishaw, M. T., and Strong, D. M. (1999) ‘Extending the technology acceptance model with
task-technology fit constructs’, Information and Management, 36 (1) pp. 9-21.
Doney, M.P. and Cannon, J.P., (1997) ‘An examination of the nature of trust in buyer–seller
relationships’, Journal of Marketing, 61, pp. 35–51.
Donovan, R.J. and Rossiter, J.R. (1982) ‘Store atmosphere: an environmental psychology
approach’, Journal of Retailing, 58, pp. 34-57.
Donthu, N. (2001) ‘Does your web site measure up?’, Marketing Management, 10(4), 29-32
Donthu, N. and Garcia, A. (1999) ‘The internet shopper’, Journal of Advertising Research,
39 (3) pp. 52-8.
Douglas, S.P., Morrin, M.A. and Craig, C.S. (1994) ‘Cross-national consumer research
traditions’ In Laurent, G., Lilien, G. and Bras B. (Eds.), Research traditions in
marketing. Boston: Kluwer.
Drasgow, F. and Kanfer, R. (1985) ‘Equivalence of psychological measurement in
heterogeneous population’ Journal of Applied Psychology, 70 (4) pp.662–680.
Duffin, D. (1997) ‘Winning customer ownership - the Jaeger service excellence storey’,
Managing Service Quality 7(2).
Eagly, A. H., Ashmore R. D., Makhijani M. G. and Longo L. C. (1991) ‘What Is Beautiful Is
Good, but…: A Metaanalytic Review of Research on the Physical Attractiveness
Stereotype’, Psychological Bulletin, 110(1) pp. 109-128
East, R., (1997), Consumer behaviour: advances and applications in marketing. Prentice
Hall.
Easterby-Smith, M., Thorpe, R., and Lowe, A. (1991) Management Research an
Introduction, London: Sage.
Eastin, M.S. (2002) ‘Diffusion of e-commerce: an analysis of the adoption of four e-
commerce activities’, Telematics and Informatics, 19: 251-67
REFERENCE
P a g e | 309
Economist Intelligence Unit (2000) ‘Doing E-Business In Saudi Arabia’ Available at:
http://www.ebusinessforum.com/index.asp?
layout=debi_country_home&country_id=SA&title=Doing%20ebusiness%20in%20Sa
udi%20Arabia [Accessed on 26 March 2007].
Eid, R., Trueman, M. and Ahmed, A. M. (2002) ‘A cross-industry review of B2B critical
success factors’, Internet research: Electronic Networking Applications and Policy,
12 (2) pp. 110-123.
Eighmey, H. and McCord, L. (1998) ‘Adding value in the information age: uses and
gratifications of sites on the world-wide-web’, Journal of Business Research, 41 pp.
187-94.
Ein-Dor, P., Segev, E. and Orgad, M. (1992) ‘The Effect of National Culture on IS:
Implications for International Information Systems’, Journal of Global Information
Management, 1 pp. 33-44.
Einwiller, S., Geissler, U., Will, M., (2000) ‘Engendering trust in Internet businesses
using elements of corporate branding’, In: H.M. Chung (Ed.), Proceedings of the
2000 Americas Conference on Information Systems (AMCIS), Long Beach, CA, pp.
733–739.
Eroglu, S.A., Machleit, K.A. and Davis, L.M. (2001) ‘Atmospheric qualities of online
retailing - a conceptual model and implications’, Journal of Business Research, 54
(2), pp. 177-84.
Fazio, R. H. and Zanna, M. P., Berkowitz, L. (ed.) (1981) ‘Direct Experience and Attitude
Behavior Consistency in Advances in Experimental Social Psychology’, New York:
Academic Press. 6, pp. 161-202.
FBIS (1998) Quoted in Okaz newspaper, Available at: www.okaz.com.sa, February 24, 1998,
reported in FBIS, February 27, 1998.
Featherman, M. S. and P. A. Pavlou (2003) ‘Predicting E-Services Adoption: A Perceived
Risk Facets Perspective’, International Journal of Human-Computer Studies, 59 pp.
451-474
Feinberg, R. A., Kadam, R., Hokama, L., Kim, I. (2002) ‘The state of electronic customer
relationship management in retailing’ International Journal of Retail and Data
Systems. 30 (10) pp. 470-481.
Ferrary, M., (2002) ‘Trust and social capital in the regulation of lending activities’, Journal of
Socio-Economics, 23(5), pp. 1–27.
REFERENCE
P a g e | 310
Festinger, L. A. (1975) A Theory of Cognitive Dissonance, Evanston, IL: Row and
Peterson.
Field, A. (2005) Discovering Statistics Using SPSS. London: Sage Publications Ltd.
Field, A. P. (2000) Discovering Statistics Using SPSS for Windows: Advanced
Techniques for the Beginner. London: Sage Publications.
Fishbein, M. and Ajzen, I., (1975), Belief, Attitude, Intention, and Behavior: An
Introduction to Theory and Research, Addison-Wesley Pub. Co
Fitzgerald, B. and Howcroft, D. (1998) ‘Towards Dissolution of the IS Research Debate:
From Polarisation to Polarity’, Journal of Information Technology, 13(4) 313-326.
Flavián, C., Guinalíu, M. and Gurrea, R. (2006) ‘The role played by perceived usability,
satisfaction, and consumer trust on website loyalty’, Information and Management, 43
(1) pp.1-14.
Flick, U. (1992) ‘Triangulation revisited: strategy of validation or alternative?’ Journal for
the Theory of Social Behaviour, 22 (2) 175–197.
Fornell, C. and Larcker, D. F. (1981) ‘Evaluating Structural Equations with Unobservable
Variables and Measurement Error’, Journal of Marketing Research, (18) pp. 39-50.
Fornell, C., and Bookstein, F., (1982), ‘Two Structural Equation Models: LISREL and PLS
Applied to Consumer Exit-Voice Theory’, Journal of Marketing Research. 19, pp.
440-452.
Fornell, C., and Westbrook, R. A., (1984) ‘The Vicious Circle of Consumer Complaints’,
Journal of Marketing, 56, pp. 6.21.
Forsythe, S.M. and Bailey, A. (1996) ‘Shopping enjoyment, perceived time poverty and time
spent shopping’, Clothing and Textiles Research Journal, 14 (3) pp. 185-191.
Foucault, B.E., Laroche, S.M., Yang, Z., McDougall, G. H. G. and Bergeron, J. (2005)
‘Internet versus bricks and mortar retailers: an investigation into intangibility and its
consequences’, Journal of Retailing, 81 (4) pp. 251-267.
Foxall, G. R. (2003) ‘The behaviour analysis of consumer choice: an introduction to the
special issue’, Journal of Economic Psychology, 24 (5) pp.581-588.
Foxall, G., and Pallister, J. (1998) ‘Measuring Purchase Decision Involvement for Financial
Services: Comparison of the Zaichkowsky and Mittal scales’, International Journal of
Bank Marketing, 16(5), pp. 180-194
Frankfort-Nachmias, C. and Nachmias, D. (1996) Research methods in the social sciences,
St. Martin Press, New York.
REFERENCE
P a g e | 311
Fukuyama, F. (1995) Trust: The Social Virtues and the Creation of Prosperity, New
York: The Free Press.
Fung, R.K.K. and Lee, M.K.O. (1999) ‘EC-trust (trust in electronic commerce): exploring the
antecedent factors’ In Haseman, W.D. and Nazareth, D.L. (Eds.), In Proceedings of
the 5th Americas Conference on Information Systems, August 13–15, pp. 517–
519.
Gabarro, J. J. (1978) The development of trust, influence, and expectations. A. G. Athos and
J. J. Gabarro, eds. Interpersonal Behavior: Communication and Understanding in
Relationships. Prentice-Hall, Englewood Cliffs, NJ
Galbreath, J. and Rogers, T. (1999) ‘Customer relationship leadership: a leadership and
motivation model for the twenty-first century business’, The TQM Magazine, 11(3)
pp. 161-171.
Galliers, R. D. and Land, F. F., (1987) ‘Choosing appropriate information systems research
methodologies’, Communications of the ACM , 30(11) pp.900–902.
Ganesan, S. (1994) ‘Determinants for Long-Term Orientation in Buyer-Seller Relationships’,
Journal of Marketing, 58, pp. 1-19.
Gefen D, (2004) ‘What makes an ERP implementation relationship worthwhile: Linking trust
mechanisms and ERP usefulness’, Journal of Management Information Systems,
21(1) pp.263–88.
Gefen, D. (2000) ‘E-Commerce: The Role of Familiarity and Trust’ Omega 28 (6), pp. 725-
737
Gefen, D. (2002) ‘Reflections on the Dimensions of Trust and Trustworthiness among Online
Consumers’, ACM SIGMIS Database, 33 (3) pp 38 - 53.
Gefen, D. and Devine, P. (2001) ‘Customer loyalty to an online store: The meaning of online
service quality’ In Proceedings of the 22nd International Conference of
Information Systems (ICIS). New Orleans, Louisiana: pp. 613-618.
Gefen, D. and Keil, M. (1998) ‘The impact of developer responsiveness on perceptions of
usefulness and ease of use: An extension of the technology acceptance model’, The
DATA BASE for advances in information Systems, 29 (2) pp. 35-49.
Gefen, D. and Straub, D. W. (1997) ‘The relative importance of perceived and adoption of
email: an extension to the technology acceptance model’, MIS Quarterly, 21 (4) pp.
389-400.
REFERENCE
P a g e | 312
Gefen, D., and Straub, D. W. (2000) ‘The Relative Importance of Perceived Ease-of-Use in
IS Adoption: A Study of E-Commerce Adoption’, Journal of the Association for
Information Systems, 1 (8) pp.1-30.
Gefen, D., Karahanna, E. and Straub, D.W. (2003) ‘Trust and TAM in online shopping: An
integrated model’, MIS Quarterly 27(1), pp. 51-90.
Gefen, D, Karahanna, E. and Straub, D. W. (2003a) ‘Inexperience and experience with online
stores: the importance of TAM and trust’, IEEE Transactions on Engineering
Management, 50(3), pp. 307–321.
Gelb, B. and Johnson, M. (1995) ‘Word-of-mouth communication: causes and
consequences’, Journal of Health Care Marketing, 15 (3) pp. 54-8.
George, H. F. (2002) ‘Influences on the Internet to make purchases’, Internet Research, 12
(2) pp. 165-80.
Geyskens, I., Steenkamp, J-B.E.M. and Kumar, N., (1997) ‘Generalizations about trust in
marketing channel relationships using meta-analysis’, International Journal of
Research in Marketing, 15, pp. 223–248.
Ghose, S., Dou, W. (1998) ‘Interactive functions and their impacts on the appeal of Internet
presence sites’, Journal of Advertising Research, 38(2), pp. 29-43
Gill, J. and Butler, R., (1996) ‘Cycles of trust and distrust in joint-ventures’, European
Management Journal, 14 (1), pp. 81–89.
Gill, J. and Johnson, P (2002) Research methods for managers. London: Sage
Gillies, C., Rigby D. (2002) ‘The story behind successful customer relations management’,
European Business Journal. London 14 (2) pp.73-77.
Girard, Tulay, Korgaonkar, P. and Silverblatt, R. (2003) ‘Relationship of Type of Product,
Shopping Orientations, and Demographics with Preference for Shopping on the
Internet’, Journal of Business and Psychology, 18 (1) pp.101-120.
Goldsmith, R.E. and Bridges, E. (2000) ‘Etailing vs retailing: Using attitudes to predict
online buying behavior’, Quarterly Journal of Electronic Commerce, 1(3) PP. 245-
253.
Granovetter, M.S., (1985) ‘Economic action and social structure’, American Journal of
Sociology, 91, pp. 481–510
Grant, L. (1998) ‘Your customers are telling the truth.’ Fortune-European Edition. pp. 164-6.
REFERENCE
P a g e | 313
Grant, R. A. (1989) ‘Building and testing causal models of an information technology's
impact’ In Proceedings of the 10th International Conference on Information
Systems. Boston, MA: pp. 173–184.
Gray, P. and J. Byun (2001) Customer Relationship Management. Irvine, CA, Centre for
Research on Information Technology and Organisation, University of California.
Grewal, D., Munger, J. L., Iyer, G. R., and Levy, M. (2003) ‘The influence of Internet-
retailing factors on price expectations’, Psychology & Marketing, 20(6), pp. 477–493.
Griffin, J. (1995) Customer Loyalty. San Francisco, CA, Jossey-Bass.
Griffin, J., (1996), ‘The Internet’s expanding role in building customer loyalty’, Direct
Marketing, 59(7), pp. 50-53.
Griffith, D. A., Matthew B. M, and Harvey, M. G. (2006) ‘An Investigation of National
Culture’s Influence on Relationship and Knowledge Resources in Interorganizational
Relationships between Japan and the United States’, Journal of International
Marketing, 14 (3) pp. 1-32.
Griffith, T.L. (1999) ‘Technology features as triggers for sensemaking’, Academy of
Management Review, 24 (3) pp.472-88.
Grönroos, C. (1997) ‘From marketing mix to relationship marketing. Towards a paradigm
shift in marketing’, Management Decision, 35 (4) pp.322-339.
Grönroos, C. (2001) ‘The perceived service quality concept – a mistake?’, Managing Service
Quality, 11 (3) pp.150-2.
Guba, E.G. and Lincoln, Y.S. (1994) Competing paradigms in qualitative research, in,
Denzin, N. K., and Lincoln, Y. (eds) Handbook of Qualitative Research. Thousand
Oaks, CA: Sage, pp. 105-117
Gummesson, E. (2000) Qualitative methods in management research. Sage Publications,
Inc.
Gupta, S., and Kim, H. W. (2007) ‘The moderating effect of transaction experience on the
decision calculus in on-line repurchase’, International Journal of Electronic
Commerce, 12(1), pp. 127–158.
Gurau, C. (2003). ‘Tailoring e-service quality through CRM’, Managing Service Quality 13
(6) pp. 520-531.
Guru, B.K., Shanmugam, B., Alam, N. and Perera, C.J. (2003) ‘An Evaluation Of IB Sites In
Islamic Countries’. Available at: http://www.arraydev.com/commerce/JIBC/0311-
01.htm#_ftnref2.
REFERENCE
P a g e | 314
Güth, W., (2001) ‘Do banks crowd in business ethics? An indirect evolutionary analysis’,
International Review of Economics and Finance, 10 1, pp. 1–17.
Ha, S. and Stoel, L. (2009) ‘Consumer e-shopping acceptance: Antecedents in a technology
acceptance model’, Journal of Business Research, 62 pp. 565–571.
Hair J., Black W., Babin B., Anderson R. and Tatham R. (2006) Multivariate Data
Analysis, (6th) Pearson Education.
Haley, G. T. (2002) ‘e-commerce in China: Changing Business as We Know It’, Industrial
Marketing Management, 31 (2) pp. 119-124.
Hamermesh, D. and A. M. Parker (2005) ‘Beauty in the Classroom: Professors’ Pulchritude
and Putative Pedagogical Productivity’, Economics of Education Review, 24 (4) pp.
369-376
Hammerasley, M., (1987). ‘Some notes on the terms' validity' and 'reliability'’ British
Educational Research Journal, 13 (1) pp.73-81.
Hampton-Sosa, W., Koufaris, M. (2005) ‘The effect of web site perceptions on initial trust in
the owner company’, International Journal of Electronic Commerce, 10(1), pp. 55-
81.
Hansen, T. and Jensen, J. M. (2009) ‘Shopping orientation and online clothing purchases: the
role of gender and purchase situation’, European Journal of Marketing, 43 (9/10) pp.
1154-1170
Harris LC, Goode MMH. (2004) ‘The four levels of loyalty and the pivotal role of trust: a
study of online service dynamics’, Journal of Retailing, 80(2) pp. 139–58.
Hart, C. W., and Johnson, M. D. (1999) ‘Growing the Trust Relationship’, Marketing
Management, 8(1), pp. 8-19.
Harvard Business School, P. (2002) Harvard business review on customer relationship
management. Boston: Harvard Business School Press.
He, F. and Mykytyn, P.P. (2007) ‘Decision Factors for the Adoption of an Online Payment
System by Customers’, International Journal of E-Business Research, 3 (4) pp.1-32.
Henard, D.H. and Szymanski, D.M., (2001), ‘Why some new products are more successful
than others’, Journal of Marketing Research, 38(3), pp. 362-375.
Henderson, R. and Divett M. J. (2003) ‘Perceived usefulness, ease of use and electronic
supermarket use’, International Journal of Human-Computer Studies, 59, pp.383-395.
REFERENCE
P a g e | 315
Hendrickson, A. R., Massey, P. D. and Cronan, T. P. (1993) ‘On the test-retest reliability of
perceived usefulness and perceived ease of use scales’, MIS Quarterly, 17 (2) pp. 227-
230.
Henning, E., Van Rensburg, W. and Smit, B. (2004) ‘Theoretical frameworks’ In: Henning
E, Van Rensburg W and Smit B (2004) Finding your way in qualitative research.
Pretoria: Van Schaik Publishers.
Henry, J.W. and Stone, R.W. (1994) ‘A structural equation model of end-user satisfaction
with a computer-based medical information system’, Information Resources
Management Journal, 7 (3) pp. 21-33.
Hetherington, K. (1992) ‘Stonehenge and its festival: spaces of consumption’ in Shields, R.
(Ed.), Lifestyle Shopping, Routledge, London, pp. 83-98.
Hildebrand, C. (1999) ‘One to a customer- Customer Relationship Management’, CIO
Magazine, 12.
Hirschman, E.C. and Holbrook, M.B. (1982) ‘Hedonic consumption: emerging concept,
methods and propositions’, Journal of Marketing, 46 (3) pp. 92-101.
Hirschman, E.C. and Holbrook, M.B. (1982), ‘Hedonic consumption: emerging concepts,
methods and propositions’, Journal of Marketing, 46, pp. 92-101.
Ho, T., Raman, K. and Watson, R., (1989) ‘Group decision support systems: the cultural
factor’, Proceedings of the tenth international conference on Information Systems, pp.
119-129.
Hoecklin, L.A., (1995) Managing Cultural Differences: Strategies for Competitive
Advantage, Addison-Wesley.
Hoelter, J. W. (1983) ‘The Analysis of Covariance Stractures: Goodness-of-Fit Indices’,
Sociological Methods and Research, 11, pp 324-344.
Hoffman, D.L. and Novak, T.P., 1996. Marketing in Hypermedia Computer-Mediated
Environments: Conceptual Foundations. Journal of Marketing, 60(3), pp. 50-68.
Hoffman, D.L., Novak, T.P. and Perlta, M. (1999) ‘Building consumer trust online’,
Association for Computing Machinery, Communications of the ACM, 42(4) pp.80-85
Hofstede, G. (1980) Culture’s Consequences, Sage, Beverly Hills.
Hofstede, G. (1984) Culture's Consequences: International Differences in Work-Related
Values. Newbury Park, CA: Sage.
Hofstede, G. (1994) ‘Management scientists are human’, Management Science, 40 pp. 4–13.
REFERENCE
P a g e | 316
Hofstede, G. (2007) ‘Geert Hofstede™ Cultural Dimensions: Geert Hofstede Analysis’,
Saudi Arabia. Available at: http://www.geert
hofstede.com/hofstede_arab_world.shtml [Accessed on 11 May 2007]
Hofstede, G. and Bond, M.H. (1988) ‘The Confucius Connection: From Cultural Roots to
Economic Growth’, Organizational Dynamics, 16 (4) pp.4-21.
Holbrook, M. B. (1986) ‘Aims, concepts, and methods for the presentation of individual
differences in aesthetic responses to design features’, Journal of Consumer Research,
13 pp. 337–347.
Holmes-Smith, P. (2000) Introduction to Structural Equation Modelling Using AMOS
4.0 and LISREL 8.30, Canberra: School Research, Evaluation and Measurement
Services,
Holt, D. B., Quelch J. A., and Taylor E. L. (2004) ‘How Global Brands Compete,’ Harvard
Business Review, 82 (9) pp. 68-75.
Hong, S.-J., Thong, J. Y. L., and Tam, K. Y. (2006). ‘Understanding continued information
technology usage behavior: A comparison of three models in the context of mobile
internet’, Decision Support Systems, 42(3) 1819–1834.
Hosmer, L. T. (1995) ‘Trust: the Connecting Link Between Organizational Theory and
Philosophical Ethics’, Academy of Management Review, 20 (2) pp. 379-403.
Hoyle, R. H. (1995) Structure Equation Modeling: Concepts, Issues, and Applications,
Thousand Oaks, Calif and London; Sage Publications.
Huang, L., Lu, M., and Wong, B. K. (2003) ‘The Impact of Power Distance on email
Acceptance: Evidence from the PRC’, Journal of Computer Information System,
44(1), pp. 93-101.
Hulland, J., Chow, Y. H. and Lam, S. (1996) ‘Use of Causal Model in Marketing Research: A
review’, International Journal of Research in Marketing, 19 (4) pp. 464-485.
Husted, B.W., (1998) ‘The ethical limits of trust in business relations’, Business Ethics
Quarterly, 8 (2), pp. 233–248
Hutcheson, G. and Sofroniou, N. (1999) The Multivariate Social Scientist: Introductory
Statistics Using Generalized Linear Models. Sage Publications.
Igbaria, M., Livari, J., and Maragahh, H. (1995) ‘Why do individuals use computer
technology? A finish case study’, Information and Management, 29 pp. 227-38.
Igbaria, M., Parasuraman, S. and Baroudi, J. J. (1996), ‘A motivational model of
microcomputer usage’, Journal of Management Information Systems, 13 (1) pp. 127-
143.
REFERENCE
P a g e | 317
Igbaria, M., Schiffman, S. J., and Wieckowski, T. J., (1994) ‘The respective roles of
perceived usefulness and perceived fun in the acceptance of microcomputer
technology’, Behaviour and Information Technology, 13 (6) pp. 349-61.
Inkpen, A.C. and Currall, S.C., (1998) ‘The nature, antecedents, and consequences of joint
venture trust’, Journal of International Management, 4 (1), pp. 1–20.
Internet World State (2009) ‘Internet Usage in the Middle East’ [Online] March 31, 2009.
Available at: http://www.internetworldstats.com/stats5.htm [Accessed on 1 May
2009].
Irani, Z, Ezingeard, J.-N, Grieve, R.J. and Race, P. (1999) ‘A case study strategy as part of an
information system research methodology: a critique’, The International Journal of
Computer Applications in Technology, 12(2) pp.190-198.
Jacoby, J. and Chestnut, W., (1978) Brand Loyalty–Measurement and Management,
Wiley.
Jacoby, J. and Kyner, D.B., (1973), ‘Brand Loyalty vs. Repeat Purchasing Behavior’,
Journal of Marketing Research, 10(1), pp. 1-9.
Jahng J., Jain, H., and Ramamurthy,. K. (2007) ‘Effects of interaction richness on consumer
attitudes and behavioral intentions in e-commerce: some experimental results’,
European Journal of Information Systems, 16, pp. 254–269.
Janda S, Trocchia PJ, Gwinner KP. (2002) ‘Consumer perceptions of Internet retail service
quality’, International Journal of Service Industry Management, 13(5) pp. 412–33.
Jarvenpaa SL, Todd PA. (1997) ‘Consumer reactions to electronic shopping on the World
Wide Web’, International Journal of Electronic Commerce, 1(2) pp. 59–88
Jarvenpaa, S. L., and Todd, P. A., (1997) ‘The psychological origins of perceived usefulness
and perceived ease of use’, Information and management, 35 pp. 237-50.
Jarvenpaa, S.L. and Todd, P.A. (1996) ‘Consumer reactions to electronic shopping on the
World Wide Web’, International Journal of Electronic Commerce, 1 (2), pp. 59–88.
Jarvenpaa, S.L., Tractinsky, N. and Vitale, M. (2000) ‘Consumer trust in an Internet store’,
Information Technology & Management, 7 (1-2) pp. 45-71.
Jarvenpaa, S.L., Tractinsky, N., Saarinen, L. and Vitale, M. (1999) ‘Consumer Trust in an
Internet Store: A Cross-Cultural Validation’, Journal of Computer Mediated
Communications, 5 (2) pp. 1-35.
Jasimuddin, S. M. (2001) ‘Saudi Arabian Banks on the Web’, Journal of Internet Banking
and Commerce, 6 (1) pp. 1-7.
REFERENCE
P a g e | 318
Jayawardhena, C. (2004) ‘The hierarchical influence of personal values on e-shopping
attitude and behaviour’, Internet Research: Electronic Networking Applications and
Policy, 14 (2) pp. 127-42.
Jayawardhena, C. and Wright, L. T. (2009) ‘An empirical investigation into e-shopping
excitement: antecedents and effects’, European Journal of Marketing, 43 (9/10) pp.
1171-1187.
Jobber, D. (2001) Principles and Practice of Marketing. London: McGraw-Hill.
Jolliffe, I., 2002. Principal Component Analysis. Springer.
Johnson, C., and Hult, P. (2008) ‘Web buyers and their expectations grow up – experienced
web buyers are becoming the new ainstream’, Forrest Research [WWW document]
http://www.forrester.com/Research/PDF/0,5110,45462,00.pdf [accessed April 2010].
Jones, M. Y., Stanaland, A. J. and Gelb, B. D. (1998) ‘Beefcake and cheesecake: insights for
advertisers’, Journal of Advertising, 27 (2), pp. 33–51.
Joines J. L., Scherer, C. W., and Scheufele, D. A. (2003) ‘Exploring motivations for
consumer web use and their implications for e-commerce’, Journal Consumer
Marketing, 20(2) pp. 90–108.
Jöreskog, K.G. and Sörbom, D. (2001) LISREL 8: User’s Reference Guide, Lincolnwood:
Scientific Software International.
Kaiser, H.F. (1974) ‘An index of factorial simplicity’, Psychometrika, 39 (1), pp. 31-36.
Kearney’s Global Retail Development Index ‘2010 Global Retail Development Index™’
Available at: http://www.atkearney.com/index.php/Publications/global-retail-
development-index.html [Accessed on Aug 7, 2010].
Kang, Y. S. Hong, S. and Lee, H. (2009) ‘Exploring continued online service usage behavior:
The roles of self-image congruity and regret’, Computers in Human Behavior, 25(1)
pp.111-122
Karahanna, E., Straub, D. W. and Chervany, N. L. (1999) ‘Information Technology Adoption
Across Time: A Cross- Sectional Comparison of Pre-Adoption and Post-Adoption
Beliefs’, MIS Quarterly, 23(2) pp.183-213.
Kedia, B.L. and Bhagat, R.S. (1991) ‘Cultural constraints on transfer of technology across
nations: Implications for research in international and comparative’, Management
Academy of Management Review, 13 (4) pp. 559–571.
Keen, C., Ruyter, K.D., Wetzels, M., and Feinberg, R. (2000) ‘An empirical analysis of
consumer preferences regarding alternative service delivery modes in emerging
REFERENCE
P a g e | 319
electronic service markets’, Quarterly Journal of Electronic Commerce, 1(1) pp.31-
47.
Keen, P., Ballance, G., Chan, S. and Schrump, S., (1999) Electronic commerce
relationships: trust by design, Prentice Hall PTR Upper Saddle River, NJ, USA.
Keeney, R. L. (1999) ‘The value of internet commerce to the customer’, Management
Science, 45(4) pp.533-542.
Kelley, H.H. and Thibaut, J.W. (1978) Interpersonal Relations - A Theory of
Interdependence, Wiley, New York, NY.
Khalifa, M. and Liu, V. (2001) ‘Satisfaction with Internet-based services: A longitudinal
study’ In Proceedings of the 22nd International Conference of Information
Systems (ICIS 2001), New Orleans, Louisiana, (pp. 601-606).
Khalifa, M. and M. Limayem (2003) ‘Drivers of Internet Shopping’, Communications of the
ACM, 46 (12) pp. 233-239.
Kim Y-K. (2002) ‘Consumer value: an application to mall and Internet shopping’,
International Journal of Retail and Distribution Management, 30(11/12) pp.595–604
Kim, D.J., Ferrin, D.L. and Rao, H.R. (2003) ‘A study of the effect of consumer trust on
consumer expectations and satisfaction: the Korean experience’, In Proceedings of the
5th International Conference on Electronic Commerce, pp. 310-315.
Kim, J. and Forsythe, S (2009) ‘Adoption of Sensory Enabling Technology for Online
Apparel Shopping’, European Journal of Marketing, 43(9/10) pp.1101-1120.
Kim, S. S. and Malhotra, N. K. (2005) ‘A longitudinal model of continued IS use: An
integrative view of four mechanisms underlying post-adoption phenomena’,
Management Science, 51(5) pp.741–755.
Kim, S. S., Malhotra, N. K. and Narasimhan, S. (2005) ‘Two competing perspectives on
automatic use: A theoretical and empirical comparison’, Information Systems
Research, 16(4) pp.418–432.
Kim, S.Y. and Lim, Y.J. (2001) ‘Consumers' perceived importance of and satisfaction with
Internet shopping’, ElectronicMarkets, 77(3) pp.148-154.
Kimber, C. (2001), Researching Online Buying’s Offline Impact, London: CACI,
Klein, L. R., (2003) ‘Creating virtual product experiences: the role of telepresence’, Journal
of Interactive Marketing, 17 (1) pp. 41-55.
Kline, R. B. (2005) Principles and practice of structural equation modeling. New York:
Guilford Press.
REFERENCE
P a g e | 320
Klopping, I.M. and McKinney, E. (2004) ‘Extending the technology acceptance model and
the task-technology fit model to consumer e-commerce’, Information Technology,
Learning, and Performance Journal, 22 pp. 35–48.
Kluckhohn, C., (1951) ‘The study of culture’, The Policy Sciences, pp. 86–101.
Kluckhorn, F. and Strodtbeck, F. L. (1961) ‘Variations in value orientations’ In R. Peterson
(Ed.), Evanston, IL.
Koppius, O., Speelman, W., Stulp, O., Verhoef, B. and Van Heck, E. (2005) ‘Why are
customers coming back to buy their airline tickets online? Theoretical explanations
and empirical evidence’, In Proceedings of the 7th International Conference on
Electronic Commerce, pp. 319-326.
Korgaonkar, P.K. and Wolin, L.D. (1999) ‘A multivariate analysis of web usage’, Journal of
Advertising Research, 39 (2) pp. 53-68.
Kotler, P. (1997) Marketing management analysis, planning, implementation and
control. Englewood Cliffs (N.J.): Prentice-Hall.
Koufaris, M. (2002) ‘Applying the technology acceptance model and flow theory to online
consumer behavior’, Information Systems Research, 13 (2) pp. 205–223.
Koufaris, M., Kambil, A. and Labarbera, P.A. (2001)’ Consumer behavior in Web-based
commerce: An empirical study’, International Journal of Electronic Commerce, 6(2)
pp.115-138.
Koufaris, M., and Hampton-Sosa., W. (2004) ‘The development of initial trust in an online
company by new customers’, Information and Management, 41(3), pp. 377–397.
Kracklauer, A., Passenheim, O., Seifert D. (2001) ‘Mutual customer approach: how industry
and trade are executing collaborative customer relationship management’,
International Journal of Retail and Data Systems, 29 (12).
Kräuter, G. S. and Kaluscha E. A. (2003). ‘Empirical research in on-line trust: a review and
critical assessment’, International Journal of Human-Computer Studies, 58 (6)
pp.783-812.
Kristensen, K., Martensen, A. and Gronholdt, L. (1999) ‘Measuring the Impact of Buying
Behaviour on Customer Satisfaction’, Total Quality Management, 10 (4/5) pp 602-
614.
Krueger, M. (2000). ‘Fulfillment: The gateway to customer loyalty’, Manufacturing Systems,
Wheaton, 18 (9) pp.32.
REFERENCE
P a g e | 321
Kumar, K. and Bjorn-Andersen, N., (1990) ‘A cross-cultural comparison of IS designer
values’, Communications of the ACM, 33(5), pp. 528-538.
Kumar, N., Scheer, L. K. and Steenkamp J.-B. E. M. (1995) ‘The Effects of Perceived
Interdependence on Dealer Attitudes’, Journal of Marketing Research, 17 pp. 348-
356.
Kwon, B., Kim, C, & Lee, E. (2002) ‘Impact of website information design factors on
consumer ratings of web-based auction sites’, Behaviour & Information Technology,
21(6), 387-402
Lai, V. and Li, H. (2005) ‘Technology acceptance model for internet banking: an invariance
analysis’, Information & Management, 42 pp.373-386
Lang, B. and Colgate, M. (2003) ‘Relationship quality, online banking and the information
technology gap’, International Journal of Bank Marketing, 21 (1) pp.29-37.
Lederer, A.L., D.J. Maupin D.J, Sena M.P. and Zhuang Y. (2000) ‘The technology
acceptance model and the World Wide Web’, Decision Support Systems, 29 (3), pp.
269–282.
Lee, D., Park, J. and Ahn, J. (2001) ‘On the Explanation of Factors Affecting E-Commerce
Adoption’, In Proceedings of the 22nd International Conference on Information
Systems, Storey, V., Sarker, S. and DeGross, J. (eds.), New Orleans, Louisiana: pp.
109-120.
Lee, J., Kim, J. and Moon, J. Y. (2000) ‘What makes Internet users visit cyber stores again?
Key design factors for customer loyalty’, In Proceedings of the Conference on
Human Factors in Computing Systems, The Hague, Netherlands, pp. 305-312.
Lee, M. K. O. and Turban, E. (2001) ‘A trust model for consumer Internet shopping’,
International Journal of Electronic Commerce, 6(1) pp.75–91.
Lee, P.M. (2002) ‘Behavioral model of online purchasers in e-commerce environment’,
Electronic Commerce Research, 2 (1-2), 75-85.
Levinthal, D.A. and Fichman, M. (1988) ‘Dynamics of interorganizational attachments:
auditor-client relationships’, Administrative Science Quarterly, 33 pp.345-69.
Lewicki, R.J. and Bunker, B., (1995) ‘Trust in relationships: a model of trust development
and decline’, In: Bunker, B. and Rubin, J., Editors, 1995. Conflict, Cooperation and
Justice, Jossey-Bass, San Francisco, pp. 133–173.
REFERENCE
P a g e | 322
Li, H., Kuo, C. and Russell, M.G. (1999) ‘The impact of perceived channel utilities, shopping
orientations, and demographics on the consumer's online buying behavior’, Journal of
Computer-Mediated Communications, 5 (2).
Li, N. and Zhang, P. (2005) ‘Toward E-Commerce Websites Evaluation and Use: An
Affective Perspective’ Post-ICIS’05 JAIS Theory Development Workshop, Las
Vegas, NV: December 14, 2005
Liang, T.P. and Lai, H.J. (2002) ‘Effect of store design on consumer purchases: An empirical
study of on-line bookstores’ Information & Management, 39(6) pp.431-444.
Liao, C., Chen, J.-L., and Yen, D. C. (2007) ‘Theory of planning behavior (TPB) and
customer satisfaction in the continued use of e-service. An integrated model’,
Computers in Human Behavior, 23(6) pp. 2804–2822.
Liao, Z. and Cheung, M.T. (2001). ‘Internet-based e-shopping and consumer attitudes: an
empirical study’, Information & Management, 38 (5) pp.299-306.
Liao, Z. and M. T. Cheung (2002) ‘Internet-Based E-Banking and Consumer Attitudes: An
Empirical Study’, Information & Management, 39 (4) pp. 283-295.
Lilien, G.L., Philip, K. and Sridhar, M.K. (1992) Marketing models. New Jersey: Prentice
Hall
Lim, L., Raman, K. and Wei, K., (1990) ‘Does GDSS promote more democratic decision-
making?-The Singaporeexperiment’, System Sciences, 1990., Proceedings of the
Twenty-Third Annual Hawaii International Conference.
Limayem, M. and Khalifa, M. (2000) ‘Business-to-consumer electronic commerce: A
longitudinal study’, In Proceedings of the 5th IEEE Symposium on Computers and
Communications, pp. 286-290.
Limayem, M., Hirt, S. G. and Cheung, C. M. K. (2007) ‘How habit limits the predictive
power of intention: The case of information systems continuance’, MIS Quarterly,
31(4) pp.705–737.
Limayem, M., Khalifa, M. and Frini, A. (2000) ‘What makes consumers buy from the
Internet? A longitudinal study of online shopping’, IEEE Transactions on Systems,
Man & Cybernetics, Part A (Systems & Humans), 30(4) pp. 421-432.
Lin, C. S., Wu, S. and Tsai, R. J. (2005) ‘Integrating perceived playfulness into expectation–
confirmation model for web portal context’, Information and Management, 42 (5) pp.
683–693.
REFERENCE
P a g e | 323
Lin, J.C.-C. and Lu, H. (2000) ‘Towards an understanding of the behavioral intention to use a
Web site’, International Journal of Information Management, 20 (3) pp. 197-208.
Lindgaard, G., Fernandes, G.J., Dudek, C. and Brownet, J. (2006) ‘Attention Web Designers:
You Have 50 Milliseconds to Make a Good First Impression!’, Behaviour and
Information Technology, 25 (2) pp. 151-126.
Lindquist, J.D. (1974) ‘Meaning of image: a survey of empirical and hypothetical evidence’,
Journal of Retailing, 50(4), pp. 29-38
Liska, Allen E. (1984) ‘A Critical Examination of the Causal Structure of the Fishbein/Ajzen
Attitude-Behavior Model’, Social Psychology Quarterly, 47(1) pp.61-74
Liu, Xiao and Kwok Kee Wei (2003) ‘An empirical study of product differences in
consumers’ e-commerce adoption behavior’, Electronic Commerce Research and
Applications, 2 (3) pp.229-239.
Lohse, G., Bellman, S. and Johnson, E. (2000) ‘Consumer Buying Behavior on the Internet:
Findings from Panel Data’, Journal of Interactive Marketing, 14 (1) pp.15-29.
Lohse, G.L. and Spiller, P., (1998) ‘Electronic shopping’, Communications of the ACM,
41(7), pp. 81-87.
Lu, H-P. and Su, P.Y. (2009) ‘Factors affecting purchase intention on mobile shopping web
Sites’ available at www.emeraldinsight.com/1066-2243.htm, Department of
Information Management, National Taiwan University of Science and Technology,
Taipei, Taiwan, ROC.
Luarn, P. and Lin H.H., (2003), ‘A consumer loyalty model for e-service context’, Journal of
Electronic Commerce Reseach, 4(4), pp. 156-167.
Lucchini, R. (1996) Theory, Method, and Triangulation in the Study of Street Children.
Childhood: A Global Journal of Child Research, 3 (2) pp.167-170
Luhmann, N. (1979) Trust and Power. Chichester, England: John Wiley & Sons.
Luo, Y., (2002) ‘Building trust in cross-cultural collaborations: toward a contingency
perspective’, Journal of Management, 28 (5), pp. 669–694
Lynch, P. D., Kent, R.J., and Srinivasan, S.S. (2001) ‘The global internet shopper: evidence
from shopping tasks in twelve countries’ Journal of Advertising Research, 41(4), 15-
23.
Ma, Q. and Liu, L. (2004) ‘The technology acceptance model: A meta-analysis of empirical
findings’, Journal of Organizational and End User Computing, 16 (1) pp. 59–72.
REFERENCE
P a g e | 324
MacNaughton, G., Rolfe S.A. and Siraj-Blatchford, I. (2007) Doing Early Childhood
Research: International perspectives on theory and practice. Australia: Allen &
Unwin.
Madar Research Group (2004) ‘B2C e-Commerce in Gulf Cooperation Council States.
Available at: http://www.madarresearch.com/archive/archive_toc.aspx?id=14
[Accessed on 26 November 2009].
Maguire, J. (2006) ‘Men, Women, and E-Commerce’, Ecommerce Guide, Available at:
http://www.ecommerce-guide.com/solutions/building/article.php/3577891 [Accessed
on 16 Dec 2009].
Malhotra, N. K. (2004) Marketing Research: an Applied Orientation, (4th) London:
Prentice Hall International.
Malone, T.W. (1981) ‘Toward a theory of intrinsically motivating instruction’, Cognitive
Science, 4 pp. 333–369.
Mark, R. (1996) Research Made Simple: a Handbook for Social Workers, Thousand
Oaks, Calif and London: Sage Publications.
Markus, L. and Soh, C. (2002) ‘Structural influences on global e-commerce activity’ Journal
of Global Information Management, 10(1) pp.5-12.
Marsh, H. W. and Hocevar, D. (1985) ‘Application of confirmatory factor analysis to the
study of self-concept: Fust- and higher-order factor models and their invariance across
groups’, Psychological Bulletin, 97 pp. 562-582.
Marshall, C. and Rossman, G.B., (1999) Designing Qualitative Research. Thousand Oaks,
Calif and London: Sage Publications.
Mathieson, K., (1991) ‘Predicting User Intentions: Comparing the Technology Acceptance
Model with the Theory of Planned Behavior’, Information Systems Research, 2(3),
pp. 173-191.
Mathieson, K., Peacock, E., and Chin, W. (2001) ‘Extending the technology acceptance
model: the influence of perceived user resources’, Adoption, diffusion, and infusion of
IT, 32(3), pp. 86-112.
Mathwick, C. (2002), ‘Understanding the online consumer: a typology of online relational
norms and behaviour’, Journal of Interactive Marketing, 16 (1) pp. 40-55.
Mathwick, C., Malhotra, N.K. and Rigdon, E. (2002) ‘The effect of dynamic retail
experiences on experiential perceptions of value: an internet and catalogue
comparison’, Journal of Retailing, 78 (1) pp.51-60.
REFERENCE
P a g e | 325
Mayer, R.J., Davis, J.H. and Schoorman, F.D. (1995) ‘An integrative model of organizational
trust’ Academy of Management Review, 20 pp.709–734.
Maznevski, M. L. and DiStefano, J. J. (1995) ‘Measuring culture in international
management: The cultural perspective questionnaire’ Working paper, University of
Virginia, Charlottesville.
McClintock, C.C., Brannon, D. and Maynard-Moody, S. (1979) ‘Applying the logic of
sample surveys to qualitative case studies: The case cluster method’, Administrative
Science Quarterly, 24 (4) pp.612-629.
McCoy, S., Galletta, D. and King, W., (2005) ‘Integrating national culture into IS research:
The need for current individual-level measures’, Communications of the AIS, 15(12),
pp. 211–224.
McCoy, S., Galletta, D. and King, W., (2007), ‘Applying TAM across cultures: the need for
caution’, European Journal of Information Systems, 16, pp. 81-90.
McDaniel, C.D. and Gates, R. (2002) Marketing research: The impact of the internet.
South-Western
McDaniel, S.W., Burnett, J.J. (1990) ‘Consumer religiosity and retail store evaluative
criteria’, Journal of the Academy of Marketing Science, 18(2), pp. 101-12.
McFarland, D. J. and Hamilton, D. (2006) ‘Adding Contextual Specifi city to the Technology
Acceptance Model’, Computers in Human Behavior, 22(3) pp. 427–447
McKnight, D. H., Cummings, L. L. and Chervany, N. L. (1998), ‘Initial Trust Formation in
New Organizational Relationships’ Academy of Management Review, 23 (3) pp. 472-
490.
Mcknight, D.H. and Chervany, N.L., (2002) ‘What Trust means in e- commerce consumer
relationships: an interdisciplinary conceptual typology’, International Journal of
Electronic Commerce, 6(2), pp. 35-59
McKnight, D.H., Choudhury, V. and Kacmar, C. (2002a) ‘The impact of initial consumer
trust on intentions to transact with a web site: a trust building model’, Journal of
Strategic Information Systems, 11 (3-4) pp. 297-323.
McKnight, D.H., Choudhury, V. and Kacmar, C. (2002b) ‘Developing and validating trust
measures for e-commerce: An integrative typology’, Information Systems Research,
13 (3) pp.334-359.
McMillan, S., Hwang, J., and Lee, G. (2003) ‘Effects of structural and perceptual factors on
attitudes toward the website’, Journal of Advertising Research, 43(4), pp. 400-409
REFERENCE
P a g e | 326
Melone, N. P. (1990) ‘A Theoretical Assessment of the User-Satisfaction Construct in
Information Systems Research’, Management Science, 36 (1).
Meltzer, M. (1999) ‘Customer Profitability: Information Just Isn’t Enough’, CRM Forum.
Available at: http://www.crm-forum.com/crm_forum_white_papers/cpie/ppr.htm,
[Accessed Feb. 2009].
Menard, S. (1995) Applied logistic regression analysis. Sage university paper series on
quantitative applications in the social science, No 106. Thousand Oaks, CA: Sage
Publications.
Menon, S. and Kahn, B. (2002) ‘Cross-category effects of induced arousal and pleasure on
the internet shopping experience’ Journal of Retailing, 78 pp.31-40.
Merriam, S. B. (1998) Qualitative Research and Case Study Applications in Education,
San Francisco, CA: Jossey-Bass Publishers.
Mertens, M. D. (1998) Research Methods in Education and Psychology, Intergrating
Diversity with Quantitative and Qualitative Approaches. Thousand Oaks, CA:
Sage Publications.
Meyers-Levy, J. (1989) ‘Gender differences in information processing: a selectivity
interpretation’ in: P. Cafferata and A. M. Tybout (Eds), Cognitive and Affective
Responses to Advertising, pp. 229–260 (Lexington, MA: Lexington).
Meyers-Levy, J. and Maheswaran, D. (1991) ‘Exploring differences in males’ and females’
processing strategy’, Journal of Consumer Research, 18 pp. 63–70.
Meyers-Levy, J. and Sternthal, B. (1991) Gender differences in the use of message cues and
judgments, 28 pp. 84-96
Meyerson, D., Weick, K.E. and Kramer, R.M. (1996) ‘Swift trust and temporary groups’, In:
Kramer, R.M., Tyler, T.R. (Eds.), Trust in Organizations: Frontiers of Theory and
Research, Thousand Oaks, CA, Sage Publications, pp. 166–195.
Micheal, J. (1997) ‘A conceptual framework for aligning managerial behaviors with cultural
work values’ International Journal of Commerce and Management, 7 (3-4) pp. 81–
101.
Middle East Internet Usage and Population Statistics, (2007). Available at:
http://www.Internet worldstats.com/stats5.htm#me [Accessed on 26 March 2007].
Miles, M. B. and Huberman, A. M. (1994) Qualitative data analysis: an expanded
sourcebook. Thousand Okas, Calif.; London, Saga.
REFERENCE
P a g e | 327
Mishra, A.K., Kramer, R. and Tyler, T., (1996) ‘Organizational Responses to Crisis: The
Centrality of Trust’, Trust in Organizations: Frontiers of Theory and Research.
Monsuwe, T. P., Dellaert, B. G. C. and de Ruyter, K. R. (2004) ‘What drives consumers to
shop online? A literature review’, International Journal of Service Industry
Management, 15 (1) pp. 102-21.
Moon, J. W. and Kim, Y. G. (2001) ‘Extending the TAM for a world-wide-web context’,
Information and Management, 38 (4) pp. 217-230.
Morgan, D. (1998) ‘Practical Strategies for Combining Qualitative and Quantitative Methods:
Application to Health Research’, Qualitative Health Research, 8(3) pp. 362-376.
Morgan, R. M. and Hunt, S. D. (1994) ‘The Commitment-Trust Theory of Relationship
Marketing’ Journal of Marketing, 58 (3) pp. 20-38.
Morris, M. G. and V. Venkatesh (2000) ‘Age Differences in Technology Adoption Decisions:
Implications for a Changing Work Force,’ Personnel Psychology, 53(2) pp.375-403.
Morris, M., Venkatesh, V. and Ackerman, P. (2005) Gender and Age Differences in
Employee Decisions about New Technology: An Extension to the Theory of Planned
Behavior. IEEE Transactions on Engineering Management, 52 (1) pp. 69 84.
Mukund, A. (2003) The Customer Relationship Management Champion. Hyderabad,
ICFAI Centre for Management Research.
Muller, S. (2002) Post-Socialist Organisational Transformation. A Retro-Perspective of a
Unique Decade of Change: A Regional Study in East Germany, PhD Thesis,
Brunel University
Myers, M.D. and Avison, D. (2002) ‘An introduction to qualitative research in information
systems’ In: Qualitative Research in Information Systems: A Reader, Myers,
M.D. and Avison, D. (eds.), pp. 3–12. Sage, London, UK.
Myers, R. (1990) Classical and modern regression with applications (2nd ed). Boston, MA:
Duxbury.
Nachmias, C. and Nachmias, D. (2000) Research in Methods in the Social Sciences, (6th)
New York: Worth Publishers.
Nations Online (2008) ‘Countries of the World by Area’ [online] Available at:
http://www.nationsonline.org/oneworld/countries_by_area.htm [Accessed on 1 March
2009].
Neuman, W. L. (2000) Social Research Methods: Qualitative and Quantitative
Approaches, (4th) Boston Mass and London: Allyn and Bacon.
REFERENCE
P a g e | 328
Newell, F. (2003) Why CRM doesn't work how to win by letting customers manage the
relationship. London: Kogan Page.
Nielsen.com, (2008), ‘Consumers Have Shopped Online - Up 40% in Two Years’, Available
at: http://www.marketingcharts.com/direct/875mm-consumers-have-shopped-online-
up-40-in-two-years-3225/ [Accessed Nov 2009].
Norris, M. J. and Inc, S. (2000) SPSS 10.0 Guide to Data Analysis, Upper Saddle River,
N.J.: Prentice Hall.
Nunnally, J.C. (1978) Theory, New York: McGraw-Hill.
Nunnally, J.C. and Bernstein, I.H. (1994) Psychometric Theory, McGraw-Hill, New York
O’Cass and T. Fenech, (2003) ‘Web retailing adoption: Exploring the nature of internet users
Web retailing behaviour’, Journal of Retailing and Consumer Services, 10 pp.81–94
O’Cass, A. (2004) ‘Fashion clothing consumption: antecedents and consequences of fashion
clothing involvement’, European Journal of Marketing, 38 (7) pp. 869-82.
O’Keefe, R., O’Connor, G. and Kung, H. J. (1998) ‘Early adopters of the Web as a retail
medium: small company winners and losers’, European Journal of Marketing, 32
(7/8) pp. 629-643.
Okaz Newspaper, Saudi Arabia. ‘New e-commerce projects.’ Available at:
http://www.okaz.com.sa/okaz/osf/20070114/con2007011478622.htm [Accessed on
Jan 14, 2007].
Okaz Newspaper, Saudi Arabia. ‘First e-mall in Saudi Arabia.’ Available at:
http://www.okaz.com.sa/new/Issues/20100506/Con20100506348653.htm [Accessed
on Aug 7, 2010].
Oliver, R. L. (1980) ‘A Cognitive Model for the Antecedents and Consequences of
Satisfaction’, Journal of Marketing Research, 17 pp. 460-469.
Oliver, R. L. (1981) ‘Measurement and Evaluation of Satisfaction Processes in Retail
Settings’, Journal of Retailing, 57 (3) pp. 25-48.
Oliver, R. L. (1993) ‘Cognitive, Affective, and Attribute Bases of the Satisfaction Response’,
Journal of Consumer Research, CRM Forum, 20 pp. 418-430.
Oliver, R. L. (1996) Satisfaction: A Behavioral Perspective on the Consumer. McGraw-
Hill, New York.
Oliver, R. L. (1999) ‘Whence consumer loyalty?’, Journal of Marketing, 63, pp. 33-44.
REFERENCE
P a g e | 329
Oliver, R. L. and Linda, G. (1981) ‘Effect of Satisfaction and Its Antecedents on Consumer
Preference and Intention’ in Advances in Consumer Research (8), K. B. Monroe (ed.),
Association for Consumer Research, Ann Arbor, MI: pp. 88-93.
Olshavsky, Richard. (1985) ‘Perceived Quality in Consumer Decision-Making: An Integrated
Theoretical Perspective’, pp. 267-296 in J. Jacoby and J. Olson (ells.), Perceived
Quality. Lexington, MA: Lexington Books.
Olsson, U.H., Foss, T. and Breivik, E. (2004) ‘Two equivalent discrepancy functions for
maximum likelihood estimation: Do their test statistics follow a non -central chi
square distribution under model misspecification?’ Sociological Methods & Research,
32 pp.453—500.
Olsson, U.H., Foss, T., Troye, S.V. and Howell, R.D. (2000) ‘The performance of ML, GLS,
and WLS estimation in structural equation modeling under conditions of mis-
specification and nonnormality’, Structural Equation Modeling, 7, 557–595.
Orlikowski, W. and Baroudi, J. (1991) ‘Studying information technology in organizations:
Research approaches and assumptions’, Information Systems Research, 2(1) pp.1–28
Otnes, C. and McGrath, M. (2001) ‘Perceptions and Realities of Male Shopping Behavior,’
Journal of Retailing, 77 (1) pp.111-137.
Ott, J.S. (1989) The organizational culture perspective. Pacific Grove, CA: Brooks/Cole.
Qureshi, I., Fang, Y., Ramsey, E., McCole, P., Ibbotson, P. and Compeau, D. (2009)
Understanding online customer repurchasing intention and the mediating role of trust–
an empirical investigation in two developed countries, European Journal of
Information Systems, 18, pp. 205-222.
Palmer, J. W., Bailey, J. P. and Faraj, S. (2000), ‘The Role of Intermediaries in the
Development of Trust in the WWW: The Use and Prominence of Trusted Third
Parties and Privacy Statements’, Journal of Computer-Mediated Communication, 51
(3). Available at: http://www.ascusc.org/jcmc/vol51issue31 palmer.html
Parahoo, K. (1997) Nursing Research: Principles, Process and Issues, Basingstoke:
Macmillan.
Park, C. and Jun, J.K. (2003) ‘A cross-cultural comparison of Internet buying behaviour:
Effects of Internet usage, perceived risks, and innovativeness’, International
Marketing Review, 20 (5) pp. 534-553.
Parsons AG. (2002) ‘Non-functional motives for online shoppers: why we click’, Journal of
Consumer Marketing, 19(5) pp. 380–92.
REFERENCE
P a g e | 330
Parsons, A. G. (2003) ‘Assessing the effectiveness of shopping mall promotions: customer
analysis’, International Journal of Retail and Distribution Management, 31(2), pp.
74-79.
Patterson, P. G., Johnson, L. W. and Spreng, R. A. (1997) ‘Modeling the Determinants of
Customer Satisfaction for Business-to-Business Professional Services’, Journal of the
Academy of Marketing Science, 25(1) pp. 4-17
Patton, M. Q. (1987) How to use Qualitative Methods in Evaluation, (2nd) Newbury Park,
Calif and London: Sage Publications.
Patton, M.Q. (2002) Qualitative Research and Evaluation Methods. Newbury Park, Calif
and London: Sage.
Pavlou, P. A. and Chai L. (2002) ‘What drives electronic commerce across cultures? A cross-
cultural empirical investigation of the theory of planned behavior’ Journal of Electronic
Commerce Research, 3(4) pp.240-253.
Pavlou, P.A. (2003) ‘Consumer acceptance of electronic commerce: integrating trust and risk
with the technology acceptance model’, International Journal Electron Commerce,
7(3) pp.101–34.
Pavlou, P.A. and Fygenson, M. (2006) ‘Understanding and predicting electronic commerce
adoption: an extension of the theory of planned behavior’, MIS Quarterly, 30 (1) pp.
115-43.
Pavlou, R.A. (2001). ‘Integrating trust in electronic commerce with the technology
acceptance model: Model development and validation’ In Proceedings of the 7th
Americas Conference on Information Systems (AMCIS 2001), Boston, M A, (816-
822).
Penn, Schoen & Berland Associates, Inc (2009) ‘Is Online Shopping Affected by a
Recession?’ available at http://ezinearticles.com/?Is-Online-Shopping-Affected-by-a-
Recession?&id=2684936. [Accessed on 26 November 2009].
Penn, Schoen & Berland Associates, Inc (2009) ‘New Info Shoppers’ Available at:
http://www.psbresearch.com/ [Accessed on 26 November 2009].
Persson, P. (2004). Customer Relationship Management: How a CRM system can be used in
the sales process. Department of Business Administration and Social Science.
Stockholm, Lulea University of Technology, Master's thesis. Available at
http://epubl.luth.se/1402-1617/2004/124/LTU-EX-04124-SE.pdf
Peter, J. and Olson, J., (2005), Customer behaviour and marketing strategy, New York:
Irwin
REFERENCE
P a g e | 331
Peterson, R. A., Balasubramanian, S, and Bronnenberg, B. J. (1997) ‘Exploring the
implications of the Internet for consumer marketing’, Journal of the Academy of
Marketing Science, 25 (4) pp. 329-46
Petrissans, A. (1999) ‘Customer Relationship Management: The changing economics of
customer relationship’, IDC and Gap Gemini, white paper.
Petska, K. (2002) Computer Industry Almanac, 8th edn Buffalo Grove, IL: Computer
Industry Almanac, Inc.
Phau, I. and Poon, S.M. (2000) ‘Factors influencing the types of products and services
purchased over the Internet’, Internet Research: Electronic Networking Applications
and Policy, 10(2), 102-113.
Pinsonneault, A. and Kraemer, K. L. (1993) ‘Survey research methodology in management
information systems: An assessment’, Journal of Management Information System, 10
(2) pp. 75-106.
Png, I.P., Tan, B.C.Y. and Wee, K. (2001) ‘Dimensions of National Culture and Corporate
Adoption of IT Infrastructure’ IEEE Transactions on Engineering Management, 48
pp. 36-45.
Porter C. S, Donthu, N. (2006) ‘Using the Technology Acceptance Model to explain how
attitudes determine Internet usage: The role of perceived access barriers and
demographics’, Journal of Business Research, 59(9) pp. 999-1007.
Premkumar G., Ramamurthy, K. and Crum M. R. (1997) ‘Determinants of EDI Adoption in
the Transportation Industry’, European Journal of Information Systems, 6 (2) pp. 107-
21.
Premkumar, G. and Bhattacherjee, A. (2008) ‘Explaining information technology usage: A
test of competing models’, Omega, 36 (1) pp. 64-75.
Quinn, F. (1996) ‘Becoming a customer-driven organisation: three key questions.’ Managing
Service Quality, 6(6) pp. 6-11.
Quinones, M.A., Ford, J.K. and Teachout, M.S. (1995) ‘The relationship between work
experience and job performance: A conceptual and meta-analytic review’, Personnel
Psychology, 48 (4) pp.887-910.
Ragin, C. C. (1987) The Comparative Method: Moving Beyond Qualitative and
Quantitative Strategies. London: University of Califonia Press.
Ragin, C. C. (2000) Fuzzy-Set Social Science. Chicago: Chicago University Press.
REFERENCE
P a g e | 332
Raijas, A.and Tuunainen, V.K. (2001) ‘Critical factors in electronic grocery shopping’,
International Review of Retail, Distribution and Consumer Research, 77(3) pp.255-
265.
Rainie L, Horrigan J. A. (2005) ‘decade of adoption: How the internet has woven itself into
American life’, Pew internet & american life project, available at:
http://www.pewinternet.org/Reports/2005/How-the-internet--has-woven-itself-into-
American-life.aspx [accessed April 2010].
Raman, K. and Wei, K., (1992) ‘The GDSS Research Project’, Computer Augmented
Teamwork: A Guided Tour, pp. 210-220.
Raman, P. (1999). Way to Create Loyalty. Kuala Lumpur: New Straits Times.
Ramaswami, S.N., Strader, T.J. and Brett, K. (2000) ‘Determinants of on-line channel use for
purchasing financial products’, International Journal of Electronic Commerce, 5(2)
pp.95-118.
Ratnasingham, P. (1998a) ‘The Importance of Trust in Electronic Commerce,’ Internet
Research: Electronic Networking Applications and Policy. 8 (4) pp 313-321.
Reached, F. F. and Teal T. (2001) The loyalty effect the hidden force behind growth,
profits, and lasting value. Boston, Mass: Harvard Business School.
Reda, S. (2000) ‘Customer relationship management’, Stores Magazine, pp. 6-33.
Reichers, A.E. and Scheidner, B. (1990) Climate and culture: An evolution of constructs, In
B. Schneider (Ed.), Organizational climate and culture (pp. 5–39). San Francisco, CA:
Jossey-Bass.
Reicheld, F. F. and Schefter, P. (2000) ‘E-Loyalty: Your Secret Weapon on the Web’,
Harvard Business Review, 78 (4) pp. 105-113.
Reichheld, F.F. (1993) ‘Loyalty-based management’, Harvard business review, 71(2), pp. 64-
73.
Remenyi, D., Williams, B., Money, A. and Swartz, E. (1998) Doing research in business
and management: an introduction to process and method. Sage Publications Ltd.
Rempel, J. K., J. G. Holmes, M. P. Zanna. (1985) ‘Trust in close relationships’, Journal of
personality and social psychology, 49(1) pp. 95–112
Rensvold, R.B. and Cheung, G.W. (1998) ‘Testing measurement models for factorial
invariance: a systematic approach’, Educational and Psychological Measurement, 58
(6) pp.1017–1034.
REFERENCE
P a g e | 333
Ricard, L., Préfontaine, L.and Sioufi, M. (2001) ‘New technologies and their impact on
French consumer behaviour: an investigation in the banking sector’, International
Journal of Bank Marketing, 19 (7) pp.299-311.
Richardson J. (2005) ‘Design and conduct a survey’, Complementary Therapies in Medicine,
13 pp. 47–53
Riege, A.M. (2003) ‘Validity and reliability tests in case study research: a literature review
with'hands-on' applications for each research phase’, Qualitative Market Research:
An International Journal, 6 (2) pp.75-86.
Rigby, D. K., Reichheld, F. F., and Schefter P. (2002) ‘Avoid the four perils of CRM’,
Harvard Business Review, 80 (2) pp.101-109.
Ring, P. S., A. H. Van de Ven. (1994) ‘Developmental processes of cooperative
interorganizational relationships’, Academy of management review, 19(1) pp. 90-118
Ritchie, J. and Lewis, J. (2003) Qualitative Research Practice: A Guide for Social Science
Students and Researches, London: Sage Publications.
Riyadh Exhibitions Co. Ltd (1997) The 6th International Information Technology Exhibition
for Saudi Arabia Available at: www.recexpo.com, [Accessed on 19 March 2007].
Robey, D. (1979) ‘User attitudes and management information systems use’, Academy of
Management Journal, 22 pp. 527–538
Robson, C. (1993) Real world research; a resource for social scientists and practitioner
researchers. Oxford: Blackwell.
Rogers, E. M. (1995) Diffusion of Innovations (4th ed.), New York: Free Press.
Roger, S., and Victor, J. (2006) Data collection and analysis, SAGE Pulications, London.
Rose, G., and Straub, D. W. (1998) ‘Predicting General IT Use: Applying TAM to the Arabic
World’, Journal of Global Information Management, 6 (3) pp. 39-46.
Rosenthal, R. and DePaulo, B. M. (1979) ‘Sex differences in accommodation in nonverbal
communication’ In R. Rosenthal (Ed.), Skill in Nonverbal Communication: Individual
Differences, Cambridge, MA: Oelgeschlager, Gunn and Hain Publishers, Inc. pp. 68–
103
Rotter, J. B. (1967) ‘A new scale for the measurement of interpersonal trust’, Journal of
Personality, 35, pp. 651-665
Rotter, J. B. (1971) ‘Generalized expectancies for inter-personal trust’, American
Psychologist, 26, pp. 443-452.
REFERENCE
P a g e | 334
Rousseau, D.M., Sitkin, S.B., Burt, R.S. and Camerer, C. (1998) ‘Not so different after all: A
cross-discipline view of trust’, Academy of Management Review, 23(3), pp. 393-404
Russell, J. A. (2003) ‘Core Affect and the Psychological Construction of Emotion’
Psychological Review, 110 (1) pp. 145-172
Rust, R.T. and Oliver, R.L., (2000), ‘Should We Delight the Customer?’ Journal of the
Academy of Marketing Science, 28(1), pp. 86-94.
Ruyter, K.D., Wetzels, M. and Kleijnen, M. (2001) ‘Customer adoption of e-service: An
experimental study’, International Journal of Service Industry Management, 72(2)
184-207.Sale, J., Lohfeld, L., and Brazil, K. (2002) ‘Revisiting the Quantitative-
Qualitative Debate: Implications for Mixed-Methods Research’, Quality and
Quantity, 36(1) pp. 43-53.
Salisbury, W.D., Pearson, R.A., Pearson, A.W. and Miller, D.W. (2000) ‘Perceived security
and world wide web purchase intention’, Industrial Management & Data Systems,
101 (4) pp.165-76
Sarantakos, S. (2005) Social Research, 3rd edition, Melbourne Australia; MacMillan, pp.115
Saudi Aramco World ‘The Search Began In 1933’ Available at:
http://www.saudiaramcoworld.com/issue/196302/the.search.began.in.1933.htm
[Accessed on Mar 14, 2010].
Saudi Telecommunication, STC, (2009), ‘Infrastructure and Capabilities, STC has implemented a
large core and access fixed network covering the entire kingdom of Saudi Arabia’, Saudi
Arabia: Available at: http://www.alriyadh.com/2006/08/27/article182047.html
http://www.stc.com.sa/cws/portal/en/business/bus-wholesale/stc-lnd-whlslr-
news_and_acti/stc-lnd-whlslr-infcap, [Accessed on 24 December 2009].
Saunders, M., Lewis, P. and Thornhil, A. (1997) Research Methods for Business Students.
London: Pitman Publishing.
Saunders, M., Thornhill, A. and Lewis, P. (2009) Research methods for business students.
London: Financial Times/Prentice Hall
Schoenbachler, D.D. and Gordon, G.L. (2002) ‘Multi-channel shopping: Understanding what
drives channel choice’, Journal of Consumer Marketing, 79 (1) pp.42-53.
Schwab, D.P. (1980) ‘Construct validity in organizational behavior’ In: Staw, B.M.,
Cummings, L.L. (Eds.), Research in organizational behavior. Greenwish, CN: JAI
Press, 2 pp. 3-43.
REFERENCE
P a g e | 335
Shankar, V., Urban, G.L. and Sultan, F., (2002) ‘Online trust: a stakeholder perspective,
concepts, implications, and future directions’, Journal of Strategic Information
Systems, 11(3-4), pp. 325–344
Shergill G. S. and Chen, Z., (2005) ‘Web-based shopping: Consumers' attitudes towards
online shopping in New Zealand’, Journal of Electronic Commerce Research, 6(2),
pp.78-92.
Sheppared, B., Hartwick, J., and Warshaw, P. (1988) ‘The theory of reasoned action: A Meta
analysis of past research with recommendations for modification and future research’,
Journal of Consumer Research, 15(3), pp. 325-343.
Sheth, J.N.and Parvatiyar, A. (1995) ‘Relationship marketing in consumer markets:
antecedents and consequences’, Journal of the Academy of Marketing Science, 23 (4)
pp.255-69.
Shield, R. (2002) Diamond Stories. Ithaca, NY: Cornell University Press.
Shih, Y. Y. and Fang, K. (2004) ‘The use of decomposed theory of planned behaviour to
study internet Banking in Taiwan’, Internet Reseach, 14 (3) pp. 213-223.
Shim S., Eastlick M. A., Lotz S. L. and Warrington, P. (2001) ‘An online prepurchase
intentions model: the role of intention to search’, Journal of Retailing, 77 pp.397-416.
Shop.org and Boston Consulting Group (2000) ‘State of Online Retailing 3.0’, Washington,
D. C.: National Retail Federation. Available at:http://www.shop.org.
Shop.org, (2001) ‘Shop.org Press Room’, Washington, D. C.: National Retail Federation.
[Available at: http://.shop.org].
Shun, C. and Yunjie, X. (2006) ‘Effects of outcome, process and shopping enjoyment on
online consumer behaviour’, Electronic Commerce Research and Applications, 5 (4)
pp.272–281.
Simon, S.J. and Peppas, S.C (2005) ‘Attitudes towards product website design: a study of the
effects of gender’, Journal of Marketing Communications, 11 (2) pp. 129-144.
Sirdeshmukh, D., Singh, J. and Sabol, B., (2002), ‘Consumer Trust, Value, and Loyalty in
Relational Exchanges’. Journal of Marketing, 66(1), pp. 15-37.
Snoj B., Korda A.P. and Mumel D., (2004), ‘The relationships among perceived quality,
perceived risk and perceived product value’, Journal of Product and Brand
Management, 13(3), pp. 156-167.
So, M. W. C., Wong, T. N., and Sculli, S. D. (2005). ‘Factors affecting intentions to purchase
via the internet’, Industrial Management & Data Systems, 105 (9) pp.1225-1244
REFERENCE
P a g e | 336
Sohn, C. (1999) ‘The properties of Internetbased markets and customers' behavior’ In
Proceedings of the 5th Americas Conference on Information Systems (AMCIS
1999), Milwaukee, Wisconsin.
Sohn, S. Y. and Lee, J. S. (2006) ‘Cost of ownership model for a CRM system’, Science of
Computer Programming, 60(1) pp.68.
Song, J. and Zahedi, P.M. (2001) ‘Web design in e-commerce: A theory and empirical
analysis’ In Proceedings of the 22nd International Conference of Information
Systems (ICIS 2001), New Orleans, Louisiana, pp. 205-220.
Spector, P.E., Cooper, C.L. and Sparks, K., (2001) ‘An International Study of the
Psychometric Properties of the Hofstede Values Survey Module 1994: A Comparison
of Individual and Country/Province Level Results’, An International Review, 50(2),
pp. 269-281.
Spero, I. and Stone, M. (2004) ‘Agents of change: How young consumers are changing the
world of marketing’, Qualitative Market Research: An International Journal, 7 (2)
pp.153-159.
Spreng, R. A., MacKenzie, S. B. and Olshavsky, R. W. (1996) ‘A Reexamination of the
Determinants of Consumer Satisfaction’, Journal of Marketing, 60 pp. 15-32.
Srinivasan, S., Anderson, R. and Ponnavolu (2002) ‘Customer loyalty in e-commerce: an
exploration of its antecedents and consequences’, Journal of Retailing, 78(1), pp. 41-
50.
Stafford, T.F., Turan, A. and Raisinghani, M.S. (2004) ‘International and cross-cultural
influences on online shopping behaviour’, Journal of Global Information
Management, 7(2) pp. 70-87, 2004
Starkey, M. and N. Woodcock (2002) ‘CRM systems: Necessary, but not sufficient. REAP
the benefits of customer management’, The Journal of Database Marketing, 9 (3) pp.
267-275.
Statistics Denmark (2007) Available at:
www.dst.dk/Statistik/Nyt/Emneopdelt/nytsingle.aspx?countid¼12005 [Accessed on 2
February 2008].
Steadman, L.B.and Palmer, C.T. (1995) ‘Religion as an identifiable traditional behavior subject
to natural selection’, Journal of Social and Evolutionary Systems, 18 pp.149-164.
Steenkamp, J., and Baumgartner, H., (1998) ‘Assessing Measurement Invariance in Cross-
Cultural Research’, Journal of Consumer Research, 25, pp. 78-79.
REFERENCE
P a g e | 337
Stefanou, C. J., Sarmaniotis, C., Stafyla, A. (2003) ‘CRM and customer-centric knowledge
management: an empirical research’, Business Process Management Journal, 9 (5)
pp. 617-634.
Sterne, J. (1996) Customer Service on the Internet: Building Relationships, Increasing
Loyalty, and Staying Competitive. New York, NY: John Wiley and Sons.
Stewart, D. W, and Zhao, Q. (2000) ‘Internet marketing, business models, and public policy’,
J Public Policy Mark, 19 (2) pp. 287–96.
Stewart, K. J. (1999) ‘Transference as a means of building trust in World Wide Web sites’ P.
De and J. I. DeGross, eds. In Proceedings of the 20th International Conference on
Information Systems, December, Charlotte, NC. pp. 459–464.
Storbacka, K., Strandvik, T., Grönroos, C. (1994) ‘Managing Customer Relationships for
Profit: The Dynamics of Relationship Quality’, International Journal of Service
Industry Management, 5 (5) pp. 21-38.
Straub, D. W, Gefen, D, Boudreau, M. C. (2005) ‘Quantitative Research’ .In Research in
Information Systems: A Handbook for Research Supervisors and Their
Students. Avison, D. and Pries-Heje, J. (Ed.), Amsterdam: Elsevier.
Straub, D. W. and Watson, R. T. (2001) ‘Research commentary: transformational issues in
researching IS and net-enabled organizations’, Information Systems Research, 12 (4)
pp.337-345.
Straub, D. W., Keil, M., and Brennan, W. (1997) ‘Testing the Technology Acceptance Model
Across Cultures: A Three Country Study’, Information & Management, 33 pp. 1-11.
Straub, D., Boudreau, M. .and Gefen, D. (2004) ‘Validation guidelines for IS positivist
research’, Communications of the Association for Information Systems, 13 pp.380-
427.
Straub, D.W. (1989) ‘Validating instruments in MIS research’, MIS Quarterly 13 (2) pp.147-
169.
Straughn, R. and Albers-Miller, N. (2001) ‘An International investigation of Cultural and
Demographic Effects of Domestic Retail Loyalty’, International Marketing Review,
18 (5) pp. 521-541.
Strauss, A. and J. Corbin (1990) Basics of Qualitative Research. Sage, Newbury Park.
Subramanian, G. H. (1994) ‘A replication of perceived usefulness and perceived ease of use
measurement’, Decision Sciences, 25 (5/6) pp. 863-874.
REFERENCE
P a g e | 338
Succi, M. J. and Walter, Z. D. (1999) ‘Theory of user acceptance of information
technologies: an examination of health care professionals’, In Proceedings of the
32nd Hawaii International Conference on System Sciences (HICSS), pp. 1-7.
Suh, B. and I. Han (2003) ‘The Impact of Customer Trust and Perception of Security Control
on the Acceptance of Electronic Commerce’, International Journal of Electronic
Commerce, 7 (3) pp.135-161
Suh B, Han I. (2002) ‘Effect of trust on customer acceptance of Internet banking’, Electronic
Commerce Research and Appllications, 1(3/4) pp. 247–63.
Sultan F, Mooraj HA. (2001) ‘Designing a trust-based E-business strategy’, Marketing
Management, 10(4) pp. 40–5.
Swan, J. E. and Trawick, I. F. (1981) ‘Disconfirmation of Expectations and Satisfaction with
a Retail Service’, Journal of Retailing, 57 pp. 49-67.
Swan, J.E., Bowers, M.R. and Richardson, L.D., (1999) ‘Customer trust in the salesperson:
an integrative review and meta-analysis of the empirical literature’, Journal of
Business Research, 44, pp. 93-107
Synodinos, N. E. (2001) ‘Understanding Japanese consumers: some important underlying
factors’, Japanese Psychological Research, 43(4) pp. 235-248.
Syodinos, N. E. (2001) ‘Understanding Japanese consumers: some important underlying
factors’, Japanese Psychological Research, 43 (4) pp.235-248.
Szajna, Bernadette (1996) ‘Empirical evaluation of the revised technology acceptance
model’, Management Science, 42(1) pp. 85–92.
T.F. Stafford, Turan, A. and Raisinghani, M.S. (2004) ‘International and Cross-Cultural
Influences on Online Shopping Behavior’, Journal of Global Information Technology
Management, 7 (2) pp.70.
Tabachnick, B. and Fidell, L. (2007) Using Multivariate Statistics (5th ed.). Boston: Allyn
and Bacon.
Takada, H. and Jain, D. (1991) ‘Cross-national analysis of diffusion of consumer durable
goods in Pacific Rim countries’, Journal of Marketing, 55 pp. 48–54.
Tan, Y-H., and Thoen, W., (2001) ‘Toward a generic model of Trust for electronic
commerce’ International Journal of Electronic Commerce, 5(2) pp. 61-74.
Taylor, S., and Todd, P. A. (1995) ‘Understanding Information Technology Usage: A Test of
Competing Models’, Information Systems Research, 6 (2) pp. 144-176.
REFERENCE
P a g e | 339
Taylor, S., and Todd, P. A. (1995) ‘assessing IT usage: the role of prior experience’, MIS
Quarter, 19(4), pp. 561-570.
Teo T. (2001) ‘Demographic and motivation variables associated with Internet usage
activities’, Internet Research, 11(2) pp. 125–37.
Teo, T. S. H. and Tan, M. (2000) ‘Factors influencing the adaption of internet banking’,
Journal of the Association for Information Systems, 1 (5) pp. 1-42.
Teo, T. S. H., Lim, V. K. G. and Lai, R. Y. C. (1999) ‘Intrinsic and extrinsic motivation in
Internet usage’, Omega, 27 (1) pp. 25-37.
The Communications and Information Technology Commission, 2009, ‘Internet Usage in the
Kingdom of Saudi Arabia’ [report] Available at:
http://www.citc.gov.sa/NR/rdonlyres/7C7FF07E-9AF6-46C9-9D16-
EFECDD5400A0/0/Internet_Usage_Study_in_KSABusiness_EstablishmentEN.pdf,
[Accessed on 6 August 2009].
The Economist Intelligence Unit (2007) ‘Saudi Arabia risk: Infrastructure risk’ March 23,
2007, Available at: http://voipservices.tmcnet.com/news/2007/03/23/107993.htm
[Accessed on 29 March 2007].
The Mosaic Group (1998) ‘The Global Diffusion of the Internet Project: An Initial Inductive
Study’, The MOSAIC Group, Fairfax, VA,
http://mosaic.unomaha.edu/GDI1998/GDI1998.html (Accessed on 2 October 2,
2007), pp. 216.
Thompson, R.L., Higgins, C.A. and Howell, J.M. (1991) ‘Personal computing: Toward a
conceptual model of utilization’, MIS Quarterly, 15 pp. 125–143.
Thong, J. Y. L., Hong, S.-J., and Tam, K. Y. (2006) ‘The effects of post-adoption beliefs on
the expectation–confirmation model for information technology continuance’,
International Journal of Human-Computer Studies, 64 (9) pp.799–810.
Tigert, D.J. (1983) ‘Pushing the hot buttons for a successful retailing strategy’, in Darden,
W.R., Lusch, R.F. (Eds), Patronage Behavior and Retail Management, North-Holland,
New York, NY, pp.89-113
Tigre, P. B. and Dedrick, J. (2004) ‘E-commerce in Brazil: local adaptation of a global
technology’, Electronic Markets, 14 (1) pp.36-47.
Tomkins, C., (2001) ‘Interdependencies, trust and information in relationships, alliances and
networks’, Accounting, Organizations and Society, 26, pp. 161–191.
REFERENCE
P a g e | 340
Totty, M. (2001) ‘Information, please: How three companies are using the web to find out
more about their customer-or to let their customers know more about them’, Wall
Street Journal, p. R6.
Tractinsky, N. (2004) ‘Toward the Study of Aesthetics in Information Technology’ In
Proceedings of 25th International Conference on Information Systems,
Washington D.C., USA, Dec. 13-16, 2004.
Tractinsky, N., Katz A.S.and Ikar, D. (2000) ‘What is beautiful is usable’, Interacting with
Computers, 13 (2) pp. 127–145.
Triandis, H.C. (1980) ‘Values, attitudes, and interpersonal behavior’, in Howe, H.E. and
Page, M.M. (Eds), Nebraska Symposium on Motivation, Lincoln, NE: University of
Nebraska Press.
Triandis, H.C. (1989) ‘Cross-Cultural Studies of Individualism and Collectivism,’ In J. Berman
(ed), Nebraska Symposium on Motivation, Lincoln, NE: University of Nebraska Press,
pp. 41-133.
Trochim, W.M.K. and Donnelly, J.P. (2001) Research methods knowledge base. Atomic
Dog Publ.
Tse, D. K. and Wilton, P. C. (1988) ‘Models of Consumer Satisfaction: An Extension’,
Journal of Marketing Research, 25 pp. 204-212
Tull, D.S. and Hawkins, D.I. (1984) Marketing Research: Measurement and Method, 3rd
ed. New York: Macmillan Publishing Co. Inc.,
Urban, G.L., Sultan, F. and Qualls, W.J. (2000) ‘Placing trust at the center of your Internet
strategy’, Sloan Management Review, 42 (1) pp. 39.
Van Amstel, P., Van der Eijk, P., Haasdijk, E. and Kuilman, D. (2000) ‘An interchange
format for cross-media personalized publishing’, Computer Networks, 33 (1-6)
pp.179-195.
Van de Vijver, F.J.R. and Harsveld, M. (1994) ‘The incomplete equivalence of the paper-
and- pencil and computerized versions of the general aptitude test battery’, Journal of
Applied Psychology, 79 pp.852-859
Van der Heijden, H. (2003) ‘Factors Influencing the Usage of Websites - the Case of a
Generic Portal in the Netherlands’, Information & Management, 40 (6) pp.541-549
Van der Heijden, H. (2004) ‘User acceptance of hedonic information systems’, MIS Quarter,
28 (4) pp. 695-703.
REFERENCE
P a g e | 341
Van der Heijden, H., Verhagen, T. and Creemers, M. (2003) ‘Understanding online purchase
intentions: contributions from technology and trust perspectives’, European Journal
of Information Systems, 12 (1) pp. 41-8.
Van der Heijden, V.D. (2000) ‘E-TAM: a revision of the technology acceptance model to
explain web site revisits’, Research Memorandum, Vrije Universiteit, Amsterdam, 29.
Van der Heijden, H., and Verhagen, T (2004) ‘Online store image: conceptual foundations
and empirical measurement’, Information and Management, 41(5), pp. 609–617.
Van Looy, B., Van Dierdonck, R., and Gemmel, P. (2003) Services Management: An
Integrated Approach, Pitman, Boston, MA
Van Slyke, C., Comunale, C. and Belanger, F. (2002) ‘Gender Differences in Perceptions of
Web Based Shopping’, Communications of ACM, 45(7) pp. 82-86.
Vellido, A., Lisboa, P.J.G. and Meehan, K. (2000) ‘Quantitative characterization and
prediction of on-line purchasing behavior: A latent variable approach’, International
Journal of Electronic Commerce, 4 (4) pp. 83-104.
Venkatesh, V. (1999) ‘Creation of favorable user perceptions: exploring the role of intrinsic
motivation’ MIS Quarterly, 23 (2) pp. 239-260.
Venkatesh, V. (2000) ‘Determinants of Perceived Ease of Use: Integrating Control, Intrinsic
Motivation, and Emotion into the Technology Acceptance Model’, Information
Systems Research, 11 (4) pp. 342-365.
Venkatesh, V. and Davis, F. (2000) ‘A Theoretical Extension of the Technology Acceptance
Model: Four Longitudinal Field Studies’, Management Science, 46 (2) pp. 186-204.
Venkatesh, V. and Morris, M. G. (2000) ‘Why don’t men ever stop to ask for directions?
Gender, social influence, and their role in technology acceptance and usage behavior’,
MIS Quarterly, 24 pp.115–139.
Venkatesh, V., Morris, M. and Ackerman, P. (2000) ‘A Longitudinal Field Investigation of
Gender Differences in Individual Technology Adoption Decision Making Processes’,
Organizational Behavior and Human Decision Processes, 83 (1) pp.33-60.
Venkatesh, V., Morris, M. G., Davis, G. B. and Davis, F. D. (2003) ‘User Acceptance of
Information Technology: Toward a Unified View’, MIS Quarterly, 27 (3) pp.425-478
Venkatesh, V., Speier, C. and Morris, M.G. (2002) ‘User Acceptance Enablers in Individual
Decision Making About Technology: Toward an Integrated Model’, Decision
Sciences, 33 (2) pp. 297.
REFERENCE
P a g e | 342
Verhoef, P. C. and Langerak, F. (2001) ‘Possible determinants of consumers’ adoption of
electronic grocery shopping in the Netherlands’, Journal of Retailing and Consumer
Services, 8 (5) pp. 275-285.
Vijayasarathy LR, Jones JM. (2000) ‘Print and Internet catalog shopping: assessing attitudes
and intentions’, Journal of Internet Research, 10(3) pp. 191–202
Vijayasarathy, L. R. (2002) ‘Product characteristics and internet shopping intentions’,
Internet Research: Electronic Networking and Policy, 12 (5) pp.411-426.
Vijayasarathy, L.R. (2004) ‘Predicting consumer intentions to use online shopping: the case
for an augmented technology acceptance model’, Information and Management, 41
(6) pp.747–762.
Wa, C.T.T., Hom, H. and Kolwoon, H.K., (2003), An Integrated Online Customer Loyalty
Model. Hong Kong Polytechnic University
Wagner, M. (2007) ‘Picture this: dynamic product imagery shrinks the gap between the
online and offline shopping experiences’ Available at:
http://www.internetretailer.com/article.asp?id=21900 [Accessed Nov 2009].
Walsham, G. (1995) ‘Interpretive case studies in IS research: nature and method’ European
Journal of Information Systems, 4 pp.74–81
Ward, M.R. and Lee, M.J. (2000) ‘Internet shopping, consumer search and product branding’
Journal of Product and Brand Management, 9 (1) pp.6-20.
Weber, M. (1958) From Max Weber: Essays in Sociology, H. Gerth and C. Wright (eds.)
New York: Oxford University Press
Webster, J. (1989) ‘Playfulness and computers at work’ Unpublished Ph.D. dissertation, New
York: New York University.
Webster, J. (1992) ‘Microcomputer playfulness: Development of a measure of workplace
implications’, MIS Quarterly, 16 (2) pp.201–226.
Whitcomb, L. L., Erdener, C. B. AND Li, C. (1998) ‘Business Ethical Values in China and
the U.S.’ Journal of Business Ethics, 17 (8) pp.839-852.
Wicks, A.C., Berman, S.L. and Jones, T.M., (1999) ‘The structure of optimal trust: moral and
strategic implications’, Academy of Management Review, 24(1), pp. 99–116
Wicks, A.C., Berman, S.L. and Jones, T.M., (1999) ‘The structure of optimal trust: moral and
strategic implications’, Academy of Management Review, 24 (1), pp. 99–116.
Williamson, A. W. (2006) ‘Colleage Students Embrace the Web’, eMarketing.com, Avaialble
at: http://www.imediaconnection.com/content/8237.asp, [Accessed April 2010].
REFERENCE
P a g e | 343
Williamson, O.E., (1993) ‘Calculativeness, trust and economic organization’, Journal of Law
and Economics, 30, pp. 131–145
Wirtz, B. W., and Lihotzky, N. (2003) ‘Customer retention management in the B2C
electronic business’, Long Range Planning 36, pp. 517–532. Wright, B. D., and
Masters, G. N. (1982) Rating Scale Analysis. Mesa Press, Chicago.
World Internet Users and Population Stats. (2007) Available at: http://www.Internet
worldstats.com/stats.htm, [Accessed on 4 April 2007].
World Internet Users and Population Stats. (2009) Available at: http://www.Internet
worldstats.com/stats.htm, [Accessed on 7 April 2010].
Wolfinbarger M, Gilly MC. (2003) ‘e-TailQ: dimesionalizing, measuring and predicting etail
quality’, Journal of Retailing, 79(3) pp.183–98.
Yamagishi, T. and Yamagishi, M. (1994) ‘Trust and commitment in the United States and
Japan’, Motivation and Emotion, 18 pp.129-166.
Yang, Z. and R. T. Peterson. (2004) ‘Customer perceived value, satisfaction, and loyalty: The
role of switching costs’, Psychology & Marketing, 21 (10) pp.799.
Yi He, Merz, M.A. and Alden, D.L. (2008) ‘Diffusion of Measurement Invariance
Assessment in Cross-National Empirical Marketing Research: Perspectives from the
Literature and a Survey of Researchers’ Journal of International Marketing, 16 (2)
pp. 64 – 83.
Yi Y. (1990) ‘A critical review of consumer satisfaction’, In: Zeithmal VA., editor. Review
of marketing, vol. 4. Chicago, IL: American Marketing Association, p. 68–123
Yi, M. Y. and Hwang, Y. (2003) ‘Predicting the Use of Web-Based Information Systems:
Self-Efficacy, Enjoyment, Learning Goal Orientation, and the Technology
Acceptance Model’, International Journal of Human-Computer Studies, 59 (4)
pp.431-449
Yin, R.K. (2003) Applications of case study research (Vol. 34). Newbury Park, CA: EUA,
Sage Publications Inc.
Yin, R.K. (2008) Case study research: Design and methods. Sage Publications, Inc.
Yoon, S. J., (2002) ‘The antecedents and consequences of trust in onlinepurchase decisions’,
Journal of Interactive Marketing, 16(2), pp. 47–63.
Young, M. and Stepankek, M. (2003) ‘CRM Strategies: Loyalty Programs That Are
Working’, Journal of Marketing Research, 28 pp. 84–96.
REFERENCE
P a g e | 344
Yousef, T. (2004) ‘Trends in online marketing in the Middle East’, Gulf Marketing Review
Magazine.
Yu, J., Ha, I., Choi, M., Rho, J. (2005). ‘Extending the TAM for a t-commerce’, Information
& Management, 42 (7) pp. 965-976.
Zeithaml, V.A., (1988) ‘Consumer perceptions of price, quality and value: a means-end
model and synthesis of evidence’, Journal of Marketing, 52, pp. 2–22.
Zikmund, W. G. (2003) Business research methods. Mason: Thomson South-Western.
Zeithaml VA, Parasuraman A, Malhotra A. (2000) ‘A conceptual framework for
understanding e-service quality: implications for future research and managerial
practice’, Working Paper No.00–115. Cambridge, MA: Marketing Science Institute;
2000.
Zucker, L. G. (1986) ‘Production of Trust: Institutional Sources of Economic Structure,
1840-1920,’ in Research in Organizational Behavior, Staw B. M. and Cummings L.
L. (eds.), Greenwich, CT: JAI Press, 8 pp.53-111.
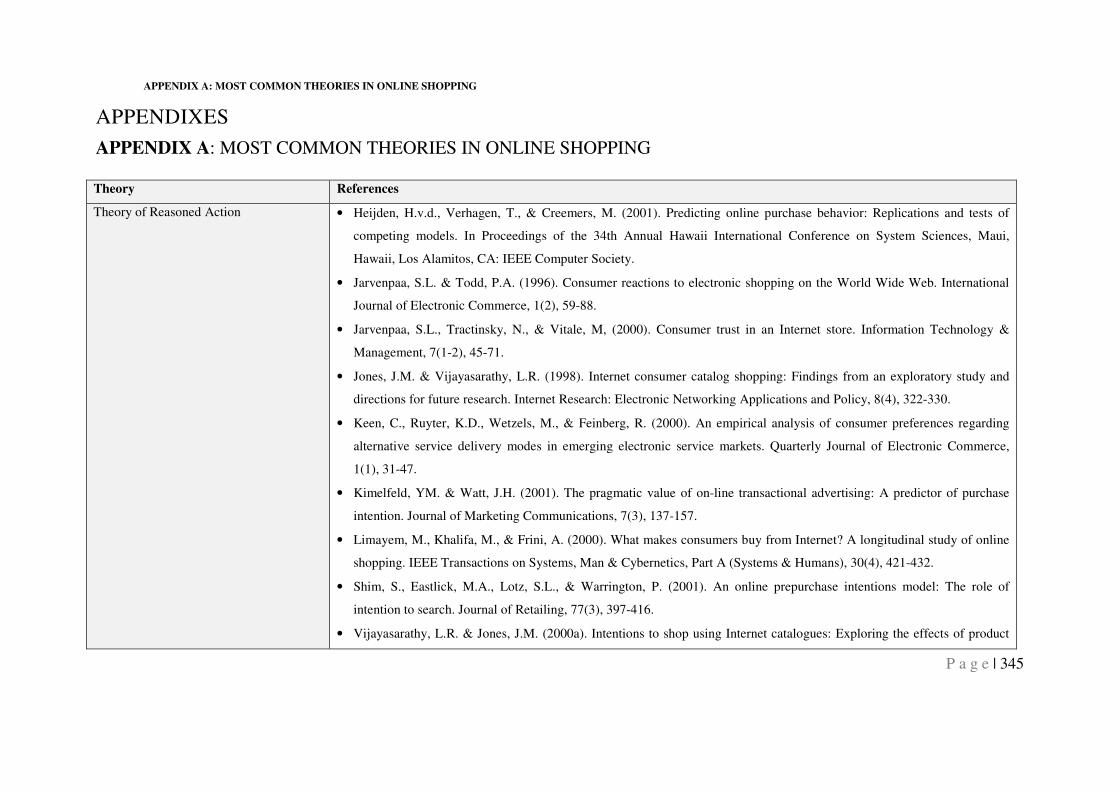
APPENDIX A: MOST COMMON THEORIES IN ONLINE SHOPPING
P a g e | 345
APPENDIXES
APPENDIX A: MOST COMMON THEORIES IN ONLINE SHOPPING
Theory References
Theory of Reasoned Action • Heijden, H.v.d., Verhagen, T., & Creemers, M. (2001). Predicting online purchase behavior: Replications and tests of
competing models. In Proceedings of the 34th Annual Hawaii International Conference on System Sciences, Maui,
Hawaii, Los Alamitos, CA: IEEE Computer Society.
• Jarvenpaa, S.L. & Todd, P.A. (1996). Consumer reactions to electronic shopping on the World Wide Web. International
Journal of Electronic Commerce, 1(2), 59-88.
• Jarvenpaa, S.L., Tractinsky, N., & Vitale, M, (2000). Consumer trust in an Internet store. Information Technology &
Management, 7(1-2), 45-71.
• Jones, J.M. & Vijayasarathy, L.R. (1998). Internet consumer catalog shopping: Findings from an exploratory study and
directions for future research. Internet Research: Electronic Networking Applications and Policy, 8(4), 322-330.
• Keen, C., Ruyter, K.D., Wetzels, M., & Feinberg, R. (2000). An empirical analysis of consumer preferences regarding
alternative service delivery modes in emerging electronic service markets. Quarterly Journal of Electronic Commerce,
1(1), 31-47.
• Kimelfeld, YM. & Watt, J.H. (2001). The pragmatic value of on-line transactional advertising: A predictor of purchase
intention. Journal of Marketing Communications, 7(3), 137-157.
• Limayem, M., Khalifa, M., & Frini, A. (2000). What makes consumers buy from Internet? A longitudinal study of online
shopping. IEEE Transactions on Systems, Man & Cybernetics, Part A (Systems & Humans), 30(4), 421-432.
• Shim, S., Eastlick, M.A., Lotz, S.L., & Warrington, P. (2001). An online prepurchase intentions model: The role of
intention to search. Journal of Retailing, 77(3), 397-416.
• Vijayasarathy, L.R. & Jones, J.M. (2000a). Intentions to shop using Internet catalogues: Exploring the effects of product
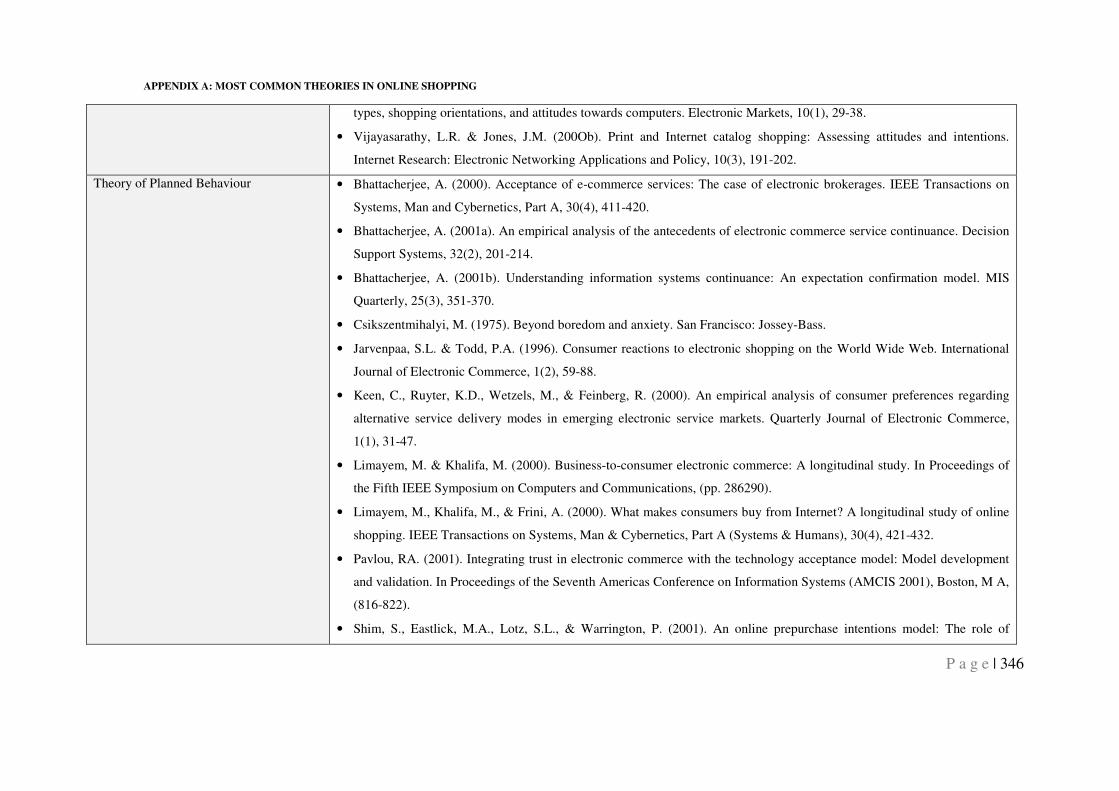
APPENDIX A: MOST COMMON THEORIES IN ONLINE SHOPPING
P a g e | 346
types, shopping orientations, and attitudes towards computers. Electronic Markets, 10(1), 29-38.
• Vijayasarathy, L.R. & Jones, J.M. (200Ob). Print and Internet catalog shopping: Assessing attitudes and intentions.
Internet Research: Electronic Networking Applications and Policy, 10(3), 191-202.
Theory of Planned Behaviour • Bhattacherjee, A. (2000). Acceptance of e-commerce services: The case of electronic brokerages. IEEE Transactions on
Systems, Man and Cybernetics, Part A, 30(4), 411-420.
• Bhattacherjee, A. (2001a). An empirical analysis of the antecedents of electronic commerce service continuance. Decision
Support Systems, 32(2), 201-214.
• Bhattacherjee, A. (2001b). Understanding information systems continuance: An expectation confirmation model. MIS
Quarterly, 25(3), 351-370.
• Csikszentmihalyi, M. (1975). Beyond boredom and anxiety. San Francisco: Jossey-Bass.
• Jarvenpaa, S.L. & Todd, P.A. (1996). Consumer reactions to electronic shopping on the World Wide Web. International
Journal of Electronic Commerce, 1(2), 59-88.
• Keen, C., Ruyter, K.D., Wetzels, M., & Feinberg, R. (2000). An empirical analysis of consumer preferences regarding
alternative service delivery modes in emerging electronic service markets. Quarterly Journal of Electronic Commerce,
1(1), 31-47.
• Limayem, M. & Khalifa, M. (2000). Business-to-consumer electronic commerce: A longitudinal study. In Proceedings of
the Fifth IEEE Symposium on Computers and Communications, (pp. 286290).
• Limayem, M., Khalifa, M., & Frini, A. (2000). What makes consumers buy from Internet? A longitudinal study of online
shopping. IEEE Transactions on Systems, Man & Cybernetics, Part A (Systems & Humans), 30(4), 421-432.
• Pavlou, RA. (2001). Integrating trust in electronic commerce with the technology acceptance model: Model development
and validation. In Proceedings of the Seventh Americas Conference on Information Systems (AMCIS 2001), Boston, M A,
(816-822).
• Shim, S., Eastlick, M.A., Lotz, S.L., & Warrington, P. (2001). An online prepurchase intentions model: The role of
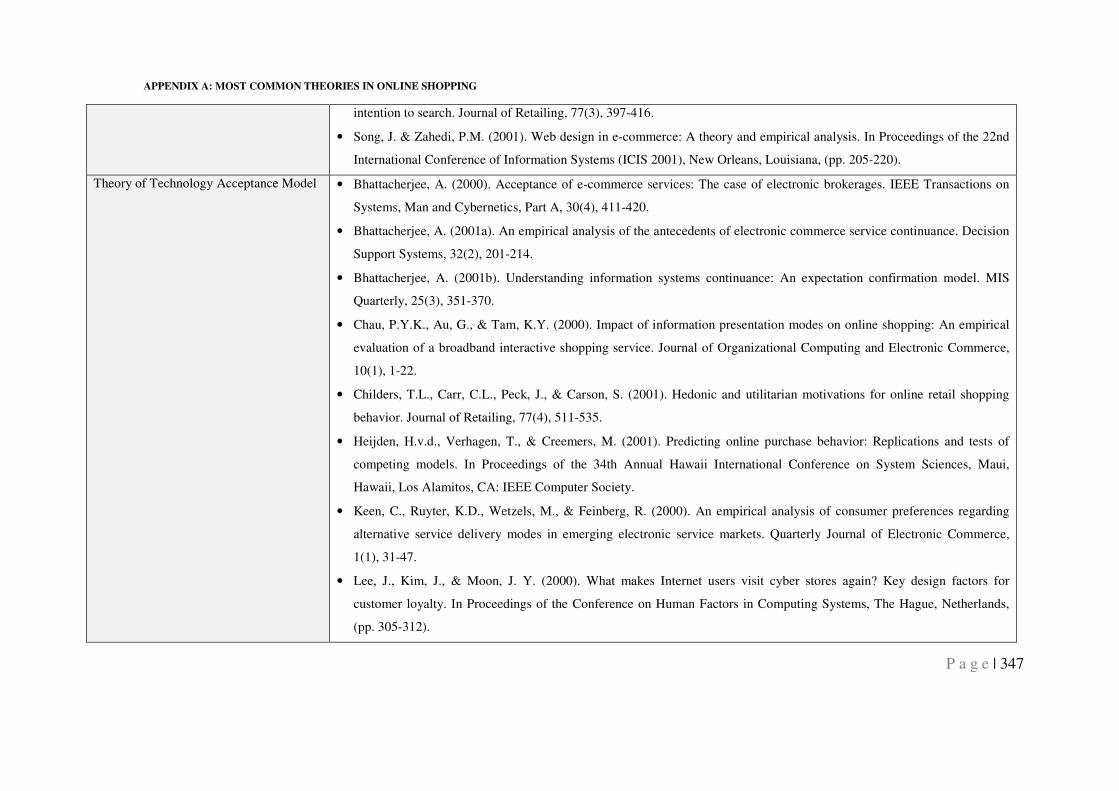
APPENDIX A: MOST COMMON THEORIES IN ONLINE SHOPPING
P a g e | 347
intention to search. Journal of Retailing, 77(3), 397-416.
• Song, J. & Zahedi, P.M. (2001). Web design in e-commerce: A theory and empirical analysis. In Proceedings of the 22nd
International Conference of Information Systems (ICIS 2001), New Orleans, Louisiana, (pp. 205-220).
Theory of Technology Acceptance Model • Bhattacherjee, A. (2000). Acceptance of e-commerce services: The case of electronic brokerages. IEEE Transactions on
Systems, Man and Cybernetics, Part A, 30(4), 411-420.
• Bhattacherjee, A. (2001a). An empirical analysis of the antecedents of electronic commerce service continuance. Decision
Support Systems, 32(2), 201-214.
• Bhattacherjee, A. (2001b). Understanding information systems continuance: An expectation confirmation model. MIS
Quarterly, 25(3), 351-370.
• Chau, P.Y.K., Au, G., & Tam, K.Y. (2000). Impact of information presentation modes on online shopping: An empirical
evaluation of a broadband interactive shopping service. Journal of Organizational Computing and Electronic Commerce,
10(1), 1-22.
• Childers, T.L., Carr, C.L., Peck, J., & Carson, S. (2001). Hedonic and utilitarian motivations for online retail shopping
behavior. Journal of Retailing, 77(4), 511-535.
• Heijden, H.v.d., Verhagen, T., & Creemers, M. (2001). Predicting online purchase behavior: Replications and tests of
competing models. In Proceedings of the 34th Annual Hawaii International Conference on System Sciences, Maui,
Hawaii, Los Alamitos, CA: IEEE Computer Society.
• Keen, C., Ruyter, K.D., Wetzels, M., & Feinberg, R. (2000). An empirical analysis of consumer preferences regarding
alternative service delivery modes in emerging electronic service markets. Quarterly Journal of Electronic Commerce,
1(1), 31-47.
• Lee, J., Kim, J., & Moon, J. Y. (2000). What makes Internet users visit cyber stores again? Key design factors for
customer loyalty. In Proceedings of the Conference on Human Factors in Computing Systems, The Hague, Netherlands,
(pp. 305-312).
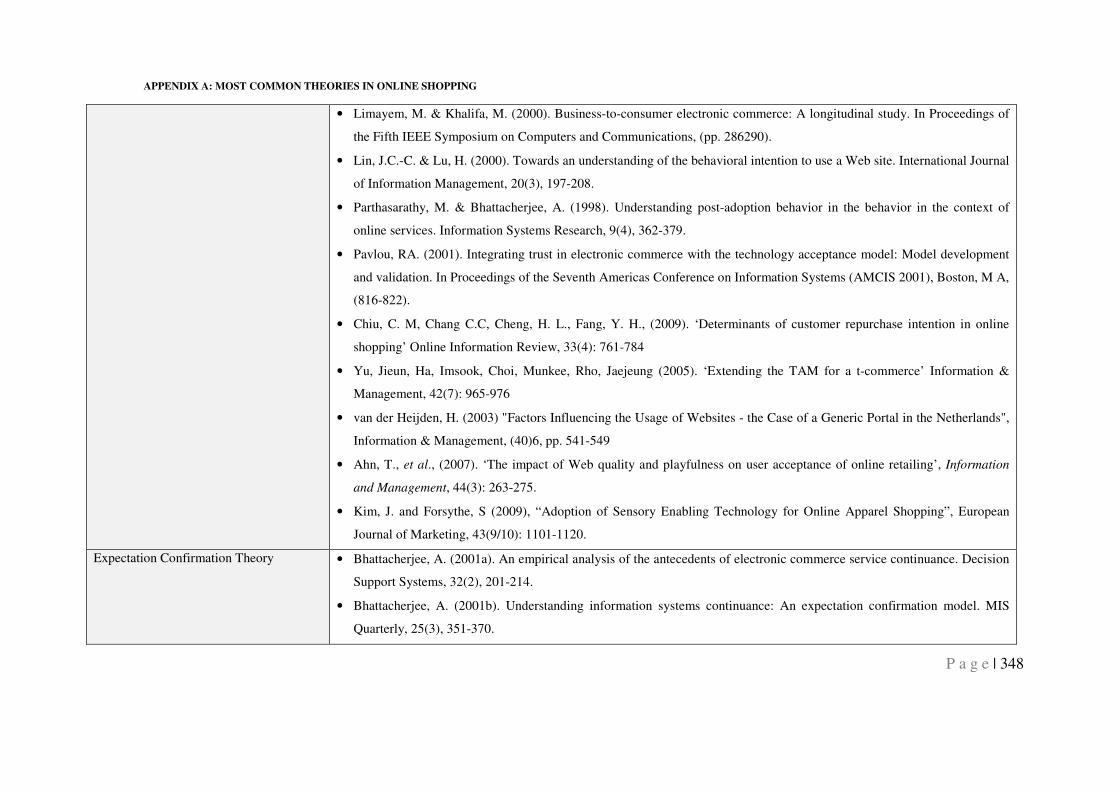
APPENDIX A: MOST COMMON THEORIES IN ONLINE SHOPPING
P a g e | 348
• Limayem, M. & Khalifa, M. (2000). Business-to-consumer electronic commerce: A longitudinal study. In Proceedings of
the Fifth IEEE Symposium on Computers and Communications, (pp. 286290).
• Lin, J.C.-C. & Lu, H. (2000). Towards an understanding of the behavioral intention to use a Web site. International Journal
of Information Management, 20(3), 197-208.
• Parthasarathy, M. & Bhattacherjee, A. (1998). Understanding post-adoption behavior in the behavior in the context of
online services. Information Systems Research, 9(4), 362-379.
• Pavlou, RA. (2001). Integrating trust in electronic commerce with the technology acceptance model: Model development
and validation. In Proceedings of the Seventh Americas Conference on Information Systems (AMCIS 2001), Boston, M A,
(816-822).
• Chiu, C. M, Chang C.C, Cheng, H. L., Fang, Y. H., (2009). ‘Determinants of customer repurchase intention in online
shopping’ Online Information Review, 33(4): 761-784
• Yu, Jieun, Ha, Imsook, Choi, Munkee, Rho, Jaejeung (2005). ‘Extending the TAM for a t-commerce’ Information &
Management, 42(7): 965-976
• van der Heijden, H. (2003) "Factors Influencing the Usage of Websites - the Case of a Generic Portal in the Netherlands",
Information & Management, (40)6, pp. 541-549
• Ahn, T., et al., (2007). ‘The impact of Web quality and playfulness on user acceptance of online retailing’, Information
and Management, 44(3): 263-275.
• Kim, J. and Forsythe, S (2009), “Adoption of Sensory Enabling Technology for Online Apparel Shopping”, European
Journal of Marketing, 43(9/10): 1101-1120.
Expectation Confirmation Theory • Bhattacherjee, A. (2001a). An empirical analysis of the antecedents of electronic commerce service continuance. Decision
Support Systems, 32(2), 201-214.
• Bhattacherjee, A. (2001b). Understanding information systems continuance: An expectation confirmation model. MIS
Quarterly, 25(3), 351-370.
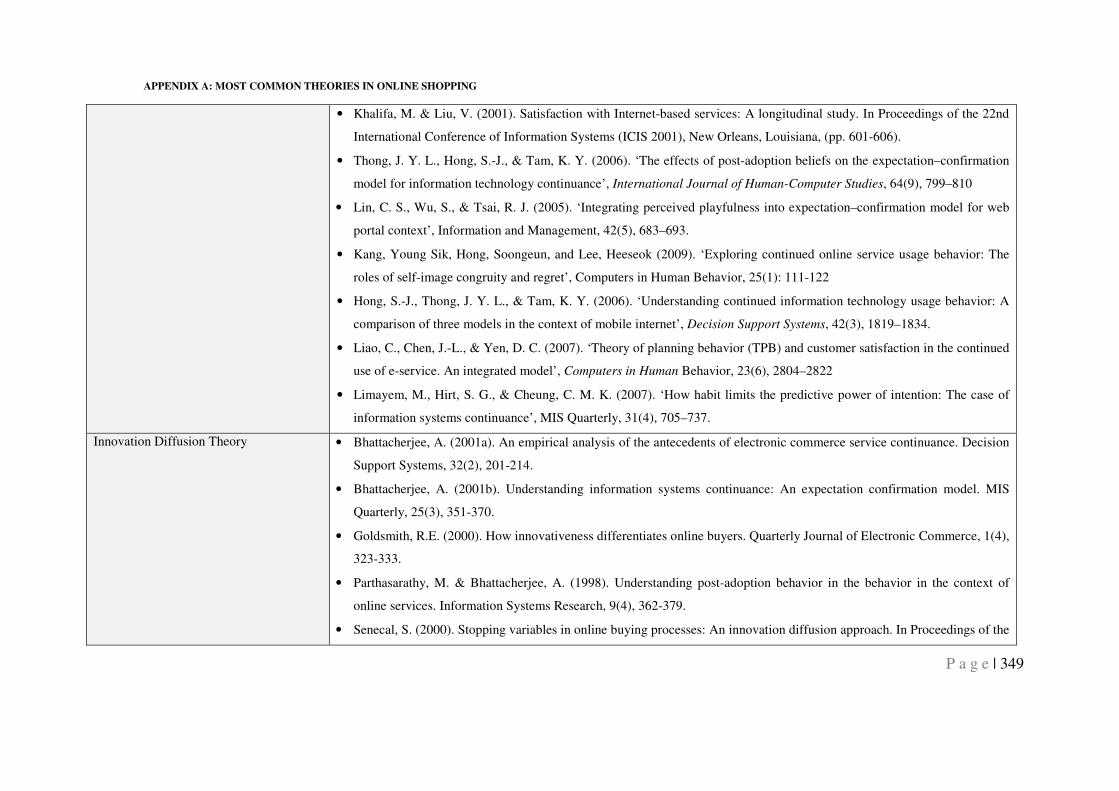
APPENDIX A: MOST COMMON THEORIES IN ONLINE SHOPPING
P a g e | 349
• Khalifa, M. & Liu, V. (2001). Satisfaction with Internet-based services: A longitudinal study. In Proceedings of the 22nd
International Conference of Information Systems (ICIS 2001), New Orleans, Louisiana, (pp. 601-606).
• Thong, J. Y. L., Hong, S.-J., & Tam, K. Y. (2006). ‘The effects of post-adoption beliefs on the expectation–confirmation
model for information technology continuance’, International Journal of Human-Computer Studies, 64(9), 799–810
• Lin, C. S., Wu, S., & Tsai, R. J. (2005). ‘Integrating perceived playfulness into expectation–confirmation model for web
portal context’, Information and Management, 42(5), 683–693.
• Kang, Young Sik, Hong, Soongeun, and Lee, Heeseok (2009). ‘Exploring continued online service usage behavior: The
roles of self-image congruity and regret’, Computers in Human Behavior, 25(1): 111-122
• Hong, S.-J., Thong, J. Y. L., & Tam, K. Y. (2006). ‘Understanding continued information technology usage behavior: A
comparison of three models in the context of mobile internet’, Decision Support Systems, 42(3), 1819–1834.
• Liao, C., Chen, J.-L., & Yen, D. C. (2007). ‘Theory of planning behavior (TPB) and customer satisfaction in the continued
use of e-service. An integrated model’, Computers in Human Behavior, 23(6), 2804–2822
• Limayem, M., Hirt, S. G., & Cheung, C. M. K. (2007). ‘How habit limits the predictive power of intention: The case of
information systems continuance’, MIS Quarterly, 31(4), 705–737.
Innovation Diffusion Theory • Bhattacherjee, A. (2001a). An empirical analysis of the antecedents of electronic commerce service continuance. Decision
Support Systems, 32(2), 201-214.
• Bhattacherjee, A. (2001b). Understanding information systems continuance: An expectation confirmation model. MIS
Quarterly, 25(3), 351-370.
• Goldsmith, R.E. (2000). How innovativeness differentiates online buyers. Quarterly Journal of Electronic Commerce, 1(4),
323-333.
• Parthasarathy, M. & Bhattacherjee, A. (1998). Understanding post-adoption behavior in the behavior in the context of
online services. Information Systems Research, 9(4), 362-379.
• Senecal, S. (2000). Stopping variables in online buying processes: An innovation diffusion approach. In Proceedings of the
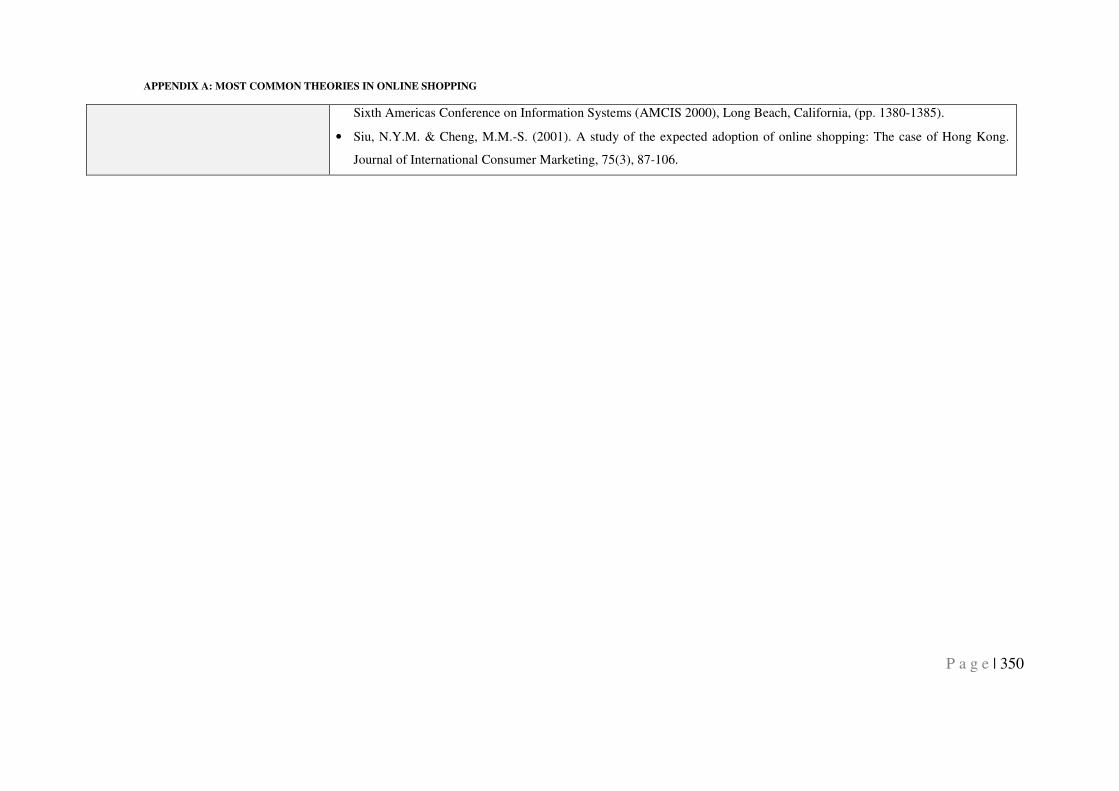
APPENDIX A: MOST COMMON THEORIES IN ONLINE SHOPPING
P a g e | 350
Sixth Americas Conference on Information Systems (AMCIS 2000), Long Beach, California, (pp. 1380-1385).
• Siu, N.Y.M. & Cheng, M.M.-S. (2001). A study of the expected adoption of online shopping: The case of Hong Kong.
Journal of International Consumer Marketing, 75(3), 87-106.
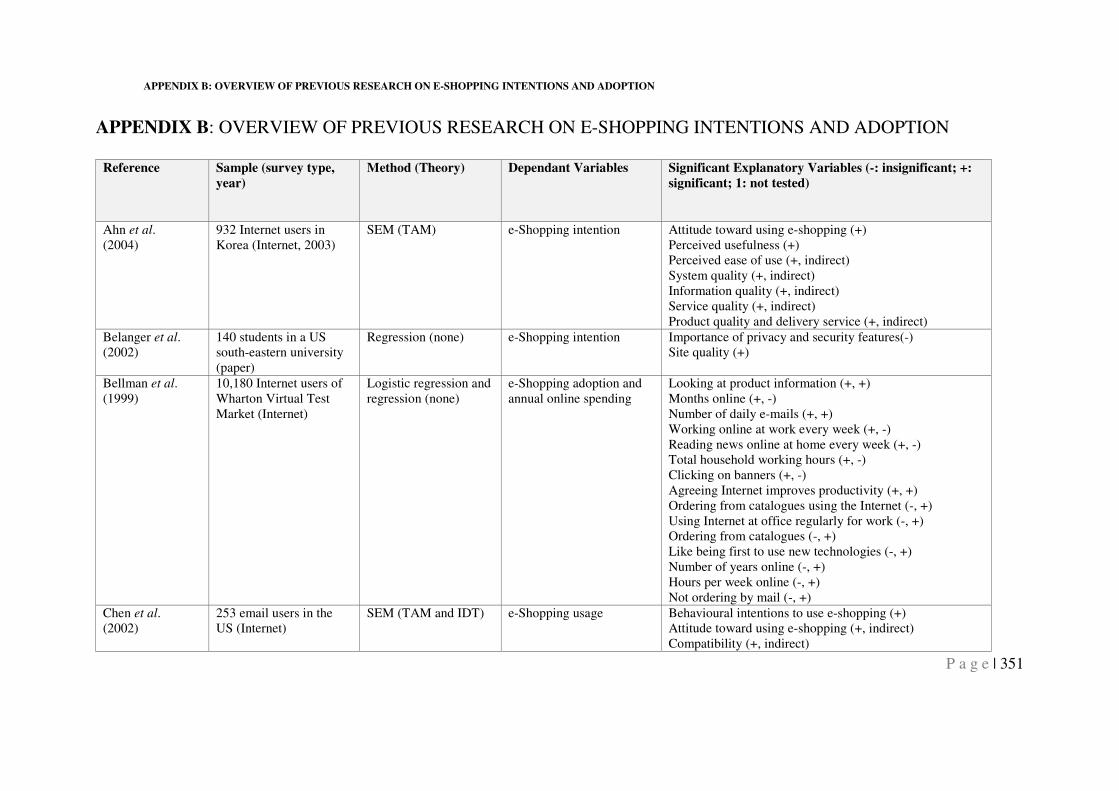
APPENDIX B: OVERVIEW OF PREVIOUS RESEARCH ON E-SHOPPING INTENTIONS AND ADOPTION
P a g e | 351
APPENDIX B: OVERVIEW OF PREVIOUS RESEARCH ON E-SHOPPING INTENTIONS AND ADOPTION
Reference Sample (survey type,
year)
Method (Theory) Dependant Variables Significant Explanatory Variables (-: insignificant; +:
significant; 1: not tested)
Ahn et al. (2004)
932 Internet users in Korea (Internet, 2003)
SEM (TAM) e-Shopping intention Attitude toward using e-shopping (+) Perceived usefulness (+) Perceived ease of use (+, indirect) System quality (+, indirect) Information quality (+, indirect) Service quality (+, indirect) Product quality and delivery service (+, indirect)
Belanger et al. (2002)
140 students in a US south-eastern university (paper)
Regression (none) e-Shopping intention Importance of privacy and security features(-) Site quality (+)
Bellman et al. (1999)
10,180 Internet users of Wharton Virtual Test Market (Internet)
Logistic regression and regression (none)
e-Shopping adoption and annual online spending
Looking at product information (+, +) Months online (+, -) Number of daily e-mails (+, +) Working online at work every week (+, -) Reading news online at home every week (+, -) Total household working hours (+, -) Clicking on banners (+, -) Agreeing Internet improves productivity (+, +) Ordering from catalogues using the Internet (-, +) Using Internet at office regularly for work (-, +) Ordering from catalogues (-, +) Like being first to use new technologies (-, +) Number of years online (-, +) Hours per week online (-, +) Not ordering by mail (-, +)
Chen et al. (2002)
253 email users in the US (Internet)
SEM (TAM and IDT) e-Shopping usage Behavioural intentions to use e-shopping (+) Attitude toward using e-shopping (+, indirect) Compatibility (+, indirect)
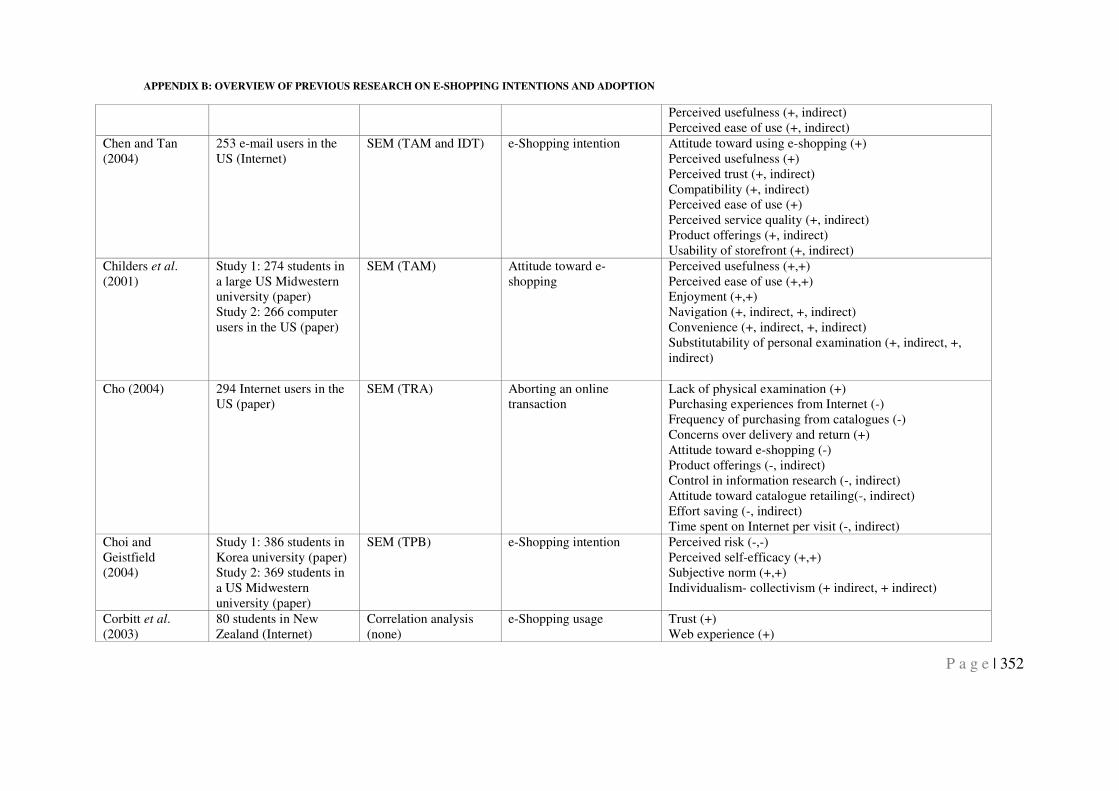
APPENDIX B: OVERVIEW OF PREVIOUS RESEARCH ON E-SHOPPING INTENTIONS AND ADOPTION
P a g e | 352
Perceived usefulness (+, indirect) Perceived ease of use (+, indirect)
Chen and Tan (2004)
253 e-mail users in the US (Internet)
SEM (TAM and IDT) e-Shopping intention Attitude toward using e-shopping (+) Perceived usefulness (+) Perceived trust (+, indirect) Compatibility (+, indirect) Perceived ease of use (+) Perceived service quality (+, indirect) Product offerings (+, indirect) Usability of storefront (+, indirect)
Childers et al. (2001)
Study 1: 274 students in a large US Midwestern university (paper) Study 2: 266 computer users in the US (paper)
SEM (TAM) Attitude toward e-shopping
Perceived usefulness (+,+) Perceived ease of use (+,+) Enjoyment (+,+) Navigation (+, indirect, +, indirect) Convenience (+, indirect, +, indirect) Substitutability of personal examination (+, indirect, +, indirect)
Cho (2004) 294 Internet users in the US (paper)
SEM (TRA) Aborting an online transaction
Lack of physical examination (+) Purchasing experiences from Internet (-) Frequency of purchasing from catalogues (-) Concerns over delivery and return (+) Attitude toward e-shopping (-) Product offerings (-, indirect) Control in information research (-, indirect) Attitude toward catalogue retailing(-, indirect) Effort saving (-, indirect) Time spent on Internet per visit (-, indirect)
Choi and Geistfield (2004)
Study 1: 386 students in Korea university (paper) Study 2: 369 students in a US Midwestern university (paper)
SEM (TPB) e-Shopping intention Perceived risk (-,-) Perceived self-efficacy (+,+) Subjective norm (+,+) Individualism- collectivism (+ indirect, + indirect)
Corbitt et al. (2003)
80 students in New Zealand (Internet)
Correlation analysis (none)
e-Shopping usage Trust (+) Web experience (+)
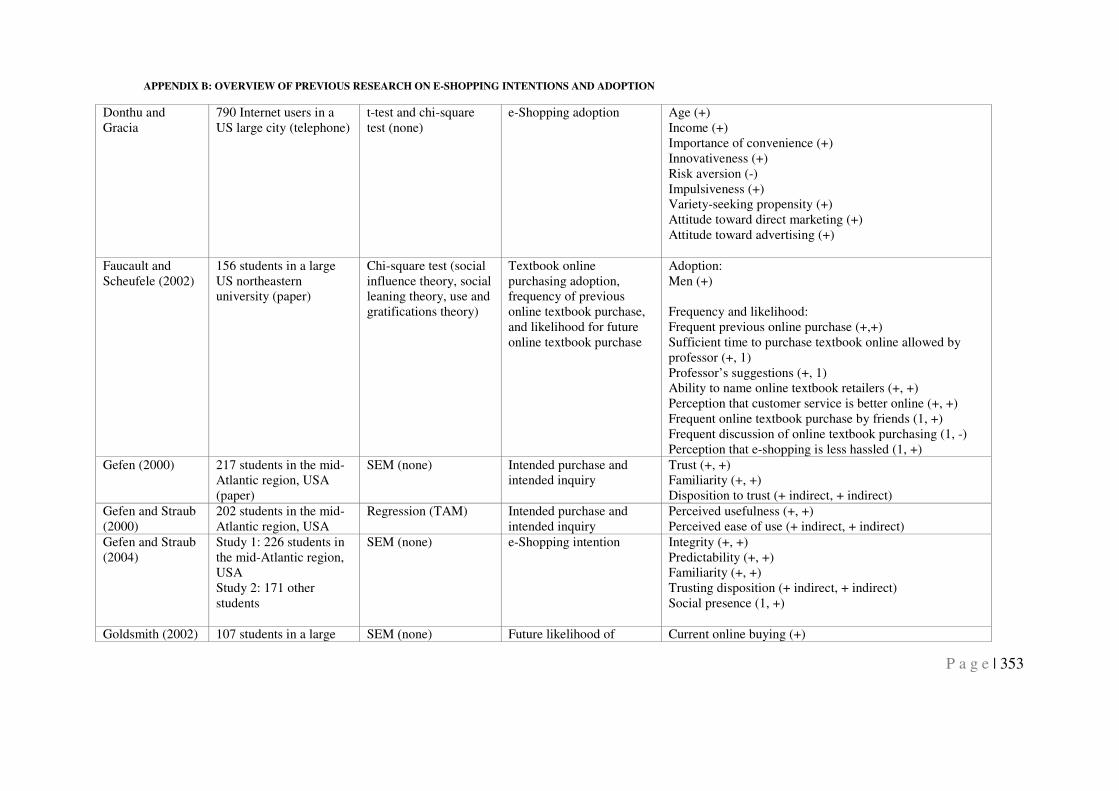
APPENDIX B: OVERVIEW OF PREVIOUS RESEARCH ON E-SHOPPING INTENTIONS AND ADOPTION
P a g e | 353
Donthu and Gracia
790 Internet users in a US large city (telephone)
t-test and chi-square test (none)
e-Shopping adoption Age (+) Income (+) Importance of convenience (+) Innovativeness (+) Risk aversion (-) Impulsiveness (+) Variety-seeking propensity (+) Attitude toward direct marketing (+) Attitude toward advertising (+)
Faucault and Scheufele (2002)
156 students in a large US northeastern university (paper)
Chi-square test (social influence theory, social leaning theory, use and gratifications theory)
Textbook online purchasing adoption, frequency of previous online textbook purchase, and likelihood for future online textbook purchase
Adoption: Men (+) Frequency and likelihood: Frequent previous online purchase (+,+) Sufficient time to purchase textbook online allowed by professor (+, 1) Professor’s suggestions (+, 1) Ability to name online textbook retailers (+, +) Perception that customer service is better online (+, +) Frequent online textbook purchase by friends (1, +) Frequent discussion of online textbook purchasing (1, -) Perception that e-shopping is less hassled (1, +)
Gefen (2000) 217 students in the mid-Atlantic region, USA (paper)
SEM (none) Intended purchase and intended inquiry
Trust (+, +) Familiarity (+, +) Disposition to trust (+ indirect, + indirect)
Gefen and Straub (2000)
202 students in the mid- Atlantic region, USA
Regression (TAM) Intended purchase and intended inquiry
Perceived usefulness (+, +) Perceived ease of use (+ indirect, + indirect)
Gefen and Straub (2004)
Study 1: 226 students in the mid-Atlantic region, USA Study 2: 171 other students
SEM (none) e-Shopping intention Integrity (+, +) Predictability (+, +) Familiarity (+, +) Trusting disposition (+ indirect, + indirect) Social presence (1, +)
Goldsmith (2002) 107 students in a large SEM (none) Future likelihood of Current online buying (+)
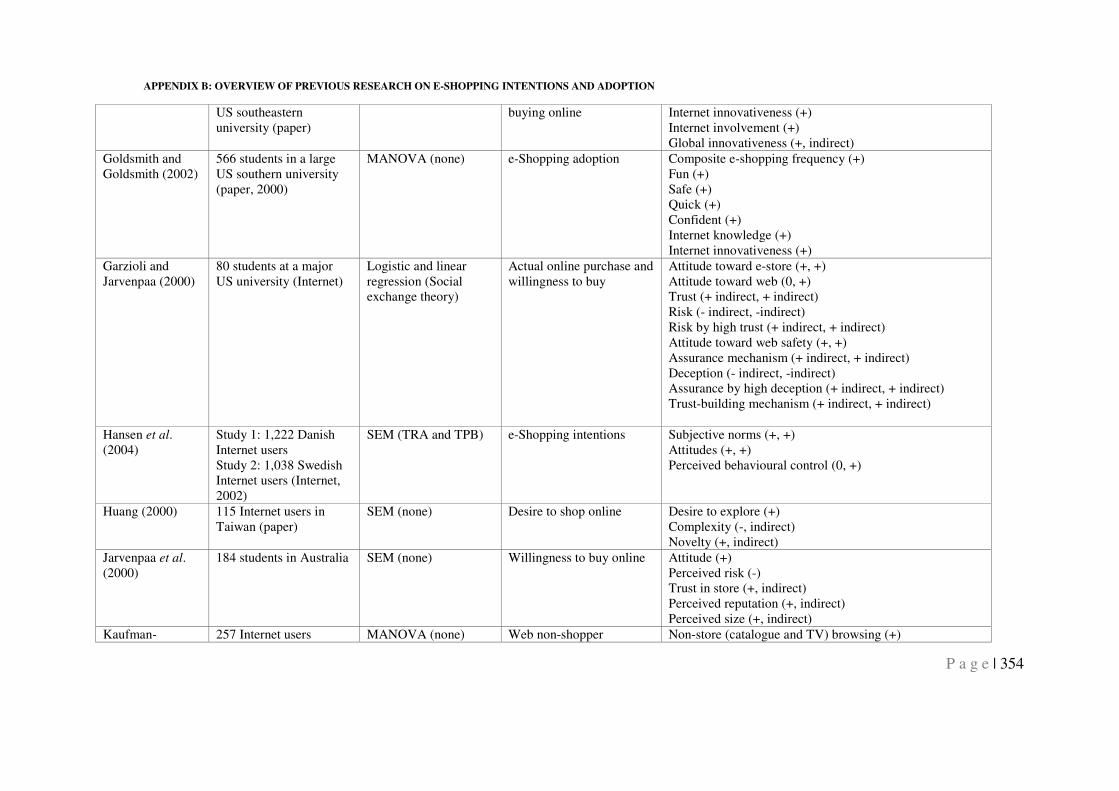
APPENDIX B: OVERVIEW OF PREVIOUS RESEARCH ON E-SHOPPING INTENTIONS AND ADOPTION
P a g e | 354
US southeastern university (paper)
buying online Internet innovativeness (+) Internet involvement (+) Global innovativeness (+, indirect)
Goldsmith and Goldsmith (2002)
566 students in a large US southern university (paper, 2000)
MANOVA (none) e-Shopping adoption Composite e-shopping frequency (+) Fun (+) Safe (+) Quick (+) Confident (+) Internet knowledge (+) Internet innovativeness (+)
Garzioli and Jarvenpaa (2000)
80 students at a major US university (Internet)
Logistic and linear regression (Social exchange theory)
Actual online purchase and willingness to buy
Attitude toward e-store (+, +) Attitude toward web (0, +) Trust (+ indirect, + indirect) Risk (- indirect, -indirect) Risk by high trust (+ indirect, + indirect) Attitude toward web safety (+, +) Assurance mechanism (+ indirect, + indirect) Deception (- indirect, -indirect) Assurance by high deception (+ indirect, + indirect) Trust-building mechanism (+ indirect, + indirect)
Hansen et al. (2004)
Study 1: 1,222 Danish Internet users Study 2: 1,038 Swedish Internet users (Internet, 2002)
SEM (TRA and TPB) e-Shopping intentions Subjective norms (+, +) Attitudes (+, +) Perceived behavioural control (0, +)
Huang (2000) 115 Internet users in Taiwan (paper)
SEM (none) Desire to shop online Desire to explore (+) Complexity (-, indirect) Novelty (+, indirect)
Jarvenpaa et al. (2000)
184 students in Australia SEM (none) Willingness to buy online Attitude (+) Perceived risk (-) Trust in store (+, indirect) Perceived reputation (+, indirect) Perceived size (+, indirect)
Kaufman- 257 Internet users MANOVA (none) Web non-shopper Non-store (catalogue and TV) browsing (+)
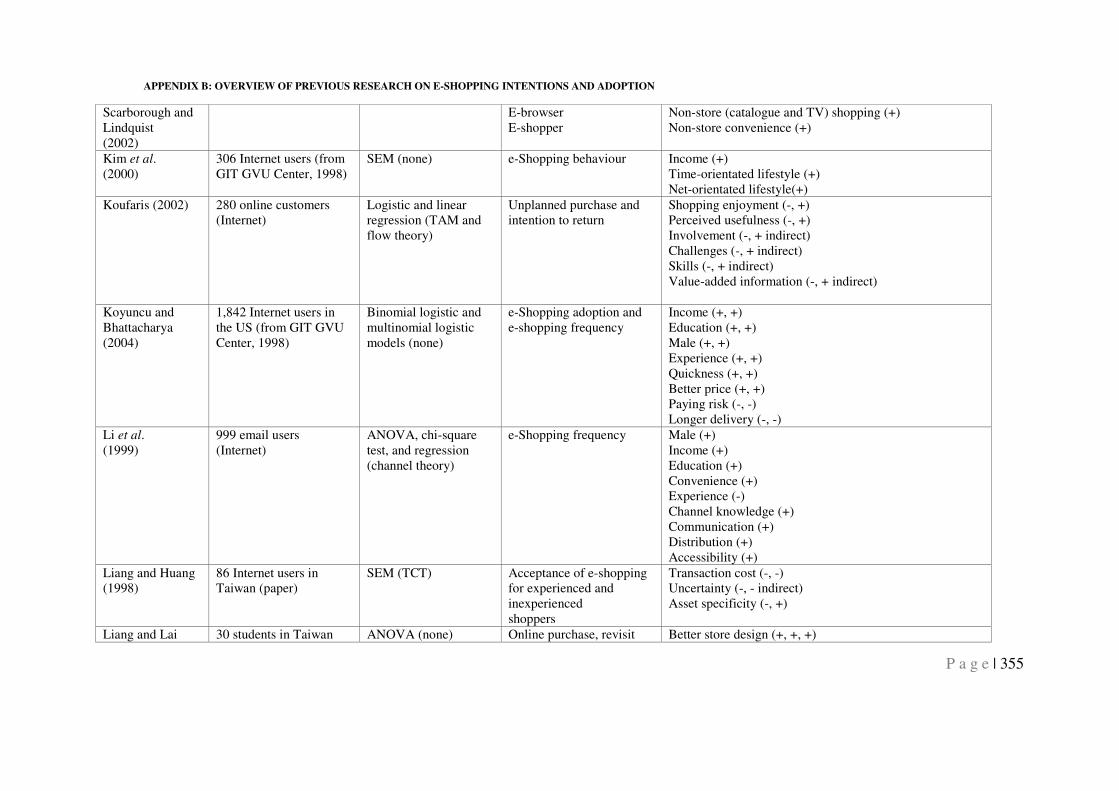
APPENDIX B: OVERVIEW OF PREVIOUS RESEARCH ON E-SHOPPING INTENTIONS AND ADOPTION
P a g e | 355
Scarborough and Lindquist (2002)
E-browser E-shopper
Non-store (catalogue and TV) shopping (+) Non-store convenience (+)
Kim et al. (2000)
306 Internet users (from GIT GVU Center, 1998)
SEM (none) e-Shopping behaviour Income (+) Time-orientated lifestyle (+) Net-orientated lifestyle(+)
Koufaris (2002) 280 online customers (Internet)
Logistic and linear regression (TAM and flow theory)
Unplanned purchase and intention to return
Shopping enjoyment (-, +) Perceived usefulness (-, +) Involvement (-, + indirect) Challenges (-, + indirect) Skills (-, + indirect) Value-added information (-, + indirect)
Koyuncu and Bhattacharya (2004)
1,842 Internet users in the US (from GIT GVU Center, 1998)
Binomial logistic and multinomial logistic models (none)
e-Shopping adoption and e-shopping frequency
Income (+, +) Education (+, +) Male (+, +) Experience (+, +) Quickness (+, +) Better price (+, +) Paying risk (-, -) Longer delivery (-, -)
Li et al. (1999)
999 email users (Internet)
ANOVA, chi-square test, and regression (channel theory)
e-Shopping frequency Male (+) Income (+) Education (+) Convenience (+) Experience (-) Channel knowledge (+) Communication (+) Distribution (+) Accessibility (+)
Liang and Huang (1998)
86 Internet users in Taiwan (paper)
SEM (TCT) Acceptance of e-shopping for experienced and inexperienced shoppers
Transaction cost (-, -) Uncertainty (-, - indirect) Asset specificity (-, +)
Liang and Lai 30 students in Taiwan ANOVA (none) Online purchase, revisit Better store design (+, +, +)
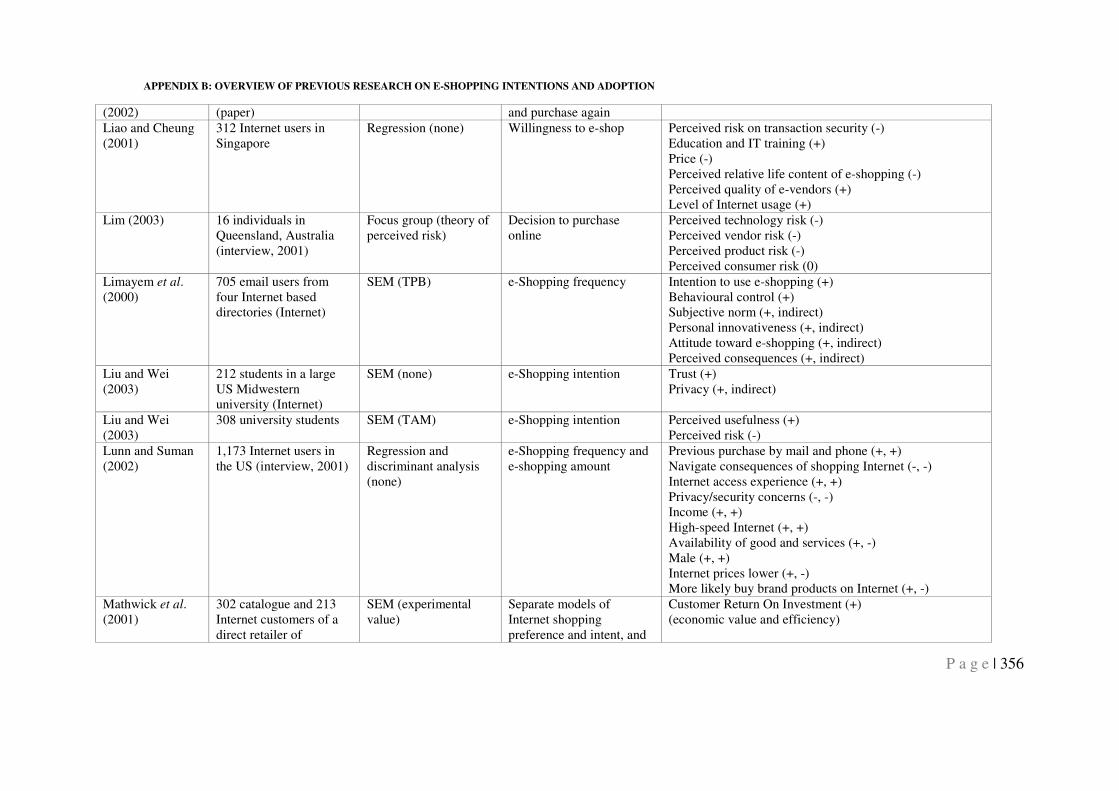
APPENDIX B: OVERVIEW OF PREVIOUS RESEARCH ON E-SHOPPING INTENTIONS AND ADOPTION
P a g e | 356
(2002) (paper) and purchase again Liao and Cheung (2001)
312 Internet users in Singapore
Regression (none) Willingness to e-shop Perceived risk on transaction security (-) Education and IT training (+) Price (-) Perceived relative life content of e-shopping (-) Perceived quality of e-vendors (+) Level of Internet usage (+)
Lim (2003) 16 individuals in Queensland, Australia (interview, 2001)
Focus group (theory of perceived risk)
Decision to purchase online
Perceived technology risk (-) Perceived vendor risk (-) Perceived product risk (-) Perceived consumer risk (0)
Limayem et al. (2000)
705 email users from four Internet based directories (Internet)
SEM (TPB) e-Shopping frequency Intention to use e-shopping (+) Behavioural control (+) Subjective norm (+, indirect) Personal innovativeness (+, indirect) Attitude toward e-shopping (+, indirect) Perceived consequences (+, indirect)
Liu and Wei (2003)
212 students in a large US Midwestern university (Internet)
SEM (none) e-Shopping intention Trust (+) Privacy (+, indirect)
Liu and Wei (2003)
308 university students SEM (TAM) e-Shopping intention Perceived usefulness (+) Perceived risk (-)
Lunn and Suman (2002)
1,173 Internet users in the US (interview, 2001)
Regression and discriminant analysis (none)
e-Shopping frequency and e-shopping amount
Previous purchase by mail and phone (+, +) Navigate consequences of shopping Internet (-, -) Internet access experience (+, +) Privacy/security concerns (-, -) Income (+, +) High-speed Internet (+, +) Availability of good and services (+, -) Male (+, +) Internet prices lower (+, -) More likely buy brand products on Internet (+, -)
Mathwick et al. (2001)
302 catalogue and 213 Internet customers of a direct retailer of
SEM (experimental value)
Separate models of Internet shopping preference and intent, and
Customer Return On Investment (+) (economic value and efficiency)
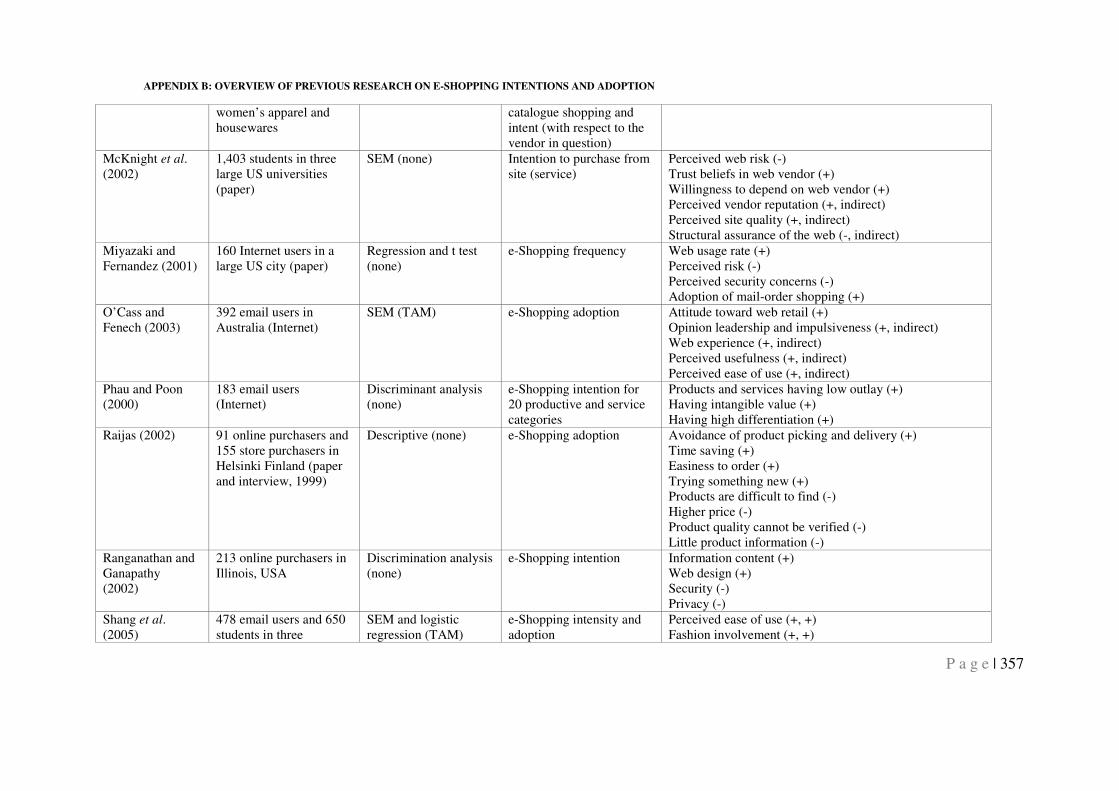
APPENDIX B: OVERVIEW OF PREVIOUS RESEARCH ON E-SHOPPING INTENTIONS AND ADOPTION
P a g e | 357
women’s apparel and housewares
catalogue shopping and intent (with respect to the vendor in question)
McKnight et al. (2002)
1,403 students in three large US universities (paper)
SEM (none) Intention to purchase from site (service)
Perceived web risk (-) Trust beliefs in web vendor (+) Willingness to depend on web vendor (+) Perceived vendor reputation (+, indirect) Perceived site quality (+, indirect) Structural assurance of the web (-, indirect)
Miyazaki and Fernandez (2001)
160 Internet users in a large US city (paper)
Regression and t test (none)
e-Shopping frequency Web usage rate (+) Perceived risk (-) Perceived security concerns (-) Adoption of mail-order shopping (+)
O’Cass and Fenech (2003)
392 email users in Australia (Internet)
SEM (TAM) e-Shopping adoption Attitude toward web retail (+) Opinion leadership and impulsiveness (+, indirect) Web experience (+, indirect) Perceived usefulness (+, indirect) Perceived ease of use (+, indirect)
Phau and Poon (2000)
183 email users (Internet)
Discriminant analysis (none)
e-Shopping intention for 20 productive and service categories
Products and services having low outlay (+) Having intangible value (+) Having high differentiation (+)
Raijas (2002) 91 online purchasers and 155 store purchasers in Helsinki Finland (paper and interview, 1999)
Descriptive (none) e-Shopping adoption Avoidance of product picking and delivery (+) Time saving (+) Easiness to order (+) Trying something new (+) Products are difficult to find (-) Higher price (-) Product quality cannot be verified (-) Little product information (-)
Ranganathan and Ganapathy (2002)
213 online purchasers in Illinois, USA
Discrimination analysis (none)
e-Shopping intention Information content (+) Web design (+) Security (-) Privacy (-)
Shang et al. (2005)
478 email users and 650 students in three
SEM and logistic regression (TAM)
e-Shopping intensity and adoption
Perceived ease of use (+, +) Fashion involvement (+, +)
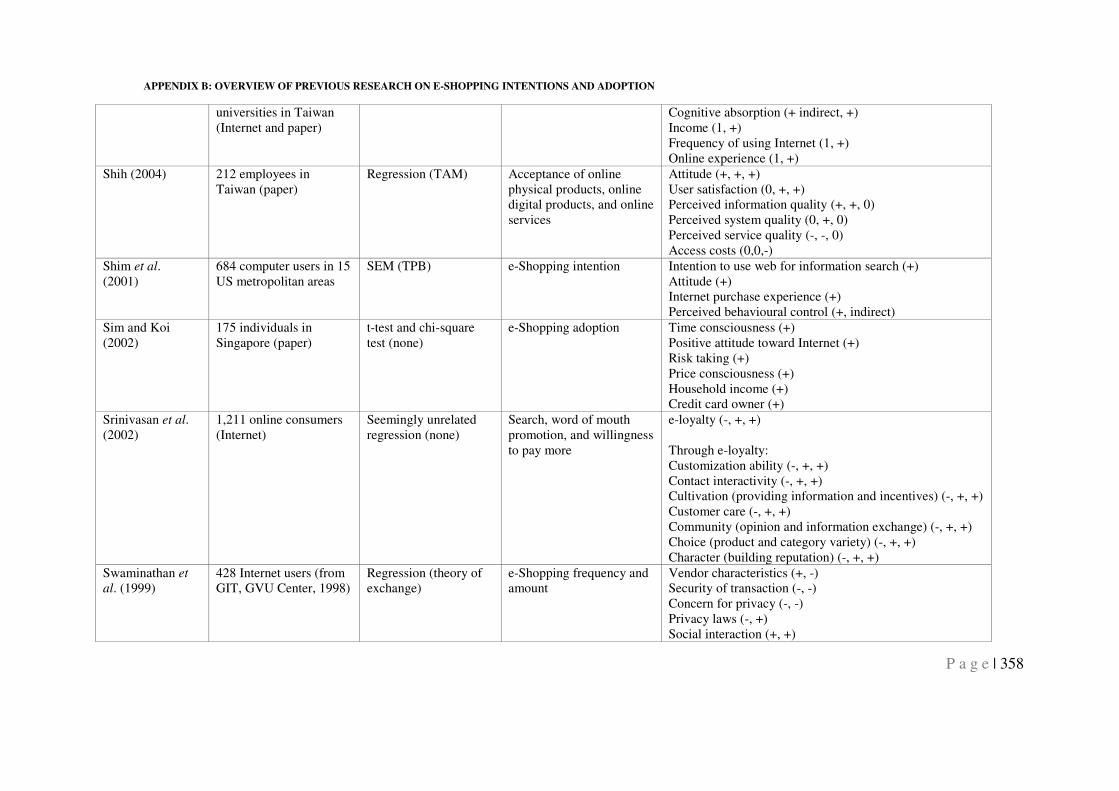
APPENDIX B: OVERVIEW OF PREVIOUS RESEARCH ON E-SHOPPING INTENTIONS AND ADOPTION
P a g e | 358
universities in Taiwan (Internet and paper)
Cognitive absorption (+ indirect, +) Income (1, +) Frequency of using Internet (1, +) Online experience (1, +)
Shih (2004) 212 employees in Taiwan (paper)
Regression (TAM) Acceptance of online physical products, online digital products, and online services
Attitude (+, +, +) User satisfaction (0, +, +) Perceived information quality (+, +, 0) Perceived system quality (0, +, 0) Perceived service quality (-, -, 0) Access costs (0,0,-)
Shim et al. (2001)
684 computer users in 15 US metropolitan areas
SEM (TPB) e-Shopping intention Intention to use web for information search (+) Attitude (+) Internet purchase experience (+) Perceived behavioural control (+, indirect)
Sim and Koi (2002)
175 individuals in Singapore (paper)
t-test and chi-square test (none)
e-Shopping adoption Time consciousness (+) Positive attitude toward Internet (+) Risk taking (+) Price consciousness (+) Household income (+) Credit card owner (+)
Srinivasan et al. (2002)
1,211 online consumers (Internet)
Seemingly unrelated regression (none)
Search, word of mouth promotion, and willingness to pay more
e-loyalty (-, +, +) Through e-loyalty: Customization ability (-, +, +) Contact interactivity (-, +, +) Cultivation (providing information and incentives) (-, +, +) Customer care (-, +, +) Community (opinion and information exchange) (-, +, +) Choice (product and category variety) (-, +, +) Character (building reputation) (-, +, +)
Swaminathan et
al. (1999) 428 Internet users (from GIT, GVU Center, 1998)
Regression (theory of exchange)
e-Shopping frequency and amount
Vendor characteristics (+, -) Security of transaction (-, -) Concern for privacy (-, -) Privacy laws (-, +) Social interaction (+, +)
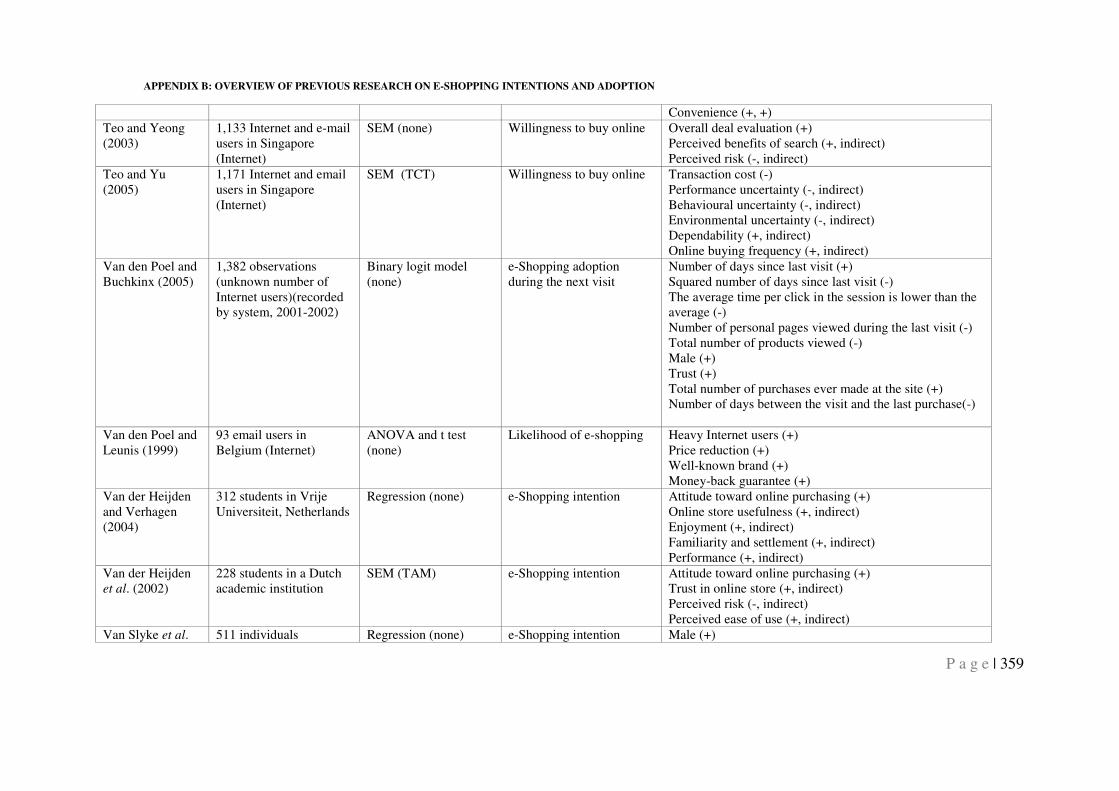
APPENDIX B: OVERVIEW OF PREVIOUS RESEARCH ON E-SHOPPING INTENTIONS AND ADOPTION
P a g e | 359
Convenience (+, +) Teo and Yeong (2003)
1,133 Internet and e-mail users in Singapore (Internet)
SEM (none) Willingness to buy online Overall deal evaluation (+) Perceived benefits of search (+, indirect) Perceived risk (-, indirect)
Teo and Yu (2005)
1,171 Internet and email users in Singapore (Internet)
SEM (TCT) Willingness to buy online Transaction cost (-) Performance uncertainty (-, indirect) Behavioural uncertainty (-, indirect) Environmental uncertainty (-, indirect) Dependability (+, indirect) Online buying frequency (+, indirect)
Van den Poel and Buchkinx (2005)
1,382 observations (unknown number of Internet users)(recorded by system, 2001-2002)
Binary logit model (none)
e-Shopping adoption during the next visit
Number of days since last visit (+) Squared number of days since last visit (-) The average time per click in the session is lower than the average (-) Number of personal pages viewed during the last visit (-) Total number of products viewed (-) Male (+) Trust (+) Total number of purchases ever made at the site (+) Number of days between the visit and the last purchase(-)
Van den Poel and Leunis (1999)
93 email users in Belgium (Internet)
ANOVA and t test (none)
Likelihood of e-shopping Heavy Internet users (+) Price reduction (+) Well-known brand (+) Money-back guarantee (+)
Van der Heijden and Verhagen (2004)
312 students in Vrije Universiteit, Netherlands
Regression (none) e-Shopping intention Attitude toward online purchasing (+) Online store usefulness (+, indirect) Enjoyment (+, indirect) Familiarity and settlement (+, indirect) Performance (+, indirect)
Van der Heijden et al. (2002)
228 students in a Dutch academic institution
SEM (TAM) e-Shopping intention Attitude toward online purchasing (+) Trust in online store (+, indirect) Perceived risk (-, indirect) Perceived ease of use (+, indirect)
Van Slyke et al. 511 individuals Regression (none) e-Shopping intention Male (+)
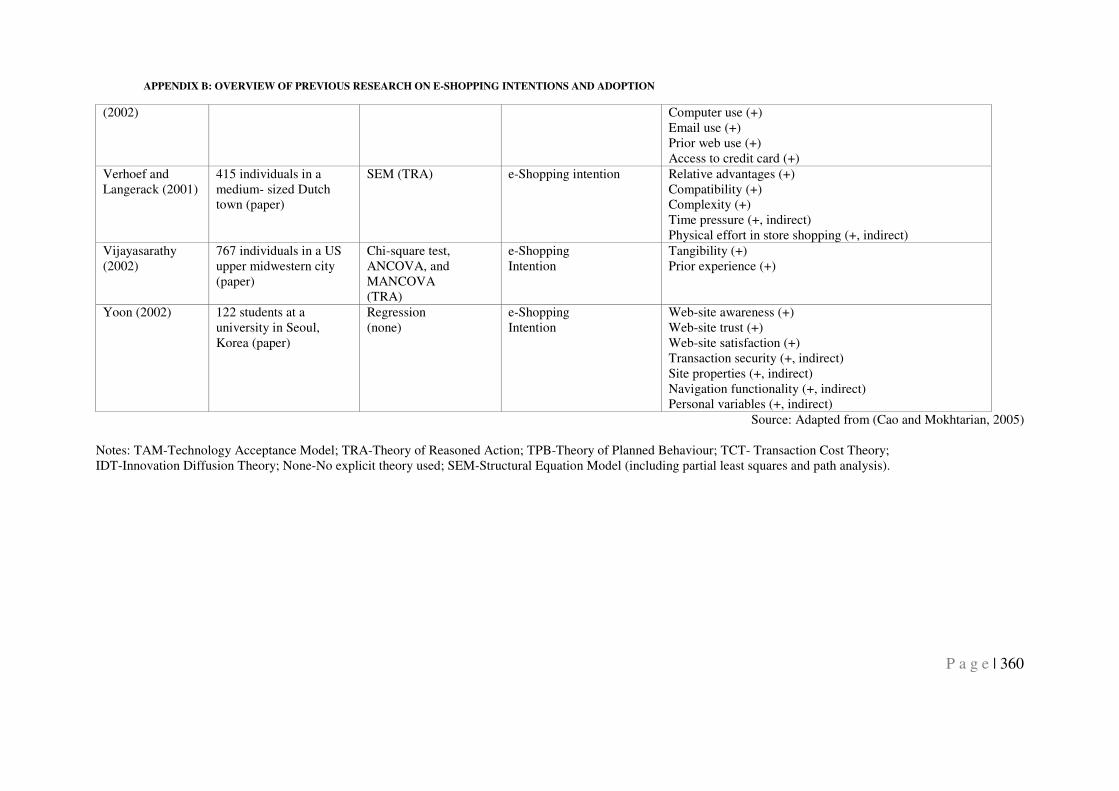
APPENDIX B: OVERVIEW OF PREVIOUS RESEARCH ON E-SHOPPING INTENTIONS AND ADOPTION
P a g e | 360
(2002) Computer use (+) Email use (+) Prior web use (+) Access to credit card (+)
Verhoef and Langerack (2001)
415 individuals in a medium- sized Dutch town (paper)
SEM (TRA) e-Shopping intention Relative advantages (+) Compatibility (+) Complexity (+) Time pressure (+, indirect) Physical effort in store shopping (+, indirect)
Vijayasarathy (2002)
767 individuals in a US upper midwestern city (paper)
Chi-square test, ANCOVA, and MANCOVA (TRA)
e-Shopping Intention
Tangibility (+) Prior experience (+)
Yoon (2002) 122 students at a university in Seoul, Korea (paper)
Regression (none)
e-Shopping Intention
Web-site awareness (+) Web-site trust (+) Web-site satisfaction (+) Transaction security (+, indirect) Site properties (+, indirect) Navigation functionality (+, indirect) Personal variables (+, indirect)
Source: Adapted from (Cao and Mokhtarian, 2005) Notes: TAM-Technology Acceptance Model; TRA-Theory of Reasoned Action; TPB-Theory of Planned Behaviour; TCT- Transaction Cost Theory; IDT-Innovation Diffusion Theory; None-No explicit theory used; SEM-Structural Equation Model (including partial least squares and path analysis).
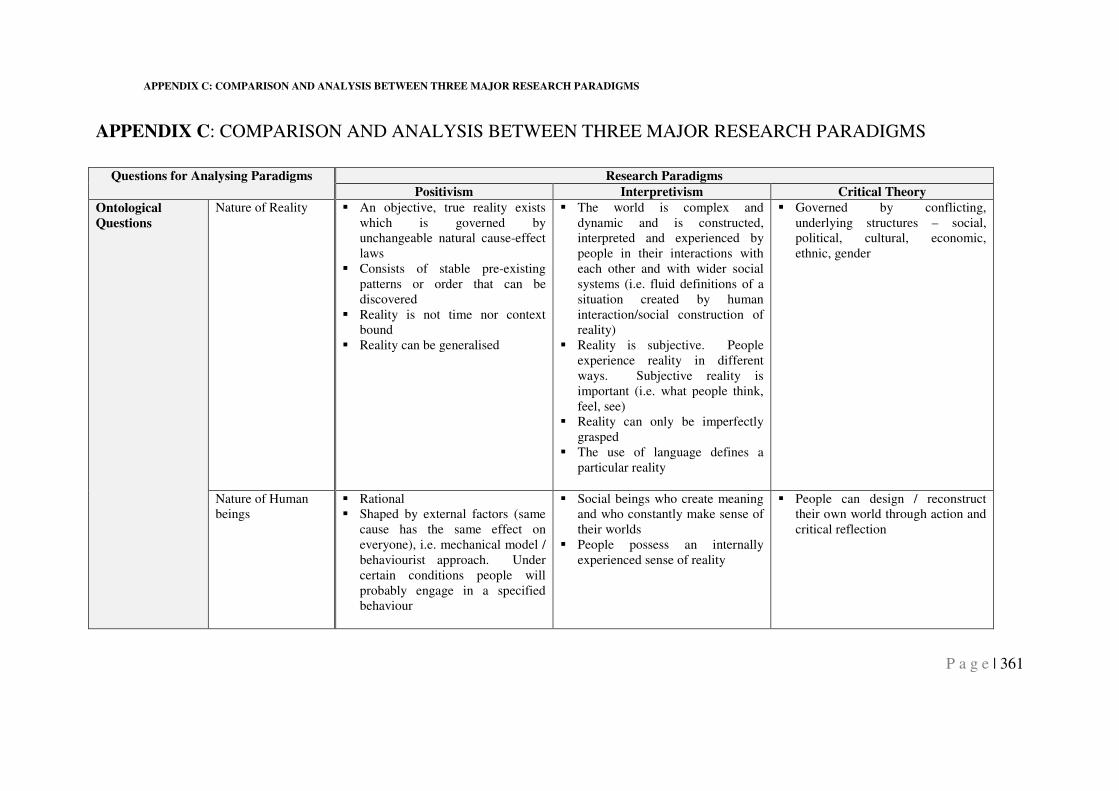
APPENDIX C: COMPARISON AND ANALYSIS BETWEEN THREE MAJOR RESEARCH PARADIGMS
P a g e | 361
APPENDIX C: COMPARISON AND ANALYSIS BETWEEN THREE MAJOR RESEARCH PARADIGMS
Questions for Analysing Paradigms Research Paradigms
Positivism Interpretivism Critical Theory
Ontological
Questions
Nature of Reality � An objective, true reality exists which is governed by unchangeable natural cause-effect laws
� Consists of stable pre-existing patterns or order that can be discovered
� Reality is not time nor context bound
� Reality can be generalised
� The world is complex and dynamic and is constructed, interpreted and experienced by people in their interactions with each other and with wider social systems (i.e. fluid definitions of a situation created by human interaction/social construction of reality)
� Reality is subjective. People experience reality in different ways. Subjective reality is important (i.e. what people think, feel, see)
� Reality can only be imperfectly grasped
� The use of language defines a particular reality
� Governed by conflicting, underlying structures – social, political, cultural, economic, ethnic, gender
Nature of Human beings
� Rational � Shaped by external factors (same
cause has the same effect on everyone), i.e. mechanical model / behaviourist approach. Under certain conditions people will probably engage in a specified behaviour
� Social beings who create meaning and who constantly make sense of their worlds
� People possess an internally experienced sense of reality
� People can design / reconstruct their own world through action and critical reflection
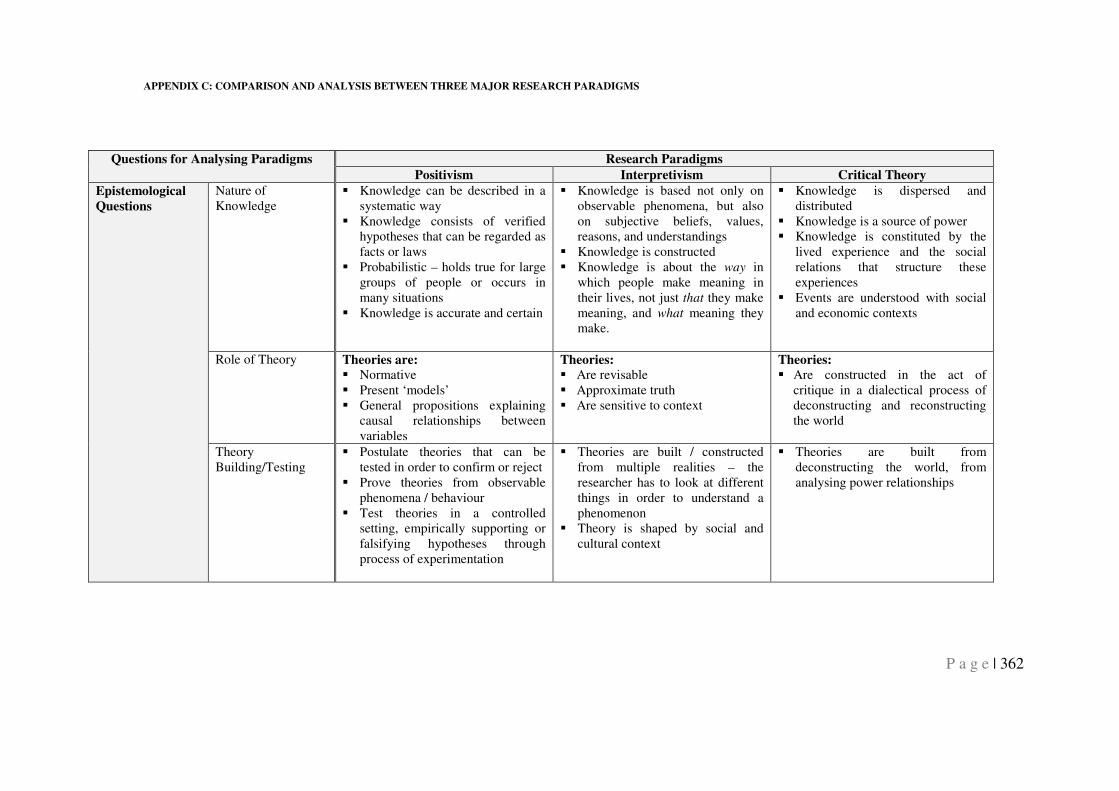
APPENDIX C: COMPARISON AND ANALYSIS BETWEEN THREE MAJOR RESEARCH PARADIGMS
P a g e | 362
Questions for Analysing Paradigms Research Paradigms
Positivism Interpretivism Critical Theory
Epistemological
Questions
Nature of Knowledge
� Knowledge can be described in a systematic way
� Knowledge consists of verified hypotheses that can be regarded as facts or laws
� Probabilistic – holds true for large groups of people or occurs in many situations
� Knowledge is accurate and certain
� Knowledge is based not only on observable phenomena, but also on subjective beliefs, values, reasons, and understandings
� Knowledge is constructed � Knowledge is about the way in
which people make meaning in their lives, not just that they make meaning, and what meaning they make.
� Knowledge is dispersed and distributed
� Knowledge is a source of power � Knowledge is constituted by the
lived experience and the social relations that structure these experiences
� Events are understood with social and economic contexts
Role of Theory Theories are:
� Normative � Present ‘models’ � General propositions explaining
causal relationships between variables
Theories:
� Are revisable � Approximate truth � Are sensitive to context
Theories:
� Are constructed in the act of critique in a dialectical process of deconstructing and reconstructing the world
Theory Building/Testing
� Postulate theories that can be tested in order to confirm or reject
� Prove theories from observable phenomena / behaviour
� Test theories in a controlled setting, empirically supporting or falsifying hypotheses through process of experimentation
� Theories are built / constructed from multiple realities – the researcher has to look at different things in order to understand a phenomenon
� Theory is shaped by social and cultural context
� Theories are built from deconstructing the world, from analysing power relationships
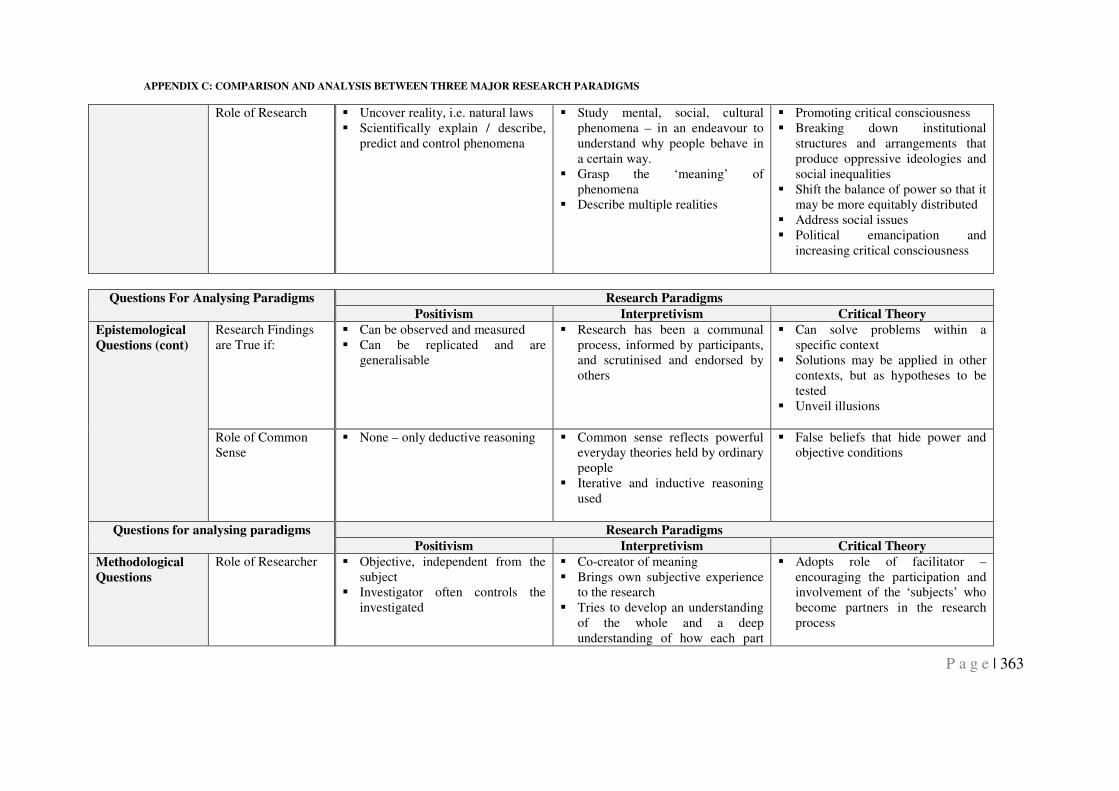
APPENDIX C: COMPARISON AND ANALYSIS BETWEEN THREE MAJOR RESEARCH PARADIGMS
P a g e | 363
Role of Research � Uncover reality, i.e. natural laws � Scientifically explain / describe,
predict and control phenomena
� Study mental, social, cultural phenomena – in an endeavour to understand why people behave in a certain way.
� Grasp the ‘meaning’ of phenomena
� Describe multiple realities
� Promoting critical consciousness � Breaking down institutional
structures and arrangements that produce oppressive ideologies and social inequalities
� Shift the balance of power so that it may be more equitably distributed
� Address social issues � Political emancipation and
increasing critical consciousness
Questions For Analysing Paradigms Research Paradigms
Positivism Interpretivism Critical Theory
Epistemological
Questions (cont)
Research Findings are True if:
� Can be observed and measured � Can be replicated and are
generalisable
� Research has been a communal process, informed by participants, and scrutinised and endorsed by others
� Can solve problems within a specific context
� Solutions may be applied in other contexts, but as hypotheses to be tested
� Unveil illusions
Role of Common Sense
� None – only deductive reasoning � Common sense reflects powerful everyday theories held by ordinary people
� Iterative and inductive reasoning used
� False beliefs that hide power and objective conditions
Questions for analysing paradigms Research Paradigms
Positivism Interpretivism Critical Theory
Methodological
Questions
Role of Researcher � Objective, independent from the subject
� Investigator often controls the investigated
� Co-creator of meaning � Brings own subjective experience
to the research � Tries to develop an understanding
of the whole and a deep understanding of how each part
� Adopts role of facilitator – encouraging the participation and involvement of the ‘subjects’ who become partners in the research process
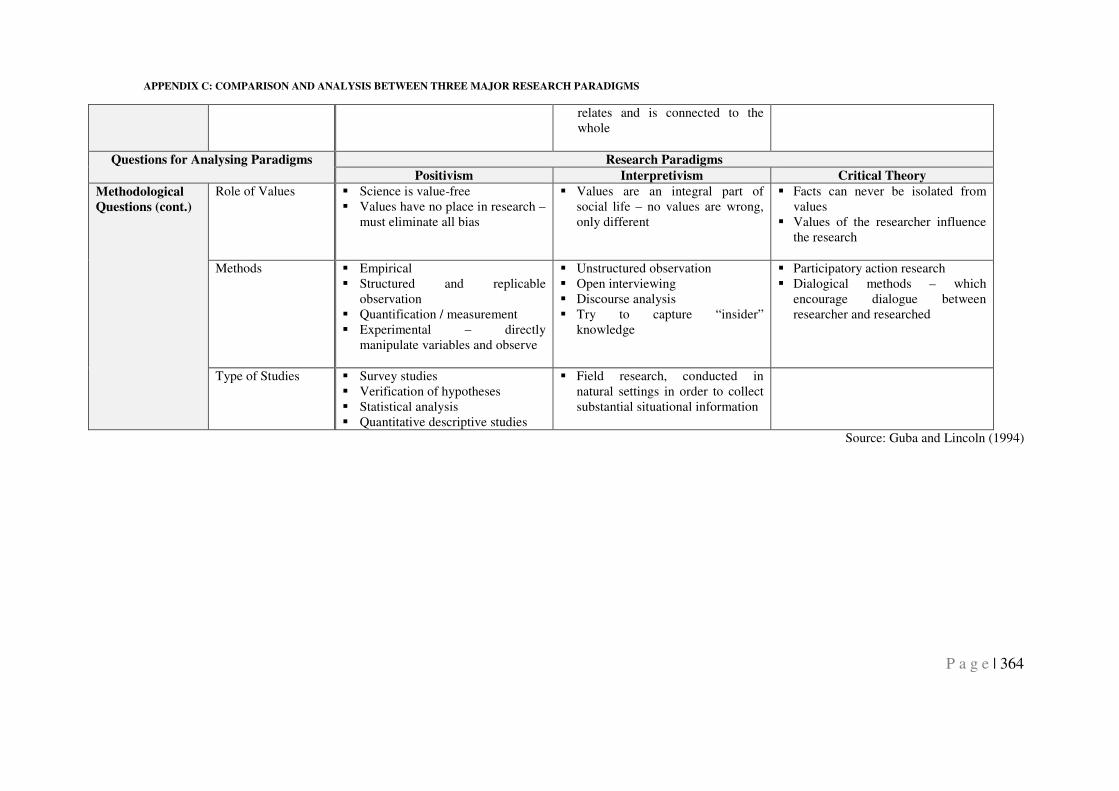
APPENDIX C: COMPARISON AND ANALYSIS BETWEEN THREE MAJOR RESEARCH PARADIGMS
P a g e | 364
relates and is connected to the whole
Questions for Analysing Paradigms Research Paradigms
Positivism Interpretivism Critical Theory
Methodological
Questions (cont.) Role of Values � Science is value-free
� Values have no place in research – must eliminate all bias
� Values are an integral part of social life – no values are wrong, only different
� Facts can never be isolated from values
� Values of the researcher influence the research
Methods � Empirical � Structured and replicable
observation � Quantification / measurement � Experimental – directly
manipulate variables and observe
� Unstructured observation � Open interviewing � Discourse analysis � Try to capture “insider”
knowledge
� Participatory action research � Dialogical methods – which
encourage dialogue between researcher and researched
Type of Studies � Survey studies � Verification of hypotheses � Statistical analysis � Quantitative descriptive studies
� Field research, conducted in natural settings in order to collect substantial situational information
Source: Guba and Lincoln (1994)
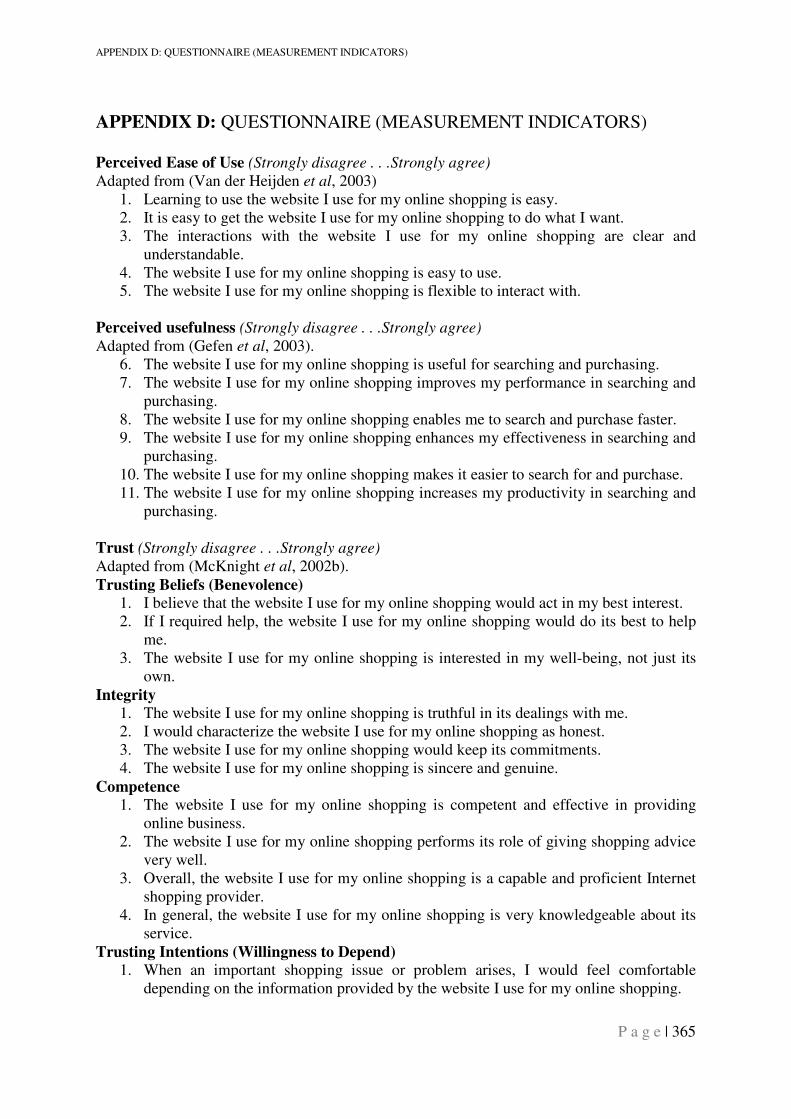
APPENDIX D: QUESTIONNAIRE (MEASUREMENT INDICATORS)
P a g e | 365
APPENDIX D: QUESTIONNAIRE (MEASUREMENT INDICATORS)
Perceived Ease of Use (Strongly disagree . . .Strongly agree)
Adapted from (Van der Heijden et al, 2003) 1. Learning to use the website I use for my online shopping is easy. 2. It is easy to get the website I use for my online shopping to do what I want. 3. The interactions with the website I use for my online shopping are clear and
understandable. 4. The website I use for my online shopping is easy to use. 5. The website I use for my online shopping is flexible to interact with.
Perceived usefulness (Strongly disagree . . .Strongly agree)
Adapted from (Gefen et al, 2003). 6. The website I use for my online shopping is useful for searching and purchasing. 7. The website I use for my online shopping improves my performance in searching and
purchasing. 8. The website I use for my online shopping enables me to search and purchase faster. 9. The website I use for my online shopping enhances my effectiveness in searching and
purchasing. 10. The website I use for my online shopping makes it easier to search for and purchase. 11. The website I use for my online shopping increases my productivity in searching and
purchasing.
Trust (Strongly disagree . . .Strongly agree)
Adapted from (McKnight et al, 2002b). Trusting Beliefs (Benevolence)
1. I believe that the website I use for my online shopping would act in my best interest. 2. If I required help, the website I use for my online shopping would do its best to help
me. 3. The website I use for my online shopping is interested in my well-being, not just its
own. Integrity
1. The website I use for my online shopping is truthful in its dealings with me. 2. I would characterize the website I use for my online shopping as honest. 3. The website I use for my online shopping would keep its commitments. 4. The website I use for my online shopping is sincere and genuine.
Competence
1. The website I use for my online shopping is competent and effective in providing online business.
2. The website I use for my online shopping performs its role of giving shopping advice very well.
3. Overall, the website I use for my online shopping is a capable and proficient Internet shopping provider.
4. In general, the website I use for my online shopping is very knowledgeable about its service.
Trusting Intentions (Willingness to Depend)
1. When an important shopping issue or problem arises, I would feel comfortable depending on the information provided by the website I use for my online shopping.
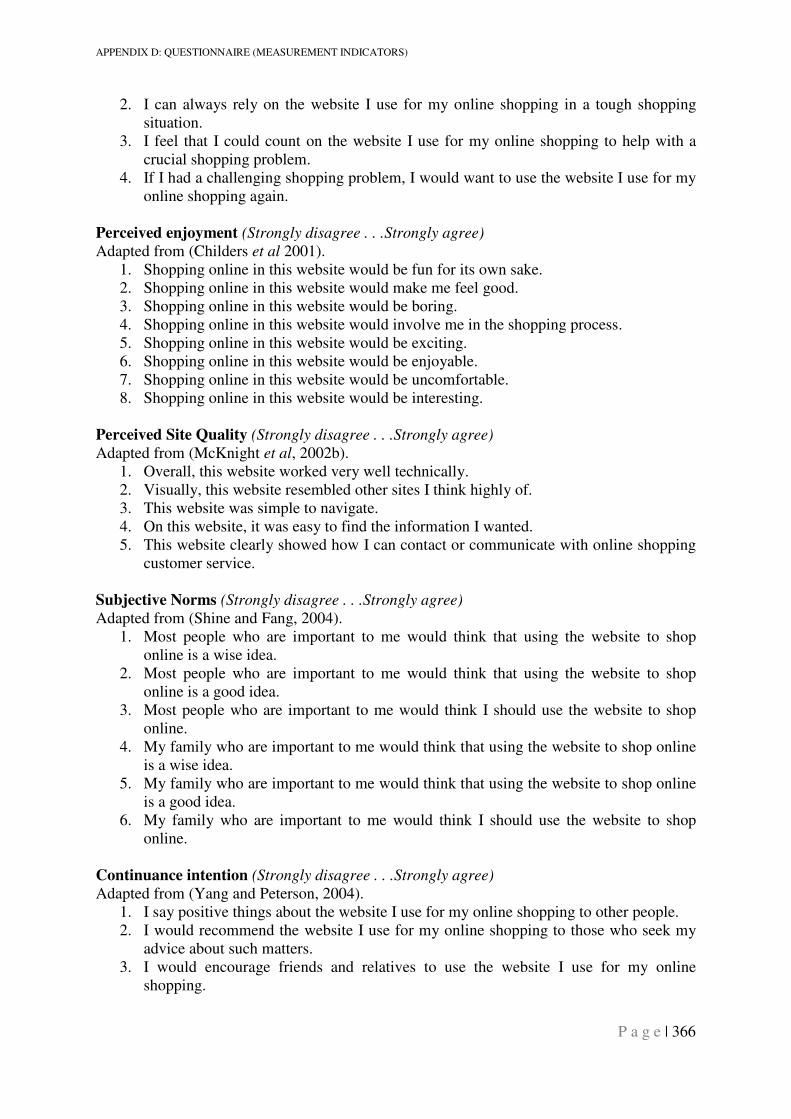
APPENDIX D: QUESTIONNAIRE (MEASUREMENT INDICATORS)
P a g e | 366
2. I can always rely on the website I use for my online shopping in a tough shopping situation.
3. I feel that I could count on the website I use for my online shopping to help with a crucial shopping problem.
4. If I had a challenging shopping problem, I would want to use the website I use for my online shopping again.
Perceived enjoyment (Strongly disagree . . .Strongly agree)
Adapted from (Childers et al 2001). 1. Shopping online in this website would be fun for its own sake. 2. Shopping online in this website would make me feel good. 3. Shopping online in this website would be boring. 4. Shopping online in this website would involve me in the shopping process. 5. Shopping online in this website would be exciting. 6. Shopping online in this website would be enjoyable. 7. Shopping online in this website would be uncomfortable. 8. Shopping online in this website would be interesting.
Perceived Site Quality (Strongly disagree . . .Strongly agree)
Adapted from (McKnight et al, 2002b). 1. Overall, this website worked very well technically. 2. Visually, this website resembled other sites I think highly of. 3. This website was simple to navigate. 4. On this website, it was easy to find the information I wanted. 5. This website clearly showed how I can contact or communicate with online shopping
customer service.
Subjective Norms (Strongly disagree . . .Strongly agree)
Adapted from (Shine and Fang, 2004). 1. Most people who are important to me would think that using the website to shop
online is a wise idea. 2. Most people who are important to me would think that using the website to shop
online is a good idea. 3. Most people who are important to me would think I should use the website to shop
online. 4. My family who are important to me would think that using the website to shop online
is a wise idea. 5. My family who are important to me would think that using the website to shop online
is a good idea. 6. My family who are important to me would think I should use the website to shop
online.
Continuance intention (Strongly disagree . . .Strongly agree)
Adapted from (Yang and Peterson, 2004). 1. I say positive things about the website I use for my online shopping to other people. 2. I would recommend the website I use for my online shopping to those who seek my
advice about such matters. 3. I would encourage friends and relatives to use the website I use for my online
shopping.
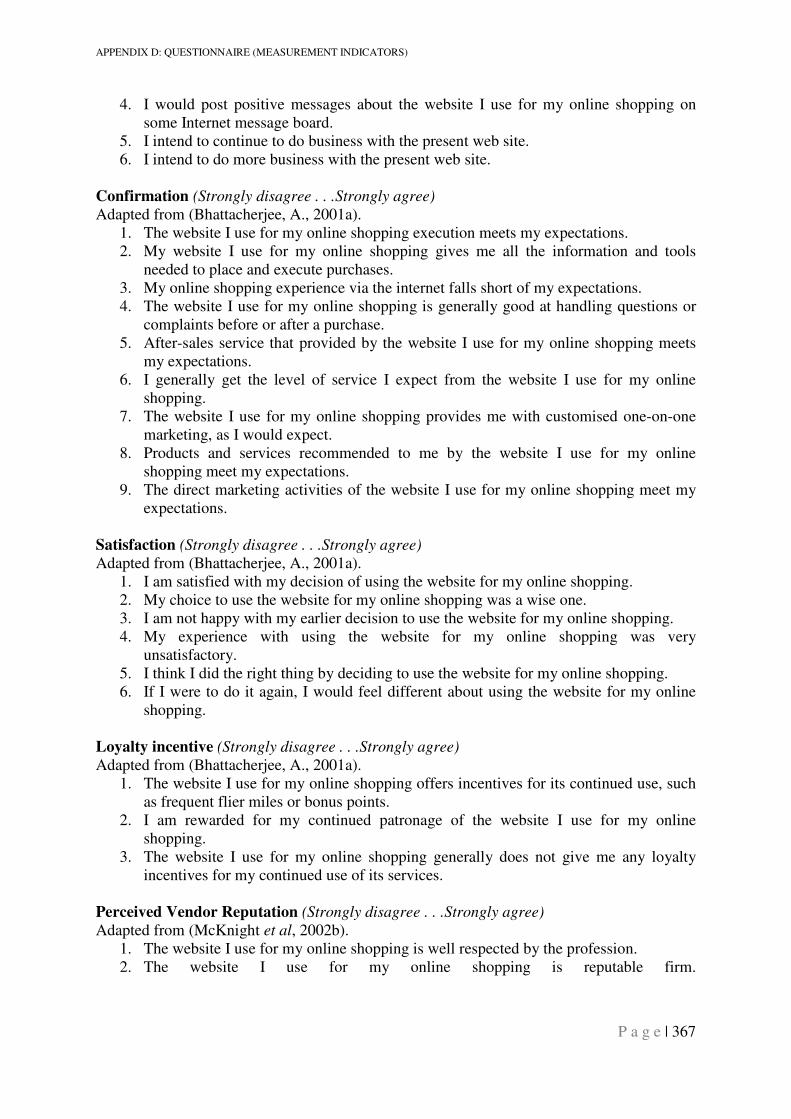
APPENDIX D: QUESTIONNAIRE (MEASUREMENT INDICATORS)
P a g e | 367
4. I would post positive messages about the website I use for my online shopping on some Internet message board.
5. I intend to continue to do business with the present web site. 6. I intend to do more business with the present web site.
Confirmation (Strongly disagree . . .Strongly agree)
Adapted from (Bhattacherjee, A., 2001a). 1. The website I use for my online shopping execution meets my expectations. 2. My website I use for my online shopping gives me all the information and tools
needed to place and execute purchases. 3. My online shopping experience via the internet falls short of my expectations. 4. The website I use for my online shopping is generally good at handling questions or
complaints before or after a purchase. 5. After-sales service that provided by the website I use for my online shopping meets
my expectations. 6. I generally get the level of service I expect from the website I use for my online
shopping. 7. The website I use for my online shopping provides me with customised one-on-one
marketing, as I would expect. 8. Products and services recommended to me by the website I use for my online
shopping meet my expectations. 9. The direct marketing activities of the website I use for my online shopping meet my
expectations.
Satisfaction (Strongly disagree . . .Strongly agree)
Adapted from (Bhattacherjee, A., 2001a). 1. I am satisfied with my decision of using the website for my online shopping. 2. My choice to use the website for my online shopping was a wise one. 3. I am not happy with my earlier decision to use the website for my online shopping. 4. My experience with using the website for my online shopping was very
unsatisfactory. 5. I think I did the right thing by deciding to use the website for my online shopping. 6. If I were to do it again, I would feel different about using the website for my online
shopping. Loyalty incentive (Strongly disagree . . .Strongly agree)
Adapted from (Bhattacherjee, A., 2001a). 1. The website I use for my online shopping offers incentives for its continued use, such
as frequent flier miles or bonus points. 2. I am rewarded for my continued patronage of the website I use for my online
shopping. 3. The website I use for my online shopping generally does not give me any loyalty
incentives for my continued use of its services. Perceived Vendor Reputation (Strongly disagree . . .Strongly agree)
Adapted from (McKnight et al, 2002b). 1. The website I use for my online shopping is well respected by the profession. 2. The website I use for my online shopping is reputable firm.
APPENDIX E: PILOT STUDY SURVEY QUESTIONNAIRES (ENGLISH AND ARABIC LANGUAGES)
P a g e | 368
APPENDIX E: PILOT STUDY SURVEY QUESTIONNAIRES (ENGLISH AND ARABIC LANGUAGES)
Customer Continuance e-Shopping Intention In the developing countries -
The case of Saudi Arabia I am currently a PhD researcher at the Business School, Brunel University in West London, UK. As part of my academic research, I am investigating and understanding the factors that influence continuance online shopping in the Kingdom of Saudi Arabia. In this context, I would highly appreciate if you could kindly give a few minutes of your valuable time to complete this questionnaire. It should take you about 15 – 20 minutes to complete.
In the context of this questionnaire, e-shopping, electronic shopping, online shopping, and
internet shopping are considered the same. All these activities can include the activity of
searching, buying, and selling, products and services through the internet. Your participation in this study is completely voluntary. There are no foreseeable risks associated with this project. However, if you feel uncomfortable answering any questions, you can withdraw from the survey at any point. It is very important for us to learn your opinions. Your survey responses will be strictly confidential. If you have questions at any time about the survey or the procedures, you may contact me at my email address specified below. Your contribution to this questionnaire would help us understand the factors that influence continuance online shopping Thank you very much for your time and support. Talal Al-maghrabi PhD Researcher Brunel Business School Marketing Department Brunel University United Kingdom [email protected]
Dr Charles Dennis FCIM Senior Lecturer Brunel Business School Brunel University Uxbridge, Middlesex, UB8 3PH, United Kingdom Tel: +44 (0) 1895 265242 E-mail: [email protected]

APPENDIX E: PILOT STUDY SURVEY QUESTIONNAIRES (ENGLISH AND ARABIC LANGUAGES)
P a g e | 369
Please express your extent of agreement or disagreement with the following
Strongly
disagree
Dis-
agree
Some
what
disagree
Neutral
Some
what
agree
Agree Strongly
agree
1. Learning to use the website I use for my online shopping is easy.
2. It is easy to get the website I use for my online shopping to do what I want.
3. The interactions with the website I use for my online shopping are clear and understandable.
4. The website I use for my online shopping is easy to use.
5. The website I use for my online shopping is flexible to interact with.
6. The website I use for my online shopping is useful for searching and purchasing.
7. The website I use for my online shopping improves my performance in searching and purchasing.
8. The website I use for my online shopping enables me to search and purchase faster.
9. The website I use for my online shopping enhances my effectiveness in searching and purchasing.
10. The website I use for my online shopping makes it easier to search for and purchase.
11. The website I use for my online shopping increases my productivity in searching and purchasing.
12. I believe that the website I use for my online shopping would act in my best interest.
13. If I required help, the website I use for my online shopping would do its best to help me.
14. The website I use for my online shopping is interested in my well-being, not just its own.
15. The website I use for my online shopping is truthful in its dealings with me.
16. I would characterize the website I use for my online shopping as honest.
17. The website I use for my online shopping would keep its commitments.
18. The website I use for my online shopping is sincere and genuine.
19. The website I use for my online shopping is competent and effective in providing online business.
20. The website I use for my online shopping performs its role of giving shopping advice
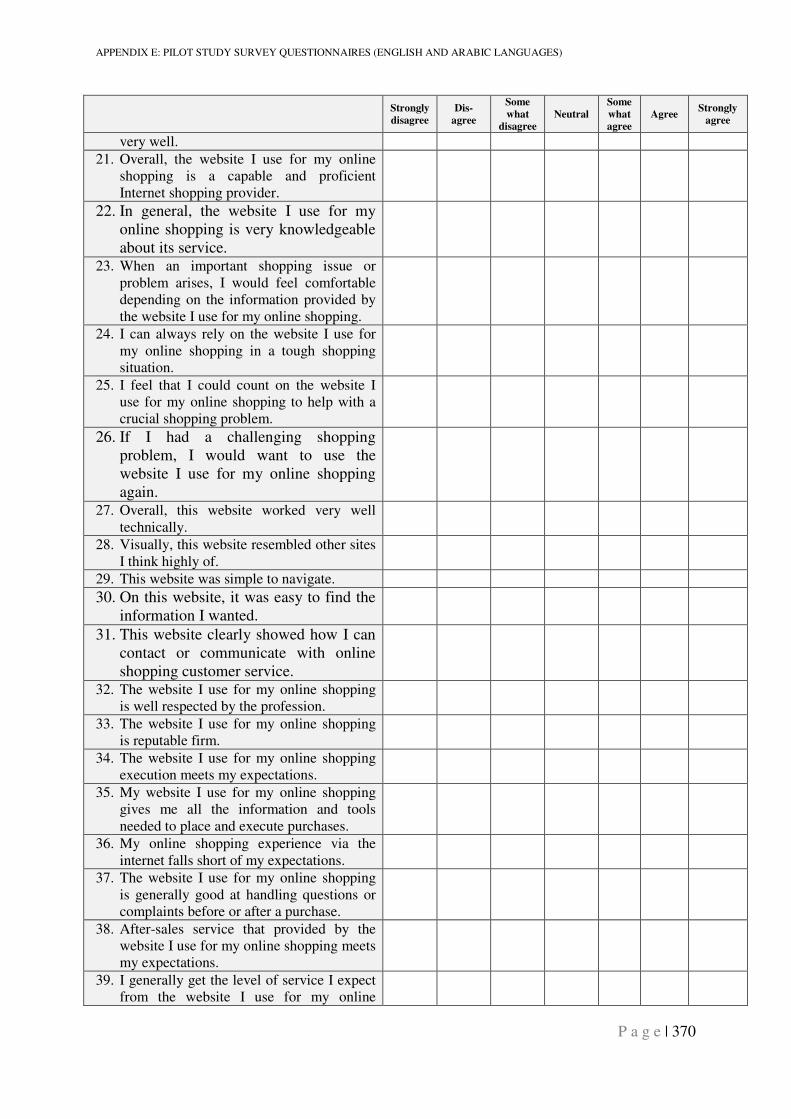
APPENDIX E: PILOT STUDY SURVEY QUESTIONNAIRES (ENGLISH AND ARABIC LANGUAGES)
P a g e | 370
Strongly
disagree
Dis-
agree
Some
what
disagree
Neutral
Some
what
agree
Agree Strongly
agree
very well.
21. Overall, the website I use for my online shopping is a capable and proficient Internet shopping provider.
22. In general, the website I use for my online shopping is very knowledgeable about its service.
23. When an important shopping issue or problem arises, I would feel comfortable depending on the information provided by the website I use for my online shopping.
24. I can always rely on the website I use for my online shopping in a tough shopping situation.
25. I feel that I could count on the website I use for my online shopping to help with a crucial shopping problem.
26. If I had a challenging shopping problem, I would want to use the website I use for my online shopping again.
27. Overall, this website worked very well technically.
28. Visually, this website resembled other sites I think highly of.
29. This website was simple to navigate.
30. On this website, it was easy to find the information I wanted.
31. This website clearly showed how I can contact or communicate with online shopping customer service.
32. The website I use for my online shopping is well respected by the profession.
33. The website I use for my online shopping is reputable firm.
34. The website I use for my online shopping execution meets my expectations.
35. My website I use for my online shopping gives me all the information and tools needed to place and execute purchases.
36. My online shopping experience via the internet falls short of my expectations.
37. The website I use for my online shopping is generally good at handling questions or complaints before or after a purchase.
38. After-sales service that provided by the website I use for my online shopping meets my expectations.
39. I generally get the level of service I expect from the website I use for my online
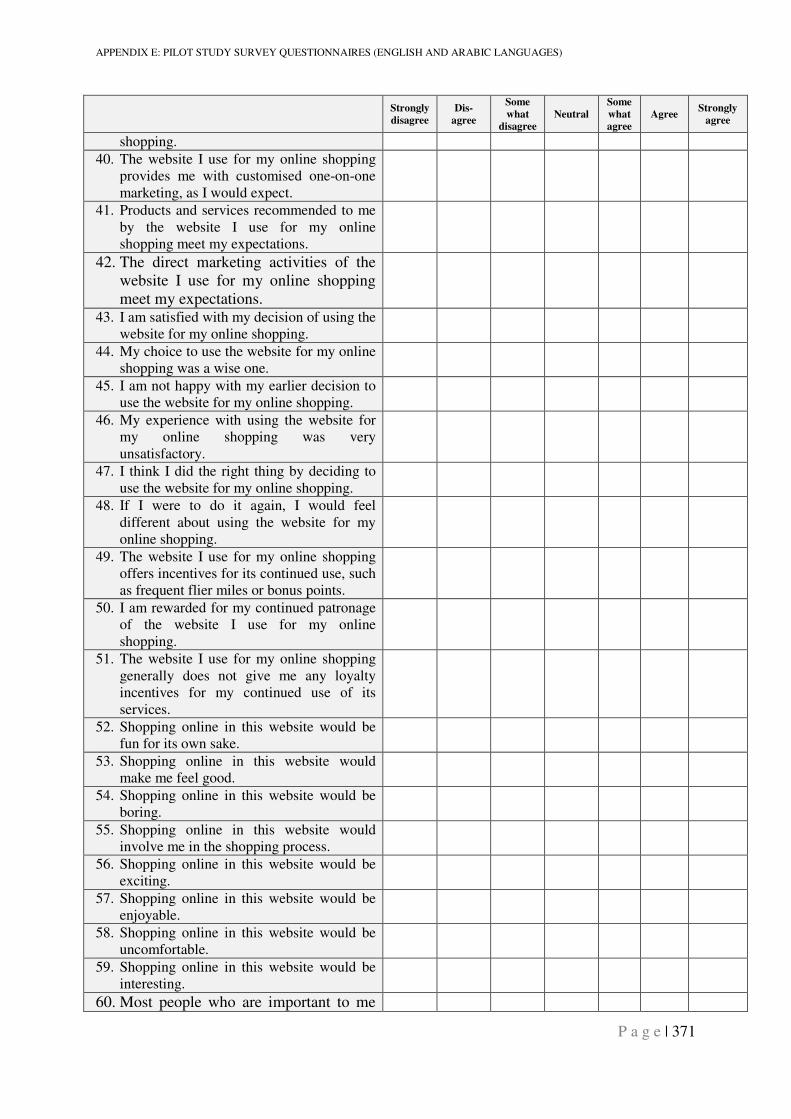
APPENDIX E: PILOT STUDY SURVEY QUESTIONNAIRES (ENGLISH AND ARABIC LANGUAGES)
P a g e | 371
Strongly
disagree
Dis-
agree
Some
what
disagree
Neutral
Some
what
agree
Agree Strongly
agree
shopping.
40. The website I use for my online shopping provides me with customised one-on-one marketing, as I would expect.
41. Products and services recommended to me by the website I use for my online shopping meet my expectations.
42. The direct marketing activities of the website I use for my online shopping meet my expectations.
43. I am satisfied with my decision of using the website for my online shopping.
44. My choice to use the website for my online shopping was a wise one.
45. I am not happy with my earlier decision to use the website for my online shopping.
46. My experience with using the website for my online shopping was very unsatisfactory.
47. I think I did the right thing by deciding to use the website for my online shopping.
48. If I were to do it again, I would feel different about using the website for my online shopping.
49. The website I use for my online shopping offers incentives for its continued use, such as frequent flier miles or bonus points.
50. I am rewarded for my continued patronage of the website I use for my online shopping.
51. The website I use for my online shopping generally does not give me any loyalty incentives for my continued use of its services.
52. Shopping online in this website would be fun for its own sake.
53. Shopping online in this website would make me feel good.
54. Shopping online in this website would be boring.
55. Shopping online in this website would involve me in the shopping process.
56. Shopping online in this website would be exciting.
57. Shopping online in this website would be enjoyable.
58. Shopping online in this website would be uncomfortable.
59. Shopping online in this website would be interesting.
60. Most people who are important to me
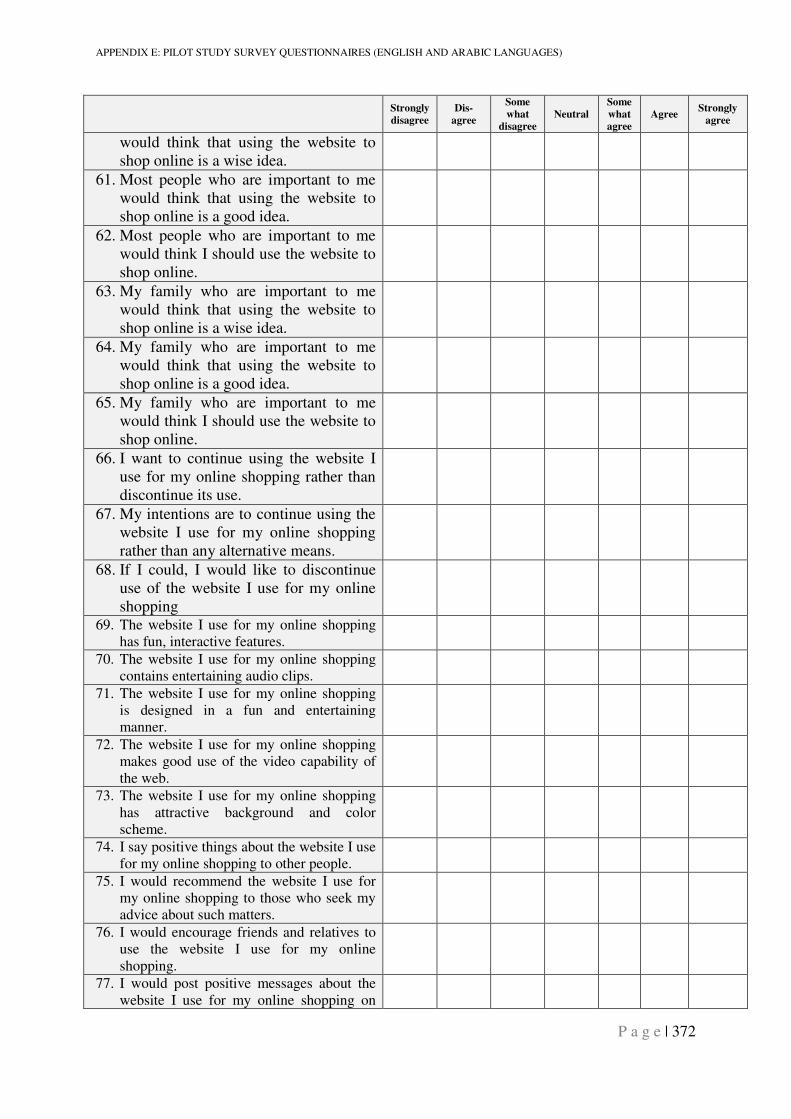
APPENDIX E: PILOT STUDY SURVEY QUESTIONNAIRES (ENGLISH AND ARABIC LANGUAGES)
P a g e | 372
Strongly
disagree
Dis-
agree
Some
what
disagree
Neutral
Some
what
agree
Agree Strongly
agree
would think that using the website to shop online is a wise idea.
61. Most people who are important to me would think that using the website to shop online is a good idea.
62. Most people who are important to me would think I should use the website to shop online.
63. My family who are important to me would think that using the website to shop online is a wise idea.
64. My family who are important to me would think that using the website to shop online is a good idea.
65. My family who are important to me would think I should use the website to shop online.
66. I want to continue using the website I use for my online shopping rather than discontinue its use.
67. My intentions are to continue using the website I use for my online shopping rather than any alternative means.
68. If I could, I would like to discontinue use of the website I use for my online shopping
69. The website I use for my online shopping has fun, interactive features.
70. The website I use for my online shopping contains entertaining audio clips.
71. The website I use for my online shopping is designed in a fun and entertaining manner.
72. The website I use for my online shopping makes good use of the video capability of the web.
73. The website I use for my online shopping has attractive background and color scheme.
74. I say positive things about the website I use for my online shopping to other people.
75. I would recommend the website I use for my online shopping to those who seek my advice about such matters.
76. I would encourage friends and relatives to use the website I use for my online shopping.
77. I would post positive messages about the website I use for my online shopping on
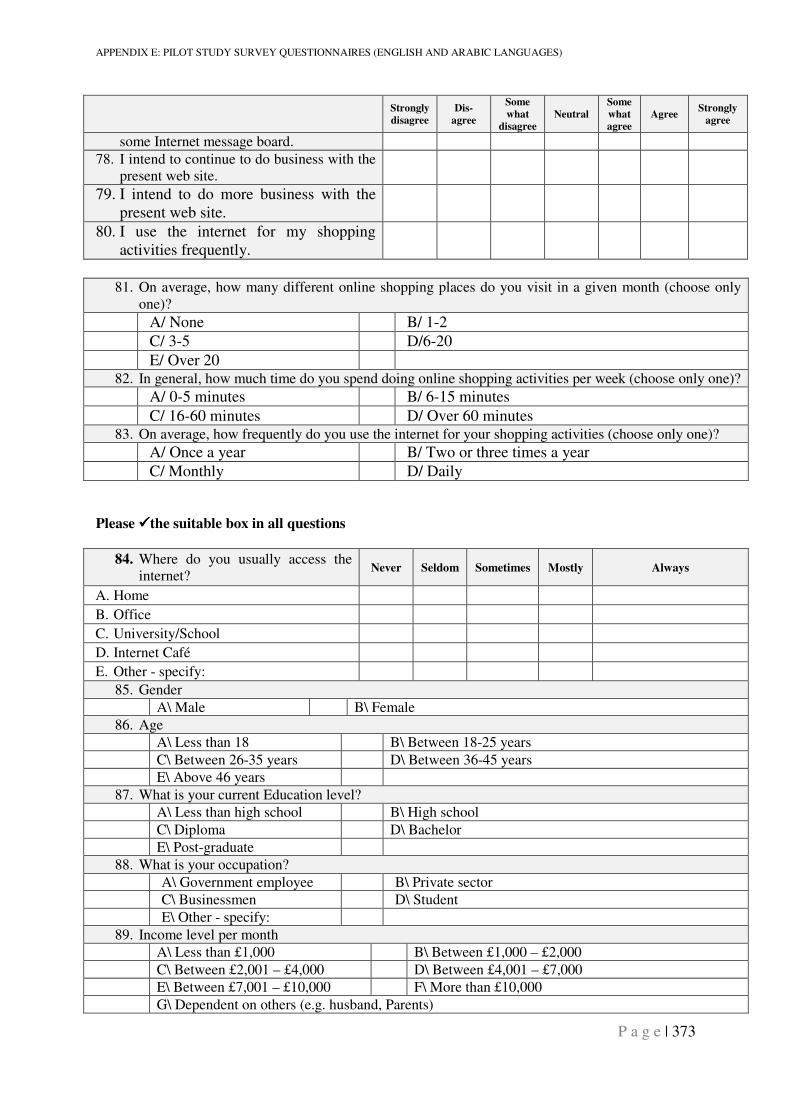
APPENDIX E: PILOT STUDY SURVEY QUESTIONNAIRES (ENGLISH AND ARABIC LANGUAGES)
P a g e | 373
Strongly
disagree
Dis-
agree
Some
what
disagree
Neutral
Some
what
agree
Agree Strongly
agree
some Internet message board.
78. I intend to continue to do business with the present web site.
79. I intend to do more business with the present web site.
80. I use the internet for my shopping activities frequently.
81. On average, how many different online shopping places do you visit in a given month (choose only
one)?
A/ None B/ 1-2 C/ 3-5 D/6-20 E/ Over 20
82. In general, how much time do you spend doing online shopping activities per week (choose only one)?
A/ 0-5 minutes B/ 6-15 minutes C/ 16-60 minutes D/ Over 60 minutes
83. On average, how frequently do you use the internet for your shopping activities (choose only one)?
A/ Once a year B/ Two or three times a year C/ Monthly D/ Daily
Please ����the suitable box in all questions
84. Where do you usually access the internet?
Never Seldom Sometimes Mostly Always
A. Home B. Office C. University/School D. Internet Café E. Other - specify:
85. Gender
A\ Male B\ Female
86. Age
A\ Less than 18 B\ Between 18-25 years
C\ Between 26-35 years D\ Between 36-45 years
E\ Above 46 years
87. What is your current Education level?
A\ Less than high school B\ High school
C\ Diploma D\ Bachelor
E\ Post-graduate
88. What is your occupation?
A\ Government employee B\ Private sector
C\ Businessmen D\ Student
E\ Other - specify:
89. Income level per month
A\ Less than £1,000 B\ Between £1,000 – £2,000
C\ Between £2,001 – £4,000 D\ Between £4,001 – £7,000
E\ Between £7,001 – £10,000 F\ More than £10,000
G\ Dependent on others (e.g. husband, Parents)
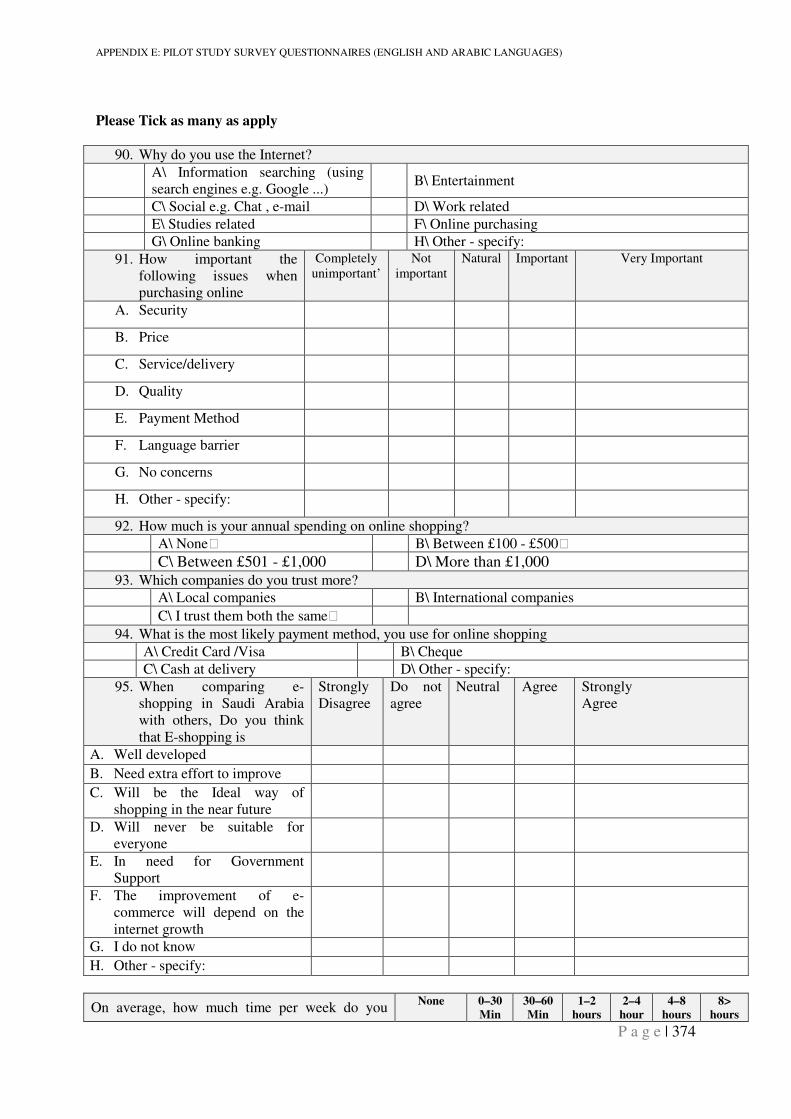
APPENDIX E: PILOT STUDY SURVEY QUESTIONNAIRES (ENGLISH AND ARABIC LANGUAGES)
P a g e | 374
Please Tick as many as apply
90. Why do you use the Internet? A\ Information searching (using
search engines e.g. Google ...)
B\ Entertainment
C\ Social e.g. Chat , e-mail D\ Work related
E\ Studies related F\ Online purchasing
G\ Online banking H\ Other - specify:
91. How important the following issues when purchasing online
Completely unimportant’
Not important
Natural Important Very Important
A. Security
B. Price
C. Service/delivery
D. Quality
E. Payment Method
F. Language barrier
G. No concerns
H. Other - specify:
92. How much is your annual spending on online shopping?
A\ None B\ Between £100 - £500
C\ Between £501 - £1,000 D\ More than £1,000 93. Which companies do you trust more?
A\ Local companies B\ International companies
C\ I trust them both the same 94. What is the most likely payment method, you use for online shopping
A\ Credit Card /Visa B\ Cheque
C\ Cash at delivery D\ Other - specify:
95. When comparing e-shopping in Saudi Arabia with others, Do you think that E-shopping is
Strongly Disagree
Do not agree
Neutral Agree Strongly Agree
A. Well developed B. Need extra effort to improve C. Will be the Ideal way of
shopping in the near future
D. Will never be suitable for everyone
E. In need for Government Support
F. The improvement of e-commerce will depend on the internet growth
G. I do not know H. Other - specify:
On average, how much time per week do you None
0–30
Min
30–60
Min
1–2
hours
2–4
hour
4–8
hours
8>
hours
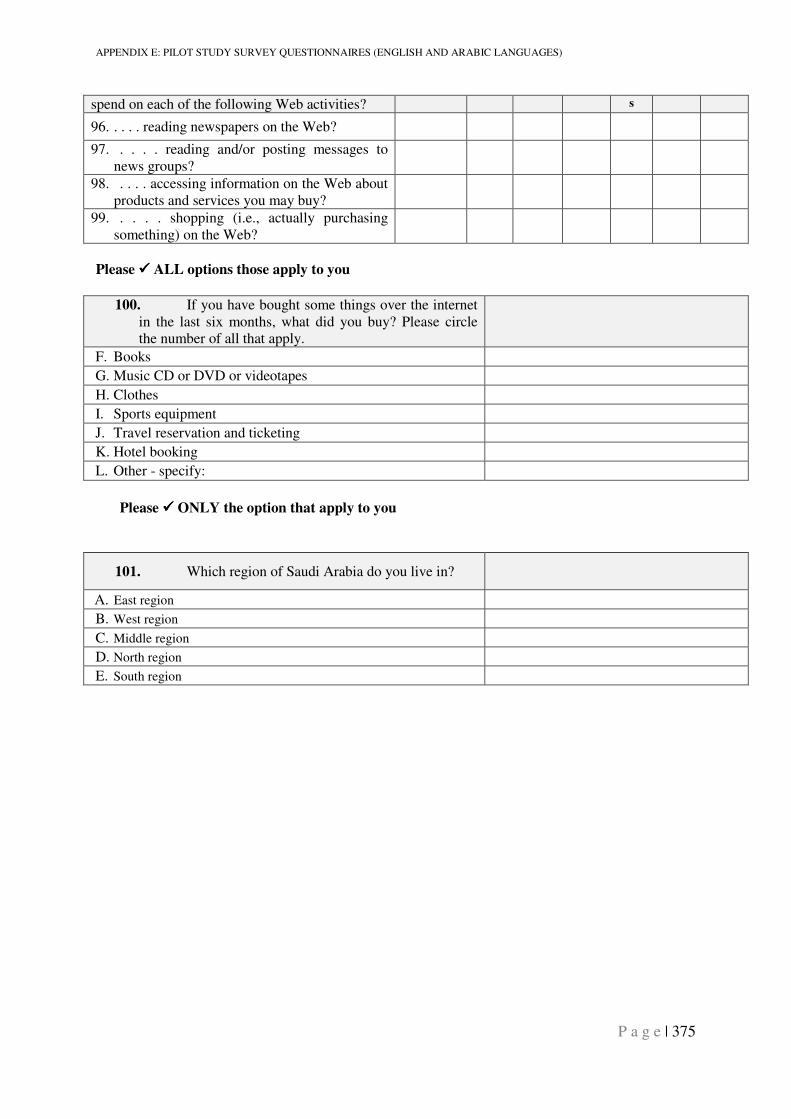
APPENDIX E: PILOT STUDY SURVEY QUESTIONNAIRES (ENGLISH AND ARABIC LANGUAGES)
P a g e | 375
spend on each of the following Web activities? s
96. . . . . reading newspapers on the Web?
97. . . . . reading and/or posting messages to news groups?
98. . . . . accessing information on the Web about products and services you may buy?
99. . . . . shopping (i.e., actually purchasing something) on the Web?
Please ���� ALL options those apply to you
100. If you have bought some things over the internet
in the last six months, what did you buy? Please circle the number of all that apply.
F. Books G. Music CD or DVD or videotapes H. Clothes I. Sports equipment J. Travel reservation and ticketing K. Hotel booking L. Other - specify:
Please ���� ONLY the option that apply to you
101. Which region of Saudi Arabia do you live in?
A. East region B. West region C. Middle region D. North region E. South region

APPENDIX E: PILOT STUDY SURVEY QUESTIONNAIRES (ENGLISH AND ARABIC LANGUAGES)
P a g e | 376
�� ��� ا� ا��� ا�
ا����) دراس� ��&�� ا�&%$# ا��"!ة �� اس��اری� ا����ق ا����و��)*
� ����ن ��� در%! ا.�آ,+راة '& %$#"! � و��. 01$� $�ه@ا ا=?,<�$ن ا=.5, و�& ی: ى آ:9ء #7 أ6 و1,& . ا.5�44! ا.�3,4ة -أ�K '& ا.5�44! ا." ��! ا.J"+دی! ?,4 اری! ا.,J+ق ا=.5, و�&.FH$دة ا.�آ,+راة .EFG ا."�$D ا.BC4 ة '& ا ,�أر%+ #�L . M< ا=
7# M��L ی754 ا.,ّ" ف = P��!، 4�L$ أRا�S4� !�T?Uا V�L !�$%Wا !#�X4.ل ا.4"�+#$ت ا[\ . M�# ن$�#7 ا.R+,4^ أن یJ,[ ق ا=?,< 7�� $#)15 ( V.إ)20 (P.$4آW !X�Rد.
ی��� ت&ی57 �5�6 م��4*� م� ) ����و��، ا����ق *( ا����)، ا�/اء ا����و��، أو ا�/اء *( ا����)ا����ق ا(*,�$ �$ن (� .أ�/@� و*�,�$ت ا�(?< *� ا��&,�م$ت، ��&$ وشاء وا��>$ر�� ��� ا�;:م$ت وا��%�4$ت *( ا���
L$دة #$ . = تJ,[ ق وR,$ 6+ی] '& اV�L !�$%W أي ?Cال. , و�&ا. %$ء ا7L !�$%W ا�T?U! '& ا.G اغ ا.4,$ح L< ا=?,<�$ن ا=.5
�e'Uت5+ن أول أ'5$رك ه& ا !$F.$4م إه�L +%أر M��L i>jة = ت�$j]4.ط ا$X�.و.+ ش" ت أن ا V,1. !�T?Uا m"� ت<�و �R�J$ن وا.@ي = ی754 أن یX$س �CJال وWا �5G5+.+%& '& ت�? �"�ُ p�Xت !�T?Uا q@7#5 رة، ه�أ%+�,r &' M$ی! . ا�1 أو ?Cا.
K� ,�Wا >L ق+J,.ل وا?,4 اری! ا+>R ��eX�. !X$ی$ ا.4F4! ا.X�",4! �,�3ی� L+ا#Rرة د+D ء$�� &' !� .اUه4
'& 1$.! و%+د أي ا?,JG$رات .�یE5 أو ت+دون ا.94ی� #7 ا.4"�+#$ت . أر%+ ا.,5 م �uآ4$ل ا=?,<�$ن Uه4�! ذ.M ش$آ ًا .�L$J# E5ت&� #"& L< ا.< ی�اDء ا.,+ا$% . : [email protected]
$ًG�? E5� .ش$آ ًا ت"$و
E6]ل ا.4[ �& /أ\+آ !�� �$01 دآ,+راة '& ا.,J+یi وا.,:$رة ا=.5, و
� .4Lx$ل�� آ��! � و�، .��ن، ا.5�44! ا.�� �3,4ة%$#"! � و
تH$ر.9 دی��9/ ا.�آ,+ر #H ف �03 ا.�آ,+راة و#3$ض �$.:$#"!
�� .4Lx$ل�آ��! � و ��%$#"! � و،� ا.5�44! ا.�3,4ة .��ن، 265242 1895 (0) 44+ ت�G+ن
�� [email protected] ای4
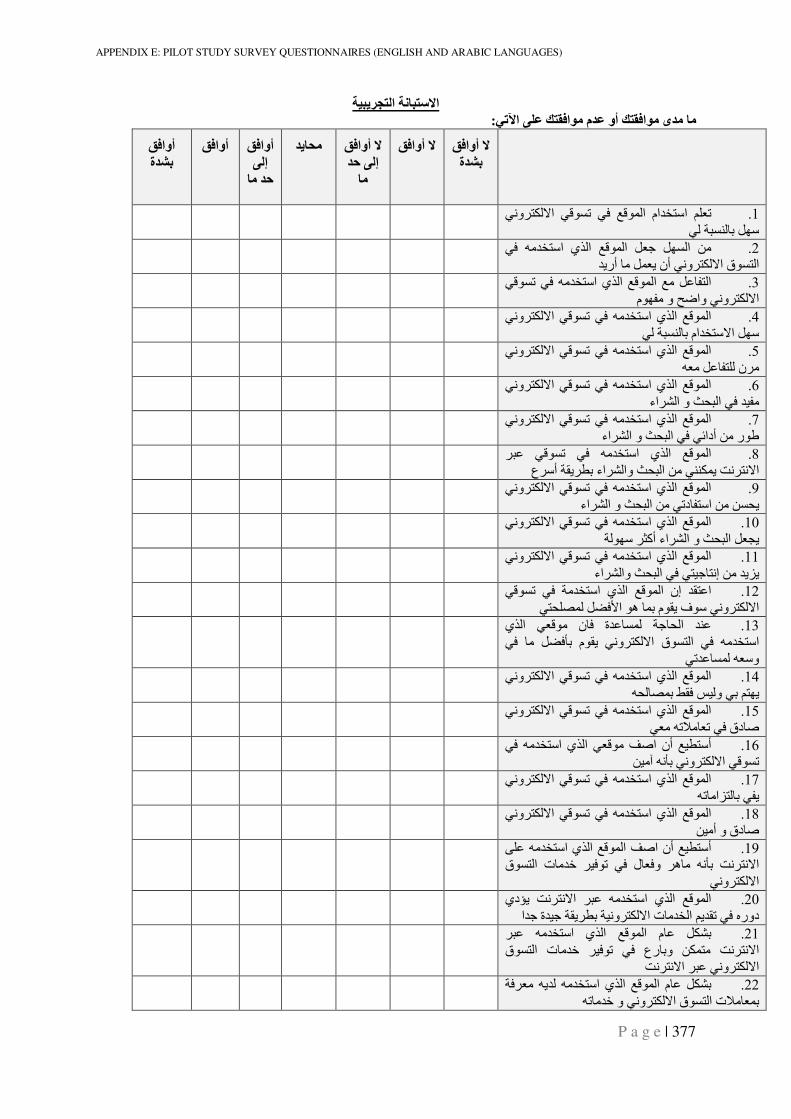
APPENDIX E: PILOT STUDY SURVEY QUESTIONNAIRES (ENGLISH AND ARABIC LANGUAGES)
P a g e | 377
ا�س�($�� ا��4ی(�� :م$ م:ى م�ا�>�C أو *:م م�ا�>�B,* C اAت�
G�أوا � �/:ة
G�أوا � G�أوا � : B�إ
م$
أوا�G م?$ی: B�إ : م$
G�أوا G�أوا �/:ة
1. ' ^R+4.ام ا�z,?ا E�"ت &�& تR+J& ا=.5, و&. !>J�.$� �F?
2. &' P#�z,?ا.@ي ا ^R+4.ا �"% �FJ.7 ا# ا.,J+ق ا=.5, و�& أن ی"4� #$ أری�
3. &R+Jت &' P#�z,?ا.@ي ا ^R+4.ا ^# �L$G,.ا ا=.5, و�& واض} و #FG+م
4. &�ا.R+4^ ا.@ي ا?,P#�z '& تR+J& ا=.5, و&. !>J�.$� ام�z,?=ا �F?
5. &�ا.R+4^ ا.@ي ا?,P#�z '& تR+J& ا=.5, و P"# �L$G,�. ن #
6. &�ا.R+4^ ا.@ي ا?,P#�z '& تR+J& ا=.5, و�� '& ا.<03 و ا.H اءG#
7. &�ا.R+4^ ا.@ي ا?,P#�z '& تR+J& ا=.5, و 6+ر #7 أدائ& '& ا.<03 و ا.H اء
8. L &R+Jت &' P#�z,?ا.@ي ا ^R+4.ا >�K ی��54& #7 ا.<03 وا.H اء �j یX! أ? ع ,� ا=
9. &�ا.R+4^ ا.@ي ا?,P#�z '& تR+J& ا=.5, و ی7J3 #7 ا?,G$دت& #7 ا.<03 و ا.H اء
10. &�ا.R+4^ ا.@ي ا?,P#�z '& تR+J& ا=.5, و!.+F? ~اء أآ H.ا.<03 و ا � ی:"
11. �& ا.R+4^ ا.@ي ا?,P#�z '& تR+J& ا=.5, و�,& '& ا.<03 وا.H اء%$,� ی9ی� #7 إ
12. &R+Jت &' !#�z,?ا.@ي ا ^R+4.إن ا �X,Lا&,3�S4. �e'Uم �4$ ه+ ا+Xف ی+? &� ا=.5, و
��L ا.�L$J4. !%$3ة '$ن #+R"& ا.@ي .13 &' $# �e'�� م+Xی &�ا?,P#�z '& ا.,J+ق ا=.5, و
و?"�L$J4. Pت&
14. ' P#�z,?ا.@ي ا ^R+4.ا &�& تR+J& ا=.5, وP3.$S4� �X' p� یE,F �& و.
15. &�ا.R+4^ ا.@ي ا?,P#�z '& تR+J& ا=.5, و&"# Pدق '& ت"$#]ت$D
16. &' P#�z,?ا.@ي ا &"R+# �Dأن ا ^�j,?أ7�#� P��� &� تR+J& ا=.5, و
17. &�ا.R+4^ ا.@ي ا?,P#�z '& تR+J& ا=.5, وP9ا#$ت,.$� &Gی
.R+4^ ا.@ي ا?,P#�z '& تR+J& ا=.5, و�& ا .187� D$دق و أ#
19. V�L P#�z,?ا.@ي ا ^R+4.ا �Dأن ا ^�j,?أ�P #$ه و'"$ل '& ت+'� \�#$ت ا.,J+ق �� K� ,�ا=
&� ا=.5, و
�K یCدي .20 ,�ا.R+4^ ا.@ي ا?,L P#�z< ا=��ة %�ا% !Xی j� !�� دورq '& ت�XیE ا.�z#$ت ا=.5, و
21. >L P#�z,?ا.@ي ا ^R+4.م ا$L �5H��K #,754 و�$رع '& ت+'� \�#$ت ا.,J+ق ,�ا=
K� ,� ا=.5, و�& L< ا=
22. !' "# Pی�. P#�z,?ا.@ي ا ^R+4.م ا$L �5H�Pو \�#$ت &� �4"$#]ت ا.,J+ق ا=.5, و
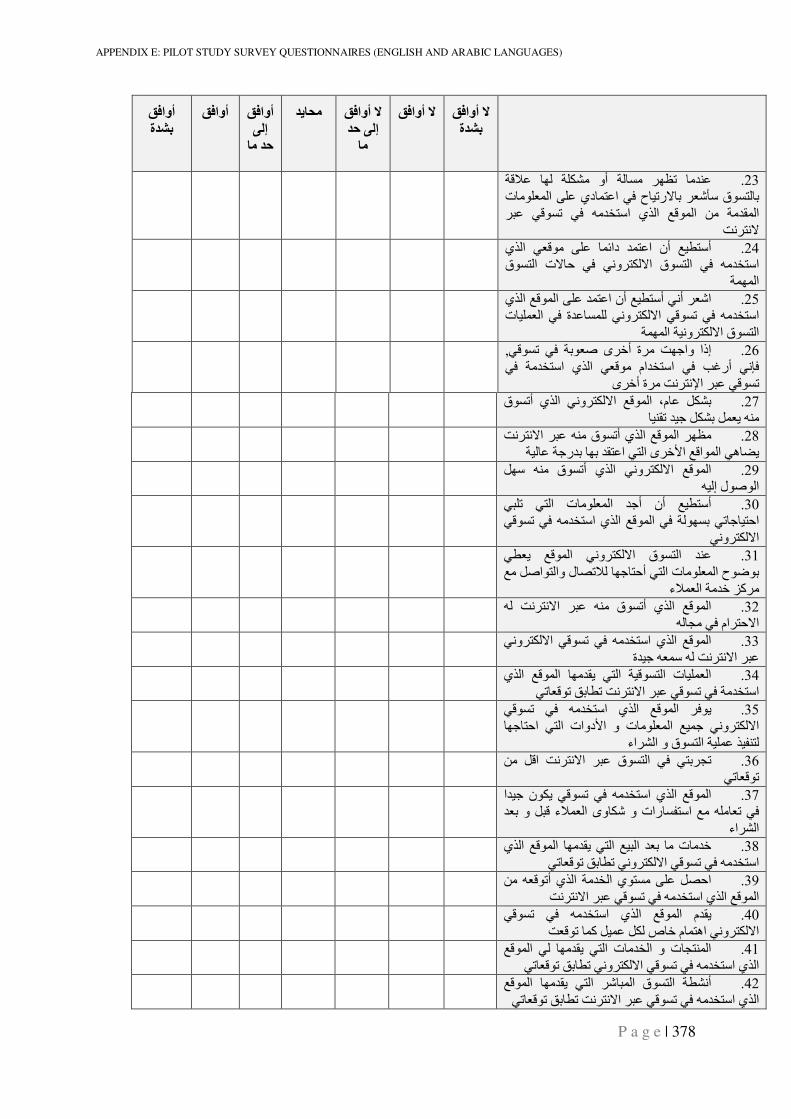
APPENDIX E: PILOT STUDY SURVEY QUESTIONNAIRES (ENGLISH AND ARABIC LANGUAGES)
P a g e | 378
G�أوا � �/:ة
G�أوا � G�أوا � : B�إ
م$
أوا�G م?$ی: B�إ : م$
G�أوا G�أوا �/:ة
23. !R[L $F. !�5H# أو !.$J# Fت� $#��L& اL,4$دي V�L ا.4"�+#$ت �$.,J+ق ?�ش" �$=رت�$ح '
>L &R+Jت &' P#�z,?ا.@ي ا ^R+4.7 ا# !#�X4.اK� ,�=
�^ أن اL,�4 دائR+# V�L $4"& ا.@ي .24j,?أا?,P#�z '& ا.,J+ق ا=.5, و�& '& 1$=ت ا.,J+ق
!4F4.ا
�^ أن اV�L �4,L ا.R+4^ ا.@ي .25j,?أ &�اش" أL$J4�. &��ة '& ا."�4�$ت ا?,P#�z '& تR+J& ا=.5, و
!4F4.ا !�� ا.,J+ق ا=.5, و
26. &R+Jت &' !�+"D ة أ\ ى # KF%إذا وا , &' !#�z,?ا.@ي ا &"R+# ام�z,?ا &' �rأر &�u'
�K # ة أ\ ى ,�Wا >L &R+Jت
5� L$م، ا.R+4^ ا=.5, و�& ا.@ي أتJ+ق .27H�$��Xت ��% �5H� � #�P ی"4
�F�# K ا.R+4^ ا.@ي أتJ+ق .28 ,�#�L P< ا= !�.$L !%ر�� $F� �X,Lى ا.,& ا \Uا ^Rه& ا.4+ا$eی
29. �F? P�# ق+Jا.@ي أت &�ا.R+4^ ا=.5, و P� ا.+D+ل إ.
�^ أن أ%� ا.4"�+#$ت ا.,& ت�<& .30j,?أ &R+Jت &' P#�z,?ا.@ي ا ^R+4.ا &' !.+FJ� &ت$%$�ا1,
&� ا=.5, و
31. &�ا.R+4^ ی"��L &j ا.,J+ق ا=.5, و ^# �Dل وا.,+ا$Sت[. $F%$,1ض+ح ا.4"�+#$ت ا.,& أ+�
# آ9 \�#! ا."4]ء
32. P. K� ,�ا.R+4^ ا.@ي أتJ+ق #�L P< ا=P.$:# &' ا=1, ام
33. &�ا.R+4^ ا.@ي ا?,P#�z '& تR+J& ا=.5, و��ة% P"4? P. K� ,� L< ا=
34. $F#�Xا.,& ی !�R+J,.ت ا$�ا.R+4^ ا.@ي ا."�4�K تi�$j ت+R"$ت& ,� ا?,�z#! '& تL &R+J< ا=
35. &R+Jت &' P#�z,?ا.@ي ا ^R+4.ی+' ا $F%$,1دوات ا.,& اUا.4"�+#$ت و ا ^�4% &�ا=.5, و
�4�! ا.,J+ق و ا.H اءL @�G�,.
36. 7# �Rا K� ,�ت: �,& '& ا.,J+ق L< ا= ت+R"$ت&
37. z,?ا.@ي ا ^R+4.ا ا���#P '& تR+J& ی5+ن %� و �"� >R رات و ش5$وى ا."4]ء$JG,?ا ^# P�#$"ت &'
ا.H اء
\�#$ت #$ �"� ا.<�^ ا.,& یF#�X$ ا.R+4^ ا.@ي .38 ا?,P#�z '& تR+J& ا=.5, و�& تi�$j ت+R"$ت&
39. 7# P"R+ا.@ي أت !#�z.ي ا+,J# V�L �S1ا ,��Kا.R+4^ ا.@ي ا?,P#�z '& تL &R+J< ا=
40. &R+Jت &' P#�z,?ا.@ي ا ^R+4.م ا�XیK"R+آ4$ ت ��4L � ا=.5, و�& اه,4$م \$ص .5
41. ^R+4.ا &. $F#�Xت ا.,& ی$#�z.ا.�4,:$ت و ا ا.@ي ا?,P#�z '& تR+J& ا=.5, و�& تi�$j ت+R"$ت&
42. ^R+4.ا $F#�Xق ا.4<$ش ا.,& ی+J,.ا !jH�أ >L &R+Jت &' P#�z,?ت&ا.@ي ا$"R+ت i�$jت K� ,� ا=
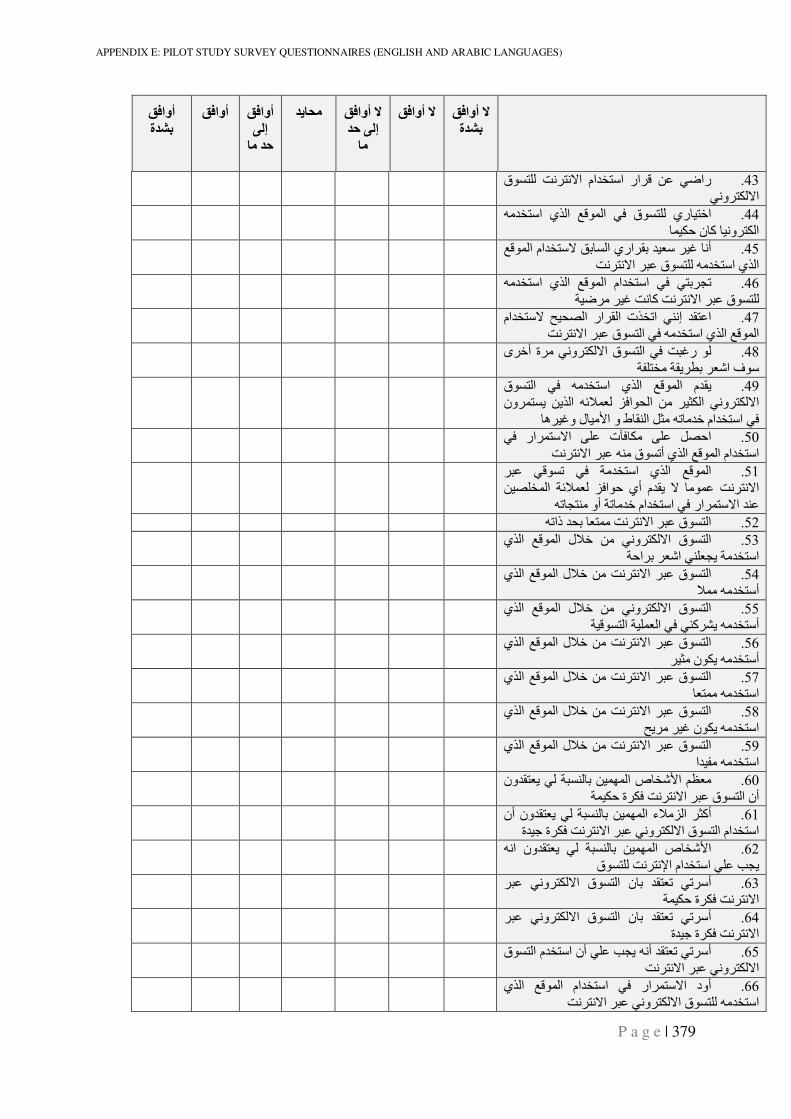
APPENDIX E: PILOT STUDY SURVEY QUESTIONNAIRES (ENGLISH AND ARABIC LANGUAGES)
P a g e | 379
G�أوا � �/:ة
G�أوا � G�أوا � : B�إ
م$
أوا�G م?$ی: B�إ : م$
G�أوا G�أوا �/:ة
�J,�. K+ق .43 ,�راض& R 7L ار ا?,�zام ا=&� ا=.5, و
44. P#�z,?ا.@ي ا ^R+4.ق '& ا+J,�. ري$�ا\,$4��$ آ$ن 51� ا.5, و
45. ^R+4.ام ا�z,?= i�$J.اري ا X� ��"? �r $�أK� ,� ا.@ي ا?,J,�. P#�z+ق L< ا=
.R+4^ ا.@ي ا?,P#�z ت: �,& '& ا?,�zام ا .46!�� # ضr K��K آ$ ,� .�,J+ق L< ا=
3�} =?,�zام .47S.ار ا X.ت ا@zات &��ا�X,L إK� ,� ا.R+4^ ا.@ي ا?,P#�z '& ا.,J+ق L< ا=
.+ رK>r '& ا.,J+ق ا=.5, و�& # ة أ\ ى .48!G�,z# !Xی j� "ف اش+?
ی�Xم ا.R+4^ ا.@ي ا?,P#�z '& ا.,J+ق .49ا=.5, و�& ا.5~� #7 ا.3+ا'9 ."4]ئP ا.@ی7 یJ,4 ون
� ه$rل و$�#Uط و ا$X�.ا �~# Pام \�#$ت�z,?ا &'
� V�L #5$'�ت V�L ا=?,4 ار '& .50S1اK� ,� ا?,�zام ا.R+4^ ا.@ي أتJ+ق #�L P< ا=
51. >L &R+Jت &' !#�z,?ا.@ي ا ^R+4.ا�4L K+#$ = ی�Xم أي 1+ا'9 . ,��7 ا=S�z4.4]ئ! ا"
Pام \�#$ت! أو #�,:$ت�z,?ا=?,4 ار '& ا ��L
52. P4,"$ ��3 ذات# K� ,� ا.,J+ق L< ا=
ا.,J+ق ا=.5, و�& #7 \]ل ا.R+4^ ا.@ي .53 ا?,�z#! ی:"��& اش" � ا1!
�K #7 \]ل ا.R+4^ ا.@ي .54 ,�ا.,J+ق L< ا=[4# P#�z,?أ
, و�& #7 \]ل ا.R+4^ ا.@ي ا.,J+ق ا=.5 .55!�R+J,.ا !� أ?,P#�z یH آ�& '& ا."�4
�K #7 \]ل ا.R+4^ ا.@ي .56 ,�ا.,J+ق L< ا= � أ?,P#�z ی5+ن #~
�K #7 \]ل ا.R+4^ ا.@ي .57 ,�ا.,J+ق L< ا=$",4# P#�z,?ا
�K #7 \]ل ا.R+4^ ا.@ي .58 ,�ا.,J+ق L< ا= # �r ی5+ن P#�z,?ی}ا
�K #7 \]ل ا.R+4^ ا.@ي .59 ,�ا.,J+ق L< ا=��اG# P#�z,?ا
4�J�.$� 7<! .& ی",�Xون .60F4.ص ا$zشUا E�"#!4��K '5 ة 51 ,� أن ا.,J+ق L< ا=
4�J�.$� 7<! .& ی",�Xون أن .61F4.أآ~ ا.9#]ء ا�K '5 ة %��ة ,� ا?,�zام ا.,J+ق ا=.5, و�& L< ا=
4�J�.$� 7<! .& ی",�Xون ا�P ا .62F4.ص ا$zشU�J,�. K+ق ,�Wام ا�z,?ا &�L � ی:
63. >L &�أ? ت& ت",�X �$ن ا.,J+ق ا=.5, و!4��K '5 ة 51 ,� ا=
64. >L &�أ? ت& ت",�X �$ن ا.,J+ق ا=.5, و�K '5 ة %��ة ,� ا=
أ? ت& ت",�X أ�P ی:� �L& أن ا?,�zم ا.,J+ق .65�K ا=.5, ,� و�& L< ا=
أود ا=?,4 ار '& ا?,�zام ا.R+4^ ا.@ي .66 K� ,� ا?,J,�. P#�z+ق ا=.5, و�& L< ا=
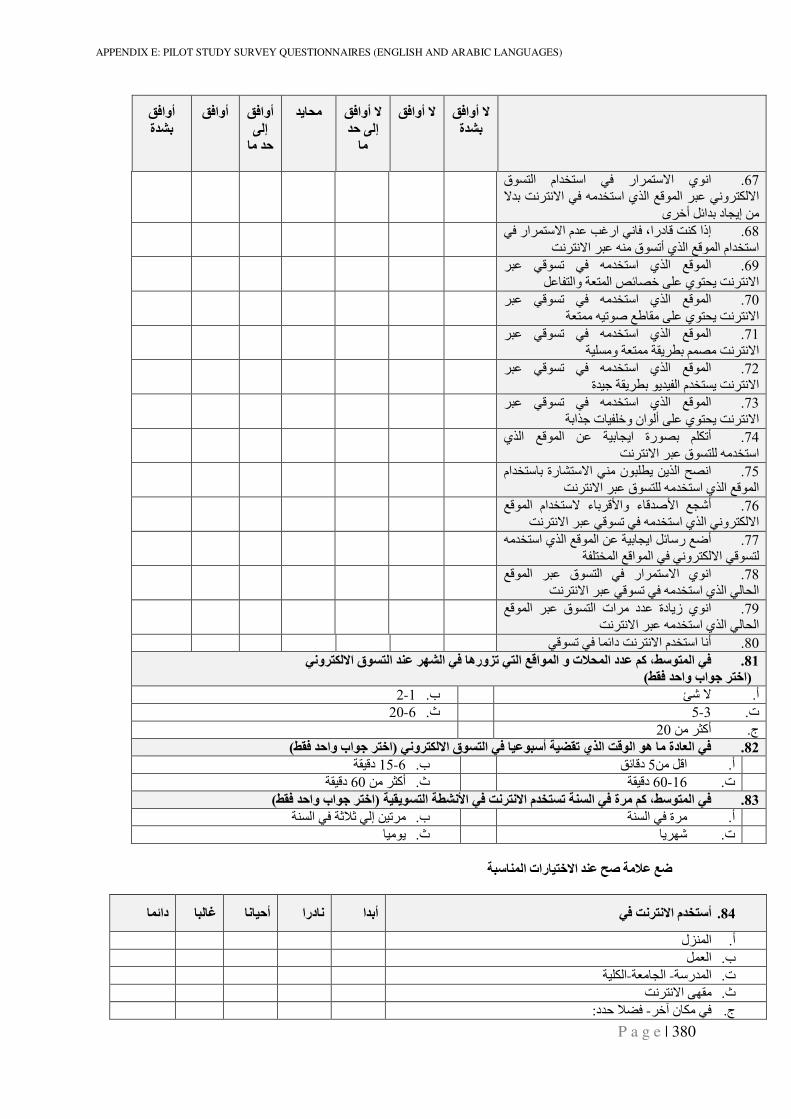
APPENDIX E: PILOT STUDY SURVEY QUESTIONNAIRES (ENGLISH AND ARABIC LANGUAGES)
P a g e | 380
G�أوا � �/:ة
G�أوا � G�أوا � : B�إ
م$
أوا�G م?$ی: B�إ : م$
G�أوا G�أوا �/:ة
ا�+ي ا=?,4 ار '& ا?,�zام ا.,J+ق .67 =�� K� ,�ا=.5, و�& L< ا.R+4^ ا.@ي ا?,P#�z '& ا=
#7 إی:$د ��ائ� أ\ ى
� �Lم ا= .68rار &�?,4 ار '& إذا آ�R K$درا، '$K� ,� ا?,�zام ا.R+4^ ا.@ي أتJ+ق #�L P< ا=
69. >L &R+Jت &' P#�z,?ا.@ي ا ^R+4.ا�L$G,.ئ� ا.4,"! وا$S\ V�L ی3,+ي K� ,� ا=
70. >L &R+Jت &' P#�z,?ا.@ي ا ^R+4.ا!",4# P��K ی3,+ي D ^6$X# V�L+ت ,� ا=
71. >L &R+Jت &' P#�z,?ا.@ي ا ^R+4.ا�!ا�J#4,"! و# !Xی j� E4S# K� ,�=
72. >L &R+Jت &' P#�z,?ا.@ي ا ^R+4.ا��ة% !Xی j� +ی��G.م ا�z,Jی K� ,� ا=
73. >L &R+Jت &' P#�z,?ا.@ي ا ^R+4.ا�$ت %@ا�!G�\أ.+ان و V�L ی3,+ي K� ,� ا=
أتS� E�5+رة ای:$��! 7L ا.R+4^ ا.@ي .74��Kا?,J,�. P#�z+ق L< ا= ,
ا�S} ا.@ی7 ی�j<+ن #�& ا=?,H$رة �$?,�zام .75K� ,� ا.R+4^ ا.@ي ا?,J,�. P#�z+ق L< ا=
76. ^R+4.ام ا�z,?= ء$� RUء وا$R�DUأش:^ اK� ,� ا=.5, و�& ا.@ي ا?,P#�z '& تL &R+J< ا=
77. P#�z,?ا.@ي ا ^R+4.7 اL !�أض^ ر?$ئ� ای:$�' &� & ا.4+اR^ ا.R+J,.!G�,z4& ا=.5, و
78. ^R+4.ا >L ق+J,.ي ا=?,4 ار '& ا+�اK� ,� ا.3$.& ا.@ي ا?,P#�z '& تL &R+J< ا=
79. ^R+4.ا >L ق+J,.د # ات ا�L ي زی$دة+�اK� ,� ا.3$.& ا.@ي ا?,L P#�z< ا=
80. &R+Jدائ4$ '& ت K� ,� أ�$ ا?,�zم ا=
*%: ا����ق ا����و���� ا����سL، آ� *:د ا� .81M/�ا ��وره$ Oت ���ا PQا���ت و اR?�
)L<� :ج�اب وا )اخ� 2-1 . ب = ش� . أ
20-6 . ث 5-3 . ت
20أآ~ #7 . ج
)اخ� ج�اب وا: �>L(�� ا�&$دة م$ ه� ا��Q) ا�Yي ت>��W أس(�*�$ �� ا����ق ا����و�� .82
� #7 . أ R5ا iئ$R15-6 . ب د !X�Rد
�X! 60-16 . ت R60أآ~ #7 . ث د !X�Rد
)اخ� ج�اب وا: �>L(�� ا����سL، آ� مة �� ا��%� ت��;:م ا����) �� ا]�/@� ا����ی>�� .83
# ت�7 إ.& B[B! '& ا.�J! . ب # ة '& ا.�J! . أ
ی+#�$ . ث شF ی$ . ت
Pم� ضR* ]# :%* %$س(� ا�خ��$رات��ا
84. �� (� دا_�$ ^$�($ أ�$�$ �$درا أ�:ا أس�;:م ا���
ا.9�4ل . أ
ا."4� . ب
ا.�5�!-ا.:$#"! -ا.�4ر?! . ت
�K . ث ,� #VFX ا=
:'e] �1د -'& #5$ن �\ . ج
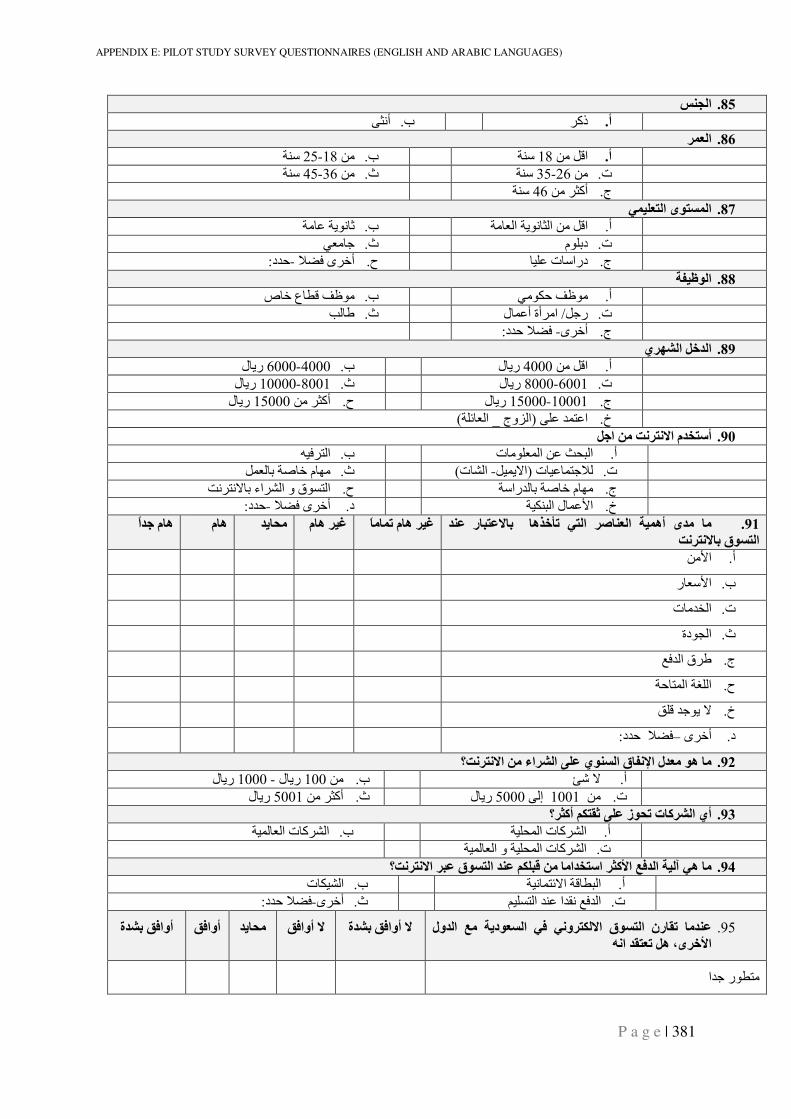
APPENDIX E: PILOT STUDY SURVEY QUESTIONNAIRES (ENGLISH AND ARABIC LANGUAGES)
P a g e | 381
ا�%4` .85
أ�~V . ب ذآ . أ
86. ا�&�
� #7 . أ R25-18#7 . ب ?�! 18ا !�?
?�! 45-36#7 . ث ?�! 35-26#7 . ت
?�! 46أآ~ #7 . ج
ا�����ى ا��&,��� .87
� #7 ا.~$�+ی! ا."$#! . أ Rب ا . !#$L !ی+�$B
%$#"& . ث مد��+ . ت
�$ . ج �L ح درا?$ت . [e' �1د-أ\ ى :
88. �7�c��ا
#+�� jR$ع \$ص . ب #+�� 51+#& . أ
� . ث ا# أة أ4L$ل / ر%� . ت .$6
:'e] �1د -أ\ ى . ج
ي .89M/�ا e:خ�ا
� #7 . أ Rری$ل 6000-4000 . ب ری$ل 4000ا
ری$ل 10000-8001 . ث ری$ل 8000-6001 . ت
ری$ل 15000أآ~ #7 . ح ری$ل 15000-10001 . ج
)ا."$ئ�!_ ا.9وج (V�L اL,�4 . خ
90. eم� اج (� أس�;:م ا���
ا., '�P . ب ا.<7L 03 ا.4"�+#$ت . أ
�$ت . ت L$4,%[.)��4� . ث )ا.H$ت -ا=ی4".$� !D$\ م$F#
�K . ح #F$م \$D! �$.�را?! . ج ,� ا.,J+ق و ا.H اء �$=
: �1د-أ\ ى 'e] . د ا4LU$ل ا.<�5�! . خ
: م$ م:ى أه��� ا�&%$# ا��� ت6خYه$ �$�*�($ر *% .91(� ا����ق �$���
ه$م ج:ًا ه$م م?$ی: ^� ه$م ^� ه$م ت�$مَ$
اU#7 . أ
اU?"$ر . ب
ا.�z#$ت . ت
ا.:+دة . ث
6 ق ا.�'^ . ج
ا.�[! ا.4,$1! . ح
= ی+%� i�R . خ
:'e] �1د–أ\ ى . د
م$ ه� م&:ل ا7�j$ق ا��%�ي *,B ا�/اء م� ا����)؟ .92
ری$ل 1000 -ری$ل 100#7 . ب = ش� . أ
ری$ل 5001أآ~ #7 . ث ری$ل 5000إ.V 1001#7 . ت
؟ .93lأآ ���<! B,* آ$ت ت?�ز أي ا�/
ا.H آ$ت ا."$.4�! . ب ا.H آ$ت ا.�34�! . أ
ا.H آ$ت ا.�34�! و ا."$.4�! . ت
اس�;:ام$ م� Q(,�� *%: ا����ق *( ا����)؟ .94lا]آ P�:�ا ���n م$ ه�
�! . أ ��5$تا. . ب ا.<R$j! ا=ئ,$4H
�E . ت �J,.ا ��L ا�X� : 'e] �1د-أ\ ى . ث ا.�'^
*%:م$ ت>$رن ا����ق ا����و�� �� ا��&�دی� مP ا�:ول .95 ا]خى، هe ت&�>: ا�5
أوا�G �/:ة أوا�G م?$ی: � أوا�G � أوا�G �/:ة
#,j+ر %�ا
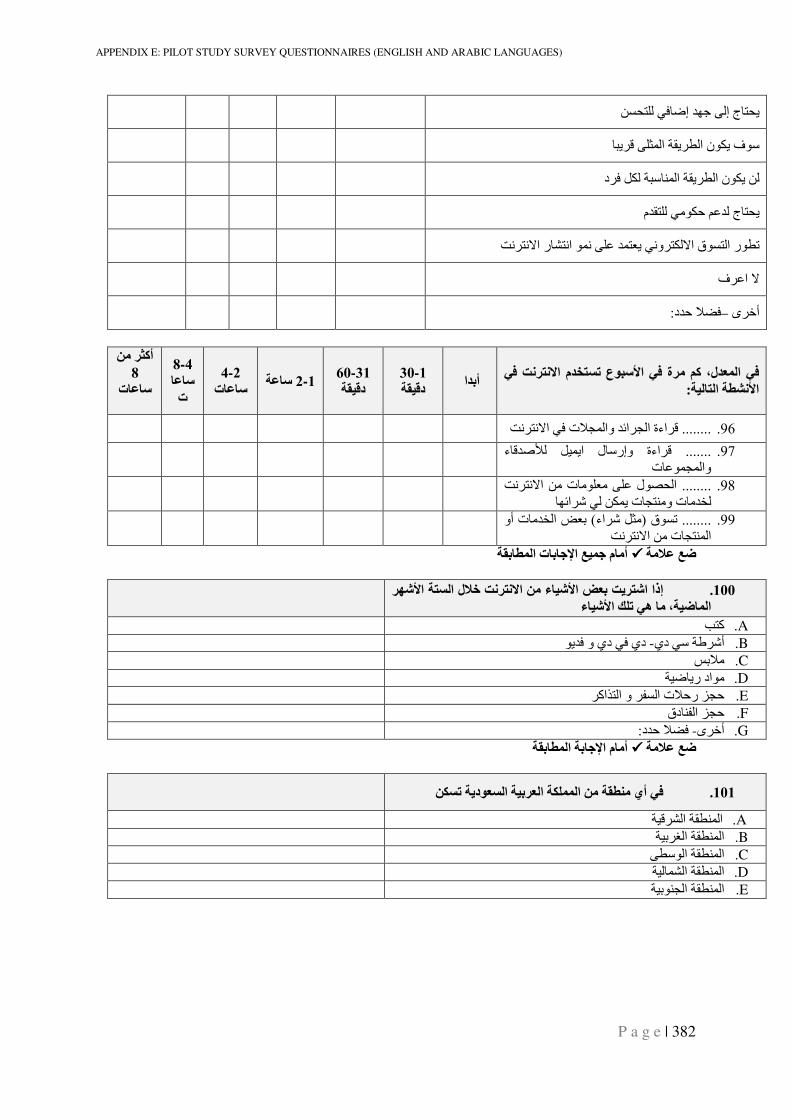
APPENDIX E: PILOT STUDY SURVEY QUESTIONNAIRES (ENGLISH AND ARABIC LANGUAGES)
P a g e | 382
7J3,�. &'$إض �F% V.ی3,$ج إ
?+ف ی5+ن ا.j یX! ا.R V�~4 ی<$
ی5+ن ا.j یX! ا.$�4?<! .5� ' د.7
ی3,$ج .��X,�. &#+51 ELم
K� ,��4+ ا�,H$ر ا= V�L �4,"ی &� تj+ر ا.,J+ق ا=.5, و
= اL ف
:'e] �1د–أ\ ى
�� (��� ا��&:ل، آ� مة �� ا]س(�ع ت��;:م ا��� :ا]�/@� ا��$���
أ�:ا1-30
�<�Qد
31-60 �<�Qد
س$*� 1-22-4
س$*$ت
4-8 س$*$ ت
م� lأآ8
س$*$ت
96. ........K� ,� R اءة ا.: ائ� وا.4:]ت '& ا=
� .R�Dx$ء ....... .97�R اءة وإر?$ل ای4 وا.L+4:4$ت
98. ........ K� ,�ا.S3+ل V�L #"�+#$ت #7 ا=$Fت و#�,:$ت ی754 .& ش ائ$#�z.
�"m ا.�z#$ت أو )#~� ش اء(تJ+ق ........ .99K� ,� ا.�4,:$ت #7 ا=
أم$م ج��P اjج$�$ت ا��@$�>����� ضR* Pم�
100. Mا]ش ����ل اRخ (�إذا اش�ی) �&p ا]ش�$ء م� ا��� ا��$ض��، م$ ه� ت,C ا]ش�$ء
A. � آ,
B. دي '& دي و '�ی+ -أش 6! ?& دي
C. p�[#
D. !� #+اد ری$ض
E. و ا.,@اآ GJ.9:1 ر1]ت ا
F. :1دق$�G.9 ا
G. �1د -أ\ ى [e' :
أم$م اjج$�� ا��@$�>����� ضR* Pم�
�� أي م%@>� م� ا���,�� ا�&��� ا��&�دی� ت��� .101
A. !�R H.ا !Xj�4.ا
B. !� ا.Xj�4! ا.[ �
C. Vj?+.ا !Xj�4.ا
D. !�.$4H.ا !Xj�4.ا
E. !� ا.Xj�4! ا.:�+�
APPENDIX F: PILOT STUDY
P a g e | 383
APPENDIX F: PILOT STUDY
A preliminary questionnaire for this pilot study was prepared for the following reasons:
• To detect any problems in the research design and instrumentation.
• To delete any irrelevant items in the questionnaire for the study.
• To test the applicability of the measurement scales. The aim of this pilot study was to ensure that the items in the survey used for each construct were understandable to the respondents to ensure a high level of content validity (Churchill, 1979). I have asked most of the participants to identify the questions or items that were not clear to them, and I provided advice on modifying those items, especially as the survey was available in both Arabic and English languages. After validating the pilot study, the final survey considered four important criteria in its design: speed, information, collection, costs and non-response rate (Tull and Hawkins, 1993). Data collection for this pilot study took place between December 24, 2006 and January 24, 2007, in Saudi Arabia and London. A draft paper survey was made, which was then pre-tested by two people to test its clarity and layout. After the revision, an informal pre-test was given to 35 people. 22 valid surveys returned back (data were pooled from 22 people: 11 in Saudi Arabia and 11 in London), 6 returned incomplete but with good feedback, and 7 were not received. Participants were asked to apply the questions to the websites that they used most frequently for their e-shopping when considering buying products, services, or searching for information. Likewise, participants were asked to examine the survey instrument, and comment on its format and length, as well as the wording of each individual item. This was to measure participants’ thoughts and opinions about e-shopping. Ambiguous items would be considered for rewording in the final study based on participant feedback. Classification and demographic data such as age, gender, Internet usage, purchase intention, income, on-line issues, and on-line spending were collected at the beginning of the session. This would be reversed on the final data collection to be at the end of the session in order to save time and allow participants to concentrate on the main constructs items. The 22 people gave their opinions of the survey, and the way the questions were worded. This valuable feedback would be considered later when revising the final survey. The following observations summarize the feedback gained from the pilot or pre-test survey:
• The survey was slightly long.
• It is hard to have the commitment of people to participate.
• Layout, length, language and time are very important items when doing the survey.
• Only the English version was used in the pilot study, even in Saudi Arabia.
• Some questions were deemed less important, and others were not clear and caused confusion, such as the use of the phrases wise to use and good to use.
• Similarly worded questions might cause confusion because of the translation process if left, especially in the final survey where two versions will exist (Arabic and English).
The pilot study survey was collected from a sample of 22 in Saudi Arabia and UK. They represent online users who are undergraduates, postgraduates, and working professionals and experts. The UK samples represent some postgraduate Saudi students who are studying in the UK, as well as other non-Saudi students at Brunel University. 81.8% of the participants were
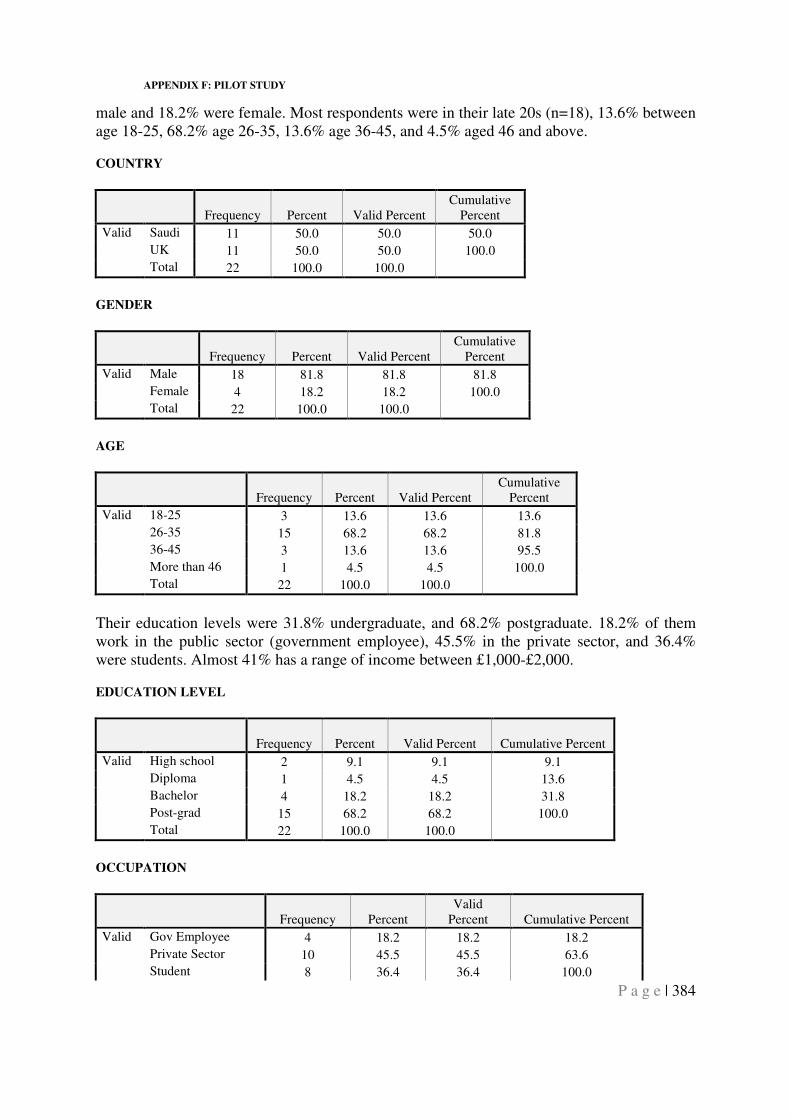
APPENDIX F: PILOT STUDY
P a g e | 384
male and 18.2% were female. Most respondents were in their late 20s (n=18), 13.6% between age 18-25, 68.2% age 26-35, 13.6% age 36-45, and 4.5% aged 46 and above.
COUNTRY
Frequency Percent Valid Percent Cumulative
Percent
Valid Saudi 11 50.0 50.0 50.0
UK 11 50.0 50.0 100.0
Total 22 100.0 100.0
GENDER
Frequency Percent Valid Percent Cumulative
Percent
Valid Male 18 81.8 81.8 81.8
Female 4 18.2 18.2 100.0
Total 22 100.0 100.0
AGE
Frequency Percent Valid Percent Cumulative
Percent
Valid 18-25 3 13.6 13.6 13.6
26-35 15 68.2 68.2 81.8
36-45 3 13.6 13.6 95.5
More than 46 1 4.5 4.5 100.0
Total 22 100.0 100.0
Their education levels were 31.8% undergraduate, and 68.2% postgraduate. 18.2% of them work in the public sector (government employee), 45.5% in the private sector, and 36.4% were students. Almost 41% has a range of income between £1,000-£2,000.
EDUCATION LEVEL
Frequency Percent Valid Percent Cumulative Percent
Valid High school 2 9.1 9.1 9.1
Diploma 1 4.5 4.5 13.6
Bachelor 4 18.2 18.2 31.8
Post-grad 15 68.2 68.2 100.0
Total 22 100.0 100.0
OCCUPATION
Frequency Percent Valid
Percent Cumulative Percent
Valid Gov Employee 4 18.2 18.2 18.2
Private Sector 10 45.5 45.5 63.6
Student 8 36.4 36.4 100.0
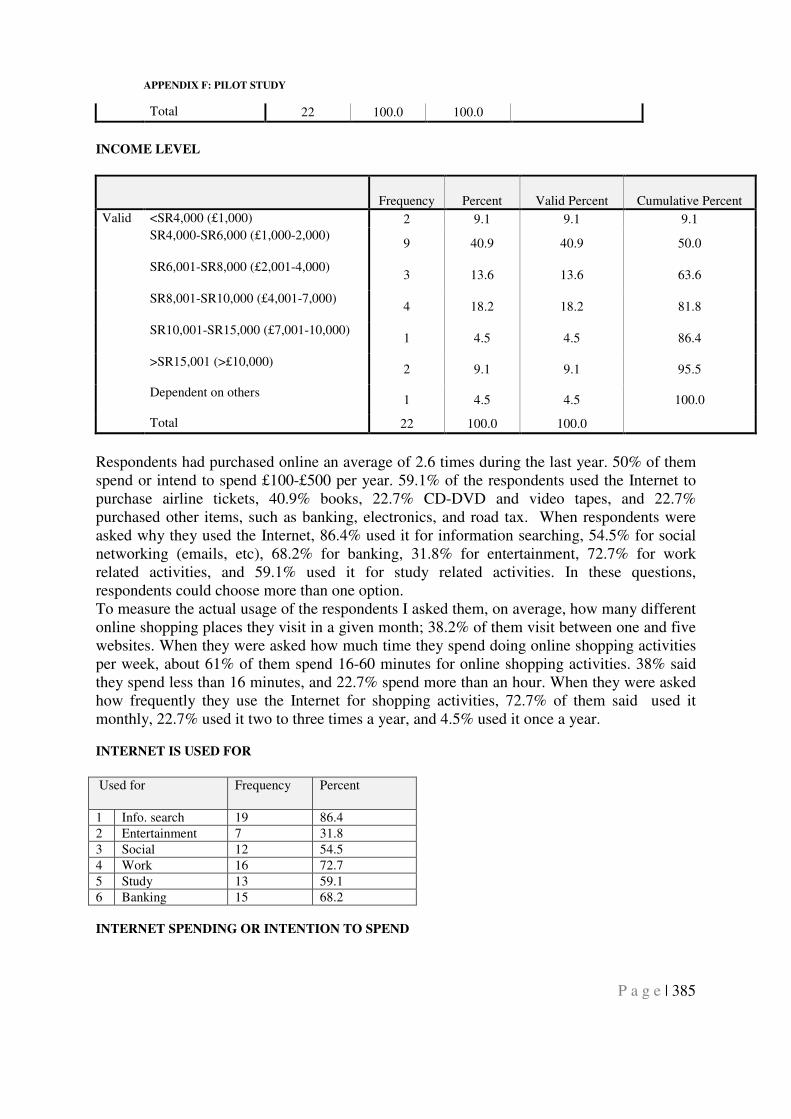
APPENDIX F: PILOT STUDY
P a g e | 385
Total 22 100.0 100.0
INCOME LEVEL
Frequency Percent Valid Percent Cumulative Percent
Valid <SR4,000 (£1,000) 2 9.1 9.1 9.1
SR4,000-SR6,000 (£1,000-2,000) 9 40.9 40.9 50.0
SR6,001-SR8,000 (£2,001-4,000) 3 13.6 13.6 63.6
SR8,001-SR10,000 (£4,001-7,000) 4 18.2 18.2 81.8
SR10,001-SR15,000 (£7,001-10,000) 1 4.5 4.5 86.4
>SR15,001 (>£10,000)
2 9.1 9.1 95.5
Dependent on others
1 4.5 4.5 100.0
Total 22 100.0 100.0
Respondents had purchased online an average of 2.6 times during the last year. 50% of them spend or intend to spend £100-£500 per year. 59.1% of the respondents used the Internet to purchase airline tickets, 40.9% books, 22.7% CD-DVD and video tapes, and 22.7% purchased other items, such as banking, electronics, and road tax. When respondents were asked why they used the Internet, 86.4% used it for information searching, 54.5% for social networking (emails, etc), 68.2% for banking, 31.8% for entertainment, 72.7% for work related activities, and 59.1% used it for study related activities. In these questions, respondents could choose more than one option. To measure the actual usage of the respondents I asked them, on average, how many different online shopping places they visit in a given month; 38.2% of them visit between one and five websites. When they were asked how much time they spend doing online shopping activities per week, about 61% of them spend 16-60 minutes for online shopping activities. 38% said they spend less than 16 minutes, and 22.7% spend more than an hour. When they were asked how frequently they use the Internet for shopping activities, 72.7% of them said used it monthly, 22.7% used it two to three times a year, and 4.5% used it once a year.
INTERNET IS USED FOR
Used for Frequency Percent
1 Info. search 19 86.4
2 Entertainment 7 31.8
3 Social 12 54.5
4 Work 16 72.7
5 Study 13 59.1
6 Banking 15 68.2
INTERNET SPENDING OR INTENTION TO SPEND
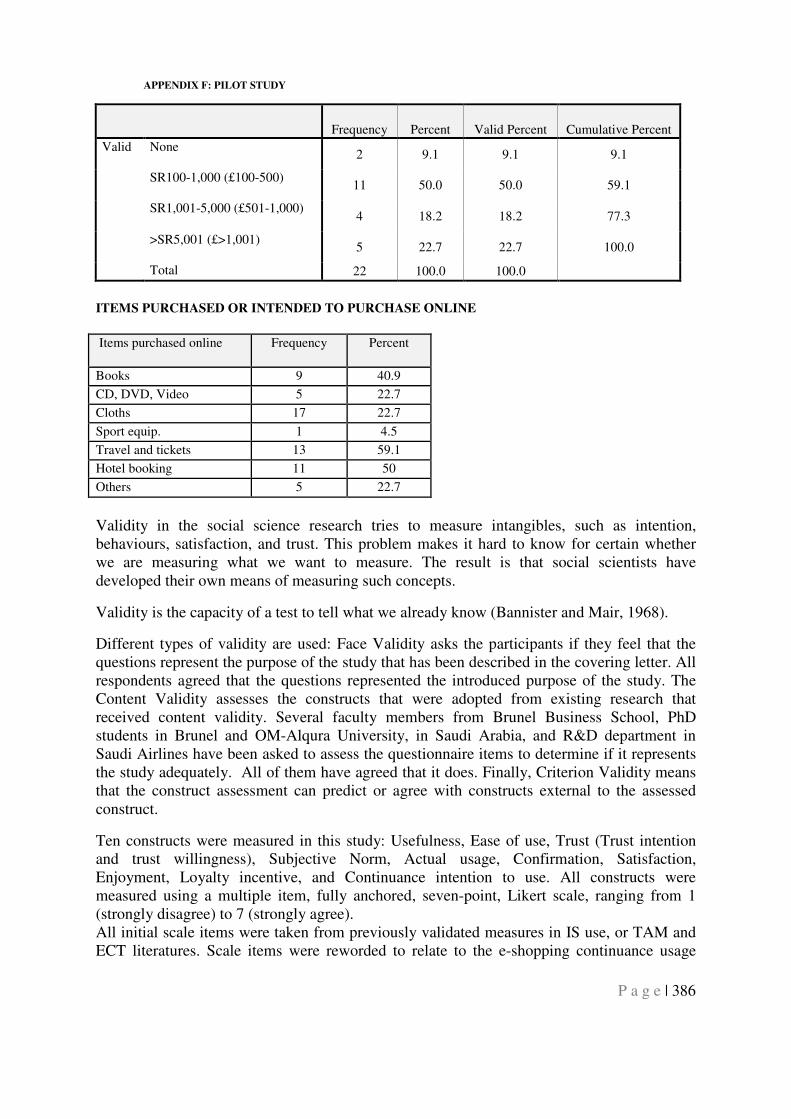
APPENDIX F: PILOT STUDY
P a g e | 386
Frequency Percent Valid Percent Cumulative Percent
Valid None
2 9.1 9.1 9.1
SR100-1,000 (£100-500)
11 50.0 50.0 59.1
SR1,001-5,000 (£501-1,000) 4 18.2 18.2 77.3
>SR5,001 (£>1,001)
5 22.7 22.7 100.0
Total 22 100.0 100.0
ITEMS PURCHASED OR INTENDED TO PURCHASE ONLINE
Items purchased online Frequency Percent
Books 9 40.9
CD, DVD, Video 5 22.7
Cloths 17 22.7
Sport equip. 1 4.5
Travel and tickets 13 59.1
Hotel booking 11 50
Others 5 22.7
Validity in the social science research tries to measure intangibles, such as intention, behaviours, satisfaction, and trust. This problem makes it hard to know for certain whether we are measuring what we want to measure. The result is that social scientists have developed their own means of measuring such concepts.
Validity is the capacity of a test to tell what we already know (Bannister and Mair, 1968).
Different types of validity are used: Face Validity asks the participants if they feel that the questions represent the purpose of the study that has been described in the covering letter. All respondents agreed that the questions represented the introduced purpose of the study. The Content Validity assesses the constructs that were adopted from existing research that received content validity. Several faculty members from Brunel Business School, PhD students in Brunel and OM-Alqura University, in Saudi Arabia, and R&D department in Saudi Airlines have been asked to assess the questionnaire items to determine if it represents the study adequately. All of them have agreed that it does. Finally, Criterion Validity means that the construct assessment can predict or agree with constructs external to the assessed construct.
Ten constructs were measured in this study: Usefulness, Ease of use, Trust (Trust intention and trust willingness), Subjective Norm, Actual usage, Confirmation, Satisfaction, Enjoyment, Loyalty incentive, and Continuance intention to use. All constructs were measured using a multiple item, fully anchored, seven-point, Likert scale, ranging from 1 (strongly disagree) to 7 (strongly agree). All initial scale items were taken from previously validated measures in IS use, or TAM and ECT literatures. Scale items were reworded to relate to the e-shopping continuance usage
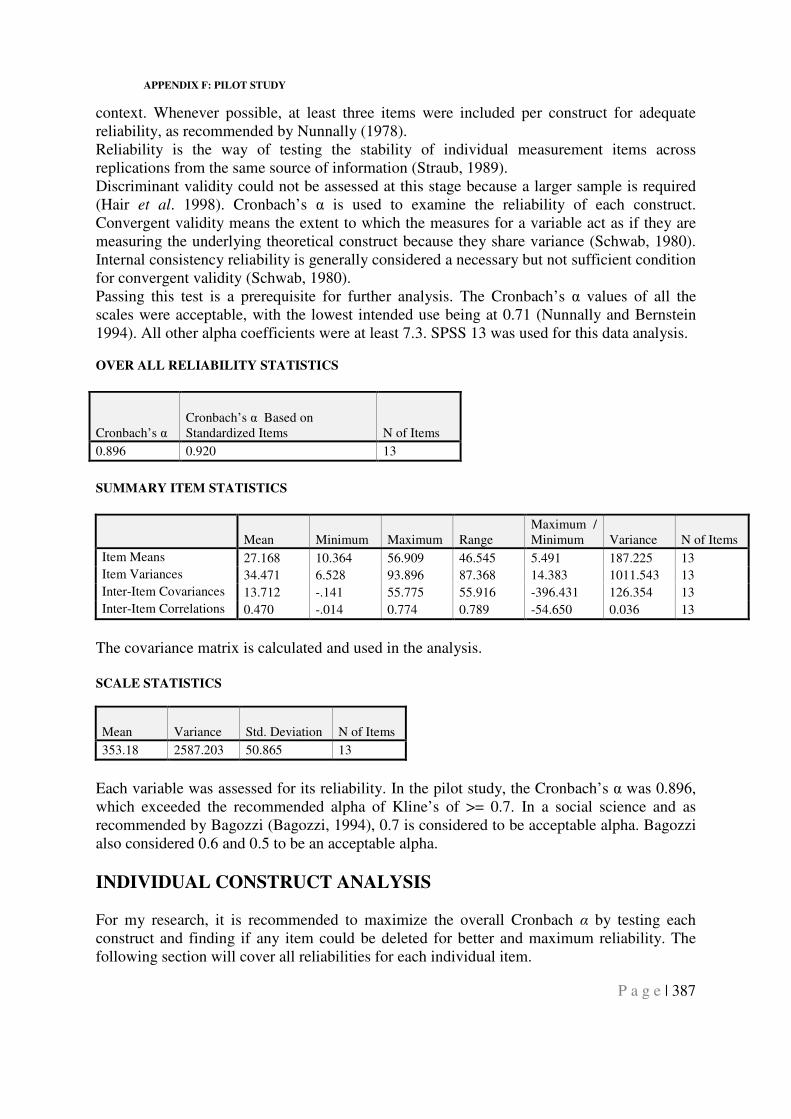
APPENDIX F: PILOT STUDY
P a g e | 387
context. Whenever possible, at least three items were included per construct for adequate reliability, as recommended by Nunnally (1978). Reliability is the way of testing the stability of individual measurement items across replications from the same source of information (Straub, 1989). Discriminant validity could not be assessed at this stage because a larger sample is required (Hair et al. 1998). Cronbach’s α is used to examine the reliability of each construct. Convergent validity means the extent to which the measures for a variable act as if they are measuring the underlying theoretical construct because they share variance (Schwab, 1980). Internal consistency reliability is generally considered a necessary but not sufficient condition for convergent validity (Schwab, 1980). Passing this test is a prerequisite for further analysis. The Cronbach’s α values of all the scales were acceptable, with the lowest intended use being at 0.71 (Nunnally and Bernstein 1994). All other alpha coefficients were at least 7.3. SPSS 13 was used for this data analysis.
OVER ALL RELIABILITY STATISTICS
Cronbach’s α Cronbach’s α Based on Standardized Items N of Items
0.896 0.920 13
SUMMARY ITEM STATISTICS
Mean Minimum Maximum Range Maximum / Minimum Variance N of Items
Item Means 27.168 10.364 56.909 46.545 5.491 187.225 13
Item Variances 34.471 6.528 93.896 87.368 14.383 1011.543 13
Inter-Item Covariances 13.712 -.141 55.775 55.916 -396.431 126.354 13
Inter-Item Correlations 0.470 -.014 0.774 0.789 -54.650 0.036 13
The covariance matrix is calculated and used in the analysis. SCALE STATISTICS
Mean Variance Std. Deviation N of Items
353.18 2587.203 50.865 13
Each variable was assessed for its reliability. In the pilot study, the Cronbach’s α was 0.896, which exceeded the recommended alpha of Kline’s of >= 0.7. In a social science and as recommended by Bagozzi (Bagozzi, 1994), 0.7 is considered to be acceptable alpha. Bagozzi also considered 0.6 and 0.5 to be an acceptable alpha.
INDIVIDUAL CONSTRUCT ANALYSIS For my research, it is recommended to maximize the overall Cronbach α by testing each construct and finding if any item could be deleted for better and maximum reliability. The following section will cover all reliabilities for each individual item.
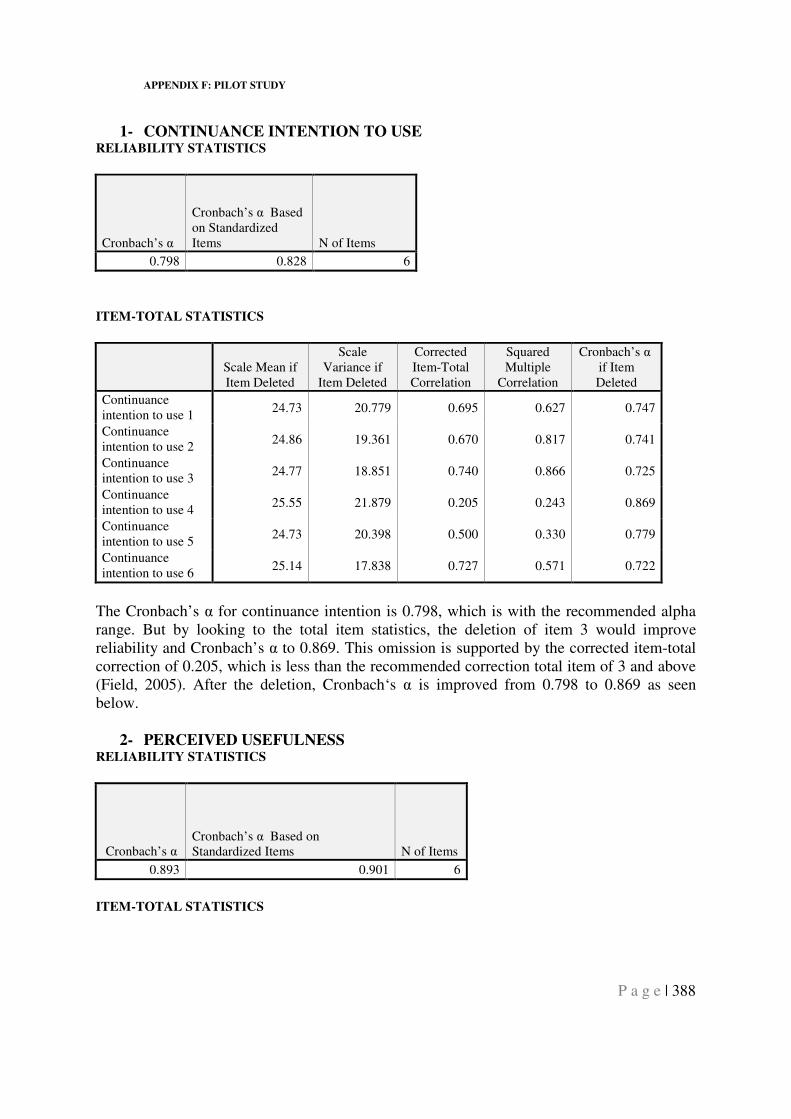
APPENDIX F: PILOT STUDY
P a g e | 388
1- CONTINUANCE INTENTION TO USE
RELIABILITY STATISTICS
Cronbach’s α
Cronbach’s α Based on Standardized Items N of Items
0.798 0.828 6
ITEM-TOTAL STATISTICS
Scale Mean if Item Deleted
Scale Variance if
Item Deleted
Corrected Item-Total Correlation
Squared Multiple
Correlation
Cronbach’s α if Item Deleted
Continuance intention to use 1
24.73 20.779 0.695 0.627 0.747
Continuance intention to use 2
24.86 19.361 0.670 0.817 0.741
Continuance intention to use 3
24.77 18.851 0.740 0.866 0.725
Continuance intention to use 4
25.55 21.879 0.205 0.243 0.869
Continuance intention to use 5
24.73 20.398 0.500 0.330 0.779
Continuance intention to use 6
25.14 17.838 0.727 0.571 0.722
The Cronbach’s α for continuance intention is 0.798, which is with the recommended alpha range. But by looking to the total item statistics, the deletion of item 3 would improve reliability and Cronbach’s α to 0.869. This omission is supported by the corrected item-total correction of 0.205, which is less than the recommended correction total item of 3 and above (Field, 2005). After the deletion, Cronbach‘s α is improved from 0.798 to 0.869 as seen below.
2- PERCEIVED USEFULNESS RELIABILITY STATISTICS
Cronbach’s α Cronbach’s α Based on Standardized Items N of Items
0.893 0.901 6
ITEM-TOTAL STATISTICS
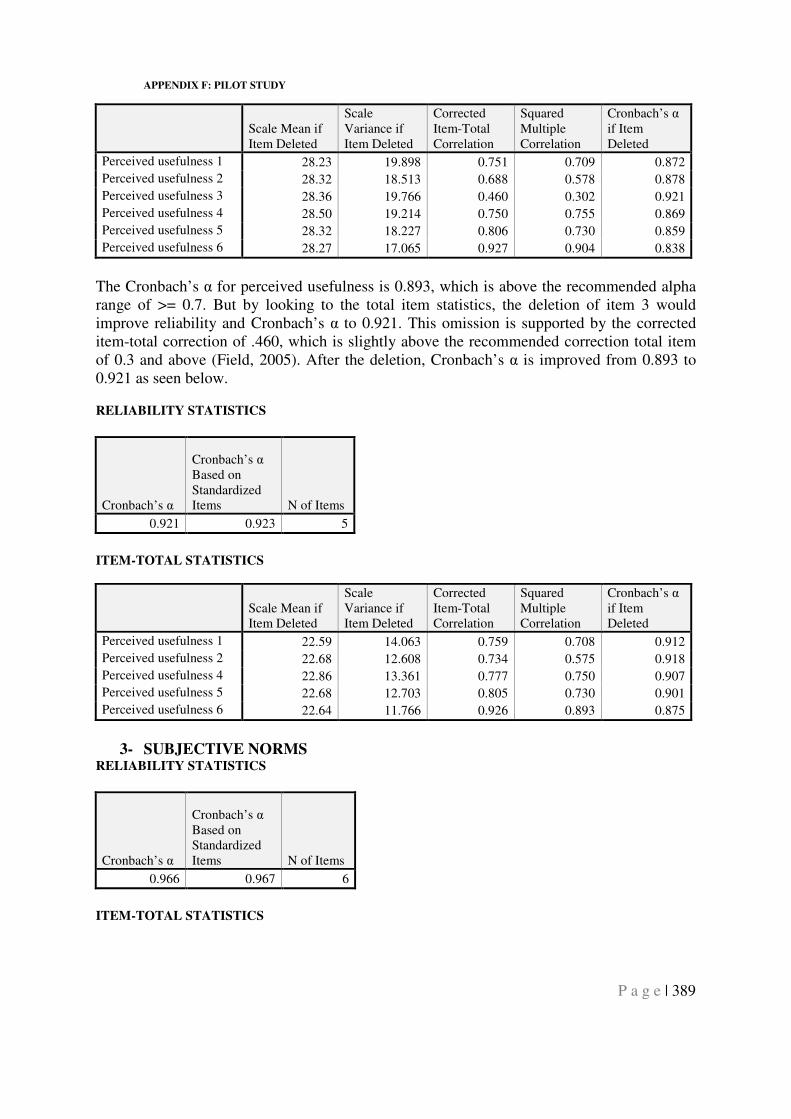
APPENDIX F: PILOT STUDY
P a g e | 389
Scale Mean if Item Deleted
Scale Variance if Item Deleted
Corrected Item-Total Correlation
Squared Multiple Correlation
Cronbach’s α if Item Deleted
Perceived usefulness 1 28.23 19.898 0.751 0.709 0.872
Perceived usefulness 2 28.32 18.513 0.688 0.578 0.878
Perceived usefulness 3 28.36 19.766 0.460 0.302 0.921
Perceived usefulness 4 28.50 19.214 0.750 0.755 0.869
Perceived usefulness 5 28.32 18.227 0.806 0.730 0.859
Perceived usefulness 6 28.27 17.065 0.927 0.904 0.838
The Cronbach’s α for perceived usefulness is 0.893, which is above the recommended alpha range of >= 0.7. But by looking to the total item statistics, the deletion of item 3 would improve reliability and Cronbach’s α to 0.921. This omission is supported by the corrected item-total correction of .460, which is slightly above the recommended correction total item of 0.3 and above (Field, 2005). After the deletion, Cronbach’s α is improved from 0.893 to 0.921 as seen below.
RELIABILITY STATISTICS
Cronbach’s α
Cronbach’s α Based on Standardized Items N of Items
0.921 0.923 5
ITEM-TOTAL STATISTICS
Scale Mean if Item Deleted
Scale Variance if Item Deleted
Corrected Item-Total Correlation
Squared Multiple Correlation
Cronbach’s α if Item Deleted
Perceived usefulness 1 22.59 14.063 0.759 0.708 0.912
Perceived usefulness 2 22.68 12.608 0.734 0.575 0.918
Perceived usefulness 4 22.86 13.361 0.777 0.750 0.907
Perceived usefulness 5 22.68 12.703 0.805 0.730 0.901
Perceived usefulness 6 22.64 11.766 0.926 0.893 0.875
3- SUBJECTIVE NORMS RELIABILITY STATISTICS
Cronbach’s α
Cronbach’s α Based on Standardized Items N of Items
0.966 0.967 6
ITEM-TOTAL STATISTICS
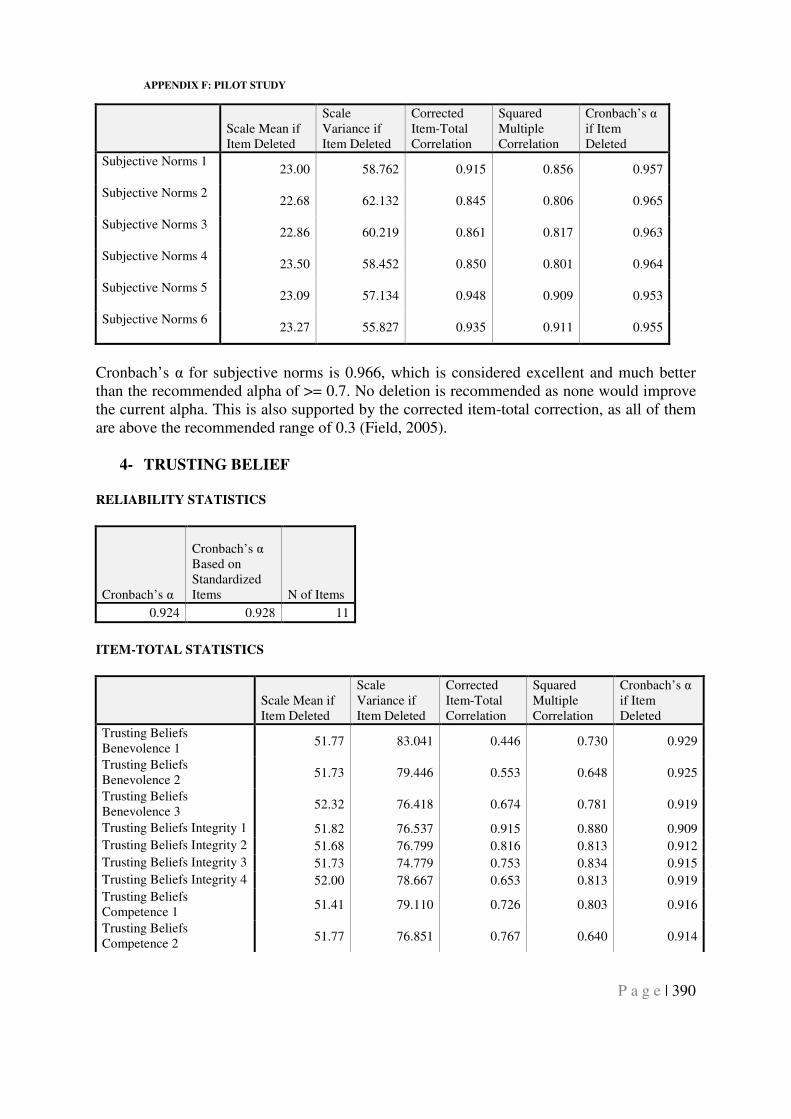
APPENDIX F: PILOT STUDY
P a g e | 390
Scale Mean if Item Deleted
Scale Variance if Item Deleted
Corrected Item-Total Correlation
Squared Multiple Correlation
Cronbach’s α if Item Deleted
Subjective Norms 1 23.00 58.762 0.915 0.856 0.957
Subjective Norms 2 22.68 62.132 0.845 0.806 0.965
Subjective Norms 3 22.86 60.219 0.861 0.817 0.963
Subjective Norms 4 23.50 58.452 0.850 0.801 0.964
Subjective Norms 5 23.09 57.134 0.948 0.909 0.953
Subjective Norms 6 23.27 55.827 0.935 0.911 0.955
Cronbach’s α for subjective norms is 0.966, which is considered excellent and much better than the recommended alpha of >= 0.7. No deletion is recommended as none would improve the current alpha. This is also supported by the corrected item-total correction, as all of them are above the recommended range of 0.3 (Field, 2005).
4- TRUSTING BELIEF
RELIABILITY STATISTICS
Cronbach’s α
Cronbach’s α Based on Standardized Items N of Items
0.924 0.928 11
ITEM-TOTAL STATISTICS
Scale Mean if Item Deleted
Scale Variance if Item Deleted
Corrected Item-Total Correlation
Squared Multiple Correlation
Cronbach’s α if Item Deleted
Trusting Beliefs Benevolence 1
51.77 83.041 0.446 0.730 0.929
Trusting Beliefs Benevolence 2
51.73 79.446 0.553 0.648 0.925
Trusting Beliefs Benevolence 3
52.32 76.418 0.674 0.781 0.919
Trusting Beliefs Integrity 1 51.82 76.537 0.915 0.880 0.909
Trusting Beliefs Integrity 2 51.68 76.799 0.816 0.813 0.912
Trusting Beliefs Integrity 3 51.73 74.779 0.753 0.834 0.915
Trusting Beliefs Integrity 4 52.00 78.667 0.653 0.813 0.919
Trusting Beliefs Competence 1
51.41 79.110 0.726 0.803 0.916
Trusting Beliefs Competence 2
51.77 76.851 0.767 0.640 0.914
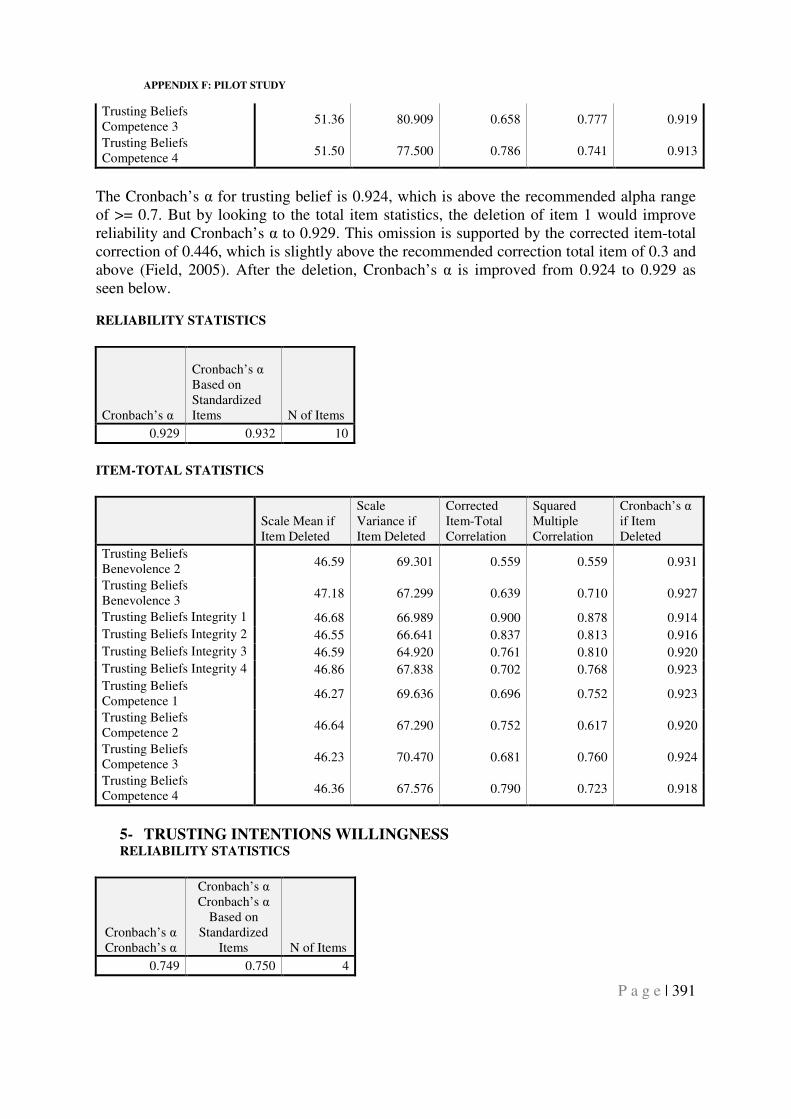
APPENDIX F: PILOT STUDY
P a g e | 391
Trusting Beliefs Competence 3
51.36 80.909 0.658 0.777 0.919
Trusting Beliefs Competence 4
51.50 77.500 0.786 0.741 0.913
The Cronbach’s α for trusting belief is 0.924, which is above the recommended alpha range of >= 0.7. But by looking to the total item statistics, the deletion of item 1 would improve reliability and Cronbach’s α to 0.929. This omission is supported by the corrected item-total correction of 0.446, which is slightly above the recommended correction total item of 0.3 and above (Field, 2005). After the deletion, Cronbach’s α is improved from 0.924 to 0.929 as seen below.
RELIABILITY STATISTICS
Cronbach’s α
Cronbach’s α Based on Standardized Items N of Items
0.929 0.932 10
ITEM-TOTAL STATISTICS
Scale Mean if Item Deleted
Scale Variance if Item Deleted
Corrected Item-Total Correlation
Squared Multiple Correlation
Cronbach’s α if Item Deleted
Trusting Beliefs Benevolence 2
46.59 69.301 0.559 0.559 0.931
Trusting Beliefs Benevolence 3
47.18 67.299 0.639 0.710 0.927
Trusting Beliefs Integrity 1 46.68 66.989 0.900 0.878 0.914
Trusting Beliefs Integrity 2 46.55 66.641 0.837 0.813 0.916
Trusting Beliefs Integrity 3 46.59 64.920 0.761 0.810 0.920
Trusting Beliefs Integrity 4 46.86 67.838 0.702 0.768 0.923
Trusting Beliefs Competence 1
46.27 69.636 0.696 0.752 0.923
Trusting Beliefs Competence 2
46.64 67.290 0.752 0.617 0.920
Trusting Beliefs Competence 3
46.23 70.470 0.681 0.760 0.924
Trusting Beliefs Competence 4
46.36 67.576 0.790 0.723 0.918
5- TRUSTING INTENTIONS WILLINGNESS RELIABILITY STATISTICS
Cronbach’s α Cronbach’s α
Cronbach’s α Cronbach’s α
Based on Standardized
Items N of Items
0.749 0.750 4
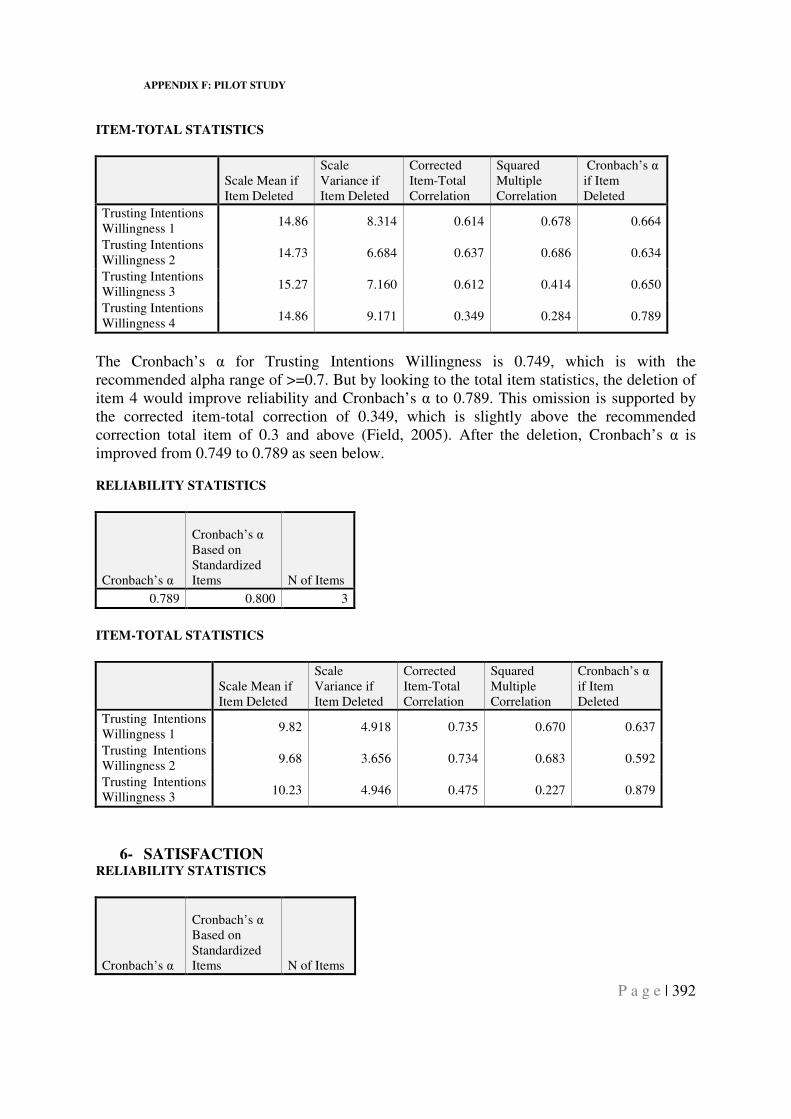
APPENDIX F: PILOT STUDY
P a g e | 392
ITEM-TOTAL STATISTICS
Scale Mean if Item Deleted
Scale Variance if Item Deleted
Corrected Item-Total Correlation
Squared Multiple Correlation
Cronbach’s α if Item Deleted
Trusting Intentions Willingness 1
14.86 8.314 0.614 0.678 0.664
Trusting Intentions Willingness 2
14.73 6.684 0.637 0.686 0.634
Trusting Intentions Willingness 3
15.27 7.160 0.612 0.414 0.650
Trusting Intentions Willingness 4
14.86 9.171 0.349 0.284 0.789
The Cronbach’s α for Trusting Intentions Willingness is 0.749, which is with the recommended alpha range of >=0.7. But by looking to the total item statistics, the deletion of item 4 would improve reliability and Cronbach’s α to 0.789. This omission is supported by the corrected item-total correction of 0.349, which is slightly above the recommended correction total item of 0.3 and above (Field, 2005). After the deletion, Cronbach’s α is improved from 0.749 to 0.789 as seen below.
RELIABILITY STATISTICS
Cronbach’s α
Cronbach’s α Based on Standardized Items N of Items
0.789 0.800 3
ITEM-TOTAL STATISTICS
Scale Mean if Item Deleted
Scale Variance if Item Deleted
Corrected Item-Total Correlation
Squared Multiple Correlation
Cronbach’s α if Item Deleted
Trusting Intentions Willingness 1
9.82 4.918 0.735 0.670 0.637
Trusting Intentions Willingness 2
9.68 3.656 0.734 0.683 0.592
Trusting Intentions Willingness 3
10.23 4.946 0.475 0.227 0.879
6- SATISFACTION RELIABILITY STATISTICS
Cronbach’s α
Cronbach’s α Based on Standardized Items N of Items
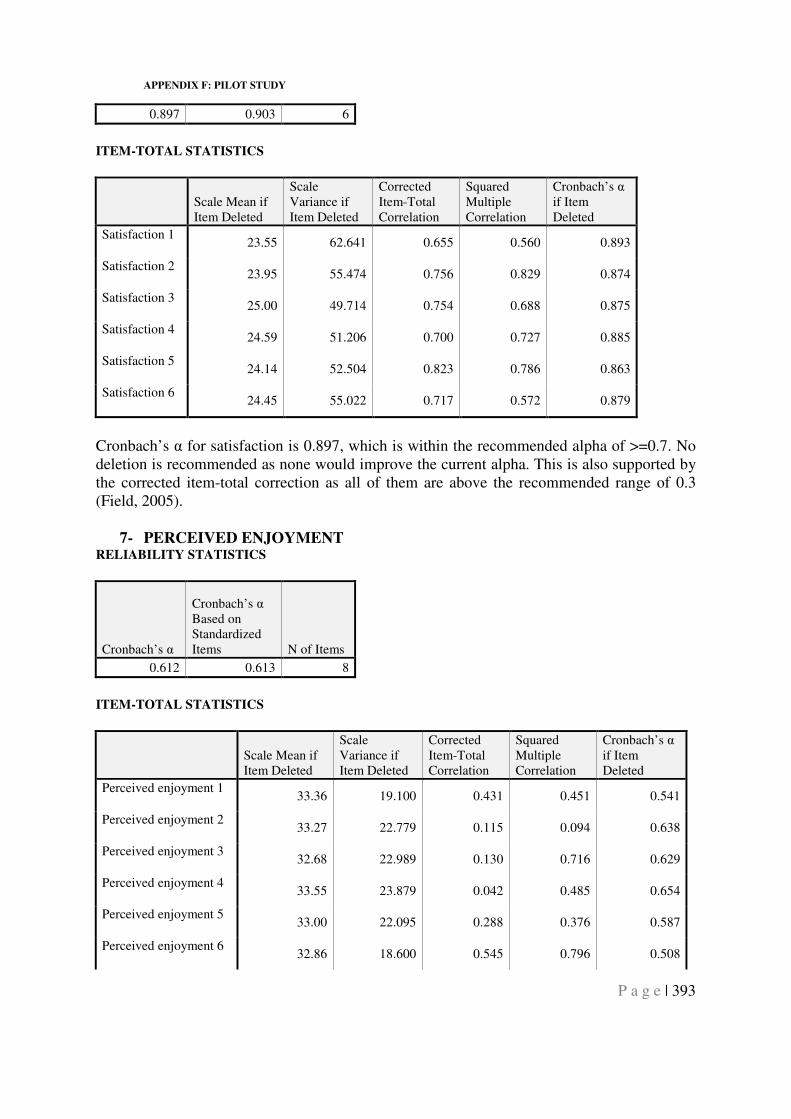
APPENDIX F: PILOT STUDY
P a g e | 393
0.897 0.903 6
ITEM-TOTAL STATISTICS
Scale Mean if Item Deleted
Scale Variance if Item Deleted
Corrected Item-Total Correlation
Squared Multiple Correlation
Cronbach’s α if Item Deleted
Satisfaction 1 23.55 62.641 0.655 0.560 0.893
Satisfaction 2 23.95 55.474 0.756 0.829 0.874
Satisfaction 3 25.00 49.714 0.754 0.688 0.875
Satisfaction 4 24.59 51.206 0.700 0.727 0.885
Satisfaction 5 24.14 52.504 0.823 0.786 0.863
Satisfaction 6 24.45 55.022 0.717 0.572 0.879
Cronbach’s α for satisfaction is 0.897, which is within the recommended alpha of >=0.7. No deletion is recommended as none would improve the current alpha. This is also supported by the corrected item-total correction as all of them are above the recommended range of 0.3 (Field, 2005).
7- PERCEIVED ENJOYMENT RELIABILITY STATISTICS
Cronbach’s α
Cronbach’s α Based on Standardized Items N of Items
0.612 0.613 8
ITEM-TOTAL STATISTICS
Scale Mean if Item Deleted
Scale Variance if Item Deleted
Corrected Item-Total Correlation
Squared Multiple Correlation
Cronbach’s α if Item Deleted
Perceived enjoyment 1 33.36 19.100 0.431 0.451 0.541
Perceived enjoyment 2 33.27 22.779 0.115 0.094 0.638
Perceived enjoyment 3 32.68 22.989 0.130 0.716 0.629
Perceived enjoyment 4 33.55 23.879 0.042 0.485 0.654
Perceived enjoyment 5 33.00 22.095 0.288 0.376 0.587
Perceived enjoyment 6 32.86 18.600 0.545 0.796 0.508
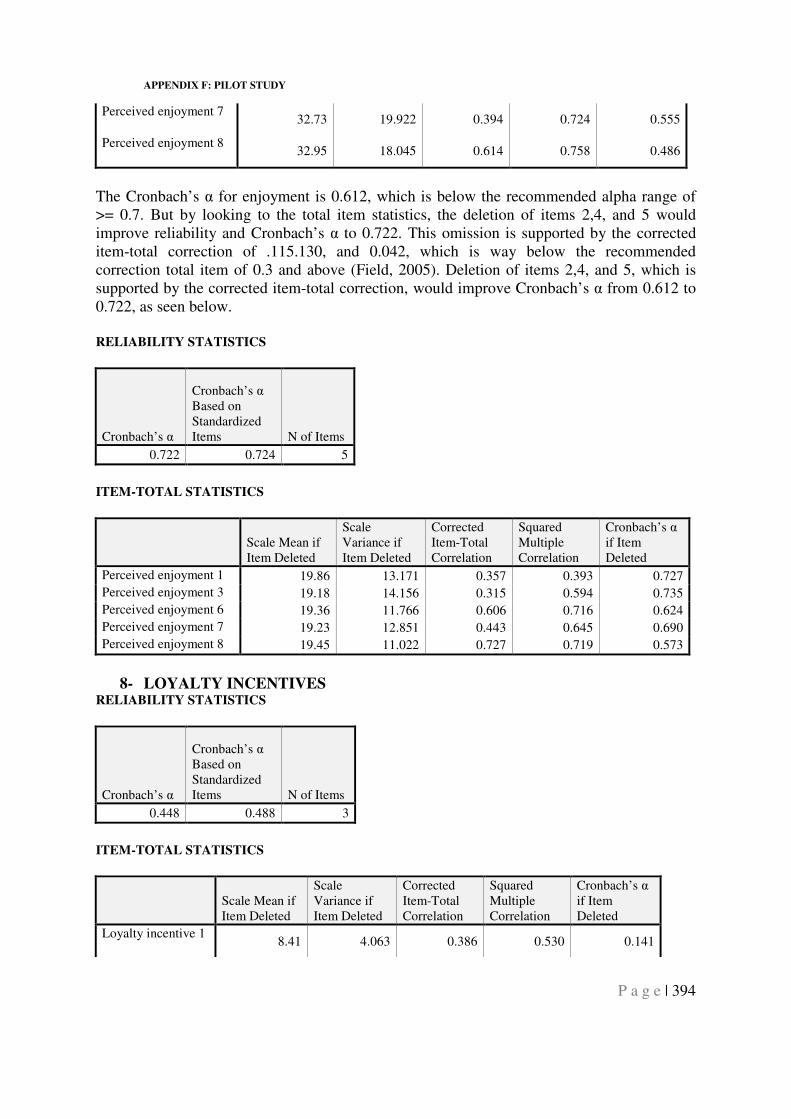
APPENDIX F: PILOT STUDY
P a g e | 394
Perceived enjoyment 7 32.73 19.922 0.394 0.724 0.555
Perceived enjoyment 8 32.95 18.045 0.614 0.758 0.486
The Cronbach’s α for enjoyment is 0.612, which is below the recommended alpha range of >= 0.7. But by looking to the total item statistics, the deletion of items 2,4, and 5 would improve reliability and Cronbach’s α to 0.722. This omission is supported by the corrected item-total correction of .115.130, and 0.042, which is way below the recommended correction total item of 0.3 and above (Field, 2005). Deletion of items 2,4, and 5, which is supported by the corrected item-total correction, would improve Cronbach’s α from 0.612 to 0.722, as seen below. RELIABILITY STATISTICS
Cronbach’s α
Cronbach’s α Based on Standardized Items N of Items
0.722 0.724 5
ITEM-TOTAL STATISTICS
Scale Mean if Item Deleted
Scale Variance if Item Deleted
Corrected Item-Total Correlation
Squared Multiple Correlation
Cronbach’s α if Item Deleted
Perceived enjoyment 1 19.86 13.171 0.357 0.393 0.727
Perceived enjoyment 3 19.18 14.156 0.315 0.594 0.735
Perceived enjoyment 6 19.36 11.766 0.606 0.716 0.624
Perceived enjoyment 7 19.23 12.851 0.443 0.645 0.690
Perceived enjoyment 8 19.45 11.022 0.727 0.719 0.573
8- LOYALTY INCENTIVES
RELIABILITY STATISTICS
Cronbach’s α
Cronbach’s α Based on Standardized Items N of Items
0.448 0.488 3
ITEM-TOTAL STATISTICS
Scale Mean if Item Deleted
Scale Variance if Item Deleted
Corrected Item-Total Correlation
Squared Multiple Correlation
Cronbach’s α if Item Deleted
Loyalty incentive 1 8.41 4.063 0.386 0.530 0.141
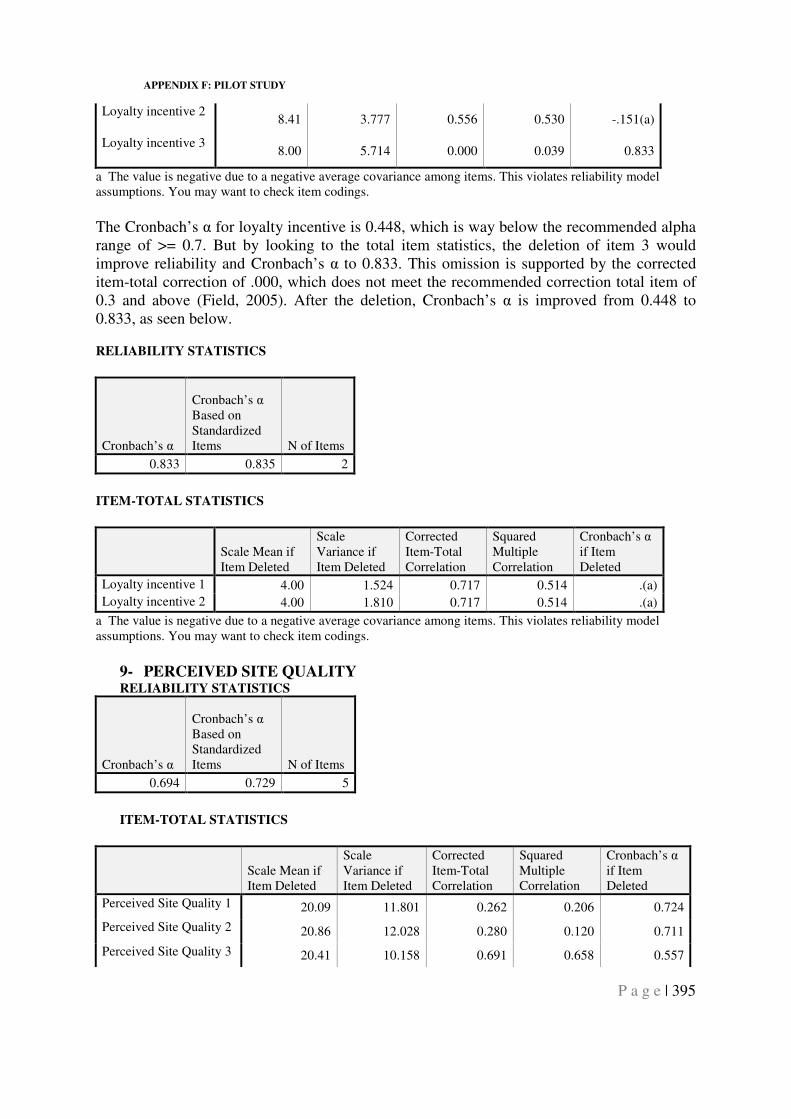
APPENDIX F: PILOT STUDY
P a g e | 395
Loyalty incentive 2 8.41 3.777 0.556 0.530 -.151(a)
Loyalty incentive 3 8.00 5.714 0.000 0.039 0.833
a The value is negative due to a negative average covariance among items. This violates reliability model assumptions. You may want to check item codings.
The Cronbach’s α for loyalty incentive is 0.448, which is way below the recommended alpha range of >= 0.7. But by looking to the total item statistics, the deletion of item 3 would improve reliability and Cronbach’s α to 0.833. This omission is supported by the corrected item-total correction of .000, which does not meet the recommended correction total item of 0.3 and above (Field, 2005). After the deletion, Cronbach’s α is improved from 0.448 to 0.833, as seen below.
RELIABILITY STATISTICS
Cronbach’s α
Cronbach’s α Based on Standardized Items N of Items
0.833 0.835 2
ITEM-TOTAL STATISTICS
Scale Mean if Item Deleted
Scale Variance if Item Deleted
Corrected Item-Total Correlation
Squared Multiple Correlation
Cronbach’s α if Item Deleted
Loyalty incentive 1 4.00 1.524 0.717 0.514 .(a)
Loyalty incentive 2 4.00 1.810 0.717 0.514 .(a)
a The value is negative due to a negative average covariance among items. This violates reliability model assumptions. You may want to check item codings.
9- PERCEIVED SITE QUALITY RELIABILITY STATISTICS
Cronbach’s α
Cronbach’s α Based on Standardized Items N of Items
0.694 0.729 5
ITEM-TOTAL STATISTICS
Scale Mean if Item Deleted
Scale Variance if Item Deleted
Corrected Item-Total Correlation
Squared Multiple Correlation
Cronbach’s α if Item Deleted
Perceived Site Quality 1 20.09 11.801 0.262 0.206 0.724
Perceived Site Quality 2 20.86 12.028 0.280 0.120 0.711
Perceived Site Quality 3 20.41 10.158 0.691 0.658 0.557
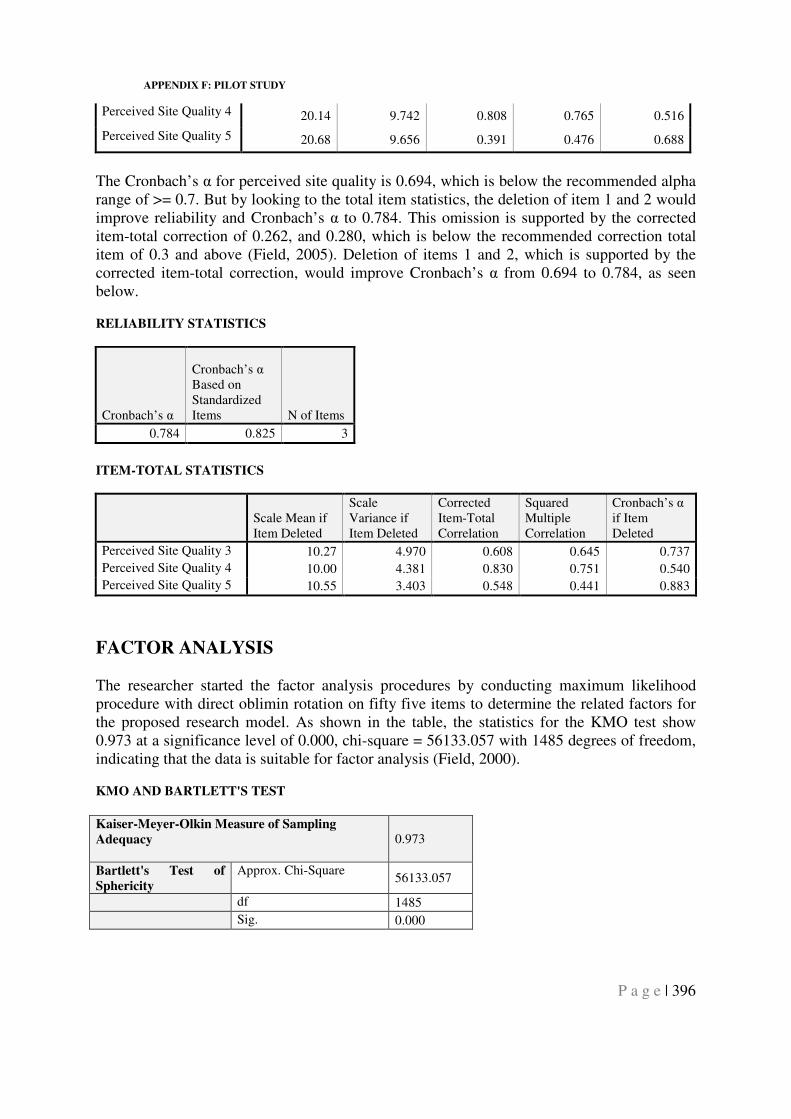
APPENDIX F: PILOT STUDY
P a g e | 396
Perceived Site Quality 4 20.14 9.742 0.808 0.765 0.516
Perceived Site Quality 5 20.68 9.656 0.391 0.476 0.688
The Cronbach’s α for perceived site quality is 0.694, which is below the recommended alpha range of >= 0.7. But by looking to the total item statistics, the deletion of item 1 and 2 would improve reliability and Cronbach’s α to 0.784. This omission is supported by the corrected item-total correction of 0.262, and 0.280, which is below the recommended correction total item of 0.3 and above (Field, 2005). Deletion of items 1 and 2, which is supported by the corrected item-total correction, would improve Cronbach’s α from 0.694 to 0.784, as seen below.
RELIABILITY STATISTICS
Cronbach’s α
Cronbach’s α Based on Standardized Items N of Items
0.784 0.825 3
ITEM-TOTAL STATISTICS
Scale Mean if Item Deleted
Scale Variance if Item Deleted
Corrected Item-Total Correlation
Squared Multiple Correlation
Cronbach’s α if Item Deleted
Perceived Site Quality 3 10.27 4.970 0.608 0.645 0.737
Perceived Site Quality 4 10.00 4.381 0.830 0.751 0.540
Perceived Site Quality 5 10.55 3.403 0.548 0.441 0.883
FACTOR ANALYSIS The researcher started the factor analysis procedures by conducting maximum likelihood procedure with direct oblimin rotation on fifty five items to determine the related factors for the proposed research model. As shown in the table, the statistics for the KMO test show 0.973 at a significance level of 0.000, chi-square = 56133.057 with 1485 degrees of freedom, indicating that the data is suitable for factor analysis (Field, 2000).
KMO AND BARTLETT'S TEST
Kaiser-Meyer-Olkin Measure of Sampling
Adequacy 0.973
Bartlett's Test of
Sphericity
Approx. Chi-Square 56133.057
df 1485
Sig. 0.000
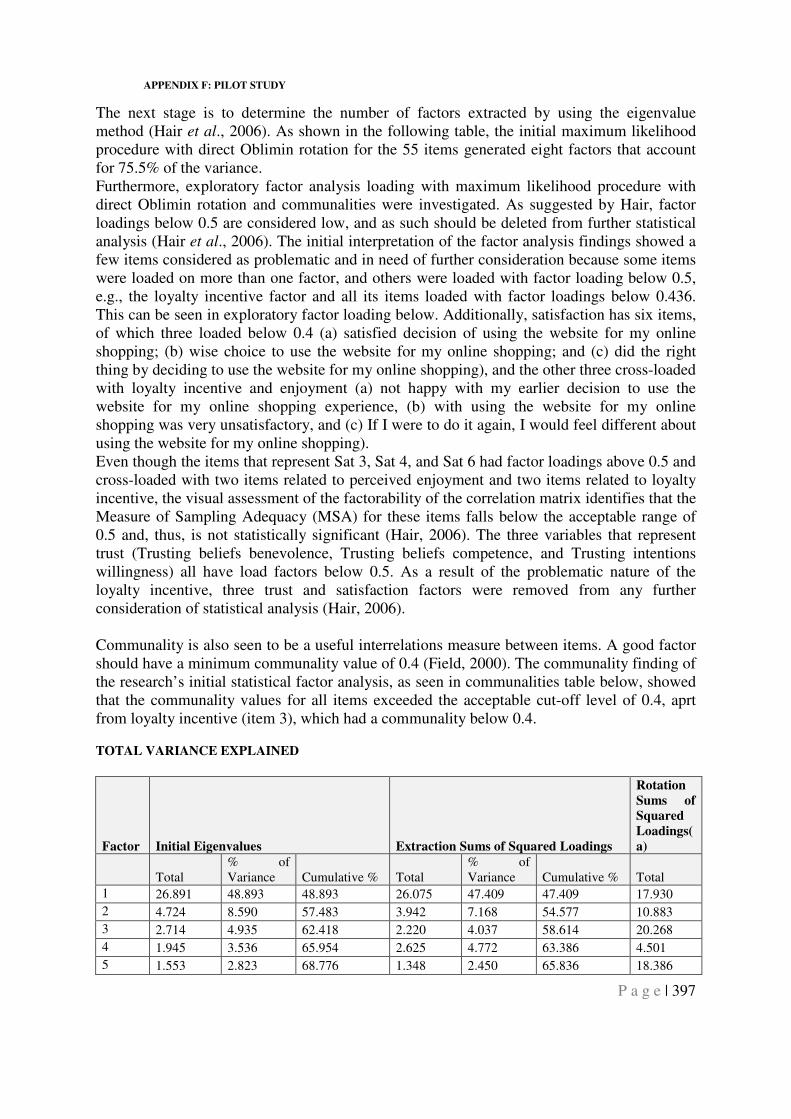
APPENDIX F: PILOT STUDY
P a g e | 397
The next stage is to determine the number of factors extracted by using the eigenvalue method (Hair et al., 2006). As shown in the following table, the initial maximum likelihood procedure with direct Oblimin rotation for the 55 items generated eight factors that account for 75.5% of the variance. Furthermore, exploratory factor analysis loading with maximum likelihood procedure with direct Oblimin rotation and communalities were investigated. As suggested by Hair, factor loadings below 0.5 are considered low, and as such should be deleted from further statistical analysis (Hair et al., 2006). The initial interpretation of the factor analysis findings showed a few items considered as problematic and in need of further consideration because some items were loaded on more than one factor, and others were loaded with factor loading below 0.5, e.g., the loyalty incentive factor and all its items loaded with factor loadings below 0.436. This can be seen in exploratory factor loading below. Additionally, satisfaction has six items, of which three loaded below 0.4 (a) satisfied decision of using the website for my online shopping; (b) wise choice to use the website for my online shopping; and (c) did the right thing by deciding to use the website for my online shopping), and the other three cross-loaded with loyalty incentive and enjoyment (a) not happy with my earlier decision to use the website for my online shopping experience, (b) with using the website for my online shopping was very unsatisfactory, and (c) If I were to do it again, I would feel different about using the website for my online shopping). Even though the items that represent Sat 3, Sat 4, and Sat 6 had factor loadings above 0.5 and cross-loaded with two items related to perceived enjoyment and two items related to loyalty incentive, the visual assessment of the factorability of the correlation matrix identifies that the Measure of Sampling Adequacy (MSA) for these items falls below the acceptable range of 0.5 and, thus, is not statistically significant (Hair, 2006). The three variables that represent trust (Trusting beliefs benevolence, Trusting beliefs competence, and Trusting intentions willingness) all have load factors below 0.5. As a result of the problematic nature of the loyalty incentive, three trust and satisfaction factors were removed from any further consideration of statistical analysis (Hair, 2006). Communality is also seen to be a useful interrelations measure between items. A good factor should have a minimum communality value of 0.4 (Field, 2000). The communality finding of the research’s initial statistical factor analysis, as seen in communalities table below, showed that the communality values for all items exceeded the acceptable cut-off level of 0.4, aprt from loyalty incentive (item 3), which had a communality below 0.4.
TOTAL VARIANCE EXPLAINED
Factor Initial Eigenvalues Extraction Sums of Squared Loadings
Rotation
Sums of
Squared
Loadings(
a)
Total % of Variance Cumulative % Total
% of Variance Cumulative % Total
1 26.891 48.893 48.893 26.075 47.409 47.409 17.930
2 4.724 8.590 57.483 3.942 7.168 54.577 10.883
3 2.714 4.935 62.418 2.220 4.037 58.614 20.268
4 1.945 3.536 65.954 2.625 4.772 63.386 4.501
5 1.553 2.823 68.776 1.348 2.450 65.836 18.386
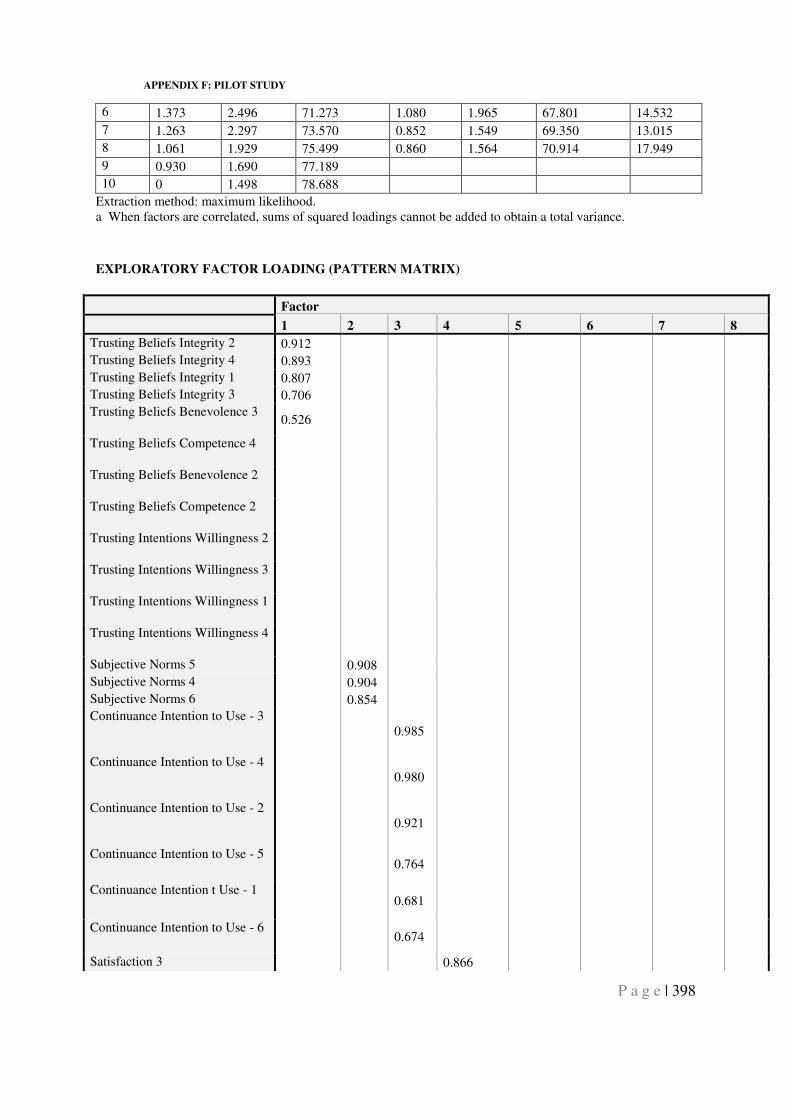
APPENDIX F: PILOT STUDY
P a g e | 398
6 1.373 2.496 71.273 1.080 1.965 67.801 14.532
7 1.263 2.297 73.570 0.852 1.549 69.350 13.015
8 1.061 1.929 75.499 0.860 1.564 70.914 17.949
9 0.930 1.690 77.189
10 0 1.498 78.688
Extraction method: maximum likelihood. a When factors are correlated, sums of squared loadings cannot be added to obtain a total variance.
EXPLORATORY FACTOR LOADING (PATTERN MATRIX)
Factor
1 2 3 4 5 6 7 8
Trusting Beliefs Integrity 2 0.912
Trusting Beliefs Integrity 4 0.893
Trusting Beliefs Integrity 1 0.807
Trusting Beliefs Integrity 3 0.706
Trusting Beliefs Benevolence 3 0.526
Trusting Beliefs Competence 4
Trusting Beliefs Benevolence 2
Trusting Beliefs Competence 2
Trusting Intentions Willingness 2
Trusting Intentions Willingness 3
Trusting Intentions Willingness 1
Trusting Intentions Willingness 4
Subjective Norms 5 0.908
Subjective Norms 4 0.904
Subjective Norms 6 0.854
Continuance Intention to Use - 3 0.985
Continuance Intention to Use - 4 0.980
Continuance Intention to Use - 2 0.921
Continuance Intention to Use - 5 0.764
Continuance Intention t Use - 1 0.681
Continuance Intention to Use - 6 0.674
Satisfaction 3 0.866
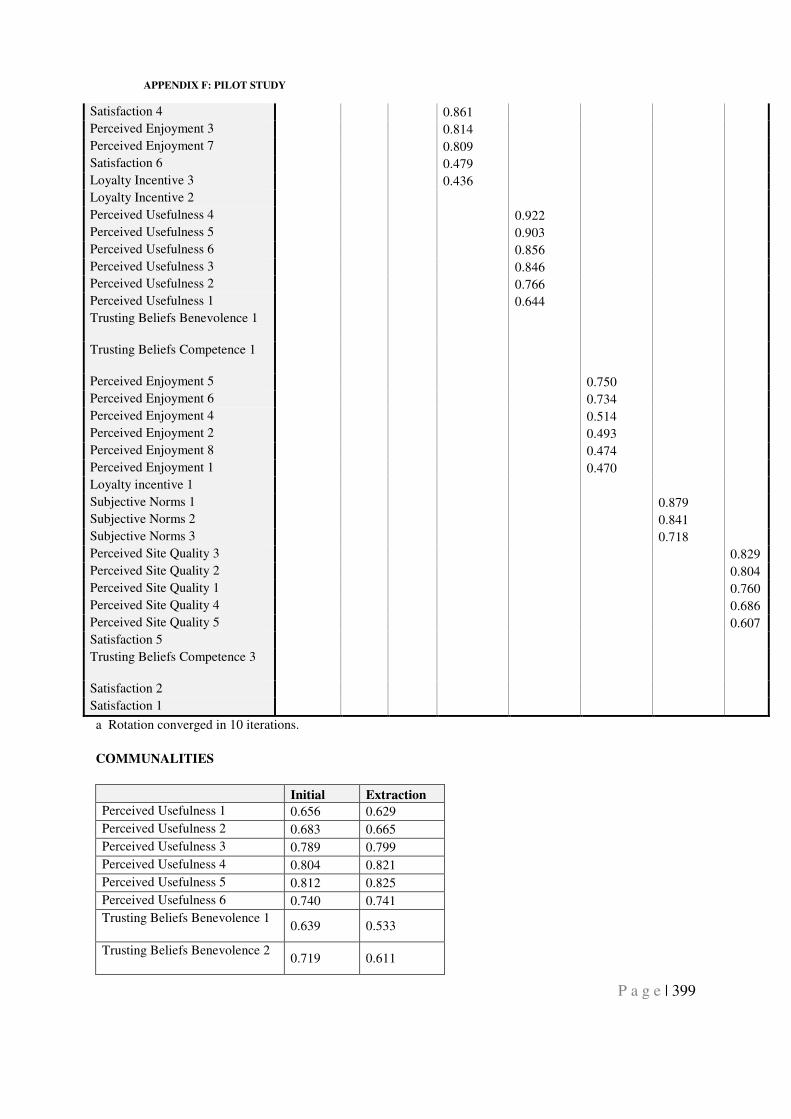
APPENDIX F: PILOT STUDY
P a g e | 399
Satisfaction 4 0.861
Perceived Enjoyment 3 0.814
Perceived Enjoyment 7 0.809
Satisfaction 6 0.479
Loyalty Incentive 3 0.436
Loyalty Incentive 2
Perceived Usefulness 4 0.922
Perceived Usefulness 5 0.903
Perceived Usefulness 6 0.856
Perceived Usefulness 3 0.846
Perceived Usefulness 2 0.766
Perceived Usefulness 1 0.644
Trusting Beliefs Benevolence 1
Trusting Beliefs Competence 1
Perceived Enjoyment 5 0.750
Perceived Enjoyment 6 0.734
Perceived Enjoyment 4 0.514
Perceived Enjoyment 2 0.493
Perceived Enjoyment 8 0.474
Perceived Enjoyment 1 0.470
Loyalty incentive 1
Subjective Norms 1 0.879
Subjective Norms 2 0.841
Subjective Norms 3 0.718
Perceived Site Quality 3 0.829
Perceived Site Quality 2 0.804
Perceived Site Quality 1 0.760
Perceived Site Quality 4 0.686
Perceived Site Quality 5 0.607
Satisfaction 5
Trusting Beliefs Competence 3
Satisfaction 2
Satisfaction 1
a Rotation converged in 10 iterations.
COMMUNALITIES
Initial Extraction
Perceived Usefulness 1 0.656 0.629
Perceived Usefulness 2 0.683 0.665
Perceived Usefulness 3 0.789 0.799
Perceived Usefulness 4 0.804 0.821
Perceived Usefulness 5 0.812 0.825
Perceived Usefulness 6 0.740 0.741
Trusting Beliefs Benevolence 1 0.639 0.533
Trusting Beliefs Benevolence 2 0.719 0.611
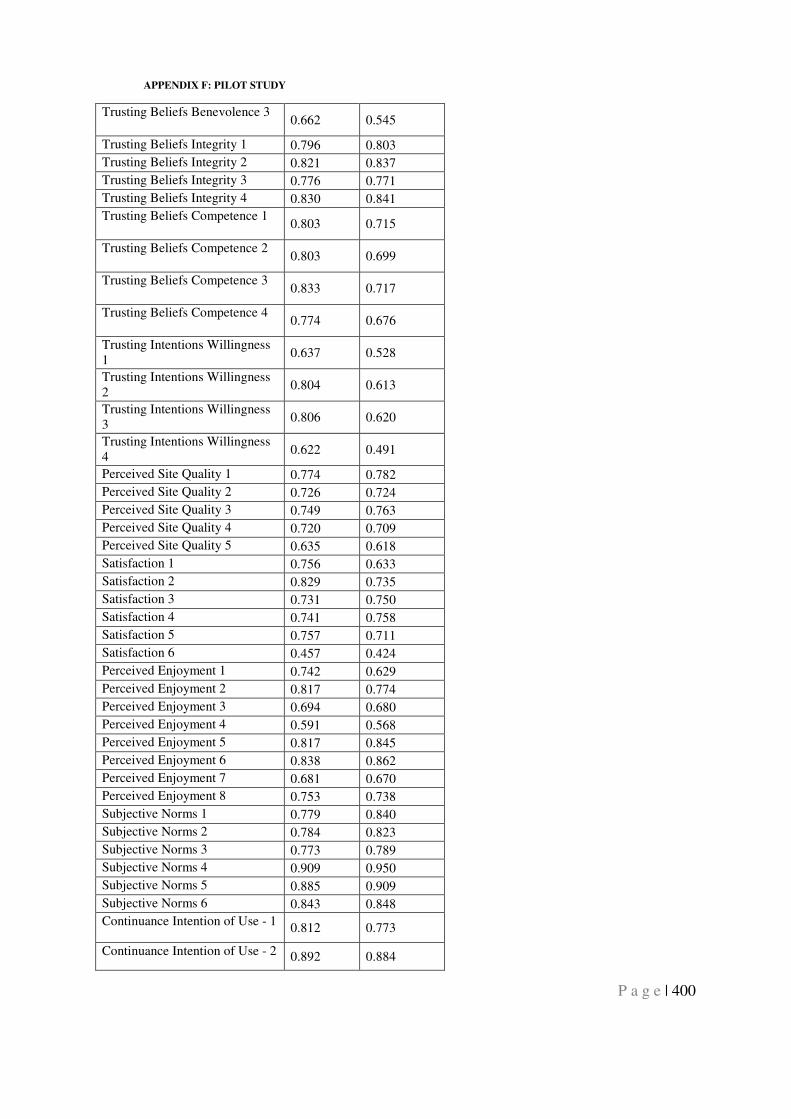
APPENDIX F: PILOT STUDY
P a g e | 400
Trusting Beliefs Benevolence 3 0.662 0.545
Trusting Beliefs Integrity 1 0.796 0.803
Trusting Beliefs Integrity 2 0.821 0.837
Trusting Beliefs Integrity 3 0.776 0.771
Trusting Beliefs Integrity 4 0.830 0.841
Trusting Beliefs Competence 1 0.803 0.715
Trusting Beliefs Competence 2 0.803 0.699
Trusting Beliefs Competence 3 0.833 0.717
Trusting Beliefs Competence 4 0.774 0.676
Trusting Intentions Willingness 1
0.637 0.528
Trusting Intentions Willingness 2
0.804 0.613
Trusting Intentions Willingness 3
0.806 0.620
Trusting Intentions Willingness 4
0.622 0.491
Perceived Site Quality 1 0.774 0.782
Perceived Site Quality 2 0.726 0.724
Perceived Site Quality 3 0.749 0.763
Perceived Site Quality 4 0.720 0.709
Perceived Site Quality 5 0.635 0.618
Satisfaction 1 0.756 0.633
Satisfaction 2 0.829 0.735
Satisfaction 3 0.731 0.750
Satisfaction 4 0.741 0.758
Satisfaction 5 0.757 0.711
Satisfaction 6 0.457 0.424
Perceived Enjoyment 1 0.742 0.629
Perceived Enjoyment 2 0.817 0.774
Perceived Enjoyment 3 0.694 0.680
Perceived Enjoyment 4 0.591 0.568
Perceived Enjoyment 5 0.817 0.845
Perceived Enjoyment 6 0.838 0.862
Perceived Enjoyment 7 0.681 0.670
Perceived Enjoyment 8 0.753 0.738
Subjective Norms 1 0.779 0.840
Subjective Norms 2 0.784 0.823
Subjective Norms 3 0.773 0.789
Subjective Norms 4 0.909 0.950
Subjective Norms 5 0.885 0.909
Subjective Norms 6 0.843 0.848
Continuance Intention of Use - 1 0.812 0.773
Continuance Intention of Use - 2 0.892 0.884
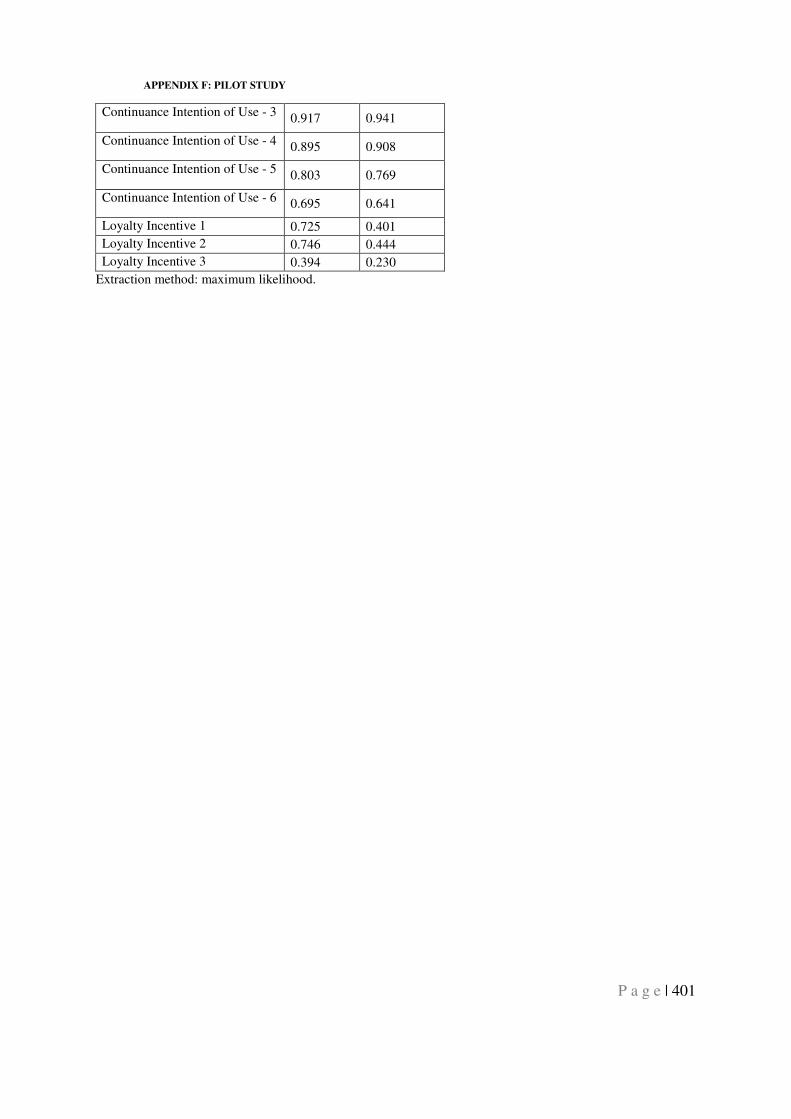
APPENDIX F: PILOT STUDY
P a g e | 401
Continuance Intention of Use - 3 0.917 0.941
Continuance Intention of Use - 4 0.895 0.908
Continuance Intention of Use - 5 0.803 0.769
Continuance Intention of Use - 6 0.695 0.641
Loyalty Incentive 1 0.725 0.401
Loyalty Incentive 2 0.746 0.444
Loyalty Incentive 3 0.394 0.230
Extraction method: maximum likelihood.
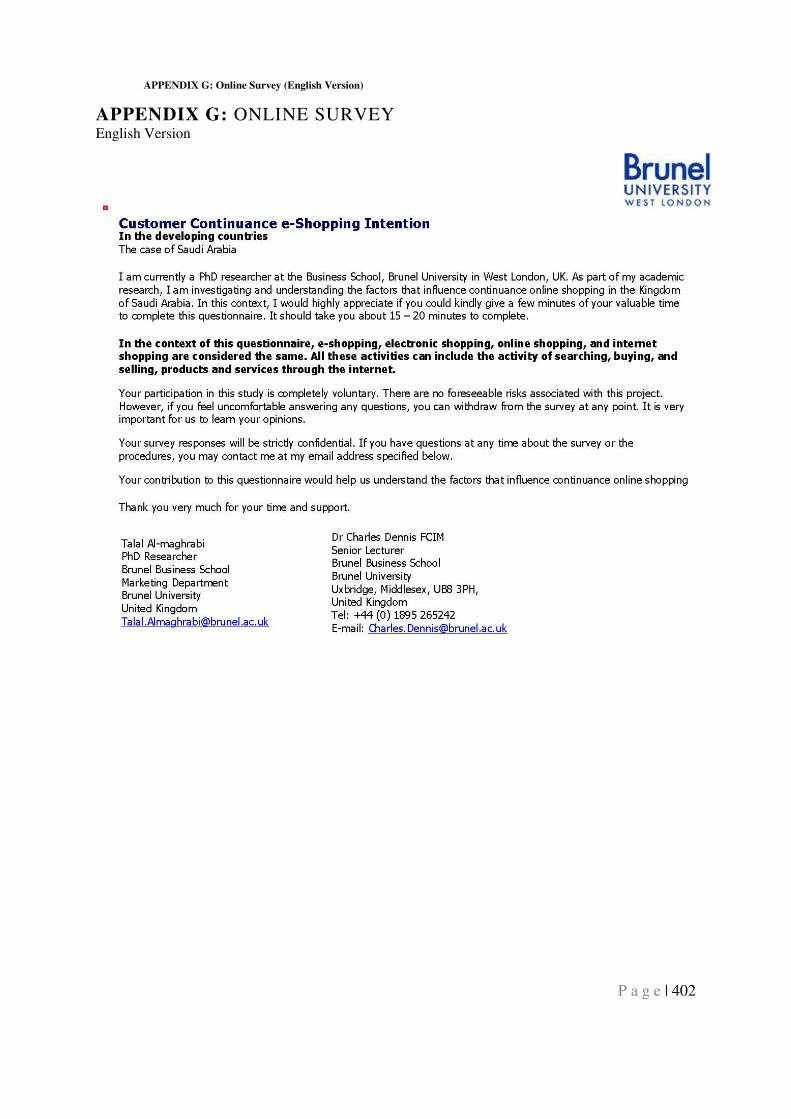
APPENDIX G: Online Survey (English Version)
P a g e | 402
APPENDIX G: ONLINE SURVEY English Version
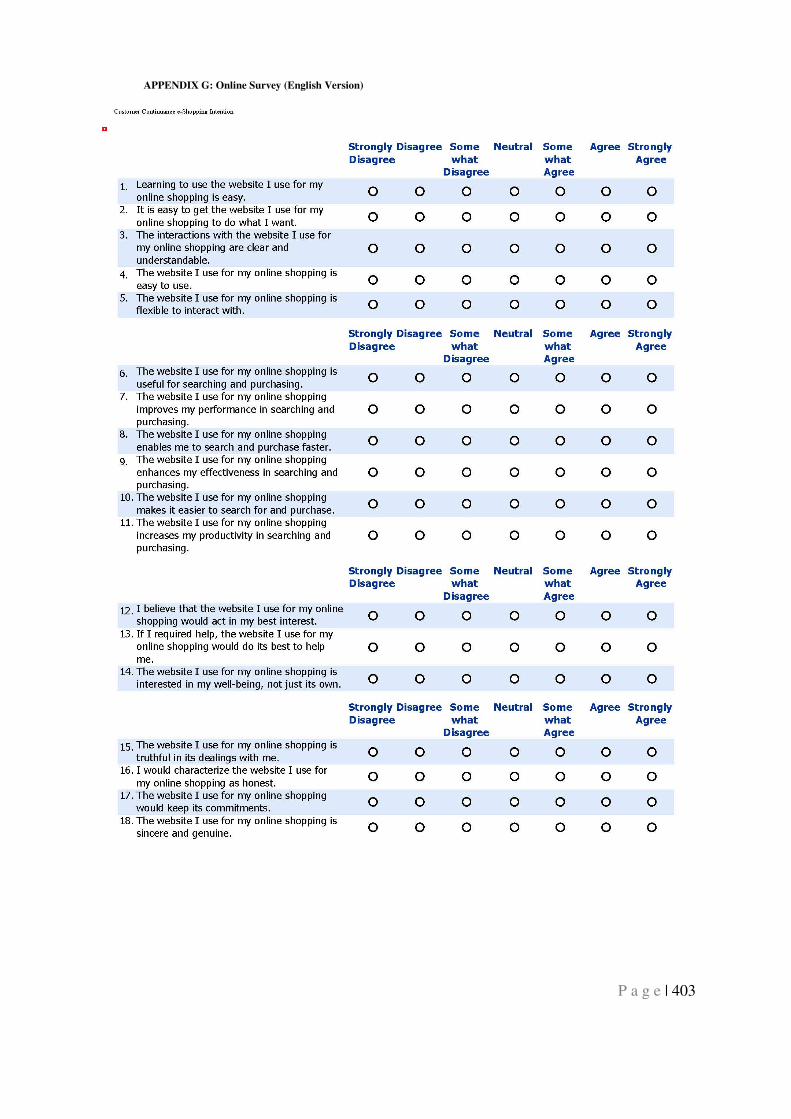
APPENDIX G: Online Survey (English Version)
P a g e | 403
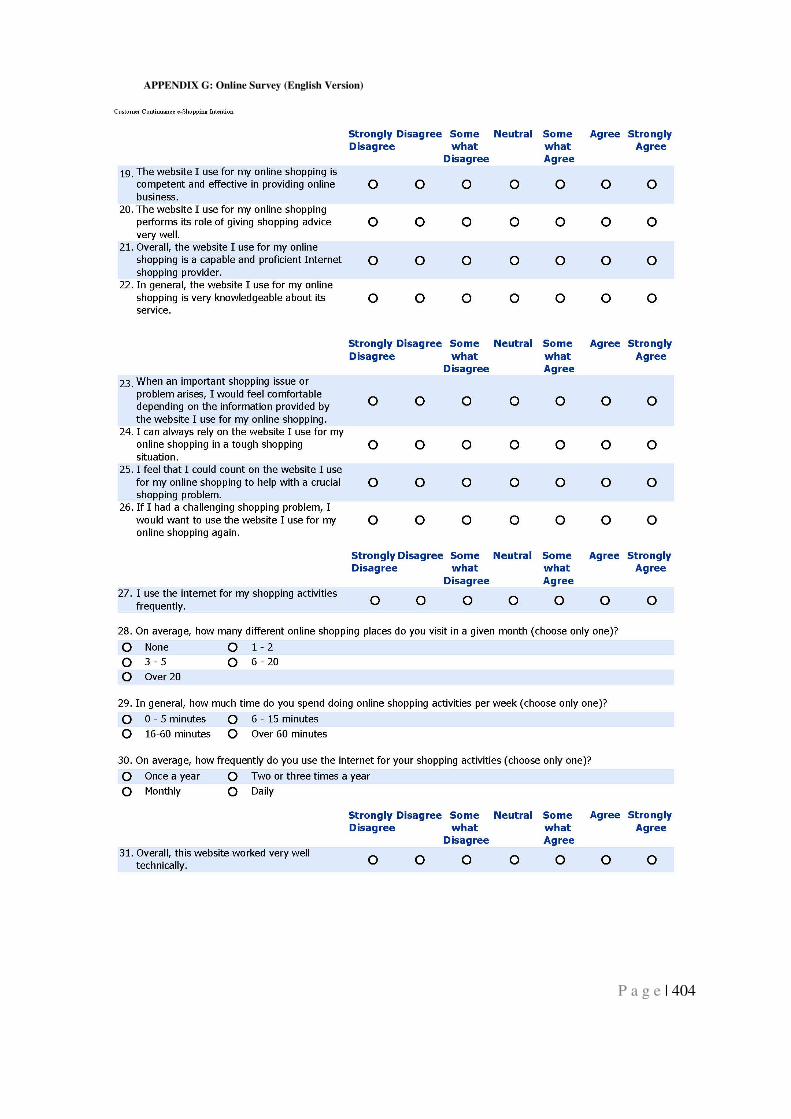
APPENDIX G: Online Survey (English Version)
P a g e | 404
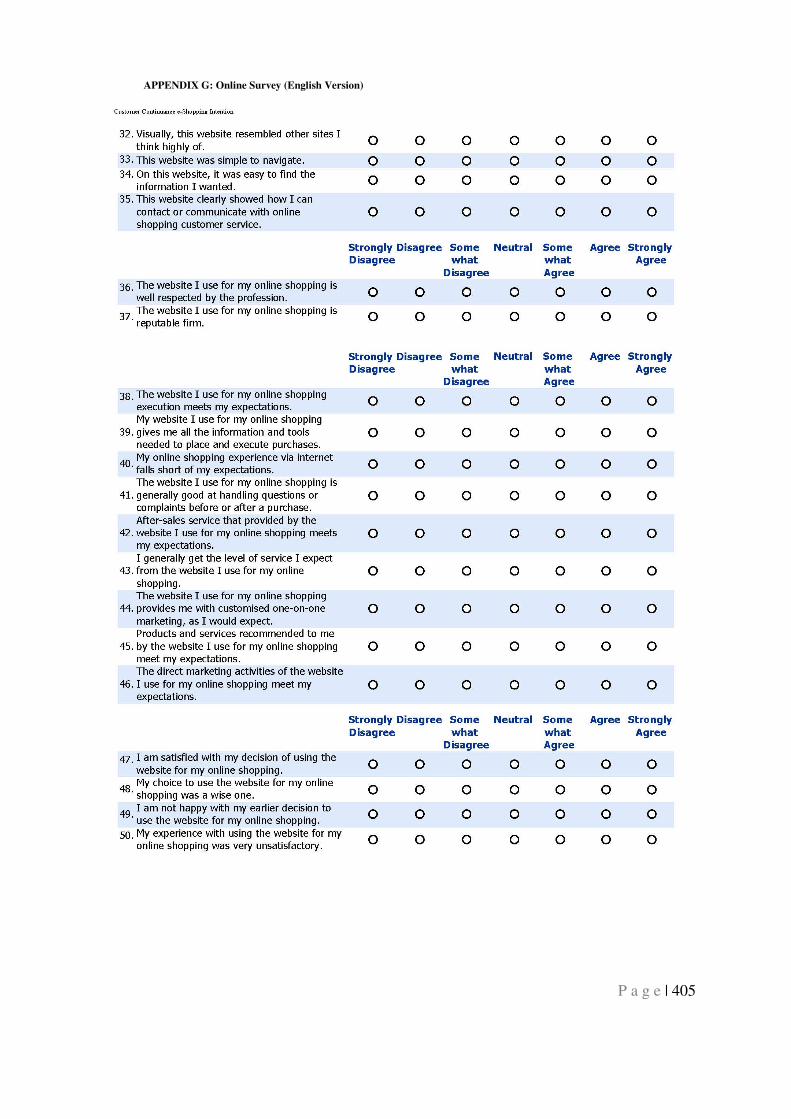
APPENDIX G: Online Survey (English Version)
P a g e | 405
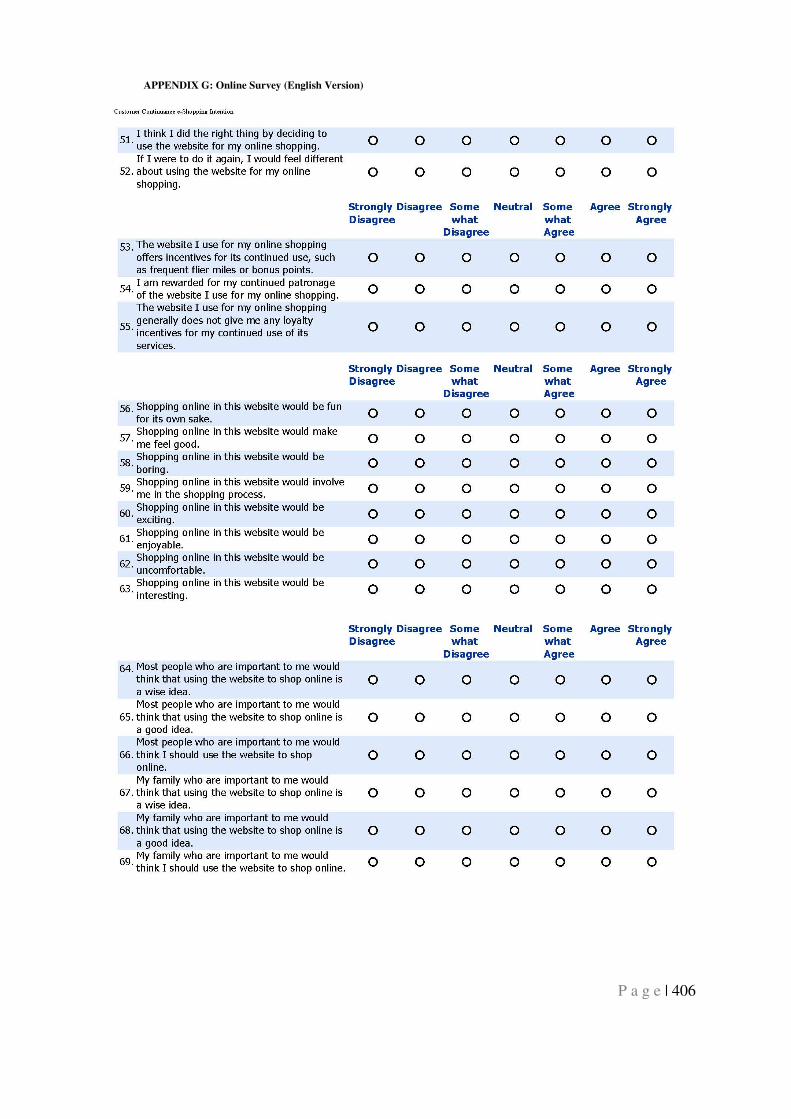
APPENDIX G: Online Survey (English Version)
P a g e | 406
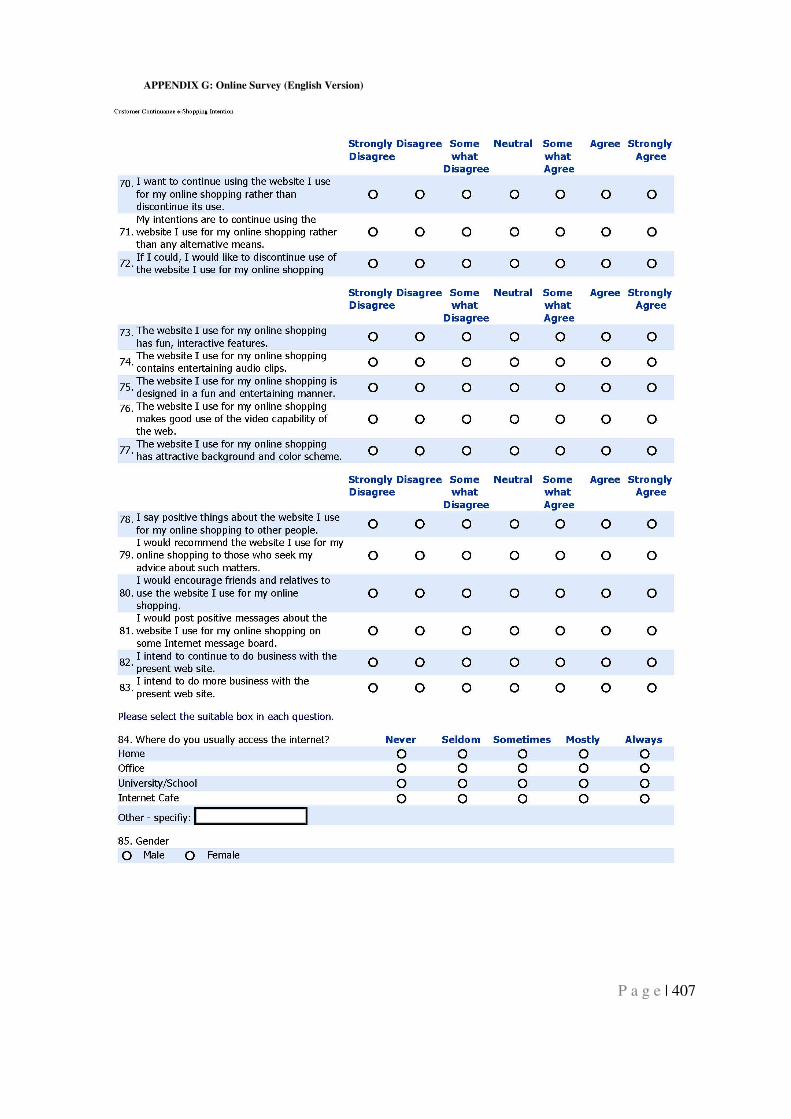
APPENDIX G: Online Survey (English Version)
P a g e | 407
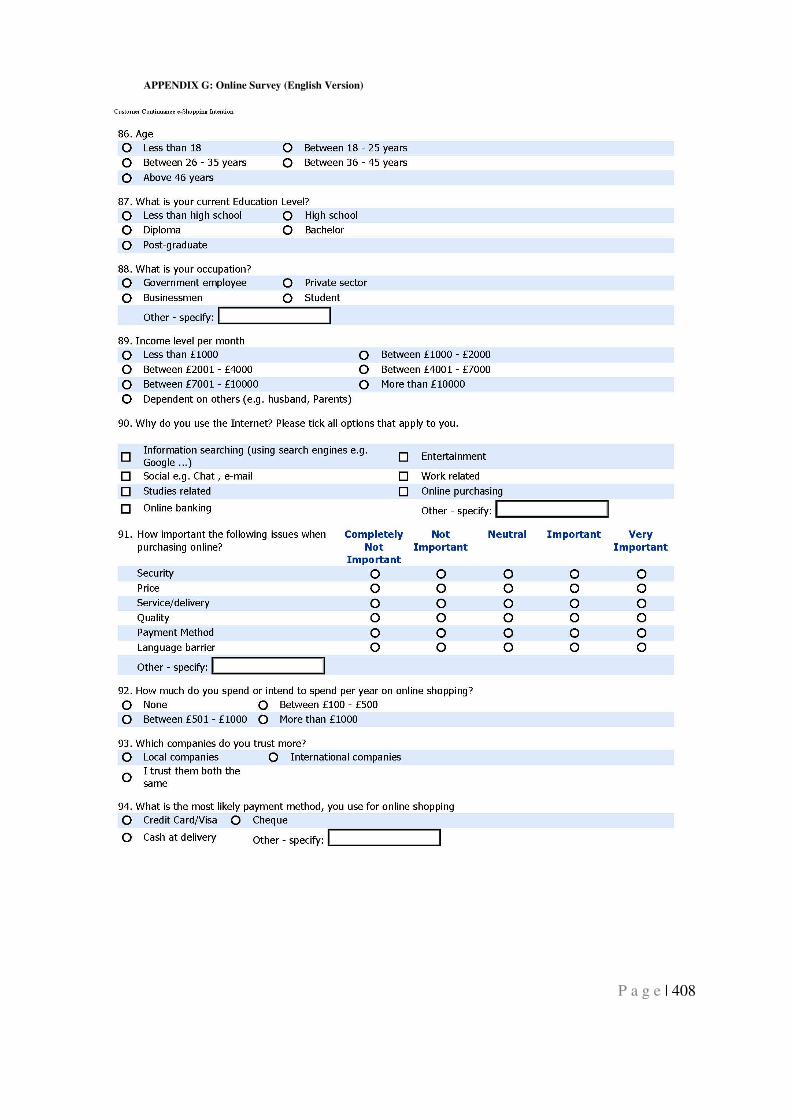
APPENDIX G: Online Survey (English Version)
P a g e | 408
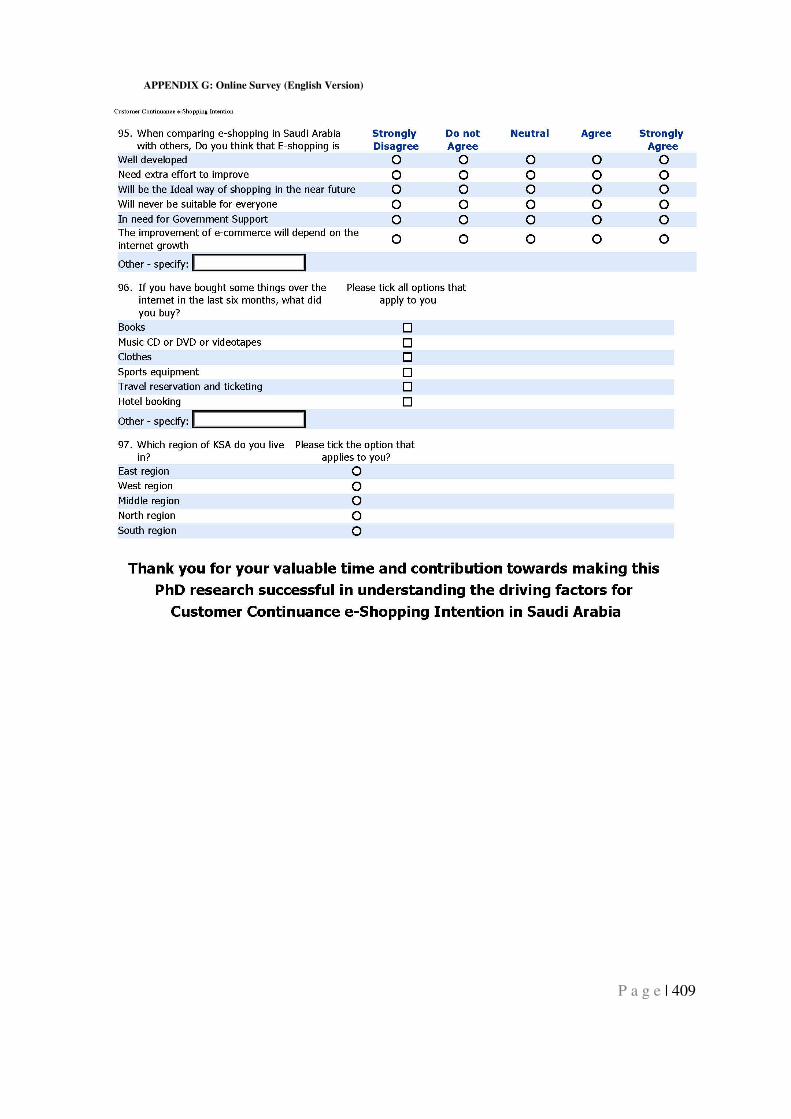
APPENDIX G: Online Survey (English Version)
P a g e | 409

APPENDIX H: ONLINE SURVEY (ARABIC VERSION)
P a g e | 410
Arabic version
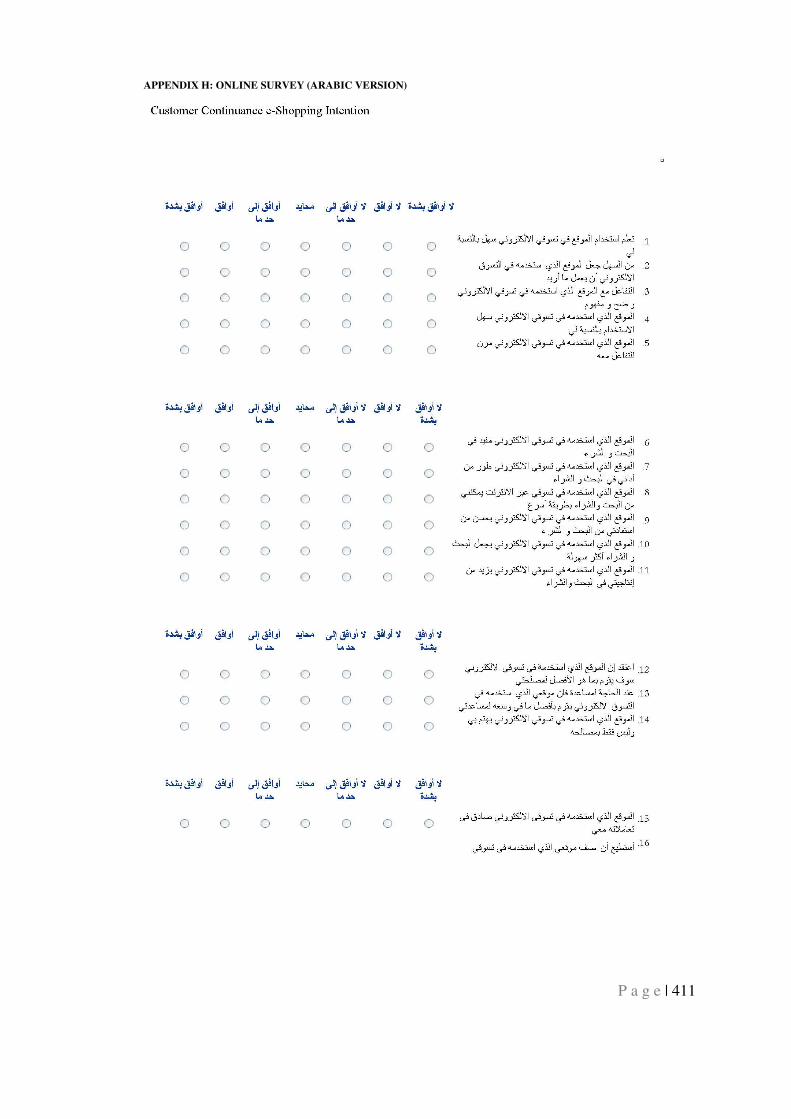
APPENDIX H: ONLINE SURVEY (ARABIC VERSION)
P a g e | 411
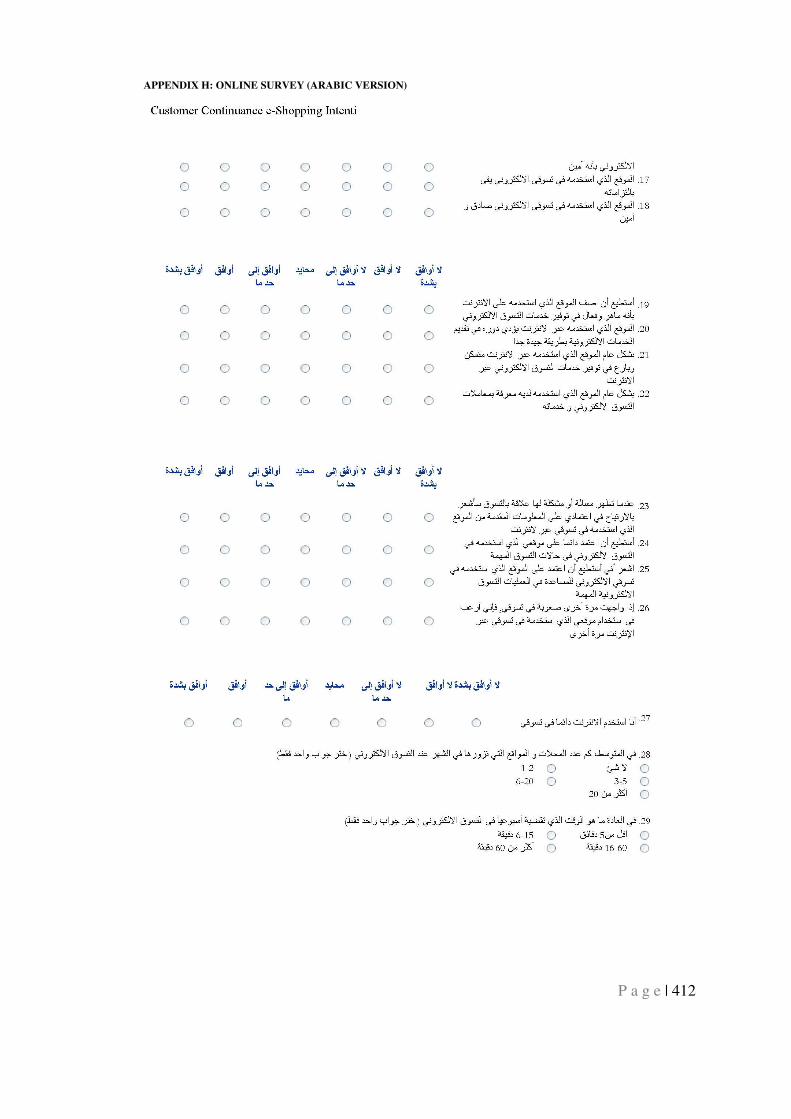
APPENDIX H: ONLINE SURVEY (ARABIC VERSION)
P a g e | 412
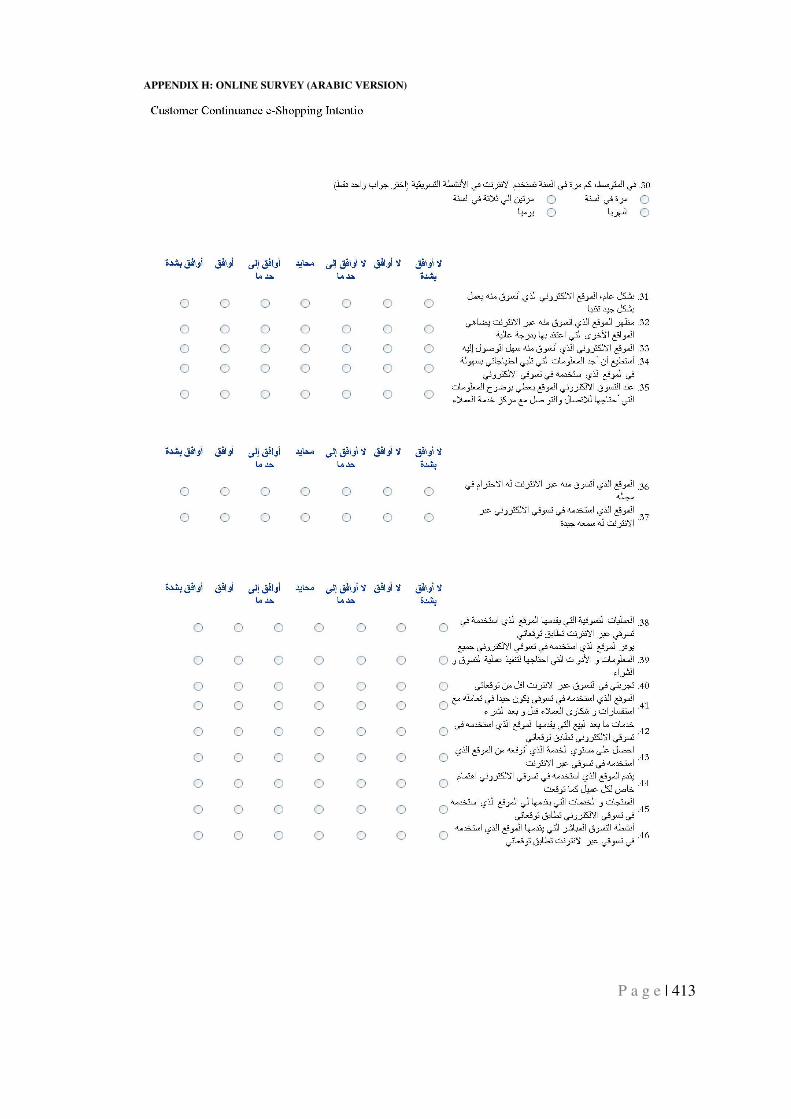
APPENDIX H: ONLINE SURVEY (ARABIC VERSION)
P a g e | 413
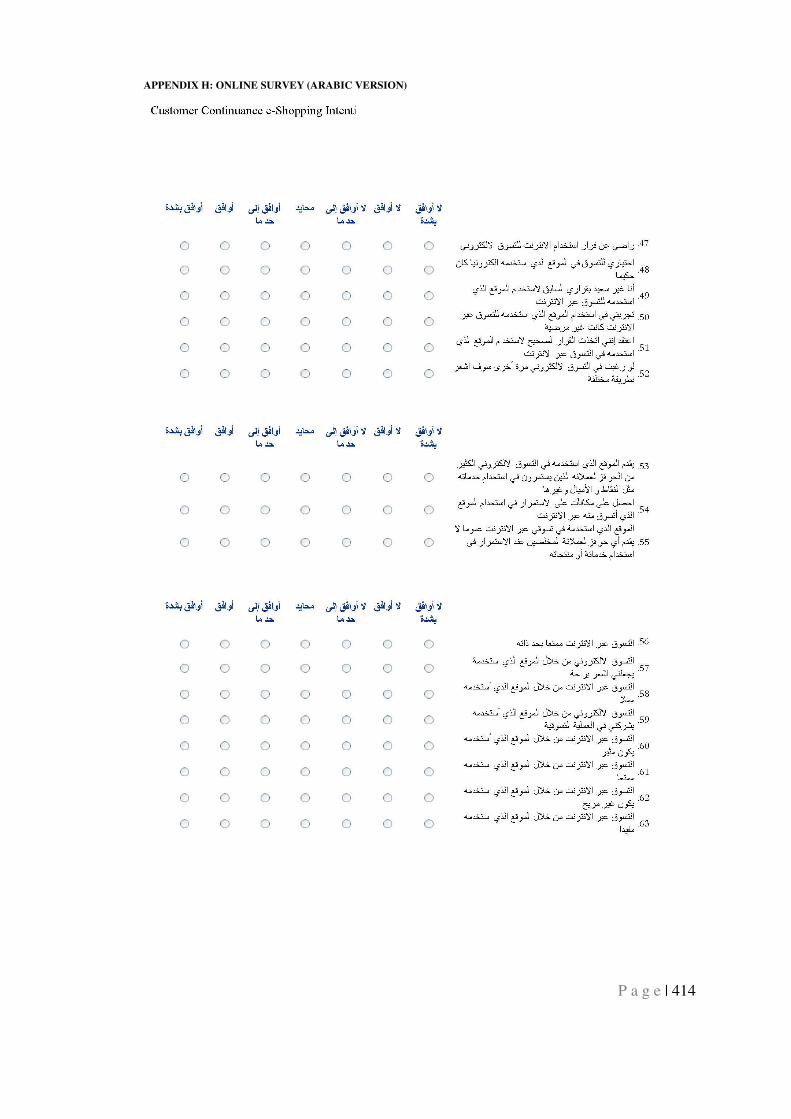
APPENDIX H: ONLINE SURVEY (ARABIC VERSION)
P a g e | 414
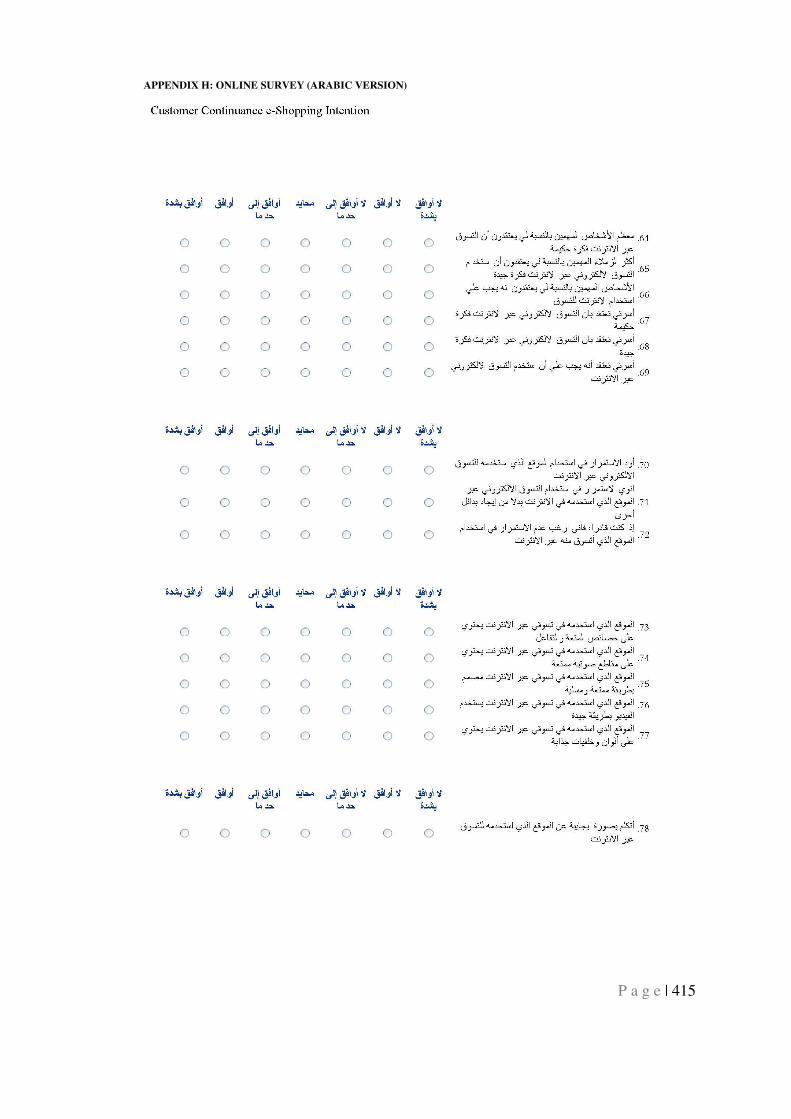
APPENDIX H: ONLINE SURVEY (ARABIC VERSION)
P a g e | 415
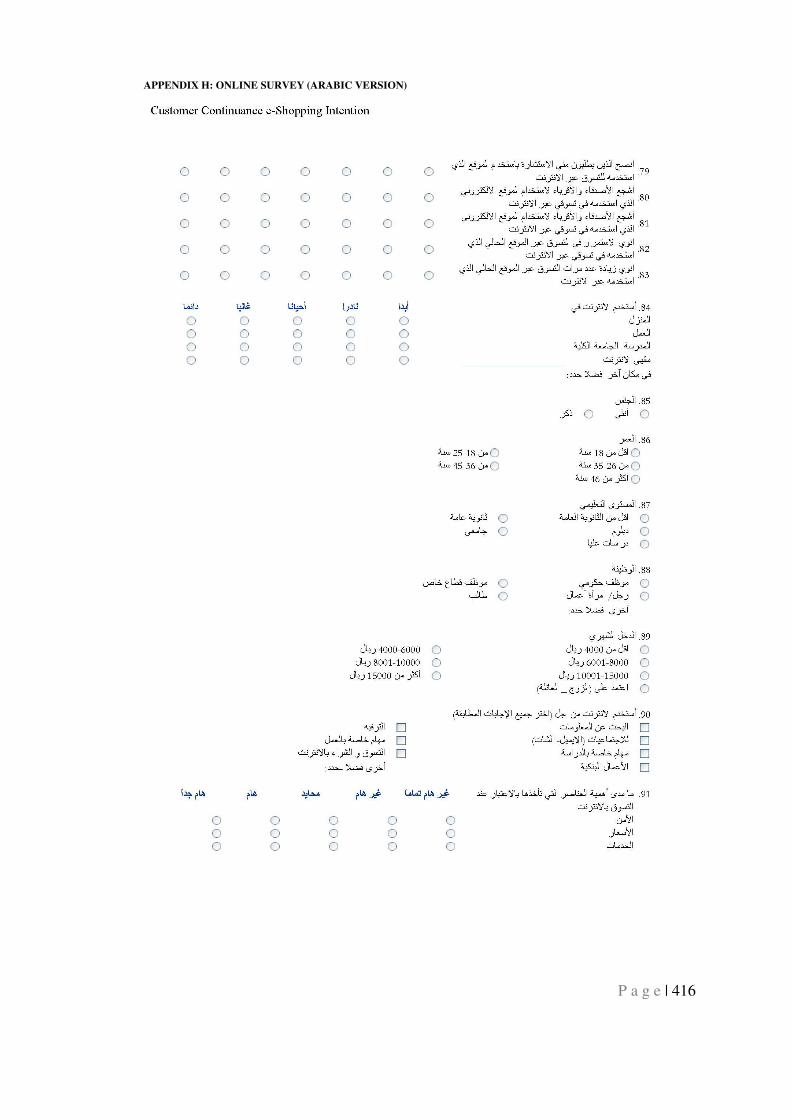
APPENDIX H: ONLINE SURVEY (ARABIC VERSION)
P a g e | 416
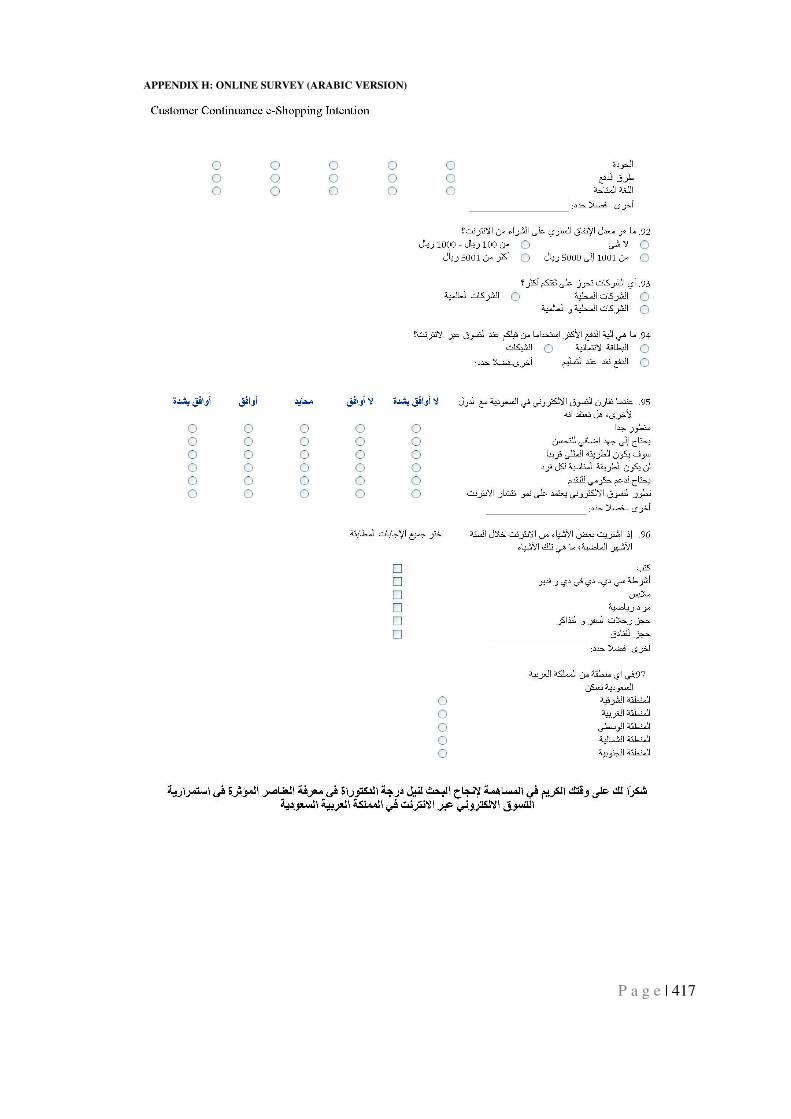
APPENDIX H: ONLINE SURVEY (ARABIC VERSION)
P a g e | 417
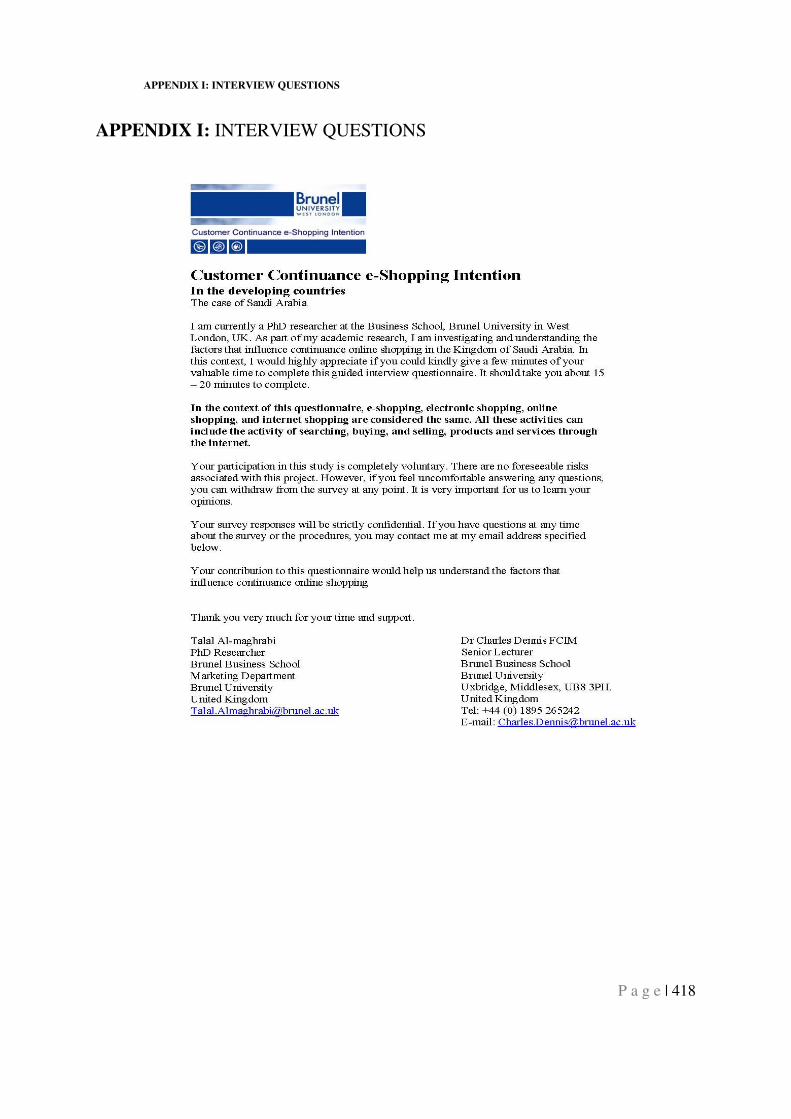
APPENDIX I: INTERVIEW QUESTIONS
P a g e | 418
APPENDIX I: INTERVIEW QUESTIONS
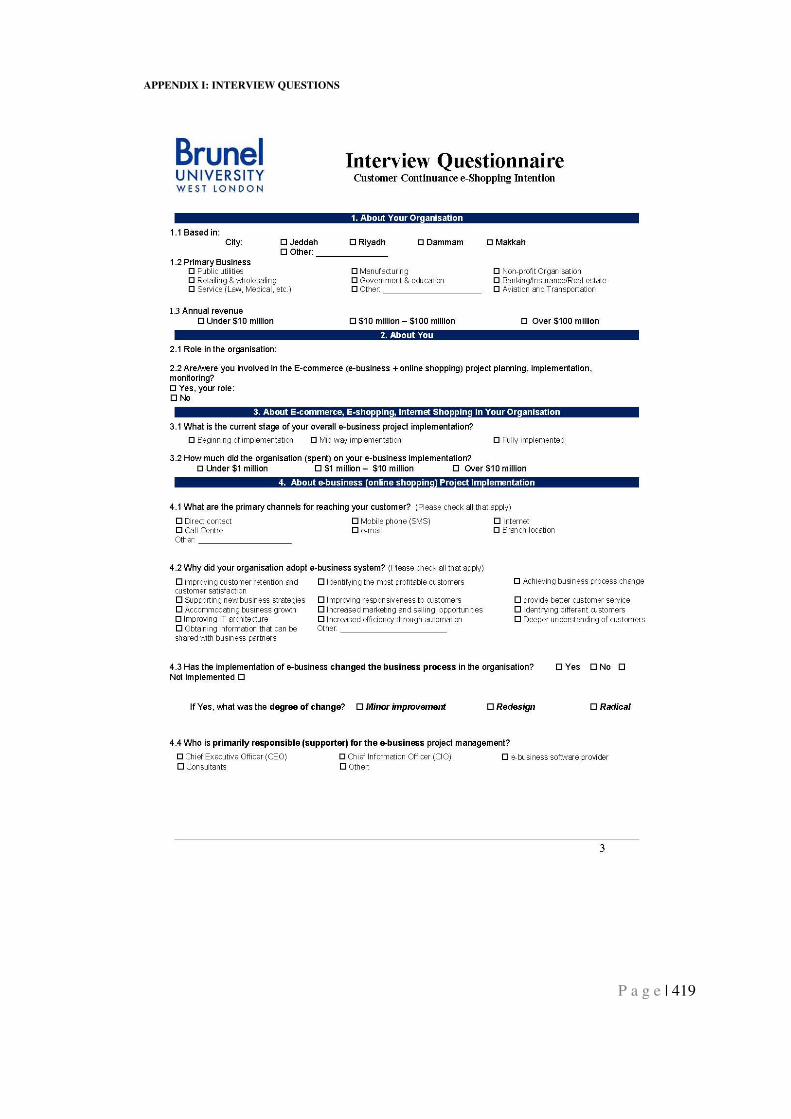
APPENDIX I: INTERVIEW QUESTIONS
P a g e | 419
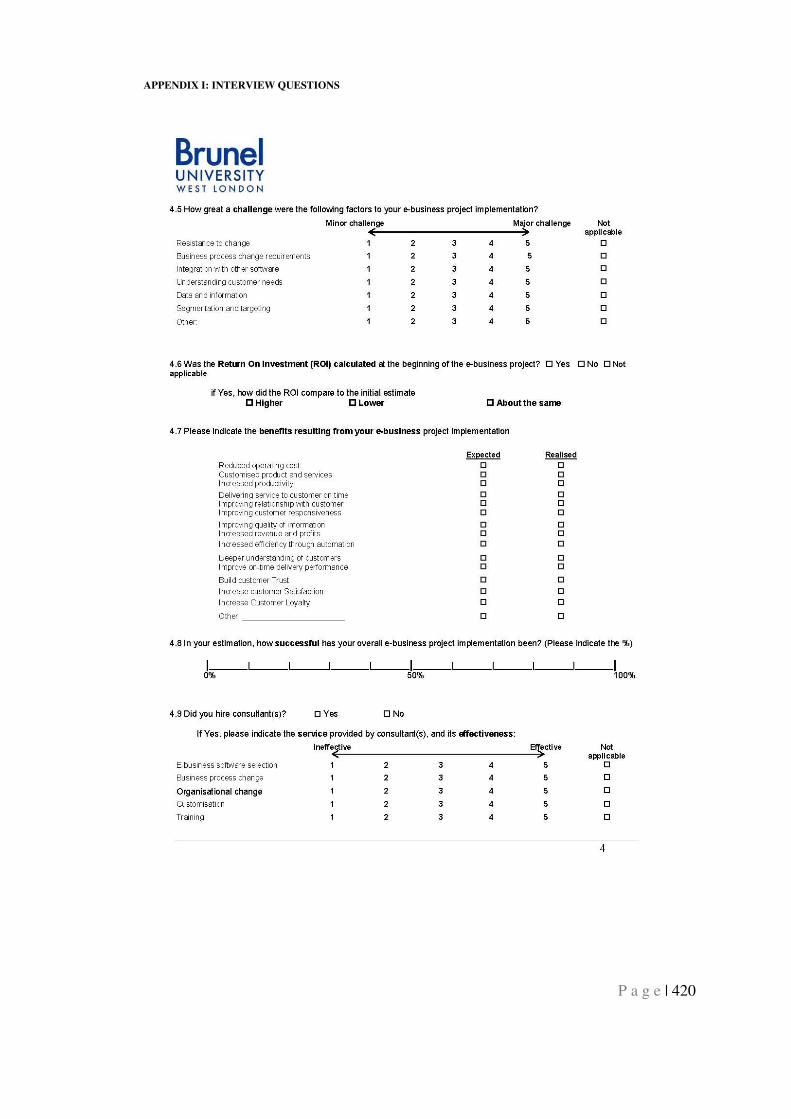
APPENDIX I: INTERVIEW QUESTIONS
P a g e | 420
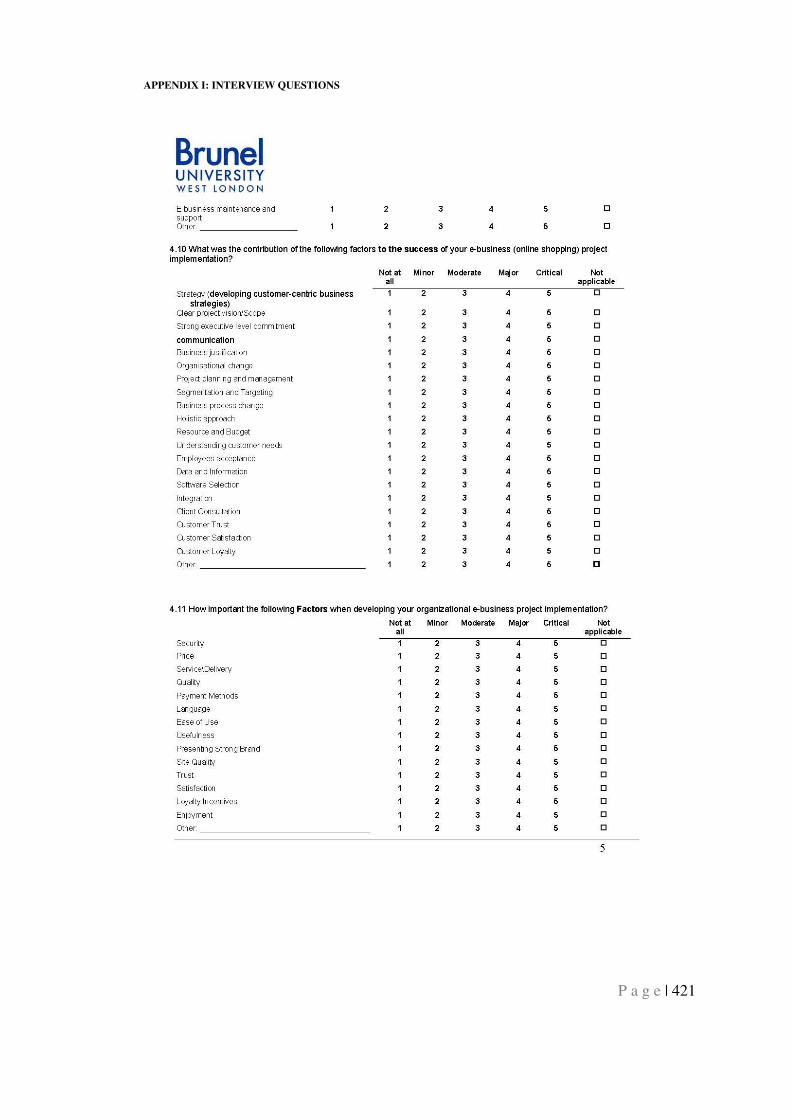
APPENDIX I: INTERVIEW QUESTIONS
P a g e | 421
APPENDIX I: INTERVIEW QUESTIONS
P a g e | 422


