Embed Size (px)
Citation preview
International Journal of Adhesion & Adhesives 41 (2013) 80–91
Contents lists available at SciVerse ScienceDirect
International Journal of Adhesion & Adhesives
0143-74
http://d
n Corr
E-m
journal homepage: www.elsevier.com/locate/ijadhadh
The fatigue response of environmentally degraded adhesively bondedaluminium structures
S. Sugiman a, A.D. Crocombe b,n, I.A. Aschroft c
a Department of Mechanical Engineering, Faculty of Engineering, University of Mataram, Mataram, West Nusa, Tenggara 83125, Indonesiab Division of Mechanical, Medical and Aerospace Engineering, Faculty of Engineering and Physical Sciences, University of Surrey, Guildford, Surrey, GU2 7XH, UKc Wolfson School of Mechanical and Manufacturing Engineering, Loughborough University, Loughborough, UK
a r t i c l e i n f o
Article history:
Accepted 1 August 2012Experimental studies have been undertaken investigating the effect of moisture on the fatigue response
of adhesively bonded monolithic single lap joints and laminated doublers loaded in bending, both made
Available online 22 October 2012Keywords:
Epoxy/Epoxides
Aluminium and alloys
Finite element stress analysis
Fatigue
Environmental issues
96/$ - see front matter & 2012 Elsevier Ltd. A
x.doi.org/10.1016/j.ijadhadh.2012.10.003
esponding author. Tel.: þ44 1483 689194.
ail address: [email protected] (A.D. Cr
a b s t r a c t
of the same materials. The joints were aged in deionised water at a temperature of 50 1C for up to
2 years exposure. The backface strain technique was employed to monitor damage initiation and
propagation in the joints. The test results show that the fatigue life degraded with increasing moisture
content and tended to level off when approaching saturation. The failure surfaces were cohesive in the
adhesive. Numerical fatigue modelling has been undertaken to predict the fatigue response of these
joints utilising a strain-based fatigue damage law integrated with a bilinear traction-separation
cohesive zone model. The residual stresses due to thermal and swelling strain were included in the
model. Good agreement was found between the predicted fatigue response and the experimental
results.
& 2012 Elsevier Ltd. All rights reserved.
1. Introduction
In service, adhesively bonded joints are often subjected tofatigue loading. Under such loading, the joints will fail at stresslevels much lower than those under monotonic loading. Themechanical properties of the joints will generally be adverselyaffected during operation in an aqueous environment [1]. Thisthen becomes an extensive research field, experimentally andnumerically, as many factors influence the fatigue performance ofthe joint.
Many studies of the effect of surface treatment on aluminium-adhesive joint fatigue performance have been reported in theliterature including chromic acid etching (CAE), phosphoric acidanodising (PAA), phosphoric acid anodising and priming (PAAP),grit blasted and degreasing (GBD) and silane treatments [2–6]. Ina dry condition, the fatigue failure surfaces of these treatmentsare generally cohesive in the adhesive, however under wetconditions, the PAA and PAAP surface treatments generally con-tinue to fail cohesively, while failure with other surface treat-ments are often more interfacial.
Some environmental fatigue crack growth studies have beenperformed by conditioning the specimen during the test [2–5].Based on a fracture mechanics approach (Paris law), Liechti et al.
ll rights reserved.
ocombe).
[7] found that in air and in salt water, raising the temperaturereduced the threshold energy release rate and this decrease wasmore in salt water than in air. Ferreira et al. [8] studied compositebonded joints and showed that degradation at a high immersiontemperature (70 1C) was much more than at a temperature of40 1C. This is due to the increase of moisture diffusion as well astemperature effects.
Experimental studies on the fatigue life of aged adhesivelybonded joints tend to be time consuming; therefore, developing apredictive response using numerical modelling is worthwhile.Two approaches to this modelling are a cycle-by-cycle approach[9–11] and characterising the cyclic loading by the maximumfatigue load [12–15]. In high cycle fatigue, a cycle-by-cycleapproach can be very demanding in terms of computational cost.Therefore, considering only the maximum fatigue load is oftenmore practical. Recently, Khoramishad et al. [14] used a max-imum strain-based fatigue model in conjunction with a maximumfatigue load approach to predict the fatigue life of unaged singlelap joints and laminated doublers loaded in bending using abilinear traction–separation cohesive zone model. This model wasfurther generalised to accommodate the effect of load ratio on thefatigue life and was successfully applied to predict the fatigueresponse of adhesively bonded joints with different adhesivesystems [15]. In those works [14,15], the traction was degraded,however the cohesive stiffness remained constant over the entirelife. This seems counter-intuitive as one might expect the stiff-ness of the material to degrade as the damage accumulated.
S. Sugiman et al. / International Journal of Adhesion & Adhesives 41 (2013) 80–91 81
Furthermore, the critical traction value was high compared withthe cohesive strength of the bulk adhesive (although someliterature report [16,17] that the limiting traction can be treatedpurely as a penalty parameter). This resulted in unrealistic stressstates in the adhesive layer.
The backface strain technique was initially used to monitorcrack initiation and propagation in welded structures [18]. Thiswas then extended to adhesively bonded joints to detect damageinitiation [19]. Further study showed that the peak strain oftenoccurred when the damage has reached the detecting gaugeposition [20]. Experimental evidence combining microscopyimages of partially fatigued joints with backface strain measure-ments showed that the damage initiation process occupied up to50% of total fatigue life [21]. However, the proportion of initiationand propagation phases in the fatigue life of single lap joints hasbeen shown to depend on overlap length, applied stress level andfillet shape [22]. Further, Solana et al. [13] and Khoramishad et al.[14,15] predicted the backface strain response using finite ele-ment modelling (FEM) of the bonded joint and although they useda different approach to model adhesive damage, good agreementwas found between FEM and experimental results in both cases.
This paper presents experimental and numerical studies ofthe fatigue response of monolithic single lap joints (MSLJ) andlaminated doublers loaded in bending (LDB) aged in deionisedwater at temperature of 50 1C for up to 2 years. Numerical model-ling used a maximum strain-based fatigue damage modelintegrated with the cohesive zone model to predict the fatigueresponse of the aged joints and included residual stresses due tothermal and swelling strains. The backface strain technique wasused to monitor the fatigue damage evolution in the adhesivelayer and thus to provide a means of calibrating the parameters inthe strain-based fatigue damage law. Further evidence of experi-mental damage was obtained using in-situ video-microscopy.
2. Experimental method
2.1. MSLJ manufacturing
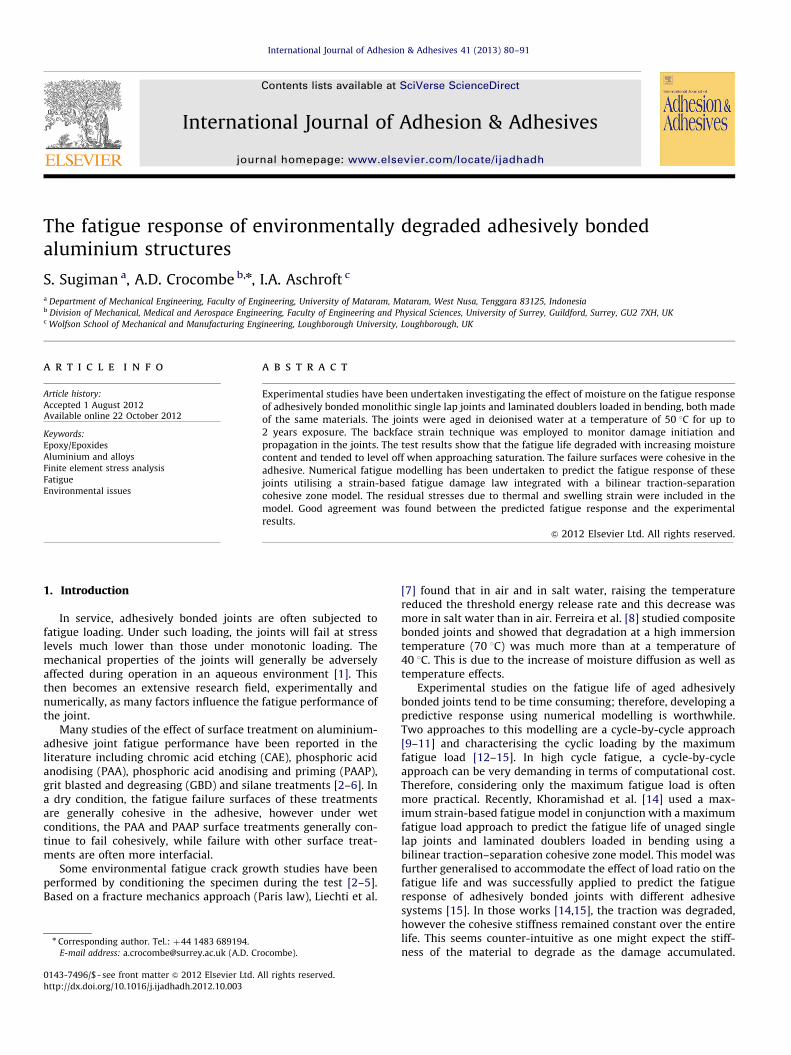
The single lap joint substrates were Al 2024-T3 with athickness of 4.7 mm. To accelerate saturation in the adhesivelayer, a specimen width of only 5 mm was used. Details of thespecimen are shown in Fig. 1(a). Prior to bonding, the surface ofthe aluminium substrate was treated using chromic acid etching
100
30
FM73M OST
Al2024-T3
Unit: mm
4
42
SG2 1
3 4SG
40
8.25
159.5
2
4SG1 SG2
Specimen width: 15 mm Unit: mm
Fig. 1. The specimen and dimensions of (a) monolithic single lap joint, (b) laminat
(CAE) followed by phosphoric acid anodising (PAA) andthen by applying the primer BR127. This treatment process wasundertaken at Airbus, Bristol, UK. The film adhesive FM 73M OSTwas used to bond these substrates. Two layers of the adhesive,with dimension approximately (30�5) mm, were cut and thenlaid up on both aluminium surfaces. A light pressure was appliedto remove air bubbles and to ensure the adhesive made contactwith the aluminium surface. The two aluminium substrates werethen bonded together in the fixture at a pressure of 0.3 MPa andthis pressure was maintained during curing of the adhesive. Steelspacers of thickness of 4.9 mm were used to maintain theadhesive thickness at 0.2 mm. The specimens were cured in theoven at a temperature of 120 1C for 1 h as recommended by themanufacture [23].
2.2. Laminated metal doubler
The test specimens, Fig. 1(b), were cut from a large curvedlaminated panel with bonded ‘‘T’’ stiffeners. The laminate wasmade of aluminium 2024-T3 bonded using the same adhesive asthe MSLJ. The laminate consisted of six layers of aluminium andfive layers of adhesive (FM 73 OST), with thicknesses of approxi-mately 1.6 mm and 0.15 mm, respectively. The stringer bondedonto the laminate panel was aluminium 7055-T7751. The surfacetreatment of aluminium surfaces and curing temperature andpressure for the adhesive were the same as with the MSLJ. Thelength and the thickness of the stringers varied from 85 to 93 mmand 9.5 to 10.5 mm, respectively. The thickness of the stringeradhesive layer was not constant along the length due to thecurvature of the laminate. It was thinner at the edge (0.1 mm) andthicker at the centre (0.2 mm). The doubler specimens (Fig. 1(b))contained discontinuities in the form of butts between adjacentco-planar aluminium sheets. The butt region was filled withadhesive.
2.3. Specimen ageing
The ageing of MSLJ and LDB was carried out by immersing thespecimens in deionised water at a temperature of 5071 1C. Thespecimens were laid up on perforated corrugated stainless steel toensure that all sides of adhesive layer were in complete contactwith the water. The specimens were kept in the deionised waterfor 1 year (wet-1y) and 2 years (wet-2y). FE based diffusion
100
0.2
5
4.7 Al2024-T3
2
0.2
40
9115
2
4PSG3SG4
ed doublers loaded in bending. The stringer web is removed in the figure (b).
S. Sugiman et al. / International Journal of Adhesion & Adhesives 41 (2013) 80–9182
modelling discussed in the partner paper [24] indicated thatfor the MSLJ (width¼5 mm) the adhesive layer had reachedsaturation within a year and immersion up to 2 years providedprolonged exposure after saturation. The LDB (width¼15 mm)was not fully saturated, even after 2 years exposure.
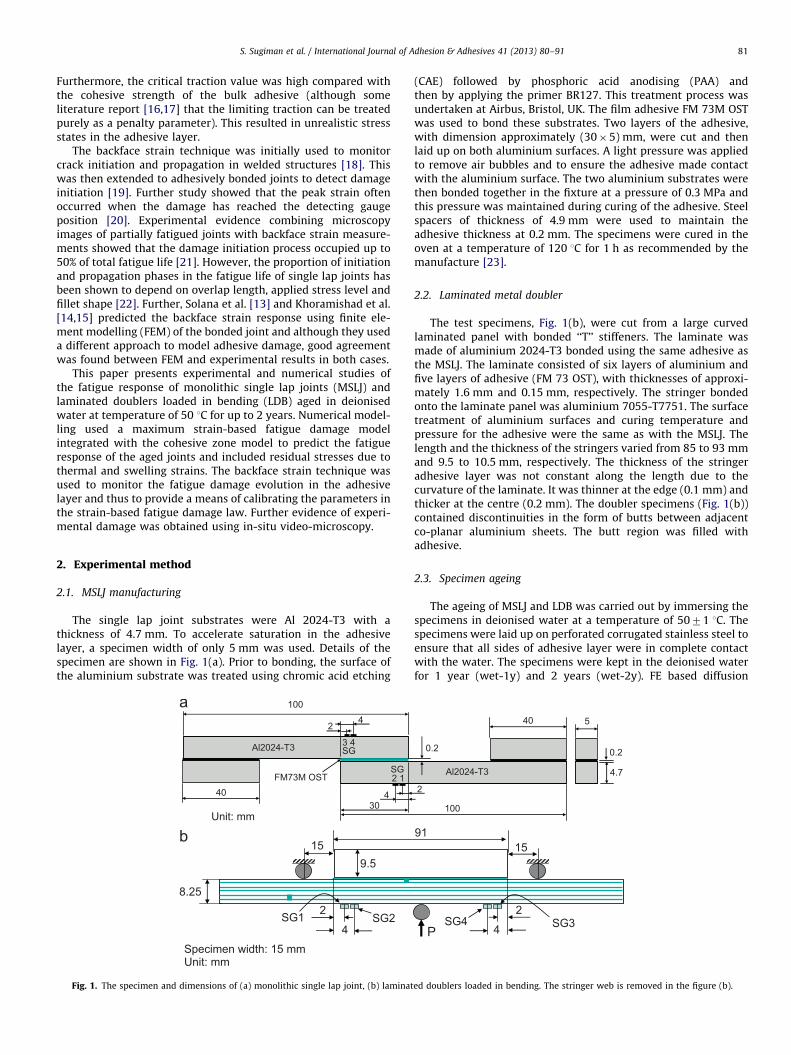
Table 2Static strength of MSLJ and LDB under dry and wet conditions [22,25].
Condition Exp. failure load Predicted failure load
MSLJ (kN) LDB (kN) MSLJ (kN) LDB (kN)
Dry 3.9370.08 5.0570.09 3.95 4.81
Wet-1y 3.0670.14 4.3470.10 3.10 4.30
Wet-2y 2.9770.11 4.0270.05 2.87 4.08
0.6
0.65
2.4. Mechanical testing
For both joint types, after exposure but before fatigue testing,strain gauges (SGs) were attached to the aluminium substrate tomonitor the damage in adhesive layer during testing. The centreof the strain gauges was located on the substrate inside theoverlap end (e.g, see Fig. 1). It is recommended that the centres ofgauges are located 1–2 mm inside the edge of lap [20]. Additionalstrain gauges were used to get more information on the damagepropagation. The position of these extra strain gauges varied. Inthe labelling of strain gauges, those that were closer to the end ofthe overlap were assigned an odd number, as seen in Fig. 1.
For LDB testing, the distance from the support roller to theedge of stringer was kept constant at 15 mm, regardless of thestringer length (Fig. 1(b)). This was sufficient distance to provideaccess for the in-situ video microscope and ensured that at theoverlap ends the relation between the force and the moment wasthe same in all specimens.
For both MSLJ and LDB, the fatigue testing was performed inload control with a sinusoidal wave form, using an Instron 1341servo-hydraulic machine. The stress ratio (R) and frequency were0.1 and 5 Hz, respectively. Based on temperature measurementstaken in previous fatigue test programmes, specimen heating wasnot expected to be a problem at this frequency. Two maximumload levels were applied, 60% and 50% of the static strength ofeach condition (unaged and aged) for the MSLJ and 50% and 40%of the static strength of each condition (unaged and aged) for LDB.Video microscopy was utilised to visually monitor the damagepropagation. It should be noted that later in the paper, the load-life curves for all the joints were normalised using the staticstrength of the unaged condition.
0.2
0.25
0.3
0.35
0.4
0.45
0.5
0.55
1000 10000 100000Number of cycles
Pm
ax/P
S(d
ry)
EXP-Dry EXP-Wet-1y
EXP-Wet-2y FEM-Dry
FEM-Wet1y FEM-Wet2y
Fig. 2. The fatigue life of MSLJ under unaged and aged condition. The load level is
normalised by the unaged static strength.
3. Experimental results
This paper investigates the fatigue response of monolithicsingle lap joint and laminated doubler in bending in an agedcondition. It follows from work reported elsewhere [24,25] thatwas undertaken investigating the quasi-static response of thesame joints in both unaged and aged conditions. The moisture-dependent mechanical properties of the adhesive, including thecohesive zone properties, that were developed in this earlierquasi-static work and used in the FEM later, are summarised inTable 1. The properties were taken to degrade linearly betweenthe limiting values given. The experimental and predicted staticresponse of these joints has been presented in [24,25] and asummary of the experimental and predicted static strengths areshown in Table 2.
Table 1The properties of the aged adhesive used in the FEM of MSLJ [24,25].
Adhesive
Condition E (MPa) Kn (N/mm3) Ks¼Kt (N/mm3)
Dry 2300 100,000 35,750
1 year 1960 80,000 28,550
2 year 1862 79,250 28,350
3.1. Monolithic single lap joints
Fig. 2 shows the load–life response of unaged and aged MSLJsat various load levels. The fatigue life for the aged joints decreasedconsiderably (approximately by factor of 10 at the same loadlevel) compared with the unaged joints. Further aging for a longertime at saturation (wet-2y) only decreased the fatigue lifemarginally. This is similar to the static response (Table 2)although the damage mechanism was not the same. In general,the degradation of the joints due to combined environmental andfatigue loading is considerably greater than under static loading.Although the degradation is considerable, the failure surfacesof the joints were still cohesive in the adhesive layer for allconditions and all load levels considered. Clearly, the adhesivelayer still remained the ‘‘weak link’’, even in the presence of waterfor sustained periods. This is due to the superior surface prepara-tion used on the substrates.
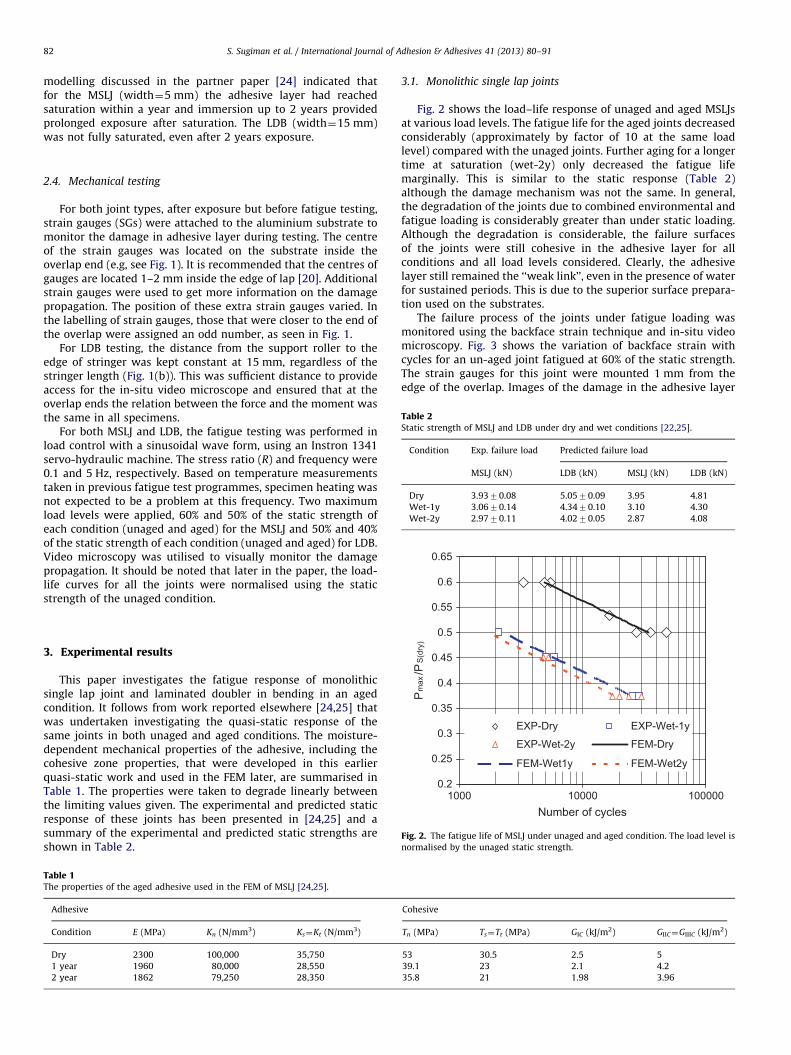
The failure process of the joints under fatigue loading wasmonitored using the backface strain technique and in-situ videomicroscopy. Fig. 3 shows the variation of backface strain withcycles for an un-aged joint fatigued at 60% of the static strength.The strain gauges for this joint were mounted 1 mm from theedge of the overlap. Images of the damage in the adhesive layer
Cohesive
Tn (MPa) Ts¼Tt (MPa) GIC (kJ/m2) GIIC¼GIIIC (kJ/m2)
53 30.5 2.5 5
39.1 23 2.1 4.2
35.8 21 1.98 3.96
0
200
400
600
800
1000
1200
1400
1600
1 10 100 1000 10000Number of cycles, N
Bac
kfac
e st
rain
(Mic
ro s
train
)
0
2
4
6
8
10
12
Dam
age
zone
(DZ)
leng
th (m
m)
BFS at SG1
BFS at SG3
DZ at SG1 side
DZ at SG3 side
N=0
N=2,000
N=4,000
1 mm SG1 side
N=0
N=1,000
N=2,000
1 mmSG3 side
Fig. 3. The unaged MSLJ failure process with fatigue loading at a load level of 60%.
(a) Showing the variation of backface strain (BFS) and damage zone (DZ) size with
cycles (b) and (c) Showing the images of the damage in the adhesive layer at a
selected number of cycles at both ends. Black arrows show approximately the tip
of the damage.
0
100
200
300
400
500
600
700
800
900
1000
100 1000 10000 100000Number of cycles, N
Bac
kfac
e st
rain
(Mic
ro s
train
)
0
1
2
3
4
5
6
7
8
9
Dam
age
zone
(DZ)
leng
th (m
m)
BFS at SG1 sideBFS at SG3 sideDZ at SG1 sideDZ at SG3 side
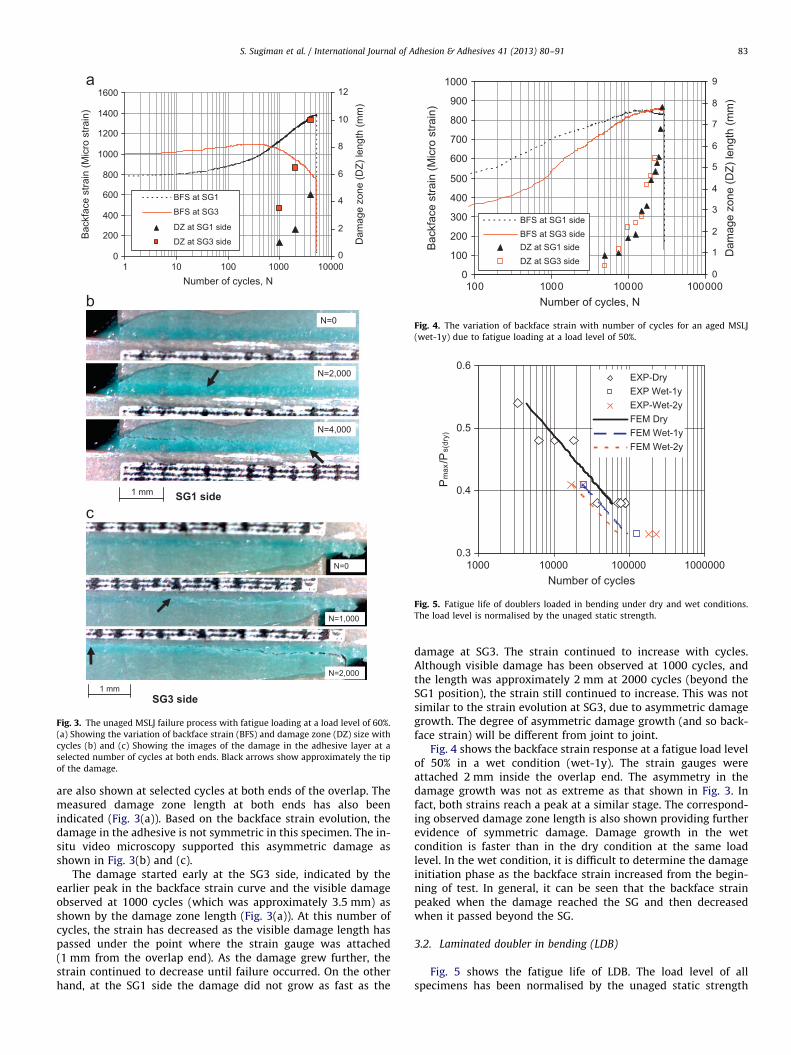
Fig. 4. The variation of backface strain with number of cycles for an aged MSLJ
(wet-1y) due to fatigue loading at a load level of 50%.
0.3
0.4
0.5
0.6
1000 10000 100000 1000000Number of cycles
Pm
ax/P
s(dr
y)
EXP-DryEXP Wet-1yEXP-Wet-2yFEM DryFEM Wet-1yFEM Wet-2y
Fig. 5. Fatigue life of doublers loaded in bending under dry and wet conditions.
The load level is normalised by the unaged static strength.
S. Sugiman et al. / International Journal of Adhesion & Adhesives 41 (2013) 80–91 83
are also shown at selected cycles at both ends of the overlap. Themeasured damage zone length at both ends has also beenindicated (Fig. 3(a)). Based on the backface strain evolution, thedamage in the adhesive is not symmetric in this specimen. The in-situ video microscopy supported this asymmetric damage asshown in Fig. 3(b) and (c).
The damage started early at the SG3 side, indicated by theearlier peak in the backface strain curve and the visible damageobserved at 1000 cycles (which was approximately 3.5 mm) asshown by the damage zone length (Fig. 3(a)). At this number ofcycles, the strain has decreased as the visible damage length haspassed under the point where the strain gauge was attached(1 mm from the overlap end). As the damage grew further, thestrain continued to decrease until failure occurred. On the otherhand, at the SG1 side the damage did not grow as fast as the
damage at SG3. The strain continued to increase with cycles.Although visible damage has been observed at 1000 cycles, andthe length was approximately 2 mm at 2000 cycles (beyond theSG1 position), the strain still continued to increase. This was notsimilar to the strain evolution at SG3, due to asymmetric damagegrowth. The degree of asymmetric damage growth (and so back-face strain) will be different from joint to joint.
Fig. 4 shows the backface strain response at a fatigue load levelof 50% in a wet condition (wet-1y). The strain gauges wereattached 2 mm inside the overlap end. The asymmetry in thedamage growth was not as extreme as that shown in Fig. 3. Infact, both strains reach a peak at a similar stage. The correspond-ing observed damage zone length is also shown providing furtherevidence of symmetric damage. Damage growth in the wetcondition is faster than in the dry condition at the same loadlevel. In the wet condition, it is difficult to determine the damageinitiation phase as the backface strain increased from the begin-ning of test. In general, it can be seen that the backface strainpeaked when the damage reached the SG and then decreasedwhen it passed beyond the SG.
3.2. Laminated doubler in bending (LDB)
Fig. 5 shows the fatigue life of LDB. The load level of allspecimens has been normalised by the unaged static strength
1000
1200
1400
1600
1800
2000
2200
2400
Number of cycles
Bac
kfac
e st
rain
(mic
rost
rain
)
SG3
SG4
800900
100011001200
130014001500
16001700
Number of cycles
Bac
kfac
e st
rain
(mic
rost
rain
)
SG3SG4
400
600
800
1000
1200
1400
1600
Number of cycles
Bac
kfac
e st
rain
(mic
rost
rain
)
SG3
SG4
700
800
900
1000
1100
1200
1300
100 1000 10000 100 1000 10000 100000
100 1000 10000 100000 1000000 100 1000 10000 100000 1000000
Number of cycles
Bac
kfac
e st
rain
(mic
rost
rain
)
SG3
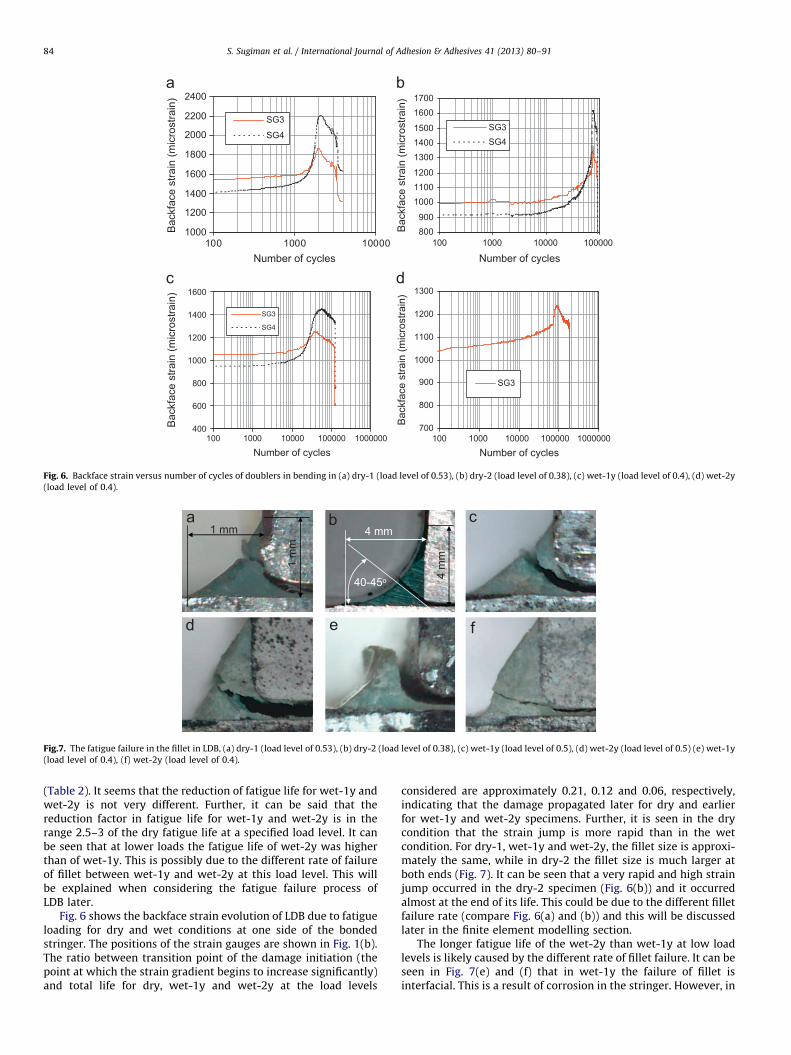
Fig. 6. Backface strain versus number of cycles of doublers in bending in (a) dry-1 (load level of 0.53), (b) dry-2 (load level of 0.38), (c) wet-1y (load level of 0.4), (d) wet-2y
(load level of 0.4).
40-45o
4 mm
4 m
m1 m
m
1 mm
Fig.7. The fatigue failure in the fillet in LDB, (a) dry-1 (load level of 0.53), (b) dry-2 (load level of 0.38), (c) wet-1y (load level of 0.5), (d) wet-2y (load level of 0.5) (e) wet-1y
(load level of 0.4), (f) wet-2y (load level of 0.4).
S. Sugiman et al. / International Journal of Adhesion & Adhesives 41 (2013) 80–9184
(Table 2). It seems that the reduction of fatigue life for wet-1y andwet-2y is not very different. Further, it can be said that thereduction factor in fatigue life for wet-1y and wet-2y is in therange 2.5–3 of the dry fatigue life at a specified load level. It canbe seen that at lower loads the fatigue life of wet-2y was higherthan of wet-1y. This is possibly due to the different rate of failureof fillet between wet-1y and wet-2y at this load level. This willbe explained when considering the fatigue failure process ofLDB later.
Fig. 6 shows the backface strain evolution of LDB due to fatigueloading for dry and wet conditions at one side of the bondedstringer. The positions of the strain gauges are shown in Fig. 1(b).The ratio between transition point of the damage initiation (thepoint at which the strain gradient begins to increase significantly)and total life for dry, wet-1y and wet-2y at the load levels
considered are approximately 0.21, 0.12 and 0.06, respectively,indicating that the damage propagated later for dry and earlierfor wet-1y and wet-2y specimens. Further, it is seen in the drycondition that the strain jump is more rapid than in the wetcondition. For dry-1, wet-1y and wet-2y, the fillet size is approxi-mately the same, while in dry-2 the fillet size is much larger atboth ends (Fig. 7). It can be seen that a very rapid and high strainjump occurred in the dry-2 specimen (Fig. 6(b)) and it occurredalmost at the end of its life. This could be due to the different filletfailure rate (compare Fig. 6(a) and (b)) and this will be discussedlater in the finite element modelling section.
The longer fatigue life of the wet-2y than wet-1y at low loadlevels is likely caused by the different rate of fillet failure. It can beseen in Fig. 7(e) and (f) that in wet-1y the failure of fillet isinterfacial. This is a result of corrosion in the stringer. However, in
1
2
3
0
200
400
600
800
1000
1200
1400
1600
1800
0 20000 40000 60000 80000 100000
Number of cycles
Bac
k fa
ce s
train
(mic
rost
rain
) SG3SG4
SG3SG424
12
3
1 mm
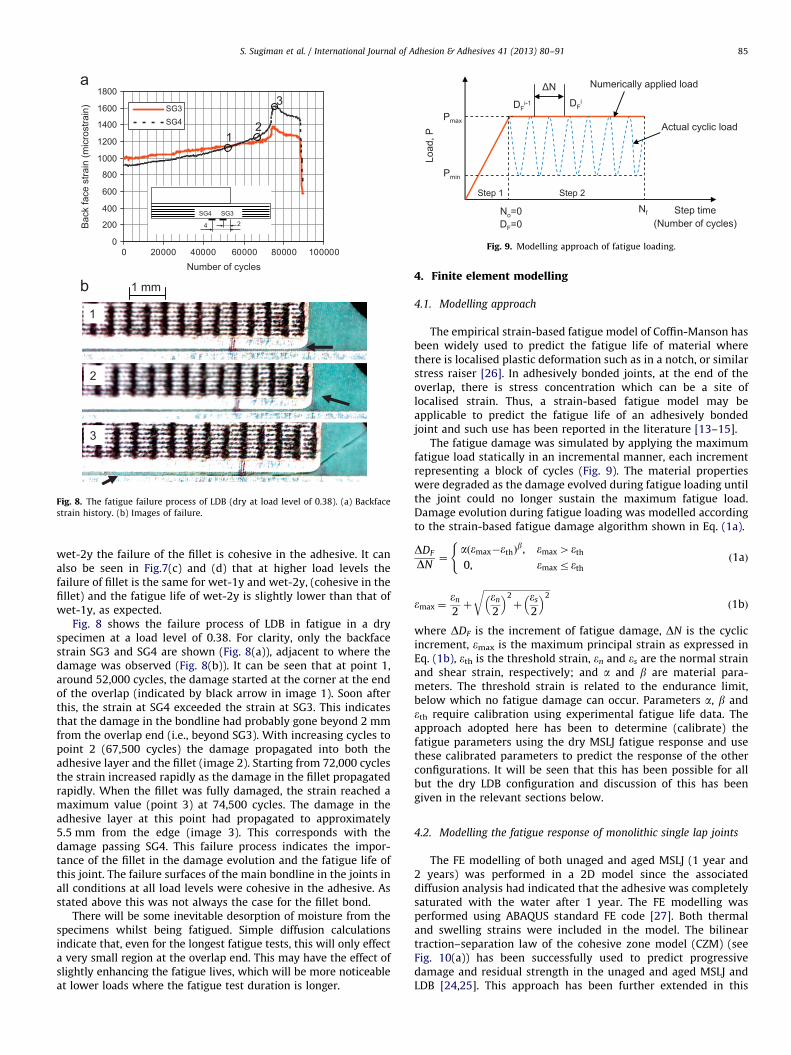
Fig. 8. The fatigue failure process of LDB (dry at load level of 0.38). (a) Backface
strain history. (b) Images of failure.
Fig. 9. Modelling approach of fatigue loading.
S. Sugiman et al. / International Journal of Adhesion & Adhesives 41 (2013) 80–91 85
wet-2y the failure of the fillet is cohesive in the adhesive. It canalso be seen in Fig.7(c) and (d) that at higher load levels thefailure of fillet is the same for wet-1y and wet-2y, (cohesive in thefillet) and the fatigue life of wet-2y is slightly lower than that ofwet-1y, as expected.
Fig. 8 shows the failure process of LDB in fatigue in a dryspecimen at a load level of 0.38. For clarity, only the backfacestrain SG3 and SG4 are shown (Fig. 8(a)), adjacent to where thedamage was observed (Fig. 8(b)). It can be seen that at point 1,around 52,000 cycles, the damage started at the corner at the endof the overlap (indicated by black arrow in image 1). Soon afterthis, the strain at SG4 exceeded the strain at SG3. This indicatesthat the damage in the bondline had probably gone beyond 2 mmfrom the overlap end (i.e., beyond SG3). With increasing cycles topoint 2 (67,500 cycles) the damage propagated into both theadhesive layer and the fillet (image 2). Starting from 72,000 cyclesthe strain increased rapidly as the damage in the fillet propagatedrapidly. When the fillet was fully damaged, the strain reached amaximum value (point 3) at 74,500 cycles. The damage in theadhesive layer at this point had propagated to approximately5.5 mm from the edge (image 3). This corresponds with thedamage passing SG4. This failure process indicates the impor-tance of the fillet in the damage evolution and the fatigue life ofthis joint. The failure surfaces of the main bondline in the joints inall conditions at all load levels were cohesive in the adhesive. Asstated above this was not always the case for the fillet bond.
There will be some inevitable desorption of moisture from thespecimens whilst being fatigued. Simple diffusion calculationsindicate that, even for the longest fatigue tests, this will only effecta very small region at the overlap end. This may have the effect ofslightly enhancing the fatigue lives, which will be more noticeableat lower loads where the fatigue test duration is longer.
4. Finite element modelling
4.1. Modelling approach
The empirical strain-based fatigue model of Coffin-Manson hasbeen widely used to predict the fatigue life of material wherethere is localised plastic deformation such as in a notch, or similarstress raiser [26]. In adhesively bonded joints, at the end of theoverlap, there is stress concentration which can be a site oflocalised strain. Thus, a strain-based fatigue model may beapplicable to predict the fatigue life of an adhesively bondedjoint and such use has been reported in the literature [13–15].
The fatigue damage was simulated by applying the maximumfatigue load statically in an incremental manner, each incrementrepresenting a block of cycles (Fig. 9). The material propertieswere degraded as the damage evolved during fatigue loading untilthe joint could no longer sustain the maximum fatigue load.Damage evolution during fatigue loading was modelled accordingto the strain-based fatigue damage algorithm shown in Eq. (1a).
DDF
DN¼
a emax�ethð Þb, emax4eth
0, emaxreth
(ð1aÞ
emax ¼en
2þ
ffiffiffiffiffiffiffiffiffiffiffiffiffiffiffiffiffiffiffiffiffiffiffiffiffiffiffiffiffien
2
� �2
þes
2
� �2r
ð1bÞ
where DDF is the increment of fatigue damage, DN is the cyclicincrement, emax is the maximum principal strain as expressed inEq. (1b), eth is the threshold strain, en and es are the normal strainand shear strain, respectively; and a and b are material para-meters. The threshold strain is related to the endurance limit,below which no fatigue damage can occur. Parameters a, b andeth require calibration using experimental fatigue life data. Theapproach adopted here has been to determine (calibrate) thefatigue parameters using the dry MSLJ fatigue response and usethese calibrated parameters to predict the response of the otherconfigurations. It will be seen that this has been possible for allbut the dry LDB configuration and discussion of this has beengiven in the relevant sections below.
4.2. Modelling the fatigue response of monolithic single lap joints
The FE modelling of both unaged and aged MSLJ (1 year and2 years) was performed in a 2D model since the associateddiffusion analysis had indicated that the adhesive was completelysaturated with the water after 1 year. The FE modelling wasperformed using ABAQUS standard FE code [27]. Both thermaland swelling strains were included in the model. The bilineartraction–separation law of the cohesive zone model (CZM) (seeFig. 10(a)) has been successfully used to predict progressivedamage and residual strength in the unaged and aged MSLJ andLDB [24,25]. This approach has been further extended in this
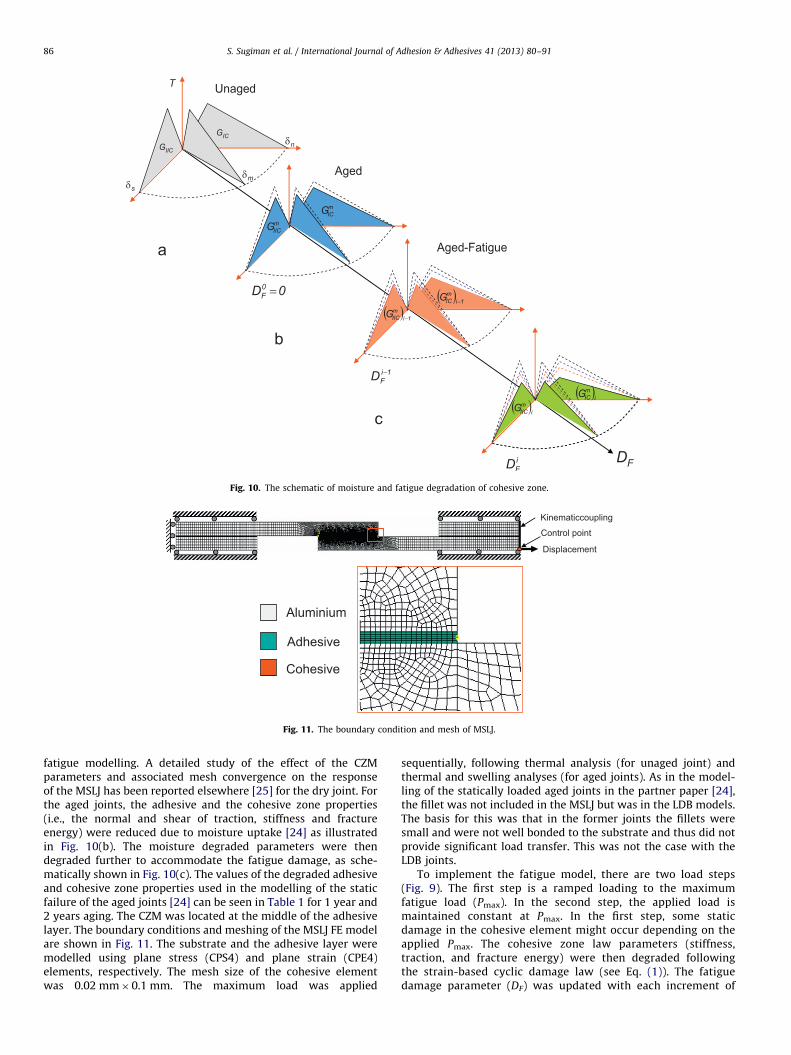
Fig. 10. The schematic of moisture and fatigue degradation of cohesive zone.
Kinematiccoupling
Control point
Displacement
Fig. 11. The boundary condition and mesh of MSLJ.
S. Sugiman et al. / International Journal of Adhesion & Adhesives 41 (2013) 80–9186
fatigue modelling. A detailed study of the effect of the CZMparameters and associated mesh convergence on the responseof the MSLJ has been reported elsewhere [25] for the dry joint. Forthe aged joints, the adhesive and the cohesive zone properties(i.e., the normal and shear of traction, stiffness and fractureenergy) were reduced due to moisture uptake [24] as illustratedin Fig. 10(b). The moisture degraded parameters were thendegraded further to accommodate the fatigue damage, as sche-matically shown in Fig. 10(c). The values of the degraded adhesiveand cohesive zone properties used in the modelling of the staticfailure of the aged joints [24] can be seen in Table 1 for 1 year and2 years aging. The CZM was located at the middle of the adhesivelayer. The boundary conditions and meshing of the MSLJ FE modelare shown in Fig. 11. The substrate and the adhesive layer weremodelled using plane stress (CPS4) and plane strain (CPE4)elements, respectively. The mesh size of the cohesive elementwas 0.02 mm�0.1 mm. The maximum load was applied
sequentially, following thermal analysis (for unaged joint) andthermal and swelling analyses (for aged joints). As in the model-ling of the statically loaded aged joints in the partner paper [24],the fillet was not included in the MSLJ but was in the LDB models.The basis for this was that in the former joints the fillets weresmall and were not well bonded to the substrate and thus did notprovide significant load transfer. This was not the case with theLDB joints.
To implement the fatigue model, there are two load steps(Fig. 9). The first step is a ramped loading to the maximumfatigue load (Pmax). In the second step, the applied load ismaintained constant at Pmax. In the first step, some staticdamage in the cohesive element might occur depending on theapplied Pmax. The cohesive zone law parameters (stiffness,traction, and fracture energy) were then degraded followingthe strain-based cyclic damage law (see Eq. (1)). The fatiguedamage parameter (DF) was updated with each increment of
S. Sugiman et al. / International Journal of Adhesion & Adhesives 41 (2013) 80–91 87
cycles (DN). The degraded material properties produced newmaximum principal strains, which were also updated. Thisprocess continued until the material was no longer able tosustain the maximum fatigue load, at which point the jointfailed. The fatigue life was calculated from the accumulated time(cycles) in the 2nd step.
The fatigue parameters (a, b, and eth) in strain-based fatiguemodel have to be calibrated against the experimental data toobtain appropriate values. Khoramishad [28] conducted a para-metric study on the effect of these parameters on the fatigue life.Increasing a accelerated the fatigue damage evolution and led todecreasing fatigue life with no dependency on the load levelapplied. On the other hand, increasing b and eth deceleratedfatigue damage evolution and therefore increased the fatigue life.The effect of both (b and eth) was more pronounced at lower loadlevels when the strain is lower. Knowing the effect of the fatigueparameters on the fatigue life, an iterative method was used inconjunction with the unaged fatigue joint responses (load–lifeand load–backface strain) to obtain appropriate values so that thepredicted fatigue life was in good agreement with the experi-mental data. These data were then used to predict the fatigueresponses of the aged joints. The effect of cyclic increment sizewas considered in the calibration. Convergence was obtained at
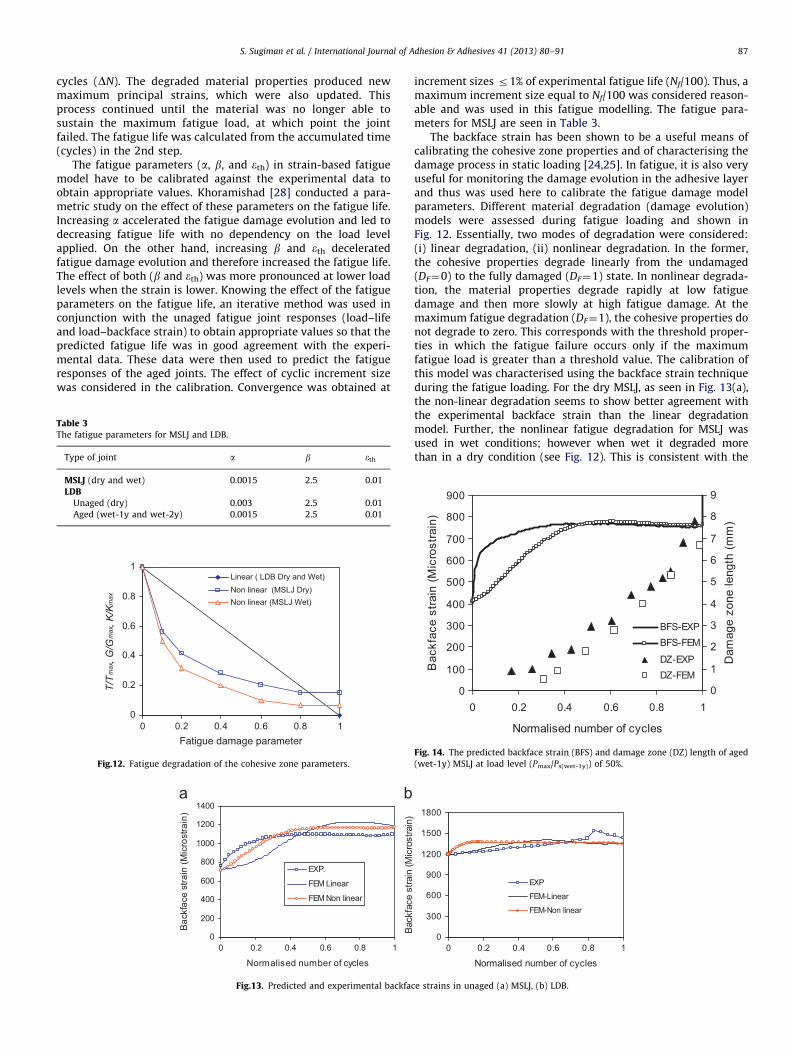
Table 3The fatigue parameters for MSLJ and LDB.
Type of joint a b eth
MSLJ (dry and wet) 0.0015 2.5 0.01
LDBUnaged (dry) 0.003 2.5 0.01
Aged (wet-1y and wet-2y) 0.0015 2.5 0.01
0
0.2
0.4
0.6
0.8
1
0 0.2 0.4 0.6 0.8 1Fatigue damage parameter
T/T
max
, G/G
max
, K/K
max
Linear ( LDB Dry and Wet)Non linear (MSLJ Dry)Non linear (MSLJ Wet)
Fig.12. Fatigue degradation of the cohesive zone parameters.
0
200
400
600
800
1000
1200
1400
Normalised number of cycles
Back
face
stra
in (M
icro
stra
in)
EXP.
FEM Linear
FEM Non linear
0 0.2 0.4 0.6 0.8 1
Fig.13. Predicted and experimental backfac
increment sizes r1% of experimental fatigue life (Nf/100). Thus, amaximum increment size equal to Nf/100 was considered reason-able and was used in this fatigue modelling. The fatigue para-meters for MSLJ are seen in Table 3.
The backface strain has been shown to be a useful means ofcalibrating the cohesive zone properties and of characterising thedamage process in static loading [24,25]. In fatigue, it is also veryuseful for monitoring the damage evolution in the adhesive layerand thus was used here to calibrate the fatigue damage modelparameters. Different material degradation (damage evolution)models were assessed during fatigue loading and shown inFig. 12. Essentially, two modes of degradation were considered:(i) linear degradation, (ii) nonlinear degradation. In the former,the cohesive properties degrade linearly from the undamaged(DF¼0) to the fully damaged (DF¼1) state. In nonlinear degrada-tion, the material properties degrade rapidly at low fatiguedamage and then more slowly at high fatigue damage. At themaximum fatigue degradation (DF¼1), the cohesive properties donot degrade to zero. This corresponds with the threshold proper-ties in which the fatigue failure occurs only if the maximumfatigue load is greater than a threshold value. The calibration ofthis model was characterised using the backface strain techniqueduring the fatigue loading. For the dry MSLJ, as seen in Fig. 13(a),the non-linear degradation seems to show better agreement withthe experimental backface strain than the linear degradationmodel. Further, the nonlinear fatigue degradation for MSLJ wasused in wet conditions; however when wet it degraded morethan in a dry condition (see Fig. 12). This is consistent with the
0
300
600
900
1200
1500
1800
0 0.2 0.4 0.6 0.8 1
Normalised number of cycles
Back
face
stra
in (M
icro
stra
in)
EXP
FEM-Linear
FEM-Non linear
e strains in unaged (a) MSLJ, (b) LDB.
0
100
200
300
400
500
600
700
800
900
0 0.2 0.4 0.6 0.8 1
Normalised number of cycles
Bac
kfac
e st
rain
(Mic
rost
rain
)
0
1
2
3
4
5
6
7
8
9
Dam
age
zone
leng
th (m
m)
BFS-EXPBFS-FEM
DZ-EXPDZ-FEM
Fig. 14. The predicted backface strain (BFS) and damage zone (DZ) length of aged
(wet-1y) MSLJ at load level (Pmax/Ps(wet-1y)) of 50%.

S. Sugiman et al. / International Journal of Adhesion & Adhesives 41 (2013) 80–9188
experimental backface strain result. Higher degradation in theearly cycles was observed in dry and wet condition at both 60%and 50% load levels; however, the degradation was more pro-nounced under the wet condition than that under the drycondition.
The predicted fatigue life for MSLJ, as seen in Fig. 2, showsgood agreement with the experimental data. The residual stressesdue to thermal and swelling strain were assessed in the model-ling. When included they decreased the fatigue life by approxi-mately 8%. Further, the agreement between the predicted andexperimental backface strain and damage zone length was found,for example, in aged (wet-1y) MSLJ at load level of 50% as shownin Fig. 14. The strain gauge was attached 2 mm inside the end ofoverlap and the FE predictions were obtained assuming sym-metric damage. It seems that at cycles up to N/Nf¼ 0.5, thepredicted backface strain is lower than the experimental data andat higher cycles the backface strain is in good agreement with theexperiment data. In the same way, the predicted damage zonelength is also under predicted in the early cycles (up to N/Nf¼ 0.5)and beyond this good agreement is obtained. This disagreementat the early cycles is possibly due to the failure of the fillet, whichoccurs experimentally at the adherend-fillet interface, and wasnot included in the FE modelling.
4.3. Modelling the fatigue response of laminated doubler in bending
The FE model of the LDB was modelled in 3D, because the jointhad not reached saturation and it was necessary to determine thespatial distribution of water at 1 year and 2 years. This has beendiscussed in a little more detail in the partner paper [24]. Theproperties used in the FE modelling of the aged joint (adhesive inthe bonded stringer and laminate and cohesive zone model) werethe same as the MSLJ (see Table 1). Fig. 15 shows the meshing andboundary conditions applied to the LDB. As the failure in LDB wasin the bondline between laminate and stringer, the cohesiveelement (COH3D) was used only in this bondline. The thicknessof the adhesive in the bondline varied linearly, from 0.1 mm at theend of the overlap to 0.2 mm at the middle, however thethickness of cohesive element was uniform, 0.02 mm, located inthe middle of the adhesive layer and through the fillet, matchingthe observed path of failure. The mesh size of the CZM in thebondline and in the fillet was 0.25 mm�0.25 mm and 0.098 mm�0.25 mm respectively. The aluminium layers, stringer, and adhesivewere modelled as 8-node linear bricks (C3D8). Tie constraints wereapplied between the aluminium and main bondline surfaces.
Aluminium
Adhesive
Cohesive
Z-symmetry
X-symmetry
Kinematic coupling (U1, U2, UR1,UR2,UR3)
U2=UR1=UR3=0 Displacement
X
Y
Z
Control point
Fig. 15. FE boundary condition and meshing of LDB.
The thermal and swelling strains were included in the FEmodel following the same procedure as the MSLJ. As the LDB wasnot saturated, the properties of adhesive vary according to themoisture content. This is achieved in ABAQUS by defining fieldvariable dependent material properties. As with the MSLJs, theeffect of time of exposure (1 year or 2 years) on properties wasaccommodated by having separate moisture degradation curvesfor 1 year and 2 years exposure.
A summary of predicted static strength is seen in Table 2,while Fig. 5 shows the predicted fatigue life of the LDB in unagedand aged conditions using the fatigue parameters shown inTable 3. In general, good agreement was seen between thepredicted and experiment data under all conditions. However,the wet-2y predicted result was slightly under predicted at loadlevel (Pmax/Ps(dry))¼0.4 and over predicted at a lower load level(i.e., Pmax/Ps(dry)¼0.33). As discussed earlier (see Section 3.2), thiswas due to the different rates of failure of the fillets. The fillet sizein this modelling is the average size and there is considerablevariation of the fillet size in practice. The swelling and thermalresidual strains were included in the model. The residual stressesthese induced did not affect the predicted static strength of LDB.However, they did affect the fatigue life of the joints. A 30%reduction of fatigue life has been found by including theseresidual stresses.
The different value of a between the calibrated MSLJ and theunaged (dry) LDB (see Table 3) is possibly due to differences inmanufacturing of the joints and the age of the adhesive. However,under aged conditions the fatigue parameters of MSLJ and LDB arethe same. This perhaps indicates that the effect of manufacturingand age of an adhesive is not as significant when consideringmoisture degraded joints. A further difference in fatigue degrada-tion between MSLJ and LDB may be due to mode mixity. Currentlyboth mode I and mode II parameters experience the same degreeof cyclic degradation as this was simplest and as data is onlyavailable from two different configurations. It may be that themode I and mode II parameters degrade at different rates. Toinvestigate this would require additional joint configurationshaving other mode mixities and this needs to be studied furtherin the future. In LDB (see Fig. 13(b)), a linear fatigue degradationmodel shows better agreement with the experimental backfacestrain. Another difference between predicted (using a linearfatigue degradation) and experimental backface strains is theadhesive fillet, which was not included in this calibration. Theeffect of fillet is discussed below.
0
500
1000
1500
2000
2500
0 0.2 0.4 0.6 0.8 1Normalised number of cycles
Bac
kfac
e st
rain
(Mic
rost
rain
)
EXP
FEM-3DFEM-2D-F0
FEM-2D-F1FEM-2D-F2
Fig. 16. The predicted backface strain of LDB under dry condition.
S. Sugiman et al. / International Journal of Adhesion & Adhesives 41 (2013) 80–91 89
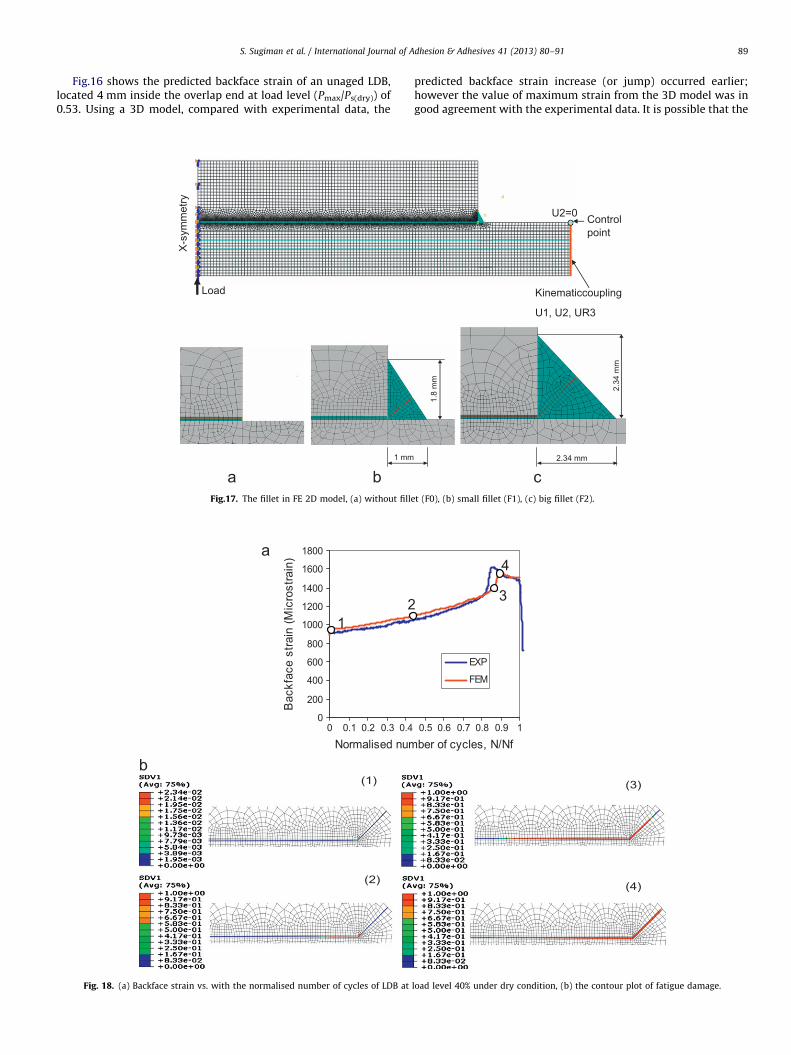
Fig.16 shows the predicted backface strain of an unaged LDB,located 4 mm inside the overlap end at load level (Pmax/Ps(dry)) of0.53. Using a 3D model, compared with experimental data, the
Fig.17. The fillet in FE 2D model, (a) without fille
Fig. 18. (a) Backface strain vs. with the normalised number of cycles of LDB at
predicted backface strain increase (or jump) occurred earlier;however the value of maximum strain from the 3D model was ingood agreement with the experimental data. It is possible that the
t (F0), (b) small fillet (F1), (c) big fillet (F2).
load level 40% under dry condition, (b) the contour plot of fatigue damage.
S. Sugiman et al. / International Journal of Adhesion & Adhesives 41 (2013) 80–9190
predicted failure at the end of the overlap region, which includedthe fillet, was in error. To consider the different failure paths inthis region, a 2D FEM model was created with the different sizesof fillet; without fillet (F0), small fillet (F1) and big fillet (F2). TheFE boundary condition, mesh and fillet size are as seen in Fig. 17.The failure of the fillet was modelled by putting the cohesiveelement in the fillet, with the cohesive element thicknessapproximately 0.02 mm. The mesh size of the cohesive elementwas (0.02�0.1) mm. As seen in Fig. 16, for LDB without a fillet(F0) the strain jump occurred at N/Nf¼0.2 and the maximumstrain is considerably lower than the experimental data. Introdu-cing a small fillet (F1) shifted the strain jump to N/Nf¼0.6 whichis close to the experiment data. The maximum strain was alsoonly slightly lower than the experiment data. Increasing again thesize of fillet (F2) shifted the strain jump to N/Nf¼0.9, close tothe end of fatigue life. Thus, the size of fillet affects the fatiguedamage evolution and finally the predicted fatigue life. Using thesame fatigue damage model parameters the fatigue life increaseswith increasing fillet size. To illustrate this, the fatigue life of LDBwithout a fillet (F0), with a small fillet (F1) and with a big fillet(F2) was 2,000 cycles, 2,857 cycles, and 6,044 cycles respectivelyat load level of 0.53.
To get a better understanding of the fatigue failure process ofLDB, the 2D (F2) model damage evolution at a load level of 40% inan unaged condition is presented in Fig. 18. This can also becompared with the experimental failure process at the same loadlevel. The fillet size in the FE 2D model is shown in Fig. 17(c). Thefillet in the actual specimen is also big, but it is not a triangle (seeFig. 7b). Nevertheless, the length of the failure path is approxi-mately the same, so the triangular fillet can be considered to berepresentative. Fig. 18 shows the variation of the backface strainwith cycles and contour plots of predicted fatigue damageat selected numbers of cycles. The backface strain gauge wasattached on the laminate at 4 mm inside the end of overlap.For comparison, the experiment backface strain is also shown(Fig. 18a). It seems that the agreement between FEM and experi-ment backface strain is good. In Fig. 18(b), at low cycles (point 1),a little fatigue damage, indicated by ‘‘SDV1’’, is observed, localisedin the corner of the end of overlap. The damage then propagatesstably with increasing cycles into the centre of the bondline andthe fillet; however, it is faster in the bondline. This stable damagepropagation is indicated by a gradually increasing backface strain(point 2–3). Beyond point 3 the backface strain starts to riserapidly (as the damage propagation in the fillet increases) and itreaches a peak point (when the fillet nearly fails, point 4). At thispoint, the observed damage zone length in the bondline isapproximately 5.5 mm which is very close to that observed inthe experiment (E5.5 mm) (see Fig. 8(b)(3) and Fig. 18(b)(4)).After the fillet failed, rapid damage propagation to the centre ofthe bondline occurred until the joint failed. Thus, based on thebackface strain and fatigue damage contour, it appears that, infatigue loading, the fillet plays an important role in the damageevolution and also the fatigue life of the LDB.
5. Conclusions
Fatigue testing and FE modelling of unaged and aged MSLJ andLDB have been undertaken. Some important findings obtained areoutlined below:
a.
The moisture degraded the fatigue life of the joints (MSLJand LDB). The fatigue life decreased with increasing moisturecontent, levelling off when approaching moisture saturation.The moisture also caused the damage initiation to occur earlierin the aged than in the unaged joints.b.
The backface strain technique has been successfully employedto monitor the fatigue damage evolution in the adhesive layerin both MSLJ and LDB. This technique was also found to be auseful means of calibrating the fatigue parameters in bothMSLJ and LDB.c.
The strain-based cyclic damage applied to the cohesive zonemodel has been successfully utilised to model the fatigueresponse of the unaged and aged the joints, in terms of thefailure load and the failure process. Non-linear fatigue degra-dation of the cohesive zone model parameters gave betteragreement with the MSLJ experiment data, whereas, linearfatigue degradation appeared to be more appropriate for LDB.d.
The adhesive fillet was found to play an important role inthe fatigue damage evolution and predicted fatigue life ofthe LDB.Acknowledgement
The authors would like to thank Airbus (Bristol, UK) whosupplied the laminated doubler material and the surface treat-ment of the aluminium. Also thanks to Directorate General ofHigher Education, Ministry of Education, Republic of Indonesiawhich support funding in this research.
References
[1] Kinloch AJ. Adhesion and adhesives: science and technology. London: Chap-man & Hall; 1987.
[2] Fernando M, Harjoprayitno WW, Kinloch AJ. A fracture mechanics study ofthe influence of moisture on the fatigue behaviour of adhesively bondedaluminium-alloy joints. Int J Adhes Adhes 1996;16:113–9.
[3] Kinloch AJ, Little MSG, Watts JF. The role of the interphase in the environ-mental failure of adhesive joints. Acta Mater 2000;48:4543–53.
[4] Jethwa JK, Kinloch AJ. The fatigue and durability behaviour of automotiveadhesives. Part I: Fracture mechanic tests. J Adhes 1997;61:71–95.
[5] Abel M-L, Adams ANN, Kinloch AJ, Shaw SJ, Watts JF. The effects of surfacepretreatment on the cyclic-fatigue characteristics of bonded aluminium-alloyjoints. Int J Adhes Adhes 2006;26:50–61.
[6] Briskham P, Smith G. Cyclic stress durability testing of lap shear jointsexposed to hot-wet conditions. Int J Adhes Adhes 2000;20:33–8.
[7] Liechti KM, Arzoumanidis GA, Park S-J. Fatigue fracture of fully saturatedbonded joints. J Adhes 2002;78:383–411.
[8] Ferreira JAM, Reis PN, Costa JDM, Richardson MOW. Fatigue behaviour ofcomposite adhesive joints. Compos Sci Technol 2002;62:1373–9.
[9] Nguyen O, Repetto EA, Ortiz M, Radovitzkya RA. Cohesive model of fatiguecrack growth. Int J Fract 2001;110:351–69.
[10] Maiti S, Geubelle PH. A cohesive model for fatigue of polymers. Eng FractMech 2005;72:691–708.
[11] Roe KL, Siegmund T. An irreversible cohesive zone model for interface fatiguecrack growth simulation. Eng Fract Mech 2003;70(2):209–32.
[12] Robinson P, Galvanetto U, Tumino D, Bellucci G, Violeau D. Numericalsimulation of fatigue-driven delamination using interface elements. IntJ Numer Methods Eng 2005;632:1824–48.
[13] Solana AG, Crocombe AD, Ashcroft IA. Fatigue life and backface strainpredictions in adhesively bonded joints. Int J Adhes Adhes 2010;30:36–42.
[14] Khoramishad H, Crocombe AD, Katnam KB, Aschroft IA. Predicting fatiguedamage in adhesively bonded joints using a cohesive zone model. IntJ Fatigue 2010;32(7):1146–58.
[15] Khoramishad H, Crocombe AD, Katnam KB, Aschroft IA. A generalised damagemodel for constant amplitude fatigue loading of adhesively bonded joints. IntJ Adhes Adhes 2010;30:513–21.
[16] Diehl T. On using a penalty-based cohesive-zone finite element approach.Part I: Elastic solution benchmarks. Int J Adhes Adhes 2008;28:237–55.
[17] Diehl T. On using a penalty-based cohesive-zone finite element approach:Part II—Inelastic peeling of an epoxy-bonded aluminium strip. Int J AdhesAdhes 2008;28:256–65.
[18] Abe H, Satoh T. Non-destructive detection method of fatigue crack in spot-welded joints. Yosetsu Gakkai Ronbunshu/Q J. Jpn Weld Soc 1986;4(4):666–73.
[19] Zhang ZH, Shang JK, Lawrence FV. A backface strain technique for detectingfatigue-crack initiation in adhesive joints. J Adhes 1995;49(1-2):23–36.
[20] Crocombe AD, Ong CY, Chan CM, Wahab MMA. Investigating fatigue damageevolution in adhesively bonded structures using backface strain measure-ment. J Adhes 2002;78(9):745–76.

S. Sugiman et al. / International Journal of Adhesion & Adhesives 41 (2013) 80–91 91
[21] Solana AG, Crocombe AD, Abdel Wahab MM, Ashcroft IA. Fatigue initiation inadhesively-bonded single-lap joints. J Adhes Sci Technol 2007;21(14):1343–57.
[22] Quaresimin M, Ricotta M. Life prediction of bonded joints in compositematerials. Int J Fatigue 2006;28(10):1166–76.
[23] Cytec Engineered Materials, FMs 73 toughened epoxy film, TechnicalService, 1300 Revolution Street, Havre de Grace, Maryland, 1998.
[24] Sugiman S, Crocombe AD. Experimental and numerical studies on the staticresponse of aged adhesively joints. Int J Adhes Adhes 2013;40:224–37.
[25] Sugiman S, Crocombe AD. Modelling the static response of unaged adhesivelybonded structures. Eng Fract Mech 2012. http://dx.doi.org/10.1016/j.engfracmech.2012.10.014.
[26] Zheng X. On some basis problems of fatigue research in engineering. Int J Fatigue2001;23:751–66.
[27] ABAQUS. User manual, version 6.9.1, Habbit. USA: Karlsson& Sorensen, Inc.;2009.
[28] H Khoramishad, Modelling fatigue damage in adhesively bonded joints. PhDthesis. University of Surrey, Guildford, UK, 2010.


