Embed Size (px)
Citation preview

s
(GMM)d several.
only.e eruptionofwas seen
pings of; the floors
Icarus 169 (2004) 3–28www.elsevier.com/locate/icaru
The final Galileo SSI observations of Io: orbits G28-I33
Elizabeth P. Turtle,a,b,∗ Laszlo P. Keszthelyi,c Alfred S. McEwen,a Jani Radebaugh,a
Moses Milazzo,a Damon P. Simonelli,d Paul Geissler,c David A. Williams,e Jason Perry,a
Windy L. Jaeger,a Kenneth P. Klaasen,d H. Herbert Breneman,d Tilmann Denk,f
Cynthia B. Phillips,g and
the Galileo SSI Team
a Lunar and Planetary Laboratory, University of Arizona, Tucson, AZ 85721-0092, USAb Planetary Science Institute, 1700 E. Fort Lowell, Suite 106, Tucson, AZ 85719, USA
c Astrogeology Program, U.S. Geological Survey, Flagstaff, AZ 86001, USAd Jet Propulsion Laboratory, 4800 Oak Grove Dr., Pasadena, CA 91109, USA
e Department of Geological Sciences, Arizona State University, Tempe, AZ 85287, USAf DLR, Rutherfordstr. 2, 12489 Berlin, Germanyg SETI Institute, Mountain View, CA 94043, USA
Received 21 April 2003; revised 12 October 2003
Abstract
We present the observations of Io acquired by the Solid State Imaging (SSI) experiment during the Galileo Millennium Missionand the strategy we used to plan the exploration of Io. Despite Galileo’s tight restrictions on data volume and downlink capability anspacecraft and camera anomalies due to the intense radiation closeto Jupiter, there were many successful SSI observations during GMMFour giant, high-latitude plumes, including the largest plume everobserved on Io, were documented over a period of eight months;faint evidence of such plumes had been seen since the Voyager 2 encounter, despite monitoring by Galileo during the previous five yearsMoreover, the source of one of the plumes was Tvashtar Catena, demonstrating that a single site can exhibit remarkably diversstyles—from a curtain of lava fountains, to extensive surface flows, and finally a∼ 400 km high plume—over a relatively short periodtime (∼ 13 months between orbits I25 and G29). Despite this substantial activity, no evidence of any truly new volcanic centerduring the six years of Galileo observations. The recent observations also revealed details of mass wasting processes acting on Io. Slumand landsliding dominate and occur in close proximity to each other, demonstrating spatial variation in material properties over distanceseveral kilometers. However, despite the ubiquitous evidence for mass wasting, the rate of volcanic resurfacing seems to dominateof paterae in proximity to mountainsare generally free of debris. Finally, the highest resolution observations obtained during Galileo’s finalencounters with Io provided further evidence for a wide diversity of surface processes at work on Io. 2003 Elsevier Inc. All rights reserved.
Keywords:Io; Surfaces, satellite; Satellites of Jupiter; Volcanism; Tectonics; Geological processes
his-undat-ndinto
ex-r in, Ioet
re-ing
ion,hor-zed004;
1. Introduction
The Galileo spacecraft had a long and productivetory. It was launched in October 1989, entered orbit aroJupiter in December 1995 after releasing a jovianmospheric probe, completed 34 orbits in its nominal athree extended missions, and ended by plummeting
* Corresponding author.E-mail address:[email protected] (E.P. Turtle).
0019-1035/$ – see front matter 2003 Elsevier Inc. All rights reserved.doi:10.1016/j.icarus.2003.10.014
Jupiter in September 2003. Late in the first missiontension Galileo’s periapse was lowered closer to Jupiteorder to approach the innermost of the galilean satellites(e.g., McEwen et al., 2000; Keszthelyi et al., 2001; Turtleal., 2001, 2002 [the 2002 correction provides improvedproductions of the images]). Here we describe the imagobservations of Io made during the final mission extensthe Galileo Millennium Mission (GMM): orbits G28 througA34 (Table 1), including three close Io encounters duringbits I31, I32, and I33 (Fig. 1). Observations that are analyin detail elsewhere in this issue (e.g., Radebaugh et al., 2

4E
.P.Turtle
eta
l./Icaru
s169
(2004)
3–28
e close GMM flybys (Table 1): I31 (northern track overide and solid over the dayside. Triangles represent the
Fig. 1. Map of Io illustrating Galileo’s ground tracks, when within 100,000 km of Io’s surface (within∼ 3 to 4 hr of closest-approach), for the threanti-jovian hemisphere), I32 (southern track over anti-jovian hemisphere), and I33 (track over sub-jovian hemisphere). Each track is dashed over Io’s night sstart (inbound segment) of the track, asterisks indicate closest-approach, and squares represent the end (outbound segment) of the track.

Final Galileo SSI observations of Io 5
er
Table 1Galileo’s final orbits
Orbit Date of Io closest approach Range to surface of Io at C/A Sub-spacecraft point at C/A Comments(C/A) (km) (Lat., W. Lon.)
G28 21 May 2000 379,000 0.9,285 Ganymede flybyG29 30 December 2000 963,000 0.8,22 Ganymede flyby; joint with Cassini encountC30 23 May 2001 342,000 −1.2,85 Callisto flybyI31 6 August 2001 194 78,172 Io flyby; SSI anomaliesI32 16 October 2001 184 −79,223 Io flybyI33 17 January 2002 102 −44,317 Io flyby; spacecraft anomaliesA34 5 November 2002 45,800 −6,266 Amalthea flyby; no remote sensingJ35 21 September 2003 – – Jupiter impact
bed
h-ingictedlable’s
fi-im-
e thdia-
arre-theuc-sfulthe
nd-
ileo-3).chtioneterript
ofhe-IRare-hefulnddascedfil-the8b;
tant7 inm-
atalay-tlyrd
ionsal.,
ityand
ons-
malym-led
e-aft’s.g.,ncetionionse-gleceignedor-
cov-thaty.esi-thshe
Geissler et al., 2004; Williams et al., 2004) are descrionly briefly here.
Throughout the Galileo mission, the extent of higresolution imaging was tightly constrained by the fleetdurations of close approaches to the satellites, the restrcapacity of the onboard tape recorder, and the time avaifrom the Deep Space Network for downlink via Galileolimited low-gain antenna. Moreover, during Galileo’snal orbits, spacecraft and camera anomalies severelypacted the planned observations. These anomalies werinevitable effects of age, accelerated by the intense ration, detrimental to spacecraft electronics, encountered neJupiter (Keszthelyi et al., 2001; Klaasen et al., 2003), andsulted in the loss of numerous observations during two ofGMM Io flybys. Nonetheless, we have described the unscessful observations (Appendix A) as well as the succesones because the regions of Io we chose to target withlimited high-resolution observations reflect our understaing of Io and assumptions we made about its nature.
1.1. The solid state imaging camera
The Solid State Imaging (SSI) camera on the Galspacecraft used an 800× 800 pixel charge coupled device (CCD) as its detector (Klaasen et al., 1997, 200Galileo was NASA’s first planetary mission to employ suan instrument. Exposure time, gain state, filter, summamode, and compression mode were the primary paramthat could be adjusted. In the context of this manuscthe most pertinent parameter was the choice of whicheight available filters to use. At Io, we primarily used tviolet (413 nm), green (559 nm), red (665 nm), near(756 nm), 1 µm (> 968 nm), and clear filters. The clefilter was a broad wavelength filter with an effective wavlength of 652 nm that was used for the majority of thigh-resolution images. The violet filter was most usefor detecting SO2-rich plumes and deposits. The green ared filters, in combination with the violet filter, providethe best “true-color” data from Io. The 756 nm filter woften used in place of the red filter to provide enhandiscrimination of color variations. The 1 µm and clearters, in combination, provided the best constraints ontemperatures of active lavas (e.g., McEwen et al., 199Radebaugh et al., 2004).
e
s
2. Observations and discussion
2.1. Orbit G28
No SSI observations were made of Io during the disG28 encounter in May 2000. The previous encounter, I2February 2000, had been the first Io flyby without any caera or spacecraft anomalies; however, the available downlinkafter I27 was severely limited and only a portion of the dcould be returned prior to G28. Therefore, to enable pback of some of the remaining I27 data, during G28 slighmore than one full track of I27 data on Galileo’s onboatape recorder was not overwritten. (The I27 observatare discussed in Keszthelyi et al., 2001, and Turtle et2001, 2002.) In order to facilitate fitting the highest priorG28 data onto the three remaining tape tracks, the SSINIMS (Near-Infrared Mapping Spectrometer) observatiof Io originally planned for G28 were sacrificed. Following the G28 encounter, the SSI camera suffered an anothat was attributed at the time to a malfunction of the caera’s light-flood function, which was consequently disabby ground command (Klaasen et al., 2003).
2.2. Orbit G29
This orbit had a distant encounter with Io at the end of Dcember 2000, which coincided with the Cassini spacecrflyby of Jupiter for a gravity assist on its way to Saturn (ePorco et al., 2003). The planned SSI Io imaging sequeconsisted of three global color observations, an observaof the Prometheus plume on the limb, and eight observatwhile Io was in Jupiter’s shadow (Table 2). The geomtry of the G29 encounter provided global, low-phase an(∼ 9◦–21◦) coverage, which is good for monitoring surfachanges. These global color observations were also desto compensate for the loss of low-phase imaging duringbits E15 and E18, and to complete the global low-phaseerage needed for photometric mapping, complementingat high-phase (∼ 70◦–80◦) which emphasizes topographWe used four filters: green, red, violet and 756 nm (framusing SSI’s 889 nm and 1 µm (968 nm) filters were elimnated due to a reduction in sensitivity at longer wavelengafter the camera’s light-flood capability was disabled). T

6 E.P. Turtle et al. / Icarus 169 (2004) 3–28
me
de; IM4
Table 2Galileo SSI observations during orbit G29
Observation Number of framesa Resolution Filter(s) Notes(m pixel−1)
GLOCOL01 2 IM8/480 1× 2 OCM 11,000 Violet, green, red, 756 nm Lost due to camera anomalyPROMTH01 2 IM8/480 1 1× 2 OCM 11,000 Clear, violet Long-exposure, intentionally overexposed, clear fra
bled profusely. Short-exposure, clear and violet OCMwas lost due to the camera anomaly.
GLOCOL02 2 HIM/560 1× 2 OCM 10,000 Violet, green, red, 756 nmGLOCOL03 2 HIM/400 1× 2 OCM 17,000 Violet, green, red, 756 nmECLIPS01 2 HMA 1× 2 OCM 24,000 Clear, violet, 1 µm Lost second OCM due to camera anomalyECLIPS02 2 HMA 1× 2 OCM 24,000 Clear, violet, 1 µm Lost due to camera anomalyECLIPS03 2 HMA 1× 2 OCM 24,000 Clear, violet, 1 µm Lost due to camera anomalyECLIPS04 2 HMA 1× 2 OCM 25,000 Clear, violet, 1 µm Lost due to camera anomalyECLIPS05 2 HMA 1× 2 OCM 25,000 Clear, violet, 1 µm Lost due to camera anomalyECLIPS06 2 HMA 1× 2 OCM 25,000 Clear, violet, 1 µm Lost due to camera anomalyECLIPS07 2 HMA 1× 2 OCM 25,000 Clear, violet, 1 µm Lost due to camera anomalyECLIPS08 2 HMA 1× 2 OCM 25,000 Clear, violet, 1 µm Lost due to camera anomaly
a In this and all subsequent tables the following abbreviations are used: HMA, half-frame, full resolution mode; IM8 and HIM, full resolution mo,full resolution, essentially losslessly compressed to tape; OCM, on chipmosaic (Klaasen et al., 1997). For some observations only partial frames were recordedto tape. In these cases the frame mode is followed by the number of lines recorded (out of a maximum of 800).
m-lu-by
dueG28n in-yodss-
ex-hesd inrfill-
hesings ofaly.yet
m-ilarPelethe
ly1;ra-
son003wasit-suren29,(thew-t of
ingen
al-en-in--the
003).ionslmi-
gedver-ser-ace
1).atesedme
cted1),al.,meninghis
Galileo observations of Io in eclipse were to provide coplementary information to the continuous, but lower resotion, movies which were to be acquired simultaneouslyCassini.
Unfortunately most of these observations were lostto a recurrence of the anomaly encountered after theGanymede flyby (subsequent investigation traced it to atermittent failure within the SSI circuitry, likely triggered bradiation, rather than simply a problem with the light-flo(Klaasen et al., 2003)). PROMTH01 was partially succeful. One clear filter image had been intentionally overposed in the hope that it would reveal the distal reacof the Prometheus plume. The long-exposure resulteextensive saturation and even bleeding (caused by oveing of pixels in the CCD) in the image, but part of tlimb was unaffected and the plume was detected riabove it. Shorter-exposure violet and clear observationthe plume were lost as a result of the camera anomThe global color frames that were successful revealedanother major ionian surprise. GLOCOL02 (top, left iage in Fig. 2) showed a giant red plume deposit, simto that which has been observed consistently aroundby Voyager and Galileo, but centered near the site ofTvashtar eruptions (63◦ N) that were witnessed fortuitousby Galileo during I25 and I27 (Keszthelyi et al., 200McEwen et al., 2003). The red ring had an averagedius of 720 km (Geissler et al., 2004), and by comparito simultaneous Cassini observations (Porco et al., 2McEwen et al., 2003) it was determined that the plume385±30 km high. No plume (of any size) had ever been wnessed at high latitude and, although Voyager 2 had seenface deposits indicative of higher-latitude plumes (McEwand Soderblom, 1983), in its five years at Jupiter before GGalileo had barely detected only one other such deposit“North polar ring” described in Geissler et al. (2004)). Hoever, the Tvashtar plume would prove to be just the firs
;
-
four giant plumes observed in Io’s north polar region dur2001, a major surprise in the final orbits of Galileo (McEwet al., 2003).
2.3. Orbit C30
Following the G29 encounter it was determined that,though it did not seem possible to prevent SSI fromtering the anomalous state, cycling the power to thestrument returned it to its nominal state. Therefore, commands to power-cycle the camera were incorporated intoC30 encounter command sequences (Klaasen et al., 2Despite these precautions, all of the SSI Io observatduring C30 failed. These had consisted of a 4 kmpixe−1
eclipse observation of hotspots on the sub-jovian hesphere, a 3.4 kmpixel−1 color observation of Io’s leadinhemisphere with a half-frame in the violet filter designto search for evidence of a continuing plume eruption oTvashtar, and a 3.9 kmpixel−1 color observation at comparable phase angle to the July 1999, C21 global color obvation (Plate 1 in Keszthelyi et al., 2001) to detect surfchanges (Table 3).
2.4. Orbit I31
Orbit I31 included a low altitude (∼ 200 km) flyby overIo’s high northern latitudes in August 2001 (Table 1; Fig.If the ∼ 400 km high plume observed over Tvashtar in l2000 were still active during I31, Galileo would have pasthrough it. Indeed, although SSI saw no evidence for pluactivity at Tvashtar, Galileo’s Plasma Subsystem deteSO2 at this point in the flyby (Frank and Paterson, 200perhaps from an all-vapor “stealth” plume (Johnson et1995) over Tvashtar or from a dustier neighboring pluthat was detected in the images (see below). In planthe imaging observations (Table 4; Appendix A.1) for t

Final Galileo SSI observations of Io 7
01el
Fig. 2. Global color observations from G29, I31, and I32. For G29, GLOCOL02 ison the left and GLOCOL03 is on the right. For both I31 and I32, GLOCOLis on the left and GLOCOL02 is on the right. Although Io is scaled to the same size in each image, the resolutions of the observations ranged from 5 km pix−1
for I32 GLOCOL01 to 19.6 km pixel−1 for I31 GLOCOL02 (Tables 2, 4, 5). (Iolooks generally yellower in I31 and whiter in I32 due to some variation inthe balance between the three single-filter images that were used to assemblethese color images.) Unless otherwise noted, all images in this manuscript areoriented with North approximately to the top of the figure.

8 E.P. Turtle et al. / Icarus 169 (2004) 3–28
alyalyaly
Table 3Galileo SSI observations during orbit C30
Observation Number of framesa Resolution (m pixel−1) Filter(s) Notes
HSPOTS01 2 IM8 3,900 Clear, violet Lost due to camera anomLEDHEM01 3.5 IM8 3,400 Violet, green, 756 nm Lost due to camera anomCHANGE01 3 IM8 3,900 Violet, green, 756 nm Lost due to camera anom
a See footnote for Table 2.
verlar
oc-ntagonWendlyookalso
ions
al-ausainura-ughtheited-houtifiedde-
thatom-of
rva-4),rthe-
rme,tallyhtarever),d
ipt tohe
mea
flyby we endeavored to achieve a balance between coage of new territory and re-imaging targets of particuinterest from previous flybys at higher resolution or to dument surface changes. We also intended to take advaof Galileo’s first opportunity to observe Voyager 1 targetsthe sub-jovian hemisphere of Io at medium resolution.designed three observations (MASUBI01, LEIZI_01, aKANEHE01 (Table 4, Appendix A.1)) that would not onprovide important comparisons to Voyager 1 images to lfor surface changes over the intervening 22 years, butfacilitate targeting the even higher resolution observatof these features that would be possible on orbit I33.
The anomalies during C30 had the benefit that theylowed the Galileo engineers to accurately diagnose the cas a faulty operational amplifier in the camera’s signal ch(probably radiation damaged) that tended to go into sattion when triggered by high voltage signals passing throthis circuit. To avoid generating such high voltages,SSI detector erase cycle, like the light-flood, was inhib(Klaasen et al., 2003). In addition, commands to intentionally power cycle the camera were interspersed througthe flyby. Furthermore, the imaging sequence was modto include a few distant contingency observations of Io,
-
e
e
signed to monitor surface activity at a range from Jupiterwas hoped to be safe from radiation-induced camera analies. This final precaution paid off; due to a recurrencethe camera anomaly during orbit I31 the distant obsetions, PLUMES01, GLOCOL01, and GLOCOL02 (Tablewere the only successful observations acquired. Neveless they revealed yet more surprises about Io.
2.4.1. PLUMES01This inbound observation at a range of 20RJ was op-
timized in phase angle, 133◦, to observe a plume oveTvashtar were one still to be active. Instead of a single frathree were planned because the spacecraft’s orientation athis time was such that one of its booms could periodicobscure Io. Although no plume was detected over Tvasin the images, this observation caught the tallest plumeseen on Io, reaching to∼ 500 km above the surface (Fig. 3for which the name Thor* has been provisionally approve(asterisks are used here and throughout the manuscrindicate names that have provisional IAU approval). Tsource of the plume, at 41◦ N, 134◦ W, was far from anypreviously recognized active volcano or hotspot. This plumay have been the source of the SO2 that the Galileo Plasm
e
ra, see
Table 4Galileo SSI observations during orbit I31
Observation Number of framesa Resolution Filter(s) Notes(m pixel−1)
PLUMES01 3 HMA/320 18,000 Violet Added as contingencyMAXRES01b Deleted due to data volume constraintsTVASHT01 1× 6 IM4 3–5 Clear Lost due to camera anomalyPROMTH01 1× 6 IM8 43–45 Clear Lost due to camera anomalyTVASHT02 1× 6 IM8 50 Clear Lost due to camera anomalyPROMTH02b Deleted due to data volume constraintsSAVITR01 2× 4 IM8 130–140 Clear Last frame was reduced to 320 lines to conserv
data volumeLost due to camera anomaly
AMRANI01 1 × 6 IM8 140 Clear Lost due to camera anomalySUSANO01 4-color IM8 140 Violet, green, red, 756 nm (N.B. actually an observation of Itzamna Pate
Appendix A.1.8, SUSANO01)Lost due to camera anomaly
MASUBI01 1× 5 IM8 390 Clear Lost due to camera anomalyLEIZI_01 1× 4 IM8 395 Clear Lost due to camera anomalyKANEHE01 1× 2 IM4 404 Clear Lost due to camera anomalyTERMIN01 1× 5 IM4 405–414 Clear Lost due to camera anomalyTERMIN02 1× 4 IM8 415 Clear Lost due to camera anomalyGLOCOL01 HMA/370 1× 3 OCM 19,400 Violet, green, 756 nm Added as contingencyGLOCOL02 HMA/370 1× 3 OCM 19,600 Violet, green, 756 nm Added as contingency
a See footnote for Table 2.b Observations that were in the original imaging sequence, but deleted from the final sequence.

Final Galileo SSI observations of Io 9
’snoi
lume
Fig. 3. Two images from the 18 km pixel−1, I31 PLUMES01 observation revealed a bright plume extending 500 km above Io’s sunlit northwestern limb. Ionight side can also be seen because of illumination by Jupiter. The contrast inthe images has been enhanced to show the plume, therefore backgroundseand vertical stripes from bad columns on the CCD can also be seen.
Table 5Galileo SSI observations during orbit I32
Observation Number of framesa Resolution (m pixel−1) Filter(s) Notes
LOKI_01 2 IM4 1,100 ClearPELE_01 5 IM8 60–65 Clear, 1 µm Through spacecraft boomsMAXRES01b Deleted due to data volume constraintsTELGNS01 1× 4 IM4 9–11 ClearEMAKNG01 1× 4 IM4 32–34 ClearTELGNS02 1× 2 IM8 41–42 ClearTOHIL_01 1× 5 IM8 50–52 ClearTUPAN_01 3-color IM8 132 Violet, green, 756 nmEMAKNG02b Deleted due to data volume constraintsTVASHT01 1× 2 IM8 200 ClearGSHBAR01 1× 2.4 IM4 250 ClearSHMASH01b Deleted in exchange for contingency observationsTERMIN01 1× 6 IM8 325 ClearTERMIN02 1× 6 IM8 330–335 Clear Two frames retargeted to observe source of new I31 pEAAM_01b Deleted in exchange for contingency observationsGLOCOL01 4-color IM8 5,000 Violet, green, red, 756 nm Added as contingency after C30GLOCOL02 2 IM8/400 1× 2 OCMs 9,800 Violet, green, red, 756 nm Added as contingency after C30
a See footnote for Table 2.b Observations that were in the original imaging sequence, but deleted from the final sequence.
r-
2)selowi-
ge,welsseriodvi-ughdes
1.2adr
sit
htar
atan-iediousht-
Subsystem detected near closest-approach (Frank and Pateson, 2001).
2.4.2. GLOCOL01This outbound observation (middle, left image in Fig.
at a range of 21.7RJ was also a contingency in caof camera problems closer to Jupiter. It was a veryphase angle (3.5◦) observation of the sub-jovian hemsphere (sub-spacecraft longitude 336◦ W) at a resolution of19.4 kmpixel−1. The images revealed another new, larred plume deposit, this time around Dazhbog Patera, asas remnants of recent red deposits around Surt (discuin more detail by Geissler et al., 2004). Thus, over a peof several months during Galileo’s last orbits we found edence for four large eruptions at high latitudes, even tholittle plume activity had been evident at comparable latituduring the first five years of the mission.
ld
2.4.3. GLOCOL02Another outbound contingency image at a range of 3
RJ, this observation (middle, right image in Fig. 2) ha low phase angle, 27◦, and a good view of Tvashta(sub-spacecraft longitude, 125◦ W) at a resolution of 19.6kmpixel−1. This observation revealed a new whitish depo(Fig. 2) from the 500 km high plume at 41◦ N, 134◦ W(Fig. 3) superimposed upon the red ring around Tvas(McEwen et al., 2003; Geissler et al., 2004)
2.5. Orbit I32
Orbit I32 included another very close Io flyby, this timehigh southern latitudes (Table 1; Fig. 1). As before, in plning the imaging sequence (Table 5) for this flyby we trto balance coverage of new territory against that of prevtargets of particular interest at different resolutions or liging conditions or to document surface changes.

10 E.P. Turtle et al. / Icarus 169 (2004) 3–28
I31are
oce-ithfore
uringervaSI-
platanttoeereseI27
egesrfulcentard
lavad theokiith
t)eright-adowr thantersRa
notrup-hatst
0–e-es-
withTheuc-
ons totheaughper-i-onac-04;
ob-
7nusthat
thater-n Io
ons:va-be
ichpri-n
theouth-at-ses.t of
a-ution
there tohernis il-26
wns-at areelief
After the devastating camera anomalies during theflyby, the Galileo engineers revised the spacecraft softwto remove the erase command from the power cycle prdure (which during I31 had brought the camera online werase enabled and then subsequently disabled it). As bepower-cycle sequences were included at several times dthe encounter when there was time between SSI obstions, but this time they were to be implemented only if Sengineering data indicated that the camera was in the anomalous state (Klaasen et al., 2003). Furthermore, the scanform was stowed whenever it was not used for a significperiod of time to provide additional radiation shieldingthe SSI camera. These precautionary measures paid off; thanomaly did not recur and all of the I32 observations wsuccessfully acquired. This orbit marked Galileo’s fifth cloIo flyby but was only the second trouble-free encounter (had been the first).
2.5.1. LOKI_01This 1.1 kmpixel−1, near-terminator observation of th
Loki region is one of the highest-resolution sets of imaever acquired of Loki, the Solar System’s most powevolcano. The observation (Fig. 4) revealed that the relavas in Loki and other nearby paterae are strongly forwscattering, consistent with relatively flat, smooth, glassysurfaces (see Geissler et al., 2004). It has also providebest topographic constraints on the patera: the rim of Lcan be no more than 100 m tall. This result, combined w
Fig. 4. In this 1.1 km pixel−1, near-terminator (illumination is from the lefview of Loki Patera the normally darkpatera floor looks bright, as do thfloors of other smaller paterae in the image. We have interpreted this bening as being due to forward scattering off of glassy lava surfaces. Shmeasurements at the patera rim indicate that its height is no greate100 m. Near the bottom of the image, two mountains several kilomehigh (Schenk et al., 2001) and some bright flows extending north fromPatera can be seen.
,
-
-
the observation that the margins of Loki’s dark lavas havechanged despite the frequent, large-volume, effusive etions inferred at Loki, is consistent with the hypothesis tLoki is a lava lake with an episodically overturning cru(Rathbun et al., 2002; Lopes et al., 2004).
2.5.2. PELE_01This five-frame, two-color (clear and 1 µm filters), 6
65 m pixel−1, nighttime observation of Pele (Fig. 8 in Radbaugh et al., 2004) finally found the large area of incandcent lava that we had tried to target but had missedthe I24 and I27 observations (Keszthelyi et al., 2001). (long-wavelength filter was used, despite a potential redtion in sensitivity because the camera’s light-flood functihad been disabled, in order to allow lava temperaturebe estimated. Fortunately, this problem did not impairtemperature analysis (Radebaugh et al., 2004).) Radebet al. (2004) used this observation to derive color tematures of at least 1420± 100 K, consistent with compostions ranging from basaltic to ultramafic. The distributiof glowing lava at Pele is consistent with a region oftive fountaining in a lava lake (Radebaugh et al., 20Lopes et al., 2004).
2.5.3. TELGNS01 and TELGNS02The southeastern scarp of Telegonus Mensae was
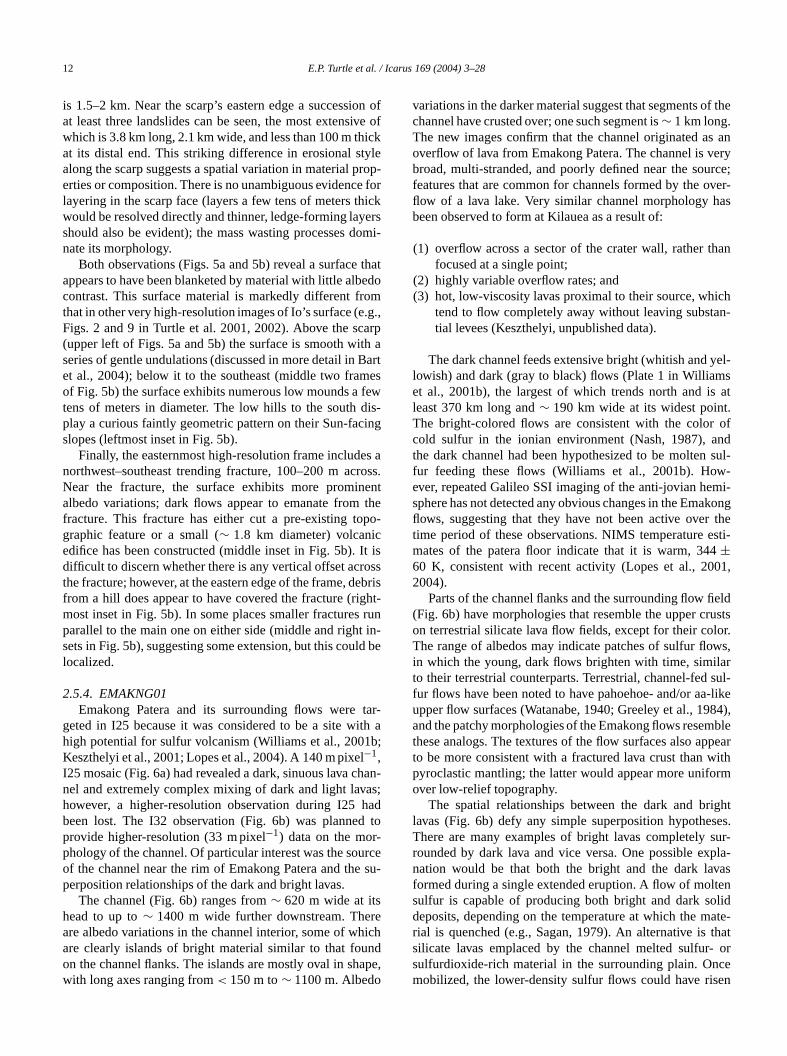
served during I32 at 10 m pixel−1 and at 41 m pixel−1 forcontext. From a 350 m pixel−1 observation made during I2(Turtle et al., 2001, 2002), the eastern margin of TelegoMensae had been seen to be scalloped, a morphologycan result from erosion by sapping. So, it was hopedthis observation might provide an opportunity to undstand whether sapping is an active erosional process o(a goal which had been thwarted on two earlier occasiI27 SAPPNG01, a very high resolution, oblique obsertion, without context, in which the scarp turned out tofacing away from the camera; and I31 TVASHT02, whwas lost). However, the spectacular I32 images (Fig. 5)marily revealed evidence for gravity-driven mass wasting ithe form of slumps and landslides. The amphitheaters onsoutheastern margin and the straight scarps along the sern margin exhibit morphologies typical of slumping: fltopped blocks with hummocky textures along their baThere are some intriguing valleys in the upper right parthe context mosaic (Fig. 5a), where it looks like layered mterial may have been eroded, however, the highest resolimages (Fig. 5b) did not cover this area.
The very high-resolution images (Fig. 5b) showsouthern scarp of Telegonus Mensae, the dark fractuits east, and the plains that lie between them. The soutscarp faces away from the Sun, nevertheless much of itluminated, indicating that its average slope is less than◦.Interestingly, there are positive relief features (∼ 1 km long)on the face of this block that suggest some manner of dolope creep. Based on measurements of the shadows thcast along the scarp face, we estimate that the total r

Final Galileo SSI observations of Io 11
et.e
(a)
(b)
Fig. 5. (a) Context mosaic(42 m pixel−1) of the southeastern margin of Telegonus Mensae, with the high-resolution frames (shown separately in (b)) ins(b) High-resolution(9.6 m pixel−1) mosaic from the south-facing scarp of Telegonus Mensae across the plains to a dark fracture. Illumination is from thupper right in both mosaics, so the terrain in the top left corner of each mosaic is elevated above that to the bottom and the right.
12 E.P. Turtle et al. / Icarus 169 (2004) 3–28
on oive oickylerop
e forhickersomi
thaedoom.g.,arpth aBartes
fewis-
ing
s arosstthe
po-
It isossebright-runin-
ld be
tar-ith ab;
hanas;had
to-rcesu-
reichndape
f the
s aneryrce;ver-as
han
ichn-
yel-s
s att.ofndsul-
w-mi-kongthesti-
01,
eldusts
lor.ws,arsul--like84),blepearith
rm
ightses.sur-pla-vastenlidate-
that- orceen
is 1.5–2 km. Near the scarp’s eastern edge a successiat least three landslides can be seen, the most extenswhich is 3.8 km long, 2.1 km wide, and less than 100 m that its distal end. This striking difference in erosional stalong the scarp suggests a spatial variation in material perties or composition. There is no unambiguous evidenclayering in the scarp face (layers a few tens of meters twould be resolved directly and thinner, ledge-forming layshould also be evident); the mass wasting processes dnate its morphology.
Both observations (Figs. 5a and 5b) reveal a surfaceappears to have been blanketed by material with little albcontrast. This surface material is markedly different frthat in other very high-resolution images of Io’s surface (eFigs. 2 and 9 in Turtle et al. 2001, 2002). Above the sc(upper left of Figs. 5a and 5b) the surface is smooth wiseries of gentle undulations (discussed in more detail inet al., 2004); below it to the southeast (middle two framof Fig. 5b) the surface exhibits numerous low mounds atens of meters in diameter. The low hills to the south dplay a curious faintly geometric pattern on their Sun-facslopes (leftmost inset in Fig. 5b).
Finally, the easternmost high-resolution frame includenorthwest–southeast trending fracture, 100–200 m acNear the fracture, the surface exhibits more prominenalbedo variations; dark flows appear to emanate fromfracture. This fracture has either cut a pre-existing tographic feature or a small (∼ 1.8 km diameter) volcanicedifice has been constructed (middle inset in Fig. 5b).difficult to discern whether there is any vertical offset acrthe fracture; however, at the eastern edge of the frame, dfrom a hill does appear to have covered the fracture (rimost inset in Fig. 5b). In some places smaller fracturesparallel to the main one on either side (middle and rightsets in Fig. 5b), suggesting some extension, but this coulocalized.
2.5.4. EMAKNG01Emakong Patera and its surrounding flows were
geted in I25 because it was considered to be a site whigh potential for sulfur volcanism (Williams et al., 2001Keszthelyi et al., 2001; Lopes et al., 2004). A 140 m pixel−1,I25 mosaic (Fig. 6a) had revealed a dark, sinuous lava cnel and extremely complex mixing of dark and light lavhowever, a higher-resolution observation during I25been lost. The I32 observation (Fig. 6b) was plannedprovide higher-resolution (33 m pixel−1) data on the morphology of the channel. Of particular interest was the souof the channel near the rim of Emakong Patera and theperposition relationships of the dark and bright lavas.
The channel (Fig. 6b) ranges from∼ 620 m wide at itshead to up to∼ 1400 m wide further downstream. Theare albedo variations in the channel interior, some of whare clearly islands of bright material similar to that fouon the channel flanks. The islands are mostly oval in shwith long axes ranging from< 150 m to∼ 1100 m. Albedo
ff
-
-
t
.
s
-
,
variations in the darker material suggest that segments ochannel have crusted over; one such segment is∼ 1 km long.The new images confirm that the channel originated aoverflow of lava from Emakong Patera. The channel is vbroad, multi-stranded, and poorly defined near the soufeatures that are common for channels formed by the oflow of a lava lake. Very similar channel morphology hbeen observed to form at Kilauea as a result of:
(1) overflow across a sector of the crater wall, rather tfocused at a single point;
(2) highly variable overflow rates; and(3) hot, low-viscosity lavas proximal to their source, wh
tend to flow completely away without leaving substatial levees (Keszthelyi, unpublished data).
The dark channel feeds extensive bright (whitish andlowish) and dark (gray to black) flows (Plate 1 in Williamet al., 2001b), the largest of which trends north and ileast 370 km long and∼ 190 km wide at its widest poinThe bright-colored flows are consistent with the colorcold sulfur in the ionian environment (Nash, 1987), athe dark channel had been hypothesized to be moltenfur feeding these flows (Williams et al., 2001b). Hoever, repeated Galileo SSI imaging of the anti-jovian hesphere has not detected any obvious changes in the Emaflows, suggesting that they have not been active overtime period of these observations. NIMS temperature emates of the patera floor indicate that it is warm, 344±60 K, consistent with recent activity (Lopes et al., 202004).
Parts of the channel flanks and the surrounding flow fi(Fig. 6b) have morphologies that resemble the upper cron terrestrial silicate lava flow fields, except for their coThe range of albedos may indicate patches of sulfur floin which the young, dark flows brighten with time, similto their terrestrial counterparts. Terrestrial, channel-fedfur flows have been noted to have pahoehoe- and/or aaupper flow surfaces (Watanabe, 1940; Greeley et al., 19and the patchy morphologies of the Emakong flows resemthese analogs. The textures of the flow surfaces also apto be more consistent with a fractured lava crust than wpyroclastic mantling; the latter would appear more unifoover low-relief topography.
The spatial relationships between the dark and brlavas (Fig. 6b) defy any simple superposition hypotheThere are many examples of bright lavas completelyrounded by dark lava and vice versa. One possible exnation would be that both the bright and the dark laformed during a single extended eruption. A flow of molsulfur is capable of producing both bright and dark sodeposits, depending on the temperature at which the mrial is quenched (e.g., Sagan, 1979). An alternative issilicate lavas emplaced by the channel melted sulfursulfurdioxide-rich material in the surrounding plain. Onmobilized, the lower-density sulfur flows could have ris

Final Galileo SSI observations of Io 13
ce
(a)
(b)
Fig. 6. (a) I25 observation of Emakong patera at 140 m pixel−1 mosaicked with the high-resolution (∼ 30 m pixel−1) frames from I32. The patera is the sourof numerous dark and light lava flows. (b) High-resolution (∼ 30 m pixel−1) I32 mosaic of a lava channel to the east of Emakong Patera.
ow.ea-est
asl.,epor-
here
oweta-ra,
ong
through cracks to pond in places on top of the silicate flThese sulfur flows then brightened over time to form the ftures seen in the latest images. Such a process was suggfor the similarly convoluted mixture of dark and bright lavseen at∼ 8 m pixel−1 at Chaac Patera (Keszthelyi et a2001; Williams et al.,2002b). Additional data from futurmissions will be necessary to determine the relative pro
ed
tions of silicate and sulfurous materials here and elsewon Io.
A dark line on the patera floor can be seen to follthe base of the surrounding wall. One possible interprtion is that it is a shadow cast by the rim of the patein which case the height of the rim is∼ 230 m (Williamset al., 2002a). However, comparison to the I25 Emak

14 E.P. Turtle et al. / Icarus 169 (2004) 3–28
nator.
ed
(a)
Fig. 7. (a) High-resolution (50 m pixel−1) and (b) context (∼ 325 m pixel−1) mosaics of Tohil Mons and Tohil and Radegast Paterae near the termiThe illumination is from the right in both mosaics. Tohil Patera (near the upper right edge of the mosaics) has multiple flows with varied albedos on its floor.Radegast Patera, a small, dark-floored patera between Tohil Patera and the peak of Tohil Mons, is∼ 20 km across. The peak of Tohil Mons (as determinfrom the I24 and I27 stereo observation, Schenk etal., 2001, and in preparation) lies just to the north ofthe bottom left frame in (a), labeled “peak” in(b).
om-sis-ndorif-
omthepa-
esislava
een
ur-t the
d inightori-esinterthis
observation (Fig. 6a) suggests that the dark ring may cpletely encircle the patera floor, which would be content with the broken crust of a lava lake, with a straline from a time when the lake was at a higher level,with exposed walls composed of dark material. It is dficult to be certain which of these options is correct frthe SSI images; however, I32 NIMS data indicate thathottest areas within Emakong Patera coincide with thetera rim (Lopes et al., 2004), supporting the hypoththat the dark curve represents the disrupted edge of alake.
2.5.5. TOHIL_01Tohil Mons and Tohil and Radegast Paterae had b
observed during both I24 and I27 (at∼ 190 and∼ 165m pixel−1, respectively) in order to acquire stereo data (Ttle et al., 2001, 2002). These observations revealed thamountain is up to 9.4 km high (Schenk et al., 2001, anpreparation) but the limited vertical resolution and the hSun obscured topographic details; Io’s mountains are noously difficult to distinguish in low-incidence-angle imag(cf., Gish Bar* Mons in Section 2.5.8 and Tohil MonsFig. 10 in Turtle et al., 2001, 2002). During the I32 encounit was possible to acquire a five-frame mosaic across

Final Galileo SSI observations of Io 15
(b)
Fig. 7. Continued.
herer-freolarils,
.g.,
gde-ow
l hun-alsandout7b)the
region near the terminator at∼ 50 m pixel−1 to reveal topo-graphic details (Fig. 7a). Furthermore, slightly later anotobservation (TERMIN01) captured Tohil, still near the tminator, at∼ 325 m pixel−1 (Fig. 7b). The combination othe I24 and I27 high-Sun observations, which provide steviews and highlight albedo variations, with the spectacuI32 low-Sun observations, which reveal topographic detahas proven quite useful for interpreting Tohil’s geology (eWilliams et al., 2004).
Tohil Mons, like all other ionian mountains, is beineroded by mass wasting. A series of large landslideposits extend west from the mountain (Fig. 7b). Shadmeasurements reveal that their distal scarps are severadred meters high. The lower left frame of Fig. 7a revea rugged surface with relief of a few hundred metersan apparent small landslide (5–13 km long) extendingfrom the shadow of the scarp. In the context mosaic (Fig.a straight ridge can be seen to extend southwest from

16 E.P. Turtle et al. / Icarus 169 (2004) 3–28
e deughlderwsaicherst-theTur-theconathall,
to inents
sternara-
t onoor
fromhisex-
d this
004;al.,ebrihts ththe
romeeprs toisi-be
ionndrastrmi-of
lay-re-
s;
.e e
eep;e gen beconstera
en-ivethew
er oflated
teraute to,rentn ap-n attelyship
uc-ob-
wereromtheostdi-entlica-ialsf thefromter-
thee ofith
feen-sixled, soereba-3)03)al.,99;ethe
sili-r, butcen-
ettheno-red
oldesand
peak. In the high-resolution mosaic shadows obscure thpression that lies directly to the east of the peak. Althothis depression bears some resemblance to a summit cathere is little evidence for a volcanic origin; no lava floare seen within or emanating from it in the context mos(Fig. 7b) or in the earlier high-Sun observations. Anotpossibility for the formation of this depression is northeaward slumping of the large block that can be seen inI32 context mosaic and the earlier stereo observations (tle et al., 2001, 2002) to form the northeastern border ofdepression. However, this interpretation appears to be insistent with the lack of significant amounts of debris benethe block, indeed this area is instead inscribed by the smdark-floored Radegast Patera. This patera also appearsterrupt a series of northwest-southeast trending lineamthat resemble an imbricate thrust belt along the northeamargin of the mountain (Jaeger et al., 2002, and in preption).
Surprisingly, given the degree of mass wasting evidenthe western and southern flanks of the mountain, the flof Radegast Patera is quite clean; collapse of materialthe patera walls is limited to the margins of the patera. Tindicates that the volcanic resurfacing rate in the pateraceeds the rate of mass wasting from the patera walls anhigh ridges immediately to the south. Another possibilitythat this patera, like others on Io (Radebaugh et al., 2Keszthelyi et al., 2004; Williams et al., 2004; Lopes et2004), is or has been a lava lake capable of consuming dthat fell into it from the mountain. This interpretation migexplain the observation that Radegast Patera interruptseries of scarps along Tohil Mons’ eastern margin andlack of debris despite possible northeastward slumping fthe peak. The patera itself is only a few hundred meters dbut to its south the mountain rises several hundred metetwo kilometers above the floor. The darkest lava flow vble on the floor of the patera was observed by NIMS towarmer than the surrounding surface, 325±50 K, indicativeof recent activity (Lopes et al., 2004).
The illuminated faces of scarps in the high-resolutmosaic (which appear uniformly bright in Fig. 7a, secoand third frames from the lower left, because the conthas been enhanced to bring out material near the tenator) show no strong evidence for layering. The lackobvious stratigraphy is somewhat surprising; however,ers would have to be a few hundred meters thick to besolved directly in these 50 m pixel−1 images, whereas Io’lava flows seem to be∼ 1–10 m thick (Davies et al., 2000Williams et al., 2001a).
Tohil Patera exhibits surprisingly little topographic reliefFrom the scarps along the eastern edge of the patera wtimate that it is no more than a few hundred meters dthose scarps that are steep enough to cast shadows arerally less than 100 m high. Striking albedo contrasts caseen both outside the patera and on its floor (first and seframes from the upper right in Fig. 7a). Very bright flowwith crenulated margins occur on the southwestern pa
-
a,
-
-
e
s
e
,
s-
n-
d
floor. These flows have a NIMS spectral signature ofhanced SO2 content (Lopes et al., 2001), possibly indicatof SO2 flows like those inferred in Balder Patera (Smyet al., 2000; Williams et al., 2002b). A very dark lava flomore than 26 km long runs southwest across the centTohil Patera. In these cases albedo contrasts are correwith identifiable lava flows; however to the east of the pasome other process appears to cause, or at least contribalbedo variations. The contacts between zones with diffealbedos are generally smooth and sometimes they evepear diffuse, unlike the lobate borders of lava flows seethis resolution. In some places bright material compleencloses dark material, elsewhere the opposite relationoccurs. It is difficult to explain these relationships with scessive surface flows. Furthermore, unlike the Emakongservation (Fig. 6b), the Sun was low when these imagesacquired, so topographic relief can be distinguished falbedo variations of the surface materials. Surprisinglyalbedo variations are not correlated with relief (this is mstriking in the upper right corner of Fig. 7a), another incation that they are not simply due to lava flows of differages or compositions (and an observation that has imptions for the interpretation of the bright and dark materoutside of Emakong Patera as well). Perhaps some osurface albedo changes are due to heating of materialbelow or to preferential deposition of frost on cooler maial. From shadow measurements, the topography withinpatera is only on the order of a few tens of meters. Outsidthe patera there is significantly more topographic relief wscarps∼ 100 m high.
2.5.6. TUPAN_01This magnificent 132 m pixel−1, three-color mosaic o
Tupan Patera (Fig. 8) reveals complex interactions betwdifferent color units in and around the∼ 900 m deep (determined from shadow measurements) patera. (Originallyfilters were planned, but after the light-flood was disabthe utility of the 889 nm and 1 µm filters was decreasedthose images, along with that through the clear filter, wdropped to save data volume.) Bright red material, probly rich in short-chain sulfur (e.g., McEwen et al., 200or perhaps sulfur dichloride (Schmitt and Rodriguez, 20released by very recent volcanic activity (McEwen et1998a; Geissler et al., 1999; Lopes-Gautier et al., 19Phillips, 2000), coversmuch of the patera floor and thcentral “island” and there are some diffuse deposits onsurface above the patera wall to the east. Black, likelycate, lava dominates the eastern part of the patera floois limited to isolated patches on the western side. Thetral region is not covered by dark, i.e., recent (McEwenal., 1985, 1997) lava flows, indicating that it stands abovefloor. However, the fact that it is not high enough to cast aticeable shadow limits its height to less than a few hundmeters. NIMS data reveal that this central “island” is c(Lopes et al., 2004). A relatively uniform black line tracthe edge of the patera floor in the western half of Tupan

Final Galileo SSI observations of Io 17
Fig. 8. A∼ 132 m pixel−1 color observation (only slightly enhanced from true color) of Tupan Patera. Illumination is from the right.
sitstranca-
uche.g.sts-
andfloo
eri-to
ow-edri-
terarmileliq-ort
ast-ter-lsothe
rongbe-
cate
03;
ofer aable
kmingil-htarma-va01).h acraftctednd
arisap-aksn ra-rgertaine-d topa-or
the edge of the “island,” and outlines light-colored depoon the northern patera floor. Perhaps this represents a sline due to withdrawal or degassing of lava after solidifition of a crust (as may also be the case at Emakong). Sdeflation has been seen in many terrestrial lava lakes (Kilauea Iki). However, the low albedo of this line suggethat the edges were recently molten, consistent with interaction of a lava lake’s crust with the confining walls.
The occurrence of bright material on the westernnorthern, and to a lesser extent the eastern, paterais consistent with the hypothesis that sulfur-rich matals in the patera walls and the “island” are melting duethe high temperatures of the silicate lava and then fling out over warm, but solidified, silicate crust (discussin more detail in Keszthelyi et al., 2004). From the vaation in the amount of bright material across the pafloor, we infer that the eastern part of the floor is still waenough to vaporize sulfur-rich liquid from the walls, whthe northern and western parts are cool enough for theuid to persist and solidify on the surface. NIMS data suppthis idea; the hottest part of the patera floor is the eern side, where the dark lava is observed, and the lighcolored western and northern portion of the floor is awarm, but cooler (Lopes et al., 2004). Several areas oneastern side of the patera floor are green, providing stsupport for the hypothesis that a chemical interactiontween red sulfur deposits from outgassing and warm sili
d
,
r
lavas results in green-colored material (McEwen et al., 20Williams et al., 2004).
2.5.7. TVASHT01This 200 m pixel−1 mosaic (Fig. 9) completed a series
observations of the Tvashtar Catena region acquired ovperiod of just under two years. The intense and unpredicteruption witnessed at Tvashtar was first seen as a 50long curtain of fire fountains on 26 November 1999, durorbit I25 (McEwen et al., 2000; Keszthelyi et al., 2001; Wson and Head, 2001). Galileo’s next observation of TvasCatena (22 February 2000, during orbit I27) revealedjor activity in the form of surface flows or perhaps a lalake in the large patera to the west (Keszthelyi et al., 20Galileo’s orbit G29 on 30 December 2000 coincided witJupiter flyby by the Cassini spacecraft, and both spacemade observations of Io. Quite surprisingly Cassini detea plume almost 400 km high (McEwen et al., 2003) aGalileo revealed a Pele-type plume deposit around Tvasht(Fig. 2). At the time of Galileo’s final observation of thregion, the I32 encounter on 16 October 2001, Tvashtarpears to have been quiet (Fig. 9). Bright and dark strethought to be remnants of the plume eruption can be seediating away from a shallow patera nested within the laeastern patera of Tvashtar Catena, the site of the I25 cuof fire fountains (labeled I25). To the southwest, emplacment of bright streaks appears to have been controllesome extent by the edge of the plateau surrounding thetera. Although we had expected that lava flow margins

18 E.P. Turtle et al. / Icarus 169 (2004) 3–28
tera.bas th
Fig. 9. Tvashtar Catena at∼ 200 m pixel−1. Illumination is from the right, revealing three smaller paterae (labeled) set into the floor of the eastern large paBright and dark streaks can be seen to have emanated from the westernmost of these three paterae, the site of the I25 eruption (indicated by the lines laeled“I25”) (McEwen et al., 2000). This patera is believed to have been the source ofthe plume observed in G29. The large, dark-floored, western patera wesite of extensive surface flows and small breakouts (indicated bythe lines labeled “I27”) during I27 (Keszthelyi et al., 2001).
fol-ledasubtles se
ra,
ser-but
s,n toor-
ark,patheces
ap-al.,re-
ap
Oc-urstuted1).re-liesestsvasther04;ob-the
km-
03).thewerSut-ta
i-as-I31ast
patera boundaries within Tvashtar might have changedlowing such dramatic activity, the I32 observation revealittle modification. The final forms of the new dark lavmatch dark patterns observed earlier, suggesting that stopographic confinement is controlling the extent of surfacflows. (For more details of the observed surface changeGeissler et al., 2004; Milazzo et al., in preparation.)
2.5.8. GSHBAR01This 250 m pixel−1, high-Sun mosaic of Gish Bar Pate
the 11-km-high mountain it neighbors (Gish Bar* Mons), anintriguing Y-shaped fracture to its west, and Monan* Mons(Fig. 10a) was planned as the first part of a stereo obvation (the second part was to be acquired during I33,was lost due to a spacecraft safing event). Despite this losthe I32 observation provided an interesting comparisoobservations made two years earlier (Fig. 10b), duringbits C21 and I24 (Turtle et al., 2001, 2002). Numerous dand presumably recent, lava flows can be seen on thetera floor. Many apparent changes in albedo betweenobservations can be attributed to the significant differenin the illumination and viewing geometries (see figure ction for details) of the observations (e.g., Simonelli et1997; Phillips,2000), but others may be the result ofcent eruptions. The southeastern corner of the patera
e
e
-
-
pears to have darkened significantly between July andtober 1999 (Fig. 10b), perhaps as a result of an outbobserved from Earth in August 1999 that has been attribto Gish Bar (Howell et al., 2001; Keszthelyi et al., 200If this was a lava flow, the fact that the margins of thisgion did not change between the two observations impthat the lava was topographically confined, which suggthat this part of the patera might consist of ponded laor even a lava lake, as has been hypothesized for oionian paterae (Lopes et al., 2004; Keszthelyi et al., 20Radebaugh et al., 2004; Rathbun et al., 2002). A NIMSservation of Gish Bar in I32 revealed that this part ofpatera was warm (Lopes et al., 2004).
The I32 SSI image appears to show a new, dark, 30-long flow covering an area of∼ 1430 km2 in the north-western part of the patera (Fig. 10; Perry et al., 20Assuming that this is a flow that started shortly afterI24 observation in October 1999, we can derive a lolimit of 22 m2 sec−1 for the coverage rate. However, NIMdata from I31 (August 2001) showed only low thermal oput at this site, while the I32 (October 2001) NIMS darevealed a significant increase (of two orders of magntude) in thermal output (Lopes et al., 2004). So, if wesume that this is a flow that began shortly after theNIMS observation, we derive a coverage rate of at le

Final Galileo SSI observations of Io 19
asto
he
as
(a)
(b)
Fig. 10. (a) A∼ 250 m pixel−1 mosaic from Monan* Mons to Gish Bar Patera. Gish Bar Patera is 106× 115 km (Radebaugh et al., 2001). The Sun whigh (∼ 14◦ incidence angle), so there is little topographic information; 11-km-high (Schenk et al., 2001) Gish Bar* Mons, which abuts Gish Bar Pateraits northeast, is barely distinguishable here. Brightness variations represent variations in the albedos of the surface material. (b) Surface changes on the floorof Gish Bar Patera over a period of 27 months from observations made during C21 (July 1999), I24 (October 1999), and I32 (October 2001). Many of tdifferences can be attributed to the different illumination geometries of the observations: the phase angles of the observations were∼ 6◦ , ∼ 20◦ , and∼ 47◦,respectively; incidence angles were∼ 46◦, ∼ 76◦ , and∼ 14◦ ; and emission angles were∼ 50◦, ∼ 58◦, and∼ 46◦). Furthermore, the C21 observation wtaken through SSI’s green filter, while the I24 and I32 observations were taken through the clear filter. The large, very dark area (labeled “new flow”) inthewestern part of the patera may be a recent lava flow.
l-.
ore93;dthe
theonerob-klyhol-reend-tly
as00;for
a-
the11;this,
.5.5for
andCu-
04)hy isn-cesuresart
1)orthnts),
230 m2 sec−1, which is similar to that of the 1997 Pilan Patera eruption,∼ 330 m2 sec−1 (Davies et al., 2001)For comparison, this coverage rate(230 m2 sec−1) is abouttwice the peak rate of the current Kilauea eruption and mthan 500 times Kilauea’s typical rate (Mattox et al., 19Heliker and Mattox, 2003). Activity at Gish Bar continueinto at least December 2001, when it was observed fromKeck Observatory in Hawaii (Marchis et al., 2002).
Another intriguing feature seen in this observation isY-shaped fracture to the west of Gish Bar Patera. This isof the few examples of a fracture seen on Io’s surface; pably because features without significant relief are quicobscured due to the high resurfacing rate. The morpogy is similar to extensional regimes on Earth, with thfaults (one being much longer than the other two) exteing from a common point. Extensional faulting is currena model for the formation of some ionian paterae, suchHi’iaka Patera (McEwen et al., 2000; Jaeger et al., 20Radebaugh et al., 2001). However, there is no evidencecurrent volcanic activity along this fracture.
2.5.9. TERMIN01This ∼ 330 m pixel−1, near-terminator observation tr
versed Io from Mycenae Regio at∼ 40◦ south to ColchisRegio just north of the equator, and it demonstrateswide range of volcanic styles that are found on Io (Fig.see also Williams et al., 2004). Starting in the south,observation revealed that Mycenae Regio consists of thindigitate lava flows. As discussed previously (Section 2TOHIL_01), part of this observation served as contextthe high-resolution mosaic across Tohil Mons and TohilRadegast Paterae (Fig. 7a). The flows emanating fromlann Patera (McEwen et al., 2000; Williams et al., 20apparently traverse very shallow slopes as no topograpevident in this low-Sun view. North of Culann Patera lie hudreds of kilometers of layered plains, which in some plaare cut by arcuate, generally north–south trending fract(Fig. 11) and in others exhibit low ridges (see Fig. 6 in Bet al., 2004).
At the northern end of the mosaic (top frame of Fig. 1lies Michabo Patera, which spans almost 100 km from nto south, is∼ 1.5 km deep (based on shadow measureme

20 E.P. Turtle et al. / Icarus 169 (2004) 3–28
ande
ev-ms
res-
to79;usu-uite
westothePa-
snicob-7D27hichith
nmof
ov-orbit2).in
eld,979romun-
. Therth-ex-elyandd-theowrthinfromfea-nddowsit is
onlyrade-
k ofits
d-tern
hepart,
Fig. 11. Mosaic of I32 near-terminator images at∼ 325 m pixel−1 fromthe dark lava flows of Mycenae Regio in the south, across Tohil MonsCulann Patera, to Michabo Patera and Tsui Goab Tholus and Fluctus in thnorth. The illumination is from the right.
and appears to be set into a low plateau. There is littleidence of lava flows associated with this patera (Williaet al., 2004). To the east of Michabo is Tsui Goab Tholus,which appears to be a small shield volcano with two dep
sions near its summit. On Io it is uncommon for lavasbuild substantial edifices around vents (Smith et al., 19Schaber, 1982; Jaeger et al., 2003); lava flows areally long and thin and paterae are incised, sometimes qdeeply, into the surface (Radebaugh et al., 2001). To theof the tholus lies Tsui Goab Fluctus, a field of high-albedlava flows that appear to embay the western margin ofsmall shield. These flows, like some seen near Emakongtera (EMAKNG01, Fig. 6) could consist of sulfur (Williamet al., 2001b). The bright flow field is the only fresh volcadeposit in this area where a low-intensity hotspot wasserved by NIMS during I27 (February 2000; hotspot I2in Lopes et al., 2001). The relatively low intensity of the Ihot spot does not rule out a low-temperature eruption, wtogether with the bright albedo (Fig. 11) is consistent wsulfur flows.
2.5.10. TERMIN02This ∼ 330 m pixel−1, near-terminator observatio
(Fig. 12a) was originally designed to traverse Io fro∼ 15◦ N near Zamama northwards to an intriguing groupyellow-floored paterae near 65◦ N. However, it was rapidlymodified after I31 so that the northernmost two frames cered the site of the new plume eruption detected on that(see Sections 2.4.1 PLUMES01 and 2.4.3 GLOCOL0Starting at Zamama (lower left frame and left insetFig. 12a), the observation reveals that this lava flow fiwhich formed sometime between the Voyager flybys in 1and the first Galileo observations in 1996, emanates fone of two small volcanic constructs that are several hdred meters high (based on shadow measurements)vent is a radial fissure starting near the summit of the noern small shield and feeding a broader flow field thattends∼ 160 km across the plains. This situation is preciswhat was predicted from the morphologies of the lavasthe distribution of the colorful diffuse deposits surrouning Zamama (Keszthelyi et al., 2001). Moving northeast,second and third frames of this mosaic contain lava flfields and Thomagata* and Reshef* Paterae. It is uncleawhether the broad, shield-like features or plateaus wiwhich the paterae are incised were created by eruptionsthe paterae, or if they were pre-existing topographictures. Thomagata* Patera is 56 km long, 26 km across a1.2–1.6 km deep (based on measurements of the shacast by the patera walls). The raised plateau surroundingmore than 100 km across and its western margin rises∼ 200 m above the plain. Although it looks like the patefloor sits lower than the surrounding plain, this cannot betermined from the image; the fact that the western flanthe plateau is completely illuminated only indicates thatslope is less than 20◦. If the patera floor and the surrouning plain were at the same level, the slope of the wesflank of the plateau would be just over 2◦. Reshef* Patera is∼ 60 km long and∼ 35 km across. The southern part of tpatera floor is set somewhat deeper than the northern

Final Galileo SSI observations of Io 21
o.tion
per
(a)
(b)
Fig. 12. (a) Mosaic of I32 near-terminator images at 330–340 m pixel−1 from Zamama to the source of the I31 plume, Thor* , the largest ever seen on IIllumination is from the right. Enlarged andcontrast enhanced views of Zamama and Thor* are inset at the bottom of the figure because the illuminavariation across the scene is so great that it is difficult to discern features at the eastern and western edges. The scale also varies, so 200-km scale bars areincluded at both edges of the mosaic. (b) The same region seen in July 1999 (C21). The source of the I31 plume is the faint, light-colored flows at the upright corner. These flows have the same outline as the new dark flows seen during I32 in (a).

22 E.P. Turtle et al. / Icarus 169 (2004) 3–28
ea-
t inthin00-garsw-fusehapearkris-ionallyere-new
ftss oom
menob-uedI31ringof
02he
he-et
n-) att-
in
thelor.a-and
geov-agerg
anges
houtal.,newins.ets,-
allyand
her-d onthatetter–
m-lu-b-
ats
ngtoi-
d an
∼ 1.6 and∼ 1.3 km, respectively (based on shadow msurements).
The northeastern frames of this mosaic (right inseFig. 12a) reveal a series of discontinuous, dark flows wian irregular network of fractures near the source of the 5km-tall, I31 plume, Thor* . At the regional scale seen durinorbit I31, the large, whitish deposit from the plume appegenerally symmetric (middle, right image of Fig. 2); hoever, at the local scale seen during orbit I32, the dark difdeposits can be seen to have formed in a crescent sfollowing the flows. It is difficult to discern whether thbright diffuse deposit, which generally lies beyond the done, was symmetric or not at the time of orbit I32. Surpingly, comparison to earlier (orbit C21) images of this reg(Fig. 12b) indicates that the new, dark lava flows actuhave the same outlines as earlier bright, yellow flows. Thfore, as at Tvashtar, an eruption that at first seemed to beturned out to be a reactivation of an earlier eruptive site.
2.5.11. GLOCOL01This 5 kmpixel−1, four-color observation (bottom, le
image in Fig. 2) was added as a contingency against lohigh-resolution imaging due to camera and spacecraft analies near Jupiter. Although extreme contrast enhancedoes reveal a hint of something above the limb in thisservation, there is no indisputable evidence for contineruption of the giant plume that was observed during(PLUMES01), and whose source region was imaged duI32 (TERMIN02). This may be consistent with the lackany obvious blurring of the higher-resolution TERMINframes; such blurring has sometimes been observed wimaging through plumes (e.g., Amirani in Plate 6 of Kesztlyi et al., 2001; and Zamama in cover image of McEwenal., 1998b).
2.5.12. GLOCOL02This observation (bottom, right image in Fig. 2) co
sisted of two on-chip-mosaics (cf. Klaasen et al., 19979.8 kmpixel−1 in four colors. Unfortunately due to poining uncertainties in one of the mosaics, the disks of Io
e
,
f-t
n
the violet and 756 nm filters overlap each other, limitingamount of the surface that can be reconstructed in full coNonetheless this final view of Io provided further informtion on the evolution of the plume deposits around PeleDazhbog (Geissler et al., 2004).
2.6. Orbit I33
I33 was to provide Galileo’s first opportunity to imathe sub-jovian side of Io at moderate to high resolution, cering sites not seen at such resolutions since the Voyflybys in 1979 (Fig. 1; Table 6; Appendix A.2). In lookinat targets of Voyager’s highest-resolution,∼ 500 m pixel−1,imaging (e.g., Apis and Inachus Tholi, Mbali Patera, PMensa) we were searching for evidence not only of chanin superficial deposits as have been monitored througthe Galileo mission (e.g., Phillips, 2000; Geissler et2004) but also of morphological changes such as apatera or a massive landslide from one of Io’s mountaWe planned very high-resolution views of Voyager targsuch as Mbali Patera (20 m pixel−1) and the tholi mentioned above (13 m pixel−1), which are two of only fourionian volcanic structures (Jaeger et al., 2003) that acturesemble volcanoes with summit calderas seen on EarthMars, and therefore may consist of more evolved, higviscosity lavas than those seen elsewhere on Io. Basepast experience with very high-resolution observationsdid not have adequate context, we avoided imaging at bthan 10 m pixel−1, restricting our highest-resolution (1020 m pixel−1) observations to those for which the geoetry of the flyby allowed acquisition of medium resotion (∼ 100 m pixel−1) context imaging. These context oservations included a three-color view of Mbali Patera90 m pixel−1. The loss of the I31 medium resolution viewof Masubi, Kanehekili, and Lei Zi Flucti made targetithe I33 imaging sequence significantly more difficult dueuncertainties of∼ 1◦ in the basemap of the sub-jovian hemsphere. The geometry of the I33 encounter also provideopportunity to acquire:
alyalyalyalyaly
alyalyalyalyalyalyalyaly
Table 6Galileo SSI observations during orbit I33
Observation Number of framesa Resolution (m pixel−1) Filter(s) Notes
PELE_01 1× 3.8 IM8 12 Clear, 1 µm Lost due to spacecraft anomTHOLI_01 1× 3 IM4 13 Clear Lost due to spacecraft anomMBALI_01 1 × 4 IM8 20 Clear Lost due to spacecraft anomKANEHE01 1× 4 IM4 27 Clear Lost due to spacecraft anomTHOLI_02 1× 5 IM4 85 Clear Lost due to spacecraft anomMBALI_02 3 1× 2 IM8 90–94 Violet, green, 756 nm Lost due to spacecraft anomKANEHE02 1× 4 IM4 98 Clear Lost due to spacecraft anomHIIAKA01 1 × 4 IM4 111 Clear Lost due to spacecraft anomPAN_02 1× 4 IM4 122 Clear Lost due to spacecraft anomGSHBAR01 1× 4 IM4 130–135 Clear Lost due to spacecraft anomMASKAN01 1× 9.5 IM4 335 Clear Lost due to spacecraft anomGLOCOL01 2× 3 3-color IM4 1,400 Violet, green, 756 nm Lost due to spacecraft anomGLOCOL02 3-color IM4 2,400 Violet, green, 756 nm Lost due to spacecraft anom
a See footnote for Table 2.

Final Galileo SSI observations of Io 23
Bar
ha-
esten
o
tsnder
hane-r Io
aslileorevi-ughlowse-tion
d thekedeamsuc-st Ioesde
ed tocur-sultbut
ingfill
nlink
thinob-acke-ave
ityn-
rvedringuldof
fornsror-adide
ests004;rup-me
et
vera
us
at-chedare
meersingewht-
melemsentry
i-onlyianhosece-ichtiontuni-ween
rva-edde-f. 2
(1) the second half of the stereo observation of GishPatera and Gish Bar* Mons at 130 m pixel−1 (the firsthalf was successfully acquired during orbit I32);
(2) a 110 m pixel−1 view of Hi’iaka Montes and Patera witthe opposite illumination from the I24 and I25 observtions (Figs. 6 and 8b in Turtle et al., 2001, 2002), to tthe hypothesis of massive strike-slip faulting (McEwet al., 2000; Jaeger et al., 2000);
(3) a 122 m pixel−1 observation of Pan Mensa and its twassociated paterae; and
(4) a 335 m pixel−1 observation of Masubi Fluctus and iplume, which had been observed to fluctuate and wadramatically throughout the Galileo mission (Phillips,2000; Geissler et al., 2004).
Furthermore, this encounter allowed for a 1.4 kmpixel−1
color mosaic over the portion of Io between 320◦ W and30◦ W that had not been imaged at resolutions better t∼ 10 kmpixel−1 by either Voyager or Galileo. Finally, wplanned a 2.4 kmpixel−1 color view of the anti-jovian features that had been studied so closely during the earlieflybys.
Regrettably Galileo went into safing about 27 minutesbefore closest approach to Io. Although the problem wsuspected to be a despun-bus reset, similar to what Gahad experienced and handled successfully 20 times in pous encounters (Theilig et al., 2002), it was different enothat the onboard software patch did not catch it and althe spacecraft to ignore it and continue the observationquence. It was speculated that an unusually long-durabus reset, or two occurring in rapid succession, preventepatch from working. Radiation levels near perijove peaat the highest level seen since I27. The reduced flight tworked to return the spacecraft to the nominal state andcessfully restarted the I33 sequence, but not before the laobservation had been lost. Truncated observation sequencto be uplinked in case of spacecraft problems had beenveloped ahead of time, as usual, but these were intendprotect the Io closest-approach data from an anomaly ocring before, rather than during, the encounter. As a reof the safing event, three tracks of I32 data (everythingthe two GLOCOL observations) were not overwritten durI33, and in the aftermath we took advantage of this fact tosome gaps in I32 images that had been caused by dowproblems during I32 playback.
2.7. Orbit A34
Orbit A34 included a 160-km-altitude flyby of Amalthea,one of the small, irregularly shaped satellites located wiJupiter’s ring system. Unfortunately, remote sensingservations were not supported during the flyby. The lof imaging on this orbit was disappointing, not only bcause high-resolution observations of Amalthea would hhelped greatly in interpreting its intriguing low dens(1.0± 0.5 g cm−3, derived from gravity measurements (A
-
derson et al., 2002)) and the nature of the objects obseby Galileo’s star tracker (Fieseler and Ardalan, 2003) duthe flyby, but also because the geometry of this orbit wohave allowed Galileo’s best, moderate-resolution viewIo’s sub-jovian hemisphere, providing additional contextregions which would only have been visible at resolutiobetter than∼ 100 m pixel−1 during I33. Furthermore, aftethe loss of the I33 data, A34 became Galileo’s only opptunity to view this side of Io at moderate resolution. We hhoped for two valuable observations to be taken from insIo’s orbit. The first was a 500 m pixel−1 daylight view of Pil-lan and Pele Paterae which would have provided critical tof the lava lake hypothesis for Pele (Radebaugh et al., 2Lopes et al., 2004) and allowed us to determine if the etion at Pillan involved eruptions of lava along the safaults that dissect the neighboring mountain (Williamsal., 2001a). The second was a 500 m pixel−1 strip from Lokito Ra Patera, which would have provided the best view eof the Solar System’s most powerful volcano, Loki, andmuch better look at Ra, the most likely site of voluminosulfur volcanism on Io.
2.8. J35
Galileo ended its mission by plunging into Jupiter’smosphere on 21 September 2003. As Galileo approaJupiter it successfully acquired and returned data thatcurrently being analyzed at the time of this writing.
3. Conclusions and hopes for future observations
Despite the extremely tight restrictions on data voluand downlink capacity, during Galileo’s final encountwith Io, we tried to achieve a balance between explornew territory and building upon previous results with nobservations at different resolutions, under different liging or viewing angles, or to monitor changes over ti(Tables 2–6). Unfortunately camera and spacecraft probwere encountered frequently in the perilous environmclose to Io. Moreover, until orbit I33, Galileo’s trajectorestricted us primarily to observing the anti-jovian hemsphere. Regrettably, no images were returned from thetwo encounters that did provide views of the sub-jovhemisphere at resolutions comparable to or exceeding tof Voyager: a close flyby during I33 that suffered a spacraft safing event, and a distant one during A34 at whpoint insufficient resources remained to support acquisiof remote sensing observations. The loss of these opporties to search for geologic changes over the 22 years betthe two missions was a keen disappointment.
Nonetheless there were many successful SSI obsetions during the Galileo Millennium Mission that advancour understanding of Io (e.g., Geissler et al., 2004; Rabaugh et al., 2004; Williams etal., 2004). The discovery ofour giant, high latitude plumes during G29 and I31 (Figs

24 E.P. Turtle et al. / Icarus 169 (2004) 3–28
ob979in
h der. 2)
alsonelyAnI31,b),ncted6).nicere-istlsooc-.ap-Pelepat-ionsTu-ests ofr
igh-al.,finityrela
ousre andraee thgen
asing5b)t-s of, themallow-d thetpa-as
dur-ofur-
faceting,dly
Tur-
en-omcanut
sup-
ers.s a
sednotat
ncesand
rnedvo-likedif-
oreop-terreewen-
.uch
r-andtecttlyor-03;tednsitenta-
be
se-ello and
iongiesob-
o’svas;ns to
and 3) was surprising because, although Voyager 2 hadserved surface deposits from high-latitude plumes in 1(McEwen and Soderblom, 1983), in Galileo’s five yearsorbit around Jupiter, it had barely detected one other sucposit (Geissler et al., 2004). No high-latitude plume had evebeen detected directly. The Tvashtar plume eruption (Figwas not only a surprise because of its high latitude, butbecause it demonstrated that remarkably diverse eruptiostyles were possible at a single location within a relativshort period of time (13 months between I25 and G29).interesting aspect of the new plume observed duringThor* , was that its source was not actually new (Fig. 12but simply reactivated after aperiod of dormancy more thafive years long (no evidence for activity had been deteat this location in Galileo’s first observations of Io in 199In fact, there was no evidence for any truly new volcacenter seen during six years of Galileo observations; thfore, activity at volcanic centers on Io is likely to persfor centuries. The I32 TERMIN01 observation (Fig. 11) arevealed potentially active sulfur flows from an eruption dumented by NIMS in February 2000 (Lopes et al., 2001)
Another important result is that many of Io’s pateraepear to be persistent lava lakes (e.g., Lopes et al., 2004;Radebaugh et al., 2004; Loki, Rathbun et al., 2002). Theerae containing these lakes may form as heat from intrusmelts and vaporizes sulfurous volatiles in the crust (cf.pan in Fig. 8; Keszthelyi et al., 2004). Some of the biggconstraints on Io’s subsurface have come from studiethe interaction of ionian tectonic and volcanic features, foexample our suite of observations of Tohil Mons and neboring Radegast and Tohil Paterae (Fig. 7; Williams et2004). Mountains have been demonstrated to have an affor paterae (Jaeger et al., 2003) suggesting a genetictionship. Mountain building can be driven by the enormcompressive stresses that accumulate in the lithospheit is buried by Io’s rapid volcanic resurfacing (Schenk aBulmer, 1998; Turtle et al., 2001). Observations of pateneighboring mountains appear to demonstrate that, onccompressive stresses are relieved, magma uses the orofaults as conduits to the surface (Jaeger et al., 2003).
The recent observations also revealed details of the mwasting processes acting on Io. Slumping and landsliddominate at both large (Fig. 7b) and small scales (Fig.and can occur in close proximity to each other, demonstraing spatial variation in material properties over distanceseveral kilometers. Despite the ubiquitous mass wastingrate of volcanic resurfacing seems to dominate on the sscale (e.g., the generally clean patera floor in Fig. 7a). Hever, catastrophic landslides such as those that createmassive deposits to the west of Tohil (Fig. 7b; Williamsal., 2004) could rapidly make such drastic alterations totera boundaries that we would be unable to identify themsuch without actually observing the events themselves.
Finally, the highest resolution observations obtaineding Galileo’s final encounters with Io widen the varietymorphologies observed on Io (Fig. 5b), thus providing f
-
-
,
-
s
eic
s
e
ther evidence for an extremely diverse assortment of surprocesses at work on Io, including volcanism, mass waspossibly tidal kneading (Bart et al., 2004), and undoubteothers we have yet to understand (e.g., Fig. 5b; Fig. 9 intle et al., 2001, 2002).
There are also a number of conclusions regardinggineering and mission-planning that we can draw frGalileo’s second set of close Io flybys. First, a spacecraftbe built to function in this hostile radiation environment, bit requires exceptional engineering design and missionport. The latest Io images are testaments to the talents anddedication of two generations of scientists and engineSecond, Io, being a geologically active planet, requiredifferent observational strategy from that commonly uat other planets. Complete spatial coverage is simplysufficient; to really understand Io, temporal monitoringhigh spatial resolution is essential. We believe the sequeof observations we acquired over Prometheus, Pele,Tvashtar told us more about Io than we could have leafrom single observations at additional locations. The elution witnessed at Tvashtar demonstrated that, muchterrestrial volcanoes, a single site on Io can exhibit quiteferent eruption styles at different times.
We hope that additional missions will be sent to explIo in the near future (Spencer et al., 2002). The nextportunity anticipated at the time of this writing is a Jupiflyby by the New Horizons mission on its way to exploPluto and the Kuiper Belt. As currently scheduled, NHorizons is to be launched in January 2006 and wouldcounter Jupiter at a distance of∼ 32RJ in January 2007Many useful observations could be made of Io during san encounter: global color imaging (at∼ 45 kmpixel−1,as well as∼ 11 kmpixel−1 monochrome; J. Spencer, pesonal communication, 2003) to detect surface changesplumes, and eclipse observations to monitor and dehotspots. The Jupiter Icy Moons Orbiter that is currenunder discussion would also provide an important opptunity to observe Io (McEwen, 2003; Spencer et al., 20Smythe et al., 2003). Although this mission is not expecto orbit Io itself, nonetheless imaging of Io at resolutiobetter than∼ 1 kmpixel−1 should be possible from orbaround Ganymede and Europa, depending on instrumtion (McEwen, 2003; Spencer et al., 2003).
There are important imaging goals at Io that remain tomet: global color coverage at 200 m pixel−1 and relativelyhigh incidence angle, the conditions we found most uful for interpreting regional geologic relationships, as was low-phase-angle coverage, which accentuates albedcolor variations (sadly a large gap between 320◦ W and30◦ W longitudes that was not imaged at< 10 kmpixel−1 byeither Voyager or Galileo still persists); very high resolutobservations (with context!) of scarps where morpholosuggestive of sapping or sublimation degradation areserved; high-resolution, dual-filter observations of all of Ihotspots to determine eruption temperatures of Io’s lamore extensive and higher-resolution stereo observatio
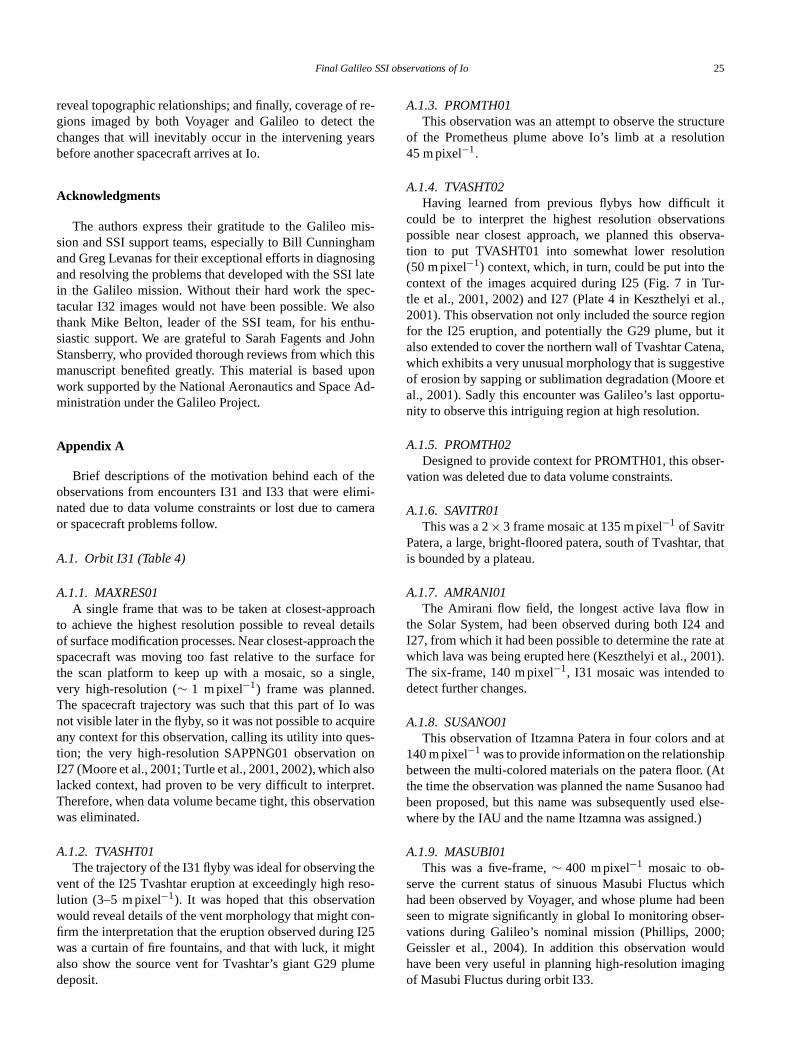
Final Galileo SSI observations of Io 25
f re-thears
is-aminglatec-
alsohu-JohnhisponAd-
eimi-
era
achtailsh thfor
gle,.wasires-onlsoet.n
heso-n
on-I25htme
turetion
itonserva-neur-al.,iont itena,tivee etrtu-
er-
that
inand
e at01).o
atip(At
o hadelse-
hichbeener-;ulding
reveal topographic relationships; and finally, coverage ogions imaged by both Voyager and Galileo to detectchanges that will inevitably occur in the intervening yebefore another spacecraft arrives at Io.
Acknowledgments
The authors express their gratitude to the Galileo msion and SSI support teams, especially to Bill Cunninghand Greg Levanas for their exceptional efforts in diagnosand resolving the problems that developed with the SSIin the Galileo mission. Without their hard work the spetacular I32 images would not have been possible. Wethank Mike Belton, leader of the SSI team, for his entsiastic support. We are grateful to Sarah Fagents andStansberry, who provided thorough reviews from which tmanuscript benefited greatly. This material is based uwork supported by the National Aeronautics and Spaceministration under the Galileo Project.
Appendix A
Brief descriptions of the motivation behind each of thobservations from encounters I31 and I33 that were elnated due to data volume constraints or lost due to camor spacecraft problems follow.
A.1. Orbit I31 (Table 4)
A.1.1. MAXRES01A single frame that was to be taken at closest-appro
to achieve the highest resolution possible to reveal deof surface modification processes. Near closest-approacspacecraft was moving too fast relative to the surfacethe scan platform to keep up with a mosaic, so a sinvery high-resolution (∼ 1 m pixel−1) frame was plannedThe spacecraft trajectory was such that this part of Ionot visible later in the flyby, so it was not possible to acquany context for this observation, calling its utility into quetion; the very high-resolution SAPPNG01 observationI27 (Moore et al., 2001; Turtle et al., 2001, 2002), which alacked context, had proven to be very difficult to interprTherefore, when data volume became tight, this observatiowas eliminated.
A.1.2. TVASHT01The trajectory of the I31 flyby was ideal for observing t
vent of the I25 Tvashtar eruption at exceedingly high relution (3–5 m pixel−1). It was hoped that this observatiowould reveal details of the vent morphology that might cfirm the interpretation that the eruption observed duringwas a curtain of fire fountains, and that with luck, it migalso show the source vent for Tvashtar’s giant G29 pludeposit.
e
A.1.3. PROMTH01This observation was an attempt to observe the struc
of the Prometheus plume above Io’s limb at a resolu45 m pixel−1.
A.1.4. TVASHT02Having learned from previous flybys how difficult
could be to interpret the highest resolution observatipossible near closest approach, we planned this obstion to put TVASHT01 into somewhat lower resolutio(50 m pixel−1) context, which, in turn, could be put into thcontext of the images acquired during I25 (Fig. 7 in Ttle et al., 2001, 2002) and I27 (Plate 4 in Keszthelyi et2001). This observation not only included the source regfor the I25 eruption, and potentially the G29 plume, bualso extended to cover the northern wall of Tvashtar Catwhich exhibits a very unusual morphology that is suggesof erosion by sapping or sublimation degradation (Mooral., 2001). Sadly this encounter was Galileo’s last opponity to observe this intriguing region at high resolution.
A.1.5. PROMTH02Designed to provide context for PROMTH01, this obs
vation was deleted due to data volume constraints.
A.1.6. SAVITR01This was a 2× 3 frame mosaic at 135 m pixel−1 of Savitr
Patera, a large, bright-floored patera, south of Tvashtar,is bounded by a plateau.
A.1.7. AMRANI01The Amirani flow field, the longest active lava flow
the Solar System, had been observed during both I24I27, from which it had been possible to determine the ratwhich lava was being erupted here (Keszthelyi et al., 20The six-frame, 140 m pixel−1, I31 mosaic was intended tdetect further changes.
A.1.8. SUSANO01This observation of Itzamna Patera in four colors and
140 m pixel−1 was to provide information on the relationshbetween the multi-colored materials on the patera floor.the time the observation was planned the name Susanobeen proposed, but this name was subsequently usedwhere by the IAU and the name Itzamna was assigned.)
A.1.9. MASUBI01This was a five-frame,∼ 400 m pixel−1 mosaic to ob-
serve the current status of sinuous Masubi Fluctus whad been observed by Voyager, and whose plume hadseen to migrate significantly in global Io monitoring obsvations during Galileo’s nominal mission (Phillips, 2000Geissler et al., 2004). In addition this observation wohave been very useful in planning high-resolution imagof Masubi Fluctus during orbit I33.

26 E.P. Turtle et al. / Icarus 169 (2004) 3–28
er-
of aslerery
rto
obo
r-
b-than
ughbe
I27suc-lpedhatac-ons04;
husbe
lavaonly-l theateas.
ow
the-lost
spot004).tersonlan
eir. Noth-
lsoichthosethe
-
e, inoy-
ath-ne-
en
ob-llythetwo
itial to
by00;
A.1.10. LEIZI_01This was a four-frame,∼ 400 m pixel−1 mosaic of Lei
Zi Fluctus. It, too, would have aided in planning highresolution imaging of this region in during I33.
A.1.11. KANEHE01This observation was a two-frame,∼ 400 m pixel−1 mo-
saic of Janus Patera and Kanehekili Fluctus, the sitenumber of major eruptions witnessed by Galileo (Geiset al., 2004). It was also designed to aid in targeting vhigh-resolution imaging of this region during I33.
A.1.12. TERMIN01This was a five-frame,∼ 410 m pixel−1, near-terminato
view that started at Prometheus and ran northward∼ 60◦ N including Chaac, Balder, and Surya Paterae, Sand Arinna Flucti, and large unnamed patera at∼ 50◦ N.
A.1.13. TERMIN02This was a four-frame,∼ 415 m pixel−1, near-terminato
view running from∼ 45◦ S to 5◦ S, including Shamash, Tohil, Radegast, Culann and some unnamed paterae.
A.2. Orbit I33 (Table 6)
This encounter was Galileo’s first opportunity to oserve Io’s sub-jovian hemisphere at resolutions less1 kmpixel−1.
A.2.1. PELE_01This observation consisted of 3.8 frames (looking thro
Galileo’s booms, so it was likely that one or more wouldobstructed) in the clear and 1 µm filters at 12 m pixel−1. Al-though we had missed the most active area in I24 and(Keszthelyi et al., 2001), these observations and thecessful I32 observation (Radebaugh et al., 2004) had heto locate the region of interest so we were optimistic twe could target it successfully with this observation toquire very high-resolution data on the thermal emissifrom this apparent active lava lake (Lopes et al., 20Radebaugh et al., 2004).
A.2.2. THOLI_01This observation consisted of a 1× 3 mosaic at∼ 13
m pixel−1 across the margin of Inachus Tholus. Inacand Apis Tholi, which were observed by Voyager, mayrare ionian shield volcanoes composed of high-silicaflows, as opposed to the mafic lavas that are more commobserved on Io (Williams etal., 2001a). This very highresolution observation was specifically targeted to reveamorphology of the margin of Inachus Tholus to investigwhether it was formed by higher viscosity lavas. I33 wGalileo’s only opportunity to see the tholi at high resolutionA context observation at∼ 85 m pixel−1 was also planned.
A.2.3. MBALI_01This observation was an attempt to observe a fl
vent at 20 m pixel−1. Previous, very high-resolution (< 50m pixel−1) attempts had not been successful, e.g., Promeus (Keszthelyi et al., 2001) and Tvashtar, which wasduring I31.
A.2.4. KANEHE01This 1 × 4 mosaic at 27 m pixel−1 was designed to
observe Kanehekili, a persistent high-temperature hotwhich has undergone many changes (Geissler et al., 2I33 was Galileo’s only opportunity to see this volcanic cenat high resolution, which would have provided a comparito potential ultramafic flow morphology observed at Pilduring I24 (Keszthelyi et al., 2001).
A.2.5. THOLI_02This was a five-frame mosaic at∼ 85 m pixel−1 con-
taining an oblique view of Apis and Inachus Tholi: thmargins, summit paterae, and the contact between themonly did this observation provide context for the very higresolution view of the margin of Inachus Tholus, but it agave the only high-resolution view of their summits, whappear to resemble other planetary calderas, such asat Olympus Mons and Mauna Loa, more than do any ofother paterae on Io.
A.2.6. MBALI_02In addition to providing context for the very high
resolution observation of Mbali’s vent, this 90 m pixel−1,1 × 2 mosaic was designed in three colors to investigatdetail, the relationships of the colorful deposits seen in Vager images.
A.2.7. KANEHE02This was a four-frame mosaic of Kanehekili Fluctus
∼ 100 m pixel−1 to provide context for the earlier very higresolution observation and to give a broader view of Kahekili’s interaction with nearby mountains.
A.2.8. HIIAKA01The Hi’iaka Montes–Hi’iaka Patera complex had be
imaged in I24 and I27 at∼ 570 and∼ 360 m pixel−1, re-spectively (Turtle et al., 2001, 2002). In both of theseservations the illumination was from the west, potentiaconcealing tectonic evidence that would provide clues tonature of the interaction between the patera and themountains. The four-frame,∼ 110 m pixel−1, I33 mosaichad the opposite illumination from the earlier views, soprovided a complementary observation that was essenttesting the hypothesis that Hi’iaka Montes had been riftedstrike-slip faulting (McEwen et al., 2000; Jaeger et al., 20Turtle et al., 2001, 2002).

Final Galileo SSI observations of Io 27
,raeex-and
sti-rt.
ekili
r
d
ntun-nd
.L.,rm,ea.
004.
Sil-Io.
n,A.,tion104.IAU
s-4.,
65–
, J.,169,
flow
’o-l.
n-139.SSI.
ffectonsAb-
en,s.
95.
onnd
52., J.,
stics,36,
as,stem509.-
d99
f Io’s9,
am,ityEOS
t
O:14
s on
ol-s.
i, L.,-ging
n by
nism
igh-
. Thewl-ridge
Mi-.P.,
A.2.9. PAN_02This four-frame,∼ 120 m pixel−1 mosaic of Pan Mensa
a mountain which was shown by Voyager 1 to have patelocated at either end, provided another opportunity toplore the nature of the relationship between mountainspaterae.
A.2.10. GSHBAR01This four-frame mosaic at∼ 130 m pixel−1 was the sec-
ond part of a stereo observation (I32 GSHBAR01) to invegate the relationship betweenGish Bar Patera and Gish Ba*
Mons, as well as a mysterious Y-shaped crack to its wes
A.2.11. MASKAN01This was a 9.5-frame mosaic at∼ 335 m pixel−1 along
Masubi Fluctus and extending northeast past KanehFluctus, both sites of persistent high-temperature activity(Geissler et al., 2004; Phillips, 2000).
A.2.12. GLOCOL01This 1.4 kmpixel−1, 2 × 3 frame, regional, three-colo
mosaic covered part of Io never seen at better than∼ 10kmpixel−1 by either Voyager or Galileo. It would have fillea large gap between 320◦ W and 30◦ W longitude, allowinga global geologic map to finally be constructed for Io.
A.2.13. GLOCOL02This was a final three-color view of part of Io’s anti-jovia
hemisphere at 2.4 kmpixel−1 covering many of the mosdramatic features observed during Galileo’s close encoters with Io, including Prometheus, Amirani, Tvashtar, aThor* .
References
Anderson, J.D., Anabtawi, A., Jacobson, R.A., Johnson, T.V., Lau, EMoore, W.B., Schubert, G., Taylor, A.H., Thomas, P.C., WeinwuG., 2002. Gravity field, topography, and interior structure of AmalthEOS Trans. AGU Fall Meet. Suppl. 83. Abstract F854.
Bart, G.D., Turtle, E.P., Jaeger, W.L., Keszthelyi, L.P., Greenberg, R., 2Ridges and tidal stress on Io. Icarus 169, 111–126.
Davies, A.G., Lopes-Gautier, R., Smythe, W.D., Carlson, R.W., 2000.icate cooling model fits to Galileo NIMS data of volcanism onIcarus 148, 211–225.
Davies, A.G., Keszthelyi, L.P., Williams, D.A., Phillips, C.B., McEweA.S., Lopes, R.M.C., Smythe, W.D., Kamp, L.W., Soderblom, L.Carlson, R.W., 2001. Thermal signature, eruption style, and erupevolution at Pele and Pillan on Io. J. Geophys. Res. 106, 33079–33
Fieseler, P.D., Ardalan, S.M., 2003. Objects near Jupiter V (Amalthea),Circ. 8107.
Frank, L.A., Paterson, W.R., 2001. Passage through Io’s ionospheric plamas by the Galileo spacecraft. J. Geophys. Res. 106, 26209–2622
Geissler, P.E., McEwen, A.S., Keszthelyi, L., Lopes-Gautier, R., GranahanJ., Simonelli, D.P., 1999. Global color variations on Io. Icarus 140, 2282.
Geissler, P., McEwen, A.S., Phillips, C.B., Keszthelyi, L.P., Spencer2004. Surface changes on Io during the Galileo mission. Icarus29–64.
Greeley, R., Theilig, E., Christensen, P., 1984. The Mauna Loa sulfuras an analog to secondary sulfur flows on Io. Icarus 60, 189–199.
Heliker, C., Mattox, T.N., 2003. The first two decades of the Pu’u ‘OKupaianaha eruption: chronology and selected bibliography. US GeoSurv. Prof. Pap. 1676, 1–27.
Howell, R.R., 13 colleagues, 2001. Ground-based observations of volcaism on Io in 1999 and early 2000. J. Geophys. Res. 106, 33129–33
Jaeger, W.L., Turtle, E.P., McEwen, A.S., Keszthelyi, L.P., the GalileoTeam, 2000. Possible tectonic origin for Hi’iaka Patera, Io. EOS TransAGU Spring Meet. Suppl. 81. Abstract S291.
Jaeger, W.L., Turtle, E.P., Keszthelyi, L.P., McEwen, A.S., 2002. The eof thrust fault geometries on the surface deformation of Io: implicatifor mountains and paterae. In: Proc. Lunar Planet. Sci. Conf. 33rd.stract #1741.
Jaeger, W.L., Turtle, E.P., Keszthelyi, L.P., Radebaugh, J., McEwA.S., Pappalardo, R.T., 2003. Orogenic tectonism on Io. J. GeophyRes. 108 (E8). 10.1029/2002JE001946.
Johnson, T.V., Matson, D.L., Blaney, D.L., Veeder, G.J., Davies, A., 19Stealth plumes on Io. Geophys. Res. Lett. 22, 3293–3296.
Keszthelyi, L., 13 colleagues, 2001. Imaging of volcanic activityJupiter’s moon Io by Galileo during the Galileo Europa Mission athe Galileo Millennium Mission. J. Geophys. Res. 106, 33025–330
Keszthelyi, L.P., Jaeger, W.L., Turtle, E.P., Milazzo, M., Radebaugh2004. A post-Galileo view of Io’s interior. Icarus 169, 271–286.
Klaasen, K.P., 15 colleagues, 1997. Inflight performance charactericalibration, and utilization of the Galileo SSI camera. Opt. Eng.3001–3027.
Klaasen, K.P., Breneman, H.H., Simon-Miller, A.A., Banfield, D., LevanG.C., 2003. Operations and calibration of the solid-state imaging syduring the Galileo extended mission at Jupiter. Opt. Eng. 42, 494–
Lopes-Gautier, R., 13 colleagues, 1999.Active volcanism on Io: global distribution and variations in activity. Icarus 140, 243–264.
Lopes, R.M.C., 14 colleagues, 2001. Ioin the near infrared: Near-InfrareMapping Spectrometer (NIMS) results from the Galileo flybys in 19and 2000. J. Geophys. Res. 106, 33053–33078.
Lopes, R.M.C., 10 colleagues, 2004. Lava lakes on Io: observations ovolcanic activity from Galileo NIMS during the 2001 flybys. Icarus 16140–174.
Marchis, F., de Pater, I., Le Mignant, D., Roe, H.G., Fusco, T., GrahJ.R., Prange, R., Macintosh, B., 2002. Monitoring Io volcanic activusing the Keck AO system: 2–5 µm sunlit and eclipse observations.Trans. AGU Fall Meet. Suppl. 83. Abstract F832.
Mattox, T.N., Heliker, C., Kauahikaua, J., Hon, K., 1993. Developmenof the 1990 Kalapana flow field, Kilauea volcano, Hawaii. Bull. Vol-canol. 55, 407–413.
McEwen, A.S., 2003. High-resolution imaging and topography from JIMthe HiRISE model. In: Forum on Jupiter Icy Moons Orbiter, LPI, 12–June. Abstract #9007.
McEwen, A.S., Soderblom, L.A., 1983. Two classes of volcanic plumeIo. Icarus 55, 191–217.
McEwen, A.S., Matson, D.L., Johnson, T.V., Soderblom, L.A., 1985. Vcanic hot spots on Io: correlation withlow-albedo calderas. J. GeophyRes. 90, 12345–12379.
McEwen, A.S., Simonelli, D.P., Senske, D.R., Klaasen, K.P., KeszthelyJohnson, T.V., Geissler, P.E., Carr,M.H., Belton, M.J.S., 1997. Hightemperature hot spots on Io as seen by the Galileo Solid State Ima(SSI) experiment. Geophys. Res. Lett. 24, 2443–2446.
McEwen, A.S., 13 colleagues, 1998a. Active volcanism on Io as seeGalileo SSI. Icarus 135, 181–219.
McEwen, A.S., 14 colleagues, 1998b. High-temperature silicate volcaon Jupiter’s moon Io. Science 281, 87–90.
McEwen, A.S., 25 colleagues, 2000. Galileo at Io: results from hresolution imaging. Science 288, 1193–1198.
McEwen, A.S., Keszthelyi, L., Lopes, R., Schenk, P., Spencer, J., 2003lithosphere and surface of Io. In: Bagenal, F., McKinnon, W., Doing, T. (Eds.), Jupiter: Planet, Satellites and Magnetosphere. CambUniv. Press, Cambridge. In press.
Moore, J.M., Sullivan, R.J., Chuang, F.C., Head, J.W., McEwen, A.S.,lazzo, M.P., Nixon, B.E., Pappalardo, R.T., Schenk, P.M., Turtle, E

28 E.P. Turtle et al. / Icarus 169 (2004) 3–28
alileo
elts,
hLu-
onv. of
e,
, W.,ra?
ies,a-ges.
L.,0).
lites
ust7.Thed
its of9).
for75–
es of
.,de-
e
et.
mu-d.),
Soc.
fromact
02.As-
oys.
-tion
n
he
lua-ical
W.,ongonf.
es,es.
.P.,y, R.,
tenasms,997–
2001. Landform degradation and slope processes on Io: the Gview. J. Geophys. Res. 106, 33223–33240.
Nash, D.B., 1987. Sulfur in vacuum: sublimation effects on frozen mand applications to Io’s surface and torus. Icarus 72, 1–34.
Perry, J., Radebaugh, J., Lopes, R., McEwen, A., Keszthelyi, L., 2003. Gisbar patera, Io: geology and volcanic activity, 1996–2001. In: Proc.nar Planet. Sci. Conf. 34th. Abstract #1720.
Phillips, C.B., 2000. Voyager and Galileo views of volcanic resurfacingIo and the search for geologic activity on Europa. PhD thesis. UniArizona, Tucson.
Porco, C.C., 23 colleagues, 2003. Cassini imaging of Jupiter’s atmosphersatellites, and rings. Science 299, 1541–1547.
Radebaugh, J., Keszthelyi, L.P., McEwen, A.S., Turtle, E.P., JaegerMilazzo, M., 2001. Paterae on Io: a new type of volcanic caldeJ. Geophys. Res. 106, 33005–33020.
Radebaugh, J., McEwen, A.S., Milazzo, M.P., Keszthelyi, L.P., DavA.G., Turtle, E.P., Dawson, D.D.,2004. Observations and tempertures of Io’s Pele Patera from Cassini and Galileo spacecraft imaIcarus 169, 65–79.
Rathbun, J.A., Spencer, J.R., Davies, A.G., Howell, R.R., Wilson,2002. Loki, Io: a periodic volcano. Geophys. Res. Lett. 29 (110.1029/2002GL014747.
Sagan, C., 1979. Sulphur flows on Io. Nature 280, 750–753.Schaber, G.G., 1982. The geology of Io. In: Morrison, D. (Ed.), Satel
of Jupiter. Univ. of Arizona Press, Tucson, pp. 556–597.Schenk, P.M., Bulmer, M.H., 1998. Origin of mountains on Io by thr
faulting and large-scale mass movements. Science 279, 1514–151Schenk, P.M., Hargitai, H., Wilson, R., McEwen, A., Thomas, P., 2001.
mountains of Io: global and geological perspectives from Voyager anGalileo. J. Geophys. Res. 106, 33201–33222.
Schmitt, B., Rodriguez, S., 2003. Possible identification of local deposCl2SO2 on Io from NIMS/Galileo spectra. J. Geophys. Res. 108 (E10.1029/2002JE001988.
Simonelli, D.P., Veverka, J., McEwen, A.S., 1997. Io: Galileo evidencemajor variations in regolith properties. Geophys. Res. Lett. 24, 242478.
Smith, B.A., 21 colleagues, 1979. The Jupiter system through the eyVoyager 1. Science 204, 951–972.
Smythe, W.D., Lopes-Gautier, R., Douté, S., Kieffer, S.W., Carlson, R.WKamp, L., Leader, F.E., 2000. Evidence for massive sulfur dioxideposit on Io. Bull. Am. Astron. Soc. 32, 1047–1048. Abstract.
Smythe, W.D., Lopes, R., Spencer, J.R., 2003. Io in the infrared—scienc
opportunities with the JIMO mission. EOS Trans. AGU Fall MeSuppl. 84. Abstract #P12A-1048.
Spencer, J.R., 19 colleagues, 2002. The future of Io exploration. Comnity white paper for the planetary decadal survey. In: Sykes, M. (EThe Future of Solar System Exploration, 2003–2013. In: Astron.Pac. Conf. Ser., vol. 270, pp. 201–216.
Spencer, J.R., Lopes, R., Smythe, W.D., 2003. Io science opportunitiesthe JIMO mission. EOS Trans. AGU Fall Meet. Suppl. 84. Abstr#P12A-1047.
Theilig, E.E., Bindschadler, D.L., Schimmels, K.A., Vandermey, N., 20Project Galileo: farewell to the major moons of Jupiter. 53rd Intl.tron. Congress. Paper #IAC-02-Q.2.01.
Turtle, E.P., 11 colleagues, 2001. Mountains on Io: high-resolution Galileobservations, initial interpretations, and formation models. J. GeophRes. 106, 33175–33200.
Turtle, E.P., 11 colleagues, 2002. Correction to: mountains on Io: highresolution Galileo observations, initial interpretations, and formamodels. J. Geophys. Res. 107 (E9). 10.1029/2002JE001928.
Watanabe, T., 1940. Eruptions of molten sulphur from the Siretoko–IôsaVolcano, Hokkaidô. Jpn.J. Geol. Geogr. 17, 289–310.
Williams, D.A., Davies, A.G., Keszthelyi, L.P., Greeley, R., 2001a. Tsummer 1997 eruption at Pillan Patera on Io: implications for ultrabasiclava flow emplacement. J. Geophys. Res. 106, 33105–33120.
Williams, D.A., Greeley, R., Lopes, R.M.C., Davies, A.G., 2001b. Evation of sulfur flow emplacement on Io from Galileo data and numermodeling. J. Geophys. Res. 106, 33161–33174.
Williams, D.A., Keszthelyi, L.P., Davies, A.G., Greeley, R., Head, J.the Galileo SSI Team, 2002a. High-resolution views of Io’s emakPatera: latest Galileo imaging results. In: Proc. Lunar Planet. Sci. C33rd. Abstract #1339.
Williams, D.A., Radebaugh, J., Keszthelyi, L.P., McEwen, A.S., LopR.M.C., Douté, S., Greeley, R., 2002b. Geologic mapping of thChaac–Camaxtli region of Io from Galileo imaging data. J. GeophyRes. 107 (E9). 10.1029/2001JE001821.
Williams, D.A., Schenk, P.M., Moore, J.M., Keszthelyi, L.P., Turtle, EJaeger, W.L., Radebaugh, J., Milazzo, M.P., Lopes, R.M.C., Greele2004. Mapping of the Culann–Tohil region of Io from Galileo imagingdata. Icarus 169, 80–97.
Wilson, L., Head, J.W., 2001. Lava fountains from the 1999 Tvashtar Cafissure eruption on Io: implications for dike emplacement mechanieruption rates, and crustal structure. J. Geophys. Res. 106, 3233004.


