Embed Size (px)
Citation preview
1
The fractionated orthology of Bs2 and Rx/Gpa2 supports shared synteny of disease
resistance in the Solanaceae
Michael Mazourek*, Elizabeth T. Cirulli*2, Sarah M. Collier*†, Laurie G. Landry*,
Byoung-Cheorl Kang*††, Edmund A. Quirin§, James M. Bradeen§, Peter Moffett†3 and
Molly Jahn1§§
*Department of Plant Breeding and Genetics, Cornell University, Ithaca, NY 14853
†Boyce Thompson Institute for Plant Research, Ithaca, NY 14853
††Department of Plant Sciences, Seoul National University, San 56-1 Sillim-dong, Gwanak-gu,
Seoul, 151-921 Korea
§Department of Plant Pathology, University of Minnesota, St. Paul, MN 55108
§§College of Agriculture and Life Science, University of Wisconsin, Madison, WI 53706
1To whom correspondence should be addressed
2Present Address: Center for Human Genome Variation, Duke University, Durham, NC 27708
3Present Address: Département de Biologie, Université de Sherbrooke, 2500 Boulevard de
l’Université, Sherbrooke QC, J1K 2R1, Canada
Genetics: Published Articles Ahead of Print, published on May 27, 2009 as 10.1534/genetics.109.101022
2
Running title: Bs2 fractionated orthology Keywords: Capsicum, NB-LRR, R gene, Bs2, comparative map
Corresponding Author:
Molly Jahn1
University of Wisconsin-Madison,
College of Agricultural and Life Sciences
e-mail: [email protected]
phone: (608) 262-4930
address: 140 Agricultural Hall, Madison, WI 53706
3
ABSTRACT
Comparative genomics provides a powerful tool for the identification of genes that
encode traits shared between crop plants and model organisms. Pathogen resistance conferred by
plant R genes of the NB-LRR class is one such trait with great agricultural importance that
occupies a critical position in understanding fundamental processes of pathogen detection and
coevolution. The proposed rapid rearrangement of R genes in genome evolution would make
comparative approaches tenuous. Here, we test the hypothesis that orthology is predictive of R
gene genomic location in the Solanaceae using the pepper R gene Bs2. Homologs of Bs2 were
compared in terms of sequence and gene and protein architecture. Comparative mapping
demonstrated Bs2 shared macrosynteny with R genes that best fit criteria to be its orthologs.
Analysis of the genomic sequence encompassing solanaceous R genes revealed the magnitude of
transposon insertions and local duplications that resulted in the expansion of the Bs2 intron to
27kb and the frequently detected duplications of the 5’ end of R genes. However, these
duplications did not impact protein expression or function in transient assays. Taken together our
results support a conservation of synteny for NB-LRR genes and further show their distribution
in the genome has been consistent with global rearrangements.
INTRODUCTION
R genes have a central role in plant disease resistance to mediate pathogen detection and
response (GLAZEBROOK 2005; MARTIN et al. 2003). Although R genes are only one of the
components required for these responses, they are consistently identified as a critical determinant
for qualitative and quantitative resistance (FLUHR 2001; WISSER et al. 2006). The structure,
mechanism of action and evolution of this gene family are still being elucidated and are critical
4
issues for a more efficient deployment of disease resistances in agricultural crops (FRIEDMAN and
BAKER 2007; MCDOWELL and SIMON 2006; TAKKEN et al. 2006; VAN OOIJEN et al. 2007).
Comparative studies of sequence similarity between plant R proteins and proteins of
innate immunity in animals have made important contributions toward understanding R protein
structure, the role of individual protein domains, and the mechanism by which R proteins
identify and respond to foreign proteins (NURNBERGER et al. 2004; RAIRDAN and MOFFETT 2007;
TAKKEN et al. 2006). Both share a central nucleotide binding (NB) site and a region of homology
termed the “ARC” domain (collectively referred to as NBS or NB-ARC) (RAIRDAN and
MOFFETT 2007; VAN DER BIEZEN and JONES 1998). The plant counterparts have a highly variable
leucine rich repeat (LRR) domain at the C-terminus and at the N-terminus have either a domain
with homology to the Toll and interleukin-1 receptors (TIR), or lack this feature, instead
possessing a domain that that may include a coiled-coil (CC) motif. Due to uncertainty regarding
the presence of a coiled-coil motif, this class of NB-LRRs is often referred to as non-TIR
proteins. The LRR domains are highly variable and tend to be under diversifying selection to
adapt to continually changing pathogen proteins (MEYERS et al. 1998b; MICHELMORE and
MEYERS 1998; MONDRAGON-PALOMINO et al. 2002). Other conserved patterns have been
identified in the N-terminus of non-TIR proteins, most notably, an “EDxxD” motif which
mediates an intra-molecular interaction (RAIRDAN et al. 2008). The interaction with cellular
factors is mediated by the N-terminal domains of NB-LRR proteins although domain swapping
experiments between closely related NB-LRR proteins have shown that recognition specificity is
determined by the LRR domains (RAIRDAN and MOFFETT 2007; VAN OOIJEN et al. 2007).
The clustering of R genes has provided insight into both their ability to evolve rapidly
and challenges to their identification and cloning. R genes often occur in clusters of tandem
5
duplications that can span several megabases and include a multitude of copies of functional R
genes, pseudogenes, and other genes within the clusters (KUANG et al. 2004; MEYERS et al.
1998a; SMITH et al. 2004). Of the various modes of evolution ascribed to these clusters, sequence
exchange between R genes within the cluster by unequal crossing over or illegitimate
recombination is especially noteworthy (ELLIS et al. 2000; FRIEDMAN and BAKER 2007;
HULBERT et al. 2001; MCDOWELL and SIMON 2006; MICHELMORE and MEYERS 1998; WICKER et
al. 2007). Under stress conditions, transposon activation, recombination activation and chromatin
modifications related to small RNAs may be induced (FRIEDMAN and BAKER 2007; LEVY et al.
2004; YI and RICHARDS 2007).
Two distinct models for the genome-wide arrangement and distribution of NB-LRR genes
and these clusters have been proposed. The first predicts rapid rearrangement of R gene
distribution during genome evolution, yielding poor conservation of R gene locations (LEISTER et
al. 1998; MEYERS et al. 2003; RICHLY et al. 2002). Indeed, in monocots, extensive loss of
genome-wide R gene colinearity has been attributed to frequent R gene duplication and ectopic
transposition (GALE and DEVOS 1998; PATERSON et al. 2003). In contrast, the second model
supports genome-wide conservation of R gene distribution maintained during speciation.
According to this model, most duplication and recombination of R gene sequences should occur
within restricted chromosomal regions, yielding clusters of closely related R gene sequences.
The resulting orthology relationships (homologs related by speciation, not duplication) are
complex due to “fractionation” (repeated cycles of duplication, deletion and recombination) but
can, as we have previously shown, be reconstructed (GRUBE et al. 2000b). Analysis of R genes
using the complete A. thaliana genome sequence supports this model and accounts for the
consensus of NB-LRR sequences (BAUMGARTEN et al. 2003). Resistance to a particular pathogen
6
type is not conserved, and highly similar NB-LRR proteins may confer resistance to very
different pathogens (GRUBE et al. 2000b).
Bs2 encodes a non-TIR NB-LRR protein identified in Capsicum chacoense that confers
resistance to the bacterium Xanthomonas campestris pv. vesicatoria. This R gene has greatest
sequence identity to Rx and Gpa2 in potato that confer resistance to a virus and nematode
respectively (BENDAHMANE et al. 1999; TAI et al. 1999b; VAN DER VOSSEN et al. 2000). Despite
the difference in the pathogens recognized by these genes, they are distinguishable from all other
known R genes by marked sequence and structural features. In this study, we demonstrate that
these three R genes are derived from syntenic regions in solanaceous genomes as predicted by
our model of conservation of synteny. In performing these comparisons, we explore conserved
amino acids patterns associated with proteins of the non-TIR family and the local genomic
context of R genes of the Solanaceae. Finally, advances in the development of the Solanaceae as
a system for comparative genomics highlight a role for chromosomal rearrangements in R gene
distribution throughout plant genomes.
MATERIALS AND METHODS
Plant material: Capsicum genotypes used in this study were C. annuum ‘NuMex R
Naky’ (‘R Naky’), ‘Early CalWonder 300’ (ECW), ‘Early CalWonder-123R’ (ECW123)
(provided by Robert Stall), ‘Yolo Wonder’ (YW), ‘Perennial’ (A. Palloix, INRA, France), C.
chinense PI159234 and C. chacoense PI439414 (USDA ARS Southern Regional PI Station,
Griffin, GA), and an F2 population of 75 individuals derived from the cross ‘R Naky’ × PI159234
(LIVINGSTONE et al. 1999). A tomato mapping population of 88 F2 individuals originating from a
cross between S. pennellii and S. lycopersicum was provided by S. Tanksley.
7
R gene sequence analysis: NB-LRR sequences were obtained from the NCBI GenBank
database (www.ncbi.nlm.nih.gov) in December 2004 using the Bs2 protein sequence
(AAF09256) as a query in BLASTP and are detailed in TABLE 1. Later searches established that
since the original survey no proteins in the Bs2/Gpa2/Rx clade have been described with a
characterized role in disease resistance.
Dendrogram Construction: Input sequences for dendrogram construction consisted of
452 amino acids of the NB-ARC and flanking regions of R proteins aligned using DIALIGN
(KUMAR et al. 2001; MORGENSTERN et al. 1998). The aligned sequences commenced seven
amino acids before the “GMG” motif and extended 10 amino acids past the “MHD” motif of this
region. The high divergence at the nucleotide level did not permit recombination detection. A
neighbor-joining dendrogram was constructed using MEGA 2.1 (KUMAR et al. 2001). The p-
distance model was employed with pairwise deletion gap handling. Ten thousand bootstrap
replications were generated to examine the robustness of data trends.
Coiled-coil domain prediction: To predict coiled-coils, deduced R protein sequences were
analyzed using the COILS (LUPAS et al. 1991) and Marcoil (DELORENZI and SPEED 2002)
programs. When analyzing the dataset with COILS, the 14 and 21 amino acid window sizes were
used with the most encompassing matrix, MTIDK. For Marcoil, three matrices were used:
9FAM, MTK, and MTIDK. The outputs were graphed as the coils score along the length of the
protein and results were divided into three categories based on descriptive criteria. Regions that
were predicted by both algorithms to contain coiled-coils with likelihood greater than or equal to
40% were classified as “strong”. Regions that were predicted by both algorithms to contain
coiled-coils with likelihood between 10% and 40% or that were predicted by only one algorithm
to contain coiled-coils with likelihood greater than 85% were subjectively classified as “weak.”
8
Other regions were assumed to not harbor a coiled-coil motif.
Hydrophobic domain prediction: Sequences were analyzed using the Kyte-Doolittle
hydrophobicity plot in the Lasergene program, Protean (DNAStar, Madison, WI). A sliding
window of nine amino acids, the ideal window size for finding hydrophobic domains in globular
proteins (KYTE and DOOLITTLE 1982), was used. A moving average trendline with a period of
nine was plotted over the data to assist visualization. Protein regions scoring above a stringent
threshold of 2.1 units above the grand average hydropathy for each protein were considered to be
hydrophobic.
Leucine Rich Repeats: The C terminal LRR domain consists of a variable number of
leucine rich repeats. The pattern LXXLXXLXXLXLXX(N/C/T)(X)XLXXIPXX was originally
reported as the consensus sequence for these repeats (JONES and JONES 1997). The underlined
portion of the consensus sequence matched the examined protein sequences best. For
consistency, we reevaluated the LRR descriptions of all R proteins in our dataset and manually
reannotated Pi-Ta, Dm3, RP3, and RPG1b LRRs.
Analysis of duplicated genome sequences: The DotPlot program in Lasergene’s Megalign
was used to compare various DNA sequences. The Bs2 YAC (AY702979) was aligned against
itself, using a minimum similarity of 65% and a window size of 50, and the Rx/Gpa2 contig
(AF265664) alignment used 65% similarity and a 75 base window. The solanaceous R genes
were aligned against their respective genomic sequence to find local duplications (Mi 1.2,
U81378; RB, AY303171; R1, EF514212; Tm22, AF536201). Pairwise percent similarity of
duplications were calculated using Megalign’s ClustalV. Regions that were repeated one or more
times within the Bs2 BAC were assigned putative identifications using BLASTX on default
settings. Transposon identification was performed using CENSOR (KOHANY et al. 2006).
9
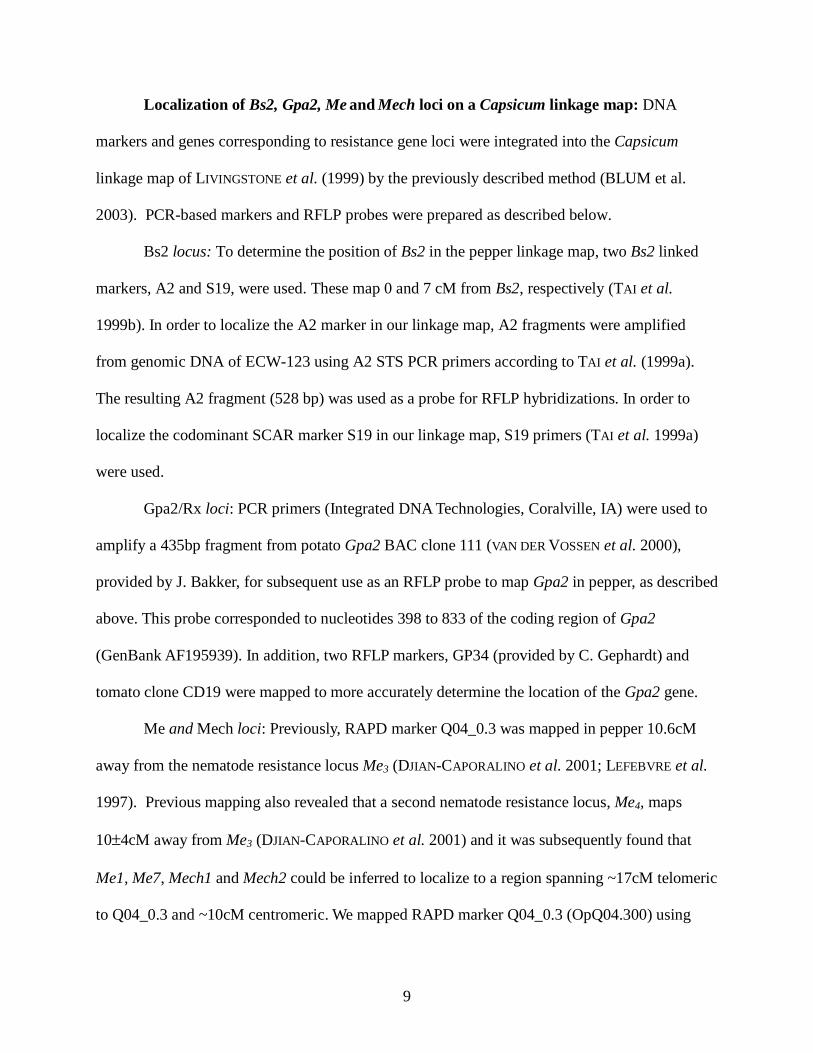
Localization of Bs2, Gpa2, Me and Mech loci on a Capsicum linkage map: DNA
markers and genes corresponding to resistance gene loci were integrated into the Capsicum
linkage map of LIVINGSTONE et al. (1999) by the previously described method (BLUM et al.
2003). PCR-based markers and RFLP probes were prepared as described below.
Bs2 locus: To determine the position of Bs2 in the pepper linkage map, two Bs2 linked
markers, A2 and S19, were used. These map 0 and 7 cM from Bs2, respectively (TAI et al.
1999b). In order to localize the A2 marker in our linkage map, A2 fragments were amplified
from genomic DNA of ECW-123 using A2 STS PCR primers according to TAI et al. (1999a).
The resulting A2 fragment (528 bp) was used as a probe for RFLP hybridizations. In order to
localize the codominant SCAR marker S19 in our linkage map, S19 primers (TAI et al. 1999a)
were used.
Gpa2/Rx loci: PCR primers (Integrated DNA Technologies, Coralville, IA) were used to
amplify a 435bp fragment from potato Gpa2 BAC clone 111 (VAN DER VOSSEN et al. 2000),
provided by J. Bakker, for subsequent use as an RFLP probe to map Gpa2 in pepper, as described
above. This probe corresponded to nucleotides 398 to 833 of the coding region of Gpa2
(GenBank AF195939). In addition, two RFLP markers, GP34 (provided by C. Gephardt) and
tomato clone CD19 were mapped to more accurately determine the location of the Gpa2 gene.
Me and Mech loci: Previously, RAPD marker Q04_0.3 was mapped in pepper 10.6cM
away from the nematode resistance locus Me3 (DJIAN-CAPORALINO et al. 2001; LEFEBVRE et al.
1997). Previous mapping also revealed that a second nematode resistance locus, Me4, maps
10±4cM away from Me3 (DJIAN-CAPORALINO et al. 2001) and it was subsequently found that
Me1, Me7, Mech1 and Mech2 could be inferred to localize to a region spanning ~17cM telomeric
to Q04_0.3 and ~10cM centromeric. We mapped RAPD marker Q04_0.3 (OpQ04.300) using
10
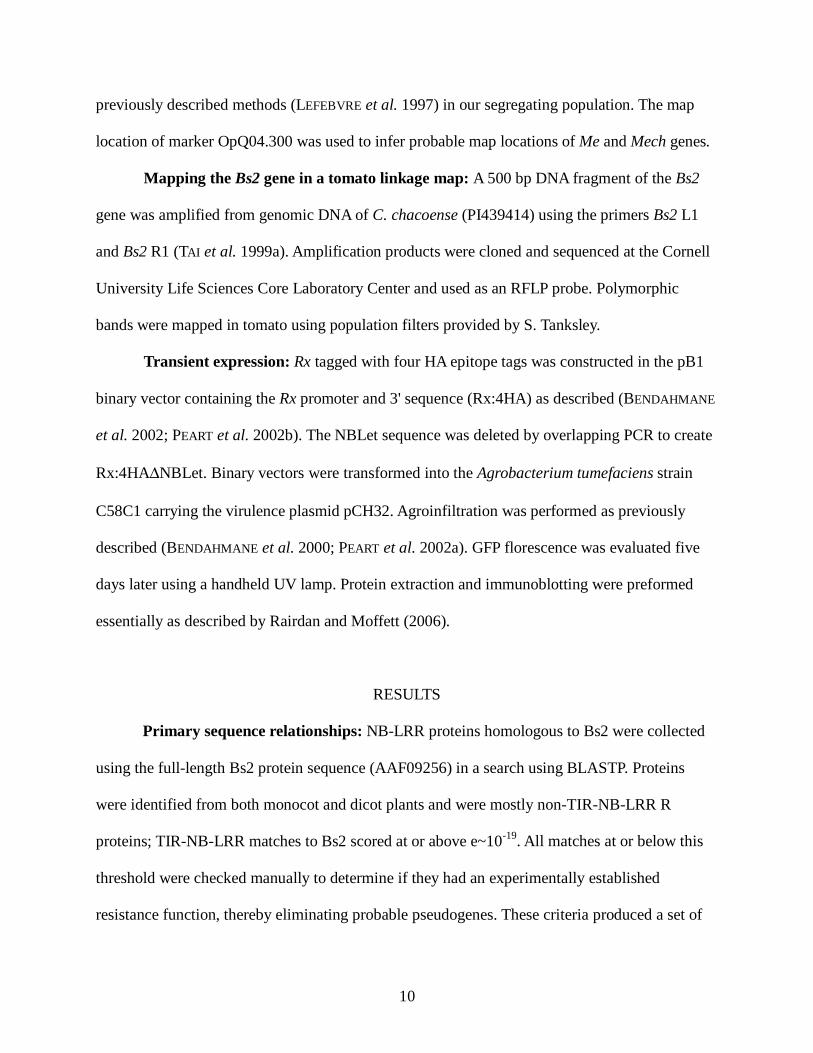
previously described methods (LEFEBVRE et al. 1997) in our segregating population. The map
location of marker OpQ04.300 was used to infer probable map locations of Me and Mech genes.
Mapping the Bs2 gene in a tomato linkage map: A 500 bp DNA fragment of the Bs2
gene was amplified from genomic DNA of C. chacoense (PI439414) using the primers Bs2 L1
and Bs2 R1 (TAI et al. 1999a). Amplification products were cloned and sequenced at the Cornell
University Life Sciences Core Laboratory Center and used as an RFLP probe. Polymorphic
bands were mapped in tomato using population filters provided by S. Tanksley.
Transient expression: Rx tagged with four HA epitope tags was constructed in the pB1
binary vector containing the Rx promoter and 3' sequence (Rx:4HA) as described (BENDAHMANE
et al. 2002; PEART et al. 2002b). The NBLet sequence was deleted by overlapping PCR to create
Rx:4HAΔNBLet. Binary vectors were transformed into the Agrobacterium tumefaciens strain
C58C1 carrying the virulence plasmid pCH32. Agroinfiltration was performed as previously
described (BENDAHMANE et al. 2000; PEART et al. 2002a). GFP florescence was evaluated five
days later using a handheld UV lamp. Protein extraction and immunoblotting were preformed
essentially as described by Rairdan and Moffett (2006).
RESULTS
Primary sequence relationships: NB-LRR proteins homologous to Bs2 were collected
using the full-length Bs2 protein sequence (AAF09256) in a search using BLASTP. Proteins
were identified from both monocot and dicot plants and were mostly non-TIR-NB-LRR R
proteins; TIR-NB-LRR matches to Bs2 scored at or above e~10-19. All matches at or below this
threshold were checked manually to determine if they had an experimentally established
resistance function, thereby eliminating probable pseudogenes. These criteria produced a set of
11
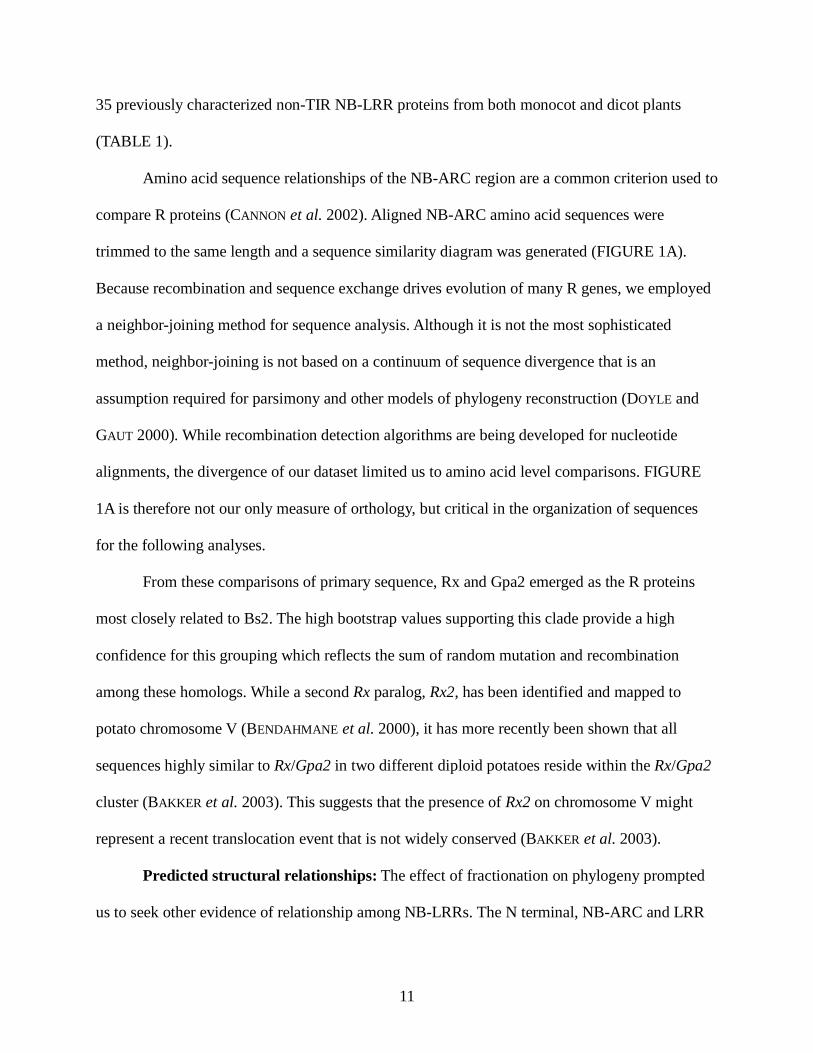
35 previously characterized non-TIR NB-LRR proteins from both monocot and dicot plants
(TABLE 1).
Amino acid sequence relationships of the NB-ARC region are a common criterion used to
compare R proteins (CANNON et al. 2002). Aligned NB-ARC amino acid sequences were
trimmed to the same length and a sequence similarity diagram was generated (FIGURE 1A).
Because recombination and sequence exchange drives evolution of many R genes, we employed
a neighbor-joining method for sequence analysis. Although it is not the most sophisticated
method, neighbor-joining is not based on a continuum of sequence divergence that is an
assumption required for parsimony and other models of phylogeny reconstruction (DOYLE and
GAUT 2000). While recombination detection algorithms are being developed for nucleotide
alignments, the divergence of our dataset limited us to amino acid level comparisons. FIGURE
1A is therefore not our only measure of orthology, but critical in the organization of sequences
for the following analyses.
From these comparisons of primary sequence, Rx and Gpa2 emerged as the R proteins
most closely related to Bs2. The high bootstrap values supporting this clade provide a high
confidence for this grouping which reflects the sum of random mutation and recombination
among these homologs. While a second Rx paralog, Rx2, has been identified and mapped to
potato chromosome V (BENDAHMANE et al. 2000), it has more recently been shown that all
sequences highly similar to Rx/Gpa2 in two different diploid potatoes reside within the Rx/Gpa2
cluster (BAKKER et al. 2003). This suggests that the presence of Rx2 on chromosome V might
represent a recent translocation event that is not widely conserved (BAKKER et al. 2003).
Predicted structural relationships: The effect of fractionation on phylogeny prompted
us to seek other evidence of relationship among NB-LRRs. The N terminal, NB-ARC and LRR
12
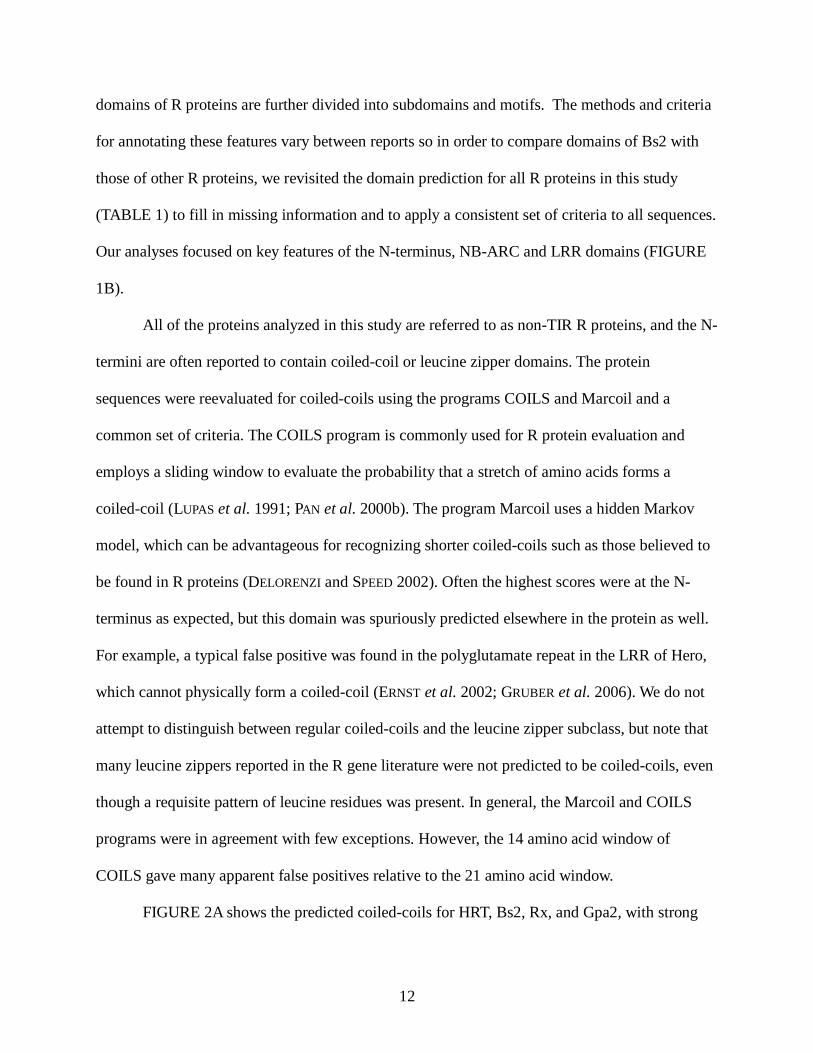
domains of R proteins are further divided into subdomains and motifs. The methods and criteria
for annotating these features vary between reports so in order to compare domains of Bs2 with
those of other R proteins, we revisited the domain prediction for all R proteins in this study
(TABLE 1) to fill in missing information and to apply a consistent set of criteria to all sequences.
Our analyses focused on key features of the N-terminus, NB-ARC and LRR domains (FIGURE
1B).
All of the proteins analyzed in this study are referred to as non-TIR R proteins, and the N-
termini are often reported to contain coiled-coil or leucine zipper domains. The protein
sequences were reevaluated for coiled-coils using the programs COILS and Marcoil and a
common set of criteria. The COILS program is commonly used for R protein evaluation and
employs a sliding window to evaluate the probability that a stretch of amino acids forms a
coiled-coil (LUPAS et al. 1991; PAN et al. 2000b). The program Marcoil uses a hidden Markov
model, which can be advantageous for recognizing shorter coiled-coils such as those believed to
be found in R proteins (DELORENZI and SPEED 2002). Often the highest scores were at the N-
terminus as expected, but this domain was spuriously predicted elsewhere in the protein as well.
For example, a typical false positive was found in the polyglutamate repeat in the LRR of Hero,
which cannot physically form a coiled-coil (ERNST et al. 2002; GRUBER et al. 2006). We do not
attempt to distinguish between regular coiled-coils and the leucine zipper subclass, but note that
many leucine zippers reported in the R gene literature were not predicted to be coiled-coils, even
though a requisite pattern of leucine residues was present. In general, the Marcoil and COILS
programs were in agreement with few exceptions. However, the 14 amino acid window of
COILS gave many apparent false positives relative to the 21 amino acid window.
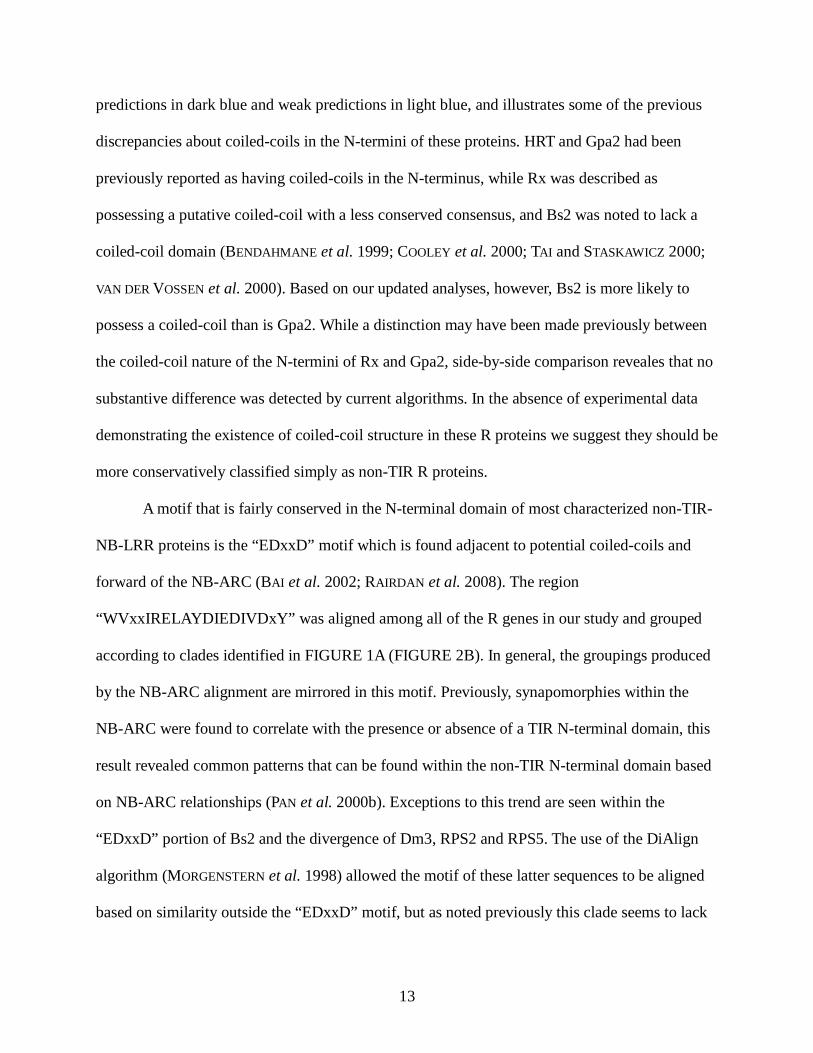
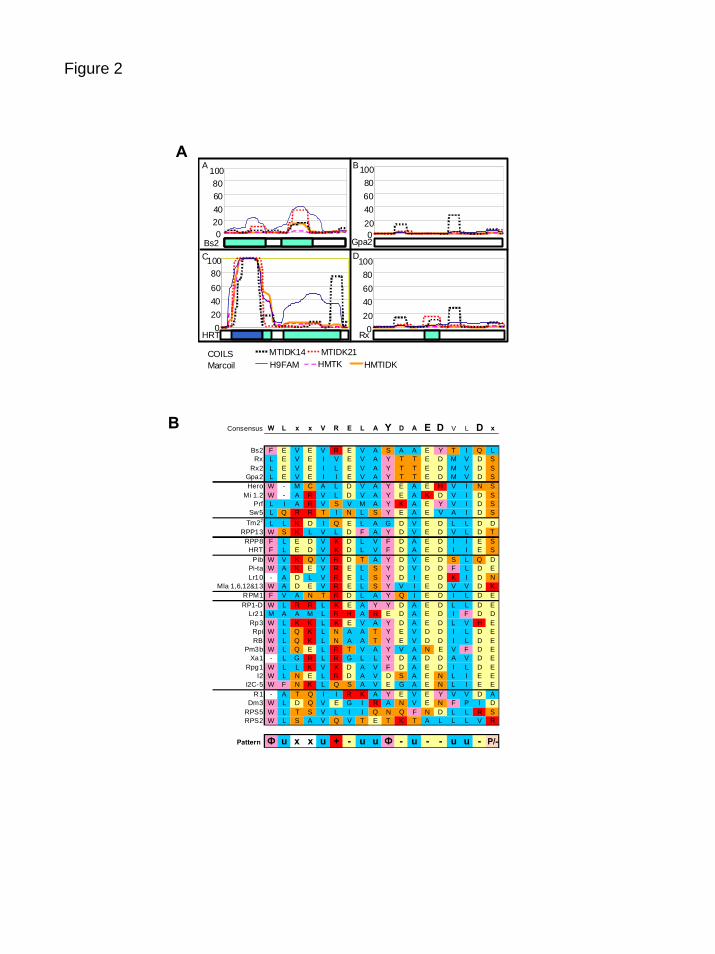
FIGURE 2A shows the predicted coiled-coils for HRT, Bs2, Rx, and Gpa2, with strong
13
predictions in dark blue and weak predictions in light blue, and illustrates some of the previous
discrepancies about coiled-coils in the N-termini of these proteins. HRT and Gpa2 had been
previously reported as having coiled-coils in the N-terminus, while Rx was described as
possessing a putative coiled-coil with a less conserved consensus, and Bs2 was noted to lack a
coiled-coil domain (BENDAHMANE et al. 1999; COOLEY et al. 2000; TAI and STASKAWICZ 2000;
VAN DER VOSSEN et al. 2000). Based on our updated analyses, however, Bs2 is more likely to
possess a coiled-coil than is Gpa2. While a distinction may have been made previously between
the coiled-coil nature of the N-termini of Rx and Gpa2, side-by-side comparison reveales that no
substantive difference was detected by current algorithms. In the absence of experimental data
demonstrating the existence of coiled-coil structure in these R proteins we suggest they should be
more conservatively classified simply as non-TIR R proteins.
A motif that is fairly conserved in the N-terminal domain of most characterized non-TIR-
NB-LRR proteins is the “EDxxD” motif which is found adjacent to potential coiled-coils and
forward of the NB-ARC (BAI et al. 2002; RAIRDAN et al. 2008). The region
“WVxxIRELAYDIEDIVDxY” was aligned among all of the R genes in our study and grouped
according to clades identified in FIGURE 1A (FIGURE 2B). In general, the groupings produced
by the NB-ARC alignment are mirrored in this motif. Previously, synapomorphies within the
NB-ARC were found to correlate with the presence or absence of a TIR N-terminal domain, this
result revealed common patterns that can be found within the non-TIR N-terminal domain based
on NB-ARC relationships (PAN et al. 2000b). Exceptions to this trend are seen within the
“EDxxD” portion of Bs2 and the divergence of Dm3, RPS2 and RPS5. The use of the DiAlign
algorithm (MORGENSTERN et al. 1998) allowed the motif of these latter sequences to be aligned
based on similarity outside the “EDxxD” motif, but as noted previously this clade seems to lack
14
the most conserved portion of the motif (RAIRDAN et al. 2008). Given this dataset, a slightly
modified consensus for this region was observed (FIGURE 2B). Considering amino acid
properties, a general pattern is suggested and described in the FIGURE 2 legend.
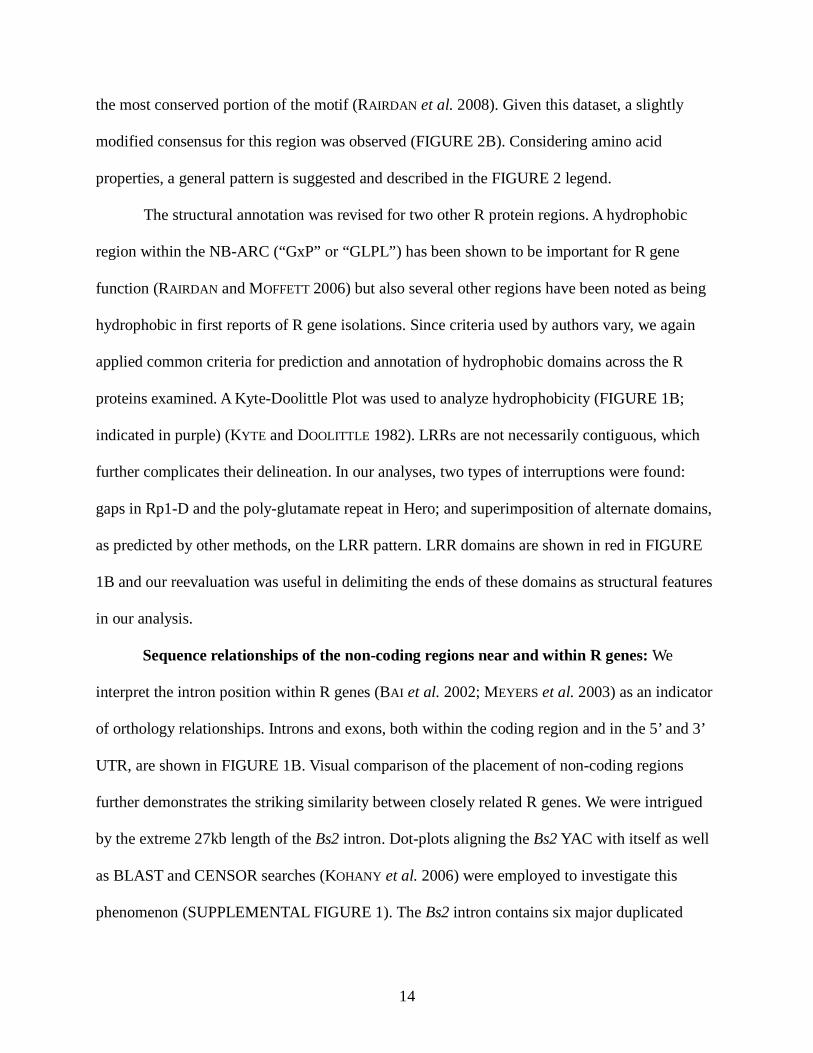
The structural annotation was revised for two other R protein regions. A hydrophobic
region within the NB-ARC (“GxP” or “GLPL”) has been shown to be important for R gene
function (RAIRDAN and MOFFETT 2006) but also several other regions have been noted as being
hydrophobic in first reports of R gene isolations. Since criteria used by authors vary, we again
applied common criteria for prediction and annotation of hydrophobic domains across the R
proteins examined. A Kyte-Doolittle Plot was used to analyze hydrophobicity (FIGURE 1B;
indicated in purple) (KYTE and DOOLITTLE 1982). LRRs are not necessarily contiguous, which
further complicates their delineation. In our analyses, two types of interruptions were found:
gaps in Rp1-D and the poly-glutamate repeat in Hero; and superimposition of alternate domains,
as predicted by other methods, on the LRR pattern. LRR domains are shown in red in FIGURE
1B and our reevaluation was useful in delimiting the ends of these domains as structural features
in our analysis.
Sequence relationships of the non-coding regions near and within R genes: We
interpret the intron position within R genes (BAI et al. 2002; MEYERS et al. 2003) as an indicator
of orthology relationships. Introns and exons, both within the coding region and in the 5’ and 3’
UTR, are shown in FIGURE 1B. Visual comparison of the placement of non-coding regions
further demonstrates the striking similarity between closely related R genes. We were intrigued
by the extreme 27kb length of the Bs2 intron. Dot-plots aligning the Bs2 YAC with itself as well
as BLAST and CENSOR searches (KOHANY et al. 2006) were employed to investigate this
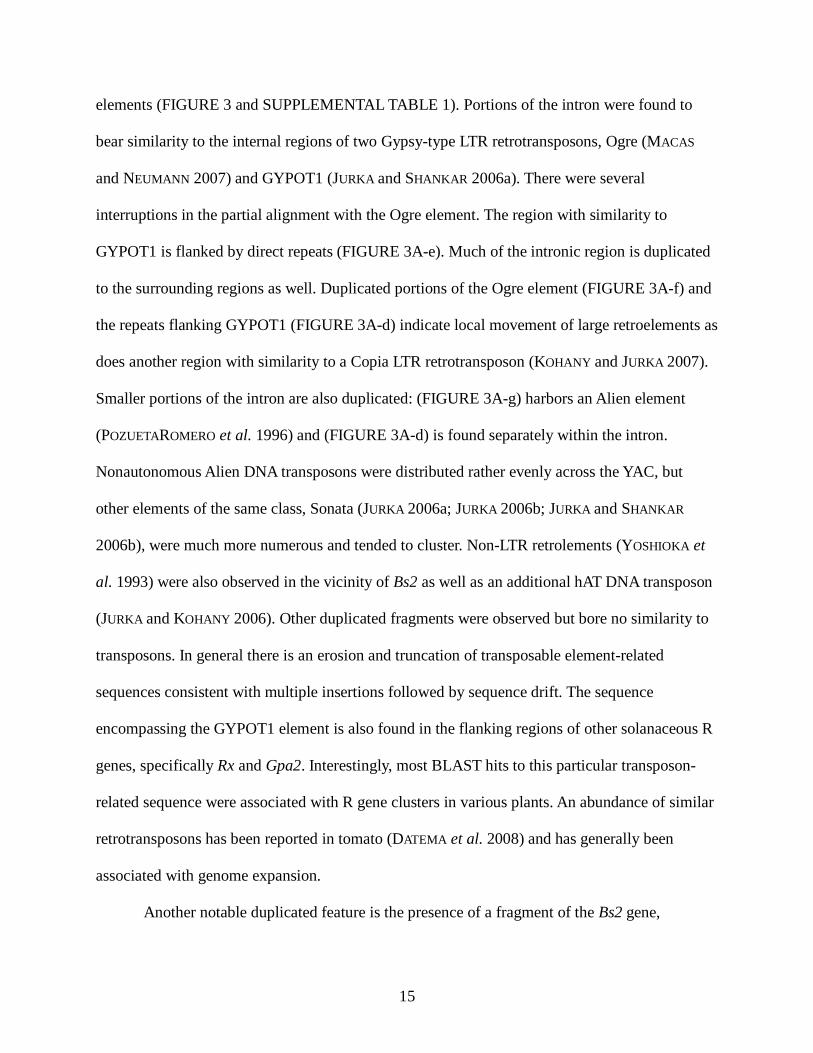
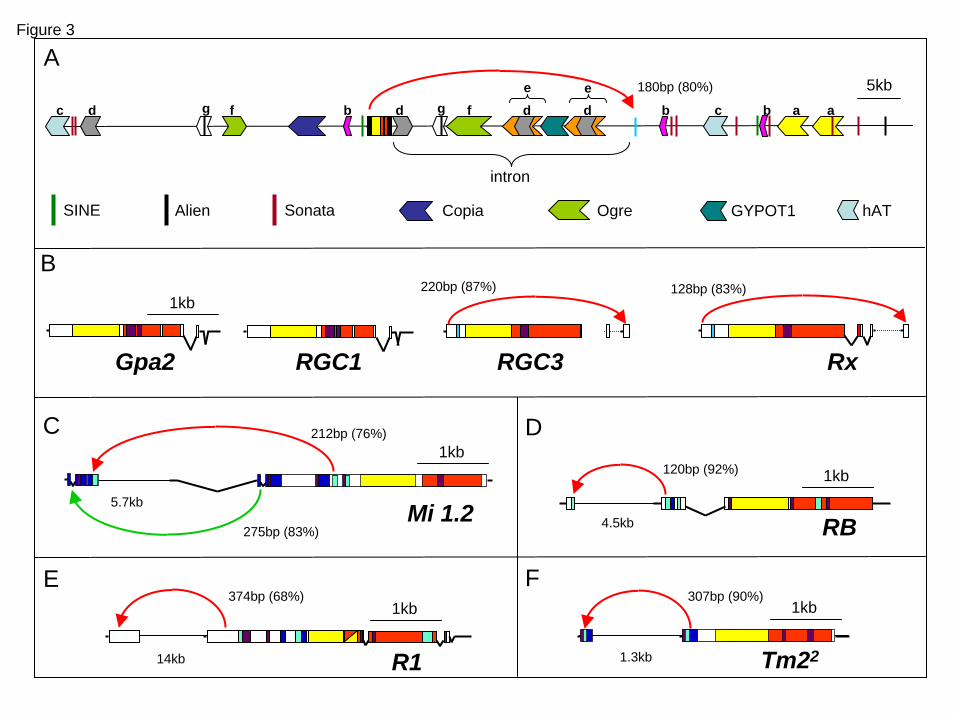
phenomenon (SUPPLEMENTAL FIGURE 1). The Bs2 intron contains six major duplicated
15
elements (FIGURE 3 and SUPPLEMENTAL TABLE 1). Portions of the intron were found to
bear similarity to the internal regions of two Gypsy-type LTR retrotransposons, Ogre (MACAS
and NEUMANN 2007) and GYPOT1 (JURKA and SHANKAR 2006a). There were several
interruptions in the partial alignment with the Ogre element. The region with similarity to
GYPOT1 is flanked by direct repeats (FIGURE 3A-e). Much of the intronic region is duplicated
to the surrounding regions as well. Duplicated portions of the Ogre element (FIGURE 3A-f) and
the repeats flanking GYPOT1 (FIGURE 3A-d) indicate local movement of large retroelements as
does another region with similarity to a Copia LTR retrotransposon (KOHANY and JURKA 2007).
Smaller portions of the intron are also duplicated: (FIGURE 3A-g) harbors an Alien element
(POZUETAROMERO et al. 1996) and (FIGURE 3A-d) is found separately within the intron.
Nonautonomous Alien DNA transposons were distributed rather evenly across the YAC, but
other elements of the same class, Sonata (JURKA 2006a; JURKA 2006b; JURKA and SHANKAR
2006b), were much more numerous and tended to cluster. Non-LTR retrolements (YOSHIOKA et
al. 1993) were also observed in the vicinity of Bs2 as well as an additional hAT DNA transposon
(JURKA and KOHANY 2006). Other duplicated fragments were observed but bore no similarity to
transposons. In general there is an erosion and truncation of transposable element-related
sequences consistent with multiple insertions followed by sequence drift. The sequence
encompassing the GYPOT1 element is also found in the flanking regions of other solanaceous R
genes, specifically Rx and Gpa2. Interestingly, most BLAST hits to this particular transposon-
related sequence were associated with R gene clusters in various plants. An abundance of similar
retrotransposons has been reported in tomato (DATEMA et al. 2008) and has generally been
associated with genome expansion.
Another notable duplicated feature is the presence of a fragment of the Bs2 gene,
16
specifically a portion of the 5’ end of the gene repeated past the 3’ end of the functional gene.
Other solanaceous R genes were tested for similar truncated NB-LRRs or “NBLets” (FIGURE 3)
because of a similar report for Tm22 (LANFERMEIJER et al. 2003). Only Rx and RGC3, a
pseudogene near Rx, share the same type of trailing 5’ gene fragment as Bs2; the absence of a
NBLet for Gpa2 may be due to the loss of its terminal exon as compared to Rx. NBLets were
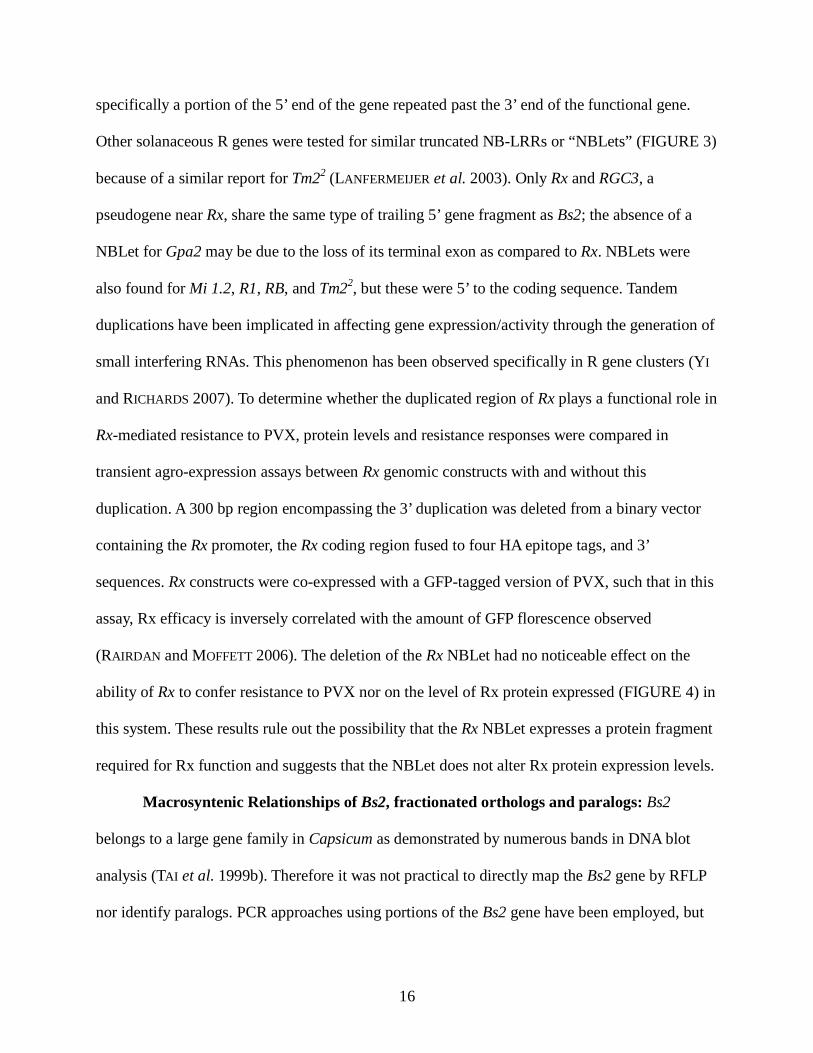
also found for Mi 1.2, R1, RB, and Tm22, but these were 5’ to the coding sequence. Tandem
duplications have been implicated in affecting gene expression/activity through the generation of
small interfering RNAs. This phenomenon has been observed specifically in R gene clusters (YI
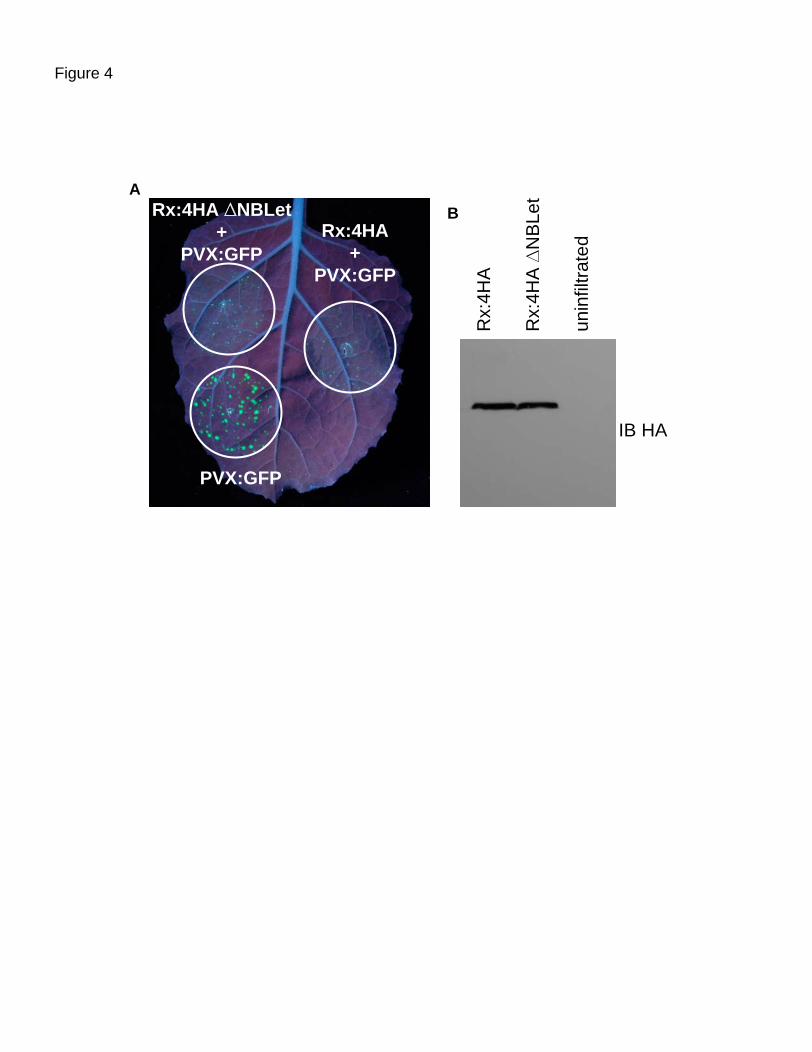
and RICHARDS 2007). To determine whether the duplicated region of Rx plays a functional role in
Rx-mediated resistance to PVX, protein levels and resistance responses were compared in
transient agro-expression assays between Rx genomic constructs with and without this
duplication. A 300 bp region encompassing the 3’ duplication was deleted from a binary vector
containing the Rx promoter, the Rx coding region fused to four HA epitope tags, and 3’
sequences. Rx constructs were co-expressed with a GFP-tagged version of PVX, such that in this
assay, Rx efficacy is inversely correlated with the amount of GFP florescence observed
(RAIRDAN and MOFFETT 2006). The deletion of the Rx NBLet had no noticeable effect on the
ability of Rx to confer resistance to PVX nor on the level of Rx protein expressed (FIGURE 4) in
this system. These results rule out the possibility that the Rx NBLet expresses a protein fragment
required for Rx function and suggests that the NBLet does not alter Rx protein expression levels.
Macrosyntenic Relationships of Bs2, fractionated orthologs and paralogs: Bs2
belongs to a large gene family in Capsicum as demonstrated by numerous bands in DNA blot
analysis (TAI et al. 1999b). Therefore it was not practical to directly map the Bs2 gene by RFLP
nor identify paralogs. PCR approaches using portions of the Bs2 gene have been employed, but
17
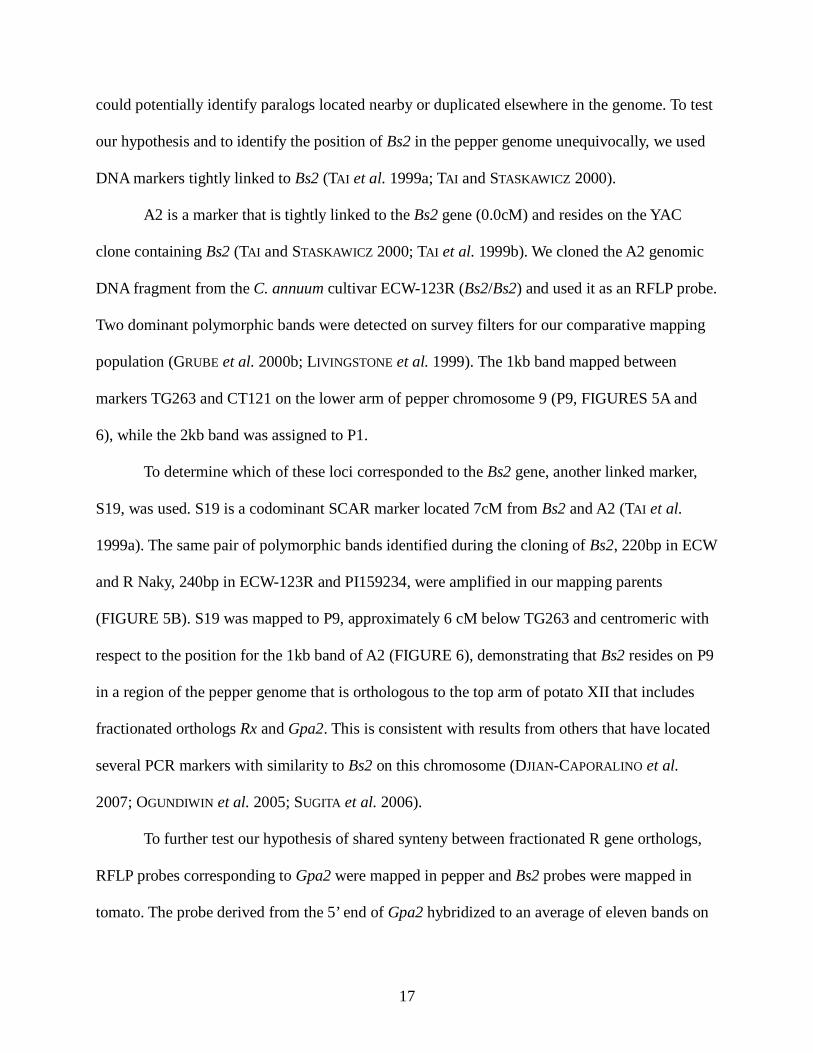
could potentially identify paralogs located nearby or duplicated elsewhere in the genome. To test
our hypothesis and to identify the position of Bs2 in the pepper genome unequivocally, we used
DNA markers tightly linked to Bs2 (TAI et al. 1999a; TAI and STASKAWICZ 2000).
A2 is a marker that is tightly linked to the Bs2 gene (0.0cM) and resides on the YAC
clone containing Bs2 (TAI and STASKAWICZ 2000; TAI et al. 1999b). We cloned the A2 genomic
DNA fragment from the C. annuum cultivar ECW-123R (Bs2/Bs2) and used it as an RFLP probe.
Two dominant polymorphic bands were detected on survey filters for our comparative mapping
population (GRUBE et al. 2000b; LIVINGSTONE et al. 1999). The 1kb band mapped between
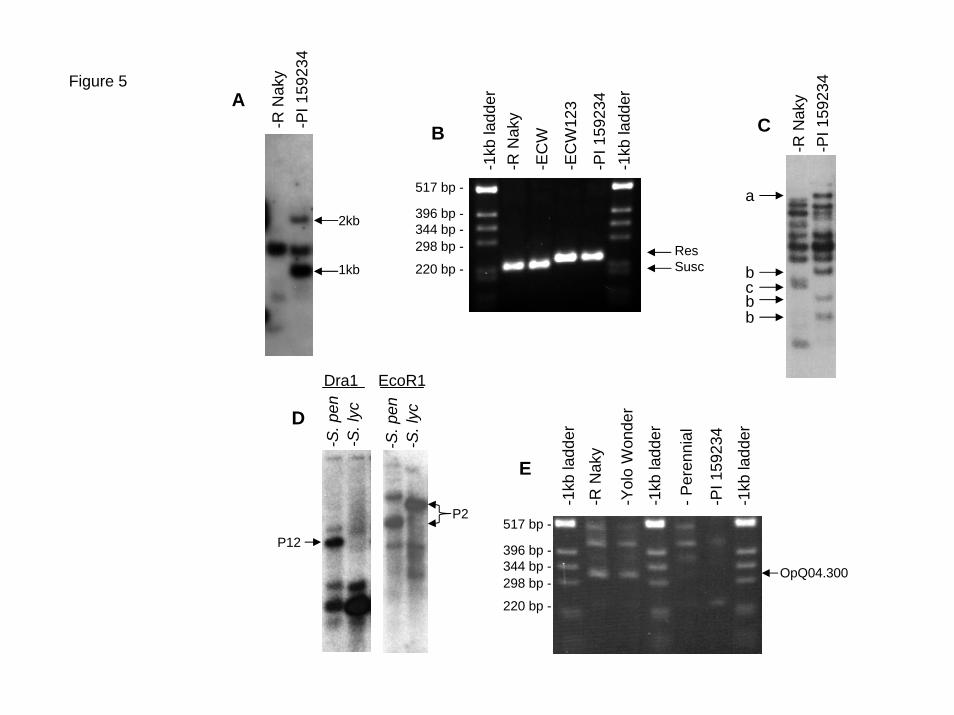
markers TG263 and CT121 on the lower arm of pepper chromosome 9 (P9, FIGURES 5A and
6), while the 2kb band was assigned to P1.
To determine which of these loci corresponded to the Bs2 gene, another linked marker,
S19, was used. S19 is a codominant SCAR marker located 7cM from Bs2 and A2 (TAI et al.
1999a). The same pair of polymorphic bands identified during the cloning of Bs2, 220bp in ECW
and R Naky, 240bp in ECW-123R and PI159234, were amplified in our mapping parents
(FIGURE 5B). S19 was mapped to P9, approximately 6 cM below TG263 and centromeric with
respect to the position for the 1kb band of A2 (FIGURE 6), demonstrating that Bs2 resides on P9
in a region of the pepper genome that is orthologous to the top arm of potato XII that includes
fractionated orthologs Rx and Gpa2. This is consistent with results from others that have located
several PCR markers with similarity to Bs2 on this chromosome (DJIAN-CAPORALINO et al.
2007; OGUNDIWIN et al. 2005; SUGITA et al. 2006).
To further test our hypothesis of shared synteny between fractionated R gene orthologs,
RFLP probes corresponding to Gpa2 were mapped in pepper and Bs2 probes were mapped in
tomato. The probe derived from the 5’ end of Gpa2 hybridized to an average of eleven bands on
18
pepper genomic survey blots. The prominent polymorphic bands were mapped and all localized
to a region on P9 each 3cM from marker TG263 (FIGURES 5C and 6). While Bs2 is a member
of a large gene family in pepper, it produces few bands on tomato genomic DNA survey blots
[FIGURE 5D and (TAI et al. 1999b)]. While one of the major polymorphic bands mapped to
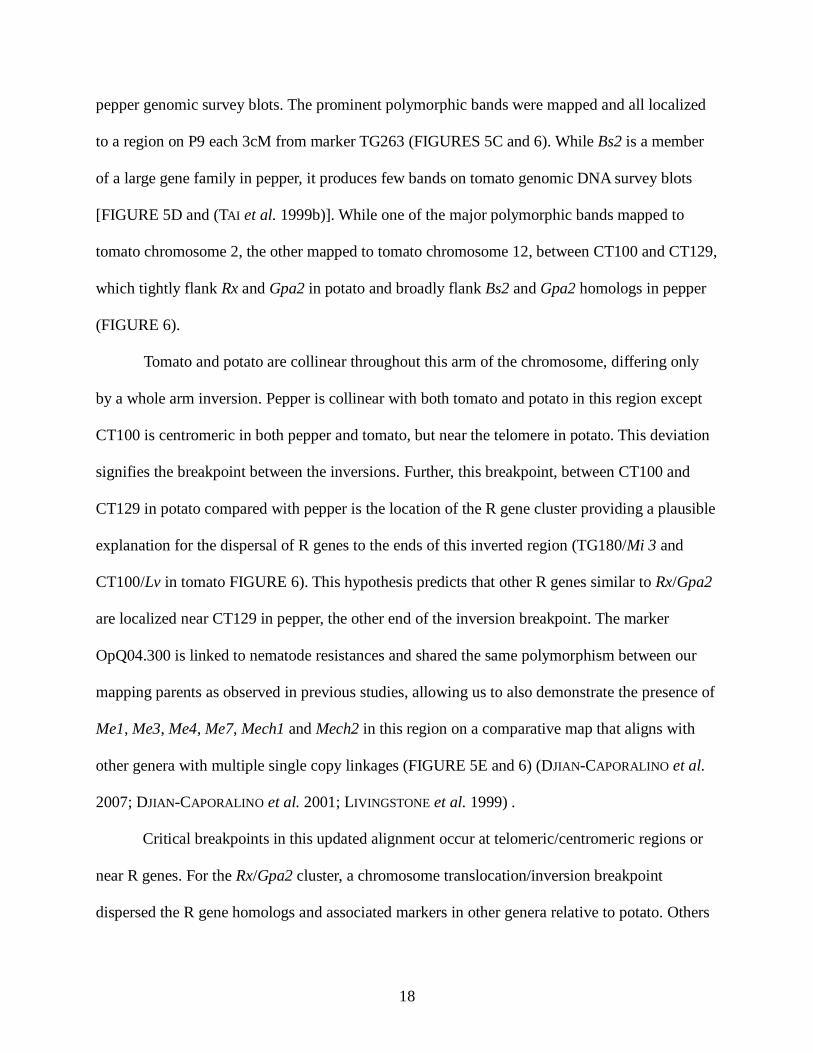
tomato chromosome 2, the other mapped to tomato chromosome 12, between CT100 and CT129,
which tightly flank Rx and Gpa2 in potato and broadly flank Bs2 and Gpa2 homologs in pepper
(FIGURE 6).
Tomato and potato are collinear throughout this arm of the chromosome, differing only
by a whole arm inversion. Pepper is collinear with both tomato and potato in this region except
CT100 is centromeric in both pepper and tomato, but near the telomere in potato. This deviation
signifies the breakpoint between the inversions. Further, this breakpoint, between CT100 and
CT129 in potato compared with pepper is the location of the R gene cluster providing a plausible
explanation for the dispersal of R genes to the ends of this inverted region (TG180/Mi 3 and
CT100/Lv in tomato FIGURE 6). This hypothesis predicts that other R genes similar to Rx/Gpa2
are localized near CT129 in pepper, the other end of the inversion breakpoint. The marker
OpQ04.300 is linked to nematode resistances and shared the same polymorphism between our
mapping parents as observed in previous studies, allowing us to also demonstrate the presence of
Me1, Me3, Me4, Me7, Mech1 and Mech2 in this region on a comparative map that aligns with
other genera with multiple single copy linkages (FIGURE 5E and 6) (DJIAN-CAPORALINO et al.
2007; DJIAN-CAPORALINO et al. 2001; LIVINGSTONE et al. 1999) .
Critical breakpoints in this updated alignment occur at telomeric/centromeric regions or
near R genes. For the Rx/Gpa2 cluster, a chromosome translocation/inversion breakpoint
dispersed the R gene homologs and associated markers in other genera relative to potato. Others
19
have observed the genomic distribution of R genes as a somewhat random phenomenon (LEISTER
et al. 1998; PAN et al. 2000a; RICHLY et al. 2002), but it has been since shown in Arabidopsis that
R gene locations are consistent with the rearrangements of their chromosomal context
(BAUMGARTEN et al. 2003). In the Solanaceae, 22 genome rearrangements distinguish tomato
and pepper (LIVINGSTONE et al. 1999). The analysis of Grube et al. (2000b) and subsequent R
gene discovery in tomato, pepper and potato described herein were combined to examine the
association of R genes with chromosome breakpoints (FIGURE 7). In every case, we could
associate at least one source of resistance with every breakpoint. Despite the limitation of only
including NB-LRRs near breakpoints that have a known phenotype, the sequence relationship
between Hero and Prf is seen to be reflected in their genomic relationship. As shown by
Baumgarten et al. (2003), this sequence relationship is not expected for every R gene that can be
aligned in the genome because clusters are heterogeneous. This hypothesis can be further tested
in a comparative system when the completed tomato genome sequence allows these comparisons
to be made at a higher resolution across the Solanaceae.
DISCUSSION
The ability to determine orthology is critical in the application of comparative genomics
to questions of R gene evolution, function and discovery. Here we investigate the homology
relationships of Bs2, a major gene in Capsicum for resistance to bacterial spot, and other non-
TIR NB-LRRs. From analyses of sequence, gene architecture, predicted protein structure and
macrosynteny, Bs2 is a fractionated ortholog of members of the Rx/Gpa2 locus. In contrast to
monocots, recent reports in dicots illustrate fractionated synteny and micro-colinearity can be
found across genera for R genes and other tandemly duplicated genes (BALLVORA et al. 2007;
20
SCHLUETER et al. 2008). Approaches to understanding and utilizing R gene macrosynteny in the
Solanaceae are certainly viable. The cloning of the late blight resistance gene R3a from potato
based on I2 in tomato illustrates the potential of these comparative approaches (HUANG et al.
2005). Extensions of our model provide for the a priori localization of cloned R gene sequences
in one species based on the genomic location of its fractionated ortholog in a model species, and
a selection criterion for candidate sequences where resistances align in comparative maps.
Comparative maps are critical for understanding and identifying rearrangement breakpoints that
fragment these relationships.
The clustering of R genes and complex recombination of paralogs within clusters pose a
special challenge in studies of their evolution. This recombination results in varying levels of
sequence exchange through a form of in vivo DNA shuffling that generates diversity as well as
gain and loss of R genes (MICHELMORE and MEYERS 1998; SONG et al. 2002). We qualify this
claim of orthology and acknowledged the “fractionation” of the evolutionary history of R genes
(recombination, duplication and deletion) that also does not allow for the creation of a true
phylogeny by conventional methods. These limitations lead to our application of additional
criteria that can be used to support a common history. It has been noted that for some regions of
the R genes, sequence similarity is not sufficient to allow the pairing required for conventional
recombination (WICKER et al. 2007). The frequently reported association of transposable
element-derived sequences within R gene clusters provides the requisite conserved sequences for
recombination to occur and the presence of transposons elsewhere in the genome would provide
a means for inter-chromosomal sequence exchange (MEYERS et al. 2003).
The relationship of R gene clusters and chromosome rearrangement warrants further
investigation. The breakpoint of the translocation that differentiates pepper chromosome 9,
21
potato chromosome XII and tomato chromosome 12 is apparently in or near an R gene cluster
(GRUBE et al. 2000b; LIVINGSTONE et al. 1999). This phenomenon is repeated throughout
comparative maps of the Solanaceae and is summarized in FIGURE 7. Every chromosomal
rearrangement breakpoint is associated with one or more R genes or mapped resistances.
Previously, it has been shown that genomic rearrangement and duplication are significant sources
of R gene dispersal and duplication, which is further complicated by ancestral polyploids
(AMELINE-TORREGROSA et al. 2008; BAUMGARTEN et al. 2003). Increased sequence information
will provide resolution of the precise relationship of R gene clusters, embedded transposons and
chromosome breakpoints that may be detected on comparisons between related genera. These
processes also may explain the dramatic expansion observed in some R gene clusters (MEYERS et
al. 1998a). The translocation breakpoint proposed within the Rx/Gpa2 cluster would result in
these sequences being dispersed to the centromeric and telomeric regions of the lower arm of P9
(FIGURE 6). Two other modes of expansion were witnessed in dot-plots of the genomic
sequences of these R gene regions that would further disperse R genes in the genome because
clusters are heterogeneous. This hypothesis can be further tested in a comparative system when
genome sequence allows these comparisons to be made at a higher resolution across the
Solanaceae.
The clustering of these duplicated sequences also leads to unique regulatory and
functional properties (FRIEDMAN and BAKER 2007; TAM et al. 2008). Small RNAs have been
described as coordinately regulating these R gene clusters at a post-transcriptional level (YI and
RICHARDS 2007). We speculated that NBLets adjacent to functional R genes may also have a role
in this regulatory process. Our test of the effect on expression and function of Rx with and
without an adjacent NBLet did not detect any differences indicating that the Rx mRNA
22
expression, stability and translation is unaffected by the NBLet per se. It remains possible
however that the NBLet may affect local chromatin structure in its endogenous context, which in
turn could affect R gene expression levels (FRIEDMAN and BAKER 2007). NBLets are not
exclusive to the non-TIR NB-LRR class of R genes; they have been noted in the TIR class as
well (GRAHAM et al. 2002). Xa21, a member of a third class of R genes has been shown to have a
highly-conserved 5’ domain that is important for mediating recombination between genetically
linked paralogs (SONG et al. 1997).
A subset of R genes, including Bs2 and Rx, provide durable resistances, but as others are
overcome, there is a need for new sources of resistance and to reconsider approaches to using
these genes in crop improvement (LECOQ et al. 2004; MCDOWELL and WOFFENDEN 2003).
According to our model, large scale sequencing of the easily obtained NB-ARC domains from a
new source of resistance can be grouped by sequence similarity and these groups will reflect
corresponding R gene clusters on comparative maps of reference plants. This strategy can be
tested in application to the cloning of Lv and Mi 3 in tomato using homology to Bs2 and Rx/Gpa2
as references (FIGURE 6). The importance of the genetic background of a plant is linked to
complexity of R gene clustering and mechanism and poses different challenges to plant breeders.
The introgression of a new resistance gene will occur at regions of the genome that may already
contain resistance genes (MICHELMORE 2003). So called “jackpot” cultivars can be seen as a
source of cassettes of resistances and contain clusters of many tightly linked resistances (GRUBE
et al. 2000a). However, merging selected genes of these clusters is a much more daunting
prospect.
A major barrier to understanding R gene similarities and function is the lack of structural
information. Successes in this area have so far capitalized on regions of shared similarity and
23
homology modeling in the NB and ARC domains and to some degree the highly divergent LRR,
but so far the N-terminal domain of the non-TIR class lacks this benefit (CHATTOPADHYAYA and
PAL 2008; MCHALE et al. 2006; TAKKEN et al. 2006). While some motifs have been found in
these variable regions, the major feature ascribed to these proteins, a coiled-coil domain, has
never been demonstrated, only computationally predicted. Since oligomerization of NB-LRR
associated coiled-coil domains has not been reported, and cellular proteins that interact with this
domain show no common structures, it would seem that the existence of a coiled-coil structure
either has a role in protein conformation or is simply an artifact of the prediction programs
(DEYOUNG and INNES 2006).
The convoluted history of R gene diversity is being explicated with increasing resolution.
Comparative studies are one tool to investigate shared aspects of R genes, but often reveal
striking differences that are fundamental to their evolution and mode of action; R proteins must
at once be highly adaptive to changing pathogens, yet retain sufficient similarity to interface with
host proteins and signal transduction networks. Elucidating the mechanisms of genome-level
processes that have operated in different lineages is a key step in both translational goals and the
factors that govern the evolution of this gene family.
ACKNOWLEDGEMENTS
We thank B. Staskawicz and R. Freedman for providing the Capsicum YAC clone
sequence, C. Gephardt for providing us with the GP34 potato clone, J. Bakker for the potato
Gpa2 clone, and R. Stahl for providing us with C. annuum ECW123 seed. We are grateful to
Greg Rairdan for generating initial Rx constructs and to M. Sacco for coining the term NBLet.
Our gratitude to R. Grube, B. Baker, and J. Rouppe van der Voort for helpful conversations
24
regarding the mapping of R genes in the Solanaceae and K. Perez for critical review of the
manuscript. This work was supported in part by the National Science Foundation (DBI-0218166
and IOB-0343327 to MJ and IOS-0744652 to PM). MM was supported by a Barbara McClintock
Award (Robert Rabson), Olin Fellowship, the CALS Dean’s fund and a gift from Kalsec Inc.
SMC was supported by an NSF Graduate Research Fellowship. BK received support from
USDA IFAFS Award No. 2001-52100-113347 and NSF Plant Genome Award No. 0218166.
LITERATURE CITED
AMELINE-TORREGROSA, C., B.-B. WANG, M. S. O'BLENESS, S. DESHPANDE, H. ZHU et al., 2008
Identification and characterization of nucleotide-binding site-leucine-rich repeat genes in
the model plant Medicago truncatula. Plant Physiol. 146: 5-21.
BAI, J. F., L. A. PENNILL, J. C. NING, S. W. LEE, J. RAMALINGAM et al., 2002 Diversity in
nucleotide binding site-leucine-rich repeat genes in cereals. Genome Research 12: 1871-
1884.
BAKKER, E., P. BUTTERBACH, J. ROUPPE VAN DER VOORT, E. VAN DER VOSSEN, J. VAN VLIET et al.,
2003 Genetic and physical mapping of homologues of the virus resistance gene Rx1 and
the cyst nematode resistance gene Gpa2 in potato. Theoretical and Applied Genetics 106:
1524-1531.
BALLVORA, A., A. JOCKER, P. VIEHOVER, H. ISHIHARA, J. PAAL et al., 2007 Comparative
sequence analysis of Solanum and Arabidopsis in a hot spot for pathogen resistance on
potato chromosome V reveals a patchwork of conserved and rapidly evolving genome
segments. BMC Genomics 8: 112.
BAUMGARTEN, A., S. CANNON, R. SPANGLER and G. MAY, 2003 Genome-level evolution of
resistance genes in Arabidopsis thaliana. Genetics 165: 309-319.
BENDAHMANE, A., G. FARNHAM, P. MOFFETT and D. C. BAULCOMBE, 2002 Constitutive gain-of-
function mutants in a nucleotide binding site-leucine rich repeat protein encoded at the Rx
locus of potato. Plant Journal 32: 195-204.
BENDAHMANE, A., K. KANYUKA and D. C. BAULCOMBE, 1999 The Rx gene from potato controls
25
separate virus resistance and cell death responses. Plant Cell 11: 781-791.
BENDAHMANE, A., M. QUERCI, K. KANYUKA and D. C. BAULCOMBE, 2000 Agrobacterium
transient expression system as a tool for the isolation of disease resistance genes:
application to the Rx2 locus in potato. Plant Journal 21: 73-81.
CANNON, S. B., H. Y. ZHU, A. M. BAUMGARTEN, R. SPANGLER, G. MAY et al., 2002 Diversity,
distribution, and ancient taxonomic relationships within the TIR and non-TIR NBS-LRR
resistance gene subfamilies. Journal of Molecular Evolution 54: 548-562.
CHATTOPADHYAYA, R., and A. PAL, 2008 Three-dimensional models of NB-ARC domains of
disease resistance proteins in tomato, arabidopsis, and flax. 25: 357-371.
COOLEY, M. B., S. PATHIRANA, H. J. WU, P. KACHROO and D. F. KLESSIG, 2000 Members of the
Arabidopsis HRT/RPP8 family of resistance genes confer resistance to both viral and
oomycete pathogens. Plant Cell 12: 663-676.
DATEMA, E., L. A. MUELLER, R. BUELS, J. J. GIOVANNONI, R. G. F. VISSER et al., 2008
Comparative BAC end sequence analysis of tomato and potato reveals overrepresentation
of specific gene families in potato. BMC Plant Biology 8: 34.
DELORENZI, M., and T. SPEED, 2002 An HMM model for coiled-coil domains and a comparison
with PSSM-based predictions. Bioinformatics 18: 617-625.
DEYOUNG, B. J., and R. W. INNES, 2006 Plant NBS-LRR proteins in pathogen sensing and host
defense. Nature Immunology 7: 1243-1249.
DJIAN-CAPORALINO, C., A. FAZARI, M. J. ARGUEL, T. VERNIE, C. VANDECASTEELE et al., 2007
Root-knot nematode (Meloidogyne spp.) Me resistance genes in pepper (Capsicum
annuum L.) are clustered on the P9 chromosome. Theoretical and Applied Genetics 114:
473-486.
DJIAN-CAPORALINO, C., L. PIJAROWSKI, A. FAZARI, M. SAMSON, L. GAVEAU et al., 2001 High-
resolution genetic mapping of the pepper (Capsicum annuum L.) resistance loci Me3 and
Me4 conferring heat-stable resistance to root-knot nematodes (Meloidogyne spp.).
Theoretical and Applied Genetics 103: 592-600.
DOYLE, J. J., and B. S. GAUT, 2000 Evolution of genes and taxa: a primer. Plant Molecular
Biology 42: 1-23.
ELLIS, J., P. DODDS and T. PRYOR, 2000 Structure, function and evolution of plant disease
resistance genes. Current Opinion in Plant Biology 3: 278-284.
26
ERNST, K., A. KUMAR, D. KRISELEIT, D. U. KLOOS, M. S. PHILLIPS et al., 2002 The broad-
spectrum potato cyst nematode resistance gene (Hero) from tomato is the only member of
a large gene family of NBS-LRR genes with an unusual amino acid repeat in the LRR
region. Plant Journal 31: 127-136.
FLUHR, R., 2001 Sentinels of disease. Plant resistance genes. Plant Physiology 127: 1367-1374.
FRIEDMAN, A. R., and B. J. BAKER, 2007 The evolution of resistance genes in multi-protein plant
resistance systems. Current Opinion in Genetics & Development 17: 493-499.
GALE, M. D., and K. M. DEVOS, 1998 Comparative genetics in the grasses. Proceedings of the
National Academy of Sciences 95: 1971-1974.
GLAZEBROOK, J., 2005 Contrasting mechanisms of defense against biotrophic and necrotrophic
pathogens. Annual Review of Phytopathology 43: 205-227.
GRAHAM, M. A., L. F. MAREK and R. C. SHOEMAKER, 2002 Organization, expression and
evolution of a disease resistance gene cluster in soybean. Genetics 162: 1961-1977.
GRUBE, R. C., J. R. BLAUTH, M. S. ARNEDO ANDRÉS, C. CARANTA and M. K. JAHN, 2000a
Identification and comparative mapping of a dominant potyvirus resistance gene cluster
in Capsicum. Theoretical and Applied Genetics 101: 852-859.
GRUBE, R. C., E. R. RADWANSKI and M. JAHN, 2000b Comparative genetics of disease resistance
within the Solanaceae. Genetics 155: 873-887.
GRUBER, M., J. SODING and A. N. LUPAS, 2006 Comparative analysis of coiled-coil prediction
methods. Journal of Structural Biology 155: 140-145.
HUANG, S., E. A. G. VAN DER VOSSEN, H. KUANG, V. G. A. A. VLEESHOUWERS, N. ZHANG et al.,
2005 Comparative genomics enabled the isolation of the R3a late blight resistance gene
in potato. The Plant Journal 42: 251-261.
HULBERT, S. H., C. A. WEBB, S. M. SMITH and Q. SUN, 2001 Resistance gene complexes:
Evolution and utilization. Annual Review of Phytopathology 39: 285-312.
JONES, D. A., and J. D. G. JONES, 1997 The role of leucine-rich repeat proteins in plant defences,
pp. 89-167 in Advances in Botanical Research, edited by J. H. ANDREWS, I. C. TOMMERUP
and J. A. CALLOW. Academic Press.
JURKA, J., 2006a SONATA1: Non-autonomous DNA transposon from Solanum species. Repbase
Reports 6: 267.
JURKA, J., 2006b SONATA2: Non-autonomous DNA transposon from Solanum species. Repbase
27
Reports 6: 268.
JURKA, J., and O. KOHANY, 2006 hAT-2_SD hAT transposon from Solanum demissum. Repbase
Reports 6: 492.
JURKA, J., and R. SHANKAR, 2006a GYPOT1: Gypsy-type element from black cottonwood.
Repbase Reports 6: 488.
JURKA, J., and R. SHANKAR, 2006b SONATA3: Non-autonomous DNA transposon from Solanum
species. Repbase Reports 6: 508.
KOHANY, O., A. J. GENTLES, L. HANKUS and J. JURKA, 2006 Annotation, submission and
screening of repetitive elements in Repbase: RepbaseSubmitter and Censor. BMC
Bioinformatics 7: 474.
KOHANY, O., and J. JURKA, 2007 LTR retrotransposons from grapevine. Repbase Reports 7: 696.
KUANG, H., S. S. WOO, B. C. MEYERS, E. NEVO and R. W. MICHELMORE, 2004 Multiple genetic
processes result in heterogeneous rates of evolution within the major cluster disease
resistance genes in lettuce. Plant Cell 16: 2870-2894.
KUMAR, S., K. TAMURA, I. B. JAKOBSEN and M. NEI, 2001 MEGA2: molecular evolutionary
genetics analysis software. Bioinformatics 17: 1244-1245.
KYTE, J., and R. F. DOOLITTLE, 1982 A simple method for displaying the hydropathic character of
a protein. Journal of Molecular Biology 157: 105-132.
LANFERMEIJER, F. C., J. DIJKHUIS, M. J. G. STURRE, P. DE HAAN and J. HILLE, 2003 Cloning and
characterization of the durable tomato mosaic virus resistance gene Tm-22 from
Lycopersicon esculentum. Plant Molecular Biology 52: 1039-1051.
LECOQ, H., B. MOURY, C. DESBIEZ, A. PALLOIX and M. PITRAT, 2004 Durable virus resistance in
plants through conventional approaches: a challenge. Virus Research 100: 31-39.
LEFEBVRE, V., C. CARANTA, S. PFLIEGER, B. MOURY, A. M. DAUBEZE et al., 1997 Updated
intraspecific maps of pepper. Capsicum & Eggplant Newsletter: 35-41.
LEISTER, D., J. KURTH, D. A. LAURIE, M. YANO, T. SASAKI et al., 1998 Rapid reorganization of
resistance gene homologues in cereal genomes. Proceedings of the National Academy of
Sciences 95: 370-375.
LEVY, M., O. EDELBAUM and I. SELA, 2004 Tobacco mosaic virus regulates the expression of its
own resistance gene N. Plant Physiology 135: 2392-2397.
LIVINGSTONE, K. D., V. K. LACKNEY, J. R. BLAUTH, R. VAN WIJK and M. K. JAHN, 1999 Genome
28
mapping in Capsicum and the evolution of genome structure in the Solanaceae. Genetics
152: 1183-1202.
LUPAS, A., M. VANDYKE and J. STOCK, 1991 Predicting coiled coils from protein sequences.
Science 252: 1162-1164.
MACAS, J., and P. NEUMANN, 2007 Ogre elements - A distinct group of plant Ty3/gypsy-like
retrotransposons. Gene 390: 108-116.
MARTIN, G. B., A. J. BOGDANOVE and G. SESSA, 2003 Understanding the functions of plant
disease resistance proteins. Annual Review of Plant Biology 54: 23-61.
MCDOWELL, J. M., and S. A. SIMON, 2006 Recent insights into R gene evolution. Molecular Plant
Pathology 7: 437-448.
MCDOWELL, J. M., and B. J. WOFFENDEN, 2003 Plant disease resistance genes: recent insights
and potential applications. Trends in Biotechnology 21: 178-183.
MCHALE, L., X. TAN, P. KOEHL and R. W. MICHELMORE, 2006 Plant NBS-LRR proteins:
adaptable guards. Genome Biology 7: 212.
MEYERS, B. C., D. B. CHIN, K. A. SHEN, S. SIVARAMAKRISHNAN, D. O. LAVELLE et al., 1998a The
major resistance gene cluster in lettuce is highly duplicated and spans several megabases.
Plant Cell 10: 1817-1832.
MEYERS, B. C., A. KOZIK, A. GRIEGO, H. H. KUANG and R. W. MICHELMORE, 2003 Genome-wide
analysis of NBS-LRR-encoding genes in Arabidopsis. Plant Cell 15: 809-834.
MEYERS, B. C., K. A. SHEN, P. ROHANI, B. S. GAUT and R. W. MICHELMORE, 1998b Receptor-like
genes in the major resistance locus of lettuce are subject to divergent selection. Plant Cell
10: 1833-1846.
MICHELMORE, R. W., 2003 The impact zone: genomics and breeding for durable disease
resistance. Current Opinion in Plant Biology 6: 397-404.
MICHELMORE, R. W., and B. C. MEYERS, 1998 Clusters of resistance genes in plants evolve by
divergent selection and a birth-and-death process. Genome Research 8: 1113-1130.
MONDRAGON-PALOMINO, M., B. C. MEYERS, R. W. MICHELMORE and B. S. GAUT, 2002 Patterns
of positive selection in the complete NBS-LRR gene family of Arabidopsis thaliana.
Genome Research 12: 1305-1315.
MORGENSTERN, B., K. FRECH, A. DRESS and T. WERNER, 1998 DIALIGN: Finding local
similarities by multiple sequence alignment. Bioinformatics 14: 290-294.
29
NURNBERGER, T., F. BRUNNER, B. KEMMERLING and L. PIATER, 2004 Innate immunity in plants
and animals: striking similarities and obvious differences. Immunological Reviews 198:
249-266.
OGUNDIWIN, E. A., T. F. BERKE, M. MASSOUDI, L. L. BLACK, G. HUESTIS et al., 2005
Construction of 2 intraspecific linkage maps and identification of resistance QTLs for
Phytophthora capsici root-rot and foliar-blight diseases of pepper (Capsicum annuum L.).
Genome 48: 698-711.
PAN, Q. L., Y. S. LIU, O. BUDAI-HADRIAN, M. SELA, L. CARMEL-GOREN et al., 2000a
Comparative genetics of nucleotide binding site-leucine rich repeat resistance gene
homologues in the genomes of two dicotyledons: Tomato and Arabidopsis. Genetics 155:
309-322.
PAN, Q. L., J. WENDEL and R. FLUHR, 2000b Divergent evolution of plant NBS-LRR resistance
gene homologues in dicot and cereal genomes. Journal of Molecular Evolution 50: 203-
213.
PATERSON, A. H., J. E. BOWERS, D. G. PETERSON, J. C. ESTILL and B. A. CHAPMAN, 2003
Structure and evolution of cereal genomes. Current Opinion in Genetics & Development
13: 644-650.
PEART, J. R., G. COOK, B. J. FEYS, J. E. PARKER and D. C. BAULCOMBE, 2002a An EDS1
orthologue is required for N-mediated resistance against tobacco mosaic virus. Plant
Journal 29: 569-579.
PEART, J. R., R. LU, A. SADANANDOM, I. MALCUIT, P. MOFFETT et al., 2002b Ubiquitin ligase-
associated protein SGT1 is required for host and nonhost disease resistance in plants.
Proceedings of the National Academy of Sciences 99: 10865-10869.
POZUETAROMERO, J., G. HOULNE and R. SCHANTZ, 1996 Nonautonomous inverted repeat Alien
transposable elements are associated with genes of both monocotyledonous and
dicotyledonous plants. Gene 171: 147-153.
RAIRDAN, G., and P. MOFFETT, 2007 Brothers in arms? Common and contrasting themes in
pathogen perception by plant NB-LRR and animal NACHT-LRR proteins. Microbes and
Infection 9: 677-686.
RAIRDAN, G. J., S. M. COLLIER, M. A. SACCO, T. T. BALDWIN, T. BOETTRICH et al., 2008 The
Coiled-Coil and Nucleotide Binding Domains of the Potato Rx Disease Resistance
30
Protein Function in Pathogen Recognition and Signaling. Plant Cell 20: 739-751.
RAIRDAN, G. J., and P. MOFFETT, 2006 Distinct domains in the ARC region of the potato
resistance protein Rx mediate LRR binding and inhibition of activation. 18: 2082-2093.
RICHLY, E., J. KURTH and D. LEISTER, 2002 Mode of amplification and reorganization of
resistance genes during recent Arabidopsis thaliana evolution. Molecular Biology and
Evolution 19: 76-84.
SCHLUETER, J. A., B. E. SCHEFFLER, S. JACKSON and R. C. SHOEMAKER, 2008 Fractionation of
Synteny in a Genomic Region Containing Tandemly Duplicated Genes across Glycine
max, Medicago truncatula, and Arabidopsis thaliana. Journal of Heredity 99: 390-395.
SMITH, S. M., A. J. PRYOR and S. H. HULBERT, 2004 Allelic and haplotypic diversity at the Rp1
rust resistance locus of maize. Genetics 167: 1939-1947.
SONG, R., V. LLACA and J. MESSING, 2002 Mosaic organization of orthologous sequences in grass
genomes. Genome Research 12: 1549-1555.
SONG, W. Y., L. Y. PI, G. L. WANG, J. GARDNER, T. HOLSTEN et al., 1997 Evolution of the rice
Xa21 disease resistance gene family. Plant Cell 9: 1279.
SUGITA, T., K. YAMAGUCHI, T. KINOSHITA, K. YUJI, Y. SUGIMURA et al., 2006 QTL analysis for
resistance to phytophthora blight (Phytophthora capsici Leon.) using an intraspecific
doubled-haploid population of Capsicum annuum. Breeding Science 56: 137-145.
TAI, T., D. DAHLBECK, R. E. STALL, J. PELEMAN and B. J. STASKAWICZ, 1999a High-resolution
genetic and physical mapping of the region containing the Bs2 resistance gene of pepper.
Theoretical and Applied Genetics 99: 1201-1206.
TAI, T., and B. J. STASKAWICZ, 2000 Construction of a yeast artificial chromosome library of
pepper (Capsicum annuum L.) and identification of clones from the Bs2 resistance locus.
Theoretical and Applied Genetics 100: 112-117.
TAI, T. H., D. DAHLBECK, E. T. CLARK, P. GAJIWALA, R. PASION et al., 1999b Expression of the
Bs2 pepper gene confers resistance to bacterial spot disease in tomato. Proceedings of the
National Academy of Sciences of the United States of America 96: 14153-14158.
TAKKEN, F. L. W., M. ALBRECHT and W. I. L. TAMELING, 2006 Resistance proteins: molecular
switches of plant defence. Current Opinion in Plant Biology 9: 383-390.
TAM, O. H., A. A. ARAVIN, P. STEIN, A. GIRARD, E. P. MURCHISON et al., 2008 Pseudogene-
derived small interfering RNAs regulate gene expression in mouse oocytes. Nature 453:
31
534-538.
VAN DER BIEZEN, E. A., and J. D. G. JONES, 1998 The NB-ARC domain: a novel signalling motif
shared by plant resistance gene products and regulators of cell death in animals. Current
Biology 8: 226-227.
VAN DER VOSSEN, E. A. G., J. VAN DER VOORT, K. KANYUKA, A. BENDAHMANE, H. SANDBRINK et
al., 2000 Homologues of a single resistance-gene cluster in potato confer resistance to
distinct pathogens: a virus and a nematode. Plant Journal 23: 567-576.
VAN OOIJEN, G., H. A. VAN DEN BURG, B. J. C. CORNELISSEN and F. L. W. TAKKEN, 2007 Structure
and function of resistance proteins in solanaceous plants. Annual Review of
Phytopathology 45: 43-72.
WICKER, T., N. YAHIAOUI and B. KELLER, 2007 Illegitimate recombination is a major
evolutionary mechanism for initiating size variation in plant resistance genes. Plant
Journal 51: 631-641.
WISSER, R. J., P. J. BALINT-KURTI and R. J. NELSON, 2006 The genetic architecture of disease
resistance in maize: A synthesis of published studies. Phytopathology 96: 120-129.
YI, H., and E. J. RICHARDS, 2007 A cluster of disease resistance genes in Arabidopsis is
coordinately regulated by transcriptional activation and RNA silencing. Plant Cell 19:
2929-2939.
YOSHIOKA, Y., S. MATSUMOTO, S. KOJIMA, K. OHSHIMA, N. OKADA et al., 1993 Molecular
characterization of a short interspersed repetitive element from tobacco that exhibits
sequence homology to specific transfer-RNAs. Proceedings of the National Academy of
Sciences 90: 6562-6566.
32
32
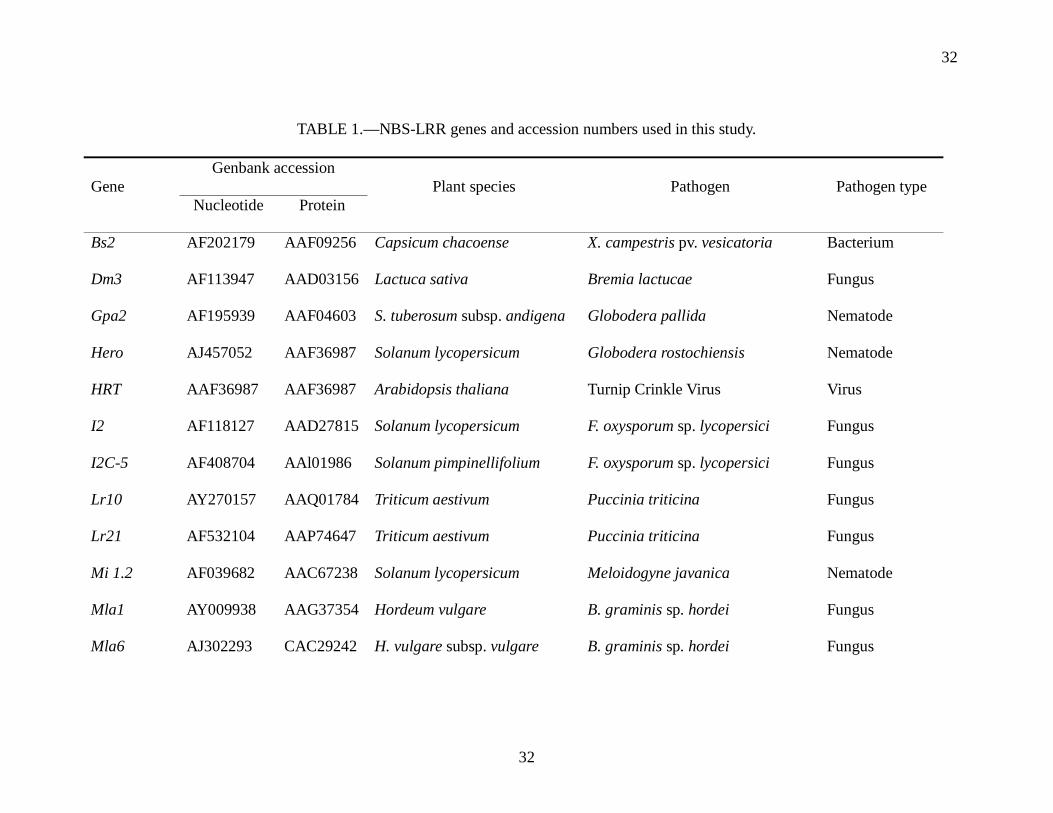
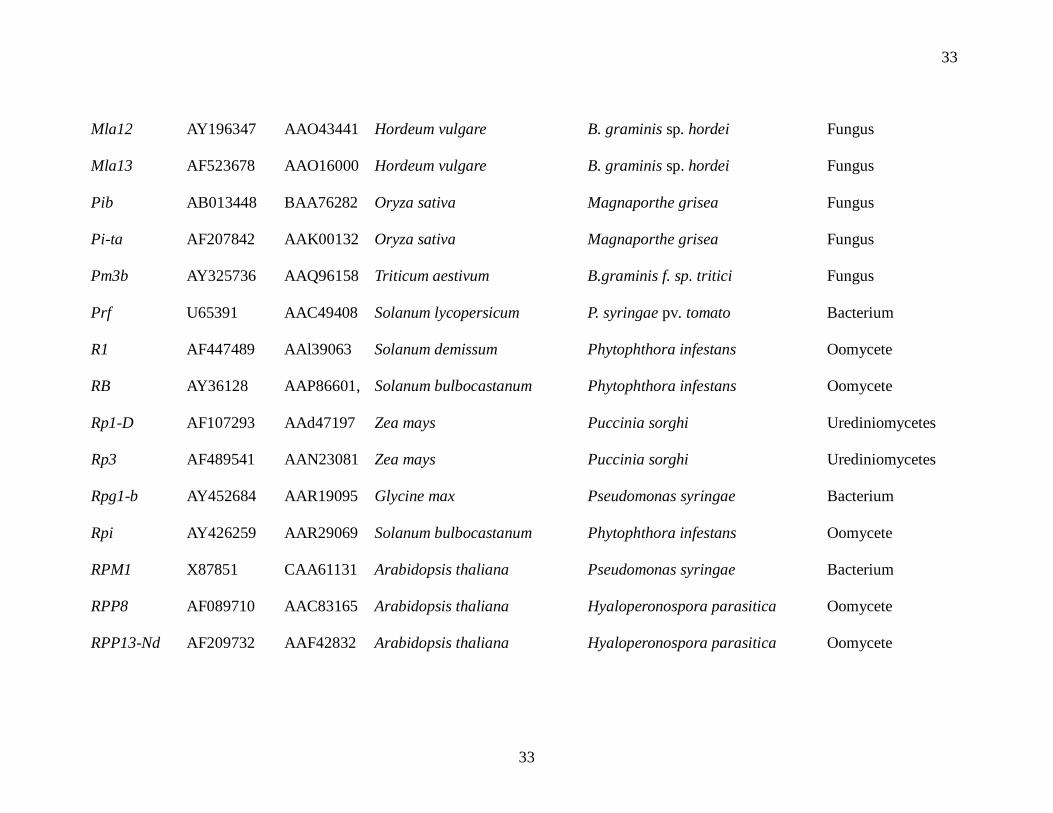
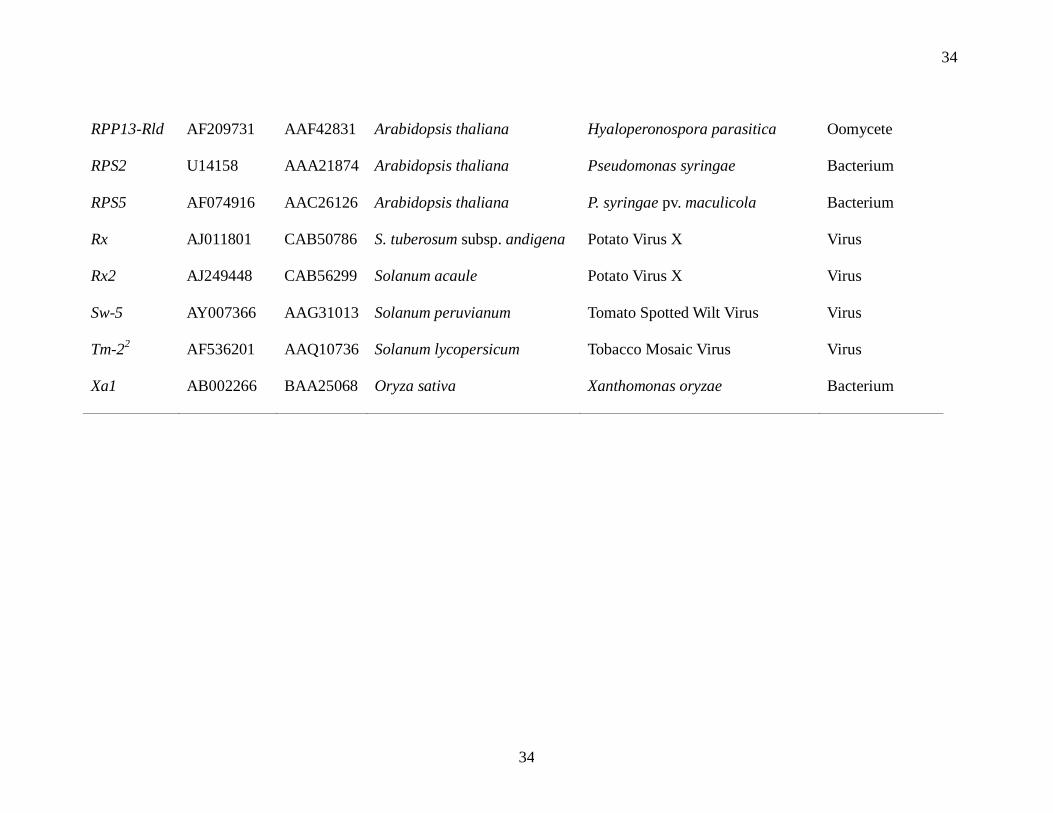
TABLE 1.—NBS-LRR genes and accession numbers used in this study.
Gene Genbank accession
Plant species Pathogen Pathogen type Nucleotide Protein
Bs2 AF202179 AAF09256 Capsicum chacoense X. campestris pv. vesicatoria Bacterium
Dm3 AF113947 AAD03156 Lactuca sativa Bremia lactucae Fungus
Gpa2 AF195939 AAF04603 S. tuberosum subsp. andigena Globodera pallida Nematode
Hero AJ457052 AAF36987 Solanum lycopersicum Globodera rostochiensis Nematode
HRT AAF36987 AAF36987 Arabidopsis thaliana Turnip Crinkle Virus Virus
I2 AF118127 AAD27815 Solanum lycopersicum F. oxysporum sp. lycopersici Fungus
I2C-5 AF408704 AAl01986 Solanum pimpinellifolium F. oxysporum sp. lycopersici Fungus
Lr10 AY270157 AAQ01784 Triticum aestivum Puccinia triticina Fungus
Lr21 AF532104 AAP74647 Triticum aestivum Puccinia triticina Fungus
Mi 1.2 AF039682 AAC67238 Solanum lycopersicum Meloidogyne javanica Nematode
Mla1 AY009938 AAG37354 Hordeum vulgare B. graminis sp. hordei Fungus
Mla6 AJ302293 CAC29242 H. vulgare subsp. vulgare B. graminis sp. hordei Fungus
33
33
Mla12 AY196347 AAO43441 Hordeum vulgare B. graminis sp. hordei Fungus
Mla13 AF523678 AAO16000 Hordeum vulgare B. graminis sp. hordei Fungus
Pib AB013448 BAA76282 Oryza sativa Magnaporthe grisea Fungus
Pi-ta AF207842 AAK00132 Oryza sativa Magnaporthe grisea Fungus
Pm3b AY325736 AAQ96158 Triticum aestivum B.graminis f. sp. tritici Fungus
Prf U65391 AAC49408 Solanum lycopersicum P. syringae pv. tomato Bacterium
R1 AF447489 AAl39063 Solanum demissum Phytophthora infestans Oomycete
RB AY36128 AAP86601, Solanum bulbocastanum Phytophthora infestans Oomycete
Rp1-D AF107293 AAd47197 Zea mays Puccinia sorghi Urediniomycetes
Rp3 AF489541 AAN23081 Zea mays Puccinia sorghi Urediniomycetes
Rpg1-b AY452684 AAR19095 Glycine max Pseudomonas syringae Bacterium
Rpi AY426259 AAR29069 Solanum bulbocastanum Phytophthora infestans Oomycete
RPM1 X87851 CAA61131 Arabidopsis thaliana Pseudomonas syringae Bacterium
RPP8 AF089710 AAC83165 Arabidopsis thaliana Hyaloperonospora parasitica Oomycete
RPP13-Nd AF209732 AAF42832 Arabidopsis thaliana Hyaloperonospora parasitica Oomycete
34
34
RPP13-Rld AF209731 AAF42831 Arabidopsis thaliana Hyaloperonospora parasitica Oomycete
RPS2 U14158 AAA21874 Arabidopsis thaliana Pseudomonas syringae Bacterium
RPS5 AF074916 AAC26126 Arabidopsis thaliana P. syringae pv. maculicola Bacterium
Rx AJ011801 CAB50786 S. tuberosum subsp. andigena Potato Virus X Virus
Rx2 AJ249448 CAB56299 Solanum acaule Potato Virus X Virus
Sw-5 AY007366 AAG31013 Solanum peruvianum Tomato Spotted Wilt Virus Virus
Tm-22 AF536201 AAQ10736 Solanum lycopersicum Tobacco Mosaic Virus Virus
Xa1 AB002266 BAA25068 Oryza sativa Xanthomonas oryzae Bacterium
35
35
Figure Legends
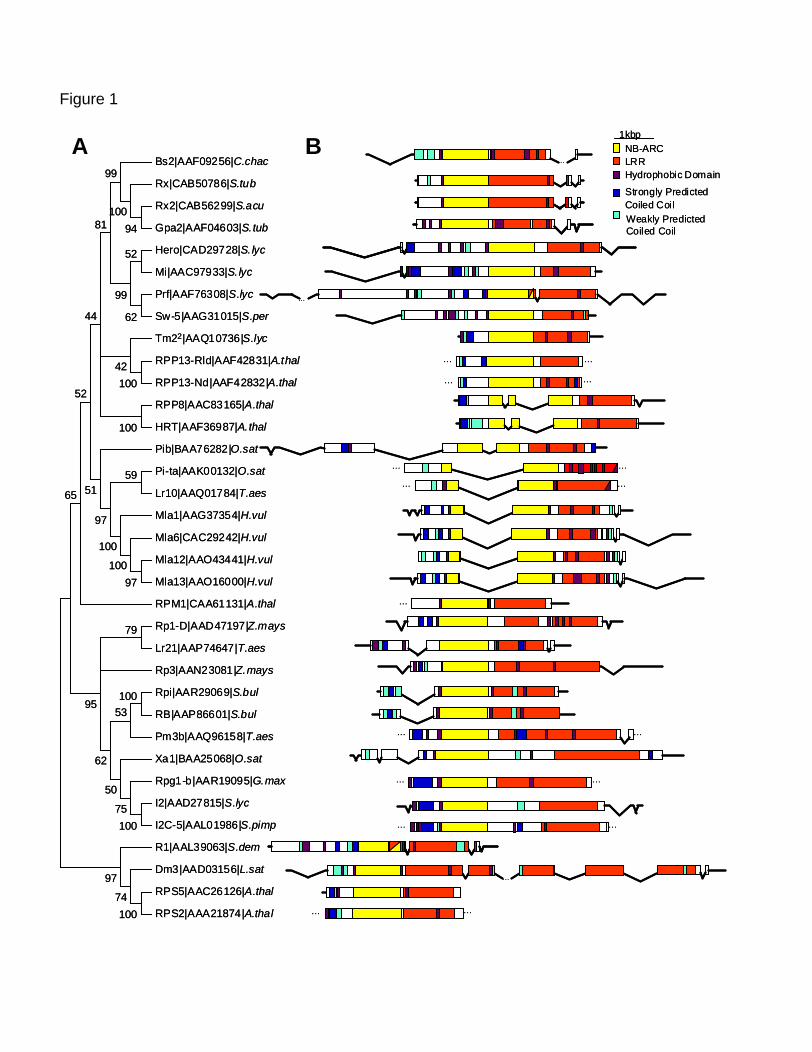
FIGURE 1.—Sequence similarity relationships among Bs2 homologs.
(A) A neighbor-joining consensus tree constructed from NBS domain protein sequences of
previously cloned R genes. Bootstrap values of 40% or greater are indicated. Following the
protein sequence name in taxon labels are GenBank accession numbers and an abbreviated
bionomial of the organism: A.thal (Arabidopsis thaliana), C.chac (Capsicum chacoense), G.max
(Glycine max), H.vul (Hordeum vulgare), O.sat (Oryza sativa), S.acu (Solanum acaule), S.bul
(Solanum bulbocastum), S.dem (Solanum demissum), S.lyc (Solanum lycopersicon), S.per
(Solanum peruvanium), S.pimp (Solanum pimpennillifolium), S.tub (Solanum tuberosum), T.aes
(Triticum aestivum), and Z.mays (Zea mays). (B) To the right of each taxon description is a scale
diagram showing gene structure. Untranslated regions are represented by horizontal lines, introns
by diagonal lines, and exons by colored bars. The colors represent the domains encoded by the
sequence according to the key. Resistance genes that are closely related to each other, as shown
in the tree, have similar size and placement of domains, introns, exons, and untranslated regions.
FIGURE 2.—Comparison of N-terminal features of non-TIR R genes.
(A) Coiled-coil prediction. Marcoil and COILS coiled-coil prediction outputs for different
matrices or window sizes, as indicated, are represented graphically above the first 165 amino
acids of selected protein sequences from FIGURE 1. The Y axis represents percent probability of
forming a coiled-coil for each algorithm. The box below each graph represents the strength of the
prediction, with dark blue for strongly predicted and light blue for weakly predicted coiled-coils.
Side-by-side comparison predicts that HRT will form a coiled-coil, while Bs2, Rx and Gpa2 will
not. MTIDK stands for the coiled-coil proteins used in the prediction matrix: myosins,
36
36
tropomyosins, intermediate filaments, desmosomal proteins and kinesins. 14 and 21 indicate the
size in amino acids of the sliding window used by the algorithm. 9FAM includes all 9 families
known to form coiled-coils and the MTK matrix is a smaller matrix only including myosins,
tropomyosins and kinesins. (B) An alignment of the N-terminal, non-TIR motif region described
by Bai et al and Rairdan et al organized according to groups defined by the tree in FIGURE 1A.
Amino acids are colored according to their properties. A consensus is shown above the alignment
with letter size representing conservedness. A general pattern identified based on amino acid
properties is shown below the alignment (Ф, aromatic; u, aliphatic; +, basic; -, acidic, p, polar
and x, nonconserved)
FIGURE 3.—Duplicated elements in solanaceous R gene clusters.
Dot-plots were generated within and between R gene clusters to reveal duplicated elements.
Homologous elements are shaded similar colors. The scale bar represents size of the elements,
while the distance between elements in kilobase pairs is presented as text. (A) The YAC
sequence containing the Bs2 gene was found to contain 6 elements duplicated 2 to 3 times that
filled much of the contig and 27kb intron. (B) One of these is also present in the BAC sequence
containing Rx and Gpa2. (A-F) The 5’ end of many solanaceous R genes was found duplicated to
a proximal position. The length and percent sequence identity of these features are indicated. (C)
Mi 1.2 has two such duplications: one is the 5’ end and the other is within the gene at a position
comparable to the other R genes that lack the 5’ extension found on Mi 1.2.
FIGURE 4.—Effect of the Rx NBLet on Rx function. (A) PVX resistance conferred by Rx in its
complete genomic context (Rx:4HA) and without the Rx NBLet (Rx:4HA ∆NBLet). Rx
37
37
constructs were transiently co-expressed in N. benthamiana leaves with an infectious PVX:GFP
clone via agroinfiltration. PVX:GFP accumulation was monitored as GFP florescence under UV
lightat 5 d after infiltration. PVX:GFP infiltrated in the absence of Rx is shown at bottom left for
comparison. (B) Western blot analysis showing Rx accumulation when expressed with and
without NBLet. N. benthamiana leaves were infiltrated with Agrobacterium containing Rx
constructs, and samples were collected 2 d later. Rx protein levels were detected by anti-HA
immunoblotting.
FIGURE 5.— Molecular marker polymorphisms related to Bs2 homologs.
(A) RFLP polymorphism of STS marker A2 on pepper DNA digested with TaqI. Note
polymorphic bands of 1 kb, which maps to pepper chromosome P9, and 2 kb between mapping
population parents ‘R Naky’ and PI159234. (B) SCAR marker S19 amplified using parents. Note
polymorphism between mapping population parents R Naky and PI159234. (C) RFLP
polymorphism of potato Gpa2 fragment on pepper DNA digested with BstNI. The bands marked
“a” and “b” are found only in mapping population parent PI159234, while the band marked “c”
is found only in mapping population parent R Naky. (D) Bs2 fragment as an RFLP probe on
tomato DNA. Note multiple bands of varying intensity. (E) RAPD marker Q4_0.300 in pepper.
Note polymorphisms between mapping population parents R Naky and PI159234.
FIGURE 6.— Comparative genetic map for pepper chromosome P9.
Scale representation of tomato chromosome 12, pepper chromosome P9 and potato chromosome
XII aligned via shared molecular markers. Markers placed at LOD 3 or greater unless shown in
parentheses, in which case they were placed at LOD 2 or greater. R gene names are italicized.
38
38
The location of multiple pepper homologs of Gpa2 (pepGpa2) is indicated with a bracket, as are
the positions of Me and Mech nematode resistances.
FIGURE 7.— Colocalization of R gene clusters and chromosome breakpoints on comparative
maps of tomato and pepper.
Tomato chromosomes (solid) and pepper chromosomes (no fill) are shown aligned based on
shared markers as presented in Livingstone et al.(1999). A meta-analysis of R gene position in
solanaceous genomes by Grube et al., (GRUBE et al. 2000b) was continued with an focus on R
genes that occurred at chromosome breakpoints on the comparative map. A subset of pepper R
genes are shown next to pepper chromosomes, tomato R genes are shown next to the tomato
chromosomes and potato R genes are underlined. Representative RFLP markers linked to the R
genes are given in parenthesis. Chromosomal inversions are indicated with a circular arrow and
chromosomes that are separated by translocations are connected by dotted lines.
FIGURE S1.—Bs2 YAC dotplot.
The YAC sequence containing the Bs2 gene was compared against itself using a window of 50
basepairs and sequence identity cutoff of 65%. The units on the axes are kilobases. The diagram
of the Bs2 YAC from FIGURE 3A is shown along these axes in its orientation as found in
GenBank..
FIGURE S2.—Rx/Gpa2 BAC dotplot.
The contig containing Rx, Gpa2 and two pseudogenes was aligned against itself. A window of 75
39
39
basepairs and a sequence identity cutoff of 65% was used for visualization. Colored dots
represent the genes Rx (red), Gpa2 (yellow), and pseudogenes (blue). The units for the labeled
axes are kilobases.
A BBs2|AAF09256|C.chac
Rx|CAB50786|S.tub
Rx2|CAB56299|S.acu
Gpa2|AAF04603|S.tub
Hero|CAD29728|S.lyc
Mi|AAC97933|S.lyc
Prf|AAF76308|S.lyc
Sw-5|AAG31015|S.per
Tm22|AAQ10736|S.lyc
RPP13-Rld|AAF42831|A.thal
RPP13-Nd|AAF42832|A.thal
RPP8|AAC83165|A.thal
HRT|AAF36987|A.thal
Pib|BAA76282|O.sat
Pi-ta|AAK00132|O.sat
Lr10|AAQ01784|T.aes
Mla1|AAG37354|H.vul
Mla6|CAC29242|H.vul
Mla12|AAO43441|H.vul
Mla13|AAO16000|H.vul
RPM1|CAA61131|A.thal
Rp1-D|AAD47197|Z.mays
Lr21|AAP74647|T.aes
Rp3|AAN23081|Z.mays
Rpi|AAR29069|S.bul
RB|AAP86601|S.bul
Pm3b|AAQ96158|T.aes
Xa1|BAA25068|O.sat
Rpg1-b|AAR19095|G.max
I2|AAD27815|S.lyc
I2C-5|AAL01986|S.pimp
R1|AAL39063|S.dem
Dm3|AAD03156|L.sat
RPS5|AAC26126|A.thal
RPS2|AAA21874|A.thal
94100
100
100
100
100
100
99
62
52
99
74
97
79
75
53
50
62
95
81
65
42
44
52
5159
97
100
10097
Bs2|AAF09256|C.chac
Rx|CAB50786|S.tub
Rx2|CAB56299|S.acu
Gpa2|AAF04603|S.tub
Hero|CAD29728|S.lyc
Mi|AAC97933|S.lyc
Prf|AAF76308|S.lyc
Sw-5|AAG31015|S.per
Tm22|AAQ10736|S.lyc
RPP13-Rld|AAF42831|A.thal
RPP13-Nd|AAF42832|A.thal
RPP8|AAC83165|A.thal
HRT|AAF36987|A.thal
Pib|BAA76282|O.sat
Pi-ta|AAK00132|O.sat
Lr10|AAQ01784|T.aes
Mla1|AAG37354|H.vul
Mla6|CAC29242|H.vul
Mla12|AAO43441|H.vul
Mla13|AAO16000|H.vul
RPM1|CAA61131|A.thal
Rp1-D|AAD47197|Z.mays
Lr21|AAP74647|T.aes
Rp3|AAN23081|Z.mays
Rpi|AAR29069|S.bul
RB|AAP86601|S.bul
Pm3b|AAQ96158|T.aes
Xa1|BAA25068|O.sat
Rpg1-b|AAR19095|G.max
I2|AAD27815|S.lyc
I2C-5|AAL01986|S.pimp
R1|AAL39063|S.dem
Dm3|AAD03156|L.sat
RPS5|AAC26126|A.thal
RPS2|AAA21874|A.thal
94100
100
100
100
100
100
99
62
52
99
74
97
79
75
53
50
62
95
81
65
42
44
52
5159
97
100
10097
1kbpNB-ARCLRRHydrophobic Domain
Strongly Predicted Coiled CoilWeakly Predicted Coiled Coil
1kbpNB-ARCLRRHydrophobic Domain
Strongly Predicted Coiled CoilWeakly Predicted Coiled Coil
……
… …… …
… …… …
… …… …
……
… …… …
… …… …
……
… …… …
… …… …
… …… …
……
Figure 1
Bs2
HRT Rx
H9FAM HMTK HMTIDKMarcoilMTIDK14 MTIDK21COILS
C DGpa2
020406080
100
020406080
100
020406080
100
020406080
100 BAA
B
Figure 2
Consensus W L x x V R E L A Y D A E D V L D x
Bs2 F E V E V R E V A S A A E Y T I Q LRx L E V E I V E V A Y T T E D M V D S
Rx2 L E V E I L E V A Y T T E D M V D SGpa2 L E V E I I E V A Y T T E D M V D SHero W - M C A L D V A Y E A E H V I N S
Mi 1.2 W - A R V L D V A Y E A K D V I D SPrf L I A R V S V M A Y K A E Y V I D S
Sw5 L Q R R T I N L S Y E A E V A I D STm22 L L K D I Q E L A G D V E D L L D D
RPP13 W S K L V L D F A Y D V E D V L D TRPP8 F L E D V K D L V F D A E D I I E S
HRT F L E D V K D L V F D A E D I I E SPib W V K Q V R D T A Y D V E D S L Q D
Pi-ta W A K E V R E L S Y D V D D F L D ELr10 - A D L V R E L S Y D I E D K I D N
Mla 1,6,12&13 W A D E V R E L S Y V I E D V V D KRPM1 F V A N T R D L A Y Q I E D I L D ERP1-D W L R R L K E A Y Y D A E D L L D E
Lr21 M A A M L R H A R E D A E D I F D DRp3 W L K K L K E V A Y D A E D L V H ERpi W L Q K L N A A T Y E V D D I L D ERB W L Q K L N A A T Y E V D D I L D E
Pm3b W L Q E L R T V A Y V A N E V F D EXa1 - L G R L R G L L Y D A D D A V D E
Rpg1 W L L K V K D A V F D A E D I L D EI2 W L N E L R D A V D S A E N L I E E
I2C-5 W F N K L Q S A V E G A E N L I E ER1 - A T Q I I R K A Y E V E Y V V D A
Dm3 W L D Q V E G I R A N V E N F P I DRPS5 W L T S V L I I Q N Q F N D L L R SRPS2 W L S A V Q V T E T K T A L L L V R
Pattern Ф u x x u + - u u Ф - u - - u u - P/-
RxGpa2
1kb
Tm221.3kbR114kb
1kb307bp (90%)374bp (68%)
5.7kb Mi 1.2
1kb212bp (76%)
275bp (83%) RB4.5kb
1kb120bp (92%)
180bp (80%)
220bp (87%) 128bp (83%)
A
C
B
E F
D
intron
1kb
5kb
SonataAlien Copia Ogre GYPOT1 hAT
RGC1 RGC3
Figure 3
SINE
aab bb cc ddded
eff gg
Rx:
4HA
Rx:
4HA
∆N
BLe
t
unin
filtra
ted
IB HA
Rx:4HA+
PVX:GFP
Rx:4HA ∆NBLet+
PVX:GFP
PVX:GFP
AB
Figure 4
-PI 1
5923
4
1kb
2kb
-R N
aky
-PI 1
5923
4
-Yol
oW
onde
r
-Per
enni
al
-1kb
ladd
er
-1kb
ladd
er
-1kb
ladd
er
517 bp -
396 bp -344 bp -298 bp -
220 bp --R
Nak
yOpQ04.300
E
a
b
bcb
-R N
aky
-PI 1
5923
4
B
AC
517 bp -
396 bp -344 bp -298 bp -
220 bp -
-PI 1
5923
4-1
kb la
dder
-1kb
ladd
er-R
Nak
y
-EC
W
-EC
W12
3
ResSusc
D
EcoR1Dra1
-S. l
yc-S
. pen
-S. l
yc-S
. pen
P12
P2
Figure 5
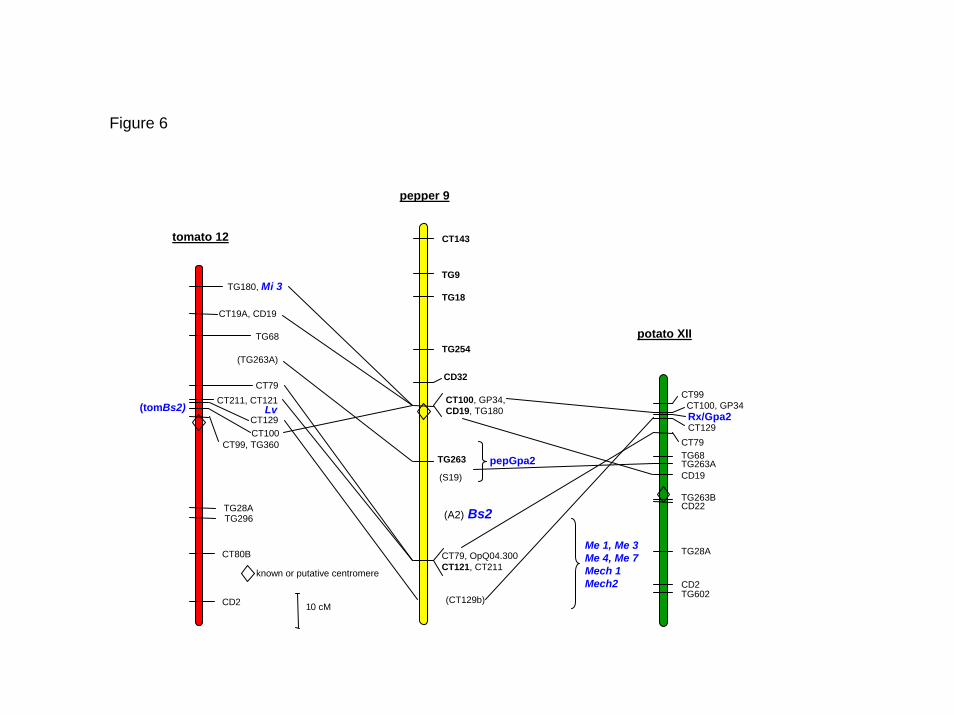
CT211, CT121
CT129CT129
(A2) Bs2
10 cM
known or putative centromere
Lv
Me 1, Me 3Me 4, Me 7 Mech 1 Mech2
(tomBs2)
tomato 12
pepper 9
(TG263A)
TG180, Mi 3
CT19A, CD19
TG68
CT79
CT100CT99, TG360
TG28ATG296
CT80B
CD2
CD32
CT100, GP34, CD19, TG180
TG263
(S19)
pepGpa2
CT79, OpQ04.300 CT121, CT211
(CT129b)
CT143
TG9
TG18
TG254potato XII
CT99CT100, GP34Rx/Gpa2
CT79TG68TG263ACD19
TG263BCD22
TG28A
CD2TG602
Figure 6
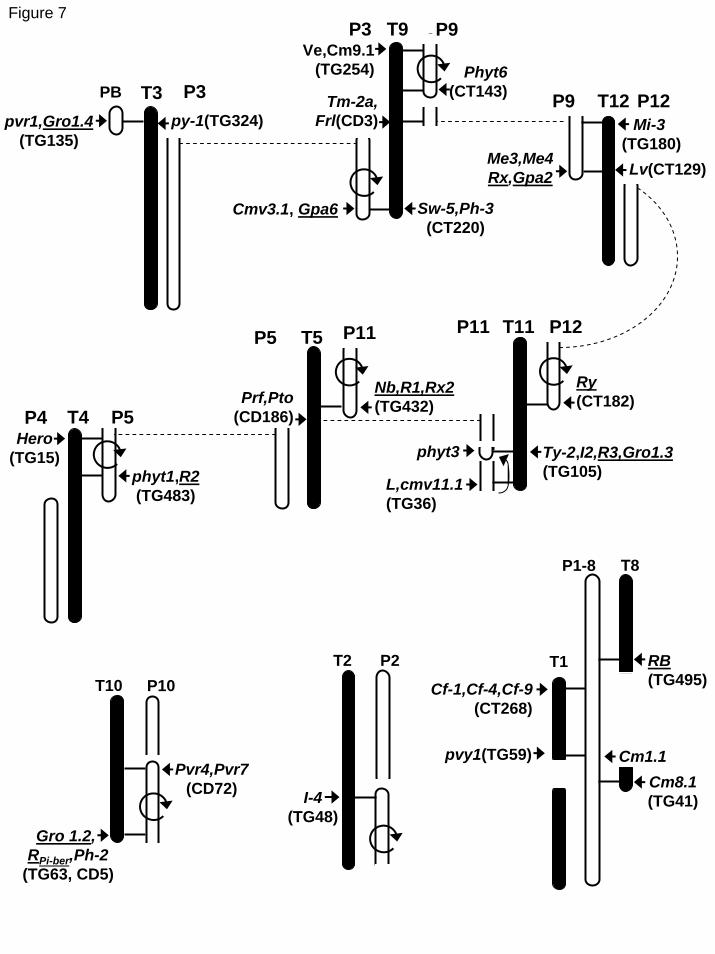
T3 P3py-1(TG324)pvr1,Gro1.4
(TG135)
PB T12 P12P9Mi-3
(TG180)Lv(CT129)Me3,Me4
Rx,Gpa2
Ve,Cm9.1(TG254)
T9P3 P9
Tm-2a,Frl(CD3)
Sw-5,Ph-3(CT220)
Phyt6(CT143)
Cmv3.1, Gpa6
T2 P2
I-4(TG48)
Pvr4,Pvr7(CD72)
T10 P10
Gro 1.2, RPi-ber,Ph-2
(TG63, CD5)
T1
T8P1-8
RB(TG495)
Cm8.1(TG41)
Cf-1,Cf-4,Cf-9(CT268)
pvy1(TG59) Cm1.1
T5P5 T11 P12P11
Prf,Pto(CD186)
P11
Nb,R1,Rx2(TG432)T4P4 P5
phyt1,R2(TG483)
Hero(TG15) Ty-2,I2,R3,Gro1.3
(TG105)L,cmv11.1(TG36)
Ry(CT182)
phyt3
Figure 7


