Embed Size (px)
Citation preview
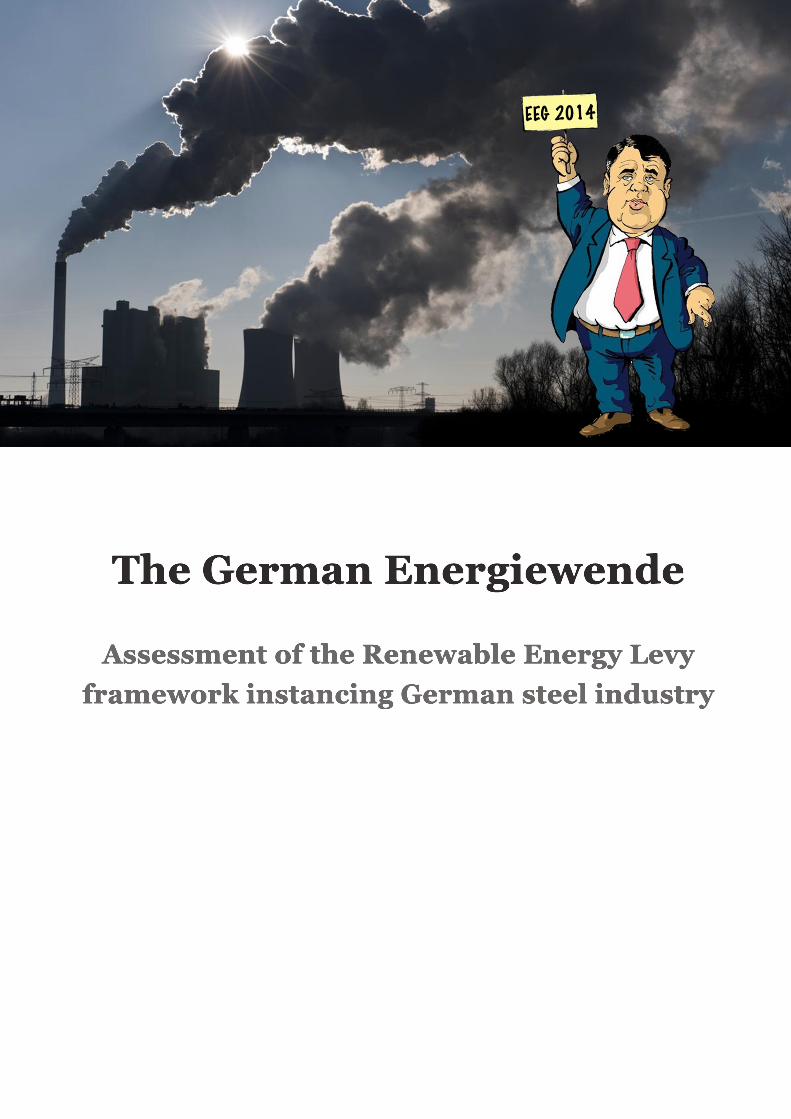
The German Energiewende
Assessment of the Renewable Energy Levy framework instancing German steel industry
I
ABSTRACT Over the past decades it became evident that Earth’s population cannot rely on electricity production from fossil fuels in the future. However, the path to a sustainable energy system has to be led by a political framework to achieve the global, European and national targets in 2050. The Renewable Energies Act has been firstly released in 2000 and is to be further developed to incorporate changes so far, especially the increase of Renewable Energies. The discussion of a fundamental modification is very current since the revised Renewable Energies Act is scheduled for 2014.
In the beginning of the year, a first draft law has been released by the Germany Government. Representatives of various interest groups publish reports and analyses in order to propose amendments to the former and this draft law. This dissertation gathers and discusses suggestions and models in regards to the Renewable Energy Levy, which is the fundamental source of income to subsidise the renewables. The energy intensive industry, the steel industry in particular, displays a very important branch in Germany’s value chain. The Renewable Energy Levy carries a high share that do not account for the promotion of Renewable Energy (RE) but for privileging industry to being exempt. Further, the
electricity market cannot integrate the increasing amount of RE, which led to another financial deficit that is balanced by means of a share of the Renewable Energy Levy.
Consultation of experts in this field has shown that there are viable improvements for the current situation. In summary it is reckoned that the steel industry in Germany can stay competitive on an international market. A continued special equalisation scheme for the highly energy intensive industry with minor amendments in its amount but with modification in its criteria reduces the amount of companies being exempt from paying the Renewable Energy Levy. Larger capacities of RE are obliged to be sold more demand side oriented by means of direct marketing. Domestically produced electricity from by-products is still exempt due to the Protection of Confidence. Newly installed plants can be charged partly with the Renewable Energy Levy. To ensure future efficiency investments, a certified energy management system is to be pursued and more carefully realised to safeguard a development towards a higher share of electric steel. Additionally, CO2 savings technology has to be implemented within Basic Oxygen Furnace steel manufacturing.
Title: The German Energiewende - Assessment of the Renewable Energy Levy framework instancing German steel industry
Project Period: Spring period, 10th February to 4th June 2014
Handed in by Annabelle Rahel Kern
Supervisor: Professor Frede Hvelpelund
Number of Pages 36 (61 all inclusive)
II
PREFACE This dissertation is submitted as a fulfilment of the requirements for the 4th semester postgraduate degree course, MSc Sustainable Energy Planning and Management, at the Department of Development and Planning at Aalborg University. It has been carried out during the period from 10th February to 5th June 2014.
The dissertation is submitted individually and represents my own work. It comprises the main report and the attached appendices, A and B. For references the Harvard method is used.
ACKNOWLEDGEMENT The dissertation at hand as a result of my five-year period of studying, has benefited from the help of a lot of people that I want to thank here.
First of all I want to express my sincere thanks for the on-going feedback and critics of my supervisor, Frede Hvelpelund. Despite the spatial distance, his understanding, patience and input made this work possible.
I also like to show my recognition to the many who have contributed to my research with their expertise. Thank you for taking the time to support my work:
• Wirtschaftsvereinigung Stahl • Energieintensive Industrien Deutschland • Verband der industriellen deutschen Industrie • Öko-Institut e.V. • Bundesverband Erneuerbarer Energien e.V. • Bund der Energieverbraucher • Vebraucherzentrale Hessen e.V.
I am especially grateful for the support of my family throughout my studies, my mother Mary Braun-Kern in particular. She has encouraged me to begin my studies in the energy field and has always been there for me with all her motherly care.
With the support of my partner, René Stoermer, I had the courage to choose Denmark as my destination for my Masters degree and the associated exchange to England. He consistently makes me to outgrow myself and overcome my limits.
My sincere thanks goes to my friend and colleague from Manchester Metropolitan University Neil Alistair Prescott for proofreading my dissertation.
III
TABLE OF CONTENTS 1! INTRODUCTION*...............................................................................................................*1!1.1! CHALLENGES*OF*THE*ENERGIEWENDE*........................................................................*1!
2! RESEARCH*DESIGN*.........................................................................................................*3!2.1! THEORETICAL*APPROACH*................................................................................................*3!2.2! RESEARCH*QUESTION*.........................................................................................................*4!2.3! DELIMITATION*.....................................................................................................................*4!2.4! RESEARCH*METHODOLOGY*..............................................................................................*5!2.5! PROJECT*REPORT*STRUCTURE*.......................................................................................*5!
3! GERMANY’S*ENERGY*POLICY*......................................................................................*7!3.1! CURRENT*ACHIEVEMENTS*................................................................................................*7!3.2! RENEWABLE*ENERGIES*ACT*.............................................................................................*8!3.3! SUMMARY*............................................................................................................................*12!
4! ELECTRICITY*PRICE*....................................................................................................*13!4.1! PRIVATE*CONSUMERS*.....................................................................................................*13!4.2! INDUSTRIAL*CONSUMERS*..............................................................................................*14!4.3! BUSINESS*AND*INDUSTRY*REDUCTIONS*...................................................................*15!4.4! CRITICAL*JUDGEMENT*OF*EXEMPTIONS*...................................................................*16!
5! STEEL*INDUSTRY*.........................................................................................................*18!5.1! DEFINTION*AND*MEANING*............................................................................................*18!5.2! SUMMARY*AND*PROSPECT*............................................................................................*19!
6! METHODOLOGY*............................................................................................................*21!6.1! RESEARCH*STRATEGY*.....................................................................................................*21!6.2! HYPOTHESES*......................................................................................................................*22!6.3! QUESTIONNAIRE*...............................................................................................................*22!
7! PRESENTATION*AND*DISCUSSION*OF*FINDINGS*...............................................*23!7.1! INTERVIEW*PROCEDURE*................................................................................................*23!7.2! PRESENTATION*OF*RESULTS*........................................................................................*24!7.3! ASSESSMENT*OF*RESULTS*..............................................................................................*30!7.4! LIMITATION*OF*RESULTS*...............................................................................................*33!
8! CONCLUSION*..................................................................................................................*34! *
IV
LIST OF TABLES Table 1 - Energy political objectives to achieve the Energiewende (BMWi, 2010) ..................... 7!Table 2 - Development of gross energy production by energy source (AG Energiebilanzen,
2013) ...................................................................................................................................... 8!Table 3 - Overview of basic compensation for feeding-in RE over the EEG laws, tariffs varies
depending on plant size (Bundesregierung, 1990) (BMUB, 2000) (BMUB, 2004) (BMUB, 2010) (BMUB, 2012) ............................................................................................................ 9!
Table 4 - User groups and their simplified average charges on the electricity price (Matthes, 2014) (Statistisches Bundesamt, 2013) (BDEW, 2013) (Bundesministerium der Justiz, 2012) .................................................................................................................................... 15!
Table 5 - Comparison between Electric and Oxygen Furnace steel production in 2013 (Stahlinstitut VDEh, 2014) .................................................................................................. 18!
Table 6 - Global steel production and usage in 2012 (World Steel Association, 2013) ............. 20!Table 7 - Contacted entities and answer scope (green= answer given, blue= no official voice in
this regard, red= not answered) ........................................................................................... 23!Table 8 - Potentials for savings in the European steel industry until 2050 (own calculation based
on (Wörtler, 2013)) .............................................................................................................. 29!
LIST OF FIGURES Figure 1 - Project Structure in Project Approach Formatting ....................................................... 6!Figure 2 - Composition of the full EEG Levy in 2014 (Own presentation based on
(Bundesverband Erneuerbare Energien e.V., 2013)) .......................................................... 11!Figure 3 - Development of average Electricity Prices for unprivileged consumers (BDEW,
2013) .................................................................................................................................... 14!Figure 4 - Net electricity consumption of user groups in 2011 (Own presentation based on
(BDEW, 2012)) ................................................................................................................... 14!Figure 5 - Proposed amendments to EEG 2012 from Öko-Institut e.V. (Own presentation based
on (Matthes, 2014)) ............................................................................................................. 25!
1
1 INTRODUCTION
1.1 CHALLENGES OF THE ENERGIEWENDE The term ‘Energiewende’ or energy turnaround was shaped with Germany’s radical decision to phase out nuclear power completely. Already years before, the path was chosen to head into a more sustainable future in energy production and energy consumption. Sustainable meaning, social, environmental and economical, which is summarised in the Triple-Bottom Line concept (Elkington, 1998).
But what are the consequences? And above all, who is financially responsible for the politically settled targets?
The direction is distinctively shaped: Milestones have already been determined for the coming 36 years leading the way to an energy system that is environmentally friendly that is not emitting CO2 that is economically competitive and finally is to remain social welfare. But of course, this major change, in a long existing and established energy system, does not come without enormous investments in all kinds of areas. It is not only the production side that has to be transformed, but also the transport and consumption is to be modified in order to meet the targets in 2050.
Currently there are numerous flaws in the system that prevent an efficient and fair distribution of cost (Hallerberg, 2013). The German Government provides financial incentives in form of subsidies, feed-in tariffs and compensations that should draw energy producers into investing in renewable energy power plants. This is due to the fact that most renewable energies in its total production cost are not competitive against full load hour, base load power plants such as coal and nuclear. That means that the price that is attained for the actual electricity is currently not sufficient to cover the investment and maintenance cost for renewables because of little annual production and hence small profit margins. To continue encouraging investors to build solar and wind parks, guaranteed compensatory payments are determined for a period of 20 year to minimise risk (BMUB, 2000). The problem is that these payments do not equal the price for the electricity that is obtained at nowadays electricity market. This issue is even more intensified as electricity prices started to dwindle in 2008. To still be able to pay out the agreed compensation, the government has, over a period of years, introduced different additions to the electricity bill. Therefore every consumer of electricity unconsciously supports the expansion of renewable energies and hence fosters the Energiewende. In addition to the decreasing electricity prices, the exemption and reduction of certain charges for energy intensive manufactures, creates an issue in the willingness to implement the transition. Another barrier is the failed commerce with CO2 quotas. With the revenues from CO2-emitting industry, especially energy producers, another gap was supposed to be filled. Unfortunately the trading prices have been low since the quota system was introduced to the trading market.
One main concern that affects the entire population of Germany is in fact the abovementioned financial difference that has to be carried by businesses and households. This becomes increasingly burdensome for poorer, private electricity consumers but it also reduces the competiveness of companies that are legally obliged to pay the Renewable Energy (EEG) Levy.
2
This implies already that not the whole industry is supposed to contribute with certain taxes and charges. When it comes to the electricity bill, there is a huge difference in Cent per kWh depending on the amount used and peak or base load power usage. It is believed that the current system is questionable in initiating an economically sustainable way to a stable and independent energy system based on renewable energy.
The newly formed German Government, the Federal minister for technology and energy Sigmar Gabriel in particular, recognises the drawbacks of the last Renewable Energies Act amendment from 2012. He is therefore currently working on an essential transformation of the latter and announced the reformation to the main challenge for the legislative period. With an ambitious enhancement of the 2020 goal from formerly 35% to now discussed 40% the challenges would increase even more. Further, this achievement should be reached with lower feed-in tariffs than before, according to the first proposal of Gabriel. But the major discussions circle around the exempted energy-intensive industry in Germany. To unburden households and smaller businesses, it is considered to discard the reductions of the Renewable Energy (EEG) Levy for energy intensive industries. (Stalinski, 2014)
In 2011 46% (BDEW, 2012) of the electricity was consumed by manufacturing industry in Germany, which equals around 250 TWh (BDEW, 2012). The gross value added-share of the manufacturing industry grew in the past years to a peak of 25% in 2012 (Statistisches Bundesamt, 2014) and confirms the strong industrial position of Germany on the international market. The main producing industries that contribute to this high share of gross value added are the chemical products, steel and aluminium products, paper, glass and construction materials (in order of revenue (VIK, 2010)). The European steel industry stands still for innovation, growth and employment (Europäische Kommission, 2013) and is therefore to be fostered and remained. So far the steel industry is exempted from paying the full EEG Levy of currently 6.24 ct/kWh to 0.05 ct/kWh. The migration of the industry in general and the steel industry in particular might result in a collapse in the German economy.
This thesis seeks to examine how the current allocation of the EEG Levy might be modified in order to achieve a more sustainable path towards the Energiewende. This shall be realised by assessing impacts of the first draft law (Bundesregierung, 2014) of the German Government and counterproposals in regards to the EEG Levy. These aspects are referred to the energy intensive industry, using the example of the steel industry in Germany.
3
2 RESEARCH DESIGN
2.1 THEORETICAL APPROACH The dissertation at hand seeks new insights in the topic of the EEG Levy in Germany. Specifically, it takes a critical view on the current composition structure and how it may be modified in order to improve its fairness and sustainability in the amendment to the Renewable Energies Act, which is recently politically discussed. In order to do so, this dissertation takes a deductive approach (Saunders, 2009) with moving from the general information about political energy goals and the funding of expanding Renewable Energy (RE) to the exemptions of entities not obliged paying the Levy. To investigate the justification of the two main exemptions, namely special equalisation scheme (§40 ff. EEG) and domestically produced electricity (§37 EEG), an exploratory study is required. This means that it is evident that the current structure of the EEG Levy cannot be continued but there is not yet a definite solution that is sustainably bearable for the whole of German electricity consumers. Therefore a literature review is done to research the current regulation and exceptions. Based on those findings, hypotheses are phrased that are further investigated for falsification or confirmation by means of expert interviews. Specifically, the interviews are needed to assess the possibility and extent of a change in the EEG Levy exemption, the two abovementioned in particular applied to one sector in the highly energy intensive industry, steel manufacturing and recycling. To examine the topic in a valid way it is necessary to shine light on the research question from different points of views. Hence, not only representatives from the steel industry will be interviewed but also the domestic consumer cooperative and neutral associations active in energy research.
As stated before the electricity cost for such companies are much lower than for example the prices that households pay. However, with the apportion of the EEG Levy in terms of a partial surcharge upon the industrial electricity price, the industry might trouble to offer competitive prices on an international market. With an increase of the Levy the energy cost of producing industry could rise to an unbearable competitive disadvantage on the market. In an industry such as steel, an increase in energy cost cannot be easily allotted to the selling prices. If a country’s industry offers a homogeneous good on an international market for a higher price than competing companies, buyers might change their suppliers. In light of this, a manufacturing company would move their location to a site with competitive energy prices to offer the goods for a competitive price. This, in turn, could result in socio-economic changes for Germany. With a high share of Germany’s electricity consumption, the question seems appropriate why especially large consumers do not need to contribute in the same ratio. Therefore and because this topic is highly relevant, it needs to be analysed to which extent a change in the EEG Levy regulation regarding the compensation regulation of energy intensive industry would impact their competitiveness and hence economical stand on the market.
In summary it is reckoned that the impact of the Energiewende in regards to its funding, which is mainly done through the EEG Levy might therefore severely affect the German economy.
4
2.2 RESEARCH QUESTION Based on the lately discussed issues of the EEG Levy funding the renewable energy transition in Germany, it is the intent of this dissertation to answer the following research question:
How can the Renewable Energy Levy structure be redesigned in order to keep the German steel industry competitive while pursuing energy savings?
In order to answer the main research question, specific topics have to be elaborated on and investigated. The following sub-questions have been developed with this in mind.
• How is the Renewable Energy Levy gathered and utilised within the Energiewende? • How is the electricity price composed today and which shares do the energy intensive
industry pay compared to households? • What importance does the steel industry have for the German economy and how can
energy saving potentials be utilised?
2.3 DELIMITATION This dissertation deals with the EEG Levy structure and its issues within the country of Germany. Specifically that means that law, GDP, political targets are limited to the national level. Effects and influences of the European Union or even globally are considered where it is deemed to be appropriate and necessary. This is the case where overarching regulation or trading is looked at.
Electricity, which is sold and purchased in Germany, is traded on the European Energy Exchange (EEX) and therefore the electricity market price is the same for every participating country. The surcharges on top of the obtained electricity price, however, are set by the respective country, in case of this thesis by German law. In general it also has to be said that only the electricity market is considered in this scope, not the possibilities and prices of the heat market.
To display the effects of the EEG Levy for energy intensive industry the steel industry is used exemplary. Other similarly consuming industries might face the same problems but are not analysed by the author within this scope. Additionally, since the steel industry is very complex in its further processing application and trading, relevant background is given to the reader where necessary to clarify the steel industry’s importance to the German production and its financial meaning and the issues it is dealing with.
The amendment to the Renewable Energies Act and the statements gathered from interviews will be analysed only in regards to relevant topics that are, in turn, required to answer the research questions. Those are the special equalisation scheme (§40 ff. EEG), produced domestically (§37 EEG) and the trading of renewable energy. Other topics might still be relevant for the successful transformation of the German energy system. However to effectively answer the research question in a target-oriented way this limitation was deemed necessary. Further, the domestically produced electricity is seen in the context of secondary products or also called by-products. Renewable Energy plants that consume electricity for themselves are left out. In the Renewable Energies Act this is also part of the regulation.
5
2.4 RESEARCH METHODOLOGY In the following the methods used in this dissertation are outlined. A brief overview of every method chosen is given, including its importance and highlighting its relevance.
2.4.1 LITERATURE REVIEW
In order to gain relevant information that is important to the development of the project, a literature review has been conducted. This includes collecting secondary data about the political development in Germany in its energy regards, the Renewable Energies Act in particular, consulting the historical electricity market and price data and finally about German steel industry. It is important to lay the foundation to firstly understand the framework in which Germany has to fulfil its targets and further, to better comprehend the conducted interview and its content. Secondary data is consolidated from official reports mainly, complemented with news articles, homepages’ information and secondary statements by representatives.
2.4.2 HYPOTHESES
Based on the knowledge gathered in the literature, hypotheses have been phrased in order to summarise and reflect this information. They are biased depending on the interest group who has given the information but treated objectively in order to falsify or confirm the hypotheses.
2.4.3 EXPERT INTERVIEW
To analyse the hypotheses in a proper way, experts have been consulted as primary research, active in a field of steel industry, political matters and energy related concerns. A list has been created with all relevant contacts (see ‘Assessment of results’ in section 7.4) that are deemed to be qualified to give statement to eventually answer the research question. Contact details have been used to approach individuals via telephone. The answers and further queries have been answered mostly via E-Mail due to time restrictions of the interviewees. The primary information that has been gathered from interviewees gives great indication of how amendments to the Renewable Energies Act 2014 could modify efficiently and therefore how the EEG Levy could be restructured to make the distribution of cost fairer and to keep the steel industry competitive.
2.5 PROJECT REPORT STRUCTURE After demonstrating the issues that demand investigation the research aim and its methodology is outlined in Chapter 2. The foundation for the Energiewende in Germany has been the first release of the Renewable Energies Act in 2000. Developing from there, changes and its outcomes are illustrated in Chapter 3. Special detail is placed upon the funding of the energy turnaround; Renewable Energy Levy, CO2 quotas and other. To understand the context of the Renewable Energy Levy and the electricity price, information about the European electricity market and different electricity consumer prices is given in Chapter 4. In this connection the reductions and exemptions for the German industry is illustrated and critically discussed. As a next step summarised inside knowledge about the steel industry and its meaning for the German economy is given in Chapter 5. Assumed and expected development of the global steel industry’s future is also outlined.
6
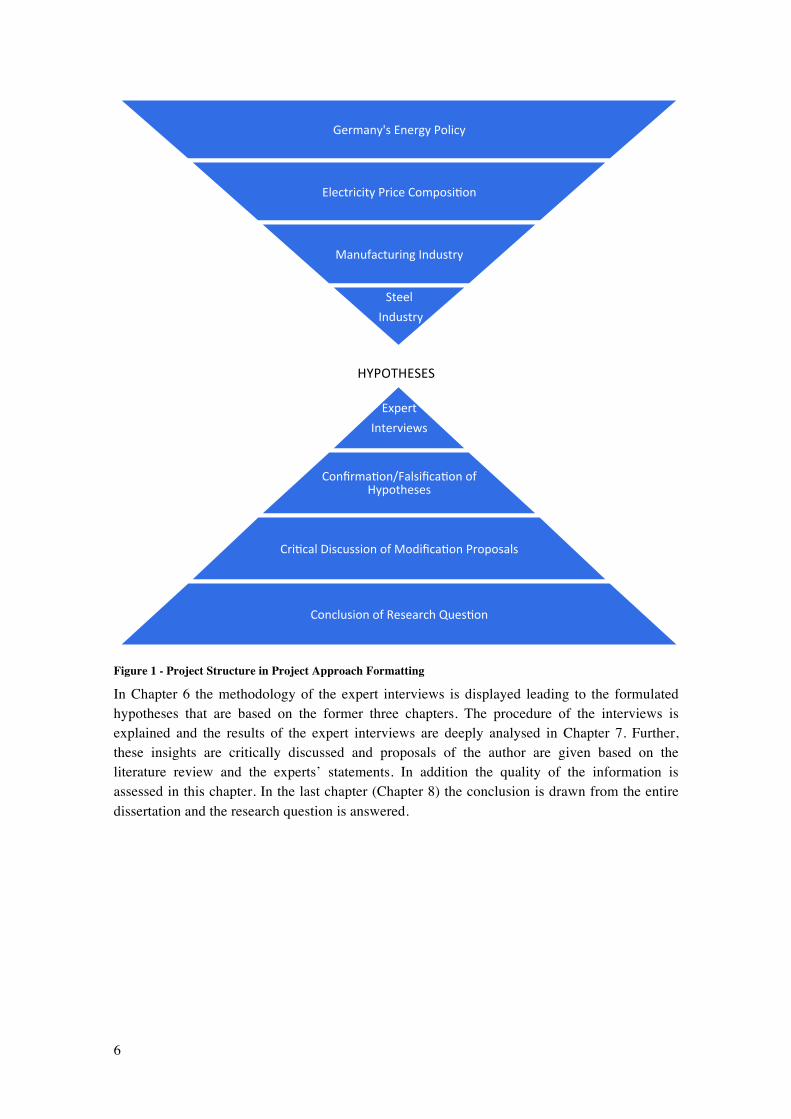
HYPOTHESES(
Figure 1 - Project Structure in Project Approach Formatting
In Chapter 6 the methodology of the expert interviews is displayed leading to the formulated hypotheses that are based on the former three chapters. The procedure of the interviews is explained and the results of the expert interviews are deeply analysed in Chapter 7. Further, these insights are critically discussed and proposals of the author are given based on the literature review and the experts’ statements. In addition the quality of the information is assessed in this chapter. In the last chapter (Chapter 8) the conclusion is drawn from the entire dissertation and the research question is answered.
Germany's(Energy(Policy(
Electricity(Price(Composi:on(
Manufacturing(Industry(
Steel((Industry(
(
Expert((Interviews(
Confirma:on/Falsifica:on(of(Hypotheses(
Cri:cal(Discussion(of(Modifica:on(Proposals(
Conclusion(of(Research(Ques:on(
7
3 GERMANY’S ENERGY POLICY
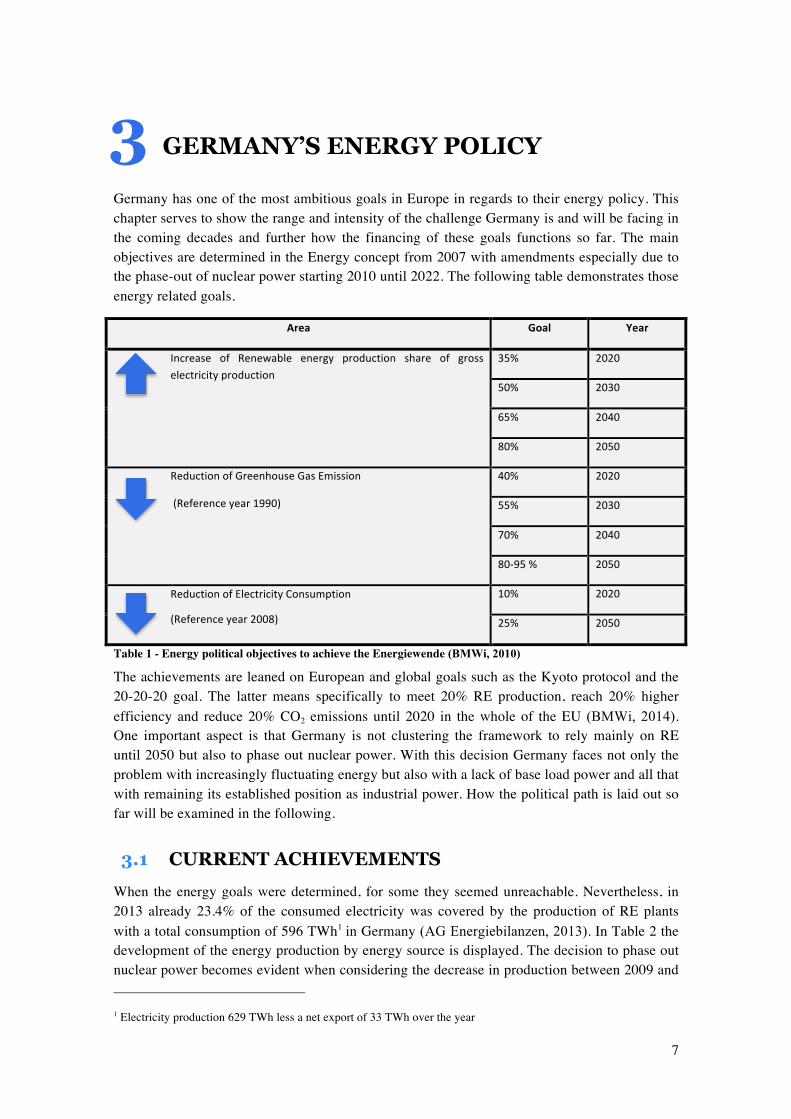
Germany has one of the most ambitious goals in Europe in regards to their energy policy. This chapter serves to show the range and intensity of the challenge Germany is and will be facing in the coming decades and further how the financing of these goals functions so far. The main objectives are determined in the Energy concept from 2007 with amendments especially due to the phase-out of nuclear power starting 2010 until 2022. The following table demonstrates those energy related goals.
Area% Goal% Year%
Increase( of( Renewable( energy( production( share( of( gross(electricity(production(
35%(( 2020(
50%( 2030(
65%( 2040(
80%( 2050(
Reduction(of(Greenhouse(Gas(Emission(
((Reference(year(1990)((
40%( 2020(
55%( 2030(
70%( 2040(
80X95(%( 2050(
Reduction(of(Electricity(Consumption(
(Reference(year(2008)(
10%( 2020(
25%( 2050(
Table 1 - Energy political objectives to achieve the Energiewende (BMWi, 2010)
The achievements are leaned on European and global goals such as the Kyoto protocol and the 20-20-20 goal. The latter means specifically to meet 20% RE production, reach 20% higher efficiency and reduce 20% CO2 emissions until 2020 in the whole of the EU (BMWi, 2014). One important aspect is that Germany is not clustering the framework to rely mainly on RE until 2050 but also to phase out nuclear power. With this decision Germany faces not only the problem with increasingly fluctuating energy but also with a lack of base load power and all that with remaining its established position as industrial power. How the political path is laid out so far will be examined in the following.
3.1 CURRENT ACHIEVEMENTS When the energy goals were determined, for some they seemed unreachable. Nevertheless, in 2013 already 23.4% of the consumed electricity was covered by the production of RE plants with a total consumption of 596 TWh1 in Germany (AG Energiebilanzen, 2013). In Table 2 the development of the energy production by energy source is displayed. The decision to phase out nuclear power becomes evident when considering the decrease in production between 2009 and 1 Electricity production 629 TWh less a net export of 33 TWh over the year
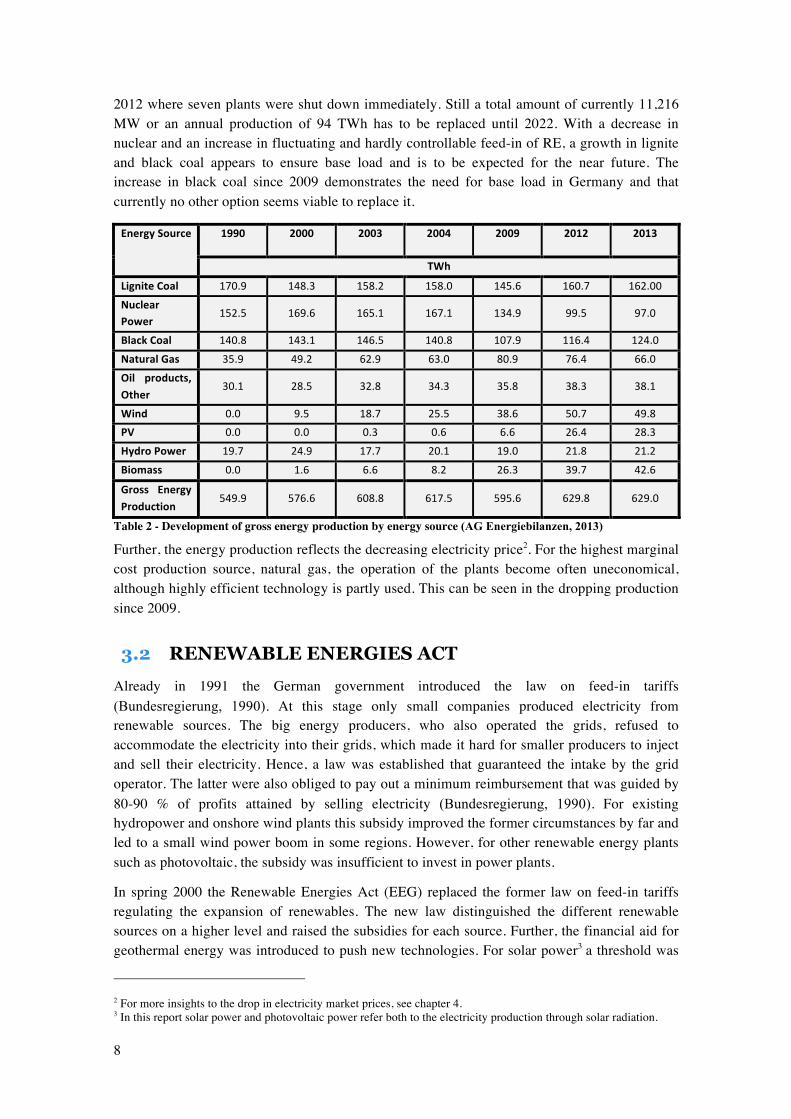
8
2012 where seven plants were shut down immediately. Still a total amount of currently 11,216 MW or an annual production of 94 TWh has to be replaced until 2022. With a decrease in nuclear and an increase in fluctuating and hardly controllable feed-in of RE, a growth in lignite and black coal appears to ensure base load and is to be expected for the near future. The increase in black coal since 2009 demonstrates the need for base load in Germany and that currently no other option seems viable to replace it.
Energy%Source% 1990% 2000% 2003% 2004% 2009% 2012% 2013%
TWh%
Lignite%Coal% 170.9( 148.3( 158.2( 158.0( 145.6( 160.7( 162.00(
Nuclear%Power%
152.5( 169.6( 165.1( 167.1( 134.9( 99.5( 97.0(
Black%Coal% 140.8( 143.1( 146.5( 140.8( 107.9( 116.4( 124.0(
Natural%Gas% 35.9( 49.2( 62.9( 63.0( 80.9( 76.4( 66.0(
Oil% products,%Other%
30.1( 28.5( 32.8( 34.3( 35.8( 38.3( 38.1(
Wind% 0.0( 9.5( 18.7( 25.5( 38.6( 50.7( 49.8(PV% 0.0( 0.0( 0.3( 0.6( 6.6( 26.4( 28.3(
Hydro%Power% 19.7( 24.9( 17.7( 20.1( 19.0( 21.8( 21.2(
Biomass% 0.0( 1.6 6.6( 8.2( 26.3( 39.7( 42.6(
Gross% Energy%Production%
549.9( 576.6( 608.8( 617.5( 595.6( 629.8( 629.0(
Table 2 - Development of gross energy production by energy source (AG Energiebilanzen, 2013)
Further, the energy production reflects the decreasing electricity price2. For the highest marginal cost production source, natural gas, the operation of the plants become often uneconomical, although highly efficient technology is partly used. This can be seen in the dropping production since 2009.
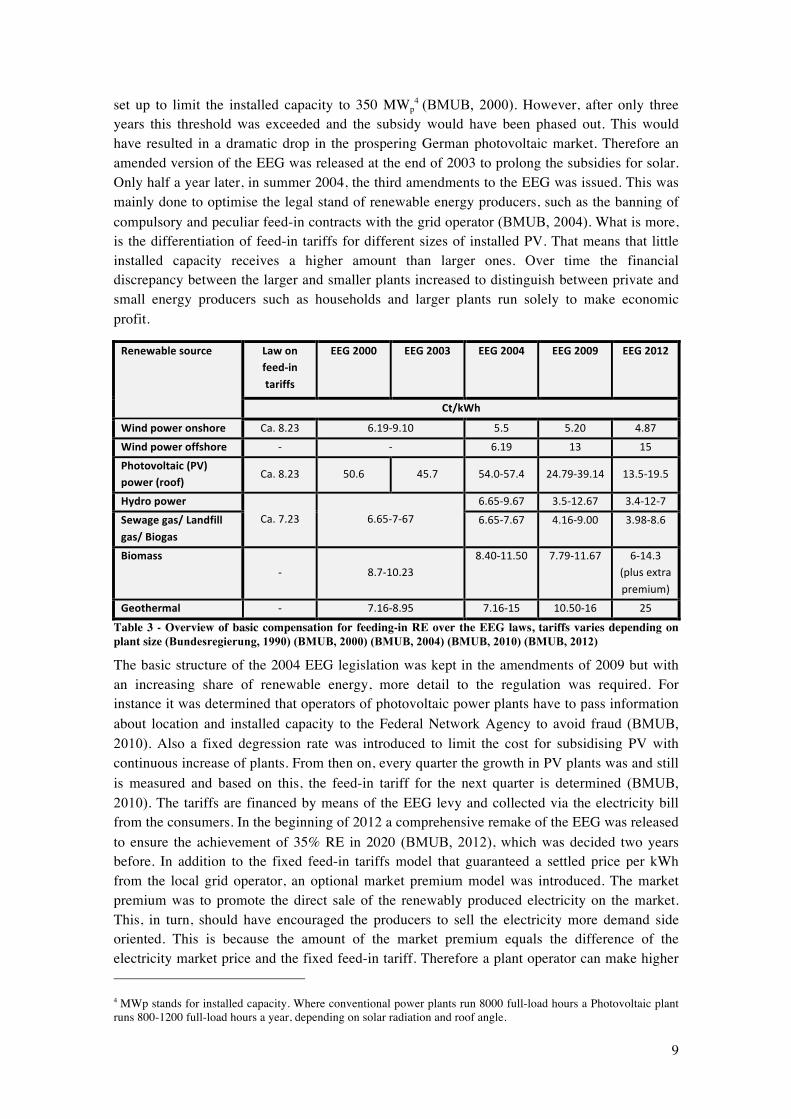
3.2 RENEWABLE ENERGIES ACT Already in 1991 the German government introduced the law on feed-in tariffs (Bundesregierung, 1990). At this stage only small companies produced electricity from renewable sources. The big energy producers, who also operated the grids, refused to accommodate the electricity into their grids, which made it hard for smaller producers to inject and sell their electricity. Hence, a law was established that guaranteed the intake by the grid operator. The latter were also obliged to pay out a minimum reimbursement that was guided by 80-90 % of profits attained by selling electricity (Bundesregierung, 1990). For existing hydropower and onshore wind plants this subsidy improved the former circumstances by far and led to a small wind power boom in some regions. However, for other renewable energy plants such as photovoltaic, the subsidy was insufficient to invest in power plants.
In spring 2000 the Renewable Energies Act (EEG) replaced the former law on feed-in tariffs regulating the expansion of renewables. The new law distinguished the different renewable sources on a higher level and raised the subsidies for each source. Further, the financial aid for geothermal energy was introduced to push new technologies. For solar power3 a threshold was
2 For more insights to the drop in electricity market prices, see chapter 4. 3 In this report solar power and photovoltaic power refer both to the electricity production through solar radiation.
9
set up to limit the installed capacity to 350 MWp4 (BMUB, 2000). However, after only three
years this threshold was exceeded and the subsidy would have been phased out. This would have resulted in a dramatic drop in the prospering German photovoltaic market. Therefore an amended version of the EEG was released at the end of 2003 to prolong the subsidies for solar. Only half a year later, in summer 2004, the third amendments to the EEG was issued. This was mainly done to optimise the legal stand of renewable energy producers, such as the banning of compulsory and peculiar feed-in contracts with the grid operator (BMUB, 2004). What is more, is the differentiation of feed-in tariffs for different sizes of installed PV. That means that little installed capacity receives a higher amount than larger ones. Over time the financial discrepancy between the larger and smaller plants increased to distinguish between private and small energy producers such as households and larger plants run solely to make economic profit.
Renewable%source% Law%on%feedNin%tariffs%
EEG%2000% EEG%2003% EEG%2004% EEG%2009% EEG%2012%
Ct/kWh%
Wind%power%onshore% Ca.(8.23( 6.19X9.10( 5.5( 5.20( 4.87(
Wind%power%offshore% X( X( 6.19( 13( 15(
Photovoltaic%(PV)%power%(roof)%
Ca.(8.23( 50.6( 45.7( 54.0X57.4( 24.79X39.14( 13.5X19.5(
Hydro%power%Ca.(7.23( 6.65X7X67(
6.65X9.67( 3.5X12.67( 3.4X12X7(
Sewage%gas/%Landfill%gas/%Biogas%
6.65X7.67( 4.16X9.00( 3.98X8.6(
Biomass%X( 8.7X10.23(
8.40X11.50( 7.79X11.67( 6X14.3((plus(extra(premium)(
Geothermal% X( 7.16X8.95( 7.16X15( 10.50X16( 25(
Table 3 - Overview of basic compensation for feeding-in RE over the EEG laws, tariffs varies depending on plant size (Bundesregierung, 1990) (BMUB, 2000) (BMUB, 2004) (BMUB, 2010) (BMUB, 2012)
The basic structure of the 2004 EEG legislation was kept in the amendments of 2009 but with an increasing share of renewable energy, more detail to the regulation was required. For instance it was determined that operators of photovoltaic power plants have to pass information about location and installed capacity to the Federal Network Agency to avoid fraud (BMUB, 2010). Also a fixed degression rate was introduced to limit the cost for subsidising PV with continuous increase of plants. From then on, every quarter the growth in PV plants was and still is measured and based on this, the feed-in tariff for the next quarter is determined (BMUB, 2010). The tariffs are financed by means of the EEG levy and collected via the electricity bill from the consumers. In the beginning of 2012 a comprehensive remake of the EEG was released to ensure the achievement of 35% RE in 2020 (BMUB, 2012), which was decided two years before. In addition to the fixed feed-in tariffs model that guaranteed a settled price per kWh from the local grid operator, an optional market premium model was introduced. The market premium was to promote the direct sale of the renewably produced electricity on the market. This, in turn, should have encouraged the producers to sell the electricity more demand side oriented. This is because the amount of the market premium equals the difference of the electricity market price and the fixed feed-in tariff. Therefore a plant operator can make higher 4 MWp stands for installed capacity. Where conventional power plants run 8000 full-load hours a Photovoltaic plant runs 800-1200 full-load hours a year, depending on solar radiation and roof angle.
10
profit when selling the electricity at peak times for higher prices utilising the market premium. (Bundesverband Erneuerbare Energien e.V., 2013). The already mentioned fluctuating feed-in was to be mitigated with the direct sale. However, this model was slowly adopted and is now mainly applied for water, not so much for biomass, wind and photovoltaic (Rostankowski, 2013). Therefore this has to be more incentivised in the coming EEG.
For biogas power plants a flexibility premium for existing and newly built plants was determined. Participating operators enable a shift in electricity production of up to 12 hours. To improve the stand of storage supply, power grid charges were eliminated to avoid a double charge of first when accommodating, and again when feeding in. (BMUB, 2012)
Table 3 illustrates how the feed-in tariffs are adjusted to the markets reactions. The high compensation for feeding-in electricity from solar radiation resulted in a strong decline in tariffs, whereas the compensation for geothermal electricity was continuously raised to encourage the expansion of plants.
When an investor decides to invest in a renewable energy power plant, the funding rate at the date where the plant is connected to the grid is determining and will be paid out for every fed-in kWh over 20 years (BMUB, 2000). That means that the operators of the plant are not responsible to offer and sell their electricity to the daily changing market price. It is rather the case that no matter which electricity price is realised, depending on supply and demand, the producer receives the arranged amount. Like stated above, this discrepancy is balanced out with a few charges. How the composition of collecting the required capital is specifically done, is analysed in the following sections.
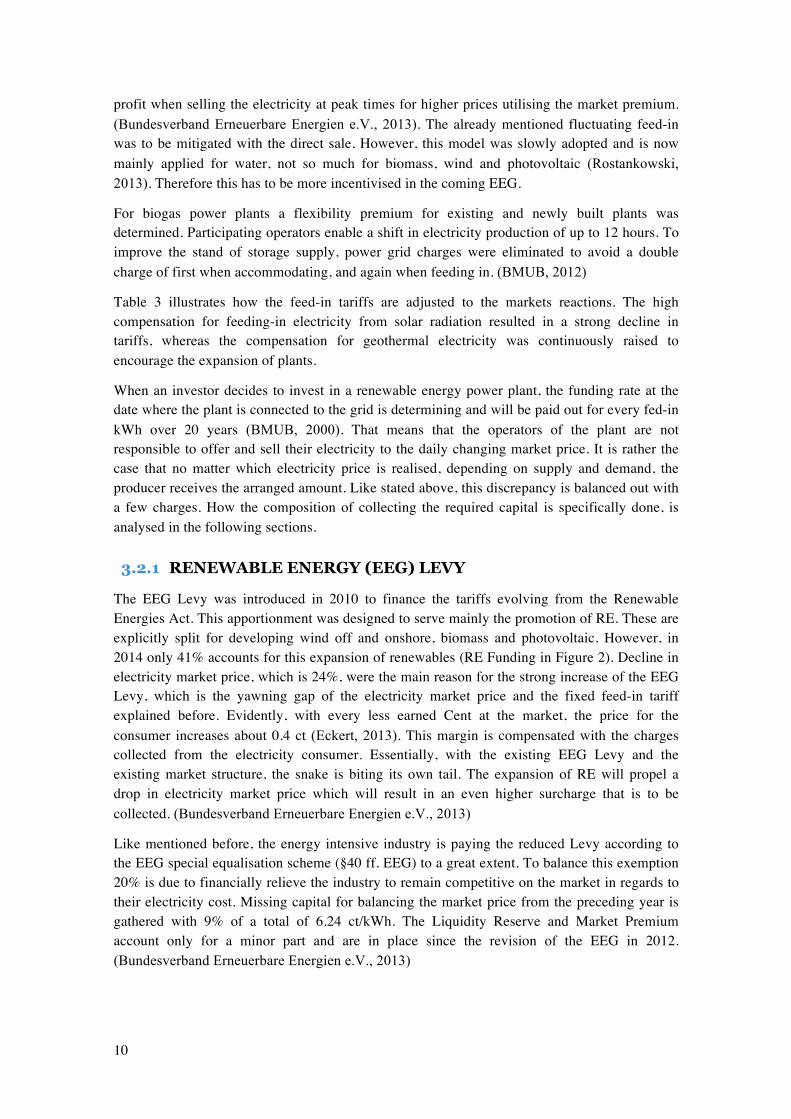
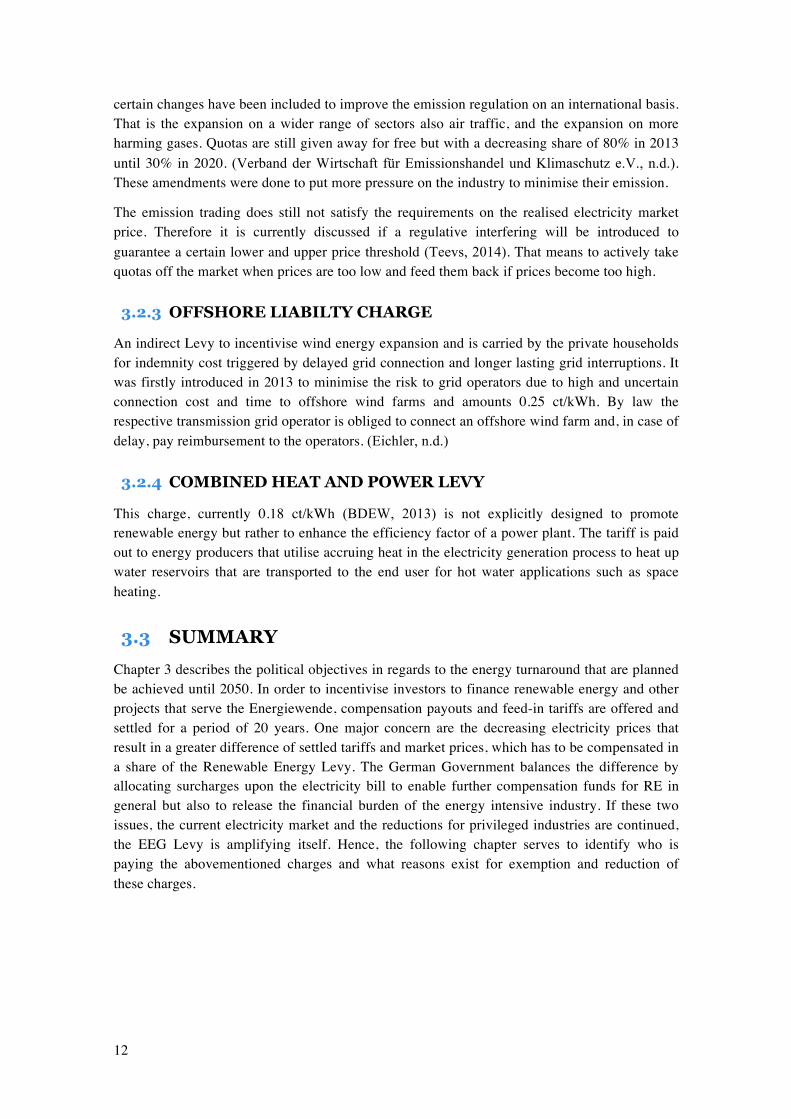
3.2.1 RENEWABLE ENERGY (EEG) LEVY
The EEG Levy was introduced in 2010 to finance the tariffs evolving from the Renewable Energies Act. This apportionment was designed to serve mainly the promotion of RE. These are explicitly split for developing wind off and onshore, biomass and photovoltaic. However, in 2014 only 41% accounts for this expansion of renewables (RE Funding in Figure 2). Decline in electricity market price, which is 24%, were the main reason for the strong increase of the EEG Levy, which is the yawning gap of the electricity market price and the fixed feed-in tariff explained before. Evidently, with every less earned Cent at the market, the price for the consumer increases about 0.4 ct (Eckert, 2013). This margin is compensated with the charges collected from the electricity consumer. Essentially, with the existing EEG Levy and the existing market structure, the snake is biting its own tail. The expansion of RE will propel a drop in electricity market price which will result in an even higher surcharge that is to be collected. (Bundesverband Erneuerbare Energien e.V., 2013)
Like mentioned before, the energy intensive industry is paying the reduced Levy according to the EEG special equalisation scheme (§40 ff. EEG) to a great extent. To balance this exemption 20% is due to financially relieve the industry to remain competitive on the market in regards to their electricity cost. Missing capital for balancing the market price from the preceding year is gathered with 9% of a total of 6.24 ct/kWh. The Liquidity Reserve and Market Premium account only for a minor part and are in place since the revision of the EEG in 2012. (Bundesverband Erneuerbare Energien e.V., 2013)
11
Figure 2 - Composition of the full EEG Levy in 2014 (Own presentation based on (Bundesverband Erneuerbare Energien e.V., 2013))
As it can be seen, the main part of the EEG Levy does not contribute to the expansion of RE directly but rather to balance privileged consumers and the definite feed-in tariff payments to RE operators.
3.2.2 CO2 QUOTA SYSTEM
CO2-quota trade is a regulative tool and is used to internalise external cost back to the responsible party. As a first step, the government agreed to a total amount of tonnes CO2-equivalents5 that could be emitted in a fixed period of time, 2005-2007. Depending on how little or large the amount is, the emission targets get more or less ambitious. In a second move the amount of tonnes was allocated to the emitting industry. In the end of the period every emitting party had to prove that the emitted CO2 did not exceed the permitted amount. In case the allocated amount was not sufficient to continue production, additional quotas had to be purchased on the market. That means that if one company receives too many quotas allocated than needed, they can be sold to a company that requires more. That incentivises companies not only to limit their emission to a minimum to meet their allocated amount but also to make processes more efficient to emit less and therefore be able to sell the quotas on the market (Verband der Wirtschaft für Emissionshandel und Klimaschutz e.V., n.d.). The reason why the system did not work in the first trading period was the high amount of quotas released, which resulted in low market prices. The profits from selling additional quotas were solely assigned to the climate and energy fund used to promote renewable energy and other projects towards the Energiewende (BMU, 2012). Further, the majority of the initial allocation quotas had been given out for free. Those two facts led to far too little earnings than expected. Lessons learned, in the second four-year period the amount of quotas was cut down and parts of the quotas had to be purchased, but still the trading prices were too low. In 2013 the third period was initiated with the main difference to former trading periods that the emission trading and regulation takes place on a superior European level, adapting the release of emission trading policy from 2009. That also includes the determining and distribution of the quotas. Over a period of eight years
5 CO2 equivalents apply to actual CO2. Other harming emissions like methane, nitrous oxides and chlorofluorocarbons are converted into CO2 equivalents, depending on their impact on the atmosphere.
RE(Funding(41%(
Decline(Market(Price(24%(
Industry(Privilege(20%(
Supplement(of(Preceding(Year(
9%(
Liquidity(Reserve(4%( Market(Premium(
2%(
6.24%ct/kWh%
12
certain changes have been included to improve the emission regulation on an international basis. That is the expansion on a wider range of sectors also air traffic, and the expansion on more harming gases. Quotas are still given away for free but with a decreasing share of 80% in 2013 until 30% in 2020. (Verband der Wirtschaft für Emissionshandel und Klimaschutz e.V., n.d.). These amendments were done to put more pressure on the industry to minimise their emission.
The emission trading does still not satisfy the requirements on the realised electricity market price. Therefore it is currently discussed if a regulative interfering will be introduced to guarantee a certain lower and upper price threshold (Teevs, 2014). That means to actively take quotas off the market when prices are too low and feed them back if prices become too high.
3.2.3 OFFSHORE LIABILTY CHARGE
An indirect Levy to incentivise wind energy expansion and is carried by the private households for indemnity cost triggered by delayed grid connection and longer lasting grid interruptions. It was firstly introduced in 2013 to minimise the risk to grid operators due to high and uncertain connection cost and time to offshore wind farms and amounts 0.25 ct/kWh. By law the respective transmission grid operator is obliged to connect an offshore wind farm and, in case of delay, pay reimbursement to the operators. (Eichler, n.d.)
3.2.4 COMBINED HEAT AND POWER LEVY
This charge, currently 0.18 ct/kWh (BDEW, 2013) is not explicitly designed to promote renewable energy but rather to enhance the efficiency factor of a power plant. The tariff is paid out to energy producers that utilise accruing heat in the electricity generation process to heat up water reservoirs that are transported to the end user for hot water applications such as space heating.
3.3 SUMMARY Chapter 3 describes the political objectives in regards to the energy turnaround that are planned be achieved until 2050. In order to incentivise investors to finance renewable energy and other projects that serve the Energiewende, compensation payouts and feed-in tariffs are offered and settled for a period of 20 years. One major concern are the decreasing electricity prices that result in a greater difference of settled tariffs and market prices, which has to be compensated in a share of the Renewable Energy Levy. The German Government balances the difference by allocating surcharges upon the electricity bill to enable further compensation funds for RE in general but also to release the financial burden of the energy intensive industry. If these two issues, the current electricity market and the reductions for privileged industries are continued, the EEG Levy is amplifying itself. Hence, the following chapter serves to identify who is paying the abovementioned charges and what reasons exist for exemption and reduction of these charges.
13
4 ELECTRICITY PRICE
The electricity price experienced a tremendous and unexpected change in the last decade. This is due to an increase in RE reflected in the merit order effect, which is a consequence of supply capacity from different technologies with different marginal cost structures on the existing electricity market. The merit order is determined by sorting all power plants according to their marginal costs. The power plants with the lowest marginal cost are injected in order up to the point where current demand is covered. The power plant injected last sets the price on the market. In earlier days that resulted in an acceptable price at base load times, where nuclear and coal was run, and a higher price at peak times where power plants with the highest fuel cost such as natural gas were run. With the release of the Renewable Energies Act this merit order effect was reversed. According to the regulation, produced electricity from RE had to be injected first since their fuel cost is basically zero. Increasing feed-in of RE led to a price shift to even lower prices at peak times. It is claimed that this decrease at the electricity market through renewables amounts 6-10 €/MWh (BMU, 2007) (Matthes, 2014) (Bütikofer, 2014). After the announcement that nuclear power is to be phased out by 2022, one expected increasing prices and blackouts due to lacking base load power. When looking at the electricity market prices the opposite is true. The prices even decrease to an average of 45 €/MWh today instead of 55 €/MWh since the peak in 2008 (European Energy Exchange AG, 2014).
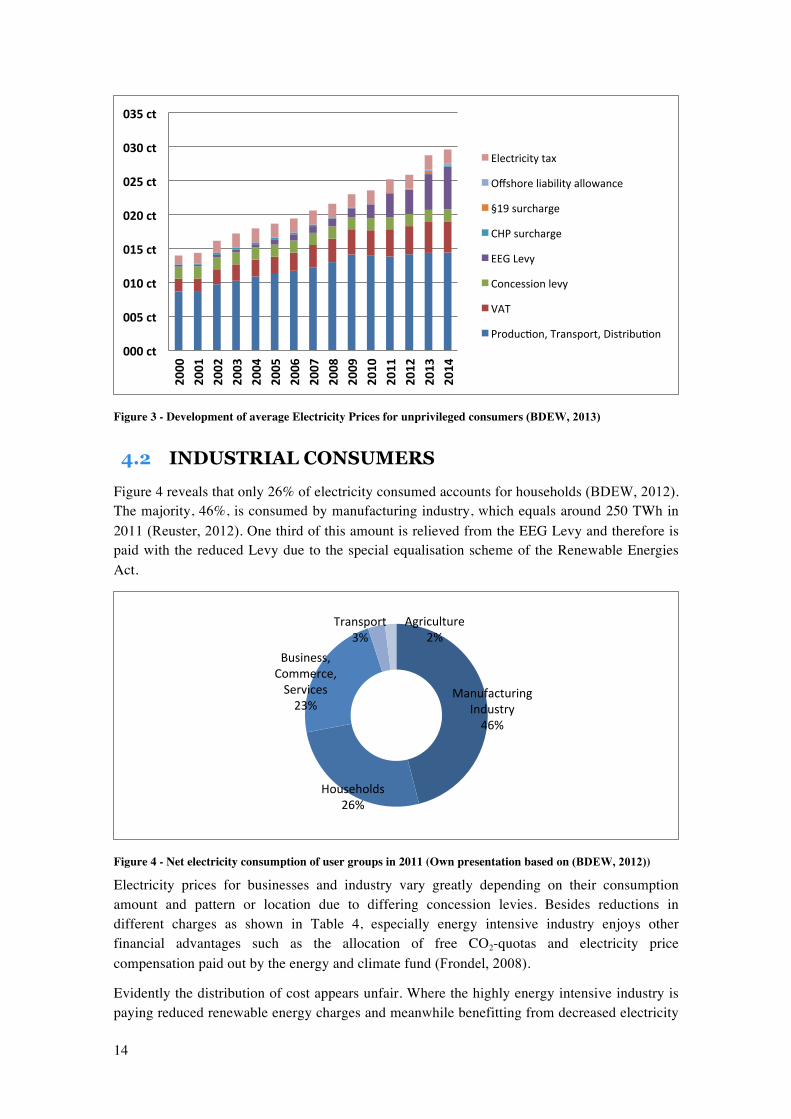
4.1 PRIVATE CONSUMERS Nevertheless, the prices that are carried forward to the private end user or also called not-privileged consumers, increased significantly. In 2000 a German average three-person household with an annual consumption of 3,500 kWh had to pay 13.94 ct/kWh whereas in 2013 the prices rose to 28.73 ct/kWh (BDEW, 2013) as a total amount for electricity, which can be seen in Figure 3. One main reason for the increase is the rising amount of the EEG Levy. In 2014 this charge increased again about 0.963 ct/kWh to a total of 6.24 ct/kWh, which equals over 20% of the whole electricity price. However, the increase in electricity price is not solely affiliated with the increased RE charges. The price for generation, transport and distribution has risen over the past years as well. In 2000 only 8.62 ct/kWh accounted for the energy itself. In 2013 it was already 14.32 ct/ kWh (BDEW, 2013). This might be traced back to the strong price increase for importing fossils like coal, gas, and oil, which more then doubled since the year 2000 (Statistisches Bundesamt, 2013). Operators of fossil fuel plants might have allocated increased cost in production such as increased importing prices and CO2-quotas. Currently fossil fuelled power plants struggle with low electricity prices that are obtained at the market. Older and inefficient plants have to be shut down and operators have to deal with a dropping financial situation. (stern.de GmbH, 2014).
This steady price increase in electricity per kWh prompted households to consistently lower their consumption by replacing old devices with efficient ones. Simultaneously the need for more electronic devices rose, hence the net electricity consumption has not much changed over the past decade. (BDEW, 2013). It should be the intention that the private consumer benefits from decreased electricity prices due to the increasing share of RE, as they are financing the latter by means of the EEG Levy (BUND, 2014).
14
Figure 3 - Development of average Electricity Prices for unprivileged consumers (BDEW, 2013)
4.2 INDUSTRIAL CONSUMERS Figure 4 reveals that only 26% of electricity consumed accounts for households (BDEW, 2012). The majority, 46%, is consumed by manufacturing industry, which equals around 250 TWh in 2011 (Reuster, 2012). One third of this amount is relieved from the EEG Levy and therefore is paid with the reduced Levy due to the special equalisation scheme of the Renewable Energies Act.
Figure 4 - Net electricity consumption of user groups in 2011 (Own presentation based on (BDEW, 2012))
Electricity prices for businesses and industry vary greatly depending on their consumption amount and pattern or location due to differing concession levies. Besides reductions in different charges as shown in Table 4, especially energy intensive industry enjoys other financial advantages such as the allocation of free CO2-quotas and electricity price compensation paid out by the energy and climate fund (Frondel, 2008).
Evidently the distribution of cost appears unfair. Where the highly energy intensive industry is paying reduced renewable energy charges and meanwhile benefitting from decreased electricity
000%ct%
005%ct%
010%ct%
015%ct%
020%ct%
025%ct%
030%ct%
035%ct%
2000%
2001%
2002%
2003%
2004%
2005%
2006%
2007%
2008%
2009%
2010%
2011%
2012%
2013%
2014%
Electricity(tax(
Offshore(liability(allowance(
§19(surcharge(
CHP(surcharge(
EEG(Levy(
Concession(levy(
VAT(
Produc:on,(Transport,(Distribu:on(
Manufacturing(Industry(46%(
Households(26%(
Business,(Commerce,(Services(23%(
Transport(3%(
Agriculture(2%(
15
prices, small and medium-sized businesses and households are carrying the financial burden of the energy transition with 20% of their own charge. Specifically that means those companies account for 18% of consumed electricity but they are contributing with only 0.3% of the total gathered surcharge (Faulstrich, 2012).
4.3 BUSINESS AND INDUSTRY REDUCTIONS Due to administrative limits, the Renewable Energies Act assumes that companies operating in manufacturing and extractive or mining industry compete on the international market (BMUB, 2012). Also there is no official definition for energy intensive industry in particular. To ensure not harming and burdening Germany’s economy, these industries receive the privilege in form of a compensation regulation depending on their electricity consumption. Companies that are producing their own electricity are not obliged to pay the Levy on the generated amount.
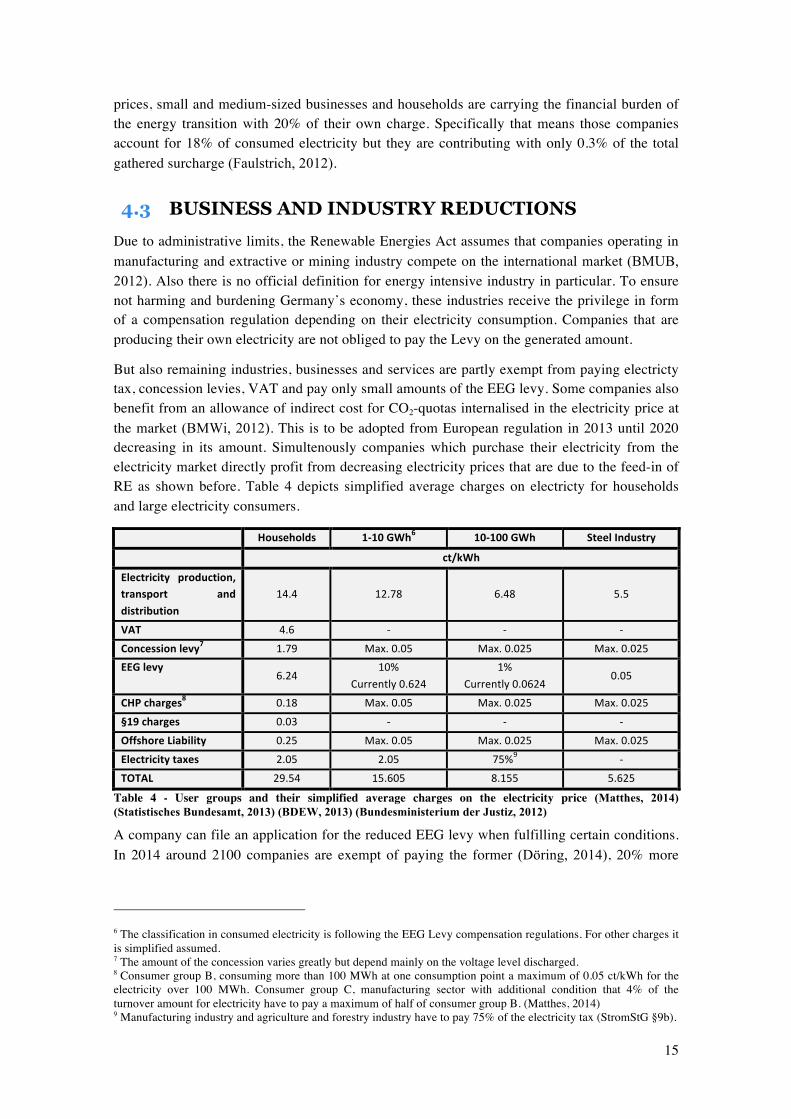
But also remaining industries, businesses and services are partly exempt from paying electricty tax, concession levies, VAT and pay only small amounts of the EEG levy. Some companies also benefit from an allowance of indirect cost for CO2-quotas internalised in the electricity price at the market (BMWi, 2012). This is to be adopted from European regulation in 2013 until 2020 decreasing in its amount. Simultenously companies which purchase their electricity from the electricity market directly profit from decreasing electricity prices that are due to the feed-in of RE as shown before. Table 4 depicts simplified average charges on electricty for households and large electricity consumers.
% Households% 1N10%GWh6% 10N100%GWh% Steel%Industry%
% ct/kWh%
Electricity% production,%transport% and%distribution%
14.4( 12.78( 6.48( 5.5(
VAT% 4.6( X( X( X(
Concession%levy7% 1.79( Max.(0.05( Max.(0.025( Max.(0.025(EEG%levy%
6.24(10%((
Currently(0.624(1%((
Currently(0.0624(0.05(
CHP%charges8% 0.18( Max.(0.05( Max.(0.025( Max.(0.025(
§19%charges% 0.03( X( X( X(
Offshore%Liability% 0.25( Max.(0.05( Max.(0.025( Max.(0.025(
Electricity%taxes% 2.05( 2.05( 75%9( X(
TOTAL% 29.54( 15.605( 8.155( 5.625(
Table 4 - User groups and their simplified average charges on the electricity price (Matthes, 2014) (Statistisches Bundesamt, 2013) (BDEW, 2013) (Bundesministerium der Justiz, 2012)
A company can file an application for the reduced EEG levy when fulfilling certain conditions. In 2014 around 2100 companies are exempt of paying the former (Döring, 2014), 20% more
6 The classification in consumed electricity is following the EEG Levy compensation regulations. For other charges it is simplified assumed. 7 The amount of the concession varies greatly but depend mainly on the voltage level discharged. 8 Consumer group B, consuming more than 100 MWh at one consumption point a maximum of 0.05 ct/kWh for the electricity over 100 MWh. Consumer group C, manufacturing sector with additional condition that 4% of the turnover amount for electricity have to pay a maximum of half of consumer group B. (Matthes, 2014) 9 Manufacturing industry and agriculture and forestry industry have to pay 75% of the electricity tax (StromStG §9b).
16
than the year before. Privileged companies are supposedly relieved of a total of 5.1 billion € in 2014 due to the EEG Levy, including 169 different sectors (Döring, 2014) (Hoffmann, 2013).
4.3.1 MANUFACTURING INDUSTRY
Privileged companies and domestic producers represent the great majority of exempted firms. One third or 80 TWh (relative to 2011 consumption) are burdened with the EEG Levy (Reuster, 2012). To apply for the special equalisation scheme (§40 ff. EEG) and hence being privileged, a manufacturing company has to fulfil the following prerequisites (BMU, BAFA, 2013):
• At least 1 GWh electricity consumption annually • Certificated Energy Management System • At least 14% of the gross value added accounts for energy cost • Actual payment of the EGG Levy
Companies with electricity consumption greater than 1 GWh annually have to prove a certified Energy Management System according to EMAS, ISO 50001 formerly EN 16001 or ISO 14001 (BMU, BAFA, 2013), to demonstrate the willingness of reducing and monitoring the energy consumption in all sectors of the company. If the application is approved, the firm’s contribution to the EEG Levy amounts to 0.05 ct/kWh, depending on their annual electricity consumption as seen in Table 4 (BMUB, 2012). The steel industry pays currently 300 million € for the support of Renewable Energy due to the special equalisation scheme. Without this reduction it would be more than double, 700 million €. (Kerkhoff, 2014).
A company and also other producers are entirely exempt from paying the EEG Levy on electricity that is produced domestically (§37 EEG). A quarter of the utilised electricity in the manufacturing industry is produced domestically (Reuster, 2012). This is often the case and specifically economical when secondary products such as heat or gases accrue (Kerkhoff, 2014). Some are also producing their own electricity by means of renewable energy plants. This electricity is not only exempt from the EEG Levy but also every other charge shown in Table 4.
For railway operator a special regulation exists, which is rather complex structured. Eventually it means that the largest electricity consumer in Germany, which is the Deutsche Bahn, pays a Levy of 0.05 ct/kWh (BMU, BAFA, 2013).
4.4 CRITICAL JUDGEMENT OF EXEMPTIONS In general it can be said that there is a need for a general regulation and consistency for the various exemptions or reductions in the charges on the electricity price (Küchler, 2012). The main problem with the EEG Levy appeared with the release of the EEG in 2012. Here it was determined that companies that consume more than 1 GWh a year can file an application for reduction. Formerly it was 10 GWh. This led to a stampede for the applications in not only the steel, paper and chemical industry that but also food production, newspaper publishers and wood processing companies (Knipper, 2013) (Döring, 2014). Hence, around 2100 companies are fully exempt from paying the EEG Levy 2014.
With every extra exempt company the burden for the parties paying the Levy grows. This year 1.248 ct or 20% of the EEG Levy compensates the exemption of privileged companies as it can be seen in Figure 2. Simultaneously, every consumer that is purchasing electricity at the
17
electricity market directly is benefitting from decreasing prices due to the feed-in of electricity produced by renewable sources. As sources have found out (BMU, 2007) (Matthes, 2014) (Bütikofer, 2014), electricity prices have fallen between 0.6-1.0 ct/kWh due to the merit order effect. Hence, it should be bearable for industrial consumers to repay this benefit financially by means of an increased Levy.
What is more, is the distortion between different branches or sectors within Germany in regards to their economical situation from those, which can make use of the regulation and those who cannot due to electricity consumption and share of electricity from their gross value added. It can also lead to an extensive use of electricity in order to consume more than 1 GWh and hence being able to apply for exemption.
Another argument against the compensation regulation on side of the EU committee is the equal status of European countries in regards to the principle of international or European competition. Hence, this EEG exception for energy intensive industry in Germany is investigated as an illegal subsidy and the committee announced an inspection procedure in 2013, which will take at least one year (Norddeutscher Rundfunk, 2013). The counterargument of the Wirtschaftsvereinigung Stahl (Kerkhoff, 2014) is that the reductions are no subsidy but allows Germany to be on a competitive European level in the first place, as this Levy is only a national surcharge.
With rising electricity cost industry was increasingly tempted to produce parts of the required electricity for themselves. Especially the steel producing industry is utilising accruing gases or excess heat from the smelter processes to produce energy ever since in order to improve efficiency. In case the domestic electricity production (§37 EEG) would fall under the EEG Levy for the whole of the steel industry a total of 100 million € would be due only in 2014 (Kerkhoff, 2014).
The reason why manufacturing industry is paying the reduced EEG Levy is due to the need of international competitiveness. If the special equalisation scheme reduction (§40 ff. EEG) would be removed, over 1 billion € would be due in 2014 for the entire steel industry (Kerkhoff, 2014). However, the framework for exemptions does not provide any indication how this exposure for competitiveness is determined (Faulstrich, 2012). It is evident that companies, which are offering goods on the international market are pressurised to compete with the supply and cannot allocate increases in energy cost onto their selling prices. Since it is politically discussed to remove the two discussed exemptions (Stalinski, 2014), the next chapter will assess if the steel industry - as an example of the highly energy intensive manufacturers in Germany - is reasonably exempt or if allocations can be made without harming economic wellbeing of the industry in question. Another issue that is to be investigated is if a criterion can be found that can distinguish between sectors that are affected by international competition and those that are not.
18
5 STEEL INDUSTRY
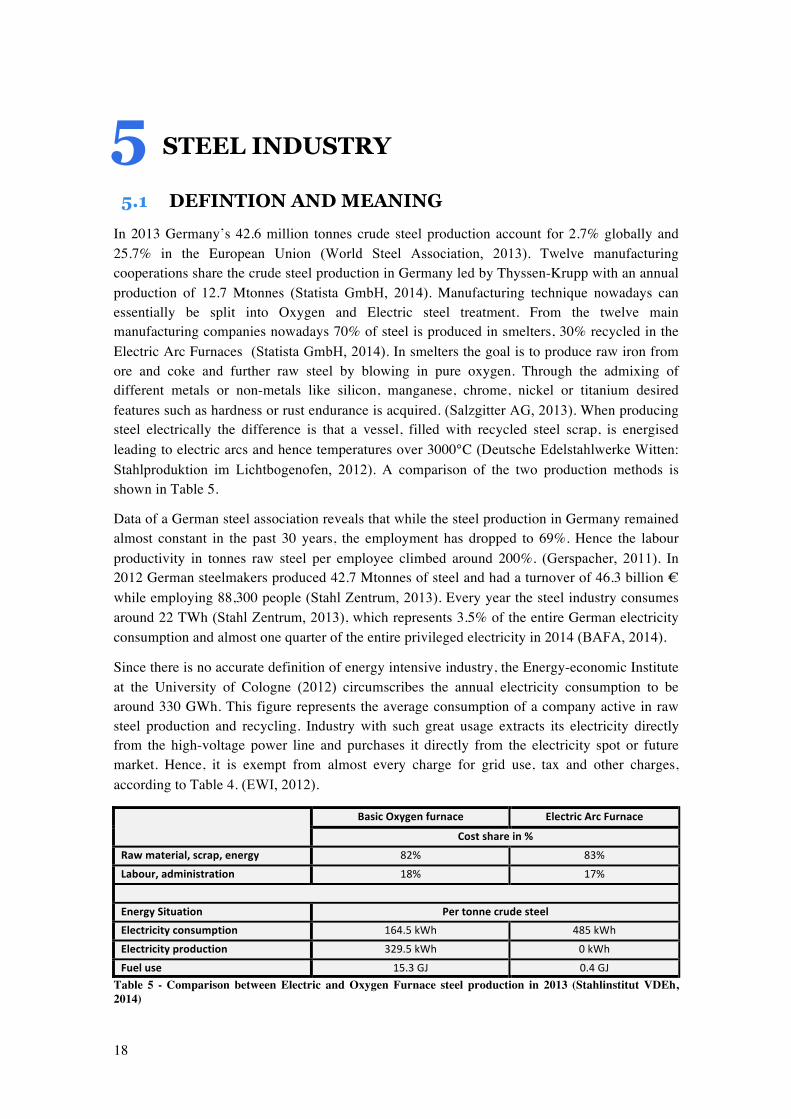
5.1 DEFINTION AND MEANING In 2013 Germany’s 42.6 million tonnes crude steel production account for 2.7% globally and 25.7% in the European Union (World Steel Association, 2013). Twelve manufacturing cooperations share the crude steel production in Germany led by Thyssen-Krupp with an annual production of 12.7 Mtonnes (Statista GmbH, 2014). Manufacturing technique nowadays can essentially be split into Oxygen and Electric steel treatment. From the twelve main manufacturing companies nowadays 70% of steel is produced in smelters, 30% recycled in the Electric Arc Furnaces (Statista GmbH, 2014). In smelters the goal is to produce raw iron from ore and coke and further raw steel by blowing in pure oxygen. Through the admixing of different metals or non-metals like silicon, manganese, chrome, nickel or titanium desired features such as hardness or rust endurance is acquired. (Salzgitter AG, 2013). When producing steel electrically the difference is that a vessel, filled with recycled steel scrap, is energised leading to electric arcs and hence temperatures over 3000°C (Deutsche Edelstahlwerke Witten: Stahlproduktion im Lichtbogenofen, 2012). A comparison of the two production methods is shown in Table 5.
Data of a German steel association reveals that while the steel production in Germany remained almost constant in the past 30 years, the employment has dropped to 69%. Hence the labour productivity in tonnes raw steel per employee climbed around 200%. (Gerspacher, 2011). In 2012 German steelmakers produced 42.7 Mtonnes of steel and had a turnover of 46.3 billion € while employing 88,300 people (Stahl Zentrum, 2013). Every year the steel industry consumes around 22 TWh (Stahl Zentrum, 2013), which represents 3.5% of the entire German electricity consumption and almost one quarter of the entire privileged electricity in 2014 (BAFA, 2014).
Since there is no accurate definition of energy intensive industry, the Energy-economic Institute at the University of Cologne (2012) circumscribes the annual electricity consumption to be around 330 GWh. This figure represents the average consumption of a company active in raw steel production and recycling. Industry with such great usage extracts its electricity directly from the high-voltage power line and purchases it directly from the electricity spot or future market. Hence, it is exempt from almost every charge for grid use, tax and other charges, according to Table 4. (EWI, 2012).
% Basic%Oxygen%furnace% Electric%Arc%Furnace%
Cost%share%in%%%Raw%material,%scrap,%energy% 82%( 83%(
Labour,%administration% 18%( 17%(
(
Energy%Situation% Per%tonne%crude%steel%Electricity%consumption% 164.5(kWh( 485(kWh(
Electricity%production% 329.5(kWh( 0(kWh(
Fuel%use% 15.3(GJ( 0.4(GJ(Table 5 - Comparison between Electric and Oxygen Furnace steel production in 2013 (Stahlinstitut VDEh, 2014)
19
The importance of steel lays not solely in its raw production for the German value chain but in its processing industry. After rolling the steel slabs, two product categories can be classified, which is flat and round steel. Flat steel plates are rolled on coils and are forwarded for the use of wind turbines, household appliances, automotive or aerospace. Round steel is further processed into pipes, beams or rails and is used in the track transport sector, construction, electrical engineering and machine engineering. (Salzgitter AG, 2013). Including all steel producing and processing industries, 3.5 million people are employed and are therefore account for 3 out of 4 employees in the manufacturing industry in Germany. Most of them are employed in machine engineering and the highest turnover exists in automobile industry. (Stahl Zentrum, 2011). Apparently every 1€ value added generated in the steel industry accounts for 1.70€ in value added in upstream suppliers (Stahl Zentrum, 2013). Part of these industries pays the EEG Levy according to their electricity consumption (BAFA, 2014). The automobile industry for instance is almost completely paying the Levy. In case German steel industry would migrate to other countries, further processing companies would have to import semi-finished goods from outside Germany, which might result in a higher financial dependence. Since steel is represented in a wide range of industries in Germany, further assessment will conveniently consider the steel manufacturers solely, meaning steel production and recycling. Effects in steel processing industries are shown only where appropriate and deemed to be essential to answer the research question. However, it is important to keep in mind, which chain reaction might be triggered.
5.2 SUMMARY AND PROSPECT The national economy of Germany developed over time to a country where the service business became the main profit source with a GDP share of 69%. But still the manufacturing industry is a historically well-established source of income and presents 25.5% or 700 million € of the GDP in Germany. (Statistisches Bundesamt, 2014). Steel is a major resource for automotive, machine engineering, electrical engineering, building sector, and of course the steel and metal processing industry itself. The latter utilise more than 10% of steel products for their daily production chain, steel and metal industry 59%. (Schmidt-Brockhoff, 2012)
On the other side of the coin the steel production and recycling demonstrate a highly energy intensive sector. Of a total of 596 TWh of electricity consumption in 2013, the steel industry used 22 TWh. Where Germany’s position on the global raw steel market takes the 7th place, in the European Union it is by a large margin in the leading position in producing steel. However, the largest producer of steel worldwide is ArcelorMittal, which is located in Luxemburg and produces 93 Mtonnes a year (Statista GmbH, 2014) and produces also at four locations within Germany. The global price for raw steel amounts 278€ per tonne (19th May 2014) (Stahlpreise.eu, 2014) and is traded at the London Metal Exchange market.
According to the World Steel Association, China’s demand for steel has grown over 20 percentage point in the last 10 years (2002-2012), but is also producing around the same amount more (World Steel Association, 2013). In contrast, NAFTA countries and the European Union use only around half of what they have in 2002, production went down concurrently. The production and usage of steel can be seen in Table 6.
Interestingly, exports of finished and semi-finished steel products have increased in actual numbers as well as the total worldwide production. The percentage share however, decreased since a peak in 2000 with roughly 40% exports to around 29% today. Here, Germany takes the 6th position (6 Mtonnes) in exporting steel products after China and the European Union.
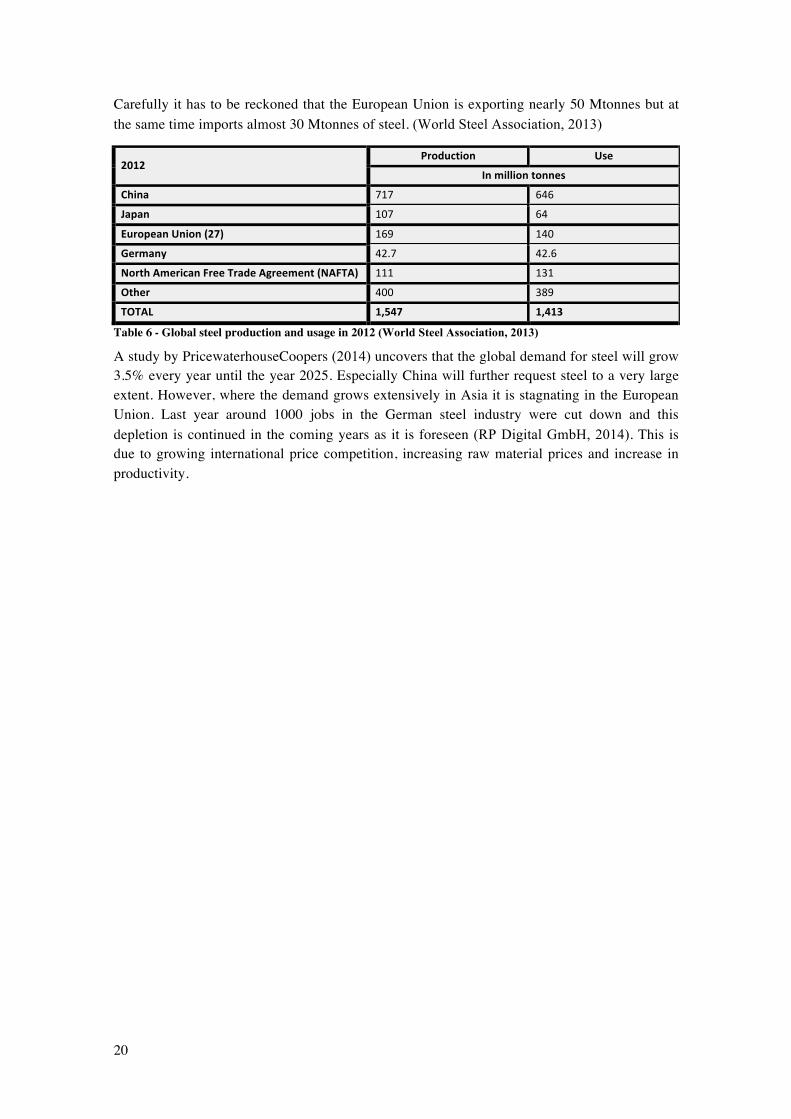
20
Carefully it has to be reckoned that the European Union is exporting nearly 50 Mtonnes but at the same time imports almost 30 Mtonnes of steel. (World Steel Association, 2013)
2012 Production Use
In%million%tonnes China 717 646 Japan 107 64 European%Union%(27) 169 140 Germany 42.7 42.6 North%American%Free%Trade%Agreement%(NAFTA) 111 131 Other 400 389 TOTAL 1,547 1,413
Table 6 - Global steel production and usage in 2012 (World Steel Association, 2013)
A study by PricewaterhouseCoopers (2014) uncovers that the global demand for steel will grow 3.5% every year until the year 2025. Especially China will further request steel to a very large extent. However, where the demand grows extensively in Asia it is stagnating in the European Union. Last year around 1000 jobs in the German steel industry were cut down and this depletion is continued in the coming years as it is foreseen (RP Digital GmbH, 2014). This is due to growing international price competition, increasing raw material prices and increase in productivity.
21
6 METHODOLOGY
6.1 RESEARCH STRATEGY The discussion of a fundamental modification of the existing EEG regulation is very current. A number of proposals have been developed on how the amendments in the Renewable Energies Act could be optimised to improve efficiency and fairness (Initiative Neue Soziale Marktwirtschaft, n.d.) (Matthes, 2014) (Rheinisch-Westfälisches Institut für Wirtschaftsforschung, 2012) (BUND, 2014). However, these proposals do assess the consequences of their suggested modification only to a small extent. They also do not investigate a change in particular detail, meaning biased representation. Hence, the following interviews serve to find out to which extent the special equalisation scheme (§40 ff. EEG) and domestically produced electricity (§37 EEG) for energy intensive industry on the example of steel production and recycling can be raised. It further seeks to find other restructuring alternatives than removing the compensation regulation for steel completely by still aiming for energy savings.
All associations and societies that are deemed to be appropriate to give a statement to the question, have offered details to contact competent persons. Those people will be asked to speak for the opinion of their company or industry not with their personal opinion. Where no specific person was found, the general contact was used. As stated before it is deemed to be necessary to examine the research question from different point of views. This is because only one opinion might pursue only own interests and will rather not treat the problem objectively. Hence, neutral entities and consumer representatives are contacted as well10. The first draft law, released 8th April, is assessed as well.
According to Saunders et al. (2009) it is more likely to gain information from interviewees when contacted personally than sending an E-Mail with a questionnaire. Another reason why the interviews are targeted to be carried out on the telephone is to react and adjust questions according to the interviewees’ response and being able to immediately ask queries. This also means that the prepared questions are non-standardised in order to be flexible. Except for the World Steel Association located in Brussels, all contacts have been addressed in German language.
Based on the information presented and discussed in the previous chapters, relevant subjects have been phrased referring to the research question.
How can the Renewable Energy Levy structure be redesigned in order to keep the German steel industry competitive while pursuing energy savings?
As an expansion to the special equalisation scheme, it is deemed to be important to also assess changes in the EEG Levy structure in regards to the domestically produced electricity because it is common use to employ secondary products in steel production for electricity generation and therefore affects the steel industry not less than the former.
10 The contacted entities can be found in Appendix A
22
6.2 HYPOTHESES Based on the literature found and presented in the former chapters, five hypotheses have been phrased which are to be confirmed or falsified by the experts that are contacted. The non-standardised questionnaire covers the content of the hypotheses. Eventually the topics, which can be seen below and in the questionnaire are phrased to help answer the research question of this dissertation.
• Evidently, industry purchasing their electricity directly at the electricity market benefit financially from decreasing prices. Therefore it should be possible to increase the current EEG Levy without harming the companies' competitiveness.
• Domestically produced electricity cannot be covered by the EEG Levy in full without harming the companies' competitiveness.
• A fairer criterion for EEG Levy exemptions and reductions due to international competitiveness is the export figures in addition to the electricity consumption share of value added.
• The only possibility to make the EEG Levy structure fairer is to change the electricity market for RE by making it more demand side oriented.
• With continued low electricity prices, there is no incentive for the highly energy intensive industry to invest in energy saving potentials.
6.3 QUESTIONNAIRE The questions asked to the respective associations have been adjusted dependant on their field of expertise. Therefore some contacts have only been approached with a selection of the questions.
• The energy intensive industry benefits from decreasing electricity price due to the feed-in of RE. Would it therefore be possible to increase the EEG Levy from currently 0.05 ct/kWh due to special equalisation scheme (§40 ff. EEG) to a higher share?
• Would a partly inclusion of domestically produced electricity (§37 EEG) into the EEG Levy be possible or would the electricity generation from by-products within the steel industry become uneconomical?
• What would the socio-economic effects be for the steel production sites in Germany on European and international competition? And further, for the national value chain such as automobile and machine engineering? Is a migration of the steel industry realistic or do other criteria outweigh the attractiveness of German production sites?
• In case the privileging of energy intensive companies will be continued, how would a proper set of criteria reflect the exposure to international competition?
• What might other alternatives be to change the current EEG Levy allocation in order to unburden middle-sized companies and households by still pursuing Germany’s energy goals?
• Do any energy saving potentials exist in steel production?
23
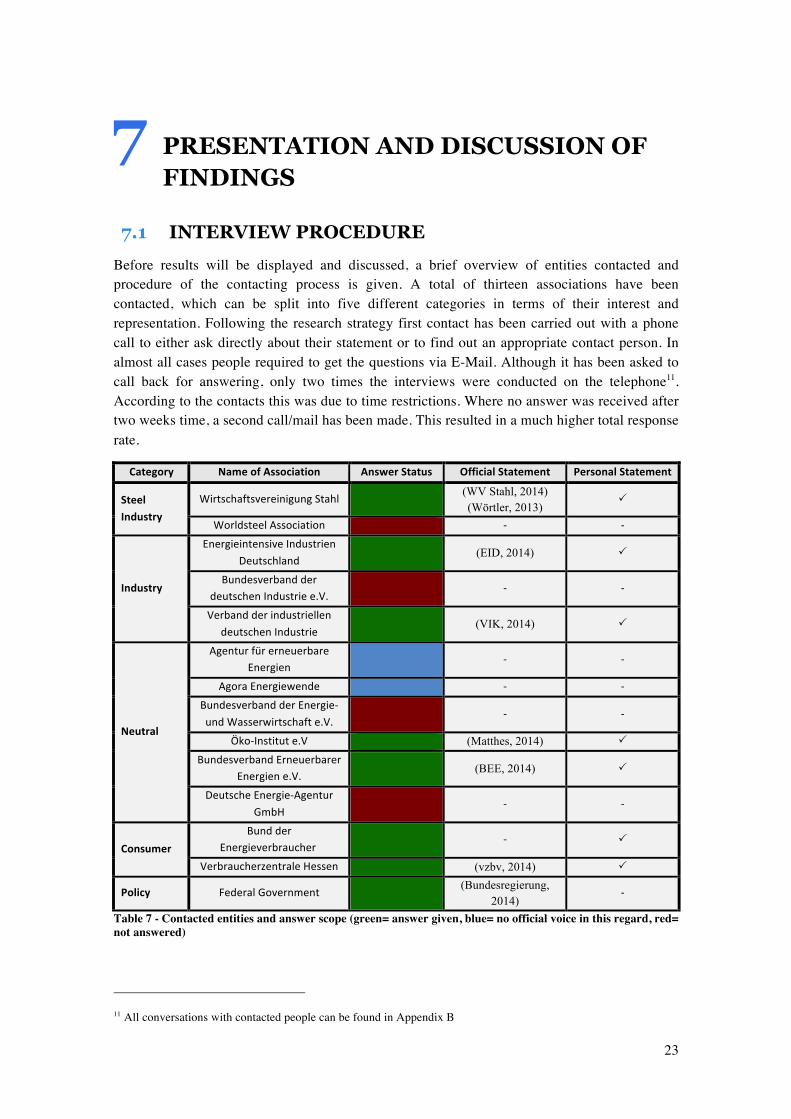
7 PRESENTATION AND DISCUSSION OF FINDINGS
7.1 INTERVIEW PROCEDURE Before results will be displayed and discussed, a brief overview of entities contacted and procedure of the contacting process is given. A total of thirteen associations have been contacted, which can be split into five different categories in terms of their interest and representation. Following the research strategy first contact has been carried out with a phone call to either ask directly about their statement or to find out an appropriate contact person. In almost all cases people required to get the questions via E-Mail. Although it has been asked to call back for answering, only two times the interviews were conducted on the telephone11. According to the contacts this was due to time restrictions. Where no answer was received after two weeks time, a second call/mail has been made. This resulted in a much higher total response rate.
Category% Name%of%Association% Answer%Status% Official%Statement% Personal%Statement%
Steel%Industry%
Wirtschaftsvereinigung(Stahl( ( (WV Stahl, 2014)((Wörtler, 2013)(
!
Worldsteel(Association( ( X( X(
Industry%
Energieintensive(Industrien(Deutschland(
( (EID, 2014)( !(
Bundesverband(der(deutschen(Industrie(e.V.(
( X( X(
Verband(der(industriellen(deutschen(Industrie(
( (VIK, 2014)( !(
Neutral%
Agentur(für(erneuerbare(Energien(
( X( X(
Agora(Energiewende( ( X( X(
Bundesverband(der(EnergieX(und(Wasserwirtschaft(e.V.(
( X( X(
ÖkoXInstitut(e.V( ( (Matthes, 2014)( !(
Bundesverband(Erneuerbarer(Energien(e.V.(
( (BEE, 2014)( !(
Deutsche(EnergieXAgentur(GmbH(
( X( X(
Consumer%Bund(der(
Energieverbraucher((( X( !(
Verbraucherzentrale(Hessen( ( (vzbv, 2014)( !(
Policy% Federal(Government( ( (Bundesregierung, 2014)(
X(
Table 7 - Contacted entities and answer scope (green= answer given, blue= no official voice in this regard, red= not answered)
11 All conversations with contacted people can be found in Appendix B
24
Questions have been answered as in a personal statement and an official statement (see Table 7) that was just recently published from respective entities and was used to supplement the personal statement. Overall the data was gathered in a period of 25th March to 14th April 2014. The personal statement relates directly to the sent questions whereas the official statement that has been attached from most, applies to political publications with references to planned changes in the Renewable Energies Act amendment ranging from January to March 2014. Only two entities forwarded to other entities because they see themselves not as the official voice to the topic (characterised in blue).
7.2 PRESENTATION OF RESULTS The results are structured as follows. Hypotheses phrased in section 6.2 are taken to lead through the findings from the interviews. Hence, firstly the hypothesis is repeated followed by the statements including argumentation from different associations. It has to be said that statements are summarised from personal and official statements of the respective entities. Some associations do not have an official opinion about some topics. If this is the case when presenting the findings, these companies are left out. If interviewees from the same category do have the same opinion it will be condensed.
1. Evidently, industry purchasing their electricity directly at the electricity market benefit financially from decreasing prices. Therefore it should be possible to increase the current EEG Levy without harming the companies' competitiveness.
The energy intensive industries, including the steel industry deem this hypothesis to be untrue. First, the reduced contribution of 0.05 ct/kWh has been determined when electricity prices have been only half of what they are today. This contribution of 0.05 ct/kWh has been chosen as the limit that does not affect companies’ competitiveness badly. As a second point, 24 European countries trade at the EEX market, which means that the merit order effect benefits not only the German companies but also every other participant trading at the EEX. Further it is told that most energy intensive companies purchase their electricity not at the spot market but did close long-term contracts at the futures market. The merit order appears to have considerably less impact on the prices at this market in contrast to fuel and CO2 cost. Since the EEG Levy is only a national charge, the negative influence of the Energiewende would only burden German companies’ cost and hence their competitiveness.
As a major consequence of a potential increase of the EEG Levy for the industry it was told that there would not be an immediate migration of steel producing sites. It would rather be a gradual process of a shift of refurbishment investments to other locations where the income margin would be higher than at German sites. With these modernisation activities the efficiency of sites outside Germany would grow and at the same time production volume would be shifted.
The recent first draft law (8th April 2014) from the Federal Government determines the maintenance of the special equalisation scheme in the coming EEG version, which relieved representatives of energy intensive companies and those companies themselves. In conformity with the EU committee, the Government decided on 65 energy intensive sectors (of currently 169) where 15% of the EEG Levy becomes due, however with a maximum limit of 4% of its gross value added. For heavy energy users such as the steel industry this limit may recede to 0.5%. This means around 500 companies less than being exempt this year.
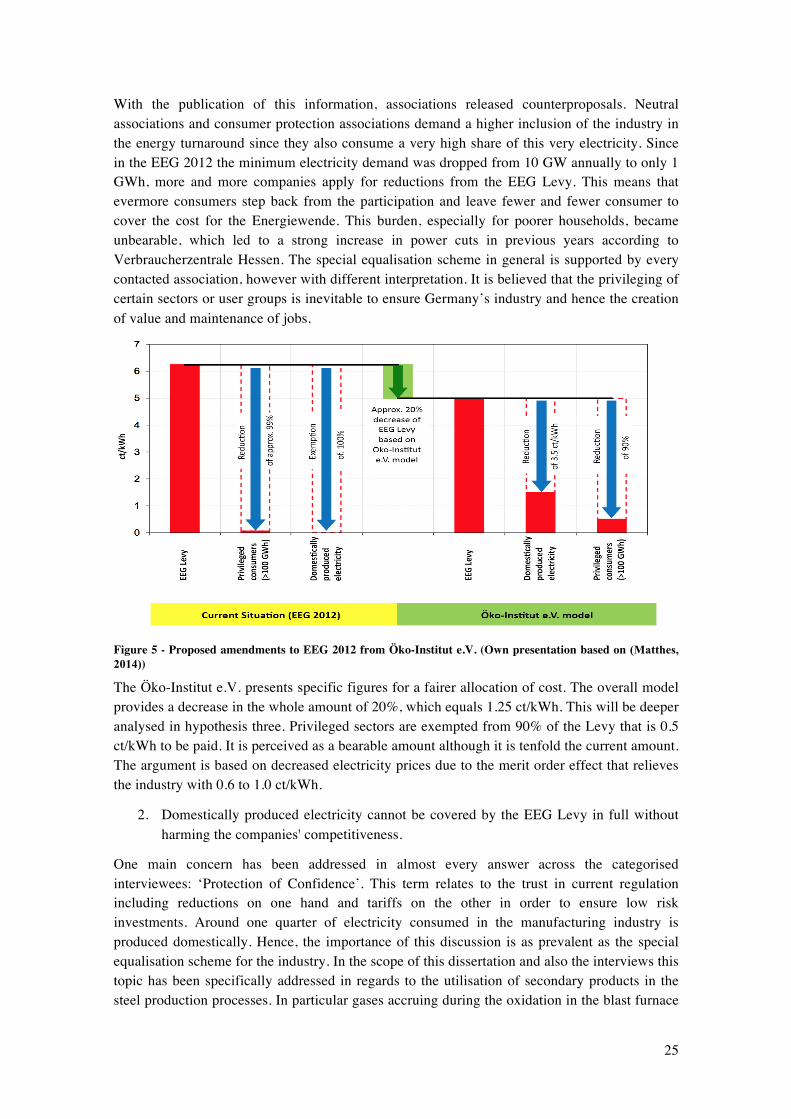
25
With the publication of this information, associations released counterproposals. Neutral associations and consumer protection associations demand a higher inclusion of the industry in the energy turnaround since they also consume a very high share of this very electricity. Since in the EEG 2012 the minimum electricity demand was dropped from 10 GW annually to only 1 GWh, more and more companies apply for reductions from the EEG Levy. This means that evermore consumers step back from the participation and leave fewer and fewer consumer to cover the cost for the Energiewende. This burden, especially for poorer households, became unbearable, which led to a strong increase in power cuts in previous years according to Verbraucherzentrale Hessen. The special equalisation scheme in general is supported by every contacted association, however with different interpretation. It is believed that the privileging of certain sectors or user groups is inevitable to ensure Germany’s industry and hence the creation of value and maintenance of jobs.
Figure 5 - Proposed amendments to EEG 2012 from Öko-Institut e.V. (Own presentation based on (Matthes, 2014))
The Öko-Institut e.V. presents specific figures for a fairer allocation of cost. The overall model provides a decrease in the whole amount of 20%, which equals 1.25 ct/kWh. This will be deeper analysed in hypothesis three. Privileged sectors are exempted from 90% of the Levy that is 0.5 ct/kWh to be paid. It is perceived as a bearable amount although it is tenfold the current amount. The argument is based on decreased electricity prices due to the merit order effect that relieves the industry with 0.6 to 1.0 ct/kWh.
2. Domestically produced electricity cannot be covered by the EEG Levy in full without harming the companies' competitiveness.
One main concern has been addressed in almost every answer across the categorised interviewees: ‘Protection of Confidence’. This term relates to the trust in current regulation including reductions on one hand and tariffs on the other in order to ensure low risk investments. Around one quarter of electricity consumed in the manufacturing industry is produced domestically. Hence, the importance of this discussion is as prevalent as the special equalisation scheme for the industry. In the scope of this dissertation and also the interviews this topic has been specifically addressed in regards to the utilisation of secondary products in the steel production processes. In particular gases accruing during the oxidation in the blast furnace
26
are incinerated in gas power plants. The electricity generated from these gases or also energy from excess heat is currently free from any charges.
Most of the interviewees represent the opinion that domestically produced electricity should be continuously free from the EEG Levy. This is based on simple climate and environmental reasoning. In the steel producing process, the emerging of these gases cannot be prevented. Hence, it is just most efficient to utilise the energy; comparable with the cogeneration of power and heat. If old sites would be loaded with the full EEG Levy those plants become uneconomical and would be shut down. This means that electricity that is currently produced on site within the manufacturing company would then be abstracted from the grid. Therefore another argument on side of the industry is that additional energy and hence CO2 would be generated.
Only two represented associations have a differing opinion about the financial strain of the EEG Levy for domestically produced and consumed electricity. Öko-Institut e.V. suggests releasing this specific electricity with 3.5 ct/kWh as a lumped sum from the EEG Levy, which would mean a 1.5 ct/kWh charge as of the current Levy and the 20% reduction in their model. Cause of this argumentation is the existing power line from the power grid to the companies. It is argued that the steel industry is not self-sufficient, also when only considering the amount that is internally produced. This means specifically that fluctuations while producing in the domestic grid are balanced by means of the power grid. Due to the ‘Protection of Confidence’ however, it is proposed to burden domestic electricity only partly. Moreover there should be no distinction between old and new sites and technology due to practicability reasons. A similar approach is taken by the VZ. This is the application to new as well as existing plants no matter the ‘Protection of Confidence’. However, the difference is the amount that domestic electricity would be burdened with, which is 10% of the actual Levy, currently 0.624 ct/kWh.
The first draft of law sees the protection of confidence as a much more intense aspect. Therefore the Government settled on a continued exemption for domestic electricity within the industry. However, newly constructed plants for the use of secondary product utilisation will be charged with a maximum of 15% that is 0.9 ct/kWh for this year. For small plants a protection in form of a minimum limit will be introduced.
3. A fairer criterion for EEG Levy exemptions and reductions due to international competitiveness is the export figures in addition to the electricity consumption share of value added.
Trade intensity is the term that has been named several times within the interviews. However, some entities see the exposure to competitiveness not accurately reflected in import and export figures. One argument against the criterion ‘intensity of trade’ that is currently discussed on a European level is the neglect of the value chain, which has shown to be very high on a national basis in the steel industry (see section 5.1). Further, those figures are based on bygone years, which do not include potential competition. The Wirtschaftsvereinigung Stahl (WV) recommends using a criterion named ‘intensity of electricity cost’. It is defined as the ratio of additional charges due to RE funding (EEG Levy) to gross value added. If this ratio applies to 2.5% and very intensive companies at least 5% this very company should be exempt. In addition it is asked to include a criterion for the products that are traded at the stock market, since an increase in cost cannot be apportioned to buyers in this framework. The Energieintensive Industrien Deutschland simplifies the subject as they say there is no
27
recognised manufacturing industry in Germany that does not stand in international competition. Hence, no other criterion is required.
The proposal of the Öko-Institut e.V. provides a solution for the EU committee questioned subsidy of the EEG Levy because a EU regulation is already in place for an allowance of indirect cost for CO2-quotas internalised in the electricity price at the market. This model starts with the compensation of a specific percentage value and is decreasing over time. It has the intention to support energy intensive industry and is to incentivise efficiency investments and setting a growth impulse. Overall 15 sectors are determined to require this financial aid including steel. Based on this model an approach is taken to improve the EEG Levy exemptions. The first component is the reduction of sectors that are currently privileged, which is also the main intention of other neutral and consumer protection associations. From formerly 169 only 15 sectors will be privileged. This would reduce the privileged electricity capacity from around 150 to 110 TWh.
4. The only possibility to make the EEG Levy structure fairer is to make the feed-in of RE more demand side oriented.
In the first law draft of the EEG 2014 it seems that only minor changes are targeted and no specific solution is sought to tackle the main issue. That is is the current composition if the EEG Levy triggered by the electricity market and its incompatibility with increasing renewable energy capacity. Right now it does not support a sustainable transition because the EEG Levy rises heavily with increasing RE and simultaneously decreasing market prices. Further, conventional power plants suffer from too low electricity prices. There is a consensus of interviewed entities that the mere allocation onto consumers and reallocation onto energy intensive industry does not solve this issue.
The first crunch point in the first draft law is to redeem non-privileged electricity consumers from an exceedingly increasing EEG Levy. To lower the cost of the energy transition annually, a cap is intended to be placed for each and every renewable energy source for every year. At the same time the feed-in tariffs are determined to be lower as in EEG 2012, declining every year. So far the average feed-in tariff has been 17 ct/kWh, which is to be decreased to an average of 12 ct/kWh. These two changes, the cap and decreased tariffs, are heavily criticised because it is seen as slowing down the transition. Firstly, because especially the cheapest renewable energy solutions, wind onshore (Fraunhofer ISE, 2013), should be favoured instead of assigning a cap for a maximum expansion. Secondly, the protection of trust applies also for feed-in tariffs. Several renewable energy plants are planned and currently built, calculated and deemed to be financially feasible with existing feed-in tariffs. Private and municipal founders will have serious difficulty to run the plants with lowered tariffs (Weinhold, 2014), (Nestle, 2014). This is especially prevalent for wind parks onshore, which have a planning and approval phase of 4-6 years. Simultaneously, the expansion targets of RE have not been altered to take the latter into account. Specifically that means a 40-45 % benchmark of RE in 2025 and 55-60 % in 2035.
A second large aspect is the marketing of renewable energy. Obviously the current electricity market cannot be continued with an expected and desired increase of RE. Therefore, interviewed associations come to a unite voice that is direct marketing. However, specifics vary from a voluntary to an obliged direct marketing for smaller and bigger producers. The main concern in this regard for operators of RE is the increased risk of their investment. At peak times a price higher than the average can be gained whereas in times of excess supply prices
28
dwindle. This brings great risk, especially for private and municipal cooperatives without sufficient equity to compensate possible losses.
The proposal in the first draft law from the German Government suggests the following procedure. As mentioned before the fixed feed-in tariff is to be reduced to an average of 12 ct/kWh. The tariff system will be phased out stepwise and replaced with direct marketing as from:
• 1st August 2014: new plants with a capacity of 500 kW • 1st January 2016: new plants with a capacity of 250 kW • 1st August 2017: new plants with a capacity of 100 kW
This is deemed to be appropriate to prepare operators or potential operator of RE plants to the transition from a fixed tariff to a demand side oriented direct marketing. It means that from 2017 on no more tariffs will be distributed except for small PV plants on private ground with smaller capacity than 100 kW. For plants larger than the respective capacity, therefore starting with direct marketing, there will be an additional premium paid out that is to close the gap from electricity price and the tariff. As from 2017 onwards this premium system is also phased out. Instead there will be a tendering model for an open space for PV or wind. The investor bidding the lowest premium, wins the spot for constructing the RE plant and receives this premium for a certain period on top of the market price. The Bundesverband Erneuerbarer Energien e.V. supports this opinion, however with higher minimum capacities. It is to include also 250 kW plants to receive the feed-in tariff in 2017. They also argue for a voluntary instead of an obliging direct marketing to, again, protect smaller producers.
This planned out-phasing of tariffs and the transition to a tender model discriminates against private and municipal cooperatives. A decentralised energy system is desired to diverge from oligopolistic large power plants. However, with the projected changes this development will be decelerated. According to a study carried out by the University Leuphana, Lüneburg (Nestle, 2014), RE plants from citizens’ initiatives have a share of 25% of all renewable electricity produced. This study alerts that the increasing financial risk due to possible low electricity prices cannot be compensated by cooperatives.
Nevertheless, the tendering model is also supported by Verbraucherzentrale Hessen because it provides the incentive for a demand side oriented feed-in of renewable energy. It secondly takes the power of decision from political entities to the free enterprise economy.
The German Government targets only a minimum increase of the Renewable Energy Levy until 2017, which is 7.2 ct/kWh. This is supposedly being reached with the cost-cutting measures presented above.
Lastly, the regulation for the railway industry in Germany should be changed since they do not stand in international competition. So far they are exempt from paying the Renewable Energy Levy. The main problem is that an allocation of increased cost is possible due to their monopoly position. If the biggest electricity consumer in Germany were to pay the full EEG Levy, the ticket prices might rise exceedingly. This concerns also the Verbraucherzentrale Hessen, which is why they claim to still keep the railway exempt. They also believe that less people would use the railway for travel but prefer using the car instead, which is counterproductive to decarbonisation.
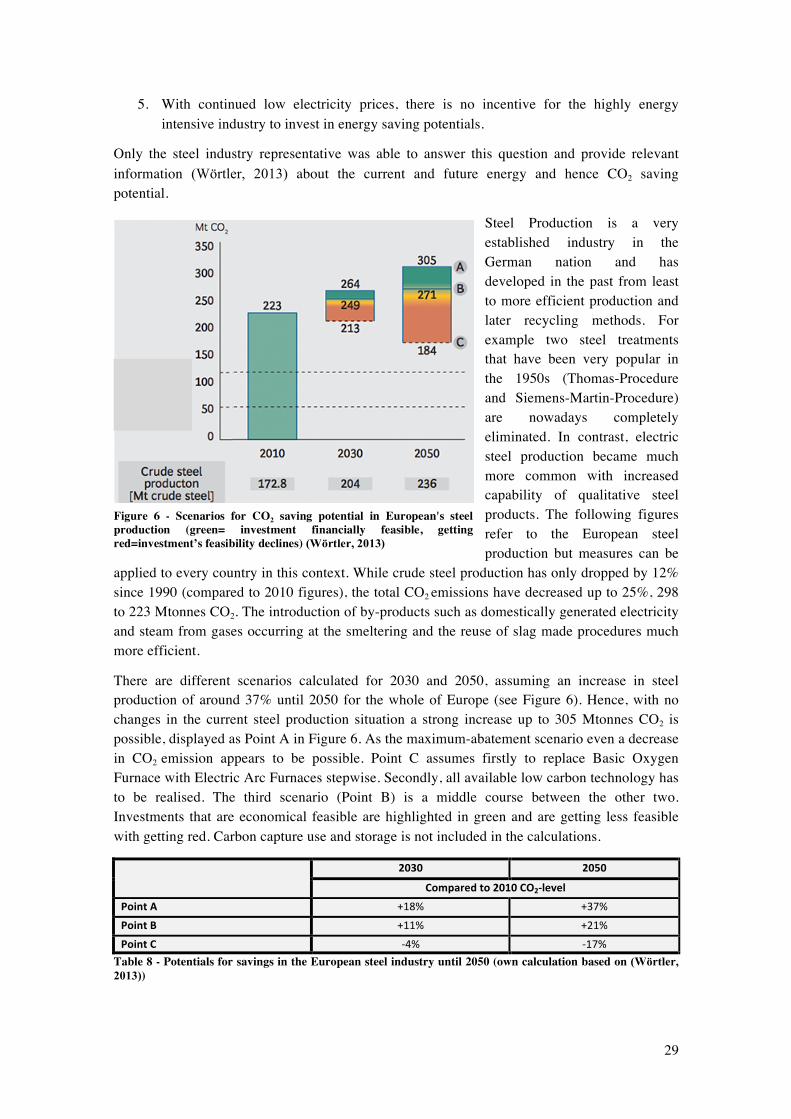
29
5. With continued low electricity prices, there is no incentive for the highly energy intensive industry to invest in energy saving potentials.
Only the steel industry representative was able to answer this question and provide relevant information (Wörtler, 2013) about the current and future energy and hence CO2 saving potential.
Steel Production is a very established industry in the German nation and has developed in the past from least to more efficient production and later recycling methods. For example two steel treatments that have been very popular in the 1950s (Thomas-Procedure and Siemens-Martin-Procedure) are nowadays completely eliminated. In contrast, electric steel production became much more common with increased capability of qualitative steel products. The following figures refer to the European steel production but measures can be
applied to every country in this context. While crude steel production has only dropped by 12% since 1990 (compared to 2010 figures), the total CO2 emissions have decreased up to 25%, 298 to 223 Mtonnes CO2. The introduction of by-products such as domestically generated electricity and steam from gases occurring at the smeltering and the reuse of slag made procedures much more efficient.
There are different scenarios calculated for 2030 and 2050, assuming an increase in steel production of around 37% until 2050 for the whole of Europe (see Figure 6). Hence, with no changes in the current steel production situation a strong increase up to 305 Mtonnes CO2 is possible, displayed as Point A in Figure 6. As the maximum-abatement scenario even a decrease in CO2 emission appears to be possible. Point C assumes firstly to replace Basic Oxygen Furnace with Electric Arc Furnaces stepwise. Secondly, all available low carbon technology has to be realised. The third scenario (Point B) is a middle course between the other two. Investments that are economical feasible are highlighted in green and are getting less feasible with getting red. Carbon capture use and storage is not included in the calculations.
% 2030% 2050%
Compared%to%2010%CO2Nlevel%Point%A% +18%( +37%(
Point%B% +11%( +21%(
Point%C% X4%( X17%(Table 8 - Potentials for savings in the European steel industry until 2050 (own calculation based on (Wörtler, 2013))
Figure 6 - Scenarios for CO2 saving potential in European's steel production (green= investment financially feasible, getting red=investment’s feasibility declines) (Wörtler, 2013)
30
Hence, the middle course is utilising the highest CO2 saving potential with the most reasonable investment. This results in a saving of 21% until 2050 with a total increase of crude steel production of 37%. Because of little incentive for steel manufacturers to target Point C, measures to achieve Point B will be explained in more detail.
The Electric Arc Furnace will replace Basic Oxygen Furnace to a ratio of 44%-56% in 2050. For a scrap based recycling furnace it is the highest share possible due to the limitation of available scrap. Although good quality can be achieved with Electric Arc Furnace nowadays, for some applications the emerged composition is not sufficient, such as the automobile industry. This increase in electric steel results in a CO2 saving of 8 Mtonnes. CO2 saving technology needs to be implemented in Basic Oxygen and Electric Arc Furnace. Basic oxygen furnace routes save up to 14 Mtonnes CO2 (6%) by improving heat recovery and better usage of occurred gases in the process. Here it has to be said, that over the past decades the Basic Oxygen Furnace has improved already strongly leaving only minor potential of savings. For scrap based steel recycling leads to another 12 Mtonnes CO2 (25%) reduction mostly due to an increase of RE and hence, a smaller CO2 burden on electricity consumed (1990 - 585 g CO2/kWh; 2050 - 210 g CO2/kWh.
7.3 ASSESSMENT OF RESULTS In this section the results from the former section are being critically compared and discussed by the author and supported by secondary data. As an outcome the target is to formulate solution approaches that are targeted on the welfare of every interest group in this context and the broad electricity consumers in Germany.
1. Evidently, industry purchasing their electricity directly at the electricity market benefit financially from decreasing prices. Therefore it should be possible to increase the current EEG Levy without harming the companies' competitiveness.
First of all, it has to be said that exception regulations of the EEG Levy is deemed to be reasonable for the good of Germany’s economy. However, the adjustment of the minimum electricity consumption from 10 GWh to only 1 GWh annually has been an unwise decision because this includes a wide range of companies that do not trade at international markets and therefore do not need the subsidy to preserve their international competitiveness. In addition there should be other criteria developed that limit reductions to a specific field of electricity consumers, including the steel industry. This topic will be further analysed in hypothesis three.
The amount of reduction should be determined in a percentage share of the increasing Levy, since it is also changing for the rest of the consumers. The first draft law of the German Government would see an amount of currently 0.031 ct/kWh (0.5%) for industries such as steel being appropriate. There it has to be reckoned that this amount is smaller than the one due for the past years. The proposed share of 10% (0.5 ct/kWh with the reduced Levy) however, is believed to be rather high but cannot appropriately be judged by the author. It is proven that the merit order effect due to the increasing feed-in of RE has a reducing impact on the electricity price at the spot market. Hence, the argument for the structural subsidy because of the merit order effect appears viable. The trend shows a continuing increased capacity traded at the spot market. Nevertheless, most industries still purchase their base and peak load at the futures market and only remaining quantities are bought at the day ahead market (Ollrog, 2012). However, the effect of RE on the futures market is controversial. This is of course every
31
company’s own strategic decision and should perhaps be reconsidered in the future. However, numerous studies represent the argumentation that the merit order effect exists at the futures market although less than at the spot market (Sensfuß, 2011).
2. Domestically produced electricity cannot be covered by the EEG Levy in full without harming the companies' competitiveness.
Due to the ‘Protection of confidence’ and the ecological reasoning behind the usage of by-products, it is believed that a continued exemption for domestically produced electricity is viable for existing plants. In case those plants would appear to be economically useless in a steel manufacturing process they would be shut down. Accruing heat and gases would be wasted and additional electricity would be consumed from the public grid. This would firstly lead to a total increase in electricity consumption/production and secondly in higher CO2 emissions. For newly installed plants this is a different story. Companies would know the on-going cost and could include a partial amount of the EEG Levy in the feasibility calculations of future investments. As it is shown in hypothesis five, there is still a considerable potential for CO2 and hence energy savings. Of course great care should be taken when determining the percentage share to still keep a reasonable amount of investments economically viable. Although the proposed model (20% decrease of the current EEG Levy) of the Öko-Institut e.V.would not work with leaving out on the domestically produced electricity, it is seen as irresponsible since 1.5 ct/kWh would be around a quarter of industries electricity price.
3. A fairer criterion for EEG Levy exemptions and reductions due to international competitiveness is the export figures in addition to the electricity consumption share of value added.
The Öko-Institut e.V. does suggest a quite interesting proposal that is derived from the CO2 trading regulation, applied in the whole European Union. When a political solution for the concerns about the EEG Levy reductions and its violation of the principle of competition is found between the EU committee and the German Government, this will be the basis for criteria for further exemptions. Contacts did also confirm that these regulations are not fixed yet and will have a strong impact on the design of the Renewable Energies Act 2014. Nonetheless, some summarised proposals are made.
The electricity consumption should definitely be continued as a criterion for the reduced EEG Levy. The exact minimum or application of the value is not to be judged by the author, although it is suggested to decrease the current value of 10 GWh annually. The criteria of the Wirtschaftvereinigung Stahl could be considered. The Energieintensive Industrien Deutschland does propose to exempt companies solely because it is manufacturing. However, this aspect solely is deemed to not appropriately reflect international competitiveness.
The certification of an energy management system is also desired, however it needs to be observed if appropriate targets are set every year and are being implemented. Also the share of energy cost to the gross value added is further seen as necessary.
4. The only possibility to make the EEG Levy structure fairer is to change the electricity market for RE by making it more demand side oriented.
In the opinion of the author the decision in regards to direct marketing of the German Government will determine the future path of the Energiewende. If they want to steward a decentralized and a more individual designed energy system, the direct marketing should have
32
exceptions for smaller plants without declining character over the coming years. Thus the feed-in tariff system should be continued for the power plants operated by private and municipal cooperatives. In addition it is not deemed to be promoting, if the feed-in tariffs are lowered too much. On the other hand, if the German Government intends to facilitate an oligopolistic energy system as currently with conventional energy the introduction of the tendering model is appropriate. It is believed that this will suppress smaller energy suppliers sooner or later due to higher cost and risk that can only be carried by entities with high equity.
Here the former proposal seems more appropriate in order to ensure national support in the further process of the Energiewende and a higher acceptance towards financial responsibility such as the Renewable Energy Levy. For larger space for RE that can only be financed by companies anyway, a tendering model might be suitable to steer large amounts of electricity more demand side oriented and only payout premium that is needed by the market economy.
What is more is the cap for especially biomass and wind power on land. Since the water resources for water energy are only limited in Germany and geothermal energy is still in its infancy, biomass is reckoned to be the currently economical and ecological best alternative to replace nuclear capacity. Excessive cultivation of maize or other edible plant has to be regulated in another scope.
The planned amount of the Renewable Energy Levy and its assumed increase is doubted. It still will be a 15% increase from 2014 level and the intended measures are not believed to solve the fundamental problem but rather to introduce certain changes that tinker with the direct cost to a small extent. It has always been clear that the energy turnaround is not possible without tremendous investment. However the planned modification of the framework does not move the EEG Levy towards the right direction, which is the funding of RE projects instead of compensating market structures and avow for the privileged industry. The EEG Levy did not rise until 2012 where bar of minimum electricity consumption was lowered, as seen in Figure 3.
5. With continued low electricity prices, there is no incentive for the highly energy intensive industry to invest in energy saving potentials.
Results to this hypothesis can be summarised briefly. With a potential increase in demand of European steel in the coming decade there is economical room for investments in CO2 saving measures, which will however not equally result in energy savings. The replacement of producing steel in the Basic Oxygen Furnace by recycling steel in Electric Arc Furnaces is indeed one of the most important measures in achieving the most reasonable CO2 saving of 21% until 2050 (these figures are solely based on the deep study by the Steel Institute VDEh and The Boston Consulting Group (2013). Here it has to be considered that the ratio of Basic Oxygen Furnace and Electric Arc Furnaces treatments of the whole of Europe is the same as in Germany. The availability of steel scrap however, cannot be assessed here but might be similar as well. This means that a similar figure could be achieved in Germany until 2050. As shown above, these savings come from a higher demand of electricity instead of fuel and with assuming to achieve the energy targets of Germany and Europe until 2050, this could be possible. However, this is not to be mistaken with energy savings. As seen in Table 5 the Electric Arc Furnaces steel scrap recycling is not less energy intensive, just the distribution appears to be different. Also, the potential for CO2 saving due to the transition from fuel to electricity is a measure that the automotive industry is encountering, therefore it is deemed to be a viable argument.
33
7.4 LIMITATION OF RESULTS This section serves the reason to evaluate not the content but the quality of the primary data gathered. Of course, while pursuing the literature research and the interviews great care has been taken to understand and evaluate the information that has been used. However, due to time and scope constraints, there might be certain limitations that have to be mentioned in order to ascertain the results.
The first draft law (Bundesregierung, 2014), which is illustrated in the former section, is not to be held as a fixed law yet. There is room for amendments that might be incorporated in the final version that is planned to be signed in August 2014.
Found information is deemed to be rather representative due to the consolidation of established and influential associations. Nevertheless there may be constraints in its overall reliability. Not all contacts did come back after assuring a reply due to possible time restrictions or general application forms did answer at all. The results do only present information from associations that did reply and also only the chance has been given to entities contacted (see Table 7). All established associations regarded as beneficial for this research have been contacted, however it might be possible to have missed smaller entities. It further is possible to have a certain bias in the summarised answers, due to a high share of interest groups in favour of the wellbeing of energy intensive industry and its continued profit margin. Nevertheless, it is tried to keep any subjective opinion out of sight and evaluate the results rationally.
The downside of a semi-structured interview is its reliability (Saunders, 2009). The specific person asked may respond in a different way than another person in the same organisation would have answered. Since most of the interviews have been carried out via E-Mail eventually, the answers are more reliable, especially because the majority did refer to the official statement paper of the respective association. Additionally the repeatability of the research is rather low. However, since this research is undertaken at a specific point in time where this research question is of prevalent importance it is not the intent to achieve similar results at another moment.
Finally, it has been the intention to derive from findings in the steel industry to other energy intensive industry. These are specifically industries such as chemical products, paper, glass and construction materials. It can reasonably be assumed that these industries do face similar issues, since they also stand in international competition, which is why they cannot allocate nationally increased energy cost onto selling prices. They also consume a very high amount of electricity, which means an increase in the EEG Levy would affect the economy greatly. One main difference is the importance of national processing industries for the steel industry. For the formerly mentioned industries this is not as vital as for steel.
34
8 CONCLUSION
It has been the intention of this dissertation to propose amendments to the existing structure of the EEG Levy. The expertise of interviewees helped to complement the literature research about the political viewpoint and the steel industry’s background. Specifically, the study sought to address the following research question:
How can the Renewable Energy Levy structure be redesigned in order to keep the German steel industry competitive while pursuing energy savings?
In order to maintain the steel industry’s competitiveness the whole framework of the Renewable Energy (EEG) Levy has to work properly. Therefore also other aspects have to be considered and assessed in addition to the steel industry’s actual responsibilities and liberties. Hence, the following sub-questions that have been answered throughout the dissertation refer to the main research question, however, do examine the bigger picture.
• How is the Renewable Energy Levy gathered and utilised within the Energiewende?
The subsidising scheme and the obliging acceptance of energy from renewable sources has given the impulse for a growing market of renewable energy since 2000. With a determined duration of 20 years an operator of a RE power plant receives a feed-in tariff, according to the respective Renewable Energies Act in place, often higher than prices attained at the electricity market. However, the grid operator who pays the feed-in tariff to the plant operator receives the electricity price and gets the remaining amount balanced by the Government. This remaining amount is financed by means of the EEG Levy that is gathered over the electricity bill from consumers. Two issues arose over time with the EEG Levy. Firstly, to ensure industries that consume large amounts of electricity every year remain competitive, a special equalisation scheme (§40 ff. EEG) has been introduced to privilege these consumers. The not paying of some, burdens the remaining many. Secondly, the increasing feed-in of electricity from RE triggered the merit order effect. Today the merit order stands for 6-10 € per MWh price decrease at the European Energy Exchange (EEX) market. These two developments changed the composition of the EEG Levy composition. By now, only 40% account for the actual funding of RE, whereas 20% for each of the two abovementioned issues are allotted to households and medium sized companies by using the Renewable Energy Levy.
• How is the electricity price composed today and which shares do the energy intensive industry pay compared to households?
While the electricity prices for households and also medium sized companies did increase in the past 14 years around 100%, mostly due to risen surcharges, prices at the electricity market dropped around 20% because of the merit order effect. This contradiction is greatly discussed because every average German household pays more than 200€ a year only to fund the Energiewende but gets increasing electricity prices in return.
Almost half of the electricity consumed in Germany is utilised by manufacturing industry. This very energy intensive industry is paying reduced amounts for all surcharges, where the highest reduction appears to be 0.05 of 6.24 ct/kWh of the Renewable Energy Levy in 2014. This
35
exception has been introduced to protect the industries’ competitiveness on the international market, since national increases in energy cost cannot be easily allotted to prices on international markets. However, since in the Renewable Energies Act in 2012 the minimum limit of 10 GWh annually has been reduced to 1 GWh, also a vast amount of other companies applied for reductions within the Renewable Energy Levy, resulting in exempt companies in total in 2014. One third of the electricity consumed by the industry is charged with the reduced Levy. Due to this intervention in the principle of international competition, the EU committee is investigating this issue and are currently trying to find a fitting solution in consultation with the German Government.
Another aspect is the domestically produced electricity (§37 EEG) that is fully exempt from being charged any electricity charge. One quarter of electricity consumed by the industry is produced domestically and therefore not charged. Because of environmental and financial reasons it would be pointless to consume extra electricity when not utilising electricity from by-products.
• What importance does the steel industry have for the German economy and how can energy saving potentials be utilised?
The German steel industry is a very important part of Germany’s manufacturing industry, which stands for 25% of the GDP today. With a total consumption of around 250 TWh annually for energy intensive industry, it accounts for almost half of the entire German electricity consumption. The steel industry has a special recognition in manufacturing industry due to its high national interconnection to its processing industry. Intermediate steel products are further used for renewable energy plants, several transport applications such as aerospace and automotive as well as construction and machine engineering. Due to increasing raw material and energy cost, the past decades forced the steel manufacturers to improve production methods. Beside a more efficient use of material such as the containing of residues, by-products like excess heat and gases are being utilised for electricity generation to reduce energy and CO2. Nevertheless, a study shows that until 2050 there is an economical viable potential to save 21% of the currently emitted CO2 in the whole of Europe and possibly solely Germany as well. This is mainly possible with the replacement of Basic Oxygen Furnace steel producing sites with Electric steel sites. For Steel Arc Furnaces there is no fuel necessary, however the electricity consumption for recycling steel scrap is threefold of the Oxygen Furnace. As a second measure the political settled energy goals are to be achieved in order to reach the CO2-emission savings with consuming the electricity from RE plants and hence low carbon burden.
Further research is suggested in regards to the energy saving potential in Germany’s steel industry. Data lacked for specific or average energy cost for producing and recycling steel. Therefore the share of total cost accounting for electricity or fuel could not be revealed and hence, specific saving scenarios were not possible to produce.
In regards to the main research question, several improvement aspects have been found for the existing issues.
First of all, it is seen as reasonable to still pursue the special equalisation scheme but only for highly energy intensive industry. Hence, criteria have to be amended in order to reach a proper distinction. A combination of the exemption list from the CO2 trading regulation and additional aspects is seen as decent. Firstly, it cannot be renounced from a certified energy management system to determine environmental savings and also to fulfil them. A fixed share of energy cost
36
from gross value added and a minimum electricity consumption annually is also considered to be wise. Definitely, the number of companies being privileged in the future has to be reduced, which can be achieved by raising the bar of minimum electricity consumption from 1 GWh to a higher number. Before the EEG 2012 and the minimum electricity consumption of 10 GWh annually, the EEG Levy increase has been fair enough. Lastly, since all highly energy intensive industries in Germany face international competition, another criterion is not required to verify this aspect. The Renewable Energy Levy for privileged consumers should be determined as a percentage figure and should be fractionally raised. A percentage might also urge the industry to support a functional and sustainable Renewable Energy regulation to not let the Levy increase heavily.
It is perceived reasonable to burden future investments for producing electricity domestically with a part of the Renewable Energy Levy. The amount is not to be set too high so investments remain financially feasible. Existing plants by contrast, are not to be charged whatsoever due to the Protection of Confidence.
As desirable as it would be to have a consistent regulation for the marketing of RE, it is suggested to arrange different specifications. Larger projects for RE generation must sell electricity demand side oriented directly to a consumer. However, a minimum limit has to be determined to encourage a decentralised energy system. The protection of smaller RE projects is fundamental to minimise investment risk for municipal and private cooperatives with low equity. For these projects the fixed feed-in tariff system is to be continued. The duration and amount has to be carefully considered. Since it is planned to decrease the tariffs from 17 to 12 ct/kWh, it is possible to exclude numerous projects from its implementation.
A cap for the expansion of RE, as it is planned in the first draft law of the German Government, is believed to be questionable. It seems as if the Government tries to cut cost in order to keep the RE funding share in the Renewable Energy Levy as small as possible, however, the other shares are not properly reviewed.
In summary, it can be said that it is possible to keep the steel industry competitive with continued low contribution for consumed electricity and domestically produced electricity. Pushing the limit of minimal electricity consumption to a higher amount and therefore reducing the amount of companies being privileged can do this continued exemption. Secondly, by moving large RE capacities to a more demand side oriented direct marketing. The privileged contribution is to be adjusted to the development of the Renewable Energy regulation by means of a percentage amount. To guarantee future investments in CO2 savings a certified energy management system is to be administered to ensure a development towards a higher share of electric steel. Other efficiency measures are to be charged partly with the EEG Levy.
IX
REFERENCE LIST AG Energiebilanzen, 2013. Stromerzeugung nach Energieträgern. Statistisches Bundesamt; Bundesministerium für Wirtschaft und Technologie; BDEW Bundesverband der Energie- und Wasserwirtschaft e.V.; Statistik der Kohlenwirtschaft e.V.; AG Energiebilanzen e.V.
Bütikofer, R., 2014. Sündenbock Energiewende. [Online] Available at: http://www.zeit.de/wirtschaft/unternehmen/2014-02/stahl-energiewende-klima-konjunktur [Accessed 06 March 2014].
BAFA, 2014. www.bafa.de. [Online] Available at: http://www.google.de/url?sa=t&rct=j&q=&esrc=s&source=web&cd=2&ved=0CD0QFjAB&url=http%3A%2F%2Fwww.bafa.de%2Fbafa%2Fde%2Fenergie%2Fbesondere_ausgleichsregelung_eeg%2Fpublikationen%2Fstatistische_auswertungen%2Fbesar_2014.xls&ei=hWp7U6ynJdGQ4gT5u4Bg&usg=AFQjCNHF9TZxQ9GLRJKGxCjp_As64Xy9AQ&sig2=nK622pONjHo3oNUqJC6WLg&bvm=bv.67229260,d.bGE [Accessed 20 May 2014].
BDEW, 2012. Industrie nutzt die Ha ̈lfte des Stroms. [Online] Available at: https://www.bdew.de/internet.nsf/id/FD83494C299CD937C12579F4004063A3/$file/Netto-Stromverbrauch%20nach%20Verbrauchergruppen%202011_08Aug2012_o_jaehrlich_Ki.pdf [Accessed 31 January 2014].
BDEW, 2013. BDEW-Strompreisanalyse November 2013. Bundesverband der Energie- und Wasserwirtschaft e.V. https://www.bdew.de/internet.nsf/id/123176ABDD9ECE5DC1257AA20040E368/$file/131120_BDEW_Strompreisanalyse_November%202013.pdf.
BDEW, 2013. Bruttostromerzeugung nach Energieträgern 2013. [Online] Available at: http://bdew.de/internet.nsf/res/01%20Bruttostromerzeugung%20nach%20Energieträgern%202013/$file/140113-Grafik-Energietrger-1.jpg [Accessed 29 January 2014].
BDEW, 2013. Entwicklung des Netto-Stromverbrauchs in Deutschland 1998 bis 2012 nach Verbrauchergruppen in Mrd. kWh. [Online] Available at: https://www.bdew.de/internet.nsf/id/59D800ACCCF331D6C12579F4003FA640/$file/Netto-Stromverbrauch%20nach%20Verbrauchergruppen%20Entwicklung%201998_2012%2030Aug2013_o_jaehrlich_Ki.pdf [Accessed 05 February 2014].
BEE, 2014. BEE-Stellungnahme zum EEG-Referentenwurf vom 4. März 2014. Statement. Bundesverband Erneuerbarer Energien e.V.
BMU, BAFA, 2013. Hintergrundinformationen zur Besonderen Ausgleichsregelung - Antragsverfahren 2013 auf Begrenzung der EEG-Umlage 2014. Bundesministerium fu ̈r Umwelt, Naturschutz und Reaktorsicherheit, Bundesamt fu ̈r Wirtschaft und Ausfuhrkontrolle. http://www.bafa.de/bafa/de/energie/besondere_ausgleichsregelung_eeg/publikationen/bmwi/eeg_hintergrundpapier_2013.pdf.
BMU, 2007. Fachgespräch zum Merit-Order-Effekt im Auftrag des BMU. Berlin: Bundesministerium für Umwelt, Naturschutz und Reaktorsicherheit.
BMU, 2012. Emissionshandel fu ̈r Klimaschutz und Energiewende. Bundesministeriums fu ̈r Umwelt, Naturschutz und Reaktorsicherheit. http://www.bmub.bund.de/fileadmin/Daten_BMU/Download_PDF/Emissionshandel/faltblatt_emissionshandel_bf.pdf.
BMUB, 2000. Gesetz fu ̈r den Vorrang Erneuerbarer Energien. Bundesministerium für Umwelt, Naturschutz, Bau und Reaktorsicherheit. http://www.gesetze-im-internet.de/bundesrecht/eeg/gesamt.pdf.
X
BMUB, 2004. Mindestvergu ̈tungssa ̈tze nach dem neuen Erneuerbare-Energien-Gesetz (EEG). vom 21. Juli 2004. Bundesministerium für Umwelt, Naturschutz, Bau und Reaktorsicherheit. http://www.erneuerbare-energien.de/fileadmin/ee-import/files/pdfs/allgemein/application/pdf/verguetungssaetze_nach_eeg.pdf.
BMUB, 2010. Vergu ̈tungssa ̈tze und Degressionsbeispiele nach dem neuen Erneuerbare-Energien-Gesetz (EEG).vom 31. Oktober 2008 mit A ̈nderungen vom 11. August 2010. Bundesministerium für Umwelt, Naturschutz, Bau und Reaktorsicherheit. http://www.erneuerbare-energien.de/fileadmin/ee-import/files/pdfs/allgemein/application/pdf/eeg_2009_verguetungsdegression_bf.pdf.
BMUB, 2012. Vergu ̈tungssa ̈tze, Degression und Berechnungsbeispiele nach dem neuen Erneuerbare-Energien-Gesetz (EEG) vom 04. August 2011 (‚EEG 2012’). Bundesministerium für Umwelt, Naturschutz, Bau und Reaktorsicherheit. http://www.erneuerbare-energien.de/fileadmin/Daten_EE/Dokumente__PDFs_/verguetungssaetze_eeg_2012_bf.pdf.
BMWi, 2010. Energiekonzept - fu ̈r eine umweltschonende, zuverla ̈ssige und bezahlbare Energieversorgung. Munich: Bundesministerium für Wirtschaft und Technologie.
BMWi, 2012. Hintergrundpapier zur sog. Strompreiskompensation. Bundesministerium fu ̈r Wirtschaft und Technologie. https://www.bmwi.de/BMWi/Redaktion/PDF/S-T/strompreiskompensation-hintergrundpapier,property=pdf,bereich=bmwi2012,sprache=de,rwb=true.pdf.
BMWi, 2014. Europäische Energiepolitik. [Online] Available at: http://www.bmwi.de/DE/Themen/Energie/Energiepolitik/europaeische-energiepolitik.html [Accessed 04 February 2014].
BUND, 2014. Eckpunkte für ein EEG 2.0. Berlin: Bund fu ̈r Umwelt und Naturschutz Deutschland e.V.
Bundesministerium der Justiz, 2012. Stromsteuergesetz §9a. Bundestag.
Bundesregierung, 1990. Gesetz u ̈ber die Einspeisung von Strom aus erneuerbaren Energien in das o ̈ffentliche Netz. Die Deutsche Bundesregierung. http://www.ena.de/pdf_bunker/stromeinspeisungsgesetz.pdf.
Bundesregierung, 2014. Entwurf eines Gesetzes zur grundlegenden Reform des Erneuerbare-Energien-Gesetzes und zur Änderung weiterer Bestimmungen des Energiewirtschaftsrechts. First draft law. Die Deutsche Bundesregierung.
Bundesverband Erneuerbare Energien e.V., 2013. BEE-Hintergrund zur EEG-Umlage 2013. Berlin. http://www.bee-ev.de/_downloads/publikationen/positionen/2013/20131015_BEE-Hintergrund_EEG-Umlage-2014.pdf.
Döring, T.&.D.M.&.H.D., 2014. Bärenmarke jetzt EEG-befreit. [Online] Available at: http://www.handelsblatt.com/unternehmen/industrie/oekostrom-finanzierung-baerenmarke-jetzt-eeg-befreit/9466740.html [Accessed 03 March 2014].
Deutsche Edelstahlwerke Witten: Stahlproduktion im Lichtbogenofen. 2012. [http://www.youtube.com/watch?v=Iy7M7tr_YeY] Directed by Deutsche Edelstahlwerke Witten. Germany: AKTIVvideo Produktion.
Eckert, W., 2013. Die Preisfrage der Ökostromförderung. [Online] Available at: http://www.tagesschau.de/wirtschaft/eeg-umlage100.html [Accessed 27 January 2014].
Eichler, M., n.d. Die EEG-Umlage, Bestandteile und Prognosen ab 2014. [Online] Available at: http://www.wie-energiesparen.info/fakten-wissen/eeg-umlage-bestandteile-prognosen-ab-2014/ [Accessed 06 March 2014].
XI
Eichler, M., n.d. Die Offshore-Umlage (Haftungsumlage) nach dem EnWG. [Online] Available at: http://www.wie-energiesparen.info/fakten-wissen/offshore-haftungs-umlage-enwg/ [Accessed 04 February 2014].
EID, 2014. Stellungnahme der Energieintensiven Industrien in Deutschland (EID). Statement. Energieintensiven Industrien in Deutschland.
Elkington, J., 1998. Cannibals with Forks: Triple Bottom Line of 21st Century Business. New Society Publishers.
European Energy Exchange AG, 2014. EPEX Spot market. [Online] Available at: ww.eex.de [Accessed 07 February 2014].
Europäische Kommission, 2013. Stahl hat Zukunft in Europa. [Online] Available at: http://ec.europa.eu/enterprise/magazine/articles/sustainable-industry-innovation/article_11094_de.htm [Accessed 10 February 2014].
EWI, 2012. Analyse der Stromkostenbelastung der energieintensiven Industrie. Collogne: Energiewirtschaftliches Institut an der Universita ̈t zu Ko ̈ln. http://www.ewi.uni-koeln.de/fileadmin/user_upload/Publikationen/Studien/Politik_und_Gesellschaft/2012/2012-09_Stromkostenbelastung.pdf.
Faulstrich, M.W.&.C.H.&.M., 2012. Energiewende -A Pricey Challenge. CESifo DICE, pp.1-23.
Fraunhofer ISE, 2013. Stromgestehungskosten Erneuerbare Energien. FRAUNHOFER-INSTITUT FU ̈R SOlARE ENERGIESYSTEME ISE. http://www.ise.fraunhofer.de/de/veroeffentlichungen/veroeffentlichungen-pdf-dateien/studien-und-konzeptpapiere/studie-stromgestehungskosten-erneuerbare-energien.pdf.
Frondel, M.&.S.C.M., 2008. CO2-Emissionshandel: Auswirkungen auf Strompreise und energieintensive Industrien. Essen: Rheinisch-Westfälisches Institut für Wirtschaftsforschung (RWI).
Gerspacher, A.&.A.M.&.D.E.W., 2011. Zukunftsmarkt Energieeffiziente Stahlherstellung. Fraunhofer Institut fu ̈r System- und Innovationsforschung (ISI).
Hallerberg, M., 2013. Effizient und gerecht? Wer wirklich für die Energiewende bezahlt. [Online] Available at: http://www.focus.de/politik/gastkolumnen/hertieschool/effizient-und-gerecht-wer-wirklich-fuer-die-energiewende-bezahlt_aid_1073613.html [Accessed 30 January 2014].
Hoffmann, K.P., 2013. Noch mehr Betriebe werden von den Kosten der Energiewende verschont. [Online] Available at: http://www.tagesspiegel.de/politik/ausnahmen-bei-der-eeg-umlage-noch-mehr-betriebe-werden-von-den-kosten-der-energiewende-verschont/9186584.html [Accessed 03 March 2014].
Initiative Neue Soziale Marktwirtschaft, n.d. Ein Wettbewerbsmodell für Erneuerbare Energien. [Online] Available at: http://www.insm.de/insm/kampagne/energiewende/details-energiewende.html [Accessed 03 March 2014].
International Atomic Energy Agency, 2014. Nuclear Share of Electricity Generation in 2012. [Online] Available at: http://www.iaea.org/PRIS/WorldStatistics/NuclearShareofElectricityGeneration.aspx [Accessed 22 January 2014].
Küchler, S.&.H.J., 2012. Strom- und Energiekosten der Industrie. Greenpeace e.V..
Kerkhoff, H.J., 2014. Bisherige Vorschläge zur Entlastung der Industrie von der EEG-Umlage sind unzureichend. [Online] Available at: http://www.stahl-
XII
online.de/index.php/medieninformation/die-zukunft-der-stahlindustrie-steht-auf-dem-spiel/ [Accessed 20 May 2014].
Kerkhoff, H.J., 2014. Stahl an der Grenze der Belastbarkeit - Zur Lage der Stahlindustrie in Deutschland und Europa. Düsseldorf: Wirtschaftsvereinigung Stahl im Stahl-Zentrum.
Kiel, P., 2001. Einführung in die DIN-Normen. Stuttgart/Leipzig/Wiesbaden: B.G. Teubner GmbH.
Knipper, T., 2013. Diese Unternehmen sind von der Öko-Strom-Umlage befreit. [Online] Available at: http://www.cicero.de/kapital/diese-unternehmen-sind-von-der-oeko-strom-umlage-befreit/53249 [Accessed 26 January 2014].
Matthes, D.F.&.J.C.&.V.G.&.D.M.H.&.H.H., 2014. Vorschlag fu ̈r eine Reform der Umlage-Mechanismen im Erneuerbare Energien Gesetz (EEG). Öko-Institut e.V. http://www.oeko.de/oekodoc/1856/2014-003-de.pdf.
Nestle, U., 2014. Marktrealita ̈t von Bu ̈rgerenergie und mo ̈gliche Auswirkungen von regulatori‐ schen Eingriffen in die Energiewende. Bu ̈ndnisses Bu ̈rgerenergie e.V, Bundes fu ̈r Um‐ welt und Naturschutz Deutschland.
Netztransparenz.de, n.d. KWK-Verfahrensbeschreibung und -Umsetzungshilfen. [Online] Available at: http://www.eeg-kwk.net/de/KWK_Verfahrensbeschreibung_und_Umsetzungshilfen.htm [Accessed 24 February 2014].
Norddeutscher Rundfunk, 2013. Berlin schießt scharf gegen Brüssel. [Online] Available at: https://www.tagesschau.de/wirtschaft/eeg138.html [Accessed 03 March 2014].
Ollrog, M.-C.&.B.A., 2012. Die Industrie profitiert von der Energiewende. [Online] Available at: http://www.finance-magazin.de/maerkte-wirtschaft/deutschland/die-industrie-profitiert-von-der-energiewende/Marc-Christian Ollrog und Alina Bartscher [Accessed 16 April 2014].
Patel, S., 2013. Germany's Energy Transistion Experiment. Energy Policy, 157(5), pp.34-52.
PricewaterhouseCoopers, 2014. China benötigt 2025 so viel Stahl wie der gesamte Rest der Welt.
Reuster, L.&.K.S., 2012. Industriebegünstigungen bei der EEG-Umlage und deren Auswirkung auf die restlichen Stromverbraucher. Campact e.V..
Rheinisch-Westfälisches Institut für Wirtschaftsforschung, 2012. Marktwirtschaftliche Energiewende: Ein Wettbewerbsrahmen für die Stromversorgung mit alternativen Technologien.
Rostankowski, A.&.B.A.&.G.N.&.H.&.S.M.&.R.C., 2013. Laufende Evaluierung der Direktvermarktung von Strom aus Erneuerbaren Energien - Stand 10/2013. Fraunhofer ISE, Fraunhofer IWES, IKM.
RP Digital GmbH, 2014. Stahlindustrie will bis 2015 weitere 2000 Jobs abbauen. [Online] Available at: http://www.rp-online.de/wirtschaft/stahlindustrie-will-bis-2015-weitere-2000-jobs-abbauen-aid-1.4028964 [Accessed 03 March 2014].
Salzgitter AG, 2013. Stahlproduktion der Salzgitter Flachstahl GmbH. [https://www.youtube.com/watch?v=TIzBHqpygag] Available at: https://www.youtube.com/watch?v=TIzBHqpygag [Accessed 23 February 2014].
Saunders, M.&.L.P.&.T.A., 2009. Research methods for business students. 5th ed. Harlow: Pearson Education.
XIII
Schmidt-Brockhoff, D.J.R.&.P.v.H.&.D.N.N.&.T., 2012. Die Stahlindustrie in Deutschland „Ru ̈ckgrat des Industriestandorts Deutschland“. Booz & Company Inc.
Sensfuß, D.F., 2011. Analysen zum Merit-Order Effekt erneuerbarer Energien. Karlsruhe: Fraunhofer ISI.
Stahl Zentrum, 2011. Wettbewerbsfähige Rahmenbedingungen für Stahlindustrie. [Online] Available at: http://www.stahl-online.de/index.php/themen/wirtschaft/wirtschaftpolitik/ [Accessed 05 March 2014].
Stahl Zentrum, 2013. Die Stahlindustrie als energieintensive Branche. [Online] Available at: http://www.stahl-online.de/index.php/themen/energie-und-umwelt/energie/ [Accessed 03 March 2013].
Stahl Zentrum, 2013. Stahlindustrie in Deutschland 2012. [Online] Available at: http://www.stahl-online.de/wp-content/uploads/2013/08/20131121_Stahlindustrie-in-Deutschland-2012.png [Accessed 17 February 2014].
Stahl Zentrum, 2013. Stahlunternehmen: Unverzichtbar für die Wirtschaft. [Online] Available at: http://www.stahl-online.de/index.php/themen/wirtschaft/stahlindustrie-in-deutschland/ [Accessed 17 February 2014].
Stahlpreise.eu, 2014. www.stahlpreise.eu. [Online] Available at: http://www.stahlpreise.eu/2014/04/aktuelle-stahlpreise-pro-tonne-1000-kg.html [Accessed 20 May 2014].
Stalinski, S., 2014. EEG 2.0 - Was sich künftig ändern soll. [Online] Available at: http://www.tagesschau.de/inland/faqoekostrom100.html [Accessed 03 March 2014].
Statista GmbH, 2014. Größte Stahlkonzerne weltweit nach erzeugter Rohstahlmenge im Jahr 2012 (in Millionen Tonnen). [Online] Available at: http://de.statista.com/statistik/daten/studie/166153/umfrage/die-15-groessten-stahlkonzerne-nach-weltweitem-umsatz/ [Accessed 03 March 2014].
Statista GmbH, 2014. Größte Stahlproduzenten in Deutschland nach Produktionsmenge im Jahr 2012 (in Millionen Tonnen). [Online] Available at: http://de.statista.com/statistik/daten/studie/153022/umfrage/die-groessten-stahlproduzenten-nach-produktionsmenge-in-deutschland/ [Accessed 17 February 2014].
Statistisches Bundesamt, 2013. Preise - Daten zur Energiepreisentwicklung. Wiesbaden.
Statistisches Bundesamt, 2014. Bruttoinlands-Produkt 2013 Fu ̈r Deutschland. Statistisches Bundesamt, Wiesbaden.
stern.de GmbH, 2014. Gewinn bei Eon halbiert: Kraftwerke werden stillgelegt. [Online] Available at: http://www.stern.de/wirtschaft/news/gewinn-bei-eon-halbiert-kraftwerke-werden-stillgelegt-2096084.html [Accessed 07 April 2014].
Teevs, C., 2014. Emissionshandel: EU-Kommission fordert Mindestpreis für Verschmutzungsrechte. [Online] Available at: http://www.spiegel.de/wirtschaft/unternehmen/eu-kommission-fordert-mindestpreis-fuer-verschmutzungsrechte-a-943999.html.
t-online.de, 2012. Geldschwund bei der Energiewende gefährdet Förderprojekte. [Online] Available at: http://www.t-online.de/wirtschaft/energie/versorgerwechsel/id_57783080/energiewende-milliarden-fehlen-wegen-eingebrochenem-co2-rechtehandel.html [Accessed 31 January 2014].
UBA, 2013. O ̈konomische Bewertung von Umweltscha ̈den. Umweltbundesamt.
XIV
Verband der Wirtschaft für Emissionshandel und Klimaschutz e.V., n.d. 3. Handelsperiode. [Online] Available at: http://www.co2ncept-plus.de/emissionshandel/eu-handelssystem/3-handelsperiode/ [Accessed 03 February 2014].
VIK, 2010. Energieintensive Branchen. [Online] Available at: http://vik.de/Energieintensive_Branchen.html [Accessed 10 February 2014].
VIK, 2014. VIK-Stellungnahme zum Entwurf eines Gesetzes zur grundlegenden Reform des Erneuerbare-Energien-Gesetzes und zur Änderung weiterer Vorschriften des Energiewirtschaftsrechts. Statement. Verband der industriellen deutschen Industrie.
vzbv, 2014. EEG-Reform 2014: Weichenstellung für eine erfolgreiche Energiewende?. Statement. Verbraucherzentrale Bundesverband e.V..
Wörtler, M.&.S.F.&.V.N.&.S.T.&.D.P.&.L.H.B.&.G.J.-T., 2013. Steel's Contribution To A Low-Carbon Europe 2050. Steel Institute VDEh, The Boston Consulting Group.
Weinhold, N., 2014. Bürgerprojekte sollten nicht so großen Risiken ausgesetzt sein. Erneuerbare Energien - Das Magazin, 25 February.
World Steel Association, 2013. Crude steel production - December 2013. worldsteel.org.
World Steel Association, 2013. World Steel in Figures 2013.
WV Stahl, 2014. Belastung der Eigenstromerzeugung in den Eckpunkten zur EEG-Reform. Statement. Wirtschaftsvereinigung Stahl.


![The Pennsylvania-German Society : [Publications]](https://img.pdfslide.net/doc/110x75/63225035117b4414ec0bd81b/the-pennsylvania-german-society-publications.jpg)


