Embed Size (px)
Citation preview

The Impact of Aid on Bureaucratic Quality: Does the Mode of Delivery Matter? by Pablo Selaya and Rainer Thiele
No. 1494 | March 2009
Kiel Institute for the World Economy, Düsternbrooker Weg 120, 24105 Kiel, Germany
Kiel Working Paper No. 1494 | March 2009
The Impact of Aid on Bureaucratic Quality:
Does the Mode of Delivery Matter?*
by Pablo Selaya and Rainer Thiele
Abstract:
We show that the impact of foreign aid on bureaucratic quality in recipient countries varies
with the mode of delivery. Specifically, grants are found to impair the functioning of the
bureaucracy, whereas loans are not. The negative impact of grants is larger when they are
given as budget support rather than as assistance for specific projects or for programs in
general.
Keywords: Foreign aid, bureaucratic quality
JEL classification: F35
Pablo Selaya Department of Economics University of Copenhagen 1455 Copenhagen K, Denmark Telephone: +45 3532 3091 E-mail: [email protected]
Rainer Thiele Kiel Institute for the World Economy Duesternbrooker Weg 120 24105 Kiel, Germany Telephone: +49 431 8814-215 E-mail: [email protected]
* We thank PEGNet for funding Pablo Selaya's stay in Kiel during which most of the research underlying this paper was undertaken. ____________________________________ The responsibility for the contents of the working papers rests with the author, not the Institute. Since working papers are of a preliminary nature, it may be useful to contact the author of a particular working paper about results or caveats before referring to, or quoting, a paper. Any comments on working papers should be sent directly to the author. Coverphoto: uni_com on photocase.co
1
I. Introduction
Donors try to contribute to better institutions in developing countries through substantial
technical support, putting a particular emphasis on enabling local bureaucracies to improve their
performance and standards. In theory, aid has the potential to raise bureaucratic quality, as it can
release governments of binding revenue constraints, enabling them for instance to pay higher
salaries to civil servants. Yet, a variety of factors created by the aid process itself, such as the
provision of technical assistance that inhibits the recipient government's own capacity and
initiative, or the donor fragmentation caused by the presence of multiple agencies and
development agendas (Knack and Rahman, 2007), can become serious obstacles to the
development of better local bureaucracies.
Surprisingly, only a limited number of studies have analyzed empirically development aid's
capacity to promote better bureaucracies. For a sample of 34 African countries, Bräutigam and
Knack (2004) find that high levels of aid are associated with declines in the overall quality of
governance. Covering a broader cross-section of aid recipients, Knack and Rahman (2007)
identify a negative effect of donor fragmentation on bureaucratic quality.
In this paper we present an empirical assessment of the effects of aid on bureaucratic quality
across countries, aiming to contribute to the literature in two major respects. Conceptually, our
paper is the first to study a salient characteristic of development aid in recent years, namely that
donors have started to disburse it with increasing degrees of discretion in the use of funds, with
the aim of giving more substance to the idea of aid ownership in recipient countries (see e.g.
DFID, 2005). Empirically, we overcome an important drawback of the existing literature by
focusing on disaggregated flows of aid rather than on a single aid aggregate. This explicitly takes
into account the fact that some forms of aid are more likely to affect governance than others.
Our main findings suggest that the impact of foreign aid on bureaucratic quality in recipient
countries varies with the mode of delivery. Specifically, grants are found to impair the
functioning of the bureaucracy, whereas loans are not. We also find that the negative impact of
grants is larger when they are given as budget support rather than as assistance for specific
projects or for programs in general.
2
The remainder of the paper is organized as follows. The data and the method of estimation are
discussed in Section II. Section III presents the results. The paper closes with some concluding
remarks.
II. Data and Method
Our dependent variable is the average level of bureaucratic quality. We take the corresponding
index from the International Country Risk Guide (ICRG) as a proxy. This index gives countries a
score ranging from 0 to 4 according to the overall level of bureaucratic quality, as perceived by
the population, and measured by a number of independent surveys. Aid data are taken from the
OECD's Creditor Reporting System (CRS).1 The data refer to actual aid disbursements.
Disbursements are to be preferred over aid commitments as the behaviour of recipients is more
likely to respond to actual transfers of resources rather than to donors' promises. We distinguish
between program and project aid, based on the OECD's Development Assistance Committee
(DAC) sector codes for aid allocation. Program aid consists of funds for "general budget
support", "developmental food aid", "other commodity assistance", and "action related to debt".
Project aid comprises investments in social and economic infrastructure, as well as aid to
production sectors such as agriculture.2
Our analysis covers the years 1995-2005, which coincides with the period in which donors started
to increasingly emphasize the crucial importance of ownership and the quality of governance for
development, and the period for which we have access to data on disaggregated aid
disbursements from the OECD.
Our basic econometric specification is
(1) ,,
0595,195,00595, ipt
iii aidbureaubureau εββα +++=Δ −−
1See Appendix A1 for precise definitions and sources of the variables used in the regressions, and Appendix A2 for summary statistics. 2For details concerning the sector codes, see Appendix A1.
3
where is the change in the level of bureaucratic quality in
country i over the period 1995-2005, bu is the initial level of bureaucratic quality,
=Δ −0595,ibureau 95,05, ii bureaubureau −
95,ireau
ptiaid,
0595, − is the average level of type t aid received for purpose p , where grants, loans},
and project aid, program aid, budget support} ; and
{∈t
{∈p iε is a zero-mean error term.
This specification reduces to an important extent problems related to omitted variables. Including
as a regressor in equation (1) helps to control for a potentially large set of historical
slow moving factors explaining differences in the level of bureaucratic quality (like ethnic
fractionalization or natural resource endowments, for example); and factors such as unobservable
dimensions of culture which might be difficult to account for directly.
95,ibureau
3 Controlling for
also helps to account for the fact that the variation in average levels of bureaucratic quality across
countries depends to a large extent on idiosyncratic initial conditions. Indeed, as shown in Table
1 for the case of total aid, various proxies for institutions, resource endowments, religion, ethno-
linguistic fractionalization and geographical location turn out to be insignificant when introduced
jointly with .
95,ibureau
95,ibureau 4
We extend equation (1) to include , a vector of time varying covariates of bureaucratic
quality to reduce the number of potentially confounding factors and help in the identification of
0595, −iX
1β :
3Notice that we could also rewrite equation (1) as
ipt
iii aidbureaubureau εββα ++−+= −,
0595,195,005, )1( , which highlights that all predetermined
characteristics of the average level of bureaucratic quality during the period of analysis are controlled for. An alternative strategy to try to account for the effect of individual predetermined confounders (especially time invariant and slow moving unobservable characteristics) is to run the regression with yearly data in first differences or with the variables transformed to deviations from their means. However, this type of strategy would lead to heavily downward-biased estimates, given the high persistence of the level of bureaucratic quality during the period of analysis. 4 By focusing on changes in bureaucratic quality, regression (1) basically explains variation within
countries. Running a regression in averages, ipt
ii aidbureau εβα ++= −−,
0595,10595, , would help to explain variation between countries. Estimates based on this approach confirm our results (not shown, but available on request).
4
(2) .X iipt
iii aidbureaubureau εββα ++++=Δ −′
−− 0595,2,
0595,195,00595, β
In our preferred specification, the vector is represented by the initial level of real GDP
per capita. Other regressors suggested in the literature, such as the number of conflicts the
government is involved in (Bräutigam and Knack 2004) and the initial level of human capital
(here proxied by enrolment in tertiary education), are not found to have an independent impact on
bureaucratic quality (cf Table 1).
0595, −iX
In estimating equation (2), the first option is to use OLS. However, an OLS regression may not
allow us to identify 1β as the impact of aid on bureaucratic quality, since causality between aid
and bureaucratic quality can run in both directions (see, e.g., Alesina and Weder, 2002, who
argue that more corrupt countries receive more aid). To account for this, we estimate equation (2)
in a 2SLS framework, using the level of population in 1995 and the level of mortality for children
under 5 in 1995 as instruments for the aid variable. The exclusion restriction justifying this
choice of instruments is that these two variables have an effect on bureaucratic quality only
because they reflect more need of aid, and, thus, are correlated with higher disbursements of aid
on average. Put differently, our identifying assumption is that, conditional on and
as covariates, the initial levels of population and child mortality do not affect the level of
bureaucratic quality directly, but only through their effect on the amount of aid disbursed to
country i .
95,ibureau
0595, −iX
As shown in the next section, this pair of instruments passes comfortably the standard tests of
strength and relevance in all cases, except when the aid variable refers to loans, where we cannot
reject with a high probability that the instruments are weak. We find that infant mortality is a
particularly weak instrument for loans. This is perhaps not very surprising though, as loans tend
to be given to richer developing countries, where infant mortality arguably is no longer among
the most pressing concerns.5 As an alternative instrument we include the (lagged) level of loan
commitments. Loan commitments are highly correlated with loan disbursements (see e.g.
5Other indicators of need, such as the share of paved roads equally fail to produce strong and valid instruments.
5
Clemens et al., 2004), and should not affect the level of bureaucratic quality directly if sufficient
time has passed since commitments were made.
Finally, since the 2SLS estimates do not allow for correct inference on the coefficients when the
instruments are weak, we additionally rely on Moreira's (2003) test for the significance of weakly
identified coefficients.
III. Results
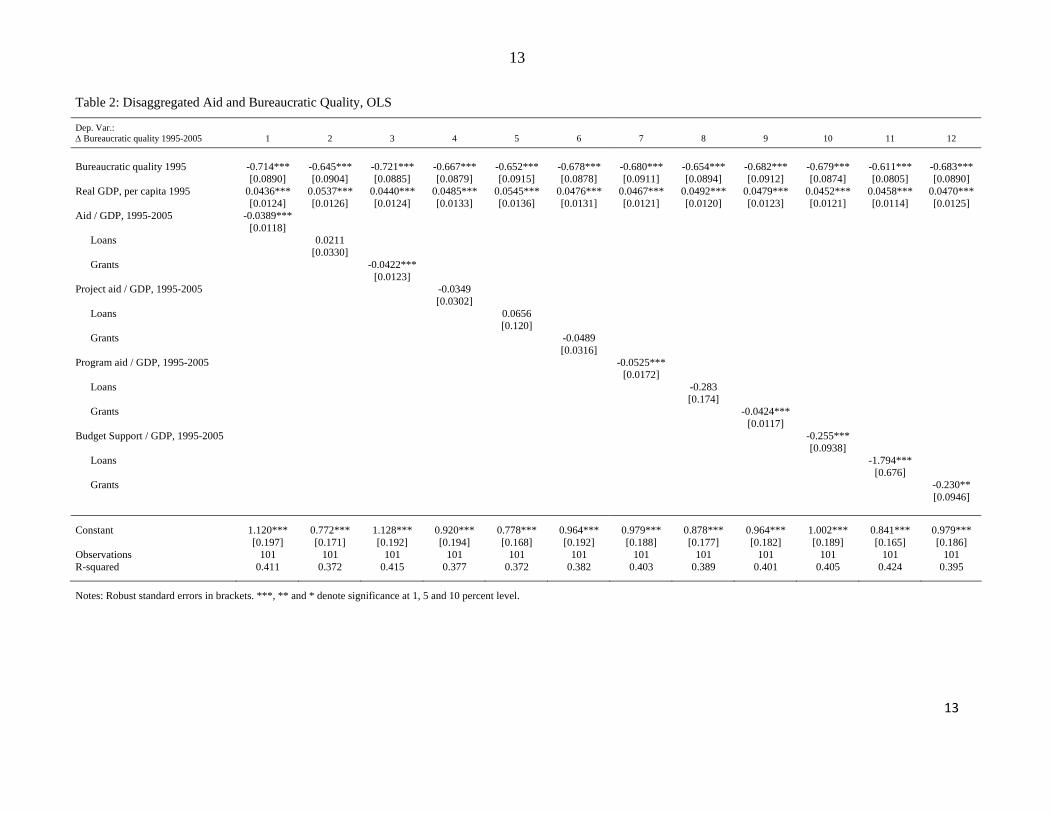
Table 2 presents the OLS regression results for the preferred specification, which includes aid as
the explanatory variable of interest, and the levels of initial bureaucratic quality and initial GDP
per capita as controls. Both controls are positively and significantly associated with average
bureaucratic quality over the period under consideration. As concerns aid, a clear pattern
emerges. First, while project aid does not seem to affect bureaucratic quality, program aid (in
general) and aid for budget support (in particular) turn out to exhibit a negative correlation with
the level of bureaucratic quality. Second, the effects are statistically significant for total levels of
aid and for the part of them being only grants, but not for loans. Third, the impacts of total aid
and grants are larger (more negative) when the funds are meant to support the fiscal budget rather
than to finance specific projects or more general programs. If we associate grants and aid for
general programs with potentially higher degrees of flexibility in the use of funds, our results
suggest that the probability of adverse effects from aid varies positively with the degree of
discretion that recipients have over the incoming resources.
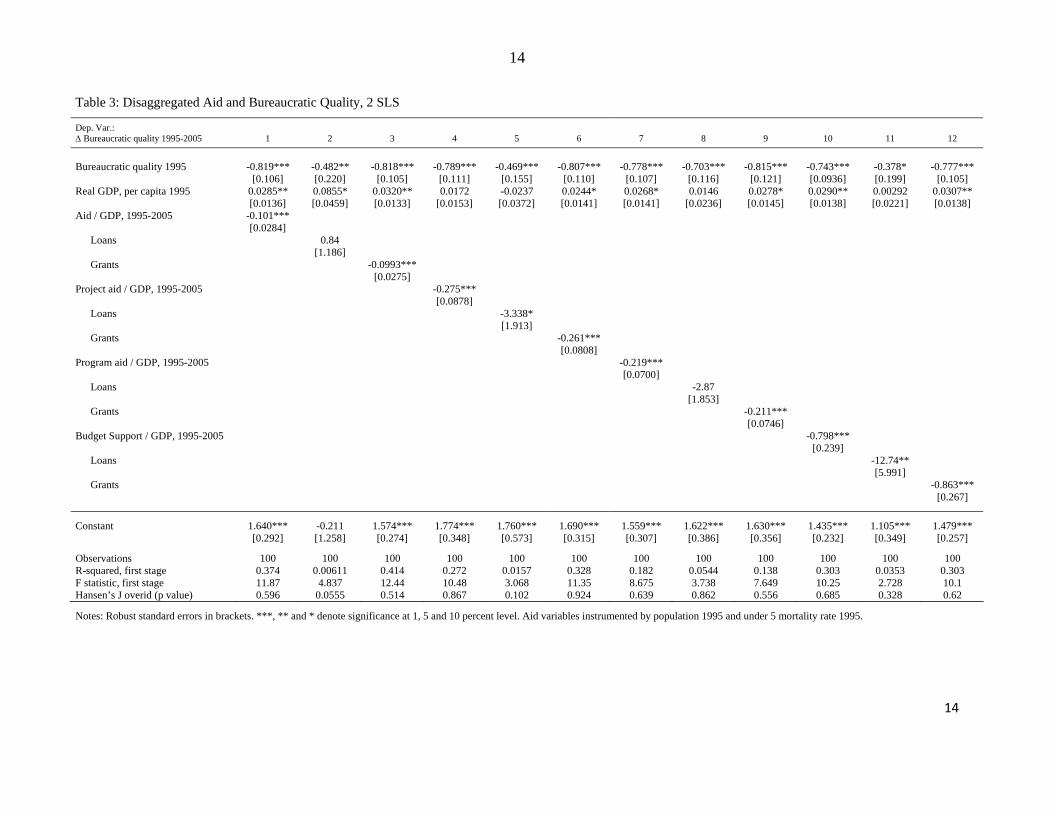
Table 3 shows the results when we estimate the model by 2SLS, instrumenting aid with initial
infant mortality and initial population. The first stage regression in this case reflects well the
main findings of the aid allocation literature (e.g. Berthélemy, 2006). That is, given equation (2)
in the previous section, the first stage regression explains the level of aid received by a country
with the initial level of population (reflecting that donors tend to give more aid in absolute terms
to countries with larger populations, even though they frequently exhibit a small country bias);
the initial level of infant mortality (representing an important specific need of the recipient
6
country), and the initial level of GDP per capita (which captures the idea that donors prefer to
give more resources to poorer countries).6
The most notable result in Table 3 is that the sign of project aid turns significantly negative. This
can be rationalized along the line of Knack and Rahman's (2007) finding that project proliferation
deteriorates bureaucratic quality, by putting a strain on the absorptive capacity of recipient
governments. The instruments we rely on in Table 3 tend to be valid (we get high p values of the
Hansen's J -test for overidentification) and fairly strong ( F -statistics exceeding the rule-of-
thumb threshold of 10), except for the case of loans. The impact of loans on bureaucratic quality
continues to be insignificant or weakly significant except for budget support, but inference about
this estimate is limited by the presence of weak instruments.
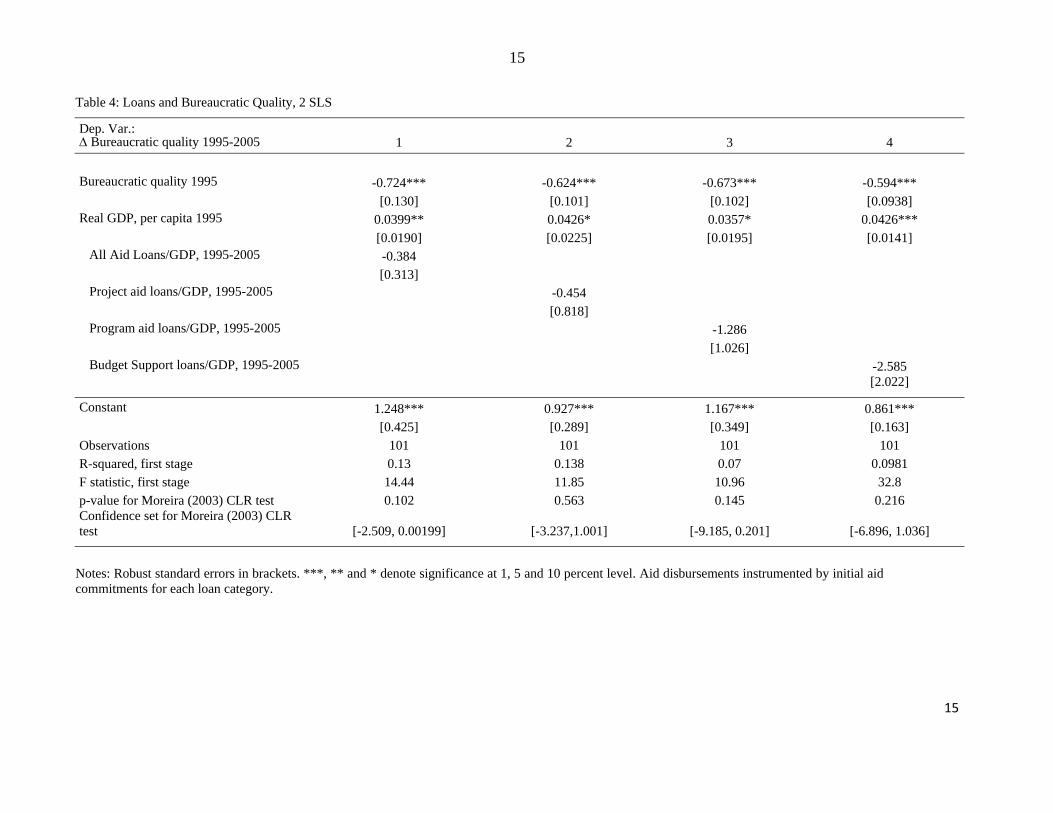
In Table 4 we introduce lagged commitments as an instrument for disbursed loans. This
instrument appears to be markedly stronger than those used before. The corresponding 2SLS
regression yields an estimate statistically not different from zero, which is corroborated by
Moreira's (2003) test. In all cases the confidence interval for the coefficient contains the value
zero.
IV. Concluding Remarks
This paper has analysed the impact of different forms of aid on bureaucratic quality in recipient
countries. The main finding is that grants impair the functioning of the local bureaucracy whereas
loans do not. In a similar vein, when investigating tax effort, another important dimension of
governance, Gupta et al. (2004) find that grants have a significant negative effect on government
revenue while loans have a significant positive effect. Taken together, these results qualify the
predominant view that loans are superior to grants as a mode of delivering aid to poor countries.
6None of the standard indicators of donor interest, such as former colonial status or religious affinity,
qualified as a potential instrument as none is found to be a significant determinant of aid allocation. This
may reflect the fact that we include aid given by multilateral agencies, which according to previous studies
is unaffected by conventional donor interest variables (e.g., Nunnenkamp and Thiele 2006).

7
Grants are found to exhibit the strongest negative effect on bureaucratic quality when they take
the form of budget support. Our analysis thus suggests a note of caution about routinely
providing aid for budget support in the name of ownership without carefully considering whether
recipient governments have put the necessary preconditions in place.
8
References
Alesina, A., and B. Weder (2002). Do Corrupt Governments Receive Less Aid? American
Economic Review 92 (4): 1126-1137.
Berthélemy, J.-C. (2006). Bilateral Donors' Interest vs. Recipients' Development Motives in Aid
Allocation: Do All Donors Behave the Same? Review of Development Economics 10 (2): 179-
194.
Bräutigam, D., and S. Knack (2004). Foreign Aid, Institutions and Governance in Sub-Saharan
Africa. Economic Development and Cultural Change 55: 255-285.
Clemens, M., S. Radelet, and R. Bhavnani (2004). Counting chickens when they hatch: The
short-term effect of aid on growth. CGDEV Working Paper 44, Center for Global
Development.
Department for International Development (DfID) (2005). Partnerships for poverty reduction:
Rethinking conditionality. A UK policy paper. Department for International Development,
Foreign & Commonwealth Office, HM Treasury. Available at
http://www.dfid.gov.uk/pubs/files/conditionality.pdf.
Gupta, S., B. Clements, A. Pivovarsky, and E. Tiongson (2004). Foreign Aid and Revenue
Response: Does the Composition of Foreign Aid Matter? In S. Gupta, B. Clements, and G.
Inchauste (eds.), Helping Countries Develop: The Role of Fiscal Policy. International
Monetary Fund, Washington, D.C.
Knack, S., and A. Rahman (2007). Donor Fragmentation and Bureaucratic Quality in Aid
Recipients. Journal of Development Economics 83: 176-197.
Moreira, M. (2003). A Conditional Likelihood Ratio Test for Structural Models. Econometrica
71 (4): 1027-1048.
Nunnenkamp, P., and R. Thiele (2006). Targeting Aid to the Needy and Deserving: Nothing but
Promises. The World Economy 29 (9): 1177-1201.
Teorell, J., S. Holmberg, and B. Rothstein (2008). The Quality of Government Dataset, version
15May08. University of Gothenburg: The Quality of Government Institute.
http://www.qog.pol.gu.se
9
Appendix
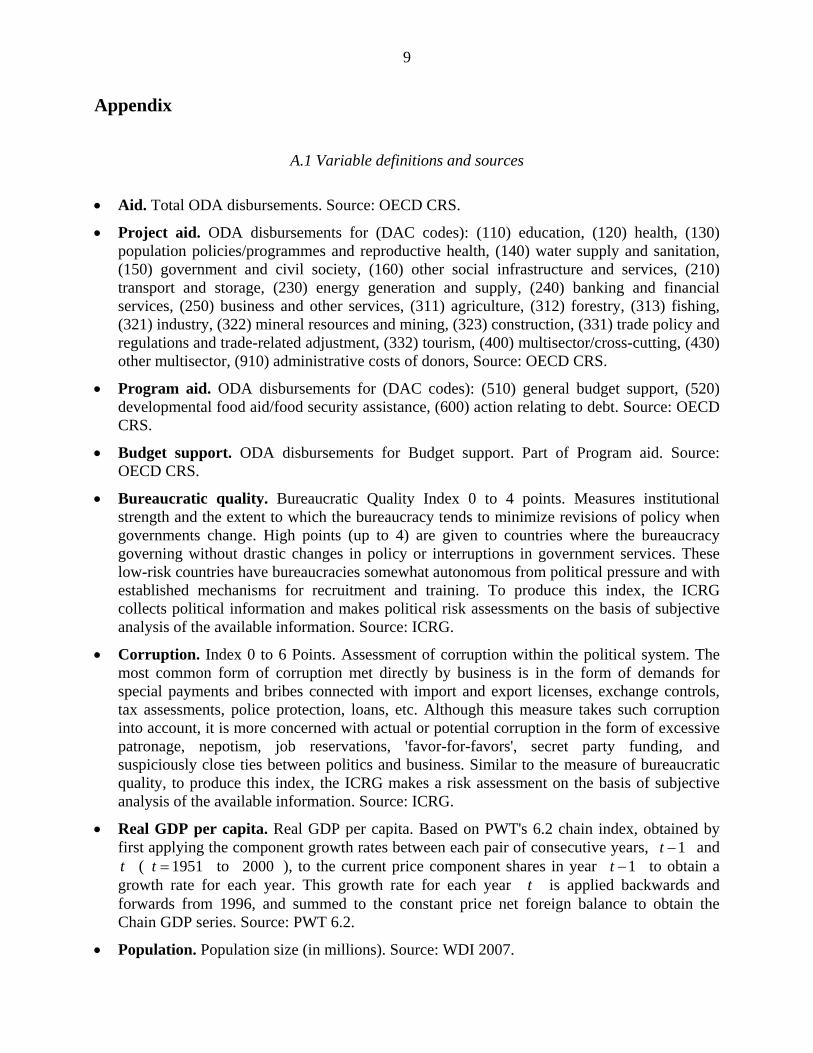
A.1 Variable definitions and sources
• Aid. Total ODA disbursements. Source: OECD CRS.
• Project aid. ODA disbursements for (DAC codes): (110) education, (120) health, (130) population policies/programmes and reproductive health, (140) water supply and sanitation, (150) government and civil society, (160) other social infrastructure and services, (210) transport and storage, (230) energy generation and supply, (240) banking and financial services, (250) business and other services, (311) agriculture, (312) forestry, (313) fishing, (321) industry, (322) mineral resources and mining, (323) construction, (331) trade policy and regulations and trade-related adjustment, (332) tourism, (400) multisector/cross-cutting, (430) other multisector, (910) administrative costs of donors, Source: OECD CRS.
• Program aid. ODA disbursements for (DAC codes): (510) general budget support, (520) developmental food aid/food security assistance, (600) action relating to debt. Source: OECD CRS.
• Budget support. ODA disbursements for Budget support. Part of Program aid. Source: OECD CRS.
• Bureaucratic quality. Bureaucratic Quality Index 0 to 4 points. Measures institutional strength and the extent to which the bureaucracy tends to minimize revisions of policy when governments change. High points (up to 4) are given to countries where the bureaucracy governing without drastic changes in policy or interruptions in government services. These low-risk countries have bureaucracies somewhat autonomous from political pressure and with established mechanisms for recruitment and training. To produce this index, the ICRG collects political information and makes political risk assessments on the basis of subjective analysis of the available information. Source: ICRG.
• Corruption. Index 0 to 6 Points. Assessment of corruption within the political system. The most common form of corruption met directly by business is in the form of demands for special payments and bribes connected with import and export licenses, exchange controls, tax assessments, police protection, loans, etc. Although this measure takes such corruption into account, it is more concerned with actual or potential corruption in the form of excessive patronage, nepotism, job reservations, 'favor-for-favors', secret party funding, and suspiciously close ties between politics and business. Similar to the measure of bureaucratic quality, to produce this index, the ICRG makes a risk assessment on the basis of subjective analysis of the available information. Source: ICRG.
• Real GDP per capita. Real GDP per capita. Based on PWT's 6.2 chain index, obtained by first applying the component growth rates between each pair of consecutive years, 1−t and
( to 2000 ), to the current price component shares in year to obtain a growth rate for each year. This growth rate for each year t is applied backwards and forwards from 1996, and summed to the constant price net foreign balance to obtain the Chain GDP series. Source: PWT 6.2.
t 1951=t 1−t
• Population. Population size (in millions). Source: WDI 2007.
10
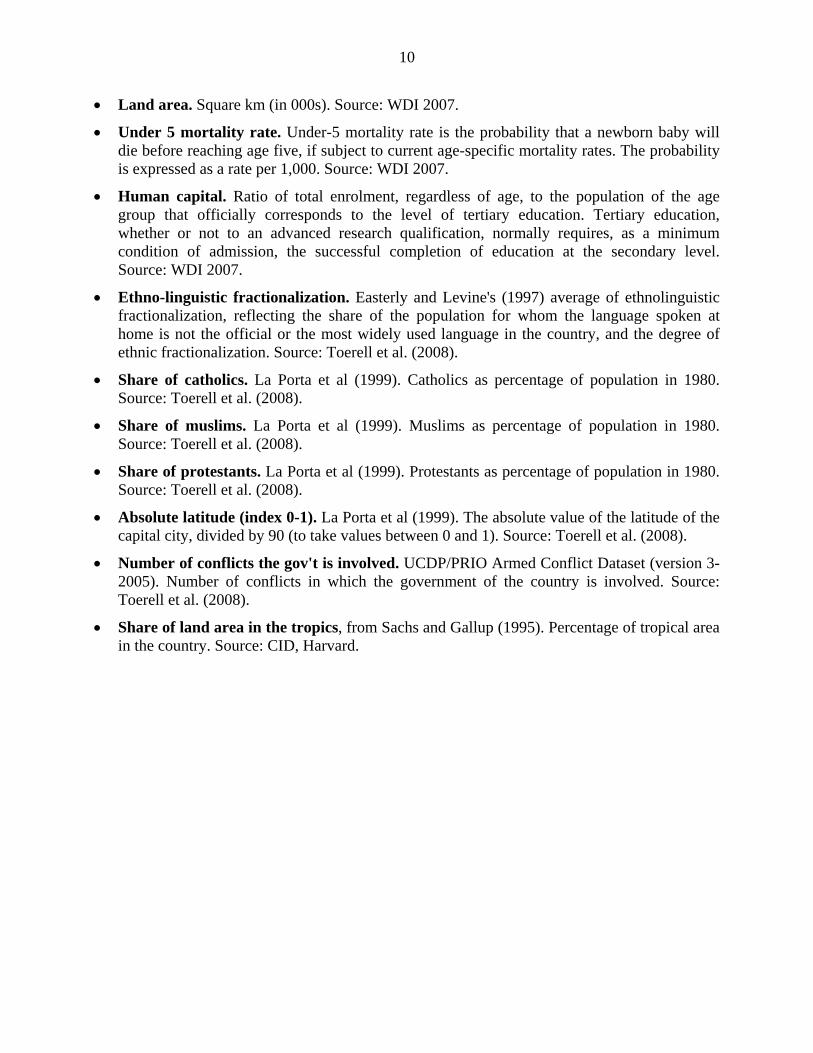
• Land area. Square km (in 000s). Source: WDI 2007.
• Under 5 mortality rate. Under-5 mortality rate is the probability that a newborn baby will die before reaching age five, if subject to current age-specific mortality rates. The probability is expressed as a rate per 1,000. Source: WDI 2007.
• Human capital. Ratio of total enrolment, regardless of age, to the population of the age group that officially corresponds to the level of tertiary education. Tertiary education, whether or not to an advanced research qualification, normally requires, as a minimum condition of admission, the successful completion of education at the secondary level. Source: WDI 2007.
• Ethno-linguistic fractionalization. Easterly and Levine's (1997) average of ethnolinguistic fractionalization, reflecting the share of the population for whom the language spoken at home is not the official or the most widely used language in the country, and the degree of ethnic fractionalization. Source: Toerell et al. (2008).
• Share of catholics. La Porta et al (1999). Catholics as percentage of population in 1980. Source: Toerell et al. (2008).
• Share of muslims. La Porta et al (1999). Muslims as percentage of population in 1980. Source: Toerell et al. (2008).
• Share of protestants. La Porta et al (1999). Protestants as percentage of population in 1980. Source: Toerell et al. (2008).
• Absolute latitude (index 0-1). La Porta et al (1999). The absolute value of the latitude of the capital city, divided by 90 (to take values between 0 and 1). Source: Toerell et al. (2008).
• Number of conflicts the gov't is involved. UCDP/PRIO Armed Conflict Dataset (version 3-2005). Number of conflicts in which the government of the country is involved. Source: Toerell et al. (2008).
• Share of land area in the tropics, from Sachs and Gallup (1995). Percentage of tropical area in the country. Source: CID, Harvard.
11
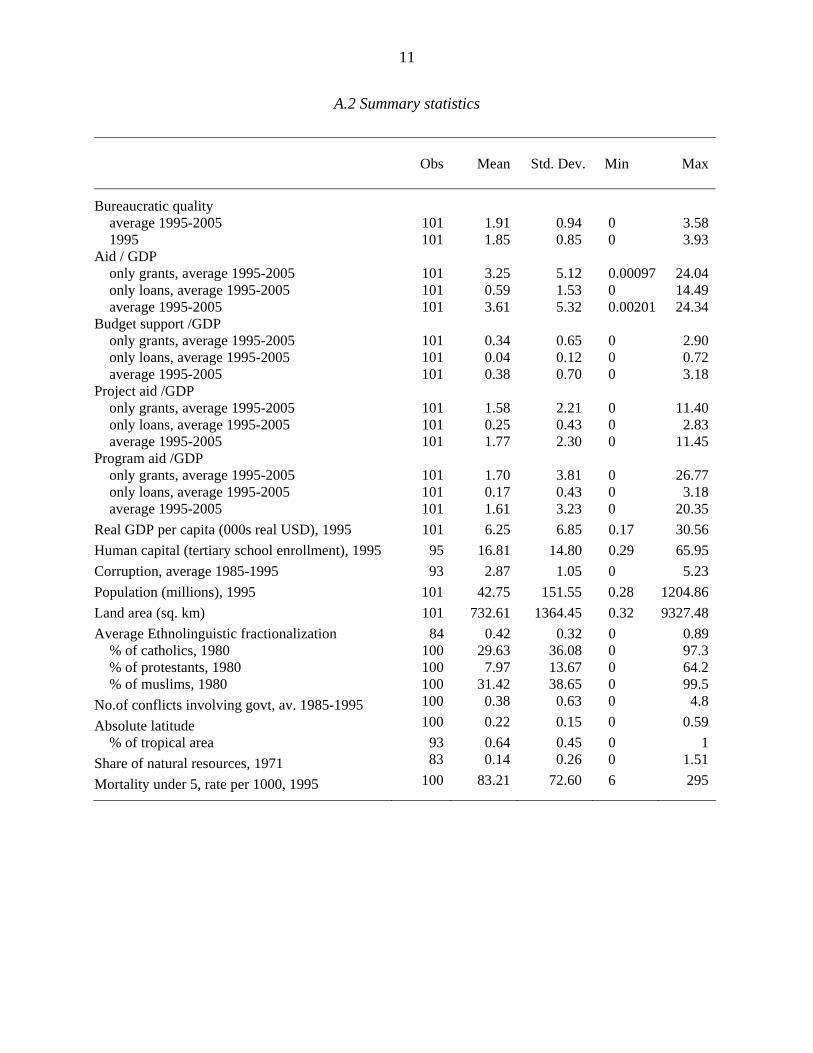
A.2 Summary statistics
Obs Mean Std. Dev. Min Max
Bureaucratic quality average 1995-2005 101 1.91 0.94 0 3.58 1995 101 1.85 0.85 0 3.93
Aid / GDP only grants, average 1995-2005 101 3.25 5.12 0.00097 24.04 only loans, average 1995-2005 101 0.59 1.53 0 14.49 average 1995-2005 101 3.61 5.32 0.00201 24.34
Budget support /GDP only grants, average 1995-2005 101 0.34 0.65 0 2.90 only loans, average 1995-2005 101 0.04 0.12 0 0.72 average 1995-2005 101 0.38 0.70 0 3.18
Project aid /GDP only grants, average 1995-2005 101 1.58 2.21 0 11.40 only loans, average 1995-2005 101 0.25 0.43 0 2.83 average 1995-2005 101 1.77 2.30 0 11.45
Program aid /GDP only grants, average 1995-2005 101 1.70 3.81 0 26.77 only loans, average 1995-2005 101 0.17 0.43 0 3.18 average 1995-2005 101 1.61 3.23 0 20.35
Real GDP per capita (000s real USD), 1995 101 6.25 6.85 0.17 30.56 Human capital (tertiary school enrollment), 1995 95 16.81 14.80 0.29 65.95 Corruption, average 1985-1995 93 2.87 1.05 0 5.23 Population (millions), 1995 101 42.75 151.55 0.28 1204.86 Land area (sq. km) 101 732.61 1364.45 0.32 9327.48 Average Ethnolinguistic fractionalization 84 0.42 0.32 0 0.89
% of catholics, 1980 100 29.63 36.08 0 97.3 % of protestants, 1980 100 7.97 13.67 0 64.2 % of muslims, 1980 100 31.42 38.65 0 99.5
No.of conflicts involving govt, av. 1985-1995 100 0.38 0.63 0 4.8
Absolute latitude 100 0.22 0.15 0 0.59 % of tropical area 93 0.64 0.45 0 1
Share of natural resources, 1971 83 0.14 0.26 0 1.51
Mortality under 5, rate per 1000, 1995 100 83.21 72.60 6 295
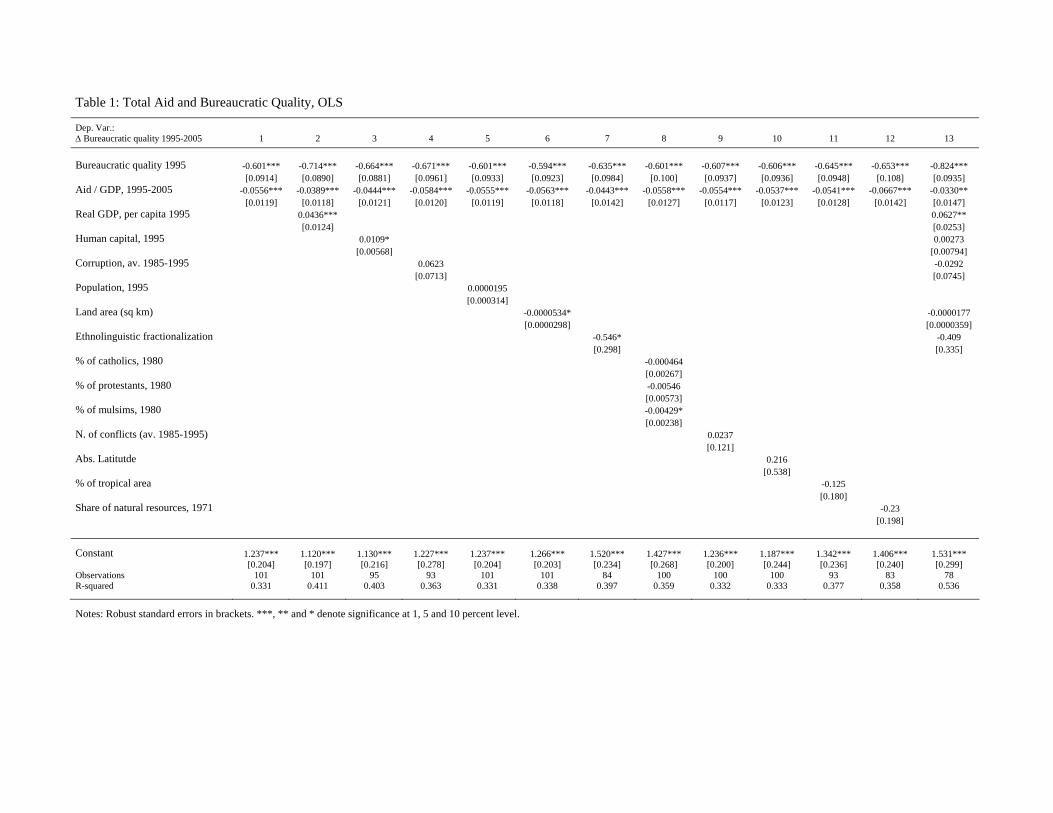
Table 1: Total Aid and Bureaucratic Quality, OLS
Dep. Var.: Δ Bureaucratic quality 1995-2005 1 2 3 4 5 6 7 8 9 10 11 12 13 Bureaucratic quality 1995 -0.601*** -0.714*** -0.664*** -0.671*** -0.601*** -0.594*** -0.635*** -0.601*** -0.607*** -0.606*** -0.645*** -0.653*** -0.824*** [0.0914] [0.0890] [0.0881] [0.0961] [0.0933] [0.0923] [0.0984] [0.100] [0.0937] [0.0936] [0.0948] [0.108] [0.0935] Aid / GDP, 1995-2005 -0.0556*** -0.0389*** -0.0444*** -0.0584*** -0.0555*** -0.0563*** -0.0443*** -0.0558*** -0.0554*** -0.0537*** -0.0541*** -0.0667*** -0.0330** [0.0119] [0.0118] [0.0121] [0.0120] [0.0119] [0.0118] [0.0142] [0.0127] [0.0117] [0.0123] [0.0128] [0.0142] [0.0147] Real GDP, per capita 1995 0.0436***
. 0.0627**
. [0 0124] 0253]
0713] 0745]00195 0314]
0298] 0359].546* 409.298] .335]
004640267]
005460573]0429*0238]
.0237 .121]
0.216.538]
0.1250.180]
-0.23.198]
[0 Human capital, 1995 0.0109* 0.00273 [0.00568] [0.00794] Corruption, av. 1985-1995 0.0623 -0.0292 [0. [0. Population, 1995 0.00 [0.00 Land area (sq km) -0.0000534*
0 -0.0000177
[0.00 [0.000 -0.Ethnolinguistic fractionalization -0
[0 [0 % of catholics, 1980 -0.0
0
[0. % of protestants, 1980 -0. [0.0 % of mulsims, 1980 -0.0
0
[0. N. of conflicts (av. 1985-1995) 0 [0 Abs. Latitutde [0 % of tropical area - [ Share of natural resources, 1971 [0
Constant 1.237*** 1.120*** 1.130*** 1.227*** 1.237*** 1.266*** 1.520*** 1.427*** 1.236*** 1.187*** 1.342*** 1.406*** 1.531*** [0.204] [0.197] [0.216] [0.278] [0.204] [0.203] [0.234] [0.268] [0.200] [0.244] [0.236] [0.240] [0.299] Observations 101 101 95 93 101 101 84 100 100 100 93 83 78 R-squared 0.331 0.411 0.403 0.363 0.331 0.338 0.397 0.359 0.332 0.333 0.377 0.358 0.536
Notes: Robust standard errors in brackets. ***, ** and * denote significance at 1, 5 and 10 percent level.
13
Table 2: Disaggregated Aid and Bureaucratic Quality, OLS
Dep. Var.: Δ Bureaucratic quality 1995-2005 1 2 3 4 5 6 7 8 9 10 11 12
Bureaucratic quality 1995 -0.714*** -0.645*** -0.721*** -0.667*** -0.652*** -0.678*** -0.680*** -0.654*** -0.682*** -0.679*** -0.611*** -0.683*** [0.0890] [0.0904] [0.0885] [0.0879] [0.0915] [0.0878] [0.0911] [0.0894] [0.0912] [0.0874] [0.0805] [0.0890] Real GDP, per capita 1995 0.0436*** 0.0537*** 0.0440*** 0.0485*** 0.0545*** 0.0476*** 0.0467*** 0.0492*** 0.0479*** 0.0452*** 0.0458*** 0.0470*** [0.0124] [0.0126] [0.0124] [0.0133] [0.0136] [0.0131] [0.0121] [0.0120] [0.0123] [0.0121] [0.0114] [0.0125] Aid / GDP, 1995-2005 -0.0389***
0
[0. 118]
0330]
123]
0302]
.120]
0316]
172]
.174]
117]
938]
676]
0946]
Loans 0.0211 [0. Grants -0.0422***
.0
[0 Project aid / GDP, 1995-2005 -0.0349 [0.
Loans 0.0656 [0
Grants -0.0489 [0. Program aid / GDP, 1995-2005 -0.0525***
.0
[0 Loans -0.283
[0 Grants -0.0424***
.0
[0 Budget Support / GDP, 1995-2005 -0.255***
0
[0. Loans -1.794***
0.
[ Grants -0.230**
[0.
Constant 1.120*** 0.772*** 1.128*** 0.920*** 0.778*** 0.964*** 0.979*** 0.878*** 0.964*** 1.002*** 0.841*** 0.979*** [0.197] [0.171] [0.192] [0.194] [0.168] [0.192] [0.188] [0.177] [0.182] [0.189] [0.165] [0.186] Observations 101 101 101 101 101 101 101 101 101 101 101 101 R-squared 0.411 0.372 0.415 0.377 0.372 0.382 0.403 0.389 0.401 0.405 0.424 0.395
Notes: Robust standard errors in brackets. ***, ** and * denote significance at 1, 5 and 10 percent level.
13
14
Table 3: Disaggregated Aid and Bureaucratic Quality, 2 SLS
Dep. Var.: Δ Bureaucratic quality 1995-2005 1 2 3 4 5 6 7 8 9 10 11 12
Bureaucratic quality 1995 -0.819*** -0.482** -0.818*** -0.789*** -0.469*** -0.807*** -0.778*** -0.703*** -0.815*** -0.743*** -0.378* -0.777*** [0.106] [0.220] [0.105] [0.111] [0.155] [0.110] [0.107] [0.116] [0.121] [0.0936] [0.199] [0.105] Real GDP, per capita 1995 0.0285** 0.0855* 0.0320** 0.0172 -0.0237 0.0244* 0.0268* 0.0146 0.0278* 0.0290** 0.00292 0.0307** [0.0136] [0.0459] [0.0133] [0.0153] [0.0372] [0.0141] [0.0141] [0.0236] [0.0145] [0.0138] [0.0221] [0.0138] Aid / GDP, 1995-2005 -0.101***
0
[0. 284]Loans 0.84
.186]
275]
878]
.913]
808]
700]Loans -2.87
.853]
746]
239]
991]
267]
[1 Grants -0.0993***
.0
[0 Project aid / GDP, 1995-2005 -0.275***
.0
[0 Loans -3.338*
[1 Grants -0.261***
0
[0. Program aid / GDP, 1995-2005 -0.219***
.0
[0
[1 Grants -0.211***
.0
[0 Budget Support / GDP, 1995-2005 -0.798***
0.
[ Loans -12.74**
5.
[ Grants -0.863***
0. [
Constant 1.640*** -0.211 1.574*** 1.774*** 1.760*** 1.690*** 1.559*** 1.622*** 1.630*** 1.435*** 1.105*** 1.479*** [0.292] [1.258] [0.274] [0.348] [0.573] [0.315] [0.307] [0.386] [0.356] [0.232] [0.349] [0.257]
Observations 100 100 100 100 100 100 100 100 100 100 100 100 R-squared, first stage 0.374 0.00611 0.414 0.272 0.0157 0.328 0.182 0.0544 0.138 0.303 0.0353 0.303 F statistic, first stage 11.87 4.837 12.44 10.48 3.068 11.35 8.675 3.738 7.649 10.25 2.728 10.1 Hansen’s J overid (p value) 0.596 0.0555 0.514 0.867 0.102 0.924 0.639 0.862 0.556 0.685 0.328 0.62
Notes: Robust standard errors in brackets. ***, ** and * denote significance at 1, 5 and 10 percent level. Aid variables instrumented by population 1995 and under 5 mortality rate 1995.
14
15
Table 4: Loans and Bureaucratic Quality, 2 SLS
Dep. Var.: Δ Bureaucratic quality 1995-2005 1 2 3 4
Bureaucratic quality 1995 -0.724*** -0.624*** -0.673*** -0.594*** [0.130] [0.101] [0.102] [0.0938] Real GDP, per capita 1995 0.0399** 0.0426* 0.0357* 0.0426*** [0.0190] [0.0225] [0.0195] [0.0141] All Aid Loans/GDP, 1995-2005 -0.384 [0.313] Project aid loans/GDP, 1995-2005 -0.454
[0.818] Program aid loans/GDP, 1995-2005 -1.286 [1.026] Budget Support loans/GDP, 1995-2005 -2.585
[2.022]
Constant 1.248*** 0.927*** 1.167*** 0.861*** [0.425] [0.289] [0.349] [0.163] Observations 101 101 101 101 R-squared, first stage 0.13 0.138 0.07 0.0981 F statistic, first stage 14.44 11.85 10.96 32.8 p-value for Moreira (2003) CLR test 0.102 0.563 0.145 0.216 Confidence set for Moreira (2003) CLR test [-2.509, 0.00199] [-3.237,1.001] [-9.185, 0.201] [-6.896, 1.036]
Notes: Robust standard errors in brackets. ***, ** and * denote significance at 1, 5 and 10 percent level. Aid disbursements instrumented by initial aid commitments for each loan category.
15


