Embed Size (px)
Citation preview

i
THE IMPACT OF CELEBRITY ENDORSEMENT ON
CONSUMER ATTITUDES IN YOGYAKARTA
A THESIS
Presented as a Partial Fulfillment of the Requirements to Obtain the Bachelor
Degree in Management Department
Written By
Name: Lukman Al Hakim
Student Number: 09311360
DEPARTEMENT OF MANAGEMENT
INTERNATIONAL PROGRAM
FACULTY OF ECONOMICS
UNIVERSITAS ISLAM INDONESIA
2016

ii

iii

iv

v
ACKNOWLEDGEMENT
Assalamualaikum Wr.Wb
Alhamdulillahi rabbil‘alamin. All praises be to Ar-Rahman Ar-Rahim Al-
Malik Al-Kuddus Allah SWT for blessing and guiding me in this great life then I
can be here to learn and finish my study in this college, and for giving me great
family, lecturers, friends, everyone, and everything that always support me in my
life to achieve my great destiny here after.
In this happy part of this thesis, I would like to say my big thanks for
everyone who ever give me help, trust, spirit and support until I can finish my
thesis. In this occasion, I would like to say thank you for:
1. Allah SWT, for all Your Kindness, Mercy, Happiness, and Lessons that
You always give to me for my better degree of life here after.
2. Muhammad SAW, for being a great figure as The Last Prophet and
making our human life becomes brighter than before.
3. My great and patient parent, ibu Kumriatul, ibu Badriah and ibu
Ussuwatun who always given Love and Life for this only son.
4. My lovely family; beautiful sister Azizah, handsome brothers Akbar,
Rama, and Zamzam, my cousins kak Indra, kak Andre, kak Boyke, mbak
Irke and all big family mbah Yu, om Hasim, om farid and pak Joko. Big
thanks for all of you that always given me love, supports, helps, and
advices for my better life.
5. My great Content Advisor, Anas Hidayat, Drs., MBA, Ph.D. who always
advised me to speed up my moves in finishing this thesis.

vi
6. My sweet Language Advisor, Alfi Zakiya, S.Kom., S.Pd. who has given
me the best grammatical and linguistic English language for my thesis.
7. Mr. Anas Hidayat, Drs, MBA, Ph.D, as the Head of Business and
Economics Department of the International Program UII. And, Mr.
Rokhedi Priyo Santoso, S.E., MIDEc., as the Deputy Head of Business
and Economics Department of the International program UII, thank you so
much for always being patient in facing all of the problems I made.
8. Mr. Yazid, Drs., MM. as the examiner for thesis exam. Thank you for your
questions and advises, Sir.
9. My sidekick brothers and sisters; Atina, Iwan, Oka, Fikri, Yayak, Fajar,
Imam Anggi, Degleng, Gemblong, Fachri, Arum, Aini, Hamdan dkk.
10. All of IP Management 2009 member, Fajar, Jihat, Fandi, Dony, Raden,
Sony, Deden, Calvin, Halim, Hifni, Ellan, Monik, Ana, Dinda, Mia, Hema,
Ica, Vika, Intan, Kamal, Iwan, Gembrik, Helmi, Tommy, Tyo, thanks for
all the happiness and togetherness we made.
11. IP family, Mr. Ahmad, Mr. Kandri, Mr. Erwan, Mrs. Alfi and all of IP
family thanks for your helps and supports.
12. All of my Darussalam Gontor fellows that always supported and
entertained me when I get bored.
13. And also thank you so much for all of you who support and help me to
finish this thesis. May Allah always bless you all.
There are some mistakes in the process of writing this thesis and it is far
from perfect. The last but not least, the researcher hopes that this research will be
helpful to give any inspiration in improving the knowledge in the future. Aamiin.

vii
Wassalamualaikum.Wr.Wb.
Yogyakarta, March 8th, 2015
Lukman Al Hakim

viii
Table of Content
Title Page ................................................................................................................. i
Approval Page ........................................................ Error! Bookmark not defined.
Legalization Page ................................................... Error! Bookmark not defined.
Declaration of Authenticity .................................... Error! Bookmark not defined.
Acknowledgement ................................................................................................... v
Table of Content .................................................................................................. viii
List of Table .......................................................................................................... xii
List of Figure ........................................................................................................ xiii
List of Appendix .................................................................................................. xiv
Abstract .................................................................................................................. xv
Abstrak ..................................................................................................................... 1
CHAPTER I INTRODUCTION ........................... Error! Bookmark not defined.
1.1 Introduction ................................................ Error! Bookmark not defined.
1.2 Research Identification .............................. Error! Bookmark not defined.
1.3 Research Formulation ................................ Error! Bookmark not defined.
1.4 Research Objectives ................................... Error! Bookmark not defined.
1.5 Research Limitation ................................... Error! Bookmark not defined.
1.6 Research Contribution ................................ Error! Bookmark not defined.
CHAPTER II LITERATURE REVIEW ............... Error! Bookmark not defined.
2.1 Theoretical Review .................................... Error! Bookmark not defined.

ix
2.2 Celebrities in advertising ........................... Error! Bookmark not defined.
2.3 Physical Attractiveness .............................. Error! Bookmark not defined.
2.4 Source of Credibility/Expertise .................. Error! Bookmark not defined.
2.5 Celebrity/Brand Congruency ..................... Error! Bookmark not defined.
2.6 The Background of Attitude ...................... Error! Bookmark not defined.
2.7 Attitude toward Advertising ....................... Error! Bookmark not defined.
2.8 Attitude toward Brand ................................ Error! Bookmark not defined.
2.9 Theoretical Framework .............................. Error! Bookmark not defined.
CHAPTER III RESEARCH METHOD ................ Error! Bookmark not defined.
3.1 Type of Study ............................................. Error! Bookmark not defined.
3.2 Research Subject ........................................ Error! Bookmark not defined.
3.2.1 Population .................................................. Error! Bookmark not defined.
3.2.2 Sampling Method ....................................... Error! Bookmark not defined.
3.3 Data Collection Method ............................. Error! Bookmark not defined.
3.4 Questioner Design ...................................... Error! Bookmark not defined.
3.5 Research Variable and Operational ............ Error! Bookmark not defined.
3.5.1 Independent Variables ............................... Error! Bookmark not defined.
3.5.2 Dependent Variables .................................. Error! Bookmark not defined.
3.6 Research Instrument Validity and Reliability .......... Error! Bookmark not
defined.
3.7 Technique of Data Analysis ....................... Error! Bookmark not defined.
CHAPTER IV DATA ANALYSIS AND DISCUSSION ... Error! Bookmark not
defined.

x
4.1 Data Collection Result ............................... Error! Bookmark not defined.
4.2 Research Instrument Test ........................... Error! Bookmark not defined.
4.2.1 Validity Test ............................................... Error! Bookmark not defined.
4.2.2 Reliability Test ........................................... Error! Bookmark not defined.
4.3 Descriptive Analysis .................................. Error! Bookmark not defined.
4.3.1 Gender ........................................................ Error! Bookmark not defined.
4.3.2 Age ............................................................. Error! Bookmark not defined.
4.3.3 Background of Education .......................... Error! Bookmark not defined.
4.3.4 Allowance Per Month ................................ Error! Bookmark not defined.
4.3.5 Marital Status ............................................. Error! Bookmark not defined.
4.3.6 Advertising Attributes ................................ Error! Bookmark not defined.
4.4 Descriptive Analysis Respondent Toward Research Variable .......... Error!
Bookmark not defined.
4.4.1 Physical Attractiveness of Celebrity Endorser ........ Error! Bookmark not
defined.
4.4.2 Source of Credibility/Expertise .................. Error! Bookmark not defined.
4.4.3 Celebrity/Brand Congruency ..................... Error! Bookmark not defined.
4.4.4 Consumer Attitude Toward Advertising .... Error! Bookmark not defined.
4.4.5 Consumer Attitude Toward Brand ............. Error! Bookmark not defined.
4.5 Structural Equation Model Analysis .......... Error! Bookmark not defined.
4.5.1 Validity and Reliability Testing Result ...... Error! Bookmark not defined.
4.5.2 Goodness of Fit Index ................................ Error! Bookmark not defined.
4.5.3 Hypotheses Testing Result ......................... Error! Bookmark not defined.
4.6 Discussion Result ....................................... Error! Bookmark not defined.

xi
CHAPTER V CONCLUSIONS AND SUGESTIONS ....... Error! Bookmark not
defined.
5.1 Conclusion ................................................. Error! Bookmark not defined.
5.2 Limitation ................................................... Error! Bookmark not defined.
5.3 Recommendation ....................................... Error! Bookmark not defined.
REFERENCES ...................................................... Error! Bookmark not defined.

xii
List of Table
Table 4.1 Validity Test .......................................... Error! Bookmark not defined.
Table 4.2 Reliability Test ....................................... Error! Bookmark not defined.
Table 4.3 Respondent Gender ................................ Error! Bookmark not defined.
Table 4.4 Respondent Age ..................................... Error! Bookmark not defined.
Table 4.5 Background of Education ...................... Error! Bookmark not defined.
Table 4.6 Allowance Per Month ............................ Error! Bookmark not defined.
Table 4.7 Allowance Per Month ............................ Error! Bookmark not defined.
Table 4.8 Descriptive Analysis of Advertising Attributes ... Error! Bookmark not
defined.
Table 4.9 Criteria of Consumer Perception ........... Error! Bookmark not defined.
Table 4.10 Descriptive Analysis Result of Physical Attractiveness .............. Error!
Bookmark not defined.
Table 4.11 Descriptive Analysis Result of Source Credibility/Expertise ...... Error!
Bookmark not defined.
Table 4.12 Descriptive Analysis Result of Celebrity/Brand Congruency ..... Error!
Bookmark not defined.
Table 4.13 Descriptive Analysis Result of Attitude Toward Advertising ..... Error!
Bookmark not defined.

xiii
Table 4.14 Descriptive Analysis Result of Attitude Toward Brand .............. Error!
Bookmark not defined.
Table 4.15 Validity and Reliability Testing Result Error! Bookmark not defined.
Table 4.16 Goodness of Fit Index .......................... Error! Bookmark not defined.
Table 4.17 Hypotheses Testing Result ................... Error! Bookmark not defined.

xiv
List of Figure
Figure 1. Conceptual Framework .......................... Error! Bookmark not defined.
Figure 2. Hypotheses Testing Result on Research Model ... Error! Bookmark not
defined.

xv
List of Appendix
Appendix A Questionnaire………………………………………………… A1
Appendix B Respondent Data……………………………………………… A2
Appendix C Result of Validity…………………………………………….. A3
Appendix D AMOS Software Output……………………………………… A4

xvi
Abstract
The use of celebrity endorsement on e-commerce advertisement is a new implementation
of marketing strategy in Indonesia. Therefore, it is important to know the factors that
influenced the consumer attitude toward e-commerce advertisement is necessary. This
research paper aimed to examine the relationship among celebrity’s physical
attractiveness, their credibility and their congruency with the brand, and consumer’s
attitudes toward advertising and brand.
This research was conducted in special region of Yogyakarta, Indonesia. Data had been
collected from 230 respondents in questionnaire form by using three e-commerce
advertisements. The data were analyzed by using AMOS 21 and hypothesis testing by
Structural Equation Modeling (SEM) analysis. The dependent variables of attitude toward
the advertising and attitude toward the brand were measured against the independent
variables of physical attractiveness, source credibility, and celebrity/brand congruency.
The result of this research indicated that celebrity endorsements positively influenced
consumer’s attitudes toward the advertising and brand. Moreover, the findings suggested
the elements of celebrity endorsement that should be taken into consideration for e-
commerce’s advertisers to hire the best celebrity in their advertisement.
Keyword: Celebrity Endorsement, Physical Attractiveness, Source Credibility, Celebrity/Brand Congruency, Consumer Attitude.

1
Abstrak
Penggunaan dukungan selebriti pada iklan e-commerce merupakan implementasi strategi
pemasaran yang baru di Indonesia. Oleh karena itu, penting untuk mengetahui factor-
faktor yang mempengaruhi sikap konsumen terhadap iklan e-commerce. Penelitian ini
bertujuan untuk menguji hubungan antara daya tarik selebriti, kredibilitas, keserasian
dengan merek, dan sikap konsumen terhadap iklan dan merek.
Penelitian ini dilakukan di Daerah Istimewa Yogyakarta, Indonesia. Data diambil dari
230 reponden dengan bentuk kuesioner menggunakan tiga iklan produk e-commerce yang
berbeda. Data dianalisis menggunakan AMOS 21 dan pengujian hipotesa dengan
menggunakan analisa Structural Equation Modeling (SEM). Variabel independen yakni
sikap konsumen terhadap iklan dan sikap konsumen terhadap merek diuji dengan variabel
independen yakni daya tarik, kredibilitas, keserasian selebriti/merek. Hasil penelitian ini
menunjukkan bahwa dukungan selebriti mempunyai pengaruh positif pada sikap
konsumen terhadap iklan dan merek. Bahkan penemuan ini menyarankan beberapa
elemen dukungan selebriti yang seharusnya menjadi pertimbangan para pengiklan e-
commerce untuk merekrut selebriti terbaik yang serasi dengan iklan mereka.
Keyword: Dukungan Selebriti, Daya Tarik, Kredibilitas, Keserasian Selebriti dan Merek, Sikap Konsumen

1
CHAPTER I
INTRODUCTION
1.1 Introduction
Every day consumers are exposed to thousands of advertisements
(Thornson, 1990) and this will become big effort for companies to create unique
advertisements in receiving attention from consumers. Celebrities can help
companies to create unique advertisement and engender a positive effect on the
attitude and sales intention towards the brand (Ranjbarian, Shekarchizade &
Momeni, 2010). Beside that, they have the ability to attract attention, make the
copy more memorable, refine the company’s image, add charm to the product,
and make it more wanted, reliable and trusted (Spielman, 1981). Celebrity is well
known and popular locally or globally, while a celebrity endorser is someone who
enjoys public recognition and who uses that recognition on behalf of a consumer
good by appearing with it in an advertisement (McCracken, 1989). Celebrities can
make people take notice of what they are endorsing and create an immediate
identity or persona for a product (Cooper, 1984).
Celebrity endorsement is not something new in advertising. Since 1979
one in every six commercials used celebrity and in 2001 the percentage grew to
25% (Erdogan et al., 2001). Endorsement of celebrities is not likely to change
because people especially in Indonesia have been obsessed with celebrities. This
is emanated from the fact that media overloads society with news and illustrations
about celebrities and gives them an entertainment function (Choi & Rifon, 2007).

2
The use of celebrity endorsement in advertisement has been implemented
into many market places of products. In order to increase product market-share,
celebrities currently endorse most of the popular brands. In Indonesia, celebrity
endorsement is chosen not only for certain products in common, it is also
implemented for online products such as Tokopedia that used Chelsea Ishlan and
Elevenia that used Cinta Laura in their ads. The use of celebrity endorsements for
online service products is new implementation in Indonesia and it is becoming
research opportunity for author to study about the impact of celebrity
endorsement.
While selecting a celebrity as endorser, the company has to decide the
promotional objective of the brand and how far the celebrity image matches with
it (Zafar and Rafique, 2010). The selection is in fact a collaboration, between the
company and the celebrity gains (Zafar and Rafique, 2010). The three variables
that have been identified in celebrity endorsements are physical attractiveness,
source credibility (trustworthiness and expertise), and celebrity/brand congruency
(Renton, 2006). Studies had proved that celebrities endorsing a company or brand
can greatly increase consumers' awareness of an advertisement, capture their
attention and make the advertisement more memorable (Zafar and Rafique, 2010).
The goal of this research is to examine the wide use of celebrity endorsements in
online service products; to find out how people view these advertisements by
measuring their attitudes toward the advertising and the brand by using the above
three variables.

3
1.2 Research Identification
In today’s competitive world, many advertising strategies have been
implemented to receive companies’ target audiences. The challenge of the
marketer is to find a hook that will hold the consumer’s attention, and the hooks
that can hold the consumer’s attention are the celebrities (Anjum, Dhanda, &
Nagra, 2012). Celebrities are able to make consumers notice what they are
endorsing, therefore consumers immediately create an identity for the product
(Cooper, 1984). Beside that, Celebrities have the ability to attract attention, make
the copy more memorable, refine the company’s image, add charm to the product,
and make it more wanted, reliable and trusted (Spielman, 1981).
While hiring celebrities to endorse companies’ products has a lot of
considerations, through the endorsement process an associative link is built
between the celebrity and the brand; this is how celebrities add meaning, or equity
to the product they are endorsing (Till, 1998). It becomes advertisers’ challenge in
making decision to choose the right celebrity that match the brand and product,
and it has also been suggested that celebrity endorsements in advertisements
seems to be more congruent with the collectivistic cultures (Praet, 2001).
In Asia, advertisement of the product is linked with concept of “face”,
orientation towards status, celebrity, beauty, modernity which leads the roots of
noticeable consumption (Schutte and Ciarlante, 1998). While in Indonesia, many
companies have implemented celebrity endorsement in ads. This is because every
company has an image, by making a celebrity spokesman for the company, they
put a significant part of the company’s image in the hands of a celebrity

4
(Hoekman, 2009). Over the last decade, the use of celebrity is also implemented
into e-commerce or online service product categories. There have not been any
studies conducted on the exact topic of this study which is, whether or not
celebrity endorsed advertisements for e-commerce online service product that has
the relationship with consumer attitude toward advertising and brand, and also
purchase intention. What is the impact of using celebrities and how can celebrities
effectively change the attitude of the consumers toward advertising and brand?
In previous studies, it had been found the measurement of consumers’
response toward celebrity endorsement in ads. Findings showed that celebrities
make advertisements more believable (Kamins et al., 1989 cited in Renton, 2006),
enhance message recall (Friedman & Friedman, 1979), create a positive attitude
toward the brand (Kamins et al., 1989 cited in Renton, 2006), and create a distinct
personality for the endorsed brand (McCracken, 1989).
1.3 Research Formulation
According to the background and the research identification’s explanation
above, the writer formulates the main problems as follow:
1. Does the physical attractiveness of the endorser, source credibility and
celebrity/brand congruency positively influence consumer attitudes toward
advertising?
2. Does the physical attractiveness of the endorser, source credibility and
celebrity/brand congruency positively influence consumer attitudes toward
brand?
5
1.4 Research Objectives
The objectives of this study are focused on the relationship of celebrity
endorsement to consumer responses. This research is intended to examine the
effect of celebrity’s physical attractiveness, source credibility, and celebrity/brand
congruency on consumer attitude toward advertising and brand, in the context of
Indonesian e-commerce/online product’ consumers.
1.5 Research Limitation
The problem in this research is limited to:
1. Indonesian celebrities in advertisement those who endorsed e-
commerce product.
2. The use of all female in advertisement.
3. Responders are differentiated based on demographic characteristics,
which is based on: gender, age, educational level, and personal
income.
1.6 Research Contribution
1. Researchers
This research result will support and broad the researcher’s
knowledge on marketing, especially the relationship of celebrity
advertisement to consumer response, which is focused on endorsed e-
commerce product. The result of this research will also be a reference for
future research in the same topic.

6
2. Academicians
For academicians, the result of this thesis may contribute to a
literature work to expand the study of marketing especially celebrity’s
endorsement relationship to consumer response. It may also be used as a
reference for further research and the outcome of this study can be used as
a reference and knowledge in the educational institution such as the writer
adopted theories from previous research.
3. The Marketers and Advertisers
The use of celebrity on e-commerce product advertisement has
been implemented over the last years in Indonesia. This result of study
may contribute marketers and advertisers to seek congruent celebrity for
endorsement. Celebrity in advertisement is chosen not only based on
popularity but also accessing the several dimensions of celebrity for good
that match with product they are endorsing. In addition, this study will
support marketer to decide the strategy of advertisement especially the use
of celebrity for endorsements.

7
CHAPTER II
LITERATURE REVIEW
2.1 Theoretical Review
Friedman and Friedman (1979, p. 63) stated that a celebrity endorser is an
individual who is known to the public for his or her achievement in other areas
than of the product class endorsed. According to Melissa St. James as cited in
Zafar and Rafique (2010), a doctoral fellow and marketing instructor at The
George Washington University, "the use of celebrities can increase consumers'
awareness of the ad, capture their attention and make advertisements more
memorable". By making a celebrity spokesman for the company, they put a
significant part of the company’s image in the hands of a celebrity (Hoekman,
2009). However, seeking celebrity for advertisement is not quiet simple based on
well-known and popularity. There are several dimensions of celebrity that should
be considered. It becomes a challenge for advertisers to find association between
celebrity and product/company for the best match product they are going to
endorse.
This chapter provide an overview of literature review on the topics of
celebrity’s dimensions in ads. The three variables that had been identified in
celebrity endorsement by previous studied are physical attractiveness, source
credibility, and celebrity/brand congruency. It also provide information about the
relationship of celebrity endorsement on consumer attitude which focused on e-
commerce product. The Fishbein theory will be used to examine how attitudes

8
and purchase intentions are formed and measured in advertising, how consumers
are informed about product through advertising, how adding celebrity to an
advertisement adds equity, or added “value” to it, and how the variables of
physical attractiveness, source credibility and celebrity/brand congruency will
affect consumer attitudes (Renton, 2006).
2.2 Celebrities in advertising
Celebrity endorser is an individual who enjoys public recognition and who
uses this recognition on behalf of a consumer good by appearing with it in an
advertisement (McCracken, 1989, p. 310). They have the ability to attract
attention, make the copy more memorable, refine the company’s image, add
charm to the product, and make it more wanted, reliable and trusted (Spielman,
1981).
However, using celebrity in advertising is important to consider. Cooper
(1984) indicated that the key to using a celebrity in an advertisement is to ensure
that the celebrity is well-known enough to get attention, but also will not upstage
the product; the product and not the personality has to be the star. The celebrity
has many roles when endorsing a product; he/she can act as an expert, a
spokesperson, a promoter, or “just be a pretty face” (Erogan et. al., 2001 cited in
Renton, 2006), adding equity (value) to the brand and enhancing the brand’s
competitive position (Till, 1998).
McCracken (1989) described the Transfer Meaning Model as one way in
which celebrities attract the attention of consumers is by meaning the celebrity

9
brings to the brand he or she is endorsing. Distinctions of status, class, gender,
age, lifestyle types, and personality types are examples of meanings represented
by the vast pool celebrities’ advertisers have at their disposal (McCracken, 1989).
Kelman (1956) indicated that the three documented ways that consumers relate to
the meanings that the celebrities can occupy are compliance, identification, and
internalization, while consumers perceive these meaning in different ways
(Renton, 2006).
Compliance can occur when an individual accepts influence from another
person or from a group because he hopes to achieve a favorable reaction from
them (Kelman, 1956). Identification can occur when an individual adopts
behavior derived from another person or group because this behavior is associated
with a satisfying self-defining relationship to this person or group (Kelman, 1956;
Cohen & Golden, 1972). Internalization can occur when an individual accepts
influence because the induced behavior is congruent with his value system
(Kelman, 1956). All the three processes are relevant to the way consumer buy
products, how the consumer relates to the celebrity, to the ad, and to the product
itself that will determine which product they will purchase.
Based on previous analysis, most of studies it is supported that celebrity
endorsers have positive influence on consumers’ behaviors (Hassan & Jamil,
2014). There are several dimensions and determinants of celebrity endorsers will
describe which factors a celebrity should have to be a solid endorser (Hoekman,
2009). The three dimensions of celebrity endorsers have been identified in past
studies are physical attractiveness, source credibility, and celebrity/brand

10
congruency. While several determinants credibility, expertise, trustworthiness,
attractiveness, similarity, liking, familiarity and the match-up congruence with the
product. In the following chapter the cohesion between all these dimensions and
determinants will be further explained.
2.3 Physical Attractiveness
According to Patzer (1985), physical attractiveness is an informational cue
which involves effects that are subtle, pervasive, and inescapable; produces a
definite pattern of verifiable differences; and transcends culture in its effects.
Celebrity endorser’s physical attractiveness got great social appraisal and
acceptability (Hassan & Jamil, 2014). It is a source to capture the attention of
audience both in print and electronic media. Physical attractiveness has positive
effect on consumer’s behavior toward the product and service while making
comparison of product with the person who is unattractive (Ohanian, 1991). The
consumer believes if they buy something a celebrity wears then they will look like
or be like the celebrity. During this process physical attractiveness is considered
to be one of the main factors (Kelman, 1956). Beside that, in this process
consumers want to identify the endorser so that they are influenced by
attractable/likeable endorsers (Kamins & Gupta, 1994). Physically attractive
celebrities are also useful for the principle of matching up the theory at the time of
selecting celebrity where attractiveness is more influential (Kamins, 1990).
Physical attractiveness is a tool to change the attitude (Menon et al., 2001).

11
2.4 Source of Credibility/Expertise
The credibility of a celebrity is described as the total amount of positive
features that create and increase the acceptation of the message (Erdogan, 1999).
Credibility is one of the most important determinants of celebrity endorsement
(Hoekman, 2009), and it is particularly important when people have a negative
attitude towards the brand and powerful arguments that are needed to inhibit the
counter arguing and positively influence the attitude towards the brand.
Consequently, when celebrities are credible it affects the acceptance of the
message and the persuasion (Belch & Belch, 2001).
According to Renton (2006) this variable has two side: trustworthiness and
expertise. Both of them are the most important aspects of credibility (Hovland et
al., 1953).
Trustworthiness
Trustworthiness refers to the honesty, integrity and believability of an
endorser (Erdogan et al., 2001, p.40). Trustworthiness is the most important factor
regarding to the source credibility and influences credibility (Hoekman, 2009).
Trust in communication is considered to be how confidence and acceptance the
listener has in accepting the message (Ohanian, 1990). Moreover, if consumers
believe what the endorser is telling and they trust him or her, trustworthiness on
ad will be higher and attitude of the consumers will increase as well (Hoekman,
2009). Therefore, advertisers should focus on trustworthiness and choose

12
endorsers who are highly viewed as honest, believable and dependable (Shimp,
1997).
Expertise
Expertise is referred to as the extent to which a communicator is perceived
to be the source of valid assertions (Erdogan et al., 2001, p. 40). Expertise is the
level of knowledge, experience or skills the endorser possesses (Hovland, Janis,
and Kelley, 1953). In order to persuade recipients of information, endorser’s
expertise has encouraged effect on receivers (Ohanian, 1990). Belch and Belch
(1994) said that information receivers have strong belief upon the person who has
a related knowledge and expertise in advocating area. Endorser with high
knowledge and skills has strong power of recommendation as compare to the
endorsers with low expertise (Ohanian, 1990). Celebrity expertise is one of the
reasons in order to find out its influence on recipients of information (Amos,
Holmes and Strutton, 2008). With regard to expertise, it is unimportant that the
celebrity is really an expert in the field (Hoekman, 2009), but it is important that
consumers think and believe a celebrity has expertise (Ohanian, 1990).
2.5 Celebrity/Brand Congruency
The “Match-Up” hypothesis, generally suggested that the message
conveyed by the image of the celebrity and the image of the product should
converge in effective advertisements and implies a need for congruency between
product image and celebrity image on an attractiveness basis (Kamins, 1990, p.
5). According to Kahle and Homer (1985), when a celebrity’s physical

13
attractiveness is congruent with the product they are endorsing, the “match-up”
hypothesis would predict a positive impact on the product and the advertisement
evaluations. If there is incongruence, those evaluations would decline. The match-
up consists of two central terms: the perceived fit and the image of the celebrity
(Misra, 1990 cited in Worthen, 2014). When a celebrity has a good image and fit
to the product and company, this will lead to greater trustworthiness and
effectiveness. By uniting those aspects, it will create two advantages working
together for the product (Erdogan, 1999). According to Hoekman (2009) the great
importance for an endorser, is the match up of the celebrity with the image and
message a company wants to propagate. According to Cooper (1984) and Forkan
(1980), showed that the match-up congruence between celebrity endorser and the
product or company is the major importance because the desire of people to
identify the product with source and congruity of source with product is much
important (Kamins and Gupta, 1994). Kamins and Gupta (1994) found that the
higher the degree of congruency between the types of endorsers and the product
advertised, the greater the trustworthiness of the endorser. The linkage between
congruence and endorser/advertiser trustworthiness was only presented for the
celebrity endorser (Kamins & Gupta, 1994). Overall, the study implied that the
congruence between the product and the celebrity endorser has the potential to be
one of the important factors in advertising (Renton, 2006).

14
2.6 The Background of Attitude
Fishbein Attitude Theory
The Fishbein Attitude Theory presents the clearest theoretical explanation
of the term “attitude” (Renton, 2006). According to Fishbein (1967), a person’s
attitude is a function of his salient beliefs (beliefs that are activated from memory
and “considered” by the person in a given situation) at a given point of time. The
definition of the attitude concept has generated a multitude of definitions, but the
most widely used one is by Fishbein (1967, p. 8) that stated an attitude is a mental
and neural state of readiness, organized through experience, exerting a directive or
dynamic influence upon the individual’s response to all objects and situations
with which it is related. Attitude can be either positive or negative, depending on
how people form them (Renton, 2006). One of the more famous and popular
scales to measure attitudes is the Fishbein Attitude Model (Renton, 2006). This
model implies that a consumer’s attitude (evaluation) toward an attitude object
(Ao) will depend on his or her belief that has about several or many attributes of
the object (Solomon, 2004 cited in Renton, 2006). The Fishbein Attitude Model
has been used extensively by consumer researchers since its conception nearly
forty years ago (Blackwell, Miniard, & Engel, 2001 cited in Renton, 2006). The
use of this model may identify these specific beliefs and combining them to derive
a measurement of the consumers’ overall attitude that can predict an attitude
toward a product or brand (Solomon, 2004 cited in Renton, 2006).
Studies had shown that attitude accessibility and confidence can be
increased by advertising; it has also been found that if the relationship between

15
attitude accessibility and attitude confidence are positive, the accessibility and
confidence will increase (Berger & Mitchell 1989 cited in Renton 2006).
According to Renton (2006), the attitude concept can be categorized into attitude
toward the advertisement (Aad) and attitude toward the brand choice (AB). Aad
includes the entire content of the ad, not just the pictorial information, as found by
Mitchell & Olson (1981) cited in Renton (2006).
2.7 Attitude toward Advertising
Attitude toward the advertisement is defined as a predisposition to respond
in a favorable or unfavorable manner to a particular advertising stimulus during a
particular exposure situation (Mackenzie, Lutz, & Belch, 1986, p. 130-131). The
attitude toward the advertisement has the ability to create affective reactions and
evaluations. The affective reactions consist of the advertisement creating a feeling
of happiness and the evaluations consist of the advertisements credibility (Baker
& Lutz, 1988). The attitude toward the advertisement is both cognitive and
emotional (Shimp, 1981). The attitude toward the advertisement is cognitive
because consumers’ will form attitudes by consciously thinking about specific
executional parts of the advertisement such as the endorser, copy, presentation
style, etc. (Shimp, 1981 cited in Worthen, 2014). The attitude toward the brand is
emotional because consumers’ form attitudes by consciously thinking about
executional parts of the advertisements this includes the parts which are found
within the advertisement, such as the endorser, color, and text (Shimp, 1981). The
attitude toward the advertisement may happen because the advertisement

16
provokes an emotional response such as love, joy, longing or sorrow this happens
without consciously processing any executional elements (Shimp, 1981).
2.8 Attitude toward Brand
According to Shimp (1981), attitude toward the brand attempts to
influence brand choice by engendering favorable consumer attitudes toward the
advertised brand. This concept is achieved by structuring advertisements to
influence consumers’ beliefs and evaluations regarding the favorable
consequences of consuming the brand (Shimp, 1981). Attitude toward the brand
(AB) includes beliefs formed from the ad brand attribute information and
inferences based on ad picture content (Gardner, 1985; Mitchell & Olson 1981
cited in Renton, 2006). Attitude toward the brand (AB) mediates the impact of the
attitude toward the advertising (Aad) on intentions in two ways, indirectly or
directly (Biehal et al. 1992 cited in Renton, 2006). Indirectly attitude toward the
advertising (Aad) has an impact on AB, therefore, AB affects the consumers’
intentions. Thus, AB, which includes beliefs formed from a brand attribute
information and inferences based on ad picture content (Mitchell & Olson, 1992
cited in Renton, 2006) mediates the impact of Aad on intention’ there is no direct
Aad-intention link (Biehal et al., 1992 cited in Renton, 2006).
2.9 Theoretical Framework
This research was aimed to examine the relationship between celebrity
endorsement and consumer attitudes which focused on e-commerce
advertisements. The three determinants of celebrity endorsements which were
17
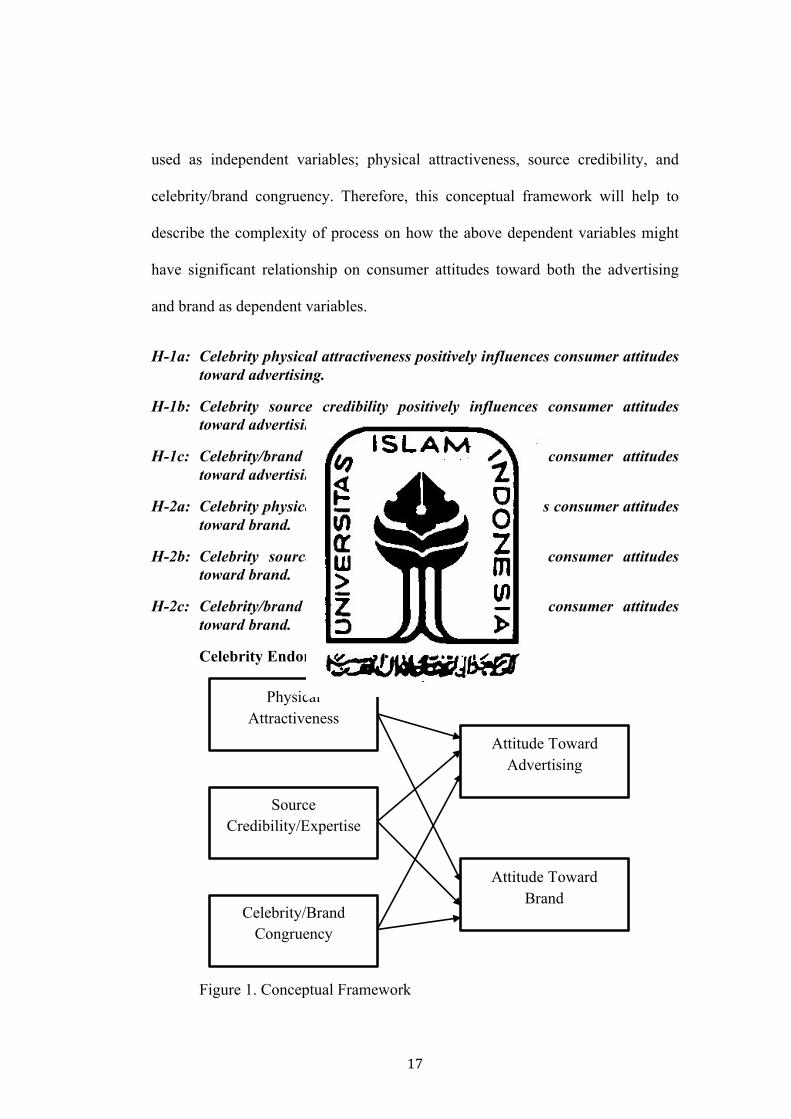
used as independent variables; physical attractiveness, source credibility, and
celebrity/brand congruency. Therefore, this conceptual framework will help to
describe the complexity of process on how the above dependent variables might
have significant relationship on consumer attitudes toward both the advertising
and brand as dependent variables.
H-1a: Celebrity physical attractiveness positively influences consumer attitudes toward advertising.
H-1b: Celebrity source credibility positively influences consumer attitudes toward advertising.
H-1c: Celebrity/brand congruency positively influences consumer attitudes toward advertising.
H-2a: Celebrity physical attractiveness positively influences consumer attitudes toward brand.
H-2b: Celebrity source credibility positively influences consumer attitudes toward brand.
H-2c: Celebrity/brand congruency positively influences consumer attitudes toward brand.
Celebrity Endorsement
Figure 1. Conceptual Framework
Physical Attractiveness
Source Credibility/Expertise
Celebrity/Brand Congruency
Attitude Toward Advertising
Attitude Toward Brand
18
CHAPTER III
RESEARCH METHOD
3.1 Type of Study
This research was a quantitative research which used applied empirical
research. The methodology used survey method by distributing questionnaire to
research subjects. The research instrument used questionnaire and also using
itemized rating scale to assess the data from 230 questionnaires that was spread
out. This research examined the relationship between celebrity endorsements and
consumer attitudes toward advertising and brand.
3.2 Research Subject
In this research, Indonesian e-commerce consumer was the research
subject used to analyze the relationship between celebrity physical attractiveness,
source credibility, celebrity congruency, and consumer attitude toward advertising
and brand.
3.2.1 Population
The population of this study was “Generation Y”, it is defined as
those individuals that were born between 1977 and 1994 (Bush, Martin, &
Bush, 2004). This generation was chosen by the researcher, because they
had the most spending power and spent an estimated $153 billion a year
on everything from computers to apparel (Brand, 2000). This generation
was very trend conscious, knowledgeable in accessing the media, as well
as advertising and they had grown up in a consumer orientated society

19
(Brand, 2000). This research used the population of “Generation Y” in the
special region of Yogyakarta.
3.2.2 Sampling Method
The sample used in this research was undergraduate and
postgraduate students currently taking classes in the Faculty of Economics
at Universitas Islam Indonesia. The subject was asked to assess the item
on different construct about correspondents’ perception toward celebrity
endorsement on e-commerce product. Beside that, the subject was asked to
assess the item on different construct such as factors viewed as customer
perceived celebrity physical attractiveness, source of credibility, and
celebrity/brand congruency on their attitude toward advertising and brand.
3.3 Data Collection Method
The data used in this research was primary data. The primary data was the
information that had not been collected and summarized before; thus, the data had
to be collected by the researcher. The data was collected by using questionnaire,
which was passed out containing questions that the respondents answered by
using a Likert scale. Then, three different advertisements showing three different
celebrity’s endorsements were shown. The first advertisement shown was
Chealsea Ishlan endorsing Tokopedia; next Cinta Laura endorsing Elevenia; and
finally Dewi Lestari endorsing Zalora. All the three advertisements were shown in
order that undergraduate and post graduate students took various classes at a large
faculty of economic at Universitas Islam Indonesia. The students were then asked
to answer the corresponding questions for advertisements. Celebrity

20
endorsements, the advertisement, the consumer’s attitude toward the advertising
and attitude toward the brand were measured.
3.4 Questioner Design
Since this research was the replication research from the previous
research, the questionnaire used or developed was the same as previous research
done by Zafar & Rafique (2010) which had been modified by adding several item
construct and had been translated into Bahasa Indonesia. The previous researcher
stated that the questions used in this survey were developed to understand
consumer’s view on celebrity endorsements, measuring their attractiveness,
expertise and trustworthiness. In addition, separate questionnaire was used to
examine consumers’ attitudes toward this form of advertising and their attitude
toward the advertised brand.
The items were tested for clarity and meaning on a group of 80
representative students of the target population. Based on the results of this test,
the items were revised and the final questionnaire was developed. The
questionnaire containing six parts, the following items were included in the
survey:
1. Demographic
This section was concerned with gathering information such as gender
and age for classification purposes.

21
2. Physical Attractiveness, Trustworthiness, Expertise
Subjects were asked to assess celebrity physical attractiveness,
trustworthiness, and expertise about advertisement. Seven points Likert
scale to measure variable were asked to show which best reflect their
feelings toward celebrity endorsements’ questions.
3. Product/Brand Congruency
This part was concerned in measuring the congruency between
celebrity and brand. Seven points Likert scale to measure variable were
asked to show which best reflect their feelings toward the congruency
between celebrity and brand. The celebrity/ brand congruency was
measured by asking how congruent (how well they fit together) was the
image of the celebrity with that of the brand advertised, along with
questions that asked how believable that celebrity was. This question had
been asked in the past research (Kamins & Gupta, 1994; Kamins, 1990;
Till & Busler, 1992; Renton, 2006; Zafar & Rafique, 2012).
4. Attitude toward the Advertisement
The respondents were asked to indicate their attitude toward
advertisement by using seven points scale used as benchmark.
5. Attitude toward the Brand
The variable of attitude toward the brand was measured by using 7-
point Likert scale by determining respondents which best reflect their
attitude toward the brand in advertisement.

22
6. Advertising Attributes
Thispart, therespondentswereasked to indicate theirbeliefs towards
questions pertaining to the advertisement.However, the 10 questions were
asked, using a 7-point Likert scale with poles of being “very likely” (7)
and “very unlikely” (1) used as the benchmark research.
3.5 Research Variable and Operational
3.5.1 Independent Variables
An independent variable is a variable that influences the dependent
variable in either a positive or a negative direction (Sekaran, 2000). In this
research three variables were considered as independent variable such as,
celebrity physical attractiveness, source of credibility, and celebrity/brand
congruency.
1. Physical Attractiveness
According to Patzer (1985), physical attractiveness is an
informational cue which involves effects that are subtle, pervasive,
and inescapable; produces a definite pattern of verifiable
differences; and transcends culture in its effects. To investigate
celebrity physical attractiveness, valid reliable scale instrument
was developed for a research on celebrity endorsement by Ohanian
(1990), which had a reliability of .904 and .903. The following is a
list of items used to measure attractiveness:

23
1) Attractive-Unattractive
2) Classy-Not Classy
3) Beautiful-Ugly
4) Elegant-Plain
5) Sexy-Not sexy
2. Source Credibility/Expertise
According to Renton (2006) this variable has two side:
trustworthiness and expertise, both are the most important aspects
of credibility (Hovland et al., 1953). Ohanian (1990) had measured
this variable with valid and reliable scale. The instrument had
reliability of .895 and .896 for trustworthiness, and .885 and 892
for expertise. The indicators used to measure of this variable are:
Trustworthiness
1) Dependable-Undependable
2) Honest-Dishonest
3) Reliable-Unreliable
4) Sincere-Insincere
5) Trustworthy-Untrustworthy
Expertise
1) Expert-Not an expert
2) Experienced-Inexperienced
3) Knowledgeable-Unknowledgeable

24
4) Qualified-Unqualified
5) Skilled-Unskilled
3. Celebrity/Brand Congruency
The “Match-Up” hypothesis that stated general suggests
that the message conveyed by the image of the celebrity and the
image of the product should converge in effective advertisements
and implies a need for congruency between product image and
celebrity image on an attractiveness basis (Kamins, 1990, p. 5).
When a celebrity has a good image and fit to the product and
company, this will lead to greater believability and so
effectiveness. In past studies, the researcher measured this variable
by asking how congruent (how well they fit together) was the
image of the celebrity with that of the brand advertised, along with
questions that ask how believable the celebrity was (Kamins &
Gupta, 1994; Kamins, 1990; Till & Busler, 1992; Renton, 2006;
Zafar & Rafique, 2010). The items to measure this variable are:
1) Familiarity of celebrity who appeared in the ad
2) Congruency of celebrity image with the brand endorsed
3) Good fit of brand for celebrity
4) Believability of celebrity endorsing the brand
5) Believability of celebrity wearing the product

25
3.5.2 Dependent Variables
A dependent variable is the primary interest variable of the
researcher (Sekaran, 2000). The dependent variable analyzed in this
research was attitude toward the advertising and brand derived from
previous study conducted by Renton, (2006) and Zafar & Rafique, (2012).
1. Attitude toward Advertising
Attitude toward the advertisement is defined as a
predisposition to respond in a favorable or unfavorable manner to a
particular advertising stimulus during a particular exposure
situation (Mackenzie, Lutz, & Belch, 1986, p. 130-131). According
to Osgood, Suci, & Tannenbaum, (1957) cited in Renton (2006), to
measure attitude toward the advertising scales were taken which
include both affective and evaluative content, and were selected
based on a review of existing research (Gardner, 1985; Mackenzie,
Lutz, & Belch, 1986; Mitchell & Olson, 1981; Kamins & Gupta,
1994; Kamins, 1990; Kahle & Homer, 1985; Baker & Churchill,
1977; Petroshius & Crocker, 1989; Biehal, Stephens, Curlo, 1992;
cited in Renton, 2006; Zafar & Rafique, 2010). The list of Items
regarding attitude toward advertising are:
1) Good-Bad
2) Interesting-Uninteresting
3) Like-Dislike
4) Creative-Uncreative

26
5) Informative-Uninformative
2. Attitude toward Brand
According to Shimp (1981), attitude toward the brand
attempted to influence brand choice by engendering favorable
consumer attitudes toward the advertised brand. According to
Osgood, Suci, & Tannenbaum’s (1957), to measure attitude toward
the brand, scales from were constructed and were selected based on
existing research (Gardner, 1985; Kamins & Gupta, 1994; Till &
Busler, 1998; Kahle & Homer, 1985; Petroshius & Crocker, 1989;
Biehal, Stephens, Curlo, 1992; cited in Renton, 2006; Zafar &
Rafique, 2010). The list of Items regarding attitude toward
advertising are:
1) Good-Bad
2) Pleasant-Unpleasant
3) Like-Dislike
4) Good Quality-Poor Quality
5) Satisfactory-Unsatisfactory
3.6 Research Instrument Validity and Reliability
According to Zikmund et al. (2010), validity test showed how an indicator
can measure the variable. Validity is a measurement showing the level of validity
or truth of an instrument. An instrument is considered valid to the extent that it
correlates with some other phenomenon on which one is interested. An indicator
will be considered as valid if it has corrected-item-total-correlation score above

27
0,30 (>_0,30), below that score the indicator is considered invalid and will not be
used for further research, in other word it had to be deleted. While reliability is the
level of how reliable the questionnaire is. Reliability test showed the consistency
of the variable measurement, which was done repeatedly (Zikmund et al., 2010).
The variable considered as reliable when the tested variable had the score of
Cronbach-alpha above 0,60, while below that score the variable was considered
unreliable and would not be used for further research.
Therefore, the researcher spread the questioner to a small number of
respondent before the real data collection in order to test the validity and
reliability of the questionnaire. For that objective, the questionnaire was spread
was to 80 (eighty) respondents. The data that had been gathered analyzed to
determine validity and reliability of the questionnaire by considering the limit or
the terms.
3.7 Technique of Data Analysis
To analyse the primary data, a quantitative research analysis is taken and
this research is going to use SEM (Structural Equation Modeling) analysis as the
analytical tool for testing the hypothesis and generate the result from the data. In
addition, AMOS software analysis had been used to carry out the investigation of
the relationship among the variables, which can influence the customer attitude
toward advertising and brand. To analyze that relation, SEM analysis uses several
steps in the analysis, they are:

28
1. Model Development Based on Theory
SEM is based on causality relationship. When one variable changes it
is assumed as a result of other variable changes. Strong causality
relationship between two variables which was assumed by the researcher
is not because of the analysis method chosen, but theoretical justification
to support the analysis (Ghozali, 2004).
2. Path Diagram and Structural Equation
According to Spirtes, P. et al. (1998) a SEM (without free parameters)
has two parts: a probability distribution (in the normal case specified by a
set of linear structural equations and a covariance matrix among the
“error” or “disturbance” terms) and an associated path diagram
corresponding to the causal relations among variables specified by the
structural equations and the correlations among the error terms. It is often
thought that the path diagram is nothing more than a heuristic device for
illustrating the assumptions of the model. Spirtes, P. et al. (1998) stated
that path diagrams can be used to solve a number of important problems in
structural equation modelling.
3. Choosing Input Matrix and Estimation Model
Model in structural equation is different from other multivariate
analysis techniques, SEM only uses data input which is
variance/covariance matrix or correlation matrix. Therefore, rough data
from questionnaire will be changed into variance/covariance matrix or
correlation matrix, so that the equation also stated as covariance structural

29
analysis. Covariance matrix has more advantage than correlation matrix in
giving comparison validity between different population and different
sample. The use of correlation is best suited if the research objectives are
simply to understand the pattern of construct relationship, but do not
describe the total variance of the construct (Ghozali, 2004).
4. Structural Equation Model (SEM) Identification
Identification problem is incapability of the proposed model to result
the estimation model. The identification problem could be seen through
the estimation result, which are: big value of standard error for one or
more coefficients, incapability of program to invert information matrix,
impossible estimation value (negative error variance), and high correlation
(>0.90). If identification problems are found, there are 3 things that must
be considered, (1) coefficient number estimated toward its covariance or
identified correlation with small values of degree of freedom (df), (2)
using reciprocal correlation among constructs, and (3) failures in
determining fix value on construct scale (Ghozali, 2004).
5. Goodness of Fit Criteria
If offending estimate happened; which determined by: negative
variance error or non-significant error variance of construct, standardized
coefficient close to value of 1.0, and high standard error; the cause of
offending estimates must be eliminated first. In SEM analysis, there is no
single statistical test tool to measure or test the model (Ferdinand, 2002).

30
The Fit Index and cut of value that is used to test whether the model can
be accepted or not is as follows:
a. Absolute Fit Measurement
1) Likelihood Ratio Chi-Square Statistic
An analytical tool to measure overall fit is likelihood ratio chi-
square statistic, with a sample of 200 respondents. A model tested
will be considered good or satisfied if the chi-square (χ²) value is
small. Small value of χ² means that the model is good (χ²= 0,
meaning that there is no difference, Ho is accepted) and accepted
based on probability with the cut of value of p>0.05 or p>0.10
(Hulland, et al., 1996, cited in Ghozali, 2004).
As this analysis objective is to develop and test a model which
is suited and fit based on the data, it requires insignificant value of
χ² that tests null hypotheses (estimated population covariance is not
equal to sample covariance). The value of χ² can be compared with
the degree of freedom (df) to get a relative value of χ² and it is used
to make conclusion that high relative value of χ² means that
significant difference between covariance matrix observed and
covariance matrix estimated.
Small value of χ² as results in the significant level of more than
0.05 that indicates that there is no significant difference between

31
covariance matrix data and covariance matrix estimated (Hair, et
al., 1995 as cited in Ghozali, 2004).
2) CMIN/DF (The minimum Sample Discrepancy Function)
The minimum Sample Discrepancy Function (CMIN) divided
by its degree of freedom (df) will result in CMIN/DF. It is used for
the researcher as the indicator to measure fit level of model.
CMIN/DF is also as chi-square statistic; χ² divided by its degree of
freedom (df) is relative χ². Value of χ² is relatively less than 2.0 or
even less than 3.0 as an indicator of acceptable fit between the
model and the data (Arbuckle, 1997 as cited in Ghozali, 2004).
3) GFI (Goodness of Fit Index)
Fit Index can measure proportion of variance in covariance
matrix sample stated by estimated matrix covariance population
(Bentler, 1983; Tanaka & Huba, 1989 as cited in Ghozali, 2004).
GFI is non-statistical measurement tool that has the value range
from 0 (poor fit) until 1.0 (perfect fit). High value in this index
shows “better fit”.
4) MSEA (The Root Mean Square Error of Approximation)
RMSEA is an index that can be used to compensate chi-square
statistics in a big sample (Baumgartner & Homburg in Ghozali,
2004). RMSEA value shows expected Goodness of Fit Index if it is
32
in estimated model in the population and the accepted value of
RMSEA is between 0.05 to 0.08 (Ghozali, 2004).
b. Incremental Fit Measurement
1) AGFI (Adjusted Goodness of Fit Index)
Ghozali (2004) stated that GFI is an analogue of R² in multiple
regressions. This Fit Index can be adjusted toward available degree
of freedom (df) to test whether the model can be accepted or not
(Arbuckle, 1997 as cited in Ghozali, 2004, p. 20). The index is
gained from the equation below:
ddbGFIAGFI )1(1 −−=
Whereas,
==∑=
•G
g
gb pd
1
)( Sample moments
d = degrees of freedom
An acceptance level is recommended if AGFI has equal
value with more than 0.90 (Hair, et al., 1995 as cited in Ghozali,
2004). GFI and AGFI are the criteria that measure the proportion
of variance in a covariance matrix sample. Value of 0.95 can be
interpreted as good overall fit level and range value 0.090-0.95
shows adequate fit level (Hulland, et al., 1996 as cited in Ghozali,
2004).

33
( ) ( )( ) 12
22
−
−=
nullnull
proposedproposednullnull
dfdfdf
TLIχ
χχ
2) TLI (Tucker Lewis Index)
TLI is incremental fit index alternative that compares tested
model with baseline model (Baugartner & Homburg, 1996 as cited
in Gozhali, 2004). The recommended value as the base of model is
≥ 0, 90 (Hair, et. al., 1995 as cited in Ghozali, 2004), and the value
that is close to 1 (one) shows a very supported value (Arbuckle,
1997 as cited in Ghozali, 2004). The index is as follows:
Or:
1−
−=
b
b
b
b
dC
dC
dC
TLI
C is discrepancy of model that is evaluated and d is degree of
freedom, meanwhile Cb and db is discrepancy and degrees of
freedom from the baseline model that has comparison.
c. Parsimonious Fit Measures
1) PNFI (Parsimonious Normal Fit Index)
PNFI is the modification of NFI and it put the number of
degree of freedom (df) in order to reach fit level. The use of PNFI
is to compare the model with different degree of freedom (df).
2) PGFI (Parsimonious Goodness of Fit Index)

34
PGFI modifies GFI based on parsimony-estimated model. The
value of PGFI is ranged between 0 – 1.0, the higher the value, the
more parsimony the model is.
6. Model Interpretation
According to Ghozali (2004), when a model is good and acceptable,
the researcher can conduct a model modification to recover the theoretical
explanation or its goodness of fit. It requires a lot of consideration before
the researcher can modify the first model. The first model need to be
estimated separately (cross-validated), and then the modified model can be
accepted. A model can be stated as good fit model if probability level of
chi-square relatively is smaller than in significant probability level (p >
0.05).

35
CHAPTER IV
DATA ANALYSIS AND DISCUSSION
The data of this research was taken from 230 respondents of
undergraduate and postgraduate students of the Faculty of Economics, Universitas
Islam Indonesia. This research was aimed to observe and analyze the impact of
the physical attractiveness of celebrity endorser, source of credibility/expertise,
and celebrity brand congruency on consumer attitudes toward advertising and
brand. In this chapter, the researcher divided this data analysis into five parts; 1)
the results of data collection that describe the amount of data that are ready to be
analyzed, 2) validity and reliability tests, 3) descriptive statistic, 4) good and
measurement of fit model, and hypothesis testing and 5) the analysis of the result
to answer the hypothesis.
4.1 Data Collection Result
Questionnaires method was used for data collection method in this
research. As described in chapter three, the sampling method in this research were
the undergraduate and postgraduate students of the Faculty of Economic,
Universitas Islam Indonesia. Same as the previous researcher, the population of
this research were taken from “Generation Y” which is defined as those
individuals that were born between 1977 and 1994 (Bush, Martin, & Bush, 2004).
This generation was chosen by researcher, because they had the most spending
power, and spend an estimated $153 billion a year on everything from computers
to apparel (Brand, 2000). College students in general were the target group of a
36
large number of academic studies on impact celebrity endorsement on consumer
attitude for the present study. In this last decade, some of students are still
categorized as “Generation Y” which were familiar with internet activities
especially e-commerce. These were the reasons for researcher to take them as a
sample for this research by taking 230 questionnaires.
4.2 Research Instrument Test
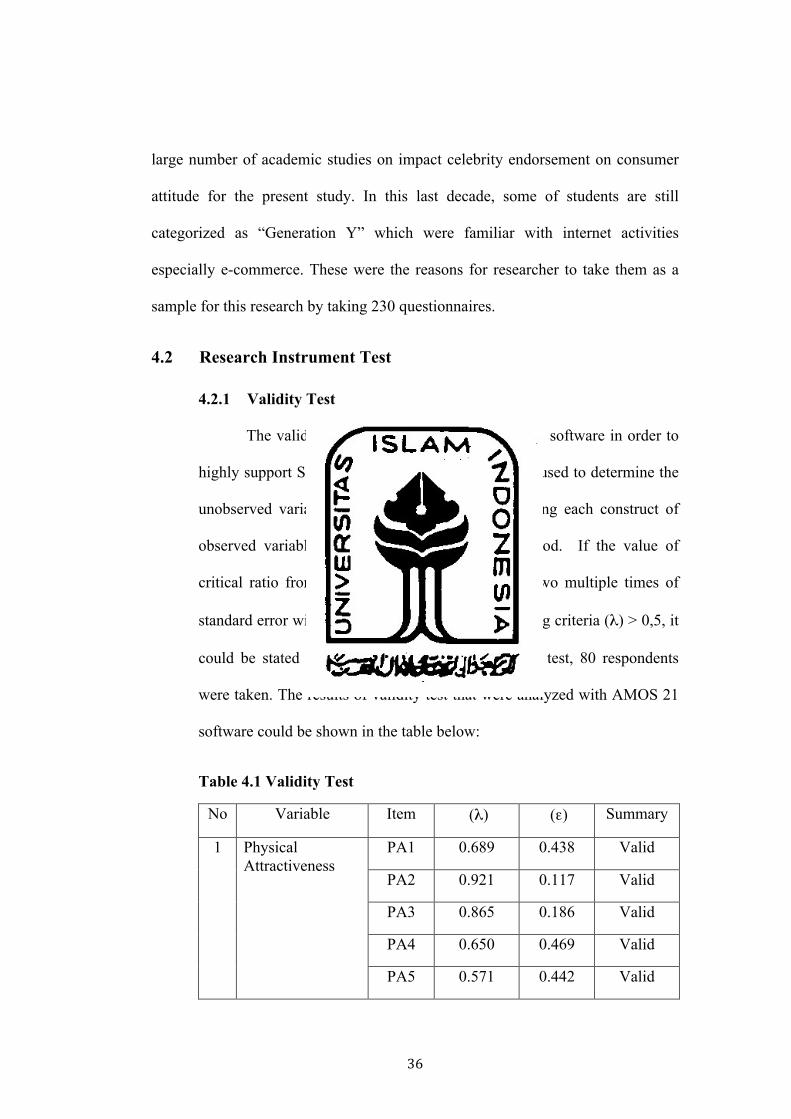
4.2.1 Validity Test
The validity test in this study used AMOS 21 software in order to
highly support SEM data analysis. Validity test was used to determine the
unobserved variable that could be measured by using each construct of
observed variable, Loading Factor of AMOS method. If the value of
critical ratio from every construct was more than two multiple times of
standard error with the assumption of standard loading criteria (λ) > 0,5, it
could be stated as Valid. To construct this validity test, 80 respondents
were taken. The results of validity test that were analyzed with AMOS 21
software could be shown in the table below:
Table 4.1 Validity Test
No Variable Item (λ) (ε) Summary
1 Physical Attractiveness
PA1 0.689 0.438 Valid
PA2 0.921 0.117 Valid
PA3 0.865 0.186 Valid
PA4 0.650 0.469 Valid
PA5 0.571 0.442 Valid

37
No Variable Item (λ) (ε) Summary
2 Trustworthiness TR1 0.914 0.128 Valid
TR2 0.916 0.145 Valid
TR3 0.788 0.382 Valid
TR4 0.048 3.018 Invalid
TR5 0.641 0.416 Valid
Expertise EX1 0.834 0.266 Valid
EX2 0.912 0.151 Valid
EX3 0.133 1.803 Invalid
EX4 0.577 0.560 Valid
EX5 0.515 0.852 Valid
3 Celebrity/Brand Congruency
CBC1 0.877 0.089 Valid
CBC2 0.300 0.518 Invalid
CBC3 0.794 0.111 Valid
CBC4 0.625 0.295 Valid
CBC5 0.729 0.186 Valid
4 Attitude Toward Advertising
ATA1 0.831 0.227 Valid
ATA2 0.880 0.242 Valid
ATA3 0.859 0.247 Valid
ATA4 0.805 0.258 Valid
ATA5 0.801 0.366 Valid
5 Attitude Toward Brand
ATB1 0.839 0.219 Valid
ATB2 0.856 0.154 Valid
ATB3 0.829 0.188 Valid
ATB4 0.820 0.196 Valid
ATB5 0.669 0.389 Valid

38
No Variable Item (λ) (ε) Summary
6 Advertising Attributes
AA1 0.785 0.386 Valid
AA2 0.868 0.233 Valid
AA3 0.871 0.173 Valid
AA4 0.857 0.285 Valid
AA5 -0.263 1.204 Invalid
AA6 0.909 0.155 Valid
AA7 0.879 0.147 Valid
AA8 0.197 1.405 Invalid
AA9 0.902 0.177 Valid
AA10 0.903 0.129 Valid
Source: primary data processed, 2015
Based on the summary of the validity test results as compiled in
the table above, it could be seen that the value of loading factor on most
indicators was greater than 0.5. According to the table above, observed
variables were those higher than 0.5 of standard loading factor which were
valid, and several variables were less than 0.5 which were invalid or the
instrument would be deleted for the next step of data analysis.
4.2.2 Reliability Test
Reliability test is a degree of the internal consistency from the
indicators of a construct that indicates the degree to where each indicator
indicates a construct / latent common factor. In other words, how specific
things support each other in explaining the general phenomenon
(Ferdinand, 2002, p. 61-62). Researchers conducted a reliability test by

39
calculating Reliability Construct of each item in a variable. In this
research, Construct Reliability was examined by calculating the index
reliability instruments used from SEM model. Fornell and Laker’s (1981)
used the following formula to find Construct Reliability:
(Σλ i)2 Construct Reliability = (Σλ i)2 + Σεi
Whereas, λ i = Standard loading factor for each indicators
(observed variable)
εi = Standard error for each indicator (1 – indicator
reliability).
Reliability test was only done to all the questions that already had
passed the validity test. The criteria used to determine the level of
reliability is the value of Construct Reliability in AMOS software. When
Construct Reliability value is getting close to 1, it indicated that the
instruments had higher reliability. Construct Reliability values between
0.70 up to 1.0 was considered reliable and Construct Reliability value less
than 0.60 was considered as poor reliability. For the calculations, the
researcher used AMOS software version 21 to analyze the data which
highly support SEM model. The results of reliability test of research
variables are presented in table below:
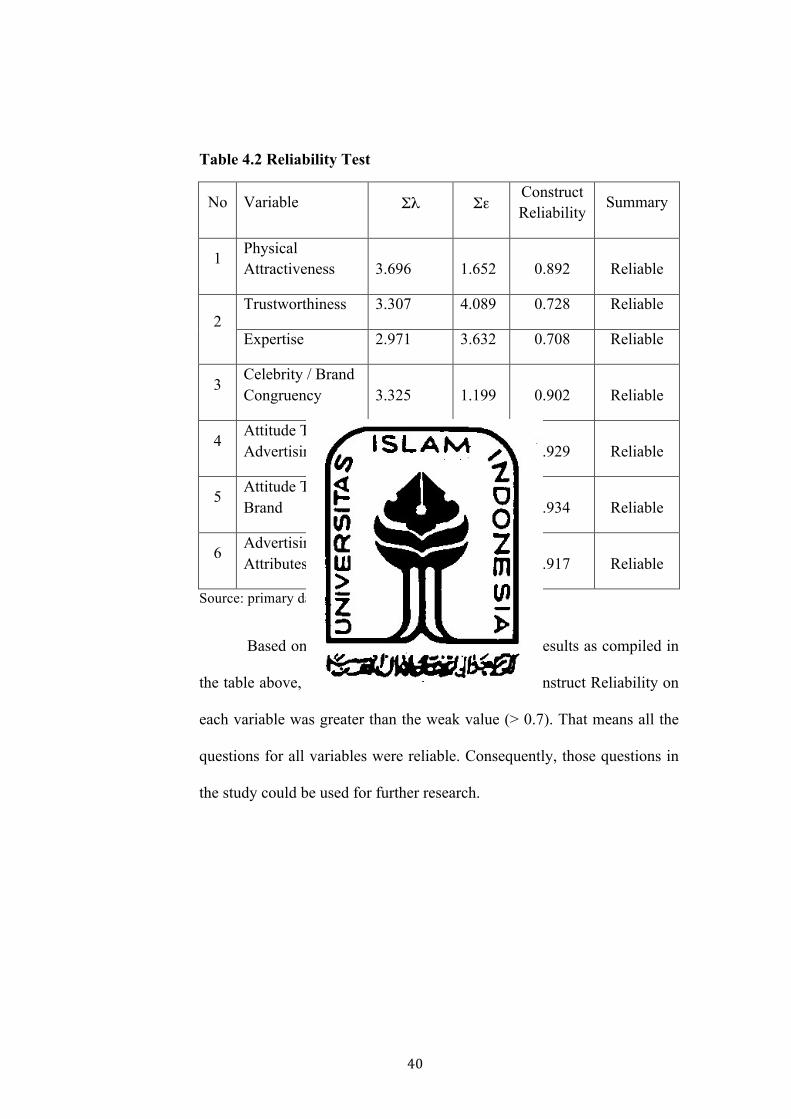
40
Table 4.2 Reliability Test
No Variable Σλ Σε Construct Reliability
Summary
1 Physical Attractiveness 3.696 1.652 0.892 Reliable
2 Trustworthiness 3.307 4.089 0.728 Reliable
Expertise 2.971 3.632 0.708 Reliable
3 Celebrity / Brand Congruency 3.325 1.199 0.902 Reliable
4 Attitude Toward Advertising 4.176 1.340 0.929 Reliable
5 Attitude Toward Brand 4.013 1.146 0.934 Reliable
6 Advertising Attributes 6.908 4.294 0.917 Reliable
Source: primary data processed, 2015
Based on the summary of the reliability test results as compiled in
the table above, it could be seen that the value of Construct Reliability on
each variable was greater than the weak value (> 0.7). That means all the
questions for all variables were reliable. Consequently, those questions in
the study could be used for further research.
41
4.3 Descriptive Analysis
Descriptive analysis is the way in which researchers do their research by
explaining and elaborating the data in the form of sentences. This part would like
to explain about the result of descriptive analysis based on the demographic of
respondents and advertising attributes which supported the variables in this
research.
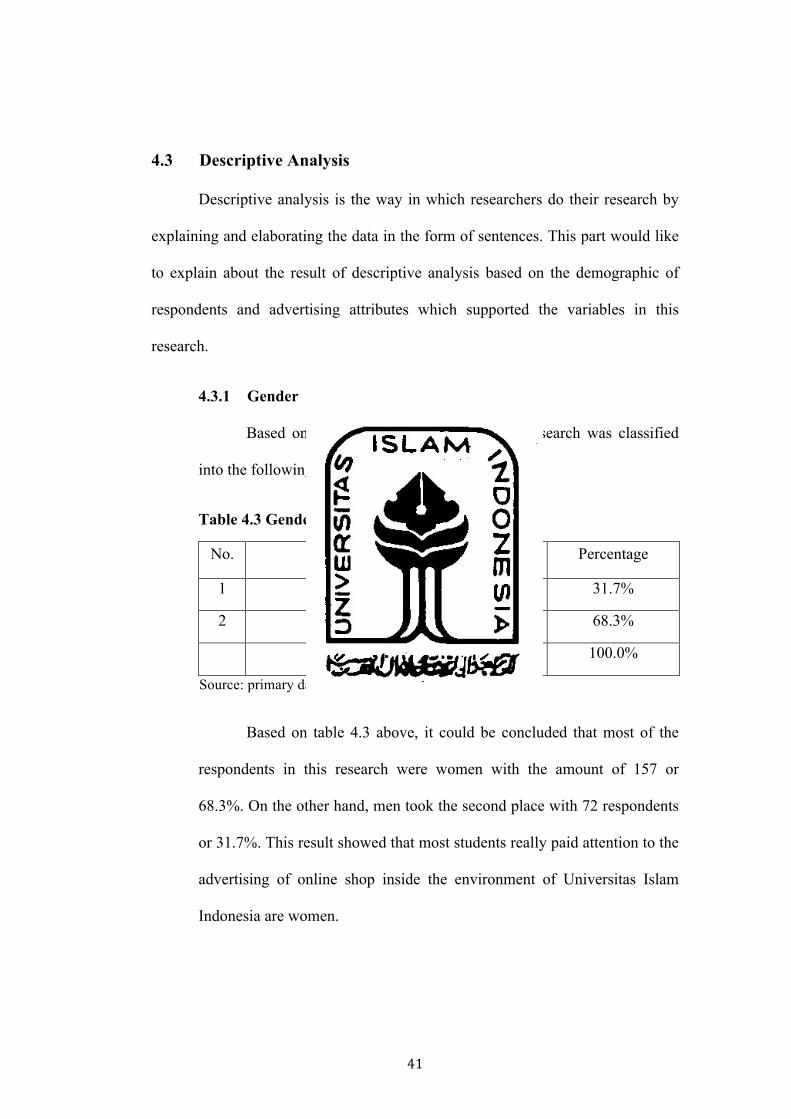
4.3.1 Gender
Based on gender, the respondents of this research was classified
into the following:
Table 4.3 Gender
No. Gender Frequency Percentage
1 Male 73 31.7%
2 Female 157 68.3%
Total 230 100.0%
Source: primary data processed, 2015
Based on table 4.3 above, it could be concluded that most of the
respondents in this research were women with the amount of 157 or
68.3%. On the other hand, men took the second place with 72 respondents
or 31.7%. This result showed that most students really paid attention to the
advertising of online shop inside the environment of Universitas Islam
Indonesia are women.

42
4.3.2 Age
Based on age, the respondents could be classified into:
Table 4.4 Age
No. Age Frequency Percentage
1 21 - 25 years old 110 47.8%
2 26 - 30 years old 90 39.1%
3 > 30 years old 30 13.0%
Total 230 100.0%
Source: primary data processed, 2015
Based on table 4.4 most respondents in this research were the
students between 21-25 years old of 47.8%. That range of age were
included as young age. It showed that the emerge of e-commerce/online
shop could be accepted by the young consumer to facilitate the whole
activity such as: lecturing, working etc.
4.3.3 Background of Education
The distribution of table 4.5 showed the characteristic of
respondents based on their education.
Table 4.5 Background of Education
No. Education Frequency Percentage
1 Elementary School 0 0%
2 Junior High School 0 0%
3 Senior High School 0 0%

43
No. Education Frequency Percentage
4 University or similar degree 230 100%
Total 230 100.0%
Source: primary data processed, 2015
The data showed that the respondents were all university students
with the amount of 230 or 100%. The respondents were undergraduate and
postgraduate students of the Faculty of Economics of Universitas Islam
Indonesia.
4.3.4 Allowance Per Month
The distribution of table 4.6 showed respondents’ characteristics
based on their allowance per month.
Table 4.6 Allowance Per Month
No. Income Frequency Percentage
1 < Rp.1,000,000 60 26.1%
2 Rp.1,100,000 – Rp.2,000,000 97 42.2%
3 Rp.2,100,000 – Rp.3,000,000 65 28.3%
4 > Rp.3,000,000 8 3.5%
Total 230 100.0%
Source: primary data processed, 2015
Table 4.6 showed that most of the respondents had the allowance
per month of between Rp. 1,000,000 – Rp. 2,000,000 or 42.2% and it was
the biggest percentage. While another frequency distribution were those
who had the allowance of less than Rp. 1,000,000 was 26,1%, between Rp.
44
2,100,000 – Rp. 3,000,000 was 28,3%, and those who had greater than Rp.
3,000,000 was 3.5%. This data analysis showed that the average allowance
of respondent was low because most of them were college students.
4.3.5 Marital Status
The distribution of table 4.7 showed the respondents`
characteristics based on marital status.
Table 4.7 Allowance Per Month
No. Marital Status Frequency Percentage
1 Unmarried 166 72.2%
2 Married 64 27.8%
3 Widow 0 0.0%
Total 230 100.0%
` Source: primary data processed, 2015
The data above showed the majority of respondents’ marital status
was unmarried of 72.2%. While another distribution, married, was 27.8%,
and 0% for widow status.
4.3.6 Advertising Attributes
In this part, the researcher described descriptive analysis of
advertising attribute which was not the main variable in this research but it
was the way to conduct analyzing celebrity endorser in advertisement. The
advertising attribute highly supported this research as advertising in
general. The measurement of each variable could be determined by

45
calculating the average of score 1 - 7 of point scale divided into four
categories; 1.0 - 2.5 as strongly disagree, 2.5 - 4.0 as disagree, 4.0-5.5 as
agree, and 5.5 – 7.0 as strongly agree. The distribution of each indicator of
advertising attribute was shown in the following table:
Table 4.8 Descriptive Analysis of Advertising Attributes
No. Advertising Attributes Means Category
1 These advertisements are misleading 2.33
Strongly
disagree
2 These advertisements are entertaining 5.16 Agree
3 These advertisements are persuasive 5.13 Agree
4 These advertisements taught me about e-
commerce/online shop 5.06 Agree
5 These advertisements tell me where I buy
online product 5.01 Agree
6 These advertisements represent a true
picture of the product advertised 5.02 Agree
7 These advertisements are better than a
commercial 4.98 Agree
8 These advertisements are better than a
commercial 4.98 Agree
Means 4.71 Agree
Source: primary data processed, 2015
Based on the descriptive analysis in the table above, the result
showed average mean of each indicator of 4.71. This score determined
46
consumer perception toward advertising in general had good result. In
another word, analysing the celebrity endorsement relationship on
consumer behaviour was likely supported. The highest score of indicators
was “these advertisements are interesting” was 5.16. While the lowest
score was 2.33 on “these advertisements are misleading” because it was
the contrary question which had high score on “very disagree”.
4.4 Descriptive Analysis Respondent Toward Research Variable
This section described the respondent’s perception or perspective toward
research variables; physical attractiveness, source of credibility, celebrity/brand
congruency, attitude toward advertising, and attitude toward brand. Subjects were
asked to assess attitude toward advertising and brand based on celebrity
endorsement which focused on e-commerce product. The measurement of each
variable could be determined by calculating the average of the score below:
Lowest score: 1
Highest score: 7
7 - 1 Interval = ⎯⎯⎯⎯ = 1,5 4
Therefore, the value of perception could be seen in table 4.6 below:
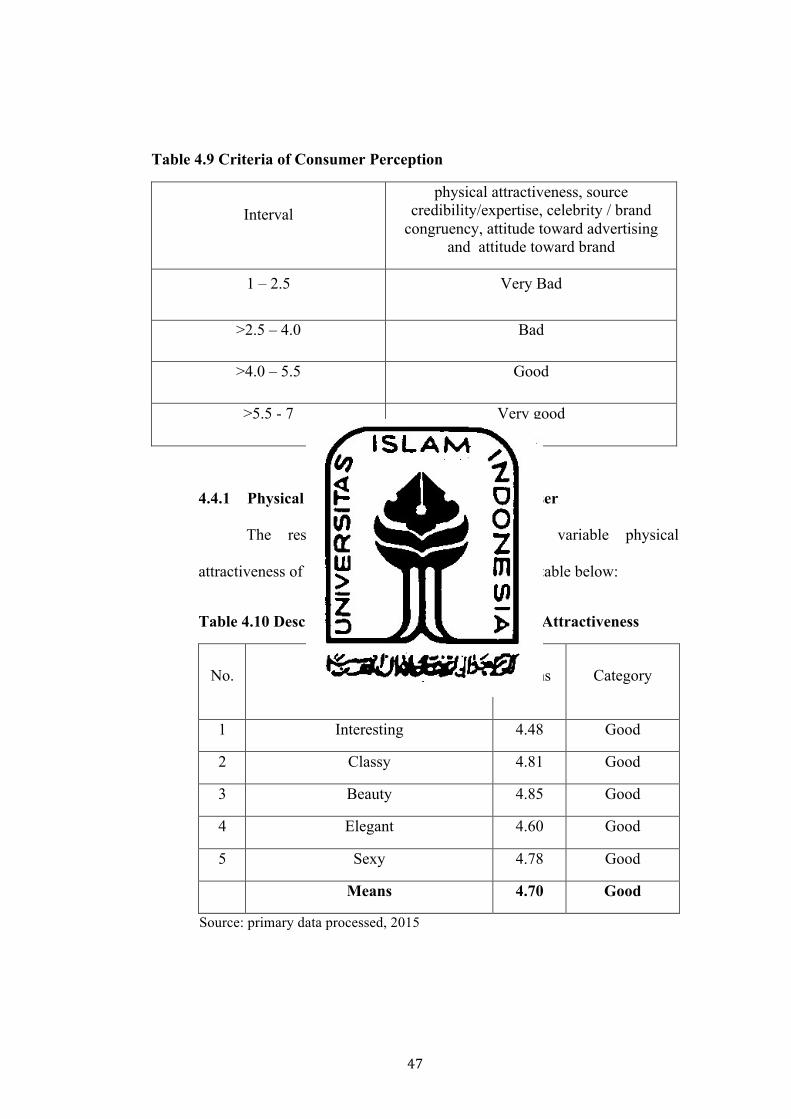
47
Table 4.9 Criteria of Consumer Perception
Interval physical attractiveness, source
credibility/expertise, celebrity / brand congruency, attitude toward advertising
and attitude toward brand
1 – 2.5 Very Bad
>2.5 – 4.0 Bad
>4.0 – 5.5 Good
>5.5 - 7 Very good
4.4.1 Physical Attractiveness of Celebrity Endorser
The result of descriptive analysis on variable physical
attractiveness of celebrity endorser was shown in the table below:
Table 4.10 Descriptive Analysis Result of Physical Attractiveness
No. Indicator Means Category
1 Interesting 4.48 Good
2 Classy 4.81 Good
3 Beauty 4.85 Good
4 Elegant 4.60 Good
5 Sexy 4.78 Good
Means 4.70 Good
Source: primary data processed, 2015
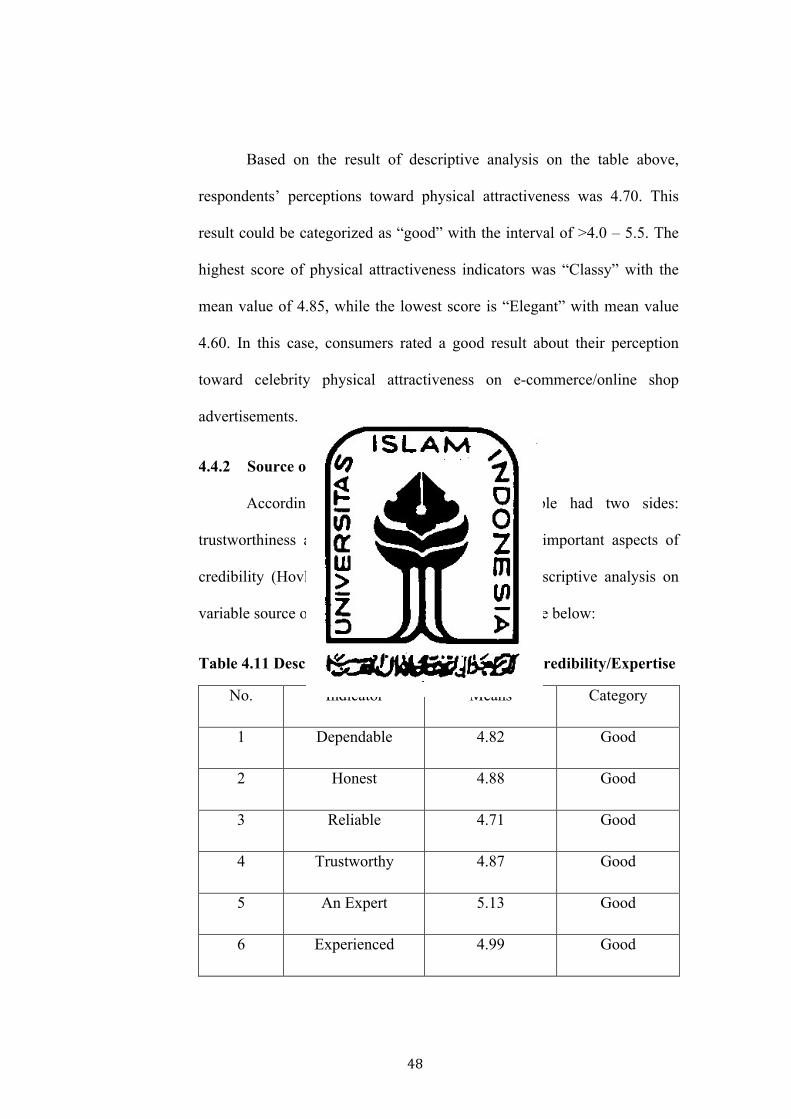
48
Based on the result of descriptive analysis on the table above,
respondents’ perceptions toward physical attractiveness was 4.70. This
result could be categorized as “good” with the interval of >4.0 – 5.5. The
highest score of physical attractiveness indicators was “Classy” with the
mean value of 4.85, while the lowest score is “Elegant” with mean value
4.60. In this case, consumers rated a good result about their perception
toward celebrity physical attractiveness on e-commerce/online shop
advertisements.
4.4.2 Source of Credibility/Expertise
According to Renton (2006), this variable had two sides:
trustworthiness and expertise, which are the most important aspects of
credibility (Hovland et al., 1953). The result of descriptive analysis on
variable source of credibility could be seen in the table below:
Table 4.11 Descriptive Analysis Result of Source Credibility/Expertise
No. Indicator Means Category
1 Dependable 4.82 Good
2 Honest 4.88 Good
3 Reliable 4.71 Good
4 Trustworthy 4.87 Good
5 An Expert 5.13 Good
6 Experienced 4.99 Good

49
No. Indicator Means Category
7 Qualified 4.97 Good
8 Skilled 4.90 Good
Means 4.82 Good
Source: primary data processed, 2015
Based on the table above, overall descriptive analysis showed that
the mean value of source credibility / expertise was 4.80. This result could
be categorized as good result with the interval of >4.0 – 5.5. The highest
score in the item of celebrity endorser was “An Expert” which wash
categorized as expertise determinant of 5.13 as the mean value. While the
lowest result was “Reliable” which was categorized as credibility
determinant of 4.71 as the mean value. Therefore, consumer perception
about this variable could be categorized as good result.
4.4.3 Celebrity/Brand Congruency
Based on the respondents` data that had been collected, descriptive
analysis of variable; celebrity and brand congruency could be seen in the
table below:

50
Table 4.12 Descriptive Analysis Result of Celebrity/Brand Congruency
No. Indicator Means Category
1 How familiar are you with the
celebrity who appeared in the ad? 5.15 Good
2 Do you think this brand is a good fit
for this celebrity to endorse? 5.23 Good
3 How believable is this celebrity
endorsing this brand? 5.15 Good
4 Do you believe this celebrity would
wear this product? 5.31 Good
Means 5.21 Good
Source: primary data processed, 2015
The result on celebrity / brand congruency indicator could be seen
in the table above. Consumer perception about this variable had good
result of the average of 5.21. The best result was in the indicator of “Do
you believe this celebrity would wear this product?” that had the mean
value of 5.31 and the lowest result was in the indicator of “How believable
is this celebrity endorsing this brand?” that had the mean value of 5.15.

51
4.4.4 Consumer Attitude Toward Advertising
The result of descriptive analysis on the variable of attitude toward
advertising could be seen in the table below:
Table 4.13 Descriptive Analysis Result of Attitude Toward Advertising
No. Indicator Means Category
1 Good (What is your felling about
this celebrity on ads?) 4.92 Good
2
Interesting (Is that celebrity
endorsement on Advertisements
interesting?)
4.80 Good
3
Like (Do you like an
Advertisements using celebrity
endorsement?)
4.80 Good
4
Creative (Is that using celebrity
endorsement on Advertisements
look creative?
4.85 Good
5
Informative (Is that using
celebrity endorsement on
Advertisements informative?)
4.77 Good
Means 4.83 Good
Source: primary data processed, 2015
Based on the descriptive analysis on the table above, the result
showed that consumer attitude toward advertising on e-commerce
advertisements which was using celebrity endorser had good result. The

52
average mean of each indicator which was located between the interval of
4.0 – 5.5 had the mean value of 4.83. The highest mean value was 4.92 as
the indicator of “Good (consumer perception toward ads)”, and the lowest
mean value was 4.77 as the indicator of “Informative”.
4.4.5 Consumer Attitude Toward Brand
The result of descriptive analysis on variable attitude toward
advertising could be seen in table below:
Table 4.14 Descriptive Analysis Result of Attitude Toward Brand
No. Indicator Means Category
1
Good (Consumer perception toward
brand advertised using celebrity
endorsement)
5.11 Good
2 Pleasant (Brand advertised using
celebrity endorsement is interesting) 5.16 Good
3
Like (Feeling about the brand
advertised using celebrity
endorsement)
5.21 Good
4 Good Quality (Quality of brand
endorsed by celebrity) 5.21 Good
5
Satisfactory (Product/brand endorsed
by celebrity will meet consumer
expectation)
5.19 Good
Means 5.18 Good
Source: primary data processed, 2015

53
Based on the above table, descriptive analysis of variable; attitude
toward brand that has been collected from respondents showed the average
of consumer attitude toward brand had the mean value of 5.18. It means
that consumer had good attitude toward e-commerce brand which was
endorsed by celebrity. The highest mean value was 5.21 with the indicator
of “Like” and “Good Quality. The lowest mean value was 5.11 with the
indicator of “Good (Consumer perception toward brand advertised using
celebrity endorsement)”.
4.5 Structural Equation Model Analysis
The tool of the quantitative analysis was Structural Equation Model
(SEM). The path analysis model was SEM (Structural Equation Model) analysis
which was the collection of statistical techniques that allowed the testing or series
of complex relationships simultaneously. This tool of analysis was used to
examine how far the dependent variable was influenced by the independent
variable.
4.5.1 Validity and Reliability Testing Result
Validity test showed how an indicator can measure the variable
(Zikmund, et al., 2010). The researcher tested the validity of the construct
indicator (item), which was included in the research, before testing the
construct reliability.
Researcher conducted validity test for each observed variable or
indicator by approaching convergent validity. Convergent validity was

54
showed by the measurement model and it determined how the estimated
variable measured as valid variable. An indicator showed as significant
convergent validity if the variable was higher than twice the standard error
(Anderson and Gebing, 1988) or had higher critical ratio than twice the
standard error (Ferdinand, 2002). AMOS program version 2.1 also
provided testing validity with standard loading of (λ) > 0.5 and it
determined as reliable if >0.7 of Construct Reliability.
In this research, Construct Reliability was examined by calculating
the index of reliability instrument from SEM model. Fornell and Laker’s
(1981) used the following formula to find Construct Reliability:
(Σλ i)2 Construct Reliability = (Σλ i)2 + Σεi
whereas, λ i = Standard loading factor for each indicators (observed
variable)
εi = Standard error for each indicator (1 – indicator
reliability).
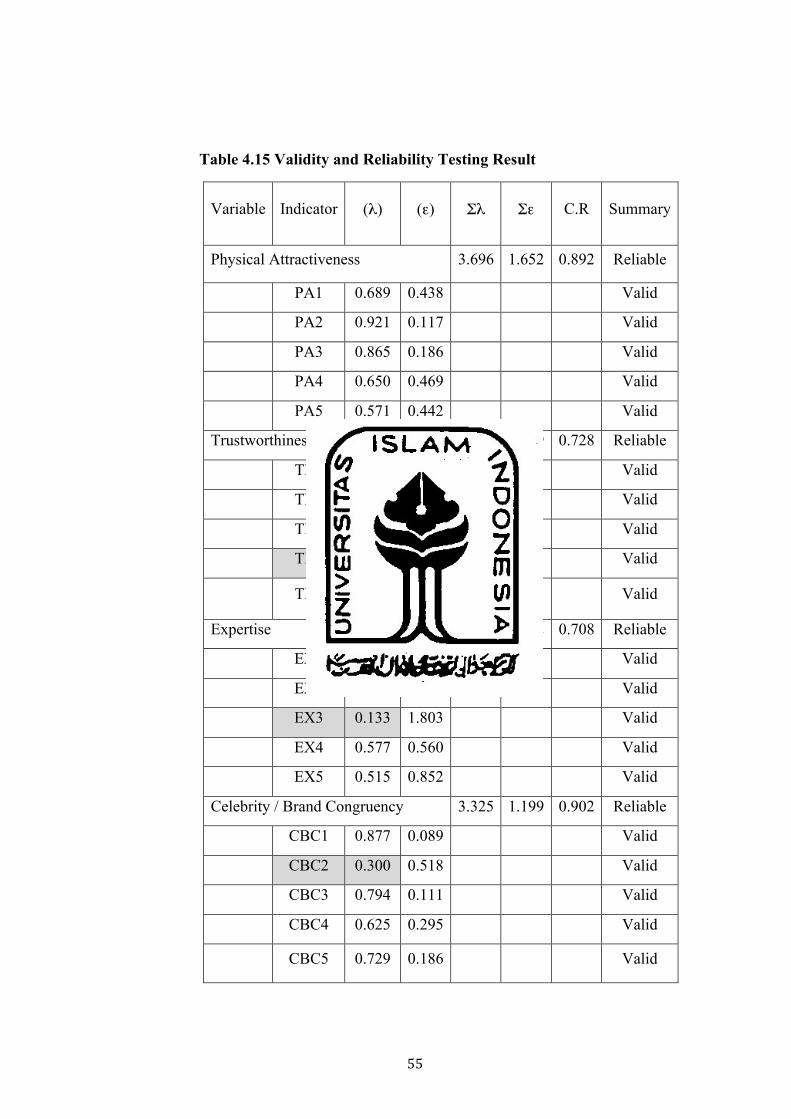
55
Table 4.15 Validity and Reliability Testing Result
Variable Indicator (λ) (ε) Σλ Σε C.R Summary
Physical Attractiveness 3.696 1.652 0.892 Reliable
PA1 0.689 0.438
Valid
PA2 0.921 0.117
Valid
PA3 0.865 0.186
Valid
PA4 0.650 0.469
Valid
PA5 0.571 0.442
Valid
Trustworthiness 3.307 4.089 0.728 Reliable
TR1 0.914 0.128
Valid
TR2 0.916 0.145
Valid
TR3 0.788 0.382
Valid
TR4 0.048 3.018
Valid
TR5 0.641 0.416
Valid
Expertise 2.971 3.632 0.708 Reliable
EX1 0.834 0.266
Valid
EX2 0.912 0.151
Valid
EX3 0.133 1.803
Valid
EX4 0.577 0.560
Valid
EX5 0.515 0.852
Valid
Celebrity / Brand Congruency 3.325 1.199 0.902 Reliable
CBC1 0.877 0.089
Valid
CBC2 0.300 0.518
Valid
CBC3 0.794 0.111
Valid
CBC4 0.625 0.295
Valid
CBC5 0.729 0.186
Valid

56
Variable Indicator (λ) (ε) Σλ Σε C.R Summary
Attitude Toward Advertising 4.176 1.340 0.929 Reliable
ATA1 0.831 0.227
Valid
ATA2 0.880 0.242
Valid
ATA3 0.859 0.247
Valid
ATA4 0.805 0.258
Valid
ATA5 0.801 0.366
Valid
Attitude Toward Brand 4.013 1.146 0.934 Reliable
ATB1 0.839 0.219
Valid
ATB2 0.856 0.154
Valid
ATB3 0.829 0.188
Valid
ATB4 0.820 0.196
Valid
ATB5 0.669 0.389
Valid
Advertising Attributes 6.908 4.294 0.917 Reliable
AA1 0.785 0.386
Valid
AA2 0.868 0.233
Valid
AA3 0.871 0.173
Valid
AA4 0.857 0.285
Valid
AA5 -0.263 1.204
Valid
AA6 0.909 0.155
Valid
AA7 0.879 0.147
Valid
AA8 0.197 1.405
Valid
AA9 0.902 0.177
Valid
AA10 0.903 0.129
Valid
Source: Primary Data (Computed 2015)
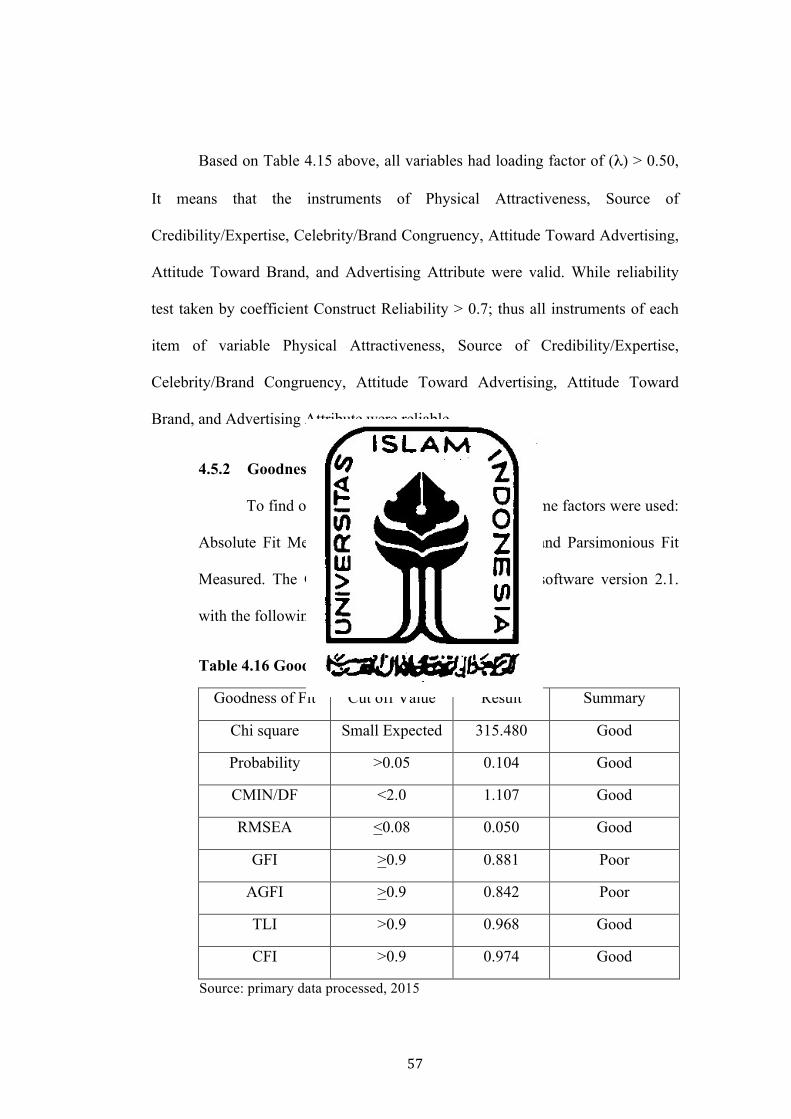
57
Based on Table 4.15 above, all variables had loading factor of (λ) > 0.50,
It means that the instruments of Physical Attractiveness, Source of
Credibility/Expertise, Celebrity/Brand Congruency, Attitude Toward Advertising,
Attitude Toward Brand, and Advertising Attribute were valid. While reliability
test taken by coefficient Construct Reliability > 0.7; thus all instruments of each
item of variable Physical Attractiveness, Source of Credibility/Expertise,
Celebrity/Brand Congruency, Attitude Toward Advertising, Attitude Toward
Brand, and Advertising Attribute were reliable.
4.5.2 Goodness of Fit Index
To find out the criteria of Goodness of Fit, some factors were used:
Absolute Fit Measured, Incremental Fit Measured and Parsimonious Fit
Measured. The Goodness of fit index used Amos software version 2.1.
with the following result:
Table 4.16 Goodness of Fit Index
Goodness of Fit Cut off Value Result Summary
Chi square Small Expected 315.480 Good
Probability >0.05 0.104 Good
CMIN/DF <2.0 1.107 Good
RMSEA <0.08 0.050 Good
GFI >0.9 0.881 Poor
AGFI >0.9 0.842 Poor
TLI >0.9 0.968 Good
CFI >0.9 0.974 Good
Source: primary data processed, 2015

58
From table 4.16, the result of analysis showed that all construct
created research model (full model), and this process of SEM full model
analysis had met the criteria of goodness of fit that had been assigned. The
goodness of fit measurement in this research had good summary such as
TLI (0.968>0.9); CFI (0.974>0.9); CMIN/DF (1.107<2); RMSEA
(0,050<0.08), Probability (0.104>0.05). While the parameter of GFI
(0,881>0,9) and AGFI (0.842<0.9) were summarized as poor. Therefore,
goodness of fit measurement was mostly summarized as good in this
research. It means that this research model had already met goodness of fit
criteria.
4.5.3 Hypotheses Testing Result
The analysis tool of this research was Structural Equation Model
(SEM). This tool was used to determine significant relationship between
independent variable and dependent variable. To determine whether the
hypotheses were supported by the data or not, the probability value of
Critical Ratio (CR) was compared with α = 5%. If the standardized
coefficient parameter was positive and the probability values of Critical
Ratio (CR) was less than α = 5%, it could be concluded that the
hypotheses were supported by the data (significantly proven). The test
results on research model could can be described as follow:
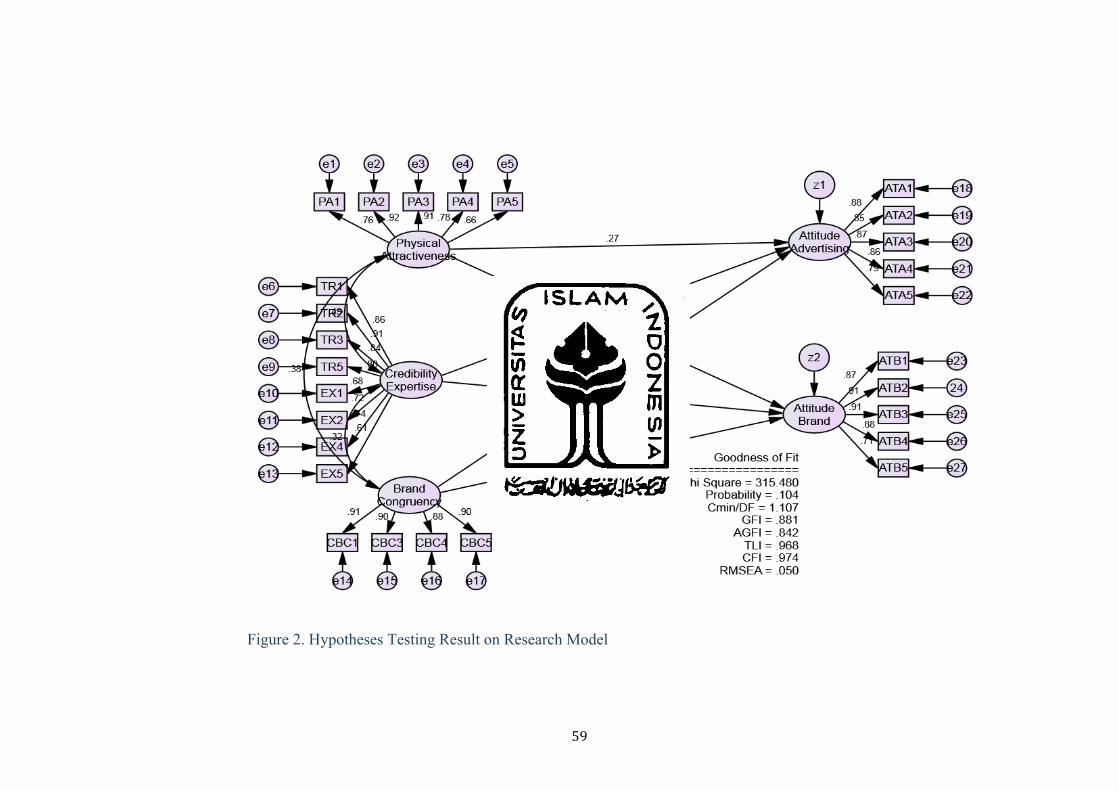
59
Figure 2. Hypotheses Testing Result on Research Model
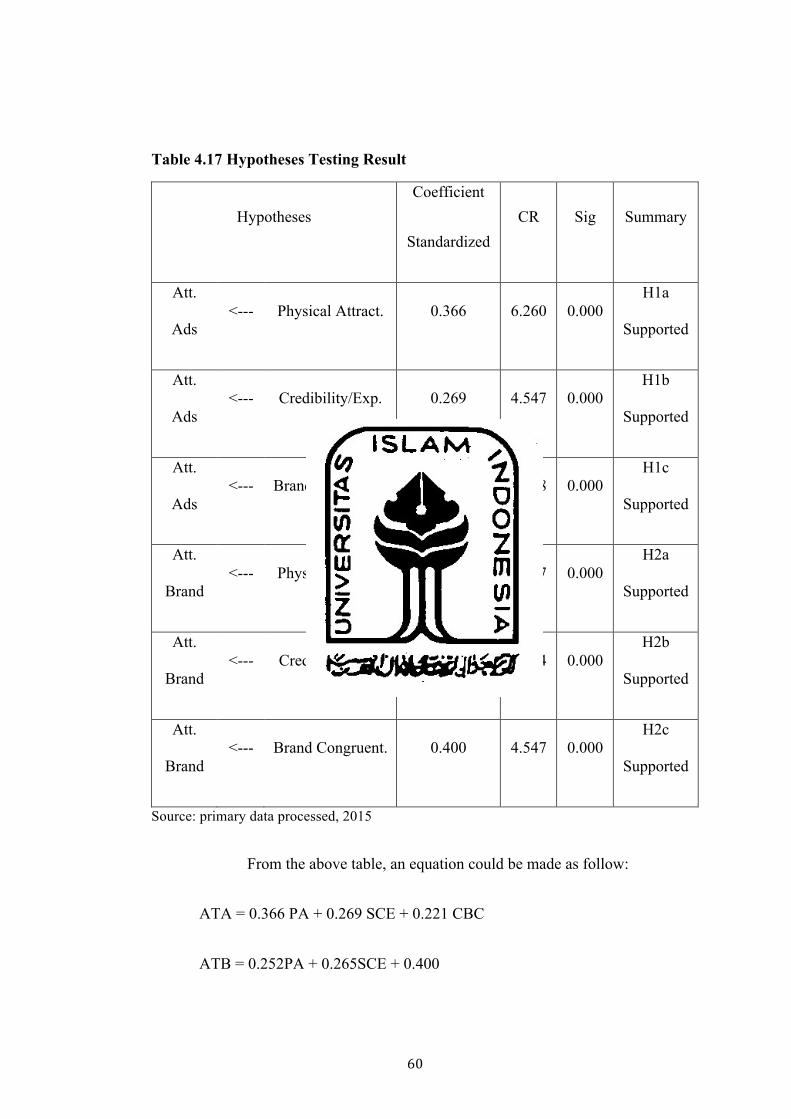
60
Table 4.17 Hypotheses Testing Result
Hypotheses Coefficient
Standardized CR Sig Summary
Att.
Ads <--- Physical Attract. 0.366 6.260 0.000
H1a
Supported
Att.
Ads <--- Credibility/Exp. 0.269 4.547 0.000
H1b
Supported
Att.
Ads <--- Brand Congruent. 0.221 4.348 0.000
H1c
Supported
Att.
Brand <--- Physical Attract. 0.252 3.877 0.000
H2a
Supported
Att.
Brand <--- Credibility/Exp. 0.265 4.054 0.000
H2b
Supported
Att.
Brand <--- Brand Congruent. 0.400 4.547 0.000
H2c
Supported
Source: primary data processed, 2015
From the above table, an equation could be made as follow:
ATA = 0.366 PA + 0.269 SCE + 0.221 CBC
ATB = 0.252PA + 0.265SCE + 0.400

61
Based on the statistical analysis by using equation model, celebrity
physical attractiveness had significant influence on consumer attitude
toward advertising. Whereas the value of coefficient standardized was
0.366 and probability as greater as 0.000<0.05. This means that this
significance stands on 5% significant or in other words, H1a is supported.
The estimated value of celebrity physical attractiveness on consumer
attitude toward advertising had a results that in line coefficient
(standardized regression weight estimate) = 0.366. This means that
physical attractiveness had positive and significant effect on consumer
attitude toward advertising.
The result of statistical analysis by using equation model showed
that celebrity expertise / credibility on consumer attitude toward
advertising had the value of 0.269. It means that every enhancement of
expertise / credibility, consumer attitude toward advertising increased to
0.269 with other constant variable assumption. The testing result found
that the value of probability was 0.000<0.05. It means that
credibility/expertise had significant influence on consumer attitude toward
advertising, or in other word, H1b was supported.
While the result of variable celebrity/brand congruency on
consumer attitude toward advertising was 0.221. It means that every one
enhancement of celebrity/brand congruency affected consumer attitude
toward advertising and increasd to 0.221 with other constant variable
assumption. The testing result found that the value of probability was

62
0.000<0.05. It means that celebrity/brand congruency had significant
influence on consumer attitude toward advertising, or in other word, H1c
was supported in this research.
The testing result of second hypotheses that showed celebrity
physical attractiveness on consumer attitude toward brand had the
coefficient value of 0.172. It means that physical attractiveness positively
influenced consumer attitude toward brand constant variable assumption
while testing result found that the value of probability was 0.000<0.05.
The estimated value of physical attractiveness on consumer attitude
toward brand had results which was in line with coefficient = 0.172. This
value described that H2a was supported in this research.
Based on the statistical analysis by using equation model that
celebrity expertise/credibility on consumer attitude toward brand was
0.265. It means that every one enhancement of celebrity
expertise/credibility increased consumer attitude toward brand 0.265 with
other constant variable assumption. The testing result found the
probability value of 0.000<0.05. It means that source credibility/expertise
positively influence consumer attitude toward brand in celebrity
endorsement of e-commerce advertisement. In other word, H2b was
supported in this research.
While the variable of celebrity/brand congruency on consumer
attitude toward brand had the result of 0.400. It means that every one

63
enhancement of celebrity/brand congruency would affect consumer
attitude toward brand increase of 0.400 with the other constant variable
assumption. The testing result found that the value of probability was
0.000<0.05. It means that celebrity/brand congruency had the significant
influence on consumer attitude toward brand. In other word, H2c was
supported in this research.
4.6 Discussion Result
Celebrities were considered as being the persuasive element in marketing
in this study. Celebrity attractiveness had positive relation which was found
between the attractiveness of celebrity and their effect on consumer attitude in
Yogyakarta. The basic reason is consumers’ attitude are influenced by person who
attractive, classy, beautiful, elegant, and sexy. The findings of this research
showed that physical attractiveness was a way to capture people attention and to
influence consumer attitude toward advertising and brand. Consumer would recall
the advertising and brand when the advertisement was endorsed by attractive
person. However, in this research, the result of analysis showed that celebrity’s
physical attractiveness had significant influence on attitude toward advertising
and brand. This result confirmed the previous research which was done by Renton
(2006) in different place and product category. Renton (2007) also stated that one
of the way in which celebrities attract the attention of consumers was by the
meaning that the celebrity brought the brand that he or she was endorsing with
which McCracken (1989) described as the Transfer Meaning Model. Research
had showed that attractive people were more successful in changing beliefs than

64
their unattractive counterparts (Kamins, 1990; Till & Busler, 1998; Kahle &
Homer, 1985; Ohanian, 1991; Chaiken, 1979; Baker & Churchill, 1977;
Petroshius & Crocker, 1989; Horai, Naccari, & Fatoullah, 1974, cited in Renton,
2006). Although the researcher has conducted this research that focused on e-
commerce advertisement, the result had showed that physical attractiveness of
celebrity could influence consumers’ attitude toward advertising and brand.
In the other side, one of celebrity important elements was celebrity source
of credibility. This variable has two side: trustworthiness and expertise (Renton,
2006). Trustworthiness refers to the honesty, integrity and believability of an
endorser (Erdogan et al., 2001:40). Trust in communication is considered to be
how confidence and acceptance the listener has in accepting the message
(Ohanian, 1990). Moreover, if consumers believe what the endorser is telling and
they trust him or her, trustworthiness on ad will be higher and attitude of the
consumers will increase as well (Hoekman, 2009). The research found celebrity
who endorsed the ads has value of honesty, dependable, reliable, and trustworthy
cloud influence consumer attitude toward the advertising and brand. In addition,
consumer tend to belief the celebrity who endorse with honesty and believably.
While expertise was the level of knowledge, experience or skills the endorser
possesses (Hovland, Janis, and Kelley, 1953). In order to persuade recipients of
information, endorser’s expertise has encouraged effect on receivers. The research
found expert celebrity, experienced, knowledgeable, and skilled could influence
consumer attitude toward advertising and brand. Celebrity expertise is one of the
reasons in order to find out its influence on recipients of information (Amos,
65
Holmes and Strutton, 2008). The information receivers have strong belief upon
the person who has a related knowledge and expertise in advocating area (Belch
and Belch 1994). In sum, the finding showed that the source of credibility had
significant relationship with consumer attitude toward advertising and brand on e-
commerce advertisement. As well as the result of this research, the research of
previous research by Renton (2007), Zafar and Rafique (2010) also showed the
same result. This result indicated celebrities who had high source of credibility
would influence consumer attitude toward advertising and brand on e-commerce
advertisement. Consumers tend to believe celebrities on advertisement about what
they were endorsing. Therefore, celebrities who had source of credibility,
expertise, and trustworthiness can effectively deliver the messages to the
consumers.
One of the celebrity factors was celebrity and brand congruency which
was stated by Kamins (1990) as the “Match-Up” hypothesis. The “Match-Up”
hypothesis generally suggested that the message conveyed by the image of the
celebrity and the image of the product should converge in effective
advertisements and implied a need for congruency between product image and
celebrity image on an attractiveness basis. According to Kahle and Homer (1985),
when a celebrity’s physical attractiveness was congruent with the product they
were endorsing, the “match-up” hypothesis would predict a positive impact on the
product and the advertisement evaluations. If there was incongruency, evaluations
would decline. This research found that celebrity/brand congruency positively
influence consumer attitude toward advertising and brand on e-commerce

66
advertising. Although by using celebrity endorsement on e-commerce was
something different, celebrity/brand congruency also played important roles on
influencing consumer attitudes. Using celebrity on endorsement should be
followed by the congruency between brand and the celebrity that would be used
for the brand. Kamins and Gupta (1994) found that the higher the degree of
congruency between the types of endorsers and the product advertised, the greater
the believability of the endorser. The linkage between congruency and
endorser/advertiser believability was only presented for the celebrity endorser
(Kamins & Gupta, 1994).
Overall, based on this research the study implied that physical
attractiveness, source of credibility/expertise, and celebrity/brand congruency had
the potential to be an important factor in e-commerce advertising. In sum, the use
of celebrities to endorse a brand can be an effective and valuable strategy and will
hamper companies to create a unique position and receive attention from
consumers. Using celebrities can help companies to create exclusive
advertisements and engender a positive effect on the attitude of consumers
towards the brand (Ranjbarian et al., 2001).

67
CHAPTER V
CONCLUSIONS AND SUGESTIONS
This chapter concluded the finding in previous chapter. Based on the
research finding of the survey and the analysis, several conclusions could be
derived regarding on celebrity endorsement in Yogyakarta on young people
consumer’s attitude toward advertising and brand that focused on e-commerce
advertisement.
5.1 Conclusion
The conclusion is a brief and precise statement drawn from the findings of
the research and discussion of the findings. The conclusion of this chapter was the
result of the research done by the researcher to find the celebrity endorsement’s
factor that influence consumer attitude toward advertising and brand, especially
on e-commerce advertising could be categorized as new e-commerce marketing in
Indonesia. There were several conclusions taken from this research, which were
derived from the data analysis results as follow:
1. Celebrity endorsement influenced the consumer attitude toward
advertising. In this research the celebrity’s physical attractiveness,
source credibility/expertise, and celebrity/brand congruency had
significant positive influence on consumer attitude toward advertising
on e-commerce product.
2. In this research, there was a positive and significant relationship of
celebrity’s physical attractiveness, source credibility/expertise, and

68
celebrity/brand congruency on consumer attitude toward brand. It
means by using celebrities on e-commerce advertisement, had good
physical attractiveness, source of credibility/expertise, and match
brand congruency would increase consumer attitude toward brand on
e-commerce product.
5.2 Limitation
As in the case with any research efforts, the limitations may occur during
the data collection. Despite the fact that the results were based on a relatively
large, randomly selected, real customer samples, a potential bias may come from
the single source of data collection procedure. Certain limitations of this research
ware taken from previous research, and also taken from the researcher. The
limitations of the study were as follow:
1. This research was conducted with limited geographical area in Sleman
Yogyakarta, with regard to the time limitation and resource. To
achieve general objectives, research should be done in other part of
Indonesia.
2. Resource limitation constrains had led to limited using all female
celebrity’s endorsement in e-commerce product advertisement. Using
celebrity endorsement in e-commerce newly in Indonesia, produce
different result by using other gender.

69
3. As the sample taken was mainly university students as undergraduate
or postgraduate students was categorized as “Generation Y” especially
for ages below 25 years old. They may often receive e-commerce
advertising in their daily activities.
5.3 Recommendation
Based on the result of research, the study found many factors of celebrity
endorsements on consumer attitude toward advertising and brand especially on e-
commerce advertisement. Moreover, the recommendations of this research were
as follow:
1. Advertisers should think over which celebrities were highly support
company for e-commerce endorsement. The result of this research
suggested many elements of celebrity endorsement that could
influence consumer attitude such as physical attractiveness, source of
credibility, and celebrity/brand congruency. The use of celebrities to
endorse a brand can be an effective and valuable strategy and will
hamper companies to create a unique position and receive attention
from consumers. Physical attractiveness, source of credibility, and
celebrity/brand congruency of celebrity are the factors should be
considered, if advertisers would hire celebrity to apply in e-commerce
advertisement. Therefore, advertisers should be smart on choosing the
right celebrities who may highly support the company by these
elements.

70
2. in this research Generation Y, consumers’ 19-36, were the only
participants.Forthemarketingaspect,thisstudyshowsmajorityofthe
Generation Y’s attitude influenced by celebrity endorsement on e-
commerce product, but if this study were conducted with other
generationstherecouldbeadifferentresult.
3. Celebrity endorsement of certain e-commerce companies in Indonesia
still used female. For marketer, this was still unknown result and will
give different result especially for consumer attitude. In addition,
advertiser should consider the elements of celebrity to chose male
celebrity in e-commerce advertisement in other product and market
segmentation.
4. For further research, researcher should conduct the survey on another
area than Yogyakarta so it can represent the overall consumer culture
and behavior in various regions.
71
REFERENCES
Anderson, J., Gerbing, W. (1988). Structural equation modelling in practice: A review and recommended two stage approach. Psychological Bulletin 27(1), 5-24
Amos C., Holmes G., Strutton D., (2008). Exploring the relationship between
celebrity endorser effects and advertising effectiveness. International Journal of Advertising, 27(2), 209-234
Baker, M., J., & Churchill, G., A. (1977). The impact of physically attractive
models on advertising evaluations. Journal of Marketing Research, 14, 538-555
Belch, G., & Belch, M., (1994). Introduction to advertising and promotion: An
integrate marketing communications perspective (3th ed. pp. 189-192), Irwin: Homewood.
Biehal, D., Gabriel, C., & Stephens, E. (1992). Attitude toward the ad and brand
choice. Journal of Advertising, 21(3), 19-37. Bush, A., J., Martin, C., A., & Bush, V., D. (2004). Sports celebrity influence on
the behavorial intentions of Generation Y. Journal of Advertising Research, 44, 108- 119.
Chaiken, S. (1979). Communicator physical attractiveness and persuasion.
Journal of Personality and Social Psychology, 37, 1387-1397. Cooper, M. (1984, September 1). Can celebrities really sell products? Marketing
& Media Decisions, 19, 64-67. Choi, S. M., Rifon, N. J., (2007). Who is the celebrity in advertising?
Understanding dimensions of celebrity images. Journal of Popular Culture, 40(2), 304-324
Dholakia, R., R., & Sternthal, B. (1977). Highly credible sources: Persuasive
facilitators or persuasive liabilities. Journal of Consumer Research, 3, 223-232.
Dinesh Kumar Gupta (2007), Impact of Celebrity Endorsement on Consumer
Buying Behavior and Brand Building. Retrieved March 20, 2016, from http://papers.ssrn.com/sol3/papers.cfm?abstract_id=1203322.
72
Erdogan, B.Z. (1999). Celebrity endorsement: a literature review. Journal of Marketing Management, 15(3), 291–31.
Ferdinand. (2002). Structural equation modeling (SEM) dalam Penelitian
Manajemen. Diponogoro, unpublished theses Program Magister Manajemen Universitas Diponegoro.
Fishbein, M. (1967). Readings in Attitude Theory and Measurement. New York,
NY: John Wiley & Sons, Inc. Fornell, C., Larcker, D.F., 1981. Evaluating structural equation models with
unobservable variables and measurement error. Journal of Marketing Research 18(1), 39-50.
Friedman, H. H., & Friedman, L. (1979). Endorser Effectiveness by Product
Type. Journal of Advertising Research, 19(5), 67-71. Ghozali, Imam (2004). Model Persamaan Struktural: Konsep dan Aplikasi
dengan program AMOS Versi 5.0. Semarang, Universitas Diponegoro. Ghozali, Imam (2005). Aplikasi Analisis Multivariate dengan Program SPSS (3th
ed.). Semarang, Badan Penerbit Universitas Diponegoro. Horai, J., Naccari, N., & Fatoullah, E. (1974). The effects of expertise and
physical attractiveness upon opinion agreement and liking. Sociometry, 37, 601-606.
Hovland, Irving L. Janis, and Harold H. Kelley (1953). Communication and Persuasion. New Haven, CT: Yale University Press.
Kahle, L.R., and Homer, P.M. (1985). Physical Attractiveness of the Celebrity
Endorser: A Social Adaptation Perspective. Journal of Consumer Research, 11(4), 954-961.
Kamins, M., A. (1990). An investigation into the “match-up” hypothesis in
celebrity advertising: When beauty may be only skin deep. Journal of Advertising, 19 (1), 4-13.
Kamins, M., A., & Gupta, K. (1994). Congruence between spokesperson and
product type: A match-up hypothesis perspective. Psychology & Marketing, 11, 569-586.
Kelman, H., C. (1956, Spring). Process of opinion change. Public Opinion
Quarterly, 33, 57-78. Khatri, P., (2006). Celebrity Endorsement: A Strategic Promotion Perspective.
Indian Media Studies Journal 1(1).
73
Hassan, S., & Jamil, R. (2014). Influence of Celebrity Endorsement on Consumer
Purchase Intention for Exiting Product: A Comparative Study. Journal of Management (4), 1-23
Hoekman, M. (2009). How does celebrity endorsement influence the attitude
towards the brand and how does negative publicity affect this relationship? Bachelor Thesis 343386, Tilburg University.
Horai, J., Naccari, N., & Fatoullah, E. (1974). The effects of expertise and
physical attractiveness upon opinion agreement and liking. Soiometry, 37, 601-606.
McCracken, G. (1989, December). Who is the celebrity endorser? Cultural
foundation of the endorsement process. Journal of Consumer Research, 16, 310-321
MacKenzie, S., B., Lutz, R., J., & Belch, G., E. (1986). The role of attitude
toward the Ad as a mediator of advertising effectiveness: A test of competing explanations. Journal of Marketing Research, 23, 130-143.
Misra, S. & Beatty, S. (1990). Celebrity spokesperson and brand congruence.
Journal of Business Research, 21(2), 159–173. Ohanian, R. (1990). Construction and validation of a scale to measure celebrity
endorsers’ perceived expertise, trustworthiness, and attractiveness. Journal of Advertising, 19(3), 39–52.
Ohanian, R. (1991). The impact of celebrity spokesperson's perceived image on
consumers' intention to purchase. Journal of Advertising Research, 31(1), 46-52
Osgood, C., E., Suci, G., J., & Tannenbaum, P., H. (1957). The measurement of
meaning. Urbana, IL: Richard D. Irwin, Inc. Patzer, G.L., (1985), Research claims that beauty is wallet deep, Marketing News,
(Aug), p30. Petroshius, S., M., & Crocker, K., E. (1989). An empirical analysis of
spokesperson characteristics on advertisement and product evaluations. Journal of the Academy of Marketing Science, 17, 217-225.
Renton, K. (2006). The Relationship of Celebrity Advertisements to Consumer
Attitudes and Purchase Intentions. Electronic Theses, Treatises and Dissertations. Paper 1895.
74
Ranjbarian, B., Shekarchizade, Z., Momeni, Z., (2010). Celebrity endorser influence on attitude toward advertisements and brands. European Journal of Social Sciences, 13(3).
Sekaran, U. (2000). Research methods for business. A skill building approach,
(3rd ed.) New York: Wiley. Schutte, H. & Ciarlante, D. (1998) Consumer Behavior in Asia. MacMillan:
London. Shimp, T. (1981). Attitude toward the ad as a mediator of consumer brand choice. Journal of Advertising Research, 10(2), 9-15. Solomon, M., R. (2004). Consumer Behavior: Buying, Having and Being. Upper
Saddl River, NJ: Pearson Education Inc. Spielman, H., M. (1981, November/December). The celebrity sells: making it
work. Marketing Times, 28, 13-14. Spirtes, P., Richardson, T., Meek, C., Scheines, R., Glymour C. (1998). Using
Path Diagrams as a Structural Equation Modeling Tool. Sociological Method Research 27(2), 187-225
Syed Rameez ul H., Raja Ahmed J. (2014). Influence of Celebrity Endorsement
on Consumer Purchase Intention for Exiting Products: A Comparative Study. Journal Management Info 4(1), 1-23 (2014), Pakistan: Departement of Management Sciences, University of Haripur.
Till, B.D., Shimp, T.A., (1998). Endorsers in advertising: The case of negative
celebrity information. Journal of Advertising, 27(1), 67-82. Thorson, E. (1990). Consumer processing of advertising. Current Issues and
Research in Advertising, 12, 197–230, University of Michigan Worthen, C. (2014). Do Celebrity Endorsed Advertisements in Fashion
Magazines Influence Purchase Intentions of Generation Y? Texas: Texas Tech University.
Zafar, Q. and Rafique, M. (2010). Impact of Celebrity Advertisement on
Customers’ Brand Perception and Purchase Intention. Asian Journal of Business and Management Sciences, 1 (11), 53-67.
Zikmund, W. G., Babin, B. J., Carr, J. C., & Griffin, M. (2010). Business research
methods (8th ed.). Mason, HO: Cengage Learning.

APPENDIX A
QUESIONARE

Kepada Yth.
Sdr/i
Di Tempat
Assalamua’laikum Wr. Wb.
Dengan Hormat,
Saya adalah mahasiswa Jurusan Manajemen Internasional Program Fakultas
Ekonomi UII yang sedang melakukan penelitian dengan judul “The Impact of
Celebrity Endorsement on Consumer Attitude In Yogyakarta (Pengaruh Selebriti
Endorser Terhadap Sikap Konsumen di Yogyakarta)”. Dimana dalam penelitian ini
saya menyusun kuisioner untuk menunjang penelitian tersebut.
Dalam kuisioner ini terdapat pernyataan-pernyataan yang dimaksudkan untuk
memperoleh penilaian Sdr/i, mengenai factor selebriti dalam iklan yang
mempengaruhi sikap Sdr/I terhadap iklan tersebut dan merek yang diiklankan.
Maka oleh karena itu saya memohon kesediaan Sdr/i untuk meluangkan waktu guna
membantu saya menjadi responden penelitian, yaitu dalam mengisi atau memilih
jawaban yang telah saya sediakan pada daftar pernyataan yang saya susun.
Karenanya, kebenaran dan kelengkapan jawaban Sdr/i akan sangat membantu saya
dalam mencapai maksud tersebut.
Atas partisipasi dan bantuan Sdr/i, saya ucapkan terima kasih.
Wassalamua’laikum Wr. Wb.
Hormat Saya,
Lukman Al Hakim

Bagian 1
Demographic
Pertanyaan dibawah ini akan menggambarkan jati diri anda. Untuk itu, anda
diminta untuk menjawab pertanyaan dibawah dengan memberi tanda (X) silang
pada jawaban yang menurut anda sesuai.
1. Apa jenis kelamin Anda?
a. Laki-laki
b. Perempuan
2. Berapakah Umur Anda sekarang?
a. 21-25 tahun
b. 26-30 tahun
c. >30 tahun
3. Berapakah pendapatan/penghasilan/uang saku (income) Anda tiap
bulannya?
a. < Rp. 1000.000
b. Rp. 1100.000 - Rp. 2000.000
c. Rp. 2100.000 – Rp. 3000.000
d. > Rp. 3100.000
4. Apa latar belakang pendidikan Anda?
a. Sekolah Dasar (SD)
b. Sekolah Menengah Pertama (SMP)
c. Sekolah Menengah Atas (SMA) atau sederajat
d. Perguruan Tinggi/Universitas
5. Apa status perkawinan Anda?
a. Belum Menikah
b. Sudah Menikah
c. Janda/Duda

Bagian 2
Physical Attractiveness, Trustworthiness, and Expertise
Anda diminta memberikan penilaian terhadap pernyataan-pernyataan yang tertera
dibawah ini berdasarkan pendapat Anda terhadap iklan yang kami lampirkan,
dengan memberikan tanda (X) silang pada nomor yang menurut anda sesuai.
Physical Attractiveness
Pernyataan-pernyataan dibawah ini berkenaan dengan Daya Tarik (Physical
Attractiveness) Celebrity Endorser dalam iklan.
1. Apakah Celebrity Endorser yang digunakan dalam iklan tersebut menarik?
Tidak Menarik 1 2 3 4 5 6 7 Menarik
2. Apakah Celebrity Endorser yang digunakan dalam iklan tersebut
menyenangkan?
Tidak Menyenangkan 1 2 3 4 5 6 7 Menyenangkan
3. Apakah Celebrity Endorser yang digunakan dalam iklan tersebut terlihat
cantik?
Buruk/tidak cantik 1 2 3 4 5 6 7 Cantik
4. Apakah Celebrity Endorser yang digunakan dalam iklan tersebut terlihat
elegan?
Tidak Elegan 1 2 3 4 5 6 7 Elegan
5. Apakah Celebrity Endorser yang digunakan dalam iklan tersebut terlihat
seksi?
Tidak Seksi 1 2 3 4 5 6 7 Seksi

Trustworthiness
Pernyataan-pernyataan dibawah ini berkenaan dengan Kredibilitas/Kepercayaan
(Trustworthiness) Celebrity Endorser dalam iklan.
1. Apakah Celebrity Endorser yang digunakan dalam iklan tersebut dapat
diandalkan?
Tidak dapat diandalkan1 2 3 4 5 6 7 Dapat diandalkan
2. Apakah Celebrity Endorser yang digunakan dalam iklan tersebut jujur
dalam menyampaikan pesan?
Tidak Jujur 1 2 3 4 5 6 7 Jujur
3. Apakah Celebrity Endorser yang digunakan dalam iklan tersebut
konsisten dalam menyampaikan pesan?
Tidak Konsisten 1 2 3 4 5 6 7 Konsisten
4. Apakah Celebrity Endorser yang digunakan dalam iklan tersebut tulus
dalam menyampaikan pesan?
Dibuat-buat 1 2 3 4 5 6 7 Tulus
5. Apakah Celebrity Endorser yang digunakan dalam iklan tersebut dapat
dipercaya dalam menyampaikan pesan?
Tidak dapat dipercaya 1 2 3 4 5 6 7 Dapat dipercaya
Expertise
Pernyataan-pernyataan dibawah ini berkenaan dengan Keahlian (Expertise)
Celebrity Endorser dalam iklan.
1. Apakah Celebrity Endorser yang digunakan dalam iklan tersebut ahli
dalam menyampaikan pesan?
Tidak Ahli 1 2 3 4 5 6 7 Ahli
2. Apakah Celebrity Endorser yang digunakan dalam iklan tersebut
berpengalaman dalam menyampaikan pesan?
Tidak berpengalaman 1 2 3 4 5 6 7 Berpengalaman

3. Bagaimana pendapat Anda tentang pengetahuan/wawasan Celebrity
Endorser terkait produk/merek yang diiklankan?
Tidak berpengatahuan 1 2 3 4 5 6 7 Berpengatahuan
4. Bagaimana menurut Anda tentang bukti kualitas Celebrity Endorser dalam
beriklan?
Tidak Berkualitas 1 2 3 4 5 6 7 Berkualitas
5. Apakah Celebrity Endorser yang digunakan dalam iklan tersebut terlihat
terampil/mempunyai skil dalam menyampaikan pesan?
Tidak Terampil 1 2 3 4 5 6 7 Terampil/punya skil
Bagian 3
Celebrity and Brand Congruency
Anda diminta memberikan penilaian terhadap pernyataan-pernyataan yang tertera
dibawah ini berdasarkan pendapat Anda terhadap iklan yang kami lampirkan,
dengan memberikan tanda (X) silang pada nomor yang menurut anda sesuai.
Pernyataan-pernyataan dibawah ini berkenaan dengan Keserasian/Keharmonian
Selebrity dan Merek (Celebrity/Brand Congruency) Celebrity Endorser dalam
iklan.
1. Apakah Anda familiar dengan Celebrity Endorser yang digunakan dalam
iklan tersebut?
Tidak Familiar 1 2 3 4 5 6 7 Familiar
2. Bagaimana pendapat Anda tentang keserasian Celebrity Endorser dengan
merek/produk yang diiklankan?
Tidak Serasi 1 2 3 4 5 6 7 Serasi
3. Apakah merek ini sangat cocok diiklankan Celebrity Endorser Tersebut ?
Tidak Cocok 1 2 3 4 5 6 7 Cocok

4. Seberapakah kepercayaan anda terhadap Celebrity yang mendukung
(endorsing) merek tersebut?
Tidak Dapat Dipercaya1 2 3 4 5 6 7 Dapat Dipercaya
5. Apakah Anda percaya Celebrity Endorser menggunakan produk dari
merek yang diiklankan?
Tidak Dapat Dipercaya1 2 3 4 5 6 7 Dapat Dipercaya
Bagian 4
Attitude toward the Advertisement
Anda diminta memberikan penilaian terhadap pernyataan-pernyataan yang tertera
dibawah ini berdasarkan pendapat Anda terhadap iklan yang kami lampirkan,
dengan memberikan tanda (X) silang pada nomor yang menurut anda sesuai.
Pernyataan-pernyataan dibawah ini berkenaan dengan Sikap Terhadap Iklan
(Attitude toward the Advertisement) Celebrity Endorser.
1. Bagaimana menurut pendapat Anda tentang iklan mengunakan Celebrity
Endorser tersebut?
Tidak Bagus 1 2 3 4 5 6 7 Bagus
2. Apakah iklan yang mengunakan Celebrity Endorser tersebut menarik?
Tidak Menarik 1 2 3 4 5 6 7 Menarik
3. Apakah Anda menyukai iklan yang didukung selebriti?
Tidak Suka 1 2 3 4 5 6 7 Suka
4. Apakah iklan yang mengunakan Celebrity Endorser tersebut sangat
kreatif?
Tidak Kreatif 1 2 3 4 5 6 7 Kreatif
5. Bagaimana menurut anda tentang informasi yang anda dapat dari iklan
yang mengunakan Celebrity Endorser tersebut?
Tidak Informatif 1 2 3 4 5 6 7 Informatif

Bagian 5
Attitude toward the Brand
Anda diminta memberikan penilaian terhadap pernyataan-pernyataan yang tertera
dibawah ini berdasarkan pendapat Anda terhadap iklan yang kami lampirkan,
dengan memberikan tanda (X) silang pada nomor yang menurut anda sesuai.
Pernyataan-pernyataan dibawah ini berkenaan dengan Sikap Terhadap Merek
(Attitude toward the Brand) Celebrity Endorser dalam iklan.
1. Bagaimana menurut pendapat Anda tentang merek yang diiklankan
mengunakan Celebrity Endorser?
Tidak Bagus 1 2 3 4 5 6 7 Bagus
2. Apakah merek yang diiklankan yang mengunakan Celebrity Endorser
tersebut menarik?
Tidak Menarik 1 2 3 4 5 6 7 Menarik
3. Apa yang Anda rasakan mengenai merek yang diiklankan dengan
Celebrity Endorser?
Tidak Suka 1 2 3 4 5 6 7 Suka
4. Bagaimana menurut Anda tentang merek yang diiklankan Celebrity
Endorser?
Kurang Berkualitas 1 2 3 4 5 6 7 Berkualitas
5. Akankah produk dari merek yang diiklankan Celebrity Endorser sesuai
ekspestasi anda?
Tidak Sesuai 1 2 3 4 5 6 7 Sesuai

Bagian 6
Advertising Attributes
Anda diminta memberikan penilaian terhadap pernyataan-pernyataan yang tertera
dibawah ini berdasarkan pendapat Anda terhadap iklan yang kami lampirkan,
dengan memberikan tanda (X) silang pada nomor yang menurut anda sesuai.
Skala penilaian dari 1 (Sangat Tidak Setuju) sampai 7 (Sangat Setuju)
berdasarkan pertanyaan yang tertera.
Pernyataan-pernyataan dibawah ini
berkenaan dengan Atribut Periklanan
(Advertsing Attribute).
Sangat
Tidak
Setuju
Netral Sangat
Setuju
Iklan ini menyesatkan. 1 2 3 4 5 6 7
Iklan ini menarik. 1 2 3 4 5 6 7
Iklan ini meyakinkan. 1 2 3 4 5 6 7
Iklan ini memberi tahu saya tentang e-
commerce / toko online
1 2 3 4 5 6 7
Iklan ini memberi tahu saya tentang apa
yang ingin saya beli/cari
1 2 3 4 5 6 7
Iklan ini memberi tahu dimana saya harus
berbelanja online
1 2 3 4 5 6 7
Iklan ini mempresentasikan gambar asli
produknya
1 2 3 4 5 6 7
Iklan ini memberi tahu saya apa yang saya
akan pakai/konsumsi
1 2 3 4 5 6 7
Iklan ini lebih baik dari pada iklan yang
tidak mengunakan dukungan selebriti.
1 2 3 4 5 6 7
Iklan ini memberi informasi tentang apa
yang tersedia di toko/pasar
1 2 3 4 5 6 7

APPENDIX B
RESPONDENT DATA

Respondent Data
Recapitulation of 230 Respondents
No. Physical Attractiveness Trustworthiness Expertise Celebrity/Brand Congruency Attitude Toward Advertising Attitude Toward Brand Advertising Attribute
PA1
PA2
PA3
PA4
PA5
TR1
TR2
TR3
TR5
EX1
EX2
EX4
EX5
CB
C1
CB
C3
CB
C4
CB
C5
AT
A1
AT
A2
AT
A3
AT
A4
ATA5
ATB1
AT
B2
AT
B3
AT
B4
AT
B5
AA1
AA2
AA3
AA4
AA6
AA7
AA9
AA10
1 6 5 5 5 6 5 4 5 6 6 5 5 5 7 6 6 6 5 4 5 4 4 5 5 5 5 6 2 5 5 4 4 4 4 4
2 4 5 5 5 7 5 4 5 4 4 5 5 5 6 7 7 7 5 5 5 5 5 7 6 7 6 5 2 5 5 6 6 6 6 5
3 4 5 5 4 7 6 6 6 6 6 6 6 6 5 6 5 6 6 6 5 5 5 6 7 5 6 7 3 6 6 6 6 6 6 6
4 5 5 5 4 5 5 5 5 5 6 6 5 5 7 6 7 6 5 5 5 5 5 6 5 7 6 6 2 5 5 5 5 5 5 5
5 5 6 5 4 5 5 6 5 6 6 6 6 5 6 7 6 7 6 5 4 6 5 7 5 6 7 6 3 6 5 5 6 5 6 5
6 4 6 6 7 5 6 7 7 6 5 5 7 7 6 6 5 6 6 6 6 6 6 5 5 6 6 6 4 7 6 6 7 6 7 6
7 4 7 7 7 7 5 5 7 6 4 4 5 5 7 7 7 7 5 5 5 5 5 6 6 6 6 6 4 7 6 7 7 6 7 6
8 4 5 5 4 6 5 6 4 5 5 4 6 7 6 6 6 6 6 7 7 6 7 6 6 6 6 6 4 7 7 7 7 7 7 7
9 4 5 6 4 5 6 6 4 6 5 5 5 5 5 7 7 5 5 5 5 5 5 5 7 5 7 7 4 7 6 7 7 6 7 6
10 7 7 6 6 5 6 6 5 6 6 6 7 6 5 6 6 5 7 6 7 7 6 5 6 5 6 6 4 7 7 7 7 7 7 7
11 4 5 4 4 4 4 4 4 5 5 4 4 4 5 5 5 4 4 4 4 4 4 5 5 5 5 5 1 4 4 4 4 4 4 4
12 6 6 6 6 6 6 6 6 6 6 6 6 6 6 6 5 5 6 6 6 6 6 7 7 6 6 6 3 6 6 6 6 6 6 6
13 4 5 5 5 5 5 5 5 5 5 5 5 4 5 5 6 6 5 4 4 5 4 6 6 5 5 7 2 5 5 5 5 5 5 5
14 5 5 6 5 5 5 5 5 4 5 5 5 6 5 5 7 7 5 6 6 5 6 7 7 7 7 7 3 6 6 6 6 6 6 6
15 5 5 5 5 5 5 5 4 5 4 5 6 6 5 6 6 5 6 6 6 6 6 6 5 5 6 6 1 5 5 4 4 4 4 4
16 4 4 4 4 6 6 6 6 6 6 6 6 7 6 6 6 6 6 7 6 6 7 7 6 6 7 7 4 6 6 7 6 6 6 6
17 6 6 6 6 6 6 6 6 5 7 6 6 6 5 6 6 6 6 6 6 3 3 5 6 6 6 7 3 6 6 5 5 6 4 5
18 4 4 4 4 5 6 6 6 5 7 7 6 4 6 6 6 6 6 4 4 6 4 4 4 4 4 4 3 6 6 6 6 6 6 6

19 5 5 4 4 6 5 5 5 4 5 4 5 4 6 6 6 6 5 4 4 5 4 5 5 5 5 5 4 7 6 6 6 5 6 6
20 4 5 5 5 5 5 4 4 4 6 5 6 5 6 6 6 6 5 4 4 4 4 4 4 4 4 5 3 6 6 6 6 6 6 6
21 4 5 5 5 5 5 5 5 5 7 6 5 5 5 5 5 5 5 5 5 5 5 7 7 7 7 7 2 5 5 6 6 6 6 6
22 4 6 6 5 5 5 4 4 6 5 5 5 4 5 6 5 6 5 4 5 5 4 5 5 5 5 5 4 5 7 7 6 7 6 6
23 6 6 6 6 6 5 5 5 4 6 6 6 5 6 6 6 6 7 7 7 6 7 6 6 6 5 6 3 6 6 6 6 6 6 6
24 5 5 5 5 6 4 4 4 4 5 4 5 4 6 6 6 6 5 4 4 5 4 6 6 6 5 6 1 4 5 4 4 5 4 5
25 5 5 5 4 6 5 5 4 5 5 5 5 4 6 6 6 6 5 4 5 5 4 5 6 5 5 5 3 6 6 6 6 6 6 6
26 5 5 5 4 5 4 4 4 4 5 5 4 4 6 6 6 6 7 7 7 6 6 7 7 7 7 5 2 5 5 5 5 5 5 5
27 5 5 5 5 5 4 5 5 5 5 5 5 4 6 6 7 6 5 4 5 5 4 6 6 6 6 6 4 6 6 6 6 6 6 6
28 6 6 6 5 6 6 6 5 5 6 6 6 6 6 6 6 6 6 7 7 7 6 7 6 7 6 7 4 7 6 7 7 6 7 6
29 6 6 6 5 6 6 7 6 7 7 6 3 3 6 6 6 6 5 5 4 5 5 6 6 6 6 7 3 6 6 6 6 6 6 6
30 5 5 5 5 6 7 7 7 5 7 7 7 7 6 6 6 6 7 7 6 6 6 6 6 6 6 6 4 7 7 6 6 6 6 6
31 5 4 5 4 6 4 5 4 5 5 4 4 5 6 6 5 6 4 5 4 4 5 4 4 4 5 4 1 4 5 6 6 5 5 5
32 4 4 5 5 4 5 4 4 5 5 5 5 4 5 6 5 6 6 6 6 6 6 6 5 5 6 5 2 6 6 5 6 6 6 6
33 4 4 4 5 4 4 4 4 4 5 5 4 4 6 6 6 7 4 4 4 4 4 5 5 5 5 5 1 4 4 4 4 4 4 4
34 4 4 5 5 4 5 5 6 5 5 6 5 6 6 6 6 6 5 6 5 5 6 6 6 6 6 6 3 6 6 6 5 6 5 6
35 5 5 5 5 5 5 5 5 6 5 5 5 5 6 6 6 6 5 5 5 5 5 4 5 6 6 5 2 5 5 5 5 5 5 5
36 5 6 5 5 5 7 7 7 6 5 5 5 5 6 6 5 6 5 5 5 5 5 6 6 6 6 6 2 4 5 5 4 5 4 5
37 4 4 4 4 4 5 5 5 5 4 5 5 6 6 6 6 7 5 6 4 5 6 6 6 6 6 6 4 5 6 4 5 6 5 6
38 7 7 7 6 6 5 5 5 6 7 7 6 6 6 6 6 6 6 6 6 6 6 6 6 6 6 6 4 7 7 6 6 7 7 7
39 4 4 5 5 4 5 5 5 5 5 5 5 5 6 6 6 6 5 5 5 5 5 5 5 6 5 6 2 5 5 5 5 5 5 5
40 5 5 5 5 5 5 5 5 6 6 6 6 6 5 6 5 4 6 6 6 6 6 5 6 7 6 6 3 6 6 6 6 6 6 6
41 4 4 4 4 5 7 7 7 6 5 5 5 5 6 6 5 6 5 5 6 6 6 5 6 6 6 6 3 7 6 5 6 6 7 6
42 5 5 5 5 5 5 5 5 5 5 4 5 4 6 6 6 6 5 4 5 5 4 6 6 6 6 5 4 6 7 7 6 7 6 7
43 6 6 6 5 5 5 6 5 6 6 5 5 6 6 6 6 6 5 6 5 5 6 4 4 4 4 4 3 6 6 6 5 5 5 6
44 5 5 6 5 5 4 4 4 5 6 6 5 4 6 6 6 7 5 4 4 5 4 5 6 6 5 6 2 5 5 6 6 6 5 5
45 5 6 6 6 6 5 6 4 5 7 7 7 7 5 6 5 6 6 6 6 5 6 5 5 5 5 5 3 6 6 6 6 6 6 6
46 6 6 6 6 6 6 6 6 6 6 6 6 6 6 6 7 6 6 6 7 6 6 6 6 6 6 5 3 6 6 6 6 5 5 5
47 5 5 5 5 5 5 5 5 6 5 4 5 5 6 6 6 6 5 5 5 5 5 6 6 6 6 5 4 5 5 5 5 5 5 5

48 7 7 7 4 7 7 7 7 6 7 7 7 6 6 6 6 6 7 6 6 7 6 5 5 5 5 7 4 7 7 7 7 7 5 5
49 5 4 4 4 5 4 3 4 5 4 4 4 4 6 6 6 6 4 4 4 4 4 5 5 5 5 6 2 5 6 5 5 6 5 6
50 6 6 5 6 6 5 5 3 5 6 6 6 6 6 6 6 6 6 6 6 6 6 5 5 5 5 6 3 6 6 5 4 5 5 4
51 4 5 5 4 4 5 4 4 4 4 5 4 4 6 6 6 6 4 4 5 4 4 6 6 6 6 6 1 4 4 4 4 4 4 4
52 4 5 4 4 5 4 4 5 4 5 4 5 4 6 6 6 6 5 4 4 5 4 6 6 6 6 5 2 5 5 5 5 5 5 5
53 4 5 4 5 4 5 5 5 5 7 6 5 4 6 6 6 6 5 4 5 5 4 6 6 6 6 5 3 6 6 6 6 6 6 6
54 5 5 5 5 5 6 6 5 6 6 6 5 7 6 6 5 6 5 7 6 5 7 5 6 6 5 5 3 6 6 6 6 6 6 6
55 4 5 5 4 4 4 5 4 5 5 7 5 7 5 6 5 6 5 7 4 5 7 5 5 5 5 5 4 5 5 7 5 5 5 5
56 5 6 6 6 5 6 6 6 6 7 7 7 7 6 6 6 7 7 6 6 6 5 7 6 7 7 7 2 5 5 5 5 5 5 5
57 7 6 6 6 5 7 7 7 7 7 7 7 7 6 6 6 6 7 6 6 6 6 6 6 6 6 6 2 7 7 6 6 5 5 6
58 4 4 4 4 5 7 6 4 6 4 4 4 3 6 6 6 6 4 3 4 4 3 5 5 5 5 5 2 5 5 5 5 5 5 5
59 5 5 6 6 5 5 5 4 5 6 5 5 6 6 6 4 6 5 6 5 5 6 6 6 6 6 6 3 6 6 6 6 6 6 6
60 5 6 5 6 5 5 5 5 6 5 4 5 4 7 7 6 7 5 4 5 5 4 6 6 6 6 6 2 5 6 5 5 6 5 6
61 5 5 6 6 6 6 6 6 6 6 6 6 5 6 6 6 6 6 5 5 6 5 4 4 4 4 4 3 6 6 5 6 5 5 5
62 4 4 5 4 4 4 4 3 4 4 4 5 5 6 6 6 6 5 5 5 5 4 6 6 6 6 6 1 4 4 4 4 4 4 4
63 7 5 6 5 6 6 5 6 5 5 5 6 6 6 6 5 6 6 6 5 6 6 5 6 6 6 6 2 7 6 5 7 6 7 6
64 5 6 6 6 5 5 5 5 5 5 4 6 7 6 6 5 6 6 7 7 6 7 7 6 6 7 7 3 6 5 6 6 5 6 5
65 4 5 4 4 4 4 5 4 5 7 6 4 5 6 6 6 6 4 5 4 4 5 4 5 5 5 5 1 4 5 4 4 5 4 5
66 4 5 5 6 5 5 5 4 5 5 4 5 5 6 6 6 6 5 5 5 5 5 5 5 6 5 5 3 6 6 6 6 6 6 6
67 5 5 5 4 6 5 5 5 4 5 5 5 4 6 6 6 7 5 4 4 5 4 5 5 5 7 5 4 5 5 4 5 5 5 5
68 6 7 7 7 6 4 5 4 5 6 6 7 7 4 4 5 5 7 7 7 7 6 6 5 5 6 5 4 7 7 7 7 7 7 7
69 5 5 5 4 5 4 4 4 4 5 5 4 5 6 6 6 6 4 5 5 4 6 6 6 6 5 5 2 5 5 5 5 5 5 5
70 4 5 5 4 5 5 5 4 5 5 4 4 4 6 6 6 6 4 4 4 4 6 6 6 6 6 5 1 5 5 4 5 5 5 5
71 7 7 7 7 7 7 7 7 6 7 7 7 7 7 7 7 7 7 7 7 7 6 6 6 7 7 5 2 5 5 4 4 5 3 4
72 4 5 6 5 4 6 5 5 5 7 6 5 5 6 6 6 6 5 5 5 5 5 4 5 5 5 5 3 5 5 6 5 5 5 5
73 4 3 3 4 4 3 3 3 3 3 4 4 4 6 6 6 6 4 4 4 4 4 5 4 5 4 4 1 3 3 2 3 4 3 3
74 4 6 6 7 6 4 4 4 4 5 4 7 6 5 5 6 6 7 6 7 7 7 7 7 7 6 7 4 7 7 7 7 7 7 7
75 5 5 5 6 5 5 6 5 6 6 6 5 5 3 3 3 3 5 5 5 5 5 6 6 6 6 6 3 6 6 6 6 6 6 6
76 5 6 7 4 5 4 4 5 6 5 5 5 5 6 6 6 6 5 5 6 5 5 7 7 7 7 7 4 6 6 7 6 6 6 6

77 4 4 4 4 5 5 5 4 5 6 6 4 4 6 6 5 6 5 5 5 5 5 5 6 6 6 6 2 7 7 5 7 5 5 5
78 4 4 5 5 4 5 5 5 7 5 5 5 5 5 5 5 5 5 5 5 5 5 6 6 6 6 6 2 5 5 5 5 5 5 5
79 6 7 6 5 6 5 5 5 5 5 6 5 5 6 6 7 7 5 5 4 4 4 5 6 6 6 7 4 7 7 7 7 7 7 7
80 5 5 5 4 5 5 5 5 7 6 6 6 5 6 6 6 6 6 5 5 6 5 5 5 6 6 5 4 7 7 7 6 6 6 6
81 5 5 5 5 5 5 5 5 5 5 4 5 4 6 6 6 6 5 4 5 5 4 6 6 6 6 5 1 4 4 4 4 4 4 4
82 4 4 4 4 5 7 7 7 6 5 5 5 5 6 6 5 6 5 5 6 6 6 5 6 6 6 6 2 5 5 5 5 5 5 5
83 5 5 5 5 5 5 6 7 6 6 6 6 6 5 6 5 4 6 6 6 6 6 5 6 7 6 6 3 6 5 5 4 4 5 5
84 4 4 5 5 4 5 5 5 5 5 5 5 5 6 6 6 6 5 5 5 5 5 5 5 6 5 6 3 6 6 6 6 6 6 6
85 7 7 7 6 6 5 5 5 6 7 7 6 6 6 6 6 6 6 6 6 6 6 6 6 6 6 6 2 4 4 5 4 5 4 4
86 4 4 4 4 4 5 5 5 5 4 5 5 6 6 6 6 7 5 6 4 5 6 6 6 6 6 6 3 5 5 4 4 4 4 5
87 5 5 4 4 5 3 3 3 4 4 4 3 3 4 4 3 4 5 4 4 5 4 4 4 4 4 4 2 4 4 4 4 4 4 4
88 6 7 7 6 6 4 4 3 3 4 4 4 4 4 4 4 4 6 4 4 6 4 4 4 4 4 4 2 3 2 2 2 2 3 2
89 4 5 5 6 6 5 5 5 5 7 5 5 4 6 6 6 6 5 4 4 5 4 4 4 5 5 4 3 6 6 6 6 6 5 5
90 5 5 6 5 5 6 5 5 5 5 6 5 5 6 5 6 6 5 5 5 5 6 6 6 6 6 6 4 6 6 7 5 5 6 6
91 5 5 5 5 5 5 5 4 5 4 5 6 6 5 4 4 5 6 6 6 6 6 5 5 5 5 5 2 5 5 5 5 5 5 5
92 5 5 6 5 5 5 5 5 5 5 5 5 6 5 5 6 6 5 6 6 7 7 5 5 5 6 5 3 6 6 6 6 6 6 6
93 4 5 5 5 6 5 5 5 5 5 5 5 4 5 5 4 5 5 4 5 5 5 6 5 5 5 5 2 5 5 5 5 5 5 5
94 6 6 6 6 6 6 6 6 6 6 6 6 6 5 5 5 6 6 6 6 6 6 6 5 5 6 5 3 6 6 6 6 6 6 6
95 3 4 3 3 5 6 6 6 5 6 6 6 6 3 3 3 3 3 3 3 3 3 6 6 6 6 6 1 3 3 3 3 3 3 3
96 6 6 5 5 6 5 6 7 6 6 7 6 5 5 5 5 5 6 5 6 6 5 5 5 5 6 5 3 6 6 4 6 6 6 5
97 3 4 5 3 3 6 6 6 6 6 6 6 6 3 3 3 3 4 3 3 4 3 4 3 3 4 3 2 6 5 6 5 6 5 5
98 3 4 4 3 3 4 5 3 4 4 3 5 6 5 4 4 5 5 6 6 5 6 5 5 5 5 5 2 6 6 6 6 5 6 6
99 3 6 6 6 5 4 4 6 4 3 3 4 4 4 4 4 4 4 4 4 4 4 5 5 5 5 5 1 6 5 6 5 6 6 5
100 3 5 5 6 3 7 6 6 6 7 7 6 6 6 6 6 6 6 6 6 6 6 5 6 6 5 6 2 6 6 5 5 6 6 6
101 5 6 6 6 5 3 4 3 4 5 5 6 6 4 5 5 4 6 5 6 5 6 4 5 5 5 5 1 6 6 6 6 6 6 6
102 2 2 3 3 3 6 6 6 6 6 6 6 6 3 3 3 3 4 5 5 4 5 2 2 2 3 2 3 4 4 3 4 3 4 4
103 3 4 4 5 3 5 5 5 5 5 5 5 4 5 5 3 5 4 4 4 4 4 5 5 5 5 5 1 5 5 5 5 5 5 5
104 3 4 3 3 5 3 4 3 5 6 5 3 4 5 5 5 5 3 5 5 3 5 3 4 3 3 4 3 3 4 3 4 3 3 4
105 4 5 5 5 4 6 7 5 6 6 6 5 6 5 5 5 5 5 6 6 5 6 5 5 6 6 5 2 5 4 5 4 5 5 4

106 6 4 5 4 6 5 4 5 4 4 4 5 5 6 6 6 6 5 5 4 5 5 5 5 5 5 5 2 6 5 4 4 4 4 4
107 3 3 4 3 3 3 3 2 2 3 3 4 4 4 5 4 5 4 4 4 4 4 5 4 4 5 4 2 3 3 3 3 3 3 3
108 4 4 5 5 4 3 4 4 4 4 4 4 4 3 3 4 4 5 4 4 5 4 4 4 4 4 4 2 5 5 5 5 5 5 5
109 4 5 4 5 4 4 4 4 4 4 3 4 3 4 3 3 3 4 3 4 3 3 4 4 4 4 4 1 4 5 4 5 4 4 5
110 4 4 5 5 4 4 4 3 4 5 4 4 5 5 5 5 5 4 5 4 4 5 5 5 5 5 5 2 5 5 5 5 5 5 5
111 6 6 6 6 6 6 5 6 5 6 6 5 5 5 5 5 5 3 4 3 4 3 5 5 5 5 5 1 4 4 4 4 4 4 4
112 6 5 5 5 5 6 6 5 5 5 5 6 6 5 5 5 5 6 6 6 6 6 5 5 5 5 5 3 6 6 6 6 6 6 6
113 4 5 5 5 4 5 5 5 5 6 6 6 6 5 4 5 5 6 6 6 6 6 6 5 5 5 5 1 4 4 5 4 5 5 4
114 3 4 4 3 4 3 4 3 4 4 6 4 6 5 5 5 5 4 4 5 5 5 4 4 4 4 4 3 4 4 6 4 6 4 4
115 4 4 4 4 5 5 5 4 4 5 5 4 6 5 5 5 5 4 6 5 4 6 5 5 5 5 5 2 5 5 5 5 5 5 5
116 3 4 3 4 5 4 4 4 4 6 5 4 3 5 5 5 5 4 3 4 4 3 5 5 5 5 5 2 5 5 5 5 5 5 5
117 3 4 3 3 5 3 3 4 3 4 3 4 3 4 4 4 5 4 3 3 4 3 4 4 4 4 4 1 4 4 4 4 4 4 4
118 3 4 4 3 3 4 3 3 2 2 4 3 3 3 3 3 3 3 3 4 3 3 3 3 3 3 3 1 3 3 3 3 3 3 3
119 4 5 6 3 4 3 3 4 3 4 4 4 4 5 5 5 5 4 4 5 4 4 5 5 5 6 5 3 5 5 6 5 6 5 5
120 6 6 6 6 5 6 6 6 5 6 6 6 6 5 5 5 5 6 6 6 6 6 5 5 5 5 5 3 6 6 6 6 6 6 6
121 5 5 5 6 4 4 4 4 4 4 5 6 5 5 4 4 5 6 5 4 6 5 4 5 5 5 5 3 6 6 3 3 4 4 6
122 6 6 6 6 6 5 5 6 5 6 6 5 5 3 5 4 5 4 4 5 5 5 4 5 6 5 5 1 3 3 3 3 3 3 3
123 3 4 5 4 3 5 4 4 4 6 5 5 4 5 5 5 5 5 4 5 5 4 5 6 5 4 6 2 4 4 5 4 5 4 4
124 6 5 4 5 4 3 3 3 2 2 3 3 3 3 4 3 4 4 4 5 4 4 3 3 3 3 3 1 4 4 4 4 4 4 4
125 3 4 4 3 3 5 5 5 5 4 5 5 5 5 6 6 6 4 4 4 4 4 5 5 5 5 5 1 4 4 4 4 3 4 2
126 4 4 4 3 4 3 3 3 3 4 4 3 4 3 3 3 3 3 4 5 5 5 3 3 3 3 3 1 5 4 4 4 4 5 4
127 5 5 5 5 5 4 4 4 4 6 5 5 5 6 5 5 5 5 5 5 5 5 5 5 5 5 5 2 4 4 4 4 4 4 4
128 3 4 4 4 5 4 4 4 5 5 4 3 3 3 4 3 3 3 3 3 3 3 5 5 5 5 5 2 5 5 5 5 5 5 5
129 4 4 3 3 4 4 4 4 4 4 3 4 3 4 3 3 4 4 3 3 4 3 3 3 4 3 3 3 6 5 5 4 4 5 5
130 5 6 6 5 5 5 5 5 5 6 6 5 3 4 5 4 5 5 4 4 5 3 5 4 4 5 4 3 6 6 6 6 6 6 6
131 3 4 4 5 3 4 4 4 4 6 4 4 3 3 3 3 4 4 3 3 4 3 4 5 5 5 5 2 4 4 5 4 5 4 4
132 4 4 5 4 4 5 5 5 5 5 5 5 5 5 5 5 5 4 4 4 4 4 5 5 5 5 5 3 5 5 4 4 4 4 5
133 4 4 4 4 4 4 5 5 5 5 5 5 5 5 5 5 5 5 5 5 5 5 5 5 5 5 5 1 4 4 4 4 4 4 4
134 4 4 4 3 4 5 5 6 4 5 5 5 5 5 5 5 5 3 4 4 4 4 5 5 5 5 5 2 3 2 2 2 2 3 2

135 4 5 5 5 4 6 6 5 5 6 6 5 5 5 5 5 5 5 5 5 5 5 5 5 5 5 5 3 6 6 6 6 6 5 5
136 4 6 5 5 5 5 5 5 5 5 4 5 5 5 4 5 5 5 5 5 5 5 6 5 5 5 5 3 6 6 5 6 6 6 6
137 3 4 4 3 3 4 4 4 4 5 4 4 4 3 4 4 3 4 4 3 4 4 4 5 4 4 5 1 4 4 4 4 4 4 4
138 4 4 3 4 4 3 3 3 5 4 4 4 3 3 4 3 3 4 3 3 4 3 5 5 5 4 5 1 4 4 4 4 4 4 4
139 6 4 4 4 5 3 4 4 4 6 4 5 5 6 5 5 5 5 5 6 5 5 5 5 5 4 5 3 6 6 6 5 5 5 6
140 4 5 5 5 4 4 4 4 3 5 5 5 5 4 4 4 5 5 5 5 5 5 5 5 4 5 5 1 5 5 4 5 4 5 5
141 3 4 4 3 5 6 6 6 6 6 6 6 6 5 5 5 6 4 4 4 4 4 6 6 6 5 4 1 3 4 4 4 4 3 4
142 5 5 4 3 5 4 4 4 4 5 4 4 4 5 5 5 3 4 4 4 4 4 4 4 4 4 4 1 4 4 4 5 5 5 4
143 5 5 5 5 5 4 4 3 4 4 4 4 4 5 5 5 5 4 4 4 4 4 5 5 5 6 4 2 5 5 5 5 5 5 5
144 5 5 5 5 4 4 5 5 4 5 5 5 6 5 4 4 5 5 6 5 5 6 6 5 5 5 4 1 4 4 4 4 4 4 4
145 3 3 3 3 4 5 5 5 5 5 3 6 6 6 6 6 6 6 6 5 6 6 6 6 5 5 5 3 6 5 6 5 6 6 5
146 5 5 5 3 4 5 5 4 5 4 5 5 5 5 5 5 5 5 5 5 5 5 5 5 5 4 6 2 5 5 5 5 5 5 5
147 6 6 6 6 5 6 6 6 4 6 6 6 6 5 5 5 5 6 5 6 5 5 5 5 5 5 6 2 6 6 6 6 6 6 6
148 3 2 3 3 2 2 2 3 3 4 3 2 3 4 4 4 3 5 5 5 5 5 3 3 3 2 5 2 5 4 5 4 5 5 4
149 3 4 4 3 3 3 3 3 5 3 3 4 4 5 5 5 5 4 4 5 4 4 4 4 4 4 4 2 2 3 4 3 3 3 3
150 4 5 5 4 5 6 6 6 6 6 5 4 3 5 5 5 5 4 3 4 4 3 5 5 5 5 4 3 5 4 6 4 6 5 4
151 4 4 4 3 4 4 4 4 6 5 5 5 4 5 5 5 5 5 4 4 5 4 4 4 5 5 4 3 6 6 6 5 5 5 5
152 5 6 5 4 5 5 5 5 5 5 5 5 6 5 6 6 6 4 4 3 3 3 4 5 5 5 6 3 6 6 6 6 6 6 6
153 3 3 4 4 3 5 5 5 5 4 5 6 5 4 4 4 4 4 4 4 4 4 5 5 5 5 5 1 4 4 4 4 4 4 4
154 3 3 3 3 4 6 5 5 5 5 5 5 6 5 5 4 5 4 4 4 4 4 4 5 5 5 4 3 6 6 4 4 4 4 4
155 4 5 6 3 4 6 6 6 6 6 6 6 5 5 5 5 5 4 4 5 4 4 6 6 6 6 4 3 5 5 6 5 6 5 5
156 4 4 4 5 4 4 5 4 5 5 5 4 4 4 5 5 4 4 4 4 4 4 5 5 5 5 3 2 5 5 5 5 5 5 5
157 3 5 5 6 5 5 5 5 5 6 6 6 5 4 5 5 5 6 5 6 6 6 6 6 6 5 6 2 6 6 6 6 6 6 6
158 3 2 2 3 3 2 2 2 2 2 3 3 3 5 5 5 5 3 3 3 3 3 4 3 4 3 2 2 2 2 1 3 3 2 2
159 3 4 5 4 3 5 4 4 4 6 5 4 4 5 4 5 5 4 4 4 4 4 3 4 4 4 4 2 4 4 5 4 5 4 4
160 6 6 6 6 6 6 6 6 5 6 6 6 6 6 6 6 6 6 6 6 6 5 5 5 6 6 4 1 4 4 3 4 4 2 3
161 3 4 4 3 4 4 4 3 4 4 3 3 3 5 5 5 5 3 3 3 3 5 5 5 5 5 4 1 4 4 3 4 3 4 4
162 4 4 4 3 4 3 3 3 3 4 4 3 4 5 5 5 5 3 4 4 3 5 5 5 5 4 4 1 4 4 4 4 4 4 4
163 5 6 6 6 5 3 4 3 4 5 5 6 6 3 4 4 4 6 6 6 6 5 5 4 4 5 5 3 6 6 6 6 6 6 6

164 4 4 4 3 5 4 4 4 3 4 4 4 3 5 5 5 6 4 3 3 4 3 4 4 4 6 4 1 4 4 3 4 3 4 4
165 3 4 4 5 4 4 4 3 4 4 3 4 4 5 5 5 5 4 4 4 4 4 4 4 5 4 6 2 5 5 5 5 5 5 5
166 3 4 3 3 3 3 4 3 4 6 5 3 4 5 5 5 5 3 4 3 3 4 3 4 4 4 6 1 3 4 3 4 3 3 4
167 4 5 5 5 4 6 6 6 6 6 6 6 6 5 4 4 5 5 6 6 5 6 6 5 5 6 6 1 5 4 5 4 5 5 4
168 6 5 5 4 5 5 4 5 4 4 4 5 5 5 5 4 5 5 5 4 5 5 4 5 5 5 5 1 6 5 4 5 4 6 5
169 5 5 5 5 5 5 6 6 6 5 5 5 5 5 5 5 5 4 4 4 4 3 5 5 5 5 5 1 3 3 3 3 3 3 3
170 3 3 3 3 3 3 4 4 4 4 4 4 4 5 5 5 5 5 4 4 5 4 3 3 3 3 3 2 5 5 4 4 4 4 4
171 4 5 4 5 4 4 4 4 5 4 3 4 3 6 5 5 6 4 3 4 4 3 5 5 5 5 5 1 4 5 4 5 4 4 5
172 4 4 5 5 4 4 4 3 4 5 4 4 5 5 5 3 5 4 5 4 4 5 5 5 5 5 5 2 5 5 5 5 5 5 5
173 3 3 3 3 4 6 5 3 5 3 3 3 2 2 2 2 2 3 2 3 3 2 4 4 4 4 4 1 4 4 4 4 4 4 4
174 6 5 5 5 4 6 6 6 6 6 6 6 6 5 5 5 5 6 5 5 5 5 5 5 5 5 5 3 6 6 5 4 5 4 5
175 7 5 5 7 7 3 3 3 3 3 3 3 3 7 7 7 7 7 6 6 6 5 7 6 7 7 6 2 5 5 5 5 5 5 5
176 4 5 5 4 4 4 5 4 5 5 7 5 7 5 6 5 6 5 7 4 5 7 5 5 5 5 5 4 5 5 7 5 7 5 5
177 6 6 6 5 5 6 6 5 6 6 6 5 7 6 7 5 6 5 7 6 5 7 5 6 6 5 5 3 6 6 6 6 6 6 6
178 4 5 6 5 4 5 5 5 5 7 6 5 4 4 4 4 5 5 4 5 5 4 6 6 6 6 5 3 6 6 6 6 6 6 6
179 6 6 6 6 6 6 6 6 6 6 6 6 6 4 4 4 4 5 4 4 5 4 6 6 6 6 5 2 5 5 5 5 5 5 5
180 7 6 7 6 6 5 4 4 4 4 5 4 4 4 4 4 4 4 4 5 4 4 6 6 6 6 6 1 4 4 4 4 4 4 4
181 6 6 5 6 6 5 5 3 5 6 6 6 6 6 6 6 6 6 6 6 6 6 5 5 5 5 6 3 6 6 5 5 4 5 4
182 5 4 4 4 5 4 3 4 5 4 4 4 4 3 4 4 4 4 4 4 4 4 5 5 5 5 6 2 5 6 5 6 5 5 6
183 5 5 5 5 6 5 5 5 5 5 5 5 5 6 6 6 6 7 6 6 7 6 5 5 5 5 7 4 7 7 7 7 5 5 5
184 5 5 5 5 5 5 5 5 6 5 4 5 5 6 6 6 6 5 5 5 5 5 6 6 6 6 5 2 5 5 5 5 5 5 5
185 6 6 6 6 6 6 6 6 6 6 6 6 6 6 7 7 6 6 6 7 6 6 6 6 6 6 5 3 6 6 6 5 5 5 5
186 5 6 6 6 6 5 6 5 5 5 5 5 5 5 5 5 6 6 6 6 5 6 5 5 5 5 5 3 6 6 6 6 6 6 6
187 5 5 6 5 5 4 4 4 5 6 6 5 4 3 4 4 3 5 4 4 5 4 5 6 6 5 6 3 5 5 6 6 5 5 5
188 6 6 6 5 5 5 6 5 6 6 5 5 6 6 6 6 6 5 6 5 5 6 6 6 6 7 5 3 6 6 6 5 5 5 6
189 5 5 5 5 5 5 5 5 5 5 4 5 4 6 6 6 6 5 4 5 5 4 6 6 6 6 5 4 6 7 7 7 7 6 7
190 4 4 4 4 5 7 7 7 6 5 5 5 5 6 5 5 6 5 5 6 6 6 5 6 6 6 6 3 7 6 5 6 6 7 6
191 5 5 5 5 5 5 5 5 7 7 7 6 6 5 5 5 4 6 6 6 6 6 5 6 7 6 6 3 6 6 6 6 6 6 6
192 4 4 5 5 4 5 7 6 6 6 6 6 6 6 6 6 6 5 5 5 5 5 5 5 6 5 7 2 5 5 5 5 5 5 5

193 5 5 5 6 6 5 5 5 6 7 7 6 6 6 6 6 6 6 6 6 6 6 6 6 6 6 7 4 7 7 6 7 7 7 7
194 6 6 6 7 6 5 5 5 5 4 5 5 6 6 6 6 7 5 6 4 5 6 6 6 6 6 7 1 5 6 4 6 4 5 6
195 5 6 5 5 5 7 7 7 6 5 5 5 5 6 5 5 6 5 5 5 5 5 6 6 6 6 6 2 4 5 5 5 5 4 5
196 5 5 5 5 5 5 5 5 6 5 5 5 5 6 6 6 6 5 5 5 5 5 4 5 6 6 5 2 5 5 5 5 5 5 5
197 4 4 5 5 4 5 5 6 5 5 6 5 6 6 6 6 6 5 6 5 5 6 6 6 6 6 6 2 6 6 6 6 5 5 6
198 5 5 5 5 4 5 5 5 5 5 5 5 5 4 4 4 4 4 4 4 4 4 5 5 5 5 5 2 4 4 4 4 4 4 4
199 3 3 4 4 3 4 3 3 4 4 4 4 3 4 4 4 5 5 5 5 5 5 5 4 4 5 4 3 5 5 4 5 4 5 5
200 4 3 4 3 5 6 6 6 6 5 5 5 5 3 3 3 3 3 4 3 3 4 3 3 3 4 3 1 3 4 5 4 3 4 4
201 4 4 4 4 5 6 6 6 4 6 6 6 6 5 5 5 5 6 6 5 5 5 5 5 5 5 5 2 6 6 5 5 6 5 5
202 5 5 5 4 5 5 6 5 6 5 5 5 5 5 5 5 5 4 4 3 4 4 5 5 5 5 6 3 5 5 5 5 5 5 5
203 5 5 5 4 5 5 6 7 6 7 7 6 5 5 5 5 5 5 6 6 6 5 6 5 6 5 6 2 6 5 6 5 6 6 5
204 4 4 4 4 4 3 4 5 5 5 5 5 5 5 6 6 5 4 3 4 4 3 5 5 5 5 5 2 5 5 5 5 5 5 5
205 6 6 6 6 4 6 6 6 6 6 5 5 6 5 4 5 5 6 6 6 5 5 6 6 6 6 4 3 4 4 4 4 4 4 4
206 4 4 4 3 5 4 4 4 4 4 4 4 6 5 5 5 5 4 3 4 4 3 4 5 4 4 4 1 5 5 5 5 5 5 5
207 4 4 4 4 5 3 3 3 3 4 3 4 3 5 5 5 5 4 3 3 4 3 5 5 5 4 5 2 3 4 3 4 3 3 4
208 5 5 5 5 5 4 4 4 3 5 5 5 4 5 5 5 5 6 6 6 5 6 5 5 5 4 5 2 5 5 5 5 5 5 5
209 3 5 5 4 4 4 4 4 4 4 4 4 3 4 4 4 5 4 3 4 4 3 4 4 4 4 4 3 4 6 6 6 5 5 5
210 3 4 4 4 4 6 6 6 6 6 6 6 5 5 6 6 6 4 4 4 4 4 6 6 6 6 6 1 4 4 5 5 4 5 5
211 3 4 4 4 4 3 3 3 3 3 3 3 3 5 5 5 5 4 3 3 3 3 3 3 3 3 4 2 5 5 5 5 5 5 5
212 4 4 3 3 5 4 4 4 3 4 3 4 3 5 5 5 5 4 3 3 4 3 4 4 4 4 4 3 6 5 5 4 5 5 5
213 3 3 3 3 4 5 5 5 4 6 6 5 3 3 4 3 4 5 3 3 5 3 4 5 5 5 5 2 5 5 5 5 5 5 5
214 5 5 5 5 5 5 5 5 4 6 5 5 5 4 4 4 5 5 5 5 2 2 4 5 5 5 6 2 5 5 4 5 3 3 4
215 3 3 3 3 5 5 5 5 5 5 5 5 6 5 5 5 5 5 6 5 5 6 6 5 5 6 6 3 5 5 6 5 6 5 5
216 4 4 4 4 4 4 4 3 4 3 4 5 5 4 6 5 4 5 5 5 5 5 5 4 4 5 5 1 4 4 3 3 3 3 3
217 4 4 5 4 4 6 6 6 6 6 6 6 6 4 6 6 6 6 6 6 6 6 6 6 6 6 6 1 5 5 5 5 5 5 5
218 3 4 4 4 4 4 4 4 4 4 4 4 3 4 4 5 5 4 3 3 4 3 5 5 4 4 6 1 4 4 4 4 4 4 4
219 5 5 5 5 5 5 5 5 5 5 5 5 5 5 5 6 6 5 5 5 5 5 6 6 5 5 5 2 5 5 5 5 5 5 5
220 3 4 3 3 5 5 5 5 5 5 5 5 5 6 6 5 5 3 3 3 3 3 4 4 4 4 4 1 3 3 3 3 3 3 3
221 6 6 5 5 4 5 5 4 5 5 5 6 5 4 4 5 4 6 5 6 6 5 4 5 4 5 5 3 6 6 6 6 6 6 6

222 3 4 5 3 4 5 5 3 5 4 4 4 4 4 4 6 4 4 4 4 4 4 4 6 4 6 6 3 6 5 6 5 6 6 5
223 3 4 4 3 5 4 5 3 4 4 3 5 6 5 5 5 5 5 6 6 5 6 5 5 5 5 5 3 6 6 6 6 6 6 6
224 3 6 6 6 6 4 4 6 5 3 3 4 4 6 6 6 6 4 4 4 4 4 5 5 5 5 5 3 6 5 6 5 6 6 5
225 3 5 5 6 4 5 6 6 5 4 4 6 6 5 4 4 5 5 5 5 5 5 4 4 5 5 5 3 6 5 5 5 5 6 5
226 4 5 4 3 4 4 5 4 5 5 5 5 4 5 4 5 6 5 4 3 5 4 6 4 5 6 5 2 5 4 4 4 3 5 4
227 4 4 4 3 4 4 4 4 4 5 5 4 4 6 4 6 5 4 4 4 4 4 5 4 6 5 5 2 4 4 4 4 4 4 4
228 3 4 4 3 6 5 5 5 5 5 5 5 5 4 6 4 5 5 5 4 4 4 5 6 4 5 6 2 5 5 5 5 5 5 5
229 3 4 4 4 6 4 3 4 3 3 4 4 4 5 5 6 6 4 4 4 4 4 6 5 6 5 4 1 4 4 5 5 5 5 4
230 5 4 4 4 5 4 3 4 5 5 4 4 4 6 6 5 5 4 3 4 3 3 4 4 4 4 5 1 4 4 3 3 3 3 3
M 4.48
4.81
4.85
4.60
4.78
4.82
4.88
4.71
4.87
5.13
4.99
4.97
4.90
5.15
5.23
5.15
5.31
4.92
4.80
4.80
4.85
4.77
5.11
5.16
5.21
5.21
5.19
2.33
5.16
5.13
5.06
5.01
5.02
4.98
4.98

APPENDIX C
RESULT OF VALIDITY & RELIABILITY

Scalar Estimates (Group number 1 - Default model) Maximum Likelihood Estimates Regression Weights: (Group number 1 - Default model)
Estimate S.E. C.R. P Label PA1 <--- Physical_Attractiveness 1.000 PA2 <--- Physical_Attractiveness 1.281 .178 7.188 *** PA3 <--- Physical_Attractiveness 1.179 .170 6.944 *** PA4 <--- Physical_Attractiveness .929 .173 5.363 *** PA5 <--- Physical_Attractiveness .734 .155 4.742 ***
Standardized Regression Weights: (Group number 1 - Default model)
Estimate PA1 <--- Physical_Attractiveness .689 PA2 <--- Physical_Attractiveness .921 PA3 <--- Physical_Attractiveness .865 PA4 <--- Physical_Attractiveness .650 PA5 <--- Physical_Attractiveness .571
Variances: (Group number 1 - Default model)
Estimate S.E. C.R. P Label Physical_Attractiveness .397 .117 3.379 *** e1 .438 .077 5.721 *** e2 .117 .043 2.690 .007 e3 .186 .045 4.115 *** e4 .469 .080 5.835 *** e5 .442 .074 5.992 ***
λ ε Σλ Σε Construct Reliability PA1 0.689 0.438 3.696 1.652 0.892 PA2 0.921 0.117 PA3 0.865 0.186 PA4 0.65 0.469 PA5 0.571 0.442

Estimates (Group number 1 - Default model) Scalar Estimates (Group number 1 - Default model) Maximum Likelihood Estimates Regression Weights: (Group number 1 - Default model)
Estimate S.E. C.R. P Label TR1 <--- Trustworthiness 1.000 TR2 <--- Trustworthiness 1.074 .090 11.920 *** TR3 <--- Trustworthiness .982 .107 9.186 *** TR4 <--- Trustworthiness .103 .252 .408 .683 TR5 <--- Trustworthiness .669 .101 6.593 ***
Standardized Regression Weights: (Group number 1 - Default model)
Estimate TR1 <--- Trustworthiness .914 TR2 <--- Trustworthiness .916 TR3 <--- Trustworthiness .788 TR4 <--- Trustworthiness .048 TR5 <--- Trustworthiness .641
Variances: (Group number 1 - Default model)
Estimate S.E. C.R. P Label Trustworthiness .650 .126 5.140 *** e1 .128 .039 3.300 *** e2 .145 .044 3.256 .001 e3 .382 .070 5.428 *** e4 3.018 .480 6.284 *** e5 .416 .070 5.930 ***
λ ε Σλ Σε Construct Reliability TR1 0.914 0.128 3.307 4.089 0.728 TR2 0.916 0.145 TR3 0.788 0.382 TR4 0.048 3.018 TR5 0.641 0.416

Estimates (Group number 1 - Default model) Scalar Estimates (Group number 1 - Default model) Maximum Likelihood Estimates Regression Weights: (Group number 1 - Default model)
Estimate S.E. C.R. P Label EX1 <--- Expertise 1.000 EX2 <--- Expertise 1.105 .145 7.628 *** EX3 <--- Expertise .231 .206 1.119 .263 EX4 <--- Expertise .678 .129 5.252 *** EX5 <--- Expertise .711 .154 4.605 ***
Standardized Regression Weights: (Group number 1 - Default model)
Estimate EX1 <--- Expertise .834 EX2 <--- Expertise .912 EX3 <--- Expertise .133 EX4 <--- Expertise .577 EX5 <--- Expertise .515
Variances: (Group number 1 - Default model)
Estimate S.E. C.R. P Label Expertise .609 .146 4.162 *** e1 .266 .075 3.556 *** e2 .151 .078 1.930 .054 e3 1.803 .287 6.271 *** e4 .560 .096 5.858 *** e5 .852 .142 5.984 ***
λ ε Σλ Σε Construct Reliability EX1 0.834 0.266 2.971 3.632 0.708 EX2 0.912 0.151 EX3 0.133 1.803 EX4 0.577 0.560 EX5 0.515 0.852

Estimates (Group number 1 - Default model) Scalar Estimates (Group number 1 - Default model) Maximum Likelihood Estimates Regression Weights: (Group number 1 - Default model)
Estimate S.E. C.R. P Label CBC1 <--- Cele_Brand_Congruency 1.000 CBC2 <--- Cele_Brand_Congruency .415 .163 2.551 .011 CBC3 <--- Cele_Brand_Congruency .797 .104 7.657 *** CBC4 <--- Cele_Brand_Congruency .798 .138 5.761 *** CBC5 <--- Cele_Brand_Congruency .843 .121 6.961 ***
Standardized Regression Weights: (Group number 1 - Default model)
Estimate CBC1 <--- Cele_Brand_Congruency .877 CBC2 <--- Cele_Brand_Congruency .300 CBC3 <--- Cele_Brand_Congruency .794 CBC4 <--- Cele_Brand_Congruency .625 CBC5 <--- Cele_Brand_Congruency .729
Variances: (Group number 1 - Default model)
Estimate S.E. C.R. P Label Cele_Brand_Congruency .297 .065 4.566 *** e1 .089 .029 3.041 .002 e2 .518 .084 6.194 *** e3 .111 .025 4.508 *** e4 .295 .052 5.677 *** e5 .186 .036 5.165 ***
λ ε Σλ Σε Construct Reliability CBC1 0.877 0.089 3.325 1.199 0.902 CBC2 0.300 0.518 CBC3 0.794 0.111 CBC4 0.625 0.295 CBC5 0.729 0.186

Estimates (Group number 1 - Default model) Scalar Estimates (Group number 1 - Default model) Maximum Likelihood Estimates Regression Weights: (Group number 1 - Default model)
Estimate S.E. C.R. P Label ATA1 <--- Att_the_Advertisement 1.000 ATA2 <--- Att_the_Advertisement 1.277 .133 9.625 *** ATA3 <--- Att_the_Advertisement 1.170 .126 9.282 *** ATA4 <--- Att_the_Advertisement .966 .115 8.417 *** ATA5 <--- Att_the_Advertisement 1.135 .136 8.357 ***
Standardized Regression Weights: (Group number 1 - Default model)
Estimate ATA1 <--- Att_the_Advertisement .831 ATA2 <--- Att_the_Advertisement .880 ATA3 <--- Att_the_Advertisement .859 ATA4 <--- Att_the_Advertisement .805 ATA5 <--- Att_the_Advertisement .801
Variances: (Group number 1 - Default model)
Estimate S.E. C.R. P Label Att_the_Advertisement .507 .114 4.444 *** e1 .227 .045 5.089 *** e2 .242 .054 4.442 *** e3 .247 .052 4.773 *** e4 .258 .049 5.307 *** e5 .366 .069 5.334 ***
λ ε Σλ Σε Construct Reliability ATA1 0.831 0.227 4.176 1.340 0.929 ATA2 0.880 0.242 ATA3 0.859 0.247 ATA4 0.805 0.258 ATA5 0.801 0.366
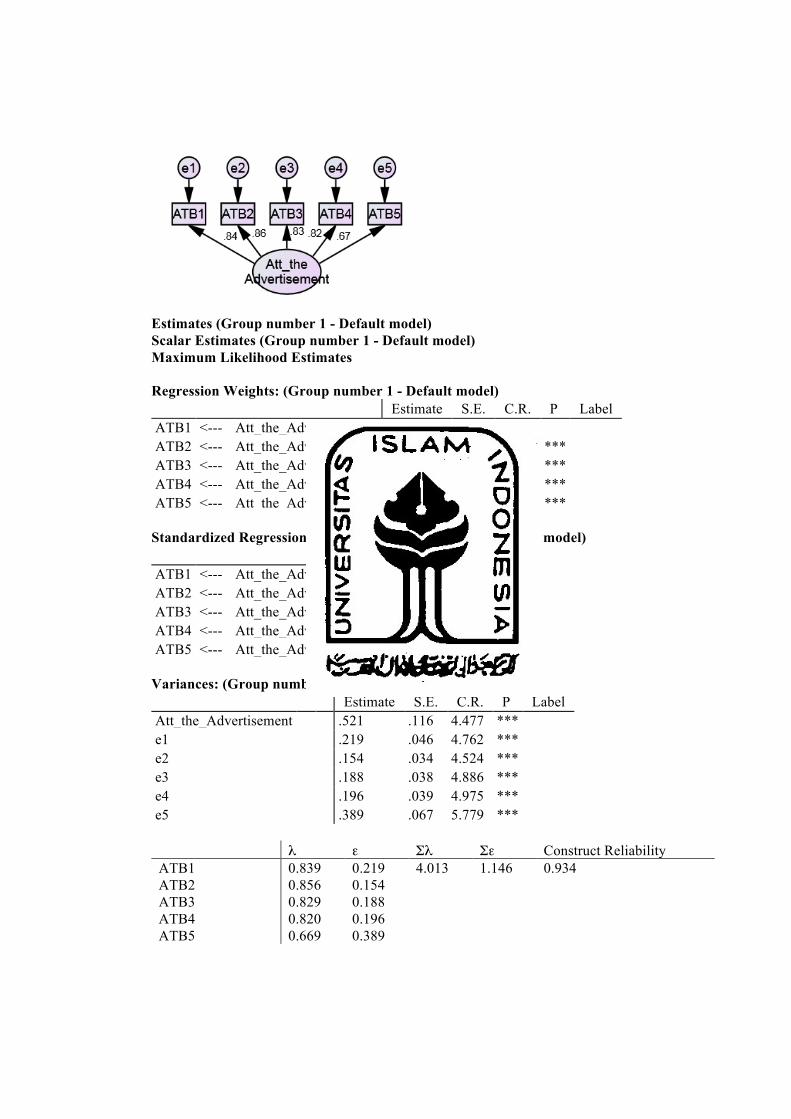
Estimates (Group number 1 - Default model) Scalar Estimates (Group number 1 - Default model) Maximum Likelihood Estimates Regression Weights: (Group number 1 - Default model)
Estimate S.E. C.R. P Label ATB1 <--- Att_the_Advertisement 1.000 ATB2 <--- Att_the_Advertisement .901 .098 9.174 *** ATB3 <--- Att_the_Advertisement .889 .102 8.748 *** ATB4 <--- Att_the_Advertisement .880 .102 8.616 *** ATB5 <--- Att_the_Advertisement .778 .120 6.492 ***
Standardized Regression Weights: (Group number 1 - Default model)
Estimate ATB1 <--- Att_the_Advertisement .839 ATB2 <--- Att_the_Advertisement .856 ATB3 <--- Att_the_Advertisement .829 ATB4 <--- Att_the_Advertisement .820 ATB5 <--- Att_the_Advertisement .669
Variances: (Group number 1 - Default model)
Estimate S.E. C.R. P Label Att_the_Advertisement .521 .116 4.477 *** e1 .219 .046 4.762 *** e2 .154 .034 4.524 *** e3 .188 .038 4.886 *** e4 .196 .039 4.975 *** e5 .389 .067 5.779 ***
λ ε Σλ Σε Construct Reliability ATB1 0.839 0.219 4.013 1.146 0.934 ATB2 0.856 0.154 ATB3 0.829 0.188 ATB4 0.820 0.196 ATB5 0.669 0.389

Estimates (Group number 1 - Default model) Scalar Estimates (Group number 1 - Default model) Maximum Likelihood Estimates Regression Weights: (Group number 1 - Default model)
Estimate S.E. C.R. P Label AA1 <--- Advertising_Attributes 1.000 AA2 <--- Advertising_Attributes 1.071 .120 8.923 *** AA3 <--- Advertising_Attributes .935 .104 8.967 *** AA4 <--- Advertising_Attributes 1.126 .129 8.764 *** AA5 <--- Advertising_Attributes -.380 .163 -2.327 .020 AA6 <--- Advertising_Attributes 1.092 .115 9.523 *** AA7 <--- Advertising_Attributes .896 .099 9.077 *** AA8 <--- Advertising_Attributes .303 .175 1.736 .083 AA9 <--- Advertising_Attributes 1.117 .119 9.419 *** AA10 <--- Advertising_Attributes .960 .102 9.438 ***
Standardized Regression Weights: (Group number 1 - Default model)
Estimate AA1 <--- Advertising_Attributes .785 AA2 <--- Advertising_Attributes .868 AA3 <--- Advertising_Attributes .871 AA4 <--- Advertising_Attributes .857 AA5 <--- Advertising_Attributes -.263 AA6 <--- Advertising_Attributes .909 AA7 <--- Advertising_Attributes .879 AA8 <--- Advertising_Attributes .197 AA9 <--- Advertising_Attributes .902 AA10 <--- Advertising_Attributes .903

Variances: (Group number 1 - Default model) Estimate S.E. C.R. P Label
Advertising_Attributes .620 .149 4.147 *** e1 .386 .065 5.918 *** e2 .233 .042 5.584 *** e3 .173 .031 5.563 *** e4 .285 .050 5.652 *** e5 1.204 .192 6.268 *** e6 .155 .030 5.188 *** e7 .147 .027 5.506 *** e8 1.405 .224 6.276 *** e9 .177 .034 5.279 *** e10 .129 .024 5.264 ***
λ ε Σλ Σε Construct Reliability AA1 0.785 0.386 6.908 4.294 0.917 AA2 0.868 0.233 AA3 0.871 0.173 AA4 0.857 0.285 AA5 -0.263 1.204 AA6 0.909 0.155 AA7 0.879 0.147 AA8 0.197 1.405 AA9 0.902 0.177 AA10 0.903 0.129

APPENDIX D
AMOS SOFTWARE OUTPUT


Analysis Summary Date and Time Date: Tuesday, November 24, 2015 Time: 11:00:15 AM Title full model: Tuesday, November 24, 2015 11:00 AM Groups Group number 1 (Group number 1) Notes for Group (Group number 1) The model is recursive. Sample size = 230 Variable Summary (Group number 1) Your model contains the following variables (Group number 1) Observed, endogenous variables PA1 PA2 PA3 PA4 PA5 EX5 EX4 EX2 EX1 TR5 TR3 TR2 TR1 CBC5 CBC4 CBC3 CBC1 ATA1 ATA2 ATA3 ATA4 ATA5 ATB1 ATB2 ATB3 ATB4 ATB5 Unobserved, endogenous variables Attitude_Advertising Attitude_Brand Unobserved, exogenous variables Physical_Attractiveness e1 e2 e3 e4 e5 Credibility_Expertise e13 e12

e11 e10 e9 e8 e7 e6 Brand_Congruency e17 e16 e15 e14 e18 e19 e20 e21 e22 e23 24 e25 e26 e27 z1 z2 Variable counts (Group number 1)
Number of variables in your model: 61 Number of observed variables: 27 Number of unobserved variables: 34 Number of exogenous variables: 32 Number of endogenous variables: 29
Parameter Summary (Group number 1)
Weights Covariances Variances Means Intercepts Total Fixed 34 0 0 0 0 34 Labeled 0 0 0 0 0 0 Unlabeled 28 33 32 0 0 93 Total 62 33 32 0 0 127
Assessment of normality (Group number 1)
Variable min max skew c.r. kurtosis c.r. ATB5 2.000 7.000 -.307 -1.901 .280 .866 ATB4 2.000 7.000 -.434 -2.687 .311 .963 ATB3 2.000 7.000 -.403 -2.498 .199 .617 ATB2 2.000 7.000 -.527 -3.262 .363 1.123 ATB1 2.000 7.000 -.278 -1.720 .029 .090 ATA5 2.000 7.000 -.052 -.325 -.775 -2.400 ATA4 2.000 7.000 -.052 -.324 -.178 -.552 ATA3 3.000 7.000 .104 .647 -.700 -2.167 ATA2 2.000 7.000 .071 .440 -.791 -2.448 ATA1 3.000 7.000 .107 .663 -.347 -1.073 CBC1 2.000 7.000 -.754 -4.670 .163 .505

Variable min max skew c.r. kurtosis c.r. CBC3 2.000 7.000 -.649 -4.021 .002 .008 CBC4 2.000 7.000 -.562 -3.477 .017 .053 CBC5 2.000 7.000 -.741 -4.588 .439 1.357 TR1 2.000 7.000 -.088 -.544 -.159 -.493 TR2 2.000 7.000 -.077 -.475 -.253 -.784 TR3 2.000 7.000 .095 .590 -.506 -1.565 TR5 2.000 7.000 -.436 -2.699 .060 .185 EX1 2.000 7.000 -.283 -1.755 -.017 -.051 EX2 3.000 7.000 -.083 -.515 -.594 -1.839 EX4 2.000 7.000 -.177 -1.097 -.073 -.225 EX5 2.000 7.000 -.108 -.669 -.743 -2.300 PA5 2.000 7.000 -.051 -.315 -.219 -.679 PA4 3.000 7.000 .105 .651 -.739 -2.287 PA3 2.000 7.000 -.055 -.343 -.221 -.684 PA2 2.000 7.000 -.018 -.112 .090 .278 PA1 2.000 7.000 .337 2.089 -.531 -1.644 Multivariate 70.610 13.530
Observations farthest from the centroid (Mahalanobis distance) (Group number 1)
Observation number Mahalanobis d-squared p1 p2 214 61.182 .000 .041 148 59.730 .000 .002 122 58.721 .000 .000 17 57.473 .001 .000 175 55.995 .001 .000 222 54.520 .001 .000 206 54.158 .001 .000 9 51.684 .003 .000 104 51.564 .003 .000 114 51.264 .003 .000 29 48.944 .006 .000 102 47.745 .008 .000 173 47.162 .010 .000 88 46.640 .011 .000 203 46.095 .012 .000 111 45.963 .013 .000 124 44.931 .017 .000 26 44.808 .017 .000 74 43.385 .024 .000 95 43.171 .025 .000 5 42.291 .031 .000 48 42.172 .032 .000 7 41.612 .036 .000 97 41.229 .039 .000 101 41.081 .040 .000 145 41.057 .041 .000 121 40.500 .046 .000

Observation number Mahalanobis d-squared p1 p2 192 39.903 .052 .000 28 39.555 .056 .000 228 39.506 .057 .000 226 39.432 .058 .000 205 39.375 .059 .000 200 39.186 .061 .000 224 38.989 .064 .000 139 36.951 .096 .004 99 36.674 .101 .006 14 36.450 .106 .007 227 36.143 .112 .010 126 36.057 .114 .008 3 35.846 .119 .009 58 35.643 .123 .010 100 35.559 .125 .008 55 34.826 .143 .040 176 34.826 .143 .027 118 34.767 .145 .021 92 34.744 .145 .015 119 34.451 .153 .023 1 34.323 .157 .022 76 34.156 .162 .024 161 33.824 .171 .041 213 33.789 .172 .032 166 33.624 .177 .035 180 33.540 .180 .031 155 33.540 .180 .021 229 33.431 .183 .020 70 33.270 .188 .022 2 33.244 .189 .017 83 33.182 .191 .014 216 32.715 .207 .039 217 32.669 .208 .032 230 32.581 .211 .030 152 32.487 .215 .028 158 31.678 .244 .166 68 31.664 .245 .135 10 31.366 .256 .200 79 31.243 .261 .207 141 30.979 .272 .277 45 30.870 .277 .280 177 30.715 .283 .306 96 30.647 .286 .290 191 30.567 .289 .280 182 30.508 .292 .261 142 30.414 .296 .258 31 30.220 .304 .305 130 30.216 .305 .260

Observation number Mahalanobis d-squared p1 p2 18 30.151 .307 .245 190 29.943 .317 .300 221 29.890 .319 .279 98 29.833 .322 .261 131 29.763 .325 .250 64 29.697 .328 .237 6 29.659 .330 .212 225 29.464 .339 .260 123 29.387 .342 .253 32 29.213 .351 .296 204 29.059 .358 .330 63 29.052 .358 .286 164 28.998 .361 .268 199 28.802 .371 .326 138 28.668 .377 .353 156 28.524 .384 .386 89 28.480 .387 .361 163 28.313 .395 .410 107 28.221 .400 .414 187 27.842 .419 .599 67 27.842 .419 .547 23 27.786 .422 .529 22 27.608 .431 .589 41 27.606 .431 .538 82 27.606 .431 .485
Models Default model (Default model) Notes for Model (Default model) Computation of degrees of freedom (Default model)
Number of distinct sample moments: 378 Number of distinct parameters to be estimated: 93 Degrees of freedom (378 - 93): 285
Result (Default model) Minimum was achieved Chi-square = 315.480 Degrees of freedom = 285 Probability level = .104 Group number 1 (Group number 1 - Default model) Estimates (Group number 1 - Default model) Scalar Estimates (Group number 1 - Default model) Maximum Likelihood Estimates

Regression Weights: (Group number 1 - Default model) Estimate S.E. C.R. P Label
Attitude_Advertising <--- Physical_Attractiveness .263 .058 4.547 *** Attitude_Advertising <--- Credibility_Expertise .435 .069 6.260 *** Attitude_Advertising <--- Brand_Congruency .205 .047 4.348 *** Attitude_Brand <--- Physical_Attractiveness .249 .064 3.877 *** Attitude_Brand <--- Credibility_Expertise .317 .078 4.054 *** Attitude_Brand <--- Brand_Congruency .374 .055 6.756 *** PA1 <--- Physical_Attractiveness 1.000 PA2 <--- Physical_Attractiveness 1.069 .069 15.425 *** PA3 <--- Physical_Attractiveness 1.057 .070 15.116 *** PA4 <--- Physical_Attractiveness .999 .078 12.786 *** PA5 <--- Physical_Attractiveness .744 .065 11.407 *** EX5 <--- Credibility_Expertise 1.000 EX4 <--- Credibility_Expertise 1.032 .055 18.789 *** EX2 <--- Credibility_Expertise 1.106 .113 9.817 *** EX1 <--- Credibility_Expertise 1.041 .113 9.241 *** TR5 <--- Credibility_Expertise 1.149 .108 10.680 *** TR3 <--- Credibility_Expertise 1.362 .123 11.075 *** TR2 <--- Credibility_Expertise 1.377 .118 11.710 *** TR1 <--- Credibility_Expertise 1.275 .117 10.866 *** CBC5 <--- Brand_Congruency 1.000 CBC4 <--- Brand_Congruency .991 .048 20.775 *** CBC3 <--- Brand_Congruency .972 .043 22.373 *** CBC1 <--- Brand_Congruency .987 .042 23.774 *** ATA1 <--- Attitude_Advertising 1.000 ATA2 <--- Attitude_Advertising 1.096 .058 18.913 *** ATA3 <--- Attitude_Advertising 1.085 .060 17.974 *** ATA4 <--- Attitude_Advertising .989 .042 23.336 *** ATA5 <--- Attitude_Advertising 1.027 .070 14.688 *** ATB1 <--- Attitude_Brand 1.000 ATB2 <--- Attitude_Brand .984 .050 19.627 *** ATB3 <--- Attitude_Brand 1.049 .052 20.085 *** ATB4 <--- Attitude_Brand .979 .053 18.424 *** ATB5 <--- Attitude_Brand .835 .066 12.583 *** Standardized Regression Weights: (Group number 1 - Default model)
Estimate Attitude_Advertising <--- Physical_Attractiveness .269 Attitude_Advertising <--- Credibility_Expertise .366 Attitude_Advertising <--- Brand_Congruency .221 Attitude_Brand <--- Physical_Attractiveness .252 Attitude_Brand <--- Credibility_Expertise .265 Attitude_Brand <--- Brand_Congruency .400 PA1 <--- Physical_Attractiveness .761 PA2 <--- Physical_Attractiveness .923 PA3 <--- Physical_Attractiveness .907 PA4 <--- Physical_Attractiveness .783

Estimate PA5 <--- Physical_Attractiveness .664 EX5 <--- Credibility_Expertise .611 EX4 <--- Credibility_Expertise .739 EX2 <--- Credibility_Expertise .718 EX1 <--- Credibility_Expertise .679 TR5 <--- Credibility_Expertise .799 TR3 <--- Credibility_Expertise .843 TR2 <--- Credibility_Expertise .912 TR1 <--- Credibility_Expertise .859 CBC5 <--- Brand_Congruency .904 CBC4 <--- Brand_Congruency .883 CBC3 <--- Brand_Congruency .902 CBC1 <--- Brand_Congruency .909 ATA1 <--- Attitude_Advertising .877 ATA2 <--- Attitude_Advertising .852 ATA3 <--- Attitude_Advertising .872 ATA4 <--- Attitude_Advertising .864 ATA5 <--- Attitude_Advertising .794 ATB1 <--- Attitude_Brand .866 ATB2 <--- Attitude_Brand .907 ATB3 <--- Attitude_Brand .914 ATB4 <--- Attitude_Brand .879 ATB5 <--- Attitude_Brand .706 Covariances: (Group number 1 - Default model)
Estimate
S.E.
C.R. P Labe
l Physical_Attractiveness
<-->
Credibility_Expertise .283 .052 5.401 ***
Physical_Attractiveness
<--> Brand_Congruency .285 .058 4.904 ***
Credibility_Expertise <--> Brand_Congruency .196 .047 4.172 ***
e18 <--> e22 -.067 .015 -4.308 ***
e19 <--> e22 .233 .040 5.885 ***
e18 <--> e21 .088 .025 3.556 ***
e19 <--> e21 -.063 .015 -4.157 ***
e7 <--> e6 .091 .027 3.364 ***
e8 <--> z1 -.072 .025 -2.817 .00
5
e11 <--> e10 .351 .048 7.336 ***
e12 <--> z1 .180 .034 5.270 ***

Estimate
S.E.
C.R. P Labe
l
e13 <--> e12 .362 .045 8.132 ***
e13 <--> e6 -.027 .014 -1.877 .06
1
e1 <--> e5 .096 .037 2.586 .01
0
e3 <--> e5 -.075 .024 -3.142 .00
2
e13 <--> e19 .267 .038 7.036 ***
e13 <--> z1 .204 .042 4.906 ***
e13 <--> e18 -.049 .027 -1.863 .06
2
e13 <--> e21 -.117 .026 -4.460 ***
e13 <--> e22 .272 .040 6.722 ***
e12 <--> e18 .065 .016 3.971 ***
e11 <--> e14 -.084 .018 -4.624 ***
24 <--> e27 .073 .022 3.265 .00
1
e14 <--> e25 .046 .013 3.554 ***
e17 <--> e20 -.056 .017 -3.211 .00
1
e1 <--> e14 .059 .022 2.681 .00
7
e1 <--> e17 -.049 .023 -2.078 .03
8
e4 <--> z1 .074 .026 2.820 .00
5
e4 <--> e25 .061 .020 2.982 .00
3
e5 <--> Brand_Congruency .148 .041 3.587 ***
e9 <--> e15 .034 .020 1.646 .10
0
e9 <--> e17 -.050 .020 -2.441 .01
5
e15 <--> e23 -.045 .016 -2.759 .00
6

Correlations: (Group number 1 - Default model) Estimate
Physical_Attractiveness <--> Credibility_Expertise .488 Physical_Attractiveness <--> Brand_Congruency .383 Credibility_Expertise <--> Brand_Congruency .320 e18 <--> e22 -.231 e19 <--> e22 .654 e18 <--> e21 .416 e19 <--> e21 -.242 e7 <--> e6 .404 e8 <--> z1 -.196 e11 <--> e10 .608 e12 <--> z1 .453 e13 <--> e12 .620 e13 <--> e6 -.058 e1 <--> e5 .191 e3 <--> e5 -.260 e13 <--> e19 .539 e13 <--> z1 .373 e13 <--> e18 -.123 e13 <--> e21 -.276 e13 <--> e22 .470 e12 <--> e18 .224 e11 <--> e14 -.282 24 <--> e27 .279 e14 <--> e25 .299 e17 <--> e20 -.267 e1 <--> e14 .205 e1 <--> e17 -.162 e4 <--> z1 .182 e4 <--> e25 .236 e5 <--> Brand_Congruency .237 e9 <--> e15 .136 e9 <--> e17 -.198 e15 <--> e23 -.226 Variances: (Group number 1 - Default model)
Estimate S.E. C.R. P Label Physical_Attractiveness .703 .104 6.790 *** Credibility_Expertise .478 .087 5.480 *** Brand_Congruency .787 .088 8.912 *** z1 .371 .048 7.770 *** z2 .340 .044 7.721 *** e1 .512 .053 9.678 *** e2 .140 .023 6.109 *** e3 .170 .025 6.735 *** e4 .443 .046 9.589 *** e5 .493 .051 9.705 *** e13 .804 .069 11.634 ***

Estimate S.E. C.R. P Label e12 .424 .043 9.751 *** e11 .550 .055 10.065 *** e10 .604 .061 9.964 *** e9 .357 .039 9.174 *** e8 .361 .042 8.535 *** e7 .183 .029 6.231 *** e6 .276 .036 7.668 *** e17 .177 .022 8.159 *** e16 .219 .025 8.695 *** e15 .171 .021 8.152 *** e14 .161 .020 7.923 *** e18 .201 .026 7.598 *** e19 .304 .039 7.850 *** e20 .250 .033 7.674 *** e21 .223 .031 7.192 *** e22 .415 .048 8.737 *** e23 .229 .026 8.830 *** 24 .143 .018 7.795 *** e25 .149 .020 7.471 *** e26 .194 .022 8.622 *** e27 .483 .049 9.947 *** Matrices (Group number 1 - Default model) Total Effects (Group number 1 - Default model)
Brand_Congruency
Credibility_Expertise
Physical_Attractiveness
Attitude_Brand
Attitude_Advertising
Attitude_Brand .374 .317 .249 .000 .000
Attitude_Advertising .205 .435 .263 .000 .000
ATB5 .312 .265 .208 .835 .000 ATB4 .366 .311 .244 .979 .000 ATB3 .392 .333 .261 1.049 .000 ATB2 .368 .312 .245 .984 .000 ATB1 .374 .317 .249 1.000 .000 ATA5 .210 .446 .270 .000 1.027 ATA4 .202 .430 .260 .000 .989 ATA3 .222 .471 .286 .000 1.085 ATA2 .224 .476 .289 .000 1.096 ATA1 .205 .435 .263 .000 1.000 CBC1 .987 .000 .000 .000 .000 CBC3 .972 .000 .000 .000 .000 CBC4 .991 .000 .000 .000 .000 CBC5 1.000 .000 .000 .000 .000 TR1 .000 1.275 .000 .000 .000 TR2 .000 1.377 .000 .000 .000 TR3 .000 1.362 .000 .000 .000 TR5 .000 1.149 .000 .000 .000 EX1 .000 1.041 .000 .000 .000

Brand_Congruency
Credibility_Expertise
Physical_Attractiveness
Attitude_Brand
Attitude_Advertising
EX2 .000 1.106 .000 .000 .000 EX4 .000 1.032 .000 .000 .000 EX5 .000 1.000 .000 .000 .000 PA5 .000 .000 .744 .000 .000 PA4 .000 .000 .999 .000 .000 PA3 .000 .000 1.057 .000 .000 PA2 .000 .000 1.069 .000 .000 PA1 .000 .000 1.000 .000 .000
Standardized Total Effects (Group number 1 - Default model) Brand_Con
gruency Credibility_Expertise
Physical_Attractiveness
Attitude_Brand
Attitude_Advertising
Attitude_Brand .400 .265 .252 .000 .000
Attitude_Advertising .221 .366 .269 .000 .000
ATB5 .283 .187 .178 .706 .000 ATB4 .352 .233 .222 .879 .000 ATB3 .366 .242 .231 .914 .000 ATB2 .363 .240 .229 .907 .000 ATB1 .347 .230 .219 .866 .000 ATA5 .176 .291 .214 .000 .794 ATA4 .191 .316 .232 .000 .864 ATA3 .193 .319 .235 .000 .872 ATA2 .189 .312 .229 .000 .852 ATA1 .194 .321 .236 .000 .877 CBC1 .909 .000 .000 .000 .000 CBC3 .902 .000 .000 .000 .000 CBC4 .883 .000 .000 .000 .000 CBC5 .904 .000 .000 .000 .000 TR1 .000 .859 .000 .000 .000 TR2 .000 .912 .000 .000 .000 TR3 .000 .843 .000 .000 .000 TR5 .000 .799 .000 .000 .000 EX1 .000 .679 .000 .000 .000 EX2 .000 .718 .000 .000 .000 EX4 .000 .739 .000 .000 .000 EX5 .000 .611 .000 .000 .000 PA5 .000 .000 .664 .000 .000 PA4 .000 .000 .783 .000 .000 PA3 .000 .000 .907 .000 .000 PA2 .000 .000 .923 .000 .000 PA1 .000 .000 .761 .000 .000
Direct Effects (Group number 1 - Default model)
Brand_Congruency
Credibility_Expertise
Physical_Attractiveness
Attitude_Brand
Attitude_Advertising
Attitude_Brand .374 .317 .249 .000 .000

Brand_Congruency
Credibility_Expertise
Physical_Attractiveness
Attitude_Brand
Attitude_Advertising
Attitude_Advertising .205 .435 .263 .000 .000
ATB5 .000 .000 .000 .835 .000 ATB4 .000 .000 .000 .979 .000 ATB3 .000 .000 .000 1.049 .000 ATB2 .000 .000 .000 .984 .000 ATB1 .000 .000 .000 1.000 .000 ATA5 .000 .000 .000 .000 1.027 ATA4 .000 .000 .000 .000 .989 ATA3 .000 .000 .000 .000 1.085 ATA2 .000 .000 .000 .000 1.096 ATA1 .000 .000 .000 .000 1.000 CBC1 .987 .000 .000 .000 .000 CBC3 .972 .000 .000 .000 .000 CBC4 .991 .000 .000 .000 .000 CBC5 1.000 .000 .000 .000 .000 TR1 .000 1.275 .000 .000 .000 TR2 .000 1.377 .000 .000 .000 TR3 .000 1.362 .000 .000 .000 TR5 .000 1.149 .000 .000 .000 EX1 .000 1.041 .000 .000 .000 EX2 .000 1.106 .000 .000 .000 EX4 .000 1.032 .000 .000 .000 EX5 .000 1.000 .000 .000 .000 PA5 .000 .000 .744 .000 .000 PA4 .000 .000 .999 .000 .000 PA3 .000 .000 1.057 .000 .000 PA2 .000 .000 1.069 .000 .000 PA1 .000 .000 1.000 .000 .000
Standardized Direct Effects (Group number 1 - Default model)
Brand_Congruency
Credibility_Expertise
Physical_Attractiveness
Attitude_Brand
Attitude_Advertising
Attitude_Brand .400 .265 .252 .000 .000
Attitude_Advertising .221 .366 .269 .000 .000
ATB5 .000 .000 .000 .706 .000 ATB4 .000 .000 .000 .879 .000 ATB3 .000 .000 .000 .914 .000 ATB2 .000 .000 .000 .907 .000 ATB1 .000 .000 .000 .866 .000 ATA5 .000 .000 .000 .000 .794 ATA4 .000 .000 .000 .000 .864 ATA3 .000 .000 .000 .000 .872 ATA2 .000 .000 .000 .000 .852 ATA1 .000 .000 .000 .000 .877

Brand_Congruency
Credibility_Expertise
Physical_Attractiveness
Attitude_Brand
Attitude_Advertising
CBC1 .909 .000 .000 .000 .000 CBC3 .902 .000 .000 .000 .000 CBC4 .883 .000 .000 .000 .000 CBC5 .904 .000 .000 .000 .000 TR1 .000 .859 .000 .000 .000 TR2 .000 .912 .000 .000 .000 TR3 .000 .843 .000 .000 .000 TR5 .000 .799 .000 .000 .000 EX1 .000 .679 .000 .000 .000 EX2 .000 .718 .000 .000 .000 EX4 .000 .739 .000 .000 .000 EX5 .000 .611 .000 .000 .000 PA5 .000 .000 .664 .000 .000 PA4 .000 .000 .783 .000 .000 PA3 .000 .000 .907 .000 .000 PA2 .000 .000 .923 .000 .000 PA1 .000 .000 .761 .000 .000
Indirect Effects (Group number 1 - Default model)
Brand_Congruency
Credibility_Expertise
Physical_Attractiveness
Attitude_Brand
Attitude_Advertising
Attitude_Brand .000 .000 .000 .000 .000
Attitude_Advertising .000 .000 .000 .000 .000
ATB5 .312 .265 .208 .000 .000 ATB4 .366 .311 .244 .000 .000 ATB3 .392 .333 .261 .000 .000 ATB2 .368 .312 .245 .000 .000 ATB1 .374 .317 .249 .000 .000 ATA5 .210 .446 .270 .000 .000 ATA4 .202 .430 .260 .000 .000 ATA3 .222 .471 .286 .000 .000 ATA2 .224 .476 .289 .000 .000 ATA1 .205 .435 .263 .000 .000 CBC1 .000 .000 .000 .000 .000 CBC3 .000 .000 .000 .000 .000 CBC4 .000 .000 .000 .000 .000 CBC5 .000 .000 .000 .000 .000 TR1 .000 .000 .000 .000 .000 TR2 .000 .000 .000 .000 .000 TR3 .000 .000 .000 .000 .000 TR5 .000 .000 .000 .000 .000 EX1 .000 .000 .000 .000 .000 EX2 .000 .000 .000 .000 .000 EX4 .000 .000 .000 .000 .000 EX5 .000 .000 .000 .000 .000

Brand_Congruency
Credibility_Expertise
Physical_Attractiveness
Attitude_Brand
Attitude_Advertising
PA5 .000 .000 .000 .000 .000 PA4 .000 .000 .000 .000 .000 PA3 .000 .000 .000 .000 .000 PA2 .000 .000 .000 .000 .000 PA1 .000 .000 .000 .000 .000
Standardized Indirect Effects (Group number 1 - Default model)
Brand_Congruency
Credibility_Expertise
Physical_Attractiveness
Attitude_Brand
Attitude_Advertising
Attitude_Brand .000 .000 .000 .000 .000
Attitude_Advertising .000 .000 .000 .000 .000
ATB5 .283 .187 .178 .000 .000 ATB4 .352 .233 .222 .000 .000 ATB3 .366 .242 .231 .000 .000 ATB2 .363 .240 .229 .000 .000 ATB1 .347 .230 .219 .000 .000 ATA5 .176 .291 .214 .000 .000 ATA4 .191 .316 .232 .000 .000 ATA3 .193 .319 .235 .000 .000 ATA2 .189 .312 .229 .000 .000 ATA1 .194 .321 .236 .000 .000 CBC1 .000 .000 .000 .000 .000 CBC3 .000 .000 .000 .000 .000 CBC4 .000 .000 .000 .000 .000 CBC5 .000 .000 .000 .000 .000 TR1 .000 .000 .000 .000 .000 TR2 .000 .000 .000 .000 .000 TR3 .000 .000 .000 .000 .000 TR5 .000 .000 .000 .000 .000 EX1 .000 .000 .000 .000 .000 EX2 .000 .000 .000 .000 .000 EX4 .000 .000 .000 .000 .000 EX5 .000 .000 .000 .000 .000 PA5 .000 .000 .000 .000 .000 PA4 .000 .000 .000 .000 .000 PA3 .000 .000 .000 .000 .000 PA2 .000 .000 .000 .000 .000 PA1 .000 .000 .000 .000 .000

Modification Indices (Group number 1 - Default model) Covariances: (Group number 1 - Default model)
M.I. Par Change z1 <--> z2 5.765 .053 e26 <--> Credibility_Expertise 5.561 .048 e23 <--> Credibility_Expertise 4.572 -.046 e22 <--> 24 4.892 .025 e21 <--> 24 5.815 -.025 e19 <--> Credibility_Expertise 4.178 .028 e19 <--> 24 6.056 -.022 e14 <--> z2 7.992 -.048 e6 <--> 24 8.247 .038 e8 <--> e6 4.958 .046 e10 <--> 24 4.606 .035 e10 <--> e21 5.103 -.035 e11 <--> 24 5.158 -.034 e11 <--> e21 4.094 .029 e12 <--> e23 7.002 .034 e13 <--> e10 4.554 -.037 e5 <--> e15 5.597 .048 e5 <--> e8 4.798 .063 e3 <--> e7 4.895 -.031 e2 <--> z1 4.110 -.034 e2 <--> e6 7.524 -.041 e2 <--> e7 6.260 .033 e1 <--> z1 6.392 .062 Variances: (Group number 1 - Default model)
M.I. Par Change Regression Weights: (Group number 1 - Default model)
M.I. Par Change ATB5 <--- Attitude_Advertising 4.579 .120 ATB5 <--- ATA2 6.064 .103 ATB5 <--- ATA1 7.548 .130 ATB4 <--- Credibility_Expertise 7.377 .131 ATB4 <--- TR1 6.608 .080 ATB4 <--- TR2 9.802 .096 ATB4 <--- TR5 7.117 .086 ATB4 <--- EX4 4.057 .067 ATB2 <--- ATA4 4.278 -.059 ATB1 <--- Credibility_Expertise 4.586 -.109 ATB1 <--- TR1 5.748 -.080 ATB1 <--- TR2 5.306 -.075 ATB1 <--- TR5 6.072 -.084 ATB1 <--- EX1 6.437 -.082 ATA5 <--- EX4 4.707 -.061 ATA5 <--- PA1 4.357 -.052 ATA2 <--- EX2 5.064 .046

M.I. Par Change ATA1 <--- PA1 4.363 .042 CBC1 <--- Attitude_Brand 4.151 -.069 CBC1 <--- ATB2 5.948 -.074 TR1 <--- ATA5 5.302 -.070 TR1 <--- ATA2 5.918 -.075 TR2 <--- ATB3 4.918 -.067 TR2 <--- ATB2 4.843 -.071 TR2 <--- PA3 4.383 -.062 EX2 <--- ATA5 8.656 .103 EX2 <--- ATA2 7.784 .099 EX2 <--- EX5 10.826 .108 EX5 <--- PA3 4.006 .059 EX5 <--- PA1 5.500 .061 PA5 <--- TR3 4.043 .080 PA2 <--- ATA5 5.938 -.070 PA2 <--- ATA2 5.230 -.066 PA1 <--- ATA1 5.250 .112 Minimization History (Default model)
Iteration
Negative eigenvalues
Condition #
Smallest eigenvalue
Diameter F NTri
es Ratio
0 e 31 -1.943 9999.000
6362.764 0 9999.0
00
1 e 39 -1.374 2.371 4246.974 19 .506
2 e* 34 -2.175 .784 3369.2
04 5 1.036
3 e 30 -.955 .169 3212.394 6 .773
4 e 26 -1.065 .496 2701.017 6 .970
5 e* 18 -.922 .588 2249.3
49 5 .786
6 e* 7 -.294 .720 1665.3
43 5 .855
7 e* 0 18488.1
42 1.023 927.947 5 .880
8 e 0 12905.364 .351 826.72
4 6 .000
9 e 0 5077.398 .722 621.52
8 3 .000
10 e 0 2364.204 .939 479.70
2 1 1.009
11 e 0 3346.344 .372 448.66
1 1 1.140
12 e 0 4380.989 .259 445.65
6 1 1.116
13 e 0 5420.688 .085 445.48
2 1 1.061

Iteration
Negative eigenvalues
Condition #
Smallest eigenvalue
Diameter F NTri
es Ratio
14 e 0 5492.973 .011 445.48
0 1 1.008
15 e 0 5488.989 .000 445.48
0 1 1.000
Model Fit Summary CMIN
Model NPAR CMIN DF P CMIN/DF Default model 93 315.480 285 .104 1.107 Saturated model 378 .000 0 Independence model 27 6575.865 351 .000 18.735
RMR, GFI
Model RMR GFI AGFI PGFI Default model .065 .881 .842 .664 Saturated model .000 1.000 Independence model .450 .155 .090 .144
Baseline Comparisons
Model NFI Delta1
RFI rho1
IFI Delta2
TLI rho2 CFI
Default model .932 .917 .974 .968 .974 Saturated model 1.000 1.000 1.000 Independence model .000 .000 .000 .000 .000
Parsimony-Adjusted Measures
Model PRATIO PNFI PCFI Default model .812 .757 .791 Saturated model .000 .000 .000 Independence model 1.000 .000 .000
NCP
Model NCP LO 90 HI 90 Default model 160.480 107.153 221.748 Saturated model .000 .000 .000 Independence model 6224.865 5964.890 6491.236
FMIN
Model FMIN F0 LO 90 HI 90 Default model 1.945 .701 .468 .968 Saturated model .000 .000 .000 .000 Independence model 28.716 27.183 26.048 28.346
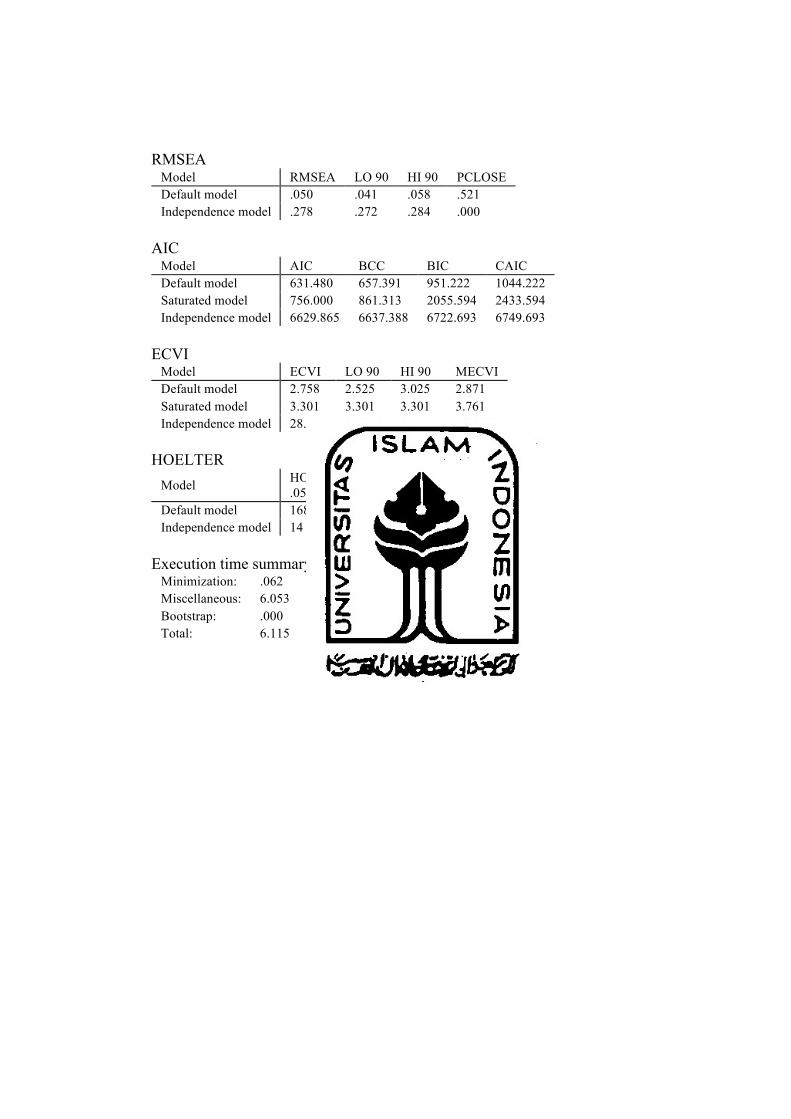
RMSEA Model RMSEA LO 90 HI 90 PCLOSE Default model .050 .041 .058 .521 Independence model .278 .272 .284 .000
AIC
Model AIC BCC BIC CAIC Default model 631.480 657.391 951.222 1044.222 Saturated model 756.000 861.313 2055.594 2433.594 Independence model 6629.865 6637.388 6722.693 6749.693
ECVI
Model ECVI LO 90 HI 90 MECVI Default model 2.758 2.525 3.025 2.871 Saturated model 3.301 3.301 3.301 3.761 Independence model 28.951 27.816 30.115 28.984
HOELTER
Model HOELTER .05
HOELTER .01
Default model 168 177 Independence model 14 15
Execution time summary
Minimization: .062 Miscellaneous: 6.053 Bootstrap: .000 Total: 6.115

75