Embed Size (px)
Citation preview
Journal of Purity, Utility Reaction and Environment Vol.2 No.2, April 2013, 20-33
ABSTRACT Telecom networks constitute a significant part of Internet & Communication Technology (ICT). With
the growth of traffic volume in telecom networks, the energy consumption and carbon footprint increase
rapidly. Therefore, as the awareness of sustainable environment increases, all industries including Telco
have started their green initiatives to reduce the energy consumption that will lead to the reduction of
carbon emission. In general, typical telecom networks can be divided into several sections which are
core, metro and access network. In this explanatory research, it aims to focus on the access network so
called the “last mile”, to analyse the impact of Gigabit Passive Optical Network (GPON) as fixed
access network technology to power consumption and carbon footprint in Malaysia. In Malaysia,
GPON is being deployed to provide broadband service; among other access technology such as Digital
Subscriber Loop (DSL). GPON technology utilizes fiber optic to connect the central office equipment
(Optical Line Terminal-OLT) to the customer device (Optical Network Unit –ONU). By using
deductive approach, secondary data from Telekom Malaysia’s (TM) network inventory list is used to
determine the number of access network equipment deployed in the entire network. The maximum
power consumption for all access network equipment is identified based on the hardware specification
and converted to carbon emission. This conversion is based on GHG protocol Scope 2 (Indirect
Emission) where the carbon emission is estimated based on the purchased electricity. Based on the
The Impact of GPON Technology on Power Consumption
and Carbon Footprint in Malaysia
Siti Sawiah Ramli 1,2,a, Md. Hisam Hanapei2,b, Mohamed Razman Yahya2,c, Nurul Afzan Omar2,d, Mahmoud Khalid Almsafir1,e
1Graduate Business, College of Graduate Studies, University Tenaga Nasional, Campus
Putrajaya, Jalan IKRAM-UNITEN, 43300 Kajang, Selangor
2Telekom Research & Development Sdn Bhd, TM Innovation Center, Lingkaran Teknokrat
Timur, 63000, Cyberjaya, Selangor
[email protected]; [email protected]; [email protected]; [email protected]; [email protected]
ISSN (Online): 2232-1179
ISSN (Print) : 2314-8101
Journal of Purity, Utility Reaction and Environment Vol.2 No.2, April 2013, 20-33
21
analysis, it is found out that the impact of GPON technology on power consumption per subscriber and
annual carbon footprint are less than other fixed access technologies deployed in Malaysia.
Keywords: Power consumption, carbon footprint, GPON, GHG Protocol.
1. Introduction
As the awareness of sustainable environment increases, most corporations have started the
initiatives to reduce power consumption and carbon footprint. Taken as part of Corporate
Social Responsibility (CSR), Telekom Malaysia (TM) has also aggressively put effort to
reduce power consumption and subsequently its carbon footprint. Based on Telekom Malaysia
Annual Report (2011), the company has launched a Carbon Management Plan and carried out a
company-wide audit of carbon emissions to serve as a baseline for future planning and
activities.
Bolla et al., (2011) and Roy (2008) and in their study mentioned that, another reason why
corporations work hard to reduce their power consumption is because of the increase in energy
prices. This increase in energy price has result a substantial energy cost for large service
provider.
According to The Climate Group (2008), the carbon footprint for all ICT is estimated to be
1-2% of worldwide total footprint and the network elements contribution is about 33% of the
total ICT carbon footprint. As the customer population growth and the spreading or broadband
access, more and more network elements need to be deployed to provide the service.
Therefore, it is important for Telco to start considering green telecommunication network and
energy optimization in their current and future network deployment.
In TM, GPON technology has been deployed among other fixed access network technology
to provide broadband service in Malaysia. GPON technology is utilizing fiber optic for the last
mile which connects the central office equipment to the customer premises equipment
(Horiuchi and Suzuki ,2007).
1.1 Research Objectives
The objectives of this research are to find out the impact of GPON technology on the
power consumption of access network equipment in TM and to find out the impact of GPON
technology on the carbon footprint of access network equipment in TM.
1.2 Research Question
RQ1: How does GPON technology impacting the power consumption of access network
equipment in TM?
RQ2: How does GPON technology impacting the carbon footprint of access network
equipment in TM?
Journal of Purity, Utility Reaction and Environment Vol.2 No.2, April 2013, 20-33
22
1.3 Problem Statement
As there are many fixed access network technology available for Telco to choose from, the
aspect of power consumption and carbon emission need to be considered as well. In a study
carried out by Ennser et al. (2010), they point out that the performance and deployment aspect
of all these different technologies; for example GPON and DSL have their own trade off. This
is because these technologies use different network elements and architecture. These
differences will lead to different performance level as well as differences in power
consumption and carbon emission. Therefore, this study will be able to provide some
information on these two aspects (power consumption and carbon footprint). The findings will
enable Telco to better manage and optimize their network deployment and utilization to reduce
the power consumption and carbon footprint.
2. Literature Review
Recently, the awareness about sustainable environment has increases rapidly. Many studies
has been caried out which relates the industries to its carbon footprint. Carbon footprint is a
term used to describe calculation of total carbon emissions of a system that relates the energy
consumption in terms of the amount of greenhouse gas (GHG) produced to support agiven
activity (or piece of equipment); it is typically expressed in equivalent tons of carbon dioxide
(CO2) that is, CO2e (Minoli, 2010). Based on this definition, power or energy consumption is
the main parameter use to measure carbon emission. Therefore, in order to reduce carbon
emission, power consumption should be reduced.
In Copenhagen 2009, Prime Minister of Malaysia made a voluntary commitment to reduce
CO2 intensity by 40% by 2020 relative to 2005 levels which can be achieved by having
renewable energy contribution at 11% by 2020 (Gee, 2012). However, as a developing
countries, it is a big challenge to all sectors in Malaysia since development still need to go on.
For example, in the case of ICT sectors, the increase of broadband service demand in Malaysia
is so great and this require more equipment to be deployed to provide and extend the service
coverage. According to Muniandy and Muniandy (2012), Malaysia shows a repidly growing
number of Internet users, where in 1995 it was only 0.1% and within 10 years (2005) it grews
up to 37.9%. Currently, based on Malaysian Communication and Multimedia Commission
(MCMC) Pocket Book of Statistic (2012), Malaysian broadband subscription was about 5.9
million in quarter 3 2012.
Such increase in broadband and internet penetration happens almost everywhere in the
world. Therefore, all Telco are deploying more network elements to extend the broadband
services coverage to more users with more bandwidth and these network elements consume
huge amount of energy. This increasing trend has been confirmed in recent reports published
by Telco and Internet Service provider in other countries as well. Based on Nippon Telegraph
and Telephone Corportion (NTT) CSR report (2010), the electricity consumption for
telecommunication in 2009 is 763.95 million kWh and in 2010 it has increased by 98.61
million kWh (approximately 0.8 TWh). As for Telecom Italia, based on a study carried out by
Bianco et al. (2007), it requires more than 2TWh of electrical energy in 2007. These numbers
shows that the energy usage of Telcos are relatively very high and it keeps on increasing.
Journal of Purity, Utility Reaction and Environment Vol.2 No.2, April 2013, 20-33
23
More network elements means more power utilization which result to the increase in
carbon footprint. Based on The Climate Group (2008), carbon footprint for ICT is estimated to
be 1-2% of worldwide carbon footprint and the network elements contribution is about 33% of
the total ICT carbon footprint, while the rest is composed of data centers, personal computers,
printers and peripherals. This finding is align with another study in Europe carried out by ETSI
(2012) where ICT industry is responsible for less than 2% of global carbon emission and
consumes 7% of electricity generated in Europe. However, if the business of ICT operates in
business as usual scenario, this fraction will be double by 2020 as reported by Vereecken,
Heddeghem, Colle, Pickavet and Demeester (2010).
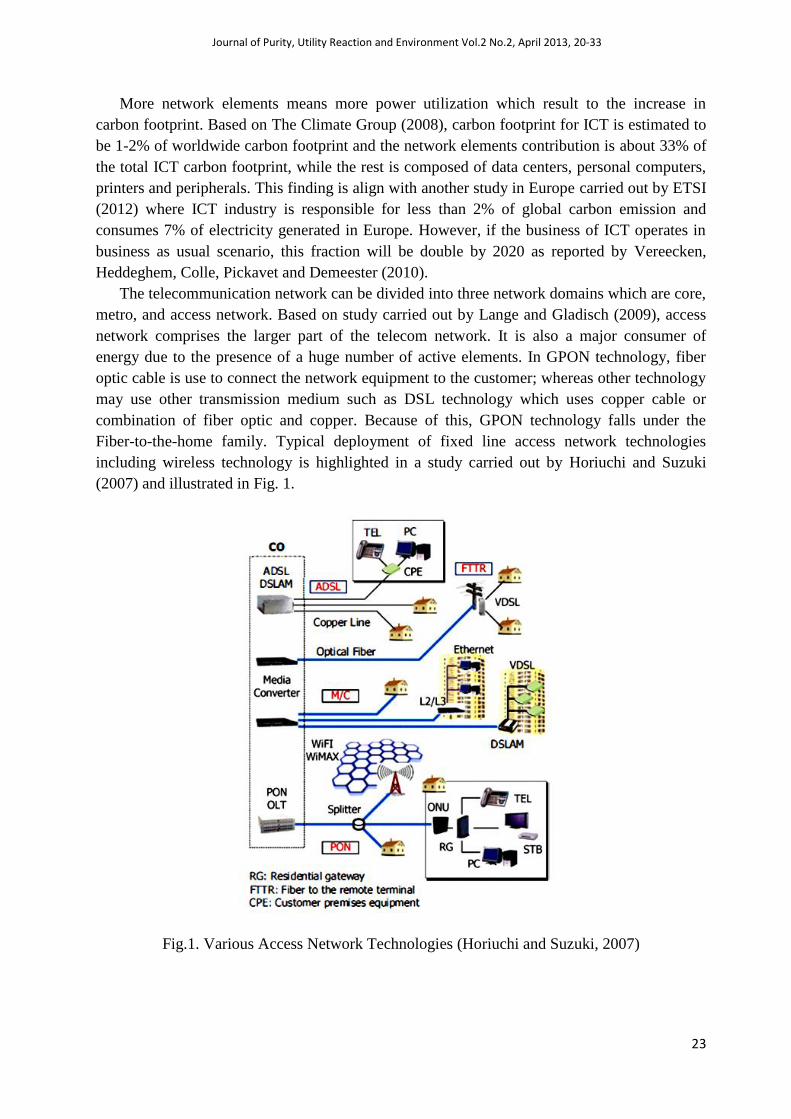
The telecommunication network can be divided into three network domains which are core,
metro, and access network. Based on study carried out by Lange and Gladisch (2009), access
network comprises the larger part of the telecom network. It is also a major consumer of
energy due to the presence of a huge number of active elements. In GPON technology, fiber
optic cable is use to connect the network equipment to the customer; whereas other technology
may use other transmission medium such as DSL technology which uses copper cable or
combination of fiber optic and copper. Because of this, GPON technology falls under the
Fiber-to-the-home family. Typical deployment of fixed line access network technologies
including wireless technology is highlighted in a study carried out by Horiuchi and Suzuki
(2007) and illustrated in Fig. 1.
Fig.1. Various Access Network Technologies (Horiuchi and Suzuki, 2007)
Journal of Purity, Utility Reaction and Environment Vol.2 No.2, April 2013, 20-33
24
Vereecken et al., (2011) has carried out a study on power consumption in
Telecommunication Network on most of the access network technology including fixed line
access network technology such as GPON and DSL. Depending on countries, different
technology is being used to provide broadband service. According to Cota and Pavicic (2011),
the global deployment percentage for DSL, Cable Modem, FTTx (including GPON) and other
technologies are 63.41%, 20.40%, 13.23%, and 2.96% respectively, with a strong growth in
fiber based technology is being projected.
Based on a study by Xiyang and Chuanqing (2009), PON subscribers are expected to grow
dramatically at a compound annual growth of 150% through 2010 in North America and Asia
Pacific, with GPON gaining traction in China and North America, and EPON dominating
Japan while European broadband subscribers will largely continue to use DSL, although each
region has its own variations within it.
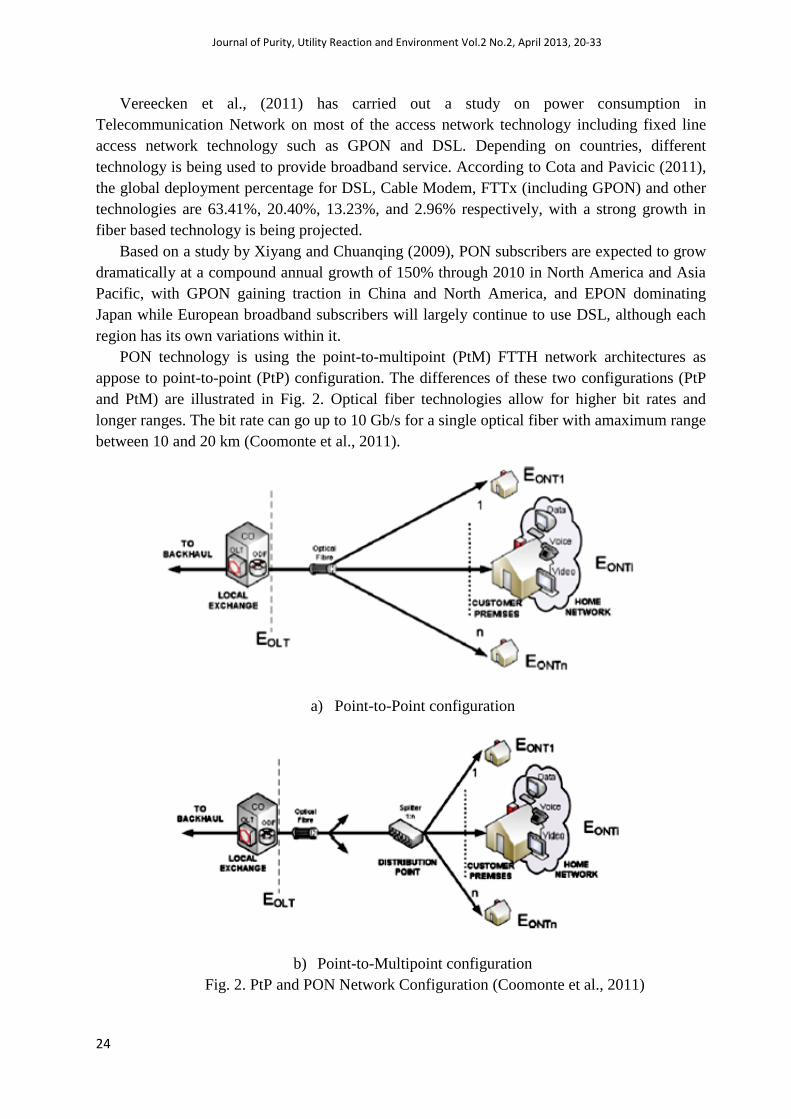
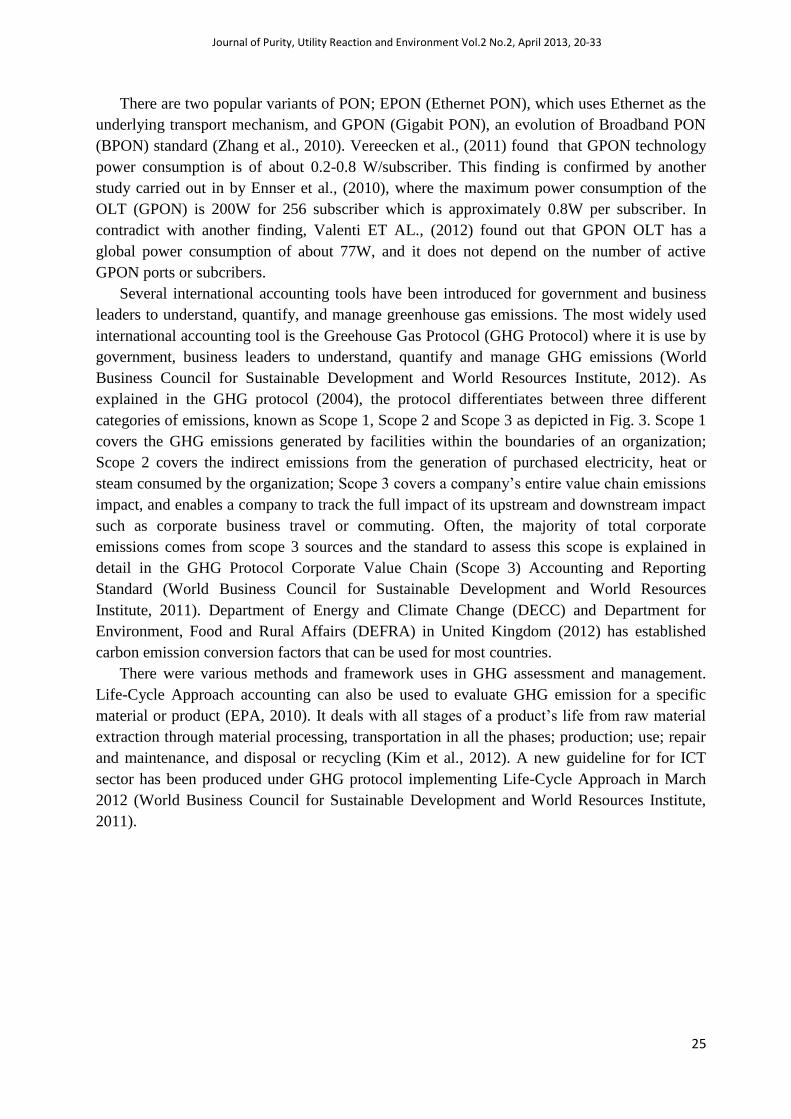
PON technology is using the point-to-multipoint (PtM) FTTH network architectures as
appose to point-to-point (PtP) configuration. The differences of these two configurations (PtP
and PtM) are illustrated in Fig. 2. Optical fiber technologies allow for higher bit rates and
longer ranges. The bit rate can go up to 10 Gb/s for a single optical fiber with amaximum range
between 10 and 20 km (Coomonte et al., 2011).
a) Point-to-Point configuration
b) Point-to-Multipoint configuration
Fig. 2. PtP and PON Network Configuration (Coomonte et al., 2011)
Journal of Purity, Utility Reaction and Environment Vol.2 No.2, April 2013, 20-33
25
There are two popular variants of PON; EPON (Ethernet PON), which uses Ethernet as the
underlying transport mechanism, and GPON (Gigabit PON), an evolution of Broadband PON
(BPON) standard (Zhang et al., 2010). Vereecken et al., (2011) found that GPON technology
power consumption is of about 0.2-0.8 W/subscriber. This finding is confirmed by another
study carried out in by Ennser et al., (2010), where the maximum power consumption of the
OLT (GPON) is 200W for 256 subscriber which is approximately 0.8W per subscriber. In
contradict with another finding, Valenti ET AL., (2012) found out that GPON OLT has a
global power consumption of about 77W, and it does not depend on the number of active
GPON ports or subcribers.
Several international accounting tools have been introduced for government and business
leaders to understand, quantify, and manage greenhouse gas emissions. The most widely used
international accounting tool is the Greehouse Gas Protocol (GHG Protocol) where it is use by
government, business leaders to understand, quantify and manage GHG emissions (World
Business Council for Sustainable Development and World Resources Institute, 2012). As
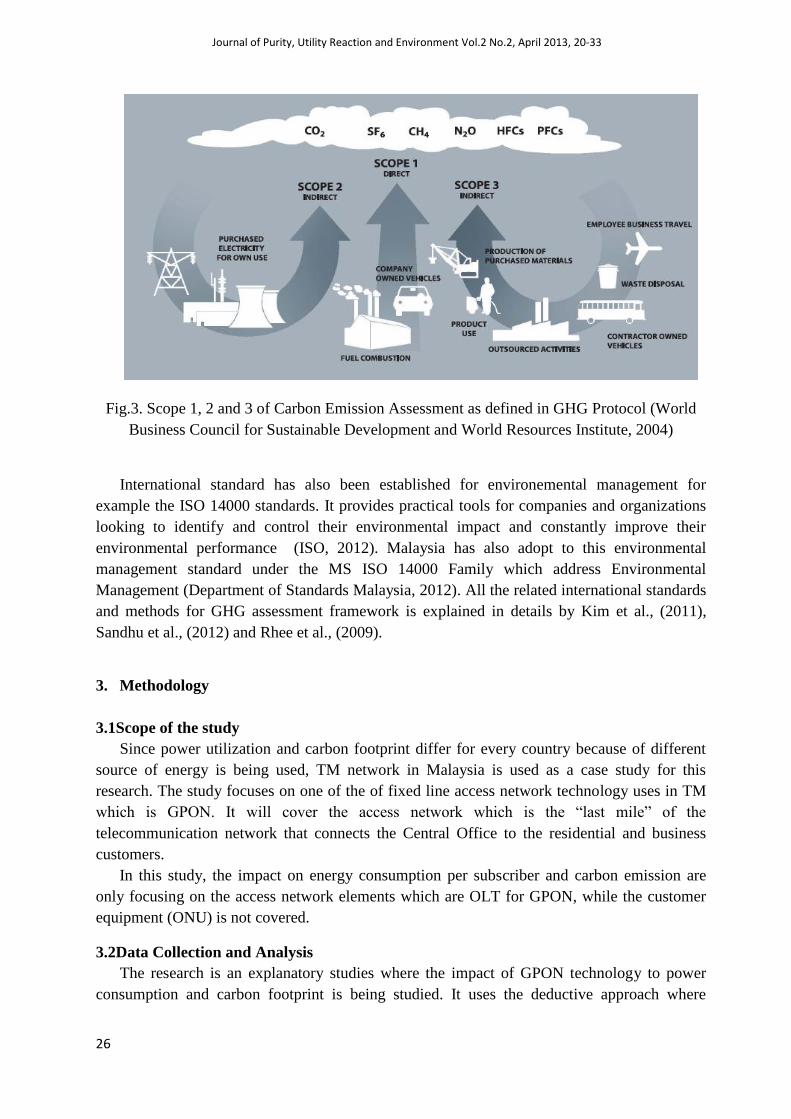
explained in the GHG protocol (2004), the protocol differentiates between three different
categories of emissions, known as Scope 1, Scope 2 and Scope 3 as depicted in Fig. 3. Scope 1
covers the GHG emissions generated by facilities within the boundaries of an organization;
Scope 2 covers the indirect emissions from the generation of purchased electricity, heat or
steam consumed by the organization; Scope 3 covers a company’s entire value chain emissions
impact, and enables a company to track the full impact of its upstream and downstream impact
such as corporate business travel or commuting. Often, the majority of total corporate
emissions comes from scope 3 sources and the standard to assess this scope is explained in
detail in the GHG Protocol Corporate Value Chain (Scope 3) Accounting and Reporting
Standard (World Business Council for Sustainable Development and World Resources
Institute, 2011). Department of Energy and Climate Change (DECC) and Department for
Environment, Food and Rural Affairs (DEFRA) in United Kingdom (2012) has established
carbon emission conversion factors that can be used for most countries.
There were various methods and framework uses in GHG assessment and management.
Life-Cycle Approach accounting can also be used to evaluate GHG emission for a specific
material or product (EPA, 2010). It deals with all stages of a product’s life from raw material
extraction through material processing, transportation in all the phases; production; use; repair
and maintenance, and disposal or recycling (Kim et al., 2012). A new guideline for for ICT
sector has been produced under GHG protocol implementing Life-Cycle Approach in March
2012 (World Business Council for Sustainable Development and World Resources Institute,
2011).
Journal of Purity, Utility Reaction and Environment Vol.2 No.2, April 2013, 20-33
26
Fig.3. Scope 1, 2 and 3 of Carbon Emission Assessment as defined in GHG Protocol (World
Business Council for Sustainable Development and World Resources Institute, 2004)
International standard has also been established for environemental management for
example the ISO 14000 standards. It provides practical tools for companies and organizations
looking to identify and control their environmental impact and constantly improve their
environmental performance (ISO, 2012). Malaysia has also adopt to this environmental
management standard under the MS ISO 14000 Family which address Environmental
Management (Department of Standards Malaysia, 2012). All the related international standards
and methods for GHG assessment framework is explained in details by Kim et al., (2011),
Sandhu et al., (2012) and Rhee et al., (2009).
3. Methodology
3.1Scope of the study
Since power utilization and carbon footprint differ for every country because of different
source of energy is being used, TM network in Malaysia is used as a case study for this
research. The study focuses on one of the of fixed line access network technology uses in TM
which is GPON. It will cover the access network which is the “last mile” of the
telecommunication network that connects the Central Office to the residential and business
customers.
In this study, the impact on energy consumption per subscriber and carbon emission are
only focusing on the access network elements which are OLT for GPON, while the customer
equipment (ONU) is not covered.
3.2Data Collection and Analysis
The research is an explanatory studies where the impact of GPON technology to power
consumption and carbon footprint is being studied. It uses the deductive approach where
Journal of Purity, Utility Reaction and Environment Vol.2 No.2, April 2013, 20-33
27
secondary data from TM’s network inventory list (last update in March 2012) and power
utilization are used to analyse the impact of the dependent variable to the independent variable.
The data is analysed based on Scope 2 (purchased electricity) of GHG protocol. Scope 1
and Scope 3 are not included in this research paper. There are two parts of analysing the data.
The first part is to determine the power consumption of each network element based on the
hardware specification provided by the product manufacturers.
Based on total power consume in a year, the carbon emission is calculated using the Scope
2 GHG protocol tools as in Eq. 1.
Carbon Emission = Annual Electricity Consumption * Emission FactorMalaysia (1)
The carbon emission (tCO2/year) is calculated by multiplying the annual electricity
consumption (kWh/year) with the emission factors for that particular country, in this case for
Malaysia (tCO2/kWh). Emission factor for Malaysia as provided by DECC and DEFRA(2012)
is listed in Table 1.
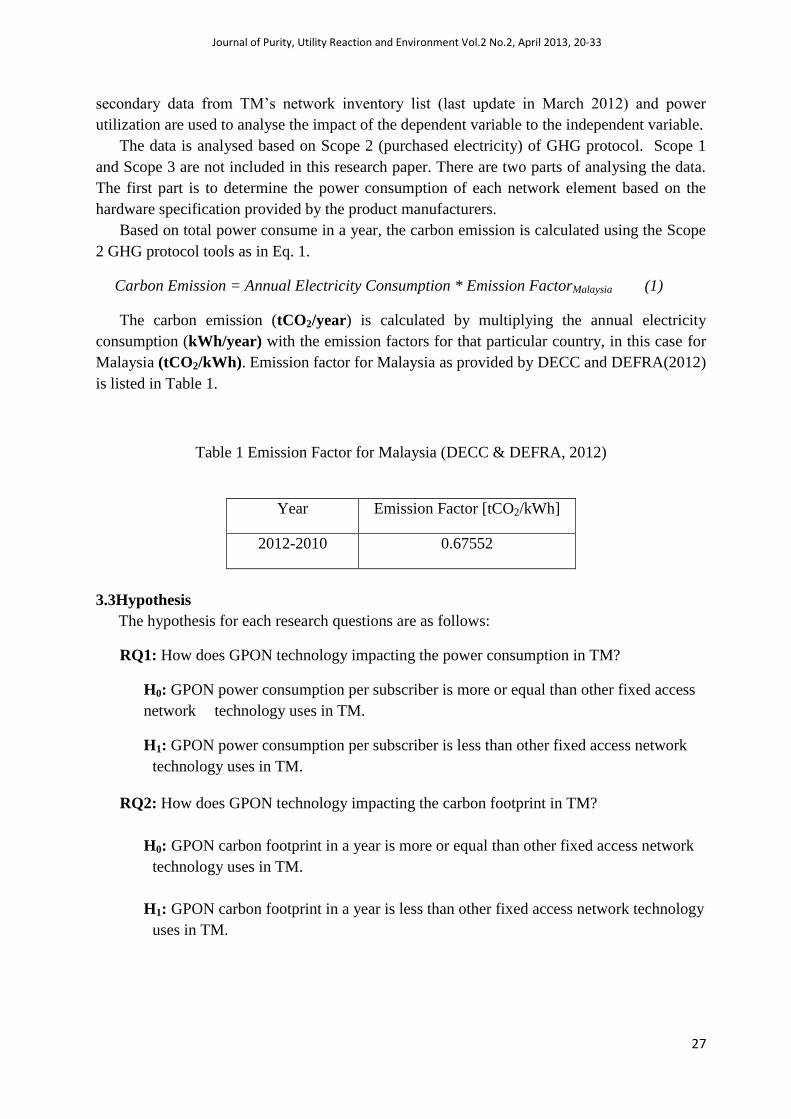
Table 1 Emission Factor for Malaysia (DECC & DEFRA, 2012)
Year Emission Factor [tCO2/kWh]
2012-2010 0.67552
3.3Hypothesis
The hypothesis for each research questions are as follows:
RQ1: How does GPON technology impacting the power consumption in TM?
H0: GPON power consumption per subscriber is more or equal than other fixed access
network technology uses in TM.
H1: GPON power consumption per subscriber is less than other fixed access network
technology uses in TM.
RQ2: How does GPON technology impacting the carbon footprint in TM?
H0: GPON carbon footprint in a year is more or equal than other fixed access network
technology uses in TM.
H1: GPON carbon footprint in a year is less than other fixed access network technology
uses in TM.
Journal of Purity, Utility Reaction and Environment Vol.2 No.2, April 2013, 20-33
28
4. Result and Discussion
Technology used by TM to provide broadband access services is based on fixed line access
technology; which are Gigabit Passive Optical Network (GPON) and Digital Subscriber Line
(DSL; ADSL2+and VDSL2). GPON technology was installed at new deployment area and
VDSL2 has been deployed at high-rise buildings to provide High Speed Broadband service for
bandwidth more than 5Mbps. ADSL2+ is deployed to provide broadband services for
bandwidth below 4 Mbps.
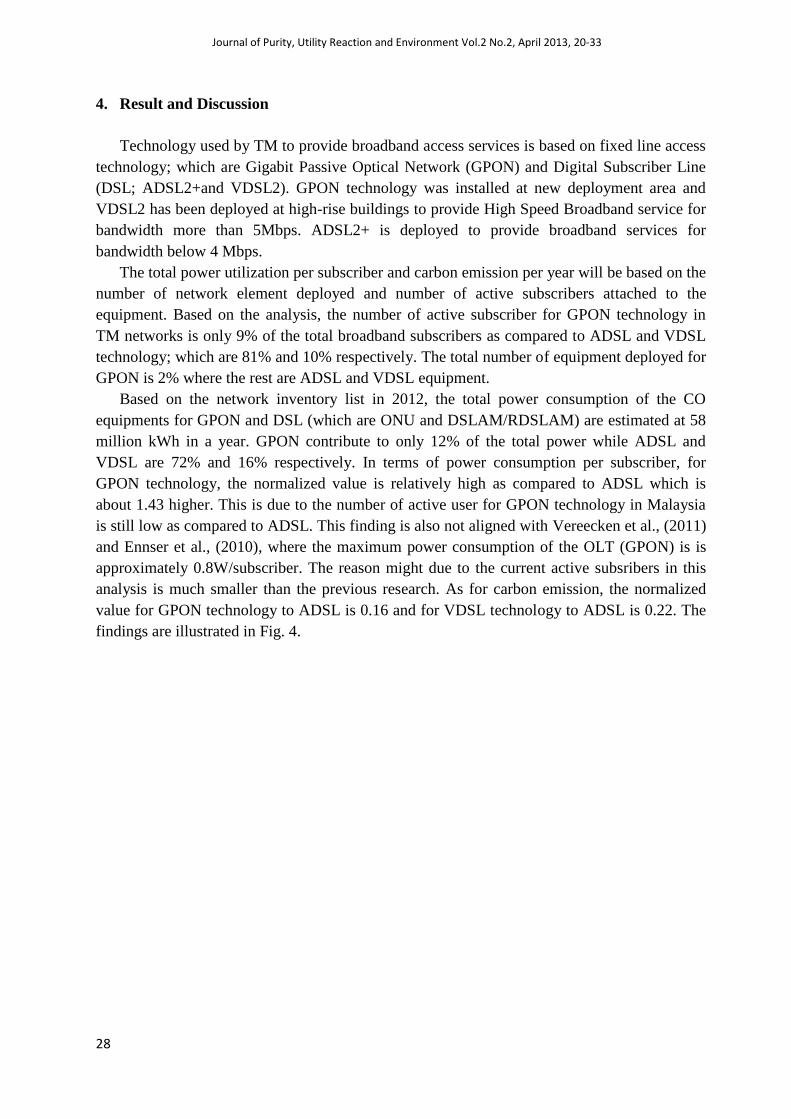
The total power utilization per subscriber and carbon emission per year will be based on the
number of network element deployed and number of active subscribers attached to the
equipment. Based on the analysis, the number of active subscriber for GPON technology in
TM networks is only 9% of the total broadband subscribers as compared to ADSL and VDSL
technology; which are 81% and 10% respectively. The total number of equipment deployed for
GPON is 2% where the rest are ADSL and VDSL equipment.
Based on the network inventory list in 2012, the total power consumption of the CO
equipments for GPON and DSL (which are ONU and DSLAM/RDSLAM) are estimated at 58
million kWh in a year. GPON contribute to only 12% of the total power while ADSL and
VDSL are 72% and 16% respectively. In terms of power consumption per subscriber, for
GPON technology, the normalized value is relatively high as compared to ADSL which is
about 1.43 higher. This is due to the number of active user for GPON technology in Malaysia
is still low as compared to ADSL. This finding is also not aligned with Vereecken et al., (2011)
and Ennser et al., (2010), where the maximum power consumption of the OLT (GPON) is is
approximately 0.8W/subscriber. The reason might due to the current active subsribers in this
analysis is much smaller than the previous research. As for carbon emission, the normalized
value for GPON technology to ADSL is 0.16 and for VDSL technology to ADSL is 0.22. The
findings are illustrated in Fig. 4.
Journal of Purity, Utility Reaction and Environment Vol.2 No.2, April 2013, 20-33
29
Fig. 4. Normalization of GPON and DSL Technology – Power consumption per subscriber,
Power Consumption and Carbon Emission in a year
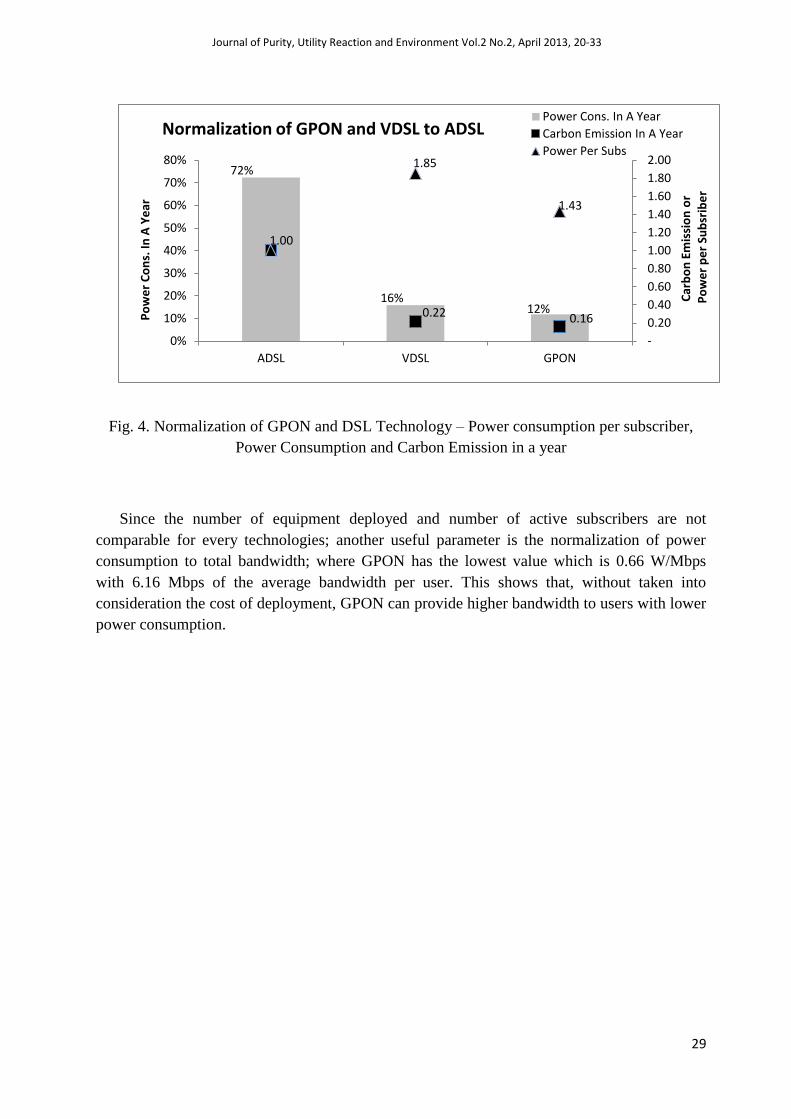
Since the number of equipment deployed and number of active subscribers are not
comparable for every technologies; another useful parameter is the normalization of power
consumption to total bandwidth; where GPON has the lowest value which is 0.66 W/Mbps
with 6.16 Mbps of the average bandwidth per user. This shows that, without taken into
consideration the cost of deployment, GPON can provide higher bandwidth to users with lower
power consumption.
72%
16% 12% 0.22 0.16
1.00
1.85
1.43
-
0.20
0.40
0.60
0.80
1.00
1.20
1.40
1.60
1.80
2.00
0%
10%
20%
30%
40%
50%
60%
70%
80%
ADSL VDSL GPON
Car
bo
n E
mis
sio
n o
r P
ow
er
pe
r Su
bsr
ibe
r
Po
we
r C
on
s. In
A Y
ear
Normalization of GPON and VDSL to ADSL
Power Cons. In A Year
Carbon Emission In A Year
Power Per Subs
Journal of Purity, Utility Reaction and Environment Vol.2 No.2, April 2013, 20-33
30
Fig. 5. GPON and DSL Technology – Average Bandwidth
Based on the analysis and result, the accepted hypothesis is that GPON technology power
consumption per subscriber is higher that ADSL technology. This is because the number of
active user for GPON is much lower as compared to ADSL. As for carbon emission in a year,
the accepted hypothesis is that, GPON carbon emission in a year is much lower than ADSL.
Even if the number of GPON OLT deployed are low and the number of subscribers are
relatively very small as compared to DSL technology, GPON power to bandwidth
normalization is significantly small as compared to DSL since GPON can provide much higher
average bandwidth to users. Therefore, the power consumption and carbon emission can be
further reduced by increasing the equipments utilization.
5. Conclusion
This research paper has achieved its objective to find out the impact of GPON technology
on power consumption and carbon footprint in Malaysia by using TM as a case study. In the
context of TM, GPON technology power consumption per subscriber is higher than ADSL. As
for carbon footprint in a year, GPON is significantly lower than the ADSL and VDSL. This is
because the number of active user for GPON in this analysis is much lower as compared to
ADSL and the number of equipment deployed for ADSL is much higher than GPON.
Therefore, in order to reduce power consumption and carbon emission, equipment utilization
should be increased.
3.58
0.83 0.66
0.92
6.32 6.16
0.00
1.00
2.00
3.00
4.00
5.00
6.00
7.00
0.00
0.50
1.00
1.50
2.00
2.50
3.00
3.50
4.00
ADSL VDSL GPON
Ave
rage
Ban
dw
idth
pe
r u
ser,
Mb
ps/
sub
Po
we
r to
To
tal B
and
wid
th, W
/Mb
ps
GPON and DSL: Average Bandwidth and Power to Total Bandwidth
W/Mbps
Mbps/sub
Journal of Purity, Utility Reaction and Environment Vol.2 No.2, April 2013, 20-33
31
6. Policy Implication and Future Research
These findings can be used as a based line for Telco to craft their policy and guideline in
access network planning and deployment. Power consumption and carbon emission should be
one of the criteria in selecting the access technology besides performance and deployment cost.
This study opens up future research on maximizing the equipment utilization to further reduce
the power consumption and carbon footprint. Besides that, renewable energy should be
considered as another wise option for a sustainable future.
References
Bianco, C., Cucchietti, F., & Griffa, G. (2007). Energy consumption trends in the next
generation access network — a telco perspective. Telecommunications Energy Conference
INTELEC 2007. 29th International , 737-742.
Bolla, R., Davoli, F., Bruschi, R., Christensen, K., Cucchietti, F., & Singh, S. (2011). The
potential impact of green technologies in next-generation wireline networks: is there room
for energy saving optimization? IEEE Communications Magazine:Communication,
Networking & Broadcasting , 80-86.
Coomonte, R., Lastres, C., Feijóo, C., & Martín, Á. (2011). A simplified energy consumption
model for fiber-based Next Generation Access Network. Telematics and Informatics , 375-
386.
Cota, P., & Pavicic, T. (2011). New Technologies for Improvement of Characteristics in DSL
Access Network. IEEE Conference Publication: MIPRO, 2011 Proceedings of the 34th
International Convention , (pp. 511-516).
DECC & DEFRA. (2012). Guidelines to Defra / DECC's GHG Conversion Factors for
Company Reporting.
Department of Standards Malaysia. (2012). Malaysian Standards Online. Retrieved Dec 2012,
from http://www.msonline.gov.my/display.php?view=66
Ennser, K., Devlin, B., & Mangeni, S. (2010). Towards Greener Optical Access Networks.
IEEE Conference Publication: Transparent Optical Networks (ICTON), 2010 12th
International Conference on Communication, Networking & Broadcasting ; Computing &
Processing (Hardware/Software) ; Photonics & Electro-Optics, (pp. 1-4).
EPA. (2010). Life‐Cycle GHG Accounting Versus GHG Emission Inventories.
ETSI. (2012, September). ETSI standards focus on energy efficiency and sustainability. ETSI
Newsletter , p. 7.
Journal of Purity, Utility Reaction and Environment Vol.2 No.2, April 2013, 20-33
32
Gee, L. T. (2012, May 9-10). Current status on carbon capture and storage initiative in
Malaysia. 4th IEA International CCS Regulatory Network Meeting . Paris.
Horiuchi, Y., & Suzuki, M. (2007). Infrastructure and Challenges for Convergence of Radio,
Fibre and DSL Technology. VDE Conference Publication: Optical Communication
(ECOC), 2007 33rd European Conference and Ehxibition of Photonics & Electro-Optics ,
(pp. 1-4).
ISO. (2012). ISO 14000-Environmental Management. Retrieved Dec 2012, from
http://www.iso.org/iso/home/standards/management-standards/iso14000.htm
Kim, Y.-W., Yim, J., Park, K.-s., & Kim, H. J. (2012). An assessment framework of GHG and
energy intensity of the ICT sector. IEEE Conference Publications: ICT Convergence
(ICTC), 2012 International Conference, (pp. 195-200).
Malaysian Communications and Multimedia Commission. (2012). Communicationa and
Multimedia Pocket Book of Statistic Q3, 2012.
Minoli, D. (2010). Designing green networks with reduced carbon footprint. Journal of
Telecommunications Management , 15-35.
Muniandy, L., & Muniandy, B. (2012). State of Cyber Security and the Factors Governing its
Protection in Malaysia. International Journal of Applied Science and Technology , 106-
112.
NTT Communications Group. (2010). Corporate Social Responsibility Report.
Rhee, J. M., Lim, D. S., & Chung, S.-Y. (2009). A Proposal of GHG Inventory Implementation
for Telecommunication Sector in Korea. IEEE Conference Publication:
Telecommunications Energy Conference, (pp. 1-4).
Roy, S. (2008). Energy logic: A road map to reducing energy consumption in telecom
munications networks. IEEE Conference Publications: Telecommunications Energy
Conference, (pp. 1-9).
Sandhu, S., Rawal, A., Kaur, P., & Gupta, N. (2012). Major components associated with Green
Networking in Information Communication Technology systems. IEEE Conference
Publications: Computing, Communication and Applications (ICCCA), 2012 International
Conference, (pp. 1-6).
Telekom Malaysia. (2011). Telekom Malaysia Annual Report.
The Climate Group. (2008). SMART 2020: Enabling the low carbon economy in the
information age. Global eSustainability Iniative (GeSI).
Journal of Purity, Utility Reaction and Environment Vol.2 No.2, April 2013, 20-33
33
Valenti, A., Matera, F., & Beleffi, G. (2012). Power Consumption Measurements of Access
Networks in a Wide Geographical Area Test Bed and Economic Perspectives. IEEE
Conference Publications:Future Network & Mobile Summit (FutureNetw), 2012 , (pp. 1-6).
Vereecken, W., Heddeghem, W. V., Colle, D., Pickavet, M., & Demeester, P. (2010). Overall
ICT Footprint and Green Communication. IEEE Conference Publications:
Communications, Control and Signal Processing (ISCCSP), 2010 4th International
Symposium , (pp. 1-6).
Vereecken, W., Heddeghem, W. V., Deruyck, M., Puype, B., Lannoo, B., Joseph, W., et al.
(2011). Power Consumption in Telecommunication Networks: Overview and Reduction
Strategies. IEEE Journasl and Magazines: Communication Magazine , 62-69.
World Business Council for Sustainable Development and World Resources Institute. (2012).
Greenhouse Gas Protocol. Retrieved Dec 2012, from http://www.ghgprotocol.org/
World Business Council for Sustainable Development and World Resources Institute. (2012).
GHG Protocol Product Standard ICT Sector Guidance.
World Business Council for Sustainable Development and World Resources Institute. (2011).
Product Life Cycle Accounting and Reporting Standard.
World Business Council for Sustainable Development and World Resources Institute. (2004).
The Greenhouse Gas Protocol: A Corporate Accouting and Reporting Standard (Revised
Edition).
World Business Council for Sustainable Development and World Resources Institute. (2011).
The Greenhouse Gas Protocol: Corporate Value Chain (Scope 3) Accounting and
Reporting Standard.
Xiyang, Z., & Chuanqing, C. (2009). Discuss of a Distributed Structure in Access Network.
IEEE Conference Publications: Intelligent Information Technology Application, 2009. IITA
2009. Third International Symposium, (pp. 718-721).
Zhang, Y., Chowdhury, P., Tornatore, M., & Mukherjee, B. (2010). Energy Efficiency in
Telecom Optical Networks. IEEE Journals and Magazines: Communications Surveys &
Tutorials , 441-458.


