Embed Size (px)
Citation preview

The Impacts of Aqueous Ions on Interfacial Tension and Wettabilityof an Asphaltenic−Acidic Crude Oil Reservoir during Smart WaterInjectionMostafa Lashkarbolooki, Shahab Ayatollahi,*,† and Masoud Riazi
Enhanced Oil Recovery (EOR) Research Center, School of Chemical and Petroleum Engineering, Shiraz University, Post Office Box7134851154, Shiraz, Iran
ABSTRACT: The use of adjusted/optimized saline watercategorized into two different classes namely smart water(SW) and low salinity (LoSal) water injection has beenproposed for more oil recovery from specific types of oilreservoirs. There are possible mechanisms concerning SWflooding that have been proposed in the literature, some ofthem are still subject to more examination. In this study, anexperimental investigation is performed to determine theinfluence of type and amount of salt to the surface properties including interfacial tension (IFT) and contact angle (CA) ofaqueous solution + acidic and asphaltenic crude oil + carbonate rock systems. For this purpose, the concentration of differentsalts including NaCl, KCl, Na2SO4, MgSO4, CaSO4, CaCl2, and MgCl2 are examined in a wide range of concentrations. Themeasurements revealed that salinity has dual impacts on the CA of water wet surfaces of carbonate rock. That is, CA couldremain unchanged or increase as a function of brine salinity, though the increase was still within the strongly water-wet region ofwettability with high film stability. The results of IFT measurements show that using ions especially divalent cations in thepresence of chloride anion could substantially decrease the IFT values. The results show that the lowest IFT values are obtainedat high salinity conditions (above 0.053 mol·kg−1) especially if divalent ions of MgCl2 are utilized. High values of IFT areobtained if monovalent salts such as NaCl and KCl are used.
1. INTRODUCTION
It is well-known that approximately more than half of the oilremains trapped underground after primary and secondary(water flooding) oil recovery stages. More than 50 % of theknown petroleum reserves are placed in carbonate reservoirs.1
The capillary forces in the pores and throats would entrap theoil ganglia and retain them as an unrecovered phase in thereservoir. The trapped oil cannot be recovered by conventionalmethods. Therefore, during the recent decades, manyresearchers utilized different methods to mobilize and producethe trapped oil under stabilized conditions called enhanced oilrecovery (EOR) processes.2
One of the well-established EOR methods to improve oilrecovery is the injection of saline water, known as low salinity(LoSal) water-flooding.1 In this regard, several research workshave investigated the impact of brine composition on oilrecovery under the title of LoSal injection process,3−11 but nosignificant LoSal water-flooding potential has been re-ported.12−15 For example, Winoto et al.12 investigated theeffect of LoSal water injection into sandstone and carbonateoutcrop with gas permeabilities ranging from 1.49 mD to 7187mD and porosities from 10 % to 39 %. The average tertiary oilrecovery was only 1.5 % of the original oil in place (OOIP)with the highest value of 5.8 % of OOIP and minimum of zero.The tests on core plugs of six sandstone and three carbonatesshowed increased oil recovery using low salinity connate andinjected brine. Six of the plugs showed an increase in recovery
for the low salinity water floods, while three of them exhibitedthat the LoSal flooding hinders the oil recovery efficiency.12 Inaddition, Tang and Morrow13 carried out some LoSal floodingexperiments using Berea sandstone with three crude oil andthree reservoir brine samples. They showed that the salinity ofthe connate brine has a major influence on wettability and oilrecovery at reservoir temperature conditions.The experimental results demonstrated that the LoSal water-
flooding performance is controlled by the presence of clayminerals, high concentration of divalent cations (i.e., Ca2+,Mg2+) in the formation water, oil composition, and oil-wet/intermediate-wet conditions of the rock surface.16,17 On thebasis of this finding, it is necessary that the formation rock beoil-wet toward intermediate-wet in order to obtain a moreproper oil recovery using LoSal water-flooding.13−15,18,19 In thisstudy, however, the efficiency of SW injection for stronglywater-wet cases is investigated.It is well understood that the IFT is an important factor in
EOR processes that would influence capillary forces throughwhich the trapped oil could be mobilized.20−23 However, theexperimental data on IFT for complex fluid systems involvingmulticomponent phases are scarce.24 The IFT of crude oil in areservoir is a complex function of wide ranges of unknown
Received: June 10, 2014Accepted: October 1, 2014Published: October 20, 2014
Article
pubs.acs.org/jced
© 2014 American Chemical Society 3624 dx.doi.org/10.1021/je500730e | J. Chem. Eng. Data 2014, 59, 3624−3634

factors, including temperature, pressure, salinity, amount, andtype of heteroatoms present, acid number, base number, pH ofthe aqueous phase, viscosity, type, and amount of surface activematerial such as asphaltene and resin, amount of dissolvedgases, and the presence of fine solids.24−26
Regarding these effective parameters, many investigationshave been performed demonstrating that salts can significantlyimpact the IFT of crude oil + water systems.24 The likelymechanism is that the presence of salt can alter the distributionof surface active components present in the oil phase into theaqueous phase due to a salting-in and salting-out effects, henceaffecting the IFT and consequently the oil recovery efficiency.The salting-out effect is a phenomenon in which the polarorganic components are more preferred to move into the oilphase or toward the solid surface with increasing brine salinity(at high salt concentration).27 Whereas, the salting-in effect isthe opposite trend if the solubility of polar organic speciesincreases in the aqueous phase (at low salt concentration).4 Onthe contrary, in the salting-in effect polar organic species tendto be dissolved in water.4 Polar organic species could bedissolved in water by hydrogen bonds created around itshydrophobic part. Inorganic ions (e.g., Na+, Ca2+, and Mg2+)would break up the water structure created around the organicmolecules; consequently, the solubility of organic moleculesdecreases in the water phase. Hence, inorganic ions are knownas structure breakers.28
In brief, the salting-in effect accelerates the diffusion ofsurface active components from bulk solution to the interface atlow salt concentration.29 On the other hand, the aqueoussolubility of petroleum hydrocarbon species decreases withincreasing salinity at high salt concentration (salting-outeffect).30−32
It is normally expected that the IFT of hydrocarbon andwater systems (without natural surfactant such as asphalteneand resin, which naturally exist in crude oil) increases as the saltconcentration increases.33−36 However, the opposite trend hasbeen also reported by several researchers.35,36 For instance, theopposite trends were reported by Alotaibi et al.37 and Serrano-Saldana et al.38 for the IFT of dodecane + brine and dodecane+ NaCl aqueous solutions, respectively. On the basis of theresults obtained by Alotaibi et al.37 a critical salt concentrationcan be specified at which the IFT reaches to its minimum value.In addition, the obtained results by Serrano-Saldana et al.38
showed that the presence of salt in the aqueous phase decreasesthe IFT of a brine−oil system. On the contrary to theaforementioned trends, Aveyard and Saleem33 and Cai et al.35
reported that the IFT of the systems of dodecane + NaCl, KCl,and Na2SO4 aqueous solution and dodecane + NaCl, CaCl2,and MgCl2 aqueous solution increases. This observation wasalso reported by different authors for other hydrocarbons,including hexane,34−36 heptane,33 octane,35 decane,33,35 tetra-decane, hexadecane, hexane + decane, hexane + decane +hexadecane,35 cyclohexane, and toluene.36
In addition, Cai et al.35 investigated the effect of carbonnumber on the IFT of hydrocarbon + brine systems. Theymeasured the IFT of five normal alkanes versus water + brine(prepared by NaCl, CaCl2, and MgCl2) as well as somehydrocarbon mixture versus water + brine using pendant-droptensiometry. They reported that not only does the highermolecular weight of normal alkane increase the IFT, but alsothe presence of salt in the aqueous phase results in higher IFTvalues. However, the remarkable point is the main effect of saltconcentration on IFT changes rather than the salt species.
Inspecting the reported results for the salinity effects on theIFT of aqueous solutions + crude oil (with natural surfactant),showed some contradictory outcomes. For an example, IFTstudies with formation brines and synthetic reservoir brines thathave been performed by Isaacs and Smolek39 showed that theincrease in salinity of the aqueous phase decreases the IFTvalues. Besides, Xu40 measured the IFT between Yates crude oiland aqueous solutions represented by Yates formation brine,diluted formation brine with 50 % distilled water, NaClsolution, CaCl2 solution, and pure deionized water. Theobtained results exhibited that the dilution of the brine phaseresulted in higher IFT values, compared to the original brine.On the other hand, Yousef et al.41 observed a contradicting
trend compared with those observed by Isaacs and Smolek37
and Xu.40 They studied the IFT variation using crude oilsamples from carbonate oil reservoirs and different brinesincluding synthetic field connate water, seawater, and differentdiluted versions of seawater. They observed a general trend ofIFT reduction as a result of the salinity reduction.Vijapurapu and Rao42 also reported the effect of brine
dilution on the IFT of dead Yates crude oil. They introducedcritical brine concentration at which the IFT reaches itsminimum value. Moreover, in a study performed by Hamoudaand Karoussi,43 IFT measurement between 0.005 M (mol L−1
solution) stearic acid in decane and 0.1 M concentration ofNa2SO4 or MgCl2 was performed to study the effect of theseions in saline water. Their results showed that the presence ofmagnesium ions introduces a greater effect on the IFT than thesulfate ions present in the water. As discussed above, althoughseveral investigations have been performed during the pastdecade, no clear trend about the influence of salinity on the IFTvariation has been proposed.24
In addition, regarding wettability alteration several inves-tigations were also performed. On the basis of the obtainedresults, a general opinion is that the wettability alteration is dueto complex interactions occurring in a crude oil−brine-rock(COBR) system. Such interactions are strongly dependent onoil and brine compositions, rock mineralogy, temperature,pressure, and the contact time between the phases.44−50 It hasbeen shown, for instance, that the presence of polar organiccomponents in crude oil can modify the complex rock + fluidand fluid + fluid interactions in COBR systems. These polarcomponents are determining factors on the solubility, interfacialactivity, and stability of large molecules in the oil (such asasphaltene and resin).32 It is also reported that the salting-outeffect increases the preference of the organic material for the oilphase or the solid surface, and thereby increases the possibilityof wettability alteration toward more oil-wet conditions.27
Because this possibility rises from the presence of ions in thesolution, it seems that using smart water (SW) is preferred forenhanced oil recovery through both mechanisms of wettabilityalteration and IFT variation. SW can be made by adjusting/optimizing the ion composition of the injected fluid in such away that the change in the equilibrium of the initial COBRsystem modifies the initial wetting conditions, consequentlymobilizing the oil out of the reservoir rock.1
The formation water may be of high salinity, and it is usuallyrich in Na+, Ca2+, Mg2+, and Cl− and a small amount of SO4.
2,28
Generally, the oil recovery from carbonate rocks is well below30 % due to low water wetness, natural fractures, lowpermeability, and the heterogeneous nature of rock properties.1
Bringing into account all of these contradicting results andthe importance of EOR from carbonate formations indicates
Journal of Chemical & Engineering Data Article
dx.doi.org/10.1021/je500730e | J. Chem. Eng. Data 2014, 59, 3624−36343625

the need of further investigation of the effect of type and theamount of salts on IFT and wettability. In this study, to presentdeep insight on the interaction of salinity and surfaceproperties, the impact of different salts including NaCl, KCl,Na2SO4, MgSO4, CaSO4, CaCl2, and MgCl2 with differentconcentrations on the IFT and CA using one of the southernIranian crude oil and a carbonate rock sample are investigated.
2. EXPERIMENTAL SECTION2.1. Drop-Shape Analysis Apparatus. In this study, a
drop-shape analysis (DSA 100, KRUSS, Germany) apparatuswas used for the measurement of both the equilibrium IFT ofthe crude oil + brine system and the contact angle. The DSAtechnique is probably the most advanced and accurate methodfor measuring both the IFT and contact angle. In comparisonto the other existing methods, the DSA technique for thependant-drop case is accurate for the IFT measurement (0.05mN·m−1), fully automatic, and completely free of the operator’ssubjectivity.51,52 At present, this technique has become astandard method for measuring the IFT.24
The DSA 100 instrument is composed of the following mainparts: syringe piston actuator, sample cell, light source, lens, andCCD camera as well as personal computer to control themicrosyringe pump and image processing software (see Figure1).In brief, for IFT measurements, a microsyringe was fitted
with a U-shape needle and loaded with the fluid with lowerdensity (i.e., crude oil). The syringe was placed in a motordriven piston and the tip of the U-shaped needle waspositioned in an optically clear vessel and immersed in theaqueous phase. The crude oil droplet is positioned at the tip ofthe needle and then, the image of the drop was recorded usinga CCD camera equipped with a macrolens.In light of the low injection rate, the injection continued to
the point at which the drop comes close to leaving the tip of the
U-shaped needle under the effect of buoyancy force not theinjection force. Through application of computer image analysisand processing techniques, an accurate interfacial profile of thependant oil drop is obtained at different times until the dropleaves the tip of the needle. Finally, the image of the pendantdrop is analyzed and the IFT is determined. The obtainedresults revealed that the dynamic IFT gradually approaches aconstant value with passing time which is commonly called theequilibrium IFT. The equilibrium IFT is always considered asthe last measured IFT value as a function of time.Two parameters of the pendant drop that should be
experimentally determined are the equatorial diameter D andthe diameter d at the distance D from the top of the drop (seeFigure 1a).53,54 The IFT is then calculated from the followingequation:53−55
γρ
=Δ gD
H
2
(1)
where g and Δρ are acceleration of gravity and the differencebetween crude oil drop and aqueous solution densities,respectively. The shape-dependent parameter (H) dependson a value of the shape factor (S = d/D).54−56 In addition, thecontact angle was measured with the sessile up experiment asshown in Figure 1b.
2.2. Crude Oil Properties. The chemical analysis of thecrude oil supplied from one of the Iranian oil reservoirs ispresented in Tables 1 and 2. The acidic components in crudeoils consist of organic acids, inorganic acids, and some othercompounds such as esters, phenols, amines, and pyrrole series,that affect the oil acidity.57 The acidity of a crude oil is mostcommonly expressed by its total acid number (TAN), which isthe number of milligrams of KOH determined by nonaqueoustitration (ASTM D 664-1989) needed to neutralize the acidityin one gram of oil.58 In the petroleum industry, if the TAN of acrude oil is higher than 0.5 mg KOH·g−1, the crude oil is
Figure 1. Schematic diagram of the drop-shape analyzer (DSA 100) for IFT measurement (a); cell of DSA 100 for contact angle (CA) measurement(b).
Journal of Chemical & Engineering Data Article
dx.doi.org/10.1021/je500730e | J. Chem. Eng. Data 2014, 59, 3624−36343626
considered as acidic.59 For this reason, the TAN of crude oilwas measured using a potentiometric titration based on theASTM D 664 method and the TAN was obtained at about 1.5mg KOH·g−1.In addition, the model crude oil was analyzed by infrared
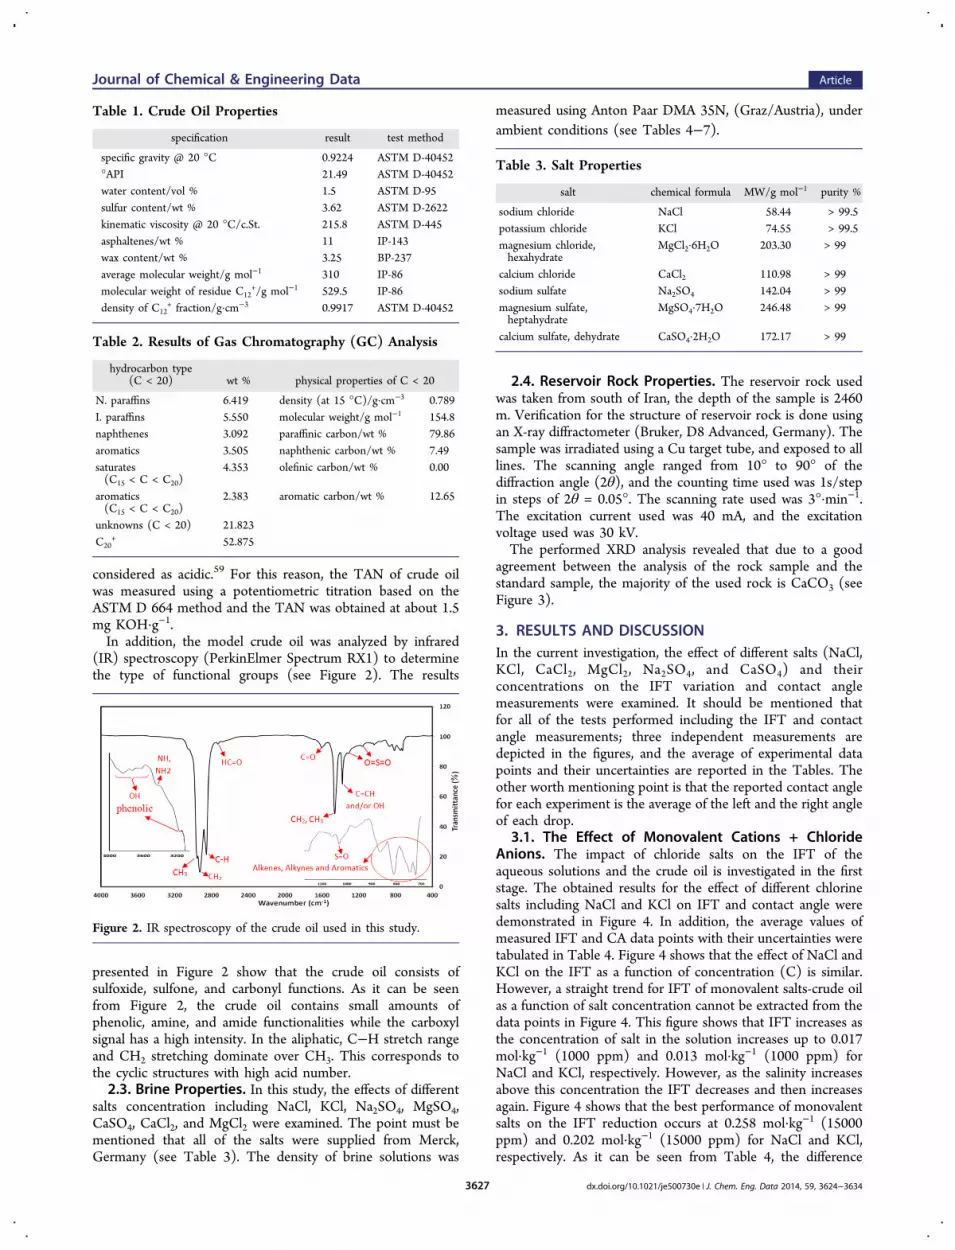
(IR) spectroscopy (PerkinElmer Spectrum RX1) to determinethe type of functional groups (see Figure 2). The results
presented in Figure 2 show that the crude oil consists ofsulfoxide, sulfone, and carbonyl functions. As it can be seenfrom Figure 2, the crude oil contains small amounts ofphenolic, amine, and amide functionalities while the carboxylsignal has a high intensity. In the aliphatic, C−H stretch rangeand CH2 stretching dominate over CH3. This corresponds tothe cyclic structures with high acid number.2.3. Brine Properties. In this study, the effects of different
salts concentration including NaCl, KCl, Na2SO4, MgSO4,CaSO4, CaCl2, and MgCl2 were examined. The point must bementioned that all of the salts were supplied from Merck,Germany (see Table 3). The density of brine solutions was
measured using Anton Paar DMA 35N, (Graz/Austria), underambient conditions (see Tables 4−7).
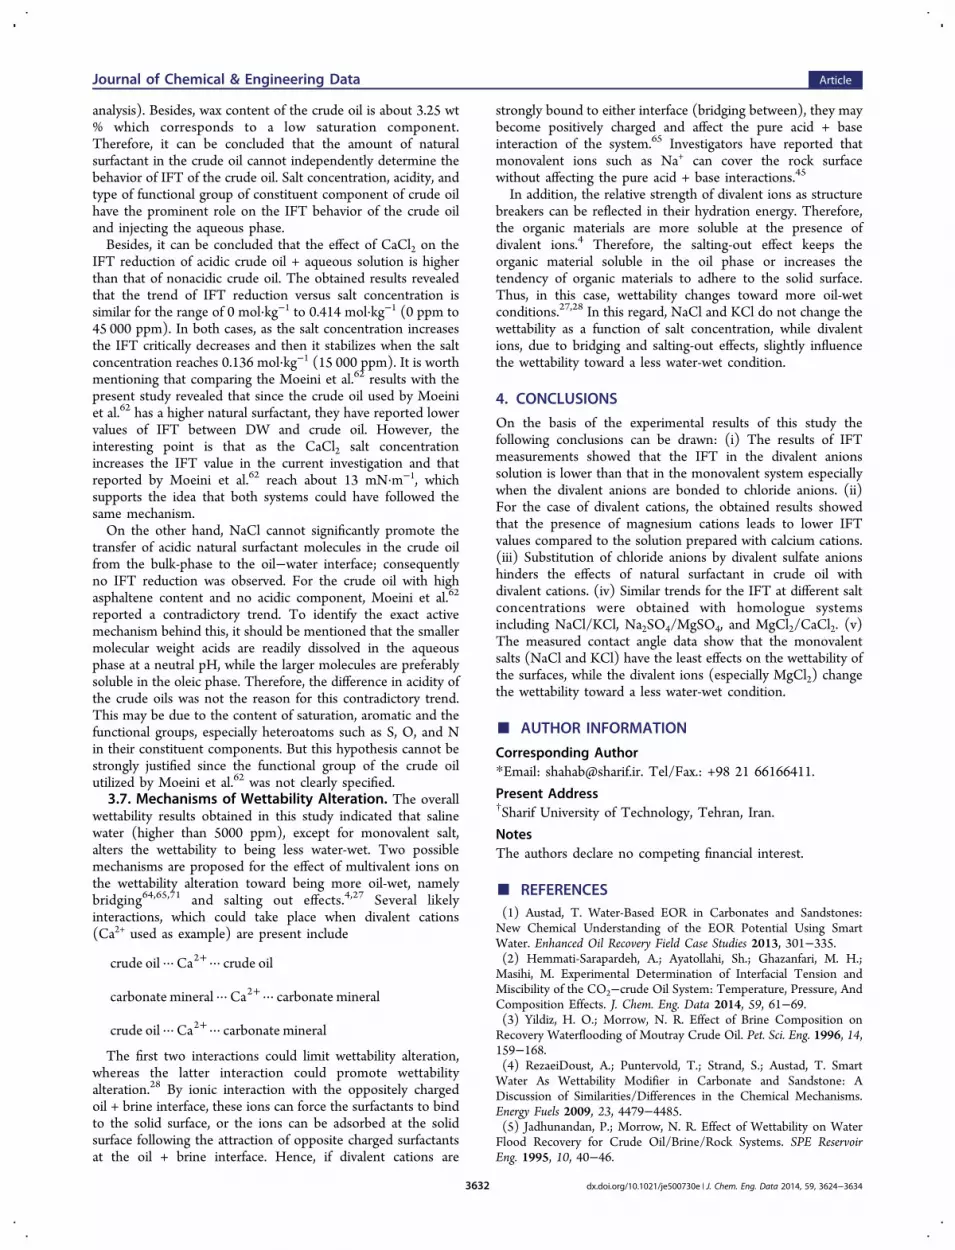
2.4. Reservoir Rock Properties. The reservoir rock usedwas taken from south of Iran, the depth of the sample is 2460m. Verification for the structure of reservoir rock is done usingan X-ray diffractometer (Bruker, D8 Advanced, Germany). Thesample was irradiated using a Cu target tube, and exposed to alllines. The scanning angle ranged from 10° to 90° of thediffraction angle (2θ), and the counting time used was 1s/stepin steps of 2θ = 0.05°. The scanning rate used was 3°·min−1.The excitation current used was 40 mA, and the excitationvoltage used was 30 kV.The performed XRD analysis revealed that due to a good
agreement between the analysis of the rock sample and thestandard sample, the majority of the used rock is CaCO3 (seeFigure 3).
3. RESULTS AND DISCUSSIONIn the current investigation, the effect of different salts (NaCl,KCl, CaCl2, MgCl2, Na2SO4, and CaSO4) and theirconcentrations on the IFT variation and contact anglemeasurements were examined. It should be mentioned thatfor all of the tests performed including the IFT and contactangle measurements; three independent measurements aredepicted in the figures, and the average of experimental datapoints and their uncertainties are reported in the Tables. Theother worth mentioning point is that the reported contact anglefor each experiment is the average of the left and the right angleof each drop.
3.1. The Effect of Monovalent Cations + ChlorideAnions. The impact of chloride salts on the IFT of theaqueous solutions and the crude oil is investigated in the firststage. The obtained results for the effect of different chlorinesalts including NaCl and KCl on IFT and contact angle weredemonstrated in Figure 4. In addition, the average values ofmeasured IFT and CA data points with their uncertainties weretabulated in Table 4. Figure 4 shows that the effect of NaCl andKCl on the IFT as a function of concentration (C) is similar.However, a straight trend for IFT of monovalent salts-crude oilas a function of salt concentration cannot be extracted from thedata points in Figure 4. This figure shows that IFT increases asthe concentration of salt in the solution increases up to 0.017mol·kg−1 (1000 ppm) and 0.013 mol·kg−1 (1000 ppm) forNaCl and KCl, respectively. However, as the salinity increasesabove this concentration the IFT decreases and then increasesagain. Figure 4 shows that the best performance of monovalentsalts on the IFT reduction occurs at 0.258 mol·kg−1 (15000ppm) and 0.202 mol·kg−1 (15000 ppm) for NaCl and KCl,respectively. As it can be seen from Table 4, the difference
Table 1. Crude Oil Properties
specification result test method
specific gravity @ 20 °C 0.9224 ASTM D-40452°API 21.49 ASTM D-40452water content/vol % 1.5 ASTM D-95sulfur content/wt % 3.62 ASTM D-2622kinematic viscosity @ 20 °C/c.St. 215.8 ASTM D-445asphaltenes/wt % 11 IP-143wax content/wt % 3.25 BP-237average molecular weight/g mol−1 310 IP-86molecular weight of residue C12
+/g mol−1 529.5 IP-86density of C12
+ fraction/g·cm−3 0.9917 ASTM D-40452
Table 2. Results of Gas Chromatography (GC) Analysis
hydrocarbon type(C < 20) wt % physical properties of C < 20
N. paraffins 6.419 density (at 15 °C)/g·cm−3 0.789I. paraffins 5.550 molecular weight/g mol−1 154.8naphthenes 3.092 paraffinic carbon/wt % 79.86aromatics 3.505 naphthenic carbon/wt % 7.49saturates(C15 < C < C20)
4.353 olefinic carbon/wt % 0.00
aromatics(C15 < C < C20)
2.383 aromatic carbon/wt % 12.65
unknowns (C < 20) 21.823C20
+ 52.875
Figure 2. IR spectroscopy of the crude oil used in this study.
Table 3. Salt Properties
salt chemical formula MW/g mol−1 purity %
sodium chloride NaCl 58.44 > 99.5potassium chloride KCl 74.55 > 99.5magnesium chloride,hexahydrate
MgCl2·6H2O 203.30 > 99
calcium chloride CaCl2 110.98 > 99sodium sulfate Na2SO4 142.04 > 99magnesium sulfate,heptahydrate
MgSO4·7H2O 246.48 > 99
calcium sulfate, dehydrate CaSO4·2H2O 172.17 > 99
Journal of Chemical & Engineering Data Article
dx.doi.org/10.1021/je500730e | J. Chem. Eng. Data 2014, 59, 3624−36343627

between IFT of this optimum salt concentration and deionizedwater for this crude oil was only ∼1.8 and ∼1.2 mN·m−1 forNaCl and KCl, respectively. Therefore, it can be concluded thatthe studied monovalent salts were not able to considerablypromote the natural surfactant molecules in the crude oil totransfer from the bulk-phase to the oil−water interface. Also, anunexpected behavior was observed as the concentration of saltin the solution increased up to 0.017 mol·kg−1 (1000 ppm) and0.013 mol·kg−1 (1000 ppm) for NaCl and KCl, respectively. Atthis point, the difference between the IFT of both themonovalent salt + crude oil and deionized water + crude oilsystems was ∼4.1 mN·m−1 (see Table 4). It appears thatbecause of the low synergism between the monovalent salt andthe natural surfactant in the crude oil, the effect of salinity onthe water + hydrocarbon IFT is the dominant mechanism.Hence, when inorganic salts (Na+ and K+) are present in theaqueous phase, the water molecules can form a cage-like
hydrogen-bonded structure around the salt ions. At theinterface, water molecules are in contact with another phaseand the hydrogen bonding is disrupted creating a higher energyenvironment for the ions. Therefore, the salts are depleted nearthe interface and the surface excess concentration (thedifference between solute concentration in the bulk and thatat the interface) of salts is negative.24 As shown by the Gibbsadsorption isotherm (eq 2), IFT increases when inorganic saltsare added to the aqueous phase.24,60
∑γ = − ΓRT ad d lni i (2)
where dγ is the change in IFT of the solution, R is the gasconstant, T is the absolute temperature, and Γi and ai are thesurface excess concentration and the activity of the ithcomponent in the solution, respectively. The summation istaken over all the species in the solution.Adding salts to the system can alter the distribution of
natural surfactants (including asphaltene and resin) at theinterface owing to electrostatic effects and consequently IFTvalues changes. Hence, the obtained results demonstrated thatas the concentration of monovalent salt (NaCl and KCl)increases higher than 0.017 mol·kg−1 (1000 ppm) and 0.013mol·kg−1 (1000 ppm) for NaCl and KCl, respectively, theactivity coefficient of the salt increases and the salt moleculestransfer to the oil phase,61 the cations near the surface couldtend to interact with the natural surfactant, polar asphaltenesand resins leading to a level of solubility in both oleic andaqueous phases.62 With the cations present at the interface,negative surface excess concentration for salt turns to bepositive in addition to the positive Γasphaltene, which con-sequently lowers the IFT according to the Gibbs adsorptionisotherm (eq 2). However, for the higher salt concentration, atrend of increasing IFT was noticed leaving an optimum salinitybehind. The dominant mechanism in this region is suggested tobe the salting-out effect. The natural surfactants are depletednear the interface and transferred back to the oil phase andbreak the balance of oil−water interface adsorption.63
Consequently, the concentration of salts and natural surfactantat the interface will be depleted and Γasphaltene and Γsalt becomenegative, therefore the IFT increases.In addition, as the salinity increases above 0.519 mol·kg−1
(3000 ppm) and 0.405 mol·kg−1 (3000 ppm) for NaCl andKCl, respectively (see Figure 4), the IFT insignificantlydecreases again. This observed trend can be related to thepacking efficiency of surfactants occuring at the solutioninterface that enhances the capability of the surfactants for IFTreduction. In more detail, as the salt concentration increases tovalues higher than 0.519 mol·kg−1 (30 000 ppm) and 0.405mol·kg−1 (30 000 ppm) for NaCl and KCl, respectively, (after
Table 4. Density, Average IFT, and CA of Sodium and Potassium Chlorides along with Their Uncertainties at Different SaltConcentrations
NaCl KCl
concentration density IFT CA concentration density IFT CA
ppm mol·kg−1 g·cm−3 mN m−1 deg mol·kg−1 g·cm−3 mN m−1 deg
0 0 0.9979 ± 0.0005 22.32 ± 0.14 18.93 ± 0.31 0 0.9979 ± 0.0005 22.32 ± 0.14 18.93 ± 0.311000 0.017 0.9990 ± 0.0005 26.48 ± 0.21 18.80 ± 0.11 0.013 0.9991 ± 0.0005 26.38 ± 0.20 20.47 ± 0.035000 0.086 1.0010 ± 0.0005 23.84 ± 0.17 18.67 ± 0.35 0.067 1.0031 ± 0.0005 22.18 ± 0.24 21.17 ± 0.1715000 0.258 1.0081 ± 0.0005 20.56 ± 0.22 18.87 ± 0.32 0.202 1.0121 ± 0.0005 21.16 ± 0.21 20.73 ± 0.3130000 0.519 1.0188 ± 0.0005 24.80 ± 0.13 18.87 ± 0.23 0.405 1.0239 ± 0.0005 25.34 ± 0.27 20.57 ± 0.1145000 1.256 1.0280 ± 0.0005 24.44 ± 0.16 19.10 ± 0.32 0.609 1.0361 ± 0.0005 23.50 ± 0.14 21.40 ± 0.26
Figure 3. Results of XRD of the reservoir rock used in this study.
Figure 4. Effects of sodium and potassium chlorides on the IFT andCA versus salt concentration: blue □, IFT of NaCl; red ◇, IFT ofKCl; ○, CA of NaCl; △, CA of KCl. Filled marker represents theaverage of three measurements.
Journal of Chemical & Engineering Data Article
dx.doi.org/10.1021/je500730e | J. Chem. Eng. Data 2014, 59, 3624−36343628

the salting out effect reduced the natural surfactant at theinterface), the remaining natural surfactant molecules orientedorderly in the interface (packing effect) leading to less IFTreduction. As it is shown in Table 4 and Figure 4, for all themonovalent salts including NaCl and KCl; the measured CAs,considering the uncertainties, were almost overlapping eachother and show strong water wetness conditions.3.2. The Effect of Divalent Cation + Chloride Anions.
In this section, the effect of divalent cation + chloride anions onthe equilibrium IFT and CA of crude oil versus CaCl2 andMgCl2 concentration are investigated (see Figure 5 and Table
5). A close look in this figure shows that the IFT of CaCl2 andMgCl2 aqueous solution and crude oil is a strong function ofsalt concentration. In other words, as the salt concentrationincreases the IFT substantially decreases and then it stabilizes.In addition, it can be seen from Table 5 that the IFTs of brine +crude oil systems could reduce to low values of ∼4.0 and ∼13.5mN·m−1 for MgCl2 and CaCl2, respectively, when the saltconcentration is in the range of 0.158 mol·kg−1 to 0.478 mol·kg−1 (15 000 ppm to 45 000 ppm) and 0.136 mol·kg−1 to 0.414mol·kg−1 (15 000 ppm to 45 000 ppm) for MgCl2 and CaCl2,respectively. It has been reported already that the divalent metalions enhancing the complexity are Ca2+ and Mg2+.64 These ionscan mask the simple acid + base interaction between oil + brineand brine + solid interfaces,45,65 hence, affecting more thesolubility of organic material in the aqueous phase (salting-ineffect). This observed trend can be related to the fact that polarorganic components of natural surfactants (i.e., asphaltene andresin) react with the divalent ions (MgCl2 and CaCl2)consequently producing complex ions,1,66 which dissolve easierin the water phase and therefore further reduce the IFT values.
In the presence of high salinity brine the salting-out effect hasbeen reported to decrease the preference of polar organicspecies for the water phase.30−32 It has also been reported thatthe surface active contribution of acidic and basic species forIFT reduction is higher for their activity in the water phasecompared with that in the oil phase.32 It can be concluded thatthe more acid/base present in the water phase there is, themore IFT reduction takes place. In this case, the high affinity ofthe divalent cation to the oxygen of the natural surfactant(obtained by IR spectroscopy) mitigated the reduction of bothcoverage fraction of chain groups at high salt concentrationsand polar organic species to the water phase (mitigated thesalting-out effect), therefore IFT would be stabilized between0.158 mol·kg−1 to 0.478 mol·kg−1 (15 000 ppm to 45 000 ppm)and 0.136 mol·kg−1 to 0.414 mol·kg−1 (15 000 to 45 000 ppm)for MgCl2 and CaCl2, respectively. In addition, MgCl2 showed ahigher effect on the IFT reduction than CaCl2 which could berelated to the fact that the affinity of Mg2+ toward oxygen(present in the resin and asphaltene molecules and detected incrude oil by IR spectroscopy) is more than that of Ca2+.67 Ascan be seen from Table 5, the addition of divalent cations to theaqueous phase increases the CA (∼3.1 and ∼5.7 for Ca2+ andMg2+, respectively); however, the increase is still within thestrongly water-wet region of wettability conditions (∼22.1 and∼24.6 for Ca2+ and Mg2+, respectively). Finally, it can beconcluded that the divalent cation (i.e., MgCl2) that leads tohigher IFT reduction shows a higher increase of CA as well.
3.3. The Effect of Monovalent and Divalent Cation +Sulfate Anions. In the third series of the performedexperiments, the effect of monovalent and divalent cation +sulfate anions on the IFT and contact angle were evaluated. AsFigure 6 shows, there is no significant difference betweenNa2SO4 and MgSO4 for the observed trend of IFT variation asa function of salt concentrations.In the first stage, as the salt concentration increases to 0.106
mol·kg−1 and 0.115 mol·kg−1 (15 000 ppm) for Na2SO4 andMgSO4, respectively, the IFT reduces to a minimum value,while further increase of salt concentration leads to higher IFTvalues. This observed trend could be related to the capability ofthese salts to promote natural surfactant migration from crudeoil to the oil−water interface. With respect to this fact, as theconcentration of monovalent salt increases, it is possible thatthe electrical double layer of anionic natural surfactants in crudeoil is more compressed by Mg2+ and Na+ ions. Then, theelectrostatic repulsion among natural surfactant molecules canbe weakened, consequently reducing the intermoleculardistance at the interface.68 As the concentration of these saltsincreases, the intermolecular distance decreases resulting in theincrease of the coverage fraction of the methyl groups,
Figure 5. Effects of magnesium and calcium chlorides on the IFT andCA as a function of salt concentration: blue □, IFT of MgCl2; red ◇,IFT of CaCl2; ○, CA of MgCl2; △, CA of CaCl2. Filled markerrepresents the average of three measurements.
Table 5. Density, Average IFT, and CA of Magnesium and Calcium Chlorides along with Their Uncertainties at Different SaltConcentrations
MgCl2 CaCl2
concentration density IFT CA concentration density IFT CA
ppm mol·kg−1 g·cm−3 mN m−1 deg mol·kg−1 g·cm−3 mN m−1 deg
0 0 0.9979 ± 0.0005 22.32 ± 0.14 18.9 ± 0.32 0 0.9979 ± 0.0005 22.32 ± 0.14 18.9 ± 0.321000 0.011 0.9986 ± 0.0005 23.10 ± 0.21 18.4 ± 0.26 0.009 0.9989 ± 0.0005 21.82 ± 0.16 21.7 ± 0.235000 0.053 1.0012 ± 0.0005 5.70 ± 0.14 22.7 ± 0.20 0.045 1.0021 ± 0.0005 16.79 ± 0.15 20.9 ± 0.1715000 0.158 1.0098 ± 0.0005 4.24 ± 0.08 23.7 ± 0.40 0.136 1.0074 ± 0.0005 14.06 ± 0.11 20.8 ± 0.3530000 0.318 1.0210 ± 0.0005 3.99 ± 0.13 24.7 ± 0.35 0.274 1.0161 ± 0.0005 13.75 ± 0.03 21.9 ± 0.2645000 0.479 1.0326 ± 0.0005 4.29 ± 0.05 24.6 ± 0.26 0.414 1.0251 ± 0.0005 13.25 ± 0.11 22.1 ± 0.43
Journal of Chemical & Engineering Data Article
dx.doi.org/10.1021/je500730e | J. Chem. Eng. Data 2014, 59, 3624−36343629

decreasing the IFT. But, further increases of concentrationmake the intermolecular distance very narrow so thathydrophobic chains of two neighboring molecules overlapeach other. Consequently the coverage fraction of the methylgroup reduces and therefore the IFT increases.In addition, the obtained results indicated that the synergism
of MgSO4 + this asphaltenic crude oil is more noticeable thanthat of Na2SO4 + crude oil. This is mostly due to the presenceof the sulfate anion in both Na2SO4 and MgSO4 aqueoussolution. Therefore, it can be concluded that Mg2+ cationsintroduce a higher adsorption capability of natural surfactant tothe interface of crude oil + aqueous solution compared to Na+
cations. As Table 6 shows, for MgSO4 and Na2SO4, the changein brine salinity from deionized water to high salinity leads to ahigher CA up to ∼3.2 and ∼1.1 degree, respectively. Similar todivalent cations bonded to chloride anions (i.e., MgCl2 andCaCl2), the divalent sulfate anion resulted in a higher IFTreduction for MgSO4 and a higher increase of the CA as well.3.4. The Effect of CaSO4 Aqueous Solution. Finally, in
the last series of tests, the effect of CaSO4 concentration on theIFT and contact angle variation was investigated. It should bementioned that the solubility of CaSO4 in water is as low asabout 2.1 mg·mL−1 at 20 °C (anhydrous).69 Hence, the effectof this salt on the IFT and CA is only investigated at 0.007 mol·kg−1 (1000 ppm) and 0.011 mol·kg−1 (1500 ppm) (see Figure7 and Table 7). Table 7 shows that the IFT was reduced to 2.8mN·m−1 compared to the deionized water. In addition,examining the results given in Figure 7 demonstrates that nosignificant effect on the contact angle was observed by CaSO4.3.5. Comparing the Effect of Chloride and Sulfate
Anions. In this section, comparison was performed betweenthe effect of sulfate and chloride anions on the IFT and CA.Figure 8 compares the IFT of the systems including the Mg2+
cation in the presence of sulfate and chloride anions at differentsalt concentrations. Close examination on the obtained resultsshows that the IFT of MgCl2 aqueous solution + asphaltenicand acidic crude oil is significantly lower than that of MgSO4aqueous solution. Since the Mg2+ cation is present in bothMgCl2 and MgSO4 aqueous solutions, it can be concluded that
Figure 6. Effects of Na2SO4 and MgSO4 on the IFT and CA as afunction of salt concentration: blue □, IFT of Na2SO4; red ◇, IFT ofMgSO4; ○, CA of Na2SO4; △, CA of MgSO4. Filled marker representsthe average of three measurements.
Table 6. Density, Average IFT, and CA of Sodium and Magnesium Sulfates along with Their Uncertainties at Different SaltConcentrations
Na2SO4 MgSO4
concentration density IFT CA concentration density IFT CA
ppm mol·kg−1 g·cm−3 mN m−1 deg mol·kg−1 g·cm−3 mN m−1 deg
0 0 0.9979 ± 0.0005 22.32 ± 0.14 18.9 ± 0.32 0 0.9979 ± 0.0005 22.32 ± 0.14 18.9 ± 0.321000 0.007 0.9986 ± 0.0005 22.89 ± 0.08 20.3 ± 0.29 0.008 0.9995 ± 0.0005 21.65 ± 0.11 19.4 ± 0.295000 0.035 1.0021 ± 0.0005 22.58 ± 0.31 19.9 ± 0.26 0.042 1.0041 ± 0.0005 21.75 ± 0.15 22.7 ± 0.3215000 0.106 1.0118 ± 0.0005 19.03 ± 0.06 20.0 ± 0.35 0.125 1.0151 ± 0.0005 16.21 ± 0.18 22.0 ± 0.4030000 0.213 1.0232 ± 0.0005 20.64 ± 0.12 20.0 ± 0.30 0.249 1.0319 ± 0.0005 20.77 ± 0.16 21.8 ± 0.3545000 0.320 1.0350 ± 0.0005 20.77 ± 0.13 20.0 ± 0.30 0.373 1.0480 ± 0.0005 21.89 ± 0.14 22.2 ± 0.29
Figure 7. Effects of CaSO4 on the IFT and CA as a function of saltconcentration: blue □, IFT of CaSO4, CA of CaSO4. Filled markerrepresents the average of three measurements.
Table 7. Density, Average IFT, and CA of Calcium Sulfatesalong with Their Uncertainties at Different SaltConcentrations
CaSO4
concentration density IFT CA
ppm mol·kg−1 g·cm−3 mN m−1 deg
0 0 0.9979 ± 0.0005 22.32 ± 0.14 18.9 ± 0.321000 0.007 0.9980 ± 0.0005 19.52 ± 0.01 20.7 ± 0.381500 0.011 0.9994 ± 0.0005 21.17 ± 0.24 19.2 ± 0.26
Figure 8. Comparing the effects of MgSO4 and MgCl2 on the IFT andCA as a function of salt concentration: blue □, IFT of MgCl2; red ◇,IFT of MgSO4; ○, CA of MgCl2; △, CA of MgSO4. Filled markerrepresents the average of three measurements.
Journal of Chemical & Engineering Data Article
dx.doi.org/10.1021/je500730e | J. Chem. Eng. Data 2014, 59, 3624−36343630

sulfate anion effectively hinders the formation of complex ionsbetween the natural anionic surfactant (contained oxygen andsulfur in their structure) and the Mg2+ cations. This observationcould be related to two different facts including the bigger sizeof the sulfate anion compared to the chloride anion and theexistence of heteroatoms such as oxygen and sulfur in thesulfate structure. Therefore, the synergism of the chloride anionbonded to the Mg2+ cation for IFT reduction is higher than thatof the sulfate anion. The results also show that the chlorideanion (MgCl2) not only significantly reduces the IFT but alsoincreases the CA more than the sulfate anion (MgSO4).Moreover, comparing the effect of Na2SO4 and NaCl
concentration (see Figure 9) indicated that the synergism of
the sulfate divalent anion bonded to Na+ to reduce the IFT washigher than that of chloride monovalent anion bonded to Na+.Considering all of the examined salt concentrations, Na2SO4introduced slightly better performance compared to NaCl fortransferring the natural surfactant into the interface andreducing the IFT value. In addition, as it can be seen fromFigure 9, the sulfate anion, which causes higher IFT reductionfor Na2SO4, further increases the contact angle compared thechloride anion.Figure 10 shows the results of all measured IFT values for the
seven salts used in this study. These results exhibit the bestperformance of each salt compared with deionized water(ΔIFT), which leads to the following conclusion:
Δ > > > >
> >
IFT of MgCl CaCl MgSO Na SO CaSO
NaCl KCl2 2 4 2 4 4
In other words, the divalent cation bonded to the chlorideanion has the highest performance in IFT reduction. Theresults also showed that substitution of the chloride anion tothe divalent sulfate anion could reduce the performance andsynergism of the complex ion of natural surfactant in the crudeoil with the divalent cation. In addition, the overall resultdemonstrated that the monovalent ions lead to lower IFTreduction considering their slight synergism with the naturalsurfactant of the used crude oil.
3.6. Comparing the Effect of Different Crude Oil.Contradicting results were reported by Moeini et al.62
examining the IFT of heavy crude oil with an API of 20.2and asphaltene content of 13.3 %. They measured the IFTbetween heavy crude oil + NaCl and CaCl2 aqueous solution at313.15 K and atmospheric pressure. The brine concentrationwas changed within the range of 0 mol·kg−1 to 6.62 mol·kg−1 (0ppm to 200 000 ppm) and 0 to 2.18 mol.kg−1 (0 ppm to 200000 ppm) for NaCl and CaCl2, respectively. Their resultsdemonstrated that for both salts, the IFT decreases significantlyat the beginning, while this reduction was reversed to anincreasing trend with a low gradient. The overall resultsrevealed that the optimum salinity of NaCl and CaCl2 systemsranged between 0.54 mol·kg−1 and 1.11 mol·kg−1 (20 000 ppmand 40 000 ppm) and 0.18 mol·kg−1 to 0.36 mol·kg−1 (20 000ppm and 40 000 ppm), respectively. In addition, in all the saltconcentrations, higher IFT values were obtained using CaCl2compared to NaCl aqueous solution.Since the properties of the crude oil used in this study and
the crude oil used by Moeini et al.62 are very similar in terms ofAPI and asphaletene content, the acid numbers were alsocompared. Comparing the acid number of these two crude oilsrevealed that the acidity of crude oil used in this study withTAN = 1.5 mg KOH·g−1 is considerably higher than that usedby Moeini et al.62 (TAN = 0.06 mg KOH·g−1). Therefore, theacid content of the crude oil used in this study could be themain factor to produce different results. In light of this fact, IRspectroscopy analysis could reliably show the involvedfunctional groups in the crude oil that are responsible foracidity of the crude oil. The results demonstrated in Figure 2show that the high acidity of the crude oil used in the currentstudy is based on the sulfoxide, sulfone (with sulfur content of3.62 wt % (see Table 2)) and carbonyl function contents. Asalready discussed in most of the previously published works,22
almost all crude oil types consist of C, H, O, N, and S elements.Heteroatoms such as sulfur, nitrogen, and oxygen are mainlyconcentrated in acidic compounds, especially the element ofoxygen. Further study indicated that over 60 % of the acidiccompounds in crude oils contain two or more oxygen atoms,and compounds containing only one oxygen atom accountedfor less than 10 %. Meanwhile, approximately 25 % of the acidicspecies were sulfur-containing compounds and almost 50 % ofacidic compounds contained nitrogen.70
The other important difference between crude oil of thisstudy and Moeini et al.62 is the content of saturation andaromatic in their constituent components. The total saturationand aromatic component of the crude oil used by Moeini etal.62 is 72 %. This value is considerably higher than that used inthis study (Table 1 shows the details of the hydrocarbon type ofthe used crude oil in this study that was obtained from GC
Figure 9. Comparing the effects of Na2SO4 and NaCl on the IFT andCA as a function of salt concentration: blue □, IFT of Na2SO4, red ◇,IFT of NaCl; ○, CA of Na2SO4; △, CA of NaCl. Filled markerrepresents the average of three measurements.
Figure 10. Comparison of all measured IFT results with the sevensalts studied based on the difference of the best performancescompared to deionized water (Δ IFT).
Journal of Chemical & Engineering Data Article
dx.doi.org/10.1021/je500730e | J. Chem. Eng. Data 2014, 59, 3624−36343631
analysis). Besides, wax content of the crude oil is about 3.25 wt% which corresponds to a low saturation component.Therefore, it can be concluded that the amount of naturalsurfactant in the crude oil cannot independently determine thebehavior of IFT of the crude oil. Salt concentration, acidity, andtype of functional group of constituent component of crude oilhave the prominent role on the IFT behavior of the crude oiland injecting the aqueous phase.Besides, it can be concluded that the effect of CaCl2 on the
IFT reduction of acidic crude oil + aqueous solution is higherthan that of nonacidic crude oil. The obtained results revealedthat the trend of IFT reduction versus salt concentration issimilar for the range of 0 mol·kg−1 to 0.414 mol·kg−1 (0 ppm to45 000 ppm). In both cases, as the salt concentration increasesthe IFT critically decreases and then it stabilizes when the saltconcentration reaches 0.136 mol·kg−1 (15 000 ppm). It is worthmentioning that comparing the Moeini et al.62 results with thepresent study revealed that since the crude oil used by Moeiniet al.62 has a higher natural surfactant, they have reported lowervalues of IFT between DW and crude oil. However, theinteresting point is that as the CaCl2 salt concentrationincreases the IFT value in the current investigation and thatreported by Moeini et al.62 reach about 13 mN·m−1, whichsupports the idea that both systems could have followed thesame mechanism.On the other hand, NaCl cannot significantly promote the
transfer of acidic natural surfactant molecules in the crude oilfrom the bulk-phase to the oil−water interface; consequentlyno IFT reduction was observed. For the crude oil with highasphaltene content and no acidic component, Moeini et al.62
reported a contradictory trend. To identify the exact activemechanism behind this, it should be mentioned that the smallermolecular weight acids are readily dissolved in the aqueousphase at a neutral pH, while the larger molecules are preferablysoluble in the oleic phase. Therefore, the difference in acidity ofthe crude oils was not the reason for this contradictory trend.This may be due to the content of saturation, aromatic and thefunctional groups, especially heteroatoms such as S, O, and Nin their constituent components. But this hypothesis cannot bestrongly justified since the functional group of the crude oilutilized by Moeini et al.62 was not clearly specified.3.7. Mechanisms of Wettability Alteration. The overall
wettability results obtained in this study indicated that salinewater (higher than 5000 ppm), except for monovalent salt,alters the wettability to being less water-wet. Two possiblemechanisms are proposed for the effect of multivalent ions onthe wettability alteration toward being more oil-wet, namelybridging64,65,71 and salting out effects.4,27 Several likelyinteractions, which could take place when divalent cations(Ca2+ used as example) are present include
··· ···+crude oil Ca crude oil2
··· ···+carbonate mineral Ca carbonate mineral2
··· ···+crude oil Ca carbonate mineral2
The first two interactions could limit wettability alteration,whereas the latter interaction could promote wettabilityalteration.28 By ionic interaction with the oppositely chargedoil + brine interface, these ions can force the surfactants to bindto the solid surface, or the ions can be adsorbed at the solidsurface following the attraction of opposite charged surfactantsat the oil + brine interface. Hence, if divalent cations are
strongly bound to either interface (bridging between), they maybecome positively charged and affect the pure acid + baseinteraction of the system.65 Investigators have reported thatmonovalent ions such as Na+ can cover the rock surfacewithout affecting the pure acid + base interactions.45
In addition, the relative strength of divalent ions as structurebreakers can be reflected in their hydration energy. Therefore,the organic materials are more soluble at the presence ofdivalent ions.4 Therefore, the salting-out effect keeps theorganic material soluble in the oil phase or increases thetendency of organic materials to adhere to the solid surface.Thus, in this case, wettability changes toward more oil-wetconditions.27,28 In this regard, NaCl and KCl do not change thewettability as a function of salt concentration, while divalentions, due to bridging and salting-out effects, slightly influencethe wettability toward a less water-wet condition.
4. CONCLUSIONS
On the basis of the experimental results of this study thefollowing conclusions can be drawn: (i) The results of IFTmeasurements showed that the IFT in the divalent anionssolution is lower than that in the monovalent system especiallywhen the divalent anions are bonded to chloride anions. (ii)For the case of divalent cations, the obtained results showedthat the presence of magnesium cations leads to lower IFTvalues compared to the solution prepared with calcium cations.(iii) Substitution of chloride anions by divalent sulfate anionshinders the effects of natural surfactant in crude oil withdivalent cations. (iv) Similar trends for the IFT at different saltconcentrations were obtained with homologue systemsincluding NaCl/KCl, Na2SO4/MgSO4, and MgCl2/CaCl2. (v)The measured contact angle data show that the monovalentsalts (NaCl and KCl) have the least effects on the wettability ofthe surfaces, while the divalent ions (especially MgCl2) changethe wettability toward a less water-wet condition.
■ AUTHOR INFORMATION
Corresponding Author*Email: [email protected]. Tel/Fax.: +98 21 66166411.
Present Address†Sharif University of Technology, Tehran, Iran.
NotesThe authors declare no competing financial interest.
■ REFERENCES(1) Austad, T. Water-Based EOR in Carbonates and Sandstones:New Chemical Understanding of the EOR Potential Using SmartWater. Enhanced Oil Recovery Field Case Studies 2013, 301−335.(2) Hemmati-Sarapardeh, A.; Ayatollahi, Sh.; Ghazanfari, M. H.;Masihi, M. Experimental Determination of Interfacial Tension andMiscibility of the CO2−crude Oil System: Temperature, Pressure, AndComposition Effects. J. Chem. Eng. Data 2014, 59, 61−69.(3) Yildiz, H. O.; Morrow, N. R. Effect of Brine Composition onRecovery Waterflooding of Moutray Crude Oil. Pet. Sci. Eng. 1996, 14,159−168.(4) RezaeiDoust, A.; Puntervold, T.; Strand, S.; Austad, T. SmartWater As Wettability Modifier in Carbonate and Sandstone: ADiscussion of Similarities/Differences in the Chemical Mechanisms.Energy Fuels 2009, 23, 4479−4485.(5) Jadhunandan, P.; Morrow, N. R. Effect of Wettability on WaterFlood Recovery for Crude Oil/Brine/Rock Systems. SPE ReservoirEng. 1995, 10, 40−46.
Journal of Chemical & Engineering Data Article
dx.doi.org/10.1021/je500730e | J. Chem. Eng. Data 2014, 59, 3624−36343632

(6) Tang, G.-Q.; Morrow, N. R. Influence of Brine Composition andFines Migration on Crude Oil Brine Rock Interactions and OilRecovery. J. Pet. Sci. Eng. 1999, 24, 99−111.(7) Jafar Fathi, S.; Austad, T.; Strand, S. Smart Water As a WettabilityModifier in Chalk: The Effect of Salinity and Ionic Composition.Energy Fuels 2010, 24, 2514−2519.(8) Strand, S.; Austad, T.; Puntervold, T.; Høgnesen, E. J.; Olsen, M.;Michael, S.; Barstad, F. Smart Water for Oil Recovery from FracturedLimestone: A Preliminary Study. Energy Fuels 2008, 22, 3126−3133.(9) Strand, S.; Hognose, E. J.; Austad, T. Wettability Alteration ofCarbonatesEffects of Potential Determining Ions (Ca2+ and SO4
2−)and Temperature. Colloids Surf. A 2006, 275, 1−10.(10) Zhang, P.; Austad, T. Wettability and Oil Recovery fromCarbonates: Effects of Temperature and Potential Determining Ions.Colloids Surf. A 2006, 275, 179−187.(11) Zhang, P.; Tweheyo, M. T.; Austad, T. Wettability Alterationand Improved Oil Recovery by Spontaneous Imbibitions of Seawaterinto Chalk, Impact of the Potential Determining Ions Ca2+, Mg2+ andSO4
2−. Colloids Surf. A 2007, 301, 199−208.(12) Winoto, W.; Loahardjo, N.; Xie, X. S.; Yin, P.; Morrow, N. R.Secondary and Tertiary Recovery of Crude Oil from Outcrop andReservoir Rocks by Low Salinity Waterflooding. Soc. Petrol. Eng. 2012,SPE-154209-MS.(13) Tang, G. Q.; Morrow, N. R. Salinity, Temperature, OilComposition, And Oil Recovery by Waterflooding. Soc. Petrol. Eng.1997, SPE-36680-PA.(14) Morrow, N. R.; Tang, G.; Valat, M.; Xie, X. Prospects ofImproved Oil Recovery Related to Wettability and Brine Composition.J. Pet. Sci. Eng. 1998, 20, 267−276.(15) Mcguire, P. L.; Chatham, J. R.; Paskvan, F. K.; Sommer, D. M.;Carini, F. H. Low Salinity Oil Recovery: An Exciting New EOROpportunity for Alaska’s North Slope. Soc. Pet. Eng. 2005, SPE-93903-MS.(16) Lager, K.; Webb, J.; Black, C. J. J.; Singleton, M.; Sorbie, K. S.Low Salinity Oil RecoveryAn Experimental Investigation, A. Interna-tional Symposium of the Society of Core Analysts, 12−16 September 2006Trondheim, Norway, SCA2006−36, 1−12.(17) Yousef, A. A.; Al-Salah, A.; Al- Jawfi., M. Smart Water Floodingfor Carbonate Reservoirs: Salinity and Role of Ions, Presented at theSPE Middle East Oil and Gas Show and Conference, 25−28September 2011, Manama, Bahrain, SPE 141082.(18) Austad, T.; RezaeiDoust, A.; Puntervold, T. ChemicalMechanism of Low Salinity Water Flooding in Sandstone Reservoirs.Soc. Pet. Eng. 2010, SPE-129767-MS.(19) Ligthelm, D. J., Gronsveld, J.; Hofman, J. P.; Brussee, M. J.;Marcelis, F.; Linde, H. A. Novel Waterflooding Strategy byManipulation of Injection Brine Composition, Shell InternationalExploration and Production B.V. Soc. Pet. Eng. 2009, SPE-119835-MS.(20) Bera, A.; Mandal, A.; Guha, B. B. Synergistic Effect of Surfactantand Salt Mixture on Interfacial Tension Reduction between Crude Oiland Water in Enhanced Oil Recovery. J. Chem. Eng. Data 2014, 59,89−96.(21) Georgiadis, A.; Maitland, G.; Trusler, J. P. M.; Bismarck, A.Interfacial Tension Measurements of the (H2O + n-Decane + CO2)Ternary System at Elevated Pressures and Temperatures. J. Chem. Eng.Data 2011, 56, 4900−4908.(22) Escrochi, M.; Mehranbod, N.; Ayatollahi, Sh. The Gas−oilInterfacial Behavior during Gas Injection into an Asphaltenic OilReservoir. J. Chem. Eng. Data 2013, 58, 2513−2526.(23) Zolghadr, A.; Escrochi, M.; Ayatollahi, Sh. Temperature andComposition Effect on CO2 Miscibility by Interfacial TensionMeasurement. J. Chem. Eng. Data 2013, 58, 1168−1175.(24) Kumar, B. Effect of Salinity on the Interfacial Tension of Model andCrude Oil Systems. M.S. Thesis, Calgary, Alberta, September 2012.(25) Buckley, J. S.; Fan, T. Crude Oil/Brine Interfacial Tensions.Petrophysics 2007, 48, 175−185.(26) Sztukowski, D. M.; Yarranton, H. W. Characterization andInterfacial Behavior of Oil Sands Solids Implicated in EmulsionStability. J. Dispersion Sci. Technol. 2004, 25, 299−310.
(27) Standal, S.; Haavik, J.; Blokhus, A. M.; Skauge, A. Effect of PolarOrganic Components on Wettability As Studied by Adsorption andContact Angles. J. Pet. Sci. Eng. 1999, 24, 131−144.(28) Kaliyugarasan, J. Surface Chemistry Study of Low SalinityWaterflood. Master Thesis, Petroleum Technology−Reservoir Chem-istry, Centre for Integrated Petroleum Research (Uni CIPR),Department of Chemistry, University of Bergen, June 2013.(29) Bai, J.; Fan, W.; Nan, G.; Li, S.; Yu, B. Influence of Interactionbetween Heavy Oil Components and Petroleum Sulfonate on theOil−Water Interfacial Tension. J. Dispersion Sci. Technol. 2010, 31,551−556.(30) Yi, C.; Xie, Sh.; Qiu, X. Salting-Out Effect of DipotassiumHydrogen Phosphate on the Recovery of Acetone, Butanol, AndEthanol from a Prefractionator. J. Chem. Eng. Data 2014, 59, 1507−1514.(31) Piero, M.; Hans, A.; Karlsson, T. Salting-Out Parameters forOrganic Acids. J. Chem. Eng. Data 1982, 27, 155−156.(32) Standal, S. H.; Blokhus, A. M.; Haavik, J.; Skauge, A.; Barth, T.Partition Coefficient and Interfacial Activity for Polar Components inOil/Water Model Systems. J. Colloid Interface Sci. 1999, 212, 33−41.(33) Aveyard, R.; Saleem, S. M. Interfacial Tensions at Alkane-Aqueous Electrolyte Interfaces. J. Chem. Soc. Faraday Trans. I 1976, 72,1609−1617.(34) Ikeda, N.; Aratono, M.; Motomura, K. Thermodynamic Studyon the Adsorption of Sodium Chloride at the Water/Hexane Interface.J. Colloid Interface Sci. 1992, 149, 208−215.(35) Cai, B.; Yang, J.; Guo, T. Interfacial Tension of Hydrocarbon +Water/Brine Systems Under High Pressure. J. Chem. Eng. Data 1996,41, 493−496.(36) Badakshan, A.; Bakes, P. The Influence of Temperature andSurfactant Concentration on Interfacial Tension of Saline Water andHydrocarbon System in Relation to Enhanced Oil Recovery byChemical Flooding, Soc. Pet. Eng. 1990, SPE-20290.(37) Alotaibi, M. B.; Nasr-El-Din, H. A. Effect of Brine Salinity onReservoir Fluids Interfacial Tension. Soc. Pet. Eng. 2009, SPE-121569.(38) Serrano-Saldana, E.; Dominguez-Ortiz, A.; Perez-Aguilar, H.;Komhauser-Strauss, I.; Rojas-Gonzalez, F. Wettability of Solid/Brine/n-Dodecane Systems: Experimental Study of the Effects of IonicStrength and Surfactant Concentration. Colloids Surf. A 2004, 241,343−349.(39) Isaacs, E. E.; Smolek, K. F. Interfacial Tension Behavior ofAthabasca Bitumen/Aqueous Surfactant Systems. Can. J. Chem. Eng.1983, 61, 233−240.(40) Xu, W. Experimental Investigation of Dynamic InterfacialInteractions at Reservoir Conditions, MSc. Thesis, Louisiana StateUniversity, Louisiana, 2005.(41) Yousef, A. A.; Al-Saleh, S.; Al-Jawfi, M.; Aramco S. Improved/Enhanced Oil Recovery from Carbonate Reservoirs by TuningInjection Water Salinity and Ionic Content. Soc. Pet. Eng. 2012,SPE-154076-MS.(42) Vijapurapu, C. S.; Rao, D. N. Compositional Effects of Fluid onSpreading, Adhesion and Wettability in Porous Media. Colloids Surf. A2004, 241, 335−342.(43) Hamouda, A. A.; Karoussi, O. Effect of Temperature,Wettability and Relative Permeability on Oil Recovery from Oil-WetChalk. Energies 2008, 1, 19−34.(44) Jadhunandan, P. P.; Morrow, N. R. Effect of Wettability onWaterflood Recovery for Crude Oil/Brine/Rock Systems. Soc. Petrol.Eng. 1991. 66th Annual Technical Conference and Exhibition of theSPE, Dallas, 11 October, SPE 22597; SPE Reservoir Engineering, pp40−46, February 1995.(45) Buckley J. S. Mechanisms and Consequences of WettabilityAlteration by Crude Oils. Ph.D. Thesis, Heriot-Watt UniversityPetroleum Engineering, Edinburgh, Scotland, 1996.(46) Standal, S. H. Wettability of Solid Surfaces Induced by Adsorptionof Polar Organic Components in Crude Oil. Ph.D. Thesis, Department ofChemistry, University of Bergen, Bergen, Norway, 1999.
Journal of Chemical & Engineering Data Article
dx.doi.org/10.1021/je500730e | J. Chem. Eng. Data 2014, 59, 3624−36343633

(47) Buckley, J. S.; Takamura, K., Morrow, N. R. Influence ofElectrical Surface Charges on the Wetting Properties of Crude Oils.Soc. Pet. Eng. 1989 SPE 16964-PA.(48) Morrow, N. R. Wettability and Its Effect on Oil Recovery. Soc.Pet. Eng. 1990, SPE 21621-PA.(49) Nasralla, R. A.; Bataweel, H. A.; Nasr-El-Din, H. A. Investigationof Wettability Alteration by Low Salinity Water. Soc. Pet. Eng. 2011,SPE 146322-MS.(50) Nasralla, R. A.; Nasr-El-Din, H. A. Double-Layer Expansion: Is ita Primary Mechanism of Improved Oil Recovery by Low-SalinityWaterflooding? Soc. Pet. Eng. 2012, SPE 154334-MS.(51) Xing, W.; Song, Y.; Zhang, Y.; Nishio, M.; Zhan, Y.; Jian, W.;Shen, Y. Research Progress of the Interfacial Tension in SupercriticalCO2−Water/Oil System. Energy Procedia 2013, 37, 6928−6935.(52) Bashforth, F.; Adams, J. C. An Attempt to Test the Theory ofCapillary Action; Cambridge University Press: London, 1892.(53) Stauffer, C. E. The measurement of surface tension by thependent drop technique. J. Phys. Chem. 1965, 69, 1933−1938.(54) Andreas, J. M.; Hauser, E. A.; Tucker, W. B. Boundary tensionby pendent drops. J. Phys. Chem. 1938, 42, 1001−1019.(55) Adamson, A. W.; Gast, A. P. Physical Chemistry of Surfaces, 6thed.; John Wiley & Sons, Inc.: New York, 1997.(56) Drelich, J.; Fang, C.; White, C. L. Measurement of InterfacialTension in Fluid−Fluid Systems. Encycl. Surf. Colloid Sci. 2002, 3152−3166.(57) Galimberti, R.; Ghiselli, C.; Chiaramonte, M. A. Acidic PolarCompounds in Petroleum: A New Analytical Methodology andApplications As Molecular Migration Indices. J. Org. Geochem. 2000,31, 1375−1386.(58) Standard Test Method for Acid Number of Petroleum Products byPotentiometric Titration; An American National Standard, BritishStandard 4457, Designation 177/96; ASTM International: WestConshohocken, PA, 2004.(59) Xinheng, C.; Songbai, T. Review and Comprehensive Analysisof Composition and Origin of High Acidity Crude Oils. China Pet.Process. Petrochem. Technol. 2011, 13, 6−15.(60) Hiemenz, P. C.; Rajagopalan, R. Principles of Colloid and SurfaceChemistry, 3rd ed.: Marcel Dekker: New York, 1997.(61) Al-Sahhaf, T.; Elkamel, A.; Suttar Ahmed, A.; Khan, A. TheInfluence of Temperature, Pressure, Salinity, And SurfactantConcentration on the Interfacial Tension of the n-Octane−WaterSystem. Chem. Eng. Commun. 2005, 192, 667−684.(62) Moeini, F.; Hemmati-Sarapardeh, A.; Ghazanfari, M. H.; Masihi,M.; Ayatollahi, Sh. Toward Mechanistic Understanding of HeavyCrude Oil/Brine Interfacial Tension: The Roles of Salinity, Temper-ature and Pressure. Fluid Phase Equilib. 2014, 375, 191−200.(63) Chang, R. Physical Chemistry for Chemical and Biological Sciences;University Science Books: Mill Valley, CA, 2000.(64) Anderson, W. G. Wettability Literature Survey−Part 1: Rock/Oil/Brine Interactions and the Effects of Core Handling onWettability. Soc. Pet. Eng. 1986 SPE-13932-PA.(65) Buckley, J. S.; Liu, Y.; Monsterleet, S. Mechanisms of WettingAlteration by Crude Oils. Soc. Pet. Eng. 1998, SPE-37230-PA.(66) Hu, X.; Li, Y.; Sun, H.; Song, X.; Li, Q.; Cao, X.; Li, X. Effect ofDivalent Cationic Ions on the Adsorption Behavior of ZwitterionicSurfactant at Silica/Solution Interface. J. Phys. Chem. B 2010, 114,8910−8916.(67) Krebs, J.; Michalak, M. Calcium: A Matter of Life or Death;Elsevier: Amsterdam, The Netherlands, 2007.(68) Qiao, W.; Li, J.; Zhu, Y.; Cai, H. Interfacial Tension Behavior ofDouble Long-Chain 1,3,5-Triazine Surfactants for Enhanced OilRecovery. Fuel 2012, 96, 220−225.(69) Gangolli, S. The Dictionary of Substances and Their Effects: C;Royal Society of Chemistry: Cambridge, UK, 1999.(70) Tomczyk, N. A.; Winans, R. E.; Shinn, J. H. On the Nature andOrigin of Acidic Species in Petroleum: 1. Detailed Acid TypeDistribution in a California Crude Oil. Energy Fuels 2001, 15, 1498−1504.
(71) Liu, Y.; Buckley, J. S. Evolution of Wetting Alteration byAdsorption from Crude Oil New. Soc. Pet. Eng. 1997, SPE- 28970-PA.
Journal of Chemical & Engineering Data Article
dx.doi.org/10.1021/je500730e | J. Chem. Eng. Data 2014, 59, 3624−36343634


