Embed Size (px)
Citation preview
www.elsevier.com/locate/lithos
Lithos 87 (2006
The isotopic composition of zircon and garnet: A record of the
metamorphic history of Naxos, Greece
L. Martin a,*, S. Duchene a, E. Deloule a, O. Vanderhaeghe b
a CRPG, UPR-CNRS 2300, BP 20, 54501 Vandœuvre, Franceb G2R, UMR-CNRS 7566, BP 239, 54506 Vandœuvre, France
Received 13 November 2003; accepted 2 June 2005
Available online 6 October 2005
Abstract
Growth of zircon with respect to that of garnet has been studied using a combination of petrography, U–Pb dating and
oxygen isotope analysis. The aim is to document the mechanism and pressure–temperature conditions of zircon growth during
metamorphism in order to better constrain the Tertiary metamorphic history of Naxos, Greece. Two metamorphisms are
recognised: (1) an Eocene Franciscan metamorphism (M1) and (2) a widespread Miocene Barrovian metamorphism (M2) that
increases from greenschist facies up to partial melting. An amphibolite sample contains zircon crystals characterised by a
magmatic core and two metamorphic rims, denoted as A and B, dated at 200–270, 42–69, and 14–19 Ma, respectively. The first
metamorphic rim A (d18O=7F1x) preserves the d18O value of the magmatic core (6.2F0.8x), whereas rim B is
characterised by higher d18O values (7.8F1.8x). These observations indicate the formation of A rims by solid-state
recrystallisation in a closed system with regard to oxygen and those of B in an open system. Compositional zoning in garnet
is interpreted as the result of decompressional heating. Zircon B rims and garnet rims display similar d18O values which
indicates a contemporaneous growth of garnet and zircon rims during the Miocene Barrovian event (M2). Calcic gneiss and
metapelite samples contain zircon crystals with single metamorphic overgrowths aged 41–57 Ma. d18O values measured in
zircon overgrowths (11.8F1.4x) from the calcic gneiss are similar to those measured in garnet rims (11.4F1.1x) from the
same rock. This suggests that garnet rims and zircon overgrowths grew during the high pressure–low temperature event in
equilibrium with prograde fluids. In the metapelite sample, d18O values are similar in garnet cores (14.8F0.2x) and in zircon
metamorphic overgrowths (14.2F0.5x). As zircon overgrowths have been dated at ca. 50 Ma by U–Pb, garnet cores and
zircon overgrowths are interpreted to have grown during the high pressure event.
As demonstrated here for the island of Naxos, correlating the crystallisation of zircon with that of metamorphic index
minerals such as garnet using stable isotope composition and U–Pb determination is a powerful tool for deciphering the
mechanism of zircon growth and pin-pointing zircon crystallisation within the metamorphic history of a terrain. This approach
is potentially hampered by an inability to verify the degree of textural equilibrium of zircon with other mineral phases, and the
possible preservation (in metamorphic rims) of isotopic signatures from pre-existing zircon when they form by recrystallisation.
0024-4937/$ - s
doi:10.1016/j.lith
* Correspondin
E-mail addre
) 174–192
ee front matter D 2005 Elsevier B.V. All rights reserved.
os.2005.06.016
g author. Tel.: +33 3 83 59 42 42; fax: +33 3 83 51 17 98.
ss: [email protected] (L. Martin).
L. Martin et al. / Lithos 87 (2006) 174–192 175
Nevertheless, this study illustrates the application of this approach in providing key constraints on the timing and mechanism of
growth of minerals important to understanding metamorphic petrogenesis.
D 2005 Elsevier B.V. All rights reserved.
Keywords: U/Pb; Absolute age; O-18 /O-16; Garnet; Zircon; Naxos
1. Introduction
Constraint on the timing of a metamorphic event
is nowadays often accomplished by U–Pb isotopic
dating of zircon. Lee et al. (1997), and Cherniak and
Watson (2000) experimentally determined that the
closure temperature of the U–Th–Pb isotopic system
in zircon is greater than 900 8C and that Pb isotope
ratios will not be altered by volume diffusion under
most geologic conditions. Consequently, zircon is
able to preserve multistage magmatic and meta-
morphic histories (e.g., Zeck and Whitehouse,
1999; Moller et al., 2002). Metamorphic zircon
growth occurs as thin overgrowths or rims around
relict cores or as small equant grains (Hoskin and
Schaltegger, 2003) from which U–Pb ages can be
determined using high mass resolution ion microp-
robes (Ireland, 1995). However, Rizvanova et al.
(2000) showed that the U–Th–Pb system can be
disturbed at temperatures lower than 900 8C in the
presence of fluids. Additionally, neither the mechan-
isms of growth nor the stability field of zircon during
metamorphism are well constrained. Previous studies
have shown that zircon can grow (i) in closed system
at the rock scale by solid-state recrystallisation of
protolith zircon (Hoskin and Black, 2000), by dis-
solution–recrystallisation (Pidgeon, 1992; Pan,
1997), or by destabilisation of Zr-bearing accessory
(e.g., ilmenite; Bingen et al., 2001) and major miner-
als (e.g., amphibole and garnet; Fraser et al., 1997),
and (ii) in open systems, during partial melting
(Roberts and Finger, 1997) or fluid circulation (Wil-
liams et al., 1996).
In order to recover pressure–temperature condi-
tions of zircon crystallisation, several attempts have
been made to link zircon growth to an index mineral
of metamorphism. (1) Net transfer reactions invol-
ving the breakdown or crystallisation of a Zr-bearing
phase such as hornblende or garnet have been iden-
tified (Fraser et al., 1997). (2) Mineral inclusions
preserved in zircon can provide direct information
of a mineral assemblage before and during zircon
growth (Gebauer et al., 1997; Hermann et al., 2001).
However, as pointed out by Rubatto (2002) such
inclusions are rare. (3) The comparison of trace
element patterns in zircon and other minerals such
as garnet or feldspar can be used to assess their
concurrent growth (Peucat et al., 1995; Schaltegger
et al., 1999; Rubatto, 2002). This method has to be
used with caution because of the wide range of
possible zircon trace element compositions (Hoskin
and Ireland, 2000; Rubatto, 2002), the possible exis-
tence of an inherited component when solid-state
recrystallisation of protolith zircon occurs (Hoskin
and Black, 2000), and because the partitioning of
trace elements between zircon and other phases is
not well quantified. In this respect, the evaluation of
trace element partitioning coefficients between garnet
and zircon in equilibrium at granulite facies grade
(Rubatto, 2002) appears to be a potential tool to link
zircon to garnet growth (Whitehouse and Platt,
2003).
Another way to correlate metamorphic zircon
rims with garnet growth that has, to our knowledge,
not previously been investigated is via oxygen iso-
tope compositions. On the one hand, oxygen isotope
provide information on the closure of the system
with respect to fluids; and on the other hand, they
are good tracers of concomitant growth of garnet
and zircon as there is no fractionation of oxygen
isotope at equilibrium between them (Zheng, 1993;
Valley et al., 1994).
In this study, the oxygen isotope composition of
zircon and garnet are measured for a suite of samples
from Naxos, Greece, in order to first investigate zir-
con growth mechanisms and second to discuss the
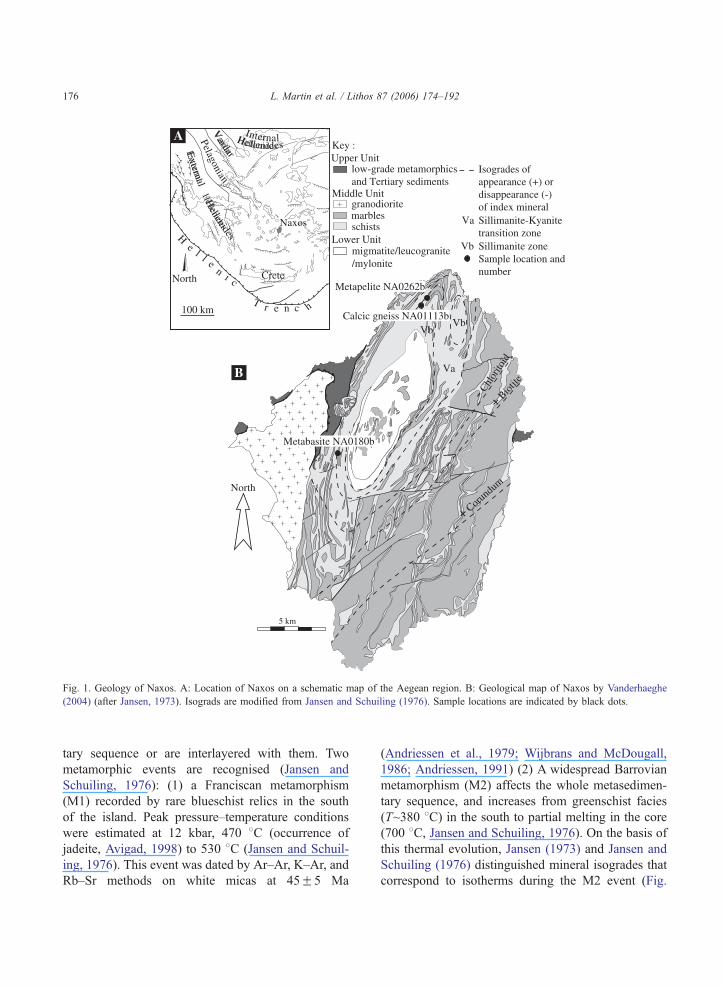
geological significance of zircon U–Pb ages. Naxos
lies in the Aegean region, at the north of the Hellenic
subduction zone (Fig. 1A). Naxos displays a migma-
tite dome forms rimmed by a metasedimentary
sequence (marble and schist, bMiddle unitQ, Fig.
1B). Metabasites locally cross-cut the metasedimen-
North
5 km
- Chl
orito
ïd+ B
iotit
e
Metapelite NA0262b
+ Coru
ndum
Lower Unit
low-grade metamorphics and Tertiary sediments
marblesschists
Middle Unit
migmatite/leucogranite/mylonite
Upper Unit
granodiorite
Key :
Va
VbVb
Sample location and number
Isogrades of appearance (+) or disappearance (-) of index mineral
Va Sillimanite-Kyanite transition zone
Vb Sillimanite zone
Calcic gneiss NA01113b
Metabasite NA0180b
100 km
Naxos
H
el l e
ni c
T r e n c h
North CreteCreteCrete
External
Hellenides
External
Hellenides
PelagonianV
ardarV
ardar
HellenidesHellenides
InternalA
B
Fig. 1. Geology of Naxos. A: Location of Naxos on a schematic map of the Aegean region. B: Geological map of Naxos by Vanderhaeghe
(2004) (after Jansen, 1973). Isograds are modified from Jansen and Schuiling (1976). Sample locations are indicated by black dots.
L. Martin et al. / Lithos 87 (2006) 174–192176
tary sequence or are interlayered with them. Two
metamorphic events are recognised (Jansen and
Schuiling, 1976): (1) a Franciscan metamorphism
(M1) recorded by rare blueschist relics in the south
of the island. Peak pressure–temperature conditions
were estimated at 12 kbar, 470 8C (occurrence of
jadeite, Avigad, 1998) to 530 8C (Jansen and Schuil-
ing, 1976). This event was dated by Ar–Ar, K–Ar, and
Rb–Sr methods on white micas at 45F5 Ma
(Andriessen et al., 1979; Wijbrans and McDougall,
1986; Andriessen, 1991) (2) A widespread Barrovian
metamorphism (M2) affects the whole metasedimen-
tary sequence, and increases from greenschist facies
(T~380 8C) in the south to partial melting in the core
(700 8C, Jansen and Schuiling, 1976). On the basis of
this thermal evolution, Jansen (1973) and Jansen and
Schuiling (1976) distinguished mineral isogrades that
correspond to isotherms during the M2 event (Fig.
L. Martin et al. / Lithos 87 (2006) 174–192 177
1B). Isogrades and the main foliation are concentric
with the structure of the dome and the latter is gen-
erally marked by M2 metamorphic minerals, such as
biotite. Partial melting in the migmatitic core was
dated at 16–20 Ma by U–Pb dating on zircon (Keay,
1998; Keay et al., 2001).
U–Pb dating on zircon by Keay (1998) provide
evidence for different age components at 28, 42, 54
Ma in the migmatitic core and 35, 42, 48, 64 Ma
outside the core. These data suggest that several
zircon growth stages occurred during the M1 meta-
morphism and between M1 and M2. On the basis of
petrographic interpretations, the author explained the
numerous modelled growth stages by precipitation
from successive infiltrating fluids. These results
raise the following questions: (1) By which mechan-
isms did zircon form during Naxos metamorphism?
(2) Is it possible to relate these scattered ages to
metamorphic pressure–temperature conditions? These
questions will be addressed through U–Pb geochro-
nological studies associated with petrography and
isotopic analysis. For this purpose, three samples
have been selected in the metasedimentary sequence
in the vicinity of the migmatitic core of the island
(Fig. 1B). The samples are an amphibolite NA0180b,
a calc-silicate gneiss NA01113b, and a metapelite
NA0262b.
2. Analytical techniques
Elemental compositions of garnet and zircon
were analysed with a CAMECA SX 100 electron
microprobe at the Henri Poincare University, Nancy.
Acceleration voltage was 10 kV and beam current
10 nA for major minerals, 100 nA for zircon. The
detection limits fall between 0.05 and 0.1% wt. for
major elements and are reported in Table 3 for
trace elements in zircon. Garnet zoning was imaged
with a Hitachi 2500 scanning electron microscope
(SEM).
For U–Pb and oxygen isotope measurements, zir-
con crystals were extracted from the 50–200 Am size
fraction with heavy liquids and magnetic separation.
Individual zircon grains were then handpicked and
mounted in epoxy resin together with 91500 standard
zircon grains. After polishing, all grains were exam-
ined in back-scattered electron microscopy and catho-
doluminescence using a Philips XL30 SEM in order
to characterise their internal texture. Zircon crystals
were then chosen for in situ analyses on the basis of
their internal texture, size and absence of inclusions.
U–Pb analyses were performed with Cameca
IMS1270 at CRPG-CNRS in Nancy using an O2�
primary ion beam accelerated at 13 kV with an
intensity of 10 nA (Deloule et al., 2002). Analytical
data were corrected for instrumental fractionation
using the 91500 zircon standard, dated at 1062.4F0.4 Ma (Wiedenbeck et al., 1995). Corrections for
common lead use the measured 204Pb content and
take into account the Stacey and Kramers (1975) lead
evolution. Oxygen isotopic compositions in garnet
and zircon were measured with the Cameca
IMS1270 in Nancy using a Cs+ primary ion beam
accelerated at 10 kV with an intensity of 10 nA. The
detection mode is multicollection in FC/FC mode.
For zircon, instrumental mass fractionation was cor-
rected using the 91500 zircon standard whose d18O
value was measured at 10.09F0.24x using BrF5extraction and gas source mass spectrometer at
CRPG. Oxygen isotope measurements of garnet
were performed on thin section. Standard grains
were mounted on a separated polished section. In
garnet, the instrumental mass fractionation is depen-
dant on the elemental composition (Eiler et al., 1997).
This matrix effect was corrected using a set of garnet
standards of different elemental compositions follow-
ing Vielzeuf et al. (2003). The standards used in this
study were B114 (d18O=9.3x, France-Lanord et al.,
1988; Vielzeuf et al., 2003), GrsSE (d18O=3.8x)
and SpeSE (d18O=5.4x) (Elphick et al., 1985;
Eiler et al., 1997), and UWG-2 (d18O=5.8x, Valley
et al., 1995). For each garnet sample, three garnet
standards with the most appropriate composition
were chosen. In all cases (U–Pb and oxygen isotopic
compositions), the size of the elliptical spot was ca.
20�15 Am. The errors reported for U–Pb and oxy-
gen isotopic compositions are all at one sigma and
take into account both internal (analytical) and exter-
nal (standard reproducibility) errors. Error on oxygen
isotope measurements in garnet is typically in the
range of 0.2–0.5x. Error on oxygen isotope mea-
surements in zircon is between 0.4x and 1xbecause of the instability of the primary beam on
zircon due to the size of the grains and their high
relief. Photomicrographs of zircon were taken before
L. Martin et al. / Lithos 87 (2006) 174–192178
and after isotopic analysis in order to check the
location of the analyses.
3. Samples description
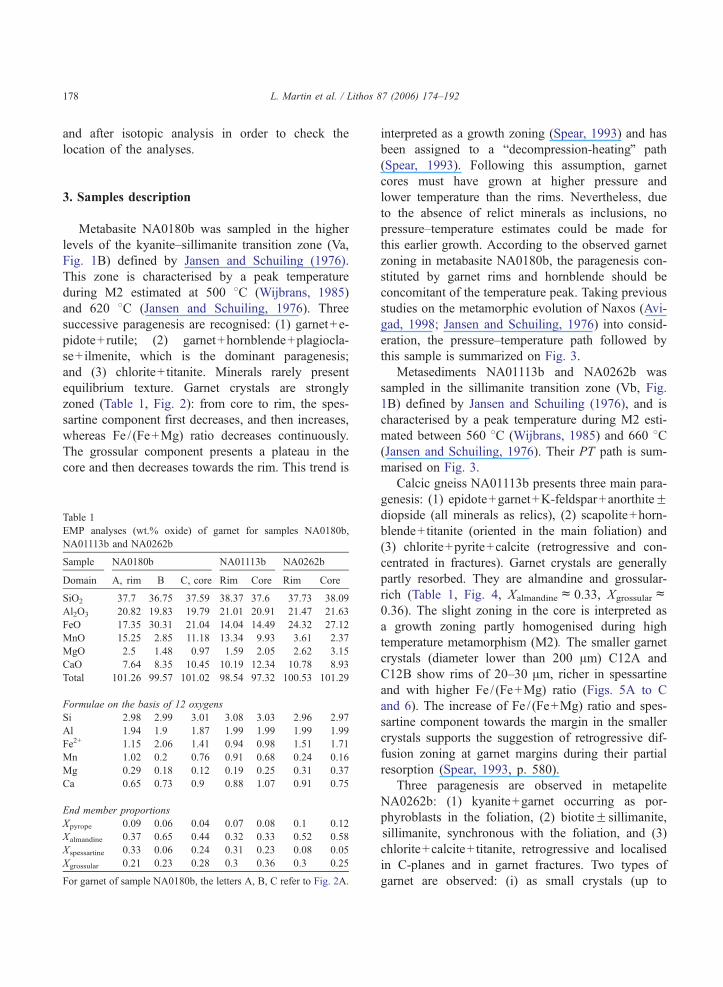
Metabasite NA0180b was sampled in the higher
levels of the kyanite–sillimanite transition zone (Va,
Fig. 1B) defined by Jansen and Schuiling (1976).
This zone is characterised by a peak temperature
during M2 estimated at 500 8C (Wijbrans, 1985)
and 620 8C (Jansen and Schuiling, 1976). Three
successive paragenesis are recognised: (1) garnet+e-
pidote+ rutile; (2) garnet+hornblende+plagiocla-
se+ ilmenite, which is the dominant paragenesis;
and (3) chlorite+ titanite. Minerals rarely present
equilibrium texture. Garnet crystals are strongly
zoned (Table 1, Fig. 2): from core to rim, the spes-
sartine component first decreases, and then increases,
whereas Fe / (Fe+Mg) ratio decreases continuously.
The grossular component presents a plateau in the
core and then decreases towards the rim. This trend is
Table 1
EMP analyses (wt.% oxide) of garnet for samples NA0180b,
NA01113b and NA0262b
Sample NA0180b NA01113b NA0262b
Domain A, rim B C, core Rim Core Rim Core
SiO2 37.7 36.75 37.59 38.37 37.6 37.73 38.09
Al2O3 20.82 19.83 19.79 21.01 20.91 21.47 21.63
FeO 17.35 30.31 21.04 14.04 14.49 24.32 27.12
MnO 15.25 2.85 11.18 13.34 9.93 3.61 2.37
MgO 2.5 1.48 0.97 1.59 2.05 2.62 3.15
CaO 7.64 8.35 10.45 10.19 12.34 10.78 8.93
Total 101.26 99.57 101.02 98.54 97.32 100.53 101.29
Formulae on the basis of 12 oxygens
Si 2.98 2.99 3.01 3.08 3.03 2.96 2.97
Al 1.94 1.9 1.87 1.99 1.99 1.99 1.99
Fe2+ 1.15 2.06 1.41 0.94 0.98 1.51 1.71
Mn 1.02 0.2 0.76 0.91 0.68 0.24 0.16
Mg 0.29 0.18 0.12 0.19 0.25 0.31 0.37
Ca 0.65 0.73 0.9 0.88 1.07 0.91 0.75
End member proportions
Xpyrope 0.09 0.06 0.04 0.07 0.08 0.1 0.12
Xalmandine 0.37 0.65 0.44 0.32 0.33 0.52 0.58
Xspessartine 0.33 0.06 0.24 0.31 0.23 0.08 0.05
Xgrossular 0.21 0.23 0.28 0.3 0.36 0.3 0.25
For garnet of sample NA0180b, the letters A, B, C refer to Fig. 2A.
interpreted as a growth zoning (Spear, 1993) and has
been assigned to a bdecompression-heatingQ path
(Spear, 1993). Following this assumption, garnet
cores must have grown at higher pressure and
lower temperature than the rims. Nevertheless, due
to the absence of relict minerals as inclusions, no
pressure–temperature estimates could be made for
this earlier growth. According to the observed garnet
zoning in metabasite NA0180b, the paragenesis con-
stituted by garnet rims and hornblende should be
concomitant of the temperature peak. Taking previous
studies on the metamorphic evolution of Naxos (Avi-
gad, 1998; Jansen and Schuiling, 1976) into consid-
eration, the pressure–temperature path followed by
this sample is summarized on Fig. 3.
Metasediments NA01113b and NA0262b was
sampled in the sillimanite transition zone (Vb, Fig.
1B) defined by Jansen and Schuiling (1976), and is
characterised by a peak temperature during M2 esti-
mated between 560 8C (Wijbrans, 1985) and 660 8C(Jansen and Schuiling, 1976). Their PT path is sum-
marised on Fig. 3.
Calcic gneiss NA01113b presents three main para-
genesis: (1) epidote+garnet+K-feldspar+anorthiteFdiopside (all minerals as relics), (2) scapolite+horn-
blende+ titanite (oriented in the main foliation) and
(3) chlorite+pyrite+calcite (retrogressive and con-
centrated in fractures). Garnet crystals are generally
partly resorbed. They are almandine and grossular-
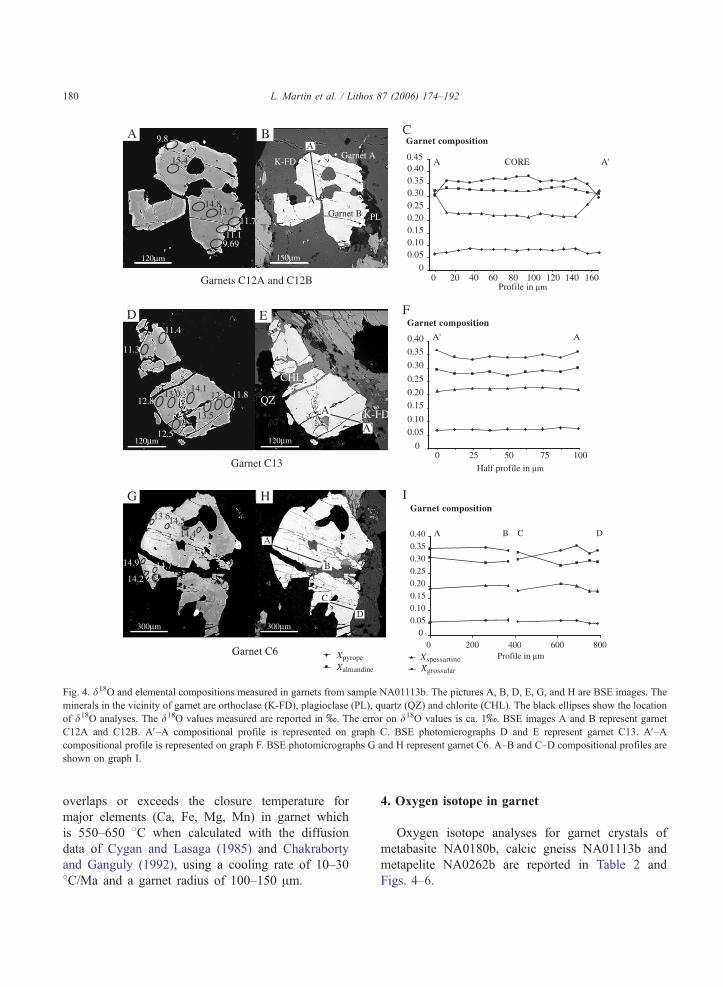
rich (Table 1, Fig. 4, Xalmandinec0.33, Xgrossularc0.36). The slight zoning in the core is interpreted as
a growth zoning partly homogenised during high
temperature metamorphism (M2). The smaller garnet
crystals (diameter lower than 200 Am) C12A and
C12B show rims of 20–30 Am, richer in spessartine
and with higher Fe / (Fe+Mg) ratio (Figs. 5A to C
and 6). The increase of Fe / (Fe+Mg) ratio and spes-
sartine component towards the margin in the smaller
crystals supports the suggestion of retrogressive dif-
fusion zoning at garnet margins during their partial
resorption (Spear, 1993, p. 580).
Three paragenesis are observed in metapelite
NA0262b: (1) kyanite+garnet occurring as por-
phyroblasts in the foliation, (2) biotiteF sillimanite,
sillimanite, synchronous with the foliation, and (3)
chlorite+calcite+ titanite, retrogressive and localised
in C-planes and in garnet fractures. Two types of
garnet are observed: (i) as small crystals (up to
Temperature (°C)
Pres
sure
(kb
ar)
100 200 300 400 500 600 700
2
4
6
8
10
12
14
Kyanite
Andalusite
M1 in the SE
M1 in the migmatitic coreM1 ?
Sillimanite
BI
M2
NA0180b
NA01113b and NA0262b
MMM2
Prograde fluids
Syn and post M
2 fluids
Prog
rade
fluids
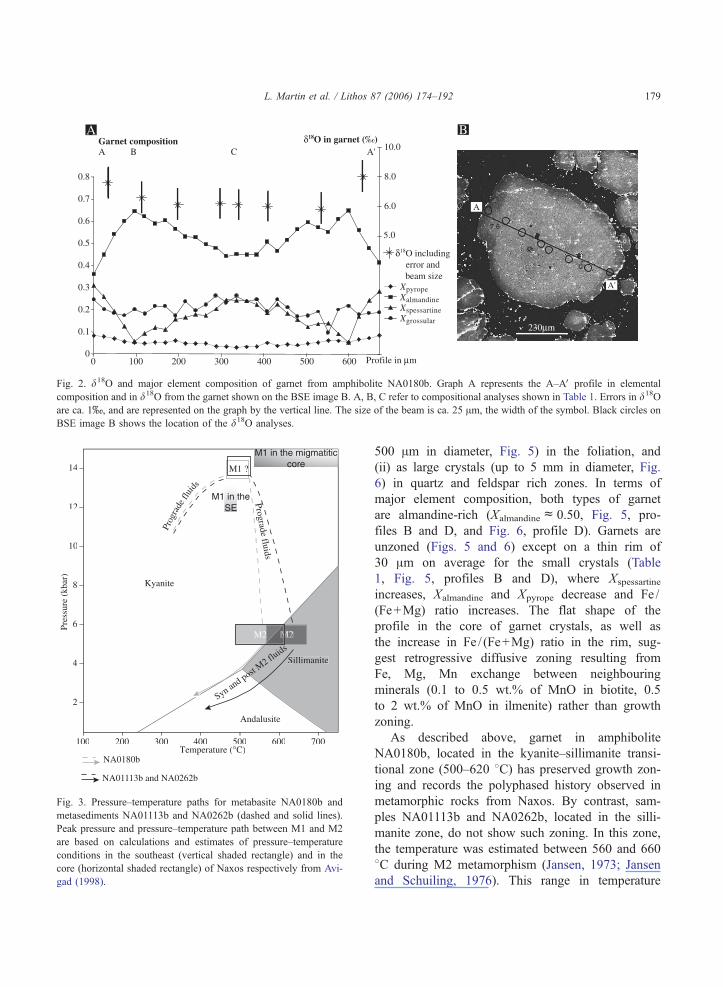
Fig. 3. Pressure–temperature paths for metabasite NA0180b and
metasediments NA01113b and NA0262b (dashed and solid lines).
Peak pressure and pressure–temperature path between M1 and M2
are based on calculations and estimates of pressure–temperature
conditions in the southeast (vertical shaded rectangle) and in the
core (horizontal shaded rectangle) of Naxos respectively from Avi-
gad (1998).
0
0.1
0.2
0.3
0.4
0.5
0.6
0.7
0.8
0 100 200 300 400 500 600 Profile in μm
Garnet composition δ18O in garnet (‰)
6.0
8.0
10.0
5.0
δ18O including error and beam size
7.6
A'
A
230μm
Β C A'A
A B
Xpyrope
Xgrossular
Xspessartine
Xalmandine
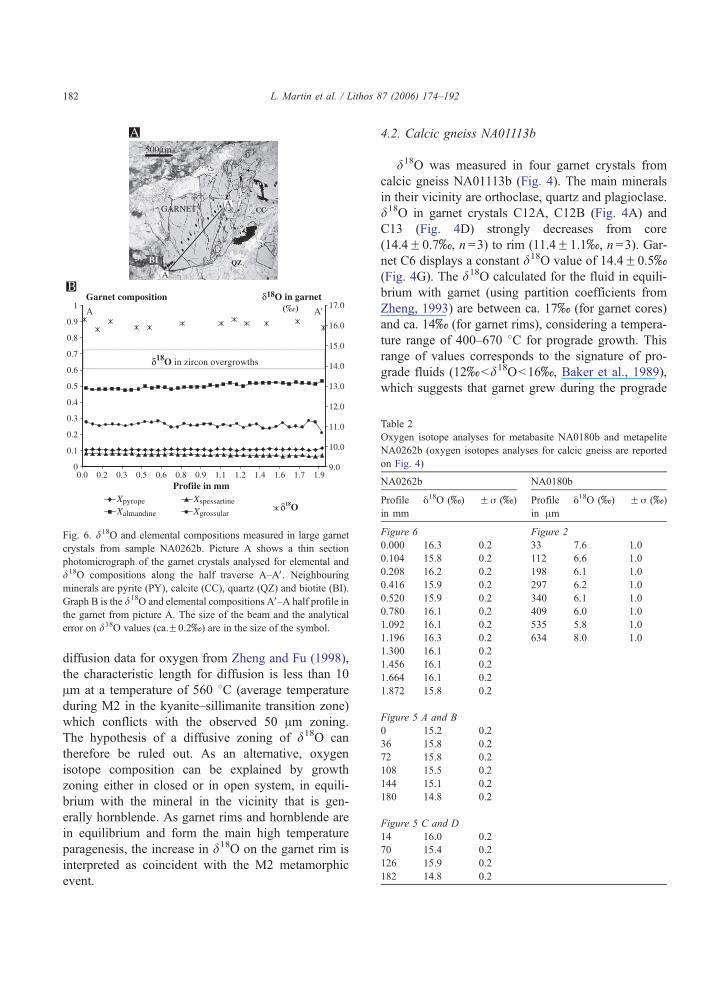
Fig. 2. d18O and major element composition of garnet from amphibolite NA0180b. Graph A represents the A–AV profile in elemental
composition and in d18O from the garnet shown on the BSE image B. A, B, C refer to compositional analyses shown in Table 1. Errors in d18O
are ca. 1x, and are represented on the graph by the vertical line. The size of the beam is ca. 25 Am, the width of the symbol. Black circles on
BSE image B shows the location of the d18O analyses.
L. Martin et al. / Lithos 87 (2006) 174–192 179
500 Am in diameter, Fig. 5) in the foliation, and
(ii) as large crystals (up to 5 mm in diameter, Fig.
6) in quartz and feldspar rich zones. In terms of
major element composition, both types of garnet
are almandine-rich (Xalmandinec0.50, Fig. 5, pro-
files B and D, and Fig. 6, profile D). Garnets are
unzoned (Figs. 5 and 6) except on a thin rim of
30 Am on average for the small crystals (Table
1, Fig. 5, profiles B and D), where Xspessartine
increases, Xalmandine and Xpyrope decrease and Fe /
(Fe+Mg) ratio increases. The flat shape of the
profile in the core of garnet crystals, as well as
the increase in Fe / (Fe+Mg) ratio in the rim, sug-
gest retrogressive diffusive zoning resulting from
Fe, Mg, Mn exchange between neighbouring
minerals (0.1 to 0.5 wt.% of MnO in biotite, 0.5
to 2 wt.% of MnO in ilmenite) rather than growth
zoning.
As described above, garnet in amphibolite
NA0180b, located in the kyanite–sillimanite transi-
tional zone (500–620 8C) has preserved growth zon-
ing and records the polyphased history observed in
metamorphic rocks from Naxos. By contrast, sam-
ples NA01113b and NA0262b, located in the silli-
manite zone, do not show such zoning. In this zone,
the temperature was estimated between 560 and 660
8C during M2 metamorphism (Jansen, 1973; Jansen
and Schuiling, 1976). This range in temperature
9.8
15.4
14.813.7
11.7
11.19.69
Garnet A
Garnet B
A
A'
K-FD
PL
A B
120μm 150μm
Garnets C12A and C12B
11.4
11.3
12.813.0
14.1
12.5
13.5
12.3 11.8 QZA
A'
D E
CHL
K-FD
120μm 120μm
Garnet C13
13.614.5
14.4
14.9 14.7
14.2
A
B
C
D
G H
300μm 300μm
Garnet C6 XpyropeXalmandine
XspessartineXgrossular
AA'
Garnet composition
0.35
0.40
0.15
0.100.05
0.30
0.25
0.20
F
10025 50 750
Half profile in μm
0
0
A
0.350.400.45
0.150.100.05
0.300.250.20
A'CORE
C
20 40 80 100 140 16060 1200
Garnet composition
Profile in μm
IGarnet composition
0
0.05
0.10
0.15
0.20
0.25
0.30
0.35
0.40
0 200 400 600 800Profile in μm
BA C D
Fig. 4. d18O and elemental compositions measured in garnets from sample NA01113b. The pictures A, B, D, E, G, and H are BSE images. The
minerals in the vicinity of garnet are orthoclase (K-FD), plagioclase (PL), quartz (QZ) and chlorite (CHL). The black ellipses show the location
of d18O analyses. The d18O values measured are reported in x. The error on d18O values is ca. 1x. BSE images A and B represent garnet
C12A and C12B. AV–A compositional profile is represented on graph C. BSE photomicrographs D and E represent garnet C13. AV–Acompositional profile is represented on graph F. BSE photomicrographs G and H represent garnet C6. A–B and C–D compositional profiles are
shown on graph I.
L. Martin et al. / Lithos 87 (2006) 174–192180
overlaps or exceeds the closure temperature for
major elements (Ca, Fe, Mg, Mn) in garnet which
is 550–650 8C when calculated with the diffusion
data of Cygan and Lasaga (1985) and Chakraborty
and Ganguly (1992), using a cooling rate of 10–30
8C/Ma and a garnet radius of 100–150 Am.
4. Oxygen isotope in garnet
Oxygen isotope analyses for garnet crystals of
metabasite NA0180b, calcic gneiss NA01113b and
metapelite NA0262b are reported in Table 2 and
Figs. 4–6.
BIOTITE
100μm
A
A'
C
B
0
0.1
0.2
0.3
0.4
0.5
0.6
0.7
0.8
0.9
1.0
Profile in μm
Garnet composition
9
10
11
12
13
14
15
16
17
δ18O in zircon overgrowths
δ18O in garnet(‰)
0 10050 150 20025 75 125 175 225
D
0
0.1
0.2
0.3
0.4
0.5
0.6
0.7
0.8
0.9
1.0
Half-profile in μm
Garnet composition
9
10
11
12
13
14
15
16
17
δ18O in zircon overgrowths
δ18O in garnet(‰)
1000 25 50 75 125 150 175 200
AA'
BIOTITE
100μmA
XpyropeXalmandine
XspessartineXgrossular δ18O
A A'
A A'
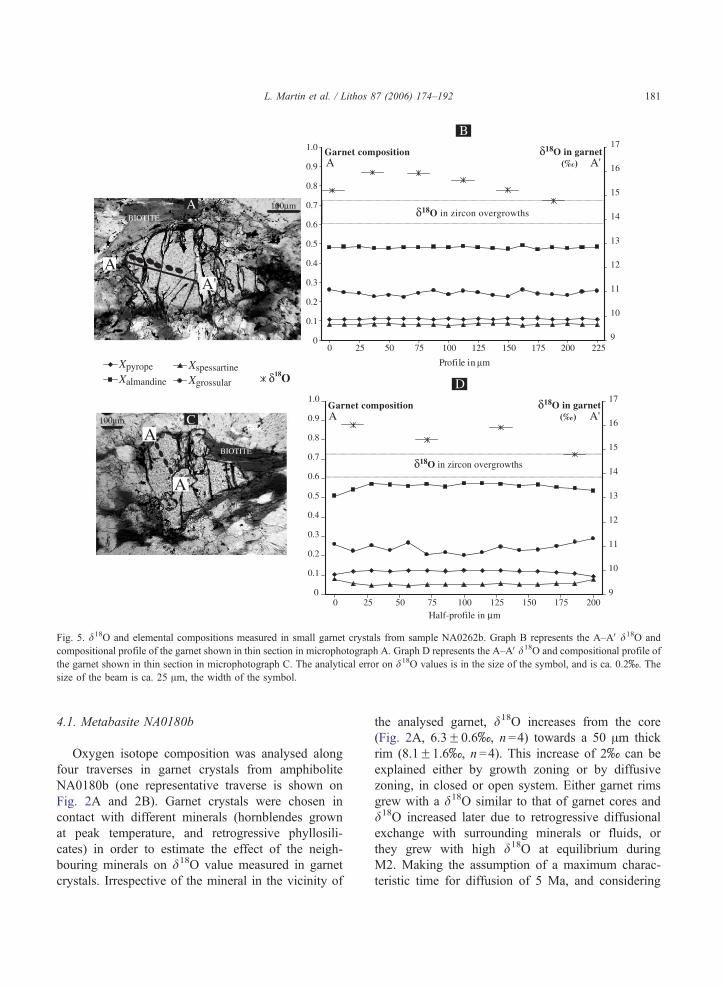
Fig. 5. d18O and elemental compositions measured in small garnet crystals from sample NA0262b. Graph B represents the A–AV d18O and
compositional profile of the garnet shown in thin section in microphotograph A. Graph D represents the A–AV d18O and compositional profile of
the garnet shown in thin section in microphotograph C. The analytical error on d18O values is in the size of the symbol, and is ca. 0.2x. The
size of the beam is ca. 25 Am, the width of the symbol.
L. Martin et al. / Lithos 87 (2006) 174–192 181
4.1. Metabasite NA0180b
Oxygen isotope composition was analysed along
four traverses in garnet crystals from amphibolite
NA0180b (one representative traverse is shown on
Fig. 2A and 2B). Garnet crystals were chosen in
contact with different minerals (hornblendes grown
at peak temperature, and retrogressive phyllosili-
cates) in order to estimate the effect of the neigh-
bouring minerals on d18O value measured in garnet
crystals. Irrespective of the mineral in the vicinity of
the analysed garnet, d18O increases from the core
(Fig. 2A, 6.3F0.6x, n =4) towards a 50 Am thick
rim (8.1F1.6x, n =4). This increase of 2x can be
explained either by growth zoning or by diffusive
zoning, in closed or open system. Either garnet rims
grew with a d18O similar to that of garnet cores and
d18O increased later due to retrogressive diffusional
exchange with surrounding minerals or fluids, or
they grew with high d18O at equilibrium during
M2. Making the assumption of a maximum charac-
teristic time for diffusion of 5 Ma, and considering
A
BI
PY
500μm
A'
A
A
GARNET CC
QZ
B
0
0.1
0.2
0.3
0.4
0.5
0.6
0.7
0.8
0.9
1
0.0 0.2 0.3 0.5 0.6 0.8 0.9 1.1 1.2 1.4 1.6 1.7 1.9Profile in mm
9.0
10.0
11.0
12.0
13.0
14.0
15.0
16.0
17.0
XpyropeXalmandine
XspessartineXgrossular
δ18O
δ18O in zircon overgrowths
A A'
δ18O in garnet(‰)
Garnet composition
Fig. 6. d18O and elemental compositions measured in large garnet
crystals from sample NA0262b. Picture A shows a thin section
photomicrograph of the garnet crystals analysed for elemental and
d18O compositions along the half traverse A–AV. Neighbouring
minerals are pyrite (PY), calcite (CC), quartz (QZ) and biotite (BI).
Graph B is the d18O and elemental compositions AV–A half profile in
the garnet from picture A. The size of the beam and the analytical
error on d18O values (ca.F0.2x) are in the size of the symbol.
Table 2
Oxygen isotope analyses for metabasite NA0180b and metapelite
NA0262b (oxygen isotopes analyses for calcic gneiss are reported
on Fig. 4)
NA0262b NA0180b
Profile
in mm
y18O (x) Fj (x) Profile
in Amy18O (x) Fj (x)
Figure 6 Figure 2
0.000 16.3 0.2 33 7.6 1.0
0.104 15.8 0.2 112 6.6 1.0
0.208 16.2 0.2 198 6.1 1.0
0.416 15.9 0.2 297 6.2 1.0
0.520 15.9 0.2 340 6.1 1.0
0.780 16.1 0.2 409 6.0 1.0
1.092 16.1 0.2 535 5.8 1.0
1.196 16.3 0.2 634 8.0 1.0
1.300 16.1 0.2
1.456 16.1 0.2
1.664 16.1 0.2
1.872 15.8 0.2
Figure 5 A and B
0 15.2 0.2
36 15.8 0.2
72 15.8 0.2
108 15.5 0.2
144 15.1 0.2
180 14.8 0.2
Figure 5 C and D
14 16.0 0.2
70 15.4 0.2
126 15.9 0.2
182 14.8 0.2
L. Martin et al. / Lithos 87 (2006) 174–192182
diffusion data for oxygen from Zheng and Fu (1998),
the characteristic length for diffusion is less than 10
Am at a temperature of 560 8C (average temperature
during M2 in the kyanite–sillimanite transition zone)
which conflicts with the observed 50 Am zoning.
The hypothesis of a diffusive zoning of d18O can
therefore be ruled out. As an alternative, oxygen
isotope composition can be explained by growth
zoning either in closed or in open system, in equili-
brium with the mineral in the vicinity that is gen-
erally hornblende. As garnet rims and hornblende are
in equilibrium and form the main high temperature
paragenesis, the increase in d18O on the garnet rim is
interpreted as coincident with the M2 metamorphic
event.
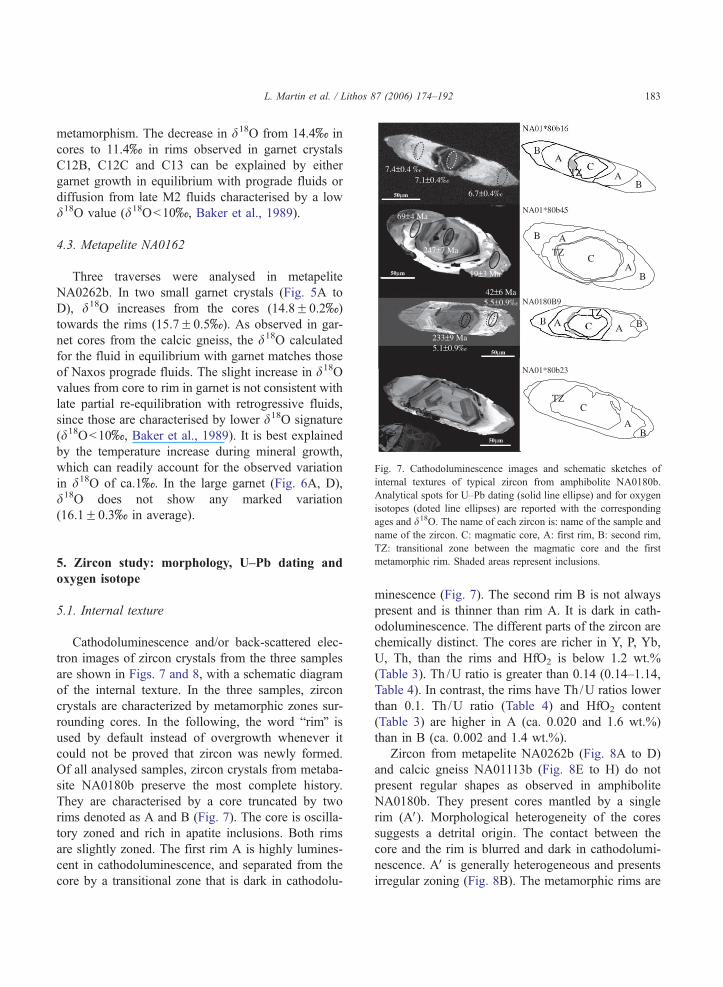
4.2. Calcic gneiss NA01113b
d18O was measured in four garnet crystals from
calcic gneiss NA01113b (Fig. 4). The main minerals
in their vicinity are orthoclase, quartz and plagioclase.
d18O in garnet crystals C12A, C12B (Fig. 4A) and
C13 (Fig. 4D) strongly decreases from core
(14.4F0.7x, n =3) to rim (11.4F1.1x, n=3). Gar-
net C6 displays a constant d18O value of 14.4F0.5x(Fig. 4G). The d18O calculated for the fluid in equili-
brium with garnet (using partition coefficients from
Zheng, 1993) are between ca. 17x (for garnet cores)
and ca. 14x (for garnet rims), considering a tempera-
ture range of 400–670 8C for prograde growth. This
range of values corresponds to the signature of pro-
grade fluids (12xbd18Ob16x, Baker et al., 1989),
which suggests that garnet grew during the prograde
50μm
7.4±0.4 ‰7.1±0.4‰
6.7±0.4‰50μm
69±4 Ma
247±7 Ma
19±3 Ma50μm
42±6 Ma5.5±0.9‰
233±9 Ma5.1±0.9‰
50μm
B
B
A
A
TZC
A AB B
TZC
A
A
B
BTZ C
NA01*80b16
NA01*80b45
NA0180B9
NA01*80b23
AB
CTZ
Fig. 7. Cathodoluminescence images and schematic sketches o
internal textures of typical zircon from amphibolite NA0180b
Analytical spots for U–Pb dating (solid line ellipse) and for oxygen
isotopes (doted line ellipses) are reported with the corresponding
ages and d18O. The name of each zircon is: name of the sample and
L. Martin et al. / Lithos 87 (2006) 174–192 183
metamorphism. The decrease in d18O from 14.4x in
cores to 11.4x in rims observed in garnet crystals
C12B, C12C and C13 can be explained by either
garnet growth in equilibrium with prograde fluids or
diffusion from late M2 fluids characterised by a low
d18O value (d18Ob10x, Baker et al., 1989).
4.3. Metapelite NA0162
Three traverses were analysed in metapelite
NA0262b. In two small garnet crystals (Fig. 5A to
D), d18O increases from the cores (14.8F0.2x)
towards the rims (15.7F0.5x). As observed in gar-
net cores from the calcic gneiss, the d18O calculated
for the fluid in equilibrium with garnet matches those
of Naxos prograde fluids. The slight increase in d18O
values from core to rim in garnet is not consistent with
late partial re-equilibration with retrogressive fluids,
since those are characterised by lower d18O signature
(d18Ob10x, Baker et al., 1989). It is best explained
by the temperature increase during mineral growth,
which can readily account for the observed variation
in d18O of ca.1x. In the large garnet (Fig. 6A, D),
d18O does not show any marked variation
(16.1F0.3x in average).
name of the zircon. C: magmatic core, A: first rim, B: second rim
TZ: transitional zone between the magmatic core and the firs
metamorphic rim. Shaded areas represent inclusions.
5. Zircon study: morphology, U–Pb dating andoxygen isotope
5.1. Internal texture
Cathodoluminescence and/or back-scattered elec-
tron images of zircon crystals from the three samples
are shown in Figs. 7 and 8, with a schematic diagram
of the internal texture. In the three samples, zircon
crystals are characterized by metamorphic zones sur-
rounding cores. In the following, the word brimQ is
used by default instead of overgrowth whenever it
could not be proved that zircon was newly formed.
Of all analysed samples, zircon crystals from metaba-
site NA0180b preserve the most complete history.
They are characterised by a core truncated by two
rims denoted as A and B (Fig. 7). The core is oscilla-
tory zoned and rich in apatite inclusions. Both rims
are slightly zoned. The first rim A is highly lumines-
cent in cathodoluminescence, and separated from the
core by a transitional zone that is dark in cathodolu-
f
.
,
t
minescence (Fig. 7). The second rim B is not always
present and is thinner than rim A. It is dark in cath-
odoluminescence. The different parts of the zircon are
chemically distinct. The cores are richer in Y, P, Yb,
U, Th, than the rims and HfO2 is below 1.2 wt.%
(Table 3). Th /U ratio is greater than 0.14 (0.14–1.14,
Table 4). In contrast, the rims have Th /U ratios lower
than 0.1. Th /U ratio (Table 4) and HfO2 content
(Table 3) are higher in A (ca. 0.020 and 1.6 wt.%)
than in B (ca. 0.002 and 1.4 wt.%).
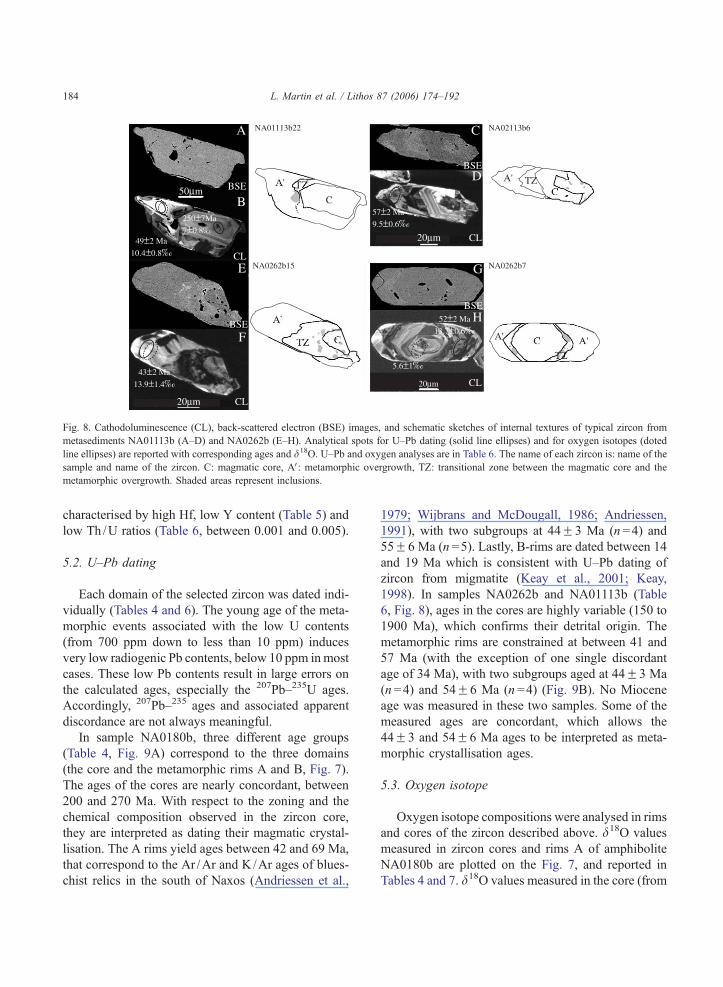
Zircon from metapelite NA0262b (Fig. 8A to D)
and calcic gneiss NA01113b (Fig. 8E to H) do not
present regular shapes as observed in amphibolite
NA0180b. They present cores mantled by a single
rim (AV). Morphological heterogeneity of the cores
suggests a detrital origin. The contact between the
core and the rim is blurred and dark in cathodolumi-
nescence. AV is generally heterogeneous and presents
irregular zoning (Fig. 8B). The metamorphic rims are
CTZA'
57±2 Ma
9.5±0.6‰
C
DBSE
CL20μm
NA02113b6
C
TZA'
49±2 Ma
10.4±0.8‰
250±7Ma
7±0.8‰
A
BBSE
CL
50μm
NA01113b22
A'A'
TZ
C
NA0262b7
5.6±1‰
G
HBSE
20μm
52±2 Ma
13.7±0.6‰
CL
A'
TZ C
43±2 Ma
13.9±1.4‰
E
F
CL
BSE
20μm
NA0262b15
Fig. 8. Cathodoluminescence (CL), back-scattered electron (BSE) images, and schematic sketches of internal textures of typical zircon from
metasediments NA01113b (A–D) and NA0262b (E–H). Analytical spots for U–Pb dating (solid line ellipses) and for oxygen isotopes (doted
line ellipses) are reported with corresponding ages and d18O. U–Pb and oxygen analyses are in Table 6. The name of each zircon is: name of the
sample and name of the zircon. C: magmatic core, AV: metamorphic overgrowth, TZ: transitional zone between the magmatic core and the
metamorphic overgrowth. Shaded areas represent inclusions.
L. Martin et al. / Lithos 87 (2006) 174–192184
characterised by high Hf, low Y content (Table 5) and
low Th /U ratios (Table 6, between 0.001 and 0.005).
5.2. U–Pb dating
Each domain of the selected zircon was dated indi-
vidually (Tables 4 and 6). The young age of the meta-
morphic events associated with the low U contents
(from 700 ppm down to less than 10 ppm) induces
very low radiogenic Pb contents, below 10 ppm inmost
cases. These low Pb contents result in large errors on
the calculated ages, especially the 207Pb–235U ages.
Accordingly, 207Pb–235 ages and associated apparent
discordance are not always meaningful.
In sample NA0180b, three different age groups
(Table 4, Fig. 9A) correspond to the three domains
(the core and the metamorphic rims A and B, Fig. 7).
The ages of the cores are nearly concordant, between
200 and 270 Ma. With respect to the zoning and the
chemical composition observed in the zircon core,
they are interpreted as dating their magmatic crystal-
lisation. The A rims yield ages between 42 and 69 Ma,
that correspond to the Ar /Ar and K/Ar ages of blues-
chist relics in the south of Naxos (Andriessen et al.,
1979; Wijbrans and McDougall, 1986; Andriessen,
1991), with two subgroups at 44F3 Ma (n =4) and
55F6 Ma (n =5). Lastly, B-rims are dated between 14
and 19 Ma which is consistent with U–Pb dating of
zircon from migmatite (Keay et al., 2001; Keay,
1998). In samples NA0262b and NA01113b (Table
6, Fig. 8), ages in the cores are highly variable (150 to
1900 Ma), which confirms their detrital origin. The
metamorphic rims are constrained at between 41 and
57 Ma (with the exception of one single discordant
age of 34 Ma), with two subgroups aged at 44F3 Ma
(n =4) and 54F6 Ma (n =4) (Fig. 9B). No Miocene
age was measured in these two samples. Some of the
measured ages are concordant, which allows the
44F3 and 54F6 Ma ages to be interpreted as meta-
morphic crystallisation ages.
5.3. Oxygen isotope
Oxygen isotope compositions were analysed in rims
and cores of the zircon described above. d18O values
measured in zircon cores and rims A of amphibolite
NA0180b are plotted on the Fig. 7, and reported in
Tables 4 and 7. d18O values measured in the core (from
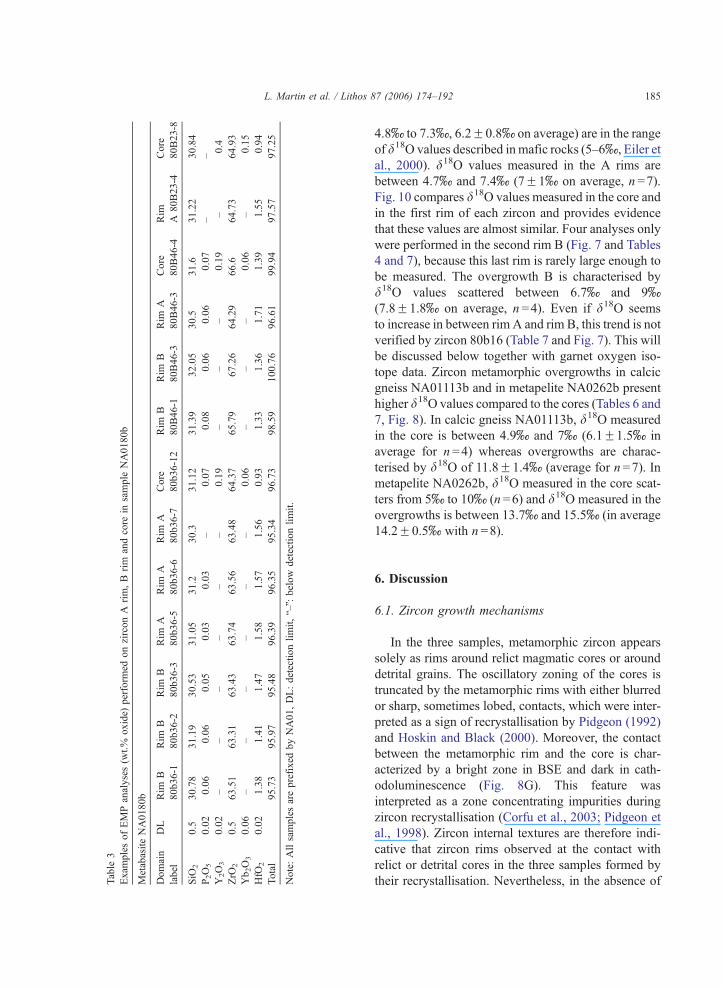
Table
3
Exam
plesofEMPanalyses(w
t.%
oxide)
perform
edonzirconA
rim,Brim
andcore
insample
NA0180b
MetabasiteNA0180b
Domain
label
DL
Rim
B
80b36-1
Rim
B
80b36-2
Rim
B
80b36-3
Rim
A
80b36-5
Rim
A
80b36-6
Rim
A
80b36-7
Core
80b36-12
Rim
B
80B46-1
Rim
B
80B46-3
Rim
A
80B46-3
Core
80B46-4
Rim
A80B23-4
Core
80B23-8
SiO
20.5
30.78
31.19
30.53
31.05
31.2
30.3
31.12
31.39
32.05
30.5
31.6
31.22
30.84
P2O5
0.02
0.06
0.06
0.05
0.03
0.03
–0.07
0.08
0.06
0.06
0.07
––
Y2O3
0.02
––
––
––
0.19
––
–0.19
–0.4
ZrO
20.5
63.51
63.31
63.43
63.74
63.56
63.48
64.37
65.79
67.26
64.29
66.6
64.73
64.93
Yb2O3
0.06
––
––
––
0.06
––
–0.06
–0.15
HfO
20.02
1.38
1.41
1.47
1.58
1.57
1.56
0.93
1.33
1.36
1.71
1.39
1.55
0.94
Total
95.73
95.97
95.48
96.39
96.35
95.34
96.73
98.59
100.76
96.61
99.94
97.57
97.25
Note:Allsamplesareprefixed
byNA01,DL:detectionlimit,b–Q:below
detectionlimit.
L. Martin et al. / Lithos 87 (2006) 174–192 185
4.8x to 7.3x, 6.2F0.8x on average) are in the range
of d18O values described inmafic rocks (5–6x, Eiler et
al., 2000). d18O values measured in the A rims are
between 4.7x and 7.4x (7F1x on average, n =7).
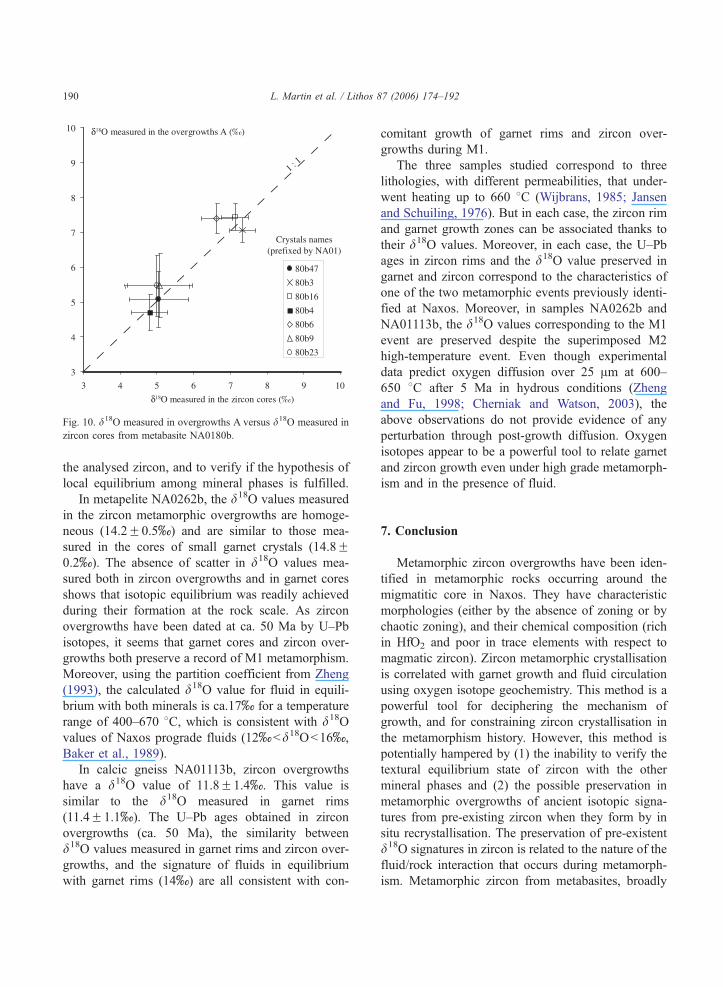
Fig. 10 compares d18O values measured in the core and
in the first rim of each zircon and provides evidence
that these values are almost similar. Four analyses only
were performed in the second rim B (Fig. 7 and Tables
4 and 7), because this last rim is rarely large enough to
be measured. The overgrowth B is characterised by
d18O values scattered between 6.7x and 9x(7.8F1.8x on average, n =4). Even if d18O seems
to increase in between rim A and rim B, this trend is not
verified by zircon 80b16 (Table 7 and Fig. 7). This will
be discussed below together with garnet oxygen iso-
tope data. Zircon metamorphic overgrowths in calcic
gneiss NA01113b and in metapelite NA0262b present
higher d18O values compared to the cores (Tables 6 and
7, Fig. 8). In calcic gneiss NA01113b, d18O measured
in the core is between 4.9x and 7x (6.1F1.5x in
average for n=4) whereas overgrowths are charac-
terised by d18O of 11.8F1.4x (average for n=7). In
metapelite NA0262b, d18O measured in the core scat-
ters from 5x to 10x (n =6) and d18O measured in the
overgrowths is between 13.7x and 15.5x (in average
14.2F0.5x with n =8).
6. Discussion
6.1. Zircon growth mechanisms
In the three samples, metamorphic zircon appears
solely as rims around relict magmatic cores or around
detrital grains. The oscillatory zoning of the cores is
truncated by the metamorphic rims with either blurred
or sharp, sometimes lobed, contacts, which were inter-
preted as a sign of recrystallisation by Pidgeon (1992)
and Hoskin and Black (2000). Moreover, the contact
between the metamorphic rim and the core is char-
acterized by a bright zone in BSE and dark in cath-
odoluminescence (Fig. 8G). This feature was
interpreted as a zone concentrating impurities during
zircon recrystallisation (Corfu et al., 2003; Pidgeon et
al., 1998). Zircon internal textures are therefore indi-
cative that zircon rims observed at the contact with
relict or detrital cores in the three samples formed by
their recrystallisation. Nevertheless, in the absence of
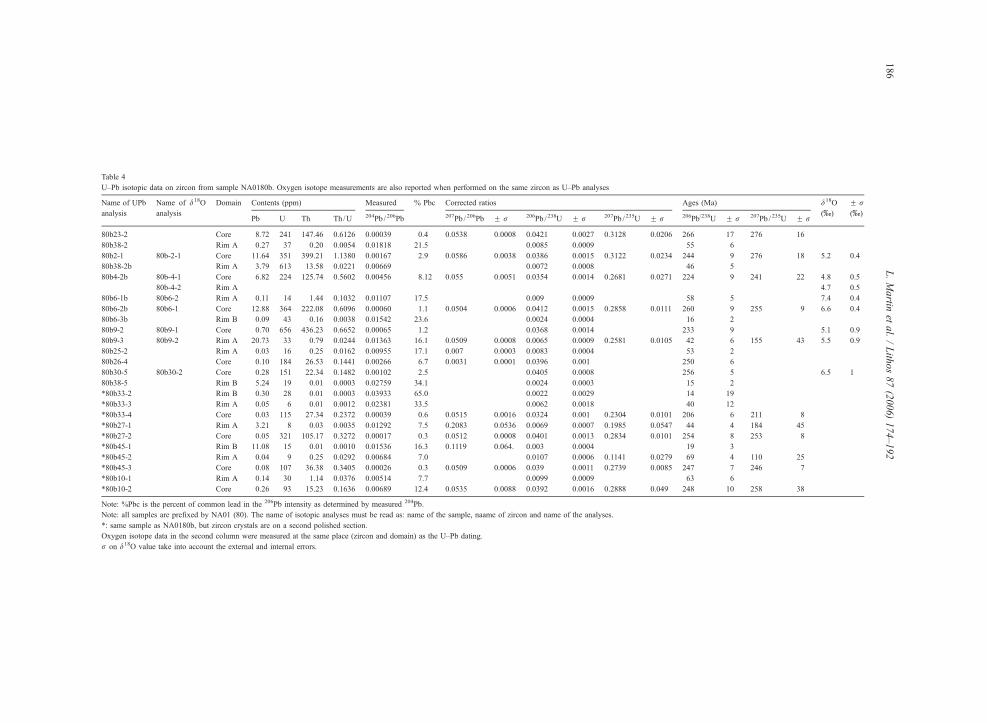
Table 4
U–Pb isotopic data on zircon from sample NA0180b. Oxygen isotope measurements are also reported when performed on the same zircon as U–Pb analyses
Name of UPb
analysis
Name of d18O
analysis
Domain Contents (ppm) Measured % Pbc Corrected ratios Ages (Ma) d18O
(x)
F r(x)
Pb U Th Th/U 204Pb / 206Pb 207Pb / 206Pb F r 206Pb / 238U F r 207Pb / 235U F r 206Pb/238U F r 207Pb / 235U F r
80b23-2 Core 8.72 241 147.46 0.6126 0.00039 0.4 0.0538 0.0008 0.0421 0.0027 0.3128 0.0206 266 17 276 16
80b38-2 Rim A 0.27 37 0.20 0.0054 0.01818 21.5 0.0085 0.0009 55 6
80b2-1 80b-2-1 Core 11.64 351 399.21 1.1380 0.00167 2.9 0.0586 0.0038 0.0386 0.0015 0.3122 0.0234 244 9 276 18 5.2 0.4
80b38-2b Rim A 3.79 613 13.58 0.0221 0.00669 0.0072 0.0008 46 5
80b4-2b 80b-4-1 Core 6.82 224 125.74 0.5602 0.00456 8.12 0.055 0.0051 0.0354 0.0014 0.2681 0.0271 224 9 241 22 4.8 0.5
80b-4-2 Rim A 4.7 0.5
80b6-1b 80b6-2 Rim A 0.11 14 1.44 0.1032 0.01107 17.5 0.009 0.0009 58 5 7.4 0.4
80b6-2b 80b6-1 Core 12.88 364 222.08 0.6096 0.00060 1.1 0.0504 0.0006 0.0412 0.0015 0.2858 0.0111 260 9 255 9 6.6 0.4
80b6-3b Rim B 0.09 43 0.16 0.0038 0.01542 23.6 0.0024 0.0004 16 2
80b9-2 80b9-1 Core 0.70 656 436.23 0.6652 0.00065 1.2 0.0368 0.0014 233 9 5.1 0.9
80b9-3 80b9-2 Rim A 20.73 33 0.79 0.0244 0.01363 16.1 0.0509 0.0008 0.0065 0.0009 0.2581 0.0105 42 6 155 43 5.5 0.9
80b25-2 Rim A 0.03 16 0.25 0.0162 0.00955 17.1 0.007 0.0003 0.0083 0.0004 53 2
80b26-4 Core 0.10 184 26.53 0.1441 0.00266 6.7 0.0031 0.0001 0.0396 0.001 250 6
80b30-5 80b30-2 Core 0.28 151 22.34 0.1482 0.00102 2.5 0.0405 0.0008 256 5 6.5 1
80b38-5 Rim B 5.24 19 0.01 0.0003 0.02759 34.1 0.0024 0.0003 15 2
*80b33-2 Rim B 0.30 28 0.01 0.0003 0.03933 65.0 0.0022 0.0029 14 19
*80b33-3 Rim A 0.05 6 0.01 0.0012 0.02381 33.5 0.0062 0.0018 40 12
*80b33-4 Core 0.03 115 27.34 0.2372 0.00039 0.6 0.0515 0.0016 0.0324 0.001 0.2304 0.0101 206 6 211 8
*80b27-1 Rim A 3.21 8 0.03 0.0035 0.01292 7.5 0.2083 0.0536 0.0069 0.0007 0.1985 0.0547 44 4 184 45
*80b27-2 Core 0.05 321 105.17 0.3272 0.00017 0.3 0.0512 0.0008 0.0401 0.0013 0.2834 0.0101 254 8 253 8
*80b45-1 Rim B 11.08 15 0.01 0.0010 0.01536 16.3 0.1119 0.064. 0.003 0.0004 19 3
*80b45-2 Rim A 0.04 9 0.25 0.0292 0.00684 7.0 0.0107 0.0006 0.1141 0.0279 69 4 110 25
*80b45-3 Core 0.08 107 36.38 0.3405 0.00026 0.3 0.0509 0.0006 0.039 0.0011 0.2739 0.0085 247 7 246 7
*80b10-1 Rim A 0.14 30 1.14 0.0376 0.00514 7.7 0.0099 0.0009 63 6
*80b10-2 Core 0.26 93 15.23 0.1636 0.00689 12.4 0.0535 0.0088 0.0392 0.0016 0.2888 0.049 248 10 258 38
Note: %Pbc is the percent of common lead in the 206Pb intensity as determined by measured 204Pb.
Note: all samples are prefixed by NA01 (80). The name of isotopic analyses must be read as: name of the sample, naame of zircon and name of the analyses.
*: same sample as NA0180b, but zircon crystals are on a second polished section.
Oxygen isotope data in the second column were measured at the same place (zircon and domain) as the U–Pb dating.
r on d18O value take into account the external and internal errors.
L.Martin
etal./Lith
os87(2006)174–192
186
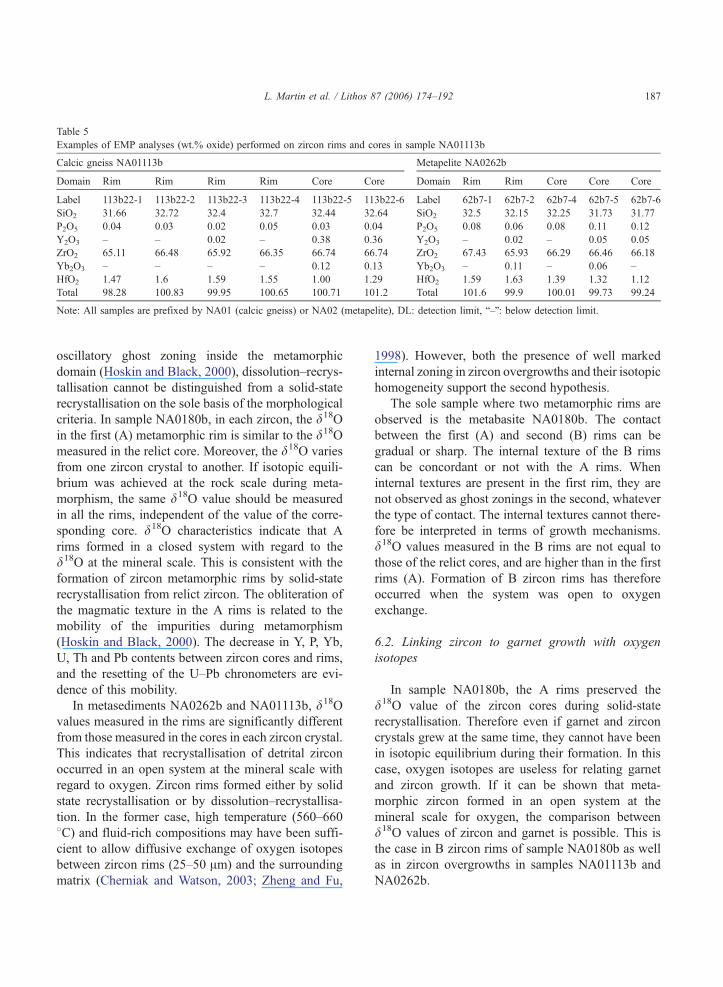
Table 5
Examples of EMP analyses (wt.% oxide) performed on zircon rims and cores in sample NA01113b
Calcic gneiss NA01113b Metapelite NA0262b
Domain Rim Rim Rim Rim Core Core Domain Rim Rim Core Core Core
Label 113b22-1 113b22-2 113b22-3 113b22-4 113b22-5 113b22-6 Label 62b7-1 62b7-2 62b7-4 62b7-5 62b7-6
SiO2 31.66 32.72 32.4 32.7 32.44 32.64 SiO2 32.5 32.15 32.25 31.73 31.77
P2O5 0.04 0.03 0.02 0.05 0.03 0.04 P2O5 0.08 0.06 0.08 0.11 0.12
Y2O3 – – 0.02 – 0.38 0.36 Y2O3 – 0.02 – 0.05 0.05
ZrO2 65.11 66.48 65.92 66.35 66.74 66.74 ZrO2 67.43 65.93 66.29 66.46 66.18
Yb2O3 – – – – 0.12 0.13 Yb2O3 – 0.11 – 0.06 –
HfO2 1.47 1.6 1.59 1.55 1.00 1.29 HfO2 1.59 1.63 1.39 1.32 1.12
Total 98.28 100.83 99.95 100.65 100.71 101.2 Total 101.6 99.9 100.01 99.73 99.24
Note: All samples are prefixed by NA01 (calcic gneiss) or NA02 (metapelite), DL: detection limit, b–Q: below detection limit.
L. Martin et al. / Lithos 87 (2006) 174–192 187
oscillatory ghost zoning inside the metamorphic
domain (Hoskin and Black, 2000), dissolution–recrys-
tallisation cannot be distinguished from a solid-state
recrystallisation on the sole basis of the morphological
criteria. In sample NA0180b, in each zircon, the d18O
in the first (A) metamorphic rim is similar to the d18Omeasured in the relict core. Moreover, the d18O varies
from one zircon crystal to another. If isotopic equili-
brium was achieved at the rock scale during meta-
morphism, the same d18O value should be measured
in all the rims, independent of the value of the corre-
sponding core. d18O characteristics indicate that A
rims formed in a closed system with regard to the
d18O at the mineral scale. This is consistent with the
formation of zircon metamorphic rims by solid-state
recrystallisation from relict zircon. The obliteration of
the magmatic texture in the A rims is related to the
mobility of the impurities during metamorphism
(Hoskin and Black, 2000). The decrease in Y, P, Yb,
U, Th and Pb contents between zircon cores and rims,
and the resetting of the U–Pb chronometers are evi-
dence of this mobility.
In metasediments NA0262b and NA01113b, d18O
values measured in the rims are significantly different
from those measured in the cores in each zircon crystal.
This indicates that recrystallisation of detrital zircon
occurred in an open system at the mineral scale with
regard to oxygen. Zircon rims formed either by solid
state recrystallisation or by dissolution–recrystallisa-
tion. In the former case, high temperature (560–660
8C) and fluid-rich compositions may have been suffi-
cient to allow diffusive exchange of oxygen isotopes
between zircon rims (25–50 Am) and the surrounding
matrix (Cherniak and Watson, 2003; Zheng and Fu,
1998). However, both the presence of well marked
internal zoning in zircon overgrowths and their isotopic
homogeneity support the second hypothesis.
The sole sample where two metamorphic rims are
observed is the metabasite NA0180b. The contact
between the first (A) and second (B) rims can be
gradual or sharp. The internal texture of the B rims
can be concordant or not with the A rims. When
internal textures are present in the first rim, they are
not observed as ghost zonings in the second, whatever
the type of contact. The internal textures cannot there-
fore be interpreted in terms of growth mechanisms.
d18O values measured in the B rims are not equal to
those of the relict cores, and are higher than in the first
rims (A). Formation of B zircon rims has therefore
occurred when the system was open to oxygen
exchange.
6.2. Linking zircon to garnet growth with oxygen
isotopes
In sample NA0180b, the A rims preserved the
d18O value of the zircon cores during solid-state
recrystallisation. Therefore even if garnet and zircon
crystals grew at the same time, they cannot have been
in isotopic equilibrium during their formation. In this
case, oxygen isotopes are useless for relating garnet
and zircon growth. If it can be shown that meta-
morphic zircon formed in an open system at the
mineral scale for oxygen, the comparison between
d18O values of zircon and garnet is possible. This is
the case in B zircon rims of sample NA0180b as well
as in zircon overgrowths in samples NA01113b and
NA0262b.
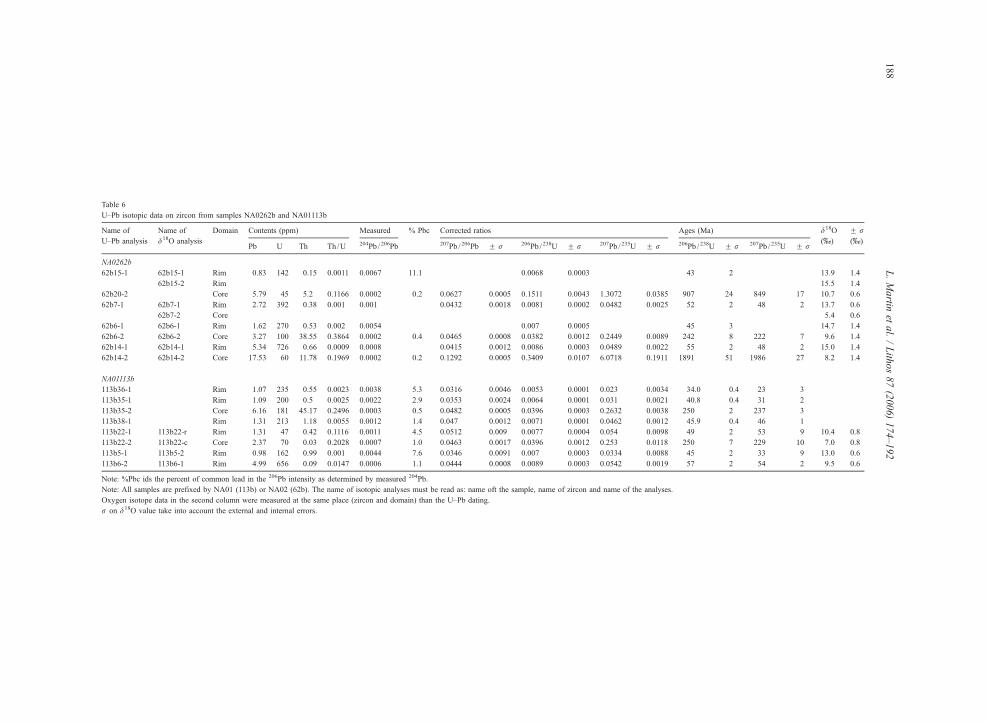
Table 6
U–Pb isotopic data on zircon from samples NA0262b and NA01113b
Name of
U–Pb analysis
Name of
d18O analysis
Domain Contents (ppm) Measured % Pbc Corrected ratios Ages (Ma) d18O
(x)
F r(x)
Pb U Th Th/U 204Pb / 206Pb 207Pb / 206Pb F r 206Pb / 238U F r 207Pb / 235U F r 206Pb / 238U F r 207Pb / 235U F r
NA0262b
62b15-1 62b15-1 Rim 0.83 142 0.15 0.0011 0.0067 11.1 0.0068 0.0003 43 2 13.9 1.4
62b15-2 Rim 15.5 1.4
62b20-2 Core 5.79 45 5.2 0.1166 0.0002 0.2 0.0627 0.0005 0.1511 0.0043 1.3072 0.0385 907 24 849 17 10.7 0.6
62b7-1 62b7-1 Rim 2.72 392 0.38 0.001 0.001 0.0432 0.0018 0.0081 0.0002 0.0482 0.0025 52 2 48 2 13.7 0.6
62b7-2 Core 5.4 0.6
62b6-1 62b6-1 Rim 1.62 270 0.53 0.002 0.0054 0.007 0.0005 45 3 14.7 1.4
62b6-2 62b6-2 Core 3.27 100 38.55 0.3864 0.0002 0.4 0.0465 0.0008 0.0382 0.0012 0.2449 0.0089 242 8 222 7 9.6 1.4
62b14-1 62b14-1 Rim 5.34 726 0.66 0.0009 0.0008 0.0415 0.0012 0.0086 0.0003 0.0489 0.0022 55 2 48 2 15.0 1.4
62b14-2 62b14-2 Core 17.53 60 11.78 0.1969 0.0002 0.2 0.1292 0.0005 0.3409 0.0107 6.0718 0.1911 1891 51 1986 27 8.2 1.4
NA01113b
113b36-1 Rim 1.07 235 0.55 0.0023 0.0038 5.3 0.0316 0.0046 0.0053 0.0001 0.023 0.0034 34.0 0.4 23 3
113b35-1 Rim 1.09 200 0.5 0.0025 0.0022 2.9 0.0353 0.0024 0.0064 0.0001 0.031 0.0021 40.8 0.4 31 2
113b35-2 Core 6.16 181 45.17 0.2496 0.0003 0.5 0.0482 0.0005 0.0396 0.0003 0.2632 0.0038 250 2 237 3
113b38-1 Rim 1.31 213 1.18 0.0055 0.0012 1.4 0.047 0.0012 0.0071 0.0001 0.0462 0.0012 45.9 0.4 46 1
113b22-1 113b22-r Rim 1.31 47 0.42 0.1116 0.0011 4.5 0.0512 0.009 0.0077 0.0004 0.054 0.0098 49 2 53 9 10.4 0.8
113b22-2 113b22-c Core 2.37 70 0.03 0.2028 0.0007 1.0 0.0463 0.0017 0.0396 0.0012 0.253 0.0118 250 7 229 10 7.0 0.8
113b5-1 113b5-2 Rim 0.98 162 0.99 0.001 0.0044 7.6 0.0346 0.0091 0.007 0.0003 0.0334 0.0088 45 2 33 9 13.0 0.6
113b6-2 113b6-1 Rim 4.99 656 0.09 0.0147 0.0006 1.1 0.0444 0.0008 0.0089 0.0003 0.0542 0.0019 57 2 54 2 9.5 0.6
Note: %Pbc ids the percent of common lead in the 206Pb intensity as determined by measured 204Pb.
Note: All samples are prefixed by NA01 (113b) or NA02 (62b). The name of isotopic analyses must be read as: name oft the sample, name of zircon and name of the analyses.
Oxygen isotope data in the second column were measured at the same place (zircon and domain) than the U–Pb dating.
r on d18O value take into account the external and internal errors.
L.Martin
etal./Lith
os87(2006)174–192
188
0
1
2
3
4
0 25 50 75 100
0
1
2
0 25 50 75 100
206Pb-238U Ages (Ma)
Num
ber
of a
naly
ses
14-19 Ma
42-69 Ma
Num
ber
of a
naly
ses
A
B
41-57 Ma
206Pb-238U Ages (Ma)
Metasediments NA01113b and NA0262b
Metabasite NA0180b
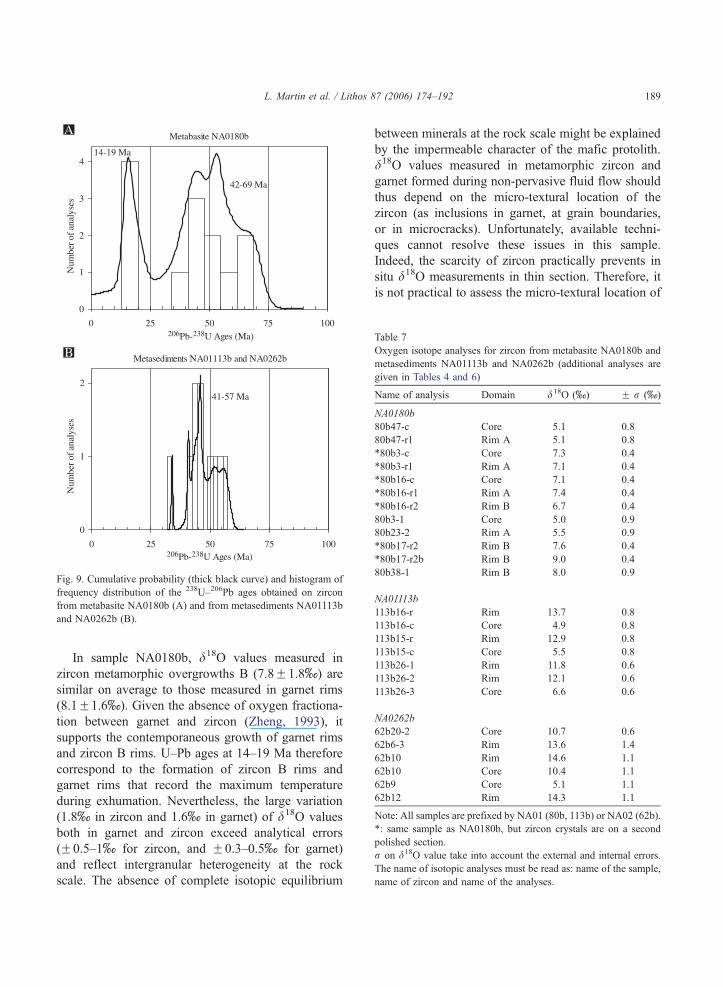
Fig. 9. Cumulative probability (thick black curve) and histogram of
frequency distribution of the 238U–206Pb ages obtained on zircon
from metabasite NA0180b (A) and from metasediments NA01113b
and NA0262b (B).
Table 7
Oxygen isotope analyses for zircon from metabasite NA0180b and
metasediments NA01113b and NA0262b (additional analyses are
given in Tables 4 and 6)
Name of analysis Domain d18O (x) F r (x
NA0180b
80b47-c Core 5.1 0.8
80b47-r1 Rim A 5.1 0.8
*80b3-c Core 7.3 0.4
*80b3-r1 Rim A 7.1 0.4
*80b16-c Core 7.1 0.4
*80b16-r1 Rim A 7.4 0.4
*80b16-r2 Rim B 6.7 0.4
80b3-1 Core 5.0 0.9
80b23-2 Rim A 5.5 0.9
*80b17-r2 Rim B 7.6 0.4
*80b17-r2b Rim B 9.0 0.4
80b38-1 Rim B 8.0 0.9
NA01113b
113b16-r Rim 13.7 0.8
113b16-c Core 4.9 0.8
113b15-r Rim 12.9 0.8
113b15-c Core 5.5 0.8
113b26-1 Rim 11.8 0.6
113b26-2 Rim 12.1 0.6
113b26-3 Core 6.6 0.6
NA0262b
62b20-2 Core 10.7 0.6
62b6-3 Rim 13.6 1.4
62b10 Rim 14.6 1.1
62b10 Core 10.4 1.1
62b9 Core 5.1 1.1
62b12 Rim 14.3 1.1
Note: All samples are prefixed by NA01 (80b, 113b) or NA02 (62b)
*: same sample as NA0180b, but zircon crystals are on a second
polished section.
r on d18O value take into account the external and internal errors
The name of isotopic analyses must be read as: name of the sample
name of zircon and name of the analyses.
L. Martin et al. / Lithos 87 (2006) 174–192 189
In sample NA0180b, d18O values measured in
zircon metamorphic overgrowths B (7.8F1.8x) are
similar on average to those measured in garnet rims
(8.1F1.6x). Given the absence of oxygen fractiona-
tion between garnet and zircon (Zheng, 1993), it
supports the contemporaneous growth of garnet rims
and zircon B rims. U–Pb ages at 14–19 Ma therefore
correspond to the formation of zircon B rims and
garnet rims that record the maximum temperature
during exhumation. Nevertheless, the large variation
(1.8x in zircon and 1.6x in garnet) of d18O values
both in garnet and zircon exceed analytical errors
(F0.5–1x for zircon, and F0.3–0.5x for garnet)
and reflect intergranular heterogeneity at the rock
scale. The absence of complete isotopic equilibrium
between minerals at the rock scale might be explained
by the impermeable character of the mafic protolith.
d18O values measured in metamorphic zircon and
garnet formed during non-pervasive fluid flow should
thus depend on the micro-textural location of the
zircon (as inclusions in garnet, at grain boundaries,
or in microcracks). Unfortunately, available techni-
ques cannot resolve these issues in this sample.
Indeed, the scarcity of zircon practically prevents in
situ d18O measurements in thin section. Therefore, it
is not practical to assess the micro-textural location of
)
.
.
,
3
4
5
6
7
8
9
10
3 4 5 6 7 8 9 10
80b47
80b3
80b16
80b4
80b6
80b9
80b23
δ18O measured in the zircon cores (‰)
δ18O measured in the overgrowths A (‰)
Crystals names(prefixed by NA01)
1 : 1
Fig. 10. d18O measured in overgrowths A versus d18O measured in
zircon cores from metabasite NA0180b.
L. Martin et al. / Lithos 87 (2006) 174–192190
the analysed zircon, and to verify if the hypothesis of
local equilibrium among mineral phases is fulfilled.
In metapelite NA0262b, the d18O values measured
in the zircon metamorphic overgrowths are homoge-
neous (14.2F0.5x) and are similar to those mea-
sured in the cores of small garnet crystals (14.8F0.2x). The absence of scatter in d18O values mea-
sured both in zircon overgrowths and in garnet cores
shows that isotopic equilibrium was readily achieved
during their formation at the rock scale. As zircon
overgrowths have been dated at ca. 50 Ma by U–Pb
isotopes, it seems that garnet cores and zircon over-
growths both preserve a record of M1 metamorphism.
Moreover, using the partition coefficient from Zheng
(1993), the calculated d18O value for fluid in equili-
brium with both minerals is ca.17x for a temperature
range of 400–670 8C, which is consistent with d18Ovalues of Naxos prograde fluids (12xbd18Ob16x,
Baker et al., 1989).
In calcic gneiss NA01113b, zircon overgrowths
have a d18O value of 11.8F1.4x. This value is
similar to the d18O measured in garnet rims
(11.4F1.1x). The U–Pb ages obtained in zircon
overgrowths (ca. 50 Ma), the similarity between
d18O values measured in garnet rims and zircon over-
growths, and the signature of fluids in equilibrium
with garnet rims (14x) are all consistent with con-
comitant growth of garnet rims and zircon over-
growths during M1.
The three samples studied correspond to three
lithologies, with different permeabilities, that under-
went heating up to 660 8C (Wijbrans, 1985; Jansen
and Schuiling, 1976). But in each case, the zircon rim
and garnet growth zones can be associated thanks to
their d18O values. Moreover, in each case, the U–Pb
ages in zircon rims and the d18O value preserved in
garnet and zircon correspond to the characteristics of
one of the two metamorphic events previously identi-
fied at Naxos. Moreover, in samples NA0262b and
NA01113b, the d18O values corresponding to the M1
event are preserved despite the superimposed M2
high-temperature event. Even though experimental
data predict oxygen diffusion over 25 Am at 600–
650 8C after 5 Ma in hydrous conditions (Zheng
and Fu, 1998; Cherniak and Watson, 2003), the
above observations do not provide evidence of any
perturbation through post-growth diffusion. Oxygen
isotopes appear to be a powerful tool to relate garnet
and zircon growth even under high grade metamorph-
ism and in the presence of fluid.
7. Conclusion
Metamorphic zircon overgrowths have been iden-
tified in metamorphic rocks occurring around the
migmatitic core in Naxos. They have characteristic
morphologies (either by the absence of zoning or by
chaotic zoning), and their chemical composition (rich
in HfO2 and poor in trace elements with respect to
magmatic zircon). Zircon metamorphic crystallisation
is correlated with garnet growth and fluid circulation
using oxygen isotope geochemistry. This method is a
powerful tool for deciphering the mechanism of
growth, and for constraining zircon crystallisation in
the metamorphism history. However, this method is
potentially hampered by (1) the inability to verify the
textural equilibrium state of zircon with the other
mineral phases and (2) the possible preservation in
metamorphic overgrowths of ancient isotopic signa-
tures from pre-existing zircon when they form by in
situ recrystallisation. The preservation of pre-existent
d18O signatures in zircon is related to the nature of the
fluid/rock interaction that occurs during metamorph-
ism. Metamorphic zircon from metabasites, broadly
L. Martin et al. / Lithos 87 (2006) 174–192 191
resistant to fluid infiltration, retains the isotopic sig-
nature of the pre-existent magmatic zircon. In con-
trast, metamorphic zircon from metapelite, in which
fluids are pervasive, is in isotopic equilibrium with
those fluids. These cases exemplify two end-members
of recrystallisation processes, in the solid-state or
dissolution–reprecipitation.
Three stages of metamorphic zircon growth were
dated at 55, 45, and 16 Ma. Nevertheless, the two
first events correspond to similar pressure–tempera-
ture conditions (a high pressure low temperature
environment, corresponding to prograde garnet
growth) and stable isotope fluid composition (d18O
values for fluids in equilibrium with zircon higher
than 12x). These conditions prevailed during a per-
iod of ca. 10 Ma. The last event took place in a
medium pressure (MP)–medium temperature (MT)
environment, characterised by circulation of low
d18O (b10x) fluids.
Although the MP–MT M2 metamorphism event is
apparently dominant in the field and petrographically,
garnet and zircon have largely preserved a record of
the earlier high pressure–low temperature M1 meta-
morphic event.
Acknowledgements
This work was funded by CNRS IT-programs
2001, 2002, and UHP BQR 2000.
We thank F. Diot, A. Kohler, and J. Ravaux for
their assistance for SEM and cathodoluminescence
imaging, and electron microprobe analyses. We are
also grateful to D. Mangin and M. Champenois for
their help with SIMS measurements. The quality of
the manuscript was improved by careful reviews by P.
Hoskin, M. Whitehouse and B. Bingen.
References
Andriessen, P.A.M., 1991. K–Ar and Rb–Sr age determinations on
micas of impure marbles of Naxos, Greece: the influence of
metamorphic fluids and lithology on the blocking temperature.
Schweizerische Mineralogie und Petrologie Mitteilungen 71,
89–99.
Andriessen, P.A.M., Boelrijk, N.A.I.M., Hebeda, E.H., Priem,
H.N.A., Verdurmen, E.A.T., Verchure, R.H., 1979. Dating the
events of metamorphism and granitic magmatism in the Alpine
Orogen of Naxos (Cyclades, Greece). Contributions to Mine-
ralogy and Petrology 69, 215–225.
Avigad, D., 1998. High-pressure metamorphism and cooling on SE
Naxos (Cyclades, Greece). European Journal of Mineralogy 10,
1309–1319.
Baker, J., Bickle, M.J., Buick, I.S., Holland, T.J.B., Matthews,
A., 1989. Isotopic and petrological evidence for the infiltra-
tion of water-rich fluids during the Miocene M2 metamorph-
ism on Naxos, Greece. Geochimica et Cosmochimica Acta 53,
2037–2050.
Bingen, B., Austrheim, H., Whitehouse, M.J., 2001. Ilmenite as a
source for zirconium during high-grade metamorphism? Tex-
tural evidence from the Caledonides of western Norway and
implications for zircon geochronology. Journal of Petrology 42,
355–375.
Chakraborty, S., Ganguly, J., 1992. Cation diffusion in aluminosi-
licate garnets: experimental determination in spessartine–alman-
dine couples, evaluation of effective binary diffusion
coefficients, and applications. Contributions to Mineralogy
and Petrology 111, 74–96.
Cherniak, D.J., Watson, E.B., 2000. Pb diffusion in zircon. Chemi-
cal Geology 172, 5–24.
Cherniak, D.J., Watson, E.B., 2003. Diffusion in zircon. Reviews in
Mineralogy and Geochemistry, 113–143.
Corfu, F., Hanchar, J.M., Hoskin, P.W.O., Kinny, P.D., 2003. Atlas
of zircon textures. Reviews in Mineralogy and Geochemistry
53, 469–500.
Cygan, R.T., Lasaga, A.C., 1985. Self diffusion of magnesium in
garnet at 750 to 900 8C. American Journal of Science 285,
328–350.
Deloule, E., Alexandrov, P., Cheilletz, A., Laumonier, B., Barbey,
P., 2002. In situ U–Pb zircon ages for Early Ordovician mag-
matism in the eastern Pyrenees, France: the Canigou orthog-
neisses. International Journal of Earth Science (Geologisches
Rundschau) 91, 398–405.
Eiler, J.M., Graham, C.M., Valley, J.W., 1997. SIMS analysis of
oxygen isotopes: matrix effects in complex minerals and
glasses. Chemical Geology 138, 221–244.
Eiler, J.M., Schiano, P., Kitchen, N., Stolper, E.M., 2000. Oxygen-
isotope evidence for recycled crust in the sources of mid-ocean-
ridge basalts. Nature (London) 403, 530–534.
Elphick, S.C., Ganguly, J., Loomis, T.P., 1985. Experimental deter-
mination of cation diffusivities in aluminosilicate garnets. Con-
tribution to Mineralogy and Petrology 90, 36–44.
France-Lanord, C., Sheppard, S.M.F, LeFort, P., 1988. Hydrogen
and oxygen variations in the high Himalaya peraluminous Ma-
naslu leucogranite; evidence for heterogeneous sedimentary
source. Geochimica et Cosmochimica Acta 52, 513–526.
Fraser, G., Ellis, D., Eggins, S., 1997. Zirconium abundance in
granulite-facies minerals, with implications for zircon geochro-
nology in high-grade rocks. Geology 25, 607–610.
Gebauer, D., Schertl, H.P., Brix, M., Schreyer, W., 1997. 35 Ma
old ultrahigh-pressure metamorphism and evidence for very
rapid exhumation in the Dora Maira Massif, western Alps.
Lithos 41, 5–24.
Hermann, J., Rubatto, D., Korsakov, A., Shatsky, V.S., 2001. Multi-
ple zircon growth during fast exhumation of diamondiferous,
L. Martin et al. / Lithos 87 (2006) 174–192192
deeply subducted continental crust (Kokchetav Massif, Kazakh-
stan). Contributions to Mineralogy and Petrology 141, 66–82.
Hoskin, P.W.O., Black, L.P., 2000. Metamorphic zircon formation
by solid-state recrystallisation of protolith igneous zircon. Jour-
nal of Metamorphic Geology 18, 423–439.
Hoskin, P.W.O., Ireland, T.R., 2000. Rare earth element chemistry
of zircon and its use as a provenance indicator. Geology 28,
627–630.
Hoskin, P.W.O., Schaltegger, U., 2003. The composition of zircon
and igneous and metamorphic petrogenesis. Reviews in Miner-
alogy and Geochemistry 53, 27–62.
Ireland, T.R., 1995. Ion microprobe mass spectrometry: techniques
and applications in cosmochemistry, geochemistry, and geochro-
nology. Advances in Analytical Geochemistry 2, 1–118.
Jansen, J.B.H., 1973. Geological Map of Greece, Island of Naxos.
Institute for Geology and Mineral Resources, Athens. 341 pp.
Jansen, J.B.H., Schuiling, R.D., 1976. Metamorphism on Naxos:
petrology and geothermal gradients. American Journal of
Science 276, 1225–1253.
Keay, S., 1998. The geological evolution of the Cyclades, Greece.
Constraints from SHRIMP U–Pb geochronology. PhD Thesis,
Australian National University, Canberra. 335 pp.
Keay, S., Lister, G., Buick, I., 2001. The timing of partial melting,
Barrovian metamorphism and granite intrusion in the Naxos
metamorphic core complex, Cyclades, Aegean Sea, Greece.
Tectonophysics 342, 275–312.
Lee, J.K.W., Williams, I.S., Ellis, D.J., 1997. Pb, U and Th diffusion
in natural zircon. Nature 390, 159–161.
Moller, A., O’Brien, P.J., Kennedy, A., Kroner, A., 2002. Polyphase
zircon in ultrahigh-temperature granulites (Rogaland, SW Nor-
way): constraints for Pb diffusion in zircon. Journal of Meta-
morphic Geology 20, 727–740.
Pan, Y., 1997. Zircon- and monazite-forming metamorphic reactions
at Manitouwadge, Ontario. The Canadian Mineralogist 35,
105–118.
Peucat, J.-J., Hirata, T., Nesbitt, R.W., 1995. REE fractionation
(ICPMS LASER) evidence in metamorphic zircon during
granulite facies metamorphism and anatectic processes. Terra
Abstracts 7, 346.
Pidgeon, R.T., 1992. Recrystallisation of oscillatory zoned zircon:
some geochronological and petrological implications. Contribu-
tions to Mineralogy and Petrology 110, 463–472.
Pidgeon, R.T., Nemchin, A.A., Hitchen, G.J., 1998. Internal struc-
tures of zircons from Archaean granites from the Darling
Range Batholith; implications for zircon stability and the inter-
pretation of zircon U–Pb ages. Contributions to Mineralogy and
Petrology 132, 300–306.
Rizvanova, N.G., Levchenkov, O.A., Belous, A.E., B., N.I., Masle-
nikov, A.N., Komarov, A.N., Makeev, A.F., Levskiy, L.K.,
2000. Zircon reaction and stability of the U–Pb isotope system
during interaction with carbonate fluid: experimental hydrother-
mal study. Contributions to Mineralogy and Petrology 139,
101–114.
Roberts, M.P., Finger, F., 1997. Do U–Pb zircon ages from
granulites reflect peak metamorphic conditions? Geology 25,
319–322.
Rubatto, D., 2002. Zircon trace element geochemistry: partitioning
with garnet and the link between U–Pb ages and metamorphism.
Chemical Geology 184, 123–138.
Schaltegger, U., Fanning, M., Gunther, D., Morin, J.C., Schulmann,
K., Gebauer, D., 1999. Growth annealing and recrystallisation of
zircon and preservation of monazite in high grade metamorph-
ism: conventional and in situ U–Pb isotope, cathodolumines-
cence and microchemical evidence. Contributions to
Mineralogy and Petrology 134, 186–201.
Spear, F.S., 1993. Metamorphic Phase Equilibria and Pressure–
temperature–time Paths. Mineralogical Society of America
Monograph. 799 pp.
Stacey, J.C., Kramers, J.D., 1975. Approximation of terrestrial lead
isotopes evolution by a two stage model. Earth and Planetary
Science Letters 26, 207–221.
Valley, J.W., Chiarenzelli, J.R., McLelland, J.M., 1994. Oxygen
isotope geochemistry of zircon. Earth and Planetary Science
Letters 126, 187–206.
Valley, J.W., Kitche, N., Kohn, M.J., Niendorf, C.R., Spicuzza,
M.J., 1995. UWG-2, a garnet standard for oxygen isotope ratios;
strategies for high precision and accuracy with laser heating.
Geochimica et Cosmochimica Acta 59, 5223–5231.
Vanderhaeghe, O., 2004. Structural record of the Naxos dome
formation. In: Whitney, D.L., Teyssier, C., Siddoway, C.S.
(Eds.), Gneiss Domes in Orogeny, Geological Society of Ame-
rica Special Paper.
Vielzeuf, D., Champenois, M., Valley, J.W., Brunet, F., 2003. SIMS
analyses of oxygen isotopes: matrix effects in Fe–Mg–Ca gar-
nets. Geophysical Research Abstracts 5, 10926.
Whitehouse, M.J., Platt, J.P., 2003. Dating high-grade metamorph-
ism-constraints from rare-earth elements in zircon and garnet.
Contributions to Mineralogy and Petrology 145, 61–74.
Wiedenbeck, M., Alle, P., Corfu, F., Griffin, W.L., Meier, M.,
Oberli, F., Von Quadt, A., Roddick, J.C., Spiegel, W., 1995.
Three natural zircon standards for U–Th–Pb, Lu–Hf, trace ele-
ment and REE analyses. Geostandards Newsletter 19, 1–23.
Wijbrans, J.R., 1985. Metamorphic histories by the 40Ar / 39Ar age
spectrum method. PhD Thesis, A.N.U., Canberra.
Wijbrans, J.R., McDougall, I., 1986. 40Ar / 39Ar dating of white
micas from an Alpine high-pressure metamorphic belt on
Naxos (Greece): the resetting of the argon isotopic system.
Contributions to Mineralogy and Petrology 93, 187–194.
Williams, I.S., Buick, I.S., Cartwright, I., 1996. An extended epi-
sode of Early Mesoproterozoic fluid flow in the Reynolds
Range, central Australia. Journal of Metamorphic Geology 14,
29–47.
Zeck, H.P., Whitehouse, M.J., 1999. Hercynian Panafrican Prote-
rozoic and Archean ion microprobe zircon ages for a Betic-Rif
core complex, Alpine belt, W. Mediterranean. Consequences for
its P–T–t path. Contributions to Mineralogy and Petrology 134,
134–149.
Zheng, Y.F., 1993. Calculation of oxygen isotope fractionation in
anhydrous silicate minerals. Geochemica et Cosmochimica Acta
57, 1079–1091.
Zheng, Y.F., Fu, B., 1998. Estimation of oxygen diffusivity from
anion porosity in minerals. Geochemical Journal 32, 71–89.


