Embed Size (px)
Citation preview
Western University Western University
Scholarship@Western Scholarship@Western
Electronic Thesis and Dissertation Repository
8-20-2015 12:00 AM
The Kinetics of Cystatin C: A Marker for Dialysis Adequacy The Kinetics of Cystatin C: A Marker for Dialysis Adequacy
Huang S. Shih-Han, The University of Western Ontario
Supervisor: Dr. Robert Lindsay, The University of Western Ontario
A thesis submitted in partial fulfillment of the requirements for the Doctor of Philosophy degree
in Medical Biophysics
© Huang S. Shih-Han 2015
Follow this and additional works at: https://ir.lib.uwo.ca/etd
Part of the Circulatory and Respiratory Physiology Commons
Recommended Citation Recommended Citation Shih-Han, Huang S., "The Kinetics of Cystatin C: A Marker for Dialysis Adequacy" (2015). Electronic Thesis and Dissertation Repository. 3084. https://ir.lib.uwo.ca/etd/3084
This Dissertation/Thesis is brought to you for free and open access by Scholarship@Western. It has been accepted for inclusion in Electronic Thesis and Dissertation Repository by an authorized administrator of Scholarship@Western. For more information, please contact [email protected].
i
THE KINETICS OF CYSTATIN C: A MARKER FOR DIALYSIS ADEQUACY
(Thesis format: Integrated-Article)
by
Shih-Han Susan Huang, BSc, MD, and PhD
Graduate Program in Medical Biophysics
A thesis submitted in partial fulfillment of the requirements for the degree of
Doctor of Philosophy
The School of Graduate and Postdoctoral Studies The University of Western Ontario
London, Ontario, Canada
© Shih-Han S. Huang 2015 THE UNIVESRITY OF WESTERN ONTARIO
ii
Abstract When 90% or more of native kidney function is lost, renal replacement therapy
must be initiated to sustain life. Renal transplantation is the preferred method, but
availability is limited. The ideal dialysis prescription remains elusive. Small
molecular weight molecules (such as urea and creatinine) have been used as
markers of both kidney (native and transplant) and dialysis toxin clearance
(function), but there are pitfalls in using these markers to assess total ‘renal’ dose
(kidney plus dialysis). Body weight, gender and other factors also affect the
concentrations of these small molecules, but not cystatin C. Furthermore,
cystatin C has been shown to be a better marker for estimating kidney function
than creatinine, and is associated with cardiovascular morbidity and mortality.
Studies have shown that it is removed by dialysis. Therefore, we investigated the
use of cystatin C, a naturally occurring endogenous protein, as a marker for
estimating dialysis adequacy and renal clearance. This investigation was
comprised of four studies to understand the kinetics of cystatin C in patients with
advanced kidney disease with or without dialysis. We found that the amount of
cystatin C reduction was influenced positively by hemodialysis blood flow rate
and treatment time, and negatively by ultrafiltration rate. We further
demonstrated that renal hyperfiltration significantly influenced the error of
creatinine-based glomerular filtrate rate equation, but not for the cystatin C
equation. Therefore, cystatin C appears to be a useful marker for the assessment
of kidney function in patients with advanced kidney disease but not yet on
dialysis. This was taken further in our third study where we developed an
equation, which gave a better estimate of residual renal function than previously
published equations in patients on dialysis but who have some remaining kidney
function. Finally, we confirmed our hypothesis that cystatin C is cleared during
dialysis by both diffusion and convection. It is distributed mainly in the
extracellular space but equilibrates slowly between the extravascular and
intravascular spaces. Furthermore, we have shown that cystatin C while cleared
by dialysis is stable between dialysis treatments rather than being influenced by
iii
a single dialysis treatment. It is a marker for both dialysis and renal clearances
and, thus, gives a stable index of total renal clearance.
The long term goal will be to define the cystatin C threshold level that influences
patient morbidity and mortality and to allow better dialysis prescriptions for
patients with varying (and changing) residual renal function.
Keywords
Cystatin C, Dialysis, Dialysis Adequacy, Hemodialysis, Nuclear Glomerular
Filtration Rate, Residual Renal Function
iv
Co-Authorship Statement
Chapter 2 has been adapted from a version of a manuscript submitted to the
Clinical Journal of the American Society of Nephrology, 2011. The title of this
manuscript is “Cystatin C Reduction Ratio Depends on Normalized Blood Liters
Processed and Fluid Removal during Hemodialysis”, by: Huang, Filler, Yasin,
and Lindsay. Huang, Filler, and Lindsay formulated the research idea and
designed the study. Huang collected the data. Huang and Yasin performed the
statistical analysis. The data were interpreted by Huang, Filler, Yasin and
Lindsay. Each author contributed important intellectual content during the
manuscript drafting and revising and accepted accountability for the overall work
by ensuring that questions pertaining to the accuracy or integrity of any portion of
the work are appropriately investigated and resolved.
Chapter 3 has been adapted from the paper entitled “Hyperfiltration Affects
Accuracy of Creatinine eGFR Measurements”, published in the Clinical Journal of
the American Society of Nephrology, 2011 by: Huang, Sharma, Yasin, Lindsay,
Clark and Filler. Huang, Filler, and Lindsay formulated the research idea and
designed the study. This is a post-hoc analysis of a published study. Huang and
Yasin performed the statistical analysis. The data were interpreted by Huang,
Sharma, Lindsay, Clark and Filler. Each author contributed important intellectual
content during manuscript drafting or revision and accepted accountability for the
overall work by ensuring that questions pertaining to the accuracy or integrity of
any portion of the work are appropriately investigated and resolved.
Chapter 4 has been adapted from a version of a manuscript submitted to the
Peritoneal Dialysis International, 2011. The title of this manuscript is “Residual
Renal Function Calculated from Serum Cystatin C Measurements and a
Knowledge of the Standard Weekly Kt/V (Urea)”, by Huang, Filler, and Lindsay.
Huang, Filler, and Lindsay formulated the research idea and designed the study.
Huang collected the data. Huang performed the statistical analysis. The data
v
were interpreted by Huang, Filler, and Lindsay. Each author contributed
important intellectual content during manuscript drafting or revision and accepted
accountability for the overall work by ensuring that questions pertaining to the
accuracy or integrity of any portion of the work are appropriately investigated and
resolved.
Chapter 5 has been adapted from a version of a manuscript submitted to the
American Journal of Kidney Disease, which has been published as a Research
Letter in the journal. The title is “The Kinetics of Cystatin C Removal by
Hemodialysis”, Huang; Tirona; Reid-Wilkinson; Thomson; Filler; Stodilka;
Lindsay. Huang, Filler, Stodilka and Lindsay formulated the research idea and
designed the study. Huang, and Reid-Wilkinson collected the data. Huang
performed the statistical analysis. The data were interpreted by Huang, Tirona,
Thomson, Stodilka and Lindsay. Each author contributed important intellectual
content during manuscript drafting or revision and accepted accountability for the
overall work by ensuring that questions pertaining to the accuracy or integrity of
any portion of the work are appropriately investigated and resolved.
Huang takes responsibility for that all four studies: that they have been reported
honestly, accurately, and transparently; that no important aspects of the studies
have been omitted, and that any discrepancies from the studies as planned have
been adequately explained.

vi
Acknowledgments
William Arthur Ward stated that, “The mediocre teacher tells. The good teacher
explains. The superior teacher demonstrates. The great teacher inspires.” The
last describes my supervisor, Dr. Robert Lindsay. He took me under his wing
from the start and has helped me in every step throughout my training. He is
always there to support me as a trainee, researcher and friend. I think he has
truly gone above and beyond what a typical supervisor does. His passion for
science and medicine has truly inspired me to become a better researcher and
clinician. Thank you, Bob – any of my past and future accomplishments would
not be possible without your inspiration.
I am also very grateful to my co-supervisor, Dr. Robert Stodilka, and my PhD
mentorship advisor, Dr. Guido Filler. I met them as a trainee and a student, and
both of them spent time to guide me in the right direction for my research
development and help me to form research collaborations. Their advice and
support were very helpful.
I would especially like to thank to Dr. William Clark, who has also been
consistently a great mentor to me. I cannot even count the numbers of times he
has encouraged and generously supported me throughout the last 7 years. It was
his inspiration that directed me into the nephrology research field. Furthermore,
my thanks go to Dr. Chris McIntyre who has provided me with invaluable
expertise in writing my PhD thesis and guidance on future dialysis research.
I have been blessed to learn from, and now to work with, a wonderful group of
nephrologists. Being in this positive environment has helped me in becoming a
confident researcher, and a more empathetic clinician. It is true that, “Good
teachers know how to bring out the best in students”, a quote from Charles
Kuralt. Drs. Peter Blake, Amit Garg, Arsh Jain, Claude Kortas, Louise Moist, and
Nabil Sultan have all been great teachers, friends and colleagues.

vii
Thanks also go to Drs. Claire Grant, Lakshman Gunaratham, Andrew House,
Hari Iyer, Anthony Jevnikar, Norman Muirhead, Faisal Rehman, Michael Rieder,
Dongmei Sun, and Benjamin Thomson. In addition, Kerri Gallo, the home
hemodialysis group (Rosemary Leitch, Sharon Kamphius, Cathy Dominski, and
Katherine Pepe), and the peritoneal dialysis group have provided insight,
expertise, and assistance that greatly supported this research. I also would like to
acknowledge the financial supports of the CIHR for the fellowship and the Vanier
CGS award.
Throughout my life, I have been blessed with loving family. I would like to
dedicate this thesis to my family:
To my grandparents, I wish they could physically be here to see my
accomplishment.
To my parents, Sherman and Lily, who taught me by example and are always
there for me.
To my brother, George, who has supported me through every single step of my
life.
To my sister, Flora, who is my best friend and my best supporter. Through my life
journey, you have always been there during both the highs and the lows.
viii
Table of Contents
Abstract ................................................................................................................ ii Co-Authorship Statement .................................................................................. iv Acknowledgments .............................................................................................. vi Table of Contents ............................................................................................. viii List of Tables ....................................................................................................... x List of Figures ..................................................................................................... xi List of Appendices ........................................................................................... xiii List of Abbreviations ........................................................................................ xiv 1. CHAPTER 1. GENERAL INTRODUCTION ................................................... 1
1.1. INTRODUCTION TO RENAL CLEARANCE ........................................... 1 1.1.1. Renal and Urinary Collecting System ................................................ 1 1.1.2. Glomerular Filtration, Filtration Fraction and Chronic Kidney Disease ............................................................................................................. 2 1.1.3. Methods of Measuring Glomerular Filtration Rate ............................ 5 1.1.4. Methods of Estimating Glomerular Filtration Rate: Biomarkers ..... 8 1.2. INTRODUCTION TO RENAL REPLACEMENT THERAPY .................. 13 1.2.1. History and Development of Renal Replacement Therapy ............ 13 1.2.2. History and Development of Hemodialysis ..................................... 13 1.2.3. History and Development of Peritoneal Dialysis ............................ 15 1.3. COMPONENTS OF HEMODIALYSIS .................................................... 16 1.3.1. Vascular Access ................................................................................. 17 1.3.2. Dialysate Circuit ................................................................................. 17 1.3.3. Blood Circuit ....................................................................................... 18 1.3.4. Dialyzer ............................................................................................... 18 1.3.5. Hemodialysis Machines ..................................................................... 22 1.4. HEMODIALYSIS MODALITIES ............................................................. 23 1.5. THE PHYSIOLOGY OF HEMODIALYSIS CLEARANCE ...................... 24 1.5.1. Basic Concepts of Diffusion and Convection ................................. 24 1.5.2. Chronic Hemodialysis Access and Blood Flow Rate ..................... 26 1.5.3. Dialyzer ............................................................................................... 31 1.5.4. Dialysate and Its Flow Rate ............................................................... 33 1.5.5. Hemodialysis Frequency and Duration ............................................ 38 1.5.6. Convective Clearance ........................................................................ 38 1.6. THE KINETICS OF SOLUTE CLEARANCE BY HEMODIALYSIS ....... 40 1.6.1. Body Compartments .......................................................................... 40 1.6.2. Compartmental Modeling .................................................................. 41 1.6.3. Uremic Toxins .................................................................................... 47 1.6.4. Urea Clearance and Kinetic Modeling .............................................. 49 1.6.5. Urea as a Marker for Dialysis Adequacy .......................................... 58 1.6.6. Cystatin C as a Marker for Renal Clearance .................................... 60 1.7. Cystatin C as a New Marker for Dialysis Adequacy .......................... 62
ix
2. Chapter 2. Cystatin C Reduction Ratio Depends on Normalized Blood Liters Processed and Fluid Removal .............................................................. 88
2.1. INTRODUCTION .................................................................................... 88 2.2. MATERIAL AND METHODS ................................................................. 90 2.3. RESULTS ............................................................................................... 93 2.4. DISCUSSION ......................................................................................... 99
3. Chapter 3. Hyperfiltration Affects Accuracy of Creatinine eGFR Measurement ................................................................................................... 107
3.1. INTRODUCTION .................................................................................. 107 3.2. MATERIALS AND METHODS ............................................................. 108 3.3. RESULTS ............................................................................................. 111 3.4. DISCUSSION ....................................................................................... 115
4. Chapter 4. Short Communication: Residual Renal Function Calculated from Serum Cystatin C Measurements and A Knowledge of The Standard Weekly Kt/V (Urea) .......................................................................................... 125
4.1. INTRODUCTION .................................................................................. 125 4.2. MATERIAL AND METHODS ............................................................... 126 4.3. RESULTS ............................................................................................. 127 4.4. DISCUSSION ....................................................................................... 129
5. CHAPTER 5. THE KINETICS OF CYSTATIN C REMOVAL BY HEMODIALYSIS ............................................................................................... 133
5.1. INTRODUCTION .................................................................................. 133 5.2. METHODS ............................................................................................ 134 5.3. RESULTS ............................................................................................. 139 5.4. DISCUSSION ....................................................................................... 142 5.5. CONCLUSIONS ................................................................................... 145
6. CHAPTER 6. LIMITATIONS, FUTURE WORK AND SIGNIFICANCE ...... 150 6.1. OVERVIEW AND SUMMARY .............................................................. 150 6.2. LIMITATIONS OF CURRENT WORK .................................................. 152 6.3. FUTURE WORK ................................................................................... 154 6.4. SIGNIFICANCE .................................................................................... 157
Appendices ...................................................................................................... 161 Curriculum Vitae .............................................................................................. 168
x
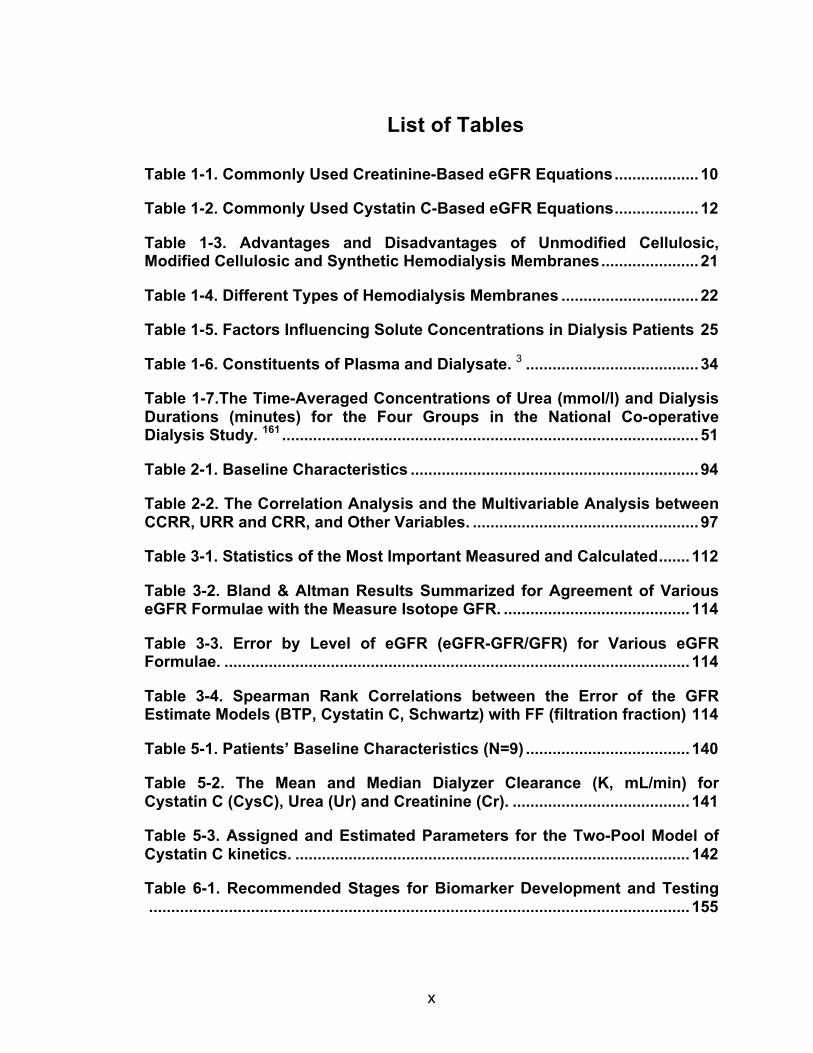
List of Tables
Table 1-1. Commonly Used Creatinine-Based eGFR Equations ................... 10
Table 1-2. Commonly Used Cystatin C-Based eGFR Equations ................... 12
Table 1-3. Advantages and Disadvantages of Unmodified Cellulosic, Modified Cellulosic and Synthetic Hemodialysis Membranes ...................... 21
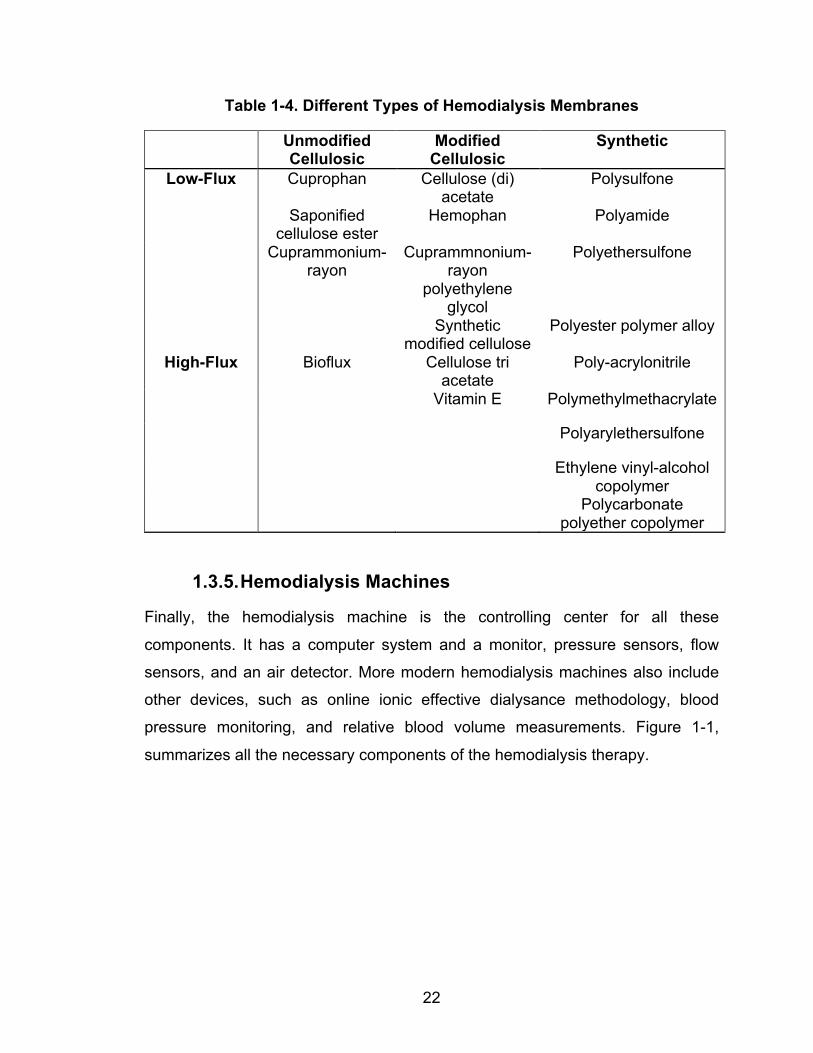
Table 1-4. Different Types of Hemodialysis Membranes ............................... 22
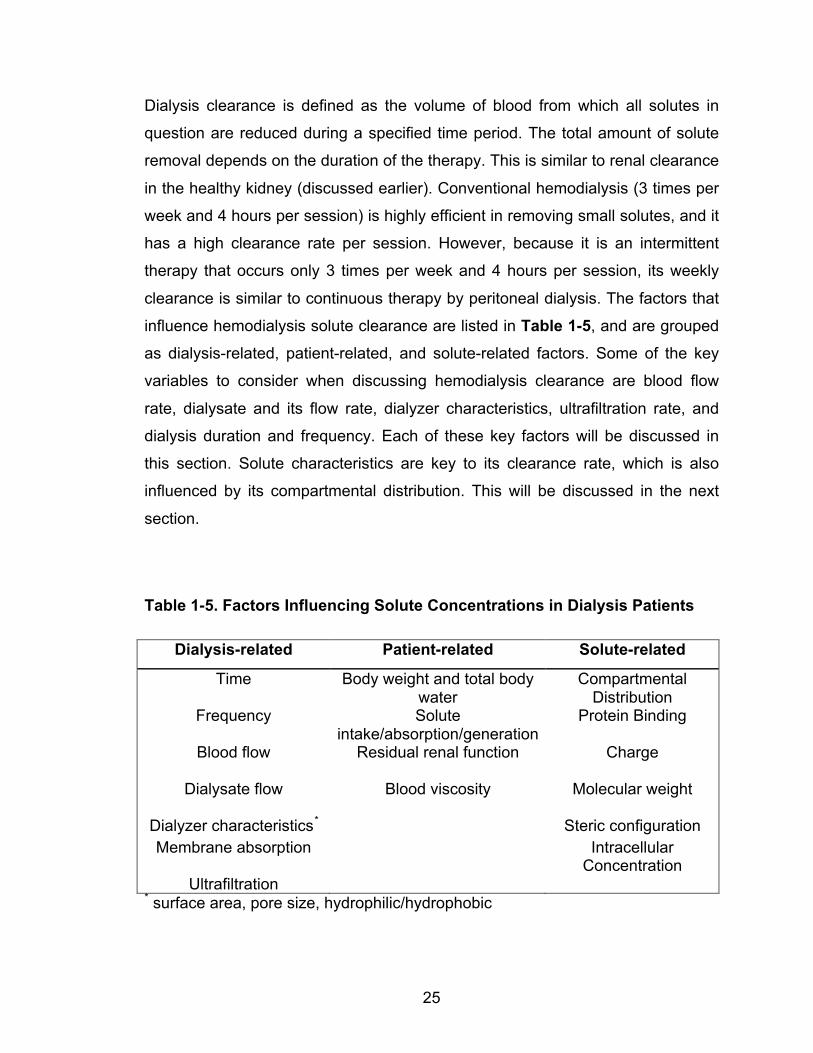
Table 1-5. Factors Influencing Solute Concentrations in Dialysis Patients 25
Table 1-6. Constituents of Plasma and Dialysate. 3 ....................................... 34
Table 1-7.The Time-Averaged Concentrations of Urea (mmol/l) and Dialysis Durations (minutes) for the Four Groups in the National Co-operative Dialysis Study. 161 .............................................................................................. 51
Table 2-1. Baseline Characteristics ................................................................. 94
Table 2-2. The Correlation Analysis and the Multivariable Analysis between CCRR, URR and CRR, and Other Variables. ................................................... 97
Table 3-1. Statistics of the Most Important Measured and Calculated ....... 112
Table 3-2. Bland & Altman Results Summarized for Agreement of Various eGFR Formulae with the Measure Isotope GFR. .......................................... 114
Table 3-3. Error by Level of eGFR (eGFR-GFR/GFR) for Various eGFR Formulae. ......................................................................................................... 114
Table 3-4. Spearman Rank Correlations between the Error of the GFR Estimate Models (BTP, Cystatin C, Schwartz) with FF (filtration fraction) 114
Table 5-1. Patients’ Baseline Characteristics (N=9) ..................................... 140
Table 5-2. The Mean and Median Dialyzer Clearance (K, mL/min) for Cystatin C (CysC), Urea (Ur) and Creatinine (Cr). ........................................ 141
Table 5-3. Assigned and Estimated Parameters for the Two-Pool Model of Cystatin C kinetics. ......................................................................................... 142
Table 6-1. Recommended Stages for Biomarker Development and Testing .......................................................................................................................... 155
xi
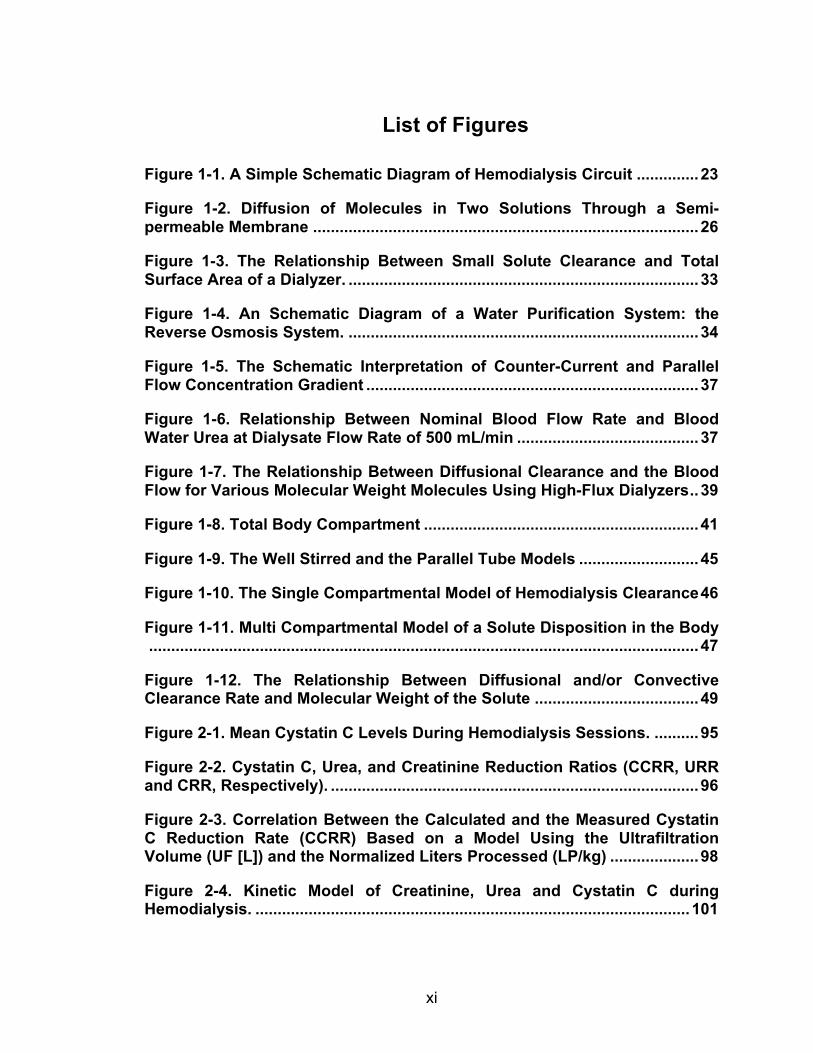
List of Figures
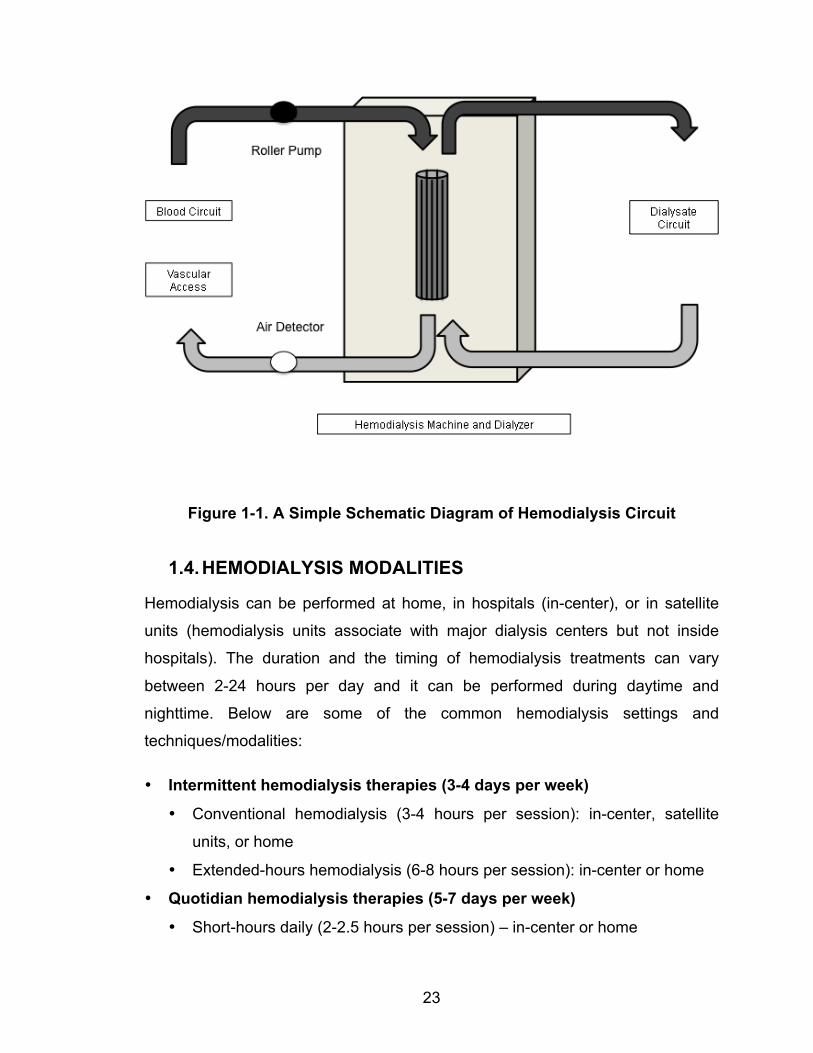
Figure 1-1. A Simple Schematic Diagram of Hemodialysis Circuit .............. 23
Figure 1-2. Diffusion of Molecules in Two Solutions Through a Semi-permeable Membrane ....................................................................................... 26
Figure 1-3. The Relationship Between Small Solute Clearance and Total Surface Area of a Dialyzer. ............................................................................... 33
Figure 1-4. An Schematic Diagram of a Water Purification System: the Reverse Osmosis System. ............................................................................... 34
Figure 1-5. The Schematic Interpretation of Counter-Current and Parallel Flow Concentration Gradient ........................................................................... 37
Figure 1-6. Relationship Between Nominal Blood Flow Rate and Blood Water Urea at Dialysate Flow Rate of 500 mL/min ......................................... 37
Figure 1-7. The Relationship Between Diffusional Clearance and the Blood Flow for Various Molecular Weight Molecules Using High-Flux Dialyzers .. 39
Figure 1-8. Total Body Compartment .............................................................. 41
Figure 1-9. The Well Stirred and the Parallel Tube Models ........................... 45
Figure 1-10. The Single Compartmental Model of Hemodialysis Clearance 46
Figure 1-11. Multi Compartmental Model of a Solute Disposition in the Body ............................................................................................................................ 47
Figure 1-12. The Relationship Between Diffusional and/or Convective Clearance Rate and Molecular Weight of the Solute ..................................... 49
Figure 2-1. Mean Cystatin C Levels During Hemodialysis Sessions. .......... 95
Figure 2-2. Cystatin C, Urea, and Creatinine Reduction Ratios (CCRR, URR and CRR, Respectively). ................................................................................... 96
Figure 2-3. Correlation Between the Calculated and the Measured Cystatin C Reduction Rate (CCRR) Based on a Model Using the Ultrafiltration Volume (UF [L]) and the Normalized Liters Processed (LP/kg) .................... 98
Figure 2-4. Kinetic Model of Creatinine, Urea and Cystatin C during Hemodialysis. .................................................................................................. 101
xii
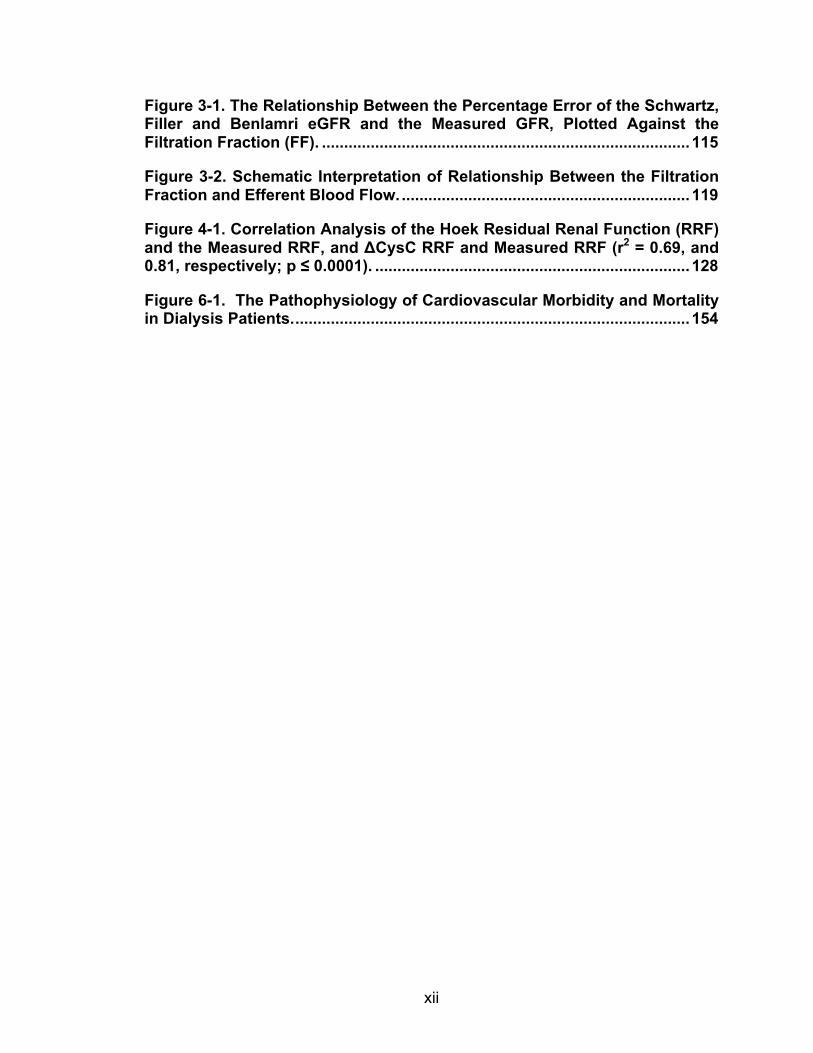
Figure 3-1. The Relationship Between the Percentage Error of the Schwartz, Filler and Benlamri eGFR and the Measured GFR, Plotted Against the Filtration Fraction (FF). ................................................................................... 115
Figure 3-2. Schematic Interpretation of Relationship Between the Filtration Fraction and Efferent Blood Flow. ................................................................. 119
Figure 4-1. Correlation Analysis of the Hoek Residual Renal Function (RRF) and the Measured RRF, and ΔCysC RRF and Measured RRF (r2 = 0.69, and 0.81, respectively; p ≤ 0.0001). ....................................................................... 128
Figure 6-1. The Pathophysiology of Cardiovascular Morbidity and Mortality in Dialysis Patients. ......................................................................................... 154
xiii
List of Appendices
Appendix A: Human Sciences Research Ethics Board Approval .............. 161
Appendix B. Copyright Material and Permission for the Four Publication Papers .............................................................................................................. 162
Appendix C. Copyright Material and Permission for the Figures ............... 166
xiv
List of Abbreviations β2-M β2-Microglobulin
A1C Glycated Hemoglobin A1C
AGE Advanced Glycation End-Products
BTP Beta Trace Protein
BSA Body Surface Area
BUN Blood Urea Nitrogen
CAPD Continuous Ambulatory Peritoneal Dialysis
CysC Serum Cystatin C
CCRR Cystatin C Reduction Ratio
CKD Chronic Kidney Disease
CKD-EPI Chronic Kidney Disease Epidemiology Collaboration Equation
CrCl Creatinine Clearance
CRR Creatinine Reduction Ratio
CV Coefficient of Variation (Standard Deviation/Mean)
EID Effective Ionic Dialysance
FF Filtration Fraction
FHN Frequent Hemodialysis Network
ECV Extracellular Volume
GFR Glomerular Filtration Fate
eGFR Estimated Glomerular Filtration Rate
IDMS Isotope Dilution Mass Spectrometry
K Clearance in mL/min
xv
K0A Mass Transfer Coefficient of the Dialyzer
KDOQI Kidney Disease Outcome Quality Improvement
Kt/V Dimensionless Parameter for Assessing Hemodialysis Efficiency
Kt/Vurea Dimensionless Parameter for Assessing Hemodialysis Urea
Efficiency
eKt/Vurea Equilibrated Kt/V of Urea
In (x) Natural Logarithm of x (loge (x)), where e = 2.718281828459
Log (x) Logarithm of x to base of 10 (log10 (x))
LP Liters Processed
LP/kg Liters Processed Normalized by Body Weight
MDRD The Abbreviated 4-variable Modification of Diet in Renal Disease
estimated Glomerular Filtration Rate
NCDS National Co-operative Dialysis Study
Qb Blood Flow Rate
Qp Plasma Flow Rate
Qd Dialysate Flow Rate
SCr Serum Creatinine
Sp Kt/Vurea Single Pool Kt/V of Urea
Std Kt/ Vurea Weekly “Standardized” Kt/V of urea
SUr Serum Urea
TNF Tumor Necrosis Factor
UKM Urea Kinetic Modeling
URR Urea Reduction Ratio
xvi
51Cr-EDTA Chromium 51-labeled Ethylenediaminetetraacetate
99mTc-DTPA Technetium 99m-labeled Diethylenetriaminepentaacetic Acid
1
1. CHAPTER 1. GENERAL INTRODUCTION
1.1. INTRODUCTION TO RENAL CLEARANCE
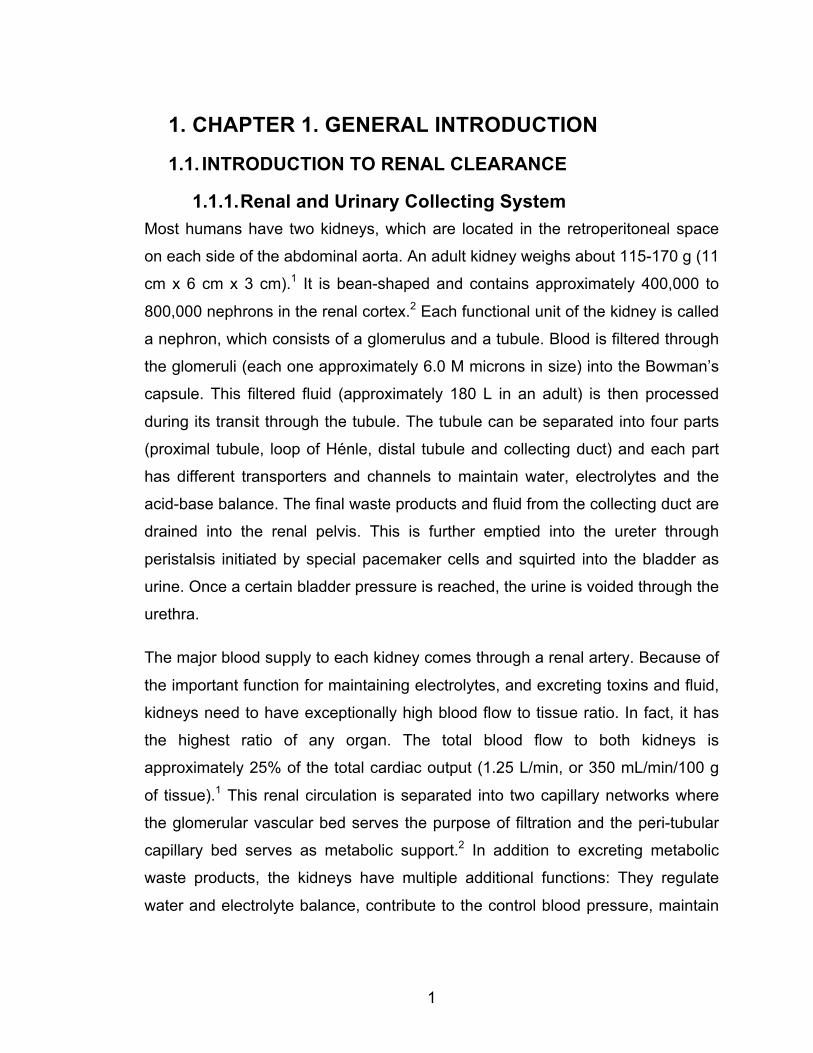
1.1.1. Renal and Urinary Collecting System Most humans have two kidneys, which are located in the retroperitoneal space
on each side of the abdominal aorta. An adult kidney weighs about 115-170 g (11
cm x 6 cm x 3 cm).1 It is bean-shaped and contains approximately 400,000 to
800,000 nephrons in the renal cortex.2 Each functional unit of the kidney is called
a nephron, which consists of a glomerulus and a tubule. Blood is filtered through
the glomeruli (each one approximately 6.0 M microns in size) into the Bowman’s
capsule. This filtered fluid (approximately 180 L in an adult) is then processed
during its transit through the tubule. The tubule can be separated into four parts
(proximal tubule, loop of Hénle, distal tubule and collecting duct) and each part
has different transporters and channels to maintain water, electrolytes and the
acid-base balance. The final waste products and fluid from the collecting duct are
drained into the renal pelvis. This is further emptied into the ureter through
peristalsis initiated by special pacemaker cells and squirted into the bladder as
urine. Once a certain bladder pressure is reached, the urine is voided through the
urethra.
The major blood supply to each kidney comes through a renal artery. Because of
the important function for maintaining electrolytes, and excreting toxins and fluid,
kidneys need to have exceptionally high blood flow to tissue ratio. In fact, it has
the highest ratio of any organ. The total blood flow to both kidneys is
approximately 25% of the total cardiac output (1.25 L/min, or 350 mL/min/100 g
of tissue).1 This renal circulation is separated into two capillary networks where
the glomerular vascular bed serves the purpose of filtration and the peri-tubular
capillary bed serves as metabolic support.2 In addition to excreting metabolic
waste products, the kidneys have multiple additional functions: They regulate
water and electrolyte balance, contribute to the control blood pressure, maintain
2
acid-base balance, produce erythropoietin, and convert vitamin D to its active
form 1,25-dihydroxy-vitamin D.3
1.1.2. Glomerular Filtration, Filtration Fraction and Chronic Kidney Disease
Although a kidney has multiple tasks, kidney function is typically assessed by the
glomerular filtration rate and, to a lesser extent, renal blood flow.4 It is important
to measure accurately or estimate the glomerular filtration rate for early detection
and monitoring of kidney function impairment, determining drug dosages based
on renal clearance and assessing eligibility for kidney donation.
A glomerulus contains a network of many capillaries and it has unique structural
support to hold the capillaries, the endothelium with numerous fenestrations, the
glomerular basement membrane and cells such as podocytes and mesangial
cells. The diameter of a endothelial fenestration is approximately 70–100 nm.5
The glomerular basement membrane forms both a size and charge barrier to
filtration. The podocytes probably form the most important filtration barrier for
plasma proteins.6 In normal conditions, urine formation starts when the blood
from the afferent arterioles filtrates through the glomerular capillaries that consist
of a filtrate with small plasma proteins and electrolytes. The amount of the filtered
blood per time interval normalized to an idealized body surface area (1.73m2) is
called the glomerular filtration rate (GFR, mL/min/1.73m2), which is determined
by the hydrostatic pressure and colloid osmotic (oncotic) pressure across the
capillary membrane, and the capillary filtration coefficient in the glomerulus.3
Filtration occurs by means of the transcapillary pressure difference:
𝑺𝒊𝒏𝒈𝒍𝒆 𝑵𝒆𝒑𝒉𝒓𝒐𝒏 𝑮𝑭𝑹 = 𝑲𝒇 (∆𝑷𝒉 − ∆𝝅) Equation 1-1
where Kf is a coefficient determined by hydraulic conductivity and the surface
area, ΔPh and Δπ are the hydrostatic pressure and the oncotic pressure
differences between the capillary and the Bowman’s space (the beginning of the
tubular component of a nephron), respectively. If the hydraulic pressure
3
difference is smaller than the oncotic pressure, there is no filtration. The hydraulic
pressure differences (ΔPh) between the capillary and the Bowman’s space do not
alter much at the beginning and the end of the glomerular capillary. However, the
oncotic pressure difference (Δπ) rises from 18 to 34 mmHg along the glomerular
capillary.5 This is due to plasma filtration into the Bowman’s space, a fluid which
has no protein passes. The oncotic pressure increases within the capillary and
thus is reduced in the Bowman’s space. Therefore, the amount of filtration
reduces along the capillary pathway.
𝑺𝒊𝒏𝒈𝒍𝒆 𝑵𝒆𝒑𝒉𝒓𝒐𝒏 𝑮𝑭𝑹 = 𝑸𝒂𝒇𝒇𝒆𝒓𝒆𝒏𝒕 𝟏− 𝝅𝑨∆𝑷𝒉
Equation 1-2
where πA is the initial capillary oncotic pressure, and Qafferent is the afferent blood
flow rate. Assuming πA and ΔPh are unchanged constant, then the single nephron
GFR varies, according to the Qafferent.5 In general, the single nephron GFR,
afferent and efferent blood flow rate, oncotic and hydraulic pressure are stable:
this renal aurtoregulation is controlled by changes in afferent and efferent
arteriolar resistance.7
It is impractical, or even impossible, to measure GFR at the glomerular level. The
GFR measurement is the overall glomerular filtration rate in one or both kidneys
in a subject. A normal GFR in an adult is approximately 125 mL/min.1 Therefore,
an average adult has a glomerular filtration rate of 180 L per day. If this filtered
fluid is not reabsorbed, the patient will lose a significant number of electrolytes.
As a result, the majority of the filtered electrolytes (such as sodium and
potassium) and plasma fluid are reabsorbed. Currently, kidney function is
reported based on GFR, either measured or estimated. The ideal markers for
assessing GFR should be freely filtered by glomeruli without tubular secretion
and reabsorption.3 This will be discussed in the next section.
Another variable that is closely linked to GFR is the renal filtration fraction (FF).
FF is the amount of renal plasma flow that is filtered. It is calculated by the
following equation:1
4
𝑭𝒊𝒍𝒕𝒓𝒂𝒕𝒊𝒐𝒏 𝑭𝒓𝒂𝒄𝒕𝒊𝒐𝒏 𝑭𝑭 = 𝑮𝑭𝑹𝑹𝒆𝒏𝒂𝒍 𝑷𝒍𝒂𝒔𝒎𝒂 𝑭𝒍𝒐𝒘
Equation 1-3
A normal FF is approximately 18.7 ± 3.2% in healthy young adults between the
ages of 20 and 30 years.8 When the FF is above the reference interval of 18-
22%, it is considered hyperfiltration.9 Hyperfiltration can occur at the individual
glomerular level in a situation where GFR is decreased. Early development of
diabetic nephropathy is commonly associated with hyperfiltration and is a
maladaption process.10 This can lead to poor renal outcome.11 Reducing
hyperfiltration through medications, such as angiotensin receptor blockers or
angiotensin converting enzyme inhibitors, may prevent or reduce the rate of renal
function decline.
As kidney function is commonly measured by GFR, the National Kidney
Foundation has proposed five stages of Chronic Kidney Diseases (CKD).12
Measurements of urinary sediments, markers of renal damage, renal imaging
and renal pathologic abnormalities can help identify kidney diseases where the
GFR is not significantly altered. Therefore, the CKD Stages 1 and 2 are defined
as kidney damage, which are measured by using urinary, imaging or pathologic
methods, with normal or increased GFR (≥ 90 mL/min/1.73m2) and with mildly
decreased GFR (60-89 mL/min/1.73m2). The CKD Stages 3-5 are defined mainly
by GFR measurements: 30-59 mL/min/1.73m2, 15-29 mL/min/1.73m2, and <15
mL/min/1.73m2, respectively.
The CKD staging system has some issues and it has received some major
criticisms.13 It does not consider the underlying pathophysiology of renal failure.
Furthermore, proteinuria (protein in the urine) is an important renal prognostic
indicator: the current CKD staging system does not take it into account.
Therefore, Tonelli et al. have proposed a new classification system based on
both the GFR and the proteinuria level.14 This classification has not yet been
widely adapted. For physicians and health care providers, it is important to know
that the management of CKD patients should be individualized and should not be
based solely on the CKD stages.
5
1.1.3. Methods of Measuring Glomerular Filtration Rate
Over the last 80 years, several methods have been developed to assess GFR.
Each of these methods has its pros and cons - some are more invasive and time-
consuming, while others may not be sufficiently sensitive or specific. Here, we
will discuss the methods for assessing GFR.
(1) The Inulin Study
Inulin is a fructose polymer made from the Jerusalem artichoke that does not
have non-renal elimination, no plasma protein binding, and is neither absorbed or
excreted by the tubule. It has the characteristics of an ideal renal marker for GFR
measurements.15 Therefore, inulin clearance is considered the gold standard for
measuring GFR.16,17 This method was initially developed in 1935 by Homer
Smith.17 In the traditional method, an intravenous infusion of inulin is given after a
bolus injection until a steady state is reached. Urinary inulin clearance is then
measured. Because it is time consuming, modified versions of the traditional
inulin clearance were developed. Several hours of inulin infusion is the ideal
method for measuring clearance, and to minimize error, catheterization is best for
accurate urine collection. Despite the use of these methods, there is a 10% inter-
assay variability with inulin measurements due to analytical challenges and the
inhomogeneity of the biomarker, especially when older biochemical methods are
employed, rather than mass spectrometry.16 Because of its invasiveness
(catheterization) and difficulties with the availability of inulin, an inulin study is
rarely performed and is limited to a research setting.18
(2) The Nuclear GFR Study
In the 1970’s, nuclear medicine techniques replaced the inulin clearance method.
The techniques, which use radio-labeled markers that have similar properties to
inulin, have produced findings comparable to inulin GFR clearance studies of
patients with GFRs above 20 mL/min/1.73m2.19,20 A bolus of clearly measured
and suitable compound, which was injected through a venipuncture, is commonly
6
utilized. The rate of decreasing plasma concentration of the compound, after
adjusting for its inherited decay rate, is measured and is used to calculate renal
GFR. In Europe, chromium 51-labeled ethylenediaminetetraacetate (51Cr-EDTA)
is the most widely used radio-labeled isotope. Technetium 99m-labeled
diethylenetriaminepentaacetic acid (99mTc-DTPA) is the most commonly used
GFR marker in North America.21-23 Although some studies have observed
systematic differences between 51Cr-EDTA and 99mTc-DTPA, these differences
are small and 99mTc-DTPA is recommended as an acceptable alternative to 51Cr-
EDTA.20,21,24-27 Other exogenous markers that have been utilized are 125Iodine
iothalamate, iothalamate and iohexol. The latter two have been used without
being radiolabeled. All markers except iothalamate have a small amount of
plasma protein binding.
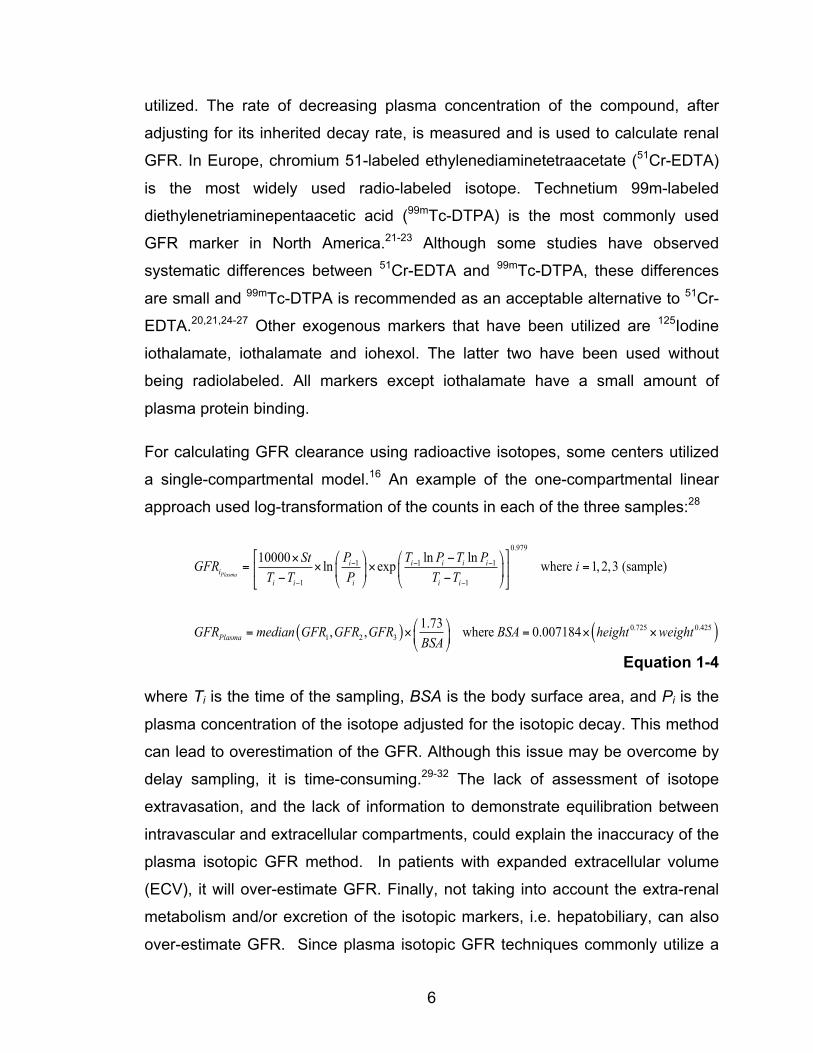
For calculating GFR clearance using radioactive isotopes, some centers utilized
a single-compartmental model.16 An example of the one-compartmental linear
approach used log-transformation of the counts in each of the three samples:28
Equation 1-4
where Ti is the time of the sampling, BSA is the body surface area, and Pi is the
plasma concentration of the isotope adjusted for the isotopic decay. This method
can lead to overestimation of the GFR. Although this issue may be overcome by
delay sampling, it is time-consuming.29-32 The lack of assessment of isotope
extravasation, and the lack of information to demonstrate equilibration between
intravascular and extracellular compartments, could explain the inaccuracy of the
plasma isotopic GFR method. In patients with expanded extracellular volume
(ECV), it will over-estimate GFR. Finally, not taking into account the extra-renal
metabolism and/or excretion of the isotopic markers, i.e. hepatobiliary, can also
over-estimate GFR. Since plasma isotopic GFR techniques commonly utilize a
( ) ( )
0.979
1 1 1
1 1
0.725 0.4251 2 3
ln ln10000 ln exp where 1,2,3 (sample)
1.73, , where 0.007184
Plasma
i i i i ii
i i i i i
Plasma
P T P T PStGFR iT T P T T
GFR median GFR GFR GFR BSA height weightBSA
− − −
− −
⎡ ⎤⎛ ⎞ ⎛ ⎞−×= × × =⎢ ⎥⎜ ⎟ ⎜ ⎟
− −⎝ ⎠ ⎝ ⎠⎣ ⎦
⎛ ⎞= × = × ×⎜ ⎟⎝ ⎠
7
single bolus-injection technique, it is important that the entire quantity of
radioisotope enters the intravascular space, since extravasation can lead to the
overestimation of GFR.
There are certain compartmental methods where the timing of the blood
sampling can result in different values. It has been considered that the slope-
intercept method, restricting the blood samples to the second of the two
exponential components, provides the best compromise between accuracy and
reliability, in addition to its simplicity.33 The Brochner-Mortensen technique has
been developed to correct the systematic error of the slope-intercept
technique.34,35 Appropriate pharmacokinetic approaches using the actual time
point of sampling and Bayesian estimation for the calculation of the GFR from the
isotope counts are important.36 The frequency and timing of collected samples
matter, and are significant for accurate plasma isotopic GFR determination.21,22 It
is generally recognized that at least 3 sampling points are required.
The accuracy of plasma isotopic GFR measurement when the GFR is below 20-
30 mL/min/1.73m2 is limited.37,38 Therefore, the plasma isotopic GFR method can
over-estimate GFR unless sampling time is extended; this may not be practical,
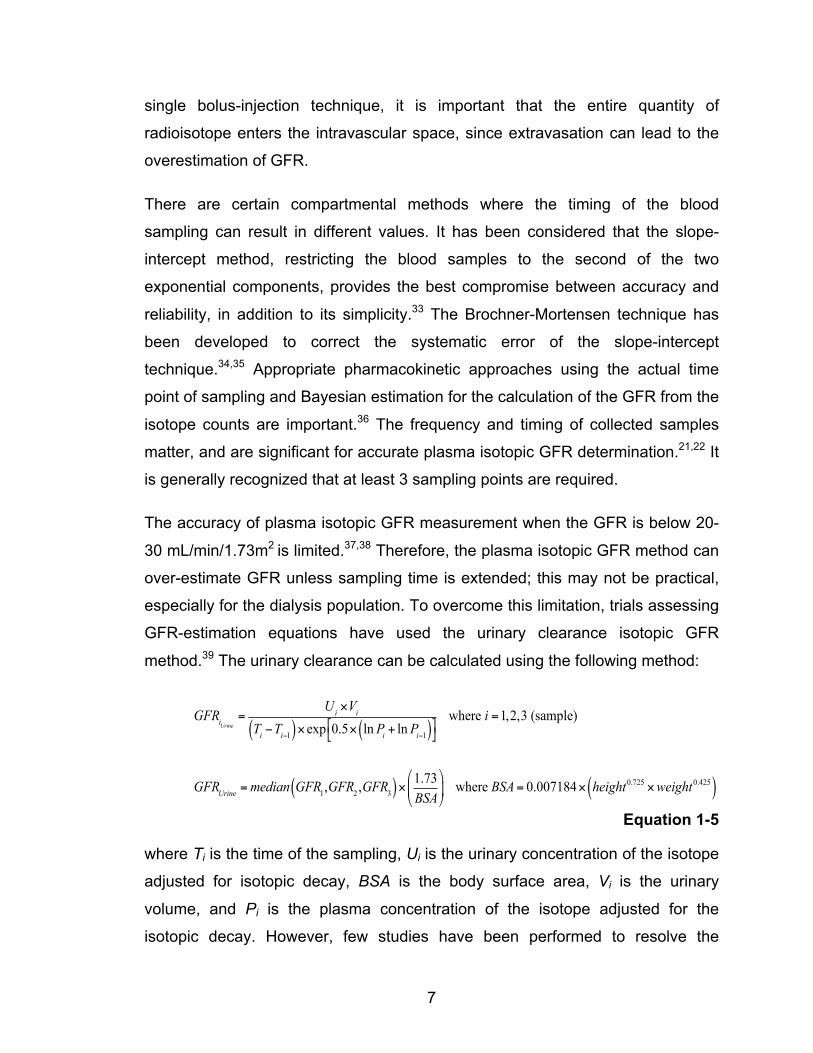
especially for the dialysis population. To overcome this limitation, trials assessing
GFR-estimation equations have used the urinary clearance isotopic GFR
method.39 The urinary clearance can be calculated using the following method:
Equation 1-5
where Ti is the time of the sampling, Ui is the urinary concentration of the isotope
adjusted for isotopic decay, BSA is the body surface area, Vi is the urinary
volume, and Pi is the plasma concentration of the isotope adjusted for the
isotopic decay. However, few studies have been performed to resolve the
GFRiUrine =Ui ×Vi
Ti −Ti−1( )× exp 0.5× ln Pi + ln Pi−1( )#$
%&
where i =1,2,3 (sample)
GFRUrine =median GFR1,GFR2 ,GFR3( )× 1.73BSA'
()
*
+, where BSA= 0.007184× height0.725 ×weight0.425( )
8
question as to whether urinary isotopic GFR could serve as a suitable
replacement method.
(3) Endogenous Biomarkers to Estimate GFR
Although using exogenous markers, such as inulin and nuclear isotopes, to
measure GFR is considered more accurate; the method is invasive and time-
consuming, and not practical for day-to-day use. Therefore, endogenous
biomarkers are commonly used to estimate. The ideal biomarkers in patients
with chronic kidney diseases should confirm the level of renal function, measure
the total “renal clearance” and predict the outcomes of “renal health”. Once the
potential biomarkers are identified, they need to go through vigorous
development and testing. In stage 1, pre-clinical research identifies promising
markers that require further exploration. In stage 2, the potential biomarker is
tested in human beings to determine if it can distinguish individuals severely
affected with the disease from those who are healthy. In stage 3, retrospective
studies establish whether the biomarker detects disease before the clinical
diagnosis becomes evident. In stage 4, the biomarker undergoes prospective
evaluation to determine the performance characteristics of the test in a setting in
which it will be clinically applied. Finally, in stage 5, the focus is on the use of
biomarkers to assess in the natural course of illness. When biomarkers are used
for screening, it should be shown in randomized controlled trials that the
application of interventions earlier in the process is indeed beneficial. Several
biomarkers have been used to estimate glomerular filtration rate and have gone
through at least stage 3 or 4; they include small plasma solutes such as
creatinine, and endogenous small molecular weight proteins such as cystatin C,
beta-trace protein and B2 microglobulin.
1.1.4. Methods of Estimating Glomerular Filtration Rate: Biomarkers
(1) Creatinine
9
Creatinine is a small molecular weight solute (113 Dalton).40,41 It is the product of
creatine and phosphocreatine, and is filtered by glomeruli. Proper and Mandel in
1937 proposed that it could be used for assessing kidney function.42 There are
various methods and reference ranges for serum creatinine measurements.43,44
Recently, the isotope dilution-mass spectrometry (IDMS) reference method has
improved and standardized the accuracy of creatinine measurements by
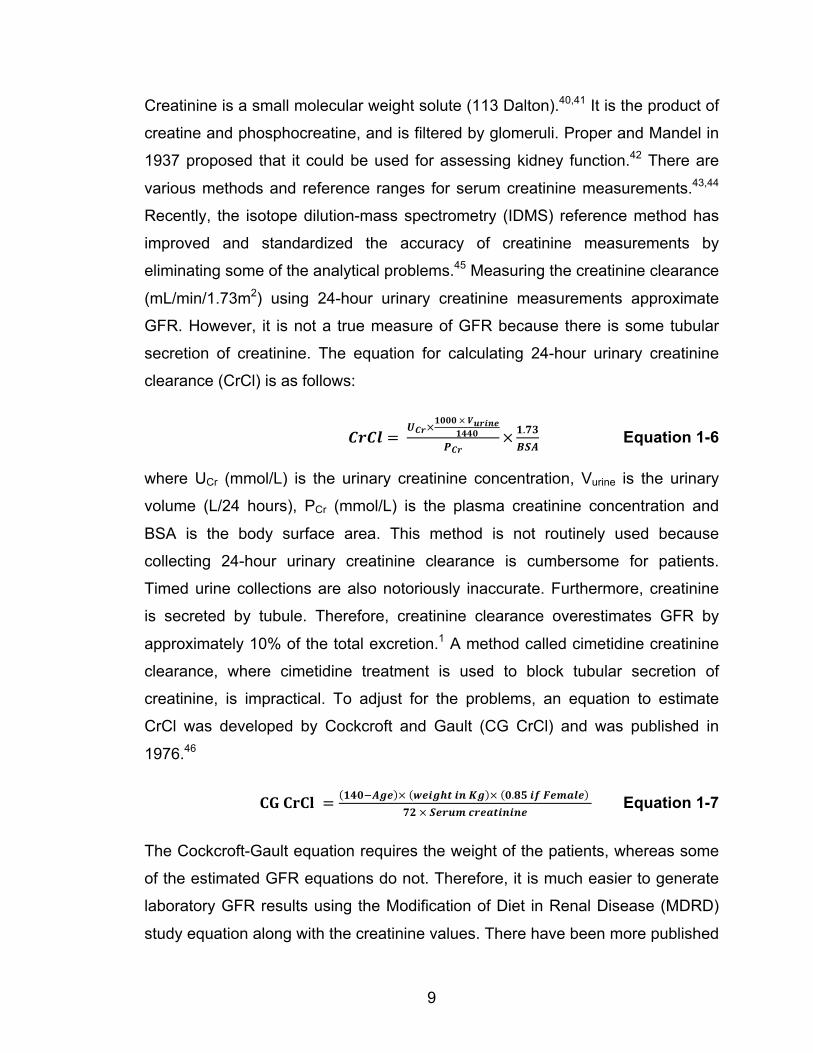
eliminating some of the analytical problems.45 Measuring the creatinine clearance
(mL/min/1.73m2) using 24-hour urinary creatinine measurements approximate
GFR. However, it is not a true measure of GFR because there is some tubular
secretion of creatinine. The equation for calculating 24-hour urinary creatinine
clearance (CrCl) is as follows:
𝑪𝒓𝑪𝒍 = 𝑼𝑪𝒓×
𝟏𝟎𝟎𝟎 × 𝑽𝒖𝒓𝒊𝒏𝒆𝟏𝟒𝟒𝟎
𝑷𝑪𝒓× 𝟏.𝟕𝟑𝑩𝑺𝑨
Equation 1-6
where UCr (mmol/L) is the urinary creatinine concentration, Vurine is the urinary
volume (L/24 hours), PCr (mmol/L) is the plasma creatinine concentration and
BSA is the body surface area. This method is not routinely used because
collecting 24-hour urinary creatinine clearance is cumbersome for patients.
Timed urine collections are also notoriously inaccurate. Furthermore, creatinine
is secreted by tubule. Therefore, creatinine clearance overestimates GFR by
approximately 10% of the total excretion.1 A method called cimetidine creatinine
clearance, where cimetidine treatment is used to block tubular secretion of
creatinine, is impractical. To adjust for the problems, an equation to estimate
CrCl was developed by Cockcroft and Gault (CG CrCl) and was published in
1976.46
𝐂𝐆 𝐂𝐫𝐂𝐥 = 𝟏𝟒𝟎!𝑨𝒈𝒆 × 𝒘𝒆𝒊𝒈𝒉𝒕 𝒊𝒏 𝑲𝒈 × 𝟎.𝟖𝟓 𝒊𝒇 𝑭𝒆𝒎𝒂𝒍𝒆 𝟕𝟐 × 𝑺𝒆𝒓𝒖𝒎 𝒄𝒓𝒆𝒂𝒕𝒊𝒏𝒊𝒏𝒆
Equation 1-7
The Cockcroft-Gault equation requires the weight of the patients, whereas some
of the estimated GFR equations do not. Therefore, it is much easier to generate
laboratory GFR results using the Modification of Diet in Renal Disease (MDRD)
study equation along with the creatinine values. There have been more published
10
studies on using other creatinine-based estimating GFR (eGFR) equations than
the Cockcroft-Gault equation. As a result, the Cockcroft-Gault equation is not as
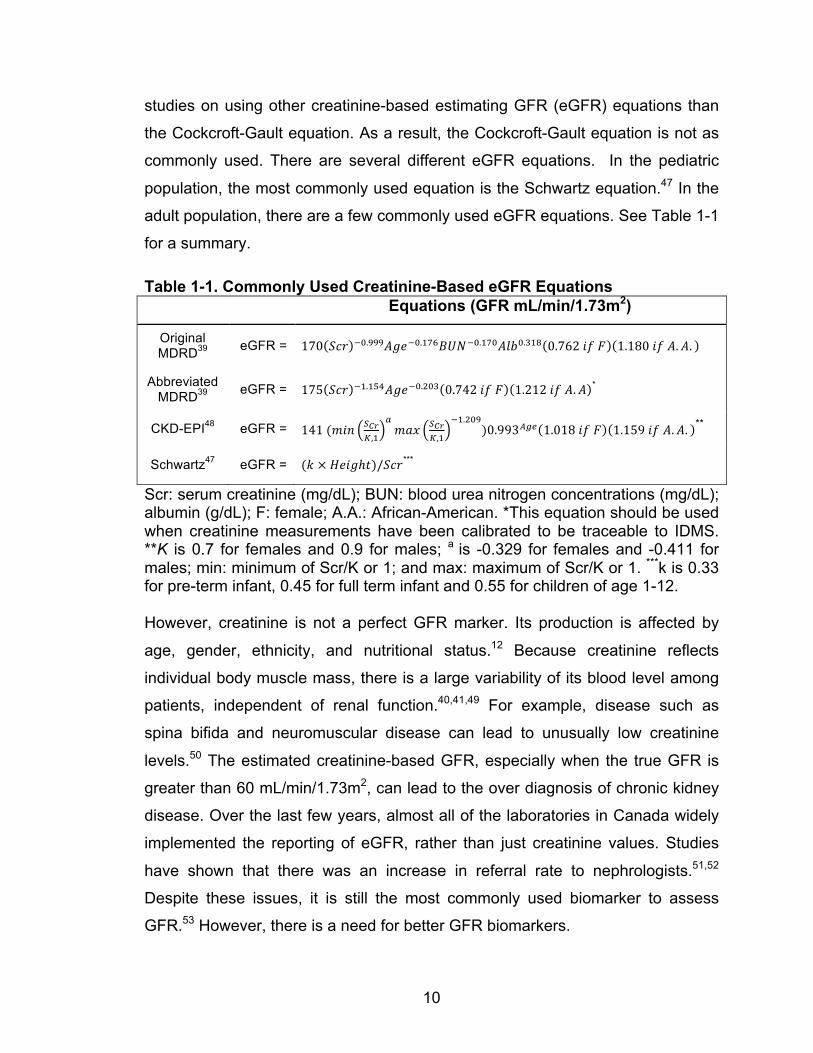
commonly used. There are several different eGFR equations. In the pediatric
population, the most commonly used equation is the Schwartz equation.47 In the
adult population, there are a few commonly used eGFR equations. See Table 1-1
for a summary.
Table 1-1. Commonly Used Creatinine-Based eGFR Equations Equations (GFR mL/min/1.73m2)
Original MDRD39 eGFR = 170 𝑆𝑐𝑟 !!.!!!𝐴𝑔𝑒!!.!"#𝐵𝑈𝑁!!.!"#𝐴𝑙𝑏!.!"# 0.762 𝑖𝑓 𝐹 1.180 𝑖𝑓 𝐴.𝐴.
Abbreviated MDRD39 eGFR = 175 𝑆𝑐𝑟 !!.!"#𝐴𝑔𝑒!!.!"# 0.742 𝑖𝑓 𝐹 1.212 𝑖𝑓 𝐴.𝐴 *
CKD-EPI48 eGFR = 141 (𝑚𝑖𝑛 !!"!,!
!𝑚𝑎𝑥 !!"
!,!
!!.!"#)0.993!"# 1.018 𝑖𝑓 𝐹 1.159 𝑖𝑓 𝐴.𝐴. **
Schwartz47 eGFR = (𝑘 × 𝐻𝑒𝑖𝑔ℎ𝑡)/𝑆𝑐𝑟***
Scr: serum creatinine (mg/dL); BUN: blood urea nitrogen concentrations (mg/dL); albumin (g/dL); F: female; A.A.: African-American. *This equation should be used when creatinine measurements have been calibrated to be traceable to IDMS. **K is 0.7 for females and 0.9 for males; a is -0.329 for females and -0.411 for males; min: minimum of Scr/K or 1; and max: maximum of Scr/K or 1. ***k is 0.33 for pre-term infant, 0.45 for full term infant and 0.55 for children of age 1-12. However, creatinine is not a perfect GFR marker. Its production is affected by
age, gender, ethnicity, and nutritional status.12 Because creatinine reflects
individual body muscle mass, there is a large variability of its blood level among
patients, independent of renal function.40,41,49 For example, disease such as
spina bifida and neuromuscular disease can lead to unusually low creatinine
levels.50 The estimated creatinine-based GFR, especially when the true GFR is
greater than 60 mL/min/1.73m2, can lead to the over diagnosis of chronic kidney
disease. Over the last few years, almost all of the laboratories in Canada widely
implemented the reporting of eGFR, rather than just creatinine values. Studies
have shown that there was an increase in referral rate to nephrologists.51,52
Despite these issues, it is still the most commonly used biomarker to assess
GFR.53 However, there is a need for better GFR biomarkers.
11
(2) Cystatin C
Serum cystatin C is a mid sized molecule with molecular weight of 13 kDalton.54
It is positively charged with an isoelectric point of 9.3 and is an inhibitor of
cysteine proteases.55-57 This protein is produced at a very constant rate by all
nucleated cells.58,59 The secretion of cystatin C is affected only by a few states,
such as inflammation, uncontrolled hyperthyroidism and large doses of
glucocorticoids.60-62 Furthermore, age-dependency reference intervals have been
suggested.63,64 Currently, cystatin C levels are measured by automated and rapid
particle-enhanced immunoturbidimetric (PETIA) and immunonephelometric
(PENIA) methods rather than the original radioimuno- or enzyme-linked
immunosorbant assays. This allows rapid and more precise measurements.65
Approximately 94% of cystatin C is freely filtered in the glomeruli, and 99% of this
filtered cystatin C is degraded in the tubular cells.56 In a thorough meta-analysis,
Dharnidharka et al.66 demonstrated that cystatin C is an excellent marker for
kidney function assessment in patients with chronic kidney disease. Similar
observations about the superiority of cystatin C-based eGFR measurements
have been noted by Stevens et al. in chronic kidney disease.67 White et al.
further showed that cystatin C is also superior to creatinine in assessing kidney
function in adult patients after renal transplantation.68,69 Several cystatin C
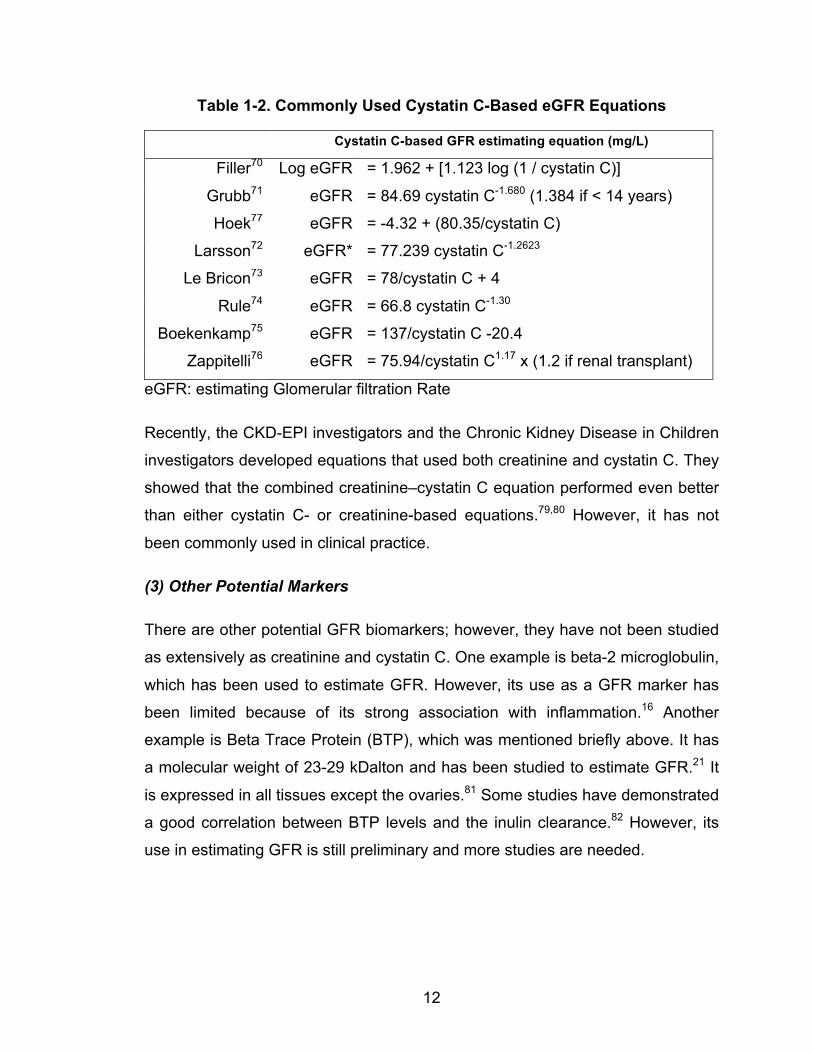
estimating equations are summarized in Table 1-2.70-77 We recently published the
results of a study, which compared all cystatin C-based estimating equations to
the creatinine-based estimating equations (the abbreviated 4-variable
Modification of Diet in Renal Disease and the Chronic Kidney Disease
Epidemiology Collaboration Equations).78 We found that in this heterogeneous
sample, the cystatin C-based Hoek equation performed the best overall. Stevens
et al. also showed the superiority of cystatin-C-based GFR measurement.67
Furthermore, White et al. demonstrated that cystatin C-based equations, in
particular the Filler equation, performed better than the creatinine-based GFR
equation in renal transplant patients.69
12
Table 1-2. Commonly Used Cystatin C-Based eGFR Equations
Cystatin C-based GFR estimating equation (mg/L)
Filler70 Log eGFR = 1.962 + [1.123 log (1 / cystatin C)]
Grubb71 eGFR = 84.69 cystatin C-1.680 (1.384 if < 14 years)
Hoek77 eGFR = -4.32 + (80.35/cystatin C)
Larsson72 eGFR* = 77.239 cystatin C-1.2623
Le Bricon73 eGFR = 78/cystatin C + 4
Rule74 eGFR = 66.8 cystatin C-1.30
Boekenkamp75 eGFR = 137/cystatin C -20.4
Zappitelli76 eGFR = 75.94/cystatin C1.17 x (1.2 if renal transplant)
eGFR: estimating Glomerular filtration Rate
Recently, the CKD-EPI investigators and the Chronic Kidney Disease in Children
investigators developed equations that used both creatinine and cystatin C. They
showed that the combined creatinine–cystatin C equation performed even better
than either cystatin C- or creatinine-based equations.79,80 However, it has not
been commonly used in clinical practice.
(3) Other Potential Markers
There are other potential GFR biomarkers; however, they have not been studied
as extensively as creatinine and cystatin C. One example is beta-2 microglobulin,
which has been used to estimate GFR. However, its use as a GFR marker has
been limited because of its strong association with inflammation.16 Another
example is Beta Trace Protein (BTP), which was mentioned briefly above. It has
a molecular weight of 23-29 kDalton and has been studied to estimate GFR.21 It
is expressed in all tissues except the ovaries.81 Some studies have demonstrated
a good correlation between BTP levels and the inulin clearance.82 However, its
use in estimating GFR is still preliminary and more studies are needed.
13
1.2. INTRODUCTION TO RENAL REPLACEMENT THERAPY
1.2.1. History and Development of Renal Replacement Therapy
When 90% or more of usual kidney function is lost, either kidney transplantation
or dialysis is required to sustain life. As of December 31, 2012, there were
41,252 Canadians living with end-stage kidney disease and 23,814 persons in
Canada (58%) were receiving dialysis; the remaining 42% had a functioning
transplanted kidney.83 Hemodialysis is the most common form of dialysis, which
is typically delivered three times a week with a machine connected to a patient’s
vascular system. Mortality remains high (approximately 18 to 20% per year)
despite improvements in technology for dialysis, development of new
pharmaceutical agents, and nearly 50 years of experience. Although dialysis can
sustain life, it rarely restores health. Patients undergoing dialysis have
considerable complications often requiring hospitalization, and relatively poor
functional status and health-related quality of life. The “renal health” of the
dialysis patient relates to that component of health directly or indirectly impaired
by loss of kidney function and, hence, possibly restored by effective (“adequate”)
dialysis therapy.
1.2.2. History and Development of Hemodialysis
Dialysis uses very basic concepts, such as osmosis and diffusion, to clear extra
fluid and substances from the body. The first person to describe this process was
Thomas Graham84, known as the ‘Father of Dialysis’. He first studied diffusion in
gases and later performed a series of experiments in liquids. He predicted that
‘dialysis’ would be an important treatment for renal failure. Subsequently, Fick85
published a quantitative description of diffusion.
Hemodialysis is a procedure that circulates blood from the body over an external
circuit, exchanges substances between blood and dialysate through a semi-
permeable membrane, and returns the ‘purified’ blood to the patient. The process
is done outside of the body. Abel86 and colleagues created the first artificial
14
kidney in 1913. They dialyzed anesthetized animals using vividiffusion machines,
which consisted of tubes with semipermeable membranes. He was also the first
person to use an anticoagulant, Hirudin, to prevent clotting in the dialyzer.
Subsequently, Haas87 documented the first human hemodialysis treatment in
1924. Although none of their patients survived, they started the use of the
Collodion dialyzer membrane and was the first person to use heparin to prevent
dialyzer clotting. Heparin is still the most commonly used method of
anticoagulation in hemodialysis therapies.
Kolff88 in 1943 developed a more practical rotating drum hemodialysis machine
and working dialyzer, and performed the first hemodialysis treatment where the
patient survived. Although the basic concept of dialysis has not changed, the
technical improvement in this rotating drum became the first major breakthrough
in clinical hemodialysis. Kolff used a new material called cellophane, where the
blood travelled through the inside the cellophane membrane tube and rotated
through the dialysate fluid. The substances were removed and/or exchanged
through the cellophane membrane. At this point, dialysis was to provide life
support while waiting for recovery from acute renal failure. Kolff89 developed the
next-generation dialysis machine, known as the Kolff-Brigham Kidney. These
machines were used in the Korean War and significantly improved the survival
rate of the soldiers. Kolff’s dialysis machine did not allow for excess fluid
removal. It was Alwall90,91 who modified the machine and allowed a negative
pressure to be applied for fluid removal. He also invented the arteriovenous
shunt for hemodialysis in a rabbit in 1948. He later collaborated with a
businessman and founded one of the major dialysis companies, Grambro, Inc.
Improvements in equipment design and dialyzer occurred over the next few
decades, but the basic concepts of dialysis, based on diffusion, have not
changed.
Before the 1960’s, chronic hemodialysis was believed to be impossible. This is
because when hemodialysis started, each hemodialysis session required
physicians to cut down to the vessels to create vascular access. The damaged
15
veins and arteries made it difficult to find access to a patient’s blood after several
sessions of treatment. The challenge of creating a reusable vascular access in
humans was solved by Scribner. He worked with Quinton92 in the 1960’s who
designed a U-Shaped Teflon tube that connected between artery and vein.
Quinton later started a business called Quinton Instruments, which sold his
inventions, including treadmills for cardiac stress tests. However, the Scribner’s
shunt has problems, especially with clotting. Appell, Cimino, and Brescia93
pioneered the arterial-venous fistula for chronic vascular access that is used for
hemodialysis patients today. An arterial-venous fistula is created by arterializing
a vein by connecting it to an artery. These major improvements and advances in
technology have helped the development of our current hemodialysis machines
and equipment.
1.2.3. History and Development of Peritoneal Dialysis
Peritoneal dialysis was the first renal replacement therapy to be applied clinically.
In 1877,94 Wegner documented osmotic ultrafiltration in Germany and infused a
concentrated glucose solution into the peritoneal cavity of animals to increase
fluid removal. During a peritoneal dialysis treatment, the peritoneal solution
(dialysate) is infused into the peritoneal cavity, which is the space between the
parietal peritoneum (the part that lines the abdominal wall) and the visceral
peritoneum (the part that lines the visceral gastrointestinal tracts). The peritoneal
membrane serves as the ‘membrane’ that separates the dialysate from the
mesenteric blood flow. The surface area of the peritoneum membrane, which is
covered by mesothelial cells, is approximately 1.00-2.07 m2 in adults.95 The
interstitial layers are embedded with microvessels, or peritoneal blood supplies.
As a result, both diffusion and convection clearance can be achieved between
the peritoneal blood and dialysate fluid.
In 1923, Ganter96 applied this therapy clinically and treated a woman with
obstructive uremia by infusing 1.5 L of saline into her abdominal cavity. She
showed some temporary improvement, but died later. Like hemodialysis,
intermittent peritoneal dialysis treatments prior to the 1960’s were used as short-
16
term renal replacement therapies due to a lack of permanent peritoneal dialysis
catheters.97-99 It was Tenckhoff100 who designed a permanent and safe catheter,
which allowed the development of chronic peritoneal dialysis. Later, Popovich
and Moncrief101 using glass containers had the first clinical application of
continuous ambulatory peritoneal dialysis (CAPD). They also developed a
comprehensive calculation for dialysis clearance using the volume and the dwell
time of dialysate solutions.102 The major comorbidity of these patients was
peritonitis (infection of the peritoneum). It was known that the risks were related
to the patients’ peritoneal dialysis technique and the connecting system. The
peritonitis rate has significantly improved since Oreopoulos introduced peritoneal
dialysate into plastic bags and used the Y connecting system, introduced by
Buoncristiani,103,104 with the flush-before-fill technique. These simple concepts
have dramatically reduced the peritoneal dialysis peritonitis complication rate.
Although the automated cycler system was developed in 1962 by Boen, it has
only become a common peritoneal dialysis technique over the last 10-20
years.105 Today, the common peritoneal dialysis prescription uses an automated
cycler machine at night, which allows approximately 4 exchanges in 8-10 hours
overnight, and up to two exchanges over 4-14 hours during daytime.
1.3. COMPONENTS OF HEMODIALYSIS
Both peritoneal dialysis and hemodialysis use the concepts of diffusion and
convection clearance. Peritoneal dialysis uses the peritoneal blood flow, which
allows molecules and fluid exchange to occur between the blood and dialysate in
the peritoneal cavity. The dialysate fluid is drained and then the new dialysate
fluid is infused. It is considered a continuous dialysis therapy. Similarly,
hemodialysis uses the diffusion and convection clearance mechanisms.
However, the blood is first removed from the body. As a result, fluid and
molecules are exchanged outside of the body through a hemodialysis machine
and a dialyzer. Dialysate runs in the counter-current direction in the dialyzer to
maximize the concentration gradient. The ‘clean’ blood is then returned back to
the patients. The therapy is usually performed three times per week, with four
17
hours each session. However, prolonged and/or frequent hemodialysis is
performed only in a small population of patients, usually in the home setting. The
focus of this chapter will be on hemodialysis, including its components and
mechanisms, dialysis and patient physiology, and the concepts of dialysis
adequacy and kinetics. The five major components of hemodialysis are: a
vascular access, a dialysate circuit, a blood circuit, a dialyzer and a hemodialysis
machine.
1.3.1. Vascular Access
A vascular access for a patient allows a gate for the blood to pass into the
hemodialysis circuit. It is considered the Achilles’ heel of hemodialysis. Without a
permanent vascular access, chronic hemodialysis cannot occur. However, the
access can fail due to infection, stenosis, thrombosis or fibrin sheath formation.
The commonly used vascular accesses currently are: arterial-venous fistulae
(created by connecting a patient’s artery to a vein), arterial-venous graft (created
by connecting patient’s artery to a vein, through a synthetic hollow tube), and
central venous catheter (inserted into an internal jugular vein, a femoral vein, or a
sub-clavian vein). To lower the infection rate, the central venous catheter usually
tunnels under the skin for chronic use.
1.3.2. Dialysate Circuit
Another component of hemodialysis is a dialysate circuit. It is the circuit where
the dialysate leaves its source/supply and passes through the dialyzer. Dialysate
is the clean fluid that exchanges the electrolytes, toxins and fluid with the blood.
Dialysate is generated from a water supply (i.e. from the city) after meeting
certain universal standards. Because of the large water exposure, it is important
that the water goes through a vigorous detoxing process, using a combination of
water softener, activated carbon filter, reverse osmosis, and/or distillation. The
clean water can be delivered to the dialysis machine, mixing with the
concentrated electrolytes (such as sodium, potassium and bicarbonate) to form
dialysate, which allows hemodialysis to occur. Its composition of sodium,
18
potassium and bicarbonate can be adjusted. To ensure the patient is not
exposed to a hyper- or hypo-osmolar dialysis solution, which can be fatal, the
dialysate conductivity (usually 12-16 mS/cm) is monitored in modern
hemodialysis machines. During a 4-hour hemodialysis treatment, the patient is
exposed to ~100 L of water.
1.3.3. Blood Circuit
The third component is a blood circuit. This is a circuit where the blood leaves
the patient from the vascular access, passes through the dialyzer, and returns
back to the patient. To allow for an efficient hemodialysis treatment with the
current hemodialysis regime (four-hours thrice weekly), the blood flow rate needs
to be at least 250 mL/min in adults, and is usually between 300-400 mL/min. In
children, 5-8 mL/kg/min are targeted. The inflow bloodline (arterial) connects
from the patient’s vascular access to the dialyzer. The outflow bloodline (venous)
returns the blood from the dialyzer back to the patient. Before the roller pump
was used in modern hemodialysis machines, the inflow bloodline would need to
connect to an artery and the outflow bloodline was connected to a vein. The
blood flow rate depended on the blood pressure difference between the artery
and the vein. This pressure difference also allowed ultrafiltration to occur. With
modern technology, the roller pump is placed in the arterial line to generate
‘negative’ pressure. Therefore, both the arterial and venous lines can be placed
in the venous system of a hemodialysis patient. Blood flow rate is a function of
the roller pump rotation rate and the bloodline pump segment volume. However,
because of the negative pressure generated by the roller pump, air can get into
the bloodline if there is a breakage in the bloodline system. An air detector is
placed in the venous line as a safety measure before the blood is returned back
to the patients, in order to avoid an air embolism.
1.3.4. Dialyzer
A dialyzer is where dialysis occurs. It contains many thin semi-permeable
membrane hollow fibers with many small pores. It allows the molecules and fluid
19
to be exchanged between the blood and the dialysate. The blood flows within the
hollow fibers in one direction and the dialysate flows outside the hollow fibers in
the opposite direction. This counter-current flow maintains some concentration
gradient between the blood and the dialysate. As the dialyzer membrane acts as
a separator between the blood and the dialysate, there are two liquid phases: the
transport (solute transport due to diffusion and convection) and the contact
phases (blood material interaction with the dialyzer material). There is also
adsorption of proteins on the membrane, which more commonly occurs for the
hydrophobic molecules. One of the issues with dialyzer membranes is activation
of the coagulation system leading to dialyzer thrombosis. As the dialyzer
membrane is a foreign body, the blood coagulation system may be activated
when blood comes into contact with the membrane. Dialyzer membrane
thrombosis can lead to significant reduction in blood flow and diffusion capacity.
The use of heparin has significantly reduced clot formation on the dialyzer
membrane.
Dialyzer membranes have undergone significant development in the last century.
The first human dialysis was performed using cellulose membranes. Cellulose is
a polysaccharide polymer that consists of repeating units of cellobiose monomer.
Each cellobiose monomer constitutes two glucose molecules, which contains
three hydroxyl groups (-OH) that can lead to chemical reactions forming esters or
ethers. Kolff began to use cellophane materials for dialysis. In the 1960s,
cuprophane had become popular.106,107 Both cellophane and cuprophane are
types of cellulosic membranes.48 Cuprophan is a low flux membrane with a wall
thickness of 5-20 µm. Although it is good for small solute clearance, it has very
low sieving capacity for large solute. It is also considered bio-incompatible.
Bioflux, on the other hand, has a similar structure to cuprophan, but has larger
pore diameters. Therefore, it has higher flux and has better clearance for medium
solutes. Cuprammonium rayon was introduced to increase the removal of higher
molecular weight molecules. It replaced the hydroxyl groups with hydrogen
bonds. The bio-incompatibility of these membranes is because of the hydroxyl
groups (-OH), which can activate the complement system and lead to
20
inflammatory reactions (interleukin-1, 6, and 8, and TNF-α) with activation of
complement factors. Some patients develop anaphylactoid reaction (C3a and
C5a) and leukopenia during dialysis. Therefore, there was a big movement to
develop more biocompatible membranes.
The modified cellulosic dialyzers were developed and acetate or hemophane was
used to replace the hydroxyl groups on the cellulosic backbone. Hemophan has
5% of the hydroxyl groups substituted to diethyl-amino-ethyl groups. It has
reduced complement activation to some degree, but it is also considered a low
flux membrane. Synthetically modified cellulose has 20-25% of the hydroxyl
groups substituted by benzyl groups. It is approximately 8-9 µm in thickness. It is
considered more biocompatible as compared to hemophane and cuprophan.
Celluose acetate (and di- and tri-acetate) substitutes the hydroxyl group with
CH3CO radicals. The cuprammonium-rayon polyethylene glycol substitutes the
hydroxyl groups with polyethylene glycol chains.
There was a significant increased in the use of synthetic membrane dialyzers
over the last 10-20 years.108 Now, the more commonly used dialyzers in North
America contain synthetic membranes (based on synthetic polymers).109 These
materials are more biocompatible and heat resistant with endotoxin retention.
They are more permeable. The natural stiffness of the material provides
membrane strength and overall the structural support.110 Cellulose membranes
have the thinnest membrane and the synthetic membranes are much thicker.111
By contrast, the membrane inner diameters are relative similar between cellulosic
and synthetic membrane (170-230 µm). The common synthetic membranes are
polyacrylonitrile, polysulfone and polyamide. One of the major issue that needs to
be addressed for cellulose dialyzer membranes is complement activation.
Synthetic dialyzer membranes are less likely to bind to complement-regulating
protein and are considered more biocompatible. The development of synthetic
membranes was started in 1970 using polyacrylnitrile materials, with the desire to
increase higher molecular weight solutes clearance.111 Subsequently,
polysulfone membrane has become the most widely used synthetic dialyzer.
21
Some of the polysulfone membrane was developed using a steam sterilization
technique with another safety feature, endotoxin retention. The various
proportion of hydrophilic and hydrophobic composition different between different
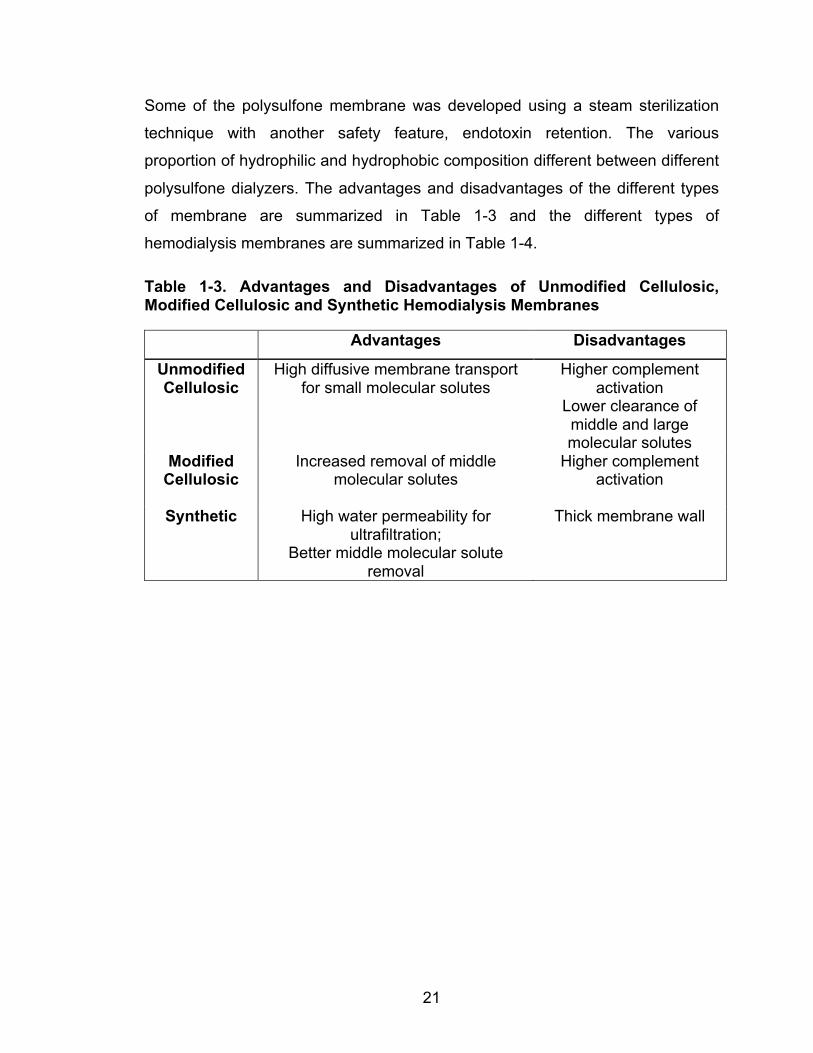
polysulfone dialyzers. The advantages and disadvantages of the different types
of membrane are summarized in Table 1-3 and the different types of
hemodialysis membranes are summarized in Table 1-4.
Table 1-3. Advantages and Disadvantages of Unmodified Cellulosic, Modified Cellulosic and Synthetic Hemodialysis Membranes
Advantages Disadvantages
Unmodified Cellulosic
High diffusive membrane transport for small molecular solutes
Higher complement activation
Lower clearance of middle and large molecular solutes
Modified Cellulosic
Increased removal of middle molecular solutes
Higher complement activation
Synthetic High water permeability for
ultrafiltration; Better middle molecular solute
removal
Thick membrane wall
22
Table 1-4. Different Types of Hemodialysis Membranes
Unmodified Cellulosic
Modified Cellulosic
Synthetic
Low-Flux Cuprophan Cellulose (di) acetate
Polysulfone
Saponified cellulose ester
Hemophan Polyamide
Cuprammonium-rayon
Cuprammnonium-rayon
polyethylene glycol
Polyethersulfone
Synthetic modified cellulose
Polyester polymer alloy
High-Flux Bioflux Cellulose tri acetate
Poly-acrylonitrile
Vitamin E Polymethylmethacrylate
Polyarylethersulfone
Ethylene vinyl-alcohol copolymer
Polycarbonate polyether copolymer
1.3.5. Hemodialysis Machines
Finally, the hemodialysis machine is the controlling center for all these
components. It has a computer system and a monitor, pressure sensors, flow
sensors, and an air detector. More modern hemodialysis machines also include
other devices, such as online ionic effective dialysance methodology, blood
pressure monitoring, and relative blood volume measurements. Figure 1-1,
summarizes all the necessary components of the hemodialysis therapy.
23
Figure 1-1. A Simple Schematic Diagram of Hemodialysis Circuit
1.4. HEMODIALYSIS MODALITIES
Hemodialysis can be performed at home, in hospitals (in-center), or in satellite
units (hemodialysis units associate with major dialysis centers but not inside
hospitals). The duration and the timing of hemodialysis treatments can vary
between 2-24 hours per day and it can be performed during daytime and
nighttime. Below are some of the common hemodialysis settings and
techniques/modalities:
• Intermittent hemodialysis therapies (3-4 days per week)
• Conventional hemodialysis (3-4 hours per session): in-center, satellite
units, or home
• Extended-hours hemodialysis (6-8 hours per session): in-center or home
• Quotidian hemodialysis therapies (5-7 days per week)
• Short-hours daily (2-2.5 hours per session) – in-center or home
24
• Nocturnal (8-10 hours per night) – home
• Slow continuous dialysis therapies (24 hours per day)
• Continuous renal replacement therapy, usually with venous to venous
access and less commonly with arterial to venous access
o Hemodialysis only: Continuous venovenous hemodialysis – intensive
care units
o Hemofiltration only: Continuous venovenous hemofiltration – intensive
care units
o Both hemodialysis and hemofiltration: Continuous venovenous
hemodiafiltration – intensive care units
• Slow continuous ultrafiltration (SCUF) with no dialysis or replacement fluid
- in-center
1.5. THE PHYSIOLOGY OF HEMODIALYSIS CLEARANCE
1.5.1. Basic Concepts of Diffusion and Convection
Diffusional clearance occurs when solutes from solution A (blood) move to
solution B (dialysate) and are driven by concentration differences through a
semipermeable membrane (Figure 1-2). Molecules and ions dissolved in the
solutions are in constant motion. More of the molecules on average moves from
high concentration solution to low concentration solution. Only molecules that are
smaller than the pore size can pass through the membrane. Water molecules
can also ‘diffuse’ through a semi-permeable membrane. The term ultrafiltration
refers to the situation where water molecules move from solution A (blood) to
solution B (dialysate). This process is driven by either a hydrostatic or an osmotic
gradient through a semipermeable membrane. The hydrostatic pressure
difference between the two sides of the semi-permeable membrane is opposed
by osmotic pressure. As a result, convectional clearance can occur when water
moves from one solution to another solution through the semipermeable
membrane (i.e. blood to dialysate), and the water is accompanied by other
solutes. This process is called convection or solvent drag.
25
Dialysis clearance is defined as the volume of blood from which all solutes in
question are reduced during a specified time period. The total amount of solute
removal depends on the duration of the therapy. This is similar to renal clearance
in the healthy kidney (discussed earlier). Conventional hemodialysis (3 times per
week and 4 hours per session) is highly efficient in removing small solutes, and it
has a high clearance rate per session. However, because it is an intermittent
therapy that occurs only 3 times per week and 4 hours per session, its weekly
clearance is similar to continuous therapy by peritoneal dialysis. The factors that
influence hemodialysis solute clearance are listed in Table 1-5, and are grouped
as dialysis-related, patient-related, and solute-related factors. Some of the key
variables to consider when discussing hemodialysis clearance are blood flow
rate, dialysate and its flow rate, dialyzer characteristics, ultrafiltration rate, and
dialysis duration and frequency. Each of these key factors will be discussed in
this section. Solute characteristics are key to its clearance rate, which is also
influenced by its compartmental distribution. This will be discussed in the next
section.
Table 1-5. Factors Influencing Solute Concentrations in Dialysis Patients
Dialysis-related Patient-related Solute-related
Time Body weight and total body water
Compartmental Distribution
Frequency Solute intake/absorption/generation
Protein Binding
Blood flow Residual renal function
Charge
Dialysate flow Blood viscosity
Molecular weight
Dialyzer characteristics* Steric configuration Membrane absorption Intracellular
Concentration Ultrafiltration
* surface area, pore size, hydrophilic/hydrophobic
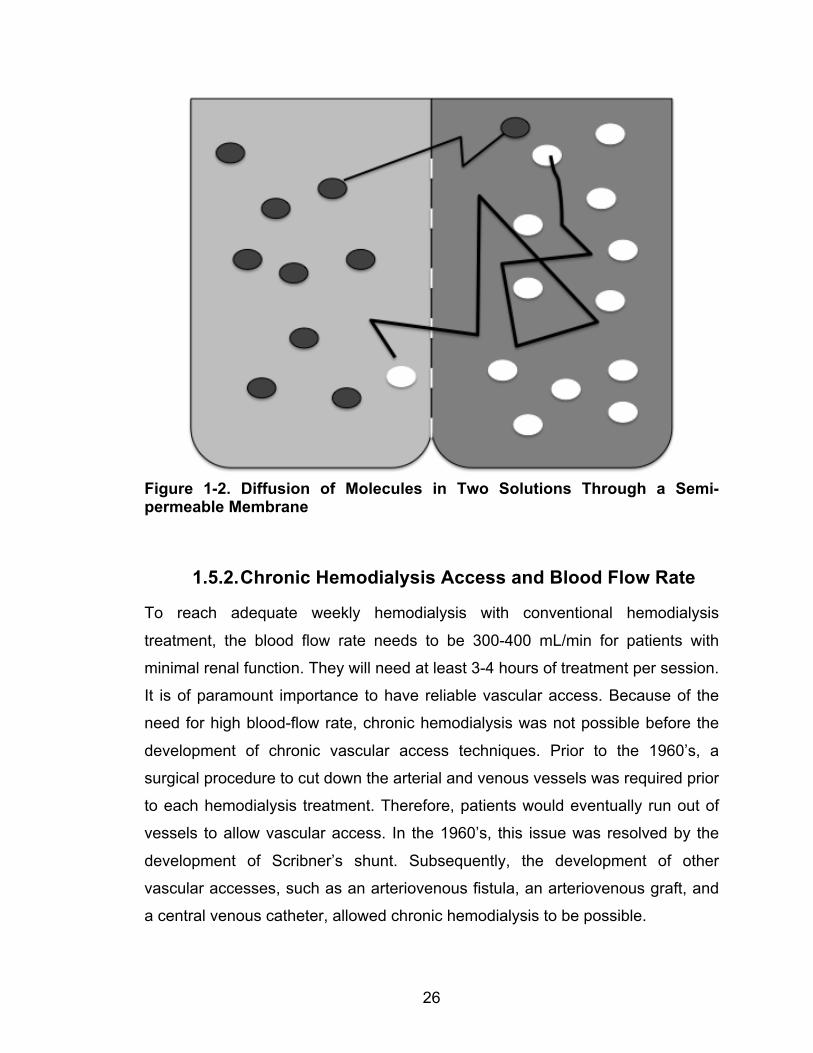
26
Figure 1-2. Diffusion of Molecules in Two Solutions Through a Semi-permeable Membrane
1.5.2. Chronic Hemodialysis Access and Blood Flow Rate
To reach adequate weekly hemodialysis with conventional hemodialysis
treatment, the blood flow rate needs to be 300-400 mL/min for patients with
minimal renal function. They will need at least 3-4 hours of treatment per session.
It is of paramount importance to have reliable vascular access. Because of the
need for high blood-flow rate, chronic hemodialysis was not possible before the
development of chronic vascular access techniques. Prior to the 1960’s, a
surgical procedure to cut down the arterial and venous vessels was required prior
to each hemodialysis treatment. Therefore, patients would eventually run out of
vessels to allow vascular access. In the 1960’s, this issue was resolved by the
development of Scribner’s shunt. Subsequently, the development of other
vascular accesses, such as an arteriovenous fistula, an arteriovenous graft, and
a central venous catheter, allowed chronic hemodialysis to be possible.
27
Connecting a vein to an artery creates an arteriovenous fistula. With the use of
an artificial graft, an arteriovenous graft can be created. The advantage of an
arteriovenous graft over a fistula is that it is available within a few weeks after its
surgical creation. However, it has shorter access survival time as compared to
fistula. There is also a higher risk of graft infection, thrombosis and stenosis.
Therefore, the arteriovenous fistula is still the preferred chronic vascular access
for hemodialysis patients over the arteriovenous graft. Another common vascular
access in hemodialysis patients is the central venous catheter. It is most
commonly placed through the internal jugular vein with cuffed tunneled catheters
just under the skin. Other insertion sites such as subclavian and femoral veins
have been used. Rarely, translumbar catheters to inferior vena cava have been
used in patients with challenging vascular access. Each catheter has two
lumens, one is the venous port and one is the arterial port. These two
ports/lumens are within the venous system of the patient. Formation of a
thrombus and/or a fibrin sheath at the tip of the catheter can cause delayed
catheter dysfunction or a reduction in blood flow rate, and/or lead to recirculation.
Sometimes, the blood flow rates are significantly affected and the arterial and
venous lumens need to be reversed. This further increases the amount of access
recirculation and reduces the solute clearance. Infection is another common
complication when using the central venous catheter. Because the arteriovenous
fistula method is consistently associated with the lowest risk of mortality versus
arterio-venous grafts or catheters, therefore, the arteriovenous fistula is
considered the preferred vascular access for hemodialysis patients. The
discussion below will focus on the arteriovenous fistula.
After the arteriovenous fistula creation surgery, there is an increase in shear
stress in the vasculature because of the local substantial increase in blood flow.
As a fistula matures, the diameter of the proximal part of the vein will grow.
Experimental models showed that this is followed by compensatory changes,
which are related to the release of nitro-oxide, prostacyclin and other mediators,
as well as changes in endothelial cells and the remodeling of cellular and
extracellular components of the wall. These adaptations may take 2-3 months to
28
develop.112-114 Surgical technique is quite critical to the success of fistula
creation.115 A well-developed fistula can usually reach a flow rate of 645 ± 332
mL/min in the forearm and 1336 ± 689 mL/min at the brachial or upper arm.116
By contrast, some patients may develop a high blood flow rate in their fistula
(>2,000 mL/min or access flow rate/cardiac output >30-35%). If the flow rate of
the arteriovenous fistula is very high, patients can develop left ventricular
hypertrophy and/or high output cardiac failure. A patient with total cardiac output
of 7,400 mL/min and vascular access flow of 4,100 mL/min can reduce the
systematically functional cardiac output. A group of high vascular access flow
patients (3,135 ± 692 mL/min) demonstrated a significant reduction in functional
cardiac output after access creation.117 Left ventricular mass regression,
however, can be seen after ligation of the arteriovenous fistula.118 This can
significantly compromise cardiac function. By contrast, a high output state does
not seem to increase mortality. In fact, a study has shown that high access flow
rate was associated with increased survival.119
Blood flow rate at the needling sites of the fistula will depend on the arterial flow
prior to entering the fistula (stenosis at the anastomosis site), collateral vascular
system (taking away the blood flowing to the fistula), and the flow resistance
within the fistula (stenosis of the fistula), and at the distal part of the venous
system (central stenosis). One of the common issues with an arteriovenous
fistula is reduction in access flow rate due to stenosis. As the stenosis gets more
severe, the access flow rate can be reduced; in addition, the hemodialysis
clearance will be reduced. Severe arteriovenous fistula stenosis is also a sign of
a failing fistula. This can also increase clotting risk and/or lead to acute
thrombosis of the fistula. If the stenosis is distal to the arterial needle during
hemodialysis, recirculation can occur. When the arteriovenous fistula flow rate is
less than the extracorporeal blood flow rate (<300-400 mL/min), recirculation will
occur.
Therefore, routine monitoring of the access function is recommended;
measurement of the access blood flow rate is the preferred method. The gold
29
standard for measurement of the access blood flow (Qa; mL/min) is an indicator
dilution technique.120 A dilutant, such as sodium, is injected into the venous line,
and it can be detected in the dialyzer inlet immediately after. The indicator is the
ultrasound velocity of the blood and the dilution is by saline solution. Another
technique, such as thermodilution, has also been used: it is well validated and
established and employs Krivitski’s theory:
𝐐𝐚 = 𝐐𝐛 × 𝟏!𝐑𝐑
Equation 1-8
where Qb is the blood flow (mL/min) through the dialyzer and R is the proportion
of circulated blood through the access induced by reversing the arterial and the
venous dialysis line. Other indicator dilution methods exist.121 Another
phenomenon can be observed in an arteriovenous fistula: cardiopulmonary
recirculation. This results when the ‘clean blood’ bypasses the systemic
microcirculation from cardio and pulmonary vessels and returns to the extra-
corporeal circuit. Therefore, retrograded ‘clean blood’ will flow and mix with the
blood that enters the hemodialysis machine. This can affect the clearance. The
amount of cardiopulmonary recirculation is proportional to the arteriovenous
fistula flow rate and is inversely proportional to the cardiac output.
Repeated needle entries into the fistula prior to each hemodialysis treatment
allow access to high blood flow during hemodialysis. The viscosity of blood is 3
times higher than that of water. This is because the hematocrit of the blood is ~
40% (the percentage of the blood that is cells). In addition, there are proteins in
the plasma, although these effects on viscosity are much smaller. Unlike in
simple fluids, blood viscosity varies by shear rates, and shear stress affects the
particles and other contents of blood, such as hemoglobin. Therefore, the half-life
of red blood cells is shorter in hemodialysis patients, because a small amount of
hemolysis can occur with each hemodialysis treatment. Blood flow (Qb) through a
vessel is dependent on the pressure difference (ΔP) between the two ends of the
vessels and the vascular resistance (R). This follows Ohm’s Law:
30
𝑸𝒃 = ∆𝑷𝑹 Equation 1-9
Newtonian fluid (i.e. water) is a fluid in which the viscous stresses and the strain
rate are related by a constant viscosity tensor. It does not relate to the flow rate.
The Poiseuille’s law provides a helpful measure of the dependence of flow on
viscosity and tube geometry. The Poiseuille’s law is described as the following:
𝑹 = 𝟖𝝁𝑳𝝅𝒓𝟒 Equation 1-10
where R is the resistance, µ is the blood viscosity, L is the access length, and r is
the access radius.107 For example, with a reduction in r of 50%, R will increase by
16 times. Although Poiseuille’s law is a widely used equation for fluid flow
resistance measurements, it has certain restriction to Newtonian fluid with
laminar flow in a straight tubes. Blood is a non-Newtonian fluid. This relationship
will only serve as an estimate for the blood flow, especially in the dialysis tubing
where the flow is laminar. In addition, the Reynolds number for straight, smooth,
laminar flow of Newtonian fluid is usually ~ 2300. For blood, the Reynolds
number is related to the blood flow, and tube diameter. In the extracorporeal
circuit in dialysis patients where the tube diameter is 4.5 mm and the viscosity is
3.5 mPa/S (with hematocrit of 0.38), the Reynolds number is below 500 for the
blood flow < 600 mL/min (i.e. blood flow of 400 mL/min has Reynolds number
~600).107 These are important factors to consider when assessing the blood flow
rate of the fistula, as well as the extracorporeal blood flow rate within the
connecting tubing and the dialyzer.
In the extracorporeal circuit, there is generally laminar flow. However, the flows at
the cannulation and connector sites are turbulent. The flow rate is proportional to
the pressure differences between the inlet and the outlet of the circuit, and
inversely proportional to the blood viscosity and the resistance of the circuit.
Historically, the pressure differences between the artery and vein were used as
the driving force in the extracorporeal circuit of a hemodialysis system. However,
today’s hemodialysis machines use a pump-driven extracorporeal system. Most
of these machines use rotary peristaltic pumps. A pump that allows flow reversal
31
has also been developed. This has been used in single-needle hemodialysis,
especially in nocturnal hemodialysis patients and/or in patients with a new fistula.
The stroke volume can be calculated based on the following equation122:
𝑺𝒕𝒓𝒐𝒌𝒆 𝑽𝒐𝒍𝒖𝒎𝒆 = 𝑫 𝒅𝟐 𝝅𝟒 Equation 1-11
A typical pump has the diameter of its pump bed (D) of 8.8 cm and the tubing
cross-section diameter (d) as 0.8 cm. The blood flow rate will be the product of
the stroke volume per revolution and the rotation speed of the roller. Some
hemodialysis machines, such as the Fresenius A2008C®, have a built in system
to calculate the flow.
Although the blood flow rate is typically set at 400 mL/min during a hemodialysis
treatment, the actual blood flow rate is lower than 400 mL/min. Recently, in one
of our published studies (see Chapter 5), we measured the true blood flow rate
and compared this to the machine blood flow rate.123 This was measured by the
Transonic HD01 monitor (Transonic Systems, Ithaca, NY). When the
hemodialysis machine blood flow rates were set at 200 mL/min and 400 mL/min,
the actual blood flow rates were 179 ± 2 and 331 ± 6 mL/min, respectively.
1.5.3. Dialyzer
Each dialyzer contains 7000-14000 hollow fibers. Resistance in the dialyzer can
affect the blood flow rate. The smaller inner fiber diameter provides a shorter
diffusive distance for the solute, but it has a higher shear rate as compared to the
larger size fiber.120 The membrane of the hollow fibers consist of millions of pores
that allow diffusion and ultrafiltration to occur. These pores allow the fluid and
solutes to diffuse across the membrane through concentration gradients. The
pore-related characteristics such as pore size and pore density influence the
permeability of the solute. Water permeability is strongly related to the pore
radius only. The larger the pores, the less transmembrane pressure is required
for fluid transport. However, the larger the pores, the more the larger molecules,
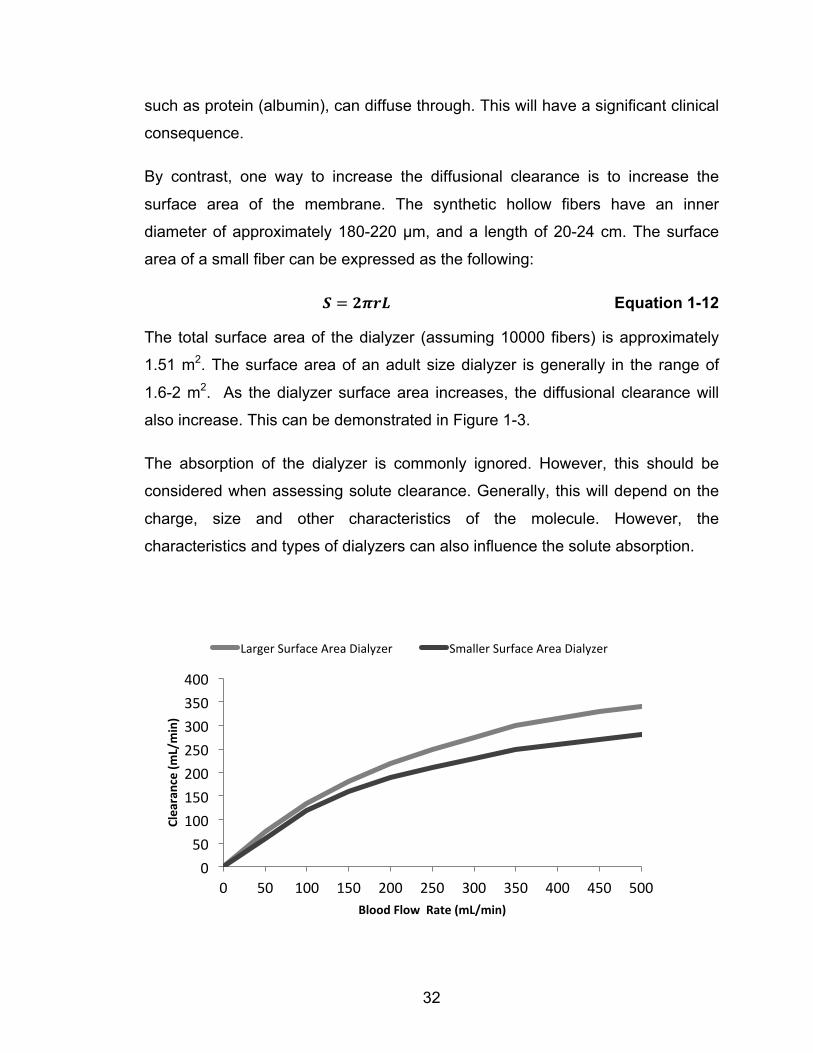
32
such as protein (albumin), can diffuse through. This will have a significant clinical
consequence.
By contrast, one way to increase the diffusional clearance is to increase the
surface area of the membrane. The synthetic hollow fibers have an inner
diameter of approximately 180-220 µm, and a length of 20-24 cm. The surface
area of a small fiber can be expressed as the following:
𝑺 = 𝟐𝝅𝒓𝑳 Equation 1-12
The total surface area of the dialyzer (assuming 10000 fibers) is approximately
1.51 m2. The surface area of an adult size dialyzer is generally in the range of
1.6-2 m2. As the dialyzer surface area increases, the diffusional clearance will
also increase. This can be demonstrated in Figure 1-3.
The absorption of the dialyzer is commonly ignored. However, this should be
considered when assessing solute clearance. Generally, this will depend on the
charge, size and other characteristics of the molecule. However, the
characteristics and types of dialyzers can also influence the solute absorption.
0 50
100 150 200 250 300 350 400
0 50 100 150 200 250 300 350 400 450 500
Clearance (m
L/min)
Blood Flow Rate (mL/min)
Larger Surface Area Dialyzer Smaller Surface Area Dialyzer
33
Figure 1-3. The Relationship Between Small Solute Clearance and Total Surface Area of a Dialyzer. Larger surface area dialyzer (1.8 m2) and smaller surface area dialyzer (Reprinted with permission from reference by Ronco et al. 124)
1.5.4. Dialysate and Its Flow Rate
Dialysate is an important part of the hemodialysis treatment. In current use,
dialysate water comes from purified water. A healthy person drinks ~1.5 – 2 L of
water per day which is 10 -15 L per week, but a hemodialysis patient can be
exposed to ~ 400 L of water per week. Dialysate water is exposed to blood
directly; thus barriers such as intestinal protection are eliminated. Water
contaminants, including particles (ion, sand, and clay), chemicals, and micro-
organisms/endotoxins (virus and fungi) need to be removed.
For dialysate water, water purification is commonly done by using city water
purified through distillation, reverse osmosis, ultrafiltration and/or deionizer
systems. Because a distillation system is expensive and given the large amount
of purified water required for hemodialysis units, ultrafiltration (using various
sizes of filters), reverse osmosis and/or deionizer are more commonly used. In
addition, softeners to remove calcium and magnesium, and activated carbon to
removed organic contaminants, chlorine and chloramine, are common devices
employed in the water purification systems.
Reverse osmosis is an effective way of removing organic and inorganic solutes.
As water flows through the system, it is pushed through a very tight membrane.
Although the osmotic gradient at the ‘rejected’ side is much higher than the
‘permeated’ side, the hydraulic pressure is high enough to push the fluid against
the osmotic force. These membranes are quite similar to dialyzers. By
monitoring the conductivity of the ‘permeated’ water, as the conductivity
increases, it provides an indication of the poor performance of the membrane.
A deionizer system removes inorganic ions by an ionic exchange process. The
water passes through a cationic resin, where the cation will exchange with H+.
Then, the water passes through the anionic resin and the anion will exchange
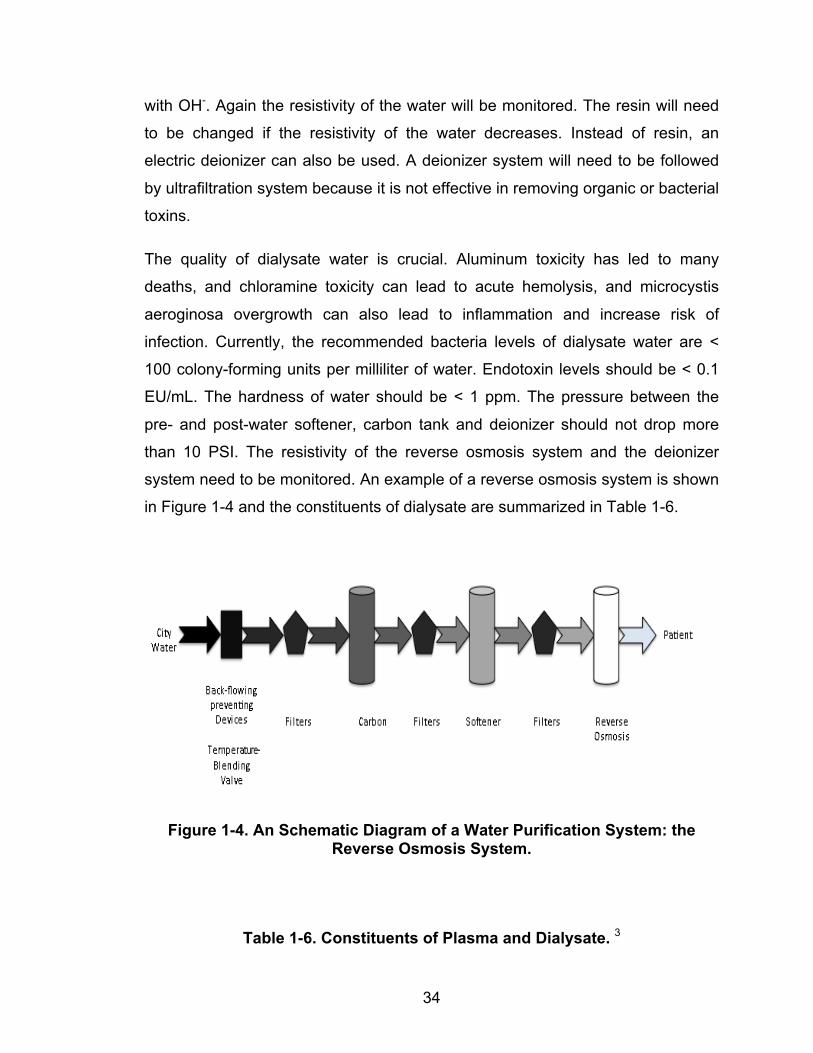
34
with OH-. Again the resistivity of the water will be monitored. The resin will need
to be changed if the resistivity of the water decreases. Instead of resin, an
electric deionizer can also be used. A deionizer system will need to be followed
by ultrafiltration system because it is not effective in removing organic or bacterial
toxins.
The quality of dialysate water is crucial. Aluminum toxicity has led to many
deaths, and chloramine toxicity can lead to acute hemolysis, and microcystis
aeroginosa overgrowth can also lead to inflammation and increase risk of
infection. Currently, the recommended bacteria levels of dialysate water are <
100 colony-forming units per milliliter of water. Endotoxin levels should be < 0.1
EU/mL. The hardness of water should be < 1 ppm. The pressure between the
pre- and post-water softener, carbon tank and deionizer should not drop more
than 10 PSI. The resistivity of the reverse osmosis system and the deionizer
system need to be monitored. An example of a reverse osmosis system is shown
in Figure 1-4 and the constituents of dialysate are summarized in Table 1-6.
Figure 1-4. An Schematic Diagram of a Water Purification System: the Reverse Osmosis System.
Table 1-6. Constituents of Plasma and Dialysate. 3
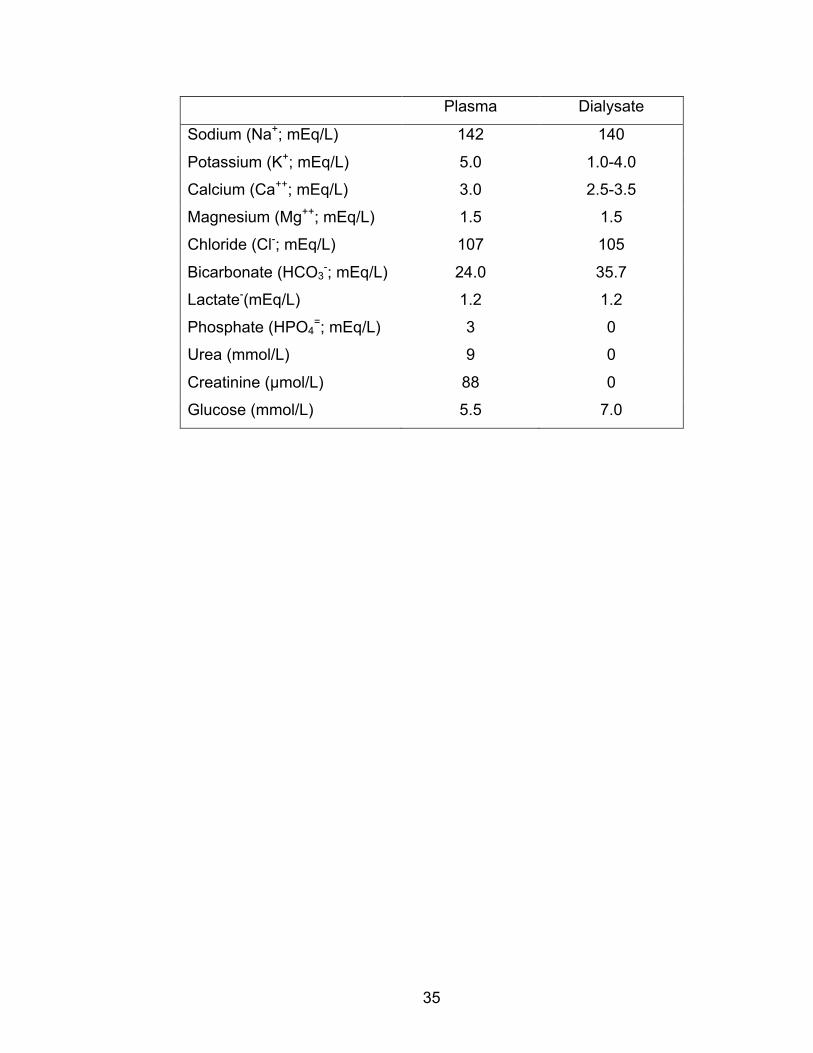
35
Plasma Dialysate
Sodium (Na+; mEq/L) 142 140
Potassium (K+; mEq/L) 5.0 1.0-4.0
Calcium (Ca++; mEq/L) 3.0 2.5-3.5
Magnesium (Mg++; mEq/L) 1.5 1.5
Chloride (Cl-; mEq/L) 107 105
Bicarbonate (HCO3-; mEq/L) 24.0 35.7
Lactate-(mEq/L) 1.2 1.2
Phosphate (HPO4=; mEq/L) 3 0
Urea (mmol/L) 9 0
Creatinine (µmol/L) 88 0
Glucose (mmol/L) 5.5 7.0
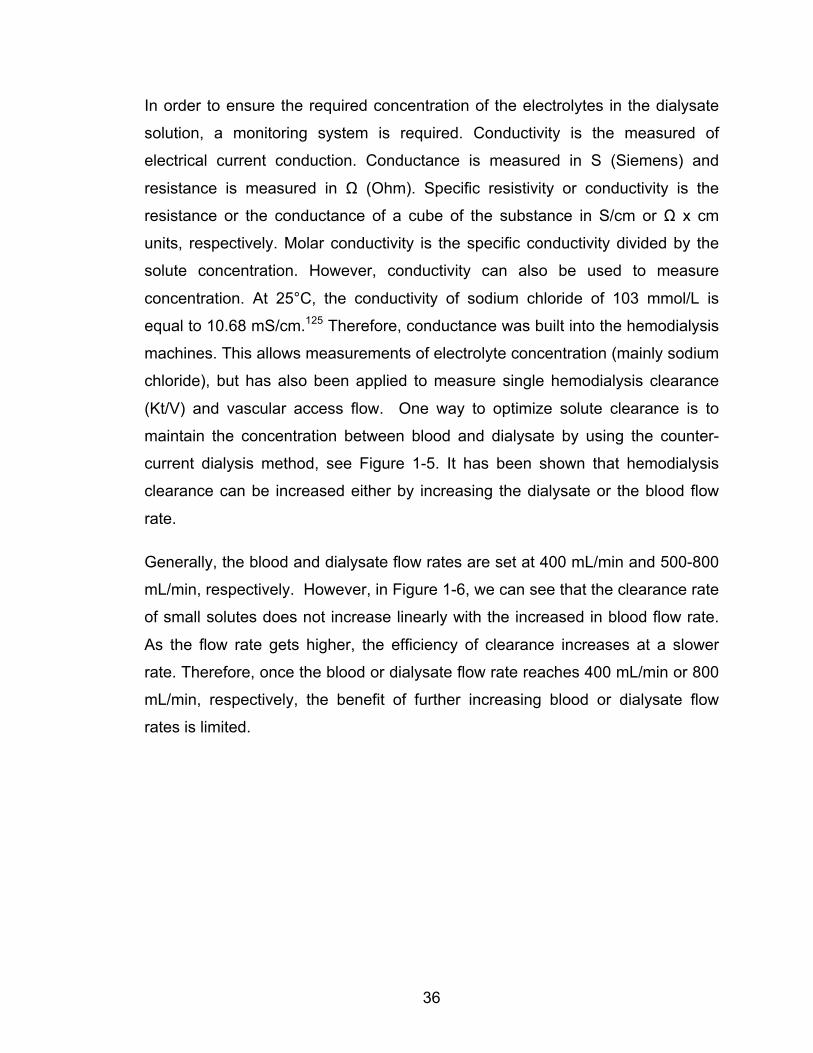
36
In order to ensure the required concentration of the electrolytes in the dialysate
solution, a monitoring system is required. Conductivity is the measured of
electrical current conduction. Conductance is measured in S (Siemens) and
resistance is measured in Ω (Ohm). Specific resistivity or conductivity is the
resistance or the conductance of a cube of the substance in S/cm or Ω x cm
units, respectively. Molar conductivity is the specific conductivity divided by the
solute concentration. However, conductivity can also be used to measure
concentration. At 25°C, the conductivity of sodium chloride of 103 mmol/L is
equal to 10.68 mS/cm.125 Therefore, conductance was built into the hemodialysis
machines. This allows measurements of electrolyte concentration (mainly sodium
chloride), but has also been applied to measure single hemodialysis clearance
(Kt/V) and vascular access flow. One way to optimize solute clearance is to
maintain the concentration between blood and dialysate by using the counter-
current dialysis method, see Figure 1-5. It has been shown that hemodialysis
clearance can be increased either by increasing the dialysate or the blood flow
rate.
Generally, the blood and dialysate flow rates are set at 400 mL/min and 500-800
mL/min, respectively. However, in Figure 1-6, we can see that the clearance rate
of small solutes does not increase linearly with the increased in blood flow rate.
As the flow rate gets higher, the efficiency of clearance increases at a slower
rate. Therefore, once the blood or dialysate flow rate reaches 400 mL/min or 800
mL/min, respectively, the benefit of further increasing blood or dialysate flow
rates is limited.
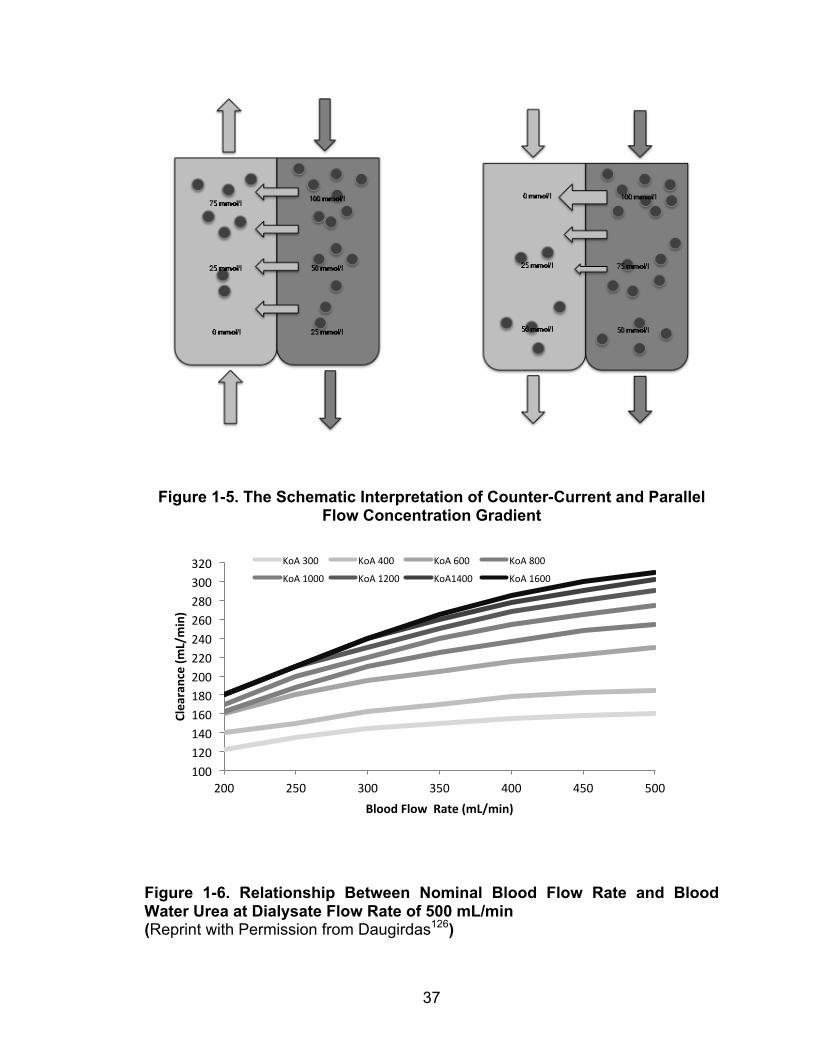
37
Figure 1-5. The Schematic Interpretation of Counter-Current and Parallel Flow Concentration Gradient
Figure 1-6. Relationship Between Nominal Blood Flow Rate and Blood Water Urea at Dialysate Flow Rate of 500 mL/min (Reprint with Permission from Daugirdas126)
100 120 140 160 180 200 220 240 260 280 300 320
200 250 300 350 400 450 500
Clearance (m
L/min)
Blood Flow Rate (mL/min)
KoA 300 KoA 400 KoA 600 KoA 800
KoA 1000 KoA 1200 KoA1400 KoA 1600
38
1.5.5. Hemodialysis Frequency and Duration
The duration and frequency of hemodialysis treatments can also affect a patient’s
total solute clearance. Although conventional thrice-weekly, four-hours
hemodialysis is the current standard of care, frequent and/or prolonged
hemodialysis (quotidian) is being used more often clinically, especially in the
home setting. Gotch127 has developed a method to estimate weekly urea
clearance (weekly standard Kt/V of urea, weekly Std Kt/Vurea) in hemodialysis
patients. This will be discussed in detail in a later section (Urea as a Marker for
Dialysis Adequacy). Briefly, the initial intent of developing this method was to
have a technique to compare small-solute clearance between conventional
hemodialysis (intermittent) and peritoneal dialysis (continuous). However, the
weekly Std Kt/Vurea has also been used to compare various hemodialysis
modalities, especially in a research settings.128 The weekly Std Kt/Vurea of a 70 kg
patient, who is on conventional hemodialysis (4 hours thrice weekly) with dry-
weight of 68 kg, and pre- and post-dialysis urea levels of 20 mmol/L and 6
mmol/L, is 2.18. By increasing the frequency to 6 sessions per week, the Std
Kt/Vurea will increase to 4.54.
1.5.6. Convective Clearance
Convective clearance is another major mechanism for solute or toxin clearance.
Ultrafiltration is important for maintaining volume homeostasis, which affects
blood pressure control. However, it is also important for middle molecular weight
solute removal when using convectional clearance. In hemodialysis, the pressure
gradient is generated by hydraulic pressure and in peritoneal dialysis, which is
generated by osmotic pressure gradient. The membrane permeability to water is
called the ultrafiltration coefficient (UFcoeff; mL/hr/mmHg),
𝑼𝑭𝒄𝒐𝒆𝒇𝒇 =𝑸𝒇𝑻𝑴𝑷
Equation 1-13
where Qf (mL/min) is the ultrafiltration rate, and TMP (mmHg) is the
transmembrane pressure gradient. A dialyzer is considered to be low flux if its
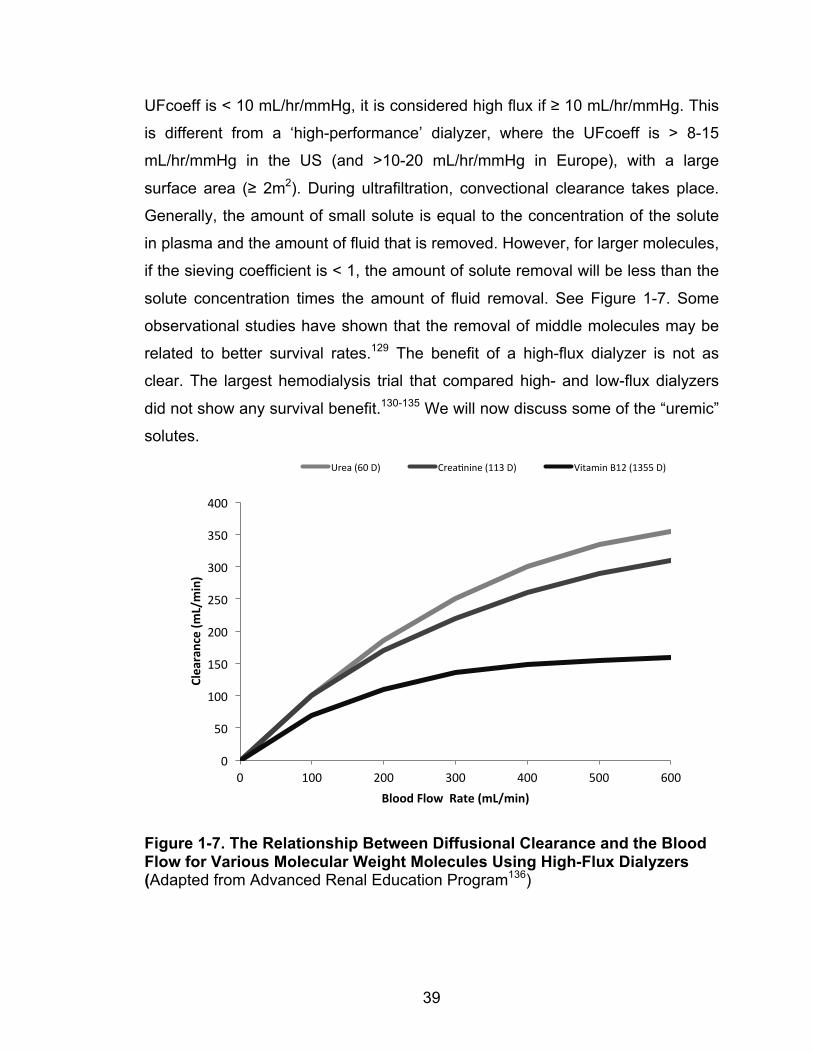
39
UFcoeff is < 10 mL/hr/mmHg, it is considered high flux if ≥ 10 mL/hr/mmHg. This
is different from a ‘high-performance’ dialyzer, where the UFcoeff is > 8-15
mL/hr/mmHg in the US (and >10-20 mL/hr/mmHg in Europe), with a large
surface area (≥ 2m2). During ultrafiltration, convectional clearance takes place.
Generally, the amount of small solute is equal to the concentration of the solute
in plasma and the amount of fluid that is removed. However, for larger molecules,
if the sieving coefficient is < 1, the amount of solute removal will be less than the
solute concentration times the amount of fluid removal. See Figure 1-7. Some
observational studies have shown that the removal of middle molecules may be
related to better survival rates.129 The benefit of a high-flux dialyzer is not as
clear. The largest hemodialysis trial that compared high- and low-flux dialyzers
did not show any survival benefit.130-135 We will now discuss some of the “uremic”
solutes.
Figure 1-7. The Relationship Between Diffusional Clearance and the Blood Flow for Various Molecular Weight Molecules Using High-Flux Dialyzers (Adapted from Advanced Renal Education Program136)
0
50
100
150
200
250
300
350
400
0 100 200 300 400 500 600
Clearance (m
L/min)
Blood Flow Rate (mL/min)
Urea (60 D) Crea@nine (113 D) Vitamin B12 (1355 D)
40
1.6. THE KINETICS OF SOLUTE CLEARANCE BY
HEMODIALYSIS
1.6.1. Body Compartments
In an average adult patient, water is 60% of total body weight. For example, a 70-
kg man has about 42 L of total body water, where 28 L is in the intracellular
compartment, 11 L in the interstitial space of extracellular compartment and 3 L
in the intravascular space. Blood contains approximately 60% plasma, which is
mostly water, 40% red blood cells, and <1% white blood cells and platelets; the
average blood volume in a 70 kg man is about 5 L. However, this percentage
may change associated with age and renal disease (Figure 1-8) The plasma and
the interstitial compartments have similar ionic compositions (sodium, potassium,
calcium, magnesium, chloride, phosphate, bicarbonate and others such as
sulfates which are not routinely measured), but there are more proteins in the
plasma. This leads to a higher concentration of cation than anion in the plasma,
because proteins are negatively charged. Furthermore, the most abundant cation
in interstitial fluid is potassium (K+) whereas sodium (Na+) is the most abundant
cation in the intravascular space. Other nonelectrolyte solutes are phospholipids,
cholesterol, glucose, urea, lactate, uric acid, creatinine, and bilirubin.1
The tissue-blood interface, which is commonly ignored, is an important factor,
which can affect the dialysis clearance of solutes. There are inter-compartment
solute mass transfers within the patient and the dialyzer clearance within the
dialyzer when considering solute transport. Low inter-compartment solute mass
transfer is responsible for solute disequilibrium during dialysis or solute rebound
post-dialysis.126 However, when slow, prolonged hemodialysis or continuous
dialysis (such as peritoneal dialysis) is used, these risks are minimized. Solute
generation in patients also can also influence the dialysis clearance
measurement.
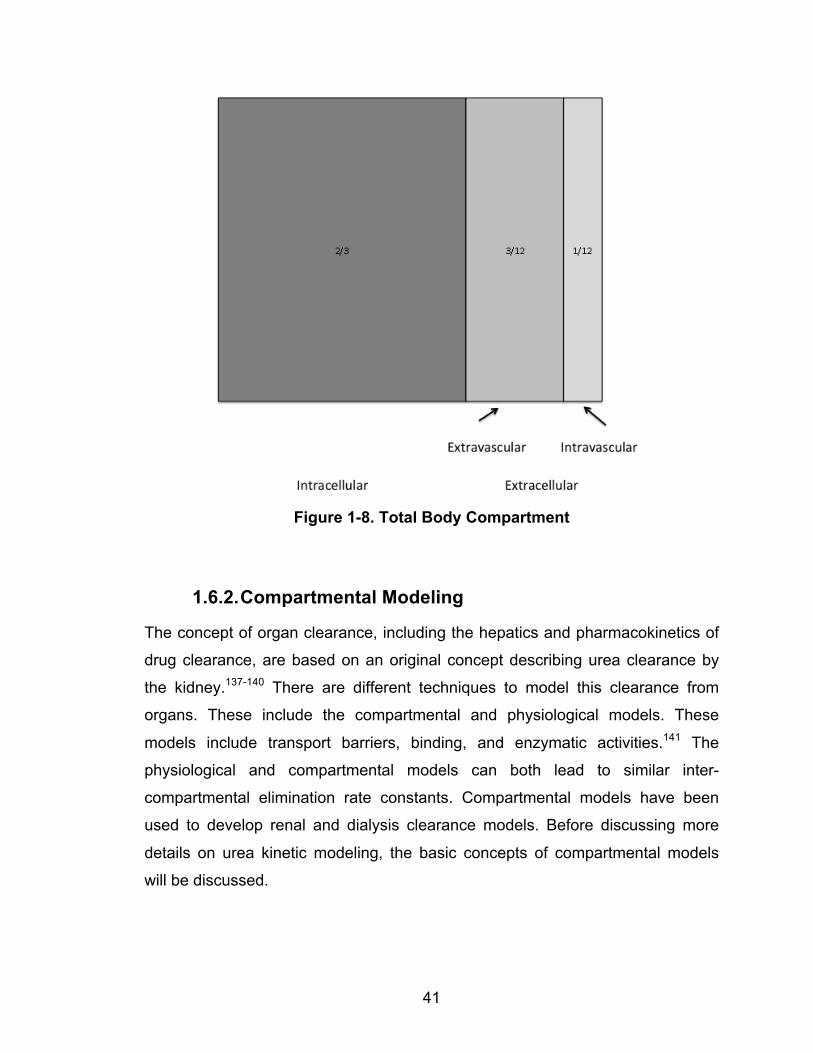
41
Figure 1-8. Total Body Compartment
1.6.2. Compartmental Modeling
The concept of organ clearance, including the hepatics and pharmacokinetics of
drug clearance, are based on an original concept describing urea clearance by
the kidney.137-140 There are different techniques to model this clearance from
organs. These include the compartmental and physiological models. These
models include transport barriers, binding, and enzymatic activities.141 The
physiological and compartmental models can both lead to similar inter-
compartmental elimination rate constants. Compartmental models have been
used to develop renal and dialysis clearance models. Before discussing more
details on urea kinetic modeling, the basic concepts of compartmental models
will be discussed.
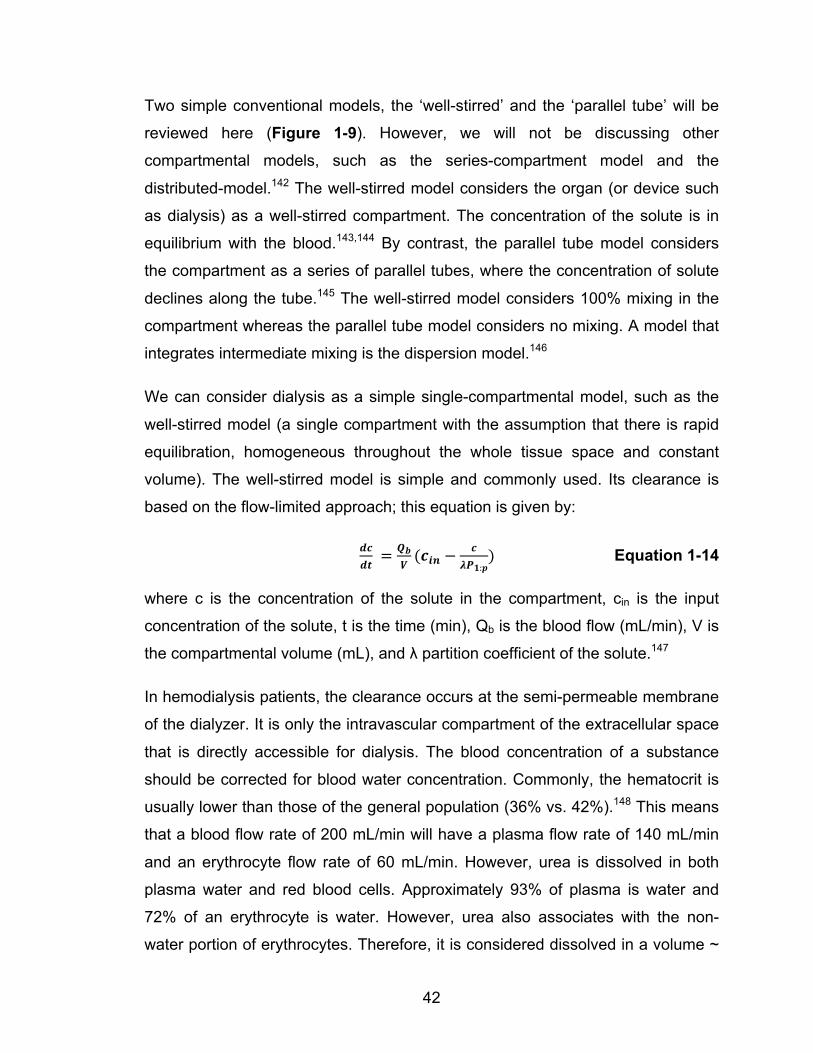
42
Two simple conventional models, the ‘well-stirred’ and the ‘parallel tube’ will be
reviewed here (Figure 1-9). However, we will not be discussing other
compartmental models, such as the series-compartment model and the
distributed-model.142 The well-stirred model considers the organ (or device such
as dialysis) as a well-stirred compartment. The concentration of the solute is in
equilibrium with the blood.143,144 By contrast, the parallel tube model considers
the compartment as a series of parallel tubes, where the concentration of solute
declines along the tube.145 The well-stirred model considers 100% mixing in the
compartment whereas the parallel tube model considers no mixing. A model that
integrates intermediate mixing is the dispersion model.146
We can consider dialysis as a simple single-compartmental model, such as the
well-stirred model (a single compartment with the assumption that there is rapid
equilibration, homogeneous throughout the whole tissue space and constant
volume). The well-stirred model is simple and commonly used. Its clearance is
based on the flow-limited approach; this equation is given by:
𝒅𝒄𝒅𝒕 = 𝑸𝒃
𝑽(𝒄𝒊𝒏 −
𝒄𝝀𝑷𝟏:𝒑
) Equation 1-14
where c is the concentration of the solute in the compartment, cin is the input
concentration of the solute, t is the time (min), Qb is the blood flow (mL/min), V is
the compartmental volume (mL), and λ partition coefficient of the solute.147
In hemodialysis patients, the clearance occurs at the semi-permeable membrane
of the dialyzer. It is only the intravascular compartment of the extracellular space
that is directly accessible for dialysis. The blood concentration of a substance
should be corrected for blood water concentration. Commonly, the hematocrit is
usually lower than those of the general population (36% vs. 42%).148 This means
that a blood flow rate of 200 mL/min will have a plasma flow rate of 140 mL/min
and an erythrocyte flow rate of 60 mL/min. However, urea is dissolved in both
plasma water and red blood cells. Approximately 93% of plasma is water and
72% of an erythrocyte is water. However, urea also associates with the non-
water portion of erythrocytes. Therefore, it is considered dissolved in a volume ~
43
80% of the erythrocytes.91 Without making this correction, urea removal will be
overestimated by 10%. The common correction factor for clearance is 0.894.91
Therefore, Qb should correct for blood water as Qp (plasma water flow rate). For
simplicity, we will leave it as Qb to illustrate the concept of solute clearance and
compartmental modeling. Finally, solute generation will need to be considered.
The mass balance equation can be expressed as:
𝑴𝒊 = 𝑸𝒃 𝑪𝒃𝒊 − 𝑪𝒃𝒇 = 𝑸𝑫 𝑪𝒅
𝒇 − 𝑪𝒅𝒊 Equation 1-15
where Qd and Qb are the volume flow rates of the dialysate and blood (mL/min),
𝐶!! and 𝐶!! are the initial solute concentrations of dialysate and blood (mmol/L),
and 𝐶!! and 𝐶!
! are the final solute concentrations of the dialysate and blood
(mmol/L). This equation can also be expressed as the following:
𝑴𝒊 = 𝑲𝒐𝑨 𝑪𝒅𝒇!𝑪𝒅
𝒊 ! 𝑪𝒃𝒊 !𝑪𝒅
𝒇
𝒍𝒏 𝑪𝒃𝒇!𝑪𝒅
𝒊 𝑪𝒃𝒊 !𝑪𝒅
𝒇 Equation 1-16
where KoA is the mass area transfer coefficient of the dialyzer (mL/min). It is also
the property of the membrane. The solute can be considered to have the
maximum clearance possible at infinite blood and dialysate flow rate.
However, the single compartmental model can over-estimate the solute removal
in hemodialysis clearance (Figure 1-10). It assumes the body acts as a single
compartment with well stirred distributing among all body compartments and
rapidly distributed among all compartments. When the inter-compartment solute
exchange rate is slower, the one compartmental model cannot fully represent the
solute clearance. To consider the whole body, the model will need to take into
account the volume distribution of the solute in the other compartments of the
body, and not just the blood-water component. For example, urea is also
dissolved in the extra-cellular and intra-cellular spaces. The inter-compartmental
solute movement can also affect the solute concentration in the blood-water.
Unless the solute equilibration rate between the compartments is rapid and
100%, there will be an overestimation of total solute clearance if the inter-
44
compartmental clearance is not considered. This can be observed with a post-
dialysis solute concentration rebound. There are other components of the solute
that need to be considered. These include its distribution at other compartments
and inter-compartmental clearance, solute generation, and renal clearance.
The multi-compartmental model describes the body as composed of multiple
compartments in which solute distributes with a mass transfer governed by the
inter-compartmental clearance constants (Figure 1-11). Solute generation
provides input into the compartments while elimination occurs through the
vascular compartment by renal, non-renal pathways as well as through dialysis.
Volume of distribution at steady-state (VSS) was calculated from the following
relationship:
𝑽𝑺𝑺 = 𝑽𝑰 𝟏+ 𝑲𝒌𝑰𝑬𝒌𝑬𝑰
Equation 1-17
VI is the solute concentration in intravascular space. KIE is the solute inter-
compartmental transfer clearance from intravascular space to extravascular
space. KEI is the solute inter-compartmental transfer clearance from
extravascular space to intravascular space. K is a constant. The rate of change
of solute mass in the multi compartmental model can be written as a differential
equation: 149 𝒅𝑴𝒊𝒅𝒕
= 𝑮− 𝑲𝑫 𝑪𝒊𝒔 − 𝑪𝑫 − 𝑲𝒓 𝑪𝒊𝒔 Equation1-18
where KD is dialysis clearance, and Kr is the renal clearance (mL/min). CIS and CD
are solute concentrations (mmol/L) in the intravascular space and dialysate.
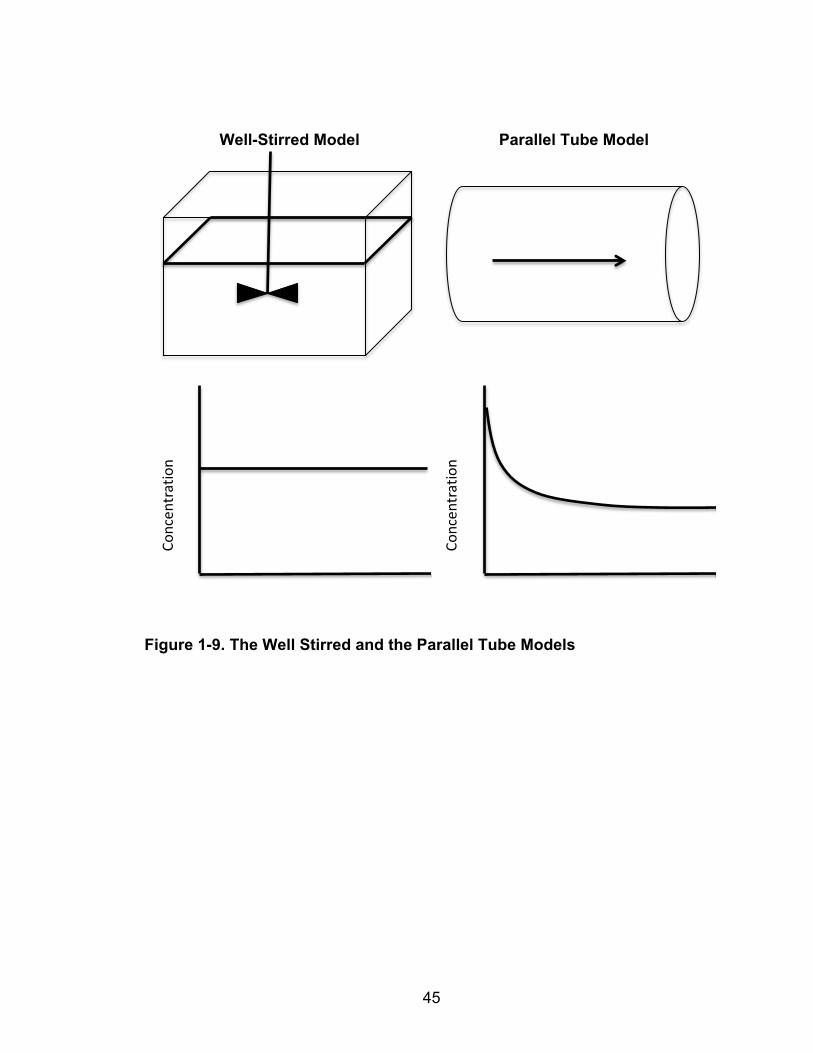
45
Well-Stirred Model Parallel Tube Model
Figure 1-9. The Well Stirred and the Parallel Tube Models
Concen
tration
Concen
tration
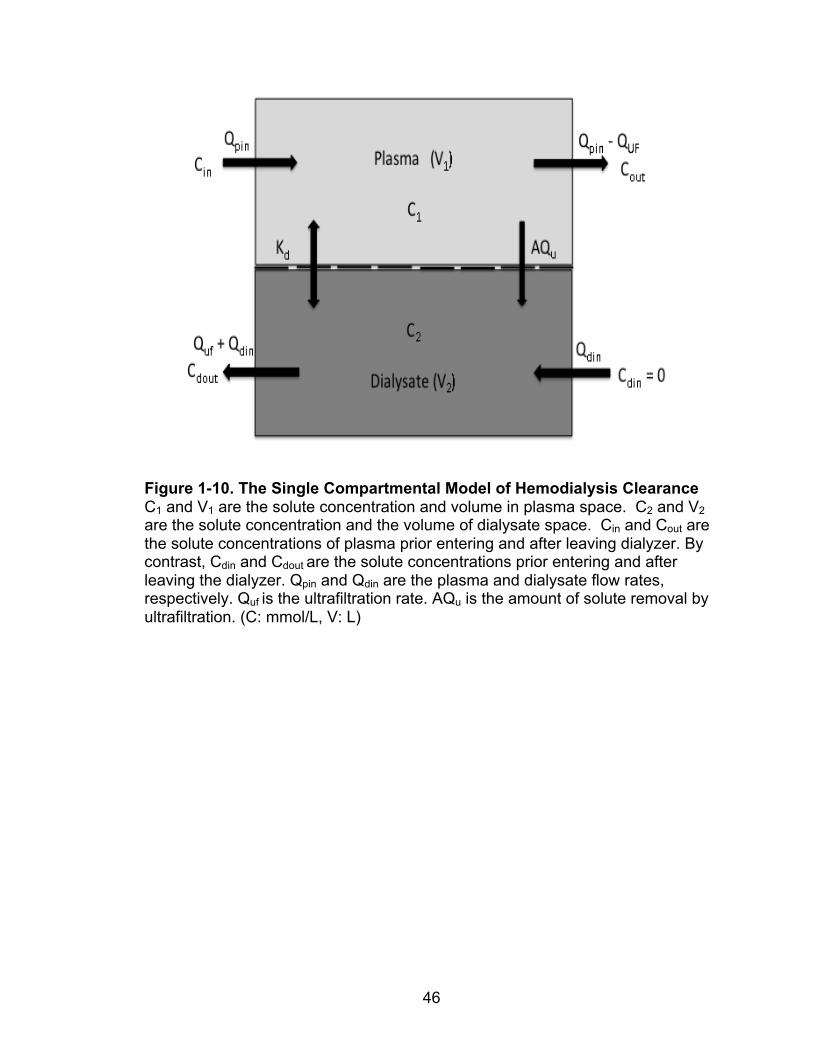
46
Figure 1-10. The Single Compartmental Model of Hemodialysis Clearance C1 and V1 are the solute concentration and volume in plasma space. C2 and V2 are the solute concentration and the volume of dialysate space. Cin and Cout are the solute concentrations of plasma prior entering and after leaving dialyzer. By contrast, Cdin and Cdout are the solute concentrations prior entering and after leaving the dialyzer. Qpin and Qdin are the plasma and dialysate flow rates, respectively. Quf is the ultrafiltration rate. AQu is the amount of solute removal by ultrafiltration. (C: mmol/L, V: L)
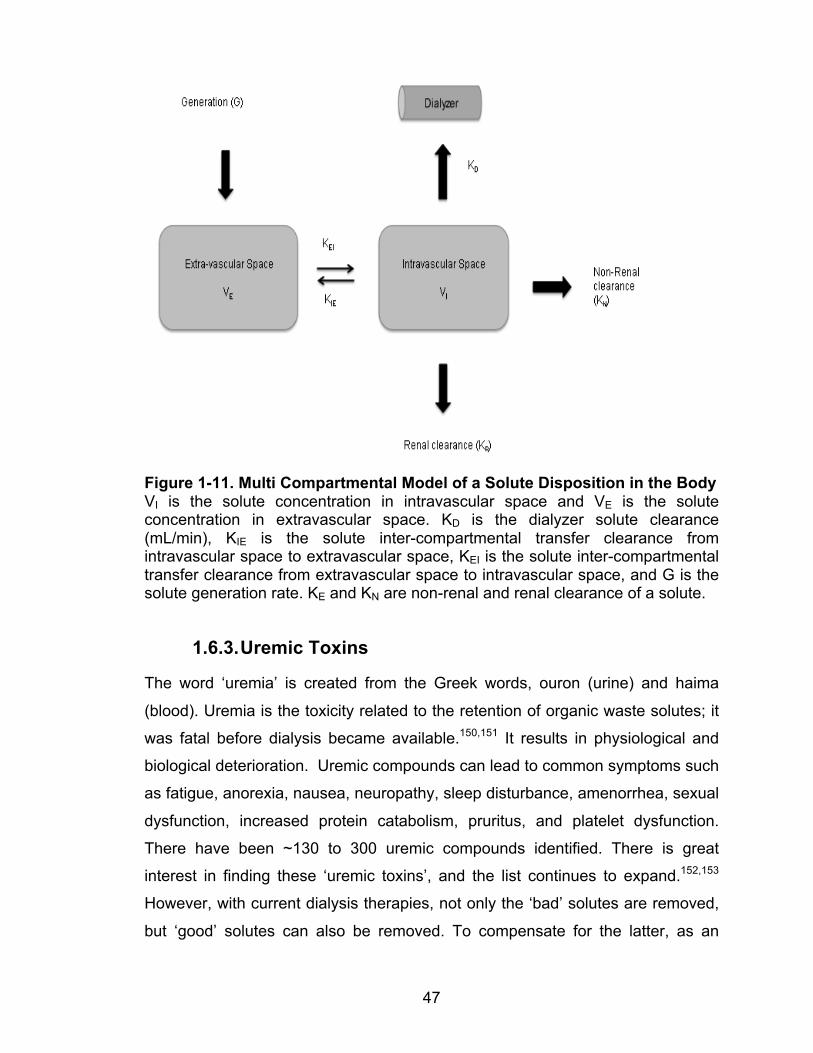
47
Figure 1-11. Multi Compartmental Model of a Solute Disposition in the Body VI is the solute concentration in intravascular space and VE is the solute concentration in extravascular space. KD is the dialyzer solute clearance (mL/min), KIE is the solute inter-compartmental transfer clearance from intravascular space to extravascular space, KEI is the solute inter-compartmental transfer clearance from extravascular space to intravascular space, and G is the solute generation rate. KE and KN are non-renal and renal clearance of a solute.
1.6.3. Uremic Toxins
The word ‘uremia’ is created from the Greek words, ouron (urine) and haima
(blood). Uremia is the toxicity related to the retention of organic waste solutes; it
was fatal before dialysis became available.150,151 It results in physiological and
biological deterioration. Uremic compounds can lead to common symptoms such
as fatigue, anorexia, nausea, neuropathy, sleep disturbance, amenorrhea, sexual
dysfunction, increased protein catabolism, pruritus, and platelet dysfunction.
There have been ~130 to 300 uremic compounds identified. There is great
interest in finding these ‘uremic toxins’, and the list continues to expand.152,153
However, with current dialysis therapies, not only the ‘bad’ solutes are removed,
but ‘good’ solutes can also be removed. To compensate for the latter, as an
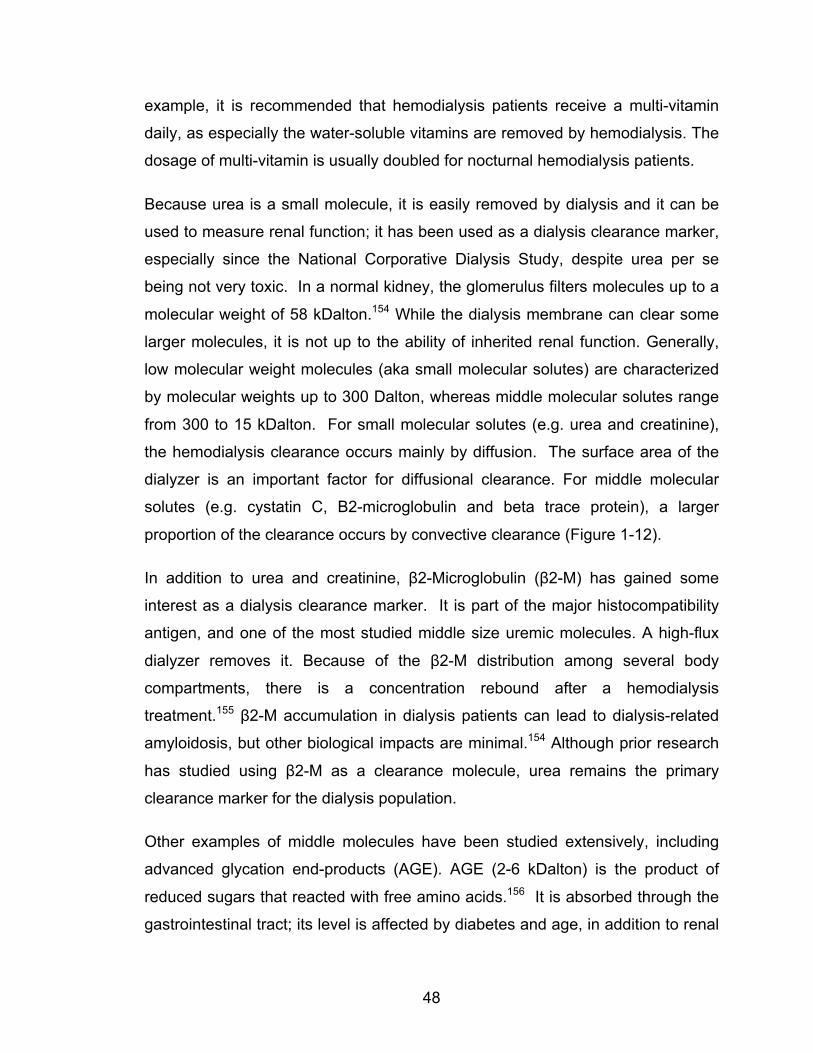
48
example, it is recommended that hemodialysis patients receive a multi-vitamin
daily, as especially the water-soluble vitamins are removed by hemodialysis. The
dosage of multi-vitamin is usually doubled for nocturnal hemodialysis patients.
Because urea is a small molecule, it is easily removed by dialysis and it can be
used to measure renal function; it has been used as a dialysis clearance marker,
especially since the National Corporative Dialysis Study, despite urea per se
being not very toxic. In a normal kidney, the glomerulus filters molecules up to a
molecular weight of 58 kDalton.154 While the dialysis membrane can clear some
larger molecules, it is not up to the ability of inherited renal function. Generally,
low molecular weight molecules (aka small molecular solutes) are characterized
by molecular weights up to 300 Dalton, whereas middle molecular solutes range
from 300 to 15 kDalton. For small molecular solutes (e.g. urea and creatinine),
the hemodialysis clearance occurs mainly by diffusion. The surface area of the
dialyzer is an important factor for diffusional clearance. For middle molecular
solutes (e.g. cystatin C, B2-microglobulin and beta trace protein), a larger
proportion of the clearance occurs by convective clearance (Figure 1-12).
In addition to urea and creatinine, β2-Microglobulin (β2-M) has gained some
interest as a dialysis clearance marker. It is part of the major histocompatibility
antigen, and one of the most studied middle size uremic molecules. A high-flux
dialyzer removes it. Because of the β2-M distribution among several body
compartments, there is a concentration rebound after a hemodialysis
treatment.155 β2-M accumulation in dialysis patients can lead to dialysis-related
amyloidosis, but other biological impacts are minimal.154 Although prior research
has studied using β2-M as a clearance molecule, urea remains the primary
clearance marker for the dialysis population.
Other examples of middle molecules have been studied extensively, including
advanced glycation end-products (AGE). AGE (2-6 kDalton) is the product of
reduced sugars that reacted with free amino acids.156 It is absorbed through the
gastrointestinal tract; its level is affected by diabetes and age, in addition to renal
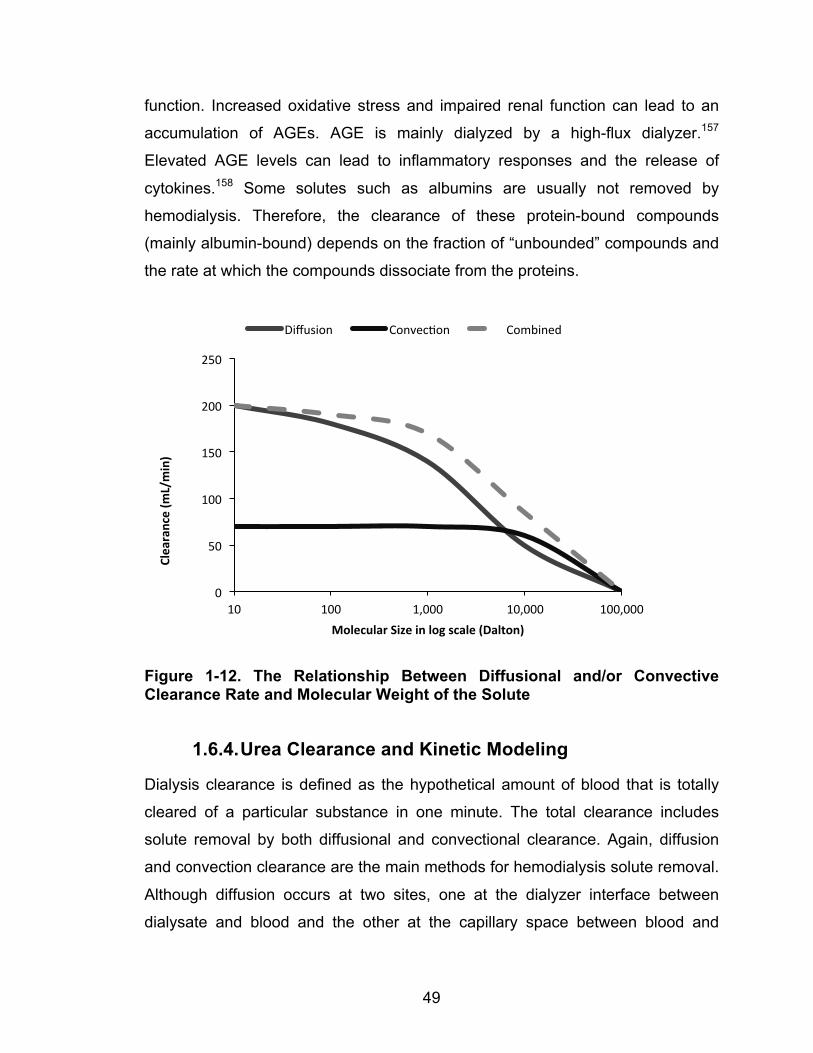
49
function. Increased oxidative stress and impaired renal function can lead to an
accumulation of AGEs. AGE is mainly dialyzed by a high-flux dialyzer.157
Elevated AGE levels can lead to inflammatory responses and the release of
cytokines.158 Some solutes such as albumins are usually not removed by
hemodialysis. Therefore, the clearance of these protein-bound compounds
(mainly albumin-bound) depends on the fraction of “unbounded” compounds and
the rate at which the compounds dissociate from the proteins.
Figure 1-12. The Relationship Between Diffusional and/or Convective Clearance Rate and Molecular Weight of the Solute
1.6.4. Urea Clearance and Kinetic Modeling
Dialysis clearance is defined as the hypothetical amount of blood that is totally
cleared of a particular substance in one minute. The total clearance includes
solute removal by both diffusional and convectional clearance. Again, diffusion
and convection clearance are the main methods for hemodialysis solute removal.
Although diffusion occurs at two sites, one at the dialyzer interface between
dialysate and blood and the other at the capillary space between blood and
0
50
100
150
200
250
10 100 1,000 10,000 100,000
Clearance (m
L/min)
Molecular Size in log scale (Dalton)
Diffusion Convec@on Combined
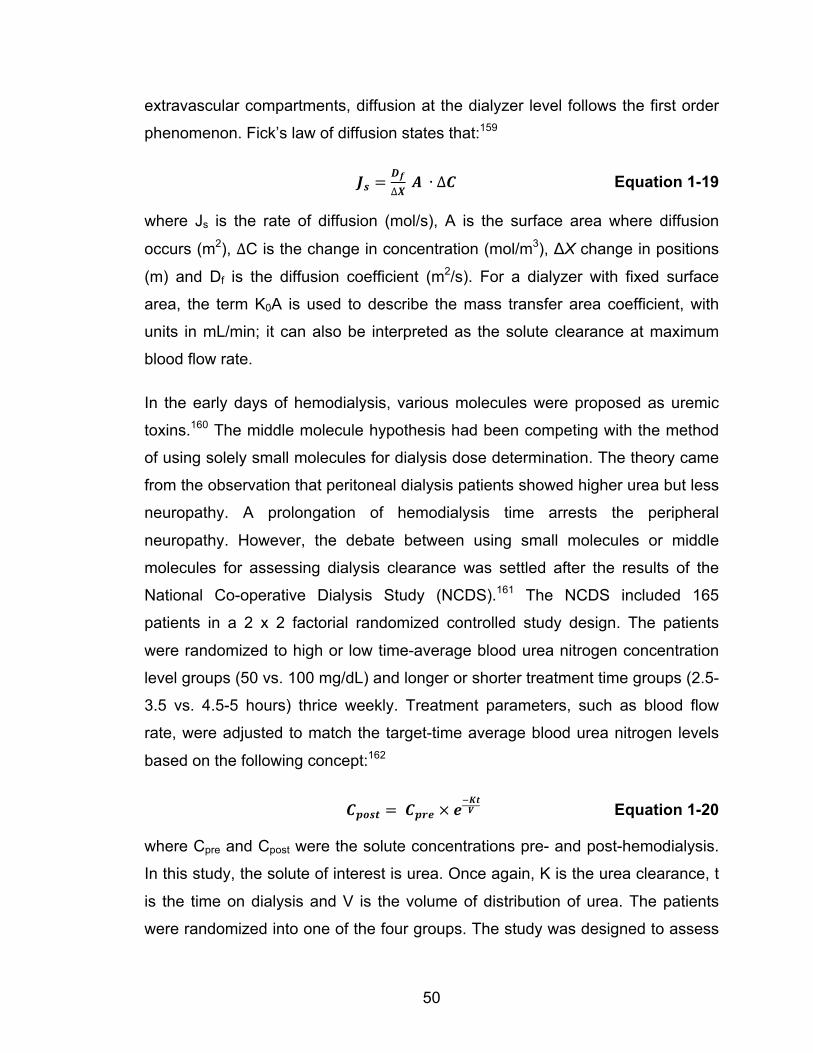
50
extravascular compartments, diffusion at the dialyzer level follows the first order
phenomenon. Fick’s law of diffusion states that:159
𝑱𝒔 =𝑫𝒇∆𝑿 𝑨 ∙ ∆𝑪 Equation 1-19
where Js is the rate of diffusion (mol/s), A is the surface area where diffusion
occurs (m2), ∆C is the change in concentration (mol/m3), ΔX change in positions
(m) and Df is the diffusion coefficient (m2/s). For a dialyzer with fixed surface
area, the term K0A is used to describe the mass transfer area coefficient, with
units in mL/min; it can also be interpreted as the solute clearance at maximum
blood flow rate.
In the early days of hemodialysis, various molecules were proposed as uremic
toxins.160 The middle molecule hypothesis had been competing with the method
of using solely small molecules for dialysis dose determination. The theory came
from the observation that peritoneal dialysis patients showed higher urea but less
neuropathy. A prolongation of hemodialysis time arrests the peripheral
neuropathy. However, the debate between using small molecules or middle
molecules for assessing dialysis clearance was settled after the results of the
National Co-operative Dialysis Study (NCDS).161 The NCDS included 165
patients in a 2 x 2 factorial randomized controlled study design. The patients
were randomized to high or low time-average blood urea nitrogen concentration
level groups (50 vs. 100 mg/dL) and longer or shorter treatment time groups (2.5-
3.5 vs. 4.5-5 hours) thrice weekly. Treatment parameters, such as blood flow
rate, were adjusted to match the target-time average blood urea nitrogen levels
based on the following concept:162
𝑪𝒑𝒐𝒔𝒕 = 𝑪𝒑𝒓𝒆 × 𝒆!𝑲𝒕𝑽 Equation 1-20
where Cpre and Cpost were the solute concentrations pre- and post-hemodialysis.
In this study, the solute of interest is urea. Once again, K is the urea clearance, t
is the time on dialysis and V is the volume of distribution of urea. The patients
were randomized into one of the four groups. The study was designed to assess
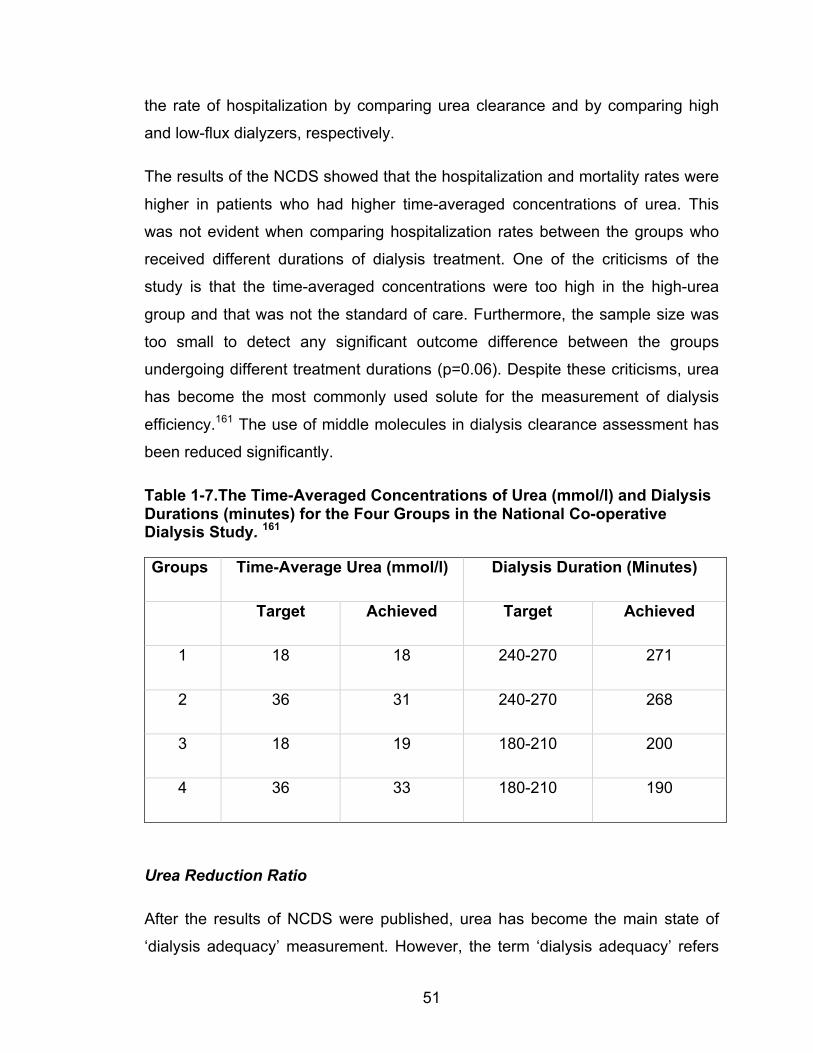
51
the rate of hospitalization by comparing urea clearance and by comparing high
and low-flux dialyzers, respectively.
The results of the NCDS showed that the hospitalization and mortality rates were
higher in patients who had higher time-averaged concentrations of urea. This
was not evident when comparing hospitalization rates between the groups who
received different durations of dialysis treatment. One of the criticisms of the
study is that the time-averaged concentrations were too high in the high-urea
group and that was not the standard of care. Furthermore, the sample size was
too small to detect any significant outcome difference between the groups
undergoing different treatment durations (p=0.06). Despite these criticisms, urea
has become the most commonly used solute for the measurement of dialysis
efficiency.161 The use of middle molecules in dialysis clearance assessment has
been reduced significantly.
Table 1-7.The Time-Averaged Concentrations of Urea (mmol/l) and Dialysis Durations (minutes) for the Four Groups in the National Co-operative Dialysis Study. 161
Groups Time-Average Urea (mmol/l) Dialysis Duration (Minutes)
Target Achieved Target Achieved
1 18 18 240-270 271
2 36 31 240-270 268
3 18 19 180-210 200
4 36 33 180-210 190
Urea Reduction Ratio
After the results of NCDS were published, urea has become the main state of
‘dialysis adequacy’ measurement. However, the term ‘dialysis adequacy’ refers
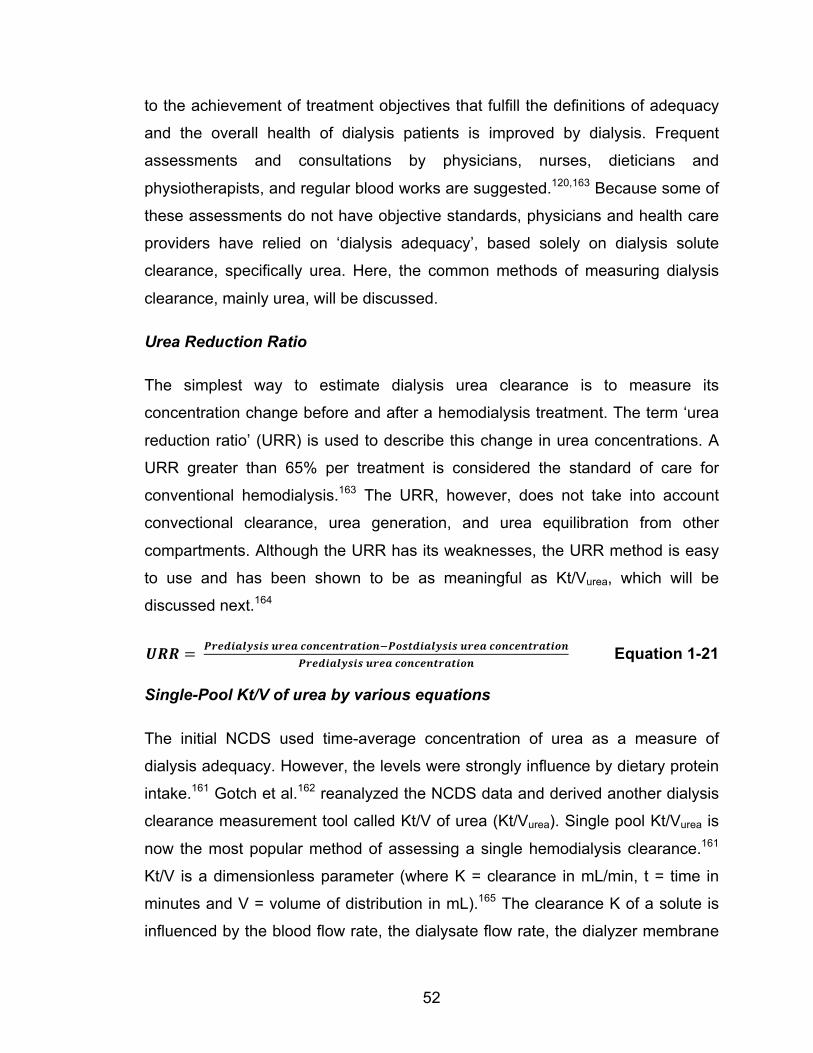
52
to the achievement of treatment objectives that fulfill the definitions of adequacy
and the overall health of dialysis patients is improved by dialysis. Frequent
assessments and consultations by physicians, nurses, dieticians and
physiotherapists, and regular blood works are suggested.120,163 Because some of
these assessments do not have objective standards, physicians and health care
providers have relied on ‘dialysis adequacy’, based solely on dialysis solute
clearance, specifically urea. Here, the common methods of measuring dialysis
clearance, mainly urea, will be discussed.
Urea Reduction Ratio
The simplest way to estimate dialysis urea clearance is to measure its
concentration change before and after a hemodialysis treatment. The term ‘urea
reduction ratio’ (URR) is used to describe this change in urea concentrations. A
URR greater than 65% per treatment is considered the standard of care for
conventional hemodialysis.163 The URR, however, does not take into account
convectional clearance, urea generation, and urea equilibration from other
compartments. Although the URR has its weaknesses, the URR method is easy
to use and has been shown to be as meaningful as Kt/Vurea, which will be
discussed next.164
𝑼𝑹𝑹 = 𝑷𝒓𝒆𝒅𝒊𝒂𝒍𝒚𝒔𝒊𝒔 𝒖𝒓𝒆𝒂 𝒄𝒐𝒏𝒄𝒆𝒏𝒕𝒓𝒂𝒕𝒊𝒐𝒏!𝑷𝒐𝒔𝒕𝒅𝒊𝒂𝒍𝒚𝒔𝒊𝒔 𝒖𝒓𝒆𝒂 𝒄𝒐𝒏𝒄𝒆𝒏𝒕𝒓𝒂𝒕𝒊𝒐𝒏𝑷𝒓𝒆𝒅𝒊𝒂𝒍𝒚𝒔𝒊𝒔 𝒖𝒓𝒆𝒂 𝒄𝒐𝒏𝒄𝒆𝒏𝒕𝒓𝒂𝒕𝒊𝒐𝒏
Equation 1-21
Single-Pool Kt/V of urea by various equations
The initial NCDS used time-average concentration of urea as a measure of
dialysis adequacy. However, the levels were strongly influence by dietary protein
intake.161 Gotch et al.162 reanalyzed the NCDS data and derived another dialysis
clearance measurement tool called Kt/V of urea (Kt/Vurea). Single pool Kt/Vurea is
now the most popular method of assessing a single hemodialysis clearance.161
Kt/V is a dimensionless parameter (where K = clearance in mL/min, t = time in
minutes and V = volume of distribution in mL).165 The clearance K of a solute is
influenced by the blood flow rate, the dialysate flow rate, the dialyzer membrane
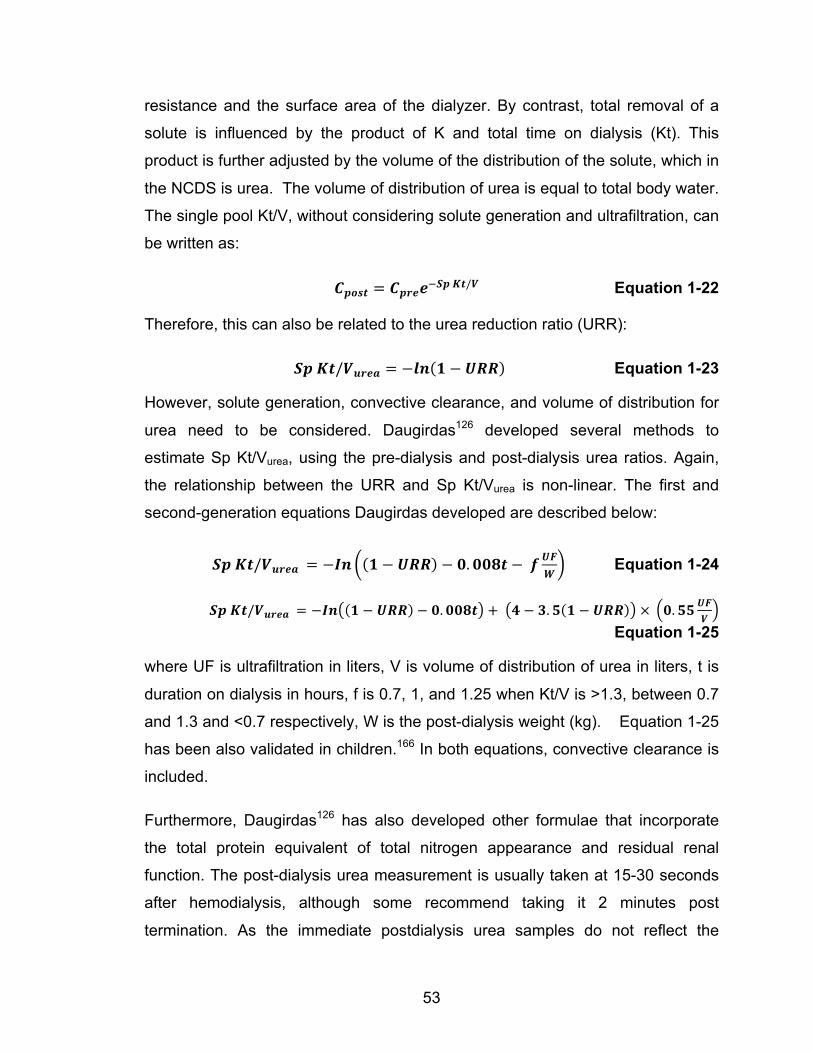
53
resistance and the surface area of the dialyzer. By contrast, total removal of a
solute is influenced by the product of K and total time on dialysis (Kt). This
product is further adjusted by the volume of the distribution of the solute, which in
the NCDS is urea. The volume of distribution of urea is equal to total body water.
The single pool Kt/V, without considering solute generation and ultrafiltration, can
be written as:
𝑪𝒑𝒐𝒔𝒕 = 𝑪𝒑𝒓𝒆𝒆!𝑺𝒑 𝑲𝒕/𝑽 Equation 1-22
Therefore, this can also be related to the urea reduction ratio (URR):
𝑺𝒑 𝑲𝒕/𝑽𝒖𝒓𝒆𝒂 = −𝒍𝒏 𝟏− 𝑼𝑹𝑹 Equation 1-23
However, solute generation, convective clearance, and volume of distribution for
urea need to be considered. Daugirdas126 developed several methods to
estimate Sp Kt/Vurea, using the pre-dialysis and post-dialysis urea ratios. Again,
the relationship between the URR and Sp Kt/Vurea is non-linear. The first and
second-generation equations Daugirdas developed are described below:
𝑺𝒑 𝑲𝒕/𝑽𝒖𝒓𝒆𝒂 = −𝑰𝒏 𝟏− 𝑼𝑹𝑹 − 𝟎.𝟎𝟎𝟖𝒕− 𝒇 𝑼𝑭𝑾
Equation 1-24
𝑺𝒑 𝑲𝒕/𝑽𝒖𝒓𝒆𝒂 = −𝑰𝒏 𝟏 − 𝑼𝑹𝑹 − 𝟎.𝟎𝟎𝟖𝒕 + 𝟒 − 𝟑.𝟓 𝟏 − 𝑼𝑹𝑹 × 𝟎.𝟓𝟓 𝑼𝑭𝑽
Equation 1-25
where UF is ultrafiltration in liters, V is volume of distribution of urea in liters, t is
duration on dialysis in hours, f is 0.7, 1, and 1.25 when Kt/V is >1.3, between 0.7
and 1.3 and <0.7 respectively, W is the post-dialysis weight (kg). Equation 1-25
has been also validated in children.166 In both equations, convective clearance is
included.
Furthermore, Daugirdas126 has also developed other formulae that incorporate
the total protein equivalent of total nitrogen appearance and residual renal
function. The post-dialysis urea measurement is usually taken at 15-30 seconds
after hemodialysis, although some recommend taking it 2 minutes post
termination. As the immediate postdialysis urea samples do not reflect the
54
“equilibrated urea” levels, the urea concentration measured immediately post-
dialysis is lower than the equilibrated sample. The urea has not equilibrated from
other compartments, such as the muscle to blood (double pool), thus Sp Kt/Vurea
overestimates the urea clearance.
In the equilibrated method blood urea samples are usually taken 30 minutes
post-dialysis. This considers the potential urea disequilibrium problem and
rebound of urea into vascular compartments, whereas the Sp Kt/Vurea method
does not. This “double-pool” Kt/Vurea is also called equilibrated Kt/Vurea (e
Kt/Vurea), which is usually 0.21 lower than the Sp Kt/Vurea.135 This difference
diminishes as the dialysis duration increases. For example, continuous
hemodialysis or peritoneal dialysis treatments are in an equilibrated condition.
Daugirdas has also developed other formulae, depending on the sampling time
and the types of accesses (arteriovenous or venovenous) that were shown to
correlate well with the measured eKt/Vurea.167,168 Although it is important to
understand the equilibrated and double-pool effects of urea, many hemodialysis
studies, especially studies that looked at survival outcomes, such as the HEMO
study (see below), were done using Sp Kt/Vurea.135 Therefore, the Sp Kt/Vurea
method is still more commonly used than the eKt/Vurea.
𝒆𝑲𝒕/𝑽𝒖𝒓𝒆𝒂 = 𝑺𝒑 𝑲𝒕/𝑽𝒖𝒓𝒆𝒂 − 𝟎.𝟒𝟕 × 𝑲 𝑽 + 𝟎.𝟎𝟏𝟕 Equation 1-26
Since the NCDS study showed that there was a significant benefit of reducing
hospitalization rates in patients who had Sp Kt/Vurea values above 0.9-0.95, the
next question was raised, ‘is there a benefit of a further increase in Kt/Vurea?’ This
question was answered by the HEMO study.135 It was a multi-center, 2x2 factorial
designed study that involved 1846 patients. The patients were randomized to
target standard and high-dose Sp Kt/Vurea, and to use high- and low-flux
dialyzers. The results showed that the high-flux dialyzer does not improve
survival rates and that targeting Sp Kt/Vurea of 1.25 is as good as 1.65. Despite
other observational studies that have shown a survival benefit in targeting higher
Sp Kt/Vurea, the HEMO study did not shown any reduced mortality from
increasing Sp Kt/ Vurea >1.25.169,170 Therefore, the KDOQI recommends targeting
55
intermittent hemodialysis clearance with a minimum Sp Kt/Vurea of 1.2 or URR of
65%. 171,172
Clinical information is required to measure and calculate Sp Kt/Vurea, including
pre-dialysis and post-dialysis weight and urea levels, ultrafiltration volume, intra-
dialysis and inter-dialytic time, and hematocrit. Only in the case of patients who
are not in a steady-state (urea generation equal to urea clearance), a pre-dialysis
urea sample is required prior to the next dialysis session. Otherwise, the
computer model can estimate the third pre-dialysis urea level. The residual renal
function and the protein equivalent of total nitrogen appearance is measured and
calculated from the inter-dialytic urine collection. Urea kinetic modeling involves
advanced mathematical calculation and, therefore, a computer-modeling
program is usually required.
Urea kinetic modeling will calculate dialysis and renal clearance, and urea
generation. The following are the steps involved in urea kinetic modeling: first,
the program calculates the Kt/Vurea of the hemodialysis treatment. This takes into
consideration renal clearance and urea generation, in addition to dialytic urea
removal by diffusion and convection. Second, an expected value can be
calculated based on a validated nomogram. Finally, the expected Kt of urea is
compared with the calculated Kt/Vurea. V is then back-calculated. The predicted V
value based on anthropometrical calculation and the calculated V value are
compared. If there is a discrepancy between these two V values, it can be due to
access recirculation when the calculated V over-estimated the athropometric V,
or malnutrition, where the calculated V under-estimated the athropometric V.165
Ionic dialysance
Another measurement technique for hemodialysis clearance has been developed
using the Effective Ionic Dialysance (EID) method. EID was first proposed by
Petitclerc et al.173 Studies have demonstrated that EID provides a reliable
surrogate for measuring either blood side or dialysate side urea clearance during
the dialysis procedure.174 It corrects for access and cardiopulmonary
56
recirculation. Furthermore, it can be done on-line during the dialysis procedure;
this requires the incorporation of two conductivity measurement cells within the
dialysis circuit. Each cell will measure the conductivity of the dialysate solution in
mS/cm. On-line dialysance requires the measurement of the conductivity of
mobile electrolytes through the dialysis membrane, at the inlet and the outlet, at
two different set points. The dialysate conductivity at the inlet at the prescribed
value of dialysate sodium (the main determinate of conductivity) is X1, the
corresponding value at dialysate outlet is measured: this is Y1. The dialysate
conductivity is, then, increased to X2 at the inlet by a step up in dialysate sodium
concentration by 10 mmol/l (1 mS/cm approximately in conductivity units). The
dialysate conductivity at the outlet is measured again after a 6-minute stable
period; this corresponds to the value Y2. Finally, the inlet conductivity is returned
to X1, and outlet conductivity is measured again to confirm (Y1) after another 6-
minute stable period. The EID measurement is completed and computed based
on
𝑬𝑰𝑫 = 𝑸𝒅+ 𝑸𝒖𝒇 𝟏− 𝒀𝟏! 𝒀𝟐𝑿𝟏!𝑿𝟐
Equation 1-27
where Qd and Quf are the dialysate and ultrafiltration flow rates, respectively.
Weekly Standardized Kt/Vurea
Using Sp Kt/Vurea > 1.2 to target hemodialysis clearance is only applied to thrice
weekly hemodialysis, and cannot apply to frequent hemodialysis and/or
peritoneal dialysis. Therefore, a method to compare various dialysis therapies
was developed by Gotch127 and Leypoldt et al.175 This dimensionless index was
named the weekly “standardized” Kt/Vurea (Std Kt/Vurea).
The concept of Std Kt/Vurea was based on two principal hypotheses. The peak
concentration hypothesis was postulated by Keshaviah:176 that uremic toxicity
correlate with the amount of time the patient spends with a urea concentration
above a threshold level, rather than the time-average urea concentration. Urea
concentrations in patients on intermittent hemodialysis change constantly, with
57
peak levels prior to hemodialysis and trough levels post-hemodialysis. By
contrast, urea concentrations in patients on peritoneal dialysis are relatively
stable. Therefore, when the peak urea concentrations are the same on
intermittent thrice-weekly hemodialysis as on peritoneal dialysis, the time-
averaged urea concentrations are lower for the thrice-weekly hemodialysis
patients. However, Depner177,178 questioned the peak concentration hypothesis
and stated that time-average urea concentrations are also important. It is the
inefficiency of intermittent hemodialysis that explains the difference between
continuous therapies and the intermittent thrice-weekly hemodialysis therapies.
Firstly, the later part of a hemodialysis treatment would have less urea removal
than the first part of the treatment. Therefore, the amount of urea removal has
lessened as the therapy continues. Secondly, the urea disequilibrium during
intermittent hemodialysis, which results in post-hemodialysis rebound, also
provides evidence of the inefficiency of intermittent hemodialysis. Likely, both the
Depner and Keshaviah theories are at least partially true.
Based on the peak concentration hypothesis, and the assumption that
intermittent thrice-weekly hemodialysis and peritoneal dialysis are equal, Gotch
developed the Std Kt/Vurea equation, and Leypold et al.175 further derived an
estimated equation that correlated with Gotch’s127 original equation. Std Kt/Vurea
is expressed as the relationship between urea generation (normalized protein
catabolic rate, nPCR) and the peak urea concentration (Cpeak urea):127
𝑺𝒕𝒅 𝑲𝒕 𝑽𝒖𝒓𝒆𝒂 = 𝟎.𝟏𝟖𝟒 𝒏𝑷𝑪𝑹!𝟎.𝟏𝟕 𝑽 × 𝟎.𝟎𝟎𝟏
𝑪𝒑𝒆𝒂𝒌 𝒖𝒓𝒆𝒂 × 𝟕 × 𝟏𝟒𝟒𝟎
𝑽 Equation 1-28
where the term 0.184 𝑛𝑃𝐶𝑅 − 0.17 𝑉 × 0.001 is equal to the urea generation rate
in mg/min and V is the total body water. The Cpeak urea takes into account the
frequency, and the duration, of the dialysis treatments. As a result, a series of
curves were generated based on this formula and a Std Kt/Vurea of 2 attained by
peritoneal dialysis is equivalent to a Sp Kt/Vurea of 1.2 achieved by thrice-weekly
hemodialysis. It is more effective to increase Std Kt/Vurea by increasing the
frequency of hemodialysis than to increase the Sp Kt/Vurea per session. Despite
58
Depner’s argument, Std Kt/Vurea is the only tool available at this point to compare
dialysis clearance between hemodialysis and peritoneal dialysis, and between
various forms of frequent hemodialysis. However, it has to be kept in mind that
this model has only been validated against clinical outcomes until the recent
Frequent Hemodialysis Network (FHN) trials.128
1.6.5. Urea as a Marker for Dialysis Adequacy
Currently, “hemodialysis adequacy” is monitored based on blood urea levels and
symptoms of uremia and volume overload. Although the concept of the “middle
molecule hypothesis” (or square meter hour hypothesis) was emerging, the
NCDS shifted the focus to small molecular weight solute removal, mainly urea,
as a dialysis adequacy marker. Again, the NCDS confirmed that urea reduction,
which translated into single-pool Kt/Vurea (Sp Kt/Vurea) > 0.9, significantly reduced
hospitalization rates.161 Therefore, conventional thrice weekly treatments
targeting a Sp Kt/Vurea ≥ 1.2 became the standard of care for the management of
patients who are on hemodialysis. Subsequently, the HEMO study did not show
any additional mortality benefit with targeting a Sp Kt/Vurea > 1.6 as compared to
1.2.135 These studies have confirmed that three times per week of a four-hour
hemodialysis regime is ‘adequate’, based on small urea clearance. Because of
these results, and for health-economic reasons, shorter and less frequent (4
hours thrice weekly) hemodialysis focusing on urea clearance, which had started
in the United States, was then adopted by the rest of the world.
Current hemodialysis clearance measurements are based on urea; however,
urea is not an ideal marker. Urea is used as a surrogate marker for the clearance
of other uremic toxins. The clearance of other uremic solutes may be related to
convectional clearance, with different production and extracellular distribution.
Some of the larger molecules are protein-bound and are therefore less likely to
clear by dialysis, especially by peritoneal dialysis therapy.179,180 Urea
measurements are influenced by urea generation, urea rebound and
recirculation. Several mathematical techniques and models have been developed
to correct these errors.92
59
Because of shorter and only thrice weekly treatments, the fluid and electrolyte
management of hemodialysis have become difficult, with significant
hemodynamic effects during and post-hemodialysis.181 In the HEMO study, the 5-
year mortality rates in patients who were on hemodialysis were 60%.135,182 The
leading cause of death in dialysis patients is cardiovascular disease, and
cardiovascular morbidity in this population is very high; heart failure developed in
up to 50% of the dialysis patients.183 A contributing factor may be that the
prevalence of existing cardiovascular disease on the initiation of dialysis
treatment is high.184 However, the chance of developing cardiovascular disease
is also very high after the initiation of dialysis. Certainly, hypertension and chronic
volume overload are common in dialysis patients.185 Ninety percent of
hypertension responds to volume control.186,187 Volume overload leads to left
ventricular hypertrophy, heart failure/dilation, and it is associated with other
cardiovascular risk factors.188 The management of volume overload in dialysis
patients is one of the major challenges for nephrologists.
Hemodialysis itself is also an independent risk factor for the development of de
novo and recurrent heart failure. A phenomenon called myocardial stunning
occurs in hemodialysis patients and can leads to transient left-ventricular
dysfunction.189 McIntyre et al.190 showed that dialysis-induced cardiac
dysfunction is associated with a reduction in global and segmental myocardial
blood flow. In patients with no cardiac stunning, the survival rate after 1 year was
100%. By contrast, in patients with cardiac stunning, the 1-year mortality rate
was 28%.191
Clearly, there are a lot of limitations with current hemodialysis treatment. Before
we can develop new techniques and devices to improve hemodialysis outcomes
and therapies, we need to have some methods to compare various hemodialysis
treatments. Using urea as the sole marker to assess ‘dialysis adequacy’ is not
adequate. The Std Kt/Vurea measurement has not yet been validated in large
prospective or randomized controlled trials, and its use in comparing various
dialysis modalities remains more theoretical than with clinically proven.
60
Therefore, an ideal dialysis adequacy marker for current hemodialysis therapies
should be simple, cleared by kidney and dialysis, and associated with:
1. Mortality outcome,
2. Cardiovascular morbidities and mortalities,
3. Volume status of the patient, and
4. The amount of dialysis (time, frequency and duration)
We propose that we should examine middle molecules, in particular, cystatin C.
1.6.6. Cystatin C as a Marker for Renal Clearance
Cystatin C is known as a γ trace protein and a base protein inhibitor with a
molecular weight of 13359 Dalton.54 It is produced at a constant rate by all
nucleated cells and appears in human plasma and serum. It is freely filtered by
the glomerulus and not secreted by the tubule. It may be influenced by high cell
turn-over rate such as in hyperthyroidism and inflammation. However, unlike
creatinine, it is not influenced by muscle mass, food intake or body surface area.
It consists of one polypeptide chain with 120 amino acids (SSPGK PPRLV GGPMD ASVEE EGVRR ALDFA VGEYN KASND MYHSR ALQVV RARKQ IVAGV NYFLD VELGR TTCTK TQPNL DNCPF HDQPH LKRKA FCSFQ IYAVP WQGTM TLSKS TCQDA). It does not have any glycosylation. It has an
isoelectric point of 9.3. It has disulphide bonds between residues 73 and 83, and
97 and 117. Its gene is located on chromosome 20 at p.11.2. Its plasma half-life
is 20 minutes under normal renal function (blood concentration of 0.96 mg/L with
range between 0.57-1.79 mg/L). Cystatin C measurement is based on enhanced
immnonephelometric assay using antibodies from a rabbit. It is calibrated using
purified cystatin from human urine against recombinant rabbit; the measurement
ranges from 0.3 to 10 mg/L.
Cystatin C has been shown to be superior to creatinine as a marker for kidney
function assessment in patients with chronic kidney disease.66,78 In addition,
cystatin C has been studied in the context of cardiovascular outcomes. One
61
study has shown that serum cystatin C is associated with cardiovascular survival
in patients with chronic kidney disease stages 3 and 4.192 Other studies have
shown that cystatin C levels are associated with vasospastic angina and
cardiovascular outcomes independent of renal function, and a level >1.3 mg/L is
a risk factor for the occurrence of fatal and non-fatal cardiovascular events.193-195
Xie et al. found that oxidants induce cystatin C elevation, which affects cardiac
extracellular remodeling by regulating Cathepsin B activity.196 Furthermore,
studies have found an association between cystatin C and monocyte levels,
which can lead to atherosclerosis.197 The above studies have shown that cystatin
C can be a marker for both kidney function and cardiovascular outcomes.
Unlike with its use in measuring residual renal function, there are few studies on
the use of cystatin C in dialysis patients. Both Delaney and Hoek suggested that
cystatin C levels mainly relate to residual renal function, rather than dialysis
clearance, whereas Thysell, Lindström and Park demonstrated the kinetics of
cystatin C in a single hemodialysis treatment.198-202 Thysell et al.198 showed that
with low-flux hemodialysis, cystatin C concentrations rose after a single treatment
by 4 ± 6.3%. Lindström et al.199 demonstrated cystatin C levels were reduced
with one dialysis session, with the highest clearance occurring with
hemofiltration, compared to hemodiafiltration and low flux hemodialysis. Park et
al.200 recently also demonstrated more effective cystatin C clearance by high-flux
hemodialysis when compared to low-flux hemodialysis. Thus it is safe to say that
cystatin C, a middle molecule, is cleared by dialysis, but there is little information
on the factors that influence this clearance. None of these studies demonstrated
any association between cystatin C and dialysis dose; we are the first to do this.
Al-Malki published a cross-sectional pilot study of cystatin C in 35 functionally
anephric patients receiving various forms of dialytic therapies (peritoneal dialysis,
conventional thrice weekly hemodialysis, and frequent short daily and nocturnal
hemodialysis).203 All patients underwent urea kinetic studies and had values
calculated for Sp Kt/Vurea and weekly Std Kt/Vurea. The study showed that
there was no correlation between pre-dialysis cystatin C levels and Sp Kt/Vurea
62
values, but there was a significant inverse linear correlation with weekly Std
Kt/Vurea values (r =-0.49; p = 0.003). In other words, cystatin C was influenced
by the weekly total dose of dialysis received, and lower pre-dialysis cystatin C
levels are found with patients undergoing more intensive dialysis (e.g. nocturnal).
In our current study we have demonstrated that cystatin C is cleared by the
kidney. As discussed above, previous studies have shown that it correlated with
cardiovascular morbidity and mortality. However, there are very few studies,
which have looked at its removal by hemodialysis.
1.7. Cystatin C as a New Marker for Dialysis Adequacy
We have proposed that cystatin C is a useful marker to gauge dialysis adequacy.
To evaluate this, we would first need to assess the pathophysiological changes in
its clearance as kidney function declines, and its ability to predict residual renal
function in end-stage renal disease. Furthermore, we need to understand its
removal during a single hemodialysis treatment. Finally, once we have confirmed
that it is removed by hemodialysis, we would assess its kinetics, volume of
distribution, rebound, and conventional and diffusion clearance during a single
hemodialysis treatment therapy. We have performed the following 4 studies.
To better understand the removal of cystatin C in a single hemodialysis
treatment, we conducted the study (Chapter 2): Cystatin C reduction ratio
depends on normalized blood liters processed and fluid removal during
hemodialysis.204 The aim of the study was to assess cystatin C kinetics in a
single hemodialysis treatment. We measured cystatin C levels at pre-, mid- and
post-hemodialysis treatment on three consecutive treatments in 15 hemodialysis
patients with no residual renal function. We hypothesized that there is significant
reduction in cystatin C level by high-flux hemodialysis treatment, and this
reduction is significantly associated with the number of liters processed and the
ultrafiltration volume.
63
To better assess the effects of hyperfiltration on cystatin C renal clearance, we
conducted the study (Chapter 3): Hyperfiltration affects accuracy of creatinine
eGFR measurement.205 In this post-hoc analysis study, 127 pediatric patients
with chronic kidney disease not yet on dialysis were observed. The goal of the
study was to see whether hyperfiltration affects the renal biomarkers, creatinine,
cystatin C and beta trace protein. We hypothesized that the accuracy of small-
molecules-based eGFR (creatinine) is significantly affected by hyperfiltration,
whereas the middle-molecules-based eGFR (cystatin C and beta-trace protein)
are not.
Currently the gold standard method of measuring residual renal function is using
24-hour urine mean urea and creatinine clearances. However, it is inconvenient
for the patients. To determine if cystatin C levels can be used to measure both
dialysis efficacy and residual renal function in dialysis patients, we conducted the
study (Chapter 4): Residual renal function calculated from serum cystatin C
measurements and a knowledge of the weekly standardized Kt/Vurea.206 We
recruited 15 patients and developed a cystatin C-based estimated residual renal
function equation. The study aimed to assess whether cystatin C levels can be
used to determine both dialysis efficacy and residual renal function in dialysis
patients. We hypothesized that the difference between the measured cystatin C
level and that estimated from the Al-Malki study, the Δcystatin C, would
significantly correlate with residual renal function as measured by the average of
urinary creatinine and urea clearances. 203 We further hypothesized that this
correlation would be significantly stronger than the association between the
measured residual renal function and the residual renal function using the Hoek
equation.201
Finally, to better examine the kinetics of cystatin C removal over the course of
single hemodialysis treatments, we conducted the study (Chapter 5): The kinetics
of cystatin C removal by hemodialysis.123 The aim of the study was to calculate
the diffusional and convectional clearances of cystatin C by hemodialysis, and to
64
estimate its volume of distribution and intra-compartmental equilibration rate
constants.
65
REFERENCES 1. Koeppen BM, Stanton, B.A. Renal Physiology. 4th ed. Philadelphia: Mosby,
Inc.; 2007.
2. Briggs JP, Kriz W., Schnermann, J.B. Overview of kidney function and
structure. In: Greengerg A, Cheung, A.K., Coffman, T.M. , ed. Primer on kidney
diseases. 4th ed. Philadelphia2005:2-19.
3. Guyton AC, Hall, J.E. Textbook of medical physiology. Philadelphia: W.B.
Saunders Company; 2000.
4. Cameron JS. Oxford textbook of clinical nephrology. 2nd ed. Oxford: Oxford
University Press; 1988.
5. Pollak MR, Quaggin SE, Hoenig MP, Dworkin LD. The glomerulus: the sphere
of influence. Clin J Am Soc Nephrol 2014;9:1461-9.
6. Scott RP, Quaggin SE. The cell biology of renal filtration. The Journal of cell
biology 2015;209:199-210.
7. Deen WM, Robertson CR, Brenner BM. A model of glomerular ultrafiltration in
the rat. Am J Physiol 1972;223:1178-83.
8. Huseman D, Gellermann J, Vollmer I, et al. Long-term prognosis of hemolytic
uremic syndrome and effective renal plasma flow. Pediatr Nephrol 1999;13:672-
7.
9. Test Guide. NIH Clinical Center, Laboratory Medicine, 2011.
10. Wiseman MJ, Mangili R, Alberetto M, Keen H, Viberti G. Glomerular
response mechanisms to glycemic changes in insulin-dependent diabetics.
Kidney Int 1987;31:1012-8.
11. Mogensen CE. Twelve shifting paradigms in diabetic renal disease and
hypertension. Diabetes Res Clin Pract 2008;82 Suppl 1:S2-9.
66
12. National Kidney F. K/DOQI clinical practice guidelines for chronic kidney
disease: evaluation, classification, and stratification. Am J Kidney Dis
2002;39:S1-266.
13. Polkinghorne KR. Controversies in chronic kidney disease staging. Clin
Biochem Rev 2011;32:55-9.
14. Tonelli M, Muntner P, Lloyd A, et al. Using proteinuria and estimated
glomerular filtration rate to classify risk in patients with chronic kidney disease: a
cohort study. Ann Intern Med 2011;154:12-21.
15. Richards AN, Westfall, B.B., Bott, P.A. Renal excretion of inulin, creatinine
and xylose in normal dogs. Proceedings of the Society for Experimental Biology
and Meicine 1934:6.
16. Filler G, Sharma AP. How to monitor renal function in pediatric solid organ
transplant recipients. Pediatr Transplant 2008;12:393-401.
17. Shannon JA, Smith, H.W. The excretion of inulin, xylose, and urea by normal
and phlorizinized man. J Clin Invest 1935:393-401.
18. Cherney DZ, Lai V, Scholey JW, Miller JA, Zinman B, Reich HN. Effect of
direct renin inhibition on renal hemodynamic function, arterial stiffness, and
endothelial function in humans with uncomplicated type 1 diabetes: a pilot study.
Diabetes Care 2010;33:361-5.
19. Morton KA, Pisani DE, Whiting JH, Jr., Cheung AK, Arias JM, Valdivia S.
Determination of glomerular filtration rate using technetium-99m-DTPA with
differing degrees of renal function. J Nucl Med Technol 1997;25:110-4.
20. Rehling M, Moller ML, Thamdrup B, Lund JO, Trap-Jensen J. Simultaneous
measurement of renal clearance and plasma clearance of 99mTc-labelled
diethylenetriaminepenta-acetate, 51Cr-labelled ethylenediaminetetra-acetate and
inulin in man. Clin Sci (Lond) 1984;66:613-9.
67
21. Filler G, Priem F, Lepage N, et al. Beta-trace protein, cystatin C, beta(2)-
microglobulin, and creatinine compared for detecting impaired glomerular
filtration rates in children. Clin Chem 2002;48:729-36.
22. Chantler C, Barratt TM. Estimation of glomerular filtration rate from plasma
clearance of 51-chromium edetic acid. Arch Dis Child 1972;47:613-7.
23. Picciotto G, Cacace G, Cesana P, Mosso R, Ropolo R, De Filippi PG.
Estimation of chromium-51 ethylene diamine tetra-acetic acid plasma clearance:
a comparative assessment of simplified techniques. Eur J Nucl Med 1992;19:30-
5.
24. Fleming JS, Zivanovic MA, Blake GM, Burniston M, Cosgriff PS, British
Nuclear Medicine S. Guidelines for the measurement of glomerular filtration rate
using plasma sampling. Nucl Med Commun 2004;25:759-69.
25. Fotopoulos A, Bokharhli JA, Tsiouris S, et al. [Comparison of six radionuclidic
and non-radionuclidic methods for the assessment of glomerular filtration rate in
patients with chronic renal failure]. Hell J Nucl Med 2006;9:133-40.
26. Biggi A, Viglietti A, Farinelli MC, Bonada C, Camuzzini G. Estimation of
glomerular filtration rate using chromium-51 ethylene diamine tetra-acetic acid
and technetium-99m diethylene triamine penta-acetic acid. Eur J Nucl Med
1995;22:532-6.
27. Fleming JS, Wilkinson J, Oliver RM, Ackery DM, Blake GM, Waller DG.
Comparison of radionuclide estimation of glomerular filtration rate using
technetium 99m diethylenetriaminepentaacetic acid and chromium 51
ethylenediaminetetraacetic acid. Eur J Nucl Med 1991;18:391-5.
28. Russell CD, Bischoff PG, Kontzen FN, et al. Measurement of glomerular
filtration rate: single injection plasma clearance method without urine collection. J
Nucl Med 1985;26:1243-7.
68
29. Peters AM, Henderson BL, Lui D, Blunkett M, Cosgriff PS, Myers MJ.
Appropriate corrections to glomerular filtration rate and volume of distribution
based on the bolus injection and single-compartment technique. Physiol Meas
1999;20:313-27.
30. Frennby B, Sterner G, Almen T, Chai CM, Jonsson BA, Mansson S.
Clearance of iohexol, 51Cr-EDTA and endogenous creatinine for determination
of glomerular filtration rate in pigs with reduced renal function: a comparison
between different clearance techniques. Scand J Clin Lab Invest 1997;57:241-
52.
31. Itoh K, Tsushima S, Tsukamoto E, Tamaki N. Accuracy of plasma sample
methods for determination of glomerular filtration rate with 99mTc-DTPA. Ann
Nucl Med 2002;16:39-44.
32. Houlihan C, Jenkins M, Osicka T, Scott A, Parkin D, Jerums G. A
comparison of the plasma disappearance of iohexol and 99mTc-DTPA for the
measurement of glomerular filtration rate (GFR) in diabetes. Aust N Z J Med
1999;29:693-700.
33. Chantler C, Garnett ES, Parsons V, Veall N. Glomerular filtration rate
measurement in man by the single injection methods using 51Cr-EDTA. Clin Sci
1969;37:169-80.
34. Brochner-Mortensen J. A simple method for the determination of glomerular
filtration rate. Scand J Clin Lab Invest 1972;30:271-4.
35. Brochner-Mortensen J, Haahr J, Christoffersen J. A simple method for
accurate assessment of the glomerular filtration rate in children. Scand J Clin Lab
Invest 1974;33:140-3.
36. Bouvet Y, Bouissou F, Coulais Y, et al. GFR is better estimated by
considering both serum cystatin C and creatinine levels. Pediatr Nephrol
2006;21:1299-306.
69
37. Itoh K. Comparison of methods for determination of glomerular filtration rate:
Tc-99m-DTPA renography, predicted creatinine clearance method and plasma
sample method. Ann Nucl Med 2003;17:561-5.
38. LaFrance ND, Drew HH, Walser M. Radioisotopic measurement of
glomerular filtration rate in severe chronic renal failure. J Nucl Med
1988;29:1927-30.
39. Levey AS, Coresh J, Greene T, et al. Using standardized serum creatinine
values in the modification of diet in renal disease study equation for estimating
glomerular filtration rate. Ann Intern Med 2006;145:247-54.
40. Heymsfield SB, Arteaga C, McManus C, Smith J, Moffitt S. Measurement of
muscle mass in humans: validity of the 24-hour urinary creatinine method. Am J
Clin Nutr 1983;37:478-94.
41. Okuda Y, Namba S, Nagata M, Hara H, Morita T. [Plasma creatinine and
cystatin C ratio is useful for discriminate diagnosis of postrenal renal failure].
Rinsho Byori 2008;56:101-7.
42. Propper HEM. Filtrations und Reabsorptionsieltung in der Nierenpathologie.
Ergebnisse der Inneren Medizin und Kinderheilkunde 1937;53:10.
43. Horio M, Orita Y. Comparison of Jaffe rate assay and enzymatic method for
the measurement of creatinine clearance. Nihon Jinzo Gakkai Shi 1996;38:296-
9.
44. Arant BS, Jr. Estimating glomerular filtration rate in infants. J Pediatr
1984;104:890-3.
45. Cobbaert CM, Baadenhuijsen H, Weykamp CW. Prime time for enzymatic
creatinine methods in pediatrics. Clin Chem 2009;55:549-58.
46. Cockcroft DW, Gault MH. Prediction of creatinine clearance from serum
creatinine. Nephron 1976;16:31-41.
70
47. Schwartz GJ, Haycock GB, Edelmann CM, Jr., Spitzer A. A simple estimate
of glomerular filtration rate in children derived from body length and plasma
creatinine. Pediatrics 1976;58:259-63.
48. Lysaght MJ. Evolution of hemodialysis membranes. Contrib Nephrol
1995;113:1-10.
49. Vinge E, Lindergard B, Nilsson-Ehle P, Grubb A. Relationships among serum
cystatin C, serum creatinine, lean tissue mass and glomerular filtration rate in
healthy adults. Scand J Clin Lab Invest 1999;59:587-92.
50. Filler G, Gharib M, Casier S, Lodige P, Ehrich JH, Dave S. Prevention of
chronic kidney disease in spina bifida. Int Urol Nephrol 2011.
51. Hemmelgarn BR, Zhang J, Manns BJ, et al. Nephrology visits and health
care resource use before and after reporting estimated glomerular filtration rate.
JAMA 2010;303:1151-8.
52. Glassock RJ. Referrals for chronic kidney disease: real problem or nuisance?
JAMA 2010;303:1201-3.
53. Levey AS, Bosch JP, Lewis JB, Greene T, Rogers N, Roth D. A more
accurate method to estimate glomerular filtration rate from serum creatinine: a
new prediction equation. Modification of Diet in Renal Disease Study Group. Ann
Intern Med 1999;130:461-70.
54. Filler G, Bokenkamp A, Hofmann W, Le Bricon T, Martinez-Bru C, Grubb A.
Cystatin C as a marker of GFR--history, indications, and future research. Clin
Biochem 2005;38:1-8.
55. Grubb AO. Cystatin C--properties and use as diagnostic marker. Adv Clin
Chem 2000;35:63-99.
71
56. Grubb A, Simonsen O, Sturfelt G, Truedsson L, Thysell H. Serum
concentration of cystatin C, factor D and beta 2-microglobulin as a measure of
glomerular filtration rate. Acta Med Scand 1985;218:499-503.
57. Grubb A, Lofberg H. Human gamma-trace. Structure, function and clinical
use of concentration measurements. Scand J Clin Lab Invest Suppl 1985;177:7-
13.
58. Ni J, Fernandez MA, Danielsson L, et al. Cystatin F is a glycosylated human
low molecular weight cysteine proteinase inhibitor. J Biol Chem 1998;273:24797-
804.
59. Abrahamson M, Olafsson I, Palsdottir A, et al. Structure and expression of
the human cystatin C gene. Biochem J 1990;268:287-94.
60. Manetti L, Pardini E, Genovesi M, et al. Thyroid function differently affects
serum cystatin C and creatinine concentrations. J Endocrinol Invest 2005;28:346-
9.
61. Stevens LA, Schmid CH, Greene T, et al. Factors other than glomerular
filtration rate affect serum cystatin C levels. Kidney Int 2009;75:652-60.
62. Foster J, Reisman W, Lepage N, Filler G. Influence of commonly used drugs
on the accuracy of cystatin C-derived glomerular filtration rate. Pediatr Nephrol
2006;21:235-8.
63. Hannemann A, Friedrich N, Dittmann K, et al. Age- and sex-specific
reference limits for creatinine, cystatin C and the estimated glomerular filtration
rate. Clin Chem Lab Med 2011.
64. Galteau MM, Guyon M, Gueguen R, Siest G. Determination of serum cystatin
C: biological variation and reference values. Clin Chem Lab Med 2001;39:850-7.
72
65. Kyhse-Andersen J, Schmidt C, Nordin G, et al. Serum cystatin C, determined
by a rapid, automated particle-enhanced turbidimetric method, is a better marker
than serum creatinine for glomerular filtration rate. Clin Chem 1994;40:1921-6.
66. Dharnidharka VR, Kwon C, Stevens G. Serum cystatin C is superior to serum
creatinine as a marker of kidney function: a meta-analysis. Am J Kidney Dis
2002;40:221-6.
67. Stevens LA, Coresh J, Schmid CH, et al. Estimating GFR using serum
cystatin C alone and in combination with serum creatinine: a pooled analysis of
3,418 individuals with CKD. Am J Kidney Dis 2008;51:395-406.
68. White C, Akbari A, Hussain N, et al. Chronic kidney disease stage in renal
transplantation classification using cystatin C and creatinine-based equations.
Nephrol Dial Transplant 2007;22:3013-20.
69. White C, Akbari A, Hussain N, et al. Estimating glomerular filtration rate in
kidney transplantation: a comparison between serum creatinine and cystatin C-
based methods. J Am Soc Nephrol 2005;16:3763-70.
70. Filler G, Lepage N. Should the Schwartz formula for estimation of GFR be
replaced by cystatin C formula? Pediatr Nephrol 2003;18:981-5.
71. Grubb A, Bjork J, Lindstrom V, Sterner G, Bondesson P, Nyman U. A
cystatin C-based formula without anthropometric variables estimates glomerular
filtration rate better than creatinine clearance using the Cockcroft-Gault formula.
Scand J Clin Lab Invest 2005;65:153-62.
72. Larsson A, Malm J, Grubb A, Hansson LO. Calculation of glomerular filtration
rate expressed in mL/min from plasma cystatin C values in mg/L. Scand J Clin
Lab Invest 2004;64:25-30.
73. Le Bricon T, Thervet E, Froissart M, et al. Plasma cystatin C is superior to
24-h creatinine clearance and plasma creatinine for estimation of glomerular
filtration rate 3 months after kidney transplantation. Clin Chem 2000;46:1206-7.
73
74. Rule AD, Bergstralh EJ, Slezak JM, Bergert J, Larson TS. Glomerular
filtration rate estimated by cystatin C among different clinical presentations.
Kidney Int 2006;69:399-405.
75. Bokenkamp A, Domanetzki M, Zinck R, Schumann G, Byrd D, Brodehl J.
Cystatin C--a new marker of glomerular filtration rate in children independent of
age and height. Pediatrics 1998;101:875-81.
76. Zappitelli M, Parvex P, Joseph L, et al. Derivation and validation of cystatin
C-based prediction equations for GFR in children. Am J Kidney Dis 2006;48:221-
30.
77. Hoek FJ, Kemperman FA, Krediet RT. A comparison between cystatin C,
plasma creatinine and the Cockcroft and Gault formula for the estimation of
glomerular filtration rate. Nephrol Dial Transplant 2003;18:2024-31.
78. Huang SH, Macnab JJ, Sontrop JM, et al. Performance of the creatinine-
based and the cystatin C-based glomerular filtration rate (GFR) estimating
equations in a heterogenous sample of patients referred for nuclear GFR testing.
Transl Res 2011;157:357-67.
79. Inker LA, Schmid CH, Tighiouart H, et al. Estimating glomerular filtration rate
from serum creatinine and cystatin C. N Engl J Med 2012;367:20-9.
80. Schwartz GJ, Munoz A, Schneider MF, et al. New equations to estimate GFR
in children with CKD. J Am Soc Nephrol 2009;20:629-37.
81. Olsen JE, Sandberg, M. Demonstration fo synthesis of betatrace protein in
different tissues of squirrel monkey. neurobiology 1975:7.
82. Priem F, Althaus H, Birnbaum M, Sinha P, Conradt HS, Jung K. Beta-trace
protein in serum: a new marker of glomerular filtration rate in the creatinine-blind
range. Clin Chem 1999;45:567-8.
74
83. CIHI Ca. Canadian Organ Replacement Register Annual Report: Treatment
of End-Stage Organ Failure in Canada, 2003-20122014.
84. Graham T. The Bakerian Lecture: Osmotic Force. Philos Trans R Soc Lond
1854:12.
85. Philibert J. One and a Half Century of Diffusion: Fick, Einstein, before and
beyond. Diffusion-Fundamentals 2005:1-10.
86. Abel J, Roundtree, L., Turner, B., . On the removal of diffusible substances
from the circulating blood of living animals by dialysis. J Pharmacol Exp Ther
1914:42.
87. Hass G. Versuche der Blutauswaschung am Lebenden mit Hilfe der Dialyse.
Klin Woncheschrift 1925.
88. Kolff W, Berk, H. De Kunstmatige nier: een dialysator met groot oppervlak.
Ned Tijdschr Geneeskd 1943.
89. Kolff W, Watschinger, B. . Further development of the coil kidney. J Lab Clin
Med 1956:9.
90. Alwall N. On the artificial kidney I: Apparatus for dialysis of blood in vivo. Acta
Med Scand 1947:8.
91. Alwall N. Therapeutic and diagnostic problems in severe renal failure.
Stockholm: Scandanavian University Books; 1963.
92. Quinton W, Dillard D, Scribner BH. Cannulation of blood vessels for
prolonged hemodialysis. Hemodial Int 2004;8:6-9.
93. Brescia MJ, Cimino JE, Appell K, Hurwich BJ, Scribner BH. Chronic
hemodialysis using venipuncture and a surgically created arteriovenous fistula.
1966. J Am Soc Nephrol 1999;10:193-9.
75
94. Wegner G. Chirurgische Bermekungen über die Peritonealhöle, mit
besonderer Berucksichtigung der Ovariotomie. Arch Klin Chir 1877:51.
95. Chagnac A, Herskovitz P, Weinstein T, et al. The peritoneal membrane in
peritoneal dialysis patients: estimation of its functional surface area by applying
stereologic methods to computerized tomography scans. J Am Soc Nephrol
1999;10:342-6.
96. Ganter G. Ueber die Beseitigung giftiger Stoffe aus dem Blute durch Dialyse.
Munch Med Wochschr 1923.
97. Grollman A, Turner LB, Levitch M, Hill D. Hemodynamics of bilaterally
nephrectomized dog subjected to intermittent peritoneal lavage. Am J Physiol
1951;165:167-72.
98. Grollman A, Turner LB, Mc LJ. Intermittent peritoneal lavage in
nephrectomized dogs and its application to the human being. AMA Arch Intern
Med 1951;87:379-90.
99. Rhoads J. Peritoneal lavage in the treatment of renal insufficiency. Am J Med
Sci 1938.
100. Tenckhoff H, Schechter H. A bacteriologically safe peritoneal access
device. Trans Am Soc Artif Intern Organs 1968;14:181-7.
101. Popovich RP, Moncrief JW, Nolph KD, Ghods AJ, Twardowski ZJ, Pyle WK.
Continuous ambulatory peritoneal dialysis. Ann Intern Med 1978;88:449-56.
102. Popovich RP, Moncrief, J.W. The definition of a novel portable/wearable
equilibrium peritoneal dialysis technique. Trans Am Soc Artif Intern Organs 1976.
103. Oreopoulos DG, Robson M, Izatt S, Clayton S, deVeber GA. A simple and
safe technique for continuous ambulatory peritoneal dialysis (CAPD). Trans Am
Soc Artif Intern Organs 1978;24:484-9.
76
104. Buoncristiani U, Di Paolo N. Autosterilizing CAPD connection systems.
Nephron 1983;35:244-7.
105. Boen ST, Mion CM, Curtis FK, Shilipetar G. Periodic peritoneal dialysis
using the repeated puncture technique and an automatic cycling machine. Trans
Am Soc Artif Intern Organs 1964;10:409-14.
106. Clark WR, Gao D. Properties of membranes used for hemodialysis therapy.
Semin Dial 2002;15:191-5.
107. Clark WR. Hemodialyzer membranes and configurations: a historical
perspective. Semin Dial 2000;13:309-11.
108. Grassmann A, Gioberge S, Moeller S, Brown G. ESRD patients in 2004:
global overview of patient numbers, treatment modalities and associated trends.
Nephrol Dial Transplant 2005;20:2587-93.
109. Ward RA, Leypoldt JK, Clark WR, Ronco C, Mishkin GJ, Paganini EP. What
clinically important advances in understanding and improving dialyzer function
have occurred recently? Semin Dial 2001;14:160-74.
110. Ronco C, Crepaldi C, Brendolan A, et al. Evolution of synthetic membranes
for blood purification: the case of the Polyflux family. Nephrol Dial Transplant
2003;18 Suppl 7:vii10-20; discussion vii55.
111. Ronco C, Ghezzi, P.M., Bowry, S.K. Membranes fro Hemodialysis. In: Horl
WH, Koch, K.M., Lindsay, R.M., Ronco, C., Winchester, J.F., ed. Replacement of
Renal Function By Dialysis. Norwell, MA: Kluwer Academic Publishers;
2004:301-23.
112. Kamiya A, Togawa T. Adaptive regulation of wall shear stress to flow
change in the canine carotid artery. Am J Physiol 1980;239:H14-21.
113. Lehoux S, Tronc F, Tedgui A. Mechanisms of blood flow-induced vascular
enlargement. Biorheology 2002;39:319-24.
77
114. Ballermann BJ, Dardik A, Eng E, Liu A. Shear stress and the endothelium.
Kidney Int Suppl 1998;67:S100-8.
115. Konner K, Nonnast-Daniel B, Ritz E. The arteriovenous fistula. J Am Soc
Nephrol 2003;14:1669-80.
116. Begin V, Ethier J, Dumont M, Leblanc M. Prospective evaluation of the
intra-access flow of recently created native arteriovenous fistulae. Am J Kidney
Dis 2002;40:1277-82.
117. Chemla ES, Morsy M, Anderson L, Whitemore A. Inflow reduction by
distalization of anastomosis treats efficiently high-inflow high-cardiac output
vascular access for hemodialysis. Semin Dial 2007;20:68-72.
118. Unger P, Velez-Roa S, Wissing KM, Hoang AD, van de Borne P.
Regression of left ventricular hypertrophy after arteriovenous fistula closure in
renal transplant recipients: a long-term follow-up. American journal of
transplantation : official journal of the American Society of Transplantation and
the American Society of Transplant Surgeons 2004;4:2038-44.
119. Al-Ghonaim M, Manns BJ, Hirsch DJ, Gao Z, Tonelli M, Alberta Kidney
Disease N. Relation between access blood flow and mortality in chronic
hemodialysis patients. Clin J Am Soc Nephrol 2008;3:387-91.
120. Clinical practice recommendations for peritoneal dialysis adequacy. Am J
Kidney Dis 2006;48 Suppl 1:S130-58.
121. Kumar V, Depner, T., Besarab, A., Ananthakrishnan, S. Arteriovenous
access for hemodialysis. In: Daugirdas JT, Blake, P.G., Ing, T.S., ed. Handbook
of dialysis, 4th edition. Philadelphia: Lippincott Williams & Wilkins; 2007:105-26.
122. Viljoen M, de Oliveira AA, Milne FJ. Physical properties of the red blood
cells in chronic renal failure. Nephron 1991;59:271-8.
78
123. Huang SH, Tirona RG, Reid-Wilkinson F, et al. The kinetics of cystatin C
removal by hemodialysis. Am J Kidney Dis 2015;65:174-5.
124. Ronco C, Clark W. Factors affecting hemodialysis and peritoneal dialysis
efficiency. Semin Dial 2001;14:257-62.
125. Polaschegg HD, Levin, N.W. Replacement of renal funciton by dialysis. In:
Winchester JF, Horl, W.H., Koch, K.M., Lindsay R.M., Ronco, C., ed.
Replacement of renal funciton by dialysis. Great Britain: Kluver Academic; 2004.
126. Daurgirdas JT. Physiologic principles and urea kinetic modeling. In:
Daugirdas JT, Blake, P.G., Ing, T.S., ed. Handbook of Dialysis. 4th ed.
Philadelphia: Lippincott Williams & Wilkins; 2007:25-58.
127. Gotch FA. The current place of urea kinetic modelling with respect to
different dialysis modalities. Nephrol Dial Transplant 1998;13 Suppl 6:10-4.
128. Group FHNT, Chertow GM, Levin NW, et al. In-center hemodialysis six
times per week versus three times per week. N Engl J Med 2010;363:2287-300.
129. Leypoldt JK, Cheung AK, Carroll CE, et al. Effect of dialysis membranes
and middle molecule removal on chronic hemodialysis patient survival. Am J
Kidney Dis 1999;33:349-55.
130. Bloembergen WE, Hakim RM, Stannard DC, et al. Relationship of dialysis
membrane and cause-specific mortality. Am J Kidney Dis 1999;33:1-10.
131. Koda Y, Nishi S, Miyazaki S, et al. Switch from conventional to high-flux
membrane reduces the risk of carpal tunnel syndrome and mortality of
hemodialysis patients. Kidney Int 1997;52:1096-101.
132. Chandran PK, Liggett R, Kirkpatrick B. Patient survival on PAN/AN69
membrane hemodialysis: a ten-year analysis. J Am Soc Nephrol 1993;4:1199-
204.
79
133. Hakim RM, Held PJ, Stannard DC, et al. Effect of the dialysis membrane on
mortality of chronic hemodialysis patients. Kidney Int 1996;50:566-70.
134. Hornberger JC, Chernew M, Petersen J, Garber AM. A multivariate analysis
of mortality and hospital admissions with high-flux dialysis. J Am Soc Nephrol
1992;3:1227-37.
135. Eknoyan G, Beck GJ, Cheung AK, et al. Effect of dialysis dose and
membrane flux in maintenance hemodialysis. N Engl J Med 2002;347:2010-9.
136. Hemodialysis - Modalities of Therapy. 2008.
137. Moller E, McIntosh JF, Van Slyke DD. STUDIES OF UREA EXCRETION.
IV: Relationship Between Urine Volume and Rate of Urea Excretion by Patients
with Bright's Disease. J Clin Invest 1928;6:485-504.
138. McIntosh JF, Moller E, Van Slyke DD. STUDIES OF UREA EXCRETION.
III: The Influence of Body Size on Urea Output. J Clin Invest 1928;6:467-83.
139. Moller E, McIntosh JF, Van Slyke DD. STUDIES OF UREA EXCRETION. II:
Relationship Between Urine Volume and the Rate of Urea Excretion by Normal
Adults. J Clin Invest 1928;6:427-65.
140. Grehant N. Mesure de l'activite physiologique des reins par le dosage de
l'uree dans la sang et dans l'urine. J Physiol Pathol Gen 1904;6:8.
141. Sirianni GL, Pang KS. Organ clearance concepts: new perspectives on old
principles. Journal of pharmacokinetics and biopharmaceutics 1997;25:449-70.
142. Liu L, Pang KS. An integrated approach to model hepatic drug clearance.
European journal of pharmaceutical sciences : official journal of the European
Federation for Pharmaceutical Sciences 2006;29:215-30.
80
143. Rowland M, Benet LZ, Graham GG. Clearance concepts in
pharmacokinetics. Journal of pharmacokinetics and biopharmaceutics
1973;1:123-36.
144. Pang KS, Rowland M. Hepatic clearance of drugs. II. Experimental
evidence for acceptance of the "well-stirred" model over the "parallel tube" model
using lidocaine in the perfused rat liver in situ preparation. Journal of
pharmacokinetics and biopharmaceutics 1977;5:655-80.
145. Winkler K, Keiding, S., Tygstrup, N., . Clearance as a quantitative measure
of liver function. In: Paumgartner P, Presig, R. , ed. The Liver: Quantittative
Aspects of Structure and Function. Basel: Karger; 1973:144-55.
146. Roberts MS, Rowland M. Hepatic elimination--dispersion model. Journal of
pharmaceutical sciences 1985;74:585-7.
147. Thompson MD, Beard DA. Development of appropriate equations for
physiologically based pharmacokinetic modeling of permeability-limited and flow-
limited transport. Journal of pharmacokinetics and pharmacodynamics
2011;38:405-21.
148. Huang SH, Heidenheim PA, Gallo K, Jayakumar S, Lindsay RM. Is there a
necessity for individual blood water corrections when conductivity-based access
blood flow measurements are made? Blood purification 2011;32:174-80.
149. Debowska M, Lindholm, B., Waniewski, J. Kinetic Modeling and Adequacy
of Dialysis. In: Carpi A, Donadio, C., Tramonti, G. , ed. Progress in Hemodialysis
- From Emergent Biotechnology to Clinical Practice. http://www.intechopen.com:
InTech; 2011.
150. Schreiner G, Maher, J. Biochemistry of uremia. Uremia. Springfield:
Charles C. Thomas; 1960:55-85.
151. Addis T. Glomerular Nephritis, Diagnosis and Treatment. New York:
MacMillan; 1949.
81
152. Duranton F, Cohen G, De Smet R, et al. Normal and pathologic
concentrations of uremic toxins. J Am Soc Nephrol 2012;23:1258-70.
153. Vanholder R, De Smet R, Glorieux G, et al. Review on uremic toxins:
classification, concentration, and interindividual variability. Kidney Int
2003;63:1934-43.
154. Vanholder RC, De Smet, R., Lameire, N.H. Uremic Toxicity. In: Horl WH,
Koch, K.M., Lindsay, R.M., Ronco, C., Winchester, J.F., ed. Replacement of
Renal Function by Dialysis. 5th ed. London: Kluwer Academic Publishers;
2004:15-55.
155. Leypoldt JK, Cheung AK, Deeter RB. Rebound kinetics of beta2-
microglobulin after hemodialysis. Kidney Int 1999;56:1571-7.
156. Brownlee M, Cerami A, Vlassara H. Advanced glycosylation end products in
tissue and the biochemical basis of diabetic complications. N Engl J Med
1988;318:1315-21.
157. Stein G, Franke S, Mahiout A, et al. Influence of dialysis modalities on
serum AGE levels in end-stage renal disease patients. Nephrol Dial Transplant
2001;16:999-1008.
158. Vlassara H, Brownlee M, Manogue KR, Dinarello CA, Pasagian A.
Cachectin/TNF and IL-1 induced by glucose-modified proteins: role in normal
tissue remodeling. Science 1988;240:1546-8.
159. Krediet RT. Peritoneal anatomy and physiology during peritoneal dialysis.
In: Horl WH, Koch, K.M., Lindsay, R.M., Ronco, C., Winchester, J.F., ed.
Replacement of Renal Function By Dialysis. Dordrecht, the Netherlands: Kluwer
Academic Publishers; 2004.
160. Teehan BP, Gacek EM, Heymach GJ, et al. A clinical appraisal of the
dialysis index. Trans Am Soc Artif Intern Organs 1977;23:548-55.
82
161. Lowrie EG, Laird NM, Parker TF, Sargent JA. Effect of the hemodialysis
prescription of patient morbidity: report from the National Cooperative Dialysis
Study. N Engl J Med 1981;305:1176-81.
162. Gotch FA, Sargent JA. A mechanistic analysis of the National Cooperative
Dialysis Study (NCDS). Kidney Int 1985;28:526-34.
163. Hemodialysis Adequacy Work G. Clinical practice guidelines for
hemodialysis adequacy, update 2006. Am J Kidney Dis 2006;48 Suppl 1:S2-90.
164. Owen WF, Jr., Lew NL, Liu Y, Lowrie EG, Lazarus JM. The urea reduction
ratio and serum albumin concentration as predictors of mortality in patients
undergoing hemodialysis. N Engl J Med 1993;329:1001-6.
165. Suri R, Blake, P.G. Adequacy of hemodialysis. In: Winchester JF, Horl,
W.H., Koch, K.M., Lindsay R.M., Ronco, C., ed. Replacement of renal funciton by
dialysis. 5th ed. Great Britain: Kluver Academic; 2004:597-638.
166. Goldstein SL, Sorof JM, Brewer ED. Natural logarithmic estimates of Kt/V in
the pediatric hemodialysis population. Am J Kidney Dis 1999;33:518-22.
167. Daugirdas JT, Levin NW, Kotanko P, et al. Comparison of proposed
alternative methods for rescaling dialysis dose: resting energy expenditure, high
metabolic rate organ mass, liver size, and body surface area. Semin Dial
2008;21:377-84.
168. Daugirdas JT, Schneditz D. Overestimation of hemodialysis dose depends
on dialysis efficiency by regional blood flow but not by conventional two pool urea
kinetic analysis. ASAIO J 1995;41:M719-24.
169. Bloembergen WE, Stannard DC, Port FK, et al. Relationship of dose of
hemodialysis and cause-specific mortality. Kidney Int 1996;50:557-65.
83
170. Leypoldt JK, Cheung AK, Deeter RB, et al. Kinetics of urea and beta-
microglobulin during and after short hemodialysis treatments. Kidney Int
2004;66:1669-76.
171. NKF-DOQI clinical practice guidelines for hemodialysis adequacy. National
Kidney Foundation. Am J Kidney Dis 1997;30:S15-66.
172. I. NKF-K/DOQI Clinical Practice Guidelines for Hemodialysis Adequacy:
update 2000. Am J Kidney Dis 2001;37:S7-S64.
173. Petitclerc T, Goux N, Reynier AL, Bene B. A model for non-invasive
estimation of in vivo dialyzer performances and patient's conductivity during
hemodialysis. Int J Artif Organs 1993;16:585-91.
174. Lindsay RM, Bene B, Goux N, Heidenheim AP, Landgren C, Sternby J.
Relationship between effective ionic dialysance and in vivo urea clearance during
hemodialysis. Am J Kidney Dis 2001;38:565-74.
175. Leypoldt JK, Jaber BL, Zimmerman DL. Predicting treatment dose for novel
therapies using urea standard Kt/V. Semin Dial 2004;17:142-5.
176. Keshaviah PR, Nolph KD, Van Stone JC. The peak concentration
hypothesis: a urea kinetic approach to comparing the adequacy of continuous
ambulatory peritoneal dialysis (CAPD) and hemodialysis. Perit Dial Int
1989;9:257-60.
177. Depner TA. Quantifying hemodialysis. American journal of nephrology
1996;16:17-28.
178. Depner TA. Benefits of more frequent dialysis: lower TAC at the same Kt/V.
Nephrol Dial Transplant 1998;13 Suppl 6:20-4.
179. Evenepoel P, Bammens B, Verbeke K, Vanrenterghem Y. Superior dialytic
clearance of beta(2)-microglobulin and p-cresol by high-flux hemodialysis as
compared to peritoneal dialysis. Kidney Int 2006;70:794-9.
84
180. Pham NM, Recht NS, Hostetter TH, Meyer TW. Removal of the protein-
bound solutes indican and p-cresol sulfate by peritoneal dialysis. Clin J Am Soc
Nephrol 2008;3:85-90.
181. Arneson TJ, Liu J, Qiu Y, Gilbertson DT, Foley RN, Collins AJ. Hospital
treatment for fluid overload in the Medicare hemodialysis population. Clinical
journal of the American Society of Nephrology : CJASN 2010;5:1054-63.
182. Paniagua R, Amato D, Vonesh E, et al. Effects of increased peritoneal
clearances on mortality rates in peritoneal dialysis: ADEMEX, a prospective,
randomized, controlled trial. J Am Soc Nephrol 2002;13:1307-20.
183. Harnett JD, Foley RN, Kent GM, Barre PE, Murray D, Parfrey PS.
Congestive heart failure in dialysis patients: prevalence, incidence, prognosis
and risk factors. Kidney international 1995;47:884-90.
184. Foley RN, Parfrey PS, Harnett JD, et al. Clinical and echocardiographic
disease in patients starting end-stage renal disease therapy. Kidney international
1995;47:186-92.
185. Papakrivopoulou E, Booth J, Pinney J, Davenport A. Comparison of volume
status in asymptomatic haemodialysis and peritoneal dialysis outpatients.
Nephron extra 2012;2:48-54.
186. Ozkahya M, Toz H, Unsal A, et al. Treatment of hypertension in dialysis
patients by ultrafiltration: role of cardiac dilatation and time factor. American
journal of kidney diseases : the official journal of the National Kidney Foundation
1999;34:218-21.
187. Charra B. Control of blood pressure in long slow hemodialysis. Blood
purification 1994;12:252-8.
188. Hung SC, Kuo KL, Peng CH, et al. Volume overload correlates with
cardiovascular risk factors in patients with chronic kidney disease. Kidney
international 2013.
85
189. Barnes E, Hall RJ, Dutka DP, Camici PG. Absolute blood flow and oxygen
consumption in stunned myocardium in patients with coronary artery disease.
Journal of the American College of Cardiology 2002;39:420-7.
190. McIntyre CW, Burton JO, Selby NM, et al. Hemodialysis-induced cardiac
dysfunction is associated with an acute reduction in global and segmental
myocardial blood flow. Clinical journal of the American Society of Nephrology :
CJASN 2008;3:19-26.
191. Burton JO, Jefferies HJ, Selby NM, McIntyre CW. Hemodialysis-induced
cardiac injury: determinants and associated outcomes. Clinical journal of the
American Society of Nephrology : CJASN 2009;4:914-20.
192. Menon V, Shlipak MG, Wang X, et al. Cystatin C as a risk factor for
outcomes in chronic kidney disease. Ann Intern Med 2007;147:19-27.
193. Ferraro S, Marano G, Biganzoli EM, Boracchi P, Bongo AS. Prognostic
value of cystatin C in acute coronary syndromes: enhancer of atherosclerosis
and promising therapeutic target. Clin Chem Lab Med 2011;49:1397-404.
194. Funayama A, Watanabe T, Tamabuchi T, et al. Elevated cystatin C levels
predict the incidence of vasospastic angina. Circ J 2011;75:2439-44.
195. Ix JH, Shlipak MG, Chertow GM, Whooley MA. Association of cystatin C
with mortality, cardiovascular events, and incident heart failure among persons
with coronary heart disease: data from the Heart and Soul Study. Circulation
2007;115:173-9.
196. Xie L, Terrand J, Xu B, Tsaprailis G, Boyer J, Chen QM. Cystatin C
increases in cardiac injury: a role in extracellular matrix protein modulation.
Cardiovasc Res 2010;87:628-35.
197. Evangelopoulos AA, Vallianou, N.G., Bountziouka, V., Katsagoni, C.,
Bathrellou, E., Vogiatzakis, E.D., Bonou, M.S., Barbetseas, J., Avgerinos, P.C.,
86
Panagiotakos, D.B. Assoication between serum cystatin C, monocytes, and other
inflammaatory markers. Internal medicine journal 2012;42:6.
198. Thysell H, Grubb A, Lindholm T, Ljunggren L, Martensson L. Cystatin C: a
new marker of biocompatibility or a good marker for the redistribution of LMW
proteins during hemodialysis? ASAIO Trans 1988;34:202-4.
199. Lindstrom V, Grubb A, Alquist Hegbrant M, Christensson A. Different
elimination patterns of beta-trace protein, beta2-microglobulin and cystatin C in
haemodialysis, haemodiafiltration and haemofiltration. Scand J Clin Lab Invest
2008;68:685-91.
200. Park JS, Kim GH, Kang CM, Lee CH. Application of cystatin C reduction
ratio to high-flux hemodialysis as an alternative indicator of the clearance of
middle molecules. Korean J Intern Med 2010;25:77-81.
201. Hoek FJ, Korevaar JC, Dekker FW, Boeschoten EW, Krediet RT.
Estimation of residual glomerular filtration rate in dialysis patients from the
plasma cystatin C level. Nephrol Dial Transplant 2007;22:1633-8.
202. Delaney MP, Stevens PE, Al Hasani M, Stowe HJ, Judge C, Lamb EJ.
Relationship of serum cystatin C to peritoneal and renal clearance measures in
peritoneal dialysis: a cross-sectional study. Am J Kidney Dis 2008;51:278-84.
203. Al-Malki N, Heidenheim PA, Filler G, Yasin A, Lindsay RM. Cystatin C
levels in functionally anephric patients undergoing dialysis: the effect of different
methods and intensities. Clin J Am Soc Nephrol 2009;4:1606-10.
204. Huang SH, Filler G, Yasin A, Lindsay RM. Cystatin C reduction ratio
depends on normalized blood liters processed and fluid removal during
hemodialysis. Clin J Am Soc Nephrol 2011;6:319-25.
205. Huang SH, Sharma AP, Yasin A, Lindsay RM, Clark WF, Filler G.
Hyperfiltration affects accuracy of creatinine eGFR measurement. Clin J Am Soc
Nephrol 2011;6:274-80.
87
206. Huang SH, Filler G, Lindsay RM. Residual renal function calculated from
serum cystatin C measurements and knowledge of the weekly standard Kt/V
urea. Perit Dial Int 2012;32:102-4.
88
2. Chapter 2. Cystatin C Reduction Ratio Depends on Normalized Blood Liters Processed and Fluid
Removal To better understand the removal of cystatin C in a single hemodialysis
treatment, here, we measured cystatin C levels at pre-, mid- and post-
hemodialysis treatment on three consecutive treatments in 15 hemodialysis
patients with no residual renal function. We found that the amount of cystatin C
reduction was influenced positively by dialysis blood flow rate and treatment time,
and negatively by ultrafiltration rate. From this we hypothesized that cystatin C
behaves as a middle molecule with distribution likely in the extracellular
compartment with a slow equilibration rate between interstitial space and
intravascular space. This Chapter is similar to work already published in the
Clinical Journal of the American Society of Nephrology in 2011. 1
2.1. INTRODUCTION
Serum creatinine and urea are small molecules that are commonly measured to
monitor renal function in patients with chronic kidney disease (CKD). Serum
creatinine (SCr) is the most commonly used surrogate marker for assessing
kidney function in patients with CKD stage I-IV. It has molecular weight of 113
Daltons and is a metabolic product of creatine and phosphocreatine.1 The use of
serum urea (SUr) is recommended by the Kidney Disease Outcomes Quality
Improvement (KDOQI) clinical practice guideline to assess dialysis clearance. 2 It
has molecular weight of 60 Daltons.3
The preferred assessment of hemodialysis (“dose”) efficiency is by urea kinetic
modeling (UKM) calculating the dimensionless parameter Kt/V (urea) (where K =
clearance in mL/min, t = time in minutes and V = volume of distribution in mL).
Kt/V values may be given for single pool (Sp Kt/V) or double pool (equilibrated or
1 Huang SH, Filler G, Yasin A, Lindsay RM. Cystatin C Reduction Ratio Depends on Normalized Blood Liters Processed and Fluid Removal During Hemodialysis. Clin J Am Soc Nephrol. 2011 Feb;6(2):319-25. PMID: 21115625.
89
eKt/V) volumes of distribution; they depend upon the urea reduction ratio (URR)
over a single hemodialysis treatment.4 To assess dialysis efficiency over a period
of one week, Gotch5,6 derived a new dialysis assessment index named the
weekly “standardized” Kt/V (Std Kt/V). Std Kt/V allows comparison of different
dialysis modalities (e.g. peritoneal versus hemodialysis) and weekly treatment
frequencies.
Cystatin C (CysC) is a low molecular weight protein (13 kDalton, 121 amino-acid
residues) that is produced by all nucleated cells.7 It is positively charged with an
iso-electric point of 9.3. CysC has attractive characteristics as a marker for
assessing native kidney or dialysis clearance. Its plasma level is not influenced
by age, gender and body mass index.8 CysC is distributed mainly extracellularly.9
Its production is relatively constant and it is freely circulating.10 However, it may
be affected by conditions that alter cell turn-over rate, such as inflammation or
thyroid dysfunction.11,12 It remains controversial whether glucocorticoid
medications may change the serum CysC level.9,13 Estimated glomerular filtration
rate (eGFR) by CysC has shown to be superior to eGFR by SCr for patients with
chronic kidney disease.14-16
There have been few studies of CysC in dialysis. In peritoneal dialysis patients,
the study by Delaney et al.17 showed that CysC levels are mainly related to the
residual renal function, rather than the dialysis clearance. Furthermore, the study
by Hoek et al.18 demonstrated a good correlation between 1/CysC and residual
renal function. To obviate the effect of residual renal function we examined pre-
dialysis or steady state serum CysC levels and found these to be influenced by
the dialytic treatment modality and the Std Kt/V and hence were lowest in
patients receiving 5-7 nights per week of hemodialysis as compared with
conventional hemodialysis and peritoneal dialysis.19 There are a few studies
using CysC reduction ratio (CCRR) to assess CysC hemodialysis clearance.
Thysell et al.20 demonstrated that with low-flux hemodialysis, CysC
concentrations rose after dialysis by 4 ± 6.3%. Furthermore, Lindström et al.21
compared CCRR after hemodiafiltration, hemofiltration and low-flux
90
hemodialysis. The post-treatment CysC concentrations were lowest after
hemofiltration, and highest after low-flux hemodialysis. A recent study by Park et
al.10 showed a more effective CysC clearance by high-flux hemodialysis
compared to low-flux hemodialysis. Although these studies have demonstrated
the potential value of CysC as an indicator of middle molecule clearance, the
variables affecting CCRR were not identified.
In this study, we aimed at assessing the CysC hemodialysis clearance and
handling compared to the two small molecules urea and creatinine. Given a
largely extracellular distribution of CysC and a presumed slow equilibration
between the intravascular and the extravascular volume because of its size, we
hypothesized that there is significant reduction in CysC level by high-flux
hemodialysis treatment, and this reduction is significantly associated with the
number of liters processed and the ultrafiltration volume.
2.2. MATERIAL AND METHODS
Participants
In this cross-sectional, single center, open study of patients with end stage renal
disease receiving hemodialysis therapy, a total of 15 patients were recruited. All
patients provided written informed consent. All patients were on thrice weekly
high-flux high-efficiency hemodialysis therapies. Only functionally anephric
patients, defined as urine output < 250 mL per day, were included in the study.
Patients were excluded if they did not consent to the study, or if during the
previous three months hospitalization or dialysis prescription changes occurred.
The study was approved by the Ethic Review Board at the University of Western
Ontario (HSREB#16599E).
Experimental Procedure
All patients were dialyzed using high-flux high-efficiency polysulphone membrane
dialyzers (Optiflux F160NR or F200NR Fresenius Inc., Toronto, Canada). Either
central venous catheters or fistulas served as dialysis access. The blood flow
91
was between 300-400 mL/min and the dialysate flow was at 500 mL/min. The
blood samples were taken through the patients’ dialysis access at the beginning,
at the middle and at the end of their dialysis sessions. The blood samples were
taken at all three hemodialysis sessions over a one-week period. In addition to
CysC, SCr, and SUr, the pre-dialysis blood samples prior the first hemodialysis
session included thyroid function (TSH) and C reactive protein (CRP)
measurements. Blood samples were taken at mid-dialysis for CysC
measurements. Finally, additional blood samples for CysC, SCr, and SUr were
taken post-dialysis. The post-dialysis blood samples utilized the 15-second slow
flow methodology to obviate urea dilution by recirculation.4 For the analyses, the
averages of all three pre-, mid- and post-dialysis measurements were used.
CysC was measured by immune nephelometry using an N-latex cystatin C kit
(Dade Behring, Mississauga, Canada) on a Behring BN ProSpec analyzer (Dade
Behring Marburg, Germany) at the reference laboratory at the Children’s Hospital
of Eastern Ontario in Ottawa. The co-efficient of variation (CV) of the CysC
measurements has been previously established at 3.1% at 1.06 mg/L; 3.5% at
2.04 mg/L and 6.7% at 5.26 mg/L. 22 CysC was reported as an absolute level in
mg/L, rather than as eGFR. SCr was measured by modified Jaffe’s reaction,
using the Synchron System Kits on a Beckman Coulter LX20 Pro (Beckman
Coulter Inc, Brea, CA) with a normal adult reference interval of 55-120 µmol/L.
CRP was measured by immunonephelometry (Dade Behring BN Prospec,
Mississauga, Canada) with CV of 4.02% at the level of 12.79 mg/L and 4.48% at
50.87 mg/L. TSH was measured by direct chemiluminescence assay (Bayer
Centaur Instrument, Germany).
The single hemodialysis treatment efficacy was taken as the Sp Kt/V calculated
by UKM. It was carried out during the second hemodialysis session of the week.
The Std Kt/V also calculated from UKM based on Gotch’s initial paper.6
Reduction ratios for CysC (CCRR), urea (URR) and creatinine (CRR) were
calculated by taking the difference between pre- and post- levels, and divided by
pre-levels. We assumed that the volume of distribution of CysC is different from
92
that of urea and creatinine yet still related to body weight. We also assumed the
dialyzer clearance of CysC is mainly related to the dialysis circuit blood flow and
total amount removed by time (surface area being similar for all). We, thus,
hypothesized that CCRR will be related to the liters of blood processed (LP; L)
during dialysis normalized by the target post-dialysis weight (LP/kg). LP (L) =
dialyzer blood flow (Qb) (mL/min) x time (min). LP values were obtained at the
end of each dialysis directly from the dialysis machine. The amount of
ultrafiltration (L) during dialysis was recorded as it was also felt to influence
CCRR by a) convective removal versus b) hemoconcentration of CysC.
Statistical Analysis
Statistical analysis was performed using the GraphPad Prism software version
4.03 for Windows (GraphPad Software, San Diego, CA, U.S.A.). For the multiple
stepwise regression analysis, Medcalc version 11.2.1.0 (Medcalc Software bvba,
Mariakerke, Belgium) was used. Contiguous data were analyzed for normal
distribution with the Shapiro-Wilk normality test. Mean and standard deviation
were reported for normally distributed data; otherwise, median, 25th, and 75th
percentiles (inter quartile range) were given. The paired t-test for normally
distributed variables and the Mann-Whitney test for non-normally distributed
variables were used to compare between the pre- and post-dialysis CysC, SCr
and SUr levels. We also compared pre-dialysis levels from the three dialysis
sessions to assess the intra-patient variability. Depending on whether or not data
were normally distributed, Pearson’s correlation or the non-parametric
(Spearman’s rank) correlation analysis was used to assess the strength of
relationship between CCRR, and URR, CRR, Sp Kt/V, Std Kt/V, TSH and CRP
as well as LP/kg and UF. Pearson correlation coefficients were expressed as r-
values and the significance level of the p-value was also recorded. A p value of
<0.05 was considered significant. For the multiple regression analysis, we
calculated the correlation coefficients r2: this is the proportion of the variation in
the dependent variable explained by the regression model. It can range from 0 to
1 and is a measure of the goodness of fit of the model.
93
2.3. RESULTS
A total of 15 patients were enrolled into the study, all functionally anephric with
urine output <250 mL per day. All patients met the inclusion criteria without
violating exclusion criteria with unchanged conventional thrice weekly in center
high-efficiency and high-flux hemodialysis prescription and without
hospitalizations over the last 3 months. The mean age ± standard deviation (SD)
was 67.3 ± 11.2 years. The most common cause of end-stage renal disease was
diabetes mellitus (53.3%). The median dialysis time was 3.75 (3, 4) hours per
session. The mean pre- and post-dialysis CysC concentrations were 5.96 ± 0.94
mg/L and 4.66 ± 1.09 mg/L, respectively (Figure 2-1). All of the patients had 9
CysC values over the one-week interval except one patient who had a single
missing post-dialysis CysC value. The mean Sp Kt/V was 1.51 ± 0.24, while the
median Std Kt/V was 2.63 (2.15, 2.71). The median TSH (normal range 0.27 to
4.20 mIU/L) was 1.62 (1.31, 3.16) mIU/L. The mean CRP concentration (normal
range ≤5.0 mg/L) was 20.51 ± 15.13 mg/L. The mean LP/kg and UF were 0.89 ±
0.21 L/kg and 2.84 ± 1.06 L. Clinical results are summarized in Table 2-1. The
URR, the CRR and the CCRR were 70.2 ± 9.0 %, 64.5 ± 8.2 % and 26.1 ± 11.8%
(p≤0.002), respectively (Figure 2-2).
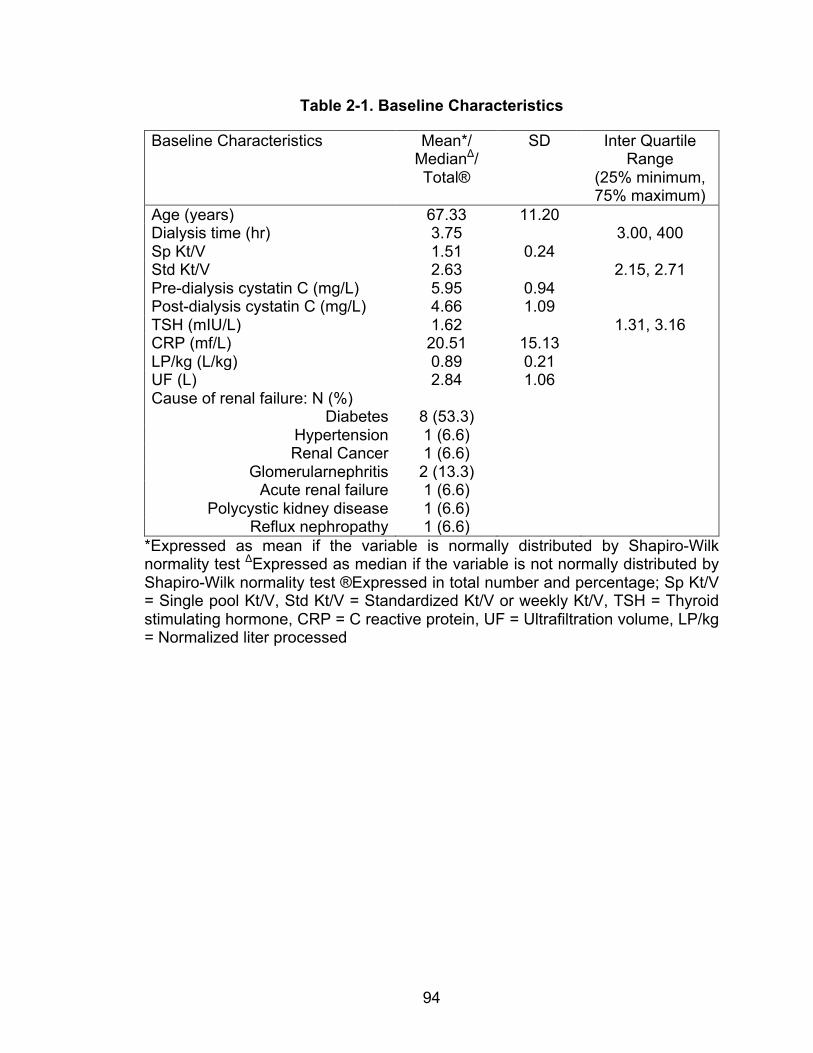
94
Table 2-1. Baseline Characteristics
Baseline Characteristics Mean*/ MedianΔ/ Total®
SD Inter Quartile Range
(25% minimum, 75% maximum)
Age (years) 67.33 11.20 Dialysis time (hr) 3.75 3.00, 400 Sp Kt/V 1.51 0.24 Std Kt/V 2.63 2.15, 2.71 Pre-dialysis cystatin C (mg/L) 5.95 0.94 Post-dialysis cystatin C (mg/L) 4.66 1.09 TSH (mIU/L) 1.62 1.31, 3.16 CRP (mf/L) 20.51 15.13 LP/kg (L/kg) 0.89 0.21 UF (L) 2.84 1.06 Cause of renal failure: N (%)
Diabetes 8 (53.3) Hypertension 1 (6.6) Renal Cancer 1 (6.6)
Glomerularnephritis 2 (13.3) Acute renal failure 1 (6.6)
Polycystic kidney disease 1 (6.6) Reflux nephropathy 1 (6.6)
*Expressed as mean if the variable is normally distributed by Shapiro-Wilk normality test ΔExpressed as median if the variable is not normally distributed by Shapiro-Wilk normality test ®Expressed in total number and percentage; Sp Kt/V = Single pool Kt/V, Std Kt/V = Standardized Kt/V or weekly Kt/V, TSH = Thyroid stimulating hormone, CRP = C reactive protein, UF = Ultrafiltration volume, LP/kg = Normalized liter processed
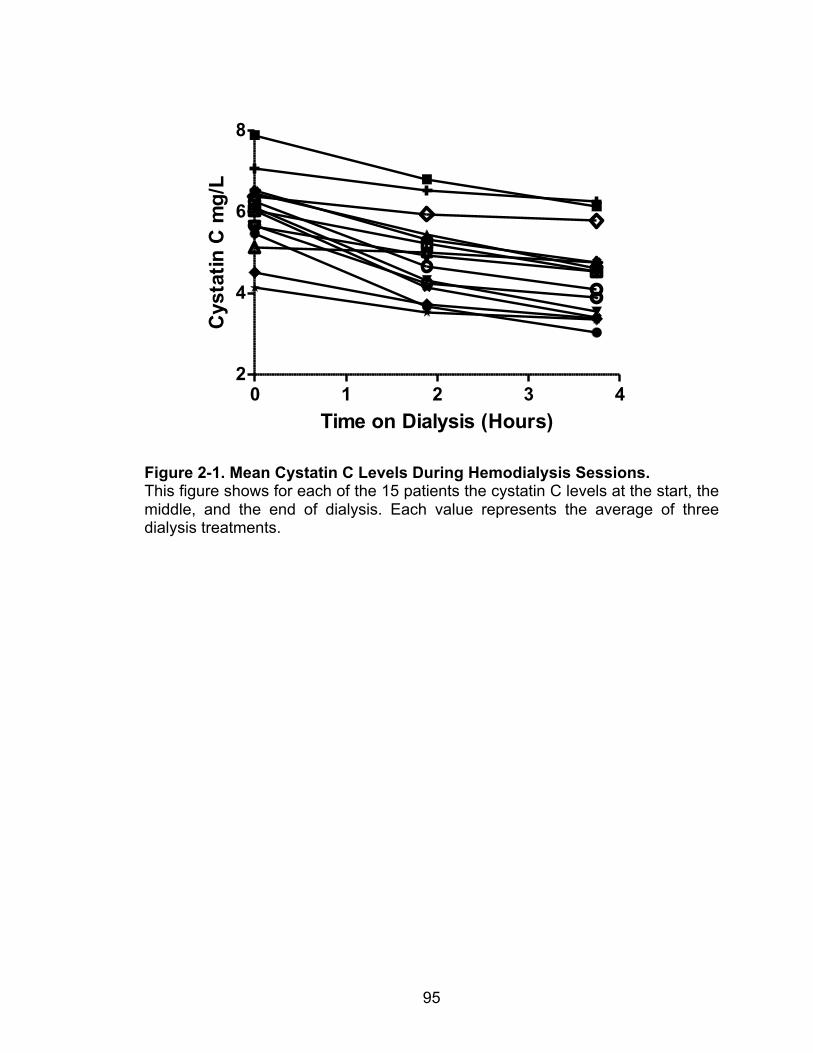
95
Figure 2-1. Mean Cystatin C Levels During Hemodialysis Sessions. This figure shows for each of the 15 patients the cystatin C levels at the start, the middle, and the end of dialysis. Each value represents the average of three dialysis treatments.
0 1 2 3 42
4
6
8
Time on Dialysis (Hours)
Cys
tatin
C m
g/L
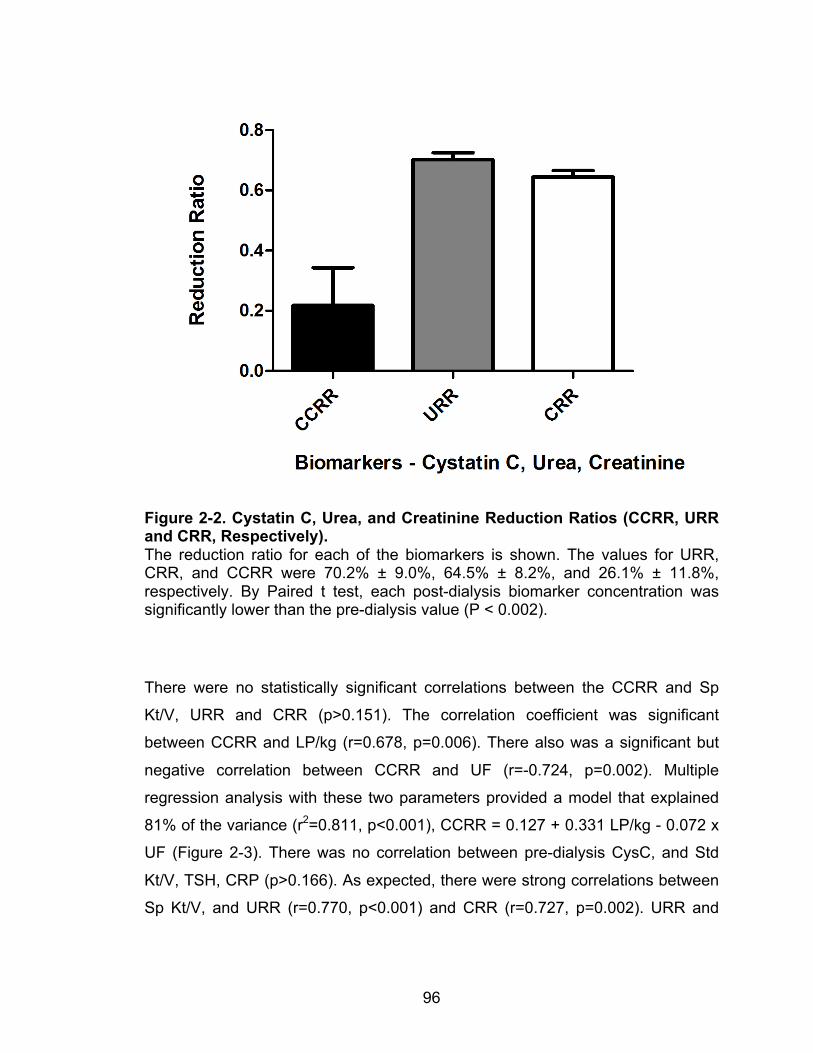
96
Figure 2-2. Cystatin C, Urea, and Creatinine Reduction Ratios (CCRR, URR and CRR, Respectively). The reduction ratio for each of the biomarkers is shown. The values for URR, CRR, and CCRR were 70.2% ± 9.0%, 64.5% ± 8.2%, and 26.1% ± 11.8%, respectively. By Paired t test, each post-dialysis biomarker concentration was significantly lower than the pre-dialysis value (P < 0.002).
There were no statistically significant correlations between the CCRR and Sp
Kt/V, URR and CRR (p>0.151). The correlation coefficient was significant
between CCRR and LP/kg (r=0.678, p=0.006). There also was a significant but
negative correlation between CCRR and UF (r=-0.724, p=0.002). Multiple
regression analysis with these two parameters provided a model that explained
81% of the variance (r2=0.811, p<0.001), CCRR = 0.127 + 0.331 LP/kg - 0.072 x
UF (Figure 2-3). There was no correlation between pre-dialysis CysC, and Std
Kt/V, TSH, CRP (p>0.166). As expected, there were strong correlations between
Sp Kt/V, and URR (r=0.770, p<0.001) and CRR (r=0.727, p=0.002). URR and
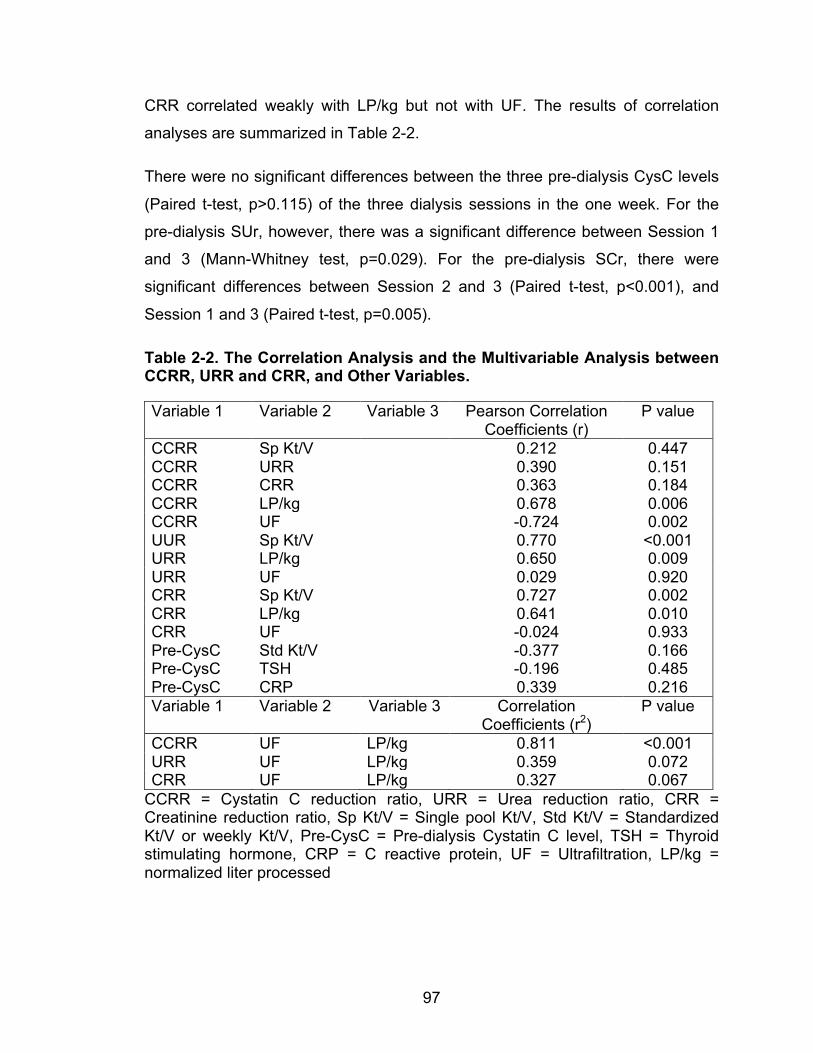
97
CRR correlated weakly with LP/kg but not with UF. The results of correlation
analyses are summarized in Table 2-2.
There were no significant differences between the three pre-dialysis CysC levels
(Paired t-test, p>0.115) of the three dialysis sessions in the one week. For the
pre-dialysis SUr, however, there was a significant difference between Session 1
and 3 (Mann-Whitney test, p=0.029). For the pre-dialysis SCr, there were
significant differences between Session 2 and 3 (Paired t-test, p<0.001), and
Session 1 and 3 (Paired t-test, p=0.005).
Table 2-2. The Correlation Analysis and the Multivariable Analysis between CCRR, URR and CRR, and Other Variables.
Variable 1 Variable 2 Variable 3 Pearson Correlation Coefficients (r)
P value
CCRR Sp Kt/V 0.212 0.447 CCRR URR 0.390 0.151 CCRR CRR 0.363 0.184 CCRR LP/kg 0.678 0.006 CCRR UF -0.724 0.002 UUR Sp Kt/V 0.770 <0.001 URR LP/kg 0.650 0.009 URR UF 0.029 0.920 CRR Sp Kt/V 0.727 0.002 CRR LP/kg 0.641 0.010 CRR UF -0.024 0.933 Pre-CysC Std Kt/V -0.377 0.166 Pre-CysC TSH -0.196 0.485 Pre-CysC CRP 0.339 0.216 Variable 1 Variable 2 Variable 3 Correlation
Coefficients (r2) P value
CCRR UF LP/kg 0.811 <0.001 URR UF LP/kg 0.359 0.072 CRR UF LP/kg 0.327 0.067
CCRR = Cystatin C reduction ratio, URR = Urea reduction ratio, CRR = Creatinine reduction ratio, Sp Kt/V = Single pool Kt/V, Std Kt/V = Standardized Kt/V or weekly Kt/V, Pre-CysC = Pre-dialysis Cystatin C level, TSH = Thyroid stimulating hormone, CRP = C reactive protein, UF = Ultrafiltration, LP/kg = normalized liter processed
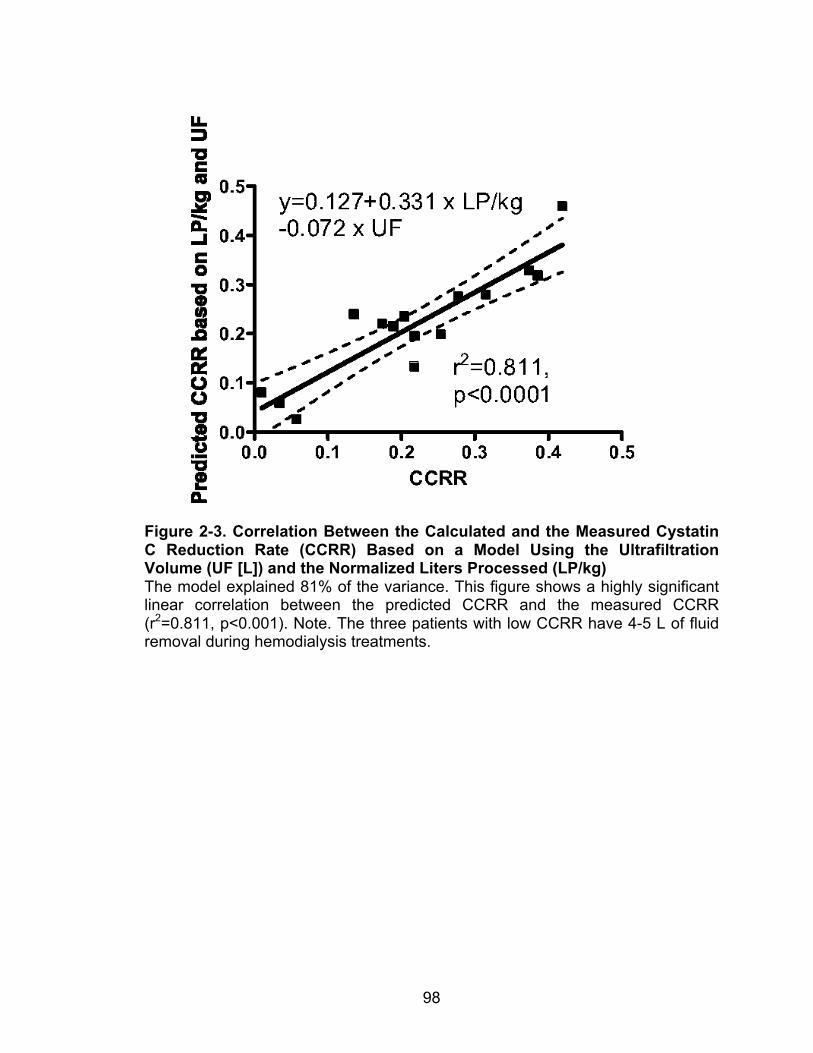
98
Figure 2-3. Correlation Between the Calculated and the Measured Cystatin C Reduction Rate (CCRR) Based on a Model Using the Ultrafiltration Volume (UF [L]) and the Normalized Liters Processed (LP/kg) The model explained 81% of the variance. This figure shows a highly significant linear correlation between the predicted CCRR and the measured CCRR (r2=0.811, p<0.001). Note. The three patients with low CCRR have 4-5 L of fluid removal during hemodialysis treatments.
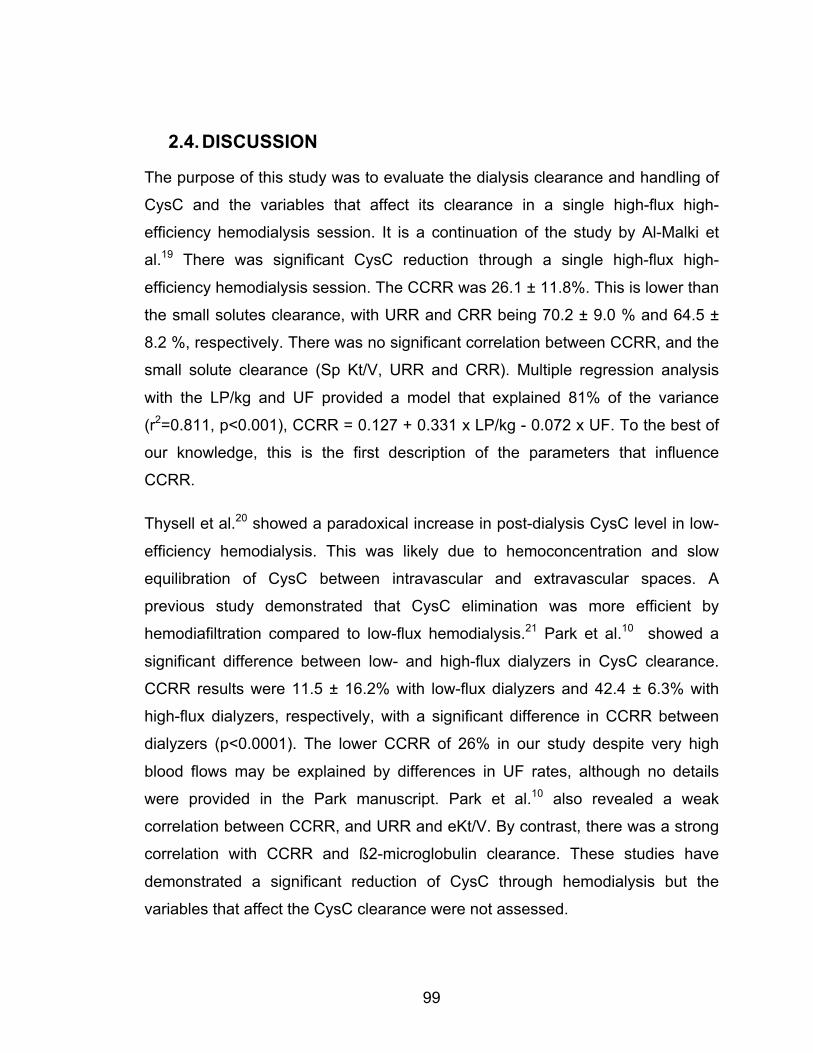
99
2.4. DISCUSSION
The purpose of this study was to evaluate the dialysis clearance and handling of
CysC and the variables that affect its clearance in a single high-flux high-
efficiency hemodialysis session. It is a continuation of the study by Al-Malki et
al.19 There was significant CysC reduction through a single high-flux high-
efficiency hemodialysis session. The CCRR was 26.1 ± 11.8%. This is lower than
the small solutes clearance, with URR and CRR being 70.2 ± 9.0 % and 64.5 ±
8.2 %, respectively. There was no significant correlation between CCRR, and the
small solute clearance (Sp Kt/V, URR and CRR). Multiple regression analysis
with the LP/kg and UF provided a model that explained 81% of the variance
(r2=0.811, p<0.001), CCRR = 0.127 + 0.331 x LP/kg - 0.072 x UF. To the best of
our knowledge, this is the first description of the parameters that influence
CCRR.
Thysell et al.20 showed a paradoxical increase in post-dialysis CysC level in low-
efficiency hemodialysis. This was likely due to hemoconcentration and slow
equilibration of CysC between intravascular and extravascular spaces. A
previous study demonstrated that CysC elimination was more efficient by
hemodiafiltration compared to low-flux hemodialysis.21 Park et al.10 showed a
significant difference between low- and high-flux dialyzers in CysC clearance.
CCRR results were 11.5 ± 16.2% with low-flux dialyzers and 42.4 ± 6.3% with
high-flux dialyzers, respectively, with a significant difference in CCRR between
dialyzers (p<0.0001). The lower CCRR of 26% in our study despite very high
blood flows may be explained by differences in UF rates, although no details
were provided in the Park manuscript. Park et al.10 also revealed a weak
correlation between CCRR, and URR and eKt/V. By contrast, there was a strong
correlation with CCRR and ß2-microglobulin clearance. These studies have
demonstrated a significant reduction of CysC through hemodialysis but the
variables that affect the CysC clearance were not assessed.

100
The results of our study suggest a very different handling of CysC compared to
the clearances of the small solutes urea and creatinine, in a single high-flux high-
efficiency hemodialysis treatment. All patients were functionally anephric, which
eliminates the effects of residual renal function on CysC clearance. Three factors
should affect CysC clearance: diffusive clearance – albeit small, convective
clearance and the ultrafiltration volume. So what do we know about Cystatin C
clearance to explain our findings? CysC is a middle molecule that distributed
mainly extracellularly.9 It is also minimally protein bound with presumed slow
redistribution between intravascular space and extravascular space because of
its size. Unfortunately, little is known about the equilibration of CysC between the
intra- and extravascular space; however, in view of what is known about other
middle molecule redistribution, we can assume a slow equilibration.20 Zingraff et
al.23 compared the clearance of radioiodinated serum amyloid P component
(125I-SAP), a constituent for systemic amyloidosis deposits, in healthy subjects
and chronic hemodialysis patients. In the hemodialysis patients, the decline was
in a biexponential mode, rather than a single-exponential slope. There was also
evidence of “tissue retention” of 125I-SAP in the extravascular space. This was
enhanced in patients with symptomatic dialysis–related amyloidosis. By contrast,
SUr and SCr are distributed both in extracellular (both intra- and extravascular)
and intracellular spaces, with presumed rapid equilibration between all three
compartments during hemodialysis.24 It is presumed that small molecules are
mostly affected by diffusive clearance and relatively unaltered by UF because of
rapid equilibration. By contrast, CCRR is affected by a combination of diffusive
and convective clearance. The data of Park et al.10 data suggest that convective
clearance is much more important for CysC. Removal of some cystatin C by
membrane adbsorbtion as does occur with B2- microglobulin must also be
considered.25 There is, as yet, no published information on this. This possibility
needs to be explored.
Given these facts and after establishing the inverse correlation between UF and
CCRR, we hypothesized that CysC, SCr, and SUr have different volumes of
distribution within different fluid body compartments and had different inter-
101
compartmental rates of equilibration. We hypothesize that SUr and even more so
SCr equilibrate quickly between the intra- and extravascular space, thereby
remaining unaffected by UF. By contrast, CysC is only altered in the intravascular
space by the dialysis, equilibrates slowly, and is largely affected by the
sometimes substantial UF observed in our patients (max 5L) in this study. Figure 2-4 presents a hypothetical model for the different handling of the two molecule
classes. This model is well supported by the fact that we can explain 81% of the
variance by UF and liters processed.
Figure 2-4. Kinetic Model of Creatinine, Urea and Cystatin C during Hemodialysis. Cystatin C is a middle molecule that is distributed mainly extracellular and minimally protein bound. It was presumed to have slow redistribution between intravascular space and extravascular space because of its size. By contrast, urea and creatinine are distributed both in extracellular (both intra- and extravascular) and intracellular spaces, with presumed rapid equilibration between all three compartments during hemodialysis. As a result, it is presumed that small molecules are mostly affected by diffusive clearance and relatively unaltered by UF because of rapid equilibration. By contrast, CCRR is affected by a combination of diffusive and convective clearance and by ultrafiltration, which may concentrate the intravascular content of Cystatin C.
102
Our study had a few limitations. It was a small pilot study of only 15 patients. All
of the patients used high-flux dialyzers. The study results are not applicable to
low-flux hemodialysis treatments. The previous study by Al-Malki et al.19
demonstrated a significant negative correlation between Std Kt/V and pre-dialysis
CysC in functionally anephric patients. We did not find such a correlation and did
not expect to due to the small samples size and the narrow range of Std Kt/V
values obtained from patients on identical dialysis modalities. We did not assess
CysC rebound post-hemodialysis. This was previously demonstrated in the study
by Lindström et al.;21 there was a rise in CysC level by 12% in the
hemodiafiltration group.
Why is CysC an attractive dialysis adequacy marker? By increasing small
molecule clearance, the HEMO and the ADEMEX studies have failed to show
any mortality benefit. By contrast, there is evidence that CysC levels associate
with clinical outcome.26,27 CysC levels have been shown to correlate with cardiac
mortality in patients with coronary heart disease.28 In patients with Stage III or IV
chronic kidney disease, the CysC level is associated with all cause and
cardiovascular disease mortality.29 If CysC level correlates with clinical outcome
in the dialysis population regardless of the residual renal function, it may become
an important dialysis adequacy parameter. As a result, further studies remain to
assess this association and the target of a satisfactory CysC level.
In conclusion, this study is the first to define the parameters that determine
CCRR. The total dialysis dose measured as normalized liters processed plus the
ultrafiltration rate are the most important determinants for CCRR. This is novel.
Based on molecular characteristics, we hypothesize on the differences that
explain the different handling of SCr and SUr on the one hand and CysC on the
other. The current study provides a first model for the kinetics of Cystatin C
removal by dialysis. Further studies are indicated.
103
REFERENCES 1. Heymsfield SB, Arteaga C, McManus C, Smith J, Moffitt S. Measurement of
muscle mass in humans: validity of the 24-hour urinary creatinine method. Am J
Clin Nutr 1983;37:478-94.
2. Hemodialysis Adequacy Work G. Clinical practice guidelines for hemodialysis
adequacy, update 2006. Am J Kidney Dis 2006;48 Suppl 1:S2-90.
3. Cheung AK. Hemodialysis and hemodiafiltration. In: Greenberg A, ed. Primer
on kidney disease. Fourth ed. Philadelphia: Elsevier Saunders; 2005:464-76.
4. Daurgirdas JT. Physiologic principles and urea kinetic modeling. In: Daugirdas
JT, Blake, P.G., Ing, T.S., ed. Handbook of Dialysis. 4th ed. Philadelphia:
Lippincott Williams & Wilkins; 2007:25-58.
5. Gotch FA. The current place of urea kinetic modelling with respect to different
dialysis modalities. Nephrol Dial Transplant 1998;13 Suppl 6:10-4.
6. Suri R, Blake, P.G. Adequacy of hemodialysis. In: Winchester JF, Horl, W.H.,
Koch, K.M., Lindsay R.M., Ronco, C., ed. Replacement of renal funciton by
dialysis. 5th ed. Great Britain: Kluver Academic; 2004:597-638.
7. Prigent A. Monitoring renal function and limitations of renal function tests.
Seminars in nuclear medicine 2008;38:32-46.
8. Sharma AP, Kathiravelu A, Nadarajah R, Yasin A, Filler G. Body mass does
not have a clinically relevant effect on cystatin C eGFR in children. Nephrol Dial
Transplant 2009;24:470-4.
9. Filler G, Bokenkamp A, Hofmann W, Le Bricon T, Martinez-Bru C, Grubb A.
Cystatin C as a marker of GFR--history, indications, and future research. Clin
Biochem 2005;38:1-8.
104
10. Park JS, Kim GH, Kang CM, Lee CH. Application of cystatin C reduction ratio
to high-flux hemodialysis as an alternative indicator of the clearance of middle
molecules. Korean J Intern Med 2010;25:77-81.
11. Manetti L, Pardini E, Genovesi M, et al. Thyroid function differently affects
serum cystatin C and creatinine concentrations. J Endocrinol Invest 2005;28:346-
9.
12. Wasen E, Isoaho R, Vahlberg T, Kivela SL, Irjala K. Association between
markers of renal function and C-reactive protein level in the elderly: confounding
by functional status. Scand J Clin Lab Invest 2008;68:484-91.
13. Foster J, Reisman W, Lepage N, Filler G. Influence of commonly used drugs
on the accuracy of cystatin C-derived glomerular filtration rate. Pediatr Nephrol
2006;21:235-8.
14. Dharnidharka VR, Kwon C, Stevens G. Serum cystatin C is superior to serum
creatinine as a marker of kidney function: a meta-analysis. Am J Kidney Dis
2002;40:221-6.
15. Lofberg H, Grubb AO. Quantitation of gamma-trace in human biological
fluids: indications for production in the central nervous system. Scand J Clin Lab
Invest 1979;39:619-26.
16. Simonsen O, Grubb A, Thysell H. The blood serum concentration of cystatin
C (gamma-trace) as a measure of the glomerular filtration rate. Scand J Clin Lab
Invest 1985;45:97-101.
17. Delaney MP, Stevens PE, Al Hasani M, Stowe HJ, Judge C, Lamb EJ.
Relationship of serum cystatin C to peritoneal and renal clearance measures in
peritoneal dialysis: a cross-sectional study. Am J Kidney Dis 2008;51:278-84.
18. Hoek FJ, Korevaar JC, Dekker FW, Boeschoten EW, Krediet RT. Estimation
of residual glomerular filtration rate in dialysis patients from the plasma cystatin C
level. Nephrol Dial Transplant 2007;22:1633-8.
105
19. Al-Malki N, Heidenheim PA, Filler G, Yasin A, Lindsay RM. Cystatin C levels
in functionally anephric patients undergoing dialysis: the effect of different
methods and intensities. Clin J Am Soc Nephrol 2009;4:1606-10.
20. Thysell H, Grubb A, Lindholm T, Ljunggren L, Martensson L. Cystatin C: a
new marker of biocompatibility or a good marker for the redistribution of LMW
proteins during hemodialysis? ASAIO Trans 1988;34:202-4.
21. Lindstrom V, Grubb A, Alquist Hegbrant M, Christensson A. Different
elimination patterns of beta-trace protein, beta2-microglobulin and cystatin C in
haemodialysis, haemodiafiltration and haemofiltration. Scand J Clin Lab Invest
2008;68:685-91.
22. Sambasivan AS, Lepage N, Filler G. Cystatin C intrapatient variability in
children with chronic kidney disease is less than serum creatinine. Clin Chem
2005;51:2215-6.
23. Zingraff J, Caillat-Vigneron N, Urena P, et al. Plasma kinetics of 125I-labelled
amyloid P component in beta 2M amyloidosis: a possible approach to quantitate
disease activity. Nephrol Dial Transplant 1995;10:223-9.
24. Kristensen K, Wide-Swensson D, Lindstrom V, Schmidt C, Grubb A,
Strevens H. Serum amyloid a protein and C-reactive protein in normal pregnancy
and preeclampsia. Gynecologic and obstetric investigation 2009;67:275-80.
25. Clark WR, Macias WL, Molitoris BA, Wang NH. Membrane adsorption of beta
2-microglobulin: equilibrium and kinetic characterization. Kidney Int
1994;46:1140-6.
26. Eknoyan G, Beck GJ, Cheung AK, et al. Effect of dialysis dose and
membrane flux in maintenance hemodialysis. N Engl J Med 2002;347:2010-9.
27. Paniagua R, Amato D, Vonesh E, et al. Effects of increased peritoneal
clearances on mortality rates in peritoneal dialysis: ADEMEX, a prospective,
randomized, controlled trial. J Am Soc Nephrol 2002;13:1307-20.
106
28. Ix JH, Shlipak MG, Chertow GM, Whooley MA. Association of cystatin C with
mortality, cardiovascular events, and incident heart failure among persons with
coronary heart disease: data from the Heart and Soul Study. Circulation
2007;115:173-9.
29. Menon V, Shlipak MG, Wang X, et al. Cystatin C as a risk factor for
outcomes in chronic kidney disease. Ann Intern Med 2007;147:19-27.
107
3. Chapter 3. Hyperfiltration Affects Accuracy of Creatinine eGFR Measurement
To better assess the effects of hyperfiltration on cystatin C renal clearance, here,
127 pediatric patients with chronic kidney disease not yet on dialysis were
observed. We demonstrated that there is a significant negative correlation
between the errors for the Schwartz estimated glomerular filtration rate and the
filtration fraction (the ratio of GFR and renal plasma flow). Both cystatin C and
beta-trace protein were not affected by differences in filtration fraction. Therefore,
cystatin C might be a useful marker for the assessment of kidney function in
advanced kidney disease. This Chapter is similar to work already published in
the Clinical Journal of the American Society of Nephrology in 2011.2
3.1. INTRODUCTION
Renal function measurement is often focused on the glomerular filtration rate
(GFR) and, to a lesser extent, on the renal blood flow.1 The gold-standard for
measuring the GFR is inulin clearance.2 However, nuclear medicine studies have
replaced inulin clearance owing to convenience and absence of urine collection.
In Europe, 51Cr-ethylenediamine tetra-acetic acid (EDTA) is the most widely used
method for the determination of GFR, whereas in North America, the 99Tc
Diethylenetriamine penta-acetic acid (DTPA) renal scan enjoys the most
widespread utilization.3-5 While less demanding than inulin clearance studies,
nuclear GFR studies are still cumbersome, invasive and involve the handling of
radiopharmaceutical substances. Endogenous markers for estimated GFR, such
as serum creatinine and more recently Cystatin C, are hampered by diagnostic
imprecision.6 Recently Beta trace protein (BTP) has been introduced as a
surrogate marker for GFR measurement.7
Creatinine (113 Dalton, neutrally charged) is the metabolic product of creatine
and phosphocreatine found in muscle, and therefore reflects muscle mass.8,9 2 Huang SH, Sharma AP, Lindsay RM, Clark WF, and Filler G. Hyperfiltration Affects Accuracy of Creatinine but not Cystatin C or Beta Trace Protein eGFR Measurement. Clin J Am Soc Nephrol. 2011 Feb;6(2):274-80. PMID: 20966120.
108
Given the large variability of muscle mass, there is substantial inter-patient
variability of serum creatinine concentration due to its high water solubility.10,11
Serum cystatin C has been shown to be an excellent marker for GFR.12,13 It is a
small molecular weight protein (13 kDalton, positive charge with isoelectric point
of 9.3) that was initially known as γ–trace protein and its amino acid sequence
was determined in 1981.14,15 This protein is produced at a very constant rate and
is affected by only a few conditions, such as uncontrolled hyperthyroidism.16 BTP
(23-29 kDalton, mildly negatively charged with isoelectric point of 5.8-6.7, also
known as prostaglandin D synthase), has been traditionally used as a marker of
cerebrospinal fluid leakage.17,18 It is expressed in all tissues except the ovaries.19
Preliminary studies have confirmed a good correlation between serum BTP
levels and GFR measurement by inulin clearance and nuclear medicine
techniques.5,20
Hyperfiltration is considered an abnormal increase in the glomerular filtration
rate.21,22 However, this definition ignores the fact that hyperfiltration can take
place in a single nephron even with globally decreased GFR. Other sources
have defined hyperfiltration as the result of an increase in the glomerular capillary
pressure.23,24 The filtration fraction (FF) is the ratio of GFR and effective renal
plasma flow (ERPF). A normal filtration fraction is 18.7±3.2 percent in healthy
young adults, between the ages of 20-30 years.25 Hyperfiltration should be
considered if the filtration fraction is above the reference interval.
We were interested in whether hyperfiltration affects the diagnostic accuracy of
commonly used eGFR measurements using creatinine, cystatin C and BTP in a
pediatric population. The precision between the surrogate markers and the eGFR
is reduced at higher GFR. One possible explanation for this phenomenon may be
that some patients have hyperfiltering and others do not.
3.2. MATERIALS AND METHODS
(1) Participants
109
The study received approval of the local ethics boards and was in accordance
with the ethical standards of the Helsinki declaration of 1975 (revised in 1983).5
Written consent was obtained in each case from the parents and in case of a
consenting minor, from the patients as well. One hundred and twenty-seven of
the patients had a 51Cr EDTA renal scan with concomitant determination of the 131I Hippurate clearance (ERPF), thus allowing for the calculation of the FF.
Hyperfiltration should be considered if the filtration fraction is above 18.7±3.2.
Venous blood samples were obtained from 127 children with various renal
pathologies, referred for determination of nuclear medicine GFR study. Patients
were recruited consecutively and their ages ranged from 1.0 to 18.0 years with a
mean of 11.5 ± 4.2 years. Thirty-five percent of patients were females. Mean
height was 136.7 ± 28.4 cm (range 62.3 - 189.1 cm), mean weight was
40.2 ± 20.0 kg (range 6.5 – 104.0 kg) and mean body surface area was
1.22 ± 0.42 m2 (range 0.33 - 2.20 m2). The main indications for GFR
measurements were: various forms of glomerulonephritis (44.7%), obstructive
uropathy (19.9%), reflux nephropathy (13.6%), post renal transplantation (5.4%),
and others (16.4%, including post hemolytic uremic syndrome, steroid sensitive
nephrotic syndrome, cystinosis, orthostatic proteinuria, etc.).
(2) Experimental Procedure
The methods for the simultaneous measurement of both GFR and ERPF using 51Cr EDTA renal scan with concomitant determination of the 131I Hippurate
clearance have been described elsewhere.25 GFR and ERPF were corrected to a
standard body surface area of mL/min/1.73 m2. For consistency, we mean by
GFR and ERPF the corrected values per 1.73 m2 body surface area throughout
the manuscript. Filtration fraction was calculated as the ratio between 51Cr EDTA
GFR and 131I Hippurate ERPF and was expressed in percent. Serum creatinine
was measured with an enzymatic assay (Ortho Clinical Diagnostics). As
enzymatic assays measure approximately 20% lower than the Jaffé method that
was used in the original formula by George Schwartz, we used 20% higher
constants (38 for children above 1 year of age, 48 for adolescent males) to
110
calculate the eGFR estimate according to Schwartz.26 We validated these
revised constants for the Schwartz formula in our patient cohort. For adolescent
males, the estimated constant was 49.4 ± 10.5, not significantly different from 48
(p=0.3271, one-sample t-test). For the non-adolescent male patients, the
constant was 40.3 ± 7.7, again not significantly different from 38. We therefore
used the constants 38 and 48. The formula reads:
Equation 3-1
The methods for the determination of Cystatin C (Siemens Diagnostics GmbH)
and BTP (Siemens Diagnostics) were described in the previous study.5 Cystatin
C eGFR was calculated using the Filler formula.27 For the BTP eGFR, we used a
recently published and validated formula by Benlamri et al.28
We calculated the error between the measured GFR and the estimated GFR for
creatinine using Schwartz, cystatin C and BTP using (estimated GFRParameter-
measured GFR)/measured GFR.
(3) Statistical Analysis All statistical analyses were performed using GraphPad Prism Software for
Science Version 4.0c, San Diego, CA, USA. Standard regression and correlation
analysis were applied. Normal distribution was assessed using the Shapiro Wilks
test.
Agreement between methods was tested using the Bland and Altman plot
method.29 The Bland and Altman plot is a statistical method used to compare two
measurement techniques. In this graphical method the differences (or
alternatively the ratios) between the two techniques are plotted against the
averages of the two techniques. Horizontal lines are drawn at the mean
difference, and at the mean difference plus and minus 1.96 times the standard
deviation of the differences. If the differences within mean ± 1.96 SD are not
GFR estimate =Height [cm] x constant
serum creatinine [µmol/L]
111
clinically important, the two methods may be used interchangeably. Standard
deviation (SD) of the differences between the two assay methods is used to
calculate the limits of agreement, computed as the mean bias plus or minus 1.96
times its SD. The bias is computed as the value determined by one method
minus the value determined by the other method. If one method is sometimes
higher, and sometimes the other method is higher, the average of the differences
will be close to zero. If it is not close to zero, this indicates that the two assay
methods are producing different results. Correlation analysis was performed
using appropriate parametric (in case of normal distribution) or non-parametric
tests (Spearman rank). In case of non-normal distribution, data are given as a
median (25th percentile, 75th percentile). The percentiles in brackets are also
known as inter-quartile range (IQR). A p-values <0.05 was considered
statistically significant.
3.3. RESULTS
The 127 children had a median age of 11.9 (IQR 8.5, 14.9) years, weighed 39.9
(28.8, 54.3) kg, and had a height of 146.0 (131.0, 163.8) cm. Mean body surface
area was 1.30±0.39 m2. The mean measured 51Cr EDTA GFR was 100.6 ± 32.1
mL/min/1.73 m2. The median 131I hippurate clearance (ERPF) was 588 (398,
739) mL/min/1.73 m2. The mean filtration fraction was 17.7± 4.5% and
hyperfiltration is considered if the filtration fraction is above 18.7±3.2. Median
serum creatinine 56 (52, 74) µmol/L, whereas median cystatin C was 0.98 (0.83,
1.21) mg/L and median BTP was 0.76 (0.62, 0.98) mg/L. The results of the most
important parameters are summarized in Table 3-1.
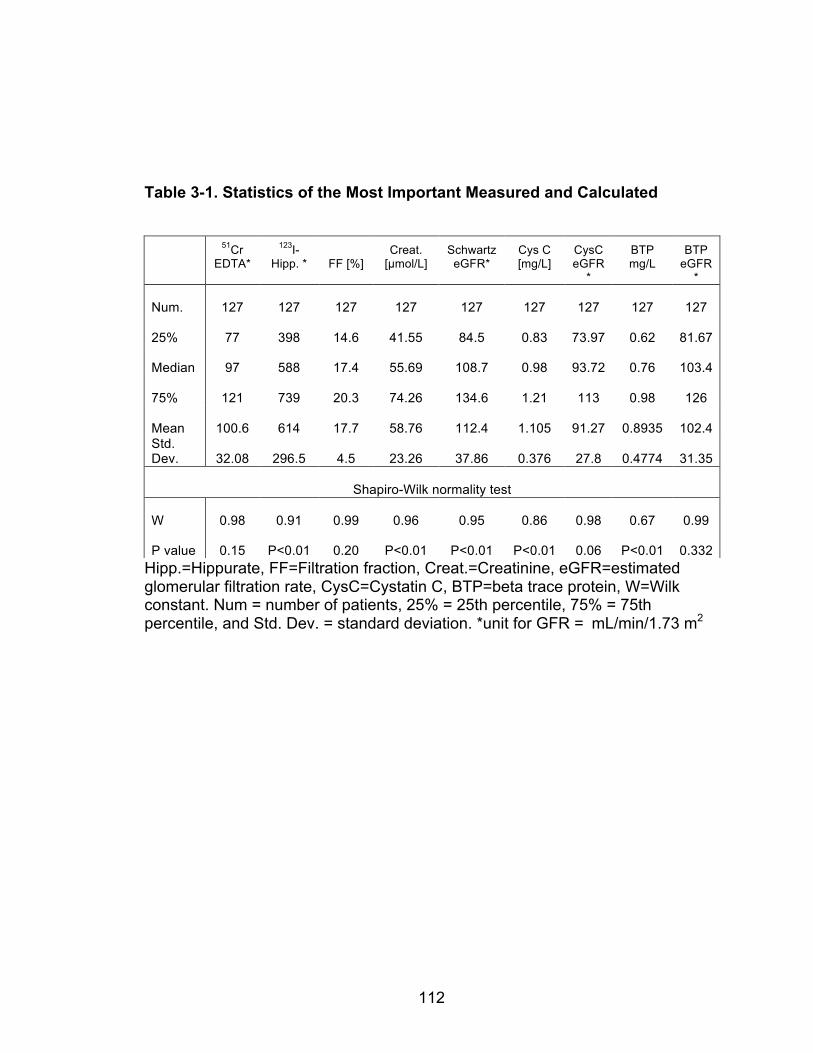
112
Table 3-1. Statistics of the Most Important Measured and Calculated
Hipp.=Hippurate, FF=Filtration fraction, Creat.=Creatinine, eGFR=estimated glomerular filtration rate, CysC=Cystatin C, BTP=beta trace protein, W=Wilk constant. Num = number of patients, 25% = 25th percentile, 75% = 75th percentile, and Std. Dev. = standard deviation. *unit for GFR = mL/min/1.73 m2
51Cr EDTA*
123I-Hipp. *
FF [%]
Creat. [µmol/L]
Schwartz eGFR*
Cys C [mg/L]
CysC eGFR
*
BTP mg/L
BTP eGFR
*
Num. 127 127 127 127 127 127 127 127 127
25% 77 398 14.6 41.55 84.5 0.83 73.97 0.62 81.67
Median 97 588 17.4 55.69 108.7 0.98 93.72 0.76 103.4
75% 121 739 20.3 74.26 134.6 1.21 113 0.98 126
Mean 100.6 614 17.7 58.76 112.4 1.105 91.27 0.8935 102.4 Std. Dev. 32.08 296.5 4.5 23.26 37.86 0.376 27.8 0.4774 31.35
Shapiro-Wilk normality test
W 0.98 0.91 0.99 0.96 0.95 0.86 0.98 0.67 0.99
P value 0.15 P<0.01 0.20 P<0.01 P<0.01 P<0.01 0.06 P<0.01 0.332
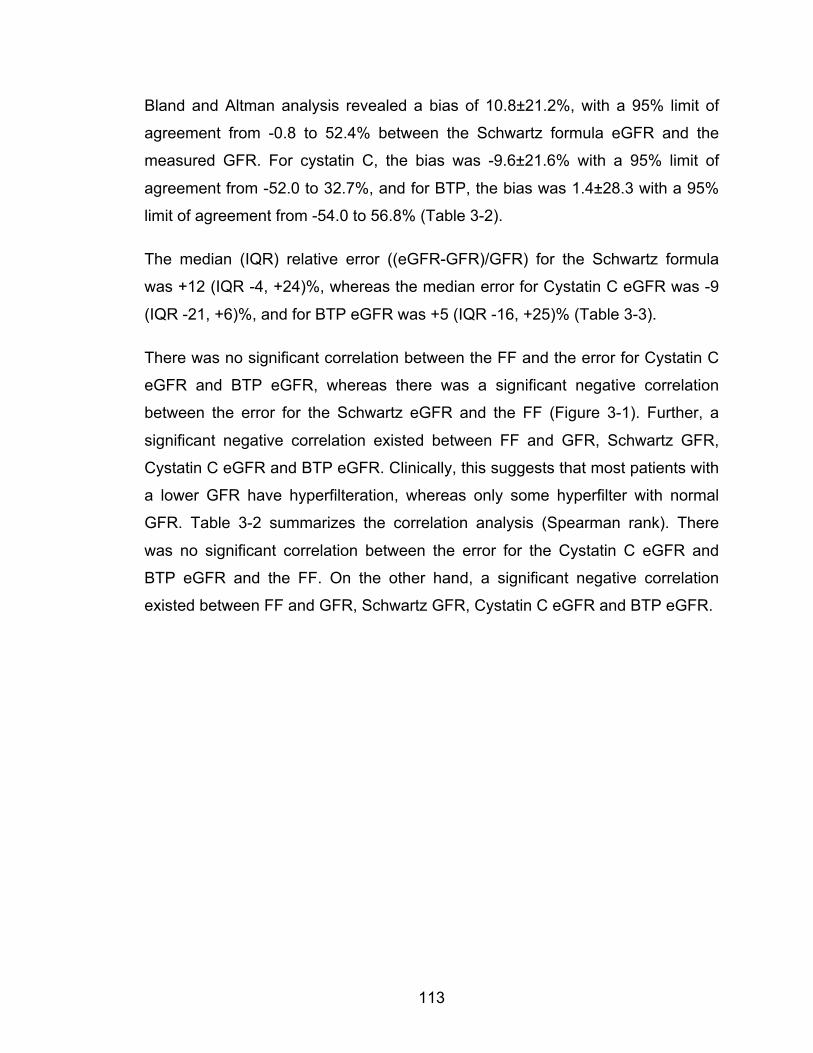
113
Bland and Altman analysis revealed a bias of 10.8±21.2%, with a 95% limit of
agreement from -0.8 to 52.4% between the Schwartz formula eGFR and the
measured GFR. For cystatin C, the bias was -9.6±21.6% with a 95% limit of
agreement from -52.0 to 32.7%, and for BTP, the bias was 1.4±28.3 with a 95%
limit of agreement from -54.0 to 56.8% (Table 3-2).
The median (IQR) relative error ((eGFR-GFR)/GFR) for the Schwartz formula
was +12 (IQR -4, +24)%, whereas the median error for Cystatin C eGFR was -9
(IQR -21, +6)%, and for BTP eGFR was +5 (IQR -16, +25)% (Table 3-3).
There was no significant correlation between the FF and the error for Cystatin C
eGFR and BTP eGFR, whereas there was a significant negative correlation
between the error for the Schwartz eGFR and the FF (Figure 3-1). Further, a
significant negative correlation existed between FF and GFR, Schwartz GFR,
Cystatin C eGFR and BTP eGFR. Clinically, this suggests that most patients with
a lower GFR have hyperfilteration, whereas only some hyperfilter with normal
GFR. Table 3-2 summarizes the correlation analysis (Spearman rank). There
was no significant correlation between the error for the Cystatin C eGFR and
BTP eGFR and the FF. On the other hand, a significant negative correlation
existed between FF and GFR, Schwartz GFR, Cystatin C eGFR and BTP eGFR.
114
Table 3-2. Bland & Altman Results Summarized for Agreement of Various eGFR Formulae with the Measure Isotope GFR. Formula Schwartz eGFR Cystatin C eGFR BTP eGFR
Bias 10.8 9.6 1.4
SD % 21.2 21.6 28.3
95% limit of agreement
-0.80 to 52.4 -52.0 to 32.7 -54.0 to 56.8
Table 3-3. Error by Level of eGFR (eGFR-GFR/GFR) for Various eGFR Formulae. Formula Schwartz eGFR Cystatin C eGFR BTP eGFR
Median error +12.0 -9.0 +5
25th percentile error
-4.0 -21.0 -16.0
75th percentile error
+24.0 +6.0 +25.0
Table 3-4. Spearman Rank Correlations between the Error of the GFR Estimate Models (BTP, Cystatin C, Schwartz) with FF (filtration fraction) Parameter Schwartz %error CysC %error BTP %error
Number of XY Pairs
127 127 127
Spearman r -0.2365 -0.08541 -0.1089
95% confidence interval
-0.3988 to -0.05968 -0.2607 to 0.09535 -0.2826 to 0.07185
P value (two-tailed)
0.0074 0.3397 0.2232
P value summary
** Ns Ns
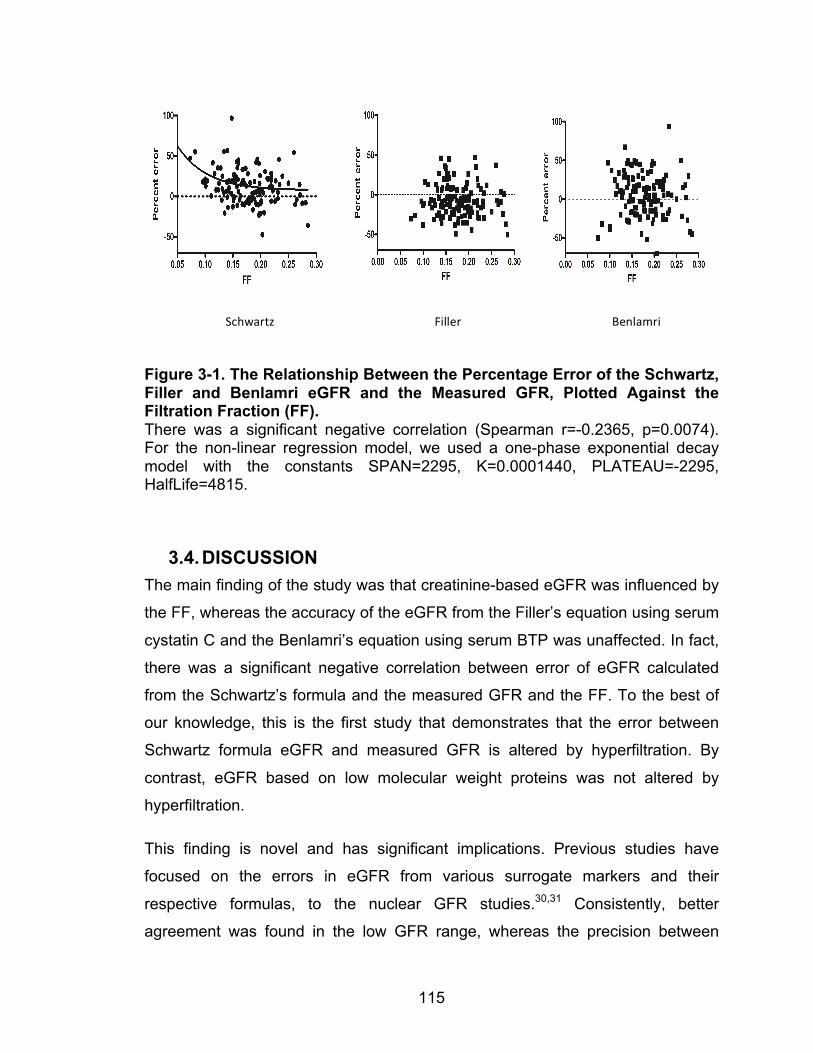
115
Figure 3-1. The Relationship Between the Percentage Error of the Schwartz, Filler and Benlamri eGFR and the Measured GFR, Plotted Against the Filtration Fraction (FF). There was a significant negative correlation (Spearman r=-0.2365, p=0.0074). For the non-linear regression model, we used a one-phase exponential decay model with the constants SPAN=2295, K=0.0001440, PLATEAU=-2295, HalfLife=4815.
3.4. DISCUSSION The main finding of the study was that creatinine-based eGFR was influenced by
the FF, whereas the accuracy of the eGFR from the Filler’s equation using serum
cystatin C and the Benlamri’s equation using serum BTP was unaffected. In fact,
there was a significant negative correlation between error of eGFR calculated
from the Schwartz’s formula and the measured GFR and the FF. To the best of
our knowledge, this is the first study that demonstrates that the error between
Schwartz formula eGFR and measured GFR is altered by hyperfiltration. By
contrast, eGFR based on low molecular weight proteins was not altered by
hyperfiltration.
This finding is novel and has significant implications. Previous studies have
focused on the errors in eGFR from various surrogate markers and their
respective formulas, to the nuclear GFR studies.30,31 Consistently, better
agreement was found in the low GFR range, whereas the precision between
Schwartz Filler Benlamri
116
measured GFR and surrogate marker eGFR worsened with normal and high
GFR values.24,32 It was therefore logical to assess the effect of hyperfiltration on
the diagnostic performance of surrogate eGFR markers. Previous studies did not
include the ERPF or the FF.
What does this mean? It appears that a small molecular weight soluble
substance can be affected by hyperfiltration that weakens its diagnostic
performance as a GFR marker, whereas low molecular weight proteins are
unaffected. This would render serum creatinine a less accurate marker for eGFR
in the presence of hyperfiltration. As GFR may remain constant in the early
stages of CKD while the nephron endowment deteriorates secondary to a renal
disease, patients with a normal GFR may or may not be hyperfiltrating. In
advanced CKD, all remaining nephrons hyperfilter.33 It is therefore conceivable
that the degree of hyperfiltration may serve as the main explanation for the
reduced precision of any surrogate GFR marker in the normal and high GFR
range. Admittedly, the correlation was only 0.24, which was significant, but not
very impressive. The study was not designed to discover a strong correlation
between the error of a creatinine-based eGFR formula and the filtration fraction.
Rather, it was designed to test the hypothesis whether some of variance of the
scatter can be explained by the degree of hyperfiltration. The clinical significance
of our findings lies in the fact that indeed some of the imprecision of creatinine-
based eGFR can be explained by hyperfiltration, and especially patients early in
the course of diabetic nephropathy and IgA nephropathy may have significant
hyperfiltration. In the low GFR range, the phenomenon becomes less important,
but our data suggest that creatinine handling may be altered by the filtration
fraction to a degree that it renders the marker less favorable when compared to
the low molecular weight eGFR markers.
Of course, the question arises as to why the small molecule creatinine is handled
differently than the small molecular weight proteins cystatin C and BTP. All
surrogate eGFR markers have different charges and isoelectric points. As
cystatin C and BTP are handled identically, electric charge is unlikely to explain
117
the negative correlation between the error in eGFR for creatinine in the
measurement of the FF. One possible explanation for this increase in error in
creatinine based eGFR using the Schwartz’s formula is that creatinine is also
secreted by the renal tubule along with the excretion from glomerular filtration
while there is minimal or no tubular reabsorption of creatinine.34 Cystatin C and
BTP are exclusively eliminated through glomerular filtration. Therefore, with low
filtration fraction, there is more blood flow in the efferent arteriole and
subsequently more creatinine available in the peritubular capillaries for tubular
secretion. This may lead to an increase of tubular secretion at lower FF, thereby
creating an overestimation in the eGFR. It should be noted that the difference
between the 25th and 75th percentile (i.e. IQR, a measure of precision) was
inferior for BTP, suggesting that of the two low molecular weight proteins,
Cystatin C should be preferred.
When the filtration fraction is increased, there is a decrease in efferent blood flow
with a subsequent decrease of creatinine available for tubular secretion.
Therefore, the eGFR from the creatinine based formula correlates better with
measured GFR at higher filtration fraction. The proposed differential handling of
creatinine with lower and higher filtration fraction is demonstrated in Figure 3-2.
As tubular secretion does not modify cystatin C and BTP concentrations, the FF
is unaffected by the error between the eGFR errors for both cystatin C and the
beta trace protein based formulae.
Our study has limitations. The first limitation is related to the nuclear medicine
methods chosen to determine GFR and ERPF. No separate gold standard such
as inulin clearance and para-aminohippuric acid (PAH) clearance were used to
evaluate the accuracy of the nuclear medicine methods. Nuclear medicine
methods are known to be imperfect measures of GFR and ERPF. Inulin and PAH
clearance studies are no longer performed in most tertiary centers. However, the
methods were validated and performed as described in as the standard of care.25
While earlier studies comparing inulin clearance and 51Cr EDTA clearance mostly
reported correlations upon introduction of the nuclear medicine methods, a
118
recent study from Medeiros et al.35 used appropriate testing for agreement with
Bland and Altman analysis for an identical method to ours and revealed narrow
limits of agreement and a difference (bias) of 2.8 and 2.7 mL/min, respectively.
They concluded that 51Cr-EDTA-Clearance was a reliable method to measure
GFR compared with Inulin clearance. The authors are unaware of any modern
studies employing Bland and Altman analysis to study agreement between 131I
Hippurate clearance with PAH clearance, however, a study from 1980
demonstrated identical results with PAH clearance and slightly better
performance of 131I Hippurate clearance that we used in our study when
compared to123I Hippurate clearance.36 Furthermore, this study was conducted in
a pediatric population and it is unclear whether these findings can be generalized
to all ages. In children, eGFR is calculated using the Schwartz’s formula that is
based on creatinine and patient height. Adult eGFR calculations based on serum
creatinine such as the Modification of Diet in Renal Disease study (MDRD)
equation and the Cockcroft-Gault equation. In children, these formulae cannot be
used before the findings of this study can be generalized. 37
The eGFR errors using the Schwartz’s formula change with the state of FF. It is
impractical to measure FF in every patient. FF can only be measured if GFR and
ERPF are determined simultaneously. In Canada, 131I or 121I paraaminohippuric
acid are not commercially available. Furthermore, for a simultaneous nuclear
medicine method, two different isotopes with gamma and beta radiation are
required, which is impractical in North America because 51Cr EDTA is not
commercially available.38 While we have a general rule of thumb that the tubular
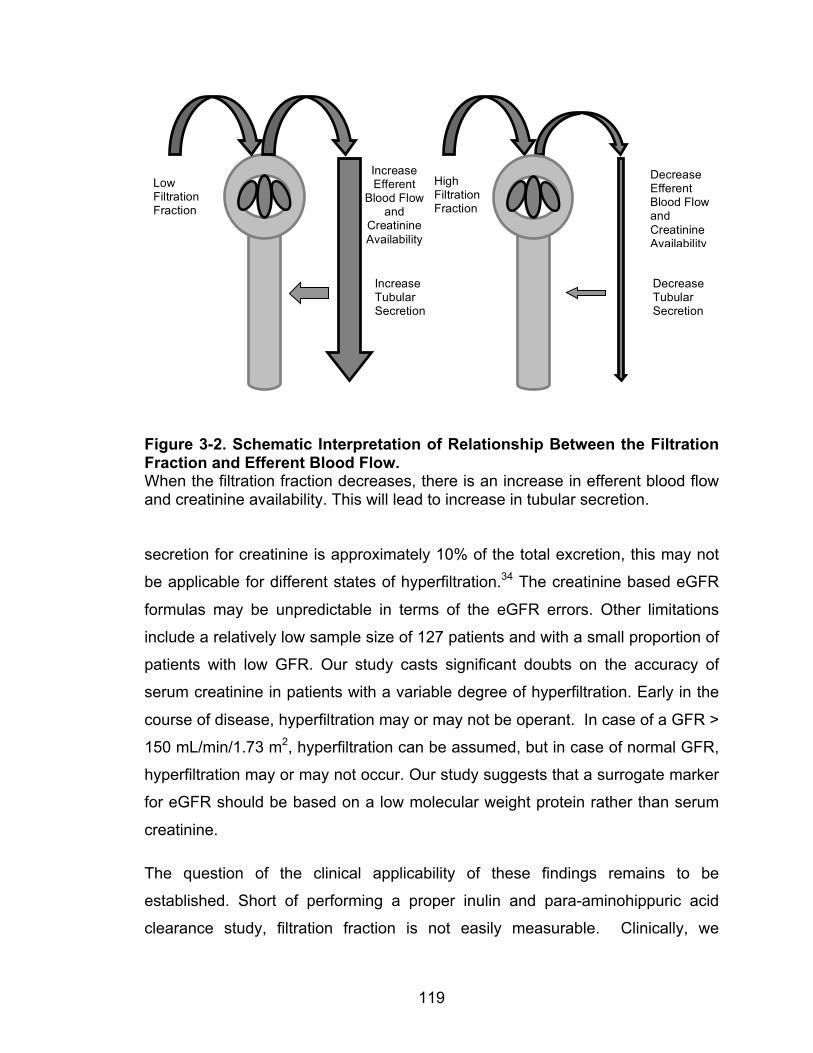
119
Figure 3-2. Schematic Interpretation of Relationship Between the Filtration Fraction and Efferent Blood Flow. When the filtration fraction decreases, there is an increase in efferent blood flow and creatinine availability. This will lead to increase in tubular secretion. secretion for creatinine is approximately 10% of the total excretion, this may not
be applicable for different states of hyperfiltration.34 The creatinine based eGFR
formulas may be unpredictable in terms of the eGFR errors. Other limitations
include a relatively low sample size of 127 patients and with a small proportion of
patients with low GFR. Our study casts significant doubts on the accuracy of
serum creatinine in patients with a variable degree of hyperfiltration. Early in the
course of disease, hyperfiltration may or may not be operant. In case of a GFR >
150 mL/min/1.73 m2, hyperfiltration can be assumed, but in case of normal GFR,
hyperfiltration may or may not occur. Our study suggests that a surrogate marker
for eGFR should be based on a low molecular weight protein rather than serum
creatinine.
The question of the clinical applicability of these findings remains to be
established. Short of performing a proper inulin and para-aminohippuric acid
clearance study, filtration fraction is not easily measurable. Clinically, we
Low Filtration Fraction
Increase Efferent
Blood Flow and
Creatinine Availability
Increase Tubular Secretion
High Filtration Fraction
Decrease Efferent Blood Flow and Creatinine Availability
Decrease Tubular Secretion
120
assume hyperfiltration whenever the GFR is high. Our study suggests that also
all patients with a low GFR hyperfilter. The importance of this study lies less in
the clinical applicability of the effect of hyperfiltration on creatinine excretion, but
rather points to an important factor that explains some of the scatter when using
surrogate markers for the estimation of eGFR. The study also suggests that
CysC is less affected by hyperfiltration than creatinine.
In conclusion, this study showed that creatinine based Schwartz’s formula is
influenced by filtration fraction. The errors of eGFR negatively correlate with
filtration fraction. Only the eGFRs based on low molecular weight proteins
(Filler’s equation using the cystatin C and the Belami’s equation using the beta
trace protein) are unaffected at different levels of FF. Further studies are required
to test the result in adult populations with other creatinine based formulae.
121
REFERENCES 1. Cameron JS. Oxford textbook of clinical nephrology. 2nd ed. Oxford: Oxford
University Press; 1988.
2. Gutman Y, Gottschalk CW, Lassiter WE. Micropuncture Study of Inulin
Absorption in the Rat Kidney. Science 1965;147:753-4.
3. Picciotto G, Cacace G, Cesana P, Mosso R, Ropolo R, De Filippi PG.
Estimation of chromium-51 ethylene diamine tetra-acetic acid plasma clearance:
a comparative assessment of simplified techniques. Eur J Nucl Med 1992;19:30-
5.
4. Chantler C, Barratt TM. Estimation of glomerular filtration rate from plasma
clearance of 51-chromium edetic acid. Arch Dis Child 1972;47:613-7.
5. Filler G, Priem F, Lepage N, et al. Beta-trace protein, cystatin C, beta(2)-
microglobulin, and creatinine compared for detecting impaired glomerular
filtration rates in children. Clin Chem 2002;48:729-36.
6. Dharnidharka VR, Kwon C, Stevens G. Serum cystatin C is superior to serum
creatinine as a marker of kidney function: a meta-analysis. Am J Kidney Dis
2002;40:221-6.
7. Poge U, Gerhardt TM, Stoffel-Wagner B, et al. beta-Trace protein is an
alternative marker for glomerular filtration rate in renal transplantation patients.
Clin Chem 2005;51:1531-3.
8. Heymsfield SB, Arteaga C, McManus C, Smith J, Moffitt S. Measurement of
muscle mass in humans: validity of the 24-hour urinary creatinine method. Am J
Clin Nutr 1983;37:478-94.
9. Okuda Y, Namba S, Nagata M, Hara H, Morita T. [Plasma creatinine and
cystatin C ratio is useful for discriminate diagnosis of postrenal renal failure].
Rinsho Byori 2008;56:101-7.
122
10. Bjornsson TD. Use of serum creatinine concentrations to determine renal
function. Clinical pharmacokinetics 1979;4:200-22.
11. Vinge E, Lindergard B, Nilsson-Ehle P, Grubb A. Relationships among serum
cystatin C, serum creatinine, lean tissue mass and glomerular filtration rate in
healthy adults. Scand J Clin Lab Invest 1999;59:587-92.
12. Lofberg H, Grubb AO. Quantitation of gamma-trace in human biological
fluids: indications for production in the central nervous system. Scand J Clin Lab
Invest 1979;39:619-26.
13. Simonsen O, Grubb A, Thysell H. The blood serum concentration of cystatin
C (gamma-trace) as a measure of the glomerular filtration rate. Scand J Clin Lab
Invest 1985;45:97-101.
14. Grubb A, Lofberg H. Human gamma-trace. Structure, function and clinical
use of concentration measurements. Scand J Clin Lab Invest Suppl 1985;177:7-
13.
15. Grubb AO. Cystatin C--properties and use as diagnostic marker. Adv Clin
Chem 2000;35:63-99.
16. Filler G, Bokenkamp A, Hofmann W, Le Bricon T, Martinez-Bru C, Grubb A.
Cystatin C as a marker of GFR--history, indications, and future research. Clin
Biochem 2005;38:1-8.
17. Hoffmann A, Nimtz M, Conradt HS. Molecular characterization of beta-trace
protein in human serum and urine: a potential diagnostic marker for renal
diseases. Glycobiology 1997;7:499-506.
18. Clausen J. Proteins in normal cerebrospinal fluid not found in serum.
Proceedings of the Society for Experimental Biology and Medicine Society for
Experimental Biology and Medicine 1961;107:170-2.
123
19. Olsen JE, Sandberg, M. Demonstration fo synthesis of betatrace protein in
different tissues of squirrel monkey. neurobiology 1975:7.
20. Priem F, Althaus H, Birnbaum M, Sinha P, Conradt HS, Jung K. Beta-trace
protein in serum: a new marker of glomerular filtration rate in the creatinine-blind
range. Clin Chem 1999;45:567-8.
21. Estorch M, Tembl A, Antonijoan R, et al. Evaluation of renal graft
haemodynamia by 51Cr-EDTA and o-[131I]iodohippurate: its use in the early
diagnosis of glomerular hyperfiltration. Nucl Med Commun 2003;24:679-82.
22. Hyperfiltration. 2009.
23. Kimura G, London GM, Safar ME, Kuramochi M, Omae T. Glomerular
hypertension in renovascular hypertensive patients. Kidney Int 1991;39:966-72.
24. Berg UB. Differences in decline in GFR with age between males and
females. Reference data on clearances of inulin and PAH in potential kidney
donors. Nephrol Dial Transplant 2006;21:2577-82.
25. Huseman D, Gellermann J, Vollmer I, et al. Long-term prognosis of hemolytic
uremic syndrome and effective renal plasma flow. Pediatr Nephrol 1999;13:672-
7.
26. Schwartz GJ, Haycock GB, Edelmann CM, Jr., Spitzer A. A simple estimate
of glomerular filtration rate in children derived from body length and plasma
creatinine. Pediatrics 1976;58:259-63.
27. Filler G, Lepage N. Should the Schwartz formula for estimation of GFR be
replaced by cystatin C formula? Pediatr Nephrol 2003;18:981-5.
28. Benlamri A, Nadarajah R, Yasin A, Lepage N, Sharma AP, Filler G.
Development of a beta-trace protein based formula for estimation of glomerular
filtration rate. Pediatr Nephrol 2010;25:485-90.
124
29. Bland JM, Altman DG. Statistical methods for assessing agreement between
two methods of clinical measurement. Lancet 1986;1:307-10.
30. Levey AS, Bosch JP, Lewis JB, Greene T, Rogers N, Roth D. A more
accurate method to estimate glomerular filtration rate from serum creatinine: a
new prediction equation. Modification of Diet in Renal Disease Study Group. Ann
Intern Med 1999;130:461-70.
31. Rule AD, Bergstralh EJ, Slezak JM, Bergert J, Larson TS. Glomerular
filtration rate estimated by cystatin C among different clinical presentations.
Kidney Int 2006;69:399-405.
32. Levey AS, Stevens LA, Schmid CH, et al. A new equation to estimate
glomerular filtration rate. Ann Intern Med 2009;150:604-12.
33. Schieppati A, Pisoni, R., Remuzzi, G. Pathophysiology and management of
chronic kidney disease. Philadelphia: Elsevier Saunders; 2005.
34. Koeppen BM, Stanton, B.A. Renal Physiology. 4th ed. Philadelphia: Mosby,
Inc.; 2007.
35. Medeiros FS, Sapienza MT, Prado ES, et al. Validation of plasma clearance
of 51Cr-EDTA in adult renal transplant recipients: comparison with inulin renal
clearance. Transplant international : official journal of the European Society for
Organ Transplantation 2009;22:323-31.
36. Stadalnik RC, Vogel JM, Jansholt AL, et al. Renal clearance and extraction
parameters of ortho-iodohippurate (I-123) compared with OIH(I-131) and PAH. J
Nucl Med 1980;21:168-70.
37. Filler G, Foster J, Acker A, Lepage N, Akbari A, Ehrich JH. The Cockcroft-
Gault formula should not be used in children. Kidney Int 2005;67:2321-4.
38. Filler G, Sharma AP. How to monitor renal function in pediatric solid organ
transplant recipients. Pediatr Transplant 2008;12:393-401.
125
4. Chapter 4. Short Communication: Residual Renal Function Calculated from Serum Cystatin C Measurements and A Knowledge of The Standard Weekly Kt/V (Urea)
Currently the gold standard method of measuring residual renal function is using
24-hour urine mean urea and creatinine clearances. However, it is inconvenient
for the patients. To determine if cystatin C levels can be used to measure both
dialysis efficacy and residual renal function in dialysis patients, we recruited 15
patients and developed a cystatin C-based estimated residual renal function
equation. This equation was a better estimate of residual renal function than
previously published equations with r2=0.81 (p< 0.0001). For our equation, we
found that the cystatin C residual renal function estimating equation performed
better when we incorporated the weekly dialysis clearance. This Chapter is
similar to work already published in the Peritoneal Dialysis International, 2011.3
4.1. INTRODUCTION The residual renal clearance was found to be a predictor of survival in dialysis
patients.1,2 It is important to monitor and to preserve residual renal function (RRF;
mL/min/1.73m2) in dialysis patients.3,4 Cystatin C (CysC) is a low molecular
weight protein. The studies by Delaney et al.5 and Hoek et al.6 showed strong
correlations between serum CysC levels and residual renal functions (RRF) in
dialysis patients. In the Hoek study, an estimating equation was developed:
estimated RRF (mL/min) = 22/CysC – 0.70. A recent study by Al Malki et al.
showed a significant inverse relationship between serum CysC levels and
‘Weekly Standardized’ Kt/V (Std Kt/V) values in functionally anephric patients:
Std Kt/V = 7.254 - 0.703 CysC.7
3 Huang SH, Filler G, Lindsay RM. Residual Renal Function Calculated from Serum Cystatin C Measurements and a Knowledge of the Standard Weekly Kt/V (Urea). Perit Dial Int. 2012 Jan-Feb;32(1):102-4. PMID: 22302925
126
In this study, we aimed to assess the role of serum CysC levels and dialytic
clearance in measuring RRF. We hypothesized this difference between the
measured CysC and that estimated from the Al Malki equation would significantly
correlate with RRF as measured by the average of urinary creatinine and urea
clearance. We also postulated that this correlation might be stronger than Hoek’s
RRF, which uses 1/CysC values alone.
4.2. MATERIAL AND METHODS
This is a cross-sectional, single center pilot study of patients with end stage renal
disease receiving peritoneal dialysis and conventional thrice weekly high-flux
hemodialysis therapy. Blood and urine samples were collected prospectively. All
patients provided written informed consent. Patients with recent changes in
dialysis prescription within the last 3 months were excluded. The study was
approved by the Ethic Review Board at the University of Western Ontario
(HSREB#16598E).
Seven of the 15 patients were on peritoneal dialysis. Eight of 15 patients were on
conventional high-flux hemodialysis therapies (3-4 hours thrice weekly). The
serum CysC, urea and creatinine levels were measured. For the hemodialysis
patients, the pre-dialysis blood samples were used to measure serum CysC on
the mid-week hemodialysis session, although our recent study demonstrated that
pre-dialysis CysC values do not vary between hemodialysis sessions. 8Serum
CysC levels were measured by immune nephelometry using an N-latex cystatin
C kit (Siemens Healthcare Diagnostics Ltd.) on a Behring BN ProSpec analyzer
(Dade Behring Marburg, Germany) at the reference laboratory at the Children’s
Hospital of Eastern Ontario in Ottawa, with established co-efficient of variation.
We obtained 24-45 hours of urinary output collection. The RRF were measured
by average urinary creatinine and urea clearance, which were further adjusted for
body surface area (BSA) using the DuBois’ formula (mRRF; mL/min/1.73m2). 9
For the peritoneal dialysis patients, a 24 hours collection of peritoneal effluent
was obtained and the total urea loss was measured. From these, the daily urea
127
clearance was calculated and the Std Kt/V values were derived (7 times daily K,
L) employing the Watson equation for V.3,10 For the hemodialysis patients, the
single hemodialysis treatment efficacy was taken as the single pool Kt/V (Sp
Kt/V) calculated by Urea Kinetic Modeling and the Std Kt/V was derived.4,11,12
All 15 patients had their RRF estimated using the Hoek equation.6 By rearranging
the Al Malki equation, we can use the Std Kt/V to predict the pre-dialysis cystatin
C levels (expected pre-dialysis cystatin C). The expected CysC levels did not
incorporate RRF.7 The differences between the expected CysC levels and the
measured CysC levels were defined as ΔCysC values. The ΔCysC estimated
RRF equation was derived using ΔCysC value.
Statistical analysis was performed using the GraphPad Prism software version
4.03 for Windows (GraphPad Software, San Diego, CA, U.S.A.). Mean and
standard deviation (SD) were reported for normally distributed data; otherwise,
median, 25th, and 75th percentiles (inter quartile range) were given. A linear
regression equation was derived from ΔCysC values. Pearson’s correlation
analysis was used to assess the strength of the relationship between measured
RRF and ΔCysC values, and the measured RRF and estimated RRF, using both
the Hoek equation and the ΔCysC equation. The Bland-Altman test was used to
calculate the bias and the standard deviation of the bias between the estimated
RRF and measured RRF. A p value of <0.05 was considered significant.
4.3. RESULTS
A total of 15 patients had completed measurements. The mean age ± standard
deviation was 63 ± 15 years. The three most common causes of end-stage renal
disease were hypertensive nephropathy (33%), diabetic nephropathy (27%) and
glomerulonephritis (14%). The mean measured pre-dialysis CysC concentration
was 4.57 ± 1.02 mg/L. The mean Std Kt/V values, with and without the
consideration of RRF, were 2.61 ± 0.67 and 1.65 ± 0.59, respectively. The mean
measured RRF was 1.73 ± 0.67 mL/min/1.73m2.
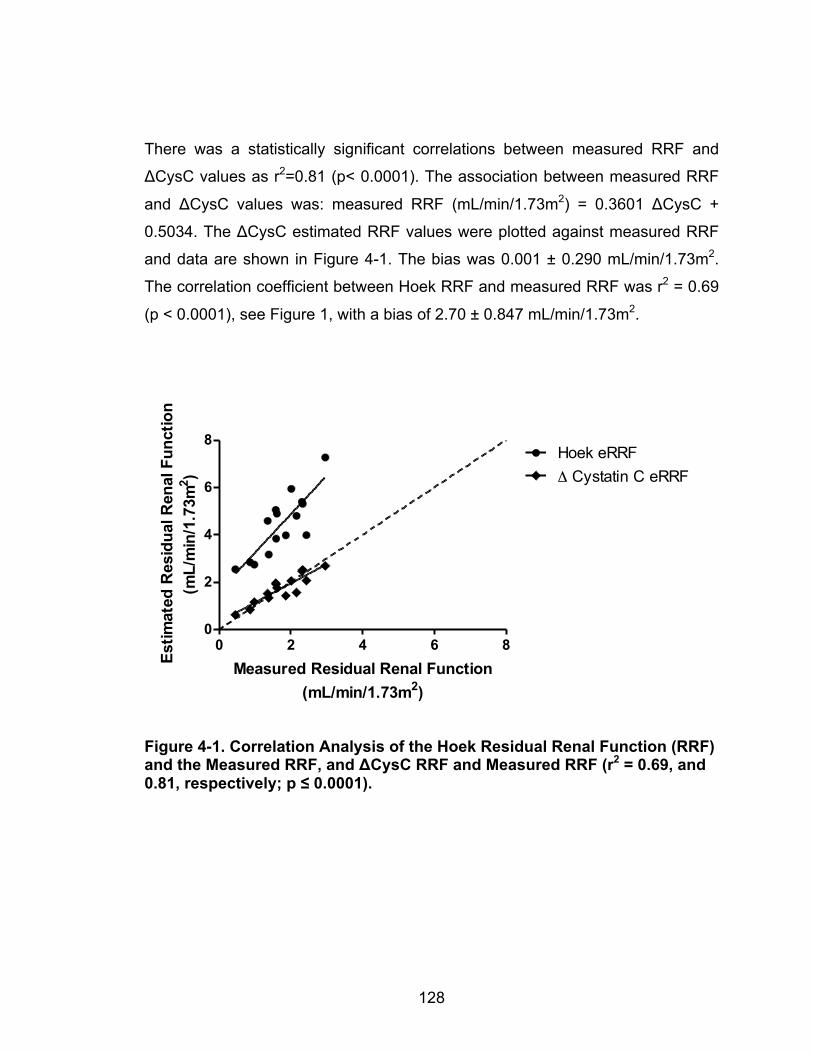
128
There was a statistically significant correlations between measured RRF and
ΔCysC values as r2=0.81 (p< 0.0001). The association between measured RRF
and ΔCysC values was: measured RRF (mL/min/1.73m2) = 0.3601 ΔCysC +
0.5034. The ΔCysC estimated RRF values were plotted against measured RRF
and data are shown in Figure 4-1. The bias was 0.001 ± 0.290 mL/min/1.73m2.
The correlation coefficient between Hoek RRF and measured RRF was r2 = 0.69
(p < 0.0001), see Figure 1, with a bias of 2.70 ± 0.847 mL/min/1.73m2.
Figure 4-1. Correlation Analysis of the Hoek Residual Renal Function (RRF) and the Measured RRF, and ΔCysC RRF and Measured RRF (r2 = 0.69, and 0.81, respectively; p ≤ 0.0001).
0 2 4 6 80
2
4
6
8Hoek eRRFΔ Cystatin C eRRF
Measured Residual Renal Function(mL/min/1.73m2)
Estim
ated
Res
idua
l Ren
al F
unct
ion
(mL/
min
/1.7
3m2 )
129
4.4. DISCUSSION
Hoek et al.6 derived an equation to obtain RRF using serum 1/CysC values in
both hemodialysis and peritoneal dialysis patients. However, they ignored the
dialytic clearance of CysC. In our study, we showed strong correlation between
measured RRF (mL/min/1.73m2) and ΔCysC levels (r2=0.81, p< 0.0001), which
considered only the dialytic clearance. The linear relationship between the two
parameters was expressed as measured RRF = 0.3601 ΔCysC + 0.5034. The
bias was 0.001 ± 0.290 mL/min/1.73m2 (p=0.40). Figure 4-1 showed that the
regression lines for ΔCysC estimated RRF, which was closer to the line of
identity compared to the Hoek’s.
Why does the Hoek RRF overestimate measured RRF? This is likely due to the
difference in Std Kt/V values in our study population and the Hoek study
population. There was a significantly higher mean pre-dialysis CysC level in the
Hoek study (5.8-6.1 mg/L) as compared to ours (4.6 ± 1.20 mg/L), even though
the measured RRF in our study was lower than Hoek’s (1.73 ± 0.67
mL/min/1.73m2 vs. 2.7-3.3 ± 1.3-1.5 mL/min/1.73m2, respectively). This indicated
that the mean Std Kt/V, without consideration of renal clearance, in the Hoek
study, was lower than our study. Therefore, it is not surprising that the Hoek RRF
systemically over-estimated the residual renal function in our study population.
Incorporating Std Kt/V can eliminate this systematic error.
The accuracy is limited regarding the nuclear medicine isotopic glomerular
filtration rate method when it is below 30 mL/min/1.73m2.13 Therefore, we used
average urinary creatinine and urea clearance as our reference RRF. We did not
find a correlation between Std Kt/V and CysC, and did not expect to because of
the small sample size and the narrow range of Std Kt/V values obtained from
patients on identical dialysis modalities. Although Sjostrom et al. suggested that
renal clearance of CysC is in a form of hyperbolic function (1/X), we were unable
to incorporate the Std Kt/V to derive RRF without using the Al Malki equation.
The major limitation of the study is its small size. Furthermore, both the Al Malki
130
equation, which was used to derive the ΔCysC, and the estimated RRF equation
in this study need further validation. Another limitation of the study is the small
and narrow range of the RRF values. However, this study was designed to
support our operational hypothesis. We found the importance of incorporating
Std Kt/V into the estimated RRF equation, as this can result in systematic bias
when the study population has different Std Kt/V values. We plan to conduct a
larger study with wide ranges of Std Kt/V values to validate the ΔCysC equation.
131
REFERENCES 1. Termorshuizen F, Dekker FW, van Manen JG, et al. Relative contribution of
residual renal function and different measures of adequacy to survival in
hemodialysis patients: an analysis of the Netherlands Cooperative Study on the
Adequacy of Dialysis (NECOSAD)-2. J Am Soc Nephrol 2004;15:1061-70.
2. Bargman JM, Thorpe KE, Churchill DN, Group CPDS. Relative contribution of
residual renal function and peritoneal clearance to adequacy of dialysis: a
reanalysis of the CANUSA study. J Am Soc Nephrol 2001;12:2158-62.
3. Clinical practice recommendations for peritoneal dialysis adequacy. Am J
Kidney Dis 2006;48 Suppl 1:S130-58.
4. Hemodialysis Adequacy Work G. Clinical practice guidelines for hemodialysis
adequacy, update 2006. Am J Kidney Dis 2006;48 Suppl 1:S2-90.
5. Delaney MP, Stevens PE, Al Hasani M, Stowe HJ, Judge C, Lamb EJ.
Relationship of serum cystatin C to peritoneal and renal clearance measures in
peritoneal dialysis: a cross-sectional study. Am J Kidney Dis 2008;51:278-84.
6. Hoek FJ, Korevaar JC, Dekker FW, Boeschoten EW, Krediet RT. Estimation of
residual glomerular filtration rate in dialysis patients from the plasma cystatin C
level. Nephrol Dial Transplant 2007;22:1633-8.
7. Al-Malki N, Heidenheim PA, Filler G, Yasin A, Lindsay RM. Cystatin C levels in
functionally anephric patients undergoing dialysis: the effect of different methods
and intensities. Clin J Am Soc Nephrol 2009;4:1606-10.
8. Huang SH, Filler G, Yasin A, Lindsay RM. Cystatin C reduction ratio depends
on normalized blood liters processed and fluid removal during hemodialysis. Clin
J Am Soc Nephrol 2011;6:319-25.
9. Du Bois D, Du Bois, E.F. Clinical Calofimetry: Tenth Paper a Formula to
Estimate the Approximate Surface Area if Height and Weight be Known. Arch
Intern Med 1916;XVII:9.
132
10. Watson PE, Watson ID, Batt RD. Total body water volumes for adult males
and females estimated from simple anthropometric measurements. Am J Clin
Nutr 1980;33:27-39.
11. Gotch FA. The current place of urea kinetic modelling with respect to
different dialysis modalities. Nephrol Dial Transplant 1998;13 Suppl 6:10-4.
12. Leypoldt JK, Jaber BL, Zimmerman DL. Predicting treatment dose for novel
therapies using urea standard Kt/V. Semin Dial 2004;17:142-5.
13. LaFrance ND, Drew HH, Walser M. Radioisotopic measurement of
glomerular filtration rate in severe chronic renal failure. J Nucl Med
1988;29:1927-30.
133
5. CHAPTER 5. THE KINETICS OF CYSTATIN C REMOVAL BY HEMODIALYSIS
There have been only a limited number of published studies to examine the
kinetics of cystatin C removal over the course of single hemodialysis treatments.
We hypothesized that the primary method of cystatin C clearance would be
convective clearance and that its volume of distribution would be similar to the
extracellular volume. We analyzed 10 hemodialysis sessions with high-flux
dialyzers from 9 patients, finding that indeed cystatin C is cleared during dialysis
by both diffusion and convection. It is distributed mainly in the extracellular space
but equilibrates slowly between the extravascular and intravascular spaces. This
Chapter is similar to work already published in the American Journal of Kidney
Disease in 2015.4
5.1. INTRODUCTION
The mainstay for calculating dialysis dose, and determining its adequacy as
delivered, is by clearance measurement of solutes that accumulate in uremic
patients. Urea (Ur) kinetic modeling is the most commonly described method. 1
Nevertheless, there are pitfalls in using Ur clearance to assess hemodialysis
dose: (1) studies have not shown any benefits of further increasing Ur clearance
once a threshold level has been reached (single pool Kt/Vurea of 1.2), and (2)
estimations of dialysis dose using Ur clearance with hemodialysis of variable
duration and frequency (standardized weekly Kt/Vurea) have not been validated.2,3
Therefore, there is an interest in assessing alternative quantitative methods and
biomarker solutes in the optimization of dialysis dose.
Cystatin C (CysC), a middle molecular protein (13.4 kDalton), is dialyzable when
a high-flux dialyzer is used. It is cleared from the blood though diffusion and
convection processes.4-6 Al-Malki et al.5 showed that pre-dialysis CysC levels in
anuric dialysis patients depended on the intensity of treatment; patients treated 4 Huang SH, Tirona RG, Reid-Wilkinson F, Thomson BKA, Filler G, Stodilka R, Lindsay RM. The Kinetics of Cystatin C Removal by Hemodialysis. Am J Kidney Dis. 2015 Jan;65(1):174-5. PMID: 25282341
134
using nocturnal hemodialysis had lower levels than those who underwent
conventional thrice-weekly treated patients. Although there was a significant
inverse correlation between the pre-dialysis blood CysC levels and the standard
weekly Kt/Vurea yet there is no relationship between this parameter and any per-
treatment urea kinetic parameter. This suggests that the pre-dialysis blood CysC
level depends on whether the treatment is chronic, rather than on a single
treatment.
In a previous study, we showed that the CysC reduction ratio ((predialysis CysC
minus postdialysis CysC)/predialysis CysC) over the course of a single dialysis
treatment (84%), mainly depended on the normalized liters of blood processed
(L/kg), and was inversely related to by the ultrafiltration volume (L). 4 We
proposed that CysC has a volume of distribution equal to the extracellular fluid
compartment volume and shows time-limited equilibration between the interstitial
space and blood water.4
As a result, we hypothesized that CysC levels may thus provide an additional
index for assessing dialysis treatment adequacy. This is analogous to the use of
hemoglobin A1C (CysC levels) and fasting glucose (single-pool Kt/Vurea) in
diabetic monitoring.7 We hypothesized that CysC would be mostly cleared by
convective clearance, unlike Ur. We, therefore, conducted this CysC kinetic study
to calculate the diffusional and convectional clearances of CysC by hemodialysis,
and to estimate its volume of distribution and intra-compartmental equilibration
rate constants.
5.2. METHODS
(1) Setting & Participants
This study included a total of 9 patients from the home hemodialysis program at
London Health Sciences Centre (London, Ontario, Canada). This study was
approved by Western University’s Health Sciences Research Ethics Board
(HSREB #: 16599E) and all patients gave signed informed consent prior to study
135
commencement. The patients were included if they had been on a stable
hemodialysis regime for at least 3 months (30 patients eligible). The patients
were excluded if they had known access recirculation or poor access flow
(access blood flow < 400 mL/min) (0 patients), or they had recent hospital
admissions (0 patients) or transportation issue/conflict with their schedule (6
patients). The remaining patients were contacted.
(2) Outcome and Measurements
We analyzed hemodialysis sessions from 9 patients. Each patient had at least 3-
hours of hemodialysis using a high-efficiency high-flux polysulphone dialyzer
(Optiflux® 160, Fresenius Medical Care North America, USA), one patient had
two such sessions and one patient underwent a 4-hour session of hemodialysis.
Each hemodialysis session consisted of 3 periods: one-hour was ultrafiltration
alone (TU), one-hour was dialysis only (TD), and the last hour was combined
ultrafiltration and dialysis (TUD). The first two periods were in random order. One
patient who had 4 hours of hemodialysis received 2 hours of TUD. We divided a
hemodialysis session into 3 different periods to minimize alteration of patients’
baseline dialysis treatment prescription.
For the TD period, the blood flow rate on the hemodialysis machine (Qb) was
varied. Patients received dialysis at Qb 200 mL/min (Qb200) for ten minutes and at
Qb 400 mL/min (Qb400) for 50 minutes in random order. The ultrafiltration volume
for the individual patient was assessed by clinical examination (blood pressure
and edema) and by the pre-hemodialysis weight. For each patient, half of the
ultrafiltration volume was removed during the TU and the other half was removed
during the TUD. No fluid was removed during the TD.
Samples from the arterial lines were taken to measure the blood concentrations
of CysC, creatinine (Cr) and Ur prior to and 30 minutes after each session.
Additional blood samples were taken from both the arterial and the venous lines
at the end of the treatment modalities (TU, TD and TUD). During the TD, the arterial
and the venous samples were taken at Qb200 and Qb400. These samples were
136
sent immediately to the London Laboratory for measurements. With the pre-
hemodialysis blood samples, we also measured C-reactive protein (CRP) and
thyroid-stimulating hormone (TSH) levels.
Serum CysC levels were measured by immune nephelometry using an N-latex
cystatin C kit (Siemens Healthcare Diagnostics Ltd., Mississauga, ON) on a
Behring BN ProSpec analyzer (Dade Behring Marburg, Germany) at the
reference laboratory at the Children’s Hospital of Eastern Ontario in Ottawa. The
coefficient of variation (CV) of the CysC measurements has been previously
established at 3.1% at 1.06 mg/L; 3.5% at 2.04 mg/L and 6.7% at 5.26 mg/L.8
CRP was measured by immunonephelometry (Dade Behring BN Prospec,
Mississauga, Canada) with CV of 4.02% at the level of 12.79 mg/L and 4.48% at
50.87 mg/L. TSH was measured by direct chemiluminescence assay (Bayer
Centaur Instrument, Germany). Ur and Cr were measured by enzymatic
photometric and enzymatic colorimetric methods, respectively, with reference
range <8.3-11.9 mmol/L and 55-120 µmol/L.
Although the machine blood pump Qb was set at either 200 or 400 mL/min during
TD, the actual Qb may be lower especially at higher pump speeds. Furthermore,
the actual Qb was converted to a plasma flow rate (includes fluids inside the red
blood cells and plasma, Qp) and a plasma water flow rate (includes only plasma,
Qpw) in the calculation of dialysis clearances; to do so, we used the generic
correction factors of 0.85 for Qp and 0.59 for QPW, which is justified in this
population.9,10 These generic factors were based on our previous study that the
mean hematocrit (Hct) ± standard deviation (SD) and blood total protein (Tp)
value ± SD were 0.36 ± 0.02 u and 66.5 ± 4.01 g/L.
Qp = Qb (0.72 Hct + [1 – Hct] [1-0.00107 Tp]) Equation 5-1
Qpw = Qb ([1 – Hct] [1-0.00107 Tp]) Equation 5-2
To prevent access recirculation, all patients who had arterial venous fistulae or
graft had access flow measured to ensure the blood flow rates were greater than
the dialysis blood flow rates and the arterial and venous needles were at least 2
137
inches apart. Although there were two patients who used central venous
catheters, we ensured these patients had good catheter blood flow to minimize
recirculation. In four of our patients, we also measured the true blood Qb to
compare this with the dialyzer blood flow rate as assessed by the blood pump.
Both Qa and Qb were measured by the Transonic HD01 monitor (Transonic
Systems, Ithaca, NY). At machine Qb of 200 mL/min and 400 mL/min (Qb200 and
Qb400) the actual blood flow rates were 179 ± 2 and 331 ± 6 mL/min, respectively.
However, for consistency and clarity, the use of the parameters, “Qb, Qb200 and
Qb400”, will be continued throughout the chapter. These values were further
corrected for Qp and Qpw. The Qp values (152 mL/min and 281 mL/min for Qb200
and Qb400, respectively) were used for the Ur and Cr clearance calculation
because Ur and Cr are distributed in plasma and intracellular space. The Qpw
values (106 mL/min and 195 mL/min for Qb200 and Qb400, respectively) were used
for CysC clearance calculation because CysC is likely distributed exclusively in
the extracellular space.
Dialyzer Clearance
At the end of each dialysis period, dialyzer clearance (K) of CysC was calculated
as follows:
𝑲 = 𝑸𝒑𝒘 𝑪𝒊𝒏!𝑪𝒐𝒖𝒕𝑪𝒊𝒏
Equation 5-3
where Qpw is the plasma water flow rate at the dialyzer inlet, and Cin and Cout are
the concentrations of the solute at the inlet and outlet of the dialyzer. For Ur and
Cr, we used Qp rather than Qpw to calculate the K values.
In addition, the sieving coefficient (S) and mass transfer area coefficient (K0A) of
CysC were calculated as follows:11
𝑺 = 𝑲𝒖𝒇𝑸𝒖𝒇 Equation 5-4
138
𝑲𝟎𝑨 = 𝑸𝒑𝒘𝑸𝒅𝑸𝒑𝒘!𝑸𝒅
𝒍𝒏 𝟏!𝑲𝒅 𝑸𝒑𝒘 𝟏! 𝑲𝒅 𝑸𝒅
Equation 5-5
where Qpw and Qd are the plasma flow rate and the dialysate flow rate. Quf is the
ultrafiltration rate. Kuf is the convective clearance for the solute (i.e. CysC). Kd is
the dialysate clearance.
Multi-compartmental Model: Kinetics of CysC Distribution and Estimation of
Volume of Distribution
The CysC inter-compartmental (intravascular to and from extravascular space)
clearance constants and CysC volume of distribution were estimated from blood
CysC time course data using a compartmental model. Briefly, the model
describes the body as two pools (two compartments defined as vascular and
extravascular spaces) to which CysC distributes with mass transfer governed by
inter-compartmental transfer constants. CysC generation provides input into the
extravascular compartment while CysC elimination occurs through the vascular
compartment by renal, non-renal pathways as well as through dialysis. While
applying this model to characterize CysC kinetics, we made several
assumptions. First, we set the CysC generation rate (117ug/min/1.73m2) based
on data from the literature.12 From our previous study, we had shown that CysC
pre-hemodialysis levels were not significantly different hemodialysis sessions.4
Therefore, we made the assumption that CysC level would reach the same pre-
hemodialysis CysC level by the next hemodialysis session. We included the
measured residual renal clearance in the model. The calculated amount of CysC
removed from subject for each dialysis period was input into the model. Volume
of the intravascular compartment (VI) was assumed to be 40 mL/kg (plasma
water volume). For each patient, the dialysis input plasma CysC concentrations,
which reflect vascular compartment concentrations, prior to and throughout the
dialysis periods, were used for least-squares fitting to the Model (Scientist,
MicroMath Scientific Software, St. Louis, MO). Data fitting furnished estimates for
three parameters: two CysC inter-compartment transfer constants (from
intravascular space to extravascular space and from extravascular space to
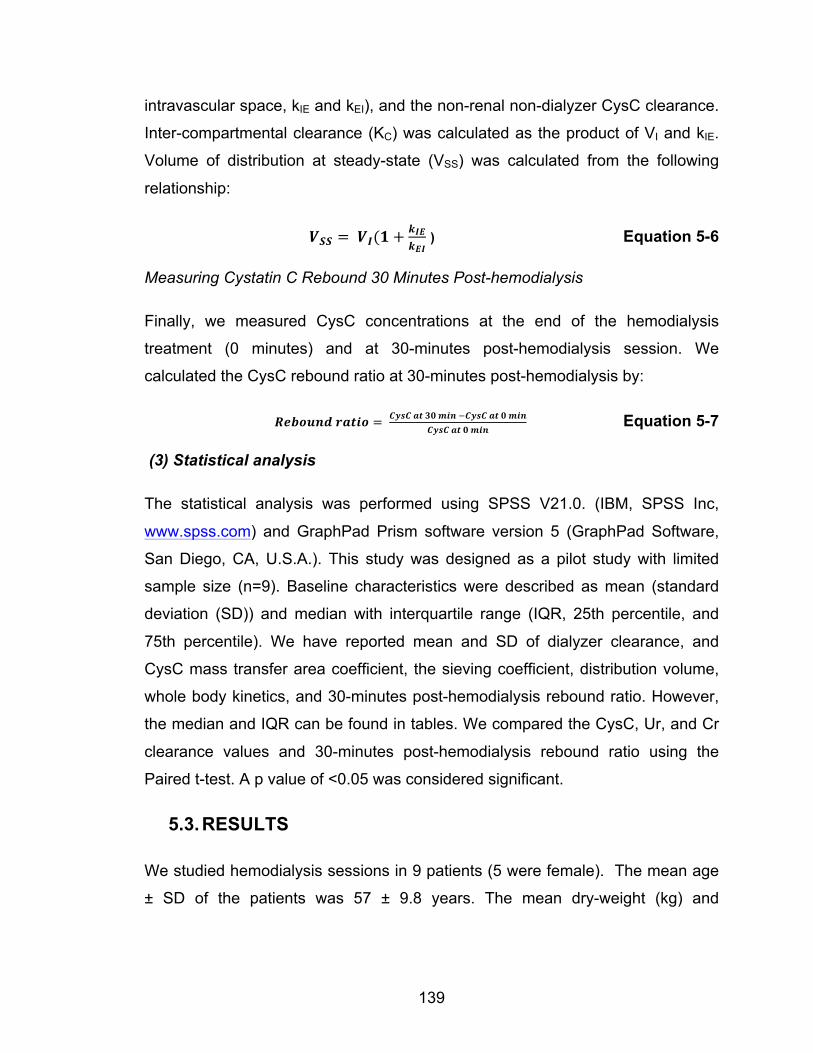
139
intravascular space, kIE and kEI), and the non-renal non-dialyzer CysC clearance.
Inter-compartmental clearance (KC) was calculated as the product of VI and kIE.
Volume of distribution at steady-state (VSS) was calculated from the following
relationship:
𝑽𝑺𝑺 = 𝑽𝑰(𝟏+𝒌𝑰𝑬𝒌𝑬𝑰
) Equation 5-6
Measuring Cystatin C Rebound 30 Minutes Post-hemodialysis
Finally, we measured CysC concentrations at the end of the hemodialysis
treatment (0 minutes) and at 30-minutes post-hemodialysis session. We
calculated the CysC rebound ratio at 30-minutes post-hemodialysis by:
𝑹𝒆𝒃𝒐𝒖𝒏𝒅 𝒓𝒂𝒕𝒊𝒐 = 𝑪𝒚𝒔𝑪 𝒂𝒕 𝟑𝟎 𝒎𝒊𝒏 !𝑪𝒚𝒔𝑪 𝒂𝒕 𝟎 𝒎𝒊𝒏𝑪𝒚𝒔𝑪 𝒂𝒕 𝟎 𝒎𝒊𝒏
Equation 5-7
(3) Statistical analysis
The statistical analysis was performed using SPSS V21.0. (IBM, SPSS Inc,
www.spss.com) and GraphPad Prism software version 5 (GraphPad Software,
San Diego, CA, U.S.A.). This study was designed as a pilot study with limited
sample size (n=9). Baseline characteristics were described as mean (standard
deviation (SD)) and median with interquartile range (IQR, 25th percentile, and
75th percentile). We have reported mean and SD of dialyzer clearance, and
CysC mass transfer area coefficient, the sieving coefficient, distribution volume,
whole body kinetics, and 30-minutes post-hemodialysis rebound ratio. However,
the median and IQR can be found in tables. We compared the CysC, Ur, and Cr
clearance values and 30-minutes post-hemodialysis rebound ratio using the
Paired t-test. A p value of <0.05 was considered significant.
5.3. RESULTS
We studied hemodialysis sessions in 9 patients (5 were female). The mean age
± SD of the patients was 57 ± 9.8 years. The mean dry-weight (kg) and
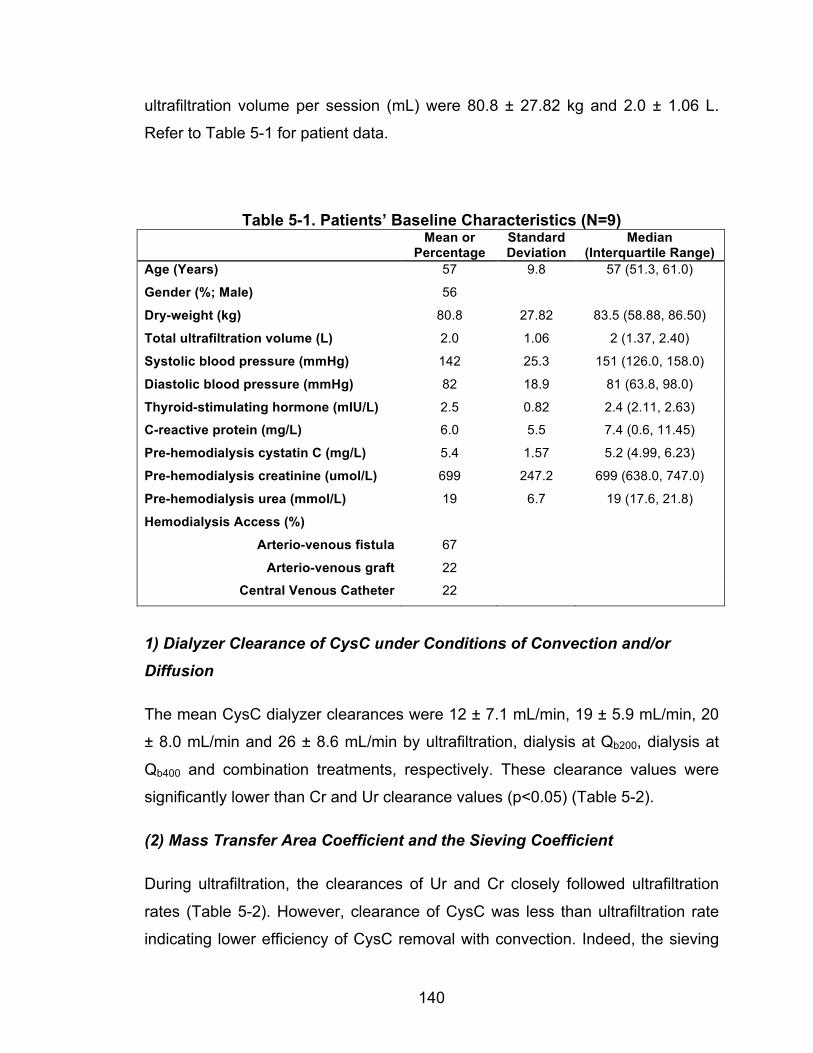
140
ultrafiltration volume per session (mL) were 80.8 ± 27.82 kg and 2.0 ± 1.06 L.
Refer to Table 5-1 for patient data.
Table 5-1. Patients’ Baseline Characteristics (N=9) Mean or
Percentage Standard Deviation
Median (Interquartile Range)
Age (Years) 57 9.8 57 (51.3, 61.0)
Gender (%; Male) 56
Dry-weight (kg) 80.8 27.82 83.5 (58.88, 86.50)
Total ultrafiltration volume (L) 2.0 1.06 2 (1.37, 2.40)
Systolic blood pressure (mmHg) 142 25.3 151 (126.0, 158.0)
Diastolic blood pressure (mmHg) 82 18.9 81 (63.8, 98.0)
Thyroid-stimulating hormone (mIU/L) 2.5 0.82 2.4 (2.11, 2.63)
C-reactive protein (mg/L) 6.0 5.5 7.4 (0.6, 11.45)
Pre-hemodialysis cystatin C (mg/L) 5.4 1.57 5.2 (4.99, 6.23)
Pre-hemodialysis creatinine (umol/L) 699 247.2 699 (638.0, 747.0)
Pre-hemodialysis urea (mmol/L) 19 6.7 19 (17.6, 21.8)
Hemodialysis Access (%)
Arterio-venous fistula 67
Arterio-venous graft 22
Central Venous Catheter 22
1) Dialyzer Clearance of CysC under Conditions of Convection and/or Diffusion
The mean CysC dialyzer clearances were 12 ± 7.1 mL/min, 19 ± 5.9 mL/min, 20
± 8.0 mL/min and 26 ± 8.6 mL/min by ultrafiltration, dialysis at Qb200, dialysis at
Qb400 and combination treatments, respectively. These clearance values were
significantly lower than Cr and Ur clearance values (p<0.05) (Table 5-2).
(2) Mass Transfer Area Coefficient and the Sieving Coefficient
During ultrafiltration, the clearances of Ur and Cr closely followed ultrafiltration
rates (Table 5-2). However, clearance of CysC was less than ultrafiltration rate
indicating lower efficiency of CysC removal with convection. Indeed, the sieving
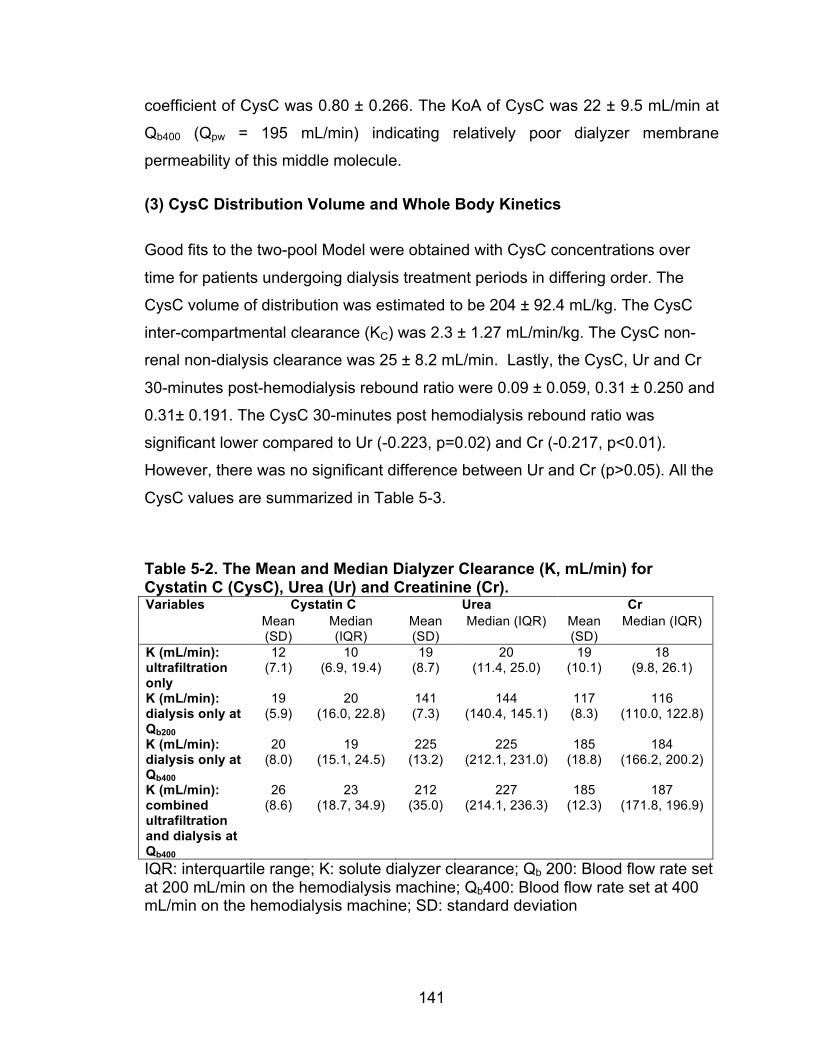
141
coefficient of CysC was 0.80 ± 0.266. The KoA of CysC was 22 ± 9.5 mL/min at
Qb400 (Qpw = 195 mL/min) indicating relatively poor dialyzer membrane
permeability of this middle molecule.
(3) CysC Distribution Volume and Whole Body Kinetics
Good fits to the two-pool Model were obtained with CysC concentrations over
time for patients undergoing dialysis treatment periods in differing order. The
CysC volume of distribution was estimated to be 204 ± 92.4 mL/kg. The CysC
inter-compartmental clearance (KC) was 2.3 ± 1.27 mL/min/kg. The CysC non-
renal non-dialysis clearance was 25 ± 8.2 mL/min. Lastly, the CysC, Ur and Cr
30-minutes post-hemodialysis rebound ratio were 0.09 ± 0.059, 0.31 ± 0.250 and
0.31± 0.191. The CysC 30-minutes post hemodialysis rebound ratio was
significant lower compared to Ur (-0.223, p=0.02) and Cr (-0.217, p<0.01).
However, there was no significant difference between Ur and Cr (p>0.05). All the
CysC values are summarized in Table 5-3.
Table 5-2. The Mean and Median Dialyzer Clearance (K, mL/min) for Cystatin C (CysC), Urea (Ur) and Creatinine (Cr). Variables Cystatin C Urea Cr
Mean (SD)
Median (IQR)
Mean (SD)
Median (IQR) Mean (SD)
Median (IQR)
K (mL/min): ultrafiltration only
12 (7.1)
10 (6.9, 19.4)
19 (8.7)
20 (11.4, 25.0)
19 (10.1)
18 (9.8, 26.1)
K (mL/min): dialysis only at Qb200
19 (5.9)
20 (16.0, 22.8)
141 (7.3)
144 (140.4, 145.1)
117 (8.3)
116 (110.0, 122.8)
K (mL/min): dialysis only at Qb400
20 (8.0)
19 (15.1, 24.5)
225 (13.2)
225 (212.1, 231.0)
185 (18.8)
184 (166.2, 200.2)
K (mL/min): combined ultrafiltration and dialysis at Qb400
26 (8.6)
23 (18.7, 34.9)
212 (35.0)
227 (214.1, 236.3)
185 (12.3)
187 (171.8, 196.9)
IQR: interquartile range; K: solute dialyzer clearance; Qb 200: Blood flow rate set at 200 mL/min on the hemodialysis machine; Qb400: Blood flow rate set at 400 mL/min on the hemodialysis machine; SD: standard deviation
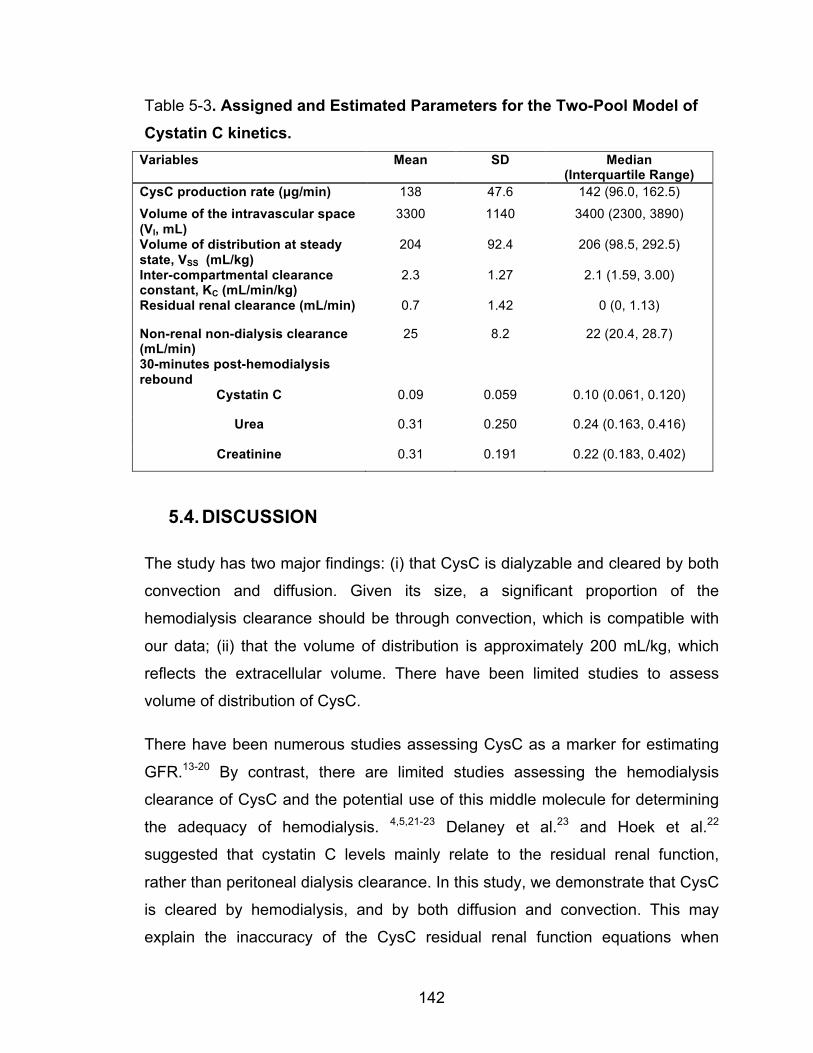
142
Table 5-3. Assigned and Estimated Parameters for the Two-Pool Model of Cystatin C kinetics.
Variables Mean SD Median (Interquartile Range)
CysC production rate (µg/min) 138 47.6 142 (96.0, 162.5)
Volume of the intravascular space (VI, mL)
3300 1140 3400 (2300, 3890)
Volume of distribution at steady state, VSS (mL/kg)
204 92.4 206 (98.5, 292.5)
Inter-compartmental clearance constant, KC (mL/min/kg)
2.3 1.27 2.1 (1.59, 3.00)
Residual renal clearance (mL/min) 0.7 1.42 0 (0, 1.13)
Non-renal non-dialysis clearance (mL/min)
25 8.2 22 (20.4, 28.7)
30-minutes post-hemodialysis rebound
Cystatin C 0.09 0.059 0.10 (0.061, 0.120)
Urea 0.31 0.250 0.24 (0.163, 0.416)
Creatinine 0.31 0.191 0.22 (0.183, 0.402)
5.4. DISCUSSION
The study has two major findings: (i) that CysC is dialyzable and cleared by both
convection and diffusion. Given its size, a significant proportion of the
hemodialysis clearance should be through convection, which is compatible with
our data; (ii) that the volume of distribution is approximately 200 mL/kg, which
reflects the extracellular volume. There have been limited studies to assess
volume of distribution of CysC.
There have been numerous studies assessing CysC as a marker for estimating
GFR.13-20 By contrast, there are limited studies assessing the hemodialysis
clearance of CysC and the potential use of this middle molecule for determining
the adequacy of hemodialysis. 4,5,21-23 Delaney et al.23 and Hoek et al.22
suggested that cystatin C levels mainly relate to the residual renal function,
rather than peritoneal dialysis clearance. In this study, we demonstrate that CysC
is cleared by hemodialysis, and by both diffusion and convection. This may
explain the inaccuracy of the CysC residual renal function equations when
143
applied to other populations, as these equations do not take into account
peritoneal dialysis clearance.24 The K by diffusion alone was higher than by
convection; however, this of course would depend on the ultrafiltration rate. The
mean ultrafiltration volume was 2.0 ± 1.06 L per session. The K by convection
can also be expressed as 13 ± 4.4 mL/min per L of ultrafiltration.
During convectional treatment, the sieving coefficient of CysC was 0.80 ± 0.266.
This is much lower than the sieving coefficients of small solutes, such as Ur and
Cr, which are close to 1.25 The sieving coefficient of beta-2 microglobulin is close
to 0.60.25 Furthermore, during diffusional dialysis, the K0A of CysC was
estimated as 22 ± 9.5 mL/min. Small solutes, such as Ur and Cr have much
higher K0A values (>700 mL/min) than CysC and reported with the same
dialyzer.26 In comparison, lysozyme, a middle molecule with molecular weight of
14.8 KDalton, has a K0A of 70 mL/min under normal clinical conditions.
Differences between CysC and lysosome K0A values may relate to differential
protein interactions with the dialyzer membrane. It is also possible that there
might be CysC dialyzer adsorption. This needs to be confirmed by staining the
dialyzer and was not done in our study.
Although Thysell et al.27 showed that with low-flux hemodialysis, blood CysC
concentrations rose after a single treatment, Lindström et al.6 demonstrated
CysC levels were reduced with a dialysis session, and high-flux hemodiafiltration
provided higher CysC clearances than did low flux hemodialysis. The study by Al
Malki et al.5 demonstrated that pre-hemodialysis CysC levels correlated
inversely with the standardized weekly Kt/Vurea, indicating that patients receiving
more intensive dialysis have lower blood levels. We previously showed that the
CysC reduction ratio over hemodialysis was 26% as compared to 70% and 65%
reduction of Ur and Cr. We proposed that CysC had a slow inter-compartmental
equilibration rate but was likely distributed throughout the extracellular space
only.4 In this study, we confirmed that the inter-compartmental equilibration rates
were slow, either from intravascular space to extravascular space or from
extravascular space to intravascular space. This explained the observed CysC
144
rebound 30-minutes post-hemodialysis of 8.5%. These rebound values (%) were
lower than for Ur and Cr. Furthermore, the average KC of CysC was 2.3
mL/min/kg; a value considerably lower than that estimated for Ur of ~8
mL/min/kg.28 We did not perform serial CysC measurements post hemodialysis.
Therefore, CysC rebound would likely be higher than 9%. Interestingly, we also
observed that with all patients who received TD followed by TU, the CysC
concentration increased in the blood during TU. This is likely due to the solute
concentration effects of ultrafiltration together with relatively slow rebound.
Indeed, dialyzer output CysC blood concentrations were greater than input blood
concentrations (4.8 mg/L vs. 5.0 mg/L, respectively, p=0.03) during TU. Modeling
of the blood CysC concentration time-course provided estimates for volume of
distribution for CysC of 204 ± 92.4 mL/kg. This is approximately 1/3 of total body
water and the volume of the extracellular space. Studies have also shown that
CysC level is an independent predictor of cardiovascular outcomes, independent
of residual renal function.29 Shlipak et al.30 demonstrated that CysC eGFR is a
better predictor of overall mortality and cardiovascular mortality in patients with
and without chronic kidney disease than Cr eGFR, and while Cr eGFR and CysC
eGFR were no different in predicting end-stage renal disease. Perhaps, CysC
could be a marker for extracellular volume and may be an attractive biomarker
for dialysis adequacy and for volume assessment.7 Further understanding of
CysC, its relationship to outcomes and how it may be removed by dialytic
methods is warranted.
This study has some shortcomings including its small sample size. The study,
however, was designed to be a pilot study of the kinetics of CysC removal during
hemodialysis. In the estimation of total body CysC kinetics, we made several
assumptions, including the CysC generation rate which we did not attempt to
measure, but used values from the work of Sjostrom et al.12 Consequently, we
estimate significant non-renal, non-dialytic clearance of CysC (25 ± 8.2 mL/min)
in this subject cohort. Moreover, the modeling results appear to correspond to
what we and others have observed, especially with regard to the volume of
distribution and inter-compartmental equilibration of CysC. Of relevance, beta-2
145
microglobulin, a commonly used middle molecule for assessing dialysis
adequacy also has a volume of distribution approximately 1/3 of the urea
distribution volume (total body water). 31,32 Finally, we had demonstrated that
there was significant CysC rebound post-hemodialysis. However, we only had
one sample 30-minutes post-hemodialysis. Further studies are needed to better
assess the duration and the extent of CysC rebound after 30 minutes of
hemodialysis.
5.5. CONCLUSIONS
This study demonstrated that CysC is cleared by hemodialysis, both through
convective and diffusive clearance. Its volume of distribution is 204 ± 92.4 kg/mL,
a value indicating a distribution limited to the extracellular space. CysC has a
slow equilibration rate with rebound of ~9 % at 30 minutes post-hemodialysis.
These findings are important for understanding CysC kinetics during
hemodialysis. The use of CysC as a dialysis adequacy marker deserves to be
further assessed.
146
REFERENCE 1. Gotch FA, Sargent JA. A mechanistic analysis of the National Cooperative
Dialysis Study (NCDS). Kidney Int 1985;28:526-34.
2. Eknoyan G, Beck GJ, Cheung AK, et al. Effect of dialysis dose and membrane
flux in maintenance hemodialysis. N Engl J Med 2002;347:2010-9.
3. Paniagua R, Amato D, Vonesh E, et al. Effects of increased peritoneal
clearances on mortality rates in peritoneal dialysis: ADEMEX, a prospective,
randomized, controlled trial. J Am Soc Nephrol 2002;13:1307-20.
4. Huang SH, Filler G, Yasin A, Lindsay RM. Cystatin C reduction ratio depends
on normalized blood liters processed and fluid removal during hemodialysis. Clin
J Am Soc Nephrol 2011;6:319-25.
5. Al-Malki N, Heidenheim PA, Filler G, Yasin A, Lindsay RM. Cystatin C levels in
functionally anephric patients undergoing dialysis: the effect of different methods
and intensities. Clin J Am Soc Nephrol 2009;4:1606-10.
6. Lindstrom V, Grubb A, Alquist Hegbrant M, Christensson A. Different
elimination patterns of beta-trace protein, beta2-microglobulin and cystatin C in
haemodialysis, haemodiafiltration and haemofiltration. Scand J Clin Lab Invest
2008;68:685-91.
7. Lindsay RM, Huang SH, Filler G. Cystatin C measurements in the assessment
of residual renal function, dialysis adequacy, and beyond. Perit Dial Int
2010;30:437-9.
8. Sambasivan AS, Lepage N, Filler G. Cystatin C intrapatient variability in
children with chronic kidney disease is less than serum creatinine. Clin Chem
2005;51:2215-6.
9. Huang SH, Heidenheim PA, Gallo K, Jayakumar S, Lindsay RM. Is there a
necessity for individual blood water corrections when conductivity-based access
blood flow measurements are made? Blood purification 2011;32:174-80.
147
10. Sargent JA, Gotch, F. A. . Principles and biophysics of dialysis. Fourth ed:
Academic Publishers; 1996.
11. Michaels AS. Operating parameters and performance criteria for
hemodialyzers and other membrane-separation devices. Transactions -
American Society for Artificial Internal Organs 1966;12:387-92.
12. Sjostrom P, Tidman M, Jones I. Determination of the production rate and
non-renal clearance of cystatin C and estimation of the glomerular filtration rate
from the serum concentration of cystatin C in humans. Scand J Clin Lab Invest
2005;65:111-24.
13. White C, Akbari A, Hussain N, et al. Estimating glomerular filtration rate in
kidney transplantation: a comparison between serum creatinine and cystatin C-
based methods. J Am Soc Nephrol 2005;16:3763-70.
14. Stevens LA, Coresh J, Schmid CH, et al. Estimating GFR using serum
cystatin C alone and in combination with serum creatinine: a pooled analysis of
3,418 individuals with CKD. Am J Kidney Dis 2008;51:395-406.
15. Zappitelli M, Parvex P, Joseph L, et al. Derivation and validation of cystatin
C-based prediction equations for GFR in children. Am J Kidney Dis 2006;48:221-
30.
16. Grubb AO. Cystatin C--properties and use as diagnostic marker. Adv Clin
Chem 2000;35:63-99.
17. Grubb A, Bjork J, Lindstrom V, Sterner G, Bondesson P, Nyman U. A
cystatin C-based formula without anthropometric variables estimates glomerular
filtration rate better than creatinine clearance using the Cockcroft-Gault formula.
Scand J Clin Lab Invest 2005;65:153-62.
18. Filler G, Bokenkamp A, Hofmann W, Le Bricon T, Martinez-Bru C, Grubb A.
Cystatin C as a marker of GFR--history, indications, and future research. Clin
Biochem 2005;38:1-8.
148
19. Filler G, Priem F, Lepage N, et al. Beta-trace protein, cystatin C, beta(2)-
microglobulin, and creatinine compared for detecting impaired glomerular
filtration rates in children. Clin Chem 2002;48:729-36.
20. Dharnidharka VR, Kwon C, Stevens G. Serum cystatin C is superior to serum
creatinine as a marker of kidney function: a meta-analysis. Am J Kidney Dis
2002;40:221-6.
21. Park JS, Kim GH, Kang CM, Lee CH. Application of cystatin C reduction ratio
to high-flux hemodialysis as an alternative indicator of the clearance of middle
molecules. Korean J Intern Med 2010;25:77-81.
22. Hoek FJ, Korevaar JC, Dekker FW, Boeschoten EW, Krediet RT. Estimation
of residual glomerular filtration rate in dialysis patients from the plasma cystatin C
level. Nephrol Dial Transplant 2007;22:1633-8.
23. Delaney MP, Stevens PE, Al Hasani M, Stowe HJ, Judge C, Lamb EJ.
Relationship of serum cystatin C to peritoneal and renal clearance measures in
peritoneal dialysis: a cross-sectional study. Am J Kidney Dis 2008;51:278-84.
24. Huang SH, Filler G, Lindsay RM. Residual renal function calculated from
serum cystatin C measurements and knowledge of the weekly standard Kt/V
urea. Perit Dial Int 2012;32:102-4.
25. Troyanov S, Cardinal J, Geadah D, et al. Solute clearances during
continuous venovenous haemofiltration at various ultrafiltration flow rates using
Multiflow-100 and HF1000 filters. Nephrol Dial Transplant 2003;18:961-6.
26. Ahmad S, Misra, M., Hoenich, N., Daugirdas, J. T. Hemodialysis Apparatus.
4th ed. Philadelphia: Lippincott Williams & Wilkins, a Wolters Kluwer Business;
2007.
27. Thysell H, Grubb A, Lindholm T, Ljunggren L, Martensson L. Cystatin C: a
new marker of biocompatibility or a good marker for the redistribution of LMW
proteins during hemodialysis? ASAIO Trans 1988;34:202-4.
149
28. Schneditz D, Fariyike B, Osheroff R, Levin NW. Is intercompartmental urea
clearance during hemodialysis a perfusion term? A comparison of two pool urea
kinetic models. Journal of the American Society of Nephrology : JASN
1995;6:1360-70.
29. Ix JH, Shlipak MG, Chertow GM, Whooley MA. Association of cystatin C with
mortality, cardiovascular events, and incident heart failure among persons with
coronary heart disease: data from the Heart and Soul Study. Circulation
2007;115:173-9.
30. Shlipak MG, Matsushita K, Arnlov J, et al. Cystatin C versus creatinine in
determining risk based on kidney function. The New England journal of medicine
2013;369:932-43.
31. Casino FG, Pedrini LA, Santoro A, et al. A simple approach for assessing
equilibrated Kt/V beta 2-M on a routine basis. Nephrol Dial Transplant
2010;25:3038-44.
32. Tattersall J. Clearance of beta-2-microglobulin and middle molecules in
haemodiafiltration. Contributions to nephrology 2007;158:201-9.
150
6. CHAPTER 6. LIMITATIONS, FUTURE WORK AND SIGNIFICANCE
6.1. OVERVIEW AND SUMMARY
From our four studies, we have shown that cystatin C could be a marker for both
dialysis and renal clearance, individually and/or combined.1-4 It is easy to
measure and is stable between dialysis treatments, rather than being influenced
by a single dialysis treatment. The cystatin C reduction ratio study showed that
during a single hemodialysis treatment, the URR, the CRR and the CCRR were
70.2±9.0 %, 64.5±8.2 % and 26.1±11.8 % (p≤0.002). There was no correlation
between the CCRR and the small molecule clearance, while the CCRR
correlated positively with liters processed (normalized by weight), and negatively
with ultrafiltration volume. Multiple regression analysis with these two parameters
provided a model that explained 81% of the variance (r2=0.811, p<0.001). The
amount of cystatin C reduction was influenced positively by dialysis blood flow
rate and treatment time, and negatively by ultrafiltration rate. Cystatin C reduction
did not correlate with any urea removal parameters such as Sp K/Vurea, URR and
CRR. From this we hypothesized that cystatin C behaves as a middle molecule
with its distribution in the extracellular compartment, with a slow equilibration rate
between the interstitial and intravascular spaces.
Cystatin C level can also be used to predict residual renal function. As kidney
function declined, there was a significant negative correlation between the error
for the creatinine-based eGFR and the filtration fraction. Both cystatin C and
beta-trace protein are not affected by differences in FF. This may be due to the
changes in tubular creatinine secretion when the filtration fraction is altered.
Previously, Hoek et al.5 developed an equation to estimate residual renal
function in patients already on dialysis: RRF = 22/Cystatin C - 0.70. However,
this equation does not take into account the dialysis clearance, which must have
some influence on cystatin C concentration. Assuming a dialysis patient has no
151
kidney function remaining, the expected cystatin C level is based on the weekly
Std Kt/Vurea equation derived from the Al-Malki study.6 The difference between
the measured and estimated cystatin C levels had a significant correlation with
the measured residual renal function, r2=0.81 (p< 0.0001). The equation we have
developed had less bias when compared to Hoek’s. We found that the pre-
dialysis cystatin C levels incorporate both the Std Kt/Vurea and the RRF values.
Finally, we have estimated that the mean cystatin C dialyzer clearances were 12
± 7.1 mL/min, 19 ± 5.9 mL/min, 20 ± 8.0 mL/min and 26 ± 8.6 mL/min by
ultrafiltration, dialysis at Qb200, dialysis at Qb400 and combination treatments,
respectively. The sieving coefficient of cystatin C was 0.80 ± 0.266. The KoA of
cystatin C was 22 ± 9.5 mL/min at Qb400 and its volume of distribution was
estimated to be 204 ± 92.4 mL/kg, with the cystatin C inter-compartmental
clearance (KC) of 2.3 ± 1.27 mL/min/kg. The cystatin C non-renal non-dialysis
clearance was 25 ± 8.2 mL/min. The cystatin C rebound was 9 ± 59%. These
results indicated that cystatin C is cleared by hemodialysis at a much slower rate
than small solutes such as creatinine and urea. Cystatin C is dialyzable and
cleared by both convection and diffusion. A significant clearance is through
convection. The estimate of the cystatin C volume of distribution of 204 mL/kg, is
approximately 1/3 of total body water and the volume of the extracellular space.
The cystatin C inter-compartmental equilibration rates were slow. This explained
the observed CysC rebound 30-minutes post-hemodialysis of only 9%.
Cystatin C levels are stable prior to hemodialysis sessions, and simple to
measure. In the Al-Malki study, researchers have shown that cystatin C levels
closely relate to dialysis intensity.6 Because cystatin C is distributed in
extracellular space, it is also closely related to extracellular volume status.
Therefore, indirectly, it is also a marker for monitoring volume status in clinical
settings. In dialysis patients, most of the excessive volume is distributed in
extracellular space. We have shown that cystatin C can also be a marker for
residual renal function. Previous studies have shown that residual renal function
is an important prognostic marker for dialysis patients.7,8 This is likely related to
152
both fluid removal and uremic toxin clearance. Intra-dialytic hypotension and
episodes of dehydration are associated with a more rapid decline in residual
renal function. 9 Preserving residual renal function is an important goal.
6.2. LIMITATIONS OF CURRENT WORK
A number of limitations currently affect the potential clinical application of cystatin
C in dialysis population. Firstly, our studies were relatively small in size.
However, these were studies with the aims to understand the clearance and
kinetics of cystatin C during dialysis treatments. As a result, sample size of the
four studies was between 10-130 depending on the objectives of the studies.
Another limitation is that we have developed a residual renal function equation
and have applied the Al-Malki equation to our studies. Both of these equations
were only internally validated. We still need to validate both equations externally
in a larger study with a different dialysis population. The applications of these two
equations to general dialysis population need to be further assessed.
Although we have confirmed that cystatin C is removed by dialysis and its
distribution in likely in extracellular space, we have not yet assessed its
association with clinical outcome, such as cardiovascular mortality and/or fluid
overload. By contrast, the NCDS showed that lower urea clearance is associated
with higher hospitalization rate in hemodialysis patients.
The most common cause of death in hemodialysis patients is cardiovascular
disease and the mortality rate of dialysis patients remains high at 5 years of
dialysis treatment.10,11 The pathophysiology of cardiovascular disease in the
dialysis population cannot be solely explained by traditional atherosclerosis
coronary artery disease. In fact, improving traditional risk factors for
cardiovascular disease have not resulted in a significant improvement in
cardiovascular morbidity and mortality. The development of cardiovascular
disease is multi-factorial (see Figure 6-1). relating to uremia, volume overload,
153
recurrent myocardial stunning and other factors resulting from ischemic perfusion
injury.12,13
Volume overload is common in dialysis patients and is a risk factor for increasing
cardiovascular morbidity and mortality. Expanded ECV becomes the main driver
for elevated blood pressure in dialysis patients. Volume overload is associated
with left ventricular hypertrophy and poor cardiovascular survival rates.14,15 Left
ventricular hypertrophy is associated with increased sudden cardiac death and
cardiovascular mortality.16,17 Improving volume control can lead to the benefit of
left ventricular mass regression.18 If a patient’s diet contains more sodium than is
recommended, this will expand the extra-cellular space. Salt restriction resulted
in better volume control and a reduction in left ventricular mass.19 By contrast,
aggressive fluid removal and targeting euvolemia can have negative
consequences. It can lead to intradialytic hypotension, and a decline in residual
renal function.9 It can also lead to myocardial stunning involving muscle fiber
survival but with poor contractile function. Therefore, accurate assessment of
volume status is important. Unfortunately, despite advances in technology, there
is currently no gold standard measurement for dry weight.
Because cystatin C is mainly distributed in extracellular space, and its level is
influenced by extracellular volume, there is a need to assess the relationship
between cystatin C levels and volume status, and cardiovascular outcome in
dialysis population.
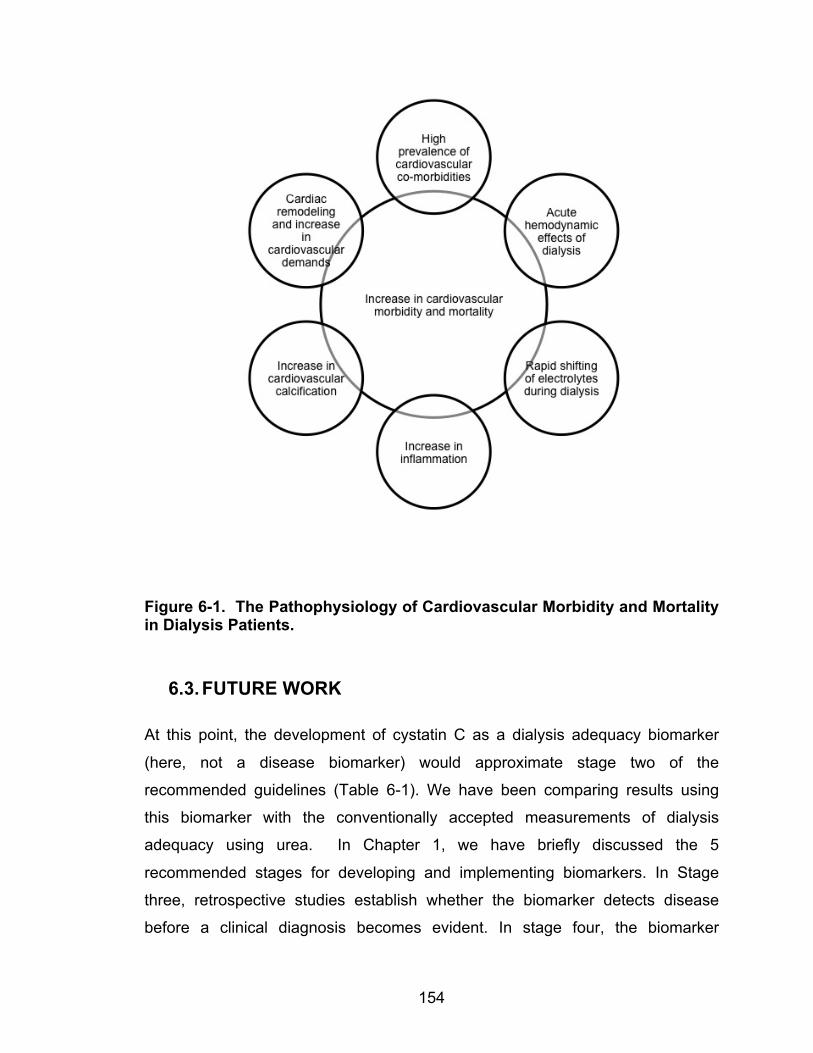
154
Figure 6-1. The Pathophysiology of Cardiovascular Morbidity and Mortality in Dialysis Patients.
6.3. FUTURE WORK
At this point, the development of cystatin C as a dialysis adequacy biomarker
(here, not a disease biomarker) would approximate stage two of the
recommended guidelines (Table 6-1). We have been comparing results using
this biomarker with the conventionally accepted measurements of dialysis
adequacy using urea. In Chapter 1, we have briefly discussed the 5
recommended stages for developing and implementing biomarkers. In Stage
three, retrospective studies establish whether the biomarker detects disease
before a clinical diagnosis becomes evident. In stage four, the biomarker
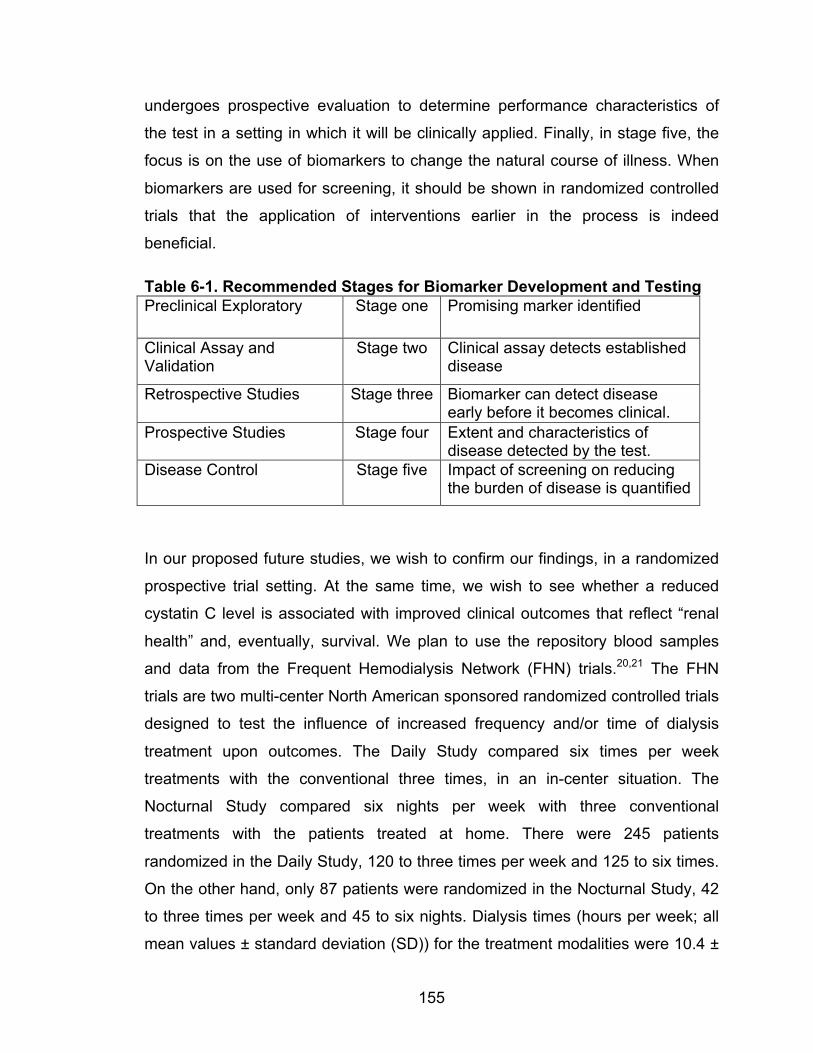
155
undergoes prospective evaluation to determine performance characteristics of
the test in a setting in which it will be clinically applied. Finally, in stage five, the
focus is on the use of biomarkers to change the natural course of illness. When
biomarkers are used for screening, it should be shown in randomized controlled
trials that the application of interventions earlier in the process is indeed
beneficial.
Table 6-1. Recommended Stages for Biomarker Development and Testing Preclinical Exploratory Stage one Promising marker identified
Clinical Assay and Validation
Stage two Clinical assay detects established disease
Retrospective Studies Stage three Biomarker can detect disease early before it becomes clinical.
Prospective Studies Stage four Extent and characteristics of disease detected by the test.
Disease Control Stage five Impact of screening on reducing the burden of disease is quantified
In our proposed future studies, we wish to confirm our findings, in a randomized
prospective trial setting. At the same time, we wish to see whether a reduced
cystatin C level is associated with improved clinical outcomes that reflect “renal
health” and, eventually, survival. We plan to use the repository blood samples
and data from the Frequent Hemodialysis Network (FHN) trials.20,21 The FHN
trials are two multi-center North American sponsored randomized controlled trials
designed to test the influence of increased frequency and/or time of dialysis
treatment upon outcomes. The Daily Study compared six times per week
treatments with the conventional three times, in an in-center situation. The
Nocturnal Study compared six nights per week with three conventional
treatments with the patients treated at home. There were 245 patients
randomized in the Daily Study, 120 to three times per week and 125 to six times.
On the other hand, only 87 patients were randomized in the Nocturnal Study, 42
to three times per week and 45 to six nights. Dialysis times (hours per week; all
mean values ± standard deviation (SD)) for the treatment modalities were 10.4 ±
156
1.6 (Daily Study, 3x/week), 12.7 ± 2.2 (Daily Study, 6x/week), 12.5 ± 2.0
(Nocturnal Study, 3x/week), and 28.2 ± 11.4 (Nocturnal Study, 6x/week) hours.
These treatments delivered weekly Std Kt/Vurea of 2.47 ± 0.27, 3.49 ± 0.63, 2.61
± 0.44, and 4.47 ± 1.60, respectively. There were two co-primary composite
outcomes for both trials: death or change in left ventricular mass in survivors
(from baseline to 12 months), as assessed by cardiac magnetic resonance
imaging, and death or change in the physical-health composite score of the
RAND 36-item health survey. Enrolment for both studies started in 2006. Once
randomized, the patients were followed for one year and the studies ended in
2010. The Daily Study showed that frequent hemodialysis, as compared with
conventional hemodialysis, was associated with more favorable results with
respect to the composite outcomes of death or change in left ventricular mass
and death or change in physical-health composite score. The study details and
results are now published in the New England Journal of Medicine.21 The
Nocturnal Study did not show a significant benefit for either of the two co-primary
outcomes. Possible explanations for the death or left ventricular mass results
(with a Hazard Ratio of 0.68) include limited sample size and patient
characteristics. The study details and results have been published.20
In both studies, urea kinetic and residual renal function information were
collected at baseline, and at four and twelve months for all trial participants. From
these data 2 separate values for weekly Std Kt/Vurea have been calculated: a
dialysis weekly Std Kt/Vurea and a total weekly Std Kt/Vurea which is adjusted
for residual renal function clearance. Most trial participants also agreed to have
blood collected at these times; these samples have been stored in a central
biorepository. Our proposed research will be a supplementary study to these
FHN trials. We have received approval from the FHN Executive committee and
will have access to all trial demographic and baseline data, as well as the urea
kinetic and residual renal function information. We will have access to the
biorepository blood samples, and thus we can make use of repeated
measurements of cystatin C (baseline, 4 months, and 12 months). Most
importantly, the blindly collected trial primary outcomes will be available to us.
157
6.4. SIGNIFICANCE
Urea clearance and kinetic modeling cannot be used as a sole method of
assessing dialysis adequacy. The pre-dialysis urea level bears no constant
relationship to adequacy outcomes; in fact a low urea gives a greater prediction
of a poor, rather than good, outcome because of its relationship to protein
malnutrition. While the correlation between cystatin C level and cardiovascular
outcome may be speculative, it is nevertheless plausible, as previously
discussed in Chapter 1.
The results of our studies are important and of clinical relevance in addressing
the adequacy of cystatin C as a biomarker. Cystatin C may give a more stable
indication of overall hemodialysis treatment efficacy, and it may be analogous to
hemoglobin A1C in diabetic management.22 Furthermore, a single pre-dialysis
cystatin C level will allow for an assessment of both residual renal function and
dialytic clearance, without the inconvenience of urine collections, multiple blood
samples and complicated mathematical computation. It is not affected by one
poor dialysis run, as are urea kinetics.
The long-term goal will be to define the cystatin C threshold level that influences
“hard outcomes” such as morbidity and mortality and to allow better dialysis
prescriptions for patients with varying (and changing) residual renal function. The
outcomes addressed by the FHN studies were surrogates for mortality in the
dialysis population. If the FHN supplementary study demonstrates a significant
positive correlation with FHN Trials outcomes, cystatin C will be the new
standard for dialysis adequacy monitoring. Should cystatin C level correlate with
FHN study outcomes, an important step in determining its value in dialysis care
will have occurred. There is the potential for the first major advancement in
assessing dialysis adequacy in thirty years. The simplicity of a single pre-dialysis,
stable blood test as such an assessment will be appealing.
158
REFERENCES 1. Huang SH, Filler G, Lindsay RM. Residual renal function calculated from
serum cystatin C measurements and knowledge of the weekly standard Kt/V
urea. Perit Dial Int 2012;32:102-4.
2. Huang SH, Filler G, Yasin A, Lindsay RM. Cystatin C reduction ratio depends
on normalized blood liters processed and fluid removal during hemodialysis. Clin
J Am Soc Nephrol 2011;6:319-25.
3. Huang SH, Sharma AP, Yasin A, Lindsay RM, Clark WF, Filler G.
Hyperfiltration affects accuracy of creatinine eGFR measurement. Clin J Am Soc
Nephrol 2011;6:274-80.
4. Huang SH, Tirona RG, Reid-Wilkinson F, et al. The kinetics of cystatin C
removal by hemodialysis. Am J Kidney Dis 2015;65:174-5.
5. Hoek FJ, Korevaar JC, Dekker FW, Boeschoten EW, Krediet RT. Estimation of
residual glomerular filtration rate in dialysis patients from the plasma cystatin C
level. Nephrol Dial Transplant 2007;22:1633-8.
6. Al-Malki N, Heidenheim PA, Filler G, Yasin A, Lindsay RM. Cystatin C levels in
functionally anephric patients undergoing dialysis: the effect of different methods
and intensities. Clin J Am Soc Nephrol 2009;4:1606-10.
7. Bargman JM, Thorpe KE, Churchill DN, Group CPDS. Relative contribution of
residual renal function and peritoneal clearance to adequacy of dialysis: a
reanalysis of the CANUSA study. J Am Soc Nephrol 2001;12:2158-62.
8. Termorshuizen F, Dekker FW, van Manen JG, et al. Relative contribution of
residual renal function and different measures of adequacy to survival in
hemodialysis patients: an analysis of the Netherlands Cooperative Study on the
Adequacy of Dialysis (NECOSAD)-2. J Am Soc Nephrol 2004;15:1061-70.
159
9. Jansen MA, Hart AA, Korevaar JC, et al. Predictors of the rate of decline of
residual renal function in incident dialysis patients. Kidney international
2002;62:1046-53.
10. Eknoyan G, Beck GJ, Cheung AK, et al. Effect of dialysis dose and
membrane flux in maintenance hemodialysis. N Engl J Med 2002;347:2010-9.
11. Paniagua R, Amato D, Vonesh E, et al. Effects of increased peritoneal
clearances on mortality rates in peritoneal dialysis: ADEMEX, a prospective,
randomized, controlled trial. J Am Soc Nephrol 2002;13:1307-20.
12. Demirci MS, Demirci C, Ozdogan O, et al. Relations between malnutrition-
inflammation-atherosclerosis and volume status. The usefulness of
bioimpedance analysis in peritoneal dialysis patients. Nephrology, dialysis,
transplantation : official publication of the European Dialysis and Transplant
Association - European Renal Association 2011;26:1708-16.
13. Hung SC, Kuo KL, Peng CH, et al. Volume overload correlates with
cardiovascular risk factors in patients with chronic kidney disease. Kidney
international 2014;85:703-9.
14. Agarwal R, Leehey DJ, Olsen SM, Dahl NV. Proteinuria induced by
parenteral iron in chronic kidney disease--a comparative randomized controlled
trial. Clinical journal of the American Society of Nephrology : CJASN 2011;6:114-
21.
15. Ritz E. Left ventricular hypertrophy in renal disease: beyond preload and
afterload. Kidney international 2009;75:771-3.
16. Zoccali C, Benedetto FA, Mallamaci F, et al. Left ventricular mass monitoring
in the follow-up of dialysis patients: prognostic value of left ventricular
hypertrophy progression. Kidney Int 2004;65:1492-8.
17. Zoccali C, Benedetto FA, Mallamaci F, et al. Prognostic value of
echocardiographic indicators of left ventricular systolic function in asymptomatic
160
dialysis patients. Journal of the American Society of Nephrology : JASN
2004;15:1029-37.
18. Lindsay RM, Leitch R, Heidenheim AP, Kortas C, London Daily/Nocturnal
Hemodialysis S. The London Daily/Nocturnal Hemodialysis Study--study design,
morbidity, and mortality results. American journal of kidney diseases : the official
journal of the National Kidney Foundation 2003;42:5-12.
19. Kayikcioglu M, Tumuklu M, Ozkahya M, et al. The benefit of salt restriction in
the treatment of end-stage renal disease by haemodialysis. Nephrology, dialysis,
transplantation : official publication of the European Dialysis and Transplant
Association - European Renal Association 2009;24:956-62.
20. Rocco MV, Lockridge RS, Jr., Beck GJ, et al. The effects of frequent
nocturnal home hemodialysis: the Frequent Hemodialysis Network Nocturnal
Trial. Kidney Int 2011;80:1080-91.
21. Group FHNT, Chertow GM, Levin NW, et al. In-center hemodialysis six times
per week versus three times per week. N Engl J Med 2010;363:2287-300.
22. Lindsay RM, Huang SH, Filler G. Cystatin C measurements in the
assessment of residual renal function, dialysis adequacy, and beyond. Perit Dial
Int 2010;30:437-9.
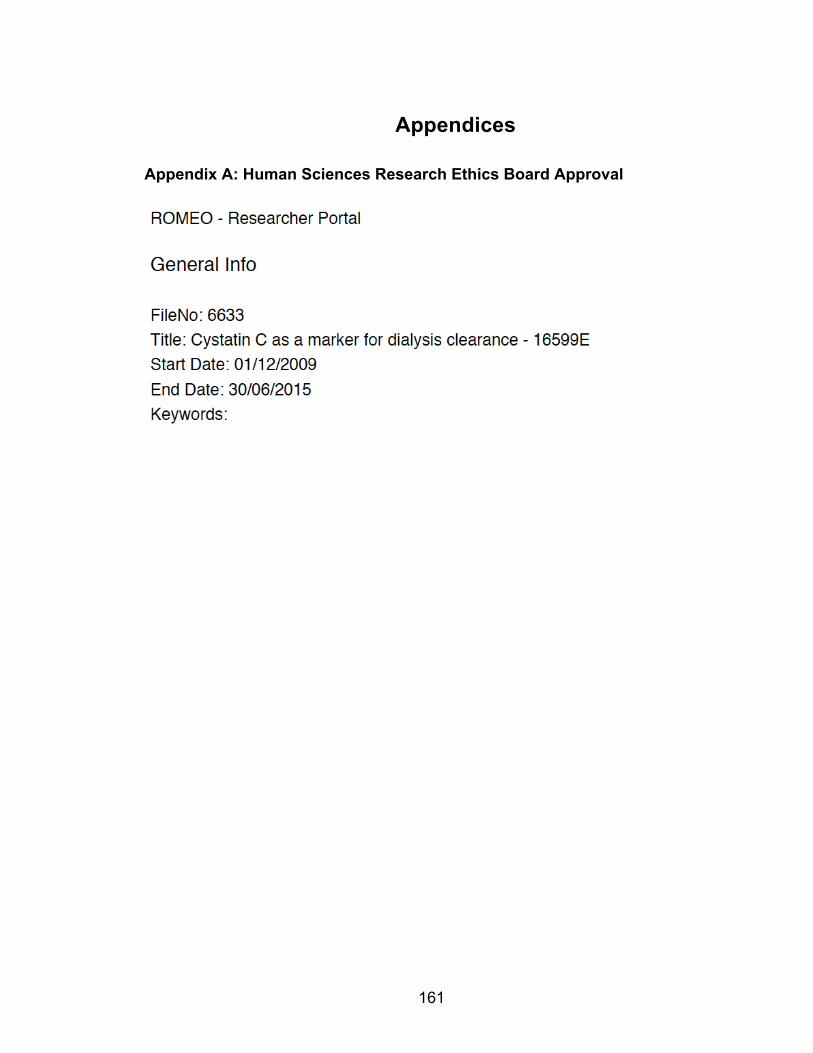
161
Appendices
Appendix A: Human Sciences Research Ethics Board Approval
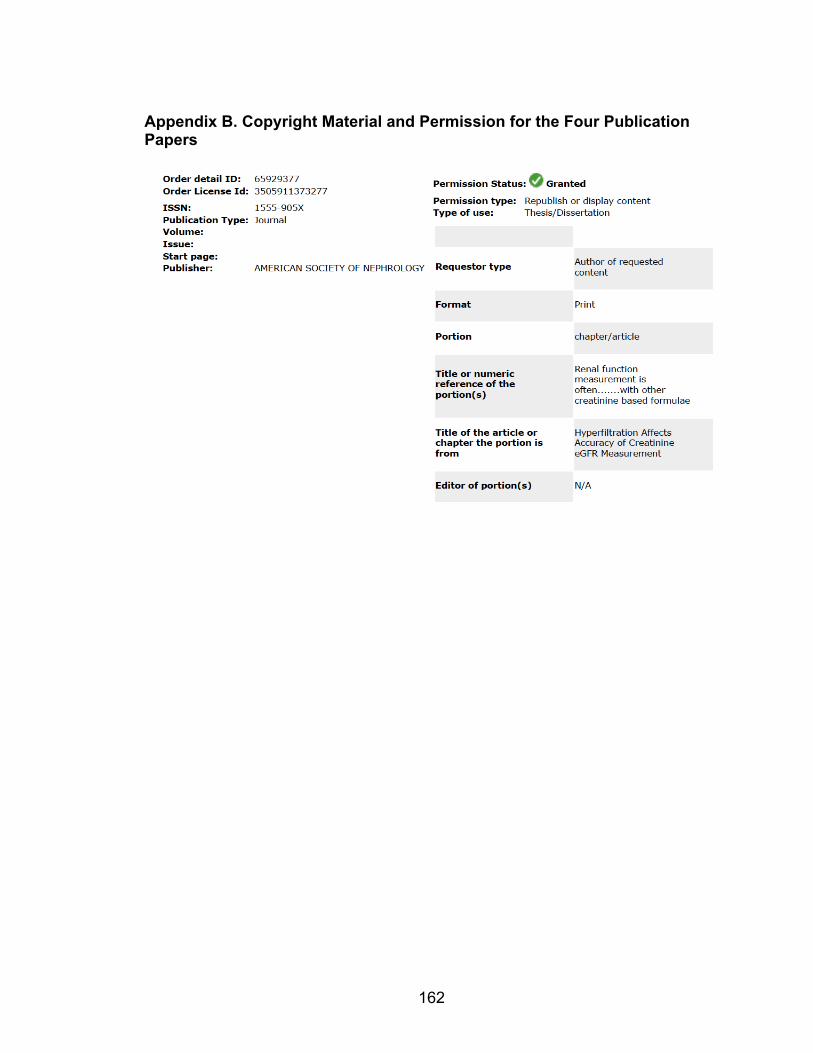
162
Appendix B. Copyright Material and Permission for the Four Publication Papers
163
164
165
166
Appendix C. Copyright Material and Permission for the Figures
167

168
Curriculum Vitae
Name: Shih-Han Susan Huang Post-secondary McMaster University Education and Hamilton, Ontario, Canada Degrees: 1998-2001 B.Sc.
University of Ottawa Ottawa, Ontario, Canada 2001-2005 M.D.
Western University London, Ontario, Canada 2009-2015 Ph.D. Candidate
Honors and G. and V. Simpson Memorial Scholarship Awards: McMaster University
1999-2000
Gladys A. Young Scholarship McMaster University 1999-2000 NSERC Scholarship for Summer Research McMaster University 1994-1995 Merit Scholarship University of Ottawa, Faculty of Medicine 2001-2002 Chinese Canadian Professionals Award - Highest Standing in Cardiology Block University of Ottawa, Faculty of Medicine 2001-2002 Faculty of Medicine Award - Second Highest Standing in Year 1 Medicine University of Ottawa, Faculty of Medicine 2001-2002 Ontario Graduate Scholarship Western University 2010
169
CIHR Fellowship Health Professional Award Western University 2012
Vanier CGS Award, CIHR Western University 2013-2015
Related Work Post-Graduate Doctor of Medicine – Internal Medicine Experience Western University
2005-2008 Post-Graduate Sub-Specialty Doctor of Medicine - Nephrology
Western University 2008-2010 Post-Graduate Research Fellowship Training - Candidate Clinician Investigator Program Western University 2010-2013
Publications: 1. Witzel S, Huang SH, Braam B, Filler G. Effect of Gender when Estimating Glomerular Filtration Rate with Beta-Trace Protein in Children. Clin J Am Soc Nephrol. 2015 March;10(3):401-9. PMID: 25542909 2. Thomson BKA, Huang SH, Lindsay RM. The Choice of Dialysate Sodium is Influenced By Hemodialysis Frequency and Duration: What should it be and For What Mordality? Seminar in Dialysis. 2015 March;28(2):180-5. PMID: 25482159 3. Huang SH, Filler G, Lindsay RM, McIntyre CW. Euvolemia in Hemodialysis Patients: A Potentially Dangerous Goal? Seminar in Dialysis. Semin Dial. 2015 Jan;28(1):1-5. PMID: 25348058 4. Huang SH, Tirona RG, Reid-Wilkinson F, Thomson BKA, Filler G, Stodilka R, Lindsay RM. The Kinetics of Cystatin C Removal by Hemodialysis. Am J Kidney Dis. 2015 Jan;65(1):174-5. PMID: 25282341 5. Filler G, Clark WF, Huang SH. Tandem hemodialysis and plasma exchange. Pediatr Nephrol. 2014 Nov;29(11):2077-82. PMID: 24022368 6. Huang SH, Crowley LE, Jefferies HJ, Eldehni MT, Odudu A, and McIntyre CW. The impact of hemodialysis on segmental and global longitudinal myocardial strain. Can J Cardiol. 2014 Nov;30(11):1422-8. PMID: 25228129
170
7. Huang SH, Eliasziw M, Spence JD, Filler G, Vezina WC, Churchill DN, Cattran DC, Richardson B, and House AA. 99mTc-DTPA Urinary Clearance Method May Be Preferable To Plasma Disappearance Method for Assessing Glomerular Filtration Rate in Diabetic Nephropathy. Nephron Clinical Practice. 2014; 128 (3-4):367-72. PMID: 25571980 8. Farah M, Hildebrand AM, Dammas H, Huang SH, Clark WF. Thrombotic Thrombocytopenic Purpura and Hemolytic Uremic Syndrome in 2012: Current Knowledge and Outcomes with Plasma Exchange. Oncology & Hematology Review. 2014;10(2):82–9. 9. Huang SH, Shah S, Thomson BKA, Laporte, S, Filler G, Lindsay RM. What is Single Needle Cannulation Hemodialysis: Is It Adequate? Blood Purif. 2014 Sep 13;38(1):13-17. PMID: 25228136 10. Clark WF, Huang SH, Garg AX, House A, Moist LM, Weir M, Sontrop JM. Drink at least 8 glasses of water a day to be healthy? Home healthcare nurse 2014 April; 32(4):237-42. 11. Filler G, Vinks AA, Huang SH, Jevnikar A, Muirhead N. Similar MPA Exposure on Modified Release and Regular Tacrolimus. Ther Drug Monit. 2014 Jun; 36(3):353-7. PMID: 24365986 12. Filler G, Grimmer J, Ball E, Sharma AP, Huang SH. Using individual DSA titers to assess for accommodation after late humoral rejection. Pediatr Transplant. 2014 Jun;18(4):E109-13. PMID: 24646330 13. Hildebrand AM, Huang SH, Clark WF. Plasma exchange for kidney disease: what is the best evidence? Adv Chronic Kidney Dis. 2014 Mar;21(2):217-27. PMID: 24602471 14. Thomson BK, Huang SH, Chan C, Urquhart B, Skanes A, Lindsay RM. Nocturnal home hemodialysis associates with improvement of electrocardiographic features linked to sudden cardiac death. ASAIO J. 2014 Jan-Feb;60(1):99-105. PMID: 24335385 15. Filler G, Berard RA, Huang SH. ACE levels may affect cystatin C measurements. Clin Biochem. 2014 Jan;47(1-2):129-31. PMID: 24161477 16. Thomson BK, Momciu B, Huang SH, Chan CT, Urquhart B, Skanes A, Krahn A, Klein G, Lindsay RM. ECG machine QTc intervals are inaccurate in hemodialysis patients. Nephron Clin Pract. 2013;124(1-2):113-8. PMID: 24192796
171
17. Clark WF, Sontrop JM, Huang SH, Gallo K, Moist L, House AA, Weir MA, Garg AX. The chronic kidney disease Water Intake Trial (WIT): results from the pilot randomised controlled trial. BMJ Open. 2013 Dec 20;3(12):e003666. PMID: 24362012 18. Thomson BK, Huang SH, Chan CT, House AA, Lindsay RM. Plasma sodium setpoint: is it constant or changed by hemodialysis prescription? ASAIO J. 2013 Sep-Oct;59(5):497-504. PMID: 23896770 19. Thomson BK, Momciu B, Huang SH, Chan CT, Urquhart BL, Skanes AC, Krahn AD, Klein GJ, Lindsay RM. Frequent Nocturnal Hemodialysis Associates with Improvement of Prolonged QTc Intervals. Nephron Clin Pract. 2013;123(1-2):74-82. PMID: 23860412 20. Hanly L, Rieder MJ, Huang SH, Vasylyeva TL, Shah RK, Regueira O, Koren G. N-acetylcysteine rescue protocol for nephrotoxicity in children caused by ifosfamide. J Popul Ther Clin Pharmacol. 2013;20(2):e132-45. 21. Sontrop JM, Dixon SN, Garg AX, Buendia-Jimenez I, Dohein O, Huang SH, Clark WF. Association between Water Intake, Chronic Kidney Disease, and Cardiovascular Disease: A Cross-Sectional Analysis of NHANES Data. American Journal of Nephrology 2013 27:434-442. PMID: 23594828 22. Thomson BK, Dixon SN, Huang SH, Leitch RE, Suri RS, Chan CT, Lindsay RM. Modifiable variables affecting interdialytic weight gain include dialysis time, frequency, and dialysate sodium. Hemodial Int. 2013 Oct;17(4):576-585. PMID: 23782770 23. Thomson BK, Huang SH, Leitch RE, Dixon S, Heidenheim P, Suri RS, Chan CT, Lindsay RM. Pre to post-dialysis plasma sodium change better predicts clinical outcomes than dialysate to plasma sodium gradient in quotidian hemodialysis. Hemodialysis International. 2013 Apr 3. PMID: 23551488 24. Filler G, Huang SH. High prevalence of renal dysfunction also after small bowel transplantation. Pediatr Transplant. 2013 Feb;17(1):8-11. PMID: 23198902 25. Filler G, Huang SH, Yasin A. The usefulness of cystatin C and related formulae in pediatrics. Clin Chem Lab Med. 2012 Dec;50(12):2081-91. Review. PMID: 23093265 26. Huang SH, Tirona RG, Ross C, Suri RS. Case Report: Atenolol overdose successfully treated with hemodialysis. Hemodial Int. 2012 Oct;17(4):652-5 PMID: 23347063
172
27. Filler G, Huang SH, Yasin A. The Usefulness of Cystatin C and Related Formulae in Pediatrics. Clinical Chemistry and Laboratory Medicine. Clin Chem Lab Med. 2012 Dec;50(12):2081-91. Review.. PMID: 23093265 28. Filler G, Grimmer J, Huang SH, Bariciak E. Cystatin C for the assessment of GFR in neonates with congenital renal anomalies. Nephrology, Dialysis, Transplant. 2012 27(9):3382-4. PMID: 22734109 29. Filler G, Huang SH. High prevalence of hypertension and renal glomerular and tubular dysfunction after orthotopic liver transplantation. Pediatr Transplant. 2012 16(3): 214-6. PMID: 22332780 30. Huang SH, Xenocostas A, Moist L, Crowther M, Moore JC, Clark WF. Case Report: Ustekinumab Associated Thrombotic Thrombocytopenic Purpura. Transfusion and Apheresis Science. 2012 47: 185-8. PMID: 22858359 31. Huang SH, Filler G, Lindsay RM. Residual Renal Function Calculated from Serum Cystatin C Measurements and a Knowledge of the Standard Weekly Kt/V (Urea). Perit Dial Int. 2012 Jan-Feb;32(1):102-4. PMID: 22302925 a. Poster Presentation - 2011 World Congress of Nephrology of the International Society of Nephrology 32. Filler G, Huang SH. Monitoring and Improving Renal Outcomes After Heart Transplantation. Pediatr Transplant. 2011 Nov;15(7):665-7. PMID: 21895904 (Citation:0) 33. Rothera C, MaCallum C, Huang SH, Heidenheim PA, and Lindsay RM. The Influence of Between Needle Cannulation Distance on the Efficacy of Hemodialysis Treatment. Hemodialysis International. 2011;15(4): 546-552. PMID: 22111824 (Citation:0) 34. Huang SH, Hildebrand A, Clark WF. Brief Review: Management of Lupus Nephritis – Randomized Controlled Trials: An Update. Open Journal of Internal Medicine, 2011, 1, 17-23. Published Online September 2011. (Citation:0) 35. Huang SH, Macnab JJ, Sontrop JM, Filler G, Gallo K, Lindsay RM, Clark WF. Performance of the Creatinine-based and the Cystatin C-based GFR Estimating Equations. Transl Res. 2011 Jun;157(6):357-67. PMID: 21575920 (Citation:1) 36. Filler G, Huang SH, Sharma AP. Should We Consider MMF Therapy After Rituximab for Nephrotic Syndrome? Pediatr Nehrol. 2011; Oct;26(10):1759-62. PMID: 21533869. (Citation:0) 37. Filler G, Huang SH, Sharma AP. Steroid-Resistant Acute Allograft Rejection in Renal Transplantation. Pediatr Nehrol. 2011 May;26(5):651-653. PMID: 21327775. (Citation: 0)
173
38. Filler G, Huang SH. A Simple Estimate or Extracellular Volume: Too Simple? Clin J Am Soc Nephrol. 2011 April; 6(4):695-695-25. PMID: 21454720 (Citation: 0) 39. Filler G, Liu D, Huang SH, Casier S, Chau LA, Madrenas J. Impaired GFR is the Most Important Determinant for FGF-23 Increase in Chronic Kidney disease. Clin Biochem. 2011 April;44(5-6):435-437. PMID: 21291879. (Citation: 1) 40. Filler G, Huang SH, Lindsay RM. Residual Renal Function Assessment with Cystatin C. Pediatric Nephrology. 2011 Mar;26(3):333-5. PMID: 21058022. (Citation: 0) 41. Huang SH, Filler G, Yasin A, Lindsay RM. Cystatin C Reduction Ratio Depends on Normalized Blood Liters Processed and Fluid Removal During Hemodialysis. Clin J Am Soc Nephrol. 2011 Feb;6(2):319-25. PMID: 21115625. (Citation: 1) 42. Huang SH, Sharma AP, Lindsay RM, Clark RF, and Filler G. Hyperfiltration Affects Accuracy of Creatinine but not Cystatin C or Beta Trace Protein eGFR Measurement. Clin J Am Soc Nephrol. 2011 Feb;6(2):274-80. PMID: 20966120. (Citation 1) 43. Huang SH, Heidenheim PA, Gallo K, Jayakumar S, Lindsay RM. Is There a Necessity for Individual Blood Water Corrections When Conductivity-based Access Blood Flow Measurements are Made. Blood Purification. 2011; 32 (3): 174-80. 44. Lindsay RM, Huang SH, Sternby J, Hertz T. The Measurement of Hemodialysis Access Blood Flow by a Conductivity Step Method. Clin J Am Soc Nephrol. 2010 Sep;5(9):1602-6. PMID: 20616158 (Citation: 1) 45. Lindsay RM, Huang SH, Filler G. Cystatin C Measurements in the Assessment of Residual Renal Function, Dialysis Adequacy, And Beyond. Perit Dial Int. 2010 Jul;30(4):437-9. PMID: 20628106 (Citation: 2) 46. Filler G, Huang SH, Sharma AP. Racial Disparities in Hemoglobin Concentration in Children with CKD. Am J Kidney Dis. 2010 Jun;55(6):981-3. PMID: 20497835 (Citation: 0) 47. Filler G, Huang SH. Progress in Pediatric Kidney Transplantation. Ther Drug Monit. 2010 June;32(3):250-2. PMID: 20431507 (Citation: 3) 48. Lepage N, Huang SH, Nieuwenhuys E, and Filler G. Pediatric Reference Intervals for Immunoglobulin G and Its Subclasses with Siemens
174
Immunonephelometric Assays. Clinical Biochemistry. 2010 May;43(7-8):694-6. PMID: 20153742. (Citation: 2) 49. Steckley JL, Tartaglia MC, Reddy H, Huang SH, Hammond R, and Hyson C. Systemic Lupus Erythematosus and Right Leg Weakness. Can. J. Neurol. Sci. 2009;36:98-101. (Citation: 0) 50. Huang SH, Johnson K, and Pipe AL. The Use of Dietary Supplements and Medications by Canadian Athletes at the Atlanta and Sydney Olympic Games. Clin J Sport Med. 2006 Jan;16(1):27-33. PMID: 16377972 (Citation: 34)


