Embed Size (px)
Citation preview

The Australian Economic Review, vol. 36, no. 4, pp. 374–96
2003 The University of Melbourne, Melbourne Institute of Applied Economic and Social ResearchPublished by Blackwell Publishing Asia Pty Ltd
Abstract
Newspoll reported in 2000 that by a margin of70 to 28 per cent, Australians would prefer thegap between rich and poor to get smallerrather than have the nation’s overall wealthgrow as quickly as possible. This articleexamines the reasons for the increase in thedispersion of earnings, and changes in unem-ployment and workforce participation, whichare central to this concern about inequality.The major finding is that the widening disper-sion of earnings and changes in labour forcestatus are principally due to changes in thestructure of labour demand in favour of moreskilled jobs. The article then considers whatthis changing job mix implies for policy di-rected to maintaining income inequality.
1. Introduction
It is widely believed that income inequality, ormore accurately the inequality of
market
in-comes, has increased in the last two decades.
1
The main reason for this increasing inequalityof market or private incomes is the increasedinequality of wages (Pappas 2001, p. 30). Thenext most important source of increasing in-equality of private incomes is probablychanges in the labour force distribution acrossincome units, involving higher unemploymentand a decline in male workforce participation(Johnson and Wilkins 2003).
The purpose of this article is to explore thesetwo reasons for the apparent increase in the in-equality of market incomes as the basis forimproved policies to preserve Australia’s tradi-tional degree of income equality. Many peopleconsider that these two causes of inequality in-volve a trade-off, with a compression of rela-tive pay rates leading to higher unemploymentand vice versa. But here the two causes of in-equality will initially be treated separately,with the principal focus on the changing dis-persion of earnings.
A further initial consideration is that inequal-ity is usually measured with reference to fami-lies who combine most of their consumption. Ifallowance is made for the income of other fam-ily members, then it has been found that lowearnings are fairly evenly spread across the dis-tribution of household incomes (Richardsonand Harding 1999). In addition, low wage earn-ers are somewhat more likely to be employedpart-time, and the increasing proportion ofpart-time workers would have contributed to
The Labour Market and Inequality
Michael Keating*Economics ProgramResearch School of Social SciencesThe Australian National University
* This article has benefited considerably from the com-ments of one referee and an editor of the journal, MarkWooden. Any remaining shortcomings are, of course,solely the responsibility of the author.

Keating: Labour Market and Inequality 375
2003 The University of Melbourne, Melbourne Institute of Applied Economic and Social Research
the wider distribution of earnings for
all
em-ployees even if their relative hourly earningshad not changed. For these reasons, the follow-ing analysis of earnings concentrates on theearnings distribution for full-time adult em-ployees. By concentrating on this largest andrelatively homogeneous group of employees, itis possible to focus on some of the underlyingchanges in the labour market that are affectingthe distribution of incomes, with less chancethat the results will be affected by the changingmix of employment types.
The article begins, in Section 2, by summa-rising the main changes in the distribution ofearnings over the last 25 years. Sections 3 to 6then seek to establish the relative influence ofchanging rates of pay and changes in the com-position of employment on the earnings distri-bution. The principal finding from this analysisis that the changes in the composition of em-ployment have had much more influence on thechange in earnings inequality than changes inrelative pay. In Section 7 the changes in thecomposition of jobs are then related to other re-search on the increase in spatial inequality inAustralia. In Section 8 it is suggested that thesefindings regarding the causes of inequalitymean that policies to change wage determina-tion arrangements and income support areunlikely to be very effective in reducing in-
equality. Instead, policy should focus on thereasons why the pattern of job creation haschanged, and these are further examined inSection 9. The key points are then summarisedin a concluding section, which leads to somepolicy proposals for improving job creation soas to increase the chances of a more equal dis-tribution of incomes.
2. Inequality and the Distribution of Earnings
The key facts describing the distribution offull-time employee earnings are summarised inTables 1 and 2, which show the ratio of theearnings of different percentiles or deciles rel-ative to the 50th percentile or median earnings.The preferred series for
all
full-time adult em-ployees is shown in Table 1, but unfortunatelythis series only extends back to 1985. Earningsdistribution data for full-time adult
non-managerial
workers are available back to1975, and the two series describe much thesame increase in the dispersion of earnings dur-ing the years when they do overlap.
Since 1975 the earnings of full-time adultnon-managerial workers in the lowest decilehave steadily declined relative to median earn-ings, while the earnings of those in the highestdecile have increased. Similarly the earnings of
Table 1 Earnings Distribution for all Full-Time Adult Employees: Ratios
Males Females Persons
P10/P50 P90/P50 P10/P50 P90/P50 P10/P50 P90/P50
1985 0.70 1.62 0.78 1.50 0.72 1.63
1987 0.69 1.62 0.75 1.50 0.70 1.63
1989 0.66 1.63 0.73 1.51 0.68 1.62
1991 0.67 1.66 0.74 1.54 0.69 1.68
1993 0.65 1.69 0.73 1.55 0.68 1.66
1994 0.65 1.67 0.73 1.54 0.68 1.65
1995 0.65 1.69 0.72 1.54 0.68 1.67
1996 0.64 1.70 0.71 1.53 0.66 1.68
1998 0.62 1.75 0.70 1.55 0.65 1.72
2000 0.62 1.76 0.69 1.58 0.65 1.73
1985–2000, per cent change –11.4 8.6 –11.5 5.3 –9.7 6.1
Sources
: ABS,
Australian Social Trends 2000
, Cat. no. 4102.0, p. 145, and unpublished data supplied by the ABS from theSurvey of Employee Earnings and Hours.

376 The Australian Economic Review December 2003
2003 The University of Melbourne, Melbourne Institute of Applied Economic and Social Research
the lower quartile of employees have slippedrelative to the median, while the earnings of theupper quartile have increased relatively.Broadly the change in the dispersion of earn-ings has been about the same for males and fe-males. However, the extent of female wagedispersion continues to be less than for males,and because the number of female employeeshas increased relatively over time, the disper-sion of earnings for persons has not widened byquite as much as for the two sexes separately.
Overall, the picture is one of increasing in-equality of earnings over the last 25 years.Moreover, this period of widening earningsdispersion contrasts with what is believed to bea long period of stability or compression of theearnings distribution during most of the twenti-eth century prior to the mid-1970s (Norris1977, p. 486).
In principle these changes in earnings disper-sion could be the result of changes in the struc-ture of employment or changes in relative ratesof pay for different types of employee. Nor isthere anything in the earnings data themselvesto say whether any changes in their dispersionrepresent changing pay relativities or changingjob structures, or some combination of both, al-
though which explanation is correct wouldmake a significant difference when judging theappropriate policy response. Fortunately thereis other information regarding the likelychange in pay rates and average earnings, andthe numbers employed in different occupa-tions, that can be used to throw some furtherlight on the widening dispersion of earnings.
Accordingly, the main focus here is on howthe changing
occupational
distribution of em-ployment and relative rates of pay for differentoccupations have combined to influence thedistribution of earnings. It is believed that oc-cupational criteria account for the main differ-ences in pay rates, and that these criterialargely, although not entirely, reflect differ-ences in skill levels. But the distribution ofearnings will change not only in response tochanges in the occupational structure of em-ployment and relative pay, but also in responseto any other residual factors. These other ‘re-sidual factors’ could include changes in thestructure of employment and/or pay relativitiesreflecting age/experience, education/skills, in-dustry, or type of employment contract. Histor-ically gender has also affected relative pay, andthe gender composition of employment has
Table 2 Distribution of Earnings for Full-Time Adult Non-Managerial Workers, 1975 to 2000
(earnings as a percentage of median earnings)
Lowest decile Lowest quartile Upper quartile Highest decile
Males
1975 76.0 85.6 121.1 141.2
1980 73.8 84.0 123.2 150.4
1985 72.5 80.7 125.7 154.1
1990 69.5 80.6 126.0 156.3
1995 67.7 79.4 127.8 160.7
1998 65.6 78.4 128.7 162.6
2000 65.0 77.5 128.2 162.9
Females
1975 80.2 88.8 115.3 136.5
1980 81.8 88.0 119.3 142.8
1985 78.6 87.3 121.2 147.9
1990 74.9 84.1 123.1 147.6
1995 73.4 84.1 125.3 152.0
1998 71.8 82.3 127.5 150.4
2000 71.5 82.1 126.3 151.8
Source
: Norris and McLean (1999), updated from ABS,
Employee Earnings and Hours, Australia
, Cat. no. 6306.0.

Keating: Labour Market and Inequality 377
2003 The University of Melbourne, Melbourne Institute of Applied Economic and Social Research
been changing, but here the two sexes are an-alysed separately.
3. Changes in Occupational Relative Pay
Ideally we would like to know how relativerates of pay have changed for the same occupa-tions. Unfortunately it is only recently, sinceSeptember 1997, that the Australian Bureau ofStatistics (ABS) has provided pure wage costindexes that are unaffected by changes in thecomposition of the labour market. These in-dexes are also not affected by changes in pen-alty payments, changes in allowances orchanges in bonuses, which fluctuate accordingto the type of work done and the performanceof that work. Prior to 1997 the best informationwas the indexes of award rates of pay for se-lected occupations. These earlier indexes donot necessarily cover the full cost of employingdifferent types of labour. In particular, theseearlier indexes of award rates of pay would notreflect any changes in over-award payments,which may have changed faster in some occu-pations than others. It is not possible to estab-lish exactly the influence of over-awardpayments on changing pay relativities overtime, and therefore the extent to which the in-dexes in Table 3 understate the movement inpay relativities. It is known, however, that theAustralian Conciliation and Arbitration Com-mission felt under some compunction to main-tain the relevance of the award structure byincreasing award rates of pay in the hope of
minimising over-award payments (Hancock1982). Both those who opposed the role of theCommission and those who supported it seemto have believed that the Commission wasbroadly successful in its endeavour to maintainthe relevance of awards; otherwise it would nothave been worth fighting over its role and in-fluence.
One other problem is that the AustralianStandard Classification of Occupations(ASCO) has not remained stable over time. Un-fortunately there is no satisfactory way of link-ing the ASCO 1 and ASCO 2 classifications ofpay rates by occupation between June and Sep-tember 1997. Accordingly, the changes in ratesof pay by occupation are shown in two separatetables (3 and 4) for the period before and after1997.
What is remarkable about the data for rela-tive pay movements (Tables 3 and 4), and espe-cially the data since 1997, is the apparent lackof change in pay relativities. For each of themajor occupational groups identified, the rele-vant index of pay rates has increased at almostthe same rate as the index for all occupationsover each period of time. Indeed, this evidencesuggests that pay relativities, at least among themajor occupational groups, have changed verylittle between the period before 1990, with var-ious forms of centralised wage determination,and the period since 1990, when pay determi-nation has become progressively more decentr-alised. Only in recent years since 1997 hasthere been any apparent tendency for the
Table 3 Indexes of Pay Rates by Occupation (ASCO 1), June 1976 to June 1997
1976 1985
a
1990 1995 1997
Managers and administrators 49.4 100.0 127.9 141.8 146.0
Professionals 48.8 100.0 128.1 142.2 146.9
Associate professionals 49.8 100.0 131.4 144.6 148.4
Tradespersons 46.8 100.0 131.5 144.9 148.7
Clerical 48.8 100.0 130.2 143.7 149.0
Sales and service workers 48.5 100.0 131.0 148.9 154.0
Production and transport workers 48.4 100.0 132.6 146.5 150.6
Labourers and related workers 47.9 100.0 131.9 144.8 148.9
All occupations 48.6 100.0 130.9 144.7 149.2
Note
: (a) July 1985 equals 100.
Sources
: ABS,
Wage Rates Indexes
, Cat. no. 6312.0, for the period 1976 to 1982, and ABS,
Award Rates of Pay Indexes
,Cat. no. 6312.0, for the period 1982 to 1997. The two periods were linked as described in the Appendix.

378 The Australian Economic Review December 2003
2003 The University of Melbourne, Melbourne Institute of Applied Economic and Social Research
increase in pay in the highly paid occupationgroups to exceed the increase in the lowly paidgroups, and the difference is still fairly small.
Much of the popular criticism of excessivepay increases has been directed at senior man-agement in the private sector. A private surveyof 11100 senior managers’ pay supports theview that during the 1990s their pay increasedaround 1 to 1.5 percentage points per annumfaster than average, although this differencewas less than during the 1980s when most otheremployees’ pay was restrained under the Ac-cord.
2
Equally important in the present contextis that such a small group is unlikely to havehad much impact on the overall distribution ofearnings.
Although the present finding that there doesnot seem to have been much change in relativepay rates among the major occupation groupsis not conclusive, it is consistent with mostother research. Thus the Economic PlanningAdvisory Commission (1996, p. 98, Table 6.1)found that between 1986 and 1995 there waslittle change in the average male full-time adultordinary time earnings of the higher skilled orhigher paid occupations relative to other occu-pations.
3
Similarly there was little change inthe return to education or to years of experienceover the last 30 years as a whole.
4
If anything,the increase in the level of educational attain-ment has been associated with a compressionof pay differentials for skills, which wouldhave acted to reduce the dispersion of earnings
overall. What seems to have happened is thatthere has been an increase in the relative de-mand for skilled workers that could have actedto increase the dispersion of relative pay rates.However, this increase in demand has beenmatched, or more than matched, by an increasein the supply of skilled workers, so that therehas been little market pressure to increase therelative pay rates of the most skilled labour.
The one finding that might suggest that rela-tive pay differentials have increased is reportedby Borland, Gregory and Sheehan (2001, Table1.2). Their data show the average earnings ofhigher paid groups of occupations increasingsubstantially more than for groups of low paidoccupations between 1990 and 2000. Changesin the relative average earnings of differentgroups of employees are, however, not neces-sarily the same as changes in their relative ratesof pay. Especially when the groups are broadlydefined, changes in their relative average earn-ings can be generated by changes in the mix ofemployment within the groups. In addition, inthis case the average earnings data reported byBorland, Gregory and Sheehan for 1990 pur-port to represent a reclassification by the ABSfrom the ASCO 1 classification to the ASCO 2classification. However, the original data, be-fore any reclassification, show much less vari-ation in the rates of change in average earningsbetween the major occupation groups, and inthe original data there is no systematic patternin the rates of increase by occupation group.
Table 4 Indexes of Total Hourly Rates of Pay by Occupation (ASCO 2), September 1997 to June 2002
1997
a
2000 2002
Managers and administrators 100.0 108.2 117.1
Professionals 100.0 108.0 117.7
Associate professionals 100.0 107.4 116.0
Tradespersons and related workers 100.0 107.3 115.6
Advanced clerical and service workers 100.0 107.2 114.2
Intermediate clerical, sales and service workers 100.0 106.8 114.6
Intermediate production and transport workers 100.0 106.7 114.4
Elementary clerical, sales and service workers 100.0 106.3 113.7
Labourers and related workers 100.0 106.9 114.7
All occupations 100.0 107.4 115.9
Note
: (a) September 1997 equals 100.
Source
: ABS,
Wage Cost Index, Australia
, Cat. no. 6345.0.

Keating: Labour Market and Inequality 379
2003 The University of Melbourne, Melbourne Institute of Applied Economic and Social Research
The ABS has now advised that its attempt tolink the ASCO 1 and ASCO 2 classifications ofaverage earnings was unsatisfactory. Conse-quently, the data supplied to Borland, Gregoryand Sheehan were in fact biased and cannot beused to make comparisons between 1990 and2000 ASCO 2 average earnings data.
In sum, the available evidence suggestsfairly strongly that relative pay rates have re-mained remarkably constant over time in Aus-tralia, notwithstanding significant changes inthe arrangements for pay determination. Thisfinding in turn suggests that the distribution ofearnings is unlikely to have been significantlyimpacted by changing pay relativities, and un-derlines the importance of now turning to ex-amine the changing distribution of jobs.
4. Changes in Employment by Major Occupation
In the last quarter of the twentieth century Aus-tralia, like other high income countries, enteredthe post-industrial age. The absolute numbersemployed in manufacturing have slowly fallenby about 20 per cent from their peak in theearly 1970s. Manufacturing now only accountsfor 12.5 per cent of total employment, half itsshare of 25.5 per cent in the mid-1960s.
Gregory (1993) appears to have been influ-enced by this decline in manufacturing em-ployment in reaching his conclusion that thewider dispersion of earnings mainly reflectedthe ‘disappearance’ of middle level jobs, suchas tradesmen’s jobs in manufacturing. This in-terpretation is supported by the apparent de-cline between 1982 and 1993–94 in theproportion of full-time jobs in the range from75 to 125 per cent of the median wage (Harding1997, Table 1). However, as Belchamber(1996) has pointed out, these comparisons de-pend upon the rate of wage increase assumed.Using other plausible assumptions, Belcham-ber contended that the growth in jobs has beenskewed in favour of high level jobs rather thanagainst middle level jobs. This conclusion isalso supported by Karmel et al. (1993), whoconcluded that the change in the distribution ofjobs was better characterised as a ‘disappearingtail’.
Much of the job growth in the 1990s was inpart-time employment and this part-time em-ployment was concentrated in the less skilledoccupations. As Wooden (2000) and subse-quently the Commonwealth Government(2001, 2002) have shown, a significantly dif-ferent picture of the composition of employ-ment growth emerges if the changingoccupational composition of employment ismeasured in terms of hours worked. Usingthese data, Wooden (2000, p. 196) found that‘changes in labour demand have clearly beenbiased towards skill’. The growth in hoursworked between 1989 and 2000 was concen-trated in the two highest skilled occupationalgroups, and the growth in hours worked in theother occupation groups involving intermedi-ate or elementary skills has been below the na-tional average.
The Commonwealth Government has ex-tended Wooden’s methodology and groupedthe hours worked in 282 occupations intothree roughly equal groups according towhether the occupation was ‘high’, ‘middle’or ‘low’ paid. The Government has then foundthat almost half (45.7 per cent) of the growthin hours worked between 1986 and 1995 wasin the ‘high paid’ occupations, and that these(high paid) occupations accounted for half(50.5 per cent) of the growth between 1996and 2000.
In order to assess the impact on the distribu-tion of earnings for full-time employees it isnecessary to consider the changing occupa-tional composition of employment for full-timeemployees. Estimates of the changes in thenumber of full-time employees for the majoroccupational groupings replicate Wooden’sfindings for the changes in hours worked (Ta-ble 5). Professionals and associate profession-als accounted for most of the job growth forfull-time employees, although jobs for inter-mediate clerical, sales and service also grewstrongly for female full-time employees. Full-time job losses were especially significantamong tradespersons and elementary clerical,sales and service employees and labourers andrelated employees, and the number of femalesin advanced clerical and service occupationsalso declined substantially.

380 The Australian Economic Review December 2003
2003 The University of Melbourne, Melbourne Institute of Applied Economic and Social Research
Table 5 Increase in Full-Time Employees by Occupation, May 1989 to May 2000
Major occupation group
Employees (’000s) Increase
(per cent)
Share of total jobs growth (per cent)May 1989 May 2000
Males
Managers and administrators 267.4 300.3 12.3 18.0
Professionals 520.6 661.5 27.1 77.0
Associate professionals 398.1 502.4 26.2 57.0
Tradespersons and related workers 858.3 802.1 –6.6 –30.7
Advanced clerical and service workers 41.8 34.9 –16.3 –3.7
Intermediate clerical, sales and service workers 331.1 360.4 8.9 16.0
Intermediate production and transport workers 526.6 537.8 2.1 6.2
Elementary clerical, sales and service workers 194.7 167.3 –14.1 –15.0
Labourers and related workers 399.7 354.4 –11.3 –24.8
Total 3538.2 3721.2 5.2 100.0
Females
Managers and administrators 26.3 47.9 82.2 7.4
Professionals 343.5 537.4 56.5 66.7
Associate professionals 160.9 240.0 49.1 27.2
Tradespersons and related workers 58.4 52.1 –10.8 –2.2
Advanced clerical and service workers 252.7 158.7 –37.2 –32.3
Intermediate clerical, sales and service workers 457.9 607.6 32.7 51.5
Intermediate production and transport workers 84.9 63.9 –24.7 –7.2
Elementary clerical, sales and service workers 200.7 194.7 –3.0 –2.1
Labourers and related workers 142.4 115.8 –18.7 –9.2
Total 1727.7 2018.1 16.8 100.0
Source
: ABS,
Labour Force, Australia
, Cat. no. 6203.0, with adjustments for consistency, as described in the Appendix.
This shift in employment among the majoroccupation groups is generally towards themore highly paid and skilled groups, and itseems likely to have altered the distribution ofindividual earnings. However, the spread ofearnings
within
each of these major occupationgroups is considerable, and for some groupsnot much less than for total employment. Ac-cordingly it is useful to examine the changingdistribution of male and female employmentamong detailed occupations, and link thischanging employment more specifically to thedistribution of earnings among occupations.
5. Changes in Employment and Earnings by Detailed Occupation
In the analysis that follows, the detailed occu-pations are grouped by income decile accord-
ing to their level of average weekly ordinarytime earnings (AWOTE) at the beginning ofeach period of comparison—1986 and 1996 re-spectively.
5
The change in each occupation-decile’s share of earnings is notionally decom-posed into the relative rate of pay increase andthe rate of employment increase relative to thetotal. This decomposition is carried out for thechange in earnings between 1986 and 1996 andbetween 1996 and 2000 separately, using occu-pational data at the four-digit code level ofASCO 1 and ASCO 2 respectively. These twoseparate periods are shown because thechanges in the occupational classificationmeant that it was not possible to derive contin-uous series for each detailed occupation at thefour-digit code level.
Unfortunately there are no publicly availabledata that would allow us to observe whether

Keating: Labour Market and Inequality 381
2003 The University of Melbourne, Melbourne Institute of Applied Economic and Social Research
relative pay rates for individual detailed occu-pations are changing and whether thesechanges are affecting the overall distribution ofearnings. Instead to test this proposition ABSsurvey data were obtained of the AWOTE ofmales and females separately in 1986, 1996and 2000 for most of the four-digit level occu-pations of the relevant ASCO classification. Ofcourse changes in relative average earnings forindividual occupations do not necessarily indi-cate changes in relative pay rates. But at thefour-digit level of occupational detail the aver-age earnings data are likely to correspond moreclosely to the pay rate of the occupation, and tobe less affected by the changing composition ofemployment within an occupation than wouldbe the case for a broader occupational group-ing. Moreover the data on average earnings dohave the advantage that they comprehend allchanges that affect the remuneration of individ-ual employees, and not just those covered inthe indexes of pay as such. These other formsof remuneration will, of course, also affect thedistribution of earnings, in just the same way aschanges in relative pay, and should be includedin the present analysis.
Indeed there are a number of reasons whythe earnings for individual occupations mayhave become more dispersed as a result ofworkplace reform in ways that are not capturedby indexes of pay, but would mostly be pickedup by the measures of average weekly earn-ings. First, the indexes of relative pay do notinclude penalty rates and bonuses, and it isquite likely that workplace reform has led tothese payments becoming more unevenlyspread. Indeed the objective of much work-place reform has been to reduce the need forpayments such as penalty rates for large bodiesof workers who were typically in manual andblue-collar jobs. While on the other hand per-formance bonuses have become more wide-spread in highly paid managerial and someprofessional jobs.
Second, there has been a deliberate attemptto try and increase the significance of careerpaths in many jobs. Where an occupation offersa career path, the earnings relativity for that oc-cupation could be affected over time by anychange in experience and seniority of the mem-
bers of that occupation. Thus it is known thatthe average age in some occupations such asteaching has risen and this might have led to aform of disguised pay increase for teacherswithout any increase in their nominal pay rate.Alternatively increased seniority paymentsmay have enabled their employer to constrainteachers’ nominal pay rates while still main-taining their overall relative earnings. Simi-larly another form of disguised pay increaseoccurred for nurses whose work was reclassi-fied upwards between 1986 and 1996, leadingto an especially rapid increase in their relativeearnings.
However, there is one disadvantage in usingdata on
average
earnings to model the impactof increases in remuneration on the distributionof total earnings. The average earnings data foreach individual occupation at the detailed levelcannot reflect any increase in the amount ofdispersion around that
average
rate of remu-neration for that individual occupation. Butworkplace reform may also have led to pay be-coming more dispersed
within
individual occu-pations at the detailed level. For example, payis gradually being determined on a more indi-vidual basis with performance pay being in-corporated even where there is enterprisebargaining covering whole groups of employ-ees. In this case there would be a greater spreadaround the average earnings for each individualoccupation than previously, as well as a greaterspread between occupations. To the extent thatthis form of pay dispersion
within
individualoccupations occurs then the present analysiswill understate the impact of changing rates ofrelative remuneration on the overall distribu-tion of earnings.
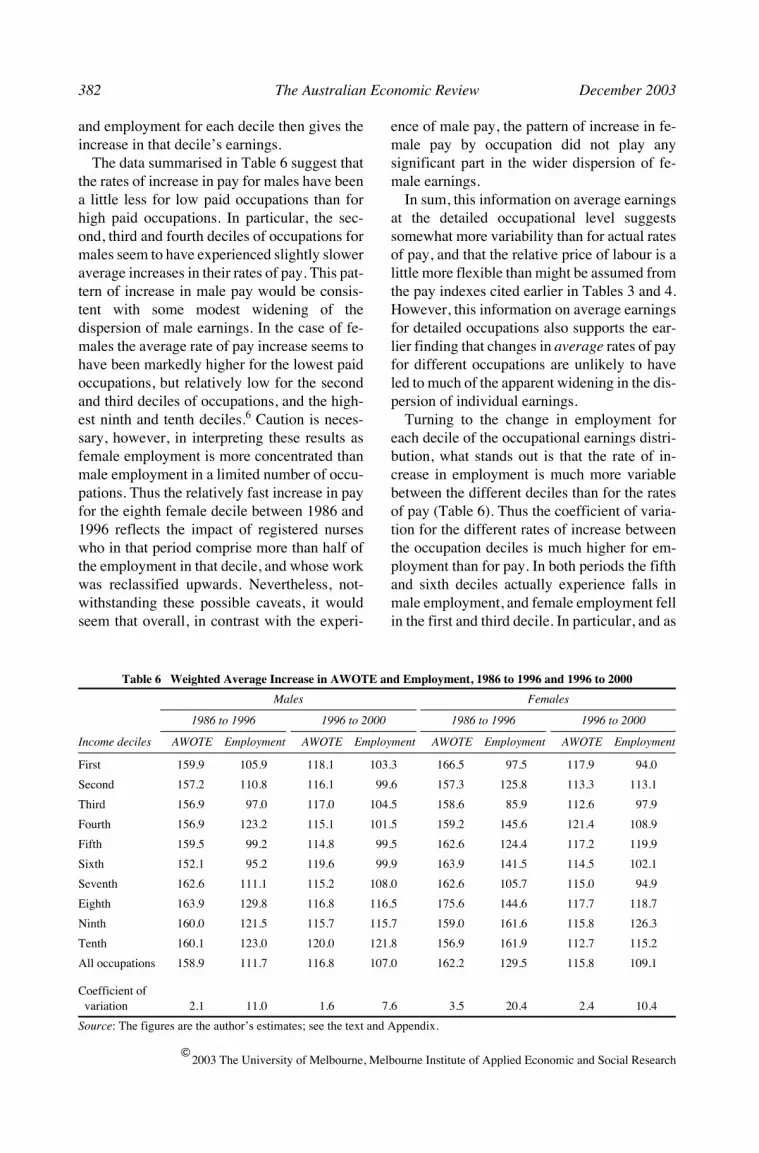
Bearing these caveats in mind, in Table 6 theweighted means of the rates of increase in theAWOTE of the individual occupations areshown for each decile of earnings. The weightsare each occupation’s share of employment in1986 and 1996, but as these are constantweights, the increases in earnings shown areunaffected by any shift in employment be-tween the individual occupations. In addition,Table 6 also shows the rate of increase in em-ployment for each of these same earningsdeciles. The combination of the increase in pay
382 The Australian Economic Review December 2003
2003 The University of Melbourne, Melbourne Institute of Applied Economic and Social Research
and employment for each decile then gives theincrease in that decile’s earnings.
The data summarised in Table 6 suggest thatthe rates of increase in pay for males have beena little less for low paid occupations than forhigh paid occupations. In particular, the sec-ond, third and fourth deciles of occupations formales seem to have experienced slightly sloweraverage increases in their rates of pay. This pat-tern of increase in male pay would be consis-tent with some modest widening of thedispersion of male earnings. In the case of fe-males the average rate of pay increase seems tohave been markedly higher for the lowest paidoccupations, but relatively low for the secondand third deciles of occupations, and the high-est ninth and tenth deciles.
6
Caution is neces-sary, however, in interpreting these results asfemale employment is more concentrated thanmale employment in a limited number of occu-pations. Thus the relatively fast increase in payfor the eighth female decile between 1986 and1996 reflects the impact of registered nurseswho in that period comprise more than half ofthe employment in that decile, and whose workwas reclassified upwards. Nevertheless, not-withstanding these possible caveats, it wouldseem that overall, in contrast with the experi-
ence of male pay, the pattern of increase in fe-male pay by occupation did not play anysignificant part in the wider dispersion of fe-male earnings.
In sum, this information on average earningsat the detailed occupational level suggestssomewhat more variability than for actual ratesof pay, and that the relative price of labour is alittle more flexible than might be assumed fromthe pay indexes cited earlier in Tables 3 and 4.However, this information on average earningsfor detailed occupations also supports the ear-lier finding that changes in
average
rates of payfor different occupations are unlikely to haveled to much of the apparent widening in the dis-persion of individual earnings.
Turning to the change in employment foreach decile of the occupational earnings distri-bution, what stands out is that the rate of in-crease in employment is much more variablebetween the different deciles than for the ratesof pay (Table 6). Thus the coefficient of varia-tion for the different rates of increase betweenthe occupation deciles is much higher for em-ployment than for pay. In both periods the fifthand sixth deciles actually experience falls inmale employment, and female employment fellin the first and third decile. In particular, and as
Table 6 Weighted Average Increase in AWOTE and Employment, 1986 to 1996 and 1996 to 2000
Males Females
1986 to 1996 1996 to 2000 1986 to 1996 1996 to 2000
Income deciles AWOTE Employment AWOTE Employment AWOTE Employment AWOTE Employment
First 159.9 105.9 118.1 103.3 166.5 97.5 117.9 94.0
Second 157.2 110.8 116.1 99.6 157.3 125.8 113.3 113.1
Third 156.9 97.0 117.0 104.5 158.6 85.9 112.6 97.9
Fourth 156.9 123.2 115.1 101.5 159.2 145.6 121.4 108.9
Fifth 159.5 99.2 114.8 99.5 162.6 124.4 117.2 119.9
Sixth 152.1 95.2 119.6 99.9 163.9 141.5 114.5 102.1
Seventh 162.6 111.1 115.2 108.0 162.6 105.7 115.0 94.9
Eighth 163.9 129.8 116.8 116.5 175.6 144.6 117.7 118.7
Ninth 160.0 121.5 115.7 115.7 159.0 161.6 115.8 126.3
Tenth 160.1 123.0 120.0 121.8 156.9 161.9 112.7 115.2
All occupations 158.9 111.7 116.8 107.0 162.2 129.5 115.8 109.1
Coefficient of variation 2.1 11.0 1.6 7.6 3.5 20.4 2.4 10.4
Source
: The figures are the author’s estimates; see the text and Appendix.

Keating: Labour Market and Inequality 383
2003 The University of Melbourne, Melbourne Institute of Applied Economic and Social Research
1 2 3 4 5 6 7 8 9 10-20
-15
-10
-5
0
5
10
15
20
Earnings
Employment
1 2 3 4 5 6 7 8 9 10-10
-5
0
5
10
15
Earnings
Employment
expected from the data for the major occupa-tional groups, employment for both sexes grewmuch faster than average in the higher earningsdeciles, with some suggestion of a ‘disappear-ing middle’ in the case of males, but not for fe-males.
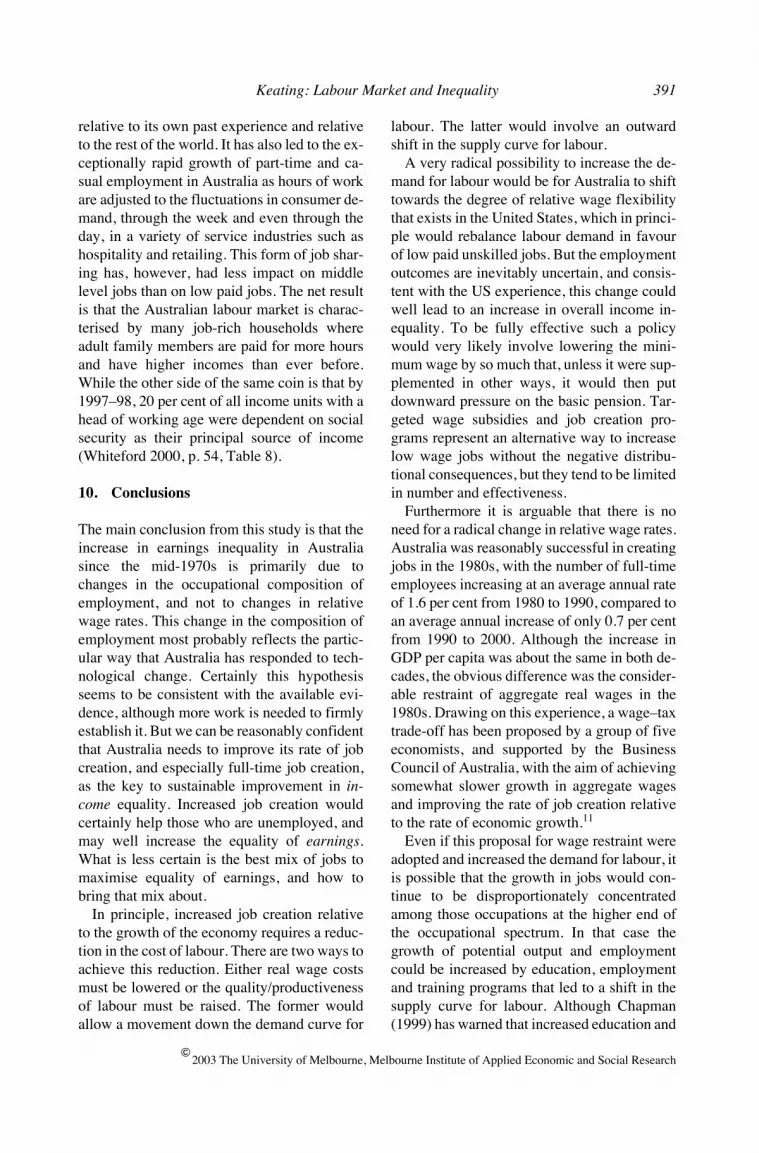
In Figures 1 to 4 the increase in pay and em-ployment for each decile of occupations iscompared with the increase for all occupations
included in this analysis. From this comparisonit is possible to assess the relative contributionsof changes in pay and in the composition ofemployment to the changing distribution ofearnings by occupations. As is shown thechange in the dispersion of earnings among oc-cupations is dominated by the change in em-ployment composition. Indeed, Figures 1 and 2suggest that the main reason why full-time
Figure 1 Males: Relative Increase in Pay and Employment by Income Decile, 1986 to 1996
Source
: The figures are the author’s estimates; see the text.
Income decile
Per cent increaserelative tomean increase
Figure 2 Males: Relative Increase in Pay and Employment by Income Decile, 1996 to 2000
Source
: The figures are the author’s estimates; see the text.
Income decile
Per cent increaserelative tomean increase

384 The Australian Economic Review December 2003
2003 The University of Melbourne, Melbourne Institute of Applied Economic and Social Research
male earnings have become more unequallydispersed when grouped by occupation is be-cause full-time employment in the top threedeciles of occupations has grown much fasterthan in the other deciles. To a much lesser ex-tent the position of these top male deciles of oc-cupations has also been reinforced by the factthat their pay also increased a little faster thanfor the other deciles. In the case of female oc-
cupations, as already noted, the rate of increasein pay was much the same throughout the dis-tribution of occupations, with no systematictendency for it to be faster for the highly paid,middle or lower paid occupations (Figures 3and 4). It was the increase in female full-timeemployment that was substantially faster forthe top three deciles of occupations, and thisemployment increase would account for all of
1 2 3 4 5 6 7 8 9 10-20
-15
-10
-5
0
5
10
15
20
Earnings
Employment
1 2 3 4 5 6 7 8 9 10-40
-30
-20
-10
0
10
20
30
Earnings
Employment
Figure 3 Females: Relative Increase in Pay and Employment by Income Decile, 1986 to 1996
Source
: The figures are the author’s estimates; see the text.
Income decile
Per cent increaserelative tomean increase
Figure 4 Females: Relative Increase in Pay and Employment by Income Decile, 1996 to 2000
Source
: The figures are the author’s estimates; see the text.
Income decile
Per cent increaserelative tomean increase

Keating: Labour Market and Inequality 385
2003 The University of Melbourne, Melbourne Institute of Applied Economic and Social Research
the increase in their share of total earnings.However, unlike males, the share of femalefull-time employment in the middle deciles ofoccupations did not decline between 1986 and1996. This finding that females in the middleincome occupations were able to maintain theirshare of employment is consistent with the ear-lier finding (Table 1) that female earnings forthe 90th percentile did not increase by as muchrelative to the median as was the case formales.
6. The Impact of Shifts in Employment by Occupation on the Dispersion of Individual Earnings
The evidence so far suggests that relative ratesof pay for different occupations have notchanged much or systematically, but thechanging occupational structure of jobs forfull-time employees seems likely to have beena factor leading to a more unequal distributionof their earnings. It is the higher skilled andpaid occupation groups that have expanded rel-ative to the rest, and this changing compositioncould be expected to raise median earnings andthus change the distribution of earnings forfull-time employees as conventionally mea-sured relative to that median.
Unfortunately, however, it is not easy to for-mally link this information covering the distri-bution of earnings among occupations with thedistribution of earnings among individuals.The only such formal link that can be made isfor the major occupation groups where infor-mation is available showing the distribution ofindividual earnings within each occupationgroup. These earnings distributions for themajor occupation groups sum to the distribu-tion of earnings for all individual employees.
The earnings distributions for the major oc-cupation groups could therefore be used to de-rive a hypothetical distribution of earnings for2000, for individual males and females sepa-rately. These hypothetical distributions werebased on the assumption that the distribution offull-time employment among the major occu-pation groups was the same as in 1989, but thatthe earnings within each major group were dis-tributed as recorded in 2000. The difference be-tween this hypothetical earnings distributionand the actual distribution for 2000 provides anestimate of how much the change in the distri-bution of employment among major occupa-tions has affected the distribution of individualearnings between 1989 and 2000. In addition,comparison of the hypothetical distribution ofearnings for 2000 with the actual distribution
Table 7 The Impact of Occupational Composition on the Distribution of Earnings
Males Females
1989
2000
1989
2000
Actual1989
composition Actual1989
composition
Earnings ($)
10th percentile 349 498 496 311 461 450
25th percentile 416 600 595 356 538 523
Median 529 800 774 426 670 632
75th percentile 681 1057 1024 532 865 817
90th percentile 862 1404 1347 644 1056 996
Ratio to median (per cent)
10th percentile 66.0 62.3 64.1 73.0 68.8 71.2
25th percentile 78.7 75.0 76.9 83.5 80.3 82.8
75th percentile 128.7 132.1 132.2 124.8 129.1 129.3
90th percentile 163.0 175.5 174.0 151.0 157.6 157.6
Ratio P10 to P90 (per cent) 40.5 35.5 36.8 48.3 43.7 45.2
Source
: The figures are the author’s estimates; see the text.

386 The Australian Economic Review December 2003
2003 The University of Melbourne, Melbourne Institute of Applied Economic and Social Research
for 1989 provides an estimate of the so-far ‘un-explained’ variation in the distribution of indi-vidual earnings.
In fact the hypothetical distributions of earn-ings for males and females both lie between theactual distributions for 1989 and 2000 (seeTable 7). The shift in the composition of em-ployment in favour of the more highly paidmajor occupation groups has increased the me-dian level of earnings and the earnings of the75th and 90th percentiles by slightly more.However, this change in the composition ofemployment did not make much difference tothe earnings of the 10th and 25th percentiles.As a summary measure, the shift in full-timeemployment among the major occupationswould seem to account for about a quarter of thechange in the ratio of the male 10th percentile’sincome to the 90th percentile’s income. Simi-larly, the occupational shift in employment ac-counted for about a third of the change in thisincome ratio for the equivalent females. In sumthese shifts in employment between major oc-cupation groups would seem to account for asignificant, but only modest, part of the chang-ing distribution of individual earnings.
Unfortunately it was not possible to calculatea similar hypothetical distribution of individualearnings using the available employment datafor detailed occupations, because there was noway of linking the available information for de-tailed occupations with the total distribution ofindividual earnings for all full-time employees.There is reason to think, however, that theabove measure of the impact of the shift of em-ployment among the major occupation groupsprobably understates the overall impact of thechanging occupational structure of employ-ment on the distribution of individual earnings.This measure relates only to the shift in em-ployment among major occupations, but therewas also a considerable increase in the disper-sion of earnings
within
most of the major occu-pation groups (Keating 2003, Tables 6–7). Theemployment data for individual occupations byincome decile suggest the employment move-ment between them could help explain at leastpart of this tendency towards a wider disper-sion of earnings
within
each of the major occu-pation groups. In that case, the changing
composition of employment among the de-tailed occupations reinforced the impact on thedistribution of individual earnings already at-tributed to the shift in employment among themajor occupations.
Of course, it is possible that other ‘institu-tional’ factors, such as changes in the type ofemployment contract and/or the power of tradeunions, could also have influenced the disper-sion of individual earnings. But any influenceexerted by these other factors could be ex-pected to change the relative average earningsof the detailed occupations. In fact, as has beenshown, these average earnings for the differentdeciles of occupations changed very little rela-tively and not systematically. It is also theoret-ically possible that other ‘institutional’ factorsled to an increase in the dispersion around theaverage earnings for each detailed occupation.But it seems unlikely that any such increase indispersion could occur without altering the rel-ativities among the average earnings of the de-tailed occupations.
In sum, although the available evidence can-not be conclusive, it strongly suggests that thechange in the occupational distribution of em-ployment has been a major cause, and quiteprobably the major cause, of the wider disper-sion of earnings among full-time employees.
7. The Relation between the Changing Composition of Jobs and Spatial Inequality
Finally, the changing composition of employ-ment also seems to be consistent with the evi-dence of greater inequality among our suburbsand regions.
Thus Gregory and Hunter (1995) found thatin 1976 the ratio of employment to the workingage population (E/P) was much the same acrossall Australian neighbourhoods. Wherever youlived your chance of being employed used to bemuch the same, and this may have been an im-portant aspect of Australia’s traditional egali-tarianism, even if the richer neighbourhoodsalways tended to have more people in highlypaid jobs. By 1991, however, this E/P ratio hadfallen everywhere, but much more dramati-cally in the poorest neighbourhoods. Indeed,

Keating: Labour Market and Inequality 387
2003 The University of Melbourne, Melbourne Institute of Applied Economic and Social Research
between 1976 and 1991, the lowest 1 per centof neighbourhoods, based on a ranking of theirsocio-economic status in 1986, lost 45 per centof their employment, 23 per cent of theirhousehold income, and male unemploymentincreased from 6.4 per cent to 28.1 per cent.While over the same period in the highest 1 percent of neighbourhoods, employment fell mar-ginally, household incomes increased by 31 percent, and male unemployment increased byonly 4.7 per cent (Gregory and Hunter 1995, p.33).
A possible explanation for this different em-ployment experience of different neighbour-hoods over the last two decades is that thoseneighbourhoods with higher socio-economicstatus have a more skilled and educated popu-lation. Thus the changes towards more unequalneighbourhoods are consistent with the strongrelationship that has now emerged betweenemployment growth and skills. Consequentlythose neighbourhoods with low socio-economic status, where the population has pooreducation and low skills, have suffered the big-gest declines in employment and in the incomethat accompanies employment.
The worry now is that the changes in job op-portunities may be interacting with the changesin neighbourhoods to reinforce the trend togreater inequality. When employment rateswere the same across all regions, it was reason-able to presume that if inequality was reducedamong individuals and families it would alsobe reduced across all regions and neighbour-hoods. But in the last two decades it is possiblethat increased inequality among regions is notpurely the counterpart of increased inequalityamong individuals. Rather the conjecture isthat the increased inequality observed amongneighbourhoods is also
a cause
of increased in-equality among individuals.
There are two reasons why unequal neigh-bourhoods can reinforce inequality. The firstreason is the conjecture that professionals arereluctant to locate in poorer neighbourhoods,and this reluctance discourages the new rapidlygrowing skilled jobs to locate in those poorerneighbourhoods. At the same time, where lessskilled jobs are being created, they tend to be inoccupations such as cleaning, waiters, and gar-
dening, so that less skilled jobs are also relocat-ing to the richer neighbourhoods. It is of coursearguable that people could migrate from thepoorer neighbourhoods to where suitable jobsexist, on a daily basis or more permanently, butthe costs involved for what is often only part-time work can be prohibitive. Instead people onthe margin become frustrated with their fruit-less job search and become welfare dependent.Over time the character of their neighbourhoodchanges, and this change further reduces op-portunities for those who live there.
The second related reason why greater in-equality among our neighbourhoods may itselfbe a cause of inequality is because educationalopportunities and performance also seem tovary according to where people live. For exam-ple, a comparison cited by Macklin (2002), ofthe Inner Eastern and North Western Regionsof Melbourne for 1999, found that in the InnerEastern Region school retention rates for boyswas as high as 94 per cent, and only 12 per centof these boys attained low grades in VCE En-glish. In the North Western Region, however,the school retention rate for boys was just 55per cent, and of these boys who stayed on asmany as 35 per cent attained low grades inVCE English. But another key difference be-tween the two regions was that the male unem-ployment rate in the Inner Eastern Region was4 per cent, while in the North Western Regionit was over 8 per cent.
Although further research is obviouslyneeded, again it is possible to conjecture thatthe difference in the social conditions and theenvironment between the two regions is a sig-nificant cause of their different scholastic per-formance. It is hard to believe that there is asystematic difference in natural ability accord-ing to where the boys live, but the boys livingin depressed regions may have less useful rolemodels and may develop behavioural prob-lems that make them less successful in learningand subsequently in employment. Moreover ifthis conjecture does provide the explanationfor the difference in scholastic performance,then it is likely that the problem is gettingworse, as the inequalities between our neigh-bourhoods are growing and are thus becomingself-reinforcing.

388 The Australian Economic Review December 2003
2003 The University of Melbourne, Melbourne Institute of Applied Economic and Social Research
8. Implications for Wage Determination and Income Support Policies
For more than 80 years following Federation,labour market regulation underpinned Austra-lia’s image of itself as an especially egalitariansociety. Indeed, arbitration was a central plankin the Australian Settlement reached in the firstdecade of the new nation (Castles 1985; Kelly1994). Moreover, because the ‘workers’ wel-fare state’ was established much earlier here,Australia did not feel it necessary to pursue thepost-war European approach of a welfare statebased upon massive social insurance. Instead,until recently, income support in Australia hasbeen limited to flat rate benefits paid to peoplewho are not employed, who could not reason-ably be expected to become employed, andwhose means are limited. For those (men) whowere employed it was assumed that their wageswould allow them and their families to main-tain a decent standard of living relative to thatof their peers, and that there would be no needfor further government support. And becausethe demands upon government revenue werekept small by this tight targeting it was possibleto finance government income support entirelyfrom consolidated revenue, and thus achievethe maximum amount of redistribution.
In the last 20 years there are signs of achange in policy thinking. First, private provi-sion for superannuation is now being mandatedby laws that rely on an extension of the govern-ment’s taxation power. Second, income sup-port for working families has been rapidlyexpanded since 1983 to offset the increased in-equality of earnings. For example, in January1997 a single income family with a dependentspouse and two children, earning two-thirds ofaverage male earnings and renting privately,received 33.3 per cent of their income fromgovernment cash transfers compared to only4.4 per cent of their income in January 1982.Indeed, while the real earnings of such a familyhardly changed over the 15 years, because ofthe substantial increases in cash transfers theirdisposable income increased by 24 per cent,and after housing costs it increased by as muchas 75 per cent (Keating 1998). Notwithstand-ing this dramatic increase in income support,
many people remain concerned that this in-creased income support is still an inadequateresponse to the increase in earnings inequality.And perhaps more relevantly they fear that thissupport may not rise sufficiently to keep pacewith increasing earnings inequality in the fu-ture.
Thus one common response to greater wageinequality is to call for re-regulation of the la-bour market, and specifically to restore the roleof the Australian Industrial Relations Commis-sion (AIRC). The present analysis, however,suggests that the widening dispersion of earn-ings has not been caused by changes in relativerates of pay. Furthermore, the increase in thedispersion of earnings commenced in the mid-1970s, well before the move to wage deregula-tion in the 1990s. Accordingly any attempt toreturn to arbitration is unlikely to achieve thehoped for reduction in inequality, even if therewere no other better way of achieving that ob-jective. To the limited extent that the remuner-ation of individuals has altered relatively, itprobably reflects elements of pay and condi-tions of employment that have always beenlargely outside the jurisdiction of the AIRC.Thus while the AIRC could determine rates ofentitlements, it could for the most part not de-termine how much access there would be toparticular entitlements. Even more impor-tantly, the most rapid growth in full-time jobshas been in those occupations where the juris-diction of arbitral processes has always beenmore limited.
7
Equally it is questionable whether increasing
government income support is well targeted tooffsetting an increase in labour market inequal-ity that apparently has not been caused by anychange in relative wage rates. For those whohave jobs, real wages have grown strongly inthe 1990s, with male average weekly earningsincreasing in real terms at an average annualrate of 1.6 per cent between 1990 and 2000.And as shown above, in the 1990s this rate ofincrease in real earnings was typical, with nosystematic variation in the relative earnings ofdifferent occupations at the four-digit level.Accordingly any increase in income support,such as the introduction of work credits, couldbe expected to flow to low wage earners whose

Keating: Labour Market and Inequality 389
2003 The University of Melbourne, Melbourne Institute of Applied Economic and Social Research
earnings have typically grown strongly in linewith the average. The only circumstanceswhere the introduction of work credits mightbe justified would be as part of a wage–taxtrade-off, especially if the burden of this trade-off falls disproportionately on low incomehouseholds.
9. Why Has the Pattern of Job Creation Changed?
The critical issue that policy needs to focus onis the pattern of job creation. If we nowbroaden our focus from the distribution of full-time
earnings
to the distribution of
incomes
,then there are three dimensions to the changingpattern of job creation that are of interest. First,as previously noted, full-time jobs growth hasbeen concentrated in higher income occupa-tions, with the number of full-time employeesin managerial and administrative, professionaland associate professional occupations increas-ing by as much as one-third between 1989 and2000. Second, because the number of full-timeemployees in the other major occupationgroups, excluding females employed as inter-mediate clerical, sales and service workers, fellby 8 per cent between 1989 and 2000, very fewfull-time jobs have been created on a net basis.Indeed, the total number of full-time employ-ees increased by only 9 per cent between 1989and 2000, or an average annual rate of increaseof less than 1 per cent, which is substantiallyless than the growth in the workforce that couldnormally be expected.
Third, low full-time jobs growth was amelio-rated to some extent by the rapid increase inpart-time and casual jobs, which respectivelyaccounted for 75 and 73 per cent of all the jobscreated between 1990 and 2000.
8
But the in-crease in total hours worked between 1989 and2000 still averaged only 0.9 per cent per annumfor males and 2.2 per cent per annum for fe-males. In addition, although the majority ofthese part-time and casual jobs are concen-trated at the lower end of the occupationalspectrum, these occupations’ share of the totalhours worked is falling (Wooden 2000, p. 195).And the earnings associated with these part-time and casual jobs are increasingly falling
behind those associated with full-time jobs(Borland, Gregory and Sheehan 2001, pp. 11–12).
9
In short, the increase in part-time and ca-sual jobs has been a useful development thathas suited many people, but not all. Most im-portantly, in the present context, these jobshave not been sufficient to maintain the equal-ity of income distribution in the face of an in-creasingly unequal distribution of the betterpaid and more permanent full-time jobs.
Overall, the net result of the changing mix ofjobs is that not only is the inequality of earn-ings increasing, but it is also becoming moredifficult for lower skilled people, and espe-cially males, to find sufficient work. The ques-tion that must be answered is why has theAustralian labour market evolved towards amore unequal incidence of job types. First, themain explanation must be some change in thestructure of demand for labour. Although someemployees prefer part-time and/or casual em-ployment, such employee preferences are un-likely to have accounted for the magnitude anduneven impact of the changes experienced. Un-fortunately, in these circumstances, the Com-monwealth Government’s approach to welfarereform, which focuses almost exclusively onthe supply of labour, would seem to be misdi-rected as it avoids the key issues affecting la-bour demand.
Second, it is unlikely that this change in thestructure of labour demand is a direct responseto the move towards a more open economy.
10
Briefly the reasons include:
• the shift in the occupational composition ofemployment has affected all industries andnot just the those industries that compete in-ternationally;
• there has been no general tendency for therelative price to fall for goods that are rela-tively dependent on unskilled labour andwhere low wage countries enjoy a compara-tive advantage; and
• there is evidence for Australia that ‘the fall inemployment associated with increased lowwage imports was outweighed by the in-crease in jobs associated with greater

390 The Australian Economic Review December 2003
2003 The University of Melbourne, Melbourne Institute of Applied Economic and Social Research
exports’ (Murtough, Pearson and Wreford1998, p. xi).
Instead the consensus is that the change inthe structure of demand for labour reflects abias in the nature of technological change infavour of skilled labour. For example, DeLaine, Laplagne and Stone (2000) found thatthe R&D intensity of an industry is positivelyassociated with its share of high skilled em-ployees, and that the more computer-intensivean industry, the more likely it is (on average) toemploy high skilled workers. A related findingby Pappas (1998) is that technological changeis favouring those jobs that involve coordinat-ing the activities of others, interpersonal rela-tions, and the preparation and analysis ofinformation, while jobs that rely on motorskills are being replaced with machinery. AndSheehan and Esposto (2001) have shown thatfull-time employment is increasing most rap-idly for those jobs that are more knowledge in-tensive, with activities such as information/data processing, reasoning/decision making,and interacting with and coordinating othersincreasing, while the requirement for physicalwork has declined.
However, the impact of technology on thestructure of labour demand is potentially thesame for all developed countries, but the wayin which they have adapted to changing tech-nology and their policy responses have dif-fered. The United States, for example, wasoutstandingly successful at creating full-timejobs in the 1990s, so that unemployment fell tohistoric lows, although US economic growthwas no faster than in Australia. Moreover,there was no resort to part-time employment inthe United States, which fell from 5.2 millionjobs in 1990 to 3.2 million jobs in 2000. UnlikeAustralia the United States has also achieved aspread of new full-time jobs across most of themajor occupation groups, other than tradesper-sons and plant and machinery operators (Shee-han 2001, p. 52, Table 3.5). But the high rate ofUS job creation is widely believed to reflect theflexibility of the US labour market, and it isconsidered that the dispersion of relative payrates in the United States widened against thosein low paid jobs. The net result is that the in-
equality of incomes increased more in theUnited States than in most other developedcountries in the 1990s.
By contrast, Germany is considered by manyto have an especially inflexible labour market.Despite the pressures from reunification therehas been little change in relative wage rates andexisting jobs have been better protected, withnew and more flexible working practices andconditions being taken up more slowly than inother comparable countries. It is also possiblethat Germany’s tradition of highly job-specifictraining has helped preserve the existing jobstructure, compared to the more general educa-tion and training in Anglo-Saxon countries, butit has made Germany less adaptable to new in-novations and consequently less new jobs arecreated (Estevez-Abe, Iversen and Soskice2001). The net result has been relatively lowproductivity growth since reunification in Ger-many, combined with almost negligible realwage growth and intractably high unemploy-ment, but the dispersion of earnings for thosewho have jobs remained largely unchanged.
A plausible hypothesis is that Australian ex-perience lies somewhere between these US andGerman outliers. First, there has apparentlybeen little or no shift in relative wage rates inAustralia. This may be partly because the edu-cation system was able to increase the supplyof skilled labour to match the rising demand forthat labour, and the supply of experienced la-bour also increased as the baby-boomer gener-ations moved through the labour force. But thestability of relative wages in Australia may alsoreflect our cultural inheritance and the as-sociated influence of our labour market ‘in-stitutions’. For example, employers areunderstandably wary about departing frombasic notions of fairness, and historic relativi-ties often define perceptions of fairness.
Second, and unlike the United States, wewere not able to create enough low and middlelevel full-time jobs, nor did Australia protectthese jobs to the same extent as in Germany.Third, instead of flexibility in relative wagerates, Australia in recent years has opted to pur-sue flexibility in how work is organised. Thisflexibility has been reflected in Australia’shigh rate of productivity growth in the 1990s
Keating: Labour Market and Inequality 391
2003 The University of Melbourne, Melbourne Institute of Applied Economic and Social Research
relative to its own past experience and relativeto the rest of the world. It has also led to the ex-ceptionally rapid growth of part-time and ca-sual employment in Australia as hours of workare adjusted to the fluctuations in consumer de-mand, through the week and even through theday, in a variety of service industries such ashospitality and retailing. This form of job shar-ing has, however, had less impact on middlelevel jobs than on low paid jobs. The net resultis that the Australian labour market is charac-terised by many job-rich households whereadult family members are paid for more hoursand have higher incomes than ever before.While the other side of the same coin is that by1997–98, 20 per cent of all income units with ahead of working age were dependent on socialsecurity as their principal source of income(Whiteford 2000, p. 54, Table 8).
10. Conclusions
The main conclusion from this study is that theincrease in earnings inequality in Australiasince the mid-1970s is primarily due tochanges in the occupational composition ofemployment, and not to changes in relativewage rates. This change in the composition ofemployment most probably reflects the partic-ular way that Australia has responded to tech-nological change. Certainly this hypothesisseems to be consistent with the available evi-dence, although more work is needed to firmlyestablish it. But we can be reasonably confidentthat Australia needs to improve its rate of jobcreation, and especially full-time job creation,as the key to sustainable improvement in
in-come
equality. Increased job creation wouldcertainly help those who are unemployed, andmay well increase the equality of
earnings
.What is less certain is the best mix of jobs tomaximise equality of earnings, and how tobring that mix about.
In principle, increased job creation relativeto the growth of the economy requires a reduc-tion in the cost of labour. There are two ways toachieve this reduction. Either real wage costsmust be lowered or the quality/productivenessof labour must be raised. The former wouldallow a movement down the demand curve for
labour. The latter would involve an outwardshift in the supply curve for labour.
A very radical possibility to increase the de-mand for labour would be for Australia to shifttowards the degree of relative wage flexibilitythat exists in the United States, which in princi-ple would rebalance labour demand in favourof low paid unskilled jobs. But the employmentoutcomes are inevitably uncertain, and consis-tent with the US experience, this change couldwell lead to an increase in overall income in-equality. To be fully effective such a policywould very likely involve lowering the mini-mum wage by so much that, unless it were sup-plemented in other ways, it would then putdownward pressure on the basic pension. Tar-geted wage subsidies and job creation pro-grams represent an alternative way to increaselow wage jobs without the negative distribu-tional consequences, but they tend to be limitedin number and effectiveness.
Furthermore it is arguable that there is noneed for a radical change in relative wage rates.Australia was reasonably successful in creatingjobs in the 1980s, with the number of full-timeemployees increasing at an average annual rateof 1.6 per cent from 1980 to 1990, compared toan average annual increase of only 0.7 per centfrom 1990 to 2000. Although the increase inGDP per capita was about the same in both de-cades, the obvious difference was the consider-able restraint of aggregate real wages in the1980s. Drawing on this experience, a wage–taxtrade-off has been proposed by a group of fiveeconomists, and supported by the BusinessCouncil of Australia, with the aim of achievingsomewhat slower growth in aggregate wagesand improving the rate of job creation relativeto the rate of economic growth.
11
Even if this proposal for wage restraint were
adopted and increased the demand for labour, itis possible that the growth in jobs would con-tinue to be disproportionately concentratedamong those occupations at the higher end ofthe occupational spectrum. In that case thegrowth of potential output and employmentcould be increased by education, employmentand training programs that led to a shift in thesupply curve for labour. Although Chapman(1999) has warned that increased education and

392 The Australian Economic Review December 2003
2003 The University of Melbourne, Melbourne Institute of Applied Economic and Social Research
training may not directly create many jobs forunemployed persons, the aim in this casewould be to shift the effective supply curve inresponse to the changing structure of demandand technology.
It is unclear, however, how such an increasein the supply of skilled labour would affect thedistribution of earnings. International compari-sons suggest that countries with highly job-specific training systems have been better atmaintaining middle level jobs, especiallytradesmen’s jobs (Estevez-Abe, Iversen andSoskice 2001). More general education andtraining risks a wider dispersion of jobs andconsequently earnings. But this more generalapproach is better able to adjust to changing de-mand and technology, and can assist more ro-bust job creation in the future. To some extenttherefore the approach taken to education andtraining may involve a trade-off between thedistribution of earnings and the rate of job cre-ation.
If Australia maintains its traditional ap-proach to education and training, and fairlyrigid relative pay rates, then an increase in thenumber of skilled employees might well con-tinue for some time to lift the median wage rel-ative to the first quartile. The trend to a widerdispersion of earnings as conventionally mea-sured would then very likely continue. In thatcase there would seem to be little that govern-ment can do directly to affect the distribution ofearnings among full-time employees. In thevery long run, however, the increased propor-tion of employees with skills could so adjustthe profile of employment that it would resultin a ‘levelling up’ of the earnings distribution.
Finally, the government could also do moreto encourage community development to tryand redress the imbalance in job opportunitiesbetween different neighbourhoods. Such actionis especially important if as seems likely thereis not only a shortage of demand for labour inneighbourhoods with a low socio-economicstatus, but that this shortage of demand for la-bour is also acting to reduce the
effective
sup-ply of labour in those neighbourhoods.Developing community-based policies will in-evitably involve an element of trial and error,but if successful in boosting employment it
might also be particularly effective in reducinginequality.
Education and training and supportingcommunity-based initiatives on the necessaryscale will, of course, be expensive. But the al-ternative of seeking to maintain income equal-ity through increasing income support wouldalso be expensive, and that support could wellflow to low paid people whose relative wagesin fact have not fallen. Moreover forcing unem-ployed people to look harder for disappearinglow paid full-time jobs, or alternatively for jobsfor which they are not presently suitable, seemsto be both practically and morally dubious. In-stead, those who have supported the disman-tling of Australia’s traditional institutions forregulating the product and labour markets needto accept that maintenance of our egalitariantraditions will require greater government in-tervention to encourage community develop-ment and more active education and trainingpolicies.
First version received March 2003;final version accepted June 2003 (Eds).
Appendix 1: Data
Indexes of Pay Rates for Major Occupation Groups
The ABS wage cost indexes for each occupa-tion have been used since September 1997.These indexes are unaffected by changes in thecomposition of the labour market, nor changesin penalty payments, bonuses and the numberof hours worked. Prior to 1997 the ABS in-dexes of award rates of pay for selected occu-pations were used.
To the extent that over-award paymentsgrew at different rates for different occupationsthe indexes of award rates of pay would fail tocapture different rates of pay increases for dif-ferent occupations. Another problem is thechanges in the occupational classification thatoccurred over time. The pay rate indexes forthe different occupations in 1976 were reas-signed to the ASCO first edition classificationby the author. In 1976 more detailed occupa-tional data were used than shown here and the

Keating: Labour Market and Inequality 393
2003 The University of Melbourne, Melbourne Institute of Applied Economic and Social Research
pay rate indexes for these more detailed occu-pations were then combined using employmentweights. Although this reassignment was al-most certainly inaccurate, any inaccuracy in as-signing indexes to the ASCO 1 classification ofoccupations would only matter if the increasein the rates of pay differed markedly amongdifferent occupations and the available infor-mation suggests that this was not the case.
Employment by Major Occupation
The estimates of employment by occupationderived from the ABS Labour Force Surveyswere used. In 1996 a revised classification ofoccupations was introduced (ASCO secondedition). Estimates were derived for earlieryears, consistent with this new classification,by applying concordance weights published bythe ABS to the ASCO first edition estimates.Further adjustments were also made usingweights provided by the ABS to allow forchanges introduced in February 2000 in theway occupation data are coded.
The ABS surveys include estimates of thenumber of full-time and part-time workers foreach of the major occupational groups. Thesurveys also include estimates of the total num-ber of full-time employees by gender, but notby occupation, and the number of employees(both full-time and part-time) by occupation.This information was used by the author to de-rive estimates of the number of full-time em-ployees by occupation.
Distribution of Earnings by Major Occupations
For a number of years the ABS has publishedestimates showing the proportion of full-timemale and female adult employees for each ofthe major occupational groups found in each$100 range of earnings. The estimates forMay 2000 were provided by the ABS on re-quest.
The influence of the changes in the occupa-tional composition of the labour force on thedistribution of earnings was calculated by as-suming no change in occupational compositionof the labour force for each gender between
May 1989 and May 2000. This alternative no-tional distribution of earnings for 2000 was de-rived by distributing the number of full-timemale and female employees in each major oc-cupation group in 1989 over the earnings distri-bution for the relevant occupation group in2000. The actual income figures for each per-centile were then interpolated within the $100income range where that percentile was lo-cated. This interpolation assumed a smoothdistribution whereas the actual distribution isnot smooth. While systematic bias is unlikely,sensitivity tests were conducted by varying theincomes within the limits of the known $100range. These variations did not change theoverall results. If equality was improved rela-tive to the median at the bottom of the distribu-tion, it tended to worsen at the top and viceversa.
In effect the distribution of earnings
within
each occupational group used the same May2000 distribution for both the actual and no-tional distribution of earnings for that year.Thus the difference between this notional andthe actual distribution of earnings could then beattributed to the changes in the relative weightsof the major occupational groups. This attribu-tion is, however, not strictly correct as differentrates of change in the proportion of teenageremployees in each occupation could bias thecomparison to some extent, although this biasis not considered to have had a major impact onthe comparison.
Average Earnings and Full-Time Employment for Detailed Occupations
The average earnings and full-time employ-ment for detailed occupations at the four-digitlevel of the Australian Standard Classificationof Occupations are collected by the ABS aspart of its surveys of employee hours and earn-ings. This information for 1986, and for bothdates in 1996, was made available for thepresent study by the Department of Employ-ment and Workplace Relations. The Depart-ment had previously used these data in theCommonwealth submissions, cited in the maintext, showing that hours worked have been in-creasing fastest in highly paid occupations. The

394 The Australian Economic Review December 2003
2003 The University of Melbourne, Melbourne Institute of Applied Economic and Social Research
ABS supplied the data for 2000. For the period1986 to 1996 ASCO 1 was used, and for the pe-riod 1996 to 2000 ASCO 2 was used. For thefirst period the employment data refer to the in-crease between August 1986 and May 1996,while the increase in AWOTE refers to the pe-riod from May 1986 to May 1996. For the sec-ond period from 1996 to 2000, the employmentdata refer to the increase between the Augustquarter 1996 and the November quarter 2000,while the increase in AWOTE refers to the pe-riod from May 1996 to May 2000. All datarefer to full-time adults, and for employmentthey refer to all employees, but for AWOTEthe data refer only to non-managerial employ-ees.
For each of the two periods compared the oc-cupations were ranked and grouped in decilesaccording to their AWOTE in the base year—May 1986 and May 1996 respectively. Becausesome occupations had very large numbers ofemployees, especially in the case of females,the occupations could not be broken up into 10exactly equal deciles, but the differences in sizeare small. The weighted increase for the aver-age earnings of each decile reflected each indi-vidual occupation’s share of employment inthat income decile in the base period. As theweights are fixed weights, the increase inAWOTE reported for each decile would be un-affected by any change in the occupationalcomposition of employment over the period.
Endnotes
1. See Harding and Greenwell (2001) andJohnson and Wilkins (2003) for a discussion ofthe changes in inequality over the 1980s and1990s.
2. The relevant data are taken from the Com-monwealth Government submission to theAustralian Industrial Relations CommissionSafety Net Review 2000–01 and are based onthe Mercer Cullen Egan Dell
Quarterly SalaryReview
and ABS Cat. no. 6302.0.
3. This study was based on 46 ABS two-digitoccupational groups. An additional analysis atthe four-digit level did not find any correlation
between the level of average earnings and thegrowth in those earnings.
4. See Barnes and Kennard (2002, ch. 3). Alsosee Borland (1999) for a useful summary andcomment on this literature.
5. Similar calculations were done for the in-crease in average weekly
total
earnings for thevarious occupations and groups of occupationsfor the first period from 1986 to 1996, and therewas no significant difference in the conclu-sions.
6. The number of female occupations for whichdata were available is not the same as for malesand therefore the average rates of increase inAWOTE for males and females are not strictlycomparable, especially in the first period from1986 to 1996.
7. In the professions for instance, even whererates of pay have historically been set by arbi-tration, typically there has been no attempt bythe arbitral authorities to determine how workshould be carried out.
8. Derived from Borland, Gregory and Sheehan(2001, Table 1.6).
9. It seems likely that the weekly earnings ofpart-time and casual employees have fallen rel-ative to full-time permanent employees, partlybecause their hourly rates of pay have fallenrelatively, and partly because the average num-ber of hours worked has also fallen relatively tothat worked by permanent full-time employ-ees.
10. The loss of jobs in footwear, clothing andtextiles is a possible exception, with some ofthe people concerned having difficulty in beingredeployed to other jobs, partly for locationalreasons. Acemoglu (2002) also argues that in-creased competition from low wage countriesmay have induced skill-biased technicalchange.
11. The original open letter to the Prime Min-ister by five economists is reproduced in

Keating: Labour Market and Inequality 395
2003 The University of Melbourne, Melbourne Institute of Applied Economic and Social Research
Dawkins (1999) and Keating (2002), and morerecently it has been elaborated on in Dawkins(2001) and Dawkins and Keating (2002).
References
Acemoglu, D. 2002, ‘Technical change, in-equality, and the labor market’,
Journal ofEconomic Literature
, vol. 40, pp. 7–72.Barnes, P. and Kennard, S. 2002,
Skill and Aus-tralia’s Productivity Surge
, ProductivityCommission Staff Research Paper, Canberra.
Belchamber, G. 1996, ‘Disappearing middle orvanishing bottom? Job growth in Australiaunder the Accord’,
Economic Record
, vol.72, pp. 287–93.
Borland, J. 1999, ‘Earnings inequality in Aus-tralia: Changes, causes and consequences’,
Economic Record
, vol. 75, pp. 177–202.Borland, J., Gregory, R. and Sheehan, P. 2001,
‘Inequality and economic change’, in
WorkRich, Work Poor: Inequality and EconomicChange in Australia
, eds J. Borland, R. Gre-gory and P. Sheehan, Centre for StrategicEconomic Studies, Victoria University, Mel-bourne.
Castles, F. 1985, The Working Class and Wel-fare, Allen & Unwin, Sydney.
Chapman, B. 1999, ‘Could increasing the skillsof the jobless be the solution to Australianunemployment?’, in Reshaping the LabourMarket: Regulation, Efficiency and Equalityin Australia, ed. S. Richardson, CambridgeUniversity Press, Melbourne.
Commonwealth of Australia 2001, Safety NetReview—Wages 2000–2001, Joint Govern-ments’ Submission, Department of Employ-ment and Workplace Relations, Canberra.
Commonwealth of Australia 2002, Safety NetReview—Wages 2001–2002, Common-wealth Submission, Department of Employ-ment and Workplace Relations, Canberra.
Dawkins, P. 1999, ‘A plan to cut unemploy-ment in Australia: An elaboration of the“five economists” letter to the Prime Minis-ter, 28th October 1998’, Mercer – Mel-bourne Institute Quarterly Bulletin ofEconomic Trends, 1.99, pp. 48–59.
Dawkins, P. 2001, ‘The “five economists’plan”: The original ideas and further devel-
opments’, paper presented to Creating Jobs:The Role of Government Conference, Aus-tralian National University, Canberra, 6–7September.
Dawkins, P. and Keating, M. 2002, ‘Full em-ployment: “The five economists’ plan revis-ited”’, paper presented to TowardsOpportunity and Prosperity Conference,University of Melbourne, April.
De Laine, C., Laplagne, P. and Stone, S. 2000,The Increasing Demand for Skilled Workersin Australia: The Role of Technical Change,Productivity Commission Staff Research Pa-per, AusInfo, Canberra.
Economic Planning Advisory Commission1996, Future Labour Market Issues for Aus-tralia, Commission Paper no. 12, AGPS,Canberra.
Estevez-Abe, M., Iversen, T. and Soskice, D.2001, ‘Social protection and the formation ofskills: A reinterpretation of the welfarestate’, in Varieties of Capitalism: The Insti-tutional Foundations of Comparative Ad-vantage, eds P. Hall and D. Soskice, OxfordUniversity Press, Oxford.
Gregory, R. G. 1993, ‘Aspects of Australianand US living standards: The disappointingdecades 1970–1990’, Economic Record, vol.69, pp. 61–76.
Gregory, R. G. and Hunter, B. 1995, ‘Themacro-economy and the growth of ghettosand urban poverty in Australia’, DiscussionPaper no. 325, Centre for Economic PolicyResearch, Australian National University.
Hancock, K. 1982, ‘The arbitration tribunalsand the labour market’, paper presented toNational Institute of Labour Studies Confer-ence, Flinders University, Adelaide.
Harding, A. 1997, ‘The suffering middle:Trends in income inequality in Australia,1982 to 1993–94’, Discussion Paper no. 21,National Centre for Social and EconomicModelling, University of Canberra.
Harding, A. and Greenwell, H. 2001, ‘Trendsin income and expenditure inequality in the1980s and 1990s’, paper presented to 30thAnnual Conference of Economists, Can-berra, 24 September.
Johnson, D. and Wilkins, R. 2003, ‘The effectsof changes in family composition and

396 The Australian Economic Review December 2003
2003 The University of Melbourne, Melbourne Institute of Applied Economic and Social Research
employment patterns on the distribution ofincome in Australia: 1982 to 1997–98’,Working Paper no. 19/03, Melbourne Insti-tute of Applied Economic and Social Re-search, University of Melbourne.
Karmel, T., Aungles, P., Sadler, C. andSpinoglio, M. 1993, ‘The disappearingmiddle? Skill levels, wage levels, andemployment growth’, mimeo, EconomicsDepartment, Australian National University.
Keating, M. 1998, ‘The role of government inwork and welfare’, Discussion Paper no.381, Centre for Economic Policy Research,Australian National University.
Keating, M. 2002, ‘Restoring full employment:The five economists’ proposals’, in The Ur-gency of Full Employment, eds E. Carlsonand W. Mitchell, University of New SouthWales Press, Sydney.
Keating, M. 2003, ‘Earnings and inequality’,Discussion Paper no. 460, Centre for Eco-nomic Policy Research, Australian NationalUniversity.
Kelly, P. 1994, The End of Certainty: Power,Politics and Business in Australia, Allen &Unwin, Sydney.
Macklin, J. 2002, ‘Postcodes for prosperity:The link between location, education andemployment’, paper presented to TowardsOpportunity and Prosperity Conference,University of Melbourne, April.
Murtough, G., Pearson, K. and Wreford, P.1998, Trade Liberalisation and EarningsDistribution in Australia, Industry Commis-sion Staff Research Paper, AGPS, Canberra.
Norris, K. 1977, ‘The dispersion of earnings inAustralia’, Economic Record, vol. 74, pp.475–89.
Norris, K. and McLean, B. 1999, ‘Changes inearnings inequality, 1975 to 1998’, Austra-lian Bulletin of Labour, vol. 25, pp. 23–31.
Pappas, N. 1998, ‘Changes in the demand forskilled labour in Australia’, in Working forthe Future: Technology and Employment inthe Global Knowledge Economy, eds P.Sheehan and G. Tegart, Victoria UniversityPress, Melbourne.
Pappas, N. 2001, ‘Family income inequality’,in Work Rich, Work Poor: Inequality andEconomic Change in Australia, eds J. Bor-land, R. Gregory and P. Sheehan, Centre forStrategic Economic Studies, Victoria Uni-versity, Melbourne.
Richardson, S. and Harding, A. 1999, ‘Poorworkers? The link between low wages, lowfamily income and the tax and transfer sys-tems’, in Reshaping the Labour Market:Regulation, Efficiency and Equality in Aus-tralia, ed. S. Richardson, Cambridge Univer-sity Press, Melbourne.
Sheehan, P. 2001, ‘The causes of increasedearnings inequality: The international litera-ture’, in Work Rich, Work Poor: Inequalityand Economic Change in Australia, eds J.Borland, R. Gregory and P. Sheehan, Centrefor Strategic Economic Studies, VictoriaUniversity, Melbourne.
Sheehan, P. and Esposto, A. 2001, ‘Technol-ogy, skills and earnings inequality: A newapproach to understanding the characteris-tics of jobs’, in Work Rich, Work Poor: In-equality and Economic Change in Australia,eds J. Borland, R. Gregory and P. Sheehan,Centre for Strategic Economic Studies, Vic-toria University, Melbourne.
Whiteford, P. 2000, The Australian System ofSocial Protection: An Overview, Policy Re-search Paper no. 1, Department of Familyand Community Services, Canberra.
Wooden, M. 2000, ‘The changing skill compo-sition of labour demand’, Australian Bulletinof Labour, vol. 26, pp. 191–8.


