Embed Size (px)
Citation preview

PROFESSOR HAROLD WAYLAND

MICROVASCULAR RESEARCH 23, 139- 170 (1982)
The Microcirculatory Society Eugene M. Landis Award Lecture
A Physicist Looks at the Microcirculation
HAROLD WAYLAND
Division of Engineering and Applied Science, California Institute of Technology, Pasadena, California 91125
Presented at the Annual Meeting of The Microcirculatory Society, Znr., Atlanta, Georgia, April 11, 1981
It is with a deep sense of gratitude to the many colleagues with whom I have worked over the last two decades that I accept the Landis Award-a recognition of the efficacy of collaborative enterprise. Merely to list these colleagues at this point would be uninteresting. Some, but unfortunately not all, will be mentioned in the following narrative of some highlights of activity in my laboratory.
It is not always easy to explain what a physicist who spent much of his professional life teaching mathematics to engineers is doing studying the micro- circulation. In my case, I have to divide the explanation into two parts: the initial stimulation of interest, and the ultimate push which got me professionally involved.
It all began when I had a postdoctoral fellowship from the American Scan- dinavian Foundation to spend a year doing research in theoretical physics at Niels Bohr’s Institute in Copenhagen, Denmark, in 1936-1937. Living in the same pension with me and my wife were Melvin and Verona Knisely. Dr. Knisely was in Copenhagen to study with the grand old man of microcirculation, Professor August Krogh. He was very much interested in the application of physical methods to his studies of the microcirculation, actively using the quartz rod illuminator which was a hallmark of much of his experimental research. Since I was a physicist, with considerable experimental experience, Knisely decided to try to get me interested in his beloved field. Eventually I was persuaded to walk around the corner from the Institute of Theoretical Physics to the Institute of Physiology to peer through a microscope at the flow of blood in the capillaries of the glomerulus of a frog kidney. It was an exciting experience but I could not see how I could use my training in such a complex field of study as the micro- circulation-after all, physicists usually seek easy problems to solve!
For several years after we returned to the United States, Knisely kept after me to get involved with him on microcirculatory research. I think he was really looking for a Methodist, albeit not of the theological variety. But I had returned to California and he to Chicago, so it seemed utterly impractical to try to work together, and I certainly did not feel competent to work in the study of the microcirculation by myself-after all, I had never studied biology even in high school.
139 M)26-2862/821020139-32$02.00/O
Copyright 0 1982 by Academic Press, Inc. All rights of reproduction in any form reserved.
Printed in U.S.A.

140 HAROLD WAYLAND
On several occasions I had borrowed films on the microcirculation made by Knisely and Edward Bloch to show to my scientific friends. I had even used one of them in a seminar at Caltech at which Professor Anthony van Harreveld happend to be present. In about 1960 Sidney Sobin got in touch with Professor van Harreveld to try to find someone with a background in continuum mechanics, who also had some interest in physiology, to talk to Sobin’s colleague, Dr. Wallace Frasher. Frasher felt the need for greater sophistication in continuum mechanics to assist in interpreting the *experimental work he was doing on the distensibility properties of the pulmonary artery, and was considering going back to school to strengthen his knowledge of this field. Sobin was hoping to find a solution that would not remove Frasher from his lab for one or more years. I agreed to talk to Dr. Frasher, and after several conversations, we agreed to try the experiment of pooling our abilities in a collaborative study. I am afraid I did not make much of a contribution to the pulmonary artery study, but together we got extremely interested in the problems of blood flow, and started a joint program in hemorheology.
As a physicist, I really had relatively little to offer: some expertise in optics, a pretty sound background in mathematics, and a recognition of the need for careful quantitative measurements. During the war, however, I had been forced into the more practical world of engineering, and had converted my background in theoretical electrodynamics into a working knowledge of fluid mechanics. Furthermore, I was no longer afraid of tackling complex problems for which there was no simple, or even unique, solution.
HEMORHEOLOGY
At the time we were beginning our collaboration there was a great deal of interest in the flow properties of blood. Considerable sophistication had gone into the development of improved viscometers, of which the GDM, developed at MIT, represented the utmost in technical development up to that time. (Gil- inson et al., 1963). Whole blood had been shown to be a non-Newtonian fluid: that is, its apparent viscosity varied with the shear rate. There were serious problems in relating measurements made in instruments for which the mechanical measurements were subject to relatively easy interpretation and the prediction of how blood would flow in circular tubes, in which the shear rate varies across the diameter of the tube. We felt that the study of the rheologic properties of blood in simple systems was already in excellent hands, and that we could probably make little fundamental contribution at that level. Furthermore, we were really more interested in how blood flowed in living systems. In particular, we felt that blood flow in the tiny vessels of the microcirculation was both the most interesting and the most challenging to study. But how were we to make quantitative measurements at this level at which red cells had to be strongly deformed even to pass through the capillaries?
We did not feel that we had the tools to permit us to make viscometric measurements directly in microvessels, but we felt that if we could make such measurements on blood as it was flowing out of a blood vessel, perhaps this would give us a better understanding of how it was behaving in the living system. At the International Congress on Rheology held at Providence, Rhode Island,
EUGENE M. LANDIS AWARD LECTURE 141
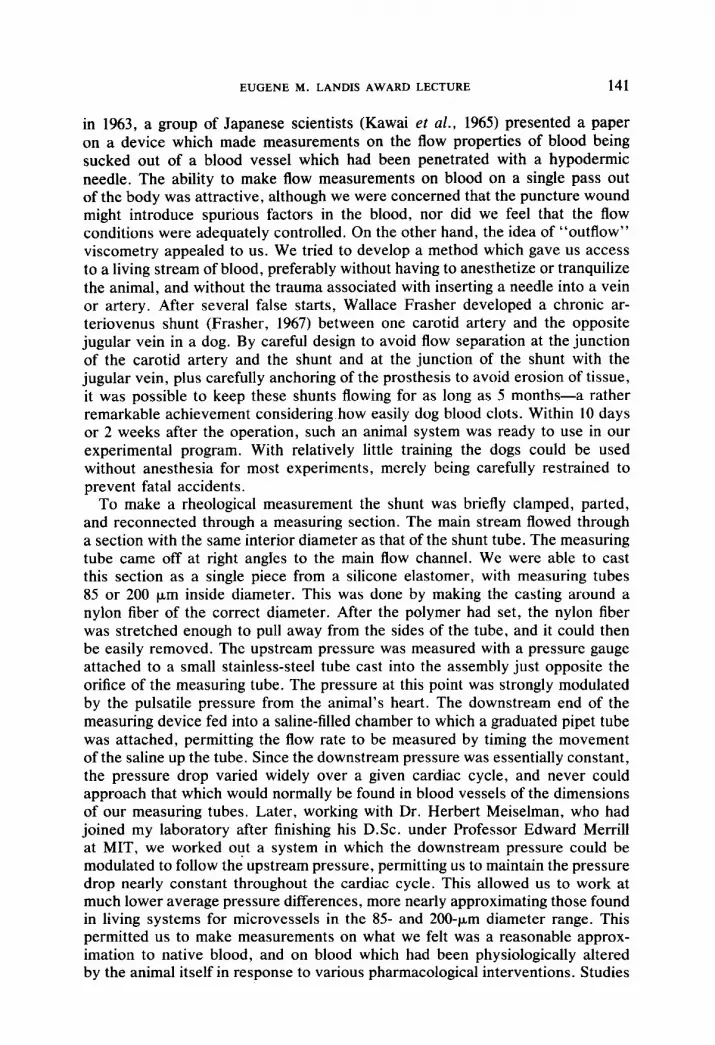
in 1963, a group of Japanese scientists (Kawai et al., 1965) presented a paper on a device which made measurements on the flow properties of blood being sucked out of a blood vessel which had been penetrated with a hypodermic needle. The ability to make flow measurements on blood on a single pass out of the body was attractive, although we were concerned that the puncture wound might introduce spurious factors in the blood, nor did we feel that the flow conditions were adequately controlled. On the other hand, the idea of “outflow” viscometry appealed to us. We tried to develop a method which gave us access to a living stream of blood, preferably without having to anesthetize or tranquilize the animal, and without the trauma associated with inserting a needle into a vein or artery. After several false starts, Wallace Frasher developed a chronic ar- teriovenus shunt (Frasher, 1967) between one carotid artery and the opposite jugular vein in a dog. By careful design to avoid flow separation at the junction of the carotid artery and the shunt and at the junction of the shunt with the jugular vein, plus carefully anchoring of the prosthesis to avoid erosion of tissue, it was possible to keep these shunts flowing for as long as 5 months-a rather remarkable achievement considering how easily dog blood clots. Within 10 days or 2 weeks after the operation, such an animal system was ready to use in our experimental program. With relatively little training the dogs could be used without anesthesia for most experiments, merely being carefully restrained to prevent fatal accidents.
To make a rheological measurement the shunt was briefly clamped, parted, and reconnected through a measuring section. The main stream flowed through a section with the same interior diameter as that of the shunt tube. The measuring tube came off at right angles to the main flow channel. We were able to cast this section as a single piece from a silicone elastomer, with measuring tubes 85 or 200 pm inside diameter. This was done by making the casting around a nylon fiber of the correct diameter. After the polymer had set, the nylon fiber was stretched enough to pull away from the sides of the tube, and it could then be easily removed. The upstream pressure was measured with a pressure gauge attached to a small stainless-steel tube cast into the assembly just opposite the orifice of the measuring tube. The pressure at this point was strongly modulated by the pulsatile pressure from the animal’s heart. The downstream end of the measuring device fed into a saline-filled chamber to which a graduated pipet tube was attached, permitting the flow rate to be measured by timing the movement of the saline up the tube. Since the downstream pressure was essentially constant, the pressure drop varied widely over a given cardiac cycle, and never could approach that which would normally be found in blood vessels of the dimensions of our measuring tubes. Later, working with Dr. Herbert Meiselman, who had joined my laboratory after finishing his D.Sc. under Professor Edward Merrill at MIT, we worked out a system in which the downstream pressure could be modulated to follow the upstream pressure, permitting us to maintain the pressure drop nearly constant throughout the cardiac cycle. This allowed us to work at much lower average pressure differences, more nearly approximating those found in living systems for microvessels in the 85 and 200-pm diameter range. This permitted us to make measurements on what we felt was a reasonable approx- imation to native blood, and on blood which had been physiologically altered by the animal itself in response to various pharmacological interventions. Studies

142 HAROLD WAYLAND
were made on the effect of heparin, platelet concentration, fibrinogen concen- tration, and hemodilution with dextrans on the flow properties of the blood over a considerable range of flow rates. Details will be found in the papers we published on this work (Frasher et al., 1968a, b, 1971; Meiselman et al., 1971a, b, 1972).
IN VW0 VELOCITY MEASUREMENTS
Although we felt that with this device we were dealing with a system more closely approximating the microcirculation than could be done in purely model systems, we were still interested in trying to make quantitative measurements directly in a living animal.
When Professor Sobin persuaded Paul Johnson to consider spending a sab- batical year in my laboratory, Dr. Johnson and I put in considerable effort in trying to decide just what we wanted to do during his time in Pasadena. Since he was particularly interested in autoregulation in the microcirculation, we began to explore just what measurements would be needed to make his studies more meaningful. He had developed his flying spot (Johnson and Greatbatch, 1966) for monitoring the diameter of arterioles and venules on-line. Wiederhielm ef al. (1964) had modified and automated the Landis micropipet pressure-measuring technique, although this method required puncturing the microvessel in which the pressure was to be measured with a micropipet. But a satisfactory method of measuring flow velocity on-line was not yet available. Good work had been done with frame-by-frame analysis of cinefilm, particularly when pictures were taken with a stroboscopic flash system. But this was tedious at best, and did not seem suitable as a basis for on-line measurements. You should all be familiar with the dual-slit velocity-measuring system which we developed, and many of you have heard Professor Johnson tell of his skepticism of what seemed to be my wild ideas. Anyway, it has now found itself, with many refinements made by other workers, to be one of the major tools of microcirculatory research.
In spite of the widespread use of the dual-slit system and its modifications, it seems to me that too few of those using the system have really understood what is known about how it operates. To some extent, at least, this is probably a matter of communication. Certainly, one of the most difficult lessons I had to learn as I became more and more involved with microcirculatory studies was that biomedical scientists often used terms in a very different way from that used by those trained as physicists. In this matter, working with Paul Johnson was a great pleasure, since he started his academic life as a physicist but saw the light in time to take his Ph.D. in physiology. He understood my vocabulary, and to some extent my prejudices, and greatly helped me to understand the vocab- ulary of physiology. But I have found that many of those who have chosen to use the dual-slit method have failed to understand the meaning of the very careful evaluation of the system made by Mary Baker while working for her Ph.D. in my laboratory.
In the original system used by Paul Johnson and myself (Wayland and Johnson, 1967) we projected the image of the blood vessel being studied onto a screen penetrated by two slits coupled by means of fiber optic guides to photomultipliers. At the magnification we usually used, the effective separation of the slits was about 40 km at the tissue level. With this relatively wide spacing we got excellent

EUGENE M. LANDIS AWARD LECTURE 143
correlation of the upstream and downstream signals for flow in capillaries, in which the erythrocytes moved in single file, but in larger microvessels the re- lationship between the two photometric signals was not so obvious. We decided to confine our initial studies to flow in capillaries. We compared the results of measuring the time delay between the two signals by direct comparison of rec- ognizable features as well as by a time-series cross correlation calculated from the digitized data from the two channels. The agreement was sufficiantly good that the choice was made on the basis of convenience and cost. Since on-line analog cross correlators were not available at the time, and the labor of digitizing the data added to the cost of computer time to perform the cross-correlation calculation was beyond our means, we confined all of our earlier studies to visual measurement of time delays. For measurements in capillaries, in which the red cells moved in a single file, it seems pretty apparent that we were, indeed, measuring the red cell velocity, but how that relates to plasma velocity and total volume flow rate has not been completely solved in the intervening years. Cer- tainly the role of deformability of the erythrocyte, the relationship between its size and the capillary diameter, the hematocrit, and the flow velocity have all been identified as factors of considerable importance.
When Peter Gaehtgens joined my laboratory in 1967, he, Herbert Meiselman, and I tried using phototransistors instead of photomultipliers to pick up the photometric signals. With this system we found that we could place the upstream and downstream sensors close enough together (at the magnification we used this was about 7 pm on the blood vessel) to give good correlation between upstream and downstream signals in glass tubes, and even in microvessels, with diameters as large as about 125 pm. In order to get the necessary magnification and light-gathering ability, we used an objective of high enough numerical ap- erture that the depth of field was 1 km or less. I naively assumed that this meant that the signals which were sharp enough to give a good correlation came entirely from the region of sharpest focus. Under this assumption, if we moved the sensors across the width of the vessel, we should get a measure of the actual velocity profile of the red cells in the vessel. We performed such measurements and got what to us were very satisfactory blunt profiles, which agreed with our preconceived notions of what we ought to find. (Gaehtgens et al., 1970, 1971).
When Mary Baker undertook the task of a critical evaluation of this method, the first thing she did was to see just what would happen if the microscope were focused at different depths through the major diameter of the tube in which the blood was flowing. According to my hypothesis, she should get the same profile by focusing in and out as by moving the field across the system with the region of sharpest focus at the fore and aft center of the tube. Imagine our surprise when she found that she could focus over distances somewhat greater than the diatmeter of the tube and still get the same measure for the apparent velocity at either low or high hematocrit (Fig. 1). This was tried with various microscope objectives, with depths of field ranging from 0.2 km (oil immersion) to greater than the diameter of the tube with the same results! This meant that whatever gave rise to our photometric signal, we were taking some sort of average through the entire flowing stream rather than processing the data from the plane of sharpest focus. By a very meticulous study (Baker and Wayland, 1974), she showed that even at a hematocrit of only 6% under conditions in which the flow

HAROLD WAYLAND
TOWARD CONDENSER TOWARD OBJECTIVE
0 ACROSS RBC IN PLASMA . FOCUS THROUGH
PARABOLA FOR KNOWN 6 I R\
L 0.4 1.2
L
FIG. 1. Apparent velocity from dual-slit method focusing through the tube (solid circles) and across the tube (open circles). (From Baker and Wayland (1974, p. 136))
profile was demonstrated to be parabolic by high-speed cinematography, the dual-slit system gave what appeared to be a blunted profile (Fig. 2). Furthermore, in those cases in which the actual velocity profile could be measured, the apparent centerline velocity measured by the dual-slit method was only 80% of the true centerline velocity. Even more startling-and more important-was the fact that the actual volume flow rate could be calculated within experimental error (at most 5%) using the measured centerline velocity and treating it as 80% of the centerline velocity of a parabolic profile. Dr. Baker worked out a hypothetical model of the measurement process which gave quite good conparisons between the flow profile as measured by cinematography and that measured by the dual- slit method as shown by the dashed line in Fig. 2. Furthermore, the correction
I RBC IN SALINE
Hf = .06
. MOTION PICTURE u.31 set-'
0 DOUBLE -SLIT
FIG. 2. Parabolic flow, as demonstrated from photographic measurements (solid circles) leads to a blunted profile with dual-slit measurements (open circles). The dashed line shows the expected modification of the parabolic profile according to the theoretical model. (From Wayland (1973, p. 348), and Baker and Wayland (1974, p. 139))

EUGENE M. LANDIS AWARD LECTURE 145
factor which she obtained both empirically and with her theoretical model gave a good correlation between volume flow rate calculated from the measured ap- parent centerline velocity and the volume flow rate obtained by meticulous experiments performed in glass tubes for tube diameters between 40 and 100 pm and hematocrits ranging from a few percent to over 50%. More recent work by Lipowsky and Zweifach (1978) has shown that the Baker correction factor is still quite good down to tube diameters as low as 17 km.
In spite of the general dissemination of these results, entirely too many re- searchers do not seem to grasp the meaning of Dr. Baker’s work. The actual results of the critical evaluation of the dual-slit method are important in their own right, but even more fundamentally it underlines the importance of under- standing the nature of the measuring volume involved in any method, as well as the way in which the measurement technique averages over that volume. A recently published paper on an evaluation of a laser-doppler system (Le-Cong and Zweifach, 1979, p. 135) continues to perpetuate the error that the dual-slit system measures the velocity associated with a narrow region near the front principal focus of the microscope objective. I had hoped that the horrib!e example which I had set, and from which Dr. Baker eventually rescued me, would deter others from making similar errors in the same field of study. For example, I have seen no evidence that the sampling volume over which velocities are averaged and the mode of averaging performed by the system has ever been satisfactorily determined for a laser-doppler system applied to blood flow studies.
INTRAVITAL MICROSCOPY
As we did more and more work on living animals Dr. Frasher and I were struck by the unsuitability of available microscopes for studies on living animals. A rather elaborate intravital microscope was available from Leitz, but it seemed to us to be rather poorly designed, since the focusing was done by moving the entire optical train-including the recording system-up and down. This gave the advantage of having the stage in a fixed vertical position, but did not permit rigid mounting of the cameras or other recording systems. We felt that rigid mounting of recording systems, with a capability of rapid change from one type of camera to another, was of very great importance. Fortunately a very simple solution was available by the use of infinity-corrected objectives and telescopic viewing. Such an approach has long been used in metallographic applications in which both the object and the recording system are heavy enough that it is impractical to move them. The basic concept harks back to a simple axiom of Euclidean geometry: parallel lines never meet. For a well-corrected lens system, light rays radiating from a point in the front focal plane of the lens which are collected by the lens will exit the system as a parallel bundle of light rays (Fig. 3). If the point lies on the lens axis, the emitted bundle will be parallel to that axis, while if it is displaced, the emitted bundle will make an angle with the axis which, to a first approximation, can be easily determined by simple geometric construction. If such a parallel bundle strikes another lens (the “transfer lens” in Fig. 3) it will be brought to focus in the back principal focal plane of the second lens. If the bundle of rays is parallel to the axis of this second lens it will be brought to focus on the axis of the lens, regardless of where it strikes

146 HAROLD WAYLAND
FIG. 3. Parallel bundles of light rays are brought to focus in the principle focal plane of the transfer lens at a point depending only on the angle at which the bundle strikes the lens. (a) Vertical movement; (b) lateral movement. (From Wayland (1975, p. 5).)
the lens. A bundle of rays making an angle with the axis will be imaged in the same focal plane, but off the axis; again, the position being determined only by the angle made with the axis rather than with the portion of the lens on which it strikes. It can be seen that the location of the image with respect to the transfer lens does not depend on the distance between the objective and that lens, but only on the properties of the transfer lens and the angles the bundles of rays make with its axis. If, of course, the lenses are too far apart, there will be vignetting of the image, but as long as each complete bundle is picked up by the transfer lens there will be no loss of light. In theory, even resolution will not be affected by the distance between the lenses, but in practice most lenses are not so well corrected on the periphery as they are at the center of the field. The magnification of the system is given by the ratio of the focal length ,of the transfer lens to that of the objective. Fortunately, a rather wide variety of infinity- corrected objectives is available from most microscope manufacturers, but one must look at their lists of lenses for metallurgical applications rather than the usual catalogs put out for biologists and medical scientists.
With this approach in mind, we took advantage of Caltech’s long experience with large optical instruments, such as astronomical telescopes, to build the prototype of the Wayland-Frasher intravital microscope, which was physically a very large instrument to permit a wide variety of applications. The recording systems are placed on a stationary table which also carries the mount for the objective. The various cameras are mounted on the arc of a circle, pointing toward its center. A 45”-front-surface mirror directs the light onto a horizontal
EUGENE M. LANDIS AWARD LECTURE 147
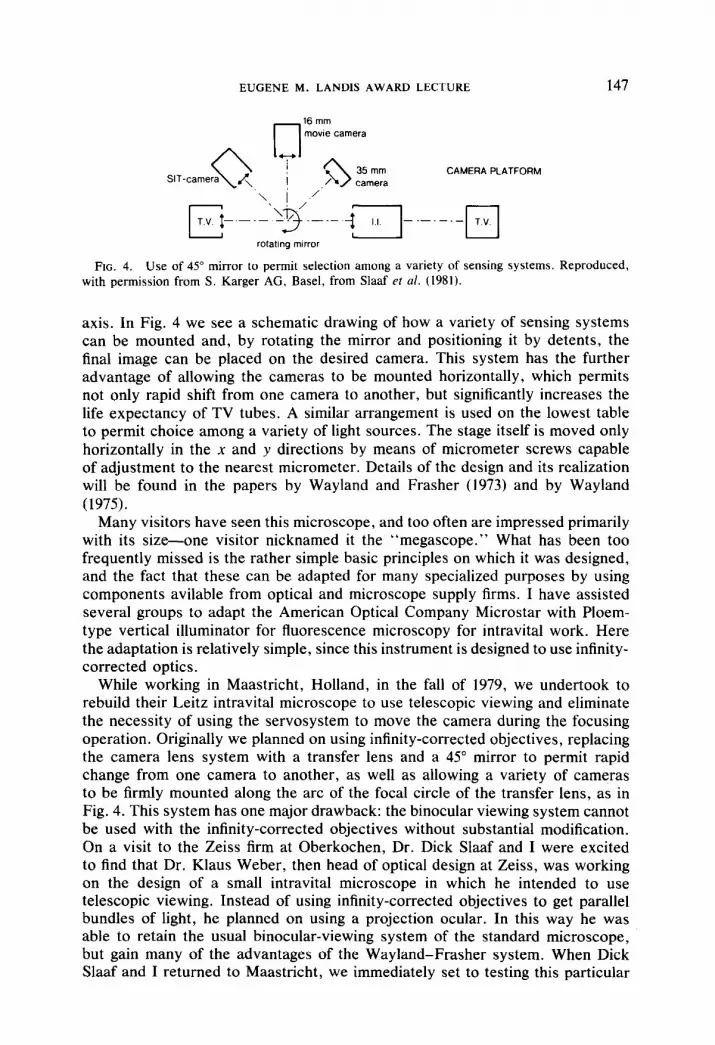
FIG. 4. Use of 45” mirror to permit selection among a variety of sensing systems. Reproduced, with permission from S. Karger AG, Basel, from Slaaf et al. (1981).
axis. In Fig. 4 we see a schematic drawing of how a variety of sensing systems can be mounted and, by rotating the mirror and positioning it by detents, the final image can be placed on the desired camera. This system has the further advantage of allowing the cameras to be mounted horizontally, which permits not only rapid shift from one camera to another, but significantly increases the life expectancy of TV tubes. A similar arrangement is used on the lowest table to permit choice among a variety of light sources. The stage itself is moved only horizontally in the x and y directions by means of micrometer screws capable of adjustment to the nearest micrometer. Details of the design and its realization will be found in the papers by Wayland and Frasher (1973) and by Wayland (1975).
Many visitors have seen this microscope, and too often are impressed primarily with its size-one visitor nicknamed it the “megascope.” What has been too frequently missed is the rather simple basic principles on which it was designed, and the fact that these can be adapted for many specialized purposes by using components avilable from optical and microscope supply firms. I have assisted several groups to adapt the American Optical Company Microstar with Ploem- type vertical illuminator for fluorescence microscopy for intravital work. Here the adaptation is relatively simple, since this instrument is designed to use infinity- corrected optics.
While working in Maastricht, Holland, in the fall of 1979, we undertook to rebuild their Leitz intravital microscope to use telescopic viewing and eliminate the necessity of using the servosystem to move the camera during the focusing operation. Originally we planned on using infinity-corrected objectives, replacing the camera lens system with a transfer lens and a 4.5” mirror to permit rapid change from one camera to another, as well as allowing a variety of cameras to be firmly mounted along the arc of the focal circle of the transfer lens, as in Fig. 4. This system has one major drawback: the binocular viewing system cannot be used with the infinity-corrected objectives without substantial modification. On a visit to the Zeiss firm at Oberkochen, Dr. Dick Slaaf and I were excited to find that Dr. Klaus Weber, then head of optical design at Zeiss, was working on the design of a small intravital microscope in which he intended to use telescopic viewing. Instead of using infinity-corrected objectives to get parallel bundles of light, he planned on using a projection ocular. In this way he was able to retain the usual binocular-viewing system of the standard microscope, but gain many of the advantages of the Wayland-Frasher system. When Dick Slaaf and I returned to Maastricht, we immediately set to testing this particular
148 HAROLD WAYLAND
pojection-eyepiece
- . - object plane
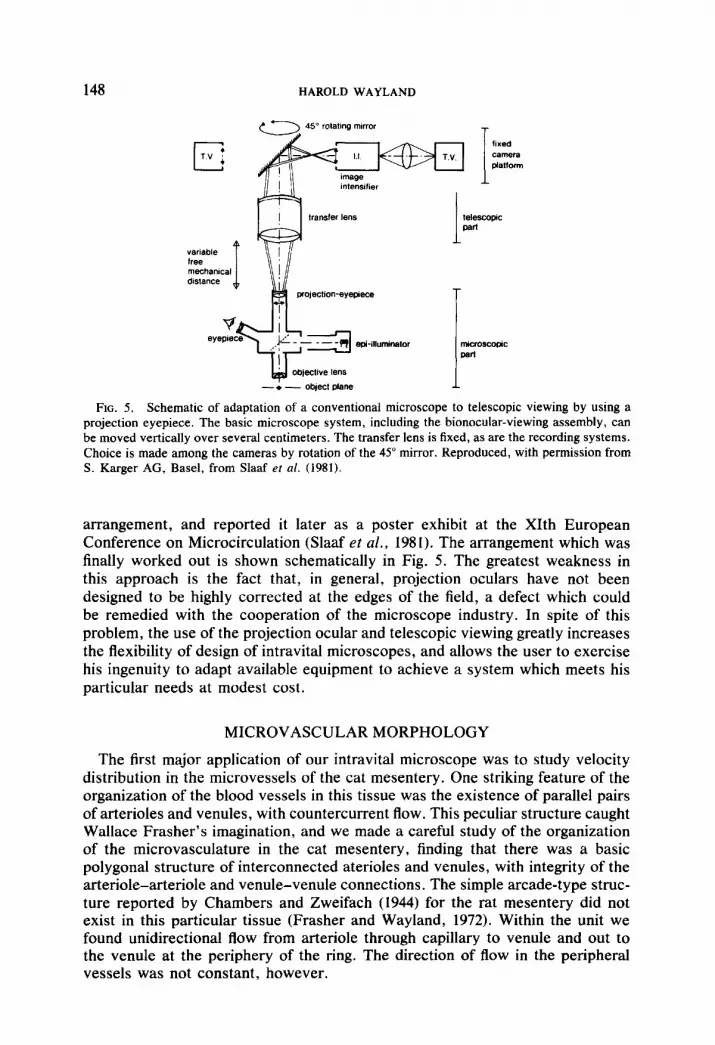
FIG. 5. Schematic of adaptation of a conventional microscope to telescopic viewing by using a projection eyepiece. The basic microscope system, including the bionocular-viewing assembly, can be moved vertically over several centimeters. The transfer lens is fixed, as are the recording systems. Choice is made among the cameras by rotation of the 45” mirror. Reproduced, with permission from S. Karger AG, Basel, from Slaaf ez al. (1981).
arrangement, and reported it later as a poster exhibit at the XIth European Conference on Microcirculation (Slaaf et al., 1981). The arrangement which was finally worked out is shown schematically in Fig. 5. The greatest weakness in this approach is the fact that, in general, projection oculars have not been designed to be highly corrected at the edges of the field, a defect which could be remedied with the cooperation of the microscope industry. In spite of this problem, the use of the projection ocular and telescopic viewing greatly increases the flexibility of design of intravital microscopes, and allows the user to exercise his ingenuity to adapt available equipment to achieve a system which meets his particular needs at modest cost.
MICROVASCULAR MORPHOLOGY
The first major application of our intravital microscope was to study velocity distribution in the microvessels of the cat mesentery. One striking feature of the organization of the blood vessels in this tissue was the existence of parallel pairs of arterioles and venules, with countercurrent flow. This peculiar structure caught Wallace Frasher’s imagination, and we made a careful study of the organization of the microvasculature in the cat mesentery, finding that there was a basic polygonal structure of interconnected aterioles and venules, with integrity of the arteriole-arteriole and venule-venule connections. The simple arcade-type struc- ture reported by Chambers and Zweifach (1944) for the rat mesentery did not exist in this particular tissue (Frasher and Wayland, 1972). Within the unit we found unidirectional flow from arteriole through capillary to venule and out to the venule at the periphery of the ring. The direction of flow in the peripheral vessels was not constant, however.

EUGENE M. LANDIS AWARD LECTURE 149
The functional importance of this particular arrangement of vessels has not been clarified for this tissue, but the consequences for such flow patterns have been neatly demonstrated in a theoretical paper by Lee and Nellis (1974). This adventure into Unitarianism has underlined what, to me, is a most important concept: if we wish to understand the relationship of the microvascular mor- phology and flow patterns to function, we must clearly understand the dynamic flow patterns of a microbed as well as the anatomical arrangement of the vessels. With the increasing capability of making detailed quantitative measurements on individual microvessels and the surrounding tissue, the problem of relating these measurements to the characteristics of the overall properties of the tissue be- comes a complicated one of sampling. If we can identify a basic functional unit- such as has proved so extremely valuable in studying the kidney-we can then more clearly design our experiments to make adequate measurements on each type of vessel and know more precisely how to weight the information collection to give a better understanding of the properties of the tissue or organ.
FLUORESCENCE STUDIES
At the time these studies were made we were illuminating the microbed by transillumination, depending on preferential absorption of the light by the hemo- globin in the erythrocytes to give contrast between the microvessels and the surrounding tissue. This worked fine in the mesentery, which is very transparent except in regions containing fatty deposits, and in which there is only a single layer of microvessels. Visits to Karl Arfors’ laboratory in Uppsala got me very interested in the possibility of using fluorescent tracers. Here was a system in which the stimulated light from the fluorochrome was being emitted from the region we wished to view. During the Second World War I had had some experience working on improved illumination systems for divers working in murky waters. It became apparent that self-luminous objects could be seen and identified under much more adverse conditions than would be possible with either absorbed or scattered light-an observation which will be obvious to anyone who has driven in the fog.
A very basic property of a fluorescent material is that the emitted light is always at a longer wavelength than the light which stimulates that emission. In Fig. 6 we see the absorption and emission patterns for fluorescein isothiocyanate conjugated to bovine serum albumin. The fluorescence in this case can be stim- ulated by light of any wavelength lying in the region covered by the absorption curve, and a rather broad band of yellow light will be emitted with the spectral distribution shown in the emission curve. By using an exciting beam of light which carries no significant amount of energy for wavelengths longer than 500 nm, and using a barrier filter which cuts off at 500 nm, but passes longer wave- lengths, the fluorescent emission can be observed with little or no interference from the exciting light. In 1967, the Dutch physicist J. S. Ploem described a most important technique for incident-light stimulation of fluorescence for microscopic studies. Our modification of his system, as we used it on our intravital micro- scope, is shown schematically in Fig. 7. We used the 488-nm line of an ionized argon laser as the stimulating light, so that we did not have to use an optical filter to restrict the wavelengths of the incident beam. The laser light was used

150 HAROLD WAYLAND
0001% FITC with BSA ,n Buffer Solution (pH: 8.5)
m
FIG. 6. Absorption and fluorsecent emission curves for fluorescein isothiocyanate conjugated to bovine serum albumin (FITC-BSA).
to illuminate a rotating scattering disk to “spoil” the spatial coherence of the light (a more detailed description will be found in Wayland et al. (1975)) and, by a suitable train of lenses this illuminated spot was imaged a few centimeters ahead of a mirror (M,, Fig. 7). The light from the laser was reflected by this dichroic mirror (M,) which was designed to reflect wavelengths below 500 nm but to transmit longer wavelengths. An image of this spot was formed on the tissue to be studied by means of the microscope objective 02, which was also used to form the image of the tissue being studied. Light scattered by the tissue which was picked up by the objective will be reflected by the dichroic mirror, while the longer-wavelength light emitted by the fluorochrome will be passed by the dichroic mirror. This is further cleaned up by a barrier filter F, designed to pass the fluorescent emission but reject shorter wavelenghts, and the final image is formed on the camera by means of the transfer lens LX.
Since fluorescent emission will always be much lower in intensity than that of the stimulating radiation, it is important to have an image-sensing system capable of operating at extremely low light levels. After careful study of various approaches, we decided to work with the silicon intensifier target image tube (SIT) in a closed-circuit television camera. This tube consists of a single stage image intensifier contained in the same envelope with a silicon vidicon television tube. The electron image from the image intensifier is formed on the target of the silicon vidicon, giving a very high overall optical gain. The spectral sensitivity

EUGENE M. LANDIS AWARD LECTURE
LEGEND La ARGON ION LASER
01 INFINITY CORRECTED MICROSCOPE OBJECTIVE
A VARIABLE APERTURE
II ROTATING DIFFUSION DISK
Ll 75 m m 1.1. LENS
B BELLOWS
Lz 150 m m 1.1. LENS
P 45’ PRISM
02 INFINITY CORRECTED MICROSCOPE OBJECTIVE
Ml DICHROIC MIRROR
4 3w m m f.1. LENS
M2 FRONT SURFACE MIRROR -
C TELEVISION CAMERA
151
-c1 OBJECT PLANE
FIG. 7. Schematic diagram of laser illumination system for fluorescent stimulation.
will depend on the nature of the photocathode in the image-intensifier section. The electronic image stored on the target is then read off by means of an electron beam, in exactly the same fashion as for any standard television tube, and can be presented on a black and white television monitor or recorded on videotape. In our experience this has proved to be a satisfactory compromise between sensitivity, resolution, and optical distortion. Higher sensitivity can be achieved with the KIT system, which has an additional stage of image intensification, but at the loss of both resolution and linearity of response. Higher sensitivity can also be achieved with a multistage image intensifier coupled to a television camera, but such a system introduces very serious spatial distortion in the image, as well as considerable nonlinearity of response.
In our experience, we found that we could record fluorescent images in real time-i.e., each field of 2629 lines was exposed for l/60 set-without having to use high levels of intensity of stimulating light. Photography on ASA 400 film required exposures (or light levels) about 500 times greater. Each section of the photomontage illustrated in Fig. 8 required at least a IO-set exposure with the same light level used for TV recording. This fluorescent picture of the micro- vasculature of the mesentery of a kitten was made using bovine serum albumin to which fluorescein isothiocyanate (FITC) had been covalently bound as a tracer. It was introduced into the blood stream intravenously. Note how much detail can be seen even in the fatty regions, as well as the clarity with which some of the lymphatics can be seen. Details of the blood flow cannot be seen because of the long exposure necessary to record the information on the film. Since hemoglobin strongly absorbs the emission from fluorescein, the moving shadows

152 HAROLD WAYLAND
FIG. 8. Photomontage of kitten mesentery taken with the fluorescent emission from fluoroscein isothiocyanate conjugated to bovine serum albumin. Note the considerable detail in the fatty regions, and the outline of a large lymphatic just to the left of the center of the picture running vertically.
of the erythrocytes in the television presentation clearly show the flow pattern, direction of flow, and even allow an estimate to be made of flow velocity in many of the microvessels.
The use of fluorescent tracers has proved useful not only in outlining the positions of lymphatics, but in recording their dynamic activity. Although we have never seen an active lymphatic in a cat mesentery, they are frequently seen in the rat. Figures 9 a and b show scenes taken from the TV monitor at two stages of lymphatic contraction in the mesentery of a rat. Although we did not carry out systematic studies on lymphatic mapping or behavior, we feel that the use of fluorescent tacers could be valuable in such studies.
The advantages of having the object we wish to see self-luminous is nicely illustrated by the problem of mapping the microvasculature in fatty tissue. Even in a two-dimensional field such as we find in the mesentery, it is extremely difficult to see the microvessels in fatty regions by transillumination (Fig. 10a) both because of the loss of contrast and because each fat depot acts as a small

EUGENE M. LANDIS AWARD LECTURE 153
lens to distort the image. The use of a fluorescent tracer in the blood stream enhances the contrast, and permits visualization not only of the vascular pattern, but also of the dynamics of the flow. The same field as shown by transillumination in Fig. 10a is shown with fluorescent illumination in Fig. lob. Combining the two types of illumination, as in Fig. 1Oc permits relating the microvasculature to the location of the fat depots. Incident-light stimulation of the fluorescence also permits working with opaque tissues. Our first venture into this field was when Janet Hock spent several months in my laboratory studying the devel- opment patterns of the microcirculation in the gingiva of puppies and kittens during tooth eruption. Using BSA-FITC as the tracer material, it proved to be possible to map the microvascular pattern at successive stages of tooth eruption in precisely the same location, since no surgical procedures were involved (Wayland and Hock, 1974).
GLOMERULAR FILTRATION
In collaboration with Professor Michael Steinhausen of the University of Hei- delberg we undertook to evaluate the possibility of using fluorescent tracer tech- niques to study some aspects of kidney function. When a tracer was injected into the bloodstream and was filtered into a tubule which was near the surface of the kidney, it proved possible to record a sharp microscopic image without having to remove the capsule of the kidney. The kidney had to be kept in a fixed position by means of a kidney spoon, but the mechanical trauma to this organ was considerably less than when micropuncture experiments are under- taken. In a sense, the incident light beam which was used to stimulate the fluorochrome can be considered to be an “optical microprobe.” With the use of a series of narrow-fraction dextrans to which FITC had been conjugated, we were able to make quantitative measurements of the molecular-weight depen- dence of glomerular filtration. Details will be found in Steinhausen et al. (1977).
INTERSTITIAL DIFFUSION
In order to do quantitative work with fluorescent intensity we had to evaluate the relationship between amount of fluorochrome in the field and light emission, and of optical response of the camera system to various light intensities. We found these both to be linear over the ranges in which we worked. In fact, our SIT camera system, in which there is no automatic gain control, proved to be linear in its response over three orders of magnitude change in light intensity. Fading of fluorescence must also be taken into account. Although we found substantial fading with continued excitation for in vitro systems with the flu- orescent materials we were using, the fading was usually insignificant in our in viva studies at the stimulation levels we used.
The most extensive set of quantitative studies which we undertook was the measurement of the molecular-weight dependence of the apparent diffusion coef- ficient in the mesenteric membrane in the cat and rat. In our earlier work (Nak- amura and Wayland, 1975) we depended on what we thought were “spontaneous leaks” in the walls of microvessels to introduce the fluorescent tracer into the

154 HAROLD WAYLAND

EUGENE M. LANDIS AWARD LECTURE 155
E .E

156 HAROLD WAYLAND

r: E m
FIG
. 10
. (a
) Fa
tty
regi
on
in r
at
mes
ente
ry
obse
rved
by
tra
nsillu
min
atio
n on
ly.
(b)
The
sam
e sc
ene
obse
rved
by
mea
ns
of f
luor
esce
nce
in
the
mic
rove
ssel
s.
(c)
The
sam
e sc
ene
with
a
com
bina
tion
of t
rans
illum
inat
ion
and
fluor
esce
nt
stim
ulat
ion.

158 HAROLD WAYLAND

EUGENE M. LANDIS AWARD LECTURE 159
C(X. c (0, t)
Distance (pm)
CONCENTRATION PROFILE OF DEXTRANS AT IO set
Fro. 11. Normalized concentration profiles for FITC-dextrans in mesenteric tissue of cat. Nor- malized experimental data are shown as solid circles. The curves are calculated for a pure diffusion model using the diffusion coefficients shown in the table in the upper right of the figure. (From Nakamura and Wayland (1975, p. 14).)
mesenteric membrane. By plotting isointensity contours in the region outside the vessel at different times, we were able to develop intensity profiles for different times. Since we had demonstrated that the intensity of fluorescent emission was a good measure of the total amount of the fluorochrome in the thin layer of tissue being studied, we assumed that these isointensity profiles also represented iso- concentration profiles. We were surprised to find how closely we could fit the experimental curves by means of a simple one-dimensional diffusion model (Fig. 11). From this model, apparent diffusion coefficients were calculated for each molecular weight of substance which we studied. The summarized results are shown in Fig. 12 which shows a remarkably small dependence on molecular weight.
When Dr. James Fox came to my laboratory to do a couple of years of postdoctoral work, we decided to look more critically at this problem. We first began to explore the nature of the “spontaneous leaks.” With increased skill in making the preparations, Dr. Fox was eventually able to make preparations which had no such initial patterns of extravasation of the high-molecular-weight substances. We eventually convinced ourselves that these were largely, if not entirely, due to the action of histamine released from damaged mast cells in the neighborhood of the microvessel walls. We also realized that if large molecules could easily cross the vessel walls at such leaky points, small molecules must have been moving into the tissue long before we introduced tracer molecules, which would lead to the possibility of considerable local edema. We then un- dertook a study of the movement of rat serum albumin and tagged dextrans in the rat mesentery in which the area to be studied was covered with oil to reduce
160 HAROLD WAYLAND
OxlO7 ,o- Cl&SW
I I I I IXIOS 1x10⁴ 1x10⁵ 1x10⁶
Mw
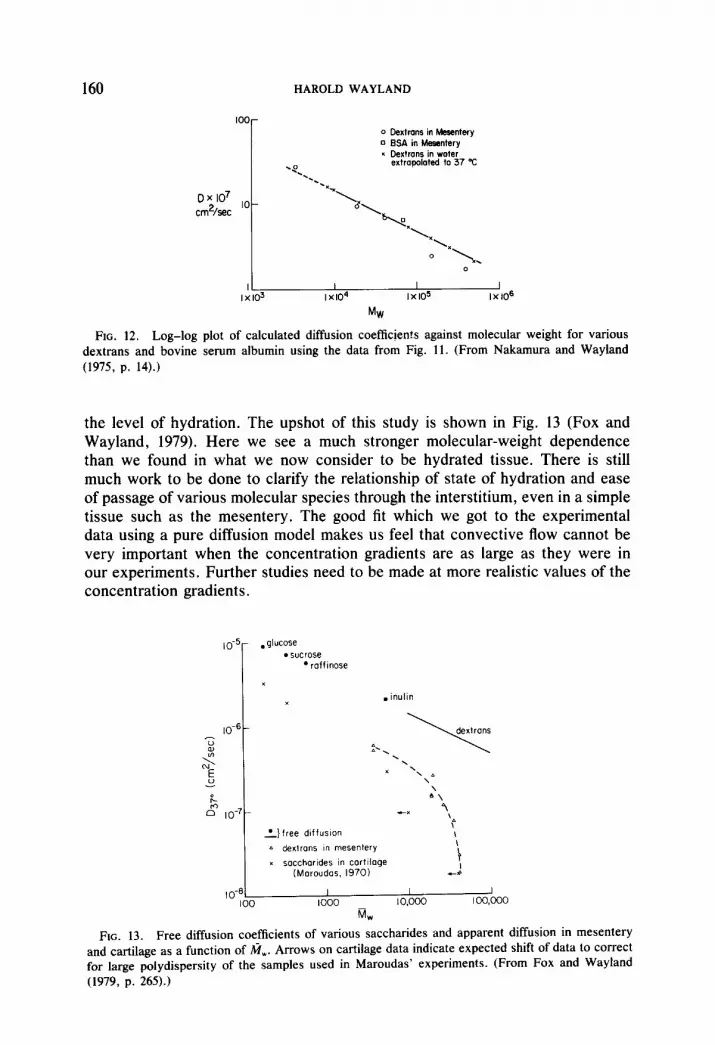
FIG. 12. Log-log plot of calculated diffusion coefficjen!s against molecular weight for various dextrans and bovine serum albumin using the data from Fig. 11. (From Nakamura and Wayland (1975, p. 141.)
the level of hydration. The upshot of this study is shown in Fig. 13 (Fox and Wayland, 1979). Here we see a much stronger molecular-weight dependence than we found in what we now consider to be hydrated tissue. There is still much work to be done to clarify the relationship of state of hydration and ease of passage of various molecular species through the interstitium, even in a simple tissue such as the mesentery. The good fit which we got to the experimental data using a pure diffusion model makes us feel that convective flow cannot be very important when the concentration gradients are as large as they were in our experiments. Further studies need to be made at more realistic values of the concentration gradients.
10-5
1
. glucose . s”crose
l raffinose
x
.inulm x
L]free diffwon
FIG. 13. Free diffusion coefficients of various saccharides and apparent diffusion in mesentery and cartilage as a function of ni,. Arrows on cartilage data indicate expected shift of data to correct for large polydispersity of the samples used in Maroudas’ experiments. (From Fox and Wayland (1979, p. 26%)

EUGENE M. LANDIS AWARD LECTURE 161
EFFECT OF HISTAMINE
Our hypotheses concerning the role of histamine in inducing local regions of increased permeability in the microvascular walls led us to further studies of the action of histamine. We had been intrigued by the early work of Majno and Palade (1961) in demonstrating what appeared to be contraction of endothelial cells due to histamine action. Another important demonstration along this line was that of Joris et al. (1972) in actually visualizing contraction of endothelial cells due to histamine action in the mesentery of the rat. The ease of locating regions of extravasation of various molecular species when they were tagged with a fluorescent tracer led us to try what I like to call the “Rhodin approach” after Johannes Rhodin, the first recipient of the Landis Award. The basic idea is to look for a particular physiologic response in a living microbed, then fix the tissue and zero in on the site of action to explore the ultrastructure in order to arrive at a clearer understanding of the relationship between structure and response.
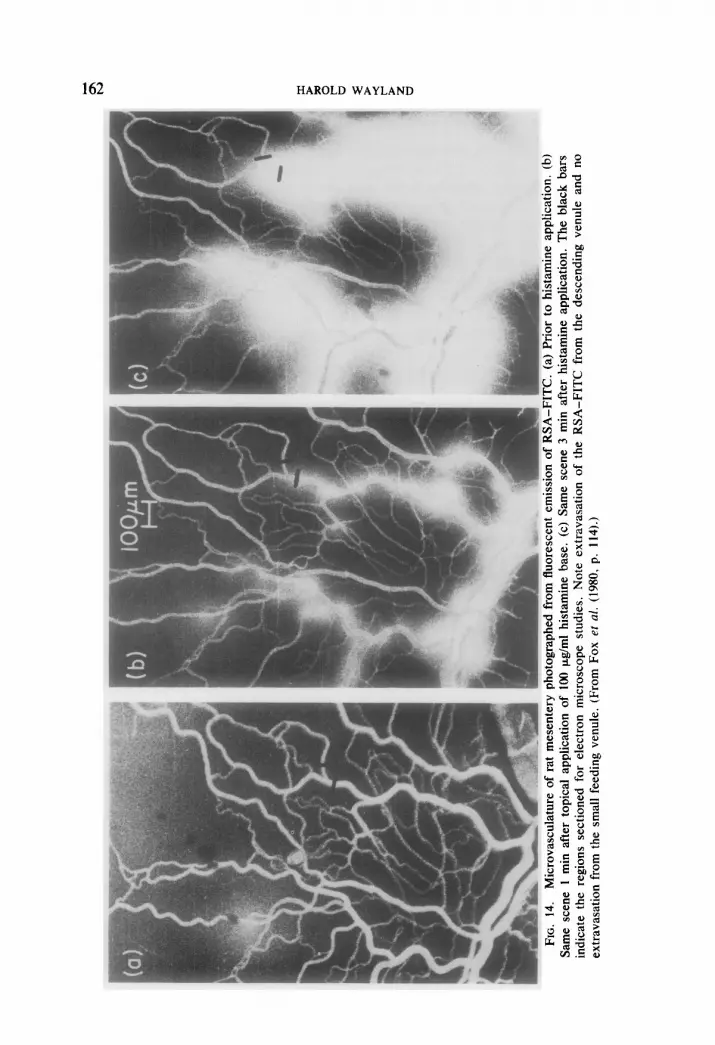
In the course of establishing dose-response characteristics for both the cat and rat mesenteries, we found that we could not predict in advance which microvessels would show leakage in response to histamine, but if such leaks occurred, they always took place in the walls of venules, never of capillaries or arterioles. An example of a responsive bed is shown in Figs. 14 a,b, and c. In Fig. 14a RSA-FITC has been injected intravenously and no leaks have ap- peared after more than 5 min. Figure 14b shows the leakage pattern 1 min after topical application of 100 pg/rnl histamine base to the membrane. The next panel, Figure 14c, shows the pattern after 3 min. At the end of 5 min a solution of glutaraldehyde (2.5%) was applied topically and the field observed until blood flow had stopped in this area. This region was then pinned out on a cork board, the animal sacrificed, and the mesenteric sample excised for postfixation and dehydration. The field had been photographically mapped prior to the application of the histamine, so that a photomontage of the region could be constructed. The area being studied was also monitored with the TV system so that the videotape could be replayed with the photomontage available to locate precisely the areas of interest. On completion of the fixation and dehydration process the tissue sample was embedded in Epon. After the embedding material had poly- merized, the whole mount was ground down to a suitable thickness to permit examination under the light microscope. For this particular sample, the areas marked with black bars in Fig. 14 were chosen for examination with the electron microscope. Careful comparison of the fixed specimen with the photographs and the videotape permitted precise selection of the regions to be sectioned. We saw no evidence of leakage from the smaller venule at the upper right of Fig. 14, and the endothelial junctions all appeared to be normal. Obviously this cannot be concluded from examining a single section, but Dr. Frank Galey, who did the electron microscopy, made a careful examination of many sections and deter- mined that this one was, indeed, typical of the walls of that particular vessel. Sections from the larger of the two venules chosen for study show distinct gaps in the endothelium. In order to ascertain the nature of the gap, serial sections were made in this area. A complete set of serial sections is necessary to determine the precise nature of the gap. We examined several endothelial gaps, using
162 HAROLD WAYLAND

EUGENE M. LANDIS AWARD LECTURE 163
computer reconstruction and reconstruction algorithms developed by Professor G. D. McCann and Dr. Michael Shantz (Shantz and McCann, 1978) of Caltech’s Bioinformation Systems Group and concluded that the major leakage occurred when cell junctions opened up (Fox et al., 1980). A cinefilm based on our histamine studies, including animated sequences showing various views from such reconstructions, is available on loan from the Millikan Library at the Cal- ifornia Institute of Technology.
In the course of our experimental work we made preliminary explorations of the possible application of fluorescent tracers in a variety of other applications. For example, in a preliminary study on the role of diabetes mellitus on athero- sclerosis, Dr. Aurora Landel found quite different patterns of sequestration of very-low-density lipoprotein (VLDL) and of high-density lipoprotein (HDL) when the apoproteins had been tagged with FITC (Figs. lSa,b) (Landel and Wayland, 1978). The strong focal deposition of VLDL on the endothelial cells compared to that of HDL may be related to the particular carbohydrate moities associated with the VLDL, which would be consistent with the findings of Williams et al. (1981) as reported at the 1981 meeting of the Microcirculatory Society.
FLUORESCENCE TAGGING OF FORMED ELEMENTS
While Dr. Marylou Ingram was working in our laboratory, she got interested in the possibility of tagging thymocytes with fluorescene diacetate. This fluoro- chrome shows strong fluorescent emission when it is in the cytoplasm of the cell, but gives an extremely weak emission if its leaks out due to cell death. Preliminary studies showed the feasibility of using this method for studying the movement of such tagged cells in the microvasculature. Although Dr. Ingram left the laboratory before we had a chance to exploit this method, some years later we found it useful in some studies proposed by Professor Harry Jacob of the University of Minnesota. He and his colleague Dr. Dale Hammerschmidt were interested in the role of leukotaxis of granulocytes induced by activation of complement on microcirculatory blood flow. Extracorporeal tagging of the granulocytes by means of fluorescene diacetate proved not to affect the chem- otactic activity induced by complement activation either with cobra-venum factor or zymosan-activated rat plasma when tested in vitro (Hammerschmidt et al., 1981). In viva experiments in the rat mesentery and cremaster muscle showed virtual cessation of flow immediately after complement activation, with a gradual resumption of flow, but with strong adhesion of the granulocytes to the vessel walls, and occasional passage of large clusters of granulocytes through the field. Such a cluster is seen in Fig. 16.
WHAT NEXT?
As most of you know, I became Professor Emeritus at Caltech in the summer of 1979. During the previous winter and spring, just prior to my retirement, my laboratory, including the Wayland-Frasher intravital microscope, was moved en bloc to the Dalton Research Center at the University of Missouri, where it has been reestablished under the direction of Professor Patrick D. Harris. By

164 HAROLD WAYLAND

EUGENE M. LANDIS AWARD LECTURE 165

FIG
. 16
. C
ompl
emen
t-ind
uced
ag
greg
ate
of g
ranu
locy
tes
which
ha
ve b
een
tagg
ed
with
flu
ores
cene
di
acte
tate
. Th
ese
were
flo
win
g in
th
e m
icro
vess
els
of a
rat
m
esen
tery
in
viv
o.

EUGENE M. LANDIS AWARD LECTURE 167
the time this talk will be published, the laboratory will move again to the Uni- versity of Louisville, where Professor Harris has become Chairman of the De- partment of Physiology. As a Professor Emeritus at Caltech I still have an office and some secretarial help, so I can enjoy the life of a scientific consultant without the need to write grant proposals-a most welcome relief!
There is a strong temptation to try to look into my “crystal ball” and suggest what I believe to be the important problems to be studied in the microcirculation. Back in 1975, Paul Johnson and I did just that, and the results of this mental exercise were finally published in 1980 in “Microcirculation, Volume III” edited by Kaley and Altura (Wayland and Johnson, 1980). In the spring of 1980 I reviewed and updated the earlier speculations (Wayland, 1981) only to find that relatively little of what Johnson and I had hoped would be done had actually been accomplished. Since these attempts at prediction of future trends are already in the open literature, I will merely urge you to read one or both of the articles.
One thing which has become eminently clear to me in my two decades of microcirculatory research is the need for further inter- and multidisciplinary studies of the microcirculation. In my opinion, this can best be attained by cooperative teamwork among individuals with significantly different training and skills. To be most effective, members of such a team must be individually committed to the solution of the problem undertaken. A consultant from another discipline can be useful, but a dedicated member of the team will be even more valuable. A sine qua non of such collaborative studies is accurate communication among the team members.
Referring to the material I have presented in this talk, you will see that I have strongly emphasized methodology. As a physicist and engineer this is the area in which I feel that I have made the most substantial contributions. But a guiding principle of all my work has been to focus on the physiological or biomedical problem at hand and then develop the tools required if, and only if, they did not already exist. At no time did we develop a method in my laboratory without clear evidence of need for that capability. I have seen much foolish work done by engineers who tried to work in the biomedical sciences without close col- laboration with colleagues with a sound training in physiology. And I have seen almost as much ineffectual-and at times, incorrect-work done by physiologists who tried to apply physical principles or methods, whether experimental or theoretical, without close enough liaison with good biophysicists or bioengineers. It is of great importance, in this time of highly sophisticated technology, to develop strong multidisciplinary teams.
With such a strong pitch for team research rather than relying on consultants, this may seem to leave scientists like myself, who have no in-house laboratory facilities, with no substantial role to play. I do feel, however, that there is a place for consultants if they are kept up to date, clearly understand the goals of the research program, and are not brought in merely to answer a few highly specific questions posed out of context.
You may wonder how I can reconcile such a philosophy of collaboration with my well-known penchant for travel. In general, I feel that my visits have been most effective when it has been possible to spend a week or more in one place. On the other hand, methodological discussions can often be of substantial service even on a short-term basis, but it is essential to be given a clear understanding

168 HAROLD WAYLAND
of the physiological or biomedical problem being attacked, rather than merely being asked technical details about equipment. A l-day visit to the University of Hong Kong in 1966 stimulated an interest in-and a local development of- the use of the dual-slit velocity system even before Paul Johnson and 1 had made our first formal presentation of the method at an American or European meeting. A lo-week lecture tour in Japan in 1973 seems to have been important in en- couraging the establishment of the Japanese Microcirculation Society. And my recent visit to the People’s Republic of China led to the opportunity for the head of the Microcirculation Laboratory of the Chinese Academy of Medical Sciences, Dr. Rui-juan Xiu, to spend a year in the United States working with my old equipment under the direction of Professor Patrick Harris.
In the hope that I can continue to give helpful stimulation to microcirculatory scientists throughout the world, and further encourage cooperation and collab- oration among those trained in different disciplines, I trust I will be able to continue carrying on in the way imagined by Professor Robert Reneman of Maastricht, the Netherlands, when, at the time of my formal retirement, he produced the cartoon shown as the tailpiece to this paper.
ACKNOWLEDGMENTS
The work of my laboratory would not have been possible without continuous support from the Heart, Lung, and Blood Institute of the National Institutes of Health under Grant HL 08977. The more substantial innovations, however, were possible only through support from private foundations: the initial design and construction of the Wayland-Frasher intravital microscope were made possible by a grant from the Alfred P. Sloan Foundation; the use of the ionized argon laser for fluorochrome stimulation and the development of digital techniques for quantitative diffusion studies were heavily dependent on a grant from the John A. Hartford Foundation; and our serious ventures into bio- chemical problems would not have been possible without funding from the Kroc Foundation. Over a period of nearly a decade, one of the great strengths of my laboratory came from an excellent staff of technical assistants: Paul Knust Graichen, M. D. Elmore, and Francis Waiyaki. I am deeply grateful for their devoted assistance.
REFERENCES
BAKER, M., AND WAYLAND, H. (1974). On-line volume flow rate and velocity profile measurements for blood in microvessels. Microvasc. Res. 7, 131-143.
CHAMBERS, R., AND ZWEIFACH, B. W. (1944). Topography and function of the mesenteric microcir- culation. Amer. J. Anai. 75, 173-205.
Fox, J. R., GALEY, F., AND WAYLAND, H. (1980). Action of histamine on the mesenteric vasculature. Microvasc. Res. 19, 108-126.
Fox, J. R., AND WAYLAND, H. (1979). Interstitial diffusion of macromolecules in the rat mesentery. Microvasc. Res. 18, 255-276.
FRASHER, W. G. (1967). Blood sampling by chronic artifical external arteriovenous shunt in dogs. J. Appi. Physiol. 22, 348-351.
FRASHER, W. G., MEISELMAN, H. J., AND WAYLAND, H. (1971). A variable shear rate capillary viscometer for out-flow viscometry in dogs. In “Theoretical and Clinical Hemorheology” (H. H. Hartert and A. L. Copley, eds.), pp. 375-380. Springer-Verlag, Berlin/Heidelberg/New York.
FRASHER, W. G., AND WAYLAND, H. (1972). A repeating modular organization of the cat mesentery. Miovasc. Res. 4, 62-76.
FRASHER, W. G., WAYLAND, H., AND MEISELMAN, H. J. (1968a). Viscometry of circulating blood in dogs. I. Heparin injection; II. Platelet removal. J. Appl. Physiol. 25, 751-760.
FRASHER, W. G., WAYLAND, H., AND SOBIN, S. (1968b). Outflow viscometery using a chronic external arterio-venous shunt. In “Hemorheology” (A. L. Copley, ed.), pp. 175-185. Pergamon, Oxford/ New York.

EUGENE M. LANDIS AWARD LECTURE 169
GAEHTGENS, P., MEISELMAN, H. J., AND WAYLAND, H. (1970). Velocity profiles of human blood at normal and reduced hematocrit in glass tubes up to 130 p diameter. Microvasc. Res. 2, 13-23.
GAEHTGENS, P., WAYLAND, H., AND MEISELMAN, H. J. (1971). Velocity profile measurements in living microvessels by a correlation method. In “Theoretical and Clinical Hemorheology”. (H. H. Hartert and A. L. Copley, eds.), pp. 381-385. Springer-Verlag, Berlin/Heidelberg/New York.
GILIN~ON, P. J., JR., DAIJWALTER, C. R., AND MERRILL, E. W. (1963). A rotational viscometer using an A.C. torque to balance loop and air bearing. Trans. Sm. Rheol. 7, 319-331.
HAMMERSCHMIDT, D. E., HARRIS, P. D., WAYLAND, H., CRADDOCK, P. R., AND JACOB, H. S. (1981). Complement-induced granulocyte aggregation in vivo. Amer. J. Pathol. 102, 146-150.
JOHNSON, P. C., AND GREATBATCH, W. H., JR. (1966). The angiometer: A flying spot microscope for measurement of blood vessel diameter. Methods Med. Res. 11, 220-227.
Jotus, I., MAJNO, G., AND RYAN, G. B. (1972). Endothelial contraction in viva; A study of the rat mesentery. Virchows Arch. B 12, 73-83.
KAWAI, H., FUKADA, E., IBE, T., AND SHONO, H. (1965). A new capillary viscometer for measuring the viscosity of small amounts of blood. In “Proc. Fourth International Congress on Rheology,” Part 4, ‘Symposium on Biorheology” (A. L. Copley, ed.), pp. 281-297. Interscience, New York.
LANDEL, A. M., AND WAYLAND, H. (1978). Preparation and characterization of VLDL-LDL-, and HDL-fluorescein isothiocyanate conjugates. In “Protides of the Biological Fluids” (H. Peters, ed.), pp. 79-82. Pergamon, Oxford/New York.
LE-CONG, P., AND ZWEIFACH, B. W. (1979). In vivo and in vitro velocity measurements in micro- vasculature with a laser. Microvasc. Res. 17, 131-141.
LEE, J. S., AND NELLIS, S. (1974). Modeling study on the distribution of flow and volume in the microcirculation of cat mesentery. Ann. Biomed. Eng. 2, 206-216.
LIWWSKY, H. H., AND ZWEIFACH, B. W. (1978). Application of the “two-slit” photometric technique to the measurement of microvascular volumetric flow rates. Microvasc. Res. 15, 93-101.
MAJNO, G., AND PALADE, G. (1961). Studies in inflammation. I. The effect of histamine and serotonin on vascular permeability: An electron microscopic study. J. Biophys. Biochem. Cytof. 11, 571405.
MAROLJDAS, A. (1970). Distribution and diffusion of solutes in articular cartilage. Biophys. J. 10, 365-379.
MEISELMAN, H. J., FRASHER, W. G., AND WAYLAND, H. (197la). The in effects offibrination on the in vivo rheology of dog blood. Microvasc. Res. 4, 26-41.
MEISELMAN, H. J., FRASHER, W. G., AND WAYLAND, H. (197lb). Variable shear rate viscometry of native dog blood: Effect of heparin injection. Biorheology 8, 91-101.
MEISELMAN, H. J., FRASHER, W. G., AND WAYLAND, H. (1972). In vivo rheology of dog blood after infusion of low-molecular-weight dextran or saline. Microvasc. Res. 4, 399-412.
NAKAMURA, Y., AND WAYLAND, H. (1975). Macromolecular transport in the cat mesentery. Microvasc. Res. 9, l-21.
PLOEM, J. S. (1967). The use of a vertical illuminator with interchangeable dichroic mirrors for fluorescence microscopy with incident light. 2. Wiss. Microsk. Microsk. Tech. 68, 129-142.
SHANTZ, M. J., AND MCCANN, G. D. (1978). Computational morphology: Three-dimensional computer graphics for electron microscopy. IEEE Trans. Biomed. Eng. BME-25, 99-103.
SLAAF, D. W., ALE\KIJNSE, R., AND WAYLAND, H. (1981). Telescopic imaging in intravital microscopy. In “11th Eur. Conf. Microcirculation,” Bibl. Amt. 20, 53-57.
STEINHAUSEN, M., WAYLAND, H., AND Fox, J. R. (1977). Renal test dyes. V. Quantitative analysis of tubular passage of FITC dextran in kidneys of rats. Pfluegers Arch. 369, 273-279.
WAYLAND, H. (1973). Photosensor methods of flow measurements in the microcirculation. Microvasc. Res. 5, 336-350.
WAYLAND, H. (1975). Intravital microscopy. In “Advances in Optical and Electron Microscopy” (R. Barer and V. E. Cosslett, eds.), Vol. 6, pp. l-47. Academic Press, New York/London.
WAYLAND, H. (1981). Some reflections on future trends in microcirculatory research. In “Progress in Microcirculation Research” (D. Garlick, ed.). Committee on Postgraduate Medical Education, University of New South Wales, Sydney, Australia, in press.
WAYLAND, H., Fox, J. R., AND ELMORE, M. D. (1975). Quantitative fluorescent studies in viva. Bibl.
Amt. 13, 61-64. WAYLAND, H., AND FRASHER, W. G. (1973). Intravital microscopy on the basis of telescopic principles:
Design and application of an intravital microscope for microvascular and neurophysiological stud- ies. In “Modem Techniques in Physiological Sciences” (J. F. Gross, R. Kauffman, and E. Wet- terer, eds.), pp. 125-153. Academic Press, New York/London.
170 HAROLD WAYLAND
WAYLAND, H., AND HOCK, J. (1974). Application of fluorescence vital microscopy to the vasculature around erupting teeth. Microvasc. Res. 7, 201-206.
WAYLAND, H., AND JOHNSON, P. (1967). Erythrocyte velocity measurement in microvessels by a two- slit photometric method. J. Appl. Physiol. 22, 333-337.
WAYLAND, H., AND JOHNSON, P. C. (1980). Future trends in microcirculatory research. In “Micro- circulation” (G. Kaley and B. M. Altura, eds.), Vol. 3, pp. 483-522. Univ. Park Press, Baltimore.
WIEDERHIELM, C. A., WOODBURY, J. W., KIRK, S., AND RUSHMER, R. F. (1964). Pulsatile pressure in the microcirculation of the frog’s mesentery. Amer. J. Physiol. 207, 173-176.
WILLIAMS, S. K., DEVENNY, J. J., AND BITENSKY, M. W. (1981). Micropinocytosis in isolated micro- vessels: Carbohydrate-selective ingestion of protein labelled with different sugars. Microwsc. Res. 21, 263 (abstract).
The author “macrocirculating” the world. (Courtesy of Professor Robert S. Reneman, University of Limburg, Maastricht, The Netherlands.)


