Embed Size (px)
Citation preview

IMPORTANT COPYRIGHT INFORMATION The following PDF article was originally published in the Journal of the Air & Waste Management Association and is fully protected under the copyright laws of the United States of America. The author of this article alone has been granted permission to copy and distribute this PDF. Additional uses of the PDF/article by the author(s) or recipients, including posting it on a Web site, are prohibited without the express consent of the Air & Waste Management Association. If you are interested in reusing, redistributing, or posting online all or parts of the enclosed article, please contact the offices of the Journal of the Air & Waste Management Association at Phone: +1-412-232-3444, ext. 6027 E-mail: [email protected] Web: www.awma.org You may also contact the Copyright Clearance Center for all permissions related to the Journal of the Air & Waste Management Association: www.copyright.com.
Copyright © 2006 Air & Waste Management Association

The National Ambient Air Monitoring Strategy: Rethinking theRole of National Networks
Richard D. ScheffeU.S. Environmental Protection Agency, Office of Air Quality Planning and Standards, Office of Airand Radiation, Research Triangle Park, NC
Paul A. SolomonU.S. Environmental Protection Agency, National Exposure Research Laboratory, Office ofResearch and Development, Las Vegas, NV
Rudolf HusarDepartment of Energy, Environmental and Chemical Engineering, Washington University, St. Louis, MO
Tim Hanley and Mark SchmidtU.S. Environmental Protection Agency, Office of Air Quality Planning and Standards, Office of Airand Radiation, Research Triangle Park, NC
Michael KoerberLake Michigan Air Directors Consortium, Rosemont, IL
Michael GilroyPuget Sound Clean Air Agency, Seattle, WA
James Hemby, Nealson Watkins, Michael Papp, Joann Rice, and Joe TikvartU.S. Environmental Protection Agency, Office of Air Quality Planning and Standards, Office of Airand Radiation, Research Triangle Park, NC
Ricard ValentinettiVermont Agency of Natural Resources, Waterbury, VT
ABSTRACTA current re-engineering of the United States routine am-bient monitoring networks intended to improve the bal-ance in addressing both regulatory and scientific objec-tives is addressed in this paper. Key attributes of thesenetwork modifications include the addition of collocatedinstruments to produce multiple pollutant characteriza-tions across a range of representative urban and rurallocations in a new network referred to as the NationalCore Monitoring Network (NCore). The NCore parame-ters include carbon monoxide (CO), sulfur dioxide (SO2),reactive nitrogen (NOy), ozone (O3), and ammonia (NH3)
gases and the major fine particulate matter (PM2.5) aerosolcomponents (ions, elemental and organic carbon frac-tions, and trace metals). The addition of trace gas instru-ments, deployed at existing chemical speciation sites anddesigned to capture concentrations well below levels ofnational air quality standards, is intended to support bothlong-term epidemiological studies and regional-scale airquality model evaluation. In addition to designing themultiple pollutant NCore network, steps were taken toassess the current networks on the basis of spatial cover-age and redundancy criteria, and mechanisms were devel-oped to facilitate incorporation of continuously operatingparticulate matter instruments.
INTRODUCTION AND RATIONALENumerous revisions to the ambient air monitoring regu-lations guiding national network operations conductedby state and local agencies and tribes (SLTs) accompaniedthe 2006 promulgation of the new fine particle stan-dards.1 In addition to updates addressing a reduced dailyfine particulate matter (PM2.5) standard (from 65 to 35
IMPLICATIONSThe nation’s routine ambient monitoring networks havebeen based on 1970s design concepts developed in theearly stages of air quality management programs. Steps tomodify national networks to address current and emergingenvironmental assessment challenges will require broadsupport across governmental agencies.
TECHNICAL PAPER ISSN:1047-3289 J. Air & Waste Manage. Assoc. 59:579–590DOI:10.3155/1047-3289.59.5.579Copyright 2009 Air & Waste Management Association
Volume 59 May 2009 Journal of the Air & Waste Management Association 579

�g/m3), the revised monitoring rule2 codified key compo-nents of the National Ambient Air Monitoring Strategy(NAAMS)3 that had been under development since 2000.The strategy in large part was driven by a confluence ofbudgetary pressures and interest from the scientific com-munity stemming from the 1999 deployment of a mas-sive PM2.5 monitoring network, as required by the 1997particulate matter (PM) standard revisions.4 Implementa-tion and operational costs for the PM2.5 network, whichhave averaged about $50 million annually, raised ques-tions regarding the capacity of the nation’s monitoringinfrastructure to incur continued layering of responsibil-ities as new air quality standards and needs emerged.Coincident with this implementation was a renewed in-terest in our “routine” networks as a critical research toolfor various scientific disciplines (health effects, exposure,atmospheric science) conveyed in a series of NationalAcademy of Sciences reports tasked with assessing the U.S.Environmental Protection Agency (EPA)’s PM researchprogram.5–7 Consequently, national networks were facedwith competing needs to be more responsive to scientificinterests while working within a so called “zero-sum”resource constraint.
A National Monitoring Steering Committee (NMSC),with representatives from EPA and SLTs, guided develop-ment of the strategy, which was subject to scientific re-view from 2002 to 2005 through the monitoring subcom-mittee of the Clean Air Scientific Advisory Committee(CASAC). CASAC strongly endorsed the themes and rec-ommendations embodied in the strategy. This paper pro-vides an overview of the NAAMS.
Rationale for a StrategyAmbient monitoring networks are a critical part of thenation’s air program infrastructure. Data from these sys-tems are used to characterize “air quality” and associateconsequent health and ecosystem impacts, develop emis-sion strategies to reduce adverse impacts, and account forprogress over time. The United States spends well over$200 million annually on routine ambient air monitoringprograms, a figure dwarfed by the billions associated with
emission reduction strategies and the costs associatedwith adverse health and ecological effects from PM.8 Am-bient data provide a basis for assessing air programprogress, thereby determining the value of those invest-ments. Obviously, the investment in and role played bynational networks demand periodic strategic planning.Dramatic and mostly positive changes in air quality havebeen observed over the last 2 decades, despite increasingpopulation, energy production, vehicle usage, and pro-ductivity. Most criteria pollutant measurements read wellbelow national standards (Figure 1). Although many ofthe criteria pollutant problems largely have been solved,current and future problems in PM, ozone, and air toxicscontinue to challenge air monitoring programs. Even pol-lutants viewed as environmental success stories such asairborne lead can re-emerge as public health concernswith modern health effects studies9 leading to possiblymore stringent air quality standards. These challengesreside in very complex air pollution behavior (e.g., non-linear relationships between emission sources and atmo-spheric concentrations) with increasing knowledge thatvery low, and difficult to measure, air pollution levels areassociated with adverse environmental and human wel-fare effects.
New directions in air monitoring are needed to reflectthe successful progress in reducing air pollution, to incor-porate new scientific findings and technologies, and tobalance societal issues such as energy production andeconomic development.10 Ambient air measurementsproduced by SLTs are high-quality, credible environmen-tal data that service a broad spectrum of clients. Thechallenge is to maintain and improve upon a valued prod-uct in an environment where monitoring programs aresubject to changes in SLT, federal, and research priorities.New and revised National Ambient Air Quality Standards(NAAQS), changing air quality (e.g., significantly reducedconcentrations of criteria pollutants), and an influx ofscientific findings and technological advancements chal-lenge the response capability of the nation’s networks.
The single-pollutant measurement approach, histori-cally administered in national networks, is not an optimal
SO
2 A
nn
ual
Mea
n
SO
2 2x
CO
1-h
r
CO
8-h
r
PM
10 A
nn
ual
Mea
n
PM
10 2
x
NO
2 A
nn
ual
Mea
n
Pb
Max
Q M
ean
PM
25 A
nn
ual
Mea
n
O3
1hr
2x
0
200
400
600
800
1000
1200
Num
ber
of S
ites
100%+ of NAAQS80 - 100% of NAAQS60 - 80% of NAAQS< 60% of NAAQS
SO
2 A
nn
ual
Mea
n
SO
2 2x
CO
1-h
r
CO
8-h
r
PM
10 A
nn
ual
Mea
n
PM
10 2
x
NO
2 A
nn
ual
Mea
n
Pb
Max
Q M
ean
PM
25 A
nn
ual
Mea
n
O3
1hr
2x
0
200
400
600
800
1000
1200
Num
ber
of S
ites
100%+ of NAAQS80 - 100% of NAAQS60 - 80% of NAAQS< 60% of NAAQS
Figure 1. Frequency of measurements relative to the standard for gaseous and PM criteria pollutants.
Scheffe et al.
580 Journal of the Air & Waste Management Association Volume 59 May 2009

design for integrated air quality management approachesthat potentially can be optimized by accounting for nu-merous programmatic and technical linkages acrossozone, PM2.5, regional haze, air toxics, and related multi-media interactions11–13 (e.g., atmospheric deposition). In-deed, the current design of the nation’s networks is basedlargely on the existing single-pollutant-focused monitor-ing regulations (Code of Federal Regulations [CFR], Parts 53and 58) that were developed in the late 1970s. Compli-cating a desire to implement change is the need to retainstability in ambient air networks for the detection oflong-term air pollution trends as well as maintaining levelfunding; thus, requiring balancing network configura-tions to support compliance, research, accountability,and infusion of new monitoring methods.
The NAAMS is built on five components (Figure 2)addressing network assessments, design, quality assur-ance, rule development, and technology, which collec-tively are intended to facilitate long-term network modi-fications. Three key areas underlying design, assessment,and technology are highlighted.
SHIFTING NETWORK DESIGN: THE NCOREMONITORING NETWORKThe new National Core Monitoring Network (Ncore) is anextension of the current air monitoring networks in-tended to address emerging issues in air monitoring andbegin filling measurement and technological gaps thathave accumulated over the years. NCore originally wasconceived as a three-tiered network (Figure 3) with grad-uated levels of measurement complexity.• Level 1: Sustained research grade stations (3–10 loca-
tions) to facilitate technology transfer between re-search and operational communities, analogous tothe PM2.5 Supersites Program.12
• Level 2: Multiple pollutant stations (�75 nationallyusing high time-resolution instruments to the extentpossible) in most major cities, important transport
corridors, and background locations intended to cap-ture urban- and regional-scale representative concen-trations.
• Level 3: A majority of the single-pollutant PM2.5 andozone sites used primarily for NAAQS compliance andair quality index (AQI) reporting, but also to comple-ment the limited number of Level 2 locations withadded spatial resolution for the most important re-gionally dispersed criteria pollutants.The final monitoring rule adopted most of the origi-
nal Level 2 recommendations under the new NCore pro-gram, reflecting an inability to fund Level 1 sites andrecognizing that inclusion of Level 3 sites as part of NCoremight impair monitoring program flexibility of SLTs.These new Level 2 sites require a core group of measure-ments that include trace gas measurements of carbon
NCoreDesign
NetworkAssessments
Revised Regulations
QualityAssurance
Technology
ReconfiguredNetworks
CurrentNetworksPM massPM spec.PAMSSLAMSAir toxicsCASTNET
NCoreDesign
NetworkAssessments
Revised Regulations
QualityAssurance
Technology
ReconfiguredNetworks
CurrentNetworksPM massPM spec.PAMSSLAMSAir toxicsCASTNET
Figure 2. Major components of the NAAMS.
Level 2: ~ 75 Multi-pollutant (MP) Sites,“Core Species” Plus
Leveraging from PAMS, Speciation Program, Air Toxics
Level 1. 3-10 Master Sites Comprehensive Measurements,
Advance Methods Serving Science and Technology Transfer Needs
Level 3: Single Pollutant Sites (e.g.> 500 sites each
for O3 and PM2.5 Mapping Support
L2
Level 3
L2
Level 3
L1
Minimum “Core” Level 2 MeasurementsPM2.5 FRM, PM(10-2.5), HNO3, NH3, Continuous NO, NOy,SO2,CO, PM2.5,O3, Meteorology (T,RH,WS,WD)
Figure 3. Graded site levels of originally proposed NCore config-uration. NH3 implemented initially as integrated filter-based methodafter evaluation; continuous methods after development and evalu-ation. True NO2 would be added to NCore following method devel-opment.
Scheffe et al.
Volume 59 May 2009 Journal of the Air & Waste Management Association 581

monoxide (CO), sulfur dioxide (SO2), and reactive nitro-gen (NOy). The term “trace” is used to emphasize theintention for broad spatial-scale representative samplingto capture characteristic pollutant concentrations, oftenin the low parts-per-billion (ppb) and sub-ppb concentra-tion range, indicative of broad population exposures and
better aligned with volume-averaged estimates (typically�100 km3) produced by gridded air quality models.Coarse particle (PM10–2.5) mass and chemical measure-ments would be conducted at all NCore locations to de-velop an information base to support future reviews of PMair quality standards. Gaseous ammonia (NH3) and truenitrogen dioxide (NO2) are intended to become NCoreparameters, pending development and/or agreement ofappropriate technologies. NO2 plays a central role in gas-phase atmospheric chemistry processes (Figure 4) and is akey parameter for diagnosing air quality model behaviorand the partitioning of deposited nitrogen species, whichcan influence and degrade terrestrial and aquatic biosys-tems. NH3, a poorly characterized species in ambient air,is a relatively ubiquitous compound neutralizing acidicgases and aerosols that participates in secondary particleformation processes. A major component of nitrogen dep-osition, the volatility of NH3 induces cycling between airand surface/water media (Figure 4) that challenges emis-sions characterizations. In addition to these core measure-ments, the NCore sites would leverage existing PM2.5
speciation, Photochemical Assessment Measurements(PAMs), and National Air Toxics Trend (NATTS) platformsoffering, in limited locations, an extensive suite of collo-cated gaseous and aerosol measurements (Figure 5).
The NCore rationale assumes that there are inherentefficiencies and synergistic information gains derivedthrough a wealth of collocated measurements supportinga multipollutant approach.14 Theoretical efficiencies arederived through economies of scales; gains include re-duced operator travel time, centralization of maintenancesupplies, system quality assurance audits, and instrumenthousing facilities. Enhanced information gains would ac-crue through a combination of adding system constraintsto the model evaluation process, increasing the number ofvariables accessible for assessment purposes such assource apportionment and epidemiological studies, and agenerally improved observation base for understandingatmospheric processes. These attributes for a monitoring
Primary Sources
HgVOC (HAPs)
COSVOC
NO2
O3O3
h
NO SO2
OH
H2SO4HNO3
NH3
OH Hgo,Hg2
OH,O3
OH
OrganicPM
RO2
HO2
OH
h
NitratePM
SulfatePM
ChemicalDeposition
gases
particles
HAPmetals
Primary Sources
HgVOC (HAPs)
COSVOC
NO2
O3O3
hv
NO SO2
OH
H2SO4HNO3
NH3
OHOH Hgo,Hg2
OH,O3
OH
OrganicPM
RO2
HO2
OH
hv
NitratePM
SulfatePM
ChemicalDeposition
gases
particles
HAPmetals
Figure 4. Chemical links illustrating relationships across criteriapollutants and hazardous air pollutants (including mercury) as wellas connections across sources, secondarily formed species, gases,PM, and deposition. Primary emissions (green) are distinguishedfrom secondarily formed species (red). Note that this diagram is ahighly condensed model that does not capture numerous differentheterogeneous processes and complex chemical pathways. Keyatmospheric species that are involved in many reactions acrosspollutant categories include ozone, the hydroxyl radical (OH), andthe nitrate radical, which is important in nighttime nitrogen chemistry(latter pathways not shown). Primary PM emissions, although sub-ject to a variety of near-source condensation and transformationprocesses relevant to total particle mass budgets, are not includedbecause they interact marginally with other atmospheric species.Adopted with permission from Scheffe et al.11 Copyright 2007 Air &Waste Management Association, EM.
Core +PM spec Core
PM specPAMS
CorePM spectoxics
core specPAMStoxics
Core
Core +PM spec Core
PM specPAMS
CorePM spectoxics
core specPAMStoxics
Core
Figure 5. Potential of developing a national system of collocated measurements through leveraging existing networks. The number ofcollocated measurements would depend on the number of supported networks addressed at a particular location (idealized approach).
Scheffe et al.
582 Journal of the Air & Waste Management Association Volume 59 May 2009

network should be viewed as complementing the strongregulatory design of most existing networks. During earlystages of formulating NCore, several concerns were raisedthat a design not focused on highest concentrationareas using Federal Reference Methods (FRMs) would beirrelevant to perceived mandates of regulatory agencies.However, building bridges to the research community,air quality modeling platforms, and eventually to otherobservational platforms (e.g., satellite and aircraft sys-tems) and environmental media are underlying NCoreobjectives.
NCore Data Objectives and Network AttributesThe NCore Level 2 sites in combination with existingroutine networks collectively are intended to address thefollowing objectives, several of which were highlighted inthe 2004 National Academy of Sciences (NAS) report,15
“Air Quality Management in the United States.”(1) Timely data reporting for public alerts based on
continuous monitors through AIRNow and re-lated air quality forecasting and public reportingmechanisms.
(2) Emission strategy development, primarily by sup-porting air quality model evaluation and applica-tion and other observational methods.11
(3) Accountability by assessing progress of imple-mented rules and programs through trackinglong-term trends of criteria and noncriteria pol-lutants and their precursors. Ideally, associationsbetween air quality changes and health outcomeswould complement these basic air quality ac-countability efforts.
(4) Epidemiological studies that contribute to ongo-ing reviews of the NAAQS.
(5) Research support that ranges across technologi-cal, health, and atmospheric process disciplines.
(6) Ecosystem assessments that recognize that na-tional air quality networks benefit ecosystem as-sessments and, in turn, benefit from data specifi-cally designed to address ecosystem analyses.
(7) Compliance that supports establishment of non-attainment/attainment areas.
The following design attributes are used to promoteintegration themes, technological improvements, andsystem efficiencies that collectively position the NCorenetwork to address the multiple data objectives listedabove.
Collocated Multiple Pollutant Measurements. The variety ofair pollution species in gas and particle phases (e.g.,ozone, PM, other criteria pollutants, and air toxics) with abroad range of physical and chemical properties are moreintegrated than the existing single-pollutant program in-frastructure suggests. From an emissions source perspec-tive, multiple pollutants or their precursors are releasedsimultaneously (e.g., combustion plume with nitrogen,carbon, hydrocarbon, mercury, sulfur gases, and PM). Me-teorological processes that shape pollutant movementand drive thermodynamics (e.g., gas-particle equilib-rium), reaction kinetics, and removal processes act on allpollutants, albeit on different time scales.
Numerous chemical and physical interactions existunderlying the dynamics of particle and ozone formationas well as a variety of air toxics components of aerosols.The overwhelming programmatic and scientific interac-tions across pollutants demand a movement toward inte-grated air quality measurement.11 Collocated monitoringof multiple pollutants, especially if measured at high timeresolution (�1 hr) will benefit health assessments, emis-sion strategy development, and a fundamental under-standing of atmospheric processes.14 Health studies withaccess to multiple pollutant data will be better positionedto tease out confounding effects of different pollutants,particularly when a variety of concentration, composi-tion, time scales, and population types are included. Eval-uation of air quality models, which drive development ofemission strategies underlying air program policy, benefitthrough constraints imposed by multiple variables, espe-cially at 1-hr time resolution or shorter, allowing for notonly operational evaluation, but diagnostic evaluation,reducing the probability of compensating errors.16,17 Justas emission sources are characterized by a multiplicity ofpollutant releases, related source apportionment modelsyield more conclusive results from use of multiple mea-surements.18,19 Multiple measurements streamline moni-toring operations and offer increased diagnostic capabili-ties to improve instrument performance.14,20–22
In addition, as we move aggressively to integratecontinuous PM (e.g., both mass and speciation) moni-tors into the network, it is important to retain severalcollocated integrated filter-based and continuous in-struments because the relationships between thesemethods are not fully understood20 and now also aresubject to future changes brought on by modificationsof aerosol composition and improvement in methods.For example, assuming proportionally greater sulfur re-ductions, aerosol nitrate gradually will partially replacesulfate,23–25 which in turn could lead to an increasedloss in measured mass due to volatilization of ammo-nium nitrate from Teflon filters.26
Given that we cannot measure everything every-where within a constrained resource environment, a nat-ural conflict arises between the relative value of spatialrichness versus multiple parameters at fewer locationswith a base of single-pollutant sites (Level 3). It is assumedthat the diagnostic value attained from combining mea-surements at fewer locations is greater than that derivedfrom single-species measurements at more locations. Partof this assumption recognizes an increased merging ofmodels and observations. As model behavior is improvedthrough multiple collocated measurements, the lack ofspatial richness in observed fields can be complementedby model-, or hybrid-model-observation, generated spa-tial and temporal characterization fields. However, addi-tional long-term or intense field studies are still requiredin the near term to further understand spatial scales ofmeasurement representativeness27on urban and regionalscales.
Emphasis on Continuously Operating Instruments. Continu-ously operating in situ instruments provide near imme-diate data delivery, enabling processing through report-ing tools such as AIRNow that effectively inform the
Scheffe et al.
Volume 59 May 2009 Journal of the Air & Waste Management Association 583

public of near-term air quality conditions. Continuousdata add insight to health assessments, addressing sub-daily averaging times, source apportionment studiesrelating impacts to direct emission sources, atmo-spheric processing and transformation, and air qualitymodels predicated on capturing diurnal air quality pat-terns of pollutant behavior.14,16,18,19
Diversity of “Representative” Locations. A variety of sitesrepresenting urban (large and medium size cities) andrural (characterizing background and transport corridors)areas support multiple objectives. National- and regional-level health assessments and air quality model evalua-tions require data representative of broad urban (e.g.,5–40 km) and regional/rural (�50 km) spatial scales.Long-term epidemiological studies that support NAAQSreviews benefit from a variety of airshed characteristicsacross different population regimes.
The NCore sites could be utilized to support develop-ment of a representative report card on air quality acrossthe nation, capable of delineating differences among geo-graphic and climatological regions. Although “high” con-centration levels will characterize many urban areas inNCore, it is important to include cities that also experi-ence less elevated pollution levels or differing mixtures ofpollutants for more statistically robust assessments.
Characterization of rural and regional environmentsto understand background conditions, transport corri-dors, regional-urban dynamics, and influences of globaltransport supports the expansion of air quality modelingdomains. Throughout the 1970s and 1980s, localizedsource-oriented dispersion modeling evolved into broaderurban-scale modeling (e.g., Urban Airshed Modeling forozone28) to regional approaches in the 1980s and 1990s(e.g., Regional Oxidant Model [ROM]29 and Regional AcidDeposition Model [RADM]30) to current national-scale ap-proaches (e.g., Community Multiscale Air Quality model[CMAQ]31) and eventually to routine applications ofcontinental/global-scale models (e.g., Goddard Earth Ob-serving System-CHEMistry [GEOS-chem]32 model). Themovement toward broader spatial-scale models coincideswith increased importance of our understanding of theregional-rural transport environment on urban and ruralconditions. As peak urban air pollution levels decline,background levels impart greater relative influence on airquality. Models need to capture these rural attributes to besuccessful in providing accurate urban concentrations.Arguably, an important fourth component is the trans-parent and readily accessible access to NCore data accom-panied by sufficient metadata to enable broad use andanalysis of NCore products. This information technologycomponent is a critical ingredient toward enabling thecommunity-bridging intentions of NCore.
NETWORK ASSESSMENTSEPA commissioned a national assessment of our monitor-ing networks in 2000, with considerations for population,pollutant concentrations, pollutant deviations from theNAAQS, pollutant estimation uncertainty, and the arearepresented by each site.3 On the basis of this nationalassessment, it was determined that substantial reductionsin monitors could be made for pollutants that are no
longer violating national air standards on a widespreadbasis, namely lead (although significant revisions to thelead standard are being considered that significantly re-duce the level of the standard), SO2, CO, NO2 and PM lessthan 10 �m in aerodynamic diameter (PM10). In parallel,the NCore network recognizes that low concentrations ofthese pollutants support a variety of health effect, sourceattribution, and model evaluation analyses. Unfortu-nately, the source-oriented site locations and method in-sensitivity of the SO2 and CO sites do not allow for ade-quate characterization of representative conditions. Evenfor those pollutants of greatest national concern, ozoneand PM2.5, sufficient redundancy was found to suggestsite reductions of 5–20% would not compromise the col-lective network information value from a spatial charac-terization perspective.
This national assessment catalyzed efforts across the10 EPA Regional Offices, a process incorporated in themonitoring regulations to be revisited every 5 yr. Al-though standardized procedures were not adhered to inthe regional assessments, differences in air quality, popu-lation, monitoring density, and objectives require flexi-bility in evaluating networks. Recognizing the desire forconsistency, the monitoring subcommittee of CASAC metin July 2003 and recommended that regional assessmentguidelines be developed for subsequent regional assess-ments at 5-yr intervals.33 Network assessments are collab-orative efforts among EPA and SLTs that incorporate ob-jective statistical evaluations along with local and policy-based considerations bearing on local decisions to changemonitors. Ideally, the combined efforts among national,regional, and local perspectives and needs will result in anoptimized realignment of air monitoring networks thatwill be more efficient, yet more responsive to the manyobjectives of the strategy. In addition, periodic assess-ments of NCore will need to be conducted to determinenot only if the program is meeting intended goals, butalso to probe relevancy with respect to future needs.
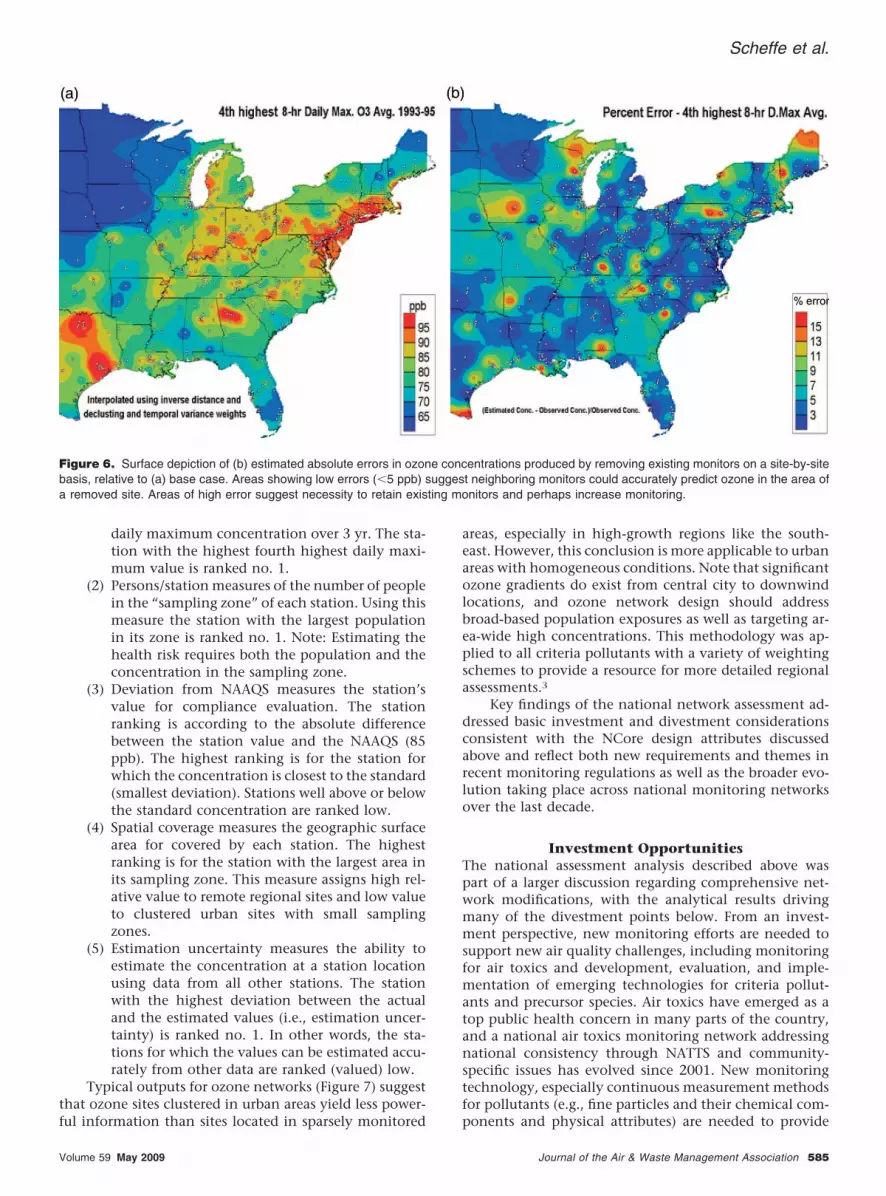
Overview of the National Assessment for OzoneAn example national assessment of the criteria pollut-ant networks was conducted in 2000 to catalyze subse-quent regional-level assessments. This assessment con-sidered concentration level, site representation of areaand population, and error uncertainty created by siteremoval as weighting parameters used to determine therelative “value” of individual sites. An indication of siteredundancy was estimated through an error analysis onthe basis of site-by-site subtraction. The national assess-ment calculated error uncertainty by modeling surfaceconcentrations (i.e., interpolating between measure-ment sites) with and without a specific monitor withthe difference reflecting uncertainty (Figure 6). Areas oflow uncertainty (e.g., �5% error difference for ozone)suggest that removal of a monitor would not compro-mise the ability to estimate air quality in the region ofthat monitor because nearby stations would adequatelycapture air quality spatial features with or without theremoved site. The assessment approach was expandedby considering five factors:
(1) Pollutant concentration as an index for healthrisk. The relevant statistic is the fourth highest
Scheffe et al.
584 Journal of the Air & Waste Management Association Volume 59 May 2009
daily maximum concentration over 3 yr. The sta-tion with the highest fourth highest daily maxi-mum value is ranked no. 1.
(2) Persons/station measures of the number of peoplein the “sampling zone” of each station. Using thismeasure the station with the largest populationin its zone is ranked no. 1. Note: Estimating thehealth risk requires both the population and theconcentration in the sampling zone.
(3) Deviation from NAAQS measures the station’svalue for compliance evaluation. The stationranking is according to the absolute differencebetween the station value and the NAAQS (85ppb). The highest ranking is for the station forwhich the concentration is closest to the standard(smallest deviation). Stations well above or belowthe standard concentration are ranked low.
(4) Spatial coverage measures the geographic surfacearea for covered by each station. The highestranking is for the station with the largest area inits sampling zone. This measure assigns high rel-ative value to remote regional sites and low valueto clustered urban sites with small samplingzones.
(5) Estimation uncertainty measures the ability toestimate the concentration at a station locationusing data from all other stations. The stationwith the highest deviation between the actualand the estimated values (i.e., estimation uncer-tainty) is ranked no. 1. In other words, the sta-tions for which the values can be estimated accu-rately from other data are ranked (valued) low.
Typical outputs for ozone networks (Figure 7) suggestthat ozone sites clustered in urban areas yield less power-ful information than sites located in sparsely monitored
areas, especially in high-growth regions like the south-east. However, this conclusion is more applicable to urbanareas with homogeneous conditions. Note that significantozone gradients do exist from central city to downwindlocations, and ozone network design should addressbroad-based population exposures as well as targeting ar-ea-wide high concentrations. This methodology was ap-plied to all criteria pollutants with a variety of weightingschemes to provide a resource for more detailed regionalassessments.3
Key findings of the national network assessment ad-dressed basic investment and divestment considerationsconsistent with the NCore design attributes discussedabove and reflect both new requirements and themes inrecent monitoring regulations as well as the broader evo-lution taking place across national monitoring networksover the last decade.
Investment OpportunitiesThe national assessment analysis described above waspart of a larger discussion regarding comprehensive net-work modifications, with the analytical results drivingmany of the divestment points below. From an invest-ment perspective, new monitoring efforts are needed tosupport new air quality challenges, including monitoringfor air toxics and development, evaluation, and imple-mentation of emerging technologies for criteria pollut-ants and precursor species. Air toxics have emerged as atop public health concern in many parts of the country,and a national air toxics monitoring network addressingnational consistency through NATTS and community-specific issues has evolved since 2001. New monitoringtechnology, especially continuous measurement methodsfor pollutants (e.g., fine particles and their chemical com-ponents and physical attributes) are needed to provide
Figure 6. Surface depiction of (b) estimated absolute errors in ozone concentrations produced by removing existing monitors on a site-by-sitebasis, relative to (a) base case. Areas showing low errors (�5 ppb) suggest neighboring monitors could accurately predict ozone in the area ofa removed site. Areas of high error suggest necessity to retain existing monitors and perhaps increase monitoring.
Scheffe et al.
Volume 59 May 2009 Journal of the Air & Waste Management Association 585

more complete, reliable, and timely air quality informa-tion and to relieve the resource burden of manual sam-pling. Resources and guidance are needed to further de-velop, evaluate, and implement continuous monitoringmethods in national routine monitoring networks, data-base development, and data analysis methods to handlethese types of data. Continued efforts are needed fordevelopment of similar methods in the ultrafine andPM10–2.5 size ranges because recent studies are also find-ing adverse health effects associated with particles inthese size ranges.19 Use of modeling results to add spatialand temporal richness in sparsely monitored areas re-quires continued development and evaluation to betterunderstand the value and caveats of these approaches forapplication to human and environmental welfare riskassessments and delineation of nonattainment areas.These recommendations reflect a community wide con-sensus formed around 2003, yet remain consistent withrecommendations generated by the 2004 NAS report, “AirQuality Management in the United States.”15 EPA’s PMSupersites Program made significant strives in the area ofmethods development and evaluation for continuousPM2.5, ultrafine, and PM10–2.5 monitoring. For example,Solomon and Sioutas20 provide initial guidance on theimplementation of current continuous methods as beingready for routine monitoring, only research studies, orstill requiring further laboratory development. Chow et al.34
provide analytical capabilities (e.g., precision, accuracy,
comparability, limits of detection) for integrated and con-tinuous methods deployed during the PM SupersitesProgram.
Divestment OpportunitiesOpportunities exist to reduce existing monitors, resultingin more efficient use of existing monitoring resources andpotentially supporting new monitoring initiatives. Manyhistorical criteria pollutant monitoring networks haveachieved their objective and demonstrate that there arelimited, if any, national or regional air quality problems,including PM10, SO2, NO2, CO, and lead. A substantialreduction in the number of monitors for these pollutantsis being considered. Consideration is being given to re-taining and relocating a certain number of trace-level SO2
and CO monitors to support air quality and emissionsmodel evaluation and source attribution analyses. Severalmonitoring sites with only one or a few pollutants shouldbe combined to form multipollutant monitoring stations.Any resource savings from such divestments must remainin the monitoring program for identified investmentneeds. A reasonable period of time is required to smoothlytransition from established to new monitoring activities.Although some will interpret divestments in currentmonitors as a diminished appreciation of those observa-tions, the intent actually is to improve characterization ofkey trace gas species. Observations of CO, SO2, and NO2
may be as important as any observation given the roles of
Figure 7. Example assessment of the eastern U.S. ozone network incorporating five evenly weighted factors. Blue circles and red squaresindicate the lowest and highest valued sites, respectively.
Scheffe et al.
586 Journal of the Air & Waste Management Association Volume 59 May 2009

those observations in a variety of health, deposition, andatmospheric science assessments and are especially criti-cal to multiple pollutant assessments.
Policy IssuesRemoval or relocation of monitors with historical regulatoryapplications creates a challenging intersection between pol-icy and technical applications. Network assessments pro-duce recommendations on removing or relocating samplerslargely on the basis of technical merit. In some instances,these recommendations conflict with existing policy, otherneeds, or the desire of community citizens. For example, arecommendation that an ozone monitor be discontinued ina nonattainment county because of redundancy of neigh-boring sampling sites creates tension between policy andtechnical perspectives. From a technical perspective, thoseresources used for a redundant observation may be betterused to fill in missing spatial gaps or to measure differentpollutants. Further complicating this scenario are concernsoften raised by citizens that associate the removal of moni-tors with a compromise in public health protection. Reach-ing a balance between policy and technical perspectivesremains a challenge to regulatory-based monitoring pro-grams. Unfortunately, policy concerns tend to slow downincorporation of innovative approaches to characterize airquality.
PROMOTING FLEXIBILITY AND ADVANCEDTECHNOLOGIESThe PM2.5 network initiated in 1999 incorporated over1100 gravimetric, filter-based sampling methods meet-ing FRM or Federal Equivalent Method (FEM) guide-lines.2 FRM and FEM status is required for regulatoryapplications such as developing design values relativeto the NAAQS for establishing an area’s attainmentstatus. Filter-based gravimetric methods are labor inten-sive; typically sample over a 24-hr time frame, therebylosing important temporal resolution; and create signif-icant data delivery delays because of laboratory chem-ical analysis and processing. Filter-based methods, suchas the FRM using Teflon filters, are subject to samplingartifacts, typically negative, which provide an inaccu-rate and low estimate of PM2.5 relative to what is actu-ally in the air.20 Note that the FRM is a regulatorystandard and not an analytical standard. Consequently,there has been interest to use continuously operatingPM2.5 monitors for over a decade. Continuous PM2.5
samplers are widely used by the AIRNow program toinform the public of an area’s air quality related to theAQI. Unfortunately, the lack of equivalency demonstra-tions for such methods has curtailed broader use ofcontinuous aerosol data. Results from the SupersitesProgram indicate that continuous methods often pro-vide a better estimate of PM2.5 than filter-based meth-ods.20,34 However, because the FRM is subject to sucherrors and because the relationship is complicated bychemical composition that varies by location, season,and source mix, national demonstrations for equiva-lency often are not achieved for continuous methods.To address the issue of regional variability in the re-sponse of continuous methods relative to FRMs, EPA
developed a new category for Class III FEM require-ments referred to as Approved Regional Methods(ARMs) and is currently reviewing submitted applications.
These comments on continuous PM measurementsreflect a small sample of a variety of technological andresource issues in the ambient monitoring program. Tech-nological advancements in ambient monitoring instru-mentation are compromised by policy constraints and ascarcity of well-defined market incentives and resourcesdriving continued methods development and evaluation.
NEXT STEPSModifications in the nations routine networks, catalyzedby the monitoring strategy, will facilitate broader integra-tion of observation systems across federal agencies, coun-tries, satellite-based sensors, and research efforts. Wellcoordinated observation efforts will better establish a ba-sis to address issues spanning a variety of pollutant cate-gories across multiple spatial and temporal scales, in-fluenced by interactions between atmospheric andterrestrial/aquatic systems and climate and air quality. Anacceleration of partnerships across agencies and nations isoccurring, driven by a combination of dwindling assess-ment resources, increased analytical demands, and greaterrecognition of co-dependencies across environmental is-sues. In addition to multiple pollutant interactions dis-cussed here, challenges of multiple spatial-scale assess-ments will drive future integration of networks. Graduallowering of U.S. ozone and PM standards, combined withenhanced growth of emissions in developing regions ofIndia, Asia, and South America, will increase the relativecontribution of intercontinental air pollution transport toregional and local areas within the United States, drivingassessment approaches that benefit from complimentaryuse of air quality models and ground- and satellite-basedair quality observations.
Interactions between climate and air quality affectingU.S. air quality are assessed through observations andmodeling tools that also support long-range transconti-nental and within-continent transport scenarios. Local-scale air quality assessment challenges include a broadsuite of particle chemical and physical properties andatmospheric chemistry phenomena associated with cur-rent exposures in near-roadway environments. Climateinteractions and related policies impact virtually all spa-tial scales. Examples include atmospheric compositionmodifications affected by penetration of emerging fuels innear-source regions and numerous global- and regional-scale meteorological influences impacting emissions andair quality. Currently, national networks with “represen-tative” monitoring are not positioned to adequately char-acterize the atmosphere in near-roadway environmentsproximate to substantial populations. Prohibitively highresource requirements to characterize complex near-fieldenvironments using traditional monitoring designs sug-gest greater reliance on flexible, periodic measurementcampaigns that provide an efficient means to capturelong-term signal changes.
Observation networks, which currently are focusedon regional and urban scales, are challenged to simulta-neously expand to more effectively address global andnear-field spatial domains. This assortment of multiple
Scheffe et al.
Volume 59 May 2009 Journal of the Air & Waste Management Association 587
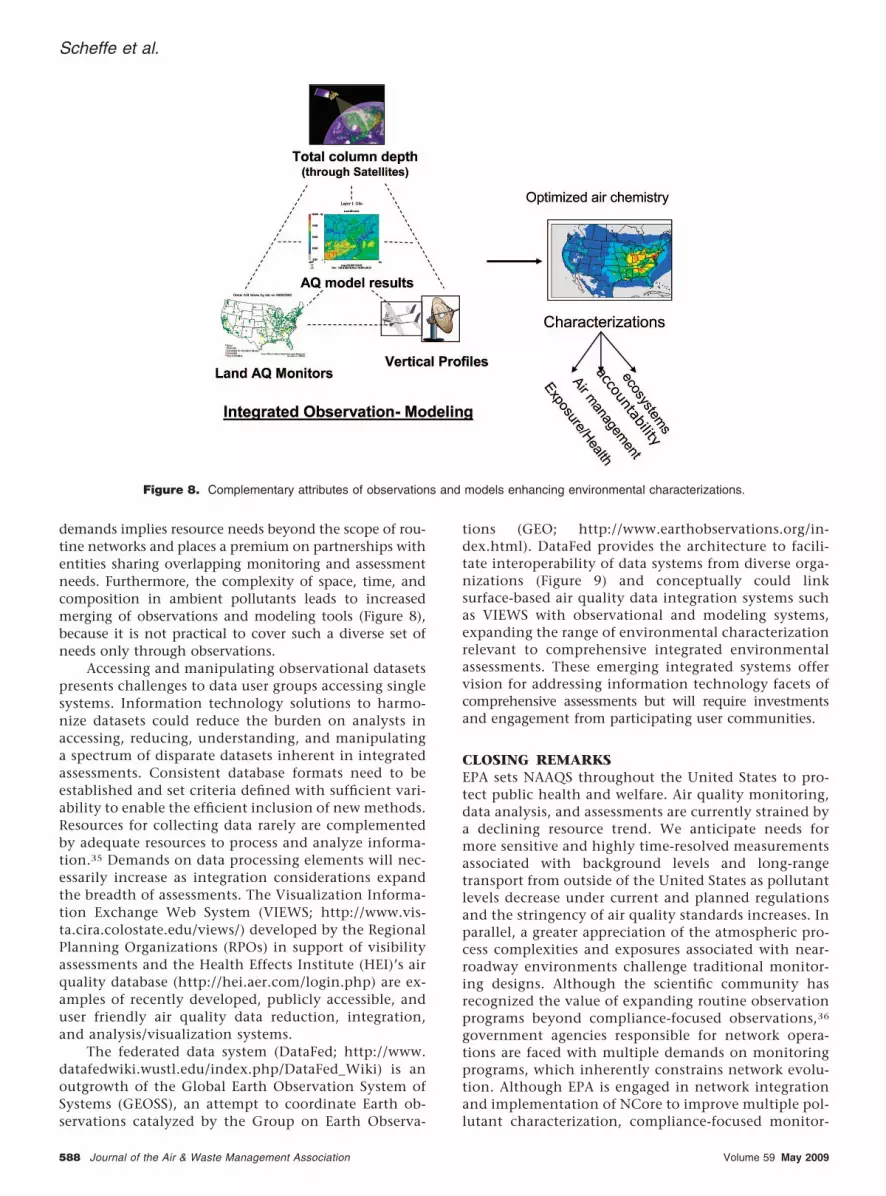
demands implies resource needs beyond the scope of rou-tine networks and places a premium on partnerships withentities sharing overlapping monitoring and assessmentneeds. Furthermore, the complexity of space, time, andcomposition in ambient pollutants leads to increasedmerging of observations and modeling tools (Figure 8),because it is not practical to cover such a diverse set ofneeds only through observations.
Accessing and manipulating observational datasetspresents challenges to data user groups accessing singlesystems. Information technology solutions to harmo-nize datasets could reduce the burden on analysts inaccessing, reducing, understanding, and manipulatinga spectrum of disparate datasets inherent in integratedassessments. Consistent database formats need to beestablished and set criteria defined with sufficient vari-ability to enable the efficient inclusion of new methods.Resources for collecting data rarely are complementedby adequate resources to process and analyze informa-tion.35 Demands on data processing elements will nec-essarily increase as integration considerations expandthe breadth of assessments. The Visualization Informa-tion Exchange Web System (VIEWS; http://www.vis-ta.cira.colostate.edu/views/) developed by the RegionalPlanning Organizations (RPOs) in support of visibilityassessments and the Health Effects Institute (HEI)’s airquality database (http://hei.aer.com/login.php) are ex-amples of recently developed, publicly accessible, anduser friendly air quality data reduction, integration,and analysis/visualization systems.
The federated data system (DataFed; http://www.datafedwiki.wustl.edu/index.php/DataFed_Wiki) is anoutgrowth of the Global Earth Observation System ofSystems (GEOSS), an attempt to coordinate Earth ob-servations catalyzed by the Group on Earth Observa-
tions (GEO; http://www.earthobservations.org/in-dex.html). DataFed provides the architecture to facili-tate interoperability of data systems from diverse orga-nizations (Figure 9) and conceptually could linksurface-based air quality data integration systems suchas VIEWS with observational and modeling systems,expanding the range of environmental characterizationrelevant to comprehensive integrated environmentalassessments. These emerging integrated systems offervision for addressing information technology facets ofcomprehensive assessments but will require investmentsand engagement from participating user communities.
CLOSING REMARKSEPA sets NAAQS throughout the United States to pro-tect public health and welfare. Air quality monitoring,data analysis, and assessments are currently strained bya declining resource trend. We anticipate needs formore sensitive and highly time-resolved measurementsassociated with background levels and long-rangetransport from outside of the United States as pollutantlevels decrease under current and planned regulationsand the stringency of air quality standards increases. Inparallel, a greater appreciation of the atmospheric pro-cess complexities and exposures associated with near-roadway environments challenge traditional monitor-ing designs. Although the scientific community hasrecognized the value of expanding routine observationprograms beyond compliance-focused observations,36
government agencies responsible for network opera-tions are faced with multiple demands on monitoringprograms, which inherently constrains network evolu-tion. Although EPA is engaged in network integrationand implementation of NCore to improve multiple pol-lutant characterization, compliance-focused monitor-
Figure 8. Complementary attributes of observations and models enhancing environmental characterizations.
Scheffe et al.
588 Journal of the Air & Waste Management Association Volume 59 May 2009

ing remains an agency priority. The larger air qualitycommunity can enable partnerships across federal andSLT agencies to effectively mine satellite data and non-routine observation programs and foster model-observation systems to address a plethora of emerging airquality management challenges.
REFERENCES1. National Ambient Air Quality Standards for Particulate Matter; Final
Rule. CFR, Part 50, Title 40, 2006.2. Revisions to Ambient Air Monitoring Regulations. CFR, Parts 53 and
58, Title 40, 2006.3. Draft Version of the National Ambient Air Monitoring Strategy; U.S. Envi-
ronmental Protection Agency; 2004; available at http://www.epa.gov/ttn/amtic/monstratdoc.html (accessed 2009).
4. National Ambient Air Quality Standards for Particulate Matter. CFR,Part 50, Title 40, 1997.
5. Research Priorities for Airborne Particulate Matter I: Immediate Prioritiesand a Long-Range Research Portfolio; National Research Council; Na-tional Academy: Washington, DC, 1998.
6. Research Priorities for Airborne Particulate Matter II: Evaluating ResearchProgress and Updating the Portfolio National Research Council; NationalAcademy: Washington, DC, 1999.
7. Research Priorities for Airborne Particulate Matter III: Early ResearchProgress; National Research Council; National Academy: Washington,DC, 2001.
8. Progress in Regulatory Reform, 2004 Report to Congress on the Costs andBenefits of Federal Regulations and Unfunded Mandates on State, Local, andTribal Entities; U.S. Office of Management and Budget; 2004; availableat http://www.whitehouse.gov/omb/inforeg/2004_cb_final.pdf (accessed2009).
9. Air Quality Criteria Document for Lead; EPA/600/R-5/144af; U.S. Envi-ronmental Protection Agency: Washington, DC, 2006.
10. Davidson, C.I.; Phalen, R.F.; Solomon, P.A. Airborne Particulate Matterand Human Health: a Review; Aerosol Sci. Technol. 2005, 38, 737-749.
11. Scheffe, R.S.; Hubbell, B.; Fox, T.; Rao, V.; Pennell, W. The Rationalefor Multipollutant, Multimedia Air Quality Management Framework;EM 2007, May, 14-20.
12. Solomon, P.A.; Hopke, P.K. Special Issue Supporting Key Scientific andPolicy- and Health-Relevant Findings from EPA’s Particulate MatterSupersites Program and Related Studies: an Integration and Synthesisof Results; J. Air & Waste Manage. Assoc. 2008, 58, 137-139.
13. Particulate Matter Science for Policy Makers: A NARSTO Assessment; Mc-Murry, P., Shepherd, M., Vickery, J., Eds.; Cambridge University: Cam-bridge, U.K., 2004.
14. Wexler, A.; Johnston, M. What Have We Learned from Highly TimeResolved Measurements during EPA’s Supersites Program and RelatedStudies? J. Air & Waste Manage. Assoc. 2008, 58, 303-319.
15. Air Quality Management in the United States; National Research Council;National Academy: Washington, DC, 2004.
16. Russell, A.G. EPA Supersites Program-Related Emissions-Based Partic-ulate Matter Modeling: Initial Applications and Advances; J. Air &Waste Manage. Assoc. 2008, 58, 289-302.
17. Seigneur, C.; Pun, B.; Pai, P.; Louis, J.-F.; Solomon, P.; Emery, C.E.;Morris, R.; Zahniser, M.; Worsnop, D.; Koutrakis, P.; White, W.; Tom-bach, I. Guidance for the Performance Evaluation of Three-Dimensional Air Quality Modeling Systems for Particulate Matter andVisibility; J. Air & Waste Manage. Assoc. 1999, 49, 588-599.
18. Watson, J.G.; Chen L.-W.A.; Chow, J.C.; Doraiswamy, P.; Lowenthal,D.H. Source Apportionment: Findings from the U.S. Supersites Pro-gram; J. Air & Waste Manage. Assoc. 2008, 58, 265-288.
19. Solomon. P.A.; Hopke, P.K.; Froines, J.; Scheffe, R. Key Scientific Find-ings and Policy- and Health-Relevant Insights from the U.S. Environ-mental Protection Agency’s Particulate Matter Supersites Program andRelated Studies: an Integration and Synthesis of Results; J. Air & WasteManage. Assoc. 2008, 58, S-3–S-92.
20. Solomon, P.A.; Sioutas, C. Continuous and Semicontinuous Monitor-ing Techniques for Particulate Matter Mass and Chemical Compo-nents: a Synthesis of Findings from EPA’s Particulate Matter SupersitesProgram and Related Studies; J. Air & Waste Manage. Assoc. 2008, 58,164-195.
21. Solomon, P.A.; Chameides, W.; Weber, R.W.; Middlebrook, A.; Ki-ang, C.S.; Russell, A.G.; Butler, A.; Turpin, B.; Mikel, D.; Scheffe, R.;Cowling, E.; Edgerton, E.; St. John, J.; Jansen, J.; McMurry, P.;Hering, S.; Bahadori, T. An Overview of the 1999 Atlanta SupersitesProject; J. Geophys. Res. Atmos. 2003, 108, 8428; doi: 10.1029/2001JD001458.
22. Weber, R.; Orsini, D.; Bergin, M.; Kiang, C.S.; Chang, M.; John, J.S.;Carrico, C.M.; Lee, Y.N.; Dasgupta, P.; Slanina, J.; Turpin, B.; Edgerton,E.; Hering, S.; Allen, G.; Solomon, P.; Chameides, W. Short-TermTemporal Variation in PM2.5 Mass and Chemical Composition duringthe Atlanta Supersite Experiment, 1999; J. Air & Waste Manage. Assoc.2003, 53, 84-91.
23. Yu, S.; Dennis, R.; Roselle, S.; Nenes, A.; Walker, J.; Eder, B.; Schere, K.;Swall, J.; Robarge, W. An Assessment of the Ability of Three-Dimensional Air Quality Models with Current Thermodynamic Equi-librium Models to Predict Aerosol NO3
�; J. Geophys. Res. 2005, 110,D07S13; doi: 10.1029/2004JD004718.
24. Tsimpidi, A.P.; Karydis, V.A.; Pandis, S.N. Response of Inorganic FineParticulate Matter to Emission Changes of Sulfur Dioxide and Ammo-nia: the Eastern United States as a Case Study; J. Air & Waste Manage.Assoc. 2007, 57, 1489-1498.
25. Pinder, R.W.; Adams, P.J.; Pandis, S.N. Ammonia Emission Controlsas a Cost-Effective Strategy for Reducing Atmospheric ParticulateMatter in the Eastern United States; Environ. Sci. Technol. 2007, 41,380-386.
26. Hering, S.V.; Cass, G.R. The Magnitude of Bias in the Measurement ofPM2.5 Arising from Volatilization of Particulate Nitrate from TeflonFilters; J. Air & Waste Manage. Assoc. 1999, 49, 725-733.
Providers
NASA DAACs
EPA R&DModel
EPA AIRNow
others
Providers
NASA DAACsNASA DAACs
EPA R&DModel
EPA AIRNow
others
Public
Manager
Scientist
Users
other
Public
Manager
Scientist
Users
other
Uniform Access
Uniform Access
Data Processing Web Service Chain
Custom Processing
SciFlo
DataFed
Data Processing Web Service Chain
Custom Processing
SciFlo
DataFed
Info Products Reports, Websites
Forecasting
Compliance
Other
Sci. Reports
Info Products Reports, Websites
Forecasting
Compliance
Other
Sci. Reports
Providers
NASA DAACs
EPA R&DModel
EPA AIRNow
others
Providers
NASA DAACsNASA DAACs
EPA R&DModel
EPA AIRNow
others
Public
Manager
Scientist
Users
other
Public
Manager
Scientist
Users
other
Uniform Access
Uniform Access
Data Processing Web Service Chain
Custom Processing
SciFlo
DataFed
Data Processing Web Service Chain
Custom Processing
SciFlo
DataFed
Info Products Reports, Websites
Forecasting
Compliance
Other
Sci. Reports
Info Products Reports, Websites
Forecasting
Compliance
Other
Sci. Reports
Figure 9. Information flow across disparate databases and users with intermediate processing steps to enable harmonization and facilitateaccess and interpretation. Figure based on information from DataFed (http://www.datafedwiki.wustl.edu/index.php/DataFed_Wiki).
Scheffe et al.
Volume 59 May 2009 Journal of the Air & Waste Management Association 589

27. Turner, J.R.; Allen, D.T. Transport of Atmospheric Fine ParticulateMatter: Part 2—Findings from Recent Field Programs on the Intraur-ban Variability in Fine Particulate Matter; J. Air & Waste Manage. Assoc.2008, 58, 196-215.
28. Scheffe, R.D.; Morris, R.E. A History of the Development and Applica-tion of the Urban Airshed Model; Atmos. Environ. 1993, 27, 23-39.
29. Lamb, R.G. Regional Scale (100 km) Model of Photochemical Air Pollution.Part 1: Theoretical Formulation; EPA 600/3-84-085; U.S. EnvironmentalProtection Agency: Washington, DC, 1983.
30. Chang, J.S.; Brost, R.A.; Isakson, I.S.; Madronich, S.; Middleton, P.;Stockwell, W.R.; Walcek, C.J. A Three-Dimensional Eulerian AcidDeposition Model: Physical Concepts and Formulation; J. Geophys.Res. 1987, 92, 14681-14700.
31. Binkowski, F.S.; Roselle, S.J. Models-3 Community Multiscale AirQuality (CMAQ) Model Aerosol Component, 1 Model Description; J.Geophys. Res. 2003, 108, 4183; doi: 10.1029/2001JD001409.
32. Bey, I.; Jacob, D.J.; Yantosca, R.M.; Logan, J.A.; Field, B.; Fiore, A.M.; Li,Q.; Liu, H.; Mickley, L.J.; Schultz, M. Global Modeling of TroposphericChemistry with Assimilated Meteorology: Model Description andEvaluation; J. Geophys. Res. 2001, 106, 23073-23096.
33. Ambient Air Monitoring Network Assessment Guidance: Analytical Tech-niques for Technical Assessments of Ambient Air Monitoring Networks; U.S.Environmental Protection Agency; 2007; available at http://www.epa.gov/ttn/amtic/files/ambient/pm25/datamang/network-assessment-guidance.pdf (accessed 2009).
34. Chow, J.C.; Doraiswamy, P.; Watson, J.G.; Chen, L.-W.A.; Ho, S.S.H.;Sodeman, D.A. Advances in Integrated and Continuous Measure-ments for Particle Mass and Chemical Composition; J. Air & WasteManage. Assoc. 2008, 58, 141-163.
35. Solomon, P.A.; Cowling, E.; Hidy, G.; Furiness, C. Comparison ofScientific Findings from Major Ozone Field Studies in North Americaand Europe; Atmos. Environ. 2000, 34, 1885-1920.
36. Chow, J.C.; Watson J.G. New Directions: Beyond Compliance AirQuality Measurements; Atmos. Environ. 2008, 42, 5166-5168.
About the AuthorsRichard Scheffe, Tim Hanley, Mark Schmidt, JamesHemby, Nealson Watkins, Michael Papp, Joann Rice, andJoe Tikvart are scientists with the EPA Office of Air QualityPlanning and Standards, Office of Air and Radiation inResearch Triangle Park, NC. Paul A. Solomon is a researchscientist with the EPA National Exposure Research Labo-ratory Office of Research and Development in Las Vegas,NV. Rudolf Husar is a professor of engineering with Wash-ington University in St. Louis, MO. Michael Koerber is di-rector of the Lake Michigan Air Directors Consortium inRosemont, IL. Michael Gilroy is a meteorologist with thePuget Sound Clean Air Agency in Seattle, WA. Ricard Val-entinetti is the air director with the Vermont Agency ofNatural Resources in Waterbury, VT. Please address cor-respondence to: Richard D. Scheffe, U.S. EnvironmentalProtection Agency Office of Air Quality Planning and Stan-dards, 4201 Alexander Drive, MD-14, Research TrianglePark, NC 27711; phone: �1-919-541-4650; e-mail:[email protected].
Scheffe et al.
590 Journal of the Air & Waste Management Association Volume 59 May 2009


