Embed Size (px)
Citation preview
A literature review:
The nature of partial discharges in stator insulation
Nathaniel Taylor , ETK, KTH
September 2008
Contents
1 Introduction 1
2 Summary 2
3 Separate summaries of the papers 7
1 Introduction
This is a literature review that was done to try to get an idea about what details areknown of the small, transient and hidden phenomenon of partial discharge (PD) in andaround the stator insulation systems of high-voltage rotating machines.
From searches made on electronic sources (mainly Google Scholar, IEEExplore), thenshort-listing of results, some twenty papers were found, and some more were found fromthe citations within these. An example of search terms used, in IEEExplore format, is:
( rotating machine <or> stator <or> epoxy-mica <or> expoy mica <or> mica epoxy )
<and> insulation <and> ( partial discharge <or> pd )
<and> ( mechanism <or> nature <or> streamer <or> townsend )
For each paper that had some relevant information, a summary is made here of themain claims of interest. Any very important or confusing points are pointed out at theend; images are sometimes included.
At the end of all the descriptions of the literature, a general summary is given, withconsideration of the gas-discharge aspects of PD in relation to standard gas-dischargetheories.
A modified ‘alpha’ citation format is used, with the first three letters of the firstauthor’s name followed by the two-digit year of publication; I find this a good clear wayto recognise the citation without having to keep thumbing to the back of the document,and it has a further advantage that the citation is consistent between different worksthat I or others might write (multiple publications in one year are the exception . . . ).
2 Summary
Here, the real ‘review’ is given, over all references together. The relevance of the refer-ences to the desired subject of the nature of PD in real stator insulation is first considered,then the references’ results are compared.
As a brief introduction to the terminology: bars and coils are the insulated conductorsof the stator, with bars being single straight parts joined at the ends after assembly, andcoils being two straight parts including their connections, joined to other coils afterassembly; the slot is the space within the iron core of the stator, where the insulatedstator windings fit; the end-winding or ‘overhang’ is the part of the windings where thebars or coils are outside the slots, going back into other slots.
Relation of experimental work to real stator PD
Gases used as the atmosphere
Many stator windings operate in atmospheric air, making relevant the literature onexperiments in air, or on effects of humidity. Most of the stator-specific referencesreviewed here have been in air at approximately atmospheric pressure.
Some large machines have windings operating in pressurised hydrogen, which explainsthe choice of this atmosphere in [Woo73, Kim97]. This has good thermal conductivityfor cooling the rotor windings, but it also has dielectric benefits for the stator from itshigher inception voltage and lack of aging reaction with epoxy, compared to atmosphericair.
Use of plain nitrogen in machine-oriented studies, as in [Woo73], is not so easy tounderstand, unless purely as a comparison with air to reveal the effects of oxygen. Theelectronegativity of oxygen is recognised by [Hud93, Flo95b] as strongly influencing thePD, so industrial nitrogen cannot be seen as electrically similar to dry air. Nitrogenmay, though, be a reasonable approximation to the air in a cavity after the oxygen hasreacted to solids.
Just [Woo73] makes use of a further gas, helium, giving a more gentle surface PDthan with nitrogen, even under very high stresses; the helium atmosphere is not foundin practical stator insulation.
Solid insulation choices
So far, the literature studied has been specific to PD in modern high-voltage statorinsulation, which uses mica flakes bonded with an epoxy resin. Older insulation systemshave used other binding materials such as bitumen, but epoxies are much the mostcommon now. The proportion by volume of mica is given in [Wic77] as around 70 %,but a manufacturer has mentioned ‘less than 10 % epoxy’ to me, for recent constructions;some of the discrepency may be due to the presence of backing tape for the mica flakes.At any rate, the proportion of epoxy is much less, by volume, than that of mica.
Some references, [Hud90, Hol91, Hud93, Hud94], have looked at plain epoxy, with itsadvantages of optical transparency and material homogeneity. This has some justification
2
when the results of interest are the properties of the cavity surface or the PD, with freshor mildly aged cavity surfaces, where the epoxy binder might still be expected to coverthe mica filler. The long-term wear and breakdown mechanisms of the insulation cannotbe expected to be well represented with just the epoxy; mica is the main part of the realinsulation, and is much the more PD-resistant of the materials.
Geometries
Most of the references used either real stator bars or coils, or models of approximatelysimilar dimensions. In [Fen03], measurement of the on-line PD of a real machine waspresented, besides laboratory work on the quite different insulation EPR (a polymericinsulation material used in some cables). In [Dym02] and [Wal91], end-winding surfacedischarges were the focus, and only real machines were mentioned. In the referencesusing plain epoxy, the test objects were laboratory ones, either a small block with asingle cavity [Hol91], or thin layers on plane electrodes, as in [Hud90] and later papersby the same author.
Applied stress
The actual electrical operating conditions of modern stator insulation are typically about3 kV/mm (rms) at 50 Hz. Higher stresses are essential for any study of long-term agingand lifetime of practical insulation materials, whose working life at normal stresses is amatter of decades.
By the well-known method of increased voltage amplitude, and increased frequencyto give an approximately proportionately large number of PD events per unit time, thetime to failure or to some aging level can be shortened. The realism of the ‘acceleration’depends on the factor being not so high as to modify the dominant aging mechanism;for example, values that cause much higher temperatures than normal or that causedischarges where there never would be discharges in normal operation.
Extremes of 15 kV/mm were used in [Wei06], at 50 Hz. In [Kim97] a more modest5.5 kV/mm was used, on the grounds that changes in deterioration mechanism occurredbeyond 6 kV/mm; the frequency here was 420 Hz, which is within the range generallythought to be a valid acceleration. The surface discharges in [Woo73] were done atstresses of up to 12 kV/mm at high frequencies of ∼1 kHz (where it’s not clear whetherthe electric field is defined in the solid or the gas, but presumably the gas), whichgave extreme heating in the N2 atmosphere. Other references stayed closer to practicalvalues of stress. Certainly, [Woo73] and [Wei06] cannot be regarded as having measured‘normal’ PD.
In some references the PD inception voltage (PDIV) is used to express the appliedvoltage, e.g. ‘up to three times the inception voltage’, paraphrased from [Flo95b]. Itshould be noted that PDIV is often defined as the level at which regular PD is detectedwhen raising the amplitude of a periodic excitation; variation in the detection sensitivityor the significance of statistical time-lag can alter this value.
3
Results
The overall picture of PD within stator insulation, given by the references that havebeen studied, is the following.
Possibility of PD inception
The operating peak electrical field in the solid insulation is about 3 kV/mm, which isabout the classic Townsend breakdown value for non-tiny gaps in atmospheric air. Theepoxy-mica insulation material has a permittivity of about εr ≈ 4; the gas in a void inthe insulation therefore experiences a similar or enhanced field, compared to the field inthe solid, depending on the shape of the void.
Voids can be small ‘bubble-like’ cavities where the epoxy binder has not reachedduring manufacture, or larger ‘delaminations’ between the layers of mica-bearing tapessometimes due to thermal cycling and mechanical or thermal stress. A small cavityin the insulation generally has so little volume that the statistical time-lag can delayPD until a strong excess field exists. A delamination, a void of modest height in thefield direction but large dimension in the plane normal to the field, will have stronglyenhanced field compared to the case if the space were filled with insulation material.
Surface discharges
Surface PD, although particularly important in the end-winding region where there is nolow-resistivity coating around the insulation surface, is not well covered by the references.Their interest in the subject lay mainly in breakdown mechanisms [Woo73] or analysisof occurred breakdowns [Wal91, Dym02], and there is not much about the dischargesthemselves, in real stator insulation, e.g. pulse sizes, waveforms, inception criteria. In[Fen03] the PDIV is shown as a function of humidity, measured between EPR-coatedelectrodes, as part of an investigation of the effects of humidity on stator insulation,presumably aimed at the insulation surface rather than at the moisture-shielded cavitieswithin the insulation. This reference goes on to show measurements on a real stator,in varying humidity, with discharge rate increasing with decreased humidity within the< 50 % range of relative humidity; this was attributed to the electronegativity of watermolecules, absorbing electrons.
Cavity discharges
Hudon In all of [Hud90, Hud93, Hud94] the test object was an epoxy-bounded 0.5 mmgap between edge-contoured plane electrodes, in which air was sealed and a modest3.2 kV at 60 Hz was applied for over a thousand hours. This is thus a classic dielectricbarrier discharge situation. The results, e.g. figures 12 to 14, show that at some timebetween tens and hundreds of hours of aging, a gradual but clear transition occurred fromstrong, spark-like discharges (mentioned in [Hud93] as being suggestive of the ‘streamer-like’ form in [Dev84]) to smaller, slower Townsend-like discharges, and ultimately topulseless glow discharge. It should be noted in advance of the results that the rise-times
4
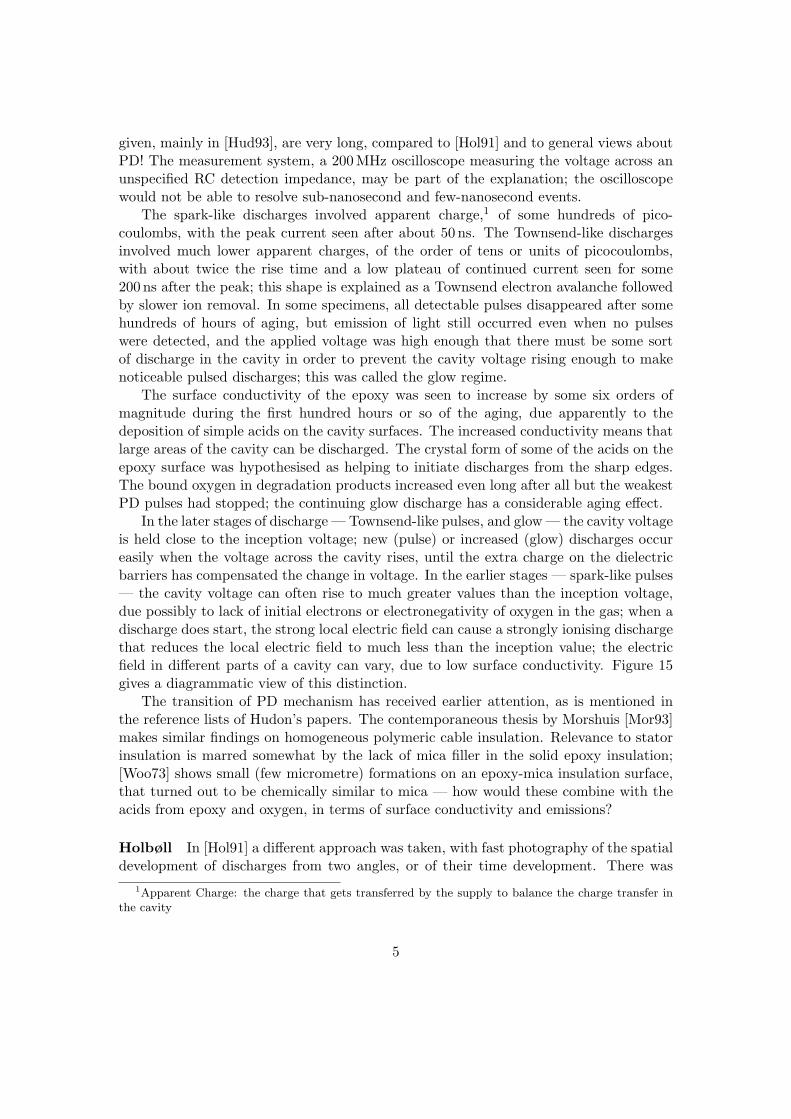
given, mainly in [Hud93], are very long, compared to [Hol91] and to general views aboutPD! The measurement system, a 200 MHz oscilloscope measuring the voltage across anunspecified RC detection impedance, may be part of the explanation; the oscilloscopewould not be able to resolve sub-nanosecond and few-nanosecond events.
The spark-like discharges involved apparent charge,1 of some hundreds of pico-coulombs, with the peak current seen after about 50 ns. The Townsend-like dischargesinvolved much lower apparent charges, of the order of tens or units of picocoulombs,with about twice the rise time and a low plateau of continued current seen for some200 ns after the peak; this shape is explained as a Townsend electron avalanche followedby slower ion removal. In some specimens, all detectable pulses disappeared after somehundreds of hours of aging, but emission of light still occurred even when no pulseswere detected, and the applied voltage was high enough that there must be some sortof discharge in the cavity in order to prevent the cavity voltage rising enough to makenoticeable pulsed discharges; this was called the glow regime.
The surface conductivity of the epoxy was seen to increase by some six orders ofmagnitude during the first hundred hours or so of the aging, due apparently to thedeposition of simple acids on the cavity surfaces. The increased conductivity means thatlarge areas of the cavity can be discharged. The crystal form of some of the acids on theepoxy surface was hypothesised as helping to initiate discharges from the sharp edges.The bound oxygen in degradation products increased even long after all but the weakestPD pulses had stopped; the continuing glow discharge has a considerable aging effect.
In the later stages of discharge — Townsend-like pulses, and glow — the cavity voltageis held close to the inception voltage; new (pulse) or increased (glow) discharges occureasily when the voltage across the cavity rises, until the extra charge on the dielectricbarriers has compensated the change in voltage. In the earlier stages — spark-like pulses— the cavity voltage can often rise to much greater values than the inception voltage,due possibly to lack of initial electrons or electronegativity of oxygen in the gas; when adischarge does start, the strong local electric field can cause a strongly ionising dischargethat reduces the local electric field to much less than the inception value; the electricfield in different parts of a cavity can vary, due to low surface conductivity. Figure 15gives a diagrammatic view of this distinction.
The transition of PD mechanism has received earlier attention, as is mentioned inthe reference lists of Hudon’s papers. The contemporaneous thesis by Morshuis [Mor93]makes similar findings on homogeneous polymeric cable insulation. Relevance to statorinsulation is marred somewhat by the lack of mica filler in the solid epoxy insulation;[Woo73] shows small (few micrometre) formations on an epoxy-mica insulation surface,that turned out to be chemically similar to mica — how would these combine with theacids from epoxy and oxygen, in terms of surface conductivity and emissions?
Holbøll In [Hol91] a different approach was taken, with fast photography of the spatialdevelopment of discharges from two angles, or of their time development. There was
1Apparent Charge: the charge that gets transferred by the supply to balance the charge transfer inthe cavity
5

also oscilloscope measurement of the current in a 50 Ω series resistance, using a 1 GHzoscilloscope. This again is in epoxy, and the main results can be seen in figures 8 to 10.
Again, there are two distinct types of discharge seen; a fast one, described as ‘streamer’,and a slow one, described as ‘diffuse’. There is not, however, a mention of a clear transi-tion in time from a predominance of one to the other; the measurements appear to havebeen made on quite new cavities without a long time of aging as in the [Hud93] series.The camera images shown, with channels for the fast discharges, and diffuse less-intenselight from the whole cavity for the slow discharges, provide a welcome verification ofthe hypotheses of [Hud90]. Later work in [Hol94] used another form of high-bandwidthmeasurement of PD currents in cavities in epoxy-mica insulation in a model of a statorbar in its slot; fast and slow discharges were again seen.
It is interesting to note that although the cavities have diameters from twice toten times the air-gap in the [Hud93] case, the oscilloscope traces and time-developmentphotographs of [Hol91] show much shorter times of the pulses. The more credible is[Hol91]: its figure of around 1 ns tallies with many other sources in the literature aboutcavity PD, its oscilloscope had a greater bandwidth, and the camera images providefurther verification.
Other The size of cavity PD pulses under reasonable voltages was given by severalreferences as having apparent charges in the order of hundreds of picocoulombs up to afew nanocoulombs.
Availability of electrons
The significance of metal-bounded cavities, as good sinks and sources of electrons, is dis-cussed in [Flo95a], with reference to the work function and to the large field-enhancement,of some hundred times, around microscopic roughness in the metal surface, which makesfield emission possible even at the normal working fields. In [Wic77] some metal-boundedcavities are compared with purely dielectric-bounded ones.
Again from [Flo95a], the significance of surface charge and trapped charge on dielec-tric bounds is discussed, as being a source of rapidly available electrons that prevent thelarge overvoltages that can arise when the statistical time-lag is affecting the discharges.
6
3 Separate summaries of the papers
[Woo73] J. Wood, D. Ryder, W. Hogg, 1973Discharge studies of epoxy/mica turbine generator insulation
The authors are from a machine manufacturer and a university. The aim is a generalimprovement in understanding of the breakdown mechanisms of stator insulation due toelectrical stress.
The PD system used has resolution of 0.5 µs and sensitivity of 0.05 pC[sic] (this seemsincredible; how about 0.05 nC, which fits better with the 70 pC mentioned by table III)for a 10 pF sample, calibrated by known-charge injection. Five materials were used, innominal thicknesses of 0.18 mm built up into five-layer objects. The materials used are:objects A&C, phlogopite mica in 0.1 mm to 1.0 mm flakelets, bonded with respectivelynovobond or a cyclo-aliphatic resin; objects B&D, the same but in a 25 mm wide tape;object E is novobond bonded muscovite mica flakes about 40 mm across faces and 25 µmthick.
Frequencies from 800 Hz to 1200 Hz were used, This ‘factor of 24’ of aging rate, on theclassic assumption of number of cycles being dominant, is claimed to be ‘not expectedto change the mechanism of damage and progression to breakdown at service stress’(based on experience, not further justified) and the dielectric loss is quite constant overthis range. Initial work was done with plain epoxy in N2 at 800 Hz to 1200 Hz, from4 kV/mm to 12 kV/mm, to confirm for example that the stress/lifetime relation was asexpected from previous work (the purpose is not very clear).
Removal of a faulted test object from the supply is noted as being very important, toallow its condition at failure to be preserved and to allow other objects to continue aging;HV fuses and special air-blast breakers were used here. It is claimed that a binocularoptical microscope is no good for more than 20× magnification with the required depthof focus; electron microscopy was used for study of surfaces.
Surface discharges were made across a 0.2 mm gap from a profiled electrode, at800 Hz.
In an atmosphere of ≥99 % N2 at normal temperature and pressure (NTP), ‘multi-samples’ (multiple samples, for repeated tests?) of objects type A,B,C,D,E were testedwith 12 kV/mm, six times the inception level, a very severe stress. Some discharges weretangential, across the insulator surface, as evidenced by tracks. Maximum dischargeswere as high as 40 nC. The thermal effect of this severe stress was considered to be themain cause of breakdown, whose progression was described as ‘removal of the bondingmaterial, delamination, internal void formation, puncture of laminations or trackingbetween flakes and butt-joints’; in this case the high stress clearly made the accelerationby frequency be invalid, due to the high temperature.
In an atmosphere of He at NTP (presumably the same high stress as with N2?),which is pointed as as having a discharge inception stress ‘considerably lower than thatof N2’. Maximum discharges were from 5 nC to 11 nC, with no breakdown up to thestop at ‘equivalent’ five years of aging; careful inspection of the degradation suggesteda process of ‘removal of bonding material, delamination and void formation, erosion of
7
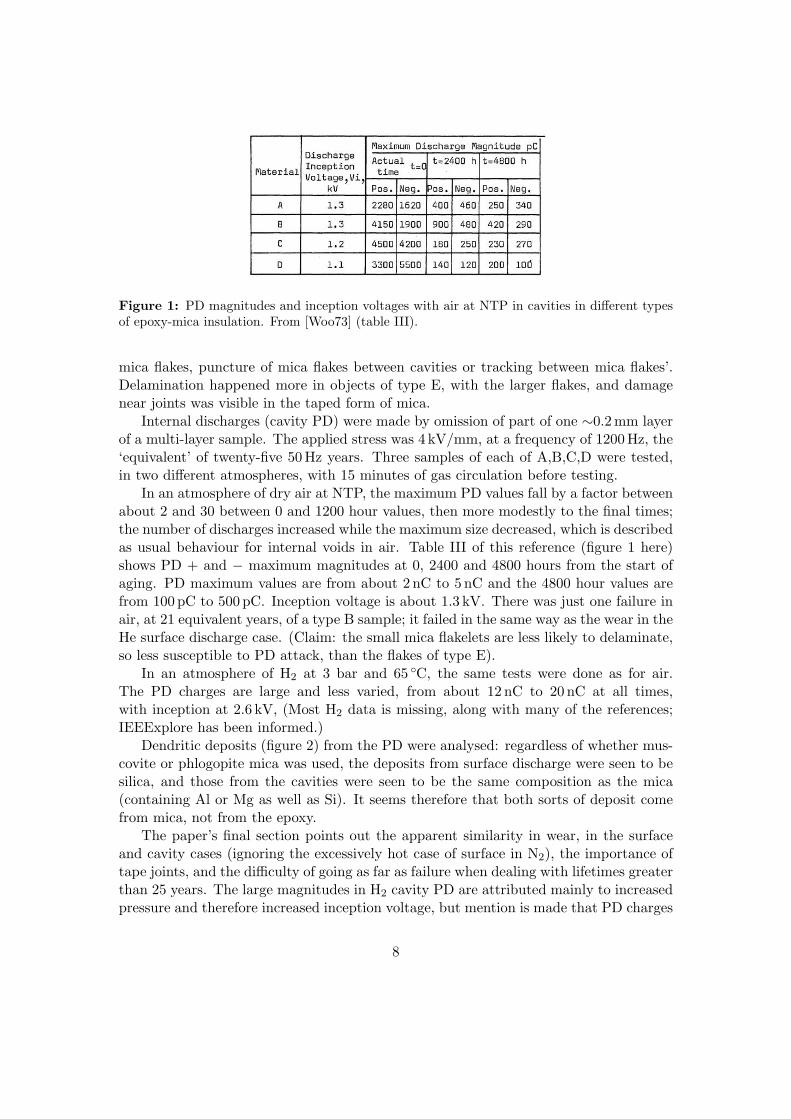
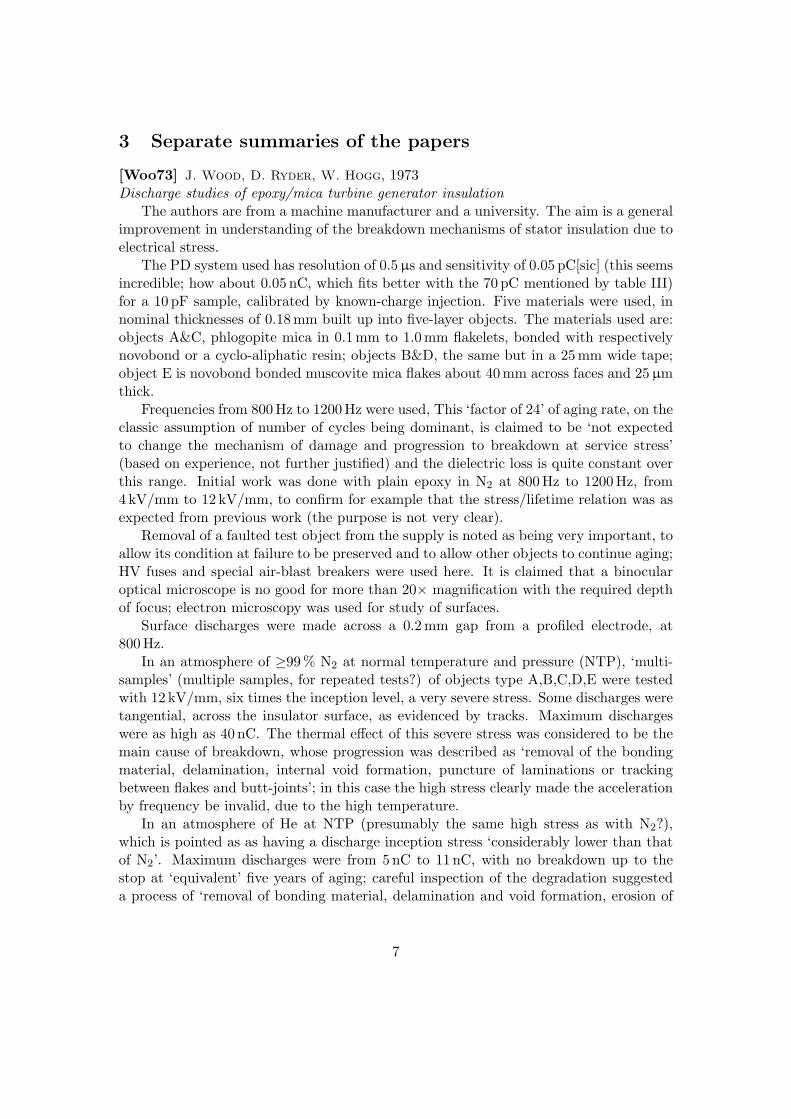
Figure 1: PD magnitudes and inception voltages with air at NTP in cavities in different typesof epoxy-mica insulation. From [Woo73] (table III).
mica flakes, puncture of mica flakes between cavities or tracking between mica flakes’.Delamination happened more in objects of type E, with the larger flakes, and damagenear joints was visible in the taped form of mica.
Internal discharges (cavity PD) were made by omission of part of one ∼0.2 mm layerof a multi-layer sample. The applied stress was 4 kV/mm, at a frequency of 1200 Hz, the‘equivalent’ of twenty-five 50 Hz years. Three samples of each of A,B,C,D were tested,in two different atmospheres, with 15 minutes of gas circulation before testing.
In an atmosphere of dry air at NTP, the maximum PD values fall by a factor betweenabout 2 and 30 between 0 and 1200 hour values, then more modestly to the final times;the number of discharges increased while the maximum size decreased, which is describedas usual behaviour for internal voids in air. Table III of this reference (figure 1 here)shows PD + and − maximum magnitudes at 0, 2400 and 4800 hours from the start ofaging. PD maximum values are from about 2 nC to 5 nC and the 4800 hour values arefrom 100 pC to 500 pC. Inception voltage is about 1.3 kV. There was just one failure inair, at 21 equivalent years, of a type B sample; it failed in the same way as the wear in theHe surface discharge case. (Claim: the small mica flakelets are less likely to delaminate,so less susceptible to PD attack, than the flakes of type E).
In an atmosphere of H2 at 3 bar and 65 C, the same tests were done as for air.The PD charges are large and less varied, from about 12 nC to 20 nC at all times,with inception at 2.6 kV, (Most H2 data is missing, along with many of the references;IEEExplore has been informed.)
Dendritic deposits (figure 2) from the PD were analysed: regardless of whether mus-covite or phlogopite mica was used, the deposits from surface discharge were seen to besilica, and those from the cavities were seen to be the same composition as the mica(containing Al or Mg as well as Si). It seems therefore that both sorts of deposit comefrom mica, not from the epoxy.
The paper’s final section points out the apparent similarity in wear, in the surfaceand cavity cases (ignoring the excessively hot case of surface in N2), the importance oftape joints, and the difficulty of going as far as failure when dealing with lifetimes greaterthan 25 years. The large magnitudes in H2 cavity PD are attributed mainly to increasedpressure and therefore increased inception voltage, but mention is made that PD charges
8
Figure 2: Electron micrographs of PD-induced changes on micaceous insulation. At the left,deposits on external surfaces; in the centre, deposits on internal surfaces, including a close-up;at the right, a puncture through a mica flake. All main pictures are to approximately the samescale, the height of the image being ∼150 µm. From [Woo73], combining several images.
can increase with temperature in epoxy systems even without change in partial dischargeinception voltage (PDIV), but the relevant references are missing in the electronic copy.
An external discussion of the paper states that the per-cycle pulse size distributionshould be shown to be the same at different frequencies used, in order to verify the ‘samemechanism’ with frequency-accelerated aging, and that stress at the corners is typicallytwice as great as on the flat sections of a stator bar. The authors response is that theyonly claimed to have used a number of cycles the same as that of 25 years at 50 Hz, thatsimilar pulse sizes do not either imply valid extrapolation, and that preliminary mea-surements with filler (mica), binder (epoxy) or a mixture, had shown little dependenceon frequency up to 1.2 kHz for ventilated PD, or up to 0.5 kHz for PD in sealed cavities.
Summary: This is well executed and described; it gives a convincing description ofepoxy-mica breakdown mechanisms, and gives PD maximum + and − magnitudes fordifferent aging state and atmosphere/temperature.
[Wic77] A. Wichmann, P. Gruenewald, 1977Influence of dielectric stress concentration on voltage endurance of epoxy-mica generatorinsulation
The authors are from a machine manufacturer, an AEG/Siemens branch. Themain aim is a better cross-section of the HV conductors and insulation of large turbo-generators, to reduce wear.
PD was studied on surfaces and artificial voids of mica splittings and papers, withvarious epoxy resin binders. Insulation thickness was 3 mm, around a stator-like conduc-tor with edge-radius 1 mm, cross section 10 mm×50 mm and length 1 m. The breakdownstrength of the complete insulation was tested at increased voltage and frequency. Arelation log t = k − αE was a ‘good’ approximation (actually, it looks rather concave in
9
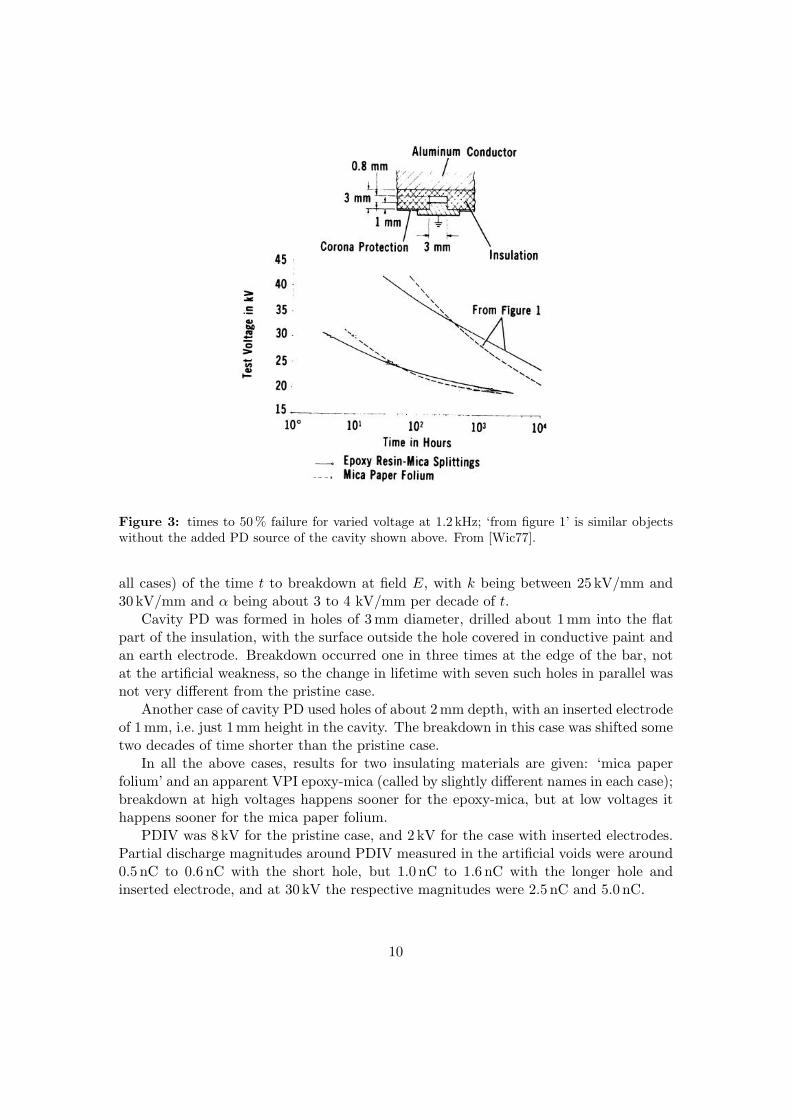
Figure 3: times to 50 % failure for varied voltage at 1.2 kHz; ‘from figure 1’ is similar objectswithout the added PD source of the cavity shown above. From [Wic77].
all cases) of the time t to breakdown at field E, with k being between 25 kV/mm and30 kV/mm and α being about 3 to 4 kV/mm per decade of t.
Cavity PD was formed in holes of 3 mm diameter, drilled about 1 mm into the flatpart of the insulation, with the surface outside the hole covered in conductive paint andan earth electrode. Breakdown occurred one in three times at the edge of the bar, notat the artificial weakness, so the change in lifetime with seven such holes in parallel wasnot very different from the pristine case.
Another case of cavity PD used holes of about 2 mm depth, with an inserted electrodeof 1 mm, i.e. just 1 mm height in the cavity. The breakdown in this case was shifted sometwo decades of time shorter than the pristine case.
In all the above cases, results for two insulating materials are given: ‘mica paperfolium’ and an apparent VPI epoxy-mica (called by slightly different names in each case);breakdown at high voltages happens sooner for the epoxy-mica, but at low voltages ithappens sooner for the mica paper folium.
PDIV was 8 kV for the pristine case, and 2 kV for the case with inserted electrodes.Partial discharge magnitudes around PDIV measured in the artificial voids were around0.5 nC to 0.6 nC with the short hole, but 1.0 nC to 1.6 nC with the longer hole andinserted electrode, and at 30 kV the respective magnitudes were 2.5 nC and 5.0 nC.
10
Similar tests were then made with small samples of various materials, still 3 mmthick. Nine specimens of each were used. The life expectancy (definition, with rangeof voltages?) of the impregnated mica paper, around 60 % mica, was about half-waybetween the shorter time of the pure resin and the longer time of the mica splittings.
Summary: Some PD charge magnitudes are given for well defined cavities, anddifferent proportions of binder and filler are compared for breakdown time.
[Reh88] R.H. Rehder, V.R. Mulhall, V.A. Moore, D.G. McLaren, 1988All stator windings are not created equal
The authors are from a machine manufacturer. There is no own experimental work;this is just a quick summary of insulation-system evolution and the present direction.
Higher frequencies for acceleration are claimed to be ‘proven by an internationalinterlaboratory test program’ to be not valid as a linear scaling, though useful in someslot and end-winding cases.
Long-term voltage degradation is by PD, energy and chemicals, changing the insu-lating material. Attention was previously on the slot section, packing the surroundingof the bars or coils and ensuring well-compacted and impregnated insulation. Now, withthese parts improved and stresses increasing, attention is moving to other places, e.g. thegas around end-winding bars or coils; Paschen’s law is mentioned as the way to decidewhether end-winding PD will occur.
[Hud90] C. Hudon, R. Bartnikas, M. Wertheimer, 1990Surface conductivity of epoxy specimens subjected to partial discharges
The authors are at a university and a machine user. The aim is a description of thePD-induced change in epoxy surfaces, of relevance to PD characteristics in epoxy-boundinsulation.
Two 50 mm diameter electrodes were coated with 1 mm and 0.5 mm thicknesses ofepoxy, with the faces separated by 0.5 mm in a sealed test cell. An applied voltage of3.2 kV 60 Hz was used, with PD measurements made on an RLC detection impedancein series with a coupling capacitor, averaging results from 100 cycles every hour or tenminutes.
Conductivity was measured between evapourated gold electrodes of 4 mm × 20 mmat a separation of 1 mm, that were deposited after the aging; the applied voltage forthese measurements was 200 V for 120 s. Specimens were stored in dry atmosphere andmeasured in a vacuum, to avoid humidity effects (known to have enormous influence onsurface conductivity).
The results of conductivity measurements are given in (Ω cm)−1, which is strangesince this is a material value rather than a surface value, so it implies that the thicknessof the measured layer is known; in the later work [Hud93], siemens are used, with similarnumbers, so it can be assumed that the current paper has wrongly described its units.
For a few minutes of ‘de-gassing’ (removal from test-cell, or after the gold-deposition?)the conductivity changed rapidly, but it became quite steady after a while; measurementswere made after 1 hour.
11
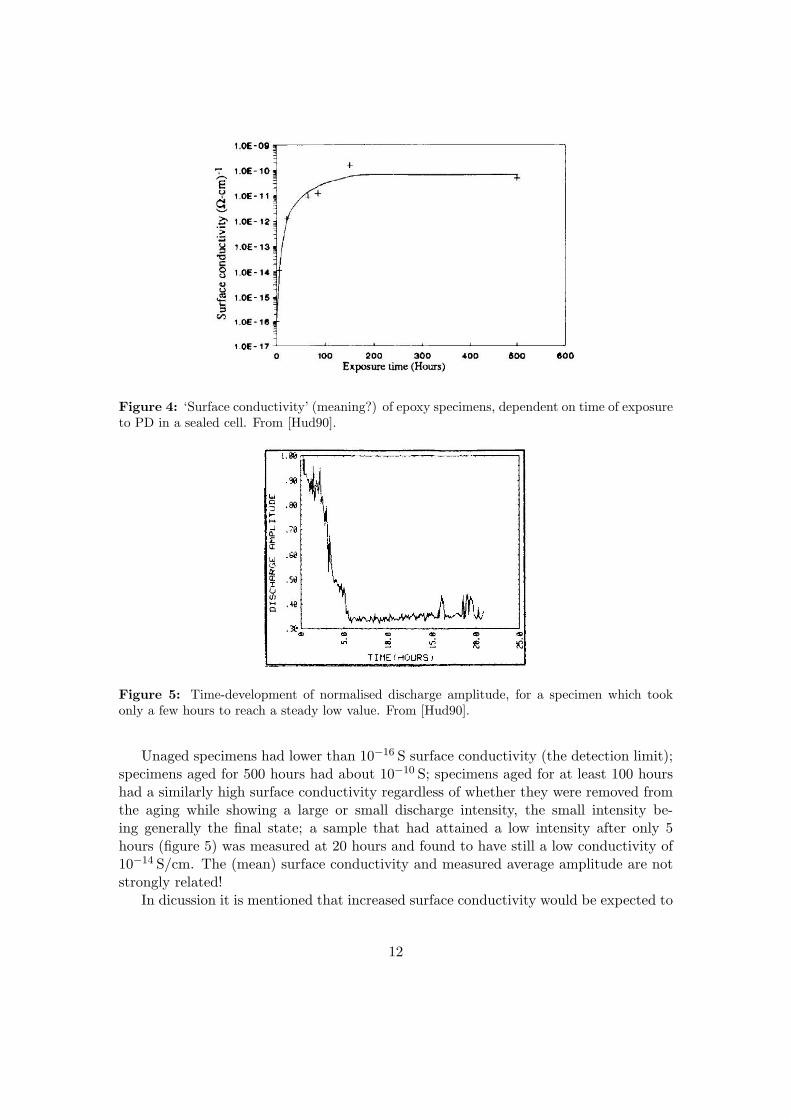
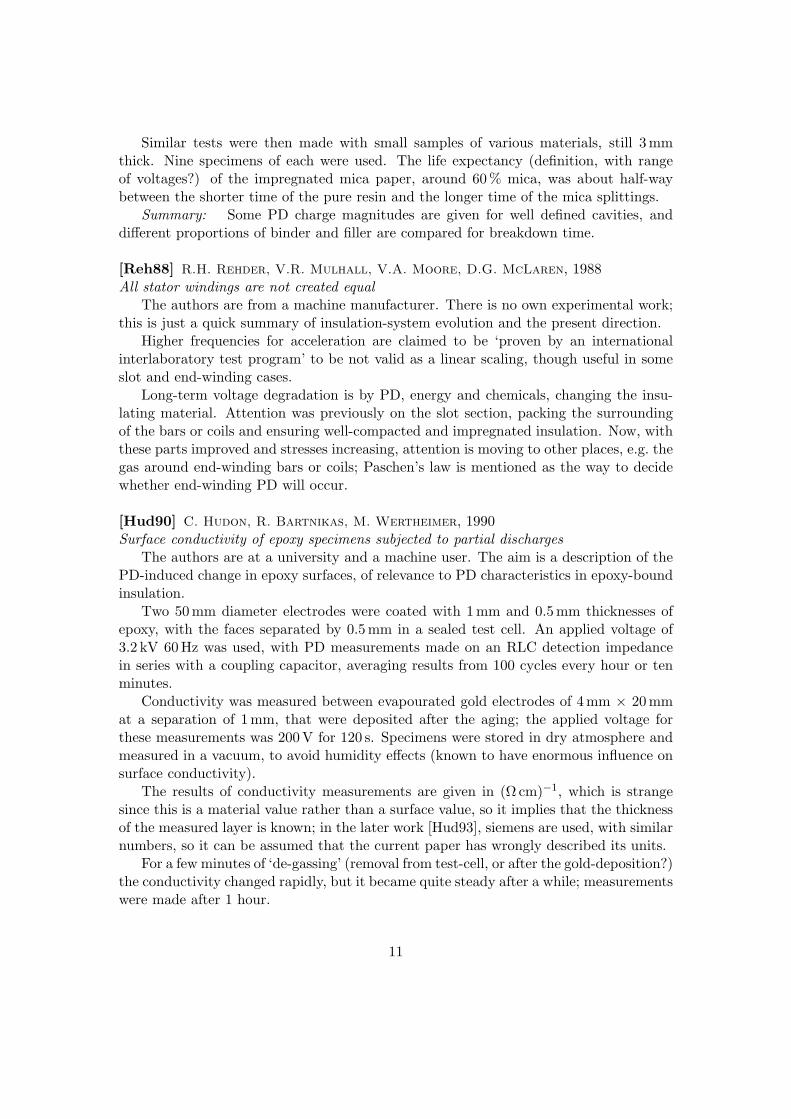
Figure 4: ‘Surface conductivity’ (meaning?) of epoxy specimens, dependent on time of exposureto PD in a sealed cell. From [Hud90].
Figure 5: Time-development of normalised discharge amplitude, for a specimen which tookonly a few hours to reach a steady low value. From [Hud90].
Unaged specimens had lower than 10−16 S surface conductivity (the detection limit);specimens aged for 500 hours had about 10−10 S; specimens aged for at least 100 hourshad a similarly high surface conductivity regardless of whether they were removed fromthe aging while showing a large or small discharge intensity, the small intensity be-ing generally the final state; a sample that had attained a low intensity after only 5hours (figure 5) was measured at 20 hours and found to have still a low conductivity of10−14 S/cm. The (mean) surface conductivity and measured average amplitude are notstrongly related!
In dicussion it is mentioned that increased surface conductivity would be expected to
12
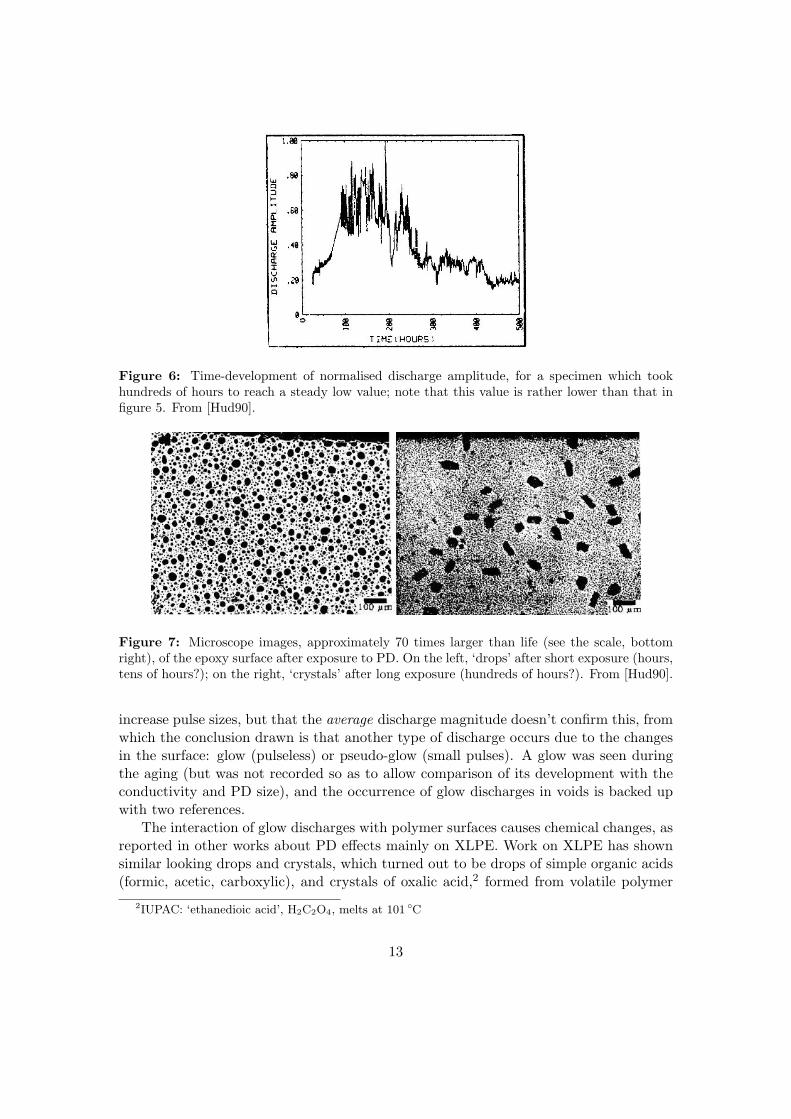
Figure 6: Time-development of normalised discharge amplitude, for a specimen which tookhundreds of hours to reach a steady low value; note that this value is rather lower than that infigure 5. From [Hud90].
Figure 7: Microscope images, approximately 70 times larger than life (see the scale, bottomright), of the epoxy surface after exposure to PD. On the left, ‘drops’ after short exposure (hours,tens of hours?); on the right, ‘crystals’ after long exposure (hundreds of hours?). From [Hud90].
increase pulse sizes, but that the average discharge magnitude doesn’t confirm this, fromwhich the conclusion drawn is that another type of discharge occurs due to the changesin the surface: glow (pulseless) or pseudo-glow (small pulses). A glow was seen duringthe aging (but was not recorded so as to allow comparison of its development with theconductivity and PD size), and the occurrence of glow discharges in voids is backed upwith two references.
The interaction of glow discharges with polymer surfaces causes chemical changes, asreported in other works about PD effects mainly on XLPE. Work on XLPE has shownsimilar looking drops and crystals, which turned out to be drops of simple organic acids(formic, acetic, carboxylic), and crystals of oxalic acid,2 formed from volatile polymer
2IUPAC: ‘ethanedioic acid’, H2C2O4, melts at 101 C
13
oxidation products (H20, CO, CO2) in the plasma; it is therefore suspected that thesame is true for the epoxy, as it would have similar oxidation products.
Summary: for three pages this paper has a lot of interesting information; the mea-sures of PD are not clear to me (e.g. intensity, amplitude, when applied to an ensemblerather than a particular pulse) and it seems that mean charge has been used in much ofthe discussion, hiding changes in the peak values; main points to note are the order ofchange of conductivity, the localisation of high conductivity parts, and the variability oftimes of changes in PD behaviour.
[Wal91] P. Walker, J.N. Champion, 1991Experience with turn insulation failures in large 13.2 kV synchronous motors
The authors are machine users, who have had a ‘very high rate of failures’ in apopulation of large (21 000 hp) motors; the results of investigation provide a theory ofend-winding PD.
Early failures occurred in the end of the first or second coil groups in several machines.A (commendable) lot of investigation was done, including analysis of surges arriving atthe machine due to switching.
It was noted that the windings had no separate turn insulation, but just strandinsulation. In the end-windings, with twisting of the coils, there was chance of delam-ination of the ground-wall, and any ensuing PDs would be in the space between thisground-wall and the thin, mica-based, conductor (strand) insulation (this is describedas ‘the arc of a partial discharge . . . play directly . . . thin conductor insulation’). Quitehigh-conductivity contamination, e.g. 3 MΩ between points separated by about a fifthof the overhang length, was found on the end-winding surface, with strong dependenceon humidity. High surface conductivity tends the stress on the ground-wall insulationto approach half of the applied value, rather than being much lower as for a floatinginsulation surface. For various sizes of such voids, the Paschen voltage of the void wascalculated, along with the (rms) applied voltage needed to achieve this; one assumes thisapplied voltage is the value between phase conductors, i.e. line voltage or applied testvoltage when one is excited and the others earthed.d = 25*[0.005, 0.01, 0.02, 0.03, 0.04, 0.05, 0.06, 0.07]; % mm void size
v_ins = [0.725, 1.15, 1.85, 2.50, 3.08, 3.60, 4.30, 4.80]; % kV in cavity
v_app = [5.75, 5.14, 5.06, 5.39, 5.75, 6.10, 6.78, 7.18]; % rms kV applied, eps_r=4.5
Conclusions are that the new, thin, strand insulation adjacent to voids is part ofthe problem; surface contamination is a problem, and there should be periodic cleaning;common test methods can fail to detect this end-winding PD source, so it is importantto measure PD on each phase while the others are earthed.
There was discussion of the paper by two others (users/consultants). Both suggestedthat half-lapped mica tape as conductor/turn insulation is inadequate, at least for criticalmachines. A relation of PD-based prognoses to later failures was asked after; it turns outthat of four new motors, the one with significantly higher PD was the first to fail, afterjust 3000 hours. The authors dispute that the weak conductor insulation is responsiblefor undue susceptibility to impulses; the wear to this by PD takes thousands of hours, and
14
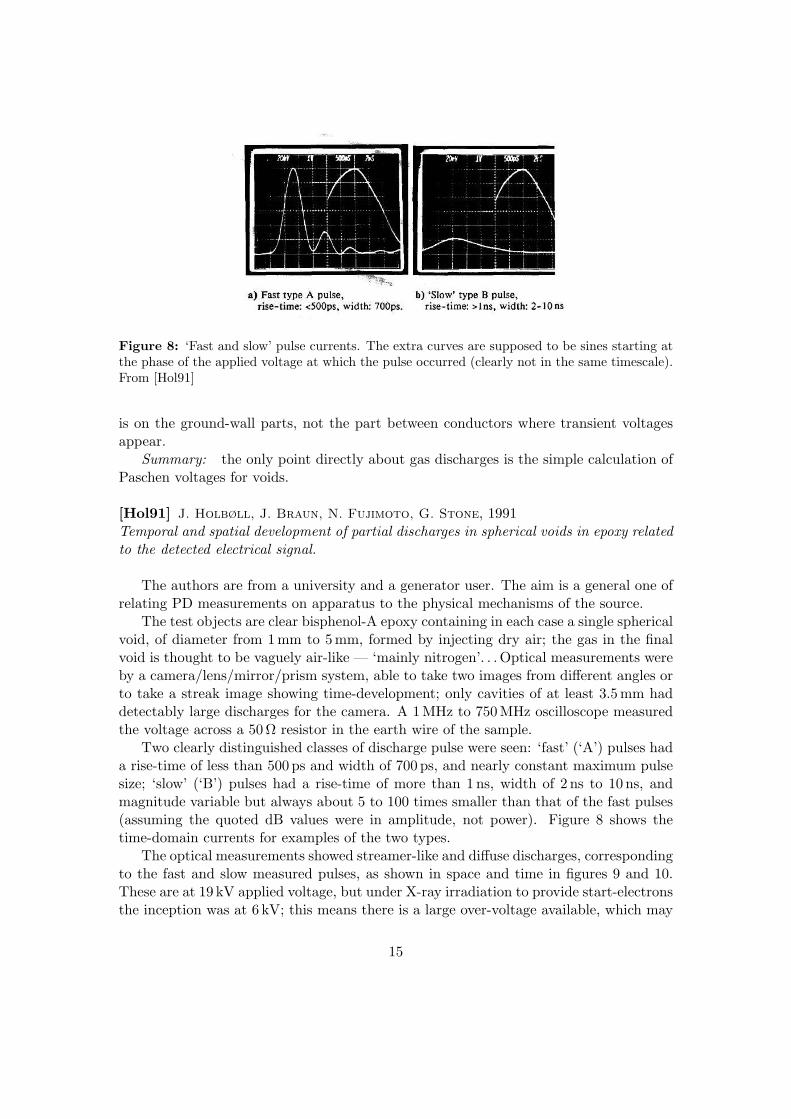
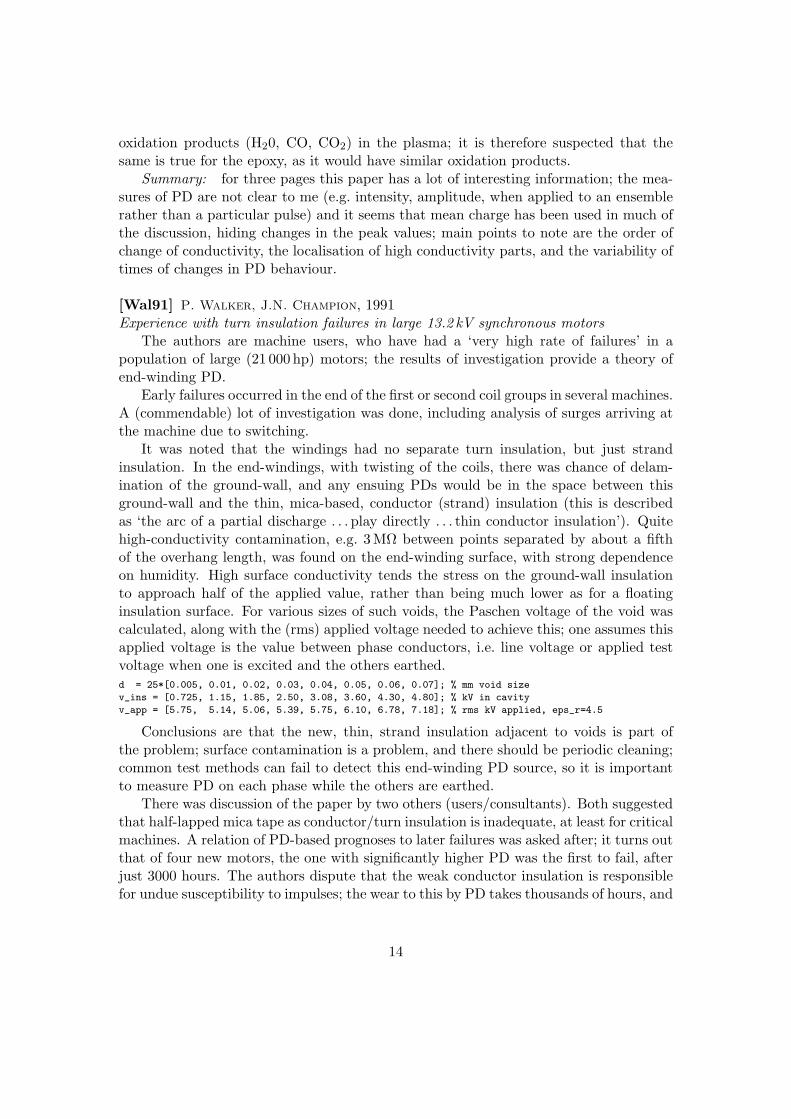
Figure 8: ‘Fast and slow’ pulse currents. The extra curves are supposed to be sines starting atthe phase of the applied voltage at which the pulse occurred (clearly not in the same timescale).From [Hol91]
is on the ground-wall parts, not the part between conductors where transient voltagesappear.
Summary: the only point directly about gas discharges is the simple calculation ofPaschen voltages for voids.
[Hol91] J. Holbøll, J. Braun, N. Fujimoto, G. Stone, 1991Temporal and spatial development of partial discharges in spherical voids in epoxy relatedto the detected electrical signal.
The authors are from a university and a generator user. The aim is a general one ofrelating PD measurements on apparatus to the physical mechanisms of the source.
The test objects are clear bisphenol-A epoxy containing in each case a single sphericalvoid, of diameter from 1 mm to 5 mm, formed by injecting dry air; the gas in the finalvoid is thought to be vaguely air-like — ‘mainly nitrogen’. . . Optical measurements wereby a camera/lens/mirror/prism system, able to take two images from different angles orto take a streak image showing time-development; only cavities of at least 3.5 mm haddetectably large discharges for the camera. A 1 MHz to 750 MHz oscilloscope measuredthe voltage across a 50 Ω resistor in the earth wire of the sample.
Two clearly distinguished classes of discharge pulse were seen: ‘fast’ (‘A’) pulses hada rise-time of less than 500 ps and width of 700 ps, and nearly constant maximum pulsesize; ‘slow’ (‘B’) pulses had a rise-time of more than 1 ns, width of 2 ns to 10 ns, andmagnitude variable but always about 5 to 100 times smaller than that of the fast pulses(assuming the quoted dB values were in amplitude, not power). Figure 8 shows thetime-domain currents for examples of the two types.
The optical measurements showed streamer-like and diffuse discharges, correspondingto the fast and slow measured pulses, as shown in space and time in figures 9 and 10.These are at 19 kV applied voltage, but under X-ray irradiation to provide start-electronsthe inception was at 6 kV; this means there is a large over-voltage available, which may
15
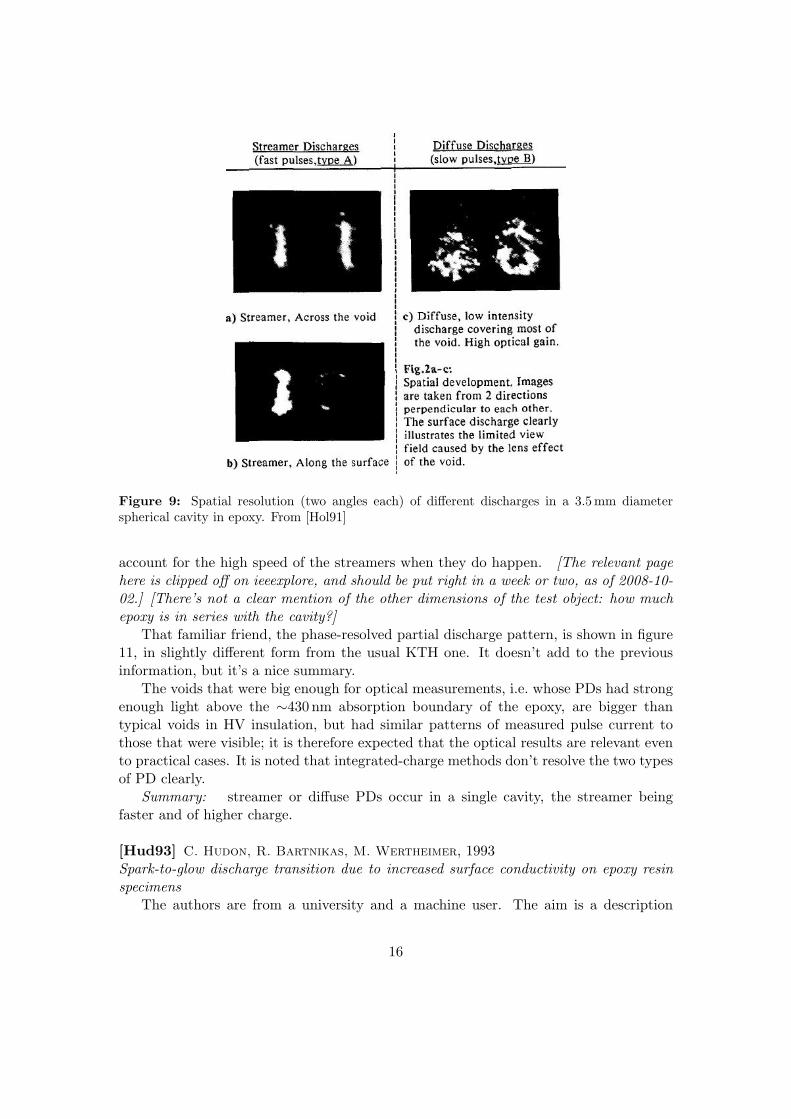
Figure 9: Spatial resolution (two angles each) of different discharges in a 3.5 mm diameterspherical cavity in epoxy. From [Hol91]
account for the high speed of the streamers when they do happen. [The relevant pagehere is clipped off on ieeexplore, and should be put right in a week or two, as of 2008-10-02.] [There’s not a clear mention of the other dimensions of the test object: how muchepoxy is in series with the cavity?]
That familiar friend, the phase-resolved partial discharge pattern, is shown in figure11, in slightly different form from the usual KTH one. It doesn’t add to the previousinformation, but it’s a nice summary.
The voids that were big enough for optical measurements, i.e. whose PDs had strongenough light above the ∼430 nm absorption boundary of the epoxy, are bigger thantypical voids in HV insulation, but had similar patterns of measured pulse current tothose that were visible; it is therefore expected that the optical results are relevant evento practical cases. It is noted that integrated-charge methods don’t resolve the two typesof PD clearly.
Summary: streamer or diffuse PDs occur in a single cavity, the streamer beingfaster and of higher charge.
[Hud93] C. Hudon, R. Bartnikas, M. Wertheimer, 1993Spark-to-glow discharge transition due to increased surface conductivity on epoxy resinspecimens
The authors are from a university and a machine user. The aim is a description
16
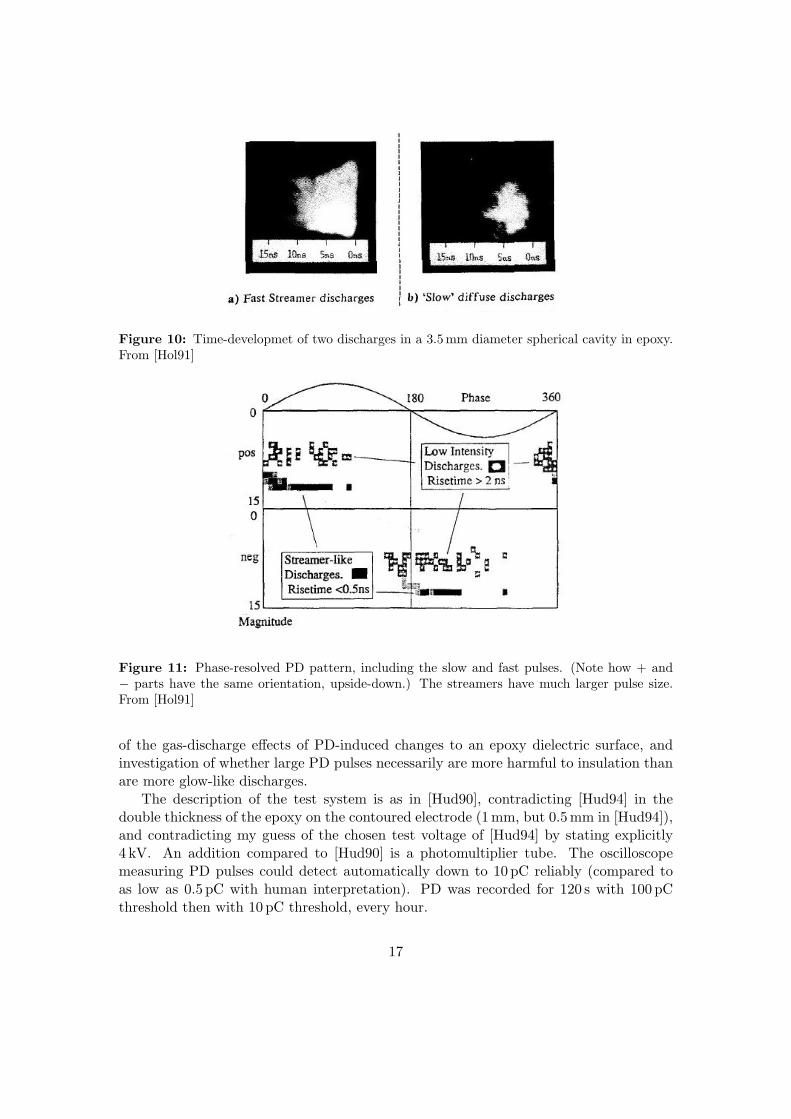
Figure 10: Time-developmet of two discharges in a 3.5 mm diameter spherical cavity in epoxy.From [Hol91]
Figure 11: Phase-resolved PD pattern, including the slow and fast pulses. (Note how + and− parts have the same orientation, upside-down.) The streamers have much larger pulse size.From [Hol91]
of the gas-discharge effects of PD-induced changes to an epoxy dielectric surface, andinvestigation of whether large PD pulses necessarily are more harmful to insulation thanare more glow-like discharges.
The description of the test system is as in [Hud90], contradicting [Hud94] in thedouble thickness of the epoxy on the contoured electrode (1 mm, but 0.5 mm in [Hud94]),and contradicting my guess of the chosen test voltage of [Hud94] by stating explicitly4 kV. An addition compared to [Hud90] is a photomultiplier tube. The oscilloscopemeasuring PD pulses could detect automatically down to 10 pC reliably (compared toas low as 0.5 pC with human interpretation). PD was recorded for 120 s with 100 pCthreshold then with 10 pC threshold, every hour.
17
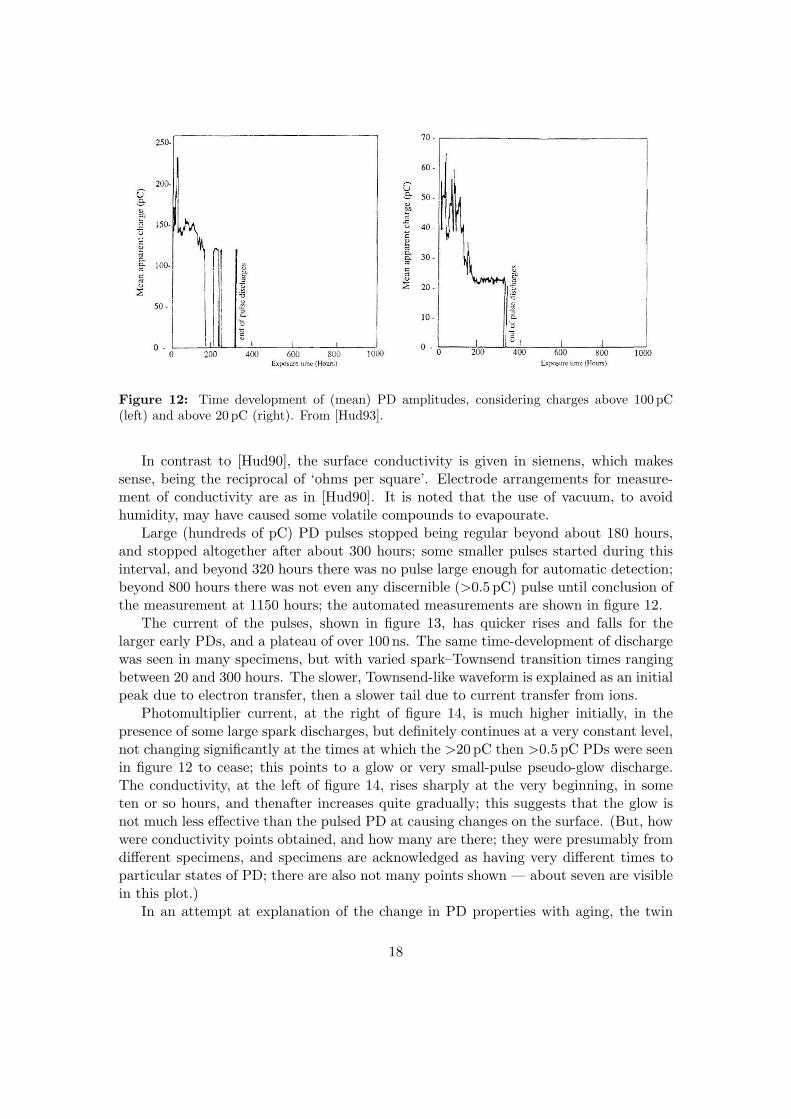
Figure 12: Time development of (mean) PD amplitudes, considering charges above 100 pC(left) and above 20 pC (right). From [Hud93].
In contrast to [Hud90], the surface conductivity is given in siemens, which makessense, being the reciprocal of ‘ohms per square’. Electrode arrangements for measure-ment of conductivity are as in [Hud90]. It is noted that the use of vacuum, to avoidhumidity, may have caused some volatile compounds to evapourate.
Large (hundreds of pC) PD pulses stopped being regular beyond about 180 hours,and stopped altogether after about 300 hours; some smaller pulses started during thisinterval, and beyond 320 hours there was no pulse large enough for automatic detection;beyond 800 hours there was not even any discernible (>0.5 pC) pulse until conclusion ofthe measurement at 1150 hours; the automated measurements are shown in figure 12.
The current of the pulses, shown in figure 13, has quicker rises and falls for thelarger early PDs, and a plateau of over 100 ns. The same time-development of dischargewas seen in many specimens, but with varied spark–Townsend transition times rangingbetween 20 and 300 hours. The slower, Townsend-like waveform is explained as an initialpeak due to electron transfer, then a slower tail due to current transfer from ions.
Photomultiplier current, at the right of figure 14, is much higher initially, in thepresence of some large spark discharges, but definitely continues at a very constant level,not changing significantly at the times at which the >20 pC then >0.5 pC PDs were seenin figure 12 to cease; this points to a glow or very small-pulse pseudo-glow discharge.The conductivity, at the left of figure 14, rises sharply at the very beginning, in someten or so hours, and thenafter increases quite gradually; this suggests that the glow isnot much less effective than the pulsed PD at causing changes on the surface. (But, howwere conductivity points obtained, and how many are there; they were presumably fromdifferent specimens, and specimens are acknowledged as having very different times toparticular states of PD; there are also not many points shown — about seven are visiblein this plot.)
In an attempt at explanation of the change in PD properties with aging, the twin
18
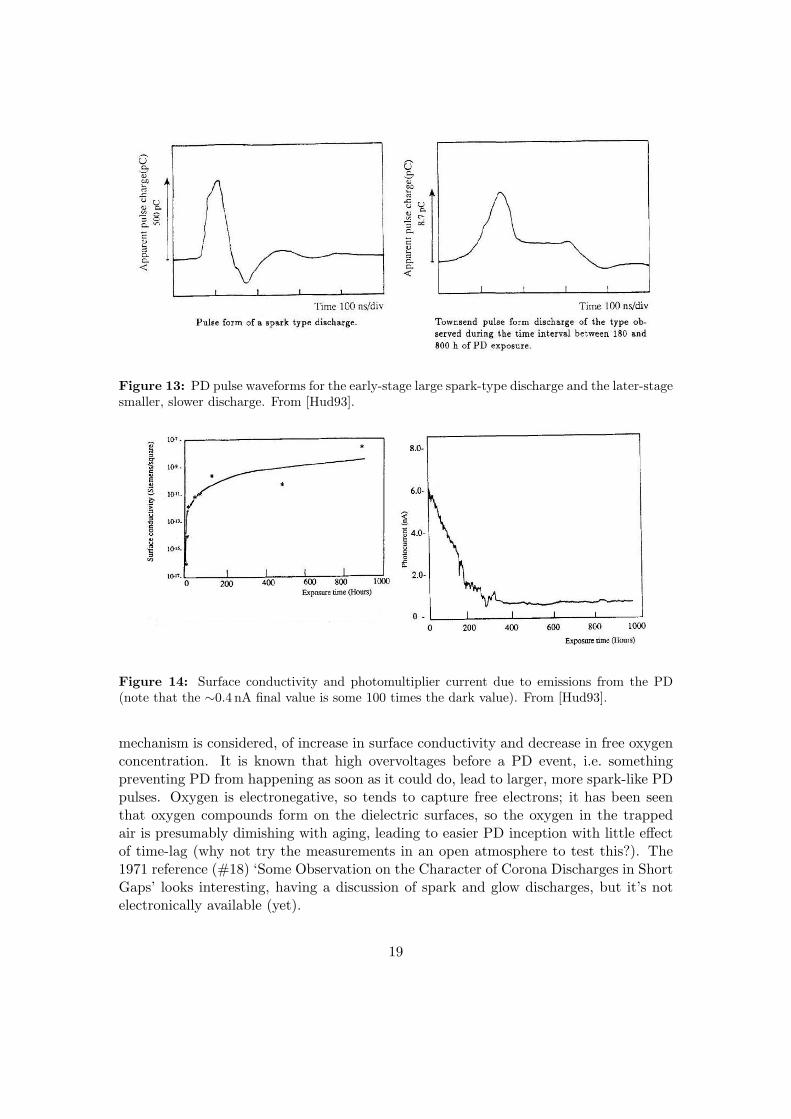
Figure 13: PD pulse waveforms for the early-stage large spark-type discharge and the later-stagesmaller, slower discharge. From [Hud93].
Figure 14: Surface conductivity and photomultiplier current due to emissions from the PD(note that the ∼0.4 nA final value is some 100 times the dark value). From [Hud93].
mechanism is considered, of increase in surface conductivity and decrease in free oxygenconcentration. It is known that high overvoltages before a PD event, i.e. somethingpreventing PD from happening as soon as it could do, lead to larger, more spark-like PDpulses. Oxygen is electronegative, so tends to capture free electrons; it has been seenthat oxygen compounds form on the dielectric surfaces, so the oxygen in the trappedair is presumably dimishing with aging, leading to easier PD inception with little effectof time-lag (why not try the measurements in an open atmosphere to test this?). The1971 reference (#18) ‘Some Observation on the Character of Corona Discharges in ShortGaps’ looks interesting, having a discussion of spark and glow discharges, but it’s notelectronically available (yet).
19
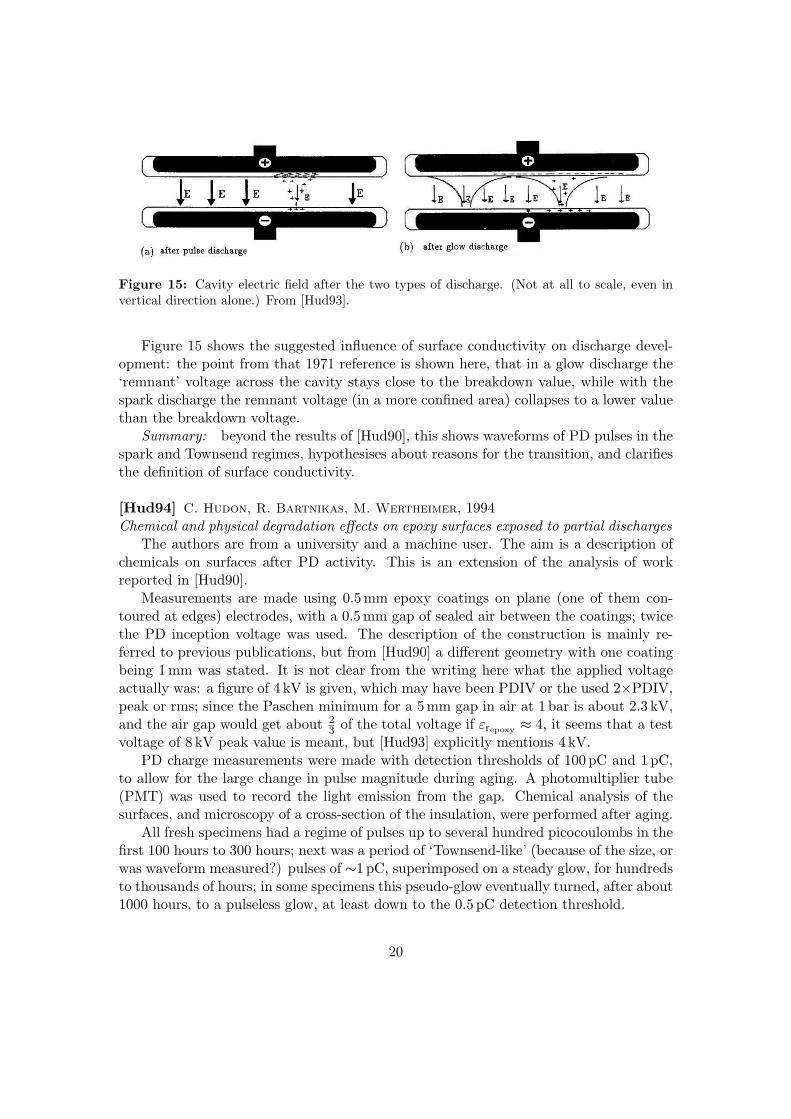
Figure 15: Cavity electric field after the two types of discharge. (Not at all to scale, even invertical direction alone.) From [Hud93].
Figure 15 shows the suggested influence of surface conductivity on discharge devel-opment: the point from that 1971 reference is shown here, that in a glow discharge the‘remnant’ voltage across the cavity stays close to the breakdown value, while with thespark discharge the remnant voltage (in a more confined area) collapses to a lower valuethan the breakdown voltage.
Summary: beyond the results of [Hud90], this shows waveforms of PD pulses in thespark and Townsend regimes, hypothesises about reasons for the transition, and clarifiesthe definition of surface conductivity.
[Hud94] C. Hudon, R. Bartnikas, M. Wertheimer, 1994Chemical and physical degradation effects on epoxy surfaces exposed to partial discharges
The authors are from a university and a machine user. The aim is a description ofchemicals on surfaces after PD activity. This is an extension of the analysis of workreported in [Hud90].
Measurements are made using 0.5 mm epoxy coatings on plane (one of them con-toured at edges) electrodes, with a 0.5 mm gap of sealed air between the coatings; twicethe PD inception voltage was used. The description of the construction is mainly re-ferred to previous publications, but from [Hud90] a different geometry with one coatingbeing 1 mm was stated. It is not clear from the writing here what the applied voltageactually was: a figure of 4 kV is given, which may have been PDIV or the used 2×PDIV,peak or rms; since the Paschen minimum for a 5 mm gap in air at 1 bar is about 2.3 kV,and the air gap would get about 2
3 of the total voltage if εrepoxy ≈ 4, it seems that a testvoltage of 8 kV peak value is meant, but [Hud93] explicitly mentions 4 kV.
PD charge measurements were made with detection thresholds of 100 pC and 1 pC,to allow for the large change in pulse magnitude during aging. A photomultiplier tube(PMT) was used to record the light emission from the gap. Chemical analysis of thesurfaces, and microscopy of a cross-section of the insulation, were performed after aging.
All fresh specimens had a regime of pulses up to several hundred picocoulombs in thefirst 100 hours to 300 hours; next was a period of ‘Townsend-like’ (because of the size, orwas waveform measured?) pulses of ∼1 pC, superimposed on a steady glow, for hundredsto thousands of hours; in some specimens this pseudo-glow eventually turned, after about1000 hours, to a pulseless glow, at least down to the 0.5 pC detection threshold.
20
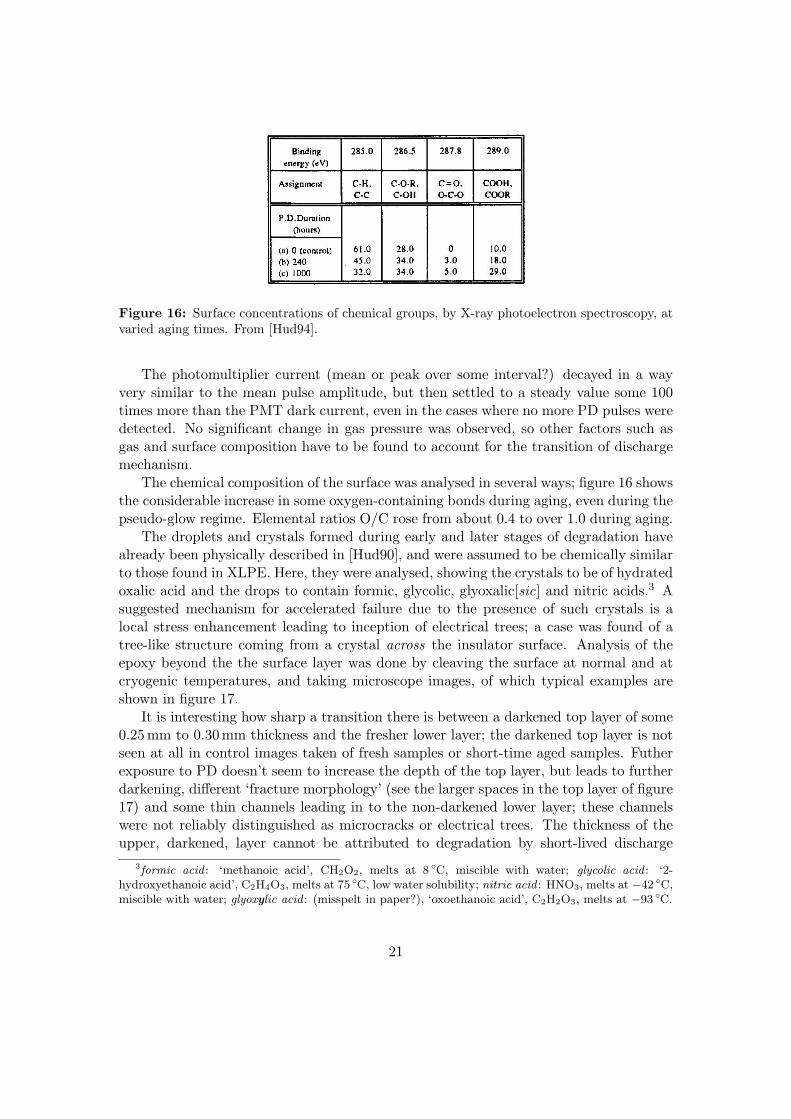
Figure 16: Surface concentrations of chemical groups, by X-ray photoelectron spectroscopy, atvaried aging times. From [Hud94].
The photomultiplier current (mean or peak over some interval?) decayed in a wayvery similar to the mean pulse amplitude, but then settled to a steady value some 100times more than the PMT dark current, even in the cases where no more PD pulses weredetected. No significant change in gas pressure was observed, so other factors such asgas and surface composition have to be found to account for the transition of dischargemechanism.
The chemical composition of the surface was analysed in several ways; figure 16 showsthe considerable increase in some oxygen-containing bonds during aging, even during thepseudo-glow regime. Elemental ratios O/C rose from about 0.4 to over 1.0 during aging.
The droplets and crystals formed during early and later stages of degradation havealready been physically described in [Hud90], and were assumed to be chemically similarto those found in XLPE. Here, they were analysed, showing the crystals to be of hydratedoxalic acid and the drops to contain formic, glycolic, glyoxalic[sic] and nitric acids.3 Asuggested mechanism for accelerated failure due to the presence of such crystals is alocal stress enhancement leading to inception of electrical trees; a case was found of atree-like structure coming from a crystal across the insulator surface. Analysis of theepoxy beyond the the surface layer was done by cleaving the surface at normal and atcryogenic temperatures, and taking microscope images, of which typical examples areshown in figure 17.
It is interesting how sharp a transition there is between a darkened top layer of some0.25 mm to 0.30 mm thickness and the fresher lower layer; the darkened top layer is notseen at all in control images taken of fresh samples or short-time aged samples. Futherexposure to PD doesn’t seem to increase the depth of the top layer, but leads to furtherdarkening, different ‘fracture morphology’ (see the larger spaces in the top layer of figure17) and some thin channels leading in to the non-darkened lower layer; these channelswere not reliably distinguished as microcracks or electrical trees. The thickness of theupper, darkened, layer cannot be attributed to degradation by short-lived discharge
3formic acid : ‘methanoic acid’, CH2O2, melts at 8 C, miscible with water; glycolic acid : ‘2-hydroxyethanoic acid’, C2H4O3, melts at 75 C, low water solubility; nitric acid : HNO3, melts at −42 C,miscible with water; glyoxylic acid : (misspelt in paper?), ‘oxoethanoic acid’, C2H2O3, melts at −93 C.
21
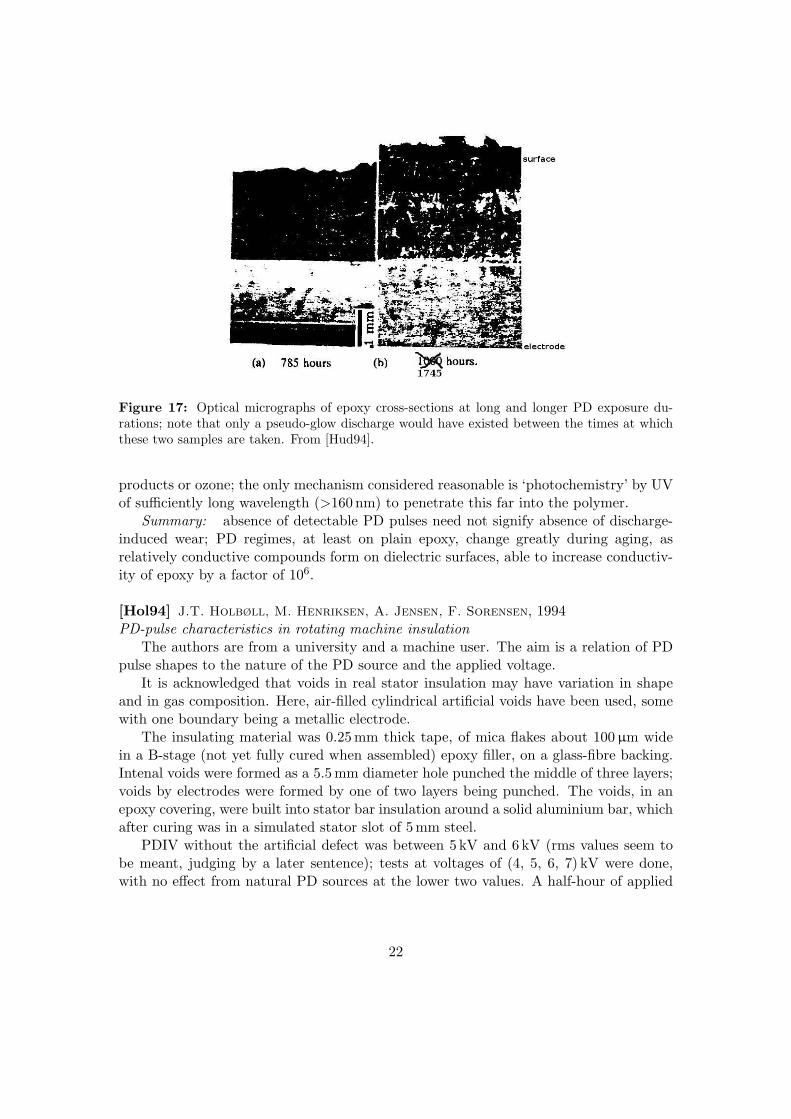
Figure 17: Optical micrographs of epoxy cross-sections at long and longer PD exposure du-rations; note that only a pseudo-glow discharge would have existed between the times at whichthese two samples are taken. From [Hud94].
products or ozone; the only mechanism considered reasonable is ‘photochemistry’ by UVof sufficiently long wavelength (>160 nm) to penetrate this far into the polymer.
Summary: absence of detectable PD pulses need not signify absence of discharge-induced wear; PD regimes, at least on plain epoxy, change greatly during aging, asrelatively conductive compounds form on dielectric surfaces, able to increase conductiv-ity of epoxy by a factor of 106.
[Hol94] J.T. Holbøll, M. Henriksen, A. Jensen, F. Sorensen, 1994PD-pulse characteristics in rotating machine insulation
The authors are from a university and a machine user. The aim is a relation of PDpulse shapes to the nature of the PD source and the applied voltage.
It is acknowledged that voids in real stator insulation may have variation in shapeand in gas composition. Here, air-filled cylindrical artificial voids have been used, somewith one boundary being a metallic electrode.
The insulating material was 0.25 mm thick tape, of mica flakes about 100 µm widein a B-stage (not yet fully cured when assembled) epoxy filler, on a glass-fibre backing.Intenal voids were formed as a 5.5 mm diameter hole punched the middle of three layers;voids by electrodes were formed by one of two layers being punched. The voids, in anepoxy covering, were built into stator bar insulation around a solid aluminium bar, whichafter curing was in a simulated stator slot of 5 mm steel.
PDIV without the artificial defect was between 5 kV and 6 kV (rms values seem tobe meant, judging by a later sentence); tests at voltages of (4, 5, 6, 7) kV were done,with no effect from natural PD sources at the lower two values. A half-hour of applied
22
voltage was used before any measurements. A stator-slot coupler (‘SSC’: a pick-up coilin the iron slot) was used for measurements, at the slot end or right by the PD source.
The results are some time-domain curves of pulses, admitted to be probably mainlyaffected by the response of all the surroundings rather than the pulse at the source. Pulseamplitude distribution for metal/dielectric bounded cavities was approximately an ex-ponential increase of number toward smaller values of signal. Three types of measuredpulse shape were found: a fast pulse with similar shape for each occurrence; a slowerpulse with varied shape; and multiple fast pulses. All were over within about 10 ns.
[Flo95a] B. Florkowska, 1995Assessment of temperature influence on partial discharges in epoxy/mica insulation
The author is at a university, investigating PD wear mechanisms with funding froma state research organisation.
The test objects were specimens of 6 kV motor coils, with end-winding corona pro-tection. Measurements were made with a PD pulse detection system, at temperaturesof room and 135 C at up to three times the inception voltage, with classic N+ and q−msort.
Some general points are made about epoxy-mica insulation (independent of the laterexperimental results). PD sources are affected by the presence of a metallic electrode onone side (cavity next to conductor) as opposed to being purely dielectric-bounded; smallvoids and the larger delaminations also have differences of PD.
In ‘micro gas-cavities’ with an electrode in contact, PD inception depends on field-emission (FE) of electrons, whose current density is described by the Fowler and Nord-heim formula4 dependent on the local electric field at the metal, which can be as muchas hundreds of times the average field in the void, and the work function of the metal;choosing a metal/dielectric (dielectric=gas?) work function of about 1 eV and a ‘fewhundred times’ enhancement, the inception could be at about 1 kV to 3 kV, with a gen-eral reduction in work function for contaminants of the metal such as metal oxides andgas adhesion.
In internal delaminations (no metal electrode present; why this distinction of ‘smallcavities by an electrode or delaminations without an electrode’ rather than treatingsize/shape and electrode present/not as independent parameters?) the discharges ‘canbe incepted’ by emission from electron traps in the dielectric surface, whose depth isestimated (based on a 1988 paper by Lewis) between 0.7 eV and 1.2 eV, of which theupper limit requires fields of about 3 kV/mm to 10 kV/mm, with emission from trapsbeing a statistical effect due to distribution of trap energies.
PDIV (Uci in this paper) increases with presence of electronegative gas, e.g. withnormal air (including O2) compared to just N2 or H2. If PD is thought to dependmainly on electrons from surfaces, rather than from within the gas, then PDIV dependsfirst on the field then on (in the dielectric case) previous discharges.
4Derived in 1928, a quantum-mechanical formula for FE from metals, on assumptions of 1D model,atomically smooth surface, and more: condensing to a and b such constants as work function, Fermilevel, electronic mass and charge, etc., the relation of field to current density is J = aE2eb/E .
23
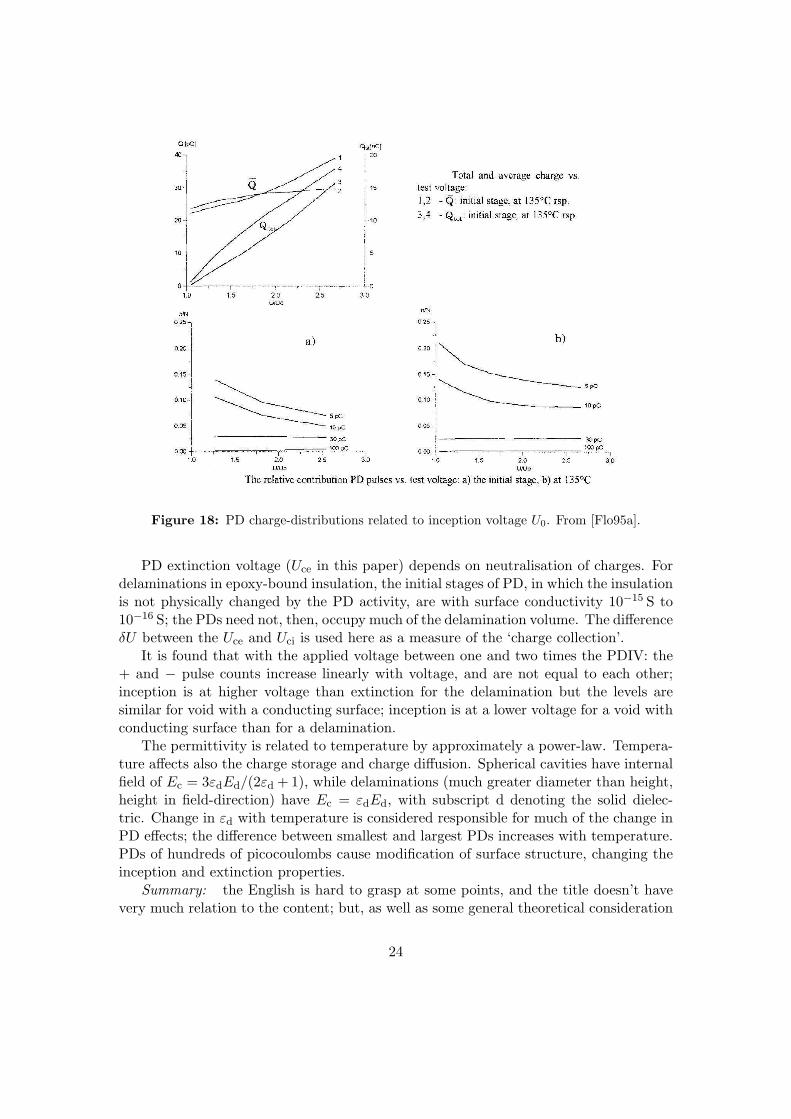
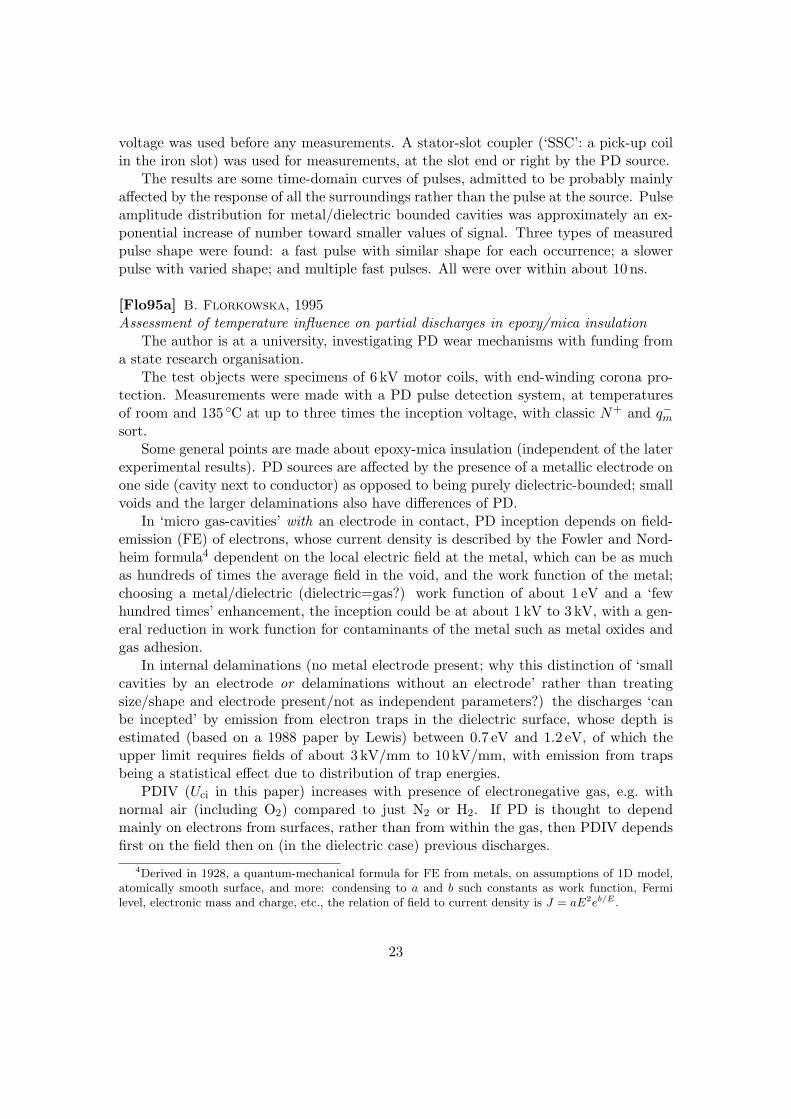
Figure 18: PD charge-distributions related to inception voltage U0. From [Flo95a].
PD extinction voltage (Uce in this paper) depends on neutralisation of charges. Fordelaminations in epoxy-bound insulation, the initial stages of PD, in which the insulationis not physically changed by the PD activity, are with surface conductivity 10−15 S to10−16 S; the PDs need not, then, occupy much of the delamination volume. The differenceδU between the Uce and Uci is used here as a measure of the ‘charge collection’.
It is found that with the applied voltage between one and two times the PDIV: the+ and − pulse counts increase linearly with voltage, and are not equal to each other;inception is at higher voltage than extinction for the delamination but the levels aresimilar for void with a conducting surface; inception is at a lower voltage for a void withconducting surface than for a delamination.
The permittivity is related to temperature by approximately a power-law. Tempera-ture affects also the charge storage and charge diffusion. Spherical cavities have internalfield of Ec = 3εdEd/(2εd + 1), while delaminations (much greater diameter than height,height in field-direction) have Ec = εdEd, with subscript d denoting the solid dielec-tric. Change in εd with temperature is considered responsible for much of the change inPD effects; the difference between smallest and largest PDs increases with temperature.PDs of hundreds of picocoulombs cause modification of surface structure, changing theinception and extinction properties.
Summary: the English is hard to grasp at some points, and the title doesn’t havevery much relation to the content; but, as well as some general theoretical consideration
24
Figure 19: Changes due the stage-I aging, shown at two temperatures. The change withtemperature is the more interesting point! From [Flo95b]
of PD cavity surfaces, there are some interesting results such as the linear relation ofPD-count to voltage.
[Flo95b] B. Florkowska, 1995A study of the partial discharge mechanism during the aging of epoxy/mica insulation
The test objects are 10 mm×25 mm copper bar, with 3.3 mm stator (epoxy withmica, presumably) insulation around, and an outer electrode of the semiconductinglayer. Conventional PD quantities were studied, at room temperature and at 135 C,with electrical stresses up to 3 kV/mm. Voltage was increased from 1.25 to 2.50 timesthe PDIV over 30 s, then held for 2500 hours. Measurements were made of short-term(stage I, after 12 hours) and long-term (stage II, after 2500 hours).
The results presented are rather poorly described; the number of samples and thenumber of cycles are not given, so the significance of e.g. a ten percent difference in PDcharge is quite lost.
The short-term test suggested no significant permanent aging in that 12 hour time.Pulse-number had a largely linear increase with U/UO up to about 2UO (but not pro-portional — the plot very clearly passes near to U = UO, not to 0). PD charges werehigher at 135 C than at 20 C, but inception voltage was lower (i.e. ease of inception washigher); Reasons advanced were higher field in the cavity, due to increased permittivity,and easier electron emission from metal or traps.
Measurements at 20 C before and after the long aging showed a large change in theshape of the PD distribution, with more of the small PDs (see figure 21), and a reduction
25
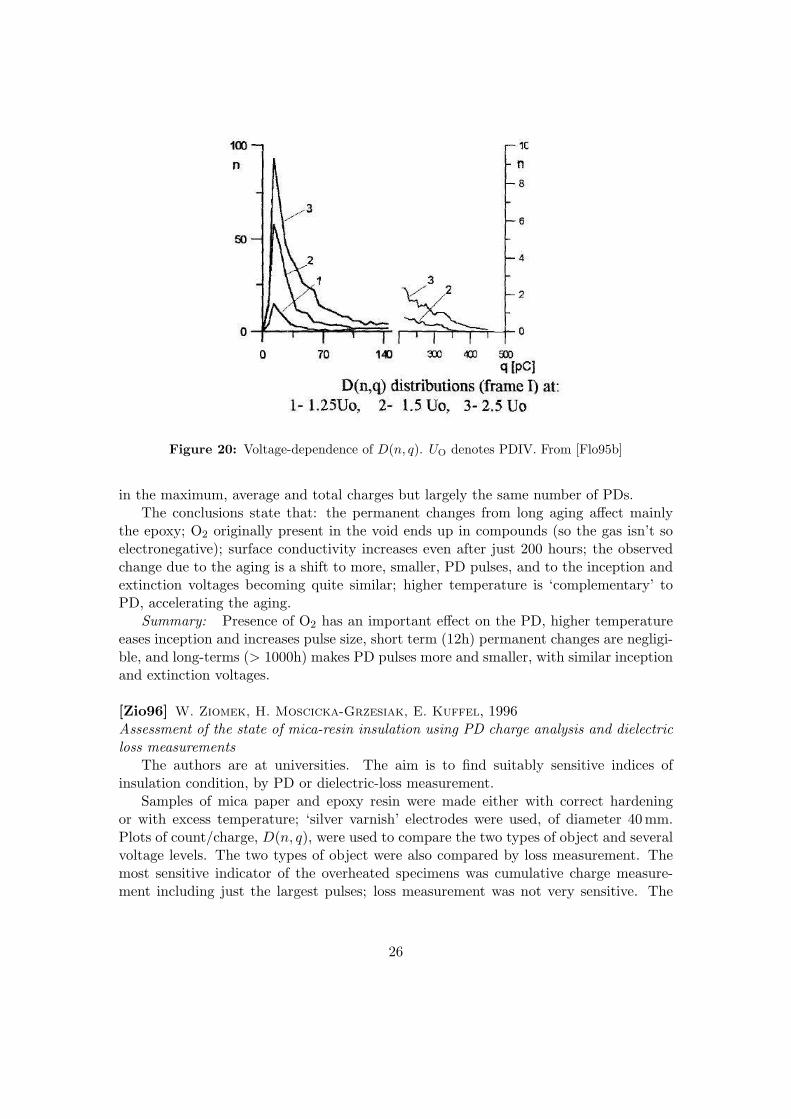
Figure 20: Voltage-dependence of D(n, q). UO denotes PDIV. From [Flo95b]
in the maximum, average and total charges but largely the same number of PDs.The conclusions state that: the permanent changes from long aging affect mainly
the epoxy; O2 originally present in the void ends up in compounds (so the gas isn’t soelectronegative); surface conductivity increases even after just 200 hours; the observedchange due to the aging is a shift to more, smaller, PD pulses, and to the inception andextinction voltages becoming quite similar; higher temperature is ‘complementary’ toPD, accelerating the aging.
Summary: Presence of O2 has an important effect on the PD, higher temperatureeases inception and increases pulse size, short term (12h) permanent changes are negligi-ble, and long-terms (> 1000h) makes PD pulses more and smaller, with similar inceptionand extinction voltages.
[Zio96] W. Ziomek, H. Moscicka-Grzesiak, E. Kuffel, 1996Assessment of the state of mica-resin insulation using PD charge analysis and dielectricloss measurements
The authors are at universities. The aim is to find suitably sensitive indices ofinsulation condition, by PD or dielectric-loss measurement.
Samples of mica paper and epoxy resin were made either with correct hardeningor with excess temperature; ‘silver varnish’ electrodes were used, of diameter 40 mm.Plots of count/charge, D(n, q), were used to compare the two types of object and severalvoltage levels. The two types of object were also compared by loss measurement. Themost sensitive indicator of the overheated specimens was cumulative charge measure-ment including just the largest pulses; loss measurement was not very sensitive. The
26
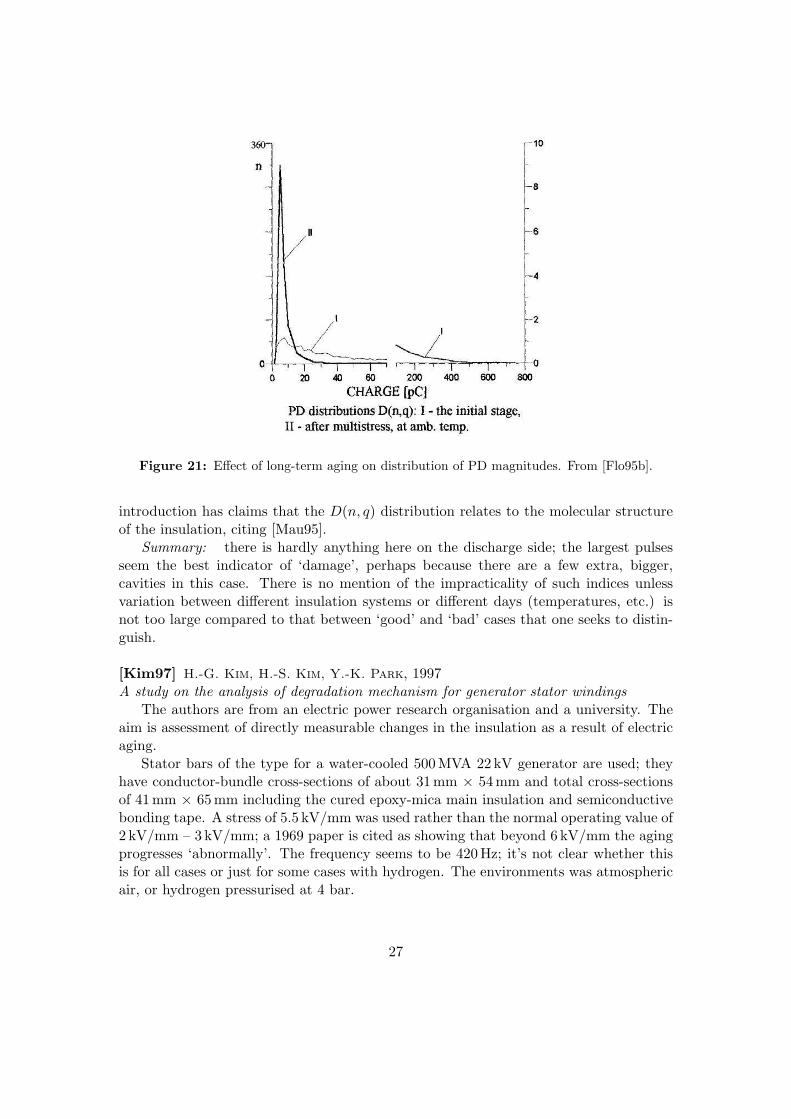
Figure 21: Effect of long-term aging on distribution of PD magnitudes. From [Flo95b].
introduction has claims that the D(n, q) distribution relates to the molecular structureof the insulation, citing [Mau95].
Summary: there is hardly anything here on the discharge side; the largest pulsesseem the best indicator of ‘damage’, perhaps because there are a few extra, bigger,cavities in this case. There is no mention of the impracticality of such indices unlessvariation between different insulation systems or different days (temperatures, etc.) isnot too large compared to that between ‘good’ and ‘bad’ cases that one seeks to distin-guish.
[Kim97] H.-G. Kim, H.-S. Kim, Y.-K. Park, 1997A study on the analysis of degradation mechanism for generator stator windings
The authors are from an electric power research organisation and a university. Theaim is assessment of directly measurable changes in the insulation as a result of electricaging.
Stator bars of the type for a water-cooled 500 MVA 22 kV generator are used; theyhave conductor-bundle cross-sections of about 31 mm × 54 mm and total cross-sectionsof 41 mm × 65 mm including the cured epoxy-mica main insulation and semiconductivebonding tape. A stress of 5.5 kV/mm was used rather than the normal operating value of2 kV/mm – 3 kV/mm; a 1969 paper is cited as showing that beyond 6 kV/mm the agingprogresses ‘abnormally’. The frequency seems to be 420 Hz; it’s not clear whether thisis for all cases or just for some cases with hydrogen. The environments was atmosphericair, or hydrogen pressurised at 4 bar.
27
When insulation breakdown occurred, the insulation around the breakdown site wasinspected. The tree channels within the insulation were seen to have, for air, a diameterof 10 µm to 20 µm and length of 200 µm to 400 µm, and for hydrogen a diameter of 1 µmto 5 µm and length of 10 µm to 50 µm. The trees in air started at the central conductor,usually at a corner, with the tree diameter increasing by some tens of times in goingaway from the conductor; there were highly carbonised traces in the channels; the largecracks in the mica are claimed to be from PD. The trees in hydrogen were smaller atthe outer side, perhaps due to the hydrogen and its pressure; their ‘microcracks’ wereclaimed to be due to replacement of K with H atoms in the mica.
Summary: it was difficult to comprehend this paper, but the basics of large differ-ences between the common air or hydrogen atmospheres are clearly strong.
[Dym02] J.H. Dymond, N. Stranges, K. Younsi, 2002Stator winding failures: contamination, surface discharge, tracking
The authors are with a machine manufacturer. The aim is an exposition of thepractical importance of breakdown that starts on surface contamination rather than inthe classic situation of voids near the central conductor.
Some surprising failures have occurred in machine insulation in environments witha lot of contaminants: it seems that the presence of varied surface concentration of(semi)conductive contaminants is critical to their contribution to tracking, since thisprovides areas of local field enhancement; examples are given where breakdown doesn’thappen when clean or when immersed in contaminant solution but happens when re-moved, or where cleaning and baking a winding allows trouble-free testing at ten timesthe voltage that previouly gave rise to discharges. The varnish is important; some typesperformed many tens of times worse than others with respect to endurance time. Astandardised test method is claimed to be needed.
Summary: surface discharges (PD) are important in this mechanism of insulationbreakdown, but there’s nothing about the PD itself in this paper.
[Fen03] M. Fenger, G.C. Stone, 2003How humidity affects partial discharge activity in stator windings
The authors are with a consultancy. The aim is a simply a description of the titlesubject: this is relevant to condition monitoring, where apparently significant changesin PD may be due just to changes in the atmosphere or machine temperature.
A transparent climate chamber was used, with PD measurements using an oscillo-scope connected through a 30 Hz to 1 MHz filter on a coupling capacitor (which seems tobe 80 pF in the figures, and 320 pF in the text). PDIV of the circuit without test objectwas much higher, >40 kV, than was ever used in tests. The test objects were lengthsof EPR-insulated cable, without their sheaths; they were connected either in pairs, tothe earth and HV electrodes, or just to the HV, with earth being a bare metal plate.Surface-separation distances of 0 mm, 2 mm and 4 mm were used, at temperatures of25 C and 50 C.
28
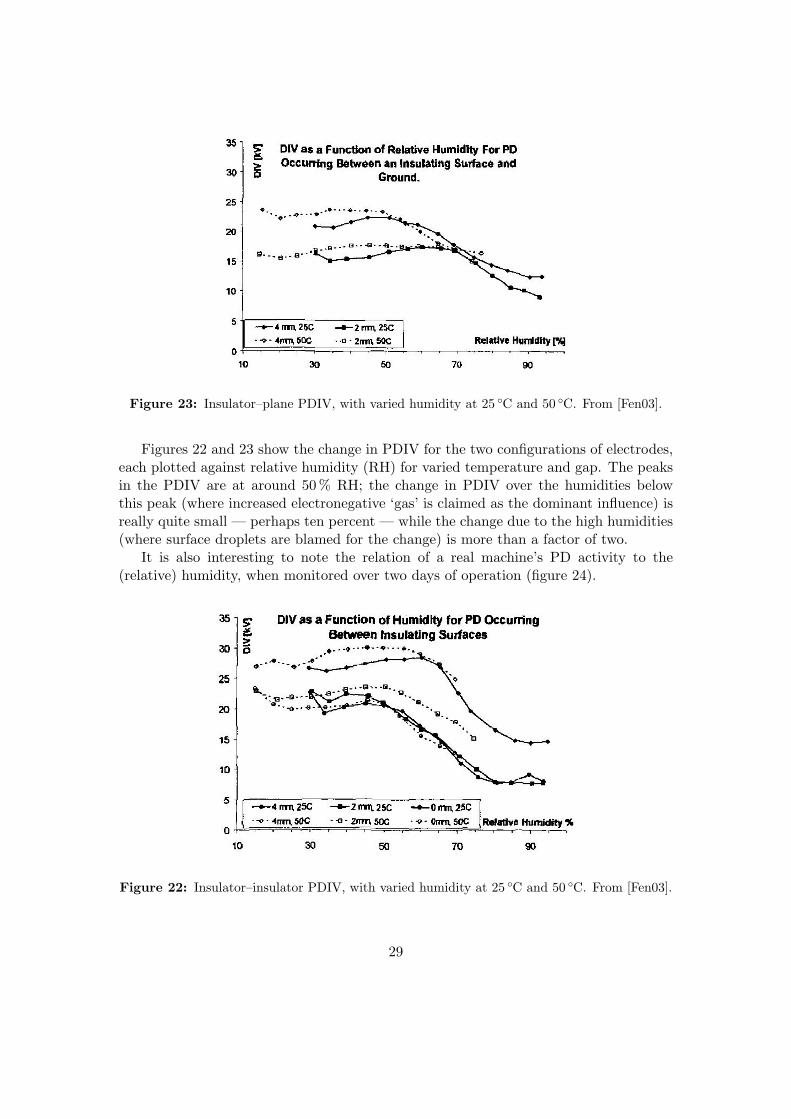
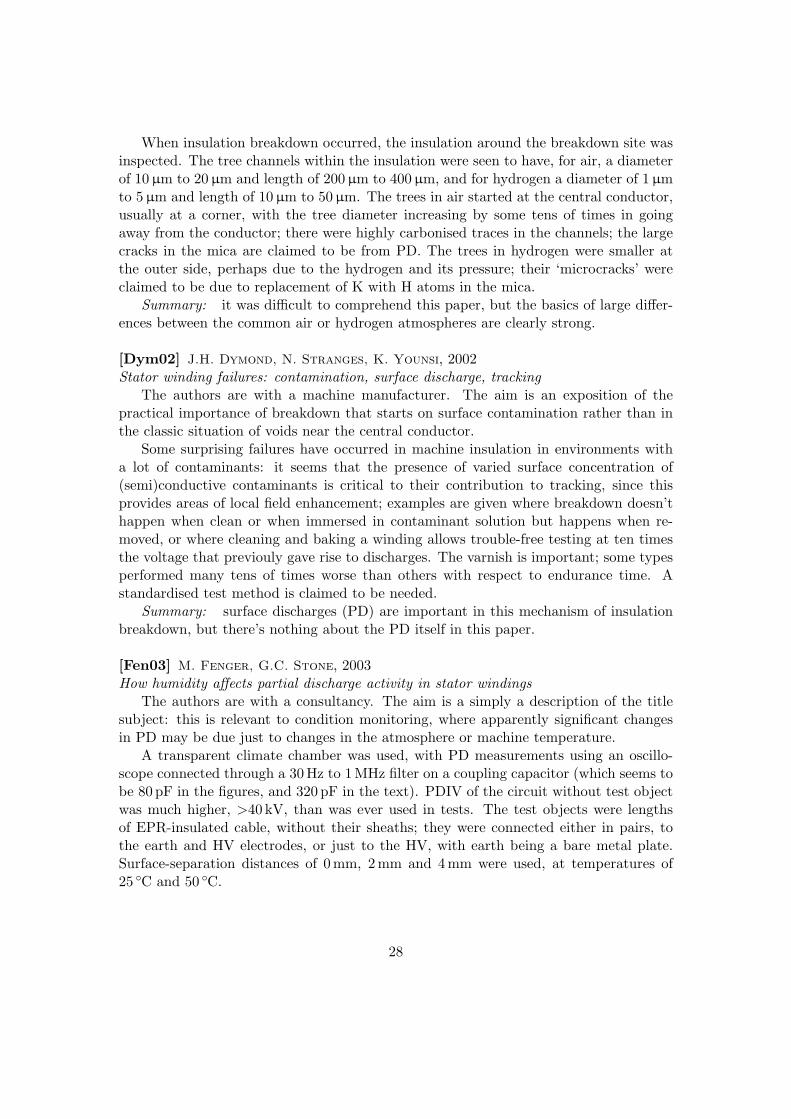
Figure 23: Insulator–plane PDIV, with varied humidity at 25 C and 50 C. From [Fen03].
Figures 22 and 23 show the change in PDIV for the two configurations of electrodes,each plotted against relative humidity (RH) for varied temperature and gap. The peaksin the PDIV are at around 50 % RH; the change in PDIV over the humidities belowthis peak (where increased electronegative ‘gas’ is claimed as the dominant influence) isreally quite small — perhaps ten percent — while the change due to the high humidities(where surface droplets are blamed for the change) is more than a factor of two.
It is also interesting to note the relation of a real machine’s PD activity to the(relative) humidity, when monitored over two days of operation (figure 24).
Figure 22: Insulator–insulator PDIV, with varied humidity at 25 C and 50 C. From [Fen03].
29
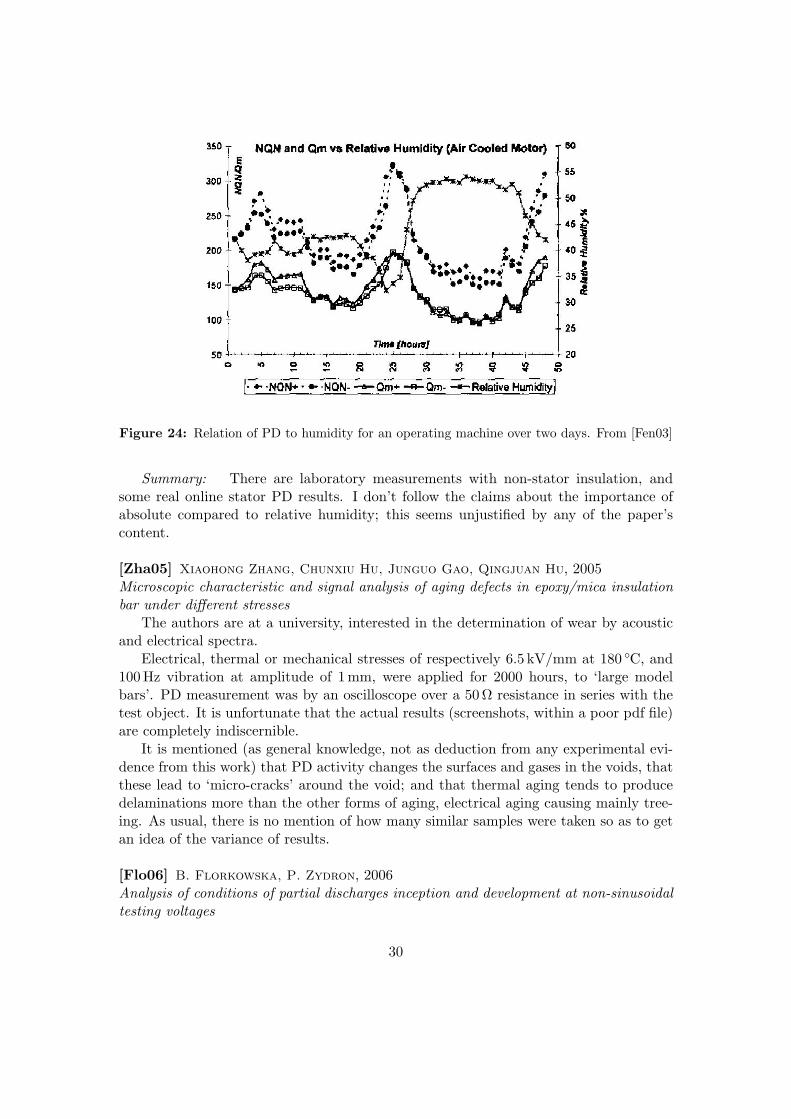
Figure 24: Relation of PD to humidity for an operating machine over two days. From [Fen03]
Summary: There are laboratory measurements with non-stator insulation, andsome real online stator PD results. I don’t follow the claims about the importance ofabsolute compared to relative humidity; this seems unjustified by any of the paper’scontent.
[Zha05] Xiaohong Zhang, Chunxiu Hu, Junguo Gao, Qingjuan Hu, 2005Microscopic characteristic and signal analysis of aging defects in epoxy/mica insulationbar under different stresses
The authors are at a university, interested in the determination of wear by acousticand electrical spectra.
Electrical, thermal or mechanical stresses of respectively 6.5 kV/mm at 180 C, and100 Hz vibration at amplitude of 1 mm, were applied for 2000 hours, to ‘large modelbars’. PD measurement was by an oscilloscope over a 50 Ω resistance in series with thetest object. It is unfortunate that the actual results (screenshots, within a poor pdf file)are completely indiscernible.
It is mentioned (as general knowledge, not as deduction from any experimental evi-dence from this work) that PD activity changes the surfaces and gases in the voids, thatthese lead to ‘micro-cracks’ around the void; and that thermal aging tends to producedelaminations more than the other forms of aging, electrical aging causing mainly tree-ing. As usual, there is no mention of how many similar samples were taken so as to getan idea of the variance of results.
[Flo06] B. Florkowska, P. Zydron, 2006Analysis of conditions of partial discharges inception and development at non-sinusoidaltesting voltages
30
The authors are at a university; the aim is to see the effects of waveform on PD.An aged stator bar (bars?) was used as the test object, in a conventional PD measure-
ment configuration, with the detection impedance in the arm of the test object, filteredat 10 kHz to 200 kHz, and sampled at ∼ 5 µs intervals. Test voltages up to twice theinception level were used: sinusoidal, triangular and trapezoidal (peak at π
4 ) at 50 Hz;from the paper’s fig.1, the peak value seems to be the common factor between thesewaveforms.
PD count is used as the dependent variable, and seems to be strongly related to theslew rate: triangular form has least PD, trapezoidal has most. Continued but dimin-ishing PD after the peak is reached is blamed on the supply filter resistance delayingthe actual test-object voltage (couldn’t delays in the presumably many small voids bea good explanation too?). The maximum count varies by more than a factor of twobetween the triangular and trapezoidal cases. Approximate linearity of count to voltage,pulse density and ‘phase range’ of activity is found for the sinusoidal and triangular cases.
[Wei06] T. Weiers, Y. Corrodi, R. Brutsch, R. Vogelsang, 2006Partial discharges in VPI winding insulations in dependence on the impregnating resin
The authors are from a university, a machine manufacturer and a machine insulationsupplier. The aim is a comparison of PD activity in various vacuum-pressure impregnated(VPI) stator insulation systems, during aging.
Various popular PD ‘indices’ are mentioned: maximum single charge in e.g. a minute;‘quadratic rate’, a sum-square measure; mean apparent charge; pulse repitition rate(too high for their equipment, dealing with multi-cavity machine insulation); statisticalmoments.
Five specimens were used for each of two impregnating materials. 360 mm of ‘slot’section high-conductivity tape was used in the middle of the bar-lengths, with 240 mmof stress grading at each end; external cross-section was 15 mm × 35 mm, and insulationthickness was 2.15 mm of 155 C insulation.
Very high overvoltages were used: 38 kV rms, at 50 Hz, giving breakdowns at 25hours for system-1, and 60 hours for system-2. PD measurements were by a couplingcapacitor and 40 kHz to 800 kHz PD system.
Mean charge had little change during aging for either impregnation system. It wasabout 0.5 nC for system-1 and 1 nC for system-2. Maximum charge and quadratic chargehad a fairly steady increase by several times, before breakdown, but no useful warningincrease just before the breakdown. Pattern skewness varied monotonically betweenabout 0.5 and −0.1 during aging, but was in opposite directions in the two impregnationsystems — system-1 has a straight increase (earlier in phase) of skewness with aging, andsystem-2 had a 1
x -like decrease. It is noted that the behaviour of system-2 is typical ofthe behaviour of stator-insulation as seen in other investigations; system-1 is consideredto be not very ‘voltage endurant’, while system-2’s behaviour is thought to have to dowith stopping of tree growth by formation of conductive ‘channels’ (conductive surfacesaround cavities?).
31
Summary: beyond the practically oriented results that the examined indices gaveno clear warning of imminent breakdown (during very artificially fast aging), there isthe claim, mainly from other work, that skewness generally decreases in aging statorinsulation, i.e. the mean phase becomes later.
32
References
[Dev84] J. C. Devins. The 1984 j. b. whitehead memorial lecture the physics of partialdischarges in solid dielectrics. IEEE Transactions on Electrical Insulation,1984. EI-19(5):475–495.
[Dym02] J. H. Dymond, N. Stranges, K. Younsi. Stator winding failures: contam-ination, surface discharge, tracking. IEEE Transactions on Industry Applica-tions, 2002. 38(2):577–583. The authors published practically the same paperin 1999, in the 46th annual Petroleum and Chemical Industry Conference.
[Fen03] M. Fenger, G. C. Stone. How humidity affects partial discharge activityin stator windings. Proceedings Electrical Insulation Conference and ElectricalManufacturing & Coil Winding Technology Conference, 2003. 2003 pp. 47–50.
[Flo95a] B. Florkowska. Assessment of temperature influence on partial dischargesin epoxy/mica insulation. International Conference on Conduction and Break-down in Solid Dielectrics (ICSD). 1995 pp. 356–360.
[Flo95b] B. Florkowska. A study of the partial discharge mechanism during the agingof epoxy/mica insulation. Conference on Electrical Insulation and DielectricPhenomena (CEIDP). 1995 pp. 331–334.
[Flo06] B. Florkowska, P. Zydron. Analysis of conditions of partial dischargesinception and development at non-sinusoidal testing voltages. Conference onElectrical Insulation and Dielectric Phenomena (CEIDP). 2006 pp. 648–651.
[Hol91] J. T. Holboll, J. M. Braun, N. Fujimoto, G. C. Stone. Temporal andspatial development of partial discharges in spherical voids in epoxy related tothe detected electrical signal. Conference on Electrical Insulation and DielectricPhenomena (CEIDP). 1991 pp. 581–588.
[Hol94] J. T. Holboll, M. Henriksen, A. Jensen, F. Sorensen. Pd-pulse charac-teristics in rotating machine insulation. International Symposium on ElectricalInsulating Materials (ISEM). 1994 pp. 322–326. ISBN: 0-7803-1942-7.
[Hud90] C. Hudon, R. Bartnikas, M. R. Wertheimer. Surface conductivity ofepoxy specimens subjected to partial discharges. International Symposium onElectrical Insulation (ISEI). 1990 pp. 153–155.
[Hud93] C. Hudon, R. Bartnikas, M. R. Wertheimer. Spark-to-glow dischargetransition due to increased surface conductivity on epoxy resin specimens.IEEE Transactions on Electrical Insulation, 1993. 28(1):1–8.
[Hud94] C. Hudon, R. Bartnikas, M. R. Wertheimer. Chemical and physicaldegradation effects on epoxy surfaces exposed to partial discharges. Interna-tional Conference on Properties and Applications of Dielectric Materials. vol. 2,1994 pp. 811–814.
33
[Kim97] H.-G. Kim, H.-S. Kim, Y.-K. Park. A study on the analysis of degrada-tion mechanism for generator stator windings. International Conference onProperties and Applications of Dielectric Materials. vol. 2, 1997 pp. 985–989.
[Mau95] C. Mauoux, C. Laurent. Contribution of partial discharges to electricalbreakdown of solid insulating materials. IEEE Transactions on Dielectrics andElectrical Insulation, 1995. 2(4):641–652.
[Mor93] P. H. F. Morshuis. Partial discharge mechanisms. Ph.D. thesis, TechnischeUniversiteit Delft, 1993.
[Reh88] R. H. Rehder, V. R. Mulhall, V. A. Moore, D. G. McLaren. All statorwindings are not created equal. International Conference on Properties andApplications of Dielectric Materials. vol. 2, 1988 pp. 442–446.
[Wal91] P. Walker, J. N. Champion. Experience with turn insulation failures inlarge 13.2 kV synchronous motors. IEEE Transaction on Energy Conversion,1991. 6(4):670–678.
[Wei06] T. Weiers, Y. Corrodi, R. Brutsch, R. Vogelsang. Partial dischargesin VPI winding insulations in dependence on the impregnating resin. Interna-tional Conference on Properties and Applications of Dielectric Materials. 2006pp. 183–186.
[Wic77] A. Wichmann, P. Gruenewald. Influence of dielectric stress concentrationon voltage endurance of epoxy-mica generator insulation. IEEE Transactionson Electrical Insulation, 1977. EI-12(6):428–434.
[Woo73] J. W. Wood, D. M. Ryder, W. K. Hogg. Discharge studies of epoxy/micaturbine generator insulation. IEEE Transactions on Power Apparatus andSystems, 1973. PAS-92(5):1531–1537.
[Zha05] X. Zhang, C. Hu, J. Gao, Q. Hu. Microscopic characteristic and signalanalysis of aging defects in epoxy/mica insulation bar under different stresses.International Symposium on Electrical Insulating Materials (ISEM). vol. 3,2005 pp. 710–713. ISBN: 4-88686-063-X.
[Zio96] W. Ziomek, H. Moscicka-Grzesiak, E. Kuffel. Assessment of the stateof mica-resin insulation using PD charge analysis and dielectric loss mea-surements. Conference on Electrical Insulation and Dielectric Phenomena(CEIDP). vol. 2, 1996 pp. 492–495.
34


