Embed Size (px)
Citation preview

David Terrance Houguet-Pincham
(Graduate Certificate Disability Studies, Masters of Human Services (Hon), Masters
of Gestalt Therapy, Diploma of Fundraising Management, Graduate Diploma of
Applied Corporate Governance, Diploma of Project Management, Graduate
Certificate of International Business, Graduate Certificate of Human Resource
Management, Masters of Business Administration)
Charles Darwin University
Faculty of Law, Education, Business and Arts
Business School
A dissertation submitted in fulfilment of the requirements for the degree of
Doctor of Business Administration
June 2017
BREAKING DOWN THE BARRIERS: THE NORTHERN
TERRITORY EXPERIENCE OF DIVERSITY IN THE
BOARDROOM

ii
TABLE OF CONTENTS
TABLE OF CONTENTS ........................................................................................... ii
LIST OF TABLES ..................................................................................................... v
LIST OF FIGURES ................................................................................................... v
LIST OF ACRONYMS AND ABBREVIATIONS ................................................ vi
ABSTRACT .............................................................................................................. vii
ORIGINALITY OF DISSERTATION ................................................................... ix
ACKNOWLEDGMENTS ......................................................................................... x
CHAPTER 1 INTRODUCTION .............................................................................. 1 1.1 Introduction ........................................................................................................ 1
1.2 Background to the study ..................................................................................... 1 1.3 Statement of the problem ................................................................................... 4 1.4 The Northern Territory in context ...................................................................... 5 1.5 Aim and objectives of the study ......................................................................... 7
1.6 Research question to be addressed and hypothesis testing ................................ 8 1.7 Definition of key terms .................................................................................... 10
1.8 Outline of the thesis ......................................................................................... 13 1.9 Chapter summary ............................................................................................. 16
CHAPTER 2 THEORETICAL FRAMEWORK AND LITERATURE
REVIEW ................................................................................................................... 17 2.1 Introduction ...................................................................................................... 17 2.2 The theoretical framework ............................................................................... 18
2.2.1 The relationship between theory and research .......................................... 18
2.2.2 Sociology and its relevance to this study .................................................. 19 2.2.3 Signalling theory ....................................................................................... 20
2.3 The changing shape of Australian society ....................................................... 25 2.3.1 The blending of cultures, the way forward for all Australians ................. 25 2.3.2 Diversity in the workplace has become a strategic business imperative .. 31
2.4 Boardrooms: The conservative nature of change ............................................. 35 2.4.1 The decline of the ‘old boy’s network’ ..................................................... 35
2.4.2 Incremental changes and the efficacy of diversity in the boardroom ....... 41 2.5 Please sir, may I have some more? .................................................................. 45
2.5.1 Society says: What about voluntary targets or binding quotas? ............... 45
2.5.2 Demographic diversity in the boardroom: An inclusive holistic
approach .................................................................................................... 51
2.6 Chapter summary ............................................................................................. 55
CHAPTER 3 METHODOLOGY ........................................................................... 59 3.1 Introduction ...................................................................................................... 59 3.2 The research question and the methodological approach ................................ 60
3.2.1 The research question ................................................................................ 60
3.2.2 Sequential mixed methods research and its applicability to this study ..... 61
3.3 Phase One: Qualitative research method .......................................................... 66 3.3.1 Selection of participants ............................................................................ 68 3.3.2 Criteria for inclusion in Group One and Group Two ................................ 70 3.3.3 Data collection method ............................................................................. 71

iii
3.3.4 Data analysis method ................................................................................ 75 3.4 Phase Two: Quantitative research method ....................................................... 76
3.4.1 Selection of participants ............................................................................ 78 3.4.2 Criteria for inclusion in Phase Two .......................................................... 79
3.4.3 Data collection method ............................................................................. 80 3.4.4 Data analysis method ................................................................................ 81
3.5 Ethical considerations ...................................................................................... 83 3.6 Chapter summary ............................................................................................. 84
CHAPTER 4 RESULTS AND ANALYSIS ........................................................... 86 4.1 Introduction ...................................................................................................... 86 4.2 Results and analysis from Phase One ............................................................... 87
4.2.1 Profile of participants from Phase One ..................................................... 88 4.2.2 Data immersion ......................................................................................... 89 4.2.3 Coding the data ......................................................................................... 89
4.3 Six themes from Phase One ............................................................................. 94 4.3.1 Theme one: Policy barriers ....................................................................... 95
4.3.2 Theme two: Resource barriers .................................................................. 97 4.3.3 Theme three: Awareness barriers .............................................................. 99 4.3.4 Theme four: Values and culture barriers ................................................. 102 4.3.5 Theme five: Fear barriers ........................................................................ 104
4.3.6 Theme six: Geographic barriers .............................................................. 107 4.4 Results and analysis from Phase Two ............................................................ 109
4.4.1 Profile of participants from Phase Two .................................................. 110
4.4.2 Scale construction ................................................................................... 111
4.4.3 Frequency distribution of demographic data .......................................... 113 4.4.4 Frequency distribution of general questions ........................................... 115
4.4.5 Summary statistics for the probable barriers ........................................... 118 4.4.6 Inferential statistics for the probable barriers ......................................... 122
4.5 Chapter summary ........................................................................................... 132
CHAPTER 5 DISCUSSION .................................................................................. 135 5.1 Introduction .................................................................................................... 135 5.2 Discussion of the findings from Phase One ................................................... 136
5.2.1 The absence of policy creates a barrier to diversity in the boardroom ... 137 5.2.2 Four lesser barriers to diversity in the boardroom .................................. 138
5.2.3 The geography of the Northern Territory creates barriers ...................... 142 5.3 Discussion of the findings from Phase Two .................................................. 144
5.3.1 No positive statistically significant relationship ..................................... 144 5.3.2 Having a formal policy encourages diversity in the boardroom ............. 148
5.4 Comparing and contrasting the results from Phase One and Phase Two ....... 150 5.4.1 Results that were similar ......................................................................... 150 5.4.2 Results that differed ................................................................................ 152
5.5 Chapter summary ........................................................................................... 154
CHAPTER 6 CONCLUSION ............................................................................... 156 6.1 Introduction .................................................................................................... 156 6.2 Aim of the study and the approach taken ....................................................... 157
6.3 The research findings ..................................................................................... 158 6.4 Implications of the findings ........................................................................... 162
6.4.1 Implications for theory ............................................................................ 164 6.4.2 Implications for policy ............................................................................ 164

iv
6.4.3 Implications for practice ......................................................................... 165 6.5 Limitations of the research ............................................................................. 165 6.6 Recommendations for further research .......................................................... 167 6.7 Chapter summary ........................................................................................... 169
APPENDICES ........................................................................................................ 171 Appendix A: GAYTMs ........................................................................................ 171 Appendix B: Information sheet for interview ...................................................... 172 Appendix C: Information sheet for survey........................................................... 175 Appendix D: Adult consent form for interview ................................................... 178
Appendix E: Open ended questions—Independent non-executive director ........ 180 Appendix F: Open-ended questions—Spokesperson from peak industry body .. 183
Appendix G: Online web survey—Independent and non-independent directors 186
REFERENCES ....................................................................................................... 202

v
LIST OF TABLES
Table 3.1: Participants in Phase One ......................................................................... 68
Table 4.1: Concepts identified in the open coding .................................................... 92
Table 4.2: Grouping of concepts into interim themes ............................................... 93
Table 4.3: Overall results of reliability testing for probable barriers ...................... 113
Table 4.4: Overall results of the summary statistics for probable barriers ............. 119
Table 4.5: Participants without a formal diversity policy (n = 24) ......................... 120
Table 4.6: Participants from organisations with a formal diversity policy (n = 6) . 121
Table 4.7: Overall results of the one sample t-tests for probable barriers .............. 124
Table 4.8: Overall results of the one sample t-test for boards with a policy ........... 125
Table 4.9: Dichotomous demographic variables ..................................................... 127
Table 4.10: Summary statistics for values and culture barrier by two age groups . 129
Table 4.11: Overall results of the independent samples t-test by two age groups .. 129
Table 4.12: Summary statistics for lack of policy barrier by gender ...................... 131
Table 4.13: Overall result of the independent samples t-test by gender ................. 131
LIST OF FIGURES
Figure 1.1: Map of Australia with the Northern Territory shown in pink (Virtual
Australia 2017) ............................................................................................ 6
Figure 3.1: Sequential mixed methods design: How this study was conducted ........ 63
Figure 4.1: Distribution of participant ages ............................................................. 114
Figure 4.2: Distribution of participants’ diversity backgrounds .............................. 115
Figure 4.3: Distribution of goals for increasing diversity of independent non-
executive directors .................................................................................. 116
Figure 4.4: Distribution of diversity characteristics supported ................................ 117

vi
LIST OF ACRONYMS AND ABBREVIATIONS
ABS Australian Bureau of Statistics
AICD Australian Institute of Company Directors
ANZ Australia and New Zealand Banking Group Ltd
ASX Australian Securities Exchange
BoD Board of directors
CMAC Corporations and Markets Advisory Committee
CSA Chartered Secretaries Australia
DIBP Department of Immigration and Boarder Protection
INED Independent non-executive director
IPO Initial public offering
KPMG Klynveld Peat Marwick Goerdeler International Cooperative
LGBTI Lesbian, gay, bisexual, transgender and intersex
NFP Not-for-profit
SPSS Statistical Package for the Social Sciences
WGEA Workplace Gender Equity Agency
WoBs Women on Boards

vii
ABSTRACT
This study investigated the internal organisational barriers to individuals from a
demographically diverse background being appointed as an independent non-
executive director (INED) of a Northern Territory (Australia) organisation. Since the
end of World War II in 1945, Australia has evolved into an egalitarian heterogeneous
multicultural society. Nevertheless, boards of directors (BoDs) have remained
homogeneous and dominated by privileged, white, middle-aged men from the ‘old
boy’s network’. As a result of this incongruence, the demographic composition of
Australia’s boardrooms has been a much discussed, debated and researched topic.
The focus of previous research has, however, been on the gender diversity of large
profit-making listed organisations located in the densely populated metropolitan
regions of Australia. This study aimed to broaden the discussion by embracing a
more inclusive holistic definition of demographic diversity at the board level. The
study investigated the internal organisational barriers to diversity in the boardroom
among three types of organisations: profit, not-for-profit and government
organisations. Collectively, the inclusive definition of demographic diversity in the
boardroom among these three organisational types in regional and remote parts of
Australia more often than not is ignored when discussing the diversity of the
country’s INEDs.
For that reason, the question of what are the internal organisational barriers to people
from demographically diverse backgrounds being appointed as INEDs of Northern
Territory organisations has remained unanswered. Thus, based on the foundation of a
research paradigm of pragmatism, this study employed a sequential exploratory
mixed methods research design to answer this question. In Phase One of the study,
viii
qualitative data were collected from two data sources to uncover the salient internal
organisational barriers to diversity in the boardroom. The first data source was
INEDs from demographically diverse backgrounds and the second was spokespeople
from peak industry bodies representing organisations with BoDs. Phase Two of the
study collected quantitative data to further explore the observations from the
qualitative phase. In Phase Two, an online survey was sent to independent and non-
independent directors of Northern Territory organisations.
The qualitative data analysis revealed six organisational barriers that either prevented
or inhibited people from demographically diverse backgrounds being appointed as
INEDs of Northern Territory organisations. However, the results of the quantitative
analysis did not support this position, determining that the internal organisational
barriers identified in Phase One were not sufficiently significant to preclude people
from demographically diverse backgrounds being appointed as INEDs. However, the
study also found that the participants from both phases considered that having a
formal board diversity policy would promote and encourage demographic diversity
in the boardroom. As a result, for Northern Territory boards to be more inclusive of
people from a variety of demographic backgrounds, BoDs may need to consider
creating formal diversity in the boardroom policies. Another important finding from
the study was that contrary to the literature’s assertions about boardrooms being
dominated by men, Northern Territory boardrooms had an equal representation of
female and male directors. The study determined that geographical factors may also
inhibit individuals from demographically diverse backgrounds being appointed as
INEDs of Northern Territory organisations.

ix
ORIGINALITY OF DISSERTATION
I hereby certify that except where otherwise acknowledged, this dissertation
described original research carried out by the author. This work has not previously
been submitted for a degree or diploma in any university. To the best of my
knowledge and belief, the thesis contains no material previously published or written
by another person except where due reference is made in the dissertation itself.
I give consent to this copy of my thesis, when deposited in the University Library,
being made available for loan and photocopying online via the University’s Open
Access repository eSpace.
D. T. Houguet-Pincham
June 2017

x
ACKNOWLEDGMENTS
I am indebted to a number of people and organisations that have provided assistance
and been supportive throughout the metamorphosis of this study. My network is
eclectic and developmental. First, I would like to credit with real gratitude some of
the people who have both assisted and inspired me. This study would not have been
possible without the support of all the participants. I wish to thank all the participants
who took part in this study for their time and openness in sharing parts of their lives.
Their insight has provided me with a greater understanding of the organisational
barriers to demographic diversity in the boardroom. Specifically, I was moved by the
trust of those participants that took part in the interviews, in how they spoke openly
about their experiences as well as their feelings about the research question. This
study would not exist without them.
I would like to thank my principal supervisor Dr Susan Bandias and my secondary
supervisor Dr Rajeev Sharma for their support, encouragement, guidance and
feedback in assisting me produce this study. To my darling husband Pasha, your
ability to listen and provide emotional and technical support throughout the study is
greatly appreciated, I love you, ‘to the moon and back’. I would like to acknowledge
Elite Editing who provided editor assistance, restricted to Standards D and E of the
Australian Standards for Editing Practice. I would also like to acknowledge several
academics from my previous studies. Pro-Vice Chancellor Lesley Chenoweth, Dr
Nicholas Buys and Professor George Kearney from Griffith University for their
belief in me and champion of my capacity to study and conduct research, for without
them this study would never have occurred. I am truly grateful to you.

1
CHAPTER 1
INTRODUCTION
1.1 Introduction
The purpose of this chapter is to provide an orientation and contextual background to
this study. The study sought to explore organisational barriers to demographic
diversity in the boardroom of Northern Territory organisations. The research
question the study sought to address was:
What are the internal organisational barriers to people from demographically
diverse backgrounds being appointed as independent non-executive directors
of Northern Territory organisations?
The chapter begins by providing a background to the research before presenting the
statement of the problem. As the geographical scope of this study is restricted to the
Northern Territory, a general overview of the region is provided. This is followed by
a description of the study’s specific aim and objectives. The chapter then presents the
research question in terms of the null hypothesis that was addressed by this study.
Next, the chapter details definitions for the key terms used throughout the thesis. The
chapter concludes with an outline of the structure of the remaining chapters.
1.2 Background to the study
An outcome of the changing shape of Australian society since the end of World War
II in 1945 is that part of the national ethos of the country includes equality of
opportunity and ‘a fair go’ without any barriers. Historically, Australia had a strong
emphasis on immigration from Anglo–Celtic countries. Nevertheless, since 1945,
consecutive governments have increasingly relaxed this policy, signalling the

2
country’s willingness to embrace growth, change and a new way of being (Burnett
1998; Walsh 2001). As a result, people have migrated to Australia from many parts
of the world, expanding both the population and its demographic composition (Mann
2012; Pakulski 2014). This influx of immigrants also transformed the nation’s
workforce to the point where diversity in the workplace evolved into a strategic
business imperative (Kramar 2012; Olsen & Martins 2012).
According to Andrews and Curtis (1998), Braithwaite and Bush (1998), Salter (2013)
and Thompson (1994), these immigrants and other socially under-valued groups
often experienced social and workplace discrimination, prejudice and isolation.
These authors maintained that to concretise Australia’s newly evolving egalitarian
tradition, successive governments implemented social and workplace laws to prevent
and inhibit these inequitable practices. These legislative initiatives signalled that
everybody in Australia deserves equality of opportunity and ‘a fair go’. The
demographic, legislative and social changes that have occurred in the country since
the end of World War II have all contributed to making Australia the egalitarian
heterogeneous society it is today (Andrews & Curtis 1998; Phillips et al. 2010).
The boardrooms of Australian organisations have, however, remained homogeneous
and dominated by privileged, white, middle-aged men (Harris 2014; Wang & Clift
2009). Lipman (2008), Perrault (2015) and Van der Walt and Ingley (2003) asserted
that these male directors were usually known to each other through their informal
‘old boy’s network’. Moreover, these men generally gained their directorships based
on who they knew rather than their qualifications, skills and what they could

3
contribute to the board. Thus, changes to the demographic composition of Australian
boardrooms have moved at a glacial rate of change (Adams 2015; Broderick 2011).
Nevertheless, as a direct result of a number of high-profile corporate collapses that
occurred in Australia from the 1980s onwards, governance and diversity researchers
have identified that BoDs generally had poor governance practices and lacked both
director independence and diversity in the boardroom (Kang et al. 2007; Leung &
Cooper 2003). Consequently, improved governance practices, independent non-
executive directors (INEDs) and board diversity emerged as strategies to rectify these
deficiencies in the boardroom (Van der Walt et al. 2006; Williams et al. 2015). While
improved governance practices and INEDs have been assimilated into boards of
directors (BoDs), only incremental changes to the composition of boards have been
achieved (Westphal & Milton 2000).
The changing demographic make-up of Australia’s heterogeneous society, improved
governance practices and directors’ independence have contributed to the growing
acknowledgment that demographic diversity at the board level is an important goal
for organisations to achieve (Upadhyay & Zeng 2014; Van der Walt et al. 2006).
There are many benefits to demographic diversity in the boardroom as director
heterogeneity improves and extends a BoD’s range of thoughts and analysis (Dhir
2015; Rhode & Packel 2014). The reality is, however, that BoDs remain dominated
by privileged, white, middle-aged men from the ‘old boy’s network’ (Perrault 2015;
Randøy et al. 2006; Tremblay et al. 2016). Therefore, this study aimed to investigate
internal organisational barriers to demographic diversity in the boardrooms of
Northern Territory profit, not-for-profit (NFP) and government organisations.
4
1.3 Statement of the problem
A review of the domestic and international literature established that globally, BoDs
have predominantly been comprised of white middle-aged men (Perrault 2015; Want
& Cliff 2009). Only in the last two decades has the demographic composition of the
boardroom received focussed attention by governance and diversity researchers and
been considered out of step with society. Numerous studies have been undertaken
examining the efficacy of diversity in the boardroom (Erhardt et al. 2003; Ferreira
2010; Vafaei et al. 2015; Wang & Clift 2009). However, the focus of empirical
research to date has been narrow and generally restricted to gender diversity and
more recently ethnic and age diversity (Ntim 2015; Upadhyay & Zeng 2014). As a
result, there is a gap in the literature. There have been no studies examining a more
inclusive holistic approach to demographic diversity in the boardroom.
Further, a review of the literature revealed that there have been no studies examining
diversity at the board level with a comparative analysis among large profit-making
listed entities, NFP and government organisations. The vast majority of empirical
studies investigating diversity in the boardroom have predominantly focussed on
large profit-making organisations (Arnegger et al. 2014; Fanto et al. 2011; Rhode &
Packel 2014; Vafaei et al. 2015), although several recent studies have investigated
the NFP sector (Azmat & Rentschler 2015; Bradshaw & Fredette 2013; Harris 2014;
Stone & Ostrower 2007). This study fills this gap by investigating simultaneously the
three different types of organisation, thereby making a contribution to the literature
on demographic diversity in the boardroom.

5
An extensive review of multiple studies on diversity in the boardroom revealed an
absence of research investigating internal organisational barriers to individuals from
demographically diverse backgrounds being appointed as INEDs (Adams &
Kirchmaier 2015; Adams & Ragunathan 2013; Azmat & Rentschler 2015; Broome &
Krawiec 2008). Further, these studies have singularly focussed on organisations in
metropolitan areas; there were no identified studies that investigated diversity in the
boardroom in regional and remote communities, such as those in the Northern
Territory. Consequently, this study investigated the internal organisational barriers
that either prevented or inhibited people from demographically diverse backgrounds
being appointed as INEDs of profit, NFP and government organisations in regional
and remote communities of the Northern Territory.
1.4 The Northern Territory in context
The Northern Territory is one of two territories in Australia, the other being the
Australian Capital Territory. As shown in Figure 1.1, the Northern Territory accounts
for a large proportion (one-sixth) of the total area of the Australian continent and
covers a vast geographical area of 1,349,129 square kilometres (Charles Darwin
University 2016). The Northern Territory extends from the dry terrain of the ‘red
centre’, with the major township being Alice Springs, to the wetlands in the ‘top
end’, with the main township being Darwin (Northern Territory Government 2014).

6
Figure 1.1: Map of Australia with the Northern Territory shown in pink
(Virtual Australia 2017)
The capital of the Northern Territory is Darwin. In contrast to the other capital cities
and inner regional areas of the country, the Australian Bureau of Statistics (ABS) has
classified Darwin as an ‘outer regional area’ of Australia (ABS 2008). The Alice
Springs region has been classified as a ‘remote area’ and the remaining geographical
area of the Northern Territory has been classified as a ‘very remote area’ (ABS
2008). Of the Northern Territory’s population, 51.3 per cent lives in the outer
regional area of Darwin, 21.7 per cent live in the remote area of Alice Springs and
the remaining 23.5 per cent of the population lives in very remote areas of the
Northern Territory (ABS 2011). In December 2016, the population of the Northern
Territory was 244,300, which makes it the least populous of Australia’s eight states
and territories (ABS 2016a; Charles Darwin University 2016).
7
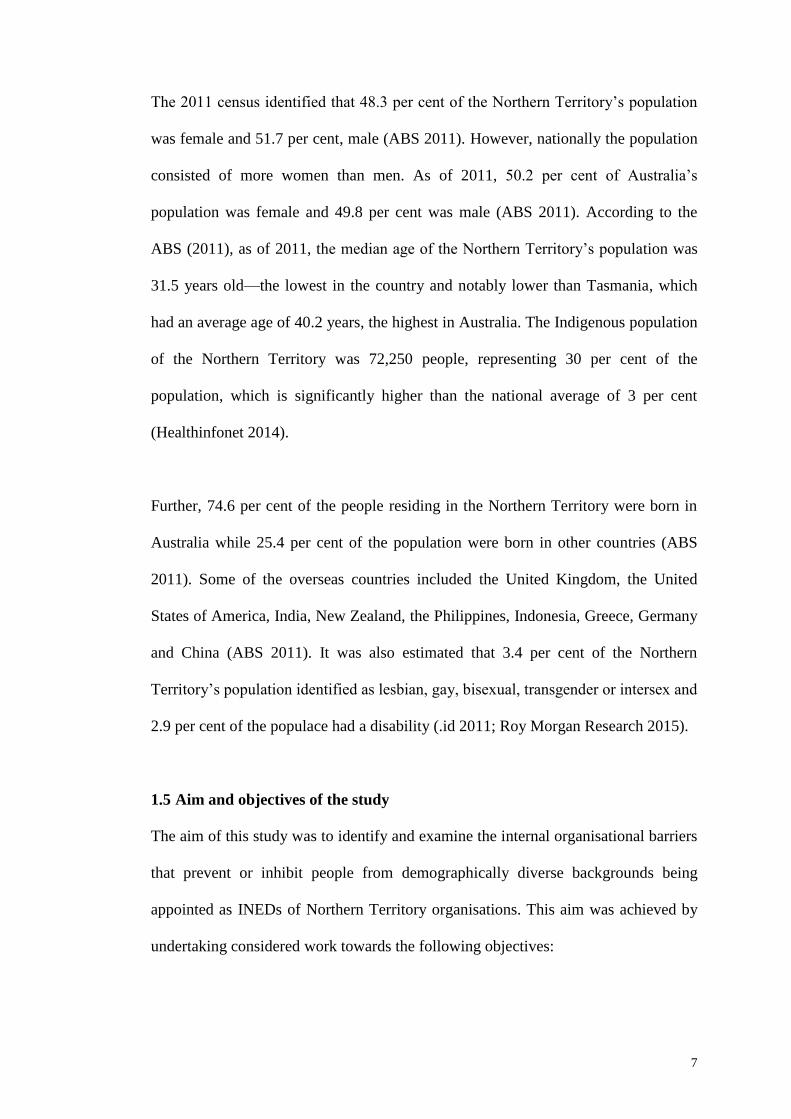
The 2011 census identified that 48.3 per cent of the Northern Territory’s population
was female and 51.7 per cent, male (ABS 2011). However, nationally the population
consisted of more women than men. As of 2011, 50.2 per cent of Australia’s
population was female and 49.8 per cent was male (ABS 2011). According to the
ABS (2011), as of 2011, the median age of the Northern Territory’s population was
31.5 years old—the lowest in the country and notably lower than Tasmania, which
had an average age of 40.2 years, the highest in Australia. The Indigenous population
of the Northern Territory was 72,250 people, representing 30 per cent of the
population, which is significantly higher than the national average of 3 per cent
(Healthinfonet 2014).
Further, 74.6 per cent of the people residing in the Northern Territory were born in
Australia while 25.4 per cent of the population were born in other countries (ABS
2011). Some of the overseas countries included the United Kingdom, the United
States of America, India, New Zealand, the Philippines, Indonesia, Greece, Germany
and China (ABS 2011). It was also estimated that 3.4 per cent of the Northern
Territory’s population identified as lesbian, gay, bisexual, transgender or intersex and
2.9 per cent of the populace had a disability (.id 2011; Roy Morgan Research 2015).
1.5 Aim and objectives of the study
The aim of this study was to identify and examine the internal organisational barriers
that prevent or inhibit people from demographically diverse backgrounds being
appointed as INEDs of Northern Territory organisations. This aim was achieved by
undertaking considered work towards the following objectives:

8
a) investigating the experiences of individuals from demographically diverse
backgrounds who have been appointed as INEDs
b) examining the opinion of peak bodies about the internal organisational barriers
to individuals from demographically diverse backgrounds being appointed as
INEDs
c) exploring the concepts and themes identified by individuals from diverse
backgrounds and peak bodies associated with internal organisational barriers to
demographic diversity in the boardroom
d) comparing the internal organisational barriers to demographic diversity in the
boardroom identified by the two groups of participants with a larger number of
independent and non-independent directors
e) exploring the perceived strategic and operational benefits of demographic
diversity in the boardroom
f) presenting a full account of the internal organisational barriers to demographic
diversity in the boardroom of Northern Territory organisations and making
recommendations based on the research findings of this study.
1.6 Research question to be addressed and hypothesis testing
To meet the study’s aim and objectives, the research design involved investigation of
the internal organisational barriers that either prevented or inhibited people from
demographically diverse backgrounds being appointed as INEDs of Northern
Territory organisations. The research question this study sought to address was:
What are the internal organisational barriers to people from demographically
diverse backgrounds being appointed as independent non-executive directors of
Northern Territory organisations?

9
To address this question, the study employed a sequential exploratory mixed method
research design. Participants were allocated to one of two study phases and
methodologies: Phase One was qualitative and Phase Two was quantitative. Phase
One comprised two sources from which data relating to the research question were
obtained. The first data source was responsive in-depth interviews with INEDs from
demographically diverse backgrounds and the second data source was in-depth
interviews with spokespersons from peak bodies representing BoDs from Northern
Territory profit, NFP and government organisations. Phase Two comprised the third
data source, which was an online survey that was sent to Northern Territory BoDs
with independent and non-independent directors.
The dependent variable in this research was demographic diversity and the
independent variables were the organisational barriers experienced by INEDs from
demographically diverse backgrounds. To determine whether there were internal
organisational barriers for people from demographically diverse backgrounds being
appointed as INEDs of Northern Territory organisations, the following null
hypothesis was tested:
There are internal organisational barriers to people from demographically
diverse backgrounds being appointed as independent non-executive directors of
Northern Territory organisations.
A review of the Australian and international literature was undertaken to investigate
the signals being transmitted from egalitarian heterogeneous societies regarding the
homogeneous composition of boardrooms and the difficulties faced by people from
demographically diverse backgrounds being appointed as INEDs. This was followed

10
by a more specific review of the empirical literature at a governance level. The
review also examined the current trends in research on demographic diversity at the
board level in Australia and internationally.
1.7 Definition of key terms
To avoid confusion, a number of key terms used commonly throughout this thesis
have been defined in advance. The study deals with the question of ‘barriers’ to
people from ‘demographically diverse backgrounds’ being appointed as ‘independent
non-executive directors’ of Northern Territory ‘organisations’. Accordingly, the
variables relevant to this topic have been given an operational definition.
Internal organisational barriers: Internal organisational barriers are any factors in
an organisation’s internal environment that prevent or inhibit progress or access to
new ways of doing things (Adams & Kirchmaier 2015; McShane et al. 2013; Naff
1995). Therefore, the internal organisational barriers to diversity in the boardroom
for this study included anything within organisations that might obstruct people from
demographically diverse backgrounds being appointed as INEDs.
Demographically diverse backgrounds: McShane et al. (2013) and Thatcher and
Patel (2011) asserted that diversity refers to the way in which people are similar or
different to each other. Generally, there are four types of diversity: demographic,
educational, functional and geographical diversity. Even though diversity may occur
in any or all of these diversity characteristics, the focus of this research is on
demographic diversity. Demographic diversity can be “categorised as falling into one
of two key dimensions: observable differences and underlying differences” (Härtel &

11
Fujimoto 2015, p. 122). For the purposes of this study, the observable characteristics
of demographic diversity include Indigenous Australians, gender, age, physical
capabilities, sensory and mental impairment and race/ethnic background. The
underlying characteristics of demographic diversity include, gender identity, sexual
orientation, marital or family status and cultural or religious background (Härtel &
Fujimoto 2015; Muchiri & Ayoko 2013).
Director: The vast majority of profit, NFP and government organisations have a
governing body. Nevertheless, there are many different designations given to the
members of these governing bodies; some examples of these include committee
member; commissioner; board member; and director. Therefore, for consistency, the
terminology ‘director’ has been employed in this study to collectively represent all
designations for the members of an organisation’s governing body.
Independent non-executive director: The Australian Securities Exchange’s
(ASX’s) Corporate Governance Principles and Recommendations characterise
independent directors as non-executive directors who are free from any interest,
position, association or relationship that could impair their actual or perceived
impartiality and objectivity (ASX 2014a).
Organisations: The focus of this research was organisations whose governing
bodies had INEDs. While there are different types of organisations, the three types
examined in this study were profit (listed, unlisted and privately owned), NFP and
government (statutory and government-owned corporations) organisations. The

12
primary difference between these three types of organisations is the reason for their
existence (Hubbard & Beamish 2011).
Profit organisations are established to produce goods and/or services and are owned
by shareholders; NFP organisations are created to be either community serving or
member serving and are owned by the members of the organisation (Cornforth 2003;
Sarros et al. 2011). Government organisations are created for different reasons.
Government-owned corporations are created to operate in commercial affairs and are
either partially or fully owned by the government and statutory organisations with
regulatory powers prescribed by law (Queensland Government 2016). Although the
purpose and expected outcomes for these organisational types may differ, the
governing body for all three is their BoDs (Viader & Espina 2014), hence their
eligibility for the study. Moreover, the role of a BoD is to manage the business of the
organisation and this role remains unchanged irrespective of whether or not the
organisation is small or large, profit or NFP, public serving or member serving
(Considine et al. 2014; Petrovic 2008).
Corporate governance: Over recent decades “there has been considerable focus
across the world on corporate governance practices” (ASX 2014a, p. 2). Much of the
debate has focussed on the role and responsibilities of BoDs and how they direct and
monitor an organisation’s performance (Dent 2014; Lessing et al. 2012). However,
there is no conclusive definition for corporate governance; therefore, for the purpose
of this study the Governance Institute of Australia’s (2015) definition was selected:
“governance encompasses the systems by which an organisation is controlled and

13
operated, and the mechanisms by which it, and its people, are held to account. Ethics,
risk management, compliance and administration are all elements of governance”.
1.8 Outline of the thesis
The remainder of this thesis is structured in five chapters. Chapter 2 begins by
presenting the theoretical framework for the study, which is followed by a review of
the literature to establish the foundation for the arguments in the subsequent chapters.
Next, Chapter 3 discusses the methodological approach used in the study. Since the
study employed a sequential mixed methods research design, the discussion includes
qualitative and quantitative approaches. The results and data analysis are provided in
Chapter 4. Chapter 5 discusses the issues raised by this research and compares the
results of the analysis of data with the findings in the literature review. Chapter 6
then presents the conclusion, implications for theory, policy and practice, the
limitations of the study and suggestions for further areas of research. Each of these
five chapters is briefly described below.
Chapter 2 commences by grounding the study in the foundations of signalling theory,
which is the theory being employed to provide directionality for the remainder of this
study. Next, the chapter moves on to the literature review, which presents
background information on the evolution of Australian society since the end of
World War II. In this regard, the chapter examines Australia’s transformation from a
predominantly Anglo–Celtic male-dominated homogeneous society to the egalitarian
heterogeneous multicultural society it is today. This is followed by an investigation
of the incongruence between Australia’s heterogeneous society and the homogeneous
composition of Australian boardrooms. Finally, the chapter discusses the incremental

14
changes to the demographic composition of BoDs and how the boardroom needs to
be inclusive of people from demographically diverse backgrounds as all Australians
deserve equality of opportunity and ‘a fair go’.
Chapter 3 commences by describing the philosophical assumptions underpinning the
study. The chapter provides an explanation for the appropriateness of employing a
sequential exploratory mixed methods research design, which has two distinct
phases. In Phase One, qualitative data were collected and in Phase Two, quantitative
data were collected. Next, the chapter provides an explanation for how the
participants in Phase One were selected, their criteria for inclusion and the data
collection and analysis methods used in Phase One. This is followed by a description
of how the participants in Phase Two were selected, their criteria for inclusion and
the data collection and analysis methods used in Phase Two. Chapter 3 concludes by
detailing ethical considerations relating to this study.
Chapter 4 communicates the empirical findings of the thesis. The chapter begins by
providing a profile of the participants that contributed to Phase One. Next, the
chapter proceeds through the various processes for the qualitative data analysis. The
emerging concepts and themes are identified and explained through the use of
template qualitative analysis of data immersion, and open and axial coding, followed
by an intense analysis of each of the probable organisational barriers to demographic
diversity in the boardroom. The intense analysis uses narratives and documentary
evidence from the interviews to demonstrate the qualitative research findings.

15
This is followed by a description of the profiles of the participants that contributed to
Phase Two of the study. The chapter then presents the results of the overall reliability
tests conducted on the sets of questions that related to the organisational barriers to
demographic diversity in the boardroom. This is followed by presentation of the
frequency distributions of the participants’ demographic data and general questions
about diversity in the boardroom. Next, summary statistics are utilised to explain the
primary characteristics of the questions relating to the barriers to demographic
diversity in the boardroom. Finally, Chapter 4 presents the results of statistical tests
used to draw conclusions about the organisational barriers to demographic diversity
in the boardroom identified in Phase One.
Chapter 5 discusses the result of the findings in relation to the research question and
then compares the findings against the background of the theory used to drive the
study and the literature reviewed in Chapter 2. The chapter commences by discussing
Phase One’s dominant internal organisational barrier to demographic diversity in the
boardroom. This is followed by a discussion on five other less dominant barriers to
board diversity found in Phase One. Next, the findings from the quantitative data
analysis for Phase Two are explored. The findings from the inferential statistics that
determined the significance of the relationship between director homogeneity and the
organisational barriers identified in Phase One are discussed. Chapter 5 concludes
with a comparison of the results of the qualitative and quantitative phases.
Chapter 6 brings the thesis to conclusion. The chapter commences by examining how
the study’s aim and objectives were achieved. This is followed by a discussion of the
research findings. Next, the chapter investigates the implications of the study’s

16
findings for theory, policy and practice. The chapter then discusses some limitations
of the study. It concludes by presenting several recommendations for diversity
researchers looking to provide equality of opportunity and ‘a fair go’ for people from
demographically diverse backgrounds wishing to be appointed as INEDs.
1.9 Chapter summary
This chapter has laid the foundations for the study by providing an introduction to,
and an overview of this study. To contextualise the research, the chapter began by
providing background information as to why there is a lack of demographic diversity
at the board level of Australian organisations. Next, the chapter presented its
statement of the problem, which defined what this study would investigate as well as
grounding the research to its geographical region by providing general information
on the Northern Territory. The chapter then outlined the study’s aim and objectives
before presenting the research question being addressed by this study and hypothesis
being tested. Next, the chapter defined several key terms that will be used throughout
the thesis. Finally, an outline of the study was presented to provide a roadmap for the
remainder of the thesis. In Chapter 2, the theory driving the study and relevant
literature are reviewed.
17
CHAPTER 2
THEORETICAL FRAMEWORK AND LITERATURE REVIEW
2.1 Introduction
The purpose of this chapter is to provide an overview of the evolution of
demographic diversity in the boardroom. Although there is a considerable body of
empirical research on the topic of board diversity, the vast majority of the research
has focussed on gender diversity. In more recent times, however, there has been a
growing concern about the need for an inclusive holistic approach to demographic
diversity in the boardroom (Adams 2015; Hillman 2015). The intention of this
chapter is to further contribute to this debate. The chapter provides the theoretical
basis for the study and demonstrates how the research question emerged from a
review of the literature. The chapter also establishes the context for the discussion of
results of the primary analysis of data in Chapter 5.
The chapter commences by examining the relationship between theory and research.
Due to the social nature of this study the relevance of sociology to the study is
discussed. The chapter then outlines the theoretical framework for the study. The
focus of the chapter then shifts to the literature review, which draws on substantive
bodies of research from multiple disciplines. The literature review commences by
examining the changing shape of Australian society before moving on to analyse the
effect of these changes on the nation’s workforce. Next, the chapter explores the
conservative nature of change in the composition of boardrooms in Australia, prior to
exploring the efficacy of boardroom gender diversity. The chapter also examines the
contemporary trend of using voluntary targets or binding quotas for reducing the

18
gender imbalance in the boardroom. The chapter concludes by exploring the growing
concern for a holistic inclusive approach to demographic diversity in the boardroom.
2.2 The theoretical framework
This section begins by exploring the correlation between theory and research. First, it
links the central constructs related to sociology and their relationship to this study.
As “the theoretical framework for all academic research is contained in the literature
review” (Quinlan 2011, p. 109), the next section grounds the research approach used
in this study in a theoretical framework comprised of the central concepts related to
the research question.
2.2.1 The relationship between theory and research
In academic settings, research and theory exist in a symbiotic developmental
relationship where research relies on theory and the evolution of theory relies on
research (Haugh 2012; Ridley 2012; Van de Ven 1989). Theories attempt to explain
phenomena under investigation and inter-relationships found in the real world. The
results and findings of research contribute to the body of knowledge on the
phenomena under investigation as well as strengthening and challenging the accepted
theory (Ertmer & Glazewski 2014). Further, theories in academic research help the
researcher in many functional ways. First, researchers employ theories to provide
intentionality and directionality by assisting them with refining and narrowing their
research field and providing focus for, and an intimate understanding of, the topic
and key concepts under investigation (Babbie 2011). Second, theories inform and
assist the researcher in the study’s design in addition to presenting them with the
investigative tools and analytic techniques needed to fully explore the phenomena
19
under investigation (Quinlan 2011). Therefore, theories help the researcher to gain an
in-depth understanding of what is occurring and contribute to the body of knowledge
on the phenomena being investigated (Machi & McEvoy 2012; Ridley 2012).
2.2.2 Sociology and its relevance to this study
According to Alexander et al. (2012), Haralambos et al. (2013) and Holmes et al.
(2012), sociology falls within the field of social science. It is the scientific study of
human society, social relationships, human behaviour and inequality in society
(Sargent et al. 1997). It also includes investigating social relationships and human
behaviour within institutions and organisations (Van Krieken 2006). These
relationships have relevance to the key concepts grounded in the research question
for this study. The subject matter within sociology is expansive, diverse and eclectic.
It ranges from the divisions of race and social class within society; to the causality of
crime; inequality in the boardroom; and social stability and radical transformational
change in whole societies (Babbie 2011; Van Krieken 2006).
Braunstein et al. (2014), Koall (2011), Psaltis (2012) and Riehl (2000) maintained
that all human beings have needs, wants and desires. The form these take relates to
the attachment humans have to social groupings and their participation in social
institutions, all of which has relevance to Australia’s heterogeneous society and
organisations with homogeneous boardrooms regarding the societal norms and
values prescribing egalitarianism, equality of opportunity, inclusion and diversity. To
better understand the multiplicity and complexity of these broad-ranging human
issues, sociology provides a critical perspective of the social world. It does this by
employing scientific theories and concepts to investigate human behaviours in a
20
systematic way. Sociology builds empirical evidence and helps researchers to gain a
better understanding of how human actions and consciousness both shape and are
shaped by the surrounding cultural and social structures, hence its relevance to this
study (Babbie 2011).
2.2.3 Signalling theory
Signalling theory postulates ‘a’ congruency of information between two parties. The
‘parties’ are the signaller and the receiver. The theory has two principal criteria: “the
signal is both observable and costly to imitate” (Certo 2003, p. 434). Signalling
theory is essentially concerned with identifying, processing and either reducing or
resolving the information asymmetry between these two parties (Bergh et al. 2014;
Miller & del Carmen Triana 2009; Spence 2002).
The creation of signalling theory can be traced to Spence’s (1973) work on labour
market economics. In his seminal article, Spence examined how job applicants seek
to promote their services to prospective employers and how employers are generally
willing to pay higher salaries to prospective employees who are potentially superior
workers. He identified that while the job applicant may know their own level of
ability, the potential employer is not able to observe this intangible attribute. Thus,
there is information asymmetry between the job applicant and the prospective
employer. In ascertaining the root cause of the information asymmetry between the
two parties, Spence’s (1973) work identified that time-consuming and costly
educational credentials can be used by applicants as a tangible observable signal to
prospective employers. This information indicates their level of skill, competency
and abilities; thereby reducing the information asymmetry between the two parties

21
and creating congruency of information as well as distinguishing job applicants
without educational credentials (Connelly et al. 2011).
An analysis of the literature (Broome & Krawiec 2008; Celani & Singh 2011;
Roberson & Park 2007; Tsui 2012) suggested that as a result of Spence’s (1973)
work, signalling theory has evolved and been operationalised in multiple disciplines.
The disciplines of anthropology, economics, sociology, linguistics, psychology and
biology have all used signalling theory (Basoglu & Hess 2014; Bergh et al. 2014;
Connelly et al. 2011). To illustrate, Bliege Bird and Smith (2005) examined the
explanatory value of signalling theory for an assortment of anthropological topics.
They focussed on three social arenas: unconditional generosity, wasteful subsistence
behaviour and artistic or craft traditions. Bliege Bird and Smith (2005) found that
signalling theory has considerable promise for generating novel and powerful
insights in the discipline of anthropology. Further, Connelly et al. (2011) asserted
that signalling theory is a valuable and influential theory for any discipline, including
business management, where there are two parties, information transmission and
information asymmetry.
The central tenet of signalling theory is that there is a signaller, a signal and a
receiver in the information transmission. While Spence’s (1973) research focussed
on the signals job applicants were sending to prospective employers, management
scholars have commonly investigated organisations, management and BoDs as the
signallers (Certo 2003; Dharmadasa et al. 2014; Lester et al. 2006; Roberson & Park
2007). Generally, the signals being transmitted by these parties to their stakeholders
are related to particular aspects of their organisations’ efficiency or effectiveness. To

22
illustrate, in a study of young entrepreneurial organisations, Deutsch and Ross (2003)
argued that the appointment of reputable INEDs acted as a signalling mechanism to
potential investors. These two authors identified that this important non-financial
information provided the legitimacy that young entrepreneurial organisations often
lacked to attract investors. They argued this reduced the information asymmetry
between the organisation and its potential investors.
Nevertheless, “the signaling environment on the whole is an under researched aspect
of signaling theory” (Connelly et al. 2011, p. 62). This study aims to extends the
scope of the signalling ‘environment’ by examining the signals transmitted from
Australia’s heterogeneous society, which is the signaller, to organisations with
homogeneous BoDs, who are the receivers. The signal, in this instance, is the societal
norms and values prescribing equality of opportunity, inclusion and diversity. This
approach was employed to identify the internal organisational barriers that either
prevent or inhibit a BoD receiving these signals and to establish the root cause of the
information asymmetry existing between these two parties.
Akerlof (1970) contended that the premise of information asymmetry, or deviation
from perfect information, is the situation in which at least one party in a contract
relationship, such as lender–borrower or seller–buyer, is unaware of pertinent
information relating to the contractual transaction, providing a commercial advantage
to the lender or seller and disadvantaging either the borrower or buyer. Nevertheless,
numerous authors have further investigated information asymmetry and expanded it
beyond the contractual context and the moral hazards that result from this
information asymmetry (Brent & Addo 2012; Leland & Pyle 1977; Tilles et al.

23
2011). These authors maintained that information asymmetry occurs in any situation
when one party in the information transaction has more, or better, information than
the other party. Rothschild and Stiglitz (1976) stated “[if organisations or]
individuals were willing or able to reveal their information, everybody could be
made better off” (p. 648).
Scholars in the disciplines of business management, human resource management
and behavioural economics have all investigated information transactions and
information asymmetry (Brent & Addo 2012; Connelly et al. 2011; Shapiro &
Stiglitz 1984). In a study of information asymmetry and investor valuation of initial
public offerings (IPOs) Cohen and Dean (2005) asserted that IPOs are characterised
by conditions of uncertainty and information asymmetry between current security
holders and potential investors. These researchers determined that credible top
management teams reduced information asymmetry between these two parties. In the
same way, the current research investigated the information asymmetry between
Australia’s heterogeneous society and organisation’s with homogeneous boards
regarding the societal norms and values prescribing equality, inclusion and diversity.
This approach was used to identify the internal organisational barriers that prevent or
inhibit BoDs from receiving these signals and established the root cause of the
information asymmetry existing between the two parties.
‘Signalling’ theory is a relatively new theory and it has been operationalised by
scholars in the management discipline to investigate the influence of information
transmission and information asymmetry in a variety of research contexts (Bergh et
al. 2014; Certo 2003; Deutsch & Ross 2003; Miller & del Carmen Triana 2009).

24
These diverse contexts include corporate governance, entrepreneurship and human
resource management. Signalling theory in diversity research has generally focussed
on investigating the signals transmitted from BoDs to their key stakeholders and
society (Dharmadasa et al. 2014; Fanto et al. 2011; Rhode & Packel 2014; Roberson
& Park 2007). It has also scrutinised the information asymmetry between the value
of diversity in the boardroom and the linkages to organisational outcomes as well as
compliance to societal norms and the values prescribing equality of opportunity,
inclusion and diversity. In a study on the ethnic and gender composition of the
boardroom, Broome and Krawiec (2008) contended that organisations are now
incorporating ethnic and gender diversity into their BoDs in an effort to meaningfully
convey to their key stakeholders their compliance with these societal norms and
values. Moreover, within the literature on management and diversity “several studies
have extended signaling constructs and integrated the theory with other explanations
of organisational phenomena” (Connelly et al. 2011, p. 46).
Accordingly, the strength of signalling theory in this study is its applicability to
exploring the incongruence and information asymmetry existing between Australian
norms and values and the continued existence of homogeneous BoDs consisting of
predominantly middle-aged white males (Hillman 2015; Wang & Clift 2009).
Moreover, this study was able to “fulfill signaling theory’s criteria that credible
signals must be both observable and costly to imitate” (Certo 2003, p. 437). Within
this study there were a number of credible signals, for example, demographic
diversity in society and the workplace and legislation prescribing egalitarianism and
preventing discrimination. These credible observable signals fulfil Spence’s (1973)
first criterion. Further, “signaling costs are to be interpreted broadly to include

25
psychic and other costs, as well as direct monetary ones. One element of cost, for
example is time” (Spence 1973, p. 359). Collectively, the time and financial costs to
organisations in establishing demographic diversity at the board level to reduce
information asymmetry fulfil Spence’s (1973) second criterion. Signalling theory
also provides a “unique, practical and empirically testable perspective on problems
of social selection under condition of imperfect information” (Connelly et al. 2011,
p. 63). Consequently, this theoretical approach was operationalised to investigate the
information asymmetry existing between Australia’s heterogeneous society and
organisations with homogeneous boardrooms.
2.3 The changing shape of Australian society
2.3.1 The blending of cultures, the way forward for all Australians
Since the end of World War II, Australian society, like numerous other Western
societies, has been the subject of subtle yet profound social changes. Believing that
Australia had narrowly avoided a Japanese invasion, after World War II in 1945 the
country’s government committed to a vigorous and sustained immigration
programme designed to increase Australia’s population (Kirk 2008). The motivation
for this immigration programme was not to increase the demographic diversity of
Australia’s population but to ensure that the nation had a sufficient populace to
provide protection from external threats, to meet its labour shortages and to generate
prosperity for the country (Tavan 2012).
Moreover, to safeguard Australia’s British heritage, the Immigration Restriction Act
of 1901, known as the White Australia Policy, favoured immigrants coming to
Australia from Britain and Ireland (Walker et al. 2003). However, to meet the

26
country’s ambitious immigration targets, the government also negotiated a series of
migration agreements with continental European countries (Walsh 2001). The
countries that were signatories to this arrangement included the Netherlands and Italy
(1951); Austria, Belgium, West Germany, Greece and Spain (1952); and Denmark,
Norway, United States, Switzerland, Sweden and Finland (1954). The immigrants
that arrived in the country were called ‘New Australians’ and were for the most part
Caucasian (Burnett 1998). They were also expected to act in accordance with strict
assimilation policies and to adopt ‘normal’ Australian cultural practices as quickly as
possible (Haebich 2008).
Kirk (2008), Mann (2012), Mason (2010) and Opperman (1966) asserted that the
White Australia Policy remained a guiding force for people migrating to the country
throughout the 1950s and 1960s. Towards the end of the 1960s, however, the federal
government began to relax the immigration policy as they began to acknowledge and
accept that Australia’s “egalitarian philosophy could not be reconciled with a policy
of racial discrimination” (Sherington 1980, p. 151). Moreover, the election of the
Whitlam Labor Government in 1972 saw a significant policy shift from maintaining
a predominantly homogeneous Australia to creating a heterogeneous multicultural
society (Mann 2012). Subsequently, in 1973, multiculturalism became a government
policy; thus, any person could apply to migrate to Australia regardless of their race,
colour, gender, ethnic origin, religion or nationality (Syed & Kramar 2009; Walker et
al. 2003).

27
This change in government policy provided legal equality between British, European
and non-European migrants coming to Australia. The immigrants were selected
based on what they might offer Australian society, rather than their nationality or
race (Van Krieken 2012). The new government policies stipulated that immigrants
must have skills or professional expertise required to fill gaps in Australia’s
workforce, or business experience and investment capital that would directly benefit
the Australian economy (Australian Government 2015). The essence of the policy
shift was to facilitate migrants’ inclusion in Australian society and they were “being
encouraged to preserve their cultures but also that Australia needed to understand
these cultures and vice versa” (Mann 2012, p. 496).
As a result of the successive government’s policies on immigration, from 1945 to
1975 Australia’s population almost doubled, from seven and a half million people to
13 million people with around three million migrants and refugees arriving in
Australia (Australian Government 2015; Sherington 1980). Numerous authors argued
that by the late 1970s, this mass migration transformed the country from being an
overwhelmingly Anglo–Celtic society to a culturally diverse society (Mann 2012;
Pakulski 2014; Syed & Kramar 2009). These diverse migrant communities brought
with them their cultural practices, which were being integrated into Australian
society and, as a direct result, they established a culture of multiculturalism within
Australia (Azmat & Rentschler 2015).
Progressively, the country’s Anglo–Celtic traditions were being “supplemented by
the Australian egalitarian traditions of ‘a fair go’, which stressed the value of
individualism, respect for diversity, tolerant accommodation of difference and

28
concern for individual and group freedom” (Pakulski 2014, p. 33). However, an
analysis of the literature suggested that not all Australians were treated equally and
some often experienced isolation and discrimination (Ho 2008; Jones 1997;
Robinson 2014; Salter 2013). To illustrate, Indigenous Australian’s experienced
institutional racism and received inadequate health services, housing and education.
Also, they did not have ownership of their traditional lands. Moreover, migrants were
often discriminated against and treated as second class citizens; women did not
receive equal pay for equal work; people with a disability were institutionalised and
homosexuality was illegal (Andrews & Curtis 1998; Hamden et al. 2011; Hogan &
Dempsey 1995; Rickard 1996). However, “Australian culture was starting to become
aware of the unfair nature of society and the inequality of its norms, rituals and
values” (Downing 1995, p. 9). This growing awareness warranted new discourses
and policies to remedy these inequalities to provide social justice, equality and ‘a fair
go’ for all Australians (Argy 2006; Greig et al. 2003; Kallen 1996).
In 1972, the Whitlam Labor Government embarked on an assertive campaign of
social reform to address inequalities experienced by multiple Australians (Greig et al.
2003; Thompson 1994). Bryson (1996), Everingham (2001), Oppenheimer (2008)
and Roskam et al. (2012) explained that these social reforms included abolishing the
White Australia Policy and formalising into legislation Indigenous rights, health,
education, immigration, foreign affairs and industrial relations. For instance, this
period saw the promulgation of the Health Insurance Act 1973, Trade Practices Act
1974, Family Law Act 1975, and the Commonwealth Racial Discrimination Act 1975
(National Archives of Australia 2016; Whitlam Institute 2015). Also, although
adopted in full by the subsequent Fraser Liberal Government, the Aboriginal Land

29
Rights Act 1976 was introduced into parliament by the Whitlam Government in 1975
(Mowbray 1998). Moreover, these and other legislative reforms attended to many
inequalities of the period and had a positive effect on the quality of life for countless
Australians. They also established the foundation for further positive social changes
within Australia (Andrews & Curtis 1998; Greig et al. 2003; Macintyre 2009).
According to Azmat and Rentschler (2015), Hogan and Dempsey (1995) and Phillips
et al. (2010), since the shift away from the White Australia Policy in the 1970s,
Australia has gone through considerable demographic, social, cultural, economic and
political change. These authors also contended that Australia has become a vibrant,
multicultural country that is one of the most culturally diverse countries in the world.
As of 2016, Australia had a population of approximately 24 million people, with
migrants arriving from over 200 countries, speaking more than 300 languages and
working in over 1,000 occupations (ABS 2013, 2016b).
Moreover, for Australians who were not treated equally and experienced isolation
and discrimination, advancements have been made to deal with many of these
inequalities. To illustrate, on 13 February 2008, Kevin Rudd, the then Prime Minister
of Australia provided an apology on behalf of Australia for government policies and
laws that inflicted profound grief, suffering and loss on Indigenous Australians
(Rudd 2008). Advancements have been made for females to be given equal pay for
identical work. However, further change is required as women currently earn only
around 80 per cent of men’s wages (McGrath-Champ & Jefferson 2013; Workplace
Gender Equity Agency (WGEA) 2016a). In addition, the process of decriminalising
homosexuality began with South Australia in 1975 and was finalised 22 years later in

30
1997 when the Tasmanian government repealed laws pertaining to homosexuality
(Carbery 2014). Further, in 1986, the Hawke Labor Government introduced the
Commonwealth Disability Services Act 1986. This Act commenced the process of
transitioning people with a disability from residential institutions and integrating
them into their local communities (Parmenter 1999).
Australia is a “nation of immigrants, generally tolerant of differences and open to a
range of cultural influences and styles” (Sheridan 1995, p. 153) and everybody in
Australia is required to uphold the country’s principles and shared values (Stannard
& Thompson 2008; Zevallos 2005). Australian principles and shared values include
respect for equal worth, dignity and freedom of the individual, freedom of speech
and association, freedom of religion and a secular government, support for
parliamentary democracy and the rule of law and equality under the law regardless of
marital status, sex, religion, nationality, sexual preference or disability (Department
of Immigration & Boarder Protection (DIBP) 2016).
While many of these principles and values are shared with other countries, they have
been adapted to Australia’s unique setting, “creating a society that is stable and at the
same time dynamic, cohesive yet diverse” (DIBP 2016, p. 174). The considerable
social, demographic, cultural, economic and political changes in Australia since the
end of World War II have increasingly transformed the nation to become the diverse
egalitarian multicultural society it is today. These changes send an unambiguous
signal that there are many ways of being Australian and that everybody living in the
country deserves equality of opportunity and ‘a fair go’. Further, the changing shape

31
of Australian society has driven changes in the demographic composition of the
country’s workforce.
2.3.2 Diversity in the workplace has become a strategic business imperative
Today’s heterogeneous workforce is notably different from the homogeneous
workforce of the past. Prior to the 1970s, Australia’s workforce was homogeneous,
with a considerable dominant majority and a few visible minorities. The workplace
was also characterised by a marked division of the sexes and their expected roles in
the workforce (Macintyre 2009; Strachan 2010). “The average member of the
workforce of the past was male and white” (Andrews & Curtis 1998, p. 14) and their
function was to be the breadwinner who supported his wife and family; whereas, the
woman’s role was to maintain the family home and raise the children. Women who
worked outside the home were in the minority and generally held traditional ‘female
jobs’, for example, nursing, housekeeper, teaching, retail salesperson or clerical
positions (Perrone et al. 2009; Strachan 2010). Moreover, only certain jobs were
available to people from ethnic backgrounds and people with disabilities were rarely
found in the workforce (Jamieson & O’Mara 1991; Thompson 1994).
The changing demographics of Australian society have resulted in a transformation
in the demographic composition of the country’s workforce. The decade of the 1970s
witnessed an increase of women, people from ethnic backgrounds and people with
disabilities entering the workforce (Australian Institute of Health & Welfare 2012;
Macintyre 2009). Nevertheless, demographically diverse employees were often
segregated, marginalised and experienced discrimination in the workplace
(Braithwaite & Bush 1998). Women often had to deal with sexual harassment, did

32
not receive equal pay for equal work and were often denied career paths (Jefferson &
Austen 2015; Strachan 2010). People from ethnic backgrounds were harassed and
victimised because of their cultural heritage (Thompson 1994). Individuals with a
disability often experienced direct and indirect discrimination (Burnett 1998;
Jamieson & O’Mara 1991). For these reasons, to comply with Australia’s egalitarian
ambitions and provide equality of employment opportunity and ‘a fair go’ for all,
further legislative reform was required to address these and other discriminatory
workplace practices (Andrews & Curtis 1998; Thompson 1994).
Apart from the Racial Discrimination Act 1975, which makes it unlawful to
discriminate in employment on the basis of race, colour or ethnic origin (Australian
Human Rights Commission 2014), a succession of federal governments introduced
further legislative reforms to eradicate discriminatory workplace practices. The
legislative reforms that promote equality of employment opportunity and inclusion in
the workplace included introduction of the Commonwealth Sex Discrimination Act
1984, Affirmative Action (Equal Employment Opportunity for Women) Act 1986,
Occupational Health and Safety Act 1991, Disability Discrimination Act 1992,
Racial Hatred Act 1995 and more recently the Workplace Gender Equity Act 2012,
which replaced the Equal Employment Opportunity for Women Act 1986 (De Cieri &
Olekalns 2001; WGEA 2016b).
These laws prohibit discrimination in the appointment and promotion of employees
on the grounds of sex, sexual preference, gender identity, political affiliation, marital
status, pregnancy, age, religion, physical or mental disability (Strachan et al. 2007).
As a result, the work environment in Australia has evolved into a heterogeneous

33
workforce inclusive of these observable and underlying employee characteristics
(Davis et al. 2016; Härtel & Fujimoto 2015; McShane et al. 2013). However, de
Vries (2015) and Warren and Antoniades (2016) contended that despite the
improvements to date, further change is needed as women and men are not equally
represented at all levels of management. This gender segregation is noticeably
demonstrated at the executive level. Similarly, lesbian, gay, bisexual, transgender
and intersex (LGBTI) equality is a relatively new phenomenon at the executive level,
as LGBTI executives remain hidden in the work environment for fear of harassment
and discrimination in the workplace (Deloitte University Leadership Centre 2013;
Galloway 2012; Human Rights Commission 2014; Rumens 2011).
According to Kramar (2012) and Olsen and Martins (2012), as a direct result of the
changing shape of Australian society and the globalisation of markets, diversity in
the workplace has become a strategic business imperative. Bond and Haynes (2014)
maintained that organisations benefit in many ways from employing people from a
demographic diverse background; attracting and retaining high-quality employees,
increasing employee adaptability and productivity, promoting greater creativity and
innovation and generating different ways of thinking for improved decision making
are some of the positive benefits of workplace diversity (Davis et al. 2016; Gröschl
2011). Further, numerous authors have asserted that employees of organisations that
embrace diversity in the workplace also experience benefits including relief from
discrimination and harassment, greater opportunity for learning and growth,
increased job satisfaction and improved health (Albrecht 2001; Ferdman & Deane
2014; Kirton & Greene 2000). As a result, organisations that can successfully
operationalise diversity in the workplace may possess sustainable advantages over
34
their key competitors. Consequently, organisations are strategically investing into
proactively promoting and managing demographic diversity in their workplaces
(Davis et al. 2016; Pitts et al. 2010).
In recent decades, managing diversity in the workplace has become an important
organisational function. Olsen and Martins (2012) and Sinclair (2006) contended that
diversity management is a key human resource and management function. Its intent
has been to create and maintain a positive work environment in which the similarities
and differences of people are respected and valued. While the aim and purpose of
diversity management is to ensure that all employees reach their full potential and
maximise their contribution to organisational goals and objectives, diversity
management goes far beyond simply hiring demographically diverse workers (Syed
& Pio 2010; Yang & Konrad 2011).
While diversity management does not appear to incorporate BoDs, it does encompass
everything else the organisation does that signals its attitude towards employees and
external stakeholders (Johnston & Malina 2008; Kramar 2012). Organisations can
operationalise numerous strategies to demonstrate their commitment to diversity.
Pitts et al. (2010) and Point and Singh (2003) maintained that some of the most
commonly employed strategies were incorporating demographic diversity into the
organisations values statement; developing policies, practices and processes designed
to manage workplace diversity; developing a diversity statement and advertising it on
the website; and creating other organisational artefacts that reflect the uniqueness of
their diversity management. As an illustration, the Australia and New Zealand
Banking Group Ltd (ANZ) provides comprehensive information on their website
35
regarding their policies on demographic diversity in the workplace (ANZ 2016). As a
further demonstration of their support for diversity, the ANZ became a principal
partner of the Sydney Gay and Lesbian Mardi Gras. They also pioneered a unique
organisational artefact to reinforce their position on diversity to their stakeholders in
the form of ‘GAYTMs’ (see Appendix A). GAYTMs are automated teller machines
that are decorated with the rainbows and rhinestones that are symbolic of the LGBTI
human rights movement (Ghaziani 2015; Gorman-Murray 2012; Wisniewski 2014).
Diversity management has developed into an essential organisational practice. The
ANZ example provides an illustration of the importance that organisations are now
placing on their diversity management practices because “organisations with diverse
employees are better suited to serve diverse external customers” (Patrick & Kumar
2012, p. 14). Since the 1970s, there have been multiple legislative and organisational
changes that have provided equality of employment opportunity to individuals from
diverse demographic backgrounds. This sends an unmistakable signal that Australia
is an egalitarian heterogeneous society with a democratic tradition and commitment
to the rule of law, human rights and equality for all Australians. These “ongoing
demographic changes have transformed Australian society. Nevertheless, they have
not been associated with an increased participation of … [people from demographic
diverse backgrounds] in the boardroom” (Azmat & Rentschler 2015, p. 3).
2.4 Boardrooms: The conservative nature of change
2.4.1 The decline of the ‘old boy’s network’
The boardroom is a place of power, where powerful people meet to talk about the
business of the organisation. Harris (2014), Perrault (2015) and Wang and Clift

36
(2009) contended that traditionally the boardroom has been dominated by privileged
upper and middle class, white, middle-aged men. These homogeneous boards are
commonly part of an informal ‘old boy’s network’ of men from the same schools,
professions, affiliations and exclusive clubs (Randøy et al. 2006; Tremblay et al.
2016). While not necessarily malicious, the ‘old boy’s network’ was, and is,
paternalistic and conservative with “old fashioned attitudes about the role of women”
(Van der Walt et al. 2006, p. 228) and other demographically diverse people being
appointed onto their BoDs.
As a direct result of the cultural, social and legislative reforms that have taken place
in Australia, the acceptance of the notion of the privileged upper and middle class,
white, middle-aged men dominating the boardroom has been increasingly rejected
(Perrault 2015). One of the main forces challenging the homogeneous composition of
the country’s boardrooms has been the women’s movement. Since the 1960s, this
movement has fought to change the power imbalance between men and women that
historically lay at the foundation of society from positions of power-over to power-
with and power-sharing (Andrew & Maddison 2010; Andrews & Curtis 1998).
Hopkins et al. (2008) and Smith (2005) argued that the women’s movement has
actively campaigned for social and legislative reforms on a number of basic human
rights. Both reproductive rights and domestic and sexual violence against women
have been major campaigns for the women’s movement. The movement has also
advocated for equal pay, an end to sex discrimination and sexual harassment in the
workplace, childcare and paid maternity leave (Andrew 2008; Strachan 2010).
Seeking equality of employment opportunity, the women’s movement has fought for

37
the inclusion of women in management and executive positions and for appointments
to the BoDs of Australian organisations (Du Plessis et al. 2014; Smith 2005).
While the structure and composition of Australian boardrooms was a topic of debate
for a number of decades, this debate did not gain traction until a number of high-
profile corporate collapses. To illustrate, “the Australian corporate cemetery of the
1980s contain a number of well-known collapses” (Sarre 2002, p. 1), Alan Bond and
Bond Corporation Holding Ltd, and Christopher Skase and Qintex Ltd are two
examples of the excesses of the 1980s (Carnegie & O’Connell 2014). In the early
2000s, the nation witnessed further high-profile corporate collapses. Ray Williams
and Rodney Adler and HIH Insurance, and One.Tel and Jodee Rich and Brad
Keeling are just two examples of these high-profile corporate collapses (Mirshekary
et al. 2005; Monem 2011).
Clarke (2004), Knott (2002), Sarre (2002) and Thoms (2008) contended that these
corporate collapses were the result of a male-dominated culture of corporate greed,
inept corporate governance practices, unethical behaviour and aggressive executive
practices. In the HIH Insurance collapse, when sentencing Rodney Adler for filing
false and misleading financial statements and failing in his fiduciary duties as a
director of HIH Insurance, Justice Dunford stated:
The offences are serious and display an appalling lack of commercial morality
… Directors are not appointed to advance their own interests but to manage the
company for the benefit of its shareholders to whom they owe fiduciary duties
… They were not stupid errors of judgement but deliberate lies, criminal and in

38
breach of his fiduciary duties to HIH as a director (Australian Securities and
Investment Commission 2005).
Further, the problems resulting from these corporate collapses affected Australia’s
“foreign debt ratios and therefore affected the entire community” (Callaghan &
Wood 2014, p. 287). Consequently, corporate governance came to the foreground as
a way to inhibit and limit the unethical and corrupt business practices carried out by
privileged, white, middle-aged men from the ‘old boy’s network’ and restore the
profound damage caused by these and other corporate collapses (Leung & Cooper
2003; Monem 2011).
Since the 1980s, numerous stakeholders including shareholders, peak industry
bodies, governments, academic institutions and suppliers have campaigned for the
creation and adoption of a new system of corporate governance (Kang et al. 2007).
These changes sought to improve the accountability of management and BoDs to the
organisational stakeholders (Williams et al. 2015). Within Australia, the release of
the Organisation for Economic Co-operation and Development’s Principles of
Corporate Governance in 1999; the ASX’s Corporate Governance Principles and
Recommendations in 2003; and the HIH’s Royal Commission Report in 2003
instigated numerous corporate governance improvements (Cortese 2009; Lipman
2008). Some of these improvements included organisations comprising a balance of
executive directors and non-executive directors; a clear division of responsibilities
between the chair and the managing director; organisations having formal and
transparent procedures for the appointment of new directors; the provision of timely

39
and quality information to BoDs; and the maintenance of organisations’ internal
control systems (Dalton & Dalton 2006; Du Plessis et al. 2005).
An examination of the Australian corporate collapses suggested that “one common
structural fault was the practice of insulating the decision making group from
outsiders” (Howard 2011, p. 429). Therefore, structural change was required and
INEDs emerged as an important governance issue. According to Lipman (2008) and
Williams et al. (2015), the reason INEDs emerged was to address potential conflicts
of interest within the ‘old boy’s network’ and introduce independence into the
boardroom. The role of INEDs is to monitor and evaluate the performance of
executive directors and BoDs. Their role enables INEDs to expose any potential
conflicts of interest or excessive risk taking by applying their independence of
thought, insight and judgement to the decision making processes in the boardroom
(Dunbar 2012).
Over the past 20 years, numerous studies have been undertaken examining the
efficacy of INEDs (Li & Xu 2014; Matolcsy et al. 2004; Siagian & Tresnaningsih
2011; Williams et al. 2015). These studies have established that there are many
benefits provided by independence in the boardroom and that director independence
is essential for the effective operation of any board (Dou et al. 2015). Moreover,
Principle Two of ASX’s Corporate Governance Principles and Recommendations
proposes that BoDs need to have an appropriate number of INEDs. An analysis of
the literature suggested that within ASX organisations, the board’s remuneration,
audit, risk and nominations committees have a majority of INEDs (Dunbar 2012;
Productivity Commission 2009; Williams et al. 2015). However, Heracleous (2001),

40
Matolcsy et al. (2004) and Ritchie (2007) found that some studies have challenged
the effectiveness of organisations having INEDs on their BoDs. Nevertheless, with
directors of organisations like Bond Corporation Holding Ltd, Qintex Ltd, HIH
Insurance and One.Tel “exhibiting fraud, deception and rich men behaving badly”
(Robins 2006, p. 45), the accountability function of INEDs in the boardroom is
crucial for effective strategy development and decision making.
Traditionally, privileged, white, middle-aged men controlling the board kept the
doors to their boardrooms determinedly closed to individuals who were not part of
their ‘old boy’s network’. Nevertheless, the role they played in corporate collapses
received a considerable amount of negative attention and an angry reaction from key
organisational stakeholders and the community (Callaghan & Wood 2014; Carnegie
& O’Connell 2014). Therefore, questions were raised about whether the “traditional
boardroom of a fairly homogeneous groups of individuals really produces the most
effective decisions and strategy for an organisation” (Deloitte Touche Tohmatsu
Limited 2015, p. 2). Azmat and Rentschler (2015) argued that one of the unconscious
and unintended attributes of homogeneity at the board level is ‘groupthink’, which in
layman’s terms is “the [circumstance] where people follow the crowd” (Australian
Institute of Company Directors (AICD) 2008). To achieve agreement and consensus
within the group, individuals over-ride their considered appraisal of alternative
courses of action in the decision making processes. Howard (2011) and Sims (1992)
asserted that groupthink introduces decision biases and blind spots where group
pressure compels directors to ‘go with the flow’ instead of challenging the dominant
view in the boardroom. Further, many corporate governance failures have resulted
from groupthink because some of the consequences of groupthink include illogical

41
and unethical decision making (Ramirez 2003). Therefore, organisations have been
pressured by their key stakeholders and the community to reduce the homogeneous
composition of their BoDs by appointing new directors from a range of backgrounds.
The underlying assumption behind this pressure was that increased demographic
diversity in the boardroom would lead to less insular decision making by BoDs,
thereby helping organisations to avoid the pitfalls of groupthink (Van der Walt et al.
2006; Westphal & Milton 2000).
Collectively, the changing shape of Australian society, improved systems of
corporate governance, the increased role of INEDs and director accountability have
all contributed to signalling society’s expectations for organisations to have diverse
boards. These changes have led to a decline in directors from the ‘old boy’s
network’, which has meaningfully advanced the requirement for greater demographic
diversity at the board level. Consequently, the long-closed door of the boardroom has
finally been jarred open and the issue of demographic diversity in the boardroom has
gained traction.
2.4.2 Incremental changes and the efficacy of diversity in the boardroom
The demographic composition of the boardroom has been a much-debated topic over
the past 20 years, and as a consequence, demographic diversity in the boardroom has
become a reality. Arguably, with the decline of the ‘old boy’s network’ BoDs have
been challenged and “urged to structure their boardroom to serve their needs and to
think about whether they have the right composition to provide the diverse
perspective that today’s business require” (Van der Walt et al. 2006, p. 129). Further,
when it comes to the deinstitutionalisation of the ‘old boy’s network’, it is without

42
question that gender diversity has been the most longstanding and debated topic
(Upadhyay & Zeng 2014). In more recent times, however, ethnic and age diversity
have come to the foreground and been considered valuable contributors to the
demographic composition of the boardroom (Ntim 2015; Singh 2007).
According to Rhode and Packel (2014), “The growing consensus in the corporate
community is that diversity in the boardroom is an important goal” (p. 382).
Noteworthy changes in ASX boardrooms, for example, demonstrate the incremental
changes that have occurred to the demographic composition of their boards. First,
gender-related data from AICD indicated that in March 2009, the percentage of
female directors in the ASX 200 was 8.3 per cent while male directors dominated the
boardroom with 91.7 per cent. In successive years, the number of female directors
increased (AICD 2012). As at March 2016, the percentage of female directors in the
ASX 200 had increased to 23.3 per cent, with male directors making up 76.7 per cent
(AICD 2016). However, as at March 2016 “a total of 20 boards in the ASX 200 still
did not have any women” (AICD 2016).
Second, ethnic-related data from Diversity Council of Australia (2016) and Johl and
O’Leary (2015) identified that there was a 22 per cent increase in directors from
ethnic backgrounds, from 24 per cent in 2004 to 29.2 per cent in 2013. Nonetheless,
ASX organisations remain dominated by Anglo–Celtic directors. Third, age-related
data from AICD (2012) established that the average age of directors in ASX
organisations in 2011 was 58.5 years, which had not changed over the previous four
years. Nevertheless, “female directors are, on average, younger than their male
counterparts (women aged between 50–59 years and men aged between 60–69

43
years)” (AICD 2012, p. 4). In spite of this, the reality is that over the past 20 years,
measurable progress towards increasing the demographic composition of BoDs has
been slow, and boardrooms of Australian organisations have remained dominated by
white, middle-aged men from the ‘old boy’s network’ (Hillman 2015; Terjesen et al.
2009; Van der Walt & Ingley 2003). However, the inclusion of gender, ethnic and
age diversity has provided a much-needed change to the demographic composition of
BoDs (Azmat & Rentschler 2015; Miller & del Carmen Triana 2009).
According to Adams (2015) and Wang and Clift (2009), the demographic changes to
BoD composition have further complemented the improved corporate governance
and accountably role of BoDs. It has also been contended that heterogeneous
boardrooms have access to a broader range of information and knowledge (Randøy
et al. 2006; Terjesen et al. 2009). Organisations with diverse boards experience
numerous benefits including fostering creativity and innovation, generating diversity
of thought, ideas and broader perspectives, creating more efficient and effective
problem solving and decision making (Dhir 2015; Howard 2011; Rhode & Packel
2014). These organisational benefits improve and extend the directors’ range of
thoughts and analyses. Therefore, organisations with heterogeneous BoDs are more
effective than those with homogeneous boards; as a consequence, there is the
potential for greater organisational outcomes.
Improved corporate governance, ethical decision making, performance, reputation
and legitimacy are some examples of the improved organisational outcomes of
demographic diversity at the board level (Arnegger et al. 2014; Harris 2014). In a
study examining the correlation between demographic diversity in the boardroom

44
and an organisation’s financial performance, Erhardt et al. (2003) established that
diversity at the board level is positively associated with an organisation’s return on
asset and return on investment. These authors contended that demographic diversity
in the boardroom positively affects an organisation’s overall financial performance.
Likewise, in a study on governance, diversity in the boardroom and an organisation’s
value, Carter et al. (2003) concluded that there is a positive relationship between
demographic diversity in the boardroom and an organisation’s overall value.
Interestingly, in a study on the influence of INEDs and female directorships on an
organisation’s performance, Terjesen et al. (2016) determined that unless a BoD is
gender diversified, INEDs do not contribute to the organisation’s performance. They
argued that independent female directors enhance boardrooms’ effectiveness.
There are numerous compelling arguments that demonstrate the many advantages of
heterogeneous BoDs. However, an organisation with a diverse board may also
experience a number of disadvantages (Ferreira 2010). These disadvantages may
include conflict, a lack of cohesion and cooperation, divisiveness and increased time
required for decision making (Du Plessis et al. 2014; Ferreira 2010). A study by Van
der Walt et al. (2006) identified that demographic diversity in the boardroom does
not necessarily enhance the performance of BoDs. Despite some possible drawbacks,
studies investigating the efficacy of diversity in the boardroom have generally
acknowledged the under-representation of individuals from diverse demographic
backgrounds in their studies and maintain their results are inconclusive (Campbell &
Mínguez-Vera 2008; Du Plessis et al. 2012). However, organisations that welcome
demographic diversity into their boardrooms “signal the organisations compliance
with the social norms embodied in antidiscrimination laws. Thus, a diverse board

45
could be justified on the grounds that they should demonstrate acceptance of social
values enshrined in the law” (Fanto et al. 2011, p. 931).
Dhir (2015), Fanto et al. (2011), Gul et al. (2013) and Perrault (2015) maintained that
organisations with a heterogeneous board may possess sustainable advantages over
their major competitors. This is because these organisations are better resourced and
better equipped to represent the needs and wants of their workforce and customers as
well as the ever-changing heterogeneous society. The slow decline of the ‘old boy’s
network’ and the incremental increase of gender, ethnic and age diversity at the
board level has provided further legitimacy of society’s expectations for reducing the
homogeneous composition of Australian boardrooms. However, due to the sluggish
nature of this change, Australian society continues to demand greater change, which
includes establishing gender-related voluntary targets or binding quotas to further
increase the number of women in the boardrooms of Australian organisations.
2.5 Please sir, may I have some more?
2.5.1 Society says: What about voluntary targets or binding quotas?
The changing shape of Australian boardrooms has been influenced by the legislative,
cultural and social reforms that have taken place in the country since the 1980s. The
improved systems of governance, director independence and accountability, and the
inclusion of gender, ethnic and age diversity in the boardroom have all contributed to
improving the overall performance of BoDs (Kang et al. 2007). While there has been
some progress, a fairer representation of people from heterogeneous demographic
backgrounds in the boardroom has a long way to go (Azmat & Rentschler 2015;
KPMG International Cooperative (KPMG) 2014). Women constitute more than 50

46
per cent of the Australian population; therefore, it makes sense to have an equal
representation of females in leadership roles (Office of Women 2012). In view of
this, the debate around demographic diversity in the boardroom has generally been
centred on gender as “women’s talents are being underutilised at decision making
levels, in particular at the top level” (Terjesen et al. 2015, p. 233).
Adams (2015), Du Plessis et al. (2014), Klettner et al. (2016) and True (2013) argued
that as a direct result of the persistent under-representation of female directorships,
proponents of boardroom reform, domestically and internationally, have called for a
sizeable increase in the number of female directors. These authors contended that
gender diversity in the boardroom represents the community’s expectations of
reducing the homogeneous make-up of the board by augmenting the heterogeneous
composition of BoDs. Gender diversity would also further improve governance
requirements and boards’ effectiveness. In March 2009, the Australian government’s
Corporations and Markets Advisory Committee (CMAC) published its Diversity on
Boards of Directors report, which advanced the issue of gender disparity in the
boardroom. The CMAC (2009) report recommended that “voluntary targets for the
appointment of more women to a board, or increased diversity by other measures,
may be a useful tool for an organisation that sets itself on this course” (p. 48). While
voluntary targets are not legislated, they are specific measurable objectives with
corresponding timeframes that are determined by BoDs (Ali et al. 2014; Klettner et
al. 2016; WGEA 2016c).

47
Apart from the CMAC, multiple peak industry bodies have supported organisations
using voluntary targets to increase the number of females in the boardroom and in
the workforce (AICD 2009; Australian Institute of Management 2012; ASX 2014b).
To illustrate, in 2009, the ASX introduced changes to their Corporate Governance
Principles and Recommendations, which required all ASX organisations to formulate
and publish a ‘diversity policy’ (KPMG 2014). These strategic changes also included
organisations disclosing, in their annual returns, voluntary targets, whether they had
achieved their targets and ‘if not, why not’. The organisations also needed to disclose
the proportion of females on staff, in senior executive positions and on their BoD
(Klettner et al. 2016; WGEA 2013).
Labelle et al. (2015) and True (2013) asserted that there are many benefits to using
targets for increasing the numbers of females in the boardroom. These researchers
contended that the ‘power-with pull’ approach of establishing voluntary targets
encourages an organisation to progress towards gender equality at a pace that is
sustainable. This approach takes into consideration organisational and boardroom
cultures. Regardless of the organisational category, targets are familiar to and
understood by all organisations. Establishing targets has been applied to many
business practices including marketing, sale performance and business negotiations,
as well as being used as an effective tool to improve employee performance (Härtel
& Fujimoto 2015; McShane et al. 2013). WGEA (2016c) maintained that voluntary
targets set by organisations create ownership of the process, thereby increasing
organisational buy-in and likelihood of success.

48
According to Davies (2015) and Du Plessis et al. (2014) there is international
consensus that a minimum of 40 per cent of a board’s directorship positions should
be comprised of women. In Australia, guiding principles for determining targets for
ASX boards were “set by Women on Boards (WoBs) and Chartered Secretaries
Australia (CSA), of 25 per cent representation of women by 2012 and 40 per cent
representation of women by 2015” (Davies 2011, p. 27). As stated earlier, the
number of women on the ASX 200 boards had slowly increased to 23.3 per cent by
March 2016. However, creating voluntary targets and compelling boards to disclose
whether they have achieved their targets and ‘if not, why not’ has not delivered
sufficient change. Australia has exceeded the 2015 timeframe set by WoBs and CSA:
it has not achieved the 2012 target of 25 per cent and has a considerable way to go
before it will reach the 2015 target of 40 per cent. This indicates that this formal
gesture prescribing equality, inclusion and diversity, sent from Australian society to
homogeneous BoDs is characterised by conditions of information asymmetry.
An analysis of the contemporary literature (Chia 2015; Klettner et al. 2016; Labelle
et al. 2015; Perrault 2015) suggested that more change is required to address white
middle-aged men dominating the boardroom. The considerable under-representation
of females in Australian BoDs has justifiably fuelled requests for more aggressive
measures to be undertaken as there is growing impatience with the glacial rate of
change. Moreover, “it is not difficult to predict that if the right gender balance is not
going to be achieved through the voluntary codes … mandatory quotas of women on
Australian boards will be dictated by legislation” (Du Plessis et al. 2012, p. 223).
However, the issue regarding the need for, and benefits of, setting quotas for

49
increasing the number of women in the boardroom to provide gender equality has
been passionately debated in Australia and internationally.
According to Du Plessis (2014), “Studies and research point to the fact that if you
have more females in the boardroom the organisation will become more profitable.
There is a strong business case for actively placing more women on boards”. Thus,
as voluntary targets for increasing the number of women in the boardroom have not
been successful in bringing about sufficient change, establishing mandatory quotas
would address the gender disparity and guarantee the much-desired change.
Numerous authors have suggested that there are several benefits to applying quotas
for increasing the number of women in the boardroom (Broderick 2011; Dhir 2015;
WGEA 2016c). They maintained that the ‘power-over push’ approach forces the
systemic problem of gender disparity at the board level to the top of the board’s
agenda. The justification for this would be to avoid any punitive measures of not
complying with legislative requirements (Dhir 2015; WGEA 2016c). Further, quotas
will create a critical mass of women in executive roles and compel organisations to
conduct a wider search for female candidates.
While mandatory quotas are a more drastic measure, a number of countries have
adopted legislation requiring organisations to have a particular percentage of female
directorships. For example, Belgium’s quota is 33 per cent; Finland, France, Iceland,
Norway and Spain have quotas of 40 per cent; and Israel has the highest mandatory
quota of 50 per cent (Ali et al. 2014; Catalyst 2014). Interestingly, women make up
over half of Australia’s population and constitute 45 per cent of its total workforce
(Broderick 2009). In spite of these facts, the percentages for mandatory quotas and

50
voluntary targets for increasing the number of women in the boardroom remain
disparate and heavily preferenced towards retaining male-dominated boardrooms.
Apart from Israel, the mandatory quotas applied to these Western countries including
Australia, fall well short of creating equality of opportunity, inclusion and gender
parity in the boardroom.
The opponents of mandatory quotas maintain that there are numerous disadvantages
to organisations being forced to comply with quotas for female directors. According
to Davies (2011), Hillman (2015), Perrault (2015) and WGEA (2016c), mandatory
quotas circumvent natural workplace progression and women should only be
appointed to BoDs on a merit basis. They also asserted that quotas dilute the calibre
of BoDs, affect women’s self-image, are tokenistic and unnecessarily add to an
organisation’s compliance management. Further, mandatory quotas may mean that
high-quality male candidates will be overlooked (WGEA 2016c). One of the most
debated topics from the opponents of quotas has been the suggestion that Australia
does not have enough female executives to fill quotas even if they were introduced.
Nevertheless, in speaking about ASX boards, Broderick (2011) stated “to that I say,
if Norway can find 1,000 suitably qualified women in a population of 4 million,
you’d think Australia could find 500 women in a population of 22 million” (p. 8).
Due to the almost imperceptible rate of change, some of Australia’s most strident
critics of mandatory quotas have supported the possibility of introducing quotas. In
2015, for example, the chair of AICD, Elisabeth Proust stated “if three years from
now we have still not managed to achieve at least 30 per cent female directors on all
ASX 200 boards then quotas is something that has to be put on the table as an
51
option” (Business First Magazine 2015). Increasingly, Australia’s heterogeneous
society has articulated the requisite need for equality, inclusion and demographic
diversity at the board level. However, homogeneous boards have correspondingly
maintained their resistance to assimilating these societal norms and values into their
boardrooms. This indicates that the transmission of information between Australia’s
heterogeneous society and homogeneous BoDs regarding the need for demographic
diversity at the board level, is characterised by conditions of information asymmetry.
While the current focus is on gender diversity and to a lesser extent ethnic and age
diversity, there is mounting concern about the need for a more inclusive holistic
approach to the demographic composition of Australian boardrooms.
2.5.2 Demographic diversity in the boardroom: An inclusive holistic approach
Historically, board diversity has been a hotly debated topic that has generally
focussed on the under-representation of women at the board level. There is, however,
still much uncertainty about what is actually meant by demographic diversity in the
boardroom: “The rule as currently designed suffers from a sort of stylistic anxiety
which translates into a frustrating … [sense of stuckness and rigidity]” (Dhir 2015, p.
231). The stuckness and rigidity around the meaning of demographic diversity in the
boardroom may well be attributed to power and privilege. In 2011, for example, the
then Governor General of Australia, Quentin Bryce, stated “I believe the “old boy’s
network” is a powerful one … No one gives up power and privilege willingly do
they?” (Executive Style 2011). Therefore, to comply with the signals being sent from
Australian society regarding the need for demographically diverse BoDs, questions
have been raised about the inadequate nature of the current interpretation of the
definition of diversity in the boardroom (Adams 2015).

52
ASX’s Corporate Governance Council (2014) and Du Plessis et al. (2012) asserted
that when thinking about diversity in the boardroom it is entirely appropriate to take
into consideration the broader dimensions of diversity. They have recommended a
more progressive and inclusive approach to demographic diversity in the boardroom.
This approach included integrating other observable and underlying demographic
characteristics such as sexual preference, gender identity, physical capability and
marital or family status. Interestingly, this inclusive holistic approach to diversity in
boardrooms is congruent and strategically aligned with the contemporary definition
of diversity in the workplace (Davis et al. 2016; Härtel & Fujimoto 2015). It is
further argued that this definition would also be more representative of Australia’s
heterogeneous society.
It has been contended that “by considering all sources of talent in the recruitment of
directors, progressive organisations with enlightened approaches to diversity achieve
improved performance” (Du Plessis et al. 2014, p. 8). Nevertheless, a review of the
literature indicated that research in this area has concentrated on gender, ethnic and
age diversity with little evidence of studies incorporating the more inclusive holistic
approach to diversity in the boardroom. Further, analysts Adams (2015), Adams et
al. (2015) and Hillman (2015) suggested that this new and enlightened approach to
diversity in the boardroom is in its embryonic stage of development. They therefore
recommended that further studies be undertaken on the demographic composition of
boards to investigate the efficacy of this new approach. Thus, there is a demonstrated
need to investigate this more inclusive holistic approach to demographic diversity in
the boardroom.

53
Adams (2015), CMAC (2009), AICD (2013) and Korn Ferry Institute (2013) argued
that the structure and composition of BoDs affects all organisations with a governing
body. However, almost all of the empirical studies, domestically and internationally,
investigating the various elements of diversity in the boardroom has focussed on
profit-making listed organisations (Arnegger et al. 2014; Carter et al. 2003; Gul et al.
2013; Singh 2007). Nevertheless, a review of the literature indicated that there have
been some studies investigating diversity in the boardroom for NFP organisations
(Azmat & Rentschler 2015; Bradshaw et al. 2009; Harris 2014; Smith 2005).
However, there were no studies identified that examined government organisations
(Terjesen et al. 2015; Tremblay et al. 2016), although the demographic diversity of
government BoDs is sporadically referred to in the literature investigating the gender
composition of boards. Interestingly, while “the progress seems steady for [profit-
making] listed organisations, it should be pointed out that some NFP organisations
… demonstrated much higher female governance representation” (Du Plessis et al.
2014, p. 35). Thus, it could be contended that there is a higher degree of information
congruency for director heterogeneity involving Australian society and the BoDs of
NFP organisations than there is for the boards of profit-making organisations.
This study focusses on profit, NFP and government organisations. A number of
underlying principles led to selection of these three organisational types. First, all
three had governing bodies. Second, no empirical research was identified that had
compared and contrasted the new enlightened meaning to diversity in the boardroom
among these three types of organisations. Third, collecting and analysing data from
the three organisational types will provide further insight into the organisational
barriers that prevent or inhibit homogeneous BoDs receiving signals from Australian

54
society regarding the need for demographic diversity at the board level. Accordingly,
this study aims to identify the root cause of information asymmetry existing between
Australia’s heterogeneous society and homogeneous BoDs.
In reviewing the available literature, the studies investigating demographic diversity
in the boardroom were almost exclusively framed in narrow, geographic terms, with
metropolitan areas being at the forefront of the debate. This was because the vast
majority of studies were focussed on large profit-making listed organisations, so the
organisations under investigation were located in densely populated metropolitan
areas. Therefore, there is an absence of research investigating demographic diversity
in the boardroom in diverse geographical locations. Specifically, there has been no
empirical research undertaken in the Northern Territory to investigate diversity in the
boardrooms of Northern Territory organisations. While there has been general
agreement that demographic diversity at the board level is an important initiative,
restricting the discussion to large profit-making organisations in metropolitan areas
in itself limits the concept of diversity in the boardroom.
Adams and Kirchmaier (2015), Azmat and Rentschler (2015), Ramirez (2003) and
Van der Walt and Ingley (2003) contended that a limitation of the existing literature
is that very few studies have examined the root cause of the under-representation of
people from demographic diverse backgrounds at the board level. They maintained
that a great deal more research is required to achieve a better understanding of the
barriers preventing or inhibiting people from demographically diverse backgrounds
being appointed to BoDs. As Bryans and Stutt (2011) posited, “it may be beneficial

55
to undertake a frank assessment of the current obstacles within organisations which
are contributing to a lack of diversity [in the boardroom]” (p. 32).
Australia’s performance towards tackling the homogeneous composition of its BoDs
continues to be of great concern. The resistance to integrating demographic diversity
in the boardroom is challenging Australia’s cultural pride as an egalitarian country
characterised by equality of opportunity, inclusion, diversity and ‘a fair go’ for all.
While there have been a number of advances made towards creating demographically
diverse boardrooms, the reality is that boards remain dominated by privileged upper
and middle class, white, middle-aged men (Hillman 2015; Wang & Clift 2009). This
lack of demographic diversity in the boardroom indicates that the signals being
transmitted from Australian society regarding the need for director heterogeneity is
characterised by conditions of information asymmetry. Thus, until the root cause of
this information asymmetry has been identified, named, processed and corrective
action operationalised to create congruency of information, the force for change will
not occur and the status quo of homogeneity in the boardroom will continue to be
reinforced.
2.6 Chapter summary
This chapter presented the theoretical basis used to recognise the incongruence
between Australia’s heterogeneous society and the homogeneous composition of the
country’s BoDs. To contextualise the study’s theoretical framework and literature
review, the chapter began by exploring the synergy between theory and research as
well as taking into consideration the relevance of sociology to this study. The chapter
then presented and reviewed the literature in relation to signalling theory, which

56
forms a framework for the present study. The signalling model is well suited to
investigating the difference between Australia’s heterogeneous society and the reality
that BoDs continue to be dominated by privileged, white, middle-aged men. The
signalling model examines the root cause of the information asymmetry causing the
incongruence between Australia’s heterogeneous society and homogeneous BoDs.
The literature review began by considering the general nature of the changing shape
of Australian society since the end of World War II. The research determined that
Australia had a strong Anglo–Celtic immigration policy. This White Australia Policy
became progressively more relaxed, making it possible for people to immigrate to the
country from many parts of the world. These changing demographics and the
increasingly diverse population resulted in a transformation in the composition of
Australia’s workforce. Diversity in the workplace has subsequently evolved into a
strategic business imperative. ‘New Australians’ and other disadvantaged people
have, however, repeatedly encountered social and workplace discrimination. In
response, the government introduced legislative reforms to redress these inequalities,
formalising the country’s position that all Australians deserve equality of opportunity
and ‘a fair go’.
The literature review then considered specific research into the conservative nature
of change with the structure and composition of the boardroom. The research
revealed that while BoDs have been dominated by white, middle-aged men from the
‘old boy’s network’, the lack of governance, director independence and demographic
diversity have seen Australian society demanding much-needed change to remedy
these deficiencies. Improved governance practices, INEDs and gender diversity

57
emerged as the focus of the debate. As indicated in the literature, though there has
been support for improved governance practices and director independence, the
benefits of demographic diversity at the board level have seen mixed results. In spite
of this, Australian society’s reluctance to tolerate homogeneous boardrooms has
emerged as a major issue needing to be addressed.
The chapter then considered the research seeking to increase the demographic
composition of the boardroom. The literature revealed that while Australia has
created voluntary targets to increase the numbers of female directorships, there
continues to be a disproportionate representation of privileged upper and middle
class, white, middle-aged men on BoDs. This has provoked calls from a number of
key stakeholders for the Australian government to establish mandatory quotas for
increasing the numbers of women in the boardroom. The literature does, however,
establish that voluntary targets and mandatory quotas is a much-contested issue.
The literature review concluded by examining the contemporary trend towards a
broader dimension of demographic diversity for BoDs. It determined that a more
inclusive holistic approach to board diversity needed to be considered, including
sexual preference, physical capability, gender identity, ethnicity, age, gender and
marital or family status. The empirical literature primarily focusses on large profit-
making listed organisations, although, there were have been some studies on NFP
organisations. However, there were no studies identified that examined government
organisations and there was an absence of literature that collectively investigated all
three organisational types. Further, the literature revealed that the studies principally

58
focussed on metropolitan areas and there were no studies specifically investigating
demographic diversity in the boardroom of Northern Territory organisations.
Along with this, diversity in the boardroom is varied and continues to be studied.
Even though numerous studies on demographic diversity in the boardroom have been
undertaken, there is a gap in identifying the internal organisational barriers that either
prevent or inhibit people from demographically diverse backgrounds being appointed
to organisations’ BoDs. The next chapter explores the methodology by which the
research question ‘What are the internal organisational barriers to people from
demographically diverse backgrounds being appointed as independent non-executive
directors of Northern Territory organisations?’ will investigate the observable and
costly signals needed to reduce the information asymmetry existing between
Australia’s heterogeneous society and homogenous BoDs.

59
CHAPTER 3
METHODOLOGY
3.1 Introduction
The purpose of this chapter is to provide an outline of the methodology as well as the
data collection and data analysis processes employed in this study. The central aim of
the study was to identify the internal organisational barriers that inhibit people from
demographically diverse backgrounds being appointed as INEDs of Northern
Territory organisations. The research was undertaken from the perspective that
information asymmetry exists between Australia’s heterogeneous society and the
country’s homogeneous BoDs. Therefore, as “one of the most important decisions to
be made in any research is the decision about methodology” (Quinlan 2011, p. 181),
this chapter argues that a sequential exploratory mixed methods research design was
appropriate for ascertaining the barriers to demographic diversity in the boardrooms
of Northern Territory organisations.
To provide a depth to the research structure and design, the chapter begins with a
discussion on the research question and methodological approach used for the study.
As this study used a sequential exploratory mixed methods research design, the
chapter then describes the selection of participants and the criteria for their inclusion
in the qualitative phase of the study. The qualitative data collection and analysis
method utilised are then outlined. Next, the chapter describes the selection of
participants and the criteria for their inclusion in the quantitative phase of the study.
This is followed by a discussion on the quantitative data collection and analysis
method utilised in this study. The chapter concludes with a discussion on the ethical
considerations for this study.

60
3.2 The research question and the methodological approach
3.2.1 The research question
Australia’s performance towards reducing the homogeneous composition of its
boardrooms continues to be of great concern. Further, the resistance to integrating
demographic diversity into BoDs is challenging Australia’s cultural pride as an
egalitarian multicultural society characterised by equality of opportunity, inclusion,
diversity and an environment that provides ‘a fair go’ for all Australians. Therefore,
this study is interested in understanding the conundrum posed by the research
question:
What are the internal organisational barriers to people from demographically
diverse backgrounds being appointed as independent non-executive directors of
Northern Territory organisations?
The experiences, perceptions and interpretations of experiences by the participants of
the study are fundamental to this question. Their experiences will assist in identifying
the perceived internal organisational barriers that prevent or inhibit homogeneous
BoDs receiving messages from Australia’s heterogeneous society regarding the
requirement for diversity in the boardroom. Further, the study’s findings will have
implications for understanding the root cause of the information asymmetry between
these two parties. This will enable consideration and operationalisation of corrective
action to generate congruence of information, sanctioning a more inclusive holistic
approach to demographic diversity in the boardroom.

61
3.2.2 Sequential mixed methods research and its applicability to this study
Creswell (2009), Johnson et al. (2007) and Teddlie and Tashakkori (2009) contended
there are three research paradigms: quantitative, qualitative and mixed methods
research. While “qualitative methods and quantitative methods involve differing
strengths and weaknesses” (Patton 2002, p. 14), neither of these two methods was
sufficient by itself to capture an adequate amount of objective information about the
research topic. As a result, this study used a mixed methods research design. One of
the advantages of using mixed methods is that it is grounded in a philosophy of
pragmatism that can accommodate singular or multiple realities, thus providing the
flexibility to combine inductive and deductive thinking (Cabrera 2011; Creswell
2009; Stoller et al. 2009). This provides researchers with the capacity to focus on a
research problem and “use all approaches available to understand the problem”
(Creswell 2014, p. 10).
There is, however, a range of typologies for categorising the different types of mixed
methods research as they can occur concurrently or sequentially and can be
explanatory, exploratory or transformative (Creswell & Plano Clark 2011). Larkin et
al. (2014) and Mason et al. (2010) contended that sequential exploratory mixed
methods research is an ideal design when little is known about a phenomenon, as this
approach provides a more comprehensive understanding of the research problem.
Thus, as little is currently known about the barriers to diversity in the boardroom of
Northern Territory organisations, this study employed a sequential exploratory mixed
methods research design, as illustrated in Figure 3.1. By using this method, it was
anticipated that the linkages between the internal organisational barriers to diversity

62
in the boardroom and the information asymmetry existing between Australia’s
heterogeneous society and homogeneous BoDs would be clearly understood.
Creswell (2014) and Teddlie and Tashakkori (2009) contended that the sequential
exploratory mixed methods design is grounded in two distinct phases. The first phase
of the research involves collecting and analysing qualitative data, which are then
used to inform the development of a quantitative instrument for the second phase of
the research. The second phase involves administering the quantitative instrument to
the sample population, followed by an analysis of the quantitative data. The study
concludes with the researcher interpreting the results from both the qualitative and
quantitative findings (Cameron 2009; Creswell 2014; Mason et al. 2010).
There are a number of compelling arguments that demonstrate the benefits of using
sequential exploratory mixed methods research. An analysis of the literature
suggested that some of the advantages included providing flexibility to the researcher
in collecting data from differing sources and being able to attend to a range of
exploratory and confirmatory questions (Bryman 2006; Johnson et al. 2007; Larkin
et al. 2014). Creswell and Plano Clark (2011), Larkin et al. (2014) and Mason et al.
(2010) also maintained that sequential exploratory mixed methods research provides
researchers the opportunity to consider a greater range of divergent views as well as
providing stronger inferences about the topic under investigation.

63
Figure 3.1: Sequential mixed methods design: How this study was conducted
Identifying barriers and
information asymmetry
Informs
Informs
Using personal experiences that
informed the genesis of the study
Gathering data from the literature on
concepts and themes
Establishing concepts and themes for
the in-depth responsive interviews
Interpretation
Phase One: Qualitative data
collection
Study One and Study Two Generating qualitative data from
interviews with two data sources
Analysing qualitative data
Establishing concepts and
themes for the quantitative
instrument
Phase Two: Quantitative data
collection
Study Three
Developing quantitative instrument,
using pre-existing information and
results of the qualitative study
Pre-testing survey
Generating quantitative data from
an online web survey
Analysing quantitative data

64
However, there are also several challenges with using sequential exploratory mixed
methods research. According to Cameron (2009), Davis et al. (2011), Johnson et al.
(2007) and Larkin et al. (2014), these challenges include the absence of clarity as to
when and at what level the methods are mixed, as well as there being an over-
emphasis on positivism. They also suggested that integrating methodologies and
methods without a clear rationale are additional challenges. However, “the main
benefit of using mixed methods is that it produces better research—because you can
answer questions with one method that can’t even be posed within the framework of
another” (Davis et al. 2011, p. 471).
Regardless of the methodologies and methods utilised, validity and reliability are of
the highest importance in all empirical studies if they are to be viewed as being
dependable, creditable and accurate (Davis et al. 2011). Researchers who employ
mixed methods research acknowledge that all research methods have limitations and
that the biases in one method could annul the biases in a different method (Cabrera
2011; Creswell 2014). As a result, one way to further strengthen a mixed methods
research design is through triangulation of data sources. An analysis of the literature
suggested the concept of triangulation entails combining multiple data sources to
study the same social phenomenon to verify the results (Flick 2014; Neuman 2006;
Teddlie & Tashakkori 2009).
According to Bryman (2006), Cameron (2009) and Davis et al. (2011), triangulation
is the operation of different types of data collection techniques to investigate the
same variables. Also, triangulation guards against bias, which increases the validity
of a study’s findings. When multiple methods lead to the same research findings, the

65
confidence in those findings is increased (Flick 2014; Sandelowski 2000). Moreover,
“triangulation of data sources as a way of seeking convergence between qualitative
and quantitative approaches has occurred within mixed methods research” (Mason et
al. 2010, p. 435). While there are multiple ways in which triangulation is possible,
the triangulation of data sources involves the assemblage of data from different
sources within the field of research (Creswell 2014; Teddlie & Tashakkori 2009).
In this study, there were two data collection phases and triangulation was
accomplished by the use of three independent data sources as illustrated in Figure
3.1. In Phase One, there were two data sources from which information relating to
the same research question were obtained. The first data source was responsive in-
depth interviews with INEDs from demographically diverse backgrounds. The
second data source was responsive in-depth interviews with spokespeople from peak
bodies. The collection of qualitative data served to uncover the salient concepts and
themes on the internal organisational barriers preventing or inhibiting homogeneous
BoDs receiving messages from Australia’s heterogeneous society regarding their
requirement for demographic diversity in the boardroom. This method was used to
discover and make inferences about the existing information asymmetry between
these two parties that would have otherwise remained undisclosed. The results of the
data collected from Phase One informed the data collection for the quantitative phase
of the study.
In Phase Two of this study, the third data source was an online survey that was sent
to multiple independent and non-independent directors of Northern Territory
organisations. The collection of quantitative information served to quantify the

66
observations from the qualitative phase of the study relating to the internal
organisational barriers that either inhibit or prevent homogeneous boards receiving
messages from Australia’s heterogeneous society. It was anticipated that the
combination of results from the qualitative and quantitative phases of the study
would enhance and maximise the reliability and validity of this study.
3.3 Phase One: Qualitative research method
The first methodological approach used in this study was based on the constructivist
paradigm, which falls within the realm of qualitative research (Denzin & Lincoln
2011; Neuman 2006). Athens (2010) and Bisman and Highfield (2012) argued that
qualitative research is inductive and exploratory in nature with concepts and themes
emerging from the data. Further, qualitative research has been applied in almost
every field of social science and it has made a valuable contribution towards
emphasising the importance of social context for understanding the social world
(Jovanović 2011; Parylo 2012; Scott & Garner 2012). “Qualitative research is a rich,
diverse and complex field” (Braun & Clarke 2013, p. 19) that is typically
characterised as soft, flexible and speculative and has as its major aim the discovery
of subjective meanings from data collected in the research process (Denzin &
Lincoln 2011; Patton 2002).
Qualitative research occurs in natural settings where human behaviour and events
occur. It begins with examining empirical data and moves towards concepts and
themes (Corbin & Strauss 2008; Teddlie & Tashakkori 2009). An analysis of the
literature suggested that the data that emerges from a qualitative study are descriptive
in nature (Braun & Clarke 2013; Denzin & Lincoln 2011; Scott & Garner 2012;

67
Somekh & Lewin 2005). That is, qualitative data are collected in the form of words
or pictures from observations or documents rather than the mathematical models or
statistical tables utilised in quantitative research. Numerous authors have suggested
that once a researcher becomes immersed in the data, they capture and discover the
principal concepts of the research that appear in the form of themes, motifs,
generalisations and taxonomies (Astin & Long 2014; Creswell 2014; Patton 2002;
Quinlan 2011). The data analysis then proceeds by extracting the concepts and
themes from the evidence and organising the data to present a coherent picture of the
topic under investigation (Corbin & Strauss 2008). The main focus of qualitative
research is on the participants’ perceptions and personal experiences and the way
they make sense of their lives and the world. It is an attempt to understand not one,
but multiple realities (Astin & Long 2014; Braun & Clarke 2013; Flick 2014; Scott
& Garner 2012).
Denzin and Lincoln (2011), Miles et al. (2014) and Parylo (2012) specified that the
use of qualitative research is particularly relevant in situations where little is known
about a social phenomenon. For that reason, as no empirical research currently exists
to explain the internal organisational barriers that prevent or inhibit homogeneous
BoDs receiving signals from Australia’s heterogeneous society regarding its requisite
for diversity in the boardroom, qualitative research was applicable to this study. The
purpose of the qualitative phase was to cultivate a deeper understanding of the
internal organisational barriers to people from demographically diverse backgrounds
being appointed as INEDs of Northern Territory organisations. Moreover, the
qualitative phase was undertaken to develop a reliable measurement instrument for
the quantitative phase of this study.

68
3.3.1 Selection of participants
One of the most important tasks in a study’s design phase is to identify and select the
most appropriate participants for the study (Creswell & Plano Clark 2011; Wilson
2014). Guest et al. (2006), Sandelowski (2000) and Sargeant (2012) maintained that
the participants selected for a study should be based on the research question, the
theoretical perspective and the empirical evidence informing the study. Accordingly,
to identify the linkages between the internal organisational barriers to demographic
diversity in the boardroom and the information asymmetry existing between
Australia’s heterogeneous society and homogeneous BoDs, Phase One of the study
required investigation of two groups of participants. As indicated in Table 3.1, the
first group of participants comprised INEDs from diverse demographic backgrounds
and the second group of participants consisted of spokespersons from peak bodies.
Table 3.1: Participants in Phase One
Phase One
Group One: Employing a qualitative methodology
Participants Independent non-executive directors from diverse demographic
backgrounds
Group Two: Employing a qualitative methodology
Participants Spokespersons from peak industry bodies
As the study used a sequential exploratory mixed methods research design, the time
and expense required to identify, interview and survey the entire target populations
for the qualitative and quantitative phases would make such a study prohibitive.
Thus, a sample of participants from both phases of the study was selected. Lune et al.
(2010) and Wilson (2014) contended that when conducting research, the sample of
participants should ideally be representative of the target population. It is, however,

69
difficult to evaluate a population to verify its overall representativeness; in practice,
it is extremely unlikely that a perfect representativeness can be determined (Creswell
2014; Neuman 2006). Further, due to the uniqueness of the topic under investigation
the researcher held the view that some participants were more suitable for this study
then other participants. Consequently, the study used the non-probability purposive
sampling technique to select participants for Phase One and Phase Two.
An analysis of the literature suggested that with non-probability purposive sampling,
participants should be selected to be part of the sample with a specific purpose in
mind (Creswell 2014; Denscombe 2014; Guest et al. 2006; Lucas 2014). Purposive
sampling entails choosing the sample of participants based on the researcher’s
knowledge about the data sources to be sampled as they actively select the most
productive sample to answer the research question (Creswell & Plano Clark 2011;
Lunenburg & Irby 2008; Mason et al. 2010). Therefore, the researcher selects the
participants based on “the criterion for inclusion in the research which is the capacity
of the participants to inform the research” (Quinlan 2011, p. 213). Moreover,
purposive sampling is characterised by a deliberate effort by the researcher to gain a
representative sample by purposefully selecting key participants on the topic under
investigation (Lucas 2014; Mason et al. 2010).
The rationale for selecting INEDs from demographically diverse backgrounds was
that they may have experienced or been affected by internal organisational barriers in
the process of either being appointed to their positions or throughout the terms of
their directorships. A purposefully selected sample of 10 INEDs provided the means
to investigate the population of this cohort. The exploration of this sample allowed
70
for the examination of the organisational barriers to diversity in the boardroom and
the potential linkages to the information asymmetry existing between Australia’s
heterogeneous society and homogeneous BoDs. Responsive in-depth interviews were
conducted as discussed in Section 3.3.3 and analysed as outlined in Section 3.3.4.
This identified a number of salient concepts and themes relating to the organisational
barriers that either prevented or inhibited homogeneous BoDs receiving signals from
Australia’s heterogeneous society regarding the need for diversity at the board level.
Hence, these concepts and themes informed the quantitative phase of the study.
Peak bodies exist in many Australian industries and they are generally created to
develop industry standards and policies in addition to promoting and representing the
interests of their members (Cheverton 2005). For that reason, a purposively selected
sample of peak industry bodies representing organisations with BoDs provided the
means to investigate this particular cohort. The exploration of this sample allowed
for the examination of the internal organisational barriers to demographic diversity in
the boardroom and the potential linkages to the information asymmetry existing
between Australian society and homogeneous BoDs. Responsive in-depth interviews
were conducted as discussed in Section 3.3.3 and analysed as outlined in Section
3.3.4. The concepts and themes that emerged from these two groups of participants
were then compared and, in conjunction with the literature review, used to develop
an online web survey for the quantitative phase of the study.
3.3.2 Criteria for inclusion in Group One and Group Two
There were a number of criteria for inclusion in Group One. First, the participants
needed to be serving as INEDs of a Northern Territory profit, NFP or government

71
organisation as well as self-identifying as being from a diversity category. The next
criterion was that they were willing to participate in the study as an informant to
discuss any internal organisational barriers they experienced in either the process of
being appointed to their position or in their role as a director. Email contact was
established with participants of Group One through the researcher’s networks and by
conducting an Internet search of Northern Territory organisations with INEDs.
There were a number of criteria for inclusion in Group Two. First, peak industry
bodies were required to represent or have an interest in Northern Territory
organisations with BoDs. The next criterion was that the body also had a position
and/or policies on demographic diversity in the boardroom. The final criterion for
inclusion was that the spokesperson was agreeable to participate as an informant to
discuss their organisation’s position on demographic diversity in the boardroom.
Contact was made with the participants from Group Two through a database of peak
industry bodies representing Northern Territory organisations with BoDs developed
by the researcher.
3.3.3 Data collection method
Creswell (2014), Lune et al. (2010), Quinlan (2011) and Vogt (2014) asserted that
data collection is the systematic approach to gathering information from a variety of
sources to acquire a comprehensive and accurate picture of a phenomenon under
investigation. Researchers should employ data collection techniques that emphasise
meaning and experience that relate to the topic being investigated (Denscombe
2014). Moreover, a “scientist gathers data using specialised techniques” (Neuman
2006, p. 8); hence, Phase One utilised responsive in-depth interviews to collect data

72
from the participants. This specialised technique was selected to elicit important
information from the participants relating to the internal organisational barriers that
inhibit homogeneous BoDs receiving signals from Australia’s heterogeneous society
regarding the need for demographic diversity in the boardroom.
Face-to-face and telephone responsive in-depth interviews are a powerful mechanism
for collecting information from participants in a study (Block & Leseho 2005; Braun
& Clarke 2013). Therefore, this technique was selected as the primary method for
collecting the qualitative data. The purpose of the responsive in-depth interviews was
not to elicit the answers to questions but to fully understand the lived experience of
interviewees and the meaning they make of their experiences relating to the topic
being investigated (Kvale & Brinkmann 2009; Marshall & Rossman 2006; Roulston
2010). This allows the respondent and researcher to explore a deeper understanding
of the research question.
Irvine et al. (2013), Lucas (2014), Roulston (2010) and Rubin and Rubin (2012) in
their instructions for conducting successful responsive in-depth interviews listed a
number of essential characteristics of qualitative interviewing:
a) Interviews are modifications or extension of ordinary conversations, however,
with an important distinction of directionality.
b) The content of the interview as well as the flow and choice of topics changes to
match what the individual interviewee knows and feels.
c) Interviewers are more interested in the understanding, knowledge and insights
of interviewees than in categorising people or events in terms of academic
theories.

73
In this study, the responsive in-depth interviews were employed to comprehensively
engage in exploring the lived experiences of the cohort of participants from Phase
One. As a result, the researcher collected data from two independent data sources
relating to the same research area. In the first instance, however, a pre-test of the
non-leading open-ended questions was conducted. Six individuals assisted with pre-
testing eight questions to “ensure that any potential problems were identified and
eliminated” (Frazer & Lawley 2000, p. 33). This gave the researcher the opportunity
to refine each question’s concept and wording. The responsive in-depth interviews
with the 10 participants were arranged via telephone during October 2016 and were
conducted by the researcher throughout October and November 2016. Sixty minutes
was allocated to complete each of the interviews; however, the interviews ranged
from 60 minutes to 120 minutes.
According to Block and Leseho (2005), Elmir et al. (2011), Ginger (2007) and Kvale
and Brinkmann (2009) it is important for the interviewer to build rapport with
participants prior to them being interviewed. These authors maintained that building
rapport with participants creates a climate of mutual trust between the interviewer
and interviewee, creating an environment for open dialogue. Moreover, the “better
the quality of the relationship between the interviewer and the interviewee, the richer
the quality of the data elicited” (Ryan & Dundon 2008, p. 443). In an attempt to build
rapport, prior to each interview commencing, the interviewer took time to connect
with each of the participants by offering general background information about
himself, which was followed by seeking general background information about each
of the interviewees.

74
The researcher then moved on to outline the process for the interview by explaining
to the participants the study’s aim and key terms used in the study, the estimated time
the interview would take, that their participation was voluntary, their right not to
discuss sensitive issues and their right to withdraw from the study at any time. The
interviewer reassured interviewees that their confidentiality would be maintained at
all times. Moreover, as “audio recording of interviews is commonly undertaken”
(Fernandez & Griffiths 2007, p. 8), the interviewer sought written permission from
the interviewees to record the interviews as a means of accurately capturing the
interview data. Once the consent form was signed by the interviewee, the researcher
commenced the interview.
While there were some non-leading, open-ended questions prepared in advance from
the themes outlined in the literature review and experience in the field, the interviews
were unstructured and responsive to the interviewees (Gubrium 2012; Josselson
2013; Rubin & Rubin 2012). Block and Leseho (2005), Ginger (2007) and Ryan and
Dundon (2008) argued that this requires the interviewer to engage in active listening
and attending skills. Further, these researchers emphasised that interviewers obtain a
great deal more information from people about their experiences if they make contact
with the interviewees and encourage them to talk freely about themselves rather than
asking a lot of questions. The conversations with the interviewees from Group One
and Group Two took a natural course of engagement and were allowed to flow
organically. The audio-recorded interviews were transcribed at a later date into a
Word document and assigned with the participant’s allocated numbers. Further, to
protect their privacy, all interviewee’s names were substituted with a pseudonym.
75
3.3.4 Data analysis method
A review of the literature suggested that the data analysis methods should correspond
with the aim and objectives of the study so that each analysis of data provides
evidence relating to the topic under investigation (Creswell 2014; Denscombe 2014;
Grbich 2013; Vogt 2014). Because qualitative research is inductive in nature,
inductive analysis is undertaken, which means that words, phrases, patterns, themes
and concepts emerge from the data (Miles et al. 2014). There are however, “few
agreed on canons for qualitative data analysis, in the sense of shared ground rules for
drawing conclusion and verifying their sturdiness” (Patton 2002, p. 432). As a result,
to analyse the data from the 10 interviews, the researcher manually operationalised
the qualitative data analysis model described by Quinlan (2011), which involved data
immersion, open and axial coding and building a valid argument for selecting each
theme from the qualitative data.
The analysis of qualitative data comprised an analysis for similarities and differences
in the participants’ responses. As the interviews were audio recorded, they were first
transcribed word for word. The 10 transcripts were then manually coded with the aid
of an independent person trained in coding techniques, to identify the concepts and
interim themes in the data. The themes identified from the data coding process then
underwent an intense analysis by focussing on one theme at a time to build a
compelling and valid argument for selecting each organisational barrier. Also,
throughout the data analysis process, the concepts and themes that developed from
the analysis were compared to the literature concerning the evolution of demographic
diversity in the boardroom.

76
3.4 Phase Two: Quantitative research method
The second methodological approach used in this study is based on the positivist
paradigm and falls within the realm of quantitative research. Quantitative research is
deductive in nature as “you may have ideas about how the world operates and want
to test these ideas against hard data” (Neuman 1997, p. 46). Also, quantitative
research is a formal, objective and rigorous process concerned with the systematic
investigation of social phenomena by examining the relationships between concepts
or ideas (Creswell 2014). Quantitative research does this by using mathematical
models, statistical tables, graphs and the testing of hypotheses to draw conclusions
about social phenomena (Bergman 2008; Quinlan 2011). Also, several authors have
maintained that a central tenet of quantitative research is the generalisability of the
findings (Andres 2012; Somekh & Lewin 2005). For that reason, for generalisation
to be possible, a sample representative of the whole population is necessary and
replication is assumed (Neuman 2006; O’Mara-Eves & Thomas 2016; Teddlie &
Tashakkori 2009).
Bergman (2008), Creswell (2014) and Neuman (2006) contended that quantitative
research is customarily characterised as ‘hard’, fixed and value-free, “involving
measurement and assumes that the phenomena under investigation can be measured”
(Watson 2015, p. 44). These authors also maintained that unlike qualitative research,
which allows unlimited expression from the participant’s responses, quantitative
research uses highly structured, rigid techniques such as surveys, including online
web surveys, which rely on responses to pre-formulated questions. Analysts Patton
(2002) and Teddlie and Tashakkori (2009) contended that one of the advantages of
using quantitative research is that the researcher can measure the reactions of a great

77
many people to a limited set of questions. This methodological approach facilitates
the comparison and statistical aggregation of data. In quantitative studies, the process
of measurement is critical and commences after the researcher has conceptualised the
concepts to be studied, formulated the research question, determined the variables
and “refined it into testable hypotheses or statements about causal relationships with
at least two variables” (Neuman 1997, p. 133).
In this study, the dependent variable was demographic diversity and the independent
variables were the organisational barriers identified in Phase One. The quantitative
phase of the study provided data that were analysed using Statistical Package for the
Social Sciences (SPSS) software and presented in statistics, graphs and tables, which
allowed for investigation of the study’s null hypothesis:
There are internal organisational barriers to people with demographically
diverse backgrounds being appointed as independent non-executive directors of
Northern Territory organisations.
The aim of Phase Two was to collect quantitative data and conduct mathematical
measurements on the relevant independent variables discovered in the qualitative
phase of this study. Further, the collection of quantitative data enabled the researcher
to measure the degree of influence these organisational barriers had towards either
preventing or inhibiting homogeneous BoDs from receiving signals from Australia’s
heterogeneous society regarding the requirement for diversity in the boardroom.

78
3.4.1 Selection of participants
The quantitative phase of the study comprised 14 purposefully selected organisations
in the Northern Territory with INEDs on their BoDs. These organisations were
selected from the three geographical regions in the Northern Territory: outer
regional, remote and very remote. Moreover, as the quantitative phase of the study
also employed non-probability purposive sampling, a calculated attempt was made
by the researcher to acquire a representative sample of profit, NFP and government
organisations from the three geographical regions of the Northern Territory. A total
of 30 independent and non-independent directors participated in an online survey.
Bergman (2008), Chudleigh and Smith (2015), Denscombe (2014) and Lune et al.
(2010) maintained that a common goal of quantitative research is to collect data that
is representative of a population. These researchers also asserted that the sample size
in quantitative studies is often much larger than that in qualitative studies because the
findings are more likely to be generalised to the entire population of the topic being
investigated. Nevertheless, as the population of boardrooms with INEDs in the
Northern Territory is relatively small, and “for small populations researcher needs a
large sampling ratio (about 30 per cent)” (Neuman 2006, p. 241). In this study, 30.3
per cent of the identifiable independent and non-independent directors were surveyed
to verify the results of the qualitative component.
The rationale for selecting independent and non-independent directors for Phase Two
was that directors would have experiential knowledge of any internal organisational
barriers to demographic diversity in the boardroom. They would also have a
functional, operational knowledge of the signals being sent from Australian society

79
regarding the requirements for diversity in the boardroom. Therefore, a purposefully
selected sample of profit, NFP and government organisations with INEDs provided
the means to investigate the population of Northern Territory independent and non-
independent directors. This sample allowed for the verification of emergent themes
from the qualitative phase relating to the linkages between the organisational barriers
to diversity in the boardroom and the information asymmetry existing between
Australia’s heterogeneous society and homogeneous boards. The online web survey
was conducted as outlined in Section 3.4.3 and analysed as outlined in Section 3.4.4.
3.4.2 Criteria for inclusion in Phase Two
There were a number of criteria for inclusion in Phase Two. First, only participants
from Northern Territory profit, NFP and government organisations with INEDs on
their BoDs were selected for this study. The next criterion was that participants were
required to be currently serving as either independent or non-independent directors.
As there are multiple NFP organisations in the Northern Territory, a specific criterion
for NFP sectors was that only large organisations with a high annual financial
turnover were selected for inclusion in this study. Another criterion for the NFP
sectors was that the organisations needed to be representative of the Northern
Territory’s NFP sectors. The NFP sectors represented within this research included
Indigenous-specific, health, cultural, arts, multicultural and sports organisations.
Within government organisations, all government-owned corporations were included
in the study. However, as there were multiple statutory organisations, only Senior
Commercial and Assets Management Class A1 organisations with annual director
remunerations were selected for inclusion in the study. Contact was made with the

80
participants of Phase Two through a database of purposefully selected profit, NFP
and government organisations with INEDs on their BoDs created by the researcher.
3.4.3 Data collection method
The Internet is a powerful tool for collecting data from people that has achieved
significant and growing support for scholarly research purposes (Blair et al. 2014).
For that reason, in the quantitative phase of the study, an online web survey was
chosen as the primary method of collecting information from the participants: “The
use of online surveys has increased dramatically over the past several years” (Andres
2012, p. 50). As a data collection tool, the Internet offers distinct advantages over
traditional survey methodologies. Some advantages of an online survey include
notable cost and time efficiencies, providing anonymity to the participants, that
sequencing of questions can be programmed to provide a seamless series of
questions, and easy access to large and remote populations (Andres 2012; Mellinger
2015; Ritter & Sue 2007).
The online survey was used to collect primary data with the aim of discovering the
root cause of the information asymmetry existing between Australia’s heterogeneous
society and homogeneous BoDs that has either prevented or inhibited demographic
diversity at the board level. In the first instance, however, an assessment of online
survey tools was undertaken to uncover the most suitable program. SurveyGizmo
was selected as the web survey tool for this study because of its data collection and
analysis features; ease of use and cost. Subsequently, the researcher used the research
findings from Phase One to develop the online web survey for the third data source.

81
The online web survey was then pre-tested by 20 people known to the researcher.
Andres (2012), Blair et al. (2014) and Bowden et al. (2002) assertd that the purpose
of pre-testing the survey is manifold and incorporates issues such as ensuring the
language used in the questions is relevant and understandable. They also contended
that by pre-testing the survey, researchers can establish whether the order of the
questions is logical and that the skip instructions are accurate and functional. Further,
by pre-testing, the researcher can determine the time it takes to answer the survey
questions as well as ascertaining whether or not the layout of the survey is appealing
and engaging (Frazer & Lawley 2000). As a direct result of the pre-testing, minor
grammatical and spelling mistakes were corrected and the corrections incorporated
into the survey, and one question was reframed.
Access to the online web survey with 14 participating organisations was arranged via
email during November 2016. The online web survey remained open throughout
November until the middle of December 2016. It was estimated that the survey
would take respondents approximately 20 minutes to complete. The email explained
the aim of the study, the estimated time the survey would take to complete, their right
not to answer questions, that their participation was voluntary and their right to
withdraw from the survey at any time. The participants were also informed that their
confidentiality and anonymity would be maintained at all times.
3.4.4 Data analysis method
Creswell (2014), Somekh and Lewin (2005), Teddlie and Tashakkori (2009) and
Vogt (2014) maintained that unlike qualitative research, quantitative studies seek to
quantify with numbers a researcher’s observations about the human behaviours under

82
investigation. As quantitative research is deductive in nature, deductive analysis is
undertaken, which gives emphasis to precise measurement, the testing of hypotheses
based on a sample of observations and statistical analysis of the data (Neuman 2006;
Watson 2015). In quantitative research, the findings are typically expressed in terms
of relationships that are presented in tables and graphs (Quinlan 2011). Thus, for this
to be achieved, the raw quantitative data from the online survey was migrated from
SurveyGizmo into analytical software, cleaned and reviewed for entry errors prior to
being analysed.
The online survey asked respondents about the probable barriers identified in Phase
One that could inhibit or prevent people from demographically diverse backgrounds
being appointed as INEDs of Northern Territory organisations. Therefore, these data
were analysed by using the SPSS program to run statistical tests. A selection of
statistical tests was performed to determine the relationship between the dependent
variable, demographic diversity, and the independent variables, being organisational
barriers to demographic diversity in the boardroom identified in Phase One.
The purpose of the quantitative analyses reported in this study was to produce
frequency distributions, summary and inferential statistics for organisational barriers
to diversity in the boardroom. Nevertheless, as the sample size for Phase Two was
n = 30, these later analyses were limited. Prior to the production of statistics, the
items in the online survey were assessed for their adequacy for being combined into
scales. Cronbach’s alpha ( ) was used to measure the internal reliability of the scales
in the online survey. Subsequent to the scales being formed, summary statistics were
conducted on each of the barriers. The scale scores were then compared using a

83
series of t-tests. In the first instance, one sample t-tests were performed on the
organisational barriers to demographic diversity in the boardroom. Further statistical
analyses were undertaken by performing independent sample t-tests on each barrier
using a number of dichotomous demographic variables.
3.5 Ethical considerations
Research ethics guide how to acquire and disseminate potentially sensitive
information in a trustworthy manner and in ways that cause no harm to the
participants taking part in the study (Braun & Clarke 2013; Cleaton-Jones & Curzon
2012; Remenyi et al. 2011). The qualitative and quantitative phases of the study
required the participants to disclose and share potentially sensitive information;
therefore, the process of obtaining these data was subject to the scrutiny of an ethics
committee. As a result, approval was sought and obtained from Charles Darwin
University’s Human Research Ethics Committee and the research was conducted in
full accordance with the approval requirements.
The process of approval involved the researcher submitting to the ethics committee a
detailed description of the study being undertaken, its significance, the methodology
and the processes being employed in the study. This included providing draft copies
of the plain language information sheets that were to be provided to the participants
prior to their commencement (see Appendix B & C) and consent forms required to
be executed by the participants of the qualitative phase prior to their commencement
(see Appendix D). In addition to these documents, draft questions for the interviews
(see Appendix E & F) and a draft of the online web survey were also provided (see
Appendix G).

84
Participation in this study was voluntary and the respondents could withdraw at any
time without penalty. Consent forms were obtained from all participants in the
qualitative phase prior to their commencement and confidentiality was maintained at
all times. An index of contact details was kept in a secure password-protected
computer at Charles Darwin University. During both phases of the study, all raw data
were de-identified and kept in a secure password-protected computer at Charles
Darwin University. At all times the researcher aimed to ensure the protection,
confidentiality and anonymity of the study participants and the appropriate handling,
use and storage of their information.
3.6 Chapter summary
This chapter has outlined the research methodology applied in a study on the internal
organisational barriers to diversity in the boardroom. Based on the literature review
and research question, the study employed a sequential exploratory mixed methods
research design incorporating qualitative and quantitative methods of acquiring data,
which included two distinct phases. In the first phase, a qualitative approach was
operationalised to develop a deeper understanding of internal organisational barriers
to demographic diversity in the boardroom. The selection and recruitment of the
purposively selected sample of participants and their criteria for inclusion in Phase
One was then outlined. This was followed by a discussion on the method utilised to
collect the qualitative data. The data analysis procedures for discovering the concepts
and themes within the qualitative phase were then described.

85
A quantitative approach was employed for Phase Two of the study to statistically
verify the emergent concepts and themes from Phase One. The selection and
recruitment of the purposive selected sample of Northern Territory organisations
with INEDs and their criteria for inclusion in the quantitative phase of the study were
then described. The method for collecting the data for Phase Two was then outlined.
The analytical steps used for the quantitative analysis were then discussed. Chapter 3
concluded with a discussion on ethical considerations in this study. The empirical
research findings of the qualitative phase and the quantitative phase are discussed in
the following chapter.

86
CHAPTER 4
RESULTS AND ANALYSIS
4.1 Introduction
The purpose of this chapter is to present the results of the data analysis of the
participant interviews and the online survey. This study was designed to identify and
examine the source of information asymmetry existing between Australia’s
heterogeneous society and homogeneous BoDs in the Northern Territory by
investigating the internal organisational barriers to diversity in the boardroom. In the
qualitative analysis of data phase, this was achieved by identifying the barriers
experienced by INEDs from demographically diverse backgrounds and spokespeople
from peak industry bodies. In the quantitative data analysis phase, the purpose of the
study was attended to by examining independent and non-independent directors’
responses to questions in an online survey about organisational barriers to diversity
in the boardroom as identified in qualitative phase.
As the study used a sequential exploratory mixed methods research design, the
chapter commences by providing a background to the qualitative data analysis. This
is followed by presentation of a profile of the participants that contributed to Phase
One. Next, the chapter outlines the data immersion processes applied in the study
prior to describing the data coding methods operationalised to elucidate the patterns,
concepts and themes from within the data. The qualitative results and analysis
section then scrutinises each of the dominant barriers that emerged from the data
coding process to confirm if they answered the research question and supported the
premise of the thesis.

87
The chapter then moves on to provide the results and analysis from the quantitative
phase. This section commences by providing a background to the quantitative
analysis of data prior to presenting a profile of the participants that contributed to
Phase Two. This is followed by a description of the scale construction for the
responses to the online survey. Next, the chapter describes the frequency distribution
of the participants’ demographic data and their responses to general questions about
demographic diversity at the board level. Summary statistics are provided on the
participant responses to the organisational barriers to demographic diversity in the
boardroom, which were identified in Phase One. The chapter concludes by providing
the results of the statistical tests undertaken to test the study’s null hypothesis.
4.2 Results and analysis from Phase One
This section presents the results of the qualitative data analysis from the interviews
with the six INEDs from demographically diverse backgrounds that represented
Group One and four spokespeople from peak industry bodies that represented Group
Two. Guest et al. (2012), Lapan et al. (2012) and Patton (2002) contended that
qualitative data analysis is a form of interpretation that requires researchers to engage
in an iterative process of critical thinking, questioning and categorising interview
data. These authors suggested that patterns, concepts and themes are identified by
bringing together components of ideas from the participants’ experiences, which are
often meaningless when viewed in isolation. The qualitative data analysis in this
study was undertaken through the process of data immersion, data coding and
building a compelling argument for each of the main barriers. Further, throughout the
process of the data analysis for the two groups of participants, there was congruence
in their responses to the interview questions, thus their data have been amalgamated.

88
4.2.1 Profile of participants from Phase One
Ten (100 per cent) participants contributed to the qualitative phase of this study: six
were from Group One and four were from Group Two. In Group One, 10 INEDs
from demographically diverse backgrounds were contacted. Ultimately, six of them
agreed to contribute to the study, representing a response rate of 60 per cent. In this
cohort of participants there were three females and three males whose ages ranged
from 30 to 64 years. Apart from the three female INEDs, the other demographic
diversity categories represented by the Group One INEDs included one with a visual
impairment; one under 40 years of age; one from a non-Anglo-Celtic race; one
Indigenous director and one director who self-identified as homosexual. Two of the
participants lived in the outer regional area of the Northern Territory, one in the
remote area, one in the very remote area and two resided in another state. Three of
the INEDs were from government organisations and three of the INEDs were from
NFP organisations. There were no profit-making organisations identified in the
Northern Territory with INEDs from demographically diverse backgrounds on their
BoDs. As a result, there were no participants in Group One from profit organisations.
In Group Two, a total of eight spokespeople from peak industry bodies was
contacted, four of whom agreed to contribute to the study, representing a response
rate of 50 per cent. In the sample of peak industry bodies, there were two female and
two male spokespeople and their ages ranged from 45 to 69 years. Apart from the
two female spokespeople, there were no other diversity categories represented within
these four participants.

89
4.2.2 Data immersion
The first step taken in the qualitative analysis was the data immersion process. Lapan
et al. (2012) and Richards and Morse (2013) argued that similar to how researchers
immerse themselves in the field when collecting data, the analysis commences by
researchers immersing themselves in the data. The data immersion process used in
this study commenced with the researcher transcribing the audio recordings of the
participant interviews. Horvat and Heron (2013) stated that “some researchers feel
that they gain a valuable insight from transcribing their own interviews” (p. 114) as
they reconnect with what was discussed in the interviews, setting the scene for the
analysis of data. The second step began with the researcher reading the 10 interview
transcripts. This reading was used to familiarise the researcher with the data from the
interviews. To produce findings that transform raw data into new knowledge, a
second reading was undertaken in which the researcher examined the transcripts in
greater detail. During this second reading, the researcher wrote descriptive comments
about the data in an attempt to identify similarities and differences within the data
(Ross 2012).
4.2.3 Coding the data
The next step taken in the qualitative analysis was coding the data. According to
Creswell and Plano Clark (2011) and Denzin and Lincoln (2011), data coding is
undertaken by dividing the data into smaller units and assigning labels to each of
these units. In this study, the data coding process was undertaken with the aid of a
trained and experienced independent person because “it is helpful to have more than
one person code the data. Each person codes the data into a classification scheme
90
separately and then the results of the coding are compared and discussed” (Patton
1990, p. 382).
The qualitative data coding began with open coding because this “aims to open up
the data, identifying concepts that seem to fit the data” (Richards & Morse 2013, p.
159), laying the foundation for the rest of the qualitative data analysis. The open
coding of the data commenced by going through each of the 10 transcripts line by -
line (Lapan et al. 2012) to discover words, phrases, patterns and descriptive
comments embedded in the transcripts relating to barriers to demographic diversity
in the boardroom. This was undertaken so that the data could be examined in greater
detail. The open coding revealed multiple words, phrases, patterns and descriptive
comments that provided evidence to support the creation of concepts germane to the
internal organisational barriers that may prevent or inhibit BoDs from receiving
signals from society regarding the need for demographic diversity in the boardroom.
The next step in the open coding of the data was to evaluate, compare and then group
the large amounts of coded data into similar provisional concepts (Quinlan 2011).
This was achieved by examining and comparing the key words, phrases, patterns and
descriptive comments to categorise the similarities and differences within the data.
Progressively, as linkages in the data were established, similar data were grouped
together under higher-order concepts. Interestingly, during the open coding process it
became apparent that many of the concepts were interconnected. Initially, there were
26 concepts identified in the line-by-line analysis. However, there were similarities
among some of these concepts; hence, they were amalgamated. The outcome of the

91
open coding of the participant transcripts was the identification of 24 concepts that
were then grouped together based on their common properties and frequency of use.
Table 4.1 presents the 24 concepts relating to the organisational barriers for
demographically diverse people being appointed as INEDs of Northern Territory
organisations identified in the open coding of the qualitative data. The table identifies
which of the participants referred to each of the 24 concepts; it displays the
participants as numbers from 1 to 10 as identification numbers allocated to the
interviewees. The ‘policy’ concepts were the most frequently referred to internal
organisational barriers to demographic diversity in the boardroom. This was followed
equally by the ‘lack of board resources’ and ‘lack of director awareness’ barriers.
These two concepts were followed by ‘values and director fears’ and finally concepts
relating to the geography of the Northern Territory.
The open coding of data was followed by axial coding of the data, which “moves the
focus around a [theme]” (Richards & Morse 2013, p. 159). The axial coding of data
involved the researcher and the independent person examining each of the concepts
identified in the open coding to identify the broader patterns of meaning among the
concepts. This involved restructuring and rebuilding the data into patterns to identify
linkages and relationships. In axial coding, the researcher “is beginning to integrate
the concepts under [themes]” (Quinlan 2011, p. 426). The outcome of axial coding of
the qualitative data was the eventual grouping of comparable concepts into six main
themes. Each of these six themes was then allocated an appellation that best
represented the phenomenon they conveyed. The axial coding process resulted in the
grouping of 24 concepts into the six themes presented in Table 4.2.

92
Table 4.1: Concepts identified in the open coding
# Concepts 1 2 3 4 5 6 7 8 9 10 Total
1 Lack of policy inhibits messages • • • • • • • • 8
2 Lack of policy limits discussion • • • • • • • • 8
3 Lack of policy limits recruitment • • • • • • • • 8
4 Lack of policy maintains homogeneity • • • • • • • • • 9
5 Lack of resources for new directors • • • • • • • • • 9
6 Lack of director training • • • • • • • • 8
7 Lack of board resources • • • • • • • • 8
8 Lack of resources to recruit directors • • • • • • • 7
9 Lack of awareness about definition • • • • • • • • 8
10 Lack of awareness about need • • • • • • • • • 9
11 Lack of awareness of economic risk • • • • • • • 7
12 Lack of awareness of diverse people • • • • • • • • 8
13 Values of directors • • • • • • 6
14 Values/culture of organisation • • • • • • 6
15 Values/culture of industry types • • • • • • 6
16 Masculine culture of boardrooms • • • • • • • • 8
17 Fear of change • • • • • 5
18 Fear of conflict • • • • • • 6
19 Needing to be politically correct • • • • • • • 7
20 Increased workload • • • • • • 6
21 Remoteness of the Northern Territory(NT) • • • • • • • 7
22 Small population of NT • • • • • 5
23 Small pool of diverse people in NT • • • • • • 6
24 NT values and culture • • • • • 5

93
Table 4.2: Grouping of concepts into interim themes
Theme one: Policy barriers
1. Not having a policy limits messages being received by directors
2. Not having a policy limits discussion about diversity in the boardroom
3. Not having a policy limits recruitment of diverse directors
4. Not having a policy keeps the ‘old boy’s network’ alive and functioning
Theme two: Resource barriers
1. Lack of resources for policy, induction and mentoring programmes limits diversity
2. Lack of resources for cultural and diversity awareness training limits diversity
3. Lack of resources for change to masculine culture of boardroom limits diversity
4. Lack of resources for recruiting and supporting diverse directors limits diversity
Theme Three: Awareness barriers
1. Lack of awareness about the definition of diversity in the boardroom
2. Lack of awareness about the business needs for diversity in the boardroom
3. Lack of awareness around the risks of not having a diverse board
4. Lack of awareness about working with directors from diverse backgrounds
Theme Four: Values and culture barriers
1. Values of some directors make demographic diversity difficult
2. Values and culture of organisations make diversity difficult
3. Values and culture of select industries make diversity difficult
4. The dominant masculine culture of boards makes diversity difficult
Theme Five: Fear barriers
1. Fear of change from the status quo constrains diversity
2. Fear of potential for increased conflict constrains diversity
3. Fear of needing to be politically correct constrains diversity
4. Fear of increased workload constrains diversity
Theme Six: Geographic barriers
1. The remoteness of the Northern Territory hampers diversity
2. The small population of the Northern Territory hampers diversity
3. Not having a pool of qualified, skill and available candidates hampers diversity
4. Values and culture of the Northern Territory and local community hampers diversity

94
4.3 Six themes from Phase One
As “[Qualitative data] analysis situates the coding process in the realm of evidence
rather than ideas” (Guest et al. 2012), after the open coding and axial coding the next
step in the qualitative analysis of data was to scrutinise each of the organisational
barriers. This was undertaken to confirm that these six organisational barriers to
demographic diversity in the boardroom provided verifiable evidence that related to
the data collected from the 10 participants as well as ensuring they answered the
research question. An analysis of the literature suggested that in this stage of the
analysis the researcher undergoes intense scrutiny by concentrating on one theme at a
time (Braun & Clarke 2006; Vaismoradi et al. 2013). For that reason, each of the six
barriers that emerged from the open coding and axial coding are expanded upon in
greater detail within the framework of the research question. This stage of the data
analysis emphasised the similarities with the participant responses concerning
organisational barriers that prevent or inhibit homogeneous BoDs receiving signals
from Australia’s heterogeneous society regarding the requirement for boardrooms to
be demographically diverse.
Creswell (2014), Grbich (2013) and Miles et al. (2014) argued that descriptions and
quotation are the essential ingredients of qualitative reporting as they “allow the
reader to enter the situations and thoughts of the individuals represented in the
report” (Patton 2002, p. 503). Therefore, participant descriptions and quotations have
been used to validate the six organisational barriers identified in the open and axial
coding of the qualitative data. Moreover, all of the participant interviews embodied
personal and sensitive information about the respondents and their BoDs. Thus, to
ensure confidentiality, the names used in this section of the thesis are pseudonyms.

95
4.3.1 Theme one: Policy barriers
The most frequently named or implied internal organisational barrier to demographic
diversity in the boardroom was attributed by the participants to the ‘lack of formal
diversity policy at the board level’. When asked if their own BoD had a formal
policy on diversity in the boardroom, all of the participants expressed uncertainty
about whether or not their board had a formal policy for its own diversity. Providing
evidence to support this position Dr Laura stated:
I feel a little embarrassed, I probably should have checked this out before the
interview but I don’t think there is a board policy for its own diversity.
Although one participant confirmed that their BoD had a formal policy on board
diversity, the consensus among the participants from Phase One was that their BoDs
did not have a formal policy supporting and promoting demographic diversity in the
boardroom. However, four participants explained that while their BoDs did not have
a formal diversity policy, there had been informal discussions in board meetings
about increasing the gender diversity of their directors to reflect the mandate from
society about having more female directors.
When discussing internal organisational barriers to diversity in the boardroom, nine
participants mentioned that their organisations had a formal policy on diversity in the
workplace. These participants also acknowledged that their workplaces had evolved
and become demographically diverse as a consequence of the formal policy. They
contended that in a similar manner to their workplaces, there was a much stronger
chance of the boardroom being demographically diverse if the BoD had a formal
policy to support and encourage diversity at the board level. As indicated by the

96
comments below, these participants considered that there were likely to be fewer
internal organisational barriers for individuals from demographically diverse
backgrounds being appointed as INEDs of Northern Territory organisations if their
BoD had a formal policy on diversity in the boardroom. This belief was best
explained by Beryl who simply stated:
I think the single most important thing is to create policies to increase the
board’s diversity.
Reinforcing Beryl’s position, Graham believed that a formal board policy would
reduce the organisational barriers to demographic diversity in the boardroom by
augmenting the directors’ level of awareness about the issue of diversity in the
boardroom:
My immediate thought was to address it [lack of diversity] by policy as the
policy should keep the proposition of diversity in the boardroom on the board
agenda.
The general view of all participants of Phase One was that there have been numerous
messages sent from society mandating diversity in the boardroom. However, not
having a formal policy meant that the issue of board diversity was omitted from
board agendas. Most participants considered the lack of formal board policy as a
credible barrier that has prevented or inhibited people from demographically diverse
backgrounds being appointed as INEDs of Northern Territory organisations. Nine
participants regarded having a formal policy as a good idea because, like other board
policies, it would concretise the BoD’s intention about its own diversity as well as

97
bringing the topic of demographic diversity in the boardroom to the foreground and
keeping the issue alive.
4.3.2 Theme two: Resource barriers
The respondents also perceived the lack of diversity management resources as an
internal organisational barrier to their boardrooms becoming demographically
diverse. Seven respondents mentioned that similar to their workplaces, diversity
awareness training for the directors would reduce these barriers by improving
directors’ level of awareness about working with people from diverse backgrounds.
They asserted that the training would resource directors with the skills to adapt to a
change in the demographic make-up of their BoDs. This belief was best explained by
Rodney, who stated:
What needs to occur is that we need to change people’s minds first. The best
way to do this is through education. We have diversity in the workplace
training so why shouldn’t there be diversity in the boardroom training … This
will benefit the directors, the employees and ultimately the organisation.
The participants also held the view that diversity awareness training would increase
directors’ skills and understanding about the many organisational benefits of
diversity in the boardroom. Some of the respondents commented that the research
topic and responsive in-depth interviews had raised their level of awareness about
these benefits. Kathy, for example, stated:
Well I’ve gained a lot from today. The interview questions have made me think
about board diversity and the benefits to my organisation. It is a really

98
important issue that needs to occur and if we keep discussing it then it will
become accepted language and practice.
In a variety of descriptive statements, the respondents also spoke about the need for
BoDs to broaden their current insular recruitment practices beyond the ‘old boy’s
network’. Indicative of this point of view, Susan stated:
I see some real narrow thinking in how some boards select new board
members. Generally, they select directors from within their own networks
because they believe it is too difficult for them to look outside this network.
Eight respondents conceded that their BoDs had utilised the directors’ personal and
professional networks when recruiting new directors. Six respondents made specific
reference to the need for BoDs to appropriately resource and broaden their strategies
when recruiting directors, which included employing specialised board recruitment
agencies. Providing evidence to support this position, Dr Laura maintained:
I think it is really important to have a proper recruitment process for new
directors, one that looks outside the BoD’s current networks … It is also really
important for boards to have the right resources when recruiting new directors,
including proper induction and mentoring, and diversity awareness training.
The universal position of the respondents was that their BoDs were deficient in
crucial diversity management resources. They held the view that the lack of training
and resources for recruiting and managing new directors played a central role in
sustaining internal organisational barriers to demographic diversity in the boardroom.
As a result, BoDs not receiving adequate training and resources has either prevented

99
or inhibited people from demographically diverse backgrounds being appointed as
INEDs of Northern Territory organisations.
4.3.3 Theme three: Awareness barriers
The directors’ lack of awareness of the definition and organisational need for
diversity at the board level was judged by many respondents to be a barrier to their
BoD reflecting the Australian norms and values of equality of opportunity, inclusion
and diversity. All respondents asserted that demographic diversity at the board level
is at a nascent stage of development and that BoDs are still coming to terms with this
concept. Eight respondents conceded that they had limited awareness about this
study’s inclusive definition of diversity in the boardroom. They highlighted that the
messages they have received from society about boards’ demographic diversity had
singularly focussed on gender diversity. Providing evidence to support this position,
Paul stated that:
I think there is a very strong gender diversity message being sent about
diversity in the boardroom … But now that you have mentioned all these other
categories I believe diversity in the boardroom should be much broader than
just gender.
The directors’ depth of awareness about diversity at the board level was reinforced
by the demographic data collected from the respondents relating to the composition
of their own BoDs. Overwhelmingly, the diversity category most represented was
‘women’ and the respondents considered that the majority of boardrooms in the
Northern Territory have an almost equal representation of female and male directors.
Providing evidence to support this position, Kathy stated:

100
There are plenty of females on boards in the Northern Territory and it is now
time to move on and progress to be more inclusive of these other demographic
categories that are the focus of your study.
A substantial number of respondents believed that their directors lacked awareness
about organisational needs for demographic diversity in the boardroom. They also
believed that this lack of awareness has added to the protectionism of homogeneous
BoDs. Five respondents grounded their views on this issue by explaining how the
demographic composition of the Northern Territory has evolved over the past 20
years. One of the respondents referenced this demographic change as being the ‘new
population of the Northern Territory’, which she defined as younger and more
multicultural and technologically proficient than her organisation’s traditional target
markets.
Almost all of the respondents mentioned that there are few BoDs in the Northern
Territory with representation of the ‘new population of the Northern Territory’. Six
participants referenced the lack of Indigenous directorships with non-Indigenous-
specific organisations. They emphasised that the lack of demographic diversity at the
board level was leading to the needs and wants of their target markets not being met.
As indicated by the comments below, these participants explained that in their
experience the absence of demographic diversity in the boardroom has resulted in ‘a’
disconnect between BoDs and their organisations’ target markets. Dr Laura, who is a
marketing executive, exemplified this point of view by commenting:
The board needs to have a level of awareness about its target markets and that
is really difficult to do when the board is not demographically diverse.

101
The majority of the respondents referenced the organisational risks and economic
costs of boardroom homogeneity and lack of connectivity to the needs and wants of
target markets. In providing evidence to support this position, Kathy, who is the only
director on her BoDs from a diversity category pointed out:
My role on this board is to be the voice of reason and to transition the board to
the relevant issues to do with the organisation’s target markets … There are
several different large target markets that we have not even accessed and there
would be a direct economic benefit if the board was more diverse.
Further, seven respondents indicated that increasing the demographic diversity of
their BoDs had the potential to introduce their organisations to new markets. This
was best exemplified by Dr Laura who stated:
It is really critical for the organisation to have [demographic] diversity on the
board so that it reflects the target users and this is now starting to happen with
us as we now have more diversity in the boardroom.
All of the participants believed that there was a lack of awareness around the
definition of diversity in the boardroom as they had generally interpreted the
meaning to symbolise gender diversity. They considered that BoDs also lacked
awareness about the organisational need for their boards to be demographically
diverse. Hence, the lack of awareness about these issues has prevented or inhibited
individuals from demographically diverse backgrounds being appointed as INEDs of
Northern Territory organisations.

102
4.3.4 Theme four: Values and culture barriers
The related concepts of ‘values’ and ‘culture’ emerged from the qualitative analysis
of data as being notable internal organisational barriers that have contributed to the
information asymmetry between Australia’s heterogeneous society and homogeneous
BoDs. Most of the interviewees maintained that the historical institution of male
directorships has restricted the evolution of the boardroom’s make-up. They asserted
that even though gender diversity had come to the foreground, the boardroom was
still dominated by masculine values and culture. When discussing their negative
experiences as INEDs, five of the interviewees from Group One commented about
the masculine values and culture of their boardrooms. For example, Kathy stated:
We are talking about a board that is made up of middle-aged white men and it
is a very masculine board with some very aggressive men on it.
One of the most frequently referenced internal organisational barrier mentioned
throughout the 10 interviews was the functional existence of the ‘old boy’s network’.
In speaking about the barriers to diversity in the boardroom, Beryl pointed out:
There is the natural prejudice of the chairman who is usually male and who
prefers people [in the boardroom] who are known to him and [are] the same as
him.
Many interviewees considered that the ‘old boy’s network’ was a considerable force
in the lack of demographic diversity in the boardroom. In providing evidence to
support this position, Graham, who is in his 50s and is the youngest and most
recently appointed director to his BoD, mentioned:

103
The board lacks the entrepreneurship and effectiveness it once had and it is the
epitome of the ‘old boy’s network’. They are just looking for what they can get
out of the board now and their own interest is very shallow.
Many interviewees thought that the historical channel of the ‘old boy’s network’ and
the masculine values and culture of the boardroom were interconnected. They held
the view that these collective factors were slowing down changes to the demographic
composition of the boardroom. They also argued that the protectionist culture of the
‘old boy’s network’ had generated an irrational fear of change to the composition of
the boardroom.
Many participants referred to directors’ personal values as possible organisational
barriers. However, three interviewees made specific detailed reference to directors’
personal values. These participants implied that the personal values of some directors
may contribute to lack of demographic diversity in the boardroom. Indicative of this
point of view, Paul mentioned:
I am aware that some board members are affiliated with religious groups and I
am pretty sure that they would find it difficult working with directors from
some of the diversity categories included in your study.
Nevertheless, the majority of the interviewees did not believe that the personal values
of directors inhibited or prevented boardrooms from being demographically diverse.
When discussing values and culture, however, there was a noticeable perception
from six interviewees about the existence of tokenism with selected directorships.
They asserted that some Indigenous directorships may well be tokenistic. This cohort

104
of interviewees implied that rather than being focussed on the skills Indigenous
directors would bring to the boardroom, some boards recruited Indigenous directors
just to act in accordance with community expectations. Dr Laura was passionate
about this perception, stating:
The one thing you hear a lot about in the Northern Territory is boards saying
that they really need an Indigenous person on their BoD. This attitude really
drives me insane because they are not thinking about the skills many
Indigenous people have.
The overall consensus among interviewees was that the masculine values and culture
within the boardroom and the lingering existence of the ‘old boy’s network’ hindered
demographic diversity at the board level. They held the view that even though many
boardrooms had an equal representation of genders, the historical convention of
males dominating BoDs along, with their fear of, and resistance to, change has
hindered boards from being inclusive of individuals from demographically diverse
backgrounds. As a result, values and culture have contributed to either preventing or
inhibiting people from demographically diverse backgrounds being appointed as
INEDs of Northern Territory organisations.
4.3.5 Theme five: Fear barriers
According to the study participants, director ‘fear’ was a further organisational
barrier that has contributed to maintaining the status quo of homogeneity at the board
level. Many participants considered that apart from gender diversity, most BoDs in
the Northern Territory had not focussed on their diversity because of the fears some

105
directors had about working with people from demographically diverse backgrounds.
In providing evidence to support this point of view, Paul stated:
These days most boards in the Northern Territory have some women on the
board but they are still rather prejudiced against some of the other diversity
categories included in your study.
Eight of the participants implied that these fears were related to the gender focus of
the messages that directors had received from society about demographic diversity in
the boardroom. They maintained that the messages had been singularly focussed on
normalising gender diversity in the boardroom rather than being inclusive of all
demographic categories. Indicative of this point of view, Susan stated:
If you did a Google search on diversity in the boardroom, 99 per cent of it
would be about gender diversity. Generally, society and boards do not see all
these other categories when it comes to diversity in the boardroom.
Many participants alleged that messages about gender diversity had reduced barriers
for women and was the reason why there were more female directorships in the
Northern Territory. They also asserted that there remains a level of ‘fear’ about
recruiting directors from the other demographic diversity categories. Almost all of
the participants suggested that a credible fear barrier could be attributed to the
uneasiness felt by some directors about how they would be expected to work with
individuals from certain diversity categories. In providing evidence to support this
position, Kathy, who is the only director on her BoD from a demographic diversity
category, explained:

106
I think some of them [directors] would be worried about needing to be
politically correct and how to work with directors who are different from them,
particularly gay and trans [transgendered] people.
Supporting Kathy’s position about the fears some directors would have in working
with people who are demographically diverse, Susan, who is an Indigenous woman,
remarked:
Gender is the most common form of diversity in the boardroom as it is the
really easy one to do in terms of it being the most comfortable for the male
directors compared with, say, Indigenous people or gay people. If you talk
about diversity at the board level in all its forms, you can see the faces of the
other directors go into panic mode.
When discussing this study’s more inclusive holistic definition for demographic
diversity in the boardroom, many participants alluded to fears directors also had
about the potential for increased conflict and protracted decision making, if there was
more diversity at the board level. Indicative of this point of view, Rodney, who is a
gay man under the age of 40 commented:
Because of the different values [conservative and religious] between me and a
few of the directors, it can be difficult to get consensus on certain issues, which
can end up in conflict. They see me as being disruptive and a trouble maker
because of my different values and way of thinking and because I don’t just
agree with them.

107
Generally, the participants from Phase One thought that the signals from society
about diversity in the boardroom had been singularly focussed on gender diversity at
the expense of the other demographic diversity categories. Hence, they believed that
there was a lack of information about the need for boardrooms to be demographically
diverse. The participants considered that this lack of information has cultivated fears
within homogeneous BoDs about how to work with directors from demographically
diverse backgrounds.
4.3.6 Theme six: Geographic barriers
Several concepts involving geography emerged from the qualitative data analysis
that the interviewees attributed to the lack of demographic diversity at the board
level. Although the study’s aim was to identify internal organisational barriers to
demographic diversity in the boardroom, embedded in the narrative were references
to how the geography of the Northern Territory has also contributed to producing
barriers. Eight interviewees proposed that the remoteness of the Northern Territory
presented a credible barrier to demographic diversity in the boardroom. In providing
evidence to support this position, Rodney, who relocated from Sydney a number of
years ago to a remote region of the Northern Territory mentioned:
Social stigma is the biggest barrier for people from diverse backgrounds being
appointed to boards in the Northern Territory … The remoteness of the region
creates a huge difference in people’s attitudes. The Northern Territory is 30
years behind the rest of Australia with respect to their attitude towards most of
the diversity categories in your study.

108
An additional, repeatedly referenced, geographical obstacle was the considerably
small population of the Northern Territory compared with the other states and
territories in Australia. Many interviewees contended that because of the small
population, there were fewer qualified and experienced people with demographically
diverse backgrounds available to sit on BoDs in the Northern Territory. Indicative of
this view point, Blair proposed that:
Any place where the population is sparse then there is a disadvantage
associated with it as there are less people and fewer individuals from
demographically diverse backgrounds with the qualifications and skill required
to be on a BoD.
Many respondents considered the Northern Territory’s remoteness and small pool of
population as external organisational barriers to boardroom diversity. However, six
interviewees believed that these geographical factors were not as big a barrier for
women compared with the other demographic diversity categories considered in this
study. This view was reinforced by the demographic data collected from respondents
at the beginning of the interview relating to the demographic make-up of their own
BoDs. The diversity category most represented in their boardroom was ‘women’.
Nevertheless, two of the interviewees firmly believed that the Northern Territory was
likely to be more accepting of people from demographically diverse backgrounds
becoming INEDs. They explained that in their experience, the Northern Territory
was less likely than other parts of Australia to discriminate against individuals from
different backgrounds. They maintained that the remoteness and small pool of
population was an advantage for people from demographically diverse backgrounds

109
wishing to be appointed as INEDs compared with the major cities in Australia.
Providing evidence to support this position, Pasha commented:
I think it would be less likely that there would be consideration being given to
diversity in the boardroom beyond gender in the big cities. The people from the
other demographic categories are more likely find resistance in the cities
compared with the Northern Territory.
However, eight interviewees considered that there were likely to be fewer barriers for
people from demographically diverse backgrounds being appointed as INEDs in the
densely populated areas of Australia compared with the Northern Territory. Thus, the
consensus of opinion was that the Northern Territory’s remoteness and small pool of
population may prevent or inhibit people from demographically diverse backgrounds
being appointed as INEDs of Northern Territory organisations.
4.4 Results and analysis from Phase Two
This section presents the result of the quantitative data analysis from the online web
survey. The online survey was completed by 30 independent and non-independent
directors from 14 Northern Territory organisations. There were six dominant barriers
to demographic diversity in the boardroom identified in Phase One. Although, the
‘skill’ of directors was intermittently referenced by participants throughout the
interviews, this was not identified as a main barrier. However, ‘skill’ was included in
the online web survey as a supplementary barrier.

110
According to O’Dwyer and Bernauer (2014), Teddlie and Tashakkori (2009) and
Vogt (2014), quantitative data analysis is the study of numeric information using a
variety of statistical techniques. They maintained that researchers “reorganise the
data into a form suitable for computers, present it in charts or graphs to summarise its
features, and interpret or give theoretical meaning to the result” (Neuman 2006, p.
314). The analysis of quantitative data commenced by downloading the raw data
from SurveyGizmo into SPSS and assessing each of the questions for their adequacy
to be combined into scales. Subsequent to the scales being formed, scale scores were
compared between questions using a series of appropriate statistical tests to establish
whether to accept or reject the study’s null hypothesis.
4.4.1 Profile of participants from Phase Two
Forty-four purposively selected organisations with INEDs were extended an
invitation to participate in the study. Ultimately, 14 of these 44 organisations
contributed to the quantitative phase of this study, which represents a response rate
of 32 per cent. One hundred per cent of the Northern Territory profit organisations,
all of which had a male chair, were invited to contribute to the study. However, most
either did not respond to the email invitation or declined to participate. The 14
organisations with INEDs that did participate in the online web survey comprised a
sample of 10 NFP organisations and 4 government organisations.
Of the 44 organisations contacted, 34 (77.3 per cent) had a male chair and 10 (22.7
per cent) had a female chair. Further, of the 14 chairs that agreed for their BoD to
participate in the study, seven (50.0 per cent) were female and seven (50.0 per cent)
were male. Thus, the seven male chairs represented 20.6 per cent of the boards with

111
male chairs and the seven female chairs represented 70 per cent of the boards with
female chairs. Nonetheless, as the survey was distributed to the independent and non-
independent directors via email to one person in each of the 14 organisations, there
was no guarantee that all directors from the 14 organisations received the survey.
In reviewing the electronic data that were publically available about the 14 BoDs that
participated in this study, and assuming the online web survey was forwarded to all
directors, it was estimated that 98 independent and non-independent directors
received the survey. The number of directors on each of the 14 BoDs fluctuated from
a minimum of 3 to a maximum of 14, with the mean number of directorships being 7.
On the 14 boards there as a total of 54 (55.1 per cent) female directorships and 44
(44.9 per cent) male directorships. Moreover, 2 of the 14 BoDs had an equal
representation of females and males, 7 boards had a majority of female directors and
5 had a majority of male directors.
4.4.2 Scale construction
Moore (2000), Quinlan (2011) and Vogt (2014) asserted that a scale is a set of items
that investigates similar aspects of a construct and is computed by averaging the
scores of each participant over the individual items. These authors maintained that in
empirical research, scales consisting of multiple items are preferred over single items
for two main reasons. The first is that most constructs are multifaceted; therefore, a
single item would not sufficiently evaluate the construct under investigation. As a
result, several items are required to capture the various aspects of the construct under
investigation. The second reason for having multiple items is that higher reliability is

112
likely from a multiple-item scale than from a single item (Ghosh & Srivastava 2014;
Neuman 2006).
Further, good scales are unidimensional and can be explored through factor analysis
and internal reliability measures. However, Hinkin et al. (1997) and Vogt (2014)
contended that conducting a factor analysis of scales requires a large sample size—at
least 100 participants. As the sample size of participants for Phase Two was n = 30,
factor analysis could not be carried out to assess the scales for this study. However,
an assessment of the scales’ internal reliability was possible and was measured by
Cronbach’s , which “is a correlational measure of the consistency of the answers to
items in a scale” (Vogt 2014, p. 35).
Bonett and Wright (2015) and O’Dwyer and Bernauer (2014) argued that Cronbach’s
is represented by a coefficient that ranges from 0 to 1 and that higher values
represent higher internal reliability: values ≥0.70 are deemed optimal as they provide
evidence that the questions on the scale are measuring the same underlying concept
(Tavakol & Dennick 2011; Vogt 2014). Similarly, a very high reliability value of
>0.95 indicates that there may be redundancy among the items in the scale measuring
the construct and low reliability according to Cronbach’s could be as a result of a
“low number of questions, poor interrelatedness between the items or heterogeneous
constructs” (Tavakol & Dennick 2011, p. 54). Each of the organisational barriers to
demographic diversity in the boardroom assessed in this study were formed into
scales and tested for their internal reliably. Table 4.3 illustrates the overall results of
Cronbach’s reliability test for the organisational barriers.

113
Table 4.3: Overall results of reliability testing for probable barriers
# Barrier N Cronbach’s alpha
1 With policy 6 0.94
Without policy 6 0.86
2 Resources 6 0.84
3 Awareness 6 0.91
4 Values & culture 6 0.86
5 Fear 6 0.92
6 Skill 6 0.91
7 Geography 6 0.78
As shown in Table 4.3, there are no unacceptably low or high internal reliability
scores for the items relating to any of the organisational barriers to demographic
diversity in the boardroom. All of the scales produced of >0.70 or <0.95, with
scores ranging between a moderate of 0.78 to a high of 0.94, which indicates
little variability among the scores within these items. Accordingly, the items in the
barriers section of the online web survey formed strong internal reliability, which
indicated that each set of six questions for the organisational barriers to demographic
diversity in the boardroom tested have functioned as a consistent whole.
4.4.3 Frequency distribution of demographic data
According to Moore (2000), Neuman (2006) and Selvanathan et al. (2016), the first
step in the process of turning quantitative data into information is to summarise the
data by creating frequency distributions. A frequency distribution is an organised
tabulation of the frequency with which each of the scores occurs in the distribution
(O’Dwyer & Bernauer 2014). Further, a frequency distribution presents the results of
data analysis in an easy-to-read format revealing whether the results are high or low
and if they are concentrated in one area or are spread out across the entire scale

114
(Neuman 2006). As a result, the analysis of quantitative data began with examining
the frequency distribution of the participants’ responses to the questions in the online
web survey.
It was estimated that 98 independent and non-independent directors received the
online survey. Thus, 30 participants completing the survey represents a response rate
of 33.3 per cent. The survey commenced by collecting demographic data about each
participant. Twenty-four (80.0 per cent) participants were from NFP organisations
and six (20.0 per cent) were from government organisations. Twenty-seven (90.0 per
cent) respondents were INEDs and three (10.0 per cent) were non-independent
directors. In the sample of 30 participants, there were 14 (46.7 per cent) female
directors and 16 (53.3 per cent) male directors. Twelve (40.0 per cent) participants
were under the age of 50 and 18 (60.0 per cent) were over the age of 50. Figure 4.1
shows the distribution of participant ages.
Figure 4.1: Distribution of participant ages

115
Nine (30.0 per cent) participants received an annual salary for their directorships
while the directorship for 21 (70.0 per cent) of respondents was voluntary. Nineteen
participants lived in the outer regional area of Darwin, three lived in the remote area
of Alice Springs and five participants lived in very remote areas of the Northern
Territory. Also, three participants lived outside of the Northern Territory. Sixteen
(53.3 per cent) participants did not identify as being from demographically diverse
backgrounds; nevertheless, 14 (46.7 per cent) of the participants did identify as being
from demographically diverse backgrounds. Figure 4.2 reveals the distribution of
diversity categories represented by these 14 participants.
Figure 4.2: Distribution of participants’ diversity backgrounds
4.4.4 Frequency distribution of general questions
The survey invited participants to answer a number of general questions relating to
diversity in the boardroom. The survey commenced by asking the participants if they
considered their board to be demographically diverse. Seventeen (56.7 per cent)
respondents judged their BoD as not being demographically diverse while 13 (43.3

116
per cent) deemed their BoD to be demographically diverse. Forty per cent of the
participants considered that their INEDs should be more demographically diverse.
Equally, 40 per cent of the respondents did not think that their INEDs needed to be
more diverse and 20 per cent were undecided. Also, 15 (50 per cent) participants
confirmed their BoD had not deliberated on the demographic diversity of their
INEDs while 12 (40 per cent) verified that their boards had considered diversity.
Three (10 per cent) participants were undecided on this issue. Figure 4.3 reveals that
76.7 per cent of the participants confirmed that their board did not have a goal or
recruitment strategy for increasing the demographic diversity of their INEDs.
However, 10.0 per cent did have goals and recruitment strategies and 13.3 per cent
did not know if their BoD had goals or recruitment strategies for increasing the
diversity of their INEDs.
Figure 4.3: Distribution of goals for increasing diversity of independent non-
executive directors

117
In additionally, participants were also asked if their BoD annually assessed the
demographic diversity of their INEDs. Twenty-two (73.3 per cent) participants
conceded that their BoDs did not assess their INED diversity. Four (13.3 per cent)
confirmed they did evaluate the demographic diversity of their INEDs and four (13.3
per cent) of the respondents did not know. Notably, 100 per cent of the participants
rejected the concept that only white, middle-aged men should be INEDs. Figure 4.4
displays the responses from the 30 participants for the demographic diversity
categories they would support being appointed as INEDs to their BoDs.
Figure 4.4: Distribution of diversity characteristics supported
The participants were asked if people from demographically diverse backgrounds
would be treated equally and given ‘a fair go’ when seeking to become INEDs on
their BoD. Twenty-three (76.7 per cent) participants believed that people from
demographically diverse backgrounds would be treated equally and given ‘a fair go’
but six (20.0 per cent) conceded that they would not be treated equally or given ‘a

118
fair go’ and one participant responded that they did not know. All the participants
were asked if their organisations had a formal diversity in the workplace policy.
Twenty-six (86.7 per cent) participants’ organisations either had a formal policy or
were in the process of developing one, one (3.3 per cent) conceded that their
organisation did not have a formal policy and three (10.0 per cent) participants did
not know if their organisation had a formal diversity in the workplace policy.
4.4.5 Summary statistics for the probable barriers
The next step in the analysis of the quantitative data was to analyse the large amount
of information collected from the participants that related to the organisational
barriers to demographic diversity in the boardroom identified in Phase One.
O’Dwyer and Bernauer (2014) and Selvanathan et al. (2016) contended that in
descriptive statistics, summary statistics are used to organise, present and explain the
primary characteristics of the data in a convenient and easy-to-read format. Thus,
summary statistics were used to describe the features of the data collected from the
participants relating to the organisational barriers for people from demographically
diverse backgrounds being appointed as INEDs of Northern Territory organisations.
Phase One identified that the most frequently named internal organisational barrier to
board demographic diversity was the lack of a formal policy on diversity in the
boardroom. For that reason, prior to asking the participants about the barriers to
board diversity they were asked if their BoD had a formal policy on diversity in the
boardroom. Interestingly, of the 30 participants that completed the online survey, six
(20 per cent) indicated that their boards did have such as policy. Moreover, having a
formal board diversity policy was not considered a barrier and these six participants

119
were asked questions about the effect of the policy on their board’s demographic
diversity. However, 24 (80 per cent) participants conceded that their board did not
have a formal policy on demographic diversity in the boardroom.
Each of the probable barriers in section E to K of the online survey (see Appendix G)
had six statements and responses were scored using a five-point Likert scale (1 =
‘Disagree strongly’ to 5 = ‘Agree strongly’). Each set of six items for a barrier was
analysed in terms of summary statistics. The arithmetic mean, standard deviation,
standard error of mean and 95 per cent confidence interval (95% CI) were used to
summarise participant responses to these six items. The individual responses for each
item were then pooled to produce an overall response for that organisational barrier.
Table 4.4 shows the overall results of the summary statistics for each of the barriers.
Table 4.4: Overall results of the summary statistics for probable barriers
# Barrier N Mean Std. dev. Std. error
mean
95% CI
1 Lack of policy 24 3.03 1.14 0.10 0.19
2 Resources 30 2.72 1.17 0.09 0.17
3 Awareness 30 2.71 1.07 0.08 0.16
4 Values & culture 30 2.26 1.16 0.09 0.17
5 Fear 30 2.39 1.16 0.09 0.17
6 Skill 30 2.61 1.17 0.09 0.18
7 Geography 30 2.89 1.16 0.09 0.17
As Table 4.4 demonstrates, the mean score for most organisational barriers was less
than 3.00, which was midway on the five-point Likert scale. This reveals that with
the exception of the lack of policy barrier (M = 3.03, SD = 1.14), the participants
from Phase Two did not consider the other organisational barriers as preventing or

120
inhibiting demographic diversity in the boardroom. Nevertheless, the lack of policy
barrier did have a mean score that was greater than midway on the Likert scale. The
items for the 24 participants whose board did not have a formal policy were designed
to ascertain whether they considered that not having a formal policy either prevented
or inhibited people from demographically diverse backgrounds being appointed as
INEDs to their boards. Table 4.5 displays the six items along with their individual
and overall summary statistics.
Table 4.5: Participants without a formal diversity policy (n = 24)
Section E: Boards of directors without a
policy
N Mean Std.
dev.
Std. error
mean
95% CI
1. Lack of policy inhibits societal views 24 3.17 1.05 0.21 0.43
2. Lack of policy causes barriers to thinking 24 3.21 1.06 0.22 0.43
3. Lack of policy creates barrier to recruiting 24 2.88 1.15 0.24 0.47
4. Lack of policy creates barriers to applying 24 2.33 0.87 0.18 0.35
5. Lack of policy is barrier to INED diversity 24 2.88 1.19 0.24 0.49
6. Board should consider developing a policy 24 3.75 1.11 0.23 0.45
Overall 144 3.03 1.14 0.10 0.19
The overall result for this internal organisational barrier indicates that on average the
24 participants whose BoD did not have a policy considered that the lack of a formal
diversity in the boardroom policy created a barrier to demographic diversity at the
board level. An interesting result from the analysis was the mean score for Item 6 (M
= 3.75, SD = 1.11), which asked participants if they believed that their BoD should
consider developing a formal policy to promote and encourage board diversity. This
is a relatively high mean score, which suggests that these 24 participants believed
that their BoD should consider developing a formal policy to support and encourage
demographic diversity in their boardrooms.

121
The six participants who corroborated that their BoD had a formal board diversity
policy were also asked several items. The items for these participants were designed
to identify whether or not they considered that their board’s formal policy supported
and encouraged demographic diversity in their boardrooms. In the same way as the
sets of items for the organisational barriers, these items were also assessed on a five-
point Likert scale (1 = ‘Disagree strongly’ to 5 = ‘Agree strongly’). The final item
was negatively worded. Therefore, the data were entered for its reverse to maintain
consistency with the other five items. These six items were also analysed in terms of
their summary statistics and the individual responses were pooled to produce an
overall response. Table 4.6 displays the six items along with their individual and
overall summary statistics.
Table 4.6: Participants from organisations with a formal diversity policy (n = 6)
Section E: Boards of directors with a
formal policy
N Mean Std.
dev.
Std. error
mean
95% CI
1. Policy reflects modern societal views 6 3.67 0.82 0.33 0.67
2. Policy has inclusive holistic approach 6 3.83 0.98 0.40 0.80
3. Policy prompts you to think of diversity 6 4.00 1.10 0.45 0.89
4. Policy has measurable objectives 6 3.33 1.21 0.49 0.99
5. Policy has increased board INED diversity 6 3.67 1.03 0.42 0.84
6. Policy itself creates a barriers (rev) 6 3.50 1.22 0.50 1.00
Overall 36 3.67 1.01 0.17 0.34
The overall result for these six items was M = 3.67 (SD = 1.01), which is a relatively
high mean score. Moreover, the mean scores for all six items were constantly high,
which indicates that all six participants believed that their formal board diversity
policy supported and encouraged demographic diversity in their boardroom. An
interesting result from the analysis was the mean score for Item 3 (M = 4.00, SD =

122
1.10). This is a convincingly high mean score, which suggests that the participants
considered that having a formal policy on diversity in the boardroom prompted them
to think about the demographic diversity of their INEDs.
4.4.6 Inferential statistics for the probable barriers
The next step in the quantitative analysis of data was to use the results from the
summary statistics to conduct inferential statistical tests on the organisational barriers
to demographic diversity in the boardroom identified in Phase One. An analysis of
the literature (O’Dwyer & Bernauer 2014; Teddlie & Tashakkori 2009; Vogt 2014)
suggested that inferential statistics are used by researchers “for drawing conclusions
about characteristics of a population, based on information available in a sample
taken from the population” (Selvanathan et al. 2016, p. 3). Thus, several statistical
tests were conducted on the barriers identified in Phase One so that the researcher
could draw conclusions about these organisational barriers for the population of
individuals from demographically diverse backgrounds wishing to be appointed as
INEDs of Northern Territory organisations. These tests were carried out as a means
to determine whether or not to reject or not reject the null hypothesis. The statistical
tests performed in this study included one sample t-tests and independent sample t-
tests for each of the organisational barriers.
4.4.6.1 One sample t-tests
According to O’Dwyer and Bernauer (2014), Quinlan (2011) and Vogt (2014), t-tests
are a specific form of inferential statistical analysis from the family of techniques
called analysis of variance, which are utilised to analyse differences among group
means. These authors asserted that all of the tests in the t-test family assess whether

123
average scores are normally distributed. However, unlike the independent and
dependent sample t-tests, the one sample t-test compares the mean from a single
sample (Rochon & Kieser 2011). Moreover, O’Dwyer and Bernauer (2014) asserted
that the one sample t-test compares the mean (µ) score found in an observed sample
to a hypothetically assumed value, which is represented as:
HO: µ = test value
HA: µ ≠ test value
The test value for the one sample t-test was set at 3.00 as this corresponds with the
‘non-committal’ response that is midway on the five-point Likert scale used to
collect the quantitative data. The one sample t-test statistic represents the proportion
of variation on scores due to the independent variable compared with the proportion
caused by error (Vogt 2014). Alan and Wayne (2007) and O’Dwyer and Bernauer
(2014) argued that the larger the t-test number, the greater the proportion of variation
in scores of the dependent variable that is caused by the independent variable. The
one sample t-test was utilised in this study to assess whether the mean value and its
corresponding uncertainty, expressed as a 95% CI, differed from the value of 3.00 to
a statistically significant extent. O’Dwyer and Bernauer (2014) and Rochon and
Kieser (2011) asserted that if the amount of variation due to the independent variable
is a large enough proportion of the total variation then the t-test will be significant.
The one sample t-test was performed for each set of six items for all organisational
barriers identified in Phase One. The results of the one sample t-tests are reported in
the following manner. First, the mean difference between the response value and the
test value is provided, followed by the t-statistic. The degrees of freedom of the t-

124
tests are provided next, which is followed by the significance statistic. In the same
way as the summary statistics, for each organisational barrier the individual results
for the six items were combined to produce an overall result for the one sample t-test
for each organisational barrier. This was undertaken as a means to either reject the
null hypothesis (HO) in favour of accepting the alternative hypothesis (HA). The
method of hypothesis testing employed in this study was:
HO: The independent variable is not an organisational barrier to demographic
diversity in the boardroom.
HA: The independent variable is an organisational barrier to demographic
diversity in the boardroom.
One sample t-tests were conducted on each barrier so that the researcher could
determine whether the general population of people from demographically diverse
backgrounds were being prevented or inhibited from being appointed as INEDs of
Northern Territory organisations. Table 4.7 reports the overall results of the one
sample t-test for each of the organisational barriers.
Table 4.7: Overall results of the one sample t-tests for probable barriers
t-test value = 3.00
# Barrier N Mean
difference
t df Sig. (2-tailed)
1 Lack of policy 24 0.035 0.365 143 0.716
2 Awareness 30 –0.300 –3.772 179 <0.001
3 Resources 30 –0.278 –3.191 179 0.002
4 Values & culture 30 –0.744 –8.621 179 <0.001
5 Fear 30 –0.606 –7.002 179 <0.001
6 Skill 30 –0.389 –4.444 179 <0.001
7 Geography 30 –0.111 –1.288 179 0.199

125
As Table 4.7 shows, the overall results for each of the barriers from the one sample t-
tests reveal that there are no statistically significant t-test scores with a value equal to
3.00. While the lack of a formal policy barrier had a positive t value it was very low.
Further, the results of the one sample t-tests for the remaining organisational barriers
revealed that these barriers all had negative t-values. Consequently, as there were no
t-test values equal to the test value of 3.00 there was sufficient evidence to reject the
study’s null hypothesis for all the organisational barriers identified in Phase One.
What is interesting about the result of the one sample t-tests is that apart from the
lack of policy barrier, the likely barriers all had negative t-test values. Further, five of
the organisational barriers’ overall t-test values were significantly less than the test
value of 3.00, and ranged from –3.12 to –8.60. Additionally, the organisational
barriers of awareness, values and culture, fears and skill all had significance statistics
of p < 0.001. The results of the one sample t-tests determined that the organisational
barriers to demographic diversity in the boardroom identified in Phase One are not
considered barriers to the general population of individuals from demographically
diverse backgrounds being appointed as INEDs or Northern Territory organisations.
However, the one sample t-test was also conducted on the summary statistic for the
six participants whose BoD did have a formal policy on diversity in the boardroom.
Table 4.8 reports the overall results of the one sample t-test for these questions.
Table 4.8: Overall results of the one sample t-test for boards with a policy
t-test value = 3.00
# Barrier N Mean
difference
t df Sig. (2-tailed)
1 Boards with a
policy
6 0.667 3.944 35 <0.001

126
As Table 4.8 reveals, the overall results for the one sample t-test for these questions
was greater than the test value of 3.00 to a statistically significant degree. As
mentioned above, the items for these six participants were designed to ascertain
whether or not they believed that their formal board diversity policy supported and
encouraged demographic diversity in their boardroom. The overall result of the one
sample t-test established that their organisation’s formal board policy did promote
and encourage demographic diversity in the boardroom.
This position was also reinforced by the participants whose BoD did not have a
formal board diversity policy. Item 6 asked the 24 participants whether they thought
that their BoD should consider developing a formal board policy to promote and
encourage demographic diversity in the boardroom. The result from the one sample
t-test for Item 6 was t = 3.30 (df = 23; p = 0.003), which is greater than the test value
of 3.00 and is statistically significant. The result from the one sample t-test for this
item showed that the BoDs should develop a formal policy to promote and encourage
diversity in the boardroom. Collectively, these two results established that having a
formal policy supports and encourages demographic diversity in the boardroom.
4.4.6.2 Independent samples t-tests
The next step in the quantitative data analysis was to undertake independent samples
t-tests to gain further insight into barriers to people from demographically diverse
backgrounds being appointed as INEDs of Northern Territory organisations. Alan
and Wayne (2007), Allen et al. (2014) and O’Dwyer and Bernauer (2014) maintained
that independent samples t-tests compare the sample mean scores between two
unrelated groups on the same dependent variable. The unrelated groups utilised for

127
the independent samples t-tests in this study were four dichotomous demographic
variables collected from the participants at the beginning of the online web survey.
Table 4.9 lists the dichotomous demographic variables selected for the independent
samples t-test.
The survey asked each of the 30 participants about their income level and provided
an income range for the respondents to select. The participants had the option to not
complete this question. As shown in Table 4.9, 27 participants completed the income
question. The independent samples t-test was employed to assess whether the sample
mean for Group One differed significantly from the sample mean for Group Two for
the organisational barriers identified in Phase One. Allen et al. (2014), O’Dwyer and
Bernauer (2014) and Vogt (2014) asserted that in the independent samples t-test the
null hypothesis states that there is no difference between two groups in their
population means. The null and alternative hypotheses are represented as:
HO: µ1 = µ2
HA: µ1 ≠ µ2
Table 4.9: Dichotomous demographic variables
# Variable Description N
1 Gender Female 14
Male 16
2 Age <50 years 12
≥50 years 18
3 Education Lower (bachelor degree or lower) 13
Higher (postgraduate diploma or higher) 17
4 Annual income Lower (≤$99,999) 8
Higher (≥$100,000) 19

128
The independent samples t-test was performed on each set of six items for each of
the barriers identified in Phase One for the four dichotomous demographic variables
listed in Table 4.9. In the same way as the one sample t-test, for each of the barriers
the individual responses to the six items were pooled to provide an overall response
on that barrier for the four dichotomous demographic variables. This was undertaken
as a means to either disprove the null hypothesis or to accept the alternative
hypothesis. The method of testing the hypothesis for the independent samples t-tests
in this study was:
HO: If the mean for Group One is = to the mean for Group Two then there is no
difference between the dichotomous demographic variables relating to that
barrier.
HA: If the mean for Group One is ≠ to the mean for Group Two then there is a
difference between the dichotomous demographic variables relating to that
barrier.
An independent samples t-test was conducted on each of the barriers identified in
Phase One with the four dichotomous demographic variables. The results determined
that there were two internal organisational barriers and two groups of dichotomous
variables with statistically significant results. First, for the values and culture barrier
compared between participants aged <50 and ≥50, the independent samples t-test
reported a statistically significant difference. The six items for the values and culture
barrier were designed to reveal participants’ views about whether their personal,
boardroom or organisational values and culture created a barrier to demographic
diversity in the boardroom. They were also asked if the Australian values and culture
created a barrier to individuals from demographically diverse backgrounds being

129
appointed as INEDs to their BoD. Table 4.10 displays the summary statistics for the
participant responses to these items by the two age groups.
Table 4.10 shows that for each of the six items, the 12 participants younger than 50
years of age recorded that values and culture was a bigger barrier to demographic
diversity in the boardroom than was reported by participants aged 50 years or over.
The independent samples t-test compared the sample mean scores for the 12
participants under 50 years (M = 2.76, SD = 1.14) and the 18 participants 50 years or
over (M = 1.92, SD = 1.04). Table 4.11 illustrates that overall, the views held by the
two age groups about the values and culture barrier were significantly different.
Table 4.10: Summary statistics for values and culture barrier by two age groups
Section F: Values and
culture barriers
N Mean Std. dev. Std. error
mean
95% CI
<50 ≥50 <50 ≥50 <50 ≥50 <50 ≥50 <50 ≥50
1. Values of the other
directors
12 18 2.67 2.28 1.15 1.18 0.33 0.28 0.67 0.56
2. Culture of boardroom 12 18 2.75 2.39 1.14 1.38 0.33 0.32 0.66 0.65
3. Your culture/religious
values
12 18 2.50 1.72 1.09 1.02 0.31 0.24 0.63 0.48
4. Values and culture of
the organisation
12 18 2.75 1.61 1.29 0.78 0.37 0.18 0.74 0.37
5. Australia’s values &
culture
12 18 3.42 1.72 1.08 0.67 0.31 0.16 0.63 0.32
6. Your personal values 12 18 2.50 1.78 1.09 0.94 0.31 0.22 0.63 0.44
Overall 72 108 2.76 1.92 1.14 1.04 0.13 0.10 0.27 0.20
Table 4.11: Overall results of the independent samples t-test by two age groups
t-test for equality of means
# Barrier Variable Mean
difference
S.E. of
diff.
t df Sig. (2-
tailed)
1 Values/Culture Age 0.847 0.168 5.041 142.356 0.000

130
The results of the independent samples t-test identified that there was sufficient
evidence to support accepting the alternative hypothesis. Therefore, the alternative
hypothesis was accepted for the values and culture barrier for the two age groups.
However, the independent samples t-tests undertaken for the remaining dichotomous
demographic variables for the values and culture barriers determined that there was
no statistically significant difference between these unrelated groups’ population
means. The overall results recorded either a considerably low or negative t value.
Consequently, the null hypothesis of no difference in views about the values and
culture between groups based on gender, education level and income was accepted.
The second internal organisational barrier with a statistically significant finding was
the lack of policy barrier according to participant gender. As discussed earlier, the six
items for the 24 participants whose BoD did not have a formal board diversity policy
were designed to ascertain whether they believed that not having a policy prevented
or inhibited people from demographically diverse backgrounds being appointed as
INEDs to their boards. Table 4.12 displays the summary statistics for the participant
responses to these questions by gender.
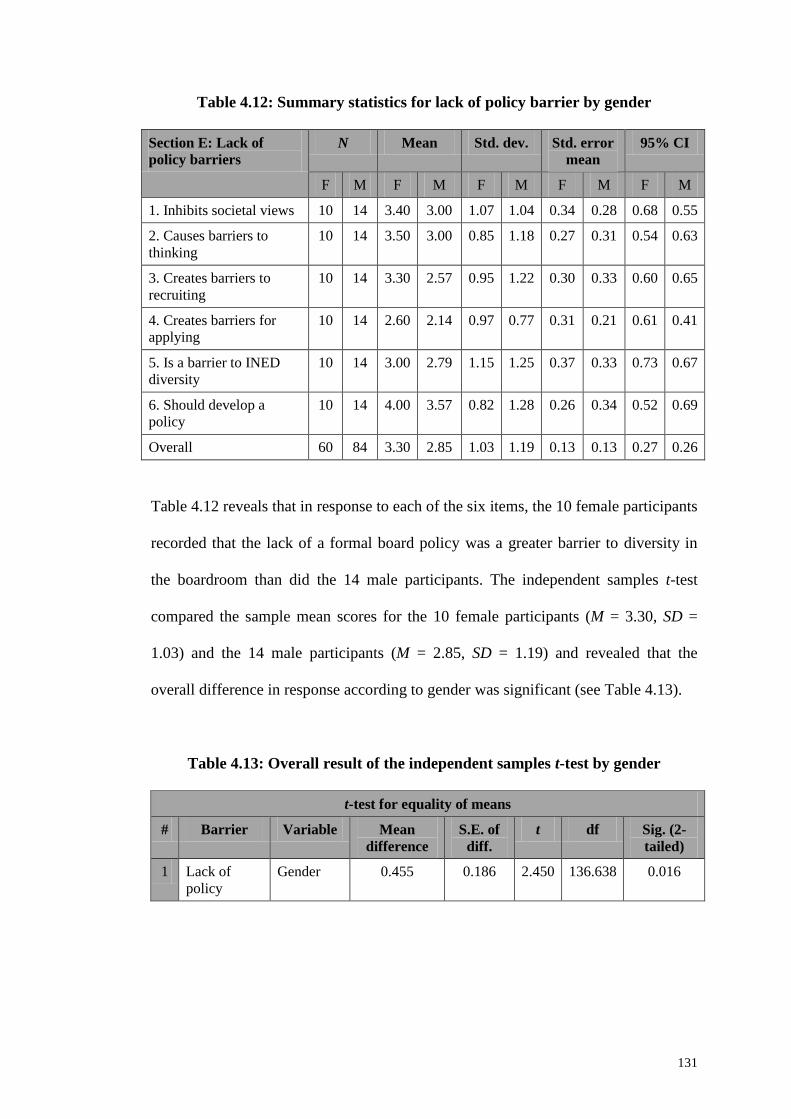
131
Table 4.12: Summary statistics for lack of policy barrier by gender
Section E: Lack of
policy barriers
N Mean Std. dev. Std. error
mean
95% CI
F M F M F M F M F M
1. Inhibits societal views 10 14 3.40 3.00 1.07 1.04 0.34 0.28 0.68 0.55
2. Causes barriers to
thinking
10 14 3.50 3.00 0.85 1.18 0.27 0.31 0.54 0.63
3. Creates barriers to
recruiting
10 14 3.30 2.57 0.95 1.22 0.30 0.33 0.60 0.65
4. Creates barriers for
applying
10 14 2.60 2.14 0.97 0.77 0.31 0.21 0.61 0.41
5. Is a barrier to INED
diversity
10 14 3.00 2.79 1.15 1.25 0.37 0.33 0.73 0.67
6. Should develop a
policy
10 14 4.00 3.57 0.82 1.28 0.26 0.34 0.52 0.69
Overall 60 84 3.30 2.85 1.03 1.19 0.13 0.13 0.27 0.26
Table 4.12 reveals that in response to each of the six items, the 10 female participants
recorded that the lack of a formal board policy was a greater barrier to diversity in
the boardroom than did the 14 male participants. The independent samples t-test
compared the sample mean scores for the 10 female participants (M = 3.30, SD =
1.03) and the 14 male participants (M = 2.85, SD = 1.19) and revealed that the
overall difference in response according to gender was significant (see Table 4.13).
Table 4.13: Overall result of the independent samples t-test by gender
t-test for equality of means
# Barrier Variable Mean
difference
S.E. of
diff.
t df Sig. (2-
tailed)
1 Lack of
policy
Gender 0.455 0.186 2.450 136.638 0.016

132
The results of the independent samples t-test identified that there was sufficient
evidence to support rejecting the null hypothesis in favour of accepting the
alternative hypothesis. Thus, the alternative hypothesis was accepted for participant
gender views on the lack of policy barrier. However, the results of the independent
samples t-tests with the remaining dichotomous demographic variables for the lack
of policy barriers determined that there was no statistically significant difference
between these unrelated groups’ population means. The overall results recorded
either a very low or negative t value. As a result, the null hypothesis was accepted for
the lack of policy barriers for the remaining three dichotomous demographic
variables of age, education and income.
The results of independent samples t-tests undertaken with the organisational barriers
of awareness, resources, fear, skill and geography with all four of the dichotomous
variables showed that there was no statistically significant difference between these
unrelated groups’ population means. The overall results of the statistical tests
reported either a considerably low or negative t value. There was no significant
difference between participant groups based on gender, age, education or income
with respect to their views on organisational barriers to diversity on their BoDs.
4.5 Chapter summary
This chapter has presented the results of the data collection and analysis for the
qualitative and quantitative phases of this research. The chapter began by introducing
the qualitative analysis method utilised before providing profiles of the participants
from Phase One. This was followed by presenting the findings from the data coding
of the participant responsive in-depth interviews based on their frequency. The

133
qualitative analysis identified that there were six probable organisational barriers that
inhibited or prevented individuals from demographically diverse backgrounds being
appointed as INEDs of Northern Territory organisations. These six barriers were lack
of policy, awareness, values and culture, fear, resource and geographical barriers. To
comply with the qualitative methodology adopted for this research, Phase One then
used quotations from the participants to build a complete argument for each of these
organisational barriers to demographic diversity in the boardroom. These barriers
became the focus of the quantitative data collection.
The chapter then presented the results of the quantitative analysis of data. This
commenced by introducing the quantitative analysis method utilised before providing
a profile of the participants from Phase Two. This was followed by introducing scale
construction and the significance of internal reliability for the survey questions.
Cronbach’s was used to test the internal reliability of the items, which revealed
that all of the items relating to the barrier questions formed good internal reliability.
Next, frequency distributions of participants’ demographic data and their responses
to general questions about demographic diversity in the boardroom were presented.
Next, the results of the summary statistics were provided, which revealed that in
contrast to the qualitative findings, the only internal organisational barrier that was
significant was the lack of a formal policy on diversity in the boardroom. One sample
t-tests were conducted for all of the organisational barriers and the results established
that the barriers to board demographic diversity identified in Phase One were not
statistically significant. As a result, the study’s overall null hypothesis (that internal
organisational barriers prevent people from demographically diverse backgrounds

134
being appointed as INEDs of Northern Territory organisations) was rejected.
Nevertheless, the analysis also determined that the participants from Phase Two held
the view that having a formal board diversity policy would promote and encourage
demographic diversity in the boardroom. To gain further insight, independent
samples t-tests were conducted on the organisational barriers based on four
dichotomous demographic variables. The results established that the values and
culture barrier was seen significantly differently depending on participant age, and
that the organisational barrier relating to a lack of policy was seen significantly
differently according to gender. The results of the research findings from Phase One
and Phase Two are discussed in the next chapter.

135
CHAPTER 5
DISCUSSION
5.1 Introduction
The purpose of this chapter is to critically examine the research findings from
Chapter 4 in the context of the study’s research question, theory and literature
relating to diversity in the boardroom. Previous domestic and international diversity
and governance researchers have extensively studied demographic diversity at the
board level (Azmat & Rentschler 2015; Dhir 2015; Kang et al. 2007; Terjesen et al.
2016). However, most studies were principally focussed on gender diversity in large
profit-making listed organisations located in densely populated regions. The current
study thus aimed to fill a gap in the literature by identifying and examining the
organisational barriers that either prevent or inhibit people from demographically
diverse backgrounds being appointed as INEDs of Northern Territory organisations.
Therefore, the findings from the data analysis presented in the previous chapter are
here discussed and analysed to “examine the extent to which the data answered the
research question or supported/failed to support the hypothesis” (Lunenburg & Irby
2008, p. 229).
There was considerable data from Phase One and Phase Two of the data analysis
stage that provided a worthwhile context to examine the internal organisational
barriers to demographic diversity in the boardroom. However, the results of a study
such as this must be interpreted with caution, particularly as there was no history of
previous empirical research investigating internal organisational barriers to people
from demographically diverse backgrounds being appointed as INEDs of Northern
Territory organisations. Moreover, there were no profit-making listed organisations

136
in either Phase One or Phase Two. Therefore, the outcomes of the data analysis relate
specifically to government and NFP boards. However, the study’s findings should be
taken into account when thinking about diversity at the board level for profit-making
organisations with INEDs in their boardroom. The findings have reinforced some of
the factors that the literature suggested may be causing information asymmetry that
is preventing or inhibiting diversity in the boardroom. The notable outcomes from
this study were that having a formal policy on diversity in the boardroom has the
potential to support and encourage board heterogeneity; that Northern Territory
boardrooms have an equal representation of female and male directors; and that the
definition of diversity in the boardroom has been interpreted to singularly represent
gender diversity.
The study employed a sequential exploratory mixed methods research design for
collecting and analysing qualitative data that informed the collection and analysis of
quantitative data. Accordingly, the chapter begins by discussing the results from the
qualitative data analysis and how the findings from Phase One answers the research
question. This is followed by a discussion on the results of the quantitative data
analysis and how the findings from Phase Two answered the study’s hypothesis. The
chapter concludes by comparing and contrasting the findings from the qualitative and
quantitative phases.
5.2 Discussion of the findings from Phase One
By exploring the experiences of INEDs from demographically diverse backgrounds
and spokespeople from peak industry bodies about the organisational barriers to
board diversity, the researcher was able to acquire in-depth information about the
137
obstacles preventing or inhibiting diversity in the boardroom. The findings from the
qualitative data analysis indicated that the participants from Phase One believed there
to be six principal barriers to individuals from demographically diverse backgrounds
being appointed as INEDs of Northern Territory organisations. Further, there was
congruence between the barriers to diversity in the boardroom identified in Phase
One and what the literature indicated as being barriers to diversity in the workplace.
While the findings revealed six organisational barriers, the internal organisational
barrier most frequently referred to by the participants of Phase One was the ‘absence
of a formal policy’ for demographic diversity in the boardroom.
5.2.1 The absence of policy creates a barrier to diversity in the boardroom
The vast majority of participants considered that not having a formal policy for
diversity in the boardroom was the most important factor preventing or inhibiting
demographic diversity at the board level. The participants believed that if their BoD
had a formal policy that replicated their diversity in the workplace policy, there was a
greater chance of boardrooms in the Northern Territory being demographically
diverse. This finding was further supported by the fact that all 10 participants’
organisations had a formal policy for diversity in the workplace and they all
considered their workplaces to be demographically diverse. Nevertheless, only one
participant corroborated that their BoD had a formal policy for diversity at the board
level. Moreover, apart from gender diversity, the majority of the participants from
Phase One did not consider that their BoD was demographically diverse. This also
indicates the existence of information asymmetry between societal expectations for
director heterogeneity and the reality of the current homogeneous composition of
boardrooms in Northern Territory. However, the empirical literature appears to be

138
deficient in identifying the absence of a formal policy for demographic diversity in
the boardroom as being a barrier. Most studies appear to be singularly focussed on
examining the efficacy of gender, and more recently age and ethnic diversity, within
the boardroom.
Peak industry bodies including the AICD, the ASX and WoBs have called on
Australian BoDs to “establish a [board] diversity policy in which clear goals, and
measurable milestones towards achieving these goals, are articulated” (AICD 2014).
Nevertheless, for demographic diversity in the boardroom to flourish it is vital that
formal board diversity policy reflects all the signals transmitted from Australia’s
heterogeneous society. This means providing equality of opportunity and ‘a fair go’
to people from any demographic background, rather than being selectively focussed
on characteristics such as gender, age and ethnicity. Moreover, introducing a formal
board diversity policy would send an unmistakable message to society and potential
INED candidates from demographically diverse backgrounds that BoDs supported
and encouraged board diversity. Therefore, formal policy has the ability to generate
information congruency between Australia’s heterogeneous multicultural society and
homogeneous BoDs, thereby improving the chances of people from demographically
diverse backgrounds being appointed as INEDs of Northern Territory organisations.
5.2.2 Four lesser barriers to diversity in the boardroom
While listing the barriers that emerged from the qualitative analysis of data, the study
also discovered there were four lesser internal organisational barriers to demographic
diversity in the boardroom. First, the participants considered that their boards lacked
the essential resources to support and encourage diversity at the board level. While

139
most participants made reference to the multiple resources their organisations had to
support and promote diversity in the workplace, they identified the absence of board
resources as a contributing factor in existing homogeneity in the boardroom. Many
participants considered that if their BoD had a formal diversity policy, their board
would probably be better resourced to support and encourage demographic diversity
at the board level.
Director diversity awareness training and sufficient resources for recruiting INEDs
from demographically diverse backgrounds were identified as the most important
resources required for transforming homogeneous boards to heterogeneous BoDs.
Most respondents asserted that similar to workplace diversity, having a formal board
demographic diversity policy with sufficient diversity management resources would
unquestionably increase directors’ level of awareness about the organisational
benefits to heterogeneity in the boardroom. Accordingly, this would foster the
recruitment of demographically diverse directors external to the ‘old boy’s network’.
This finding is consistent with what the diversity management literature asserts about
the essential elements for creating and maintaining positive work environments,
where the similarities and differences of individuals from different demographic
groups are respected and valued (Kramar 2012; Olsen & Martins 2012). Moreover, if
BoDs assigned resources for director education and recruitment of directors from
demographically diverse backgrounds, this would send an unambiguous signal to
society and potential INED candidates from diverse backgrounds that the board was
serious about, and committed to, diversity in the boardroom.

140
Second, the findings from the data analysis determined that directors also lacked
general awareness about demographic diversity in the boardroom. Almost all of the
participants considered diversity in the boardroom to relate to gender diversity. This
finding is aligned with several diversity researchers’ current thinking (Adams 2015;
Du Plessis et al. 2012). This narrow understanding about the definition of board
diversity is consistent with Northern Territory boardrooms having an almost equal
representation of female and male directors. Nevertheless, this limited understanding
about the definition of diversity in the boardroom was considered by participants as a
barrier to director heterogeneity. Further, after discussing this study’s more inclusive
holistic definition of demographic diversity, the participants considered that the
composition of the boardroom should be inclusive of all observable and underlying
diversity characteristics.
The study found that BoDs also lacked awareness about the organisational needs for,
and economic benefits of, heterogeneity in the boardroom. All participants held the
view that having INEDs from demographically diverse backgrounds would better
meet the needs and wants of their current and future target markets compared with
boardrooms that were homogeneous. Moreover, organisations with demographic
diversity in the boardroom would send an unmistakable signal to their stakeholders
that they were in a better position to understand their needs and wants. However, in
contrast to the diversity in the workplace literature, which comprehensively explores
the organisational advantages of workplace diversity, the literature on diversity in the
boardroom principally focusses on the efficacy of gender, and more recently age and
ethnic, diversity. Nonetheless, expanding directors’ level of awareness about the
definition and benefits of diversity in the boardroom has the potential to lessen the

141
information asymmetry existing between Australia’s heterogeneous society and
homogeneous boards. Arguably, augmenting directors’ level of awareness about
diversity in the boardroom would considerably improve the chances for individuals
from demographically diverse backgrounds being appointed as INEDs of Northern
Territory organisations.
The remaining two internal organisational barriers that were found to either prevent
or inhibit demographic diversity at the board level were ‘values and culture’ and
‘director fears’. Many of the participants expressed a strong desire to talk about these
barriers as they evoked powerful emotional feelings. These participants provided
detailed anecdotal evidence of their negative experiences involving these three
internal organisational barriers. They also maintained that even with an almost equal
number of women in the boardroom, there remained a dominant masculine culture in
BoDs. A rational explanation for this may be the historical convention of white,
middle-aged men dominating the boardroom and the lack of focussed attention given
to reducing director homogeneity so that BoDs can become demographically diverse.
This finding has congruence with what the literature contends as being contributing
factors to the glacial rate of change to the homogeneous make-up of the boardroom
(Adams 2015; Klettner et al. 2016; Labelle et al. 2015).
However, when discussing practical strategies for mitigating the under-representation
of INEDs from demographically diverse backgrounds at the board level, a substantial
number of the participants recommended operationalising contemporary diversity
management practices. By applying these practices at the board level, the opportunity
for information congruence occurring between Australia’s heterogeneous society and

142
homogeneous BoDs would be increased. This would therefore present people from
demographically diverse backgrounds seeking appointments as INEDs of Northern
Territory organisations with equality of opportunity and ‘a fair go’.
5.2.3 The geography of the Northern Territory creates barriers
As this study was geographically limited to Northern Territory BoDs, the responsive
in-depth interviews afforded the participants the opportunity to discuss likely
geographical barriers to demographic diversity in the boardroom. The findings
included a positive effect between the remoteness and small population of people
living in the Northern Territory as being probable external organisational barriers to
demographic diversity in the boardroom. These geographical barriers correlated with
most participants’ view that there were fewer qualified and experienced people from
demographically diverse backgrounds living in the Northern Territory than required
to fill available directorship positions. However, most participants did not consider
these geographical factors as a significant barrier for women, compared with the
other observable and underlying demographic categories incorporated in this study.
As indicated in the literature review, the geographical location of BoDs has been
inadequately addressed by empirical studies investigating diversity in the boardroom.
There were no studies identified as having investigated board diversity in regional
and remote parts of the country, such as the Northern Territory. This appears to be
because the majority of these studies have been framed in narrow geographical
terms, singularly focussing on profit-making organisations in densely populated
metropolitan regions of Australia. However, investigating diversity in boardrooms in
the Northern Territory has identified several geographical factors that may contribute

143
to creating barriers to demographic diversity at the board level. Further, by focussing
on regional and remote parts of Australia, this study has drawn attention to the fact
that boardrooms in the Northern Territory have an almost equal representation of
female and male directorships.
These research findings indicate that with the exception of gender diversity, there is a
concrete argument that both the small population of the Northern Territory and its
geographical remoteness are disadvantages for people from demographically diverse
backgrounds being appointed as INEDs. In spite of the unique demographic profile
of the Northern Territory, it could be argued that for these reasons, the status quo of
homogeneity continues to be reinforced in Northern Territory boardrooms. However,
if boards in regional and remote parts of the Australia were to operationalise
diversity management practices that support and encourage demographic diversity in
the boardroom, there is the opportunity to ameliorate these geographical barriers.
Apart from gender diversity, the existence of these organisational barriers has
revealed that the signals transmitted from Australia’s heterogeneous society to
Northern Territory homogeneous BoDs about the need for director heterogeneity
have not been successfully received. Further, internal organisational barriers appear
to be causal factors contributing to the information asymmetry between these two
parties. For this reason, the status quo of homogeneity continues to be reinforced by
homogeneous BoDs. However, identifying, naming, processing and operationalising
corrective actions to resolve these internal organisational barriers to board diversity
has the potential to bring about further change to the demographic composition of
Northern Territory boardrooms.

144
5.3 Discussion of the findings from Phase Two
The purpose of Phase Two was to quantify the observations from Phase One relating
to organisational barriers that prevented or inhibited homogeneous BoDs receiving
signals from Australia’s heterogeneous society regarding its requirement for diversity
in the boardroom. This was undertaken to determine the probable root causes of the
information asymmetry existing between these two parties. Also, by investigating the
views of a larger cohort of Northern Territory independent and non-independent
directors about the organisational barriers to board diversity, the researcher was able
to acquire important information and a deeper understanding of these barriers.
However, the results of the statistical analysis of the quantitative data revealed that
the organisational barriers identified in Phase One did not either inhibit or prevent
demographic diversity in the boardroom; therefore, the study’s null hypothesis was
rejected.
5.3.1 No positive statistically significant relationship
The findings from Phase Two in relation to the research question revealed that there
was no statistically significant relationship between the organisational barriers
identified in Phase One and the lack of demographic diversity within Northern
Territory boardrooms. This result indicates that the barriers identified in Phase One
were not considered organisational barriers for the general population of candidates
from demographically diverse backgrounds looking to be appointed as INEDs of
Northern Territory organisations. Notably, the result that there was no positive
relationship between the dependent and independent variables suggested that BoDs
with INEDs in the Northern Territory may be progressively unique in terms of
supporting and promoting demographic diversity in the boardroom.
145
There does, however, appear to be a reasonable practical explanation for the findings
from Phase Two. In contrast to the diversity literature, which contends that there is a
lack of gender diversity in the boardroom of Australian organisations, the 14 BoDs
that contributed to this study had more female directors than male directors: of the 98
potential independent and non-independent directors that were invited to participate
in this study, 55.1 per cent were female. Accordingly, the gender composition of the
BoDs that participated in Phase Two of this study was female biased. This indicates
that the signal transmitted from Australia’s heterogeneous society about the need to
increase the number of women in the boardroom has been successfully received and
operationalised by Northern Territory BoDs. Further, when discussing organisational
barriers to diversity in the boardroom and the more holistic inclusive definition of
demographic diversity in Phase One, Beryl, who was an advocate for increasing the
number of women in the boardroom stated that:
With more women on the boards of directors there is a stronger chance for
greater diversity [demographic diversity].
Beryl’s statement was reinforced by the demographic composition of participants in
Phase Two. The analysis of quantitative data determined that of the 30 participants,
14 were female, although Figure 4.2 illustrated that only 8 of these 14 women self-
identified as being from a diversity category.
There were also several participants that identified as being from other demographic
backgrounds. Four participants identified as being from an ethnic background, three
participants were under the age of 40, three were from a different religious or cultural
background, and two participants identified as being of Aboriginal and Torres Strait

146
Islander descent. There were no participants in Phase Two that self-identified as
having a physical or sensory impairment, mental health issues or being LGBTI.
Nevertheless, there were participants in Phase One that did identify with these
demographic diversity categories.
Accordingly, it appears that there may be a reasonable basis to Beryl’s assertion that
with more female directorships there is a stronger chance of achieving a more
inclusive holistic approach to demographic diversity in the boardroom. These data
provide some evidence that the credible signals transmitted from Australian society
about the need for demographic diversity in the boardroom have been received and
operationalised by the general population of NFP and government BoDs in the
Northern Territory. This finding offers further empirical evidence that Northern
Territory BoDs are progressively unique in supporting a more inclusive holistic
definition of demographic diversity in the boardroom. This reasonable level of
demographic diversity in Northern Territory boardrooms has provided a rational
explanation for rejecting the study’s null hypothesis.
The results of the principal statistical tests revealed that there was no positive
significant relationship between the organisational barriers identified in Phase One of
the study and the lack of demographic diversity in Northern Territory boardrooms.
Thus, further analysis of the data was undertaken on the organisational barriers with
the dichotomous demographic variables of gender, age, education and income.
Nevertheless, the vast majority of these additional statistical tests determined that
there was also no significant relationship between the barriers and these unrelated
variables. The above justification for why there was no significant relationship

147
between the barriers identified in Phase One and the lack of diversity in Northern
Territory boardrooms may also explain the results of the analysis of barriers and
dichotomous demographic variables. However, the results of this further data
analysis did corroborate that there was a relationship between two of the internal
organisational barriers and two of the dichotomous demographic variables. The two
barriers and dichotomous variables with a statistically significant relationship were
the values and culture barrier with respect to participant age and the lack of policy
barrier according to participant gender.
First, the findings determined that participants under 50 years of age considered that
the values and culture barrier was a greater barrier to people from demographically
diverse backgrounds being appointed as an INED of Northern Territory organisations
than did the older participants. The divergence of opinions between these two groups
of participants about the vales and culture barrier is an important finding as it
indicates that the older participants potentially held more conservative views than
younger ones. A reasonable explanation for this difference might be that participants
younger than 50 were raised in an Australian culture where multiculturalism was the
norm and the similarities and differences of people living in the country are respected
and valued. Moreover, as highlighted in the literature review, boardrooms have
generally comprised middle-age women and men over the age of 50. Therefore, this
finding also suggests that the age of directors may be a contributing factor to the
information asymmetry existing between Australia’s heterogeneous society and
homogeneous BoDs in the Northern Territory.

148
The second finding was that female participants considered that a lack of a formal
diversity policy was a bigger internal organisational barrier to individuals from
demographically diverse background being appointed as INEDs of Northern
Territory organisations than was expressed by male participants. The difference of
opinion between females and males concerning the lack of a formal board diversity
policy indicates that women may have had a greater level of awareness about the
lack of demographic diversity in the boardroom. Moreover, the female participants
may have placed greater emphasis on the importance of their BoD having a formal
board policy for producing demographic diversity in Northern Territory boardrooms
compared with the male respondents. As highlighted in the literature review, a
reasonable explanation for this difference of opinion could be that historically,
women have not been provided equality of opportunity or been given ‘a fair go’ in
the process of being appointed to BoDs. Thus, this finding suggests that the female
participants believed the lack of a formal board diversity policy to be a contributing
factor in the continued existence of information asymmetry between Australia’s
heterogeneous society and Northern Territory homogeneous boardrooms.
5.3.2 Having a formal policy encourages diversity in the boardroom
Of the 30 participants that contributed to Phase Two, six corroborated that their
BoDs had a formal policy on demographic diversity in the boardroom. The questions
for these participants were designed to acquire data about the effect of their board’s
diversity policy. The findings indicated a statistically significant positive relationship
between their BoD having a formal board diversity policy and their boardroom being
demographically diverse. The 24 participants whose board did not have a formal
diversity policy were asked if they believed that their board should develop a policy

149
to support and encourage demographic diversity in their boardrooms. The results for
this question were also positively statistically significant, suggesting that the wider
population of Northern Territory independent and non-independent directors held the
view that their BoD should consider developing a formal policy to support and
encourage demographic diversity in the boardroom.
These results are congruent with the findings from Phase One where the participants
believed that there was a much stronger chance of achieving demographic diversity
at the board level if BoDs had formal diversity policies. Proving evidence to support
this argument, Bradshaw et al. (2009) in their study of board diversity on Canadian
NFPs determined that when BoDs have clear diversity policies and practices
outlined, the range of demographic diversity in the boardroom increases. Moreover,
boards with a formal diversity policy send an unmistakable signal to potential INED
candidates that the BoD supports diversity in their boardroom. This would minimise
the information asymmetry existing between Australia’s heterogeneous society and
homogenous BoDs. Thus, a formal policy would considerably improve the chances
of people from demographically diverse backgrounds being appointed as INEDs of
Northern Territory organisations.
The findings from Phase Two determined that there were no positive significant
relationships between the lack of board diversity and the organisational barriers to
demographic diversity at the board level identified in Phase One. Notably, the results
of the quantitative data analysis were that Northern Territory boardrooms had more
female directors than male directors. The data analysis also revealed that there were
directors from several of the diversity categories incorporated in this study. Thus,
150
there was an existing degree of demographic diversity among the independent and
non-independent directors that contributed to Phase Two. Also, while Phase Two
rejected the study’s null hypothesis (that there are internal organisational barriers to
people from demographically diverse backgrounds being appointed as independent
non-executive directors of Northern Territory organisations), there was evidence that
BoDs with a formal policy on director heterogeneity would encourage demographic
diversity in the boardroom.
5.4 Comparing and contrasting the results from Phase One and Phase Two
Using a sequential exploratory mixed method design that investigated the views of
three independent data sources provided detailed qualitative and quantitative results
relating to the study’s research question:
What are the internal organisational barriers to people from demographically
diverse backgrounds being appointed as independent non-executive directors of
Northern Territory organisations?
In light of the results relating to the research question for Phase One and Phase Two
presented in Sections 5.2 and 5.3, the following discussion relates to the similarities
and differences among the findings that correlate to barriers to demographic diversity
in the boardroom.
5.4.1 Results that were similar
An analysis of the data indicated that the participants in Phase One and Phase Two of
the study identified a number of similarities. First, the majority of the participants’
organisations had diversity in the workplace policies, while most of their BoDs did

151
not have diversity in the boardroom policies. Nevertheless, a substantial number of
the participants from both phases thought that having a formal policy on diversity in
the boardroom was a good idea. As identified in Section 5.2.1 and 5.3.2, the study
identified that having a formal diversity in the boardroom policy that replicated
diversity in the workplace policies had the potential to support and encourage
demographic diversity at the board level. Accordingly, it appears that the participants
from Phase One and Phase Two considered that a formal policy on diversity in the
boardroom would increase the chances of individuals from demographically diverse
backgrounds being appointed as INEDs of Northern Territory organisations. Thus,
the findings of this study suggest that if boards are going to become demographically
diverse they need to introduce a formal diversity in the boardroom policy that
accurately reflects the signal being sent from Australia’s heterogeneous society about
the requirement for director heterogeneity.
The second key similarity between Phase One and Phase Two was related to the
gender composition of the participants’ boardrooms. The literature review identified
that boardrooms in Australia lacked demographic diversity as they remain dominated
by white, middle-aged men from the ‘old boy’s network’. Nevertheless, the literature
also reported that over the past 20 years there have been some adjustments to the
composition of the boardroom, with gender diversity coming to the foreground as
boards incrementally introduced female directors. This position was, however, not
supported by the findings of Phase One or Phase Two: the majority of boardrooms in
this Northern Territory study sample had an equal representation of female and male
directors. This finding indicates that the signals sent from Australian society about

152
the need for gender diversity at the board level have been received and successfully
operationalised by Northern Territory BoDs.
Gender equality in the boardroom of Northern Territory organisations is a significant
achievement; an encouraging outcome that should be celebrated; and unique in terms
of diversity in the boardroom in Australia. However, this finding also speaks to the
narrow specificity of the signals sent from society about the need for greater gender
diversity in the boardroom. This position has congruence with the participants’
responses and literature regarding the definition of demographic diversity in the
boardroom suffering from a sense of ‘stuckness and rigidity’. Thus, this study asserts
that gender parity at the board level does not equate to demographic diversity in the
boardroom as boards remain dominated by white, middle-aged women and men; as a
result, they remain homogeneous. At the 2011 WoBs conference, the perception of
gender homogeneity in the boardroom was anticipated by Broderick (2011), who
asserted that “some will argue that we will see the emergence of an “old girl’s
network” as we have with the ‘old boy’s network’ that the power is concentrated in
the hands of a very few” (p. 8). Thus, consistent with what contemporary diversity
researchers advocate, this study argues that when thinking about diversity in the
boardroom it is entirely appropriate to take into consideration this study’s more
inclusive holistic definition of demographic diversity.
5.4.2 Results that differed
While there were several results from Phase One and Phase Two that were similar,
several findings also differed between the phases. The participants in Phase One
were purposively selected and comprised INEDs from demographically diverse

153
backgrounds and spokespeople from peak industry bodies. These participants
corroborated that there were organisational barriers to people from demographically
diverse backgrounds being appointed as INEDs of Northern Territory organisations.
In contrast, the independent and non-independent directors from Phase Two were not
purposively selected. Moreover, the findings of the statistical analysis of data from
Phase Two did not fully support the results of Phase One. The results from Phase
Two established that the organisational barriers identified in Phase One did not either
prevent or inhibit the general population of people from demographically diverse
backgrounds being appointed as INEDs of Northern Territory organisations.
There does, however, appear to be a rational and practical explanation for the
differences between these findings. The experiences of the participants in Phase One
may be entirely different to the experiences of those in Phase Two. Also, while the
participants in Phase Two supported demographic diversity at the board level they
may not have been acquainted with the organisational barriers experienced by the
participants in Phase One when answering the questions in the online web survey.
Moreover, apart from gender diversity, the participants from Phase One did not
consider their boards to be demographically diverse. However, almost half of the
respondents in Phase Two considered their BoD to be diverse. Also, some of the
participants identified as being from diversity categories. However, the reason for the
lack of difference between the demographic composition of the BoDs from Phase
One and Phase Two was beyond the scope of this study.

154
5.5 Chapter summary
This chapter discussed the research findings from Phase One and Phase Two. It also
compared the results from the two phases. As this study employed a sequential
exploratory mixed methods research design, the chapter commenced by discussing
the results of the qualitative analysis of data from Phase One. The evidence from the
interviews with INEDs from demographically diverse backgrounds and spokespeople
from peak industry bodies identified that there were six organisational barriers to
demographic diversity in the boardroom. Next, the chapter established that the
dominant internal organisational barrier to board diversity identified in Phase One
was the absence of a formal policy on demographic diversity in the boardroom. Four
lesser internal organisational barriers to demographic diversity at the board level
were then recognised and discussed. The discussion of the qualitative phase
concluded by exploring how the external organisational barrier of the Northern
Territory’s geography created obstacles for people from demographically diverse
backgrounds being appointed as INEDs of Northern Territory organisations.
The chapter then discussed the results of the quantitative analysis of data from Phase
Two in relation to the study’s hypothesis. The evidence from the online survey with
Northern Territory independent and non-independent directors determined that there
was no positive statistically significant relationship between the organisational
barriers to board diversity found in Phase One and the lack of demographic diversity
in the boardroom. However, there was evidence to suggest that participants under 50
years of age held the view that the values and culture of the BoD created barriers to
demographic diversity in the boardroom. There was also evidence that indicated that
female participants considered that the lack of a formal diversity in the boardroom
155
policy was a barrier to demographic diversity at the board level. The chapter then
examined quantitative evidence, determining that there was a statistically significant
relationship between BoDs with a formal diversity policy and Northern Territory
boardrooms being demographically diverse. Finally, similarities and differences
between Phase One and Phase Two were discussed.

156
CHAPTER 6
CONCLUSION
6.1 Introduction
The purpose of this chapter is to bring the thesis to conclusion and to understand the
research findings in the context of the theory and literature. This research was
undertaken from the perspective that information asymmetry exists between
Australia’s heterogeneous society and homogeneous BoDs. Consequently, the study
investigated the root cause of this information asymmetry by exploring internal
organisational barriers to demographic diversity in the boardroom. This was done to
determine if there were any barriers that either prevented or inhibited individuals
from demographically diverse backgrounds being appointed as INEDs of Northern
Territory organisations. The study established that there were confirmatory and
contradictory findings between the qualitative and quantitative phases relating to
organisational barriers causing information asymmetry between the country’s
heterogeneous society and homogeneous BoDs in the Northern Territory.
This chapter commences by revisiting the aim of the study and the approach taken to
fulfil the purpose of the research. This is followed by a discussion of the research
findings that speak to the study’s research question and null hypothesis. The chapter
then explores the implications of the findings for theory, policy and practice. Next,
the chapter presents limitations of the study and then concludes by providing
recommendations for further research that may increase the likelihood of people
from demographically diverse backgrounds being appointed as INEDs.

157
6.2 Aim of the study and the approach taken
As articulated in Chapter 1, the aim of this study was to identify and investigate the
internal organisational barriers that prevent or inhibit people from demographically
diverse backgrounds being appointed as INEDs of Northern Territory organisations.
This aim was fulfilled through qualitative and quantitative data collection to answer
the research question. The question the study answered was:
What are the internal organisational barriers to people from demographically
diverse backgrounds being appointed as independent non-executive directors of
Northern Territory organisations?
To meet the aim of the study as well as answer the research question, a sequential
exploratory mixed methods research design was operationalised. In Phase One,
qualitative data were collected through responsive in-depth interviews with INEDs
from demographically diverse backgrounds and spokespeople from peak industry
bodies. The qualitative data analysis identified six organisational barriers to
demographic diversity at the board level. The results from the qualitative data
analysis informed the collection and analysis of quantitative data. In Phase Two,
quantitative data were collected from independent and non-independent directors of
Northern Territory organisations via an online web survey. This approach was taken
to determine whether or not to reject or not reject the study’s null hypothesis:
There are internal organisational barriers for people from a demographic
diverse background being appointed as an independent non-executive director
of Northern Territory organisations.

158
The quantitative data analysis identified that the organisational barriers to diversity at
the board level identified in Phase One were not significant, leading to rejection of
the study’s null hypothesis. A discussion of the results from Phase One and Phase
Two was then undertaken to examine how the results related to the study’s research
question.
6.3 The research findings
In terms of the study’s aim, research question and null hypothesis, the findings have
expanded the work of previous diversity and governance researchers investigating
white, middle-aged men from the ‘old boy’s network’ dominating the boardroom.
The results of operationalising signalling theory and the sequential exploratory
mixed methods research design have provided valuable insights into understanding
demographic diversity in the boardroom of Northern Territory organisations. When
viewed collectively, the findings provide a strategic vision and a dynamic description
in providing ‘a fair go’ for people from demographically diverse backgrounds being
appointed as INEDs. Further, with some caution, the findings discussed could be
extrapolated to all Northern Territory organisations with BoDs.
The research findings from Phase One established that there were six organisational
barriers to demographic diversity at the board level, although the results from Phase
Two provided insufficient evidence that these barriers in fact prevented or inhibited
diversity in the boardroom. While these contradictory findings are surprising, an
explanation for them was beyond the capacity of this study; nonetheless, the results
fulfil the study’s aim and answer the research question. These results identified that
some participants held the view that there were internal organisational barriers to

159
demographic diversity in the boardroom and some believed that there were no
organisational obstacles. Apart from gender diversity, however, there was empirical
evidence of a lack of demographic diversity in Northern Territory boardrooms. These
research findings are important as they demonstrate the continued existence of
information asymmetry between Australia’s heterogeneous society and homogeneous
BoDs in the Northern Territory. While this finding is important, it does not present a
full account of the results, as the actual findings are more complex.
The results from the study have drawn attention to the fact that in the Northern
Territory, having a formal BoD diversity policy was the most important factor
influencing demographic diversity at the board level. This finding recognises that
boards with a formal policy are making a clear statement about their principles,
practices and commitment to supporting diversity in the boardroom. Like diversity in
the workplace policies, formal diversity in the boardroom policies provide BoDs
with directionality and a transparent frame of reference for how they are going to
operationalise diversity at the board level. Moreover, integrating the credible signals
that have been transmitted from society, about providing equality of opportunity and
‘a fair go’ for all people, into formal board diversity policy would create congruence
of information between Australia’s heterogeneous society and BoDs. BoDs having a
formal diversity in the boardroom policy is an important finding, and it might lead to
improvements in the likelihood of people from demographically diverse background
being appointed as INEDs of Northern Territory organisations.

160
As discussed in Chapter 5, the findings from the study draw attention to the fact that
Northern Territory NFP and government boardrooms have an equal representation of
female and male directors. Even though women in the Northern Territory constitute
only 48.3 per cent of the total population, this result indicates that the targeted
signals transmitted from Australian society about augmenting female directorships
have been received and successfully operationalised. This finding also brings to light
that Northern Territory BoDs far exceed Australia’s national voluntary target of 40
per cent for women in the boardroom. Consequently, Northern Territory BoDs would
not require a mandatory quota for increasing the number of female directorships.
This result also highlights that the equal representation of women on Northern
Territory BoDs far exceeds the performance of ASX 200 boards, which has 23.3 per
cent and 20 ASX 200 BoDs without any female directors. This finding is valuable as
it sends an unambiguous signal to peak industry bodies and BoDs in other states and
the Australian Capital Territory that gender parity in the boardroom is achievable.
The current definition of diversity in the boardroom emerged as a pivotal factor in
why there were more women in Northern Territory boardrooms as well as why there
was a lack of demographic diversity at the board level. According to Adams (2015),
Du Plessis et al. (2012) and Hillman (2015), the everyday meaning of demographic
diversity in the boardroom has been interpreted to refer to gender diversity. This
might well be explained by the fact that the signals transmitted from society have
principally focussed on reducing the number of privileged, white, middle-aged men
in the boardroom by augmenting the number of female directors. These targeted
signals and the restrictive definition of boardroom diversity might, in part, account
for why there has been a lack of demographic diversity in the boardroom of Northern

161
Territory organisations. This finding is of considerable importance as expanding the
definition and signals to be inclusive of all observable and underlying demographic
characteristics would provide equality of opportunity for individuals from diverse
backgrounds. This would thus positively influence the demographic composition of
Northern Territory boardrooms.
The findings have also drawn attention to the fact that there is a lack of congruence
between the heterogeneous composition of the Northern Territory’s population and
that of the demographic composition of Northern Territory BoDs. As highlighted in
Chapter 1, the Northern Territory is the least populous of the Australian states and
territories but is still a heterogeneous multicultural society with 30 per cent of the
population identifying as Indigenous. Further, the Northern Territory has the highest
proportion of Indigenous people relative to any other jurisdiction in Australia.
Nevertheless, apart from gender diversity, the boardrooms of Northern Territory
organisations are not demographically diverse and study participants held the view
that their boardrooms should be more heterogeneous. Notably, while there was some
demographic diversity among the participants of Phase Two, there were only two
Indigenous respondents. This represents 6.7 per cent of the participants that
contributed to this study, which is considerably less than the 30 per cent of the
Northern Territory’s population that is Indigenous. These findings are important for
the reason that, apart from with respect to gender diversity, the signals that have been
sent from Australia’s heterogeneous society about the need for director heterogeneity
have not been successfully received or reflected in Northern Territory boardrooms.

162
As discussed in Chapter 2, the geographical location of BoDs has not been taken into
consideration in the literature when investigating demographic diversity in the
boardroom. However, the results from Phase One included that within the context of
the Northern Territory there were several geographical barriers to board diversity,
even though the findings from Phase Two did not support this. While, investigating
further this contradiction is beyond the study’s scope, they do reveal that external
environmental factors relating to the Northern Territory’s geography may generate
barriers to demographic diversity in the boardroom. This finding is important for two
reasons: first, it suggests that geographical factors may either prevent or inhibit
individuals from demographically diverse backgrounds being appointed as INEDs of
Northern Territory organisations; second, this finding introduces the concept of the
geographical location of BoDs as a factor that may possibly need to be taken into
consideration when looking to create demographic diversity in the boardroom.
6.4 Implications of the findings
As indicated in Chapter 2, privileged, white, middle-aged men from the ‘old boys’
network’ dominating the boardroom, behaving badly and, exhibiting fraud and
deception have all contributed to driving much-needed changes in the structure and
demographic composition of Australian BoDs. Director independence has become a
reality in the boardroom, yet BoDs have remained dominated by white, middle-aged
men. The literature review established that over the past 20 years, diversity and
governance researchers have increasingly focussed their attention on the lack of
demographic diversity in the boardroom. This study has made a contribution towards
understanding how to support demographic diversity in the boardroom.

163
The study used a sequential mixed methods research design. The research findings
from Phase One revealed that there were a number of organisational barriers to
diversity in the boardroom. However, the results from Phase Two rejected that these
barriers significantly prevented or inhibited demographic diversity at the board level.
The difference in the research findings from Phase One and Phase Two might well
be attributed to the composition of participants for each phase, as well as their
personal experiences. However, the study also identified that the participants from
both phases held the view that a formal policy on diversity in the boardroom would
increase the likelihood of individuals from demographically diverse backgrounds
being appointed as INEDs of Northern Territory organisations.
An interestingly finding from Phase One and Phase Two was the gender composition
of Northern Territory boardrooms. The participants from Phase One considered that
Northern Territory BoDs had an almost equal representation of female and male
directors. Moreover, the results from Phase Two determined that there were in fact
more female directorships than male directorships in Northern Territory boardrooms.
Therefore, this study offers suggestive empirical evidence that the era of privileged,
white, middle-aged men from the ‘old boy’s network’ dominating the boardroom of
Northern Territory organisations has come to an end. Nevertheless, the study also
asserted that with the exception of gender diversity, Northern Territory boardrooms
continue to be homogeneous as they remain governed by white, middle-aged women
and men. Presumably, these directors are members of the ‘old girl’s network’ and the
‘old boy’s network’. These research findings have implications for theory, policy and
practice, which are discussed below.
164
6.4.1 Implications for theory
As discussed in Chapter 2, signalling theory seeks to identify the root cause of the
information asymmetry existing between two parties in an information transaction.
However, the chapter also identified that signalling theory has not been extensively
used by diversity and governance researchers. When it has been applied to this field
the focus has generally been on investigating how BoDs generate information
congruence between themselves and their stakeholders. Rather than investigating the
signals that boards have been sending to their stakeholders, this study has contributed
to signalling theory by investigating the signals that have been sent from Australia’s
heterogeneous society to homogeneous BoDs. This research has contributed to
signalling theory by investigating the root cause of information asymmetry existing
between Australia’s heterogeneous society and homogeneous BoDs in the Northern
Territory.
6.4.2 Implications for policy
The research findings from this study will also be useful to policy makers interested
in diversity at the board level and policy development. The results revealed that if
Australian boardrooms are to accurately reflect the signals sent from society about
boardrooms being demographically diverse, then BoDs should have a formal policy
that supports and encourages demographic diversity in the boardroom. Similar to
diversity in the workplace policies, the results from this study suggested that boards
with a formal policy on diversity in the boardroom generated greater congruence of
information and practice between society and the BoD. Therefore, having a formal
policy about demographic diversity in the boardroom would contribute to providing

165
equality of opportunity and ‘a fair go’ for individuals from different backgrounds
being appointed as INEDs of Northern Territory organisations.
6.4.3 Implications for practice
The study has also generated several implications for practice that may be of interest
to BoDs. The findings offer BoDs and independent and non-independent directors
interested in augmenting the demographic diversity of their INEDs a practical
organising mechanism for accomplishing this result. As explained in Chapter 5 and
examined in the literature review, the majority of the participants’ organisations had
existing formal diversity in the workplace policies and diversity management
resources. Arguably, these policies and resources could be extended to be inclusive
of diversity in the boardroom. Alternatively, the BoDs could institute their own
demographic diversity in the boardroom policy and diversity management resources
to support and encourage diversity in their boardrooms.
6.5 Limitations of the research
While the study has successfully investigated the research question and the results
from the study are promising, there were several limitations of this study that may
affect the generalisability of the results. First, because the research was confined to
the sparsely populated geographically remote Northern Territory, the generalisability
of the findings to the rest of the country may be called into question. Differences
among metropolitan, regional, rural and remote areas of Australia in terms of values
and culture, level of education, political trends and business practices may influence
BoD’s views towards prospective INEDs from diversity categories. Thus, research

166
needs to be expanded to other populations to confirm the study’s research findings in
other geographical areas.
Another limitation of the study was that while a detailed Internet search was
conducted to develop the database of participants for the three data sources, there
may have been other participants better suited for the study. Further, in Group One
there were no participants from profit-making organisations because there were no
Northern Territory profit boards with INEDs from demographically diverse
backgrounds. Also, the Northern Territory only has a few profit-making listed
organisations with INEDs; not being able to secure any of these profit organisations
for inclusion in Phase Two was considered a shortcoming of this study. If directors
from profit organisations had contributed to the study, the findings for Phase One
and Phase Two may have been different. While there were sufficient responses to the
online web survey for the results to be representative, the relatively small number of
responses was considered another limitation of this study. Ultimately, not having any
profit-making organisations participating in either phase of this study, combined with
the limited number of responses to the survey, contributed to less rich information.
Finally, the participants in the qualitative and quantitative phases were self-selecting
and chose to contribute to the study in a voluntary capacity. Therefore, they may not
have been fully representative of people from demographically diverse backgrounds,
spokespeople from peak bodies or independent and non-independent directors. Other
findings may have emerged if the research had not relied on voluntary participation.
It is also unknown whether participants in Phase One or Phase Two held particular

167
points of view about diversity in the boardroom that may have differed from those
who were not purposively selected or those who chose not to participate in the study.
6.6 Recommendations for further research
The aim of the study was to identify and examine internal organisational barriers to
individuals from demographically diverse backgrounds being appointed as INEDs of
Northern Territory organisations. This was undertaken to ascertain the root cause of
information asymmetry existing between Australia’s heterogeneous society and
homogeneous BoDs. While the principal research findings from Phase One and
Phase Two were insufficiently aligned, this result is in itself an important discovery
that requires further investigation. There were some interesting results that were in
accord between Phase One and Phase Two that also need further exploration. Some
limitations of the study have been identified, which opens up new areas of study for
future diversity researchers. The following are recommendations for improvements
on the scope of this study.
To expand the generalisability of the research results, a larger study covering all
Australian states and territories would determine whether the findings of this study
are generalisable to a broader range of geographical locations including the heavily
populated capital cities. A larger study would make it possible for future researchers
to compare and contrast diversity in the boardrooms of profit, NFP and government
organisations. Also, undertaking a larger study might produce a larger number of
participants for both the qualitative and quantitative phases and provide the prospect
for a broader representation of INEDs from demographically diverse backgrounds.

168
Future studies on diversity in the boardroom could include in-depth exploration of
the independent barrier variables identified in Phase One: policy, awareness, values
and culture fear and resource barriers. Gaining a deeper understanding of the root
cause of these five internal organisational barriers to diversity in the boardroom
would strengthen recommendations for corrective actions to remediate each of these
barriers. Ameliorating these barriers would afford people from demographically
diverse backgrounds a level playing field in being appointed as INEDs of Northern
Territory organisations. Further, the dependent variable in the study was inclusive of
all observable and underlying demographic differences. However, future research
may focus on individual or a smaller number of these demographic characteristics.
As the research findings from Phase One and Phase Two were insufficiently aligned
with respect to the study’s research question, further research could be undertaken to
determine the cause of this difference. While the difference between the two phases
is an interesting outcome of the study, so too was the large number of females in
boardrooms of Northern Territory organisations. For that reason, exploratory
research could be undertaken to investigate why Northern Territory boardrooms have
a high number of female directors.
Another avenue of study could be to apply different research methodologies to
achieve a deeper understanding of how to successfully create demographically
diverse BoDs. This may include undertaking an in-depth case study examination of
profit, NFP and government organisations that already have demographically diverse
BoDs. The logic for employing the case study methodology would be to determine
the uniqueness of these BoDs and their practices in sustaining a boardroom that is

169
demographically diverse. The results of the case study may provide a road map with
directionality for BoDs on how to successfully achieve demographic diversity in
their boardrooms.
6.7 Chapter summary
This chapter has brought the thesis to conclusion. It commenced by discussing how
the study’s research aim and measurable objectives were achieved. This provided a
framework for discussing the research findings. The study established that in Phase
One, there were six organisational barriers to board diversity and that Phase Two
produced insufficient evidence that these barriers prevented or inhibited demographic
diversity in the boardroom. Generalisations from the research findings determined
that BoDs instituting a formal policy on diversity in the boardroom had a higher
probability of people from demographically diverse backgrounds being appointed as
INEDs. The research findings also identified that boards in the Northern Territory
had an equal representation of female and male directors. These findings highlighted
that, with the exception of gender diversity, Northern Territory boards do not reflect
the heterogeneous composition of the region’s population. The chapter also included
a discussion on the implications of the findings for theory, policy and practice.
Chapter 6 then scrutinised the study’s scope and provided several recommendations
for future diversity researchers looking to generate director heterogeneity in the
boardroom. The recommendations included undertaking a larger study covering all
Australian states and territories to examine the generalisability of the results. It also
suggested undertaking an in-depth investigation of the study’s independent variables
and a focussed examination of individual demographic diversity categories used in

170
this study. Research using a different methodology to attain a deeper understanding
of how to achieve demographic diversity in the boardroom was proposed. Finally,
this research offers hope to BoDs seeking to manufacture boardrooms that are
demographically diverse and individuals from demographically diverse backgrounds
wishing to be appointed as INEDs of Northern Territory organisations.

171
APPENDICES
Appendix A: GAYTMs

172
Appendix B: Information sheet for interview
This document is yours to keep
Project title: Breaking down the barriers: The Northern Territory experience of
diversity in the boardroom
About the researchers:
The project is being conducted by researchers from Charles Darwin University. The
supervisor for the project is: Dr Susan Bandias and the student undertaking the
research is: Terry Houguet-Pincham.
What this research is about:
The project seeks to understand the issues relating to the barriers to demographic
diversity in the boardroom of Northern Territory profit, not-for-profit and
government organisations. When thinking about diversity in the boardroom most
people think about gender diversity however, demographic diversity encompasses a
more inclusive approach, for example:
Being younger and under 40 Having mental health issues
From a different race or ethnic background Being gay, lesbian, bisexual,
transgender
Being from Aboriginal and Torres Strait Islanders descent Differences in marital or family status
Having a physical or sensory impairment Different religious or cultural
background
The aim of the study is to examine the internal organisational barriers that inhibit
people from demographically diverse backgrounds being appointed as independent
non-executive director of Northern Territory organisations.
What your participation would mean:
We are inviting independent non-executive directors from demographically diverse
backgrounds and spokespeople from peak industry bodies to discuss their
experiences and understanding of the internal organisational barriers to diversity in
the boardroom. This includes asking people about their positive and negative
experiences relating to diversity in the boardroom as well as their understanding of
the barriers to demographic diversity in the boardroom. These issues will be explored

173
by conducting face-to-face responsive in-depth interviews which will take
approximately one hour.
What are the benefits and risks?
There are no anticipated risks to participants as a result of participation in this
research project. The methods of collecting data will be designed to inconvenience
participants as little as possible. If however, any aspect of this study does cause
discomfort to the participants, below is a list of organisation and their telephone
numbers that are able to prove you support.
Lifeline Australia 13 11 14
Beyondblue 1300 22 4636
Mensline 1300 78 99 78
It is anticipated that the benefits in terms of identifying and understanding the
internal organisational barriers to demographic diversity in the boardroom will be
greater than the inconvenience of taking part in data collection. People who are
invited to participate do not have to participate and they can decide to withdraw from
the discussions at any time.
What will happen to the information you provide?
The answers provided by participants will be recorded but they will be kept
confidential. It will not be possible for other people to trace any comments to
particular participants. This information will help us to understand the barriers to
demographic diversity in the boardroom of Northern Territory organisations, and to
discuss some strategies for reducing these barriers. The information from participants
will be kept for 5 years and then destroyed. A report will also be published in an
academic journal. If you would like to view a synopsis of the results when they
research is completed please visit, www.diversitynt.wordpress.com.

174
Who to contact:
You can get more information about the project by contacting:
Dr Susan Bandias Supervisor Office: 8946 8834
Email: [email protected]
Terry Houguet-
Pincham
Student undertaking
research
Mobile: 0412 886 704
Email: [email protected]
This research has approval from the Charles Darwin University Human Research
Ethics Committee. If you have any concerns about the project, you can contact the
Executive Officer of the Charles Darwin University Human Research Ethics
Committee on (08) 8946 6923, or the toll free number, 1800 466 215 or by email,
[email protected]. The Executive Officer can talk to the right people at the
university on your behalf.

175
Appendix C: Information sheet for survey
This document is yours to keep
Project title: Breaking down the barriers: The Northern Territory experience of
diversity in the boardroom
I wish to invite you to participate in my research project, which is described below.
My name is Terry Houguet-Pincham and I am conducting this research as part of my
Doctor of Business Administration degree requirements in the School of Business at
Charles Darwin University. My main supervisor is Dr Susan Bandias and my
secondary supervisor is Dr Rajeev Sharma.
What this research is about:
The project seeks to understand the issues relating to the barriers to demographic
diversity in the boardroom of Northern Territory profit, not-for-profit and
government organisations. When thinking about diversity in the boardroom most
people think about gender diversity however, demographic diversity encompasses a
more inclusive approach, for example:
Being younger and under 40 Having mental health issues
From a different race or ethnic background Being gay, lesbian, bisexual,
transgender
Being from Aboriginal and Torres Strait Islanders descent Differences in marital or family status
Having a physical or sensory impairment Different religious or cultural
background
The aim of the study is to examine the internal organisational barriers that inhibit
people from demographically diverse backgrounds being appointed as an
independent non-executive director of Northern Territory organisations.
What would be expected from you?
Your involvement in this study is entirely voluntary and you must be at least 18 years
of age to participate. If you do decide to participate you can do so by accessing the
link provided and completing the survey which will take approximately 20 minutes
of your time. Once you have submitted the questionnaire your data cannot be
withdrawn as the survey is anonymous.

176
Confidentiality:
All information or personal details gathered in the course of this study are
confidential. All information will be reported as group data and you will not be able
to be identified in the final report.
What are the benefits and risks?
There are no anticipated risks to participants as a result of participation in this
research project. It is anticipated that the benefits in terms of identifying and
understanding the internal organisational barriers to demographic diversity in the
boardroom will be greater than the inconvenience of taking part in data collection.
People who are invited to participate do not have to participate and you can decide to
withdraw from the survey at any time by closing your web browser.
Questions:
The questions within this survey are not considered to be of a sensitive nature, rather
they are general, aiming to enhance our knowledge and understanding of the barriers
to diversity in the boardroom.
Use of information:
I will use information from the survey as part of my Doctoral thesis which I expect to
complete in February 2017. Results will later be used for the publication of at least
one academic journal article. However, your name cannot be linked to your response
and you will not be able to be identified.
Upsetting issues:
It is unlikely that this research will raise any personal or upsetting issues but if this
occurs, first close your web browser to discontinue the survey. Should you wish to,
below is a list of organisation and their telephone numbers that are able to provide
you support.
Lifeline Australia 13 11 14
Beyondblue 1300 22 4636
Mensline 1300 78 99 78

177
Storage of information:
All electronic data will be kept on a password-protected hard drive accessible only to
my supervisor and me. All data will be stored for 5 years and then destroyed.
Approval:
This research has approval from the Charles Darwin University Human Research
Ethics Committee.
Who to contact:
You can get more information about the project by contacting:
Dr Susan Bandias Supervisor Office: 8946 8834
Email: [email protected]
Terry Houguet-
Pincham
Student undertaking
research
Mobile: 0412 886 704
Email: [email protected]
If you have any concerns about the project, you can contact the Executive Officer of
the Charles Darwin University Human Research Ethics Committee on (08) 8946
6923, or the toll free number, 1800 466 215 or by email, [email protected]. The
Executive Officer can talk to the right people at the university on your behalf.
Thank you for taking the time to read this Information sheet. If you wish to proceed
with the survey, please click on the link below. Consent is implied by completion of
the questionnaire. Once the full questionnaire is submitted, your data cannot be
removed since the survey is anonymous. If you would like to view a synopsis of the
results when they research is completed please visit,
www.diversitynt.wordpress.com.
Kind regards
Terry Houguet-Pincham

178
Appendix D: Adult consent form for interview
Project title: Breaking down the barriers: The Northern Territory experience of
diversity in the boardroom
I,……………………………….of
……………………………………………………..
consent to participate in a study designed by researchers of Charles Darwin
University.
I understand that the purpose of the study is: To understand the issues relating to the
barriers to demographic diversity in the boardroom of Northern Territory profit, not-
for-profit and government organisations.
I acknowledge that:
The aims, methods and anticipated benefits, and possible risks of the study, have
been explained to me by the researcher.
I voluntarily and freely give my consent to my participation in this study
I voluntarily and freely give my consent for all interviews to be recorded (in
written and audio-recorded form)
I understand that aggregated (group) results will be reported in academic
journals
Individual results will not be given to any person except at my request and on
my authorisation
I am free to withdraw my consent at any time during the study, in which event
my participation in the research study will immediately cease, and any
information obtained will be returned to me or destroyed at my request.
Signature:………………………………………………………
Date:………………..

179
If you have any questions about the meaning of this form, or about the use or
exclusion of any particular information you provide, please contact:
Dr Susan Bandias Supervisor Office: 8946 8834
Email: [email protected]
Terry Houguet-
Pincham
Student undertaking
research
Mobile: 0412 886 704
Email: [email protected]
For any other concerns about the project, you can contact the Executive Officer of
the Human Research Ethics Committee at Charles Darwin University, on the toll free
number, 1800 466 215 or by email, ([email protected]). The Executive Officer can
talk to the right people at the university on your behalf.

180
Appendix E: Open ended questions—Independent non-executive director
SECTION A
Date…./…./2016
1. Setting the scene
General conversation: Researcher to start with work and academic history then ask
general questions about the interviewee
Plain language statement, reason for being selected, confidentiality will be
maintained at all times, define demographic diversity and barriers, permission for the
interview to be recorded, consent forms to be signed
SECTION B
2. Collection of demographic information
1. Name of respondent------------------------------------------------------------------
2. Name of organisation----------------------------------------------------------------
3. Gender: Female, Male, X (Indeterminate/intersex/unspecified)---------------
4. Age of the respondent
20-24, 25-29, 30-34, 35-39, 40-44, 45-49, 50-54, 55-59, 55-59, 60-64, 65-69, 70-74,
75-79, 80-84, 85 and over
5. Respondent identifies as (within diversity categories) -------------------------
6. Type of organisation (profit, NFP, gov)-------------------------------------------
7. Geographical location (Darwin, Alice Springs, Other, all of NT, all of
Australia)---
8. Paid annual rate, paid daily rate, voluntary, other-------------------------------------
9. Number of years as an INED--------------------------------------------------------
10. Your organisation has how many independent and non-independent directors---
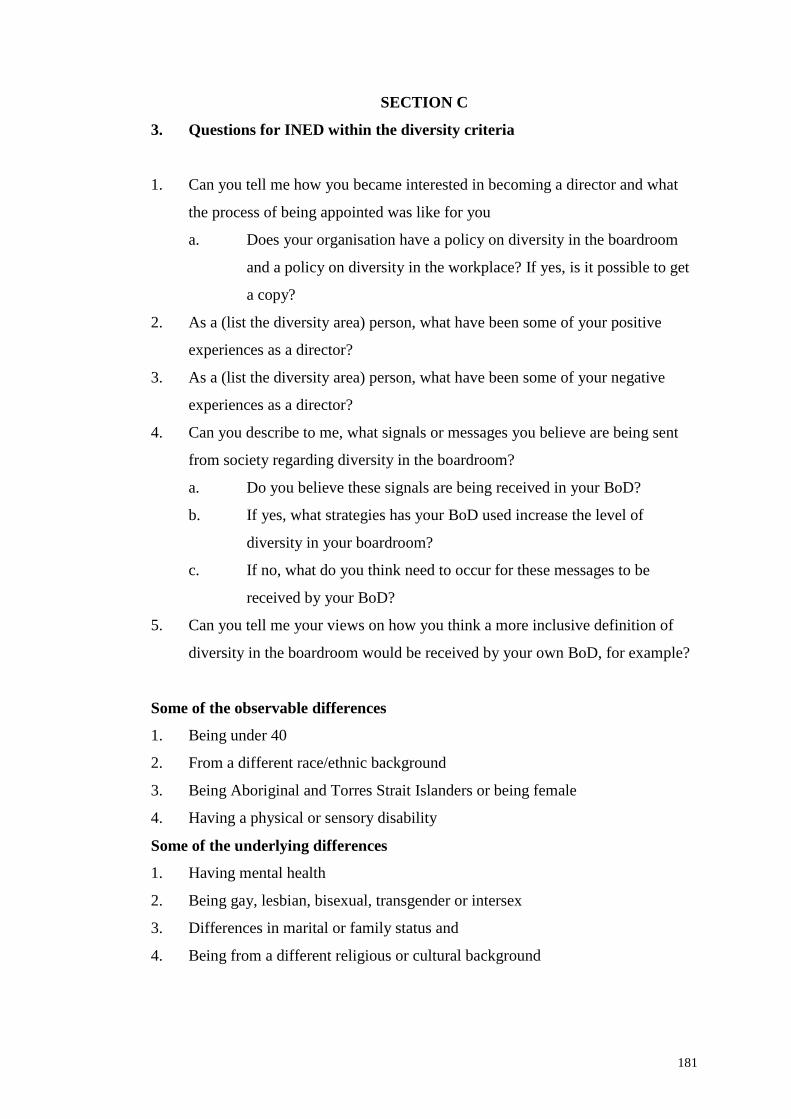
181
SECTION C
3. Questions for INED within the diversity criteria
1. Can you tell me how you became interested in becoming a director and what
the process of being appointed was like for you
a. Does your organisation have a policy on diversity in the boardroom
and a policy on diversity in the workplace? If yes, is it possible to get
a copy?
2. As a (list the diversity area) person, what have been some of your positive
experiences as a director?
3. As a (list the diversity area) person, what have been some of your negative
experiences as a director?
4. Can you describe to me, what signals or messages you believe are being sent
from society regarding diversity in the boardroom?
a. Do you believe these signals are being received in your BoD?
b. If yes, what strategies has your BoD used increase the level of
diversity in your boardroom?
c. If no, what do you think need to occur for these messages to be
received by your BoD?
5. Can you tell me your views on how you think a more inclusive definition of
diversity in the boardroom would be received by your own BoD, for example?
Some of the observable differences
1. Being under 40
2. From a different race/ethnic background
3. Being Aboriginal and Torres Strait Islanders or being female
4. Having a physical or sensory disability
Some of the underlying differences
1. Having mental health
2. Being gay, lesbian, bisexual, transgender or intersex
3. Differences in marital or family status and
4. Being from a different religious or cultural background

182
6. As a (list the diversity area) person, what, if any, internal organisational
barriers have you experienced in either being appointed or in your time as a
director?
a. Do you believe there would be difference with these barriers between
say living in the Northern Territory or a metropolitan city like,
Sydney or Melbourne?
7. As a (list the diversity area) what strategies and/or organisational changes do
you think could be undertaken to reduce barriers to diversity in the boardroom
to create a more diverse BoD
8. As a (list the diversity area) person what contribution do you believe being (list
the diversity area) has made to the boardroom and the organisation?
Finally, are there any organisation’s in the NT you can think of with INED’s that I
can invite to participate in this study?
Would you like a synopsis of the result when the research is completed? Thank
you for your time, I greatly appreciate your assistance.

183
Appendix F: Open-ended questions—Spokesperson from peak industry body
SECTION A
Date…./…./2016
1. Setting the scene
General conversation: Researcher to start with work and academic history then ask
general questions about the interviewee
Plain language statement, reason for being selected, confidentiality will be
maintained at all times, define demographic diversity and barriers, permission for the
interview to be recorded, consent forms to be signed
SECTION B
2. Collection of demographic information
1. Name of respondent------------------------------------------------------------------
2. Name of organisation----------------------------------------------------------------
3. Gender: Female, Male, X (Indeterminate/intersex/unspecified)---------------
4. Age of the respondent
20-24, 25-29, 30-34, 35-39, 40-44, 45-49, 50-54, 55-59, 55-59, 60-64, 65-69, 70-74,
75-79, 80-84, 85 and over
5. Respondent identified as (within diversity categories) ------------------------
6. Membership base---------------------------------------------------------------------
7. Number of members in the NT-----------------------------------------------------
8. Geographical location (Darwin, Alice Springs, Other, all of NT, all of
Australia)---
9. Position (Chair, secretary, CEO)----------------------------------------------------
10. Your organisation has how many independent and non-independent directors---

184
SECTION C
3. Questions for spokesperson from peak industry body
1. Can you tell me about the demographic composition of your own BoD?
a. Does your organisation have its own policy for diversity in your
boardroom and a policy on diversity in your workplace? If yes, is it
possible to get a copy?
2. As a peak industry body, can you outline for me your organisations formal or
informal position and policies on demographic diversity in the boardroom?
3. Can you describe to me, what signals or messages you believe are being sent
from society regarding diversity in the boardroom?
a. Do you believe these signals are being received by your BoD?
b. If yes, what strategies has your BoD used to increase the level of
diversity in your own boardroom and in the boardroom of your
membership?
c. If no, what do you think needs to occur for these messages to be
received by your BoD?
4. Can you tell me your views on how you think a more inclusive definition of
diversity in the boardroom would be received by your own BoD and that of
your membership, for example?
Some of the observable differences
1. Being under 40
2. From a different race/ethnic background
3. Being Aboriginal and Torres Strait Islanders or being female
4. Having a physical or sensory disability
Some of the underlying differences
1. Having mental health
2. Being gay, lesbian, bisexual, transgender or intersex
3. Differences in marital or family status and
4. Being from a different religious or cultural background
5. What do you think would be some of the positive and negative aspects of
having a demographically diverse BoD?
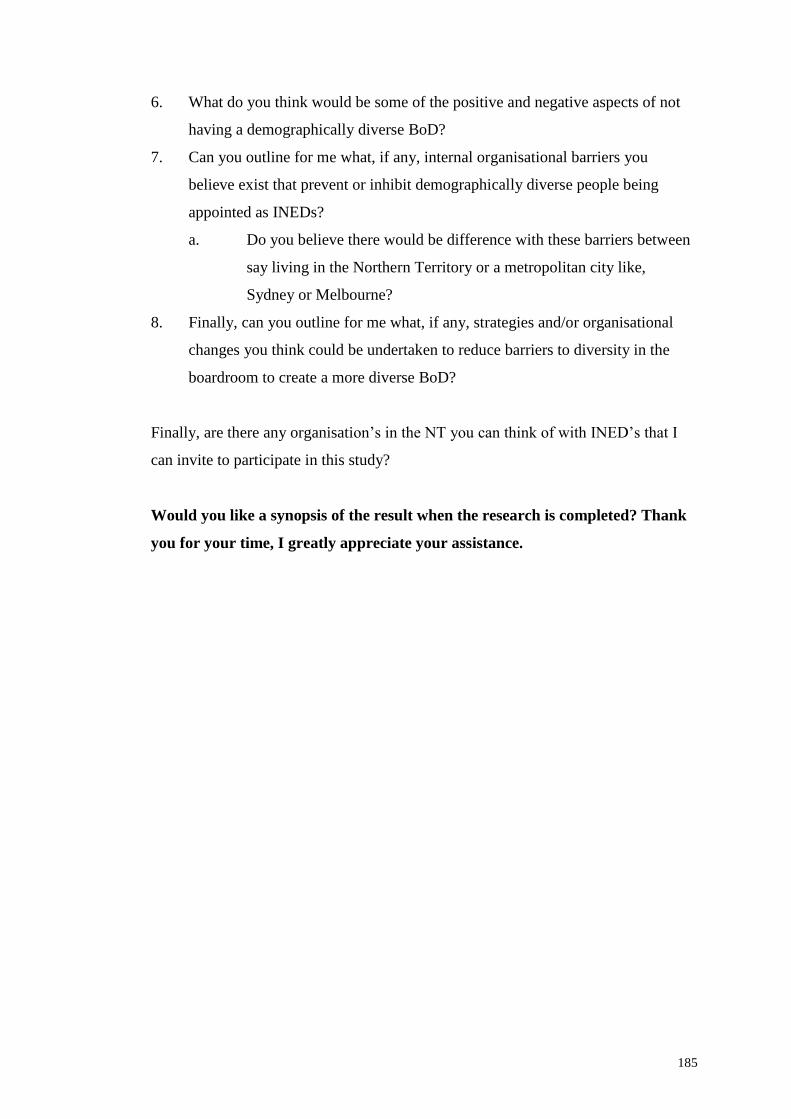
185
6. What do you think would be some of the positive and negative aspects of not
having a demographically diverse BoD?
7. Can you outline for me what, if any, internal organisational barriers you
believe exist that prevent or inhibit demographically diverse people being
appointed as INEDs?
a. Do you believe there would be difference with these barriers between
say living in the Northern Territory or a metropolitan city like,
Sydney or Melbourne?
8. Finally, can you outline for me what, if any, strategies and/or organisational
changes you think could be undertaken to reduce barriers to diversity in the
boardroom to create a more diverse BoD?
Finally, are there any organisation’s in the NT you can think of with INED’s that I
can invite to participate in this study?
Would you like a synopsis of the result when the research is completed? Thank
you for your time, I greatly appreciate your assistance.

186
Appendix G: Online web survey—Independent and non-independent directors
SECTION A
This research project seeks to understand the issues relating to the barriers to
demographic diversity in the boardroom of Northern Territory profit, not-for-profit
and government organisations. When thinking about diversity in the boardroom most
people think about gender diversity however, demographic diversity encompasses a
more inclusive approach, for example:
Observable difference Underlying differences
Being younger and under 40 Having mental health issues
From a different race or ethnic background Differences in marital/family status
Aboriginal or Torres Strait Islander descent Different religious/cultural
history
Having a physical or sensory impairment Gay, lesbian, bisexual, transgender or
intersex
The aim of the study is to examine the internal organisational barriers that inhibit
qualified, skilled and experienced people from demographically diverse backgrounds
being appointed as an independent non-executive director of Northern Territory
organisations.
Please answer all questions and use the navigation buttons at the bottom of the
survey to move from page to page. Navigating using the browser navigation will not
save your responses and will advise of an error and to start again. You can exit the
survey at any time by closing your web browser. Once you have clicked the link to
submit the survey you will not be able to retrieve your data as it will be submitted as
de-identified responses. For more information about the research project please click
here.
Next

187
SECTION B – Participant demographic details
1. What category of director are you? See definition here
X Independent Non-Executive Director (INED)
How many hours per week do you spend in your role as an INED?
X Non-independent director
X Other
Thank you for your interest however, you are not eligible to participate
X 1 to 4 hours X 5 to 8 hours X 9 to 12 hours X 13 hours
or more
2. Where do you live?
X Darwin
X Alice Springs
X Other parts of the Northern Territory
X Outside of the Northern Territory
It would be appreciated if you could briefly outline how you became a director of a
Northern Territory organisation
3. What is your gender? Please note, the Australian Government Guidelines on the recognition of sex and gender provides further details on the definition of gender including the option of ‘X’. Refer to the guidelines here.
X Female
X Male
X X (indeterminate/intersex/unspecified)
4. What is your age in years?
20-24, 25-29, 30-34, 35-39, 40-44, 45-49, 50-54, 55-59, 55-59, 60-64, 65-69, 70-74,
75-79, 80-84, 85 and over
5. Which of the following applies to your directorship?
X Paid annual rate X Paid daily rate X Voluntary X Other
6. What is your highest level of educational attainment
X Less than Year 12
X Year 12 or equivalent (HSC/Leaving certificate)
X Vocational qualification (e.g. Trade or TAFE/VET Cert III, IV etc)
X Bachelor degree
X Postgraduate diploma
X Master’s degree
X Doctorate
7. What is your current employment status?
X Full-time X Part-time X Casual X A home maker
X Not employed X Student X Retired X Unable to work
8. What is your total annual income level? (all sources)
X Nil income X $1-$49,999 X $50,000-$99,999
X $100,000-$$149, 999 X $150,000-$199,999 X $200,000-
$249,999

188
X $250,000-$299,999 X $300,000 or more
9. How many years have you been a director of this organisation?
X 0 to 3 years X 4 to 7 years X 8 to 11 years
X 12 years or more
10. In total, how many years have you been either an independent or non-
independent director of any organisations?
X 0 to 3 years X 4 to 7 years X 8 to 11 years
X 12 to 15 years X 16 years or more
11. Do you self identify as being from a demographically diverse background?
X No
X Yes If yes, please select from the options below that you identify with
X Under 40 years old
X Having mental health issues
X From a different race/ethnic background
X Gay, lesbian, bisexual, transgender or intersex
X From Aboriginal and Torres Strait Islander descent
X Differences in marital or family status
X Having a physical or sensory impairment
X From a different religious or cultural background
X Female
X Other
Next

189
SECTION C – Organisation demographic details
1. Approximately, how many years has your organisation been operating?
X 1 to 5 years X 6 to 10 years X 11 to 15 years
X 16 to 20 years X 20 years and over X Do not know
2. How is your organisation classified?
X Profit
X Not-for-profit
X Government Either Statutory or GOC
X Do not know
3. What is the make-up of your BoD? (numerical)?
Box Independent non-executive directors
Box Non-independent directors
X Do not know
4. How often does the entire board of directors meet face-to-face to discuss the
running of your organisation?
X Fortnightly X Monthly X Bi monthly X Quarterly
X Six monthly X Annually
5. Which geographical location does your organisation represent?
X Darwin
X Alice Springs
X Other parts of the Northern Territory
X All of the Northern Territory
X Other
6. To which industry group does your organisation belong?
X Agriculture, Forestry and Fishing
X Mining
X Manufacturing
X Electricity, Gas, Water, Waste Services
X Construction
X Retail Trade
X Wholesale Trade
X Health Care and Social Assistance
X Arts and Recreation Services
X Accommodation and Food Services
X Transport, Postal and Warehousing
X Administrative and Support Services
X Rental, Hiring and Real Estate Services
X Information Media and Telecommunications
X Financial and Insurance Services
X Professional, Scientific and Technical Services
X Education and Training
7. How many employees does your organisation have?
X Employment of fewer than 20 persons (small employing business)
X Employment of 20 to fewer than 200 persons (medium employing business)

190
X Employing 200 or more persons (large employing business)
X Do not know
8. How many males and females on your board of directors? (numerical)?
Females Box
Males Box
‘X’ Box
9. Given the definition of demographic diversity for this study, do you consider
your boardroom to be demographically diverse? (see definition here)
X Yes
X No
X Do not know
Next

191
SECTION D – General opening questions
1. Should only privileged upper and middle class white middle-aged men be
independent non-executive directors?
X Yes X No X Undecided
2. Is your board of directors connected to the old ways of doing business in the
boardroom including maintaining the ‘old boy’s network’?
X Yes X No X Undecided
3. In the space provide below please list the messages you believe are being sent
from Australian society to you as a director regarding diversity in the
boardroom
4. Should there be equality of opportunity and a ‘fair go’ for all people wishing to
become independent non-executive directors regardless of their demographic
characteristics?
X Yes X No X Undecided
5. Should your boards’ independent non-executive directors be more
demographically diverse?
X Yes X No X Undecided
6. In your time as a director with this organisation, have you or any of the other
directors deliberated on the diversity of your independent non-executive
directors?
X Yes X No X Undecided
7. Please select those demographic characteristics represented in your boardroom
(numerical).
X Women X People under 40
X People from Aboriginal and Torres Strait Islander descent
X People with a physical or sensory disability
X People from a different race or ethnic background
X People who are gay, lesbian, bisexual, transgender and intersex people
X People from a different religious or cultural background X
Other
8. Does your organisation have a director induction pack and/or training process?
X Yes X No X Do not know
If yes, Does the director induction pack and/or training program cover diversity in
the workplace and diversity in the boardroom?
9. Does your organisation have a policy on diversity in the workplace?
X Yes X No X Currently developing X Do not know
10. Does your organisation have a formal policy on demographic diversity in the
boardroom?
X Yes X No X Currently developing X Do not know
Next

192
SECTION E – Policy barriers
Below is a list of statements about your boards’ policy, Independent Non-Executive
Directors (INEDs) and diversity within your boardroom. Please indicate whether you
agree or disagree with each statement by selecting the phrase that best represents
your answer.
Yes, have a formal policy
1. Your policy adequately reflects modern societal views on the demographic
diversity of your boards INEDs
Agree strongly Agree Non-committal Disagree Disagree strongly
2. Your policy incorporates an inclusive holistic approach to the demographic
diversity of your boards INEDs (see definition here)
Agree strongly Agree Non-committal Disagree Disagree strongly
3. Your policy prompts you to think about the demographic diversity of your
boards INEDs
Agree strongly Agree Non-committal Disagree Disagree strongly
4. Your policy has measurable objectives for the demographic diversity of your
boards INEDs
Agree strongly Agree Non-committal Disagree Disagree strongly
5. Your policy has increased the demographic diversity of your boards INEDs
Agree strongly Agree Non-committal Disagree Disagree strongly
6. Your policy creates barriers for INEDs from demographic diverse backgrounds
being appointed to your board of directors
Agree strongly Agree Non-committal Disagree Disagree strongly
7. Are there any other comments you would like to make about your board’s
policy to do with the diversity of your INEDs?

193
Below is a list of statements about board polices on diversity in the boardroom,
Independent Non-Executive Directors (INEDs) and diversity within your boardroom.
Please indicate whether you agree or disagree with each statement by selecting the
phrase that best represents your answer.
No, do not have a formal policy
8. Not having a policy inhibits your board in reflecting modern societal views
about the demographic diversity of your INEDs
Agree strongly Agree Non-committal Disagree Disagree strongly
9. Not having a policy creates barriers to you thinking about the demographic
diversity of your INEDs
Agree strongly Agree Non-committal Disagree Disagree strongly
10. Not having a policy creates barriers to your organisation recruiting INEDs
from demographic diverse backgrounds
Agree strongly Agree Non-committal Disagree Disagree strongly
11. Not having a policy creates barriers for people from demographically diverse
seeking appointment as an INED to your board
Agree strongly Agree Non-committal Disagree Disagree strongly
12. Not having a policy creates barriers to your boards INEDs becoming more
demographically diverse
Agree strongly Agree Non-committal Disagree Disagree strongly
13. Your board should consider developing a policy to promote and encourage
diversity in your boardroom
Agree strongly Agree Non-committal Disagree Disagree strongly
14. Are there any other comments you would like to make about your board not
having a policy to do with the diversity of your INEDs?
Next

194
SECTION F – Values barriers
Below is a list of statements about values, Independent Non-Executive Directors
(INEDs) and diversity within your boardroom. Please indicate whether you agree or
disagree with each statement by selecting the phrase that best represents your answer.
1. The personal, cultural and/or religious values of the other directors creates
barriers to the demographic composition of your INEDs
Agree strongly Agree Non-committal Disagree Disagree strongly
2. The boardroom culture creates barriers to the demographic composition of your
INEDs
Agree strongly Agree Non-committal Disagree Disagree strongly
3. Your cultural and/or religious values create a barrier to the demographic
composition of your INEDs
Agree strongly Agree Non-committal Disagree Disagree strongly
4. The values and culture of your organisation creates barriers to the demographic
composition of your INEDs
Agree strongly Agree Non-committal Disagree Disagree strongly
5. Australia’s values and culture creates barriers to the demographic composition
of your INEDs
Agree strongly Agree Non-committal Disagree Disagree strongly
6. Your personal values create a barrier to the demographic composition of your
INEDs
Agree strongly Agree Non-committal Disagree Disagree strongly
7. Are there any other comments you would like to make about values and/or
culture to do with the diversity of your INEDs?
Next

195
SECTION G – Awareness barriers
Below is a list of statements about awareness, Independent Non-Executive Directors
(INEDs) and diversity within your boardroom. Please indicate whether you agree or
disagree with each statement by selecting the phrase that best represents your answer.
1. Your boards level of awareness of modern societal views on diversity in the
boardroom creates barriers to the demographic make-up of your INEDs
Agree strongly Agree Non-committal Disagree Disagree strongly
2. Your boards level of awareness of the risks involved with not having a diverse
board creates barriers to the demographic make-up of your INEDs
Agree strongly Agree Non-committal Disagree Disagree strongly
3. Your boards level of awareness of the business needs for a diverse board
creates barriers to the demographic make-up of your INEDs
Agree strongly Agree Non-committal Disagree Disagree strongly
4. Your boards level of awareness of the benefits and rewards of a diverse board
creates barriers to the demographic make-up of your INEDs
Agree strongly Agree Non-committal Disagree Disagree strongly
5. Your boards level of awareness of the complexities of operating a diverse
board creates barriers to the demographic make-up of your INEDs
Agree strongly Agree Non-committal Disagree Disagree strongly
6. Your boards level of awareness of how your organisation manages diversity in
the workplace creates a barrier to the demographic make-up of your INEDs
Agree strongly Agree Non-committal Disagree Disagree strongly
7. Are there any other comments you would like to make about your board’s level
of awareness to do with the diversity of your INEDs?
Next

196
SECTION H – Skill barriers
Below is a list of statements about skills, Independent Non-Executive Directors
(INEDs) and diversity within your boardroom. Please indicate whether you agree or
disagree with each statement by selecting the phrase that best represents your answer.
1. Your boards language and communication skills creates barriers to the
demographic composition of your INEDs
Agree strongly Agree Non-committal Disagree Disagree strongly
2. Your boards interpersonal communication skills creates barriers to the
demographic composition of your INEDs
Agree strongly Agree Non-committal Disagree Disagree strongly
3. Your boards conflict management skills creates barriers to the demographic
composition of your INEDs
Agree strongly Agree Non-committal Disagree Disagree strongly
4. Your boards diversity management skills creates barriers to the demographic
composition of your INEDs
Agree strongly Agree Non-committal Disagree Disagree strongly
5. Your boards self-awareness skill creates barriers to the demographic
composition of your INEDs
Agree strongly Agree Non-committal Disagree Disagree strongly
6. Your board need to undergo training to acquire new skills in being able to work
with INEDs from demographic diverse backgrounds
Agree strongly Agree Non-committal Disagree Disagree strongly
7. Are there any other comments you would like to make about your boards skills
to do with the diversity of your INEDs?
Next

197
SECTION I – Fear barriers
Below is a list of statements about fears, Independent Non-Executive Directors
(INEDs) and diversity within your boardroom. Please indicate whether you agree or
disagree with each statement by selecting the phrase that best represents your answer.
1. Your boards fear of the unknown of working with people who are different
from them creates barriers to the demographic make-up of your boards INEDs
Agree strongly Agree Non-committal Disagree Disagree strongly
2. Your boards fear of the potential for increased conflict in working with people
who are different from them creates barriers to the demographic make-up of
your INEDs
Agree strongly Agree Non-committal Disagree Disagree strongly
3. Your boards fear of needing to be politically correct in working with people
who are different from them creates barriers to the demographic make-up of
your INEDs
Agree strongly Agree Non-committal Disagree Disagree strongly
4. Your boards fear of protracted decision making in working with people who
are different from them creates barriers to the demographic make-up of your
INEDs
Agree strongly Agree Non-committal Disagree Disagree strongly
5. Your boards fear of increased workload in working with people who are
different from them creates barriers to the demographic make-up of your
INEDs
Agree strongly Agree Non-committal Disagree Disagree strongly
6. Your boards fear of the loss of power, privilege and income resulting from
your board becoming more diverse creates barriers to the demographic make-
up of your INEDs
Agree strongly Agree Non-committal Disagree Disagree strongly
7. Are there any other comments you would like to make about fears to do with
the diversity of your INEDs?
Next

198
SECTION J – Resource barriers
Below is a list of statements about board resources, Independent Non-Executive
Directors (INEDs) and diversity within your boardroom. Please indicate whether you
agree or disagree with each statement by selecting the phrase that best represents
your answer.
1. The administrative, financial and time resources necessary to create a diversity
policy, recruit and induct people from diverse backgrounds creates barriers to
the demographic composition of your INEDs
Agree strongly Agree Non-committal Disagree Disagree strongly
2. The financial resources required to manage a diverse board creates barriers to
the demographic composition of your INEDs
Agree strongly Agree Non-committal Disagree Disagree strongly
3. The time resources required to manage a diverse board creates barriers to the
demographic composition of your INEDs
Agree strongly Agree Non-committal Disagree Disagree strongly
4. The time and financial resources required to educate non-diverse directors on
diversity in the boardroom creates barriers to the demographic composition of
your INEDs
Agree strongly Agree Non-committal Disagree Disagree strongly
5. Your board’s budget creates barriers to the demographic composition of your
INEDs
Agree strongly Agree Non-committal Disagree Disagree strongly
6. Your board is adequately resourced to undertake the process of increasing the
demographic composition of your INEDs
Agree strongly Agree Non-committal Disagree Disagree strongly
7. Are there any other comments you would like to make about your boards
resources to do with the diversity of your INEDs?
Next

199
SECTION K – Geographical barriers
Below is a list of statements about the geography of the Northern Territory,
Independent Non-Executive Directors (INEDs) and diversity within your boardroom.
Please indicate whether you agree or disagree with each statement by selecting the
phrase that best represents your answer.
1. The remoteness of the Northern Territory creates barriers to your board
recruiting INEDs from demographic diverse backgrounds
Agree strongly Agree Non-committal Disagree Disagree strongly
2. The demographic diversity of the Northern Territory population creates
barriers to the demographic composition of your INEDs
Agree strongly Agree Non-committal Disagree Disagree strongly
3. The values and culture of your local community creates barriers to the
demographic composition of your INEDs
Agree strongly Agree Non-committal Disagree Disagree strongly
4. The values and culture of the Northern Territory creates barriers to the
demographic composition of your INEDs
Agree strongly Agree Non-committal Disagree Disagree strongly
5. The barriers to the demographic composition of your boards INEDs would be
the same for the boards in other Australian States and Territories
Agree strongly Agree Non-committal Disagree Disagree strongly
6. The Northern Territory has very few qualified and/or experienced people from
demographic diverse backgrounds which creates barriers to the demographic
composition of your INEDs
Agree strongly Agree Non-committal Disagree Disagree strongly
7. Are there any other comments you would like to make about the geography of
the Northern Territory to do with the diversity of your INEDs?
Next

200
SECTION L –General closing questions
1. Sending messages: Below are some of the ways Australian society has been
sending messages regarding the requirement for boardrooms to be
demographically diverse.
a. Australia has invested in being a secular egalitarian society
b. Australia’s values and norms support diversity, equality of opportunity and ‘a
fair go’ for all
c. Australia abolishing its ‘White Australia’ policy
d. Australia developing a policy of multiculturalism
e. Australia has progressively evolved into a diverse multicultural society and
expects boards to be diverse
f. Australia has laws in place to prevent discrimination against people who are
demographically diverse
g. Australian workplaces are demographically diverse
h. Peak industry bodies like the Australian Institute of Company Directors and the
Australian Securities Exchange advocate for diversity in the boardroom
1. Good governance promotes diversity in the boardroom
What do you believe is stopping yours or other boards from receiving these messages
so that boardrooms become more demographically diverse?
2. Would people from demographic diverse backgrounds be treated equally and
be given ‘a fair go’ when seeking to become an INED of your board, regardless
of their demographic characteristic?
X Yes X No X Do not know
3. Does your board have a diversity goal, executive mentoring and recruitment
strategy for increasing the diversity of its INEDs?
X Yes Please summarise
X No X Do not know X Currently developing
4. Does your board of directors have a succession plan
X Yes Does this succession plan incorporate
increasing the diversity of its independent non-executive directors?
X No
X Currently developing Does this succession plan incorporate
increasing the diversity of its independent non-executive directors?
X Do not know
5. Do you believe as a result of undertaking this survey that you would consider
encouraging your board to increase the demographic diversity of its INEDs?
X Yes X No X Do not know
6. At the board of director’s annual, self, peer, managerial or independent
evaluation, does your board evaluate the demographic diversity of its INEDs?
X Yes X No X Do not know

201
7. Should the demographic diversity of independent non-executive directors be
restricted to only gender, ethnicity and age?
X Yes X No X Do not know
8. In your opinion, does a voluntary target or mandatory quota of 40% for women
in the boardroom provide equality of opportunity and ‘a fair go’ for women or
do you believe a voluntary target or mandatory quota of 50% is fairer?
X 40% is fair X 50% is fair X Undecided
9. There has been a lot of public debate about the lack of diversity in the
boardroom, yet little change has occurred as boardrooms remain dominated by
upper and middle class white middle-aged men. To bring about change and
increase the number of people from demographically diverse backgrounds,
would you prefer to see:
X Voluntary targets
X Mandatory quotas
X Neither of these two practices should occur
X Do not know
X Other
10. An inclusive holistic approach to diversity in the boardroom incorporates
multiple demographic characteristic (s). Please select the demographic
characteristic you would support being on your board of directors (see
definition here)
X All demographic characteristics or
X Women
X People under 40
X People from Aboriginal and Torres Strait Islander descent
X People with a physical or sensory disability
X People from a different race or ethnic background
X People who are gay, lesbian, bisexual, transgender or intersex people
X People with a different religious or cultural background
X Other
Would you like to make any other comments about diversity in the boardroom
relating to Northern Territory organisations?
THANK YOU
Thank you for your participation in the online survey. Your responses are very
important and we thank you for your time.

202
REFERENCES
.id 2011, Northern Territory: Need for assistance,
http://profile.id.com.au/australia/assistance?WebID=160.
Adams, M 2015, 'Board diversity: More than a gender issue?', Deakin Law Review,
vol. 20, no. 1, pp. 123-152.
Adams, R, de Haan, J, Terjesen, S & Van Ees, H 2015, 'Board diversity: Moving the
field forward', Corporate Governance: An International Review, vol. 23, no. 2, pp.
77-82.
Adams, R & Kirchmaier, T 2015, 'Barriers to boardrooms', paper presented to Asian
Finance Association 2013 Conference, China.
Adams, R & Ragunathan, V 2013, 'Lehman sisters', paper presented to Financial
Research Network, Australia.
Akerlof, GA 1970, 'The market for 'lemons': Quality uncertainty and the market
mechanism', The Quarterly Journal of Economics, vol. 84, no. 3, pp. 488-500.
Alan, CE & Wayne, AW 2007, Statistical analysis quick reference guidebook, Sage
Publications.
Albrecht, MH 2001, International HRM: Managing diversity in the workplace,
Blackwell Publishers.

203
Alexander, JC, Thompson, K & Edles, LD 2012, A contemporary introduction to
sociology: Culture and society in transition, 2nd edn., Paradigm Publishers.
Ali, M, Ng, YL & Kulik, CT 2014, 'Board age and gender diversity: A test of
competing linear and curvilinear predictions', Journal of Business Ethics, vol. 125,
no. 3, pp. 497-512.
Allen, P, Bennett, K & Heritage, B 2014, SPSS statistics version 22: A practical
guide, 3rd. edn., Cengage Learning Australia.
Andres, L 2012, Designing and doing survey research, Sage Publications.
Andrew, M 2008, 'Questioning women's movement strategies: Australian activism
on work and care', Social Politics, vol. 15, no. 3, pp. 369-395.
Andrew, M & Maddison, S 2010, 'Damaged but determined: The Australian women's
movement, 1996-2007', Social Movement Studies, vol. 9, no. 2, pp. 171-185.
Andrews, KJ & Curtis, M 1998, Changing Australia: Social, cultural and economic
trends shaping the nation, Federation Press.
Argy, F 2006, Equality of opportunity in Australia: Myth and reality,
http://www.tai.org.au/node/950.

204
Arnegger, M, Hofmann, C, Pull, K & Vetter, K 2014, 'Firm size and board diversity',
Journal of Management and Governance, vol. 18, no. 4, pp. 1109-1135.
Astin, F & Long, A 2014, 'Characteristics of qualitative research and its application',
British Journal of Cardiac Nursing, vol. 9, no. 2, pp. 93-98.
ASX Corporate Governance Council 2014, Corporate governance principles and
recommendations,, http://www.asx.com.au/documents/asx-compliance/cgc-
principles-and-recommendations-3rd-edn.pdf.
Athens, L 2010, 'Naturalistic inquiry in theory and practice', Journal of
Contemporary Ethnography, vol. 39, no. 1, pp. 87-125.
Australia and New Zealand Banking Group Ltd 2016, Diversity and inclusion,
http://www.anz.com/about-us/corporate-sustainability/employees/diversity-
inclusion/.
Australian Bureau of Statistics 2008, Distribution of population across remote areas
of Australia,
http://www.abs.gov.au/AUSSTATS/[email protected]/Lookup/4102.0Chapter3002008.
Australian Bureau of Statistics 2011, Data and analysis: Northern Territory
population,
http://www.censusdata.abs.gov.au/census_services/getproduct/census/2011/quickstat
/7.

205
Australian Bureau of Statistics 2013, Australian social trends,
http://www.abs.gov.au/AUSSTATS/[email protected]/Lookup/4102.0Main+Features30April
+2013.
Australian Bureau of Statistics 2016a, Australian demographic statistics,
http://www.abs.gov.au/ausstats/[email protected]/mf/3101.0.
Australian Bureau of Statistics 2016b, Population clock,
http://www.abs.gov.au/ausstats/[email protected]/0/1647509ef7e25faaca2568a900154b63?op
endocument.
Australian Government 2015, The changing face of modern Australia – 1950s to
1970s, http://www.australia.gov.au/about-australia/australian-story/changing-face-of-
modern-australia-1950s-to-1970s.
Australian Human Rights Commission 2014, Racial discrimination,
https://www.humanrights.gov.au/employers/good-practice-good-business-
factsheets/racial-discrimination.
Australian Institute of Company Directors 2008, Group think,
http://www.companydirectors.com.au/director-resource-
centre/publications/company-director-magazine/2000-to-2009-back-
editions/2008/march/groupthink.

206
Australian Institute of Company Directors 2009, AICD Takes action on board
diversity, http://www.companydirectors.com.au/General/Header/Media/Media-
Releases/2009/AICD-Takes-Action-On-Board-Diversity.
Australian Institute of Company Directors 2012, ASX 200 snapshot report,
http://www.companydirectors.com.au/~/media/resources/director-resource-
centre/research/asx-200-snapshot-report_oct12.ashx?la=en.
Australian Institute of Company Directors 2013, Good governance principles and
guidance for not-for-profit organisations,
http://www.companydirectors.com.au/~/media/b42bd5b5ca1445f582bb96adac75232
5.ashx.
Australian Institute of Company Directors 2014, Boardroom diversity gains
momentum, http://www.companydirectors.com.au/director-resource-
centre/publications/company-director-magazine/2014-back-editions/april/ceo-report-
boardroom-diversity-gains-momentum.
Australian Institute of Company Directors 2016, Appointments to ASX 200 Boards,
http://www.companydirectors.com.au/director-resource-centre/governance-and-
director-issues/board-diversity/statistics.

207
Australian Institute of Health & Welfare 2012, Increasing Indigenous employment
rates,
http://www.aihw.gov.au/uploadedFiles/ClosingTheGap/Content/Publications/2012/ct
g-ip03.pdf.
Australian Institute of Managment 2012, Gender diversity in management: Targeting
untapped talent, https://www.aim.com.au/sites/default/files/downloads/AIM-
Research-Gender-Diversity.pdf.
Australian Securities and Investment Commission 2005, Rodney Adler sentenced to
four-and-a-half years' jail, http://asic.gov.au/about-asic/media-centre/find-a-media-
release/2005-releases/05-91-rodney-adler-sentenced-to-four-and-a-half-years-jail/.
Australian Securities Exchange 2014a, Corporate governance principles and
recommendations, http://www.asx.com.au/documents/asx-compliance/cgc-
principles-and-recommendations-3rd-edn.pdf.
Australian Securities Exchange 2014b, Improving gender diversity,
http://www.asx.com.au/education/listed-at-asx/gender-diversity.htm.
Azmat, F & Rentschler, R 2015, 'Gender and ethnic diversity on boards and
corporate responsibility: The case of the arts sector', Journal of Business Ethics, pp.
1-20.

208
Babbie, ER 2011, The basics of social research, 5th edn., Wadsworth/Cengage
Learning.
Basoglu, KA & Hess, TJ 2014, 'Online business reporting: A signaling theory
perspective', Journal of Information Systems, vol. 28, no. 2, pp. 67-101.
Bergh, DD, Connelly, BL, Ketchen, DJ & Shannon, LM 2014, 'Signalling theory and
equilibrium in strategic management research: An assessment and a research agenda:
Signalling theory in strategic management', Journal of Management Studies, vol. 51,
no. 8, pp. 1334-1360.
Bergman, MM 2008, Advances in mixed methods research: Theories and
applications, Sage Publications.
Bisman, JE & Highfield, C 2012, 'The road less travelled: An overview and example
of constructivist research in accounting', Australasian Accounting Business and
Finance Journal, vol. 6, no. 5, pp. 3-22.
Blair, J, Czaja, R & Blair, E 2014, Designing surveys: A guide to decisions and
procedures, 3rd edn., Sage Publications.
Bliege Bird, R & Smith, E 2005, 'Signaling theory, strategic interaction, and
symbolic capital', Current Anthropology, vol. 46, no. 2, pp. 221-248.

209
Block, L & Leseho, J 2005, 'Listen and I tell you something: Storytelling and social
action in the healing of the oppressed', British Journal of Guidance and Counselling,
vol. 33, no. 2, pp. 175-184.
Bond, MA & Haynes, MC 2014, 'Workplace diversity: A social-ecological
framework and policy implications', Social Issues and Policy Review, vol. 8, no. 1,
pp. 167-201.
Bonett, DG & Wright, TA 2015, 'Cronbach's alpha reliability: Interval estimation,
hypothesis testing, and sample size planning', Journal of Organisational Behavior,
vol. 36, no. 1, pp. 3-15.
Bowden, A, Fox-Rushby, JA, Nyandieka, L & Wanjau, J 2002, 'Methods for pre-
testing and piloting survey questions: Illustrations from the KENQOL survey of
health-related quality of life', Health Policy and Planning, vol. 17, no. 3, pp. 322-
330.
Bradshaw, P & Fredette, C 2013, 'Determinants of the range of ethnocultural
diversity on nonprofit boards: A study of large Canadian nonprofit organisations',
Nonprofit and Voluntary Sector Quarterly, vol. 42, no. 6, pp. 1111-1133.
Bradshaw, P, Fredette, C & Sukornyk, L 2009, A call to action: Diversity on
Canadian not-for-profit boards,
http://www.yorku.ca/mediar/special/diversityreportjune2009.pdf.

210
Braithwaite, V & Bush, J 1998, 'Affirmative action in Australia: A consensus-based
dialogic approach', NWSA Journal, vol. 10, no. 3, pp. 115-134.
Braun, V & Clarke, V 2006, 'Using thematic analysis in psychology', Qualitative
Research in Psychology, vol. 3, no. 2, pp. 77-101.
Braun, V & Clarke, V 2013, Successful qualitative research: A practical guide for
beginners, Sage Publications.
Braunstein, R, Fulton, BR & Wood, RL 2014, 'The role of bridging cultural practices
in racially and socioeconomically diverse civic organisations', American Sociological
Review, vol. 79, no. 4, pp. 705-725.
Brent, WH & Addo, CK 2012, 'Minimising information asymmetry: Does firm's
characteristics matter?', Academy of Banking Studies Journal, vol. 11, no. 1, pp. 43-
54.
Broderick, E 2009, Why gender quotas would help Australian business,
https://www.humanrights.gov.au/news/opinions/why-gender-quotas-would-help-
australian-business-2009.
Broderick, E 2011, Getting on board: Quotas and gender equality,
https://www.humanrights.gov.au/news/speeches/getting-board-quotas-and-gender-
equality-2011.

211
Broome, LL & Krawiec, KD 2008, 'Signaling through board diversity: Is anyone
listening?', University of Cincinnati Law Review, vol. 77, no. 2, pp. 431-464.
Bryans, P & Stutt, T 2011, 'Corporate law: Using the ASX corporate governance
principles on diversity to reduce leaks in your talent pipeline', Keeping Good
Companies, vol. 63, no. 1, pp. 30-33.
Bryman, A 2006, 'Integrating quantitative and qualitative research: How is it done?',
Qualitative Research, vol. 6, no. 1, pp. 97-113.
Bryson, L 1996, 'Transforming Australia's welfare state: Social policy under Labor',
Just Policy: A Journal of Australian Social Policy, no. 6, pp. 35-38.
Burnett, L 1998, Issues in immigrant settlement in Australia,
http://library.bsl.org.au/jspui/bitstream/1/4611/1/BurnettL_Issues-in-immigrant-
settlement-in-Australia_RS-10-1998.pdf.
Business First Magazine 2015, AICD might support quotas for women on boards,
http://www.businessfirstmagazine.com.au/aicd-might-support-quotas-for-women-on-
boards/13792/.
Cabrera, NL 2011, 'Using a sequential exploratory mixed method design to examine
racial hyperprivilege in higher education', New Directions for Institutional Research,
vol. 2011, no. 151, pp. 77-91.
212
Callaghan, M & Wood, G 2014, 'The engagement with business ethics', European
Business Review, vol. 26, no. 4, pp. 286-304.
Cameron, R 2009, 'A sequential mixed model research design: Design, analytical and
display issues', International Journal of Multiple Research Approaches, vol. 3, no. 2,
pp. 140-152.
Campbell, K & Mínguez-Vera, A 2008, 'Gender diversity in the boardroom and firm
financial performance', Journal of Business Ethics, vol. 83, no. 3, pp. 435-451.
Carbery, G 2014, Towards homosexual equality in Australian criminal law: A brief
history, http://www.alga.org.au/files/towardsequality2ed.pdf.
Carnegie, GD & O’Connell, BT 2014, 'A longitudinal study of the interplay of
corporate collapse, accounting failure and governance change in Australia: Early
1890s to early 2000s', Critical Perspectives on Accounting, vol. 25, no. 6, pp. 446-
468.
Carter, DA, Simkins, BJ & Simpson, WG 2003, 'Corporate governance, board
diversity, and firm value', Financial Review, vol. 38, no. 1, pp. 33-53.
Catalyst 2014, Leglislative board diverstiy, http://www.catalyst.org/legislative-
board-diversity.

213
Celani, A & Singh, P 2011, 'Signaling theory and applicant attraction outcomes',
Personnel Review, vol. 40, no. 2, pp. 222-238.
Certo, ST 2003, 'Influencing initial public offering investors with prestige: Signaling
with board structures', The Academy of Management Review, vol. 28, no. 3, pp. 432-
446.
Charles Darwin Universtity 2016, Economic profile of the Northen Territory,
http://www.economicprofile.com.au/northernterritory.
Cheverton, J 2005, 'Past their peak? Governance and the future of peak bodies in
Australia', The Australian Journal of Social Issues, vol. 40, no. 3, pp. 427-439.
Chia, Y 2015, 'Board diversity in Singapore', Singapore Academy of Law Journal,
vol. 27, no. 2, pp. 304-339.
Chudleigh, J & Smith, J 2015, 'Research essentials: Understanding the key features
of quantitative research and statistical tests', Nursing Children and Young People,
vol. 27, no. 3, pp. 12-12.
Clarke, T 2004, 'Cycles of crisis and regulation: The enduring agency and
stewardship problems of corporate governance', Corporate Governance: An
International Review, vol. 12, no. 2, pp. 153-161.

214
Cleaton-Jones, PE & Curzon, ME 2012, 'Submitting an application for research
ethics clearance', European Archives of Paediatric Dentistry, vol. 13, no. 2, pp. 60-
63.
Cohen, BD & Dean, TJ 2005, 'Information asymmetry and investor valuation of
IPOs: Top management team legitimacy as a capital market signal', Strategic
Management Journal, vol. 26, no. 7, pp. 683-690.
Connelly, BL, Certo, ST, Ireland, RD & Reutzel, CR 2011, 'Signaling theory: A
review and assessment', Journal of Management, vol. 37, no. 1, pp. 39-67.
Considine, M, O'Sullivan, S & Nguyen, P 2014, 'Governance, boards of directors and
the impact of contracting on not-for-profit organisations: An Australian study', Social
Policy and Administration, vol. 48, no. 2, pp. 169-187.
Coorporations and Markets Advisory Committee 2009, Diversity of boards of
directors,
http://www.camac.gov.au/camac/camac.nsf/byheadline/pdffinal+reports+2009/$file/
board_diversity_b5.pdf.
Corbin, JM & Strauss, AL 2008, Basics of qualitative research: Techniques and
procedures for developing grounded theory, 3rd edn., Sage Publications.
Cornforth, C 2003, The governance of public and non-profit organisations: What do
boards do?, Routledge.

215
Cortese, C 2009, 'A profile of the non-executive directors of Australia's largest
companies', Australian Accounting Review, vol. 19, no. 1, pp. 33-41.
Creswell, J 2009, Research design: Qualitative, quantitative, and mixed methods
approaches, 3rd edn., Sage Publications.
Creswell, J 2014, Research design: Qualitative, quantitative, and mixed methods
approaches, 4th edn., Sage Publications.
Creswell, J & Plano Clark, V 2011, Designing and conducting mixed methods
research, 2nd edn., Sage Publications.
Dalton, CM & Dalton, DR 2006, 'Corporate governance best practices: The proof is
in the process', Journal of Business Strategy, vol. 27, no. 4, pp. 5-7.
Davies, E 2011, Women on boards February 2011,
https://www.gov.uk/government/uploads/system/uploads/attachment_data/file/31480
/11-745-women-on-boards.pdf.
Davies, E 2015, Women on boards Davies review annual report 2015,
https://www.gov.uk/government/uploads/system/uploads/attachment_data/file/41545
4/bis-15-134-women-on-boards-2015-report.pdf.

216
Davis, DF, Golicic, SL & Boerstler, CN 2011, 'Benefits and challenges of
conducting multiple methods research in marketing', Journal of the Academy of
Marketing Science, vol. 39, no. 3, pp. 467-479.
Davis, PJ, Frolova, Y & Callahan, W 2016, 'Workplace diversity management in
Australia', Equality, Diversity and Inclusion: An International Journal, vol. 35, no. 2,
pp. 81-98.
De Cieri, H & Olekalns, M 2001, Workforce diversity in Australia: Challenges and
strategies for diversity management, Monash University, Faculty of Business and
Economics, Department of Management.
de Vries, JA 2015, 'Champions of gender equality: Female and male executives as
leaders of gender change', Equality, Diversity and Inclusion: An International
Journal, vol. 34, no. 1, pp. 21-36.
Deloitte Touche Tohmatsu Limited 2015, Diversity in the boardroom: Perspectives
and practices,
https://www2.deloitte.com/content/dam/Deloitte/za/Documents/governance-risk-
compliance/ZA_Board_Diversity_Full_Article.PDF.
Deloitte University Leadership Centre 2013, Uncovering talent: A new model for
inclusion, http://www2.deloitte.com/content/dam/Deloitte/us/Documents/about-
deloitte/us-inclusion-uncovering-talent-paper.pdf.

217
Denscombe, M 2014, The good research guide: For small-scale social research
projects, 5th edn., Open University Press.
Dent, GW 2014, 'Corporate governance without shareholders: A cautionary lesson
from non-profit organisations', Delaware Journal of Corporate Law, vol. 39, no. 1,
pp. 93-116.
Denzin, NK & Lincoln, YS 2011, The Sage handbook of qualitative research, 4th
edn., Sage Publications.
Department of Immigration & Boarder Protection 2016, Life in Australia,
https://www.border.gov.au/LifeinAustralia/Documents/lia_english_full.pdf.
Deutsch, Y & Ross, TW 2003, 'You are known by the directors you keep: Reputable
directors as a signaling mechanism for young firms', Management Science, vol. 49,
no. 8, pp. 1003-1017.
Dharmadasa, P, Gamage, P & Herath, SK 2014, 'Corporate governance, board
characteristics and firm performance: Evidence from Sri Lanka', South Asian Journal
of Management, vol. 21, no. 1, pp. 7-31.
Dhir, A 2015, Challenging boardroom homogeneity: Corporate law, governance,
and diversity, Cambridge University Press.

218
Diverstiy Council of Australia 2016, Capitalising on culture,
https://www.dca.org.au/dca-research/capitalising-on-culture.html.
Dou, Y, Sahgal, S & Zhang, EJ 2015, 'Should independent directors have term
limits? The role of experience in corporate governance', Financial Management, vol.
44, no. 3, pp. 583-621.
Downing, J 1995, Finding your voice: Reclaiming personal power through
communication, Allen & Unwin.
Du Plessis, J 2014, Do we need mandatory gender quota legislation?,
http://www.deakin.edu.au/buslaw/news/icgl-forum-do-we-need-mandatory-gender-
quota-legislation-for-boards.
Du Plessis, J, McConvill, J & Bagaric, M 2005, Principles of contemporary
corporate governance, Cambridge University Press.
Du Plessis, J, O'Sullivan, J & Rentschler, R 2014, 'Multiple layers of gender diversity
on corporate boards: To force or not to force?', Deakin Law Review, vol. 19, no. 1,
pp. 1-50.
Du Plessis, J, Saenger, I & Foster, R 2012, 'Board diversity or gender diversity?:
Perspectives from Europe, Australia and South Africa', Deakin Law Review, vol. 17,
no. 2, pp. 207-249.

219
Dunbar, N 2012, 'The role and value of independent directors in modern Australian
corporate governance', Company and Securities Law Journal, vol. 30, no. 5, pp. 312-
336.
Elmir, R, Schmied, V, Jackson, D & Wilkes, L 2011, 'Interviewing people about
potentially sensitive topics', Nurse Researcher, vol. 19, no. 1, pp. 12-16.
Erhardt, NL, Werbel, JD & Shrader, CB 2003, 'Board of director diversity and firm
financial performance', Corporate Governance: An International Review, vol. 11, no.
2, pp. 102-111.
Ertmer, PA & Glazewski, KD 2014, 'Developing a research agenda: Contributing
new knowledge via intent and focus', Journal of Computing in Higher Education,
vol. 26, no. 1, pp. 54-68.
Everingham, C 2001, 'Reconstituting community: Social justice, social order and the
politics of community', The Australian Journal of Social Issues, vol. 36, no. 2, pp.
105-122.
Executive Style 2011, GG wants female quotas on boards,
http://www.executivestyle.com.au/gg-wants-female-quotas-on-boards-1blba.
Fanto, JA, Solan, LM & Darley, JM 2011, 'Justifying board diversity', North
Carolina Law Review, vol. 89, no. 3, pp. 901-936.

220
Ferdman, B & Deane, B 2014, 'Diversity at work: The practice of inclusion',
Equality, Diversity and Inclusion: An International Journal, vol. 33, no. 8, pp. 808-
812.
Fernandez, RS & Griffiths, R 2007, 'Portable MP3 players: Innovative devices for
recording qualitative interviews', Nurse Researcher, vol. 15, no. 1, pp. 7-15.
Ferreira, D 2010, 'Board diverstiy', in R Kolb (ed.), Corporate governance: A
synthesis of theory, research and practice, John Wiley & Sons.
Flick, U 2014, The Sage handbook of qualitative data analysis, Sage Publications.
Frazer, L & Lawley, MA 2000, Questionnaire design and administration: A
practical guide, John Wiley & Sons Australia.
Galloway, L 2012, 'The experiences of male gay business owners in the UK',
International Small Business Journal, vol. 30, no. 8, pp. 890-906.
Ghaziani, A 2015, 'Gay enclaves face prospect of being passe': How assimilation
affects the spatial expressions of sexuality in the United States', International
Journal of Urban and Regional Research, vol. 39, no. 4, pp. 756-771.
Ghosh, S & Srivastava, BK 2014, 'Construction of a reliable and valid scale for
measuring organisational culture', Global Business Review, vol. 15, no. 3, pp. 583-
596.
221
Ginger, S 2007, Gestalt therapy: The art of contact, Karnac Books.
Gorman-Murray, A 2012, 'Queer politics at home: Gay men's management of the
public/private boundary', New Zealand Geographer, vol. 68, no. 2, pp. 111-120.
Governance Institute of Australia 2015, Governance foundations,
http://www.governanceinstitute.com.au/knowledge-resources/governance-
foundations/.
Grbich, C 2013, Qualitative data analysis: An introduction, 2nd edn., Sage
Publications.
Greig, AW, Lewins, FW & White, KN 2003, Inequality in Australia, Cambridge
University Press.
Gröschl, SD 2011, Diversity in the workplace: Multi-disciplinary and international
perspectives, Gower.
Gubrium, JF 2012, The Sage handbook of interview research: The complexity of the
craft, 2nd edn., Sage Publications.
Guest, G, Bunce, A & Johnson, L 2006, 'How many interviews are enough?: An
experiment with data saturation and variability', Field Methods, vol. 18, no. 1, pp.
59-82.

222
Guest, G, MacQueen, KM & Namey, EE 2012, Applied thematic analysis, Sage
Publications.
Gul, FA, Hutchinson, M & Lai, KMY 2013, 'Gender-diverse boards and properties
of analyst earnings forecasts', Accounting Horizons, vol. 27, no. 3, pp. 511-538.
Haebich, A 2008, Spinning the dream: Assimilation in Australia 1950-1970,
Fremantle Press.
Hamden, A, Newton, R, McCauley‐Elsom, K & Cross, W 2011, 'Is
deinstitutionalisation working in our community?', International Journal of Mental
Health Nursing, vol. 20, no. 4, pp. 274-283.
Haralambos, M, Holborn, M, Chapman, S & Moore, S 2013, Sociology: Themes and
perspectives, 8th edn., Collins Educational.
Harris, EE 2014, 'The impact of board diversity and expertise on nonprofit
performance', Nonprofit Management and Leadership, vol. 25, no. 2, pp. 113-130.
Härtel, CE & Fujimoto, Y 2015, Human resource management, 3rd edn., Pearson
Australia.
Haugh, H 2012, 'The importance of theory in social enterprise research', Social
Enterprise Journal, vol. 8, no. 1, pp. 7-15.

223
Healthinfonet 2014, What details do we know about the Indigenous population,
http://www.healthinfonet.ecu.edu.au/health-facts/health-faqs/aboriginal-population.
Heracleous, L 2001, 'What is the impact of corporate governance on organisational
performance?', Corporate Governance: An International Review, vol. 9, no. 3, pp.
165-173.
Hillman, AJ 2015, 'Board diversity: Beginning to unpeel the onion: Unpeeling the
onion', Corporate Governance: An International Review, vol. 23, no. 2, pp. 104-107.
Hinkin, T, Tracy, J & Enz, C 1997, 'Scale construction: Developing reliable and
valid measurement instruments', Cornell University, School of Hotel Administration.
Ho, C 2008, 'Diversifying feminism: Migrant women's activism in Australia', Signs,
vol. 33, no. 4, pp. 777-784.
Hogan, MC & Dempsey, K 1995, Equity and citizenship under Keating, 2nd edn.,
Public Affairs Research Centre.
Holmes, D, Hughes, KP & Julian, R 2012, Australian sociology: A changing society,
3rd edn., Pearson Australia.
Hopkins, L, Roarty, L & Saggers, S 2008, 'Pat Giles as critical actor within the trade
union movement of the 1970s', Women's Studies International Forum, vol. 31, no. 5,
pp. 400-412.

224
Horvat, EM & Heron, ML 2013, The beginner's guide to doing qualitative research:
How to get into the field, collect data, and write up your project, Teachers College
Press.
Howard, A 2011, 'Groupthink and corporate governance reform: Changing the
formal and informal decisionmaking processes of corporate boards', Southern
California Interdisciplinary Law Journal, vol. 20, no. 2, p. 425.
Hubbard, G & Beamish, P 2011, Strategic management: Thinking, analysis, action,
4th edn., Pearson Australia.
Human Rights Commission 2014, The cost of the closet and the rewards of
inclusion: Why the workplace environment for LGBT people matters to employers,
http://www.hrc.org/resources/the-cost-of-the-closet-and-the-rewards-of-inclusion.
Irvine, A, Drew, P & Sainsbury, R 2013, 'Am I not answering your questions
properly? Clarification, adequacy and responsiveness in semi-structured telephone
and face-to-face interviews', Qualitative Research, vol. 13, no. 1, pp. 87-106.
Jamieson, D & O’Mara, J 1991, Managing workforce 2000: Gaining the diversity
advantage, Jossey-Bass.
Jefferson, T & Austen, S 2015, 'Understanding links between gender and pay',
Journal of Australian Political Economy, The, no. 75, pp. 115-132.

225
Johl, S & O’Leary, J 2015, Capitalising on culture over time: A study of the cultural
origins of ASX directors 2004-2013, Decan Universtiy and Diverstiy Council of
Australia.
Johnson, RB, Onwuegbuzie, AJ & Turner, LA 2007, 'Toward a definition of mixed
methods research', Journal of Mixed Methods Research, vol. 1, no. 2, pp. 112-133.
Johnston, D & Malina, MA 2008, 'Managing sexual orientation diversity', Group and
Organisation Management, vol. 33, no. 5, pp. 602-625.
Jones, GE 1997, 'Advancement opportunity issues for persons with disabilities',
Human Resource Management Review, vol. 7, no. 1, pp. 55-76.
Josselson, R 2013, Interviewing for qualitative inquiry: A relational approach,
Guilford Press.
Jovanović, G 2011, 'Toward a social history of qualitative research', History of the
Human Sciences, vol. 24, no. 2, pp. 1-27.
Kallen, E 1996, 'Gay and lesbian rights issues: A comparative analysis of Sydney,
Australia and Toronto, Canada', Human Rights Quarterly, vol. 18, no. 1, pp. 206-
223.

226
Kang, H, Cheng, M & Gray, SJ 2007, 'Corporate governance and board composition:
Diversity and independence of Australian boards', Corporate Governance: An
International Review, vol. 15, no. 2, pp. 194-207.
Kirk, N 2008, 'Traditionalists and progressives: Labor, race, and immigration in post-
World War II Australia and Britain', Australian Historical Studies, vol. 39, no. 1, pp.
53-71.
Kirton, G & Greene, A 2000, The dynamics of managing diversity: A critical
approach, Butterworth-Heinemann.
Klettner, A, Clarke, T & Boersma, M 2016, 'Strategic and regulatory approaches to
increasing women in leadership: Multilevel targets and mandatory quotas as levers
for cultural change', Journal of Business Ethics, vol. 133, no. 3, pp. 395-419.
Knott, D 2002, Corporate governance: Principles, promotion and practices,
http://download.asic.gov.au/media/1340828/Monash_spch_160702.pdf.
Koall, I 2011, 'Managing complexity: Using ambivalence and contingency to support
diversity in organisations', Equality, Diversity and Inclusion: An International
Journal, vol. 30, no. 7, pp. 572-588.
Korn Ferry Institute 2013, The diversity scorecard: Measuring board composition in
Asia Pacific, http://www.kornferry.com/institute/721-the-diversity-scorecard-2013-
measuring-board-composition-in-asia-pacific.

227
KPMG International Cooperative 2014, ASX Corporate Governance Council
principles and recommendations on diversity: Analysis of disclosures for financial
years ended between 31 December 2012 and 30 December 2013,
http://www.asx.com.au/documents/asx-compliance/kpmg-report-diversity-2014.pdf.
Kramar, R 2012, 'Diversity management in Australia: A mosaic of concepts, practice
and rhetoric', Asia Pacific Journal of Human Resources, vol. 50, no. 2, pp. 245-261.
Kvale, S & Brinkmann, S 2009, InterViews: Learning the craft of qualitative
research interviewing, 2nd edn., Sage Publications.
Labelle, R, Francoeur, C & Lakhal, F 2015, 'To regulate or not to regulate? Early
evidence on the means used around the world to promote gender diversity in the
boardroom', Gender, Work and Organisation, vol. 22, no. 4, pp. 339-363.
Lapan, SD, Quartaroli, MT & Riemer, FJ 2012, Qualitative research: An
introduction to methods and designs, Jossey-Bass.
Larkin, PM, Begley, CM & Devane, D 2014, 'Breaking from binaries—using a
sequential mixed methods design', Nurse Researcher, vol. 21, no. 4, pp. 8-12.
Leland, HE & Pyle, DH 1977, 'Informational asymmetries, financial structure, and
financial intermediation', The Journal of Finance, vol. 32, no. 2, pp. 371-387.

228
Lessing, J, Morrison, D & Nicolae, M 2012, 'Educational institutions, corporate
governance and not-for-profits', Corporate Governance eJournal, pp. 1-22.
Lester, RH, Certo, ST, Dalton, CM, Dalton, DR & Cannella, AA 2006, 'Initial public
offering investor valuations: An examination of top management team prestige and
environmental uncertainty', Journal of Small Business Management, vol. 44, no. 1,
pp. 1-26.
Leung, P & Cooper, BJ 2003, 'The mad hatter's corporate tea party', Managerial
Auditing Journal, vol. 18, no. 6/7, pp. 505-516.
Li, Wa & Xu, J 2014, 'Board independence, CEO succession and the scope of
strategic change: Empirical research on the effectiveness of independent directors',
Nankai Business Review International, vol. 5, no. 3, pp. 309-325.
Lipman, T 2008, 'The role of the independent non-executive director in Australia',
DBA thesis, Macquarie University.
Lucas, SR 2014, 'Beyond the existence proof: Ontological conditions,
epistemological implications and in-depth interview research', Quality and Quantity,
vol. 48, no. 1, pp. 387-408.
Lune, H, Pumar, ES & Koppel, R 2010, Perspectives in social research methods and
analysis: A reader for sociology, Sage Publications.

229
Lunenburg, FC & Irby, BJ 2008, Writing a successful thesis or dissertation: Tips and
strategies for students in the social and behavioral sciences, Corwin Press.
Machi, LA & McEvoy, BT 2012, The literature review: Six steps to success, 2nd
edn., Corwin Press.
Macintyre, S 2009, A concise history of Australia, 3rd edn., Cambridge University
Press.
Mann, J 2012, 'The introduction of multiculturalism in Canada and Australia, 1960s–
1970s', Nations and Nationalism, vol. 18, no. 3, pp. 483-503.
Marshall, C & Rossman, GB 2006, Designing qualitative research, 4th edn., Sage
Publications.
Mason, P, Augustyn, M & Seakhoa-King, A 2010, 'Exploratory study in tourism:
Designing an initial, qualitative phase of sequenced, mixed methods research',
International Journal of Tourism Research, vol. 12, no. 5, pp. 431-448.
Mason, R 2010, 'Australian multiculturalism: Revisiting Australia's political heritage
and the migrant presence', History Compass, vol. 8, no. 8, pp. 817-827.
Matolcsy, Z, Stokes, D & Wright, A 2004, 'Do independent directors add value?',
Australian Accounting Review, vol. 14, no. 1, pp. 33-40.

230
McGrath-Champ, S & Jefferson, T 2013, 'Gender and pay equity in a global
knowledge organisation', The Economic and Labour Relations Review, vol. 24, no. 1,
pp. 97-123.
McShane, SL, Olekalns, M & Travaglione, A 2013, Organisational behaviour:
Emerging knowledge, global insights, 4th edn., McGraw Hill Australia.
Mellinger, CD 2015, 'On the applicability of internet-mediated research methods to
investigate translators' cognitive behaviour', Translation and Interpreting, vol. 7, no.
1, pp. 59-71.
Miles, MB, Huberman, AM & Saldaña, J 2014, Qualitative data analysis: A methods
sourcebook, 3rd edn., Sage Publications.
Miller, T & del Carmen Triana, M 2009, 'Demographic diversity in the boardroom:
Mediators of the board diversity-firm performance relationship', Journal of
Management Studies, vol. 46, no. 5, pp. 755-786.
Mirshekary, S, Yaftian, AM & Cross, D 2005, 'Australian corporate collapse: The
case of HIH Insurance', Journal of Financial Services Marketing, vol. 9, no. 3, pp.
249-258.
Monem, R 2011, 'The One.Tel collapse: Lessons for corporate governance',
Australian Accounting Review, vol. 21, no. 4, pp. 340-351.

231
Moore, DS 2000, Statistics: Concepts and controversies, 5th edn., W. H. Freeman.
Mowbray, M 1998, 'Subverting the Aboriginal Land Rights (NT) Act 1976: The NT
Local Government Act 1993', Indigenous Law Bulletin, vol. 4, no. 10, pp. 12-16.
Muchiri, MK & Ayoko, OB 2013, 'Linking demographic diversity to organisational
outcomes', Leadership and Organisation Development Journal, vol. 34, no. 5, pp.
384-406.
Naff, KC 1995, 'Subjective vs objective discrimination in government: Adding to the
picture of barriers to the advancement of women', Political Research Quarterly, vol.
48, no. 3, pp. 535-557.
National Archives of Australia 2016, Australian prime ministers: Gough Whitlam,
http://primeministers.naa.gov.au/primeministers/whitlam/in-office.aspx.
Neuman, WL 1997, Social research methods: Qualitative and quantitative
approaches, 3rd edn., Allyn & Bacon.
Neuman, WL 2006, Social research methods: Qualitative and quantitative
approaches, 6th edn., Allyn & Bacon.
Northen Territroy Governemnt 2014, A new life in Australia's Northen Territory,
http://www.australiasnorthernterritory.com.au/publications/Documents/lifestyle-
booklet.pdf.

232
Ntim, CG 2015, 'Board diversity and organisational valuation: Unravelling the
effects of ethnicity and gender', Journal of Management and Governance, vol. 19,
no. 1, pp. 167-195.
O’Dwyer, LM & Bernauer, JA 2014, Quantitative research for the qualitative
researcher, Sage Publications.
O’Mara-Eves, A & Thomas, J 2016, 'Ongoing developments in meta-analytic and
quantitative synthesis methods: Broadening the types of research questions that can
be addressed', Review of Education, vol. 4, no. 1, pp. 5-27.
Office of Women 2012, Gender balance on Australian government boards report
2011-2012,
https://www.dss.gov.au/sites/default/files/documents/11_2012/gender_balance_board
s_0.pdf.
Olsen, JE & Martins, LL 2012, 'Understanding organisational diversity management
programs: A theoretical framework and directions for future research', Journal of
Organisational Behavior, vol. 33, no. 8, pp. 1168-1187.
Oppenheimer, M 2008, 'Voluntary action, social welfare and the Australian
assistance plan in the 1970s', Australian Historical Studies, vol. 39, no. 2, pp. 167-
182.

233
Opperman, H 1966, Australia’s immigration policy,
http://www.multiculturalaustralia.edu.au/doc/opperman_1.pdf.
Pakulski, J 2014, 'Confusions about multiculturalism', Journal of Sociology, vol. 50,
no. 1, pp. 23-36.
Parmenter, TR 1999, 'Implications of social policy for service delivery: The promise
and the reality, are we getting real?', Journal of Intellectual and Developmental
Disability, vol. 24, no. 4, pp. 321-331.
Parylo, O 2012, 'Qualitative, quantitative, or mixed methods: An analysis of research
design in articles on principal professional development (1998-2008)', International
Journal of Multiple Research Approaches, vol. 6, no. 3, pp. 297-313.
Patrick, HA & Kumar, VR 2012, 'Managing workplace diversity: Issues and
challenges', SAGE Open, vol. 2, no. 2, p. NA.
Patton, MQ 2002, Qualitative research and evaluation methods, 3rd edn., Sage
Publications.
Perrault, E 2015, 'Why does board gender diversity matter and how do we get there?
The role of shareholder activism in deinstitutionalising 'old boys' networks', Journal
of Business Ethics, vol. 128, no. 1, pp. 149-165.

234
Perrone, KM, Wright, SL & Jackson, ZV 2009, 'Traditional and nontraditional
gender roles and work—family interface for men and women', Journal of Career
Development, vol. 36, no. 1, pp. 8-24.
Petrovic, J 2008, 'Unlocking the role of a board director: A review of the literature',
Management Decision, vol. 46, no. 9, pp. 1373-1392.
Phillips, J, Kalpdor, M & Simon-Davies, J 2010, Migration to Australia since
federation: A guide to statistics,
http://www.aph.gov.au/binaries/library/pubs/bn/sp/migrationpopulation.pdf.
Pitts, DW, Hicklin, AK, Hawes, DP & Melton, E 2010, 'What drives the
implementation of diversity management programs? Evidence from public
organisations', Journal of Public Administration Research and Theory: J-PART, vol.
20, no. 4, pp. 867-886.
Point, S & Singh, V 2003, 'Defining and dimensionalising diversity', European
Management Journal, vol. 21, no. 6, pp. 750-761.
Productivity Commission 2009, Executive remuneration in Australia,
http://www.pc.gov.au/inquiries/completed/executive-remuneration/report/executive-
remuneration-report.pdf.

235
Psaltis, C 2012, 'Culture and social representations: A continuing dialogue in search
for heterogeneity in social developmental psychology', Culture and Psychology, vol.
18, no. 3, pp. 375-390.
Queensland Government 2016, Government commercial businesses,
https://treasury.qld.gov.au/economy/government-commercial-businesses/index.php.
Quinlan, C 2011, Business research methods, South-Western Cengage Learning.
Ramirez, SA 2003, 'A flaw in the Sarbanes-Oxley reform: Can diversity in the
boardroom quell corporate corruption?', St. John's Law Review, vol. 77, no. 4, pp.
837-866.
Randøy, T, Thomsen, S & Oxelheim, L 2006, A Nordic perspective on corporate
board diversity,
https://scholar.google.com.au/scholar?q=A+Nordic+perspective+on+corporate+boar
d+diversity&hl=en&as_sdt=0&as_vis=1&oi=scholart&sa=X&ved=0ahUKEwjfkdbr
mavMAhVDJpQKHdIIDAEQgQMIGjAA.
Remenyi, D, Swan, N & Van Den Assem, B 2011, Ethics protocols and research
ethics committees: Successfully obtaining approval for your academic research,
Academic Publishing International.

236
Rhode, DL & Packel, AK 2014, 'Diversity on corporate boards: How much
difference does difference make?', Delaware Journal of Corporate Law, vol. 39, no.
2, pp. 377-426.
Richards, L & Morse, JM 2013, Readme first for a user's guide to qualitative
methods, 3rd edn., Sage Publications.
Rickard, J 1996, Australia: A cultural history, 2nd edn., Longman.
Ridley, DD 2012, The literature review: A step-by-step guide for students, 2nd edn.,
Sage Publications.
Riehl, CJ 2000, 'The principal's role in creating inclusive schools for diverse
students: A review of normative, empirical, and critical literature on the practice of
educational administration', Review of Educational Research, vol. 70, no. 1, pp. 55-
81.
Ritchie, T 2007, 'Independent directors: Magic bullet or band-aid?',
http://epublications.bond.edu.au/cgej/5, p. NA.
Ritter, LA & Sue, VM 2007, 'Systematic planning for using an online survey', New
Directions for Evaluation, no. 115, pp. 15-22.
237
Roberson, QM & Park, HJ 2007, 'Examining the link between diversity and firm
performance: The effects of diversity reputation and leader racial diversity', Group
and Organisation Management, vol. 32, no. 5, pp. 548-568.
Robins, F 2006, 'Corporate governance after Sarbanes-Oxley: An Australian
perspective', Corporate Governance: The International Journal of Business in
Society, vol. 6, no. 1, pp. 34-48.
Robinson, S 2014, 'The man question: Men and women's liberation in 1970s
Australia', Outskirts, vol. 31, p. NA.
Rochon, J & Kieser, M 2011, 'A closer look at the effect of preliminary goodness-of-
fit testing for normality for the one-sample t-test: Preliminary goodness-of-fit testing
for normality', British Journal of Mathematical and Statistical Psychology, vol. 64,
no. 3, pp. 410-426.
Roskam, J, Paterson, J & Berg, C 2012, 'Be like Gough: 75 radical ideas to transform
Australia', The Institute of Public Affairs Review: A Quarterly Review of Politics and
Public Affairs, vol. 64, no. 2, pp. 6-13.
Ross, T 2012, A survival guide for health research methods, Open University Press.
Rothschild, M & Stiglitz, J 1976, 'Equilibrium in competitive insurance markets: An
essay on the economics of imperfect information', The Quarterly Journal of
Economics, vol. 90, no. 4, pp. 629-649.
238
Roulston, K 2010, 'Considering quality in qualitative interviewing', Qualitative
Research, vol. 10, no. 2, pp. 199-228.
Roy Morgan Research 2015, Is Australia getting gayer—and how gay will we get? ,
http://www.roymorgan.com/findings/6263-exactly-how-many-australians-are-gay-
december-2014-201506020136.
Rubin, HJ & Rubin, I 2012, Qualitative interviewing: The art of hearing data, 3rd
edn., Sage Publications.
Rudd, K 2008, 'Motion of apology to Australia's Indigenous peoples', Australian
Indigenous Law Review, vol. 12, no. Special ed., pp. 1-5.
Rumens, N 2011, 'Minority support: Friendship and the development of gay and
lesbian managerial careers and identities', Equality, Diversity and Inclusion: An
International Journal, vol. 30, no. 6, pp. 444-462.
Ryan, P & Dundon, T 2008, 'Case research interviews: Eliciting superior quality
data', International Journal of Case Method Research and Application, pp. 443-450.
Salter, C 2013, Whiteness and social change: Remnant colonialisms and white
civility in Australia and Canada, Cambridge Scholars.

239
Sandelowski, M 2000, 'Combining qualitative and quantitative sampling, data
collection, and analysis techniques in mixed-method studies', Research in Nursing
and Health, vol. 23, no. 3, pp. 246-255.
Sargeant, J 2012, Qualitative research part II: Participants, analysis and quality
assurance, http://www.ncbi.nlm.nih.gov/pmc/articles/PMC3312514/pdf/i1949-8357-
4-1-1.pdf.
Sargent, MJ, Nilan, PM & Winter, G 1997, The new sociology for Australians, 4th
edn., Longman Australia.
Sarre, R 2002, 'Responding to corporate collapses: Is there a role for corporate social
responsibility?', Deakin Law Review, vol. 7, no. 1, pp. 1-19.
Sarros, JC, Cooper, BK & Santora, JC 2011, 'Leadership vision, organisational
culture, and support for innovation in not-for-profit and for-profit organisations',
Leadership and Organisation Development Journal, vol. 32, no. 3, pp. 291-309.
Scott, G & Garner, R 2012, Doing qualitative research: Designs, methods, and
techniques, Pearson.
Selvanathan, EA, Selvanathan, S & Keller, G 2016, Business statistics: Australia and
New Zealand, 7th edn., Cengage Learning.

240
Shapiro, C & Stiglitz, JE 1984, 'Equilibrium unemployment as a worker discipline
device', The American Economic Review, vol. 74, no. 3, pp. 433-444.
Sheridan, G 1995, Living with dragons: Australia confronts its Asian destiny, Allen
& Unwin in association with Mobil Oil Australia.
Sherington, G 1980, Australia's immigrants 1788-1978, Allen & Unwin.
Siagian, FT & Tresnaningsih, E 2011, 'The impact of independent directors and
independent audit committees on earnings quality reported by Indonesian firms',
Asian Review of Accounting, vol. 19, no. 3, pp. 192-207.
Sims, RR 1992, 'Linking groupthink to unethical behavior in organisations', Journal
of Business Ethics, vol. 11, no. 9, pp. 651-662.
Sinclair, A 2006, 'Critical diversity management practices in Australia: Romanced or
co-optted?', in AM Konrad, P Prasad & J Pringle (eds), Handbook of workplace
diversity, Sage Publications.
Singh, V 2007, 'Ethnic diversity on top corporate boards: A resource dependency
perspective', The International Journal of Human Resource Management, vol. 18,
no. 12, pp. 2128-2146.
241
Smith, M 2005, 'Diversity and identity in the non-profit sector: Lessons from LGBT
organisations in Toronto', Social Policy and Administration, vol. 39, no. 5, pp. 463-
480.
Somekh, B & Lewin, C 2005, Research methods in the social sciences, Sage
Publications.
Spence, M 1973, 'Job market signaling', The Quarterly Journal of Economics, vol.
87, no. 3, pp. 355-374.
Spence, M 2002, 'Signaling in retrospect and the informational structure of markets',
The American Economic Review, vol. 92, no. 3, pp. 434-459.
Stannard, J & Thompson, LJ 2008, 'Australian values, liberal traditions and
Australian democracy: Introductory considerations of government for contemporary
civil society', Social Alternatives, vol. 27, no. 1, pp. 58-63.
Stoller, E, Webster, NJ, Blixen, CE, McCormick, RA, Hund, AJ, Perzynski, AT,
Kanuch, SW, Thomas, CL, Kercher, K & Dawson, NV 2009, 'Alcohol consumption
decisions among non-abusing drinkers diagnosed with Hepatitis C: An exploratory
sequential mixed methods study', Journal of Mixed Methods Research, vol. 3, no. 1,
pp. 65-86.

242
Stone, MM & Ostrower, F 2007, 'Acting in the public interest? Another look at
research on nonprofit governance', Nonprofit and Voluntary Sector Quarterly, vol.
36, no. 3, pp. 416-438.
Strachan, G 2010, 'Still working for the man?: Women's employment experiences in
Australia since 1950', Australian Journal of Social Issues, The, vol. 45, no. 1, pp.
117-130.
Strachan, G, Burgess, J & Henderson, L 2007, 'Equal employment opportunity
legislation and policies: The Australian experience', Equal Opportunities
International, vol. 26, no. 6, pp. 525-540.
Syed, J & Kramar, R 2009, 'What is the Australian model for managing cultural
diversity?', Personnel Review, vol. 39, no. 1, pp. 96-115.
Syed, J & Pio, E 2010, 'Veiled diversity? Workplace experiences of Muslim women
in Australia', Asia Pacific Journal of Management, vol. 27, no. 1, pp. 115-137.
Tavakol, M & Dennick, R 2011, 'Making sense of Cronbach’s alpha', International
Journal of Medical Education, vol. 2, pp. 53-55.
Tavan, G 2012, 'Leadership: Arthur Calwell and the post-war immigration program',
Australian Journal of Politics and History, vol. 58, no. 2, pp. 203-220.

243
Teddlie, C & Tashakkori, A 2009, Foundations of mixed methods research:
Integrating quantitative and qualitative techniques in the social and behavioral
sciences, Sage Publications.
Terjesen, S, Aguilera, RV & Lorenz, R 2015, 'Legislating a woman’s seat on the
board: Instituttional factors driving gender quotas for boards of directors', Journal of
Business Ethics, vol. 128, no. 2, pp. 233-251.
Terjesen, S, Couto, EB & Francisco, PM 2016, 'Does the presence of independent
and female directors impact firm performance? A multi-country study of board
diversity', Journal of Management and Governance, vol. 20, no. 3, pp. 447-483.
Terjesen, S, Sealy, R & Singh, V 2009, 'Women directors on corporate boards: A
review and research agenda', Corporate Governance: An International Review, vol.
17, no. 3, pp. 320-337.
Thatcher, S & Patel, P 2011, 'Demographic faultlines: A meta-analysis of the
literature', Journal of Applied Psychology, vol. 96, no. 6, pp. 1119-1139.
Thompson, E 1994, Fair enough: Egalitarianism in Australia, UNSW Press.
Thoms, JC 2008, 'Ethical integrity in leadership and organisational moral culture',
Leadership, vol. 4, no. 4, pp. 419-442.

244
Tilles, PF, Ferreira, FF, Francisco, G, Pereira, C & Sarti, FM 2011, 'A markovian
model market: Akerlof's lemons and the asymmetry of information', Physica A:
Statistical Mechanics and its Applications, vol. 390, no. 13, pp. 2562-2570.
Tremblay, M, Gendron, Y & Malsch, B 2016, 'Gender on board: Deconstructing the
'legitimate' female director', Accounting, Auditing and Accountability Journal, vol.
29, no. 1, pp. 165-190.
True, J 2013, 'Counting women and balancing gender: Increasing women's
participation in governance', Politics and Gender, vol. 9, no. 3, pp. 351-359.
Tsui, HC 2012, 'Advertising, quality, and willingness-to-pay: Experimental
examination of signaling theory', Journal of Economic Psychology, vol. 33, no. 6, pp.
1193-1203.
Upadhyay, A & Zeng, H 2014, 'Gender and ethnic diversity on boards and corporate
information environment', Journal of Business Research, vol. 67, no. 11, pp. 2456-
2463.
Vafaei, A, Ahmed, K & Mather, P 2015, 'Board diversity and financial performance
in the top 500 Australian firms', Australian Accounting Review, vol. 25, no. 4, pp.
413-427.

245
Vaismoradi, M, Turunen, H & Bondas, T 2013, 'Content analysis and thematic
analysis: Implications for conducting a qualitative descriptive study', Nursing and
Health Sciences, vol. 15, no. 3, pp. 398-405.
Van de Ven, AH 1989, 'Nothing is quite so practical as a good theory', The Academy
of Management Review, vol. 14, no. 4, pp. 486-489.
Van der Walt, N & Ingley, C 2003, 'Board dynamics and the influence of
professional background, gender and ethnic diversity of directors', Corporate
Governance: An International Review, vol. 11, no. 3, pp. 218-234.
Van der Walt, N, Ingley, C, Shergill, GS & Townsend, A 2006, 'Board configuration:
Are diverse boards better boards?', Corporate Governance: The International
Journal of Business in Society, vol. 6, no. 2, pp. 129-147.
Van Krieken, R 2006, Sociology: Themes and perspectives, 3rd edn., Pearson
Education Australia.
Van Krieken, R 2012, 'Between assimilation and multiculturalism: Models of
integration in Australia', Patterns of Prejudice, vol. 46, no. 5, pp. 500-517.
Viader, AM & Espina, MI 2014, 'Are not-for-profits learning from for-profit-
organisations? A look into governance', Corporate Governance, vol. 14, no. 1, pp. 1-
14.

246
Virtual Australia 2017, Northen Territory,
http://www.virtualoceania.net/australia/states/northernterritory.shtml.
Vogt, WP 2014, Selecting the right analyses for your data: Quantitative, qualitative,
and mixed methods, The Guilford Press.
Walker, D, Gothard, J & Jayasuriya, L 2003, Legacies of white Australia: Race,
culture and nation, University of Western Australia Press.
Walsh, K 2001, The changing face of Australia: A century of immigration 1901-
2000, Allen & Unwin.
Wang, Y & Clift, B 2009, 'Is there a 'business case' for board diversity?', Pacific
Accounting Review, vol. 21, no. 2, pp. 88-103.
Warren, CM & Antoniades, H 2016, 'Deconstructing the glass ceiling: Gender
equality in the Australian property profession', Property Management, vol. 34, no. 1,
pp. 29-43.
Watson, R 2015, 'Quantitative research', Nursing Standard, vol. 29, no. 31, pp. 44-
48.
Westphal, JD & Milton, LP 2000, 'How experience and network ties affect the
influence of demographic minorities on corporate boards', Administrative Science
Quarterly, vol. 45, no. 2, pp. 366-398.

247
Whitlam Institute 2015, History and legacy,
https://www.whitlam.org/gough_whitlam/history_and_legacy.
Williams, BR, Bingham, S & Shimeld, S 2015, 'Corporate governance, the GFC and
independent directors', Managerial Auditing Journal, vol. 30, no. 4/5, pp. 324-346.
Wilson, V 2014, 'Research methods: Sampling', Evidence Based Library and
Information Practice, vol. 9, no. 2, pp. 45-47.
Wisniewski, M 2014, 'First look: ANZ rolls out rhinestone-studded 'GAYTMS' for
mardi gras', American Banker, vol. 179, no. 29, p. NA.
Workplace Gender Equity Agency 2013, How to set gender diversity targets:
Guidelines for setting and meeting targets to increase gender diversity in the
workplace, https://www.wgea.gov.au/sites/default/files/SETTING-GENDER-
TARGETS-Online-accessible.pdf.
Workplace Gender Equity Agency 2016a, Gender pay gap statistics,
https://www.wgea.gov.au/sites/default/files/Gender_Pay_Gap_Factsheet.pdf.
Workplace Gender Equity Agency 2016b, Workplace Gender Equity Act 2012,
https://www.wgea.gov.au/about-legislation/workplace-gender-equality-act-2012.
Workplace Gender Equity Agency 2016c, Targets and quotas,
https://www.wgea.gov.au/sites/default/files/20131119_PP_targetsquotas.pdf.

248
Yang, Y & Konrad, AM 2011, 'Understanding diversity management practices:
Implications of institutional theory and resource-based theory', Group and
Organisation Management, vol. 36, no. 1, pp. 6-38.
Zevallos, Z 2005, 'It's like we're their culture: Second-generation migrant women
discuss Australian culture', People and Place, vol. 13, no. 2, pp. 41-49.