Embed Size (px)
Citation preview

R E S E A R C H PAPERS
Acta Cryst. (1998). B54, 8-17
X-ray and Electron Diffraction Study of MgO
V. G. TSIRELSON, a~g A. S. AvILov, b Yu. A. ABRAMOV, a E. L. BELOKONEVA, c R. IO'rANEH a AriD D. FEIL d
aMendeleev University of Chemical Technology, Moscow 125047, Russia, blnsn'tute of Crystallography, Russian Academy of Sciences, Leninsky Pr 59, Moscow 117333, Russia, CGeological Department, Moscow State University, Moscow 119899, Russia, and alChemical Physics Laboratory, University of Twente, PO Box 217, 7500 AE Enschede,
The Netherlands. E-mail: [email protected]
(Received 23 January 1997; accepted 16 June 1997)
Abstract
Precise X-ray and high-energy transmission electron diffraction methods were used for the study of electron density and electrostatic potential in MgO crystals. The structure amplitudes were determined and their accuracy estimated using ab initio Hartree-Fock structure ampli- tudes as criteria. The electrostatic potential distributions, reconstructed using Fourier series from both X-ray and electron diffraction data, are in satisfactory mutual agreement and are similar to the theory. They, however, suffer from restricted experimental resolution and, there- fore, the reconstruction of the electrostatic potential via an analytical structural model is preferable. The x model of electron density was adjusted to X-ray experimental structure amplitudes and those calculated by the Hartree- Fock method. The electrostatic potential, deformation electron density and the Laplacian of the electron density were calculated with this model. The critical points in both experimental and theoretical model electron den- sities were found and compared with those for procrys- tals from spherical atoms and ions. A disagreement
11 concerning the type of critical point at (Z,Z,0) in the area of low, near-uniform electron density is observed. It is noted that topological analysis of the electron density in crystals can be related with a close-packing concept.
I. Introduction
Electron density (ED) and electrostatic potential (EP) characterize a crystal and are responsible for many of its properties (Tsirelson & Ozerov, 1996). These character- istics can be reconstructed from the data of X-ray and high-energy electron diffraction experiments and provide a useful test for new computational methods in the field of the electronic structure of solids. The binary crystals with a rock-salt-type structure are attractive from this point of view due to their simplicity and they are, therefore, the subject of many experimental and theore- tical studies. However, no complete sets of high-quality
© 1998 International Union of Crystallography Printed in Great Britain - all rights reserved
diffraction data for rock-salt type crystals are reported in the literature (Kitaneh, 1995). In the case of MgO, structure amplitudes were determined a few times by X- ray diffraction both from powder samples and from single crystals. Early work is discussed in reviews by Hosoya (1969), Dawson (1969) and Sanger (1969). They report, however, that only low- and middle-angle reflections have been measured. The lack of high-order data resulted in bias in the displacement parameters determined within the spherical atom/ion model and the isotropic atomic displacement parameters derived from X-ray diffraction show the following ranges: 0.0025 < UMg < 0.0058 and 0.0024 < Uo < 0.004 A 2. Moreover, the ratio UMg/Uo > 1 was sometimes found (Sanger, 1969; Raccah & Amott, 1967), in contrast to the expected ratio UMg/Uo < 1, as follows from theory (Gupta & Haridasan, 1973). Similar anomalies can be found in the literature for other compounds of this group (Su & Coppens, 1995). More recent single crystal measurements of Sanger (1969), Lawrence (1973a,b), Vidal-Valat et al. (1978), and Sasaki et al. (1979) yielded more extended sets of the structure amplitudes. However, the mutual discrepancy of the latter was within 6% for low-angle reflections (most likely due to improper account of the extinction) and 4% for some high-order ones, and the problem of accurate determination of the atomic thermal parameters still remained. As a result, the ED distributions reconstructed from the previous X-ray diffraction data cannot be considered as reliable.
As far as electron diffraction is concemed, intensities of the first five reflections were measured by the quantitative convergent beam electron diffraction techni- que for MgO (Spence, 1992). This is not sufficient to reconstruct the electrostatic potential distribution in the crystal. Avilov et al. (1989) collected a more extensive data set using the electron transmission technique. The statistical precision of their data, however, was insuffi- cient for a quantitative EP analysis.
The recent advancement in methods to collect and analyze data make it worthwhile to return to this old problem. Therefore, we have undertaken an attempt to
Acta Crystallographica Section B ISSN 0108-7681 © 1998

V. G. TSIRELSON et al. 9
collect a sufficiently complete set of precise experimental X-ray and electron structure amplitudes for MgO and compare them with the results of an ab initio extended basis set Hartree-Fock calculation. The results are presented in terms of ED and EP maps. Finally, we demonstrate that topological analysis provides a useful tool for renovation of such a classical concept as that of close packing in crystals.
2. X-ray diffraction analysis
2.1. Experimental
A spherical sample of a pure MgO single crystal with r = 0.175 mm was chosen from a few prepared crystals for an accurate X-ray diffraction study. The measure- ments were carried out at room temperature with a four- circle automatic Syntex Pi diffractometer with graphite- monochromated Mo Kcr radiation in the range up to sin 0/;L = 1.06 A -1, the sample being entirely immersed in the homogeneous part of the primary X-ray beam. 314 reflections with intensity I > 2o'(/) were measured in four octants of the reciprocal space with h > 0, k > 0, - < l < +, with variable (2-24 grad min -1) 0/20 scan speed depending on the value of the intensity. In addition, the 13 lowest-order reflections have been scanned along the ~p angle in order to avoid the multiple scattering. The stability of the primary X-ray beam was checked by measurement of the 111 reflection after every 50 reflections. The long time variations of the intensity were within 1.5%. The lattice parameter of the cubic unit cell refined over 15 middle-angle reflections equals 4.214 (1)A. Aider accounting for the polarization and Lorentz factors and averaging over symmetry-equivalent reflections (Rint = 0.71%), a set of 35 symmetry- independent reflections was obtained. The X-ray radia- tion absorption was accounted for using absorption coefficients from Wilson (1995): l.tr = 0.1. Estimation of thermal diffuse scattering in the one-phonon approxima- tion according to Tsarkov & Tsirelson (1991), with elastic constants measured by Haussuhl (1993), gave a correction value of 0.0149 at sin0/~. = 1.06A -1. Therefore, the effect of TDS was considered to be negligible within the accuracy achieved and no correction was applied.
Selected crystallographic and experimental data for MgO are listed in Table 1.I"
2.2. Refinements of the structural models
2.2.1. Superpositional spherical ionic model. First, the crystal structure of MgO was approximated by the superposition of spherical Mg 2+ and 02- ions. Relati- vistic scattering factors and anomalous scattering correc-
t A list of structure factors has been deposited with the IUCr (reference: SH0094). Copies may be obtained through The Managing Editor, International Union of Crystallography, 5 Abbey Square, Chester CH1 2HU, England.
Table 1. X-ray diffraction crystallographic data for MgO and results of refinement of the superpositional sphe- rical-ion model (293 K, high-order refinement, sin O/,k >
0.7 t~ -1)
Space group Fm3m a (A) 4.214 (1) Cell volume (A 3) 74.831 F(000) (electrons) 80 Number of atoms in cell 8.0 Absorption coefficient (mm- l) 107.4 Radiation, wavelength (A) Mo Ka, 0.71069 Diffractometer Syntex Pi Sample radius (mm) 0.175 Scan mode 0/20 sin 0/~r.ax (A -l) 1.068 (0 < h < +, -- < k < +,
- < / < + ) Number of measured reflections 374 Number of unique reflections 35 Rin t 0.0071 Mode of refinement F(hkI) Weighting scheme 1/[cr(F) 2 + 0.0001F z] Extinction formalism~- Zachariasen (1967), secondary Extinction parameter, A 612 R, wR (high-order) 0.00475 0.00539 Goodness-of-fit 0.98 UMg (A22) 0.0040 (7) Uo (A) 0.0043 (8)
~" Extinction was refined over full-set data (R = 0.01).
tions were taken from International Tables for Crystallography (1995, Vol. C). The thermal motion of ions was described in the harmonic approximation. An extinction correction according to Zachariasen (1967) was applied. In the first round a full data set refinement of the thermal ionic and extinction parameters, together with the scale factor, was performed. The crystal- lographic program PROMETHEUS (Zucker et al., 1983) was used. The refinement process converged to the value R = 0.01. The displacement parameter values UMg = 0.0034 (2) and Uo = 0.0037 (2) 1~2 were obtained. The extinction parameter was then fixed and a high-angle refinement (sin 0/~. > 0.7 A - l ) was undertaken. The high- order refinement results and indices are presented in Table 1.
2.2.2. Multipole and x models. In the next step the ED distribution in MgO was described in a more flexible way using the Hansen & Coppens (1978) multipole model. The local symmetry of the atomic sites in rock-salt structure is m3m. Therefore, if the local atomic coordinate system coincides with that of the unit cell, only monopole (l = 0) and two hexadecapole (l = 4) terms are nonzero in each pseudoatomic multipole set (we have restricted ourselves to the hexadecapole level of the multipole expansion). Hence, the electron density in the unit cell of MgO was described by the expression
p(r) = Esy m{pMg+ (r - rMg+ -- U) ® tMg+ (U)
+ p o _ ( r - to_ - u) ® to-(U)}, (1)
where t s is the thermal displacement distribution function

10
of the j th aspherical pseudoatom, the static charge density pj of which is represented by
pj(r) = pc(r) + Pv x3 pv(r) + x '3 {Ro(x'r)PooYoo(r/r)
+ R4(x'r)Pa0[Y40(r/r) + 0.74045yaa+(r/r)]}. (2)
Here Pc and pv are spherically averaged free-ion Mg + and O - Hartree-Fock core and valence ED's (the latter are normalized to one electron); in the absence of core and valence wavefimctions for the O 2- ion, we have used the wavefunctions of Clementi & Roetti (1974) for single charged ions in order to provide a description of the ions in the crystal. Rt = Nr"' exp(-~tr) are normalized radial functions; Ytm are real spherical harmonics, tc and x' are expansion/contraction parameters, which are refined in the fitting procedure along with the populations Pv, Poo and P4o.. Following Clementi & Raymondi (1963) and Hansen & Coppens (1978), the ~t and nt values were taken as 2.2 a.u. and 4, respectively, for all symmetry- allowed l of the Mg pseudoatom and ~0 = ~ 4 = 4.4 a.u., no = 2 and n 4 = 4 for the O pseudoatom. The thermal motion was described in the harmonic approximation. The isotropic extinction was taken into account accord- ing to Becker & Coppens (1974).
This model was refined over the full set of X-ray structure amplitudes with the MOLDOS96 program (Protas, 1995). This refinement has shown that the hexadecapole term P40 (and, hence, P44+) was different from zero only for the Mg + ion, its value being less than 2 e.s.d.'s. The population value of the second monopole, P00, of the O- pseudoatom was only 1.6 of the e.s.d.; the correlation coefficient between the Pv and the P00 populations was 0.98, even when x' was fixed at unity. Therefore, all P00 and P44+ parameters were taken as zero and the thermal parameters of the ions were refined over the high-order reflections (sin 0/~. > 0.6 A -~) and fixed. The refinement of the tc and P,, parameters of the ions (to model of Coppens et al., 1979) was then undertaken. The model parameters and disagreement factors obtained are presented in Table 2. The highest correlation during a refinement was observed for the parameter x and the valence population of oxygen with a correlation coefficient of 0.89. The extinction model (crystal of type 1, Lorentzian mosaic block disorientation dominates) was chosen for the low R factor it yields. The minimal exti cfion correction values were y = 0.63 and 0.79 for reflections 200 and 220, respectively (see discussion below).
2.2.3. Theoretical. To provide a correct comparison of experimental and theoretical results, we have fitted the same x model to a set of 46 structure amplitudes (sin 0/~ < 1.233 A -1) calculated by Azavant (1994) in the extended basis set of Dovesi et al. (1992) by the ab initio Hartree-Fock method for the three-dimensional MgO crystal. Thermal motion was taken into account by Azavant (1994), the same displacement parameters (0.0042 A -2) being used for both ions; therefore, we
ELECTRON DIFFRACTION OF MgO
Table 2. Results o f the refinement o f the tc models for
K
Pv U (A 2)
K
Pv u (A 2)
MgO
Experiment Theory Mg+: Mg+: 1.106 (69) 1.0t 0.64 (3) 0.15 (4) 0.0040 (1) 0.0042"I" O O 1.008 (4) 0.961 (7) 7.36 (3) 7.85 (4) 0.0042 (1) 0.0042t R = 0.0068; wR = R = 0•0030 0.0074; S = 0.99
~ Values not refined, but kept as fixed values•
have kept these parameters fixed during the refinement. The x value for the Mg ÷ ion could not be refined and was taken as unity. The results are listed in Table 2.
The residual experimental and theoretical maps, which characterize the quality of the model adjustment, did not show features in excess of -t-0.05 e A -3.
3. Electron diffraction analysis
3.1. Experimental
Pure metallic Mg was placed for sample preparation in a tungsten boat and burnt in air. The smoke produced by small crystallites of MgO was precipitated on a grid with small cells covered by thin celluloid film. In order to obtain a polycrystalline MgO film of appropriate thickness (10-5-10-6cm) and to avoid preferential orientation of crystallites, the grid was rotated in all directions during the process of precipitation. The average size of the crystallites obtained was within 300-500 A.
Accurate measurements of the electron diffraction intensities were carried out using the transmission technique (Vainshtein et al., 1992) on an automatic diffractometer constructed in the laboratory for electron diffraction structure analysis, Institute of Crystallogra- phy, Moscow (Avilov et al., 1991). It was created on the basis of the commercial electron diffraction device EMR- 102, applying the system of step-by-step computer- controlled scanning of the electron diffraction pattern. An accelerating voltage of 75 keV was applied. The intensity was measured using the regime of accumulation; a statistical precision of 1% was achieved by variation of the measurement time, angle range and velocity of scanning. The reflections were separated in the case of overlap. The effect of electron beam refraction on crystallite apexes was accounted for in the case of the 111 and 220 reflections. As a result, the intensities of 40 independent reflections with sin 0/~ < 1.279 A, -1 were determined and a unit-cell parameter [a = 4.210 (5)A] was obtained. These intensities were scaled on the theoretical atomic scattering functions from International

V. G. TSIRELSON et al. 11
Table 3. MgO: the results of correction of electron diffraction structure amplitudes for extinction in a two-
hM ~meor ~meas D(A) A
200 11.171 4.055 0.132 2.510 220 7.596 4.629 0.371 1.682 222 5.860 4.335 0.547 1.300 400 4.778 1.467 0.267 1.953
wave approximation
(I) ex p
t(A)f A' D'CA') (corr) 387 2.494 0.133 l l . l l 8 381 1.696 0.367 7.642 383 1.308 0.545 5.872 705 1.067 0.670 3.014
"p t(average) = 384 (3)/~.
Table~ for Crystallography (1995, Vol. C) using reflec- tions with 0.5 < sin 0/~ < 0.85 A-l; the X-ray x-model thermal parameters were used. The atomic displacement parameters were then refined over the high-order reflections (R = 0.047): the values UMg = 0.0042 (2) and Uo = 0.0044 (2)/~2 w e r e obtained. The final scale factor was calculated using reflections with sin 0/~. > 0.5 A -l.
The low-angle reflections 200, 220, 222 and 400, having too low intensities, were recognized as extinction affected. Extinction was treated in the two-wave approximation (Blackman, 1939; Cowley, 1990), accord- ing to which the relationship between the kinematic intensity Ik, and the dynamic o n e Id after integration, the latter over all possible orientations of crystallites, is related by the expression
D = Id/I * = (l/A) fJo(2x)dx. (3)
Here A = ~.(~/V)/t, where • is the electronic structure amplitude, t is the thickness of the crystallite in the film, ;~ is the radiation wavelength, V is the volume of the unit cell and Jo(2X) is the zero-order Bessel function by calculating D for every extinction-affected reflection and then calculating A in the approximation ~k = ~theory (I ~ 2 ) , the t values were determined. Due to different orientations and variations of habituses of the crystallites in the thin film, the dynamic scattering is not the same for different directions in reciproffal space. It led to a spread in thickness values, as shown in Table 3. This is why the average crystallite thickness value was calculated and new A' values were determined. With these the experi- mental intensities were corrected and subsequently the kinematic structure amplitudes ~k calculated (Table 3). The thickness value obtained for the 400 reflection was significantly different from the average. A possible reason is the presence of many wave dynamic scattering in the MgO thin film in the corresponding direction in reciprocal space.
3.2. Accuracy of the structure amplitudes and ionic displacement parameters
We like to assess the accuracy of our data by comparison with an external standard. A full set of
theoretical structure factors, calculated with the ab initio Hartree-Fock method, is available. They compare very well with our static X-ray structure factors (R = 1%). The result of the comparison is shown in Fig. l(a). The discrepancies of the 200 and 220 reflections, those most affected by extinction, were only 0.5 and 1.3%, respectively. We therefore conclude that extinction was
0.40
0.00"
-0.40
-080.66" . . . . . ~ ' . ~ " " i b ' . ' r b ' " ' i ~ ' . ' r b ' " ' ~ ' 6 7 ~ ' ' ~ ' ~ G b ' " 3 6 ' . o o
(a)
0.40
0.20
0.00
-0.20
-0.40,
-0.60.
-0.80 ............................................................ 0.00 5.00 10.00 15.00 20.00 25.00 30.00
(b)
0.40
0.00 , ~ . . . . . . . . . . . . .
-0.40
-0.80 ........................................................... 0.00 5.00 10.00 15.00 20.00 25.00 30.00
(c)
Fig. 1. Comparisons of the MgO static structure amplitudes for reflections with sin 0/~. < 1.06 A -l. The value of (Fi -- F2)/F! is depicted versus the reflections ordered along the enhancement of the scattering angle: (a) F~ is the experimental X-ray structure amplitude, F2 is the Hartree-Fock X-ray structure amplitude; (b) F~ is the experimental electron diffraction structure amplitude, F2 is the electron structure amplitude calculated from the X-ray Hartree-Fock one; (c) FI and F2 are the electron structure amplitudes calculated from both X-ray experiment and Hartree-Fock, respectively.

12 ELECTRON DIFFRACTION OF MgO
Table 4. Electron structure amplitudes (V) for some low- angle reflections of MgO
Convergent beam Transmission electron
technique diffraction Hartree-Fock Reflection (this work) (Spence, 1992) method
111 1.27 (2) 1.78 (3) 1.84 200 7.11 (7) 6.87 (4) 7.03 220 4.89 (5) 4.95 (8) 5.08 222 3.76 (4) 3.98 (6) 4.01 400 1.93 (2) 3.02 (8) 3.33
corrected in our X-ray data satisfactorily. The maximum discrepancy of 5% is noted for the low-angle reflection 111 and for the high-order reflections 751 and 733. It is significant that X-ray diffraction yields accurate values for the weak 'difference' 0rMg --fo)-type reflections. From the previous X-ray measurements, that by Sasaki et al. (1979) is closest to our results.
We now turn to the electron diffraction results. There are no methods for the averaging of many-beam electron diffraction intensities over directions and crystallite thicknesses for completely disoriented polycrystalline films, which are used in this work. Only a first step was recently carried out in this direction by Avilov & Parmon (1990, 1992) for partially oriented (textured) films. Therefore, the two-beam approximation is usually used in high-energy transmission electron diffraction for extinction correction within kinematic theory (Vainshtein et al., 1992). We have also applied this approximation. The many-wave diffraction, if present, diminishes the validity of this approximation even if the average size of the crystallites in thin films is less than the characteristic 'extinctional length'. This phenomenon manifests itself in particular for the 400 reflection of MgO.
In order to allow comparison with Hartree-Fock results, the effect of thermal motion was removed approximately by dividing the electron diffraction structure amplitudes by an overall isotropic temperature factor. Comparison of the structure amplitudes, measured by electron diffraction and calculated from the X-ray experimental and theoretical ones using the Bethe-Mott formula (Bethe, 1928; Mott, 1930), shows (Figs. 1 b and c) that the experimental electron structure amplitudes differ considerably. Discrepancy amounts to 60% for the 400 reflection and it is quite large for some reflections, including weak 'difference' high-order ones. It is impossible to distinguish the extinction-afflicted reflec- tions from any other.
For MgO some structure factors measured with the convergent beam electron diffraction method are listed by Spence (1992, 1993). Table 4 shows the electron structure amplitudes obtained with the different techni- ques. Good agreement is seen to exist between the convergent beam results and the Hartree-Fock data: R = 3.2%. The results obtained by our experiment seem to agree less well.
I j (
\ /.-
\ / /
i.) f \
1 \ /
\ \
(a)
f- /
\
V .r
k~J/'//
/ / /
/ /
) /
\ \
(b)
v I
f
Fig. 2. Deformation model electron density in the (100) plane of MgO: (a) experimental; (b) theoretical. Solid lines correspond to excessive (relatively spherical atoms) electron density; contour intervals 0.05 e/~-3.
0 Mg
Mg O Fig. 3. Laplacian of the model electron density of MgO reconstructed
from the X-ray diffraction data, (100) plane. Solid lines correspond to positive values of the Laplacian, the latter has a local minimum at the center of the plane.
Direction in crystal x (A) y (A)
[ 1 0 0 ] Experiment 0.927 (5) 0 Mg-O Theory 0.915 0 line Atomic 0.932 0
procrystal Ionic 0.924 0 procrystal
[1101 Mg-Mg Theory 0.829 0.829 line [il0] Experiment 1.054 (1) 1.054 (1) O-O Theory 1.054 1.054 line Atomic 1.054 1.054
procrystal Ionic 1.054 1.054 procrystal
V. G. TSIRELSON et al.
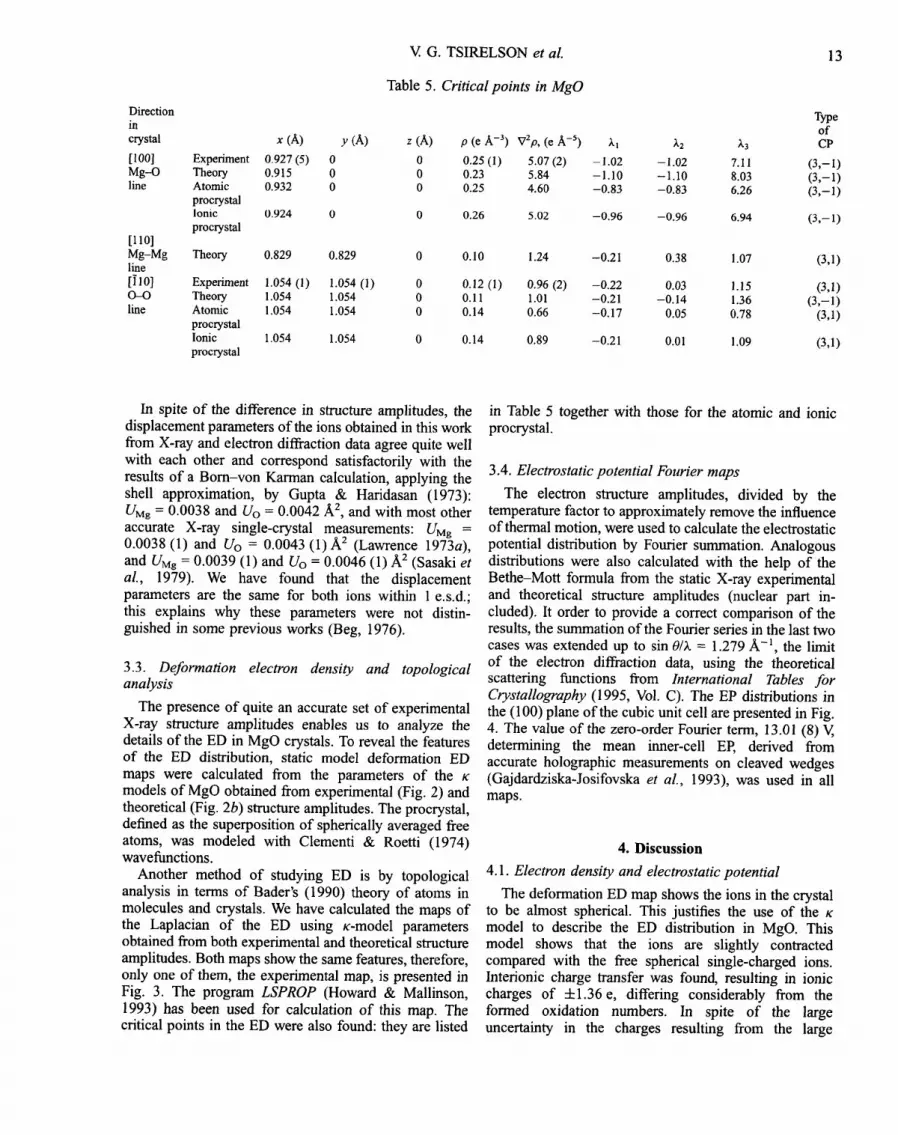
Table 5. Critical points in MgO
z (h) p (e A -3) V2p, (e A -s)
0 0.25 (1) 5.07 (2) 0 0.23 5.84 0 0.25 4.60
0 0.26 5.02
13
Type of
Xl ;k2 ~3 CP
-1.02 -1.02 7.11 (3,- I) -1.10 -1.10 8.03 (3,-1) -0.83 -0.83 6.26 (3,-1)
-0.96 -0.96 6.94 (3,-1)
0 0.10 1.24 -0.21 0.38 1.07 (3,1)
0 0.12 (1) 0.96 (2) -0.22 0.03 1.15 (3,1) 0 0.11 1.01 -0.21 -0.14 1.36 (3,-1) 0 0.14 0.66 -0.17 0.05 0.78 (3,1)
0 0.14 0.89 -0.21 0.01 1.09 (3,1)
In spite of the difference in structure amplitudes, the displacement parameters of the ions obtained in this work from X-ray and electron diffraction data agree quite well with each other and correspond satisfactorily with the results of a Bom-von Karman calculation, applying the shell approximation, by Gupta & Haridasan (1973): UMg = 0.0038 and Uo = 0.0042 A 2, and with most other accurate X-ray single-crystal measurements: UMg = 0.0038 (1) and Uo = 0.0043 (1)/k 2 (Lawrence 1973a), and UMg = 0.0039 (1) and Uo = 0.0046 (1) A z (Sasaki et al., 1979). We have found that the displacement parameters are the same for both ions within 1 e.s.d.; this explains why these parameters were not distin- guished in some previous works (Beg, 1976).
3.3. Deformation electron density and topological analysis
The presence of quite an accurate set of experimental X-ray structure amplitudes enables us to analyze the details of the ED in MgO crystals. To reveal the features of the ED distribution, static model deformation ED maps were calculated from the parameters of the x models of MgO obtained from experimental (Fig. 2) and theoretical (Fig. 2b) structure amplitudes. The procrystal, defined as the superposition of spherically averaged free atoms, was modeled with Clementi & Roetti (1974) wavefunctions.
Another method of studying ED is by topological analysis in terms of Bader's (1990) theory of atoms in molecules and crystals. We have calculated the maps of the Laplacian of the ED using x-model parameters obtained from both experimental and theoretical structure amplitudes. Both maps show the same features, therefore, only one of them, the experimental map, is presented in Fig. 3. The program LSPROP (Howard & Mallinson, 1993) has been used for calculation of this map. The critical points in the ED were also found: they are listed
in Table 5 together with those for the atomic and ionic procrystal.
3.4. Electrostatic potential Fourier maps
The electron structure amplitudes, divided by the temperature factor to approximately remove the influence of thermal motion, were used to calculate the electrostatic potential distribution by Fourier summation. Analogous distributions were also calculated with the help of the Bethe-Mott formula from the static X-ray experimental and theoretical structure amplitudes (nuclear part in- cluded). It order to provide a correct comparison of the results, the summation of the Fourier series in the last two cases was extended up to sin 0/~. = 1.279 A -1, the limit of the electron diffraction data, using the theoretical scattering functions from International Tables for Crystallography (1995, Vol. C). The EP distributions in the (100) plane of the cubic unit cell are presented in Fig. 4. The value of the zero-order Fourier term, 13.01 (8) V, determining the mean inner-cell EP, derived from accurate holographic measurements on cleaved wedges (Gajdardziska-Josifovska et al., 1993), was used in all maps.
4. Discussion
4.1. Electron density and electrostatic potential
The deformation ED map shows the ions in the crystal to be almost spherical. This justifies the use of the x model to describe the ED distribution in MgO. This model shows that the ions are slightly contracted compared with the free spherical single-charged ions. Interionic charge transfer was found, resulting in ionic charges of-1-1.36 e, differing considerably from the formed oxidation numbers. In spite of the large uncertainty in the charges resulting from the large

14 ELECTRON DIFFRACTION OF MgO
correlation in the refinement, these values are close to the charges obtained by direct integration of the ED by Vidal-Valat e t a l . (1978) (+1.36 e cation and -1 .14 e anion) and agree well with the results of a model x refinement of the ED of the MgO molecule (Brown & Spackman, 1991). Refinement of theoretical data with the same x model resulted in ionic charges close to formal values and to expanded oxygen ions (Table 2). These numbers should not be taken too seriously for various reasons: the diffuse regions of the ED are barely visible in the ED maps and are hardly represented in the
structure factors. The use of the simple x model in the refinement is justified on statistical arguments rather than on physical significance. We do realize that in this way the diffuse regions of the ED are not properly described. Furthermore, the refinement model is used to describe quantitatively the ED distribution, but is not necessarily a good tool to partition the ED. For example, the nonzero population of the Mg hexadecapole term found in the preliminary refinement mentioned above describes ED close to the oxygen ion. We now turn to the EE The value of the mean inner-cell electrostatic potential, 15.05 V,
{ i" , , \ **O i I
, , - - ; , , - \ , ,
O'
, 0 ' ~ .o . , , . ~ S° ~ ~ LP • LpLp'LP .,,. , . ,,,.) ..-
% ,
: '~ l,
Mg 0 (a)
/ L% ..:.)',,,., --
e~P 6LPQQ~t b
DqlD~ ~'~ ii, 41pAP a ~lb~ ~1, ~ LpW LpLIP
Mg 0 (b)
I
0 o ~ pOOdr • qi ~
o ~
C D
'~ ~,~ ~ ' b ~1, SO Bw'
\ %1 ,.--'" I ,
• 0 • . ' 22 , /
/ I 0
i i ~ i J
~ * ¢ ,, - %
"-,. .i:',:',., ".,.\ : ,,,...-'"" \-"; / / ~
! _
Mg 0 Mg 0
(c) (d)
Fig. 4. Electrostatic potential maps in the (100) plane of MgO calculated by Fourier summation of the static structure amplitudes from different sources: (a) electron diffraction structure amplitudes; (b) structure amplitudes calculated from the X-ray experiment using the Bethe-Mott formula (this work); (c).as for (b) with the Hartree--Fock structure amplitudes of Azavant (1994); (d) as for (b) with the X-ray experimental structure amplitudes of Sasaki et al. (1979). Contour intervals are 144 V. Solid lines correspond to positive values of the electrostatic potential.

V. G. TSIRELSON et al. 15
Table 6. Average values o f the electrostatic potential (10 at atomic positions in MgO calculated with Fourier
series (sin 0/)~ = 1.279.4 -1)
X-ray Electron X-ray (this (Sasaki et al., Hartree-Fock
diffraction work)t 1979) calculation
Mg 1179(5) 1175(4) 1123(4) 1115 O 767 (4) 832 (4) 795 (4) 787
1" The Fourier series was extended for our X-ray data until 1.279 A -I by inclusion of theoretical values (see text).
0.923 A away from the O positions is smaller than experimental error, it may well be insignificant. The Hartree-Fock calculations agree quantitatively with these results (pictures not given here).
The self-corrected values of the EP on the nuclear positions (corresponding nuclear charge contributions excluded) are -872.8 (Mg) and -610.9 V (O). The latter value is very close to the quantum mechanically calculated value of-611.417 Von the oxygen nucleus in the MgO molecule (Politzer, 1980).
calculated from the model of the ED according to Becker & Coppens (1990), is between the holographic experi- mental value of 13.01 V and the neutral-atom procrystal value of 18.41 V. This means (O'Keefe & Spence, 1994) that the ionicity of the bond in the MgO crystal is underestimated by the x model fitted to the X-ray structure amplitudes. Fourier electrostatic potential dis- tributions, calculated from the X-ray, electron diffraction and Hartree-Fock structure amplitudes, are very similar (Fig. 4). This reflects the fact that the EP is the result of an integration of the charge density and it only relatively weakly depends on deviations in individual structure amplitudes. The spread in values of the EP peaks on the nuclear positions, presented in Table 6, is only --~5%. Unfortunately, the resolution achieved is not high enough to successfully construct the EP by Fourier summation: the EP peaks on ions are too low and false minima of --~50 V are observed around the atomic positions, all distributions being distorted in the same manner. We conclude that the use of Fourier series for the EP reconstruction results in a reproducible (according to Schwarzenbach et al., 1989), but unreasonable EP. Therefore, the procedure cannot be recommended.
It should be pointed out that the EP distribution calculated with Fourier series contains contributions from all electrons and nuclei of the crystal. When we consider the nuclei as point charges, singularities appear in the potential distribution and the EP should be corrected for 'self-potential' in order to be a physically significant quantity (Bertaut, 1978). This can be achieved by removing the point charge when we calculate the potential at its position.
The x and multipole models do not suffer from these series-termination effects. We therefore turned to these methods to calculate the EP in MgO from X-ray diffraction and Hartree-Fock data using the MOL- PROP93 program (Su, 1993). The distribution of the modeled experimental EP along some directions in the cubic unit cell is presented in Fig. 5. The EP along the Mg-O line has a smooth character with a minimum of 16.9 Vat 1.334 A from the Mg site. A local maximum of 14.3 V is observed in the centre of the O-O line; this maximum corresponds with a saddle point in the three- dimensional distribution. Since the difference between its value and the values of the EP minima of 11.6 V at
4.2. Topological analysis
The good agreement between X-ray and Hartree-Fock structure amplitudes makes it worthwhile to perform a topological analysis of both the experimental and the theoretical static model ED and to compare the results. It shows that the (3,-1) critical points are placed on the Mg-O lines in MgO. The X-ray data yield a distance from the Mg nuclear position to the bond critical point of 0.93 A. This is close to the empirical crystal radius of 0.86 A for the Mg 2+ ion with coordination number 6 (Shannon, 1976) and to the best ED separation radius of 0.90 A found in MgO by Sasaki et al. (1979). The theoretical ED gives very similar results. Depletion of the ED takes place in most parts of internuclear space: the ED is concentrated mainly around both ions and their electron subshells are observed (Fig. 3).
Potential (V) 100000
10000 1oo 100
10 o 0.20.40.60.8 1 1.21.41.61.8 2 2.22.42.62.8
Interionic distance (,~) (a)
Potential (V) 100000
lOOOO
1ooo
lOO
lO o 0.2 0.4 0.6 0.8 1 1.2 1.4 1.6 1.8 2
Distance from Mg (,~) (b)
Fig. 5. Distribution of the model electrostatic potential reconstructed from the X-ray experimental structure amplitudes along different directions in the MgO crystal: (a) O--O (solid line) and Mg-Mg (dot line) directions; (b) Mg-O direction.
16 ELECTRON DIFFRACTION OF MgO
The theoretical ED demonstrates the existence of tii_h and its symmetry- (3,+3) critical points at ~4,4,,,
equivalent points. (3 , -1 ) critical points are found at the centers of the basal planes 11 (Z,Z,0), as well as additional pairs of (3,+1) critical points or the anion-anion lines. The experimental ED shows critical points at the same positions, but that at point 11 (~,z,0) appears to be of a different kind, (3,+1). All critical points are well defined, but the (3,+1) critical point in the experimental ED is characterized by a very small value of one of the Laplacian tensor eigenvalues, X2, well within experi- mental error, so the discrepancy between theory and experiment is not very significant. The interpretation of these critical points and their characteristics are less clear than often thought. According to Bader (1990), the presence of (3 , -1 ) points on internuclear lines in a system in equilibrium is a necessary and sufficient sign of a chemical bond between the atoms. Positive values of the Laplacian of the ED in these points are supposed to indicate closed-shell-type atomic interactions. When we calculate the critical point characteristics for the procrystal of MgO from free spherical atoms and ions (Table 5) we obtain the same set of critical points as was observed in the experimental ED. This means that the (3 , -1 ) critical points on the Mg-O lines in the hypothetical procrystal are of the same kind as those in the ionic M g - - O bonds in the real crystal. The quantitative characteristics of these points turn out to be quite close to the experimental ones, especially for the ionic procrystal. The same feature was recently found in other rock-salt-type procrystals (Tsirelson, 1996; Tsirelson et al., 1998). The (3 , -1 ) critical points on interatomic lines in the procrystal were also observed early in the covalent compounds as urea (Stewart, 1991), in L-alanine (Gatti et aL, 1992) and in solid molecular chlorine (Tsirelson, 1994). We do realise of course that the ED of the procrystal does not satisfy a number of quantum-chemical conditions since it is not derived from a state function. Nevertheless, the question remains whether in view of these results one can consider the existence of the (3 , -1 ) critical point on the line between atoms as a sign of chemical bonding, as was postulated by Bader (1990).
The second feature is the marginal difference from zero of the X2 value of the Laplacian tensor, as observed in the experimental ED. Therefore, (3,+1) critical points found in M g O can hardly be considered as reliable and an additional study of this problem is desirable. Anyway, the ED's of ions in the MgO crystal are well separated from each other by different types of critical points. Moreover, the pattern of pseudoatom boundaries sup- ports the classical model for rock-salt-type crystals: small cations are placed in octahedral holes between large closed-packed anions.
The support of this study by the Netherlands Organization for Scientific Researches (NWO) and
Russian Foundation for Basic Researches (grants 96- 03-32882 and 96-03-00071G) is gratefully acknowl- edged. We are thankful to Professor P. Coppens and Dr N. Hansen for valuable advise and to Professor J. Proms, Dr Z. Su, Dr S. Howard and Dr P. Mallinson for the computer programs supplied.
References
Avilov, A. S. & Parmon, V. S. (1990). Sov. Phys. Crystallogr 35, 733-737.
Avilov, A. S. & Parmon, V. S. (1992). Sov. Phys. Crystallogr. 37, 744--750.
Avilov, A. S., Semiletov, S. A. & Storoshenko, V. V. (1989). Sov. Phys. Crystallogr 34, 110-118.
Avilov, A. S., Vershinina, L. I., Orechov, S. V., Popova, L. A. & Stepanov, A. S. (1991). Izv. Akad. Nauk SSSR Set. Phys. 55, 1609-1614 (in Russian).
Azavant, P. (1994). Approche theorique de la diffusion elastique et inelastique dans les solides par la metode ab initio Hartree- Fock: Application aux sulfures de lithium et de sodium. Ph.D. Thesis, Academie de Bordeax.
Bader, R. E W. (1990). Atoms in Molecules - A Quantum Theory. Oxford University Press.
Becker, P. & Coppens, P. (1974). Acta Cryst. A30, 129-147. Becker, P. & Coppens, P. (1990). Acta Cryst. A46, 254-258. Beg, M. M. (1976). Acta Cryst. A32, 154-156. Bertaut, E. E (1978). J Phys. Chem. Solids, 39, 97-102. Bethe, H. (1928). Ann. Phys. (Leipzig) B, 87, 55-69. Blackman, M. (1939). Proc. R. Soc. London Ser A, 173, 68-82. Brown, A. S. & Spackman, M. A. (1991). Acta Cryst. A47, 21-
29. Clementi, E. & Raymondi, D. L. (1963). J. Chem. Phys. 38,
2686-2689. Clementi, E. & Roetti, C. (1974). At. Data Nucl. Data Tables,
14, 177-478. Coppens, P., Guru Row, T. N., Leung, P., Stevens, E. D., Becker,
P. & Yang, Y. W. (1979). Acta Cryst. A35, 63-72. Cowley, J. M. (1990). Diffraction Physics. 2nd ed. North-
Holland Personal Library. Amsterdam: Elsevier. Dawson, B. (1969). Acta Cryst. A25, 12-28. Dovesi, R., Roetti, C., Freyria-Fara, C., Apra, E., Saunders,
V. R. & Harrison, N. M. (1992). Philos. Trans. R. Soc. London Ser A, 341, 203-212.
Gajdardziska-Josifovska, M., McCartney, M. R., de Ruijter, W. J., Smith, D. J., Weiss, J. K. & Zuo, J. M. (1993). Ultramicroscopy, 50, 285-289.
Gatti, C., Bianchi, R., Destro, R. & Merati, E (1992). J Mol. Struct. (Theochem.) 255, 409-433.
Gupta, R. K. & Haridasan, T. M. (1973). Acta Cryst. A29, 579. Hansen, N. & Coppens, P. (1978). Acta Cryst. 34, 909-921. Haussuhl, S. (1993). Z. Krist. 204, 67-76. Hosoya, S. (1969). Acta Cryst. A25, 243-248. Howard, S. & Mallinson, P. (1993). LSPROP93. Program for
Topological Analysis of Charge Density. Unpublished. Kitaneh, R. (1995). A joint application of electron and X-ray
diffraction for study of properties of binary crystals. Ph.D. Thesis, Mendeleev University of Chemical Technology, Moscow.
Lawrence, J. L. (1973a). Acta Cryst. A29, 94-95. Lawrence, J. L. (1973b). Acta Cryst. A29, 208-209. Mott, N. E (1930). Proc. R. Soc. London Set A, 127, 658.

V. G. TSIRELSON et al. 17
O'Keefe, M. & Spence, J. C. H. (1994). Acta Cryst. AS0, 33- 45.
Politzer, P. (1980). Isr J Chem. 19, 224-232. Protas, J. (1995). MOLDOS96/MOLLY PC-DOS Updated
version (private communication). Raccah, E M. & Amott, R. J. (1967). Phys. Rev. 154, 1028-
1031. Sanger, P. L. (1969). Acta Cryst. A25, 694-702. Sasaki, S., Fujino, K. & Takeuchi, Y. (1979). Proc. Jpn Acad.
Set B, 55, 43-48. Schwarzenbach, D., Abrahams, S. C., Flack, H. D., Gonschor-
ek, W., Hahn, Th., Huml, K., March, R. E., Prince, E., Robertson, B. E., Rollett, J. S. & Wilson, A. J. C. (1989). Acta Cryst. A45, 63-75.
Shannon, R. D. (1976). Acta Cryst. A32, 451-467. Spence, J. C. H. (1992). In Electron Diffraction Techniques,
edited by J. M. Cowley, Vol. 1, pp. 360-438. Oxford University Press.
Spence, J. C. H. (1993). Acta Cryst. A49, 231-260. Stewart, R. E (1991). The Application of Charge Density
Research in Chemistry and Drug Design (NATO-ASI Series), edited by G. A. Jeffrey & J. E Piniella, p. 63. New York: Plenum Press.
Su, Z. (1993). MOLPROP93. Program for Calculations of Electrostatic Potentials, Electric Fields and Electric FieM Gradients. Buffalo: SUNY.
Su, Z. & Coppens, P. (1995). Acta Cryst. ASI, 27-32. Tsarkov, A. G. & Tsirelson, V. G. (1991). Phys. Status Solidi B,
167, 417-428. Tsirelson, V. G. (1994). Sagamore XI. Collected Abstracts,
edited by G. Loupias & S. Rabii, p. 252. Laboratoire Mineralogie-Crystallographie, Universit6 P. et M. Curie, Brest.
Tsirelson, V. G. (1996). Collected Abstracts, p. C-554. XVII Congress and Assembly of IUCr, Seattle, Washington, USA.
Tsirelson, V. G., Abramov, Yu. A., Zavodnik, V. E., Stash, A. I., Stahn, J., Pietsch, U. & Feil, D. (1998). Struct. Chem. Submitted.
Tsirelson, V. G. & Ozerov, R. P. (1996). Electron Density and Bonding in Crystals. Bristol, Philadelphia: lOP.
Vainshtein, B. K., Zvyagin, B. B. & Avilov, A. S. (1992). In Electron Diffraction Techniques, edited by J. M. Cowley, Vol. 1, pp. 216-312. Oxford University Press.
Vidal-Valat, G., Vidal, J. P. & Kurki-Suonio, K. (1978). Acta Cryst. A34, 594-602.
Wilson, A. J. C. (1995). Editor. International Tables for Crystallography, Vol. C. Dordrecht: Kluwer Academic Publishers.
Zachariasen, W. H. (1967). Acta Cryst. A24, 558-564. Zucker, U. H., Perenthaler, E., Kuhs, W. E, Bachman, R. &
Schulz, H. (1983). J. Appl. Cryst. 16, 358.
![Crystal symmetry breaking in few-quintuple Bi[sub 2]Te[sub 3] films: Applications in nanometrology of topological insulators](https://img.pdfslide.net/doc/110x75/633378fc3d0bcb45f5041b70/crystal-symmetry-breaking-in-few-quintuple-bisub-2tesub-3-films-applications.jpg)


