Embed Size (px)
Citation preview

Article
The Rag GTPase Regulates the Dynamic Behavior of
TSC Downstream of Both Amino Acid and GrowthFactor RestrictionGraphical Abstract
Highlights
d The Rag GTPase recruits TSC to lysosomes in response to
growth factor restriction
d The Rag GTPase functions as an inhibitor of TORC1 in
GATOR2 knockouts
d GATOR2 opposes the Rag-GTPase-dependent cycling of
TSC on and off lysosomes
d GATOR2 promotes the phosphorylation of AKT upstream of
the Rag GTPase
Yang et al., 2020, Developmental Cell 55, 272–288November 9, 2020 Published by Elsevier Inc.https://doi.org/10.1016/j.devcel.2020.08.006
Authors
Shu Yang, Yingbiao Zhang,
Chun-Yuan Ting, Lucia Bettedi,
Kuikwon Kim, Elena Ghaniam,
Mary A. Lilly
In Brief
Themetabolic regulator TORC1 responds
to numerous upstream signals. Yang et al.
report a unified model of TORC1
regulation in which the Rag GTPase
integrates information from the amino
acid and growth factor signaling
pathways to control the activation of the
TORC1 inhibitor TSC by regulating its
lysosomal-cytosolic exchange rate.
ll

ll
Article
The Rag GTPase Regulates the DynamicBehavior of TSC Downstream of BothAmino Acid and Growth Factor RestrictionShu Yang,1 Yingbiao Zhang,1 Chun-Yuan Ting,1 Lucia Bettedi,1 Kuikwon Kim,1 Elena Ghaniam,1 and Mary A. Lilly1,2,*1Eunice Kennedy Shriver National Institute of Child Health and Human Development, National Institutes of Health, Bethesda, MD 20892, USA2Lead Contact
*Correspondence: [email protected]
https://doi.org/10.1016/j.devcel.2020.08.006
SUMMARY
The dysregulation of the metabolic regulator TOR complex I (TORC1) contributes to a wide array of humanpathologies. Tuberous sclerosis complex (TSC) is a potent inhibitor of TORC1. Here, we demonstrate thatthe Rag GTPase acts in both the amino-acid-sensing and growth factor signaling pathways to controlTORC1 activity through the regulation of TSC dynamics in HeLa cells and Drosophila. We find that TSC lyso-somal-cytosolic exchange increases in response to both amino acid and growth factor restriction. Moreover,the rate of exchange mirrors TSC function, with depletions of the Rag GTPase blocking TSC lysosomalmobility and rescuing TORC1 activity. Finally, we show that the GATOR2 complex controls the phosphory-lation of TSC2, which is essential for TSC exchange. Our data support the model that the amino acid andgrowth factor signaling pathways converge on the Rag GTPase to inhibit TORC1 activity through the regula-tion of TSC dynamics.
INTRODUCTION
Cells must sense and adapt to a constantly changing external
environment. Accordingly, in both single-celled and multicellular
organisms, the ability to switch between anabolism, which sup-
ports growth, and catabolism, which is activated in response to
stress, is critical to the maintenance of metabolic homeostasis.
The highly conserved target of rapamycin (TOR) complex 1
(TORC1) is central to the regulation of metabolism in eukaryotes
(Dibble and Manning, 2013; Kim and Guan, 2019; Sabatini,
2017). TORC1 serves as a hub to integrate multiple upstream
signaling inputs and regulates the execution of downstream
metabolic pathways that control growth, proliferation, and cell
death (Laplante and Sabatini, 2012; Saxton and Sabatini,
2017). TORC1 consists of five subunits including mTOR, which
functions as a serine-threonine kinase, aswell as Deptor, Raptor,
mLST8, and PRAS40 (Aylett et al., 2016). In the presence of pos-
itive upstream inputs, TORC1 promotes anabolic metabolism by
phosphorylating downstream effectors such as 4E-BP1 and S6K
to increase mRNA translation and protein synthesis (Hara et al.,
1998; Schalm et al., 2003). Concurrently, TORC1 inhibits cata-
bolic pathways such as autophagy, by phosphorylating essential
autophagic proteins including ULK1 and Atg13 (Ganley et al.,
2009; Hosokawa et al., 2009). Thus, through the regulation of
mTORC1 activity, cells can rapidly react to a diverse array of
positive and negative environmental cues.
An important aspect of TORC1 regulation is its recruitment to
and activation of lysosomes. These two processes require
272 Developmental Cell 55, 272–288, November 9, 2020 Published b
different Ras-related small GTPases, Rag and Rheb, respec-
tively. In the presence of amino acids, TORC1 is translocated
from the cytosol to the lysosomal membrane by the Rags (Saba-
tini, 2017; Sancak et al., 2010; Yang et al., 2017). Specifically,
RagA or RagB dimerizes with RagC or RagD to form a heterodi-
meric complex that recruits TORC1 to the lysosome by directly
interacting with the Raptor subunit in an amino-acid-dependent
manner (Kim et al., 2008; Sancak et al., 2008). Once on the lyso-
some, Rheb binds to the subunit mTOR resulting in a conforma-
tional change that exposes active site residues allowing TORC1
to bind and phosphorylate a wide array of substrates (Yang
et al., 2017).
As small GTPases, the functions of Rags and Rheb are regu-
lated by their guanine nucleotide-binding cycle, which is tightly
controlled by upstream signals (Avruch et al., 2006; Inoki et al.,
2003; Lee et al., 2018; Nicastro et al., 2017; Roccio et al.,
2006; Shen and Sabatini, 2018; Shen et al., 2019). The Rags
switch their TORC1-recruiting function by changing their gua-
nine-nucleotide-binding status. When cells lack access to
appropriate levels of amino acids, the GTPase-activating protein
toward Rags 1 (GATOR1) complex blocks the function of TORC1
by acting as a GTPase-activating protein (GAP) toward RagA/B
(Bar-Peled et al., 2013; Panchaud et al., 2013). Thus, under
amino acid starvation the guanine-nucleotide-binding status of
RagA/B changes to GDP inhibiting the ability of the Rag hetero-
dimer to recruit TORC1 onto lysosomes (Bar-Peled et al., 2013).
Another GATOR subcomplex, GATOR2, functions to oppose
GATOR1 activity and is composed of five highly conserved
y Elsevier Inc.

llArticle
proteins (Mio, Wdr24, Wdr59, Seh1, and Sec13), several of
which have been shown to localize to lysosomes (Cai et al.,
2016; Dokudovskaya and Rout, 2011, 2015; Wei et al., 2014).
In the presence of sufficient amino acids, the GATOR2 complex
activates TORC1 activity by opposing the activity of the GATOR1
complex (Bar-Peled et al., 2013; Panchaud et al., 2013; Wei
et al., 2014). The mechanistic details of how the GATOR2 com-
plex opposes the activity of the GATOR1 complex to activate
TORC1 remain unclear.
The small GTPase Rheb is inhibited by a three-subunit com-
plex, called the tuberous sclerosis complex (TSC), comprised
the proteins TSC2, TSC1, and TBC1D7 (Dibble and Manning,
2013). In the absence of insulin, TSC2 possesses a GAP activity
toward Rheb (Inoki et al., 2003). TSC serves as a potent inhibitor
of the TORC1 signaling pathway. Mutations or deletions in TSC
subunits result in the growth of benign tumors, epilepsy, and
developmental delay (Curatolo et al., 2008). The upstream sig-
nals controlling TSC have been extensively studied (Manning
and Toker, 2017). Essentially, growth factors, including insulin,
activate class I phosphatidylinositol-3-kinase (PI3K), which in
turn stimulates the protein kinase AKT. AKT inhibits TSC by
directly phosphorylating multiple serine residues in TSC2 (Inoki
et al., 2002; Manning et al., 2002). Thus, growth factors and insu-
lin positively regulate the TORC1 signaling pathway by prevent-
ing TSC from inhibiting the TORC1 activator Rheb.
While the model that TSC controls TORC1 activity through the
inhibition of Rheb is well established, the detailed mechanism of
how TSC is regulated remains poorly understood. It is widely
accepted that TSC responds to insulin and other growth factors
through a PI3K-AKT circuit (Cai et al., 2006; Inoki et al., 2002).
However, the role of TSC in response to changes in amino acid
levels is unclear. One possibility is that TORC1 is regulated by
two independent pathways; the PI3K-AKT pathway that regu-
lates the activity of the TORC1 inhibitor TSC in response to
growth factors and the Rag GTPase pathway that responds to
amino acid levels (Bar-Peled and Sabatini, 2014; Lawrence
and Zoncu, 2019). However, multiple laboratories have reported
an essential role for TSC in the response to amino acid starvation
(Avruch et al., 2006; Demetriades et al., 2014; Gao et al., 2002;
Smith et al., 2005; Wei et al., 2014). Additionally, it is unclear
exactly how intracellular TSC dynamics impact the ability of
TSC to inhibit TORC1. Several studies have shown that TSC
shuttles between lysosomes and the cytoplasm in response to
amino acid availability (Carroll et al., 2016; Demetriades et al.,
2014), whereas others have reported that the lysosomal localiza-
tion of TSC is independent of amino acid status with the TSC
complex being released from lysosomes in response to high
levels of insulin (Menon et al., 2014). Notably, in some cell types,
such as HeLa cells, TSC is constitutively present on lysosomes
even in the presence of physiological concentrations of insulin
(Demetriades et al., 2016; Menon et al., 2014). Thus, whether
the recruitment of TSC from the cytosol to the lysosomes is a
common feature of TSC regulation in all cell types remains
unclear. Finally, the detailed mechanism of how the phosphory-
lation of TSC2 by AKT affects TSC’s function is not well
understood. Several studies proposed that TSC2 undergoes
proteasomal degradation after phosphorylation by AKT (Cai
et al., 2006; Dan et al., 2002; Plas and Thompson, 2003). Howev-
er, more recent work suggests that TSC is not regulated at the
level of protein stability but that the entire TSC complex is
released from lysosomes upon phosphorylation of the TSC2
subunit by AKT (Menon et al., 2014). Thus, a full understanding
of TSC regulation requires further exploration.
Here, we demonstrate that the regulation of TSC lysosomal
dynamics by the Rag GTPase is required for the full response
to both amino acid and growth factor restriction.Moreover, using
fluorescence recovery after photobleaching (FRAP) and a photo-
convertible fluorescently tagged TSC2, we demonstrate that in
response to negative stimuli, the Rag GTPase drives rapid
cycling of TSC on and off lysosomes in both HeLa cells and
Drosophila. Importantly, we find that GATOR2 and the Rag
GTPase impact the lysosomal cycling of TSC2 by regulating its
inhibitory phosphorylation by AKT. Our data support the model
that the Rag GTPase works in concert with the PI3/AKT/TSC
pathway to regulate TORC1 activity in response to both amino
acid and growth factor restriction.
RESULTS
Knockdowns of the Rag GTPase Increase TORC1Activity in GATOR2 Mutant Ovaries and HeLa CellsIn order to identify additional genes that function in the GATOR
pathway, we performed a suppression screen in Drosophila. In
null mutants of the GATOR2 component seh1, low TORC1 activ-
ity in the female germline results in a block to oocyte growth and
development (Senger et al., 2011; Wei et al., 2014). Expressing a
short hairpin RNA specifically against the germline seh1 tran-
script recapitulates the seh1 mutant ovarian phenotype (Fig-
ure 1A). We previously demonstrated co-depleting the GATOR1
components nprl2, nprl3, and iml1 dramatically rescues the
seh1RNAi ovarian phenotype, consistent with themodel that a pri-
mary function of the GATOR2 component seh1 is to promote
TORC1 activity through the inhibition of GATOR1 activity (Bar-
Peled et al., 2013; Panchaud et al., 2013; Wei et al., 2014). Using
this epistatic relationship, we performed an RNAi-based screen
to identify additional genes that when co-depleted with seh1,
rescued the seh1 ovarian phenotype. We predicted this screen
would identify additional genes that act with GATOR1 to inhibit
TORC1 activity. Surprisingly, we found that co-depleting the
components of Rag GTPase, RagA, and RagC, robustly rescued
the seh1 ovarian growth deficit (Figure 1A). Moreover, the rescue
of the seh1 ovarian growth phenotype was accompanied by a
rescue of TORC1 activity (Figure 1B).
The results from ourDrosophilaRNAi screen indicated that the
RagA/RagC heterodimer acts to inhibit TORC1 activity in seh1
mutant ovaries. To obtain a mechanistic understanding of this
observation, we turned to a mammalian cell culture system.
We previously determined that HeLa cell knockouts for the
GATOR2 component, WDR24, have decreased TORC1 activity
relative to wild-type (WT) HeLa cells (Cai et al., 2016). Conse-
quently, we utilized a WDR24 HeLa cell knockout (WDR24-KO)
line to examine how depleting RAGA and RAGC impacts
TORC1 activity when the GATOR2 complex is compromised
(Cai et al., 2016). First, we explored how siRNA knockdowns of
RAGA or RAGC affect TORC1 activity in WT and WDR24-KO
cells by examining the phosphorylation status of the TORC1
downstream target S6K. Consistent with our results in the
Drosophila ovary, siRNA knockdowns of RAGA (RAGA-KD)
Developmental Cell 55, 272–288, November 9, 2020 273

Figure 1. The Rag GTPase Inhibits TORC1 in GATOR2 Mutant Drosophila and HeLa Cells
(A) Co-depletions of ragA or ragC rescue the small ovary phenotype of seh1RNAi females. ragARNAi, ragCRNAi, and seh1RNAi TRiP constructs were driven by the
germline-specific driver nanos-GAL4VP16. mchRNAi: mCherry-RNAi. Scale bar: 1 mm.
(B) Knockdowns of ragA or ragC increase pS6K levels in seh1RNAi ovaries, error bars in pS6K quantification graph represent standard deviation. Unpaired
Student’s t test was used to calculate p values. mchRNAi: mCherry-RNAi. **p < 0.01.
(C) Immunoblot for P-S6K (T389) in WT and WDR24-KO HeLa cells treated with control (NT) or RAGA siRNAs. Error bars represent standard deviation.
(D) Immunoblot for P-S6K (T389) in WT and WDR24-KO HeLa cells treated with control (NT) or RAGC siRNAs.
(E) mTOR and LAMP1 immunostaining and colocalization analysis in WT andWDR24-KO HeLa cells treated with control (NT), RAGA, or RAGC siRNA. Scale bar:
10 mm. The colocalization coefficient was calculated based on 30 cells per condition. Error bars represent standard deviation. See also Figure S1.
llArticle
(Figure 1C) or RAGC (RAGC-KD) (Figure 1D) restored TORC1
activity in WDR24-KO, WDR59-KO, and MIOS-KO cells, as indi-
cated by increased p-S6K levels (Figures 1C, 1D, and S1). Inter-
estingly, RAGA-KD or RAGC-KD inWTHeLa cells under fed con-
274 Developmental Cell 55, 272–288, November 9, 2020
ditions had little effect on p-S6K levels. These data indicate that
consistent with previous work, the Rags are dispensable for
maintaining TORC1 activity under conditions of metabolic ho-
meostasis (Demetriades et al., 2014; Jewell et al., 2015).
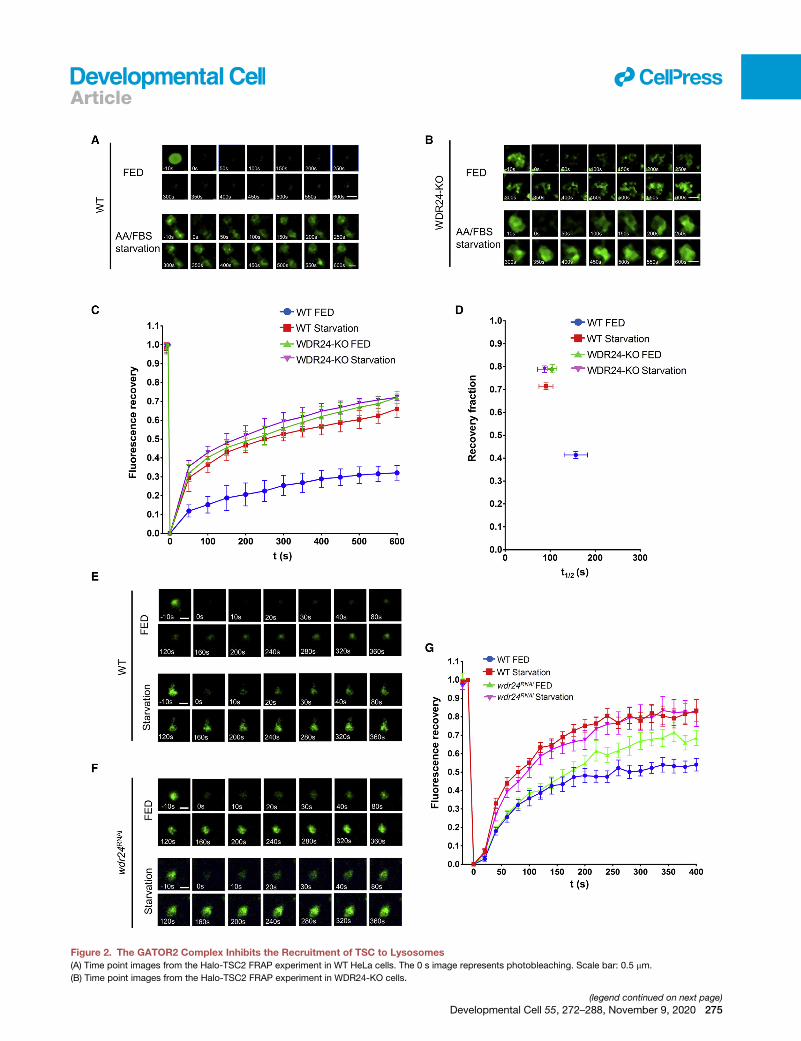
Figure 2. The GATOR2 Complex Inhibits the Recruitment of TSC to Lysosomes
(A) Time point images from the Halo-TSC2 FRAP experiment in WT HeLa cells. The 0 s image represents photobleaching. Scale bar: 0.5 mm.
(B) Time point images from the Halo-TSC2 FRAP experiment in WDR24-KO cells.
(legend continued on next page)
llArticle
Developmental Cell 55, 272–288, November 9, 2020 275

llArticle
One explanation for how depleting the Rag GTPase might
restore TORC1 activity in WDR24-KO cells is that knockdowns
of the Rag GTPases allow for the return and activation of
TORC1 on lysosomes in the WDR24-KO background. To test
this hypothesis, we examined the localization of the TORC1 sub-
unit mTOR and the lysosomal marker LAMP1 by immunofluores-
cence staining. We observed that under fed conditions, mTOR is
largely colocalized with LAMP1 in WT HeLa cells while in
WDR24-KO cells mTOR is diffusely localized in the cytosol
(Bar-Peled et al., 2013) (Figure 1E). Importantly, knockdowns
of either RAGA or RAGC in WDR24-KO cells significantly
increased the colocalization between mTOR and LAMP1 (Fig-
ure 1E), indicating that TORC1 is recruited back to lysosomes
in WDR24-KO cells in the absence of Rag GTPase. In contrast,
consistent with the minimal impact on TORC1 activity, knock-
downs of RAGA or RAGC had only a minor effect on the lyso-
somal localization of TORC1 in WT HeLa cells under fed
condition. In summary, our data support the idea that in
WDR24-KO HeLa cells, RAGA and RAGC act as inhibitors of
TORC1 by preventing its activation on lysosomes.
TheGATOR2Complex Inhibits theDynamic Recruitmentof TSC to LysosomesHow might the Rag GTPase function as an inhibitor of TORC1 in
the GATOR2 mutant background? In HeLa cells, deletions of
GATOR2 components result in a dramatic decrease in TORC1
activity, presumably due to the de-inhibition of the GATOR1
complex and conversion of the Rag GTPase into its ‘‘inactive’’
RAGAGDP form (Bar-Peled et al., 2013; Cai et al., 2016). Previous
studies demonstrated that when amino acids are limited, the Rag
GTPase, in its RAGAGDP: RAGCGTP form, recruits the TORC1 in-
hibitor TSC to lysosomal membranes (Demetriades et al., 2014).
Thus, one possible explanation for our results is that in the
absence of the GATOR2 complex, knocking down components
of the Rag GTPase prevents the recruitment of TSC to lyso-
somes, thus allowing TORC1 to bind directly to its activator
Rheb (Demetriades et al., 2014). Whereas, TSC shuttles on and
off lysosomes in response to multiple stimuli in several cell lines,
in HeLa cells, lysosomes retain a pool of TSC under conditions
that favor growth (Figure S2) (Demetriades et al., 2016; Menon
et al., 2014). However, analysis of steady-state distributions of
proteins rarely inform whether they are static or dynamic. There-
fore, we used an alternative technique to examine the regulation
and functional importance of TSC lysosomal dynamics in the
regulation of TORC1 activity in HeLa cells and Drosophila.
Because of the known role of TSC in the regulation of TORC1 ac-
tivity in response to multiple upstream inputs, we reasoned that
the lysosomal pool of TSC in HeLa cells may mask changes in
the rate of recruitment of TSC to lysosomes in response to up-
stream inputs (Demetriades et al., 2016). To test this hypothesis,
we used the FRAP (Lippincott-Schwartz et al., 2018) technique
(C) Fluorescence recovery versus time curves in (A and B). A total of 30 lysosomes
represent standard error.
(D) Plot showing the relation between the recovery fraction versus half-time (t1/2)
(E) Time point pictures from the GFP-TSC1 FRAP experiment in WT Drosophila o
(F) Time point pictures from the GFP-TSC1 FRAP experiment in wdr24RNAi Droso
(G) Fluorescence recovery versus time curves in (E and F). A total of 10 lysosome
bars represent standard error. See also Figures S2–S4.
276 Developmental Cell 55, 272–288, November 9, 2020
to examine the dynamic behavior of the TSC subunit TSC2 in
various nutrient conditions and genetic backgrounds.
We tagged TSC2 with a Halo tag and labeled it with the fluo-
rescence dye Halo Ligand-Oregon Green. First, we transiently
expressed the Halo-tagged TSC2 in HeLa cells. We confirmed
that the Halo-TSC2 protein localizes to lysosomes in both WT
and WDR24-KO cells using the lysosomal marker LAMP1 (Fig-
ure S3). To eliminate the effect of microtubule-based lysosomal
movement, we treated cells with nocodazole as suggested by a
previous study (Lawrence et al., 2018).We then photobleached a
single Halo-TSC2-labeled lysosome and used lysosomal FRAP
to determine the rate of recruitment of TSC2 to lysosomes in
WT versus WDR24-KO cells under fed versus starved condi-
tions. First, we examined if nutrient conditions control TSC2
dynamics in WT HeLa cells (Figures 2A, 2C, and 2D). In
nutrient-replete (+fetal bovine serum [FBS], +AA) conditions,
photobleached lysosomes reached 40% of their original fluores-
cence fraction with a 150-s half-time (t1/2) (Figure 2D). The partial
recovery of Halo-TSC2 indicates that there is also a significant
immobile fraction of TSC present on lysosomes under conditions
that favor growth. Under nutrient-depleted conditions, TSC2 had
a higher exchange rate as indicated by the decreased half-time
(around 100s). These results indicated that the rate of recruit-
ment of TSC2 to lysosome dramatically increases upon nutrient
limitation. Next, we used FRAP to examine the mobility of TSC2
inWDR24-KOHeLa cells (Figure 2B). We predicted thatWDR24-
KO cells cultured under fed conditions (+FBS, +AA) would have
TSC2 dynamics similar to those observed in starved (�FBS,
�AA) cells. Consistent with this prediction, TSC2 recovered to
approximately 80% of pre-bleach fluorescence fraction with a
half-time around 100 s in both fed and starved conditions (Fig-
ure 2D). Thus, we conclude that in HeLa cells, the exchange of
TSC2 between the cytoplasm and the lysosome is increased in
response to nutrient stress downstream of the GATOR2 compo-
nent WDR24.
Metabolism is often deregulated in cancer and cancer cell
lines (Cornu et al., 2013; Efeyan and Sabatini, 2010; Mossmann
et al., 2018). Thus, to complement our studies in HeLa cells, we
examined TSC1-GFP dynamics in the Drosophila ovary. We
noted that in the Drosophila ovary, consistent with what is
observed in HeLa cells, lysosomes contain a stable pool of
TSC1 under nutrient-replete conditions (Figure S4). To define
the dynamics of TSC1 in response to nutrient inputs, we per-
formed lysosomal FRAP of TSC1-GFP in the germline-derived
nurse cells of stage 6 egg chambers in cultured ovaries. We
determined that, as we observed in HeLa cells, the TSC1-GFP
rate of recovery after lysosomal photobleaching increased in
response to nutrient deprivation (Figures 2E and 2G). Addition-
ally, depleting the GATOR2 component wdr24 in the female
germline by RNAi partially phenocopied the response to nutrient
stress (Figures 2F and 2G). Taken together, these data
from different cells were used to plot the curves for each treatment. Error bars
from curves in (C). Error bars represent standard error.
vary.
phila ovary. Scale bar: 2 mm.
s in different ovaries from each treatment were used in plotting the curve. Error

Figure 3. The GATOR2 Complex Regulates the Recruitment of TSC to Lysosomes via the Rag GTPase
(A) Time point images from the Halo-TSC2 FRAP experiment in WT HeLa cells treated with non-targeting RAGA and RAGC siRNAs. Scale bar: 0.5 mm.
(B) Time point images from the Halo-TSC2 FRAP experiment in WDR24-KO HeLa cells treated with non-targeting RAGA and RAGC siRNAs.
(legend continued on next page)
llArticle
Developmental Cell 55, 272–288, November 9, 2020 277

llArticle
demonstrate that in both HeLa cells and the Drosophila ovary,
nutrient stress increases the dynamic recruitment of TSC to lyso-
somes. Moreover, in non-starvation conditions, the GATOR2
component WDR24 opposes the dynamic exchange of TSC be-
tween the lysosome and the cytoplasm.
The GATOR2 Complex Acts through the Rag GTPase toRegulate TSC Recruitment to LysosomesOne model to explain our data is that the increased rate of
recruitment of TSC to lysosomes observed during nutrient
stress, and in WDR24-KO cells, requires the activity of the Rag
GTPase. Consistent with this model, RAGA-KD or RAGC-KD in
WDR24-KO cells, but not WT HeLa cells, significantly decreased
the rate of fluorescence recovery of Halo-TSC2 after lysosomal
FRAP relative to a control siRNA (mCh) (Figures 3A–3D). Simi-
larly, in the Drosophila ovary, co-depleting ragA with wdr24 in
the female germline reversed the rapid exchange of TSC1-GFP
between the lysosome and the cytoplasm observed inwdr24RNAi
ovaries (Figures 3E–3G). These data suggest that the Rag
GTPase drives the rapid lysosomal exchange of TSC in GATOR2
mutants. Notably, siRNA knockdowns of RAGA or RAGC did not
affect the slow recruitment of TSC2 to lysosomes in WT HeLa
cells cultured in nutrient-replete condition (+FBS, +AA) (Fig-
ure 3A). This is consistent with RAGA and RAGC having minimal
effect on TORC1 activity underfed (AA+, FBS+) conditions.
Taken together, our data demonstrate that the Rag GTPase pro-
motes the recruitment of the TSC to lysosomes in the absence of
GATOR2 activity.
TSC2 inhibits TORC1 by serving as a GAP for the TORC1
activator Rheb (Inoki et al., 2003). As presented above, the
Rag GTPase promotes the dynamic recruitment of TSC to lyso-
somes in the absence of the GATOR2 component WDR24, a
condition that mimics nutrient stress. We performed co-immu-
noprecipitations (coIPs) to explore if the changes in TSC2
dynamics documented above correlate with changes in the
interaction of Rheb with TSC2 and mTOR. In WT HeLa cells
expressing a non-targeting (NT) siRNA, Rheb readily coIPs
mTOR, but not the TORC1 inhibitor TSC2, both in the presence
or absence of RAGA and RAGC (Figures 3H and 3I). These data
are consistent with the ability of mTOR to directly bind Rheb in
the absence of the Rag GTPase under nutrient-replete condi-
tions (Demetriades et al., 2014). Conversely, in WDR24-KO
cells, Rheb coIPs the TORC1 inhibitor TSC but not mTOR,
consistent with the low TORC1 activity observed in WDR24-
KO cells (Figures 3H and 3I). Moreover, knocking down RAGA
or RAGC in WDR24-KO cells, restored the interaction between
mTOR and Rheb while decreasing the interaction between
TSC2 and Rheb (Figures 3H and 3I). These data support the
(C) Fluorescence recovery versus time curves in (A and B). A total of 30 lysosom
represent standard error.
(D) Plot showing the relationship between the recovery fraction versus half-time
(E) Time point pictures from the GFP-TSC1 FRAP experiments in WT and ragARN
(F) Time point images from the GFP-TSC1 FRAP experiments in wdr24RNAi and w
(G) Fluorescence recovery versus time curves in (H and I). A total of 10 lysosome
(H) Knockdowns of RAGA or RAGC increase the interaction between mTOR and
mTOR antibody and immunoblotted by an anti-Rheb antibody.
(I) Knockdowns of RAGA or RAGC decrease the interaction between TSC2 and Rh
TSC2 antibody and immunoblotted by an anti-Rheb antibody.
278 Developmental Cell 55, 272–288, November 9, 2020
model that in GATOR2 mutant cells, the Rag GTPase recruits
TSC to lysosomes where it binds and inhibits Rheb. However,
knockdowns of the Rag GTPase components RAGA or RAGC
block recruitment of TSC2 to lysosomes, thus allowing for
the recruitment of TORC1 to lysosomes and rescue of the
WDR24-KO phenotype.
The GTP/GDP Status of RAGA and RAGC Control theRecruitment of TSC to LysosomesAs small GTPases, the Rags are cycled between GTP-bound
and GDP-bound forms. To formally test the hypothesis that
GDP/GTP binding to the Rag GTPase affects TSC2 recruitment
to the lysosome, we knocked down endogenous RAGA and
RAGC with siRNAs targeting their 30 UTR (untranslated region),
then used point mutations in RAGA and RAGC to lock the two
proteins into either a GTP-bound (RAGA-Q66L and RAGC-
Q120L) or GDP-bound (RAGA-T21N and RAGC-S75N) form.
Subsequently, the dynamics of TSC2 were examined by FRAP
for each RAGA and RAGC point mutant. First, we examined if
the Rag GTPase needs to be in the RAGAGDP: RAGCGTP config-
uration to facilitate the rapid recruitment of TSC2 to lysosomes.
We found that in contrast to the empty vector (EV) control,
expression of GDP-bound RAGA-T21N in WT and WDR24-KO
HeLa cells increased the recovery rate of Halo-TSC2, while
expression of the GTP-bound RAGA-Q66L had no effect (Fig-
ures 4A, 4B, 4E, and 4F). From these data, we conclude that
GDP-bound RAGA facilitates the dynamic recruitment of TSC
to lysosomes. Conversely with RAGC, which is in the GDP-
bound form under nutrient-replete conditions, we observed the
opposite effect. Expression of the GTP-bound RAGC-Q120L
increased the exchange rate of the Halo-TSC2 in both WT and
WDR24-KO cells, while the GDP-bound RAGC-S75N had no ef-
fect (Figures 4C, 4D, 4G, and 4H). These results demonstrate
that the guanine nucleotide-binding status of both RAGA and
RAGC impacts the dynamic recruitment of TSC to lysosomes.
Next, we examined whether GDP/GTP binding of RAGA or
RAGC affected the ability of TSC2 and TORC1 to associate
with Rheb. As shown in Figure 4I, we determined that the
GDP-bound RAGA-T21N and the GTP-bound RAGC-Q120L
increased the interaction between TSC2 and Rheb in both WT
andWDR24-KOHeLa cells (Figure 4I). In contrast, the interaction
between mTOR and Rheb increased with the transfection of the
GTP-bound RAGA-Q66L and the GDP-bound RAGC-S75N (Fig-
ure 4J). Thus, as previously suggested (Demetriades et al.,
2014), our data indicate that the guanine nucleotide-binding sta-
tus of the Rag GTPases regulates the dynamic recruitment of
TSC to the lysosome and its ability to interact with and
inhibit Rheb.
es in different cells were used to plot the curve for each treatment. Error bars
(t1/2) from the curves in (C). Error bars represent standard error.Ai Drosophila ovaries. Scale bar: 2 mm.
dr24RNAi ragARNAi Drosophila ovaries.
s from different ovaries were examined. Error bars represent standard error.
Rheb in WDR24-KO cells. Cell lysates were immunoprecipitated by an anti-
eb in WDR24-KO HeLa cells. Cell lysates were immunoprecipitated by an anti-

Figure 4. The Guanine-Nucleotide-Binding Status of RAGA and RAGC Control the Recruitment of TSC to Lysosomes
(A) Time point images from Halo-TSC2 FRAP experiment in WT HeLa cells transfected with GDP- or GTP-bound RAGA. Scale bar: 0.5 mm.
(B) Time point images from the Halo-TSC2 FRAP experiment in WDR24-KO HeLa cells transfected with GDP- or GTP-bound RAGA.
(legend continued on next page)
llArticle
Developmental Cell 55, 272–288, November 9, 2020 279

llArticle
TSC2 Rapidly Cycles on and off Lysosomes in GATOR2Mutant and Starved CellsThere are two models to explain the rapid association of TSC2
with lysosomes in WDR24-KO cells as well as in WT HeLa cells
cultured in starved conditions. One model is that during starva-
tion and inWDR24-KO cells, TSC2 is rapidly and stably recruited
to lysosomes, where it remains and functions as a GAP for lyso-
somal Rheb. A second model posits that after acting as a GAP
for lysosomal Rheb, TSC2 rapidly dissociates from the lyso-
some. In order to distinguish between these two models, we
took advantage of the photoconvertible fluorescence tag
mEOS4b (Paez-Segala et al., 2015). Before photoconversion,
mEOS4b is detected at a wavelength of 488 nm, however, after
photoconversion with a 405-nm laser, mEOS4b emits at a wave-
length of 568 nm. Bymonitoring the changes in fluorescence sig-
nals at these two wavelengths after photoconversion, it is
possible to determine both the ‘‘on rate’’ and the ‘‘off rate’’ of
the mEOS4b tagged TSC2 on lysosomes in various nutrient con-
ditions and genetic backgrounds.
First, we examined the behavior of lysosomal TSC2-mEOS4b
in WT HeLa cells cultured in nutrient-replete (+FBS, +AA) condi-
tions (Figures 5A and 5E). After photoconversion, the red fluores-
cence of the converted mEOS4b-TSC2 remained high, with
minimal fluorescence loss over time. These data indicate that
most of the TSC2 present on lysosomes is immobile under
fed conditions. Additionally, consistent with our FRAP results,
we observed minimal new recruitment of unconverted green
mEOS4b-TSC2 to lysosomes from the cytoplasmic pool (Figures
5A and 5E). In contrast, nutrient depletion (�FBS, �AA) resulted
in the rapid recruitment of the cytoplasmic green TSC2 to the
lysosome, while the fluorescence of the converted ‘‘old’’ red
TSC2 rapidly diminished (Figures 5B and 5F). The simplest
explanation for these results is that under starvation conditions,
TSC2 rapidly cycles on and off lysosomes. As predicted by our
previous results, in WDR24-KO HeLa cells TSC2-mEOS4b had
on and off rates similar to WT HeLa cells cultured in starvation
in both nutrient conditions (Figures 5C, 5D, 5G, and 5H). In sum-
mary, by using a photoconvertible fluorescence protein, we
demonstrated that TSC2 rapidly cycles between the cytoplasm
and the lysosome in GATOR2 mutants and in WT cells subject
to starvation.
The Rag GTPase Controls the Dynamic Recruitment ofTSC to Lysosomes in Response to Both Amino Acid andGrowth Factor RestrictionThe insulin-PI3K-AKT signaling pathway is a critical upstream
regulator of TSC activity (Cai et al., 2006; Dan et al., 2002; Inoki
(C) Time point images from the Halo-TSC2 FRAP experiment in WT HeLa cells tr
(D) Time point pictures from the Halo-TSC2 FRAP experiment in WDR24-KO He
(E) Fluorescence recovery versus time curves in (A and B). A total of 30 lysosome
bars represent standard error.
(F) Plot showing the relation between the recovery fraction versus half-time (t1/2)
(G) Fluorescence recovery versus time curves in (C and D). A total of 30 lysosome
bars represent standard error.
(H) Plot showing the relation between the recovery fraction versus half-time (t1/2)
(I) CoIP experiments showing that GDP-bound RAGA andGTP-bound RAGC incre
immunoprecipitated by an anti-Halo antibody and immunoblotted by an anti-GS
(J) CoIP experiment showing GTP-bound RAGA and GDP-bound RAGC increas
immunoprecipitated by an anti-Myc antibody and immunoblotted by an anti-GST
280 Developmental Cell 55, 272–288, November 9, 2020
et al., 2002). To obtain a better understanding of the regulation of
TSC dynamics, we examined the behavior of Halo-TSC2 in WT
HeLa cells under either amino acid or growth factor (FBS)
restriction using lysosomal FRAP. From these experiments, we
determined that independently restricting either amino acids
(�AA +dFBS) or serum (+AA�FBS) increased the rate of recruit-
ment of Halo-TSC2 to lysosomes relative to complete media (WT
FED) (NT images in Figures 6A, 6C, and 6E). Additionally, in all
three nutrient conditions depleting RAGA-KD significantly
decreased the rate of TSC2 fluorescence recovery in WT HeLa
cells (Figures 6C and 6E). These data indicate that the Rag
GTPase regulates TSC dynamics downstream of both amino
acid and growth factor restriction.
As predicted by our previous results (Figure 3), WDR24-KO
cells exhibited a high rate of Halo-TSC2 fluorescence recovery
after lysosomal FRAP in both fed and nutrient-depleted condi-
tions (Figure 6B). Additionally, similar to what is observed in
WT HeLa cells, knockdowns of RAGA in singly restricted condi-
tions (�AA +dFBS) and (+AA �FBS) impede the recovery of
TSC2 to lysosomes (Figures 6D and 6F).
Moreover, in amino acid or serum restriction (�AA +dFBS
or +AA� FBS) conditions, removing RAGA in WT or WDR24-
KO HeLa cells restored TORC1 activity as measured by the level
of pS6K (Figure 7A). These results again indicate in nutrient or
growth factor depletion conditions, the Rag GTPase prevents
TORC1 activity. In summary, we find that both amino acids
and growth factors individually impact the rate of exchange of
TSC between the cytosol and lysosomes as well as TORC1 ac-
tivity through the Rag GTPase.
WDR24 Opposes the AKT-Dependent Inhibition of TSCActivity and Lysosomal DynamicsIn the presence of adequate insulin, AKT phosphorylates TSC2
on multiple sites, including T1462, resulting in TSC inhibition
and release from the lysosome (Menon et al., 2014). Thus, levels
of P-TSC2 (T1462) reflect the functional status of TSC2. As re-
ported by others (Inoki et al., 2002), we find that inWTHeLa cells,
TSC2-T1462 phosphorylation is dependent on the presence of
FBS (Figure 7A). Additionally, we determined that pTSC2-
T1462 levels were modestly diminished in HeLa cells grown un-
der conditions of amino acid starvation relative to HeLa cells
grown in complete media (Figure 7A). These data are consistent
with previous work demonstrating a role for TSC in response
to amino acid stress (Demetriades et al., 2014). Surprisingly,
we found that in WDR24-KO cells, pTSC2-T1462 levels
were below detection in all three media conditions (+AA +FBS),
(+AA �FBS), and (�AA +dFBS) (Figure 7A). Thus, TSC2-T1462
ansfected with GDP- or GTP-bound RAGC.
La cells transfected with GDP- or GTP-bound RAGC.
s from 30 different cells were used to plot the curves for each treatment. Error
from the curves in (E). Error bars represent standard error.
s from different cells were used in plotting the curves for each treatment. Error
from the curves in (G). Error bars represent standard error.
ased the interaction between Halo-TSC2 and HA-GST-Rheb. Cell lysates were
T antibody. (Short: blot was exposed for 10 s; Long: 1 min)
ed the interaction between Myc-mTOR and HA-GST-Rheb. Cell lysates were
antibody.

Figure 5. TSC2 Rapidly Cycles on and off Lysosomes in GATOR2 Mutant and Starved Cells
(A) Time point images fromphotoconversion experiment inWTHeLa cells transfectedwithmEOS4b-TSC2 in nutrient-replete conditions. The 0s image represents
photoconversion. Scale bar: 0.5 mm.
(legend continued on next page)
llArticle
Developmental Cell 55, 272–288, November 9, 2020 281

llArticle
phosphorylation is dependent on the presence of the GATOR2
component WDR24, suggesting that the GATOR2 complex is
an upstream inhibitor of TSC.
Next, we examined if the downregulation of TSC2-T1462
phosphorylation observed in WDR24-KO cells is dependent on
the function of the Rag GTPase. First, we demonstrated that
knocking down RAGA in wild-type HeLa cells had no effect on
pTSC2-T1462 levels (Figure 7A). In contrast, levels of pTSC2-
T1462 were nearly undetectable in WDR24-KO cells (Figure 7A).
Importantly, pTSC2-T1462 levels were restored in RAGA-
depleted WDR24-KO cells regardless of nutrient inputs
(Figure 7A), suggesting similar to WDR24-KO, RagA is required
for the reduction in TSC2 phosphorylation observed upon either
amino acid or FBS removal (Figure 7A). Phosphorylation of
pTSC2 on T1462 occurs via AKT (Dan et al., 2002; Inoki et al.,
2002; Potter et al., 2002). AKT is activated by phosphorylation
at its Thr308 and Ser473 sites. Interestingly, we found in
WDR24-KO cells, the levels of both P-AKT T308 and S473
were lower than WT. Moreover, knockdowns of RAGA and
RAGC restore AKT phosphorylation (Figure 7B). Thus, these
data support the idea that in WDR24-KO cells the Rag GTPase
prevents, either directly or indirectly, the AKT-dependent inhibi-
tory phosphorylation of TSC2.
Conditions that favor the formation of the inactive pTSC2-
T1462 correlate with increased mobility of TSC2 on lysosomes
and decreased TORC1 activity (Figures 3, 6, and 7). Thus, we hy-
pothesized that the phosphorylation of TSC2 by AKT decreases
the lysosomal mobility of TSC. To test this model, wemade point
mutations of TSC2 that are resistant to AKT phosphorylation.
AKT phosphorylates TSC2 at T1462 and S939 (Inoki et al.,
2002). We mutated these two amino acids to alanine either
together or individually and tagged each construct with a Halo
tag. First, we confirmed that the three proteins mutants TSC2
T1462A, TSC2 S939A, and TSC2 T1462A/S939A were localized
on lysosomes by immunostaining, through colocalization with
the lysosomal marker LAMP1 (Figure S5). Next, we performed
FRAP to compare the dynamics of the Halo-TSC2 point mutants
relative to control WTHalo-TSC2. Consistent with our prediction,
in WT HeLa cells cultured in nutrient-replete conditions, all three
Halo-tagged TSC2 point mutants exhibited faster fluorescence
recovery after lysosomal FRAP relative to WT TSC2 (Figures
7C–7E). In contrast, the TSC2 point mutants had similarly high
rates of fluorescence recovery relative to WT TSC2 in WDR24-
KO HeLa cells (Figures 7F–7H). In summary, our results suggest
that AKT phosphorylation state correlates with TSC2 dynamics
and that AKT may inhibit TSC2 function by opposing its dynamic
exchange between lysosome and cytosol.
(B) Time point images from photoconversion experiment in WT HeLa cells transf
(C) Time point images from photoconversion experiment in WDR24-KO HeLa ce
(D) Time point images from photoconversion experiment in WDR24-KO HeLa ce
(E) Change in relative fluorescence of unconverted mEOS4b-TSC2 at 488 nm (gre
corresponding to the result shown in (A). A total of 30 lysosomes were used. Err
(F) Change in relative fluorescence of unconverted mEOS4b-TSC2 at 488 nm (gre
corresponding to the result shown in (B).
(G) Change in relative fluorescence of unconverted mEOS4b-TSC2 at 488 nm (gr
corresponding to the result shown in (C).
(H) Change in relative fluorescence of unconverted mEOS4b-TSC2 at 488 nm (gre
corresponding to the result shown in (D).
(I) Comparisons of the half-time (t1/2) for mEOS4b-TSC2 at 488 and 568 nm in co
282 Developmental Cell 55, 272–288, November 9, 2020
DISCUSSION
TSC is a critical inhibitor of TORC1 signaling (Dibble and Mann-
ing, 2013; Tee et al., 2002). Currently, there are two working
models for the role of TSC in the inhibition of TORC1 activity.
The first model posits that TSC lies exclusively downstream of
the PI3K-AKT growth factor signaling pathway, while the second
model proposes that TSC is a critical downstream effector of
both the growth factor signaling and amino-acid-sensing path-
ways (Demetriades et al., 2014; Gao et al., 2002; Laplante and
Sabatini, 2012; Roccio et al., 2006; Smith et al., 2005). Our find-
ings on the function of the GATOR2 complex are consistent with
the second model, which implicate different nucleotide states of
the RagGTPase in the recruitment of TORC1 versus TSC to lyso-
somes in response to amino acid starvation (Demetriades et al.,
2014; Gao et al., 2002). Moreover, we find that the Rag GTPase,
which has previously been thought to exclusively function in
amino acid sensing, regulates the recruitment of TSC to lyso-
somes in response to growth factor restriction. Thus, our data
support a model in which both the amino-acid-sensing pathway
and growth factor signaling pathway converge on the Rag
GTPase to recruit TSC to lysosomes in response to inhibitory sig-
nals. Notably, we found in both HeLa cells and Drosophila, the
Rag GTPase promotes the rapid exchange of TSC between
the lysosome and cytosol in response to negative inputs. Finally,
demonstrating further integration of the amino-acid-sensing and
growth factor signaling pathways, we show that the GATOR2
complex acts upstream of the Rag GTPase to promote both,
the activating phosphorylation of AKT and the AKT-dependent
inhibitory phosphorylation of TSC2.
An important outstanding question in the field of TORC1 regu-
lation concerns the role of the Rag GTPase and TSC (Deme-
triades et al., 2014; Dibble andManning, 2013). Our data indicate
that in both Drosophila and HeLa cells, the GATOR-Rag GTPase
axis inhibits TORC1 activity through the regulation of the dy-
namic behavior of TSC. We find that in cells without a functional
GATOR2 complex, the Rag GTPase, locked in its RAGAGDP:
RAGCGTP-bound form due to the activation of GATOR1 recruits
TSC to lysosomes precluding the recruitment and activation of
TORC1. This inhibited state is relieved by depleting RAGA or
RAGC, resulting in the recruitment and activation of TORC1 on
lysosomes. Mutations in GATOR2 components mimic amino
acid starvation (Bar-Peled et al., 2013; Wei and Lilly, 2014).
Thus, our results are consistent with reports from the Teleman
laboratory indicating that amino acid starvation promotes the
Rag GTPase-dependent recruitment of TSC to lysosomes (De-
metriades et al., 2014). Moreover, our data confirm that under
ected with mEOS4b-TSC2 under starvation condition.
lls transfected with mEOS4b-TSC2 subjected to nutrient-replete conditions.
lls transfected with mEOS4b-TSC2 under starvation condition.
en curve) and photo converted protein in 568 nm (red curve) over 600s period
or bars represent standard error.
en curve) and photo converted protein in 568 nm (red curve) over 600s period
een curve) and photo converted protein in 568 nm (red curve) over 600s period
en curve) and photo converted protein in 568 nm (red curve) over 600s period
rresponding to panels (A)–(D). Scale bars represent standard error.

(legend on next page)
llArticle
Developmental Cell 55, 272–288, November 9, 2020 283

llArticle
conditions of metabolic homeostasis TORC1 can be recruited to
lysosomes and activated by Rheb in the absence of the Rag
GTPase (Demetriades et al., 2014; Jewell et al., 2015).
Intriguingly, in budding yeast, which does not have TSC, the
homolog of the Rag GTPase, GTRl1/GTRL2, has a similar dual
role in the regulation of TORC1 activity with the overexpression
of GTR1GTP promoting TORC1 activity while GTR1GDP is associ-
ated with low TORC1 activity (Binda et al., 2009). Thus, the Rag
GTPase may have a conserved role in the inhibition of TORC1
activity that goes beyond the regulation of TSC dynamics.
Surprisingly, we also demonstrate a central role of the Rag
GTPase in the recruitment of TSC to lysosomes in response to
growth factor restriction. Specifically, the low TORC1 activity
and reduced TSC mobility associated with growth factor deple-
tion were rescued by depleting the Rag GTPase component
RagA. Taken together, our data argue that the Rag GTPase
and TSC are critical components of both the amino-acid-sensing
and growth factor signaling pathways.
The idea that TSC acts downstream of the GATOR-Rag
GTPase pathway is consistent with our previous observations
in Drosophila showing that depleting components of TSC rescue
the low TORC1 activity observed in GATOR2mutant ovaries (Cai
et al., 2016; Wei et al., 2014). Indeed, in Drosophila, TSC is
epistatic to the GATOR2 complex with respect to TORC1 activ-
ity, in that, depleting TSC in GATOR2 mutant cells resulted in
high TORC1 levels similar to those observed in TSC single mu-
tants (Cai et al., 2016; Gao and Pan, 2001; Wei et al., 2014). As
indicated above, our data are also consistent with several previ-
ous reports that TSC acts in the amino-acid-sensing pathway
(Demetriades et al., 2014, 2016; Gao et al., 2002; Wei and
Lilly, 2014).
Recent reports indicate that the recruitment of TSC to lyso-
somes is a common response to cellular stress inmanymamma-
lian cell types (Demetriades et al., 2014, 2016; Menon et al.,
2014). However, these studies have not examined if TSC remains
static on lysosomes or actively exchanges with the cytoplasmic
pool during periods of TORC1 inhibition. Using FRAP and a pho-
toconvertible TSC2 to follow the intracellular dynamics of TSC
components, we determined that the rate of exchange of TSC
between the lysosome and the cytosol increases in response
to nutrient deprivation and growth factor restriction. This rapid
increase in cycling on and off lysosomes requires the Rag
GTPase in both HeLa cells and the Drosophila ovary. Notably,
increased cycling of TSC correlates with its increased interaction
with Rheb and a concomitant decrease in TORC1 activity.
Depleting components of the Rag GTPase in cells grown in
amino acid or growth factor restricted media dramatically
Figure 6. The Rag GTPase Controls the Dynamic Recruitment of TSC
Restriction
(A) Time point images from the Halo-TSC2 FRAP experiment in WT HeLa cell
bar: 0.5 mm.
(B) Time point images from the Halo-TSC2 FRAP experiment in WDR24-KO HeL
(C) Time point images from the Halo-TSC2 FRAP experiment in WT HeLa cells tr
(D) Time point images from the Halo-TSC2 FRAP experiment in WDR24-KO
(�AA, +dFBS).
(E) Time point images from the Halo-TSC2 FRAP experiment in WT HeLa cells tr
(F) Time point images from the Halo-TSC2 FRAP experiment in WDR24-K
(+AA, �FBS).
Fluorescence recovery versus time curve was plotted by using a total of 30 lysos
284 Developmental Cell 55, 272–288, November 9, 2020
reduced the lysosomal-cytosol TSC rate of exchange,
decreased its binding with Rheb, and rescued TORC1 activity.
Thus, our data support themodel that the RagGTPase increases
the exchange rate of TSC between the lysosome and the cyto-
plasm in response to both amino acid starvation and growth fac-
tor restriction.
It has long been established that AKT controls TSC activity
through the inhibitory phosphorylation of TSC2 (Inoki et al.,
2002; Manning et al., 2002; Potter et al., 2002). More recent
studies indicate that AKT controls TSC activity by regulating
its association with Rheb on the surface of lysosomes (Menon
et al., 2014). We find that in nutrient-replete conditions, the
inhibitory phosphorylation of TSC2 by AKT slows the rate of
lysosomal-cytosolic exchange of TSC and allows for TORC1
activation. When TSC2 is rendered resistant to AKT-dependent
phosphorylation, TSC rapidly cycled on and off lysosomes in-
dependent of growth factor and amino acid status. Importantly,
cells expressing AKT-resistant TSC have low TORC1 activity
(Inoki et al., 2002; Menon et al., 2014). We determined that in
WDR24-KO cells, in which the RAG GTPase is in the RAGAGDP:
RAGCGTP state, the AKT-dependent phosphorylation of TSC2
is strongly diminished, resulting in the increased mobility of
the TSC complex on lysosomes and decreased TORC1 activity.
Depleting components of the Rag GTPase in WDR24-KO cells,
rescued these phenotypes resulting in increased AKT-depen-
dent phosphorylation of TSC, decreased TSC lysosomal
motility, and increased TORC1 activity (Inoki et al., 2002; Me-
non et al., 2014). Further examination revealed that levels of
activated AKT are kept low in WDR24-KO cells by a Rag
GTPase-dependent mechanism. These data are consistent
with previous observations that RAGA-KO cells have increased
levels of activated AKT while WDR24-KO cells fail to increase
AKT activation after Sestrin2 overexpression (Efeyan et al.,
2014; Kowalsky et al., 2020). Taken together, our data indicate
that the GATOR2 complex promotes the activation of AKT,
which facilitates the AKT-dependent inhibitory phosphorylation
of TSC, upstream of the Rag GTPase. Moreover, they demon-
strate that the rate of TSC cycling on and off lysosomes reflects
TSC activity.
Based on our data, as well as data from others (Demetriades
et al., 2014, 2016; Menon et al., 2014), we propose the
following model (Figure 7I). Under conditions of amino acid
and growth factor sufficiency, GATOR2 inhibits GATOR1 re-
sulting in the Rag GTPase adopting the RAGAGTP: RAGCGDP
configuration, which favors the recruitment and activation of
TORC1 on lysosomes and results in the limited exchange of
TSC between the lysosome and the cytoplasm. In contrast,
to Lysosomes in Response to both Amino Acids and Growth Factor
s treated with control or RAGA siRNA in FED condition (+AA, +FBS). Scale
a cells treated with control or RAGA siRNA in FED condition (+AA, +FBS).
eated with control or RAGA siRNA in amino acid starvation (�AA, +dFBS).
HeLa cells treated with control or RAGA siRNA in amino acid starvation
eated with control or RAGA siRNA in serum starvation (+AA, �FBS).
O HeLa cells treated with control or RAGA siRNA in serum starvation
omes. Error bars represent standard error.

Figure 7. Phosphorylation by AKT Decreases the Lysosomal Dynamics of TSC2
(A) Immunoblots to detect the level of P-S6K (T389), P-TSC2 (T1462) in WT, and WDR24-KO HeLa cells treated with control (NT) or RAGA siRNA, cultured
in +AA +FBS, +AA �FBS, and �AA +dFBS conditions.
(B) Immunoblots show knockdowns of RAGA and RAGC in WDR24-KO cells increase the level of P-AKT (T308) and P-AKT (S473).
(C) Time point images from the Halo-TSC2 FRAP experiment in WT HeLa cells transfected with Halo-TSC2 T1462A, Halo-TSC2 S939A, and the Halo-TSC2
T1462A/S939A. Scale bar: 0.5 mm.
(legend continued on next page)
llArticle
Developmental Cell 55, 272–288, November 9, 2020 285

llArticle
under conditions of amino acid or growth factor depletion, or
in GATOR2 mutant cells, GATOR1 is active, resulting in the
Rag GTPase adopting the RAGAGDP: RAGCGTP configuration,
which promotes the rapid exchange of TSC between the
lysosome and the cytoplasm and decreases TORC1 activity.
Under these restricted conditions (AA�, serum�, or WDR24-
KO), knockdowns of RAGA or RAGC prevent the rapid cycling
of TSC allowing for the recovery of TORC1 activity due to the
inherent ability of TORC1 to bind Rheb directly (Demetriades
et al., 2014). Currently, whether the rapid cycling of TSC on
and off lysosomes in response to upstream signals directly
promotes TSC activity, or serves a regulatory role, has not
been definitively established. In summary, our data support a
model in which both the amino-acid-sensing and growth
factor signaling pathways utilize the Rag GTPase to inhibit
TORC1 activity through the regulation of TSC lysosomal
dynamics.
A recent study reported that RAGA rapidly cycles between the
lysosome and the cytosol in response to nutrients (Lawrence
et al., 2018). Notably, RAGAGTP cycles on and of lysosomes
while RAGAGDP remains more tightly associated with the Ragu-
lator at the lysosomal surface. Intriguingly, we find that RAGAGDP
promotes the rapid cycling of the TSC complex on and off the
lysosome. Thus, in the future, it will be important to determine
precisely how the dynamic behavior of RAGA and TSC are coor-
dinated to control TORC1 activity.
STAR+METHODS
Detailed methods are provided in the online version of this paper
and include the following:
d KEY RESOURCES TABLE
d RESOURCE AVAILABILITY
(D)
rep
(E)
(F)
TSC
(G)
(H)
(I) P
GT
286
B Lead Contact
B Materials Availability
B Data and Code Availability
d EXPERIMENTAL MODEL AND SUBJECT DETAILS
B Cell Culture and Treatments
B Drosophila Stocks
B Generation MIOS and WDR59 knockout HeLa cells by
CRISPR-Cas9
d METHOD DETAILS
B ImmunofluorescenceMicroscopy for Mammalian Cells
B Fluorescence Recovery after Photobleaching (FRAP)
and mEOS4b Photoconversion
B Plasmid Transfections for Mammalian Cell
B Mammalian Cell siRNA Transfections and
Knockdowns
Fluorescence recovery versus time curves in (C). A total of 30 lysosomes from
resent standard error.
Plot showing the relation between the recovery fraction versus half-time (t1/2)
Time point images from the Halo-TSC2 FRAP experiment in WDR24-KO HeL
2 T1462A/S939A.
Fluorescence recovery versus time curves in (F). A total of 30 lysosomes from
Plot showing the relation between the recovery fraction versus half-time (t1/2)
roposed model: the GATOR complex regulates TORC1 activity by controllin
Pase and TSC2 phosphorylation. Refer to Discussion for details. See also Fig
Developmental Cell 55, 272–288, November 9, 2020
B Mammalian Protein Extraction and Immunoblot
B Mammalian Protein Co-immunoprecipitation
B Lysosomal FRAP Assay in Drosophila Germline
d QUANTIFICATION AND STATISTICAL ANALYSIS
B Sample Size and Statistical Analysis
SUPPLEMENTAL INFORMATION
Supplemental Information can be found online at https://doi.org/10.1016/j.
devcel.2020.08.006.
ACKNOWLEDGMENTS
Multiple stocks used in this study were obtained from the Bloomington
Drosophila Stock Center supported by NIH grant P40OD018537. We thank
Juan Bonifacino and Erik Snapp for comments on the manuscript. This
research was supported by the Eunice Kennedy Shriver National Institute of
Child Health and Human Development Intramural Research Program at the
National Institutes of Health (to M.A.L., HD00163 16).
AUTHOR CONTRIBUTIONS
Conceptualization, M.A.L. and S.Y.; Methodology, S.Y., Y.Z., and C.Y.T.;
Investigation, S.Y., Y.Z., C.Y.T., L.B., K.K., and E.G.; Writing — Original Draft,
S.Y. and M.A.L.; Writing—Review & Editing, C.Y.T., L.B., K.K., E.G., S.Y., and
M.A.L.; Funding Acquisition, M.A.L.; Supervision M.A.L.
DECLARATION OF INTERESTS
The authors declare no competing interests.
Received: April 27, 2020
Revised: June 30, 2020
Accepted: August 10, 2020
Published: September 7, 2020
REFERENCES
Avruch, J., Hara, K., Lin, Y., Liu, M., Long, X., Ortiz-Vega, S., and Yonezawa, K.
(2006). Insulin and amino-acid regulation ofmTOR signaling and kinase activity
through the Rheb GTPase. Oncogene 25, 6361–6372.
Aylett, C.H., Sauer, E., Imseng, S., Boehringer, D., Hall, M.N., Ban, N., and
Maier, T. (2016). Architecture of humanmTOR complex 1. Science 351, 48–52.
Bar-Peled, L., Chantranupong, L., Cherniack, A.D., Chen, W.W., Ottina, K.A.,
Grabiner, B.C., Spear, E.D., Carter, S.L., Meyerson, M., and Sabatini, D.M.
(2013). A Tumor suppressor complex with GAP activity for the Rag GTPases
that signal amino acid sufficiency to mTORC1. Science 340, 1100–1106.
Bar-Peled, L., and Sabatini, D.M. (2014). Regulation of mTORC1 by amino
acids. Trends Cell Biol. 24, 400–406.
Binda, M., Peli-Gulli, M.P., Bonfils, G., Panchaud, N., Urban, J., Sturgill, T.W.,
Loewith, R., and De Virgilio, C. (2009). The Vam6 GEF controls TORC1 by acti-
vating the EGO complex. Mol. Cell 35, 563–573.
Cai, S.L., Tee, A.R., Short, J.D., Bergeron, J.M., Kim, J., Shen, J., Guo, R.,
Johnson, C.L., Kiguchi, K., andWalker, C.L. (2006). Activity of TSC2 is inhibited
30 different cells were used in plotting the curve for each treatment. Error bars
from the curves in (D). Error bars represent standard error.
a cells transfected with Halo-TSC2 T1462A, Halo-TSC2 S939A, and the Halo-
30 different cells were used in plotting the curve for each treatment.
from the curves in (G).
g the exchange rate of TSC between lysosome and cytosol through the Rag
ure S5.

llArticle
by AKT-mediated phosphorylation and membrane partitioning. J. Cell Biol.
173, 279–289.
Cai, W., Wei, Y., Jarnik, M., Reich, J., and Lilly, M.A. (2016). The GATOR2
component Wdr24 regulates TORC1 activity and lysosome function. PLoS
Genet 12, e1006036.
Carroll, B., Maetzel, D., Maddocks, O.D., Otten, G., Ratcliff, M., Smith, G.R.,
Dunlop, E.A., Passos, J.F., Davies, O.R., Jaenisch, R., et al. (2016). Control
of TSC2-Rheb signaling axis by arginine regulates mTORC1 activity. eLife 5,
e11058.
Cornu, M., Albert, V., and Hall, M.N. (2013). mTOR in aging, metabolism, and
cancer. Curr. Opin. Genet. Dev. 23, 53–62.
Curatolo, P., Bombardieri, R., and Jozwiak, S. (2008). Tuberous sclerosis.
Lancet 372, 657–668.
Dan, H.C., Sun, M., Yang, L., Feldman, R.I., Sui, X.M., Ou, C.C., Nellist, M.,
Yeung, R.S., Halley, D.J.J., Nicosia, S.V., et al. (2002). Phosphatidylinositol
3-kinase/Akt pathway regulates tuberous sclerosis tumor suppressor complex
by phosphorylation of tuberin. J. Biol. Chem. 277, 35364–35370.
Demetriades, C., Doumpas, N., and Teleman, A.A. (2014). Regulation of
TORC1 in response to amino acid starvation via lysosomal recruitment of
TSC2. Cell 156, 786–799.
Demetriades, C., Plescher, M., and Teleman, A.A. (2016). Lysosomal recruit-
ment of TSC2 is a universal response to cellular stress. Nat. Commun.
7, 10662.
Dibble, C.C., and Manning, B.D. (2013). Signal integration by mTORC1 coor-
dinates nutrient input with biosynthetic output. Nat. Cell Biol. 15, 555–564.
Dokudovskaya, S., and Rout, M.P. (2011). A novel coatomer-related SEA com-
plex dynamically associates with the vacuole in yeast and is implicated in the
response to nitrogen starvation. Autophagy 7, 1392–1393.
Dokudovskaya, S., and Rout, M.P. (2015). SEA you later alli-GATOR - a dy-
namic regulator of the TORC1 stress response pathway. J. Cell Sci. 128,
2219–2228.
Efeyan, A., and Sabatini, D.M. (2010). mTOR and cancer: many loops in one
pathway. Curr. Opin. Cell Biol. 22, 169–176.
Efeyan, A., Schweitzer, L.D., Bilate, A.M., Chang, S., Kirak, O., Lamming, D.W.,
and Sabatini, D.M. (2014). RagA, but not RagB, is essential for embryonic
development and adult mice. Dev Cell 29, 321–329.
Ganley, I.G., Lam, du H., Wang, J., Ding, X., Chen, S., and Jiang, X. (2009).
ULK1.ATG13.FIP200 complex mediates mTOR signaling and is essential for
autophagy. J. Biol. Chem. 284, 12297–12305.
Gao, X., and Pan, D. (2001). TSC1 and TSC2 tumor suppressors antagonize
insulin signaling in cell growth. Genes Dev 15, 1383–1392.
Gao, X., Zhang, Y., Arrazola, P., Hino, O., Kobayashi, T., Yeung, R.S., Ru, B.,
and Pan, D. (2002). Tsc tumour suppressor proteins antagonize amino-acid-
TOR signalling. Nat. Cell Biol. 4, 699–704.
Hara, K., Yonezawa, K., Weng, Q.P., Kozlowski, M.T., Belham, C., and Avruch,
J. (1998). Amino acid sufficiency andmTOR regulate p70 S6 kinase and eIF-4E
BP1 through a common effector mechanism. J. Biol. Chem. 273,
14484–14494.
Heged}us, K., Takats, S., Boda, A., Jipa, A., Nagy, P., Varga, K., Kovacs, A.L.,
and Juhasz, G. (2016). The Ccz1-Mon1-Rab7 module and Rab5 control
distinct steps of autophagy. Mol. Biol. Cell 27, 3132–3142.
Hosokawa, N., Hara, T., Kaizuka, T., Kishi, C., Takamura, A., Miura, Y., Iemura,
S., Natsume, T., Takehana, K., Yamada, N., et al. (2009). Nutrient-dependent
mTORC1 association with the ULK1-Atg13-FIP200 complex required for auto-
phagy. Mol. Biol. Cell 20, 1981–1991.
Inoki, K., Li, Y., Xu, T., and Guan, K.L. (2003). Rheb GTPase is a direct target of
TSC2 GAP activity and regulates mTOR signaling. Genes Dev 17, 1829–1834.
Inoki, K., Li, Y., Zhu, T., Wu, J., and Guan, K.L. (2002). TSC2 is phosphorylated
and inhibited by Akt and suppresses mTOR signalling. Nat. Cell Biol. 4,
648–657.
Jewell, J.L., Kim, Y.C., Russell, R.C., Yu, F.X., Park, H.W., Plouffe, S.W.,
Tagliabracci, V.S., and Guan, K.L. (2015). Metabolism. Differential regulation
of mTORC1 by leucine and glutamine. Science 347, 194–198.
Kim, E., Goraksha-Hicks, P., Li, L., Neufeld, T.P., and Guan, K.L. (2008).
Regulation of TORC1 by Rag GTPases in nutrient response. Nat. Cell Biol.
10, 935–945.
Kim, J., and Guan, K.L. (2019). mTOR as a central hub of nutrient signalling and
cell growth. Nat. Cell Biol. 21, 63–71.
Kowalsky, A.H., Namkoong, S., Mettetal, E., Park, H.W., Kazyken, D., Fingar,
D.C., and Lee, J.H. (2020). The GATOR2-mTORC2 axis mediates Sestrin2-
induced AKT Ser/Thr kinase activation. J Biol Chem 295, 1769–1780.
Laplante, M., and Sabatini, D.M. (2012). mTOR signaling in growth control and
disease. Cell 149, 274–293.
Lawrence, R.E., Cho, K.F., Rappold, R., Thrun, A., Tofaute, M., Kim, D.J.,
Moldavski, O., Hurley, J.H., and Zoncu, R. (2018). A nutrient-induced affinity
switch controls mTORC1 activation by its Rag GTPase-ragulator lysosomal
scaffold. Nat. Cell Biol. 20, 1052–1063.
Lawrence, R.E., and Zoncu, R. (2019). The lysosome as a cellular centre for
signalling, metabolism and quality control. Nat. Cell Biol. 21, 133–142.
Lee, M., Kim, J.H., Yoon, I., Lee, C., Fallahi Sichani, M., Kang, J.S., Kang, J.,
Guo, M., Lee, K.Y., Han, G., et al. (2018). Coordination of the leucine-sensing
Rag GTPase cycle by leucyl-tRNA synthetase in the mTORC1 signaling
pathway. Proc. Natl. Acad. Sci. USA 115, E5279–E5288.
Lippincott-Schwartz, J., Snapp, E.L., and Phair, R.D. (2018). The development
and enhancement of FRAP as a key tool for investigating protein dynamics.
Biophys. J. 115, 1146–1155.
Manning, B.D., Tee, A.R., Logsdon, M.N., Blenis, J., and Cantley, L.C. (2002).
Identification of the tuberous sclerosis complex-2 tumor suppressor gene
product tuberin as a target of the phosphoinositide 3-kinase/akt pathway.
Mol. Cell 10, 151–162.
Manning, B.D., and Toker, A. (2017). AKT/PKB signaling: navigating the
network. Cell 169, 381–405.
Menon, S., Dibble, C.C., Talbott, G., Hoxhaj, G., Valvezan, A.J., Takahashi, H.,
Cantley, L.C., and Manning, B.D. (2014). Spatial control of the TSC complex
integrates insulin and nutrient regulation of mTORC1 at the lysosome. Cell
156, 771–785.
Mossmann, D., Park, S., and Hall, M.N. (2018). mTOR signalling and cellular
metabolism are mutual determinants in cancer. Nat. Rev. Cancer 18, 744–757.
Nicastro, R., Sardu, A., Panchaud, N., and De Virgilio, C. (2017). The architec-
ture of the Rag GTPase signaling network. Biomolecules 7, 48–68.
Paez-Segala, M.G., Sun, M.G., Shtengel, G., Viswanathan, S., Baird, M.A.,
Macklin, J.J., Patel, R., Allen, J.R., Howe, E.S., Piszczek, G., et al. (2015).
Fixation-resistant photoactivatable fluorescent proteins for CLEM. Nat.
Methods 12, 215–218.
Panchaud, N., Peli-Gulli, M.P., and De Virgilio, C. (2013). Amino acid depriva-
tion inhibits TORC1 through a GTPase-activating protein complex for the Rag
family GTPase Gtr1. Sci. Signal. 6, ra42.
Plas, D.R., and Thompson, C.B. (2003). Akt activation promotes degradation
of tuberin and FOXO3a via the proteasome. J. Biol. Chem. 278, 12361–12366.
Potter, C.J., Pedraza, L.G., and Xu, T. (2002). Akt regulates growth by directly
phosphorylating Tsc2. Nat. Cell Biol. 4, 658–665.
Ran, F.A., Hsu, P.D., Wright, J., Agarwala, V., Scott, D.A., and Zhang, F. (2013).
Genome engineering using the CRISPR-Cas9 system. Nat. Protoc. 8,
2281–2308.
Roccio, M., Bos, J.L., and Zwartkruis, F.J. (2006). Regulation of the small
GTPase Rheb by amino acids. Oncogene 25, 657–664.
Sabatini, D.M. (2017). Twenty-five years of mTOR: uncovering the link from nu-
trients to growth. Proc. Natl. Acad. Sci. USA 114, 11818–11825.
Sancak, Y., Bar-Peled, L., Zoncu, R., Markhard, A.L., Nada, S., and Sabatini,
D.M. (2010). Ragulator-Rag complex targets mTORC1 to the lysosomal sur-
face and is necessary for its activation by amino acids. Cell 141, 290–303.
Sancak, Y., Peterson, T.R., Shaul, Y.D., Lindquist, R.A., Thoreen, C.C., Bar-
Peled, L., and Sabatini, D.M. (2008). The Rag GTPases bind raptor and
mediate amino acid signaling to mTORC1. Science 320, 1496–1501.
Developmental Cell 55, 272–288, November 9, 2020 287

llArticle
Sancak, Y., Thoreen, C.C., Peterson, T.R., Lindquist, R.A., Kang, S.A.,
Spooner, E., Carr, S.A., and Sabatini, D.M. (2007). PRAS40 is an insulin-regu-
lated inhibitor of the mTORC1 protein kinase. Mol. Cell 25, 903–915.
Sarbassov, D.D., Ali, S.M., Kim, D.H., Guertin, D.A., Latek, R.R., Erdjument-
Bromage, H., Tempst, P., and Sabatini, D.M. (2004). Rictor, a novel binding
partner of mTOR, defines a rapamycin-insensitive and raptor-independent
pathway that regulates the cytoskeleton. Curr. Biol. 14, 1296–1302.
Saxton, R.A., and Sabatini, D.M. (2017). mTOR Signaling in growth, meta-
bolism, and disease. Cell 169, 361–371.
Schalm, S.S., Fingar, D.C., Sabatini, D.M., and Blenis, J. (2003). TOS motif-
mediated raptor binding regulates 4E-BP1multisite phosphorylation and func-
tion. Curr. Biol. 13, 797–806.
Senger, S., Csokmay, J., Akbar, T., Jones, T.I., Sengupta, P., and Lilly, M.A.
(2011). The nucleoporin Seh1 forms a complex with Mio and serves an essen-
tial tissue-specific function in Drosophila oogenesis. Development 138,
2133–2142.
Shaner, N.C., Lin, M.Z., McKeown, M.R., Steinbach, P.A., Hazelwood, K.L.,
Davidson, M.W., and Tsien, R.Y. (2008). Improving the photostability of bright
monomeric orange and red fluorescent proteins. Nat. Methods 5, 545–551.
Shen, K., Choe, A., and Sabatini, D.M. (2017). Intersubunit crosstalk in the rag
GTPase heterodimer enables mTORC1 to respond rapidly to amino acid avail-
ability. Mol. Cell 68, 821.
Shen, K., and Sabatini, D.M. (2018). Ragulator and SLC38A9 activate the Rag
GTPases through noncanonical GEF mechanisms. Proc. Natl. Acad. Sci. USA
115, 9545–9550.
Shen, K., Valenstein, M.L., Gu, X., and Sabatini, D.M. (2019). Arg-78 of Nprl2
catalyzes GATOR1-stimulated GTP hydrolysis by the Rag GTPases. J. Biol.
Chem. 294, 2970–2975.
288 Developmental Cell 55, 272–288, November 9, 2020
Smith, E.M., Finn, S.G., Tee, A.R., Browne, G.J., and Proud, C.G. (2005). The
tuberous sclerosis protein TSC2 is not required for the regulation of the
mammalian target of rapamycin by amino acids and certain cellular stresses.
J. Biol. Chem. 280, 18717–18727.
Sprague, B.L., and McNally, J.G. (2005). FRAP analysis of binding: proper and
fitting. Trends Cell Biol 15, 84–91.
Tee, A.R., Fingar, D.C., Manning, B.D., Kwiatkowski, D.J., Cantley, L.C., and
Blenis, J. (2002). Tuberous sclerosis complex-1 and �2 gene products func-
tion together to inhibit mammalian target of rapamycin (mTOR)-mediated
downstream signaling. Proc. Natl. Acad. Sci. USA 99, 13571–13576.
VanDoren,M.,Williamson, A.L., and Lehmann, R. (1998). Regulation of zygotic
gene expression in Drosophila primordial germ cells. Curr. Biol. 8, 243–246.
Wei, Y., and Lilly, M.A. (2014). The TORC1 inhibitors Nprl2 and Nprl3 mediate
an adaptive response to amino-acid starvation in Drosophila. Cell Death Differ
21, 1460–1468.
Wei, Y., Reveal, B., Reich, J., Laursen, W.J., Senger, S., Akbar, T., Iida-Jones,
T., Cai, W., Jarnik, M., and Lilly, M.A. (2014). TORC1 regulators Iml1/GATOR1
and GATOR2 control meiotic entry and oocyte development in Drosophila.
Proc. Natl. Acad. Sci. USA 111, E5670–E5677.
Wilson, R.I., Turner, G.C., and Laurent, G. (2004). Transformation of olfactory
representations in the Drosophila antennal lobe. Science 303, 366–370.
Yang, H., Jiang, X., Li, B., Yang, H.J., Miller, M., Yang, A., Dhar, A., and
Pavletich, N.P. (2017). Mechanisms of mTORC1 activation by RHEB and inhi-
bition by PRAS40. Nature 552, 368–373.
Zheng, C.Y., Petralia, R.S., Wang, Y.X., and Kachar, B. (2011). Fluorescence
recovery after photobleaching (FRAP) of fluorescence tagged proteins in den-
dritic spines of cultured hippocampal neurons. J Vis Exp 50, 2568.

llArticle
STAR+METHODS
KEY RESOURCES TABLE
REAGENT or RESOURCE SOURCE IDENTIFIER
Antibodies
LAMP1 Mouse
monoclonal, H4A3
Developmental Studies Hybridoma Bank Cat# H4A3; RRID:AB_2296838
mTOR (7C10) Rabbit mAb Cell Signaling Technology Cat# 2983; RRID:AB_2105622
RagA (D8B5) Rabbit mAb Cell Signaling Technology Cat# 4357; RRID:AB_10545136
RagC (D31G9) XP Rabbit mAb Cell Signaling Technology Cat# 5466; RRID:AB_10692651
RHEB (E1G1R) Rabbit mAb Cell Signaling Technology Cat# 13879; RRID:AB_2721022
TSC2 (D93F12) XP Rabbit mAb Cell Signaling Technology Cat# 4308; RRID:AB_10547134
Phospho-Tuberin/TSC2
(Thr1462) Antibody
Cell Signaling Technology Cat# 3611; RRID:AB_329855
P70 S6 kinase (49D7)
Rabbit mAb
Cell Signaling Technology Cat# 2708; RRID:AB_390722
Phospho-p70 S6K (T389)
Rabbit mAb
Cell Signaling Technology Cat# 9025; RRID:AB_2734746
Phospho-Drosophila p70 S6K
(T389) Rabbit Ab
Cell Signaling Technology Cat# 9209; RRID:AB_2269804
GAPDH (14C10) Rabbit mAb Cell Signaling Technology Cat# 2118; RRID:AB_561053
b-Actin (D6A8) Rabbit mAb Cell Signaling Technology Cat# 8457; RRID:AB_10950489
Mios (D12C6) Rabbit mAb Cell Signaling Technology Cat# 13557; RRID:AB_2798254
WDR59 (D4Z7A) Rabbit mAb Cell Signaling Technology Cat# 53385; RRID:AB_2799432
HA-Tag (C29F4) Rabbit mAb Cell Signaling Technology Cat# 3724; RRID:AB_1549585
DYKDDDDK Tag (D6W5B)
Rabbit mAb
Cell Signaling Technology Cat# 14793; RRID:AB_2572291
Myc-Tag (9B11) Mouse mAb Cell Signaling Technology Cat# 2276; RRID:AB_331783
GST (26H1) Mouse mAb Cell Signaling Technology Cat# 2624; RRID:AB_2189875
Anti-Rabbit IgG, HRP-linked Cell Signaling Technology Cat# 7074; RRID:AB_2099233
Anti-Mouse IgG, HRP-linked Cell Signaling Technology Cat# 7076; RRID:AB_330924
Akt (pan) (C67E7) Rabbit mAb Cell Signaling Technology Cat# 4691; RRID:AB_915783
Phospho-Akt (Thr308) (D25E6)
XP Rabbit mAb
Cell Signaling Technology Cat# 13038; RRID:AB_2629447
Phospho-Akt (Ser473) (D9E) XP
Rabbit mAb
Cell Signaling Technology Cat# 4060; RRID:AB_2315049
Anti HaloTag Mouse mAb Promega Cat# G9211; RRID:AB_2688011
Anti-Rabbit IgG AlexaFluor 488
conjugated
Thermo Fisher Cat# A-11008; RRID:AB_143165
Anti-Rabbit IgG AlexaFluor 594
conjugated
Thermo Fisher Cat# A-11037; RRID:AB_2534095
Anti-Mouse IgG AlexaFluor 488
conjugated
Thermo Fisher Cat# A-11029; RRID:AB_138404
Anti-Mouse IgG AlexaFluor 594
conjugated
Thermo Fisher Cat# A-11005; RRID:AB_141372
Chemicals, Peptides, and Recombinant Proteins
Fibronectin human plasma Sigma-Aldrich Cat# F0895
Paraformaldehyde Electron Microscopy Sciences Cat# 15714
Triton X-100 Sigma-Aldrich Cat# T8787
Disuccinimidyl suberate Thermo Fisher Cat# 21555
Proteinases inhibitor cocktail Thermo Fisher Cat# 78430
Phosphatases inhibitor cocktail Thermo Fisher Cat# 78420
(Continued on next page)
Developmental Cell 55, 272–288.e1–e5, November 9, 2020 e1

Continued
REAGENT or RESOURCE SOURCE IDENTIFIER
4’,6-diamidino-2-
phenylindole (DAPI)
Thermo Fisher Cat# D1306
Hoechst 33342 Thermo Fisher Cat# H3570
Nocodazole Sigma-Aldrich Cat# M1404
Critical Commercial Assays
Pierce� c-Myc-Tag IP/Co-IP Kit Thermo Fisher Cat# 23630
Halo-Trap kit Chromotek Cat# otak-20
Experimental Models: Cell Lines
HeLa (Wild type) ATCC Cat# CCL-2
HeLa, WDR24-KO (Cai et al., 2016) N/A
HeLa, WDR59-KO This paper N/A
HeLa, MIOS-KO This paper N/A
Experimental Models: Drosophila Stocks
seh1d15 Senger et al., 2011 N/A
UAS-Wdr24 RNAi Bloomington Drosophila Stock Center Cat# 62393
UAS-RagA RNAi Bloomington Drosophila Stock Center Cat# 34590
UAS-RagC RNAi Bloomington Drosophila Stock Center Cat# 32342
UAS-mCherry RNAi Bloomington Drosophila Stock Center Cat# 35787
Nanos-Gal4 Van Doren et al., 1998 N/A
TSC1-GFP Vienna Drosophila Resource Center Cat# 318377
Lamp1-3xmCherry (Hegedus et al., 2016) N/A
Oligonucleotides
ON-TARGETplus Non-targeting
siRNA control
GE Healthcare D-001810-01-05
SMARTpool: ON-TARGETplus
LAMTOR1 siRNA
GE Healthcare L-020916-02-0005
SMARTpool: ON-TARGETplus
RRAGA siRNA
GE Healthcare L-016070-00-0005
SMARTpool: ON-TARGETplus
RRAGC siRNA
GE Healthcare L-017822-01-0005
Recombinant DNA
FLAG-TSC2 Tee et al., 2002 Addgene plasmid #8996
mPlum-LAMP1 Shaner et al., 2008 Addgene plasmid #55982
mEOS4b-TSC2 This paper N/A
Halo-TSC2 This paper N/A
Halo-TSC2 T1462A This paper N/A
Halo-TSC2 S939A This paper N/A
Halo-TSC2 T1462A/S939A This paper N/A
FLAG-RAGA(T21N) Shen et al., 2017 Addgene plasmid #99715
FLAG-RAGA(Q66L) Shen et al., 2017 Addgene plasmid #99716
FLAG-RAGC(Q120L) Shen et al., 2017 Addgene plasmid #99725
FLAG-RAGC(S75N) Shen et al., 2017 Addgene plasmid #112757
HA-GST-RHEB1 Sancak et al., 2007 Addgene plasmid #14951
Myc-mTOR Sarbassov et al., 2004 Addgene plasmid #1861
HA-RAGA Shen et al., 2017 Addgene plasmid #99710
FLAG-RAGC Shen et al., 2017 Addgene plasmid #99723
Software and Algorithms
Microsoft Excel Microsoft https://products.office.com/en-us/excel
GraphPad Prism 8 GraphPad Software Inc. https://www.graphpad.com/scientific-software/prism/
(Continued on next page)
llArticle
e2 Developmental Cell 55, 272–288.e1–e5, November 9, 2020

Continued
REAGENT or RESOURCE SOURCE IDENTIFIER
Imaris 9.3.0 Bitplane Inc. https://imaris.oxinst.com/products/imaris-for-cell-biologists
ImageJ National Institutes of Health https://imagej.nih.gov/ij/
Photoshop CC Adobe https://www.adobe.com/products/photoshop.html
Other
Dulbecco’s modified Eagle’s
medium GlutaMAX�-I with
pyruvate
Thermo Fisher Cat# 10569010
Fetal bovine serum Thermo Fisher Cat# A3160602
Penicillin-Streptomycin Thermo Fisher Cat# 15140122
DMEM without amino acids MyBioSource Cat# MBS653087
Fetal bovine serum, dialyzed Thermo Fisher Cat# A3382001
TrypLETM Express Thermo Fisher Cat# 12605010
Xfect� Transfection reagent Takara Cat# 631318
Xfect� RNA Transfection
reagent
Takara Cat# 631450
Dynabeads� Protein A Thermo Fisher Cat# 1001D
M-PER mammalian protein
extraction buffer
Thermo Fisher Cat# 78503
Pierce� Protein-Free T20 (TBS)
Blocking Buffer
Thermo Fisher Cat# 37571
ClarityTMWestern ECL substrate Biorad Cat# 170-5060
llArticle
RESOURCE AVAILABILITY
Lead ContactFurther information and requests for resources and reagents should be directed to and will be fulfilled by the Lead Contact, Mary Lilly
Materials AvailabilityDrosophila stocks, HeLa cell knockout lines, and other reagents generated in this study will be available upon request from the Lead
Contact Mary Lilly ([email protected]).
Data and Code AvailabilityOriginal data are deposited in Mendeley Data: https://doi.org/10.17632/n8gztd29sv.1
EXPERIMENTAL MODEL AND SUBJECT DETAILS
Cell Culture and TreatmentsAll mammalian cells were maintained and cultured at 37�C, 5% CO2, in high-glucose Dulbecco’s modified Eagle’s medium
GlutaMAX�-I with pyruvate, supplemented with 10% Fetal bovine serum (FBS) and 100 IU/ml Penicillin-Streptomycin (refer as
the completed DMEM thereafter). For amino acid starvation, cells were cultured in the completed DMEM medium until 80%
confluency, then were washed twice with 1x phosphate buffered saline (PBS), medium was changed to DMEM without amino acids
(glucose was adjusted to 4.5g/l), with 10% dialyzed FBS for 2 hr. For FBS starvation, the medium was changed to DMEM without
adding FBS, the cells were cultured for 16 hrs. Wild-type (WT) HeLa cell was obtained from ATCC. Its identity was verified and tested
for mycoplasma.
Drosophila StocksAll Drosophila stocks were maintained at 25�C on JAZZ-mix Drosophila food (Fisher Scientific). The germline specific driver nanos-
Gal4 was obtained from Ruth Lehmann (Van Doren et al., 1998). The TSC1-GFP fTRG transgenic line (VDRC #318377) was obtained
from Vienna Drosophila Resource Center. The stocks UAS-Wdr24 RNAi (BDSC #62393), UAS-RagA RNAi (BDSC #34590), UAS-
RagC RNAi (BDSC #32342) and UAS-mCherry RNAi (BDSC #35787) were obtained from Bloomington Stock Center. The seh1D15
line is made previously (Senger et al., 2011).
Developmental Cell 55, 272–288.e1–e5, November 9, 2020 e3

llArticle
Generation MIOS and WDR59 knockout HeLa cells by CRISPR-Cas9MIOS andWDR59 were knocked out in WT HeLa cells by using CRISPR/Cas9 based on the protocol by Ran et al. (2013). Briefly, the
following sense or antisense nucleotide (sgDNA) encoding single guide RNAs (sgRNA) were assembled in vitro and cloned into the
px459 (pSpCas9(BB)-2A-Puro) plasmid.
sgMIOS_1_For: CACCGTGTGATCAAAGGGTCCACTC
sgMIOS_1_Rev: aaacGAGTGGACCCTTTGATCACAC
sgMIOS_2_For: CACCGCTAGCCAGTTACTATCCAG
sgMIOS_2_Rev: aaacCTGGATAGTAACTGGCTAGC
The combination of the sgMIOS_1 and 2 guides Cas9 to cut through the Exon 4 of the MIOS protein-coding sequence including its
start codon.
sgWDR59_1_For: CACCGACTCGGCCTCTAGCTCACCT
sgWDR59_1_Rev: aaactccccAGTATCCCGGGACCGC
sgWDR59_2_For: CACCGACTCGGCCTCTAGCTCACCT
sgWDR59_2_Rev: aaacAGGTGAGCTAGAGGCCGAGTC
The combination of the sgWDR59_1 and 2 guides Cas9 to cut through the Exon 1 of the WDR59 protein-coding sequencing
including its start codon.
The resulted px459 sgDNA constructs were verified by sequencing.
On day one, 1millionWTHeLa cells were seeded into 10-cmdish in the completed DMEMmediumwithout antibiotics. After 24 hrs,
a total of 500 ng px459 guide constructs (250 ng for each sgDNA assembly) were transfected into HeLa cells by using the Lipofect-
amine 3000 reagent. Untransfected cells were eliminated by puromycin (puromycin dihydrochloride, Thermo Fisher, A1113802) on
the next day. 48 hrs later, the culture mediumwas changed into fresh completed DMEMwithout antibiotics. Cells were disassociated
by trypsin and serial diluted to the concentration of 0.5 cells per 100 ul medium. The diluted cells were passed into 96-well plates in
the amount of 100 ul per well. 1 week after plating, the plates were examined and wells with a single cell colony were marked. After
expansion for another 2 weeks, genome of each cell colony was collected and their MIOS or WDR59 genome loci were analyzed by
PCR. Cells with PCR products of the expected size after editing by Cas9 were collected and their genome were sent for further
sequencing. Finally, the protein level of MIOS or WDR59 was verified by immunoblot using the antibodies against the two protein
respectively. Those cells with undetectable level of MIOS or WDR59 were marked as MIOS-KO and WDR59-KO cells.
METHOD DETAILS
Immunofluorescence Microscopy for Mammalian CellsHeLa cells were seeded onto the 8-well Nunc� Lab-Tek� II Chamber Slide� System (Thermo Fisher, 154534) coated with
fibronectin in the density of 104 per well and cultured in the completed DMEM medium overnight. Cells were washed 3 times with
1 x PBS and fixed with 4% paraformaldehyde (PFA) in 1 x PBS at room temperature for 15 mins. Cells were washed 3 times with
PBS and permeabilized with 0.2% Trition X-100 in PBS for 10 mins at room temperature. Then cells were blocked in blocking buffer
(0.1%BSA, 0.2% Trition X-100 in PBS) for 1 hr at room temperature. The chamber slides were incubated overnight at 4�C in blocking
buffer containing diluted primary antibody. Then they were washed 3 times in 1 x PBS and incubated in blocking buffer containing
secondary antibody conjugated with fluorophore for 1 hr in dark at room temperature, following by a 10mins’ incubation with 300 nM
4’,6-diamidino-2-phenylindole (DAPI). The chamber slides were washed 3 times in PBS and then mounted on slides using the
ProLong� Diamond Antifade solution (Thermo Fisher, P36970) after remove the chamber well. All confocal images were captured
by a Zeiss 880 laser scanning microscopy with a Plan-Apochromat 63X/1.4 oil immersion objective. Pearson’s correlation coeffi-
cients of different fluorophores were calculated by using ImageJ with Fiji plugin. 30 cells per condition were analyzed. Each set of
immunofluorescence experiments was repeated at least three times.
Fluorescence Recovery after Photobleaching (FRAP) and mEOS4b PhotoconversionFRAP experiments were performed on HeLa cells transfected with plasmid constructs as descried in the ‘‘Plasmid transfections for
mammalian cell’’ section, two days before imaging. 40 min before the experiment, HeLa cells were cultured in imaging buffer with
2.5 mg/ml nocodazole as indicated previously (Lawrence et al., 2018), with or without serum or amino acids. FRAP live cell images
were acquired at 5 s intervals for 10 min after photobleaching a single lysosome to background fluorescence level, using a Zeiss
880 system with a 100% laser power. The FRAP data were processed in GraphPad Prism 8. The recovery fraction and half-time
(t½) were calculated by fitting the FRAP fluorescence recovery curve into the model Y=Y0 + (Plateau-Y0)*(1-exp(-K*x)) through using
one-phase association as described before (Sprague and McNally, 2005; Zheng et al., 2011). Photoconversion of mEos4b was
performed by using a 405 nm laser. Red signal after conversion was acquired at 50 s intervals for 10 min. The kinetic of red decline
(post-conversion) and green recovery (pre-conversion) on lysosome represent the off and on rate of protein respectively. The
acquired images were processed by using Imaris 9.3 software.
e4 Developmental Cell 55, 272–288.e1–e5, November 9, 2020

llArticle
Plasmid Transfections for Mammalian CellPlasmid transfections into HeLa cells were performed by using the Xfect� Transfection reagent, according to manufacturer’s pro-
tocol. A total of 5 mg plasmid was used in transfection for 0.8 million cells.
Mammalian Cell siRNA Transfections and KnockdownssiRNAs against RAGGA, RAGGC and LAMTOR1/p18 in HeLa cells were from the SMARTpool ON-TARGETplus siRNA set (GE
Healthcare). All siRNAs were transfected by the Xfect� RNA Transfection reagent, according to manufacturer’s protocol. An ON-
TARGETplus Non-targeting Control siRNAs was used as the control. 0.3 million HeLa cells were seeded into 6-well plates and
cultured in completed DMEM medium overnight. For next two days, each day a combination of 5 ul siRNA stock (20 mM) and 9 ul
of the transfection reagent was added into culture medium per well. Cells were assayed in the third day for immunoblotting or
imaging.
Mammalian Protein Extraction and ImmunoblotHeLa cells were seeded into 6-well plates. 1.2 million HeLa cells from each well were washed twice by PBS. Cells were then covered
by 600 ul of theM-PERmammalian protein extraction buffer plus proteinases inhibitor cocktail with or without phosphatases inhibitor
cocktail, followed by gently shaking at room temperature for 5 mins. The solutions were collected, and the soluble parts were
separated by centrifugation. Target proteins in the soluble part were detected by immunoblot using specific antibodies. To detect
phosphorylated protein, Pierce� Protein-Free T20 (TBS) Blocking Buffer was used to block the membrane and dilute the antibodies.
HRP signals were visualized by using a ClarityTM Western ECL substrate kit (Biorad) and detected with a Biorad ChemiDocTM MP
imaging system. The grey scale of each band was quantified by Photoshop CC. Each set of immunoblot experiments was repeated
at least three times. Representative examples are shown in each figure.
Mammalian Protein Co-immunoprecipitationProteins from HeLa cells were extracted in buffer with proteinase and phosphatase inhibitor cocktail as mentioned above. Antibody
against endogenous TSC2 or mTOR was crosslinked to Dynabeads� Protein A by disuccinimidyl suberate (DSS) according to
manufacturer’s protocol. Protein extracts were incubated overnight at 4�Cwith the antibody linked protein A beads. After incubation
beads were washed three times with protein extraction buffer, then proteins were eluted by heating the beads in protein sample
buffer [60 mM Tris (pH 6.8), 10% glycerol, 100 mM DTT, 0.2% bromophenol blue, 2% SDS] at 70�C for 10 mins, followed by immu-
noblot. An anti- Rheb antibody was used to detect the interactions between TSC2- Rheb or mTOR- Rheb from different conditions.
For pulling down the Myc tagged protein, Pierce� c-Myc-Tag IP/Co-IP Kit from Thermo Fisher was used according to manufac-
turer’s instruction. For pulling down Halo-tagged protein, the Halo-Trap kit from Chromotek was used based on manufacturer’s
instruction.
Lysosomal FRAP Assay in Drosophila GermlineThe FRAP experiments were performed on stage 6 egg chambers inDrosophila ovaries. Briefly, flies were cultured in standard media
for 2-3 days before dissection. The ovaries were dissected in Schneider’s medium supplemented with 10% FBS, 10 mg/ml
insulin,100 nm nocodazole and 1mg/ml Hoechst. For acute starvation, the ovaries were dissected in amino acid starvation media
as previously described (Wilson et al., 2004) and suppled with 100 nM nocodazole and 1mg/ml Hoechst 33342. 100% laser was
used for lysosomal photobleaching, images were acquired at 10 seconds intervals for 7 mins.
QUANTIFICATION AND STATISTICAL ANALYSIS
Sample Size and Statistical AnalysisDetailed sample size can be found in figure legends. All graphs report the mean ± SEM and represent data from three independent
experiments. Unless otherwise indicates. Statistical comparisons weremade using Unpaired Student’s t-test provided by GraphPad
Prism 8 software.
Developmental Cell 55, 272–288.e1–e5, November 9, 2020 e5


