Embed Size (px)
Citation preview

_______________________________________________________________________________________________________________________________
Open Access Maced J Med Sci. 2019 Jun 15; 7(11):1729-1732. 1729
ID Design Press, Skopje, Republic of Macedonia Open Access Macedonian Journal of Medical Sciences. 2019 Jun 15; 7(11):1729-1732. https://doi.org/10.3889/oamjms.2019.351 eISSN: 1857-9655 Basic Science
The Reactivity Levels of Progesterone, Nitric Oxide and Nuclear Factor Kappa-B on the Serum of Term and Post-Term Pregnancy, Clinical Study in Padang, West Sumatera, Indonesia Defrin Defrin
1*, Eti Yerizel
2, Donel Suhaimi
3, Afriwardi Afriwardi
4
1Fetomaternal Division, Department of Obstetrics and Gynecology, Faculty of Medicine, Andalas University, Padang, West
Sumatera, Indonesia; 2Department of Biochemistry, Faculty of Medicine of Andalas University, Padang, West Sumatera,
Indonesia; 3Department of Obstetrics and Gynecology, Faculty of Medicine of Riau University, Pekanbaru, Riau, Indonesia;
4Department of Physiology, Faculty of Medicine of Andalas University, Padang, West Sumatera, Indonesia
Citation: Defrin D, Yerizel E, Suhaimi D, Afriwardi A. The Reactivity Levels of Progesterone, Nitric Oxide and Nuclear Factor Kappa-B on the Serum of Term and Post-Term Pregnancy, Clinical Study in Padang, West Sumatera, Indonesia. Open Access Maced J Med Sci. 2019 Jun 15; 7(11):1729-1732. https://doi.org/10.3889/oamjms.2019.351
Keywords: Nitric Oxide; Nuclear Factor Kappa-B; Pregnancy; Progesterone; Reactivity
*Correspondence: Defrin Defrin. Fetomaternal Division, Department of Obstetrics and Gynecology, Faculty of Medicine, Andalas University, Padang, West Sumatera, Indonesia. E-mail: [email protected]
Received: 18-Mar-2019; Revised: 10-May-2019; Accepted: 14-May-2019; Online first: 29-May-2019
Copyright: © 2019 Defrin Defrin, Eti Yerizel, Donel Suhaimi, Afriwardi Afriwardi. This is an open-access article distributed under the terms of the Creative Commons Attribution-NonCommercial 4.0 International License (CC BY-NC 4.0)
Funding: This research did not receive any financial support
Competing Interests: The authors have declared that no competing interests exist
Abstract
BACKGROUND: A variety of recent evidence exists about the clinical implication of low level of Pregnancy-associated plasma protein A (PAPP-A) in pregnancy. This glycoprotein is a protease, which releases the Insulin-like growth factor from IGFBP 4. Its role is a trophoblastic invasion of decidua, stimulation of cell mitosis and differentiation. It has an immunosuppressive effect in the placenta, inhibition of coagulation and complex role for integration of all these processes in the placenta. Level of PAPP-A (under 0.4 MoM-Multiple of Medians) in first-trimester screening in chromosomally and morphologically normal fetuses, could influence fetal weight, preeclampsia, premature birth and stillbirth. As a result of the complications as mentioned earlier, there is implication on timing, mode of delivery and condition of the newborn.
AIM: The study aims to evaluate the influence of low PAPP-A, measured in the first trimester on the outcome of pregnancy, with accent disorders, which are the result of placental insufficiency. Also, gestational week, mode of delivery and condition of newborn secondary underlying conditions will be evaluated.
MATERIAL AND METHODS: After given information and consultation about the expectation from the screening, pregnant women with a singleton pregnancy were tested for First Trimester Screening to estimate the risk for Trisomy 21, 13, 18- the most frequent chromosomopathies. After exclusion of chromosomopathies and congenital malformations, one hundred and fourteen patients enrolled in the study. The target group (n = 64) with PAPP-A below 0.4 MoM and control group (n = 50) with PAPP-A equal and above 0.4 MoM. An assessment of mode and time of delivery and presence of small for gestational age newborns, preeclampsia, premature birth and newborn condition at delivery was made.
RESULTS: The percentage of the patients delivered in term was similar between the target group (n = 64) and
the control group (n = 50), 82.81% vs 82.0% respectively. The rate of cesarean section was 29.7 % in the target group vs 32% in the control group. A significant difference was found about elective vs urgent cesarean section in favour of the target group. The difference was present about the complication in pregnancy before delivery, 56% vs 22%, p = 0.023, which were the main indication for cesarean section. The difference in newborn outcome was not significant.
CONCLUSION: There is a difference in frequency of complications, in the cases with PAPP-A under 0.4 MoM, such as premature birth, preeclampsia compound with SGA fetuses versus the control group. The difference for SGA newborn and premature birth among the groups has statistical significance. The patients delivered with cesarean section were with the main indications SGA or elevated blood pressure, often occurred combined with prematurity. Apgar score and birth weight were similar in target and control group, but the newborns with a birth weight under 2500 g. were more frequent in the target group. Because these results did not show another significance among two groups, probably lower cut-off is needed, combining with another test (Doppler of uterine arteries in the first trimester, biochemical test). Presence of other diseases which could hurt placental function should be emphasised.
Introduction
Term pregnancy generally lasts 37 to 40 weeks or 259 to 280 days counted from the first day of
the last menstrual periods. Postdate pregnancy occurs within a period of > 40 weeks to 42 weeks. The post-term pregnancy lasts more or equal to 42 weeks or 294 days, since the menstrual period followed by two weeks later ovulation [1]. The incidence of post-

Basic Science _______________________________________________________________________________________________________________________________
_______________________________________________________________________________________________________________________________
1730 https://www.id-press.eu/mjms/index
term pregnancy in the world ranges from 4-19% [2], around 6% of the 4 million babies born in the United States during 2006 were born at 42 weeks of gestation or older [3]. In Indonesia, the incidence of post-term pregnancy is approximately 10% [4].
Post-term pregnancy is often associated with an increased risk of perinatal morbidity and mortality and effected on the development of fetal [5], like perinatal mortality associated with meconium aspiration and asphyxia [6]. Furthermore, labour is one of the triggers of post-term pregnancy caused cephalo-pelvic disproportion and shoulder dystocia [2]. The study in Norway reported that the rate of cerebral palsy in post-term infants is 144 per births [7]. Generally, the post-term pregnancy occurs because of the disruption to the onset of labour, while the onset of labour itself is not yet known clearly [8].
The progesterone decrease causes the release of nitric oxide (NO) in the endometrium and cervix, as well as cytokine activation [9]. Activation of cytokines via the pathway of cyclo-oxygenase (COX) II will lead to an increase in prostaglandin E2 (PGE2) is cause to release of NO and will increase PGE2 to lead the degeneration of cervical collagen and cervical tissue remodelling resulting in cervical ripening [10].
The NF-κB is a protein complex that controls the process of DNA transcription 17, 18. High NF-κB activation decreases insulin and antioxidant capacity and increases endothelial platelet interactions, neutrophil transport and LDL oxidation, which is one of the inflammatory processes [11]. Increased the phosphorylation of A2 will be increasing the arachidonate to convert a prostaglandin by activation of high COX-2. The high COX-2 will lead to the functional withdrawal of progesterone through interaction with progesterone receptors [12]. The NF-κB reported to decrease the insulin and antioxidant and increases endothelial platelet interactions, neutrophil transport and LDL oxidation, which is one of the inflammatory processes [13].
Many theories were to explain the labour of pregnant women, example oxytocin, progesterone theory, fetal cortisol, prostaglandin, uteri structure, nutrition, circulation of blood and nerve, and decreased of the fetal head. All of the theories can be the indicator of expression the progesterone, NO, and NF-κB in term and post-term pregnancy. This study to analyse the level of progesterone, NO, and NF-κB after reactive with the serum of pregnancy.
Material and Method
The model of this study was approached the observational analytic study with cross-sectional study design in July 2017-2018 and was carried out in the
maternity clinic, primary health care and Type C Hospital, Padang and reactivity assay were conducted by Laboratory of Biomedical, Faculty of Medicine, Andalas University, Padang-Indonesia. The study population was pregnant women with 37-38 weeks gestation research site. The sample in this study was taken by consecutive sampling in the research period divided into term pregnancy (36 subjects) and post-term pregnancy (36 subjects).
Reactivity Assay
The ELISA Assay was referred to as Gani (2009) [14]. The serum of subjects inserted 10 ml into the vacutainer tubes to measure the levels of progesterone, nitric oxide, and NF-κB was detected by the ELISA method (Biorad, USA). The examination of progesterone, nitric oxide, and NF-κB began with the preparation of each reagent (Progesterone and Nitric Oxide, Colorimetric Assay Kit (R & D Systems, USA) as well as the reagent of Human NF-κB (My Biosource). Then 50 μL, blank and samples were added to 96-well plate also 100 μL HRP conjugate progesterone, nitrate reductase mixture, and NF-κB mixture. In each well added 50 μL of biotinylated antibodies then covered with a plate sealer and incubated for 60 min at 37°C, after that washed with 350 μL of wash buffer solution (three times). Then added 50 μL Substrate A and B and covered with a plate sealer and incubated for 15 min at 37°C. Then add 50 μL stop solution to each well. The colour will change from blue to yellow as the reactivity indicator and read by ELISA reader wavelengths at 450 nm.
Research Ethics
This study was approved the ethical clearance by the Faculty of Medicine, Andalas University, Padang-Indonesia.
Statistical Analysis
The reactivity levels of progesterone, NO, and NF-κB were analysed by bivariate and multivariate with the probability is p < 0,05.
Results
The term and post-term pregnancy are not significant (p > 0.05) as well as the leukocyte profile (p > 0.05) (Table 1). It has no influence on the subjects during the pregnant phase. Based on the leukocyte profile, the second groups have to exhibit the peak conditions or stress during childbirth. The most subjects with first births reached 41.7% within term pregnancy cases and 61% Post-term pregnancy.

Defrin et al. Reactivity Levels of Progesterone, Nitric Oxide and Nuclear Factor Kappa-B on the Serum of Term and Post-Term Pregnancy _______________________________________________________________________________________________________________________________
_______________________________________________________________________________________________________________________________
Open Access Maced J Med Sci. 2019 Jun 15; 7(11):1729-1732. 1731
Table 1: Distribution of Subjects of Term and Post-term Pregnancy
Characteristics Term Pregnancy Posterm Pregnancy p-value
Mother’s Age mean ± SD (year) 28.05 ± 4.08 28.69 ± 4.94 0.552 Leukocyte mean ± SD (mm
3) 10776.97 ± 1334.89 10450.75 ± 1319.03 0.301
Parity (%) 1
st parity 15 (41.7) 22 (61.1)
2nd
parity 12 (33.3) 9 (25.0) 3
rd parity 8 (22.2) 3 (8.3)
4th parity 1 (2.8) 2 (5.6)
Body Mass Index (%) Normal 7 (19.4) 9 (25.0) Overweight 23 (63.9) 20 (55.6) Obese 6 (16.7) 7 (19.4)
The profiles of the progesterone, NO, and NF-κB detected in blood serum groups term and post-term pregnancy (Table 2). Our study showed (Table 2) the rate of progesterone in the post-term pregnancy phase is much higher than term pregnancy. This data becomes a reference for controlling post-term pregnancy; also, it can reduce the incidence of post-term pregnancy in the mother and fetus. The NO term pregnancy levels are higher than the post-term pregnancy (p > 0.05) as related as the NO levels serum will increase when pregnancy until some postpartum (Table 2).
Table 2: Profile of Progesterone, NO and NF-κBon the serum of Term and Post-term Pregnancy
Variables Term Pregnancy
n = 36 Post-term Pregnancy
n = 36 p-value
Progesterone (ng/mL) mean ± SD 26.15 ± 13.04 106.73 ± 124.76 0.001
NO ( mol/L) mean ± SD 7.20 ± 5.93 6.24 ± 4.41 0.440
NF-κB (ng/mL) mean ± SD 8.16 ± 2.64 7.97 ± 2.67 0.766
Based on the multivariate analysis show the odd ratio of NO was more dominant than progesterone (Table 3) in the post-term pregnancy is strongly correlated (p < 0.05). It assumes the presence of both when pregnancy in the post pregnancy has a connection, so the content of NO levels becomes an indicator of post-term pregnancy.
Table 3: Analysis Results of Multivariate Factors Associated with Post-term Pregnancy
Variables B Standard Deviation
Wald p-value OR
Progesteron Level (ng/ ml) -0.270 0.078 11.933 0.001 0.763 NO Level ( mol/L) 0.706 0.249 8.075 0.004 2.026
The NF-κB level in term pregnancy is better than a post-term pregnancy (p > 0.05).
Discussion
The leukocyte indicators are < 6000/µL (lower limit); 15000/µL (upper limit); and 9000-25000/µL (stress conditions) [15]. These results can be the early detection of that possibility of the post-term pregnancy as well as Body Mass Index (BMI) commonly shows weight gain. Based on recommended of Institute of Medicine BMI < 19.8 kg/m
2 (gain 12.5 -18 kg), BMI =
19.8-26.0 kg/m2
(gain 11.5-16 kg), BMI > 26.0- 29.0
kg/m2
(gain 7.0-11.5 kg), and BMI > 29.0 kg/m2
(gain of 7.0 kg) [16].
In this study, progesterone was higher than NO and NFκB. Verhaegen (2012) reported that the progesterone is an indicator of the development of pregnancy and its production decreases nearing the birth [17].
Kumar (2012) suggested that the progesterone levels also have the variance at the stage of pregnancy 9-47 ng/ml (first trimester), 12-20 ng/ml (first 5-6 weeks). The produce of progesterone in pregnant phase is higher than normal as well as related to the estrogen produced mainly in the first trimester. The second trimester has milk duct development and enlarges of breasts [18]. Bhattarai (2014) reported that progesterone might help to avoid the loss of embryo [19]. Statistically analysed by Slattengren (2013) shown that the cutoff value of progesterone decrease; it has the probability of a survive pregnancy increased to 99.2% [20].
Furthermore, the synthase of NO has progressively during term pregnancy [21]. The increase of NO will cause the cervical ripening as the signs to decrease of progesterone-B receptors in myometrial cells [22]. The NO works to ripen the cervix by increasing vascular permeability, cytokine secretion, and inducing cervical apoptosis [23]. Biochemically, the NO was synthesised by L-Arginine with the help of NO synthase (NOS) and co-factors [24]. Biologically, the NO causes smooth muscle relaxation, inhibits platelet aggregation and adhesion, and inhibits cell proliferation [25] also the significance of NO as the modulator of uterine blood flow by the pathway of cyclic guanosine monophosphate (cGMP) [26].
The NF-κB reported a regulator of cytokine of pro-inflammatory that implicated as substances that trigger the initiation and process of parturition in humans [27]. The results of this study are consistent with previous studies, where the serum NF-κB levels at post-term pregnancy were lower than NF-κB levels in term pregnancy [28]. The Bivariate analyses to explained the progesterone and NO levels were significant (p < 0.25) and NF-κB is no significant (p > 0.25) it's not included in multivariate analysis. Both progesterone and NF-κB were correlated. Tan (2012) suggested who the progesterone becomes to maintain the chorionic cells from oxidative stress and apoptosis of the cell. Moreover, this hormone possesses anti-inflammatory and inhibits the transcription of NF-κB [29].
This study concluded that The NO would signify used to the variable predictor for detecting of post-term pregnancy (OR 2.026) if linked with the progesterone level in serum of pregnant women (p < 0.05).

Basic Science _______________________________________________________________________________________________________________________________
_______________________________________________________________________________________________________________________________
1732 https://www.id-press.eu/mjms/index
Acknowledgement
The authors thank the Hospital of Padang City and the Laboratory of Biomedical, Faculty of Medicine, Andalas University, Padang, West Sumatera-Indonesia.
References
1. Mandruzzato G, Alfirevic Z, Chervenak F, Gruenebaum A, Heimstad R, Heinonen S, et al. Guidelines for the management of postterm pregnancy. J Perinat Med. 2010; 38(2):111-9. https://doi.org/10.1515/jpm.2010.057 PMid:20156009
2. Galal M, Symonds I, Murray H, Petraglia F, Smith R. Postterm pregnancy Facts Views Vis Obgyn. 2012; 4(3):175-87.
3. Glass HC, Costarino AT, Stayer SA, Brett C, Cladis F, Davis PJ. Outcomes for Extremely Premature Infants. Anesth Analg. 2015; 120(6):1337-51. https://doi.org/10.1213/ANE.0000000000000705 PMid:25988638 PMCid:PMC4438860
4. Research IH. Report of the Indonesia Basic National Health. Annual Review Report. 2010; 1(1):20-45.
5. Mengesha HG, Lerebo WT, Kidanemariam A, Gebrezgiabher G, Berhane Y. Pre-term and post-term births: predictors and implications on neonatal mortality in Northern Ethiopia. BMC Nurs. 2016; 15:48. https://doi.org/10.1186/s12912-016-0170-6 PMid:27499702 PMCid:PMC4974761
6. Aslam HM, Saleem S, Afzal R, Iqbal U, Saleem SM, Shaikh WA. Risk factors of birth asphyxia. Ital J Pediatr. 2014; 40:94. https://doi.org/10.1186/s13052-014-0094-2 PMid:25526846 PMCid:PMC4300075
7. Tollånes MC, Wilcox AJ, Lie RT, Moster D. Familial risk of cerebral palsy: population based cohort study. BMJ .2014; 349:g4294. https://doi.org/10.1136/bmj.g4294 PMid:25028249 PMCid:PMC4099475
8. Caughey AB, Snegovskikh VV, Norwitz ER. Postterm pregnancy: how can we improve outcomes? Obstet Gynecol Surv. 2008; 63(11):715-24. https://doi.org/10.1097/OGX.0b013e318186a9c7 PMid:18928576
9. Schumacher A, Costa SD, Zenclussen AC. Endocrine Factors Modulating Immune Responses in Pregnancy. Front Immunol. 2014; 5:196. https://doi.org/10.3389/fimmu.2014.00196 PMid:24847324 PMCid:PMC4021116
10. Stjernholm-Vladic Y, Stygar D, Mansson C, Masironi B, Akerberg S,Wang H.Factors involved in the inflammatory events of cervical ripening in humans. Reprod Biol Endocrinol. 2004; 2:74. https://doi.org/10.1186/1477-7827-2-74 PMid:15500686 PMCid:PMC534613
11. Liu T, Zhang L, Joo D,Sun SC. NF-κB signaling in inflammation. Signal Transduct Target Ther. 2017; 2:17023. https://doi.org/10.1038/sigtrans.2017.23 PMid:29158945 PMCid:PMC5661633
12. Lawrence T. The Nuclear Factor NF-κB Pathway in Inflammation. Cold Spring Harb Perspect Biol. 2009; 1(6):a001651. https://doi.org/10.1101/cshperspect.a001651 PMid:20457564 PMCid:PMC2882124
13. Zhang C. The role of inflammatory cytokines in endothelial dysfunction. Basic Res Cardiol. 2008; 103(5):398-406. https://doi.org/10.1007/s00395-008-0733-0 PMid:18600364 PMCid:PMC2705866
14. Gani BA, Bachtiar BM, Bachtiar EWB, Wibawan IWT. The ability of IgY to recognize surface proteins of Streptococcus mutans. Dental Journal (Majalah Kedokteran Gigi). 2009; 42(4):189-193. https://doi.org/10.20473/j.djmkg.v42.i4.p189-193
15. Chandra S, Tripathi AK, Mishra S, Amzarul M, Vaish AK. Physiological Changes in Hematological Parameters During Pregnancy
Indian J Hematol Blood Transfus. 2012; 28(3):144-46. https://doi.org/10.1007/s12288-012-0175-6 PMid:23997449 PMCid:PMC3422383
16. Carmichael S, Abrams B, Selvin S. The pattern of maternal weight gain in women with good pregnancy outcomes. Am J Public Health. 1997; 87(12):1984-8. https://doi.org/10.2105/AJPH.87.12.1984 PMid:9431288 PMCid:PMC1381241
17. Oyedeji KO. Bolarinwa AF, Adegoke AO. Valuation Of Antifertility And Teratogenic Effects Of Chromatographic Fractions Of Portulaca Leracea In Male And Female Albino Rats. 2013; 5(3);440-4.
18. Kumar P, Magon N. Hormones in pregnancy. Niger Med J. 2012; 53(4):179-83. https://doi.org/10.4103/0300-1652.107549 PMid:23661874 PMCid:PMC3640235
19. Bhattarai T, Chaudhuri P, Bhattacharya K, Sengupta P. Effect of progesterone supplementation on post-coital unilaterally ovariectomized superovulated mice in relation to implantation and pregnancy. Asian J Pharm Clin Res. 2014; 7(1):29-31.
20. Slattengren AH, Prasad S, Oyola S. Is this pregnancy viable? J Fam Pract. 2013; 62(6):305-16.
21. Kho JV, Chua SS, Dallumal RM, Omar SZ. Medications Used By Pregnant Women: Any Safety Concerns? Int J Pharm Pharm Sci. 2017; 9(5):100-6. https://doi.org/10.22159/ijpps.2017v9i5.16057
22. Pang Y, Dong J, Thomas P. Progesterone increases nitric oxide synthesis in human vascular endothelial cells through activation of membrane progesterone receptor-α. Am J Physiol Endocrinol Metab. 2015; 308(10):E899-911. https://doi.org/10.1152/ajpendo.00527.2014 PMid:25805192
23. Korde Choudhari S, Chaudhary M, Bagde S, Gadbail AR, Joshi V. Nitric oxide and cancer: a review. World J Surg Oncol. 2013; 11:118. https://doi.org/10.1186/1477-7819-11-118 PMid:23718886 PMCid:PMC3669621
24. Feng C. Mechanism of nitric oxide synthase regulation: electron transfer and interdomain interactions. Coord Chem Rev. 2012; 256(3-4):393-411. https://doi.org/10.1016/j.ccr.2011.10.011 PMid:22523434 PMCid:PMC3328867
25. Bani D, Failli P, Bello MG, Thiemermann C, Sacchi TB, Bigazzi M, Masini E. Relaxin activates the L-arginine-nitric oxide pathway in vascular smooth muscle cells in culture. Hypertension. 1998; 31(6):1240-7. https://doi.org/10.1161/01.HYP.31.6.1240 PMid:9622136
26. Shahrokh E, Tehraninejad, Khazei N, Ayati E, Movafegh A, Azimaraghi O. Effect of vaginal sildenafil on in vitro fertilization success rates in women with previous failed in vitro fertilization attempts. Asian J Pharm Clin Res. 2018; 11(6):486-88. https://doi.org/10.22159/ajpcr.2018.v11i6.25645
27. Tak PP, Firestein GS. NF-κB: a key role in inflammatory diseases. J Clin Invest. 2001; 107(1):7-11. https://doi.org/10.1172/JCI11830 PMid:11134171 PMCid:PMC198552
28. Vaughan JE, Walsh SW. Activation of NF-κB in placentas of women with preeclampsia. Hypertens Pregnancy. 2012; 31(2):243-51. https://doi.org/10.3109/10641955.2011.642436 PMid:22380486 PMCid:PMC3542769
29. Tan H, Yi L, Rote NS, Hurd WW, Mesiano S. Progesterone receptor-A and-B have opposite effects on proinflammatory gene expression in human myometrial cells: implications for progesterone actions in human pregnancy and parturition. J Clin Endocrinol Metab. 2012; 97(5):E719-30. https://doi.org/10.1210/jc.2011-3251 PMid:22419721 PMCid:PMC3339884

_______________________________________________________________________________________________________________________________
Open Access Maced J Med Sci. 2019 Jun 15; 7(11):1733-1738. 1733
ID Design Press, Skopje, Republic of Macedonia Open Access Macedonian Journal of Medical Sciences. 2019 Jun 15; 7(11):1733-1738. https://doi.org/10.3889/oamjms.2019.341 eISSN: 1857-9655 Basic Science
Differences in Expression of Inflammatory Mediator in Mucosal and Polyp Tissue between Chronic Rhinosinusitis and Recurrent Chronic Rhinosinusitis Effy Huriyati
1*, Eryati Darwin
2, Yanwirasti Yanwirasti
3, Irza Wahid
4
1Postgraduate Biomedical Science, Faculty of Medicine, Andalas University, Padang, Indonesia;
2Department of Histology,
Faculty of Medicine, Andalas University, Padang Indonesia; 3Department of Anatomy, Faculty of Medicine, Andalas
University, Padang, Indonesia; 4Department of Internal Medicine, Faculty of Medicine, Andalas University, General Hospital
of Dr M. Djamil, Padang, Indonesia
Citation: Huriyati E, Darwin E, Yanwirasti Y, Wahid I. Differences in Expression of Inflammatory Mediator in Mucosal and Polyp Tissue between Chronic Rhinosinusitis and Recurrent Chronic Rhinosinusitis. Open Access Maced J Med Sci. 2019 Jun 15; 7(11):1733-1738. https://doi.org/10.3889/oamjms.2019.341
Keywords: Recurrent CRSwNP; IL-5; IL-8; IL-17A; TGF-β1
*Correspondence: Effy Huriyati. Doctoral Student of Postgraduate Biomedical Science, Faculty of Medicine, Andalas University, Padang, Indonesia. E-mail: [email protected]
Received: 29-Apr-2019; Revised: 19-May-2019; Accepted: 23-May-2019; Online first: 31-May-2019
Copyright: © 2019 Effy Huriyati, Eryati Darwin, Yanwirasti Yanwirasti, Irza Wahid. This is an open-access article distributed under the terms of the Creative Commons Attribution-NonCommercial 4.0 International License (CC BY-NC 4.0)
Funding: This research did not receive any financial support
Competing Interests: The authors have declared that no competing interests exist
Abstract
BACKGROUND: Chronic rhinosinusitis with nasal polyps (CRSwNP) remains a challenging clinical entity with its propensity for recurrence. This disease decreases the patients’ quality of life and creates a high economic burden. An effort to investigate the aetiology of recurrent polyps has to be more alert.
AIM: This study aims to prove the differences in expression of IL-5, IL-8, IL-17A and TGF-β1 in mucosal and polyp tissue between CRSwNP and recurrent CRSwNP and also to determine which expression of cytokines that have the main role in mucosal and polyp tissue in recurrent CRSwNP.
MATERIAL AND METHODS: An observational study was conducted with a comparative cross-sectional design of CRS patients with 15 recurrent CRSwNP and CRSwNP who had never undergone surgery for as many as 15 polyps. Mucosal specimens of nasal polyps are taken by brushing, and polyp tissue specimens are taken during
surgical removal of nasal polyps. Specimens from the polyp mucosa were examined by ELISA while the polyp tissue specimens were carried out immunohistochemistry (IHC).
RESULTS: The result showed that there is a significant difference in IL-5 expression in the polyp mucosal between CRSwNP with recurrent CRSwNP, where expression is higher in recurrent CRSwNP. The expression of IL-8, IL-17 and TGF-β1 were lower in recurrent CRSwNP, but the difference was not significant. In nasal polyp tissue, there is a significant difference in TGF-β1 and IL-8 expression between CRSwNP and recurrent CRSwNP, where the expression of both cytokines is lower in recurrent CRSwNP. Interleukin-5 expression was higher in recurrent CRSwNP than CRSwNP, but the difference was not significant. In the polyps mucosal, IL-5 has the main role in recurrent CRSwNP polyp, whereas TGF-β has the main role in polyp tissue.
CONCLUSION: This study concluded that the expression of IL-5 in the mucosa could be examined with simple techniques like brushing before polypectomy or FESS was performed to determine the possibility of polyps recurrencies.
Introduction
Chronic rhinosinusitis (CRS) is one of the chronic diseases that is often encountered in the community. This disease decreases the quality of life of patients, besides causing economic burdens due to the high cost of treatment [1], [2], [3]. Rinia et al. (2007) stated that the prevalence of nasal polyps in the general population reached 0.5-4.3%. Therefore polyps become one of the most common cases in
chronic upper respiratory tract infections [4]. The prevalence of chronic rhinosinusitis in Europe reaches 19.7% [2]. Rhinosinusitis with polyps often recurrence. Polyps often grow back after surgery, so patients have to experience repeated surgeries. According to Kosem et al., (2010), the rate of recurrence in nasal polyps reaches 10% [5]. Until now, there has been no benchmark for predicting cases that will experience recurrence after polypectomy [6].
Some factors that are thought to underlie the

Basic Science _______________________________________________________________________________________________________________________________
_______________________________________________________________________________________________________________________________
1734 https://www.id-press.eu/mjms/index
occurrence of nasal polyps are genetic factors, allergic factors, irritants and pollutants, the role of bacterial and fungal infections, and anatomical variations in the lateral nasal wall and local immunological balance disorders that cause chronic inflammation [2]. The differences in inflammatory patterns in CRS with polyps (CRSwNP) are, the eosinophilic Th2 inflammation pattern is commonly found in Caucasian races while neutrophilic Th1/Th17 inflammation pattern is found in Asian races [1], [7].
Various factors involved in the pathogenesis of CRSwNP make it challenging in determining the immunological phenotype and management of CRS with polyps where the tendency for recurrence is high. The difficulties in identifying trends in recurrence of CRSwNP occurred due to complex problems and the number of factors involved in CRSwNP. It is necessary to look for markers to be used as predictors in monitoring the possibility of CRSwNP being recurrent and efforts to find methods that are easy and not invasive for taking nasal polyp specimens. This study aimed to prove the differences in expression of IL-5, IL-8, IL-17A and TGF-β1 in mucosal and polyp tissue between CRSwNP and recurrent CRSwNP and also to determine which expression of cytokines that have the main role in mucosal and polyp tissue in recurrent CRSwNP.
Material and Methods
Sample
Samples were obtained from CRSwNP patients who visited the Ear, Nose and Throat (ENT) clinic in the Public Central Hospital Dr M Djamil Padang and several hospitals in West Sumatera on August 2016 until September 2018. There was 15 patient CRSwNP dan 15 patient with recurrent CRSwNP. Before the study, approval of the study was asked of respondents before the operation. Samples were taken from CRSwNP patients aged 18 to 55 years who did not use anti-allergic drugs during the washout period before brushing (chlorpheniramine 3 days, cetirizine, fexofenadine, loratadine, respectively 5 days and 2 weeks for corticosteroids).
Sampling
Brushing was performed on nasal polyps mucosa with the nasoendoscopy in a circular motion by using a modified gynecologic cytology brush. Before brushing the polyp, a cotton tampon containing lidocaine and adrenaline installed with a ratio of 4:1 for 10 minutes on the nasal cavity. Brushing was done on the mucosa of the polyp in a circular motion ten times clockwise. Samples obtained from brushing were inserted into a sterile bottle containing PBS
liquid and immediately taken to the Biomedical laboratory in the Faculty of Medicine, Andalas University and stored at a temperature of -80°C.
Retrieval of nasal polyp tissue is performed during surgical removal of the polyp by FESS (Functional Endoscopy Sinus Surgery). When FESS was performed, polyp tissue samples were put into neutral formalin liquid and immediately taken to the Anatomy Pathology Laboratory of the Andalas University Medical School to make paraffin blocks.
ELISA
In this research, human IL-5, IL-17 and TGF-β1 were used from R&D and human IL-8 from BT lab to examining nasal mucous polyps.
IHC
Immunohistochemical staining techniques using the Labeled Streptavidin-Biotin Complex (LSAB) method were carried out by manual procedure. The staining results of the preparations were measured and calculated using a microscope to assess the expression of IL-5, IL-8, IL-17, and TGF- β1. Positive values are the results of assessments of the brown intensity of epithelium and stroma seen in the light microscope.
Statistical Analysis
We use SPSS program version 17.0.0.0.
Results
Characteristic
In this study, the percentage of males in recurrent CRSwNP was higher than CRSwNP, which was 80%:66.7%, while the percentage of female in CRSwNP was higher than recurrent CRSwNP at 33.3%:20% and statistically the difference was not significant (p > 0.05). The percentage of the male is higher than female, which is 66.7%:33.3% in CRSwNP and 80%:20% in recurrent CRSwNP. The mean age was higher in the recurrent CRSwNP group (41.40 ± 10.23 years) than in the CRSwNP (36.20 ± 11.61 years) and was not significant (p > 0.05).
Table 1: Characteristics of respondents based on gender and age
Characteristics CRSwNP (n = 15) recurrent CRSwNP (n = 15) p
Sex Male
10 (66.7 %)
12 (80%)
0.682
Female 5 (33.3 %) 3 (20%) Age 36.20 ± 11.61 41.40 ± 10.23 0.204

Huriyati et al. Inflammatory Mediator in Mucosal and Polyp Tissue between Chronic Rhinosinusitis and Recurrent Chronic Rhinosinusitis _______________________________________________________________________________________________________________________________
_______________________________________________________________________________________________________________________________
Open Access Maced J Med Sci. 2019 Jun 15; 7(11):1733-1738. 1735
In this study, the mean mucosal IL-5 expression was higher in recurrent CRSwNP (2.75 ± 2.02) than CRSwNP (0.86 ± 0.13), and a statistically significant difference was found (p < 0.05). The mean interleukin-8 mucosal expression was higher in CRSwNP (327.51 ± 33.16) than recurrent CRSwNP (304.35 ± 34.86), but the difference was not statistically significant (p > 0.05). Similar to IL-8, the mean IL-17 expression in the CRSwNP mucosa (26.56 ± 22.07) is higher than the recurrent CRSwNP (20.13 ± 16.78), and statistically, the difference was not significant between CRSwNP and recurrent CRSwNP (p > 0.05). The mean TGF-β1 expression in the polyps mucosa was also higher in CRSwNP (32.40 ± 33.84) than recurrent CRSwNP (24.51 ± 17.03), and the difference was also not significant between the two groups (p > 0.05) (Table 2).
Table 2: Expression of IL-5, IL-8, IL-17, and TGF-β1 in mucosa between CRSwNP and recurrent CRSwNP
Cytokine n CRSwNP recurrent CRSwNP p
Mean ± SD (pg/dl) Mean ± SD (pg/dl)
IL-5 15 0.86 ± 0.13 2.75 ± 2.02 0.003 IL-8 15 327.51 ± 33.16 304.35 ± 34.86 0.073 IL-17 15 26.56 ± 22.07 20.13 ± 16.78 0.418 TGF-β1 15 32.40 ± 33.84 24.51 ± 17.03 0.427
In Table 3, the mean of IL-5 expression in polyp tissue was higher in recurrent CRSwNP (78.80 ± 15.01) than CRSwNP (63.46 ± 27.28), and the difference was not statistically significant (p > 0.05). The mean of IL-8 expression in polyp tissue was found higher in CRSwNP 90.20 ± 14.78) than recurrent CRSwNP (78.33 ± 18.79) and there were significant differences between the two groups (p > 0.05).
Table 3: Differences in the expression of IL-5 IL-8, IL-17, and TGF- β1 tissue between CRSwNP with recurrent CRSwNP
Cytokine n CRSwNP recurrent CRSwNP p
Mean ± SD (per 100 cells) Mean ± SD (per 100 cells)
IL-5 15 63.46 ± 27.28 78.80 ± 15.01 0.067 IL-8 15 90.20 ± 14.78 78.33 ± 18.79 0.014 IL-17 15 89.40 ± 16.48 77.13 ± 29.64 0.274 TGF-β1 15 93.66 ± 7.37 85.33 ± 12.38 0.035
The mean of IL-17 expression in CRSwNP tissue (89.40 ± 16.48) was also higher than recurrent CRSwNP (77.13 ± 29.64) but did not have a significant difference between the two groups (p > 0,05). On tissue, similar to IL-8, the mean TGF-β1 expression was higher in CRSwNP (93.66 ± 7.37) than recurrent CRSwNP (85.33 ± 12.38) and also there were significant differences between CRSwNP and recurrent CRSwNP (p > 0.05).
Table 4: Multivariate cytokine test on the mucosa of recurrent CRSwNP
Cytokine P Exp(B)
Step 1 IL-5 IL-8 IL-17 TGF-β1
0.051 0.091 0.423 0.284
0.000 1.046 1.042 1.032
Step 2 IL-5 IL-8 TGF-β1
0.040 0.102 0.226
0.000 1.044 1.044
Cytokines that have the most role in recurrent CRSwNP
The results of the mucosal analysis found that the cytokine that had the main role in the polyps mucosa in the recurrent CRSwNP was IL-5 (Table 4). Whereas in tissues, based on the analysis, TGF-β1 was the main role in polyp tissue in recurrent CRSwNP was (Table 5).
Table 5: The multivariate cytokine test on the tissue of recurrent CRSwNP
Cytokine P Exp (B)
Step 1 IL-5 IL-8 IL-17 TGF-β1
0.143 0.072 0.819 0.104
0.964 1.060 0.994 1.097
Step 2 IL-5 IL-8 TGF-β1
0.136 0.061 0.102
0.966 1.057 1.097
Step 3 IL-8 TGF-β1
0.073 0.054
1.048 1.106
Discussion
In this study, specimens were taken from mucosal in recurrent CRSwNP and CRSwNP polyps using the brushing technique. In these specimens, cytokine IL-5, IL-8, IL-17 and TGF-β1 expression were examined by ELISA technique. It was found that only IL-5 expression had a significant difference between the mucosal CRSwNP recurrent and CRSwNP (p < 0.05). Polyp tissue specimens were taken during surgical removal of polyps with the FESS technique, and then the IHC examination was carried out.
Figure 1: Description of cell expression that produces cytokines in CRSwNP tissue with 40 X 10 enlargement: a) description of IL-5 expression; b) description of IL-8 expression; c) description of IL-17 expression; d) description of TGF-β1 expression. Red arrows indicate cells that contained positive cytokines

Basic Science _______________________________________________________________________________________________________________________________
_______________________________________________________________________________________________________________________________
1736 https://www.id-press.eu/mjms/index
The results showed that only TGF-β1 and IL-8 had significant differences (p < 0.05) between CRSwNP and CRSwNP recurrent; both expressions were lower in recurrent CRSwNP than CRSwNP.
Figure 2: Description of cell expression that produces cytokines in recurrent CRSwNP tissue with 40X10 enlargement: a) description of IL-5 expression; b) description of IL-8 expression; c) description of IL-17 expression; d) description of TGF-β1 expression. Red arrows indicate cells that contained positive cytokines
Expression of IL-5 was found to be higher in mucosal CRSwNP recurrent (2.75 ± 2.02) than CRSwNP (0.86 ± 0.13) and statistically significant differences (p < 0.05). In polyp tissue, IL-5 expression in CRSwNP recurrent (78.8 ± 15.01) was also higher than CRSwNP (63.46 ± 27.28). Interleukin-5 is a cytokine that plays an important role in the differentiation, development, maturation and chemokine processes of eosinophils [8]. One study state that IL-5 and Eosinophil Cationic protein (ECP) is eosinophilic type inflammatory biomarkers that can be used as predictors and diagnostics in the future [9]. Research on the relationship of IL-5 and eosinophils with recurrence of nasal polyps has been carried out. Wei et al., (2018) conducted a multivariate analysis of recurrent CRSwNP in China obtaining IL-5 expression in polyp tissue as well as higher recurrence of CRSwNP than non-recurrent polyp CRS and was statistically significant (p = 0.001) [10]. Van Zele et al., (2014) obtained IL-5 expression which was also higher in recurrent CRSwNP (482.8pg/ml) than non-recurrent polyp CRS (144.7 pg/ml) and was statistically significant (p < 0.05). Based on their studies, it was found that the type of Th2 inflammation and eosinophilic inflammation were the main risk factors for recurrence [1]. In another study also reported that eosinophil counts by histopathological examination could be used as an easy method to do as a predictor of postoperative nasal polyps recurrence [11]. In this study, the expression of tissue IL-5 in recurrent CRSwNP was higher than CRSwNP
because IL-5 is a cytokine that plays an important role in the differentiation, development, maturation and chemokines of eosinophils where eosinophils are closely related to the recurrence of nasal polyps.
This study found that the mean mucosal IL-8 expression was higher in CRSwNP (327.51 ± 33.16) than recurrent CRSwNP (304.35 ± 34.86), but the differences in IL-8 expression were not statistically significant (p > 0.05). In the polyp tissue, it was also found that the mean IL-8 expression was higher in CRSwNP (90.20 ± 14.78) than in the recurrent CRSwNP (78.33 ± 18.79) and had a significant relationship (p < 0.05).In another study conducted by Wei et al., (2018) it was found that the mean IL-8 was also higher in CRSwNP (5080.1 pg/ml) than recurrent CRSwNP (2481.9 pg/ml) and was statistically significant [10]. Interleukin-8 is produced by monocytes, lymphocytes, endothelial granulocytes. Interleukin-8 is an inflammatory cytokine that has strong neutrophil chemotaxis activity and can induce degranulation, respiratory burst, adherence, deformation, Ca2+ mobilisation and increased regulation of neutrophils CD11b/CD18 [12]. Interleukin-8 will stimulate deformation and degranulation of neutrophils, thus releasing elastase, lactoferrin, fibronectin. Also, IL-8 can stimulate transendothelial neutrophil migration by increasing regulation of α2 integrins [13]. In addition to neutrophils, IL-8 is also a very important chemokine for eosinophils in all types of CRS and nasal polyps. Interleukin-8 is secreted by the ductal cells of the glandular and epithelial cells, attracting neutrophils to the mucosa [14], [15]. In this study, IL-8 expression in CRSwNP was higher than recurrent CRSwNP, and the difference was significant because IL-8 is a neutrophilic chemoactrant while recurrent CRSwNP is more identical to eosinophilic polyps.
The results of the ELISA examination of the polyp mucosa in this study obtained an average Interleukin-17 expression in CRSwNP (26.56 ± 22.07) was higher than the recurrent CRSwNP (20,13 ± 16,78), and the difference was not significant (p = 0.41). In nasal polyp tissue, the mean IL-17 expression was also higher in CRSwNP (89.40 ± 16.48) than recurrent CRSwNP (77.13 ± 29.64). Van Zele et al. (2014) conducted a cohort study comparing the expression of IL-17 between non-recurrent CRSwNP and recurrent CRSwNP. The results showed that IL-17 expression in CRSwNP was also higher than recurrent CRSwNP, and there were no significant differences between the two groups (p = 0.202). Van Zele et al., (2014) explained that induction of IL-17 is associated with a decreasing in the expression of IL-5 and ECP which means that it decreases eosinophilic inflammation while IL-17 can modulate life and prolong neutrophil life by decreasing neutrophil apoptosis. Th17 cells through IL-17 induce secretion of IL-6 and IL-8 in fibroblast, endothelial and epithelial cells (1). Jiang et al., (2011) also reported that there were no significant differences in

Huriyati et al. Inflammatory Mediator in Mucosal and Polyp Tissue between Chronic Rhinosinusitis and Recurrent Chronic Rhinosinusitis _______________________________________________________________________________________________________________________________
_______________________________________________________________________________________________________________________________
Open Access Maced J Med Sci. 2019 Jun 15; 7(11):1733-1738. 1737
expression of IL- 17 between CRSwNP type eosinophilic and non-eosinophilic (p > 0.05) and found that IL-17 affected the growth of nasal polyps with thickening of lamina basal cells and glandular hyperplasia [16]. Wei et al., (2018), in their study, also found there was no significant difference in IL-17 expression between CRSwNP and recurrent CRSwNP [10]. In this study, it can be concluded that IL-17 has no effect on the recurrence of CRSwNP but affects the growth of nasal polyps by extending the life of neutrophils, thickening of lamina basal cells and glandular hyperplasia.
On the polyps mucosa, the mean TGF-β1 expression was also higher in CRSwNP (32.40 ± 33.84) than in recurrent CRSwNP (24.51 ± 17.03), and there were no significant differences between these two group (p > 0,05). Transforming Growth Factor-β1 expression was higher in CRSwNP (93.66 ± 7.37) than recurrent CRSwNP (85.33 ± 12.38) in nasal polyp tissue, and there were statistically significant differences between the two groups (p < 0.05). Transforming Growth Factor Beta1 is a mediator associated with tissue remodelling. Physiologically TGF-β1 is a counter-regulatory cytokine against inflammation and initiates the process of repair and formation of fibrosis [17]. Transforming Growth Factor Beta1 is the main regulator of the immune system as a basic role in the production and secretion of the extra cellular matrix (ECM) and fibrosis molecules [18]. Other theories speculate that TGF-β1 reduce the effects of the proliferation of growth factors, such as platelet-derived growth factor (PDGF) and vascular endothelial growth factor (VEGF), which controls the proliferation of epithelial cells of nasal polyps, so that reduced the expression of TGF-β1 or inactivation of receptors of TGF-β1, therefore can explain the hyperproliferation abnormalities [19]. Van Zele reported there was no significant difference in TGF-β1 expression between recurrent and non-recurrent polyps. This explains that remodelling factors only have a role at the beginning of the development of nasal polyps but subsequently do not affect the occurrence of recurrence and prognosis of the disease [1]. In this study, it was found that TGF-β1 tissue expression in recurrent CRSwNP was lower than CRSwNP, and the difference was statistically significant. It is explained there is an imbalance between fibrinolysis and fibrinogenesis, reduced effect of proliferative inhibition by TGF-β1 so that the lower expression of TGF-β1 in tissues can predict recurrence in nasal polyps.
Based on the results of multivariate analysis, it was found that the cytokine had the main role in CRS polyp recurrence on the ELISA examination taken from the mucosal polyp was IL-5 (p < 0.05), whereas from the IHC examination was TGF-β1. In the mucosa, the cytokine that has the main role in recurrence is IL-5, where IL-5 is an interleukin that is important for the differentiation, maturation and survival of eosinophils. The increasing of IL-5 shows a
predominant T helper 2 (Th2) response, which increases infiltration of inflammatory cells, especially eosinophil [20]. Lou (2018), reported that IL-5 is an eosinophilic type of inflammatory biomarker that can be used as a predictor and diagnostics in the future [9]. Eosinophilic inflammation in CRS polyp has been widely studied as a positive predictor of nasal polyps recurrence [15], [21], [22], [23].
Thus, it can be concluded that the examination of the expression of IL-5 in the mucosa with simple techniques such as brushing in this study before polypectomy or FESS in CRSwNP can be used to determine the possibility of polyps currencies.
References
1. Van Zele T, Holtappels G, Gevaert P, Bachert C. Differences in initial immunoprofiles between recurrent and nonrecurrent chronic rhinosinusitis with nasal polyps. American journal of rhinology & allergy. 2014; 28(3):192-8. https://doi.org/10.2500/ajra.2014.28.4033 PMid:24980230
2. Tomassen P, Van Zele T, Zhang N, Perez-Novo C, Van Bruaene N, Gevaert P, et al. Pathophysiology of chronic rhinosinusitis. Proceedings of the American Thoracic Society. 2011; 8(1):115-20. https://doi.org/10.1513/pats.201005-036RN PMid:21364229
3. Eloy P, Poirrier AL, De Dorlodot C, Van Zele T, Watelet JB, Bertrand B. Actual concepts in rhinosinusitis: a review of clinical presentations, inflammatory pathways, cytokine profiles, remodeling, and management. Current allergy and asthma reports. 2011; 11(2):146-62. https://doi.org/10.1007/s11882-011-0180-0 PMid:21274665
4. Rinia AB, Kostamo K, Ebbens FA, van Drunen CM, Fokkens WJ. Nasal polyposis: a cellular-based approach to answering questions. Allergy. 2007; 62(4):348-58. https://doi.org/10.1111/j.1398-9995.2007.01323.x PMid:17362244
5. Kosem M, Bulut G, Kaya Z. Analysis of Ki-67 Immunoreactivity in Recurring and Nonrecurring Nasal Polyps. Journal of Otolaryngology-Head & Neck Surgery. 2010; 39(4):464-7.
6. Yeo NK, Eom DW, Oh MY, Lim HW, Song YJ. Expression of matrix metalloproteinase 2 and 9 and tissue inhibitor of metalloproteinase 1 in nonrecurrent vs recurrent nasal polyps. Annals of allergy, asthma & immunology : official publication of the American College of Allergy, Asthma, & Immunology. 2013; 111(3):205-10. https://doi.org/10.1016/j.anai.2013.06.023 PMid:23987197
7. Bachert C, Pawankar R, Zhang L, Bunnag C, Fokkens WJ, Hamilos DL, et al. ICON: chronic rhinosinusitis. World Allergy Organization Journal. 2014; 7(25):2-28. https://doi.org/10.1186/1939-4551-7-25 PMid:25379119 PMCid:PMC4213581
8. Pawankar R, Nonaka M, Satoru Masuno a, Kimura S. Nasal Polyposis. Current Concepts on the Pathomechanisms of Chronic Rhinosinusitis and Nasal Polyps. Berlin Heidelberg: Springer, 2010:185-8. https://doi.org/10.1007/978-3-642-11412-0_21
9. Lou H, Zhang N, Bachert C, Zhang L. Highlights of eosinophilic chronic rhinosinusitis with nasal polyps in definition, prognosis, and advancement. International forum of allergy & rhinology. 2018; 8(11):1218-25. https://doi.org/10.1002/alr.22214 PMid:30296011 PMCid:PMC6282610
10. Wei B, Liu F, Zhang J, Liu Y, Du J, Liu S, et al. Multivariate analysis of inflammatory endotypes in recurrent nasal polyposis in a Chinese population. Rhinology. 2018:216-26. https://doi.org/10.4193/Rhin17.240 PMid:29785413

Basic Science _______________________________________________________________________________________________________________________________
_______________________________________________________________________________________________________________________________
1738 https://www.id-press.eu/mjms/index
11. Tosun F, Arslan HH, Karslioglu Y, Deveci MS, Durmaz A. Relationship between postoperative recurrence rate and eosinophil density of nasal polyps. Annals of Otology, Rhinology & Laryngology. 2010; 119(7):455-9. https://doi.org/10.1177/000348941011900705 PMid:20734966
12. Suzuki H, Ikedab K. Mode of Action of Long-Term Low-Dose Macrolide Therapy for Chronic Sinusitis in the Light of Neutrophil Recruitment. Current Drug Targets - Inflammation & Allergy. 2002; 1(1):117-26. https://doi.org/10.2174/1568010023344832
13. Wen W, Liu W, Zhang L, Bai J, Fan Y, Xia W, et al. Increased neutrophilia in nasal polyps reduces the response to oral corticosteroid therapy. The Journal of allergy and clinical immunology. 2012; 129(6):1522-8 e5. https://doi.org/10.1016/j.jaci.2012.01.079 PMid:22460066
14. Perić A, Vojvodić D, Radulović V. Cytokine Profiles in Nasal Fluid in Patients with Nasal Polyps: A Flow Cytometric Study. Journal of Medical Biochemistry. 2010; 29(1):28-33. https://doi.org/10.2478/v10011-010-0003-1
15. Ikeda K, Shiozawa A, Ono N, Kusunoki T, Hirotsu M, Homma H, et al. Subclassification of chronic rhinosinusitis with nasal polyp based on eosinophil and neutrophil. The Laryngoscope. 2013; 123(11):E1-9. https://doi.org/10.1002/lary.24154 PMid:23670893
16. Jiang XD, Li GY, Li L, Dong Z, Zhu DD. The characterization of IL-17A expression in patients with chronic rhinosinusitis with nasal polyps. American journal of rhinology & allergy. 2011; 25(5):e171-5. https://doi.org/10.2500/ajra.2011.25.3645 PMid:22186234
17. Yang Y, Zhang N, Lan F, Van Crombruggen K, Fang L, Hu G, et al. Transforming growth factor-beta 1 pathways in inflammatory airway diseases. Allergy. 2014; 69(6):699-707. https://doi.org/10.1111/all.12403 PMid:24750111
18. Balsalobre L, Pezato R, Perez C-N, Alve M, Santos R, Bachert C, et al. Epithelium and stroma from nasal polyp mucosa exhibits
inverse expression of TGF-β1 as compared with healthy nasal mucosa. Journal of Otolaryngology - Head and Neck Surgery 2013; 42(29):2-5. https://doi.org/10.1186/1916-0216-42-29 PMid:23663486 PMCid:PMC3651223
19. irschberg A, o ku ti A, Darvas , ris tina A, a bor Rps, Andra s . The Pathogenesis of Nasal Polyposis by Immunoglobulin E and Interleukin-5 Is Completed by Transforming Growth Factor beta1. The Laryngoscope. 2003; 113:120-4. https://doi.org/10.1097/00005537-200301000-00022 PMid:12514394
20. Van Crombruggen K, Zhang N, Gevaert P, Tomassen P, Bachert C. Pathogenesis of chronic rhinosinusitis: inflammation. The Journal of allergy and clinical immunology. 2011; 128(4):728-32. https://doi.org/10.1016/j.jaci.2011.07.049 PMid:21868076
21. Matsuwaki Y, Ookushi T, Asaka D, Mori E, Nakajima T, Yoshida T, et al. Chronic rhinosinusitis: risk factors for the recurrence of chronic rhinosinusitis based on 5-year follow-up after endoscopic sinus surgery. International archives of allergy and immunology. 2008; 146 Suppl 1:77-81. https://doi.org/10.1159/000126066 PMid:18504412
22. Nakayama T, Yoshikawa M, Asaka D, Okushi T, Matsuwaki Y, Otori N, et al. Mucosal eosinophilia and recurrence of nasal polyps - new classification of chronic rhinosinusitis. Rhinology. 2011; 49(4):392-6.
23. Tecimer SH, Kasapoglu F, Demir UL, Ozmen OA, Coskun H, Basut O. Correlation between clinical findings and eosinophil/neutrophil ratio in patients with nasal polyps. European Archives of Oto-Rhino-Laryngology. 2014; 272(4):915-21. https://doi.org/10.1007/s00405-014-3174-4 PMid:25007735

_______________________________________________________________________________________________________________________________
Open Access Maced J Med Sci. 2019 Jun 15; 7(11):1739-1743. 1739
ID Design Press, Skopje, Republic of Macedonia Open Access Macedonian Journal of Medical Sciences. 2019 Jun 15; 7(11):1739-1743. https://doi.org/10.3889/oamjms.2019.469 eISSN: 1857-9655 Basic Science
The Protective Effect of Nitroglycerin, N-Acetyl Cysteine and Metoprolol in CCL4 Induced Animal Model of Acute Liver Injury Faruk H. Al-Jawad
1*, Zaid Al-Attar
2, Muayyad S. Abbood
3
1Department of Pharmacology & Therapeutics, Al-Nahrain College of Medicine, Al-Nahrain University, Baghdad, Iraq;
2Department of Pharmacology, Al-Kindy College of Medicine, University of Baghdad, Baghdad, Iraq;
3The High Institute for
Infertility Diagnosis and Assisted Reproductive Technologies, Al-Nahrain University, Baghdad, Iraq
Citation: Al-Jawad FH, Al-Attar Z, Abbood, MS. The Protective Effect of Nitroglycerin, N-Acetyl Cysteine and Metoprolol in CCL4 Induced Animal Model of Acute Liver Injury. Open Access Maced J Med Sci. 2019 Jun 15; 7(11):1739-1743. https://doi.org/10.3889/oamjms.2019.469
Keywords: Hepatoprotection; Metoprolol; N-acetyl cysteine; Nitroglycerin
*Correspondence: Faruk H. Al-Jawad. Department of Pharmacology & Therapeutics, Al-Nahrain College of Medicine, Al-Nahrain University, Baghdad, Iraq. E-mail: [email protected]
Received: 25-Mar-2019; Revised: 27-May-2019; Accepted: 28-May-2019; Online first: 12-Jun-2019
Copyright: © 2019 Faruk H. Al-Jawad, Zaid Al-Attar, Muayyad S. Abbood. This is an open-access article distributed under the terms of the Creative Commons Attribution-NonCommercial 4.0 International License (CC BY-NC 4.0)
Funding: This research did not receive any financial support
Competing Interests: The authors have declared that no competing interests exist
Abstract
OBJECTIVE: The current study was designed to determine the hepatoprotective effect of well-known drugs. Nitroglycerin, N-acetyl cysteine and Metoprolol in acute liver injury induced by CCL4. The antioxidant effects of b-blockers, especially carvedilol, have been described by several investigators. However, for metoprolol, the effect is a bit query as there is only one in-vitro study showing a little hepatoprotective effect. Thus, it is worthy to re-study the hepatoprotective effect of metoprolol.
AIM: To explore the possible hepatoprotective effect of Nitroglycerin, N-acetyl cysteine and Metoprolol Tartrate
MATERIAL AND METHODS: The normal serum values of ALP, AST, ALT, TSB and TSP were determined in 35 healthy rabbits allocated to 5 groups before CCL4 induction and at three occasions 24, 72, 120 hrs after induction by CCL4 and treatment with the tested drugs: Nitroglycerin, N-acetyl cysteine and Metoprolol for five successive days.
RESULTS: Showed significant decrease in serum levels of ALP, AST, ALT and TSB with a significant increase in TSP level of all the tested drugs measured at 120 hrs compared with the control and their levels measured at 24, 72 hrs.
CONCLUSION: All the tested drugs proved in having a hepatoprotective effect when they are given orally to animals. The histopathological sections of the liver tissue supported the real effect of these drugs in the management of ALI.
Introduction
Acute liver injury (ALI), is a clinical state that results from severe and extensive damage of liver tissue with reduced cell mass and blood flow. It is associated with an increase in serum alanine aminotransferase (ALT), aspartate aminotransferase (AST), alkaline phosphatase (ALT), and total serum bilirubin (TSB) [1], [2], [3].
It is a serious condition caused by different agents toxins, drug intoxication, and other factors [4], [5]. It is characterised by rapid deterioration of the liver cells function, resulting in hepatic encephalopathy & coagulopathy in the liver of normal subjects [6].
Carbon tetrachloride (CCL4), is a famous hepatotoxic agent that used orally or intraperitoneally
in animals (especially in rodents) for the induction of ALI due to the formation of free radicals mediated lipid peroxidation [7].
Carbon tetrachloride (CCL4) is a well-known hepato-toxicant via causing oxidative stress-mediated liver injury and has a similar mechanism in animals and humans [8].
CCL4 toxicity results from its bioactivation to the highly toxic reactive trichloromethyl peroxyl radical that subsequently attack the polyunsaturated fatty acids of cell membranes to propagate a chain reaction resulting in peroxidative decomposition of cytoplasmic membrane lipids [9], leading to progression of liver damage with subsequent hepatocellular carcinoma [10].
A single dose of CCL4 causes centrizonal necrosis and steatosis [11], while prolonged

Basic Science _______________________________________________________________________________________________________________________________
_______________________________________________________________________________________________________________________________
1740 https://www.id-press.eu/mjms/index
administration causes liver fibrosis, cirrhosis, and hepatocellular carcinoma [12]. CCL4 affects hepatocytes directly by altering the permeability of the plasma, mitochondrial, and lysosomal membranes. Highly reactive free radicals are also produced by the mixed function oxidase system of CYP2E1 in hepatocytes, causing severe centrilobular necrosis [13], [14]. This model has been used extensively to examine the pathogenesis of cirrhosis. Liver fibrosis is the pathologic result of ongoing chronic inflammatory liver diseases that is characterised by hepatic stellate cell (HSC) proliferation and differentiation to myofibroblast-like cells, which deposit collagen and extracellular matrix [15].
Several familiar drugs had been proved in having hepatoprotective activity against CCL4 induced model of ALI [16]. It is interesting to explore the possible hepatoprotective effect of Nitroglycerin, N-acetyl cysteine and Metoprolol Tartrate in the current study.
Material and Methods
Chemicals
All chemicals used are of analytic grades. CCL4 was supplied by Merck-Germany as a pause liquid. Nitroglycerin by Amrit medical center-Syria, N-acetyl cysteine powder from Cimex AG Ltd-Switzerland, Metoprolol tartrate from Al Parma, Barn- staple. The UK. The kits for the estimation of ALP, AST, ALT was purchased from BioMérieux- France while that for TSB & TSP from Randox-England.
Animals
Thirty-five healthy domestic rabbits weighing 700-800 gm were used in the present study. They were supplied by the animal house of Pharmacy College. Animals were housed in separated cages under good conditions of 28°C with 12 hrs of the light/dark cycle. They were fed standard oxoid pellets and were given water ad libitum.
The study was conducted according to the animal ethics committee of Al-Nahrain College of Medicine (approval number: 2016/24156). The rabbits were normally allocated to five groups. They were given a single daily dose of the following drugs for five successive days at 8.00 am.
Group-1: (control), received 3 ml of distilled water orally and without CCL4 administration.
Group-2: (drug control), received 3 ml of distilled water orally.
Group-3: received Nitroglycerin 1 mg/kg orally.
Group-4: received N-acetyl cysteine 275 mg/kg orally.
Group-5: received Metoprolol 7 mg/kg orally.
The doses of Nitroglycerin, N-acetyl cysteine and Metoprolol tartrate had been chosen after many trials in a pilot study.
At 9.00 a.m. on the first day, CCL4 was given to animals of groups 2, 3, 4 and 5 in a dose of 1 mg/kg orally for induction of ALI. Blood samples were collected from marginal ear vein of the rabbits of all groups for biochemical analysis of serum AST, ALT, ALP, TSB and TSP at three occasions, 24, 72, 120 hrs using spectrophotometer method [17] for comparison between the value of these results.
Later on, all the rabbits were sacrificed under light anaesthesia of Diethyl ether (ether) to take specimens of the liver. The histopathological examination was carried out to check the microscopic changes in the liver tissue, using a polarised microscope after fixating the sections in 10% formalin for 48 hrs & staining with hematoxylin & eosin [18].
Statistical analysis
The obtained results were expressed as means ± SEM. The difference among means has been analysed by students t-test using SPSS version 12. P values < 0.05 were considered to be significant.
Results
Administration of CCL4 to the rabbits in the group -2 produced a marked increase in serum AST, ALT, ALP &TSB levels with a decrease in TSP level compared with normal control (group-1). Both nitroglycerine (group-3) & N-acetylcysteine (group-4) revealed significant reduction in serum ALP, AST, ALT & TSB levels with significant elevation of TSP level when compared with the control (group-2) & their levels at 24, 72, 120 hrs. N-acetyl cysteine (NAC) was more potent than nitroglycerine in improving hepatic function test significantly especially ALT, AST & TSP with values 30.17 ± 3.46 , 29.67 ± 3.51 and 30.83 ± 2.41 and 5.03 ± 0.16 respectively for nitroglycerin while nitroglycerin was more potent in changing ALP and TSB significantly than NAC with values 44.45 ± 3.3 ,11.3 ± 0.28 respectively versus 48.17 ± 4.05, 11.6 ± 0.21 for NAC respectively measured at 120 hr. Metoprolol showed a significant decrease of AST at different occasions in comparison with the drug control while serum ALT, ALP levels significantly decreased at 24 hr p < 0.05 in comparison with 72, and 120 hr.

Al-Jawad et al. Protective Effect of Nitroglycerin, N-Acetyl Cysteine and Metoprolol in CCL4 Induced Animal Model of Acute Liver Injury _______________________________________________________________________________________________________________________________
_______________________________________________________________________________________________________________________________
Open Access Maced J Med Sci. 2019 Jun 15; 7(11):1739-1743. 1741
Table-1 Serum levels of ALT, AST, ALP with TSB & TSP of tested drugs: nitroglycerine, NAC, metoprolol tartrate after induction of ALI by CCL4 measured at 24, 72 & 120 hrs
Group Dose Duration
(hr) S. ALT U/L S. AST U/L S. ALP U/L TSB Umol/ L TSP g/dl
Normal control
23.72±0.94 23.38±1.38 49.03±3.23 11.27±0.61 5.58±0.11
CCL4 alone
1ml/Kg
24hr 133.32±2.72a 208.45±3.73a 206.35±3.3a 30.57±1.21a 4.3±0.23a
72hr 115.12±4.76 b 194.38±5.15 a 204.05±4.25a 26.70±1.57ab 4.60±0.17a
120hr 97.83±3.97b 146.52±6.15b 189.98±5.21a 20.13±1.56a 4.58±0.16a
Nitro-glycerine
1ml/Kg
24hr 92.17±1.17a 144.17±2.21a 126.83±2.80a 14.38±0.35a 4.45±0.57a
72hr 78.50±4.02b 108.50±6.84b 44±3.87b 13.38±0.25b 5.03±0.08b
120hr 40.42±3.10c 30.83±2.41c 44.45±3.30b 11.30±0.28c 5.03±0.16b
N-acetyl cysteine
275mg/kg
24hr 82.17±4.47a 118.17±4.94a 109.17±7.35a 13.73±0.40a 4.85±0.89a
72hr 65.67±2.62b 84.67±4.41b 62.83±4.05b 11.77±0.30b 5.12±0.79ab
120hr 30.17±3.46c 29.67±3.51c 48.17±4.05c 11.60±0.31b 5.28±0.13b
Metoprolol tartrate
7mg/kg
24hr 84.76±4.70a 102.53±2.12a 132.78±7.71a 13.62±0.68a 4.70±0.97a
72hr 64.47±2.90b 93.87±1.83b 105.77±3.48b 12.30±0.38a 4.87±0.72a
120hr 64.40±2.27b 85.70±2.45c 96.30±4b 11.58±0.49a 4.83±0.13a
Same letters mean non-significant lowering effect at (P> 0.05); -Different letters mean significant lowering effect at (P< 0.05).
Histopathological studies of liver sections supported the results obtained from serum enzymes assays, which demonstrated the normal architecture in rabbits of Group-1 (Figure 1).
Figure 1: Normal rabbit liver section showing hepatocyte architecture with normal lobular appearance (40X, H&E stain)
Whereas the liver sections of rabbits in group-2 showed a total loss of hepatic architecture with massive fatty changes, intense necrosis, congestion and infiltration of the lymphocytes around the central vein (Figure 2).
Figure 2: Liver section after administration of CCL4 showing massive necrosis, fatty changes, congestion and lymphocyte infiltration (40X, H&E stain)
The liver sections in rabbits of Group 3, 4 and 5 showed a more or less normal lobular pattern with a mild degree of congestion, fatty changes and mild lymphocytes infiltration with minimal necrosis or no necrosis indicating the hepatoprotective effect of nitroglycerin NAC & metoprolol tartrate (Figures 3A,
3B, and 3C).
A)
B)
C)
Figure 3: 3A) Liver section after CCL4 and nitroglycerine administration showing mild to moderate fatty changes, congestion & minimal necrosis (40X, H&E stain); 3B) Liver section after CCL4 and N-acetyl cysteine administration showing very minimal fatty changes with congestion and minimal necrosis (40X, H&E stain); 3C) Liver section after CCL4 and metoprolol tartrate administration showing severe fatty changes, mild congestion with multifocal hepatocellular necrosis (40X, H&E stain)
Discussion
The hepatotoxicity of CCL4 is well known for the induction of ALI in the experimental animal model. CCL4 is biotransformed in the cytochrome P-450 system to its metabolite trichloro-methyl free radical (ccl3) which in the presence of O2 forms trichloro- methyl-peroxyl free radical (ccl3O2 that attacks lipid of endoplasmic reticulum, eliciting lipid peroxidation with the leakage of hepatocellular enzymes AST, ALT and ALP in the serum causing a significant increase in

Basic Science _______________________________________________________________________________________________________________________________
_______________________________________________________________________________________________________________________________
1742 https://www.id-press.eu/mjms/index
TSB and a decrease in TSP [18]. The results of the drug control (Group-2) in the current study are compatible with the results of others [19], [20] who demonstrated that changes of CCL4 at day one might correspond to liver intoxication then the changes decrease at day four due to the normal physiology of liver regeneration [21].
Administration of nitroglycerin, which is an effective vasodilator drug in the treatment of angina pectoris (Group-3) produced significant positive results in improving ALI induced by CCL4. The results were more evident when given in a dose-dependent manner [22]. Nitroglycerin is a member of organic nitrate with antioxidant activity [23]. It causes the release of nitric oxide (NO), thus the hepatoprotective effect of the drug attributed to the effect of NO inactivation of guanylyl cyclase leading to the synthesis of CAMP (T3) [24]. Nitric oxide proved in having antiapoptotic activity in the hepatocytes. It has been shown in the following study to ameliorate the rise of ALT, AST and improve the histopathological changes that were induced by CCL4 administration [25], [26].
N-acetyl cysteine (NAC) is a mucolytic agent that reduces the viscosity of secretions & used in paracetamol poisoning (Group-4) [27]. NAC has an antioxidant and anti-inflammatory effect [28] when used in vivo & in vitro. It is a source of sulfhydryl group that indirectly increase GSH supply for glutathione peroxidase & directly reacts with reactive oxygen species [29].
The results of NAC in the current study were similar to the results of others [30] who used NAC against liver damage induced by methotrexate causing a decrease in GSH level & superoxide dismutase and catalase activity & increase in malondialdehyde level. Moreover, N-acetyl cysteine has been shown in previous studies to improve the paracetamol and phenacetin induced hepatic and blood, biochemical, and histopathological disturbances. It has an antioxidant and hepatoprotective efficacy against the drug-induced liver injury [31].
Metoprolol tartrate is a selective B1 adrenoceptor blocking drug (Group-5) produces a negative chronotropic & inotropic effect and can lower HDL level used in prophylaxis of hypertension and angina pectoris [32]. The antioxidant effect of metoprolol in vitro has been studied and described previously [1]. The antioxidant properties of metoprolol in vivo are a little bit query as there is only one study showing a little hepatoprotective effect [2]. Many drugs with putative antioxidant effects require high concentration or show antioxidant effects only under in vitro conditions. Thus, the real contribution of the putative antioxidant effects of metoprolol to its
efficacy as a hepatoprotective agent was explored in our study. This is a very important issue because this may provide a valuable contribution for the final
healing outcome.
In conclusion, nitroglycerine, N-acetyl cysteine & metoprolol tartrate had proved in having a hepatoprotective effect by increasing the normal hepatic function & enhancing the biodefense of the liver tissue against the oxidative damage produced by CCL4 administration.
Acknowledgement
The authors would like to acknowledge Al-Nahrain College of Medicine for the provided support.
References
1. Gomes A, Costa D, Lima JL, Fernandes E. Antioxidant activity of beta-blockers: an effect mediated by scavenging reactive oxygen and nitrogen species? Bioorganic & medicinal chemistry. 2006; 14(13):4568-77. https://doi.org/10.1016/j.bmc.2006.02.023 PMid:16510286
2. Zubairi M, Ahmed J, Al-Haroon S. Effect of adrenergic blockers, carvedilol, prazosin, metoprolol and combination of prazosin and metoprolol on paracetamol-induced hepatotoxicity in rabbits. Indian Journal of Pharmacology. 2014; 46(6):644-8. https://doi.org/10.4103/0253-7613.144937 PMid:25538338 PMCid:PMC4264082
3. Sabate M, Ibanez L, Perez E, Vidal X, Buti M, Xiol X, Mas A, Guarner C, Forne M, Sola R, Castellote J. Risk of acute liver injury associated with the use of drugs: a multicentre population survey. Alimentary pharmacology & therapeutics. 2007; 25(12):1401-9. https://doi.org/10.1111/j.1365-2036.2007.03338.x PMid:17539979
4. Al-Attar Z. Characterisation of drug-specific T-cell responses in hypersensitive patients and healthy donors: University of Liverpool; 2016
5. Sherlock S, Dooley J. Diseases of the Liver and Biliary System: 11th ed. Italy: Blackwell Science, 2002:111-23. https://doi.org/10.1002/9780470986820
6. Polson J, Lee WM. AASLD position paper: the management of acute liver failure. Hepatology (Baltimore, Md). 2005; 41(5):1179-97. https://doi.org/10.1002/hep.20703 PMid:15841455
7. Zhen MC, Wang Q, Huang XH, Cao LQ, Chen XL, Sun K, et al. Green tea polyphenol epigallocatechin-3-gallate inhibits oxidative damage and preventive effects on carbon tetrachloride-induced hepatic fibrosis. The Journal of nutritional biochemistry. 2007; 18(12):795-805. https://doi.org/10.1016/j.jnutbio.2006.12.016 PMid:17481882
8. Manubolu M, Goodla L, Ravilla S, Thanasekaran J, Dutta P, Malmlof K, et al. Protective effect of Actiniopteris radiata (Sw.) Link. against CCl(4) induced oxidative stress in albino rats. Journal of ethnopharmacology. 2014; 153(3):744-52. https://doi.org/10.1016/j.jep.2014.03.040 PMid:24680994
9. Plaa GL. Chlorinated methanes and liver injury: highlights of the past 50 years. Annual review of pharmacology and toxicology. 2000; 40:42-65. https://doi.org/10.1146/annurev.pharmtox.40.1.43 PMid:10836127
10. Nogueira CW, Borges LP, Souza AC. Oral administration of diphenyl diselenide potentiates hepatotoxicity induced by carbon tetrachloride in rats. Journal of applied toxicology : JAT. 2009;

Al-Jawad et al. Protective Effect of Nitroglycerin, N-Acetyl Cysteine and Metoprolol in CCL4 Induced Animal Model of Acute Liver Injury _______________________________________________________________________________________________________________________________
_______________________________________________________________________________________________________________________________
Open Access Maced J Med Sci. 2019 Jun 15; 7(11):1739-1743. 1743
29(2):156-64. https://doi.org/10.1002/jat.1394 PMid:18989868
11. Pierce RA, Glaug MR, Greco RS, Mackenzie JW, Boyd CD, Deak SB. Increased procollagen mRNA levels in carbon tetrachloride-induced liver fibrosis in rats. The Journal of biological chemistry. 1987; 262(4):1652-8.
12. Perez Tamayo R. Is cirrhosis of the liver experimentally produced by CCl4 and adequate model of human cirrhosis? Hepatology (Baltimore, Md). 1983; 3(1):112-20. https://doi.org/10.1002/hep.1840030118
13. Shi J, Aisaki K, Ikawa Y, Wake K. Evidence of hepatocyte apoptosis in rat liver after the administration of carbon tetrachloride. The American journal of pathology. 1998; 153(2):515-25. https://doi.org/10.1016/S0002-9440(10)65594-0
14. Manibusan MK, Odin M, Eastmond DA. Postulated carbon tetrachloride mode of action: a review. Journal of environmental science and health Part C, Environmental carcinogenesis & ecotoxicology reviews. 2007; 25(3):185-209. https://doi.org/10.1080/10590500701569398 PMid:17763046
15. Fujii T, Fuchs BC, Yamada S, Lauwers GY, Kulu Y, Goodwin JM, et al. Mouse model of carbon tetrachloride induced liver fibrosis: Histopathological changes and expression of CD133 and epidermal growth factor. BMC Gastroenterol. 2010; 10:79. https://doi.org/10.1186/1471-230X-10-79 PMid:20618941 PMCid:PMC2912240
16. Al-Jawad FH, Al-Hussaini J. Hepatoprotective effect of some drugs in experimental model of acute liver injury. The new Iraqi Journal of Medicine. 2013; 9(2):62-5.
17. Coral AB, Edward R, Ashood T. Textbook of Clinical Chemistry 3rd ed: Saunders company, 1999.
18. Kiernan JA. Histological & histochemical methods 3rd ed: Taylor & Francis, 1999.
19. Recknagel RO, Glende EA, Jr., Dolak JA, Waller RL. Mechanisms of carbon tetrachloride toxicity. Pharmacology & therapeutics. 1989; 43(1):139-54. https://doi.org/10.1016/0163-7258(89)90050-8
20. Taira Z, Yabe K, Hamaguchi Y, Hirayama K, Kishimoto M, Ishida S, et al. Effects of Sho-saiko-to extract and its components, Baicalin, baicalein, glycyrrhizin and glycyrrhetic acid, on pharmacokinetic behavior of salicylamide in carbon tetrachloride intoxicated rats. Food and chemical toxicology : an international journal published for the British Industrial Biological Research Association. 2004; 42(5):803-7. https://doi.org/10.1016/j.fct.2003.12.017 PMid:15046826
21. Rang HP, Dale MN, Ritter JM, Flower RJ, Henderson G. Rang & Dale's Pharmacology: Elsevier Health Sciences, 2014.
22. Munzel T, Gori T. Nitrate therapy and nitrate tolerance in patients with coronary artery disease. Current opinion in
pharmacology. 2013; 13(2):251-9. https://doi.org/10.1016/j.coph.2012.12.008 PMid:23352691
23. Gewaltig MT, Kojda G. Vasoprotection by nitric oxide: mechanisms and therapeutic potential. Cardiovascular research. 2002; 55(2):250-60. https://doi.org/10.1016/S0008-6363(02)00327-9
24. Rockey DC, Shah V. Nitric oxide biology and the liver: Report of an AASLD research workshop. Hepatology (Baltimore, Md). 2004; 39(1):250-7. https://doi.org/10.1002/hep.20034 PMid:14752845
25. Al-Jawad FH, Abdulsahib WK, Al-Attar Z, Al-Hussaini J. Protective Effect of Cimetidine, Isosorbide Dinitrate & Vitamin C in Experimental Model of Acute Liver Injury. Scholars Academic Journal of Pharmacy. 2018; 7(7):308-13.
26. Rahman A, Vasenwala SM, Iqbal M. Hepatoprotective potential of glyceryl trinitrate against chemically induced oxidative stress and hepatic injury in rats. Human & Experimental Toxicology. 2016; 36(8):785-94. https://doi.org/10.1177/0960327116665675 PMid:27758841
27. Reynolds JE. The extra pharmacopoeia. Pharmaceutical press; 1993.
28. Sadowska AM, Manuel YKB, De Backer WA. Antioxidant and anti-inflammatory efficacy of NAC in the treatment of COPD: discordant in vitro and in vivo dose-effects: a review. Pulmonary pharmacology & therapeutics. 2007; 20(1):9-22. https://doi.org/10.1016/j.pupt.2005.12.007 PMid:16458553
29. Ocal K, Avlan D, Cinel I, Unlu A, Ozturk C, Yaylak F, et al. The effect of N-acetylcysteine on oxidative stress in intestine and bacterial translocation after thermal injury. Burns. 2004; 30(8):778-84. https://doi.org/10.1016/j.burns.2004.05.006 PMid:15555789
30. Cetinkaya A, Bulbuloglu E, Kurutas EB, Kantarceken B. N-acetylcysteine ameliorates methotrexate-induced oxidative liver damage in rats. Medical science monitor : international medical journal of experimental and clinical research. 2006; 12(8):Br274-8.
31. Saleem TH, Abo El-Maali N, Hassan MH, Mohamed NA, Mostafa NA, Abdel-Kahaar E, Tammam AS. Comparative Protective Effects of N-Acetylcysteine, N-Acetyl Methionine, and N-Acetyl Glucosamine against Paracetamol and Phenacetin Therapeutic Doses-Induced Hepatotoxicity in Rats. International journal of hepatology. 2018; 2018:8. https://doi.org/10.1155/2018/7603437 PMid:30245889 PMCid:PMC6139237
32. Benowitz N. Antihypertensive drugs. In: Katzung B, Trevor R, editors. Basic & Clinical Pharmacology. 13th ed: McGraw-Hill, 2015:178-86.

_______________________________________________________________________________________________________________________________
1744 https://www.id-press.eu/mjms/index
ID Design Press, Skopje, Republic of Macedonia Open Access Macedonian Journal of Medical Sciences. 2019 Jun 15; 7(11):1744-1749. https://doi.org/10.3889/oamjms.2019.485 eISSN: 1857-9655 Basic Science
Prevalence and Anti-Microbial Susceptibility of Hospital Acquired Infections in Two Pediatric Intensive Care Units in Egypt Sally A.F. El-Sahrigy
1, Mohamed G. Shouman
1, Hanan M. Ibrahim
2, Azza M.O. Abdel Rahman
1, Sonia Adolf Habib
1*, Aser
A. Khattab3, Howayda E. Gomaa
1, Naiven A. Helmy
1
1Departments of Pediatrics, and Clinical Pathology, National Research Centre, Cairo, Egypt;
2Departments of Pediatrics, Ain
Shams, Cairo, Egypt; 3Cairo Universities, Cairo, Egypt
Citation: Gomaa HE, Helmy NA, El-Sahrigy SAF, Shouman MG, Ibrahim HM, Abdel Rahman AMO, Habib SA, Khattab AA. Prevalence and Anti-Microbial Susceptibility of Hospital Acquired Infections in Two Pediatric Intensive Care Units in Egypt. Open Access Maced J Med Sci. 2019 Jun 15; 7(11):1744-1749. https://doi.org/10.3889/oamjms.2019.485
Keywords: Hospital-acquired infection; Pediatric ICU; Anti-microbial; Egypt
*Correspondence: Sonia Adolf Habib. Departments of Pediatrics, and Clinical Pathology, National Research Centre, Cairo, Egypt. E-mail: [email protected]
Received: 21-Apr-2019; Revised: 28-May-2019; Accepted: 29-May-2019; Online first: 14-Jun-2019
Copyright: © 2019 Sally A.F. El-Sahrigy, Mohamed G. Shouman, Hanan M. Ibrahim, Azza M.O. Abdel Rahman, Sonia Adolf Habib, Aser A. Khattab, Howayda E. Gomaa, Naiven A. Helmy. This is an open-access article distributed under the terms of the Creative Commons Attribution-NonCommercial 4.0 International License (CC BY-NC 4.0)
Funding: This research did not receive any financial support
Competing Interests: The authors have declared that no competing interests exist
Abstract
BACKGROUND: Hospital-acquired (nosocomial) infection is a common serious health problem worldwide, especially in pediatric intensive care units and is associated with high mortality and morbidity, prolonged hospital stays and high cost.
AIM: To determine the types of organisms involved in hospital-acquired an infection in two pediatric intensive care units during the one-year study and its anti-microbial susceptibility.
MATERIAL AND METHODS: This study was carried out in the pediatric intensive care units (PICU) of Ain Shams & Cairo Universities, where 86 pediatric patients were recruited. Their age ranged from 1 month to 156 months with mean 20.7 ± 25.8 months. Male to female ratio was 37:29. Four samples were collected from each child for culture and sensitivity: blood, endotracheal aspirate, urine and skin swab.
RESULTS: The most common microorganism was staphylococcus while Gram-negative bacteria were the commonest group. Amikacin and imipenem are the most sensitive antibiotics. Risk estimate for different risk factors among studied patients revealed no significance.
CONCLUSION: Staphylococcus was the commonest micro-organism while Gram-negative infections were the commonest group among PICU with a predominance of Acinetobacter and Klebsiella. Respiratory infections were the most common, followed by blood-borne infection. Risk factors for mortality were not significant.
Introduction
Hospital-acquired (nosocomial) infection is a common serious health problem worldwide especially in pediatric intensive care units and is associated with high mortality and morbidity, prolonged hospital stays and high cost [1], [2].
As regard hospital-acquired infections in pediatric intensive care, few data are available from a developing country where the majority of studies were done in adults and developed countries. The risk factors for these infections that common to vulnerable pediatric patients include age, primary disease, and intensive procedures commonly used in pediatric intensive care units [3], [4], [5].
The incidence of HAI ranged from 3% to 37%, where it is higher in developing countries than in developed countries. Pathogens and antibiotic sensitivity patterns vary significantly among countries and institutions and vary within an institution over years [6], [7], [8], [9], 10], [11], [12], [13], [14], [15], [16]. This study aimed to report the prevalence of hospital-acquired infection in the pediatric intensive care units, risk factors, and its anti-microbial susceptibility.
Subjects and Methods
This study was carried out in the pediatric ICU

Gomaa et al. Prevalence and Anti-Microbial Susceptibility of Hospital Acquired Infections in Two Pediatric Intensive Care Units in Egypt _______________________________________________________________________________________________________________________________
_______________________________________________________________________________________________________________________________
Open Access Maced J Med Sci. 2019 Jun 15; 7(11):1744-1749. 1745
of Ain Shams & Cairo Universities over one-year periods (2014-2015), where 86 pediatric patients were recruited but 20 patients were excluded for insufficient data (15.6% of total PICU admission). The pediatric ICU of Cairo University is 10 beds while that of Ain Shams University is 14 beds. Their age ranged from 1 month to 156 months with mean 20.7 ± 25.8 months. Male to female ratio was 37:29. The following variables were analysed including age, sex, underlying disease, mechanical ventilation, invasive manoeuvres, a period of hospital stays, outcome, infection screening including CBC, CRP, cultures (blood, endotracheal, urine, skin swab), liver and kidney functions, and anti-microbial therapy. Patients admitted less than 24 hours in PICU were excluded were hospital-acquired infection is considered after 48 hours of admission to ICU [17].
The study was approved by the Ethical Committee of the National Research Centre. Written consent was taken from the parents of the studied patients.
Four samples (Blood, throat swab or endotracheal aspirate, urine samples, skin swabs) were obtained for microbiological assay. The samples were collected in a sterile container and sent to the lab for assessment and study as follows:
1. Blood culture technique: All of the phlebotomies were performed with peripheral sticks, and the blood samples were drawn by a clinician by the bedside after cleansing the skin with 70% isopropyl alcohol and applying 10% povidone-iodine for 1 min. The blood samples were inoculated at a volume of 1 to 5 ml into BACTEC Peds Plus/F and were placed in the BACTEC 9050 blood culture instrument. Anaerobic blood cultures were not prepared. All study bottles were incubated for 7 days. Whenever there was a sign of microbial growth, the detection time was documented. The bottles that had a positive signal were smeared and stained with Gram stain. Subcultures on blood. Mac Conkey and chocolate agar plates were done. Subcultures were incubated at 35°C for a duration of 48 h. Instrument-negative bottles were Gram stained and subcultured at the end of the 7-day protocol to confirm negativity. False-positive cultures were defined as those that were indicated by the instrument to be positive but had revealed no microorganisms by Gram staining and subculture. All isolates were considered to be clinically significant.
2. Throat swabs and endotracheal aspirate: A Gram stain was performed on all swabs and aspirates for the identification of bacteria and measurement of the white blood cell count. White cells were counted from 20 high power fields, and the average was taken. All samples were plated immediately onto blood, chocolate, and Mac Conkey agars.
3. Urine samples: Routine urine cultures were done by plating the specimens on blood agar and MacConkey's agar using calibrated loops for the
semiquantitative method. Colony counts of 102 or
103 CFU/mL were used to define probable infection
[18], [19].
4. Skin swabs: Dry sterile cotton-tip swab was rubbed on the skin, collected in a sterile container and sent to the lab. All samples were plated immediately onto blood, chocolate, and Mac Conkey agars.
Identification of isolated bacteria: The isolated microorganisms were identified by standard microbiological techniques, including Gram staining, colony characteristics, and biochemical properties. [20], [21]. gram-negative bacilli, which are oxidase negative, were identified using API 20 E (biomerieux) and API (20 NE) kit for identification of non-fermenters.
Antimicrobial susceptibility testing (AST): Kirby performed AST – Bauer disc diffusion method according to Clinical and Laboratory Standards Institute (CLSI) guidelines [22]. All isolates were tested by the standard disk diffusion method against β-lactam and non-β-lactam agents, including ampicillin, amoxicillin-clavulanic, piperacillin, third-generation cephalosporins (cefoperazone – sulbactam, cefepime), carbapenems (Imipenem), amikacin, gentamicin, ciprofloxacin and the results were also interpreted based on the CLSI guidelines. All antimicrobial disks used for susceptibility testing were obtained from BD BBL Sensi-Disc (Becton Dickinson, Sparks, Maryland, USA).
Statistical analysis
Standard computer program SPSS for Windows, release 13.0 (SPSS Inc, Tulsa, USA) (23) was used for data entry and analysis. All qualitative variables were expressed as count and per cent. Chi-
square (2) test was used to compare the frequency of
qualitative variables among the different groups. Continuous variables were evaluated using the Mann-Whitney test. Risk analysis was calculated as odds ratio and confidence intervals. For all tests, a probability (p) less than 0.05 was considered significant.
Results
Table one shows clinical laboratory descriptive data. The prevalence of HAIs in this study was 15.6% of PICUs admission. Thirty-one patients (47%) were suffering from anaemia (Hb less than
10gm/dl). Leucocytosis (↑11.000) was present in 45
patients (68%), while leucopenia (↓4000) was in 4 patients (6%). Twenty-one patients (32%) were suffering from thrombocytopenia (platelets less than
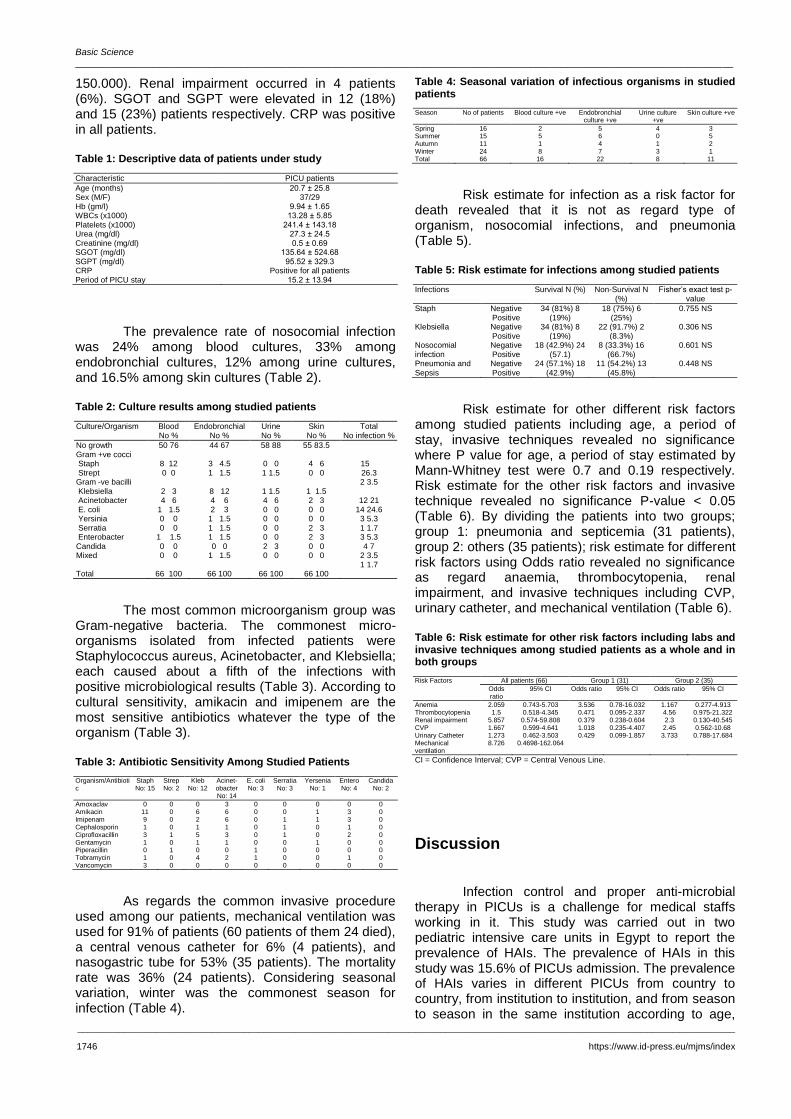
Basic Science _______________________________________________________________________________________________________________________________
_______________________________________________________________________________________________________________________________
1746 https://www.id-press.eu/mjms/index
150.000). Renal impairment occurred in 4 patients (6%). SGOT and SGPT were elevated in 12 (18%) and 15 (23%) patients respectively. CRP was positive in all patients.
Table 1: Descriptive data of patients under study
Characteristic PICU patients
Age (months) Sex (M/F) Hb (gm/l) WBCs (x1000) Platelets (x1000) Urea (mg/dl) Creatinine (mg/dl) SGOT (mg/dl) SGPT (mg/dl) CRP Period of PICU stay
20.7 ± 25.8 37/29
9.94 ± 1.65 13.28 ± 5.85
241.4 ± 143.18 27.3 ± 24.5 0.5 ± 0.69
135.64 ± 524.68 95.52 ± 329.3
Positive for all patients 15.2 ± 13.94
The prevalence rate of nosocomial infection was 24% among blood cultures, 33% among endobronchial cultures, 12% among urine cultures, and 16.5% among skin cultures (Table 2).
Table 2: Culture results among studied patients
Culture/Organism Blood No %
Endobronchial No %
Urine No %
Skin No %
Total No infection %
No growth Gram +ve cocci Staph Strept Gram -ve bacilli Klebsiella Acinetobacter E. coli Yersinia Serratia Enterobacter Candida Mixed
50 76
8 12 0 0
2 3 4 6
1 1.5 0 0 0 0
1 1.5 0 0 0 0
44 67
3 4.5 1 1.5
8 12 4 6 2 3
1 1.5 1 1.5 1 1.5 0 0
1 1.5
58 88
0 0 1 1.5
1 1.5 4 6 0 0 0 0 0 0 0 0 2 3 0 0
55 83.5
4 6 0 0
1 1.5 2 3 0 0 0 0 2 3 2 3 0 0 0 0
15 26.3 2 3.5
12 21
14 24.6 3 5.3 1 1.7 3 5.3 4 7
2 3.5 1 1.7
Total 66 100 66 100 66 100 66 100
The most common microorganism group was Gram-negative bacteria. The commonest micro-organisms isolated from infected patients were Staphylococcus aureus, Acinetobacter, and Klebsiella; each caused about a fifth of the infections with positive microbiological results (Table 3). According to cultural sensitivity, amikacin and imipenem are the most sensitive antibiotics whatever the type of the organism (Table 3).
Table 3: Antibiotic Sensitivity Among Studied Patients
Organism/Antibiotic
Staph No: 15
Strep No: 2
Kleb No: 12
Acinet-obacter No: 14
E. coli No: 3
Serratia No: 3
Yersenia No: 1
Entero No: 4
Candida No: 2
Amoxaclav Amikacin Imipenam Cephalosporin Ciprofloxacillin Gentamycin Piperacillin Tobramycin Vancomycin
0 11 9 1 3 1 0 1 3
0 0 0 0 1 0 1 0 0
0 6 2 1 5 1 0 4 0
3 6 6 1 3 1 0 2 0
0 0 0 0 0 0 1 1 0
0 0 1 1 1 0 0 0 0
0 1 1 0 0 1 0 0 0
0 3 3 1 2 0 0 1 0
0 0 0 0 0 0 0 0 0
As regards the common invasive procedure used among our patients, mechanical ventilation was used for 91% of patients (60 patients of them 24 died), a central venous catheter for 6% (4 patients), and nasogastric tube for 53% (35 patients). The mortality rate was 36% (24 patients). Considering seasonal variation, winter was the commonest season for infection (Table 4).
Table 4: Seasonal variation of infectious organisms in studied patients
Season No of patients Blood culture +ve Endobronchial culture +ve
Urine culture +ve
Skin culture +ve
Spring Summer Autumn Winter
16 15 11 24
2 5 1 8
5 6 4 7
4 0 1 3
3 5 2 1
Total 66 16 22 8 11
Risk estimate for infection as a risk factor for death revealed that it is not as regard type of organism, nosocomial infections, and pneumonia (Table 5).
Table 5: Risk estimate for infections among studied patients
Infections Survival N (%) Non-Survival N (%)
Fisher’s exact test p-value
Staph Negative Positive
34 (81%) 8 (19%)
18 (75%) 6 (25%)
0.755 NS
Klebsiella Negative Positive
34 (81%) 8 (19%)
22 (91.7%) 2 (8.3%)
0.306 NS
Nosocomial infection
Negative Positive
18 (42.9%) 24 (57.1)
8 (33.3%) 16 (66.7%)
0.601 NS
Pneumonia and Sepsis
Negative Positive
24 (57.1%) 18 (42.9%)
11 (54.2%) 13 (45.8%)
0.448 NS
Risk estimate for other different risk factors among studied patients including age, a period of stay, invasive techniques revealed no significance where P value for age, a period of stay estimated by Mann-Whitney test were 0.7 and 0.19 respectively. Risk estimate for the other risk factors and invasive technique revealed no significance P-value < 0.05 (Table 6). By dividing the patients into two groups; group 1: pneumonia and septicemia (31 patients), group 2: others (35 patients); risk estimate for different risk factors using Odds ratio revealed no significance as regard anaemia, thrombocytopenia, renal impairment, and invasive techniques including CVP, urinary catheter, and mechanical ventilation (Table 6).
Table 6: Risk estimate for other risk factors including labs and invasive techniques among studied patients as a whole and in both groups
Risk Factors All patients (66) Group 1 (31) Group 2 (35)
Odds ratio
95% CI Odds ratio 95% CI Odds ratio 95% CI
Anemia 2.059 0.743-5.703 3.536 0.78-16.032 1.167 0.277-4.913 Thrombocytopenia 1.5 0.518-4.345 0.471 0.095-2.337 4.56 0.975-21.322 Renal impairment 5.857 0.574-59.808 0.379 0.238-0.604 2.3 0.130-40.545 CVP 1.667 0.599-4.641 1.018 0.235-4.407 2.45 0.562-10.68 Urinary Catheter 1.273 0.462-3.503 0.429 0.099-1.857 3.733 0.788-17.684 Mechanical ventilation
8.726 0.4698-162.064
CI = Confidence Interval; CVP = Central Venous Line.
Discussion
Infection control and proper anti-microbial therapy in PICUs is a challenge for medical staffs working in it. This study was carried out in two pediatric intensive care units in Egypt to report the prevalence of HAIs. The prevalence of HAIs in this study was 15.6% of PICUs admission. The prevalence of HAIs varies in different PICUs from country to country, from institution to institution, and from season to season in the same institution according to age,

Gomaa et al. Prevalence and Anti-Microbial Susceptibility of Hospital Acquired Infections in Two Pediatric Intensive Care Units in Egypt _______________________________________________________________________________________________________________________________
_______________________________________________________________________________________________________________________________
Open Access Maced J Med Sci. 2019 Jun 15; 7(11):1744-1749. 1747
underlying disease, and other risk factors. The prevalence in other studies ranged from 3% to 27% where it is higher in developing countries than developed countries [6], [7], [9], [10], [11], [12], [13], [14], [15], [16]. A Turkish study in 50 PICUs to assess a national point-prevalence survey of PICUs HAIs reported the overall HAI rate as 37% [8].
The rate in our study is different from other studies wherein American study in 35 PICUs; the HAI rate was 11.9% [24]. A prevalence rate of HAI from 17 European PICUs was 23.6% [25]; while in a Spanish PICU study, the rate was 29.8% [26]. The incidence in developing countries was over 20% [27]. The prevalence was not high in our study compared to another Egyptian study done by El-Nawawy and his colleagues [6] because this study was conducted in two university hospitals with improved infection control programs.
In this study, the most common types of HAI in PICU were respiratory followed by blood borne infection, UTI, and skin. Similar to our study, many studied revealed that the most common infection was respiratory followed by blood [8], [13], [25], [28], [29], [30], [31], [32], [33], [34], [35], [36], [37], [38], [39], [40]. In other studies, the most frequent sites of infection were bloodstream, lower respiratory tract, or urinary tract [7], [9], [41], [42], [43], [44], [45]. Only one study revealed that UTI was the commonest followed by blood borne and lower respiratory tract infections [39].
The most common microorganisms in this study were Gram-negative bacteria. Although there was a controversy between studies as to regard causative organisms, many studies including this study reported that gram-negative organisms were more commonly isolated [5], [13], [39], [42], [44], [46]. The commonest micro-organisms isolated from our infected patients were Staphylococcus aureus, Acinetobacter, and Klebsiella. Many studies also revealed that Staphylococcus aureus was the commonest [5], [44], [46]. Lee et al., the study revealed that Staphylococcus aureus was the most common Gram-positive organism, while Pseudomonas aeruginosa, Escherichia coli, and Klebsiella pneumoniae were the commonest Gram-negative organisms [39]. In Becerra et al., study, Candida was the commonest bloodstream infection [7]. In Atıcı study, the most common organisms were Klebsiella spp. (19.4%), followed by Pseudomonas aeruginosa (13.8%), and Acinetobacter baumanii (12%) [9]. Vincent et al., study (2009) reported that S aureus was the most common organism, followed by Acinetobacter, and Klebsiella. Acinetobacter was found in high incidence (24% of all infected patients) [40]. One study found an increased incidence of gram-positive organisms [47] while the Sepsis Occurrence in Acutely Ill Patients (SOAP) study reported an equal frequency of gram-positive and gram-negative organisms [28]. In a study done by Vincent et al., 2006 [28], Acinetobacter was involved in 9% of all
infected patients, which was similar to the rate reported in EPIC study 1996 [48]. Similar to our study, Acinetobacter was observed to be an increased incidence in recent studies [40]. Alotaibi et al., the study concluded that
Klebsiella was the commonest
organism isolated from respiratory infection and UTI, while Klebsiella and Candida were the most common organisms that affect the bloodstream [14].
The hospital-acquired infection has commonly been used to guide empirical antibiotic treatment based on the different pathogens circulating in the hospital environment. In our study, amikacin and imipenem are the most sensitive antibiotics whatever the type of the organism which is similar to Mireya study [49].
The mortality rate in our study was 36%, which is nearly the same as reported in developing countries and higher than that reported in developed counties. In developing counties, the mortality rate ranged from 20 to 38% [3], [7], [44], [50] while in developed countries it was 7.7 to 10% [25], [51].
In this study, we found that sepsis was not a risk factor for death. Studying different risk factors for mortality among the studied patients, including age, a period of stay, type of organism, invasive techniques including CVP, urinary catheter, and mechanical ventilation revealed no significance. The risk factors for HAI in PICU differ between studies according to the method of comparison where some studies compare between the patient in ICU and patients in the pediatric ward, number of patients in the study that use invasive devices. The limitation of this study was a small number of patients. The viral infection is underdiagnosis. Mireya et al., the study revealed that age under 1 year, the severity of the disease, and mechanical ventilation were significant risk factors [49]. Rasslan et al., the study found that device associated infection rates in PICU in Egypt was higher than in developed countries and was considered as a risk factor for HAI (52). Aktar et al., the study revealed that only mechanical ventilation was found to be a risk factor for mortality in multiple logistic regression analysis [44]. Also, María et al., the study showed that disease severity and candida infection were the main risk factor for mortality [7]. Few studies showed that type of organism is a risk factor as Ashkenazi et al., the study reported mortality rate of 60% in Acinetobacter sp. bacteremia and 42% yeast associated infection [53].
As regard seasonal variation, winter was the commonest season for nosocomial infection in this study. Few studies demonstrated the impact of seasonal variation on different organisms. Caldeira et al., [54] and Fortaleza et al., [55] studies revealed an increased incidence of Gram-negative bacilli in warm weather. This controversy may be referred to that most of our patients were suffering from a respiratory infection.
In conclusion, Staphylococcus was the

Basic Science _______________________________________________________________________________________________________________________________
_______________________________________________________________________________________________________________________________
1748 https://www.id-press.eu/mjms/index
commonest micro-organism while Gram-negative infections were the commonest group among PICU with a predominance of Acinetobacter and Klebsiella. Respiratory infections were the most common, followed by blood-borne infection. Risk factors for mortality were not significant. The empirical antibiotic choice was made according to culture and sensitivity. Respiratory infections were the most common, followed by blood-borne infection. Risk factors for mortality were not significant. Infection control programs are required repetitively and periodically for proper choice of antibiotics and infection control.
References
1. Abramczyk ML, Carvalho WB, Carvalho ES, Medeiros EA. Nosocomial infection in a pediatric intensive care unit in a developing country. Braz J Infect Dis. 2003; 7:375-80. https://doi.org/10.1590/S1413-86702003000600004 PMid:14636476
2. Akash Deep, R. Ghildiyal, S. Kandian and N. Shinkre. Clinical and Microbiological Profile of Nosocomial Infections in the Pediatric Intensive Care Unit (PICU). Indian Pediatrics. 2004; 41:1238-1246.
3. Alotaibi MG, Rahman S, Al-Shalaan MA, Omair A. Frequency of Nosocomial Infections in Pediatric Intensive Care Unit at King Abdulaziz Medical City, Riyadh, Saudi Arabia. J Infect Dis Ther. 2015; 3(5):234-236. https://doi.org/10.4172/2332-0877.1000234
4. Campins M, Vaque J, Rosello J, Salcedo S, Duran M, Monge V, Garcia Caballero J, Saenz MC, Calbo F, Armadans L. Nosocomial infections in pediatric patients: a prevalence study in Spanish hospitals. Am J Infect Control. 1993; 21:8-63. https://doi.org/10.1016/0196-6553(93)90225-S
5. Choudhury J, Mohanty D, Routray S S. Microbiological profile of Nosocomial infections in the pediatric patients admitted to intensive care unit: Int J Pediatr Res. 2016; 3(2):100-104.
6. Correia M, Simao C, Lito LM, Cabecadas M, Almeida H, Carvalho A, et al. Nosocomial infections in a Pediatric Intensive Care Unit. Acta Med Port. 1997; 10:463-468.
7. Daniel WW. Biostatistics: A foundation for analysis in the health sciences. 7th (ed.) John Wiley and Sons. Inc., New York. 2000:166-7.
8. El-Nawawy AA, Abd El-Fattah MM, Metwally HA, Barakat SS, Hassan IA. One year study of bacterial and fungal nosocomial infections among patients in pediatric intensive care unit (PICU) in Alexandria. J Trop Pediatr. 2006; 52:185-191. https://doi.org/10.1093/tropej/fmi091 PMid:16186137
9. Garner JS, JarvisWR, Emori TG, Horan TC, Hughes JM. CDC definitions for nosocomial infections. Am J Infect Control. 1988; 16:128-40. https://doi.org/10.1016/0196-6553(88)90053-3
10. Garrouste-Orgeas M, Timsit JF, Taffet M, Misset B, Zahar JR, Soufir L, et al. Excess risk of death from intensive care unit-acquired nosocomial bloodstream infections: a reappraisal. Clin Infect Dis. 2006; 42:1118-26. https://doi.org/10.1086/500318 PMid:16575729
11. Grohskopf LA, Sinkowitz-Cochran RL, Garrett DO, Sohn AH, Levine GL, Siegel JD, Stover BH, Jarvis WR; Pediatric Prevention Network. A national point-prevalence survey of pediatric intensive care unit-acquired infections in the United States. J Pediatr. 2002; 140:432-438. https://doi.org/10.1067/mpd.2002.122499 PMid:12006957
12. Hmamouchi B, Chakkouri K, Nejmi SE, Chlilek A. Epidemiology of nosocomial infection in a paediatric intensive care unit. Ann Fr Anesth Reanim. 2005; 24:699-700.
https://doi.org/10.1016/j.annfar.2005.04.011 PMid:15921880
13. Jordan Garcia I, Esteban Torné E, Bustinza Arriortua A, de Carlos Vicente JC, García Soler P, Concha Torre JA, Flores González JC, Madurga Revilla P, Palomar Martínez M; VINCIP Study Group, from Spanish Society of Pediatric Intensive Care (SECIP). Trends in nosocomial infections and multidrug-resistant microorganisms in Spanish pediatric intensive care units. Enferm Infecc Microbiol Clin. 2016; 34(5):286-92. https://doi.org/10.1016/j.eimc.2015.07.010 PMid:26364857
14. Kepenekli E, Soysal A, Yalindag-Ozturk N, Ozgur O, Ozcan I, Devrim I, Akar S, Bakir M; Turkish PICU-HCAI Study Group (2015) A national point-prevalence survey of pediatric intensive care unit-acquired, healthcare-associated infections in Turkey. Jpn J Infect Dis. 2015; 13:1-17.
15. Laupland KB, Lee H, Gregson DB, Manns BJ. Cost of intensive care unit-acquired bloodstream infections. J Hosp Infect. 2006; 63: 124-32. https://doi.org/10.1016/j.jhin.2005.12.016 PMid:16621137
16. Legras A, Robert R. Nosocomial infection: prospective survey of incidence in 5 French ICUs. Intensive Care Medicine. 1999; 24:1040-1046. https://doi.org/10.1007/s001340050713
17. Marcelo L. Abramczyk, Werther B. Carvalho, Eduardo S. Carvalho and Eduardo A. S. Medeiros. Nosocomial Infection in a Pediatric Intensive Care Unit in a Developing Country. The Brazilian Journal of Infectious Diseases. 2003; 7(6):375-380. https://doi.org/10.1590/S1413-86702003000600004
18. Stamm WE, Counts GW, Running KR, Fihn S, Turck M, Holmes KK. Diagnosis of coliform infection in acutely dysuric women. N Engl J Med. 1982; 307(8):463-8. https://doi.org/10.1056/NEJM198208193070802 PMid:7099208
19. Clarridge JE, Johnson JR, Pezzlo MT, Cumitech B: laboratory diagnosis of urinary tract infections, Washington, DC American Society for Microbiology, 1998.
20. Lennette EH, Balows A, Hausler WJ, et al. Manual of clinical microbiology. Washington: American Society for Microbiology, 1985.
21. Isenberg HD, Schoenknecht FD, von Graevenitz A. Cumulative techniques: collection and processing of bacteriologic specimens. Washington: American Society for Microbiology, 1979.
22. Clinical and Laboratory Standards Institute. Performance standards for antimicrobial susceptibility testing: 17th informational supplement. CLSI document M100-S17. Wayne, PA: CLSI, 2007.
23. María R Becerra1, José A Tantaleán, Víctor J Suárez, Margarita C Alvarado, Jorge L Candela, Flor C Urcia. Epidemiologic surveillance of nosocomial infections in a Pediatric Intensive Care Unit of a developing country. BMC Pediatrics. 2010:10:66. https://doi.org/10.1186/1471-2431-10-66 PMid:20831797 PMCid:PMC2944329
24. Nejla Ben Jaballah, MD, Asma Bouziri, MD, Khaled Mnif, MD, Asma Hamdi, MD, Ammar Khaldi, MD, and Wassim Kchaou, MD. Epidemiology of hospital-acquired bloodstream infections in a Tunisian pediatric intensive care unit: A 2-year prospective study. Am J Infect Control. 2007; 35:613-8. https://doi.org/10.1016/j.ajic.2006.09.007 PMid:17980241
25. Raymond J, Aujard Y, European Study Group. Nosocomial infections in pediatric patients a European, multicenter prospective study. Infection Control & Hospital Epidemiology. 2000; 21(4):260-3. https://doi.org/10.1086/501755 PMid:10782588
26. Atici S, Soysal A, Kadayifci EK, Karaaslan A, Akkoç G, Yakut N, Demir SÖ, Girgin Fİ, Çulha G, Altınkanat G, Öztürk N. Healthcare-associated infections in a newly opened pediatric intensive care unit in Turkey: Results of four-year surveillance. The Journal of Infection in Developing Countries. 2016; 10(03):254-9. https://doi.org/10.3855/jidc.7517 PMid:27031457
27. Balaban İ, Tanır G, Timur ÖM, Öz FN, Teke TA, Bayhan Gİ, Sözak N, Göl N. Nosocomial infections in the general pediatric wards of a hospital in Turkey. Japanese journal of infectious diseases. 2012; 65(4):318-21. https://doi.org/10.7883/yoken.65.318 PMid:22814155
28. Aktar F, Tekin R, Güneş A, Ülgen C, Tan I, Ertugrul S, Köşker

Gomaa et al. Prevalence and Anti-Microbial Susceptibility of Hospital Acquired Infections in Two Pediatric Intensive Care Units in Egypt _______________________________________________________________________________________________________________________________
_______________________________________________________________________________________________________________________________
Open Access Maced J Med Sci. 2019 Jun 15; 7(11):1744-1749. 1749
M, Balık H, Karabel D, Yolbaş I. Determining the Independent Risk Factors and Mortality Rate of Nosocomial Infections in Pediatric Patients. BioMed Research International. 2016:1-5. https://doi.org/10.1155/2016/7240864 PMid:26981536 PMCid:PMC4770130
29. Almuneef MA, Memish ZA, Balkhy HH, Hijazi O, Cunningham G, et al. Rate, risk factors and outcomes of catheter-related bloodstream infection in a paediatric intensive care unit in Saudi Arabia. J Hosp Infect. 2006; 62:207-213. https://doi.org/10.1016/j.jhin.2005.06.032 PMid:16307822
30. Ashkenazi S, Leibovici L, Samra Z, Konisberger H, Drucker M. Risk factors for mortality due to bacteremia and fungemia in childhood. Clinical infectious diseases. 1992; 14(4):949-51. https://doi.org/10.1093/clinids/14.4.949 PMid:1576293
31. Brun-Buisson C, Meshaka P, Pinton P, Vallet B. EPISEPSIS Study Group. EPISEPSIS: a reappraisal of the epidemiology and outcome of severe sepsis in French intensive care units. Intensive Care Med. 2004; 30(4):580-588. https://doi.org/10.1007/s00134-003-2121-4 PMid:14997295
32. Engel C, Brunkhorst FM, Bone HG, et al. Epidemiology of sepsis in Germany: results from a national prospective multicenter study. Intensive Care Med. 2007; 33(4):606-618. https://doi.org/10.1007/s00134-006-0517-7 PMid:17323051
33. Esteban A, Frutos-Vivar F, Ferguson ND, et al. Sepsis incidence and outcome: contrasting the intensive care unit with the hospital ward. Crit Care Med. 2007; 35(5):1284-1289. https://doi.org/10.1097/01.CCM.0000260960.94300.DE PMid:17414725
34. Fortaleza CM, Caldeira SM, Moreira RG, Akazawa RT, Corrente JE, Souza LR, et al. Tropical healthcare epidemiology: weather determinants of the etiology of bloodstream infections in a Brazilian hospital. Infect Control Hosp Epidemiol. 2014; 35(1):85-88. https://doi.org/10.1086/674392 PMid:24334804
35. Friedman G, Silva E, Vincent JL. Has the mortality of septic shock changed with time? Crit Care Med. 1998; 26(12):2078-2086. https://doi.org/10.1097/00003246-199812000-00045 PMid:9875924
36. Harrison DA, Welch CA, Eddleston JM. The epidemiology of severe sepsis in England, Wales and Northern Ireland, 1996 to 2004: secondary analysis of a high quality clinical database, the ICNARC Case Mix Programme Database. Crit Care. 2006; 10(2):R42.
37. Vincent JL, Rello J, Marshall J, Silva E, Anzueto A, Martin CD, Moreno R, Lipman J, Gomersall C, Sakr Y, Reinhart K. International study of the prevalence and outcomes of infection in intensive care units. Jama. 2009; 302(21):2323-9. https://doi.org/10.1001/jama.2009.1754 PMid:19952319
38. Karlsson S, Varpula M, Ruokonen E, et al. Incidence, treatment, and outcome of severe sepsis in ICU-treated adults in Finland: the Finnsepsis study. Intensive Care Med. 2007; 33(3):435-443. https://doi.org/10.1007/s00134-006-0504-z PMid:17225161
39. Lee CY, Chen PY, Huang FL, Lin CF. Microbiologic spectrum and susceptibility pattern of clinical isolates from the pediatric intensive care unit in a single medical center-6 years' experience. J Microbiol Immunol Infect. 2009; 42(2):160-5.
40. Lisa A. Grohskopf, Ronda L. Sinkowitz-Cochran, Denise O. Garrett, Annette H. Sohn, Gail L. Levine, Jane D. Siegel, Beth H. Stover, William R. Jarvis, and the Pediatric Prevention Network. A national point-prevalence survey of pediatric intensive care unit-acquired infections in the United States. Journal of Pediatrics. 2002; 140(4):432-438. https://doi.org/10.1067/mpd.2002.122499 PMid:12006957
41. Martin CM, Priestap F, Fisher H, et al. STAR Registry Investigators. A prospective, observational registry of patients with severe sepsis: the Canadian Sepsis Treatment and Response Registry. Crit Care Med. 2009; 37(1):81-88. https://doi.org/10.1097/CCM.0b013e31819285f0 PMid:19050636
42. Mireya UA, Marti PO, Xavier KV, Cristina LO, Miguel MM,
Magda CM. Nosocomial infections in pediatric and neonatal intensive care units. Journal of infection. 2007; 54:212-220. https://doi.org/10.1016/j.jinf.2006.03.023 PMid:16678905
43. Rasslan O, Seliem ZS, Ghazi IA, El Sabour MA, El Kholy AA, Sadeq FM, Kalil M, Abdel-Aziz D, Sharaf HY, Saeed A, Agha H. Device-associated infection rates in adult and pediatric intensive care units of hospitals in Egypt. International Nosocomial Infection Control Consortium (INICC) findings. Journal of infection and public health. 2012; 5(6):394-402. https://doi.org/10.1016/j.jiph.2012.07.002 PMid:23287610
44. Richards MJ, Edwards JR, Culver DH, et al. Nosocomial Infections in Pediatric Intensive Care Units in the United States. Pediatrics. 1999; 103:804. https://doi.org/10.1542/peds.103.4.e39 PMid:10103331
45. Siegel JD, Rhinehart E, Jackson M, Chiarello L. Guideline for isolation precautions preventing transmission of infectious agents in healthcare settings, 2007. https://doi.org/10.1016/j.ajic.2007.10.007 PMid:18068815
46. Silva E, Pedro MA, Sogayar AC, et al. Brazilian Sepsis Epidemiological Study. Brazilian Sepsis Epidemiological Study (BASES study). Crit Care. 2004; 8(4):R251-R260.
47. Caldeira SM, Cunha AR, Akazawa RT, Moreira RG, Souza LD, Fortaleza CM. Weather parameters and nosocomial bloodstream infection: a case-referent study. Revista de saude publica. 2015; 49:19. https://doi.org/10.1590/S0034-8910.2015049005438 PMid:25830871 PMCid:PMC4390072
48. Spencer RC. Predominant pathogens found in the European Prevalence of Infection in Intensive Care study. Eur J Clin Microbiol Infect Dis. 1996; 15(4):281-285. https://doi.org/10.1007/BF01695658 PMid:8781877
49. Sundararajan V, Macisaac CM, Presneill JJ, Cade JF, Visvanathan K. Epidemiology of sepsis in Victoria, Australia. Crit Care Med. 2005; 33(1):71-80. https://doi.org/10.1097/01.CCM.0000150027.98160.80 PMid:15644651
50. Urrea M, Pons M, Serra M, Latorre C, Palomeque A. Prospective incidence study of nosocomial infections in a pediatric intensive care unit. Pediatr Infect Dis J. 2003; 22:490-493. https://doi.org/10.1097/01.inf.0000069758.00079.d3 PMid:12799503
51. van Gestel A, Bakker J, Veraart CP, van Hout BA. Prevalence and incidence of severe sepsis in Dutch intensive care units. Crit Care. 2004; 8(4):R153-R162. https://doi.org/10.1186/cc2858 PMid:15312213 PMCid:PMC522831
52. Vincent JL, Sakr Y, Sprung CL, et al. Sepsis Occurrence in Acutely Ill Patients Investigators. Sepsis in European intensive care units: results of the SOAP study. Crit Care Med. 2006; 34(2):344-353. https://doi.org/10.1097/01.CCM.0000194725.48928.3A PMid:16424713
53. Zingg W, Hopkins S, Gayet-Ageron A, Holmes A, Sharland M, Suetens C, Almeida M, Asembergiene J, Borg MA, Budimir A, Cairns S. Health-care-associated infections in neonates, children, and adolescents: an analysis of paediatric data from the European Centre for Disease Prevention and Control point-prevalence survey. The Lancet Infectious Diseases. 2017; 17(4):381-9. https://doi.org/10.1016/S1473-3099(16)30517-5
54. Yallew WW, Kumie A, Yehuala FM. Point prevalence of hospital-acquired infections in two teaching hospitals of Amhara region in Ethiopia. Drug Healthc Patient Saf. 2016; 8:71-6. https://doi.org/10.2147/DHPS.S107344 PMid:27601932 PMCid:PMC5003516
55. Záhorec R, Firment J, Straková J, et al. Epidemiology of severe sepsis in intensive care units in the Slovak Republic. Infection. 2005; 33(3):122-128. https://doi.org/10.1007/s15010-005-4019-2 PMid:15940412

_______________________________________________________________________________________________________________________________
1750 https://www.id-press.eu/mjms/index
ID Design Press, Skopje, Republic of Macedonia Open Access Macedonian Journal of Medical Sciences. 2019 Jun 15; 7(11):1750-1756. https://doi.org/10.3889/oamjms.2019.467 eISSN: 1857-9655 Basic Science
The Effect of Haramounting Leaf Ethanol Extract (Rhodomyrtus tomentosa (Aiton) Hassk.) on the Number of Leukocyte Type and Histology of Mice Pulmo (Mus Musculus L.) Exposed to Electronic Cigarette Syafruudin Ilyas
*, Finn Murdela, Salomo Hutahaean, Putri Cahaya Situmorang
Department of Biology, Faculty of Mathematics and Natural Sciences, Universitas Sumatera Utara, Medan, Indonesia
Citation: Ilyas S, Murdela F, Hutahaean S, Situmorang PC. The Effect of Haramounting Leaf Ethanol Extract (Rhodomyrtus tomentosa (Aiton) Hassk.) on the Number of Leukocyte Type and Histology of Mice Pulmo (Mus Musculus L.) Exposed to Electronic Cigarette. Open Access Maced J Med Sci. 2019 Jun 15; 7(11):1750-1756. https://doi.org/10.3889/oamjms.2019.467
Keywords: Electronic cigarettes; Leukocytes; Mice; Pulmo; Rhodomytrus tomentosa
*Correspondence: Syafruudin Ilyas. Department of Biology, Faculty of Mathematics and Natural Sciences, Universitas Sumatera Utara, Medan, Indonesia. E-mail: [email protected]
Received: 19-May-2019; Revised: 11-Jun-2019; Accepted: 12-Jun-2019; Online first: 13-Jun-2019
Copyright: © 2019 Syafruudin Ilyas, Finn Murdela, Salomo Hutahaean, Putri Cahaya Situmorang. This is an open-access article distributed under the terms of the Creative Commons Attribution-NonCommercial 4.0 International License (CC BY-NC 4.0)
Funding: This research was financially supported by Sumatera Utara from Talenta proposal program on Professor research grant number Certificate 2590/UN5.1.R/PPM/2018, Indonesia
Competing Interests: The authors have declared that no competing interests exist
Abstract
BACKGROUND: Haramonting leaves have a large antioxidant activity as inhibitors oxidation and form non-free radical compounds that are not reactive and relatively stable. Electronic smoking is a choice who slowly want to quit conventional smoking.
AIM: This research aimed to determine the effect of ethanol extract on hard mounting leaves on leukocyte counts and histology Pulmo on male mice exposed to an electronic cigarette.
METHODS: The samples used in this study were healthy male mice aged 8-11 weeks and weight of 25-30 g as
many as 25 individuals and ethanol extracts of hard mounting leaves with a dose of 100 mg/kgBW, 200 mg/kgBW and 300 mg/kgBW. Blood tests were carried out at the Health Laboratory of North Sumatra Office, and the preparation of Pulmo histology was carried out at the Pathology and Anatomy Laboratory of Adam Malik General Hospital Medan
RESULT: There were significant differences between the control group and all of the treatment groups in the number of lymphocytes, neutrophils, basophils and eosinophils. There was a tendency that electronic cigarette smoke could cause damage to pulmo tissue.
CONCLUSION: The results of this study indicate that the ethanol extract of hard mounting leaves could help the immune system in mice exposed to an electronic cigarette.
Introduction
One source of pollutants in the air is cigarette smoke which has toxic properties for the lungs, especially clove cigarettes (without filters). These toxic substances enter the lungs increasing free radicals that affect the imbalance of antioxidant levels in the lungs to fight oxidants. This situation is called oxidative stress. These gases include 2-nitropropane, acrylonitrile, acrolein, ammonia, acetaldehyde, dimethylnitrosamine, formaldehyde, hydrazine,
hydrogen cyanide, carbon monoxide, nitrogen oxides, pyridine, urethane, vinyl chloride, and various other nitrosamines [1].
Electronic smoking is a choice for active smokers who slowly want to quit conventional smoking. Electronic cigarettes are considered as healthy cigarettes with lower nicotine content and do not contain tobacco smoke compared to conventional cigarettes. Smoking is a major cause of lung cancer, as well as other lung diseases that are chronic and obstructive, such as bronchitis and emphysema.
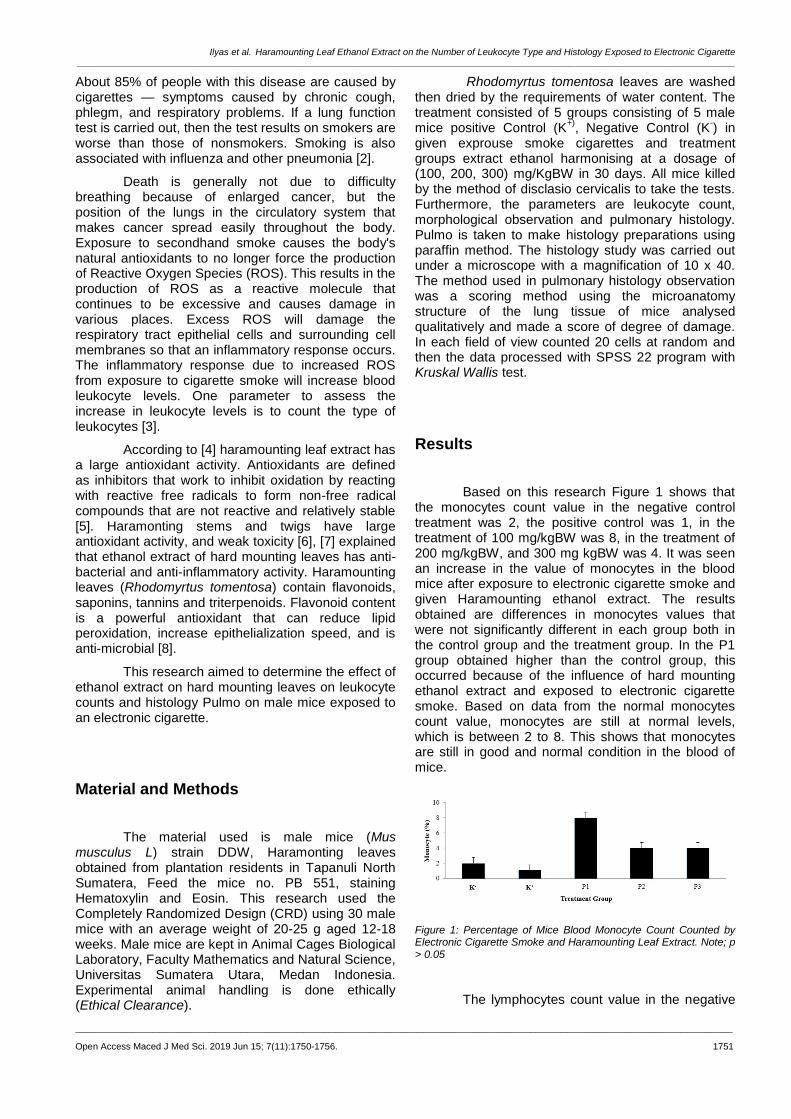
Ilyas et al. Haramounting Leaf Ethanol Extract on the Number of Leukocyte Type and Histology Exposed to Electronic Cigarette _______________________________________________________________________________________________________________________________
_______________________________________________________________________________________________________________________________
Open Access Maced J Med Sci. 2019 Jun 15; 7(11):1750-1756. 1751
About 85% of people with this disease are caused by cigarettes — symptoms caused by chronic cough, phlegm, and respiratory problems. If a lung function test is carried out, then the test results on smokers are worse than those of nonsmokers. Smoking is also associated with influenza and other pneumonia [2].
Death is generally not due to difficulty breathing because of enlarged cancer, but the position of the lungs in the circulatory system that makes cancer spread easily throughout the body. Exposure to secondhand smoke causes the body's natural antioxidants to no longer force the production of Reactive Oxygen Species (ROS). This results in the production of ROS as a reactive molecule that continues to be excessive and causes damage in various places. Excess ROS will damage the respiratory tract epithelial cells and surrounding cell membranes so that an inflammatory response occurs. The inflammatory response due to increased ROS from exposure to cigarette smoke will increase blood leukocyte levels. One parameter to assess the increase in leukocyte levels is to count the type of leukocytes [3].
According to [4] haramounting leaf extract has a large antioxidant activity. Antioxidants are defined as inhibitors that work to inhibit oxidation by reacting with reactive free radicals to form non-free radical compounds that are not reactive and relatively stable [5]. Haramonting stems and twigs have large antioxidant activity, and weak toxicity [6], [7] explained that ethanol extract of hard mounting leaves has anti-bacterial and anti-inflammatory activity. Haramounting leaves (Rhodomyrtus tomentosa) contain flavonoids, saponins, tannins and triterpenoids. Flavonoid content is a powerful antioxidant that can reduce lipid peroxidation, increase epithelialization speed, and is anti-microbial [8].
This research aimed to determine the effect of ethanol extract on hard mounting leaves on leukocyte counts and histology Pulmo on male mice exposed to an electronic cigarette.
Material and Methods
The material used is male mice (Mus musculus L) strain DDW, Haramonting leaves obtained from plantation residents in Tapanuli North Sumatera, Feed the mice no. PB 551, staining Hematoxylin and Eosin. This research used the Completely Randomized Design (CRD) using 30 male mice with an average weight of 20-25 g aged 12-18 weeks. Male mice are kept in Animal Cages Biological Laboratory, Faculty Mathematics and Natural Science, Universitas Sumatera Utara, Medan Indonesia. Experimental animal handling is done ethically (Ethical Clearance).
Rhodomyrtus tomentosa leaves are washed then dried by the requirements of water content. The treatment consisted of 5 groups consisting of 5 male mice positive Control (K
+), Negative Control (K
-) in
given exprouse smoke cigarettes and treatment groups extract ethanol harmonising at a dosage of (100, 200, 300) mg/KgBW in 30 days. All mice killed by the method of disclasio cervicalis to take the tests. Furthermore, the parameters are leukocyte count, morphological observation and pulmonary histology. Pulmo is taken to make histology preparations using paraffin method. The histology study was carried out under a microscope with a magnification of 10 x 40. The method used in pulmonary histology observation was a scoring method using the microanatomy structure of the lung tissue of mice analysed qualitatively and made a score of degree of damage. In each field of view counted 20 cells at random and then the data processed with SPSS 22 program with Kruskal Wallis test.
Results
Based on this research Figure 1 shows that the monocytes count value in the negative control treatment was 2, the positive control was 1, in the treatment of 100 mg/kgBW was 8, in the treatment of 200 mg/kgBW, and 300 mg kgBW was 4. It was seen an increase in the value of monocytes in the blood mice after exposure to electronic cigarette smoke and given Haramounting ethanol extract. The results obtained are differences in monocytes values that were not significantly different in each group both in the control group and the treatment group. In the P1 group obtained higher than the control group, this occurred because of the influence of hard mounting ethanol extract and exposed to electronic cigarette smoke. Based on data from the normal monocytes count value, monocytes are still at normal levels, which is between 2 to 8. This shows that monocytes are still in good and normal condition in the blood of mice.
Figure 1: Percentage of Mice Blood Monocyte Count Counted by Electronic Cigarette Smoke and Haramounting Leaf Extract. Note; p > 0.05
The lymphocytes count value in the negative
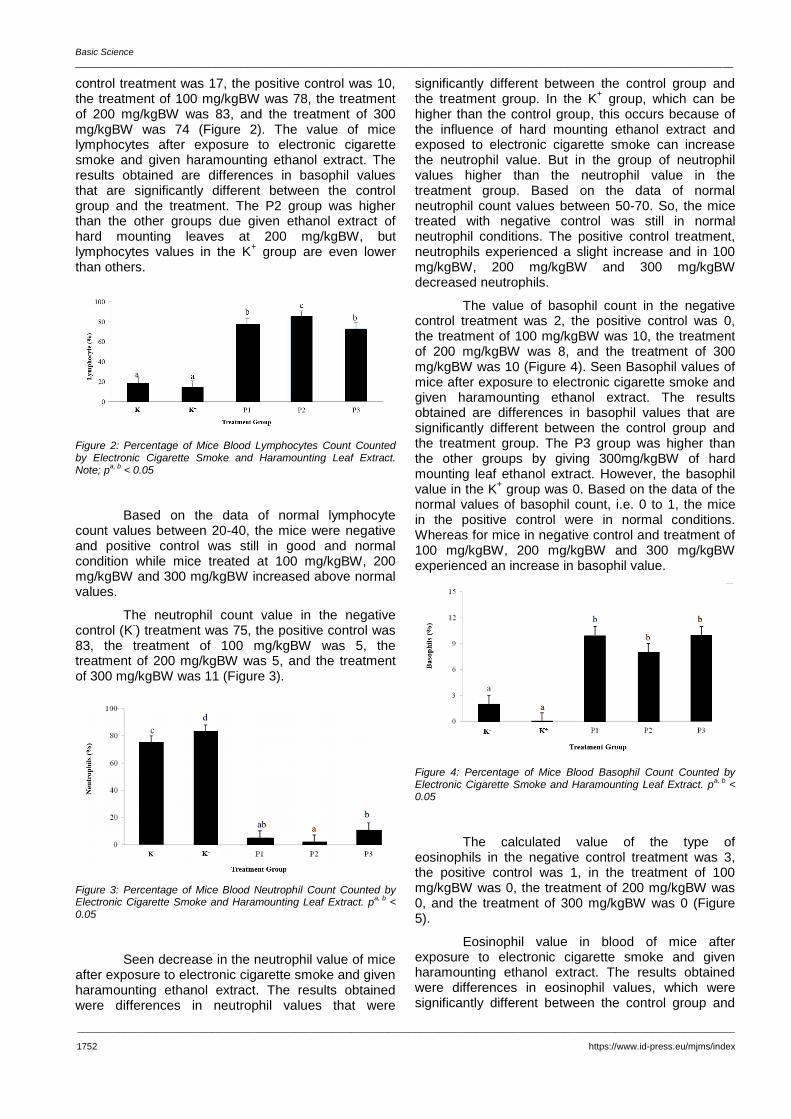
Basic Science _______________________________________________________________________________________________________________________________
_______________________________________________________________________________________________________________________________
1752 https://www.id-press.eu/mjms/index
control treatment was 17, the positive control was 10, the treatment of 100 mg/kgBW was 78, the treatment of 200 mg/kgBW was 83, and the treatment of 300 mg/kgBW was 74 (Figure 2). The value of mice lymphocytes after exposure to electronic cigarette smoke and given haramounting ethanol extract. The results obtained are differences in basophil values that are significantly different between the control group and the treatment. The P2 group was higher than the other groups due given ethanol extract of hard mounting leaves at 200 mg/kgBW, but lymphocytes values in the K
+ group are even lower
than others.
Figure 2: Percentage of Mice Blood Lymphocytes Count Counted by Electronic Cigarette Smoke and Haramounting Leaf Extract. Note; p
a, b < 0.05
Based on the data of normal lymphocyte count values between 20-40, the mice were negative and positive control was still in good and normal condition while mice treated at 100 mg/kgBW, 200 mg/kgBW and 300 mg/kgBW increased above normal values.
The neutrophil count value in the negative control (K
-) treatment was 75, the positive control was
83, the treatment of 100 mg/kgBW was 5, the treatment of 200 mg/kgBW was 5, and the treatment of 300 mg/kgBW was 11 (Figure 3).
Figure 3: Percentage of Mice Blood Neutrophil Count Counted by Electronic Cigarette Smoke and Haramounting Leaf Extract. p
a, b <
0.05
Seen decrease in the neutrophil value of mice after exposure to electronic cigarette smoke and given haramounting ethanol extract. The results obtained were differences in neutrophil values that were
significantly different between the control group and the treatment group. In the K
+ group, which can be
higher than the control group, this occurs because of the influence of hard mounting ethanol extract and exposed to electronic cigarette smoke can increase the neutrophil value. But in the group of neutrophil values higher than the neutrophil value in the treatment group. Based on the data of normal neutrophil count values between 50-70. So, the mice treated with negative control was still in normal neutrophil conditions. The positive control treatment, neutrophils experienced a slight increase and in 100 mg/kgBW, 200 mg/kgBW and 300 mg/kgBW decreased neutrophils.
The value of basophil count in the negative control treatment was 2, the positive control was 0, the treatment of 100 mg/kgBW was 10, the treatment of 200 mg/kgBW was 8, and the treatment of 300 mg/kgBW was 10 (Figure 4). Seen Basophil values of mice after exposure to electronic cigarette smoke and given haramounting ethanol extract. The results obtained are differences in basophil values that are significantly different between the control group and the treatment group. The P3 group was higher than the other groups by giving 300mg/kgBW of hard mounting leaf ethanol extract. However, the basophil value in the K
+ group was 0. Based on the data of the
normal values of basophil count, i.e. 0 to 1, the mice in the positive control were in normal conditions. Whereas for mice in negative control and treatment of 100 mg/kgBW, 200 mg/kgBW and 300 mg/kgBW experienced an increase in basophil value.
Figure 4: Percentage of Mice Blood Basophil Count Counted by Electronic Cigarette Smoke and Haramounting Leaf Extract. p
a, b <
0.05
The calculated value of the type of eosinophils in the negative control treatment was 3, the positive control was 1, in the treatment of 100 mg/kgBW was 0, the treatment of 200 mg/kgBW was 0, and the treatment of 300 mg/kgBW was 0 (Figure 5).
Eosinophil value in blood of mice after exposure to electronic cigarette smoke and given haramounting ethanol extract. The results obtained were differences in eosinophil values, which were significantly different between the control group and
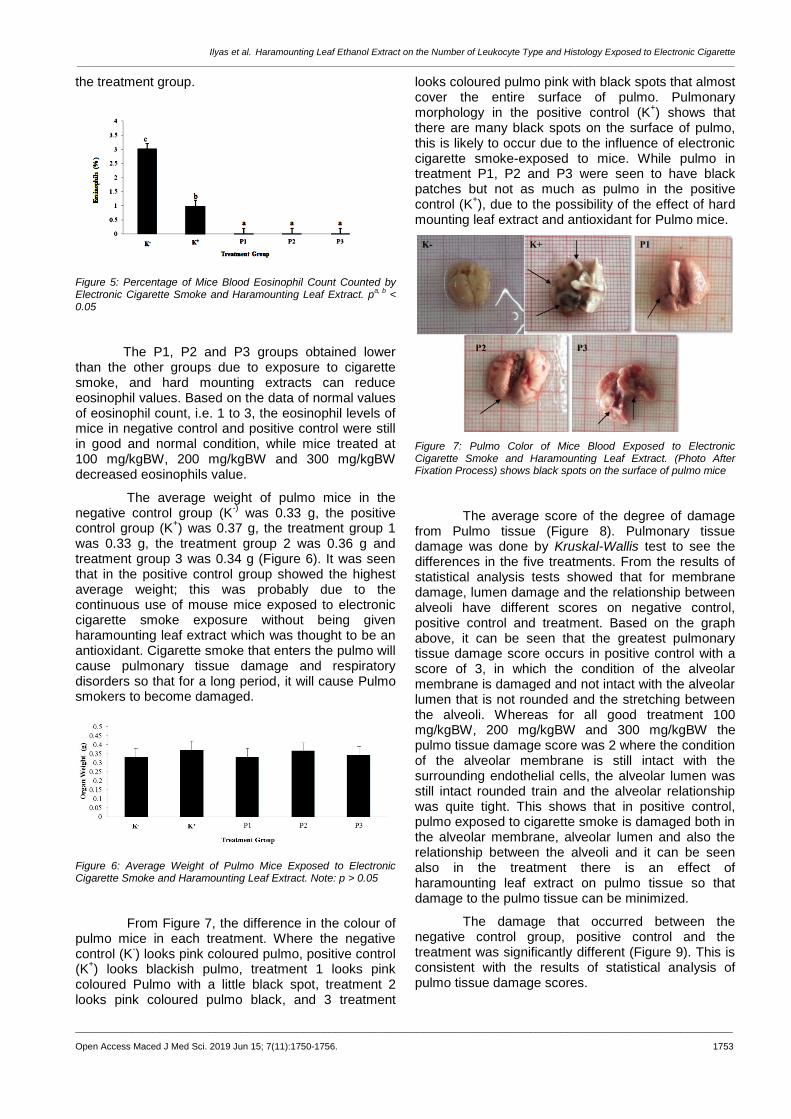
Ilyas et al. Haramounting Leaf Ethanol Extract on the Number of Leukocyte Type and Histology Exposed to Electronic Cigarette _______________________________________________________________________________________________________________________________
_______________________________________________________________________________________________________________________________
Open Access Maced J Med Sci. 2019 Jun 15; 7(11):1750-1756. 1753
the treatment group.
Figure 5: Percentage of Mice Blood Eosinophil Count Counted by Electronic Cigarette Smoke and Haramounting Leaf Extract. p
a, b <
0.05
The P1, P2 and P3 groups obtained lower than the other groups due to exposure to cigarette smoke, and hard mounting extracts can reduce eosinophil values. Based on the data of normal values of eosinophil count, i.e. 1 to 3, the eosinophil levels of mice in negative control and positive control were still in good and normal condition, while mice treated at 100 mg/kgBW, 200 mg/kgBW and 300 mg/kgBW decreased eosinophils value.
The average weight of pulmo mice in the negative control group (K
-) was 0.33 g, the positive
control group (K+) was 0.37 g, the treatment group 1
was 0.33 g, the treatment group 2 was 0.36 g and treatment group 3 was 0.34 g (Figure 6). It was seen that in the positive control group showed the highest average weight; this was probably due to the continuous use of mouse mice exposed to electronic cigarette smoke exposure without being given haramounting leaf extract which was thought to be an antioxidant. Cigarette smoke that enters the pulmo will cause pulmonary tissue damage and respiratory disorders so that for a long period, it will cause Pulmo smokers to become damaged.
Figure 6: Average Weight of Pulmo Mice Exposed to Electronic Cigarette Smoke and Haramounting Leaf Extract. Note: p > 0.05
From Figure 7, the difference in the colour of pulmo mice in each treatment. Where the negative control (K
-) looks pink coloured pulmo, positive control
(K+) looks blackish pulmo, treatment 1 looks pink
coloured Pulmo with a little black spot, treatment 2 looks pink coloured pulmo black, and 3 treatment
looks coloured pulmo pink with black spots that almost cover the entire surface of pulmo. Pulmonary morphology in the positive control (K
+) shows that
there are many black spots on the surface of pulmo, this is likely to occur due to the influence of electronic cigarette smoke-exposed to mice. While pulmo in treatment P1, P2 and P3 were seen to have black patches but not as much as pulmo in the positive control (K
+), due to the possibility of the effect of hard
mounting leaf extract and antioxidant for Pulmo mice.
Figure 7: Pulmo Color of Mice Blood Exposed to Electronic Cigarette Smoke and Haramounting Leaf Extract. (Photo After Fixation Process) shows black spots on the surface of pulmo mice
The average score of the degree of damage from Pulmo tissue (Figure 8). Pulmonary tissue damage was done by Kruskal-Wallis test to see the differences in the five treatments. From the results of statistical analysis tests showed that for membrane damage, lumen damage and the relationship between alveoli have different scores on negative control, positive control and treatment. Based on the graph above, it can be seen that the greatest pulmonary tissue damage score occurs in positive control with a score of 3, in which the condition of the alveolar membrane is damaged and not intact with the alveolar lumen that is not rounded and the stretching between the alveoli. Whereas for all good treatment 100 mg/kgBW, 200 mg/kgBW and 300 mg/kgBW the pulmo tissue damage score was 2 where the condition of the alveolar membrane is still intact with the surrounding endothelial cells, the alveolar lumen was still intact rounded train and the alveolar relationship was quite tight. This shows that in positive control, pulmo exposed to cigarette smoke is damaged both in the alveolar membrane, alveolar lumen and also the relationship between the alveoli and it can be seen also in the treatment there is an effect of haramounting leaf extract on pulmo tissue so that damage to the pulmo tissue can be minimized.
The damage that occurred between the negative control group, positive control and the treatment was significantly different (Figure 9). This is consistent with the results of statistical analysis of pulmo tissue damage scores.

Basic Science _______________________________________________________________________________________________________________________________
_______________________________________________________________________________________________________________________________
1754 https://www.id-press.eu/mjms/index
Figure 8: Scores of Degrees of Damage to Mice Pulmo Exposed to Electronic Cigarette Smoke and Haramounting Leaf Extract
For negative controls with a score of 1 where the alveolar membrane was intact, nucleated and complete with endothelial cells with the rounded alveolar lumen and tight interrelated alveolar connections. For negative control with a score of 3 where the alveolar membrane is not intact, it has no nucleus, and the surrounding endothelial cells are not visible with the alveolar lumen widened, and the relationship between the alveoli is stretched. P1, P2 and P3 groups with a score of 2 where the alveolar membrane is relatively intact with the alveolar lumen that is still rounded and the relationship between the alveoli is relatively tight.
Figure 9: Histology of Pulmo Mice Exposed to Electronic Cigarette Smoke and Haramounting Leaf Extract. K- (negative control); K + (positive control); P1, P2, P3 (treatment); Healage HE Magnification 100 x; A) Alveolar membrane; B) Lumen alveolus; C) Relationship between alveoli
Discussions
Alveolar macrophages release cytokines such as tumour necrosis factor-a (TNF-α), and TNF-α can stimulate the bone marrow to accelerate the differentiation, proliferation and maturation of granulocyte cells, especially neutrophils and monocytes which can increase the amount in the blood. Excessive increase in ROS can cause an imbalance so oxidative stress will occur. If lipid
peroxidation occurs, the structure of the monocyte cell containing the most lipids is the cell membrane will be damaged. Damage to cell membranes results in disrupted biochemical activity in cells, so cells are unable to sustain their lives, and cell death occurs [2].
Antioxidants are compounds that can inhibit reactive oxygen species and also free radicals so that antioxidants can prevent diseases associated with free radicals such as carcinogenesis, cardiovascular and ageing [9].
Lymphocytes are a type of leukocytes that have a role in the immune response. Lymphocytes show very high heterogeneity in morphology and function because they are active and can change shape and size. Lymphocytes can break through soft tissues or organs because they provide immune substances for the body's defence. Lymphocytes play a role in responding to antigens (foreign objects) by forming antibodies and developing immunity [10] because lymphocytes are immune cells that play an important role in response systems humoral and cellular invulnerability [11].
A neutrophil can phagocyte 5-20 bacteria before inactive and dead neutrophils [14]. The number of neutrophils can be increased if there is an infection, inflammation and in a state of stress. Stressful conditions in mice can trigger an increase in the production of corticosteroid hormones. Corticosteroids are produced by the adrenal cortex, which can increase anti-inflammatory, physiological and metabolic activity in the body [15]. There was an increase in neutrophils in negative controls where mice were not given any treatment. The possibility is that the mouse is in a stressful condition both with the environment outside the cage and inside the cage. While the number of neutrophils in the treatment of 100mg/kgBW, 200mg/kgBW and 300 mg/kgBW decreased. This proves that mice do not experience any anti-inflammatory activity in which there is no tissue injury or infection in the mouse tissue. The highest number of leukocyte count results is neutrophil leukocytes; this is by the statement of [16] that has the potential as an immunomodulator and maintain an acute inflammatory response in the body. It is suspected that it can increase neutrophil production which serves to maintain an acute inflammatory response in the body, in this case, non-specific neutrophils can quickly recognise and respond to a pathogen, and are important for controlling bacterial infections. The effects of ethanol intoxication are measured in other tissues where there is a decrease in enzymes in the blood, liver and kidneys but not in the heart and lymph. This means that the effect of alcohol on the number of leukocytes is related to the effects of alcohol in a chronic way that affects the bone marrow, which is the place where blood cells are produced. With this theory, it can be concluded that the effects of alcohol can chronically interfere with the production of basophils. An increase in the number of basophils indicates a leukocyte

Ilyas et al. Haramounting Leaf Ethanol Extract on the Number of Leukocyte Type and Histology Exposed to Electronic Cigarette _______________________________________________________________________________________________________________________________
_______________________________________________________________________________________________________________________________
Open Access Maced J Med Sci. 2019 Jun 15; 7(11):1750-1756. 1755
response in humoral and cellular ways to overcome the presence of substances that enter [17].
Basophils have the same function as mast cells, which generate acute inflammation in the antigen deposition site [18]. When the tissue experiences inflammation of the basophils, it releases heparin, histamine, a little bradykinin, and serotonin. Changes in the number of leukocytes in the blood circulation can be interpreted as the emergence of disease agents, inflammation, autoimmune diseases or allergic reactions [19].
Monocytes in carrying out the function of the immune system act as macrophages which swallow and destroy cells, microorganisms and foreign objects that are pathogenic. Eosinophils perform the function of the immune system by lysing as well as chemical functions, which are enzymatically [20].
Eosinophils function as phagocytes in the blood so that the presence of incoming chemicals is considered a foreign object. Therefore, eosinophil acts to repair damaged networks [15].
Eosinophils are present in the blood in small amounts, namely 1-3% of the total leukocyte population. The mechanism of action of eosinophils uses opsonisation with the help of immunoglobulin E (IgE), so eosinophils are strongly associated with its action with IgE. Eosinophils after being synthesised and enter the bloodstream then infiltrate the tissue. In this tissue eosinophils work against pathogens. The presence of pathogens will trigger an increase in the number of eosinophils in the blood. Eosinophils also play a role in the inflammatory process. Inflammation itself occurs using T helper (Th) cells. Th17 cells that are active will express IL-17, and the two cells then secrete several chemokines and cytokines such as erythropoietin, Transforming Growth Factor (TGF), MMP [21].
Cigarette smoke that enters the respiratory tract can cause airway reflex disturbances, impaired ciliary function (ciliototoxic) and increase mucus production. When smoking, various chemicals are absorbed in, and if it occurs for a long time there will be a work inhibition of the lungs, such as carbon monoxide, its presence in the lungs will reduce the blood's ability to bind oxygen from the lungs. This happens because red blood cells have a stronger affinity for carbon monoxide compared to oxygen. This situation causes shortness of breath and severe coughing for a long time [22].
The main toxins contained in cigarettes are tar, nicotine, and carbon monoxide. Cigarette smoke that enters the respiratory tract can cause airway reflex disturbances, impaired ciliary function (ciliototoxic) and increase mucus production [22]. The cough that occurs in smokers is an attempt to remove thick mucus that is difficult to be pushed out of the airway [23], states [24] that the components of cigarette smoke are CO, ammonia, hydroxylic acid
nitrogen oxides, and formaldehyde. The particles consist of tar, indole, nicotine, carbazole and cresol. This substance is toxic, irritating, and causes cancer (carcinogens). Statement [25] states that the additional flavour content in electronic cigarettes also contains carcinogens that are harmful to humans, including nitrosamines, toxic chemicals such as diethylene glycol, and components of anabasine, myosmine, and betanicotyrin tobacco specific ingredients. People who smoke for a long time have a high prevalence of several diseases such as atherosclerosis and chronic obstructive pulmonary disease (COPD) with significant systemic effects [26]. Thus, the sufferer is not only his smoker (active smoker) but also people who are in the cigarette smoke environment or referred to as passive smoking [27].
According to [28], the relationship between the alveolus that is dense in the group that is not exposed to cigarette smoke shows that the extracellular matrix which consists of collagen and elastin fibres is still intact. Lumen alveolus It seems normal not enlarged, which is common when there are lung abnormalities.
According to [29], gas absorption through the respiratory tract depends directly on the concentration of gas in the air inhaled. Most gases can switch easily across the alveolus epithelium into the plasma. Also, the respiratory tract can excrete toxins that have been absorbed from pulmo or through other pathways and with a xenobiotic metabolic enzyme system, biotransforming many toxics that can produce oxygen radicals and reactive epoxides that can cause cell damage in pulmo. According to [30], the length of exposure for inhalation poisoning and behavioural poisoning tests can be acute, chronic and chronic. But acute understanding is more common with inhalation toxicology, and chronic understanding is more common with behavioural toxicology.
In conclusion, the effect of giving haramounting leaf extract (Rhodomyrtus tomentosa (Aiton) Hassk.) to the number of normal values of the type of leukocytes mice exposed to electronic cigarettes cannot help maintain the normal value of leukocyte count. But in statistical analysis, it was seen that the change in leukocyte count value did not experience an increase or decrease that was too significant so that it was still within reasonable limits and did not endanger mice. haramounting leaf extract (Rhodomyrtus tomentosa (Aiton) Hassk.) as much as 200mg/kgBW. The effect of giving electronic cigarette smoke to mice did not statistically affect the alveolar membrane, alveolar lumen and the relationship between alveoli. However, in histological observations there is a tendency that electronic cigarette smoke can cause the alveolar membrane to lose endothelium cells in it, the alveolar lumen which is widened and not rounded intact and the relationship between the alveoli tend to be stretched.

Basic Science _______________________________________________________________________________________________________________________________
_______________________________________________________________________________________________________________________________
1756 https://www.id-press.eu/mjms/index
Acknowledgement
We are grateful to University of Sumatera Utara from Talenta proposal program on Professor research grant number Certificate 2590/UN5.1.R/PPM/2018.
References
1. Rachmadi, Afdol, Lestari, Yuniar and Yenita. Relationship Knowledge and Attitudes Against Cigarettes With Smoking Smoking Junior High School Students In Padang City. Journal of Medicine Andalas. 2013; 2(1):6-7.
2. William M., Trtchounian A, and Talbot P. Conventional and electronic cigarette (ecigarette) have different smoking characteristics. Nicotine Tobacco Res. 2010; 12:905-912. https://doi.org/10.1093/ntr/ntq114 PMid:20644205
3. Damayanti A. Penggunaan Rokok Elektronik Di Komunitas Personal Vaporizer Surabaya. Jurnal Berkala Epidemiologi. 2016; 4(2):250-261. https://doi.org/10.20473/jbe.V4I22016.250-261
4. Lavanya G, Voravutthikunchai SP, Towatana NH. Acetone Extract from Rhodomyrtus tomentosa: A Potent Natural Antioxidant. Evidence-Based Complementary and Alternative Medicine. 2012; 2012. https://doi.org/10.1155/2012/535479 PMid:23125869 PMCid:PMC3484404
5. Djamil R. and Anelia T. Penapisan Fitokimia, Uji BSLT, dan Uji Antioksidan Ekstrak Metanol beberapa Spesies Papilionaceae. Jurnal Ilmu Kefarmasian Indonesia. 2009; 7(1):190-194.
6. Kusuma IW, Ainiyati N, Suwinarti W. Search for Biological Activities drom an Invasive Shrub Species Rose Myrtle (Rhodomyrtus tomentosa). Jurnal Nusantara Bioscience. 2016; 8(1):170-174. https://doi.org/10.13057/nusbiosci/n080110
7. Mordmuang A, Voravuthikunchai SP. Rhodomyrtus tomentosa (Aiton) Hassk. leaf extract: An alternative approach for the treatment of staphylococcal bovine mastitis. Research in veterinary science. 2015; 102:242-6. https://doi.org/10.1016/j.rvsc.2015.07.018 PMid:26412553
8. Rupina W. Trianto HF and Fitrianingrum I. Efek Salep Ekstrak Etanol 70% Daun Haramounting Terhadap Re-epitelisasi Luka Insisi Kulit Tikus Wistar. Jurnal Kerfarmasian. 2016; 9(1):120-124. https://doi.org/10.23886/ejki.4.5905.26-30
9. Hoffbrand V. At a Glance Hematology. Jakarta (ID). EMS. 2006.
10. Bikrisirna SHL, Mahfudz LD, and Suthama N. Resilience of Broiler Chickens in Tropical Conditions Given Red Guava (Psidium Guajava) as a Source of Antioxidants. Agromedia. 2013; 31(2):46-57.
11. Schalm OW, Jain NC, and Carrol EJ. Veterinary Hematology. 3rd ed. Lea and Febiger, Philadephia, 1995.
12. Lockwood W. The Complete blood count and associated test, 2018.
13. Fajrunni'mah R. Noni Juice To Reduce The Amount Of
Leukocytes And Neutrophils As An Indicator Of Inflammation On Exposure To Cigarette Smoke. Journal of Health Science and Technology. 2016; 3(2).
14. Guyton AC, Hall JE. Textbook on Medical Physiology. Edition 11. Jakarta: EGCA. 2008
15. Tortora GJ, Derrickson B. Principles of anatomy & physiology. John Wiley & Sons, Incorporated; 2017.
16. Jang SAK, Park JD. Lim S, Kang KH, Yang S, Pyo and Sohn EH. The Comparative Imunomodulatory Effects of βglucan From Yeast, Bacteria, and Mushroom on the Functionof Macrophages, Journal of Food Science and Nutrition. 2009; 14:102-108. https://doi.org/10.3746/jfn.2009.14.2.102
17. Erlinger TP. WBC Count and the Risk of Cancer Mortality in a National Sample of U.S. Adults: Results from the Second National Health and Nutrition Examination Survey Mortality Study. Cancer Epidemiology, Biomarkers & Prevention. 2004;13:1052.
18. Tizard IR. Introduction to Veterinary Immunology. Airlangga University Press, Surabaya, 1988.
19. Lestari SHA, Ismoyowati, Indradji M. Study of leukocyte counts and differential leukocytes in various types of female local ducks which feed on probiotic supplementation. J Scientific Animal Husbandry. 2013; 1(2):699-709.
20. Isroli S, Susanti E, Widiastuti T, Yudiarti, and Sugiharto. Observation of a number of second chicken hematological variables in intensive maintenance. National Livestock Awakening Seminar, Semarang. 2009; 548-557.
21. Juwariyah, Arjana AZ, Rahayu ET, Rosita, Irfan RM. Leukocyte Pro Inflammatory Activity in Cases of Chronic Obstructive Pulmonary Disease Acute Exacerbation. Journal of Medicine and Health. 2017; 17(2). https://doi.org/10.18196/mm.170202
22. Santosa S, Purwito J and Widjaja JT. Comparison of the Value of Peak Flow of Expiration Between Smokers and Non-Smokers. JKM. 2004;3(2):6.
23. Surbakti NB. Pathophysiology Pocket Book. Third Edition. Jakarta: EGC Medical Book Publishers, 2007.
24. Safitri W. Dangers of Smoking for Health. UMM; 2010.
25. Westenberger BJ. Evaluation of ecigarettes. Department of Health and Human Services Food and drug Administration, center of drug evaluation and research division of pharmaceutical analysis. 2009; 1-8.
26. Yanbaeva DG, Dentener MA, Creutzberg EC, Wesseling G, Wouters, Emiel FM. Systemic effect of smoking. Chest. 2007; 131:1557-66. https://doi.org/10.1378/chest.06-2179 PMid:17494805
27. Susanna D, Hartono B, Fauzan H. Determination of nicotine levels in cigarette smoke. Makara Kesehatan. 2003; 7:2.
28. Marianti A. Antioxidant Activity of Tomato Juice in Prevention of Damage to Lung Tissues Exposed to Cigarettes. Biosaintifika Journal. 2009; 1(1):1-10.
29. Lu FC. Basic Toxicology: Principles, Target Organ and Risk Assessment. Second Edition. Jakarta: University of Indonesia Publisher, 1995.
30. Mansyur. Toxicology. Selective Toxicity and Test. Medan: USU Digital Library, 2002.

_______________________________________________________________________________________________________________________________
Open Access Maced J Med Sci. 2019 Jun 15; 7(11):1757-1761. 1757
ID Design Press, Skopje, Republic of Macedonia Open Access Macedonian Journal of Medical Sciences. 2019 Jun 15; 7(11):1757-1761. https://doi.org/10.3889/oamjms.2019.237 eISSN: 1857-9655 Basic Science
A New Solid-Phase Extraction Method for Determination of Pantoprazole in Human Plasma Using High-Performance Liquid Chromatography Dragica Zendelovska
*, Emilija Atanasovska, Kalina Gjorgjievska, Kristina Pavlovska, Krume Jakjovski, Dimce Zafirov,
Jasmina Trojacanec
Institute of Preclinical and Clinical Pharmacology and Toxicology, Medical Faculty, Ss. Cyril and Methodius University of Skopje, 50 Divizija 6, 1000 Skopje, Republic of Macedonia
Citation: Zendelovska D, Atanasovska E, Gjorgjievska K, Pavlovska K, Jakjovski K, Zafirov D, Trojacanec J. A New Solid-Phase Extraction Method for Determination of Pantoprazole in Human Plasma Using High-Performance Liquid Chromatography. Open Access Maced J Med Sci. 2019 Jun 15; 7(11):1757-1761. https://doi.org/10.3889/oamjms.2019.237
Keywords: Pantoprazole; Solid-phase extraction; High-performance liquid chromatography; Human plasma
*Correspondence: Dragica Zendelovska. Institute of Preclinical and Clinical Pharmacology and Toxicology, Medical Faculty, Ss. "Cyril and Methodius" University of Skopje, 50 Divizija 6, 1000 Skopje, Republic of Macedonia. E-mail: [email protected]
Received: 27-May-2019; Revised: 07-Jun-2019; Accepted: 08-Jun-2019; Online first: 15-Jun-2019
Copyright: © 2019 Dragica Zendelovska, Emilija Atanasovska, Kalina Gjorgjievska, Kristina Pavlovska, Krume Jakjovski, Dimce Zafirov, Jasmina Trojacanec. This is an open-access article distributed under the terms of the Creative Commons Attribution-NonCommercial 4.0 International License (CC BY-NC 4.0)
Funding: This research did not receive any financial support
Competing Interests: The authors have declared that no competing interests exist
Abstract
BACKGROUND: A new simple, selective and accurate high-performance liquid chromatographic (HPLC) method utilising solid-phase extraction for the determination of pantoprazole in human plasma samples has been developed.
AIM: The purpose of this paper was developing a new HPLC method suitable for the determination of pantoprazole in plasma samples, which enables simple and rapid isolation and concentration of the analysed drug.
METHODS: The chromatographic separation was accomplished on a LiChroCart LiChrospher 60 RP select B column using a mobile phase composed of 0.2 % (V/V) water solution of triethylamine (pH 7) and acetonitrile (58:42, V/V) followed by UV detection was at 280 nm. The solid-phase extraction method using LiChrolut RP-18 (200 mg, 3 ml) was applied to the obtained good separation of investigated drug from endogenous plasma components. Best results were achieved when plasma samples were buffered with 0.1 mol/L KH2PO4 (pH 9) before extraction, eluted and reconstituted with acetonitrile and 0.001 mol/L NaOH after extraction, respectively.
RESULTS: The standard calibration curves showed good linearity within the range of 25.0-4000.0 ng/mL with a correlation coefficient greater than 0.996. Retention times of pantoprazole and internal standard, lansoprazole was 4.1 and 6.0 min respectively. The limit of quantification was 25.0 ng/mL. For intra- and inter-day precision relative standard deviations ranged from 4.2 to 9.3%. The relative errors for stability investigations were ranged from 0.12 to -10.5%.
CONCLUSION: This method has good precision and accuracy and was successfully applied to the pharmacokinetic and bioequivalence study of 40 mg pantoprazole in healthy volunteers.
Introduction
Pantoprazole is a proton pump inhibitor used as the first-line treatment for patients with acid-peptic disorders, including erosive gastro-oesophageal reflux disease, nonerosive reflux disease and duodenal gastric ulcers. There are several investigations concerning the determination of pantoprazole in human plasma samples by high-performance liquid chromatography (HPLC). In the published methods,
liquid-liquid extraction has been used for sample preparation [1], [2], [3], [4] using different solvents. The disadvantage of these methods employing liquid-liquid extraction (with grate chemicals consumption) is that they involve several steps which can yield poor separation from the endogenous plasma interferences, these methods are time-consuming (usually up to 1 h) regarding multiple steps of extraction, drying etc. Some authors proposed methods for determination of pantoprazole in human plasma using deproteinisation as sample preparation

Basic Science _______________________________________________________________________________________________________________________________
_______________________________________________________________________________________________________________________________
1758 https://www.id-press.eu/mjms/index
method with acetonitrile or methanol [5], [6], [7], [8], single or automated on-line solid-phase extraction method [9], [10], [11], [12] or method by direct injection [13]. The solid-phase extraction method is less labour intensive due to the mechanism which allows extraction of the components in a single loading step. In comparison with liquid-liquid extraction, solid-phase extraction is better suited to enriching the concentration of the investigated components in plasma samples and not susceptible to problematic emulsions.
In this paper, we describe a new HPLC method suitable for the determination of pantoprazole in plasma samples employing solid phase extraction for sample preparation, which enables simple and rapid isolation and concentration of the analysed drug. This method is advantageous because of its simplicity, efficient clean-up of the complex biological matrix and shorter time of analysis, and it is suitable to monitor plasma concentrations during clinical pharmacokinetic studies in humans.
Methods
Chemicals and standards
Pantoprazole working standard and internal standard lansoprazole was supplied by Krka, d.d., Novo Mesto, Slovenia. HPLC grade methanol and acetonitrile were purchased from Across Organics, Belgium. Triethylamine, o-phosphoric acid, sodium hydroxide, potassium dihydrogen phosphate and columns for solid phase extraction (LiChrolut RP-18,
40-63 m, 200 mg, 3mL) were obtained from Merck (Germany).
Instrumentation and chromatographic conditions
The method development was performed with a High-pressure liquid chromatographic system consisting of an autosampler Perkin Elmer LC ISS Series 200, an ultraviolet diode array detector (Perkin Elmer LC 235 C). The system was controlled, and data analysis were performed with the software package Turbochrom Version 4.1. Plus, and UV-spectrometric data were produced by TurboScan Version 2.0. The detector was set at 280 nm, and peak areas were integrated automatically by using the software. Chromatographic separation was carried out using LiChroCart LiChrospher 60 RP select B (4.0 mm x 250 mm, 5 µm).
A series of parameters, including composition and pH of mobile phase and flow rate, were tested concerning the location and shape of the peaks of pantoprazole and the internal standard in the
corresponding chromatograms. The final choice of the mobile phase giving satisfying resolution and run time was 0.2 % (V/V) triethylamine in water with pH = 7 and acetonitrile (58:42, V/V). The triethylamine
solution was prepared by adding 200 L triethylamine in 100 mL water and pH of this solution [7] was adjusted by concentrated o-phosphoric acid. The mobile phase was filtered and degassed with helium and delivered at a flow rate of 1.2 mL/min. The injection volume was 50 µL.
Preparation of standards
Stock solutions of 1000 µg/mL of pantoprazole and lansoprazole were prepared in water and 0.05 mol/L NaOH respectively. These solutions were stored at +4°C, and no change in stability over 1 month was observed. The working solutions were prepared freshly every day by diluting appropriate portions of these solutions with water.
Sample preparation
Human plasma was prepared from heparinised whole blood samples. Blood samples were collected from healthy volunteers and stored at -20°C. After thawing, samples were spiked daily with stock solutions of pantoprazole and lansoprazole as an internal standard.
A 12 ports solid-phase extraction vacuum manifold (Merck) was used for sample preparation. A
single extraction with LiChrolut RP-18 (40-63 m) 200 mg, 3 mL standard PP-tubes was used to isolate the drug and internal standard from plasma samples. The cartridge was conditioned sequentially by elution with 2 mL methanol and 2 mL water. Spiked plasma sample (total volume 1.05 mL, 1 mL spiked plasma with pantoprazole and 0.05 mL internal standard) was buffered with 1 mL of 0.1 mol/L KH2PO4 (pH 9) and was introduced into the cartridge under vacuum at 5 psi. Water (2 mL) was used to rinse the cartridge. Elution was then performed with 0.7 mL of acetonitrile. This eluate was collected in a clean tube and was evaporated to dryness under N2 for about 20 min at 40°C. After the reconstitution of the residue with 200
L of 0.001 mol/L NaOH, a 50 L volume was injected into the HPLC system.
Calibration curves
Typical calibration curves were constructed with six blank plasma samples spiked with appropriate amounts of the standard solutions. The calibration range was 25.0-4000.0 ng/mL of pantoprazole. The standard samples were prepared according to the procedure as unknown samples. Content of pantoprazole in control and unknown samples was determined by an internal standard method using weighted (1/c) calibration curves obtained by plotting

Zendelovska et al. A New Solid-Phase Extraction Method for Determination of Pantoprazole in Human Plasma Using HPLC _______________________________________________________________________________________________________________________________
_______________________________________________________________________________________________________________________________
Open Access Maced J Med Sci. 2019 Jun 15; 7(11):1757-1761. 1759
peak height ratios of pantoprazole and the internal standard against pantoprazole concentration.
Method validation
The proposed method was validated by evaluating selectivity, precision, accuracy, linearity, sensitivity, ruggedness and stability according to guidelines for Bioanalytical Method Validation, European Medicines Agency, Committee for Medicinal Products for Human Use, 2009 [14]. The selectivity of the proposed method was determined by comparing the chromatograms of diluent, standard solutions, blank plasma and spiked plasma samples. Intra-day precision values were assessed by calculating the relative standard deviation (RSD) for eight replicates at three different concentrations spiked into blank. Inter-day precision was assessed by measuring two individually prepared spiked plasma samples at three different concentration levels of pantoprazole in 6 different days. Accuracy (intro- and inter-) was determined by calculating relative error (%). Ruggedness was performed on the second HPLC column of the same type by injecting a standard solution of pantoprazole and internal standard. Relative error was calculated by comparing the mean peak height for both substances to those obtained by changing pH value of the mobile phase from 7.0 to 7.3 and from 7.0 to 6.7 or to those obtained by changing the detection wavelength from 280 nm to 275 nm and from 280 nm to 285 nm. Stability of pantoprazole in plasma was evaluated for 2, 12 and 24 hours, after one and three freeze/thaw cycles and after 1 month stored at -20°C using spiked samples at two different concentration levels prepared in duplicate.
Results
Method development
Our objectives for this work were to develop a robust, rapid and reproducible analytical assay for pantoprazole in human plasma using HPLC-UV which after validation would be appropriate for application in a clinical study evaluating the bioequivalence of various pantoprazole formulations. Therefore, a series of studies were conducted to develop a convenient and easy-to-use method for quantitative analysis of pantoprazole in plasma samples. Several HPLC method variables concerning their effect on the separation of pantoprazole and internal standard from the matrix, reducing run time and maximising resolution were investigated.
In our extensive preliminary experiments, a series of aqueous mobile phases containing buffer solutions with different pH values in combination with different modifiers including acetonitrile, 2-propanol and triethylamine with different volume fractions were tested. The presence of triethylamine in the mobile
phase improved peak shape and increased the intensity of the observed pantoprazole signal. The results were most satisfactory when the mobile phase consisted of 0.2% (V/V) triethylamine in water with pH 7 and acetonitrile in volume fractions 58:42. A set of column packing including C8, C18 and RP select B with different lengths and particle sizes were tested and the LiChroCart LiChrospher 60 RP select B packing showed the best separation. The total chromatographic run time is 7 min, which is amenable to the high-throughput requirements of clinical study analyses. A typical chromatogram of standard solutions of pantoprazole and internal standard produced by the developed HPLC method is shown in Figure 1c. The retention time of pantoprazole and internal standard (lansoprazole) are 4.1 min and 6.0 min, respectively.
Also, to obtain satisfactory values for recovery of pantoprazole different cartridges for solid phase extraction were tested. The satisfactory values for recovery of pantoprazole and internal standard were obtained when solid phase extraction is performed on LiChrolut RP-18 tubes.
Also, to improving the extraction procedure, plasma samples were buffered with 1.0 mL of 0.1 mol/L KH2PO4 solution (pH 9) before introducing into the cartridges.
Figure 1: Chromatograms of A) diluent; B) blank plasma; C) standard solutions of pantoprazole and internal standard; D) spiked plasma sample with pantoprazole and lansoprazole
Under the chromatographic conditions described, pantoprazole and the standard internal peaks were well resolved. Endogenous plasma components did not give any interfering peaks. Typical chromatograms of blank plasma in comparison to spiked sample are shown in Figure 1b and 1d). On the other hand, the method in this report has sufficient sensitivity and reproducibility to permit the pharmacokinetic studies. The developed HPLC method can be used for the analysis of plasma samples from healthy volunteers after oral administration of 40 mg pantoprazole. A typical

Basic Science _______________________________________________________________________________________________________________________________
_______________________________________________________________________________________________________________________________
1760 https://www.id-press.eu/mjms/index
chromatogram of a plasma sample of a patient after administration of 40 mg pantoprazole is shown in Figure 2. Chromatograms showed no interfering peak at the pantoprazole and internal standard peaks position.
Figure 2: Chromatogram of plasma sample of a patient after administration of 40 mg pantoprazole (2h post-dose, the concentration of pantoprazole 2023.7 ng/mL)
Linearity
The method was validated using a six-point calibration curve ranging from 25.0 to 4000.0 ng/mL of pantoprazole. Respective weighted (1/c) linear
regression equation was: y = 0.001726 · + 0.020017. The correlation coefficient was routinely greater than 0.996.
Precision and accuracy
Intra-day precision and accuracy were determined by measuring individually prepared eight spiked plasma samples at three different concentration levels of pantoprazole, first near LOQ. Inter-day precision and accuracy were investigated by analysing 2 series of spiked plasma samples at low, middle and high concentration levels of pantoprazole in six different days. Then, the corresponding relative standard deviation and relative errors were calculated. The data for intro- and inter-day precision and accuracy of the proposed method are shown in Table 1. As can be seen from results presented in Table 1, for intra- and inter-day precision, RSDs ranged from 4.2 to 8.9% and from 4.9 to 9.3%, respectively. These data indicate a considerable degree of precision and reproducibility for the method both during one analytical run and between different runs.
Relative errors at all three concentrations studied are less than 7.0% for intra-day accuracy and 7.3% for inter-day accuracy, and it is obvious that the method is remarkably accurate, which ensures obtaining reliable results.
The lower limit of quantification
The lower limit of quantification was defined as the lowest concentration of pantoprazole on the standard curve, which can be measured with acceptable accuracy and precision (RSD less than 20%, relative error ± 20 %, n = 6) [14]. The LLOQ was estimated using the lowest calibration standard in six different analytical days. Pantoprazole concentration of 25 ng/mL was accepted as LLOQ.
Table 1: Intra-and inter-day precision and accuracy data
Pantoprazole nominal concentration (ng/mL)
Intra-day Inter-day
Mean (n = 8) observed
concentration (ng/mL)
Relative standard
deviation (%)
Mean (n = 12) observed
concentration (ng/mL)
Relative standard
deviation (%)
Precision 50.0 47.1 8.9 46.3 9.3 750.0 697.5 7.0 743.2 5.3 2500.0 2487.7 4.2 2418.3 4.9
Accuracy Relative error (%)
Relative error (%)
50.0 750.0 2500.0
47.1 697.5
2487.7
-5.9 -7.0 -0.5
46.3 743.2
2418.3
-7.3 -0.9 -3.3
Stability of pantoprazole in blood samples
Stability investigation of pantoprazole in plasma samples was performed by analysing two series of spiked samples at two different concentration levels (50 and 2500 ng/mL) after different storage conditions: immediately, after staying in an autosampler for 2, 12 and 24 hours, after one and three freeze/thaw cycles and after 1 month stored at -20°C. Samples were analysed against a calibration curve, obtained from freshly spiked calibration standards, and the obtained concentrations are compared to the nominal concentrations. The relative errors were calculated and for stability investigations after 2, 12 and 24 hours ranged from 0.12 to -10.5%, after one and three freeze/thaw cycles ranged from -2.76 to 7.88% and for after 1 month stored at -20°C ranged from 0.48 to 4.5%.
Discussion
The results from this investigation show that pantoprazole added to plasma samples is stable in the different storage conditions if we are taking into account that the criterion is mean concentration at each level should be within ± 15% of the nominal concentration [14].
In conclusion, the proposed HPLC method employing solid-phase extraction for sample preparation is simple and convenient for the determination of pantoprazole in plasma samples and the total run time for the chromatographic run is less than 7 minutes. The validation data demonstrate good precision and accuracy, which proves the reliability of

Zendelovska et al. A New Solid-Phase Extraction Method for Determination of Pantoprazole in Human Plasma Using HPLC _______________________________________________________________________________________________________________________________
_______________________________________________________________________________________________________________________________
Open Access Maced J Med Sci. 2019 Jun 15; 7(11):1757-1761. 1761
the proposed method. The quantitation of pantoprazole was not affected by any of the possible matrix interfering substances. In conclusion, this paper describes a very simple and sensitive HPLC method for the determination of pantoprazole suitable to monitor plasma concentrations during clinical pharmacokinetic studies in humans.
References
1. Bharathi DV, Hotha KK, Jagadeesh B, Chatki PK, Thriveni K, Mullangi R, Naidu A. Simultaneous estimation of four proton pump inhibitors--lansoprazole, omeprazole, pantoprazole and rabeprazole: development of a novel generic HPLC-UV method and its application to clinical pharmacokinetic study. Biomed Chromatogr. 2009; 23(7):732-9. https://doi.org/10.1002/bmc.1177 PMid:19360758
2. Noubarani M, Keyhanfar F, Motevalian M, Mahmoudian M. Improved HPLC method for determination of four PPIs, omeprazole, pantoprazole, lansoprazole and rabeprazole in human plasma. J Pharm Pharm Sci. 2010; 13(1):1-10. https://doi.org/10.18433/J3GP4Q PMid:20456825
3. Emami J, Rezazadeh M, Kalani M. Quantification of pantoprazole by high performance liquid chromatography (HPLC) method: In vitro and in vivo applications. Journal of Liquid Chromatography & Related Technologies. 2014; 37(5):681-95. https://doi.org/10.1080/10826076.2012.758137
4. Ramakrishna NV, Vishwottam KN, Wishu S, Koteshwara M. High-performance liquid chromatography method for the quantification of pantoprazole in human plasma. J Chromatogr B Analyt Technol Biomed Life Sci. 2005; 822(1-2):326-9. https://doi.org/10.1016/j.jchromb.2005.06.011 PMid:16005696
5. Battu PR, Reddy NK. Development and validation of RP-HPLC for the pantoprazole sodium sesquihydrate in pharmaceutical dosage forms and human plasma. International Journal of ChemTech Research. 2009; 1(2):195-8.
6. Li Y, Ding MJ, Ma J, Wang S, Wu XL, Xu HJ, Lu ZY, Zou JJ, Fan HW, Zhou XM. Quantification of pantoprazole in human plasma using LC-MS/MS for pharmacokinetics and bioequivalence study.
Eur J Drug Metab Pharmacokinet. 2011; 35(3-4):147-55. https://doi.org/10.1007/s13318-010-0018-5 PMid:21302042
7. Zarghi A, Shafaati A, Foroutan SM, Movahed H, Khoddam A. A rapid high-performance liquid chromatographic method for the determination of pantoprazole in plasma using UV detection. Application in pharmacokinetic studies. Arzneimittelforschung. 2008; 58(9):441-4. https://doi.org/10.1055/s-0031-1296536 PMid:18972873
8. Koçyiğit-Kaymakçoğlu B, Unsalan S, Rollas S. Determination and validation of ketoprofen, pantoprazole and valsartan together in human plasma by high performance liquid chromatography. Pharmazie. 2006; 61(7):586-9.
9. Storms ML, Stewart JT. Development of a reversed-phase liquid chromatographic method for the analysis of amoxicillin, metronidazole, and pantoprazole in human plasma using solid-phase extraction. Journal of liquid chromatography & related technologies. 2002; 25(16):2433-43. https://doi.org/10.1081/JLC-120014265
10. Tanaka M, Yamazaki H. Direct determination of pantoprazole enantiomers in human serum by reversed-phase high-performance liquid chromatography using a cellulose-based chiral stationary phase and column-switching system as a sample cleanup procedure. Anal Chem. 1996; 68(9):1513-6. https://doi.org/10.1021/ac951127n PMid:8815744
11. Srinandan V, Nagappan K, Patel S, Yamjala K, Byran G, Babu B. Simultaneous Quantification of Pantoprazole and Levosulpiride in Spiked Human Plasma Using High Performance Liquid Chromatography Tandem Mass Spectrometry. Current Pharmaceutical Analysis. 2019; 15(1):17-23. https://doi.org/10.2174/1573412914666180101142646
12. Dotsikas Y, Apostolou C, Soumelas S, Kolocouri F, Ziaka A, Kousoulos C, Loukas YL. Validation of a novel, fully automated high throughput high-performance liquid chromatographic/tandem mass Spectrometric method for quantification of pantoprazole in human plasma. J AOAC Int. 2010; 93(4):1129-36.
13. Cass QB, Degani AL, Cassiano NM, Pedrazolli J Jr. Enantiomeric determination of pantoprazole in human plasma by multidimensional high-performance liquid chromatography. J Chromatogr B Analyt Technol Biomed Life Sci. 2002; 766(1):153-60. https://doi.org/10.1016/S0378-4347(01)00472-8
14. EMEA/CHMP/EWP/192217/2009 Rev.1 Corr.2. Guideline on Bioanalytical Method Validation. London, July 2011.

_______________________________________________________________________________________________________________________________
Open Access Maced J Med Sci. 1762
ID Design Press, Skopje, Republic of Macedonia Open Access Macedonian Journal of Medical Sciences. 2019 Jun 15; 7(11):1762-1767. https://doi.org/10.3889/oamjms.2019.461 eISSN: 1857-9655 Clinical Science
The Indonesian Version of Montreal Cognitive Assessment (MoCA-Ina): The Difference Scores Between Male Schizophrenia Prescribed by Risperidone and Adjunctive of Donepezil in Public Hospital of Dr Pirngadi Medan, Indonesia Novita Linda Akbar
*, Elmeida Effendy, Vita Camellia
Department of Psychiatry, Universitas Sumatera Utara, Medan, Indonesia
Citation: Akbar NL, Effendy E, Camellia V. The Indonesian Version of Montreal Cognitive Assessment (MoCA-Ina): The Difference Scores Between Male Schizophrenia Prescribed by Risperidone and Adjunctive of Donepezil in Public Hospital of Dr Pirngadi Medan, Indonesia. Open Access Maced J Med Sci. 2019 Jun 15; 7(11):1762-1767. https://doi.org/10.3889/oamjms.2019.461
Keywords: Schizophrenia; Donepezil; Cognitive functions; MoCA-Ina
*Correspondence: Novita Linda Akbar. Department of Psychiatry, Universitas Sumatera Utara, Medan, Indonesia. E-mail: [email protected]
Received: 27-Mar-2019; Revised: 20-May-2019; Accepted: 21-May-2019; Online first: 31-May-2019
Copyright: © 2019 Novita Linda Akbar, Elmeida Effendy, Vita Camellia. This is an open-access article distributed under the terms of the Creative Commons Attribution-NonCommercial 4.0 International License (CC BY-NC 4.0)
Funding: This research did not receive any financial support
Competing Interests: The authors have declared that no competing interests exist
Abstract
BACKGROUND: Prescribing donepezil as an addition in reducing the cognitive dysfunctions among schizophrenia patients that have been given by antipsychotic (risperidone and olanzapine) is commonly used. Also, to determine the presence of the dysfunctions, an assessment is conducted by Montreal Cognitive Assessments based on Indonesian version (MoCA-Ina) to provide a more understandable test.
AIM: To determine the score differences of MoCA-Ina between male patients of schizophrenia prescribed with only risperidone, and those with the addition of Donepezil within a certain interval of times.
SETTINGS AND DESIGN: It is a pre-post-test experimental design with non-probability of consecutive sampling.
METHODS: The study involved 48 of schizophrenia patients who have been prescribed fixed dose risperidone for 4 mg/day orally, and 24 people who were the intervention group were prescribed with the additional of 5 mg of donepezil per day started from the first until sixth week, followed by the increased dosages to 10 mg until twelfth week. These patients were recruited from the Public Hospital of Dr Pirngadi Medan, Indonesia, under the Department of Psychiatry. Then, the statistical data were analysed by Mann Whitney U, Friedman, and Wilcoxon, followed by analysing of SPSS version 21.
RESULTS: The addition of five mg of Donepezil increased the MoCA-Ina score significantly compared to those who only prescribed with risperidone during all weeks of observation.
CONCLUSION: Based on the results, the addition of donepezil increased the score level of the MoCA-Ina in the intervention group.
Introduction
Schizophrenia is one of the most confusing brain impairment, which is indicated by the manifestation of acute psychotic followed by continuous dysfunction of cognitive and antisocial personalities [1]. There are many different targets and strategies that have been used to improve the cognitive functions to schizophrenia patient; however, the therapeutic therapies relatively have found the difficulties [2]. Therefore, seven cognitive domains have been identified to be considered as molecular targets in treating the schizophrenia patients cognitively, including working memory, attention and
vigilance, speed of processing, verbal and memory learning, visual and memory learning, reasoning and problem solving, and social cognition [3]. In current medical developments, schizophrenia is present due to the mental disturbance of simulations, indicated by several emotional disruptions, ideational, and cognitive dysfunctions. Regarding cognitive disturbances, the dysfunction parameters are observed in term of active and controllable processing information, such as the speed of thinking, attention, and awareness, and this happens because of the alteration within the neurochemical and neuropathological factors. Several studies have reported that the cholinergic neurotransmitter system involving the nicotinic and muscarinic receptors is

Akbar et al. The Indonesian Version of Montreal Cognitive Assessment (MoCA-Ina): The Difference Scores Between Male Schizophrenia _______________________________________________________________________________________________________________________________
_______________________________________________________________________________________________________________________________
Open Access Maced J Med Sci. 2019 Jun 15; 7(11):1762-1767. 1763
important to stimulate the neuromodulator of the cognition process to schizophrenia, despite dopamine as the main reason [4].
In addition, to improving the cognitive functions among schizophrenia patients, several antipsychotic medications are used, such as olanzapine, and risperidone, as temporal considerations. A study has reported that the second generation of antipsychotic medications, such as donepezil can stimulate the prefrontal cortex so that the cognitive functions could be improved [1]. This medication is one of the acetylcholinesterase inhibitors, which is a reversible inhibitor from the asetlkolinesterase enzyme, known chemically as (±) - 2, 3 -dihydro-5, 6 - dimethoxy – 2 - [[1- (phenylmethyl) - piperidinyl] - 1H – in - 1-one hydrochloride. The donepezil hydrochlorides are known as E2020 in pharmacology literature [4], consumed to obtain the therapeutic effects to increase the cholinergic functions. This is consumed by increasing the acetylcholine concentration throughout its hydrolysis reversible prevention within acetylcholinesterase [4]. The asetikolin transmission in central nerve system has a role in organizing the cognition functions, in particular to the attention and memory, which can be stimulated by the alpha-7 modulation inside the donepezil. The alpha-7 modulation nicotinic asetikolin of receptors have been considered as the objects of medications which are potential to treat the Alzheimer and schizophrenia [5].
In Indonesia, the assessment in determining the acuteness of schizophrenia patients before the presence of MoCA-Ina is conducted by performing weekly tests based on the Positive and Negative Syndrome Scale (PANSS) [6]. A study conducted by Friedman has reported that random consumption of donepezil was able to reduce the cognitive dysfunctions within the learning trial aspects in the form of California Verbal Learning Test, and the patients involved showed steady PANSS scores [7]. Meanwhile, another double-blind placebo-controlled trial study in the United States which involved both male and female patients with ages between 18 and 55 in 12 weeks has reported that the increase dosages of donepezil from 5 to 10 mg resulted in significant neurocognitive levels around p < 0.05 based on the Clinical Antipsychotic Trials of Intervention Effectiveness (CATIE) [8]. On the other hand, Choi et al., has reported in Japan that the increasing of cognitive functions under consumption of donepezil, galantamine, and rivastigmine was obtained with significant level of parameters of verbal learning and memory (d = 2.3; p = 0.06; 95%Cl – 0.01 to 0.46) [9].
The MoCA assessment is used to detect the light cognitive dysfunctions in any conditions including Alzheimer, Vascular Cognitive Impairment, Parkinson, Lewy body, frontotemporal dementia, multiple sclerosis, Huntington, brain tumor, ALS, sleep apnea, heart failure, drugs abuse, schizophrenia, HIV and
head trauma [10], [11]. The Indonesian version of MoCA is a sensitive instrument in screening the Mild Cognitive Impairment (MCI) which is based on the original version from Canada, implying highly to culture differentiations to Indonesia. Nevertheless, the validity and reliability tests must be conducted earlier, so that the MoCA-Ina assessment is more accurate to be conducted in assessing the cognitive impairments than those from the original version or other types of assessments. For schizophrenia patients, the Mini-Mental State Examinations (MMSE) is a common method to be conducted [12]; however, this method has a lower number of examination tests in memory assessments than those from MoCA-Ina, which take a longer time to be done due to the involvement of executive tests, such as trial making test B; more complex language ability, more attention and abstract tests, more complex visuospatial in form of 3-dimension [13].
The prescription of risperidone with the additions of donepezil is expected to increase the cognitive dysfunctions of schizophrenia patients due to its ability in accelerating the thinking process, attention and awareness, working memory, visual and memory learning, verbal and memory learning, solving methods, and verbal understanding. The measurement by using the MoCA-Ina is more sensitive and understandable for Indonesian patients than those by using the original version of MoCA.
Material and Methods
Population and demographical studies
This research is a pre-post-test design experimental non-randomized with non-probability of consecutive sampling. The samples were collected based on the Dr Pirngadi Medan, Indonesia hospital. After receiving the local ethical committee clearance, male patients who have qualified the inclusion and exclusion criteria [12] are obtained. To determine the administration of the drug, the samples were divided into two groups for this study, and all of the samples were enrolled with written consent. Group I is 24 males schizophrenia patients who have been prescribed with risperidone and donepezil, while group II is 24 males schizophrenia patients who have been given only risperidone medication. The numbers of samples were appropriated to the sample formula for numerical scale calculation of unpaired groups, based on the literature review in Indonesia [13].
The samples collecting were conducted at RSUP Dr Pirngadi Medan, Sumatera Utara province, Indonesia from November 2017 to April 2018. The samples were diagnosed based on diagnostic criteria and structured interviews of Mini ICD 10 after being interviewed and asked to fill the informed consent.

Clinical Science _______________________________________________________________________________________________________________________________
_______________________________________________________________________________________________________________________________
1764 https://www.id-press.eu/mjms/index
The inclusion criteria were male schizophrenia patients with ages between 20 and 45; duration of illness 5 to 10 years limited to determine the relationship of the duration to cognitive ability; acute phase of assessment based on PANSS with score 60-80; antipsychotic medication is risperidone; normal body mass index (BMI IMT 18.50-24.99); two categories of education levels which are senior and junior high school. Moreover, the adjustment of MoCA-Ina score to every subject is decreasing as its score is below 26 (MoCA-Ina < 26). All of the subjects behaved cooperatively to be included in this research. Meanwhile, the exclusion criteria were all male schizophrenia patients with comorbidity of common diseases, organic mental or psychiatric disorders, and drugs abuse history except smoking and caffeine.
In this study, these two groups were prescribed with a fixed dose of risperidone (4 mg/day/orally), divided into two dosages, whereas the intervention group was prescribed with 5 mg/day/orally of donepezil in the night before sleeping until six weeks. Then the dosage of donepezil was increased from 5 mg to 10 mg per day orally at night until the week of 12 for 24 patients, and for the other subjects, the prescription given was only fixed dosages accounted for 4 mg/ day orally for 12 weeks.
The MoCA-Ina assessments were performed two times between 0 week and 12 weeks. The first assessment was done at six weeks after the medication has been prescribed, as well as the second assessment, which was conducted at 12 weeks (illustrated by Figure 1). This study involved on-treatment analysis, so as long as the drop out events occurred, the subjects were replaced directly. The drop out criteria is subjects which disobeyed to consume the medication or resigning to be included in the assessment.
MoCA-Ina administration and scoring
The MoCA-Ina is designed as screening instruments in determining light cognitive dysfunction. In assessing the different cognitive domains, i.e. attention, executive functions, memory, language, visuoconstructional skills, conceptual thinking, calculation and orientation, the time needed is around 10 minutes with total score 30 points; 26 or above is considered as normal [14], [15]. The MoCA has been validated in Indonesia language by Husein et al. in 2009 known as MoCA-Ina. The assessment based on MoCA-Ina consists of eight stages: visuospatial ability/executive (dimensions and shapes understanding), naming (naming animals’ images), memory (memory measurement), attention (replaying the numerical rows), language (ability in using the language within sentences), abstraction (ability in using abstract), assessing the similarities of nouns, delayed recall (the ability in memorizing words without guidance), and orientation (the ability of orientation in understanding the years, months, days, dates, places,
and cities [14]. The score assessment of MoCA-Ina is conducted in three times among week 0, 6, and 12.
Screening and assessment of cognitive impairment
The research subjects which have been recruited are those who have MoCA-Ina score below 26 (< 26). This score indicates that the subjects showed decreasing of cognitive functions based on the total for 30. The assessments which have been conducted to determine eight domains of cognitive functions to schizophrenia patients are attention/ awareness, verbal and memory learning, visual and memory learning, logic and solving problems, processing speed, verbal fluency, working memory, and social cognition.
Statistical analysis
The analysis performed in this study used the Chi-Square and Mann Whitney U analysis in addition to compare two groups based on demographical characteristics. The results of this study are analysed based on ages, occupations, education levels, marital status, duration of illness, initial disease, body mass index, smoking habits, PANSS scores of weeks 0, and an initial score of MoCA-Ina. To determine the pairing groups of male schizophrenia patients who have been prescribed with risperidone with the addition of donepezil at week 12, the T based on pairing group test was performed provided that it meets the test requirements; otherwise the data would be transformed followed by Wilcoxon test. Whereas the data of unpaired groups at week 12 were validated by using the unpaired T-test, followed by data transformation and Mann Whitney-U test respectively if the test requirement is not available. The value of p obtained is less than 0.001, indicating significant results, with data analysis performed by SPSS version 21.
Results
Enrolment
This research is the first study conducted in Sumatera Utara province regarding the MoCA-Ina score for male schizophrenia patients who have been prescribed by risperidone and donepezil. The subjects were recruited for 48 patients, divided into 2 groups, respectively for 24 individuals. The group I was those who have consumed risperidone and donepezil, while group II was those who have only been given with risperidone. In this study, no subjects were categorised as drop out criteria, suggesting no experiences of side effects of both medications during

Akbar et al. The Indonesian Version of Montreal Cognitive Assessment (MoCA-Ina): The Difference Scores Between Male Schizophrenia _______________________________________________________________________________________________________________________________
_______________________________________________________________________________________________________________________________
Open Access Maced J Med Sci. 2019 Jun 15; 7(11):1762-1767. 1765
consumption. The average ages for these two groups are 31.38 ± 4.78 (Group I), and 31.42 ± 4.68 (Group II).
Figure 1: The flowchart of MoCA-Ina Assessment to male schizophrenia
Social demographic
The demographical data for the two groups of subjects are illustrated by the following Table 1. Based on the data, there are no differences of demographical characteristics within these groups, so that the subjects are valid based on the risperidone and donepezil prescriptions. The subjects were described as the level of educations accounted 17 people for junior high school, while 7 people were a senior high school for group I. On the other hand, group II was consisted by 18 people graduated from junior high school, and 6 people were graduated from senior high school. This demographical data provided that almost half of both groups I and II were accounted for unemployment, respectively 17 (47%) and 19 (52%). According to the healthy status, group I and II had similarity in the onset of illness duration around 24 ± 4.3 for a group I, and 23.83 ± 3.7 for group II, while the duration of illness for both groups was around 6.67 and 6.58 respectively. The similarities of demographical data were also found
both in body mass index accounted for approximately 22 and smoking status around 13 ± 2.
Table 1: Demographical characteristics of subjects
Variable Group of risperidone and
Donepezil treatment (n = 24)
Group of risperidone
treatment (n = 24) P
Age (years) 31.38 ± 4.78 31.42 ± 4.68 0.976 Education levels (%)
Junior high school Senior high school
17 (48.6%) 7 (53.8%)
18 (51.4%) 6 (46.2%)
1.000
Duration of Illness (years) 6.67 ± 1.606 6.58 ± 1.530 0.898 Onset of illness duration (years)
24.67 ± 4.331 24.83 ± 3.738 0.656
Initial score of MoCA-Ina 19.67 ± 2.200 19.92 ± 2.104 0.707 Body mass index 22.89 ± 0.940 22.69 ± 1.123 0.445 Occupations
Employment Unemployment
7 (58.3%)
17 (47.2%)
5 (41.7%)
19 (52.8%)
0.740 Smoking 12.58 ± 2.165 13.33 ± 2.408 0.292 Marital Status
Married Unmarried
4 (44.4%)
20 (51.3%)
5 (55.6%)
19 (48.7%)
1.000
MoCA-Ina Score
In this study, an initial score of MoCA-Ina was conducted for every group at the beginning of the week. The group I which has been prescribed with both risperidone and donepezil had an initial score for 19.67 with standard deviation (SD) 2.2, whereas the group II who has only given risperidone medication had an initial score for 19.92 with SD 2.1. The average score of MoCA-Ina to schizophrenia patients who have taken both risperidone and donepezil was 21.00 with SD 2.0, while the other scores who were given by only risperidone were averagely 20.45 with SD 1.9 after weeks sixth. Both groups I and II had MoCA-Ina score 22.83 (SD 1.65) and 21.25 (SD 1.93) respectively, which are illustrated in Table 2.
Table 2: Initial and final score of MoCA-Ina of research subjects
Time of assessment p-value
Week 0 (risperidone + 0 mg donepezil) 19.66 ± 2.20, < 0.001, n = 24 Week 6 (risperidone + 5 mg donepezil) 21.00 ± 2.06, < 0.001, n = 24 Week 12 (risperidone + 10 mg donepezil) 22.83 ± 1.65, < 0.001, n = 24 Week 0 (risperidone) 19.91 ± 2.10, < 0.001, n = 24 Week 6 (risperidone) 20.45 ± 1.97, < 0.001, n = 24 Week 12 (risperidone) 21.25 ± 1.93, < 0.001, n = 24
Table 2 shows the differences between MoCA-Ina scores for research subjects during weeks 0, 6, and 12. Initial scores of every subject were almost the same accounted for 19.6 and 19.9. However these numbers increased slightly different to 21.0 and 21.5 respectively. This implies the addition of donepezil as medications had a small impact on the cognitive functions. Interestingly, the p-value of MoCA-Ina increased for subjects prescribed with higher dosages of donepezil (10 mg) to 22.5 while the non-consumed donepezil patients showed small decreasing to 21.2. The increasing of MoCA-Ina based on the donepezil consumption shows that the drugability in improving the cognitive functions of schizophrenia patients. This drug works in the cholinergic path, which can repair the cognitive dysfunctions as well as donepezil. In the schizophrenia patients, the cholinergic receptor deficit occurs due to the presence of cholinesterase inhibitors that prevent the process, which can be

Clinical Science _______________________________________________________________________________________________________________________________
_______________________________________________________________________________________________________________________________
1766 https://www.id-press.eu/mjms/index
reduced by donepezil by preventing the inhibitors [15]. In the meantime, the increase of average scores of MoCA-Ina after the addition of donepezil medication for 12 weeks occurred twice between week 0 to 6 and 6 to 12, in contrast for a prescription without donepezil addition increased only in week 0 to 6, and decreased in a very small number after week 6. The following Figure 2 displays the inclining trends of MoCA-Ina scores for donepezil medications.
Figure 2: The increasing of average MoCA-Ina scores (A) the increasing trends in every week; (B) the comparison of exponential and linear increasing
Figure 2 illustrates the different patterns of inclining trends for every subject of research. The Figure 2(A) shows that the addition of risperidone and donepezil increased the scores for almost every week which had exponential pattern showed Figure 2(B), while the risperidone medication had a gradual increase of MoCA-Ina scores illustrated by the linear trend in Figure 2(B). This suggests that the addition of donepezil was able to improve the cognitive functions of male schizophrenia patients.
To every subject of the research illustrated in groups (Table 1), the demographical characteristics showed no significant differences as they are depicted with homogeneity of demographics. These phenomena suggest that there are significant results of male schizophrenia patients who have been prescribed with a combination of donepezil and Risperidone to those without the addition of donepezil. According to Figure 1 and 2, the data show a different increase of MoCA-Ina scores within week 6 and 12, which depict higher increasing for them with consumption of Risperidone and donepezil.
Discussion
According to Table 1, the demographical characteristics from every subject and the results showed no significant differences among them. In this study, subjects were divided into two groups, with an equal population of 24 patients. Group, I was prescribed with the combination of risperidone and donepezil, and the group II was given with only risperidone, which both of them were prescribed for 12 weeks. From the results, significant differences in
particular of the increase of MoCA-Ina scores were obtained.
The results of this study are appropriate to those who have been reported by Zhu, Lee, Keefe, and Friedman. All of the studies showed similar increasing trends for 12 weeks with p ≤ 0.001 [15]. Lee et al. have reported that the significant number was obtained with p < 0.05, whereas Keefe has concluded with the exact p score. Friedman which conducted the study in New York has reported significant results in the decrease of cutoff secondary memory and cognitive functions as well as reports which have been obtained by Choi in Japan with significant measurement due to the results of verbal learning and memory with p = 0.06. In this study, the results showed the increasing of MoCA-Ina scores at week 6 and 12 with p-value < 0.013. The results of this study which have similarity to the previous studies suggest that the Indonesian version of MoCA can be considered as the references in assessing the cognitive functions of male schizophrenia patients. Interestingly, the MoCA-Ina assessments are more appropriate than those from the original versions because of the language used in which provide a better understanding of the Indonesian male schizophrenia patients. This also implies to the education levels of the subjects which graduated from secondary schools.
To be concluded, in DSM 5, the schizophrenia medications with the prescribing of 4 mg risperidone can increase the MoCA-Ina scores. However, the inclining is in slight trend. Therefore, the addition of donepezil is expected to improve the cognitive functions of male schizophrenia patients significantly based on the scores of MoCA-Ina.
Acknowledgement
The author would like to thank the director of Dr Pirngadi Hospital Medan, and the head of Psychiatry Department of Dr Pirngadi Hospital Medan, North Sumatera.
References
1. Tamingga C. Schizophrenia and Other Psychotic Disorders. In: Sadock BJ, Sadock VA, Ruiz P. Kaplan & Sadock Comprehensive Textbook of Psychiatry, 9th editio., New York: Lippincott Williams & Wilkins, 2009:1433-7.
2. Goff DC, Hill M, Barch D. The treatment of cognitive impairment in schizophrenia. Pharmacology Biochemistry and Behavior. 2011; 99(2):245-53. https://doi.org/10.1016/j.pbb.2010.11.009 PMid:21115035 PMCid:PMC3114283
3. Penadés R, Pérez-García H, González-Rodríguez A, Catalan R, Bernardo M. Treating cognition in schizophrenia: searching for the

Akbar et al. The Indonesian Version of Montreal Cognitive Assessment (MoCA-Ina): The Difference Scores Between Male Schizophrenia _______________________________________________________________________________________________________________________________
_______________________________________________________________________________________________________________________________
Open Access Maced J Med Sci. 2019 Jun 15; 7(11):1762-1767. 1767
best evidence-based practices. Evidence-based Psychiatr Care. 2016:80-84.
4. O.D. Tablets, ARICEPT® (Donepezil Hydrochloride Tablets). pp. 3-30.
5. Zhu W, Zhang Z, Qi J, Liu F, Chen J, Zhao J, Guo X. Adjunctive treatment for cognitive impairment in patients with chronic schizophrenia: a double-blind, placebo-controlled study. Neuropsychiatric disease and treatment. 2014; 10:1317. https://doi.org/10.2147/NDT.S64189 PMid:25075190 PMCid:PMC4106965
6. Opler LA, Medalia A, Opler MG, Stahl SM. Pharmacotherapy of cognitive deficits in schizophrenia. CNS Spectr. 2014; 19(2):142-156. https://doi.org/10.1017/S1092852913000771 PMid:24229725
7. Keefe RS, Malhotra AK, Meltzer HY, Kane JM, Buchanan RW, Murthy A, Sovel M, Li C, Goldman R. Efficacy and safety of donepezil in patients with schizophrenia or schizoaffective disorder: significant placebo/practice effects in a 12-week, randomized, double-blind, placebo-controlled trial. Neuropsychopharmacology. 2008; 33(6):1217-28. https://doi.org/10.1038/sj.npp.1301499 PMid:17625502
8. Friedman JI, Adler DN, Howanitz E, Harvey PD, Brenner G, Temporini H, White L, Parrella M. A double blind placebo controlled trial of donepezil adjunctive treatment to risperidone for the cognitive impairment of schizophrenia. Biological psychiatry. 2002; 51(5):349-57. https://doi.org/10.1016/S0006-3223(01)01342-7
9. Choi KH, Wykes T, Kurtz MM. Adjunctive pharmacotherapy for cognitive deficits in schizophrenia: meta-analytical investigation of efficacy. The British Journal of Psychiatry. 2013; 203(3):172-8. https://doi.org/10.1192/bjp.bp.111.107359 PMid:23999481
PMCid:PMC3759029
10. Nasreddine ZS, Phillips NA, Bédirian V, Charbonneau S, Whitehead V, Collin I, Cummings JL, Chertkow H. The Montreal Cognitive Assessment, MoCA: a brief screening tool for mild cognitive impairment. Journal of the American Geriatrics Society. 2005; 53(4):695-9. https://doi.org/10.1111/j.1532-5415.2005.53221.x PMid:15817019
11. Tiffin-Richards FE, Costa AS, Holschbach B, Frank RD, Vassiliadou A, Krüger T, Kuckuck K, Gross T, Eitner F, Floege J, Schulz JB. The Montreal Cognitive Assessment (MoCA)-a sensitive screening instrument for detecting cognitive impairment in chronic hemodialysis patients. PloS one. 2014; 9(10):e106700. https://doi.org/10.1371/journal.pone.0106700 PMid:25347578 PMCid:PMC4209968
12. Sastroasmoro S, Ismael S. Dasar-dasar metodologi Penelitian Klinis, edisi ketiga. CV Sagung Seto, Jakarta. 2008.
13. D MS, Uji hipotesis komparatif numerik berpasangan. Dalam statistic untuk kedokteran dan kesehatan, deskriptif, bivariat, dan multivariat dilengkapi aplikasi SPSS, Edisi Keenam. Jakarta: Epidemilogi Indonesia, 2015.
14. Husein N, Lumempouw S, Ramli Y, Herqutanto H. Uji Validitas Dan Reliabilitas Montreal Cognitive Assessment Versi Indonesia (Moca-Ina) Untuk Skrining Gangguan Fungsi Kognitif, 2009.
15. Pae C-U. Role of the cholinesterase inhibitors in the treatment of schizophrenia. Expert Opin Investig Drugs. 2013; 22(3):293-298. https://doi.org/10.1517/13543784.2013.762355 PMid:23330829
_______________________________________________________________________________________________________________________________
Open Access Maced J Med Sci. 1768
ID Design Press, Skopje, Republic of Macedonia Open Access Macedonian Journal of Medical Sciences. 2019 Jun 15; 7(11):1768-1773. https://doi.org/10.3889/oamjms.2019.547 eISSN: 1857-9655 Clinical Science
The usefulness of Veno-Arterial Extracorporeal Membranous Oxygenation in Patients with Cardiogenic Shock Mohamed Abouelwafa
*, Waheed Radwan, Alia Abdelfattah, Akram Abdelbary, Mohamed Khaled, Wael Samy, Mohamed
Yousry, Ahmed Saeed, Mahmood Saad
Critical Care Department, Cairo University Hospitals, Cairo, Egypt
Citation: Abouelwafa M, Radwan W, Abdelfattah A, Abdelbary A, Khaled M, Samy W, Yousry M, Saeed A, Saad M. The Usefulness of Veno-Arterial Extracorporeal Membranous Oxygenation in Patients with Cardiogenic Shock. Open Access Maced J Med Sci. 2019 Jun 15; 7(11):1768-1773. https://doi.org/10.3889/oamjms.2019.547
Keywords: VA ECMO; Cardiogenic shock; Myocardial infarction; Lactate; Hemodynamics
*Correspondence: Mohamed Abouelwafa. Critical Care Department, Cairo University Hospitals, Cairo, Egypt. E-mail: [email protected]
Received: 17-Apr-2019; Revised: 09-Jun-2019; Accepted: 10-Jun-2019; Online first: 15-Jun-2019
Copyright: © 2019 Mohamed Abouelwafa, Waheed Radwan, Alia Abdelfattah, Akram Abdelbary, Mohamed Khaled, Wael Samy, Mohamed Yousry, Ahmed Saeed, Mahmood Saad. This is an open-access article distributed under the terms of the Creative Commons Attribution-NonCommercial 4.0 International License (CC BY-NC 4.0)
Funding: This research did not receive any financial support
Competing Interests: The authors have declared that no competing interests exist
Abstract
BACKGROUND: Venoarterial extracorporeal membranous oxygenation is a form of temporary mechanical circulatory support that gets as a salvage technique in patients with cardiogenic shock, we intended to evaluate the effect of (VA ECMO) support on hemodynamics and lactate levels in patients with cardiogenic shock.
AIM: The aim of our study is to detect the ability to introduce veno-arterial extracorporeal membranous oxygenation (VA ECMO) as a temporary extracorporeal life support system (ECLS) in our unit, demonstrate the role of ECMO in cardiogenic shock patients regarding improving hemodynamics and microcirculation, and demonstrate the complications and drawbacks in our first center experience regarding VA ECMO.
MATERIAL AND METHODS: This was a single-centre observational study that included 10 patients admitted with cardiogenic shock for which VA ECMO was used as mechanical circulatory support.
RESULTS: The MAP increased after initiation of the support. It was 41.8 ± 9.3 mmHg and 59.5 ± 6.8 mmHg (P = 0.005). The use of VA ECMO support was associated with a statistically significant decrease in the base deficit (-10.6 ± 4.2 and -6.3 ± 7.4, P = 0.038). The serum lactate declined from 5.9 ± 3.5 mmoL/L to 0.6 ± 4.4 mmoL/L by the use of VA ECMO; a statistically significant change (P = 0.005).
CONCLUSIONS: We concluded that VA ECMO as mechanical support for patients with cardiogenic shock might improve mean arterial blood pressure, base deficit and lactate clearance.
Introduction
Cardiogenic shock is a physiologic state where end-organ tissue hypoperfusion is a result of cardiac dysfunction. Despite many advances in the management of cardiogenic shock, mortality rates are still high [1].
Coronary revascularisation is the mainstay of therapy for cardiogenic shock caused by myocardial infarction. However, after reperfusion, areas of the myocardium may have myocardial stunning that persists despite the restoration of normal blood flow. These areas may improve with revascularisation, providing a strong rationale for supporting hemodynamics in cardiogenic shock [2].
The initial therapy of cardiogenic shock
involves careful infusion of fluids. If the shock is persistent, then pharmacologic therapy with inotropic and vasopressor agents is started. The use of inotropes and vasopressors in cardiogenic shock treatment increases myocardial oxygen demand. However, studies have not necessarily demonstrated that their use decreases mortality rates [2].
Mortality in cardiogenic shock patients occurs mainly in the first three days, so mechanical circulatory support devices should be considered as soon as possible. The results of studies on such devices are promising in improving microcirculation and microcirculation. Also, these devices are recommended for patients in persistent shock after inotropic and vasopressor therapy [3].
While the intra-aortic balloon counterpulsation (IABP) use is limited in complicated myocardial

Abouelwafa et al. Usefulness of Veno-Arterial Extracorporeal Membranous Oxygenation in Patients with Cardiogenic Shock _______________________________________________________________________________________________________________________________
_______________________________________________________________________________________________________________________________
Open Access Maced J Med Sci. 2019 Jun 15; 7(11):1768-1773. 1769
infarction cases, other mechanical circulatory support devices such as extracorporeal membrane oxygenation (ECMO) can be used in other causes of cardiogenic shock such as pulmonary embolism. However, there are still no randomised controlled studies on the use of VA ECMO in patients with cardiogenic shock.
The aim of our study is to detect the ability to introduce veno-arterial extracorporeal membranous oxygenation (VA ECMO) as a temporary extracorporeal life support system (ECLS) in our unit, demonstrate the role of ECMO in cardiogenic shock patients regarding improving hemodynamics and microcirculation, and demonstrate the complications and drawbacks in our first center experience regarding VA ECMO. Our centre is the first centre in Egypt to be recognised as an ECMO centre by the Extracorporeal Life Support Organization.
Patients and Methods
This study is a prospective observational study on patients admitted to the Critical Care Department, Cairo University Hospitals with cardiogenic shock from January 2015 to April 2017.
The present study included patients with cardiogenic shock within 6 hours of shock development, either upon admission to the intensive care unit (ICU) or during ICU stay. The excluded patients from the study are those with irreversible cause for cardiogenic shock or those with cardiogenic shock after 6 hours duration with signs of neurologic damage, prolonged multiorgan dysfunction, or futility.
The patients enrolled in our study were subjected to full medical history and thorough clinical examination (general and cardiac). Hemodynamics and vital signs such as mean arterial pressure (MAP), heart rate (HR), respiratory rate (RR), and temperature were obtained at the time of support initiation (hemodynamics 0) and 24 hours after initiation (hemodynamics 1). All patients were subjected to routine laboratory investigations including complete blood picture, coagulation profile, renal functions, liver functions, blood gases, and lactate level. Two readings were obtained at the time of support initiation (laboratory 0) and 24 hours after initiation (laboratory 1).
Chest X-ray, 12-lead ECG, and transthoracic echocardiography (aortic velocity time integral (VTI)) was done to all patients before mechanical support initiation (echocardiography 0), 24 hours after initiation (echocardiography 1), and whenever needed after that.
Acute physiological and chronic health evaluation (APACHE II) scoring system, sequential
organ failure assessment score (SOFA score), and vasoactive-inotropic score (VIS) were obtained at the time of support initiation (score 0) and 24 hours after initiation (score 1).
Cardiohelp maquet console (HLS ECMO circuit) was used in 7 patients, while Rotaflow maquet (PLS ECMO circuit) was used in 3 patients.
The HLS ECMO circuit integrates a gas exchanger (equipped with a diffusion membrane), highly efficient heat exchanger, and a centrifugal pump. Also, the integrated measuring cell is used to measure the important blood parameters of venous oxygen saturation (SVO2), hematocrit (Hct), haemoglobin (Hb), and venous temperature (Tven).
Unlike the Cardiohelp, the Rotaflow console is not portable and only has a sensor to detect the flow. The console, oxygenator, and pump are separated. The PLS ECMO set is bio line-coated.
This study was approved by the Ethical Committee Review Board of the Faculty of Medicine, Cairo University. Informed written consent was acquired from patients or relatives before their enrollment in the study.
Statistical Methods
Numerical variables were described as Mean ± standard deviation (SD). Categorical variables were described as proportions. Student ‘t’ test was used for comparisons of numerical data, with Levene test for equality of variance and paired ‘t’ test for paired comparisons. Chi-square test 2*2 was applied with Ficher exact test for comparison between categorical data. McNemar test was applied for a total less than 40 or any of observed events less than 5. P value was considered significant if ≤ 0.05. Delta change, i.e. the per cent of change, was calculated as the difference between the second and first reading divided by the first reading. Statistics were calculated using SPSS 21 package.
Results
We initially recruited 15 patients who were admitted with cardiogenic shock. Five patients were excluded because 3 of them had septic shock, and the rest (2 patients) were futile without any sign of neurological recovery.
Our study included 10 patients (7 males and 3 females with an average age of 43.4 ± 17.2 years) who were in cardiogenic shock and was supported by VA ECMO.
Patients enrolled in our study were admitted to the Critical Care Medicine Department, Cairo

Clinical Science _______________________________________________________________________________________________________________________________
_______________________________________________________________________________________________________________________________
1770 https://www.id-press.eu/mjms/index
University Hospitals during the period from January 2015 to April 2017. Six patients had a myocardial infarction, 1 patient during CPR and another patient after CPR, two patients had a pulmonary embolism, and two patients had stress-induced cardiomyopathy.
Hemodynamic monitoring
Paired comparisons were made to show the effect of VA ECMO support on hemodynamics. These comparisons showed a significant difference between MAP (0) and MAP (1) [41.8 ± 9.3 and 59.5 ± 6.8, P value = 0.005] and another significant difference between RR (0) and RR (1) [38.0 ± 11.8 and 28.0 ± 12.2, P value = 0.006].
Table 1: Comparison between hemodynamics (0) and hemodynamics (1)
Hemodynamics(0) Hemodynamics(1) P value
Temperature 37.4 ± 0.8 37.5 ± 0.7 .730 MAP 41.8 ± 9.3 59.5 ± 6.8 .005 HR 134.3 ± 15.1 113.4 ± 19.7 .076 RR 38.0 ± 11.8 28.0 ± 12.2 .006
MAP: Mean arterial pressure; HR: Heart rate; RR: Respiratory rate.
Blood gases
The paired comparisons done to show the effect of VA ECMO on blood gases showed a statistically significant difference between HCO3 (0) and HCO3 (1) [14.7 ± 2.3 and 18.3 ± 5.5, P value= 0.042] and another statistically significant difference between base deficit (0) and base deficit (1) [-10.6 ± 4.2 and -6.3 ± 7.4, P value = 0.038].
Table 2: Comparison between blood gases (0) and blood gases (1)
Blood gases (0) Blood gases (1) P value
PH 7.2 ± 0.1 7.3 ± 0.2 .155 HCO3 14.7 ± 2.3 18.3 ± 5.5 .042 Base deficit -10.6 ± 4.2 -6.3 ± 7.4 .038 PaO2 52.7 ± 19.7 58.1 ± 18.8 .009
Laboratory values
Paired comparisons were done to show the effect of VA ECMO on laboratory values where they showed a statistically significant difference between platelet (0) and platelet (1) [197.3 ± 81.9 and 146.7 ± 72.5, P value = 0.005] and another statistically significant difference between lactate (0) and lactate (1) [5.9 ± 3.5 and 4.6 ± 4.4, P value = 0.005].
Table 3: Comparison between Laboratory (0) and Laboratory (1)
Laboratory (0) Laboratory (1) P value
Sodium 140.1±4.7 141.4±4.4 .362 Potassium 4.0±1.1 3.9±0.4 .788 Creatinine 2.3±1.8 2.5±1.5 .757 Bilirubin 1.0±0.8 1.8±1.5 .138 Hematocrit 30.1±9.4 29.2±5.4 .793 White blood cell 28.6±18.1 25.7±15.0 .304 Platelets 197.3±81.9 146.7±72.5 .005 Lactate 5.9±3.5 4.6±4.4 .005
Clinical severity scores
Comparison between clinical scores (0) and clinical scores (1) in group 2 are shown in Table 4.
Table 4: Comparison between clinical scores (0) and clinical scores (1) in group 2
clinical scores (0) clinical scores (1) P value
GCS 12.3 ± 3.6 9.9 ± 4.6 .120 APACHE II 25.3 ± 6.8 20.9 ± 9.8 .092 SOFA 11.9 ± 2.9 11.1 ± 2.9 .140 Vasoactive inotropic score 89.3 ± 62.1 36.7 ± 28.6 .073
GCS: Glasgow coma scale.
Echocardiographic examination
Echocardiographic examination was done to measure LVEF, aortic VTI and PASP. No significant differences were demonstrated when comparing the values of these parameters pre and post-mechanical support.
Table 5: Comparison between echocardiography (0) and echocardiography (1) in group 2
Echocardiography (0) Echocardiography (1) P value
LVEF 40.3 ± 25.1 39.3 ± 20.9 .806 Aortic VTI 12.9 ± 8.6 12.9 ± 7.7 1.000 PASP 44.3 ± 20.6 40.4 ± 16.4 .058
The outcome of VA ECMO
The duration of support was 4.3 ± 3.1 days with average ICU stay 12.4 ± 12.7. In our 10 patients who received VA ECMO, 5 patients experienced complications, 2 patients suffered thrombocytopenia, 2 patients suffered cerebrovascular accidents, and 1 patient suffered limb ischemia.
Four patients were weaned off the mechanical support, but only one patient survived to hospital discharge.
Discussion
Percutaneous hemodynamic support has historically been limited to the IABP counterpulsation. Although the IABP is widely available, its limitations include little hemodynamic support and myocardial protection, while VA ECMO can provide full hemodynamic support, but it is limited by complexity, multiple complications, high cost, and need for perfusion expertise [3].
The benefits of mechanical circulatory support include the ability to maintain organ perfusion which, accordingly, prevents systemic shock syndrome, reducing the intracardiac filling pressures, right and leaves ventricular volumes, wall stress as well as myocardial oxygen consumption, augmenting coronary perfusion, and supporting the circulation

Abouelwafa et al. Usefulness of Veno-Arterial Extracorporeal Membranous Oxygenation in Patients with Cardiogenic Shock _______________________________________________________________________________________________________________________________
_______________________________________________________________________________________________________________________________
Open Access Maced J Med Sci. 2019 Jun 15; 7(11):1768-1773. 1771
during complex interventional procedures [3].
In our centre, the mechanical support with VA-ECMO is recently used for cardiogenic shock management. We used VA ECMO as mechanical circulatory support for a total of 10 cardiogenic shock patients with an increase in mean arterial pressure after the support initiation. The improvement of hemodynamics and oxygenation occurred after VA ECMO support initiation led to a significant reduction in the base deficit and lactate level.
There is a contradiction about the benefit of combined IABP and VA-ECMO support in patients with cardiogenic shock. In our study, we combined the use of VA ECMO and IABP in 3 patients to decrease the afterload. This combination led to weaning one patient from the ECMO support 48 hours after implementation of IABP.
A study was done by Petroni et al., [4] which
included 12 patients on VA ECMO concluded that in cardiogenic shock patients with little or no residual left ventricular ejection implanted by peripheral VA ECMO, the use of intra-aortic balloon pump was associated with smaller left ventricular dimensions and lower pulmonary artery pressures due to the restoration of pulsatility and decrease of left ventricular afterload. A study conducted by Sattler et al., [5] on 24 patients with STEMI and NSTEMI, in which 12 patients were supported by VA ECMO and the other 12 patients were supported by IABP, showed that the percentage of 30-day survival was 67% in VA ECMO-supported patients vs 33% in IABP-supported patients.
A retrospective cohort study, including 1,650 cardiogenic shock adult patients concluded that IABP, combined with VA-ECMO support, was associated with reduced mortality and successful weaning from VA-ECMO [6]. In another study done on 529 patients who received peripheral VA ECMO, where a group of them received combined ECMO and IABP treatment while the other group received ECMO support only, the researchers found that the mortality rate at 2 weeks was not different between the two groups. Moreover, more patients in the combined group received limb fasciotomy operations due to vascular complications [7].
ECMO-CPR was instituted in 2 of our study patients; however, they were deceased. A study by Shin et al., [8] suggested that patients who receive extracorporeal cardiopulmonary resuscitation (CPR) for longer than 10 minutes following in-hospital arrest have a greater chance of survival when compared to those who receive conventional CPR. The survival discharge rate with minimal neurologic impairment in the extracorporeal CPR group was significantly higher than that in the conventional CPR group.
In our study, we used VA ECMO in two patients with pulmonary embolism. In a study of 10years period (2005-2015) that included 17 patients
with confirmed or suspected pulmonary embolism, Fifteen patients (82%) suffered pre-ECMO cardiac arrest, with seven (41%) of them cannulated during cardiopulmonary resuscitation, 10 (59%) patients were weaned off ECMO and 8 patients (47%) were discharged. The study concluded that VA ECMO could be a lifesaving rescue therapy to rapidly restore the hemodynamic status when thrombolytic therapy fails or when the patient is deemed too sick to benefit from medical or surgical treatments [9].
In our study, none of the analysed variables was of help in predicting successful weaning from ECMO or heart function recovery. However, other studies have correlated echocardiographic [10] and clinical parameters as well as laboratory tests results [11] to the prediction of weaning. The lack of results in our series may be due to the limited number of patients involved in addition to the study design, which was not intended to examine this aspect.
In our study, 40% of patients could be weaned from mechanical support. This agrees with Muller et al., [12] study that was conducted on 108 patients with acute myocardial infarction supported by VA ECMO, where 35.5% of patients demonstrated successful weaning.
Echocardiography plays an important role in the management of VA ECMO patients. It is useful in-patient assessment, cannulation, and detecting complications during ECMO run as well as the possibility of weaning from ECMO support [5].
In our study, a trial of ECMO removal was done on four patients based on the improvement of MAP, oxygenation, laboratory findings, EF, and aortic VTI. This is in agreement with the study done by Aissaoui, N et al., [10] which concluded that whenever the patient is under minimal ECMO support, LVEF of ≥ 20–25%, and aortic VTI of ≥ 12 cm, ECMO removal should be considered.
In our study, 4 patients were weaned from ECMO support after decreasing serum lactate; this is in agreement with Li et al., [13] who demonstrated that the initial lactate level and early lactate clearance in the 12 h following ECMO initiation were independent predictors of successful ECMO weaning.
In our study, we gave levosimendan to 1patient to facilitate weaning. After levosimendan treatment, the patient showed improvement in EF (20% before levosimendan treatment vs 30% 24 hours after levosimendan treatment). This agrees with a study conducted on 6 patients by Affronti et al., who suggested that the treatment with levosimendan reduced the need for high-dose inotropes and facilitated weaning [14].
In femoral (VA -ECMO), vascular injuries and limb ischemia, unfortunately, occur as a result of the decrease of blood supply. In patients with a history of peripheral vascular disease, femoral cannulation should be avoided.

Clinical Science _______________________________________________________________________________________________________________________________
_______________________________________________________________________________________________________________________________
1772 https://www.id-press.eu/mjms/index
The present study demonstrated 1 patient who suffered from lower limb ischemia; however, reperfusion cannula was not inserted in this patient.
It was noted that vascular complications were associated with unsuccessful weaning from ECMO and that leg ischemia is an independent risk factor for in-hospital death [15]. To minimise such complications, a distal perfusion cannula is placed in the superficial femoral artery [16].
Some studies have shown that neurologic complications are rather common among patients receiving ECMO. These complications are generally related to thrombosis with infarction or cerebral haemorrhage [17]. In our study, 2 patients suffered from intracerebral haemorrhage without surgical intervention.
In a series of 87 adult patients, Matteen et al. found that 50% of the patients in their series suffered neurologic complications defined as stroke, intracerebral haemorrhage, seizure, encephalopathy, brain death, or coma. Moreover, they found that the increasing age was associated with higher rates of death and neurologic morbidity [17].
Lan et al., [18] found that stroke affected 7%
of the patients and was associated with significantly higher odds of death. In a meta-analysis of 1,866 adult patients with cardiogenic shock, Cheng et al., [19]
found that stroke occurred in approximately 6% of
the patients.
In our study, 4 patients were successfully removed from ECMO support, but 3 patients were complicated by a secondary bacterial infection, and septic shock then died.
A study conducted by Aubron et al., [20] on 138 patients who received ECMO support showed that 36 patients had a total of 46 infections. These patients included 24 cases of bloodstream infection (BSI), 6 of these cases were secondary to ventilator-associated pneumonia (VAP), 23 cases of VAP, and 5 cases of catheter-associated urinary tract infection (CAUTI). The most frequent pathogens were Enterobacteriaceae (found in 16 of 46 cases), and Candida was the most common cause of BSI (in 9 of 24 cases). The SOFA score before ECMO initiation and the number of days of support were independently associated with a risk of BSI.
The lower incidence of weaning from VA ECMO and high mortality rate in our study could be attributed to severe comorbidities of the patients in our study where 3 patients had ARDS, 2 patients had post-CPR, and 1patient had a multivessel disease where CABG was done.
Limitations: This study represents the first Egyptian VA ECMO experience that had an impact on a small sample of patients. The financial constraints had an impact on the number of patients included in the study because of the high cost of VA ECMO run.
Accordingly, the study was a single-centre study.
References
1. Aissaoui N, Puymirat E, Juilliere Y, Jourdain P, Blanchard D, Schiele F, et al. Fifteen-year trends in the management of cardiogenic shock and associated 1-year mortality in elderly patients with acute myocardial infarction: the FAST-MI programme. European journal of heart failure. 2016; 18(9):1144-52. https://doi.org/10.1002/ejhf.585 PMid:27594176
2. Van Herck JL, Claeys MJ, De Paep R, Van Herck PL, Vrints CJ, Jorens PG. Management of cardiogenic shock complicating acute myocardial infarction. European heart journal Acute cardiovascular care. 2015; 4(3):278-97. https://doi.org/10.1177/2048872614568294 PMid:25624526
3. Rihal CS, Naidu SS, Givertz MM, Szeto WY, Burke JA, Kapur NK, et al. 2015 SCAI/ACC/HFSA/STS Clinical Expert Consensus Statement on the Use of Percutaneous Mechanical Circulatory Support Devices in Cardiovascular Care: Endorsed by the American Heart Assocation, the Cardiological Society of India, and Sociedad Latino Americana de Cardiologia Intervencion; Affirmation of Value by the Canadian Association of Interventional Cardiology-Association Canadienne de Cardiologie d'intervention. Journal of the American College of Cardiology. 2015; 65(19):e7-e26. https://doi.org/10.1016/j.cardfail.2015.03.002 PMid:26036425
4. Petroni T, Harrois A, Amour J, Lebreton G, Brechot N, Tanaka S, et al. Intra-aortic balloon pump effects on macrocirculation and microcirculation in cardiogenic shock patients supported by venoarterial extracorporeal membrane oxygenation. Critical care medicine. 2014; 42(9):2075-82. https://doi.org/10.1097/CCM.0000000000000410 PMid:24810530
5. Sattler S, Khaladj N, Zaruba MM, Fischer M, Hausleiter J, Mehilli J, et al. Extracorporal life support (ECLS) in acute ischaemic cardiogenic shock. International journal of clinical practice. 2014; 68(4):529-31. https://doi.org/10.1111/ijcp.12380 PMid:24674706
6. Aso S, Matsui H, Fushimi K, Yasunaga H. The Effect of Intraaortic Balloon Pumping Under Venoarterial Extracorporeal Membrane Oxygenation on Mortality of Cardiogenic Patients: An Analysis Using a Nationwide Inpatient Database. Critical care medicine. 2016; 44(11):1974-9. https://doi.org/10.1097/CCM.0000000000001828 PMid:27322361
7. Lin LY, Liao CW, Wang CH, Chi NH, Yu HY, Chou NK, et al. Effects of Additional Intra-aortic Balloon Counter-Pulsation Therapy to Cardiogenic Shock Patients Supported by Extra-corporeal Membranous Oxygenation. Scientific reports. 2016; 6:23838. https://doi.org/10.1038/srep23838 PMid:27032984 PMCid:PMC4817114
8. Shin TG, Choi JH, Jo IJ, Sim MS, Song HG, Jeong YK, et al. Extracorporeal cardiopulmonary resuscitation in patients with inhospital cardiac arrest: A comparison with conventional cardiopulmonary resuscitation. Critical care medicine. 2011; 39(1):1-7. https://doi.org/10.1097/CCM.0b013e3181feb339 PMid:21057309
9. Corsi F, Lebreton G, Brechot N, Hekimian G, Nieszkowska A, Trouillet JL, et al. Life-threatening massive pulmonary embolism rescued by venoarterial-extracorporeal membrane oxygenation. Crit Care. 2017; 21(1):76. https://doi.org/10.1186/s13054-017-1655-8 PMid:28347320 PMCid:PMC5369216
10. Aissaoui N, El-Banayosy A, Combes A. How to wean a patient from veno-arterial extracorporeal membrane oxygenation. Intensive care medicine. 2015; 41(5):902-5. https://doi.org/10.1007/s00134-015-3663-y PMid:25619488
11. Luyt CE, Landivier A, Leprince P, Bernard M, Pavie A, Chastre J, et al. Usefulness of cardiac biomarkers to predict cardiac recovery in patients on extracorporeal membrane oxygenation support for refractory cardiogenic shock. Journal of critical care.

Abouelwafa et al. Usefulness of Veno-Arterial Extracorporeal Membranous Oxygenation in Patients with Cardiogenic Shock _______________________________________________________________________________________________________________________________
_______________________________________________________________________________________________________________________________
Open Access Maced J Med Sci. 2019 Jun 15; 7(11):1768-1773. 1773
2012; 27(5):524 e7-14. https://doi.org/10.1016/j.jcrc.2011.12.009 PMid:22386227
12. Muller G, Flecher E, Lebreton G, Luyt CE, Trouillet JL, Brechot N, et al. The ENCOURAGE mortality risk score and analysis of long-term outcomes after VA-ECMO for acute myocardial infarction with cardiogenic shock. Intensive care medicine. 2016; 42(3):370-8. https://doi.org/10.1007/s00134-016-4223-9 PMid:26825953
13. Li CL, Wang H, Jia M, Ma N, Meng X, Hou XT. The early dynamic behavior of lactate is linked to mortality in postcardiotomy patients with extracorporeal membrane oxygenation support: A retrospective observational study. The Journal of thoracic and cardiovascular surgery. 2015; 149(5):1445-50. https://doi.org/10.1016/j.jtcvs.2014.11.052 PMid:25534305
14. Affronti A, di Bella I, Carino D, Ragni T. Levosimendan may improve weaning outcomes in venoarterial ECMO patients. ASAIO J. 2013; 59(6):554-7. https://doi.org/10.1097/MAT.0b013e3182a4b32e PMid:24172260
15. Aziz F, Brehm CE, El-Banyosy A, Han DC, Atnip RG, Reed AB. Arterial complications in patients undergoing extracorporeal membrane oxygenation via femoral cannulation. Annals of vascular surgery. 2014; 28(1):178-83. https://doi.org/10.1016/j.avsg.2013.03.011 PMid:24064046
16. Rao AS, Pellegrini RV, Speziali G, Marone LK. A novel percutaneous solution to limb ischemia due to arterial occlusion from a femoral artery ECMO cannula. Journal of endovascular therapy : an official journal of the International Society of
Endovascular Specialists. 2010; 17(1):51-4. https://doi.org/10.1583/09-2845.1 PMid:20199267
17. Mateen FJ, Muralidharan R, Shinohara RT, Parisi JE, Schears GJ, Wijdicks EF. Neurological injury in adults treated with extracorporeal membrane oxygenation. Archives of neurology. 2011; 68(12):1543-9. https://doi.org/10.1001/archneurol.2011.209 PMid:21825216
18. Lan C, Tsai PR, Chen YS, Ko WJ. Prognostic factors for adult patients receiving extracorporeal membrane oxygenation as mechanical circulatory support--a 14-year experience at a medical center. Artificial organs. 2010; 34(2):E59-64. https://doi.org/10.1111/j.1525-1594.2009.00909.x PMid:20420591
19. Cheng R, Hachamovitch R, Kittleson M, Patel J, Arabia F, Moriguchi J, et al. Complications of extracorporeal membrane oxygenation for treatment of cardiogenic shock and cardiac arrest: a meta-analysis of 1,866 adult patients. The Annals of thoracic surgery. 2014; 97(2):610-6. https://doi.org/10.1016/j.athoracsur.2013.09.008 PMid:24210621
20. Aubron C, Cheng AC, Pilcher D, Leong T, Magrin G, Cooper DJ, et al. Infections acquired by adults who receive extracorporeal membrane oxygenation: risk factors and outcome. Infection control and hospital epidemiology. 2013; 34(1):24-30. https://doi.org/10.1086/668439 PMid:23221189

_______________________________________________________________________________________________________________________________
1774 https://www.id-press.eu/mjms/index
ID Design Press, Skopje, Republic of Macedonia Open Access Macedonian Journal of Medical Sciences. 2019 Jun 15; 7(11):1774-1781. https://doi.org/10.3889/oamjms.2019.546 eISSN: 1857-9655 Clinical Science
To Whom Thrombus Aspiration May Concern? Mohamed Samy
*, Yaser Nassar, Abo Hamila Mohamed, Walid Omar, Helmy Elghawaby
Critical Care Department, Cairo University Hospitals, Cairo, Egypt
Citation: Samy M, Nassar Y, Mohamed AH, Omar W, Elghawaby H. To Whom Thrombus Aspiration May Concern? Open Access Maced J Med Sci. 2019 Jun 15; 7(11):1774-1781. https://doi.org/10.3889/oamjms.2019.546
Keywords: Primary percutaneous coronary intervention; Thrombus aspiration; Major adverse cardiac; Cerebrovascular events
*Correspondence: Mohamed Samy. Critical Care Department, Cairo University Hospitals, Cairo, Egypt. E-mail: [email protected]
Received: 12-Apr-2019; Revised: 09-Jun-2019; Accepted: 10-Jun-2019; Online first: 16-Jun-2019
Copyright: © 2019 Mohamed Samy, Yaser Nassar, Abo Hamila Mohamed, Walid Omar, Helmy Elghawaby. This is an open-access article distributed under the terms of the Creative Commons Attribution-NonCommercial 4.0 International License (CC BY-NC 4.0)
Funding: This research did not receive any financial support
Competing Interests: The authors have declared that no competing interests exist
Abstract
BACKGROUND: Thrombus aspiration for ST-segment elevation myocardial infarction (STEMI) may improve
myocardial perfusion. However, these favourable results called into a question by data indicating not only a lack of efficacy but a risk of potentially deleterious complications.
AIM: To assess the effect of thrombus aspiration during the primary percutaneous coronary intervention (PPCI) on procedural angiographic results, stent characteristics, and major adverse cardiac and cerebrovascular events (MACCE).
METHODS: All consecutive STEMI patients candidate for PPCI and admitted to Critical Care Department, Cairo University hospitals, managed either by thrombectomy before primary PCI (if thrombus score ≥ 3) or conventional PPCI, Six hundred seven subjects were enrolled in the study divided into Group with thrombectomy before PPCI (107 subjects, 18%), and group with Conventional PCI (500 subjects, 82%). ST-segment resolution, peak CK-MB, TIMI score, thrombus score, and MBG were assessed; stent number, diameter, length and stented segment were reported and follow up MACCE was reported (in hospital and 1-year post-intervention).
RESULTS: Mean values for peak CKMB were less in thrombectomy group (228 ± 174 I/U vs 269 ± 186 I/U, p = 0.04), ST segment resolution ≥ 70% occurred in {63 subjects (58.9%) vs 233 (46.6%), p = 0.001} in thrombectomy vs conventional group respectively. TIMI score pre procedure was zero in (102 subjects (95%) vs 402 (80.4%), p = 0.001), while TIMI III post procedure was reported in (100 subjects (93.4%) vs 437 (87%), p = 0.06), MBG mean values were (2.4 ± 0.6 vs 2.0 ± 1, p = 0.001), thrombus score was higher in thrombectomy group (4.6 ± 0.4 vs 0.8 ± 1.7, p = 0.001) in thrombectomy vs conventional group respectively .Direct stenting was { 34 patients (31%) vs 102 patients (20%), p = 0.05} , mean stent diameter (2.7 ± 1.3 mm vs 3.5 ± 1.3 mm, p = 0.3), mean stent length was (19.9 mm ± 10 versus 22.7 mm ± 8 in p 0.01). mean stent number was (1.0 ± 0.5 vs 1.2 ± 0.6, p = 0.001), mean stented segment was (22.5 ± 13.5 vs 28.5 ± 15.2 mm, p = 0.001) in thrombectomy vs conventional group respectively. MACCE in hospital were reported in {9 subjects (8.4%) vs 70 (14%), p = 0.07)}. Follow up MACCE after 1 year reported in {6 subjects (5.6 %) vs 80 (16 %), p 0.= 4} in thrombectomy vs conventional group respectively.
CONCLUSION: Thrombus aspiration before primary PCI (in a selected group with thrombus score ≥ 3) improves myocardial perfusion, suggested by better ST-segment resolution, TIMI flow, less peak CKMB and MBG, associated with a higher rate of direct stenting, shorter stent length, stented segments and less number of stents. Although thrombus aspiration was done in more risky patients (higher thrombus score) MACCE (in hospital and 1 year follow up) showed no statistical difference.
Introduction
Although PCI has become established as the dominant reperfusion strategy for the treatment of STEMI, its benefit is sometimes limited. Possible explanations for this limited benefit have included delays in reperfusion and reperfusion injury. Thus, reperfusion injury has become a topic of great interest, and it has been recognised that thrombus burden and embolic debris, thrombus and atherosclerotic plaque might be important contributors [1].
Improved flow is associated with improved
indicators of reperfusion, including ST-segment resolution. Infarction size was found to be smaller in patients who underwent thrombectomy before stenting compared with controls who underwent stenting without prior thrombectomy. Finally, thrombectomy is associated with improved clinical outcomes and survival [2], [3].
A recent study showed no benefit of thrombectomy, perhaps unsurprisingly, when PCI was performed late after symptom onset [4]. In addition to the possibility that thrombus removal is not beneficial, several other possible explanations for the absence of benefit observed in these trials should be considered. Managed coronaries may have contained only a small

Samy et al. To Whom Thrombus Aspiration May Concern? _______________________________________________________________________________________________________________________________
_______________________________________________________________________________________________________________________________
Open Access Maced J Med Sci. 2019 Jun 15; 7(11):1774-1781. 1775
thrombus burden, as observed in the TOTAL (ThrOmbecTomy versus PCI ALone) optical coherence tomography substudy [5]. It is also possible that infarction was nearly complete when PCI was performed, limiting the possible benefit of any intervention, including thrombectomy.
In this study, we aimed to perform a comprehensive analysis to evaluate the outcomes associated with aspiration thrombectomy in terms of myocardial perfusion, stent characteristics, and major adverse cardiac and cerebrovascular events (MACCE).
Patients and Methods
This was a prospective case-control investigational single-centre study involved 607 patients and included all patients admitted to the Critical Care Department of Cairo University Hospitals “presenting with ST-segment elevation myocardial infarction (STEMI) and subjected to primary percutaneous coronary intervention (PCI).”
The total study group included 607 subjects. The subjects were classified into two groups according to the use of thrombus aspiration devices:
A) Group I: Included 107 subjects who underwent PCI with thrombus aspiration.
B) Group II: Included 500 subjects who underwent PCI without thrombus aspiration.
Inclusion criteria
We included all adult patients who presented with acute STEMI and fulfilled the following criteria:
- Prolonged ischemic chest pain (lasting > 30 minutes).
- ECG: ST segment elevation (> 1 mm) in 2 or more contiguous leads or ECG findings suggestive of posterior infarction [6].
- Presentation ≤ 24 hours from symptom onset.
Exclusion criteria
- Patients with acute in-stent thrombosis following elective PCI resulting in STEMI.
- Any contraindication for primary angioplasty or antiplatelet therapy.
- Patients with missing or incomplete data records.
- Previous CABG.
Methods
A) Following admission, all patients underwent the following:
- Full medical history and demographic characteristics collection.
- Detailed clinical examination on admission (with the determination of Killip class) [7].
- Collection of written informed consent entailing all ethical and moral considerations, as requested by the medical council of the Cairo University Hospitals.
B) Demographic data on admission and medical history:
- Age and gender, risk factors for coronary artery disease (CAD); the presence of DM [8], dyslipidemia [9], or hypertension [10]; smoking history; and positive family history for CAD [11], prior PCI.
C) Twelve-lead electrocardiogram (ECG):
- ECG was performed before the intervention, 1 h post-intervention, and then daily during the hospital stay and whenever indicated.
ST-segment resolution (STR)
- ST-segment resolution was classified as complete (if the resolution was more than 70%), partial (if the resolution was between 30% and 70%), or absent (if the resolution was less than 30%) [12], [13].
D) Laboratory investigations:
- Cardiac enzymes (CK-MB) were examined on admission, 6 hours and 24 hours after intervention, and when needed.
E) Diagnostic coronary angiography and PCI:
- The procedures were performed using the Integris H 3000 (Philips, NL) catheterisation laboratory.
- Identification of infarct-related artery (IRA) and the site of occlusion (Ostial, proximal, mid-segment or distal).
- Pain-to-door time, total ischemic time, and procedural time.
- Determination of TIMI flow grading before and after the procedure
- Determination of TIMI thrombus grade:
- To more objectively and quantitatively characterise thrombus on a coronary angiogram, TIMI study group developed and popularised the following thrombus grading system [14]:
TIMI Thrombus Grade 0: No cine angiographic characteristics of thrombus present.

Clinical Science _______________________________________________________________________________________________________________________________
_______________________________________________________________________________________________________________________________
1776 https://www.id-press.eu/mjms/index
TIMI Thrombus Grade 1: Hazy, possible thrombus present. Angiography demonstrates characteristics such as reduced contrast density, haziness, irregular lesion contour, or a smooth convex "meniscus" at the site of total occlusion suggestive but not diagnostic of thrombus.
TIMI Thrombus Grade 2: Thrombus present – small size: Definite thrombus with greatest dimensions less than or equal to 1/2 vessel diameter.
TIMI Thrombus Grade 3: Thrombus present – moderate size: Definite thrombus but with a greatest linear dimension greater than 1/2 but less than 2 vessel diameters.
TIMI Thrombus Grade 4:
Thrombus present – large size: As in Grade 3 but with the largest dimension greater than or equal to 2 vessel diameters.
TIMI Thrombus Grade 5: Recent total occlusion can involve some collateralization but usually does not involve extensive collateralization, tends to have a “beak” shape and a hazy edge or appearance of distinct thrombus.
F) Major adverse cardiac events (MACCE), defined as the composite of the following factors: - Target vessel revascularisation, acute coronary syndromes, death, and Stroke (clinical and/or radiological evidence of CVS); - Follow up MACCE was assessed in hospital and after 1 year.
Statistical analysis
Data were collected and coded before analysis using the professional Statistical Package for Social Sciences (SPSS 18). All data are expressed as the mean and standard deviation (SD). - Frequency tables were used for all categorical data. - Student’s t-test (unpaired) was used for all continuous data after checking normality. - The Mann-Whitney test was used when the standard deviation value was violated. - The chi-square test was used for all categorical data to test for the presence of an association. For small samples, Fisher’s exact test was used. - A P value < 0.05 was considered significant.
Results
This was a prospective case-control investigational single-centre study; conducted on subjects admitted with (STEMI) and were subjected to primary percutaneous coronary interventions.
The total study group included 607 subjects. The subjects were classified into two groups
according to the use of thrombus aspiration devices:
Group I: Included 107 subjects who underwent PPCI with thrombus aspiration.
Group II: Included 500 subjects who underwent PCI without thrombus aspiration.
Demographics and comorbidities
The mean age was 57.3 ± 11 years in total subjects, (56 ± 10 vs 57 ± 11 years, p = 0.3) in group I vs group II respectively. The majority were males 488 (80.3%) of the total study group (85% vs; 79%, P = 0.3) in group I vs group II respectively.
Table 1: Demographics and comorbidities
Total Group I Group II P Value
No. % No. % No. %
Male gender 488 80.3 92 85 397 79 0.3 Family history of IHD 197 32 39 36 158 31 0.1 Smoking 395 65 79 73 316 63 0.2 Hypertension 296 48 44 41 252 50 0.5 Diabetes Mellitus 222 36 41 38 181 36 0.3 Dyslipidemia 213 35 46 43 167 33 0.3
IHD: ischemic heart disease.
Myocardial perfusion and angiographic parameters
A) TIMI score:
- TIMI score pre-procedure was zero in (95% vs 80%, p 0.001) in group I vs group II respectively Table 2.
- TIMI III post procedure occurred in (93% vs 87% P: 0.07) while TIMI zero post procedure occurred in (0.9% vs 2.2%, P = 0.07) in group I vs group II respectively.
Table 2: Clinical characteristics for the study group
All subjects Mean ± SD
Group I Mean ± SD
Group II Mean ± SD
p-value
Age 57.3 ± 11 56 ± 10 57 ± 11 0.3 Heart rate (HR) (BPM) 86 ± 16 83 ± 16 87 ± 16 0.3 MAP /mmHg 71 ± 12 73 ± 11 71 ± 12 0.1 PDT /h 5.1 ± 2.6 5.1 ± 2.8 5.1 ± 2.4 0.5 Killip class 1.3 ± 0.7 1.2 ± 0.7 1.3 ± 0.7 0.2 Cardiac enzymes (CKMB)
CKMB 1 U/L 183 ± 148 185 + 159 183 ± 128 0.9 CKMB 2 U/L (Peak) 262 ± 185 228 + 174 269 ± 186 0.04 CKMB 3 U/L 195 ± 162 135 ± 114 208 ± 163 0.001
Clinical characteristics of the studied population Total ischemic time /h 6.4 ± 3.3 6.5 ± 2.5 6.4 ± 2.8 0.5 Procedure time /minute 42 + 21 44.1 + 16 41.3 + 22 0.1 Glycoprotein IIb/IIIa inhibitor (patient, %)
347 (57%) 78 (72%) 269 (53%) 0.001
ST resolution ≥ 70% 296 (48.8%) 63 (58%) 233 (46%) 0.01 No reflow 71 (11%) 7 (6.5%) 64 (12.8%) 0.04 Primary PCI procedure data
Stent diameter/mm 3.3 ± 1.4 2.7 ± 1.3 3.5 ± 1.3 0.3 Stent length/mm 22.1 ± 9.1 19.9 ± 10.7 22.7 ± 8.7 0.01 Stented segment/ mm 25.5 ± 14.4 22.5 ± 13.5 28.5 ± 15.2 0.001 Stent pressure/ATM 13.4 ± 4.7 12.1± 6.2 13.6 ± 4.3 0.01 No of stents 1.1 + 0.6 1.0 + 0.5 1.2 + 0.6 0.001
BPM: beat per minute; MAP: mean arterial pressure; PDT: pain to door time.
B) Thrombus score
Thrombus score 5 was present (76% vs 37%, p = 0.001) while thrombus score 0 was (0% vs 78%, p 0.001) in group I vs group II respectively Table 3.

Samy et al. To Whom Thrombus Aspiration May Concern? _______________________________________________________________________________________________________________________________
_______________________________________________________________________________________________________________________________
Open Access Maced J Med Sci. 2019 Jun 15; 7(11):1774-1781. 1777
Table 3: Angiographic findings
Group I Group II P value
TIMI pre-procedure 0 subjects / (%) 102 (95%) 402 (80.4%) 0.001 I subjects / (%) 5 (4.6%) 31(6.2%) II subjects / (%) 0 (0%) 45 (9%) III subjects / (%) 0 (0%) 22 (4.4%)
TIMI post procedure 0 subjects / (%) 1 (0.9%) 11 (2.2%) 0.07 I subjects / (%) 2 (1.8%) 13 (2.6%) II subjects / (%) 4 (3.7%) 39 (7.8%) III subjects / (%) 100 (93.4%) 437 (87.4%)
Thrombus score 0 0 (0%) 391 (78.2%) 0.001 1 0 (0%) 10 (2%) 2 4 (3.7%) 4 (0.8%) 3 6 (5.6%) 18 (3.6%) 4 15 (14%) 40 (8%) 5 82 (76.6%) 37 (7.4%)
MBG 0 subjects / (%) 6 (5.6%) 51 (10.2%) 0.001 I subjects / (%) 7 (6.5%) 85 (17%) II subjects / (%) 37 (34%) 195 (39%) III subjects / (%) 57 (53.2%) 169 (33.8%)
B) Stent characteristics
Stent diameter: mean values were (2.7 ± 1.3 vs 3.5 ± 1.3 mm, p 0.3) while Stent length: mean was (19.9 ± 10 vs 22.7 ± 8 mm, p 0.01). Stented segment mean was (22.5 ± 13.5 vs 28.5 ± 15.2 mm, p 0.001). Stent number mean was (1 ± 0.5 vs 1.2 ± 0.6, p 0.001) in group I vs group II respectively.
Major adverse cardiac and cerebrovascular events (MACCE)
I) in hospital MACCE
In the hospital, MACCE was reported in 79 subjects (13%) of total study group {9 (8.4%) vs 70 subjects (14%), p 0.07} in group I vs group II respectively Table 4.
Table 4: In Hospital MACCE
Group I Thrombectomy
9 (8.4%)
Group II Conventional
70 (14%)
P value
Mortality subjects/(%) 9 (8.4%) 59 (11.8%)
0.07
(TVR) subjects / (%) (0%) 5 (4.3%) (MI) subjects / (%) (0%) 5(4.3%) (CVS) subjects / (%) (0%) 1(0.2%)
MACCE: major adverse cardiac and cerebrovascular events; TVR: target vessel revascularization; MI: myocardial infarction; CVS: cerebrovascular stroke.
II) Follow up MACCE after 1year
Follow up MACCE after 1 year reported in {(5.6%) vs (16%), p 0.4} in thrombectomy vs conventional group respectively Table 5.
Table 5: MACCE after 1year
Group I Thrombectomy
6 (5.6%)
Group II Conventional
80 (16%)
P value
Mortality subjects/ (%) 3(2.8%) 55 (11%)
0.4
(TVR) subjects / (%) 3 (2.8 %) 21(4.2%) (MI) subjects / (%) 0(0%) 4(0.8%) (CVS) subjects / (%) 0(0%) 0(0%)
MACCE: major adverse cardiac and cerebrovascular events; TVR: target vessel revascularization; MI: myocardial infarction; CVS: cerebrovascular stroke.
Kaplan–Meier Estimates for 1-year MACCE
As Shown in the cumulative hazard rates for MACCE (death from cardiovascular causes, recurrent myocardial infarction, TVR, and HF requiring hospitalization), Hazard ratio was non significantly
lower in thrombectomy group (72.5; 95% CI, 45.2 to 99.8; p = 0.8) vs (85.7; 95% CI, 36.9 to135; p = 0.8) in thrombectomy vs conventional group respectively. The rate of the net-benefit for outcome was similar in both groups Figure 1.
Figure 1: Kaplan–Meier curve for 1-year MACCE
Further Subgroups
We did further sub-grouping according to thrombus burden (high thrombus burden ≥ 3 and low thrombus score ≤ 2), ischemia time (0-6 hrs. and 7-12 hrs.), initial TIMI flow (TIMI ≤ 1 and Normal flow), then multi-regression analysis was done using forest plot assessment for patient outcome.
B) High thrombus burden group showed a tendency in favour of thrombectomy. However, did not reach statistical; significance p = 0.2.
C) Subjects with earlier ischemic time (0-6 h) showed favour for thrombectomy. However, it did not reach statistical significance p = 0.09.
D) In the group with initial TIMI ≤ 1 also showed preferential for thrombectomy without statistical significance p = 0.08 Figure 2.
Figure 2: Forest plot in outcome in pre-specified groups
Discussion
The increase in thrombus burden is associated with higher mortality [16], [17] and manual aspiration thrombectomy has the potential to reduce the thrombus burden [18].
After the initial TAPAS [3]
trial showed an improvement in myocardial blush and

Clinical Science _______________________________________________________________________________________________________________________________
_______________________________________________________________________________________________________________________________
1778 https://www.id-press.eu/mjms/index
a reduction in mortality, and a meta-analysis of small trials [19]
also showed a reduction in mortality, routine
manual thrombectomy became a class IIa treatment recommendation in the American and European Guidelines for STEMI 2013 [20]. Subsequently, however, more recent larger trials, such as TOTAL [21] (N = 10,732)
and TASTE [18]
(N = 7244), and a
meta-analysis [22] showed an increase in the risk of
stroke with routine manual thrombectomy without any benefit in terms of MACCE. Consequently, in the updated AHA/ACC 2015 guidelines [23] manual thrombus aspiration was downgraded to a class IIb recommendation for the treatment of STEMI; in the 2017 STEMI guidelines, it was further downgraded to a class III recommendation [24].
Myocardial perfusion
In our study, the thrombectomy group showed better ST segment resolution of ≥ 70% (58% vs 46%, respectively, p 0.001) in the thrombectomy group vs the conventional group.
In our study, the peak CK-MB was lower in the thrombectomy group (228 ± 174 U/L vs 269 ± 186 U/L, p = 0.04). This is in line with Orrego et al., (2006) [25]
who reported peak CK-MB values of (790 ±
132U/L vs 910 ± 128 U/L, p = 0.0001) in the thrombectomy group vs the conventional group.
Angiographic procedure
The classic approach of pre-dilation before stent deployment and high-pressure post dilation is associated with increased procedure duration, more radiation exposure, contrast use, and increased costs compared with direct stenting [26], [27].
In our study, direct stenting was more frequent in the thrombectomy group than the conventional group (38% vs 20%, p = 0.001). Rodriguez et al., (2014) [28] reported direct stenting rates of (58% vs 45% for the thrombectomy group vs the conventional group, p = 0.009).
Yamaguchi et al., (2013) [29] reported in an
OCT study (n = 188), that thrombus aspiration before primary angioplasty in patients with STEMI was associated with significantly less tissue protrusion compared with standard PCI; it was also associated with favourably influenced lesion morphologies in the stented segment.
From this, we can state that
thrombus aspiration can decrease clot volume, which causes a higher thrombus grade.
Stent characteristics
In-stent restenosis [30] and stent thrombosis
[31] is directly related to the characteristics of the stents [32]. Thus, the stent type [33] and the use of fewer stents and stents with a larger diameter [34] and
a smaller length [33], [34] during STEMI could have long-term prognostic implications by reducing stent restenosis and stent thrombosis.
Certain stent characteristics have been associated with stent restenosis [35],
including stent
length [36] and stent diameter [37].
In the present
study, the mean stent diameter was (2.7 ± 1.3 vs 3.5 ± 1.3 mm, p = 0.3), while the stent length was significantly shorter in the thrombectomy group (19.9 ± 10 vs 22.7 ± 8 mm, p = 0.01). Also, the mean length of the stented segments was significantly lower in the thrombectomy group than in the conventional group (22.5 ± 13 vs 28.5 ± 15 mm, respectively, p = 0.001). Along the same line, Rodriguez et al., (2014) [28] reported a mean length of stented segments of (24.1 ± 11.8 vs 26.9 ± 15.7 mm, p = 0.03). In the current study, the thrombectomy group required fewer stents (1 ± 0.5 vs 1.2 ± 0.6, p = 0.001).
Multiple factors likely contribute to no-reflow. These include distal embolisation of a plaque and/or thrombus, microvascular damage, myocardial necrosis and stunning [38].
Other studies have noted
a higher rate of adverse outcomes in patients with no reflow, regardless of the method of detection. These adverse outcomes include increases in in-hospital heart failure and mortality, left ventricular remodelling at six months, and mortality at one year [39], [40].
In
the current study, the incidence of no-reflow was significantly lower in the thrombectomy group than in the conventional group {7 subjects (6.5%) vs 64 (12.8%), p = 0.04}. These findings are in line with those of the study by Orrego et al., (2006) [25], who reported that the incidence of no-reflow was significantly lower in the thrombectomy group than in the conventional group (3% vs 15%, respectively, p = 0.02).
MACCE
In our study, the rate of in-hospital MACCE was higher in the conventional group, although the difference did not reach statistical significance {9 (8.4%) vs 70 patients (14%), p = 0.07}. In comparison, follow-up MACCE after 1 year was reported in {6 subjects (5.6%) vs 80 (16 %), p = 0.4} in the thrombectomy group vs the conventional groups. This is in line with the updated meta-analysis by Ghatak et al., (2015) [41], which included 21,281 patients in 20 trials and reported no difference in mortality, recurrent MI, target vessel revascularization, early or late stent thrombosis, or net clinical benefit between thrombectomy and conventional PPCI patients during short-term or long-term follow-up. Conversely, a previous meta-analysis by Kumbhani et al., (2013) [42] that included 18 trials reported that manual thrombus aspiration was associated with a reduction in major adverse cardiac events, including mortality at 6 to 12 months, but had a trend towards a higher risk of stroke. In our study, CVS developed in one patient in the conventional group, who also developed

Samy et al. To Whom Thrombus Aspiration May Concern? _______________________________________________________________________________________________________________________________
_______________________________________________________________________________________________________________________________
Open Access Maced J Med Sci. 2019 Jun 15; 7(11):1774-1781. 1779
paroxysmal AF; consequently, we cannot provide a comment regarding CVS. Of note, the TOTAL trial [21] reported that the thrombectomy group showed significant development of CVS compared with the conventional group (0.7% vs 0.3%, p = 0.02). Recent data suggest that thrombus aspiration may be associated with stroke [43], [44]. This was not demonstrated in other single-country studies [45], [46]
raising the question of whether technique may play a role. Possible explanations for the association between stroke and thrombus aspiration include catheter-induced embolization of the thrombus into the systemic vasculature; aggressive guide catheter manipulation to pass the aspiration catheter, which dislodges aortic atheroma; and longer procedure times arising from the aspiration procedure [47].
Study Limitations
- This is a single-centre, some information of interest, such as data on the duration of diabetes mellitus ischemic heart disease, were missing.
- The treating physician was aware of the group to which the patients had been assigned.
- Myocardial blush grade assessment requires waiting approximately 5 seconds post-dye injection for proper evaluation, which was not possible for all patients.
- MACCE were assessed after 12 months post discharge. The data were collected by outpatient follow-up, record reviews, and direct contact or phone calls with the patients or their relatives.
In patients with STEMI subjected to PPCI with thrombus score ≥ 3:
- Thrombus aspiration before primary PCI improves myocardial perfusion, as indicated by the findings of better ST-segment resolution and TIMI flow and reduced peak CKMB and MBG.
- Thrombus aspiration before primary PCI was associated with a higher rate of direct stenting, shorter stent length, fewer stented segments and fewer stents.
- Despite the greater risk associated with the pre-procedure thrombus score in the thrombectomy group, there was no difference in MACCE.
References
1. Topol EJ YJ. Recognition of the importance of embolization in atherosclerotic vascular disease. Circ J. 2000; https://doi.org/10.1161/01.CIR.101.5.570 PMid:10662756
2. Vlaar PJ, Svilaas T, van der Horst IC, Diercks GFH, Fokkema ML, de Smet BJGL, et al. Cardiac death and reinfarction after 1 year in the Thrombus Aspiration during Percutaneous coronary
intervention in Acute myocardial infarction Study (TAPAS): a 1-year follow-up study. Lancet. 2008; 371(9628):1915-20. https://doi.org/10.1016/S0140-6736(08)60833-8
3. Svilaas T, Vlaar PJ, van der Horst IC, Diercks GFH, de Smet BJGL, van den Heuvel AFM, et al. Thrombus aspiration during primary percutaneous coronary intervention. N Engl J Med. 2008; 358(6):557-67. https://doi.org/10.1056/NEJMoa0706416 PMid:18256391
4. Desch S, Stiermaier T, De Waha S, Lurz P, Gutberlet M, Sandri M, et al. Thrombus Aspiration in Patients with ST-Segment Elevation Myocardial Infarction Presenting Late after Symptom Onset. JACC Cardiovasc Interv. 2016; 9(2):113-22. https://doi.org/10.1016/j.jcin.2015.09.010 PMid:26793952
5. Bhindi R, Kajander OA, Jolly SS, Kassam S, Lavi S, Niemelä K, et al. Culprit lesion thrombus burden after manual thrombectomy or percutaneous coronary intervention-alone in ST-segment elevation myocardial infarction: The optical coherence tomography sub-study of the TOTAL (ThrOmbecTomy versus PCI ALone) trial. Eur Heart J. 2015; 36(29):1892-900. https://doi.org/10.1093/eurheartj/ehv176 PMid:25994742 PMCid:PMC5061563
6. Windecker S, Kolh P, Alfonso F, Collet JP, Cremer J, Falk V, et al. 2014 ESC/EACTS Guidelines on myocardial revascularization: The Task Force on Myocardial Revascularization of the European Society of Cardiology (ESC) and the European Association for Cardio-Thoracic Surgery (EACTS) Developed with the special contribution. European Heart Journal. 2014; 35:2541-619. https://doi.org/10.1093/eurheartj/ehu278 PMid:25173339
7. Simes RJ, Topol EJ, Holmes DRJ, White HD, Rutsch WR, Vahanian A, et al. Link between the angiographic substudy and mortality outcomes in a large randomized trial of myocardial reperfusion. Importance of early and complete infarct artery reperfusion. GUSTO-I Investigators. Circulation. 1995; 91(7):1923-8. https://doi.org/10.1161/01.CIR.91.7.1923 PMid:7895348
8. American Diabetes Association. 2016 American Diabetes Association (ADA) Diabetes Guidelines Summary Recommendation from NDEI. Natl Diabetes Educ Initiat. 2016; 39(1):1-46.
9. Stone NJ, Robinson JG, Lichtenstein AH, Bairey Merz CN, Blum CB, Eckel RH, et al. 2013 ACC/AHA Guideline on the Treatment of Blood Cholesterol to Reduce Atherosclerotic Cardiovascular Risk in Adults. Circulation. 2014; 129(25 suppl 2):S1-45. https://doi.org/10.1161/01.cir.0000437738.63853.7a PMid:24222016
10. NICE. Hypertension: Clinical management of primary hypertension in adults (NICE clinical guideline 127). NICE. 2011;(April 2007):38.
11. Yeboah J, Erbel R, Delaney JC, Nance R, Guo M, Bertoni AG, Budoff M, Moebus S, Jöckel KH, Burke GL, Wong ND. Development of a new diabetes risk prediction tool for incident coronary heart disease events: the Multi-Ethnic Study of Atherosclerosis and the Heinz Nixdorf Recall Study. Atherosclerosis. 2014; 236(2):411-7. https://doi.org/10.1016/j.atherosclerosis.2014.07.035 PMid:25150939 PMCid:PMC4170005
12. Gibson CM, Cannon CP, Murphy SA, Ryan KA, Mesley R, Marble SJ, et al. Relationship of TIMI myocardial perfusion grade to mortality after administration of thrombolytic drugs. Circulation. 2000; 101(2):125-30. https://doi.org/10.1161/01.CIR.101.2.125 PMid:10637197
13. Yamamuro A, Akasaka T, Tamita K, Yamabe K, Katayama M, Takagi T, et al. Coronary flow velocity pattern immediately after percutaneous coronary intervention as a predictor of complications and in-hospital survival after acute myocardial infarction. Circulation. 2002; 106(24):3051-6. https://doi.org/10.1161/01.CIR.0000043022.44032.77 PMid:12473550
14. Gibson CM, de Lemos J a, Murphy S a, Marble SJ, McCabe CH, Cannon CP, et al. Combination therapy with abciximab reduces angiographically evident thrombus in acute myocardial infarction: a TIMI 14 substudy. Circulation. 2001; 103(21):2550-4. https://doi.org/10.1161/01.CIR.103.21.2550 PMid:11382722

Clinical Science _______________________________________________________________________________________________________________________________
_______________________________________________________________________________________________________________________________
1780 https://www.id-press.eu/mjms/index
15. Kidney Disease: Improving Global Outcomes (KDIGO) Acute Kidney Injury Work Group. KDIGO Clinical Practice Guideline for Acute Kidney Injury. Kidney Int Suppl. 2012; 2(1):1-138.
16. Napodano M, Ramondo A, Tarantini G, Peluso D, Compagno S, Fraccaro C, et al. Predictors and time-related impact of distal embolization during primary angioplasty. Eur Heart J. 2009; 30(3):305-13. https://doi.org/10.1093/eurheartj/ehn594 PMid:19153179
17. Izgi A, Kirma C, Tanalp AC, Dundar C, Oduncu V, Aung SM, et al. Predictors and clinical significance of angiographically detected distal embolization after primary percutaneous coronary interventions. Coron Artery Dis. 2007; 18(6):443-9. https://doi.org/10.1097/MCA.0b013e3282a3064e PMid:17700215
18. Fröbert O, Lagerqvist B, Olivecrona GK, Omerovic E, Gudnason T, Maeng M, et al. Thrombus aspiration during ST-segment elevation myocardial infarction. N Engl J Med. 2013; 369(17):1587-97. https://doi.org/10.1056/NEJMoa1308789 PMid:23991656
19. Kumbhani DJ, Bavry AA, Desai MY, Bangalore S, Bhatt DL. Role of aspiration and mechanical thrombectomy in patients with acute myocardial infarction undergoing primary angioplasty: An updated meta-analysis of randomized trials. J Am Coll Cardiol. 2013; 62(16):1409-18. https://doi.org/10.1016/j.jacc.2013.04.025 PMid:23665372
20. O'Gara PT, Kushner FG, Ascheim DD, Casey DE, Chung MK, De Lemos JA, et al. 2013 ACCF/AHA guideline for the management of st-elevation myocardial infarction: A report of the American college of cardiology foundation/american heart association task force on practice guidelines. Vol. 61, Journal of the American College of Cardiology. 2013.
21. Jolly SS, Cairns JA, Yusuf S, Meeks B, Pogue J, Rokoss MJ, et al. Randomized Trial of Primary PCI with or without Routine Manual Thrombectomy. N Engl J Med. 2015; 372(15):1389-98. https://doi.org/10.1056/NEJMoa1415098 PMid:25853743 PMCid:PMC4995102
22. Mastoris I, Giustino G, Sartori S, Baber U, Mehran R, Kini AS, et al. Efficacy and safety of routine thrombus aspiration in patients with ST-segment elevation myocardial infarction undergoing primary percutaneous coronary intervention: An updated systematic review and meta-analysis of randomized controlled trials. Catheter Cardiovasc Interv. 2016; 87(4):650-60. https://doi.org/10.1002/ccd.26152 PMid:26994974
23. Levine GN, Bates ER, Blankenship JC, Bailey SR, Bittl JA, Cercek B, Chambers CE, Ellis SG, Guyton RA, Hollenberg SM, Khot UN. 2015 ACC/AHA/SCAI focused update on primary percutaneous coronary intervention for patients with ST-elevation myocardial infarction: an update of the 2011 ACCF/AHA/SCAI guideline for percutaneous coronary intervention and the 2013 ACCF/AHA guideline for the management of ST-elevation myocardial infarction. Journal of the American College of Cardiology. 2016; 67(10):1235-50. https://doi.org/10.1016/j.jacc.2015.10.005 PMid:26498666
24. Authors/Task Force Members, Steg PG, James SK, Atar D, Badano LP, Lundqvist CB, Borger MA, Di Mario C, Dickstein K, Ducrocq G, Fernandez-Aviles F. ESC Guidelines for the management of acute myocardial infarction in patients presenting with ST-segment elevation: The Task Force on the management of ST-segment elevation acute myocardial infarction of the European Society of Cardiology (ESC). European heart journal. 2012; 33(20):2569-619. https://doi.org/10.1093/eurheartj/ehs215 PMid:22922416
25. Silva-Orrego P, Colombo P, Bigi R, Gregori D, Delgado A, Salvade P, et al. Thrombus Aspiration Before Primary Angioplasty Improves Myocardial Reperfusion in Acute Myocardial Infarction. The DEAR-MI (Dethrombosis to Enhance Acute Reperfusion in Myocardial Infarction) Study. J Am Coll Cardiol. 2006; 48(8):1552-9. https://doi.org/10.1016/j.jacc.2006.03.068 PMid:17045887
26. Hamon M, Richardeau Y, Lecluse E, Saloux E, Sabatier R, Agostini D, et al. Direct coronary stenting without balloon predilation in acute coronary syndromes. Am Heart J. 1999; 138(1 I):55-9. https://doi.org/10.1016/S0002-8703(99)70246-2
27. Wilson SH, Berger PB, Mathew V, Bell MR, Garratt KN, Rihal CS, et al. Immediate and late outcomes after direct stent implantation without balloon predilation. J Am Coll Cardiol. 2000; 35(4):937-43. https://doi.org/10.1016/S0735-1097(99)00639-7
28. Diego Fernández-Rodríguez, Luis Alvarez-Contreras, Victoria Martín-Yuste, Salvatore Brugaletta I, Ferreira, Marta De Antonio, Montserrat Cardona, Vicens Martí, Juan García-Picart MS. Does manual thrombus aspiration help optimize stent implantation in ST-segment elevation myocardial infarction? World J Cardiol. 2014; 6(9)1030-1037. https://doi.org/10.4330/wjc.v6.i9.1030 PMid:25276303 PMCid:PMC4176794
29. Yamaguchi T, Kubo T, Ino Y, Matsuo Y, Shiono Y, Yamano T, Taruya A, Nishiguchi T, Shimokado A, Orii M, Tanaka A. Optical coherence tomography assessment of efficacy of thrombus aspiration in patients undergoing a primary percutaneous coronary intervention for acute ST-elevation myocardial infarction. Coronary artery disease. 2015; 26(7). https://doi.org/10.1097/MCA.0000000000000291 PMid:26230885 PMCid:PMC4588603
30. Lemos PA, Van Mieghem CAG, Arampatzis CA, Hoye A, Ong ATL, McFadden E, et al. Post-sirolimus-eluting stent restenosis treated with repeat percutaneous intervention: Late angiographic and clinical outcomes. Circulation. 2004; 109(21):2500-2. https://doi.org/10.1161/01.CIR.0000130173.63105.4E PMid:15148279
31. Holmes DR, Kereiakes DJ, Garg S, Serruys PW, Dehmer GJ, Ellis SG, Williams DO, Kimura T, Moliterno DJ. Stent thrombosis. Journal of the American College of Cardiology. 2010; 56(17):1357-65. https://doi.org/10.1016/j.jacc.2010.07.016 PMid:20946992
32. Brodie B, Pokharel Y, Garg A, Kissling G, Hansen C, Milks S, et al. Predictors of early, late, and very late stent thrombosis after primary percutaneous coronary intervention with bare-metal and drug-eluting stents for st-segment elevation myocardial infarction. JACC Cardiovasc Interv. 2012; 5(10):1043-51. https://doi.org/10.1016/j.jcin.2012.06.013 PMid:23078734
33. Costa MA, Simon DI. Molecular basis of restenosis and drug-eluting stents. Circulation. 2005; 111(17):2257-73. https://doi.org/10.1161/01.CIR.0000163587.36485.A7 PMid:15867193
34. Moses JW, Dangas G, Mehran R, Mintz GS. Drug-eluting stents in the real world: how intravascular ultrasound can improve clinical outcome. Am J Cardiol. 2008; 102(9 Suppl):24J-8J. https://doi.org/10.1016/j.amjcard.2008.09.006 PMid:18928789
35. Cutlip DE, Chauhan MS, Baim DS, Ho KKL, Popma JJ, Carrozza JP, et al. Clinical restenosis after coronary stenting: Perspectives from multicenter clinical trials. J Am Coll Cardiol. 2002; 40(12):2082-9. https://doi.org/10.1016/S0735-1097(02)02597-4
36. Kobayashi Y, De Gregorio J, Kobayashi N, Akiyama T, Reimers B, Finci L, et al. Stented segment length as an independent predictor of restenosis. J Am Coll Cardiol. 1999; 34(3):651-9. https://doi.org/10.1016/S0735-1097(99)00303-4
37. Mauri L, O'Malley AJ, Cutlip DE, Ho KKL, Popma JJ, Chauhan MS, et al. Effects of stent length and lesion length on coronary restenosis. Am J Cardiol. 2004; 93(11):1340-6. https://doi.org/10.1016/j.amjcard.2004.02.027 PMid:15165911
38. Rezkalla SH, Kloner RA. Coronary No-reflow Phenomenon. Curr Treat Options Cardiovasc Med. 2005; 7(1):75-80. https://doi.org/10.1007/s11936-005-0008-0
39. De Luca G, van't Hof AW, de Boer MJ, Hoorntje JC, Gosselink AM, Dambrink JH, Ottervanger JP, Zijlstra F, Suryapranata H. Impaired myocardial perfusion is a major explanation of the poor outcome observed in patients undergoing primary angioplasty for ST-segment-elevation myocardial infarction and signs of heart failure. Circulation. 2004; 109(8):958-61. https://doi.org/10.1161/01.CIR.0000120504.31457.28 PMid:14981008
40. Baks T, van Geuns RJ, Biagini E, Wielopolski P, Mollet NR, Cademartiri F, van der Giessen WJ, Krestin GP, Serruys PW, Duncker DJ, de Feyter PJ. Effects of primary angioplasty for acute

Samy et al. To Whom Thrombus Aspiration May Concern? _______________________________________________________________________________________________________________________________
_______________________________________________________________________________________________________________________________
Open Access Maced J Med Sci. 2019 Jun 15; 7(11):1774-1781. 1781
myocardial infarction on early and late infarct size and left ventricular wall characteristics. Journal of the American College of Cardiology. 2006; 47(1):40-4. https://doi.org/10.1016/j.jacc.2005.09.008 PMid:16386662
41. Ghatak A, Singh V, Shantha GPS, Badheka A, Patel N, Alfonso CE, et al. Aspiration thrombectomy in patients undergoing primary angioplasty for ST elevation myocardial infarction: An updated meta-analysis. J Interv Cardiol. 2015; 28(6):503-13. https://doi.org/10.1111/joic.12249 PMid:26642999
42. Kumbhani DJ, Bavry AA, Desai MY, Bangalore S, Bhatt DL. Role of aspiration and mechanical thrombectomy in patients with acute myocardial infarction undergoing primary angioplasty: an updated meta-analysis of randomized trials. J Am Coll Cardiol. 2013; 62(16):1409-18. https://doi.org/10.1016/j.jacc.2013.04.025 PMid:23665372
43. Elgendy IY, Huo T, Bhatt DL, Bavry AA. Is aspiration thrombectomy beneficial in patients undergoing primary percutaneous coronary intervention meta-Analysis of randomized trials. Circ Cardiovasc Interv. 2015; 8(7). https://doi.org/10.1161/CIRCINTERVENTIONS.114.002258
44. Jolly SS, Cairns JA, Yusuf S, Rokoss MJ, Gao P, Meeks B, et al. Outcomes after thrombus aspiration for ST elevation myocardial infarction: 1-year follow-up of the prospective randomised TOTAL trial. Lancet. 2016; 387(10014):127-35.
https://doi.org/10.1016/S0140-6736(15)00448-1
45. Sirker A, Mamas M, Kwok CS, Kontopantelis E, Ludman P, Hildick-Smith D. Outcomes From Selective Use of Thrombectomy in Patients Undergoing Primary Percutaneous Coronary Intervention for ST-Segment Elevation Myocardial Infarction: An Analysis of the British Cardiovascular Intervention Society/National Institute for Cardiovascu. JACC Cardiovasc Interv. 2016; 9(2):126-34. https://doi.org/10.1016/j.jcin.2015.10.047 PMid:26793954
46. Kumbhani DJ, Bavry AA, Desai MY, Bangalore S, Byrne RA, Jneid H, et al. Aspiration thrombectomy in patients undergoing primary angioplasty: Totality of data to 2013. Catheter Cardiovasc Interv. 2014; 84(6):973-7. https://doi.org/10.1002/ccd.25532 PMid:24782350
47. Jolly SS, Cairns JA, Yusuf S, Meeks B, Gao P, Hart RG, et al. Stroke in the TOTAL trial: A randomized trial of routine thrombectomy vs. percutaneous coronary intervention alone in ST elevation myocardial infarction. Eur Heart J. 2015; 36(35):2364-72. https://doi.org/10.1093/eurheartj/ehv296 PMid:26129947 PMCid:PMC4568405

_______________________________________________________________________________________________________________________________
1782 https://www.id-press.eu/mjms/index
ID Design Press, Skopje, Republic of Macedonia Open Access Macedonian Journal of Medical Sciences. 2019 Jun 15; 7(11):1782-1787. https://doi.org/10.3889/oamjms.2019.541 eISSN: 1857-9655 Clinical Science
Primary Failure of the Arteriovenous Fistula in Patients with Chronic Kidney Disease Stage 4/5 Nikola Gjorgjievski
1*, Pavlina Dzekova-Vidimliski
1, Vesna Gerasimovska
1, Svetlana Pavleska-Kuzmanovska
1, Julija
Gjorgievska2, Petar Dejanov
1, Aleksandar Sikole
1, Ninoslav Ivanovski
3
1University Hospital of Nephrology, Faculty of Medicine, Ss Cyril and Methodius University of Skopje, Skopje, Republic of
Macedonia; 2University Children Hospital, Skopje, Republic of Macedonia;
3Zan Mitrev Clinic, Skopje, Republic of
Macedonia
Citation: Gjorgjievski N, Dzekova-Vidimliski P, Gerasimovska V, Pavleska-Kuzmanovska S, Gjorgievska J, Dejanov P, Sikole A, Ivanovski N. Primary Failure of The Arteriovenous Fistula in Patients with Chronic Kidney Disease Stage 4/5. Open Access Maced J Med Sci. 2019 Jun 15; 7(11):1782-1787. https://doi.org/10.3889/oamjms.2019.541
Keywords: Primary failure; Arteriovenous fistula; Hemodialysis; Doppler ultrasound; Chronic kidney disease
*Correspondence: Nikola Gjorgjievski. University Hospital of Nephrology, Skopje, Republic of Macedonia. E-mail: [email protected]
Received: 23-Apr-2019; Revised: 18-May-2019; Accepted: 21-May-2019; Online first: 15-Jun-2019
Copyright: © 2019 Nikola Gjorgjievski, Pavlina Dzekova-Vidimliski, Vesna Gerasimovska, Svetlana Pavleska-Kuzmanovska, Julija Gjorgievska, Petar Dejanov, Aleksandar Sikole, Ninoslav Ivanovski. This is an open-access article distributed under the terms of the Creative Commons Attribution-NonCommercial 4.0 International License (CC BY-NC 4.0)
Funding: This research did not receive any financial support
Competing Interests: The authors have declared that no competing interests exist
Abbreviations: AVF: Arteriovenous fistula; HD: Hemodialysis; VA: Vascular access; CKD: Chronic kidney disease; TCC: Tunneled central venous catheters; AVG: Arteriovenous graft; DM: Diabetes mellitus; RRT: Renal replacement therapy; PD: Peritoneal dialysis; Tx: Transplantation; DOQI: Kidney Disease Outcomes Quality Initiative; GFR: Glomerular filtration rate; DOPPS: Dialysis Outcomes and Practice Patterns Study; SD: Standard deviation; ANOVA: Analysis of variance; POCUS: Preoperative point-of-care ultrasound; HBP: High blood pressure or Hypertension; ADPKD: Autosomal dominant polycystic kidney disease; ON Obstructive nephropathy; GP: Glomerulopathy; OND: Unknown disease; ERA-EDTA: European renal association- European dialysis and transplant association
Abstract
BACKGROUND: An Arteriovenous fistula (AVF) is a creation of the natural blood vessels. It is a “gate of life” for the patients on hemodialysis.
AIM: The study aimed to analyze the predictors for primary failure of AVF such as gender, age, number and location of AVF, and primary renal disease in patients with chronic kidney disease (CKD) stage 4/5.
MATERIAL AND METHODS: The medical records of 178 created arteriovenous fistulae in patients with CKD stage 4/5, were retrospectively studied. Primary failure of AVF was defined as thrombosis or inability for cannulation of AVF within 3 months. Adequate maturation of AVF was defined as successful cannulation of AVF treatment and blood flow of > 600 ml/min.
RESULTS: The mean age of the patients was 59.75 ± 14.65 years, and 65.16% (116/178) were men. Adequate maturation of AVF was achieved in 83.71% (149/178). Primary failure of AVF occurred in 16.29% (29/178) of the created fistulae, while 10.11% (18/178) had early thrombosis. The distal arteriovenous fistulae were significantly more frequently created in male patients (51 vs 18; p = 0.015). The female patients were significantly older than the male patients (63.27 vs 57.86 years; p = 0.018).
CONCLUSION: Male gender was associated with better maturation of AVF. The age, number and location of AVF, and primary renal disease in patients with CKD stage 4/5 were not associated with primary failure of AVF.
Introduction
Chronic kidney disease (CKD) is a condition of irreversible destruction of the renal parenchyma, with a continuous decline of kidney function [1]. The number of patients with CKD requiring renal replacement therapy (RRT) is increasing worldwide,
and it is the reason why we call CKD an international health problem [2]. Hemodialysis (HD) becomes the mainstay of treatment in patients with CKD requiring RRT, despite great medical and technological progress in transplantation (Tx) and peritoneal dialysis (PD). In our country in 2002 there were 1056 patients on RRT, most of them on HD 92%. In 2016 the number of patients on RRT increased to 1665. The
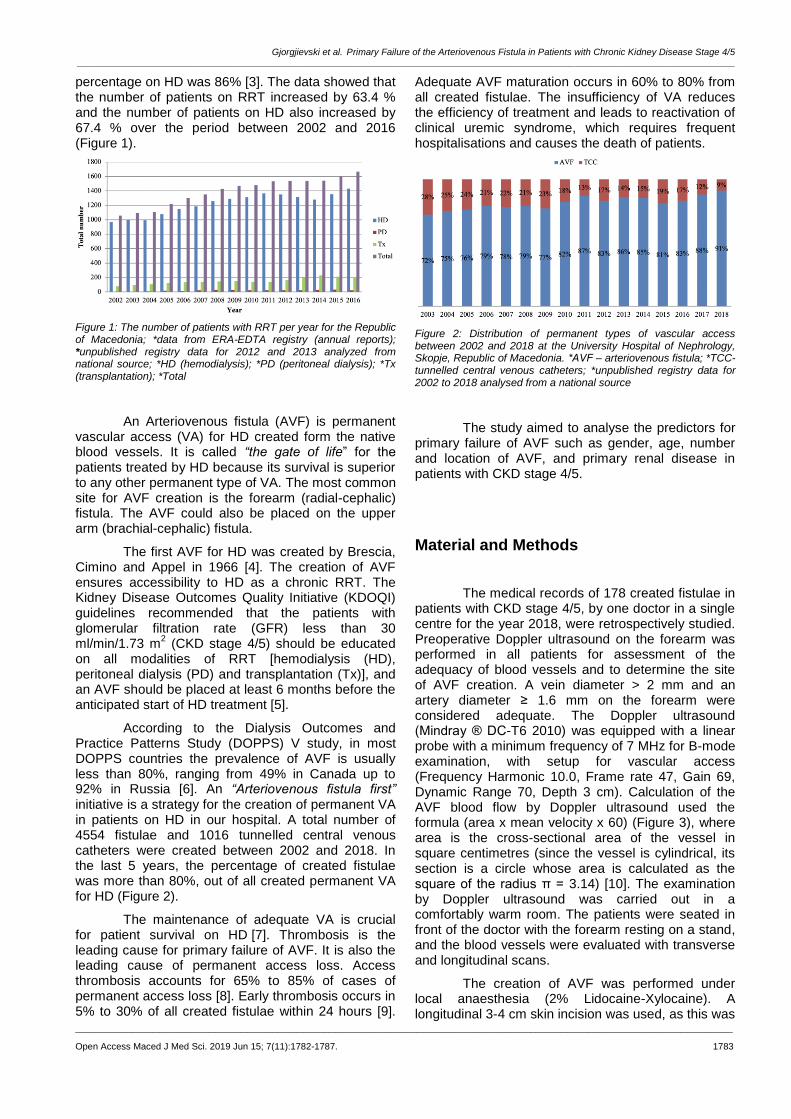
Gjorgjievski et al. Primary Failure of the Arteriovenous Fistula in Patients with Chronic Kidney Disease Stage 4/5 _______________________________________________________________________________________________________________________________
_______________________________________________________________________________________________________________________________
Open Access Maced J Med Sci. 2019 Jun 15; 7(11):1782-1787. 1783
percentage on HD was 86% [3]. The data showed that the number of patients on RRT increased by 63.4 % and the number of patients on HD also increased by 67.4 % over the period between 2002 and 2016 (Figure 1).
Figure 1: The number of patients with RRT per year for the Republic of Macedonia; *data from ERA-EDTA registry (annual reports); *unpublished registry data for 2012 and 2013 analyzed from national source; *HD (hemodialysis); *PD (peritoneal dialysis); *Tx (transplantation); *Total
An Arteriovenous fistula (AVF) is permanent vascular access (VA) for HD created form the native blood vessels. It is called “the gate of life” for the patients treated by HD because its survival is superior to any other permanent type of VA. The most common site for AVF creation is the forearm (radial-cephalic) fistula. The AVF could also be placed on the upper arm (brachial-cephalic) fistula.
The first AVF for HD was created by Brescia, Cimino and Appel in 1966 [4]. The creation of AVF ensures accessibility to HD as a chronic RRT. The Kidney Disease Outcomes Quality Initiative (KDOQI) guidelines recommended that the patients with glomerular filtration rate (GFR) less than 30 ml/min/1.73 m
2 (CKD stage 4/5) should be educated
on all modalities of RRT [hemodialysis (HD), peritoneal dialysis (PD) and transplantation (Tx)], and an AVF should be placed at least 6 months before the anticipated start of HD treatment [5].
According to the Dialysis Outcomes and Practice Patterns Study (DOPPS) V study, in most DOPPS countries the prevalence of AVF is usually less than 80%, ranging from 49% in Canada up to 92% in Russia [6]. An “Arteriovenous fistula first” initiative is a strategy for the creation of permanent VA in patients on HD in our hospital. A total number of 4554 fistulae and 1016 tunnelled central venous catheters were created between 2002 and 2018. In the last 5 years, the percentage of created fistulae was more than 80%, out of all created permanent VA for HD (Figure 2).
The maintenance of adequate VA is crucial for patient survival on HD [7]. Thrombosis is the leading cause for primary failure of AVF. It is also the leading cause of permanent access loss. Access thrombosis accounts for 65% to 85% of cases of permanent access loss [8]. Early thrombosis occurs in 5% to 30% of all created fistulae within 24 hours [9].
Adequate AVF maturation occurs in 60% to 80% from all created fistulae. The insufficiency of VA reduces the efficiency of treatment and leads to reactivation of clinical uremic syndrome, which requires frequent hospitalisations and causes the death of patients.
Figure 2: Distribution of permanent types of vascular access between 2002 and 2018 at the University Hospital of Nephrology, Skopje, Republic of Macedonia. *АVF – arteriovenous fistula; *TCC- tunnelled central venous catheters; *unpublished registry data for 2002 to 2018 analysed from a national source
The study aimed to analyse the predictors for primary failure of AVF such as gender, age, number and location of AVF, and primary renal disease in patients with CKD stage 4/5.
Material and Methods
The medical records of 178 created fistulae in patients with CKD stage 4/5, by one doctor in a single centre for the year 2018, were retrospectively studied. Preoperative Doppler ultrasound on the forearm was performed in all patients for assessment of the adequacy of blood vessels and to determine the site of AVF creation. A vein diameter > 2 mm and an artery diameter ≥ 1.6 mm on the forearm were considered adequate. The Doppler ultrasound (Mindray ® DC-T6 2010) was equipped with a linear probe with a minimum frequency of 7 MHz for B-mode examination, with setup for vascular access (Frequency Harmonic 10.0, Frame rate 47, Gain 69, Dynamic Range 70, Depth 3 cm). Calculation of the AVF blood flow by Doppler ultrasound used the formula (area x mean velocity x 60) (Figure 3), where area is the cross-sectional area of the vessel in square centimetres (since the vessel is cylindrical, its section is a circle whose area is calculated as the square of the radius π = 3.14) [10]. The examination by Doppler ultrasound was carried out in a comfortably warm room. The patients were seated in front of the doctor with the forearm resting on a stand, and the blood vessels were evaluated with transverse and longitudinal scans.
The creation of AVF was performed under local anaesthesia (2% Lidocaine-Xylocaine). A longitudinal 3-4 cm skin incision was used, as this was

Clinical Science _______________________________________________________________________________________________________________________________
_______________________________________________________________________________________________________________________________
1784 https://www.id-press.eu/mjms/index
found to give good access to both vein and artery. An end-to-side fistula was created between the cephalic vein and the radial or brachial artery, using continuous polypropylene sutures (6/0 Prolene) with the aid of 3.5x magnifying loupes (Figure 4). The length of anastomosis was 10 mm for (radio-cephalic) (Figure 5) and 5 mm for (brachial-cephalic) fistulae. A palpable date thrill was taken as an indicator for successful AVF creation. The primary failure of AVF was defined as thrombosis or inability for cannulation of fistula for HD within 3 months of creation. Early thrombosis of AVF was defined as an immediate failure due to thrombosis of the fistula within 24 hours of creation. Adequate maturation of AVF was defined as successful cannulation of AVF for efficient HD treatment and AVF blood flow of > 600 ml/min. The term maturation refers to the development of those physical characteristics that render an AVF suitable for venipuncture with large-gauge needles. Generally, the physical examination conducted by an experienced dialysis nurse is sufficiently reliable for determining whether the fistula is mature and therefore, ready for puncture [11], [12]. The problem arises when the AVF does not appear mature based on inspection alone, a situation that occurs with obese patients and with slow-maturing fistulae. In these cases, the ultrasound examination and assessment of hemodynamic parameters (AVF blood flow,) could help determine whether an AVF is suitable for cannulation or whether it has instead failed to mature and is therefore likely to undergo thrombosis or have a low flow volume. The ultrasound characteristics that confirm that an AVF is mature and, therefore, ready for use: a blood flow of > 600 ml/min, an outflow vein diameter of ≥ 6 mm, and an outflow vein depth of ≤ 6 mm below the skin surface [5]. Three different types of AVF were created: distal (radial-cephalic), middle-arm (radial-cephalic) and proximal (brachial-cephalic). The patients with created fistulae were grouped according to the aetiology of primary renal disease: diabetes mellitus (DM), high blood pressure or hypertension (HBP), autosomal dominant polycystic kidney disease (ADPKD), obstructive nephropathy (ON), glomerulopathy (GP) and unknown disease (UND).
Figure 3: Blood flow of AVF after 28 days of creation
Statistical analysis was performed using the Statistic 8 software for Windows. Data from numerical variables were presented as mean values ± standard deviation (SD). The means between the two groups were compared with a t-test. Analysis of variance (ANOVA) was used to test differences between two or more means.
Figure 4: Location of a. radial and v. cephalic at the distal forearm site
A multiple logistic regression analysis was used to determine predictors of early thrombosis and primary failure of AVF in the study population. The p-value of less than 0.05 was considered statistically significant.
Figure 5: Creation of anastomosis by a. radial and v. cephalic at the distal forearm site
Results
The mean age of the patients was 59.75 ± 14.65 years, and 65.16% (116/178) were men. The female patients were significantly older than the male patients (63.27 vs 57.86 years; p = 0.018).
Adequate maturation of AVF was achieved in 83.71% (149/178). The primary failure occurred in 16.29% (29/178) of the created fistulae, while 10.11% (18/178) had early thrombosis.
The distal AVF (radio-cephalic) was the dominant site present with 38.76% (69/178) of all

Gjorgjievski et al. Primary Failure of the Arteriovenous Fistula in Patients with Chronic Kidney Disease Stage 4/5 _______________________________________________________________________________________________________________________________
_______________________________________________________________________________________________________________________________
Open Access Maced J Med Sci. 2019 Jun 15; 7(11):1782-1787. 1785
created fistulae. Adequate maturation of distal AVF was achieved in 86.96% (60/69). Primary failure of AVF occurred in 13.04% (9/69), but early thrombosis of AVF occurred in 7.15% (5/69) (Figure 6).
The middle-arm AVF (radio-cephalic) was performed in 32.02% (57/178) of all created fistulae. Adequate maturation of middle-arm AVF was achieved in 77.19% (44/57). The primary failure occurred in 22.81% (13/57), while early thrombosis occurred in 15.79% (9/57) (Figure 6).
The proximal AVF (brachial-cephalic) was created in 29.22% (52/178) of all created fistulae. Adequate maturation of proximal AVF was achieved in 86.54% (45/52), primary failure occurred in 13.46% (7/52), out of which early thrombosis occurred in 7.69% (4/52) (Figure 6).
Figure 6: Primary outcome (adequate maturation and primary failure) of AVF in the three different locations on the forearm. *АVF – arteriovenous fistula
The distal fistulae were significantly more frequently created in men than in female patients (51 vs 18; p = 0,015). The mean number of previously created AVF was significantly higher in patients with middle-arm AVF than in patients with distal AVF (1.86 vs 1.24; p = 0,003). Also, the mean number of previously created AVF was significantly higher in patients with proximal AVF than in patients with distal AVF (3.19 vs 1.24; p = 0,000).
The distribution of the primary renal disease in patients with created fistulae was: diabetes mellitus (DM) in 29.21% (52/178), high blood pressure or hypertension (HBP) in 22.47% (40/178), autosomal dominant polycystic kidney disease (ADPKD) in 2.81% (5/178), obstructive nephropathy (ON) in 8.99% (16/178), glomerulopathy (GP) in 12.36% (22/178) and unknown disease (UND) in 24.16% (43/178). The patients with DM were significantly older than non-DM patients (63.27 vs 57.86 years; p = 0,018).
The multiple logistic regression analysis showed that age (OR = 1.1, 95%CI, 0.99-1.29, p = 0.083), number of AVF (OR = 0.92, 95%CI, 0.74-1.11, p = 0.044), location of AVF (OR = 1.0, 95%CI, 0.85-1.23, p = 0.622), and primary renal disease (OR = 1.0, 95%CI, 0.92-1.22, p = 0.350) in patients with CKD stage 4/5 were not associated with primary failure of AVF within 3 months.
Discussion
Successful creation and adequate maturation of AVF in patients with CKD stage 4/5 require a multidisciplinary approach in resolving the leading causes for primary failure. The process of AVF maturation is complex and remains poorly understood, despite numerous studies describing the pathophysiology of the process and biomechanical factors associated with maturation. The intimal hyperplasia (IH) has been identified as the main pathohistological change, which occurs in the blood vessels and was associated with the primary failure of AVF [13]. However, the creation of AVF is the first step for the patients who need a functional permanent VA for HD. Mc Lafferty at al., 2007 reported adequate AVF maturation of 82% and a primary failure rate of 18% in patients with AVF, enrolled in a comprehensive follow-up program [14]. In our study, adequate maturation was achieved in 83.71%, and primary failure occurred in 16.29% of the created fistulae.
A number of studies have focused on factors that predict a successful i.e. functional AVF [15], [16], [17], [18]. Bashar at al., 2015 reported 52 functionally matured fistula from a total of 97 fistulae (53.60%). In their study, the mean age of the patients was 60.9 ± 16.9 years, but the age was not significantly associated with the functionality of AVF. The female gender (p = 0.004), previous history of a kidney transplant (p = 0.036), patient on a calcium channel blocker at the time of AVF formation (p = 0.01) and lower haemoglobin levels were significantly associated with the functionality of AVF [19]. Also, Jemcov 2013 in her study reported that female gender was associated with prolonged AVF maturation (OR 0.35, 95% CI = 0.17-0.72; p = 0.005) and a significantly smaller size of a. radial (1.83 vs. 2.01 mm, p = 0.01) compared to the male gender [20]. Wasse at al., 2010 reported that females were 36% less likely than males to use an AVF at dialysis initiation [21]. The study by Miller et al., 2003 reported that fistula was more likely to be placed in the upper arm rather than in the forearm in women than in men (64% vs 36%) [22].
In our study, the distal fistulae were significantly more frequently created in male than in female patients (51 vs 18; p = 0.015). The diameter size of blood vessels in men was higher than in women. The number of previously created fistulae was significantly higher in patients with proximal AVF location (3.19 vs 1.24; p = 0.000) and middle-arm AVF site (1.86 vs 1.24; p = 0.003) compared to the patients with distal AVF site. The number and location of AVF were not significantly associated with the primary failure of AVF.
DM was the most common cause for CKD [23], but it was not associated with adverse outcome of fistula maturation during the first three mounts of its

Clinical Science _______________________________________________________________________________________________________________________________
_______________________________________________________________________________________________________________________________
1786 https://www.id-press.eu/mjms/index
creation, compared to the other primary renal diseases. The patients with DM were significantly older than the non-DM patients (63.27 vs 57.86 years; p = 0.018). The others etiologies of primary renal disease were also not significantly associated with primary failure of AVF. Sedlacek et al., 2001 reported that DM was not associated with adverse AVF maturation (67% matured in the diabetic group vs. 62% in non-diabetic group, chi-square = 0.27; df = 1; p = 0.61). The DM as a disease did not influence the prevalence of AVF creation in patients; 66% from the diabetic group underwent fistula placement compared to 60% from the non-diabetic group [24].
Specialists involved in the construction and maintenance of permanent VA for HD emphasise the crucial role of Doppler ultrasound for identifying blood vessels that are suitable for creation of AVF (preoperative mapping) and for early detection of complications (surveillance). One of the earliest studies was the work by Silva et al., 1998, who reported use of preoperative duplex imaging applied to forearm veins to identify usable sites for AVF construction [25]. Also, Hossain at al., 2018 reported that the primary failure rate in the ultrasound group was 18% compared with 47% (P < 0.001) in the group of patients who did not undergo ultrasound examination. In patients without preoperative ultrasound, there were higher rates of new access creation (31% vs 9%; P < .001) and fistula abandonment (66% vs 39%; P < .001). Multivariate analysis demonstrated that fistulae created without preoperative ultrasound were associated with a 3.56 greater risk of failure (95% confidence interval, 1.67-7.59; P = 0.001) compared to fistulae in the preoperative point-of-care ultrasound (POCUS) group [26]. Malovrh 1998 reported that the risk of AVF failure was increased when the internal diameter of the artery was ≤ 1.5 mm, with a success rate of 45%. His study demonstrated that duplex sonography, a non-invasive method, enabled sufficient investigation of the arteries before AVF construction [27].
Our strategy for the creation of AVF was “as many as possible” in the most distal location of the forearm, determined by preoperative doppler ultrasound. The diameter size of blood vessels analysed by preoperative Doppler ultrasound had a pivotal role in determining the location of AVF creation.
In conclusion, the hospital strategy for creating a permanent type of VA for HD was so-called “Arteriovenous fistula first”. А challenge was successful creation and adequate maturation of AVF in patients with CKD stage 4/5. The use of Doppler ultrasound had a crucial role in the creation and adequate AVF maturation. The distal forearm site dominated in the male gender, and it was in correlation with the diameter size of the blood vessels. The middle-arm AVF and the proximal AVF were more frequent sites in patients with multiple fistulae.
References
1. Couser WG, Remuzzi G, Mendis S, Tonelli M. The contribution of chronic kidney disease to the global burden of major noncommunicable diseases. Kidney international. 2011; 80(12):1258-70. https://doi.org/10.1038/ki.2011.368 PMid:21993585
2. Jha V, Garcia-Garcia G, Iseki K, et al. Chronic kidney disease: global dimension and perspectives. Lancet. 2013; 382(9888):260-272. https://doi.org/10.1016/S0140-6736(13)60687-X
3. Gjorgjievski N, Stojanoska A, Smokovska A, Dejanov P and Spasovski G. Challenges Facing the Improvement of Kidney Transplantation - Issues in a Developing Country, Republic of Macedonia. Bantao. 2018; 16(1):1-4.
4. Brescia MJ, Cimino JE, Appel K, Hurwich BJ. Chronic hemodialysis using venipuncture and a surgically created arteriovenous fistula. N Engl J Med. 1966; 275(20):108992. https://doi.org/10.1056/NEJM196611172752002 PMid:5923023
5. National Kidney Foundation. KDOQI clinical practice guidelines and clinical practice recommendations for vascular access. Am J Kidney Dis. 2006; 48 suppl 1:S176-S322. https://doi.org/10.1053/j.ajkd.2006.04.029 PMid:16813989
6. Pisoni RL, Zepel L, Port FK, Robinosn BM. Trends in US vascular access use, patients preferences, and related practices: an update from US DOPPS practice monitor with international comparisons. Am J Kidney Dis. 2015; 65(6):905-915. https://doi.org/10.1053/j.ajkd.2014.12.014 PMid:25662834
7. Strategy for access creation Guidelines, EDTA. https://www.vascularaccesssociety.com/guidelines_edta
8. Quencer KB, Friedman T. Declotting the Thrombosed Access. Tech Vasc Interv Radiol. 2017; 20:38-47. https://doi.org/10.1053/j.tvir.2016.11.007 PMid:28279408
9. Rooijens PPGM, Tordoir JHM, Stijnen T, Burgmans JPJ, Smet de AAEA, Yo TI. Radiocephalic wrist arteriovenous fistula for hemodialysis: meta-analysis indicates a high primary failure rate. Fistulae for hemodialysis. Eur J Vasc Endovasc Surg. 2004; 28:571-680. https://doi.org/10.1016/j.ejvs.2004.08.014 PMid:15531191
10. Wiese P, Nonnast-Daniel B. Colour Doppler ultrasound in dialysis access. Nephrol Dial Transpl. 2004; 19:1956-1963. https://doi.org/10.1093/ndt/gfh244 PMid:15199165
11. Malovrh M. The role of sonography in the planning of arteriovenous fistulas for hemodialysis. Semin Dial. 2003; 16:299-303. https://doi.org/10.1046/j.1525-139X.2003.16069.x PMid:12839503
12. Davidson I, Chan D, Dolmatch B, Hasan M, Nichols D, Saxena R et al. Duplex ultrasound evaluation for dialysis access selection and maintenance: a practical guide. J Vasc Access. 2008; 9:1-9. https://doi.org/10.1177/112972980800900101 PMid:18379973
13. Pushevski V, Dejanov P, Gerasimovska V, Petrushevska G, Oncevski A, Sikole A, Popov Z, Ivanovski N. Severe endothelial damage in chronic kidney disease patients prior to haemodialysis vascular access surgery. Prilozi. 2015; 36(3):43-9. https://doi.org/10.1515/prilozi-2015-0077 PMid:27442395
14. McLafferty RB, Pryor RW, Johnson CM, Ramsey DE, Hodgson KJ. Outcome of a comprehensive follow-up program to enhance maturation of autogenous arteriovenous hemodialysis access. J Vasc Surg. 2007; 45(5):981-5. https://doi.org/10.1016/j.jvs.2007.01.013 PMid:17466790
15. Okamuro L, Gray K, Korn A, Parrish A, Kaji A, Howell EC, Bowens N, de Virgilio C. Careful Patient Selection Achieves High Radiocephalic Arteriovenous Fistula Patency in Diabetic and Female Patients. Annals of vascular surgery. 2019. https://doi.org/10.1016/j.avsg.2018.12.057 PMid:30684628
16. Allon M, Litovsky L, Young CJ, Deierhoi MH, Goodman J, Hanaway M et al. Medial fibrosis, vascular calcification, intimal hyperplasia, and arteriovenous fistula maturation. Am J Kidney Dis.

Gjorgjievski et al. Primary Failure of the Arteriovenous Fistula in Patients with Chronic Kidney Disease Stage 4/5 _______________________________________________________________________________________________________________________________
_______________________________________________________________________________________________________________________________
Open Access Maced J Med Sci. 2019 Jun 15; 7(11):1782-1787. 1787
2011; 58:437-443. https://doi.org/10.1053/j.ajkd.2011.04.018 PMid:21719173 PMCid:PMC3159759
17. Lee T, Ullah A, Allon M, Succop P, El-Khatib M, Munda R et al. Decreased cumulative access survival in arteriovenous fistulas requiring interventions to promote maturation. Clin J Am Soc Nephrol. 2011; 6:575-581. https://doi.org/10.2215/CJN.06630810 PMid:21088288 PMCid:PMC3082416
18. Khavanin Z.M, Gholipour F, Naderpour Z, Porfakharan M. Relationship between Vessel Diameter and Time to Maturation of Arteriovenous Fistula for Hemodialysis Access. Int J Nephrol. 2012; 2012. https://doi.org/10.1155/2012/942950 PMid:22187645 PMCid:PMC3236464
19. Bashar K, Zafar A, Elsheikh S, Healy DA, Clarke-Moloney M, Casserly L, Burke PE, Kavanagh EG, Walsh SR. Predictive Parameters of Arteriovenous Fistula Functional Maturation in a Population of Patients with End-Stage Renal Disease. PLoS One. 2015; 10(3):e0119958. https://doi.org/10.1371/journal.pone.0119958 PMid:25768440 PMCid:PMC4358953
20. Jemcov TK. Morphological and functional vessels characteristic by assessed by ultrasonography for prediction of arteriovenous fistula maturation. J Vasc Access. 2013; 14(4):356-63. https://doi.org/10.5301/jva.5000163 PMid:23817950
21. Wasse H, Hopson DS, McClellan W. Racial and Gender Differences in Arteriovenous Fistula Use among Incident Hemodialysis Patients. Am J Nephrol. 2010; 32(3):234-241. https://doi.org/10.1159/000318152 PMid:20664254 PMCid:PMC2980520
22. Miller CD, Robbin ML, Allon M. Gender differences in outcomes of arteriovenous fistulas in hemodialysis patients. Kidney international. 2003; 63(1):346-52. https://doi.org/10.1046/j.1523-
1755.2003.00740.x PMid:12472802
23. Polenakovic M, Sikole A, Nikolov IG, Georgiev D, Selim G, Dzekova-Vidimliski P, Gelev S, Amitov V, Oncevski A, Severova G, Pavleska S, Poposki A, Kovaceska V, Alceva M, Zdravkovska V, Antararov R, Dimitrov S, Janakievska P, Damjanovski M, Karceva Sarajlija E, Velinova B, Ivanovski K, Panova B, Neskovski J, Jovcevski D, Zafiroska M, Mat R, Filipovik R, Sela L, Lamova K. Diabetics on dialysis in the Republic of Macedonia: A nationwide epidemiological study. Prilozi. 2010; 31(1):261-77.
24. Sedlacek M, Teodorescu V, Falk A , Vassalotti JA, Uribarri J. Hemodialysis access placement with preoperative noninvasive vascular mapping: comparison between patients with and without diabetes. Am J Kidney Dis. 2001; 38:560-564. https://doi.org/10.1053/ajkd.2001.26873 PMid:11532689
25. Silva MB, Hobson RW, Pappas PJ, Jamil Z, Araki CT, Goldberg MC, Gwertzman G, Padberg FT. A strategy for increasing use of autogenous hemodialysis access procedures: impact of preoperative noninvasive evaluation. J Vasc Surg. 1998; 27(2):302-7. https://doi.org/10.1016/S0741-5214(98)70360-X
26. Hossain S, Sharma A, Dubois L, DeRose G, Duncan A, Power AH. Preoperative point-of-care ultrasound and its impact on arteriovenous fistula maturation outcomes. J Vasc Surg. 2018; 68(4):1157-1165. https://doi.org/10.1016/j.jvs.2018.01.051 PMid:29784566
27. Malovrh M. Non-invasive evaluation of vessels by duplex sonography prior to construction of arteriovenous fistulas for haemodialysis. Nephrol Dial Transplant. 1998; 13:125-129. https://doi.org/10.1093/ndt/13.1.125 PMid:9481727

_______________________________________________________________________________________________________________________________
1788 https://www.id-press.eu/mjms/index
ID Design Press, Skopje, Republic of Macedonia Open Access Macedonian Journal of Medical Sciences. 2019 Jun 15; 7(11):1788-1793. https://doi.org/10.3889/oamjms.2019.356 eISSN: 1857-9655 Clinical Science
Requirement Prediction for Toluene Detox with Foods Intake Rich in CYP2E1 Enzyme and Glycine to Prevent Nerve and Kidney Damage at Shoe Home Industry Workers in Romokalisari Surabaya Abdul Rohim Tualeka
1*, Pudji Rahmawati
2, Ahsan Ahsan
3, Yashwant Pathak
4, Syamsiar S. Russeng
5, Sukarmin Sukarmin
6,
Atjo Wahyu7
1Department of Occupational Health and Safety, Faculty of Public Health, Airlangga University, 60115 Surabaya, East Java,
Indonesia; 2Department of Development of Islamic Society, State Islamic University Sunan Ampel, Surabaya, Indonesia;
3Faculty of Nurse, University of Brawijaya, Malang, Indonesia;
4College of Pharmacy, University of South Florida, Airlangga
University, Bruce B Downs Blvd, Tampa; 5Department of Occupational Health and Safety, Faculty of Public Health,
Hassanuddin University Indonesia; 6Department of Chemistry, State University of Surabaya, Surabaya, Indonesia;
7Department of Occupational Health and Safety, Faculty of Public Health, Hasanuddin University, Makassar, Indonesia
Citation: Tualeka AR, Rahmawati P, Ahsan, Pathak Y, Russeng SS, Sukarmin, Wahyu A. Requirement Prediction for Toluene Detox with Foods Intake Rich in CYP2E1 Enzyme and Glycine to Prevent Nerve and Kidney Damage at Shoe Home Industry Workers in Romokalisari Surabaya. Open Access Maced J Med Sci. 2019 Jun 15; 7(11):1788-1793. https://doi.org/10.3889/oamjms.2019.356
Keywords: CYP2E1, Detoxification, Glycine, Toluene, Workers
*Correspondence: Abdul RohimTualeka, Departement of Occupational Health and Safety, Faculty of Public Health, Airlangga University, 60115 Surabaya, East Java, Indonesia. Tel: +62-31-5920948. E-mail: [email protected] or [email protected]
Received: 27-Mar-2019; Revised: 08-May-2019; Accepted: 17-May-2019; Online first: 10-Jun-2019
Copyright: © 2019 Abdul Rohim Tualeka, Pudji Rahmawati, Ahsan, Yashwant Pathak, Syamsiar S Russeng, Sukarmin, Atjo Wahyu. This is an open-access article distributed under the terms of the Creative Commons Attribution-NonCommercial 4.0 International License (CC BY-NC 4.0)
Funding: This is an article supported by Activity Budget Plans 2017, Faculty of Public Health, Airlangga University, Indonesia
Competing Interests: The authors have declared that no competing interests exist
Abstract
BACKGROUND: Toluene was an organic compound used in chemical and drug industries, the main source of toluene emissions from fires. To reduce and even eliminate toluene toxins in chemical component could be using detoxification by foods.
AIM: This research aimed to calculate the intake of foods rich in CYP2E1 enzyme and glycine to improve toluene detoxification.
METHODS: The type of research was a descriptive study. The subject of the study was 51 workers in Romokalisari Surabaya who had worked for more than or equal to 10 years. Variables were body weight, duration of working (years), working time per week (days), and working time per day (hours). The breathing rate, intake of non-carcinogen per respondent, can be calculated by variables before. Then, the effective dose of food rich in CYP2E1 enzyme and glycine will be obtained.
RESULTS: Majority respondents had toluene concentrations below the threshold limit value (TLV). The highest effective dose of foods rich in CYP2E1 enzymes such as beef liver, beef brain, and salmon was 239.61 g, 745.45 g, and 203.3 g. Also, foods rich in glycines such as seaweed, tuna, and spinach were 432.98 mg, 934.41 mg, and 2070.71 mg.
CONCLUSION: The level of adequacy of the CYP2E1 enzyme and glycine of each person was different and varied. The effective dose required by each respondent depending on weight, length of work, and concentration of benzene in the workplace. The greater the toluene concentration, the greater the needs for foods rich in CYP2E1 enzymes and glycine. Body weight can also be another factor in differences in individual intake. Weight, length of working, and toluene concentration can affect the intake of non-carcinogen in each which can affect the effective dose of foods.
Introduction
The use of chemicals, especially hazardous chemicals, can certainly provide a threat at work. This can be a potential source that can trigger danger to the health and safety of workers [1]. One of the chemicals that are dangerous or carcinogenic is toluene. Toluene has the formula C6H5CH3, is a colourless liquid, but smells fishy and spicy like benzene. This material dissolves in diethyl ether,
ethanol, benzene, chloroform, glacial acetic acid, carbon disulfide, and acetone, but is not soluble in cold water [2].
Some industries or companies are directly related to toluene, such as the informal industry sector, one of them which is the shoe industry. The informal sector industry plays a very big role in developing countries, including Indonesia. The informal industry sector is an unorganised, irregular,

Fawzy et al. Outcomes of Using Biodegradable-Polymer Drug-Eluting Stents and Those of Using Durable-Polymer Drug-Eluting Stents _______________________________________________________________________________________________________________________________
_______________________________________________________________________________________________________________________________
Open Access Maced J Med Sci. 2019 Jun 15; 7(11):1788-1793. 1789
and mostly legal but not registered sector [3]. As Indonesia's population of 230 million increases and the world population reaches 7 billion, indirect demand for shoes will also increase [4]. One of the toluene-containing materials used in the shoe industry is glue.
The shoe industry is a home industry where location and place of the industry are in the house so that it is inseparable between shoemaking activities and household activities. One of the shoe home industries in Surabaya is in Romokalisari. In the production process, shoe artisans in Romokalisari use a variety of equipment, such as electric heating machines, nails, and hammerheads. The use of production materials depends on the high and low order; if ordered a lot, more raw materials are needed.
Workers usually glued using their fingers directly, without any personal protective equipment, either gloves or masks. The workplace air condition is also very hot, with a very strong smell of glue steam. Most workers even work bare-chested while smoking or even eating when they work. Even when resting, they rest and sleep in that room. The use of chemicals that can interfere with the health of shoe artisans includes the use of glue because in this process there is exposure to organic solvent vapour contained in the glue and is very likely to have an impact on health if continuously inhaled for a long time [5]. One of the chemicals contained in the glue used in shoe production is toluene.
Toluene exposure can cause eye and nose irritation, fatigue, confusion, dizziness, enlarged pupils, anxiety, muscle fatigue, insomnia, nerve damage, skin inflammation, even liver and kidney damage. The level of exposure also depends on the dose, duration, and work done [6].
To reduce and even eliminate toxins in chemical compounds in the body, a biotransformation process is needed. Biotransformation is a change in the toxin-catalysed by certain enzymes in living things. The purpose of biotransformation is to convert non-polar to polar, then to become hydrophilic so that it can be excreted out of the body. Biotransformation occurs in two phases. The first phase is the functional phase where the functional group matches the oxidation, reduction and hydrolysis reactions. Then the second phase is the conjugate reaction phase involving several types of endogenous metabolites in the body in the endoplasmic reticulum [7].
Research using food approaches as toluene detoxification is still very limited. Foods are rich in CYP2E1 enzymes such as beef liver, beef brains, and salmon [8], [9]. Food is rich in glycine such as tuna, seaweed, turkey skin, spinach, canned corned beef, etc. But there has never been researching that explains how much intake of these foods is needed to improve toluene detoxification, especially in populations that exposed to toluene in a long time.
Based on the background above, this research aims to calculate the intake of foods rich in CYP2E1 enzyme (beef liver, beef brain, and salmon) and glycine (seaweed, tuna, and spinach) are needed (effective dose) to detoxify toluene on shoe home industry workers in Romokalisari Surabaya.
Material and Methods
The research was a descriptive study. Subjects were workers in shoe home industry in Romokalisari Surabaya. The inclusion criteria were male workers who had worked in this industry for more than or equal to 10 years and willing to be used as research respondents. The sample of this research was 51 respondents.
Variables calculated were body weight, duration of working (years), working time per week (days), an average of working every day (hours) of respondents, toluene concentration at 9 points in this industry — a measurement of respondents weight using manual measurement method with body scales. Measurement of the duration of work, working time per week, an average of working every day were obtained with an in-depth interview with respondents. Then, measurement of toluene concentration in the work environment using the measurement method of NIOSH 1501 (2003) with aromatic hydrocarbon sampling method [10]. Air samples were taken using a calibrated personal sampler pump. The filter used to absorb toluene vapour was a charcoal tube SKC 226-01. Air samples were analysed using Gas Chromatography-Flame Ionization Detector (GC-FID). Willingness to participate in research was made in writing through informed consent, and this study had received prior ethical approval by the Ethics Committee of the Faculty of Public Health, Airlangga University with ethical number 516 KEP-K.
After getting all variables above, can be found breathing rate and intake non-carcinogen of toluene per respondents. Then, an effective dose of foods rich in CYP2E1 enzyme and glycine will be obtained by manual calculating, use the formula below :
C enzyme x 65 x 100A
Explanation:
Intake nc (non-carcinogen) =
C: Toluene concentration (mg/m3)
R: Breathing rate (m3/hour)
Dt: Duration of working (years) I: Working time per week (days) tE: Average of working time per day (hours) Wb: Weight (kg)

Clinical Science _______________________________________________________________________________________________________________________________
_______________________________________________________________________________________________________________________________
1790 https://www.id-press.eu/mjms/index
C enzyme = (Tualeka, 2018) [16].
CYP2E1 enzyme =
Glycine =
A = Content of enzyme in 100 grams of the
food CYP2E1 enzyme
Beef liver : 5.6 mg
Beef brain : 1.8 mg
Salmon : 6.6 mg Glycine
Seaweed : 3.099 g
Tuna : 1.436 g
Spinach : 0.648 g
Results
Distribution of Toluene Concentration at Workplace
Figure 1 shows that the majority of respondents are at the workplace with toluene concentration below TLV. The TLV of toluene concentration in the air is 50 ppm, while, respondents who are at the workplace with toluene concentration above TLV are 8% (4 respondents).
Figure 1: Distribution of Toluene Concentration in the Workplace
This respondent is in the same location (location 1). This location has the highest toluene concentration 138.6 ppm, while the lowest toluene concentration is 0.21, and the average of toluene concentration is 15 ppm.
Comparison between Toluene Concentration and Weight
The highest toluene concentration is 138.6 ppm (respondent 1-4), while the lowest is 0.21 ppm (respondent 46-51). The biggest weight on respondents is 82 kg (respondent 31), while the
smallest is 0.41 kg (respondent 5).
Figure 2: Comparison between Toluene Concentration and Weight
Based on Figure 2, the respondent who has the biggest weight isn’t a workplace that has the highest toluene concentration while it had a similar result to lowest toluene concentration.
Effective Dose of Food Rich in CYP2E1 Enzyme to Toluene Detox
1. Effective Dose of Beef Liver to Toluene Detox
Figure 3 shows that the highest effective dose of beef liver to toluene detox is on respondent 2 (239,610 mg/239.61 g), while the lowest is on respondent 51 (317.33 mg).
Figure 3: Effective Dose of Beef Liver to Toluene Detox
The average effective dose of beef liver to toluene detox on the respondent is 19.752 mg/19.75 g.
2. Effective Dose of Beef Brain to Toluene Detox
Figure 4 shows that the highest effective dose of the beef brain to toluene detox is on respondent 2 (745,456 mg/745.45 g).
Figure 4: Effective Dose of Beef Brain to Toluene Detox
8%
92%
C toluene above TLV
C toluene below TLV

Fawzy et al. Outcomes of Using Biodegradable-Polymer Drug-Eluting Stents and Those of Using Durable-Polymer Drug-Eluting Stents _______________________________________________________________________________________________________________________________
_______________________________________________________________________________________________________________________________
Open Access Maced J Med Sci. 2019 Jun 15; 7(11):1788-1793. 1791
The lowest is on respondent 51 (987.25 mg). The average effective dose of the beef brain to toluene detox on the respondent is 61,451 mg/61.45 g.
3. Effective Dose of Salmon to Toluene Detox
Figure 5 shows that the highest effective dose of salmon to toluene detox is on respondent 2 (203,306 mg/20.33 g).
Figure 5: Effective Dose of Salmon to Toluene Detox
The lowest is on respondent 51 (269.25 mg). The average effective dose of salmon to toluene detox on the respondent is 16,759 mg/16.75 g.
Effective Dose of Food Rich in Glycine to Toluene Detox
1. Effective Dose of Seaweed to Toluene Detox
Figure 6 shows that the highest effective dose of seaweed to toluene detox is on respondent 2 (432.98 mg).
Figure 6: Effective Dose of Seaweed to Toluene Detox
The lowest is on respondent 51 (1.48 mg). The average effective dose of seaweed to toluene detox on the respondent is 35.7 mg
2. Effective Dose of Tuna to Toluene Detox
Figure 7 shows that the highest effective dose of tuna for toluene detox is on respondent 2 (934.41 mg) while the lowest is on respondent 51 (1.23 mg).
Figure 7: Effective Dose of Tuna to Toluene Detox
The average effective dose of seaweed to toluene detox on the respondent is 77 mg.
3. Effective Dose of Spinach to Toluene Detox
Figure 8 shows that the highest effective dose of seaweed to toluene detox is on respondent 2 (2070.71 mg/0.2 g).
Figure 8: Effective Dose of Spinach to Toluene Detox
The lowest is on respondent 51 (2.74 mg). The average effective dose of seaweed to toluene detox on the respondent is 170.7 mg
Discussion
Threshold Limit Value (TLV), Weight, and Toluene Concentration
Distribution diagram analysis between toluene concentration and TLV shows that majority of respondents are at the workplace have toluene concentration below TLV. The TLV for toluene concentration according to The Regulation of Minister of Manpower and Transmigration Number PER13/MEN/X/2011 about The Threshold Limit Value of Physical and Chemical Factors at Workplace is 50 ppm (188.43 mg/m
3) [11]. Comparative diagram
analysis between toluene concentration and weight of respondents shows that respondents with the biggest weight didn't have the highest toluene concentration, and it was similar to respondents with the smallest weight didn’t have the lowest toluene concentration. This research not by the research of Mukono that toluene had a small molecular mass that would be easily dissolved in fat. It was assumed that toxic with

Clinical Science _______________________________________________________________________________________________________________________________
_______________________________________________________________________________________________________________________________
1792 https://www.id-press.eu/mjms/index
high solubility in fat (adipose) shows low concentration in the body [12]. This can be considered as a protection mechanism. So, it was concluded that there is low toluene toxicity in obese people than in thin people.
Detoxification of Toluene by Foods Rich in CYP2E1 Enzyme
Detoxification is very important to remove harmful chemicals in the body, especially toluene. Detoxification can be done foods approach, but this publicity still limited. Meanwhile, food-based nutrition continues to be a low-risk approach in the detoxification process. Several publications that had used cells, animals and clinical studies show that food-based components and nutrients could modulate the process of conversion and excretion of toxins from the body [13]. Toluene inhaled by a human while about 25-40% toluene will be excreted by expiration. The remaining 60-75% toluene will be metabolised in the liver became benzyl alcohol. Toluene will be converting to benzyl alcohol through a hydroxylation reaction. The reaction was carried out by members of the cytochrome P450 (CYP) in the liver, namely CYP1A1, CYP1A2, CYP2B6, CYP2C8, and CYP2E1 [14]. Then, benzyl alcohol will be metabolised to benzaldehyde by CYP and the alcohol dehydrogenase enzyme through an oxidation reaction. CYP was more active than the alcohol dehydrogenase enzyme. A small amount of benzaldehyde will be converted to benzylmercapturic acid while the majority of the others will be converted to benzoic acid. Benzoic acid will be metabolized to hippuric acid, which will be excreted through urine [15].
Consumption of suitable substances can detox toluene from the body, such as foods that contain CYP2E1 enzyme. High concentrations of CYP2E1 enzyme were found in some foods such as beef liver, beef brain, and salmon [9] (Minich & Hodges, 2015). The content of the CYP2E1 enzyme in 100 grams of the beef liver was 5.6 mg, in 100 grams of the beef brain was 1.8 mg, and 100 grams of salmon was 6.6 mg [16].
Based on the results, the effective dose of beef liver, beef brain, and salmon that the body requires for toluene detox from the body, as shown in Figure 3, 4, and 5. The effective dose of each food is different depending on the individual physical. The higher toluene concentration, the higher the mass of toluene detox for beef liver, beef beef, and salmon. This effective dose, also influenced by the weight and length of working of workers. This research by previous research, which states that it had a synergistic relationship with substance concentration [17]. The maximal consumption of beef liver is 239.6 g, the beef brain is 745.4 g, and salmon is 203.3 per day. Foods in the diagram can be chosen by each respondent based on the toluene concentration and
individual taste. If respondents didn't interest to consume beef liver, they could consume beef brain and salmon, and vice versa. The consumption of each food can be regulated by each respondent, can be divided into several days according to the requirements of the foods intake of respondents.
Detoxification of Toluene by Foods Rich in Glycine
High burden of toxin in this modern life, diet supplementations with healthy foods should emphasise to support the metabolic detoxification phases. Evidence for toxin metabolism and elimination. Specific foods and nutrients can induce metabolic enzymes; one of them is glycine. When toluene enters the body, about 20% toluene will be excreted through the respiratory tract, while the remaining 80% will be metabolised into benzoic acid than will conjugate with glycine in the liver to form hippuric acid which will then be excreted through urine (ATSDR, 2000 [18]). To get glycine, one source is foods. Foods containing glycine include seaweed, spinach, tuna, long beans, leeks, corned beef, dried egg white, and so on [16].
Based on our results, the effective dose of seaweed, tuna, and spinach that the body needs from toluene detox, as shown in Figure 6, 7, and 8. The effective dose of each food is different depending on the individual physical. The higher toluene concentration, it will increase the mass of toluene detox for seaweed, tuna, and spinach. This effective dose, also influenced by the weight and length of working of workers. The maximal consumption of seaweed is 432.98 mg, tuna is 934.41 mg, while spinach is 2070.71 mg per day. Foods in the diagram can be chosen by each respondent based on the toluene concentration and individual taste. If respondents don’t like seaweed, they can consume tuna and spinach, and vice versa. The consumption of each food can be regulated by each respondent, can be divided into several days according to the needs of the foods intake of respondents.
In conclusion, the majority of respondents shows toluene concentrations below the threshold limit value (TLV). Intake of foods that contain CYP2E1 enzyme (Beef liver, beef brain, and salmon) and glycine (seaweed, tuna, and spinach) were expected to increase detoxification of toluene. The effective dose was required by the respondents depending on weight, length of working, and toluene concentration at the workplace. The greater the toluene concentration, it will increase the needs for foods rich in CYP2E1 enzymes and glycine that the body needs. Body weight can also be another factor in differences in individual intake. Weight, length of working, and toluene concentration could affect the intake of non-carcinogen of each which could affect the effective dose of foods.

Fawzy et al. Outcomes of Using Biodegradable-Polymer Drug-Eluting Stents and Those of Using Durable-Polymer Drug-Eluting Stents _______________________________________________________________________________________________________________________________
_______________________________________________________________________________________________________________________________
Open Access Maced J Med Sci. 2019 Jun 15; 7(11):1788-1793. 1793
Acknowledgements
The authors would like to thank the rector of Airlangga University. The authors would like to acknowledge workers at Shoe Industry Romokalisari Surabaya, East Java, Indonesia.
Data Availability
The manuscript data used to support the findings of this study have been deposited in the Analysis Of Relationship Between Benzene Vapor And Trans Content, Trans Muconic Acid Urin With Immunoglobulin A Decrease In Shoes In Kelurahan Tambak Oso Wilangun Surabaya” with accessed on http://repository.unair.ac.id/61400/ on Airlangga University/
References
1. Muliani S. Suitability of Active Fire Protection and Employee Knowledge about Active Fire Protection Equipment at PT. PLN (Persero) Sultanbatara Area Unit Tello PLTD Makassar in 2011. Makassar: Hasanuddin University Faculty of Public Health Hasanuddin University, 2011.
2. Agency for Toxic Substance and Disease Registry (ATSDR). Toxicological Profile for Toluene. U.S. Department of Health and Human Services, Public Health Service, Division of Health Education and Promotion, 2017.
3. Widodo B. Designing systems and microcontroller applications. Jakarta: PT. Elex Media Komputindo, 2005.
4. Dayanara AD. The world population is estimated to reach seven billion in 2011, 2011. Accessed on 19 Maret 2019.
5. Lu. The Basic of Toxicology. Jakarta: Indonesia University
Press, 2006.
6. CDC. Toluene. The National Institute for Occupational Safety dan Health, 2008. https://www.cdc.gov/niosh/topics/toluene/. Diakses pada 19 Maret 2019.
7. Tualeka AR. Toksikologi Industri. Surabaya: Graha Ilmu Mulia, 2013.
8. Lieber CS. Cyp2e1: from ash to nash. Hepatology research. 2004; 28(1):1-11. https://doi.org/10.1016/j.hepres.2003.08.001 PMid:14734144
9. Minich DM Hodges RE. Modulation of Metabolic Detoxification Pathways Using Foods and Food-Derived Components: A Scientific Review with Clinical Application. Journal of Nutrition and Metabolism. 2015. 760689. https://doi.org/10.1155/2015/760689 PMid:26167297 PMCid:PMC4488002
10. National Institute for Occupational Health and Safety (NIOSH). Hydrocarbons Aromatic. Method 1501. NIOSH Manual of Analytical Methods (NMAM) Fourth Edition Issue 3, 2003.
11. Ministry of Labour and Transmigration. Ministry of Labour and Transmigration Regulations Number PER3/MEN/2011 about The Threshold Values of Physical Factors and Chemical Factors in The Workplace. Jakarta: Ministry of Labour and Transmigration, 2011.
12. Mukono HJ. Toksikologi Lingkungan. Airlangga University Press: Surabaya, 2005.
13. Cline JC. Nutritional aspects of detoxification in clinical practice. Altern Ther Health Med. 2015; 21(3):54-62.
14. Laham S, Potvin M. Biological Conversion of Benzaldehyde to Benzylmercapturic Acid in the Sprague-Dawley Rat. Drug and Chemical Toxicology. 1987; 10(3-4): 209-25. https://doi.org/10.3109/01480548709042983 PMid:3428183
15. Inoue O, Kanno E, Kasai K, Ukai H, Okamoto S., Ikeda M. Benzylmercapturic Acid is Superior to Hippuric Acid and O-cesol as a Urinary Marker of Occupational Exposure to Toluena. Toxicology Letters. 2004; 147(2):177-86. https://doi.org/10.1016/j.toxlet.2003.11.003 PMid:14757321
16. Tualeka AR. Philosophy of Occupational Health and Safety. Airlangga University Press: Surabaya, 2018.
17. Haviland AW. Antropology, 4th, Number 2. Jakarta: Erlangga, 1985.
18. Agency for Toxic Substance and Disease Registry (ATSDR). Toluene Toxicity. U. S. Department of Health and Human Services, Public Health Service, Division of Health Education and Promotion, 2000.

_______________________________________________________________________________________________________________________________
1794 https://www.id-press.eu/mjms/index
ID Design Press, Skopje, Republic of Macedonia Open Access Macedonian Journal of Medical Sciences. 2019 Jun 15; 7(11):1794-1797. https://doi.org/10.3889/oamjms.2019.353 eISSN: 1857-9655 Clinical Science
The Relationship Between Quality of Sleep and Quality of Life of Patients in Medan, Indonesia Dina Mariani
*, Riri Andri Muzasti, Alwi Thamrin
Division of Nephrology, Department of Internal Diseases, Faculty of Medicine, University of Sumatera Utara, Jl. Dr T. Mansur No. 9, Kampus Padang Bulan, Medan 20155, North Sumatera, Indonesia
Citation: Mariani D, Muzasti RA, Thamrin A. The Relationship Between Quality of Sleep and Quality of Life of Patients in Medan, Indonesia. Open Access Maced J Med Sci. 2019 Jun 15; 7(11):1794-1797. https://doi.org/10.3889/oamjms.2019.353
Keywords: Quality of life; Quality of Sleep; Hypertension; SF-36; PSQI questionnaire
*Correspondence: Dina Mariani. Division of Nephrology, Department of Internal Diseases, Faculty of Medicine, University of Sumatera Utara, Jl. Dr T. Mansur No. 9, Kampus Padang Bulan, Medan 20155, North Sumatera, Indonesia. E-mail: [email protected]
Received: 22-Mar-2019; Revised: 12-May-2019; Accepted: 14-May-2019; Online first: 28-May-2019
Copyright: © 2019 Dina Mariani, Riri Andri Muzasti, Alwi Thamrin. This is an open-access article distributed under the terms of the Creative Commons Attribution-NonCommercial 4.0 International License (CC BY-NC 4.0)
Funding: This research did not receive any financial support
Competing Interests: The authors have declared that no competing interests exist
Abstract
BACKGROUND: Hypertension is one of the most common diseases around the world, which is the most risk factor related to cardiovascular disease. The quality of life of hypertensive patients is influenced by various factors, namely age, sex, educational background, ethnicity and nutritional status. Another factor that is also important is the quality of sleep.
AIM: We aimed the assessment of sleep quality using a PSQI questionnaire, and quality of life assessment with the SF-36 questionnaire.
METHODS: This study was a cross-sectional study of 45 respondents at the H. Adam Malik Central General Hospital in Medan in 2018. Assessment of sleep quality was performed through the PSQI questionnaire (Pittsburgh Sleep Quality Index), and quality of life assessment was carried out with the SF-36 questionnaire.
RESULTS: The prevalence of impaired sleep quality in hypertensive patients was 35.6%. Most patients have a good quality of life, with 71.1%. In this study, sleep quality was found to be related to the quality of life (p = 0.037). Furthermore, variables related to sleep quality were sex (gender) (p = 0.003) and education (p = 0.005). In multivariate analysis, the quality of life is predominantly influenced by sleep quality (p = 0.025).
CONCLUSION: The quality of life of hypertensive patients is influenced by the quality of sleep.
Introduction
Hypertension is one of the most common diseases in the world [1]. For patients who have hypertension, blood pressure control is a top priority to obtain maximum function and good welfare [2]. The quality of life for hypertensive patients is influenced by several factors such as age, gender, education, ethnicity, habits and nutritional status. Moreover, another important factor that needs to be considered regarding hypertensive patient’s quality of life is the quality of sleep [3].
Ru Qing Liu et al. discovered that increased blood pressure was also associated with the Pittsburgh Sleep Quality Index (PSQI) component including short sleep duration, poor sleep quality, prolonged sleep latency and sleep disturbances [4].
Kai Lui et al. investigated the different combined associations of sleep duration and sleep quality about the prevalence of hypertension. The results showed an additive interaction between sleep quality and the prevalence of hypertension. Despite many limitations, this cross-sectional study shown that both short sleep duration and poor sleep quality were associated with the prevalence of hypertension in adult Chinese men [5]. Also, Oluwseun et al. Stated that the relationship between blood pressure and sleep quality showed an increase in blood pressure in individuals with shorter sleep duration [6].
We aimed the assessment of sleep quality using a PSQI questionnaire, and quality of life assessment with the SF-36 questionnaire.

Mariani et al. The Relationship Between Quality of Sleep and Quality of Life of Patients in Medan, Indonesia _______________________________________________________________________________________________________________________________
_______________________________________________________________________________________________________________________________
Open Access Maced J Med Sci. 2019 Jun 15; 7(11):1794-1797. 1795
Methods
This study was a cross-sectional study of 45 respondents. It was conducted at the H. Adam Malik Central General Hospital in Medan in 2018. The assessment of sleep quality was performed using a PSQI questionnaire, and quality of life assessment was carried out with the SF-36 questionnaire.
Results
The respondent's characteristics are described in Table 1 below.
Table 1: The respondent’s characteristics
Variable n Percentage (%)
Quality of life Good 32 71.1 Bad 13 28.9
Quality of sleep Good 29 64.4 Bad 16 35.6
Sex Male 18 40 Female 27 60
Educational background High 24 53.3 Low 21 46.7
Income High 34 75.6 Low 11 24.4
Age < 45 years old 10 22.2 45 – 55 years old 18 40 > 55 years old 17 37.8
Nutritional status Underweight 1 2.2 Normal weight 17 37.8 Overweight 27 60
From a total of 45 respondents, they are categorised as a male with 18 respondents (40%) and female with 27 respondents (60%). Also, the highest age range was discovered to be 45-55 years, with 18 (40%) respondents, only slightly differed to the age > 55 years with 17 (37.5%) respondents.
The quality of life of respondents was assessed by using the SF 36 questionnaire, and the result is described in Table 2.
Table 2: The characteristic of a respondent’s quality of life
Variable n Percentage (%)
Mean ± SD Normal
SF-36 total score 62.58 ± 15.52 ≥ 60 Good 32 71.1 Bad 13 28.9
Physical function 46 ± 25.08 ≥ 60 Physical limitation 27.84 ± 39.21 ≥ 60 Illness 84.38 ± 22.59 ≥ 60 General health 57.11 ± 17.95 ≥ 60 Vitality 59.33 ± 21.55 ≥ 60 Social function 80.87 ± 27.80 ≥ 60 Emotional limitation 71.78 ± 42.62 ≥ 60 Mental health 74.49 ± 18.31 ≥ 60
Based on Table 2 above, it can be seen that majority of respondents are having a good quality of life with 32 respondents (71.1%), while the other 13 respondents (28.9%) are having a bad quality of life.
Characteristic of respondents related to sleep quality
To assess the respondent quality of sleep, the PSQI questionnaire was used. The result is shown in Table 3 below.
Table 3: The relationship between respondent’s characteristics and quality of sleep
Quality of Sleep p Quality of Sleep Score (mean ± SD)
p
Bad Good
n % n %
Sex Male 11 61.1 7 38.9 0.003
a 6.33 ± 2.66 0.003
a
Female 5 18.5 22 81.5 3.81 ± 2.24 Educational background
High 12 57.1 9 42.9 0.005a
3.71 ± 1.94 0.005a
Low 4 16.7 20 83.3 6.10 ± 2.90 Income
Low 6 54.5 5 45.5 0.161b
6.18 ± 2.96 0.058a
High 10 29.4 24 70.6 4.38 ± 2.49 Age
< 45 years old 5 50 5 50 0.096a
5.80 ± 2.49 0.110b
45 – 55 years old 3 16.7 15 83.3 3.89 ± 2.52 > 55 years old 8 47.1 9 52.9 5.24 ± 2.82
Nutritional status Underweight 0 0 1 100 0.666
a 3 0.632
b
Normal weight 7 41.2 10 58.8 5.18 ± 2.56 Overweight 9 33.3 18 66.7 4.67 ± 2.83
Achi Square;
b Fischer’s Exact.
After conducting statistical analysis, several factors are considered to affect the quality of sleep of patients with hypertension, namely sex and educational background. In the other hand, economic status, age and nutritional status do not contribute to the quality of life of patients with hypertension.
Table 4: Multivariate analysis of variables affecting the quality of sleep
Variable Coefficient
p Exp (B) 95% CI Lower Upper
Final Step Sex 2.046 0.009 7.737 1.654 36.188 Educational background 2.011 0.012 7.471 1.561 35.749 Constant -2.609 0.001 0.074
Characteristics of patients related to the quality of life
After conducting statistical analysis, there is only one factor which is considered to affect the quality of life of patients with hypertension, namely quality of sleep.
Table 5: The relationship between patients' characteristics and quality of life
Quality of Life p Quality of Life Score (Mean ± SD)
p
Bad Good
n % n %
Quality of life Bad 8 50 8 50 0.037
a 54 ± 19.26 0.02
a
Good 5 17.2 24 82.8 67.17 ± 10.96 Sex
Male 7 38.9 11 61.1 0.227b
59.17 ± 17.93 0.248a
Female 6 22.2 21 77.8 64.70 ± 17.76 Educational background
High 4 16.7 20 83.3 0.053b
67.13 ± 10.82 0.039a
Low 9 42.9 12 57.1 57.19 ± 18.60 Income
Low 6 54.5 5 45.5 0.053a
51.73 ± 16.26 0.004b
High 7 20.6 27 79.4 65.97 ± 13.91 Age
< 45 years old 2 20 8 80 0.364b
61.60 ± 9.97 0.162c
45 – 55 years old
4 22.2 14 77.8 66 ± 17.61
> 55 years old 7 41.2 10 58.8 59.29 ± 16.10 Nutritional status
Underweight 0 0 1 100 0,650b
64 0.927b
Normal weight 6 35.3 11 64.7 61.59 ± 16.43 Overweight 7 25.9 20 74.1 63 ± 15.66
a Fischer’s Exact;
bChi Square.

Clinical Science _______________________________________________________________________________________________________________________________
_______________________________________________________________________________________________________________________________
1796 https://www.id-press.eu/mjms/index
While in the opposite, sex, economic status, educational background, age and nutritional status do not affect the quality of life of patients with hypertension.
Table 6: Multivariate analysis of variables affecting the quality of life
Variable Coefficient p Exp (B) 95% CI Lower Upper
Final Step Quality of sleep 1.569 0.025 4.800 1.214 18.971 Constant -1.569 0.001 0.208
Discussion
In this study, the patient's quality of life scores as a result of the total SF-36 score shows a good quality of life category with 32 people (71.1%) and bad quality of life with 13 people (28.9%).
Relationship of Patients Characteristic with Quality of Sleep
Based on the result of this study, it can be seen that sex(gender) is related to sleep quality (p = 0.003). This result was supported by Lemola's research, which found that sex was associated with sleep quality (p = 0.001) [7]. This is because female have better sleep quality with longer sleep times, compared to male [8].
Moreover, the level of education is also related to sleep quality (p = 0.005), this was also supported by Notoatmodjo, discovered that the level of education is influential in responding to something which came from outside [9].
Economic status is one of the factors that cause sleep disturbances, but this is not in line with what was stated by Tel et al. that patients with low economic status and who have good social support could have good sleep quality(10). This is in according to the results of this study, where the level of economic status is not related to sleep quality (p = 0.161).
In this study, it is found that age was not related to sleep quality (p = 0.096). This is in line with the study by Alebiosu et al., where there was no relationship between age and sleeps quality (p = 0.065) [11]. Furthermore, there were other factors, such as environment, lifestyle, and psychological stress, which caused no difference in the average bad quality of sleep in the elderly.
Furthermore, nutritional status was not related to sleep quality (p = 0.666). It is supported by Erwan's research, where there was no relationship between nutritional status and sleep quality (p = 0.09) [12]. Eating habits are the way individuals and groups
choose, consume, and use available food based on the social and cultural factors in which they live [13].
Characteristic Relationship of Patients with Quality of Life
Based on the result, sleep quality was associated with quality of life in hypertensive patients (p = 0.037). This result was supported by Nur Azmi, who obtained the results that there was a relationship between sleep quality and quality of life (p = 0.002) [3]. Sleep is one of the basic phenomena that are important for human life; the majority of human life is filled with sleep. This is also influenced by routine activities, spiritual activities, physical activities such as light exercise and the use of leisure time which increases the activity of neurotransmitters which will help to increase the fulfilment of sleep needs [13].
Moreover, this study discovered that there was no relationship between sex with the quality of life of hypertensive patients (p = 0.227). This result is in according to a study conducted by Fransisca Melani et al., who found that sex was not related to the quality of life of patients (p = 0.023) [14]. Furthermore, male respondents had a poorer quality of life than women; this was partly due to work differences, life habits, genetic or physiological conditions [15].
In this study, there was no relationship between the status of education level and quality of life (p = 0.053). The level of education does not directly affect the quality of life, but the level of education influences a person's lifestyle and habits such as smoking, alcohol, etc. [14]. Also, there was no correlation between economic status and quality of life (p = 0.053). Respondents who have low income can still use the facilities provided by the government. This shows that the quality of life is not affected by income, but many other factors [14].
All ages have the same risk in terms of changes in quality of life, where not only patients in elder age who are experiencing a decrease in quality of life but also patients with young age can also experience a decrease in quality of life due to chronic diseases. This is in line with the results of the study found that age is not related to the quality of life of hypertensive patients (p = 0.364). Also, it is supported by Nisha Bandhari's research stating age is not related to the quality of life (p = 0.001) [16].
Nutritional status is not related to the quality of life of hypertensive patients (p = 0.650). The results of this study were supported by research conducted by Yahsarul Ihksan, finding that nutritional status was not related to the quality of life of Hemodialysis patients (p = 0.028) [17]. The theory states that underweight patients have a poor quality of life, because in this study, there were few underweight patients so that different results were obtained from the theory.

Mariani et al. The Relationship Between Quality of Sleep and Quality of Life of Patients in Medan, Indonesia _______________________________________________________________________________________________________________________________
_______________________________________________________________________________________________________________________________
Open Access Maced J Med Sci. 2019 Jun 15; 7(11):1794-1797. 1797
Based on this study, it can be concluded that the quality of life is dominantly influenced by sleep quality, with the prevalence of impaired sleep quality in hypertensive patients is 35.6% and most patients have a good quality of life with 71.1%. Moreover, several variables related to sleep quality were found to be sex (gender) and educational background.
Acknowledgement
Authors are sending grateful to the director of Adam Malik General Hospital Medan. Indonesia, for allowing authors to perform the study.
Ethical Aspects
On behalf of this opportunity, authors confirm that there is no conflict of interest faced, and this study has followed the ethical aspects as regulated by the University of Sumatera Utara.
References
1. Chobanian AV, Bakris GL, Black HR, Cushman WC, Green LA, Izzo JL, et al. The Seventh Report of the Joint National Committee on Prevention, Detection, Evaluation, and Treatment of High Blood Pressure. JAMA. 2003; 289(19):2560. https://doi.org/10.1001/jama.289.19.2560 PMid:12748199
2. Roger VL, Go AS, Lloyd-Jones DM, Benjamin EJ, Berry JD, Borden WB, et al. Heart Disease and Stroke Statistics-2012 Update. Circulation. 2012; 125(1).
3. Azmi N, Karim D, Nauli FA. Gambaran kualitas hidup lansia dengan hipertensi di wilayah kerja puskesmas sidomulyo kecamatan tampan Pekanbaru. J Online Mhs Bid Ilmu Keperawatan. 2018; 5(2):439-48.
4. Liu R-Q, Qian Z, Trevathan E, Chang J-J, Zelicoff A, Hao Y-T, et al. Poor sleep quality associated with high risk of hypertension and elevated blood pressure in China: results from a large population-based study. Hypertens Res. 2016; 39(1):54-9.
https://doi.org/10.1038/hr.2015.98 PMid:26333359
5. Lu K, Ding R, Tang Q, Chen J, Wang L, Wang C, et al. Association between self-reported global sleep status and prevalence of hypertension in Chinese adults: data from the Kailuan community. Int J Environ Res Public Health. 2015; 12(1):488-503. https://doi.org/10.3390/ijerph120100488 PMid:25575370 PMCid:PMC4306875
6. Akinseye OA, Williams SK, Seixas A, Pandi-Perumal SR, Vallon J, Zizi F, et al. Sleep as a Mediator in the Pathway Linking Environmental Factors to Hypertension: A Review of the Literature. Int J Hypertens. 2015; 2015:1-15. https://doi.org/10.1155/2015/926414 PMid:25821594 PMCid:PMC4363706
7. Lemola S, Ledermann T, Friedman EM. Variability of Sleep Duration Is Related to Subjective Sleep Quality and Subjective Well-Being: An Actigraphy Study. PLoS One. 2013; 8(8):e71292. https://doi.org/10.1371/journal.pone.0071292 PMid:23967186 PMCid:PMC3743871
8. Pernambuco CS, Rodrigues BM, Bezerra JCP, Carrielo A, Fernandes AD de O, Vale RG de S, et al. Quality of life, elderly and physical activity. Health (Irvine Calif). 2012; 04(02):88-93. https://doi.org/10.4236/health.2012.42014
9. Notoatmojo S. Ilmu Perilaku Kesehatan. Jakarta: Rineka Cipta; 2010.
10. Tel H. Determining Quality of Life and Sleep in Hemodialysis Patients. Dial Transplant. 2009; 38(6):210-5. https://doi.org/10.1002/dat.20296
11. Alebiosu OC, Ogunsemi OO, Familoni OB, Adebayo PB, Ayodele OE. Original Research: Quality of Sleep among Hypertensive Patients in a Semi-Urban Nigerian Community: A Prospective Study. Postgrad Med. 2009; 121(1):166-72. https://doi.org/10.3810/pgm.2009.01.1969 PMid:19179828
12. Budi E. Kualitas Tidur dengan Index Masa Tubuh pada Mahasiswa Tahap Akhir Pada Fakultas Kesehatan Masyarakat. Yogyakarta: Universitas Muhammadiyah Yogyakarta; 2016.
13. Kara B, Tenekeci EG. Sleep Quality and Associated Factors in Older Turkish Adults With Hypertension: A Pilot Study. J Transcult Nurs. 2017; 28(3):296-305. https://doi.org/10.1177/1043659615623330 PMid:26711885
14. Melani F, Hasrat KT, Widyasti BAC, Suhadi R. Quality of Life Evaluation of Respondents with Hypertension Aged 40-75 Years Using SF-36 Instruments in Kalasan District, Sleman, Yogyakarta Province. Indones J Clin Pharm. 2017; 6(3):200-9. https://doi.org/10.15416/ijcp.2017.6.3.200
15. Budiarto E, Anggraeni D. Pengantar Epidemiologi. edisi 2. Jakarta: EGC; 2002.
16. Bhandari N, Bhusal BR, K.C. T, Lawot I. Quality of life of patient with hypertension in Kathmandu. Int J Nurs Sci. 2016; 3(4):379-84. https://doi.org/10.1016/j.ijnss.2016.10.002
17. Nasution YI. Hubungan Kualitas Tidur dengan Kualitas Hidup pada Pasien Hemodialisis Reguler. Medan: Universitas Sumatera Utara; 2017.

_______________________________________________________________________________________________________________________________
1798 https://www.id-press.eu/mjms/index
ID Design Press, Skopje, Republic of Macedonia Open Access Macedonian Journal of Medical Sciences. 2019 Jun 15; 7(11):1798-1802. https://doi.org/10.3889/oamjms.2019.290 eISSN: 1857-9655 Clinical Science
The Effect of Drug-Related Problems on Blood Glucose Level in the Treatment of Patients with Type 2 Diabetes Mellitus Silvy Hartuti
1, Azizah Nasution
1*, Santi Syafril
2
1Department of Pharmacology, Faculty of Pharmacy, Universitas Sumatera Utara, Medan 20155, Indonesia;
2Department of
Internal Medicine, Faculty of Medicine, Universitas Sumatera Utara, H. Adam Malik General Hospital, Medan, Indonesia
Citation: Hartuti S, Nasution A, Syafril S. The Effect of Drug-Related Problems on Blood Glucose Level in the Treatment of Patients with Type 2 Diabetes Mellitus. Open Access Maced J Med Sci. 2019 Jun 15; 7(11):1798-1802. https://doi.org/10.3889/oamjms.2019.290
Keywords: T2DM; BGL; DRPs; Cipolle classification
*Correspondence: Azizah Nasution. Department of Pharmacology, Faculty of Pharmacy, Universitas Sumatera Utara, Medan 20155, Indonesia. E-mail: [email protected]
Received: 11-Apr-2019; Revised: 10-Jun-2019; Accepted: 11-Jun-2019; Online first: 14-Jun-2019
Copyright: © 2019 Silvy Hartuti, Azizah Nasution, Santi Syafril. This is an open-access article distributed under the terms of the Creative Commons Attribution-NonCommercial 4.0 International License (CC BY-NC 4.0)
Funding: This research did not receive any financial support
Competing Interests: The authors have declared that no competing interests exist
Abstract
AIM: The study aimed to investigate the effect of drug-related problems (DRPs) on changes in blood glucose level (BGL) in the treatment of type 2 diabetes mellitus (T2DM) patients.
METHODS: This three-month prospective cross-sectional study was conducted to patients of T2DM with complications hospitalised in Haji Adam Malik (HAM) Hospital, Medan, Indonesia period from July to October 2018. DRPs were identified and classified by using Cipolle DRP classification and trustable literature. The data obtained were analysed by Chi-Square test (p < 0.05 implied that there was a significant relationship).
RESULTS: This study involved 81 T2DM patients, 52 (64.2%) of the patients were male, and 29 (35.8%) of them were female. Most (30.9%) of patients were at the age of 51-60 years. Combination of rapid-acting and long-acting insulin was the most frequently provided antidiabetic drugs (69.1%). There were 68 DRPs experienced by 32 (39.5%) of the patients. Percentage of DRP experienced by the 32 patients by number: 1 DRP, 53.1; 2 DRPs, 28.1; 3 DRPs, 3.1; 4 DRPs, 3.1; 5 DRPs, 3.1; 7 DRPs, 9.3. This study showed that 27.2% and 12.3 % of the patients had hyperglycemia and hypoglycemia, respectively. There was no significant relationship between BGL and indication without drug therapy (p = 0.064), ineffective provided drug (p = 0.079), and there was a significant relationship between BGL and irrational dose (p = 0.000). Furthermore, there was a significant relationship between hypoglycemia and adverse drug reaction (p = 0.000).
CONCLUSION: DRPs are common among T2DM patients and still required the attention and appropriate actions of healthcare providers.
Introduction
Diabetes mellitus (DM) is a metabolic disease characterised by high BGLs in the body caused by defects in insulin secretion, insulin action, or both. In 2017, Indonesia was ranked as the 6th highest prevalence of diabetes in the world in which the number of people with diabetes mellitus reached 10.3 million and is expected to rise to 16.7 million in 2045 [1]. It was estimated 1 death every 6 to 10 seconds caused by its complications around the world [2]. Hyperglycemia that occurs, over time, can damage various body organs, especially the nerves and blood vessels. Macrovascular and microvascular complications can occur in patients with diabetes mellitus. Common developed macrovascular complications that occur in people with diabetes is
coronary heart disease, blood vessel disease in the brain, and peripheral vascular disease [3].
The disease and its complications experienced by diabetes mellitus patients required polypharmacy (multiple drug therapy) which in turn can cause DRPs [4], that actually or potentially interfere with the desired outcome of therapy [5]. This condition can further worsen the patients’ quality of life, increase their length of stay and treatment costs. On the other side, the limitation of health resources is a serious problem in the universal health coverage era. Facts indicated that the National Health Insurance has been facing financial difficulties to run the program [6], [7]. These problems should be responded and resolved.
Several studies on DRPs have been conducted by researchers applying different

Hartuti et al. The Effect of Drug Related Problems on Blood Glucose Level in the Treatment of Patients with Type 2 Diabetes Mellitus _______________________________________________________________________________________________________________________________
_______________________________________________________________________________________________________________________________
Open Access Maced J Med Sci. 2019 Jun 15; 7(11):1798-1802. 1799
classification methods. In 2018, a study performed in Tegal, Indonesia stated that drug dose and drug choice problems were the highest DRPs of the overall incidences [8]. Also, another study conducted in Medan proved that the most frequently occurred DRP was indication without therapy and there was no significant association between the patients’ education and DRPs (p = 0.88) [9]. Research on DRPs is still limited in Indonesia.
The study aimed to investigate the effect of DRPs on changes of BGLs in the treatment of T2DM patients. This study focused on antidiabetic utilisation, identification and analysis of DRPs in the management of T2DM as well as the association between DRPs and changes of BGLs.
Methods
This prospective cross-sectional study was undertaken on T2DM inpatients admitted to HAM, Medan, Indonesia. In this study, the number of patients recruited as subjects was 81 hospitalised from July to October 2018. The patients diagnosed with T2DM with a complication, aged ≥ 18 years, received oral antidiabetics or insulin and other medicines (combination therapy) and have provided their consent were included in this study. Ethical clearance of this study was obtained from The Ethical Commission of Health Research, Faculty of Nursing, Universitas Sumatera Utara, Medan. Characteristics of patients, including gender, age, and co-morbidities, were recruited from their medical records. Drugs provided to the patients, important laboratory results and BGL as clinical outcome were also extracted from their medical records.
Characteristics of T2DM patients and drug utilisation were descriptively analysed. Incidence of DRPs in the management of T2DM was identified and analysed based on Cipolle DRP classification system that comprises indication without drug therapy, ineffective provided drug, too low doses, too high doses, drug interaction and adverse drug reaction [10]. The analysis of the occurred DRPs referred to trustable literatures including the authority on drug interactions, a sourcebook of adverse interactions, their mechanisms, Medscape Reference, IBM Micromedex Reference [11], [12], [13], [14] and guidelines for the management of T2DM [15], [16], [17], [18]. The BGLs of the T2DM patients were grouped into 3 categories that are normoglycemia (< 200 mg/dl), hyperglycemia (≥ 200 mg/dl), and hypoglycemia (< 70 mg/dl). The relationship between the occurred DRPs as an independent variable with BGL as a dependent variable was analysed by Chi-Square tests [19] in the program of Statistical Package for the Social Sciences (SPSS) version 25 (p < 0.05 is considered significant).
Results
During the study period, there were 81 patients fulfilled the inclusion criteria consisted of 64.2% male and 35.8% female. Table 1 shows the demographics of T2DM patients. Most (30.9%) of the patients were at the age of 51-60 years. The number of drugs given to the patients varies, ranging from 6 to 20 items. The most common complications or comorbidity experienced by the patients were; heart failure (11.8%) and hypertension (9.1%).
Table 1: Demographics of the T2DM patients (n = 81)
Characteristics % of patients
Gender: Male Female
64.2 35.8
Age: ≤ 40 41-50 51-60 61-70 71-80 ≥ 81
7.4 25.9 30.9 24.7 8.6 2.5
Complications/co-morbidities: Heart failure Hypertension Coronary heart disease Ischemic stroke Tuberculosis Pneumonia Others
11.8 9.1 7.3 6.8 5.5 5.5 < 5
Drug utilisation and clinical outcomes in the treatment of The T2DM patients are listed in Table 2. The most widely administered antidiabetic drug was a combination of rapid-acting and long-acting insulins received by 56 (69.1%) of the patients and insulin monotherapy by 18 (22.2%) of the patients. Table 2 also shows that, based on the results of random BGLs, most (60.5%) of the patients achieved good glycemic control or normoglycemia.
Table 2: Drug utilisation and clinical outcome in the treatment of T2DM patients (n = 81)
Drug therapy % of patients provided antidiabetics
Monotherapy of insulin: Insulin aspart Insulin aspart/protamine
Combination insulin: Insulin aspart + detemir Insulin aspart + glargine Insulin glulisine + glargine Insulin glulisine + detemir Insulin aspart/protamine + glargine
Insulin + oral antidiabetic drugs: Insulin aspart + metformin Insulin aspart + metformin + glimepiride Insulin aspart + insulin glargine + glimepiride Insulin aspart + insulin detemir + metformin
Oral antidiabetic drug: Metformin Oral antidiabetic combination: Metformin + glimepiride Glimepirid + pioglitazone
2.5
22.2
26 24.7 11.1 6.2 1.2
1.2 1.2 1.2 1.2
1.2 1.2 1.2 1.2
Random BGL: Normoglycemia (< 200 mg/dl) Hyperglycemia (≥ 200 mg/dl) Hypoglycemia (< 70 mg/dl)
60.5 27.2 12.3
The incidence of DRPs in the treatment of T2DM patients is shown in Table 3. In this study, there were 68 DRPs identified, which affected BGLs. The most common DRPs found were drug interactions (45.6%) and inadequate dose (32.4%). Adverse drug reactions were found in 10 patients who experienced hypoglycemia as the effects of insulin or an oral
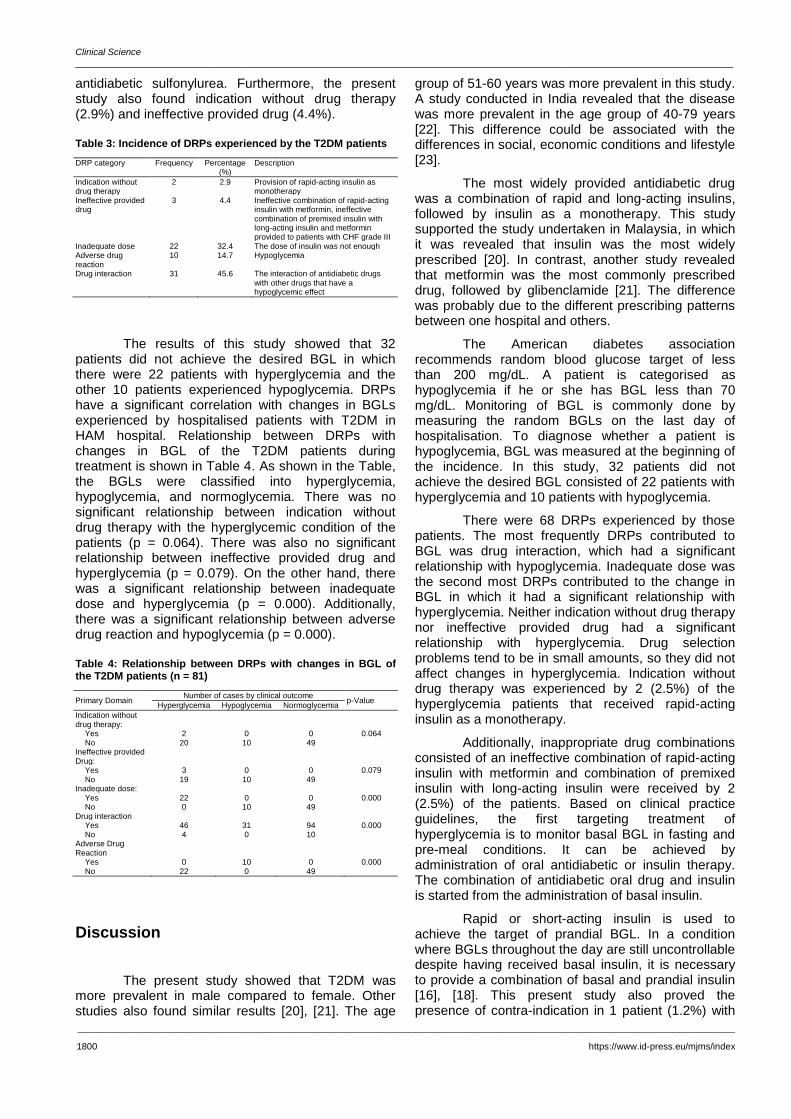
Clinical Science _______________________________________________________________________________________________________________________________
_______________________________________________________________________________________________________________________________
1800 https://www.id-press.eu/mjms/index
antidiabetic sulfonylurea. Furthermore, the present study also found indication without drug therapy (2.9%) and ineffective provided drug (4.4%).
Table 3: Incidence of DRPs experienced by the T2DM patients
DRP category Frequency Percentage (%)
Description
Indication without drug therapy
2 2.9 Provision of rapid-acting insulin as monotherapy
Ineffective provided drug
3 4.4 Ineffective combination of rapid-acting insulin with metformin, ineffective combination of premixed insulin with long-acting insulin and metformin provided to patients with CHF grade III
Inadequate dose 22 32.4 The dose of insulin was not enough Adverse drug reaction
10 14.7 Hypoglycemia
Drug interaction 31 45.6 The interaction of antidiabetic drugs with other drugs that have a hypoglycemic effect
The results of this study showed that 32 patients did not achieve the desired BGL in which there were 22 patients with hyperglycemia and the other 10 patients experienced hypoglycemia. DRPs have a significant correlation with changes in BGLs experienced by hospitalised patients with T2DM in HAM hospital. Relationship between DRPs with changes in BGL of the T2DM patients during treatment is shown in Table 4. As shown in the Table, the BGLs were classified into hyperglycemia, hypoglycemia, and normoglycemia. There was no significant relationship between indication without drug therapy with the hyperglycemic condition of the patients (p = 0.064). There was also no significant relationship between ineffective provided drug and hyperglycemia (p = 0.079). On the other hand, there was a significant relationship between inadequate dose and hyperglycemia (p = 0.000). Additionally, there was a significant relationship between adverse drug reaction and hypoglycemia (p = 0.000).
Table 4: Relationship between DRPs with changes in BGL of the T2DM patients (n = 81)
Primary Domain Number of cases by clinical outcome
p-Value Hyperglycemia Hypoglycemia Normoglycemia
Indication without drug therapy:
Yes 2 0 0 0.064 No 20 10 49
Ineffective provided Drug:
Yes 3 0 0 0.079 No 19 10 49
Inadequate dose: Yes 22 0 0 0.000 No 0 10 49
Drug interaction Yes 46 31 94 0.000 No 4 0 10
Adverse Drug Reaction
Yes 0 10 0 0.000 No 22 0 49
Discussion
The present study showed that T2DM was more prevalent in male compared to female. Other studies also found similar results [20], [21]. The age
group of 51-60 years was more prevalent in this study. A study conducted in India revealed that the disease was more prevalent in the age group of 40-79 years [22]. This difference could be associated with the differences in social, economic conditions and lifestyle [23].
The most widely provided antidiabetic drug was a combination of rapid and long-acting insulins, followed by insulin as a monotherapy. This study supported the study undertaken in Malaysia, in which it was revealed that insulin was the most widely prescribed [20]. In contrast, another study revealed that metformin was the most commonly prescribed drug, followed by glibenclamide [21]. The difference was probably due to the different prescribing patterns between one hospital and others.
The American diabetes association recommends random blood glucose target of less than 200 mg/dL. A patient is categorised as hypoglycemia if he or she has BGL less than 70 mg/dL. Monitoring of BGL is commonly done by measuring the random BGLs on the last day of hospitalisation. To diagnose whether a patient is hypoglycemia, BGL was measured at the beginning of the incidence. In this study, 32 patients did not achieve the desired BGL consisted of 22 patients with hyperglycemia and 10 patients with hypoglycemia.
There were 68 DRPs experienced by those patients. The most frequently DRPs contributed to BGL was drug interaction, which had a significant relationship with hypoglycemia. Inadequate dose was the second most DRPs contributed to the change in BGL in which it had a significant relationship with hyperglycemia. Neither indication without drug therapy nor ineffective provided drug had a significant relationship with hyperglycemia. Drug selection problems tend to be in small amounts, so they did not affect changes in hyperglycemia. Indication without drug therapy was experienced by 2 (2.5%) of the hyperglycemia patients that received rapid-acting insulin as a monotherapy.
Additionally, inappropriate drug combinations consisted of an ineffective combination of rapid-acting insulin with metformin and combination of premixed insulin with long-acting insulin were received by 2 (2.5%) of the patients. Based on clinical practice guidelines, the first targeting treatment of hyperglycemia is to monitor basal BGL in fasting and pre-meal conditions. It can be achieved by administration of oral antidiabetic or insulin therapy. The combination of antidiabetic oral drug and insulin is started from the administration of basal insulin.
Rapid or short-acting insulin is used to achieve the target of prandial BGL. In a condition where BGLs throughout the day are still uncontrollable despite having received basal insulin, it is necessary to provide a combination of basal and prandial insulin [16], [18]. This present study also proved the presence of contra-indication in 1 patient (1.2%) with

Hartuti et al. The Effect of Drug Related Problems on Blood Glucose Level in the Treatment of Patients with Type 2 Diabetes Mellitus _______________________________________________________________________________________________________________________________
_______________________________________________________________________________________________________________________________
Open Access Maced J Med Sci. 2019 Jun 15; 7(11):1798-1802. 1801
grade III heart failure in which the patient has administrated metformin as oral antidiabetic therapy. The previous study on DRP conducted by Zaman Huri and Fun Wee [20] found that approximately 24% of T2DM patients with hypertension and chronic kidney disease received metformin. Provision of metformin is a contraindication in this group of patients. This difference can be associated with many complicated factors, including the difference in prescribing pattern and the number of comorbidities suffered by the patients. In this study, there was a relatively small incidence of drug selection problems, but it is still required the attention of physicians when prescribing antidiabetic drugs to T2DM patients with complications [20].
Drug-related problems of inadequate dose related to the achievement of target BGLs were indicated in 22 patients with hyperglycemia. The result was different from the study conducted in Nigeria [21]. This difference cannot be explained due to the lack of information what drugs were found subtherapeutic dosages in the study. Besides, this study assessed the effect of DRPs on changes in BGLs as glycemic control. There were found an inadequate dose of insulin in this study related to the target of BGLs that were not reached, hyperglycemia. Clinical practice guidelines state that the initial dose of basal insulin can be started with 10 units, and its dose can be gradually increased by 2 units if fasting BGLs have not achieved the target [16]. Other literature declare that the initial daily dose of insulin can be started with 0.5-1.5 unit per kilogram body weight, then the insulin dose can be divided into basal insulin dose (50% of the initial daily dose) and prandial insulin dose (50% of the initial daily dose). Following the physiological condition of the body, insulin therapy is given once for basal and three times with prandial insulin for after-meal [24], [25], [26]. This problem also required the attention of health care providers to be able to increase the dose of insulin gradually when BGLs have not achieved the target of glycemic control.
The more the complications experienced by the patients, the more the number of drugs given to the patients and the higher the incidence of drug interactions [27]. This was in line with several studies which state that polypharmacy is closely related to DRP [28]. This was also proven based on the results of a study undertaken in Malaysia, which proved that there was a significant relationship between polypharmacy and drug interactions [20]. Increasing the number of prescripted drugs can increase the risk of drug interactions, poor control of BGLs and therapeutic outcomes. Therefore, routine monitoring and resolving of inappropriate clinical outcomes and clinically significant drug interactions are needed to optimise drug therapy [21]. The most common drugs involved in drug interactions were insulin with angiotensin receptor blocker, aspirin, quinolone and ace inhibitor. It was dissimilar to the study that reported aspirin, clopidogrel, simvastatin, amlodipine,
beta-blockers, NSAIDs agents and ACE inhibitors were most implicated in drug interactions [20], [29]. The differences can be caused by the difference in complications experienced by these patients, so the prescribed drugs will be different. The drug interactions were identified in this study with major and moderate clinical significance levels, which can affect changes in BGLs based on ensured literature and evidence. Clinicians can still use the drug simultaneously with close monitoring of BGLs and followed by the appropriate actions [20].
In this study, hypoglycemia experienced by 10 T2DM patients is an undesirable drug therapy outcome due to drug interactions, and side effects resulted in the provision of insulin or oral antidiabetic drug. This was consistent with many studies reported incidences hypoglycemia related to the use of insulin and sulfonylurea [30], [31]. Hypoglycemia can occur at any time. Therefore, routine monitoring of BGLs and appropriate efforts are needed to avoid recurrence of hypoglycemia.
It can be concluded that DRPs has a significant effect on BGLs in the treatment of patients with T2DM. DRPs of dose selection affects the BGL of hyperglycemia and DRPs of drug interactions, and unwanted drug reactions affect the occurrence of hypoglycemia. With the proven influence of DRPs on changes in BGLs in the treatment of T2DM patients, the active role of pharmacists as a part of the healthcare providers is crucial to identify and resolve the presence of DRPs which in turns optimise the treatment of patients with T2DM.
References
1. Cho N, Shaw JE, Karuranga S, Huang Y, da Rocha Fernandes JD, Ohlrogge AW, Malanda B. IDF Diabetes Atlas: Global estimates of diabetes prevalence for 2017 and projections for 2045. Diabetes research and clinical practice. 2018; 138:271-81. https://doi.org/10.1016/j.diabres.2018.02.023 PMid:29496507
2. Aguiree F, Brown A, Cho NH, Dahlquist G, Dodd S, Dunning T, Hirst M, Hwang C, Magliano D, Patterson C, Scott C. IDF diabetes atlas, 2010.
3. Standards of Medical Care for Patients With Diabetes Mellitus. Diabetes Care. American Diabetes Association; 1996; 19(Supplement 1):S8-S15. https://doi.org/10.2337/diacare.19.1.S8
4. Jamal I, Amin F, Jamal A, Saeed A. Pharmacist's interventions in reducing the incidences of drug related problems in any practice setting. International current pharmaceutical journal. 2015; 4(2):347-52. https://doi.org/10.3329/icpj.v4i2.21483
5. Pharmaceutical Care Network Europe Foundation: PCNE classification for drug-related problems, V8.02. 2017.
6. Yosephine L. Systemic challenges impede Indonesia's universal health care ambitions. Assessed on 22th October 2017.
7. Rachman A. Indonesia's Health-Care Program Struggles with Its Own Success. The Walls Street Journal. 2015.
8. Siti P, Ahmad AZ, Husni M. Analysis of drug related problems of renal failure patients with diabetes mellitus complications in regional hospital. PharmaXplore, 2018.

Clinical Science _______________________________________________________________________________________________________________________________
_______________________________________________________________________________________________________________________________
1802 https://www.id-press.eu/mjms/index
9. Azizah N, Khairunnisa, Hari RT. Drug Therapy Problems In Management of Hypertensive Outpatients Admitted To Four Indonesian Primary Health Centers. Asian J Pharm Clin Res. 2016; 87-90.
10. Law AM, Kelton WD, Strand LM, Morley PC. Pharmaceutical Care Practice: The Clinicians Guide. McGraw-Hill, 2004.
11. Tatro DS, Wickersham RM. Drug interaction facts: the authority on drug interactions, 2009. Missouri: Wolters Kluwer Health, 2009.
12. Stockley IH. Drug Interaction: A Source Book of Adverse Interactions, Their Mechanisms, Clinical Importance and Management. 5th ed. London: Pharmaceutical Press, 2001.
13. Medscape Reference. Assessed online October 1st to November 17 th. http://www.emedicine.medscape.com/article/241381-medication.
14. IBM Micromedex Reference. Assessed online August 28 th to November 27 th. Available from http://www.micromedexsolutions.com/micromedex2/librarian.
15. World Health Organization. Global Report on diabetes. Geneva: World Health Organization, 2017.
16. American Diabetes Association. Standards of Medical Care In Diabetes. 2017; 40(Suppl.1): S11-S64. https://doi.org/10.2337/dc17-S005 PMid:27979889
17. Home P, Mant J, Diaz J, Turner C. Management of type 2 diabetes: summary of updated NICE guidance. Bmj. 2008; 336(7656):1306-8. https://doi.org/10.1136/bmj.39560.442095.AD PMid:18535074 PMCid:PMC2413390
18. American Association of Clinical Endocrinologists and American College of Endocrinology - Clinical Practice Guidelines for Developing a Diabetes Mellitus Comperehensive Care Plan - 2015. Endocrinbe Practice. 2015; 21 (sppl1):1-87
19. Janes J. Categorical relationships: chi-square. Library Hi Tech. 2001; 19(3):296-8. https://doi.org/10.1108/EUM0000000005892
20. Huri HZ, Wee HF. Drug related problems in type 2 diabetes patients with hypertension: a cross-sectional retrospective study. BMC endocrine disorders. 2013; 13(1):2. https://doi.org/10.1186/1472-6823-13-2 PMid:23289895 PMCid:PMC3542270
21. Ogbonna BO, Ezenduka CC, Opara CA, Ahara L. Drug therapy problems in patients with Type-2 Diabetes in a tertiary hospital in Nigeria. Int J Innov Res Dev. 2014; 3(1):494-502.
22. Shareef JA, Fernandes J, Samaga L, Khader SA. A study on adverse drug reactions in hospitalized patients with diabetes
mellitus in a multi-speciality teaching hospital. Asian Journal of Pharmaceutical Clinical Research. 2016; 9(2):114-7.
23. Connolly V, Unwin N, Sherriff P, Bilous R, Kelly W. Diabetes prevalence and socioeconomic status: a population based study showing increased prevalence of type 2 diabetes mellitus in deprived areas. Journal of Epidemiology & Community Health. 2000; 54(3):173-7. https://doi.org/10.1136/jech.54.3.173 PMid:10746110 PMCid:PMC1731634
24. Koda-Kimble MA, Young LY, Kradjan WA, Guglielmo BJ. Applied Therapeutics: The Clinical Use of Drugs, 8th ed, Lippincott Williams and Wilkin, Philadelphia, 2005.
25. Cheng AYY, Zinman B, Khan CR, et al. (Eds). Joslin's Diabetes Mellitus. Fourth Edition. Lipincott Williams & Wilkins. Philadelphia, 2005.
26. Bode BW, Braithwaite SS, Steed RD, Davidson PC. Intravenous Insulin Infusion Therapy: Indications, Methods, and Transition to Subcutaneous Insulin Therapy. Endocrine Practice. AACE Corp (American Association of Clinical Endocrinologists); 2004; 10(Supplement 2):71-80. https://doi.org/10.4158/EP.10.S2.71 PMid:15251644
27. Peterson JF, Bates DW. Preventable medication errors: identifying and eliminating serious drug interactions. Journal of the American Pharmaceutical Association. 2001; 41(2):159-60. https://doi.org/10.1016/S1086-5802(16)31243-8
28. Viktil KK, Blix HS, Moger TA, Reikvam A. Polypharmacy as commonly defined is an indicator of limited value in the assessment of drug‐related problems. British journal of clinical pharmacology. 2007; 63(2):187-95. https://doi.org/10.1111/j.1365-2125.2006.02744.x PMid:16939529 PMCid:PMC2000563
29. Koh Y, Kutty FB, Li SC. Drug-related problems in hospitalized patients on polypharmacy: the influence of age and gender. Therapeutics and clinical risk management. 2005; 1(1):39-48. https://doi.org/10.2147/tcrm.1.1.39.53597 PMid:18360542 PMCid:PMC1661606
30. Pizzimenti V, Ientile V, Fava G, Giudice I, Bonfiglio C, Alecci U, et al. Adverse reactions with anti-diabetic drugs: Results from a prospective cohort study in Sicily, 2015.
31. Alex SM, Sreelekshmi BS, Smitha S, Jiji KN, Menon AS, Uma Devi P. Drug utilization pattern of anti-diabetic drugs among diabetic outpatients in a tertiary care hospital. Asian Journal of Pharmaceutical and Clinical Research. 2015; 8(2).

_______________________________________________________________________________________________________________________________
Open Access Maced J Med Sci. 2019 Jun 15; 7(11):1803-1807. 1803
ID Design Press, Skopje, Republic of Macedonia Open Access Macedonian Journal of Medical Sciences. 2019 Jun 15; 7(11):1803-1807. https://doi.org/10.3889/oamjms.2019.231 eISSN: 1857-9655 Clinical Science
Correlation of CD4/CD8 Ratio with Carotid Intima-Media Layer Thickness in HIV/AIDS Patients at Sanglah General Hospital, Bali, Indonesia
Susila Utama1*
, Putu Patriawan2, Aryanti Dewi
2
1Tropical and Infectious Disease Division, Internal Medicine Department, Faculty of Medicine, Udayana University, Sanglah
General Hospital, Denpasar, Bali, Indonesia; 2Pre-graduate in Internal Medicine, Faculty of Medicine, Udayana University,
Sanglah General Hospital, Denpasar, Bali, Indonesia
Citation: Utama S, Patriawan P, Dewi A. Correlation of CD4/CD8 Ratio with Carotid Intima-Media Layer Thickness in HIV/AIDS Patients at Sanglah General Hospital, Bali, Indonesia. Open Access Maced J Med Sci. 2019 Jun 15; 7(11):1803-1807. https://doi.org/10.3889/oamjms.2019.479
Keywords: CD4/CD8 ratio; HIV/AIDS; Atherosclerotic plaque
*Correspondence: Susila Utama. Tropical and Infectious Disease Division, Internal Medicine Department, Faculty of Medicine, Udayana University, Sanglah General Hospital, Denpasar, Bali, Indonesia. E-mail: [email protected]
Received: 03-Apr-2019; Revised: 29-May-2019; Accepted: 30-May-2019; Online first: 13-Jun-2019
Copyright: © 2019 Susila Utama, Putu Patriawan, Aryanti Dewi. This is an open-access article distributed under the terms of the Creative Commons Attribution-NonCommercial 4.0 International License (CC BY-NC 4.0)
Funding: This research did not receive any financial support
Competing Interests: The authors have declared that no competing interests exist
Abstract
BACKGROUND: The discovery of antiretroviral (ARV) drugs in 1996 led to a shift in the causes of mortality and morbidity of patients with HIV/AIDS. Initially, the cause of mortality and morbidity was associated with opportunistic infection HIV/AIDS-related complication, but now are more associated with non-AIDS complication such as cardiovascular disease. Atherosclerosis is a major cause of cardiovascular disease. The atherosclerosis was assessed by measuring carotid intima-media thickness (CIMT) using B mode ultrasound (USG), which is one of the diagnostic tools in indicating the presence of atherosclerotic plaque.
AIM: This study aims to evaluate the ratio of CD4 / CD8 towards carotid intima-media thickness.
METHODS: Design of study was analytic cross-sectional. This study was conducted in May – July 2017 in HIV patients who taken consecutively came to the VCT polyclinic of Sanglah hospital. Statistical analysis used Spearman correlation test to evaluate the correlation between the CD4/CD8 ratio and carotid intima-media thickness and multiple linear regression to predict carotid intima-media thickness through CD4/CD8 ratio.
RESULTS: Total from 50 samples, data characteristic were 33 males (66%) and 17 females (34%), mean of age
30.60 ± 5.58 years, median of CD4/CD8 ratio 0.275 (0.02-1.39) and median of CIMT 0.75 (0.4-1.5) mm. There is a strong negative correlation (r = -0.85; p = 0.001) CD4/CD8 ratio with CIMT. The calculation of the prediction of carotid intima media thickness can be calculated through the equation Y = 0.727 -0.791 (X1) + 0.012 (X2), where X1 is CD4/CD8 ratio and X2 is the age of the patient.
CONCLUSION: there is a significantly strong negative correlation between the CD4/CD8 ratio and CIMT in HIV patient who comes to VCT polyclinic of Sanglah Hospital. The smaller CD4/CD8 ratio, the value of CIMT will be thicker, and vice versa.
Introduction
Human Immunodeficiency Virus (HIV) is a retrovirus that attacks the human immune system. This loss of function causes a progressive immune system response disorder, which then develops into Acquired Immunodeficiency Syndrome (AIDS). Characteristics of this disease in the form of a decline in the immune system that causes opportunistic infections, secondary neoplasm, and other neurological manifestations
The discovery of antiretroviral drugs (ARVs) in 1996 is considered one of the successes in medicine in controlling HIV infection. The presence of
antiretroviral drugs causes a shift in the causes of morbidity and mortality of patients with HIV/AIDS infection. Initially, the causes of morbidity and mortality were associated with opportunistic infections associated with HIV, but now more morbidity and mortality are associated with non-AIDS complications such as cardiovascular disease, renal impairment, liver disease, neurocognitive disorders, osteoporosis, muscle atrophy, and frailty [1]. Pacheco et al., (2009) conducted a cohort study in 1538 HIV-infected patients and had taken ARVs from 1997-2006, found that 226 (14.7%) died during the study, 43.4% had non-AIDS-related complications, 37.6% had complications of opportunistic infections. Deaths associated with HIV/AIDS infection experienced a significant decrease over time (p < 0.01). In the 2005-

Clinical Science _______________________________________________________________________________________________________________________________
_______________________________________________________________________________________________________________________________
1804 https://www.id-press.eu/mjms/index
2006 period, it was found that non-AIDS-related deaths were higher than AIDS-related deaths [2].
Cardiovascular disease is an important cause of morbidity and mortality in HIV/AIDS patients. Patients with HIV/AIDS have a higher risk of having myocardial infarction and death due to cardiovascular disorders. The mortality rate of cardiovascular events in HIV/AIDS patients in Europe and North America reached 6.5%-15% [1]. Rates of hospitalization for coronary heart disease and acute myocardial infarction in HIV positive are higher than HIV negative person (6.5% versus 3.8%, p = 0.003, 4.3% versus 2.9%, p = 0.07) [3].
Atherosclerosis is a major cause of cardiovascular disease. Atherosclerosis in HIV patients occurs younger than the general population, beginning at < 30 years with an average age of 48 years. Although HIV infection itself also facilitates atherosclerosis. Atherosclerosis associated with ageing and its major pathogenesis is the occurrence of inflammatory processes. While in HIV patients, there is a chronic inflammatory process that affects the presence of premature ageing syndrome. Therefore, in HIV patients, more easily, the occurrence of atherosclerosis than with no HIV infection [4], [5], [6].
The diagnosis of early atherosclerosis is made by measuring the thickness of the carotid arteries intima tunica and the presence of atherosclerotic plaque. Measurement of Carotid intima-media thickness (CIMT) with B-mode ultrasonography (USG) is a sensitive and non-invasive technique for identifying and quantifying subclinical vascular disease and evaluating the risk of cardiovascular disease. CIMT is significantly correlated with the risk of myocardial infarction, stroke, death from coronary heart disease, or a combination of these. Carotid plaque is defined as a focal region in which a CIMT of more than 1.5 mm protrudes into the lumen [7].
Over the past three decades, the number of Cluster Differentiation (CD) 4 was used as an evaluation of HIV clinical management. In a study conducted by Villar et al., (2014), the CD4/CD8 ratio could be used as a marker of inflammation and immunosenescence and as a predictor of mortality in patients with HIV infection. This CD4/CD8 ratio indicates immune activation in people with HIV infection. The smaller the CD4/CD8 ratio, the higher the immune activation. In HIV infection, there will be CD4 cell damage that will cause the CD4 value to drop dramatically. CD4 cell decline will be compensated by continuous CD8 increases. Even with the provision of ARVs, slow CD4 cell recovery is not necessarily followed by a direct decrease in CD8 cells so that immune activation occurs continuously. This will lead to a smaller CD4/CD8 ratio that indicates high chronic inflammatory activity. This process of chronic immune activation is associated
with increased atherosclerosis. The study concluded that the ratio of CD4/CD8 inversion determines carotid intima-media thickness in patients with HIV infection (OR 2.9, CI 95%: 1.2-7.1) [4].
Atherosclerosis, which is one of the non-AIDS complications, has a major influence on the incidence of morbidity and mortality in patients with HIV/AIDS [8]. Research on the CD4/CD8 ratio associated with atherosclerosis in HIV patients is rare. This research aims to role out the association of atherosclerosis events and to determine the role of CD4/CD8 ratio in the occurrence of atherosclerosis (in this case measured by CIMT using USG) in HIV outpatients at tropical disease and infection polyclinic Sanglah General Hospital, Bali-Indonesia.
Methods
This study was an observational study with cross-sectional analytic design to determine the correlation between CD4/CD8 ratio with carotid intima-media thickness as a marker of atherosclerosis in HIV patients. The research was conducted in tropical disease and infection outpatient clinic Sanglah General Hospital, Bali-Indonesia in May 2017 until July 2017. The subjects of this study were recruited through consecutive sampling to be fulfilled the desired number of samples. The inclusion criteria in this study were HIV outpatient care in tropical disease and infection polyclinic and patients aged between 18-40 years. Exclusion criteria in this study are HIV patient with diabetes mellitus, hypertension, hypercholesterolemia, hypertriglyceridemia, malignancy, coronary heart disease, chronic renal failure, obesity, pregnancy, and cocaine users. The thickness of the Intima-Media (CIMT) of the carotid artery is the value of CIMT as measured by USG B-mode Ultrasound Logic-5 aircraft with a linear transducer frequency of 7.5 Mhz. The examination includes the thickness of the tunica intima-media of the carotid artery and the presence of atherosclerotic plaque. Measurements of CMT are performed at one point on both sides of the carotid artery, expressed in millimetres. The point is in the communist carotid artery (10 mm before the carotid bulb). The measurements of CIMT in all samples will be performed by one consultant radiology specialist. The CD4/CD8 ratio was a comparison of CD4 lymphocyte count cell count, and CD8 T lymphocyte counts examined using flow cytometry (Becton Dickinson (BD) FASCount System.
The data were analysed using Spearman correlation test to evaluate the correlation between CIMT with CD4/CD8 ratio and linear regression analysis to assess the effect and pure relationship of CD4/CD8 ratio to CIMT after controlling confounding variables by analysis.

Utama et al. Correlation of CD4/CD8 Ratio with Carotid Intima-Media Layer Thickness in HIV/AIDS Patients _______________________________________________________________________________________________________________________________
_______________________________________________________________________________________________________________________________
Open Access Maced J Med Sci. 2019 Jun 15; 7(11):1803-1807. 1805
Results
The study involved as many as 50 HIV patients who came to the tropical disease and infection polyclinic at Sanglah General Hospital, Bali-Indonesia. The complete subject characteristics can be seen in Table 1.
Table 1: Subject characteristics
Subject Characteristics Frequency
Gender Male 33 (66%) Female 17 (34%)
Age (Mean ± SD) 30.60 ± 5.58 BMI (kg/m2) (Mean ± SD) 20.52 ± 2.40 Smoking status
No 34 (68%) Yes 16 (32%)
Smoking duration (years), median (min-max) 0 (0-20) HBsAg Status
Negatif 50 (100%) Reactif 0 (0%)
Anti HCV Status Negatif 49 (98%) Reactif 1 ( 2%)
TBC status Negatif 42 (84%) On treatment 5 (10%) End of treatment 3 (6%)
Combination therapy TDF/3TC/EFV 26 (52%) AZT/3TC/NEV 7 (14%) TDF/3TC/NEV 2 (4%) AZT/3TC/EFV 2 (4%) AZT/3TC/aluvia 1 (2%) TDF/3TC/aluvia 3 (6%) Naif 9 (18%)
ARV therapy duration (month), median (min-max) 12 (0-120) CD4/CD8 ratio 0.275 (0.02- 1.39) CD4/CD8 < 1 47 (94%) CD4/CD8 ≥ 1 3 (6%) CIMT (mm), median (min-max) 0.75 (0.4-1.5)
Based on Table 1, the most gender in the study subjects were men as many as 33 people (66%), the mean age in the study subjects was 30.60 ± 5.58 years, the mean body mass index in the study subjects was 20.52 ± 2.40 kg/m
2, all patient without
comorbidity of Hepatitis B, only one patient with hepatitis C comorbidity, based on TB status 42 (84%) of study subjects had negative TB status, based on antiretroviral therapy a combination of TDF/3TC/EFV is the most commonly used regimen as mucg as 26 people (52%), based on the duration of antiretroviral treatment there was a range of ARVs in patients ranging from 0 to 120 months, based on CD4/CD8 ratios, the most is < 1 as much as 47 people (94%), CIMT thickness ranges from 0.4 to 1.5 mm. The correlation between CD4/CD8 ratio and CIMT can be seen in Table 2.
Table 2: Correlation between CD4/CD8 ratio with CIMT
Variable Median (interquartil range)
r p-value
CD4/CD8 ratio 0.275 (0.32) -0.85
0.001* CIMT 0.755 (0.4)
*significant (p < 0.05).
Based on Table 2, the correlation between CD4/CD8 ratio and carotid artery intima-media thickness, with correlation coefficient of r = -0.850 and p-value = 0.001. This indicates that the CD4/CD8 ratio has a strong negative correlation that is significant against carotid artery intima-media thickness. So, it
can be interpreted that any increase in CD4/CD8 ratio will be followed by decreased CIMT. Multiple linear regression analysis of CD4/CD8 ratio with CIMT and control of confounding factors can be seen in Table 3.
Table 3: Multiple linear regression on CD4/CD8 ratio with CIMT and confounding factors
Variable β R-square CI 95% p-value
CD4/CD8 ratio -0.791 0.561 -0.99 – (-0.592) < 0.001 Age 0.012 0.002 – 0.022 0.022 Combination of ARV 0.011 -0.013 – 0.035 0.356 Duration of smoking 0.005 -0.007 – 0.017 0.401 Gender 0.019 -0.118 – 0.156 0.781 BMI 0.000 -0.025 – 0.026 0.972 Constant 0.727 0.411 – 1.042 < 0.001
Based on Table 3, after multivariate analysis with multiple linear regression on independent variables, the effect of CD4 / CD8 ratio and other confounding variables on CIMT, the variable that proved to influence CIMT is the ratio of CD4 / CD8 and patient age.
The coefficient β ratio of CD4 / CD8 ratio (β1)-0,791 means that every 1 point increase of CD4 / CD8 ratio followed by a decrease of CIMT equal to 0,791 mm, coefficient β of age (β2) 0,012 meaning that every 1-year-old growth will be followed by CIMT increase equal to 0,012 mm. From the result of multivariate analysis with multiple linear regression with the value of β 0 that is 0,727 could be interpreted as an equation formula as follows:
Y = 0.727 - 0.791 (X1) + 0.012 (X2)
Y: Carotid intima-media thickness
X1: CD4/CD8 ratio
X2: patient age.
The value of discrimination through R-square result is 0.561, which means that the formula obtained can explain CIMT influenced by CD4 / CD8 ratio and age is 56,1% while the rest 43,9% is explained by another variable outside the research studied variable.
Discussion
The result of this study found a strong negative correlation between the CD4/CD8 ratio with CIMT. These findings are supported by research by Villar et al., (2013) that the CD4/CD8 ratio is correlated with CIMTwith r = -0.2, p = 0.037 [8]. Another interesting point with different methods obtained from Morrel et al. (2016) research found that the progression of carotid artery intima-media thickness was inversely related to CD4/CD8 ratio with OR = 0.283; CI 95% (0.099-0.809), p = 0.019 [9]. Another research conducted by Lo et al. (2010) found that the CD4/CD8 ratio was negatively correlated with the volume of atherosclerotic plaque. Also, Lo and colleagues concluded that the CD4/CD8 ratio was

Clinical Science _______________________________________________________________________________________________________________________________
_______________________________________________________________________________________________________________________________
1806 https://www.id-press.eu/mjms/index
stronger than either CD4 cell count or viral load versus plaque volume [10]. Studies conducted in New York concluded that low CD4 cell count was a major risk factor for atherosclerosis in HIV-infected patients. Compared with non-HIV-infected patients, the prevalence risk ratio of atherosclerosis in HIV patients with CD4 cell count < 200 cells / mm3 was 2 (95% CI: 1.22-3.28) in women and 1.74 (CI 95%; 1.04-2.93) in men [11]. A low CD4 value will result in a low CD4/CD8 ratio value, and this is by our study, which will lead to increased carotid intima-media thickness in HIV-infected patients. In contrast, higher CD4 values will result in a higher CD4/CD8 ratio. A high CD4/CD8 ratio indicates a low inflammatory factor and is associated with a decrease in the incidence of atherosclerosis in HIV-infected patients.
The CD4/CD8 ratio shows the level of strength of the immune system. A lower CD4/CD8 ratio indicates a higher rate of chronic inflammatory activation. Most patients with HIV infection have a low CD4/CD8 ratio, even patients who have received ARVs often fail to achieve normal CD4/CD8 ratios, despite achieving normal CD4 cell counts. This is due to immunological abnormalities in the same HIV patients encountered in elderly patients, including skewed T cell phenotype, CD8 cell activation (CD38 +), CD8 cell senescence (CD28- and CD 57 + CD28-). This immune activation considered a major factor in premature ageing in HIV patients, results in an immunocultural phenotype. CD8 increases are continuous, regardless of whether or not there is a CD4 increase. However, CD8, which has increased and activated, is CD8, which has lost its full function [9], [12]. CD8 cell activation contributes to vascular damage will mediate the occurrence of apoptosis of macrophages, smooth muscle cells, endothelial cells which subsequently lead to the formation of necrotic nuclei which is the forerunner to the formation of atherosclerotic plaque [13]. HIV-infected patients with higher CRP levels, high CD8 cell activation, high T-cell response to CMV was independently associated with a carotid increase in carotid intima-media thickness of HIV patients [11].
In this study, multivariate analysis of CD4/CD8 ratio and confounding variables were age, sex, BMI, duration of smoking and combination of ARV. After gradual multivariate analysis, it was found that CD4/CD8 ratio and age influenced carotid artery intima-media thickness in this study subjects. From the equation formula obtained is: Y = 0.727 -0.791 (X1) + 0.012 (X2), that the increase of CIMT in HIV-infected patients is influenced by the smaller ratio of CD4/CD8 and increasing age. This is by previous research results stating the role of CD4/CD8 ratio affects the occurrence of carotid artery intima-media thickening [8], [9]. In this study, age also affects the thickness of the carotid artery intima-media layer. Age can independently contribute to the development of cardiovascular disease. Every decade of age is associated with about twice the increased risk of
cardiovascular disease (OR per decade of age, i.e., 2.14, 1.80, and 2.33 for atherosclerosis, carotid stenosis, and abdominal aortic aneurysm) [15]. This is also supported by Morell's et al., (2016) study with 96 HIV-infected patients it was found that CIMTwas significantly associated with age (r = 0.497; p < 0.001) [9].
Another study conducted by Bakar et al. (2010) concluded that HIV patients with ARV treatment compared with no treatment had a lower risk of cardiovascular disease. The earlier the treatment, the risk of cardiovascular disease will be smaller. Early ARV treatment may increase CD4 cell counts faster to improve CD4/CD8 ratios. An increase in CD4/CD8 ratio will decrease the inflammatory rate that has implications for the small incidence of atherosclerosis [14].
The limitation of this study is the data taken at a time, so it is difficult to determine the cause and effect relationship. Furthermore, this study was unable to monitor how much the effect of CD4/CD8 ratio changes on carotid artery CIMT plaque changes.
In conclusion, there is a negative correlation between CD4/CD8 ratio with carotid intima-media thickness in HIV/AIDS infected patients in tropical disease and infection polyclinic at Sanglah General Hospital, Bali-Indonesia. The ratio of CD4/CD8 and age is the most important factor in the occurrence of non-AIDS complications, specifically the occurrence of atherosclerotic plaque.
References
1. Boccara F, Lang S, Meuleman C, Ederhy S, Mary-Krause M, Costagliola D, Capeau J, Cohen A. HIV and coronary heart disease: time for a better understanding. J Am Coll Cardiol. 2013; 61(5):511-523. https://doi.org/10.1016/j.jacc.2012.06.063 PMid:23369416
2. Pacheco AG, Tuboi SH, May SB, Moreira LF, Ramadas L, Nunes EP, Merçon M, Faulhaber JC, Harrison LH, Schechter M. Temporal changes in causes of death among HIV-infected patients in the HAART era in Rio de Janeiro, Brazil. J Acquir Immune Defic Synd. 2019; 51(5):624-630. https://doi.org/10.1097/QAI.0b013e3181a4ecf5 PMid:19430304 PMCid:PMC2748737
3. Cerrato E, Calcagno A, D'ascenzo F, Biondi-Zoccai G, Mancone M, Marra WG, Demarie D, Omedè P, Abbate A, Bonora S, DiNicolantonio JJ. Cardiovascular disease in HIV patients: from bench to bedside and backwards. Open heart. 2015; 2(1):e000174. https://doi.org/10.1136/openhrt-2014-000174 PMid:25815207 PMCid:PMC4368980
4. Serrano-Villar S, Pérez-Elías MJ, Dronda F, Casado JL, Moreno A, Royuela A, Pérez-Molina JA, Sainz T, Navas E, Hermida JM, Quereda C. Increased risk of serious non-AIDS-related events in HIV-infected subjects on antiretroviral therapy associated with a low CD4/CD8 ratio. PloS one. 2014; 9(1):e85798. https://doi.org/10.1371/journal.pone.0085798 PMid:24497929 PMCid:PMC3907380
5. Galkina E, Ley K. Immune and inflammatory mechanisms of atherosclerosis. Annu Rev Immunol. 2009; 27:165-197.

Utama et al. Correlation of CD4/CD8 Ratio with Carotid Intima-Media Layer Thickness in HIV/AIDS Patients _______________________________________________________________________________________________________________________________
_______________________________________________________________________________________________________________________________
Open Access Maced J Med Sci. 2019 Jun 15; 7(11):1803-1807. 1807
https://doi.org/10.1146/annurev.immunol.021908.132620 PMid:19302038 PMCid:PMC2734407
6. Currier JS, Taylor A, Boyd F. Coronary heart disease in HIV-infected individuals. J Acquir Immune Defic Syndr. 2004; 33:506-512. https://doi.org/10.1097/00126334-200308010-00012
7. Stein JH, Korcarz CE, Hurst RT, Lonn E, Kendall CB, Mohler ER, Najjar SS, Rembold CM, Post WS. Use of carotid ultrasound to identify subclinical vascular disease and evaluate cardiovascular disease risk: a consensus statement from the American Society of Echocardiography Carotid Intima-Media Thickness Task Force endorsed by the Society for Vascular Medicine. Journal of the American Society of Echocardiography. 2008; 21(2):93-111. https://doi.org/10.1016/j.echo.2007.11.011 PMid:18261694
8. Serrano‐Villar S, Moreno S, Fuentes‐Ferrer M, Sánchez‐Marcos C, Avila M, Sainz T, de Villar NG, Fernández‐Cruz A, Estrada V. The CD 4: CD 8 ratio is associated with markers of age‐associated disease in virally suppressed HIV‐infected patients with immunological recovery. HIV medicine. 2014; 15(1):40-9. https://doi.org/10.1111/hiv.12081 PMid:24007533
9. Bernal Morell E, Serrano Cabeza J, Muñoz Á, Marín I, Masiá M, Gutiérrez F, Cano A. The CD4/CD8 ratio is inversely associated with carotid intima-media thickness progression in human immunodeficiency virus-infected patients on antiretroviral treatment. AIDS research and human retroviruses. 2016; 32(7):648-53. https://doi.org/10.1089/aid.2015.0385 PMid:27005326
10. Lo J, Abbara S, Shturman L, Soni A, Wei J, Rocha-Filho JA, Nasir K, Grinspoon SK. Increased prevalence of subclinical coronary atherosclerosis detected by coronary computed tomography angiography in HIV-infected men. AIDS (London, England). 2010; 24(2):243. https://doi.org/10.1097/QAD.0b013e328333ea9e PMid:19996940 PMCid:PMC3154841
11. Kaplan RC, Kingsley LA, Gange SJ, Benning L, Jacobson LP, Lazar J, Anastos K, Tien PC, Sharrett AR, Hodis HN. Low CD4+ T cell count as a major atherosclerosis risk factor in HIV-infected women and men. AIDS (London, England). 2008; 22(13):1615. https://doi.org/10.1097/QAD.0b013e328300581d PMid:18670221 PMCid:PMC2624572
12. Clumeck N, Pozniak A, Raffi F, EACS Executive Committee. European AIDS Clinical Society (EACS) guidelines for the clinical management and treatment of HIV‐infected adults. HIV medicine. 2008; 9(2):65-71. https://doi.org/10.1111/j.1468-1293.2007.00533.x PMid:18257769
13. Kyaw T, Winship A, Tay C, Kanellakis P, Hosseini H, Cao A, Li P, Tipping P, Bobik A, Toh BH. Cytotoxic and proinflammatory CD8+ T lymphocytes promote development of vulnerable atherosclerotic plaques in apoE-deficient mice. Circulation. 2013; 127(9):1028-39. https://doi.org/10.1161/CIRCULATIONAHA.112.001347 PMid:23395974
14. Baker JV, Peng G, Rapkin J, Abrams DI, Silverberg MJ, MacArthur RD, Cavert WP, Henry WK, Neaton JD. CD4+ count and risk of non-AIDS diseases following initial treatment for HIV infection. AIDS (London, England). 2008; 22(7):841-848. https://doi.org/10.1097/QAD.0b013e3282f7cb76 PMid:18427202 PMCid:PMC3618460
15. Savji N, Rockman CB, Skolnick AH, Guo Y, Adelman MA, Riles T, Berger JS. Association between advanced age and vascular disease in different arterial territories: a population database of over 3.6 million subjects. Journal of the American College of Cardiology. 2013; 61(16):1736-43. https://doi.org/10.1016/j.jacc.2013.01.054 PMid:23500290

_______________________________________________________________________________________________________________________________
1808 https://www.id-press.eu/mjms/index
ID Design Press, Skopje, Republic of Macedonia Open Access Macedonian Journal of Medical Sciences. 2019 Jun 15; 7(11):1808-1811. https://doi.org/10.3889/oamjms.2019.231 eISSN: 1857-9655 Case Report
A Rare Case of Soft Tissue Erdheim Chester Disease: Diagnostic Dilemma and Management Aleksandra Pivkova-Veljanovska
1*, Martin Ivanovski
1, Irina Panovska-Stavridis
1, Zlate Stojanoski
1, Sanja Trajkova
1, Angelika
Karadzova-Stojanoska2, Borche Georgievski
1, Slavica Kostadinova-Kunovska
3, Rubens Jovanovic
3, Gordana Petrushevska
3
1University Clinic for Hematology, Medical Faculty, Ss Cyril and Methodius University of Skopje, Skopje, Republic of
Macedonia; 2Institute of Pathology, Medical Faculty, Ss Cyril and Methodius University of Skopje, Skopje, Republic of
Macedonia; 3University Clinic for Rheumatology, Medical Faculty, Ss Cyril and Methodius University of Skopje, Skopje,
Republic of Macedonia
Citation: Pivkova-Veljanovska A, Ivanovski M, Panovska-Stavridis I, Stojanoski Z, Trajkova S, Karadzova-Stojanoska A, Georgievski B, Kostadinova-Kunovska S, Jovanovic R, Petrushevska G. A Rare Case of Soft Tissue Erdheim Chester Disease: Diagnostic Dilemma and Management. Open Access Maced J Med Sci. 2019 Jun 15; 7(11):1808-1811. https://doi.org/10.3889/oamjms.2019.231
Keywords: Histiocytosis; Diagnosis; BRAF mutation; Interferon; Erdheim Chester Disease
*Correspondence: Aleksandra Pivkova-Veljanovska. University Clinic for Hematology, Medical Faculty, University “Ss. Cyril and Methodius” of Skopje, Skopje, Republic of Macedonia. E-mail: [email protected]
Received: 28-Feb-2019; Revised: 09-May-2019; Accepted: 10-May-2019; Online first: 05-Jun-2019
Copyright: © 2019 Aleksandra Pivkova-Veljanovska, Martin Ivanovski, Irina Panovska-Stavridis, Zlate Stojanoski, Sanja Trajkova, Angelika Karadzova-Stojanoska, Borche Georgievski, Slavica Kostadinova-Kunovska, Rubens Jovanovic, Gordana Petrushevska. This is an open-access article distributed under the terms of the Creative Commons Attribution-NonCommercial 4.0 International License (CC BY-NC 4.0)
Funding: This research did not receive any financial support
Competing Interests: The authors have declared that no competing interests exist
Abstract
BACKGROUND: Erdheim Chester disease (ECD) is a rare form of non-Langerhans histiocytosis that still
presents a diagnostic and clinical dilemma.
CASE PRESENTATION: We present a rare case of ECD, young 31 male with atypical localisation and soft tissue presentation and no bone involvement. He started clinical investigations due to subcutaneous tumour mass in the lumbar spine that caused severe back pain. Skin biopsy revealed ECD with Immunohistochemistry CD68+, CD10+, CD11c+, vimentin+, S100A4+. Activating BRAFV600E mutation was positive from the tumour tissue. The patient was referred to the haematology department. PET CT was performed for initial disease staging. Treatment was started with corticosteroids (methylprednisolone 0.5 mg/kg per day), and after 7 days, a significant clinical improvement was noticed in terms of pain disappearance with no need for pain killers. After two weeks, treatment with interferon Alfa (IFN-α) was started in a dose of 3 million units 3 times per week. After 4 months of interim treatment PET, CT revealed a significant reduction of the tumour mass. Therapy with IFN-α was continued, and the patient is still clinically in good condition.
CONCLUSION: It can be concluded that shortening the time of diagnosis of ECD is essential in treatment outcome of this disease. Still, large studies have to confirm the best treatment of this rare condition.
Introduction
Erdheim Chester disease (ECD) is a rare form of Non – Langerhans histiocytosis with unclear pathogenesis and aetiology and has been considered to be a non-neoplastic inflammatory disorder as well as a clonal neoplastic disorder [1]. The recent discovery of BRAFV600E mutations in ECD described the oncogenic nature of the disease, as well ECD histiocytes have been found to express a pattern of proinflammatory cytokines and chemokines responsible for local activation and recruitment of histiocytes [2]. The revised 2008 WHO classification of malignant haematological tumours proposed to
assign separate histiocytic proliferations and ECD is one of the three new entities that is supposed to origin from interstitial dendritic cells. The idea to create these provisional entities was to enable to collect new cases for further studies and to maintain the purity of well-defined categories. One disease site may dominate the clinical presentation and require focused treatment in addition to the treatment of underlying ECD. Clinically, some patients have indolent and asymptomatic disease. Symptomatic ECD can be further categorised as multi-organ affection (CNS cardiovascular, pulmonary, soft tissue, retroperitoneal, etc.). Severe involvement of essentially any organ system constitutes “high-risk” disease; therefore, the clinical phenotype of each patient is best

Pivkova-Veljanovska et al. A Rare Case of Soft Tissue Erdheim Chester Disease: Diagnostic Dilemma and Management _______________________________________________________________________________________________________________________________
_______________________________________________________________________________________________________________________________
Open Access Maced J Med Sci. 2019 Jun 15; 7(11):1808-1811. 1809
characterised by the most pathophysiologically affected organ. ECD is a rare, multi-system disorder requiring multidisciplinary collaboration in its diagnosis and treatment. Guidelines for diagnosis and treatment of this disease are still to be refined in terms of generating trials with targeted molecular and immunologically based treatments which are essential to furthering therapeutic progress in ECD [3].
Case Presentation
A newly diagnosed case of ECD is presented in this article, a 31 years adult male patient with multiple nodular subcutaneous tumours and aches in his back. He has been admitted to the plastic surgery clinic for diagnostic surgical biopsy (Figure 1 and 3).
Figure 1: Nodular subcutaneous tumours in the lower back of the spinal cord
Histopathology revealed chronic lymphocytic vasculitis, and he was referred to a rheumatologist for further immunological investigations and diagnostic evaluation. Due to intensive pain in the lumbar spinal cord, he performed MRI of the spinal cord, and a tumour mass in the subcutaneous tissue was noticed all over the spinal cord and in the retroperitoneal soft tissue region (Figure 2).
Figure 2: MRI of the lumbar spine; On MRI a tumour mass was found in the subcutaneous tissue all over the back of the patient and in the retroperitoneal soft tissue region
Figure 3: First skin biopsy No. 1130357: Oval skin excision measuring 1.9 x 0.8 cm with SFT measuring 1.1 cm has been received for histological analysis. Standard histological techniques have been used with H&E staining and immunohistochemical analysis for CD4, CD8, CD20, CD25, CD68, MCT
He was suggested to perform second skin biopsy that still didn’t clear the diagnosis and was in favour of inflammatory vasculitis (Figure 4).
Figure 4: Second skin biopsy: Oval skin excision measuring 2.2x0.3cm with SFT measuring 1.1cm without peculiar features have been received for DIF analysis. IgG (-), IgM (-), IgA (-), C3c (-), C1q (-), Fibrin (-). Standard histological techniques have been used with H&E staining and PAS has been done
The patient clinically worsens with severe pain in the lower lumbar spine. He was treated with NSAIL and analgesics. Due to persistent pain and negative results from immunological tests he performed third needle biopsy in which lymphocytes, plasma cells, and a large number of histiocytic cells with pleomorphic features; some of them with foamy cytoplasm, or eosinophilic cytoplasm and multinuclear giant cells. Pseudocysts lined with cells with histiocytic features were found. Immunohistochemistry revealed CD68+, CD10+, CD11c+, vimentin +, S100A4 +, negative for CD21, CD23, MAC387, S-100. The histopathology was in favour of ECD (Figure 5).
Figure 5: Third core needle biopsy No.1133255: hypocellular collagenous tissue with entrapped accumulations from polymorphous cells: lymphocytes, plasma cells, and a large number of histiocytic cells with pleomorphic features; some of them with foamy cytoplasm, or eosinophilic cytoplasm and multinuclear giant cells. Pseudocysts lined with cells with histiocytic features were found. The histology confirmed ECD (CD68+, CD10+, CD11c+, S100A4+, vimentin+)

Case Report _______________________________________________________________________________________________________________________________
_______________________________________________________________________________________________________________________________
1810 https://www.id-press.eu/mjms/index
One patient was evaluated with histopathology findings from three skin biopsies performed in the Institute of Pathology, Medical Faculty, University “Ss. Cyril and Methodius”, Skopje, Republic of Macedonia. With the diagnostic confirmation of ECD, he was referred to University Clinic for haematology. Oncogenic nature of ECD with BRAF mutation was performed with RT-PCR. Imaging was performed with MRI and PET-CT.
The patient was advised to continue evaluations and treatment at the haematology department. From haematological investigations activating BRAFV600E mutation was positive from the tumour tissue (RT PCR). Bone marrow biopsy was negative, with no infiltration for ECD. Laboratory blood tests were in the normal range. The patient performed initial PET CT for disease staging. PET CT revealed high metabolic activity in the gluteal region with deep subcutaneous infiltration and muscle affection (SUV 6.0).
Due to persistent lower back pain patient started treatment with corticosteroids (methylprednisolone) in a dose of 1mg/kg for one month. After one week he improved clinically with reduced pain, could perform the normal activity and he discontinued NSAIL and other analgesics. After diagnosis confirmation, his treatment followed with IFN alpha 3 million units 3 times per week for the next three months. After 3 months, a controlled PET CT was performed and revealed a significant reduction of tumour mass (SUV from 6 to 2.3). Therapy with IFN alpha was continued, and the patient is still clinically in good condition (Figure 6).
Figure 6: PET CT in a patient with ECD initially revealed high metabolic activity in the gluteal region with deep subcutaneous infiltration and muscle affection (SUV max 6.0) (a) and 4 months after treatment initiation with a significant reduction of the tumour mass and infiltration (SUV max 2.3) (b)
Discussion
ECD is a rare form of non-Langerhans' cell histiocytosis, a disease with unclear pathophysiology, diagnostic dilemmas and still unknown treatment options. Individuals affected by this disease are typically adults between their 50 to 70 years, but patients between the ages of 7 to 84 years have been diagnosed [3]. Males and females are almost equally affected. The multisystemic form of ECD is associated with significant morbidity, which may arise due to histiocytic infiltration of critical organ systems. Among the more common sites of involvement are the skeleton, CNS, CVS, lungs, kidneys (retroperitoneum) and skin [4], [5]. The presented patient was 31 years of age male with no previous comorbidity and rare localisation of histiocytic infiltration, which caused diagnostic difficulties. The heterogeneous manifestations of ECD vary amongst different individuals. This results in a presentation that may vary from an indolent focal disease to life-threatening organ failure. The most common presenting symptom of ECD is bone pain. General symptoms are also described in most of the ECD cases like fever, fatigue, weight loss, loss of appetite and microcytic anaemia. The presented case was a rare soft tissue presentation of ECD with no bone lesions, which caused the diagnostic dilemma and became an ECD case with significance. The aetiology of ECD is unknown yet thought to be associated with an intense TH1 immune response. It may also be associated with the V600E BRAF mutation, as described in half of the patients in recent studies. Estimates of BRAFV600E mutation frequencies in ECD currently range between 38% and 68% in most reports, with one recent report suggesting that nearly 100% (18/18) of ECD patients have the mutation, which opened a new treatment perspective for novel targeted therapy [6].
The diagnostic criteria of ECD are based on radiographic and histologic findings. Two biopsies that were initiated in the presented case revealed features of inflammatory vasculitis that did not correlate with the clinical manifestations, laboratory tests and molecular analysis. This was the reason to advise the patient for the third needle biopsy that confirmed ECD. Skeletal imaging is a very important diagnostic tool because in most of the ECD cases osteosclerotic bilateral changes in large bones can be found. Also, gamma scan assessment in ECD reveals abnormal strong labelling of distal bone ends of the large bones. The presented case has performed bone scintigraphy that revealed no tracer accumulation in distal parts of the large bones. CT scans of the lumbar region on two occasions didn’t reveal the existence of soft tissue lesion. After an MRI of the spine and PET CT, the lesion was detected. However, a definite diagnosis of ECD is established only once CD68 (+), CD1a (−) histiocytes are identified within a biopsy specimen. (7)
There is no therapeutical consensus on ECD,

Pivkova-Veljanovska et al. A Rare Case of Soft Tissue Erdheim Chester Disease: Diagnostic Dilemma and Management _______________________________________________________________________________________________________________________________
_______________________________________________________________________________________________________________________________
Open Access Maced J Med Sci. 2019 Jun 15; 7(11):1808-1811. 1811
but it is evident that initiation of therapy should be soon after diagnosis confirmation, there is no evidence for observational studies. It is still of limited alternatives. Currently, interferon-α is the most extensively studied agent in the treatment of ECD and serves as the first line of treatment [8]. The IFN-α optimal dose is 3MU/3 times per week in 3 years. There was no difference between IFN-α and pegylated formulations of IFN (Peg IFN-α). Dramatic efficacy was described in 3 cases of ECD treated with Vemurafenib, but enrollment in a prospective clinical trial is essential to document efficacy and potential toxicities as well as to determine the duration of therapy. Treatment with other agents anticytokine agents, cladribine (2CDA), tocilizumab, sirolimus, imatinib, infliximab and anakinra are currently advocated as promising second-line treatments for patients whose response to interferon-α is unsatisfactory [9], [10]. Overall, the 5 years survival of ECD is 68%. Disease surveillance is with organ-specific lesion imaging every 3 months after treatment initiation. After disease stabilisation, the intervals of the surveillance should be prolonged to 6 months. The presented case had PET CT imaging initially and 4 months after starting treatment with significant disease regression. There is no other cytokine marker that can be beneficial in disease surveillance period. C-reactive protein is usually elevated at the beginning of ECD and later decreased so that it can be used as a helpful biomarker in monitoring treatment. This case highlights the different clinical, radiological and pathological manifestations associated with ECD, the differential diagnoses and the various treatment options [11]. Due to a better characterisation of this entity, further studies that would shed new insights on the epigenetic and cytogenetic characteristics of ECD are needed, and further correlation with morphological and immunophenotypic features is also needed.
References
1. Chester W. Lipoidgranulomatose. Virchows Arch Pathol Anat. 1930; 279:561-602. https://doi.org/10.1007/BF01942684
2. Haroche J, Charlotte F, Arnaud L, et al. High prevalence of BRAF V600E mutations in ErdheimChester disease but not in other non-Langerhans cell histiocytoses. Blood. 2012; 120(13):2700-2703. https://doi.org/10.1182/blood-2012-05-430140
PMid:22879539
3. Diamond EL, Dagna L, Hyman DM, Cavalli G, Janku F, Estrada-Veras J, Ferrarini M, Abdel-Wahab O, Heaney ML, Scheel PJ, Feeley NK, Ferrero E, McClain KL, Vaglio A, Colby T, Arnaud L, Haroche J. Consensus guidelines for the diagnosis and clinical management of Erdheim-Chester disease. Blood. 2014; 124(4):483-492. https://doi.org/10.1182/blood-2014-03-561381 PMid:24850756 PMCid:PMC4110656
4. Dion E, Graef C, Miquel A, Haroche J, Wechsler B, Amoura Z, Zeitoun D, Grenier PA, Piette JC, Laredo JD. Bone involvement in Erdheim-Chester disease: imaging findings including periostitis and partial epiphyseal involvement. Radiology. 2006; 238(2):632-9. https://doi.org/10.1148/radiol.2382041525 PMid:16371583
5. Wittenberg KH, Swensen SJ, Myers JL. Pulmonary involvement with Erdheim-Chester disease: radiographic and CT findings. AJR Am J Roentgenol. 2000; 174(5):1327-31. https://doi.org/10.2214/ajr.174.5.1741327 PMid:10789787
6. Diamond EL, Subbiah V, Lockhart AC, Blay JY, Puzanov I, Chau I, Raje NS, Wolf J, Erinjeri JP, Torrisi J, Lacouture M, Elez E, Martínez-Valle F, Durham B, Arcila ME, Ulaner G, Abdel-Wahab O, Pitcher B, Makrutzki M, Riehl T, Baselga J, Hyman DM. Vemurafenib for BRAF V600-Mutant Erdheim-Chester Disease and Langerhans Cell Histiocytosis: Analysis of Data From the Histology- Independent, Phase 2, Open-label VE-BASKET Study. JAMA Oncol. 2018; 4(3):384-388. https://doi.org/10.1001/jamaoncol.2017.5029 PMid:29188284 PMCid:PMC5844839
7. Young JR, Johnson GB, Murphy RC, Go RS, Broski SM. (18) F-FDG PET / CT in Erdheim - Chester Disease: Imaging Findings and Potential BRAF Mutation Biomarker. J Nucl Med. 2018; 59(5):774-779. https://doi.org/10.2967/jnumed.117.200741 PMid:29097410
8. Fadi Braiteh, Cynthia Boxrud, Bita Esmaeli, Razelle Kurzrock. Successful treatment of Erdheim- Chester disease, a non - Langerhans - cell histiocytosis, with interferon - alfa. Blood. 2005; 106(9):2992-2994. https://doi.org/10.1182/blood-2005-06-2238 PMid:16020507
9. Adam Z, Petrášová H, Řehák Z, Koukalová R, Krejčí M, Pour L, Vetešníková E, Čermák A, Ševčíková S, Szturz P, Král Z, Mayer J. Evaluation of five years of treatment of Erdheim-Chester disease with anakinra: case report and overview of literature. Vnitr Lek Fall. 2016; 62(10):820-832.
10. Cohen-Aubart F, Maksud P, Emile JF, Benameur N, Charlotte F, Cluzel P, Amoura Z, Haroche J. Efficacy of infliximab in the treatment of Erdheim-Chester disease. Ann Rheum Dis. 2018; 77(9):1387-1390. https://doi.org/10.1136/annrheumdis-2017-212678 PMid:29363511
11. Milne P, Bigley V, Bacon CM, Neel A, McGovern N, Bomken S, Haniffa M, Diamond EL, Durham BH, Visser J, Hunt D, Gunawardena H, Macheta M, McClain KL, Allen C, Abdel-Wahab O, Collin M. Hematopoietic origin of Langerhans cell histiocytosis and Erdheim-Chester disease in adults. Blood. 2017; 130(2):167-175. https://doi.org/10.1182/blood-2016-12-757823 PMid:28512190 PMCid:PMC5524529

_______________________________________________________________________________________________________________________________
1812 https://www.id-press.eu/mjms/index
ID Design Press, Skopje, Republic of Macedonia Open Access Macedonian Journal of Medical Sciences. 2019 Jun 15; 7(11):1812-1814. https://doi.org/10.3889/oamjms.2019.538 eISSN: 1857-9655 Case Report
Henoch-Schonlein Purpura in Children: The Role of Corticosteroids Bella Kurnia
*
Podomoro Hermina Hospital, Jakarta, Indonesia
Citation: Kurnia B. Henoch - Schonlein Purpura in Children: The Role of Corticosteroids. Open Access Maced J Med Sci. 2019 Jun 15; 7(11):1812-1814. https://doi.org/10.3889/oamjms.2019.538
Keywords: Henoch Schonlein Purpura; Case; Corticosteroid
*Correspondence: Bella Kurnia. Podomoro Hermina Hospital, Jakarta, Indonesia. E-mail: [email protected]
Received: 19-Mar-2019; Revised: 01-May-2019; Accepted: 02-Jun-2019; Online first: 15-Jun-2019
Copyright: © 2019 Bella Kurnia. This is an open-access article distributed under the terms of the Creative Commons Attribution-NonCommercial 4.0 International License (CC BY-NC 4.0)
Funding: This research did not receive any financial support
Competing Interests: The authors have declared that no competing interests exist
Abstract
BACKGROUND: Henoch-schonlein purpura (HSP) is an IgA-mediated systemic small vessel vasculitis. It is the most common form of systemic vasculitis in children.
CASE REPORT: A 9 years old girl admitted to the hospital with chief complain of purplish red rash on both legs since approximately 1 week with painful knees and ankles that make the patient unable to walk. The patient was diagnosed with HSP and was treated with corticosteroid and analgesics. The patients only stayed for 2 nights at the hospital and discharged from the hospital with the ability to walk and experience no pain.
CONCLUSION: The role of corticosteroids in the treatment of HSP is still controversial. But from various research, we can conclude that the role of corticosteroid in HSP is as a symptom reliever (reduce abdominal pain and arthritis), but does not slow the progression of renal disease.
Introduction
Henoch Schonlein Purpura (HSP) is an IgA-mediated systemic small vessel vasculitis with a predilection for the skin, gastrointestinal tract, joints, and kidneys [1]. It is characterised by palpable purpura (without thrombocytopenia), abdominal pain, and arthritis. HSP is a self-limiting disease but can cause complication such as gastrointestinal haemorrhage, intussusception and end-stage renal disease (ESRD) [2]. Renal involvement in HSP affects 20-70% of patients and ranges in severity from microscopic hematuria with or without proteinuria to a nephritic/ nephrotic pattern with associated renal failure.in the majority of patients the outcome is excellent, with the incidence of severe long-term morbidity/ mortality being less than 5% [3].
Case Report
A 9 years old girl admitted to the hospital with chief complain of purplish red rash on both legs since approximately 1 week. The rash came with painful joints on the knees and ankles that make the patient unable to walk for several days. No symptom of abdominal pain and the common cold. No fever and bloody stool/ rain were reported. From physical examination: composmentis, BP 100/70, HR 80 bpm, RR 18 times per minute, and temperature 36.5°C. Physical examination from head to toe, there is a manifestation of a red purplish rash (purpura) on both of the legs below the knees, no swelling, but the reduced movement of the legs due to painful joints. No abdominal tenderness present.

Kurnia et al. Henoch - Schonlein Purpura in Children: The Role of Corticosteroids _______________________________________________________________________________________________________________________________
_______________________________________________________________________________________________________________________________
Open Access Maced J Med Sci. 2019 Jun 15; 7(11):1812-1814. 1813
Figure 1: Purpura on the leg
Routine laboratory test was performed, from the complete blood count (CBC) can be seen elevated thrombocyte count just a little (380.000 / ul), normal prothrombin time (PT) and activated partial thromboplastin time (aPTT), normal creatinine and ureum, but there is proteinuria in the urinalysis with no hematuria nor microhematuria. The patient was given medication with oral Prednisone 3 x 15 mg and ibuprofen syrup 3 x 6.25 ml. After the treatment, the painful knees disappear, but the rash still exists. And the patient was discharged from the hospital after 2 night's stay in the hospital with better clinical manifestation.
Discussion
Henoch Schonlein purpura is a self-limiting condition, usually resolving within 6 to 8 weeks. In patients with HSP, immunoglobulin A (IgA) immune complexes are deposited in the small vessels, which causes petechiae and palpable purpura. All HSP patients develop a nonpruritic rash that starts briefly as an erythematous papule or urticarial wheels and then matures into crops of petechiae and purpura. Purpura is defined as nonblanching cutaneous haemorrhages. The lesions change from red to purple to rash coloured before fading over approximately 10 days. The rash is most commonly located in dependent areas that are subject to pressure such as the lower extremities, belt line and buttocks. Non-Migratory arthritis occurs in 75% of patients. The knees and ankles are more commonly involved than small joints. The arthritis symptoms include swelling, warmth, and tenderness. Abdominal pain occurs 60-65% of patients and can mimic an acute abdomen in terms of severity [4].
According to the European
League Against Rheumatism (EULAR) and Paediatric Rheumatology European Society (PRES), the diagnosis should be based on the finding of palpable purpura in the presence of at least one of the following criteria, namely, diffuse abdominal pain, arthritis or arthralgia, renal involvement (hematuria and/or
proteinuria), and a biopsy showing predominant IgA deposition [1].
In this case, the patient has a purplish red rash (purpura) on both of the legs below the knees with non-migratory arthritis on the knees and ankles. Diagnosis Criteria for HSP according to International Consensus Conference 2006 are palpable purpura in the presence of one or more of the following: Diffuse abdominal pain; any biopsy showing predominant immunoglobulin A deposition; arthritis (acute, any joint) or arthralgia; and renal involvement (any hematuria or proteinuria) [4].
In most cases, HSP is mild and self-limiting, requiring only symptomatic treatment. Bed rest and analgesics may be required for those with arthralgia or abdominal pain. The skin manifestations rarely need treatment [5]. The goals of treating HSP are to relieve acute symptoms, prevent short-term morbidity (such as abdominal complications) and prevent chronic renal insufficiency. Because HSP is characterised by leukocyte infiltration of the blood vessel walls along with with immunoglobulin A disposition, and because corticosteroids inhibit inflammatory process, early treatment with corticosteroids has been postulated to be effective for all 3 therapeutic goals, but still much controversy remains [2]. There is no consensus regarding the indication of steroid use in HSP, but there were several studies that found the efficacy of corticosteroid for HSP.
According to Reamy et all, Oral prednisone at 1 to 2 mg per kg daily for two weeks has been used to treat moderate to severe abdominal and joint symptoms. A double-blind, randomised trial found that early treatment with prednisone reduced abdominal and joint pain severity in children. Although prednisone did not prevent renal disease. A meta-analysis found that corticosteroid use in children with HSP reduced the mean time to resolution of abdominal pain [4]. Bluman et all stated that current evidence does not support universal treatment of HSP with corticosteroids, as they do not appear to prevent the onset of renal disease or abdominal complications. However, corticosteroids do seem to have a role in the symptomatic management of HSP, specifically in treating abdominal pain, arthralgia and purpura [6], [7].
A study by Welch shows that steroids had no apparent effect on the development of nephritis, although there was a tendency for the renal disease to “resolve” more readily in the treated group [8].
A
double-blind, randomised trial by Ronkainen J et all
found that early treatment with prednisone reduced abdominal and joint pain severity in children [9]. But, from a recent large scale, RCT found that steroid treatment does not reduce the incidence and severity of nephropathy in patients with HSP [3].
It is supported
by the study from Huber et al. who did not find any difference between the corticosteroid group and control group [11]. In this case, the patient was given

Case Report _______________________________________________________________________________________________________________________________
_______________________________________________________________________________________________________________________________
1814 https://www.id-press.eu/mjms/index
corticosteroid, and the painful joints disappear within 1 day; although, the purplish red rash did not diminish.
From the explanation above, the patient was having a Henoch Schonlein Purpura with the symptom of purpura on both legs, with arthritis on the knee and ankle that make her unable to walk with proteinuria in the urinalysis. She was treated with prednisone orally, and the next day the pain is gone. From many studies, it can be concluded that the role of corticosteroid is to relieve the abdominal pain and arthritis; but it is not to cure the HSP itself nor prevent the renal disease; therefore, corticosteroids were used just as a symptom reliever.
References
1. Leung AKC, Hon, KL, Barankin B. Henoch schonlein purpura in children. Asian Journal of Clinical Pediatrics and Neonatology. 2016.
2. Weiss PF, Feinstein JA, Luan X, Burnham JM, Feudtner C. Effects of corticosteroid on henoch schonlein purpura: a systematic review. 2007. https://doi.org/10.1542/peds.2007-0667 PMid:17974746 PMCid:PMC3525094
3. Dudley J, Smith G, Edwards AL, Bayliss K, Pike K, Tizard J. Randomised, double-blind, placebo-controlled trial to determine whether steroids reduce the incidence and severity of nephropathy in henoch-scholein purpura (hsp). United Kingdom: Bristol Royal University Hospital for Children, 2013.
4. Reamy BV, Williams PM. Henoch schonlein purpura. Maryland: American Academy of Family Physicians. 2009.
5. Jauhola O. Henoch schonlein purpura in children. University of Oulu, 2012.
6. Bluman J, Goldman RD. Henoch scholein purpura in children limited benefit of corticosteroids. Canada: College of Family Physicians of Canada. 2014.
7. Mccarthy HJ, Tizard EJ. Clinical practice: diagnosis and management of henoch-scholein purpura. European Journal of Pediatrics. 2009. https://doi.org/10.1007/s00431-009-1101-2 PMid:20012647
8. Welch TR. Steroids in hsp. The Journal of Pediatrics. 2006.
9. Ronkainen J, Koskimies O, Ala-Houhala M, et al. Early prednisone therapy in Henoch-Schönlein purpura: a randomized, double-blind, placebo-controlled trial. J Pediatr. 2006; 149(2):241-247. https://doi.org/10.1016/j.jpeds.2006.03.024 PMid:16887443
10. Huber AM, King J, McLaine P, Klassen T, Pothos M. A ran- domized, placebo-controlled trial of prednisone in early He- noch Scho nlein purpura [ISRCTN85109383]. BMC Med. 2004; 2:7. https://doi.org/10.1186/1741-7015-2-7 PMid:15059282 PMCid:PMC400510

_______________________________________________________________________________________________________________________________
Open Access Maced J Med Sci. 2019 Jun 15; 7(11):1815-1817. 1815
ID Design Press, Skopje, Republic of Macedonia Open Access Macedonian Journal of Medical Sciences. 2019 Jun 15; 7(11):1815-1817. https://doi.org/10.3889/oamjms.2019.481 eISSN: 1857-9655 Case Report
Isolated Bilateral Pinna Swelling: A Rare Initial Presentation of Leprosy Salma Yasmin Mohd Yusuf
1*, Ilham Ameera Ismail
1, Rumihati Abdul Hamid
2, Nur Adliah Jamil
1, Mazapuspavina Md Yasin
1
1Primary Care Medicine Discipline, Faculty of Medicine, Universiti Teknologi MARA, 47000 Sungai Buloh, Selangor,
Malaysia; 2Putatan Health Clinic, Jalan Pusir Putih, 88200, Putatan, Kota Kinabalu, Sabah, Malaysia
Citation: Mohd Yusuf SY, Ismail IA, Abdul Hamid R, Jamil NA, Md Yasin M. Isolated Bilateral Pinna Swelling: A Rare Initial Presentation of Leprosy. Open Access Maced J Med Sci. 2019 Jun 15; 7(11):1815-1817. https://doi.org/10.3889/oamjms.2019.481
Keywords: Hepatoprotection; Metoprolol; N-acetyl cysteine; Nitroglycerin
*Correspondence: Salma Yasmin Mohd Yusuf. Primary Care Medicine Discipline, Faculty of Medicine, Universiti Teknologi MARA, 47000 Sungai Buloh, Selangor, Malaysia. E-mail: [email protected]
Received: 02-Apr-2019; Revised: 22-May-2019; Accepted: 23-May-2019; Online first: 15-Jun-2019
Copyright: © 2019 Salma Yasmin Mohd Yusuf, Ilham Ameera Ismail, Rumihati Abdul Hamid, Nur Adliah Jamil, Mazapuspavina Md Yasin. This is an open-access article distributed under the terms of the Creative Commons Attribution-NonCommercial 4.0 International License (CC BY-NC 4.0)
Funding: This research did not receive any financial support
Competing Interests: The authors have declared that no competing interests exist
Abstract
BACKGROUND: Leprosy or Hansen disease is a chronic infectious disease that causes social stigma due to its deforming bodily appearance and physical disability. It has a wide spectrum of presentation affecting diagnosis.
CASE REPORT: A 21-year-old man who presented with chronic isolated bilateral pinna swelling as a result of leprosy is reported. The bilateral pinna swelling started as multiple shiny papules with an erythematous background and progressively became hyperpigmented and lobular over two years. This rare presentation of leprosy poses initial diagnostic difficulties, leading to misdiagnoses by various health care professionals. Diagnoses ascribed include eczema, insect bite and perichondritis. A suspicion of leprosy was raised when hyperaesthetic hypopigmentation of skin started to appear on the body after two years, with worsening of the pinna swellings. This was confirmed by identification of Mycobacterium leprae in slit skin smear test and skin biopsy.
CONCLUSION: Isolated involvement of pinna in a patient without lesions in other body parts is an unusual initial
presentation of leprosy. However, leprosy should be kept as a rare differential diagnosis of isolated lesions on the ear in patients not responding to conventional treatment.
Introduction
Leprosy, also known as Hansen disease, is a chronic, infectious disease caused by Mycobacterium leprae (M. leprae) [1]. Without timely treatment, leprosy leads to disfigurement, paralysed extremities and physical disabilities [2]. Much stigma has been associated with it and colonies of sufferers were isolated on islands and asylums in the effort to prevent the spread of the disease. M. leprae transmission occurs from prolonged close contact between susceptible and genetically predisposed individuals and untreated multibacillary patients. The nasal mucosa has been hypothesised as the main entry and exit route of M. leprae where the disease is thought to spread via respiratory droplets.
Leprosy has a systemic involvement of the dermatological, neurological and rheumatological systems [3]. Due to its systemic manifestations, it is difficult to differentiate leprosy from other systemic
diseases. Incubation period also varies from 6 months to 20 years. Hence it is not uncommon for leprosy to be misdiagnosed, resulting in patients receiving late treatment [1]. The patient in this case report was subjected to repeated consultations to the healthcare professionals before a diagnosis could be established due to the unique presentation.
Up to date literature search using Pubmed/Medline, Cinahl database and Google Scholar using Mesh terms "Leprosy" [Mesh] OR "Leprosy, Multibacillary" [Mesh] OR "Leprosy, Paucibacillary" [Mesh] OR "Leprosy, Tuberculoid" [Mesh] OR "Leprosy, Lepromatous" [Mesh] OR "Leprosy, Borderline" [Mesh] revealed limited reported cases of isolated pinna swelling as an initial presentation of leprosy. Of these, five cases were of unilateral pinna involvement [3], [4], [5]. There was only one reported case of isolated bilateral pinna involvement [6].

Case Report _______________________________________________________________________________________________________________________________
_______________________________________________________________________________________________________________________________
1816 https://www.id-press.eu/mjms/index
Case Report
A 21-year-old male patient from Malaysia, with no significant past medical history, presented with complaint of painless erythematous bilateral pinna skin lesions for two weeks. He had no history of contact to any irritant or trauma and has no other skin lesions elsewhere. He was afebrile at the time of presentation and had a normal pulse rate and blood pressure. Dermatologic examination revealed erythematous and skin-coloured subcutaneous papules on both his pinna, which were painless (Figure 1). There were no other skin lesions or areas of paraesthesia on the body. Cardiovascular, respiratory and other system examinations were also normal. He was diagnosed to have infective perichondritis and received a course of broad-spectrum antibiotics, without any relief.
Figure 1: Left – initial presentation. Right – after 2 years
Over two years, he was seen by a few physicians, and progressive enlargement of the pinna swelling triggered a referral to the otolaryngologist who suggested for cosmetic surgery due to the chondral deformities or “cauliflower ear”. However, the patient did not go for cosmetic treatment. It was not until he presented again at the end of the two years to the local health clinic, with new areas of hyperaesthetic hypopigmentation over his chest and arm combined with progressive loss of sensation in the pinna area that leprosy was suspected and diagnosed.
Slit skin smear tests of his pinna, chest, palms and elbows were done, which confirmed the presence of acid-fast bacilli (AFB) of M. leprae. The slit skin smear showed high bacteriological index (Figure 2). Microscopy examination of the skin biopsy specimen reveals epidermis with spongiosis, hyperkeratosis and hypergranulosis. Sheets of histiocytes were seen within the dermis with the presence of Grenz zone. Some of the histiocytes were distended with large groups of leprosy bacilli (globe), highlighted by wide fire stain. Perivascular lymphohistiocytic infiltrates were also observed. These changes were consistent with lepromatous leprosy.
Figure 2: Patient’s slit skin smear reading
With the confirmation of diagnosis, the patient was treated with multi-drug therapy consisting of Rifampicin 600 mg, Clofazimine 300 mg and Dapsone 100 mg. Skin lesion over the chest resolved with gradual resolution of the ear lesions. Persistence of hyperpigmentation of the pinna, however, is a cause for despondency in the patient, warranting counselling.
Discussion
A disease once thought to be on the verge of becoming obsolete following the introduction of multi-drug treatment, leprosy is, unfortunately, still a public health concern in Malaysia and globally. The prevalence varies worldwide, but the resurgence of the incidence, particularly of multibacillary leprosy is a cause for concern [1], [7].
Leprosy has a wide spectrum of disease presentation, classified by Ridley and Jopling into six classes, ranging from tuberculoid pole on one end to the lepromatous pole on the other end [1], [3]. At the tuberculoid pole, the patients have cell-mediated immunity towards M. leprae, and elimination of mycobacteria can occur [3]. At the lepromatous pole, there is a lack of effective cell-mediated immunity to M. leprae, and thus bacilli proliferate [3]. The WHO classifies leprosy into paucibacillary and multibacillary based on the number of lesions [8]. Paucibacillary is less than 5 lesions, while multibacillary is more than 5 lesions [8].
Leprosy involvement of the ear pinna ranges from discrete nodules with minimal pain to ulceration with a “nibbled” defect [3], [9]. Megalobule of the pinna where the earlobe becomes greatly elongated or appear to wrinkle and hangs loose can also occur [9]. As mentioned, isolated pinna involvement, especially bilateral, without other systemic or cutaneous

Mohd Yusuf et al. Isolated Bilateral Pinna Swelling: A Rare Initial Presentation of Leprosy _______________________________________________________________________________________________________________________________
_______________________________________________________________________________________________________________________________
Open Access Maced J Med Sci. 2019 Jun 15; 7(11):1815-1817. 1817
manifestation, is very rare.
Other differential diagnoses to pinna swellings include systemic conditions like sarcoidosis, relapsing polychondritis, and otophyma [3]. Perichondritis of the non–infective nature, for example, trauma, insect bites, piercings of the affected ear and leukaemic infiltration also cause similar pinna skin lesions [10]. Otitis externa or furunculosis of the external canal and malignant external otitis are infective causes of perichondritis that must be considered [10].
In conclusion, isolated involvement of pinna in a patient without lesions in other body parts is an unusual initial presentation of leprosy. However, leprosy should be kept as a rare differential diagnosis of perichondritis in patients not responding to conventional treatment.
Timely and proper implementation of treatment will break the chain of transmission and prevent disfigurement or physical disabilities that are responsible for the stigma associated with this disease.
Acknowledgements
We would like to appreciate the cooperation of the patient and Dr Nor Haizura, Pathologist from Hospital Queen Elizabeth, Sabah for the histopathology slides.
References
1. Lastória JC. Etiopathogenic aspects - Part 1. 2014; 89(2):205-18. https://doi.org/10.1590/abd1806-4841.20142450 PMid:24770495 PMCid:PMC4008049
2. Bauer B, Trautmann A. Pediatric dermatology photoquiz. :863-4.
3. Pruthi P, Munganda H, Bangia A, Rani U, Budhiraja R, Brajpuriya S. Case Report Leprosy with Atypical Skin Lesions Masquerading as Relapsing Polychondritis. 2016; 2016. https://doi.org/10.1155/2016/7802423 PMid:28116186 PMCid:PMC5220437
4. Ramos-e-silva M, Oliveira MLW, Munhoz-da-fontoura GH. Leprosy: uncommon presentations. 2005; 509-14. https://doi.org/10.1016/j.clindermatol.2005.01.012 PMid:16179185
5. Bubna AK. Localized Glistening Nodules of the Right Ear: A Rare De novo Occurrence of Histoid Leprosy. 2016; 61(6):193701-4. https://doi.org/10.4103/0019-5154.193703 PMid:27904201 PMCid:PMC5122298
6. Liddell L, Holcomb M. Dermatologic Look-Alikes Nodules on the ear. (April 2015):65-70.
7. Kwan Z, Pailoor J, Tan LL, Robinson S, Wong S-M, Ismail R. Leprosy-an imported disease. Lepr Rev. 2014; 85(3).
8. Gaschignard J, Grant AV, Thuc N Van, Orlova M, Cobat A, Huong NT, et al. Pauci- and Multibacillary Leprosy : Two Distinct, Genetically Neglected Diseases. 2016;1-20. https://doi.org/10.1371/journal.pntd.0004345 PMid:27219008 PMCid:PMC4878860
9. Ma S, Kovarik C. Erythema and induration on the right ear and maxilla. Cutis. 2016 Jul;98(1):26-9.
10. Lucerna A, Espinosa J. Acute atraumatic pinna ( auricular ) perichondritis. World J Emerg Med. 2018; 9(2):2017-8. https://doi.org/10.5847/wjem.j.1920-8642.2018.02.013 PMid:29576831 PMCid:PMC5847504

_______________________________________________________________________________________________________________________________
1818 https://www.id-press.eu/mjms/index
ID Design Press, Skopje, Republic of Macedonia Open Access Macedonian Journal of Medical Sciences. 2019 Jun 15; 7(11):1818-1820. https://doi.org/10.3889/oamjms.2019.465 eISSN: 1857-9655 Case Report
An Atypical Presentation of a Strangulated Bochdalek Hernia in a 60-Year-Old Man
Danilo Coco1, Silvana Leanza
2
1Ospedali Riuniti Marche Nord, Pesaro (PE), Italy;
2Carlo Urbani Hospital, Jesy, Italy
Citation: Coco D, Leanza S. An Atypical Presentation of a Strangulated Bochdalek Hernia in a 60-Year-Old Man. Open Access Maced J Med Sci. 2019 Jun 15; 7(11):1818-1820. https://doi.org/10.3889/oamjms.2019.465
Keywords: Bochdalek hernia; Adult; Occlusion; Ischaemia; Laparoscopic surgery technique
*Correspondence: Danilo Coco. Ospedali Riuniti Marche Nord, Pesaro (PE), Italy. E-mail: [email protected]
Received: 07-Apr-2019; Revised: 26-May-2019; Accepted: 27-May-2019; Online first: 14-Jun-2019
Copyright: © 2019 Danilo Coco, Silvana Leanza. This is an open-access article distributed under the terms of the Creative Commons Attribution-NonCommercial 4.0 International License (CC BY-NC 4.0)
Funding: This research did not receive any financial support
Competing Interests: The authors have declared that no competing interests exist
Abstract
BACKGROUND: Bochdalek hernia is a type of congenital diaphragmatic hernia (CDH), which more commonly affects children. Congenital left diaphragmatic hernias, such as Bochdalek, rarely occur in adults. Most such cases do not present any symptoms.
CASE PRESENTATION: Here, we report the case of a 60-year-old male with a left-sided Bochdalek diaphragmatic hernia, who presented with abdominal pain and dyspnea. The patient was successfully treated by laparoscopic approach.
CONCLUSION: The 60-year-old male patient had left-sided BH and was successfully cured by the laparoscopic approach.
Introduction
Bochdalek hernia (BH) is a congenital diaphragmatic hernia, generally caused by the improper fusion of the posterolateral diaphragmatic foramina [1], resulting in the displacement of the abdominal components into the thoracic cavity (Figure 1).
Figure 1: Anatomy of diaphragmatic hernia
Generally, it occurs in children, primarily during the 9
thor 10
thweek of fetal life [2]. It rarely
occurs in adults and accounts for 0.17-6% of all diaphragmatic hernias [3]. About 80-90% of BH usually occurs on the left side. Approximately 1 in 2,200-12,500 live births is affected by BH. It was first described by Vincent Alexander Bochdalek in 1848 [4].
The most common intra-abdominal organs, such as colon and small bowel that migrate through the diaphragmatic defect, are the most obstructed because of BH [5]. Most of the BH cases are incidental, asymptomatic posterolateral diaphragmatic defects. Rare cases of BH in adults where symptoms are present might result in incarcerated bowel, intra-abdominal organ dysfunction, or severe pulmonary disease [3], [6], [7].
Here, we report the case of a 60-year-old patient who arrived in the emergency room with dyspnea and bowel obstruction.

Coco & Leanza. An Atypical Presentation of a Strangulated Bochdalek Hernia in a 60-Year-Old Man _______________________________________________________________________________________________________________________________
_______________________________________________________________________________________________________________________________
Open Access Maced J Med Sci. 2019 Jun 15; 7(11):1818-1820. 1819
Case Report
A 60-year-old male patient was admitted to the emergency room with complaints of abdominal cramps, dysphagia, constipation, and shortness of breath. He had no record of thoracic or abdominal trauma, and his medical history was non-relevant. The psychosocial history of the patient as well as his family was normal. The patients had an arterial pressure of 90/60 mmHg, cardiac rate 120 b/min, and body temperature of 38°C. Laboratory analysis showed leukocytes is of 17 mm
3/l and an elevated
protein chain reaction (PCR). Blood Gas Analysis (BGA) showed PH 7.27, PCO2 50 mmHg, PO2 70 mmHg, HCO3 17, BE-7 mEq. Physical examination elicited diffuse abdominal pain with a positive Blumberg sign, suggesting peritonitis. Bowel sounds were audible on the left side of the chest. A chest Ray showed complete opacity of the left thorax (Figure 2).
Figure 2: Chest radiography: complete opacity of the left thorax
Computer Tomography (CT) Scan showed a defect in the posterior left diaphragm and herniation of intra-abdominal fat and small bowel into the left hemithorax (Figure 3). BH was diagnosed based on the above findings. The surgery involved a laparoscopic approach. Reduction of the hernia sac and strangulated ischemic ileum was found. Ten cm of bowel was re-sectioned with lateral-lateral anastomosis. The patient was kept in the intensive care unit (ICU) for 10 days because of sepsis and acute respiratory distress syndrome (ARDS). He returned to the wards after 10 days and was discharged 19 days after surgery.
Fig.3 Computer Tomography (CT) Scan: images of a defect in the posterior left diaphragm and herniation of intra-abdominal fat and small bowel into the left hemithorax
Discussion
Generally, BH occurs during the initial weeks of a patient’s life. Diagnosis of BH after the first 8 weeks of life is assessed to be 5 – 25%. BH is one of the foremost reasons for respiratory distresses among neonates, and is the most prevalent congenital anomaly of the thorax. Most of the neonatal BHs are found on the left side [8], [9]. BH in adults is mostly asymptomatic, due to which it is discovered incidentally. Patients of BH generally report chest discomfort or symptoms related to the gastrointestinal tract. In the literature reports, there is a predominance (70 – 90% of the cases) of left-sided BH. A left-sided hernia may comprise the enteric tract, the spleen, the liver, the pancreas, a kidney or fat. Right-sided hernias are more unusual because the right pleuroperitoneal canal constricts earlier, and the liver supports the right diaphragm [10]. Surgical treatment is necessary due to a range of potential complications, which, although often asymptomatic, may lead to tissue strangulation, a pneumothorax and intestinal necrosis [11], [12]. Laaksonen et al. reported a right-sided Bochdalek hernia in a 38-year-old woman who had a history of complaints regarding abdominal pain and nausea. After being diagnosed with endometriosis, her left ovary had been removed some years ago. She was not on medication and did not have any underlying illness. There was no history of any previous abdominal or thoracic trauma. She was treated via thoracotomy assisted with laparoscopy [13]. The postoperative process was completed without any untoward development, and the patient was released from the hospital 7 days after the surgery. Atef and Emna [14] reported a case of a 56-year-old woman with Bochdalek hernia, gastric volvulus and epigastric pain, cough, vomiting for 2 weeks and shortness of breath. The bochdalek hernia was an incidental discovery through a chest radiograph, computed tomography (CT), and barium swallow analysis. The stomach was within the thorax in the left side due to the left diaphragmatic hernia of a nontraumatic reason. It was hazardous to dissect

Case Report _______________________________________________________________________________________________________________________________
_______________________________________________________________________________________________________________________________
1820 https://www.id-press.eu/mjms/index
because of numerous adhesions. Therefore, the laparotomic approach was adopted through upper midline incision to decrease content, and prolene was used to join the diaphragmatic flaw. The patient recovered in the postoperative phase without any incident and was discharged 9 days later. Another case of BH was reported by Carrascosa et al., [15]. The case was that of a 68-year-old woman with a 4-week history of right-sided chest pain and dyspnea on minimum exertion. She was asymptomatic until the present hospitalisation. In particular, she had no complaints of chronic dyspnea, chest pain, vomiting, abdominal pain and postprandial fullness. After retracting the hernia sac and the projected organs (jejunum, ileum, part of the right colon and mesenterium) to the abdominal cavity, she went through surgery to repair the diaphragm. The recovery period of 12 days went through without any incident, following which the patient was discharged.
As can be observed from the above discussion, most Bochdalek hernias appear in children and are presented with acute respiratory symptoms, and are placed on the left side. Adulthood left-sided Bochdalek hernias are extremely rare. This abnormality should be known and managed suitably to avoid potential complications. Management can be through strangulation of the hernia contents, intestinal necrosis, hemothorax, and pneumothorax. Diagnosis of BH is more likely in patients exposed to factors that increase their intra-abdominal pressure.
Since there are no specific symptoms or signs, it is crucial to obtain a CT scan as soon as possible, especially when a case is presented with acute and unexplained pain in the abdomen. This is of critical importance in managing BH patients because any delay in diagnosis could enhance the risk of death. In our case, too, the 60-year-old male patient had left-sided BH and was successfully cured by the laparoscopic approach.
References
1. Luther A, Mahajan A. Left-sided Bochdalek Hernia in an Adult: A Case Report with Review of Literature. Journal of International Medical Sciences Academy. 2015; 28(1):33-34.
2. Alam A, Chander BN. Adult Bochdalek Hernia, Case report. Medical Journal Armed Forces India. 2005; 61(3):284-286. https://doi.org/10.1016/S0377-1237(05)80177-7
3. Mullins ME, Stein J, Saini SS, Mueller PR. Prevalence of incidental Bochdalek's hernia in a large adult population. American Journal of Roentgenology. 2001; 177(2):363-366. https://doi.org/10.2214/ajr.177.2.1770363 PMid:11461863
4. Gale ME. Bochdalek hernia: prevalence and CT characteristics. Radiology. 1985; 156(2):449-52. https://doi.org/10.1148/radiology.156.2.4011909 PMid:4011909
5. Shin MS, Mulligan SA, Baxley WA, Ho KJ. Bochdalek hernia of diaphragm in the adult: diagnosis by computed tomography. Chest. 1987; 92(6):1098-101. https://doi.org/10.1378/chest.92.6.1098 PMid:3677819
6. Hung YH, Chien YH, Yan SL, Chen MF. Adult Bochdalek hernia with bowel incarceration. J Chin Med Assoc. 2008; 71:528-531. https://doi.org/10.1016/S1726-4901(08)70162-X
7. Owen ME, Rowley GC, Tighe MJ, Wake PN. Delayed diagnosis of infracted small bowel due to right-sided Bochdalek hernia. Ann R Coll Surg Engl. 2007; 89:W1-2. https://doi.org/10.1308/147870807X160407 PMid:17346388 PMCid:PMC3253648
8. Puri P, Wester T. Historical aspects of congenital diaphragmatic hernia. Pediatric Surgery International. 1997; 12(2-3):95-100. https://doi.org/10.1007/s003830050075
9. Langer JC. Congenital diaphragmatic hernia. Chest Surgery Clinics of North America. 1998; 8(2):295-314.
10. Kanazawa A, Yoshioka Y, Inoi O, Murase J, Kinoshita H. Acute respiratory failure caused by an incarcerated right-sided adult Bochdalek hernia: report of a case. Surgery today. 2002; 32(9):812-5. https://doi.org/10.1007/s005950200156 PMid:12203061
11. Garófano-Jerez JM, López-González JD, Valero-González MA, Valenzuela-Barranco M. Posterolateral Bochdalek diaphragmatic hernia in adults. Revista Española de Enfermedades Digestivas. 2011; 103(9):484-491. https://doi.org/10.4321/S1130-01082011000900009 PMid:21951119
12. Vieira LH, Del Castanhel C, Tristão LJ, Guimarães A, Ribas CS. Hérnia diafragmática congênita simulando derrame pleural. Relato de caso. Rev Bras Clin Med. São Paulo. 2013; 11(1):94-6.
13. Laaksonen E, Silvasti S, Hakala T. Right-sided Bochdalek hernia in an adult: a case report. Journal of medical case reports. 2009; 3(1):9291. https://doi.org/10.1186/1752-1947-3-9291 PMid:20062780 PMCid:PMC2803814
14. Atef M, Emna T. Bochdalek hernia with gastric volvulus in an adult: common symptoms for an original diagnosis. Medicine. 2015; 94(51). https://doi.org/10.1097/MD.0000000000002197 PMid:26705205 PMCid:PMC4697971
15. Carrascosa MF, Carrera IA, García JA, García MA, Tapia AD, Lavín AC, Caviedes JR. Symptomatic Bochdalek hernia in an adult patient. BMJ case reports. 2010; 2010:bcr0520102996. https://doi.org/10.1136/bcr.05.2010.2996 PMid:22802326 PMCid:PMC3027423

_______________________________________________________________________________________________________________________________
Open Access Maced J Med Sci. 2019 Jun 15; 7(11):1821-1824. 1821
ID Design Press, Skopje, Republic of Macedonia Open Access Macedonian Journal of Medical Sciences. 2019 Jun 15; 7(11):1821-1824. https://doi.org/10.3889/oamjms.2019.488 eISSN: 1857-9655 Case Report
Management of Systemic Steroid in HIV Patient with Toxoplasma Papillitis AA Mas Putrawati Triningrat
1*, Ratna Sari Dewi
1, Igam Juliari
1, NK Niti Susila
1, Ni Made Ayu Surasmiati
1, I Ketut Agus
Somia2
1Ophthalmology Department, Faculty of Medicine, Udayana University, Sanglah Hospital, Denpasar, Bali, Indonesia;
2Internal Medicine Department, Faculty of Medicine, Udayana Unoversity, Sanglah Hospital, Denpasar, Bali, Indonesia
Citation: Triningrat AAMP, Dewi RS, Juliari I, Susila NKN, Surasmiati NMA, Somia IKA. Management of Systemic Steroid in HIV Patient with Toxoplasma Papillitis. Open Access Maced J Med Sci. 2019 Jun 15; 7(11):1821-1824. https://doi.org/10.3889/oamjms.2019.488
Keywords: Toxoplasma Papillitis; HIV; Steroid
*Correspondence: AA Mas Putrawati Triningrat. Ophthalmology Department, Faculty of Medicine, Udayana University, Sanglah Hospital, Denpasar, Bali, Indonesia. E-mail: [email protected]
Received: 21-Apr-2019; Revised: 26-May-2019; Accepted: 27-May-2019; Online first: 14-June-2019
Copyright: © 2019 AA Mas Putrawati Triningrat, Ratna Sari Dewi, Igam Juliari, NK Niti Susila, Ni Made Ayu Surasmiati, I Ketut Agus Somia. This is an open-access article distributed under the terms of the Creative Commons Attribution-NonCommercial 4.0 International License (CC BY-NC 4.0)
Funding: This research did not receive any financial support
Competing Interests: The authors have declared that no competing interests exist
Abstract
BACKGROUND: Toxoplasmosis is a zoonotic disease caused by Toxoplasma gondii. Ocular manifestations are seen in both congenital and acquired toxoplasmosis. These can include focal inflammation within or around the optic nerve head (papillitis). Purpose of this study is evaluating the efficacy of systemic steroid in HIV patient with toxoplasma papillitis.
CASE PRESENTATION: We present a case report of a male, 46 years old with a decrease of visual acuity on the right eye for three weeks before admission to the hospital. An ophthalmology examination showed visual acuity of the right eye 1/60, mild dilatation of the pupil and posterior synechiae, vitreous was hazy, and fundus examination showed optic nerve head not well demarcated and hyperaemic with the good retina and macula reflex. Laboratory examination showed reactive anti-Toxoplasma immunoglobulin G. Patient had been treated with antiretroviral and anti-Toxoplasma drugs, then he was given steroid 250 mg intravenously four times per day for three days and tapering off orally. Visual acuity on the right eye improve from 1/60 became 6/60 after use of steroid on the third day.
DISCUSSION: Steroid can improve visual acuity for toxoplasma papillitis in this patient. But the long term and close follow up in steroid therapy is needed.
Introduction
Toxoplasmosis is a chronic disease caused by Toxoplasma gondii infection, which is an obligate intracellular parasite. The most common manifestation of Toxoplasma in HIV-infected patients is cerebral toxoplasma, whereas the most common extracerebral manifestations can be ocular and lungs diseases [1], [2], [3], [4], [5].
An ocular manifestation of toxoplasma can be in congenital or acquired. Some rare manifestations include papillitis, neuroretinitis, retrobulbar neuritis, central serous retinopathy, and scleritis. Toxoplasma papillitis mostly unilateral, and there is no predilection of gender. Clinical symptoms that appear in the form of blurry vision, red eyes, pain, and systemic symptoms such as fever and weakness [6], [7], [8],
[9], [10].
Administration of steroids in Toxoplasma papillitis expected to suppress inflammation and use with caution due to its immunosuppression effect. Although still controversial, the administration of steroids has significant benefits for the inflammatory process. Therapy with steroids is not required in ocular management of Toxoplasma, but steroids are used as adjunctive therapy in ocular toxoplasma [3], [9], [11], [12], [13], [14].
Management of Toxoplasma papillitis in HIV-infected patients is quite difficult, so it requires multidisciplinary to determine the type of therapy. The goal of this case report is to evaluate the efficacy of systemic steroid use for HIV-infected patients with Toxoplasma papillitis, so it would be better management for similar cases.

Case Report _______________________________________________________________________________________________________________________________
_______________________________________________________________________________________________________________________________
1822 https://www.id-press.eu/mjms/index
Case Presentation
A 46-years old, bisexual, male patient came with initial presentation blurry vision on the right eye since a year ago and became worse since the last 3 weeks. It felt like a worse sensation when the eyes were moving — the history of red eyes since a year ago and recurrence. The symptoms had been treated by an ophthalmologist. The patient was diagnosed with HIV and toxoplasmosis since a year ago and undergoing treatment.
General assessment on the normal limit. Ophthalmology examination on the right eye was found visual acuity 1/60 and not improved with pinhole, palpebral was normal, hyperemic conjunctiva, mild dilatation, pupil posterior synechiae, vitreous opacities, optic nerve head hyperemic and not well demarcated.
The intraocular pressure was normal. The eye movement was good in all direction. There was a defect Confrontation visual field test.
Figure 1: Anterior segment on the right eye
There was no a specific defect on the colour vision test and decreasing of contrast sensitivity (0.75). The Optical Coherence Tomography (OCT) examination showed inferior and temporal thickening, cup-disc ratio 1.00 as result of OCT Optic Nerve Head.
Figure 2: Fundus photography on the right eye (left) and left eye (right)
Laboratory tests showed an increase in erythrocyte sedimentation rate, decreased CD-4 levels to 201, reactive anti-toxoplasma immunoglobulin G with titers 58, reactive anti-rubella immunoglobulin G, reactive anti-HSV 1 and 2 immunoglobulin G.
Figure 3: Optical Coherence Tomography (OCT) (RNFL) on the right eye
The patient was diagnosed with right eye Toxoplasma Papillitis and consulted to the neuro-ophthalmology and internal medicine for the plan to administer Optic Neuritis Treatment Trial (ONTT). The patient was diagnosed with stage IV HIV infection by internal medicine and given anti-toxoplasma treatment (cotrimoxazole and clindamycin), anti-retroviral and had been done the ONTT for three days by methylprednisolone 250 mg four times per day intravenously, mecobalamin 500 mg three times per day orally, and antacids three times per day orally.
Figure 4: Optical Coherence Tomography (OCT) ONH on the right eye
Day forth of treating with ONTT, the patient still complained of nausea and dizziness, but the vision was getting better. Visual acuity of right eye 6/60 pinhole NI, normal palpebra, normal conjunctiva, clear cornea, deep ocular anterior chamber, iris and pupil dilated, there are posterior synechiae, cloudy vitreous, fundus examination is obtained by optic nerve head indeterminate hyperemia boundary with the normal retina and positive macular reflex. Intraocular pressure was normal — eyeball movement in all directions. Confrontation test of the right eye is disturbed. The patient was diagnosed with toxoplasma

Triningrat et al. Management of Systemic Steroid in HIV Patient with Toxoplasma Papillitis _______________________________________________________________________________________________________________________________
_______________________________________________________________________________________________________________________________
Open Access Maced J Med Sci. 2019 Jun 15; 7(11):1821-1824. 1823
papillitis and stage IV HIV infection. Tapering off intravenous methylprednisolone have been done and then replaced with oral methylprednisolone 32 mg twice per day, mecobalamin 500 mg three times per day orally, and antacids three times per day orally, anti-toxoplasma (cotrimoxazole and clindamycin) and antiretrovirals continued. The patient was allowed to go home and suggested to control one week later, but patients do not come for treatment.
Discussion
Toxoplasma papillitis is a rare manifestation of Toxoplasma, usually unilateral and does not have a predilection of gender. Clinical symptoms such as blurry vision, red eyes, pain, also causing systemic fever and general weakness [6], [10].
Toxoplasma gondii was first discovered in 1908 in the brains of South African rats and caused ocular disease for the first time in 1923. Transmission of Toxoplasma gondii by ingesting food containing oocysts, transplacental, through mucous membranes, after a blood transfusion or organ transplantation. Toxoplasma encephalitis is a manifestation of Toxoplasma in HIV-infected patients, but extracerebral manifestations can occur with or without encephalitis. The most common extracerebral manifestations can be ocular or pulmonary disease [3], [4], [9].
The transmission of Toxoplasma gondii by hematogenous and mostly affects the retinal vascular endothelial cells, so most of them manifest as retinitis with complaints of decreased visual acuity. Other manifestations can be vitreous and anterior uveitis. In severe vitreous can develop into epiretinal membrane and traction, headlight in the fog is found on fundus examination. Rare manifestations such as inflammation by Toxoplasma in the optic nerve head with hyperemia fundus images on the optic nerve head [3], [6], [9], [10].
The diagnosis of toxoplasma papillitis confirmed through fundal examination and supporting clinical features. If the clinical diagnosis cannot be confirmed through fundus examination, supporting examination such as increased detection of Toxoplasma gondii antibody titers in eye fluids or Toxoplasma gondii DNA and antibody tests in the blood [3], [6], [9], [10].
Management of Toxoplasma papillitis requires anti-parasitic combination such as pyrimethamine, sulfadiazine, clindamycin or azithromycin. These anti-parasitic therapies are effective for stopping the multiplication of parasites but cannot eliminate parasites from the human body. Administration of steroids in Toxoplasma papillitis should be adjunctive because it can suppress the immune response. A
case report stated, there are improvement visual acuity of ocular toxoplasma after prednisone 1 mg/kg. A study stated steroid administration begins within three days or a week after anti-toxoplasma therapy [6], [14], [15], [16], [17].
The use of steroids in good observation expected to suppress inflammation and reduce injury of ocular tissue, but the overall outcome is still uncertain. Steroids can cause side effects such as abdominal pain, bloating/flatulence, nausea, dizziness, joint pain, menstrual disorders, weight gain and increased appetite [18].
The visual acuity of patients after administration of steroid improved from 1/60 to 6/60, but patients complained of nausea and dizziness after administration of the steroid.
In conclusion, there have been reported cases of Toxoplasma papillitis in an HIV-infected patient who showed improvement in visual acuity after given systemic steroid therapy for three days. Further studies are needed to determine the efficacy and side effects of short-term systemic steroid use in HIV cases with Toxoplasma papillitis.
Reference
1. Miro JM, Murray HW, Katlama C. Toxoplasmosis. In: Dolin R, ed. AIDS Therapy. 3rd ed. Philadelphia, PA: Churchill Livingstone, 2008:659-681
2. Jones JL, Kruszon-Moran D, Sanders-Lewis K, Wilson M. Toxoplasma Gondii Infection in the United States. Am J Trop Med Hyg. 2007; 77(3):405-410. https://doi.org/10.4269/ajtmh.2007.77.405 PMid:17827351
3. Park YH, Nam HW. Clinical Feature and Treatment of Ocular Toxoplasmosis. Korean Journal of Parasitology. 2013; 51(4):393-399. https://doi.org/10.3347/kjp.2013.51.4.393 PMid:24039281 PMCid:PMC3770869
4. Jayawardene et al. Manifestation and Management of Ocular Toxoplasmosis. Indian Jr of Ophthalmol. 2008; 5(2):213-215 .
5. Luft BJ, Remington JS. Toxoplasmosis Encephalitis in AIDS. Clinical Infectious Disease. 1992; 15(2):211-222. https://doi.org/10.1093/clinids/15.2.211 PMid:1520757
6. Alipanahi R, Sayyahmelli S. Acute Papillitis in Young Female with Toxoplasmosis. Middle East African Journal Ophthalmology. 2011; 18(3):249-251. https://doi.org/10.4103/0974-9233.84060 PMid:21887084 PMCid:PMC3162741
7. Ahmed Irma, Everett A, Chang E, Luckie A. Ophthalmic Manifestation of HIV. University of California, San Fransisco, 2006:859-873.
8. Gritz David. Toxoplasmosis. Am J Trop Med Hyg. 2014; 80(2):401-409.
9. Harvey Uy. Toxoplasma Papillitis and Neuroretinitis. Philippine Journal of Ophthalmology. 2008; 30(1):48-53.
10. Myers TD, Smith JR, Wertheim MS, et al. Use Of Corticosteroid Sparing Systemic Immunosuppression for Treatment of Corticosteroid dependant Optic Neuritis not Associated with Demyelinating Disease. Br J Opthalmology. 2004; 17:3-8.
11. Gagliuso DJ, Teich SA, Friedman AH, Orellana J. Ocular Toxoplasmosis in AIDS Patients.Trans Am Opthalmol Soc. 1990;

Case Report _______________________________________________________________________________________________________________________________
_______________________________________________________________________________________________________________________________
1824 https://www.id-press.eu/mjms/index
88:63-86.
12. Holland GN. Ocular Toxoplasmosis in The Immunocompromised Host. Int Opthalmol. 1989; 13:399-402. https://doi.org/10.1007/BF02306488
13. American Academy of Ophthalmology Staff. Toxoplasma Retinochoroiditis. In: Intraocular Inflammation and Uveitis. Basic and clinical course. Section 9. San Fransisco:AAO, 2015-2016:308-309.
14. Jasper S, Satyanarayana S, et al. Corticosteroids for Ocular Toxoplasmosis. National of Health Institute Public. 2014; 4:2-16.
15. Gilbert RE, Harden M, Stanford MR. Antibiotics versus control fot Toxoplasma retinochoroiditis. Cochrane Database of Systematic Reviews. 2002; 1(10):218-226.
https://doi.org/10.1002/14651858.CD002218
16. Rush R, Sheth S. Fulminant toxoplasmic retino-choroiditis following intravitreal triamcinolone administration. Indian journal of ophthalmology. 2012; 60(2):141-143. https://doi.org/10.4103/0301-4738.94059 PMid:22446913 PMCid:PMC3339077
17. Sabates R, Pruett RC, Brockhusrt RJ. Fulminant Ocular Toxoplasmosis.American Journal of Opthalmology. 1981; 92(4):497-503. https://doi.org/10.1016/0002-9394(81)90642-5
18. Aberdein J and Singer M. Clinical Review: A Systematic Review of Corticosteroid Use in Infections. Critical Care. 2005; 10:203-213. https://doi.org/10.1186/cc3904 PMid:16356204 PMCid:PMC1550829
_______________________________________________________________________________________________________________________________
Open Access Maced J Med Sci. 2019 Jun 15; 7(11):1825-1827. 1825
ID Design Press, Skopje, Republic of Macedonia Open Access Macedonian Journal of Medical Sciences. 2019 Jun 15; 7(11):1825-1827. https://doi.org/10.3889/oamjms.2019.487 eISSN: 1857-9655 Case Report
Incomitant Exotropia After Nasal Polyp Surgery Ni Made Ayu Surasmiati
*, Ni Made Wasiastiti Budi, AAA Sukartini Djelantik, Ni Made Laksmi Utari, Putu Yuliawati, Ni Made
Ari Suryathi
Ophtalmology Department, Udayana University, Faculty of Medicine, Sanglah Hospital, Denpasar, Bali, Indonesia
Citation: Surasmiati NMA, Budi NMW, Djelantik AAA S, Utari NML, Yuliawati P, Suryathi NMA. Incomitant Exotropia after Nasal Polyp Surgery. Open Access Maced J Med Sci. 2019 Jun 15; 7(11):1825-1827. https://doi.org/10.3889/oamjms.2019.487
Keywords: Incomitant; Exotropia; Nasal Polyp
*Correspondence: Ni Made Ayu Surasmiati. Ophthalmology Department, Udayana University Faculty of Medicine Sanglah Hospital, Denpasar, Bali - Indonesia. E-mail: [email protected]
Received: 21-Apr-2019; Revised: 25-May-2019; Accepted: 26-May-2019; Online first: 14-Jun-2019
Copyright: © 2019 Ni Made Ayu Surasmiati, Ni Made Wasiastiti Budi, AAA Sukartini Djelantik, Ni Made Laksmi Utari, Putu Yuliawati, Ni Made Ari Suryathi. This is an open-access article distributed under the terms of the Creative Commons Attribution-NonCommercial 4.0 International License (CC BY-NC 4.0)
Funding: This research did not receive any financial support
Competing Interests: The authors have declared that no competing interests exist
Abstract
BACKGROUND: Incomitant exotropia is one of ocular complication that has been reported after intranasal surgery. This case report aims to describe the causes of exotropia in a patient with a history of nasal polyp surgery.
CASE PRESENTATION: A 50-years-old male, came with the main complaint of double vision 1 month after nasal polyp surgery. He also complained his right eye turned outward. The visual acuity on the right eye was 6/7.5 with his head turn to the left. On the examination, the Hirschberg test was XT 45°, and the Krimsky test > 95 ∆BI. Duction and version test on the right eye were -4 adduction. There was no shifting on the cover-uncover test. Ishihara test was within normal limit, and there was suppression on the right eye in WFDT. On force generation test, we found limited adduction on the right eye and no restriction in force duction test. Head MRI showed atrophy of medial recti on the right eye, 2.2 mm in size. The patient underwent vertical muscle transposition procedure surgery, and it was found atrophy of medial recti without any rupture. Two months after surgery, the double vision was decreased, the result of the Hirschberg test was XT 30° and Krimsky test 65°∆BI.
DISCUSSION: Nasal polyp surgery-related incomitant exotropia mostly caused by extraocular muscles rupture. In this case, we found no rupture. Therefore, we suspected the abnormalities of muscles vascularisation, supported by the atrophy of medial recti.
Introduction
A nasal polyp is a chronic inflammatory process in the nasal mucosa, or paranasal sinuses which characterised by edematous mass with infection is the most important factor in this process. Prevalence of polyp nasal in Indonesian was up to 4.63% of all register patient at Dr Soetomo Surabaya Hospital. In the last ten years, sinus surgery techniques that commonly used is Endoscopic, which is commonly used for intranasal ethmoidectomy. Besides the advantage, endoscopic had a risk to damage the extraocular muscle, especially at ethmoidal sinuses. The estimated rate of ocular injury after intranasal sinus surgery is up to 3%. The most common ocular complications after paranasal and intranasal polyps' surgery such as extraocular muscle rupture and extraocular muscle paralysis, vascular disorders or extraocular muscle innervation, microvascular infarction, chronic infection or inflammation, tumour mass compression. Incomitant
exotropia is one of ocular complication that had been reported after intranasal surgery [1], [2]. Incomitant exotropia is a form of strabismus which is outward deviation of the eyes with different angles of deviation in different motion field. The most common caused is due to paralysis or restriction [3], [4].
This case report aims to describe the causes of exotropia in a patient with a history of nasal polyp surgery.
Case Presentation
A 50-years old, male patient whose initial presentation was a double vision in the past one month after nasal polyp surgery, and it had been getting worse. The right eye turned outward with minimal blurry vision. History of trauma and neurological disorder was denied.

Case Report _______________________________________________________________________________________________________________________________
_______________________________________________________________________________________________________________________________
1826 https://www.id-press.eu/mjms/index
Figure 1: Physical finding before polyp surgery (left) dan after polyp surgery (right)
The visual acuity on the right eye was 6/7.5 with his head turn to the left. Position of the right eye was deviation laterally. On the examination, the Hirschberg test was XT 45°, and the Krimsky test > 95 ∆BI. Duction and version test on the right eye were -4 adduction. There was no shifting on the cover-uncover test. Ishihara test was within normal limit, but at Farnsworth D-15 test was found a red-green colour deficiency. There was suppression on the right eye in WFDT. The TNO test showed gross stereoscopies. On force generation test, we found limited adduction on the right eye and no restriction in force duction test.
Figure 2: Ocular movements showed right exotropia
Head MRI showed right medial rectus muscle atrophy 2.2 mm in size, hypertrophy inferior nasal concha extra and sinistra, right lateral nasal cavum deformity post-surgery, chronic of right maxillary sinusitis, right and left ethmoid, and middle left frontal.
Figure 3: Head MRI showed atrophy of medial recti
We planned surgery on the right eye, with vertical muscle transposition procedure.
During the evaluation, there was no restriction of medial recti muscle on Forced Duction Test. Atrophy of medial recti was found during exploration right eye surgery. The medication after surgery was topical antibiotic-antiinflammation.
Figure 4: Atrophy of medial recti was found during exploration right eye surgery
Two months after surgery, the double vision was decreased, the result of the Hirschberg test was XT 30° and Krimsky test 65°∆BI.
Figure 5: Ocular movements after vertical muscle transposition procedure
Discussion
A nasal polyp is a chronic inflammatory process in the nasal mucosa, or paranasal sinuses which characterised by edematous mass with infection is the most important factor in this process. Incomintant exotropia is most commonly affect ages between 30-60 years old; the prevalence of incotamitant exotropia is higher in males compared to female with ratio 2:1 to 4:1 [1].
The mechanism of ocular complications after paranasal and intranasal polyps' surgery, the most common causes due to extraocular muscle rupture and extraocular muscle paralysis, vascular disorders or extraocular muscle innervation, microvascular

Surasmiati et al. Incomitant Exotropia after Nasal Polyp Surgery _______________________________________________________________________________________________________________________________
_______________________________________________________________________________________________________________________________
Open Access Maced J Med Sci. 2019 Jun 15; 7(11):1825-1827. 1827
infarction, chronic infection or inflammation, tumour mass compression. Complications such as enophthalmos, optic nerve atrophy, orbital cellulitis, orbital bleeding, orbital wall damage, proptosis, ptosis, strabismus [1], [5].
Incomitant exotropia is a form of strabismus which is outward deviation of the eyes with different angles of deviation in different motion field. The most common caused is due to paralysis or restriction. A subjective complaint of concomitant exotropia such as diplopia, the type of diplopia is binocular diplopia, which occurs when both eyes are open and feels better when one eye is closed. Based on its location in medial rectus atrophy, the type of diplopia is horizontal. The patient complains about the double vision that is worsening if they look far away and if they look the side to damaged muscle. When diplopia complains occur, the patient frequently closes their eyes spontaneously. Usually, patients will close the disturbance eyes. Changes in head position in patients with incomitan strabismus could reduce diplopia [3], [4].
In incomitan strabismus, due to medial rectus atrophy, there is a change of direction towards the vertical axis due to horizontal muscle disorders, which are called the anomalous head position or face turn. The examination of eyeballs position can be done by cover-uncover test, alternating cover test, prism alternating cover test (PACT), cornea light reflex test (Hirschberg test) and krismsky test. In this case, we obtained on a cover-uncover examination and the alternating cover test but did not show shifting. In Hirschberg's examination found 45° exotropia, Krimsky > 95 ∆ base in [3], [6].
Sensory status examination in strabismus patients to evaluate abnormalities of binocular vision. The most common sensory status examination that performed by ophthalmologists are worth a four-dot test (WFDT) and stereoscopic. The patient, in this case only sees 2 red dots in the WDFT exam which means there is suppression in the right eye [3].
The common binocular sensory examination is a stereoscopic examination. Stereoscopic is a technique for creating or enhancing an illusion in a depth image for binocular vision and could be evaluated by TNO test. In this test, red and green glasses are used to separate shadows in each. Patient in this case report found stereoscopic gross [3], [6].
In the last ten years, sinus surgery techniques that commonly used is Functional Endoscopic Sinus Surgery (FESS), especially for surgery for sinus obstruction. Although this procedure is stated to be relatively safe, FESS can cause tissue trauma such as orbital bleeding, optic nerve injury, nasolacrimal drainage system injury, extraocular muscle rupture. Besides that, extraocular muscle paralysis, vascularity
disorders or extraocular muscle innervation, microvascular infarction, chronic infection or inflammation, and tumour mass compression also can be caused the muscular injury. The supportive examination is the head MRI which was found atrophy in the right medial rectus muscle with a size of 2.2 mm, hypertrophy of the left and right inferior nasal conca, postoperative right lateral nasal cavity deformity, right maxillary sinusitis. This is suspected as a cause of ocular complications that happened due to vascular disorders and innervation as well as the process of chronic infection or inflammation of polyps [7].
There are so many of literature regarding exotropia management such as surgical and non-surgical, but according to Dutton's research the goal of muscle atrophy management that caused by chronic inflammation and tumour mass suppression is to overcome and reduce diplopia, restore binocular single vision and a small portion can handle cosmetics. Two-month evaluation of postoperative, the double vision was reduced, Hirschberg's examination found exotropia 30° and Krimsky 65 ∆ base in.
In conclusion, incomitan exotropia is one of the reported ocular complications that can occur due to extraocular muscle atrophy which caused by vascular disorders or innervation of these muscles and can occur due to the process of chronic infection or inflammation of the surrounding tissue. The purpose/goal of surgery in such cases is to overcome and reduce the diplopia, and in small amounts can handle cosmetics.
References
1. Dutton J, Clarke MP, Strong NP, Tin W. Clinical Strabismus Management. 1999:319-320.
2. Eitzen JP, Elsas FJ. Strabismus following endoscopic intranasal sinus surgery. J Pediatric Ophthalmology Strabismus. 1991. 28:168. PMID : 1890576
3. American Academy of Ophthalmology Staff. Pediatric Ophthalmology and Strabismus. Basic and Clinical Science Course. Section 6. San Fransisco. 2015-2016; 87-98.
4. Eva Paul R, Whitcher, John P. Vaughan and Asbury's General Ophthalmology. 16th edition. 2004:230-248.
5. Al-Qurainy IA. Convergence Insufficiency and Failure of Accommodation Following Midfacial Trauma. BrJ Oral Maxillofac Surg. 1995. 33:71. https://doi.org/10.1016/0266-4356(95)90203-1
6. Wright K. Pediatric Ophthalmology for Primary Care. American Academy of Pediatric 3rd edition. 2008:49-70.
7. Shin GS, Demer JL, Rosenbaum AL. High Resolution, Dynamic Magnetic Resonance Imaging in Complicated Strabismus. J Pediatric Ophthalmology Strabismus. 1996. 33:282.

_______________________________________________________________________________________________________________________________
1828 https://www.id-press.eu/mjms/index
ID Design Press, Skopje, Republic of Macedonia Open Access Macedonian Journal of Medical Sciences. 2019 Jun 15; 7(11):1828-1833. https://doi.org/10.3889/oamjms.2019.359 eISSN: 1857-9655 Dental Science
Influence of Er, Cr: YSGG (2780 nm) and Nanosecond Nd: YAG Laser (1064 nm) Irradiation on Enamel Acid Resistance: Morphological and Elemental Analysis
Maryam M. El Mansy1*
, Mostafa Gheith2, Abo M. El Yazeed
3, Dina B. E. Farag
4
1Orthodontic and Pedodontic Department, National Research Centre, Cairo, Egypt;
2National Institute of Laser Enhanced
Sciences, Cairo University, Cairo, Egypt; 3Pediatric Dentistry, National Research Centre, Cairo, Egypt;
4Oral Biology
Department, Faculty of Dentistry, Cairo University, Cairo, Egypt
Citation: El Mansy MM, Gheith M, El Yazeed AM, Farag DBE. Influence of Er, Cr: YSGG (2780 nm) and Nanosecond Nd: YAG Laser (1064 nm) Irradiation on Enamel Acid Resistance: Morphological and Elemental Analysis. Open Access Maced J Med Sci. 2019 Jun 15; 7(11):1828-1833. https://doi.org/10.3889/oamjms.2019.359
Keywords: Enamel demineralisation; Er, Cr: YSGG laser; Nanosecond Nd: YAG laser; Enamel acid resistance
*Correspondence: Maryam M. El Mansy. Orthodontic and Pedodontic Department, National Research Centre, Cairo, Egypt. E-mail: [email protected]
Received: 17-Mar-2019; Revised: 15-May-2019; Accepted: 16-May-2019; Online first: 30-May-2019
Copyright: © 2019 Maryam M. El Mansy, Mostafa Gheith, Abo El Yazeed M, Dina B. E. Farag. This is an open-access article distributed under the terms of the Creative Commons Attribution-NonCommercial 4.0 International License (CC BY-NC 4.0)
Funding: This research did not receive any financial support
Competing Interests: The authors have declared that no competing interests exist
Abstract
BACKGROUND: Enamel demineralisation is an initial step of the serious dental problem including dental caries, white spot lesions and dental erosion.
AIM: Compare the effect of Er, Cr: YSGG (λ = 2780 nm) and nanosecond Nd: YAG (λ = 1064 nm) laser on enamel acid resistance.
MATERIAL AND METHODS: Thirty non-carious human premolars, extracted for orthodontic reasons, were used. The experimental groups (n = 10 each group) were: Group I, untreated (control); Group II, Er,Cr:YSGG laser irradiation (0.75 W, 20 Hz, 140 μs, 10 s); Group III, nanosecond pulsed Nd:YAG laser irradiation (0.8 W, 10 Hz, 7 ns, 10 s). Scanning electron microscope and Energy Dispersive X-ray Spectroscopy (EDX) were used to assess acquired enamel resistance to PH cycling.
RESULTS: After subjecting the three experimental groups to PH cycling, scanning electron microscopic examination revealed irregular porous dissoluted enamel surface in group I. However, groups II and III demonstrated partially dissoluted enamel surface. EDX analysis demonstrated the lowest mean percentage decrease in calcium and phosphorus content in group II followed by group III, then the highest mean percentage decrease was observed in untreated group I. One-way ANOVA revealed significant differences (p < 0.0001) between the tested groups.
CONCLUSIONS: Both Er, Cr: YSSG and nanosecond Nd: YAG laser irradiation were able to improve the acid resistance of enamel. However, enamel surface treated with Er, Cr: YSSG laser showed the lowest mean percentage decrease of calcium and phosphorus (highest acid resistance).
Introduction
Dental caries is a biofilm-mediated, sugar driven multifactorial, preventable, dynamic disease that occurs as a result of two interacting processes; demineralisation and remineralisation of dental hard tissues [1]. Enamel demineralisation is not only the initial step dental caries and white spot lesions, but also it is the first stage of another serious dental problem, which is dental erosion [2].
Several approaches have been made to increase enamel resistance to caries; among them, laser irradiation seems to be very promising [3]
due to
its strong interaction with dental hard tissues [4].
Lasers that have a higher absorption by dental enamel, such as CO2 (9.6 μm and 10.6 μm) [5]. Er: YAG (2.94 μm) [6] and Er, Cr: YSGG (2.79 μm) [3]
were demonstrated to promote acid resistance of enamel. The low absorbed lasers such as Nd: YAG (1.064 μm) [7]
and Argon [8]
have also been employed
with success.
Er, Cr: YSGG laser emitted at 2780 wavelength is well absorbed by water and hydroxyl radical in the hydroxyapatite. Thus, this type of laser has the potentiality to improve enamel acid resistance and prevent mineral loss by inducing chemical and morphological changes in enamel without an excessive increase of heat [9], [10].
Although the role of longer pulsed Nd: YAG

El Mansy et al. Influence of Er,Cr YSGG (2780 nm) and Nanosecond Nd:YAG Laser (1064 nm) Irradiation on Enamel Acid Resistance _______________________________________________________________________________________________________________________________
_______________________________________________________________________________________________________________________________
Open Access Maced J Med Sci. 2019 Jun 15; 7(11):1828-1833. 1829
laser on the acid resistance of enamel have been well established, the application of nanosecond pulsed Nd: YAG laser on dental enamel surface still needs to be improved [11]. The Q-switched Nd: YAG laser system with nanosecond pulses offers a significant advantage over long pulsed Nd: YAG laser as regard to pulpal heating. Previous studies showed that the temperature rise associated with nanosecond Nd: YAG irradiation is inferior to 2.5°C, which justifies its use without pulpal damage [12], [13]. It was reported that nanosecond pulsed Nd: YAG laser can be used to obtain minimal morphological alteration associated with a chemical reorganisation enhancing the microhardness values and consequently inhibiting the enamel acid dissolution [11].
Since the effect of laser irradiation on acid resistance of enamel has been observed, the studies on comparisons of acid resistance of enamel when irradiated with Er, Cr: YSGG and nanosecond pulsed Nd: YAG lasers are scarce.
The present work aims to evaluate and compare the influence of Er, Cr: YSGG and nanosecond Nd: YAG laser irradiation on acquired enamel acid resistance through scanning electron microscope examination and elemental analysis.
Material and Methods
This experimental in vitro study was held in the labs of the National Research Centre and dental laser Centre Ain Shams University, after the approval of the local ethical committee of the National Research Centre. Thirty non-carious human premolars, extracted for orthodontic reasons, were selected randomly from unknown persons.
Specimen Preparation: Each enamel surface was rinsed with deionised water and examined under a stereomicroscope (Leica Microsystem S, Switzerland). Teeth with any defects, erosions, micro-cracks or visible stains were excluded from the study. A window (4×4 mm) was measured by calibre and marked with two layers of an acid-resistant varnish. The window was located in the middle of the middle third of the buccal enamel surface [14]. All the teeth were stored in deionised water for not more than 1 week.
Experimental design: The specimens were randomly assigned to three groups of (10 specimens each) as follows: Group 1: No treatment (control), Group 2: Treated with Er, Cr: YSSG laser and Group 3: Treated with nanosecond pulsed Nd: YAG laser.
The specimens from all groups were then subjected to PH cycling (demineralisation).
Experimental procedures
a) Er,CR:YSGG laser irradiation conditions: A pulsed Er,CR:YSGG laser (Waterlase, Biolase, USA) at 2780 nm wavelength was used with the following parameters: 0.75 W, power, 12.5 mJ, pulse energy, 20 Hz, repetition rate, 140 μs, pulse width and 10 s average exposure time. The air pressure and water level were set at 11 % and 0 % respectively. Laser tip type used in the study was MZ6 Zirconia (Biolase, MD, USA)
with a length of 4 mm and diameter 600
μm. The tip was positioned perpendicular 1 mm from the enamel surface, and the samples were irradiated by scanning once in each direction, horizontal and vertical, to promote homogeneous irradiation and to cover the entire sample area. An endodontic file was fixed at the handpiece and kept a distance of 1 mm from the surface during all the procedures.
b) Nd: YAG laser irradiation conditions: A pulsed nanosecond Nd-YAG laser
(Continuum laser,
Powerlite, DLS 9000, USA) at 1064 nm wavelength was used with the following parameters: 0.8 w power, 10 Hz Repetition rate,7 ns pulse width and 10 seconds average exposure time.
c) PH cycling model: For the acid challenge, samples were submitted to a pH cycling procedure, according to previously described protocols [15], [16]. The demineralisation solution (pH 4.3) consisted of 2.0 mmol/L of Ca, 2.0 mmol/L of phosphate in a buffer solution of acetate 0.075 mol/L. Remineralization solution (pH 7.0) consisted of 1.5 mmol/L of Ca, 0.9 mmol/L of phosphate, 150 mmol/L of potassium chloride. PH was measured by a pH meter to verify the required pH accurately.
Each specimen was individually immersed in 5.0 ml of demineralising solution for 6 hours and was then washed with deionised water. This was followed by immersing the samples again in 5 ml of remineralising solution for 18 hours, which was then washed off with deionised water. This procedure was carried out for 14 days. At the end of each 5 consecutive days of cycling, the samples were kept in the remineralising solution for 2 days.
Scanning electron microscope analysis
Scanning electron microscope analysis was performed to analyse the surface morphology of the specimens at the baseline, and after pH cycling. The specimens were air-dried then examined under SEM (Quanta FEG 250/ EDS, Octane Pro, USA) at x 1000 and x5000 magnification.
Energy Dispersive X-ray Spectroscopy (EDX) analysis
Elemental analysis of enamel surface in all groups was performed at baseline of untreated sound enamel then after exposure to pH cycling. The EDX

Dental Science _______________________________________________________________________________________________________________________________
_______________________________________________________________________________________________________________________________
1830 https://www.id-press.eu/mjms/index
analysis system works as an integrated part of SEM Quanta FEG 250, attached with EDX unit. The quantitative amount of elements in the studied surfaces was determined by an X-ray microanalyser EDX using spot measurements, EDX line scans and element mapping. Weight percentage values of Calcium and Phosphorus elements were expressed as mean values.
Statistical analysis
The data obtained from the elemental analysis were subjected to statistical analysis using the SPSS software. The Shapiro-Wilk test was carried to assess the normal distribution of data. The results were analysed by ANOVA. Multiple comparisons between groups were performed by paired t-test and post-hoc Tukey test. For the entire evaluation, p was <0.05 considered to be statistically significant.
Results
SEM analysis
SEM observation showed a smooth homogenous surface at the baseline for all the experimental groups (Figure 1).
Figure 1: Scanning electron microscopic photomicrograph of sound enamel surface showing: A) smooth homogenous surface of rodless enamel (asterisks); B) the surface contained multiple scratches (red arrows); A) SEM x 1000; B) SEM x 5000)
After exposure to pH cycling, a group I, showed irregular porous dissoluted enamel surface (Figure 2).
Figure 2: Scanning electron microscopic photomicrograph of group I (untreated) showing: A) irregular dissolution porous enamel surface, B) hollowing of rod core (red arrows), raised peripheral region (yellow arrows), indistinct rod morphological appearance (asterisks); (A; SEM x1000, B; SEM x5000)
In contrast, a partially dissolved enamel surface was observed in both group II (Figure 3) and group III (Figure 4).
Figure 3: Scanning electron microscopic photomicrograph of group II (enamel treated with Er,Cr:YSGG laser) showing: (A) partially porous enamel structure intermixed with areas of rodless enamel, (B) intact rod core (red arrow), loss of rod peripheries (yellow arrow), loss of rod core (white arrow), smooth rodless enamel (asterisk). (A; SEM x 1000, B; SEM x 5000)
Energy Dispersive X-ray Spectroscopy (EDX) analysis
Comparison between the Ca and P weight percentage (mean±standard deviation) values at baseline and after demineralisation cycle within each group using paired t-test was displayed in (Table1 and 2). In all group's values of Ca and P weight percentage were significantly lower after exposure to demineralisation cycle (p < 0.0001).
Figure 4: Scanning electron microscopic photomicrograph of group III (enamel treated with Nd:YAG laser) showing: (A) partially dissoluted enamel surface, (B): eroded rod peripheries (yellow arrows), intact rod core (red arrow), fine cracks (white arrows), smooth enamel surface with no enamel rod exposure (asterisk). (A; SEM x1000, B; SEM x5000)
The mean difference of change in Ca and P weight percentage at baseline and after demineralisation within each group was calculated. Mean percentage decrease in Ca and P within each group was obtained. One-way ANOVA revealed significant differences (p < 0.0001) between the tested groups. The lowest mean percentage decrease values were recorded in group II, followed by group III, then the highest mean percentage decrease was observed in the control group (group I) (Table 1 and 2). Multiple pairwise comparisons were then made between the three groups. For Ca, group II demonstrated a significant percentage decrease as compared to group I and III. Also, group III showed a significant decrease as compared to group I (Table 1). Regarding P, the mean percentage decrease in group II differed significantly from the group I but not with

El Mansy et al. Influence of Er,Cr YSGG (2780 nm) and Nanosecond Nd:YAG Laser (1064 nm) Irradiation on Enamel Acid Resistance _______________________________________________________________________________________________________________________________
_______________________________________________________________________________________________________________________________
Open Access Maced J Med Sci. 2019 Jun 15; 7(11):1828-1833. 1831
group III. However, a significant decrease was recorded in group III as compared to the control group (Table 2).
Table 1: Descriptive analysis for weight percentage of calcium
Groups Mean ±
SD
Within-group comparison Paired t-test
Mean difference ±
SD
Mean percentage decrease ±
SD
ANOVA
p-value p-value
Group I (Untreated)
Baseline 56.26 ± 2.23 < 0.0001* 41.21 ± 2.84
a 73.19 ± 3.11
< 0.0001*
DC 15.06 ± 1.55 Group II (Er,Cr:YSSG laser)
Baseline 56.25 ± 1.84 < 0.0001* 13.51 ± 1.51
b 24.00 ± 2.48
DC 42.75 ± 1.89
Group III (Nanosecond Nd:YAG laser)
Baseline 55.58 ± 3.83 < 0.0001* 23.03 ± 2.95
c 41.51 ± 2.65
DC 32.56 ± 3.18
*Significance level at p-value ≤ 0.05. DC: Demineralization cycle; Post-hoc Tukey’s Test mean with the different superscript letter are significantly different (p < 0.0001).
Discussion
Overall management of dental caries and erosion involves consideration of methods of preventing demineralisation and also methods of encouraging remineralisation of existing lesions [17]. Researchers often use in vitro studies to study the demineralisation-remineralisation process in cariology research. The in vitro studies are simple and easy to control to meet the research requirements with more reliable assessment methods that cannot be used for in vivo experiments [1]. Based on this information, this study was carried on in vitro conditions.
Table 2: Descriptive analysis for weight percentage of phosphorus
Groups Mean ± SD
Within-group comparison Paired t-test
Mean difference ± SD
Mean percentage decrease ± SD
ANOVA
p-value p-value
Group I (Untreated)
Baseline 25.94 ± 2.15 < 0.0001* 14.84 ± 2.17
a 57.14 ± 5.62
< 0.0001*
DC 11.09 ± 1.59 Group II (Er,Cr:YSSG laser)
Baseline 25.74 ± 0.79 < 0.0001* 8.40 ± 0.87
b 32.68 ± 3.73
DC 17.34 ± 1.33
Group III (Nanosecond Nd:YAG laser)
Baseline 24.93 ± 0.91 < 0.0001* 10.15 ± 1.28
b 40.70 ± 4.74
DC 14.78 ± 1.28
*Significance level at p-value ≤ 0.05. DC: Demineralization cycle; Post-hoc Tukey’s Test: means sharing the same superscript letter are not significantly different (p = 0.2442), means with the different superscript letter are significantly different (p < 0.0001).
There are still many conflicts concerning the effect of laser irradiation on the enamel structure. This is most probably due to the high number of variables involved as it is a multifactorial process: power, pulse frequency and duration of irradiation [18]. Thus, the choice of laser parameters for different applications is very important. Regarding irradiation parameters used in the present study, all the irradiation conditions in both Er, Cr: YSGG or nanosecond Nd-YAG lasers aimed to be below the ablation threshold to avoid mechanical damage to the enamel.
Although the use of water can control the temperature increase, the water sprayed directly onto the surface of irradiated tissue can lead to greater enamel demineralisation and more ablation during an acid challenge [19].
Geraldo-Martins et al., [14]
concluded that, the presence of water during Er, Cr: YSGG laser irradiation makes it difficult to obtain an
enamel surface more resistant to acids. Therefore, we did not utilise the water spray in the present study.
The Er, Cr: YSGG power used in the present study was (0.75 W). This was based on previous studies which compared this power (0.75 W) with other Er, Cr: YSGG power values or with other types of lasers. Results revealed that 0.75 W power gave the best results regarding acid resistance enhancement [20], [21], [22]. The power of nanosecond Nd: YAG laser used in the herein study was 0.8 W. It was selected according to a previous pilot study done with 3 samples with different powers; 0.5 W, 0.8 W and 1.2 W. The power of 0.8 W revealed the best results concerning the morphological and elemental analyses. On the other hand, the power of 0.5 W did not produce any apparent effect, and 1.2 W produced an ablative effect on the enamel surface.
In the current study, several methods were used to evaluate enamel acquired acid resistance. Structural analysis was performed using a scanning electron microscope. It is used widely for studying the morphological changes of enamel and the effect of different treatment methods on its surface [23], [24]. Therefore, SEM was employed in this investigation. SEM analysis in the present study showed a smooth homogenous surface with a uniform rodless enamel surface layer at the baseline for all the experimental groups. This was by Huang et al.,
[25] and El Moshy
et al., [26] who demonstrated a smooth surface of untreated sound enamel. In Group I (untreated enamel) after pH cycling, SEM revealed irregular porous dissoluted enamel surface. Same findings were conducted by Zorba et al., [27] who demonstrated multiple pores in the etched enamel surface.
After subjecting enamel treated with Er, Cr: YSSG laser in group II to pH cycling, partially porous enamel structure intermixed with areas of rodless enamel that covered the underlying structure was observed by SEM. This was in agreement with Hossain et al., [28], Moslemi M et al., [29], and Geraldo-Martins et al., [14] who in their individual studies reported a significant decrease in enamel demineralization after surface treatment with Er, Cr: YSGG laser compared to the control group. This was attributed to the well-known thermal effect of erbium laser and its positive role in enhancing the enamel acid resistance by modification of the chemical and physical structure of enamel [21].
In Group III (enamel treated with nanosecond pulsed Nd: YAG laser), SEM after pH cycling revealed partially dissoluted enamel surface intermixed with some relatively smooth areas indicating enhanced resistance to acid dissolution. This result was in agreement with Al Jedani et al., [30] who found that enamel surface treated with nanosecond Nd: YAG showed acquired acid resistance.
In the present study, EDX was used as an elemental analytic method for both Ca and P since the

Dental Science _______________________________________________________________________________________________________________________________
_______________________________________________________________________________________________________________________________
1832 https://www.id-press.eu/mjms/index
main components of enamel hydroxyapatite are Ca and P [31]. This method permits fast and quantitative microanalysis estimating the number of minerals in a given tooth sample in a nondestructive manner [32].
The mean difference of change in Ca and P at baseline and after demineralisation within each group was calculated. This was used to obtain Ca and P percentage decrease within each group. Acquired enamel acid resistance was estimated in terms of percentage decrease values in Ca and P, along with all the experimental groups.
Results in the current work showed that the lowest mean percentage decrease in Ca and P was recorded in Er, Cr: YSSG group (II) followed by nanosecond Nd: YAG group (III), then the highest mean percentage decrease was observed in control untreated group (I). This indicates that the highest acquired enamel acid resistance was achieved upon Er, Cr: YSSG laser irradiation. In this study, upon pairwise comparison for mean percentage decrease values, the difference between both group II and III as compared to the control group was statistically significant. This indicates that both types of laser treatments improved the enamel acid resistance significantly. Our findings were in agreement with many previously reported results concerning acquired enamel acid resistance following treatment with Er, Cr: YSGG laser application [14], [21] or nanosecond Nd: YAG laser [11], [30].
Going through pairwise comparison results in the current work, the difference between group II and III was statistically significant regarding Ca percentage decrease. However, no significant difference was recorded with P. This showed that nanosecond Nd: YAG had a similar effect as Er, Cr: YSSG as regard to percentage decrease of P.
From the present study, it could be concluded that under pH, cycling conditions, both Er, Cr: YSSG and nanosecond Nd: YAG laser irradiation improved the acid resistance of enamel. However, enamel surface treated with Er, Cr: YSSG laser showed the lowest mean percentage decrease of calcium and phosphorus (highest acid resistance). Although Er, Cr: YSSG and nanosecond Nd: YAG laser seems to be a promising treatment in preventive dentistry, further researches are needed to verify the role of laser irradiation parameters to take better benefits of laser potential in enhancing enamel acid resistance.
References
1. Pitts NB, Zero N, Marsh D, Ekstrand K, Weintraub J, Ramos-Gomez F, Tagami J, Twetman S, Tsakos G, Ismail A. Dental caries. Nature Reviews Disease Primers. 2017; 3:17030. https://doi.org/10.1038/nrdp.2017.30 PMid:28540937
2. Yu OY, Zhao IS, Mei L, Lo E, Chu C. A Review of the common
models used in mechanistic studies on demineralization-remineralization for cariology research. Dentistry Journal. 2019; 18:5(2)588-597. https://doi.org/10.3390/dj5020020 PMid:29563426 PMCid:PMC5806972
3. Apel C, Meister J, Schmitt N, Graber HG, Gutknecht N. Calcium solubility of dental enamel following sub-ablative Er:YAG and Er:YSGG laser irradiation in vitro. Lasers in Surgery and Medicine. 2002; 30:337-341. https://doi.org/10.1002/lsm.10058 PMid:12116325
4. Fried D, Featherstone JD, Visuri S, Seka W, Walsh J. The caries inhibition potential of Er:YAG and Er:YSGG laser radiation. Society of Photo-Optical Instrumentation Engineers (SPIE). 1996; 2672:73-78. https://doi.org/10.1117/12.238755
5. Featherstone JD, Barrett-Vespone NA, Fried D, Kantorowitz Z, Seka W. CO2 laser inhibitor of artificial caries-like lesion progression in dental enamel. Journal of Dental Research. 1998; 77:1397-1403. https://doi.org/10.1177/00220345980770060401 PMid:9649168
6. Delbem AC and Cury JA. Effect of application time of APF and NaF gels on microhardness and fluoride uptake of in vitro enamel caries. American Journal of Dentistry. 2002; 15:169-72.
7. Zezell DM, Boari HG, Ana PA, Eduardo Cde P, Powell GL. Nd:YAG laser in caries prevention: a clinical trial. Lasers in Surgery and Medicine. 2009; 41:31-35. https://doi.org/10.1002/lsm.20738 PMid:19143016
8. Nammour S, Demortier G, Florio P, Delhaye Y, Pireaux JJ, Morciaux Y, Powell L. Increase of enamel fluoride retention by low fluence argon laser in vivo. Lasers in Surgery and Medicine: The Official Journal of the American Society for Laser Medicine and Surgery. 2003; 33(4):260-3. https://doi.org/10.1002/lsm.10219 PMid:14571451
9 Jorge AC, Cassoni A, de Freitas PM, Reis AF, Brugnera Junior A, Rodrigues JA. Influence of cavity preparation with Er,Cr:YSGG laser and restorative materials on in situ secondary caries development. Photomedicine and Laser Surgery. 2015; 33:98-103. https://doi.org/10.1089/pho.2014.3815 PMid:25654424 PMCid:PMC4340635
10. Scatolin RS, Colucci V, Lepri TP, Alexandria AK, Maia LC, Galo R, Borsatto MC, Corona SA. Er:YAG laser irradiation to control the progression of enamel erosion: an in situ study. Lasers in Medical Science. 2015; 30:1465-1473. https://doi.org/10.1007/s10103-014-1620-6 PMid:24985348
11. Antunes A, Salvador V, Scapin M A, de Rossi W, Zezell DM. Nanosecond Nd:YAG laser on dental enamel: compositional analysis by X-ray fluorescence. Laser Physics Letters. 2005; 2(6):318-323. https://doi.org/10.1002/lapl.200410181
12. Kimura Y, Wilder-Smith P, Arrastia-Jitosho AM, Liaw LH, Matsumoto K, Berns MW. Effects of nanosecond pulsed Nd: YAG laser irradiation on dentin resistance to artificial caries-like lesions. Lasers in Surgery and Medicine. 1997; 20(1):15-21. https://doi.org/10.1002/(SICI)1096-9101(1997)20:1<15::AID-LSM3>3.0.CO;2-1
13. Antunes A, de Rossi W, Zezell DM. Spectroscopic alterations on enamel and dentin after nanosecond Nd:YAG laser irradiation. Spectrochimica Acta Part A. 2006; 64:1142-1146. https://doi.org/10.1016/j.saa.2005.11.036 PMid:16822709
14. Geraldo-Martins VR, Lepri CP, Palma-Dibb RG. Influence of Er,Cr:YSGG laser irradiation on enamel caries prevention. Lasers in Medical Science. 2013; 28:33-39. https://doi.org/10.1007/s10103-012-1056-9 PMid:22350424
15. Apel C, Meister J, Götz H, Duschner H, Gutknecht N. Structural changes in human dental enamel after subablative erbium laser irradiation and its potential use for caries prevention. Caries Research. 2005; 39(1):65-70. https://doi.org/10.1159/000081659 PMid:15591737
16. Rehder Neto FC1, Maeda FA, Turssi CP and Serra MC. Potential agents to control enamel caries-like lesions. Journal of Dentistry. 2009; 37(10):786-90. https://doi.org/10.1016/j.jdent.2009.06.008 PMid:19595495

El Mansy et al. Influence of Er,Cr YSGG (2780 nm) and Nanosecond Nd:YAG Laser (1064 nm) Irradiation on Enamel Acid Resistance _______________________________________________________________________________________________________________________________
_______________________________________________________________________________________________________________________________
Open Access Maced J Med Sci. 2019 Jun 15; 7(11):1828-1833. 1833
17. Mabry TR. Prevention of Dental Disease, n 39. Textbook of Pediatric Dentistry: Infancy Through Adolescence (6th Edition). Nowak A, Christensen J R, Mabry T R, Townsend J A and Wells M H (eds). ELSEVIER, 2019:588-597.
18. Castellan CS, Luiz AC, Bezinelli LM, Lopes RM, Mendes FM, De P Eduardo C, De Freitas PM. In vitro evaluation of enamel demineralization after Er:YAG and Nd:YAG laser irradiation on primary teeth. Photomedicine and Laser Surgery. 2007; 25:85-90. https://doi.org/10.1089/pho.2006.2043 PMid:17508842
19. De Freitas PM, Rapozo-Hilo M, Eduardo Cde P, Featherstone JD. In vitro evaluation of erbium, chromium:yttrium-scandium-gallium-garnet laser-treated enamel demineralization. Lasers in Medical Science. 2010; 25:165-170. https://doi.org/10.1007/s10103-008-0597-4 PMid:18787759
20. De Oliveira RM, de Souza VM, Esteves CM, de Oliveira Lima-Arsati YB, Cassoni A, Rodrigues JA, Brugnera Junior A. Er,Cr:YSGG Laser Energy Delivery: Pulse and Power Effects on Enamel Surface and Erosive Resistance. Photomedicine and Laser Surgery. 2017; 35(11):639-646. https://doi.org/10.1089/pho.2017.4347 PMid:29099682
21. KaurT, Tripathi T, Rai P, Kanase A. SEM Evaluation of Enamel Surface Changes and Enamel Microhardness around Orthodontic Brackets after Application of CO2 Laser, Er,Cr:YSGG Laser and Fluoride Varnish: An In vivo Study. Journal of Clinical and Diagnostic Research. 2017; 11(9): ZC59-ZC63. https://doi.org/10.7860/JCDR/2017/30292.10603 PMid:29207835 PMCid:PMC5713857
22 De Freitas PM, Rapozo-Hilo M, Eduardo CP. In vitro evaluation of erbium, chromium:yttrium-scandium-gallium-garnet laser-treated enamel demineralization. Lasers in Medical Science. 2010; 25:165. https://doi.org/10.1007/s10103-008-0597-4 PMid:18787759
23. Fukuyama M, Kawamoto C, Saikaew P, Matsuda Y, Carvalho M, Selimovic D, Sano H. Effect of topical fluoride application on enamel after in‐office bleaching, as evaluated using a novel hardness tester and a transverse microradiography method. European Journal of Oral Sciences. 2017; 125(6):471-478. https://doi.org/10.1111/eos.12386 PMid:29110340
24. Belcheva A, El Feghali R, Nihtianova T, Parker S. Effect of the carbon dioxide 10,600-nm laser and topical fluoride gel application on enamel microstructure and microhardness after acid challenge: an in vitro study. Lasers in Medical Science. 2018; 33(5):1009-
1017. https://doi.org/10.1007/s10103-018-2446-4 PMid:29354864
25. Huang X, Deng M, Liu M, Cheng L, Exterkate R, Li J, Zhou X, Cate J. Comparison of Composition and Anticaries Effect of Galla Chinensis Extracts with Different Isolation Methods. The Open Dentistry Journal. 2017; 11:447-459. https://doi.org/10.2174/1874210601711010447 PMid:28979574 PMCid:PMC5611702
26. El Moshy S, Abbass MM, El-Motayam AM. Biomimetic remineralization of acid etched enamel using agarose hydrogel model. F1000 Research. 2018; 7:1476. https://doi.org/10.12688/f1000research.16050.1 PMid:30381793 PMCid:PMC6178904
27. Zorba Y O, Arslan S, Atalay A, Özcan S. Effect of resin infiltration on enamel surface properties and Streptococcus mutans adhesion to artificial enamel lesions. Dental Materials Journal. 2015; 34(1):25-30. https://doi.org/10.4012/dmj.2014-078 PMid:25748455
28. Hossain M, Kimura Y, Nakamura Y, Yamada Y, Kinoshita JI, Matsumoto K. A study on acquired acid resistance of enamel and dentin irradiated by Er,Cr:YSGG laser. Journal of Clinical Laser Medicine and Surgery. 2001; 19:159-163. https://doi.org/10.1089/10445470152927991 PMid:11469308
29. Moslemi M, Fekrazad R, Tadayon N, Ghorbani M, Torabzadeh H, Shadkar MM. Effects of Er,Cr:YSGG laser irradiation and fluoride treatment on acid resistance of the enamel. Pediatric Dentistry. 2009; 31:409-413.
30. Al-Jedani S, Al-Hadeethi Y, Ansari MS, Razvi M. Dental Hard Tissue Ablation with Laser Irradiation. Austin Dental Sciences. 2016; 1(1):1007.
31. He B1, Huang S, Zhang C, Jing J, Hao Y, Xiao L, Zhou X. Mineral densities and elemental content in different layers of healthy human enamel with varying teeth age. Archives of Oral Biology. 2011; 56(10):997-1004. https://doi.org/10.1016/j.archoralbio.2011.02.015 PMid:21411061
32. Ballal NV, Mala K and Bhat KS. Evaluation of decalcifying effect of maleic acid and EDTA on root canal dentin using energy dispersive spectrometer. Oral Surgery, Oral Medicine, Oral Pathology, Oral Radiology and Endodontology. 2011; 112(2):e78-84. https://doi.org/10.1016/j.tripleo.2011.01.034 PMid:21530335

_______________________________________________________________________________________________________________________________
1834 https://www.id-press.eu/mjms/index
ID Design Press, Skopje, Republic of Macedonia Open Access Macedonian Journal of Medical Sciences. 2019 Jun 15; 7(11):1834-1840. https://doi.org/10.3889/oamjms.2019.478 eISSN: 1857-9655 Dental Science
Assessment of Hyaluronic Acid Gel Injection in the Reconstruction of Interdental Papilla: A Randomized Clinical Trial Sara Amr Abdelraouf
1, Omnia Aboul Dahab
2, Ahmed Elbarbary
2, Amany Mohy El-Din
1, Basma Mostafa
1*
1Surgery and Oral Medicine Department, Oral and Dental Research Division, National Research Centre, Cairo, Egypt;
2Oral
Medicine and Periodontology Department, Faculty of Dentistry, Cairo University, Cairo, Egypt
Citation: Abdelraouf SA, Dahab OA, Elbarbary A, El-Din AM, Mostafa B.. Assessment of Hyaluronic Acid Gel Injection in the Reconstruction of Interdental Papilla: A Randomized Clinical Trial. Open Access Maced J Med Sci. 2019 Jun 15; 7(11):1834-1840. https://doi.org/10.3889/oamjms.2019.478
Keywords: Deficient interdental papilla; Reconstruction; Hyaluronic acid; Injection
*Correspondence: Basma Mostafa. Surgery and Oral Medicine Department, Oral and Dental Research Division, National Research Centre, Cairo, Egypt. E-mail: [email protected]
Received: 01-Apr-2019; Revised: 29-May-2019; Accepted: 30-May-2019; Online first: 14-Jun-2019
Copyright: © 2019 Sara Amr Abdelraouf, Omnia Aboul Dahab, Ahmed Elbarbary, Amany Mohy El-Din, Basma Mostafa. This is an open-access article distributed under the terms of the Creative Commons Attribution-NonCommercial 4.0 International License (CC BY-NC 4.0)
Funding: This research did not receive any financial support
Competing Interests: The authors have declared that no competing interests exist
Abstract
BACKGROUND: Various techniques have been implemented to reconstruct the deficient interdental papilla.
AIM: The present trial was conducted to assess the effect of injection of hyaluronic acid gel for the reconstruction of deficient interdental papilla.
MATERIAL AND METHODS: Thirty-six deficient interdental papilla sites in ten patients were randomly allocated into two equal groups; intervention group who received the injection of hyaluronic acid (HA) gel and control group who received the injection of saline solution as a placebo. Each deficient papilla received three injections. The first injection was given one week following the re-evaluation period (four weeks after performing full mouth supra-gingival scaling and sub-gingival debridement). The second and third injections were given after three and six weeks, respectively. The height and surface area of black triangles were recorded at baseline before the injection procedures. The participants were recalled after three and six months from the first injection for re-measuring the recorded parameters. At 6 months, patients' satisfaction was also assessed.
RESULTS: After three and six months from baseline, the results revealed a statistically significant higher mean decrease in height and surface area of black triangles in favour of the HA group. From three to six months, there was no statistically significant difference between the two groups in both parameters. At 6 months, the HA group showed a statistically significant higher mean satisfaction score than the saline group.
CONCLUSION: The use of hyaluronic acid gel for the reconstruction of interdental papillary deficiency was effective with promising levels of patients' satisfaction.
Introduction
The interdental papilla is the gingival portion that occupies the proximal area underneath the contact between two adjacent teeth. It has distinctive anatomical, histological and molecular characteristics with tremendous significant importance from an esthetic perspective, especially in the anterior region since it is almost universally displayed during smiling [1].
The interdental papillary deficiency or "the black triangle (BT)" is a large concern for dentists and patients [2]. Black triangles are rated as the third most disliked esthetic problem below caries and apparent crown margins [3]. Also, the absence of interdental papilla contributes to chronic retention of food debris
leading to subsequent affection of periodontal health. Last but not least, it also causes phonetic problems by allowing the passage of air and saliva [4]. Reconstruction of papillary insufficiency is one of the most difficult and challenging periodontal treatments. This is because the interdental papilla is a small, fragile area with minor blood supply which seems to be the major limiting factor in all surgical and augmentation techniques aiming at reconstructing the interdental papilla [5], [6].
Several surgical approaches using traditional periodontal plastic and augmentation procedures have been proposed to overcome this problem. However, these techniques were found to be invasive with increased patient morbidity, limited success and long-term stability [7], [8]. Non-surgical attempts to treat papillary deficiencies include orthodontic, restorative approaches or a combination of both. However, these

Abdelraouf et al. Assessment of Hyaluronic Acid Gel Injection in the Reconstruction of Interdental Papilla _______________________________________________________________________________________________________________________________
_______________________________________________________________________________________________________________________________
Open Access Maced J Med Sci. 2019 Jun 15; 7(11):1834-1840. 1835
methods are invasive, but time-consuming [4].
Hyaluronic acid (HA) is an essential glycosaminoglycan of the extracellular matrix of the periodontal tissues, and the majority of cells can produce it during several phases of their cell cycle. It is involved in tissue repair and wound healing by stimulating cell proliferation, migration and interaction with several growth factors. Furthermore, HA has a crucial role in space-filling owing to its hygroscopic nature. Moreover, it regulates osmotic pressure and enhances tissue lubrication and resiliency, which helps in maintaining the structural and homeostatic integrity of tissues [9]. Limited studies have utilised HA gels for papillary reconstruction but still lacking a high degree of evidence and predictability [2], [4], [10], [11], [12]. More studies are needed to evaluate the use of injectable HA-based gels as a minimally invasive approach for the treatment of interdental papillary loss.
Therefore, the aim of this randomised, placebo-controlled, parallel-grouped clinical trial was to assess the effect of injection of HA gel for the reconstruction of deficient interdental papilla.
Material and Methods
Patients' Selection
This study was carried out according to the ethical guidelines of the World Medical Association; Declaration of Helsinki as revised in 2000 for studies involving human participants and the protocol was approved by the Medical Ethical Committee at the National Research Centre (NRC) with a code no. 16 7 27. The procedures and follow up periods were clearly described in details to the selected patients. All included subjects signed written consent with the full agreement of participation in this study.
Sample size calculation based on previously published work [10], [11], [12] showed the probability of improvements among the study group, which was 0.97. Assuming that the true probability of improvements among the control group was 0.5, 13 intervention sites and 13 control sites were needed to conduct the study to be able to reject the null hypothesis that the exposure rates for intervention and control are equal with the power of 0.8. This number was increased in each group for correct non-parametric usage and to compensate for losses during the follow-up period.
Ten patients (3 males and 7 females, aged 21 to 47 years) with 36 papillae were selected from the outpatient clinic, Department of Oral Medicine and Periodontology, Faculty of Dentistry, Cairo University and outpatient clinic of Oral and Dental Research Division at NRC.
The inclusion criteria involved highly motivated patients having at least one deficient papilla in the inter-bicuspid region. Papillary deficiency types I or II, according to Nordland and Tarnow classification [13] were selected. Distance between the contact point and inter-proximal bone crest (CP-BC) of ≤ 7 mm and probing depth of ≤ 4 mm at the deficient papillary sites was mandatory for inclusion in the study. Also, full mouth plaque index (PI) and gingival index (GI) scores should be between 0-1. No open contacts between affected teeth should be present. Teeth free from caries, proximal restorations, fixed prosthesis or orthodontic appliances were selected.
Exclusion criteria excluded subjects with medical conditions that may affect periodontal healing or regeneration. Subjects with a history of allergic reactions, pregnant or breastfeeding females, smokers and alcoholics were not included. Patients with current or previous drugs intake that may predispose to gingival enlargement were not allowed to participate. Patients under orthodontic treatment or had orthodontic treatment in the past six months were not selected. Patients with a history of traumatic oral hygiene measures or periodontal surgeries over the last six months at the area of interest were not endorsed.
The participants were randomly assigned into two groups to receive either hyaluronic acid gel injection or saline injection as a placebo using a distance randomisation procedure with 1:1 allocation ratio. If the patient had more than one eligible deficient papilla, these papillae were allocated to the same treatment group. Allocation concealment was achieved by using sequentially numbered, opaque and sealed envelopes. This trial was double-blinded, where blinding included patients and the outcome assessor. It was impossible for the researcher to be blinded due to the difference in consistency and resistance to injection between hyaluronic acid gel and saline solution.
Two patients with a total of 6 deficient papillae (2 in the intervention group and 4 in the control group) did not finish their series of injections and follow up periods, so they were considered dropouts. This made a total of 8 patients with 30 deficient papillae (16 in the intervention group and 14 in the control group) who had completed the injections and followed ups and their outcomes were subjected to statistical analysis.
Hyaluronic Acid Gel
The product used in this trial was Restylane Lidocaine (Restylane-Lidocaine cross-linked Hyaluronic Acid Filler, Galderma S.A, Sweden). Restylane was the first FDA-approved HA filler in 2003. Restylane is a non-animal stabilised cross-linked HA filler with an HA concentration of 20 mg/ml. The longevity of Restylane filler in tissues is approximately 6 months. Restylane-Lidocaine (FDA

Dental Science _______________________________________________________________________________________________________________________________
_______________________________________________________________________________________________________________________________
1836 https://www.id-press.eu/mjms/index
approved in 2012) is a newer product of Restylane with 0.3% lidocaine incorporated into the syringe itself [14].
Treatment Protocol
The treatment protocol was divided into 3 phases: the pre-operative phase, where patients were examined for eligibility, the injection phase and the follow up phase.
In the pre-operative phase, the 1st visit started
by collecting detailed personal information, medical and dental history. Initial periodontal therapy including full mouth supragingival scaling and subgingival debridement was performed, and patient motivation and education for proper oral hygiene instructions were reassured. The distance between the contact area and inter-proximal bone crest (CP-BC) was then measured for eligibility at the sites of papillary deficiency using peri-apical radiographs with the paralleling technique and confirmed by bone sounding. Only sites with CP-BC distance ≤ 7mm were eligible for the study
After 4 weeks, re-evaluation was performed, and the degree of papillary deficiency according to Nordland and Tarnow classification [13] as well as plaque and gingival indices were assessed for eligibility. Alginate impression was taken for the involved arch/arches for the construction of study casts and fabrication of customised stents. Only patients with deficient papilla site/sites fulfilling the inclusion criteria were recalled, scheduled for the 1
st
injection after 1 week and signed the informed consent.
In the injection phase, 3 injections were given at each papilla site: at baseline, 3- and 6-weeks intervals. At the first injection visit, before attempting to inject, clinical measurement of the height of the black triangle was done by measuring the distance between the deficient papilla tip and contact area (PT-CP distance) to the nearest 0.5 mm (baseline). This was done using a graduated periodontal probe and the fabricated customised stent for proper and standardised positioning of the probe at each measurement interval, as shown in Figure 1.
Figure 1: Measuring the height of the black triangle (PT-CP distance)
Also, standardised digital clinical photographs were taken for the eligible deficient papillae for the baseline measurement of the surface area of black triangles. Then, the patient allocation was revealed, whether to the intervention group (HA group) or control group (saline group) and patients were ready to receive their first injection.
Every injection procedure starts with the administration of short-acting local anaesthesia using infiltration technique. The deficient papilla was injected with 0.1 mm of HA gel or saline solution using a 30-gauge disposable insulin syringe. Hyaluronic acid and saline were pre-loaded in insulin plastic syringes before injection for patient blinding. The needle was inserted 2-3 mm apical to the tip of the interdental papilla and directed coronally with an angulation of 45° to the long axis of the tooth, and the bevel directed apically (Figure 2). Then, the papilla was lightly moulded in an incisal direction for 1 minute using gauze. Finally, post-injection instructions were prescribed where 24-hour abstinence from mechanical plaque control in the area and the use of mouthwash twice daily only was advocated. The use of a soft toothbrush, together with the use of mouthwash, was indicated after the first 24 hours. Routine mechanical oral hygiene was resumed after 2 weeks.
Figure 2: Injection technique
In the follow-up phase, patients were recalled after 3 and 6 months from the first injection where clinical re-measurement of the black triangles and standardised digital clinical photographs were retaken.
Calculation of the surface area of black triangles
The surface area of the black triangle (SABT) was assessed using standardised digital clinical photographs analysed by an image analysis program (Photoshop Cs 5, Adobe Systems, San Jose, CA, USA). The surface area of the black triangle was assessed from the photographs taken at baseline

Abdelraouf et al. Assessment of Hyaluronic Acid Gel Injection in the Reconstruction of Interdental Papilla _______________________________________________________________________________________________________________________________
_______________________________________________________________________________________________________________________________
Open Access Maced J Med Sci. 2019 Jun 15; 7(11):1834-1840. 1837
(before injection), 3 and 6 months from the first injection.
Clinical photographs were obtained with the same digital camera (Nikon D5100 DSLR) mounted on a ring flashlight, using the same lens (Sigma Macro 105mm F2.8 EX) and the same focal length. The photographs were taken under the same lightning conditions and camera settings. The patients were sitting in an upright position, looking straight ahead. The Frankfort plane of the patient as well as the camera lens was positioned parallel to the ground. The photographs were captured perpendicular to the teeth adjacent to the deficient papilla. Strict care was taken to ensure that the same up-down and right-left shooting positions were reproduced at different time intervals.
For analysis, the photographs were imported to Photoshop CS5. The contrast of each photograph was adjusted to ensure that the borders of the black triangle were distinct. This was achieved by turning the area of the black triangle into completely black while the rest of the image turned white. The physical size corresponding to a pixel is different on photographs taken at different times. To reduce errors based on magnification, a 10 mm William's graduated periodontal probe was used as a scale for calibration to calculate the pixels value to be converted into mm. Then the base and height of the black triangle were measured in mm. The surface area of the black triangle (in mm
2) was calculated using the formula (0.5
X height X base) [12].
Assessment of Patients' Satisfaction
At the end of the 6 months follow up period, patients' satisfaction about their esthetic appearance was assessed using visual analogue scale (VAS) ranging from 0 to 100 (0= unsatisfied/ worst imaginable appearance, 100= very satisfied/best imaginable appearance) [15]. Clinical photographs taken before the injection procedures were shown to every patient to compare between the pre and post-injection appearance. The patient then filled in a printed VAS for patient satisfaction assessment.
Statistical analysis
Numerical data were explored for normality by checking the distribution of data using tests of normality (Kolmogorov-Smirnov and Shapiro-Wilk tests). Age and distance between the contact point and bone crest (CP-BC) data showed normal (parametric) distribution while height (PT-CP distance) and surface area of black triangle and satisfaction scores data showed non-normal (non-parametric) distribution. Data were presented as mean ± standard deviation (SD) values. For parametric data, Student’s t-test was used to compare between mean age and CP-BC distance values in the two groups. For non-
parametric data; Mann-Whitney U test was used to compare between the two groups. Wilcoxon signed rank test, and Friedman’s test was used to study the changes by time within each group. Dunn’s test was used for pair-wise comparisons between the follow-up times when Friedman’s test was significant.
Qualitative data were presented as percentages. Fisher's exact test was used for comparisons regarding qualitative data. The significance level was set at p ≤ 0.05. Statistical analysis was performed with IBM SPSS Statistics Version 20 for Windows, USA.
Results
The present study was conducted on 8 patients; 4 patients (1 male and 4 females) with 16 deficient papillae in the HA group and 4 patients (1 male and 4 females) with 14 deficient papillae in the saline group.
Demographic results
The mean age of the patients was 32.55 ± 9.3 years. There was no statistically significant difference between mean age values (p = 0.718) or gender distributions (p = 1.000) between both groups.
The height of the black triangle results
The measurements of the height of the black triangle reported that there was no statistically significant difference between the two groups either at baseline (p = 0.718), after 3 months (p = 0.640) or 6 months (p = 0.355).
In HA group; there was a statistically significant decrease in PT-CP distance measurements after 3 months (p ˂ 0.001). From 3 to 6 months, there was no statistically significant change in PT-CP distance measurements. However, the mean PT-CP distance measurements after 6 months showed a statistically significant lower value than baseline measurements. Meanwhile, in the saline group, there was no statistically significant change in PT-CP distance measurements along the study periods (p = 0.223). Comparison between changes in PT-CP distance in the two groups showed that from baseline to 3 months; HA group showed a statistically significant higher mean decrease in PT-CP distance than the saline group (p = 0.025). From 3 to 6 months, there was no statistically significant difference between the two groups (p = 0.822). From baseline to 6 months; HA group showed a statistically significant higher mean decrease in PT-CP distance than the saline group (p = 0.047).

Dental Science _______________________________________________________________________________________________________________________________
_______________________________________________________________________________________________________________________________
1838 https://www.id-press.eu/mjms/index
The surface area of the black triangle (SABT) results
The measurements of the SABT presented that there was no statistically significant difference between the two groups either at baseline or after 3 months. After 6 months, the HA group showed statistically significantly lower mean SABT measurements than the saline group. In HA group; there was a statistically significant decrease in SABT measurements after 3 months (p ˂ 0.001). From 3 to 6 months, there was no statistically significant change in the measurements. However, the mean SABT measurements after 6 months showed a statistically significant lower value than baseline measurements. While in the saline group, there was no statistically significant change in the measurements (p = 0.811). From baseline to 3 months; HA group showed a statistically significant higher mean decrease in SABT measurements than the saline group. From 3 to 6 months, there was no statistically significant difference between the two groups. From baseline to 6 months; HA group showed a statistically significant higher mean decrease in SABT measurements than the saline group.
Figure 3: Hyaluronic acid group; A) BT at baseline; B) BT at 3 months; C) BT at 6 months
Comparison between percentages (%) of change in SABT in the two groups showed that from baseline to 3 months; HA group showed statistically significant higher mean % decrease in the area than in the saline group (p ˂ 0.001). From 3 to 6 months, there was no statistically significant difference between the two groups (p = 0.224). From baseline to 6 months; HA group showed a statistically significant higher mean % decrease in SABT than saline group (p ˂ 0.001).
Correlation between changes in PT-CP distance and the SABT values revealed that from
baseline to 3 months; there was a statistically significant direct (positive) correlation between changes in PT-CP distance and changes in SABT (p ˂ 0.001). A decrease in changes in PT-CP distance is associated with a decrease in SABT measurements and vice versa. From 3 to 6 months, there was no statistically significant correlation between the two variables (p = 0.07). From baseline to 6 months; there was a statistically significant direct (positive) correlation between changes in PT-CP distance and changes in SABT (p = 0.001). A decrease in changes in PT-CP distance is associated with a decrease in SABT and vice versa. Figures 3 and 4 illustrate standardised clinical photographs and photo analysis at baseline, 3 and 6 months of HA case and saline case, respectively.
Figure 4: Saline group; A) BT at baseline; B) BT at 3 months; C) BT at 6 months
The patients' satisfaction results
Regarding patients' satisfaction about the esthetic appearance, results of the present study observed that the HA group showed statistically significant higher mean satisfaction score than the saline group after 6 months (p = 0.002). Results of the present study are illustrated in Table 1.
Table 1: Change in height and percentage of change in surface area of black triangles over time and satisfaction score after 6 months
Change in height (PT-CP) of BT
Time HA group (n = 16)
Saline group (n = 14)
p-value
Baseline - 3 months -0.31± 0.25 -0.07± 0.18 0.025* Mean ± SD
3 months - 6 months -0.06 ± 0.17 0.04 ± 0.13 0.822 Mean ± SD
Baseline - 6 months -0.25 ± 0.26 -0.03 ± 0.13 0.047* Mean ± SD
Percentage of change in surface area of BT
Baseline - 3 months -36.5 ± 24.4 -0.9 ± 10.6 < 0.001* Mean ± SD
3 months - 6 months -11.8 ± 30.3 0.9 ± 8.9 0.224 Mean ± SD
Baseline - 6 months -45.0 ± 28.5 -2.0 ± 11.4 < 0.001* Mean ± SD
Satisfaction score
6 months 45 ± 12.65 27.86 ± 12.51 0.002* Mean ± SD
*Significant: Significance level was set at p ≤ 0.05.

Abdelraouf et al. Assessment of Hyaluronic Acid Gel Injection in the Reconstruction of Interdental Papilla _______________________________________________________________________________________________________________________________
_______________________________________________________________________________________________________________________________
Open Access Maced J Med Sci. 2019 Jun 15; 7(11):1834-1840. 1839
Discussion
This randomized clinical trial aimed to assess the effect of injection of HA gel compared to a saline solution as a placebo for the reconstruction of deficient interdental papilla. This was presented as the change in height (PT-CP distance) and percentage of change in surface area of a black triangle; both measured at baseline, 3- and 6-months intervals. Since patients' reported outcomes are of paramount importance these days, patients' satisfaction of their final esthetic appearance was also assessed after at the end of the study using a visual analogue scale (VAS).
Changes in the height of black triangles (PT-CP distance) over time in the present study were compared between the HA and saline groups. A statistically significant higher mean decrease in PT-CP was observed in favour of the HA group at baseline, 3 and 6 months. These results are in contrast with the findings reported by Bertl et al., [2]. They reported no statistically significant difference between the two groups over time. Their results may be justified by the use of a gel with different HA concentration, different injection technique and the position of the papillary defects adjacent to implants. Such defects have different histological features compared to defects adjacent to natural teeth.
The mean percentages of reduction in black triangle surface area in the HA group in the present study were 36.5 ± 24.4% and 45.0 ± 28.5% from baseline to 3 months and from baseline to 6 months respectively. These results are consistent with a previously conducted study [11] who reported mean percentages of reduction of 29.52 ± 18.72% in the period of baseline to 3 months and 47.33 ± 20.20% in the period of baseline to 6 months. In agreement with the present study, the mean percentage of reduction in another study performed by Awartani and Tatakis [12] was 41 ± 37% after 6 months. A case series [10] also reported a mean reduction percentage of 91.1 ± 11.99% after 25 months to follow up following HA injection. They did not provide any data on SABT at baseline but only recommended the injection of HA gel on small papillary defects. The higher percentage of reduction in their study is most likely attributed to the smaller black triangles size at baseline, and the longer follows up period. Also, another case series [4] recorded a mean reduction percentage of 92.55% ± 13.46% after 6 months. The mean surface area at baseline in their study was nearly 3 times smaller than the mean surface area at baseline in the present study. Moreover, the higher percentage of papillary fill in their study might be due to the use of a different HA gel with higher HA concentration and the higher number of injections.
In the present study, results reported that HA group showed statistically significant higher mean satisfaction scores than the saline group. This goes in
parallel with the statistically significant papillary fill observed in the HA group. These results are in agreement with a study conducted in 2015 [12] who evaluated the patients' satisfaction in which 7 out of 9 patients were satisfied with their smile and the papillary fill, and 6 of them would choose to repeat the procedure. On the contrary, a previous study [2] found no statistically significant difference in VAS scores of patient's satisfaction after 6 months between the HA and saline groups at any time point or within the groups over time. This is consistent with the fact that no difference in papillary fill was found between the two groups.
Although no complete papillary fill was seen in the HA group in the present study, the HA group showed higher satisfaction scores than the saline group. The satisfaction level of the aesthetic appearance is a subjective outcome seen in different perspectives. The use of HA-based gel caused a statistically significant increase in papillary fill; yet, incomplete papillary fill may somehow limit its clinical significance. The most critical pre-treatment determinant of complete papillary reconstruction is the size of the papillary defect before treatment. The choice of the eligible defects in the present study was dependent upon the distance between the CP-BC and the papillary classification according to Nordland and Tarnow [13]. This classification gives no highlights on the importance of the width and area of the black triangle at baseline. Complete papillary fill could be achieved in small papillary defects [10] and with increased number of injections [4].
In conclusion, within the limitations of this study, the use of commercially available hyaluronic acid gel for the treatment of interdental papillary deficiency was effective with promising levels of patients' satisfaction. This trial paves the way for a series of future studies to determine the appropriate protocol of injection and to identify the pre-treatment determinants for better outcomes. Further long-term studies should be conducted with larger sample size using higher HA concentrations with increasing the number of injections.
References
1. Csiszar A, Wiebe C, Larjava H, Hakkinen L. Distinctive molecular composition of human gingival interdental papilla. J Periodontol. 2007; 78:304-314. https://doi.org/10.1902/jop.2007.060165 PMid:17274720
2. Bertl K, Gotfredsen K, Jensen SS, Bruckmann C, Stavropoulos A. Can hyaluronan injections augment deficient papillae at implant-supported crowns in the anterior maxilla? A randomized controlled clinical trial with 6 months follow-up. Clin Oral Implants Res. 2017; 28:1054-1061. https://doi.org/10.1111/clr.12917 PMid:27378556
3. Cunliffe J, Pretty I. Patients' ranking of interdental "black triangles" against other common aesthetic problems. Eur J Prosthodont Restor Dent. 2009; 17:177-181.
Dental Science _______________________________________________________________________________________________________________________________
_______________________________________________________________________________________________________________________________
1840 https://www.id-press.eu/mjms/index
4. Lee W, Kim H, Yu S, Kim B. Six Month Clinical Evaluation of Interdental Papilla Reconstruction with Injectable Hyaluronic Acid Gel Using an Image Analysis System. Journal of Esthetic and Restorative Dentistry. 2016; 28:221-230. https://doi.org/10.1111/jerd.12216 PMid:27159838
5. Singh VP, Uppoor AS, Nayak DG, Shah D. Black triangle dilemma and its management in esthetic dentistry. Dent Res J. 2013; 10:296-301.
6. Al-Zarea BK, Sghaireen MG, Alomari WM, Bheran H, Taher I. Black Triangles Causes and Management: A Review of Literature. British Journal of Applied Science & Technology. 2015; 6:1-7. https://doi.org/10.9734/BJAST/2015/11287
7. Georgieva I, Peev S, Gerova T, Mitteva M, Bazitova- Zlazitova- Zlateva M. Interdental papillae height assessment in the aesthetic zone of the maxilla Scripta Scientifica Medicinae Dentalis. 2017; 3:11-16. https://doi.org/10.14748/ssmd.v3i1.2179
8. Alahmari F. Reconstruction of Lost Interdental Papilla: A Review of Nonsurgical Approaches. J Dent Medical Sciences. 2018; 17:59-65.
9. Ascher B, Bayerl C, Brun P, Kestermont P, Rzany B, Poncet M, Guennoun M, Podda M. Efficacy and safety of a new hyaluronic acid dermal filler in the treatment of severe nasolabial lines 6-month interim results of a randomized, evaluator-blinded, intra-individual comparison study. Journal of Cosmetic Dermatology. 2011; 10:94-98. https://doi.org/10.1111/j.1473-2165.2011.00550.x PMid:21649813
10. Becker W, Gabitov I, Stepanov M, Kois J, Smidt A, Becker BE.
Minimally invasive treatment for papillae deficiencies in the esthetic zone: a pilot study. Clin Implant Dent Relat Res. 2010; 12:1-8. https://doi.org/10.1111/j.1708-8208.2009.00247.x PMid:19843105
11. Mansouri SS, Ghasemi M, Salmani Z, Shams N. Clinical Application of Hyaluronic Acid Gel for Reconstruction of Interdental Papilla at the Esthetic zone. Journal Of Islamic Dental Association Of Iran. 2013; 25:152-157.
12. Awartani FA, Tatakis DN. Interdental papilla loss: treatment by hyaluronic acid gel injection: a case series. Clin Oral Investig. 2016; 20:1775-1780. https://doi.org/10.1007/s00784-015-1677-z PMid:26613740
13. Nordland WP, Tarnow DPA. classification system for loss of papillary height. J Periodontol. 1998; 69:1124-1126. https://doi.org/10.1902/jop.1998.69.10.1124 PMid:9802711
14. Mansouri Y, Goldenberg G. Update on hyaluronic acid fillers for facial rejuvenation. Cutis. 2015; 96:85-88.
15. Mcguire MK, Scheyer ET. A randomized, double-blind, placebo-controlled study to determine the safety and efficacy of cultured and expanded autologous fibroblast injections for the treatment of interdental papillary insufficiency associated with the papilla priming procedure. J Periodontol. 2007; 78:4-17. https://doi.org/10.1902/jop.2007.060105 PMid:17199533

_______________________________________________________________________________________________________________________________
Open Access Maced J Med Sci. 2019 Jun 15; 7(11):1841-1846. 1841
ID Design Press, Skopje, Republic of Macedonia Open Access Macedonian Journal of Medical Sciences. 2019 Jun 15; 7(11):1841-1846. https://doi.org/10.3889/oamjms.2019.332 eISSN: 1857-9655 Dental Science
Intrusive Arch versus Miniscrew-Supported Intrusion for Deep Bite Correction Manal Mohamed El Namrawy
1*, Fouad El Sharaby
2, Mohamed Bushnak
3
1Orthodontics Department, Beni-Suef University, Beni-Suef City, Egypt;
2Faculty of Dentistry, Cairo University, Cairo, Egypt;
3Department of Orthodontics, Faculty of Dentistry, Cairo University, Cairo, Egypt
Citation: El Namrawy MM, El Sharaby F, Bushnak M. Intrusive Arch versus Miniscrew-Supported Intrusion for Deep Bite Correction. Open Access Maced J Med Sci. 2019 Jun 15; 7(11):1841-1846. https://doi.org/10.3889/oamjms.2019.332
Keywords: incisors intrusion; deep bite treatment; intrusive arch
*Correspondence: Manal Mohamed El Namrawy. Orthodontic Department, Beni-Suef University, Beni-Suef City, Egypt. E-mail: [email protected]
Received: 13-Mar-2019; Revised: 10-May-2019; Accepted: 12-May-2019; Online first: 13-Jun-2019
Copyright: © 2019 Manal Mohamed El Namrawy, Fouad El Sharaby, Mohamed Bushnak. This is an open-access article distributed under the terms of the Creative Commons Attribution-NonCommercial 4.0 International License (CC BY-NC 4.0)
Funding: This research did not receive any financial support
Competing Interests: The authors have declared that no competing interests exist
Abstract
BACKGROUND: Intrusion of maxillary incisors is the treatment of choice to correct deep bite problem in gummy smile patients.
AIM: The objective of this study was to compare the effectiveness and efficiency of miniscrew-supported intrusion versus intrusion arch for treatment of deep bite.
METHODS: The study sample consisted of 30 post pubertal patients (21 females and 9 males) with an age range from 17 to 29. They were divided into 2 groups (15 subjects in each group). Group 1 underwent maxillary incisor intrusion using miniscrews, and in group 2 intrusive arch was used. Pre and post-treatment lateral cephalometric x-rays and study models were made to evaluate the demo-skeletal effects. During the study period, no other intervention was attempted. Paired t-test was used to study the changes after treatment.
RESULTS: The mean amount of overbite correction was 2.6 ± 0.8 (0.49 mm per month) in the miniscrew-supported intrusion group and 2.9 ± 0.8 (0.60 mm per month) in the intrusive arch group. No statistically significant difference was found in the extent of maxillary incisor intrusion between the two systems. The two intrusion systems were statistically different in the extent of incisor proclination, as an intrusive arch group tended to proline upper incisors more than miniscrews-supported intrusion group.
CONCLUSION: Both systems successfully intruded the 4 maxillary incisors almost with no loss to the sagittal and
vertical anchorage, although intrusive arch tended to proline upper incisors significantly.
Introduction
Deep overbite has been considered as one of the most common malocclusion problems that are difficult to be treated and retained. Correction of the deep bite is often a main objective of the orthodontic treatment because of its potentially detrimental effects on periodontal health, temporomandibular joint function, as well as esthetics. Prevalence of deep overbite was found to be 21% to 26% in the normal population, and about 75% in orthodontic patients [1], [2].
Extrusion of posterior teeth is one of the most common methods to correct deep bite in growing patients [3]. The intrusion of upper and/or lower incisors is a desirable method to correct deep bite in many adolescents and adult patients [4]. Flaring of incisors may be effective for the correction of mild to
moderate deep bite. Relative intrusion is the treatment of choice for adolescents [5].
Maxillary incisor intrusion is the treatment of choice in non-growing patients to correct deep bite and gummy smile caused by super-eruption of maxillary incisors [6], [7]. Three treatment modalities were proved to effectively decrease deep overbite by intruding upper incisors: J-hooks headgear, intrusion arches and miniscrew system. However, the intrusion effect of J-hooks headgear may vary since it depends upon patient cooperation [8]. Although, intrusive arches are an alternative in wide spread use; undesirable side effects such as extrusion of posterior teeth and flaring of anterior teeth may compromise their efficiency [9].
The intrusive arch fabricated with TMA wire was found to exert the lowest force compared to utility arches of St.St. and Eligiloy [10], [11]. Recently, miniscrews were used to provide anchorage for

Dental Science _______________________________________________________________________________________________________________________________
_______________________________________________________________________________________________________________________________
1842 https://www.id-press.eu/mjms/index
intruding maxillary incisors by application of force close to the centre of resistance with no counteractive movement in molars. However, extra cost, patient tolerance and looseness of the screw during treatment may compromise their use [12], [13].
Since the comparative clinical performance of the intrusive arch and miniscrew-supported intrusion has not previously been reported, the objective of this study was to compare the effectiveness and efficiency of these two treatment modalities for maxillary incisor intrusion.
Material and Methods
The sample was selected from the population who sought orthodontic treatment at the outpatient clinic, Department of Orthodontics, Faculty of Oral and Dental Medicine, Beni-Suef University. Thirty post pubertal patients (21 females and 9 males) with deep bite and age range from 17 to 29 years participated in this study. The inclusion criteria for selection of both treatment groups were the following: post pubertal patients (as verified from their CVM [14]) with age more than 17 years, Class I or Class II malocclusion, excessive gingival display on smiling, 4 mm overbite or greater and super-eruption of maxillary incisors. While the exclusion criteria were: having missing teeth on the anterior maxillary area, any history of trauma or root canal treatment, previous orthodontic treatment, and having any hormonal disorder or syndromes. The detailed case history was taken for each patient. Clinical examination and an individualised diagnostic chart were made. The study was approved and supported by the medical, scientific ethics committee of Cairo University. A consent form was obtained from all the patients and/or parents after an explanation of the purpose of the study.
Table 1: Demographic data
Parameters Miniscrew
(n=15) Intrusive arch
(n=15) P-value
Age (Years) Mean ± SD
19.5 ± 2.5
22.6 ± 5.3
0.057
Gender n (%) Male Female
3 (20) 12 (80)
6 (40) 9 (60)
0.232
Treatment duration (Months) Mean ± SD
5.3 ± 1
4.8 ± 1
0.152
*: Significant at P ≤ 0.05
This prospective clinical trial compared two non-compliance, segmented mechanics for treatment of deep overbite; Miniscrews-supported intrusion and intrusive arch. According to the treatment modality used, the participants were randomly allocated to the two groups. Group 1: maxillary incisor intrusion using miniscrews and group 2: maxillary incisor intrusion using intrusive arches.
The appliance used was a pre-adjusted edgewise Brackets (0.022” x 0.028”) slot size and Roth prescription (series2000; Ormco, Glendora, Calif). The posterior anchor unit was supported by a transpalatal arch with wire diameter (0.04”) and cemented to the first maxillary molar. The alignment was carried out in the upper arch using 0.016” and then (0.016” x 0.022”) nickel-titanium wires and followed by (0.016” x 0.022”) St.St. I was stabilizing arch wire (Ormco). After alignment, the brackets of the 4 maxillary incisors were laced by ligature wire, and the stainless-steel wire was cut into two buccal segments and a maxillary anterior segment.
In group1 intrusion of maxillary incisors was done using two miniscrews (Jeil medical Co., Seoul, Korea), 1.4 mm in diameter and 6 mm in length. The miniscrews were placed at the mucogingival junction distal to the maxillary lateral incisors. The miniscrews were loaded 2 weeks later with medium super-elastic nickel-titanium closed-coil springs (3M UnitekTM TAD constant force coil spring 3 mm medium force). A force of 100g was measured using a calibrated Dontrix gauge (Correx; Ortho Care, Saltaire, United Kingdom).
Figure 1: Maxillary incisors intrusion using mini-screws (start of treatment)
In group 2 intrusion of upper incisors was done using an intrusive arch that was fabricated using 0.017” x 0.025” TMA (Ormco) wire and placed in the auxiliary slot of the maxillary bands. It was activated with a Tweed loop plier (Pin Tech Instruments, Sialkot, Pakistan) to produce an intrusive force of 100 g as applied and measured using the same force gauge.
Figure 2: Maxillary incisor intrusion using the intrusive arch (start of treatment)

El Namrawy et al. Intrusive Arch versus Miniscrew-Supported Intrusion for Deep Bite Correction _______________________________________________________________________________________________________________________________
_______________________________________________________________________________________________________________________________
Open Access Maced J Med Sci. 2019 Jun 15; 7(11):1841-1846. 1843
Control appointments were scheduled every 4 weeks, and the force level was checked at every appointment and adjusted whenever needed. No other treatment was performed until suitable overbite was achieved. Termination of the intervention was done after 6 months of treatment or if one of the following was observed 1) Reaching adequate overbite 2) Sever inflammation or miniscrews failure.
The outcome measures that were evaluated were; the rate of intrusion, skeletal, dental and soft tissue effects. Also, patient tolerance and pain experience were evaluated using a questionnaire with pain assessed as mild, moderate or severe. Evaluation of the skeleton-dental changes was carried out using lateral cephalometric radiographs and study models.
Figure 3: Dental and soft tissue measurements
1. U1-VCP, 2. CR-VCP, 3. U6-VCP, 4. CR-VCP, 5. U1PP, 6. CR-PP, 7. U1-HCP, 8. CR-HCP, 9. U6-PP, 10. CR-PP, 11. U6-HCP, 12. CR-HCP, 13. U1-PP0, 14. U1-SN0, 15. U1-HCP0, 16. U6PP0, 17. LS-Eplane, 18. LI-Eplane.
Statistical Analysis
A power analysis was designed to have adequate power to apply a 2-sided statistical test of the research hypothesis (Null hypothesis) that there was no difference between the two groups. Using alpha (α) level of 0.05 (5%) and Beta (β) level of 0.10 (10%), i.e. power= 90%; the predicted minimum sample size (n) was 11 cases in each group. Over-
sampling was done to compensate for dropouts or any failures. After a 2-week interval, 15 study models and 15 cephalograms were randomly selected and re-measured by the same investigator for reproducibility of the measurements. Measurement error was assessed using Dahlberg’s formula: Measurement
error= ; Where (d) is the difference between the measurements and (n) is the number of duplicates. The errors were 0.28 mm for linear measurements and 0.5° for angular measurements in the lateral cephalometric radiographs. Also, it was 0.12 mm for the cast measurements. Numerical data were explored for normality using Kolmogorov-Smirnov and Shapiro-Wilk tests. Numerical data were presented as mean and standard deviation (SD) values. For parametric data; Student’s t-test was used to compare between the two groups. Paired t-test was used to study the changes after treatment in each group. For non-parametric data; Mann-Whitney U test was used to compare between the two groups. Wilcoxon signed-rank test was used to study the changes after treatment in each group. Qualitative data were presented as frequencies and percentages. The significance level was set at P≤0.05. Statistical analysis was performed with IBM® SPSS® Statistics Version 20 for Windows.
Results
The total rate of intrusion was 2.6 ± 0.8 for miniscrews-supported intrusion group and 2.9 ± 0.8 for the intrusive arch group. The monthly rate of intrusion was 0.49 mm/month for miniscrews-supported intrusion group and 0.60 mm/month for Intrusive arch group.
Table 2: Comparison between rates of intrusion in the two groups
Parameters Miniscrew Intrusive arch P-value
Treatment duration (months) 5.3 ± 1 4.8 ± 1 0.152 Total rate of intrusion (mm) 2.6 ± 0.8 2.9 ±0.8 0.461 Monthly rate of intrusion (mm) 0.49 0.60
There was no statistically significant difference between mean changes in skeletal measurements of the two groups.
The intrusive arch group showed statistically significantly higher mean an increase in U1-VCPmm, U1-PP°, U1-SN° and U1-HCP° than Miniscrew group. Miniscrew group showed a statistically significantly higher decrease in CR-PPmm than the intrusive arch group.
Table 3: Comparisons between amounts of change in skeletal
n
d
2
2

Dental Science _______________________________________________________________________________________________________________________________
_______________________________________________________________________________________________________________________________
1844 https://www.id-press.eu/mjms/index
measurements in the two groups
Skeletal measurements Miniscrew Intrusive
arch P-value
Anteroposterior SNA (°)
1 ± 4.7
-0.1 ± 0.4
0.967 SNB (°) 0 ± 0 -0.1 ± 0.3 0.775
ANB (°) -0.2 ± 0.4 -0.1 ± 0.3 0.539
A-VCP (mm) -0.3 ± 0.4 -0.1 ± 0.4 0.567
B-VCP (mm) 0 ± 0 -0.2 ± 0.5 0.775
AB perpendicular to HCP Vertical
-0.3 ± 0.6 -0.03 ± 0.1 0.512
GoMe.SN (°) 0 ± 0 0.3 ± 0.6 0.367
N-ANS (mm) -0.2 ± 0.5 0 ± 0 0.539
ANS-ME (mm) 0.1 ± 0.3 0.3 ± 0.6 0.539
ANS-HCP (mm) 0.1 ± 0.3 0 ± 0 0.539
PNS-HCP (mm) Rotation
0.1 ± 0.5 0 ± 0 0.775
SN.PP (°) 0.1 ± 0.3 0 ± 0 0.539
GoMe.PP (°) 0.1 ± 0.4 0.4 ± 1 0.148
*: Significant at P ≤ 0.05.
There was no statistically significant difference between mean changes of other dental and soft tissue measurements in the two groups
Table 4: Comparisons between changes in dental measurements in the two groups
Dental Measurements Miniscrew Intrusive arch P-value
Anteroposterior U1-VCP (mm)
-1 ± 1.7
1.8 ± 2.6
0.002*
CR-VCP (mm) -1.5 ± 0.9 -0.7 ± 1.4 0.174
U6-VCP (mm) 0 ± 0 -0.3 ± 0.6 0.217
Molar CR-VCP (mm) Vertical
0 ± 0 0 ± 0 1.000
UI-PP (mm) -2.9 ± 1.1 -2.4 ± 0.9 0.233
CR-PP (mm) -2.3 ± 0.8 -1.6 ± 0.8 0.026*
U1-HCP (mm) -2.9 ± 2 -2.8 ± 1.1 0.775
CR-HCP (mm) -2.6 ± 1.9 -2.3 ± 1.8 0.187
U6-PP (mm) 0 ± 0 -0.1 ± 0.3 0.775
Molar CR-PP (mm) 0 ± 0 -0.03 ± 0.1 0.775
U6-HCP (mm) 0 ± 0 -0.1 ± 0.4 0.775
Molar CR-HCP (mm) Rotation
0 ± 0 -0.3 ± 1.3 0.775
U1-PP (°) 2.3 ± 5.7 7.9 ± 4.7 0.010*
U1-SN (°) 2 ± 5.5 7.7 ± 4.7 0.006*
U1-HCP (°) 2.2 ± 5.9 7.7 ± 4.2 0.013*
U6-PP (°) 0.03 ± 0.1 -1 ± 1.5 0.098
U6-SN (°) -0.1 ± 0.3 -0.8 ± 1.3 0.116
U6-HCP (°) -0.1 ± 0.3 -0.7 ± 1.2 0.116
*: Significant at P ≤ 0.05.
The intrusive arch group showed statistically
significantly higher mean an increase in overjet than Miniscrew group. There was no statistically significant difference between mean changes of other cast measurements in the two groups.
Figure 4: Maxillary incisors intrusion using (left) miniscrews and (right) intrusive arch
Similarly, there was no statistically significant
difference regarding patients’ tolerance to treatment between the two groups after treatment.
Table 5: Comparisons between changes in soft tissue measurements in the two groups
Soft tissue Measurements
Miniscrew Intrusive arch P-value
LS-E plane (mm) -0.3 ± 0.6 -0.06 ± 0.7 0.345
LI-E plane (mm) -0.1 ± 0.3 -0.2 ± 0.6 0.539
*: Significant at P ≤ 0.05.
Discussion
Deep bite is a complex orthodontic problem that needs to be corrected. Maxillary incisor intrusion is recommended in non-growing patients with deep overbites, especially in those with a gummy smile [15]. The position of maxillary incisors, especially about the upper lip is a key factor in determining the type of treatment since overbite correction with maxillary incisor intrusion in patients with insufficient incisor display leads to flattening of the smile arc and reduces smile attractiveness [16], [17].
Table 6: Comparisons between changes in cast measurements of the two groups
Cast Measurements Miniscrew Intrusive arch P-value
Over bite (mm) -2.6 ± 0.8 -2.9 ± 0.8 0.461 Over jet (mm) -0.4 ± 1.2 1.4 ± 1.1 <0.001* Inter-canine width (mm) -0.6 ± 0.5 -0.4 ± 0.7 0.653 Inter-molar width (mm) 0 ± 0 0 ± 0 1.000
*: Significant at P ≤ 0.05.
The only applied force was the maxillary incisor intrusion force to evaluate the genuine treatment efficiency of the two intrusion systems. It is suggested that an intrusive force should be constant, and low load-deflection mechanisms should be used during incisor intrusion [6].
Table 7: Comparisons between patients’ tolerance of treatment in the two groups
Tolerance Miniscrew Intrusive arch P-value
n, (%) Tolerance Pain, discomfort or inflammation
10 (66.7) 5 (33.3)
6 (40) 9 (60)
0.143
*: Significant at P ≤ 0.05.
Different force ranges from 40 to 100 g have
been used in recent literature. Steenbergen compared the effect of 40 g and 80 g [18]. Polat used 80 g [13], and Senisik used a range from 90 to 100g [19] while Deguchi et al. used 80-120 g [8].
Conventional intrusion-arch mechanics frequently cause labial tipping of the incisors, which does not always give favourable treatment outcomes [4], [9]. To minimise this effect, the forces were applied through the centre of resistance (CR) to intrude the teeth without producing any labial or lingual rotation. The centre of resistance can be

El Namrawy et al. Intrusive Arch versus Miniscrew-Supported Intrusion for Deep Bite Correction _______________________________________________________________________________________________________________________________
_______________________________________________________________________________________________________________________________
Open Access Maced J Med Sci. 2019 Jun 15; 7(11):1841-1846. 1845
estimated to be located near the geometric centre of their root. In-vitro studies with different methods such as the laser reflection technique, holographic interferometry, photo-elastic stress analysis the finite element method [20] and in-vivo studies were performed to determine the CR of the incisors. All showed that the CRs of the 4 incisors lie 8 to 10 mm apically and 5 to 7 mm distally to the lateral incisors. By placing the screws laterally to the maxillary lateral incisors, the intrusive force could be applied close to the CR of the 4 incisors [21].
Segmented mechanics have been used in this trial as it was claimed to avoid any anterior torque. A system of this type is described as being statically determinate.
Most of the previous studies used either the incisor crown tip or the apex for the evaluation of the amount of intrusion. If the attainment of true intrusion is the purpose of treatment, its evaluation should be made using the centre of resistance of the incisor. Only a few studies have incorporated the CR for the measurement of the amount of intrusion [13], [22], [23]. Therefore the CR of the maxillary central incisor was determined for each patient rather than for the anterior segment because of its ease of location and high reproducibility [13], [18]. It was taken as the point located at one-third of the distance of the root length apical to the alveolar crest.
Two reference planes were constructed for measurement confirmation of dental movements. The first reference plane was the constructed horizontal plane (drawn 7
o to the SN plane) and the second was
constructed vertical at the Sella point as the palatal plane could not be reliable due to its position near to the area of intrusion. Polat-ozsoy found that the palatal plane moved after intrusion [13].
Overbite correction was faster in the intrusive arch group since overbite reduction was obtained by both maxillary incisor intrusion and protrusion.
Repeated measures showed no statistically significant intergroup difference in the value of maxillary incisor true intrusion. Mean amount of true intrusion in the group (1) was 2.6 ± 1.9 and in the group (2) 2.3 ± 1.8. These results are almost similar to Senisik in comparing miniscrews and Connecticut intrusive arch [10].
After intrusion, in the miniscrew group, there was a statistically significant decrease in mean U1-VCPmm, CR-VCPmm, U1-PPmm, CR-PPmm, U1-HCPmm, and CR-HCPmm that show that the maxillary incisors moved upward and backwards. The possible reason for the maxillary incisor retraction could be the direction of the intrusion force, which may be applied distal to the CR of the four incisors, these results agree with those of recent studies [8], [23]. Further, a comparison of this study with previous reports of incisor intrusion with miniscrews cannot be made because of the differences in the direction of
force application and measurements. In this study miniscrews placed between laterals and canines resulting in over bite correction by 2.6 ± 0.8 mm while using a mini implant placed between the maxillary central incisors by Ohnishi et al. in obtained 3.5 mm of incisor intrusion relative to the maxillary incisor tip [12]. Kim et al. applied a segmental intrusion force between the maxillary central incisors [24].
In the intrusive arch group, there was a statistically significant increase in mean U1-VCP mm, U1-PP
0, U1-SN
0, and U1-HCP
0 measurements after
treatment, showing incisors proclamation of 7.70 with
this intrusion mechanics. Kinzel et al found similar amounts of proclination during incisor intrusion with conventional mechanics [23]. The minimum amount of proclination shown in literature was by Weiland et al, using intrusion base arches [25]. However, Vansteenbergen et al found about 8
0 of incisor
proclination using the same arch [18].
In contrast, Deguchi et al. achieved retrusion of maxillary incisors during maxillary incisor intrusion, which was at variance with the present study [8]. In their study, an additional force in the posterior direction was applied with the intrusive force; thus, during the intrusion, retrusion of maxillary incisors was obtained. According to the results of this study, maxillary incisor intrusion with miniscrews was effective in reducing the amount of protrusion.
The overbite was significantly reduced with intrusive arch by 2.9 ± 0.8 mm and miniscrew treatment by 2.6 ± 0.8 mm. Over bite reduction in the intrusive arch was obtained by both maxillary incisor intrusion and protrusion. However, there was no statistically significant difference between the two groups in over bite reduction. There was a statistically significant difference in over jet between the two groups after treatment. The intrusive arch group showed a significant increase in overjet while decreased in miniscrews group.
First maxillary molars showed no significant changes in both groups. In miniscrew–supported intrusion there was no strain on the posterior segment while in intrusive arch group anchorage reinforcement was done due to the risk of distal molar tipping as recommended in intrusion mechanics. DeVincenzo and Winn used a Nance appliance with intrusion arches and minimised the amount of molar movement [26]. In the present study, the posterior anchorage unit was stabilised using dual mechanics; a heavy stainless steel arch wires and TPA to counteract the moments produced during incisor intrusion [27].
Inter canine width significantly decreased in both groups, and that was one of the side effects of intrusion mechanics as mentioned by Burstone. Inter molar width was preserved in the present study using a passive transpalatal arch.
The side effects in this study were minimal; two miniscrews were loosened in the first month of

Dental Science _______________________________________________________________________________________________________________________________
_______________________________________________________________________________________________________________________________
1846 https://www.id-press.eu/mjms/index
orthodontic force loading. These were replaced immediately, although, there was no statistically significant difference concerning patient’s tolerance between the two groups. Clinically patients in the intrusive arch group reported more discomfort than miniscrews group.
The selection of either miniscrew-supported intrusion or intrusive arch must depend on the diagnosis, treatment objectives and substantiated with evidence. According to the result of this study, maxillary incisor intrusion with miniscrews was effective in reducing the amount of protrusion. Hence advocated in patients with deep bite and proclaimed incisors while intrusive arch may be recommended in patients with excessive over the bite and retruded incisors.
In conclusion, Both intrusion arches and miniscrews’ supported intrusion were effective in reducing deep overbite with a total amount of upper incisors’ intrusion of (2.6 ± 0.8 mm) and (2.9 ± 0.8 mm) respectively. Selection between the two techniques should be based on the pretreatment maxillary incisors’ position as intrusion arches may result in a further increase in incisors’ inclination contrary to miniscrews’ supported intrusion.
References
1. Bergersen E. A longitudinal study of anterior vertical overbite from eight to twenty years of age. Angle Orthod. 1988; 58(3):237-256.
2. Proffit W, FIelds HJ, Moray LJ. Prevalence of malocclusion and orthodontic treatment need in the US. Int J Adult Orthodon Orthognath Surg. 1998; 13:97-106.
3. Hellsing E, Hellsing G, Eliasson S. Effects of fixed anterior biteplane therapy:a radiographic study. Am J Orthod Dentofacial Orthop. 1996; 110:61-68. https://doi.org/10.1016/S0889-5406(96)70088-4
4. Otto RL, Anholm JM, Engel G a. A comparative analysis of intrusion of incisor teeth achieved in adults and children according to facial type. Am J Orthod. 1980; 77:437-446. https://doi.org/10.1016/0002-9416(80)90108-6
5. Hellsing E. Increased overbite and craniomandibular disorders.a clinical approach. Am J Orthod Dentofac Orthop. 1990; 98:516-522. https://doi.org/10.1016/0889-5406(90)70018-8
6. Burstone CR. Deep overbite correction by intrusion. Am J Orthod. 1977; 72(1):1-22. https://doi.org/10.1016/0002-9416(77)90121-X
7. Ng J, Major PW, Heo G, Flores-Mir C. True incisor intrusion attained during orthodontic treatment: A systematic review and meta-analysis. Am J Orthod Dentofac Orthop. 2005; 128:212-219. https://doi.org/10.1016/j.ajodo.2004.04.025 PMid:16102407
8. Deguchi T, Murakami T, Kuroda S, Yabuuchi T, Kamioka H, Takano-Yamamoto T. Comparison of the intrusion effects on the maxillary incisors between implant anchorage and J-hook headgear. Am J Orthod Dentofac Orthop. 2008; 133:654-660. https://doi.org/10.1016/j.ajodo.2006.04.047 PMid:18456138
9. Davidovitch M, Rebellato J. Two-couple orthodontic appliance systems utility arches:a two-couple intrusion arch. Semin Orthod. 1995; 1:25-30. https://doi.org/10.1016/S1073-8746(95)80085-9
10. Sifakakis I, Pandis N, Makou M, Eliades T, Christoph B. Forces and moments generated with various incisor intrusion systems on maxillary and mandibular anterior teeth. Angle Orthod. 2009; 79:928-933. https://doi.org/10.2319/120908-622.1 PMid:19705954
11. Lewis P. Correction of deep overbite: a report of three cases. Am J Orthod Dentofac Orthop. 1987; 91:342-345. https://doi.org/10.1016/0889-5406(87)90177-6
12. Ohnishi H, Yagi T, Yasuda Y, Takada K. A mini-implant for orthodontic anchorage in a deep overbite case. Angle Orthod. 2005; 75:444-452.
13. Polat-Ozsoy O, Arman-Ozcirpici A, Veziroglu F. Miniscrews for upper incisor intrusion. Eur J Orthod. 2009; 31:412-416. https://doi.org/10.1093/ejo/cjn122 PMid:19289539
14. Wong RWK, Alkhal H a., Rabie a. BM. Use of cervical vertebral maturation to determine skeletal age. Am J Orthod Dentofac Orthop. 2009; 136(4):484.e6. https://doi.org/10.1016/j.ajodo.2007.08.033 PMid:19815140
15. Janzen E. A balanced smile is a most important treatment objective. Am J Orthod. 1977; 72:359-372. https://doi.org/10.1016/0002-9416(77)90349-9
16. Lindauer SJ, Lewis SM, Shroff B. Overbite correction and smile Aesthetics. Semin Orthod. 2005; 11:62-66. https://doi.org/10.1053/j.sodo.2005.02.003
17. Sarver D, Ackerman M. Dynamic smile visualization and quantification: Part I. Evolution of the concept and dynamic records for smile capture. Am J Orthod Dentofac Orthop. 2003; 124(1):4-12. https://doi.org/10.1016/S0889-5406(03)00306-8
18. Van Steenbergen E, Burstone CJ, Prahl-Andersen B, Aartman IH a. The influence of force magnitude on intrusion of the maxillary segment. Angle Orthod. 2005; 75(5):723-729.
19. Senisik NE, Turkkahraman H. Treatment effects of intrusion arches and mini-implant systems in deepbite patients. Am J Orthod Dentofac Orthop. 2012; 141:723-733. https://doi.org/10.1016/j.ajodo.2011.12.024 PMid:22640674
20. Turk T, Elekdag-Turk, Dincer M. Clinical evaluation of the centre of resistance of the upper incisors during retraction. Eur J Orthod. 2005; 27:196-201. https://doi.org/10.1093/ejo/cjh096 PMid:15817629
21. Burstone CJ. Biomechanics of deep overbite correction. Semin Orthod. 2001 ;7:26-33. https://doi.org/10.1053/sodo.2001.21059
22. Hong RK, Hong HP, Koh HS. Effect of Reverse Curve Mushroom Archwire on Lower Incisors in Adult Patients: A Prospective Study. Angle Orthod. 2001; 71(6):425-432.
23. Kinzel J, Aberschek P, Mischak I, Droschl H. Study of the extent of torque, protrusion and intrusion of the incisors in the context of Class II, division 2 treatment in adults. J Orofac Orthop. 2002; 63(4):283-299. https://doi.org/10.1007/s00056-002-0109-2 PMid:12198744
24. Kim TW, Kim H, Lee SJ. Correction of deep overbite and gummy smile by using a mini-implant with a segmented wire in a growing Class II Division 2 patient. Am J Orthod Dentofac Orthop. 2006; 130:676-685. https://doi.org/10.1016/j.ajodo.2005.07.013 PMid:17110268
25. Weiland F, Bantleon H, Droschl H. Evaluation of continuous arch and segmented arch leveling techniques in adult patients--a clinical study. Am J Orthod Dentofac Orthop. 1996; 110(6):647-652. https://doi.org/10.1016/S0889-5406(96)80042-4
26. DeVincenzo JP, Winn MW. Maxillary incisor intrusion and facial growth.Angle Orthod. 1987; 57:279-289.
27. Matsui S, Caputo a. a., Chaconas SJ, Kiyomura H. Center of resistance of anterior arch segment. Am J Orthod Dentofac Orthop. 2000; 118:171-178. https://doi.org/10.1067/mod.2000.103774 PMid:10935957

_______________________________________________________________________________________________________________________________
Open Access Maced J Med Sci. 2019 Jun 15; 7(11):1847-1853. 1847
ID Design Press, Skopje, Republic of Macedonia Open Access Macedonian Journal of Medical Sciences. 2019 Jun 15; 7(11):1847-1853. https://doi.org/10.3889/oamjms.2019.484 eISSN: 1857-9655 Dental Science
Enhancement of Healing of Periodontal Intrabony Defects Using 810 nm Diode Laser and Different Advanced Treatment Modalities: A Blind Experimental Study Shrief Hemaid
1*, Ali Saafan
1, Manal Hosny
2, Gernot Wimmer
3
1Dental Laser Applications, Department of Medical Applications of Laser, National Institute for Laser Enhanced Sciences,
Cairo University, Cairo, Egypt; 2Department of Oral Medicine and Periodontology, Faculty of Dentistry, Cairo University,
Cairo, Egypt; 3Department of Oral Medicine and Periodontology, Meduni Graz, Graz, Austria
Citation: Hemaid S, Saafan A, Hosny M, Wimmer G. Enhancement of Healing of Periodontal Intrabony Defects Using 810 nm Diode Laser and Different Advanced Treatment Modalities: A Blind Experimental Study. Open Access Maced J Med Sci. 2019 Jun 15; 7(11):1847-1853. https://doi.org/10.3889/oamjms.2019.484
Keywords: NanoHydroxyApatite; Laser biostimulation; Periodontal intrabony defects; Rabbits; Platelet-rich fibrin
*Correspondence: Shrief Hemaid. Dental Laser Applications, Department of Medical Applications of Laser, National Institute for Laser Enhanced Sciences, Cairo University, Cairo, Egypt. E-mail: [email protected]
Received: 18-Apr-2019; Revised: 23-May-2019; Accepted: 24-May-2019; Online first: 14-Jun-2019
Copyright: © 2019 Shrief Hemaid, Ali Saafan, Manal Hosny, Gernot Wimmer. This is an open-access article distributed under the terms of the Creative Commons Attribution-NonCommercial 4.0 International License (CC BY-NC 4.0)
Funding: This research did not receive any financial support
Competing Interests: The authors have declared that no competing interests exist
Abstract
BACKGROUND: Low-level laser therapy (LLLT) in the early stage of bone healing was demonstrated as a positive local biostimulative effect. It was also shown that platelet-rich fibrin (PRF) and nanohydroxyapatite alloplast (NanoHA) are effective in treating periodontal intrabony defects.
AIM: The study aimed to evaluate the combined effects of LLLT (810 nm), PRF and NanoHA on induced intrabony periodontal defects healing.
MATERIAL AND METHODS The study was conducted on 16 defects in 8 adult male rabbits (n = 16) divided into 4 groups; Control non-treated group (C), laser irradiated control group (CL), PRF+NanoHA graft (NanoHA-Graft+PRF) treated group and laser irradiated and treated group (NanoHA-Graft+PRF+L). CT radiography was made at baseline, 15 and 30 days later. The defects were induced in the form of one osseous wall defects of 10 mm height, 4 mm depth between the 1
st and the 2
nd molars using a tapered fissure drill coupled to a high-speed
motor. Statistical analysis was done using ANOVA.
RESULTS: (NanoHA-Graft+PRF+L) group significantly produced bone density higher than C, CL and NanoHA-
G+PRF alone.
CONCLUSION: The combination of LLLT+PRF+NanoHA as a treatment modality induced the best results in bone formation in the bone defect more than LLLT alone or PRF+NanoHA alone.
Introduction
Periodontitis is a chronically multifactorial inflammatory disease related to dysbiotic plaque biofilms and characterised by the gradual destruction of dental supportive apparatus [1]. It is caused by specific microorganisms resulting in progressive destruction of the periodontal ligament [PDL] and clinical attachment loss (CAL) or alveolar bone with pocket formation, recession or both [1], [2], [3], [4].
Periodontal therapy's general objectives include 1 — prevention of primary and secondary periodontal diseases through infection and inflammation control and 2. The maintenance or improvement of all supporting structures and tissues (gingivae, PDL], cement and alveolar bone), in health
and function, comfort and aesthetic [5].
Periodontal regeneration is a complex multifactorial process involving biologic events like cell adhesion, migration, proliferation, and differentiation in a composed sequence. Regenerative periodontal procedures [6], [7], [8] include soft tissue grafts, bone grafts, root biomodifications, guided tissue regeneration [GTR], laser biostimulation and combinations of these procedures.
After Maiman had introduced the first actual laser system in 1960, [9] the laser was introduced in dentistry than in periodontology and divided into high-level laser [HLL] and Low-Level laser [LLL].
Recently, LLLT has been used as a bio-stimulator for tissue repair, as it helps to improve local circulation, cell proliferation and collagen synthesis [10], [11], [12].

Dental Science _______________________________________________________________________________________________________________________________
_______________________________________________________________________________________________________________________________
1848 https://www.id-press.eu/mjms/index
At the cellular level, LLL induces biochemical, bioelectric and bioenergetic improvements, leading to increased metabolism, mitotic activity of epithelial cells, fibroblasts cell proliferation and maturation, collagen construction, granulation tissue increase, decrease of inflammatory mediators, triggering the healing process through changes in capillary density and stimulation of local microcirculation [13], [14], [15].
In some studies, on new bone formation, it was stated that the laser's biostimulation effect is not only due to its specific characteristics but also to the development of a series of local conditions that accelerate the bone formation and oedema resolution [16].
This study aimed to evaluate the effect of LLLT in combination with Nano-HA bone graft and autologous PRF compared to the effect of the combined treatment of Nano-HA bone graft and autologous PRF on induced periodontal intrabony defects in rabbits as experimental animal models.
Material and Methods
Preparation of animals
After Experimental Animal Research Ethics committee approval (Cu/I/F/11/19), This study was done over 16 intrabony defects in 8 adult male rabbits, aged 7-8 months and with an average body weight more than 2.5 kg. Before the procedures, all rabbits were separated from each other, then acclimatised in the laboratory environment for 5 days. They were fed by a special, pelleted commercial diet. They were anaesthetised using general anaesthesia with Subcutaneous injections of Ketamine and Xylazine HCl.
Experimental groups and induction of periodontal defects The study included preparation of 16 periodontal defects at the region of interest [ROI] that were grouped (4 defects in each group) as follows;
I) control group [C group]: the induced defects were left without adding any materials nor irradiated by laser therapy.
II) control laser group [(CL) group]: the induced defects were irradiated by Laser only.
III) the treated group (G+PRF): the induced periodontal defects were induced then treated by adding the graft material and PRF without laser irradiation.
IV) the test group (L+G+PRF): the induced defects were irradiated by laser after adding graft and the PRF to the defects.
These 4 groups were distributed randomly in rabbits where each group contains 2 rabbits(4defects) as follows:
Group 1 (Rabbits 1&2) the right-side defects
were [C group] while the left side defects were
[(CL)-group].
Group 2 (Rabbits 3&4), the right-side defects
were [C group] while the left side defects were
[(G+PRF)-group].
Group 3 (Rabbits 5&6) the right-side defects
were [(G+PRF)-group] while the left-side
defects were [(L+G+PRF)].
Group 4 (Rabbits 7&8); the right-side defects
were [(CL)-group], while the left-side defects
were (L+G+PRF).
The surgical field was prepared for the surgical intervention by being shaved carefully, then sterilised using ethanol 70%. A 5 cm rostro-caudal full-thickness incision was made in the skin and the underlying muscles for exposure of the ROI, which is the interdental area between the mandibular 1
st and
2nd
molars of all rabbits without vertical incisions.
After retraction of the flap corono-apically, 1- osseous-wall defect [17], [18] was then induced by exposing the distal surface of distal root of the 1
st
molar and mesial surface of mesial root of the 2nd
molar with the aid of a stopper-premeasured tapered FG drill coupled to a high-speed motor with copious physiological saline irrigation.
The defect presented the following measures: 10 mm corono-apical (measured from the cemento-enamel junction to the most apical edge of the defect) and 4 mm deep (buccolingual direction) measured from the surface of the alveolar bone to the lingual surface of the defect. The exposed roots were curetted using Gracey curette G5/6 to remove the Sharpey’s fibres of the periodontal ligament and cementum.
Figure 1: Defect induction

Hemaid et al. Enhancement of Healing of Periodontal Intrabony Defects Using 810 nm Diode Laser and Different Advanced Treatment Modalities _______________________________________________________________________________________________________________________________
_______________________________________________________________________________________________________________________________
Open Access Maced J Med Sci. 2019 Jun 15; 7(11):1847-1853. 1849
PRF preparation
To prepare PRF, five-millilitre blood samples were collected from each rabbit before sedation using capillary tubes from the inner canthus of the eye into syringes without anti-coagulants then centrifuged at 30.000 RPM for 15 min. PRF was picked up and compressed between 2 sterile glass slides to form a thin membrane and divided into 2 pieces; one was used as a membrane, and the other was cut into pieces to be mixed with the Nano-HA reinforced Fisiograft.
Defects treatment
Some periodontal defects were filled with the mix of FISIOGRAFT NanoHA-reinforced bone graft and PRF and then covered by PRF membrane according to the group.
Figure 2: Filling the defect with the mix of NanoHA+PRF
The laser was applied before flap closure according to the blinding procedures using Diode laser –[GaAlAs] 810 nm- in a continuous mode of power 100 mW for 180 sec to get 18 J. with delivery tip 0.35 cm radius and 0.385 cm
2 area. Energy density
applied was about 46.8 J/cm2. The flap was
repositioned after suturing the muscles with simple interrupted pattern with 3-0 Vicryl while the skin was sutured with 3-0 Silk. The wound was left undressed to the open environment. The laser then was applied daily for 5 consecutive days postoperatively according to the blinding procedures.
Postoperative management and assessment
Baseline CT radiography was operated and repeated on the living rabbits at the 15
and 30 days
later. The rabbits were then housed in an individual cage. The room was maintained at 22˚ relative humidity and a 12-hour light-dark cycle. Food and water were provided ad libitum. Postoperative
analgesic (Diclofenac Sodium) was taken once daily for 3 days S.C 10 mg/kg. Postoperative antibiotic (Ceftriaxone) was taken once daily for 3 days S.C. 25 mg/kg.
Laser device was operated daily to each rabbit in 4 sessions (2 to the right side and 2 to the left side) of 90 seconds every session where;
˗ In group 1and 3, the device was adjusted to the non-laser mode for the right side and adjusted to laser mode for the left side.
˗ In group 2, the device was adjusted to the non-laser mode for the right side and the left side.
˗ In group 4, the device was adjusted to laser mode for the right and the left sides.
Figure 3: Laser biostimulation
CT radiographs were taken for the live animals at baseline, 15 and 30
days later.
The collected data were analysed statistically using SPSS (version 20), and Excel 2013 programs were used for data analysis. Mean, and standard deviation of quantitative data was estimated. Bone density at baseline, 15
th and 30
th days were analysed
with ANOVA test to determine the differences within each group and between groups at different observation periods. The significance (σ) level was set at P ≤ 0.05.

Dental Science _______________________________________________________________________________________________________________________________
_______________________________________________________________________________________________________________________________
1850 https://www.id-press.eu/mjms/index
Figure 4: CT radiography for the rabbit
Randomisation and blinding procedures
For randomisation, the rabbits were numbered and randomly allocated in the groups (1, 2, 3, 4).
Figure 5: Baseline CT radiography of one of (G+PRF+L) group
rabbits
For blinding procedures: Triple blinding was applied where all surgical procedures were performed by the periodontist researcher. Laser device was adjusted by the main operator and operated blindly by another clinician. The CT radiography was operated by a technician and analysed by a radiologist who didn’t know the group allocation of the defect. The statistician also didn’t know the treatment modality of each group.
Results
Differences in bone densities within each group at different time intervals
Changes in mean bone density of ROI in different groups are presented and compared at different observation periods (Table 1).
Figure 6: 15th day CT radiography of one of (G+PRF+L) group
rabbits
All treatment groups showed increased bone density after 15 and 30 days. Only the (C) group showed a non-significant increase after 15
and 30
days compared to baseline. While the groups (CL), (G+PRF) and (G+PRF+L) showed significant increase after 15 days compared to the baseline (P= 0.00 , P= 0.00 and P= 0.00 respectively) and also showed significant increase after 30 days compared to the baseline (P= 0.00 , P= 0.00 and P= 0.00 respectively). Only (G+PRF+L) group showed a significant increase in bone density from the 15
th day to the 30
th day (p=
0.026).
Table 1: Comparison between groups and between time intervals within each group
Mean values P- value
C G+ PRF C L G+PRF+L CL: C
GPRF:C G+PRF+L: G+PRF
G+PRF+L: CL
G+PRF+L: C
(0) 149.67± 159.13
165 ± 187.1
147.48± 177.77
243.12 ± 189.55
1.0 0.293 0.0049 * 0.209 0.208
15th day
356 ± 534.81
644.1 ± 289.7
465.06± 180.55
749.74 ± 244.15
0.77 0.072 0.771 0.049* 0.0023*
15: 0 0.98 0.00 0.00 0.00
30th day
391.25± 151.79
648.7± 273.2
564.67± 410.87
1061.94± 624.46
0.87 0.485 0.026* 0.083 0.0036*
30: 0 0.166 0.00 0.00 0.00
30: 15 0.967 0.998 0.598 0.026
Differences between groups bone density at baseline
At baseline, there was a significant difference in bone density of ROI between group (G+PRF+L) and (G+PRF) and between (G+PRF) and (CL) group (P = 0.049) and (P = 0.022).
Figure 7: 30th day CT radiography of one of (G+PRF+L) group
rabbits

Hemaid et al. Enhancement of Healing of Periodontal Intrabony Defects Using 810 nm Diode Laser and Different Advanced Treatment Modalities _______________________________________________________________________________________________________________________________
_______________________________________________________________________________________________________________________________
Open Access Maced J Med Sci. 2019 Jun 15; 7(11):1847-1853. 1851
Changes between groups in bone density after 15 days After 15 days, there was a significant
difference between (G+PRF+L) and (C) and between (G+PRF+L) and (CL); P= 0.002 and 0.049 respectively.
Figure 8: Baseline CT radiography assessment of one of (G+PRF+L) group rabbits
Changes between groups in bone density after 30 days After 30 days, there was a significant difference between (G+PRF+L) and (C) and between (G+PRF+L) and (G+PRF); P-value = 0.004 and 0.027 respectively.
Figure 9: Bone Density in animal groups throughout time intervals;
baseline, after 15 days & 30 days
Discussion The effects of LLLT and a combination of PRF and Nano-HA graft on bone healing were evaluated in the current experimental study.
There is no experimental study to our
knowledge that has evaluated the combined effect of LLLT, PRF and Nano-HA graft on bone healing. A few potential limitations are needed to be considered before reaching conclusions based on the present results. Although the methodology of the current study can be applied in various settings, these results were applied exclusively to experimental animal studies and mayn’t be considered generalizable. The present study was conducted on 16 defects. Our findings, however, were consistent and coherent, indicating the study's external validity strongly.
One of the challenges of clinical and experimental research is to develop the bioactive surgical additives used to regulate inflammation and increase the speed of the healing process. PRF consists of an autologous leukocyte-platelet-rich fibrin matrix composed of a tetramolecular structure with cytokines, platelets and stem cells within it, acting as a biodegradable scaffold that promotes the development of micro-vascularization and can guide epithelial cell migration to its surface [2], [19], [20], [21], [22]. It has also been demonstrated that PRF is an effective treatment for periodontal intrabony defects. In 2013 Qi Li et al. reported that PRF enhances osteogenic lineage differentiation of alveolar bone progenitors more than of periodontal progenitors by augmenting osteoblast differentiation and mineralised nodule formation via its principal component fibrin [23]. Pripatnanont et al. in 2013 [24]

Dental Science _______________________________________________________________________________________________________________________________
_______________________________________________________________________________________________________________________________
1852 https://www.id-press.eu/mjms/index
reported that PRF had a positive effect on bone formation when used alone or combined with autogenous bone.
When twenty patients were treated with nanocrystalline hydroxyapatite (NcHA) alone or with PRF in split-mouth study design, the results showed that the clinical advantages of NcHA bone graft in combination with PRF were superior to those of the NcHA alone [25], [26], [27].
In the present investigation, using PRF + Nano-HA as one of the treatment modalities in induced intrabony defects didn’t show significant bone formation compared to the control group whereas there were significant differences in bone density between after 15 and 30 days compared to baseline (p = 0.000, p = 0.000). This agrees with Elgendy [2015] et al. study [26].
LLLT alone showed increased mitochondrial activity, synthesis of DNA / RNA in osteoblasts, cell viability, and alkaline phosphatase [16]. A recent experimental study showed that in the early stages of bone healing, LLLT had a positive local biostimulative effect [28].
The results of the current study didn’t show statistical-significant improvements in bone healing after LLLT alone compared to the control group, whereas there were significant differences in bone density between 15 and 30 days of healing compared to baseline. (p = 0.000, p = 0.000 respectively).
In large bone defects, LLLT has been used to accelerate healing [29]. Stimulating osteogenesis [30] is considered a non-invasive, safe technique.
In the present investigation, the combined use of PRF+Nano-HA+Laser as one of the treatment modalities for induced intrabony surgical defects showed a statistically significant increase in a bone density greater than in the control group after 15&30 days (p = 0.002 and 0.004 respectively). And there were significant differences in bone density between 15
th day compared to baseline, 30
th day compared to
baseline and 30th day compared to 15
th day (p =
0.000, p = 0.000 and p = 0.026 respectively).
Bone healing is a complex process comprising prolonged inflammation, bone formation, and bone remodelling processes. The mechanism of action of LLLT, bone substitute, and PRF are different in accelerating the process of bone healing. LLLT and PRF and NanoHA's synergic effect could be superior to their separate use.
No study has assessed this possible synergistic effect to date. The combined effect of LLLT with PRF and NanoHA graft as a method of treatment in intrabony surgical defects in this experiment showed the highest amount of bone formation with the best quality of the newly formed bone. Radiographical examination and statistical analysis confirmed the superiority of the bioactive combination of surgical
additive PRF+NanoHA+LLLT in periodontal intrabony defect repair.
Within the limitation of this experimental study, the following could be concluded; the use of PRF+NanoHA mix results in an increase in bone fill and density regarding the radiographical outcomes in induced periodontal intrabony defects in rabbits, and LLLT may improve the effects of this mix significantly.
References
1. Papapanou PN, Sanz M, Buduneli N, et al. Periodontitis: Consensus report of workgroup 2 of the 2017 World Workshop on the Classification of Periodontal and Peri-Implant Diseases and Conditions. J Clin Periodontol. 2018; 45(December 2017):S162-S170. https://doi.org/10.1111/jcpe.12946 PMid:29926490
2. Chandran P, Sivadas A. Platelet-rich fibrin : Its role in periodontal regeneration. Saudi J Dent Res. 2014; 5(2):117-122. https://doi.org/10.1016/j.ksujds.2013.09.001
3. G. Caton J, Armitage G, Berglundh T, et al. A new classification scheme for periodontal and peri-implant diseases and conditions - Introduction and key changes from the 1999 classification. J Clin Periodontol. 2018; 45(March):S1-S8. https://doi.org/10.1111/jcpe.12935 PMid:29926489
4. Needleman I, Garcia R, Gkranias N, et al. Mean annual attachment, bone level, and tooth loss: A systematic review. J Clin Periodontol. 2018; 45(May 2017):S112-S129. https://doi.org/10.1111/jcpe.12943 PMid:29926483
5. Siaili M, Chatzopoulou D, Gillam DG. An overview of periodontal regenerative procedures for the general dental practitioner. Saudi Dent J. 2018; 30(1):26-37. https://doi.org/10.1016/j.sdentj.2017.11.001 PMid:30166868 PMCid:PMC6112342
6. Trombelli L. Which reconstructive procedures are effective for treating the periodontal intraosseous defect? Periodontol 2000. 2005; 37(1):88-105. https://doi.org/10.1111/j.1600-0757.2004.03798.x PMid:15655027
7. Regeneration P. Academy Report. 2005;(September):1601-1622.
8. Needleman I, Tucker R, Giedrys - Leeper E, Worthington H. Guided tissue regeneration for periodontal intrabony defects - a Cochrane Systematic Review. Periodontol 2000. 2005; 37(1):106-123. https://doi.org/10.1111/j.1600-0757.2004.37101.x PMid:15655028
9. Klement W, Willens R, Duwez P. © 1960 Nature Publishing Group. Nat No 4740. 1960; 187:896-870. https://doi.org/10.1038/187869b0
10. Elavarasu S, Naveen D, Thangavelu A. Lasers in periodontics. J Pharm Bioallied Sci. 2012. https://doi.org/10.4103/0975-7406.100245 PMid:23066266 PMCid:PMC3467892
11. Smith KC. Laser (and LED) Therapy Is Phototherapy. Photomed Laser Surg. 2005; 23(1):78-80. https://doi.org/10.1089/pho.2005.23.78 PMid:15782040
12. Vladimirov YA, Osipov AN, Klebanov GI. Photobiological Principles of Therapeutic Applications of Laser Radiation. Biochem. 2004; 69(1):81-90. https://doi.org/10.1023/B:BIRY.0000016356.93968.7e
13. Walsh LJ. The current status of low level laser therapy in dentistry. Part 1 . Soft tissue applications. 1997;(4). https://doi.org/10.1111/j.1834-7819.1997.tb00129.x PMid:9316312
14. Walsh LJ. The current status of low level laser therapy in dentistry . Part 2 . Hard tissue applications. 1997;(5).

Hemaid et al. Enhancement of Healing of Periodontal Intrabony Defects Using 810 nm Diode Laser and Different Advanced Treatment Modalities _______________________________________________________________________________________________________________________________
_______________________________________________________________________________________________________________________________
Open Access Maced J Med Sci. 2019 Jun 15; 7(11):1847-1853. 1853
https://doi.org/10.1111/j.1834-7819.1997.tb00134.x PMid:9409045
15. Anna Mathew P, More V, B.S JP. Lasers - It's Role in Periodontal Regeneration. Heal Informatics - An Int J. 2018; 7(2/3/4):01-07. https://doi.org/10.5121/hiij.2018.7401
16. Huang Y-Y, Sharma SK, Carroll J, Hamblin MR. Biphasic Dose Response in Low Level Light Therapy - an Update. Dose-Response. 2011; 9(4):dose-response. https://doi.org/10.2203/dose-response.11-009.Hamblin PMid:22461763 PMCid:PMC3315174
17. Struillou X, Boutigny H, Soueidan A, Layrolle P. Experimental Animal Models in Periodontology: A Review. Open Dent J. 2010; 4(1):37-47. https://doi.org/10.2174/1874210601004010037 PMid:20556202 PMCid:PMC2885595
18. Kim C-S, Kim C-K, Wikesjö UME, et al. Periodontal Repair in Surgically Created Intrabony Defects in Dogs: Influence of the Number of Bone Walls on Healing Response. J Periodontol. 2005; 75(2):229-235. https://doi.org/10.1902/jop.2004.75.2.229 PMid:15068110
19. Sculean A, Nikolidakis D, Schwarz F. Regeneration of periodontal tissues: Combinations of barrier membranes and grafting materials - Biological foundation and preclinical evidence: A systematic review. J Clin Periodontol. 2008; 35(SUPPL. 8):106-116. https://doi.org/10.1111/j.1600-051X.2008.01263.x PMid:18724845
20. Sculean A, Nikolidakis D, Nikou G, Ivanovic A, Chapple ILC, Stavropoulos A. Biomaterials for promoting periodontal regeneration in human intrabony defects: A systematic review. Periodontol 2000. 2015. https://doi.org/10.1111/prd.12086 PMid:25867987
21. Preeja C, Arun S. Platelet-rich fibrin: Its role in periodontal regeneration. Saudi J Dent Res. 2014. https://doi.org/10.1016/j.ksujds.2013.09.001
22. Tsai CH, Shen SY, Zhao JH, Chang YC. Platelet-rich fibrin modulates cell proliferation of human periodontally related cells in vitro. J Dent Sci. 2009; 4(3):130-135. https://doi.org/10.1016/S1991-7902(09)60018-0
23. Li Q, Pan S, Dangaria SJ, et al. Platelet-Rich Fibrin Promotes Periodontal Regeneration and Enhances Alveolar Bone Augmentation. Biomed Res Int. 2013; 2013:1-13. https://doi.org/10.1155/2013/729413 PMid:24319687
PMCid:PMC3844276
24. Pripatnanont P, Nuntanaranont T, Vongvatcharanon S, Phurisat K. The primacy of platelet-rich fibrin on bone regeneration of various grafts in rabbit's calvarial defects. J Cranio-Maxillofacial Surg. 2013; 41(8):e191-e200. https://doi.org/10.1016/j.jcms.2013.01.018 PMid:23395296
25. Singh V, Nayak D, Uppoor A, Shah D. Nano-crystalline hydroxyapatite bone graft combined with bioresorbable collagen membrane in the treatment of periodontal intrabony defects: A randomized controlled clinical trial. J Indian Soc Periodontol. 2013; 16(4):562. https://doi.org/10.4103/0972-124X.106912 PMid:23493628 PMCid:PMC3590728
26. Elgendy E, Abo Shady T. Clinical and radiographic evaluation of nanocrystalline hydroxyapatite with or without platelet-rich fibrin membrane in the treatment of periodontal intrabony defects. J Indian Soc Periodontol. 2015; 19(1):61. https://doi.org/10.4103/0972-124X.148639 PMid:25810595 PMCid:PMC4365160
27. Trombelli L, Farina R. Clinical outcomes with bioactive agents alone or in combination with grafting or guided tissue regeneration. J Clin Periodontol. 2008; 35(SUPPL. 8):117-135. https://doi.org/10.1111/j.1600-051X.2008.01265.x PMid:18724846
28. Aboelsaad NS, Soory M, Gadalla LMA, et al. Effect of soft laser and bioactive glass on bone regeneration in the treatment of bone defects (an experimental study). Lasers Med Sci. 2009; 24(4):527-533. https://doi.org/10.1007/s10103-008-0590-y PMid:18626570
29. Zhang JC, Lu HY, Lv GY, Yan ACMG, The CH. The repair of critical-size defects with porous hydroxyapatite / polyamide nanocomposite : an experimental study in rabbit mandibles. Int J Oral Maxillofac Surg. 2010; 39(5):469-477. https://doi.org/10.1016/j.ijom.2010.01.013 PMid:20194003
30. Garcia VG, Fernandes LA, De Almeida JM, et al. Comparison between laser therapy and non-surgical therapy for periodontitis in rats treated with dexamethasone. Lasers Med Sci. 2010; 25(2):197-206. https://doi.org/10.1007/s10103-009-0678-z PMid:19440786
_______________________________________________________________________________________________________________________________
1854 https://www.id-press.eu/mjms/index
ID Design Press, Skopje, Republic of Macedonia Open Access Macedonian Journal of Medical Sciences. 2019 Jun 15; 7(11):1854-1859. https://doi.org/10.3889/oamjms.2019.462 eISSN: 1857-9655 Public Health
Formula Feeding and Associated Factors among a Group of Egyptian Mothers Safaa Tawfik, Dina Saied, Ola Mostafa, Marwa Salem
*, Eman Habib
Medical School, Faculty of Medicine, Kasr Al Ainy, Cairo, Egypt
Citation: Tawfik S, Saied D, Mostafa O, Salem M, Habib E.. Formula Feeding and Associated Factors among a Group of Egyptian Mothers. Open Access Maced J Med Sci. 2019 Jun 15; 7(11):1854-1859. https://doi.org/10.3889/oamjms.2019.462
Keywords: Exploratory study; Breastfeeding; Infants; Mixed feeding; Artificial milk
*Correspondence: Marwa Salem. Medical School, Faculty of Medicine, Kasr Al Ainy, Cairo, Egypt. E-mail: [email protected]
Received: 31-Mar-2019; Revised: 22-May-2019; Accepted: 23-May-2019; Online first: 31-May-2019
Copyright: © 2019 Safaa Tawfik, Dina Saied, Ola Mostafa, Marwa Salem, Eman Habib. This is an open-access article distributed under the terms of the Creative Commons Attribution-NonCommercial 4.0 International License (CC BY-NC 4.0)
Funding: This research did not receive any financial support
Competing Interests: The authors have declared that no competing interests exist
Abstract
BACKGROUND: Breastfeeding provides an unequalled way of infant nutrition, despite that, the rate of exclusive breastfeeding for the first 6 months in Egypt is only 13%, and the rates of artificial feeding are rising.
AIM: The current study aimed to explore the reasons for the use of artificial feeding among mothers receiving subsidised milk from formula dispensing centres in Egypt, and to detect the reasons behind the use of a formula only for infant feeding rather than mixed breastfeeding and artificial feeding.
METHODS: This exploratory cross-sectional study involved 197 mothers; who attended centres for dispensing subsidised artificial formula at primary health care facilities (PHC) in El-Fayom and Ismailia governorates via a purposive sampling technique. The study spanned over 6-months duration from June till December 2018.
RESULTS: A statistically significant higher percentage of artificial feeding only was noticed in male infants (47.5% in the AF group only versus 28.7% in the mixed feeding group (p = 0.018), and infants aged 6-12 months (47.5% in the AF group only versus 28.7% in the mixed feeding group, p = 0.032). A statistically significant higher percentage of artificial feeding only was noticed among infants born to mothers who have general anaesthesia during labour (67.2% in the AF group only versus 41.9% in the mixed feeding group, p = 0.004), and among infants born to mothers who think that formula feeding is better (13.1% in the AF group only versus 0.7% in the mixed feeding group, or that formula has a similar quality to breast milk (6.6%% in the AF group only versus 4.4% in the mixed feeding group, p = 0.0004. The most common reasons for formula feeding reported by both groups were perceived breast milk insufficiency (60.9%), weak babies (50.3%), and doctors’ advice (37%). Previous negative breastfeeding experience and the need for own body privacy were the two reasons which differed statistically in both groups p = 0.004 and 0.008, respectively.
CONCLUSION: Antenatal care education is essential to improve mothers’ knowledge and practice of breastfeeding. Baby-friendly hospital initiative implementation is essential to ensure early initiation and continuation of breastfeeding.
Introduction
Infant nutrition is an important determinant of future health [1]. The long-term benefits of breastfeeding in enhancing maternal and infant health have been well documented in the literature for several years [2]. Compared to exclusively breastfed infants, formula-fed infants are not only deprived of the benefits of breast milk but also more likely to
respiratory infection, otitis media and sudden infant death syndrome [1]. Moreover, formula fed infants are more likely to rapid weight gain in their first year of life; which increases their risk to develop childhood obesity with its subsequent complications [3].
Despite this increasing body of knowledge, breastfeeding rates remain below-recommended standards; globally, only 40% of mothers exclusively breastfeed their children for six months [4]. In Egypt, breastfeeding practices are not always optimal.
Tawfik et al. Formula Feeding and Associated Factors among a Group of Egyptian Mothers _______________________________________________________________________________________________________________________________
_______________________________________________________________________________________________________________________________
Open Access Maced J Med Sci. 2019 Jun 15; 7(11):1854-1859. 1855
Exclusive breastfeeding (EBF) among infants under two months of age constitutes 71%. However, The EDHS 2014 survey found that by the age of 4-5 months, only 13 per cent are exclusively breastfed [5].” Many studies have shown that all alternatives to breastfeeding lead to worse health outcomes for both the infant and the mother, with few exceptions [6], [7], [8].
There are various factors that affect the decision regarding the initiation and duration of exclusive breastfeeding, including sociodemographic factors (education level, monthly household income, and parity), residence and cultural beliefs, employment policies, health-related factors and biosocial factors (breastfeeding support) [9], [10]. Also, Infants' characteristics are important factors such as gender, birth weight, and age have an impact on the mothers' breastfeeding attitude [11].
While many studies have highlighted the negative effects of formula supplementation on the BF relationship [11], few have highlighted the reasons that women choose to formula feed their infants. Limited data are available specifically looking at maternal decision making from both perspectives [2]. So, it is important to explore the mother’s attitudes towards breastfeeding and to identify the infant characteristics to evaluate which interventions that are needed to promote EBF [11]. Similarly, the literature review showed there is a lack of studies in this area in Egypt. Therefore, this study aims to assess some of the influences on mother's decision making regarding the introduction of artificial formula to her infant and to identify the associations if any; among these influences and infant's feeding choices.
Methods
Study setting and design
This is an exploratory cross-sectional study involved mothers who attended centres for dispensing subsidised artificial formula at primary health care facilities (PHC) in El-Fayom and Ismailia governorates. The study spanned over 6-months duration from June till December 2018.
Sampling technique and sample size
Using Epi info version 6, the following data were entered:
- expected prevalence of artificial feeding only among all formula feeding (mixed feeding and exclusive artificial feeding):74.8% [12].
- Level of precision: 5%
- Confidence level: 95%
It was found that the least sample size required is 195 mothers who are recruited via a convenience sampling technique.
Inclusion criteria
Biological mothers of healthy infant born at term, between birth and 2 years of age, and who supplement their infants with the artificial formula (AF).
Exclusion criteria
Non Egyptian mothers, mothers with medical conditions that interfere with breast feeding, and infants with congenital malformation that would interfere with breast feeding.
Data collection tool
A pre-tested structured interview questionnaire was used to collect data from the study participants. It covered the following items:
Socio-demographic characteristics and obstetric history of the mothers related to breastfeeding: education, working status, mode of delivery, anesthesia exposure, antenatal breastfeeding education sessions, and current feeding practice, demographic characteristics of the enrolled infants: gender, birth weight, age, and child's rank, in addition to mother's beliefs and attitude that can influence decision making on breastfeeding practices, including receiving antenatal education, mother's intentions to breastfeed at pregnancy, current mother desire to breastfeed, and the leading factors, that led to artificial formula introduction; ranked according to importance to each participant as reported by the mothers. Questions used in this questionnaire were adopted from the available literature [13], [14].
The original language of the included items was English; they were translated to Arabic by two experts followed by back translation to English by other independent experts.
Pilot testing: The preliminary data collection form was tested on 32 women (attended a nearby PHC and beyond the sample size) to assess the clarity and comprehension of questions, and the time needed to answer the questionnaire.
Statistical analysis
Pre-coded data were entered into the Statistical Package of Social Science (SPSS) version 21.0 (SPSS Inc. IBM, U.S.A.).
The data were summarised using mean and SD, and range for quantitative variables. Numbers and percentages were used for qualitative variables.

Public Health _______________________________________________________________________________________________________________________________
_______________________________________________________________________________________________________________________________
1856 https://www.id-press.eu/mjms/index
Comparison between groups was performed using the Chi-square test for qualitative variables. For each test, a p-value of less than 0.05 was considered statistically significant.
Ethical considerations
The Ethical Review Committee in the Faculty of Medicine at Cairo University revised and approved the study protocol (N-56-2016). Informed consent was obtained directly from the enrolled mothers before data collection and after explanation of the study objectives and importance. The enrolled mothers were assured that refusal to participate in the study would not affect formula cans dispensing or the care they receive. All procedures for data collection were treated with confidentiality according to Helsinki declarations of biomedical ethics.
Results
The current study enrolled 197 mothers. More than half of the mothers had a high school or higher education, and more than one-tenth of them were illiterate. Nearly three quarters were unemployed. Nearly three fourth delivered by Caesarean section and only more than forth of them had a normal vaginal delivery. Half of them had general anaesthesia during labour, less than a third had epidural, and only one fifth had none. Four-fifths of the mothers did not have antenatal breastfeeding education. More than two-thirds of the mother used mixed artificial, and breastfeeding, and less than a third feed their babies' artificial milk only as shown in Table 1.
Table 1: Maternal Background characteristics (n = 197)
Mothers’ characteristics N %
Education Illiterate Primary and middle school High school or higher
25 61 111
12.7 31.0 56.3
Working status Unemployed Employed
141 56
71.6 28.4
Mode of delivery Vaginal Cesarean section
55 142
28.0 72.0
Anaesthesia during labour None General Epidural
42 98 57
21.3 49.7 29.0
Antenatal breastfeeding education No Yes
157 40
79.7 20.3
Current feeding practice Mixed breastfeeding and artificial feeding Artificial feeding only
136 61
69.0 31.0
As displayed in Table 2 out of the 197 infants, 56.3 % were boys, 12.4% had a low birth weight. More than half of the infants were less than six months of age, more than a third were 6-12 months old, and one-tenth was older than 12 months. More than half of infants were ranked as a first child.
Table 2: Percent distribution of the enrolled infants by background characteristics (n = 197)
Infant characteristics Frequency Per cent
Sex Boy Girl
111 86
56.3 43.7
Birth weight* < 2.5 kg > 2.5 kg
24
169
12.4 85.8
Age groups in months < 6 6-12 > 12
109 68 20
55.3 34.5 10.2
Child rank First Second ++
106 91
53.8 46.2
*Birth weight (n = 193): 4 mothers did not remember.
Comparing the effect of different infant factors on the feeding methods, there was a statistically significant difference between the mixed feeding group and the artificial feeding group regarding infants’ sex; where a higher percentage of males were fed artificial feeding only compared to females (p = 0.018). As shown in Table 3, A statistically significant higher percentage of the younger age group (< 6 months) were fed by mixed feeding compared to the older age groups (p = 0.032). The other infant factors, including infants’ birth weight, infants’ weight for age Z scores, and infants’ rank among siblings, were not shown to have any effect on the feeding method.
Table 3: Relation between infants’ characteristics and breastfeeding status (n = 197)
Characteristic
Breastfeeding status P value Mixed feeding Only Artificial
formula
N % N %
Infant Gender Boy 69 50.7 42 68.9 0.018*
Girl 67 49.3 19 31.1 Birth weight < 2.5 kg 16 11.9 8 13.6 0.754
> 2.5 kg 118 88.1 51 86.4 Current weight/age (Z-score) -0.8 ± 2.2 -0.7 ± 2.0 -0.9 ± 2.7 0.494 Age group < 6 months 81 59.6 28 45.9 0.032*
6-12 months 39 28.7 29 47.5 > 12 months 16 11.7 4 6.6
Child's rank
First
75 55.1 31 50.8 0.573
Second ++ 61 44.9 30 49.2
*Statistical significance was defined as p < 0.05.
Among maternal factors, both exposures to general anaesthesia during labour and mothers’ perception of formula versus breastfeeding were shown to affect the feeding method. A statistically significant higher percentage of mothers who had general anaesthesia during labour fed their babies artificial feeding only compared to mothers who did not have anaesthesia and those who had epidural anaesthesia (p = 0.004). Also, a statistically significant higher percentage of mothers who thought that formula equals breast milk in quality or even better than breast milk used artificial formula only compared to mothers who thought that breast milk is better (p = 0.0004).
The other maternal characteristics, including education, occupation, mode of delivery and antenatal education, did not have any statistically significant effect on the feeding method, as shown in Table 4.

Tawfik et al. Formula Feeding and Associated Factors among a Group of Egyptian Mothers _______________________________________________________________________________________________________________________________
_______________________________________________________________________________________________________________________________
Open Access Maced J Med Sci. 2019 Jun 15; 7(11):1854-1859. 1857
Table 4: Relation between mothers’ characteristics and feeding methods (n = 197)
Characteristic
Breastfeeding status P value Mixed feeding Only
Artificial formula
N % N %
Mother Education level Illiterate 15 11 10 16.4
0.233 Primary & middle school 39 28.7 22 36.1 High school or higher 82 60.3 29 47.5
Occupation
Unemployed 94 69.1 47 77.0 0.254 Employed 42 30.9 14 23
Mode of delivery Vaginal delivery 42 30.9 13 21.3 0.166 Cesarean section 94 69.1 48 78.7
Anesthesia None 33 24.3 9 14.8 0.004* General 57 41.9 41 67.2
Epidural 46 33.8 11 18 Formula/breastfeeding perception
Breast feeding is better 129 94.9 49 80.3 0.0004* Equal 6 4.4 4 6.6 Formula is better 1 0.7 8 13.1
Antenatal education
No 105 77.2 52 85.2 0.346 Yes 31 22.8 9 14.8
*Statistical significance was defined as p < 0.05.
It was noticed that the majority of both groups (artificial feeding and mixed feeding groups) reported that they had an intention to breastfeed when they were pregnant, with no statistically significant difference between them (untabulated results).
Table 5 shows the reasons for the introduction of artificial formula as reported by the mothers. The most common reason was fear of breast milk insufficiency, followed by the inability of the baby to suckle due to illness, and then doctors’ advice. The least common reasons were fathers’ disagreement with infant breastfeeding and the intention of the mother to return to smoking.
Table 5: Reasons for artificial formula feeding as reported by the mothers (n = 197)
Factors for artificial formula introduction N %
Perceived insufficient milk 120 60.9
Sick baby/unable to suckle 99 50.3
Encouraged by a doctor 77 37
The belief that formula is equal to breast milk or better 63 32
Maternal nipple pain/ cracks 58 29.4
Maternal medications 57 29
Breastfeeding is inappropriate 40 20
Felt tied down 38 19.3
Previous negative breastfeeding experience 35 17.8
Employment/ studying 34 17.3
Family and home responsibilities 25 12.7
The desire for dieting to lose weight 23 11.7
To make someone else feed the baby 12 6
Someone wanted to feed the baby 10 5
Need for own body privacy 12 6
Hormonal contraceptive use 9 4.6
Infant's father's opinion 4 2
Return to smoking 3 1.5
Mothers were allowed to select more than one reason
Comparing the reported reasons for the introduction of formula feeding among the two groups of mixed feeding and artificial feeding only, no statistically significant differences were detected except for previous negative breastfeeding experience and the need for own body privacy which were both significantly higher among the artificial feeding group as seen in Figure 1.
Figure 1: Comparison between the mixed feeding and artificial feeding groups regarding two reasons of formula introduction (presented in percentage); BF: Breastfeeding
Discussion
The current study explored the characteristics of formula-fed infants and their mothers, and the associated factors for mothers’ choice to artificially feed their babies, whether totally or in addition to breastfeeding. Significant infant factors which were related to breastfeeding and formula feeding were gender and young age group. Significant maternal factors which were related to formula feeding only were exposed to general anaesthesia during labour and the perception that formula is as good as breast milk or even superior to breast milk.
Many studies pointed to the drawbacks of subsidising infants’ formula. In addition to deprivation of both infants and mothers from the benefits of breastfeeding, it also had led to a misconception that formula is a better alternative to breastfeeding as it is endorsed by the government [7], [8]. In the current study, the prevalence of artificial feeding only was significantly higher than mixed feeding among infant boys compared to infant girls. This may be due to male gender preference in the Egyptian culture, with a misconception that male babies should receive the most valuable nutrition, which comes from an artificial fortified source rather than breast milk. This misconception is further enhanced by the aggressive advertisement by artificial feeding companies. This finding is contrary to the findings of other studies where no significant relationship was found between infants’ gender and bottle feeding [14], or breastfeeding [15]. This was also contrary to another study where exclusive breastfeeding was significantly higher among male infants [17]. The difference may be explained by cultural factors; where mothers included in that study were from a rural area; were breastfeeding in the norm. In addition to that, rural mothers are not exposed to formula advertisement as urban mothers included in the current study due to the differences in economic resources. Advertising for and

Public Health _______________________________________________________________________________________________________________________________
_______________________________________________________________________________________________________________________________
1858 https://www.id-press.eu/mjms/index
marketing of breast milk substitutes can undermine a mother’s choice to breastfeed [18].
The age of infants in the present study was shown to affect mothers’ choices of the method of feeding; where a higher percentage of the younger age group (< 6 months) were fed by breastfeeding in addition to formula compared to the older age groups who were fed artificial formula only. Similarly, young infants’ age (< 6 months) was associated with a higher prevalence of breastfeeding in a study performed in Ethiopia [14]. Our findings are consistent with the Egyptian DHS 2014 which stated that only 4 in 10 children under 6 months of age are being exclusively breastfed, and around 3 in 10 of children under 6 months are being bottle fed [5].
Birth order was not associated with the choice of feeding method in this study. This contradicts the finding of another Egyptian study where infants with higher birth order (third or more) were more likely to be artificially fed [12].
The present study showed no association between mothers’ education level and the choice of feeding method. This is contrary to another study performed in the USA; where mothers with higher levels of education were more likely to practice exclusive breastfeeding than those with lower levels of education [17]. Mothers’ occupation in the present study did not have an effect on their choice of feeding method contrary to Ethiopian study; where mothers 'occupation was positively associated with bottle feeding [14]. This difference may be explained by the socio-cultural differences between the study participants.
Parity was not shown to have a significant effect on mothers’ choice of the method of feeding, unlike another study were primiparous state was associated with higher rates of breastfeeding [17]. This is contrary to the finding of another Egyptian study where primiparous status was associated with high rates of artificial feeding [12]. It is therefore essential to provide antenatal and post-natal breastfeeding education to all mothers, whether primiparous or multiparous.
In the present study, the mode of delivery did not affect the maternal choice of infant feeding method, unlike the results reported by other studies where cesarean delivery was more associated with formula feeding [12] and [17], [19]. On the other hand, the use of general anaesthesia during delivery in the current study was associated with significantly higher rates of formula feeding only. This may be due to the lack of practice of immediate skin to skin contact early after delivery when using general anaesthesia. This highlights the importance of implementation of the baby friendly hospital initiative to encourage early initiation and later continuation of breastfeeding.
A small number of participant mothers in the current study reported receiving antenatal education
about breastfeeding. Surprisingly, receiving such education did not seem to have any effect on maternal choice to use formula feeding. This finding raises a concern about the quality of antenatal care and the content of the provided education message.
The most commonly reported reason for formula supplementation was the perception of inadequate milk supply. This finding is in agreement with previous literature [20], [21], [22], [23], where the most common reason for formula feeding on mother’ perspective was insufficient milk supply. This highlights the importance of educating mothers about milk production, milk supply, as well as infants’ needs in the first weeks of life. Mothers should be informed that inadequate milk production is primarily caused by formula supplementation; leading to improper breast stimulation and emptying. In particular, mothers should be educated that the small volumes of colostrum produced in the first days of breastfeeding adequately meet infants’ needs.
Professional advice offered to the mothers has a strong influence on their decision of initiation and continuation of breastfeeding [24]. Unfortunately, the third common reason to use a formula in the current study, as reported by the mothers was doctors’ advice. Furthermore, there was a statistically significant difference between the two groups of mothers according to their perception about the superiority of breastfeeding versus formula feeding. A statistically significant higher percentage of mothers who believed that breast milk was better than formula used mixed feeding compared to those who believed that formula is equal or better than breast milk; who used only artificial formula. This highlights the importance of training of health care providers so that they could offer proper advice to the expectant and lactating mothers. Mothers of all breastfeeding experience levels should receive equal attention regarding breastfeeding support.
Undergraduate curricula should include adequate information on breastfeeding so that health care professionals would be competent in this area. Choosing to use formula should be limited to exceptional situations, where mother’s milk can be considered unsuitable for her baby. Under such situations, expressed breast milk should be considered first before deciding formula feeding.
The current study findings should be viewed concerning the following limitation: It involved interviews with health care providers, thus reflected the barriers to implement BFHI from their perspective only. Further research is required to assess the barriers from the recipients' perspective by interviewing mothers during antenatal and early postnatal care.
This study concluded that the prevalence of formula feeding is high mainly among mothers who were exposed to general anaesthesia during labour and had a faulty perception that formula is as good as

Tawfik et al. Formula Feeding and Associated Factors among a Group of Egyptian Mothers _______________________________________________________________________________________________________________________________
_______________________________________________________________________________________________________________________________
Open Access Maced J Med Sci. 2019 Jun 15; 7(11):1854-1859. 1859
breast milk or even superior to breast milk. Therefore, health education and awareness programs about the importance of exclusive breastfeeding and the hazards of formula use should be provided to the expectant and new mothers. At the hospital level, epidural labour analgesia should be strongly promoted instead of general anaesthesia.
Acknowledgement
The authors are thankful for the enrolled mothers for their active participation in the present study.
References
1. Kaar JL, Sauder KA, Shapiro AL, Starling AP, Ringham BM, Johnson SL, Dabelea D. Infant feeding practices in a diverse group of women: The Healthy Start Study. Clinical Medicine Insights: Pediatrics. 2019; 13:1-8. https://doi.org/10.1177/1179556518824362 PMid:30718970 PMCid:PMC6348534
2. Radzyminski S, Callister LC. Mother's beliefs, attitudes, and decision making related to infant feeding choices. The Journal of perinatal education. 2016; 25(1):18-28. https://doi.org/10.1891/1058-1243.25.1.18 PMid:26848247 PMCid:PMC4719110
3. Feldman‐Winter L, Burnham L, Grossman X, Matlak S, Chen N, Merewood A. Weight gain in the first week of life predicts overweight at 2 years: A prospective cohort study. Maternal & child nutrition. 2018; 14(1):e12472. https://doi.org/10.1111/mcn.12472 PMid:28636245
4. World Health Organization. Implementation guidance: protecting, promoting and supporting breastfeeding in facilities providing maternity and newborn services: the revised baby-friendly hospital initiative.
5. El-Zanaty F, Way A. Egyptian Demographic and health survey, 2014, Ministry of health and population, National population council, and ORC Macro, Egypt, 2015.
6. Rollins NC, Bhandari N, Hajeebhoy N, Horton S, Lutter CK, Martines JC, Piwoz EG, Richter LM, Victora CG, Group TL. Why invest, and what it will take to improve breastfeeding practices? The Lancet. 2016; 387(10017):491-504. https://doi.org/10.1016/S0140-6736(15)01044-2
7. The Lancet. Breastfeeding. January 29, 2016. http://www.thelancet.com/series/breastfeeding
8. Zimmerman R. Study: Breastfeeding Even More of a Health issue for Moms Tan for Babies. Common Health, 2016.
9. Tan KL. Factors associated with exclusive breast-feeding among infants under six months of age in peninsular Malaysia. Int Breast-feed J. 2011; 6:2. https://doi.org/10.1186/1746-4358-6-2 PMid:21284889 PMCid:PMC3039569
10. Kozhimannil KB, Jou J, Attanasio LB, Joarnt LK, McGovern P. Medically complex pregnancies and early breastfeeding behaviors: a retrospective analysis. PLoS One. 2014; 9(8):e104820. https://doi.org/10.1371/journal.pone.0104820 PMid:25118976 PMCid:PMC4132072
11. Westmar H, Johansson L. Breastfeeding attitudes and confidence among mothers in a rural area of Thailand.
12. Kandeel WA, Rabah TM, Zeid DA, El-Din EM, Metwally AM, Shaalan A, El Etreby LA, Shaaban SY. Determinants of Exclusive Breastfeeding in a Sample of Egyptian Infants. Open Access Maced J Medl Sci. 2018; 6(10):1818. https://doi.org/10.3889/oamjms.2018.359 PMid:30455755 PMCid:PMC6236050
13. Berde AS. Factors associated with bottle feeding in Namibia: findings from Namibia 2013 demographic and health survey. Journal of tropical pediatrics. 2017; 64(6):460-7. https://doi.org/10.1093/tropej/fmx091 PMid:29206941
14. Kebebe T, Assaye H. Intention, magnitude and factors associated with bottle feeding among mothers of 0-23 months old children in Holeta town, Central Ethiopia: a cross sectional study. BMC Nutrition. 2017; 3(1):53. https://doi.org/10.1186/s40795-017-0174-y
15. Shosha G. The influence of infants" characteristics on breastfeeding attitudes among Jordanian mothers. Open Journal of Nursing. 2015; 5(04):295. https://doi.org/10.4236/ojn.2015.54032
16. Al Ghwass M, Ahmed D. Prevalence and Predictors of 6 Month Exclusive Breastfeeding in a Rural Area in Egypt. Breastfeeding Medicine. 2011; 191-196. https://doi.org/10.1089/bfm.2011.0035 PMid:21770735
17. Pierro J, Abulaimoun B, Roth P, Blau J. Factors Associated with Supplemental Formula Feeding of Breastfeeding Infants During Postpartum Hospital Stay. BREASTFEEDING MEDICINE. 2016; 11(4). https://doi.org/10.1089/bfm.2015.0091 PMid:27027901
18. Adhikari T, Subedi I. Knowledge and practice on breastfeeding among mothers of infant. Journal of Food Science and Technology Nepal. 2013; 8:71-74. https://doi.org/10.3126/jfstn.v8i0.11754
19. Hegazy RA, Abdelaziz SB, Fahmy AA, Shaeer EK. Failed Breast Feeding among Egyptian Women at One Month Postpartum: A Cross-Sectional Community Based Study. Clinics Mother Child Health. 2015; 12:170. https://doi.org/10.4172/2090-7214.1000170
20. Lin SY, Lee JT, Yang CC, et al. Factors related to milk supply perception in women who underwent cesarean section. J Nurs Res. 2011; 19:94-101. https://doi.org/10.1097/JNR.0b013e31821988e9 PMid:21586986
21. Lou Z, Zeng G, Huang L, et al. Maternal reported indicators and causes of insufficient milk supply. J Hum Lact. 2014; 30:466-473. https://doi.org/10.1177/0890334414542685 PMid:25031029
22. Rahman A, Akter F. Reasons for formula feeding among rural Bangladeshi mothers: A qualitative exploration. PloS one. 2019; 14(2):23. https://doi.org/10.1371/journal.pone.0211761 PMid:30807588 PMCid:PMC6391007
23. DaMota K, Bañuelos J, Goldbronn J, Vera-Beccera LE, Heinig MJ. Maternal request for in-hospital supplementation of healthy breastfed infants among low-income women. Journal of Human Lactation. 2012; 28(4):476-82. https://doi.org/10.1177/0890334412445299 PMid:22628291
24. Smale M, Renfrew MJ, Marshall JL, Spiby H. Turning policy into practice: more difficult than it seems. The case of breastfeeding education. Maternal & child nutrition. 2006; 2(2):103-13. https://doi.org/10.1111/j.1740-8709.2006.00045.x PMid:16881920

_______________________________________________________________________________________________________________________________
1860 https://www.id-press.eu/mjms/index
ID Design Press, Skopje, Republic of Macedonia Open Access Macedonian Journal of Medical Sciences. 2019 Jun 15; 7(11):1860-1866. https://doi.org/10.3889/oamjms.2019.347 eISSN: 1857-9655 Public Health
The Knowledge and Attitudes about the Benefits, Risks and Use of Medicine in Aged Primary Students in Indonesia Syofyan Syofyan
1,2*, Dachriyanus Dachriyanus
2, Masrul Masrul
3, Rosfita Rasyid
3
1Public Health Science, Faculty of Medicine, Andalas University, Padang, West Sumatera, Indonesia;
2Faculty of Pharmacy,
Andalas University, Padang, West Sumatera, Indonesia; 3Faculty of Medicine, Andalas University, Padang, West Sumatera,
Indonesia
Citation: Syofyan S, Dachriyanus D, Masrul M, Rasyid R. The Knowledge and Attitudes about the Benefits, Risks and Use of Medicine in Aged Primary Students in Indonesia. Open Access Maced J Med Sci. 2019 Jun 15; 7(11):1860-1866. https://doi.org/10.3889/oamjms.2019.347
Keywords: Attitudes; Benefits; Children; Knowledge; Risks; Use of medicine
*Correspondence: Syofyan Syofyan, Doctoral Student of Public Health Science, Faculty of Medicine, Andalas University, Padang, West Sumatera, Indonesia. E-mail: [email protected]
Received: 16-Mar-2019; Revised: 13-May-2019; Accepted: 14-May-2019; Online first: 14-Jun-2019
Copyright: © 2019 Syofyan Syofyan, Dachriyanus Dachriyanus, Masrul Masrul, Rosfita Rasyid. This is an open-access article distributed under the terms of the Creative Commons Attribution-NonCommercial 4.0 International License (CC BY-NC 4.0)
Funding: This research did not receive any financial support
Competing Interests: The authors have declared that no competing interests exist
Abbreviations: CHC: chronic hepatitis C; NS: not statistically significant; S: statistically significant; BMI: body mass index; AST: aspartate transaminase; ALT: alanine aminotransferase; HDL-C: high-density lipoprotein cholesterol; LDL-C: low-density lipoprotein cholesterol; HOMA-IR: Homeostasis Model Assessment of Insulin Resistance. a(Chi-square test) b(Student t-test) c(Mann-Whitney test)
Abstract
BACKGROUND: Medication always has a ratio of benefits and risks to become a safety measure. Therefore, its use must be careful, especially for children, because it can potentially occur drug incidents in children. As drug users, children are required to be active in using it, but children's knowledge and attitudes about benefits, risks (dangers) and use of medicine are still very shallow and fragmented.
AIM: This study aims to look at the description of children's knowledge and attitudes about medicine from the perspective of the benefits, risks or dangers and use of medicine and the factors that influence them.
MATERIAL AND METHODS: The study was conducted by the analytic method with a cross-sectional approach using a questionnaire instrument in grade V elementary school-age children in Padang City, Indonesia. The total sample size obtained was 503 students.
RESULTS: The results showed that children's knowledge of medicine was generally categorised as low, with an average score of 4.70 (SD 1.82) from a scale of 9. Knowledge of drug use was much lower, namely the average score of 1.21 (0.74), followed by knowledge of drug hazards an average score of 1.69 (1.03) and drug benefits an average score of 1.80 (0.69). Age variables, address of residence, family income, the existence of families working as health workers and sources of drug information significantly influence students knowledge (P < 0.05). Whereas students attitudes towards medicine tend to be more positive with an average score of 7.18 (1.77), where the average score of attitudes towards benefits, risks (hazards) and drug use are 1.79 (0.46), respectively, 1.10 (0.58) and 4.29 (1.37). Address of residence, companion during illness, achievement in school and experience in hospital care have a significant effect on student attitudes (P < 0.05).
CONCLUSION: This study concluded that indicate that students knowledge of benefits, risks and use of medicine is still low and very limited. While related to student attitudes, in general, it tends to be more positive, except about the dangers of medicine that show a negative attitude. The low level of knowledge and limited attitudes of children are the reason for the need for drug education given to children, especially in schools as an integral part of health education.
Introduction
Medication always has a ratio of benefits and risks to become a safety measure. Therefore, its use must be careful, especially for children. This is due to among others due to variations in size, physiological limitations and communication barriers in children. As a result, it can potentially occur drug incidents in children [1], [2]. The incidence of this drug can be the occurrence of various problems related to medicine (DRP). The most common DRP in children is in the form of poisoning, non-compliance with medication,
adverse drug events (ADE) and improper drug use [3], [4].
The occurrence of poisoning can occur due to many factors. In the United States reported in 2015, there were more than 440,000 calls (about 1 call per minute) because the child who swallowed medicine (unintentional general exposure), was given too much medication or received the wrong medication (unintentional therapeutic error) [5], [6]. In 2014 there were 57,448 children under the age of 6 who were admitted to the ER due to medication problems without supervision or as a result of dosing errors. About 16% of this is severe poisoning that causes

Syofyan et al. The Knowledge and Attitudes about the Benefits, Risks and Use of Medicine in Aged Primary Students in Indonesia _______________________________________________________________________________________________________________________________
_______________________________________________________________________________________________________________________________
Open Access Maced J Med Sci. 2019 Jun 15; 7(11):1860-1866. 1861
death [6], [7].
The accidental use of children for certain medicine is due to the child's perception of being mistaken about medicine. Tablets that are coloured like pink can be mistaken for candy by children [8]. Therefore, drug safety in children must be a serious concern. Moreover, the use of medicine has become a common activity for children both through prescribing and self-medication [9], [10].
Studies show that the practice of self-medication using over the counter (OTC) medicine, especially the analgesic group in children, has begun at the age of 11 or 12 years [11], [12]. In Finland, children under 12 years old have practised self-medication, especially the use of vitamins [3]. In Denmark, children aged 11-15 years are used to practising self-medication for minor ailments, especially for headaches and gastric disorders [10]. The same thing happened in 20 countries surveyed that the prevalence of the use of OTC medicine especially headache medicine in children aged 11-15 years is increasing even some of them are toxic so that they can be problematic for health [13].
On the one hand, as drug users, children are required to have an active role [14]. But on the other hand, their knowledge and attitudes regarding medicine are still very limited and fragmented [8], [15], [16], [17], [18], [19]. Children's knowledge about medicine is obtained only from their daily experiences [8], [19]. While it is related to children's attitudes towards medicine, several studies show that children's attitudes are generally negative towards medicine such as the fear of taking medication, not adhering to taking medication or even taking excessive medication because of the sweetness of the drug syrup [19]. But in several other studies, children also showed positive attitudes to medicine [20], [21].
Based on the above, it is very important to teach children about medicines at school so that children can receive correct and complete information about medicine. With this drug education, children will be prepared to become rational drug users when they grow up and at the same time are expected to be agents of change in rational drug use for their families at home.
Children in different cultures in all countries of the world usually have similarities in what they know about medicine [22]. Indonesia, as a country with the largest population in the world, including the age group of its children is likely to have the same tendency in terms of knowledge and attitudes about medicines as in previous studies. However, studies and data have not been found that illustrate how the level of knowledge and attitudes of children about medicine is mainly related to the problems of the benefits and risks or dangers of medicine and their use.
This study aims to look at an overview of the
knowledge and attitudes of elementary school-age children (class V) about medicine from the perspective of the benefits, risks or dangers and drug use by children in Indonesia, especially in the city of Padang and what factors influence it.
Material and Methods
This study was a cross-sectional survey conducted from June to July 2018 in the city of Padang, West Sumatra, Indonesia. The sample chosen was class V elementary school age, children. The location of the study was conducted in 10 (ten) elementary schools spread over 3 (three) sub-districts namely North Padang, South Padang and Bungus Teluk Kabung.
The number of samples taken was 503 people. Sampling uses the stratified random sampling method. The first stage in the form of school selection uses a probability proportional to size (PPS) method, which is based on a database of the number of elementary school students in the sub-district as a size that is used as the basis for opportunities in selecting samples. From selected schools, student samples were selected using the simple random sampling method.
The selected school received prior permission from the Padang City Education Office, West Sumatra. Then an official letter is submitted through the Chair of the Public Health Study Program, Faculty of Medicine, Andalas University to each selected school. Before starting the study, ethics approval was first requested from the Ethics Committee Faculty of Medicine, Andalas University, Padang. Each parent of the student selected as a sample was also asked for his consent to permit his child to be included in this study.
This research is in the form of a quantitative study using an instrument in the form of a closed questionnaire to see the knowledge and attitudes of elementary students about medicine. This questionnaire is based on previously modified similar research adapted to conditions in Indonesia [15], [16], [17], [18], [20], [24], [25]. This questionnaire consists of 3 parts, namely the first part contains the sociodemographic characteristics of the respondents; the second part contains aspects of knowledge, and the third part contains aspects of attitude. Each part of knowledge and attitude consists of 3 categories, namely drug benefits, risks or dangers of medicine and drug use. In the knowledge section, the answers consist of yes, no and don't know. Likewise, in the attitude section, answers consist of agreeing, disagreeing and not knowing. For each correct answer given a score of 1 and the wrong or not knowing given

Public Health _______________________________________________________________________________________________________________________________
_______________________________________________________________________________________________________________________________
1862 https://www.id-press.eu/mjms/index
a score of 0. The draft questionnaire that has been prepared asked for opinions of community pharmacists and clinical pharmacy related to the content validation and then validation test for 30 elementary students. Before the research began, the research team who served as enumerators were gathered to be given training on how to collect data on students. Filling out questionnaires by students is done in the classroom with the help of enumerators. Completing this questionnaire takes about 30 minutes.
The collected data is coded and then sent to the SPSS database for Windows version 21. Univariate analysis (descriptive) includes frequency, percentage, average and standard deviation. Bivariate analysis between dependent variables (knowledge and attitudes about medicine) and independent variables (respondents sociodemographic characteristics) were determined using the Chi-Square test. The level of significance was set at p < 0.05.
Results
The sociodemographic characteristics of respondents in this study, as presented in Table 1. Respondents were generally 10-11 years old (73.4%), male sex (52.3%) and 43.3% had received achievement 10 (ten) big at school. Respondents mostly resided in the city centre, namely in North Padang and the middle area in South Padang (80.0%). 48.1% of families have a moderate income, and as many as 32.6% have families working in the health sector. Mothers are people who always accompany children when they are sick (85.3%), and only 24.7% say they have been hospitalised. For drug information, children generally state that they get it from their parents (66.6%).
Table 1: Sociodemographic characteristics of children’s
Sociodemography of respondents Variables Amount %
Age 10 – 11 369 73.4 12 – 14 134 26.6
Gender Female 240 47.7 Male 263 52.3
Residence North Padang 201 40.0 South Padang 201 40.0 Bungus Teluk Kabung 101 20.0
Family income < Rp 2.500.000 197 39.2 Rp 2.500.000 – 5.000.000 242 48.1 > Rp 5.000.000 64 12.7
The family as health workers
Exist 164 32.6 Nothing 339 67.4
Companion during illness Father 46 9.1 Mother 429 85.3 Another brother 28 5.6
Sources of drug information Parents 335 66.6 Friends / others 14 2.8 School teachers 48 9.5 Drug advertisements in newspapers
10 2.0
Drug advertisements on TV 67 13.3 Internet 29 5.8
Feat Top 10 218 43.3 Does not make top 10 285 56.7
Have been treated in a hospital Ever 124 24.7 Never 379 75.3
Questionnaire results related to student's knowledge of medicine, in general, can be seen in Table 2. This knowledge questionnaire is categorised into 3 types, namely about the benefits of the drug, the risk or danger of the drug and the use of the drug itself. In the category of drug benefits, almost all children (94.6%) stated that the drug should be taken when sick. However, children's knowledge about the types of medicine associated with the benefits is still low. As many as 40.0% of children stated that the same drug could be used for all ages and only 25.6% of children could answer correctly that the same drug could be used to treat different diseases/symptoms.
It is also related to knowledge about the risks/ dangers of medicine where the results are also low. Of the three questions about the dangers of medicine, the lowest answers were found on drug side effects, where only 42.5% of children knew that medicine could cause side effects. Likewise, with the types of medicine that cannot be used for all ages, only 61.8% answered correctly, and 64.2% of children knew that medicine could cause poisoning if the use were not right. Low knowledge is also shown in questions about drug use. Generally, children (90.9%) children state that the drug should be minimum after eating. Regarding the storage of medicine, around 56.7% of children agreed that medicine should not be stored in the refrigerator. Some 56.1% of children also answered correctly that heat and sunlight could damage medicine.
Table 2: Children's knowledge about medicine
No Questions
Respondents
Correct answer
Total (%) correct answer
Benefits of medicine 1 When we are sick, we have to take medicine Yes 476 (94.6) 2 The same medicine can be used for all ages No 302 (60.0) 3 The same drug can be used to treat different
diseases/symptoms Yes 129 (25.6)
Risk/danger of medicine 1 Some medicine may not be used by children Yes 311 (61.8) 2 Some medicine can cause unwanted things like
allergies/itching on the skin Yes 214 (42.5)
3 Some medicine if used not according to the rules, can cause poisoning
Yes 323 (64.2)
Drug use 1 The drug should be used after meals No 46 (9.1) 2 Medicines should be stored in the refrigerator No 280 (56.7) 3 Heat and sunlight can damage medicine Yes 382 (56.1)
From the three categories above, it can be obtained that overall children's knowledge of medicine is still low, as shown in table 3. The average scores obtained for each of these categories are 1.80,1.69 and 1.21 of scale 3. If combined these three categories, the average knowledge score of children is 4.70 from scale 9 or around 52.22% and this includes the low category
Table 3: Average score of answers to questions about children's knowledge
Variables Minimum score
Mean (SD) Maximum score
Total score
The mean of the total
score
Benefits of medicine 1 1.80 (0.69) 3 3 60.00 Risk / danger of medicine
1 1.69 (1.03) 3 3 56.33
Drug use 1 1.21 (0.74) 3 3 40.33 Total 1 4.70 (1.57) 9 9 52.22

Syofyan et al. The Knowledge and Attitudes about the Benefits, Risks and Use of Medicine in Aged Primary Students in Indonesia _______________________________________________________________________________________________________________________________
_______________________________________________________________________________________________________________________________
Open Access Maced J Med Sci. 2019 Jun 15; 7(11):1860-1866. 1863
Table 4 shows the relationship between sociodemographic characteristics and respondents' knowledge. The results of the analysis using the chi-square test obtained several variables that were significantly related (P < 0.05).
These variables are age, area of residence, family income, the presence or absence of families working in the health sector and sources of information on medicine obtained. Whereas related to children's attitudes about medicine (Table 5), as well as the knowledge above, are also categorised into three types.
First, children's attitudes related to the problem of the benefits of the drug have positive results. 95.0% of children agree that the drug is very useful to cure disease, and 84.1% of children are not afraid to take medication.
Instead, the second attitude about the risks/dangers of medicine is even more negative. A total of 81.49% of children did not agree to take the same medication as adults to get well soon. However, only 28.0% agreed that medicine could have adverse effects on health.
Table 4: The relationship of sociodemographic with the knowledge of the respondent
No. Variables Mean (SD) Median
(min-max) P-value
Age 10-11 5.05 (1.82) 5 (1-8) 0.000*
12-14 4.35 (1.74) 4 (1-9) Gender Female 4.72 (1.80) 5.0 (1-9) 0.088
Male 5.00 (1.84) 5.0 (1-8) Residence North Padang 5.35 (1.82) 5.0 (1-8) 0.000*
South Padang 4.56 (1.76) 5.0 (1-9) Bungus Teluk Kabung 4.52 (1.75) 4.0 (1-8)
Family income < Rp 2.500.000 4.58 (1.72) 4.0 (1-9) 0.008*
Rp 2.500.000 – 5.000.000 5.00 (1.87) 5.0 (1-8) > Rp 5.000.000 5.22 (1.83) 5.0 (2-8)
The family as health workers
Exist 5.19 (1.84) 5.0 (1-9) 0.004*
Nothing 4.71 (1.79) 5.0 (1-8) Companion during illness
Father 4.93 (1.85) 5.0 (1-8) 0.525 Mother 4.88 (1.82) 5.0 (1-9) Another brother 4.50 (1.86) 4.0 (1-8)
Sources of drug information
Parents 4.92 (1.72) 5.0 (1-9) 0.010*
Friends / others 3.36 (1.45) 3.0 (2-7) School teachers 4.90 (1.59) 5.0 (2-8) Drug advertisements in newspapers
4.30 (1.49) 4.0 (3-7)
Drug advertisements on TV 5.15 (1.59) 5.0 (1-8) Internet 5.03 (1.80) 5.0 (2-8)
Feat Top 10 4.94 (1.84) 5.0 (1-8) 0.436 Does not make top 10 4.81 (1.81) 5.0 (1-9)
Have been treated in a hospital
Ever 4.98 (1.74) 5.0 (1-8) 0.370 Never 4.83 (1.85) 5.0 (1-9)
Furthermore, students' attitudes about drug use look more positive. Of the six questions, five of them behaved correctly with the percentage of answers agreeing to be greater than 60%.
Only the attitude about the need to wait for parents first when taking medicine is answered with a statement of disagreement that is as much as 51.7%.
Overall, from the attitude aspect it can be shown in Table 6 that children's attitudes about benefits, the risks/dangers of medicine and their use are more positive with an average score of 7.18 in a scale of 10 or 71.77%, although for the hazard category children tend to be negative with an average score of 1.10 on a scale of 2 or 55.0%.
Table 5: Children's attitudes towards medicine
No
Statements
Respondents
Correct answer
Total (%) correct answer
Benefits of medicine 1 The medicine is very useful to cure diseases Agree 478 (95.0) 2 I am not afraid or anxious about taking medicine Agree 423 (84.1) Risk/danger of medicine
1 I want to take the same medicine taken by an adult, to quickly recover
Disagree 412 (81.9)
2 Medicine can give a result that is bad for health Agree 141 (28.0) The use of medicine
1 When will take medicine when sick; I want to drink a lot of medicine to recover
Disagree 316 (62.8)
2 I always wait for parents when taking medicine Agree 260 (51.7)
3 When will be drunk medicine by parents/family; I would ask you first to the parents/family about what medicine I drink it
Agree 401 (79.7)
4 When will be drunk medicine by parents/family; I would ask you first to the parents/family how much medicine I was taking it
Agree 385 (76.5)
5 When will be drunk medicine by parents/family; I would ask you first to the parents/family about how many times a day should be taking the medicine
Agree 430 (85.5)
6 I can get information about the storage of label drug/drug packaging
Agree 364 (72.4)
The results of the analysis with the chi-square test to see the relationship between the characteristic variables and the attitude of the respondents (Table 7) obtained the existence of several variables that were significantly associated (P < 0.05).
Table 6: The average score of answers to questions about the attitudes of children
Variables Minimum
score Mean (SD)
Maximum score
Total score
% the mean of the total
score
Benefits of medicine 0 1.79 (0.46) 2 2 89.50 Risk / danger of medicine 0 1.10 (0.58) 2 2 55.00 The use of medicine 0 4.29 (1.37) 6 6 71.50 Total 0 7.18 (1.77) 10 10 71.77
These variables are a place of residence, companion during illness, achievement in school and experience having been treated in a hospital.
Table 7: Sociodemographic relationships with children's attitudes
No. Variables Mean (SD) Median (min-
max) P-
value
Age 10-11 7.27 (1.73) 8.0 (2-10) 0.098 12-14 6.92 (1.87) 7.0 (2-10)
Gender Female 7.07 (1.95) 7.0 (2-10) 0.417 Male 7.28 (1.59) 8.0 (2-10)
Residence North Padang 7.34 (1.72) 8.0 (2-10) 0.049* South Padang 6.92 (1.83) 7.0 (2-10) Bungus Teluk Kabung 7.36 (1.72) 8.0 (2-10)
Family income < Rp 2.500.000 7.22 (1.80) 8.0 (2-10) 0.841 Rp 2.500.000 – 5.000.000 7.16 (1.70) 8.0 (2-10) > Rp 5.000.000 7.11 (1.98) 7.0 (2-10)
The family as health workers
Exist 7.32 (1.84) 8.0 (2-10) 0.081 Nothing 7.11 (1.74) 7.0 (2-10)
Companion during illness
Father 6.74 (2.24) 7.0 (2-10) 0.000*
Mother 7.34 (1.64) 8.0 (2-10) Another brother 5.46 (1.91) 5.0 (2-9)
Sources of drug information
Parents 7.35 (1.66) 8.0 (2-10) 0.144 Friends / others 6.14 (2.60) 6.0 (2-10) School teachers 7.00 (1.75) 7.0 (3-10) Drug advertisements in newspapers
7.10 (1.59) 7.0 (4-9)
Drug advertisements on TV
6.91 (2.02) 7.0 (2-10)
Internet 6.65 (1.88) 7.0 (3-9)
Feat Top 10 7.33 (1.81) 8.0 (2-10) 0.012
*
Does not make top 10 7.06 (1.73) 7.0 (2-10) Have been treated in a hospital
Ever 6.79 (1.97) 7.0 (2-10) 0.031*
Never 7.30 (1.69) 8.0 (2-10)
Discussion
In this study, the sample is children of grade V
Public Health _______________________________________________________________________________________________________________________________
_______________________________________________________________________________________________________________________________
1864 https://www.id-press.eu/mjms/index
elementary school students. The selection of class V students is because children in this class have relatively stable behaviours and beliefs about health [23] and good communication skills. The selection of the three sub-districts in this study was based on the representation of the sociodemographic characteristics of Padang City where North Padang represented the downtown area, South Padang represented the middle region, and Bungus Teluk Kabung represented the periphery. These sociodemographic characteristics can, at the same time, show the socio-economic status (SES) of the community. The downtown area describes the high category SES, the middle region as the middle category SES and the peripheral area as the low SES category. Previous research shows that SES variables are one of the factors that influence children's knowledge [16], [20], [24].
The results of this study show that children's knowledge, in general, is still categorised as low and fragmented. This result is in line with all existing research related to children's knowledge where limited and fragmented knowledge is obtained [8], [15], [16], [17], [18], [19], [21].
The low level of children's knowledge is very reasonable because so far children only get it from their daily experience from observing medicine that have been used alone or from families who use medicine [8], [16], [17], [18], [19]. This is reinforced by drug information sources obtained by children generally from parents (66.6%). Only around 9.5% is obtained from teachers in schools. The results of this study are in line with previous studies [16], [17], [18].
Knowledge about medicine can be influenced by personal factors (age and internal control locus degrees) and environmental factors, namely the educational environment (SSE). The existence of drug advertisements does not influence knowledge but can only increase perceptions in children that medicine are beneficial [26].
In terms of age, previous studies showed that children aged 10-11 years had a better knowledge of elementary students ages 6-7 and 8-9 years [16]. The higher the age of the child, the better the child's knowledge [17], [19], [20]. In this study also found a meaningful relationship between age and knowledge. But it is precisely the 10-11-year age group whose average score is higher than the 12-14-year age group. This may be because children aged 12-14 are class-dwelling children who are still in grade V of the elementary school which according to age, children aged 12-14 years are in class VI or VII group.
Students' knowledge is influenced by socioeconomic status (SES) of families where families with high SES knowledge are better compared to families with low SES [16], [20], [24]. In this study, it was found that the same thing that SES affects student knowledge. Students living in the downtown area have better knowledge scores than knowledge
scores on students in the other two regions. Likewise, students who live in the city centre have better knowledge scores compared to students who live in the suburbs.
Medicine are more viewed by children as something useful when sick because medicine can treat diseases, and this is in line with previous studies [15]. This is because children view medicine more as a curative rather than preventive measure [15], [24].
Meanwhile, the concept of risk or danger on medicine is understood if the drug is used improperly (misuse) for example a large number [25], the presence of drug side effects [15] and medicine that have expired (expired date) [17]. Most children acknowledge that medicine can cause harm to the body, such as when taking other people's medications, especially older people, taking the wrong medication or taking medicine for the wrong disease [22]. In this study, it was found that knowledge about the risks or dangers of medicine is quite low, as well as research conducted in India [25].
In this study, only about 42.5% knew that the drug had side effects. Previous research in Spain found 64.9% of children knew that medicine had side effects [17] and in India at 59.6% [18]. While related to the problem of drug poisoning, it was found that 64.2% stated that the drug could cause poisoning if used not according to the rules. In India, it was found that 50% of children stated that the drug was dangerous if the drug was taken in large or incorrect quantities [25].
As age increases, the child's ability to identify potential risks or the dangers of a drug is getting better. Older children are more careful when using medicine from younger children. In the UK, cases of accidentally taking medicine are the main reason why children are taken to hospital. Children under the age of 7 years are the group that has the most potential for the risk of medicine because children generally regard medicine as something good for them [8].
Knowledge about the use of medicine also shows that the child is still superficial, especially knowledge about how to take medicine whether before food or after food. The majority of children said that every medication should be eaten first. Only around 9.1% answered correctly that the drug should not be used after meals. The habit of having to eat before taking medicine seems to have been planted for a long time from parental behaviour. Even though the use of medicine does not have to have to eat first, there are even those who are recommended to take a medication just before eating or on an empty stomach.
Likewise, with knowledge about drug storage. Storage of medicine in the refrigerator may be considered as storing fruits so the child feels the drug should be stored in the refrigerator. Children also don't know very much that heat or sunlight can damage medicine.

Syofyan et al. The Knowledge and Attitudes about the Benefits, Risks and Use of Medicine in Aged Primary Students in Indonesia _______________________________________________________________________________________________________________________________
_______________________________________________________________________________________________________________________________
Open Access Maced J Med Sci. 2019 Jun 15; 7(11):1860-1866. 1865
To see the relationship between sociodemographic characteristics and respondents' knowledge, statistical analysis was performed using Chi-Square test. The results obtained that there is a meaningful relationship between several variables with knowledge. These variables are age, place of residence, family income, the presence or absence of families working in the health sector and drug information sources.
Related to attitudes, it was found in previous studies that 7-year-old children had begun to learn to develop attitudes towards medicine [19]. Children's attitudes toward medicine can tend to be negative or positive. In this study, it was found that student attitudes in general about medicine tend to be positive. Several other studies show the same thing where children's attitudes about medicine are generally also positive [20] [21]. However, negative attitudes of children were found in the risk category or drug hazard, where only 28.0% of children answered correctly that medicine could have adverse effects on health. This certainly needs to be a concern because children view medicine as something harmless so that there is the potential for the risk of medicine. While other studies show the opposite attitude where children generally have a negative attitude towards the use of medicine such as choosing not to be used if possible [19], this difference in results is possible because of differences in the research methods used by each researcher.
The results of statistical tests using Chi-Square test showed that children's attitudes about medicine were significantly affected by several factors (P < 0.05). These factors are residential address factors, companion during illness, achievement in school and experience having been hospitalised.
The results of this study indicate that students 'knowledge of medicines is still low and very limited, even though students' attitudes about medicine tend to be more positive. But the attitude about the dangers of medicine is even more negative. The low level of knowledge and limited attitudes are the reasons for the need for drug education given to children, especially in schools as an integral part of health education.
References
1. Neuspiel DR, Taylor MM. Reducing the Risk of Harm From Medication Errors in Children. Health Services Insights. 2013; 6:47-59. https://doi.org/10.4137/HSI.S10454 PMid:25114560 PMCid:PMC4089677
2. World Health Organization (WHO). Promoting safety of medicines for children. Geneva: World Health Organization, 2007.
3. Holstein BE, Hansen EH, Due P, Almarsdo AB. Self-reported medicine use among 11- to 15-year-old girls and boys in Denmark 1988 - 1998. Scand J Public Health. 2003; 31:334-341.
https://doi.org/10.1080/14034940210165082 PMid:14555369
4. Lindell-Osuagwu L, Sepponen K, Farooqui S, Kokki H, Hämeen-Anttila K, Vainio K. Parental reporting of adverse drug events and other drug-related problems in children in Finland. European journal of clinical pharmacology. 2013; 69(4):985-94. https://doi.org/10.1007/s00228-012-1426-z PMid:23093040
5. Mowry JB, Spyker DA, Brooks DE, Zimmerman A, Schauben JL. 2015 Annual Report of the American Association of Poison Control Centers' National Poison Data System (NPDS): 33rd Annual Report. Clinical Toxicology. 2016; 54(10):924-1109. https://doi.org/10.1080/15563650.2016.1245421 PMid:28004588
6. MacKay JM, Murphy K, Steel A. Safe Medicine Storage: A Look at the Disconnect Between Parent Knowledge and Behavior. Washington DC: Safe Kids Worldwide, March 2017. https://doi.org/10.1136/injuryprev-2017-042560.28
7. Lovegrove M, Weilde NJ, Budnitz DS. Trends in Emergency Department Visits for Unsupervised Pediatric Medication Exposures, 2004-2013. Pediatrics. 2015; 136(4):e821-e829. https://doi.org/10.1542/peds.2015-2092 PMid:26347435 PMCid:PMC4651433
8. Whatley B, Williams SE, Gard PR, MacAdam AB. Healthy children's identification and risk perception of medicines in England. Res Social Adm Pharm. 2012; 8(5):478-483. https://doi.org/10.1016/j.sapharm.2011.11.004 PMid:22264962
9. Clavenna A, Bonati M. Drug prescriptions to outpatient children: A review of the literature. Eur J Clin Pharmacol. 2009; 65(8):749-755. https://doi.org/10.1007/s00228-009-0679-7 PMid:19529926
10. Ylinen S, Hämeen-Anttila K, Sepponen K, Lindblad AK, Ahonen R. The use of prescription medicines and self-medication among children - a population-based study in Finland. Pharmacoepidemiol Drug Saf. 2010; 19(10):1000-1008. https://doi.org/10.1002/pds.1963 PMid:20712023
11. Chambers CT, Reid GJ, McGrath PJ, Finley GA. Self-administration of over-the-counter medication for pain among adolescents. Arch Pediatr Adolesc Med. 1997; 151(5):449-455. https://doi.org/10.1001/archpedi.1997.02170420019003 PMid:9158435
12. Hansen EH, Holstein BE, Due P, Currie CE. International survey of self-reported medicine use among adolescents. Annals of Pharmacotherapy. 2003; 37(3):361-6. https://doi.org/10.1345/aph.1C111 PMid:12639163
13. Holstein BE, Andersen A, Fotiou A, Gobina I, Godeau E, Hansen EH, Iannotti R, Levin K, Nic Gabhainn S, Ravens-Sieberer U, Välimaa R. Adolescents' medicine use for headache: Secular trends in 20 countries from 1986 to 2010. Eur J Public Health. 2015; 25:76-79. https://doi.org/10.1093/eurpub/ckv035 PMid:25805794 PMCid:PMC4408544
14. Sanz EJ. Concordance and children's use of medicines. BMJ. 2003; 327:858-860. https://doi.org/10.1136/bmj.327.7419.858 PMid:14551105 PMCid:PMC214037
15. Kärkkäinen S, Hämeen-Anttila K, Vainio K, Kontturi S, Patrikainen R, Keinonen T. Fourth graders' perceptions about medicines and medicine use. Health Educ. 2014; 114(1):43-57. https://doi.org/10.1108/HE-03-2013-0009
16. Bozoni K, Kalmanti M, Koukouli S. Perception and knowledge of medicines of primary schoolchildren: the influence of age and socioeconomic status. Eur J Pediatr. 2006; 165(1):42-49. https://doi.org/10.1007/s00431-005-1760-6 PMid:16222526
17. Aramburuzabala P. Children's Knowledge of Medicines, Implications for Health Education. Educacao Sociedade & Culturas. 2013; 38(135-149).
18. Bankar MA, Sujata SD. Promoting the proper use of medicines in rural school children of India. Int J Basic Clin Pharmacol. 2013; 2(4):375-380. https://doi.org/10.5455/2319-2003.ijbcp20130806
19. Hämeen-Anttila K, Juvonen M, Ahonen R, Bush PJ, Airaksinen M. How well can children understand medicine related topics? Patient Educ Couns. 2006; 60(2):171-178. https://doi.org/10.1016/j.pec.2004.12.011 PMid:15939568
20. Dawood OT, Ibrahim MIM, Abdullah AC. Factors influencing

Public Health _______________________________________________________________________________________________________________________________
_______________________________________________________________________________________________________________________________
1866 https://www.id-press.eu/mjms/index
chidrens knowledge and attitudes toward medicines in Malaysia. JMH. 2011; 8(4)288-298. https://doi.org/10.1016/j.jomh.2011.04.005
21. Sharaideh R, Wazaify M, Albsoul-Younes AM. Knowledge and attitude of school children in Amman/Jordan toward the appropriate use of medicines: A cross-sectional study. Saudi Pharmaceutical Journal. 2013; 21(1):25-33. https://doi.org/10.1016/j.jsps.2012.01.001 PMid:23960817 PMCid:PMC3745049
22. Bush PJ, Cebotarenco N. It's time chlidren learned about medicine. Journal of Pharmaceutical Health Service Research. 2010; 1:3-8.
23. Hämeen-Anttila K, Bush PJ. Healthy children's perceptions of medicines: a review. Research in Social and Administrative
Pharmacy. 2008; 4(2):98-114. https://doi.org/10.1016/j.sapharm.2007.05.002 PMid:18555964
24. Dawood OT, Ibrahim MIM, Abdullah AC. Chidrens knowledge and beliefs about medicines, Journal of child Health Care. 2015; 19(1)73-83. https://doi.org/10.1177/1367493513496911 PMid:23975718
25. Desai C, Girdhar AO, Shah UH. Knowledge and Awareness about Medicines among Primary Schoolchildren in Ahmedabad, India. Regional Health Forum. 2005; 9(2):1-8.
26. Almarsdottir AB, Zimmer C. Children's knowledge about medicines. Childhood. 1998; 5(3):265-281. https://doi.org/10.1177/0907568298005003003
_______________________________________________________________________________________________________________________________
Open Access Maced J Med Sci. 2019 Jun 15; 7(11):1867-1872. 1867
ID Design Press, Skopje, Republic of Macedonia Open Access Macedonian Journal of Medical Sciences. 2019 Jun 15; 7(11):1867-1872. https://doi.org/10.3889/oamjms.2019.537 eISSN: 1857-9655 Public Health
Mortality Rate Due to Circulatory and Alcohol-Dependent Diseases in Different Climatic Zones of Russia Natalia Nikitina
*, Tatiana Yakovleva, Zhanna Gardanova, Natalia Mikhailova, Albina Gaponenko, Elena Koverkina
Pirogov Russian National Research Medical University, Moscow, Russia
Citation: Nikitina N, Yakovleva T, Gardanova Z, Mikhailova N, Gaponenko A, Koverkina E. Mortality Rate Due to Circulatory and Alcohol-Dependent Diseases in Different Climatic Zones of Russia. Open Access Maced J Med Sci. 2019 Jun 15; 7(11):1867-1872. https://doi.org/10.3889/oamjms.2019.537
Keywords: Circulatory diseases; Alcohol-dependent diseases; Climatic zone; Mortality
*Correspondence: Natalia Nikitina. Pirogov Russian National Research Medical University, Moscow, Russia. E-mail: [email protected]
Received: 18-Mar-2019; Revised: 31-May-2019; Accepted: 01-Jun-2019; Online first: 14-Jun-2019
Copyright: © 2019 Natalia Nikitina, Tatiana Yakovleva, Zhanna Gardanova, Natalia Mikhailova, Albina Gaponenko, Elena Koverkina. This is an open-access article distributed under the terms of the Creative Commons Attribution-NonCommercial 4.0 International License (CC BY-NC 4.0)
Funding: This research did not receive any financial support
Competing Interests: The authors have declared that no competing interests exist
Abstract
AIM: Evaluation of the impact of climatic factors on the formation of mortality due to circulatory diseases and a
group of diseases related to alcohol consumption identified as alcohol-dependent.
METHODS: The study subject was the adult population residing in different climatic zones of Russia: in the second, third and fourth zones, with different conditions: average annual temperature (5.2°C; 1-2°C; -2.0°C), snow cover duration (≤ 150 days, ≤ 180 days, ≈ 220 days) sunshine duration and the presence of polar night and polar day in the territory of the fourth climatic zone. The assessment “impact-case of death” was carried out by calculating the standardized incidence ratio (SIR) with 95% confidence intervals (CI) for circulatory system diseases (CSD) and alcohol-dependent diseases (ADD) in accordance with the international classification of diseases (ICD-X).
RESULTS: The SIR of death from alcohol-dependent diseases for the female population in the 4th climatic zone (Murmansk Region) was the highest: the SIR of death from ADD 1.87; 95% CI (1.5-2.7), the SIR of death from CSD 1.3; 95% CI (1.2-2.3). For the female population in the 3rd climatic zone (Novosibirsk Region), the SIR of death has amounted to: SIRADD 1.52; 95% CI (1.2-1.87), SIRCSD 1.14; 95 CI (1.01-1.3). Living in the 3rd climatic zone was not so important for the health of the male population: the SIR of death from CSD 1.1; 95% CI (1.05-1.13); the SIR of death from ADD 0.8; 95% CI (0.65-0.98). However, living in the 4th climatic zone (Murmansk Region) poses a higher risk of death for the male population: SIRCSD 1.22 (22.0%); 95% CI (1.02-3.95); SIRADD 1.45 (45.0%); 95% CI (0.98-2.1).
CONCLUSION: Living in high northern latitudes contributes to higher levels of mortality, both female and male, from circulatory and alcohol-dependent diseases.
Introduction
The number of studies aimed at assessing the interrelationship of climatic phenomena with public health is currently increasing. Typically, these studies focus on the influence of hot climate on public health or the waves of dramatic warming in Europe, North America, China, and Russia [1], [2], [3], [4], [5], [6], [7], [8], [9], [10].
However, a smaller number of studies are focused on the evaluation of the effect of low temperatures on public health [11], [12], [13], [14]. A large-scale cohort study has revealed an inverse correlation between average annual temperature, average annual sunny hours and alcohol consumption per capita (p = -0.5 and -0.57, respectively) [13].
Large Russian territory is located in regions where winter temperatures reach extremely low values against the backdrop of other important factors: high wind speed, the duration of snow cover, as well as photoperiodicity, high air ionization, sudden nonperiodic fluctuations of geomagnetic and static electric field strength, atmospheric pressure drops, and low partial density of oxygen in the air.
The climate of northern Russia causes mobilization of adaptation mechanisms of the human body. Long living on the territory with extremely low winter temperatures and other climatic conditions unfavorable for public health is considered as a stress factor, which requires the mobilization of all resources of the body [15], [16], [17].
It is known that in the North, continuous adaptation to high latitudes leads to changes aimed at

Public Health _______________________________________________________________________________________________________________________________
_______________________________________________________________________________________________________________________________
1868 https://www.id-press.eu/mjms/index
adjusting to the general biological mechanism of hypoxia. Peripheral vascular spasm and increased peripheral resistance at low environmental temperatures cause a tendency towards increasing blood pressure. At the same time, there is an increase in heart rate; a reduction in the minute volume of the circulatory system; an increase in blood circulation in order to ensure a smooth exchange of oxygen in tissue capillaries; an increase in the mass of the right ventricular myocardium in response to hypertension pulmonary circulation. The cardiovascular system is among the first to respond to extreme external factors [14], [15]. There is a high probability of formation of psychological tension among the population [7], [15], [16], which in turn can provoke alcohol consumption followed by widely ranging changes in health status [17], [18].
The problem of the influence of meteorological factors on the body has been studied for a long time. The works that appeared more than 30 years ago raised the issue of the need for a comprehensive study of the influence of meteorological factors on human health [14]. Diseases of the cardiovascular system are characteristic of the northern territories of Russia (3rd and 4th zones) and their prevalence among the working-age population ranges from 60 to 75% [13], [15]. Works draw attention to the fact that heart and blood vessels diseases as a cause of death have a higher proportion in the northern territories than in the middle zone of the country. There is every reason to believe that essential hypertension is one of the typical diseases of adaptation to extreme conditions of high latitudes, which is a serious problem.
The aim of this work is to assess the influence of natural and climatic factors of different climatic zones of Russia on the formation of male and female population mortality from circulatory system diseases (CSD) and deaths associated with alcohol use (alcohol-dependent causes of death). The object of the study was the adult population living in rural areas in the 2nd, 3rd and 4th climatic zones of Russia.
Material and Methods
An epidemiological study of mortality (male and female) has been carried out in three regions of Russia in different climatic zones. The choice of regions was based on their similar key socio-economic characteristics, i.e. it is advisable to minimize other differences that are hindering factors for the identification of the role of climatic factors in the formation of public health.
The allocation of climatic zones was based on climate characteristics that affect the processes of heat exchange, and subjectively on the perception of
a comfort climate [19], [20], [21]. Important factors influencing health reasonably include socioeconomic characteristics (income, health care, etc.) and ethnic composition, since a traditional diet and lifestyle can also influence health.
It is virtually impossible to ensure the similarity of territories in all socio-economic, environmental and geographic parameters. Therefore, first of all, the choice of regions for comparative analysis was based on those factors, which affect the public according to many researchers [22], [23], [24]. The average income, unemployment rate, and medical care were taken into account. Please explain tools to measure the difference of climate, how to measure alcohol concentration and respiration rate.
The climate characteristic of the areas selected for the study is formed on the basis of official long-term Russian Hydrometeorological Service meteorological data on temperature, humidity, speed and the prevailing direction of movement of air masses, rainfall, solar radiation, number of days per year with negative air temperatures and other climate indicators. For the measurement of all climate parameters, the specialists of the hydrometeorological service use instruments and equipment verified by metrological agencies and corresponding to the established requirements by the measurement range and permissible error.
Based on climate indicators, the space of Russia is conditionally divided into four climatic zones: 1st – Arctic, 2nd – Subarctic, 3rd – Moderate, 4
th –
Subtropical. Climate data obtained by specialists of the Russian Hydrometeorological Service are published in the form of climate reference books and are available for various purposes (in construction, agriculture, when planning energy consumption, designing heat-protective clothing for working in an open area, for comparing the comfort of living of the population). Based on the difference in the complex of climatic indicators, the main ones of which are temperature and air velocity, the Penza region belongs to the 3rd climatic zone, the Novosibirsk region belongs to the 2nd climatic zone, the Murmansk region belongs to the 1st climatic zone.
The Murmansk (4th climatic zone), Novosibirsk (3rd climatic zone) and Penza Regions (2nd climatic zone) are located in different climatic zones but have closest socio-economic parameters. The national composition is mostly presented by the Russian population: 89.0%, 93.1%, and 86.8%, respectively. The number of physicians per 10,000 people, as well as the ratio of average income per capita (rubles per month) to the subsistence minimum, was higher in the Murmansk Region (Table 1).
More doctors per 10,000 people in the Murmansk and Novosibirsk Regions could promote the availability of medical care, and, hence, better detection of diseases. Secondly, the availability of medical care helps to reduce mortality, since diseases

Nikitina et al. Mortality Rate Due to Circulatory and Alcohol-Dependent Diseases in Different Climatic Zones of Russia _______________________________________________________________________________________________________________________________
_______________________________________________________________________________________________________________________________
Open Access Maced J Med Sci. 2019 Jun 15; 7(11):1867-1872. 1869
are detected at an earlier stage and their timely treatment brings greater success.
Table 1: Basic socio-economic characteristics of the Penza, Novosibirsk, and Murmansk Regions of Russia [25]
Socio-economic characteristics
Climatic zone
2nd 3rd 4th
Penza region Novosibirsk
Region Murmansk
Region Rural population 1,368,657 2,731,176 771,100 The ratio of average income per capita (rubles per month) to the subsistence minimum
2.87 3.0 3.25
Population with income below the subsistence minimum (% of total population) in 2016
12.6 12.1 10.9
Unemployment rate, % 4.6 5.1 7.2 Number of physicians, people (per 10,000 inhabitants)
39.3 55.9 57.0
Thus, the indicators reflecting the availability of medical care and the level of material security can imply a lower level of mortality in the Murmansk and Novosibirsk Regions compared to the Penza Region. Climatic characteristics vary dramatically in the selected regions of Russia (Table 2).
Table 2: Characteristics of some climatic parameters in the Penza, Novosibirsk and Murmansk Regions of Russia [25], [26]
Climate features
Climatic zone
2nd 3rd 4th
Penza Region Novosibirsk Region
Murmansk Region
Temperate continental
Continental Subarctic marine
Average t°C in January -9.8; -10.7 -16; -17 -10; -12 Wind speed (m/s) 3.6 ≤ 6.0 ≥ 7.0 Duration of snow cover (days) ≤ 150 ≤ 180 220 Average t°C in July 20.2 18.3 8-14 Average annual temperature, °C 5.2 1-2 -2.0 Duration of sunshine (hours/year) 1700-2000 1700-2000 ≤ 1700
Climate features
- - Polar night: 02.12–11.01 Polar day:
22.05–22.07 Heating season duration (days) (at t ≥ 8°C)
200 225 274
An air transfer from the west to the east dominates in the territory of the Penza Region, as throughout the whole climatic zone, that is why the climate is strongly influenced by Atlantic air masses.
The Novosibirsk Region is located in the south-east of the West Siberian Plain. Plain territories allow free spreading of cold waves from the north and the waves of heat from the southwest. In this regard, the winter can be characterized by both severe frost and short thaws.
The Murmansk Region is located in the subarctic zone on the Kola Peninsula; the climate is temperately arctic, maritime, influenced by the warm Gulf Stream. The region is located on the border between the vast mainland area and the Barents Sea. Almost the entire territory lies north of the Arctic Circle. The Murmansk coast suffers the greatest wind speed: up to 40 m/s and more. Due to high humidity and strong winds, even a light frost is hard to endure. The period of polar night is characterized by the deficit of natural light and UV radiation.
When conducting a comparative analysis of mortality in different regions of Russia, the main
attention was focused on diseases of the circulatory system (CSD) and alcohol-dependent diseases (ADD) that were allocated in accordance with ICD-X.
In addition to acute alcohol intoxication, the last group of death causes included: harmful alcohol consumption, alcohol addiction, other and unspecified mental disorders and behavioral disorders caused by alcohol; alcoholic psychosis; encephalopathy, dementia, degeneration of the nervous system caused by alcohol; alcoholic polyneuropathy, alcoholic myopathy, alcoholic cardiomyopathy, alcoholic gastritis, cirrhosis, alcoholic pancreatitis, accidental alcohol poisoning, intentional self-poisoning and effects of alcohol.
Calculations of mortality rates were based on the Rosstat data: information analysis content: regional data on the population of the Russian Federation by sex and age, distribution of deceased by sex, age groups and death causes (statistical form No. S51), statistical bulletin “Socio-economic indicators of poverty”, statistical bulletin “Population income and expenditure”, Demographic Yearbook of Russia 2014-2016.
In order to exclude the impact of region-specific production and ecological factors of the urban environment, the age-specific mortality rates of the rural population in different climatic zones were compared.
Age structural differences recalibrate mortality rates. In the Murmansk Region, the number of men aged 20-29 was two times higher than the corresponding number in the Novosibirsk and Penza Regions, and the proportion of older age groups, by contrast, was substantially less.
The statistical estimation of “impact-death case” was performed by calculating the standard incidence ratio (SIR) with a 95% confidence interval (CI) [23], [27].
The standardized incidence ratio (SIR) of adverse health effects was calculated as the ratio of the actual number of disease cases among exposed individuals to their expected number derived on the assumption that risk indicators in the control are taken as a standard. 95%CI of the relative risk was calculated using the following formula:
95%CI = explnOP±1.96σ (lnOP).
The control was the population in the 2nd climatic zone (Penza Region), since climatic characteristics of this region are more favorable to the population in comparison with the 3rd and 4th climatic zones. The standard was selected for the specific material and in relation to the established objectives. Extensive and intensive indicators that reflect the structure of death causes and their frequency in certain age groups were also calculated.

Public Health _______________________________________________________________________________________________________________________________
_______________________________________________________________________________________________________________________________
1870 https://www.id-press.eu/mjms/index
Results
Diseases of the circulatory system (CSD) traditionally occupy the first place among other death causes. The studied federal subjects of Russia are no exception. Among all death causes for males (20-79 years) in the studied regions of Russia, the proportion of deaths from CSD ranged from 44.4% in the Penza Region up to 48.6% in the Murmansk Region. The greatest percentage of female deaths from CSD was in the Murmansk Region – 62.4%, in the Penza Region – 58.4%, in the Novosibirsk Region –55.4%.
Studies have shown that alcohol-dependent death causes in the Novosibirsk Region constitute 5.1% among all causes, in the Murmansk Region – 10.0%. The corresponding factors for women were two times lower (Figure 1).
Figure 1: Proportion of alcohol-dependent death causes among all causes for individuals aged 20-79 living in various climatic zones of Russia in 2016
Most of these death causes (30.0-40.0%) were registered in the age group 20-39 years. The proportion of these deaths causes decreases with age.
The leading place in the structure of the alcohol-dependent death causes in the Murmansk Region belongs to cardiomyopathy (68.0% for men and 57.0% for women). In two other regions, this factor was lower: in the Novosibirsk Region – 21.4% for men, 45.2% for women. In the Penza Region, the proportion of deaths from alcohol cardiomyopathy was much lower – 15.1% for men and 25.0% for women.
Figure 2: Standardized incidence ratio (SIR) for circulatory diseases (CSD) and alcohol-dependent diseases (ADD) in 2016 for women (20-79 years) in rural areas living in different climatic zones (indicators for the Penza Region were taken for 1.0)
Figure 2 and 3 present the standardized incidence ratio for two groups of causes for the male and female population.
The impact of cold climate on female mortality from CSD and ADD is obvious and is confirmed by the accuracy of the obtained results. The SIR of death from ADD for the 4th climatic zone (Murmansk Region) was the highest: the SIR of death from ADD 1.87; 95%CI (1.5-2.7); the SIR of death from CSD 1.3; 95%CI (1.2-2.3). For the female population in the Novosibirsk Region (3rd climatic zone), the SIR of death was: SIRADD 1.52; 95%CI (1.2-1.87), SIRCSD 1.14; 95%CI (1.01-1.3).
Figure 3: Standardized incidence ratio for death from circulatory diseases (CSD) and alcohol-dependent diseases (ADD) in 2016 for men (20-79 years) in rural areas living in different climatic zones (indicators for the Penza Region were taken for 1.0)
Living in the 3rd climatic zone was not so important for the health of the male population: the SIR of death from CSD 1.1; 95%CI (1.05-1.13); the SIR of death from ADD 0.8; 95CI (0.65-0.98). However, living in the 4th climatic zone (Murmansk Region) poses a higher risk of death for male population: the SIR of death from CSD 1.22 (22.0%); 95%CI (1.02-3.95); the SIR of death from ADD 1.45 (or 45.0%); 95%CI (0.98-2.1).
Figure 4: Mortality from CSD in the Penza, Novosibirsk and Murmansk Regions in 2016 (per 1000 women living in rural areas) p ≤ 0.005
Assessment of age-related mortality from CSD has shown increased mortality of individuals over 40, for both males and females. Differences in

Nikitina et al. Mortality Rate Due to Circulatory and Alcohol-Dependent Diseases in Different Climatic Zones of Russia _______________________________________________________________________________________________________________________________
_______________________________________________________________________________________________________________________________
Open Access Maced J Med Sci. 2019 Jun 15; 7(11):1867-1872. 1871
mortality increase along with age.
Figure 5: Mortality from CSD in the Penza, Novosibirsk and Murmansk Regions in 2016 (per 1000 men living in rural areas) p ≤ 0.005
Discussion
Large Russian territory is located in high latitudes, with low environmental temperatures, long winter, and the polar night. The climate of the northern territories promotes the formation of mortality from cardiovascular diseases and death causes that are connected with alcohol to one degree or another. The need to exclude the “hindering” factors related to the socio-economic sphere of life has made this work more complex. A comparative analysis of health indicators for population living in regions in different climatic zones (2nd, 3rd, 4th climatic zones of Russia) with similar socio-economic characteristics has revealed that mortality from cardiovascular diseases among the population living in the Novosibirsk and Murmansk Regions (3rd and 4th climatic zones) is growing more intense with age. In this case, one can talk about the premature aging of the population living in the northern territories.
The obtained data are consistent with earlier studies that describe a syndrome of “polar” stress, which reduces adaptive reserves of the human body, accelerating the premature aging. This is demonstrated by higher and earlier indicators of mortality from circulatory diseases (CSD) [13], [15]. The widespread belief of wider alcohol consumption in northern latitudes is apparently not groundless. This is evidenced by more meaningful consequences for the health of people living in high latitudes: a high risk of death from alcohol-dependent causes among all causes is noted in the 3rd (for women) and 4th (for men and women) climatic zones (Novosibirsk Region, Murmansk Region).
In turn, this can provoke a wide range of diseases. The results obtained are consistent with the data described by other researchers [21], [28], [29], [30], [31], [32].
The mortality study of the male population of Izhevsk (3rd Climate Zone) showed that most causes of death, with the exception of tumors, correlate with alcohol consumption [28]. For three decades, fluctuations in mortality from circulatory system diseases (CSD) almost simultaneously follow the same tendency as the mortality rate from causes clearly associated with alcohol [27]. This trend is particularly noticeable in the fluctuations in mortality from coronary heart disease (CHD) and from cerebrovascular disease (CVD). But, as the authors indicate, those who died of alcoholic cardiomyopathy had the highest level of alcohol in the blood (1.45‰). In contrast, in those who died from all forms of cerebrovascular disease, the level of alcohol in blood was zero or very low.
Long-term studies conducted in Surgut (4th climatic zone) showed that the frequency of hospitalization of hypertensive patients increases during cold periods of the year by 2-3 times on average. Obliterating diseases of the vascular system appear at a younger age and often have a malignant course. The development of the atherosclerotic process in its classical version begins at the age of 40–50 years. Once arisen, the obliterating process has no tendency to reverse development, and the result of this process in 40% of patients is disability [31], [32].
The above studies address the health of the male population living in the northern regions of Russia. But as the obtained results showed, for the female population living in the northern regions, the damage from alcohol-related diseases significantly exceeds the losses of those who live in more comfortable climatic conditions.
The calculation of values and significance of standardized incidence ratio indicate the relationship between mortality from causes, which occur due to alcohol consumption with climatic characteristics of the northern regions.
In conclusion:
1. The natural and climatic conditions of the 4th, 3rd and 2nd climatic zones of Russia (Murmansk, Novosibirsk, and Penza Regions) vary in average annual temperature (by more than -5°C and -7°C), wind speed in winter by two and more times, average temperature in January (-17°C versus -9.8°C) and in the number of sunny days. The distinctive features of the Murmansk Region are: polar night, a long winter period: more than 270 days, with strong winds.
2. It has been revealed that the contribution of the climatic factor in the 4th climatic zone to the formation of male mortality from circulatory diseases and alcohol-dependent death causes has amounted to 22.0% and 45.0%, as compared with those factors obtained for the population of the 2nd climatic zone (Penza Region).
3. The climate of the 3rd and 4th climatic

Public Health _______________________________________________________________________________________________________________________________
_______________________________________________________________________________________________________________________________
1872 https://www.id-press.eu/mjms/index
zones of Russia has the greatest impact on the health of the female population. The contribution of the climatic factor to the formation of female mortality from circulatory diseases and death causes associated with alcohol consumption compared with those factors obtained for the population of the 2nd climatic zone (Penza Region) have amounted to 30.0% and 87.0%, respectively.
References
1. Ellis KN, Brown VM, Hathaway JM, Howe DA, Epps TH, Mason LR. Summer temperature variability across four urban neighborhoods in Knoxville, Tennessee, USA. Theor Appl Climatol. 2017; 127(3-4):701. https://doi.org/10.1007/s00704-015-1659-8
2. Tomczyk AM, Bednorz E, Piotrowski P. Warm periods in northern Europe with respect to atmospheric circulation. Theor Appl Climatol. 2017; 129(1-2):623-34. https://doi.org/10.1007/s00704-015-1727-0
3. Zhang B, Li G, Ma Y, Pan X. Projection of temperature-related mortality due to cardiovascular disease in Beijing under different climate change, population, and adaptation scenarios. Environ Res. 2018; 162:152-59. https://doi.org/10.1016/j.envres.2017.12.027 PMid:29306663
4. Revich BA, Shaposhnikov DA, Avaliani, SL, Rubinshtein KG, Yemelina SV, Shiryaev MV, Semutnikova EG, Zakharova PV, Kislov OYu. Assessment of health risks posed by high temperature and air pollution for population of Moscow. Hygiene and Sanitation. 2015; 1:36-40.
5. Mazzarella A, Scafetta N. Evidences for a quasi 60-year north Atlantic oscillation since 1700 and its meaning for global climate change. Theor Appl Climatol. 2012; 3-4:599-609. https://doi.org/10.1007/s00704-011-0499-4
6. Li Y, Ren T, Kinney PL, Joyner A, Zhang W. Projecting future climate change impacts on heat-related mortality in large urban areas in China. Environ Res. 2018; 163:171-85. https://doi.org/10.1016/j.envres.2018.01.047 PMid:29448153
7. Manning C, Clayton S. Threats to mental health and wellbeing associated with climate change. InPsychology and climate change. 2018:217-44. https://doi.org/10.1016/B978-0-12-813130-5.00009-6
8. Pascal M, Wagner V, Corso M, Laidi K, Bodo P. Mortality from heat and cold in 18 French cities. Environ Int. 2018; 121(1):189-98. https://doi.org/10.1016/j.envint.2018.08.049 PMid:30216771
9. Lee W, Choi HM, Lee JY, Kim DH, Kim H. Temporal changes in mortality impacts of heat wave and cold spell in Korea and Japan. Environ Int. 2018; 116:136-46. https://doi.org/10.1016/j.envint.2018.04.017 PMid:29679776
10. Smith ET, Sheridan SC. The influence of extreme cold events on mortality in the United States. Sci Total Environ. 2019; 647:342-51. https://doi.org/10.1016/j.scitotenv.2018.07.466 PMid:30081371
11. Chen TH, Li X, Zhao J, Zhang K. Impacts of cold weather on all-cause and cause-specific mortality in Texas, 1990-2011. Environ Pollut. 2017; 225:244-51. https://doi.org/10.1016/j.envpol.2017.03.022 PMid:28390302
12. Shah ND, Cruz-Lemini M, Abraldes JG, Altamirano J, Bataller R. Colder weather and fewer sunlight hours increase alcohol consumption and alcoholic cirrhosis worldwide. J Hepatol. 2017:66(1):80. https://doi.org/10.1016/S0168-8278(17)30424-5
13. Dorshakova NV, Karapetyan TA. Features of pathology for
northern residents. Hum Ecol. 2004; 6:48-52.
14. Kaznacheyev VP. Modern aspects of adaptation. Novosibirsk; 1980.
15. Sidorov PI, Menshikov LI, Buzinov RV, Vyazmin AM. Strategy of adaptation to the impacts of climate change on population health in the Arkhangelsk Region and Nenets Autonomous District of the Russian Federation. Arkhangelsk; 2012.
16. Yoo MG, Park KJ, Kim HJ, Jang HB, Park SI. Association between alcohol intake and incident hypertension in the Korean population. Alcohol. 2019; 77:19-25. https://doi.org/10.1016/j.alcohol.2018.09.002 PMid:30236891
17. Rodrigues P, Santos-Ribeiro S, Teodoro T, Gomes FV, Lima JAC. Association between alcohol intake and cardiac remodeling. J Am Coll Cardiol. 2018; 72(13):1452-62. https://doi.org/10.1016/j.jacc.2018.07.050 PMid:30236306
18. Prokhorov BB. Environmental health zoning and regional health forecast for the population of Russia. Moscow: MNEPU; 1996.
19. Trofimova IE, Balybina AS. Classification of climates and climatic zoning of the West Siberian plain. Geography and Natural Resources 2014; 2:11-21. https://doi.org/10.1134/S1875372814020024
20. Ivanov AI, Chernyshov NV, Kuzin EN. Natural conditions of the Penza Region. Contemporary condition. Volume 1. Geological environment, relief, climate, surface water, soil and vegetation. Monograph. Penza: RIO PGAU; 2017.
21. Andreev EM, Shkolnikov VM. Relationship between mortality levels and economic development in Russia and its regions. Demographic Review. 2018; 5(1):6-24.
22. Ivanova AE, Zemlyanova EV, Mikhailov AYu, Golovenkin SE. Differences in adult mortality by education level in Russia. Health Care of the Russian Federation. 2014; 58(2):4-8.
23. Merkov AM, Polyakov LE. Sanitary statistics. Moscow, 1974.
24. Medkov VM. Demography. Moscow, 2005:163-7.
25. Federal State Statistics Service. Regions of Russia. Main characteristics of subjects of the Russian Federation. Moscow, 2017:835.
26. Kupriyanov VV. Climate. Penza encyclopedia. Moscow: Scientific publishing company The Big Russian Encyclopedia, 2001:238-40.
27. Breslow NE. Statistical methods in cancer research II. The design and analysis of cohort studies. IARC Scientific Publish. 1987; 82:1-406.
28. Karpin VA, Gudkov AB, Usynin AF, Stolyarov VV. Analysis of the influence of heliogeomagnetic anomalies on the inhabitants of the northern urbanized territory. Human ecology. 2018; 11:10-15. https://doi.org/10.33396/1728-0869-2018-11-10-15
29. Andreev EM, Kiryanov, NA, Leon D., Mackey M., Tomkins S., Shkolnikov, VM. Alcohol abuse and premature mortality in Russia on the example of Izhevsk. Narcology. 2008; 7(7(79)):38-52.
30. Leon D.A., Shkolnikov V., McKee M., Kyrianov N., Andreev E. Alcohol and mortality from circulatory system diseases. Demoscope Weekly. 2011; 461-462:4.
31. Drozhzhin EV. Features of the course of obliterating diseases of the vascular system in the conditions of the Far North. Collected Scientific Works of Surgut State University. Issue 12. Natural sciences. Surgut: SurGU Publishing House, 2003:64-67.
32. Drozhzhin EV. Characteristic features of the clinical course of obliterating diseases of the vascular system in people of the younger age group. Proceedings of the Surgut State University. Issue 12. Natural sciences. Surgut: SurGU Publishing House, 2003:61-64.

_______________________________________________________________________________________________________________________________
Open Access Maced J Med Sci. 2019 Jun 15; 7(11):1873-1878. 1873
ID Design Press, Skopje, Republic of Macedonia Open Access Macedonian Journal of Medical Sciences. 2019 Jun 15; 7(11):1873-1878. https://doi.org/10.3889/oamjms.2019.457 eISSN: 1857-9655 Public Health
Early Social Orphanhood as a Relevant Problem of Russian Health Care (On the Example of the Chelyabinsk Region, Russia) O. A. Manerova
1*, A. Yu. Markina
2
1I.M. Sechenov First Moscow State Medical University (Sechenov University), 119991, Trubetskaya Street, 8-2, Moscow,
Russia; 2South Ural State Medical University, 454092, Vorovskogo Street, 64, Chelyabinsk, Russia
Citation: Manerova OA, Markina AY. Early Social Orphanhood As A Relevant Problem of Russian Health Care (On the Example of The Chelyabinsk Region, Russia). Open Access Maced J Med Sci. 2019 Jun 15; 7(11):1873-1878. https://doi.org/10.3889/oamjms.2019.457
Keywords: Orphan children; Early social orphanhood; Health care; Medical legislation
*Correspondence: O.A. Manerova. I.M. Sechenov First Moscow State Medical University (Sechenov University), 119991, Trubetskaya Street, 8-2, Moscow, Russia. E-mail: [email protected]
Received: 22-Mar-2019; Revised: 18-May-2019; Accepted: 19-May-2019; Online first: 13-Jun-2019
Copyright: © 2019 O. A. Manerova, A. Yu. Markina. This is an open-access article distributed under the terms of the Creative Commons Attribution-NonCommercial 4.0 International License (CC BY-NC 4.0)
Funding: This research did not receive any financial support
Competing Interests: The authors have declared that no competing interests exist
Abstract
BACKGROUND: The second decade of this century is characterised by the fact that the number of pregnant women who intend to give up their children has considerably decreased. However, despite this, the proportion between the number of abandoned children and all newborns increased from 2009 to 2014.
AIM: The goal of this work is to scientifically substantiate changes in Russian legislation based on a comprehensive analysis of the main trends in the development of early social orphanhood and changes in the medical and social characteristics of mothers who give up their children.
MATERIAL AND METHODS: The general aggregate of mothers who gave up their children in the Chelyabinsk
Region has been studied. In total, 1,438 mothers were observed in 2009-2017. The information has been copied from the reports and records for 2009-2017 found in 51 maternity homes of the Chelyabinsk Region: reporting form No. 32 “Information on Medical Care for Pregnant Women, New Mothers and Women in Labor” and registered form No. 96 “Labor and Delivery Medical Record”.
RESULTS: During the period under study, on average, 158 newborns per year were abandoned in maternity homes of the region: 51 children were abandoned by residents of the regional centre, 74 and 33 were abandoned by the women who lived in urban districts and rural municipalities, respectively. Today, mothers who give up their children tend to be marginalised. Two-thirds of them give birth to children out of marriage. Seven out of ten do not have a regular income, and six out of ten have socially significant diseases caused by their lifestyle.
CONCLUSIONS: The decline in attention to the prevention of early social orphanhood is caused by the inevitable increase in the number of newborns left without parental care. Every year, the number of well adapted in society women who give up their children when they find themselves in a difficult life situation is decreasing. The number of marginalised pregnant women is growing. Reducing the rate of abandonment of newborns among the marginalised contingent of pregnant women requires changes in the medical legislation of the Russian Federation.
Introduction
At the cusp of the 20th-21
st centuries, Russia
underwent the third wave of orphanhood, reasons for which considerably differed from the first two ones. The orphanhood of the first wave associated with the Civil War and the second wave associated with the Great Patriotic War were caused by parents’ deaths. Now orphans are children who have biological parents not involved in their upbringing and care [1]. As of December 31, 2013, in the state data bank, the number of orphans and children left without parental
care was 501,023 [2].
Sociologists [3] and psychologists [4] have been trying to explain social orphanhood as a form of deviant motherhood for a long time. Thus, supporters of the socialisation theory consider the abandonment of the newborn as a consequence of unsuccessful or insufficient socialisation of the woman herself [2], [5].
E.R. Yarskaya-Smirnova, together with co-authors, determines subjective and objective factors of the abandonment risk [6]. The objective factors include somatic or mental diseases in the woman’s history or their occurrence during her pregnancy, as

Public Health _______________________________________________________________________________________________________________________________
_______________________________________________________________________________________________________________________________
1874 https://www.id-press.eu/mjms/index
well as the child’s disability. According to M.A. Kostenko, the latter factor is especially important in the background of the low availability of timely medical, pediatric care. The subjective factors include non-readiness to perform parental responsibilities, pressure from the social environment, and the woman’s deviant behaviour. The mothers who give up their children make up a non-uniform group. They are not always the main initiators of the abandonment, and close people are often involved in making the decision. The relatives’ influence can be both indirect and direct [6], [7]. At the beginning of the 21
st century,
healthy children are abandoned more often than children with disabilities, and this mainly comes with the “social disadvantage of the mother (family) and her addiction (alcoholism, drug addiction)”.
The analysis of foreign sources has shown that this problem is not urgent for the indigenous population of the European Union. Researchers study the problem of early social orphanhood in the third world countries and the indigenous people of economically developed countries that emerged from former colonies [5], [7], [8], [9], [10]. However, while in the third world countries the main cause of early social orphanhood is maternal death during delivery and subsequent refusal of the community to bring up a weakened and sick newborn [8], [10], [11], [12], in the Russian Federation, in 80% of cases, it is caused by deviant motherhood of mothers who give up their children justifying this by their difficult material status or living conditions [13].
Since the beginning of the new century social orphanhood, which, according to the children’s surgeon L. Roshal, was omitted by the Russian society, has attracted the public attention. It was followed by considerable funding, primarily within the “Health” national project that was a program to improve the health of Russian citizens. It was announced by President V.V. Putin and started on January 1, 2006. According to this project, RUB 425.3 billion was allocated to improve the quality of medical care from 2006 to 2009. Although the project did not aim at preventing social orphanhood, while performing its normal functions, the obstetric and gynaecological service managed to work efficiently to reduce the number of mothers abandoning their newborns, and thus reduced the number of early social orphans [14]. However, in the 2010s, the efforts of obstetric and social services ceased being so efficient. Despite a considerable reduction in the number of pregnant women who were classified as potential mothers who would give up their children and, therefore, were subject to preventive work, the number of newborns left without the parental care slightly decreased from 0.3% of all newborns in 2011 down to 0.25% in 2014 (Information on identifying and organizing the life of orphans and children left without parental care, 2015).
The latest study on the early social orphanhood in Chelyabinsk as a typical regional centre of the Russian industrial region was carried out
by O.V. Denisov, the chief obstetrician-gynaecologist of the city of Chelyabinsk, almost ten years ago. During this period, the socio-medical characteristics of mothers who abandon their children greatly transformed [14]. Most of such women ceased to be sensitive not only to psychological effects but also to material incentives. The habitual image of a mother who gives up a child as a young woman who is immature psychologically and personally and is greatly influenced by the people, she is surrounded by is not consistent with the reality any more.
The goal of this work is to scientifically substantiate changes in Russian legislation based on a comprehensive analysis of the main trends in the development of early social orphanhood and changes in the medical and social characteristics of mothers who give up their children.
Material and Methods
The above goal of the study was achieved using the method of copying data from the reports and records for 2009-2017 found in all maternity homes of the Chelyabinsk Region: reporting form No. 32 “Information on Medical Care for Pregnant Women, New Mothers and Women in Labor” and registered form No. 96 “Labor and Delivery Medical Record”. These are the data obtained from legal entities – medical organisations that provide obstetric and gynaecological care during pregnancy, childbirth and postnatal period. The history of childbirth is the main medical document of the maternity home (maternity ward of the hospital), which is compiled for every pregnant woman, a woman in labour or new mother. The general aggregate of mothers who had given up their children in the Chelyabinsk Region was studied. In total, 1,438 mothers from 51 maternity homes were observed in 2009-2017. These maternity homes were divided into three groups of administrative and territorial entities – the megalopolis, the regional centre of Chelyabinsk (nine maternity homes), 11 municipal districts (16 maternity homes), and 26 rural municipal areas (26 maternity homes). The division into these three groups of territories is related to different standards of living in them, along with the existing cultural differences and national traditions of the local population.
The statistical regularity was analysed by using the SPSS Statistics Base 22.0 statistical software package. The average and relative values and their representativeness errors were calculated. To determine the randomness or significance of changes in the levels of indicators over the years of the study, a non-parametric test – the iteration criterion (Z) – was used due to improper distribution of observation units.

Manerova et al. Early Social Orphanhood As A Relevant Problem of Russian Health Care (On the Example of The Chelyabinsk Region, Russia) _______________________________________________________________________________________________________________________________
_______________________________________________________________________________________________________________________________
Open Access Maced J Med Sci. 2019 Jun 15; 7(11):1873-1878. 1875
The study received a positive conclusion of the ethical commission concerning the observance of ethical standards (approved by Order No. 5 of 05/26/2017, South Ural State Medical University).
Results
In the Chelyabinsk Region, the work on preventing early social orphanhood interpreted as women’s giving up their children in obstetric facilities was efficient for the first time when implementing the “Health” national project in 2006-2008. The number of newborns abandoned decreased annually. However, the 2009 economic crisis interrupted not only this positive trend but also the research itself. The present study began in 2015. Over the next nine years, an average of 158 babies was abandoned in maternity homes of the region per year: 51 children (32.3%) were born by residents of the regional centre, 74 (46.8%) and 33 (20.9%) were children born by the women who lived in municipal districts and rural municipal areas, respectively.
Figure 1: Dynamics of the Prevalence of Abandonment of Newborns in the Chelyabinsk Region for 2009-2017 (per 1,000 newborns)
Due to the different number of women giving birth to children in three groups of territories, the indicator of the prevalence of abandonment of newborns is more informative. It is obtained by the ratio of the number of abandonment of newborns to the total number of births per 1,000 newborns. The study of the prevalence rate showed that women living in municipal districts had abandoned their children most often: an average of 4.5 ± 0.9 cases per 1,000 newborns (Figure 1). The peak of abandonment among residents of municipal districts was from 2009 to 2012. However, then the indicator reliably (Z < Z05) decreased to the values that are close to those of the regional centre and the rural area. In total, over nine years of study, the prevalence rate of abandonment of newborns by women in maternity homes in urban districts declined considerably (Z < Z05): from 5.2 cases per 1,000 babies in 2009 down to 2.5 cases in 2017. The rate of decline was 52%. There were similar dynamics for the prevalence rate of abandonment of newborns among the residents of the
regional centre. This figure also decreased considerably (Z < Z05): from 3.8 cases per 1,000 babies in 2009 down to 1.7 cases in 2017. The decline rate was 51.3%.
On average, the prevalence rate of abandonment of newborns among the women living in rural areas is approximately the same as among the residents of the regional centre: 3.5 ± 0.2 and 3.3 ± 0.4 cases per 1,000 newborns, respectively. However, the dynamics of this indicator for nine years of observation can be characterised as stable (Z > Z05), i.e. the levels of the indicator change within random fluctuations.
Since 2013, the prevalence rates of abandonment of newborns in three groups of territories had become close to one another and, until 2016, there were no considerable differences (Z > Z05). However, in 2017, this indicator for the rural women grew up to 3.3 cases per 1,000 newborns.
The habitual image of a mother who abandons her children as a young woman who is immature psychologically and personally and is greatly influenced by the people, she is surrounded by is not consistent with the reality any more. Only every tenth mother who abandons her child in the Chelyabinsk Region is characterised like that. Now, a typical representative of the women under study is a woman, whose average age is about 27. The ratio of older women has considerably increased. Thus, the proportion of women aged 30-39 has doubled as compared to the first decade of the new century. Also, it has become a regular thing to meet women aged 40-49 who abandon their children. This has not been observed before.
Such a phenomenon as the repeated abandonment of a child is especially noteworthy. Unfortunately, it is impossible to accurately determine the number of previous cases of abandoning children by such mothers in maternity homes because they are not registered. However, according to the expert opinion of obstetrician-gynaecologists, reflected in the present article, who are responsible for unofficial (until 2012) and official registration (since 2012) of abandoned newborns, in many maternity homes of the Chelyabinsk Region, there were cases of repeated abandonment of a child. Also, some present mothers giving up their children abandoned their older child later (thereby also making them social orphans) rather than during their stay in the maternity home. They disclosed this information when they came to maternity homes to give birth to their last child. As a result, for nine years of the observation, there is information about 12 women living in the Chelyabinsk Region who have given up their children more than once.
Such cases are not singular. This is indirectly indicated by the obstetric history of mothers who abandoned their children in the Chelyabinsk Region. By the age of 27, they have already got an average of

Public Health _______________________________________________________________________________________________________________________________
_______________________________________________________________________________________________________________________________
1876 https://www.id-press.eu/mjms/index
four pregnancies, taking into account the latest that made them the object of this study. Registered form No. 96 “Labor and Delivery Medical Record” provided more evidence the marginalisation of women who abandon their newborns. Thus, considering the previous pregnancies of the mothers who abandoned their children at birth, it is necessary to note that an average of 1.8 of such pregnancies ended up in childbirth or 1.3 in abortion at the request of the woman who lived in the regional centre, 1.9 or 1.6 – if such woman lived in a municipal district, and 1.8 and 1.2 – if she lived at a rural area, respectively. It is noticeable that 80% of these women terminated their pregnancy and thus demonstrated their unwillingness to have a child. Probably, they could not solve the issue on the latest pregnancy due to some circumstances. As a result, by 35 years old – the age allowed for voluntary sterilisation – representatives of this group might have more than six pregnancies, including two or three that ended up with childbirth and abandoning more than one child. It is possible to comply with another condition – having two children – for voluntary sterilisation among mothers who abandon their children only if to take into account the fact of the birth itself because these women are not involved in bringing up their children in its legal sense.
Today, mothers who abandon their children are characterised by one key feature – they tend to be marginalised. Thus, according to the data of the present study, two-thirds of these adult women do not have stable and strong family relations, and their children’s fathers are casual partners: on average, this is 65.8 ± 4.1% of such mothers who live in the regional centre, 63.3 ± 6.1% and 62.5 ± 3.1% are from municipal districts and rural areas, respectively. Even more representatives of the group under study do not have a regular income: on average, it is 71.6 ± 2.2% among those living in the regional centre, 77.7 ± 2.2% and 59.2 ± 2.5% among those who live in municipal districts and rural areas, respectively. It is necessary to note that over nine years of the observation, the proportion of the women without a stable income (Z < Z05) increased in all compared groups of territories.
However, the most important feature of marginalisation is socially significant diseases determined by Order of the Government of the Russian Federation No. 715 dated 01.12.2004 “On approving the list of socially significant diseases and the list of diseases that are dangerous to others” caused or leading to asocial behaviour. These are HIV, intellectual disabilities, hepatitis B, C, drug addiction, alcoholism, other pathological addictions, infections mainly transmitted sexually, and tuberculosis (Resolution of the Government of the Russian Federation No. 715, 2004) [15]. The highest incidence of this disease is among mothers who give up their children living in municipal districts: 811.9 cases per 1,000 of the corresponding group, i.e. four out of five have a socially dangerous disease. This indicator is twice lower in mothers who abandon their
children living in rural areas. This level of the socially considerable pathology is in the intermediate position in residents of the regional centre.
The first place in terms of morbidity is occupied by mental and behavioural disorders associated with the use of psychoactive substances. Thus, half of the mothers who abandon their children living in municipal districts suffer from alcoholism or drug addiction. Every fourth mother from the regional centre and every fifth one from the rural area suffers from the same dependence. Infectious diseases – mainly, hepatitis C and B, as well as syphilis – are in second place in terms of prevalence among socially dangerous diseases. Six cases of tuberculosis registered in mothers who abandoned their children during 2009-2017 are noticeable because according to the official data (reporting form No. 32), the prevalence of socially significant pathology with the remaining pregnant women whose pregnancy ended up with childbirth and who live in the Chelyabinsk Region, but not included in the group under study, is within the limit of error.
Figure 2: Dynamics of HIV Prevalence among Pregnant Women who Delivered Babies in the Chelyabinsk Region in 2009 – 2017 (per 1,000 pregnant women who delivered babies)
HIV prevalence is a separate issue. According to Form No. 32, “Information on Medical Care for Pregnant Women, Women in Labor and New Mothers”, the incidence of HIV is extremely low among pregnant women living in the regional centre but not included in the group under study. It is from 0.2 to 0.7 cases per 1,000 pregnant women who ended their pregnancy with childbirth (Figure 2), and it changes over the observation period within random fluctuations. This situation looks completely different among mothers who give up their children – 70.5 cases per 1,000 of the relevant group. This is the average for six years since the official registration of newborns abandoned in obstetric facilities. Moreover, in 2014, every sixth mother abandoning her child was HIV-infected.
Discussion
In Russia, the main efforts to prevent early social orphanhood largely still belong to enthusiasts.

Manerova et al. Early Social Orphanhood As A Relevant Problem of Russian Health Care (On the Example of The Chelyabinsk Region, Russia) _______________________________________________________________________________________________________________________________
_______________________________________________________________________________________________________________________________
Open Access Maced J Med Sci. 2019 Jun 15; 7(11):1873-1878. 1877
Therefore, there is an urgent need for a unified national policy aimed at reducing the number of newborns left by mothers.
It is necessary to note that the latest study on early social orphanhood in Chelyabinsk, a typical regional centre of the industrial region, was conducted by O.V. Denisov, chief obstetrician-gynaecologist, almost ten years ago [14]. During this period, the socio-medical characteristics of mothers who give up their children have been greatly transformed [14]. Most of such women have ceased to be sensitive not only to psychological effects but also to material incentives.
While earlier, the work on preventing the abandonment of newborns started in female counselling centres and was efficient in the cases with women were well-adjusted in society but somehow ended up in difficult life situations [14]. Now, this is not enough. The reason is that only every third of future mothers who abandon their children is registered in the female counselling centre, and only every sixth attends it relatively systematically. The rest of them visit it at the 30
th week of pregnancy to obtain a
disability certificate for the pre-maternity leave. It is noteworthy that the average first appearance time for the registration is from 20.7 weeks in the regional centre to 21.6 weeks in cities of the region.
As a result, the traditional methods aimed at preventing the abandonment of newborns and implemented by medical staff in female counselling centres don’t work. To reduce the abandonment rate among marginalised pregnant women, it is necessary to change the medical legislation. The following recommendations are promising:
– To reduce the age of voluntary medical sterilisation from 35 to 27 years for women suffering from socially significant diseases and having two births or one birth and child abandonment in their history;
– To include two or more socially significant diseases (the most frequent combinations of drug addiction with HIV and hepatitis C, B or alcoholism with syphilis and substance abuse) or one socially significant disease and the fact of abandonment or deprivation of motherhood in the list of social indications for the pregnancy termination;
– To prevent all forms of social orphanhood more efficiently and timely, to allow registering the mothers who abandoned their children without parental care in Russian subjects on a legislative basis.
The following main conclusions can be made:
1. The decline of attention to the prevention of early social orphanhood is caused by the inevitable increase in the number of newborns left without parents.
2. Every year, the number of well-adapted in
society women who leave their children when finding themselves in difficult life situations is decreasing, and the marginalized contingent of pregnant women is growing.
3. Reducing the rate of abandonment of newborns among the marginalized contingent of pregnant women requires changes in the medical legislation of the Russian Federation.
References
1. Albitsky VY, Baranov AA, Gasilovskay TA, Ibragimova AI, Konova SR. Medical and social problems of modern orphans. Litterra, Мoscow. 2007.
2. Kozlova TZ. Ludi, lishennye roditelskih prav: ih sotsializatsiya i zhiznennye traektorii [People deprived of parental rights: their socialization and life trajectories]. Moscow: ITC Dashkov and Co., 2015.
3. Ponomareva, EV. Deviantnoye materinstvo kak faktor formirovaniya obraza materey u detey [Deviant maternity as a factor in forming the image of mothers in children]. In Laws and Traditions of Developing Science in Modern Society: Collection of articles (Part 2). Ufa: BashSU RIC, 2013:241 - 252.
4. Khlebosolova AN, Shvets VA. Psikhologicheskie prichiny otkaza ot materinstva [Psychological causes of refusal from the maternity]. In Psychology of the 21st Century: Collection of materials of the VI International Scientific Practical Conference of Young Scientists (Vol. 2). Saint-Petersburg: Leningrad Pushkin State University, 2010:58 - 64.
5. Yamin AE, Boulanger VM, Falb KL, Shuma J, Leaning J. Costs of inaction on maternal mortality: qualitative evidence of the impacts of maternal deaths on living children in Tanzania. PloS one. 2013; 8(8):e71674. https://doi.org/10.1371/journal.pone.0071674 PMid:23990971 PMCid:PMC3747181
6. Yarskaya-Smirnova ER, Teper GA, Grek, NV. Broshennye deti: problemy profilaktiki rannego sotsialnogo sirotstva [Abandoned children: problems of preventing early social orphanhood]. Woman in the Russian society. 2008; 3:31 - 48.
7. Rivers J, Mason J, Silvestre E, Gillespie S, Mahy M, Monasch R. Impact of orphanhood on underweight prevalence in sub-Saharan Africa. Food and nutrition bulletin. 2008; 29(1):32-42. https://doi.org/10.1177/156482650802900104 PMid:18510203
8. Ronsmans C, Chowdhury ME, Dasgupta SK, Ahmed A, Koblinsky M. Effect of parent's death on child survival in rural Bangladesh: a cohort study. The Lancet. 2010; 375(9730):2024-31. https://doi.org/10.1016/S0140-6736(10)60704-0
9. Zubrick SR, Mitrou F, Lawrence D, Silburn SR. Maternal death and the onward psychosocial circumstances of Australian Aboriginal children and young people. Psychological medicine. 2011; 41(9):1971-80. https://doi.org/10.1017/S0033291710002485 PMid:21208493
10. Kasedde S, Doyle AM, Seeley JA, Ross DA. They are not always a burden: Older people and child fostering in Uganda during the HIV epidemic. Social Science & Medicine. 2014; 113:161-8. https://doi.org/10.1016/j.socscimed.2014.05.002 PMid:24880658 PMCid:PMC4065328
11. Christopher C, Umemura T, Mann T, Jacobvitz D, Hazen N. Marital quality over the transition to parenthood as a predictor of coparenting. Journal of Child and Family Studies. 2015 Dec 1;24(12):3636-51. https://doi.org/10.1007/s10826-015-0172-0
12. Nolvi S, Karlsson L, Bridgett DJ, Pajulo M, Tolvanen M, Karlsson H. Maternal postnatal psychiatric symptoms and infant

Public Health _______________________________________________________________________________________________________________________________
_______________________________________________________________________________________________________________________________
1878 https://www.id-press.eu/mjms/index
temperament affect early mother-infant bonding. Infant Behavior and Development. 2016; 43:13-23. https://doi.org/10.1016/j.infbeh.2016.03.003 PMid:27054496
13. Dubrovin MS, Krom IL, Chizhov MV. Sovremennye osnovaniya fenomena sotsialnogo sirotstva v Rossii [Modern basics of social orphanhood in Russia]. Bulletin of Online Conferences on Medicine. 2016; 6(1):69 - 70.
14. Denisov OV. Mediko-sotsialnyye aspekty "sotsialnogo sirotstva" i osobennosti realizatsii akushersko-ginekologicheskoy sluzhboy Natsionalnogo proyekta "Zdorovye" v reshenii dannoy problemy [Medico-social aspects of "social orphanhood" and features of implementing the "Health" National Project by the
obstetric and gynecological service when solving this problem]. Ural Medical Journal. 2009; 10(64):139 - 313.
15. Resolution of the Government of the Russian Federation No. 715 On the approval of the list of socially significant diseases and the list of diseases that are dangerous to others. Moscow, dated December 1, 2004.

_______________________________________________________________________________________________________________________________
Open Access Maced J Med Sci. 2019 Jun 15; 7(11):1879-1883. 1879
ID Design Press, Skopje, Republic of Macedonia Open Access Macedonian Journal of Medical Sciences. 2019 Jun 15; 7(11):1879-1883. https://doi.org/10.3889/oamjms.2019.314 eISSN: 1857-9655 Public Health
Studying the Prevalence of Medical Interventions in the Recipes Amin Alinezhad, Molouk Haji Babaei
*, Kheirollah Gholami, Seyed Hamid Khoei
Department of Clinical Pharmacy, School of Pharmacy, Tehran University of Medical Sciences, Tehran, Iran
Citation: Alinezhad A, Haji Babaei M, Gholami K, Khoei SH. Studying the Prevalence of Medical Interventions in the Recipes. Open Access Maced J Med Sci. 2019 Jun 15; 7(11):1879-1883. https://doi.org/10.3889/oamjms.2019.314
Keywords: Recipe; Drug; Drug interaction; Quick index of intervention
*Correspondence: Molouk Haji Babaei, Department of Clinical Pharmacy, School of Pharmacy, Tehran University of Medical Sciences, Tehran, Iran. Tel: +982164121203. E-mail: [email protected]
Received: 30-Mar-2019; Revised: 17-May-2019; Accepted: 18-May-2019; Online first: 14-Jun-2019
Copyright: © 2019 Amin Alinezhad, Molouk Haji Babaei, Kheirollah Gholami, Seyed Hamid Khoei. This is an open-access article distributed under the terms of the Creative Commons Attribution-NonCommercial 4.0 International License (CC BY-NC 4.0)
Funding: This research did not receive any financial support
Competing Interests: The authors have declared that no competing interests exist
Abstract
BACKGROUND: Drug interaction is a term used to refer to unfavourable side effects caused by mixing or taking two or more drugs simultaneously. Although it is not possible to identify all drug interactions, awareness of therapeutic team of potential drug interactions, risk factors that enhance the possibility of these interactions and familiarity with mechanisms of drug interactions can help reduce real drug interactions.
AIM: The present research seeks to study the frequency and intensity of possible interactions among various age groups and their correlation with doctor’s speciality, time of drug prescription, patient’s gender, etc.
MATERIAL AND METHOD: This is observational, cross-sectional research conducted in spring and winter to study the prevalence of drug interactions among 6000 recipes belonging to 2 private and 2 public drug stores. The information associated with recipes was recorded, and drug interactions were studied based upon quick index of interactions using Up to Date software. Quick index of medical interactions is a response to data dealing with how drugs interact with one another. The risk factor is divided into groups A, B, C, D, and X according to this index with each one having its own definition. The data analysis was studied in terms of prevalence type of drug interactions and the possible correlation with other parameters. SPSS v.16 was used for statistical analysis.
RESULTS: The average age of the patients was 42.07 ± 21.56 years. The frequency of male patients was 41.7%. An average number of 4.82 ± 1.91 drugs were prescribed for each patient and an average number of 1.95 ± 2.40 drugs had interaction with one another with levels C, D, and X having the following drug interaction levels: 1.60 ± 2.05, 0.275 ± 0.69, and 0.072 ± 0.31. No such interactions were observed in 31.1% (1846 cases) of recipes. The presence of drug interaction was statistically significant in terms of age, season, drug store and speciality of doctor (P-value < 0.05). The average number of interactions in the recipes issued by psychologists, cardiologists, rheumatologist, neurologists, and general practitioners was more, and this result was statistically significant (P-value < 0.05).
CONCLUSION: Considering the results achieved in this research, we may conclude that the drug interactions in recipes exhibit a noticeable frequency with the highest frequency observed in level C influenced by factors such as age, season, class of drugs, and expertise of the doctor.
Introduction
Drug interaction is a term used to refer to unwanted side effects caused by mixing or taking two or more drugs simultaneously. No such side effects are observed when the drugs are taken individually. Drug interaction may take place between various drugs, drugs prescribed by the doctor and those without a recipe, drugs and herbal medicines, supplementary drugs or vitamin supplements, drugs and some foods [1]. These interactions usually present themselves in a pharmacokinetic or pharmacodynamic fashion. In pharmacokinetic interactions, one drug may change metabolism, disposal or distribution of another medicine. In pharmacodynamic interventions, the exclusive function of drug changes as a result of other drugs’
influence [2]. Drug interactions are classified based upon the degree of importance, and this degree comprises intensity and evidence. The quick index of drug interactions is a response to data describing how drugs interact with one another. This index divides risk factor indexes to groups A, B, C, D, and X with each one having an exclusive definition. As we move from level A to level X, the urgency of response to drug interaction increases. Generally speaking, classes A and B are important only in scientific discussion, and no importance is attached to them in clinical discussions. However, the remaining three interactions always require clinical considerations [3].
According to the report issued by American Association of Doctors, as many as 44 to 98 thousand deaths occur every year as a result of drug interaction with more than 7 thousand cases being the result of negative side effects of medicines. As many as 6.7%

Public Health _______________________________________________________________________________________________________________________________
_______________________________________________________________________________________________________________________________
1880 https://www.id-press.eu/mjms/index
of the patients in a hospital experience unfavourable drug side effects and this causes 0.34% of the death toll among them. In 2012, the death caused by the unfavourable side effects of interactions had the 4
th
place following cardiovascular diseases, diabetes, and AIDS in the U.S. [4]. The danger of occurrence and intensity of drug interventions are influenced by factors such as number of drugs taken, length of treatment, patient’s age, number of doctors prescribing the medicine and stage of disease [1], [4].
Drug interaction is an important issue in drug safety, and it is a potential reason for the drug’s side effects among those patients hospitalised in the hospital. Their effect is well known as an important factor in drug therapy, and it may result in the total failure of the treatment process [5]. Drug interactions may potentially increase the death toll of patients as they cause unwanted side effects, reduce the effectiveness and increase the toxicity of medicine and impair patient’s cooperation with the treatment diet prescribed [6]. Drug interactions are estimated to be responsible for 20 to 30% of all unwanted medical reactions. These interactions require clinical action and consideration in 70% of the cases and may result in life-threatening incidents or death in 1 to 2% of the cases [7]. Although it is not possible to identify all drug interactions, awareness of therapeutic team of potential drug interactions, risk factors that enhance the possibility of these interactions and familiarity with mechanisms of drug interactions can help reduce real drug interactions [8].
As there is no detailed and exact information concerning the prevalence of such interactions in Iran, and no research has been conducted on drug interactions in recipes of private and public drug stores in any Iranian cities, the present research seeks to study the frequency and intensity of possible interactions in various age groups, different classes of medicines and their correlation with doctor’s specialty, level of interactions and the correlation between the level of interactions with when the recipes were taken to these drug stores.
Material and Methods
This is observational, cross-sectional research conducted in spring and winter to study the prevalence of drug interactions in 2 private and 2 public drug stores. According to calculations, as many as 3000 recipes were found for each season. Then, the information associated with these private and public drug stores including the name and number of drugs prescribed, doctor’s speciality, age and gender of patients, date of drug prescription and patient’s insurance coverage was recorded. Drug interaction was studied based on the quick index of interventions (Table 1) using Up to Date software. As levels A and
B interventions are not clinically important; they are not reported here [9].
Table 1: Different types of interventions and their classification
Classification Interaction Definition
A No intervention specified
The data indicate no pharmacodynamic or pharmacokinetic interactions between factors
B No action needed
Data indicate drug interactions during simultaneous usage without any evidence indicating clinical concerns
C Monitor Therapy
Data indicate drug interactions with clinical symptoms. The good points of simultaneous use of these drugs are more than their harms. Appropriate monitoring is required for the potential negative effects. It is probably necessary to adjust the dose of one or both drugs during treatment.
D Consider Therapy Modification
The data show that drugs may have a clinical interaction with one another. It is necessary to exclusively examine each patient to see if the positive results outnumber the negative ones or not. It is also necessary to take the actions required to minimise the toxicity caused by simultaneous use. These actions may range from invasive monitoring, changing the empirical dose, and taking alternative measures
X Preventing the interaction
Data indicate interactions with clinical side effects. The dangers usually outweigh the benefits. The
The data were analysed in terms of prevalence and type of medical interactions and possible correlation with other parameters. SPSS v.16 was used for statistical analysis.
Results
The patients and recipes studied in this research numbered 6000 with 3000 recipes for winter and a similar number for the spring of 2015. The average age of the patients was 42.07 ± 21.56 years old. The frequency of male patients was 2500 (41.7%) people. To study drug interaction, only those recipes with at least two drugs were included. The average number of drugs in each recipe, the number of interacting medicines and the number of interacting medicines in terms of their interaction is presented in Table 2.
Table 2: Frequency of variables
Variable Average SD Minimum Maximum
Number of drugs per recipe 4.820 1.91 2 16 Number of interactions per recipe 1.95 2.40 0 21 C interactions 1.60 2.05 0 20 D interactions 0.275 0.69 0 13 X interactions 0.072 0.31 0 5
As many as 4 drug stores were selected as
targets. As the approximate number of monthly recipes within that period was 8000 in Isar drug store and 6000 in three drug stores in Karaj, Sharyar, and Taleghan, a 30% share was defined for Isar drugstore (900 for each season) and the share of each of the three remaining drugstores was 23.3% (700 for each season). The frequency of insurance coverage was also studied in the recipes of patients. For this purpose, the insurances were divided into 4 categories: Social Security, Medical Services, Armed Forces, and others. The frequencies of insurance among these patients were 76.8%, 15.5%, 6.9%, and

Alinezhad et al. Studying the Prevalence of Medical Interventions in the Recipes _______________________________________________________________________________________________________________________________
_______________________________________________________________________________________________________________________________
Open Access Maced J Med Sci. 2019 Jun 15; 7(11):1879-1883. 1881
0.7% respectively. The expertise of those doctors prescribing the medicines was also studied (Figure 1).
Figure 1: The frequency of doctors’ shares in the number of recipes
The prevalence of drug interactions was studied based on different variables. The average number of interacting items with various levels of drug interactions was studied for each variable. The average number of interacting items in each interaction level is presented in Table 3. The result shows there is a significant relationship between all frequency of interaction and the average number of interacting items with various levels of interaction for each variable (p-value < 0.05), except the frequency of interaction between male and female and items C, X and total (p-value > 0.05).
Table 3: The frequency of interaction and the average number of interacting items with various levels of interaction for each variable
Variable Frequency of interaction (%)
The average number of interacting items
Total C D X
gender Male 69.1 2.34 ± 1.937
2.00 ± 1.596
0.71 ± .0261
0.32 ± 0.079
Female 68.9 2.44 ± 1.948
2.09 ± 1.596
0.68 ± 0.284
0.30 ± 0.068
P-value *0.865 **0.785 **0.387 **0.021 **0.097 Age
< 18 59.4 1.74 ± 1.231
1.61 ± 1.125
0.31 ± 0.074
0.17 ± 0.029
18-64 69.6 2.43 ± 1.994
2.05 ± 1.607
0.74 ± 0.308
0.32 ± 0.079
≥ 64 74.6 2.61 ± 2.354
2.31 ± 1.962
0.70 ± 0.308
0.34 ± 0.083
P-value ***0.000 ***0.000 ***0.000 ***0.000 ***0.000 Season Winter 6.71 2.25 ±
1.834 1.95 ± 1.517
0.69 ± 0.255
0.27 ± 0.060
Spring 70.8 2.53 ± 2.053
2.14 ± 1.675
0.70 ± 0.294
0.34 ± 0.084
P-value *0.003 **0.001 **0.005 **0.003 **0.007 Drug store
Isar 70.1 2.32 ± 1.891
1.20 ± 1.551
0.69 ± 0.278
0.27 ± 0.064
Shahryar
71.5 2.76 ± 2.180
2.30 ± 1.801
0.73 ± 0.286
0.39 ± 0.90
Taleghani
66.2 2.16 ± 1.776
1.90 ± 1.447
0.60 ± 0.263
0.26 ± 0.063
Karaj 67.7 2.31 ± 1.941
1.99 ± 1.598
0.75 ± 0.270
0.29 ± 0.075
P-value ***0.011 ****0.000 ****0.000 ****0.000 ****0.000 Doctor General 76.5 2.46 ±
2.235 2.11 ± 1.904
0.76 ± 0.255
0.38 ± 0.105
Specialist
64.4 2.34 ± 1.768
1.99 ± 1.411
0.71 ± 0.304
0.25 ± 0.053
P-value *0.000 **0.000 **0.000 **0.000 **0.000
* Fisher’s Exact Test; ** Mann-Whitney U test; *** Pearson Chi-Square; **** Kruskal Wallis test.
The prevalence of drug interactions was also studied based on the speciality of the doctor. According to the results, the prevalence of drug interactions among patients undergoing treatment under doctors with different specialities is significantly different (Table 4).
Table 4: Prevalence of drug interactions in terms of the speciality of doctors
Drug interaction Total
No Yes
Number % Number % Number %
General 530 23.5 1722 76.5 2252 100 Cardiologist 98 22.9 330 77.1 428 100 Neurologists 60 15.7 321 84.3 381 100 Psychologists 32 9.4 307 90.6 339 100 Pediatrician 183 55.5 147 44.5 330 100 Gynecologist 241 59.5 164 40.5 405 100 Urinary tract 71 43.6 92 56.4 163 100 Infection 18 43.9 23 56.1 41 100 Internist 183 35.3 335 64.7 518 100 Glands 38 31.7 82 68.3 120 100 Digestion 69 55.6 55 44.4 124 100 Lungs 26 26.3 73 73.7 99 100 Nephrology 31 27.0 84 73.0 115 100 Emergency service
30 35.3 55 64.7 85 100
General surgery
63 50.0 63 50.0 126 100
Orthopedist 36 28.3 91 71.7 127 100 Cancer 22 53.7 19 46.3 41 100 Anesthesia 9 40.9 13 59.1 22 100 Eye 31 63.3 18 36.7 49 100 Ear, pharynx, nose
54 53.5 47 46.5 101 100
Radiology 1 50.0 1 50.0 2 100 Skin 16 64.0 9 36.0 25 100 Rheumatology 16 17.6 75 82.4 91 100 Physical medicine
5 31.3 4137 69.0 6000 100
Total 1863 31.1 4137 69.0 6000 100
The average number of interacting items in various levels of drug interventions was investigated about the type of doctors, including general practitioners and specialists, to determine the correlation between each class of interactions with doctor’s speciality.
The average number of interacting items in each class of interaction can be observed in Figure 2. The difference across all variables was statistically significant (P-value = 0.000).
Figure 2: The average number of interacting items in terms of the level of interaction in the recipe of each doctor
The frequency of interaction was also calculated for various drug classes and reported in table 5. According to results, the drugs associated with the nervous system had a frequency of 38%.
The drugs prescribed for the musculoskeletal system, alimentary tract and metabolism, and cardiovascular system had frequency levels of 19%, 15% and 10%.

Public Health _______________________________________________________________________________________________________________________________
_______________________________________________________________________________________________________________________________
1882 https://www.id-press.eu/mjms/index
Table 5: Frequency of interaction in various classes of drugs
Drug category Number of interactions
Frequency (%)
Nervous system 1574 38
Musculoskeletal system 785 19
Alimentary tract and metabolism 616 15
Cardiovascular system 399 10
Blood and blood-forming organs 228 6
Antiinfectives for systemic use 150 4
Systemic hormonal preparations, excl. Sex hormones and insulins
140 3
Respiratory system 108 3
Genitourinary system and sex hormones 35 1
Antiparasitic products, insecticides and repellents 25 0.608569
Sensory organs 25 0.608569
Antineoplastic and immunomodulating agents 18 0.438169
Dermatologicals 5 0.121714
Discussion
Drug interaction is a general term used to talk about cases where the expected therapeutic effect of one medicine is modified by another. When two or more drugs are prescribed simultaneously, they may intervene with one another. As new drugs are introduced to the market every year, the importance of having medical information including awareness of contraindications, interventions and interactions of drugs with one another, the cautions and warnings associated with them, important side effects, etc. increases [3].
According to the results of this research, an average number of 4.82 ± 1.91 items were prescribed for each patient of whom 1.95 ± 2.40 had drug interaction in each recipe with levels C, D, and X interactions having a share of 1.60 ± 2.05, 0.275 ± 0.69, and 0.0 ± 072.31 respectively. No interactions were observed in 31.1% (1846 cases) of recipes.
Crucial-Souza and Jaos Carlos Thomson (2006) conducted research and studied the frequency of drug interaction in an educational hospital in Brazil [10]. In this research, 300 recipes belonging to those patients hospitalised in the hospital were studied. This group utilised DrugReax system to analyse drug interaction. According to their results, drug interactions were observed in 49.7% of all recipes, while 3.4% of the recipes exhibited acute interactions. Compared to the results achieved in this research, the total frequency of interaction and acute interaction in the population studied in Iran was much less. According to their results, digoxin-hydrochlorothiazide interaction was the most common one. These two drugs played a minor role in the recipes studied in this research, and it might be due to the greater generality of the population studied in this research. The frequency of interaction and the average number of interacting items with various levels of interaction for the age variable shows there is a significant relationship between them. Also, according to the results of this research, the frequency of interaction among females older than 55 years suffering from
cardiovascular diseases was significantly higher than other patients. In line with the results of the research conducted in Brazil, older age can influence drug interaction.
Furthermore, gender has no significant influence on the occurrence of interactions except level D. As shown in Table 3; only level D has a significant difference in interaction. Although the frequency of intervention was so great among the recipes issued by cardiologists in our research, the greatest level of frequency was observed in the recipes issued by psychologists. This difference might be due to the large statistical population of our research.
In 2003, Sabin S. Egger et al., [11] researched to study the frequency of drug interaction in the recipes of those patients who were being discharged from hospitals. As many as 500 patients were studied in this research and 60% of the recipes reported at least one drug interaction. According to this group, the level of frequency of low, average, and high interactions was 17.9%, 69.9%, and 12.2% respectively. This frequency is different from what we found in our research, and this difference can be attributed to the difference in the size of the population.
Juan Merlo et al. (2001) published the results of the research they had conducted on all the recipes of January 1999 in Sweden [12]. As many as 962013 recipes with at least 2 items fetched from the database of Swedish Health Organization were studied. Data were stratified by age and sex, and odds ratios were calculated using multilevel logistic regression. According to the results of their research, 13.6% of all the recipes had at least one drug interaction. They claimed that factors such as older age and a higher number of drugs per recipe increase the possibility of a drug interaction. This fact is in line with the results of the current research. They also showed that level C drug interactions exhibited the greatest frequency in the Swedish population, and this result was also observed in the Iranian population, too. According to their research, level D drug interactions exhibited the second highest frequency in both the Iranian and Swedish population.
Rachel P. Riechelmann et al., (2007) [13] studied drug interaction in the recipes of those patients who have cancer. They utilised Drug Interaction Facts software version 4.0 for their research. As many as 405 patients were studied in this research. Considering the items prescribed in each recipe, as many as 276 potential cases of drug intervention were predicted, but only 109 patients experienced such interactions. Nine of these interactions were acute, and 77% were mild. As it turned out in this research, the highest level of frequency was observed in drugs not associated with cancer such as warfarin, antihypertensive, corticosteroids and anticonvulsants. The authors

Alinezhad et al. Studying the Prevalence of Medical Interventions in the Recipes _______________________________________________________________________________________________________________________________
_______________________________________________________________________________________________________________________________
Open Access Maced J Med Sci. 2019 Jun 15; 7(11):1879-1883. 1883
concluded that the prevalence of drug interaction in the population studied was influenced by the number of medical items in the recipe, the therapeutic method utilised and the tumour.
In 2011, Fariba Ahmadizar et al., [14] studied the frequency of drug interactions in the recipes of general and specialised practitioners in Iranian population. As many as 28956638 recipes in 2007 and 15510912 recipes in 2008 were collected from Iran Medical Sciences University and analysed using Pardazesh Nosakh, a prescription processing software program, provided by the National Committee of Rational Drug Use. This program was developed for the DOS operating system and Novell Network in 1998. Drug interactions were observed in the recipes issued by internists, cardiologists, neurologists, psychiatrists, neurosurgeons, general surgeons, infectious diseases specialists, urologists, dermatologists, ear, throat and nose specialists, optometrists, orthopedists, and paediatricians. According to the results, the highest degree of frequency was observed in the recipes issued by cardiologists, internists, urologists, and neurologists. Similar to the results achieved in our research, cardiologists and neurologists have the greatest share in drug interactions.
In conclusion, considering the results achieved in this research, a noticeable frequency was found for drug interaction in recipes. The highest frequency of drug interaction was observed in level C interactions. On the other hand, it has been proved that factors such as age increase the possibility of interactions, and as people grow older, the number of interacting items and level of interaction goes up. As some diseases are dependent upon season, the time and season when the drug is prescribed can also increase the possibility of drug interactions. Furthermore, gender has no significant influence on the occurrence of interactions except level D. As shown; only level D has a significant difference in interaction. Type of drug store and patients’ insurance coverage were the other factors that had a noticeable influence on the occurrence of interactions. The frequency of these interactions in the class of the nervous system and the musculoskeletal system was so great. Doctor’s speciality also plays a major role in the occurrence of interactions with greater degrees of frequency observed in the recipes of general practitioners. As of specialists, the highest rate of interaction was observed in the items issued by psychiatrists.
References
1. De Almeida M, Gama CS, Akamine N. Prevalence and classification of drug-drug interactions in intensive care patients. Einstein. 2007; 5:347-51.
2. Papadopoulos J, Smithburger PL. Common drug interactions leading to adverse drug events in the intensive care unit: Management and pharmacokinetic considerations. Critical care medicine. 2010; 38:S126-S35. https://doi.org/10.1097/CCM.0b013e3181de0acf PMid:20502166
3. Lacy C, Armstrong LL, Goldman MP, Lance LL. Drug information handbook: Lexi-comp HudsonOH; 1999.
4. Kohn LT, Corrigan JM, Donaldson MS. To err is human: building a safer health system: National Academies Press; 2000.
5. Van Leeuwen R, Swart E, Boven E, Boom F, Schuitenmaker M, Hugtenburg J. Potential drug interactions in cancer therapy: a prevalence study using an advanced screening method. Annals of oncology. 2011:mdq761. https://doi.org/10.1093/annonc/mdq761 PMid:21343376
6. Lu C, Liao M, Cohen L, Q Xia C. Emerging in vitro tools to evaluate cytochrome P450 and transporter-mediated drug-drug interactions. Current drug discovery technologies. 2010; 7(3):199-222. https://doi.org/10.2174/157016310793180549 PMid:20843292
7. Köhler G, Bode-Böger S, Busse R, Hoopmann M, Welte T, Böger R. Drug-drug interactions in medical patients: effects of in-hospital treatment and relation to multiple drug use. International journal of clinical pharmacology and therapeutics. 2000; 38(11):504-13. https://doi.org/10.5414/CPP38504 PMid:11097142
8. Chiu Y-Y, Ereshefsky L, Preskorn SH, Poola N, Loebel A. Lurasidone drug-drug interaction studies: a comprehensive review. Drug metabolism and drug interactions. 2014; 29(3):191-202. https://doi.org/10.1515/dmdi-2014-0005 PMid:24825095
9. Wong K, Yu SK, Holbrook A. A systematic review of medication safety outcomes related to drug interaction software. J Popul Ther Clin Pharmacol. 2010; 17(2):e243-55.
10. Cruciol-Souza JM, Thomson JC. Prevalence of potential drug-drug interactions and its associated factors in a Brazilian teaching hospital. J Pharm Pharm Sci. 2006; 9(3):427-33.
11. Egger SS, Drewe J, Schlienger RG. Potential drug-drug interactions in the medication of medical patients at hospital discharge. European Journal of Clinical Pharmacology. 2003; 58(11):773-8. https://doi.org/10.1007/s00228-002-0557-z PMid:12634985
12. Merlo J, Liedholm H, Lindblad U, Björck-Linné A, Fält J, Lindberg G, et al. Prescriptions with potential drug interactions dispensed at Swedish pharmacies in January 1999: cross sectional study. BMJ. 2001; 323(7310):427. https://doi.org/10.1136/bmj.323.7310.427 PMid:11520839 PMCid:PMC37552
13. Riechelmann RP, Tannock IF, Wang L, Saad ED, Taback NA, Krzyzanowska MK. Potential Drug Interactions and Duplicate Prescriptions Among Cancer Patients. Journal of the National Cancer Institute. 2007; 99(8):592-600. https://doi.org/10.1093/jnci/djk130 PMid:17440160
14. Ahmadizar F, Soleymani F, Abdollahi M. Study of Drug-Drug Interactions in Prescriptions of General Practitioners and Specialists in Iran 2007-2009. Iranian Journal of Pharmaceutical Research. 2011; 10(4):921-31.

_______________________________________________________________________________________________________________________________
1884 https://www.id-press.eu/mjms/index
ID Design Press, Skopje, Republic of Macedonia Open Access Macedonian Journal of Medical Sciences. 2019 Jun 15; 7(11):1884-1890. https://doi.org/10.3889/oamjms.2019.486 eISSN: 1857-9655 Review Article
The Role of Nanomaterials in the Treatment of Diseases and Their Effects on the Immune System Razieh Rezaei
1,2, Mohsen Safaei
1*, Hamid Reza Mozaffari
2,3, Hedaiat Moradpoor
4, Sara Karami
5, Amin Golshah
6, Behroz
Salimi7, Hossein Karami
7
1Advanced Dental Sciences Research Laboratory, School of Dentistry, Kermanshah University of Medical Sciences,
Kermanshah, Iran; 2Medical Biology Research Centre, Kermanshah University of Medical Sciences, Kermanshah, Iran;
3Department of Oral and Maxillofacial Medicine, School of Dentistry, Kermanshah University of Medical Sciences,
Kermanshah, Iran; 4Department of Prosthodontics, School of Dentistry, Kermanshah University of Medical Sciences,
Kermanshah, Iran; 5Students Research Committee, Kermanshah University of Medical Sciences, Kermanshah, Iran;
6Department of Orthodontics, School of Dentistry, Kermanshah University of Medical Sciences, Kermanshah, Iran;
7School
of Dentistry, Kermanshah University of Medical Sciences, Kermanshah, Iran
Citation: Rezaei R, Safaei M, Mozaffari HR, Moradpoor H, Karami S, Golshah A, Salimi B, Karami H. The Role of Nanomaterials in the Treatment of Diseases and Their Effects on the Immune System. Open Access Maced J Med Sci. 2019 Jun 15; 7(11):1884-1890. https://doi.org/10.3889/oamjms.2019.486
Keywords: Nanomedicine; Nanomaterials; Immune system; Autoimmune diseases; Nanotoxicology
*Correspondence: Mohsen Safaei. Advanced Dental Sciences Research Laboratory, School of Dentistry, Kermanshah University of Medical Sciences, Kermanshah, Iran. E-mail: [email protected]
Received: 21-Apr-2019; Revised: 27-May-2019; Accepted: 28-May-2019; Online first: 14-Jun-2019
Copyright: © 2019 Razieh Rezaei, Mohsen Safaei, Hamid Reza Mozaffari, Hedaiat Moradpoor, Sara Karami, Amin Golshah, Behroz Salimi, Hossein Karami. This is an open-access article distributed under the terms of the Creative Commons Attribution-NonCommercial 4.0 International License (CC BY-NC 4.0)
Funding: This research did not receive any financial support
Competing Interests: The authors have declared that no competing interests exist
Abstract
Nanotechnology has been widely exploited in recent years in various applications. Different sectors of medicine and treatment have also focused on the use of nanoproducts. One of the areas of interest in the treatment measures is the interaction between nanomaterials and immune system components. Engineered nanomaterials can stimulate the inhibition or enhancement of immune responses and prevent the detection ability of the immune system. Changes in immune function, in addition to the benefits, may also lead to some damage. Therefore, adequate assessment of the novel nanomaterials seems to be necessary before practical use in treatment. However, there is little information on the toxicological and biological effects of nanomaterials, especially on the potential ways of contacting and handling nanomaterials in the body and the body response to these materials. Extensive variation and different properties of nanomaterials have made it much more difficult to access their toxicological effects to the present. The present study aims to raise knowledge about the potential benefits and risks of using the nanomaterials on the immune system to design and safely employ these compounds in therapeutic purposes.
Introduction
Nanomaterials have structures smaller than 100 nm with physicochemical properties capable of affecting biological processes [1]. The nanomaterials can be synthesised from a wide range of materials, the most common of which being silicates, non-oxide ceramics and metal oxides. Nanomaterials have many features and capabilities with unique structural characteristics such as desirable size, greater solubility, easier to pass through cellular barriers and
more reactivity [2]. The application of nanotechnology has created new hopes in solving today’s human problems. In recent decades, the nanotechnology has been introduced as a factor affecting different industries, and the use of nanomaterials has expanded rapidly in various fields. The pharmaceutical and medical industries have also benefited by the use of nanotechnology such that it has led to the introduction of new applied products into the market [3], [4].
Nanotechnology has been used in the fields of prevention, diagnosis and treatment of various

Rezaei et al. The Role of Nanomaterials in the Treatment of Diseases and Their Effects on the Immune System _______________________________________________________________________________________________________________________________
_______________________________________________________________________________________________________________________________
Open Access Maced J Med Sci. 2019 Jun 15; 7(11):1884-1890. 1885
diseases. However, the interaction of nanomaterials and the immune system remains somewhat unknown. Previous studies have shown that the nanomaterials can cause excitation or suppression of immune responses through binding to blood proteins. Adsorption of these proteins bound to nanomaterials is recognised by various immune cells. Also, they affect the interaction of nanoparticles (NPs) with other blood components [5], [6]. Nanomaterials contribute to the activity of the adjuvant by increasing antigen presentation to the immune system as well as the enhancement of the innate immune responses. Determining the degree of biocompatibility of nanomaterials with the immune system is largely fulfilled by their surface chemistry. Today, the nanotechnology is widely used to improve targeted immune responses to the prevention and treatment of infectious and non-infectious diseases. Localised nano immunotherapy through the reduction of systemic toxicity improves the immunostimulatory molecules [7]. The applications of nanotechnology in medicine and immunology are extensive. This study has reviewed some applications of nanomaterials in medicine, the use of nanomaterials in the treatment of autoimmune diseases, the effect of nanomaterials on immune responses, the use of nanomaterials in vaccine design and the effects of nanomaterials on the body and the immune system.
The nanomaterials and their application in medicine
Despite the medical advances in recent years, some diseases such as AIDS [8], [9], cancer [10], [11], infectious diseases [12], diabetes [13], chronic pain [14], [15] and autoimmune diseases [16], [17], have not been treated. Since nanoparticles are the foundation of nanotechnology, their use in the medical branch has opened new perspectives in therapy [18]. Accordingly, the properties of nanoparticles should first be evaluated; and if approved, they will be then used for therapeutic purposes. Nanomedicine deals with the ever-increasing advances in theories, devices and nanoscale apparatuses as well as with nanostructures specific for the diagnosis, prevention, or treatment of diseases. The use of nanomaterials in medical interventions has led to direct contact of the nanomaterials with the human body [19]. The nanomedicine can be accomplished by detecting, restoring and regenerating damaged tissues at the molecular levels. Another research topic in the nanomedicine is the extensive design and the use of various research tools to produce drugs with a targeted release in the body. In this drug delivery method, the drug is directed to the target cells and delivered to the desired site [20].
Considering the antimicrobial properties of
different types of nanoparticles, such as nanosilver, nano titanium and copper nanoparticles, one of their important applications is to control a variety of pathogens. Also, recent results have shown that gold nanoparticles and also magnetic nanomaterials due to their unique properties can be recruited in various areas of treatment and nanomedicine [21], [22], [23]. Researchers, through the exploitation of the outer surface of nanomaterials, have established nanoscale interactions between materials and biological systems to dramatically enhance their performance and create new structures [24]. The use of intelligent devices in medicine with the least damage to surrounding tissues is another application of the nanomaterials. Another application of nanomaterials in the medical field is the production of compatible components in sensor systems that can diagnose and prevent diseases. Environmental sensors are designed on a very fine chip to complete the experiments that communicate with the outside of the patient’s body reveal the internal body conditions such as heart attack, tumour, or localised infections [25], [26]. Magnetic resonance imaging (MRI) is an advanced and non-invasive technique for the early diagnosis of many diseases, including cancer [27]. Several diseases can be currently diagnosed with a drop of blood-based on laser systems in the infrared, visible, and ultraviolet frequency ranges. New approaches for producing DNA-based nanoscale tools also show the advancement of nanotechnology in life sciences and medicine [28], [29]. The use of these new therapies makes many diseases detectable and treatable at the onset. However, despite all the advantages of nanoparticles (such as identifying the disease location and drug delivery), they should escape somehow from the immune system, which is recognised as an invader. The defence system able to destroy nanoparticles is a major barrier to using nanotechnology in medicine. The applied nanoparticles are systematically trapped within minutes and then removed from the body. Cell membrane-coated nanoparticles can stay intact for several hours without any damage in the body. Among these particles, protein nanoparticles are of interest because of numerous benefits such as easy access to their resources, renewable resources, reasonable cost, biocompatibility, biodegradability, the presence of multiple functional groups to carry high doses of the drug, and the ability to link simultaneously targeting groups to target nanoparticles to certain cells or tissues [30], [31], [32].
The nanomaterials and the treatment of autoimmune diseases
In the autoimmune diseases, the immune invasion to certain tissues endangers their structural

Review Article _______________________________________________________________________________________________________________________________
_______________________________________________________________________________________________________________________________
1886 https://www.id-press.eu/mjms/index
and functional compatibility [16], [17]. The nanomaterials have been engineered to modulate the antigen-presenting cells (APCs), as well as to downregulate innate immune signals that reinforce adaptive autoimmune responses [33]. In a study by Schweingruber et al., [34] on the pharmacological treatment of experimental autoimmune encephalomyelitis (EAE), glucocorticoid loaded liposomes were found effective at doses lower than conventional glucocorticoid therapy through affecting the macrophages. One of the main limitations of conventional specific antigen-based methods for the treatment of autoimmune diseases is the antigenic complexity of autoimmune diseases and the need to target the multiple characteristics of autoreactive T cells. The nanoparticles coated by peptide-loaded major histocompatibility complex (pMHC) increase CD4
+ regulatory T cells with lower acidity. These
nanoparticles in the target tissue also inhibit polyclonal autoimmune responses through a targeted selection of autoantigen loaded APCs [35], [36], [37]. New compounds of nanoparticles, such as nanoparticles with multiple surfaces, will help to develop the future generation of nano-based drugs for the treatment of autoimmune diseases [38], [39].
The effect of nanomaterials on the immune responses
The innate immunity is, in fact, a non-specific, natural, non-clonal, germline-encoded and non-anticipatory system, while the adaptive immunity is a specific, clonal, somatic, and anticipatory system [40]. The nanoparticles properties such as size, hydrophobicity, surface charge and coating agents determine their level of interaction with the immune system [41]. Adsorption of molecules on the NPs in specific microenvironments makes them be recognised as foreign agents by the innate immune system, resulting in an inflammatory response. The NPs have no direct contact with innate immune cells, except with molecules ornamented on their surface. On the other hand, a large amount of NPs loaded in chemotherapies for antitumor therapy is taken by leukocytes. Therefore, there is a potential loss of innate immune response [42].
Delayed adaptive immunity occurs based on the type and extent of innate immune responses and can expand and enhance inflammatory responses. The adsorption of body molecules on the surface of NPs causes their deformation, folding and immunogenicity, resulting in the adaptive immune response. The induction of NPs interferes with the molecular mechanisms of dendritic cells (DCs), affects the peptides presented to T cells and thus modulates the adaptive immune responses [43], [44]. In a study by Gustafsson et al., [45] TiO2 NPs injected
intravenously to rats caused an early immune response in the lungs and resulted in a consequent increase in the IFN-γ, IL-4 and IL-10 levels after several days.
The application of nanomaterials in vaccine design
The success of human papillomavirus (HPV) and hepatitis B virus (HBV) based particles in humans have led to the development of various virus-like particles (VLPs) and virus-based nanoparticles VNPs vaccine. One of the concerns about the use of engineered nanoparticles is their potential toxicity in the human body. Some of the contributing factors to the toxic effects of some materials in the human body are the low rate of biodegradability, high surface area to volume ratio, the ability of biological membrane coatings, and high reactivity. Self-assembly ability of a large variety of viral capsid subunits in VLPs shows advances in the vaccine design. The VLPs have a regular and multifaceted structure that is not usually a component of the host proteins, so they form pathogen-associated molecular patterns (PAMPs), which create the mechanisms for assessing the innate immune [46], [47].
Also, most of the VLPs enclose nucleic acids during production, as they may stimulate specific Toll-like receptors (TLRs). The features of the VLPs can be used in the vaccine design because they facilitate their taking by the antigen presenting cells (APCs), producing long-term cytotoxic T lymphocyte (CTL) responses and antibody responses [48], [49]. The VLPs are better and safer than other subunit vaccines because of lacking any genetic material. Although the production of synthetic particles usually has undesirable immunogenicity and conditions for removing in the body, their production is easier and safer than the VLPs [50].
The biocompatible and biodegradable microparticles are used in oral immunisation to induce local and systemic immune responses. One of the biodegradable materials is poly (lactic-co-glycolide) (PLGA) copolymers that can be manipulated by altering the polymer composition and molecular weight. PLG microspheres are commonly used as carriers of bacterial vaccines, and few are studied for viral vaccines [51]. Liposomes are composed of two layers of phospholipids that are associated with cholesterol to stabilise the artificial membrane [52]. Also, the liposomes are mostly unable to provoke potent immune responses that require the use of adjuvants. Immune stimulating complexes (ISCOMs) are spherical micelles with a diameter of about 40 nm consisting of a mixture of Quil A saponins as strong adjuvants, cholesterol and phospholipids. The use of

Rezaei et al. The Role of Nanomaterials in the Treatment of Diseases and Their Effects on the Immune System _______________________________________________________________________________________________________________________________
_______________________________________________________________________________________________________________________________
Open Access Maced J Med Sci. 2019 Jun 15; 7(11):1884-1890. 1887
ISCOMS for rotavirus and herpes simplex virus type 2 (HSV-2) vaccines is allowed in horses. Despite the advances in ISCOMS, their use is limited due to problems similar to those of the liposomes. Also, nanoemulsions (NEs) based vaccines are noninflammatory mucosal adjuvants that can be an appropriate candidate for use in the vaccine platform. Although the process of developing new vaccines continues to be improving, formulations that work well in laboratory animals are usually expensive in human clinical trials, and there is little hope for their applications [53], [54]. In this regard, human experiments need to anticipate an outbreak of the disease so that to be able to protect against them. Since vaccines are of the most effective strategies to improve health worldwide, ongoing efforts are needed to improve vaccine immunity and efficacy.
Nanotoxicology
Nanoscale materials have found new properties and function over non-nano equivalent materials because of their small size and large surface area. Studies have shown that those properties of nanoparticles that lead to changes in their physicochemical properties [55], [56] can also cause potential toxicity. The nanotechnology is developing rapidly and has undoubtedly both beneficial and harmful effects on humans and the environment. Therefore, it is very necessary to apply different methods for evaluating the toxicity of nanomaterials, particularly the presence of nanoparticles in airborne workplace pollutants that could affect the health of workers. In cellular models, dendritic cells, epithelial cells and macrophages are commonly used to evaluate the toxicological and immunological effects of engineered nanomaterials (ENM). The standardisation of the ENM immunotoxicity test and the effect of the ENM on the body should be further investigated [57]. During usage or production of the ENM, the body is usually exposed through the lungs. It has been evidenced that the nanoparticles stimulate more strongly than particles with a larger size and can induce inflammatory and toxic responses in the lungs. Calu-3 and A549, which are human epithelial cell lines, are widely used to investigate the response of immune cells exposed to the ENM. The exposure of the respiratory tract to zinc oxide nanoparticles stimulates eosinophils and thus upregulates the serum IgE levels. Also, exposure to nanoparticles can cause the proliferation of respiratory epithelial cells, cell hyperplasia, and pulmonary fibrosis [58], [59]. Most toxicology studies have been carried out on nanomaterials such as metals, metal oxides, carbon nanotubes, fullerenes, polymer nanoparticles, and quantum dots. Wang et al., [60] showed that the distribution status of multiwalled carbon nanotubes (MWCNTs) also affects the
profibrogenic cellular responses and pulmonary fibrosis in addition to inducing pulmonary toxicity.
Schinwald et al., [61] reported that graphene-based nanoplatelets through the pharyngeal aspiration and direct intrapleural installation could enter the lung and the pleural space and cause inflammation. Based on different results, researchers have concluded that nanoplatelets emphasise the complexity of nanoparticle toxicology and are likely to pose a nanohazard about the toxicity of the structure. Studying titanium dioxide nanoparticles indicated that the release of these nanoparticles from membrane-bound organelles could interact with cellular signalling to activate cell activation. Rossi et al., [62] exposed asthmatic rats to titanium dioxide particles and observed that ovalbumin (OVA) induced allergic pulmonary inflammation was significantly suppressed, indicating significantly decreased levels of cytokines, chemokines, leukocytes and antibodies in allergic asthma. Various studies have also shown that the changes caused by the nanoparticles, for example, and surface coating can lead to alterations in toxicological properties.
According to several studies, the skin is an important route for the penetration of nanoparticles in both occupational and consumer areas [63]. Although zinc oxide and titanium dioxide nanoparticles, the members of metal oxide nanoparticles, are commonly used in personal care formulations as protective agents against UV light, they are unable to penetrate the stratum corneum [64]. In contradiction to the previous report, Gulson et al., [65] exhibited that low amounts of zinc from zinc oxide nanoparticles used in sunscreens can pass through the protective layers of the skin and are found in the blood and urine. Several studies have shown that the safety and toxicity of nanoparticles in both in vitro and in vivo conditions are important for clinical applications.
Conclusion
The use of nanoparticles, according to their unique immunological characteristics, which are determined by size, shape, charge, porosity and hydrophobicity, enables researchers to change the immune responses arbitrarily using new and unexpected approaches. In the future, the application of nanotechnology in immunology may affect novel strategies for preventing or treating human diseases. In this context, nanotechnology will continue to introduce remarkable insights into the nature of immune responses and will create increasingly new materials and products based on nanoparticles. Moreover, nanoparticles because of their desirable surface area to volume ratio are highly reactive, which leads to their harmful interaction with biological systems and the environment, thereby creating

Review Article _______________________________________________________________________________________________________________________________
_______________________________________________________________________________________________________________________________
1888 https://www.id-press.eu/mjms/index
toxicity. Moreover, the small size of nanomaterials will allow them to penetrate into deeper areas of biological systems that are inaccessible to larger particles. Due to different properties of the nanoparticles, their application for therapeutic purposes, especially the effect on the immune system, requires further attention and research.
References
1. Safaei M, Karimi N, Alavi M, Taran M. Application of nanomaterial in nutrition and food sciences. J Adv Appl Sci Res. 2017; 1(12):1-16.
2. Zhang L, Jiang Y, Ding Y, Povey M, York D. Investigation into the antibacterial behaviour of suspensions of ZnO nanoparticles (ZnO nanofluids). J Nanopart Res. 2007; 9:479-489. https://doi.org/10.1007/s11051-006-9150-1
3. Safaei M, Taran M. Optimal conditions for producing bactericidal sodium hyaluronate-TiO2 bionanocomposite and its characterization. Int J Biol Macromol. 2017; 104:449-456. https://doi.org/10.1016/j.ijbiomac.2017.06.016 PMid:28619641
4. Morigi V, Tocchio A, Bellavite Pellegrini C, Sakamoto JH, Arnone M, Tasciotti E. Nanotechnology in medicine: from inception to market domination. J Drug Deliv. 2012; 389485. https://doi.org/10.1155/2012/389485 PMid:22506121 PMCid:PMC3312282
5. Goppert TM, Muller RH. Polysorbate-stabilized solid lipid nanoparticles as colloidal carriers for intravenous targeting of drugs to the brain: comparison of plasma protein adsorption patterns. J Drug Target. 2005; 13:179-187. https://doi.org/10.1080/10611860500071292 PMid:16036306
6. Toy R, Roy K. Engineering nanoparticles to overcome barriers to immunotherapy. Bioeng Transl Med. 2016; 1:47-62. https://doi.org/10.1002/btm2.10005 PMid:29313006 PMCid:PMC5689503
7. Kwong B, Liu H, Irvine DJ. Induction of potent anti-tumor responses while eliminating systemic side effects via liposome-anchored combinatorial immunotherapy. Biomaterials. 2011; 32:5134-5147. https://doi.org/10.1016/j.biomaterials.2011.03.067 PMid:21514665 PMCid:PMC3140866
8. Moyer E, Hardon A. A disease unlike any other? Why HIV remains exceptional in the age of treatment. Med Anthropol. 2014; 33:263-269. https://doi.org/10.1080/01459740.2014.890618 PMid:24661122
9. Margolis DM, Koup RA, Ferrari G. HIV antibodies for treatment of HIV infection. Immunol Rev. 2017; 275:313-323. https://doi.org/10.1111/imr.12506 PMid:28133794 PMCid:PMC5556378
10. Mozaffari HR, Izadi B, Sadeghi M, Rezaei F, Sharifi R, Jalilian F. Prevalence of oral and pharyngeal cancers in Kermanshah province, Iran: A ten-year period. Int J Cancer Res. 2016; 12:169-175. https://doi.org/10.3923/ijcr.2016.169.175
11. Mozaffari HR, Payandeh M, Ramezani M, Sadeghi M, Mahmoudiahmadabadi M, Sharifi R. Efficacy of palifermin on oral mucositis and acute GVHD after hematopoietic stem cell transplantation (HSCT) in hematology malignancy patients: a meta-analysis of trials. Wspolczesna Onkol. 2017; 21:299-305. https://doi.org/10.5114/wo.2017.72400 PMid:29416437 PMCid:PMC5798422
12. Imani MM, Safaei M. Optimized Synthesis of Magnesium Oxide Nanoparticles as Bactericidal Agents. J Nanotechnol. 2019; 6063832. https://doi.org/10.1155/2019/6063832
13. Wong CY, Al-Salami H, Dass CR. Potential of insulin nanoparticle formulations for oral delivery and diabetes treatment.
J Control Release. 2017; 264:247-275. https://doi.org/10.1016/j.jconrel.2017.09.003 PMid:28887133
14. Sharifi R, Khazaei S, Mozaffari HR, Amiri SM, Iranmanesh P, Mousavi SA. Effect of massage on the success of anesthesia and infiltration injection pain in maxillary central incisors: Double-blind, crossover trial. Dent Hypotheses. 2017; 8(3):61–64. https://doi.org/10.4103/denthyp.denthyp_52_16
15. Chakravarthy KV, Boehm FJ, Christo PJ. Nanotechnology: A Promising New Paradigm for the Control of Pain. Pain Med. 2017; 19:232-243. https://doi.org/10.1093/pm/pnx131 PMid:29036629
16. Mozaffari HR, Zavattaro E, Saeedi M, Lopez-Jornet P, Sadeghi M, Safaei M, Imani MM, Nourbakhsh R, Moradpoor H, Golshah A, Sharifi R. Serum and salivary interleukin-4 levels in patients with oral lichen planus: A systematic review and meta-analysis. Oral Surg Oral Med Oral Pathol Oral Radiol. 2019. https://doi.org/10.1016/j.oooo.2019.04.003 PMid:31097393
17. Mozaffari HR, Zavattaro E, Abdolahnejad A, Lopez-Jornet P, Omidpanah N, Sharifi R, Sadeghi M, Shooriabi M, Safaei M. Serum and Salivary IgA, IgG, and IgM Levels in Oral Lichen Planus: A Systematic Review and Meta-Analysis of Case-Control Studies. Medicina. 2018; 54(6):99. https://doi.org/10.3390/medicina54060099 PMid:30513983 PMCid:PMC6306895
18. Chen WY, Lin JY, Chen WJ, Luo L, Wei-Guang Diau E, Chen YC. Functional gold nanoclusters as antimicrobial agents for antibiotic-resistant bacteria. Nanomedicine (Lond). 2010; 5:755-764. https://doi.org/10.2217/nnm.10.43 PMid:20662646
19. Marchesan S, Prato M. Nanomaterials for (Nano) medicine. ACS Med Chem Lett. 2013; 4:147-149. https://doi.org/10.1021/ml3003742 PMid:24900637 PMCid:PMC4027518
20. Hassan S, Prakash G, Ozturk AB, Saghazadeh S, Sohail MF, Seo J, Dokmeci MR, Zhang YS, Khademhosseini A. Evolution and clinical translation of drug delivery nanomaterials. Nano Today. 2017; 15:91-106. https://doi.org/10.1016/j.nantod.2017.06.008 PMid:29225665 PMCid:PMC5720147
21. Beyth N, Houri-Haddad Y, Domb A, Khan W, Hazan R. Alternative antimicrobial approach: nano-antimicrobial materials. Evid-Based Complementary Altern Med. 2015; 246012. https://doi.org/10.1155/2015/246012 PMid:25861355 PMCid:PMC4378595
22. Safaei M, Taran M. Fabrication, characterization, and antifungal activity of sodium hyaluronate-TiO2 bionanocomposite against Aspergillus niger. Mater Lett. 2017; 207:113-116. https://doi.org/10.1016/j.matlet.2017.07.038
23. Safaei M, Taran M, Imani MM. Preparation, structural characterization, thermal properties and antifungal activity of alginate-CuO bionanocomposite. Mater Sci Eng C. 2019; 101:323-329. https://doi.org/10.1016/j.msec.2019.03.108 PMid:31029325
24. Zhang XQ, Xu X, Bertrand N, Pridgen E, Swami A, Farokhzad OC. Interactions of nanomaterials and biological systems: Implications to personalized nanomedicine. Adv Drug Deliv Rev. 2012; 64:1363-1384. https://doi.org/10.1016/j.addr.2012.08.005 PMid:22917779 PMCid:PMC3517211
25. Agoulmine N, Kim K, Kim S, Rim T, Lee JS, Meyyappan M. Enabling communication and cooperation in bio-nanosensor networks: toward innovative healthcare solutions. IEEE Wirel Commun. 2012; 19:42-51. https://doi.org/10.1109/MWC.2012.6339471
26. Salvati E, Stellacci F, Krol S. Nanosensors for early cancer detection and for therapeutic drug monitoring. Nanomedicine. 2015; 10:3495-3512. https://doi.org/10.2217/nnm.15.180 PMid:26606949
27. Schoots IG, Roobol MJ, Nieboer D, Bangma CH, Steyerberg EW, Hunink MM. Magnetic resonance imaging-targeted biopsy may enhance the diagnostic accuracy of significant prostate cancer detection compared to standard transrectal ultrasound-guided biopsy: a systematic review and meta-analysis. Eur Urol. 2015; 68:438-450. https://doi.org/10.1016/j.eururo.2014.11.037 PMid:25480312

Rezaei et al. The Role of Nanomaterials in the Treatment of Diseases and Their Effects on the Immune System _______________________________________________________________________________________________________________________________
_______________________________________________________________________________________________________________________________
Open Access Maced J Med Sci. 2019 Jun 15; 7(11):1884-1890. 1889
28. Cyranoski D. Japan sets sights on success in nanotechnology. Nature. 2000; 408:624. https://doi.org/10.1038/35046296 PMid:11117757
29. Zahid M, Kim B, Hussain R, Amin R, Park SH. DNA nanotechnology: a future perspective. Nanoscale Res Lett. 2013; 8:119. https://doi.org/10.1186/1556-276X-8-119 PMid:23497147 PMCid:PMC3599551
ur , raicu , op L , omuleasa , herman , erindan- eagoe I he new era of nanotechnology, an alternative to change cancer treatment Drug Des Dev Ther. 2017; 11:2871-2890. https://doi.org/10.2147/DDDT.S142337 PMid:29033548 PMCid:PMC5628667
31. Lohcharoenkal W, Wang L, Chen YC, Rojanasakul Y. Protein nanoparticles as drug delivery carriers for cancer therapy. BioMed Res Int. 2014; 180549. https://doi.org/10.1155/2014/180549 PMid:24772414 PMCid:PMC3977416
32. Corbo C, Molinaro R, Parodi A, Toledano Furman NE, Salvatore F, Tasciotti E. The impact of nanoparticle protein corona on cytotoxicity, immunotoxicity and target drug delivery. Nanomedicine. 2016; 11:81-100. https://doi.org/10.2217/nnm.15.188 PMid:26653875 PMCid:PMC4910943
33. Klippstein R, Pozo D. Nanotechnology-based manipulation of dendritic cells for enhanced immunotherapy strategies. Nanomedicine. 2010; 6:523-529. https://doi.org/10.1016/j.nano.2010.01.001 PMid:20085824
34. Schweingruber N, Haine A, Tiede K, Karabinskaya A, van den randt , Wüst S, Metselaar M, old R, uckermann , Reichardt HM, Lühder F Liposomal encapsulation of glucocorticoids alters their mode of action in the treatment of experimental autoimmune encephalomyelitis. J Immunol. 2011; 187:4310-4318. https://doi.org/10.4049/jimmunol.1101604 PMid:21918186
35. Tsai S, Shameli A, Yamanouchi J, Clemente-Casares X, Wang J, Serra P, Yang Y, Medarova Z, Moore A, Santamaria P. Reversal of autoimmunity by boosting memory-like autoregulatory T cells. Immunity. 2010; 32:568-580. https://doi.org/10.1016/j.immuni.2010.03.015 PMid:20381385
36. Clemente-Casares X, Tsai S, Yang Y, Santamaria P. Peptide-MHC-based nanovaccines for the treatment of autoimmunity: a "one size fits all" approach?. J Mol Med. 2011; 89:733-742. https://doi.org/10.1007/s00109-011-0757-z PMid:21499734
37. Clemente-Casares X, Santamaria P. Nanomedicine in autoimmunity. Immunol Lett. 2014; 158:167-174. https://doi.org/10.1016/j.imlet.2013.12.018 PMid:24406504
38. Tran LT, Lesieur S, Faivre V. Janus nanoparticles: materials, preparation and recent advances in drug delivery. Expert Opin Drug Deliv. 2014; 11:1061-1074. https://doi.org/10.1517/17425247.2014.915806 PMid:24811771
39. Kaewsaneha C, Tangboriboonrat P, Polpanich D, Eissa M, Elaissari A. Janus colloidal particles: preparation, properties, and biomedical applications. ACS Appl Mater Interfaces. 2013; 5:1857-1869. https://doi.org/10.1021/am302528g PMid:23394306
40. Cooper EL. Evolution of immune systems from self/not self to danger to artificial immune systems (AIS). Phys Life Rev. 2010; 7:55-78. https://doi.org/10.1016/j.plrev.2009.12.001 PMid:20374928
41. Aggarwal P, Hall JB, McLeland CB, Dobrovolskaia MA, McNeil SE. Nanoparticle interaction with plasma proteins as it relates to particle biodistribution, biocompatibility and therapeutic efficacy. Adv Drug Deliv Rev. 2009; 61:428-437. https://doi.org/10.1016/j.addr.2009.03.009 PMid:19376175 PMCid:PMC3683962
42. Moyano DF, Liu Y, Peer D, Rotello VM. Modulation of immune response using engineered nanoparticle surfaces. Small. 2016; 12:76-82. https://doi.org/10.1002/smll.201502273 PMid:26618755 PMCid:PMC4749139
43. Klippstein R, Pozo D. Nanotechnology-based manipulation of dendritic cells for enhanced immunotherapy strategies. Nanomedicine. 2010; 6:523-529.
https://doi.org/10.1016/j.nano.2010.01.001 PMid:20085824
44. Aldinucci A, Turco A, Biagioli T, Toma FM, Bani D, Guasti D, Manuelli C, Rizzetto L, Cavalieri D, Massacesi L, Mello T. Carbon nanotube scaffolds instruct human dendritic cells: modulating immune responses by contacts at the nanoscale. Nano Lett. 2013; 13:6098-60105. https://doi.org/10.1021/nl403396e PMid:24224474
45 ustafsson Å, Lindstedt E, Elfsmark LS, ucht Lung exposure of titanium dioxide nanoparticles induces innate immune activation and long-lasting lymphocyte response in the Dark Agouti rat. J Immunotoxicol. 2011; 8:111-121. https://doi.org/10.3109/1547691X.2010.546382 PMid:21309687 PMCid:PMC3104284
46. Das J, Choi YJ, Song H, Kim JH. Potential toxicity of engineered nanoparticles in mammalian germ cells and developing embryos: treatment strategies and anticipated applications of nanoparticles in gene delivery. Hum Reprod Update. 2016; 22:588-619. https://doi.org/10.1093/humupd/dmw020 PMid:27385359
47. Buonaguro L, Pulendran B. Immunogenomics and systems biology of vaccines. Immunol Rev. 2011; 239:197-208. https://doi.org/10.1111/j.1600-065X.2010.00971.x PMid:21198673 PMCid:PMC3253346
48. Ludwig C, Wagner R. Virus-like particles-universal molecular toolboxes. Curr Opin Biotechnol. 2007; 18:537-545. https://doi.org/10.1016/j.copbio.2007.10.013 PMid:18083549
49. Peek LJ, Middaugh CR, Berkland C. Nanotechnology in vaccine delivery. Adv Drug Deliv Rev. 2008; 60:915-928. https://doi.org/10.1016/j.addr.2007.05.017 PMid:18325628
50. Roy P, Noad R. Virus-like particles as a vaccine delivery system: Myths and facts. Hum Vaccin. 2008; 4:5-12. https://doi.org/10.4161/hv.4.1.5559 PMid:18438104
51. Audran R, Peter K, Dannull J, Men Y, Scandella E, Groettrup M, Gander B, Corradin G. Encapsulation of peptides in biodegradable microspheres prolongs their MHC class-I presentation by dendritic cells and macrophages in vitro. Vaccine. 2003; 21:1250-1255. https://doi.org/10.1016/S0264-410X(02)00521-2
52. Alavi M, Karimi N, Safaei M. Application of various types of liposomes in drug delivery systems. Adv Pharm Bull. 2017; 7:3-9. https://doi.org/10.15171/apb.2017.002 PMid:28507932 PMCid:PMC5426731
53. Kersten GF, Crommelin DJ. Liposomes and ISCOMS. Vaccine. 2003; 21:915-920. https://doi.org/10.1016/S0264-410X(02)00540-6
54. Zhao L, Seth A, Wibowo N, Zhao CX, Mitter N, Yu C, Middelberg AP. Nanoparticle vaccines. Vaccine. 2014; 32:327-337. https://doi.org/10.1016/j.vaccine.2013.11.069 PMid:24295808
55. Stampfli MR, Anderson GP. How cigarette smoke skews immune responses to pro- mote infection, lung disease and cancer. Nat Rev Immunol. 2009; 9:377-384. https://doi.org/10.1038/nri2530 PMid:19330016
56. Barton GM. A calculated response: control of inflammation by the innate immune system. J Clin Invest. 2008; 118:413-420. https://doi.org/10.1172/JCI34431 PMid:18246191 PMCid:PMC2214713
57. Clift MJ, Gehr P. Nanotoxicology: a perspective and discussion of whether or not in vitro testing is a valid alternative. Arch Toxicol. 2011; 85:723-731. https://doi.org/10.1007/s00204-010-0560-6 PMid:20499226
58. Dekali S, Gamez C, Kortulewski T, Blazy K, Rat P, Lacroix G. Assessment of an in vitro model of pulmonary barrier to study the translocation of nanoparticles. Toxicol Rep. 2014; 1:157-171. https://doi.org/10.1016/j.toxrep.2014.03.003 PMid:28962236 PMCid:PMC5598380
59. Cho WS, Duffin R, Howie SE, Scotton CJ, Wallace WA, MacNee W, Bradley M, Megson IL, Donaldson K. Progressive severe lung injury by zinc oxide nanoparticles; the role of Zn2+ dissolution inside lysosomes. Part Fibre Toxicol. 2011; 8:27. https://doi.org/10.1186/1743-8977-8-27 PMid:21896169 PMCid:PMC3179432
60. Wang X, Xia T, Addo Ntim S, Ji Z, Lin S, Meng H, Chung CH,

Review Article _______________________________________________________________________________________________________________________________
_______________________________________________________________________________________________________________________________
1890 https://www.id-press.eu/mjms/index
George S, Zhang H, Wang M, Li N. Dispersal state of multiwalled carbon nanotubes elicits profibrogenic cellular responses that correlate with fibrogenesis biomarkers and fibrosis in the murine lung. ACS Nano. 2011; 5:9772-9787. https://doi.org/10.1021/nn2033055 PMid:22047207 PMCid:PMC4136431
61. Schinwald A, Murphy FA, Jones A, MacNee W, Donaldson K. Graphene-based nanoplatelets: a new risk to the respiratory system as a consequence of their unusual aerodynamic properties. ACS Nano. 2012; 6:736-746. https://doi.org/10.1021/nn204229f PMid:22195731
62. Rossi EM, Pylkkanen L, Koivisto AJ, Nykasenoja H, Wolff H, Savolainen K, Alenius H. Inhalation exposure to nanosized and fine TiO2 particles inhibits features of allergic asthma in a murine model. Part Fibre Toxicol. 2010; 7:35. https://doi.org/10.1186/1743-8977-7-35 PMid:21108815 PMCid:PMC3003234
63. Crosera M, Bovenzi M, Maina G, Adami G, Zanette C, Florio C, Larese FF. Nanoparticle dermal absorption and toxicity: a review of the literature. Int Arch Occup Environ Health. 2009; 82:1043-1055. https://doi.org/10.1007/s00420-009-0458-x PMid:19705142
64. Ryman-Rasmussen JP, Riviere JE, Monteiro-Riviere NA. Penetration of intact skin by quantum dots with diverse physicochemical properties. Toxicol Sci. 2006; 91:159-165. https://doi.org/10.1093/toxsci/kfj122 PMid:16443688
65. Gulson B, McCall M, Korsch M, Gomez L, Casey P, Oytam Y, Taylor A, McCulloch M, Trotter J, Kinsley L, Greenoak G. Small amounts of zinc from zinc oxide particles in sunscreens applied outdoors are absorbed through human skin. Toxicol Sci. 2010; 118:140-149. https://doi.org/10.1093/toxsci/kfq243 PMid:20705894


