Embed Size (px)
Citation preview

UNIVERSITY OF MICHIGAN
JOHN M. OLIN CENTER FOR LAW & ECONOMICS
THE REAL IMPACT OF ELIMINATING AFFIRMATIVE ACTION IN AMERICAN
LAW SCHOOLS: AN EMPIRICAL CRITIQUE OF RICHARD SANDER’S STUDY
DAVID L. CHAMBERS
TIMOTHY T. CLYDESDALE WILLIAM C. KIDDER
AND RICHARD O. LEMPERT
PAPER #05-007
THIS PAPER CAN BE DOWNLOADED WITHOUT CHARGE AT:
MICHIGAN JOHN M. OLIN WEBSITE HTTP://WWW.LAW.UMICH.EDU/CENTERSANDPROGRAMS/OLIN/PAPERS.HTM
THE REAL IMPACT OF ELIMINATING AFFIRMATIVE ACTION IN AMERICAN LAW SCHOOLS: AN EMPIRICAL CRITIQUE OF
RICHARD SANDER’S STUDY
DAVID L. CHAMBERS, TIMOTHY T. CLYDESDALE, WILLIAM C. KIDDER, AND RICHARD O. LEMPERT
[TO APPEAR IN MAY 2005 STANFORD L. REV.]
Abstract In an article in Stanford Law Review, Richard Sander argues that the practice of American law schools of taking race into account in admissions to law school perversely leads to fewer black lawyers entering the bar each year than would be the case without affirmative action. Sander’s claim is that, while ending affirmative action would reduce somewhat the number of black students admitted to any law school, there would in the end be more black lawyers because those black students who do attend law school would no longer attend schools where they are over their heads academically and would graduate and pass the bar at much higher rates than they do today. To reach his conclusions he relieves on projections based on an analysis of several datasets including the Bar Passage Study of the Law School Admissions Council. The article that follows is a response to Sander, also to be published in the Stanford Law. Resting on a reanalysis of the same datasets on which Sander relies, it concludes that ending affirmative action for black applicants to law school, far from leading to a net increase in the numbers of black attorneys, would probably lead to a decline of new lawyers in the range of 30 to 40 percent each year.

[TO APPEAR IN MAY 2005 STANFORD L. REV.]
THE REAL IMPACT OF ELIMINATING AFFIRMATIVE
ACTION IN AMERICAN LAW SCHOOLS: AN EMPIRICAL CRITIQUE OF RICHARD SANDER’S STUDY*
David L. Chambers**
Timothy T. Clydesdale***
William C. Kidder****
Richard O. Lempert***** INTRODUCTION.......................................................................................................................2 I. THE EFFECTS OF ENDING AFFIRMATIVE ACTION ON THE PRODUCTION OF AFRICAN AMERICAN ATTORNEYS.............................................................................................................................3
A. The Effects on Law School Applications, Admissions, and Matriculation.........3 1. Sander’s projections are based on 2001 data, which do not reflect current trends 4 2. Sander overestimates the numbers of African Americans who would apply to law school, get into the law school to which they would apply, or choose to enroll ............................6
B. The Effects on Law School Performance, Graduation, and Passage of the Bar10 1. Concerns about statistical methods.....................................................................10 2. Law school performance and graduation ..........................................................13 3. Performance on the bar examination..................................................................19
C. The Bottom Line: The Net Effects on the Numbers of African American Lawyers 23 II. THE IMPACT OF ENDING AFFIRMATIVE ACTION ON THE DISTRIBUTION OF AFRICAN AMERICAN STUDENTS AMONG LAW SCHOOLS.......................................................................................................24 CONCLUSION.........................................................................................................................29
* We are grateful to Richard Sander for providing access to his data and for the exchanges of ideas and
information by electronic mail and telephone over the past several months. We are also grateful to the authors of the other responses in this issue for sharing their thoughts and drafts. We have benefited greatly from the comments received on our drafts and research from Terry Adams, Katherine Barnes, Bart Bingenheimer, Kimberlé Crenshaw, Troy Duster, Cheryl Harris, Goodwin Liu, David Benjamin Oppenheimer, Dan Rubinfeld, Stephen Raudenbush, and Susan K. Serrano. We thank the African American Policy Forum and the Leadership Conference on Civil Rights for hosting a conference and Christopher Edley, Dean of the Boalt Hall School of Law, for organizing a meeting of scholars where many of these ideas were first presented
** Wade H. McCree, Jr. Collegiate Professor of Law (Emeritus), University of Michigan. The four of us are listed alphabetically; we contributed equally to this essay.
*** Associate Professor of Sociology, The College of New Jersey. **** Researcher, Equal Justice Society, San Francisco. ***** Eric Stein Distinguished University Professor of Law and Sociology at the University of Michigan,
currently on leave as Division Director for the Social and Economic Sciences at the National Science Foundation. His work on this Article was done while serving at the National Science Foundation, but any opinions, findings, conclusions or recommendations expressed here are those of the authors and do not necessarily reflect the views of the National Science Foundation.

INTRODUCTION
In 1970, there were about 4,000 African American lawyers in the United States. Today there are more than 40,000. The great majority of the 40,000 have attended schools that were once nearly all white, and most were the beneficiaries of affirmative action in their admission to law school. American law schools and the American bar can justly take pride in the achievements of affirmative action: the training of tens of thousands of African American (as well as Latino, Asian American, and Native American) practitioners, community leaders, judges and law professors; the integration of the American bar; the services that minority attorneys have provided to minority individuals and organizations once poorly serviced by white lawyers; and the educational benefits that law students of all backgrounds derive from studying in a racially diverse environment.1
But not every student admitted through affirmative action realizes his or her ambition to practice law. Of the African American students who entered law school in the Fall of 1991, the one year for which we have good data, about 40% either did not graduate or graduated but had not passed a bar exam within two years of graduation. Only 17% of the white students in the 1991 cohort suffered either of these fates.
In A Systemic Analysis of Affirmative Action in American Law Schools (“Systemic Analysis”), Professor Richard Sander argues that if affirmative action were eliminated in law school admissions, the rate at which African American students fail to graduate and pass the bar would be reduced substantially without any concomitant loss in the numbers of African Americans joining the bar.2 He acknowledges that fewer African American students would be admitted to law school, but predicts that those who were admitted would graduate and pass the bar at much higher rates because they would no longer be attending schools where the competition was too stiff for them. Professor Sander builds to an astonishing forecast: “that the number of black lawyers produced by American law schools each year and subsequently passing the bar would probably increase if those schools collectively stopped using racial preferences.”3 In particular, he predicts that the cohort entering law school in 2001 would have produced 7.9% more new black lawyers entering the bar.
We agree with Sander that the high rate at which African American students fail to graduate and fail to pass the bar is alarming.4 Indeed, we take the problem so seriously that despite the high value we place on racial diversity within law schools, the four of us would not support affirmative action as currently practiced in law school admissions if we believed that employing race-neutral admissions criteria would in fact lead to a net increase in the number of African Americans passing the bar.5 We find, however, that while Sander has appropriately forced us and others to take a hard look at the actual workings of affirmative action, he has significantly overestimated the costs of affirmative action and failed to demonstrate benefits from ending it. The conclusions in Systemic Analysis rest on a series of statistical errors, oversights, and implausible assumptions. It is these empirical shortcomings that we address in this Article.
The next Part of the Article deals step-by-step with the process of becoming a lawyer, from application, admission and enrollment in law school through graduation and sitting for the bar exam.
1. Professor Lawrence describes these achievements as the “forward-looking purpose” of affirmative action,
which involves “preparing students for the work of fighting the disease of racism and creating a better world.” Charles R. Lawrence III, Each Other’s Harvest: Diversity’s Deeper Meaning, 31 U.S.F. L. RE V. 757, 765-66 (1997).
2. Richard H. Sander, A Systemic Analysis of Affirmative Action in American Law Schools, 57 STAN. L. REV. 367 (2004) [hereinafter Sander, Systemic Analysis].
3. Id. at 474.
4. We have been concerned about African American drop out and bar failure rates long before publication of Sander’s article, and two of us had written on this issue before knowing of Sander’s work. See David L. Chambers, Who Gets In? The Quest for Diversity After Grutter, 52 BUFFALO L. REV. 531, 569-76 (2004); Timothy T. Clydesdale, A Forked River Runs Through the Law School: Toward Understanding Race, Gender, Age, and Related Gaps in Law School Performance and Bar Passage, 29 LAW & SOC. INQUIRY 711 (2004).
5. Like Professor Sander, we would still likely support the degree of affirmative action needed to ensure there was not a virtual absence of African American students at any law school.

At each stage we explain why the findings and claims in Systemic Analysis are not supported by the data. We conclude that if affirmative action was ended, there would be a substantial net decline in the number of African Americans entering the bar rather than the 7.9% increase that Sander forecasts. We cannot say precisely how severe this decline would be, but our best estimate is that it would be in the range of 30% to 40%.
In the final Part, we shift to a related question: Without affirmative action, how would African Americans be distributed across the range of Amer ican law schools? Sander acknowledges that the numbers of African Americans at the dozen or so most elite schools would be reduced by at least three fourths, but expects that most other schools would have as many African American students as they do today. We disagree. We believe that that the numbers of African Americans would decline substantially at the great majority of the nation’s fifty to eighty most selective law schools and expect that this decline would be followed in turn by a decline in the number of African Americans attaining the sorts of leadership positions that graduates of these schools attain today.
As we begin, we want to emphasize the limited scope of our response. First, Professor Sander confines his analysis to African Americans, and we have done the same. His findings and ours might be quite different for Latinos, Native Americans, and other groups that have benefited from affirmative action. Second, Professor Sander addresses more aspects of the affirmative action system than we examine here. We focus solely on the likely consequences of ending affirmative action because we agree with Sander that it is a “central question.”6 Indeed, it is almost certainly the central question of interest to policymakers and the public that his article raises. We want to make clear, however, that our silence on other claims Sander makes, such as his claims regarding the evidence before the Court in Grutter on the University of Michigan Law School’s admissions procedures 7 or his analysis of the job market for African American graduates8 does not mean that we agree with Professor Sander. Had we been allowed more space, we would have disputed aspects of these claims as well.
Indeed, space prevents us from being as detailed as we would like in dealing with some aspects of Systematic Analysis we do address. For those readers who desire a finer grained analysis, we have created a longer version on the web.9 It is on the web also that we will respond to the counterclaims that Professor Sander makes in this Issue.
I. THE EFFECTS OF ENDING AFFIRMATIVE ACTION ON THE PRODUCTION OF AFRICAN AMERICAN
ATTORNEYS
A. The Effects on Law School Applications, Admissions, and Matriculation
Part VIII of Systemic Analysis estimates the impact on African American enrollments in law
6. Sander, Systemic Analysis, supra note 2, at 468. 7. For a response to claims much like those Sander makes about the University of Michigan Law School’s
admission system, see the expert testimony of Stephen Raudenbush which was offered in Grutter. Testimony of Stephen W. Raudenbush in Grutter v. Bollinger (E.D.Mich., Jan. 19, 2001), available at http://www.umich.edu/~urel/admissions/legal/grutter/gru.trans/gru1.19.01.html. (last visited March 21, 2005).
8. See responses by David Wilkins and Michele Landis Dauber in this Issue. Sander’s discussion of law graduate earnings in the second year after law school rests on his analysis of data from “After the J.D.” study, in which he has participated as a member of the steering committee. Sander, Systemic Analysis , supra note 2, at 456-62. His partners in the study have done their own analysis of the same data and believe that Sander significantly overstates what the data show. (Statement of Ronit Dinovitzer, Bryant Garth, Bob Nelson, Joyce Sterling and Gita Wilder, to the authors, February 15, 2005). We will add this statement to the website where the web version of our Article is posted. See note 8, infra. So far as we could find, none of Sander’s After the JD collaborators agrees with his conclusion that affirmative action produces for most African Americans a significantly harmful earnings tradeoff between prestige and law school grades.
9. The longer version is available at http://www.law.umich.edu/CentersAndPrograms/olin/abstracts/05-005.htm and at http://www.equaljusticesociety.org/research.html

school if affirmative action were ended tomorrow.10 Sander’s estimate is built of the following steps: (1) an assumption that there would be no decline in African American applications to law school; (2) an estimate that there would be only a 14% decline in the numbers of African American applicants who would be admitted to at least one school and that those eliminated would be the 14% of current African American law students with the lowest entry credentials; (3) an assumption that among those admitted, African Americans would maintain current matriculation rates (i.e., that “cascading” to lower schools would not reduce the rate at which admitted African Americans chose to enroll in law school); and hence, (4) a forecast that there would be only a 14% decline in the total number of African Americans matriculating in American law schools. We believe each of these assumptions and predictions is unsound and that all of them err in the direction of overestimating the probable levels of matriculation by African Americans.
Sander rests his conclusion that ending affirmative action would produce only a 14% decline in African American matriculation to law school on the research of Linda Wightman, who directed the Bar Passage Study for the Law School Admission Council (LSAC).11 Using what she referred to as the “grid” method, which applies white admission rates to African Americans with similar LSAT scores and similar undergraduate gradepoint averages (UGPA), Wightman concluded that, in 2001, if African American law students had been admitted in the same proportions as whites with similar credentials, 14% of the African American students who received at least one offer of admission would not have received any offers at all, even if they had applied to a wide range of schools to which they never actually applied.12 Sander accepts Wightman’s 14% figure as a realistic estimate of the probable decline in African American admissions. For two different sets of reasons, the actual decline in matriculation by African American students would be much greater.
1. Sander’s projections are based on 2001 data, which does not reflect current trends
Sander bases his predictions on data from the year 2001, which was the most recent year available to Wightman when she wrote her article. While Sander treats 2001 as representative of what would happen if affirmative action ended at law schools today,13 no single year can serve that function. Further, 2001 turns out to have been one in a group of adjacent years when white and overall application levels to law school were comparatively low.
In Table 1, we provide for each year from 1991 through 2004 grid model estimates based on exactly the same procedure that Wightman used for 2001. The Table reveals that the projected size of the decline in African American admissions in any given year is strongly tied to the size of the overall
10. Sander, Systemic Analysis, supra note 2, at 470-75. 11. Linda F. Wightman, The Consequences of Race-Blindness: Revisiting Prediction Models wth Current Law
School Data, 53 J. LEGAL EDUC. 229, 233-34 (2003) [hereinafter Wightman, Consequences of Race-Blindness]. Wightman placed all applicants for law school onto a grid arranged by ranges of LSAT scores and ranges of undergraduate gradepoint averages (UGPA). For each box in the grid she calculated the percentage of whites who were admitted to at least one law school and applied that percentage to the numbers of African Americans in the same box. Id. at 233-34.
12. Sander describes Wightman’s approach in detail in his article. Sander, Systemic Analysis, supra note 2, at 471-72. By using the grid, Wightman’s model indirectly takes into account the factors other than grades and LSAT scores that affect admissions decisions. Wightman also employs a second, logistic regression approach to determine what proportion of African American students could still get into the very law schools to which they actually applied. Using this approach, she found that in 2001 there would have been a 38% decline in African Americans receiving admission offers. Wightman, Consequences of Race-Blindness, supra note 11, at 243 tbl.7. Sander dismisses this second approach as “nonsensical” for estimating the effects of ending affirmative action because he believes that if affirmative action ended, African Americans would no longer apply only to the schools that they did in the past. Sander, Systemic Analysis , supra note 2, at 471 n.275. This objection assumes that even the “safety” schools these students applied to were more selective than the schools that would attract these applicants today.
13. Id. at 475-78; see also Richard H. Sander, House of Cards for Black Law Students, L.A. TIMES, Dec. 20, 2004, at B11.

applicant pool. It is, in particular, tied to the volume of applicants with high LSATs and UGPAs .14 In the “dot com” boom years 1997-2001, young white college graduates in much larger than usual numbers took jobs rather than applying to law schools. While African American applic ations to law school grew slightly during this period, total applications to law schools declined from a high of 99,000 in 1991 to a low of 72,000 in 1998. By 2001, they had risen slightly to 77,000, and, by 2004, they had returned to the levels of 1991.
TABLE 1: “GRID MODEL” ESTIMATES FOR EFFECTS ON AFRICAN AMERICAN LAW SCHOOL
ADMISSION OFFERS FROM ELIMINATING AFFIRMATIVE ACTION, 1991-200415
Year
Size of the
Overall Applicant
Pool
# of African Americans Actually Offered
Admission at ABA Law Schools
Projected # of African
Americans Admitted to Some ABA Law School
without Affirmative
Action
Percentage Change in
African Americans’ Admission
Offers
1991 99,327 3,435 1,631 -52.5% 1992 97,719 3,587 1,810 -49.5% 1993 91,892 3,726 2,093 -43.8% 1994 89,633 3,884 2,305 -40.1% 1995 84,305 3,750 2,554 -31.9% 1996 76,687 3,583 3,105 -13.3% 1997 72,340 3,535 3,212 -9.1% 1998 71,726 3,790 3,388 -10.6% 1999 74,380 3,743 3,379 -9.7% 2000 74,550 3,649 3,206 -12.1% 2001 77,235 3,706 3,182 -14.1% 2002 90,853 3,706 2,998 -19.1% 2003 99,504 3,565 2,705 -24.1% 2004 100,604 3,664 2,472 -32.5%
Source: Law School Admission Council, National Decision Profiles, 1992-2000, 2002-2004; Wightman 2003.
In 2004, as Table 1 shows, we estimate that ending affirmative action would have cut by about
32.5% the numbers of African Americans who would have been admitted to any accredited law school. Because of improvements in African American entry credentials over the years and a small
14. For example, in 2001, 1,923 African American applicants were admitted to law school with LSATs between 140 and 149. Without affirmative action, the grid model suggests that about 1,552 of the 1,923 (80.7%) could still have secured admission to some law school. In 2004, 1,625 African American applicants with 140-149 LSATs were admitted to law school, but the grid model predicts that only 837 (51.5%) would have been admitted without affirmative action. What happened between 2001 and 2004 was a huge increase in the numbers of applicants to law school with LSATs above 149. In 2004, there were 13,344 more white and African American applicants with LSATs above 149 than there had been in 2001, but the ratio was about 20 whites for every 1 African American.
15. Data for 2001 and 1991 from Sander, Systemic Analysis , supra note 2, at 472 tbl. 8.1 (citing Wightman, Consequences of Race-Blindness, supra note 11, at 243 tbl.1). Data for 1992-2000 and 2002-2004 are our grid model calculations for all applicants reporting LSAT and UGPA, based upon Law School Admission Council, National Decision Profiles, 1992-2004. Wightman’s estimates for 1991 and 2001 are from slightly smaller samples than our grid model estimates, and all the grid model estimates exclude applicants without LSATs and UGPAs, so the figures are not exactly comparable to overall LSAC or ABA data on matriculants, contra Sander’s Table 8.2. 2004 data became available in late December 2004 upon request from LSAC, after the Systemic Analysis article was in press.

increase in the number of law schools, the projected decline for 2004 is smaller than the projection had been in 1991 when total applications were about the same, but 32.5% is still an enormous reduction, much higher than the estimate of 14% for 2001. The overall pattern from 1991 through 2004 suggests that the impact of ending affirmative action on potential African American admissions to law school would vary across years, but that in most years the negative impact would be substantially greater than it would have been in 2001.16 Indeed, the numbers lost would be so great, that even if Sander were correct that the remaining black students would graduate and pass the bar at the same rate as their white classmates (and we explain later why he is not), there would have been a net loss in 2004 of about 21% in the number of African American lawyers produced under Sander’s model, and from early indications, nearly the same loss in 2005 as well. 17
2. Sander overestimates the numbers of African Americans who would apply to law school, get into the law school to which they would apply, or choose to enroll
The grid model is useful solely for suggesting how many African Amer icans might have been admitted to some law school somewhere without affirmative action, if they had chosen to apply to the school that would admit them. It offers an upper bound estimate of the numbers of African American who could enter law school by race-neutral criteria. 18 Wightman, from whom Sander borrowed his grid approach, made clear that the grid model cannot tell us whether African American students would actually apply to significantly lower-ranked law schools to which they never applied in real life, and she cautioned against the very use Sander makes of the model’s approach.19 Nor can the grid model tell us whether African Americans, even if their law school aspirations were not dampened by the diminished prestige of the schools they might attend, would successfully identify and apply to schools that would admit them. In short, the grid model cannot provide even a loose estimate of how many African Americans would in fact matriculate in law school, but Sander, though recognizing that the model cannot tell us what African Americans would actually do, in the end treats it as if it does. We no more than Sander can state precisely how many African Americans would enter law school in a world without affirmative action, but we can offer reasons, supported by evidence and common sense, why the number Sander gives us is a substantial overestimate.
First, Sander incorrectly believes that, if affirmative action were ended, law would remain as appealing to African Americans for a career as it is today. He acknowledges that an African American college student “attracted to the law but not desperate to have a legal career might have second thoughts if she faced the prospect of attending a fortieth-ranked school instead of one ranked
16. Further reason to be cautious about relying on 2001 data is that the years 1997 - 2001 were also the years just
after Hopwood v. Texas, 78 F.3d 932 (5th Cir. 1996), rev’d in part by Grutter v. Bollinger, 539 U.S. 306 (2003) and Proposition 209, Cal. Const. Art. I, §31. It appears that during these years, many schools were being more cautious about affirmative action. See William C. Kidder, Silence, Segregation, and Student Activism at Boalt Hall, 91 CAL. L. REV. 1167, 1180 fig.2 (2003) (book review). With the Grutter decision, the legal uncertainty of affirmative action—at least at the federal level—has been removed.
17. Regarding estimates for 2005, the number of persons taking the LSAT have proven a good proxy for application trends, and in 2004, the June, October, and December LSATs combined (people applying for 2005 entry) had 1% fewer testers than those same three LSAT administrations in 2003, but still 37% more than 2000 (2001 applicants). LSAC, Tests Administered (2004), available at http://www.lsacnet.org/LSAC.asp?url=lsac/data/applicant-data.htm (last visited Mar. 1, 2005).
18. The grid has other limitations. Among them is the fact that the results of the grid model turn in part on the number and size of the cells on the grid. In the grid Wightman (and Sander) used, for example, each cell includes a range of 0.25 of a gradepoint in undergraduate grades and a range of 5 LSAT points. These large cells (each has a range of 75 points on Sander’s 1000 point index) almost certainly lead to a slight overestimation of the number of African American applicants who would be admitted, given the probable black-white distribution of index scores within any given cell.
19. Linda F. Wightman, The Threat to Diversity in Legal Education: An Empirical Analysis of the Consequences of Abandoning Race as a Factor in Law School Admission Decisions, 72 N.Y.U. L. REV. 1, 18, 22-29 (1997) [hereinafter Wightman, Threat to Diversity].

fourteenth.20 He nonetheless guesses that there would be no decline in law school applications because African Amer icans will learn of his findings and recognize that they will, in general, have a better chance of passing the bar by going to the fortieth ranked school.21 Our estimate is that many of the African Americans who now secure admission to the fourteenth ranked school could, in the absence of affirmative action, at best expect admission only to a school in the sixtieth to eightieth rank range 22 and we expect that whether it is the fortieth or the eightieth ranked school that would admit them, many African Americans who now opt to attend elite law schools will turn to other careers.
Even today, for many African American students applying to law school, other career paths appear to be nearly as attractive as law.23 A large proportion of applicants to law school (of all backgrounds) are tentative in their commitment to law school, much more tentative than, say, applicants to medical school.24 Among the respondents to the Bar Passage Study, for example, 54% of African Americans and 52% of whites said that they had considered applying to graduate and professional programs other than law in the preceding two years. A less robust commitment to applying to law school among African Americans is also evident in that black students apply later in the admissions cycle compared to whites, apply to fewer schools on average than whites (4.2 versus 4.7 in 1999-2003), and take the LSAT later in the admissions cycle.25 For some African Americans, the ending of affirmative action would probably be the “tipping point” away from law school and in favor of other career paths.26
Even those African American students who could still get into one of the nation’s most selective law schools may find attending law school less attractive than they do today. By Sander’s own estimates, without affirmative action African Americans would constitute only about 1 or 2% of the student body at the most elite law schools.27 Today, the top thirty law schools in U.S. News & World Report (U.S. News) have student bodies that are, on average, 8.1% African American (excluding the three schools where affirmative action has been prohibited by law).28 Many African American students care about attending a law school that has other minority students. On the Bar Passage Study survey, 68% of African American students at the two most elite tiers of schools said that the numbers of minority students at the school they were attending was a very important or somewhat important reason for applying.29 We thus expect that some African American students who could still get into an
20. Sander, Systemic Analysis, supra note 2, at 476. 21. Id. at 476-77. 22. See text infra Part II. 23. The consequences of ending affirmative action in law school, but not in other graduate and professional
schools, are difficult to test empirically. In our web version, we discuss the possible especially severe effects on law schools if they were the only educational institutions prohibited from employing affirmative action.
24. The average medical school candidate invests several years of effort into pre-med courses and consequently applies to a dozen schools. Barbara Barzansky & Sylvia I. Etzel, Educational Programs in U.S. Medical Schools, 2002-2003, 290 J. AM. M EDICAL ASS’N 1190, 1192 tbl.3 (2003). By contrast, the average law school applicant applies to only about 5 schools. See Law School Admission Council National Applicant Trends, 2003-04 LSAC REPORT 1 (showing that between 1991 and 2003 law school applications per applicant ranged from 4.8 to 5.3).
25. Id. Law School Admission Council, Distribution of Number of Applications Per Student (2004);, Disparate Outcomes by Design: University Admission Tests , 12 BERKELEY LA RAZA L.J. 377, 385 (2001) (expert Report of Jay Rosner in Grutter v. Bollinger). These factors also suggest that the grid model underestimates the impact of ending affirmative action.
26. The figures above on applications in recent years reveal how widely applications swing in response to mild changes in the economy. And as Sander himself notes, “My own unpublished research suggests that a talented young person of any race growing up in a low-to-modest socioeconomic environment has a better chance of reaching the upper-middle class through ordinary capitalism than through a graduate degree, like law school.” Sander, Systemic Analysis, supra note 2, at 425 n.165.
27. Id. at 483. 28. LAW SCHOOL ADMISSION COUNCIL & AM. BAR ASS’N, OFFICIAL GUIDE TO ABA-APPROVED LAW SCHOOLS
2003 EDITION 26-35 (Wendy Margolis et al., eds., 2002). Boalt Hall, UCLA, and the University of Texas are excluded. If included, the top 30 schools had 7.4% African American students.
29. Twenty-eight percent said it was “very important,” forty percent said it was “somewhat important.” The percentage was much the same at other tiers of law schools. At the historically black schools, the proportion who said the number of minorities at the school was “very important” to their decision was much higher.

elite law school will choose not to apply at all, rather than be a part of a tiny minority.30 Second, Professor Sander assumes that so long as an African American considering law school
could get into some law school, she will apply to that law school regardless of where it is in the United States. Although large numbers of law students, including African American students, travel substantial distances from home to attend the nation’s most selective law schools, most students who attend lower-tier schools live in the same or an adjacent state.
The question that Sander’s imagined future poses is whether African American students now traveling afar to attend relatively prestigious schools would be willing to travel similar distances to attend lower tier schools. Sander believes the question is of minimal significance because there are plenty of lower-tier law schools in the states where most African Americans already live. While it is true that lower-tier law schools are located throughout the country, we are quite uncertain exactly what admissions landscape African Americans now at higher-tier law schools would face in a world without affirmative action. It is important to remember that if affirmative action ended, African Americans who applied to a nearby lower-tier school with credentials within the range that might secure admission will not necessarily be accepted. If race is irrelevant to admissions, the lower their credentials are within the pool of admissible applicants, the more they will have to offer other strong qualities apart from race to secure admission.31 African Americans who are not admitted to the nearby lower-tier schools will have to turn elsewhere and a disproportionate number of the lower-tier schools that might have space for them are located in states in the Great Plains, Rocky Mountains, Southwest, Pacific Northwest, and rural New England, where few African Americans go to law school today32 and where African Americans from other parts of the country may be reluctant to move, especially if the schools in these other locations primarily place their graduates in locations where African Americans are unlikely to want to live and practice.
Third, Sander acknowledges that the availability of financial aid can affect decisions about attending law school, but points to the “After the JD” study to show that African American students receive about three times as much in “grants and aid” from law schools as students of other races and concludes that financial considerations will not reduce post-affirmative action law school enrollment estimates.33 His forecast is doubtful. If African American students currently receive grants in part through race-conscious programs not solely related to need, these programs are likely to end with the end of affirmative action. If the reason they receive more grants is because they have greater need, then that need will continue even if affirmative action is ended.
Today, even with extensive scholarships, more African Americans than whites borrow to attend
30. Our data indicate a significant relative decline in black law school applications to Boalt Hall, UCLA, UC
Davis, UC Hastings, University of Texas, University of Houston, and University of Washington in the late 1990s, immediately following affirmative action bans. Detailed 1996-98 data from Boalt also show a 25% drop in black applicants with 160+ LSAT scores. At the undergraduate level in California and Texas, applicant and yield rate data is more ambiguous. See David Card & Alan B. Krueger, Would the Elimination of Affirmative Action Affect Highly Qualified Minority Applicants? Evidence from California and Texas 25 (March 2004), (unpublished NBER Working Paper 10366), at http://www.nber.org/papers/w10366. But see Mark C. Long, College Applications and the Effect of Affirmative Action, 121 J. ECONOMETRICS 319, 325 (2004) (finding that “California’s underrepresented minorities significantly lowered their number of score reports sent to in-state, public colleges of all quality levels” and finding “similar, but less striking” results in Texas); Saul Geiser & Kyra Caspary, “No Show” Study: College Destinations of UC Applicants Who Do Not Enroll at UC, 1997-2002 13-14 (Aug. 2003) (Report by the UC Office of the President Admissions Research Unit showing underrepresented minorities are less likely to matriculate at UC, both overall and among those in the top of the applicant pool, a pattern that has become more pronounced since Proposition 209). 31. Nearly all law schools select their admittees from a large pool of applicants. In 2003, all but four of the 183
ABA-accredited law schools reported rejecting at least half of those who applied. Moreover, in every index range from which law schools admit significant numbers of applicants there are substantially more nonblack than black applicants.
32. See Ranking the Nation’s Law Schools According to Percentage of Black Students, 33 J. BLACKS IN HIGHER EDUC., 86-87 (2001) (showing that there were fifty-two law schools where African Americans were 4.0% or less of the student body, mostly middle-to-lower ranked schools in states or areas with small black populations, such as Maine (0.8%), Nebraska (1.9%), Oregon (2.2%), and New Mexico (3.5%)).
33. Sander, Systemic Analysis, supra note 2, at 477.

law school (95% versus 84%), and those who borrow borrow as much on average as white students.34 Thus, in deciding whether to attend a lower-tier law school, an African American student who could attend a more elite school today is likely to be affected by his estimate of the size his educational debt will be in relation to the earnings he can expect to receive, and the earnings of graduates of lower-tier schools are in general much lower than the earnings of the graduates of elite schools.35 Sander argues that these status-associated differences would be more than made up for by the better grades the student would receive at the lower-tier school because grades are more important than prestige in predicting earnings. We strongly doubt his conclusions in this regard, especially as they apply to African Americans attending elite law schools.36 As Professor Wilkins points out in this Issue, law school prestige is a much more conspicuous long-range signal in the labor market than grades.37
We have suggested several reasons why, if affirmative action were ended, fewer African Americans than today would apply to law school. We also expect that many African Americans who could get in somewhere would apply only to law schools that do not admit them. Even with affirmative action in place, hundreds of African Americans with solid credentials are currently rejected by every school to which they apply.38 An end of affirmative action, by restricting greatly the range of schools available to most African American applicants, would surely increase the number of futile applications. Thus, Sander’s posited national admissions market, where, without affirmative action, the vast majority of African Americans would smoothly “cascade” down a tier or two is quite implausible. 39 Many African American students who would be admitted to some law school in an imagined world where they would be willing to go anywhere will, in the real world where they choose five or six schools to apply to, see their admission offers diminish from one or two to none.
Thus abolishing affirmative action would reduce the number of African American law students for two different sorts of reasons. One is that it would exclude students whose LSAT scores and UGPAs are so low that they could not get into a school even if they applied to a broad range of schools. Applicant data from 2004 indicates that this decline would be approximately 32.5% of current African American law students, much more than the 14.1% that Sander forecasts on the basis of data from 2001. A second reason is that some African Americans who could get into some law school somewhere would no longer choose to apply to law school, or would apply only to schools that would not admit them, or would be accepted someplace but decide not to attend. We cannot calculate the size of this group with precision, but we believe that an additional 10 to 15% or so
34. See RONIT DINOVITZER ET AL., AFTER THE JD: FIRST RESULTS OF A NATIONAL STUDY OF LEGAL CAREERS 73 tbl.10.1 (2004), available at http://www.abf-sociolegal.org/NewPublications/AJD.pdf (last visited Mar. 1, 2005). Within the BPS, using rough measures of income, parental education, and parental occupational status, Wightman found that 50.7% of African American law students came from lower-middle class backgrounds, compared to only 22.3% of whites. Wightman, Threat to Diversity, supra note 19, at 42 n.99 tbl.N.7, 43 tbl.9. She cites this finding as one reason among many that the grid model is unrealistic. Id. at 23-25.
35. The “After the JD” dataset, though not yet available to the public (including us), provides useful information on debt in relation to earnings in a preliminary report. Dividing law schools into five tiers, it found unsurprisingly, that the median income of recent graduates rises with each tier of law school in the prestige hierarchy. Somewhat surprisingly, however, it also found that debts among those who had borrowed were almost constant across tiers. Most people do not realize that many schools in the lower tiers are as expensive to attend as schools at the top. Thus between graduates of the first and fourth-tier schools, there was a difference of more than 2 to 1 in median second-year earnings ($135,000 versus $60,000) but very little difference in median educational debt ($80,000 versus $75,000). DINOVITZER
ET AL., supra note 33, at 75, tbl. 10.3. 36. Richard O. Lempert, et al., Michigan’s Minority Graduates in Practice: The River Runs Through the Law
School, 25 LAW & SOC. INQUIRY 395, 447-53 (2000); DAVID WILKINS ET AL., HARVARD LAW SCHOOL: REPORT ON THE STATE OF BLACK ALUMNI, 1969-2000, at 42 tbls.14 -17 (2002). See note 8, supra.
37. David B. Wilkins, A Systemic Response to Systemic Disadvantage, 57 STAN. L. REV. __(2005). 37. In 2004, for example, 422 African American students with LSAT scores of 150 or more were denied
admission to all the ABA-accredited schools to which they applied. Law Sch. Admission Council, National Decision Profiles, supra note 15. In 2003, the figure was 386.
38. See Sander, Systemic Analysis , supra note 2, at 413. Yet another reason his cascade theory is unrealistic is that the vast majority of the eighty or so public law schools in the U.S. have student bodies overwhelmingly comprised of in-state residents. At these schools, state legislatures often limit the number of out-of-state students who may enroll, and the out-of-state applicants who are admitted tend to have higher LSATs and UGPAs than in-state students.

decline in African American matriculants on top of the 32% who would not be admitted is a conservative forecast. We thus estimate a total decline in African American enrollments of around 40 to 50%, about three times greater than Sander’s prediction.
B. The Effects on Law School Performance, Graduation and Passage of the Bar Nearly the entire second half of Systemic Analysis is devoted to the claim that African Americans
law students do poorly in law school, on the bar, and in the labor market because they have been going to the wrong law schools.
Using regression analysis, Professor Sander attempts a straightforward tale: because of affirmative action, African American students arrive at law school with much lower LSATs and UGPAs than their white classmates. Because of their lower credentials, they get lower grades in law school than their white classmates do. Because they get lower grades, they graduate at lower rates than their white classmates and fail the bar at much higher rates. Since at each of these steps, according to Sander, factors associated with being black apart from grades and credentials have no statistical relationship to lower performance, black students would perform as well as whites if they simply went to schools where their entry credentials were like those of the white students. They are, in other words, the victims of a mismatch, affirmative action having seduced them into schools where they are doomed to do less well than they otherwise could. Systemic Analysis’s ultimate conclusion is blunt: “by every means I have been able to quantify, blacks as a whole would be unambiguously better off in a system without any racial preferences at all than they are under the current regime.”40
Sander makes it sound so simple. A leads inexorably to B, and B leads inexorably to C. In fact, Sander misinterprets has own results and vastly overstates what his data show. Examining his case with care and using the same data, we find that eliminating affirmative action would improve neither graduation nor bar passage rates to anywhere near the extent that Sander foresees.
1. Concerns about statistical methods
Professor Sander rests all his important claims about black student performance on statistical analyses. If his analyses are inadequate, his conclusions are unreliable. If readers misinterpret the weight they should accord Sander’s statistical results, they are likely to give more weight to his conclusions than they deserve. Hence we take a brief excursion into some statistical issues, for Professor Sander has significantly overreached in the conclusions he draws from his models.
To begin with, when he discusses the relationship between entry credentials and later outcomes, such as graduation or bar passage, he invites readers to interpret measures of statistical significance as if they were measures of practical significance. Sander writes:
The “t-statistic” tells us how consistent or reliable a relationship is, with a higher t-statistic indicating a stronger, more reliable association. T-statistics generally increase as a function of the standardized coefficient and the size of the sample. T-statistics above 2.0 are usually taken to signify that the independent variable is genuinely helpful in predicting the dependent variable. A t-statistic of less than 2.0 indicates a weak, inconsistent relationship—one that might well be due to random fluctuations in the data.41
Sander’s guidance is wrong. T-statistics and their associated significance tests do not in themselves tell us whether a relationship is strong or weak or whether, “the independent var iable is genuinely helpful in predicting the dependent variable,” at least if what one means by “helpful” is that knowing the independent variable will, to some important degree, improve our ability to predict the dependent variable. 42 Tests of statistical significance can be particularly misleading in large samples
39. Id. at 482-83. 40. Id. at 428-29. Sander then notes, “The ‘p -value’ contains the same information as the t-statistic, but it has a
more intuitive, accessible meaning.” Id. at 429. Consequently, our criticism relates to Sander’s presentation of p-values and t-statistics.
41. In his classic textbook, Blalock explains, “Statistical significance should not be confused with practical

where weak relationships can easily be significant.43 Sander’s Table 6.1, in which he uses logistic regression to predict bar passage in a sample of 21,425 cases, provides a striking illustration.44 Because 95% of those in the sample who took the bar passed it, if one simply “predicts” that each person in the sample passed, she will be right 95% of the time. If one applies Sander’s model which takes account of factors like law school grades and LSAT scores, the total number of correct predictions increases by 29 cases, so that 95.1% of all cases are predicted correctly.45 In such a large dataset that miniscule improvement is significant at the .001 level, but Sander is not justified in characterizing Table 6.1 as a “robust test” of the notion that “race seems irrelevant”46 on the bar exam, and his implication that it gives us a good idea of what distinguishes bar passers from those who never pass is wrong.47 We know little more about who passes and who fails the bar exam than the fact that most law school graduates pass, which we knew before we ran the regression.
In addition, Table 6.1 and the tables that present the results from Sander’s other logistic regressions raise concerns about Sander’s use and omission to use diagnostic statistics, that is, statistics which test the strength of the associations reported in the models, and how well they fit the data. One statistic frequently used for this purpose, but not included in Systemic Analysis is the Nagelkerke R-square.48 In Sander’s Table 6.1, this figure is about .325,49 which had it been reported would have alerted the knowledgeable reader to the likelihood that Table 6.1 leaves much of what leads to bar passage unexplained
Perhaps the most intuitively understandable information that Sander might have provided is information about how well his model does in identifying those who pass and fail the bar. His model generates for each graduate a predicted probability of passing the bar based on the graduate’s scores on the independent variables and the overall likelihood that a person in the sample will pass the bar. One can thus distinguish between graduates who are predicted to have a 50% or better chance of passing the bar and those who are predicted to have a less than 50% chance of passing and compare these predictions to actual outcomes. Our replication of Sander’s analysis indicates that his model, using the .5 cut-point, is highly accurate in predicting who passed the bar since it incorrectly labels as “fails” only 91 of the 20,399 graduates who passed. It does a dismal job, however, in predicting who significance. Statistical significance can tell us only that certain sample differences would not occur very frequently by chance if there were no differences whatsoever in the population. It tells us nothing about the magnitude or importance of those differences.” HUBERT BLALOCK , SOCIAL STATISTICS 126 (1960).
42. David H. Kaye & David A. Freedman, Reference Guide on Statistics, in FEDERAL JUDICIAL CENTER, REFERENCE GUIDE ON SCIENTIFIC EVIDENCE 333, 379 (2nd ed., 2000) (“Statistical significance may result from a small correlation and a large number of points. In short, the p-value does not measure the strength or importance of an association.”); Daniel L. Rubinfeld, Reference Guide on Multiple Regression, in REFERENCE GUIDE ON SCIENTIFIC
EVIDENCE , in FED. JUDICIAL CTR., supra. at 178, 192 (2d ed., 2000) (“However, it is possible with a large data set to find statistically significant coefficients that are practically insignificant.”).
43. See Sander, Systematic Analysis, supra note 2, at 444. The flaws in Professor Sander’s Table 6.1 are important both because the problems in it are common to many of his logistic regression models and because Professor Sander regards the inferences he draws from Table 6.1 as central to his entire analysis. Indeed, it is fair to say that if Table 6.1 does not stand, his entire analysis of the probable effects of ending affirmative action falls with it.
45. Under a model that separately analyzes Native Americans, there is an improvement of 31 cases (95.2%). 46.Id. at 445, 445 n.212. 47. Kaye & Freedman, supra note 43, at 380-81 (“When practical significance is lacking—when the size of a
disparity or correlation is negligible—there is no reason to worry about statistical significance.”). 48. N.J.D. Nagelkerke, A Note on a General Definition of the Coefficient of Determination, 78 BIOMETRIKA 691
(1991); G. David Garson, Logistic Regression, in PA 765 STATNOTES: AN ONLINE TEXTBOOK, available at http://www2.chass.ncsu.edu/garson/pa765/logistic.htm (last visited Mar. 1, 2005) (“[Nagelkerke’s R2] is part of SPSS output and is the most-reported of the R-squared estimates.”); Kenneth N. Klee, One Size Fits Some: Single Asset Real Estate Bankruptcy Cases, 87 CORNELL L. REV. 1285, 1327, 1327 n.154 (2002) (summarizing R2, Cox and Snell’s R2, Nagelkerke’s R2, etc.).
49. The Nagelkerke R2 is not a true R2 statistic as it is based on likelihood ratios, but it does give one some purchase on how well a logistic model is doing in explaining outcomes. We say “about .325” because we were unable to reproduce Sander’s Table 6.1 precisely. Our regression, for example, had about 0.25% more cases in it than Sander reports for his Table 6.1. We do not believe the differences are important, since the Wald statistics our model yielded were very close to those that Sander reports and the significance levels for the variables in the model were about the same.

will fail, as it correctly labels as fails only 129 of the 1074 sample students who actually did fail, for a success rate of only 12%.50 Thus the variables included in Table 6.1 do not support Sander’s claim that “If we know someone’s law school grades, we can make a very good guess about how easily she will pass the bar.”51 In fact, if we just knew law school grades, we would label only 37 of those who failed correctly or 3.4%, and we would incorrectly guess that 45 of those who passed had failed. In other words, we would have predicted more bar outcomes correctly by predicting that everyone passed than we did by knowing the grades the graduates received in law school.
Rather than present a range of diagnostics that would have suggested the shakiness of its statistical foundations, Systemic Analysis presents only the Somers D statistic when it reports logistic regression results.52 Moreover, Somers D is explained in a way that is likely to confuse those unfamiliar with it:
The “Somers’s D” is a measure of the model’s effectiveness in predicting outcomes. A model has a Somers’s D of zero if it does not improve our ability to predict a typical individual’s outcome; it has a value of one if it perfectly predicts every individual’s outcome.53 On seeing that Table 6.1 had a Somers D of .763 and baseline accuracy of about 95%, the reader
might assume that the table was close to 99% accurate,54 which would be impressive indeed. However, in light of the diagnostics we’ve just discussed the implication that we are dealing with a near perfect model is implausible. The reason for the apparent contradiction lies in the nature of logistic regression and how the Somers D statistic is calculated. The bottom line is that given that about 95% of those who took the bar passed, Somer’s D presents a misleading portrait of how the model does.55 It certainly should not have been the only regression diagnostic presented.
Numerous other statistical problems can be found in Professor Sander’s analysis. These include excluding race as a cause of outcomes in models plagued by multicollinearity,56 neglecting to model
50. One can use cut points other than 0.5; for example, one could predict that only those with a 0.75 probability of
passing the bar would in fact pass. When one does this the ability to correctly predict failures increases but the false negative rate—actual passers who are predicted to fail—also rises.
51. Id. 52. The Somers D is a standard diagnostics in SAS, but it is not a logistic regression option in some other popular
logistic regression packages like SPSS and STATA. 53. Id. at 438; see also id. at 438 n.191 (“For example, if 10% of our sample did not complete law school, we
could guess any given person’s graduation chances with 90% accuracy simply by consistently guessing that each person would graduate. A Somers’s D of 0 in a model for predicting whether a person would graduate would thus indicate a model with that same 90% accuracy rate; a Somers’s D of 100 would indicate a model with 100% accuracy; a Somers’s D of 0.645, like the actual model above, would indicate a model with an accuracy of approximately 96.45%.”).
54. We reach this number by multiplying the difference between 95% and 100%, or 5% by .763 and adding the result to 95%. See supra note 49.
55. Somer’s D is a function of the number of concordant pairs, the number of discordant pairs and the number of case types. What this means is that if A who passed the bar had a calculated probability of passing the bar of 0.95 and B who failed had a calculated probability of passing of 0.94, the case would be considered concordant and a success for the model. Similarly if C and D had bar passage probabilities of 0.05 and 0.04 respectively and student C passed the bar while D did not, the case would be considered concordant. Knowing the characteristics of A and B on the independent variables giving rise to these probabilities, however, one would have predicted that both A and B would have passed the bar and would similarly have predicted that neither C nor D would have passed. Because the overall bar passage rate was so high, there is a very high initial probability that any given student would pass the bar. Thus it is likely that both individuals in many of the concordant pairs had estimated bar pass probabilities above 50%, leading to a high Somer’s D if the model’s variables do distinguish between those who have a greater and lesser chance of passing, while at the same time producing a model that cannot accurately identify as failures most students who in fact failed. What this means is that the variables in Sander’s Table 6.1 equation are predictive of the likelihood of bar passage, but they are not determinative to nearly the extent he suggests.
56. Cf. Kristine S. Knaplund & Richard H. Sander, The Art and Science of Academic Support, 45 J. LEGAL EDUC. 157, 218 (1995) (In his appendix on regression, Sander notes, “Any time a regression includes two independent variables that are themselves closely associated, it is hard for a regression model to sort out which variable is causing what effect.”). Sander also acknowledges multicollinearity in footnote 211 of Systemic Analysis, but argues it is not a problem. While that argument may be sound as applied to OLS regression where regression coefficients are not distorted, in logistic regression multicollinearity can affect the regression weights as well as their significance levels.

selection effects when predicting student performance57 and treating law school tier not as a set of nominal variables but as an interval scale measure.58 In sum, the statistical misstatements and modeling errors in Systemic Analysis mean that the conclusions appear to have far more evidentiary support than they in fact do.
2. Law school performance and graduation
Sander assumes that if affirmative action ended, black students would attend law schools where they would have the same entry credentials as whites and forecasts that they would receive the same grades and graduate and pass the bar at the same rates as their white classmates.59 Thus, his estimate in Table 8.2 that the 2001 law school cohort would have produced 7.9% more black attorneys without affirmative action derives from simply applying the white graduation rates and the bar pass rates in 1991 from the BPS to the black students in the same index score ranges (500-520 520-540, etc.) who entered law school a decade later.
For several reasons, we believe that Sander overestimates the grades that black students would receive at the schools they would attend if there were no affirmative action, as well as their rates of graduation. First, despite the statistical significance of grades in the graduation model, it appears that gains in African American law school grades attributable to ending affirmative action would have little or no effect on the graduation chances of those African Americans still attending law school.60 Their chances of graduating would be about what they are today, even if they attended lower-tier law schools and received somewhat better grades because of less stiff competition. Overall, graduation chances might be slightly better for some and slightly worse for others depending on the school they moved from and the school they moved to.61 (The likely outcomes on the bar exam are similarly
Thus, Sander includes in his Table 6.1 LSGPA, LSAT scores and UGPA along with race. But the first three variables are highly correlated with race as well as with the dependent variable of bar passage. Indeed, the first three variables are better predictors of whether someone is black or white than they are, along with race, gender, and law school tier, of bar passage. Hence it is not surprising that when race is included in this model it has no significant effects. Moreover, since LSAT is validated only as a predictor of LSGPA, and the latter variable is in the model, LSAT arguably has no place in a well-specified model of variables predicting law school graduation.
57. Students are admitted to law schools for reasons the bar passage study measures, like their LSAT scores, and reasons it does not measure, like information from references describing work habits. If one is trying, as Sander is, to explain outcomes that may be affected by both measured and unmeasured variables and if people are selected for a treatment (e.g., entrance into a certain quality law school) in part for reasons the data do not measure, causal conclusions about the effects of the measured variables may be misleading. There are statistical ways to attempt to cope with this problem. Sander does not employ them. For example, Clydesdale uses Heckman regression methods to correct for sample selection bias in the BPS, Clydesdale, supra note 4, at 717; and Alon and Tienda use both Heckman methods and propensity score analysis to control for selection bias in analyzing the mismatch hypothesis at the undergraduate level. Sigal Alon & Marta Tienda, Assessing the “Mismatch” Hypothesis: Differentials in College Graduation Rates by Institutional Selectivity, 78 SOCIOLOGY OF EDUC. __ (forthcoming 2005) (manuscript at 3, on file with authors).
58. Sander acknowledges that including the tier variables as deviations from an omitted tier is the statistically appropriate method of modeling this variable, but he argues that this makes no difference. Sander, Systemic Analysis , supra note 2, at 439 n.194. The claim of “no difference” is wrong. Not only is the model’s overall performance slightly though not consequentially different, but also, and more importantly, differences in the performance of students in different tiers are obscured. The latter shortcoming hides information relevant to the question of whether African Americans are “mismatched” and to Sander’s 4% solution. Infra Part II.
59. Sander, Systemic Analysis , supra note 2, at 429 n.175 (“[T]he data show that if blacks were admitted to law schools through race-neutral selection, they would perform as well as whites.”). This is the corollary of Sander’s claim that, “It is only a slight oversimplification to say that the performance gap in Table 5.1 is a by-product of affirmative action.” Id. at 429.
60. Cf. Wightman, Threat to Diversity, supra note 19, at 35 (noting that while LSAT and UGPA had validity in the admissions process, for the BPS “they are not significant predictors of graduation from law school.”).
61. Cf. id. at 36 tbl.7. (projecting that African Americans admitted under race-blind admissions in 1991 would have a 80.49% graduation rate compared to 77.9% for those who would be denied admission under a regression model based on LSAT and UGPA). If this model overstates the impact of ending affirmative action, as Sander argues, one would expect even greater convergence between black graduation rates with and without affirmative action.

murky, as we will see in the next Part.) Secondly, Sander’s expectation that African Americans would earn the same grades as their white
classmates derives from his assumption that, if affirmative action ended, the entry credentials of African American and white students at any given school would be the same. 62 His assumption is unjustified. Even if law schools adopted strictly “race-neutral” admissions criteria and each school selected all admittees from a common pool of students within the same above-average range of LSAT scores and UGPAs, it would still be the case that, within that range, the African American applicants and admittees would, on average, have lower LSATs and UGPAs than the whites, because that is where African American students fall in the overall national pool of applicants.63
Scholars of all persuasions have recognized the likely persistence of credential disparities between black and white students within selective institutions in a world without affirmative action. Bowen and Bok, supporters of affirmative action, recognized it,64 as did Stephan Thernstrom and Abigail Thernstrom, who are critics.65 So have many others.66
In the months since the appearance of his article, Sander has acknowledged that a gap in black-white entry credentials would persist within law schools, but dismisses the disparity as trivial, estimating that post-affirmative action the black-white credential gap at any given school would average only 6 points on a 1000-point scale.67 We were not able to obtain a step-by-step description of how Sander came up with his estimate of only a 6-point gap. However, our review of the relevant literature68 as well our look at the BPS69 suggest that a gap this small is exceedingly unlikely.70
62. Sander, Systematic Analysis , supra note 2, at 474 n.282. 63. CLAUDE S. FISCHER ET AL., INEQUALITY BY DESIGN: CRACKING THE BELL CURVE MYTH 46 (1996) (“Race-
neutral selection processes pass disparities in the applicant pool through the freshman class. Therefore, we cannot read a gap in test scores as if it reflected an edge that the admission process gives to some students at the expense of others.”). For example, for admittees to UCLA Law School in 2003, the LSAT 25th percentile was 162 and the 75th percentile was 168. We would expect the typical African American admitted under race-blind admissions to UCLA would be much more likely to have a 162 than a 168 on the LSAT.
64. WILLIAM G. BOWEN & DEREK BOK, THE SHAPE OF THE RIVER: LONG-TERM CONSEQUENCES OF CONSIDERING
RACE IN COLLEGE AND UNIVERSITY ADMISSIONS 42-43 (1998) (finding at College and Beyond institutions where they had detailed application data, they found that realistic race-blind simulations only marginally closed the black-white SAT gap and that the African Americans who would have been admitted would still have had much lower SAT scores than the whites).
65. Stephan Thernstrom & Abigail Thernstrom, Reflections on The Shape of the River, 46 UCLA L. REV. 1583, 1628 n.168 (1999) (book review) (treating a three-digit black-white SAT gap among Berkeley’s 1998 admits (on a 400-1600 scale) as unremarkable.)
66. Liu, supra note __, at 1064; Expert Report of Claude M. Steele in Grutter v. Bollinger and Gratz v. Bollinger , reprinted in 5 M ICH. J. RACE & L. 439, 449 (1999); Thomas J. Kane, Misconceptions in the Debate Over Affirmative Action in College Admissions, in CHILLING ADMISSIONS: THE AFFIRMATIVE ACTION CRISIS AND THE SEARCH FOR ALTERNATIVES 17, 19-20 (Gary Orfield & Edward Miller, eds., 1998); Fischer et al., supra note 63, at 46.
67. At a panel at the Annual Meeting of the Association of American Law Schools and in his rejoinder to a draft of this response posted on his website.
68. See sources cited, supra notes 64-67 see also William T. Dickens & Thomas J. Kane, Racial Test Score Differences as Evidence of Reverse Discrimination: Less than Meets the Eye, 38 INDUS. REL. 331, 347-48 (1999) (“Reasonable values for the correlation of tests with performance and white-black differences in other abilities suggest that test score differences between the average equally qualified black and white could easily be as large as .85 standard deviation.”).
69. For instance, we looked at tier-three schools in the BPS since without affirmative action many black students now at elite schools might find these were the schools that would admit them. Among whites admitted to schools in this tier, 80% had index scores between -1.12 standard deviations below the mean and 0.22 standard deviations above it (the 10th and 90th percentiles). If we look at all whites and African Americans with scores in this range, which we might think of as the normal range of admits, we find that the median African American admittee’s index is almost half a standard deviation below the median white admittee’s index (Whites = -0.27 and African Americans = -0.75.) These within-tier differences are likely to be attenuated at particular law schools, but they are still likely to be considerable within schools and overlap substantially across same-tier schools.
70. One may find similar claims about the implications of ending affirmative action for the black-white credential gap in RICHARD J. HERRNSTEIN & CHARLES M URRAY, THE BELL CURVE 451-55 (1994) and Gail L. Heriot & Christopher T. Wonnell, Standardized Tests Under the Magnifying Glass: A Defense of the LSAT Against Recent Charges of Bias, 7 TEX. REV. L. & POL. 467, 476-77 (2003), but in each case the claim is based entirely on speculation with no evidence.

Consider, for example, what happened at several California law schools in the early years after Proposition 209 prohibited taking race into account in admissions, years when even Sander seems willing to concede that the law schools were rigorously complying with Proposition 209.71 In 1997-1999, the African American students who were admitted to the law schools at Berkeley, UCLA, and UC Davis had test scores and grades within the same range as the white admittees but, as a group, the African American admittees had LSAT scores 5 to7 points lower than whites on a scale with a 60-point range, as well as lower UGPAs.72 Admissions credentials differences that large translate to a black-white gap of about 75 points on Sander’s 1000 point scale.73 At many law schools, a gap this large among whites would translate into a standard deviation or more.74 Similar gaps between the credentials of entering African Americans and whites persisted among undergraduates at UC Berkeley in the years immediately after Proposition 20975 and the University of Texas at Austin in the year following the Hopwood decision,76 as well as among students at the University of California medical schools.77 Thus, if Sander’s claim is correct that “one hundred persons with an LSAT score of 161 are highly likely to have higher law school grades and higher pass rates on the bar than one hundred persons with an LSAT of 160,”78 then the presence of continuing black-white disparities among same-school matriculants renders untenable his claim that, post-affirmative action, African Americans would do as well as their white classmates.
Third, Systemic Analysis is wrong for yet another reason in concluding that, within schools, African American students would perform as well as whites absent affirmative action. As studies conducted by the LSAC have shown more than once, even among white and African American students with identical entry credentials, African American students typically receive somewhat lower law school grades than whites.79
Sander’s claim to the contrary rests entirely on his analysis of a dataset he assembled in 1995 that
71. Sander, Systemic Analysis , supra note 2, at 418 n.141; Richard H. Sander, Experimenting with Class-Based
Affirmative Action, 47 J. LEGAL EDUC. 472 (1997); Richard Sander, Colleges Will Just Disguise Racial Quotas, L.A. TIMES, June 30, 2003, at B11. Sander believes that cheating by admissions staffs has gone on more recently, but even without cheating, a gap in admissions credentials is certain to continue.
72. Ellen Cook, UC Admissions Data Vault (2003), available at http://home.sandiego.edu/~e_cook/ (last visited Mar. 15, 2005).
73. Admittedly, the gap on the LSAT among matriculants (data that we could not obtain for this Article) would be smaller in absolute terms given that the top admittees to UC law schools frequently enroll at more elite schools like Stanford. On the other hand, the relative size of the test score gap among matriculants at a school like UCLA is also shaped by the fact that the LSAT standard deviation is smaller among matriculants than admits for the same reason.
74. Sander, Systemic Analysis , supra note 2, at 416 tbl. 3.2. (At four of the six tiers of law schools, the standard deviation in the index for whites was between seventy-three and seventy-five.)
75. Proposition 209 shrank the African Americans admission rate from nearly 50% in 1997 to 20% in 1998, but for the 333 matriculating African American freshmen in 1998-2000 who were not recruited athletes, the 75th percentile score on the SAT was 57-90 points lower each year than the 25th percentile for Berkeley’s white freshmen. Data provided by UC Berkeley Office of the Assistant Vice Chancellor—Admissions & Enrollment Unit (Jan. 2005). Note that this was before UC adopted the 4% plan and “comprehensive review.”
76. Gary M. Lavergne & Bruce Walker, Implementation and Results of the Texas Automatic Admissions Law (HB 588), 2002 UNIV. OF TEX. AT AUSTIN OFFICE OF ADMISSIONS 16 tbl.7(b) (Fall 2003), available at http://www.utexas.edu/student/admissions/research/HB588-Report6-part1.pdf (last visited Mar. 15 2005) (reporting a mean black-white gap among 1997 UT-Austin freshmen, prior to the 10% plan, of 156 points on the SAT (black n = 185)).[Your editor changed 185 to 135. We changed it back because 135 is for those not in the top 10%, 135 + 50 = all black freshmen at UT in 1997]
77. The hundreds of African Americans and Latinos offered admission to the five UC medical schools in 1997-1999 had UGPAs which were over one-quarter of a grade point lower than white/Asian American admittees, as well as substantial MCAT differences. Cook, supra note 72.
78. Sander, Systemic Analysis , supra note 2, at 423 n.159. Needless to say, we believe the credential gap would be much larger than one point on the LSAT, which is why this is a significant issue even though we believe Sander overstates the connection between index scores and bar passage.
79. See, e.g., Lisa C. Anthony & Mei Liu, Analysis of Differential Prediction of Law School Performance by Racial/Ethnic Subgroups Based on the 1996-1998 Entering Law School Classes 00-02, LAW SCHOOL ADMISSIONS COUNCIL LSAT TECHNICAL REP.10 fig. 4c (April 2003). Note that there is considerable variation across schools in Figure 4c, including underprediction at a dozen schools. Id.
included grades for the first semester of the first year at 20 law schools. He calls this dataset the National Survey of Law School Performance (NSLSP). He uses this dataset rather than the Bar Passage Study (BPS) dataset that he relies on for his other tables of law school and bar performance because he believes that it offers certain statistical advantages. If he had used the BPS, he would have reached quite different conclusions, conclusions that would have been more consistent with almost all the research that has been done relating standardized test scores among African Americans to later graded performance. In another article, one of us, Timothy Clydesdale, used the BPS to analyze law school grades and found that after controlling for LSAT scores and undergraduate grades, being African American remained negatively related to performance.80 Moreover, he found that African American students were not alone in this regard: Latinos, Asian Americans, and law students over thirty also underperformed.81
Sander’s reasons for not using the BPS have some force but are not fully persuasive.82 Moreover, the weaknesses of the BPS do not alter the fact that Sander’s decision to analyze the NSLSP, and the model he uses to analyze it, raise serious problems of their own. As an initial matter, the NSLSP contains information only on grades in the first semester of law school.83 Sander offers no evidence that first-semester grades are a reliable indicator of performance during the rest of law school.84 Even more troubling, in performing his analysis of the NSLSP, Sander handled students’ race in a puzzling and distorting manner. The NSLSP has an abnormally high rate of missing data about race, with 24.6% (1176 of 4774) of respondents failing to indicate their race. (By contrast, in the same year just 0.6% (272) of the 42,151 first-year matriculants at ABA law schools failed to report their race/ethnicity to LSAC.)85 Sander compounded this missing data problem by lumping those who did not report their race with the white respondents, assuming that those who did not reveal their race were probably white.86 Such an assumption might be plaus ible in other contexts, but not for the NSLSP, which contains easy-to-spot evidence strongly suggesting that a large proportion of those who
80. In an OLS regression on first year grades of 24,998 students in the BPS, using LSAT, UGPA, racial groups
and law school tiers as cont rols, being black (as opposed to white) has an unstandardized coefficient of -.687, p<.001. Clydesdale, supra note 4, at 754.
81. Id.; see also Anthony & Liu, supra note 79 at 12 fig.5c, 13 fig.6c. 82. Sander rejected the BPS because it did not standardize the students’ LSAT scores and undergraduate grades
according to the law school they attended. Without standardization, he believes that regression results on law school performance would “be meaningless at best and highly misleading at worst.” Sander, Systemic Analysis, supra note 2, at 428 n.172. There is substance to his concern. Clydesdale sought to deal with the standardization problem by controlling for law school tier. This control should help because law schools tend to be homogenous within tiers (and different across tiers) on admission credentials. Indeed, credential homogeneity was a factor Wightman used to sort schools into tiers. Sander himself describes the standard deviation among whites and among African Americans in first-tier schools as “strikingly small.” Id. at 415. They are similarly small at most of the other tiers. See id. at 416 tbl.3.2. Still, we cannot be confident how well the tier control does its job. Anthony and Liu’s study, supra note 79. does not have this problem, however, and its consistency with Clydesdale’s findings is good reason to accept the latter’s conclusions on this issue.
83. Sander’s Table 5.2 is mislabeled as predicting “First-Year Law School Grades.” Id. at 428. The dataset actually consists only of first-semester grades. Id. at 421. On the page before Table 5.2 is Table 5.1, which is based on the BPS and is also labeled as representing “First-Year GPAs.” This table actually does report grades for the full first year.
84. Jamie Muskovan, a research assistant at the University of Michigan, studied for us the grades of a random selection of white students and of all black students in the two most recent classes recent classes at the University of Michigan Law School for which grades were available. She found that, among black students, the grades they received during their first semester explained only 27% of the variance in the grades they received in their third year (R = .520). Although these results are from one school only, they may explain why all the factors in Sander’s model account for only 19% of variance (Table 5.2), when LSAC studies of ABA law schools covering the same period, which include only data on LSAT and unadjusted UGPA, explain 25% of variance in school grades for the full first year. Lisa C. Anthony et al., Predictive Validity of the LSAT: A National Summary of the 1995-1996 Correlation Studies , 97-01 LAW
SCH. ADMISSION COUNCIL LSAT TECHNICAL REP. 6 tbl.2 (August 1999); Wightman, supra note 19, at 31-34. 85. LAW SCH. ADMISSION COUNCIL, MINORITY DATABOOK, 28 tbl.V-3 (Kent D. Lollis ed., 2002. An additional
2.7% classified themselves as “other.” Id. 86. Sander states that, as far as he can determine, “students not reporting race were predominantly white or Asian,
which supports the approach taken in this table.” Sander, Systemic Analysis, supra note 2, at 430 n.175.

failed to report their race were not white.87 Table 2 displays three ways Sander might have handled the missing data group in his analysis: the way that he actually handled it and two methodologically more appropriate (though not perfect) ways, one excluding the nonrespondents and the other treating them as a separate category. Under either alternative, being African American is significantly and negatively associated with law school grades. Ultimately, the likely difference in grades between whites and African Americans with identical credentials would be modest but not trivial, with African Amer icans ending up about 5 or 6% lower in class rank than white students with the same credentials. The predicted differences between the groups might well have been greater if all NSLSP students had actually answered the question about race. Accordingly, in the analysis of the NSLSP, race appears irrelevant only when the data are mishandled.88
TABLE 2: FACTORS ASSOCIATED WITH FIRST-SEMESTER LAW SCHOOL GPA, COMPARING
SANDER’S MODEL WITH ALTERNATIVE MODELS
Sander’s Table 5.2 results
Corrected Model 1, separately
identifying non-reported race
Corrected Model 2, eliminating
respondents with missing race data
Independent Variable
Std Coef.
t-statistic Std Coef.
t-statistic Std Coef.
t-statistic
Standardized LSAT (zLSAT)
.385*** 25.975 .365***
24.463 .338*** 18.839
Standardized UGPA (zUGPA)
.212*** 14.915 .202***
14.171 .204*** 12.082
Male .018 1.289 .020 1.454 .037* 2.281 Asian -.007 -.516 -.025† -1.747 -.030† -1.864 Black -.007 -.480 -.030* -1.996 -.042* -2.351 Hispanic -.011 -.793 -.029* -2.010 -.039* -2.296 Other (Reported) Race1
-.021 -1.489 -.040 **
-2.816 -.048** -2.948
Race Not Reported Neither excluded nor separately
identified
-.103**
*
7.055 Excluded
Model N N=4,257 N=4,257 N=3,231 Adjusted R-square .190 .199 .175
Source: National Survey of Law School Performance. †(p<.1); *(p<.05); **(p<.01); ***(p<.001) 1Native American, Pacific Islander, multiracial, or
“other” race. Our analyses of both the NSLSP and BPS thus reveal that Sander is wrong when he concludes
that the current lower performance by African Americans in law school is “a simple and direct
87. Within the NSLSP, the LSATs, UGPAs, and law school grades of those declining to state their racial/ethnic
group are midway between the black and white averages. In addition, 16% of the NSLSP respondents who failed to identify their race reported elsewhere on the survey experiencing “substantial hostility along racial lines,” compared to 8% of respondents identifying themselves as white, 19% of those identifying themselves as Hispanic, and 31% of those identifying themselves as African American. Thus, we think it is almost certain that those who did not respond to the race inquiry included a substantial proportion of nonwhites. It is no wonder that when this group is lumped together with the whites, white performance does not appear that different from minority performance. Sander was made aware of the problem with lumping race nonrespondents with whites prior to the publication of his article, but left Table 5.2 as it was. Id.
88. Also consistent with Clydesdale’s analysis of the BPS, it is not just African American students in the NSLSP who tend to receive lower grades than whites when controlling for admissions credentials. This appears true of all ethnic groups, though the significance levels for Asians are marginal, possibly because of smaller sample size.

consequence of the disparity in entering credentials between African Americans and whites.”89 It is not. Exactly why African Americans perform somewhat less well in law school than their credentials would predict remains unclear. It may be due in part to statistical artifacts,90 but it could also reflect a variety of phenomena related to the experiences of black students during law school.91 Sander rejects the possibility that stereotype threat and test anxiety contribute to the lower grades African Americans receive. 92 He justifies this rejection by pointing, repeatedly, to a finding from the NSLSP that the gap between the grades of African American and white law students is as large in first-year writing courses, where students have plenty of time for their assignments, as it is in more traditional first-year courses with timed exams.93 It turns out, however, that NSLSP data are of little value for making this claim. The NSLSP sample included only 59 African American students with grades in first-semester writing courses, and 46 of them attended a single law school where the black students may have had particularly poor writing skills.94
Sander concludes his section on law school performance with a discussion of graduation rates. The BPS reports that 19.2% of African American students and 8.2% of white students who started law school in 1991 failed to complete law school within six years. Sander finds that within the BPS, first year law school grades are by far the best predictor of who graduates and that being African American is unrelated to graduation. However, as we explained in Part I.A, Sander’s conclusion reaches far beyond what is supported by his data and even if black students’ grades improved somewhat, the rate of graduation might change very little.95 Even if first year law school grades are the most important predictor of graduation among the variables in the model, and even if we know first year grades and all the other information in the model, there is still much we do not know about the causes of failure to finish law school.
89. Id. at 427. 90. See, e.g., Robert L. Linn & C. Nicholas Hastings, Group Differentiated Prediction, 8 APPLIED PSYCHOL.
MEASUREMENT 165 (1984). 91. See Clydesdale, supra note 4, at 758-61. Law school atmosphere effects are also suggested by Anthony and
Liu’s identification of a subset of schools where African American students perform as well as or better than their credentials predict. Anthony and Liu, supra.note 79, at 10 fig. 4c. Moreover, in a study coauthored by Sander of 1,100 third-year law students at eleven law schools, the authors found that “[w]omen, blacks, and Asians are disproportionately represented among the alienated students.” Mitu Gulati et al., The Happy Charade: An Empirical Examination of the Third Year of Law School, 51 J. LEGAL EDUC. 235, 255 (2001). An interesting and related possibility that we cannot test empirically is whether the ending of affirmative action itself would cause a worsened campus climate that might translate into lower rates of completing law school for African Americans. The post-209 climate issue was raised by students of color at UCLA and other UC law schools in Grutter. See Grutter Testimony of Chrystal Blossom James , 12 BERKELEY LA RAZA L.J. 433, 438 (2001); Brief of Amici Curiae UCLA School of Law Students of Color in Support of Respondent, Grutter v. Bollinger, 539 U.S. 982 (2003) (No. 02-241), available at http://www.umich.edu/~urel/admissions/legal/gru_amicus-ussc/um/UCLA-gru.doc. Cf. Cecil J. Hunt, II, Guests in Another’s House: An Analysis of Racially Disparate Bar Performance, 23 FLA. ST. L. REV. 721, 774 (1996).
92. Sander, Systemic Analysis , supra note 2, at 427. For a summary of the research literature on stereotype threat, see for example, Claude M. Steele et al., Contending with Group Image: The Psychology of Stereotype Threat and Social Identity Theory, 34 ADVANCES IN EXPERIMENTAL SOC. PSYCHOL. 379-440 (M. Zanna ed., 2002).
93. Sander, Systemic Analysis , supra note 2, at 373, 424, 427, 435 n.182. Sander’s attempted refutation also fails because totally apart from the small and biased sample of NSLSP students with first term writing course grades, stereotype threat and test anxiety do not necessarily disappear as causes of poor performance simply because there is little or no time pressure on an assignment. See Ian Ayres & Richard Brooks, Does Affirmative Action Reduce the Numbers of Black Lawyers?, 57 Stan. L. Rev. __, ___ (CITE TO TEXT AT NOTES 63-65 IN FEB. 7 DRAFT) (2005)
94. Of the twenty schools in the NSLSP, this school has by far the lowest standing in the U.S. News rankings of law schools. In a footnote, Sander acknowledges the need for more research and that his legal writing sample is “small.” Id. at 434 n.182.
95. We essentially reproduced Sander’s results, with coefficient significance levels and the relative importance of the independent variables being close to the same (e.g., the Wald statistic for LSGPA in our model is 1460.75; in Sander’s it is 1452.36. Id. at 439 tbl. 5.6). Looking at diagnostics that Sander does not present, we found a Nagelkerke R2 of .261. While the model is almost perfect (99.7% accurate) in correctly identifying those who graduate when the criterion for predicting graduation is an estimated probability of graduation that is .5 or more, it does miserably in predicting who will not graduate, as it correctly identifies only 10.8% of those who do not graduate, a result, almost certainly, of a highly skewed dataset as well as model deficiencies.

3. Performance on the bar examination
The Bar Passage Study was undertaken by LSAC to explore whether whites, African Americans, and other racial and ethnic groups passed the bar at similar rates, and, more broadly, to explore what factors account for who does and does not pass the bar.96 Building on surveys of the entering law school class of 1991, it remains the only substantial national study ever conducted of African American and white bar passage. BPS data indicate that, among students who graduated from law school in 1994 or 1995 and who took a bar examination one or more times before the end of 1996, 3.3% of whites and 22.4% of African Americans never passed the exam. Sander believes that if affirmative action ended, African Americans, no longer mismatched, would perform in law school as well as their white classmates, and then graduate and pass the bar at the same rates.97 He believes that, in this way, about three-fourths of the bar passage gap between whites and African Americans would be eliminated.98
We have already discussed the reasons we believe that Sander, in discussing his analysis of bar passage in Table 6.1 and the mismatch theory he builds from it, greatly overstates the degree to which law school grades and entry credential actually help distinguish those who pass the bar from those who fail.99 But ultimately his mismatch theory is unconvincing because it fails to stand up against the data that the BPS itself offers about bar passage by students of similar credentials at different tiers of schools.
A simple prediction flows directly from the mismatch hypothesis: for a black student with a given index score, the lower the student’s tier, the better he or she should do in law school and on the bar. Indeed, it should not matter whether the student has a higher or lower index score than other students in the tier; either way that student should be advantaged on the bar if Sander is correct in his suppositions, because she should get better grades than she otherwise would and thus be more likely to graduate and pass the bar. 100
96. Henry Ramsey, Jr., Historical Introduction, in LINDA F. WIGHTMAN, LSAC NATIONAL LONGITUDINAL BAR
PASSAGE STUDY iii-vii (1998). 97. Sander, Systemic Analysis , supra note 2, at 448-54. Sander tries to bolster his case for the mismatch
hypothesis by citing others who have studied the issue, chiefly at the undergraduate level. Id. at 450-54. But the evidence from other studies is mixed and most are not fully applicable to the situation of American law schools. We address some of Sander’s claims about the implications of the literature he cites in our longer web version. We do want to note that one article Sander relies on in his web reply, Stacy Berg Dale & Alan B. Krueger, Estimating the Payoff to Attending a More Selective College: An Application of Selection on Observables and Unobservables , 117 Q.J. ECON. 1491 (2002), has a more nuanced message when read in context. Dale and Krueger found that “the school a student attends is systematically related to his or her subsequent earnings,” id. at 1518, and that “the returns to school characteristics such as average SAT score or tuition are greatest for students from more disadvantaged backgrounds.” Id. at 1524-25. There were apparently too few black students in the 1976 College and Beyond sample for Dale and Krueger to separate African Americans from whites with respect to disadvantage, but we know from the BPS data that African Americans in law school have significantly more disadvantaged socioeconomic backgrounds than whites. Wightman, Threat to Diversity, supra note 19, at 42 n.99 tbl.N7 (50.7% versus 22.3% are lower-middle class). For a well done refutation of the undergraduate mismatch hypothesis, see Alon & Tienda, supra note 57.
98. Sander, Systemic Analysis, supra note 2, at 474 n.282. 99. See supra Part I.B.1. That Sander has not sufficiently established a strong connection between index scores
and eventual bar outcomes is corroborated in other ways. For example, in Part IV Sander claims that LSAT scores and UGPAs explain “well over 35%” of the variance in bar exam results, which he characterizes as an “impressive” figure. Sander, Systemic Analysis , supra note 2, at 421. However, that claim is not accurate as applied to the BPS. Sander cites an unpublished study of the July 2003 California bar by Klein and Bolus, who looked at scaled bar scores (a 1460, 1470, etc.), not exam pass/fail, the question that we and Sander are addressing here. Wightman’s analysis of the BPS data, the best nationwide data we have, reveals that LSAT and UGPA explain only about 10% of the variance in bar exam pass/fail status. Wightman, Threat to Diversity in Legal Education, supra note 19, at 38-39; WIGHTMAN, LSAC NATIONAL LONGITUDINAL BAR PASSAGE STUDY, supra note 96, at 37-40. Only by including law school grades in the model—unknown when admission decisions are made—could Wightman explain 35% of variance in bar pass/fail status within the BPS. Id. at 39 (for thirty-nine jurisdictions with sufficient data, a .58 correlation between law school GPA/LSAT and bar passage within jurisdictions, and a .52 correlation across jurisdictions).
100. In our longer web version we also present differences in black-white bar pass rates by law school tier and
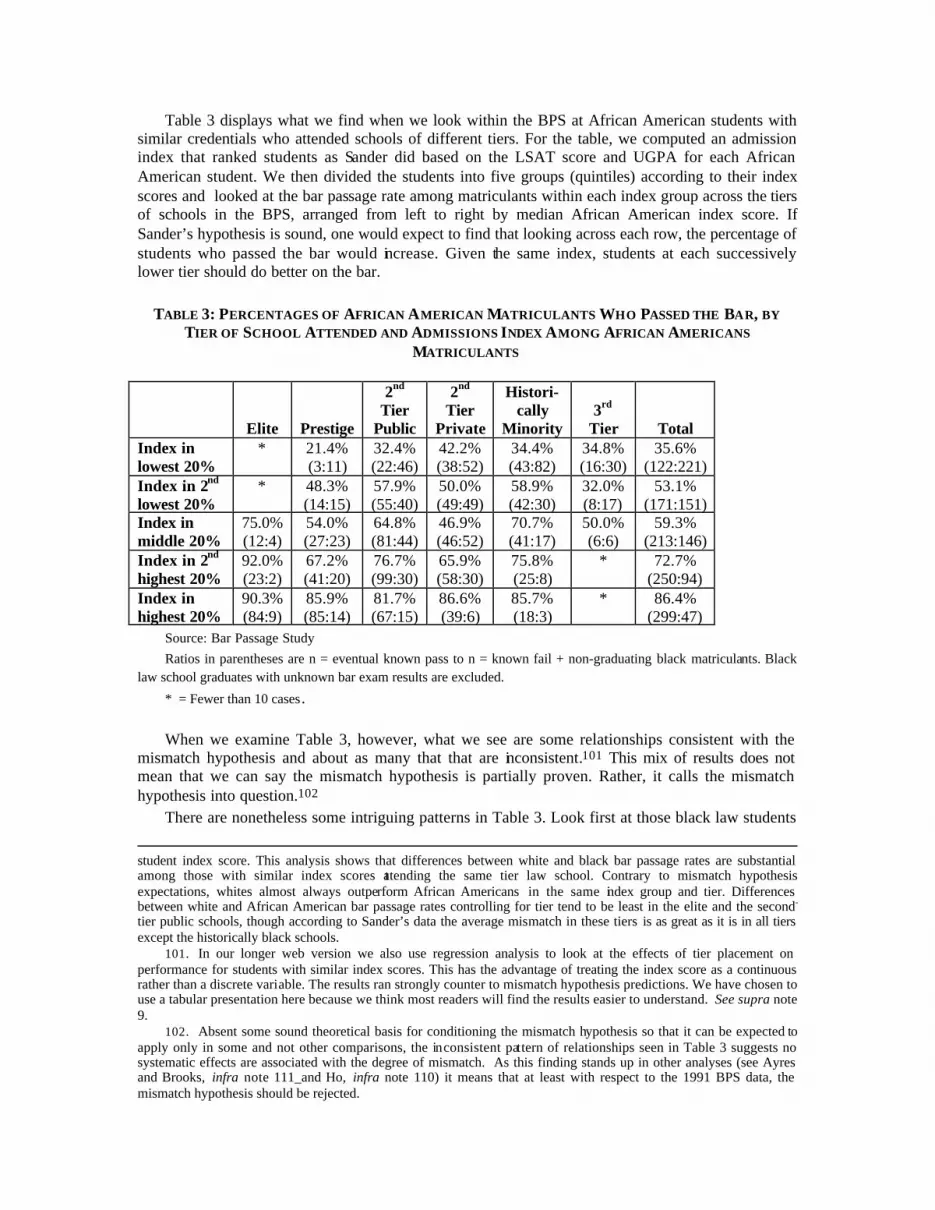
Table 3 displays what we find when we look within the BPS at African American students with similar credentials who attended schools of different tiers. For the table, we computed an admission index that ranked students as Sander did based on the LSAT score and UGPA for each African American student. We then divided the students into five groups (quintiles) according to their index scores and looked at the bar passage rate among matriculants within each index group across the tiers of schools in the BPS, arranged from left to right by median African American index score. If Sander’s hypothesis is sound, one would expect to find that looking across each row, the percentage of students who passed the bar would increase. Given the same index, students at each successively lower tier should do better on the bar.
TABLE 3: PERCENTAGES OF AFRICAN AMERICAN MATRICULANTS WHO PASSED THE BAR, BY
TIER OF SCHOOL ATTENDED AND ADMISSIONS INDEX AMONG AFRICAN AMERICANS
MATRICULANTS
Elite
Prestige
2nd Tier
Public
2nd Tier
Private
Histori- cally
Minority
3rd
Tier
Total Index in lowest 20%
* 21.4% (3:11)
32.4% (22:46)
42.2% (38:52)
34.4% (43:82)
34.8% (16:30)
35.6% (122:221)
Index in 2nd lowest 20%
* 48.3% (14:15)
57.9% (55:40)
50.0% (49:49)
58.9% (42:30)
32.0% (8:17)
53.1% (171:151)
Index in middle 20%
75.0% (12:4)
54.0% (27:23)
64.8% (81:44)
46.9% (46:52)
70.7% (41:17)
50.0% (6:6)
59.3% (213:146)
Index in 2nd highest 20%
92.0% (23:2)
67.2% (41:20)
76.7% (99:30)
65.9% (58:30)
75.8% (25:8)
* 72.7% (250:94)
Index in highest 20%
90.3% (84:9)
85.9% (85:14)
81.7% (67:15)
86.6% (39:6)
85.7% (18:3)
* 86.4% (299:47)
Source: Bar Passage Study Ratios in parentheses are n = eventual known pass to n = known fail + non-graduating black matriculants. Black
law school graduates with unknown bar exam results are excluded.
* = Fewer than 10 cases. When we examine Table 3, however, what we see are some relationships consistent with the
mismatch hypothesis and about as many that that are inconsistent.101 This mix of results does not mean that we can say the mismatch hypothesis is partially proven. Rather, it calls the mismatch hypothesis into question.102
There are nonetheless some intriguing patterns in Table 3. Look first at those black law students
student index score. This analysis shows that differences between white and black bar passage rates are substantial among those with similar index scores attending the same tier law school. Contrary to mismatch hypothesis expectations, whites almost always outperform African Americans in the same index group and tier. Differences between white and African American bar passage rates controlling for tier tend to be least in the elite and the second-
tier public schools, though according to Sander’s data the average mismatch in these tiers is as great as it is in all tiers except the historically black schools.
101. In our longer web version we also use regression analysis to look at the effects of tier placement on performance for students with similar index scores. This has the advantage of treating the index score as a continuous rather than a discrete variable. The results ran strongly counter to mismatch hypothesis predictions. We have chosen to use a tabular presentation here because we think most readers will find the results easier to understand. See supra note 9.
102. Absent some sound theoretical basis for conditioning the mismatch hypothesis so that it can be expected to apply only in some and not other comparisons, the inconsistent pattern of relationships seen in Table 3 suggests no systematic effects are associated with the degree of mismatch. As this finding stands up in other analyses (see Ayres and Brooks, infra note 111_and Ho, infra note 110) it means that at least with respect to the 1991 BPS data, the mismatch hypothesis should be rejected.

who attended elite law schools. Almost none of these students were in the two lowest quintiles of the black admissions index across all schools,103 but those in the other three quintiles, contrary to the mismatch theory, passed the bar at higher rates than similarly credentialed black students in all other tiers. Now look at the other extreme, students in the third-tier schools, which attract few black students in the top two quintiles.104 In nearly all cases, black students in these schools do worse or no better than students in the same index quintiles at higher-ranking law schools. Thus, in neither the most elite schools nor the least elite schools does the mismatch theory find support.
Table 3 offers other interesting comparisons but no consistent message. Perhaps most striking is the performance of students at historically black schools. If index credentials are held constant, these students perform on the bar about as well as or better than black students in all other tiers except the elite tier. If we didn’t have the data on third-tier law schools, we might suppose we had here evidence for the mismatch hypothesis.105 But it seems far more likely that the performance of students in the historically black law schools supports a different hypothesis: namely that there is something about cultural understandings in or the educational atmosphere surrounding most predominantly white law schools that keeps many black students from reaching their full potential. 106 Why this occurs is beyond the scope of this Article, but stereotype threat, financial circumstances, and the presence of black faculty may play a role.107
It is, of course, possible that students in higher-tier schools are more able than students with the same index scores in lower tier schools in ways that index scores alone do not capture. For example, the component of the index based on undergraduate grades does not take into account the difficulty of the applicant’s undergraduate major or the overall quality of the student body at the college she attended. Thus, students selected by higher-tier schools might generally have attended more demanding colleges and taken more challenging courses than students with similar index scores accepted only at lower-tier schools. On this ground, Sander has argued that our finding that higher-tier students in the BPS pass the bar at higher rates than students with the same index scores from lower tier schools is not necessarily inconsistent with his mismatch theory.108 After all, the higher-tier
103. In fact, at the elite schools, there were only two African Americans in the bottom two quintiles. Both passed the bar.
104. There were a combined total of only ten black students at the third-tier schools with indices in the top two quintiles. Six of them passed the bar.
105. Even if there were substance to the mismatch hypothesis and attending a historically black school avoided mismatches, it wouldn’t help much in producing new black attorneys since those displaced by the cascaders down would in large part be African Americans.
106. Henry Braddock II & William T. Trent, Correlates of Academic Performance among Black Graduate and Professional Students, in COLLEGE IN BLACK AND WHITE: AFRICAN AMERICAN STUDENTS IN PREDOMINANTLY WHITE AND IN HISTORICALLY BLACK PUBLIC UNIVERSITIES 161, 173 (Walter R. Allen et al. eds., 1991) (“For Black professional students, grade performance is explained by a more diverse set of factors including social background factors such as sex and age, major-field competitiveness, interaction with white faculty, and the presence and role of Black faculty in the students’ programs.”). A parallel phenomenon appears at the undergraduate level See e.g., Walter R. Allen, The Color of Success: African-American College Student Outcomes at Predominantly White and Historically Black Public Colleges and Universities, 62 HARV. EDUC. REV. 26, 41 (1992) (“Finally, little doubt exists over the negative impact of hostile racial and social relationships on Black student achievement.”).
107. For more on stereotype threat and cites to relevant literature, see Steele et al., supra note 96. A second hypothesis is that financial circumstances lead to higher drop-out rates (and hence failure to pass the bar) at more elite schools since the predominantly minority law schools have the least expensive tuition of any tier. Wightman, Consequences of Race-Blindness, supra note 11, at 246 n.28. A third hypothesis is that that the interaction at historically black law schools with many black faculty members is a positive factor. See Elizabeth Mertz, et al., What Difference Does Difference Make? The Challenge for Legal Education, 48 J. LEGAL EDUC. 1, 74 (1998) (finding, in a systematic observational study of classrooms in eight law schools for an entire semester, that “The most striking [pattern] is the connection between the presence of a teacher of color and greater participation by students of color.”). 108 These remarks were made by Sander at a panel discussion of his work at the Annual Meeting of the AALS, January 8, 2005, San Francisco, CA. and in a talk at the University of Michigan Law School, January 24, 2005. Sander cites undergraduate school as an unmeasured variable that can influence law school admission, and it is plausible to think that it also influences law school success. But several LSAC validity studies show that adjusting UGPA based on a ranking of quality of the undergraduate institution does not consistently improve the prediction of law school grades above the combination of students’ LSATs and unadjusted UGPAs. See e.g., Donald A. Rock & Franklin R. Evans,

students might have passed the bar at even higher rates if they had attended lower-tier schools. We believe that this selection bias argument deserves consideration, despite the fact that Sander’s own central thesis—that lower African American law school (and bar) performance is “simply a function” of lower LSATs and UGPAs —leaves no room for it.109
While selection bias might mean that students at tier-one schools would have done even better if they had attended tier-three law schools, the mere fact that something is possible does not mean it is likely, and in this case the evidence is to the contrary. A recent paper by Daniel E. Ho responding to Systemic Analysis has examined the selection bias issue exhaustively and found that the combination of self and school selection may indeed explain why the African American students in one tier do better than similarly credentialed African American students in another tier, but the data also indicate that African American student success would not be improved by matriculation at less competitive law schools.110 These findings suggest that if students in tier-one schools do better than similarly credentialed students in less selective tiers, then admissions officers at the top-tier schools are doing their job well and are able to identify students whose chances of graduating and passing the bar are not just good but better than those of other African American students with similar quantitative credentials.
In another article in this Issue, Ayres and Brooks identify a second way to test the mismatch theory that uses the BPS dataset and that largely (though not entirely) avoids the problem of selection bias.111 We find the Ayres-Brooks analysis on this point compelling.112 Here we provide a very brief summary of their findings. Within the BPS dataset, they identify a substantial group of African American students, all of whom had been admitted to two or more schools, one of which was their “first choice.” They then divide this group into two subgroups and compare the law school grades and bar passage rates of the students who elected to attend their first-choice school with those of the students who attended their second or third choice schools. Ayres and Brooks reason that, if the mismatch theory were sound, the students who elected to attend their second-choice schools ought to perform better in law school and on the bar than those who went to their first-choice school. Their approach largely controls for selection bias because the students attending their second-choice schools had been attractive enough as applicants that they could have matriculated at a more elite school. Ayers and Brooks find that students who attended their second choice school neither received better first-year grades nor passed the bar at higher rates (after possible multiple attempts) than those who went to their first-choice school,113 and conclude that, for African American students, the BPS does not support Sander’s mismatch theory.
The Effectiveness of Several Grade Adjustment Methods for Predicting Law School Performance, in LAW SCH. ADMISSION COUNCIL, REPORTS OF LSAC SPONSORED RESEARCH: VOLUME IV, 1978-1983 363, 444 (1984) (arguing “against the use of these types of grade adjustment techniques” in part because of “relatively modest and unstable validity gains”). 109 According to the argument of Sander’s article, unmeasured variables have very little to do with which black applicants a law school decides to admit and virtually nothing to do with the success of black students after admission. In these circumstances, there would be almost no room for missing information to bias our findings. Sander, Systemic Analysis, supra note 2, at 429; see also calculations underlying 473 tbl.8.2. We think, however, that Sander was correct in his web reply and not in his Article that selection by law schools on unmeasured variables that also correlate with success occurs and should be taken into account in building causal models of graduation and bar passage. However, we, unlike Sander, are not attempting causal modeling. Rather, we are presenting a portrait of what happens, or happened with the 1991 cohort, under affirmative action. What happened in consistent with the claims of elite school admissions officers that in admitting minority students they look beyond test scores to other factors that predict whether an applicant can meet their school’s academic expectations. 110 Daniel E. Ho, Why Affirmative Action Does Not Cause Black Students to Fail the Bar,114 YALE L.J. ___ (forthcoming 2005).
111. Ian Ayres & Richard Brooks, Does Affirmative Action Reduce the Number of Black Lawyers?, 57 STAN. L. REV. __, __ (2005). [pages 14 – 21 of draft] .
112. After reading their article in draft, we performed our own analysis of the data and reached the same results. 113. Id. at [draft p. 19 -20]

C. The Bottom Line: The Net Effects on the Numbers of African American Lawyers
In Table 8.2 of his article, Sander makes an overall forecast about the effects of ending affirmative action. He concludes that, despite a decline of 14.1% in the numbers of African American students admitted to law school, there would have been a net increase of 7.9% in the numbers of African American attorneys entering the bar in 2001. In Table 4, we have done our own calculations of the same steps in Table 8.2 and arrive at quite different estimates.
TABLE 4: CONTRASTING ESTIMATES OF THE EFFECTS OF ELIMINATING AFFIRMATIVE ACTION ON
THE PRODUCTION OF AFRICAN AMERICAN ATTORNEYS
Stage of the Process
Sander’s Estimates (using data from 1991
and 2001)
Our Rough Estimates (using data from 1991
and 2004) Applicants Unchanged -15% to -25% Admittees -14.1% -40% to -50%
Matriculants -14.1% -40% to -50% Graduates -8.1% -35% to -45%
Passing the Bar +7.9% -30% to -40% Source: For Sander’s estimates, see Sander, Systemic Analysis , supra note 2, at 473 tbl. 8.2. For our estimates: projections based on Bar Passage Study and 2004 LSAC admissions data How did Sander and we arrive at such different numbers? As to applic ations, Sander assumes
that, without affirmative action, all those who applied before would apply again (including those whose credentials were so low that they would no longer have any hope of being admitted anywhere). We believe that applications would decline both from those who recognize that with race-neutral criteria they will be accepted nowhere and from those who could still get in somewhere, but who, for the reasons we spell out in Part I.A.2., above, would decide that they do not want to attend or cannot afford to attend the sorts of schools that might admit them.114 We estimate that the total decline in applications would be around 15 to 25%.
As to admissions, Sander estimates a decline of 14.1%, adopting Linda Wightman’s estimation, using the grid model with 2001 data, of the proportion of African American students who would not be admitted to any of the country’s ABA approved law schools. To reach our estimate, we applied Wightman’s grid method to more recent 2004 admissions information and, as we report in Part I.A.1., found that, because of a large increase in white applicants, 32.5% of black students would not have been admitted anywhere in that year, even if they had applied to a wide range of schools. Our ultimate estimate of a decline of 40 to 50% in the number of admittees includes both the drop in the number of admissible students and our earlier estimate of those who could still get in somewhere but would no longer choose to apply.
Sander’s remaining estimates are not only biased by the cohort he examined but also affected by an error in his treatment of the 14.1% of students he assumed could not get into any law school. Sander misapplied Wightman’s results when he based his estimates of the proportion of black students who would graduate and pass the bar by removing the entire bottom 14.1% of African Americans by
114. Ironically, it is conceivable that ending affirmative action could have the smallest effect on the number of
applications by African American in the lowest index score ranges. In 2004, market signals did not stop 1,384 African Americans with 120-134 LSATs from applying to law school, even though only 15 (1%) were admitted. Underrepresented minorities from disadvantaged backgrounds tend to have less access to good information about higher education. Grace Kao & Marta Tienda, Educational Aspirations of Minority Youth, 106 AM. J. EDUC. 349 (1998). There are also cyclical barriers in the information market, including the fact that many students send in their applications a month or more before they receive their LSAT scores.

index scores from the 1991 sample and keeping all of those with higher index scores.115 In doing so, he did not realize or take into account the fact that Wightman’s model indicates that some African American applicants with very low index scores would get into some law school if they succeeded at the same rate as similarly credentialed whites and some with higher index scores would have been excluded. The result of Sander’s oversight is that he mistakenly eliminates 366 African American admittees with index scores under 500, and mistakenly retains 339 African American admittees with 500-700 index scores and 27 with 700+ index scores.116 Accepting all of Sander’s other methods, this one error on Sander’s part inflates the African American 2001 post-affirmative action bar passage rate (as a percentage of entering law students) by about 2.7 percentage points.
At the matriculation stage, both Sander and we assume that the rate at which African Americans accept offers of admission would remain the same after affirmative action.117 Sander and we also both believe that a higher proportion of the African American students who matriculate would go on to graduate and pass the bar, but our estimate of the improvement differs substantially from his. In our view, whatever improvement would occur would be a function of eliminating from law school most of the students with the very lowest LSATs and UGPAs, while Sander believes that the improvement would be partly a result of the elimination of those students and as much or more a function of the much better law school grades that he believes African American students would earn if they attended law schools where their entry credentials were the same as those of their white classmates.118 In the end, because of eliminating what he perceives as a mismatch, Sander forecasts a net increase of 7.9% in the number of new lawyers who would enter the bar, while we, who regard the mismatch theory as unproven and unpromising, foresee a net decline in the range of 30 to 40%.
We believe that a 30 to 40% decline in the number of African American lawyers entering the bar each year would be intolerable.
II. THE IMPACT OF ENDING AFFIRMATIVE ACTION ON THE DISTRIBUTION OF AFRICAN AMERICAN
115. But see Wightman, Consequences of Race-Blindness, supra note 11, at 242 tbl.6. Within each of 90
LSAT/UGPA cells, Wightman’s grid model applies the white admission rate to the black applicants in the same cells. 116. Authors’ grid-model calculations from LSAC, 2001 National Decision Profiles, supra note 14, which
produced a 14.3% decline in black admission offers. The chart below shows the way that Sander’s model removed from the hypothetical class too many of the students with low indicies and too few of those with high indicies. For both models in the chart, total black admittees = 3,159. Some index ranges are not shown (e.g., 460-480) because there were zero admittees in those bands under our method of calculating the midpoint index score for each of 90 cells. [FIX SPACING SO THAT CHART DOES NOT COVER TEXT OF FOOTNOTES.]
2001 African American Admittees Without Affirmative Action
050
100150200250300350400450
300-
320
340-
360
360-
380
380-
400
400-
420
420-
440
440-
460
480-
500
500-
520
520-
540
540-
560
580-
600
600-
620
620-
640
640-
660
680-
700
700-
720
720-
740
740-
760
780-
800
800-
820
820-
840
840-
860
860-
880
880-
900
900-
920
920-
940
Grid Model
Sander's GridModel
Note the cutoff scores separating the ranges repeat (500-520, 520-540, etc.), which follows the format in Sander’s Table 8.2 spreadsheet. At a practical level, this did not cause double-counting for our grid model estimates because the index score means for the cells did not fall exactly at the cutoff (e.g., 520). We assume the same is true of Sander’s article.
117. Actually, we expect that there would be a slightly greater drop-off between acceptances and matriculation than there is now, but we had no way to forecast, among those who could have matriculated, how many would simply decide not to apply to law school at all and how many would apply and, after being admitted, decide not to matriculate. For this reason we built into the “application” line in the table our entire forecast of the decline we expected in matriculation among those who could have received an offer of admission to law school without affirmative action.
118. Even if we accept Sander’s method for comparing African American performance with and without affirmative action, when we use 2004 data we calculate a 21% decline in the number of black lawyers if affirmative action is discontinued. See supra Part I.A. But since Sander has failed to prove the mismatch hypothesis, a more appropriate method for computing the decline is to apply black BPS pass rates (by index score range) to both current admittees and grid model admittees. This second approach, even though it does not incorporate our arguments about declining black applications and yield rates (which are difficult to model), shows a drop of 30% in African American attorneys without affirmative action for 2004. A related issue is that Sander’s 2001 “with affirmative action” figures in Table 8.2 are based on African Americans in the BPS cohort entering law school in 1991. However, index scores for African Americans enrolled in law school improved since 1991, particularly in the recent wave of increased admissions competition. In the 1991 BPS, 77.7% of African Americans had index scores of 500+, compared to 96.4% in 2004. Likewise, the percentage of African Americans with 600+ index scores improved from 41.4% in 1991 to 62.4% in 2004.

STUDENTS AMONG LAW SCHOOLS
The huge drop we have forecast in the number of African American students who would matriculate at American law schools in a world without affirmative action would not be spread evenly across schools of all tiers. Even with his much more modest predicted decline of 14%, Sander recognizes that if affirmative action were ended, the numbers of African American students at the nation’s “most elite law schools,”119 currently about 8% of their student bodies, would plummet to “the range of 1 to 2%.”120 At the same time, he implies that at schools other than the most elite, the numbers of African American students would change very little: the African American students who now attend the most elite schools would instead enroll at the next-most-elite schools; those who now attend the next-most-elite would attend schools in the next group down the hierarchy; and so forth.
One of Sander’s own tables strongly suggests that many more than just the most elite schools would experience a substantial decline in the number of African American students. In Table 3.2, Sander reports that, in 1991, at the time of the Bar Passage Study, the median application index for African Americans in the 14 first-tier schools, which was 705, was 83 points lower than the median index score for whites in the third-tier schools (the midrange public schools).121 These 1991 data suggest that, without affirmative action, few African American students at first-tier schools would have had the index scores needed to be assured of admission at third-tier schools, and many would have had scores that would make admission unlikely.122 Since there are a total of eighty schools in the top three tiers, it follows that many African American students who were admitted in 1991 to a first-tier school might not have been admitted that year to any of the top eighty schools. This is true even though we have seen that the typical black student admitted to a first-tier school was an excellent bet to graduate and pass the bar.
Perhaps Sander’s expectation that a substantial decline in African American students would occur at only the fourteen first-tier schools grows out of his reliance on data from 2001, when by Wightman’s calculations many more African Americans than in 1991 could have secured admission to at least one law school without affirmative action.123 It is true, as we have seen, that between 1991 and 2001, the number of white applicants declined substantially 124 and the gap between white and black entry credentials narrowed somewhat.125 Yet even in 2001, it remained true that, in comparison to those of other races, few African American applicants had the sort of entry credentials that would have assured them admission to any of the schools in the top three tiers in a completely race-blind admissions system.126 By 2004, chances of admissions for African American students at the schools in the top three tiers would have diminished further, because of an enormous rise in 2002, 2003, and 2004 in the numbers of non-African American applicants with high credentials.127
119. Sander, Systemic Analysis, supra note 2, at 483. 120. Id. 121. Id. at 416. 122. At the third-tier schools, the standard deviation for whites on the index was 73. Id. Thus, the median index
for African Americans attending first-tier schools was more than a standard deviation lower than the median index for whites at third-tier schools.
123. For 1991, ten years before, Wightman had forecast that about 52.5 % of African Americans who matriculated that year could not have gotten into any American law school without the help of affirmative action. When she repeated the same analysis using 2001 data, Wightman, forecast that 14% of African American students would have found no law school to accept them. Wightman, Consequences of Race-Blindness, supra note 11 at 243 tbl.7, 244 n26..
124. See supra Table 1 and accompanying text. 125. In the 1992 national admission pool, the mean black-white gap on the LSAT was 11.4 points (on a scale of
120-180, with a standard deviation of approximately 10). By 2003, the gap had narrowed to 10.7 points. Law School Admission Council, Average UGPA, Average LSAT, and Counts by Ethnic Groups – 1984-85 to Fall 2003 (2004).
126. Of the 15,421 applicants to law school in 2001 with LSAT scores of 160 or above (roughly the 83d percentile), only 254 (or 1.6%) were African American.
127. In 2001 there were 77,235 applicants to law school, of whom 28,811 had LSATs of 155 or above. In 2004, there were 100,604 applicants to law school, of whom 38,134 had LSAT scores of 155 or above.

It is extremely difficult to determine exactly how many law schools would experience severe declines in their numbers of African American students if affirmative action were ended, for many contingencies would be in play: the future numbers of white, African American and other applicants; changes in admissions criteria applied by schools; changes in African Americ ans’ admissions credentials; and so forth. What we can do, following the example of Linda Wightman, is to model the impact of ending affirmative action on law schools at different levels by assuming a race-blind system in which law school admissions decisions are based only on LSAT scores and undergraduate grades.128
Making this assumption, Wightman applied a logistic regression model to 2001 data and estimated that, without affirmative action, African American enrollment at the first-tier schools would decline by over four-fifths and at each of the next two tiers by approximately two-thirds.129 While Wightman’s approach may be criticized for both over- and under-estimating the probable impact of ending affirmative action at schools of different tiers,130 we believe that in the case of the higher-tier schools, it provides a plausible approximation of the likely impact that ending affirmative action would have on African American enrollments.
We made our own attempt to model the probable effects on African American enrollment by tiers, and while our model is even cruder than Wightman’s, it produces similar results and we believe fairly illustrates the sorts of effects that ending affirmative action might have. Using 2003 admissions data and U.S. News rankings,131 we divided law schools into groups by rank. We then combined LSAT scores and UGPA into an index following Sander’s formula and assumed that all the first-year places available at the top ten schools would be filled by the students with the highest admission indices, that all places at the 11th through 25th school would be filled with those with the next highest indices and so forth. 132 Table 5, in Line B, presents the results of our model. In each of the top three ranges of schools, fewer than 2% of the students would be African American.
128. The picture would be essentially the same if other factors influenced admissions but relative to LSAT scores
and UGPAs they were of small moment and distributed randomly across applicants. 129. Wightman, Consequences of Race-Blindness, supra note 11, at 247 tbl.9. 130. It overestimates declines because it estimates the probability of acceptance only for persons who actually
applied to the very school. As Sander points out, if affirmative action ended, many African Americans would probably apply to lower-tier schools than those to which they would have applied previously. On this ground, Sander calls Wightman’s regression approach “nonsensical” as a basis for predicting African American enrollments. Sander, Systemic Analysis, supra note 2, at 471, n.275. This criticism has force when Wightman’s model is used to estimate the overall decline in African American enrollment, but it has little force when applied to her estimates of declines in higher-tier schools, because these are the students, who, if they applied at all in a regime without affirmative action, would probably be admitted to schools in the lower tiers. In another sense, Wightman’s methods in her tier-by-tier regression tend to understate the probable decline in African American students, especially at the second- and third-tier schools, because a person who applied and would have been accepted at a first-tier school was also counted in Wightman’s regressions as having been accepted in the second or third tier if the person also applied to a school in that tier. Wightman’s regression and grid models are best seen as attempts to establish upper and lower bounds on the effects of ending affirmative action. Each contains, as Wightman recognizes, unrealistic assumptions. These must be taken into account in any use of these models, but they provide no basis for adopting the one and dismissing the other as “nonsensical.”
131. Schools of Law, U.S. NEWS & WORLD REPORT, April 12, 2004, at 69. Admittedly, these rankings are controversial and warrant criticism. Richard O. Lempert, Of Polls and Prestige: One Faculty Member’s Candid Views, 34 LAW QUADRANGLE NOTES 62, 68 (1990) (criticizing the U.S. News rankings). However, our options are limited because, for confidentiality reasons, none of the LSAC-BPS publications identify the law schools in the six clusters that Wightman devised. 132 We are grateful to Josiah Evans, research associate at the Law School Admissions Council for preparing this table.

TABLE 5: AFRICAN AMERICAN ENROLLMENTS AT U.S. LAW SCHOOLS IN 2003 IF LSAT AND UGPA WERE THE SOLE CRITERIA FOR SELECTION
Range of Law Schools
Top 10
11th-25th
26th- 50th
51st-100th
Group 3
Group 4
A
Estimated Number of African American students
23
44
99
292
263
574
B
Estimated % of Student Body who would be African American
0.75%
1.01%
1.68%
2.38%
3.72%
4.69%
C
Doubling B to account for factors other than LSATs and UGPA
1.50%
2.02%
3.36%
5.74%
7.44%
9.38%
Source: 2003 LSAC admissions data. The results in Table 5, Line B are low—unrealistically low—because not all students apply to the
highest-tier law school that will admit them and because no law schools simply admit all the highest scoring applicants. It is this attention to other factors, specifically applicants’ race and ethnicity, that has characterized affirmative action, but even apart from their race, one might expect many black applicants to have distinguishing life experiences or skills that would lead a school to want to enroll them. We don’t know how many this would be, but let us assume line B is low by a factor of two, because African American applicants were stronger than other applicants on non-index credentials (or because applicants of other races with high admission indices disproportionately chose to attend lower-tier schools). Reflecting this assumption line C in the table doubles the percentages in Line B.133 Even with doubling, only 1.5% of the students at the top ten schools, 2.0% of those at the next fifteen schools, and 3.4% of those at the next twenty-five schools would be African American. Taken together, at the top fifty schools, African Americans would, in 2003, have constituted only about 2.5% of admitted students, a number that is down by about two-thirds from their actual numbers and close to Wightman’s estimated drop for schools below the very top.
Consider the implications of a decline of this scale. If African Americans constituted only 2.5% of the student bodies of these schools, rather than the roughly 8% that they represent today, then a law school that had eighty students in each of four first-year sections would have, on average, only two African American students in each section after the end of affirmative action. This compares to the six or seven African American students in each such section today.
With declines of this magnitude, three harmful consequences are likely to occur at the affected law schools. First, some very able African Americans who would not want to be part of a tiny racial minority would decide not to apply to any of these schools, further reducing the numbers of African American students.134 Second, those few who did matriculate would likely feel conspicuous and isolated, participate less in class, and otherwise contribute less to the intellectual life around them.135
133 We have no data that indicates that African American students would, apart from their race, be more attractive to law school admissions officers than white, Asian or Hispanic students, though we think it plausible that some experiences linked to their race would cause them disproportionately to stand out as applicants who would make for a more well-rounded class, at least as compared to white students. We may be generous in assuming their attractive features apart from race would double their chances of admission.
134. See discussion supra, text at notes 27-30. 135. Patricia Gurin et al., Diversity in Higher Education: Theory and Impact on Educational Outcomes , 72 HARV.
EDUC. REV. 330, 360 (2002) (“The worst consequence of the lack of diversity arises when a minority student is a token in a classroom. In such situations, the solo or token minority individual is often given undue attention, visibility, and distinctiveness, which can lead to greater stereotyping by majority group members.”). A study including focus groups and surveys found underrepresented minority students encountered these sorts of problems at UC Berkeley after Prop. 209. Daniel Solorzano et al., Keeping Race in Place: Microaggressions and Campus Racial Climate at the University

And third, white students at these schools would lose the opportunity to learn from and interact with African American students.136 We live in a multiracial society, but one that still endows race with great social significance.137 Racial understanding comes in significant part from actual interaction.
Other, broader societal harms would also flow from cutting African American enrollments by over two-thirds at the most selective fifty or eighty law schools. As the majority opinion in Grutter recognized,138 the nation’s top law schools produce a disproportionate share of the leaders of the American bar, of elected and appointed officials, and of policymakers and opinion shapers in the country. Over the past thirty years, because of affirmative action, thousands of African Americans have graduated from elite and near elite schools, which has helped them open the doors needed to become part of the next generation of leaders.139 The elimination of affirmative action admissions at the nation’s elite law schools would thus be likely to substantially diminish African American representation in such leadership positions as partners in corporate law firms,140 professors teaching at law schools,141 and federal judges. 142 Of course, many white and minority leaders have also attended law schools farther down the U.S. News rankings, but the range of career opportunities is simply narrower at the less prestigious schools and it is harder to rise to positions of prominence.
It is at the most elite schools where the effects on the white and minority students of ending affirmative action would be most unambiguously harmful. Yet as we saw earlier, African Americans at first-tier schools graduate and pass the bar at higher rates than African Americans with the same credentials at schools in the lower tiers.143 Other evidence suggests that they earn higher incomes than the graduates of lower tiers.144 They are quite unlikely to regard themselves as the victims of affirmative action. Thus, ending affirmative action would offer no benefits to these students and cause a substantial loss both to them and to the white and other students attending top tier schools.
Near the end of his article, Sander proposes, as an alternative to ending affirmative action
of California, Berkeley, 23 CHICANO-LATINO LAW REVIEW 15 (2002).
136. Cf. Mitchell J. Chang et al., Cross-Racial Interaction Among Undergraduates: Some Consequences, Causes, and Patterns, 45 RESEARCH IN HIGHER EDUC. 529, 545-45 (2004) (studying national longitudinal survey data, and concluding “Thus, even though the percentage of students of color has a positive effect on cross-racial interactions as a whole, this effect is accounted for most often through the experiences of white students. . .”).
137. M ICHAEL K. BROWN ET AL., WHITE-WASHING RACE: THE M YTH OF A COLOR-BLIND SOCIETY (2003); Cheryl I. Harris, Critical Race Studies, An Introduction, 49 UCLA L. Rev. 1215, 1217 (2002).
138. Grutter v. Bollinger 123 S.Ct.2341, 2341 (2003). 139. Am. Bar Ass’n Commission on Opportunities for Minorities in the Profession, Miles to Go 2000: Progress of
Minorities in the Legal Profession (2000); David B. Wilkins, Rollin’ on the River: Race, Elite Schools, and the Equality Paradox, 25 LAW & SOC. INQUIRY 527, 535-36 (2000).
140. David B. Wilkins & G. Mitu Gulati, Why are There So Few Black Lawyers in Corporate Law Firms, 84 CAL. L. REV. 493, 563-64 (1996).
141. For example, of the 604 African American law professors in the latest AALS Directory, 48.1% graduated from the law schools ranked 1-10 in U.S. News, and 60.1% graduated from the law schools ranked 1-20. Authors’ calculations based on data from the AALS 2003-04 DIRECTORY . An additional 13.1% had other advanced degrees from elite schools (J.S.D. or LL.M. from Stanford, etc.), and analysis of African American professors at the top 75 law schools (n = 266) indicated that 74.4% graduated from the top 20 law schools. We are not arguing that all these professors directly benefited from an affirmative action plus factor, nor are we arguing that none would have become professors had they attended lower ranked schools in the absence of affirmative action. What is clear, however, is that law school prestige matters a great deal in the law teaching market. See also Robert J. Borthwick & Jordan R. Schau, Gatekeepers of the Profession: An Empirical Profile of the Nation’s Law Professors, 25 U. M ICH. J.L. REFORM 191, 227 tbl.27 (1991) (in study of 872 law professors, 60% graduated from the top 25 schools).
142. African Americans were 10.7% of all active Article III federal judges last year. ADMINISTRATIVE OFFICE OF THE U.S. COURTS, THE JUDICIARY FAIR EMPLOYMENT PRACTICES ANNUAL REPORT 23 tbl.1A (2003). Of the 104 African American judges for whom we could obtain data, over 40% were graduates of the top twenty law schools. Compiled from AM. BAR ASS’N, THE DIRECTORY OF M INORITY JUDGES OF THE UNITED STATES (3d ed., 2001) together with the online Judicial Yellow Book, by Aimee S. Mangan, Faculty Services Librarian, University of Michigan Law Library (Dec. 2004). Over 90% of these judges graduated from law school in the 1950s, 1960s, or 1970s.
143. At these tier-one schools, whites on the BPS graduated at higher levels than African Americans and passed the bar at slightly higher rates than African Americans, but Sander has been unable to prove that “mismatch” is the reason for the difference.
144. See discussion supra note 35.
altogether, that law schools “only use preferential admissions preferences for blacks to the extent necessary to prevent black enrollments from falling below 4% of total enrollment.”145 Whatever else might be said of this recommendation, it would produce harm at the most elite schools, because it would deprive roughly half of the African American students who attend these schools today of an education they have been putting to very good use. Indeed, in the case of elite schools, Sander’s recommendation seems directed at a problem that does not exist. The bar passage data that Sander analyzes, the After the J.D. data he also examines, and a close examination of the graduates of one elite law school 146 reveal no important differences between African American and white students with respect to graduation rates, bar passage rates given graduation, and measured career success.
CONCLUSION
Over the past thirty-five years, the system of affirmative action has permitted tens of thousands of African Americans to enter the American bar. Yet for every three African Americans who become lawyers, two others start law school but never graduate or graduate but never pass the bar. This high rate of drop out and bar failure, much higher than for whites, is a very serious problem, and, as H. L. Mencken observed, “for every problem, there is a solution that is simple, neat and wrong.”147 In his conclusion, Sander claims that “the production of black lawyers would rise significantly in a world without racial preferences," because black law students, no longer "mismatched" at the schools they attend, would graduate and pass the bar at much higher rates.148 His conclusions are simple, neat and wrong. As we have demonstrated here, they rest on a seriously flawed appraisal of the current evidence. We believe that, using the same evidence, we have demonstrated just the opposite: that, without affirmative action, both the enrollment of black law students (particularly at the fifty or eighty most selective schools) and the production of black lawyers would significantly decline. Sander has not made his case for the effects of a "mismatch." Our ultimate conclusion is simple but sound: Sander's article simply does not deserve the attention it has attracted.
145. Sander, Systemic Analysis, supra note 2, at 483.
146. Lempert et al., supra note 35. 147 Joshua Aronson, The Threat of Stereotype, EDUC. LEADERSHIP , Nov. 2004, at 14, 18 (quoting Mencken). 148 Sander, Systemic Analysis, supra note 2, at 476.