Embed Size (px)
Citation preview
1
The Recently Compiled Turkish Strong-Motion Database: Preliminary
Investigation for Seismological Parameters
S. Akkar1, Z. Çağnan2, E. Yenier1, Ö. Erdoğan1, M.A. Sandıkkaya1 and
P. Gülkan1 1Earthquake Engineering Research Center, Middle East Technical University, Main
Campus 06531, Ankara Turkey 2Department of Civil Engineering, Middle East Technical University, Northern Cyprus
Campus, Kalkanli Güzelyurt, KKTC, Mersin 10, Turkey
Abstract: Strong-motion data recorded by the Turkish national strong-motion network
has been compiled and processed systematically for the first time, together with detailed
geophysical and geotechnical site measurements for all of its stations. The catalog
information of 18 seismological agencies and other sources were examined to obtain
reliable source, geometry and distance parameters for each event. The high quality
digital and analog strong-motion data was processed by a uniform methodology to
remove the high- and low-frequency noise. Currently, the seismological and spectral
information of 4203 strong-motion records are available for use by earth scientists and
earthquake engineers. In this article, we present the fundamental features of this database
and explain our methodology in their calculation. We present several comparisons of our
database with other related studies to verify our approach during the computational stage
of the seismological parameters. The results confirm the reliability of our calculations.
The database has also enabled us to derive empirical magnitude conversion relationships
to estimate moment magnitude in terms of different magnitude scales. The article ends
with a discussion of the likely improvements in the European accelerometric data through
the contributions of this strong-motion database applicable for seismically active shallow-
crust regions. The findings of this article emphasize the necessity of global strong-
motion databases in Europe for better estimation of seismic hazard in regions of similar
seismotectonic environment.
Keywords: Turkish/European strong-motion data; site-to-source distance metrics;
magnitude scaling relationships; strong-motion data processing
*ManuscriptClick here to download Manuscript: Akkar_etal_TSMD_Paper1_v3.0.pdf Click here to view linked References
2
1. Introduction
In Turkey, the first strong-motion instruments were installed in 1973. This marks the
establishment of nationwide strong-motion network that has been operated by the
Earthquake Research Department (ERD) of the General Directorate of Disaster Affairs
(GDDA). Instruments first used were of Kinemetrics SMA-1 type (analog recorders),
which recorded their first main shock at Denizli during the 19 August 1976 earthquake
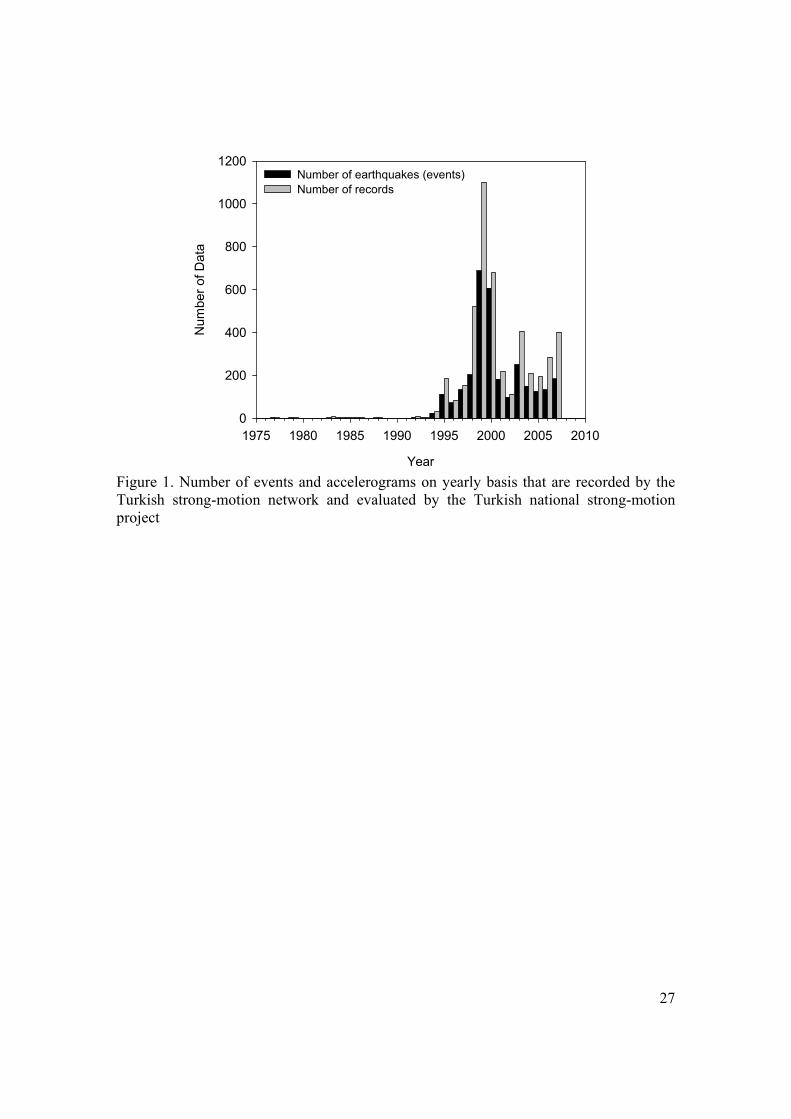
(Ateş and Bayülke, 1982). Since then the strong-motion network has recorded a
significant number of accelerograms, in particular after 1995 (Figure 1). As of the first-
quarter of 2009, the total number of strong-motion instruments in the national network is
327, all of which are digital recorders representing several technological generations.
With the accumulation of accelerometric data in Turkey, various researchers have
compiled the seismic catalog information of the corresponding events as well as the
relevant strong-motion data to improve seismic hazard and risk mitigation studies in
Turkey (e.g. Erdik; 1984, Ambraseys et al., 1993; İnan et al., 1996; Aydan and Hasgör,
1997; Durukal et al., 1998; Çelebi et al., 2001; Erdik and Durukal, 2001; Zaré and Bard,
2002; Rathje et al., 2003). These provide useful information about the Turkish strong-
motion recordings. However, some of these studies are rather dated, failing to reflect
recent developments in the relevant fields of strong-motion studies, and others lack up-to-
date seismic catalog information, or they only focus on specific earthquakes. In almost
all cases, the strong-motion site information is either entirely missing or is based on
expert opinion without a reliable in-situ geophysical survey. In an attempt to estimate the
Turkish strong-motion site conditions Zaré and Bard (2002) used horizontal-to-vertical
(H/V) spectral ratios. However, they were unable to validate their findings through field
tests. To the best of our knowledge, the only exceptions where geophysical and / or
geotechnical techniques in determining the site classification of Turkish strong-motion
sites were conducted are Rathje et al. (2003) and Gülkan et al. (2007). The former study
ran Spectral Analysis of Surface Waves (SASW analysis) for a limited number of strong-
motion sites that recorded accelerograms from the 1999 Kocaeli and Düzce events. The
geophysical and geotechnical site surveys presented in Gülkan et al. (2007) describe the
3
site features of recently deployed strong-motion stations along the North- and East-
Anatolian fault zones. Although the local site conditions at these stations are
satisfactorily reported, the number of ground-motions recorded by these stations
constitutes a small portion of the overall database. Consequently, the datasets assembled
from the Turkish strong motions represent potentially misleading information that is
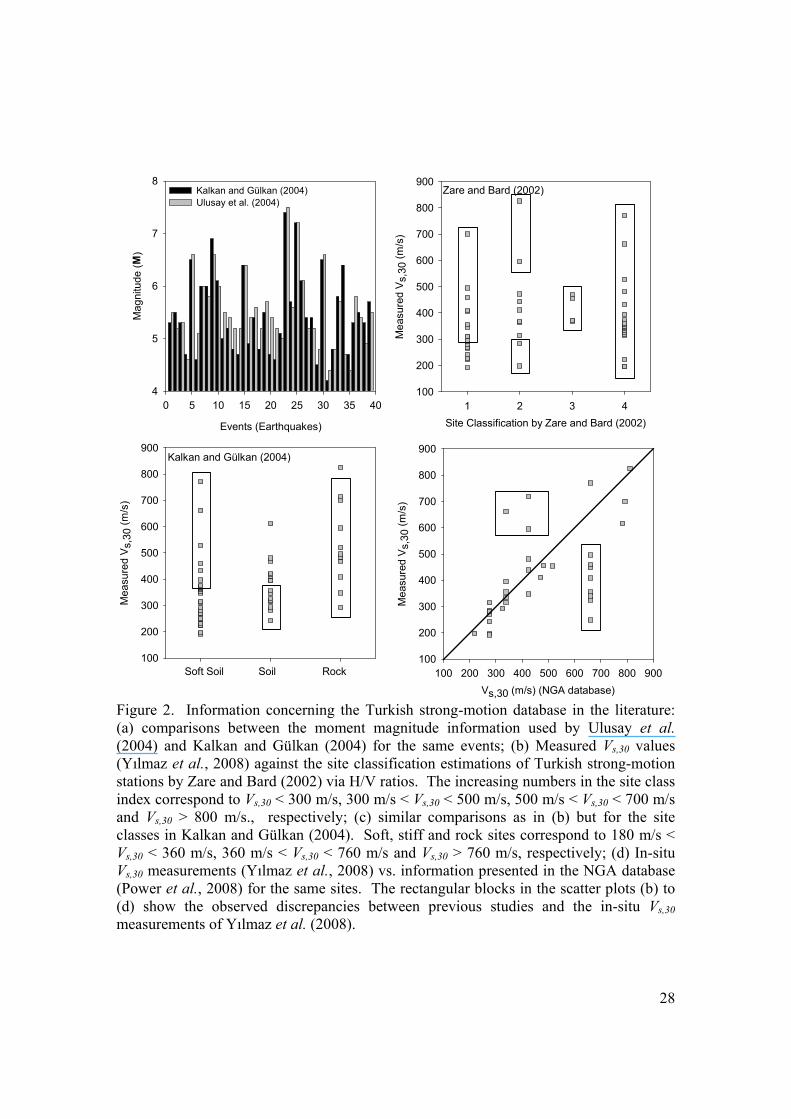
described by different cases in Figure 2. As presented in Figure 2.a, when the datasets of
Ulusay et al. (2004) and Kalkan and Gülkan (2004) are carefully studied, their magnitude
information reveals significant discrepancies for the same events. This is more evident
for small magnitude cases. The site classifications of many Turkish strong-motion sites
presented in Zaré and Bard (2002), Kalkan and Gülkan (2004) and NGA metadata (Chiou
et al., 2008) show differences with respect to our in-situ Vs,30 measurements (Yılmaz et
al., 2008). These are also described as scatter plots in Figures 2b - 2d.
In recent times, many of the efforts in large-scale strong-motion projects have resorted to
the compilation of reliable databases because high-quality datasets would more
realistically address the impact of ground-motion uncertainty on research in both
seismology and earthquake engineering. Bearing this in mind, a project entitled
“Compilation of Turkish strong-motion network according to the international
standards1” was jointly launched by ERD-GDDA and EERC-METU2 in November
2005. Financial support has been granted by TUBITAK3. The principal objectives of the
project are: (1) compilation of the seismic catalogue for earthquakes recorded at strong-
motion stations of the Turkish national network, (2) classification of accelerometric data
recorded by the Turkish national network according to waveform quality and its uniform
processing, (3) site characterization of strong-motion stations through in-situ geotechnical
and geophysical surveys. Within this context we evaluated a total of 2996 events and
4607 records that span the time interval between 1976 - 2007 (This paper includes events
and records until 2006). The P- and S-wave velocity profiles as well as the soil-column
lithology of 243 strong-motion sites have been measured within the scope of this project.
1 Abbreviated as Turkish national strong-motion project (T-NSMP) throughout this paper 2 Earthquake Engineering Research Center – Middle East Technical University 3 Scientific and Technical Research Council of Turkey
4
The re-compiled database associated with the above information is disseminated through
the Web at http://daphne.deprem.gov.tr.
This article describes the significant seismological features of the new Turkish strong-
motion database and the procedures followed while compiling the catalog information
together with its data processing stage. We provide statistics of the database and
comparisons from independent studies to describe its limitations and reliability for case
specific earthquake engineering and seismological studies. As part of the above topics
we also present empirical magnitude scaling relationships to convert various magnitude
scales to moment magnitude (M). The article presents the overall bounds of the new
Turkish database through comparisons with the European strong-motion data presented in
Akkar and Bommer (2007). This comparison also reveals the likely contribution of our
new dataset to the European strong-motion database and emphasizes the necessity for
establishing global strong-motion databases for improving the accuracy of earthquake
related studies in and around Europe. The material covered in this paper is also useful for
assembling reliable suites of accelerograms from the new Turkish strong-motion database
that can lead to more reliable seismic hazard and risk analysis in this region.
2. Database development
We classify the information collected for each entry in the database under three headings:
(1) earthquake information (date, epicentral coordinates, magnitude, depth, faulting type),
(2) station information (coordinates, location, ID, altitude, P- and S-wave profiles and
corresponding soil conditions) and (3) record information (trigger times, peak ground
motion amplitudes and spectral values for each component, record type, various source-
to-site distance metrics, as well as low- and high-cut filter values used in the processing
of each waveform). The earthquake information was obtained from both national and
international seismic agencies (Appendix A). In fact, the database contains the
earthquake related parameters from each seismic agency as well as from the preferred
agencies that are ranked by predetermined priority levels. The highest priority for local
5
magnitudes and earthquake origin times are given to Turkish national seismic agencies.
For other earthquake parameters, the data published from the international agencies are
accepted as more reliable since these collect data from worldwide broadband stations.
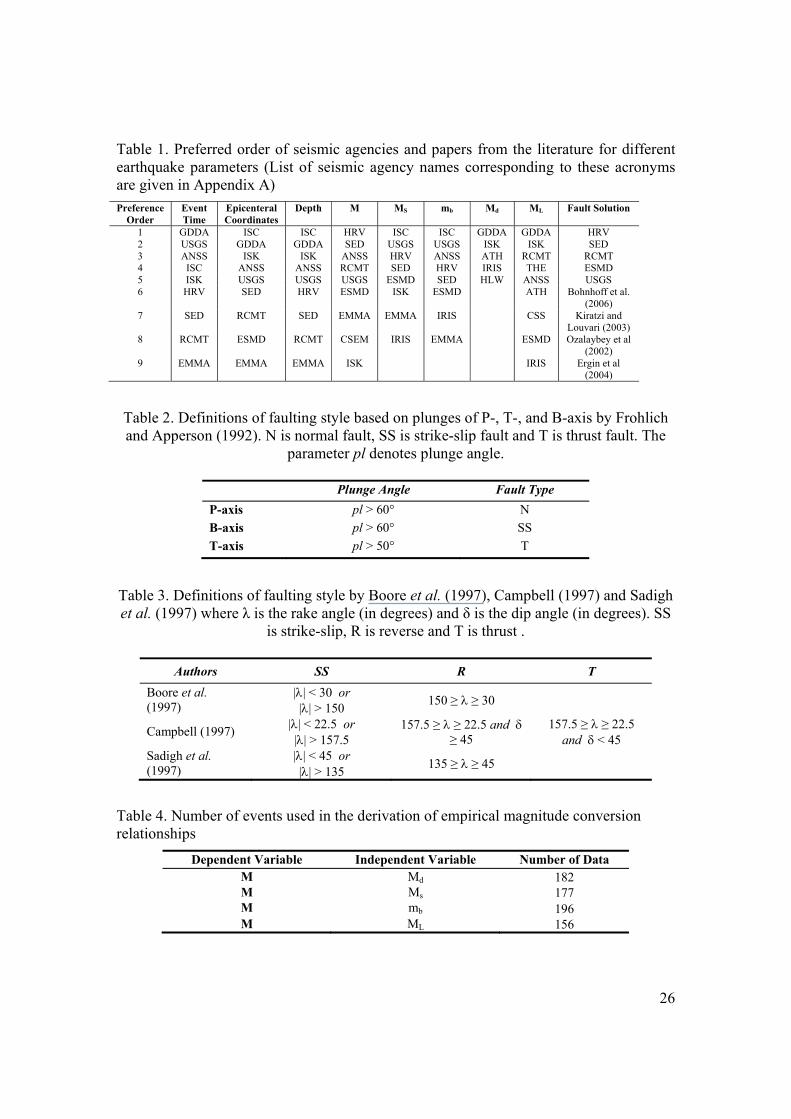
Table 1 lists the preference order of seismic agencies as well as some papers whose data
we used in collecting the earthquake parameter information. In the following sections,
we discuss data gathering procedures for earthquake, station and record related
parameters in greater detail.
2.1. Basic Earthquake Information
The earthquake information gathered for each event in the database consists of the
earthquake date, epicentral coordinates, earthquake magnitude in various scales (moment
magnitude (M), surface-wave magnitude (Ms), body-wave magnitude (mb), duration
magnitude (Md), and local magnitude (ML)), depth, and faulting type. Almost 75 percent
of events have complete epicentral location, origin time and depth information. Of these
events, Md values had been assigned to 70 percent; mb and ML values to 25 percent each;
Ms and M values for 14 and 7 percent, respectively, based on the various seismic agency
catalogues listed in Table 1. In the interest of obtaining more homogenous magnitude
information and increasing the number of events associated with moment magnitude
values, we developed empirical magnitude-conversion equations relying on the database
at hand. Detailed description for these expressions will be presented later in this article.
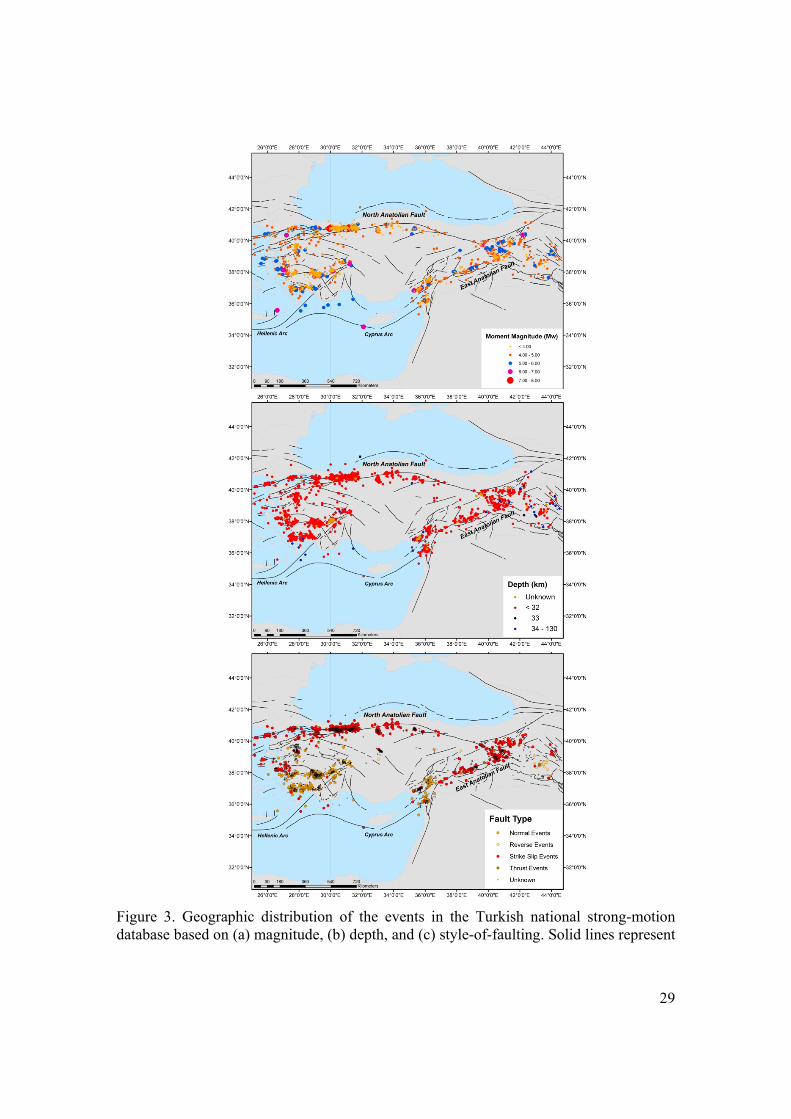
Figures 3.a - 3.c illustrate the geographic distribution of the events in the national strong-
motion database in terms of corresponding magnitude, depth and faulting style
parameters, respectively. The majority of the events in the database are shallow crustal
earthquakes (depths less than 15 km) associated with the transform North and East
Anatolian faults that run in the west-east and southwest-northeast orientations across the
country, respectively. The few earthquakes with depths exceeding 40 km have occurred
mostly in the southwest and eastern parts of Turkey falling on the Hellenic Arc and the
Bitlis-Zagros Suture Zone, respectively (Bozkurt, 2001). It is the converging Eurasian,
African and Arabian plates in the Eastern Mediterranean region that cause subduction
6
along the Hellenic and Cyprus Arcs; hence the observed deep-focus earthquakes in
Figure 3b. Figure 3.c shows that most of the events in the database are for earthquakes
with strike-slip and normal faulting. In this study, the faulting styles are primarily
determined from the criteria proposed by Frohlich and Apperson (1992) after obtaining
the fault plane solutions from the seismic agencies and other sources in the literature
listed in Table 1. The method of Frohlich and Apperson uses the plunges of P, T and B
axes for the fault plane solutions (Table 2). For cases when these parameters had not
been not provided by the preferred seismic agency or if the events were classified as
“odd4” by Frohlich and Apperson, then the rake angle intervals proposed by Boore et al.
(1997), Campbell (1997) and Sadigh et al. (1997) were used in the determination of
faulting style (Table 3). In the case of conflicting results between these three methods, the
commonly estimated faulting style was accepted as the optimally “correct” style-of-
faulting. In order to increase the number of database entries with known fault
mechanisms, locations of events were correlated with the locations of known faults.
With this rather crude method, the percentage of events with known fault mechanism was
increased to 55 percent. The style of faulting patterns observed in Figure 3.c are
consistent with the general tectonic settings of Turkey: the strike-slip events mostly take
place along the North- and East-Anatolian Fault Zones; and the normal events are in the
western parts of the Central Anatolia (i.e. West Anatolian Extensional Province; Bozkurt,
2001) which is bounded by several active normal faults.
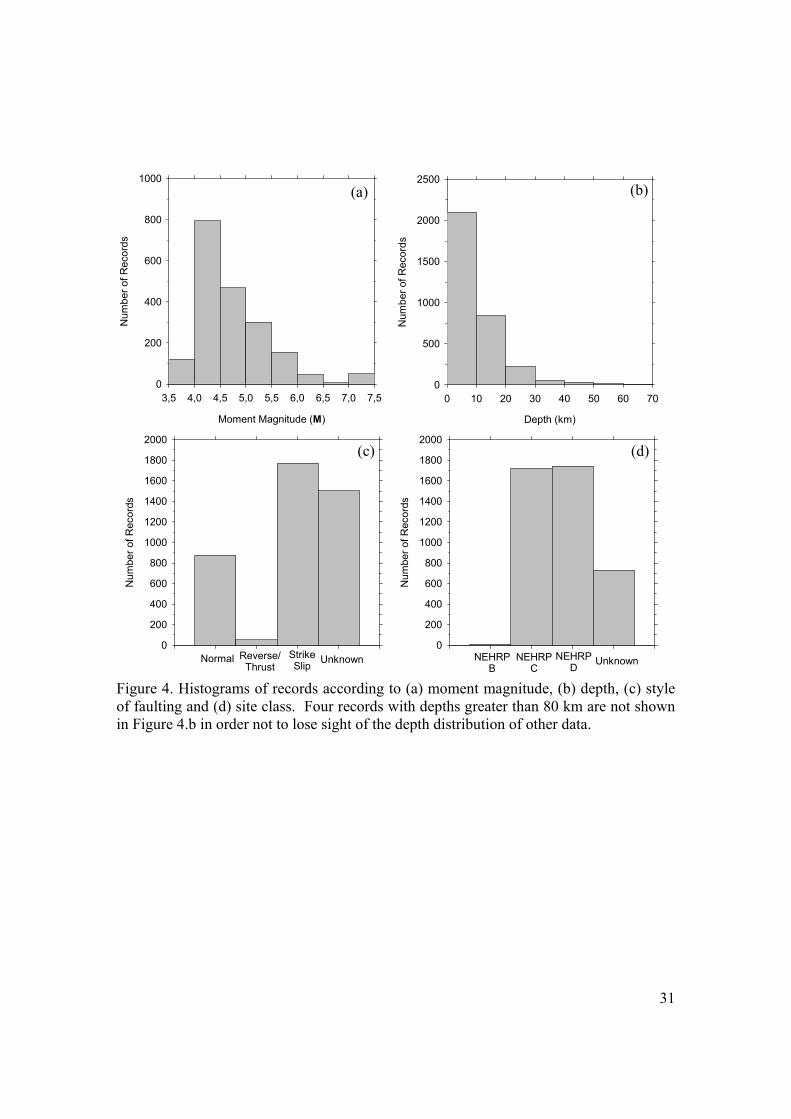
The spatial distributions of magnitude, depth and faulting style in Figure 3 are
summarized by the descriptive statistics of Figure 4. According to these figures, 80
percent of the records have magnitudes less than 5 (Figure 4.a) and 90 percent of the
records are from shallow crustal earthquakes (Figure 4.b). There is a clear gap of data for
the magnitude interval of 6.5-7.0 (Figure 4.a). Almost 60 percent of the records have
strike-slip or normal type fault mechanisms whereas only one percent of data belongs to
the thrust or reverse type faulting style (Figure 4.c). The rupture mechanism of the
4 The odd style-of-faulting generally refers to oblique faults. The reason we did not use this classification is to avoid complex fault descriptions in the database. The user can infer this faulting style definition from the database by using the plunges of P, T and B axes of available fault plane solutions.
7
remainder could not be identified due to the missing fault solutions or their vague
locations with respect to the well-known faulting zones.
2.2. Station Information
The station information for each record involves coordinates, location, ID, altitude and
site conditions. The first four parameters were obtained from the header information of
the records provided by GDDA. The local site conditions at 243 out of 327 stations were
obtained by conducting field tests within the scope of the T-NSMP project (Yılmaz et al.,
2008). The field tests carried out at each site of interest involved multi-channel analysis
of surface waves (MASW), standard penetration test (SPT) and geotechnical laboratory
tests (Sandıkkaya, 2008). Borehole seismic tests (BST) were also conducted for some
sites to validate the Vs (S-wave velocity) measurements of MASW. The Vs results of
these two methodologies were similar, varying between 10-15 percent band and
providing confidence in the MASW-based Vs measurements at other sites. Detailed
discussions on the in-situ geophysical and geotechnical site surveys are discussed in
Sandıkkaya et al. (2009). The average shear-wave velocity of the upper 30 m soil layer
(Vs,30) obtained at each strong-motion site through MASW was used for describing the
pertaining soil classification. Of the investigated strong-motion sites 56 percent fall into
NEHRP C (360 m/s ≤ Vs,30 < 760 m/s) site class whereas 42 percent of the recording
stations feature NEHRP D (180 m/s ≤ Vs,30 < 360 m/s) soil conditions (BSSC, 2003). The
entire field work showed that only 2 percent of the strong-motion sites are classified as
NEHRP B (760 m/s ≤ Vs,30 < 1500 m/s). Figure 4.d gives the distribution of records in
the database with respect to local soil conditions. As expected from above statistics, 82
percent of the records in the database correspond to NEHRP C or D type soil conditions
and only 1 percent of the accelerograms have Vs,30 > 760 m/s (NEHRP B site conditions).
The local soil conditions of approximately 17 percent of the database cannot be identified
as they belong to the temporary stations deployed for recording aftershock data after
major events. Within the scope of T-NSMP project no geophysical or geotechnical site
surveys have been carried out at these temporary station sites.
8
2.3. Record Information
The record information for each entry of the database involves peak ground motion
values (i.e. PGA, PGV and PGD) and spectral quantities for each acceleration
component, as well as low- and high-cut filter values used in the processing of
waveforms. We processed all records with M ≥ 3.5, and only for these records PGV,
PGD and spectral quantities were computed because ground motion records of events
with smaller magnitudes are unlikely to be significant for engineering use. PGA values
are listed for both raw and processed accelerometric data in the database. There are 1945
ground-motion records in the Turkish strong-motion database with M ≥ 3.5 out of a total
of 4203 accelerograms (inventory information until the end of 2006). However, not all of
these records could be processed as some are affected by non-standard recording and
digitization problems. In this study, the waveform qualities of all records were
categorized as specified in Douglas (2003) based on the following five categories of non-
standard errors: spike, insufficient digitizer resolution (IDR), multi-event (or multiple
shock, MS, events), S-wave triggered (S-WT), early termination during coda (ETDC).
The IDR non-standard error was further divided into three categories: moderate, poor and
very poor based on the number of levels of acceleration in the records; an objective
method suggested by Douglas (2003). Records with non-standard errors of spike,
moderate IDR and MS were processed after special treatment but the rest of the records
were excluded from the scope of the T-NSMP project. After eliminating poor quality
records with incurable non-standard problems, a total of 1320 three-component strong-
motion accelerograms with M ≥ 3.5 were available for processing. This value is almost
seven times larger than that analyzed by Zaré and Bard (2002), exceeding the number of
processed data in the European strong-motion database (Ambraseys et al., 2000 and
2004), and is comparable with the NGA database (3551 records; Chiou et al., 2008).
More importantly, the accelerograms were processed by following a uniform procedure.
This step constitutes one of the most critical tasks undertaken within the scope of the
project because application of appropriate processing techniques to eliminate the high-
and low-frequency noises and other type of defects would enhance the usefulness of these
9
records in engineering seismology and earthquake engineering related studies. The
processing technique is summarized in the following paragraphs.
A bi-directional, fourth-order Butterworth filter was used during the filtering process.
The Butterworth type of filter was preferred as it has the flattest possible pass-band
magnitude response and its pulse response in the time domain behaves better than the
Chebyshev type filter. Butterworth filters also have better rate of decay than Bessel type
filters. The choice of an acausal (bi-directional) filter was to prevent any phase distortion
in the processed signal. As shown by various studies (e.g. Boore and Akkar, 2003; Boore
and Bommer, 2005) spectral and peak ground values are less sensitive to the chosen filter
cut-off when the data is filtered by phaseless (acausal) filters.
Before starting the actual filtering, an initial baseline adjustment was applied to the
accelerograms. If there was a pre-event buffer in the accelerograms (digital records), the
mean of 90 percent of this pre-event time was removed from the entire record (i.e. if there
is 10 seconds long pre-event time in the record, the average of 9 seconds portion of this
was removed from the wholeaccelerogram). If there was no pre-event information in the
acceleration time series (analog records), the mean of the entire record was computed and
removed from the entire acceleration time series. The long-period (low-frequency) filter
cut-offs for removing the noise in the mean removed accelerograms were estimated in the
frequency domain based on the iterative procedure suggested by Akkar and Bommer
(2006). This procedure requires the calculation of theoretical source spectrum corner-
frequency in low-frequency range that guides the analyst while determining the low-cut
filter frequency and is based on the assumption that filtered data must follow the
theoretical source spectrum in the low-frequency region of the spectrum (i.e. trends
proportional to f2 in the low-frequency range). In this study, the double-corner source
spectrum model proposed by Atkinson and Silva (2000) and Brune’s single-corner source
spectrum (ω2 model) presented in Joyner and Boore (1988) were used for guidance in
low-cut filter decision. High-cut filter values for removing short-period (high-frequency)
noise were selected by the behavior of theoretical spectrum at high frequency range. The
10
selected high-cut filters satisfy the high-frequency decay proportional to the gradient of
1/f2 in the processed data.
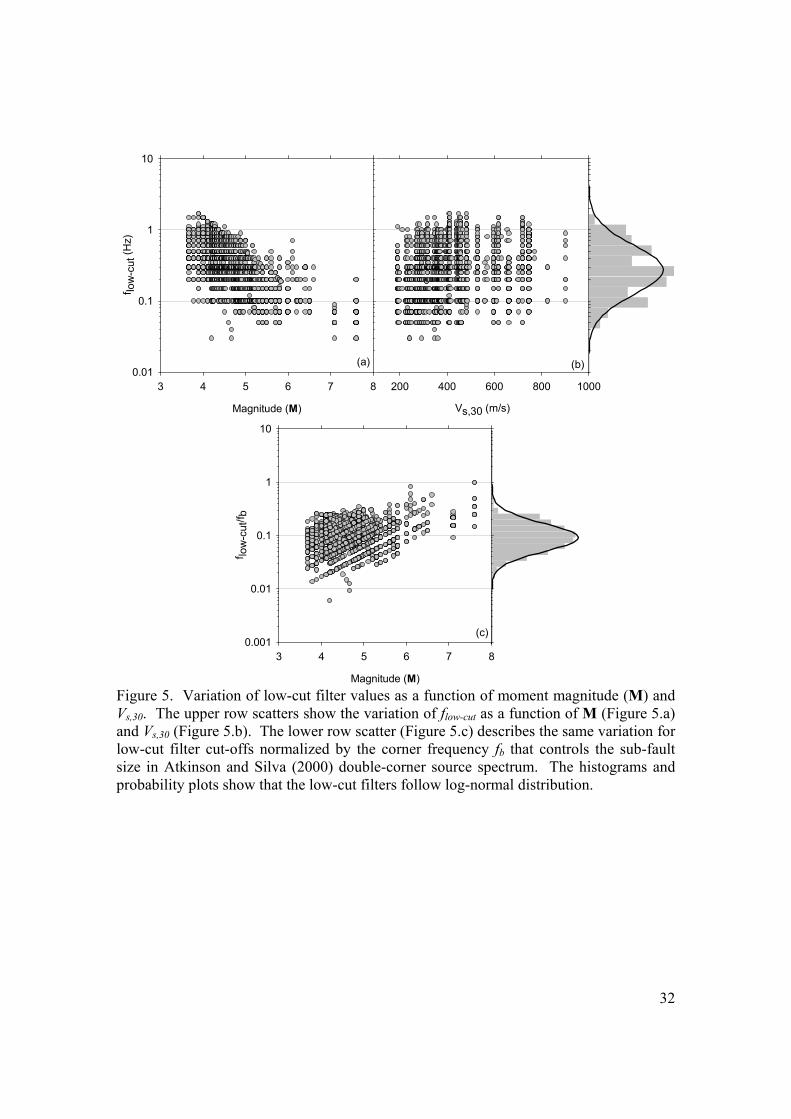
Moment magnitude and Vs,30 dependent variation of low-cut filter (flow-cut) values
implemented during the filtering process are displayed as scatter plots in Figure 5.
Among other issues, low-cut filter frequencies constitute one of the major concerns in
digital filtering because they directly influence the usable spectral ranges of the processed
records. Improper low-cut filter values would result in less efficient strong-motion
databases. The upper-left plot (Figure 5.a) indicates that the chosen flow-cut values are
strongly correlated with magnitude. The increase in magnitude lowers the chosen flow-cut.
This indicates that the usable spectral period ranges of the accelerograms in the Turkish
strong-motion database increase with larger magnitude values. A consistent variation
with the theoretical source spectrum behavior dictating enhanced low-frequency
components is associated with higher magnitudes. We note that there is no apparent
trend in the variation of flow-cut as a function of Vs,30 (Figure 5.b). In other words, the
choice of flow-cut is quite random in terms of site class. The normal probability curve and
the frequency distribution of flow-cut in log-axis reveal similarities advocating a log-normal
distribution for low-cut filter values with a median value equal to 0.3 Hz. Figure 5.c
reveals similar information but this time we normalized the flow-cut with the corresponding
fb (sub-fault size controlling corner-frequency in the theoretical double-corner source
spectrum used here). Given the uncertainty associated with the derivation of theoretical
source spectra, ratios smaller than one would suggest negligible interference of low-cut
filtering to the genuine low-frequency content of the accelerogram (ideal filtering).
However, ratios greater than one can be interpreted as the removal of an integral part of
the signal while filtering out the long-period noise. The scatters in Figure 5.c indicate
that the entire database was processed with filter cut-offs less than fb. This observation
once again emphasizes longer usable spectral period ranges of the processed records in
the database, which can be interpreted as the recovery of optimum information from the
accelerometric data. The normal probability comparison with the flow-cut/fb distribution in
log-axis once again reveals a good match and shows a median value of ∼ 0.1 emphasizing
that the selected low flow-cut values are generally lower than the critical filter frequencies
11
that may spoil the behavior of data in the frequency domain. (Note: flow-cut/fb ratios of
some large magnitude events are close to 1. These records might have been affected by
excessive filtering). These observations provide hints that an optimum processing
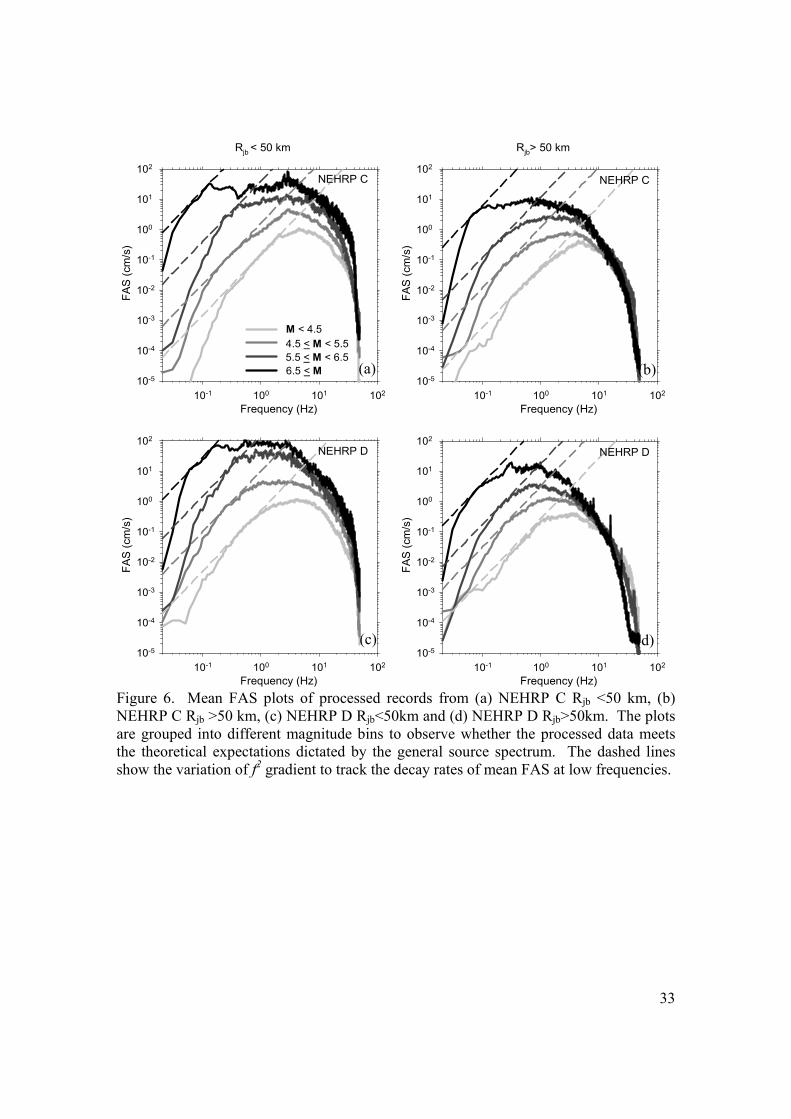
technique has been implemented in our new database. This fact is further documented in
Figure 6 that illustrates the mean Fourier amplitude spectra (FAS) of the processed
records grouped in different magnitude and distance bins. The low-frequency variations
in each magnitude bin are proportional to the gradient of f2 that are shown by the
corresponding f vs. f2 dashed lines superimposed on the plots. Moreover, the corner-
frequencies at the low-frequency end are strictly functions of magnitude that is also
consistent with the source-spectrum theory discussed in the text.
The other important information given for each record is the source-to-site distances that
are measured from various references. Depending on the level of fault geometry
information gathered from the seismic agencies listed in Table 1, we calculated the
Joyner-Boore distance, Rjb, epicentral distance, Repi, hypocentral distance, Rhyp, and
closest distance to rupture, Rrup (the reader is referred to Abrahamson and Schedlock,
1997 for the generic definitions of these distance metrics). In the case of events whose
true rupture locations were sought through special studies, we used that information for
the computation of source-to-site distances instead of the agencies listed in Table 1 (i.e.
the 1999 Kocaeli earthquake; Delouis et al., 2002). For cases where rupture parameters
are unknown through the geological and geophysical observations, the concerned
variables (i.e. subsurface rupture length, rupture width and rupture area) which are
required for the calculation of some of the distance metrics defined above were estimated
from the empirical relationships of Wells and Coppersmith (1994). The information
compiled from different seismic agencies reveals complete source and fault geometry
data for 80 percent of the processed records in the database. Thus, we calculated the
aforementioned distance metrics only for these cases.
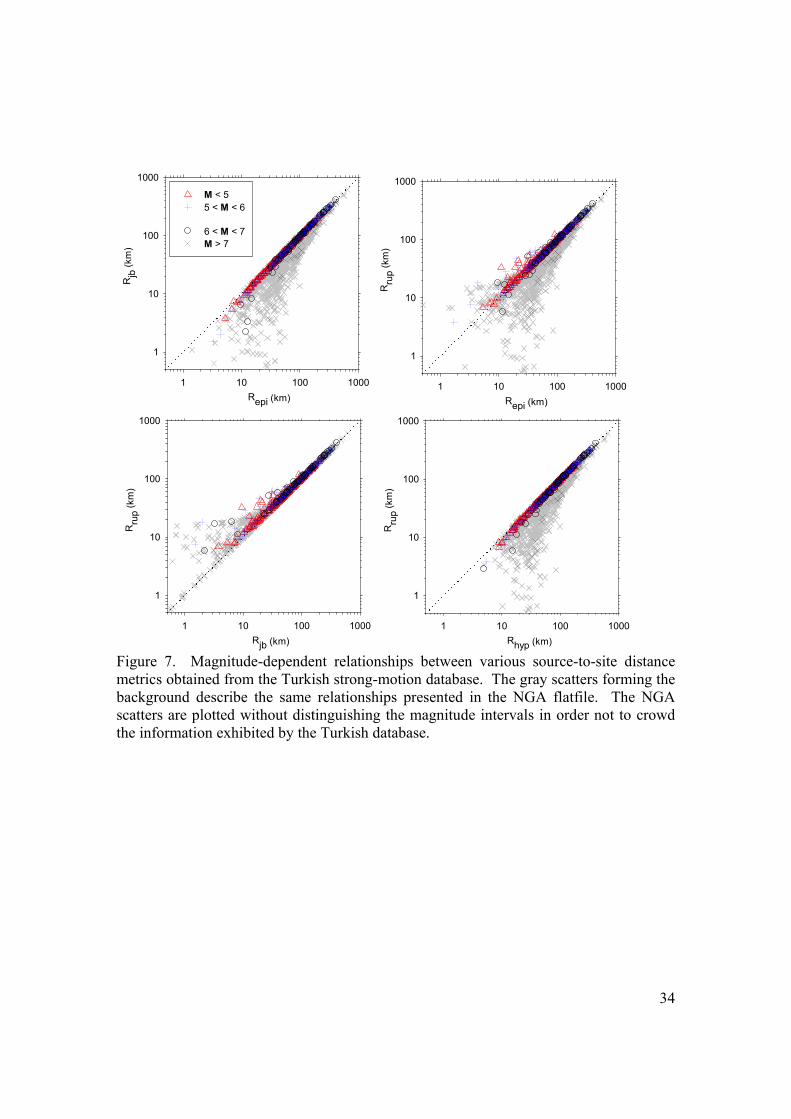
We illustrate the relationships between these distance metrics (i.e. Rjb vs. Repi, Rrup vs.
Repi, Rrup vs. Rjb and Rrup vs. Rhyp) in Figure 7 for different magnitude intervals. The gray
scatter points (presented in the background of each plot) describe the same relationships
12
that were obtained from the NGA strong-motion database. The NGA scatters are not
subdivided into different magnitude bins in order to keep the plots as clean as possible.
The gross comparisons between these two databases reveal similar patterns for the
relationships between different source-to-site distance metrics, confirming the reliability
of our distance calculations. More comprehensive comparisons for the magnitude-
dependent source-to-site distance relationships obtained from the Turkish and NGA
databases are given in Erdoğan (2008).
Figure 7.a shows that Rjb attains smaller values with respect to Repi, especially for large
magnitude events (M ≥ 6). The discrepancies between Rjb and Repi diminish at large
distances except for a few events with M > 7. When M is greater than 6 and epicentral
distances are less than 40 km, the discrepancy between Rjb and Repi becomes noticeable
depending on the location of the hypocenter or the size of the fault plane. The scatters in
Figure 7.b reveal that Repi generally tends to be larger than Rrup for increasing magnitude
and decreasing distance but this trend is not as clear as in the case of Rjb vs. Repi scatters.
This might be due to the event-dependent variation of depth as well as the dipping angle
that play important roles in the calculation of Rrup. In the case of Rrup vs. Rjb relationship
(Figure 7.c), Rjb tends to be smaller than Rrup for Rjb < 20 km regardless of the variations
in magnitude. For larger distances, Rjb is approximately equal to Rrup, which means that
above approximately 20-30 km, the differences in the definitions of these distance
metrics become immaterial. This can be attributed to the importance of earthquake depth
that marks the major differences between Rjb and Rrup for sites close to the fault rupture
plane. As the recording station is located away from the source, depth reduces its
significance and consequently Rjb ≈ Rrup. Note that the database consists mainly of
shallow earthquakes and this feature reinforces our observations on the similarity of Rrup
and Rjb at the intermediate and large distances. It is depicted from Figure 7.d that Rhyp is
always equal to or greater than Rrup. When the ground motions are from large events (i.e.
M > 7), and represent close-to-intermediate distance recordings (i.e. 10 km < Rhyp < 50
km), the discrepancy between these two distance metrics becomes larger. The increase in
discrepancy may stem from the increased dimensions of ruptured fault plane at large
13
magnitude events. Note that for events with M < 6, regardless of the distance value, Rhyp
is approximately equal to Rrup.
The calculated source-to-site distances metrics has also enabled us to verify some of the
important assumptions by Scherbaum et al. (2004) who developed empirical conversion
relationships to estimate Repi, Rhyp and Rrup from Rjb. Scherbaum et al. (2004) derived
their empirical relationships through regression analysis on stochastically simulated data.
We believe that these relationships are useful while evaluating various GMPEs that use
different source-to-site distance measures. Thus, observations on their limitations are
important for their rational use. One of the major assumptions in these empirical models
is that residuals between various distance measures can be expressed as gamma and
normal random variables. We tested this assumption by examining the distribution of
residuals between Rjb and corresponding Repi using our database. Similar checks can also
be made for the residuals between other distance metrics but paucity of data did not allow
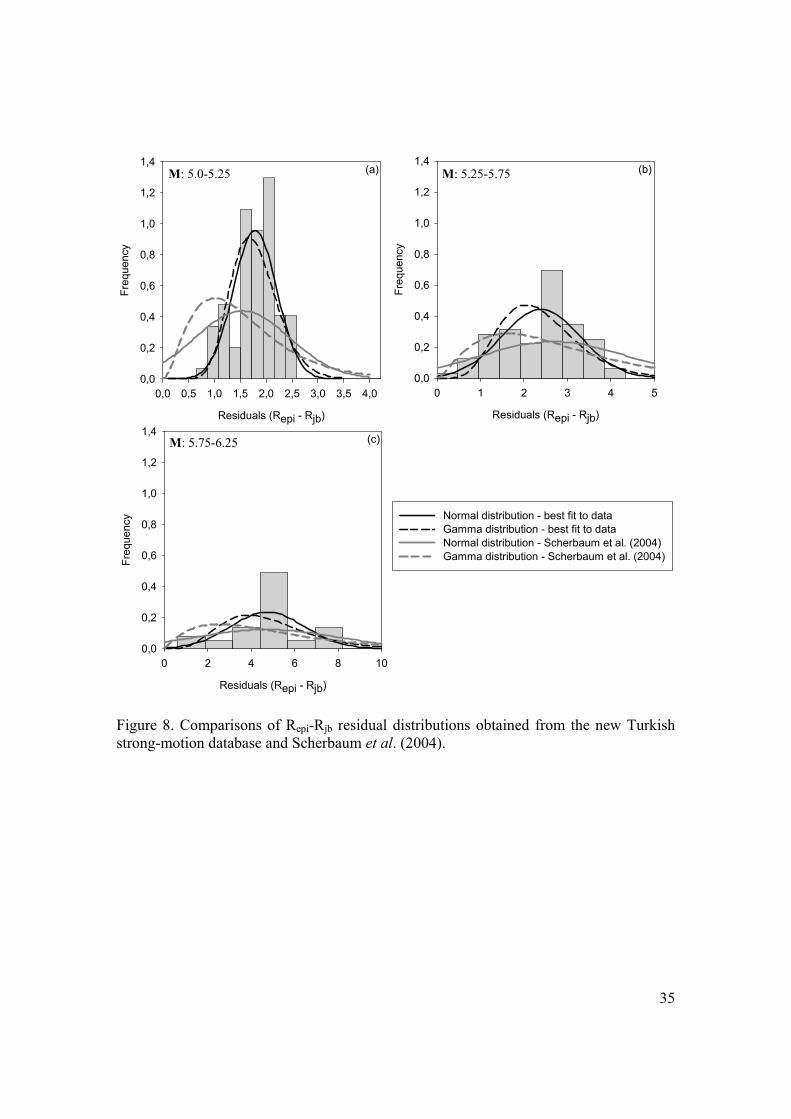
us to carry out that analysis. Figures 8.a to 8.c illustrate the Rjb - Repi residuals and their
corresponding distributions for magnitude-distance bins of (a) 5 ≤ M < 5.25 and 0 ≤ Rjb ≤
100 km, (b) 5.25 ≤ M < 5.75 and 0 ≤ Rjb ≤ 100 km, and (c) 5.75 ≤ M < 6.25 and 0 ≤ Rjb ≤
100 km, respectively. We plotted two sets of normal and gamma distributions in these
figures: using their relevant parameters derived from our database and using the
parameters proposed by Scherbaum et al. (2004). The comparisons indicate that normal
and gamma distributions represent fairly well the residual variation between Rjb and Repi
but the same distributions plotted from the proposed parameters of Scherbaum et al.
(2004) fail to follow the expected trends in the data. This is also validated by the Chi-
Square tests at 5% significance level. The variances calculated from our database are
lower than those proposed in Scherbaum et al. (2004). This causes the discrepancy in
normal and gamma distributions proposed by Scherbaum et al. (2004) despite the
similarities between the mean values defined by Scherbaum et al. (2004) and this study.
Confined to the findings of this article, the random Rrup, Repi and Rhyp estimations by
Scherbaum et al. (2004) may vary within a wider band when compared to the variations
in the actual data.
14
3. Magnitude conversion relationships
As noted in the previous section, we derived empirical magnitude conversion
relationships to obtain a more homogenous strong-motion database and to increase its
usability for seismic hazard related studies. The proposed empirical relationships
calculate the expected moment magnitude from Ms, Md, ML and mb. Table 4 lists the
number of data used in the regression analysis of different magnitude pairs. These pairs
are directly extracted from the magnitude catalog information published by the preferred
agencies listed in Table 1. The examination of Table 4 indicates that the M vs. mb has
the highest number of data although the majority of the events in the database are
reported in Md.
We performed linear (ordinary least squares, OLS) and orthogonal (total least squares,
TLS) regressions to compute the relationships between M and the other magnitude
scales. The ordinary least squares method assumes that only the dependent (response)
variable is random. In other words, the measurement errors are introduced only into the
dependent variable. The orthogonal regression considers the measurement errors on both
dependent and independent variables (Carroll and Ruppert, 1996). The major
shortcoming in the application of orthogonal regression to magnitude conversion
equations, however, is that it requires knowledge of the variance ratio between the two
magnitude scales under consideration (Castellaro and Bormann, 2007). To estimate the
global standard deviation for a given magnitude scale, corresponding magnitudes should
be based on at least three station estimates. This information is not available for the
magnitude estimates of many events obtained from national and international seismic
agencies. Thus, we set the variance ratios to 1, which formally coincides with the
assumption that standard deviations of different magnitudes are approximately equal.
This approach is suggested as the conventional approach for unknown variance ratio by
Castellaro et al. (2006). The Chi-square regression approach is the third approach that is
applied to the development of empirical magnitude conversion relationships by Grünthal
et al. (2009). As for linear models and equal magnitude variances the Chi-square
regression reduces to TLS and it was not employed in this study. Applicability of linear
15
models to the data in hand was assured by carrying out analysis of variance (ANOVA),
details of which can be found in Erdoğan (2008).
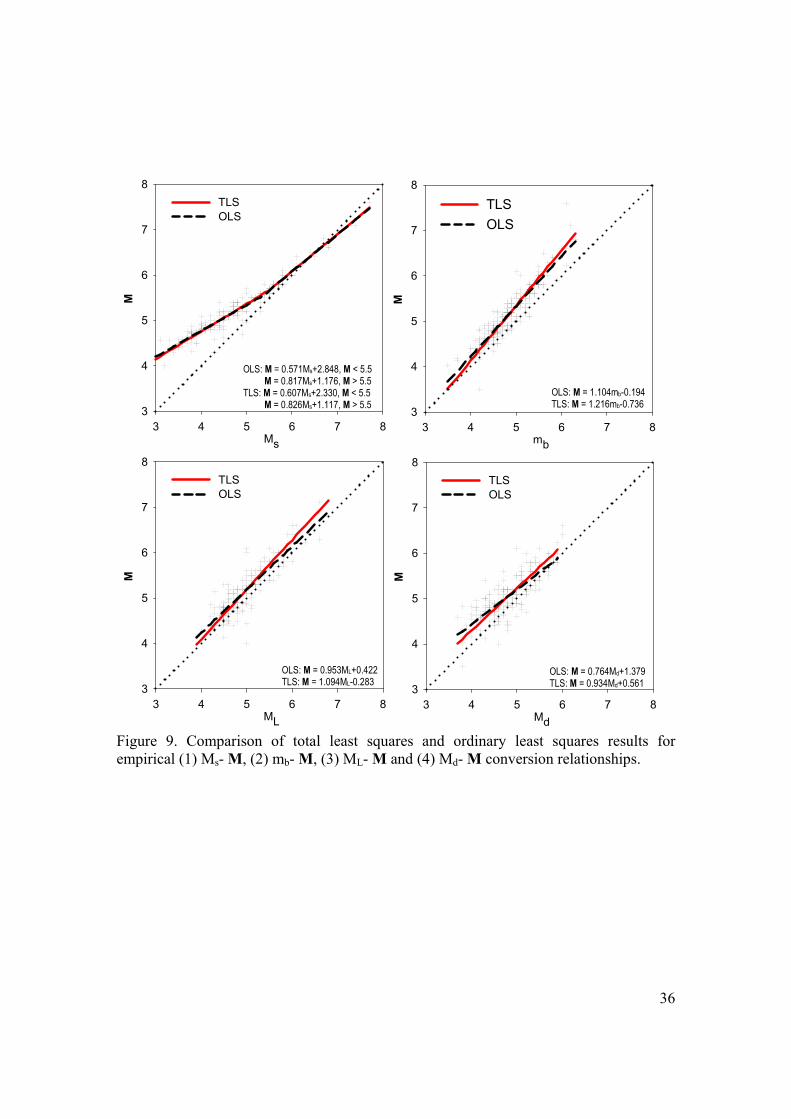
Figures 9.a – 9.d illustrate the comparisons of OLS and TLS approaches. The plots
indicate that the functional models examined here yield approximately the same results
for the M vs. Ms relationship, but there are observable discrepancies in the other
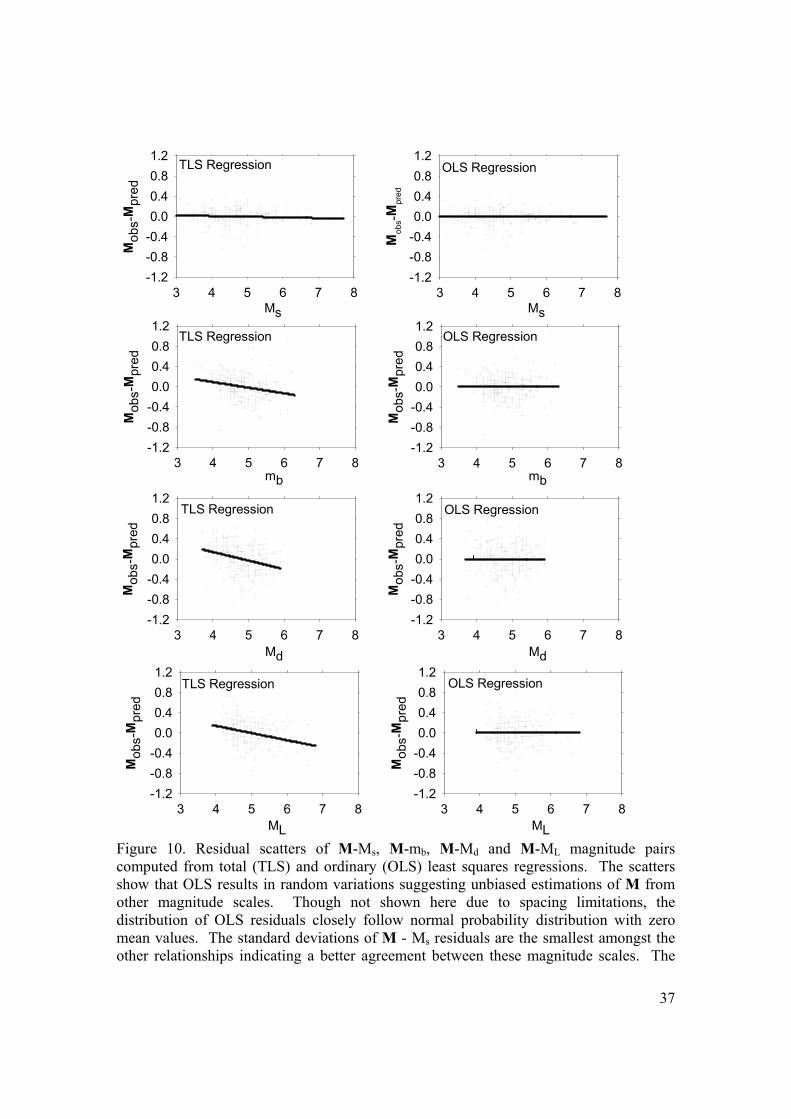
relationships. Residual scatters resulting from these regression methods are presented in
Figures 10.a – 10.h. Linear trend lines on the residuals show whether the estimations are
biased towards conservative or non-conservative values. A significant slope in these
linear trends indicates biased estimations for the concerned functional model. These
plots show that the variation in the ordinary least squares residual scatters is quite random
and does not show any significant tendency towards either conservative or non-
conservative estimations. For orthogonal regression, slopes of the linear trends are
different than zero, suggesting the existence of tendency towards conservative or non-
conservative estimations. This observation may advocate the dependency of TLS
calculations on the variance estimations of dependent and independent variables. Bearing
on the uncertainties associated with TLS and the observed performance of OLS shown in
by the residual scatters, we preferred using the empirical expressions computed from the
OLS regression for magnitude conversions.
The final forms of the empirical magnitude conversion equations obtained in this study
are given below. Each relationship is strictly valid for the magnitude interval used during
its derivation. These ranges are given next to each equation.
)16.0(194.0)03.0(104.1M ±−±= bm for 3.5< mb < 6.3 (1)
)11.0(484.2)02.0(571.0M ±+±= sM for 3.0 < Ms < 5.5 (2a)
)18.0(176.1)03.0(817.0M ±+±= sM for 5.5 ≤ Ms < 7.7 (2b)
)21.0(422.0)04.0(953.0M ±+±= LM for 3.9 < ML < 6.8 (3)
)2.0(379.1)04.0(764.0M ±+±= dM for 3.7 < Md < 6.0 (4)
16
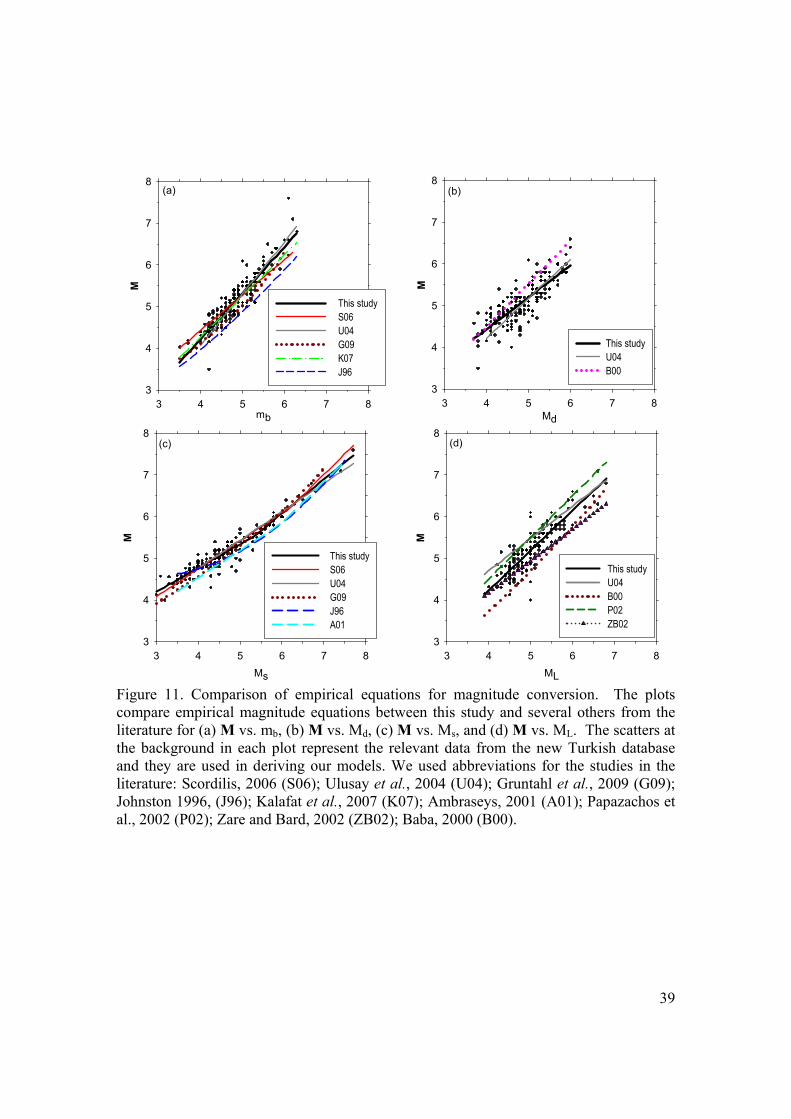
The empirical magnitude conversion equations presented are compared with the
previously developed magnitude conversion equations for Turkey (Ulusay et al., 2004;
Kalafat et al., 2007), as well as with the recent European expressions (Grünthal et al.,
2009; Ambraseys, 2001) and global/regional (Scordilis, 2006; Baba et al., 2000)
equations. The comparisons are given in Figures 11.a – 11.d. In case of M vs. mb
relationship, estimates by Ulusay et al. (2004) and Kalafat et al. (2007) yield closer
results to this study whereas the relationship proposed by Johnston (1996) and Grünthal
et al. (2009) calculate slightly lower M estimations when compared to our results.
Scordilis (2006) overestimates M values for mb < 5 events and underestimates the M
values for mb > 5. In case of the M – Md relationship, Ulusay et al. (2004), Baba et al.
(2000) and this study yield similar results.
In general, the linear regression models of this study result in fairly similar estimates with
the other studies in case of the M vs. Ms conversion relationship. A close examination of
Figure 11.c shows that Ulusay et al. (2004) and Scordilis (2006) relationships provide
very similar results to this study particularly for events with M < 6. On the other hand,
the relationship proposed by Ambraseys (2001) is relatively different. Ambraseys (2001)
yields lower estimations with respect to our expression. The discrepancy between two
expressions varies between 5- to 10-percent and it diminishes with increasing magnitude.
When M - ML relationship is of concern (Figure 11.d), it is observed that there exists
considerable differences between the M estimations of other studies with those obtained
from this study. It should be noted that the ML estimates generally depend on the
information disseminated by local seismic agencies. Therefore, discrepancies observed
between this study and other international studies would not be surprising due to the
differences in the databases. The sources of differences between the empirical
expressions derived from the Turkish ground-motion database may stem from the
methodologies, magnitude limits used in the regression analysis, or choices of seismic
agencies for obtaining moment magnitude values. Ulusay et al. (2004) used only 27 M -
ML pairs from ERD catalogues for deriving the ML-based relationship but the regression
methodology is not clearly stated in their paper. Thus, we cannot come to a clear
conclusion about the observed discrepancy between our study and this study for M - ML
17
conversion. We note that the consistent estimates form the empirical magnitude
relationships are bounded with the reliability and accuracy of the methodologies used in
magnitude calculations. We believe that the empirical expressions presented here are
based on trustworthy magnitude values and they can be used in confidence at least for the
hazard studies in Turkey within their range of applicability.
4. Summary and Conclusions
We have described the important seismological features of the new Turkish strong-
motion database that has been compiled and processed under the project entitled
“Compilation of Turkish strong-motion network according to the international
standards.” A total of 4607 records from 2996 events (ERD-GDDA catalog between
1976 and 2007) have been compiled and processed together with the in-situ site surveys
of 243 strong-motion stations through a project funded by TÜBİTAK, Turkey’s national
research support authority. The database is being disseminated at
http://daphne.deprem.gov.tr. The re-structured database contains reliable information on
the earthquake source parameters (through the investigations of 18 seismic agencies and
some relevant papers in the literature) and site character of strong-motion stations (via
geotechnical borehole logs and MASW). This detailed inventory has permitted us
compute various source-to-site distance metrics for each record, faulting mechanisms of
the events, and magnitude conversion relationships to further homogenize the database
for different seismological parameters. When this information is combined with the site
characterization of strong-motion stations and uniform data processing, the resulting
database can be considered as a significant source for seismic risk and hazard studies for
Turkey and for regions of similar seismotectonic features.
The descriptive statistics on data processing and other relevant observations advocate the
use of optimum filter cut-offs for the processed accelerograms. This can also be
interpreted as longer usable spectral periods for engineering and strong-motion
seismology studies. Notwithstanding that remark, the statistical results and comparisons
with the global NGA metadata suggest that the computed source-to-site distances follow
18
rational trends with physical explanations. Our observations also indicate that the
distance-dependent probability distributions of Scherbaum et al. (2004) and the new
database exhibit similarities except for the fact that the dispersions between different
distance metrics in our database are relatively smaller. These comparative evaluations
give us confidence in our source parameter calculations. The empirical magnitude
conversion relationships of this study are generally in good agreement with the similar
expressions derived in the literature. Within this context, we can confidently propose the
empirical magnitude relationships presented here for their efficient use in seismic hazard
studies in particular for Turkey.
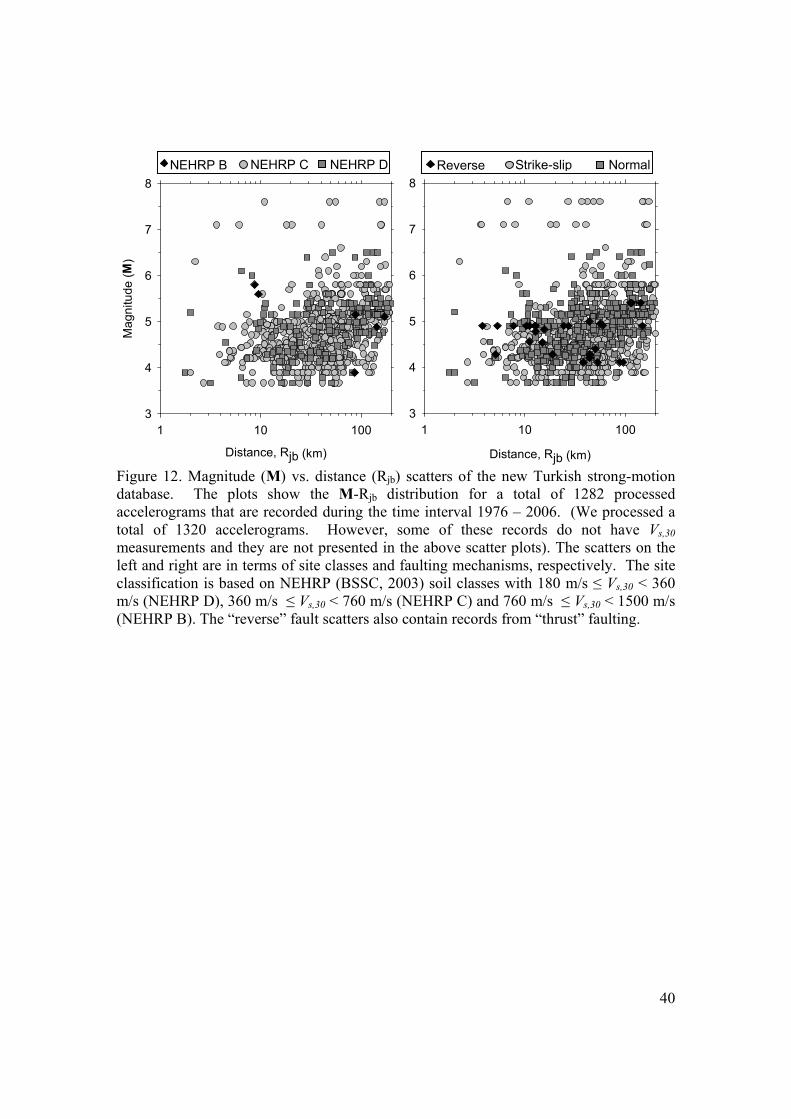
The conclusive picture of the above summary is given in Figure 12 that describes the
magnitude vs. distance scatters of the processed records in the new Turkish database.
The site-class and faulting-style dependent scatters in Figure 12 show that our database is
well distributed between magnitudes 3.5 and 6.5 and for distances between 5 and 200 km.
The recordings of magnitude above 7 are from the 1999 Marmara earthquakes and they
cannot fill the entire distance band for the magnitude range between 7 and 7.5. Although
the scatters display a total of 1282 processed records, small number of records from rock
site stations (i.e. 760 m/s < Vs,30 < 850 m/s) and reverse faulting events is impossible to
ignore. The database contains mainly stiff-to-dense soil recordings (NEHRP C and D
with 360 m/s ≤ Vs,30 < 760 m/s and 180 m/s ≤ Vs,30 < 360 m/s, respectively) and normal
and strike-slip faulting events, reflecting the general tectonics of Anatolian peninsula.
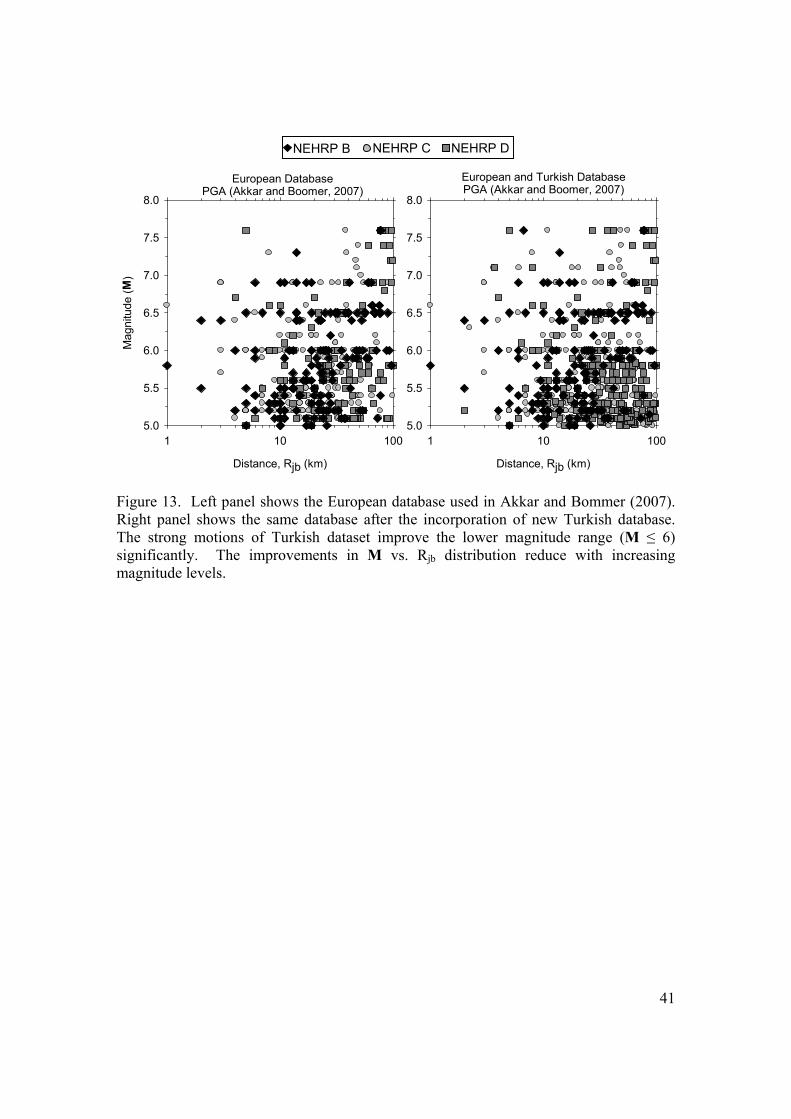
In closure, Figure 13 summarizes the contribution of the new Turkish accelerometric
recordings to the current state of European strong-motion database. We used the
European database of Akkar and Bommer (2007) to delineate the differences in M – Rjb
distribution before and after the incorporation of two datasets. The tectonic settings of
both databases are the same hence their integration would not result in biased discussions.
The comparative plots emphasize that the magnitude and distance distributions improve
significantly when the new Turkish data is integrated into the European dataset. The
scatter plots depict that the improvements are more apparent in the lower magnitude
interval whereas there are still some gaps at higher magnitude and larger distance
19
intervals. As discussed throughout this paper the loss of uniformity in magnitude and
distance distribution would increase the uncertainty in the hazard and risk related studies.
This fact emphasizes the importance of establishing ground-motion datasets from a series
of reliable global strong-motion databases in order to increase the level of confidence in
the outcomes of seismic studies. As a matter of fact, one of the main objectives of
ongoing large-scale ground-motion studies (e.g. EC FP7 – Seismic Hazard
Harmonization in Europe, SHARE) is to render reliable and well-distributed databases to
improve the quality of hazard related studies in and around Europe. We believe that our
new database will significantly contribute to such initiatives.
5. Acknowledgments
This research is funded by the Scientific and Technical Research Council of Turkey with
award no. 105G016. The authors express their sincere gratitude for this grant. The
contributions of Earthquake Research Department of General Directorate of Disaster
Affairs during the entire course of this project are also acknowledged by the authors. The
authors thank to Dr. David M. Boore, Dr. John Douglas, Professor Pierre-Yves Bard and
Prof. Julian J. Bommer for their technical support during the conduct of the project. The
constructive comments by Dr. Dino Bindi also helped us improving the technical essence
of the paper.
20
References Abrahamson, N. A. and Shedlock, K. M., (1997). Overview, Seismological Research Letters, Vol. 68, pp.9-23. Akkar, S. and Bommer, J.J., (2007). Prediction of elastic displacement response spectra in Europe and the Middle East,” Earthquake Engineering and Structural Dynamics, Vol. 36, pp. 1275-1301. Akkar, S. and Bommer, J. J., (2006). Influence of Long-period Filter Cut-Off on Elastic Spectral Displacements, Earthquake Engineering and Structural Dynamics, Vol. 35, pp.1145-1165. Ambraseys, N., Douglas, J., Sigbjornsson, R., Bergethierry, C., Suhadolc, P., Costa, G., Smit, P.M., (2004). Dissemination of European strong motion data volume 2, Proceedings of 13th World Conference on Earthquake Engineering, Vancouver, B.C., Canada, August 1-6 2004, paper no. 32. Ambraseys, N.N., (2001). Reassessment of Earthquakes, 1900-1999, in the Eastern Mediterranean and the Middle East, Geophysics Journal International, Vol. 145, pp.471-485. Ambraseys, N., Smit P., Berardi R., Rinaldis D., Cotton F., and Berge-Thierry C. (2000). Dissemination of European Strong-Motion Data. CD-ROM collection, European Commission, Directorate General XII, Science, Research and Development, Environment and Climate Programme, Bruxelles. Ambraseys, N., Durukal, E. and Free, M., (1993). Re-evluation of strong-motion data in Tukey, ESEE Research Report, No. 93/2; Imperial College of Science, Technology and Medicine, Civil Engineering Department, London SW7 2 BU Atkinson, G. M., and Silva, W., (2000). Stochastic modeling of California ground motions, Bulletin of the Seismological Society of America, Vol. 90, pp.255-274. Aydan, O., and Hasgür, Z., (1997). The characteristics of acceleration waves of Turkish earthquakes, Proceedings of the 4th National Confeernce on Earthquake Engineering, Ankara, Turkish National Committee of eartqhauke Engineering, pp. 30– 37, (in Turkish). Baba A.B., Papadimitriou E.E., Papazachos B.C., Papaioannou C.A., and Karakostas B.G. (2000). Unified local magnitude scales for earthquakes of southern Balkan area, Pure Applied Geophysics, Vol. 157, pp.765-783. Barka A., Reilinger R. (1997). Active tectonics of the Eastern Mediterranean region deduced from GPS, neotectonic, and seismicity data. Annali Geofisica, Vol.40, pp.587-610.
21
Bohnhoff, M., Grosser, H., and Dresen, G., (2006). Straing partitioning and stress rotation at the North Anatolian fault zone from aftershock focal mechanisms of the 1999 Izmit Mw=7.4 earthquake. Geophysical Journal International, Vol. 166, pp. 373-385. Boore, D. M. and Akkar, S., (2003). Effect of causal and acausal filters on elastic and inelastic response spectra, Earthquake Engineering and Structural Dynamics, Vol. 32, pp.1729-1748. Boore, D. M. and Bommer, J. J., (2005). Processing of strong-motion accele-rograms: needs, options and consequences, Soil Dynamics and Earthquake Engineering, Vol. 25, pp.93-115. Boore, D. M., Joyner, W. B. and Fumal, T. E., (1997). Equations for estimating horizontal response spectra and peak acceleration from western North American earthquakes: a summary of recent work, Seismological Research Letters, Vol. 68, pp.128-153. Bozkurt, E., (2001). Neotectonics of Turkey - a synthesis, Geodinamica Acta, Vol. 14, pp.3-30. Building Seismic Safety Council (BSSC), (2003). NEHRP Recommended Provisions for Seismic Regulations for New Buildings and Other Structures, FEMA-450, 2003 revision, Federal Emergency Management Agency, Washington D. C. Campbell, K. W., (1997). Empirical near-source attenuation relationships for horizontal and vertical components of peak ground acceleration, peak ground velocity, and pseudo-absolute acceleration response spectra, Seismological Research Letters, Vol. 68, pp.154-179. Ateş, R.C. and Bayülke N., (1982). The 19 August 1976 Denizli, Turkey, earthquake: evaluation of the strong motion accelerograph record. Bulletin of Seismological Society of America, Vol.72, pp.1635–1649. Carroll, R. J. and Ruppert, D., (1996). The use and misuse of orthogonal regression in linear errors-in-variables models, The American Statistician, Vol. 50, pp.1-6. Castellaro, S. and Bormann, P., (2007). Performance of different regression procedures on the magnitude conversion problem, Bulletin of the Seismological Society of America, Vol. 97, pp.1167-1175. Castellaro, S., Mulargia, F., and Kagan, Y. Y., (2006). Regression problems for magnitudes, Geophysics Journal International, Vol. 165, pp.913–930. Chiou, B., Darragh, R., Gregor, N., and Silva, W., (2008). NGA project strong-motion database, Earthquake Spectra, Vol.24, pp.23-44.
22
Çelebi, M., Akkar, S., Gülerce, U., Şanlı, A., Bundock, H. and Salkın, A., (2001): Main shock and aftershock records of the 1999 İzmit and Düzce, Turkey earthquakes, USGS/OFDA Project [USGS Project No.: 1-7460-63170], USGS Open-File Report 01-163. Delouis, B., Giardini, D. Lundgren, P., and Salichon, J. (2002). Joint inversion of InSAR, GPS, Teleseismic, and strong-motion data for the spatial and temporal distribution of earthquake slip: application to the 1999 İzmit mainshock Bulletin of the Seismological Society of America, Vol. 92, pp.278-299. Douglas, J., (2003). What is a poor quality strong-motion record?, Bulletin of Earthquake Engineering, Vol. 1, pp.141-156. Durukal E., Alpay, Y., Biro, T., Mert, A. and Erdik, M. (1998). Analysis of strong motion data of the 1995 Dinar, Turkey Earthquake, Second Japan-Turkey Workshop: Earthquake Disaster Prevention Research in Turkey, 23-25 February 1998, Technical University of İstanbul. Erdik, M. and Durukal, E., (2001). 1999 Kocaeli and Düzce, Turkey earthquakes: strong-ground motion, XV ICSMGE TC4 'Lessons learned from recent strong earthquakes', 25 August 2001, İstanbul, Turkey Erdik, M., (1984). Report on the Turkish earthquake of October 30, 1983, Earthquake Spectra, Vol. 1, pp.151-172. Erdoğan Ö. (2008). “Main Seismological Features of Recently Compiled Turkish Strong Motion Database” M. Sc. Thesis, Middle East Technical University, Ankara. Ergin, M., Aktar, M. and Eyidoğan, H., (2004). Present-day seismicity and seismotectonics of the Cilician Basin: Eastern Mediterranean region of Turkey, Bulletin of Seismic Society of America, Vol. 94, 930-939. Ergin, K., Güçlü, U. and Uz, Z., (1967). A catalog of earthquakes for Turkey and surrounding area; 11 A.D. to 1964 A. D., Publications of Mining Engineering, No: 24, Technical University of İstanbul. Frohlich, C. and Apperson, K. D., (1992). Earthquake focal mechanisms, moment tensors, and the consistency of seismic activity near plate boundaries, Tectonics, Vol. 11, pp.279-296. Grünthal, G., Wahlstrom, R., and Stromeyer, D., (2009). The unified catalogue of earthquakes in central, northern, and northwestern (CENEC) - updated and expanded to the last millennium. Journal of Seismology, (Published online on 13 January 2009). Gülkan, P., Çeken, U., Çolakoğlu, Z., Uğraş, T., Kuru, T., Apak, A., Anderson, J.G., Sucuoğlu, H., Çelebi, M., Akkar, D.S., Yazgan, U. and Denizlioğlu A.Z., (2007).
23
Enhancement of the National Strong Motion Network in Turkey, Seismological Research Letters, Vol. 78, pp.429-438. İnan, E., Çolakoğlu, Z., Koç, N., Bayülke, N. and Çoruh, E., (1996). Earthquake catalogs with acceleration records from 1976 to 1996, General Directorate of Disaster Affairs, Earthquake Research Department, Ankara, Turkey (98 pp., in Turkish). Johnston, A.C., (1996). Seismic Moment Assessment of Earthquakes in Stable Continental Regions – I. Intrumental Seismicity. Geophysics Journal International, Vol. 124, pp.381-414. Joyner, W. B., Boore, D. M., (1988). Measurement, characterization, and prediction of strong ground motion. Earthquake Engineering and Soil Dynamics II, Proceedings of American Society of Civil Engineers Geotechnical Engineering Division Specialty Conference, Park City, Utah, 43-102. Kalafat, D., Güneş, Y., Kara, M., Deniz, P., Kekovalı, K., Kuleli, H. S., Gülen, L., Yılmazer, M. and Özel, N. M., (2007). A revised and extended earthquake catalogue for Turkey since 1900 (Mw ≥ 4.0), Bosphorus University, İstanbul. Kalkan, E., and Gülkan, P., (2004). Site-dependent spectra derived from ground motion records in Turkey, Earthquake Spectra, Vol. 20, pp.1111-1138. Kiratzi, A. and Louvari, E., (2003). Focal mechanisms of shallow earthquakes in the Aegean Sea and the surrounding lands determined by waveform modeling: a new database, Journal of Geodynamics, Vol. 36, pp.251-274. Özalaybey, S., Ergin, M., Aktar, M., Tapırdamaz, C., Biçmen, F. and Yörük, A., (2002). The 1999 Izmit earthquake sequence in Turkey: seismological and tectonic aspects, Bulletin of Seismic Society of America, Vol. 92, pp.376-386. Rathje, E. M., Stokoe II, K. H. and Rosenblad, B. L., (2003). Strong-motion station characterization and site effects during the 1999 earthquakes in Turkey, Earthquake Spectra, Vol. 19, pp.653-676. Sadigh, K., Chang, C. Y., Egan, J. A., Makdisi, F. and Youngs, R. R., (1997). Attenuation relationships for shallow crustal earthquakes based on California strong motion data, Seismological Research Letters, Vol. 68, pp.180-189. Sandıkkaya, M. A., Yılmaz, M. T., Bakır S. B., Yılmaz, Ö., (2009). Site classification of Turkish national strong-motion stations, submitted to Journal of Seismology for review. Sandıkkaya, M. A., (2008). Site classification of national strong-motion recording sites, M.Sc. Thesis, Civil Engineering Department, Middle East Technical University, Ankara.
24
Scherbaum, F., Schmedes, J. and Cotton, F., (2004). On the conversion of source-to-site distance measures for extended earthquake source models, Bulletin of the Seismological Society of America, Vol. 94, pp.1053-1069. Scordilis, E.M., (2006). Empirical global relations converting Ms and mb to moment magnitude, Journal of Seismology, Vol.10, pp.225-236. Ulusay, R., Tuncay, E., Sönmez, H. and Gökçeoğlu, C., (2004). An attenuation relationship based on Turkish strong motion data and iso-acceleration map of Turkey, Engineering Geology, Vol. 74, pp.265-291. USGS (1999) Implications for earthquake risk reduction in the United States from Kocaeli, Turkey earthquake of August 17 1999. U.S.G.S. Circular 1193, 65p. Wells, D. L. and Coppersmith, K. J., (1994). New empirical relationships among magnitude, rupture length, rupture width, rupture area, and surface displacement, Bulletin of the Seismological Society of America, Vol. 84, pp.974-1002. Yılmaz, Ö., Savaşkan, E., Bakır, B. S., Yılmaz, M. T., Eser, M. , Akkar, S., Tüzel, B., İravul, Y., Özmen, Ö. T., Denizlioğlu, A. Z., Alkan, A., and Gürbüz, M. (2008). “Shallow Seismic and Geotechnical Site Surveys at the Turkish National Grid for Strong-Motion Seismograph Stations” 14th World Conference on Earthquake Engineering, Beijing. Zaré, M. and Bard, P. Y., (2002). Strong motion dataset of Turkey: data processing and site classification, Soil Dynamics and Earthquake Engineering, Vol. 22, pp.703-718.

25
APPENDIX A Table A.1 List of Agencies Used in the Compilation of Database
Acronyms Agency ISC International Seismological Centre HRV Harvard Centroid Moment Tensor USGS United States Geological Survey ANSS Advanced National Seismic System Catalog Database ISK Istanbul Kandilli Observatory and Earthquake Research Institute GDDA General Directorate of Disaster Affairs of Turkey SED Swiss Seismological Service RCMT European Mediterranean Regional Centroid Moment Tensors Database ESMD European Strong Motion Database EMMA Earthquake Mechanisms of the Mediterranean Area Database IRIS Incorporated Research Institutions for Seismology ATH National Observatory of Athens, Greece THE Geophysical Laboratory, University of Thessaloniki, Greece HLW National Research Institute of Astronomy and Geophysics, Helwan,
Cairo, Egypt CSS Cyprus Station – Geological Survey Department, Nicosia, Cyprus CSEM European Mediterranean Seismological Center JER Jerusalem Station- Geophysical Institute of Israel PPT Geophysical Laboratory, Papeete, French Polynesia
26
Table 1. Preferred order of seismic agencies and papers from the literature for different earthquake parameters (List of seismic agency names corresponding to these acronyms are given in Appendix A) Preference
Order Event Time
Epicenteral Coordinates
Depth M MS mb Md ML Fault Solution
1 GDDA ISC ISC HRV ISC ISC GDDA GDDA HRV 2 USGS GDDA GDDA SED USGS USGS ISK ISK SED 3 ANSS ISK ISK ANSS HRV ANSS ATH RCMT RCMT 4 ISC ANSS ANSS RCMT SED HRV IRIS THE ESMD 5 ISK USGS USGS USGS ESMD SED HLW ANSS USGS 6 HRV SED HRV ESMD ISK ESMD ATH Bohnhoff et al.
(2006) 7 SED RCMT SED EMMA EMMA IRIS CSS Kiratzi and
Louvari (2003) 8 RCMT ESMD RCMT CSEM IRIS EMMA ESMD Ozalaybey et al
(2002) 9 EMMA EMMA EMMA ISK IRIS Ergin et al
(2004)
Table 2. Definitions of faulting style based on plunges of P-, T-, and B-axis by Frohlich and Apperson (1992). N is normal fault, SS is strike-slip fault and T is thrust fault. The
parameter pl denotes plunge angle.
Plunge Angle Fault Type P-axis pl > 60° N B-axis pl > 60° SS T-axis pl > 50° T
Table 3. Definitions of faulting style by Boore et al. (1997), Campbell (1997) and Sadigh et al. (1997) where λ is the rake angle (in degrees) and δ is the dip angle (in degrees). SS
is strike-slip, R is reverse and T is thrust .
Authors SS R T Boore et al. (1997)
|λ| < 30 or |λ| > 150 150 ≥ λ ≥ 30
Campbell (1997) |λ| < 22.5 or |λ| > 157.5
157.5 ≥ λ ≥ 22.5 and δ ≥ 45
157.5 ≥ λ ≥ 22.5 and δ < 45
Sadigh et al. (1997)
|λ| < 45 or |λ| > 135 135 ≥ λ ≥ 45
Table 4. Number of events used in the derivation of empirical magnitude conversion relationships
Dependent Variable Independent Variable Number of Data M Md 182 M Ms 177 M mb 196 M ML 156
27
Figure 1. Number of events and accelerograms on yearly basis that are recorded by the Turkish strong-motion network and evaluated by the Turkish national strong-motion project
Year
1975 1980 1985 1990 1995 2000 2005 2010
Num
ber o
f Dat
a
0
200
400
600
800
1000
1200Number of earthquakes (events)Number of records
28
Events (Earthquakes)
0 5 10 15 20 25 30 35 40
Mag
nitu
de (M
)
4
5
6
7
8Kalkan and Gülkan (2004)Ulusay et al. (2004)
Zare and Bard (2002)
Site Classification by Zare and Bard (2002)1 2 3 4
Mea
sure
d V s
,30
(m/s
)100
200
300
400
500
600
700
800
900
Kalkan and Gülkan (2004)
Soft Soil Soil Rock
Mea
sure
d V s
,30
(m/s
)
100
200
300
400
500
600
700
800
900
Vs,30 (m/s) (NGA database)100 200 300 400 500 600 700 800 900
Mea
sure
d V s
,30
(m/s
)
100
200
300
400
500
600
700
800
900
Figure 2. Information concerning the Turkish strong-motion database in the literature: (a) comparisons between the moment magnitude information used by Ulusay et al. (2004) and Kalkan and Gülkan (2004) for the same events; (b) Measured Vs,30 values (Yılmaz et al., 2008) against the site classification estimations of Turkish strong-motion stations by Zare and Bard (2002) via H/V ratios. The increasing numbers in the site class index correspond to Vs,30 < 300 m/s, 300 m/s < Vs,30 < 500 m/s, 500 m/s < Vs,30 < 700 m/s and Vs,30 > 800 m/s., respectively; (c) similar comparisons as in (b) but for the site classes in Kalkan and Gülkan (2004). Soft, stiff and rock sites correspond to 180 m/s < Vs,30 < 360 m/s, 360 m/s < Vs,30 < 760 m/s and Vs,30 > 760 m/s, respectively; (d) In-situ Vs,30 measurements (Yılmaz et al., 2008) vs. information presented in the NGA database (Power et al., 2008) for the same sites. The rectangular blocks in the scatter plots (b) to (d) show the observed discrepancies between previous studies and the in-situ Vs,30 measurements of Yılmaz et al. (2008).
29
Figure 3. Geographic distribution of the events in the Turkish national strong-motion database based on (a) magnitude, (b) depth, and (c) style-of-faulting. Solid lines represent

30
general fault interpretations of Barka and Reilinger (1997) and USGS (1999) in the region.
31
Moment Magnitude (M)
3,5 4,0 4,5 5,0 5,5 6,0 6,5 7,0 7,5
Num
ber o
f Rec
ords
0
200
400
600
800
1000
Depth (km)
0 10 20 30 40 50 60 70N
umbe
r of R
ecor
ds0
500
1000
1500
2000
2500
Num
ber o
f Rec
ords
0
200
400
600
800
1000
1200
1400
1600
1800
2000
Normal Reverse/Thrust
StrikeSlip Unknown
Num
ber o
f Rec
ords
0
200
400
600
800
1000
1200
1400
1600
1800
2000
NEHRPB
NEHRPC
NEHRPD Unknown
Figure 4. Histograms of records according to (a) moment magnitude, (b) depth, (c) style of faulting and (d) site class. Four records with depths greater than 80 km are not shown in Figure 4.b in order not to lose sight of the depth distribution of other data.
(a)
(c)
(b)
(d)
32
Figure 5. Variation of low-cut filter values as a function of moment magnitude (M) and Vs,30. The upper row scatters show the variation of flow-cut as a function of M (Figure 5.a) and Vs,30 (Figure 5.b). The lower row scatter (Figure 5.c) describes the same variation for low-cut filter cut-offs normalized by the corner frequency fb that controls the sub-fault size in Atkinson and Silva (2000) double-corner source spectrum. The histograms and probability plots show that the low-cut filters follow log-normal distribution.
Vs,30 (m/s)
200 400 600 800 1000
Magnitude (M)
3 4 5 6 7 8
f low
-cut
(Hz)
0.01
0.1
1
10
Magnitude (M)
3 4 5 6 7 8
f low
-cut
/f b
0.001
0.01
0.1
1
10
(a) (b)
(c)
33
Figure 6. Mean FAS plots of processed records from (a) NEHRP C Rjb <50 km, (b) NEHRP C Rjb >50 km, (c) NEHRP D Rjb<50km and (d) NEHRP D Rjb>50km. The plots are grouped into different magnitude bins to observe whether the processed data meets the theoretical expectations dictated by the general source spectrum. The dashed lines show the variation of f2 gradient to track the decay rates of mean FAS at low frequencies.
Rjb < 50 km
Frequency (Hz)10-1 100 101 102
FAS
(cm
/s)
10-5
10-4
10-3
10-2
10-1
100
101
102
NEHRP C
Rjb> 50 km
Frequency (Hz)10-1 100 101 102
FAS
(cm
/s)
10-5
10-4
10-3
10-2
10-1
100
101
102
NEHRP C
Frequency (Hz)10-1 100 101 102
FAS
(cm
/s)
10-5
10-4
10-3
10-2
10-1
100
101
102
NEHRP D
Frequency (Hz)10-1 100 101 102
FAS
(cm
/s)
10-5
10-4
10-3
10-2
10-1
100
101
102
NEHRP D
M < 4.54.5 < M < 5.55.5 < M < 6.56.5 < M (a)
(c)
(b)
(d)
34
Figure 7. Magnitude-dependent relationships between various source-to-site distance metrics obtained from the Turkish strong-motion database. The gray scatters forming the background describe the same relationships presented in the NGA flatfile. The NGA scatters are plotted without distinguishing the magnitude intervals in order not to crowd the information exhibited by the Turkish database.
Repi (km)1 10 100 1000
Rjb
(km
)
1
10
100
1000
M < 55 < M < 6
6 < M < 7M > 7
Rjb (km)1 10 100 1000
Rru
p (k
m)
1
10
100
1000
Repi (km)1 10 100 1000
Rru
p (k
m)
1
10
100
1000
Rhyp (km)1 10 100 1000
Rru
p (k
m)
1
10
100
1000
35
(a)
Residuals (Repi - Rjb)
0,0 0,5 1,0 1,5 2,0 2,5 3,0 3,5 4,0
Freq
uenc
y
0,0
0,2
0,4
0,6
0,8
1,0
1,2
1,4(b)
Residuals (Repi - Rjb)
0 1 2 3 4 5Fr
eque
ncy
0,0
0,2
0,4
0,6
0,8
1,0
1,2
1,4
(c)
Residuals (Repi - Rjb)
0 2 4 6 8 10
Freq
uenc
y
0,0
0,2
0,4
0,6
0,8
1,0
1,2
1,4
Normal distribution - best fit to dataGamma distribution - best fit to dataNormal distribution - Scherbaum et al. (2004)Gamma distribution - Scherbaum et al. (2004)
Figure 8. Comparisons of Repi-Rjb residual distributions obtained from the new Turkish strong-motion database and Scherbaum et al. (2004).
M: 5.0-5.25 M: 5.25-5.75
M: 5.75-6.25
36
Figure 9. Comparison of total least squares and ordinary least squares results for empirical (1) Ms- M, (2) mb- M, (3) ML- M and (4) Md- M conversion relationships.
Ms3 4 5 6 7 8
M
3
4
5
6
7
8TLSOLS
mb3 4 5 6 7 8
M3
4
5
6
7
8
TLSOLS
ML3 4 5 6 7 8
M
3
4
5
6
7
8TLSOLS
Md3 4 5 6 7 8
M
3
4
5
6
7
8TLSOLS
OLS: M = 0.571Ms+2.848, M < 5.5 M = 0.817Ms+1.176, M > 5.5 TLS: M = 0.607Ms+2.330, M < 5.5 M = 0.826Ms+1.117, M > 5.5
OLS: M = 1.104mb-0.194 TLS: M = 1.216mb-0.736
OLS: M = 0.953ML+0.422 TLS: M = 1.094ML-0.283
OLS: M = 0.764Md+1.379 TLS: M = 0.934Md+0.561
37
Figure 10. Residual scatters of M-Ms, M-mb, M-Md and M-ML magnitude pairs computed from total (TLS) and ordinary (OLS) least squares regressions. The scatters show that OLS results in random variations suggesting unbiased estimations of M from other magnitude scales. Though not shown here due to spacing limitations, the distribution of OLS residuals closely follow normal probability distribution with zero mean values. The standard deviations of M - Ms residuals are the smallest amongst the other relationships indicating a better agreement between these magnitude scales. The
Ms3 4 5 6 7 8
Mob
s-Mpr
ed
-1.2-0.8-0.40.00.40.81.2
Ms3 4 5 6 7 8
Mob
s-M
pred
-1.2-0.8-0.40.00.40.81.2
mb3 4 5 6 7 8
Mob
s-M
pred
-1.2-0.8-0.40.00.40.81.2
mb3 4 5 6 7 8
Mob
s-M
pred
-1.2-0.8-0.40.00.40.81.2
Md3 4 5 6 7 8
Mob
s-M
pred
-1.2-0.8-0.40.00.40.81.2
Md3 4 5 6 7 8
Mob
s-M
pred
-1.2-0.8-0.40.00.40.81.2
OLS Regression
ML3 4 5 6 7 8
Mob
s-M
pred
-1.2-0.8-0.40.00.40.81.2
ML3 4 5 6 7 8
Mob
s-M
pred
-1.2-0.8-0.40.00.40.81.2
OLS Regression
OLS Regression
OLS Regression
TLS Regression
TLS Regression
TLS Regression
TLS Regression

38
largest standard deviation among these empirical regression models to the M vs. Md expression suggesting a more complicated relation between these two parameters. This is most likely due to magnitude saturation effects.
39
Figure 11. Comparison of empirical equations for magnitude conversion. The plots compare empirical magnitude equations between this study and several others from the literature for (a) M vs. mb, (b) M vs. Md, (c) M vs. Ms, and (d) M vs. ML. The scatters at the background in each plot represent the relevant data from the new Turkish database and they are used in deriving our models. We used abbreviations for the studies in the literature: Scordilis, 2006 (S06); Ulusay et al., 2004 (U04); Gruntahl et al., 2009 (G09); Johnston 1996, (J96); Kalafat et al., 2007 (K07); Ambraseys, 2001 (A01); Papazachos et al., 2002 (P02); Zare and Bard, 2002 (ZB02); Baba, 2000 (B00).
mb3 4 5 6 7 8
M
3
4
5
6
7
8
This studyS06U04 G09 K07J96
Md3 4 5 6 7 8
M
3
4
5
6
7
8
This studyU04B00
Ms
3 4 5 6 7 8
M
3
4
5
6
7
8
This studyS06 U04 G09 J96 A01
ML
3 4 5 6 7 8
M
3
4
5
6
7
8
This studyU04B00P02 ZB02
(a) (b)
(c) (d)
40
Figure 12. Magnitude (M) vs. distance (Rjb) scatters of the new Turkish strong-motion database. The plots show the M-Rjb distribution for a total of 1282 processed accelerograms that are recorded during the time interval 1976 – 2006. (We processed a total of 1320 accelerograms. However, some of these records do not have Vs,30 measurements and they are not presented in the above scatter plots). The scatters on the left and right are in terms of site classes and faulting mechanisms, respectively. The site classification is based on NEHRP (BSSC, 2003) soil classes with 180 m/s ≤ Vs,30 < 360 m/s (NEHRP D), 360 m/s ≤ Vs,30 < 760 m/s (NEHRP C) and 760 m/s ≤ Vs,30 < 1500 m/s (NEHRP B). The “reverse” fault scatters also contain records from “thrust” faulting.
Distance, Rjb (km)
1 10 100
Mag
nitu
de (M
)
3
4
5
6
7
8
Distance, Rjb (km)
1 10 1003
4
5
6
7
8NEHRP C NEHRP DNEHRP B Strike-slip Normal Reverse
41
Figure 13. Left panel shows the European database used in Akkar and Bommer (2007). Right panel shows the same database after the incorporation of new Turkish database. The strong motions of Turkish dataset improve the lower magnitude range (M ≤ 6) significantly. The improvements in M vs. Rjb distribution reduce with increasing magnitude levels.
Distance, Rjb (km)
1 10 100
Mag
nitu
de (M
)
5.0
5.5
6.0
6.5
7.0
7.5
8.0
Distance, Rjb (km)
1 10 1005.0
5.5
6.0
6.5
7.0
7.5
8.0
European DatabasePGA (Akkar and Boomer, 2007)
European and Turkish DatabasePGA (Akkar and Boomer, 2007)
NEHRP C NEHRP DNEHRP B


![Muslims in Thailand: A Topical Bibliography [Compiled April, 2015]](https://img.pdfslide.net/doc/110x75/6331fac2b6829c19b80bbee2/muslims-in-thailand-a-topical-bibliography-compiled-april-2015.jpg)


![12-15 AI 5.40 Compiled ASA 220 (mark-up) [electronic]](https://img.pdfslide.net/doc/110x75/6322c30c887d24588e045e07/12-15-ai-540-compiled-asa-220-mark-up-electronic.jpg)


