Embed Size (px)
Citation preview

INSTITUTE OF DEVELOPING ECONOMIES
IDE Discussion Papers are preliminary materials circulated to stimulate discussions and critical comments
Keywords: FDI; Multinational firm; Firm heterogeneity; Productivity JEL classification: F21, F23, D24 * Corresponding author: Hyun-Hoon Lee, Division of Economics and International Trade,
Kangwon National University, Chuncheon, 200-701, South Korea. Phone: 82-33-250-6186; Fax:
82-33-256-4088; Email: [email protected]
IDE DISCUSSION PAPER No. 267
The Role of Home and Host Country Characteristics in FDI: Firm-Level Evidence from Japan, Korea and Taiwan Kazunobu HAYAKAWA, Hyun-Hoon LEE Donghyun PARK December 2010
Abstract There is a large and growing empirical literature that investigates the determinants of outward foreign direct
investment (FDI). This literature examines primarily the effect of host country characteristics on FDI even
though home country characteristics also influence the decision of firms to invest abroad. In this paper, we
examine the role of both host and home country characteristics in FDI. To do so, we constructed a firm-level
database of outward FDI from Japan, Korea, and Taiwan. Our empirical analysis yields two main findings.
First, host countries with better environment for FDI, in terms of larger market size, smaller fixed entry
costs, and lower wages, attract more foreign investors. Second, firms from home countries with higher wages
are more likely to invest abroad. An interesting and significant policy implication of our empirical evidence
is that policymakers seeking to promote FDI inflows should prioritize countries with higher wages.

The Institute of Developing Economies (IDE) is a semigovernmental,
nonpartisan, nonprofit research institute, founded in 1958. The Institute
merged with the Japan External Trade Organization (JETRO) on July 1, 1998.
The Institute conducts basic and comprehensive studies on economic and
related affairs in all developing countries and regions, including Asia, the
Middle East, Africa, Latin America, Oceania, and Eastern Europe. The views expressed in this publication are those of the author(s). Publication does not imply endorsement by the Institute of Developing Economies of any of the views expressed within.
INSTITUTE OF DEVELOPING ECONOMIES (IDE), JETRO 3-2-2, WAKABA, MIHAMA-KU, CHIBA-SHI CHIBA 261-8545, JAPAN ©2010 by Institute of Developing Economies, JETRO No part of this publication may be reproduced without the prior permission of the IDE-JETRO.

1
The Role of Home and Host Country Characteristics in FDI: Firm-Level Evidence from Japan, Korea and Taiwan
Kazunobu HAYAKAWA# Inter-Disciplinary Studies Center, Institute of Developing Economies, Japan
Hyun-Hoon LEE§
Department of International Trade and Business, Kangwon National University, Korea
Donghyun PARK Economics and Research Department, Asian Development Bank, Philippines
Abstract There is a large and growing empirical literature that investigates the determinants of outward foreign direct investment (FDI). This literature examines primarily the effect of host country characteristics on FDI even though home country characteristics also influence the decision of firms to invest abroad. In this paper, we examine the role of both host and home country characteristics in FDI. To do so, we constructed a firm-level database of outward FDI from Japan, Korea, and Taiwan. Our empirical analysis yields two main findings. First, host countries with better environment for FDI, in terms of larger market size, smaller fixed entry costs, and lower wages, attract more foreign investors. Second, firms from home countries with higher wages are more likely to invest abroad. An interesting and significant policy implication of our empirical evidence is that policymakers seeking to promote FDI inflows should prioritize countries with higher wages.
Keywords FDI; Multinational firm; Firm heterogeneity; Productivity
JEL Classification
F21, F23, D24
# We would like to thank Kuo-I Chang and Kiyoyasu Tanaka for their invaluable comments. The financial support by a JSPS Grant-in-Aid for Young Scientists (B) is also acknowledged. § Corresponding author. Hyun-Hoon Lee, Division of Economics and International Trade, Kangwon National University, Chuncheon, 200-701, South Korea. Phone: 82-33-250-6186; Fax: 82-33-256-4088; Email: [email protected]

2
1 Introduction
The most distinctive feature of the current wave of globalization is the prominent role
of multinational enterprises (MNEs). For example, a large share of global trade takes place
among the different components of an MNE. While the world economy has experienced
earlier episodes of globalization, companies which operate in several countries played a
much smaller role during those historical episodes. MNEs have expanded their activities
into an ever-growing number of countries to the extent that many of them have become
truly global organizations with a global presence. In particular, the larger, more
well-established MNEs have set up global production and distribution networks which
supply the entire world. It has become increasingly meaningless to talk about the
nationality of some MNEs. Within this broader trend of the globalization of MNEs, there is
considerable heterogeneity in the location of their activities. While virtually all countries
now compete vigorously for FDI inflows, the distribution of those inflows is far from
uniform. While advanced economies and fast-growing emerging markets such as China pull
in enormous amounts of FDI inflows, some regions such as sub-Saharan Africa lag far
behind. It is important for FDI-seeking policymakers to have a good grasp of the
underlying drivers of the MNEs’ location decisions in order to attract inward FDI.
Firm characteristics and host country characteristics shape the systematic pecking order
of the MNEs’ investment decision-making process. According to Helpman, Melitz and
Yeaple (2004), a firm’s relative productivity plays a major role in this process because only
more productive firms can earn enough operating profits to recoup the high sunk costs of
investing in a foreign country. Such sunk costs include the cost of acquiring information so

3
as to overcome the lack of knowledge and familiarity with the country. Yeaple (2009)
further extends this insight to propose two types of pecking order in investment
decision-making. First, more productive MNEs can invest in a larger number of countries
because those firms can cover the higher total sunk costs associated with investing in a
larger number of separate foreign markets. Second, countries with a more favorable
investment environment attract a larger number of MNEs since it is easier to earn profits in
such countries. The combined pecking order predicts that only the most productive MNE
would invest in the least attractive host countries, and progressively less productive firms
invest in progressively more attractive countries. Using cross-sectional data on outward
FDI from the US, Yeaple (2009) empirically examines the two theoretical pecking orders.
His evidence confirms that countries with better investment environments attract more US
MNEs and more productive US MNEs invest in more foreign countries.
In addition to firm characteristics and host country characteristics, Yeaple (2009) sets
forth a theoretical model which incorporates home country characteristics, in particular
wages, into the investment decision-making process. The two main alternatives for a firm
to enter a foreign market are (1) to either invest and produce in that market or (2) to
produce in the home country and export to that market. Firms will decide to invest if and
only if profits from investing are non-negative and exceed those from exporting. Higher
wages at home will raise domestic production costs and adversely affect the profitability of
exporting vis-à-vis investing. Therefore, firms from high-wage countries are more likely to
invest abroad than firms from low-wage countries. More generally, the pecking order of
investment decision-making depends not only on firm characteristics and host country

4
characteristics, but also on home country characteristics. However, Yeaple (2009) does not
empirically examine how different wage levels in different countries influence the pecking
order since he only considers a single home country – the US.
The central objective of this paper is to empirically examine the role of home country
characteristics in the pecking order of MNEs’ investment decision-making. Such an
empirical examination is largely absent from the large empirical literature on the
determinants of FDI and hence our primary contribution to that literature. Policy
implications pertaining to host country characteristics are fundamentally different from
those pertaining to home country characteristics.1 The former provides guidance on how
host countries can reform their policies in order to attract more foreign investment. For
example, greater legal and regulatory certainty makes a country more attractive to foreign
investors. On the other hand, the latter informs policy makers about which countries they
should prioritize in their efforts to promote inward FDI. Since policy resources for
promoting inward FDI are usually limited, especially for developing countries, it is
important to allocate such resources to their most productive uses. For example, if firms
from higher wage countries are more likely to invest abroad, it would be more efficient for
the host country to concentrate its promotional efforts on those countries. An empirical
analysis of the effect of home country characteristics on outward FDI pecking order would
be valuable for deriving this type of policy implications.
In order to perform our empirical analysis, we constructed an original firm-level
1 One example of studies using the firm-level FDI data in a multiple country setting is Navaretti, Castellani, and Disdier (2010), which show how outward investments in cheap labor countries affect the home activities of French and Italian firms that turn multinational.

5
database of outward FDI from Japan, Korea and Taiwan. Besides data availability, the
choice of the three countries was motivated by the following three reasons. First, there are
sizable differences among the three countries’ wage levels. As noted earlier, we can expect
the home-country wage level to have a major influence on the decision of firms to invest
abroad. In 2005, the manufacturing wages of Japan, Korea and Taiwan were US$30,000,
US$25,000 and US$16,000, respectively. Such wage differences are likely to generate
different patterns of MNE activity among the three countries. Second, the three countries
are major sources of outward FDI with investments all over the world. Many MNEs from
the three countries have operations in many different regions. Third, since the three
countries share a similar geographical location, we can expect trade costs with host
countries in the rest of the world to be similar. This enables us to concentrate on the effect
of wage differences among the three countries.
The rest of this paper is organized as follows. Section 2 outlines the theoretical
framework of Yeaple (2009) and derives two testable hypotheses from that framework. One
of the two hypotheses was not explicitly spelled out in Yeaple (2009). Section 3 describes
the data and methodology used in our empirical analysis. Section 4 reports and discusses
the main findings that emerge from our empirical analysis, and Section 5 concludes the
paper.
2 Theoretical Framework
In this section, we describe the theoretical model which underpins and motivates our
empirical analysis. The model is identical to that of Yeaple (2009). Nevertheless, we

6
present the model here since Yeaple (2009) does not explicitly highlight the role of home
country characteristics in the outward FDI pecking order. His model is based on Helpman,
Melitz and Yeaple (2004) and based on standard assumptions widely used in the recent
literature on firm heterogeneity. More specifically, consumers have CES utility function
defined over differentiated products produced by various firms. The market structure for the
differentiated products is Dixit-Stiglitz monopolistic competition, and there are ice berg
trade costs for shipping them between countries. 2 The empirical distribution of
productivity φ is assumed to be Pareto: 1 .
Under those assumptions, the productivity cutoff for home country j firms investing in
host country h can be derived as below. Productivity cutoff refers to the productivity level
above which firms invest and below which firms do not.
⁄ 1
where σ, Aj, Fj, and τhj are the elasticity of substitution, host country j’s market size, fixed
entry costs in host country j, and trade cost between countries h and j, respectively. wj and
wh represent wages in host country j and home country h, respectively. Furthermore, Yeaple
(2009) derives the relationship between the number of country h firms that invest in country
j and the productivity cutoff as follows:
2 Substituting equation (2) into equation (1), we obtain:
2 As in Yeaple (2009), we do not take into consideration any type of interaction among overseas plants. Such interaction has been closely examined in some studies, including Yeaple (2003), Grossman, Helpman, and Szeidl (2006), Baltagi, Egger, and Pfaffermayr (2007), and Ekholm, Forslid, and Markusen (2007).

7
1
1 ⁄
3
where Nh indicates the number of firms in country h. We can observe the following from (3).
First, the host economy’s market size Aj is positively associated with the number of country
h firms that invest in country j, Nhj. Second, an increase in the host economy’s wages wj
lowers Nhj. Third, fixed entry cost Fj is negatively associated with Nhj. Fourth, trade cost
between countries h and j τhj is positively associated with Nhj. Fifth, and this observation is
especially important for our paper, home country’s wages wh are positively associated with
Nhj.
On the basis of (3), we can derive the role of host country characteristics in the outward
FDI pecking order – i.e. the relationship between Nhj and country j’s characteristics.
Suppose that there are some country h firms whose productivity exceeds the cutoff for
investing in country j. Those firms also invest in countries which have a more favorable
environment than country j because the productivity cutoff for investing in those countries
is lower than the cutoff for investing in country j. In other words, the more favorable the
investment environment of a country, the more firms the country attracts. Specifically, let
Λhj be the set of country h firms which invests in country j. Suppose that the number of
such firms is increasing in j so that country J is the most attractive. Then, it must be the
case that:
Λ Λ Λ Λ (4)

8
This is a pecking order determined by the host country’s relative attractiveness, and can be
summarized as follows.
Proposition 1: Countries with a more favorable environment for inward FDI - in terms of
larger market size, larger trade costs, smaller fixed entry costs, and lower wages - attract a
larger number of firms from abroad.
We can derive another proposition, which is not explicitly derived in Yeaple (2009). As
shown above, the productivity cutoff for investing in any country falls as the home
country’s wage rises. Therefore, if all home countries have identical distribution of
productivity, identical number of firms, and identical trade costs with host countries, the
number of firms from countries with higher wages is larger in any host country. This is
because such firms face lower productivity cutoff for investing in any country than firms
from countries with lower wages. Specifically, we obtain the following:
for if 5
This result can be summarized as follows:
Proposition 2: A larger number of firms invest abroad from countries with higher wages
than from countries with lower wages.
These two propositions can be empirically tested, as explained in the next section.

9
3 Data and Empirical Framework
In this section, we describe the data and empirical framework we use for our testing of
the two propositions derived in the previous section. Extending Yeaple (2009)3, we regress
the following equation in order to examine the validity of Proposition 1.
ln Nijt = β1 ln GDPjt + β2 ln Taxjt + β3 ln Tariffjt + β4 ln Distanceij + β5 WTOijt + β6 ln Wagesjt + ut + εijt. (6)
where Nijt is the number of country i firms investing in country j at time t, GDPjt is country
j’s GDP at time t, Distanceij is geographical distance between countries i and j, and Wagesjt
is wages in country j at time t. WTOijt takes a value of one if both countries are WTO
members and zero otherwise. Following Yeaple (2009), we do not attempt to strictly define
proxies for every variable in the theoretical model. However, we expect GDP, tax, and
wages to be related to market size A, fixed costs F, and wages w in the model, respectively.
Also, distance and tariff are related to trade costs τ. We also introduce a year dummy.
We extend equation (6) so as to enable us to examine home country characteristics as
follows. As explained in Section 2, the validity of Proposition 2 requires certain
assumptions. In particular, our three home countries need to have identical productivity
distribution, number of firms, and trade costs with all host countries. We expect the home
country dummy to address the first two conditions. Furthermore, the geographical
proximity of the three countries to each other lends some support to the third assumption.
To further address the third assumption, we include home country-host country pair dummy
variables. In this case, we have to drop the country dummies due to perfect
3 More precisely, Yeaple (2009) introduces the host country’s GDP and GDP per capita, geographical distance between countries, and English-speaking dummy variable.

10
multi-collinearity. We experiment with two alternative ways to incorporate home and host
wages into the empirical model as follows.
ln Nijt = β1 ln GDPjt + β2 ln Taxjt + β3 ln Tariffjt + β4 ln Distanceij + β5 WTOijt + β6 ln Wagesjt + β7 ln Wagesit + uij + ut + εijt. (7)
ln Nijt = β1 ln GDPjt + β2 ln Taxjt + β3 ln Tariffjt + β4 ln Distanceij + β5 WTOijt
+ β8 ln (Wagesjt/Wagesit) + uij + ut + εijt. (8) The inclusion of the wage ratio in (8) imposes restrictive assumptions about the coefficients
for home and host wages, but mitigates multi-collinearity.
In our analysis, we focus on the number of firms from a given home country investing
in a given host country. Our three home countries are Japan, Korea, and Taiwan.4 Our
sample period is 1997-2005. Parent firms and their overseas affiliates are restricted to those
in the manufacturing industry. We use three firm-level databases for our dependent variable,
firm’s overseas affiliates – (1) Overseas Japanese Companies Data (Toyo Keizai Inc.) in the
case of Japan5, (2) Korean Business Directory 2007/2008 (KOTRA) in the case of Korea6,
and (3) Taiwan Stock Exchange-Market Observation Post System (Taiwan Stock Exchange
Corp.)7 in the case of Taiwan.
The Overseas Japanese Companies Data is the database of foreign affiliates of Japanese
firms. It includes around 20,000 overseas affiliates of Japanese firms in 130 countries as of 4 The 58 host countries are Argentina, Australia, Austria, Bangladesh, Belgium, Bolivia, Brazil, Canada, Chile, China, Costa Rica, Czech Republic, Denmark, Dominican Republic, El Salvador, France, Guatemala, Guyana, Honduras, Hong Kong, Hungary, India, Indonesia, Iran, Ireland, Israel, Italy, Jordan, Lao PDR, Luxembourg, Malaysia, Mauritius, Mexico, Mongolia, Netherlands, New Zealand, Nicaragua, Norway, Pakistan, Panama, Papua New Guinea, Philippines, Poland, Romania, Russian Federation, Saudi Arabia, Singapore, South Africa, Spain, Sri Lanka, Swaziland, Sweden, Switzerland, Thailand, Turkey, United Kingdom, United States, Vietnam. 5 See the website http://www.toyokeizai.net/shop/cdrom/kaigai_cd/detail/BI/0660130b1de80bc637ac64cba63ca12a
/. 6 See the website http://www.gpcbooks.co.kr/newmall/shop/item.php?it_id=908140001. 7 See the website http://newmops.twse.com.tw.

11
2006. The database includes information about the name of foreign affiliates and their
parent firms, their location, and key indicators such as capital, sales, and the number of
employees. The Korean Business Directory 2007/2008 conducted a survey in October to
collect information on the activities of Korean multinational firms. The survey found that
there were around 9,000 overseas affiliates of Korean firms in 73 countries. The survey
provides information on variables such as the name, address, telephone number, and fax
number of parent firms, number of affiliate employees, and entry mode. The Japanese and
Korean databases include both listed and non listed companies in the stock market of the
respective country. On the other hand, Taiwanese data from the Taiwan Stock
Exchange-Market Observation Post System are limited to listed companies in the
Taiwanese stock market. This database includes around 5,500 overseas affiliates of
Taiwanese firms in 89 countries as of 2006. The data include basic information such as
affiliates’ name, address, and telephone number and the amount of investment. For the sake
of consistency, we restrict our sample companies to listed companies in all three countries.
The data sources for the explanatory variables are as follows. The data for GDP and
geographical distance between countries are from the World Development Indicator and the
CEPII website, respectively. MFN tariff rates - weighted-average - and corporate tax rates
are from the UNCTAD Handbook of Statistics online and KPMG’s Corporate and Indirect
Tax Rate Survey - various years - respectively. The WTO dummy is based on information
from the WTO website. The data for wages, which are the average annual payment for
manufacturing workers, are obtained from the Industrial Statistics Database of the United

12
Nations Industrial Development Organization.8 The wages for Taiwan and China are from
the PC-AXIS database -National Statistics - and China Labour Statistical Yearbook,
respectively. GDP and wages are deflated by the US GDP deflator.
Table 1 provides an overview of the destination of outward FDI from the MNEs of the
three countries in 1997 and 2005. Other East Asian countries include ASEAN, Mongolia,
Korea, Japan, and Taiwan. There are three interesting points about the table. First, Asia is
the main destination for the outward FDI of all three countries. In 2005, Asia accounted for
66%, 77%, and 62% of Japanese, Korean and Taiwanese outward FDI, respectively. Second,
whereas most Korean and Taiwanese MNEs invest in China or Hong Kong, Japanese
MNEs tend to invest in the other East Asian countries. The Japanese tendency is consistent
with a well-known stylized fact. Since the Plaza Accord of 1985, Japanese firms have
invested heavily in ASEAN countries, and developed intra-East Asian production and
distribution networks. Third, between 1997 and 2005, China’s share of outward FDI rose
substantially for Japan and Korea but not for Taiwan. In line with the stylized facts outlined
by Aw and Lee (2008), the top two overseas investment destinations for Taiwanese
manufacturing firms are China and the US.
[Table 1]
4 Empirical Results
In this section, we report and discuss the main findings which emerge from our
empirical analysis described in the preceding section. Table 2 shows the basic descriptive
8 Yeaple (2009) introduces GDP per capita instead of wages.

13
statistics of our sample. We first try the estimation of the equation including only year
dummy variables. Column (I) in Table 3 reports the OLS result of equation (7). There are
five points to be noted about the results in Table 3. First, the estimated coefficient for the
host country’s GDP is positive and significant. A 10% increase in the host country’s GDP is
associated with a 6% increase in the number of firms investing in that country. Second, the
estimated coefficient for the host country’s tax rate is negative and significant. This
indicates that lower corporate taxes in the host country attract a larger number of foreign
MNEs. Third, while the host country’s tariff rate is insignificant, distance is negative and
significant. Shorter distance between the home and host country lowers the productivity
cutoff for entry. According to Chen and Moore (2010) and Kleinert and Toubal (2010), one
possible explanation is that distance is positively related to fixed entry costs. Another
possible explanation is that the trade cost associated with importing intermediate goods
from the home country is positively associated with distance. Fourth, the estimated
coefficient for the WTO dummy is unexpectedly negative and significant. WTO
membership is expected to boost FDI inflows since it opens the door to global markets and
more generally, improves the host country’s economic prospects.
[Table 2]
[Table 3]
Fifth, and most significantly for our paper, there is a clear contrast between the
estimated coefficients for the host country’s wages and home country’s wages. On one hand,
the estimated coefficient for host wages is negative and significant, indicating that the
lower wages in host economies decrease the productivity cutoff for investing in those

14
countries. Specifically, a 10% decline in the host country’s wages leads to a 1.5% increase
in the number of firms investing in that host country. On the other hand, home wages are
positive and significant. A 10% rise in the home country’s wages leads to a 25% increase in
the number of firms investing abroad. In short, home and host wages have opposing effects
on FDI. Interestingly and significantly, the impact of home wages is much bigger than the
impact of host wages. Therefore, while there has been relatively little empirical analysis on
the role of home wages in FDI, our evidence suggests that home wages play a substantial
role. Overall, our results indicate that host country wages have a negative effect on FDI
whereas home country wages have a positive effect.
Column (III) reports the results of equation (8), which incorporates the ratio of host
wages to home wages. The WTO dummy is now positive and significant, and thus
consistent with our expectations. While host tariff is now negative and significant, host tax
becomes insignificant. The somewhat paradoxical result for the host tariff may be due to
the fact that while a lower tariff lowers the costs of exporting, it may also lower the cost of
importing intermediate goods, which are assembled in the host country for export to
third-country markets. The variable of greatest interest to us is the wage ratio. In line with
our expectations, the estimated coefficient of the wage ratio is negative and significant.
Lower host wages or higher home wages or both increase FDI between the two countries.
More precisely, our results imply that a 10% increase in the ratio of host wages to home
wages leads to a 5% decrease in the number of home country firms investing in the host
country.
Columns (II) and (IV) report the results of regressions which include country-pair

15
dummy variables. These estimations address the three assumptions underlying Proposition
2: the three home countries have identical productivity distributions, total number of firms,
and trade costs with all host countries. Compared with (I), (II) shows a smaller estimated
coefficient for the home wage, although it is still larger than the estimated coefficient for
the host wage. Host wage is negative but insignificant. Significantly for our purposes, (IV)
shows that the ratio of host wages to home wages still has a significant negative effect.
However, the magnitude of the effect declines relative to (III). A 10% increase in the wage
ratio leads to a 1% fall in the number of investors.
We perform two types of robustness checks. First, we exclude China and Hong Kong
from our sample. They are very important host countries for our three home countries and
are obviously outliers. Second, we use the number of overseas affiliates from each home
country as the dependent variable rather than the number of firms from each home country.
These two numbers become identical if and only if all firms have at most one affiliate in
each country. In reality, a large number of firms have multiple affiliates in a given foreign
country. Table 4 reports the results of these robustness checks. The results in Table 4 are
almost identical to those in Table 3. This indicates that lower host wages or higher home
wages or both would increase FDI inflows.
[Table 4]
Finally, we take a look at how outward FDI to low income countries might differ from
outward FDI to high income countries. To do that, we first divide host countries into high
and low income countries based on the World Bank classification. We then run the above
regressions for those two groups of host countries separately. The results are reported in
16
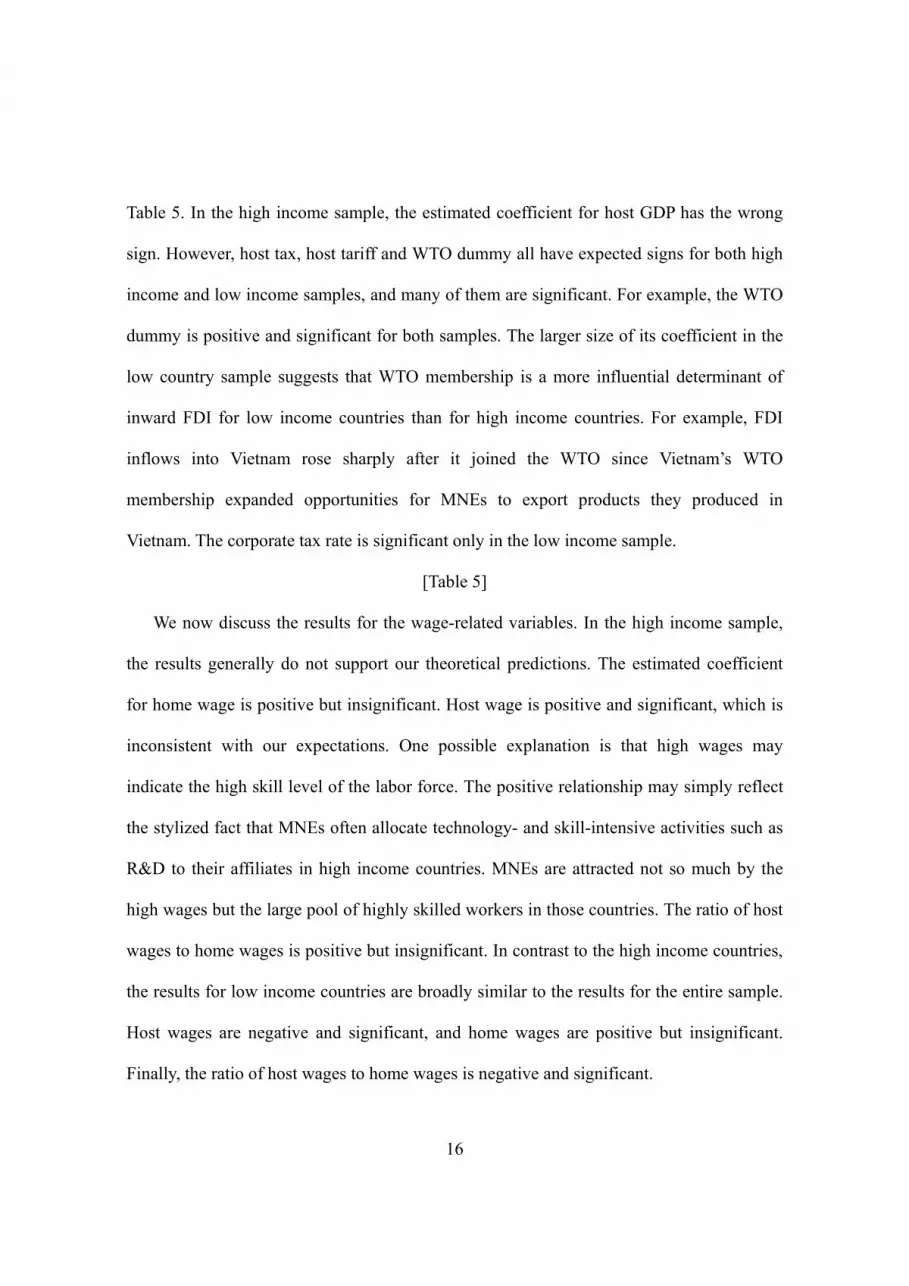
Table 5. In the high income sample, the estimated coefficient for host GDP has the wrong
sign. However, host tax, host tariff and WTO dummy all have expected signs for both high
income and low income samples, and many of them are significant. For example, the WTO
dummy is positive and significant for both samples. The larger size of its coefficient in the
low country sample suggests that WTO membership is a more influential determinant of
inward FDI for low income countries than for high income countries. For example, FDI
inflows into Vietnam rose sharply after it joined the WTO since Vietnam’s WTO
membership expanded opportunities for MNEs to export products they produced in
Vietnam. The corporate tax rate is significant only in the low income sample.
[Table 5]
We now discuss the results for the wage-related variables. In the high income sample,
the results generally do not support our theoretical predictions. The estimated coefficient
for home wage is positive but insignificant. Host wage is positive and significant, which is
inconsistent with our expectations. One possible explanation is that high wages may
indicate the high skill level of the labor force. The positive relationship may simply reflect
the stylized fact that MNEs often allocate technology- and skill-intensive activities such as
R&D to their affiliates in high income countries. MNEs are attracted not so much by the
high wages but the large pool of highly skilled workers in those countries. The ratio of host
wages to home wages is positive but insignificant. In contrast to the high income countries,
the results for low income countries are broadly similar to the results for the entire sample.
Host wages are negative and significant, and home wages are positive but insignificant.
Finally, the ratio of host wages to home wages is negative and significant.

17
5 Concluding Observations
The central objective of our paper, and its primary contribution to the existing empirical
literature on the determinants of FDI, is to examine the role of home country characteristics
in the pecking order of MNEs’ investment decision-making. We use firm-level data from
Japan, Korea and Taiwan, three East Asian economies which are globally significant
sources of outward FDI, for our empirical analysis. According to the theoretical pecking
order set forth and empirically tested by Yeaple (2009), only the most productive firms
invest in the least attractive countries, and progressively less productive firms invest in
progressively more attractive countries. This type of pecking order assumes that MNEs’
investment location decisions are shaped by a combination of the firm’s own characteristics
and host country characteristics. However, home country characteristics are also likely to
exert a significant influence on a firm’s decision to invest abroad. In the case of our three
countries, high and rising wages at home pushed many manufacturing firms to shift their
productive activities abroad. Yeaple (2009) proposes a model which incorporates home
country characteristics, in particular wages, into MNEs’ investment decision-making but
does not empirically test for their effect on outward FDI. Our paper seeks to contribute to
the literature by empirically investigating the role of home country wages on the pecking
order of MNEs’ investment decision-making.
Our empirical analysis yields a number of interesting findings but for our purposes the
most relevant ones are those which pertain to the effect of home wages on our dependent
variable – i.e. the number of home country firms investing in a host country. Our empirical

18
evidence indicates that home country wages have a positive and significant effect on the
number of investors, in line with our theoretical prediction. More precisely, we find that a
10% increase in home country wages leads to a 25% increase in the number of home
country firms investing abroad. Our evidence suggests that host country wages have a
negative and significant effect on the number of investors. This result is also consistent with
economic intuition. More precisely, we find that a 10% increase in host country wages
leads to a 1.5% decline in the number of foreign investors. An alternative specification of
the estimating equation involves replacing home and host country wage with the ratio of
host country wage to home country wage. In line with our expectations, we find that the
wage ratio has a negative and significant effect on the number of investors. All in all, our
evidence indicates that host country wages have a negative impact on FDI whereas home
country wages have a positive impact. Most significantly, our evidence provides some
support to the notion that the pecking order of MNEs’ investment decision-making is
influenced by both home and host country characteristics.
The most salient policy implication which emerges from our empirical findings is that it
may be more efficient for host country policymakers to concentrate their limited policy
resources on countries with higher wages. Since our analysis indicates that firms from
countries with higher wages are more likely to invest abroad than those from countries with
lower wages, it will be more productive for investment promotion authorities to target the
former. Furthermore, our results imply that policies specifically targeting high wage
countries may be more effective than general tax concessions or the establishment of
special economic zones that are open to all investor countries. At a broader level, since we

19
find that home country characteristics influence the outward FDI of home country firms,
host country policymakers should take them into account when allocating their policy
resource for attracting FDI. In this connection, Cole, Elliott and Virakul (2010) find that
among MNEs investing in Thailand, those from certain countries or regions are more likely
to export. To the extent that exporting is a major policy objective, this has significant policy
implications. Our paper is far from definitive and marks at best an important first step
toward exploring the role of home country characteristics in the pecking order of MNEs’
investment decision-making. Promising areas for research include looking at other home
countries and other home country characteristics.

20
References Aw, B-Y. and Lee, Y., 2008, Firm Heterogeneity and Location Choice of Taiwanese
Multinationals, Journal of International Economics, 75: 167-179. Baltagi, B.H., Egger, P., Pfaffermayr, M., 2007, Estimating Models of Complex FDI: are
There Third-country Effects?, Journal of Econometrics, 140: 260-281. Chen, M. and Moore, M., 2010, Location Decision of Heterogeneous Multinational Firms,
Journal of International Economics, 80(2): 188-199. Cole, M., Elliott, R. and Virakul, S. (2010), “Firm Heterogeneity, Origin of Ownership and
Export Participation,” World Economy 33(2): 264-291. Ekholm, K., Forslid, R., and Markusen, J., 2007, Export-platform Foreign Direct
Investment, Journal of European Economic Association, 5(4): 776-795. Grossman, G., Helpman, E., and Szeidl, A., 2006, Optimal Integration Strategies for the
Multinational Firm, Journal of International Economics, 70: 216-238. Helpman, E., Melitz, M., and Yeaple, S., 2004, Export versus FDI with Heterogeneous
Firms, American Economic Review, 94(1): 300-316. Kleinert, J. and Toubal, F., 2010, Gravity for FDI, Review of International Economics,
18(1): 1-13. Navaretti, B., Castellani, D., and Disdier, A-C., 2010, How Does Investing in Cheap
Labour Countries Affect Performance at Home? Firm-level Evidence from France and Italy, Oxford Economic Papers, 62(2): 234-260.
Yeaple, S., 2003, The Complex Integration Strategies of Multinationals and Cross Country
Dependencies in the Structure of Foreign Direct Investment, Journal of International Economics, 60(2): 293–314.
Yeaple, S., 2009, Firm Heterogeneity and the Structure of U.S. Multinational Activity,
Journal of International Economics, 78(2): 206-215.

21
Table 1: Distribution of Firms Investing in each Region, by Home Country (%)
1997 2005 1997 2005 1997 2005Africa 1 0.4 1 1 0.5 4America 21 18 16 13 23 25
USA 14 12 7 7 15 14Other America 7 6 8 6 8 11
Asia 61 66 77 77 64 62China & Hong Kong 16 22 42 50 43 43Other East Asia 43 41 24 19 21 18Other Asia 3 3 11 9 0.5 1
Europe 15 14 5 8 11 8Pacific 2 2 1 1 1 1World 100 100 100 100 100 100
Japan Korea Taiwan
Note: Other East Asian countries include ASEAN countries, Mongolia, Korea, Japan, and Taiwan. Sources: Overseas Japanese Companies Data (Toyo Keizai Inc.), Korean Business Directory 2007/2008 (KOTRA); Taiwan Stock Exchange-Market Observation Post System (Taiwan Stock Exchange Corp.)

22
Table 2. Basic Descriptive Statistics Obs. Mean Std. Dev. Min Max
Number of Investing Firms 941 2.19 1.79 0 6.71Host GDP 941 25.99 1.66 20.39 30.03Host Tax 941 0.28 0.05 0.12 0.45Host Tariff 941 0.06 0.06 0 0.38Distance 941 8.92 0.66 7 9.84WTO 941 0.82 0.39 0 1Host Wage 941 8.99 1.25 6.18 10.79Home Wage 941 9.90 0.33 9.34 10.34Wage Ratio 941 -0.91 1.31 -4.03 1.22
Notes: All variables except for WTO dummy are taken logs. “Number of Investing Firms” is the number of firms investing from home country i in host country j at time t. The wage ratio is defined as the ratio of country j wages to country i wages at time t.

23
Table 3. Baseline Results (I) (II) (III) (IV)
Host GDP 0.581*** 0.150 0.649*** 0.199*[0.044] [0.118] [0.044] [0.107]
Host Tax -1.268* -1.095*** -1.352 -1.084***[0.766] [0.419] [0.951] [0.419]
Host Tariff -1.1 -1.098** -5.522*** -1.106**[1.001] [0.480] [1.113] [0.480]
Distance -1.071*** -0.795***[0.067] [0.069]
WTO -0.231* 0.503*** 0.459*** 0.496***[0.130] [0.043] [0.132] [0.042]
Host Wage -0.150** -0.070[0.059] [0.081]
Home Wage 2.513*** 0.209*[0.149] [0.116]
Wage Ratio -0.532*** -0.115*[0.060] [0.068]
Year YES YES YES YESPair NO YES NO YESObservations 941 941 941 941R-squared 0.5073 0.507 0.3855 0.3855
Notes: The dependent variable is the number of firms investing from country i in country j at time t. The wage ratio is defined as the ratio of host country j wages to home country i wages at time t. Heteroskedasticity-consistent standard errors (White) are in parentheses. ***, **, and * show 1%, 5%, and 10% significance, respectively.

24
Table 4. Robustness Checks
(II) (IV) (II) (IV)Host GDP 0.165 0.217** 0.154 0.228**
[0.119] [0.110] [0.124] [0.113]Host Tax -1.122*** -1.118*** -1.039** -1.023**
[0.423] [0.424] [0.443] [0.443]Host Tariff -1.096** -1.087** -1.241** -1.254**
[0.496] [0.496] [0.507] [0.507]WTO 0.520*** 0.508*** 0.553*** 0.541***
[0.046] [0.045] [0.046] [0.045]Host Wage -0.086 -0.057
[0.083] [0.086]Home Wage 0.242** 0.267**
[0.119] [0.122]Wage Ratio -0.136* -0.125*
[0.069] [0.072]Year YES YES YES YESPair YES YES YES YESObservations 910 910 941 941R-squared 0.452 0.3098 0.5039 0.3929
Exluding CHN & HKG Number of Affiliates
Notes: The dependent variable in column “Excluding CHN & HKG” is the number of firms investing from country i in country j at time t. In this column, we exclude China and Hong Kong from our sample of host countries. The dependent variable in the column “Number of Affiliates” is the number of overseas affiliates from each home country. The wage ratio is defined as the ratio of host country j wages to home country i wages at time t. Heteroskedasticity-consistent standard errors (White) are in parentheses. ***, **, and * show 1%, 5%, and 10% significance, respectively.

25
Table 5. High Income versus Low Income
(II) (IV) (II) (IV)Host GDP -0.383* -0.083 0.306** 0.295**
[0.228] [0.198] [0.133] [0.124]Host Tax -0.453 -0.145 -2.017*** -2.018***
[0.646] [0.640] [0.583] [0.582]Host Tariff -5.423** -6.027** -1.111** -1.108**
[2.457] [2.464] [0.487] [0.486]WTO 0.419*** 0.385*** 0.645*** 0.648***
[0.061] [0.060] [0.060] [0.060]Host Wage 0.440** -0.238***
[0.202] [0.087]Home Wage 0.283 0.202
[0.179] [0.146]Wage Ratio 0.038 -0.230***
[0.130] [0.078]Year YES YES YES YESPair YES YES YES YESObservations 485 485 456 456R-squared 0.5225 0.355 0.554 0.4459
High Income Low Income
Notes: The dependent variable is the number of firms investing from home country i in host country j at time t. The wage ratio is defined as the ratio of host country j wages to home country i wages at time t. Heteroskedasticity-consistent standard errors (White) are in parentheses. ***, **, and * show 1%, 5%, and 10% significance, respectively. The classification of high and low income countries is based on the World Bank classification.