Embed Size (px)
Citation preview
ELSEVIER Tectonophysics 310 (1999) 1–35www.elsevier.com/locate/tecto
The Siberian lithosphere traverse:mantle terranes and the assembly of the Siberian Craton
W.L. Griffin a,b,Ł, C.G. Ryan b, F.V. Kaminsky a,c, Suzanne Y. O’Reilly a, L.M. Natapov a,T.T. Win b, P.D. Kinny d, I.P. Ilupin e
a GEMOC National Key Centre, Department of Earth and Planetary Sciences, Macquarie University, Sydney, NSW 2109, Australiab CSIRO Exploration and Mining, P.O. Box 126, North Ryde, NSW 2113, Australia
c KM Diamond Exploration, 815 Evelyn Street, West Vancouver, BC B7T 1J1, Canadad Department of Applied Physics, Curtin University of Technology, G.P.O. Box U1987, Perth, WA 6001, Australia
e TsNIGRI, Varshavskoe Sh. 129b, Moscow, Russia
Received 23 July 1998; accepted 25 March 1999
Abstract
The kimberlite fields scattered across the NE part of the Siberian Craton have been used to map the subcontinentallithospheric mantle (SCLM), as it existed during Devonian to Late Jurassic time, along a 1000-km traverse NE–SW acrossthe Archean Magan and Anabar provinces and into the Proterozoic Olenek Province. 4100 garnets and 260 chromitesfrom 65 kimberlites have been analysed by electron probe (major elements) and proton microprobe (trace elements).These data, and radiometric ages on the kimberlites, have been used to estimate the position of the local (paleo)geothermand the thickness of the lithosphere, and to map the detailed distribution of specific rock types and mantle processesin space and time. A low geotherm, corresponding approximately to the 35 mW=m2 conductive model of Pollack andChapman [Tectonophysics 38, 279–296, 1977], characterised the Devonian lithosphere beneath the Magan and Anabarcrustal provinces. The Devonian geotherm beneath the northern part of the area was higher, rising to near a 40 mW=m2
conductive model. Areas intruded by Mesozoic kimberlites are generally characterised by this higher, but still ‘cratonic’geotherm. Lithosphere thickness at the time of kimberlite intrusion varied from ca. 190 to ca. 240 km beneath the ArcheanMagan and Anabar provinces, but was less (150–180 km) beneath the Proterozoic Olenek Province already in Devoniantime. Thinner Devonian lithosphere (140 km) in parts of this area may be related to Riphean rifting. Near the northern endof the traverse, differences in geotherm, lithosphere thickness and composition between the Devonian Toluopka area andthe nearby Mesozoic kimberlite fields suggest thinning of the lithosphere by ca. 50–60 km, related to Devonian riftingand Triassic magmatism. A major conclusion of this study is that the crustal terrane boundaries defined by geologicalmapping and geophysical data (extended from outcrops in the Anabar Shield) represent major lithospheric sutures,which continue through the upper mantle and juxtapose lithospheric domains that differ significantly in composition androck-type distribution between 100 and 250 km depth. The presence of significant proportions of harzburgitic and depletedlherzolitic garnets beneath the Magan and Anabar provinces is concordant with their Archean surface geology. The lack ofharzburgitic garnets, and the chemistry of the lherzolitic garnets, beneath most of the other fields are consistent with theProterozoic surface rocks. Mantle sections for different terranes within the Archean portion of the craton show pronounceddifferences in bulk composition, rock-type distribution, metasomatic overprint and lithospheric thickness. These obser-
Ł Corresponding author. Tel.: C61-2-9850-8954; Fax: C61-2-9850-8943=8428; E-mail: [email protected]
0040-1951/99/$ – see front matter 1999 Elsevier Science B.V. All rights reserved.PII: S 0 0 4 0 - 1 9 5 1 ( 9 9 ) 0 0 1 5 6 - 0

2 W.L. Griffin et al. / Tectonophysics 310 (1999) 1–35
vations suggest that individual crustal terranes, of both Archean and Proterozoic age, had developed their own lithosphericroots, and that these differences were preserved during the Proterozoic assembly of the craton. Data from kimberlite fieldsnear the main Archean–Proterozoic suture (the Billyakh Shear Zone) suggest that reworking and mixing of Archean andProterozoic mantle was limited to a zone less than 100 km wide. 1999 Elsevier Science B.V. All rights reserved.
Keywords: lithosphere; kimberlites; Siberia; Archean; craton; mantle
1. Introduction
Archean cratons contain the remnants of the ear-liest continental crust, and xenolith suites from kim-berlites show that the deep lithospheric keels beneathsome of these cratons contain rock types not foundelsewhere. Understanding of the nature and originof these ‘continental roots’ is crucial to models forEarth’s early evolution, yet our knowledge is frag-mentary and dominated by data from a few localities.Geophysical data can give an indication of the phys-ical properties of the rocks that exist at depth today,but our ability to correlate these data with real rocktypes is still limited. Xenolith suites carried to thesurface in volcanic rocks provide useful insights, butare very limited in distribution; most available sam-ples come from small areas on a few cratons. Thesexenolith studies provide the geological equivalentof scattered microprobe analyses, taken at randomon a large and complex specimen. For a better un-derstanding of the formation of cratons and theirroots, we need larger series of samples, with muchgreater geographic spread and from volcanic rockscovering significant time spans. Only with this in-formation can we begin to answer questions aboutthe relationships between crustal genesis, the forma-tion of continental roots, and the modification anddestruction of the lithosphere.
Over the last ten years, advances in microbeamanalytical technology have led to the developmentof techniques for mapping the thermal state, com-position and structure of the lithospheric mantle, us-ing heavy mineral concentrates from volcanic rocks(Griffin and Ryan, 1995; Ryan et al., 1996; Griffin etal., 1996, 1998). The lithospheric sections producedby these studies show the vertical distribution of tem-perature, rock types and some types of metasomaticprocesses (O’Reilly and Griffin, 1996). They can beused to map the lithosphere in three dimensions (or
four, where different time slices are available) andexamine the relations between mantle and crustalprocesses, ranging from major tectonic episodes tocrustal magmatism and the generation of economicmineral deposits. They also provide petrological datathat can be used to constrain geophysical models andto interpret aspects of regional geophysical data.
An integration of geological mapping and geo-physical data shows that the Siberian Platform innorthern Russia consists of a series of Archean andProterozoic crustal terranes, welded together duringthe Proterozoic and later subjected to several periodsof lithospheric extension (Rosen et al., 1994; Figs. 1and 2). A chain of Paleozoic to Mesozoic kimber-lite fields (here called the ‘Olenek trend’) stretchesnearly 1000 km SW–NE across the north-centralpart of the platform, and a trail of Mesozoic kim-berlites (the ‘Anabar trend’) extends 320 km to thenorthwest from the middle part of the Olenek trend,along the eastern boundary of the Anabar Shield(Fig. 1). These kimberlites provide the widespreadnet of sampling sites needed to map the lithosphericmantle across the major tectonic boundaries seen inthe crust, over a time span of >300 Ma.
In this report we use geochemical data on garnetsand chromites from many of these kimberlite fieldsto probe the lithospheric mantle across the northernpart of the platform, during Devonian and Mesozoictime. The data illustrate significant regional varia-tions in the thermal state and composition of theupper mantle during Devonian time, and also sug-gest significant changes in lithosphere structure, atleast locally, between Devonian and Mesozoic time.The links between surface geology and mantle com-position show that crustal terrane boundaries arereflected in the mantle, and provide a better under-standing of the behaviour of the lithosphere duringand after the Proterozoic assembly of the SiberianCraton.

W.L. Griffin et al. / Tectonophysics 310 (1999) 1–35 3
ANABAR
OLENEKS
ayan
o-Ta
ymyr
Fau
lt Z
one
KotuykanShear Zone
MARKHA
DALDYN
Aekit Orogenic Belt
HAPSCHAN
BIREKTE
MAGAN
Mirnyy
BillyakhShear Zone
Akitk
an F
old
belt
Lena Fault Zone
Lena
Rive
r
Lake B
aikal
Irkutsk
52˚
60˚
68˚
126˚102˚ 138˚
68˚
60˚
52˚
126˚
0 500
108˚ 114˚ 120˚
Kimberlite
Anabar Shield
Major Shear Zones
Tectonic Front
Fig. 1. Terrane map of the eastern part of the Siberian Platform, after Rosen et al. (1994), showing the major kimberlite trends. The An-abar Province consists of the Daldyn and Markha terranes, and the Olenek Province consists of the Hapschan, Birekte and Aekit terranes.
2. Regional geological setting
2.1. Basement terranes and craton assembly
The Siberian Craton (Figs. 1 and 2) represents arelatively stable platform area, surrounded by majorPhanerozoic suture zones formed by the assemblyof the Pangea supercontinent during the Paleozoicand Mesozoic. The southern margin was affectedby the Devonian collision with the Barguzin ter-
rane. The eastern border of the craton is definedby the Verkhoyansk orogenic belt, which representsa Riphean to Mesozoic stable-margin foreland se-ries, folded and thrust westward by a late Mesozoiccollision. The South Taymyr orogenic belt to thenorthwest also was formed by a Mesozoic collisionthat affected the previously stable margin of thecraton.
The craton now is largely covered by 2–14 kmof Riphean (800–1600 Ma) to Lower Cretaceous

4 W.L. Griffin et al. / Tectonophysics 310 (1999) 1–35
Fig. 2. Modified terrane map (see text) of the Siberian Platform, showing the locations of kimberlite fields and major aulacogens. Fornames of fields 1–18, see Table 1. Others, not discussed here: 14 D Lower Lena; 19 D Lower Kuonamka; 20 D Orto Irigakh; 21 DKharamai; 22 D Dalbicha; 23 D Chadobez; 24 D Central Anabar; 25 D Severnei; 26 D Morkoka; 27 D Markha.
sediments and Triassic traps; outcrops of basementoccur in the Anabar and Aldan shields, and in a smallarea of the Olenek uplift. Provinces and terraneswithin the craton have been mapped on the basis ofknown crustal shear zones, boreholes to basement,crustal xenolith suites in kimberlites, and especiallyby regional-scale magnetic anomaly patterns. Majorterrane boundaries in the northern part of the craton,
modified from those of Rosen et al. (1994) are shownin Fig. 1; the northern part of the craton studied forthis report is made up of the Magan, Anabar andOlenek provinces.
2.1.1. Magan ProvinceThe basement rocks of this province are exposed
in the western part of the Anabar Shield, where

W.L. Griffin et al. / Tectonophysics 310 (1999) 1–35 5
they are separated from the Anabar Province alongthe Kotuykan Shear Zone. This is a major suture,with a deformation zone 10–30 km wide and as-sociated gravity and magnetic anomalies that canbe traced under the Paleozoic cover for ca. 1300km to the southeast. The western boundary of theMagan Province, the Sayan–Taymyr Fault Zone, isdefined entirely on geophysical grounds. Basementrocks exposed in the Anabar Shield are high-gradegranulites, mainly with felsic-intermediate igneousprotoliths, and xenoliths of similar rocks are foundin the kimberlite pipes of the Malo-Botuobiya field,which lies within this province. Limited zircon dataare interpreted by Rosen et al. (1994) as indicatingcrustal formation ages of ca. 3.0 Ga, with signifi-cant periods of granulite-facies metamorphism andanorthosite intrusion.
2.1.2. Anabar ProvinceThis province is divided by Rosen et al. (1994)
into two terranes, the Daldyn and the Markha. TheDaldyn terrane, as exposed in the Anabar Shield,consists of high-grade metamorphic rocks, thrust tothe southwest over the Magan Province along theKotuykan Shear Zone. Its northern boundary is theBillyakh Shear Zone, a major suture marked by ashear belt 10–20 km wide, and traceable for ca. 1500km to the southeast by magnetic and gravity anoma-lies. The exposed rocks are felsic to mafic granulitesof both supracrustal and igneous protoliths, reflect-ing metamorphism at lower-crustal conditions (8–12 kbar); similar rocks are found as xenoliths inthe Udachnaya kimberlite pipe of the Daldyn field,which lies within this terrane. Zircon ages indicatecrustal formation at ca. 3.0 Ga, with (minor?) meta-morphic events down to ca. 1.9 Ga. The Markhaterrane is not exposed at the surface; an irregularSW–NE boundary separating it from the Daldyn ter-rane is based on changes in the style and orientationof gravity and magnetic anomalies, accompanied byminor faulting in the overlying sediments. Crustalxenoliths in the kimberlites of the Alakit and Up-per Muna fields also are different from those in theDaldyn field; they are mainly mafic to intermedi-ate volcanic rocks, metamorphosed in amphibolite togranulite facies. The few reliable geochronologicaldata are interpreted by Rosen et al. (1994) to indicateages similar to those of the Daldyn terrane.
To the south, the Magan and Anabar provincesabut the Akitkan Fold Belt, which is a major Pro-terozoic orogenic belt over 1500 km long and 50–250 km wide, separated from these provinces by theLena Fault Zone, recognised mainly on the basis ofgeophysical anomalies.
2.1.3. Olenek ProvinceThis province is made up of the Hapschan,
Birekte and Aekit terranes. The Hapschan terraneis exposed in the eastern part of the Anabar Shield;it consists of amphibolite or lower granulite-faciesmetasupracrustal rocks, thrust to the southwest overthe Daldyn terrane along the Billyakh Shear Zone.Zircon ages indicate Mesoproterozoic deformation,and suggest that the supracrustal rocks are of Pale-oproterozoic age. SHRIMP dating of zircons froma crustal xenolith in the Chomur pipe (Chomurdakhfield) gives an age of 1780 š 45 Ma (Appendix A).The extent of this terrane depends on interpretationof magnetic anomalies; alternative interpretations areshown in Figs. 1 and 2. The Birekte terrane is dis-tinguished from the Hapschan terrane entirely ongeophysical grounds, as the basement is overlain byup to 10 km of Riphean and Phanerozoic sediments.The SW margin of the terrane is defined by a se-ries of major curvilinear magnetic anomalies, whichmay represent a shear zone with associated intru-sive rocks. A similar but less pronounced anomalyin the middle of the terrane, between the Merchim-den and Toluopka–Upper Molodo kimberlite fields,may represent another large shear zone. The geo-physical anomaly pattern beneath the Birekte terraneis interpreted by Rosen et al. (1994) as indicatinga greenstone–granite basement. The Aekit orogenicbelt is exposed in the Olenek Uplift. The rocks arelow-grade folded supracrustals with minor graniticintrusives. K–Ar data suggest that these rocks com-prise a Mesoproterozoic fold belt; the age of theoriginal basement is unknown.
Rosen et al. (1994) suggest that ½90% of the Pre-cambrian basement of the craton was extracted fromthe mantle during the Archean, and probably beforeor around 3.0 Ga. A major orogenic event is recog-nised in the Magan and Anabar provinces within theAnabar Shield at 2.5–2.7 Ga. Geochronological dataon rocks within the Kotuykan and Billyakh shearzones, and on some syntectonic intrusive rocks, sug-

6 W.L. Griffin et al. / Tectonophysics 310 (1999) 1–35
gest that the assembly of at least the northern partof the Siberian Craton took place by collision be-tween the different terranes between 2.0 and 1.9 Ga.The one zircon date on a basement xenolith in theChomurdakh field might suggest a slightly youngerage. This assembly may have involved remobilisa-tion of the Archean basement, at least in the northernparts of the area.
2.2. Platform cover, aulacogens and volcanism
The sedimentary cover of the Siberian Platformranges in thickness from 2–2.5 km (Olenek Uplift,Anabar Shield margins) to 12–14 km (Vilyui Basin).This cover accumulated from Riphean to Cretaceoustime (ca. 1200–1300 Ma). Sedimentary rocks accu-mulated in large basins, connected with epochs ofextension.
Extension in the Middle Riphean led to the de-velopment of the Udzha and Majmecha aulacogensto the east and west of the Anabar Shield. The widedistribution of Riphean, Vendian and lower Paleo-zoic sediments on the Siberian Platform suggeststhe presence of other Riphean aulacogens beneathyounger deposits (Zonenshain et al., 1990). Kimber-lite pipes related to the Riphean extension stage areunknown, although the occurrence of pyrope garnetsin Paleozoic beach placers in the SW part of the cra-ton suggests that Precambrian kimberlites may exist(V. Afanasiev, pers. commun., 1997).
On the east side of the Siberian Platform theDevonian Vilyui and Kyutungda aulacogens extendinto the platform from the ancient passive margin.All of the Upper Devonian kimberlite occurrenceslie between these aulacogens. The Vilyui aulacogen(Fig. 2) contains 7–8 km of Upper Devonian–LowerCarboniferous rocks alone (evaporites and bimodalvolcanics). The narrow (50 km) Kyutungde aulaco-gen (Fig. 2) is filled by Upper Devonian–LowerCarboniferous evaporites.
Two major Lower Triassic rift zones are knownto the west and to the north of the SiberianPlatform, the meridional Ob aulacogen under theWest Siberian Basin and the sublatitudinal Enysey–Kchatanga aulacogen under the basin of the samename. The thickness of sedimentary rocks along therift axes reaches 20–24 km; the superdeep Tjumenwell penetrated more than 1000 m of Lower Tri-
assic tholeiitic basalts. These aulacogens appear torepresent two branches of a triple-junction rift sys-tem, related to the eruption of the Siberian Traps(1,400,000 km3); the inferred ‘hot spot’ was locatedat the intersection of the aulacogens. West of the An-abar Shield there is a belt of Lower Triassic alkali–ultramafic intrusions with carbonatites, younger thanthe Siberian Traps. The end of Middle Jurassic timesaw the beginning of the breakup of Pangea, andSiberia may also have been affected by this exten-sion.
3. Samples and methods
3.1. Samples
4100 chrome-pyrope garnets have been analysedfrom 65 localities in 14 different kimberlite fields(Table 1; Fig. 2); within the Alakit field the kim-berlites have been divided into three subfields. Onlya small sample was available from some pipes, butbecause adjacent kimberlites often sample quite dif-ferent sections of the mantle, and as the data are con-sidered only on the scale of kimberlite fields, it wasconsidered important to include even these scatteredsamples. A specific effort was made to analyse bothhigh- and low-grade pipes in fields where both arepresent, to get a more complete picture of the litho-spheric column. In several cases different phases ofsingle pipes have been analysed; a series of unbiasedconcentrates from phases of the Udachnaya pipe, pro-vided by Almazy Rossi-Sakha, was especially useful.We also have analysed garnets from two alluvial de-posits, one within the Upper Motorchuna field (asso-ciated with the Aerogeologicheskaya pipe) and onefrom the Kyutungde River near the Toluopka field.Over 260 chromites have been analysed from sixof the kimberlite fields to help constrain the GarnetGeotherms along the traverse. The samples providedby others include a range of grain sizes, and probablyrepresent varying degrees of selectivity with regardto colour and other criteria. Samples prepared by uswere selected to include representative proportions ofthe full range of Cr-pyrope colours, from orange-pinkto red, purple and green garnets. In some cases thismay have produced a more representative picture thanwas available in earlier compilations.

W.L. Griffin et al. / Tectonophysics 310 (1999) 1–35 7
Table 1Location and sample data
Map No. Field Pipe Grade a No. gnts. anal. No. chrom. anal.
1 Malo-Botuobiya, 62º250N, 113º400E Amakinskaya M 132Internationalnaya H 72 8Mir H 113 36Tayozhnaya L 125
Total 442 44
2 Alakit — main part, 66º050N, 110º450E Aikhal H 48 35Komsomolskaya M 49Krasnopresnenskaya L 17Nachalnaya L 113Podtrappovaya B 4Radiovolnovaya L 30Sytykanskaya H 94 27Vostok T 10Yubileinaya H 74 26
Total 439 88
Alakit — Iskorka group, 66º70N, 110º480E Iskorka, pipe C dyke T 54Kollektivnaya T 87Svetlaya (SV) T 101
Total 242
Alakit — NIIGA group, 66º100N, 110º500E Marshrutnaya L 52NIIGA M 158Radiogeodezicheskaya L 65
Total 275
3 Daldyn, 66.20ºN, 112.25ºE BukovinskayaDalnaya — massive L 49Dalnaya — breccia L 58Dolgozhdannaya L 66Geophyzicheskaya — massive L 50Geophyzicheskaya — breccia L 50Molodost M 37 9Osennaya M 45Udachnaya H 268 48Yakutskaya T 53Zamitsa L 150 19
Total 826 76
4 Upper Muna, 67º200N, 114º500E Novinka H 47Zapolarnaya M 131Zimnaya L 117
Total 295
5 Chomurdakh, 68º200N, 116º300E Chomur T 52Druzhba T 53Nadyozhnaya L 82Olimp T 53
Total 240
8 Upper Motorchuna, 69º50N, 118º450E Aerogeologicheskaya T 35 8Baltiiskaya B 49Petrogradskaya B 50alluvium 47
Total 181

8 W.L. Griffin et al. / Tectonophysics 310 (1999) 1–35
Table 1 (continued)
Map No. Field Pipe Grade a No. gnts. anal. No. chrom. anal.
9 Merchimden, 70ºN, 119º350E Bezymannaya B 6Nemagnitnaya B 60Neulovimaya B 24Operatorskaya B 14Podsnezhnaya B 57Trilobit-1 B 3Yegorich T 49
Total 213
10 Upper Molodo, 70º150N, 121º200E Granatovaya B 22Khrizolitovaya B 70Meri B 8 5
Total 100
11 Kuoika (with Dianga), 70º250N, 121º350E Muza B 128Obnazhennaya B 139Vtorogodnitsa B 46Dianga T? 98 6
Total 411
12 Toluopka, 70º150N, 122º150E Ivushka L? 48Kyuty River Alluvials 75
Total 123
13 Kuranakh D Little Kuonamka, 68º450N, 113º400E Kuranakhskaya B 8Malokuonapskaya B 41Universitetskaya T 89
Total 138
14 Luchakan, 69ºN, 114º300E Dame-E T 10Dame-W T 39Krasivaya B 9Lykhchan-E T 6Lykhchan-W T 6Pozdnaya B 12
Total 82
18 Middle Kuonamka D Ari-Mastakh, 70º400N, 112º250E Kharakhtakh B 3Cholbon B 3Makarovskaya B 112
Total 118
TOTAL 4119 261
a Carats=100 tonnes; B D 0; T D <1; L D 1–10; M D 10–50; H D >50. Lat.=long. values represent approximate centre of field.
3.2. Analytical methods
Major-element data on garnets and chromiteshave been obtained with the CAMEBAX electronmicroprobe at the School of Earth Sciences, Mac-quarie University, using standard techniques. Datafrom this microprobe have been independently ver-ified by cross-analysis in Australia (CSIRO) andNorway (Mineralogical–Geological Museum).
The trace element analyses used here have beenobtained with the HIAF proton microprobe at CSIROExploration and Mining, North Ryde. The methodsused in this laboratory have been described in detailby Ryan et al. (1990a,b). The proton microprobe isbased on a tandem electrostatic accelerator, whichprovides a beam of 3 MeV protons, and the protonbeam is focussed onto the sample by an electro-static lens. The characteristic X-rays generated by

W.L. Griffin et al. / Tectonophysics 310 (1999) 1–35 9
the proton bombardment are collected by a Si(Li)energy-dispersive detector and displayed as spectra.Quantitative concentration data are extracted fromthese spectra as described by Ryan et al. (1990b).Normalisation to EMP values for Fe is used to cor-rect for differences in sample conductivity; otherwisethe method is independent of standards. Typical ana-lytical precision and accuracy are better than š10%for most elements discussed here.
In this work, the typical size of the beam spoton the sample was 30–50 µm, and beam currentswere 10–15 nA. Samples were counted to a uniformaccumulated live charge of 3 µC, corresponding toanalysis times of 5–8 min.
Zircon megacrysts were dated using the SHRIMPion microprobe at Curtin University of Technology,Western Australia, using standard U–Pb analyticalprocedures. Samples were mounted in epoxy resinalong with a chip of a standard zircon of knownage, sectioned approximately in half and gold-coatedprior to analysis. In order to maximise the analyticalprecision of individual SHRIMP 20 µm spot analy-ses (important for any low-U and=or relatively youngzircons), cathodoluminescence imaging was used toidentify those areas of the sectioned grains highestin uranium. It is from such areas that the highestcount-rates of radiogenic Pb isotopes are obtained.Consequently, the U and other elemental concentra-tions listed in the data table are averages for theanalysed spots only, not for the entire grains. Quotedages are based on the measured 206Pb=238U ratios, af-ter correction for common Pb and instrumental Pb=Uisotopic fractionation. The correction for commonPb was based on the measured 207Pb=206Pb ratio,using modelled common Pb compositions and as-suming U–Pb isotopic concordance in all samples.The correction for Pb=U fractionation was achievedby construction of Pb=U versus UO=U calibrationcurves for each analytical session based on analysesof the chips of standard zircon that were included ineach sample mount.
3.3. Tectonic nomenclature
For convenience in the discussion below, werecognise a threefold division of tectonic blocks,modified from Janse (1994). This division is basedon the tectonothermal age of crustal blocks, as de-
fined by the last major tectonic or magmatic event.In this terminology, Archons have a tectonothermalage ½2.5 Ga, Protons an age 2.5–1.0 Ga and Tectons<1.0 Ga.
3.4. Interpretative tools
3.4.1. Rock-type identificationThe mineral assemblage from which a given gar-
net macrocryst was derived can be estimated fromthe relationship between CaO and Cr2O3 contents(Fig. 3a). One important boundary in this plot isthat dividing the lherzolite paragenesis (olivine Corthopyroxene C clinopyroxene C garnet š spinel)from the harzburgite paragenesis (lacking clinopy-roxene). This ‘thermodynamic’ definition empha-sises the important distinction between rocks inwhich the garnet is Ca-saturated through equilib-rium with cpx, and those in which the Ca content ofthe garnet is not buffered by the mineral assemblage.Various divisions between these two fields have beensuggested (Fig. 3a); here we adopt the one proposedby Gurney (1984), although some garnets classifiedas harzburgitic by this method could be derived fromlherzolites with unusually Na-rich, and hence Ca-poor, cpx (Sobolev, 1974). We further subdivide thefield of harzburgitic garnets in Fig. 3a into calcicharzburgite and low-Ca harzburgite. This line en-closes 50% of diamond-inclusion garnets from SouthAfrica (Gurney, 1984; Griffin et al., 1992), and thushighlights an important class of extremely depletedgarnets, genetically associated with some diamonds.Another line separates Ca-rich garnets of the typeusually found in wehrlite (olivine C clinopyroxeneC garnet) assemblages.
3.4.2. Thermometry, geotherms and lithospherethickness
The key to the use of heavy-mineral concentratesin lithosphere mapping has been the development ofgeothermometers that can be applied to single grainsof chrome-pyrope garnet and chromite. We will usethe temperature calibrations of Ryan et al. (1996)for the Ni content of garnet, and the Zn contentof chromite, to obtain equilibration temperatures forindividual mineral grains. The analysis of Ni ingarnet can be done routinely by proton microprobewith a precision better than that required for the

10 W.L. Griffin et al. / Tectonophysics 310 (1999) 1–35
Fig. 3. Geochemical signatures in garnets. (a) CaO–Cr2O3 plot with boundaries of fields for garnets from different parageneses. Data areshown for garnets cratonic lherzolite and harzburgite (cpx-free) xenoliths, and lherzolite xenoliths from the Thumb diatreme (ColoradoPlateau) and Phanerozoic terranes (E. China and Baikal region). (b) Zr–TiO2 relationships in garnets from xenoliths, showing fieldstypical of depleted peridotites, peridotites with phlogopite-related metasomatism and high-temperature peridotites affected by melt-relatedmetasomatism.
applications described below (š50ºC; Ryan et al.,1996).
In principle, the depth of origin of each grainin a concentrate can be derived by referring thesetemperatures to the local (paleo)geotherm at the timethe host volcanic rock erupted. Where suites of freshmantle-derived xenoliths are available, the geothermmay be constructed by detailed analysis of mineralchemistry (Finnerty and Boyd, 1987). In most cases,however, the geotherm parameters must be deriveddirectly from the concentrates, using the techniquesdescribed by Ryan et al. (1996). This approach usesalgorithms based on a combination of experimentaland empirical data sets, to calculate the pressure(PCr) at which each garnet in a concentrate wouldhave been in equilibrium with chrome spinel (Ryanet al., 1996). If no spinel was present, the calcu-lated PCr will be underestimated. Hence, when thegarnets from a concentrate are plotted in a PCr–TNi
diagram (Fig. 4), the ‘Garnet Geotherm’ is definedby the envelope of maximum PCr at each TNi, as-suming those garnets coexisted with chrome spinel.The method gives good agreement with geothermsderived by P–T estimates on xenoliths (Ryan et al.,1996; Griffin et al., 1996). Comparison of the TZn
spectrum of chromites from the same concentrate
provides additional constraints on the interpretationof the geotherm. Above some temperature, the lo-cus of maximum PCr in most Garnet Geothermsno longer follows a conductive model. Analysis ofchromite (s.l.) concentrates from such localities (e.g.Kaapvaal; Ryan et al., 1996) commonly shows fewchromites with temperatures higher than this point,suggesting that most higher-temperature garnets areundersaturated in Cr, and that the geotherm cannotbe defined above this point.
Many xenolith-derived geotherms show an inflec-tion (‘kink’ or ‘step’) at high temperatures, witha magnitude depending in detail on the geother-mobarometers used; these discontinuities reflect achange from an essentially conductive type ofgeotherm to a steeper temperature gradient. Xeno-liths along the steeper limb of such geotherms (orabove a high-temperature ‘step’) commonly havefoliated microstructures and show geochemical evi-dence of infiltration by asthenosphere-derived melts(Smith and Boyd, 1987; Griffin et al., 1989; Smith etal., 1991). These samples are interpreted as comingfrom near the lithosphere–asthenosphere boundary(LAB).
Estimation of lithosphere thickness by the use ofmineral data is more difficult and speculative, par-

W.L. Griffin et al. / Tectonophysics 310 (1999) 1–35 11
Fig. 4. TNi–PCr plots (see text) showing Garnet Geotherms (Ryan et al., 1996) for selected kimberlite fields along the Olenek trend.Conductive model geotherms of Pollack and Chapman (1977) corresponding to surface heat flows of 35, 40 and 45 mW=m2 are shownfor reference. Dashed lines show lithosphere–asthenosphere boundary derived from plots in Fig. 5. Symbols show garnets classified intolithologies according to Fig. 3a.
ticularly because the definition of the lithosphere–asthenosphere boundary depends on the criteriachosen. The lithosphere may be defined in termsof its thermal characteristics alone; McKenzie andBickle (1988) place the lithosphere–asthenosphere
boundary in a transition zone between a conductivegeotherm (lithosphere) and an adiabatic one (as-thenosphere). Geochemists, on the other hand, tendto regard the lithosphere as consisting of stable, rela-tively depleted material, distinct from the convecting
12 W.L. Griffin et al. / Tectonophysics 310 (1999) 1–35
and presumably more ‘fertile’ asthenosphere. Thisdepleted lithosphere is recognised by the presence ofY-depleted garnets, defined as those with <10 ppmY; this value represents the median Y content of>6000 garnets from Archean cratons (Griffin et al.,1999c).
In many garnet concentrates there is a dis-tinct upper temperature limit to the distribution ofY-depleted garnets, and this commonly coincideswith the temperature where the geotherm no longerappears to follow a simple conductive model (Grif-fin and Ryan, 1995; Griffin et al., 1996; Ryan etal., 1996); we adopt this temperature as defining theLAB (Fig. 5). Higher-temperature garnets tend tohave undepleted trace-element chemistry similar tothe garnets of high-temperature sheared xenoliths.The lithosphere thickness determined in this mannerranges from 150 to 250 km in cratonic areas; theboundary so defined thus lies within the thicker ‘tec-tosphere’ of Jordan (1988) and probably representsa zone of pronounced magma–wall rock interaction(O’Reilly and Griffin, 1996).
Once the garnet geotherm is established, the depthof origin of each grain is derived by projecting its TNi
to the geotherm. Garnets with TNi above the pointof the ‘kink’ can only be projected to a hypotheticalkinked limb, which we have taken, by comparisonwith many xenolith geotherms (Finnerty and Boyd,1987), to be parallel to the diamond–graphite equi-librium curve of Kennedy and Kennedy (1976).
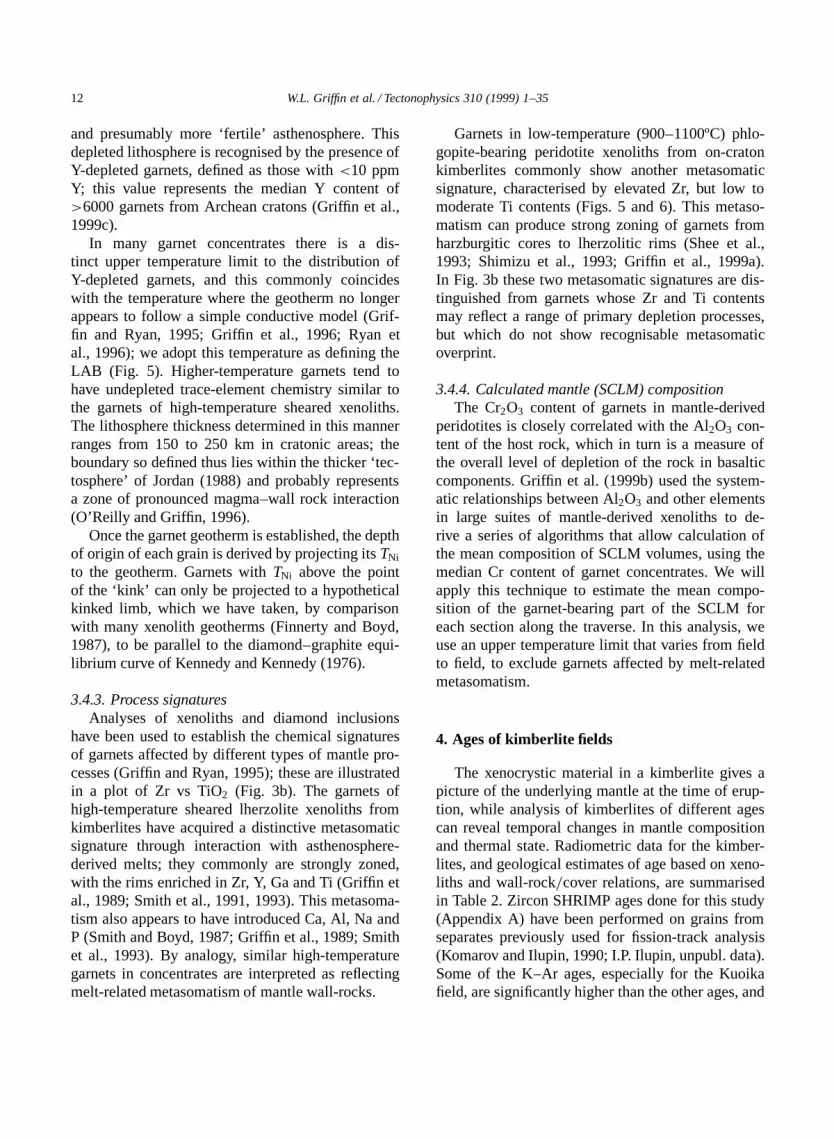
3.4.3. Process signaturesAnalyses of xenoliths and diamond inclusions
have been used to establish the chemical signaturesof garnets affected by different types of mantle pro-cesses (Griffin and Ryan, 1995); these are illustratedin a plot of Zr vs TiO2 (Fig. 3b). The garnets ofhigh-temperature sheared lherzolite xenoliths fromkimberlites have acquired a distinctive metasomaticsignature through interaction with asthenosphere-derived melts; they commonly are strongly zoned,with the rims enriched in Zr, Y, Ga and Ti (Griffin etal., 1989; Smith et al., 1991, 1993). This metasoma-tism also appears to have introduced Ca, Al, Na andP (Smith and Boyd, 1987; Griffin et al., 1989; Smithet al., 1993). By analogy, similar high-temperaturegarnets in concentrates are interpreted as reflectingmelt-related metasomatism of mantle wall-rocks.
Garnets in low-temperature (900–1100ºC) phlo-gopite-bearing peridotite xenoliths from on-cratonkimberlites commonly show another metasomaticsignature, characterised by elevated Zr, but low tomoderate Ti contents (Figs. 5 and 6). This metaso-matism can produce strong zoning of garnets fromharzburgitic cores to lherzolitic rims (Shee et al.,1993; Shimizu et al., 1993; Griffin et al., 1999a).In Fig. 3b these two metasomatic signatures are dis-tinguished from garnets whose Zr and Ti contentsmay reflect a range of primary depletion processes,but which do not show recognisable metasomaticoverprint.
3.4.4. Calculated mantle (SCLM) compositionThe Cr2O3 content of garnets in mantle-derived
peridotites is closely correlated with the Al2O3 con-tent of the host rock, which in turn is a measure ofthe overall level of depletion of the rock in basalticcomponents. Griffin et al. (1999b) used the system-atic relationships between Al2O3 and other elementsin large suites of mantle-derived xenoliths to de-rive a series of algorithms that allow calculation ofthe mean composition of SCLM volumes, using themedian Cr content of garnet concentrates. We willapply this technique to estimate the mean compo-sition of the garnet-bearing part of the SCLM foreach section along the traverse. In this analysis, weuse an upper temperature limit that varies from fieldto field, to exclude garnets affected by melt-relatedmetasomatism.
4. Ages of kimberlite fields
The xenocrystic material in a kimberlite gives apicture of the underlying mantle at the time of erup-tion, while analysis of kimberlites of different agescan reveal temporal changes in mantle compositionand thermal state. Radiometric data for the kimber-lites, and geological estimates of age based on xeno-liths and wall-rock=cover relations, are summarisedin Table 2. Zircon SHRIMP ages done for this study(Appendix A) have been performed on grains fromseparates previously used for fission-track analysis(Komarov and Ilupin, 1990; I.P. Ilupin, unpubl. data).Some of the K–Ar ages, especially for the Kuoikafield, are significantly higher than the other ages, and

W.L. Griffin et al. / Tectonophysics 310 (1999) 1–35 13Y
T (Ni) (˚C)
14001000
Upper Muna Upper Molodo
Chomurdakh Toluopka
Daldyn Merchimden Kuoika
Malo-Botuobiya
Alakit
600 14001000600 14001000600
100
1
10
100
1
10
100
1
10
Zr + Sr metasom.Sr metasom.High TiMagma (Zr + Ti)Hydrous Zr meta.Depleted
Fig. 5. Y–TNi plots for selected fields along the Olenek trend, showing estimation of temperature of lithosphere–asthenosphere boundaryfrom distribution of Y-depleted (Y � 10 ppm) garnets. Symbols show garnets classified in terms of metasomatic signatures based onFig. 3b.
in several cases they contradict reliable geologicaldating, suggesting a problem with excess Ar. Rb–Srages for several pipes in the Kharamai field are muchyounger than U–Pb ages on zircon and perovskite;the reason is unknown.
In most cases the zircon fission-track ages, whichare most sensitive to post-emplacement reheating,agree within 10–15% with U–Pb dates on zirconsfrom the same pipes. Where the same samples havebeen used for both determinations, differences of 40

14 W.L. Griffin et al. / Tectonophysics 310 (1999) 1–35Y
Zr (ppm)
10050
Upper Muna Upper Molodo
Chomurdakh
Toluopka
Daldyn Merchimden Kuoika
Malo-Botuobiya
Alakit
40
0
0
20
40
0
20
40
0
20
100500100500
Zr + Sr metasom.Sr metasom.High TiMagma (Zr + Ti)Hydrous Zr meta.Depleted
Fig. 6. Y–Zr plots for garnets from selected fields, showing differences in degree of depletion and metasomatic style. Symbols as inFig. 5.
Ma are common, and there is no consistent patternof one method giving higher or lower ages than theother. Perovskite U–Pb ages (Kinny et al., 1997) fallwithin the range of fission-track and zircon U–Pbages from the same field. The only pipe for whichboth zircon and perovskite U–Pb ages are available isMarychka, in the Upper Molodo field, and the ages
agree within analytical error (159–161 Ma). TheDianga pipe, which lies near the Kuoika field andcommonly is included in it, gives a Triassic Rb–Sr(mica–whole rock) age, but our new U–Pb date onzircon is 155 Ma, consistent with ages on the Kuoikapipes. The new data also show that the Ukukit fieldscontain kimberlites of Silurian (ca. 400–420 Ma)

W.L. Griffin et al. / Tectonophysics 310 (1999) 1–35 15Ta
ble
2A
ges
ofki
mbe
rlite
field
s
Map
No.
Fiel
dPi
peR
adio
met
ric
data
(Ma)
Geo
logi
cald
ata
Age
(Ma)
ofm
ain
activ
ity
fissi
ontr
ack
aU
–Pb
bU
–Pb
cR
b–Sr
dK
–Ard
zirc
onzi
rcon
pero
vski
te
1L
.Bot
uobi
yaA
mak
insk
aya
486
450
324–
379
Xen
olith
sof
D3f
m1
basa
lts35
0–37
0In
tern
atio
naln
aya
368,
352š
1336
0L
.Dev
.–E
.Car
b.Ta
yozh
naya
397
403
(som
eO
rd.–
Sil.?
)M
ir35
8š
636
232
4š
1140
3š
15X
enol
iths
ofD
3fm
2ba
salts
Dac
hnay
a35
8š
637
9
2A
laki
tSy
tyka
nska
ya38
4š
1434
435
0–38
0Pi
peN
o.3
358
350š
13sp
ores=po
llen
D3
(³D
3fv1
)L
.Dev
.–E
.Car
b.Sv
etla
ya36
8,37
2š
334
4xe
nolit
hsw=
D2g
v2–D
3fr1
cora
lsK
olle
ktiv
naya
385,
461š
2434
7Is
kork
a36
4M
oskv
ichk
a35
0š
15,3
42š
15D
ruzh
ba35
8š
4Su
veni
r36
2š
5
3D
aldy
nL
etna
ya39
235
0–37
0U
dach
naya
-E36
7š
533
3–41
3ab
unda
ntxe
nolit
hsw
ithL
.Dev
.–E
.Car
b.U
dach
naya
-W36
1š
4,35
3š
532
2–42
6D
2gv–
D3f
rbr
achi
opod
s,ot
her
Zag
adoc
hnay
a37
0š
1942
0š
20Si
luri
anan
dD
evon
ian
mac
rofo
ssils
Mas
takh
329š
17Po
larn
aya
357š
3D
alna
ya35
5š
5A
eros
emoc
hnay
a35
9š
4
4U
pper
Mun
aK
omso
mol
skay
a37
5–38
233
0–36
0M
agni
tnay
a33
4š
4E
.Car
boni
fero
usN
ovin
ka36
0,42
6š
2032
5Y
ears
Yak
utia
330,
355,
362š
534
5š
12Z
apol
arna
ya36
0š
10Z
imna
ya35
4š
20In
terk
osm
os45
8š
12V
ein
‘2’
376
5C
hom
urda
khSo
pka
396š
7X
enol
iths
ofD
3fr
basa
lts37
0–44
0Sn
ezhi
nka
381š
13D
evon
ian
Cho
mur
377š
1441
6š
6,40
0š
15G
orna
tska
ya41
9š
10Sv
etla
ya34
4D
ruzh
ba40
8,44
841
1U
rals
kaya
406š
8Pe
reva
lnay
aII
380
Pere
valn
aya
III
374,
375
422š
5A
nom
aly
180=
7843
6š
7K
haiy
rgas
takh
421š
10

16 W.L. Griffin et al. / Tectonophysics 310 (1999) 1–35Ta
ble
2(c
ontin
ued)
Map
No.
Fiel
dPi
peR
adio
met
ric
data
(Ma)
Geo
logi
cald
ata
Age
(Ma)
ofm
ain
activ
ity
fissi
ontr
ack
aU
–Pb
bU
–Pb
cR
b–Sr
dK
–Ard
zirc
onzi
rcon
pero
vski
te
6W
.Uku
kit
Ano
mal
y46
a=65
415š
10D
evon
ian
basa
ltsas
xeno
liths
—37
5–43
0A
nom
aly
70a=
6540
0š
5no
Tri
assi
cba
salts
Dev
onia
nA
nom
aly
62a=
6843
8š
22A
nom
aly
36=65
413š
7A
nom
aly
26-1=65
375–
455
Len
ingr
ad67
4š
16A
nom
aly
165
424š
29A
nom
aly
152
419š
10A
nom
aly
134
408š
19
7E
.Uku
kit
Uku
kit-
I43
4š
30X
enol
iths
ofD
evon
ian
basa
lts38
0–41
0K
urun
g43
2š
15D
evon
ian
Tur
istic
hesk
aya
382
No
P–M
zte
rrig
enou
sro
cks
Ore
khov
aya
408š
14
8O
gone
r-U
rjac
hFe
stiv
alna
ya41
8š
15Si
luri
an
9U
.Mot
orch
una
Aer
ogeo
logi
ches
kaya
450š
2440
3Si
luri
an
10M
erch
imde
nM
alvi
na34
1š
1748
0X
enol
iths
ofD
evon
ian
basa
lts36
0–38
0Po
dsne
zhna
ya47
5š
11N
ote
rrig
enou
sP–
Mz
rock
sD
ev.–
E.C
arb.
Nem
agni
tnay
a38
7š
14B
ody
534
7š
1842
8š
14Pj
ero
332
Vos
tok-
636
3š
1441
9š
1040
0K
osm
os-4
375
Ope
rato
rska
ya55
5š
21?
Ope
rato
rska
yaA
371
Ope
rato
rska
yaB
380
mea
nR
b–Sr
age
377
Ma
Bel
ka39
7O
besc
haju
schn
aya
394
Phlo
gopi
tova
ya32
6š
10B
esym
anna
ya37
6L
vina
yaL
apa
354
Nec
hto
379
Gor
nost
ai37
4T
rilo
bit
327
Bur
atin
o41
9
11U
pper
Mol
odo
Gra
nato
vaya
188
186š
10,1
95š
10Ju
rass
ic(o
rM
Z)
spor
es14
0–16
5M
aryc
hka
171š
1315
916
1an
dpo
llen.
Man
yxe
nolit
hsof
Jura
s.–C
reta
c.M
olod
o-I
246š
10T
1do
leri
tes
Chr
isol
itova
ya15
0š
715
6

W.L. Griffin et al. / Tectonophysics 310 (1999) 1–35 17
Tabl
e2
(con
tinue
d)
Map
No.
Fiel
dPi
peR
adio
met
ric
data
(Ma)
Geo
logi
cald
ata
Age
(Ma)
ofm
ain
activ
ity
fissi
ontr
ack
aU
–Pb
bU
–Pb
cR
b–Sr
dK
–Ard
zirc
onzi
rcon
pero
vski
te
12To
luop
kaE
xtra
-I37
4š
9>
Perm
ian
360–
380
Ext
ra-I
I37
4D
evon
ian
Ivus
hka
unde
rL
ower
Perm
ian
sedi
men
ts
13K
uoik
aSe
raya
534š
20J2
-K14
0–18
0V
eche
rnay
a40
3š
50Ju
ras.
–Cre
tac.
Mam
a33
9š
11Sn
ezhn
aya
I43
4š
16L
jusy
a34
0š
16V
toro
godn
itza
374š
12xe
nolit
hsof
Mz
sand
ston
eO
livin
ovay
a35
5š
7xe
nolit
hsof
Mz
sand
ston
eV
odoz
azde
lnay
a37
6š
5O
bnaz
henn
aya
185–
188
418š
14xe
nolit
hsof
Mz
sand
ston
eR
uslo
vaya
158š
833
5,34
1,38
1š
25M
ontic
helo
vito
vaya
148š
4,17
0š
355
0š
14Sm
ezhn
aya
185–
288
160š
2M
uza
151
Toku
r15
1M
elka
ya17
8š
12Pj
atni
za15
7š
1615
6š
8in
trud
esPe
rmia
nse
dim
ents
Slju
dank
a14
7š
614
8in
trud
esPe
rmia
nse
dim
ents
Ano
mal
y23=78
122š
3A
nom
aly
4315
9A
nom
aly
3615
9Pe
rvom
disn
aya
134š
1R
ubin
177š
11L
udm
ila18
3š
9Ir
ina
149
Kau
kas
153
Vel
ikan
128š
2,15
9š
2D
iang
a15
6š
1023
4Ju
rass
ic
15K
uran
akh
Mal
okuo
nam
skay
a22
2,22
3š
722
4š
726
3š
16X
enol
iths
ofC
2-P
and
P2se
dim
ents
,22
0–24
0K
uran
akhs
kaya
252š
11T
1ba
salts
and
tuff
s,Pr
-T1
foss
ilsT
rias
sic
Los
249š
12(E
quis
etum
)V
ympe
l24
2š
14U
nive
rsite
tska
ya23
824
8š
10
16L
ucha
kan
Luc
htch
anII
227š
6A
sfo
rK
uran
akh
210–
245
Dam
aII
246š
10T
rias
sic
Kra
siva
ya25
3š
10Po
sdna
ya21
723
2š
8A
nom
aly
89=65
238š
8O
triz
atel
naya
229š
9D
uoin
aya
240š
9Sk
iper
‘bir
igin
dite
’15
8š
6

18 W.L. Griffin et al. / Tectonophysics 310 (1999) 1–35
Tabl
e2
(con
tinue
d)
Map
No.
Fiel
dPi
peR
adio
met
ric
data
(Ma)
Geo
logi
cald
ata
Age
(Ma)
ofm
ain
activ
ity
fissi
ontr
ack
aU
–Pb
bU
–Pb
cR
b–Sr
dK
–Ard
zirc
onzi
rcon
pero
vski
te
18M
id.K
uona
mka
Lom
onos
ova
150š
4P2
-J1
ca.1
50Z
avar
itska
ya14
8š
3T
rias
sic
May
skay
a24
6š
1024
0–24
5D
yuim
ovoc
hka
229š
3T
rias
sic
Kha
tyry
k3
224š
2A
rktik
a23
2š
4
20O
rto
Irig
akh
Ano
mal
y12=85
315
8š
715
0–16
0A
nom
aly
74=85
315
6š
6Ju
rass
icA
nom
aly
50=64
3215
2š
3
21K
hara
mai
Bol
oto
I16
2,16
6<
T1i
nca
.240
?E
venk
iiska
ya15
6(E
.Tri
assi
c)A
chta
chI
168–
172
Ula
chun
313
6,17
6U
lach
un1
245š
316
8,17
8B
illac
h2
182
Ecl
ogit
171
mea
nR
b–Sr
age
169
Ma
Pods
nezh
naya
141
X-2
617
7A
nom
aly
SH21
242š
23
24A
naba
rSe
rbia
nD
yke
362š
7
25Se
vern
eiR
assv
et37
4š
14a
344
340–
380
27M
arkh
aB
otuo
bins
kaya
364š
9un
der
L.J
uras
sic
sedi
men
ts35
0–37
0
aM
ostd
ata
from
Kom
arov
and
Ilup
in(1
990)
;tho
sew
ithš
from
Bra
khfo
gel(
1984
).b
Dat
aw
ithš,
this
repo
rt;o
ther
sfr
omD
avis
etal
.(19
80),
Bra
khfo
gel(
1984
)an
dN
.V.S
obol
ev,p
ers.
com
mun
.(19
95).
cD
ata
from
Kin
nyet
al.(
1997
)an
dre
fere
nces
ther
ein.
dD
ata
from
Bra
khfo
gel(
1984
,and
pers
.com
mun
.)ex
cept
Mar
kha
field
(Aga
shev
etal
.,19
98)
and
Ana
bar
field
(Min
gazo
vet
al.,
1996
).

W.L. Griffin et al. / Tectonophysics 310 (1999) 1–35 19
age, and that those of the Orto-Irygakh field at thenorthern end of the Anabar trend are Jurassic, likethose of the Kuoika field. A SHRIMP U–Pb age of155 Ma on zircon from the Skiper ‘birigindite’ (analkali basalt) in the Luchakan field shows Jurassicas well as Triassic magmatic activity (though theformer is not kimberlitic) also in this part of theAnabar trend.
Each of the well-dated Devonian kimberlite fieldsof the Olenek trend shows a range of ages. If only U–Pb and Rb–Sr ages are considered, this range is½100Ma in the Malo-Botuobiya, Upper Muna and Mer-chimden fields, and ca. 80 Ma in the Chomurdakhfield. The Daldyn and Alakit fields show the smallestspread, on the order of 30 Ma. Too few data are avail-able for comparison from the Upper Motorchuna andToluopka fields. The Triassic Kuranakh and Luchakanfields show ranges (Rb–Sr) of only 20–25 Ma, whilethe Jurassic Kuoika and Kharamai fields appear tohave intruded over periods of 40–50 Ma.
Several zircons, including two from crustal xeno-liths, give ages ranging from 1890 to 1780 Ma(Appendix A); these are broadly consistent with theknown ages of granites, interpreted as related to thecraton assembly (Rosen et al., 1994).
5. Results
5.1. Geotherms and lithosphere thickness
TNi and PCr data for selected kimberlite fieldsalong the Olenek trend are shown in Fig. 4; the Gar-net Geotherm is indicated, as well as an estimate oflithosphere thickness derived from the Y–TNi plotsin Fig. 5. These plots also include model conduc-tive geotherms corresponding to surface heat flowvalues of 35, 40 and 45 mW=m2 (Pollack and Chap-man, 1977); these are intended to provide a referenceframework for the Garnet Geotherms, which are de-rived independently. Plots of Y vs Zr (Fig. 6) and Zrvs TiO2 (Fig. 7) are used to illustrate the distributionof depleted and metasomatised mantle types.
5.1.1. Devonian kimberlite fieldsMalo-Botuobiya field. The garnet data (Fig. 4) de-fine a Garnet Geotherm that lies close to a 35mW=m2 conductive model up to 1000ºC, and the
range of chromite temperatures is consistent withthe presence of Cr-saturated garnets up to this point.There are relatively few data points between 1000ºand 1150ºC, and most garnets with TNi ½ 1100ºCshow a strong signature of melt-related metasoma-tism. However, depleted garnets are present up to ca.1150ºC (Fig. 5), suggesting that the lithosphere mayextend to depths of ca. 190 km.
Alakit field. This field can be divided into the mainpart, occupying the central and southern part of thefield, the NIIGA group in the north-central portion,and the Iskorka group about 10 km south of the NI-IGA group. The garnet data from the main part andthe NIIGA group (Fig. 4) define a geotherm closeto the 35 mW=m2 conductive model, up to at least1050ºC. The chromite data are consistent with thepresence of Cr-saturated garnets over this tempera-ture range. Depleted garnets are present at least upto 1250ºC, while garnets with the signature of melt-related metasomatism become dominant above ca.1200ºC (Fig. 6); this suggests a lithosphere thicknessof ca. 240 km.
The low-grade pipes in the Iskorka group (notshown) are dominated by low-temperature garnets,which are consistent with a 35 mW=m2 conductivegeotherm, but most of those with TNi ½ 1050ºC areaffected by melt-related metasomatism. The avail-able radiometric data do not indicate a younger agefor the pipes in this field, so no temporal evolutionof the geotherm is indicated. The garnet data suggestpenetration of asthenospheric magmas to higher lev-els than further south, and this may imply a structuralcontrol, such as a deep fault.
Daldyn field. A detailed discussion of the litho-spheric column beneath this field is given by Griffinet al. (1996). The Garnet Geotherm (Fig. 4) lies nearthe 35 mW=m2 conductive model, and this is con-strained by chromite TZn values that extend up toat least 1100ºC. The Garnet Geotherm is supportedby thermobarometry on xenoliths (Boyd, 1984; Grif-fin et al., 1996; Boyd et al., 1997); most data areconsistent with a geotherm near the 35 mW=m2
model at T � 1100ºC, but a large group of shearedgarnet lherzolite xenoliths with T ½ 1200ºC liesabove this geotherm and is interpreted as reflect-ing heating near the base of the lithosphere. This
20 W.L. Griffin et al. / Tectonophysics 310 (1999) 1–35Z
r (p
pm)
Upper Muna Upper Molodo
Chomurdakh Toluopka
Daldyn Merchimden Kuoika
Malo-Botuobiya
Alakit
100
10
100001000100 100001000 100001000
100
10
100
10
TiO (ppm)2
Zr + Sr metasom.Sr metasom.High TiMagma (Zr + Ti)Hydrous Zr meta.Depleted
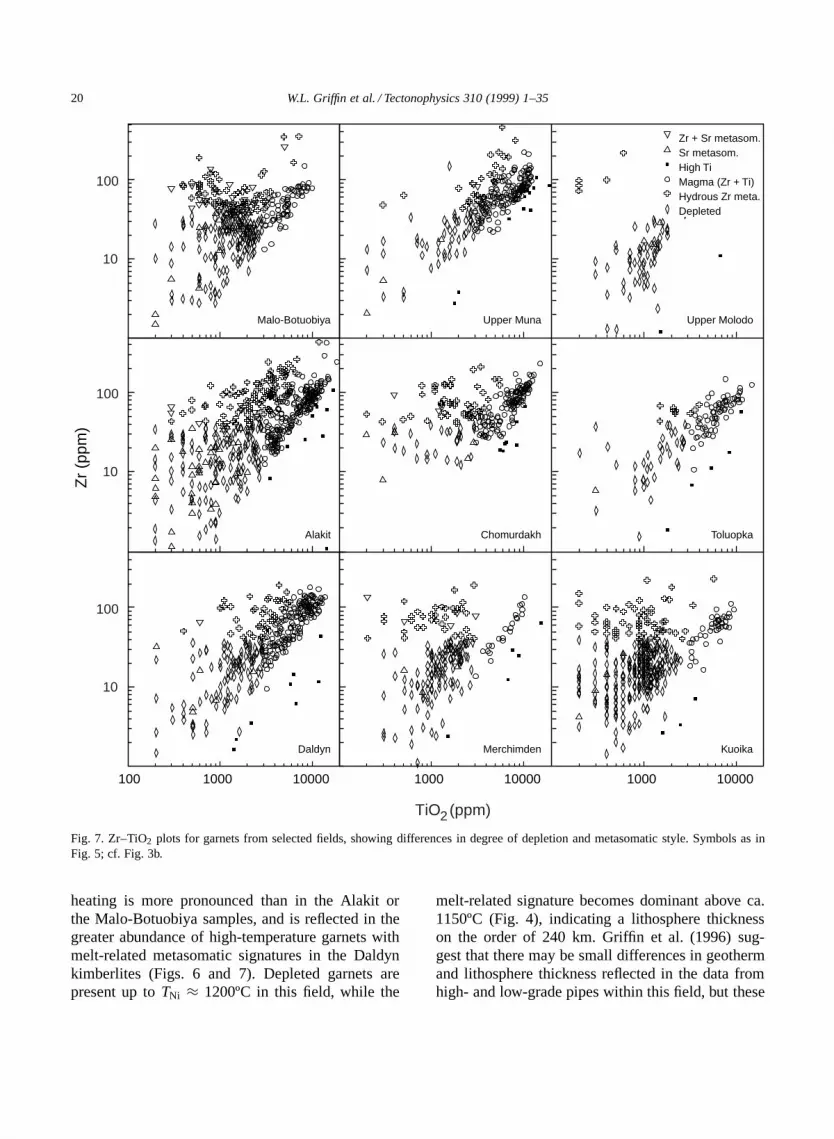
Fig. 7. Zr–TiO2 plots for garnets from selected fields, showing differences in degree of depletion and metasomatic style. Symbols as inFig. 5; cf. Fig. 3b.
heating is more pronounced than in the Alakit orthe Malo-Botuobiya samples, and is reflected in thegreater abundance of high-temperature garnets withmelt-related metasomatic signatures in the Daldynkimberlites (Figs. 6 and 7). Depleted garnets arepresent up to TNi ³ 1200ºC in this field, while the
melt-related signature becomes dominant above ca.1150ºC (Fig. 4), indicating a lithosphere thicknesson the order of 240 km. Griffin et al. (1996) sug-gest that there may be small differences in geothermand lithosphere thickness reflected in the data fromhigh- and low-grade pipes within this field, but these

W.L. Griffin et al. / Tectonophysics 310 (1999) 1–35 21
differences are small compared to those between thefields discussed in this report, and may be within thesampling uncertainties.
Upper Muna field. The garnet data for this fielddefine a geotherm near a 38 mW=m2 conductivemodel, higher than the one derived for the moresoutherly fields (Fig. 4). The Y, Zr and Ti data, takentogether, indicate that the base of the lithosphere wasnear 1200ºC, corresponding to a depth of ³200–210 km. Melt-related metasomatism is dominant atT ½ 1200ºC (Figs. 6 and 7).
Chomurdakh field. The Garnet Geotherm for theChomurdakh field (Fig. 4) is similar to that forthe Upper Muna field, and the concentrates containa small proportion of harzburgitic garnets. However,the Y and Ti data suggest that depleted materialextends only to ca. 1150ºC; nearly all garnets withhigher TNi show the effects of melt-related metaso-matism (Figs. 6 and 7). This suggests that the baseof the lithosphere was at a depth of ca. 190 km.
Upper Motorchuna field. The scattered data for gar-nets from this field (not shown) suggest a geothermclose to the 40 mW=m2 conductive model at least upto 1100ºC. A few high-Cr chromites are present, withTZn ³ 950–1050ºC. The garnets are almost entirelyof lherzolitic type, and the degree of Y-depletion islow. This makes the identification of the base of thelithosphere ambiguous. Y-depleted garnets are foundup to TNi ³ 1300ºC, but Ti depletion is found only atTNi � 1200ºC. Nearly all garnets with TNi ½ 1150ºCshow the effects of melt-related metasomatism, andthis temperature is taken as an approximation to thebase of the lithosphere; it corresponds to a depth ofca. 175 km.
Merchimden field. The garnets from this field definea 40 mW=m2 conductive geotherm from 800º to1000ºC (Fig. 4). Y-depleted garnets are found almostentirely below 1000ºC, and most garnets with TNi ½950ºC are affected by metasomatism (Figs. 6 and7); the lithosphere base therefore is taken at 950ºC,corresponding to a depth of ca. 130–140 km.
Toluopka field. This northernmost Devonian field isrepresented only by garnets from the Ivushka pipe
(Pokhilenko and Sobolev, 1995) and from the nearbyKyutungde River alluvial deposits (Sobolev et al.,1981). The inferred geotherm (Fig. 4) lies betweenthe 35 and 40 mW=m2 conductive models. Depletedgarnets are present up to ca. 1250ºC but melt-relatedmetasomatism is dominant at T ½ 1200ºC, implyinga lithosphere base near 180 km.
5.1.2. Mesozoic kimberlite fieldsKuoika field (including Dianga pipe). The data fromthe Jurassic–Cretaceous Kuoika pipes define a 40mW=m2 geotherm up to ca. 1000ºC (Fig. 4). Thesesamples contain few depleted garnets, and essen-tially all grains with TNi ½ 1000ºC show melt-relatedmetasomatism, implying that the base of the litho-sphere was near 150 km.
Upper Molodo field. All of the garnets from thisfield give low temperatures, and they do not definea good geotherm, although they are consistent witha 40 mW=m2 conductive model like that derivedfor the Kuoika field (Fig. 4). A few chromites fromthe Mary pipe suggest a lower geotherm and haveTZn � 800ºC. The base of the lithosphere is notconstrained by these data except to set a minimumdepth of ³100 km.
Kuranakh field. The garnet data (not shown) define a40 mW=m2 geotherm; all the garnets are lherzoliticexcept for four mildly subcalcic grains with lowTNi. Y- (and Zr-) depleted garnets are restricted toTNi � 1000ºC. These data suggest a lithosphere basenear 140 km depth.
Luchakan field. The garnet data (not shown) definea conductive geotherm near the 40 mW=m2 modelup to ³1200ºC. The upper end of this geotherm iscontrolled by several harzburgitic garnets, none ofwhich, however, are depleted in Y or Zr. Garnetsdepleted in Y, Zr and Ti are restricted to TNi �1100ºC, corresponding to a lithosphere ca. 170 kmthick.
Middle Kuonamka field. This field is representedmainly by data from the Makarovskaya pipe, whichlies on the border of the field. All of the garnetsare lherzolitic and most give relatively low temper-atures. The geotherm lies near a 37 mW=m2 con-

22 W.L. Griffin et al. / Tectonophysics 310 (1999) 1–35
ductive model up to at least 900ºC. The chromitedata are consistent with a 35 mW=m2 geotherm atT � 800ºC, but suggest that the geotherm is higherat higher temperature; high-Cr chromites are presentup to TZn ³ 1050ºC. Y-depleted garnets also con-tinue up to 1100ºC, the maximum observed TNi.If these are considered to fall on the conductivegeotherm, they imply a lithosphere thickness ½160km. However, the absence of diamonds in these pipessuggests that the geotherm may ‘kink’ at a lowertemperature, reducing the lithosphere thickness toca. 140 km.
5.2. Lithosphere composition
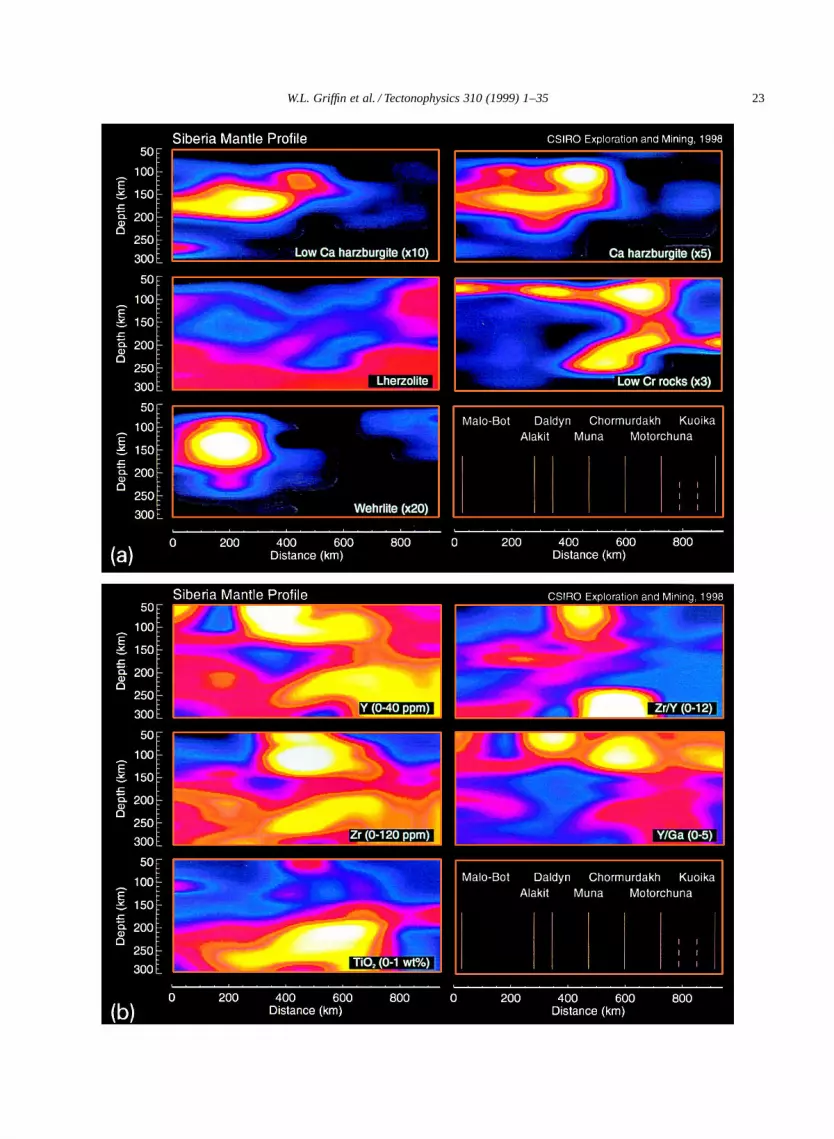
5.2.1. Distribution of rock typesThe distribution of several rock types with depth
along the Olenek trend, as estimated from the relativeabundance of different garnet types (Fig. 3a) inthe concentrates from each field, is shown as a‘chemical tomography’ image in Fig. 8a. Becauseof the contouring technique used in constructing thisfigure, data at depths <100 km or >250 km containsignificant artefacts and must be interpreted withcare.
Harzburgitic rocks are generally restricted to thesouthern half of the trend, within the areas underlainby Archean crustal terranes (the Archon); there alsois a small cluster beneath the Devonian Toluopkafield at the north end of the traverse. The low-Caharzburgites are concentrated in a restricted depthrange, with most being derived from 150 to 180km depth. Garnets from calcic harzburgites show awider vertical distribution, with discontinuities be-tween some fields clearly visible. These discontinu-ities correspond to the terrane boundaries mappedin the crustal rocks (cf. Figs. 1 and 2). Wehrliticgarnets show a more restricted lateral distribution,being concentrated at the southern end of the tra-verse (Malo-Botuobiya and Alakit fields).
Low-Cr lherzolitic garnets (�1.5% Cr2O3), occurmainly at shallow depth in the southern part of thetraverse, but make up most of the lithospheric mantlebeneath the north-central part of the traverse (the
Fig. 8. Contoured data for garnets from fields along the Olenek trend. Location of selected fields shown in lower right box of each figure.(a) Rock-type distribution, from garnets classified according to Fig. 3a. (b) Distribution of trace element signatures in garnets.
Proton). These low-Cr garnets are derived from rela-tively undepleted lherzolites (Griffin et al., 1999b,c)and their distribution indicates a significant differ-ence in mantle composition between the southernand the northern parts of the traverse. The deep‘slab’ of such rocks dipping southwards beneath theharzburgitic part of the lithosphere is interpreted asreflecting a high proportion of asthenosphere-derivedmaterial in the lower lithosphere beneath this part ofthe traverse.
The depth distribution of harzburgitic garnets inthe kimberlite fields of the Olenek trend is shownin more detail in Fig. 9. The maximum propor-tion of such garnets is significantly higher in theAlakit and Daldyn fields than in the fields to thenorth and south. Harzburgitic garnets are essentiallyabsent in the Upper Motorchuna and Merchimdenfields, but are found again beneath the Toluopkafield. The detailed depth distribution of harzburgiticgarnets shows marked changes over short distances,most notably between the Alakit, Daldyn and Up-per Muna fields. The Malo-Botuobiya, Alakit andDaldyn fields contain the highest density of datapoints, from the largest number of kimberlites, andtherefore should give the most precise data. Betweenthe Alakit and Daldyn fields, the contour for 30%harzburgitic garnets drops from ca. 105 km to ca. 145km, and the density of contours in these two fieldsshows that the mantle beneath the Daldyn field ismore strongly stratified in terms of harzburgite con-centration (cf. Griffin et al., 1996). In contrast, boththe Malo-Botuobiya and Upper Muna fields containmuch lower proportions of harzburgitic rocks, spreadmore evenly over the depth range sampled by thekimberlites.
The mantle beneath the Chomurdakh field con-tains a lower proportion of harzburgite, concentratedin the depth range 140–160 km. Beneath the Tolu-opka field even smaller proportions are present,centred around 160 km. The Mesozoic (Jurassic–Cretaceous) pipes of the Upper Molodo and Kuoikafields at the northern end of the Olenek trend donot contain significant amounts of harzburgitic gar-nets, implying a temporal change in the composition
W.L. Griffin et al. / Tectonophysics 310 (1999) 1–35 23

24 W.L. Griffin et al. / Tectonophysics 310 (1999) 1–35
Fig. 9. Detailed distribution of harzburgitic garnets (defined as in Fig. 3a) within each field along the Olenek trend. Lithosphere–asthenosphere boundary (LAB) defined as in Fig. 5. The position of the LAB in two different time slices is shown at the northern endof the traverse.
of the mantle beneath the northernmost part of thetraverse between Devonian and Jurassic time.
The depth of the spinel–garnet lherzolite transi-tion is controlled by the mean degree of depletion ofthe mantle and by the geotherm. In highly depletedsections with low geotherms, as in the Magan andAnabar provinces, this transition will lie near 100km depth. In concentrates from the Daldyn field,few garnets have TNi < 750ºC, corresponding to adepth of ca. 110 km (Fig. 4), while TZn estimatesfor chromites extend to below 700ºC. In the less de-pleted lithosphere beneath the Malo-Botuobiya field,TNi values extend down to 650ºC, and chromite TZn
to 600ºC, giving a depth for the spinel–garnet lher-zolite transition of <90 km. In most of the otherfields, minimum temperature estimates for garnetand chromite concentrates are similar, suggestingthat Tmin is controlled by the sampling mechanism,and giving only a maximum depth for the transition.
5.2.2. Distribution of trace element signaturesGriffin et al. (1998, 1999b,c) showed that Y=Ga
of peridotitic garnet increases, and Zr=Y decreases,with increasing fertility of the host rock, as measuredby cpx=gnt ratios and total (cpx C gnt) content. Thesame work showed that fertility measured in thisway increases as the tectonothermal age of the over-lying crust decreases, defining an irreversible secularchange in SCLM composition worldwide. This re-lationship appears to hold for the Siberian traversesamples, as shown by Fig. 10; the highest Zr=Y val-ues are found in the southern part of the traverse,where the crust is Archean, while the garnets fromthe northern part plot outside the field of Archongarnets. The highest mean Y=Ga and lowest meanZr=Y values are found in the Mesozoic pipes of theKuoika field, within the Proton.
The distribution of trace-element signatures in thegarnets along the traverse is shown as a chemical

W.L. Griffin et al. / Tectonophysics 310 (1999) 1–35 25
Fig. 10. Mean Zr=Y–Y=Ga of lherzolitic garnets from each field.Fields for garnet concentrates from Archons, Protons and Tectonsfrom Griffin et al. (1998). Increasing Y=Ga and decreasing Zr=Yin peridotitic garnets correlates with lower degrees of depletion.
tomography image in Fig. 8b. A marked increase inmean Ti, Y and Zr contents near the base of each sec-tion marks the lithosphere–asthenosphere boundaryas defined in this work; it represents the dominanceof garnets affected by high-temperature melt-relatedmetasomatism. The LAB is deepest beneath the Dal-dyn and Alakit fields, and shallows northward alongthe traverse.
The generally depleted nature of the Archon litho-sphere is shown by the overall low values of TiO2 inthe garnets of the southern part of the traverse. Thehighly depleted core of the lithosphere beneath theArchon is outlined by areas of low Y and especiallylow Y=Ga in the depth range 120–220 km. Higherlevels of Y and Y=Ga at shallower depths, especiallyin the middle of the traverse, may indicate that thelithosphere is less depleted at depths <130 km thanat deeper levels, but the data are sparse in severalfields, and must be interpreted with caution.
5.2.3. Calculated lithosphere compositionThe mean composition of the garnet-bearing
SCLM beneath each field, calculated from the me-dian garnet Cr2O3 contents (Griffin et al., 1999b), is
shown in Table 3. In each case the mean lherzoliteand harzburgite compositions were calculated sepa-rately, and then combined in the proportions shownfor the garnet types. The variation of the DepletionIndex (DI; Mg=Ca C Al) for the calculated SCLMbeneath each field along the Olenek trend, and sev-eral along the Anabar trend, is shown in Fig. 11, andcompared with the variation in the mean Y=Ga of thegarnets. These independent criteria illustrate the de-pleted nature of the mantle beneath the Archon, andthe lower degree of depletion beneath the Proton.
The mean SCLM composition beneath the Alakitand Daldyn fields is similar, despite the differencesin the degree of stratification shown in Fig. 9. Themean SCLM both to the south (Malo-Botuobiyafield) and north (Upper Muna field) is significantlyless depleted, as shown by lower DI and highermean Y=Ga in the garnets. All of these sectionsfall within the range of composition found for litho-spheric mantle beneath Archons worldwide (Griffinet al., 1999b). The SCLM beneath the Chomurdakhfield, despite its lower proportion of harzburgite, hasa mean composition similar to that of the Malo-Botuobiya field.
The least depleted mantle is found beneath theUpper Motorchuna, Merchimden, Upper Molodoand Kuoika fields, where the lithosphere is dom-inated by lherzolites with low-Cr garnet. The DIvalues are typical of Proton SCLM worldwide, whilethe mean Y=Ga of the garnets is even higher than inmany Proton sections (Griffin et al., 1998). At thenorthern end of the traverse, the average SCLM sam-pled by the Devonian pipes of the Toluopka area issignificantly more depleted than that sampled by theMesozoic Kuoika pipes. Spetsius (1995) has demon-strated that the mantle reflected in the xenoliths fromthese younger pipes is considerably less depletedthan that beneath the Anabar and Magan provinces.
The pipes of the Anabar trend are scattered alongthe Billyakh Shear Zone, which is interpreted as themajor boundary between Archean and Proterozoicterranes (Rosen et al., 1994). The garnet data and thecalculated SCLM composition for the Kuranakh andLuchakan fields are typical of Proterozoic mantle;the SCLM of the Middle Kuonamka field is similarin mean composition to that of the Malo-Botuobiyaand Upper Muna fields. This suggests that the SCLMis Archean, and the lack of harzburgitic garnets in

26 W.L. Griffin et al. / Tectonophysics 310 (1999) 1–35
Table 3Lithospheric mantle compositions, calculated from garnets
Archons Malo Bot. Alakit Daldyn U. Muna Chomurdakh Toluopka Kuonamka Average archon(world)
Garnet Cr2O3 4.60 6.12 5.70 4.84 4.30 4.73 5.43 5.05SiO2 45.81 45.64 45.68 45.78 45.87 45.78 45.68 45.73TiO2 0.05 0.03 0.04 0.05 0.05 0.05 0.04 0.04Al2O3 1.24 0.86 0.94 1.17 1.36 1.17 0.95 1.05Cr2O3 0.32 0.26 0.27 0.31 0.34 0.31 0.27 0.29FeO 6.52 6.33 6.37 6.48 6.58 6.49 6.37 6.43MnO 0.11 0.11 0.11 0.11 0.11 0.11 0.11 0.11MgO 44.84 45.90 45.67 45.03 44.50 45.02 45.64 45.36CaO 0.74 0.51 0.56 0.70 0.81 0.70 0.57 0.63Na2O 0.09 0.06 0.07 0.08 0.10 0.08 0.07 0.07
mg# 92.47 92.83 92.75 92.53 92.69 92.69 92.66 92.64Mg=Si 1.46 1.50 1.49 1.47 1.49 1.49 1.48 1.48Ca=Al 0.55 0.55 0.55 0.55 0.55 0.55 0.55 0.55Cr=Al 0.38 0.44 0.42 0.38 0.41 0.41 0.41 0.40Cr=Cr C Al 0.15 0.17 0.16 0.15 0.14 0.15 0.16 0.16
Protons Merchimden U. Motor. U. Molodo Kuoika Kuranakh Luchakan Kuonamka Average proton(world)
Garnet Cr2O3 2.80 3.77 2.76 3.14 3.28 2.65 5.34 3.12SiO2 44.82 44.22 44.85 44.59 44.50 44.93 43.60 44.62TiO2 0.09 0.07 0.09 0.08 0.08 0.10 0.04 0.08Al2O3 2.28 1.63 2.31 2.03 1.93 2.40 0.95 2.06Cr2O3 0.42 0.41 0.42 0.42 0.41 0.42 0.39 0.42FeO 7.88 7.74 7.89 7.83 7.81 7.90 7.60 7.83MnO 0.13 0.13 0.13 0.13 0.13 0.13 0.13 0.13MgO 41.93 43.94 41.83 42.71 43.01 41.56 46.06 42.61CaO 2.01 1.44 2.03 1.78 1.70 2.11 0.83 1.82Na2O 0.16 0.11 0.16 0.14 0.14 0.17 0.07 0.14
mg# 90.47 91.01 90.44 90.69 90.77 90.37 91.54 90.65Mg=Si 1.40 1.48 1.39 1.43 1.44 1.38 1.58 1.43Ca=Al 0.80 0.80 0.80 0.80 0.80 0.80 0.80 0.80Cr=Al 0.27 0.37 0.27 0.30 0.31 0.26 0.61 0.30Cr=Cr C Al 0.11 0.14 0.11 0.12 0.13 0.11 0.22 0.12
the concentrate may reflect a sampling bias; the datafor this field come from a single pipe (Table 1) and alimited depth range.
6. Discussion
6.1. Mantle terranes — major provinces
Subcalcic harzburgitic garnets are, on a world-wide scale, found commonly in kimberlites and
other volcanic rocks erupted through terranes withArchean crust and rarely in areas with Proterozoicor younger crust. This has led several authors (Boydet al., 1993; Helmstaedt and Gurney, 1995) to re-gard these garnets as the signature of an Archean‘mantle root’ at depth. Our mapping of represen-tative lithospheric sections worldwide confirms thisgeneral picture; in Proterozoic terranes any ‘harzbur-gitic’ garnets are typically only mildly subcalcic, andthey tend to be concentrated at relatively shallowdepth (Griffin et al., 1998).

W.L. Griffin et al. / Tectonophysics 310 (1999) 1–35 27
Fig. 11. Variation of Depletion Index (Mg=Ca C Al) for calculated SCLM compositions (Table 3) and mean Y=Ga of lherzolitic garnets,along the Olenek trend and for selected fields from the Anabar trend. The two independent measures of degree of depletion mirror oneanother. Mean values of each parameter for Archons, Protons and Tectons are from Griffin et al. (1998, 1999c).
The Billyakh Shear Zone (Fig. 1) divides theAnabar Province, in which the platform sedimentsand traps are underlain by Archean crust, from theOlenek Province, where the known basement rocksare strongly deformed and metamorphosed Protero-zoic supracrustal rocks. These supracrustal rocksmay lie on Archean basement that is not exposed,but their deformation and the presence of Proterozoicgranites in the Olenek Uplift suggests that a Protero-zoic tectonothermal event affected the crust beforeor during craton assembly (Rosen et al., 1994).
The data shown in Figs. 6–11 indicate that theMagan and Anabar provinces are underlain by litho-spheric mantle of fundamentally different characterfrom that under the Olenek Province. The mantle be-neath the Magan and Anabar provinces shares manycharacteristics with that under other Archean cratons,such as the Kaapvaal Craton in southern Africa. Itis thick, strongly depleted, as shown by low medianY contents and high median Cr contents in peri-dotitic garnets, contains high proportions of calcicand low-Ca harzburgites, has a very low geotherm,and shows extensive low-temperature metasomatism
reflected in the high Zr=Y of many garnets. Themantle beneath the Olenek Province is thinner, has ahigher geotherm and contains little harzburgite. Theoverall level of depletion is much lower (Fig. 11;Table 3) and the Zr–Y–Ga relationships of the lher-zolitic garnets are similar to those from mantle be-neath other Proterozoic terranes (Fig. 10).
In detail, the boundary between the two provincesmay be complex. The Mesozoic Luchakan field con-tains a few harzburgitic garnets, apparently derivedfrom the deepest regions sampled. This field lies verynear the NE-dipping Billyakh Shear zone; it is possi-ble that the harzburgitic garnets are derived from theunderlying lithosphere of the Anabar Province. TheMesozoic Middle Kuonamka field, which lies furtherto the northwest along this boundary, contains noharzburgitic material, and the Kuranakh field, whichlies 50–75 km inside the Hapschan terrane to thenortheast, contains only minor harzburgitic material,apparently from shallow depth.
The Chomurdakh field also lies in the Hapschanterrane as mapped by Rosen et al. (1994). It hasa small but significant component of the harzbur-

28 W.L. Griffin et al. / Tectonophysics 310 (1999) 1–35
gite component characteristic of Archean lithosphere(Fig. 4), but the harzburgites are concentrated at shal-lower depth, and the mean DI of the mantle is lower,than in the fields to the south (Fig. 11). The combina-tion may suggest that the sample represents partiallyreworked Archean mantle, or a tectonic mixture ofArchean and Proterozoic SCLM.
The traces of the Billyakh Shear Zone and theHapschan–Birekte terrane boundary in this area arebased on interpretation of magnetic anomalies. Ouranalysis of the magnetic anomaly pattern (Fig. 2),and the data from the garnet concentrates, suggestthat the more important boundary is the one betweenthe Chomurdakh and Upper Motorchuna fields. Wetherefore interpret the area beneath the Chomurdakhfield as the thinned edge of the Anabar Province,separating it from the areas of more typically Pro-terozoic lithosphere to the northwest and northeast.
The harzburgitic garnets from the Toluopka fieldindicate that Archean lithosphere was present be-neath this area during Devonian time. Too little ma-terial is available for a detailed comparison with theAnabar–Magan provinces lithosphere, but the datasuggest that the Toluopka lithosphere was thinner,somewhat hotter and less depleted (Fig. 8). As notedabove, this lithosphere may have been eroded andreplaced by a more typical Proton-Tecton type ofmantle before the intrusion of the Jurassic pipes ofthe Kuoika and Upper Molodo fields.
The marked differences in lithosphere thicknessand composition between the Devonian Merchim-den and Toluopka fields suggest a major boundarybetween them, which may correspond to the strongcurvilinear magnetic anomaly zone shown by Rosenet al. (1994). This may mark an unrecognised terraneboundary within the Olenek Province.
6.2. Mantle terranes — lithology variations acrossmajor boundaries
The techniques applied here allow the definitionof variations in the vertical distribution of rock types— a mantle stratification — beneath each kimberlitepipe. Our data suggest that within a single kimberlitefield, which may be 50–80 km across, differences inmantle stratification generally are within the resolv-ing power of our techniques. Thus across the Daldynfield, the strong concentration of harzburgitic garnets
between 150 and 180 km, defined in the Udachnayapipe (Griffin et al., 1996) also is consistent with thedata in other pipes where less material has been anal-ysed. In the Alakit field, the stratification is similarin the main part and in the NIIGA area at the north-ern end; as noted above, garnets from the Iskorkagroup of pipes show a very strong high-temperaturemetasomatic overprint.
The distribution of kimberlite fields within theMagan and Anabar provinces is such that we havedata from only one field within each terrane, as de-fined by crustal geology and geophysics. However,the variations in rock-type distribution between thesefields (Figs. 6 and 9), and in particular the large dif-ferences between the Alakit and Daldyn fields (sep-arated by ca. 75 km) suggest that the major changesin mantle stratification along the traverse are relatedto the terrane boundaries mapped at the surface. Thevertical distribution of mean Y contents and Zr=Yratios (Fig. 6), which reflect metasomatic processes,also changes markedly across terrane boundaries.
These variations strongly suggest that most of thecrustal terrane boundaries extend through the litho-spheric mantle at steep angles, separating mantlevolumes with different rock-type distributions anddifferent metasomatic histories. These represent fun-damental lithospheric domains where crust and man-tle have remained coupled through major tectonicepisodes, including the accretion of the terranes toform the craton.
6.3. Thermal state of the lithosphere
The variations in the geotherm across the regionin Devonian time are reflected in the position ofthe 1000ºC isotherm (Fig. 12). This isotherm is,within the uncertainties of measurement, flat acrossthe southern part of the traverse, including the Malo-Botuobiya, Alakit and Daldyn fields. It lies at 175–180 km depth, reflecting a low geotherm, near the 35mW=m2 conductive model of Pollack and Chapman(1977; Fig. 4). The data from the Devonian Up-per Muna and Chomurdakh fields give a somewhathigher geotherm, reflected in the 1000ºC isothermrising to ca. 160 km depth. Within the Birekte ter-rane, the geotherm lies near the 40 mW=m2 conduc-tive model of Pollack and Chapman (1977) in Meso-zoic kimberlite fields, bringing the 1000ºC isotherm

W.L. Griffin et al. / Tectonophysics 310 (1999) 1–35 29
Fig. 12. Cartoon illustrating variation in lithosphere structure, composition and thermal state along the Olenek trend. The depth variationof the 1000ºC isotherm reflects lateral variation in the paleogeotherm, and is mirrored by variation in depth to the graphite–diamondtransition. Variation in depth to the spinel–garnet lherzolite transition reflects variations in both the geotherm and the mean degree ofdepletion; the transition has been observed in the Malo-Botuobiya and Daldyn fields, and is estimated in the others.
up to ca. 130 km depth. The Devonian geotherm be-neath the Toluopka field was lower, and this isothermtherefore would have been deeper (140–150 km)during Devonian time (Fig. 12).
The position and form of the mantle geothermis in part controlled by the heat production in thecrustal ‘lid’ (Morgan, 1995); this heat production islowest in granulite-facies rocks, and especially inrelatively high-pressure granulite terranes. The lowgeotherm registered in the Malo-Botuobiya, Alakitand Daldyn fields therefore is consistent with theevidence, from crustal xenoliths and the exposuresin the Anabar Shield, that the crust in these ar-eas consists of granulite-facies rocks with low heatproduction. The higher geotherm beneath the Up-per Muna field suggests that either the crustal rocks
or the lithospheric mantle have a somewhat higherheat production than those beneath the Alakit field.The higher geotherm beneath most of the OlenekProvince is consistent with other evidence that themetamorphic grade of the crustal rocks is generallylower than in the Magan and Anabar terranes. Evenduring eruption of the Mesozoic kimberlites at thenorth end of the Olenek trend, the paleogeothermwas close to a ‘cratonic’ 40 mW=m2 reference line.
The few measurements of surface heat flowwithin the platform are summarised by Duchkovand Sokolova (1997); within the eastern part of theplatform, the data are strongly concentrated aroundthe diamond-producing kimberlite fields. No detailedagreement can be expected between the actual mea-surements and the values predicted by the Pollack and
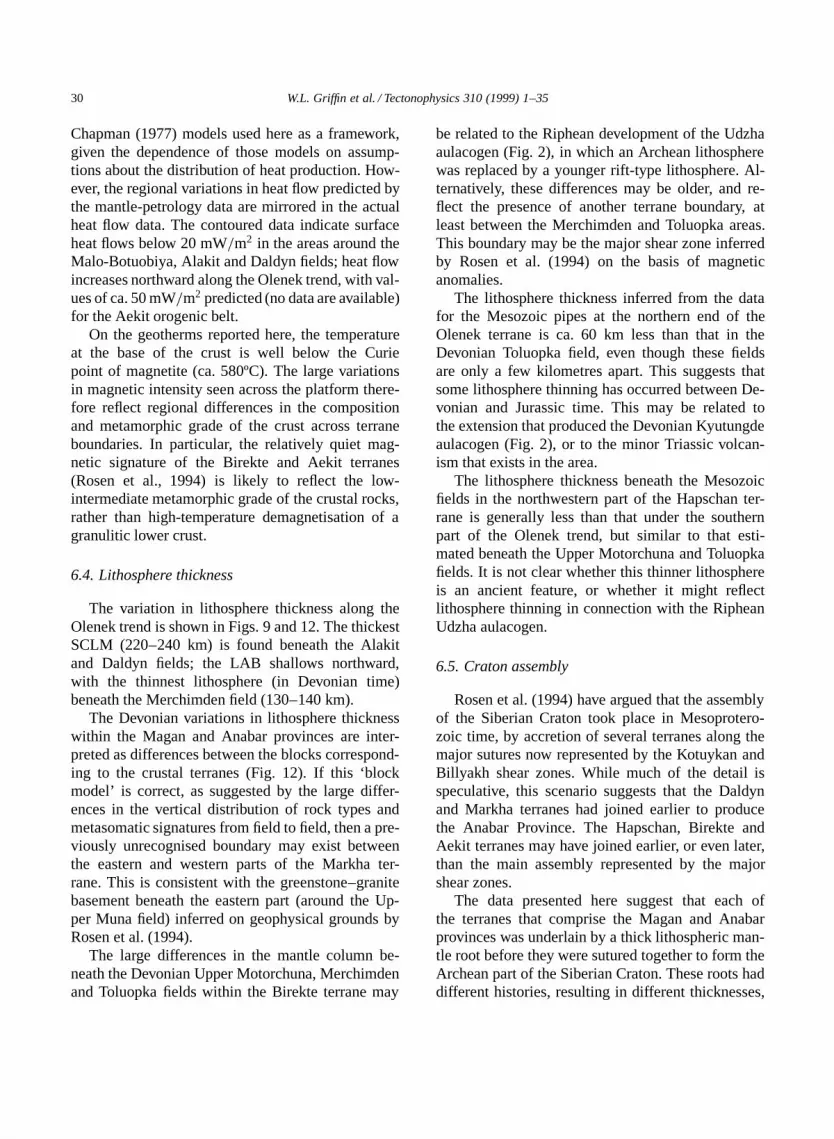
30 W.L. Griffin et al. / Tectonophysics 310 (1999) 1–35
Chapman (1977) models used here as a framework,given the dependence of those models on assump-tions about the distribution of heat production. How-ever, the regional variations in heat flow predicted bythe mantle-petrology data are mirrored in the actualheat flow data. The contoured data indicate surfaceheat flows below 20 mW=m2 in the areas around theMalo-Botuobiya, Alakit and Daldyn fields; heat flowincreases northward along the Olenek trend, with val-ues of ca. 50 mW=m2 predicted (no data are available)for the Aekit orogenic belt.
On the geotherms reported here, the temperatureat the base of the crust is well below the Curiepoint of magnetite (ca. 580ºC). The large variationsin magnetic intensity seen across the platform there-fore reflect regional differences in the compositionand metamorphic grade of the crust across terraneboundaries. In particular, the relatively quiet mag-netic signature of the Birekte and Aekit terranes(Rosen et al., 1994) is likely to reflect the low-intermediate metamorphic grade of the crustal rocks,rather than high-temperature demagnetisation of agranulitic lower crust.
6.4. Lithosphere thickness
The variation in lithosphere thickness along theOlenek trend is shown in Figs. 9 and 12. The thickestSCLM (220–240 km) is found beneath the Alakitand Daldyn fields; the LAB shallows northward,with the thinnest lithosphere (in Devonian time)beneath the Merchimden field (130–140 km).
The Devonian variations in lithosphere thicknesswithin the Magan and Anabar provinces are inter-preted as differences between the blocks correspond-ing to the crustal terranes (Fig. 12). If this ‘blockmodel’ is correct, as suggested by the large differ-ences in the vertical distribution of rock types andmetasomatic signatures from field to field, then a pre-viously unrecognised boundary may exist betweenthe eastern and western parts of the Markha ter-rane. This is consistent with the greenstone–granitebasement beneath the eastern part (around the Up-per Muna field) inferred on geophysical grounds byRosen et al. (1994).
The large differences in the mantle column be-neath the Devonian Upper Motorchuna, Merchimdenand Toluopka fields within the Birekte terrane may
be related to the Riphean development of the Udzhaaulacogen (Fig. 2), in which an Archean lithospherewas replaced by a younger rift-type lithosphere. Al-ternatively, these differences may be older, and re-flect the presence of another terrane boundary, atleast between the Merchimden and Toluopka areas.This boundary may be the major shear zone inferredby Rosen et al. (1994) on the basis of magneticanomalies.
The lithosphere thickness inferred from the datafor the Mesozoic pipes at the northern end of theOlenek terrane is ca. 60 km less than that in theDevonian Toluopka field, even though these fieldsare only a few kilometres apart. This suggests thatsome lithosphere thinning has occurred between De-vonian and Jurassic time. This may be related tothe extension that produced the Devonian Kyutungdeaulacogen (Fig. 2), or to the minor Triassic volcan-ism that exists in the area.
The lithosphere thickness beneath the Mesozoicfields in the northwestern part of the Hapschan ter-rane is generally less than that under the southernpart of the Olenek trend, but similar to that esti-mated beneath the Upper Motorchuna and Toluopkafields. It is not clear whether this thinner lithosphereis an ancient feature, or whether it might reflectlithosphere thinning in connection with the RipheanUdzha aulacogen.
6.5. Craton assembly
Rosen et al. (1994) have argued that the assemblyof the Siberian Craton took place in Mesoprotero-zoic time, by accretion of several terranes along themajor sutures now represented by the Kotuykan andBillyakh shear zones. While much of the detail isspeculative, this scenario suggests that the Daldynand Markha terranes had joined earlier to producethe Anabar Province. The Hapschan, Birekte andAekit terranes may have joined earlier, or even later,than the main assembly represented by the majorshear zones.
The data presented here suggest that each ofthe terranes that comprise the Magan and Anabarprovinces was underlain by a thick lithospheric man-tle root before they were sutured together to form theArchean part of the Siberian Craton. These roots haddifferent histories, resulting in different thicknesses,

W.L. Griffin et al. / Tectonophysics 310 (1999) 1–35 31
bulk compositions, degrees of depletion, rock-typestratification and distribution of metasomatic over-prints. These differences had been generated duringthe development of the individual crustal blocks, andwere preserved during the process of accretion. Ifthis interpretation of the data is correct, it may implythat even such relatively small crustal blocks wereable to develop and retain a thick root. However, italso is possible that each of these terranes was partof a larger block that was disrupted before assemblyof these fragments; in this case the lithospheric rootswould still have had to be preserved during lateralmovements.
The Proterozoic rocks of the Olenek Provincealso had a cratonic root, ranging from 150 to 180km thick, but except in the Toluopka area there is noevidence that this root had Archean characteristics.Archean crust may underlie the exposed rocks of theOlenek Province, but if the province had an Archeanroot, it was largely removed, or modified to typicalProterozoic composition, prior to the collision ofthe Olenek Province with the Anabar Province. Thedata from the Chomurdakh, Kuranakh and Luchakanfields, near the Billyakh Shear Zone, suggest thatthe collision led to some reworking and mixing oflithospheric mantle from the two provinces, but thismay be limited to a zone <100 km thick.
Post-collision rifting in the Udzha (Riphean),Majmecha and Kyutungde aulacogens has thinnedthe lithosphere, and probably has led to changes incomposition, including the removal of the vestigialArchean mantle at the north end of the traverse. Theprocesses involved need further investigation, butmay have included both thermal erosion, dispersal ofthe root by rifting and replacement with upwellingasthenospheric material, or compositional modifica-tion by interaction with asthenosphere-derived melts(Griffin et al., 1999b).
6.6. Implications for mineral exploration
The kimberlites of the Siberian Platform havebeen the focus of extensive diamond explorationprograms, and several of them are, or have been, sig-nificant diamond producers. The presence of com-mercial quantities of diamonds in a kimberlite re-quires both a suitable lithospheric environment, andsampling of this lithosphere within the diamond sta-
bility field (Helmstaedt and Gurney, 1995; Griffinand Ryan, 1995). The requirements for diamondstability include a lithosphere that is thick (typi-cally >180 km), has a low geotherm, and has notbeen subjected to extensive metasomatic activity.High degrees of depletion, as seen in the Archeanlithosphere, also are favourable, though not essential(Janse, 1994). The data presented here constrain ar-eas and time slices appropriate to economic diamonddeposits within the platform. The Archean core ofthe platform, which contains the known economicpipes, clearly meets the requirements listed above.Parts of the Habschan terrane probably are underlainby Archean mantle, but this appears to be reworkedduring Proterozoic time, and thus less prospective.Our data suggest that Archean mantle also may havebeen present beneath part of the Olenek terrane, butremoved during Late Devonian extension; the areaprobably is prospective for diamonds in lower Pa-leozoic kimberlites, but not in the younger ones. Itappears unlikely that the relatively young pipes ofthe Anabar trend will be prospective for diamonds,while the presence of economic placer deposits inthat region may suggest the presence of older pipes.
7. Conclusions
(1) The province and terrane boundaries mappedby geophysical data (extended from outcrops inthe Anabar Shield) represent fundamental translith-ospheric sutures, which continue with steep dipsthrough the lithospheric mantle and juxtapose man-tle domains that differ significantly in compositionand rock-type distribution.
(2) A low geotherm, corresponding approximatelyto the 35 mW=m2 conductive model of Pollackand Chapman (1977), characterised the Devonianlithosphere beneath the Magan and Anabar crustalprovinces; this is consistent with the known or in-ferred presence of Archean depleted granulites in theupper (and presumably lower) crust. The Devoniangeotherm beneath the northern fields was higher,rising to near the 40 mW=m2 conductive model ofPollack and Chapman (1977) in the Merchimdenfield. The areas intruded by Mesozoic kimberlitesare generally characterised by this higher, but still‘cratonic’ geotherm.

32 W.L. Griffin et al. / Tectonophysics 310 (1999) 1–35
(3) Lithosphere thickness at the time of kimberliteintrusion varied from ca. 190 to ca. 240 km withinthe Magan and Anabar provinces, but was less be-neath the Olenek Province already in Devonian time.The thinnest Devonian lithosphere was beneath theMerchimden field; this thinning may be related toRiphean rifting, or it may be an ancient feature andimply a terrane boundary between the Merchimdenand Toluopka areas.
(4) The difference in geotherm, lithosphere thick-ness and composition between the Toluopka areaand the nearby Mesozoic Kuoika and Upper Molodofields suggests thinning of the lithosphere by ca. 50–60 km between Early Devonian and Jurassic time.
(5) The presence of significant proportions ofharzburgite in the SCLM beneath the Magan andAnabar provinces is consistent with their Archeansurface geology, while the lack of such rocks be-neath most of the other fields is consistent withtheir Proterozoic surface rocks. The data from theToluopka field indicate that Archean crust may bepresent beneath the cover rocks. A major tectonicboundary, corresponding to the margin of the Aekitorogenic belt, may separate this area from the UpperMotorchuna–Merchimden area further south.
(6) The geochemical data suggest that the areaaround the Chomurdakh field represents the thinnedand partially reworked (in the Proterozoic collision)edge of the Anabar Province. The presence of mi-nor harzburgite in the relatively undepleted lherzoliticmantle beneath the Luchakan field suggests a similarreworked Archean mantle. By inference, much of thelithosphere beneath at least the southern edge of the
Olenek Province may have been originally Archean,but reworked during the Proterozoic assembly of thecraton, or earlier.
(7) The processes that generated the crustal ter-ranes recognised within the Archean Magan and An-abar provinces also created distinctive lithosphericmantle roots beneath each; these mantle volumesretained their identities during craton assembly.Similarly, the accretion of the Proterozoic OlenekProvince, with its own distinctive lithospheric man-tle, to the Archean core of the craton did not destroythe preexisting Archean root, and may only haveinvolved reworking and mixing along a zone <100km wide.
Acknowledgements
We thank V.M. Zuev and S.M. Bezborodov ofAlmazy Rossi-Sakha, Prof. N.V. Sobolev, Dr. N.P.Pokhilenko and Dr. S. Talnikova for their gener-ous donation of some of the samples used here.Sally-Ann Hodgekiss produced many of the figureswith great skill and enormous patience. We alsothank Frank Arnott, Bruce Wyatt and Norm Pearsonfor many useful and entertaining discussions. Themanuscript was improved by constructive reviewsby F.R. Boyd and N.V. Sobolev. The research wassupported by ARC grants to S.Y. O’Reilly, and bycontributions from RTZ Exploration. This is contri-bution 154 from the ARC National Key Centre forGeochemical Evolution and Metallogeny of Conti-nents (GEMOC).

W.L
.Griffin
etal./Tectonophysics
310(1999)
1–3533
Appendix A
SHRIMP data for zircons from Siberian kimberlites
Field Body Grains Spots U Th Th=U Pb Average % common 206Pb=238Pb š95% Age š Comment(ppm) (ppm) (ppm) 206Pb=204Pb 206Pb (Ma)
Alakit Radiovolnovaya 1 4 38 6 0.17 2 300 4.59 0.0361 0.001 229 6 ?contaminant
Upper Muna 325 yrs of Yakutia 5 14 10 3 0.35 1 32 18.7 0.055 0.0019 345 12
Chomurdakh Anomaly 180=78 2 5 30 12 0.4 2 550 3.25 0.0699 0.0011 436 7Khaiyrgastakh 1 6 56 40 0.71 5 460 3.36 0.0674 0.0016 421 10
Ukukit West Leningrad 4 8 69 28 0.4 8 1100 1.09 0.1102 0.0028 674 16 ?inheritedAnomaly 165 1 3 47 19 0.41 3 940 0.66 0.068 0.0048 424 29Anomaly 152 1 6 26 8 0.29 2 500 2.43 0.0672 0.0016 419 10Anomaly 134 3 7 19 7 0.32 2 330 10.8 0.0653 0.0031 408 19
Ukukit East Orekhovaya 2 6 188 203 1.08 15 4710 0.18 0.0653 0.0024 408 14
Merchimden Body No. 5 1 6 9 3 0.35 1 110 11 0.0687 0.0023 428 14Vostok 6 1 5 10 2 0.24 1 88 13.4 0.0671 0.0017 419 10
Kuoika Dianga 2 5 31 16 0.52 1 580 3.89 0.0245 0.0016 156 10Kuoika Pyatnitsa 1 5 90 74 0.8 2 1340 1.67 0.0245 0.0013 156 8
Kuranakh Malokuonamskaya 6 12 22 6 0.28 1 53 17.8 0.0354 0.0011 224 7
Luchakan Skiper ‘birigindite’ 1 5 261 543 2.08 10 630 2.19 0.0248 0.001 158 6
Mid Kuonapka Lomonosova 1 5 140 171 1.22 5 280 5.7 0.0236 0.0006 150 4(Ary-Mastakh) Zavaritskaya 1 4 778 571 0.73 21 1380 2.03 0.0233 0.0005 148 3
Orto-Irigakh Anomaly 12=853 2 4 23 12 0.52 1 62 17.2 0.0248 0.0011 158 7Anomaly 74=853 1 6 26 13 0.5 1 200 7.98 0.0245 0.0009 156 6Anomaly 50=6432 1 5 159 76 0.44 4 640 1.95 0.0239 0.0004 152 3
Kharamay Anomaly SH21 1 6 10 3 0.25 1 61 25.8 0.0383 0.0037 242 23
Alakit Aikhal 2 5 174 153 0.88 71 4950 0.36 0.1155 0.0015 1888 23 xenolithV.S. Sobelev 2 6 33 30 0.93 13 3540 0.86 0.1124 0.0026 1838 42
Chomurdakh Chomur 3 8 16 11 0.66 6 1410 1.39 0.1088 0.0027 1780 45 xenolith

34 W.L. Griffin et al. / Tectonophysics 310 (1999) 1–35
References
Agashev, A.M., Tomin, A.S., Watanabe, T., Pokhilenko, N.P.,1998. Preliminary age determination of recently discoveredkimberlites of the Siberian kimberlite province. Ext. Abstr. 7thInt. Kimberlite Conf., pp. 9–10.
Boyd, F.R., 1984. A Siberian geotherm based on lherzolite xeno-liths from the Udachnaya kimberlite, U.S.S.R. Geology 12,528–530.
Boyd, F.R., Pearson, D.G., Nixon, P.H., Mertzman, S.A., 1993.Low-calcium garnet harzburgites from southern Africa: theirrelations to craton structure and diamond crystallisation. Con-trib. Mineral. Petrol. 113, 352–366.
Boyd, F.R., Pokhilenko, N.P., Pearson, D.G., Mertzman, S.A.,Sobolev, N.V., Finger, L.W., 1997. Composition of theSiberian cratonic mantle: evidence from Udachnaya peridotitexenoliths. Contrib. Mineral. Petrol. 128, 228–246.
Brakhfogel, F.F., 1984. Geological aspects of kimberlite mag-matism in the northeastern Siberian Platform (in Russian).Yakutian Inst. Geol., Yakutsk.
Davis, G.L., Sobolev, N.V., Khar’kiv, A.D., 1980. New data onthe age of yakutian kimberlites obtained by the uranium–leadmethod on zircons. Dokl. AN SSSR 254, 175–180.
Duchkov, A.D., Sokolova, L.S., 1997. Thermal structure of thelithosphere of the Siberian Platform. Russ. Geol. Geophys. 38(2), 528–537.
Finnerty, A.A., Boyd, F.R., 1987. Thermobarometry for garnetperidotite xenoliths: a basis for mantle stratigraphy. In: Nixon,P.H. (Ed.), Mantle Xenoliths. Wiley, New York, pp. 381–402.
Griffin, W.L., Ryan, C.G., 1995. Trace elements in indicatorminerals: area selection and target evaluation in diamond ex-ploration. J. Geochem. Explor. 53, 311–337.
Griffin, W.L., Smith, D., Boyd, F.R., Cousens, D.R., Ryan, C.G.,Sie, S.H., Suter, G.F., 1989. Trace element zoning in garnetsfrom sheared mantle xenoliths. Geochim. Cosmochim. Acta.53, 561–567.
Griffin, W.L., Gurney, J.J., Ryan, C.G., 1992. Variations in trap-ping temperatures and trace elements in peridotite-suite in-clusions from African diamonds: evidence for two inclusionsuites, and implications for lithosphere stratigraphy. Contrib.Mineral. Petrol. 110, 1–15.
Griffin, W.L., Kaminsky, F.V., Ryan, C.G., O’Reilly, S.Y., Win,T.T., Ilupin, I.P., 1996. Thermal state and composition ofthe lithospheric mantle beneath the Daldyn kimberlite field,Yakutia. Tectonophysics 262, 19–33.
Griffin, W.L., O’Reilly, S.Y., Ryan, C.G., Gaul, O., Ionov, D.,1998. Secular variation in the composition of subcontinentallithospheric mantle. In: Braun, J., Dooley, J.C., Goleby, B.R.,van der Hilst, R.D., Klootwijk, C.T. (Eds.), Structure andEvolution of the Australian Continent. Geodynamics Vol. 26,American Geophysical Union, Washington, DC, pp. 1–26.
Griffin, W.L., Shee, S.R., Ryan, C.G., Win, T.T., Wyatt, B.A.,1999a. Harzburgite to lherzolite and back again: Metasomaticprocesses in ultramafic xenoliths from the Wesselton kimber-lite, Kimberley, South Africa. Contrib. Mineral. Petrol. 134,232–250.
Griffin, W.L., O’Reilly, S.Y., Ryan, C.G., 1999b. The composi-
tion and origin of subcontinental lithospheric mantle. In: Fei,Y., Bertka, C.M., Mysen, B.O. (Eds.), Mantle Petrology: FieldObservations and High-Pressure Experimentation: A Tributeto Francis R. (Joe) Boyd. The Geochemical Society, Houston,Spec. Publ. 6 (in press).
Griffin, W.L., Fisher, N.I., Friedman, J.H., Ryan, C.G., O’Reilly,S.Y., 1999c. Cr-pyrope garnets in the lithospheric mantle, I.Compositional systematics and relations to tectonic setting. J.Petrol. 40 (in press).
Gurney, J.J., 1984. A correlation between garnets and diamonds.In: Glover, J.E., Harris, P.G. (Eds.), Kimberlite Occurrenceand Origins: a Basis for Conceptual Models in Exploration.Geol. Dep. and Univ. Extension, Univ. Western Australia,Publ. 8, pp. 143–166.
Helmstaedt, H.H., Gurney, J.J., 1995. Geotectonic controls ofprimary diamond deposits: implications for area selection. J.Geochem. Explor. 53, 125–144.
Janse, A.J.A., 1994. Is Clifford’s Rule still valid? Affirmativeexamples from around the world. In: Meyer, H.O.A., Leonar-dos, O. (Eds.), Diamonds: Characterization, Genesis and Ex-ploration. Dep. Nacional da Prod. Mineral., Brazilia, CPRMSpec. Publ. 1A=93, pp. 215–235.
Kennedy, C.S., Kennedy, G.C., 1976. The equilibrium boundarybetween graphite and diamond. J. Geophys. Res. 81, 2467–2470.
Kinny, P.D., Griffin, B.J., Heaman, L.M., Brakhfogel, F.F., Spet-sius, Z.V., 1997. SHRIMP U–Pb ages of perovskite fromYakutian kimberlites. Russ. Geol. Geophys. 38 (1), 97–105.
Komarov, A.N., Ilupin, I.P., 1990. Geochronology of kimberlitesin the Siberian Platform (in Russian). Geochimica 3, 365–372.
McKenzie, D., Bickle, M.J., 1988. The volume and compositionof melt generated by extension of the lithosphere. J. Petrol. 29,625–679.
Mingazov, D.T., Golota, L.E., Istomin, V.A., 1996. First occur-rences of Paleozoic kimberlites in the central Anabar Shield(in Russian). Dokl. Akad. Nauk 347, 72–76.
Morgan, P., 1995. Diamond exploration from the bottom up:regional geophysical signatures of conditions favorable fordiamond exploration. J. Geochem. Explor. 53, 145–166.
O’Reilly, S.Y., Griffin, W.L., 1996. 4-D lithospheric mapping:a review of the methodology with examples. Tectonophysics262, 3–18.
Pokhilenko, N.P., Sobolev, N.V., 1995. Mineralogical mappingof the northeast section of the Yakutian kimberlite provinceand its main results. Ext. Abstr. 6th Int. Kimberlite Conf., pp.446–448.
Pollack, H.N., Chapman, D.S., 1977. On the regional variationof heat flow, geotherms and lithosphere thickness. Tectono-physics 38, 279–296.
Rosen, O.M., Condie, K.C., Natapov, L.M., Nozhkin, A.D.,1994. Archean and early Proterozoic evolution of the SiberianCraton: a preliminary assessment. In: Condie, K. (Ed.),Archean Crustal Evolution. Elsevier, Amsterdam, pp. 411–459.
Ryan, C.G., Cousens, D.R., Sie, S.H., Griffin, W.L., Suter, G.F.,1990a. Quantitative PIXE microanalysis of geological material

W.L. Griffin et al. / Tectonophysics 310 (1999) 1–35 35
using the CSIRO proton microprobe. Nucl. Instr. MethodsB47, 55–71.
Ryan, C.G., Cousens, D.R., Sie, S.H., Griffin, W.L., 1990b.Quantitative analysis of PIXE spectra in geoscience applica-tions. Nucl. Instr. Methods B49, 271–276.
Ryan, C.G., Griffin, W.L., Pearson, N., 1996. Garnet Geotherms:a technique for derivation of P–T data from Cr-pyrope garnets.J. Geophys. Res. 101, 5611–5625.
Shee, S.R., Wyatt, B.A., Griffin, W.L., 1993. Major and traceelement mineral chemistry of peridotite xenoliths from theWesselton kimberlite, South Africa. Abstr. IAVCEI GeneralAssembly, Canberra, p. 98.
Shimizu, N., Boyd, F.R., Pokhilenko, N.P., 1993. Trace elementzoning patterns of mantle garnets. Geol. Soc. Am. Abstr.Progr. 25 (6), A36.
Smith, D., Boyd, F.R., 1987. Compositional heterogeneities in ahigh-temperature lherzolite nodule and implications for mantleprocesses. In: Nixon, P.H. (Ed.), Mantle Xenoliths. Wiley,New York, pp. 551–561.
Smith, D., Griffin, W.L., Ryan, C.G., Cousens, D.R., Sie, S.H.,Suter, G.F., 1991. Trace-element zoning of garnets from The
Thumb: a guide to mantle processes. Contrib. Mineral. Petrol.107, 60–79.
Smith, D., Griffin, W.L., Ryan, C.G., 1993. Compositionalevolution of high-temperature sheared lherzolite PHN 1611.Geochim. Cosmochim. Acta 57, 605–613.
Sobolev, N.V., 1974. Deep-Seated Inclusions in Kimberlites andthe Problem of the Composition of the Upper Mantle (inRussian). Nauka Press, Novosibirsk, 264 pp. [English Transla-tion (1977), ed. by F.R. Boyd, American Geophysical Union,Washington, DC, 279 pp.]
Sobolev, N.V., Belik, Yu.P., Pokhilenko, N.P., Krivonos, V.F.,Polyakov, N.V., 1981. Chromium-bearing pyropes in theLower Carboniferous deposits of the Kyutyungde depression.Sov. Geol. Geophys. 32, 127–130.
Spetsius, Z.V., 1995. Occurrence of diamond in the mantle: acase study from the Siberian Platform. J. Geochem. Explor.53, 25–40.
Zonenshain, L.P., Kuznin, M.I., Natapov, L.M., 1990. Tectonicsof the Lithospheric Plates of the USSR Territory, Vols. 1, 2 (inRussian). Nedra, Moscow, 325 pp., 330 pp.


