Embed Size (px)
Citation preview
The somatotopy of speech: Phonation and articulation in the human motor cortex
Steven Brown a,*, Angela R. Laird b, Peter Q. Pfordresher c, Sarah M. Thelen b, Peter Turkeltaub d, Mario Liotti aaDepartment of Psychology, Simon Fraser University, Burnaby, BC, CanadabResearch Imaging Center, University of Texas Health Science Center at San Antonio, San Antonio, TX, USAcDepartment of Psychology, University at Buffalo, Buffalo, New York, NY, USAdDepartment of Neurology, Hospital of the University of Pennsylvania, Philadelphia, PA, USA
a r t i c l e i n f o
Article history:Accepted 5 December 2008Available online 21 January 2009
Keywords:SpeechVocalizationPhonationLarynxArticulationBrainfMRINeuroimagingMeta-analysisALE
a b s t r a c t
A sizable literature on the neuroimaging of speech production has reliably shown activations in the oro-facial region of the primary motor cortex. These activations have invariably been interpreted as reflecting‘‘mouth” functioning and thus articulation. We used functional magnetic resonance imaging to comparean overt speech task with tongue movement, lip movement, and vowel phonation. The results showedthat the strongest motor activation for speech was the somatotopic larynx area of the motor cortex, thusreflecting the significant contribution of phonation to speech production. In order to analyze further thephonatory component of speech, we performed a voxel-based meta-analysis of neuroimaging studies ofsyllable-singing (11 studies) and compared the results with a previously-published meta-analysis of oralreading (11 studies), showing again a strong overlap in the larynx motor area. Overall, these findingshighlight the under-recognized presence of phonation in imaging studies of speech production, and sup-port the role of the larynx motor cortex in mediating the ‘‘melodicity” of speech.
! 2008 Elsevier Inc. All rights reserved.
1. Introduction
Phonation is an important ‘‘umbrella” process when thinkingabout human vocalization, taking account of much of the segmen-tal aspect of speech, of suprasegmental processes like intonation(Ladd, 1996) and lexical tone (Yip, 2002), and of singing (Sundberg,1987). Modulation of the pitch and duration of voiced soundsunderlies the melodic and rhythmic aspects of speech. The olderliterature on intonation employed the term ‘‘melodicity” to referto the basic acoustic stream of voicing that occurs during speechproduction (Fónagy, 1981; Fónagy & Magdics, 1963).
Standard models of vocal production posit the existence of a vo-cal ‘‘source” – i.e., subglottal air pressure from the lungs producingvibration of the vocal-folds in the airstream – followed by ‘‘filter-ing” of the source’s sound wave by a series of articulators in theoral and nasal cavities, to ultimately select out certain resonant fre-quencies in that wave. While all vowels and most consonants re-quire phonation, some consonants can be generated in avoiceless fashion. For fricatives like the /s/ sound, this can simplyinvolve the generation of broadband noise at the larynx in the ab-sence of periodic vocal-fold vibration. However, the majority of the
speech stream is phonated. For many languages, the proportion ofa spoken sentence’s duration taken up by vowels alone is 40–50%(Ramus, Nespor, & Mehler, 1999). This does not take into accountthe degree of phonation that comes from voiced consonants, whichwould make the overall voiced component of a sentence’s durationeven higher.
While phonation is a critical component of speech, neuroimag-ing studies have rarely recognized this point. Imaging studies ofspeech production reliably show activity in the ventral part ofthe precentral gyrus – corresponding with the somatotopic ‘‘orofa-cial” region of the motor and premotor cortices – and this activa-tion has almost invariably been interpreted as reflectingarticulation (e.g., Fox et al., 2001). The strong, if unspoken, assump-tion is that speech is first and foremost an articulatory process.Most studies that have sought to examine phonatory aspects ofspeech have (1) been perceptual rather than production studies(although see Barrett, Pike, & Paus, 2004), and (2) focused onsuprasegmental processes like prosody or lexical tone rather thanthe basic speech stream. A handful of studies have tried to distin-guish brain areas for articulation and phonation. For example, Mur-phy et al. (1997) compared vocalization of a simple phrase withsilent mouthing of the phrase (to reveal phonation) and withmouth-closed vocalization of the phrase using the /a/ vowel alone(to reveal articulation). Their primary interest was in examiningbrain areas involved in respiration for speech. They identified abilateral region of the sensorimotor cortex that was more active
0278-2626/$ - see front matter ! 2008 Elsevier Inc. All rights reserved.doi:10.1016/j.bandc.2008.12.006
* Corresponding author. Present address: Department of Psychology, Neurosci-ence and Behaviour, McMaster University, 1280 Main St. W, Hamilton, Ont., CanadaL8S 4K1. Fax: +1 905 529 6225.
E-mail address: [email protected] (S. Brown).
Brain and Cognition 70 (2009) 31–41
Contents lists available at ScienceDirect
Brain and Cognition
journal homepage: www.elsevier .com/ locate /b&c
when speech breathing was involved than simple mouthing. Like-wise, Terumitsu, Fujii, Suzuki, Kwee, and Nakada (2006) used inde-pendent components analysis (ICA) to contrast vocalization of astring of labial syllables with silent articulation of the string with-out voicing of the vowels or consonants. Their analysis revealed abilateral region close to the classical tongue region associated withtongue movement and a left-dominant area dorsal to that involvedin phonation.
Recent work from our lab has led to the characterization of asomatotopic representation of the larynx in the human motor cor-tex (Brown, Ngan, & Liotti, 2008). Related work from another labhas shown that this same general region contains a representationof the expiratory muscles as well (Loucks, Poletto, Simonyan, Rey-nolds, & Ludlow, 2007; Simonyan, Saad, Loucks, Poletto, & Ludlow,2007). In fact, this area is very close to that which Murphy et al.(1997) associated with speech breathing. (For simplicity, we willrefer to this general area as the ‘‘larynx motor cortex” in this arti-cle.) Hence, the two major components that comprise the vocalsource appear to be in close proximity in the motor cortex, perhapsreflecting a unique cortical-level type of respiratory/phonatorycoupling specific to human vocalization; for almost all other spe-cies, this coupling occurs in the brainstem alone (Jürgens, 2002).Given that our fMRI study showed that the larynx motor cortexwas activated comparably by vocal and non-vocal laryngeal tasks(i.e., vocal-fold adduction alone), this area would seem like a goodcandidate for being a regulator of the melodicity of complex hu-man vocalizations such as speaking and singing.
In order to examine the phonatory component of speech, weanalyzed motor cortex activations for a speech production task incomparison to elemental control tasks for tongue movement, lipmovement, and monotone vowel phonation, with the intent oflooking for potential additivity. In a second study, we used activa-tion likelihood estimation (ALE) meta-analysis to compare a previ-ously-published meta-analysis of word production (Turkeltaub,Eden, Jones, & Zeffiro, 2002) with a new meta-analysis of simplephonation, namely syllable production. The goal of the combinedanalysis was to characterize the neural contribution of phonationto speech production, a point that has been absent in most previ-ous neuroimaging analyses of speech production.
2. Materials and methods
2.1. Functional MRI
2.1.1. SubjectsSixteen subjects (eight males, eight females), with a mean age
of 28.4 years (ranging from 21 to 49 years), participated in thestudy after giving their informed consent (Clinical Research EthicsBoard, University of British Columbia). Each individual was with-out neurological, psychiatric or audiological illness. Subjects wereall fluent English speakers but were unselected with regard tohandedness. Three of the subjects were left-handed.
2.1.2. TasksSubjects performed six oral tasks (one task per fMRI scan), each
one according to a simple blocked design of 16 s of a resting condi-tion and 16 s of an oral task. The task order was randomized acrosssubjects. All tasks were performed with the eyes open. Four of thetasks are described in this study. (1) Speech. Subjects read passagesaloud from the medieval epic poem Beowulf with the teeth to-gether, and thus with no jaw movement. Subjects were trainedto read the passages at a very slow pace (1–2 syllables per second)so as to make the rate more comparable with the following threecomparison tasks. (2) Monotone-phonation using the schwa vowel.Subjects were instructed to sing a comfortable pitch of their choice
using the schwa vowel, with the teeth together but with a verysmall lip opening to permit oral air flow and avoid humming.Hence, articulatory changes should have been minimal withinthe task-blocks, as well as between the task and rest blocks. Aftereach 4–6-note breath cycle, subjects were to take a gentle, con-trolled inspiration through the mouth. The recommended rate ofvocalization was 1 Hz. This could be considered equivalently as amonovowel or monotone task. (3) Lip protrusion. Subjects were in-structed to pucker their lips and then return them to a resting po-sition, and to do so at a rate of roughly 1 Hz. They were encouragedto make a small gesture and to avoid contracting other facial mus-cles. (4) Vertical tongue movement within the mouth. Subjects wereinstructed to move the tip of their tongue from the floor of themouth to the hard palate with the lips together but with the teethjust slightly separated so as to create adequate space for tonguemovement. The recommended rate was 1 Hz. The results for thelast two tasks are partially described in Brown et al. (2008). Sub-jects underwent a 30-min training session on a day prior to thescanning session in order to learn how to perform the tasks in ahighly controlled manner with a minimum of head or bodymovement.
2.1.3. Magnetic resonance imagingMagnetic resonance images were acquired with a Philips Achi-
eva 3-Tesla MRI at the MRI Research Centre of the University ofBritish Columbia in Vancouver. The subject’s head was firmly se-cured using a custom head holder and ‘‘memory” pillow. Ear plugswere used to help block out scanner noise. Subjects performedeach task as 16 s epochs of an oral task alternating with 16 sepochs of rest during the course of a 602400 scan. During all tasksbut speech, the name of the task (‘‘Lips”) positioned above across-hair was projected from an LCD projector onto a screenmounted at the head of the MRI table, with an angled mirror onthe head coil reflecting text from the screen into the participant’sfield of view. During the speech task, short passages from Beowulfwere projected; a different passage was presented during each taskepoch. During the rest periods for all tasks but speech, the word‘‘Rest”, positioned above a cross-hair, was projected onto thescreen. During the rest periods for the speech task, an abstract linedrawing was projected so as to subtract out visual activations asmuch as possible, as pilot testing showed that the cross-hair alonedid not achieve this. All stimuli were created and presented usingPresentation software (Neurobehavioral Systems, Albany, CA).
Functional images sensitive to the ‘‘blood oxygen level depen-dent” (BOLD) signal were collected with a gradient echo sequence(TR = 2000 ms, TE = 30 ms, flip angle 90", 36 slices, 3 mm slicethickness, 1 mm gap, matrix = 80 ! 80, field of view = 240 mm,voxel size 3 mm isotropic), effectively covering the whole brain(145 mm of axial extent). A total of 192 brain volumes was ac-quired over 602400 of scan time, corresponding with 12 alternationsbetween 16 s epochs of rest and 16 s epochs of task.
2.1.4. Image analysisFunctional images were reconstructed offline, and the scan ser-
ies was realigned and motion corrected using the methods in SPM2(Welcome Department of Cognitive Neurology, University CollegeLondon, UK), as implemented in Matlab (Mathworks, Natick,MA). While subject motion was a concern for this study, analysisof the realignment parameters indicated that translation and rota-tion corrections did not exceed an acceptable level of 1.5 mm and1.5", respectively, for any of the participants. Following realign-ment, a mean functional image was computed for each run. Themean image was normalized to the Montreal Neurological Institute(MNI) template (Friston et al., 1995a, 1995b), and this transforma-tion was then applied to the corresponding functional series. Thenormalized functional images (4 mm isotropic voxels) were
32 S. Brown et al. / Brain and Cognition 70 (2009) 31–41
smoothed with an 8 mm (full-width-at-half-maximum) isotropicGaussian filter. The BOLD response for each task-block was mod-eled as the convolution of a 16 s boxcar with a synthetic hemody-namic response function composed of two gamma functions. Betaweights associated with the modeled hemodynamic responseswere computed to fit the observed BOLD-signal time course in eachvoxel for each subject using the general linear model, as imple-mented in SPM2. Each subject’s data was processed using afixed-effects analysis, corrected for multiple comparisons usingfamily-wise error, with a threshold of p < 0.05 (t > 4.99) and no ex-tent threshold. Contrast images for each task-versus-rest analysisfor each subject were brought forward into a random effects anal-ysis, where a significance level of p < 0.025 was employed (‘‘falsediscovery rate” correction for multiple comparisons for the wholebrain; Genovese, Lazar, & Nichols, 2002) and no extent threshold.The critical t value varied across contrasts and was: t > 3.59 forspeech, t > 4.36 for tongue movement, t > 4.47 for lip movement,and t > 5.07 for monotone-phonation. MNI coordinates were con-verted into the coordinates of Talairach and Tournoux (1988) usinga non-linear transformation, as implemented in the WFU PickAtlas(Maldjian, Laurienti, Kraft, & Burdette, 2003) and based on themethod of Brett (imaging.mrc-cbu.cam.ac.uk/imaging/MniTalai-rach), except for the case of the cerebellum, where MNI coordi-nates are retained. This was because of errors incurred bycoordinate conversion.
2.2. ALE meta-analysis
2.2.1. Inclusion criteria for papersMeta-analysis of 11 published studies of syllable-singing was
performed using activation likelihood estimation (ALE) analysis.The studies are listed in Table 2. Our inclusion criteria were: (1)that the papers provided either Talairach or MNI coordinates fortheir activation foci (hence excluding Özdemir, Nortona, & Schlaug,2006); (2) that all of the brain was imaged; (3) that only syllableswere sung, but no words or sentences (hence excluding Jeffries,Fritz, & Braun, 2003, and Kleber, Birbaumer, Veit, Trevorrow, & Lot-ze, 2007); and (4) that overt phonation was used as part of the task(hence excluding all studies of covert production). (5) We decidedto exclude articles that only presented high-level contrasts, i.e., nocontrast to a low-level control condition such as rest or a percep-tual baseline, as we wanted to place our focus on motor activa-tions. On this basis, we excluded the article of Saito, Ishii, Yagi,Tatsumi, and Mizusawa (2006).
2.2.2. Activation likelihood estimation (ALE) analysisCoordinates for activation foci from conditional contrasts were
taken from the original publications. No deactivations were exam-ined in the meta-analysis, as none of the papers reported them. Weused the implementation of ALE (Laird et al., 2005a) that is con-tained within the BrainMap database (http://brainmap.org; Fox &Lancaster, 2002; Laird et al., 2005b). MNI coordinates were auto-matically converted to Talairach coordinates using the method ofBrett cited above. All coordinates were then blurred with a full-width-at-half-maximum of 12 mm. The ALE statistic was com-puted for every voxel in the brain according to the algorithm devel-oped by Turkeltaub et al. (2002). A permutation test using 5000permutations was performed to determine the statistical signifi-cance of the ALE results, which were thresholded at p < 0.05 usingthe ‘‘false discovery rate” correction for multiple comparisons(Laird et al., 2005a). The ALE maps presented in Fig. 2 are shownoverlaid onto an anatomical template generated by spatially nor-malizing the International Consortium for Brain Mapping (ICBM)template to Talairach space (Kochunov et al., 2002).
Fig. 2 also shows the results of a re-analysis of the Turkeltaubet al. (2002) reading data that we use as a comparison for the re-
sults of the syllable-singing meta-analysis. The data are differentin two respects compared to the original publication. First, ouranalysis used a false discovery rate threshold of 0.05 based on5000 permutations in order to correct for multiple comparisons,whereas the original analysis was uncorrected and used a thresh-old of p < 0.0001 based on 1000 permutations; and second, MNIcoordinates were presented in the Turkeltaub analysis, whereaswe converted MNI coordinates into Talairach space. In addition,Table 3 presents submaxima for several of the major peaks, someof which are not reported in the original publication. In order tomake the syllable-singing and reading analyses more comparable,we applied an extent threshold of 400 mm3 to the reading analy-sis, corresponding to the smallest cluster reported for the sylla-ble-singing analysis. Finally, although a new transformationprocedure for converting MNI coordinates to Talairach coordi-nates was published (Lancaster et al., 2007) and became imple-mented into the ALE procedure, we chose to use Brettprocedure in this analysis for two reasons. First, we wanted thefMRI results to correspond with previously-published results fromthis data set (Brown et al., 2008), which used the Brett transform.Second, we wanted the reading meta-analysis coordinates tomatch as closely as possible the published coordinates in Turkel-taub et al. (2002).
3. Results
3.1. fMRI
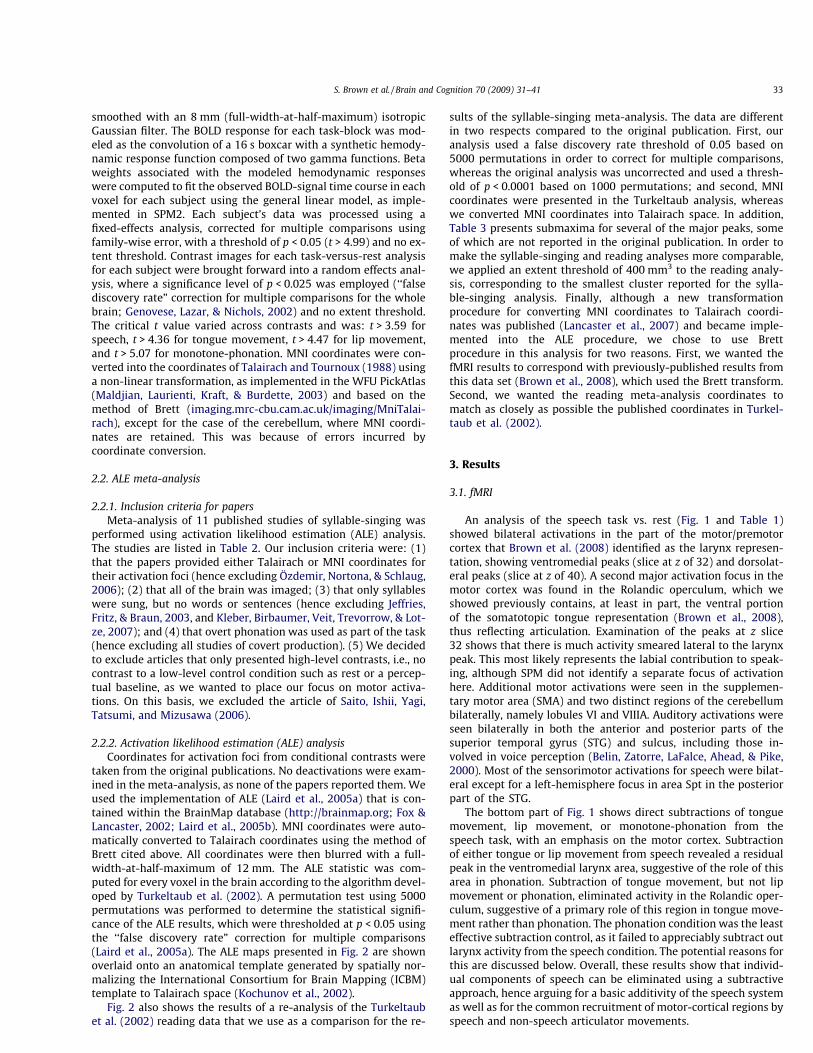
An analysis of the speech task vs. rest (Fig. 1 and Table 1)showed bilateral activations in the part of the motor/premotorcortex that Brown et al. (2008) identified as the larynx represen-tation, showing ventromedial peaks (slice at z of 32) and dorsolat-eral peaks (slice at z of 40). A second major activation focus in themotor cortex was found in the Rolandic operculum, which weshowed previously contains, at least in part, the ventral portionof the somatotopic tongue representation (Brown et al., 2008),thus reflecting articulation. Examination of the peaks at z slice32 shows that there is much activity smeared lateral to the larynxpeak. This most likely represents the labial contribution to speak-ing, although SPM did not identify a separate focus of activationhere. Additional motor activations were seen in the supplemen-tary motor area (SMA) and two distinct regions of the cerebellumbilaterally, namely lobules VI and VIIIA. Auditory activations wereseen bilaterally in both the anterior and posterior parts of thesuperior temporal gyrus (STG) and sulcus, including those in-volved in voice perception (Belin, Zatorre, LaFalce, Ahead, & Pike,2000). Most of the sensorimotor activations for speech were bilat-eral except for a left-hemisphere focus in area Spt in the posteriorpart of the STG.
The bottom part of Fig. 1 shows direct subtractions of tonguemovement, lip movement, or monotone-phonation from thespeech task, with an emphasis on the motor cortex. Subtractionof either tongue or lip movement from speech revealed a residualpeak in the ventromedial larynx area, suggestive of the role of thisarea in phonation. Subtraction of tongue movement, but not lipmovement or phonation, eliminated activity in the Rolandic oper-culum, suggestive of a primary role of this region in tongue move-ment rather than phonation. The phonation condition was the leasteffective subtraction control, as it failed to appreciably subtract outlarynx activity from the speech condition. The potential reasons forthis are discussed below. Overall, these results show that individ-ual components of speech can be eliminated using a subtractiveapproach, hence arguing for a basic additivity of the speech systemas well as for the common recruitment of motor-cortical regions byspeech and non-speech articulator movements.
S. Brown et al. / Brain and Cognition 70 (2009) 31–41 33
3.2. ALE meta-analysis
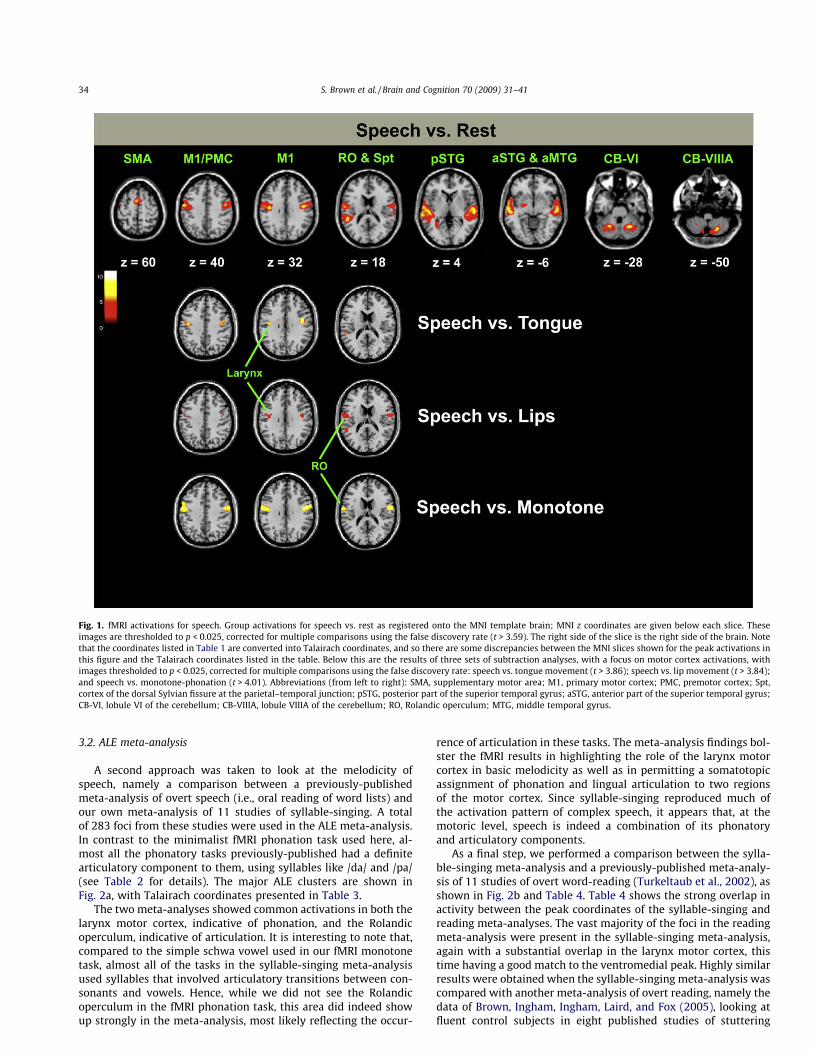
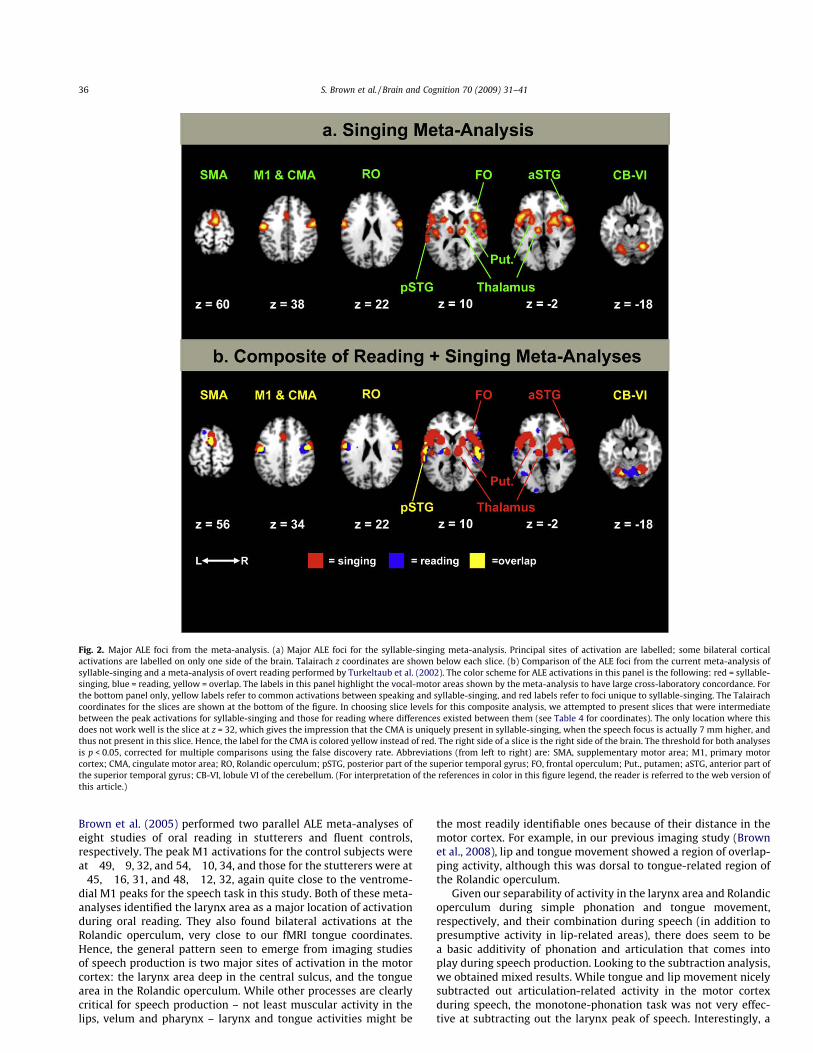
A second approach was taken to look at the melodicity ofspeech, namely a comparison between a previously-publishedmeta-analysis of overt speech (i.e., oral reading of word lists) andour own meta-analysis of 11 studies of syllable-singing. A totalof 283 foci from these studies were used in the ALE meta-analysis.In contrast to the minimalist fMRI phonation task used here, al-most all the phonatory tasks previously-published had a definitearticulatory component to them, using syllables like /da/ and /pa/(see Table 2 for details). The major ALE clusters are shown inFig. 2a, with Talairach coordinates presented in Table 3.
The two meta-analyses showed common activations in both thelarynx motor cortex, indicative of phonation, and the Rolandicoperculum, indicative of articulation. It is interesting to note that,compared to the simple schwa vowel used in our fMRI monotonetask, almost all of the tasks in the syllable-singing meta-analysisused syllables that involved articulatory transitions between con-sonants and vowels. Hence, while we did not see the Rolandicoperculum in the fMRI phonation task, this area did indeed showup strongly in the meta-analysis, most likely reflecting the occur-
rence of articulation in these tasks. The meta-analysis findings bol-ster the fMRI results in highlighting the role of the larynx motorcortex in basic melodicity as well as in permitting a somatotopicassignment of phonation and lingual articulation to two regionsof the motor cortex. Since syllable-singing reproduced much ofthe activation pattern of complex speech, it appears that, at themotoric level, speech is indeed a combination of its phonatoryand articulatory components.
As a final step, we performed a comparison between the sylla-ble-singing meta-analysis and a previously-published meta-analy-sis of 11 studies of overt word-reading (Turkeltaub et al., 2002), asshown in Fig. 2b and Table 4. Table 4 shows the strong overlap inactivity between the peak coordinates of the syllable-singing andreading meta-analyses. The vast majority of the foci in the readingmeta-analysis were present in the syllable-singing meta-analysis,again with a substantial overlap in the larynx motor cortex, thistime having a good match to the ventromedial peak. Highly similarresults were obtained when the syllable-singing meta-analysis wascompared with another meta-analysis of overt reading, namely thedata of Brown, Ingham, Ingham, Laird, and Fox (2005), looking atfluent control subjects in eight published studies of stuttering
Fig. 1. fMRI activations for speech. Group activations for speech vs. rest as registered onto the MNI template brain; MNI z coordinates are given below each slice. Theseimages are thresholded to p < 0.025, corrected for multiple comparisons using the false discovery rate (t > 3.59). The right side of the slice is the right side of the brain. Notethat the coordinates listed in Table 1 are converted into Talairach coordinates, and so there are some discrepancies between the MNI slices shown for the peak activations inthis figure and the Talairach coordinates listed in the table. Below this are the results of three sets of subtraction analyses, with a focus on motor cortex activations, withimages thresholded to p < 0.025, corrected for multiple comparisons using the false discovery rate: speech vs. tongue movement (t > 3.86); speech vs. lip movement (t > 3.84);and speech vs. monotone-phonation (t > 4.01). Abbreviations (from left to right): SMA, supplementary motor area; M1, primary motor cortex; PMC, premotor cortex; Spt,cortex of the dorsal Sylvian fissure at the parietal–temporal junction; pSTG, posterior part of the superior temporal gyrus; aSTG, anterior part of the superior temporal gyrus;CB-VI, lobule VI of the cerebellum; CB-VIIIA, lobule VIIIA of the cerebellum; RO, Rolandic operculum; MTG, middle temporal gyrus.
34 S. Brown et al. / Brain and Cognition 70 (2009) 31–41
(data not shown). However, we chose to focus here on the Turkel-taub analysis because it was based on 172 foci, compared to only73 foci for the stuttering controls. The overall profile, however,was very similar.
4. Discussion
In this study, we attempted to look at speech in a somatotopicmanner, and especially to illuminate the role of phonation inspeech production. We use these analyses to formulate a generalmodel of vocalization in the brain.
4.1. Phonation and articulation
Our previous fMRI study (Brown et al., 2008) established a rep-resentation of the larynx in the motor cortex, one which overlapsan area involved in voluntary control of expiration (Loucks et al.,2007; Simonyan et al., 2007). Using this motor cortex focus as areference, we were able to demonstrate for the first time that con-nected speech gives its principal motor cortex activation in the lar-ynx area, thereby supporting the notion that much of the speechsignal is voiced, including all vowels and a majority of consonants.Previous neuroimaging studies on speech production have notmade this point about phonation, and have instead talked aboutactivity in the ‘‘mouth” or ‘‘face” area of the motor cortex (e.g.,Fox et al., 2001), with the implication being that speech is mainlyarticulatory. Knowing the location of the larynx area, we were ableto interpret residual activations in the motor strip as being relatedto articulation, mainly in the Rolandic operculum for tongue move-ment and the region lateral to the larynx area for lip movement.This is a first step toward a somatotopic dissection of phonationand articulation in the cortical motor system. The study of Terumi-tsu et al. (2006) seemed poised to make the same point, in that theauthors compared phonated vs. mouthed versions of the samepolysyllable string. However, their analyses did not involve a directcontrast between the voiced and unvoiced tasks, and what theycalled ‘‘phonation” in their ICA analysis included articulation aswell as phonation, as evidenced by ICA clusters in the Rolandicoperculum.
The results with the speech task match very closely the findingsof two voxel-based meta-analyses of overt reading. Turkeltaubet al. (2002) published an activation likelihood estimation (ALE)meta-analysis of 11 studies of oral reading, and found the regionof greatest concordance across these studies in the motor cortexto be at "48, "12, 36, and 44, "10, 34, very close to our ventrome-dial speech peaks at "40, "12, 30, and 44, "10, 30. Likewise,
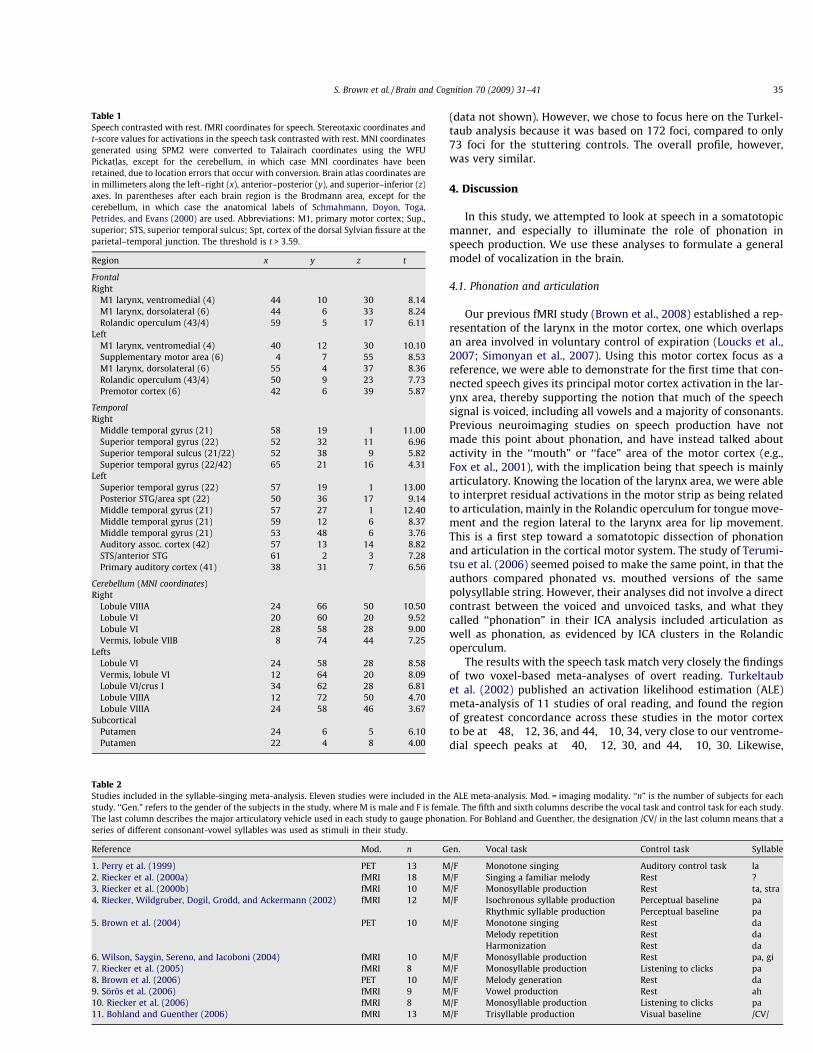
Table 1Speech contrasted with rest. fMRI coordinates for speech. Stereotaxic coordinates andt-score values for activations in the speech task contrasted with rest. MNI coordinatesgenerated using SPM2 were converted to Talairach coordinates using the WFUPickatlas, except for the cerebellum, in which case MNI coordinates have beenretained, due to location errors that occur with conversion. Brain atlas coordinates arein millimeters along the left–right (x), anterior–posterior (y), and superior–inferior (z)axes. In parentheses after each brain region is the Brodmann area, except for thecerebellum, in which case the anatomical labels of Schmahmann, Doyon, Toga,Petrides, and Evans (2000) are used. Abbreviations: M1, primary motor cortex; Sup.,superior; STS, superior temporal sulcus; Spt, cortex of the dorsal Sylvian fissure at theparietal–temporal junction. The threshold is t > 3.59.
Region x y z t
FrontalRightM1 larynx, ventromedial (4) 44 "10 30 8.14M1 larynx, dorsolateral (6) 44 "6 33 8.24Rolandic operculum (43/4) 59 "5 17 6.11
LeftM1 larynx, ventromedial (4) "40 "12 30 10.10Supplementary motor area (6) "4 7 55 8.53M1 larynx, dorsolateral (6) "55 "4 37 8.36Rolandic operculum (43/4) "50 "9 23 7.73Premotor cortex (6) "42 "6 39 5.87
TemporalRightMiddle temporal gyrus (21) 58 "19 "1 11.00Superior temporal gyrus (22) 52 "32 11 6.96Superior temporal sulcus (21/22) 52 "38 9 5.82Superior temporal gyrus (22/42) 65 "21 16 4.31
LeftSuperior temporal gyrus (22) "57 "19 1 13.00Posterior STG/area spt (22) "50 "36 17 9.14Middle temporal gyrus (21) "57 "27 1 12.40Middle temporal gyrus (21) "59 "12 "6 8.37Middle temporal gyrus (21) "53 "48 6 3.76Auditory assoc. cortex (42) "57 "13 14 8.82STS/anterior STG "61 "2 "3 7.28Primary auditory cortex (41) "38 "31 7 6.56
Cerebellum (MNI coordinates)RightLobule VIIIA 24 "66 "50 10.50Lobule VI 20 "60 "20 9.52Lobule VI 28 "58 "28 9.00Vermis, lobule VIIB 8 "74 "44 7.25
LeftsLobule VI "24 "58 "28 8.58Vermis, lobule VI "12 "64 "20 8.09Lobule VI/crus I "34 "62 "28 6.81Lobule VIIIA "12 "72 "50 4.70Lobule VIIIA "24 "58 "46 3.67
SubcorticalPutamen "24 "6 "5 6.10Putamen "22 "4 8 4.00
Table 2Studies included in the syllable-singing meta-analysis. Eleven studies were included in the ALE meta-analysis. Mod. = imaging modality. ‘‘n” is the number of subjects for eachstudy. ‘‘Gen.” refers to the gender of the subjects in the study, where M is male and F is female. The fifth and sixth columns describe the vocal task and control task for each study.The last column describes the major articulatory vehicle used in each study to gauge phonation. For Bohland and Guenther, the designation /CV/ in the last column means that aseries of different consonant-vowel syllables was used as stimuli in their study.
Reference Mod. n Gen. Vocal task Control task Syllable
1. Perry et al. (1999) PET 13 M/F Monotone singing Auditory control task la2. Riecker et al. (2000a) fMRI 18 M/F Singing a familiar melody Rest ?3. Riecker et al. (2000b) fMRI 10 M/F Monosyllable production Rest ta, stra4. Riecker, Wildgruber, Dogil, Grodd, and Ackermann (2002) fMRI 12 M/F Isochronous syllable production Perceptual baseline pa
Rhythmic syllable production Perceptual baseline pa5. Brown et al. (2004) PET 10 M/F Monotone singing Rest da
Melody repetition Rest daHarmonization Rest da
6. Wilson, Saygin, Sereno, and Iacoboni (2004) fMRI 10 M/F Monosyllable production Rest pa, gi7. Riecker et al. (2005) fMRI 8 M/F Monosyllable production Listening to clicks pa8. Brown et al. (2006) PET 10 M/F Melody generation Rest da9. Sörös et al. (2006) fMRI 9 M/F Vowel production Rest ah10. Riecker et al. (2006) fMRI 8 M/F Monosyllable production Listening to clicks pa11. Bohland and Guenther (2006) fMRI 13 M/F Trisyllable production Visual baseline /CV/
S. Brown et al. / Brain and Cognition 70 (2009) 31–41 35
Brown et al. (2005) performed two parallel ALE meta-analyses ofeight studies of oral reading in stutterers and fluent controls,respectively. The peak M1 activations for the control subjects wereat "49, "9, 32, and 54, "10, 34, and those for the stutterers were at"45, "16, 31, and 48, "12, 32, again quite close to the ventrome-dial M1 peaks for the speech task in this study. Both of these meta-analyses identified the larynx area as a major location of activationduring oral reading. They also found bilateral activations at theRolandic operculum, very close to our fMRI tongue coordinates.Hence, the general pattern seen to emerge from imaging studiesof speech production is two major sites of activation in the motorcortex: the larynx area deep in the central sulcus, and the tonguearea in the Rolandic operculum. While other processes are clearlycritical for speech production – not least muscular activity in thelips, velum and pharynx – larynx and tongue activities might be
the most readily identifiable ones because of their distance in themotor cortex. For example, in our previous imaging study (Brownet al., 2008), lip and tongue movement showed a region of overlap-ping activity, although this was dorsal to tongue-related region ofthe Rolandic operculum.
Given our separability of activity in the larynx area and Rolandicoperculum during simple phonation and tongue movement,respectively, and their combination during speech (in addition topresumptive activity in lip-related areas), there does seem to bea basic additivity of phonation and articulation that comes intoplay during speech production. Looking to the subtraction analysis,we obtained mixed results. While tongue and lip movement nicelysubtracted out articulation-related activity in the motor cortexduring speech, the monotone-phonation task was not very effec-tive at subtracting out the larynx peak of speech. Interestingly, a
Fig. 2. Major ALE foci from the meta-analysis. (a) Major ALE foci for the syllable-singing meta-analysis. Principal sites of activation are labelled; some bilateral corticalactivations are labelled on only one side of the brain. Talairach z coordinates are shown below each slice. (b) Comparison of the ALE foci from the current meta-analysis ofsyllable-singing and a meta-analysis of overt reading performed by Turkeltaub et al. (2002). The color scheme for ALE activations in this panel is the following: red = syllable-singing, blue = reading, yellow = overlap. The labels in this panel highlight the vocal-motor areas shown by the meta-analysis to have large cross-laboratory concordance. Forthe bottom panel only, yellow labels refer to common activations between speaking and syllable-singing, and red labels refer to foci unique to syllable-singing. The Talairachcoordinates for the slices are shown at the bottom of the figure. In choosing slice levels for this composite analysis, we attempted to present slices that were intermediatebetween the peak activations for syllable-singing and those for reading where differences existed between them (see Table 4 for coordinates). The only location where thisdoes not work well is the slice at z = 32, which gives the impression that the CMA is uniquely present in syllable-singing, when the speech focus is actually 7 mm higher, andthus not present in this slice. Hence, the label for the CMA is colored yellow instead of red. The right side of a slice is the right side of the brain. The threshold for both analysesis p < 0.05, corrected for multiple comparisons using the false discovery rate. Abbreviations (from left to right) are: SMA, supplementary motor area; M1, primary motorcortex; CMA, cingulate motor area; RO, Rolandic operculum; pSTG, posterior part of the superior temporal gyrus; FO, frontal operculum; Put., putamen; aSTG, anterior part ofthe superior temporal gyrus; CB-VI, lobule VI of the cerebellum. (For interpretation of the references in color in this figure legend, the reader is referred to the web version ofthis article.)
36 S. Brown et al. / Brain and Cognition 70 (2009) 31–41

similar result was found in the study of Murphy et al. (1997). Theircontrast was better matched than ours in that they compared thevocalization of a phrase with mouth-closed vocalizing of the samephrase using the /a/ vowel. Hence, much about the melody andrhythm of the original phrase should have been contained in theunarticulated version. Their subtraction revealed bilateral peaksin the sensorimotor cortex quite close to the ventromedial larynxarea. Why might the larynx activation during speech be difficultto subtract out with phonatory control tasks, especially given theefficiency of the subtraction of articulatory areas using articulatorycontrols tasks? One speculation is that co-articulation duringspeech production may activate the larynx area in a much strongermanner than tasks that involve a single articulatory posture, suchas during the monovowel tasks used in this study and that of Mur-phy et al. (1997). Likewise, speech tasks show an oscillatory cyclingbetween voiced and unvoiced sounds that is not seen in the con-trols tasks. Given the overlap in the larynx coordinates betweenthe reading and syllable-singing meta-analyses, the effect thatwe and Murphy et al. are seeing is most likely quantitative ratherthan qualitative. Further work is needed to enlighten this point, not
least an analysis of potential neural sub-domains within the larynxmotor cortex for vocal-fold tension vs. relaxation, and abductionvs. adduction.
4.2. A neural model of vocalization
Wewould like to consolidate the results of the fMRI experimentand meta-analyses into a model of vocalization (Fig. 3), one that fo-cuses on the generation of sounds at the vocal source, and hencephonation. A very similar model of vocal production is presentedby Bohland and Guenther (2006), as discussed below. The fMRImonotone-phonation task as well as the 5-note phonation taskused in Brown et al. (2008) were designed to be as pure a modelof phonation as possible, minimizing the contribution of articula-tion to the brain activations. We would like to consider the activa-tion pattern of these tasks as a minimal model of ‘‘primary” areasfor phonation, and then contrast that with data from the fMRIspeech task and the two meta-analyses in order to characterize‘‘secondary” areas that may tap more into articulation or generalorofacial functioning than phonation.
The primary vocal circuit consists principally of three motorareas: (1) the larynx motor cortex and associated premotor cortex;
Table 3Syllable-singing ALE clusters. Major ALE clusters for the syllable-singing meta-analysis. The table shows the principal ALE clusters derived from the meta-analysis ofthe 11 studies of syllable-singing. After each anatomical name in the ‘‘region” columnis the Brodmann number in parentheses. The columns labelled as x, y, and z are theTalairach coordinates for the weighted center of each cluster. The ALE score shown isthe true value multiplied by 103. The right column shows the size of each cluster inmm3. Note that the rightmost column specifies three large clusters, submaxima ofwhich are identified in the column for cluster size (mm3). Abbreviations: M1, primarymotor cortex; Ant., anterior; Sup., superior.
Region x y z ALE (# 10"3) (mm3)
FrontalRightFrontal operculum (44) 44 10 10 20.1 34,200
(Cluster 1)Rolandic operculum (4/6/43) 60 "4 24 19.9 Cluster 1M1 larynx (4/6) 54 "4 38 19.2 Cluster 1Supplementary motor area (6) 6 0 60 19.2 11,040
(cluster 3)LeftM1 larynx (4/6) "50 "10 40 21.5 28,920
(cluster 2)Rolandic operculum (4/6/43) "58 "2 22 18.3 Cluster 2Cingulate motor area (32/6) "2 6 46 14.1 Cluster 3Cingulate motor area (32/6) "2 16 32 10.7 Cluster 3
TemporalRightAnt. Sup. temporal gyrus (22) 52 4 "4 17.8 Cluster 1Superior temporal gyrus (22) 58 "28 10 13.5 Cluster 1Superior temporal gyrus (22) 58 "10 10 11.5 Cluster 1
LeftAnt. sup. temporal gyrus (22) "44 10 0 20.5 Cluster 2Primary auditory cortex (41) "40 "22 10 12.9 Cluster 2Superior temporal gyrus (22) "60 "22 4 11.8 Cluster 2Primary auditory cortex (41) "34 "34 14 11.2 Cluster 2Superior temporal gyrus (22) "58 "36 8 10.5 Cluster 2
SubcorticalRightPutamen 24 2 "2 17.7 Cluster 1Ventral thalamus 14 "20 6 17.3 Cluster 1
LeftVentral thalamus "10 "18 0 17.0 3352Putamen "22 4 4 15.8 Cluster 2
CerebellumRightLobule VI 24 "60 "20 21.7 4056
LeftLobule VI "34 "50 "30 15.4 1672Lobule VI "22 "64 "18 13.0 2376Vermis V/VI "4 "56 "28 11.0 504
Table 4Syllable singing vs. reading meta-analyses. Meta-analysis coordinates for syllable-singing vs. reading. Talairach coordinates for the clusters for the syllable-singingmeta-analysis (current study) and reading meta-analysis (from Turkeltaub et al.,2002) are shown side by side. Note the strong overlap in activation peaks for the twoanalyses. Abbreviations: M1, primary motor cortex; Ant., anterior; Sup., superior.
Region Syllable singing Reading
x y z x y z
FrontalRightFrontal operculum (44) 44 10 10Frontal operculum (45) 56 20 4Rolandic operculum (4/6/43) 60 "4 24 48 "3 24M1 larynx (4/6) 54 "4 38 44 "10 34Supplementary motor area (6) 6 0 60 0 2 54
LeftM1 larynx (4/6) "50 "10 40 "46 "12 36Rolandic operculum (4/6/43) "58 "2 22 "48 "8 22Cingulate motor area (32/6) "2 6 46 "2 12 45Cingulate motor area (32/6) "2 16 32Frontal operculum (44) "52 4 10
TemporalRightAnt. sup. temporal gyrus (22) 52 4 "4Superior temporal gyrus (22) 58 "28 10 54 "28 6Superior temporal gyrus (22) 58 "10 10 54 "14 8
LeftAnt. sup. temporal gyrus (22) "44 10 0Primary auditory cortex (41) "40 "22 10Superior temporal gyrus (22) "60 "22 4 "52 "14 4Primary auditory cortex (41) "34 "34 14Superior temporal gyrus (22) "56 "43 13Superior temporal gyrus (22) "58 "36 8 "56 "32 4
SubcorticalRightPutamen 24 2 "2Ventral thalamus 14 "20 6
LeftVentral thalamus "10 "18 0 "18 "16 2Putamen "22 4 4
CerebellumRightLobule VI 24 "60 "20 28 "57 "21Vermis V/VI 16 "66 "16
LeftLobule VI "34 "50 "30 "36 "38 "24Lobule VI "22 "64 "18 "14 "66 "16Vermis V/VI "4 "56 "28
S. Brown et al. / Brain and Cognition 70 (2009) 31–41 37
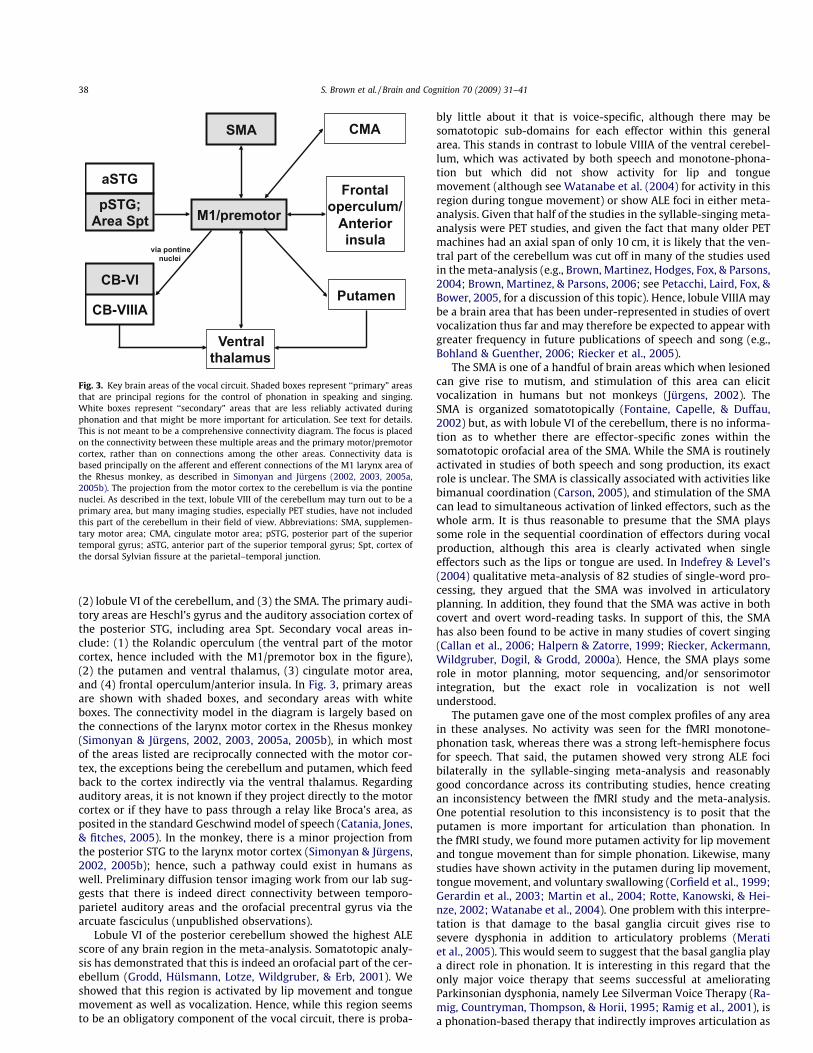
(2) lobule VI of the cerebellum, and (3) the SMA. The primary audi-tory areas are Heschl’s gyrus and the auditory association cortex ofthe posterior STG, including area Spt. Secondary vocal areas in-clude: (1) the Rolandic operculum (the ventral part of the motorcortex, hence included with the M1/premotor box in the figure),(2) the putamen and ventral thalamus, (3) cingulate motor area,and (4) frontal operculum/anterior insula. In Fig. 3, primary areasare shown with shaded boxes, and secondary areas with whiteboxes. The connectivity model in the diagram is largely based onthe connections of the larynx motor cortex in the Rhesus monkey(Simonyan & Jürgens, 2002, 2003, 2005a, 2005b), in which mostof the areas listed are reciprocally connected with the motor cor-tex, the exceptions being the cerebellum and putamen, which feedback to the cortex indirectly via the ventral thalamus. Regardingauditory areas, it is not known if they project directly to the motorcortex or if they have to pass through a relay like Broca’s area, asposited in the standard Geschwindmodel of speech (Catania, Jones,& fitches, 2005). In the monkey, there is a minor projection fromthe posterior STG to the larynx motor cortex (Simonyan & Jürgens,2002, 2005b); hence, such a pathway could exist in humans aswell. Preliminary diffusion tensor imaging work from our lab sug-gests that there is indeed direct connectivity between temporo-parietel auditory areas and the orofacial precentral gyrus via thearcuate fasciculus (unpublished observations).
Lobule VI of the posterior cerebellum showed the highest ALEscore of any brain region in the meta-analysis. Somatotopic analy-sis has demonstrated that this is indeed an orofacial part of the cer-ebellum (Grodd, Hülsmann, Lotze, Wildgruber, & Erb, 2001). Weshowed that this region is activated by lip movement and tonguemovement as well as vocalization. Hence, while this region seemsto be an obligatory component of the vocal circuit, there is proba-
bly little about it that is voice-specific, although there may besomatotopic sub-domains for each effector within this generalarea. This stands in contrast to lobule VIIIA of the ventral cerebel-lum, which was activated by both speech and monotone-phona-tion but which did not show activity for lip and tonguemovement (although see Watanabe et al. (2004) for activity in thisregion during tongue movement) or show ALE foci in either meta-analysis. Given that half of the studies in the syllable-singing meta-analysis were PET studies, and given the fact that many older PETmachines had an axial span of only 10 cm, it is likely that the ven-tral part of the cerebellum was cut off in many of the studies usedin the meta-analysis (e.g., Brown, Martinez, Hodges, Fox, & Parsons,2004; Brown, Martinez, & Parsons, 2006; see Petacchi, Laird, Fox, &Bower, 2005, for a discussion of this topic). Hence, lobule VIIIA maybe a brain area that has been under-represented in studies of overtvocalization thus far and may therefore be expected to appear withgreater frequency in future publications of speech and song (e.g.,Bohland & Guenther, 2006; Riecker et al., 2005).
The SMA is one of a handful of brain areas which when lesionedcan give rise to mutism, and stimulation of this area can elicitvocalization in humans but not monkeys (Jürgens, 2002). TheSMA is organized somatotopically (Fontaine, Capelle, & Duffau,2002) but, as with lobule VI of the cerebellum, there is no informa-tion as to whether there are effector-specific zones within thesomatotopic orofacial area of the SMA. While the SMA is routinelyactivated in studies of both speech and song production, its exactrole is unclear. The SMA is classically associated with activities likebimanual coordination (Carson, 2005), and stimulation of the SMAcan lead to simultaneous activation of linked effectors, such as thewhole arm. It is thus reasonable to presume that the SMA playssome role in the sequential coordination of effectors during vocalproduction, although this area is clearly activated when singleeffectors such as the lips or tongue are used. In Indefrey & Level’s(2004) qualitative meta-analysis of 82 studies of single-word pro-cessing, they argued that the SMA was involved in articulatoryplanning. In addition, they found that the SMA was active in bothcovert and overt word-reading tasks. In support of this, the SMAhas also been found to be active in many studies of covert singing(Callan et al., 2006; Halpern & Zatorre, 1999; Riecker, Ackermann,Wildgruber, Dogil, & Grodd, 2000a). Hence, the SMA plays somerole in motor planning, motor sequencing, and/or sensorimotorintegration, but the exact role in vocalization is not wellunderstood.
The putamen gave one of the most complex profiles of any areain these analyses. No activity was seen for the fMRI monotone-phonation task, whereas there was a strong left-hemisphere focusfor speech. That said, the putamen showed very strong ALE focibilaterally in the syllable-singing meta-analysis and reasonablygood concordance across its contributing studies, hence creatingan inconsistency between the fMRI study and the meta-analysis.One potential resolution to this inconsistency is to posit that theputamen is more important for articulation than phonation. Inthe fMRI study, we found more putamen activity for lip movementand tongue movement than for simple phonation. Likewise, manystudies have shown activity in the putamen during lip movement,tongue movement, and voluntary swallowing (Corfield et al., 1999;Gerardin et al., 2003; Martin et al., 2004; Rotte, Kanowski, & Hei-nze, 2002; Watanabe et al., 2004). One problem with this interpre-tation is that damage to the basal ganglia circuit gives rise tosevere dysphonia in addition to articulatory problems (Meratiet al., 2005). This would seem to suggest that the basal ganglia playa direct role in phonation. It is interesting in this regard that theonly major voice therapy that seems successful at amelioratingParkinsonian dysphonia, namely Lee Silverman Voice Therapy (Ra-mig, Countryman, Thompson, & Horii, 1995; Ramig et al., 2001), isa phonation-based therapy that indirectly improves articulation as
M1/premotor
SMA
Ventral thalamus
pSTG; Area Spt
CMA
Frontal operculum/
Anterior insula
CB-VIIIA Putamen
via pontine nuclei
aSTG
CB-VI
Fig. 3. Key brain areas of the vocal circuit. Shaded boxes represent ‘‘primary” areasthat are principal regions for the control of phonation in speaking and singing.White boxes represent ‘‘secondary” areas that are less reliably activated duringphonation and that might be more important for articulation. See text for details.This is not meant to be a comprehensive connectivity diagram. The focus is placedon the connectivity between these multiple areas and the primary motor/premotorcortex, rather than on connections among the other areas. Connectivity data isbased principally on the afferent and efferent connections of the M1 larynx area ofthe Rhesus monkey, as described in Simonyan and Jürgens (2002, 2003, 2005a,2005b). The projection from the motor cortex to the cerebellum is via the pontinenuclei. As described in the text, lobule VIII of the cerebellum may turn out to be aprimary area, but many imaging studies, especially PET studies, have not includedthis part of the cerebellum in their field of view. Abbreviations: SMA, supplemen-tary motor area; CMA, cingulate motor area; pSTG, posterior part of the superiortemporal gyrus; aSTG, anterior part of the superior temporal gyrus; Spt, cortex ofthe dorsal Sylvian fissure at the parietal–temporal junction.
38 S. Brown et al. / Brain and Cognition 70 (2009) 31–41
a by-product (Dromey, Ramig, & Johnson, 1995; Sapir, Spielman,Ramig, Story, & Fox, 2007). The role of the putamen in phonationand articulation is in need of further exploration. For the timebeing, we put it in the category of ‘‘secondary” areas. We do thesame for the ventral thalamus. Its co-occurrence with the putamen(i.e., both were absent in the fMRI monotone task, both were pres-ent in the syllable-singing meta-analysis, and the thalamus wasonly present in articles that reported putamen activation in the syl-lable-singing meta-analysis) probably reflects the connectivity ofthe basal ganglia, which sends its output from the internal segmentof the globus pallidus to anterior parts of the ventral thalamus. Thecerebellum’s projection to the cerebral cortex also passes through apart of the ventral thalamus (posterior to the basal ganglia projec-tion), and so it is unclear why there should be an absence of ventralthalamus activation in the presence of strong cerebellar activity.The thalamus showed relatively low concordance across studiesin the meta-analysis.
One interesting point of reference with regard to the basal gan-glia comes from the studies of Riecker et al. (2005), Riecker, Kass-ubek, Groschel, Grodd, and Ackermann (2006), which wereincluded in the meta-analysis. These studies examined the tempoof vocalization, looking at monosyllable /pa/ repetitions over therange of 2–6 Hz. What was found was that activity in lobules VIand VIIIA of the cerebellum showed positive correlations with syl-lable rate whereas activity in the putamen and caudate nucleusshowed negative correlations. Putamen activity decreased mono-tonically for speaking rates ranging from 2 to 6 Hz (Riecker, Kass-ubek, Groschel, Grodd, & Ackermann, 2006); the two cerebellarregions showed the reverse pattern. Our profile of high cerebellumand low putamen does not follow from the assumption that thesepatterns would extend to 1 Hz, the suggested production rate forour fMRI monotone task. Again, the absence of articulatory changesin our singing task may be a more important factor than tempo perse in explaining the absence of putamen activity.
The cingulate motor area gave low concordance in the meta-analysis, and was not found to be active in the speech or mono-tone-phonation fMRI tasks. Unlike the larynx motor cortex, theCMA is the only cortical part of the monkey brain which, when le-sioned, disrupts vocalization (Sutton, Larson, & Lindeman, 1974,but see Kirzinger & Jürgens, 1982). The projection from the cingu-late cortex to the periaqueductal gray is thought to represent anancestral vocalization pathway in primates that is perhaps moreimportant for involuntary vocalizations than voluntary ones likespeech. This area may indeed be more involved in emotive vocal-izations than learned vocalizations such as speech and song in hu-mans. It is interesting to note that almost all of the studies in themeta-analysis that showed CMA activation employed monotonetasks rather than melodic singing tasks. Hence, the CMA may havesome preference for simple vocal tasks, as shown by its activationin monotone (Brown et al., 2004; Perry et al., 1999), monovowel(Sörös et al., 2006), and monosyllable (Bohland & Guenther,2006; Riecker et al., 2006) tasks. This hypothesis is consistent withthe reading study of Barrett et al. (2004), in which subjects had toread semantically-neutral passages under conditions of either hap-py or sad mood induction. Regressions with affect-induced pitchrange showed that the more monotonous the speech became dur-ing sad speech, the greater the activity in the CMA. The majorTalairach coordinate for this regression was at "8, 18, 34, whichcorresponds quite well with one of the CMA coordinates fromthe syllable-singing meta-analysis at "2, 16, 32. CMA activitymay thus be sensitive to melodic complexity, showing a preferencefor low-complexity vocal tasks having minimal pitch variation,which may reflect its evolution from a system involved in simple,stereotyped vocalizations. Might the CMA be the brain’s ‘‘chant”center? Further work is needed to clarify the role of the cingulatecortex in vocalization.
The frontal operculum and medial-adjacent anterior insularepresent yet another difficult case for our model. As with theputamen, activity in this region was much stronger inthe meta-analysis than the fMRI monotone task. We again makethe speculation that this area encodes generalized orofacialfunctions and thus might be equally involved in articulationand phonation. The fMRI study showed comparable activity inthe frontal operculum for lip movement and tongue movementas for vocalization. This casts doubts on a phonation-specific roleof this region. In addition, the most typical type of symptom asso-ciated with damage to the anterior insula is apraxia of speech andnot dysphonia alone (Jordan & Hillis, 2006; Ogar, Slama, Dronkers,Amici, & Gorno-Tempini, 2005). Hence, damage to this region ismuch more likely to result in articulatory deficits than phonatoryones, although both seem to co-occur. As Ogar et al. (2005) pointout: ‘‘Prosodic deficits, however, are thought to be a secondary ef-fect of poor articulation” (p. 428). It is for these reasons that weput the frontal operculum and adjacent anterior insula into thecategory of ‘‘secondary” areas for vocalization. Several models ofvocal production have ascribed an important role for the anteriorinsula in phonological processing (Ackermann & Riecker, 2004;Bohland & Guenther, 2006; Indefrey & Level, 2004; Rieckeret al., 2005, 2006). In Indefrey and Level’s (2004) meta-analysis,they associated the anterior insula most strongly with ‘‘phonolog-ical code retrieval”, which is a process of searching for phonolog-ical words that match a lexically selected item. They found lessevidence for a role of the anterior insula in actual speech produc-tion, a result counter to the perspective of Ackermann and Riec-ker (2004). Riecker et al. (2006) found that activity in the insulaincreased monotonically with syllable rate, hence showing a sim-ilar profile to the cerebellum (as well as larynx motor cortex andSMA). So the frontal operculum/anterior insula is almost certainlya vocal-motor area, but its exact role is in need of furtheranalysis.
The model in Fig. 3 shows striking similarities with the ‘‘basicspeech production network” proposed by Bohland and Guenther(2006), which includes all of the areas mentioned here. In fact,there is no region of disagreement between our model and theirs.Perhaps the only motivational difference relates to our goal ofdefining a network of vocal production based on phonation, lead-ing to our distinction between primary and secondary areas forvocalization. Their model was based on a series of syllable tasks,ranging from simple to complex trisyllables. Hence, articulationwas an important component of all of their tasks. It is possiblethat a task based on vowels alone would yield different results.For example, the vowel production task of Perry et al. (1999)failed to show activity in some of the areas that we have specu-lated to be associated with articulation (e.g., putamen) but didshow activity in others (Rolandic operculum, frontal operculum),whereas the vowel production task of Sörös et al. (2006) failed toshow activity in the Rolandic operculum but did show activity inthe putamen and frontal operculum. Further work is clearlyneeded to verify the phonation network postulated in our pri-mary areas.
5. Conclusions
Using two complementary comparisons between speech andnon-speech oral tasks (fMRI and meta-analysis), we have at-tempted to disentangle phonation and articulation in speech, andhave shown that motor-control models like the ‘‘source-filter”model can be represented somatotopically in the motor cortex. Aprincipal site of activation for speech is the larynx representationin the motor cortex, in keeping with the overwhelmingly voicednature of speech. Additional activity in the Rolandic operculumfor tongue movement and other parts of the motor cortex
S. Brown et al. / Brain and Cognition 70 (2009) 31–41 39
contribute to an overall sense of additivity of phonation and artic-ulation during speech production.
Acknowledgments
This work was supported by a grant to SB from the GrammyFoundation. ARL and SMT were supported by the Human Brain Pro-ject of the NIMH (R01-MH074457-01A1), and PQP by NSF grant0642592. We thank Trudy Harris, Jennifer McCord, and BurkhardMädler at the MRI Research Centre of the University of BritishColumbia for expert technical assistance. We thank Roger Ingham(University of California at Santa Barbara) for critical reading of aprevious version of the manuscript.
References
Ackermann, H., & Riecker, A. (2004). The contribution of the insula to motor aspectsof speech production: A review and a hypothesis. Brain and Language, 89,320–328.
Barrett, J., Pike, G. B., & Paus, T. (2004). The role of the anterior cingulate cortex inpitch variation during sad affect. European Journal of Neuroscience, 19, 458–464.
Belin, P., Zatorre, R. J., LaFalce, P., Ahead, P., & Pike, B. (2000). Voice-selective areas inhuman auditory cortex. Nature, 403, 309–312.
Bohland, J. W., & Guenther, F. H. (2006). An fMRI investigation of syllable sequenceproduction. Neuroimage, 32, 821–841.
Brown, S., Ingham, R. J., Ingham, J. C., Laird, A. R., & Fox, P. T. (2005). Stuttered andfluent speech production: An ALE meta-analysis of functional neuroimagingstudies. Human Brain Mapping, 25, 105–117.
Brown, S., Martinez, M. J., Hodges, D. A., Fox, P. T., & Parsons, L. M. (2004). The songsystem of the human brain. Cognitive Brain Research, 20, 363–375.
Brown, S., Martinez, M. J., & Parsons, L. M. (2006). Music and language side by side inthe brain: A PET study of the generation of melodies and sentences. EuropeanJournal of Neuroscience, 23, 2791–2803.
Brown, S., Ngan, E., & Liotti, M. (2008). A larynx area in the human motor cortex.Cerebral Cortex, 18, 837–845.
Callan, D. E., Tsytsarev, V., Hanakawa, T., Callan, A. M., Katsuharab, M., Fukuyama,H., et al. (2006). Song and speech: Brain regions involved with perception andcovert production. Neuroimage, 31, 1327–1342.
Carson, R. G. (2005). Neural pathways mediating bilateral interactions between theupper limbs. Brain Research Reviews, 49, 641–662.
Catania, M., Jones, D. K., & fitches, D. H. (2005). Perisylvian language networks of thehuman brain. Annals of Neurology, 57, 8–16.
Corfield, D. R., Murphy, K., Josephs, O., Fink, G. R., Frackowiak, R. S., Guz, A., et al.(1999). Cortical and subcortical control of tongue movement in humans: Afunctional neuroimaging study using fMRI. Journal of Applied Physiology, 86,1468–1477.
Dromey, C., Ramig, L., & Johnson, A. B. (1995). Phonatory and articulatory changesassociated with increased vocal intensity in Parkinson disease: A case study.Journal of Speech and Hearing Research, 38, 751–764.
Fónagy, I. (1981). Emotions, voice and music. Research Aspects on Singing, 33, 51–79.Fónagy, I., & Magdics, K. (1963). Emotional patterns in intonation and music.
Zeitschrift für Phonetik, 16, 293–326.Fontaine, D., Capelle, L., & Duffau, H. (2002). Somatotopy of the supplementary
motor area: Evidence from correlation of the extent of surgical resection withthe clinical patterns of deficit. Neurosurgery, 50, 297–305.
Fox, P. T., Huang, A., Parsons, L. M., Xing, J.-H., Zamarippa, F., Rainey, L., et al. (2001).Location-probability profiles for the mouth region of the human primarymotor-sensory cortex: Model and validation. Neuroimage, 13, 196–209.
Fox, P. T., & Lancaster, J. L. (2002). Mapping context and content: The BrainMapmodel. Nature Reviews Neuroscience, 3, 319–321.
Friston, K. J., Ashburner, J., Frith, C. D., Pauline, J.-B., Heather, J. D., & Frackowiak, R. S.J. (1995a). Spatial registration and normalization of images. Human BrainMapping, 3, 165–189.
Friston, K. J., Holmes, A. P., Worley, K. J., Pauline, J.-B., Frith, C. D., & Frackowiak, R. S.J. (1995b). Statistical parametric maps in functional imaging: A general linearapproach. Human Brain Mapping, 2, 189–210.
Genovese, C. R., Lazar, N. A., & Nichols, T. (2002). Thresholding of statistical maps infunctional neuroimaging using the false discovery rate. Neuroimage, 15,870–878.
Gerardin, E., Lehericy, S., Potion, J. B., Teens du Montcel, S., Margin, J. F., Pompon, F.,et al. (2003). Foot, hand, face and eye representation in the human striatum.Cerebral Cortex, 13, 162–169.
Grodd, W., Hülsmann, E., Lotze, M., Wildgruber, D., & Erb, M. (2001). Sensorimotormapping of the human cerebellum: fMRI evidence of somatotopic organization.Human Brain Mapping, 13, 55–73.
Halpern, A. R., & Zatorre, R. J. (1999). When that tune runs through your head: A PETinvestigation of auditory imagery for familiar melodies. Cerebral Cortex, 9,697–704.
Indefrey, P., & Level, W. J. M. (2004). The spatial and temporal signatures of wordproduction components. Cognition, 92, 101–144.
Jeffries, K. J., Fritz, J. B., & Braun, A. R. (2003). Words in melody: An H215O PET study
of brain activation during singing and speaking. Neuroreport, 14, 749–754.Jordan, L. C., & Hillis, A. E. (2006). Disorders of speech and language: Aphasia,
apraxia and dysarthria. Current Opinion in Neurology, 19, 580–585.Jürgens, U. (2002). Neural pathways underlying vocal control. Neuroscience and
Biobehavioral Reviews, 26, 235–258.Kirzinger, A., & Jürgens, U. (1982). Cortical lesion effects and vocalization in the
squirrel monkey. Brain Research, 233, 299–315.Kleber, B., Birbaumer, N., Veit, R., Trevorrow, T., & Lotze, M. (2007). Overt and
imagined singing of an Italian aria. Neuroimage, 36, 889–900.Kochunov, P., Lancaster, J., Thompson, P., Toga, A. W., Brewer, P., Hardies, J., et al.
(2002). An optimized individual target brain in the Talairach coordinate system.Neuroimage, 17, 922–927.
Ladd, D. R. (1996). Intonational phonology. Cambridge: Cambridge University Press.Laird, A. R., Fox, P. M., Price, C. J., Glahn, D. C., Uecker, A. M., Lancaster, J. L., et al.
(2005b). ALE meta-analysis: Controlling the false discovery rate and performingstatistical contrasts. Human Brain Mapping, 25, 155–164.
Laird, A. R., McMillan, K. M., Lancaster, J. L., Kochunov, P., Turkeltaub, P. E., Pardo, J.V., et al. (2005a). A comparison of label-based meta-analysis and activationlikelihood estimation in the stroop task. Human Brain Mapping, 25, 6–21.
Lancaster, J. L., Tordesillas-Gutiérrez, D., Martinez, M., Salinas, F., Evans, A., Zilles, K.,et al. (2007). Bias between MNI and Talairach coordinates analyzed using theICBM-152 brain template. Human Brain Mapping, 28, 1194–1205.
Loucks, T. M., Poletto, C. J., Simonyan, K., Reynolds, C. L., & Ludlow, C. L. (2007).Human brain activation during phonation and exhalation: Common volitionalcontrol for two upper airway functions. Neuroimage, 36, 131–143.
Maldjian, J. A., Laurienti, P. J., Kraft, R. A., & Burdette, J. H. (2003). An automatedmethod for neuroanatomic and cytoarchitectonic atlas-based interrogation offMRI data sets. Neuroimage, 19, 1233–1239.
Martin, R. E., MacIntosh, B. J., Smith, R. C., Barr, A. M., Stevens, T. K., Gati, J. S., et al.(2004). Cerebral areas processing swallowing and tongue movement areoverlapping but distinct: A functional magnetic resonance imaging study.Journal of Neurophysiology, 92, 2428–2443.
Merati, A., Heman-Ackah, Y. D., Abaza, M., Altman, K. W., Sulica, L., & Belamowicz, S.(2005). Common movement disorders affecting the larynx: A report from theNeurolaryngology Committee of the AAO-HNS. Otolaryngol. Head and NeckSurgery, 133, 654–665.
Murphy, K., Corfield, D. R., Guz, A., Fink, G. R., Wise, R. J. S., Harrison, J., et al. (1997).Cerebral areas associated with motor control of speech in humans. Journal ofApplied Physiology, 83, 1438–1447.
Ogar, J., Slama, H., Dronkers, N., Amici, S., & Gorno-Tempini, M. R. (2005). Apraxia ofspeech: An overview. Neurocase, 11, 427–432.
Özdemir, E., Nortona, A., & Schlaug, G. (2006). Shared and distinct neural correlatesof singing and speaking. Neuroimage, 33, 628–635.
Perry, D. W., Zatorre, R. J., Petrides, M., Alivisatos, B., Meyer, E., & Evans, A. C. (1999).Localization of cerebral activity during simple singing. Neuroreport, 10,3979–3984 (Also Neuroreport, 10, 3452–3458).
Petacchi, A., Laird, A. R., Fox, P. T., & Bower, J. M. (2005). Cerebellum and auditoryfunction: An ALE meta-analysis of functional neuroimaging studies. HumanBrain Mapping, 25, 118–128.
Ramig, L., Countryman, S., Thompson, L., & Horii, Y. (1995). A comparison of twoforms of intensive speech treatment for Parkinson disease. Journal of Speech andHearing Research, 38, 1232–1251.
Ramig, L., Sapir, S., Countryman, S., Pawlas, A., O’Brien, C., Hoehn, M., et al. (2001).Intensive voice treatment (LSVT) for individuals with Parkinson disease: A two-year follow-up. Journal of Neurology, Neurosurgery and Psychiatry, 71, 493–498.
Ramus, F., Nespor, M., & Mehler, J. (1999). Correlates of linguistic rhythm in thespeech signal. Cognition, 73, 265–292.
Riecker, A., Ackermann, H., Wildgruber, D., Dogil, G., & Grodd, W. (2000a). Oppositehemispheric lateralization effects during speaking and singing at motor cortex,insula and cerebellum. Neuroreport, 11, 1997–2000.
Riecker, A., Ackermann, H., Wildgruber, D., Meyer, J., Dogil, G., Haider, H., et al.(2000b). Articulatory/phonetic sequencing at the level of the anteriorperisylvian cortex: A functional magnetic resonance fMRI study. Brain andLanguage, 75, 259–276.
Riecker, A., Kassubek, J., Groschel, K., Grodd, W., & Ackermann, H. (2006). Thecerebral control of speech tempo: Opposite relationship between speaking rateand BOLD signals changes at striatal and cerebellar structures. Neuroimage, 29,46–53.
Riecker, A., Mathiak, K., Wildgruber, D., Erb, M., Hertrich, I., Grodd, W., et al. (2005).fMRI reveals two distinct cerebral networks subserving speech motor control.Neurology, 64, 700–706.
Riecker, A., Wildgruber, D., Dogil, G., Grodd, W., & Ackermann, H. (2002).Hemispheric lateralization effects of rhythm implementation during syllablerepetitions: An fMRI study. Neuroimage, 16, 169–176.
Rotte, M., Kanowski, M., & Heinze, H. J. (2002). Functional magnetic resonanceimaging for the evaluation of the motor system: Primary and secondary brainareas in different motor tasks. Stereotactic and Functional Neurosurgery, 78, 3–16.
Saito, Y., Ishii, J., Yagi, K., Tatsumi, I. F., & Mizusawa, H. (2006). Cerebral networks forspontaneous and synchronized singing and speaking. Neuroreport, 17,1893–1897.
Sapir, S., Spielman, J., Ramig, L., Story, B., & Fox, C. (2007). Effects of intensive voicetreatment LSVT on vowel articulation in dysarthric individuals with idiopathicParkinson disease: Acoustic and perceptual findings. Journal of Speech Languageand Hearing Research, 50, 899–912.
40 S. Brown et al. / Brain and Cognition 70 (2009) 31–41
Schmahmann, J. D., Doyon, J., Toga, A. W., Petrides, M., & Evans, A. C. (2000). MRIatlas of the human cerebellum. San Diego: Academic Press.
Simonyan, K., & Jürgens, U. (2002). Cortico-cortical projections of the motorcorticallarynx area in the rhesus monkey. Brain Research, 949, 23–31.
Simonyan, K., & Jürgens, U. (2003). Efferent subcortical projections of the laryngealmotorcortex in the rhesus monkey. Brain Research, 974, 43–59.
Simonyan, K., & Jürgens, U. (2005a). Afferent subcortical connections into the motorcortical larynx area in the rhesus monkey. Neuroscience, 130, 119–131.
Simonyan, K., & Jürgens, U. (2005b). Afferent cortical connections of the motorcortical larynx area in the rhesus monkey. Neuroscience, 130, 133–149.
Simonyan, K., Saad, Z. S., Loucks, T. M., Poletto, C. J., & Ludlow, C. L. (2007).Functional neuroanatomy of human voluntary cough and sniff production.Neuroimage, 37, 401–409.
Sörös, P., Guttman Sokoloff, L., Bose, A., McIntosh, A. R., Graham, S. J., & Stuss, D. T.(2006). Clustered functional MRI of overt speech production. Neuroimage, 32,376–387.
Sundberg, J. (1987). The science of the singing voice. Dekalb, IL: Northern IllinoisUniversity Press.
Sutton, D., Larson, C., & Lindeman, R. C. (1974). Neocortical and limbic lesion effectson primate phonation. Brain Research, 71, 61–75.
Talairach, J., & Tournoux, P. (1988). Co-planar stereotaxic atlas of the human brain.New York: Thieme Medical Publishers.
Terumitsu, M., Fujii, Y., Suzuki, K., Kwee, I. L., & Nakada, T. (2006). Human primarymotor cortex shows hemispheric specialization for speech. Neuroreport, 17,1091–1095.
Turkeltaub, P. E., Eden, G. F., Jones, K. M., & Zeffiro, T. A. (2002). Meta-analysis of thefunctional neuroanatomy of single-word reading: Method and validation.Neuroimage, 16, 765–780.
Watanabe, J., Motoaki, S., Miura, N., Watanabe, Y., Yasuhiro, M., Matsue, Y., et al.(2004). The human parietal cortex is involved in spatial processing of tonguemovement: An fMRI study. Neuroimage, 21, 1289–1299.
Wilson, S. M., Saygin, A. P., Sereno, M. I., & Iacoboni, M. (2004). Listening to speechactivates motor areas involved in speech production. Nature Neuroscience, 7,701–702.
Yip, M. (2002). Tone. Cambridge: Cambridge University Press.
S. Brown et al. / Brain and Cognition 70 (2009) 31–41 41


