Embed Size (px)
Citation preview

The SS+-tree: An Improved Index Structure for Similarity Searches in aHigh-Dimensional Feature SpaceR. Kurniawati�, J. S. Jin, and J. A. ShepherdSchool of Computer Science and EngineeringUniversity of New South WalesSydney 2052, AustraliaABSTRACTIn this paper, we describe the SS+-tree, a tree structure for supporting similarity searches in a high-dimensionalEuclidean space. Compared to the SS-tree, the tree uses a tighter bounding sphere for each node which is anapproximation to the smallest enclosing sphere and it also makes a better use of the clustering property of theavailable data by using a variant of the k-means clustering algorithm as the split heuristic for its nodes. Alocal reorganization rule is also introduced during the tree building to reduce the overlapping between the nodes'bounding spheres.Keywords: high-dimensional indexing and retrieval, similarity search, multimedia databases, enclosing spheres,enclosing boxes (MBR) 1. INTRODUCTIONRepresenting images by a vector of features is a useful approach to handling the retrieval of images fromimage databases.10,17,19 Under such a scheme, similarity searches can be performed by using the Euclideandistance between two vectors as a measure of dissimilarity. However, feature vectors for images tend to havehigh-dimensionality and hence are not well-suited for indexing via the conventional access structures.Similarity searches1,26,25 are generalized k-nearest neighbor searches, where we can choose to trade the searchperformance with accuracy. In similarity searches, we can specify the approximation error � allowed and thesearch result will get the k-nearest neighbour within (1 + �) from the closest missed true nearest neighbour.2. ISSUES RELATED TO SIMILARITY SEARCHES IN AHIGH-DIMENSIONAL SPACEA similarity search in a high-dimensional space is a di�cult problem, and in general, as Minsky and Papertconjectured,16 we will end-up having to examine a signi�cant portion of the data. There have been a number ofindexing data structures suggested to handle high-dimensional data: the Similarity Search tree (SS-tree),27 the�Corresponding author: E-mail: [email protected]; Telephone: 61-2-9385-3979; Fax: 61-2-9385-5995

Telescopic Vector tree (TV-tree),9,13 and the X-tree.4 These new structures all perform better than the R�-tree,the best conventional multidimensional indexing structure available, for various reasons: the TV-tree actuallyreduces the dimension of the vectors by collapsing the �rst few dimensions with the same values, the SS-treeutilizes the clustering property of the data, and the X-tree tries to minimize the overlapping between nodes'bounding boxes (hyperboxes)�.Preliminary analytical results with R-tree-like structure18,12 showed that the expected number of leaf nodestouched by a window query is proportional to the area covered by the bounding boxes, the weighted sum ofthe bounding boxes perimeter, and the weighted sum of the number of leaf nodes. The analytical result is inagreement with the performance enhancement techniques for the R-tree related structures. All the overlappingreduction techniques are actually an indirect way of reducing the total volume and surface area. E�orts to gethigh utilization will tend to minimize the number of nodes. The surface area minimizing split heuristic used byR�-tree is one of the reasons for the tree's good performance.3. SS+-TREE PROPERTIESSome of the most of often discussed properties of a R-tree based multidimensional access structure are splittingheuristics, the shape of the bounding envelope of each node, the criteria used to choose the subtree to insert thenew data, and the heuristics used to reduce overlapping between the nodes and bad decisions made earlier. Theseproperties are not independent of each other. The splitting heuristic and subtree selection criteria will determinethe shape of each node and hence the goodness of the bounding envelope. The goodness of the bounding envelopewill also determine the extent of the overlapping between nodes. The heuristics used to reduce overlappings andearly bad decisions will also a�ect the shape of the nodes.3.1. Node Split HeuristicAlmost every tree-based multidimensional access structure, e.g. the R-tree and its variants,8,3,21 SS-tree,27X-tree,4 uses a splitting plane that is perpendicular to one of the coordinate axes. Except for SS-tree, the splitcriteria used are mainly topological ones, eg. the minimization of the perimeter, area, the increase of the node'sarea, or overlappings. Because the tree structure aims to support similarity searches, we would like nearby vectorsto be collected in the same or nearby nodes. This means that we prefer a division of the data that re ect thedata clustering and also means that the less the variance within the nodes is the better.Dividing data into groups while optimizing a statistic has been studied extensively in the clustering area. Forthe SS+-tree, we chose the widely used k-means clustering algorithm.14 The computational complexity for thisclustering algorithm is O(cni), where n is the number of data and c is the number of cluster, and i is the maximumnumber of iterations done by the algorithm. Applied as the splitting heuristic, the number of clusters c will betwo, the number of data points is bounded by the maximum node's capacity plus one, and we can always set anupper bound for the number of iteration done by the algorithm. With this splitting rule we have a greater degreeof freedom and the algorithm will seek to minimize the variance in the resulting partitions. Also note that in aEuclidean space, this splitting heuristic will tend to produce spherical-shaped nodes. Related to these splittingheuristic, like the SS-tree, we use the closest centroid as the criterion for choosing the subtree into which we insertnew data.�Throughout this paper we will use the more familiar two- or three-dimensional term: boxes for hyperboxes, circles or spheres forhyperspheres, lines or planes for d� 1 dimensional hyperplanes, and perimeters or surface areas for (d� 1)-dimensional face volume.

3.2. Overlap ReductionUsing k-means splitting rules has it own consequencesy, one node with a bigger variance might overlap a smallernode (see Figure 1a for an illustration { here we use bounding spheres for the nodes, but a similar situation willalso occur even if we use bounding boxes). This kind of situation is not desirable since it will be di�cult for usto determine which node is better when we do the search and also the total volume/area of the nodes is actuallylarger than if we don't have any node that \eats" another.
(a) Before (b) AfterFigure 1: The nodes con�guration before and after the application of the local reorganization rule.To alleviate the situation where a node boundary expands and heavily overlaps its siblings, the parent ofthe nodes which have been recently updated should check this situation (it will take O(n) time, where n is thenumber of child within the parent node). If we have this situation, we invalidate all the children (say k) involvedand do a general k-means clustering of the grandchildren. The result of this rule can be seen in Figure 1b.The reorganization itself, if necessary, will take O(nk) time and measures should be taken to make this happeninfrequently, like putting a guard that will decay with the insertions of new dataz.We also considered the use of R+-like downward split propagation to completely remove the overlappingbetween nodes using the power planes2 between the spheres as the dividing plane. We �nally discarded the ideasince the scope of reorganization resulting from the downward split propagation could involve the whole subtreeand the fragmentation that could happen will be very large since the number of possible power planes of n spheresis ndd=2e, where d is the dimensionality of the space.3.3. Nodes' Bounding EnvelopeFor the nearest neighbor queries in Euclidean space, Cleary5 has proved that decomposition into sphericalregions is optimal in the sense that it minimizes the expected number of regions touched. Our intuition in twoand three dimensional spaces leads us to expect that trees using bounding spheres for its nodes will performworse than the one using bounding boxes (see Figure 2a and 2b as an examplex). The immediately apparentproblem with spheres in Euclidean space is that we cannot cover the space with spheres without overlappings;yThis e�ect will happen to any splitting heuristic ignoring overlap minimization as a criterion.zThe tree used for producing the experimental results (section 4.) does not have these guards.xThe bounding envelope of a parent node doesn't have to enclose all the bounding envelopes of the parent's children. We usea lazy bounding envelope enlargement scheme; we only enlarge the bounding envelope if it does not enclose the newly inserteddata/reinserted node.
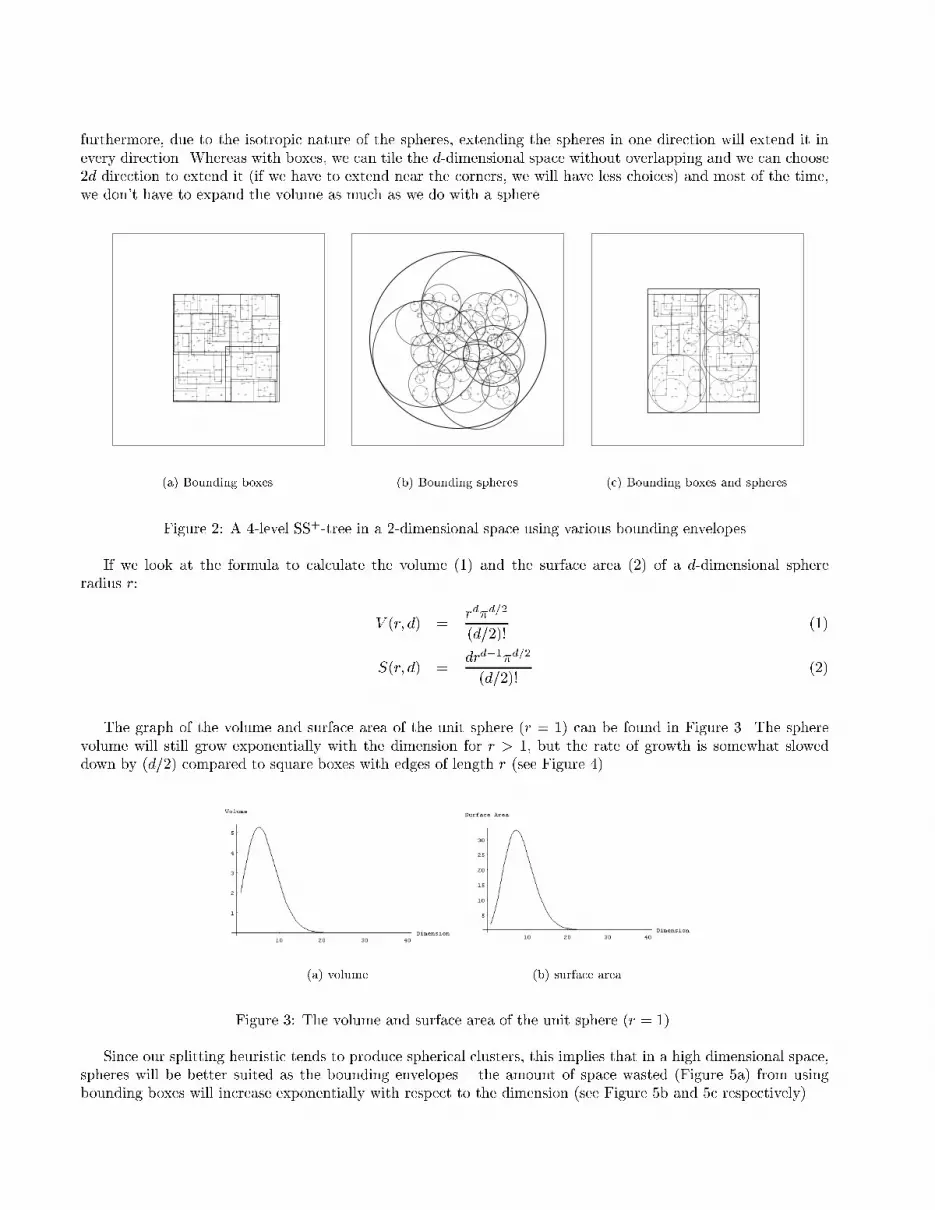
furthermore, due to the isotropic nature of the spheres, extending the spheres in one direction will extend it inevery direction. Whereas with boxes, we can tile the d-dimensional space without overlapping and we can choose2d direction to extend it (if we have to extend near the corners, we will have less choices) and most of the time,we don't have to expand the volume as much as we do with a sphere.
(a) Bounding boxes (b) Bounding spheres (c) Bounding boxes and spheresFigure 2: A 4-level SS+-tree in a 2-dimensional space using various bounding envelopesIf we look at the formula to calculate the volume (1) and the surface area (2) of a d-dimensional sphereradius r: V (r; d) = rd�d=2(d=2)! (1)S(r; d) = drd�1�d=2(d=2)! (2)The graph of the volume and surface area of the unit sphere (r = 1) can be found in Figure 3. The spherevolume will still grow exponentially with the dimension for r > 1, but the rate of growth is somewhat sloweddown by (d=2) compared to square boxes with edges of length r (see Figure 4).(a) volume (b) surface areaFigure 3: The volume and surface area of the unit sphere (r = 1).Since our splitting heuristic tends to produce spherical clusters, this implies that in a high dimensional space,spheres will be better suited as the bounding envelopes { the amount of space wasted (Figure 5a) from usingbounding boxes will increase exponentially with respect to the dimension (see Figure 5b and 5c respectively).

(a) r = 1 (b) r = 2 (c) r = 3 (d) r = 4Figure 4: The volume of spheres with r = 1; 2; 3; 4 and the volume of square boxes with sides equal to r (the boxvolumes are drawn in thicker lines).Wasted Area
Sphere,radius r
Square box,side = 2r
(a) The wasted area (b) The wasted area with respectto the dimension (divided by rd) (c) Log the scale of graph (b)Figure 5: The wasted area resulting from using boxes instead of spheres for bounding spherical shaped nodes.Because the sphere volume grows exponentially with the dimension, in a high dimensional space a smallincrease in the radius of the sphere will give us a large increase in the surface area and volume of the sphere. Inaccord with the analytical results of R-tree,18,12 we want to minimize the total surface area and volume of thesebounding envelopes. Computing the smallest enclosing sphere is not feasible in a high dimensional space, sincethe time complexity is exponential in the number of dimensions (for approaches using linear programming15,6,7)or even super-exponential.24We use an approximation to the smallest enclosing sphere calculated by a spatial search utilizing the goldenratio ( )20 [ is the ratio with which we can divide a straight line such that the ratio of the shorter segment to thelonger one equals the ratio of the longer segment to the original line ( = (p5� 1)=2 = 0:6180339887 : : :)]. Theuse of the golden ratio in the search for the center of the smallest enclosing sphere was proposed11 as a way topreprocess data before feeding them to Welzl's smallest enclosing sphere algorithm.24 Compared to other accessstructures using bounding spheres, the SS-tree27 uses the centroid and the distance of the farthest element fromthe centroid as the center and radius of the bounding sphere (which most of the time will not be the optimal onewith respect to volume and surface area) and the sphere-tree23 uses the minimum bounding sphere computedby a variant of the method described by Elzinga and Hearn7 which at best is dependent exponentially on thedimension (the sphere-tree was only tested for 2-dimensional spatial data).An illustration of the working of the algorithm can be found in Figure 6. The algorithm starts with a guess(C1) of the initial center of the sphere which is the midpoint of the bounding box of all the points, it then�nds the farthest point from this center (F1), and moves the center towards this farthest point using the ratio(the new guess for the center should be closer to the previous guess, hence the ratio of the distance of the newcenter (C2) to the farthest point (F1) to the distance of the previous center (C1) and F1 should be equal to = 0:618 : : :). For the next iterations, we can shorten the line segment from the current center (C2) to the
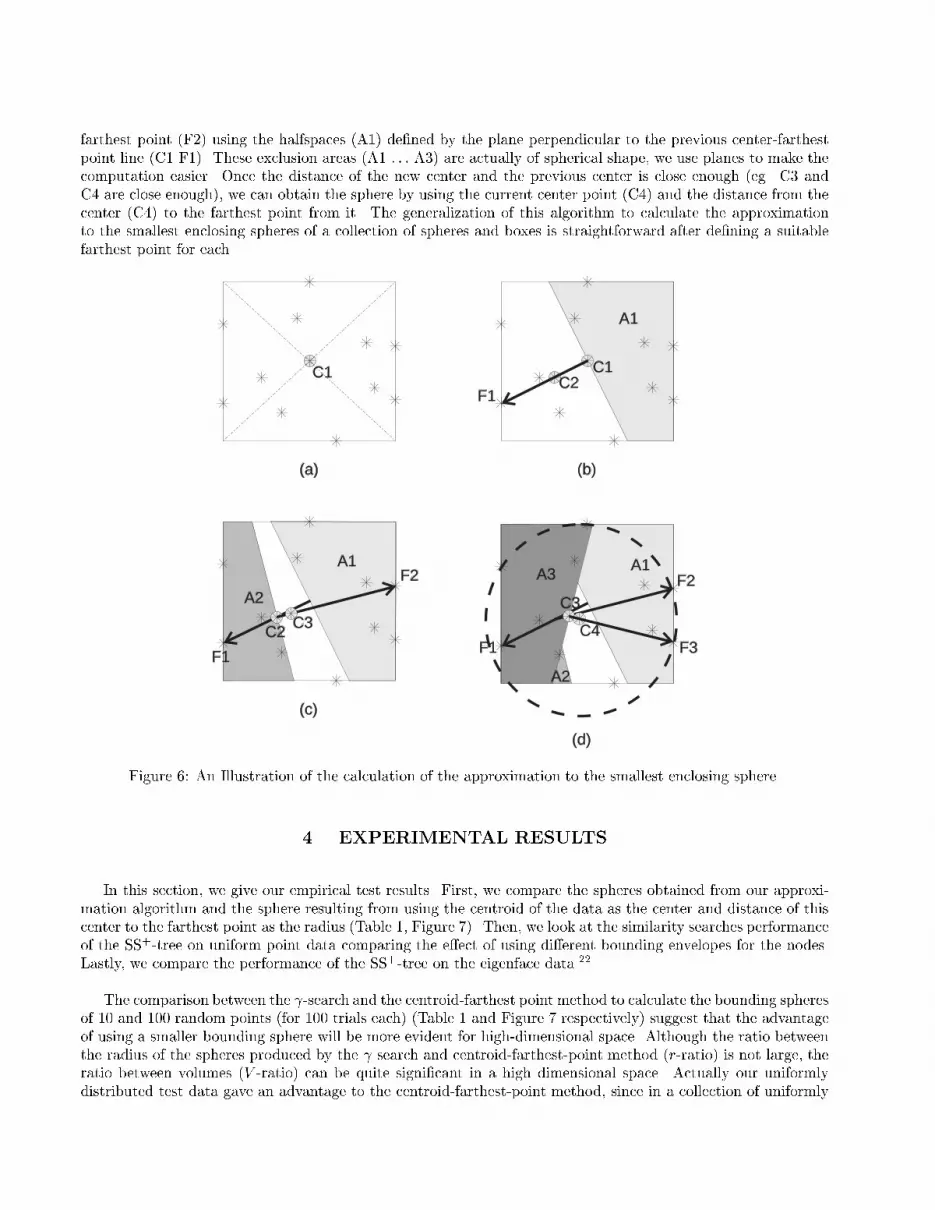
farthest point (F2) using the halfspaces (A1) de�ned by the plane perpendicular to the previous center-farthestpoint line (C1 F1). These exclusion areas (A1 : : : A3) are actually of spherical shape, we use planes to make thecomputation easier. Once the distance of the new center and the previous center is close enough (eg. C3 andC4 are close enough), we can obtain the sphere by using the current center point (C4) and the distance from thecenter (C4) to the farthest point from it. The generalization of this algorithm to calculate the approximationto the smallest enclosing spheres of a collection of spheres and boxes is straightforward after de�ning a suitablefarthest point for each.C1
(a)
C1C2
A1
(b)
A2
C3
A1
C2
(c)
C4
A3
C3
A1
A2
(d)
F1
F2
F1F1
F2
F3
Figure 6: An Illustration of the calculation of the approximation to the smallest enclosing sphere.4. EXPERIMENTAL RESULTSIn this section, we give our empirical test results. First, we compare the spheres obtained from our approxi-mation algorithm and the sphere resulting from using the centroid of the data as the center and distance of thiscenter to the farthest point as the radius (Table 1, Figure 7). Then, we look at the similarity searches performanceof the SS+-tree on uniform point data comparing the e�ect of using di�erent bounding envelopes for the nodes.Lastly, we compare the performance of the SS+-tree on the eigenface data.22The comparison between the -search and the centroid-farthest point method to calculate the bounding spheresof 10 and 100 random points (for 100 trials each) (Table 1 and Figure 7 respectively) suggest that the advantageof using a smaller bounding sphere will be more evident for high-dimensional space. Although the ratio betweenthe radius of the spheres produced by the search and centroid-farthest-point method (r-ratio) is not large, theratio between volumes (V -ratio) can be quite signi�cant in a high dimensional space. Actually our uniformlydistributed test data gave an advantage to the centroid-farthest-point method, since in a collection of uniformly

10 points within each sphere 100 points within each sphereDim Cntrd r-ratio V -ratio Cntrd r-ratio V -ratio10 1.925 2.149 1.117 3.012 2.268 2.412 1.064 1.85420 2.621 2.873 1.096 6.294 2.993 3.179 1.062 3.34150 3.984 4.270 1.072 32.079 4.413 4.675 1.059 17.766100 5.557 5.881 1.058 288.730 6.195 6.384 1.031 20.246Table 1: Comparison of the methods for calculating bounding spheres on random points using -search andcentroid-farthest-point method.Dimension
Logratio
1
10
100
1000
0 20 40 60 80 100
V-ratio
r-ratio
(a) 10 points each Dimension
LogRatio
1
10
100
0 20 40 60 80 100
V-ratio
r-ratio
(b) 100 points eachFigure 7: Graphs of the log ratio of the radius and volume resulting from the -search and the centroid methodsto calculate the enclosing sphere.distributed data points, the centroid will be approximately at the middle. This explains why the r-ratios (andcorrespondingly the V -ratios) for the enclosing spheres of 100 points are smaller than the ratios for the enclosingspheres of 10 points.For all the k-nearest neighbor searches experiments, we chose k = 21 (to simulate 20-nearest neighbour queryfrom using points not in the dataset) and the query point was chosen randomly from the dataset{. For thecomparisons, we use the same metric used by White26 for assessing the performance, ie. the number of leaf nodesthat has to be examined (ltouched), the number of internal nodes accessed (inode), the number of leaf nodes thatactually contain any of the nearest-neighbor set (lused), and the number of last useful leaf node accessed duringthe search (llast). The last two numbers are used to measure the tree's suitability for similarity searches (withsmaller llast and lused, we will have a better approximate query performance). We did around 1000 randomqueries using points from the dataset chosen using Bernoulli trial and the values listed in the tables and thecorresponding graphs are the average. The criteria used for the branch-and-bound nearest-neighbor search arethe same for all SS+-tree with any bounding envelopes (we used the nearest centroid criterion)k.The comparison between the SS+-tree using bounding boxes and spheres (Figure 8 and Table 2 respectively)support our conjecture in Section 3.3. However, as we shall see later, this result is actually dependent on theshape of the cluster of points within each node, which in turn depends on the splitting heuristics used and thedata distribution. The version of SS+-tree using approximation to the smallest enclosing spheres produced bythe search performed best for all trial. The version using bounding spheres calculated using centroid-farthest-point method su�ered form the extra space covered by the bounding spheres. The version using bounding boxes{the same setting used for testing the original SS-tree26kWe actually have tried several branching criteria for the nearest-neighbor search, including the minimum distance (the optimisticmeasure), minimum of the maximum distance (the pessimistic measure), and several other heuristics. Our preliminary experimentssuggested that the nearest centroid criterion was the best in terms of minimizing the number of leaf nodes that had to be examined.

SS+-tree (Gamma) SS+-tree (Cntrd) Boxdim ltouch lused llast inodes ltouch lused llast inodes ltouch lused llast inodes2 4.05 3.04 2.32 3.00 4.47 2.97 2.32 3.15 3.89 3.07 2.28 2.654 16.55 6.48 10.57 8.07 20.36 6.56 12.78 9.58 17.51 6.27 10.48 6.766 49.20 9.61 28.48 16.02 63.96 9.95 35.27 18.59 58.51 10.01 32.19 15.268 135.86 13.70 64.26 17.00 166.20 13.23 64.32 19.00 175.41 13.73 63.75 20.0010 297.57 17.27 98.21 19.00 365.75 16.57 92.69 19.00 410.26 17.02 92.08 20.00Table 2: A comparison of the SS+-tree using spheres calculated with -search, spheres calculated using centroidand farthest point, and the SS+-treee using bounding boxes for uniformly distributed data (size 20000).Dimension
LeavesTouched
0
50
100
150
200
250
300
350
400
450
0 2 4 6 8 10
SS+-Gamma
SS+-Ctrd
SS+-Box
(a) Leaves touched Dimension
LeavesUsed
0
2
4
6
8
10
12
14
16
18
0 2 4 6 8 10
SS+-Gamma
SS+-Cntrd
SS+-Box
(b) Leaves used Dimension
LastLeafUsed
0
10
20
30
40
50
60
70
80
90
100
0 2 4 6 8 10
SS+-Gamma
SS+-Cntrd
SS+-Box
(c) The last used leafFigure 8: A comparison of the SS+-trees using bounding spheres and bounding boxes.performed worse, which could be attributed to the amount of wasted area occurred from covering spherical shapednodes using boxes.We had also done experiments with a mixture of bounding boxes and bounding spheres (Figure 2c), but wedid not get good result. This can be explained because when we bound spheres using boxes we will get a penalty(the wasted area) that will increase with the dimension and a similar case will also happen when we try to boundboxes using spheres.SS+-tree (Box) SS+-tree (Sphere) SS-treedim ltouch lused llast inodes ltouch lused llast inodes ltouch lused llast inodes10 65.36 8.39 24.77 8.47 64.42 8.71 24.87 6.96 85.84 9.793 28.37 7.9720 104.19 9.05 31.62 7.75 90.27 9.53 31.28 7.02 115.9 10.74 38.51 7.0050 157.26 10.51 37.83 11.17 134.11 10.50 38.15 10.19 158.1 13.65 55.73 9.98100 293.83 14.83 79.71 57.70 226.34 14.59 79.98 35.06 309.7 19.06 104.7 34.5Table 3: A comparison of the SS+-tree using bounding boxes, SS+-tree using bounding spheres, and the SS-treefor the EigenFace dataset (size 7562).Table 3 and Figure 9 show that the SS+tree consistently accessed fewer nodes than SS-tree for the 21-nearestneighbour searches in the eigenface data The values listed in Table 3 and Figure 9 are for SS+-tree with boundingrectangles. The SS+-tree with bounding spheres performed only slightly better than the SS-tree although bothversions of the SS+-tree have smaller lleaf and lused. This result is due to the nature of the eigenface data(Figure 10) that has a big scale di�erence between axes. Covering points with this distribution using spheres willresult in covering a lot of empty space, due to the spheres' isotropic nature. Another observation is that SS+-treeactually accessed a higher number of internal nodes compared to SS-tree for the eigenface data. We attributed

Dimension
LeavesTouched
0
50
100
150
200
250
300
350
0 20 40 60 80 100
SS+-Sphere
SS+-Box
SS-tree
(a) Leaves touched Dimension
LeavesUsed
4
6
8
10
12
14
16
18
20
0 20 40 60 80 100
SS+-Sphere
SS+-Box
SS-tree
(b) Leaves used Dimension
LastLeafUsed
0
20
40
60
80
100
120
0 20 40 60 80 100
SS+-Sphere
SS+-Box
SS-tree
(c) The last used leafFigure 9: A comparison of the SS+-tree using bounding boxes, SS+-tree using bounding spheres, and the SS-treefor the EigenFace dataset (size 7562).this result to the slightly high fragmentation resulting from the frequent application of the unrestricted localreorganization rule which ignored under owed nodes.
Dimension
Range
-15000
-10000
-5000
0
5000
10000
15000
Figure 10: The range of values of the EigenFace dataset5. CONCLUSIONBounding spheres seem to perform better if we have a similar range of values for every axis. For data withunequal distribution for each axis, it might be better to use ellipsoid envelopes if we use a variance minimizingsplit heuristic. Compared to spheres, bounding boxes can adapt better to data with non-symmetrical distribution.The k-means splitting and reorganizing heuristics result in a tree with a low variance { a low variance willalso mean we have more compact nodes. The k-means reorganization rule helps reduce the overlappings. There

are cases where overlappings are unavoidable, in which case it is better not to split the node at all and have onebig node in place of several heavily overlapping ones (similar to the supernodes in X-trees4).ACKNOWLEDGEMENTSWe thank David White for providing the SS-tree source code and his test data and David Madore for hisdiscussion about the properties of boxes and spheres in a high-dimensional Euclidean space.REFERENCES[1] S. Arya, D. M. Mount, N. S. Netanyahu, R. Silverman, and A. Y. Wu. An optimal algorithm for approximatenearest neighbor searching. 5th Ann. ACM-SIAM Symposium on Discrete Algorithms, pages 573{582, 1995.revised version.[2] F. Aurenhammer. Voronoi diagrams| A survey of a fundamental geometric data structure. ACM ComputingSurveys, 23(3):345{405, Sept. 1991.[3] N. Beckmann, H.-P. Kriegel, R. Schneider, and B. Seeger. The R�-tree: an e�cient and robust access methodfor points and rectangles. ACM SIGMOD, pages 322{331, May 1990.[4] S. Berchtold, D. A. Keim, and H.-P. Kriegel. The X-tree: An index structure for high-dimensional data. InProc. 22th Int. Conf. on Very Large Data Bases, pages 28{39, Bombay, India, 1996.[5] J. G. Cleary. Analysis of an algorithm for �nding nearest neighbors in Euclidean space. ACM Transactionson Mathematical Software, 5(2):183{192, June 1979.[6] D. Elzinga and D. Hearn. The minimum covering sphere problem. Management Science, 19(1):96{104, sep1972.[7] D. J. Elzinga and D. W. Hearn. Geometrical solutions for some minimax location problems. TransportationScience, 6(4):379{394, 1972.[8] A. Guttman. R-trees: A dynamic index structure for spatial searching. In Proc. ACM SIGMOD Conf.,pages 47{57, Boston, MA, June 1984. Also published in/as: UCB, Elec.Res.Lab, Res.R. No.M83-64, 1983,with Stonebraker,M. and reprinted in M. Stonebraker, Readings in Database Sys., Morgan Kaufmann, SanMateo, CA, 1988.[9] H. V. Jagadish. Indexing for retrieval by similarity. In V. Subrahmanian and S. Jajodia, editors, MultimediaDatabase Systems: Issues and Research Directions. Springer-Verlag, Berlin, 1996.[10] J. Jin, L. S. Tiu, and S. W. S. Tam. Partial image retrieval in multimedia databases. In Proceedings of Imageand Vision Computing New Zealand, pages 179{184, Christchurch, 1995. Industrial Research Ltd.[11] J. S. Jin, B. W. Lowther, D. J. Robertson, and M. E. Je�eries. Shape representation and pattern matchingunder the multi-channel theory. In Proceedings of The 3rd Paci�c Rim International Conference on Arti�cialIntelligence, pages 970{975, Beijing, 1994.[12] I. Kamel and C. Faloutsos. On packing R-trees. Second Int. Conf. on Information and Knowledge Manage-ment (CIKM), pages 490{499, Nov. 1993.[13] K.-I. Lin, H. V. Jagadish, and C. Faloutsos. The TV-tree: An index structure for high-dimensional data.VLDB Journal, 3(4):517{549, Oct. 1994.

[14] J. B. MacQueen. Some methods for classi�cation and analysis of multivariate observations. In Proceedingsof the Berkeley Symposium on Mathematical Statistics and Probability, volume 1(5), pages 281{297, 1967.[15] N. Megiddo. Linear-time algorithms for linear programming in R3 and related problems. SIAM Journal onComputing, 12:759{776, 1983.[16] M. Minsky and S. Papert. Perceptrons: An Introduction to Computational Geometry. MIT Press, Cambridge,1969.[17] W. Niblack, R. Barber, W. Equitz, M. Flickner, E. Glasman, D. Petkovic, P. Yanker, C. Faloutsos, andG. Taubin. The QBIC project: Querying images by content using color, texture and shape. SPIE 1993Intl. Symposium on Electronic Imaging: Science and Technology, Storage and Retrieval for Image and VideoDatabases, 1908:173{187, Feb. 1993. Also available as IBM Research Report RJ 9203 (81511), Feb. 1, 1993,Computer Science.[18] B.-U. Pagel, H.-W. Six, H. Toben, and P. Widmayer. Towards an analysis of range queries performance inspatial data structures. In Proc. ACM SIGACT-SIGMOD-SIGART Symp. on Principles of Database Sys.,Washington, DC, May 1993.[19] A. Pentland, R. W. Picard, and S. Sclaro�. Photobook: Content-based manipulation of image databases. InSPIE Storage and Retrieval Image and Video Databases II, volume 2185, San Jose, Feb 1995. SPIE. Also inInternational Journal of Computer Vision, Fall 1995.[20] M. Schroeder. Fractals, Chaos, Power Laws: Minutes From an In�nite Paradise. W.H. Freeman andCompany, New York, 1991.[21] T. Sellis, N. Roussopoulos, and C. Faloutsos. The R+tree: A dynamic index for multi-dimensional objects.In Proceedings of the 13th Conference on Very Large Databases, pages 507{518, Los Altos, CA, Sept. 1987.Morgan Kaufman. also available as SRC-TR-87-32, UMIACS-TR-87-3, CS-TR-1795.[22] M. Turk and A. Pentland. Eigenfaces for recognition. Journal of Cognitive Neuroscience, 3(1):71{86, 1991.[23] P. J. M. van Oosterom. Reactive data structures for geographic information systems. Oxford UniversityPress, New York, 1993.[24] E. Welzl. Smallest enclosing disks (balls and ellipsoids). In H. Maurer, editor, Proceedings of New Resultsand New Trends in Computer Science, pages 359{370. LNCS 555. Springer, June 1991.[25] D. A. White and R. Jain. Algorithms and strategies for similarity retrieval. Technical Report VCL-96-01,Visual Computing Laboratory, University of California, San Diego, 9500 Gilman Drive, Mail Code 0407, LaJolla, CA 92093-0407, July 1996.[26] D. A. White and R. Jain. Similarity indexing: Algorithms and performance. In Proceedings of the SPIE:Storage and Retrieval for Image and Video Databases IV, volume 2670, San Jose, CA, Feb. 1996.[27] D. A. White and R. Jain. Similarity indexing with the SS-tree. In Proc. 12th IEEE International Conferenceon Data Engineering, New Orleans, Louisiana, Feb. 1996.


