Embed Size (px)
Citation preview

Kidney International, Vol. 48 (1995), pp. 866—875
TECHNICAL NOTE
The standard peritoneal permeability analysis: A tool for theassessment of peritoneal permeability characteristics in
CAPD patientsMARJA M. PANNEKEET, ALEXANDER L.T. IMHOLZ, DICK G. STRUIJK, GER C.M. KOOMEN,
MONIQUE J. LANGEDIJK, NATALIE SCHOUTEN, RuDI DE WAART, Joa& HIRALALL,and RAYMOND T. KREDIET
Departments of Nephrology and Clinical Chemistty, Academic Medical Center, Amsterdam; Foundation for Home-Dialysis Midden en West Nederland,Utrecht; and Dutch Customs Laboratoiy, Amsterdam, the Netherlands
The standard peritoneal permeability analysis: A tool for the assess-ment of peritoneal permeability characteristics in CAPD patients. Pen-toneal transport characteristics in CAPD patients are often assessed by theperitoneal equilibration test (PET), which uses a four hour dwell withglucose 2.27% dialysate. From the test, the dialysate/plasma ratio ofcreatinine (D/Pr), the dialysate/initial dialysate ratio of glucose (DID0)and net ultrafiltration (NUF, drained minus instilled volume) are calcu-lated. The standard penitoneal permeability analysis (SPA) is a modifica-tion and extension of the PET: glucose 1.36% dialysate is used, to whichdextran 70 (1 g/liter) is added for the calculation of fluid kinetics. Masstransfer area coefficients (MTAC's) of low molecular weight solutes,clearances of proteins and the change in intrapenitoneal volume (zIPV)can be assessed. In this study the SPA was analyzed, and a comparisonwith the PET was made. A total number of 138 SPA's was analyzed in 86different clinically stable patients. Normal values were calculated for bothSPA and PET parameters in the same tests. Median (ranges) of compa-rable transport parameters from SPA and PET were: MTACCr, 10.4mllmin (5.7 to 19.3); glucose absorption, 61% (35 to 87); IPV, 9.5 ml(—761 to 310); D/Pr, 0.76 (0.53 to 1.14); D/D0, 0.37(0.13 to 0.56); NUF,—75 ml (—675 to 450). The agreement between SPA and PET wasanalyzed using the method of Bland and Altman. A fairly good agreementwas present between NUF and IPV. Systematic errors were found whenD/Pcr and MTACC. were compared: D/P overestimated MTAC mainly inthe low range, whereas in the high range values were underestimated. Asimilar pattern was seen for the transport parameters of glucose. In 40patients negative net ultrafiltration was present, and possible reasons forthis were assessed. In 9 patients no reason could be identified. It can beconcluded that the SPA provides useful and extensive information onperitoneal transport parameters. Compared to the PET, the SPA hasbetter discriminative power for the transport of glucose and creatinine.
Measurement of the transport properties of the peritonealmembrane is used in individual patients treated with peritonealdialysis for both the characterization of the functional state of thisbiological membrane and the assessment of the required dialysisdose. Such measurements are useful because patients show dis-tinct intra- and intenindividual variabilities [1—41. Moreover, the
Received for publication January 30, 1995and in revised form April 14, 1995Accepted for publication April 17, 1995
© 1995 by the International Society of Nephrology
continuous exposure to dialysis fluids may lead to functionalalterations in the membrane [5—11]. The peritoneal equilibrationtest (PET) is currently the most widely used test to assessperitoneal transport in CAPD patients [12]. The principle of sucha test was proposed by several authors [13—16], but standardizedto its present form by Twardowski et al in 1987 [12]. The PET isperformed during a four hours dwell using glucose 2.27% dialy-sate. It measures low molecular weight solute transfer and netultrafiltration. The dialysate/plasma ratio of creatinine (DIPr)atthe end of the procedure, and the dialysate240/initial dialysateratio of glucose (DID0) are calculated and used as parameters ofsolute transport. Net ultrafiltration (NUF) is calculated as thedifference between the drained and the instilled volume. Patientsare categorized into low, low-average, high-average and hightransporters according to the values of solute transport. A hightransporter is defined as a patient with either a D/Pr exceedingthe mean + I SD, or a D/D0 of less than the mean DID0 — I SD.
High average transporters have a D/Pr between the mean andmean + I SD, or a D/D0 between the mean and mean —1 SD.Analogously, the other two groups are defined. Recommenda-tions have been made on the mode and quantity of peritonealdialysis according to the transport status of the patients [17, 181.
One of the major reasons for the wide-spread use of the PET isthe standardization of the procedure and the simplicity of itscalculations [7, 17, 18]. The PET is based on the assumption thatperitoneal transport is diffusive. However, especially when hyper-tonic dialysis fluids are used DIPr is also influenced by convectivetransport from the circulation to the peritoneal cavity [19].Likewise DID0 is not only dependent on diffusion, but also onuptake into the lymphatic system. Furthermore, net ultrafiltrationis determined by transcapillary ultrafiltration, and by lymphaticdrainage of the peritoneal cavity.
The standard penitoneal permeability analysis (SPA), as devel-oped in our unit, is a modification and extension of the PET.Several differences exist: the SPA is performed using glucose1.36% dialysate, preceded by rinsing of the peritoneal cavity.Dextran 70 is added to the test solution for the measurement offluid kinetics and residual volume [20]. The transport of lowmolecular weight solutes is expressed as the mass transfer area
866

Pannekeet et alt Standard peritoneal penneabilily analysis 867
coefficient (MTAC) of urea, creatinine and urate. The glucoseabsorption is calculated relative to the amount instilled. Inaddition, peritoneal clearances of 132-microglobulin, albumin, IgGand a2-macroglobulin are assessed. These values are used tocalculate the peritoneal restriction coefficient, which can beregarded as a parameter for the intrinsic permeability of theperitoneum to macromolecules (see Methods section) [1]. Theparameters obtained in the PET can easily be used to calculate theMTAC of low molecular weight solutes and the absorption ofglucose. Conversely, the determinations done in the SPA can alsobe expressed as D/Pcr and DID0 glucose.
The aims of the present study were first to analyze the SPA ina large group of patients to define normal ranges, and subse-quently, we compared the data on the transport of low molecularweight solutes obtained with the values of DIPCr and D/D0 in thesame tests in each individual patient. The agreement of the twomethods for the characterization of peritoneal transport and theconsequences for clinical practice were assessed. Finally, thepatients with negative net ultrafiltration were identified andanalyzed, with regard to the potential causes.
Patients
A total number of 138 standard peritoneal permeability analy-ses (SPA) was performed in 86 clinically stable CAPD patientswith a median age of 51 years, range 21 to 80 years. The medianduration of CAPD treatment was 2.1 years, range 0.33 to 13.5years. SPA's are performed in all patients in our peritonealdialysis unit on a yearly and voluntary basis. The tests are repeatedmore frequently when clinical problems occur. All analyzed SPA'swere done between November 1990 and April 1994. Forty-fivepatients were studied once. In 30 patients two, and in ii patientsthree or more tests were done for various reasons. All patientsused commercially available, glucose based dialysate (DianeaF1;Baxter BY, Utrecht, The Netherlands). At the time of the test, 42patients used 1.5 liter exchanges, 92 used 2 liters and 4 patients 2.5liters of dialysate. None of the patients had peritonitis during thetest or four weeks prior to the SPA.
Procedure of the SPA
The SPA is performed in an outpatient setting. The patient sitsin a comfortable armchair during the test. All tests are performedduring a four hours dwell with Dianeal> 1.36% dialysate using thevolume the patient is accustomed to. To all test bags dextran 70,I glliter (Macrodex; NPBI, Emmercompascuum, The Nether-lands) is added to calculate peritoneal fluid kinetics [20, 211. Priorto instillation of the test solution the peritoneal cavity is rinsedwith Dianeal® 1.36% and immediately drained by gravity afterinflow is completed. Dialysate samples from the test bag of 10 mleach are collected before inflow and at 10, 20, 30, 60, 120, 180 and240 minutes after instillation of the test solution. To avoid adead-space effect, 100 to 200 ml is temporarily drained before thecollection of each sample. After drainage at 240 minutes theperitoneal cavity is rinsed with Dianeal® 1.36% again, similar tothe start of the procedure. Samples from this bag are used tocalculate the residual volume. Blood samples are taken at the startand at the end of the test. Dextran 1, Promiten® (NPBI), 20 ml isgiven intravenously after the first blood sample is drawn, toprevent possible anaphylaxis to dextran 70 [22].
Solute transport
(1)
Assays
Total dextran was determined by means of high performanceliquid chromatography [231. For urea the DAM-TCS TechniconSD4 to 001 DK1 method was used. Creatinine was measured byeither the modified Jaffe method or with an enzymatic method(Hitachi H747, Boehringer Mannheim, Germany). For glucose aglucose oxidase-peroxidase method was used. All were deter-mined on autoanalyzers (SMA and SMA-Il; Technicon Corp.,Terrytown, NJ, USA). Creatinine concentrations were correctedfor the glucose concentration in the dialysate, when measuredaccording to Jaffe. Beta-2-microglobulin was determined with amicroparticle enzyme immunoassay with an IMx system (AbbottDiagnostics, North Chicago, IL, USA). Albumin, IgG and a-2-macroglobulin were all measured by nephelometry (BN100;Behring, Marburg, Germany), with commercial antisera (Dako-patts, Glostrupp, Denmark).
Calculations in the SPA
Each experiment was analyzed individually for the determina-tion of solute transport of low molecular weight solutes andmacromolecules, for the restriction coefficient and for fluid kinet-ics.
Solutes are transported from the peritoneal capillaries into theperitoneal cavity by both diffusion and convective transport. Thedifference between blood and dialysate concentrations deter-mined the diffusion of a solute. Convective transport was depen-dent on the transcapillary ultrafiltration rate, the sieving coeffi-cient (the concentration ratio of a solute in the ultrafiltrate and inthe plasma) and on the concentration in the membrane. For thetransport of low molecular weight solutes a clearance cannot beused, because after a dwell of four hours a near equilibriumsituation is often present. Therefore, the transport of low molec-ular weight solutes is expressed as the mass transfer area coeffi-cient (MTAC). This is the maximal theoretical clearance of asolute by diffusion at t = 0, and thus before diffusion has actuallystarted. The MTAC was calculated for urea, urate and creatinine.Two models were used: a modification [3] of the Garred et almodel [24] and the model according to Waniewski et at [25]. Thetwo methods differ in the value which is attributed to F. This is aweighing factor, which estimates the relative importance of con-vective transport in comparison to diffusive transport [25]. A valueof F = 0, as applied by Garred et at, means that convectivetransport is more important than diffusion. This is not the caseduring peritoneal dialysis, as has been shown previously [261.Therefore, in the model proposed by Waniewski et a! [25], a valueof F = 0.5 was applied. In the Garred model MTAC wascalculated using the equation:
Vd VPMTAC (mi/mm) —. In
Vd (P - D,
in which Vd is the volume of the drained bag, and V1 the instilledvolume. D represents the dialysate concentrations of the soluteafter 240 minutes, and P the mean plasma concentration of thissolute. The Waniewski model corrects for convective transportmore appropriately, with the application of a correction factor

868 Pannekeet et a!: Standard peritoneal permeability analysis
F = 0.5 [25, 27], as well as for plasma water [27]. The model usesthe following equation:
v v0- F (P — D10)MTAC (mi/mm) = — in v -F (P — D)
in which V10 represents the intraperitoneal volume, and D10 thedialysate concentration at t = 10 minutes, whereas Vt and D arethese parameters at time t = 240 minutes. Vm is the meanintraperitoneal volume, calculated as the area under the intraper-itoneal volume versus time curve, divided by the dwell time. Thisarea was calculated by the trapezium rule [28]. Using this methodthe area under the curve between two dialysate samples iscalculated as the mean of the intraperitoneal volume at the twosample times, multiplied with the time interval between thesamples.
Glucose absorption was calculated as the difference betweenthe amount of glucose instilled and the amount recovered, relativeto the amount instilled.
Protein clearances were calculated from the amount of proteinin the effluent according to:
PrDr + PrRVCl (mi/mm) = __________
(Pr)tIn this equation the dialysate protein content in the drained testbag (PrDr) and in the residual volume (PrRV) relative to theplasma protein concentration (Pro) in time (t) is calculated. Aclearance can be used for the transport of macromoleculesbecause the diffusion of these solutes is so slow that theirconcentration in the dialysate after four hours can be neglected.The intrinsic permeability to macromolecules can be functionallycharacterized by the peritoneal restriction coefficient (rc). This isthe slope of the power relationship between the clearance ofserum proteins and their free diffusion coefficient in water (Dw)[1, 29, 30]:
Clearance = a DWrC
Fluid kinetics
Fluid is transported from the peritoneal capillaries into theperitoneal cavity and transported back by uptake into the lym-phatic system and by backfiltration. Therefore, the net changes inintraperitoneal volume are the result of transcapillary ultrafiltra-tion and lymphatic absorption. Both parameters can be assessedwith an intraperitoneally administered volume marker like dextan70. The convective loss of dextran during the dwell was used tocalculate the effective lymphatic absorption (ELAR). This impliesthat all pathways of lymphatic drainage from the peritoneal cavity,both subdiaphragmatic and interstitial, are included in the defi-nition of the ELAR. It is calculated from the dextran disappear-ance rate:
(Dx1 — DXr)ELAR (mi/mm) = ________
(DXgeom)t
in which the difference between the instilled (i) and recovered (r)dextran mass is divided by the geometric mean of the dialysatedextran concentrations [29]. The change in intraperitoneal vol-ume (IPV) during the dwell can be calculated from the dilutionof dextran after correction for incomplete recovery. This param-
(2)
eter is comparable to the net ultrafiltration in the PET. Thetranscapillary ultrafiltration at any time point (TCUF) is calcu-lated from the theoretical intraperitoneal volume at that time(when both lymphatic absorption and the sampling would nothave been present), minus the initial IPV. Likewise, the netultrafiltration rate (NUFR) is calculated, by dividing theL\JPV24Q by the dwell time [29]. The residual volume (RV) isdetermined by the following equation, in which rs is rinsingsolution, ts is test solution, V is volume, and C is concentration[31]:
(V•C)RV(ml) =
— (6)
A first analysis revealed a correlation with body surface area(BSA) for both MTACCr (r = 0.17, P = 0.05) and ELAR (r =—0.25, P = 0.003). Therefore, transport parameters of the SPAwere corrected for BSA, where appropriate.
Statistical analysis
Results are expressed as mean SD for data with a normaldistribution. Median values and ranges are given for asymmetri-
(3\ cally distributed data. For the definition of the normal ranges ofthe parameters, only the most recent SPA of every patient wasincluded in the calculations (N = 86). This avoids an excessivecontribution of values obtained shortly after the initiation ofCAPD.
For the comparison of SPA with PET, all data were used (N =138). The PET categorization was performed as usual [121. Thepatients were categorized in the SPA, analogous to the methoddescribed above for the PET categorization, after the data hadbeen adjusted for skewed distribution. In unimodel skew distri-butions, like most data obtained from the SPA, the moment ofskewness is measured by calculating the coefficients of skewness[32]. We calculated these for our data. Subsequently the data wereidentified that would be required for a normal distribution (that is,
(4\ coefficient of skewness is zero). For positively skewed distribu-tions (tail to the right, coefficient of skewness >0), data with thehighest values were omitted one by one, until that set of data werefound with a coefficient of skewness closest approaching zero. Inthis way, data exceeding the upper level of normal distribution(outliers) could be identified and a categorization of the data inanalogy of the PET (mean 1 SD) could be performed.
The Spearman rank correlation test was used to assess thecorrelations between the SPA and the PET results. In addition,both tests were compared using the method introduced by Blandand Altman [33, 34J. In this type of analysis the difference betweenindividual values of SPA and PET were plotted against theirmeans. As MTAC's were expressed in mi/mm and DIP ratio's hadno dimension; all 138 values were expressed as percentages oftheir mean.
The outliers of MTAC, ELAR, and residual volume weredetermined using the method as mentioned above for not nor-
(5) mally distributed data, and used for the identification of data outof the normal range in the tests with negative net ultrafiltration.
Results
Nomial values
Normal values for the transport parameters of low-molecularweight solutes in 86 different patients, for both SPA and PET, are

Pannekeet et a!: Standard peritoneal permeability analysis 869
Table 1. Normal values for the transport of low molecular weight solutes from standard peritoneal permeability analyses (SPA) and PET results ofthe same tests in 86 clinically-stable CAPD patients
Parameter Median Total rangeMean of normal
distribution95% Confidence
interval N
Standard permeability analysisAccording to simplified Garred model
MTACuraMTACCMTACurate
According to Waniewski modelMTACuraMTACCrMTACurateGluc.abs.
16.49.98.2
17.610.98.9
61
9.5—26.35.6—17.94.0—22.1
9.5—26.35.7—19.34.4—23.835—87
16.09.47.9
17.510.28.6
61
10.7—21.25.5—13.43.9—11.8
11.5—23.55.7—14.74.1—13.035—87
817485
83747685
Peritoneal equilibraiton testD/PcrDID0
0.790.36
0.52—1.140.13—0.56
0.770.37
0.59—0.950.20—0.53
8585
N is the number of patients used for the calculation of the 95% confidence interval after omitting the outliers (see text).Abbreviations are: D/DO, initial dialysate glucose concentration/glucose concentration at t =240 mm; D/Pcr, dialysate/plasma ratio of creatinine at= 240 mm; Gluc.abs., glucose absorption (%); MTAC, mass transfer area coefficient (ml/min/1.73 m2).
Table 2. Normal values for the transport of macromolecules from 86 standard peritoneal permeability analyses
Mean of normal 95% ConfidenceParameter Median Total range distribution interval N
C1132m 851 341—2414 853 400—1310
ClaIb 92 10—260 89 34—1448078
ClIgG 47 10—148 45 15—76 79
Clazm 15 3—67 13 3—23rc 2.32 1.89—3.22 2.26 1.92—2.59
6870
N is the number of patients used for the calculation of the 95% confidence interval after omitting the outliers (see text).Abbreviations are: a2m, alpha-2 macroglobulin; alb, albumin; J32m, beta-2 microglobulin; Cl, clearance (d/min/1.73 m2); rc, restriction.
Table 3. Normal values for fluid transport from 86 standard peritoneal permeability analyses
Mean of normal 95% ConfidenceParameter Median Total range distribution interval N
Standard permeability analysisMean TCUFR 1.1 0.1—3.0 1.05 0.30—1.80 79ELAR 0.95 0.36—3.9 0.75 0.40—1.16 51Mean NUFR 0.07 —2.5—+1.5 0.1 —0.8—+1.1 78IPV 230 —761—+310 30 —201—+360 78RV 230 44—706 203 34—372 75
Peritoneal equilibration testNet UF —85 —675—+450 —84 —454--+286 83
N is the number of patients used for the calculation of the 95% confidence interval after omitting the outliers (see text).Abbreviations are: IPV, change in intraperitoneal volume (ml); ELAR, effective lymphatic absorption rate (ml/min/1.73 m2); NUFR, net
ultrafiltraiton rate (ml/min/1.73 m2); RV, residual volume (ml); TCUFR, transcapillary ultrafiltration rate (ml/min/1.73 m2); UF, ultrafiltration (ml).
shown in Table 1. The transport parameters of macromoleculesand those for fluid kinetics are given in Tables 2 and 3.
SPA versus PET
The comparison of the 138 PET and SPA results revealedstrong correlations between D/Pr and MTACCI (both methods,r � 0.85, P < 0.00001), between DID0 and glucose absorption (r =—0.91, P < 0.00001), and between net ultrafiltration and iIPV(r = 0.68, P < 0.00001), as shown in Figure 1. Net ultrafiltrationand MPV are compared using the Bland and Altman plots inFigure 2. The random distribution that was present when the
differences between the two parameters were plotted against theirmeans implied that no systematic errors relative to the magnitudeof ultrafiltration were present. However, the mean differencebetween net ultrafiltration and LIPV was slightly negative, prob-ably because the residual volume is taken into account only inLJPV. The comparison of the simplified Garred model and theWaniewski model for MTACC. showed no indication for asystematic error relative to the absolute value either (Fig. 3). Notethat the mean value for MTACCr was somewhat higher using theWaniewski model.
The pattern that was observed for the comparison between

870 Pannekeet et al: Standard peritoneal permeability analysis
U) 750C)
0)0055'
Fig. 1. Correlations between SPA and PET parameters in 138 tests perfbrmed in 86 stable CAPD patients. (A) MTACCr versus DIPCr (N = 138; r = 0.85;P < 0.0001). (B) Glucose absorption versus DID0 glucose (N = 138; r = —0.91; P < 0.00001). (C) IPV versus net ultrafiltration (N = 138; r = 0.68;P < 0.00001. Correlation coefficients are based on linear regression analysis.
Fig. 2. Analysis of the agreement between JPV(SPA) and net ultrafiltration (PET), as assessed bythe method of Bland and Altman. No systematicerrors are made relative to the magnitude ofultrafiltration. Mean net ultrafiltration is exceededby zdPV because the residual volume is takeninto account only in the calculations of the latter.
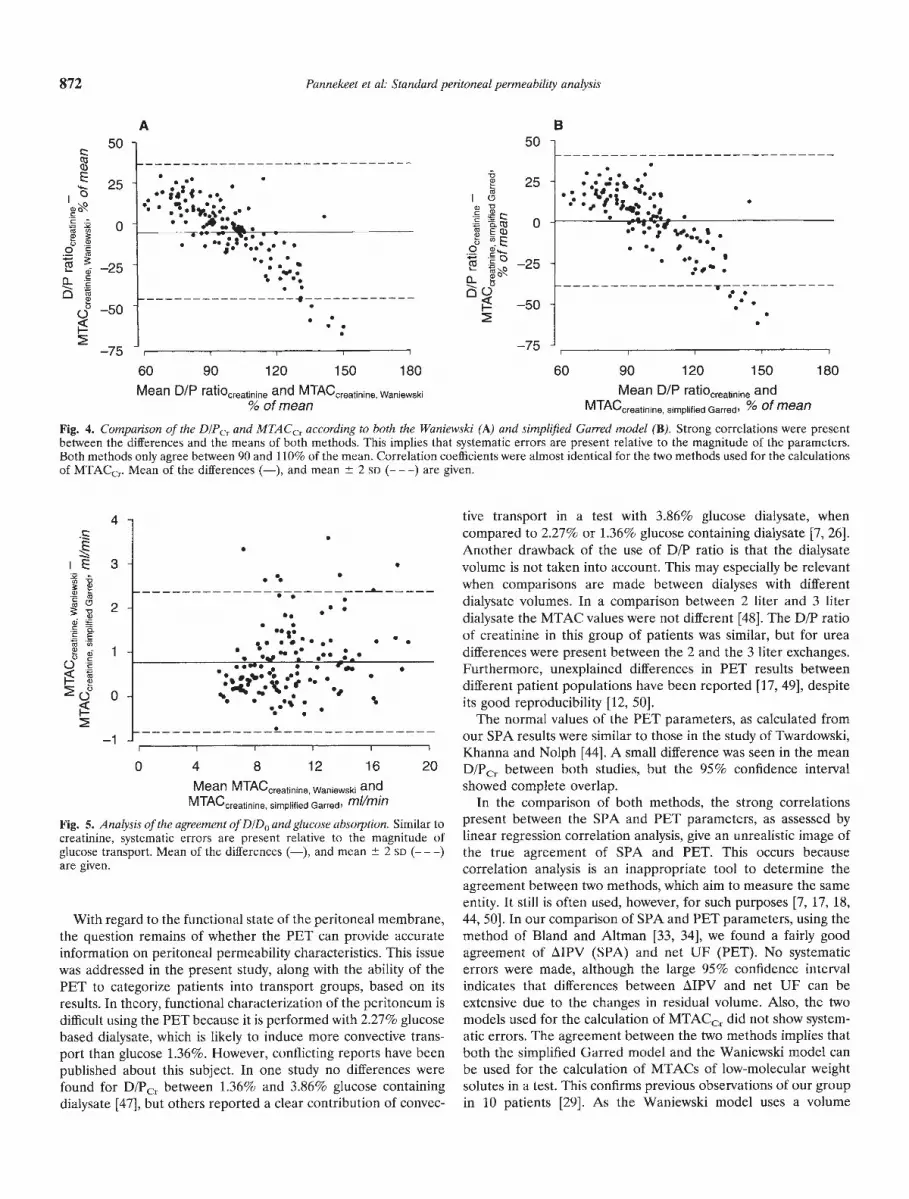
MTACCr and DIPcr is shown in Figure 4. It is evident that norandom distribution was present. On the contrary, strong corre-lations were found between the differences and means of thetransport parameters of creatinine. The correlation coefficients ofthese relationships were r = —0.83 and —0.82 (P < 0.00001 forboth). This implies that systematic errors were present relative tothe magnitude of the transport parameters. These errors mainlyoccurred in the extreme ranges. Between 90 and 110% of themean values the two methods agreed fairly well, but in the low andhigh ranges differences were more pronounced (Fig. 4). A similarpattern was observed for the comparison between DID0 glucoseand the glucose absorption, as is shown in Figure 5.
We further addressed the consequences of these systematicerrors for clinical practice. In Table 4 the categorization intransport groups is shown for the transport parameters of creat-mine and glucose. It is clear that some patients were placed in
different transport categories, based on whether the SPA or thePET was used for the calculations. This phenomenon was mostevident for creatinine (59 out of 138 tests would have led tomisplacement), but although to a lesser extent, it was also presentfor glucose (31 out of 1138 tests).
Analysis of patients with negative ultrafiltration in the SPAForty patients of the 86 patients had negative net ultrafiltration
(IPV < 0 ml) during the SPA with glucose 1.36% dialysate. Thepossible reasons for this lack of ultrafiltration, such as a largeeffective peritoneal surface area (high MTACCI), a small effectiveperitoneal surface area (low MTACCr), a high ELAR, a largeresidual volume (RV), or a combination of them, were analyzed inthese patients. Values were considered abnormal when theyexceeded the 95% confidence interval given in Table 1. TheWaniewski model was used for the calculation of MTACCr. Table
A20
16
95
12
B C
8
4
0
•. •.
•
350
120
- —110
—570
—800
•..
•
••
0.50 0.70 0.90 1.10 1.30 1.50D/P ratio creatinine
35 '0 0.12 0.24 0.36 0.48 0.60
Glucose adsorption, %
—750—480 —210 60 330 600Net UF, ml
E>a-
U-
z
1000
750
500
250
0
—250
—500
—750
.
.,—•- + 2SD• .•S
S
Mean
-2SD
—750 —520 —290 —60 170 400Mean of net UF and JPV, ml

Pannekeet et al: Standard peritoneal perineabilily analysis 871
5 shows the results of this analysis. In 31 patients one or morepossible explanations for the negative ultrafiltration were found.No reason for the lack of net ultrafiltration could be identified inthe other 9 patients (23%).
Discussion
In the present transversal study normal values were obtained ina large group of stable CAPD patients for the mass transfer areacoefficients of low-molecular weight solutes, clearances of serumproteins, and the kinetics of fluid transport, measured during astandard peritoneal permeability analysis (SPA). The SPA can beregarded as a modification of the commonly used PET; the maindifferences are the use of glucose 1.36% dialysate and theadministration of dextran 70 for the measurement of fluid kinet-ics.
The transport capacity of the peritoneum for solutes and fluid,in its function as a dialysis membrane, is dependent on its surfacearea. The anatomic (mesothelial) surface area bears some rela-tionship to body surface area [35, 36]. The functional or effectiveperitoneal surface area is probably mainly determined by thenumber of perfused capillaries. This may be the explanation forthe weak, but significant correlations that were found between thetransport parameters and body surface area. The practical conse-quence is that the parameters of peritoneal transport should beexpressed per 1.73 m2.
The normal values for the SPA found in this study are based onsingle tests in 86 different patients. Even when the outliers wereomitted, the 95% confidence interval of most parameters was verywide, implying large interindividual variability. No differencesexisted between the MTAC's of low-molecular weight solutes,calculated according to the two different models used in thepresent study. This could be expected because convective trans-port was limited as much as possible by the use of glucose 1.36%dialysate. The transport of low molecular weight solutes showedthe highest MTAC for urea, followed by creatinine and urate, asexpected based on their increasing molecular weight. Similarly,
the clearances of macromolecules were lower the higher theirmolecular weight.
The values obtained in this study are similar to those reportedin previous studies performed by our group [11, 29, 37, 38], exceptfor the ELAR. The 95% confidence interval of ELAR was 0.40 to1.16 ml/min/1.73 m2, whereas mean values ranging from 1.03 to1.37 ml/min have been reported in previous studies in our groupusing dextran 70 as a volume marker [20, 21, 29, 37, 38]. However,the median value in the present study was similar to that of 1.0mi/mm found in an analysis of the first 30 patients [23]. The largeinter- and intra-individual variability is the most probable causefor these differences. The magnitude of the interindividual varia-tion is illustrated by the total range that was 0.36 to 3.9 mI/min/1.73 m2 in the present study. The presence of outliers with veryhigh ELARs could have influenced our previous studies that weredone in a smaller number of patients. An intraindividual coeffi-cient of variation for ELAR of 23% was found in the study ofImholz [39]. In that study six SPA's were performed within aperiod of two weeks in eight stable CAPD patients. The influenceof posture on transport parameters was also adressed in thatstudy. It showed that net ultrafiltration is higher in the supine thanin the upright position, which is caused by a combination of aslightly higher TCUFR and lower ELAR [39]. The SPA is notperformed in a recumbent position, because this is less comfort-able for the patients. Furthermore, the test does not aim tomeasure maximal values. Because of the influence of posture,however, the test should always be performed in a standardizedway.
The ELARs we found in the present study are markedly lowerthan the mean values obtained with autologous hemoglobin (1.59mI/mm) [40], and human serum albumin (1.49 mi/mm and 1.52ml/min) [41, 42]. For radio-iodated serum albumin mean values of1.9 mllmin [43] and 1.7 mllmin [19] have been reported for 3.86%glucose dialysate, and of 1.2 mi/mm for 1.36% and 2.27% glucosedialysate [19]. It is speculative whether the lower values obtainedwith dextran 70 are only the result of the small series using theother markers, or whether the other markers give some overesti-mation of the effective lymphatic absorption rate. The PET hasbeen advocated both for the characterization of the peritonealmembrane for solute transport, and for the prediction of weeklycreatinine and urea clearances to determine the adequacy ofdialysis [12, 17, 18]. Furthermore, recommendations for the modeof dialysis treatment have been made according to a division infour transport groups [12, 17, 18, 44]. The measurement ofadequacy of peritoneal dialysis by means of the PET has beenquestioned in several studies [17, 45, 46]. Davies et al describedthe PET as a useful adjunct to peritoneal dialysis prescription, butlimit the use of this test to repeated measurements in one patient[17]. Other studies reported both over- and underestimation of24-hour creatinine clearances by the PET [45, 46]. Problems occurwhen extrapolation of four hour DIP ratios to 24-hour clearancesare performed [45, 46]. Also, differences in over- or underestima-tion exist in the different transport groups, and in the influence ofthe use of different solutions for the test [46]. As in the PET,extrapolation of data from the SPA to 24 hour clearances isdifficult and should be avoided. The only way to perform acurateprescription of dialysis treatment is based on 24-hour dialysateand urine collections. The SPA can, however, be useful in findingpossible causes of ultrafiltration problems, as shown in the presentstudy.
150
a)EI-
a)0C)
.20 Q.
a)C,)0C)
c,)
100
50
0
—50
—100
..
.a • ••I •
• ••••y.• . .• S • • •.. •,s•
75 90 105 120Mean D/D0 ratio glucose and glucose absorption
% of mean
Fig. 3. Analysis of the agreement between MTACCr according to theWaniewski model and the simplified Garred model. Differences are ran-domly distributed when plotted against their means, implying closeagreement of both methods. Mean of the differences (—), and mean 2SD (———) are given.
872 Pannekeet et al: Standard peritoneal permeability analysis
I I I I I
0 4 8 12 16 20Mean MTACcreatinine Waniewski and
MTACcreatinine simplified Garred' mi/mm
Fig. 5. Analysis of the agreement of DID0 and glucose absorption. Similar tocreatinine, systematic errors are present relative to the magnitude ofglucose transport. Mean of the differences (—), and mean 2 SD (— — —)are given.
A
c 50 50cq)E...
Ig-
.2a
'— s!;:-O
25
0
— ..)
J—50
—75
5
.•• •'.•..•. • •'•y. •. ••• .
•.. -v.---——• . •• .1 •
.I
g
Ia
.2 S'.-.-°'—.
0 0
25
0
—25
50
—75
•••.••%•..- .—-. 5:
B
•:• •# ' •Se
60 90 120 150 180 60 90 120 150 180
Mean DIP ratiocreatinine and% ofmean
MTACcreatinine Waniewski Mean D/P ratiocreatinine
MTACcreatinine simplified Garred'
and% of mean
Fig. 4. Comparison of the DIPCr and MTACCr according to both the Waniewski (A) and simplified Garred model (B). Strong correlations were presentbetween the differences and the means of both methods. This implies that systematic errors are present relative to the magnitude of the parameters.Both methods only agree between 90 and 110% of the mean. Correlation coefficients were almost identical for the two methods used for the calculationsof MTACCr. Mean of the differences (—), and mean 2 SD (— — —) are given.
4 tive transport in a test with 3.86% glucose dialysate, when• compared to 2.27% or 1.36% glucose containing dialysate [7, 26].
Another drawback of the use of DIP ratio is that the dialysateE 3 • volume is not taken into account, This may especially be relevantcomparisons are made between dialyses with different
c' 2 • : dialysate volumes. In a comparison between 2 liter and 3 liter• • dialysate the MTAC values were not different [48]. The D/P ratio
= . s.• • • • of creatinine in this group of patients was similar, but for ureas 1 .• •, • • differences were present between the 2 and the 3 liter exchanges.
•. z: •: '.. • Furthermore, unexplained differences in PET results between
0 s s • • different patient populations have been reported [17, 49], despite• • •' • • its good reproducibility [12, 50].• The normal values of the PET parameters, as calculated from
—1 ____________________________________________ our SPA results were similar to those in the study of Twardowski,Khanna and Nolph [44]. A small difference was seen in the meanD/Pcr between both studies, but the 95% confidence intervalshowed complete overlap.
In the comparison of both methods, the strong correlationspresent between the SPA and PET parameters, as assessed bylinear regression correlation analysis, give an unrealistic image ofthe true agreement of SPA and PET. This occurs becausecorrelation analysis is an inappropriate tool to determine theagreement between two methods, which aim to measure the sameentity. It still is often used, however, for such purposes [7, 17, 18,
With regard to the functional state of the peritoneal membrane, 44, 50]. In our comparison of SPA and PET parameters, using thethe question remains of whether the PET can provide accurate method of Bland and Altman [33, 34], we found a fairly goodinformation on peritoneal permeability characteristics. This issue agreement of LIPV (SPA) and net UF (PET). No systematicwas addressed in the present study, along with the ability of the errors were made, although the large 95% confidence intervalPET to categorize patients into transport groups, based on its indicates that differences between zIPV and net UF can beresults. In theory, functional characterization of the peritoneum is extensive due to the changes in residual volume. Also, the twodifficult using the PET because it is performed with 2.27% glucose models used for the calculation of MTACCr did not show system-based dialysate, which is likely to induce more convective trans- atic errors. The agreement between the two methods implies thatport than glucose 1.36%. However, conflicting reports have been both the simplified Garred model and the Waniewski model canpublished about this subject. In one study no differences were be used for the calculation of MTACs of low-molecular weightfound for D/PC. between 1.36% and 3.86% glucose containing solutes in a test. This confirms previous observations of our groupdialysate [471, but others reported a clear contribution of convec- in 10 patients [29]. As the Waniewski model uses a volume

Pannekeet el a!: Standard peritoneal permeability analysis 873
Table 4. Comparison of transport categories for SPA and PET results from all 138 tests
MTACr mi/min/1.73 m2 Glucose absorption %
Low LA HA High Total Low LA HA High Total
DIPcr DID0Low 12 6 1 0 19 Low 15 6 0 0 21LA 10 18 18 0 46 LA 2 38 11 0 51HA 0 7 23 17 47 HA 0 1 44 7 52High 0 1 0 25 26 High 0 0 4 10 14Total 22 32 42 42 138 Total 17 45 59 17 138
The transport categorization of creatinine is shown in the left part of the table, the transport categorization of glucose in the right part. The boldnumbers show corresponding transport groups for both tests. See Table I for abbreviations.
Table 5. Possible reasons for negative ultrafiltration in a SPA using1.36% glucose based diaiysate in 40 CAPD patients
Reason fornegative net UF
Number ofpatients Median Range
High MTACC, 12 14.8 13.8 —19.2
Low MTACCr 0 — —ELAR 24 1.8 1.3—3.9RV 5 452 378—633No reason found 9 — —Total 50
a In 8 patients a combination of 2, and in one of 3 possible causes waspresent.
Normal limits are based on mean 2 SD after omitting the outliers(Tables 1 and 3). See Table 1 for normal ranges and abbreviations.
marker, while the simplified Garred model uses only plasmavalues, dialysate values after drainage and the drained volume, itimplies that the simplified Garred model can be used for thecalculation of the MTACCr in clinical practice.
In contrast to the comparison of the two MTAC models, thepattern of the relationship between the differences and the meansof the transport parameters of creatinine was very different.Systematic errors relative to the magnitude of transport wereclearly present. These errors cannot be attributed solely toconvective transport, because errors were similar for both theWaniewski model and the simplified Garred model. It implies thatDIP ratios cannot be used as a simple estimation of the MTAC.The same holds true for DID0 glucose and glucose absorption.Comparing DIP ratios with MTACs one could argue about theproblem of the gold standard. We think that the MTAC should beconsidered the reference method because: (1) it is the theoreticalmaximum diffusional clearance at time zero, so not influenced bysaturation of the dialysate during the dwell; (2) it is not dependenton the tonicity of the dialysate [29]; (3) it is not influenced by thedialysate volume in the range between 2 and 3 liters [26]; and (4)it has a better discriminative power, especially in the extremeranges, as shown in the present study. The latter may be ofimportance for clinical practice, since this could result in earlierdiscovery of changes in peritoneal function.
According to some authors, advice for dialysis treatment can begiven based on the PET categorization in transport groups [12, 17,18, 50]. Our study has shown that in a large number of tests thepatient is placed into a different transport category, based oneither SPA or PET results. This implies that these patients wouldreceive different advice for their dialysis treatment. It againillustrates that tests of short duration have only a limited value in
the choice of the most adequate dialysis scheme. For estimation ofthe adequacy of any prescribed dialysis dose, 24-hour dialysateand urine collections are essential to measure the appearancerates of urea and creatinine in relation to the plasma concentra-tions [51].
Using the results of the SPA, the possible causes for ultrafil-tration failure can be established, as was done in the patients witha negative net ultrafiltration. The most frequent reason for lack ofultrafiltration is a large effective peritoneal surface area, leadingto a rapid disappearance of glucose [8, 9]. In addition a higheffective lymphatic absorption rate has been described as apossible cause [43, 52, 531. Also, a large residual volume leads toan immediate dilution of the solution and thus to an instantdecrease of the osmotic gradient. One or more possible causescould be identified in most patients in the present analysis. Thelarge number attributed to a high ELAR is probably caused by therelatively low mean value for ELAR we found in the presentstudy. The upper limit of the 95% confidence interval of thenormally distributed data were 1.16 ml/minll.73 m2. When we setan arbitrary limit to ELAR of 2 ml/min/1.73 m2, a value exceedingthis limit was found in only nine patients.
None of the reasons for ultrafiltration failure mentioned abovecould be identified in 23% of the patients with negative ultrafil-tration. It has been made likely that a part of the transcapillarytransport of water, induced by an osmotic gradient, takes placethrough ultrasmall pores [54]. This may be the explanation for thesieving of sodium that occurs during dialysis using 3.86% glucosedialysate [19, 55]. In a recent study in six other CAPD patientswith very severe unexplained net ultrafiltration failure, who werestudied with 3.86% glucose dialysate, we found no sieving ofsodium, and interpreted this finding as possible impairment oftranscellular water transport [56]. It remains speculative whethersuch impaired transcellular water transport was also the cause ofnet ultrafiltration failure in the patients of the present study,because they were only studied with glucose 1.36% containingdialysate.
In conclusion, the SPA provides useful and extensive informa-tion on transport parameters of the peritoneal membrane inperitoneal dialysis patients. When compared to the PET, the SPAhas better discriminative power for both the transport of creati-nine and glucose. The results obtained with the classical PETprocedure should be used to calculate the MTACCI and theabsorption of glucose. More information can be obtained when avolume marker is administered intraperitoneally. In patients withunexplained net ultrafiltration failure a SPA using 3.86% glucose-containing dialysate should probably be added to the investiga-tion.

874 Pannekeet et al: Standard peritoneal permeability analysis
Acknowledgment
This study was supported by the Dutch Kidney Foundation (Grant93/1302).
Reprint requests to Marja M. Pannekeet, M.D., Department of Medicine,Renal Unit, F4-215, Academical Medical Center, P.O. Box 22700, 1100 EDAmsterdam, The Netherlands.
References
1. ZEMEL D, KRE0IET RT, KOOMEN GCM, STRUIJK DG, ARI5z L:Day-to-day variability of protein transport used as a method foranalyzing peritoneal permeability in CAPD. Petit Dial mt 11:217—223,1991
2. RANOERSON DH, FARRELL PC: Mass transfer properties of the humanperitoneum. ASAJO J 3:140—146, 1980
3. Ktoiur RT, BOESCHOTEN EW, ZUYOERHOUDT FMJ, STRACKEE J,ARIsz L: Simple assessment of the efficacy of peritoneal transport incontinuous ambulatory peritoneal dialysis patients. Blood Purif 4:194—203, 1986
4. KREDIET RT, STRUIJK DG, BOESCHOTEN FW, KOGMEN GCM,STOUTHARO JML, HoER FJ, ARlsz L: The time course of pcritonealtransport kinetics in continuous ambulatory peritoneal dialysis pa-tients who develop sclerosing peritonitis. Am J Kidney Dis 13:299—307,1989
5. DouiE JW, ZAIC1 M, WILsoN L: Ultrastructural studies on theperitoneum with special respect to chronic ambulatory peritonealdialysis. Scot Med J 26:213—223, 1981
6. DOBBIE JW, ANOERSON JD, HIN0 C: Long-term effects of peritonealdialysis on peritoneal morphology. Petit Dial list 14(Suppl 3):S16—520,1994
7. HEIMBORGER 0, WANIEWSKI J, WERYNSRI A, SUN PARK M, LtN0HOLMB: Dialysate to plasma solute concentration (D/P) versus peritonealtransport parameters in CAPD. Nephrol Dial Transplant 9:47—59, 1994
8. KREDtET RT, BOESCHOTEN FW, ZUY0ERHOUOT FMJ, ARIsz L:Peritoneal transport characteristics of water, low-molecular weightsolutes and proteins during long-term continuous ambulatory perito-neal dialysis. Petit Dial Bull 6:61—65, 1986
9. WIOEROE, T-E, SMauY LC, MJALANO 5, DAI-IL K, BERG 1<3, A.&s TW:Long-term changes in transperitoneal water transport during contin-uous ambulatory peritoneal dialysis. Nephron 38:238—247, 1984
10. STRUIJK DG, KREDIET RT, KOOMEN GCM, HOEK FJ, BOE5CHOTENEW, vu REIJOEN HJ, ARI5z L: Functional characteristics of theperitoncal membrane in long-term continuous ambulatory peritonealdialysis. Nephron 59:213—220, 1991
11. STRUIJK DG, KREOIET RT, KOOMEN GCM, B0E5cH0TEN EW, HOEKFJ, ARIsz L: A prospective study of peritoneal transport in CAPDpatients. Kidney mt 45:1739—1744, 1994
12. TwARuowsRI ZJ, NOLPH KD, KHANNA R, PROwANT BF, RYAN LP,MOOREHL, NIELSEN MP: Peritoneal equilibration test. Petit Dial Bull7:138—147, 1987
13. GROLLMAN A, TURNER LB, McLE&N JA: Intermittent peritoneallavage in nephrectomized dogs and its application to the human being.Arch mtMed 87:379—390, 1951
14. BOEN ST: Peritoneal dialysis: A clinical study of factors governing itseffectiveness. Thesis, University of Amsterdam, November, 1959, p 26
15. BOEN ST: Kinetics of peritoneal dialysis. Medicine (Balt) 40:243—287,1961
16. VERGER C, BRUNSCHvICG 0, LE CFIARPENTIER Y, LAvERGNE A,VANTELON J: Peritoneal structure alterations on CAPD, in Advances
in Petitoneal Dialysis, edited by GAHL GM, KESSEL M, NOLPH KD,Amsterdam, Exerpta Medica, 1981, pp 10—15
17. DAVIES SJ, BRowI't B, BRYAN J, RUSSELL 01: Clinical evaluation of theperitoneal equilibration test: A population-based study. Nephrol DialTransplant 8:64—70, 1993
18. TwARoowSIcs ZJ: PET: A simpler approach for determining prescrip-tionS for adequate dialysis therapy. Adv Petit Dial 6:186—191, 1990
19. HEIMBURGER 0, WANIEWSRI J, WERYNSKI A, LINDHOLM B: A quan-titative description of solute and fluid transport during peritoncaldialysis. Kidneylist 41:1320—1332, 1992
20. KREOIET RT, STRUIJR DO, KOOMEN GCM, ARI5z L: Peritoneal fluidkinetics during CAPD measured with intraperitoneal dextran 70.ASAIO Trans 37:662—667, 1991
21. STRUIJK DG, KOOMEN GCM, KREDIET RT, ARISZ L: Indirect mea-surement of lymphatic absorption in CAPD patients is not influencedby trapping. Kidney mt 41:1668—1675, 1992
22. RENCK H, LJUNGSTROM HG, HE0IN H, RICHTER W: Prevention ofdextran induced anaphylactic reaction by haptcn inhibition. Acta Chir
Scan 149:355—360, 198323. KOOMEN GCM, KREOIET RT, LEEGwATER ACJ, STRUIJK DG, ARISZ
L, HOER FJ: A fast reliable method for the measurement of intraper-itoneal dextran 70, used to calculate lymphatic absorption. Adv PetitDial 7:10—14, 1991
24. GARREO LI, CANAUO B, FARRELL PC: A simple kinetic model forassessing peritoneal mass transfer in chronic ambulatory peritonealdialysis. ASAIO J 6:131—137, 1983
25. WANIEWSRI J, WERYNSRI A, HEIMBURGER 0, LINOHOLM B: Simplemodels for description of small solute transport in peritoneal dialysis.Blood Punf 9:129—141, 1991
26. GOTCH F, SCHOENEELD N: The peritoneal equilibration test (PET) isnot a realistic measure of peritoncal clearance. (abstract) JASN 2:361,1991
27. WANIEwSKI J, HEIMEURGER 0, LINDHOLM B: Aqueous solute concen-trations and evaluation of mass transport coefficients in peritonealdialysis. Nephrol Dial Transplant 7:50—56, 1992
28. ALTMAN DG: Practical Statistics/br Medical Research. London, Chap-
man and Hall, 1991, pp 431—43329. KREOIET RT, ZEMEL D, STRUIJK DG, KOOMEN GCM, ARI5z L:
Individual characterization of the peritoneal restriction barrier tomacromolecules. Adv Petit Dial 7:15—20, 1991
30. IMHOLZ ALT, KOOMEN GCM, STRUIJK DO, ARI5Z L, KREOIET RT:Effect of dialysatc osmolality on the transport of low-molecular weightsolutes and proteins during CAPD. Kidney Jot 43:1339—1346, 1993
31. IMHOLZ ALT, KOOMEN 0CM, STRUIJK DG, ARI5z L, KREDIET RT:Residual volume measurements with exogenous and endogenoussolutes during CAPD. Adv Petit Dial 8:33—38, 1992
32. EL5T0N RC, JOHNSON WD: Essentials of Biostatistics, Philadelphia,(PUBLISHER), 1987, pp 52—55
33. BLANO MI,ALTMAN DG: Statistical methods for assessing agreementbetween two methods of clinical measurement. Lancet 1:307—310,
198634. ALTMAN DG, BLAND JM: Measurement in medicine: The analysis of
method comparing studies. Statistician 32:307—317, 198335. ESPERANZA MI, COLLINS DL: Peritoneal dialysis efficiency in relation
to body weight. JPed Surg 1:162—169, 196636. RUBIN I, CLAwSON M, PLANCH A, JONES 0: Measurement of perito-
neal surface area in man and rat. Am J Med Sci 298:453—458, 198837. IMHOLZ ALT, KOOMEN 0CM, STRUIJK DG, ARISZ L, KREOIET RT:
Effect of an increased intra-peritoneal pressure on fluid and solutetransport during CAPD. Kidney Int 44:1078—1085, 1993
38. IMHOLZ ALT, KOOMEN 0CM, STRUIJK DG, ARI5z L, KREOIET RT:Fluid and solute transport in CAPD patients using ultralow sodiumdialysate. Kidney list 46:333—340, 1994
39. IMHOLZ ALT: Peritoneal fluid and solute transport in CAPD patients.PhD Thesis, University of Amsterdam, 1994, pp 33—50
40. KREDIET RT, STRUIJK DO, BOESCHOTEN EW, HOER FJ, ARI5z L:Measurement of intraperitoneal fluid kinetics in CAPD patients bymeans of autologous haemoglobin. Neth J Med 33:28 1—290, 1988
41. MACTIER RA, KHANNA R, TWARDOWSKI Z, MOORE H, NOLPH KD:Contribution of lymphatic absorption to loss of ultrafiltration andsolute clearances in continuous ambulatory peritoneal dialysis. I ClinInvest 80:1311—1316, 1987
42. Cwsis PCK, WA P0, TAM SCF, ft MSM, FANG OX, CHENG IKP:
Factors affecting lymphatic absorption in chinese patients on contin-uous ambulatory peritoneat dialysis. Petit Dial lot 11:147—151, 1991
43. HEtMBURGER 0, WANIEWSKI J,WERYNSKI A, TRANAEUS A, LINOHOLMB: Peritoneal transport in CAPD patients with permanent loss ofultrafiltration capacity. Kidney lot 38:495—506, 1990
44. TWARDOWSKI ZJ, KHANNA R, NOLPH KD: Peritoneal dialysis modifi-cations to avoid CAPD drop-out. Adv Petit Dial 3:171—178, 1987
45. BURKART JM, JoRDAN JR, ROCCOMV: Assessment of dialysis dose bymeasured clearance versus extrapolated data. Petit Dial Int 13:184—
188, 1993

Pannekeet et a!: Standard peritoneal permeability analysis 875
46. HARTY JC, GOLDSMITH DJA, BOULTON H, HEELIS N, UTrLEY L,MoRRIs J, VENNING MC, GOKAL R: Limitations of the peritonealequilibration test in prescribing and monitoring dialysis therapy.Nephrol Dial Transplant (in press)
47. VIRGA G, AMId G, DA RIN G, VIANELLO A, CALCONI G, DA PORTO A,Boccl C: Comparison of fast peritoneal equilibration tests with 1.36and 3.86% dialysis solutions. Blood Punf 12:113—120, 1994
48. KREDIET RT, BOESCHOTEN EW, STRUIJK DG, ARISZ L: Differences inthe peritoneal transport of water, solutes and proteins betweendialysis with two- and with three liter exchanges. Nephrol DialTransplant 2:198—204, 1988
49. WONG FKM, LI CS, MAK CK, CHAU KF, CH0I KS: Peritonealequilibration test in Chinese patients. Adv Pent Dial 10:38—41, 1994
50. TRIVEDI H, KHANNA R, Lo W-K, PROWANT BF, NOLPH KD: Repro-ducibility of the peritoneal equilibration test in CAPD patients.ASAJO J M892-M895, 1994
51. KREDIET RT, KOOMEN GCM, STRUIJK DG, VAN OLDEN RW, IMHOLZALT, BOESCHOTEN EW: Practical methods for assessing dialysis
efficiency during peritoneal dialysis. Kidney mt 46(Suppl 48): S7-S13,1994
52. MACTIER RA, KHANNA R, TWARDOWSKI ZJ, NOLPH KD: Ultrafiltra-tion failure in continuous ambulatory peritoneal dialysis due toexcessive peritoneal cavity lymphatic absorption. Am J Kidney Dis10:461—466, 1987
53. KREDIET RT, IMHOLZ ALT, STRUIJK DG, KOOMEN GCM, ARISZ L:Ultrafiltration failure in continuous ambulatory peritoneal dialysis.Pent Dial mt 13(Suppl 2):S59—S66, 1993
54. RIPPE B, STELIN G, HARALDSON B: Computer simulations of perito-neal transport in CAPD. Kidney mt 40:315—325, 1991
55. NOLPH KD, TWARDOWSKI ZJ, POPOVICH RP, RUBIN J: Equilibrationof peritoneal dialysis solutions during long-dwell exchanges. J Lab ClinMed 93:246—256, 1979
56. MONQUIL MCJ, IMHOLZ ALT, STRUIJK DG, KREDIET RT: Doesimpaired transcellular water transport contribute to net ultrafiltrationfailure during CAPD? Pent Dial mt (in press)


