Embed Size (px)
Citation preview
JAPAN INTERNATIONAL COOPERATION AGENCY (JICA)
STATE WATER DIRECTORATE CROATIAN WATERS
THE REPUBLIC OF CROATIA
THE STUDY FOR WATER POLLUTION REDUCTION
ON THE SAVA RIVER BASIN IN THE REPUBLIC OF CROATIA
FINAL REPORT
Vol. 3 : SUPPORTING REPORT (1/3) (Master Plan : Appendix A to D)
AUGUST 2001
CTI ENGINEERING INTERNATIONAL CO., LTD.
IN ASSOCIATION WITH
NIHON SUIDO CONSULTANTS CO., LTD.
No.
SSS
J R
01 –111
JAPAN INTERNATIONAL COOPERATION AGENCY (JICA)
STATE WATER DIRECTORATE CROATIAN WATERS
THE REPUBLIC OF CROATIA
THE STUDY FOR WATER POLLUTION REDUCTION
ON THE SAVA RIVER BASIN IN THE REPUBLIC OF CROATIA
FINAL REPORT
Vol. 3 : SUPPORTING REPORT (1/3) (Master Plan : Appendix A to D)
AUGUST 2001
CTI ENGINEERING INTERNATIONAL CO., LTD.
IN ASSOCIATION WITH
NIHON SUIDO CONSULTANTS CO., LTD.
EXCHANGE RATE
The currency exchange rates used in this Study are:
US Dollar (US$) 1.00 = Japanese Yen (¥) 116
= Croatian Kuna (Kn.) 8.3
As of February 2001
COMPOSITION OF REPORT
Vol. 1 EXECUTIVE SUMMARY
Vol. 2 MAIN REPORT
Vol. 3 SUPPORTING REPORT (APPENDIX A TO K)
APPENDIX A Socio-economy
APPENDIX B Water Quality and Pollution Mechanism
APPENDIX C Industrial Wastewater Treatment
APPENDIX D Sewerage Development (Master Plan Study)
APPENDIX E Sewerage Development (Feasibility Study)
APPENDIX F Water Quality Monitoring and GIS Data Base
APPENDIX G Institutional Aspects
APPENDIX H Economic and Financial Analysis
APPENDIX I Environmental Aspects
APPENDIX J Sewer Maintenance
APPENDIX K Planning Manual for Small Scale Sewage Treatment System
Vol. 4 DATA BOOK

APPENDIX A
SOCIOECONOMIC CONDITIONS
A - i
APPENDIX A
SOCIOECONOMIC CONDITIONS
Table of Contents
CHAPTER I EXISTING SOCIOECONOMIC CONDITIONS.............. A-1 1.1 Introduction............................................................................. A-1 1.2 Socioeconomic Conditions of the Study Area ........................ A-1
1.2.1 Population and Administrative Units ......................... A-1 1.2.2 Gross Domestic Product............................................. A-3 1.2.3 Industry ...................................................................... A-4 1.2.4 Agriculture, Livestock and Fish Cultivation.............. A-6 1.2.5 Tourism ...................................................................... A-7 1.2.6 Employment ............................................................... A-7 1.2.7 Other Socioeconomic Indicators ............................... A-8
CHAPTER II PROJECTION OF FUTURE SOCIOECONOMY ........... A-9 2.1 Existing Plans ......................................................................... A-9
2.1.1 Spatial Planning Strategy of the Republic of Croatia A-9 2.1.2 Short Term Economic Revitalization Program.......... A-11
2.2 Population ............................................................................... A-11 2.2.1 Zagreb City ................................................................ A-11 2.2.2 Zagreb County............................................................ A-11 2.2.3 Sisak-Moslavina County ............................................ A-12 2.2.3 Karlovac County ........................................................ A-12
2.3 GDP Projection at National Level .......................................... A-12 2.4 Industry ................................................................................... A-14 2.5 Agriculture and Livestock....................................................... A-14 2.6 Tourism................................................................................... A-14
REFERENCES ................................................................................................ A-15
A - ii
List of Tables
Table A.1.1 Zagreb County Population as of 1991/1999................................... A-T1 Table A.1.2 Sisak-Moslavina County Population as of 1991/1999.................... A-T2 Table A.1.3 Karlovac County Population as of 1991/1999................................ A-T3 Table A.1.4 Gross Domestic Product at Current Prices by Sector ..................... A-T4 Table A.1.5 Structure of Gross Domestic Product at Current Prices ................. A-T5 Table A.1.6 Rate of Growth of Gross Domestic Product by Sector................... A-T6 Table A.1.7 Summary of Production Volume by Selected Industrial
Sectors in Croatia ........................................................................... A-T7 Table A.1.8 Production Volume by Category in the Sector of Manufacture
of Beverages ................................................................................... A-T8 Table A.1.9 Production Volume by Category in the Sector of Manufacture
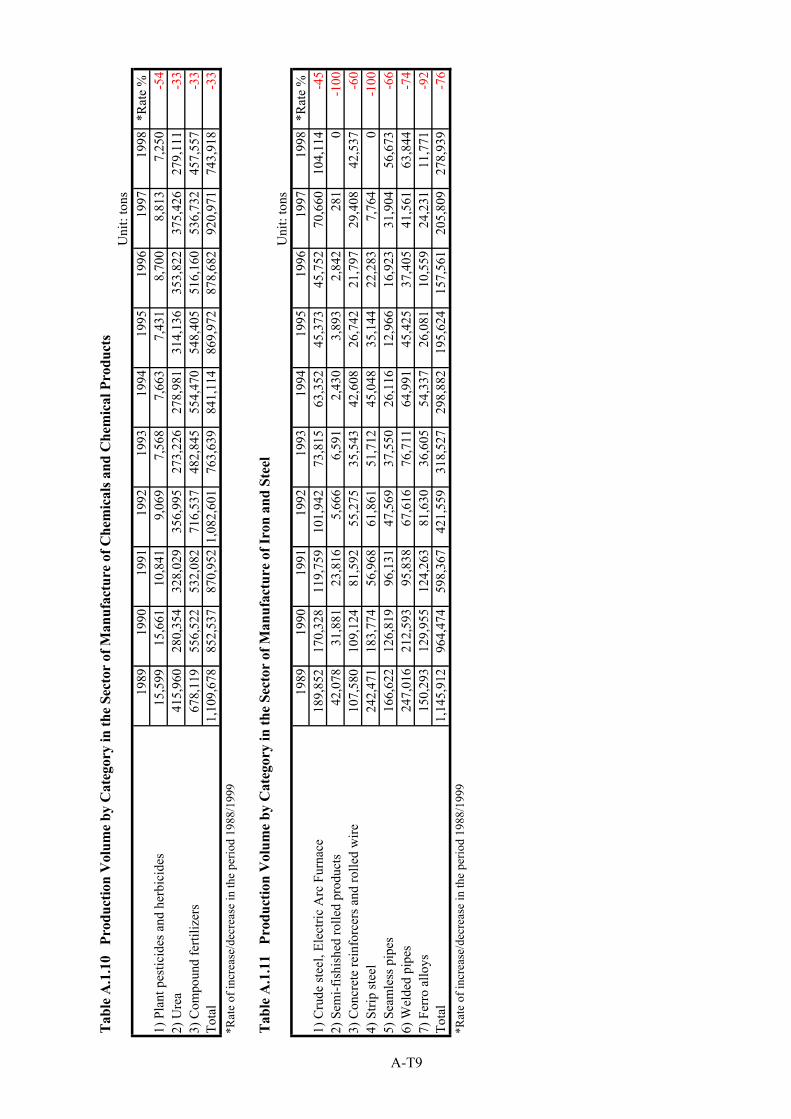
of Petroleum Products .................................................................... A-T8 Table A.1.10 Production Volume by Category in the Sector of Manufacture
of Chemicals and Chemical Products............................................. A-T9 Table A.1.11 Production Volume by Category in the Sector of Manufacture
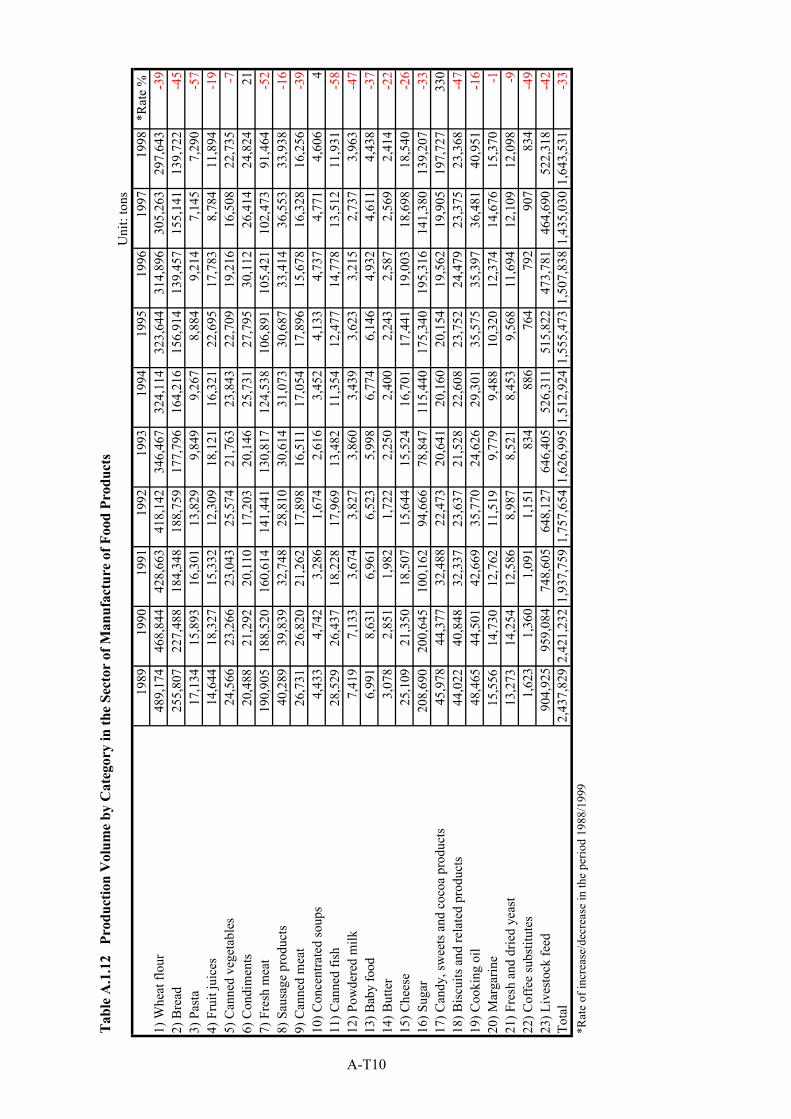
of Iron and Steel ............................................................................. A-T9 Table A.1.12 Production Volume by Category in the Sector of Manufacture
of Food Products............................................................................. A-T10 Table A.1.13 Production Volume by Category in the Sector of Manufacture
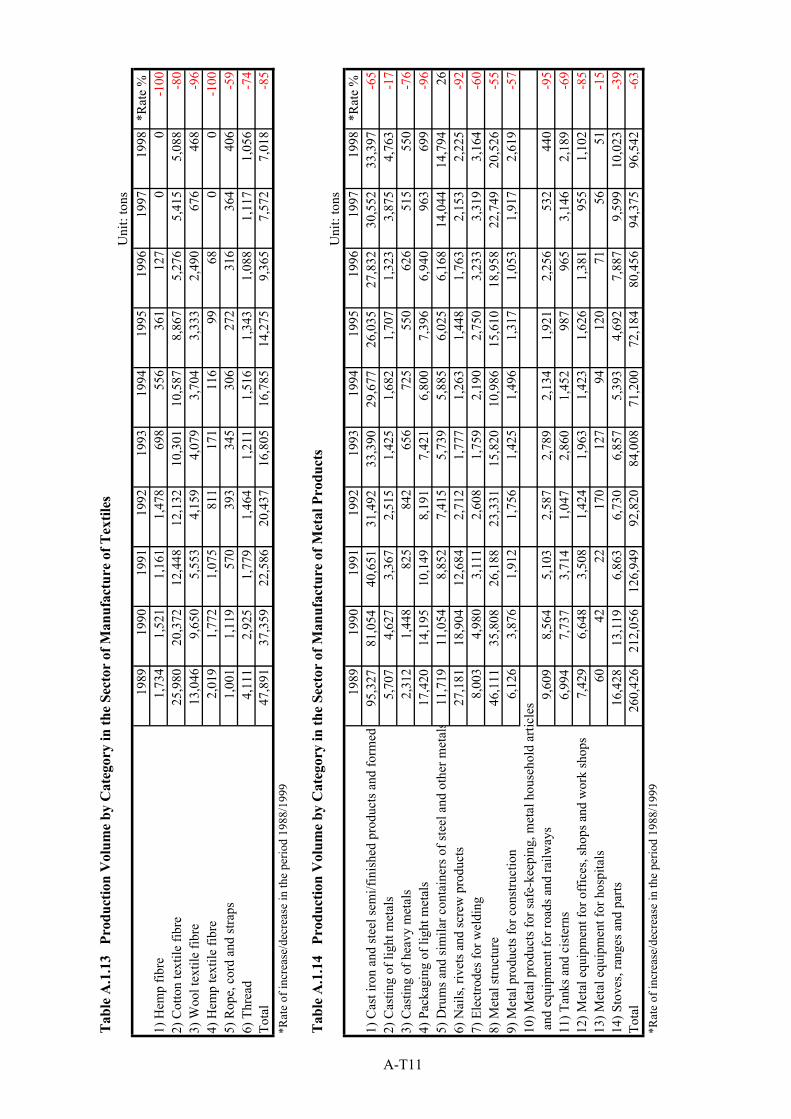
of Textiles....................................................................................... A-T11 Table A.1.14 Production Volume by Category in the Sector of Manufacture
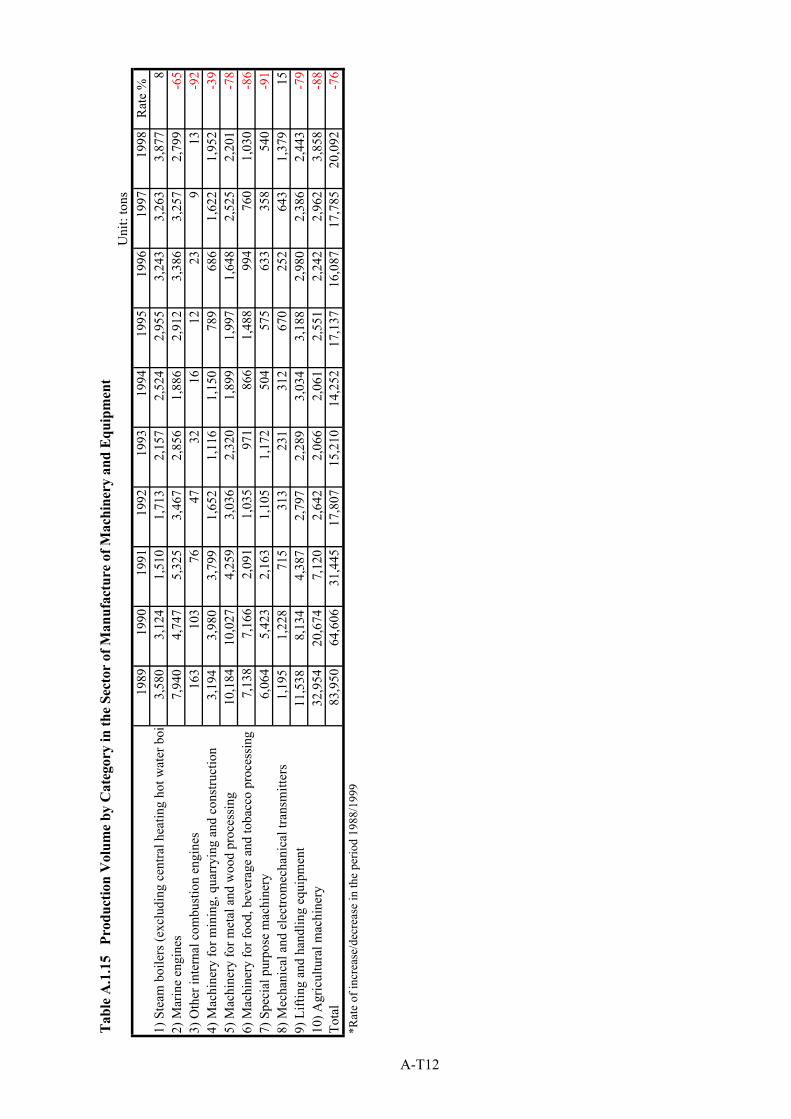
of Metal Products ........................................................................... A-T11 Table A.1.15 Production Volume by Category in the Sector of Manufacture
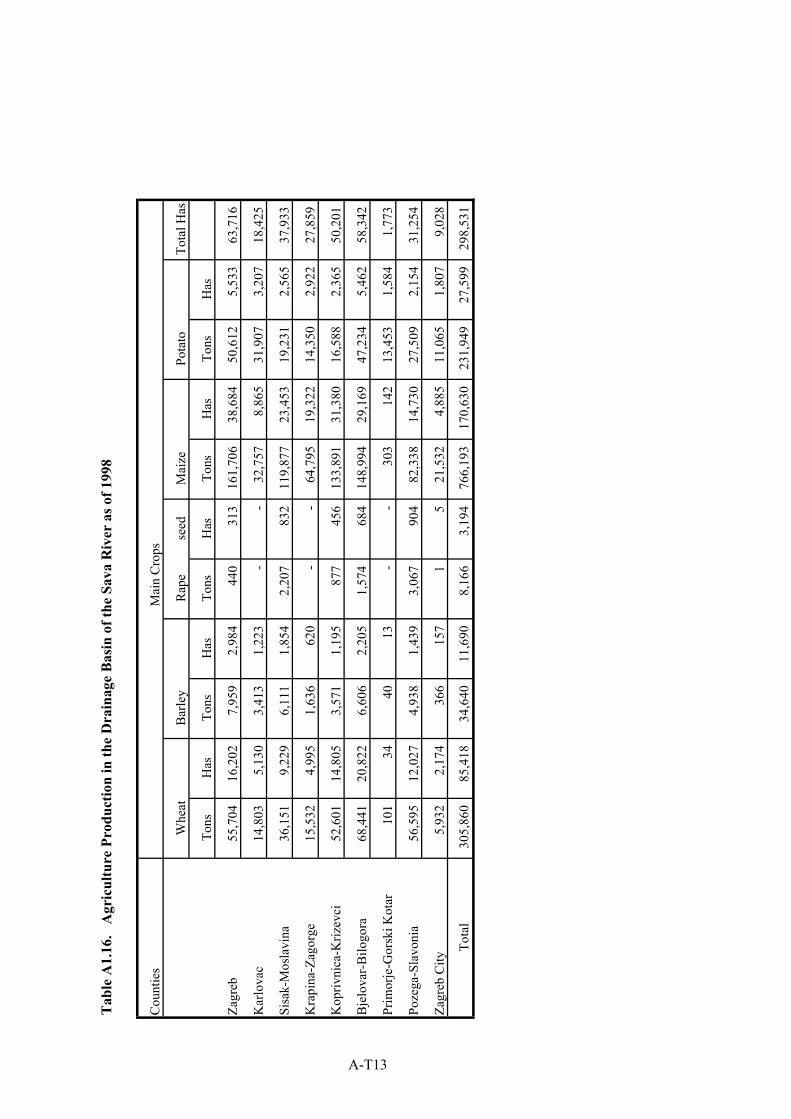
of Machinery and Equipment ......................................................... A-T12 Table A.1.16 Agriculture Production in the Drainage Basin of the
Sava River as of 1998..................................................................... A-T13 Table A.1.17 Production of Fish in Ponds of the Study Area as of 1999............. A-T14 Table A.2.1 Projection of the Population in Towns/Municipalities of
Zagreb County................................................................................ A-T15 Table A.2.2 Projection of the Population in Towns/Municipalities of
Sisak-Moslavina County ................................................................ A-T16 Table A.2.3 Projection of the Population in Towns/Municipalities of
Karlovac County............................................................................. A-T17
A-1
APPENDIX A SOCIOECONOMIC CONDITIONS
CHAPTER I EXISTING SOCIOECONOMIC CONDITIONS
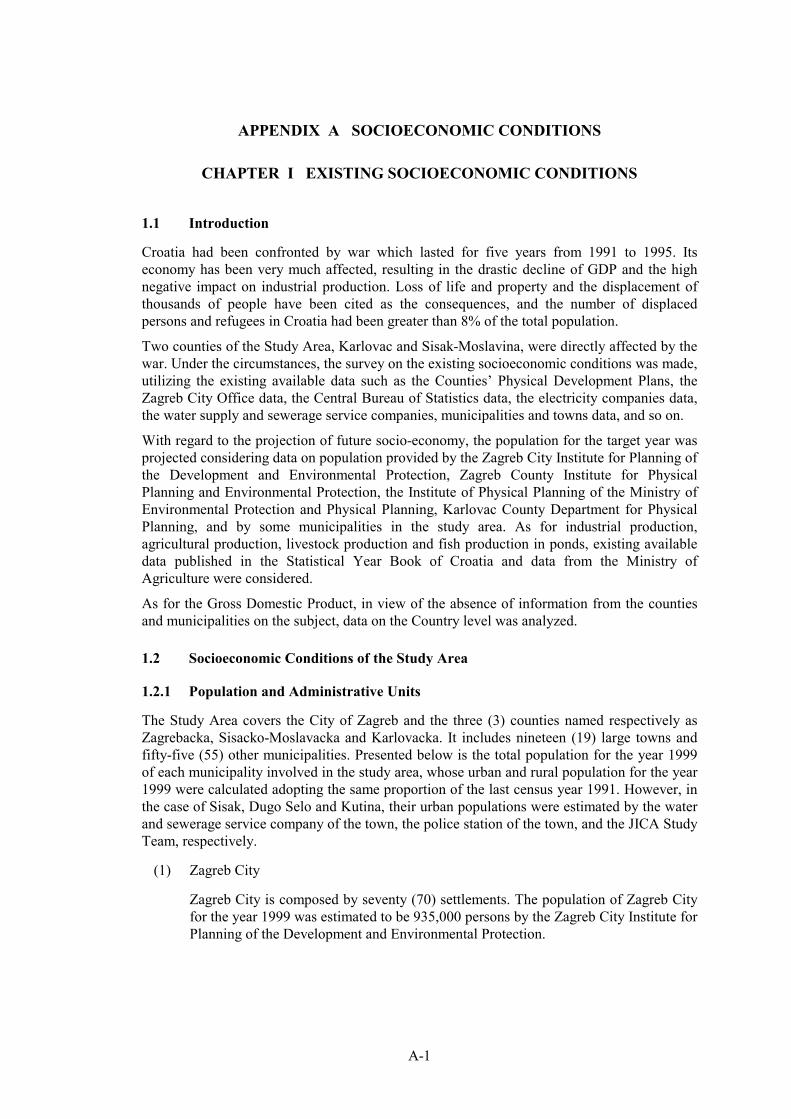
1.1 Introduction
Croatia had been confronted by war which lasted for five years from 1991 to 1995. Its economy has been very much affected, resulting in the drastic decline of GDP and the high negative impact on industrial production. Loss of life and property and the displacement of thousands of people have been cited as the consequences, and the number of displaced persons and refugees in Croatia had been greater than 8% of the total population.
Two counties of the Study Area, Karlovac and Sisak-Moslavina, were directly affected by the war. Under the circumstances, the survey on the existing socioeconomic conditions was made, utilizing the existing available data such as the Counties’ Physical Development Plans, the Zagreb City Office data, the Central Bureau of Statistics data, the electricity companies data, the water supply and sewerage service companies, municipalities and towns data, and so on.
With regard to the projection of future socio-economy, the population for the target year was projected considering data on population provided by the Zagreb City Institute for Planning of the Development and Environmental Protection, Zagreb County Institute for Physical Planning and Environmental Protection, the Institute of Physical Planning of the Ministry of Environmental Protection and Physical Planning, Karlovac County Department for Physical Planning, and by some municipalities in the study area. As for industrial production, agricultural production, livestock production and fish production in ponds, existing available data published in the Statistical Year Book of Croatia and data from the Ministry of Agriculture were considered.
As for the Gross Domestic Product, in view of the absence of information from the counties and municipalities on the subject, data on the Country level was analyzed.
1.2 Socioeconomic Conditions of the Study Area
1.2.1 Population and Administrative Units
The Study Area covers the City of Zagreb and the three (3) counties named respectively as Zagrebacka, Sisacko-Moslavacka and Karlovacka. It includes nineteen (19) large towns and fifty-five (55) other municipalities. Presented below is the total population for the year 1999 of each municipality involved in the study area, whose urban and rural population for the year 1999 were calculated adopting the same proportion of the last census year 1991. However, in the case of Sisak, Dugo Selo and Kutina, their urban populations were estimated by the water and sewerage service company of the town, the police station of the town, and the JICA Study Team, respectively.
(1) Zagreb City
Zagreb City is composed by seventy (70) settlements. The population of Zagreb City for the year 1999 was estimated to be 935,000 persons by the Zagreb City Institute for Planning of the Development and Environmental Protection.
A-2
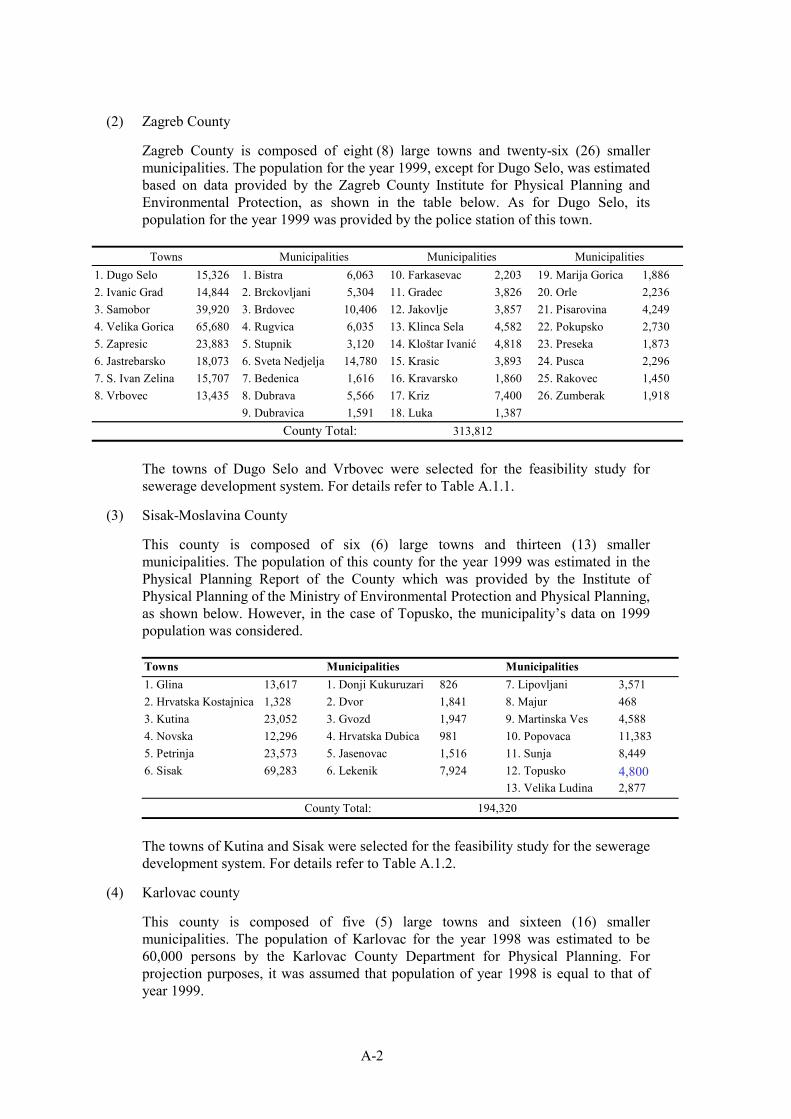
(2) Zagreb County
Zagreb County is composed of eight (8) large towns and twenty-six (26) smaller municipalities. The population for the year 1999, except for Dugo Selo, was estimated based on data provided by the Zagreb County Institute for Physical Planning and Environmental Protection, as shown in the table below. As for Dugo Selo, its population for the year 1999 was provided by the police station of this town.
Towns Municipalities Municipalities Municipalities
1. Dugo Selo 15,326 1. Bistra 6,063 10. Farkasevac 2,203 19. Marija Gorica 1,886 2. Ivanic Grad 14,844 2. Brckovljani 5,304 11. Gradec 3,826 20. Orle 2,236 3. Samobor 39,920 3. Brdovec 10,406 12. Jakovlje 3,857 21. Pisarovina 4,249 4. Velika Gorica 65,680 4. Rugvica 6,035 13. Klinca Sela 4,582 22. Pokupsko 2,730 5. Zapresic 23,883 5. Stupnik 3,120 14. Kloštar Ivanić 4,818 23. Preseka 1,873 6. Jastrebarsko 18,073 6. Sveta Nedjelja 14,780 15. Krasic 3,893 24. Pusca 2,296 7. S. Ivan Zelina 15,707 7. Bedenica 1,616 16. Kravarsko 1,860 25. Rakovec 1,450 8. Vrbovec 13,435 8. Dubrava 5,566 17. Kriz 7,400 26. Zumberak 1,918 9. Dubravica 1,591 18. Luka 1,387
County Total: 313,812
The towns of Dugo Selo and Vrbovec were selected for the feasibility study for sewerage development system. For details refer to Table A.1.1.
(3) Sisak-Moslavina County
This county is composed of six (6) large towns and thirteen (13) smaller municipalities. The population of this county for the year 1999 was estimated in the Physical Planning Report of the County which was provided by the Institute of Physical Planning of the Ministry of Environmental Protection and Physical Planning, as shown below. However, in the case of Topusko, the municipality’s data on 1999 population was considered.
Towns Municipalities Municipalities 1. Glina 13,617 1. Donji Kukuruzari 826 7. Lipovljani 3,571 2. Hrvatska Kostajnica 1,328 2. Dvor 1,841 8. Majur 468 3. Kutina 23,052 3. Gvozd 1,947 9. Martinska Ves 4,588 4. Novska 12,296 4. Hrvatska Dubica 981 10. Popovaca 11,383 5. Petrinja 23,573 5. Jasenovac 1,516 11. Sunja 8,449 6. Sisak 69,283 6. Lekenik 7,924 12. Topusko 4,800 13. Velika Ludina 2,877
County Total: 194,320
The towns of Kutina and Sisak were selected for the feasibility study for the sewerage development system. For details refer to Table A.1.2.
(4) Karlovac county
This county is composed of five (5) large towns and sixteen (16) smaller municipalities. The population of Karlovac for the year 1998 was estimated to be 60,000 persons by the Karlovac County Department for Physical Planning. For projection purposes, it was assumed that population of year 1998 is equal to that of year 1999.
A-3
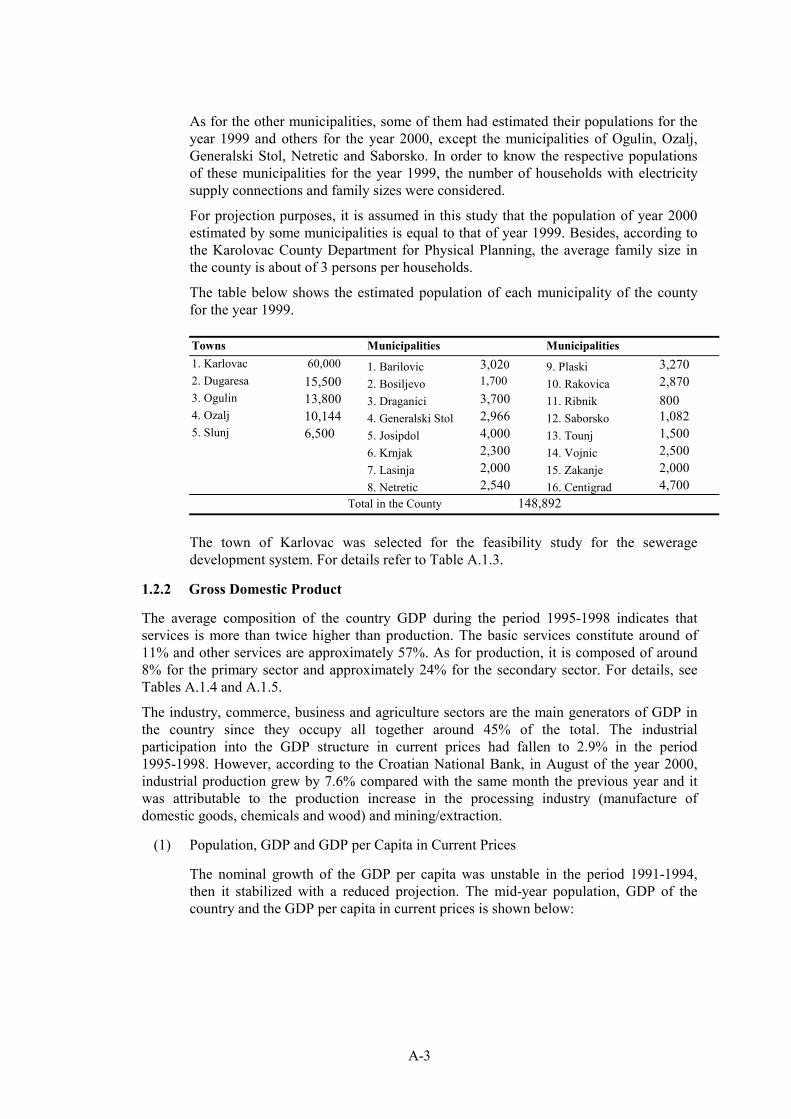
As for the other municipalities, some of them had estimated their populations for the year 1999 and others for the year 2000, except the municipalities of Ogulin, Ozalj, Generalski Stol, Netretic and Saborsko. In order to know the respective populations of these municipalities for the year 1999, the number of households with electricity supply connections and family sizes were considered.
For projection purposes, it is assumed in this study that the population of year 2000 estimated by some municipalities is equal to that of year 1999. Besides, according to the Karolovac County Department for Physical Planning, the average family size in the county is about of 3 persons per households.
The table below shows the estimated population of each municipality of the county for the year 1999.
Towns Municipalities Municipalities 1. Karlovac 60,000 1. Barilovic 3,020 9. Plaski 3,270 2. Dugaresa 15,500 2. Bosiljevo 1,700 10. Rakovica 2,870 3. Ogulin 13,800 3. Draganici 3,700 11. Ribnik 800 4. Ozalj 10,144 4. Generalski Stol 2,966 12. Saborsko 1,082 5. Slunj 6,500 5. Josipdol 4,000 13. Tounj 1,500 6. Krnjak 2,300 14. Vojnic 2,500 7. Lasinja 2,000 15. Zakanje 2,000 8. Netretic 2,540 16. Centigrad 4,700
Total in the County 148,892
The town of Karlovac was selected for the feasibility study for the sewerage development system. For details refer to Table A.1.3.
1.2.2 Gross Domestic Product
The average composition of the country GDP during the period 1995-1998 indicates that services is more than twice higher than production. The basic services constitute around of 11% and other services are approximately 57%. As for production, it is composed of around 8% for the primary sector and approximately 24% for the secondary sector. For details, see Tables A.1.4 and A.1.5.
The industry, commerce, business and agriculture sectors are the main generators of GDP in the country since they occupy all together around 45% of the total. The industrial participation into the GDP structure in current prices had fallen to 2.9% in the period 1995-1998. However, according to the Croatian National Bank, in August of the year 2000, industrial production grew by 7.6% compared with the same month the previous year and it was attributable to the production increase in the processing industry (manufacture of domestic goods, chemicals and wood) and mining/extraction.
(1) Population, GDP and GDP per Capita in Current Prices
The nominal growth of the GDP per capita was unstable in the period 1991-1994, then it stabilized with a reduced projection. The mid-year population, GDP of the country and the GDP per capita in current prices is shown below:
A-4
Year Population GDP GDP GDP GDP Average Annual
Exchange Rate Mills. Mills. Kuna Mills. US$ Per capita Kuna Per capita: US$ Kuna: 1US$
1991 4.513 441.2 18,156.4 97.762 4023.1 0.0243
1992 4.470 2,706.6 10,240.6 605.50 2,291 0.2643
1993 4.641 39,004.3 10,902.7 8,404.28 2,349 3.5774
1994 4.649 87,441.4 14,585 18,808.64 3,137 5.9953
1995 4.669 98,381.5 18,811.1 21,071.21 4,029 5.23
1996 4.494 107,980.6 19,872 24,027.72 4,422 5.4338
1997 4.572 123,811.0 20,108.6 27,080.27 4,398 6.1571
1998 4.501* 138,392* 21,751.8 30,746.94* 4,833* 6.3623
1999 4.60** 143,500.0** 20,176** 31,180.54** 4,383.97** 7.1124
2000 4.56** 157,000.0** 19,430.6** 34,378.29** 4,254.74** 8.08*** * preliminary data; ** estimated; *** as of June, 2000 Source: Central Bureau of Statistics, Croatian National Bank, Ministry of Finance
(2) GDP, Rate of Growth in Constant Prices 1997 (%)
The table below gives the summary of the growth rate of GDP for the period 1991-1999:
Year 1991 1992 1993 1994 1995 1996 1997 1998 1999 GDP(%) -21.1 -11.7 -8 5.9 6.8 5.9 6.8 2.5* -0.3** * preliminary data; ** obtained from a three-month calculation of GDP Source: Central Bureau of Statistics, Croatian National Bank
From the table above it can be concluded that the economic sector had declined in the period 1991-1993. From 1994 the recovery process had begun, however, by year 1999 it had declined to minus 0.3%. Table A.1.6 shows the rate of growth of GDP by sector for the period 1996-1998.
1.2.3 Industry
(1) Industrial Production in the Study Area
At present there are 8,737 registered industries in the study area. From this amount, 5,364 are in operation as shown in the table below.
A-5
1998 1999 2000 County
Registered Registered Active %* Registered Active %*
Zagreb 1,516 1,527 951 62 1,569 999 64
Sisak-Moslavina 422 422 249 59 431 261 61
Karlovac 464 469 293 62 502 323 64
Zagreb City 6,102 6,135 3,665 60 6,235 3,781 61
Total in the Study Area 8,504 8,553 5,158 60 8,737 5,364 61
Total in Croatia 18,011 18,133 10,807 60 18,579 11,346 61
* Percentage of factories working at present
Historical production of these factories is only available for those located in Zagreb City for the period 1986-1996, which is presented in the next table:
1986 1990 1991 1995 1996
Indices of Production in Zagreb City 100 90.2 66.3 54.0 54.1
From the above tables it can be concluded that the number of factories and its production had decreased in the Study Area. In case of Zagreb City the reduction on production was almost half for the period 1986-1996. Considering that the other counties of the Study Area were more directly influenced by the consequences of the war, it is assumed that in these counties the production was much more hampered.
(2) Industrial Production in all Croatia
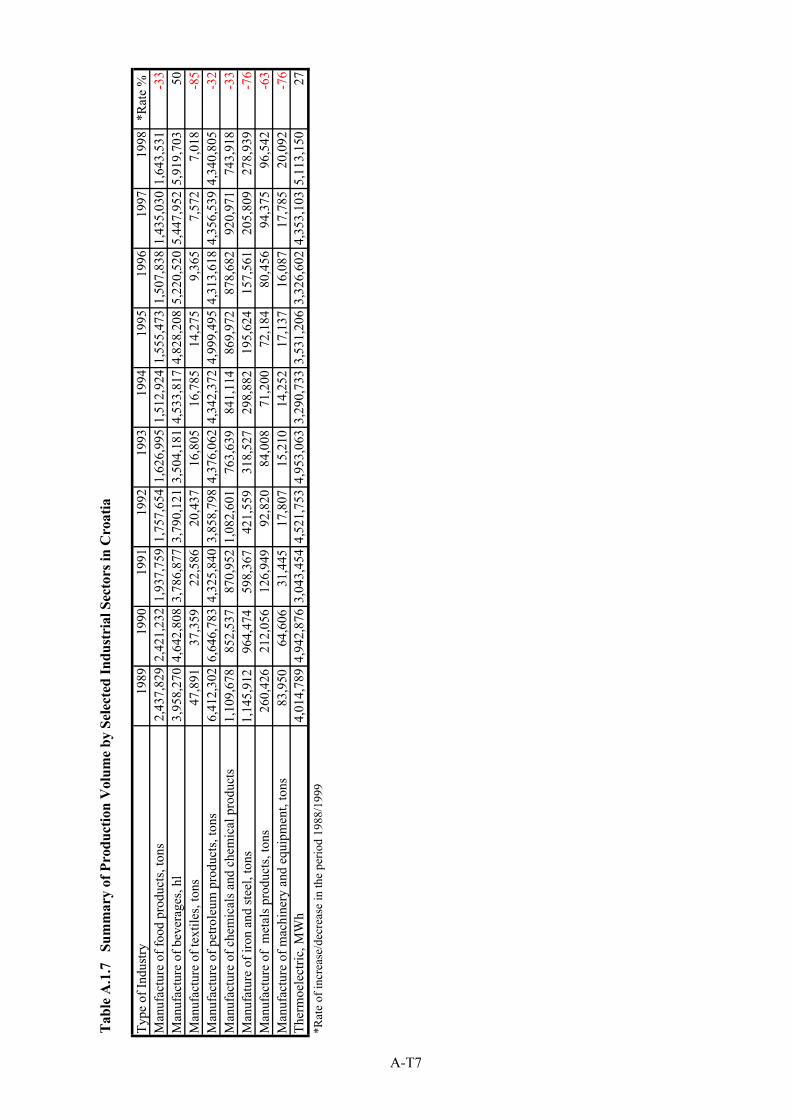
Officials of the Ministry of Finance had mentioned that industrial production in Croatia had fallen by around 55% compared with the production before the war. In this Study the production of some industries at national level was analyzed. The selection of industries for the analysis was made in due consideration to their types of production similar to those existing in the Study Area. The summary of industrial production by selected sectors is presented in Table A.1.7. On the other hand, for analysis purposes, these sectors were divided into two categories according to their production values as follows.
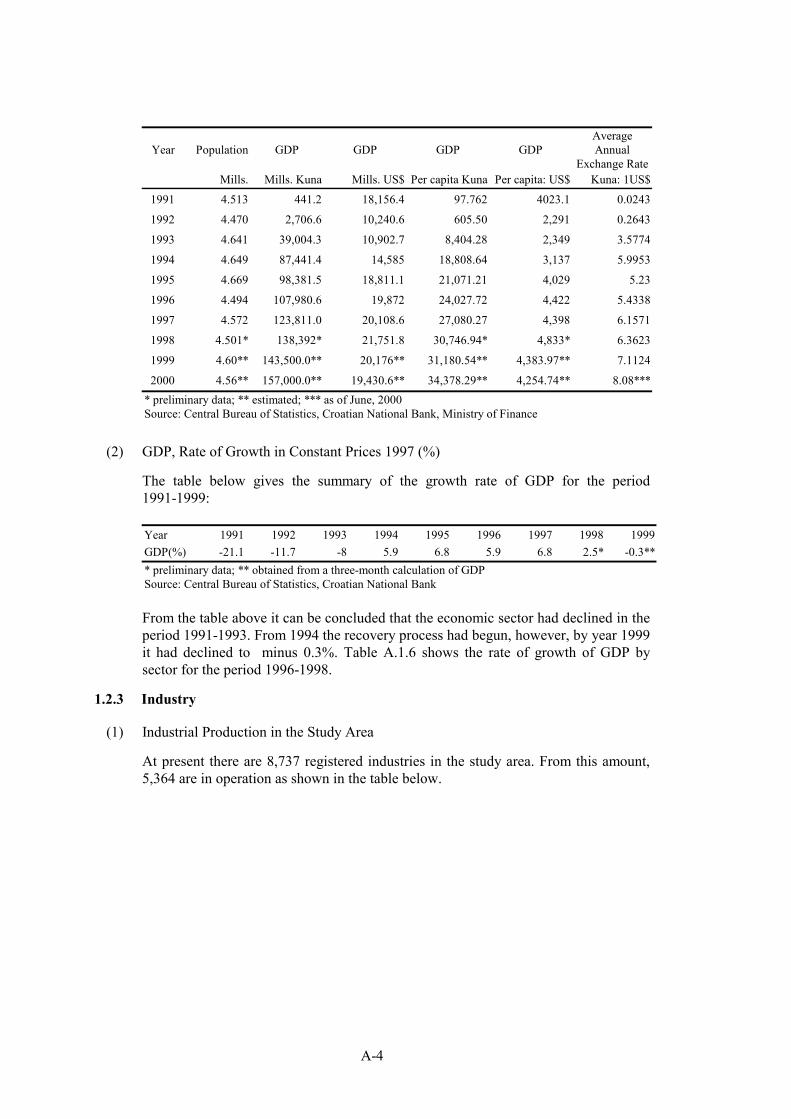
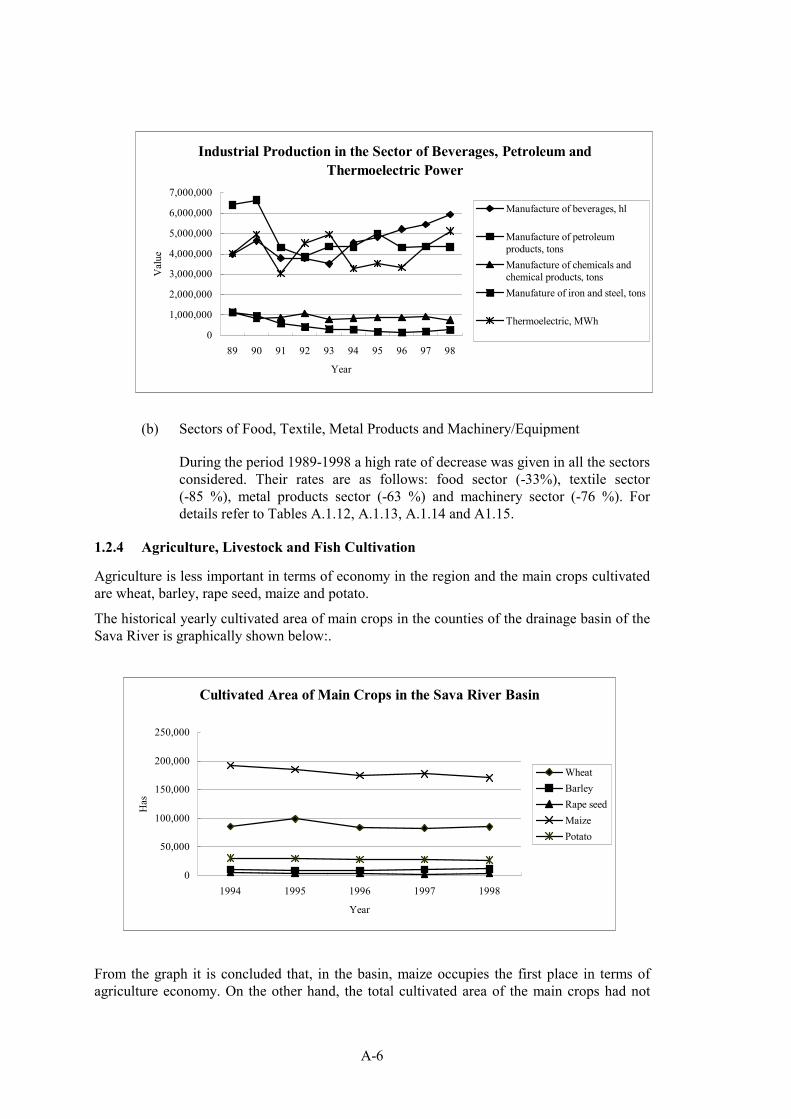
(a) Sectors of Beverages, Petroleum, Chemical, Iron & Steel and Thermoelectric Power
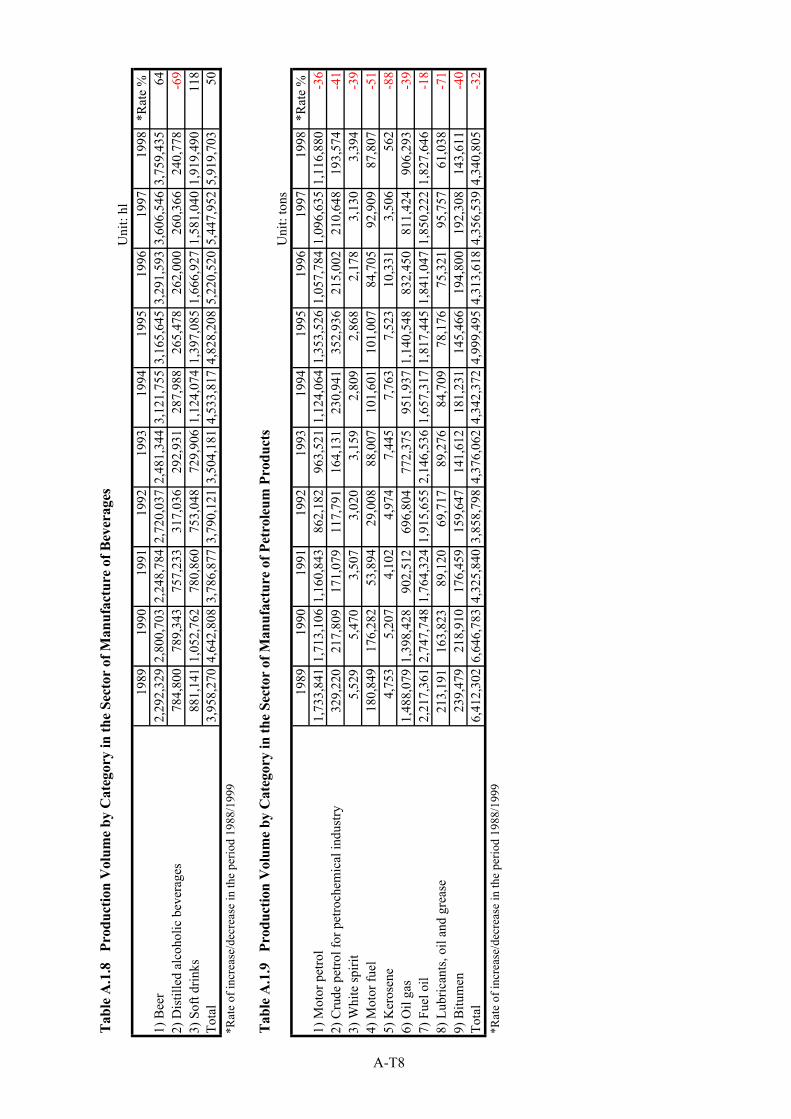
The volume of industrial production recorded in the period 1989-1998 was analyzed. From the analysis it is concluded that the sectors of beverages and thermoelectric power had experienced a rate of growth of 50% and 27%, respectively. However, the production growth rates of other sectors in the same period had decreased; namely, iron & steel sector (-76 %), petroleum sector (-32 %), and chemical sector (-32 %). The summary is graphically presented as follows. For more details, refer to Tables A.1.8, A.1.9, A.1.10 and A.1.11.
A-6
Industrial Production in the Sector of Beverages, Petroleum andThermoelectric Power
0
1,000,000
2,000,000
3,000,000
4,000,000
5,000,000
6,000,000
7,000,000
89 90 91 92 93 94 95 96 97 98
Year
Val
ue
Manufacture of beverages, hl
Manufacture of petroleumproducts, tonsManufacture of chemicals andchemical products, tonsManufature of iron and steel, tons
Thermoelectric, MWh
(b) Sectors of Food, Textile, Metal Products and Machinery/Equipment
During the period 1989-1998 a high rate of decrease was given in all the sectors considered. Their rates are as follows: food sector (-33%), textile sector (-85 %), metal products sector (-63 %) and machinery sector (-76 %). For details refer to Tables A.1.12, A.1.13, A.1.14 and A1.15.
1.2.4 Agriculture, Livestock and Fish Cultivation
Agriculture is less important in terms of economy in the region and the main crops cultivated are wheat, barley, rape seed, maize and potato.
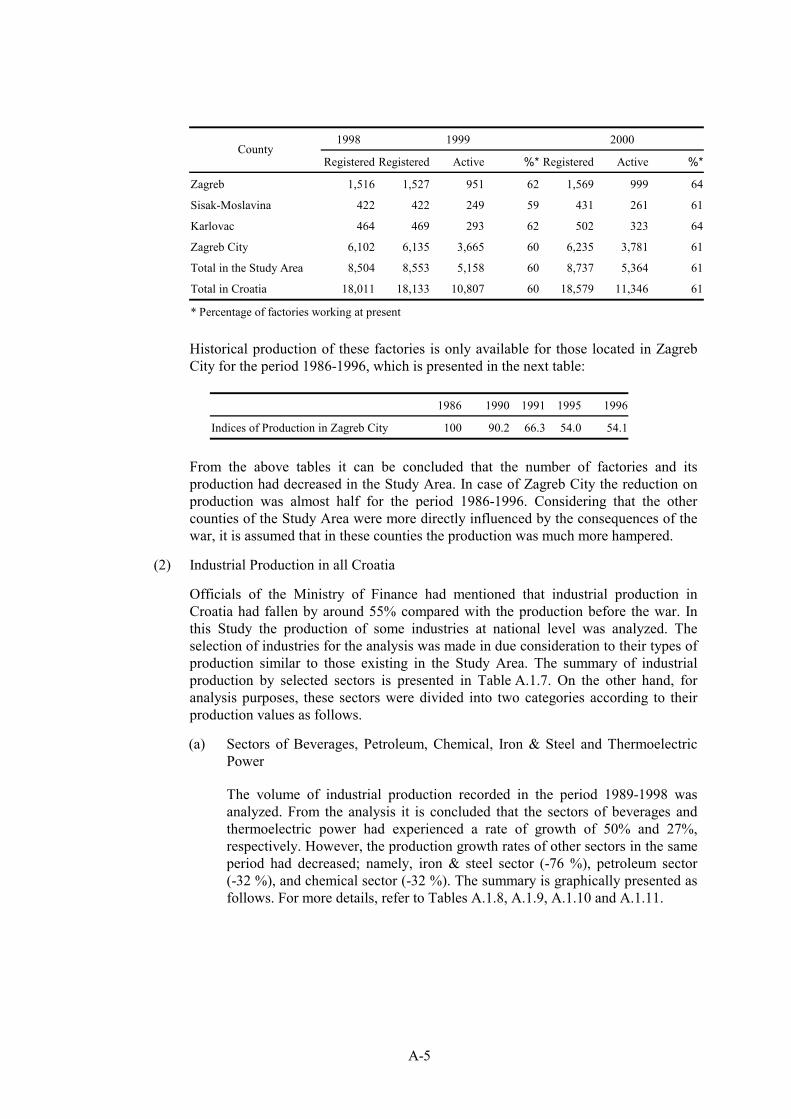
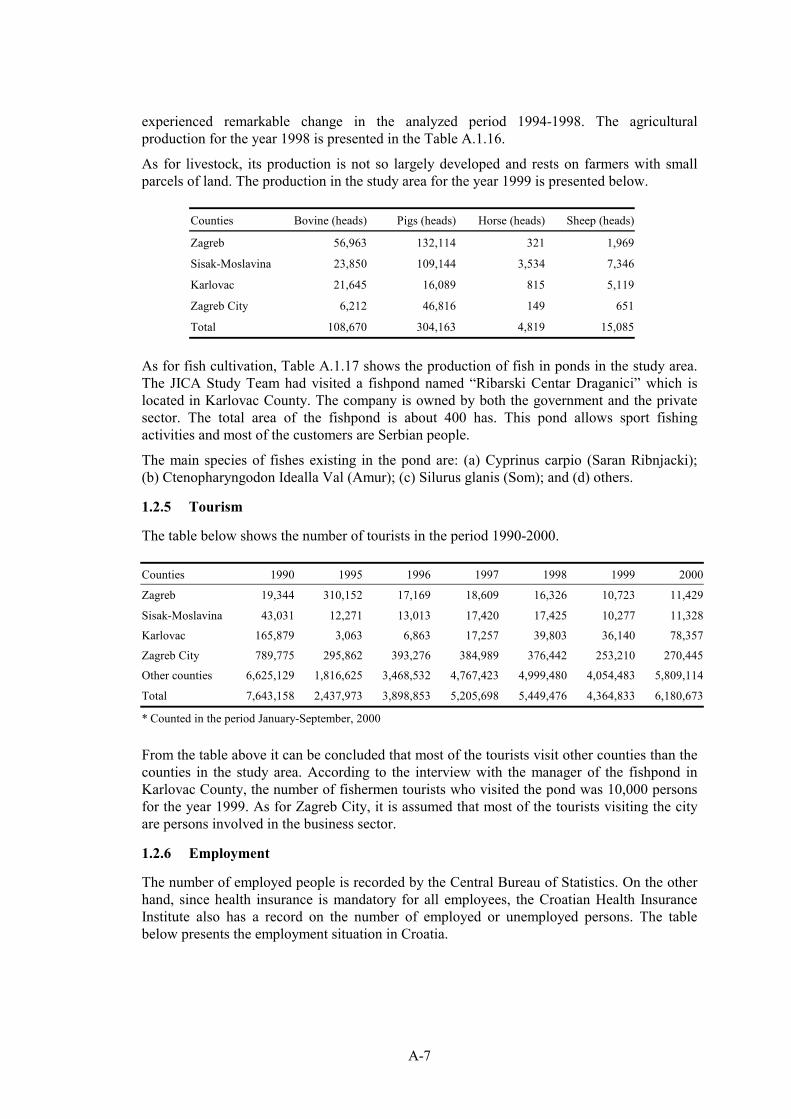
The historical yearly cultivated area of main crops in the counties of the drainage basin of the Sava River is graphically shown below:.
From the graph it is concluded that, in the basin, maize occupies the first place in terms of agriculture economy. On the other hand, the total cultivated area of the main crops had not
Cultivated Area of Main Crops in the Sava River Basin
0
50,000
100,000
150,000
200,000
250,000
1994 1995 1996 1997 1998
Year
Has
WheatBarleyRape seedMaizePotato
A-7
experienced remarkable change in the analyzed period 1994-1998. The agricultural production for the year 1998 is presented in the Table A.1.16.
As for livestock, its production is not so largely developed and rests on farmers with small parcels of land. The production in the study area for the year 1999 is presented below.
Counties Bovine (heads) Pigs (heads) Horse (heads) Sheep (heads)
Zagreb 56,963 132,114 321 1,969
Sisak-Moslavina 23,850 109,144 3,534 7,346
Karlovac 21,645 16,089 815 5,119
Zagreb City 6,212 46,816 149 651
Total 108,670 304,163 4,819 15,085
As for fish cultivation, Table A.1.17 shows the production of fish in ponds in the study area. The JICA Study Team had visited a fishpond named “Ribarski Centar Draganici” which is located in Karlovac County. The company is owned by both the government and the private sector. The total area of the fishpond is about 400 has. This pond allows sport fishing activities and most of the customers are Serbian people.
The main species of fishes existing in the pond are: (a) Cyprinus carpio (Saran Ribnjacki); (b) Ctenopharyngodon Idealla Val (Amur); (c) Silurus glanis (Som); and (d) others.
1.2.5 Tourism
The table below shows the number of tourists in the period 1990-2000. Counties 1990 1995 1996 1997 1998 1999 2000
Zagreb 19,344 310,152 17,169 18,609 16,326 10,723 11,429
Sisak-Moslavina 43,031 12,271 13,013 17,420 17,425 10,277 11,328
Karlovac 165,879 3,063 6,863 17,257 39,803 36,140 78,357
Zagreb City 789,775 295,862 393,276 384,989 376,442 253,210 270,445
Other counties 6,625,129 1,816,625 3,468,532 4,767,423 4,999,480 4,054,483 5,809,114
Total 7,643,158 2,437,973 3,898,853 5,205,698 5,449,476 4,364,833 6,180,673
* Counted in the period January-September, 2000
From the table above it can be concluded that most of the tourists visit other counties than the counties in the study area. According to the interview with the manager of the fishpond in Karlovac County, the number of fishermen tourists who visited the pond was 10,000 persons for the year 1999. As for Zagreb City, it is assumed that most of the tourists visiting the city are persons involved in the business sector.
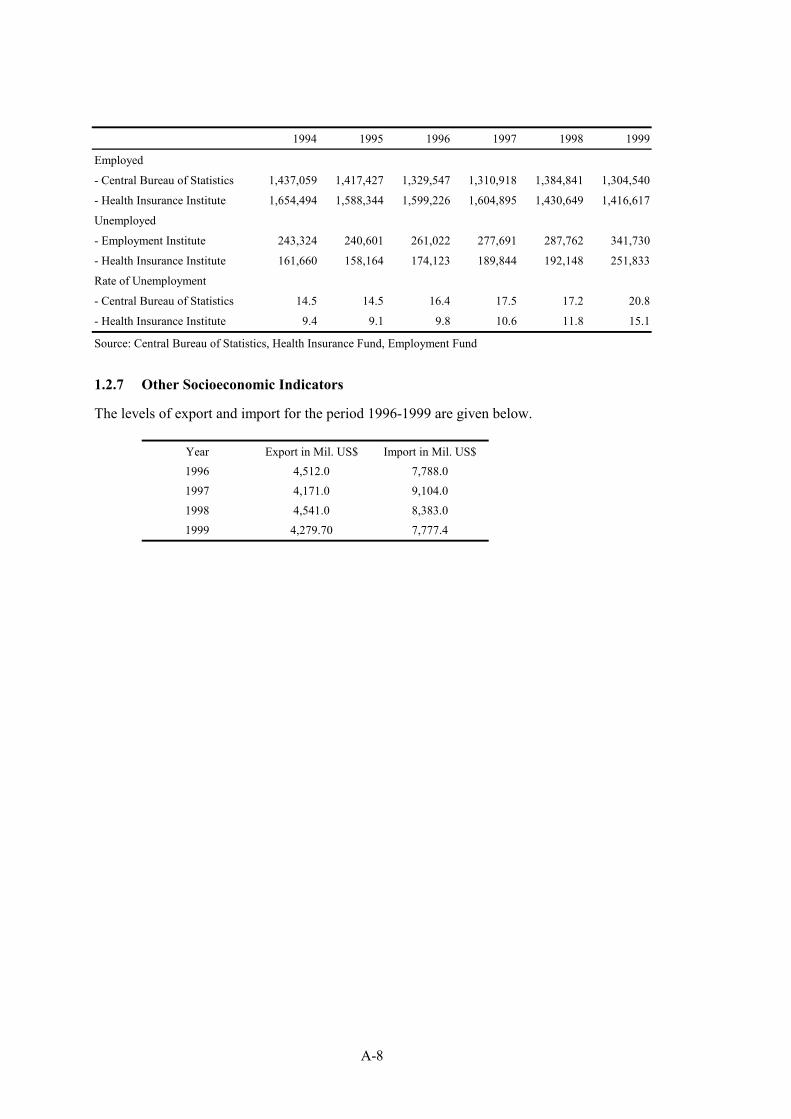
1.2.6 Employment
The number of employed people is recorded by the Central Bureau of Statistics. On the other hand, since health insurance is mandatory for all employees, the Croatian Health Insurance Institute also has a record on the number of employed or unemployed persons. The table below presents the employment situation in Croatia.
A-8
1994 1995 1996 1997 1998 1999
Employed - Central Bureau of Statistics 1,437,059 1,417,427 1,329,547 1,310,918 1,384,841 1,304,540
- Health Insurance Institute 1,654,494 1,588,344 1,599,226 1,604,895 1,430,649 1,416,617
Unemployed
- Employment Institute 243,324 240,601 261,022 277,691 287,762 341,730
- Health Insurance Institute 161,660 158,164 174,123 189,844 192,148 251,833
Rate of Unemployment
- Central Bureau of Statistics 14.5 14.5 16.4 17.5 17.2 20.8
- Health Insurance Institute 9.4 9.1 9.8 10.6 11.8 15.1
Source: Central Bureau of Statistics, Health Insurance Fund, Employment Fund
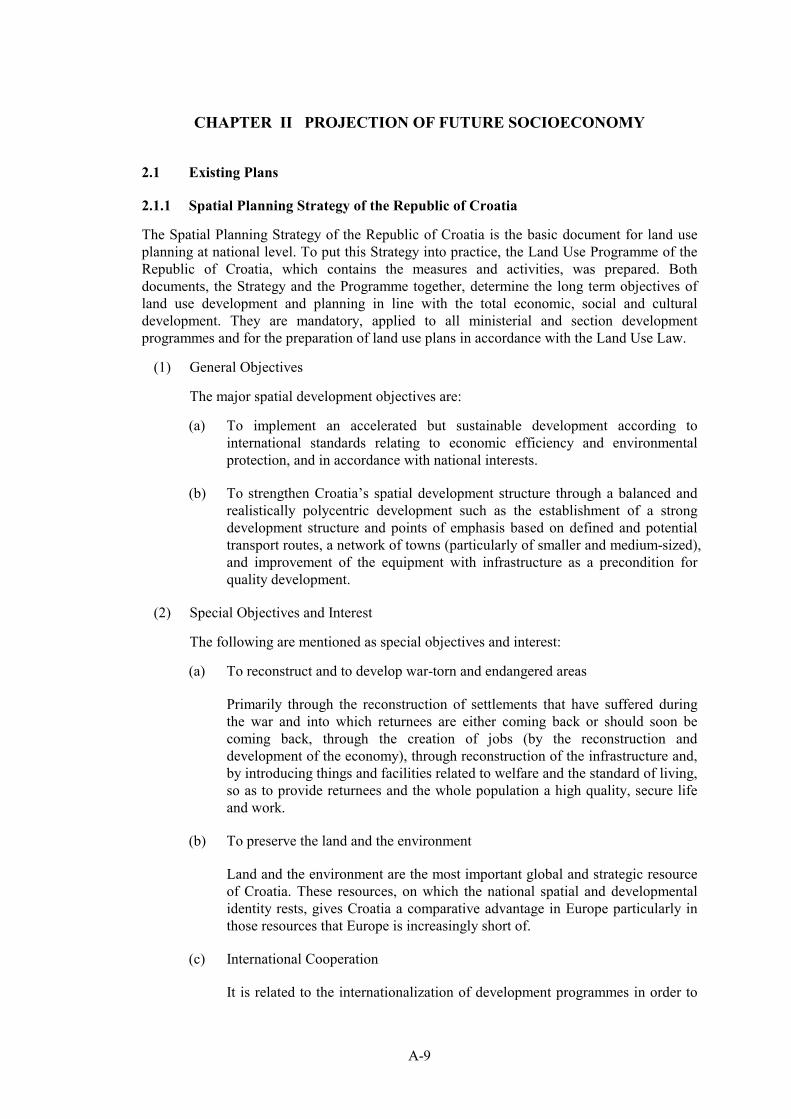
1.2.7 Other Socioeconomic Indicators
The levels of export and import for the period 1996-1999 are given below.
Year Export in Mil. US$ Import in Mil. US$ 1996 4,512.0 7,788.0 1997 4,171.0 9,104.0 1998 4,541.0 8,383.0 1999 4,279.70 7,777.4
A-9
CHAPTER II PROJECTION OF FUTURE SOCIOECONOMY
2.1 Existing Plans
2.1.1 Spatial Planning Strategy of the Republic of Croatia
The Spatial Planning Strategy of the Republic of Croatia is the basic document for land use planning at national level. To put this Strategy into practice, the Land Use Programme of the Republic of Croatia, which contains the measures and activities, was prepared. Both documents, the Strategy and the Programme together, determine the long term objectives of land use development and planning in line with the total economic, social and cultural development. They are mandatory, applied to all ministerial and section development programmes and for the preparation of land use plans in accordance with the Land Use Law.
(1) General Objectives
The major spatial development objectives are:
(a) To implement an accelerated but sustainable development according to international standards relating to economic efficiency and environmental protection, and in accordance with national interests.
(b) To strengthen Croatia’s spatial development structure through a balanced and realistically polycentric development such as the establishment of a strong development structure and points of emphasis based on defined and potential transport routes, a network of towns (particularly of smaller and medium-sized), and improvement of the equipment with infrastructure as a precondition for quality development.
(2) Special Objectives and Interest
The following are mentioned as special objectives and interest:
(a) To reconstruct and to develop war-torn and endangered areas
Primarily through the reconstruction of settlements that have suffered during the war and into which returnees are either coming back or should soon be coming back, through the creation of jobs (by the reconstruction and development of the economy), through reconstruction of the infrastructure and, by introducing things and facilities related to welfare and the standard of living, so as to provide returnees and the whole population a high quality, secure life and work.
(b) To preserve the land and the environment
Land and the environment are the most important global and strategic resource of Croatia. These resources, on which the national spatial and developmental identity rests, gives Croatia a comparative advantage in Europe particularly in those resources that Europe is increasingly short of.
(c) International Cooperation
It is related to the internationalization of development programmes in order to
A-10
speed up development, protect the environment, ensure expert, scientific, technological and material support from international figures, harmonization with the world qualitative development trends, integration into the European development system, and the protection of natural assets (especially those that are valuable in the world and in Europe).
(d) Advancement of the Effectiveness of Systems for Managing Space
This will permit the introduction of new views of development, new initiatives and figures, all the while ensuring protection and rational use of all national assets.
(3) Orientations for Development of Goals
For the development of goals, the Spatial Planning Strategy give some orientations where particular interests of Croatia are:
(a) To use the State’s favorable transport-related geographical and strategic position and its belonging to Central European, Danubian and Mediterranean spatial development units, along with the use of European integration elements for internal consolidation.
(b) Not to accept development models and out-dated technologies being abandoned by developed countries, but to foster development programs with technologies which promote space and do not pollute the environment (low water and energy consumption), while reconstruction of destroyed areas is to be carried out in a way to allow future development along with the correction of previous mistakes.
(c) To preserve physical and ecological integrity of resources areas by applying development models adequate to the features of space.
(d) To develop major infrastructure systems so as to enable the full functional integration of Croatian territory into the European networks.
(4) Goals
Finally, the Spatial Planning Strategy give some goals to be reached by each development sector. The following gives the referred goals for those sectors related to this study:
(a) Settlement Development Sector
(i) Growth reduction of large cities.
(ii) Functional restoration of smaller and medium-sized towns and local centers.
(iii) Prevention of unnecessary expansion, mainly, along the state road network and in areas of valuable natural resources.
(b) Energy Development Sector
(i) By year 2010, Croatia has to make up for the predicted lack of energy and ensure new 1,500 MW of power.
(ii) Provision of transport and distribution to ensure security of supply.
A-11
(c) Water Management Sector
(i) An increase of Croatia’s coverage with water supply from 63% to 81-90% is forecasted.
(ii) Significant investments in the construction of sewerage networks and treatment plants.
(d) Economic Development Sector
(i) Transformation and rehabilitation of existing, partially used or under-utilized industrial zones with shut down production.
(ii) Improvement on tourism development making use of the existence of preserved and attractive natural environment as an advantage of Croatian space.
2.1.2 Short Term Economic Revitalization Program
The Ministry of Finance had prepared a revitalization program for the period 2000-2004. Currently this program is under consideration of the Parliament. The main policies of this program are as follows:
(1) Privatization of public enterprises
(2) Improvement of the productivity of the industrial sector
(3) Promotion of investment domestically and internationally
(4) Pension system reform
(5) Promotion of tourism and business activities
2.2 Population
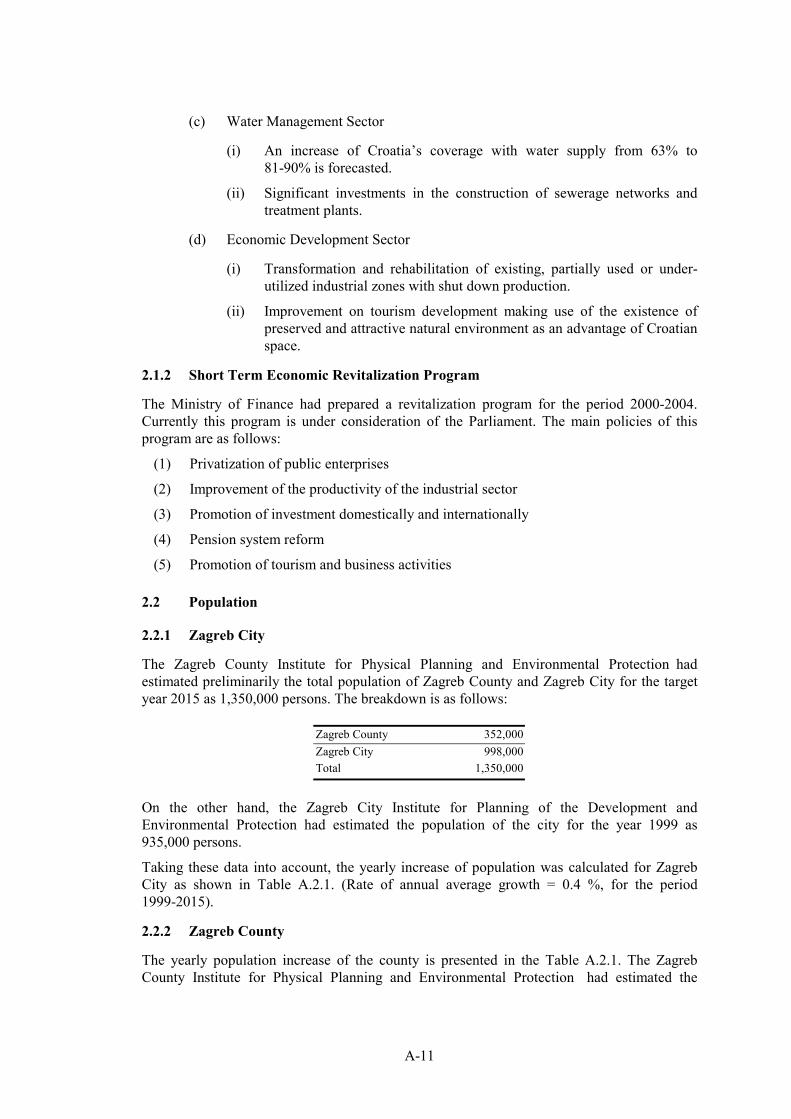
2.2.1 Zagreb City
The Zagreb County Institute for Physical Planning and Environmental Protection had estimated preliminarily the total population of Zagreb County and Zagreb City for the target year 2015 as 1,350,000 persons. The breakdown is as follows:
Zagreb County 352,000 Zagreb City 998,000 Total 1,350,000
On the other hand, the Zagreb City Institute for Planning of the Development and Environmental Protection had estimated the population of the city for the year 1999 as 935,000 persons.
Taking these data into account, the yearly increase of population was calculated for Zagreb City as shown in Table A.2.1. (Rate of annual average growth = 0.4 %, for the period 1999-2015).
2.2.2 Zagreb County
The yearly population increase of the county is presented in the Table A.2.1. The Zagreb County Institute for Physical Planning and Environmental Protection had estimated the
A-12
population of the Zagreb County for the target year 2015 as 352,000 persons, which will be distributed in the following manner:
(1) Towns and Municipalities with remarkable rate of growth of population
Dugo Selo, Ivanic Grad, Samobor, Velika Gorica, Zapresic, Bistra, Brckovljani, Brdovec, Rugvica, Stupnik and Sveta Nedjelja had a dynamic growth in its population in the last years and it is expected that they will grow in the future with an annual average rate of 0.95% for the period 1999-2015 (population in 2015 = 239,000 persons).
(2) Towns and Municipalities with lower rate of growth of population
Jastrebarsko, Sveti Ivan Zelina, Vrbovec, Bedenica, Dubrava, Dubravica, Farkasevac, Gradec, Jakovlje, Klinca Sela, Kloštar Ivanić, Krasic, Kravarsko, Kriz, Luka, Marija Gorica, Orle, Pisanoriva, Pokupsko, Preseka, Pusca, Rakovec and Zumberack have to grow with an annual average rate of 0.25% for the period 1999-2015 to reach the estimated population of 113,000 persons (352,000-239,000).
Among these towns and municipalities, Dugo Selo and Vrbovec were selected for feasibility study for the sewerage development system. The estimated population of these towns for the year 2015 are 13,632 and 13,999, respectively.
2.2.3 Sisak-Moslavina County
Sisak-Moslavina County also had suffered from the war in the period 1991-1995.
The population for the year 1999 and 2010 were estimated in the Physical Planning Report of the County which was provided by the Institute of Physical Planning of the Ministry of Environmental Protection and Physical Planning.
Taking into account these estimations, the projection for the target year 2015 was made. See Table A.2.2.
2.2.3 Karlovac County
The population of Karlovac Town for the year 2005 and 2015 were estimated by the Karlovac County Department of Physical Planning as 58,000 and 60,000 persons, respectively.
As for the other towns and municipalities, the projection of their population were made using the same estimated annual rate of growth as Karlovac Town. Refer to Table A.2.3.
2.3 GDP Projection at National Level
The Ministry of Finance had estimated in its short term economic revitalization program, which is under consideration of the Parliament, the following rates of growth of GDP for the period 2000-2004:
Year 2000 2001 2002 2003 2004 Average for the period GDP(%) 2.8 3 3.5 4 5 3.6
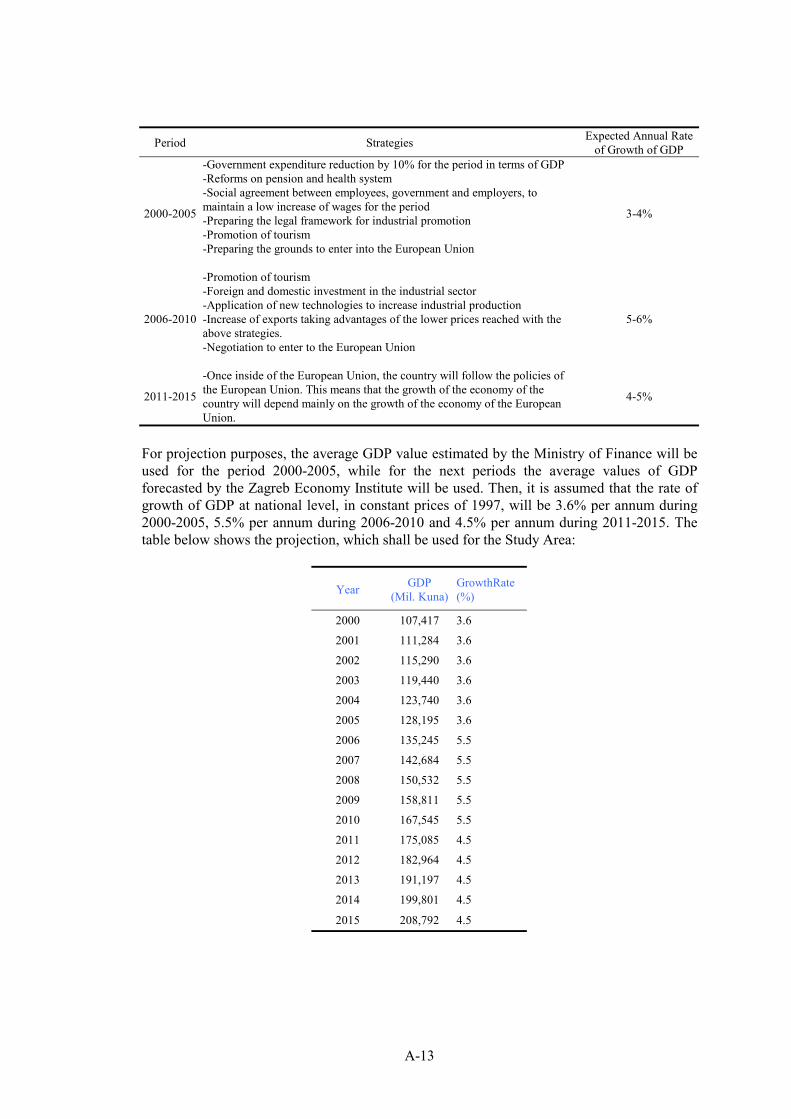
On the other hand, the Zagreb Economy Institute is preparing some strategies to be recommended to the government to make up for the continuous deficit in the balance of payment of the country recorded in the recent years. The table below presents the major strategies and the expected rate of growth of the GDP if they are applied by the government in the period 2000-2015.
A-13
Period Strategies Expected Annual Rate of Growth of GDP
2000-2005
-Government expenditure reduction by 10% for the period in terms of GDP -Reforms on pension and health system -Social agreement between employees, government and employers, to maintain a low increase of wages for the period -Preparing the legal framework for industrial promotion -Promotion of tourism -Preparing the grounds to enter into the European Union
3-4%
2006-2010
-Promotion of tourism -Foreign and domestic investment in the industrial sector -Application of new technologies to increase industrial production -Increase of exports taking advantages of the lower prices reached with the above strategies. -Negotiation to enter to the European Union
5-6%
2011-2015
-Once inside of the European Union, the country will follow the policies of the European Union. This means that the growth of the economy of the country will depend mainly on the growth of the economy of the European Union.
4-5%
For projection purposes, the average GDP value estimated by the Ministry of Finance will be used for the period 2000-2005, while for the next periods the average values of GDP forecasted by the Zagreb Economy Institute will be used. Then, it is assumed that the rate of growth of GDP at national level, in constant prices of 1997, will be 3.6% per annum during 2000-2005, 5.5% per annum during 2006-2010 and 4.5% per annum during 2011-2015. The table below shows the projection, which shall be used for the Study Area:
Year GDP (Mil. Kuna)
GrowthRate (%)
2000 107,417 3.6
2001 111,284 3.6
2002 115,290 3.6
2003 119,440 3.6
2004 123,740 3.6
2005 128,195 3.6
2006 135,245 5.5
2007 142,684 5.5
2008 150,532 5.5
2009 158,811 5.5
2010 167,545 5.5
2011 175,085 4.5
2012 182,964 4.5
2013 191,197 4.5
2014 199,801 4.5
2015 208,792 4.5
A-14
2.4 Industry
The Ministry of Finance had estimated the current rate of growth of the manufacture sector as 2.7%. The estimation was made based on the observation of values during the months of January-September of year 2000.
Since no projection on industrial growth was available at the national/local level, it was assumed that the industrial sector will grow at the same values of the estimated GDP until the target year, as indicated below:
Period 2000-2005 2006-2010 2011-2015 Rate of Growth of Industry Sector (%) 3.6 5.5 4.5
2.5 Agriculture and Livestock
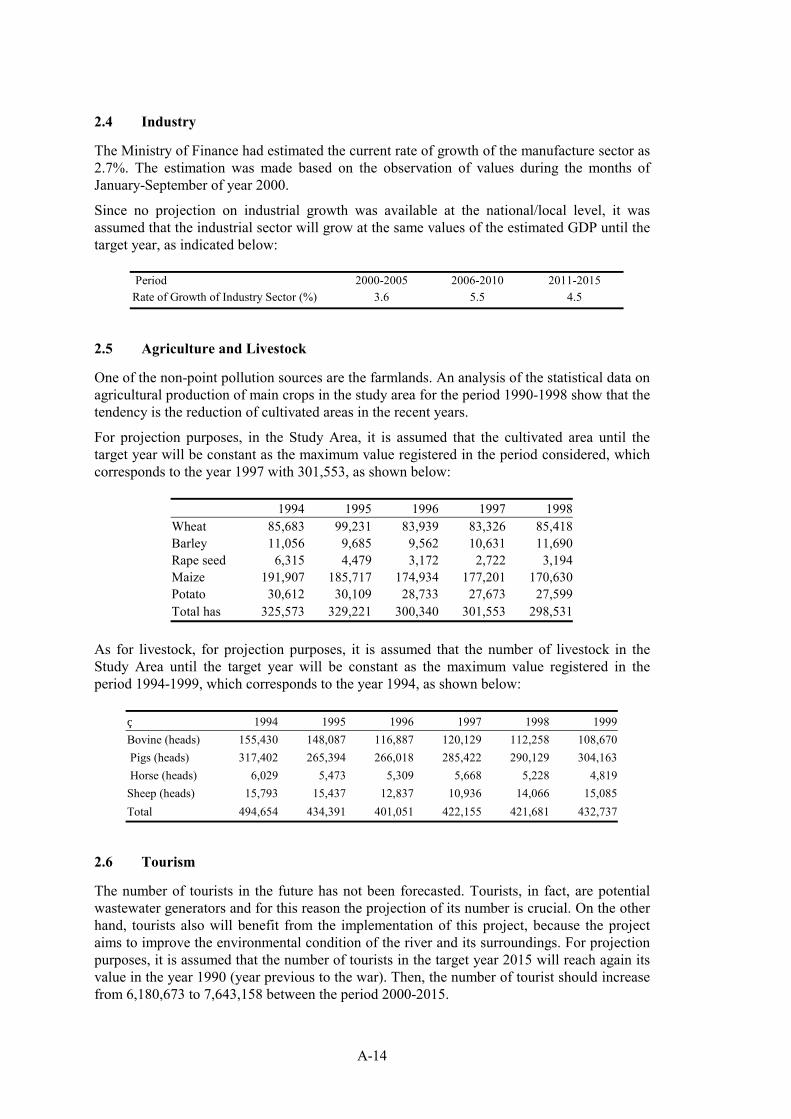
One of the non-point pollution sources are the farmlands. An analysis of the statistical data on agricultural production of main crops in the study area for the period 1990-1998 show that the tendency is the reduction of cultivated areas in the recent years.
For projection purposes, in the Study Area, it is assumed that the cultivated area until the target year will be constant as the maximum value registered in the period considered, which corresponds to the year 1997 with 301,553, as shown below:
1994 1995 1996 1997 1998 Wheat 85,683 99,231 83,939 83,326 85,418 Barley 11,056 9,685 9,562 10,631 11,690 Rape seed 6,315 4,479 3,172 2,722 3,194 Maize 191,907 185,717 174,934 177,201 170,630 Potato 30,612 30,109 28,733 27,673 27,599 Total has 325,573 329,221 300,340 301,553 298,531
As for livestock, for projection purposes, it is assumed that the number of livestock in the Study Area until the target year will be constant as the maximum value registered in the period 1994-1999, which corresponds to the year 1994, as shown below:
1994 1995 1996 1997 1998 1999 Bovine (heads) 155,430 148,087 116,887 120,129 112,258 108,670 Pigs (heads) 317,402 265,394 266,018 285,422 290,129 304,163 Horse (heads) 6,029 5,473 5,309 5,668 5,228 4,819 Sheep (heads) 15,793 15,437 12,837 10,936 14,066 15,085 Total 494,654 434,391 401,051 422,155 421,681 432,737
2.6 Tourism
The number of tourists in the future has not been forecasted. Tourists, in fact, are potential wastewater generators and for this reason the projection of its number is crucial. On the other hand, tourists also will benefit from the implementation of this project, because the project aims to improve the environmental condition of the river and its surroundings. For projection purposes, it is assumed that the number of tourists in the target year 2015 will reach again its value in the year 1990 (year previous to the war). Then, the number of tourist should increase from 6,180,673 to 7,643,158 between the period 2000-2015.
A-15
REFERENCES
1) Physical Development Plan of Zagreb County. Report 1. Draft Version, September, 2000.
2) Data on population provided by the Zagreb City Institute for Planning of the Development and Environmental Protection.
3) Physical Development Plan of Sisak-Moslavina County. Final Report. Year 2000. Information provided by the Institute of Physical Planning depending on the Ministry of Environmental Protection and Physical Planning.
4) Data provided by Karlovac County Department for Physical Planning
5) Spatial Planning Strategy of the Republic of Croatia. Ministry of Environmental Protection and Physical Planning.
6) Revitalization Program. Ministry of Finance
7) Estimation on GDP by Zagreb Economy Institute
8) Data provided by the Ministry of Tourism
9) Data on Agriculture and fish production provided by Ministry of Agriculture and Forestry
10) Electricity Company for Croatia
11) Electricity Company of Karlovac County
12) Data on population by some Municipalities and Towns of Karlovac and Sisak-Moslavina Counties
13) Data on population given by the Water & Sewerage Company of Sisak town
14) Data on population given by Police Station of Dugo Selo town
15) Croatian National Bank
16) Central Bureau of Statistics
17) Chamber of Economy of Zagreb City
18) Chamber of Economy of Zagreb County
19) Chamber of Economy of Sisak-Moslavina County
20) Chamber of Economy of Karlovac County

TABLES
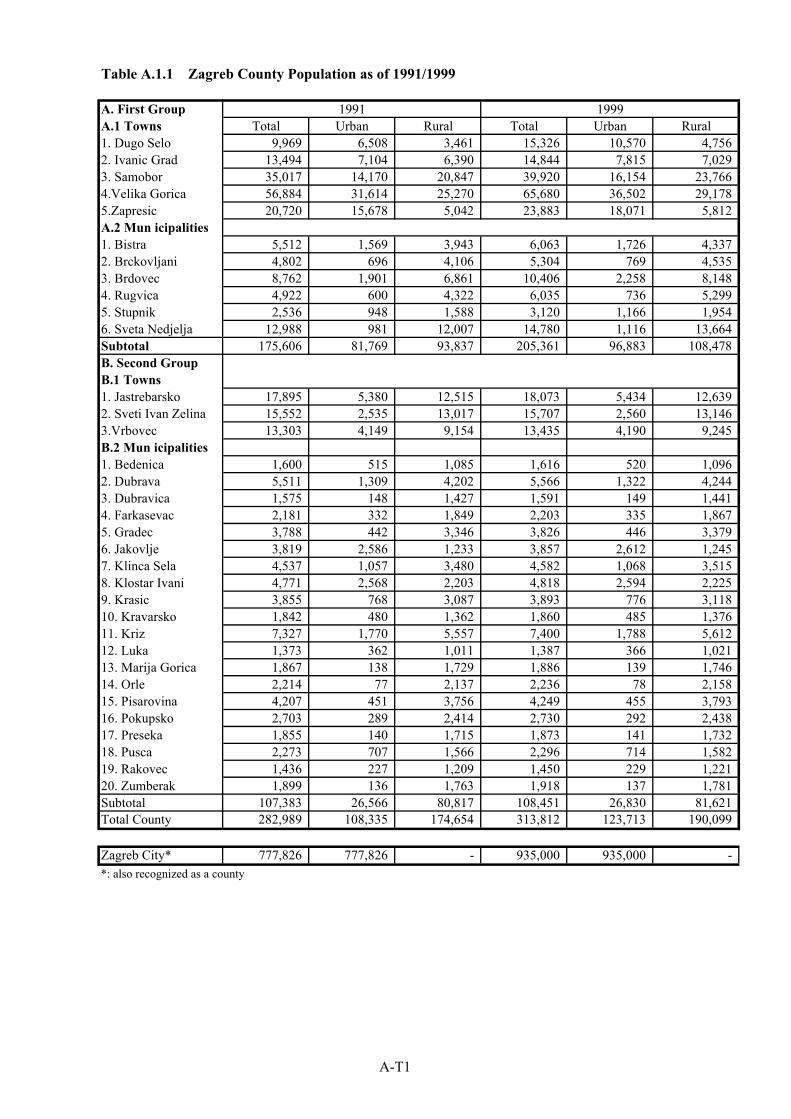
Table A.1.1 Zagreb County Population as of 1991/1999
A. First Group 1991 1999A.1 Towns Total Urban Rural Total Urban Rural1. Dugo Selo 9,969 6,508 3,461 15,326 10,570 4,756 2. Ivanic Grad 13,494 7,104 6,390 14,844 7,815 7,029 3. Samobor 35,017 14,170 20,847 39,920 16,154 23,766 4.Velika Gorica 56,884 31,614 25,270 65,680 36,502 29,178 5.Zapresic 20,720 15,678 5,042 23,883 18,071 5,812 A.2 Mun icipalities1. Bistra 5,512 1,569 3,943 6,063 1,726 4,337 2. Brckovljani 4,802 696 4,106 5,304 769 4,535 3. Brdovec 8,762 1,901 6,861 10,406 2,258 8,148 4. Rugvica 4,922 600 4,322 6,035 736 5,299 5. Stupnik 2,536 948 1,588 3,120 1,166 1,954 6. Sveta Nedjelja 12,988 981 12,007 14,780 1,116 13,664 Subtotal 175,606 81,769 93,837 205,361 96,883 108,478 B. Second GroupB.1 Towns 1. Jastrebarsko 17,895 5,380 12,515 18,073 5,434 12,639 2. Sveti Ivan Zelina 15,552 2,535 13,017 15,707 2,560 13,146 3.Vrbovec 13,303 4,149 9,154 13,435 4,190 9,245 B.2 Mun icipalities 1. Bedenica 1,600 515 1,085 1,616 520 1,096 2. Dubrava 5,511 1,309 4,202 5,566 1,322 4,244 3. Dubravica 1,575 148 1,427 1,591 149 1,441 4. Farkasevac 2,181 332 1,849 2,203 335 1,867 5. Gradec 3,788 442 3,346 3,826 446 3,379 6. Jakovlje 3,819 2,586 1,233 3,857 2,612 1,245 7. Klinca Sela 4,537 1,057 3,480 4,582 1,068 3,515 8. Klostar Ivani 4,771 2,568 2,203 4,818 2,594 2,225 9. Krasic 3,855 768 3,087 3,893 776 3,118 10. Kravarsko 1,842 480 1,362 1,860 485 1,376 11. Kriz 7,327 1,770 5,557 7,400 1,788 5,612 12. Luka 1,373 362 1,011 1,387 366 1,021 13. Marija Gorica 1,867 138 1,729 1,886 139 1,746 14. Orle 2,214 77 2,137 2,236 78 2,158 15. Pisarovina 4,207 451 3,756 4,249 455 3,793 16. Pokupsko 2,703 289 2,414 2,730 292 2,438 17. Preseka 1,855 140 1,715 1,873 141 1,732 18. Pusca 2,273 707 1,566 2,296 714 1,582 19. Rakovec 1,436 227 1,209 1,450 229 1,221 20. Zumberak 1,899 136 1,763 1,918 137 1,781 Subtotal 107,383 26,566 80,817 108,451 26,830 81,621 Total County 282,989 108,335 174,654 313,812 123,713 190,099
Zagreb City* 777,826 777,826 - 935,000 935,000 - *: also recognized as a county
A-T1
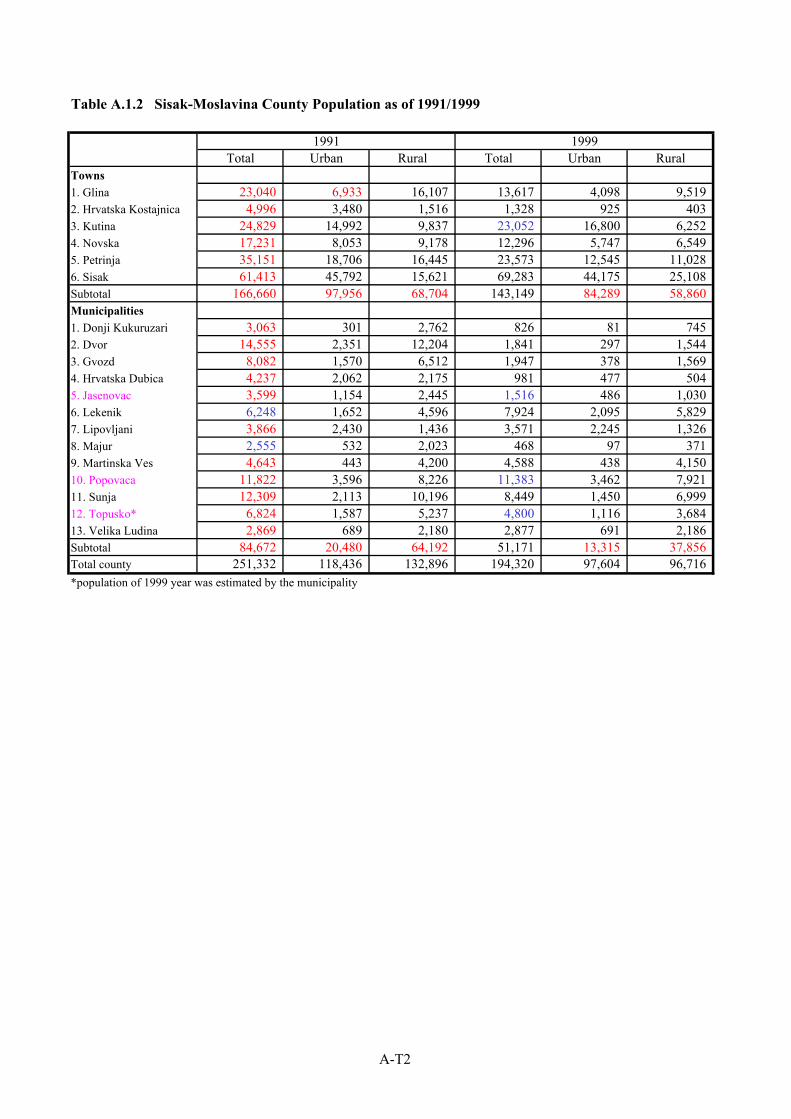
Table A.1.2 Sisak-Moslavina County Population as of 1991/1999
1991 1999Total Urban Rural Total Urban Rural
Towns 1. Glina 23,040 6,933 16,107 13,617 4,098 9,519 2. Hrvatska Kostajnica 4,996 3,480 1,516 1,328 925 403 3. Kutina 24,829 14,992 9,837 23,052 16,800 6,252 4. Novska 17,231 8,053 9,178 12,296 5,747 6,549 5. Petrinja 35,151 18,706 16,445 23,573 12,545 11,028 6. Sisak 61,413 45,792 15,621 69,283 44,175 25,108 Subtotal 166,660 97,956 68,704 143,149 84,289 58,860 Municipalities 1. Donji Kukuruzari 3,063 301 2,762 826 81 745 2. Dvor 14,555 2,351 12,204 1,841 297 1,544 3. Gvozd 8,082 1,570 6,512 1,947 378 1,569 4. Hrvatska Dubica 4,237 2,062 2,175 981 477 504 5. Jasenovac 3,599 1,154 2,445 1,516 486 1,030 6. Lekenik 6,248 1,652 4,596 7,924 2,095 5,829 7. Lipovljani 3,866 2,430 1,436 3,571 2,245 1,326 8. Majur 2,555 532 2,023 468 97 371 9. Martinska Ves 4,643 443 4,200 4,588 438 4,150 10. Popovaca 11,822 3,596 8,226 11,383 3,462 7,921 11. Sunja 12,309 2,113 10,196 8,449 1,450 6,999 12. Topusko* 6,824 1,587 5,237 4,800 1,116 3,684 13. Velika Ludina 2,869 689 2,180 2,877 691 2,186 Subtotal 84,672 20,480 64,192 51,171 13,315 37,856 Total county 251,332 118,436 132,896 194,320 97,604 96,716 *population of 1999 year was estimated by the municipality
A-T2
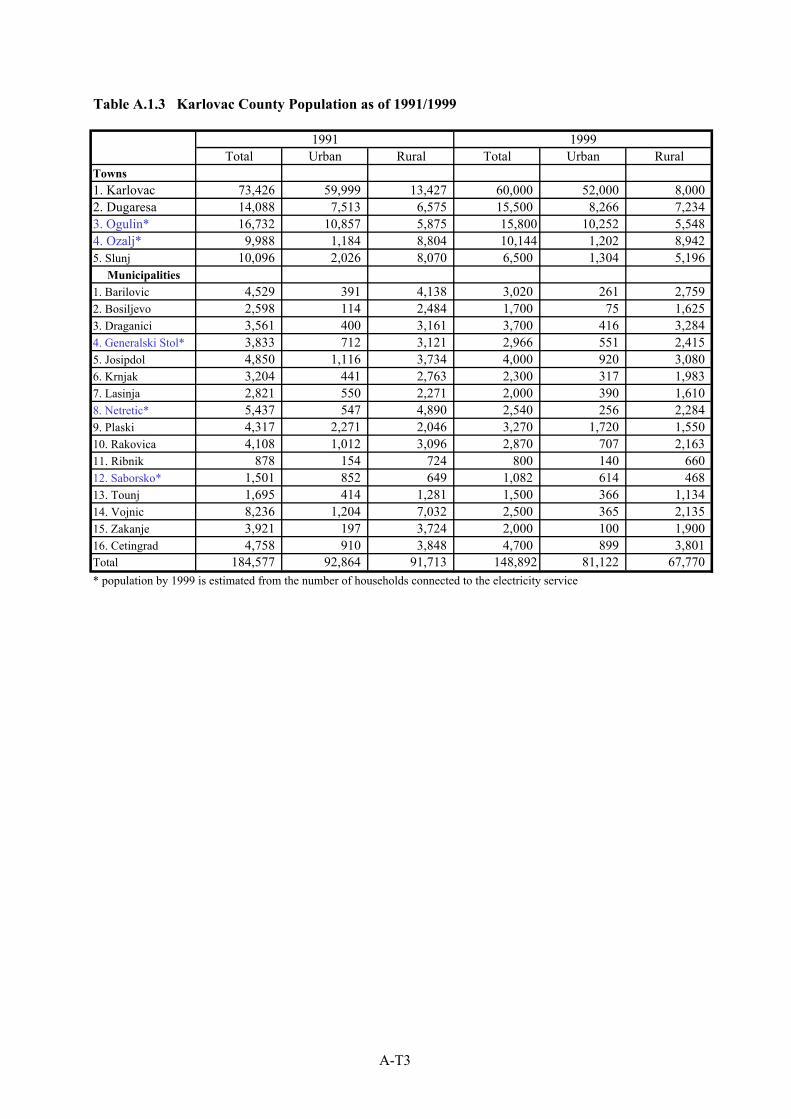
Table A.1.3 Karlovac County Population as of 1991/1999 1991 1999 Total Urban Rural Total Urban RuralTowns 1. Karlovac 73,426 59,999 13,427 60,000 52,000 8,000 2. Dugaresa 14,088 7,513 6,575 15,500 8,266 7,234 3. Ogulin* 16,732 10,857 5,875 15,800 10,252 5,548 4. Ozalj* 9,988 1,184 8,804 10,144 1,202 8,942 5. Slunj 10,096 2,026 8,070 6,500 1,304 5,196
Municipalities1. Barilovic 4,529 391 4,138 3,020 261 2,759 2. Bosiljevo 2,598 114 2,484 1,700 75 1,625 3. Draganici 3,561 400 3,161 3,700 416 3,284 4. Generalski Stol* 3,833 712 3,121 2,966 551 2,415 5. Josipdol 4,850 1,116 3,734 4,000 920 3,080 6. Krnjak 3,204 441 2,763 2,300 317 1,983 7. Lasinja 2,821 550 2,271 2,000 390 1,610 8. Netretic* 5,437 547 4,890 2,540 256 2,284 9. Plaski 4,317 2,271 2,046 3,270 1,720 1,550 10. Rakovica 4,108 1,012 3,096 2,870 707 2,163 11. Ribnik 878 154 724 800 140 660 12. Saborsko* 1,501 852 649 1,082 614 468 13. Tounj 1,695 414 1,281 1,500 366 1,134 14. Vojnic 8,236 1,204 7,032 2,500 365 2,135 15. Zakanje 3,921 197 3,724 2,000 100 1,900 16. Cetingrad 4,758 910 3,848 4,700 899 3,801 Total 184,577 92,864 91,713 148,892 81,122 67,770 * population by 1999 is estimated from the number of households connected to the electricity service
A-T3
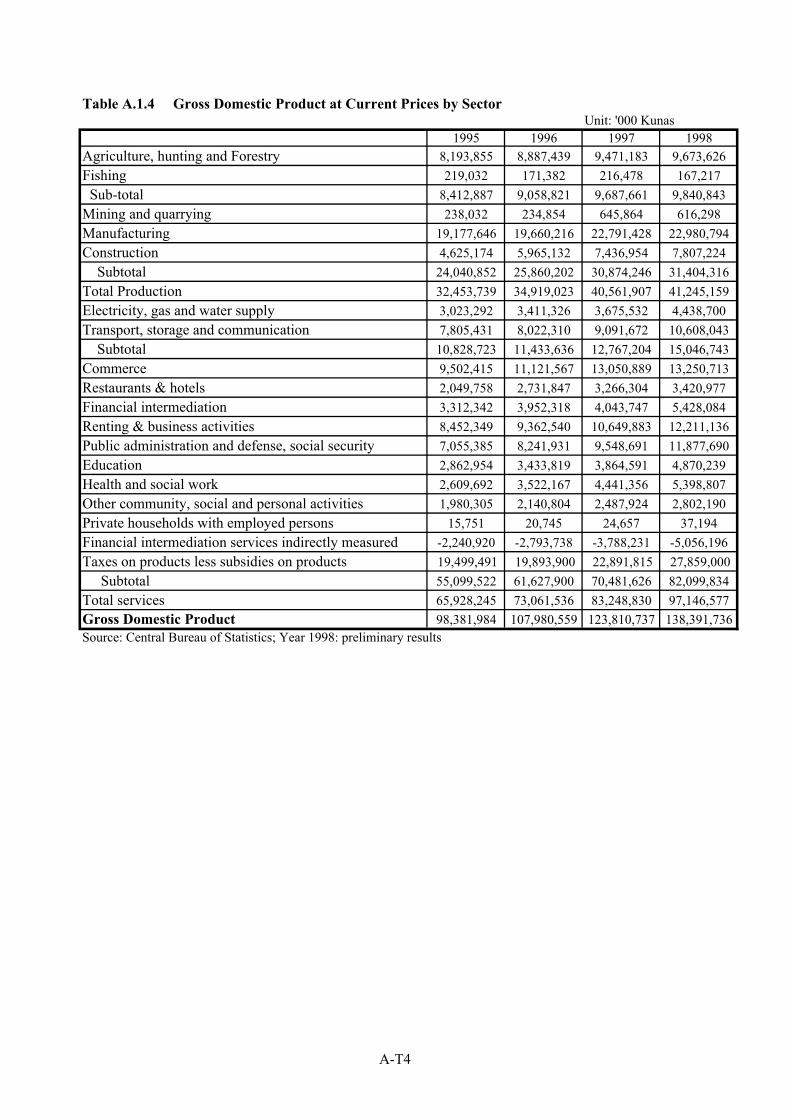
Table A.1.4 Gross Domestic Product at Current Prices by SectorUnit: '000 Kunas
1995 1996 1997 1998Agriculture, hunting and Forestry 8,193,855 8,887,439 9,471,183 9,673,626Fishing 219,032 171,382 216,478 167,217 Sub-total 8,412,887 9,058,821 9,687,661 9,840,843Mining and quarrying 238,032 234,854 645,864 616,298Manufacturing 19,177,646 19,660,216 22,791,428 22,980,794Construction 4,625,174 5,965,132 7,436,954 7,807,224 Subtotal 24,040,852 25,860,202 30,874,246 31,404,316Total Production 32,453,739 34,919,023 40,561,907 41,245,159Electricity, gas and water supply 3,023,292 3,411,326 3,675,532 4,438,700Transport, storage and communication 7,805,431 8,022,310 9,091,672 10,608,043 Subtotal 10,828,723 11,433,636 12,767,204 15,046,743Commerce 9,502,415 11,121,567 13,050,889 13,250,713Restaurants & hotels 2,049,758 2,731,847 3,266,304 3,420,977Financial intermediation 3,312,342 3,952,318 4,043,747 5,428,084Renting & business activities 8,452,349 9,362,540 10,649,883 12,211,136Public administration and defense, social security 7,055,385 8,241,931 9,548,691 11,877,690Education 2,862,954 3,433,819 3,864,591 4,870,239Health and social work 2,609,692 3,522,167 4,441,356 5,398,807Other community, social and personal activities 1,980,305 2,140,804 2,487,924 2,802,190Private households with employed persons 15,751 20,745 24,657 37,194Financial intermediation services indirectly measured -2,240,920 -2,793,738 -3,788,231 -5,056,196Taxes on products less subsidies on products 19,499,491 19,893,900 22,891,815 27,859,000 Subtotal 55,099,522 61,627,900 70,481,626 82,099,834Total services 65,928,245 73,061,536 83,248,830 97,146,577Gross Domestic Product 98,381,984 107,980,559 123,810,737 138,391,736Source: Central Bureau of Statistics; Year 1998: preliminary results
A-T4
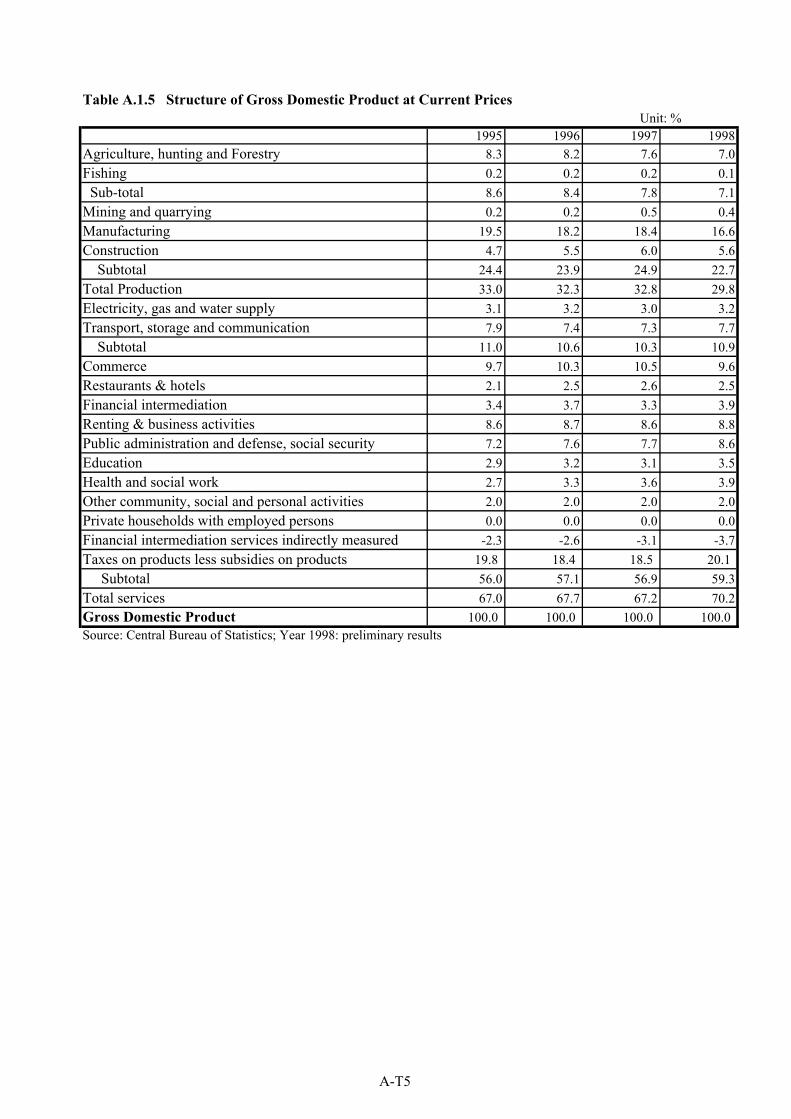
Table A.1.5 Structure of Gross Domestic Product at Current Prices Unit: %
1995 1996 1997 1998Agriculture, hunting and Forestry 8.3 8.2 7.6 7.0Fishing 0.2 0.2 0.2 0.1 Sub-total 8.6 8.4 7.8 7.1Mining and quarrying 0.2 0.2 0.5 0.4Manufacturing 19.5 18.2 18.4 16.6Construction 4.7 5.5 6.0 5.6 Subtotal 24.4 23.9 24.9 22.7Total Production 33.0 32.3 32.8 29.8Electricity, gas and water supply 3.1 3.2 3.0 3.2Transport, storage and communication 7.9 7.4 7.3 7.7 Subtotal 11.0 10.6 10.3 10.9Commerce 9.7 10.3 10.5 9.6Restaurants & hotels 2.1 2.5 2.6 2.5Financial intermediation 3.4 3.7 3.3 3.9Renting & business activities 8.6 8.7 8.6 8.8Public administration and defense, social security 7.2 7.6 7.7 8.6Education 2.9 3.2 3.1 3.5Health and social work 2.7 3.3 3.6 3.9Other community, social and personal activities 2.0 2.0 2.0 2.0Private households with employed persons 0.0 0.0 0.0 0.0Financial intermediation services indirectly measured -2.3 -2.6 -3.1 -3.7Taxes on products less subsidies on products 19.8 18.4 18.5 20.1 Subtotal 56.0 57.1 56.9 59.3Total services 67.0 67.7 67.2 70.2Gross Domestic Product 100.0 100.0 100.0 100.0 Source: Central Bureau of Statistics; Year 1998: preliminary results
A-T5
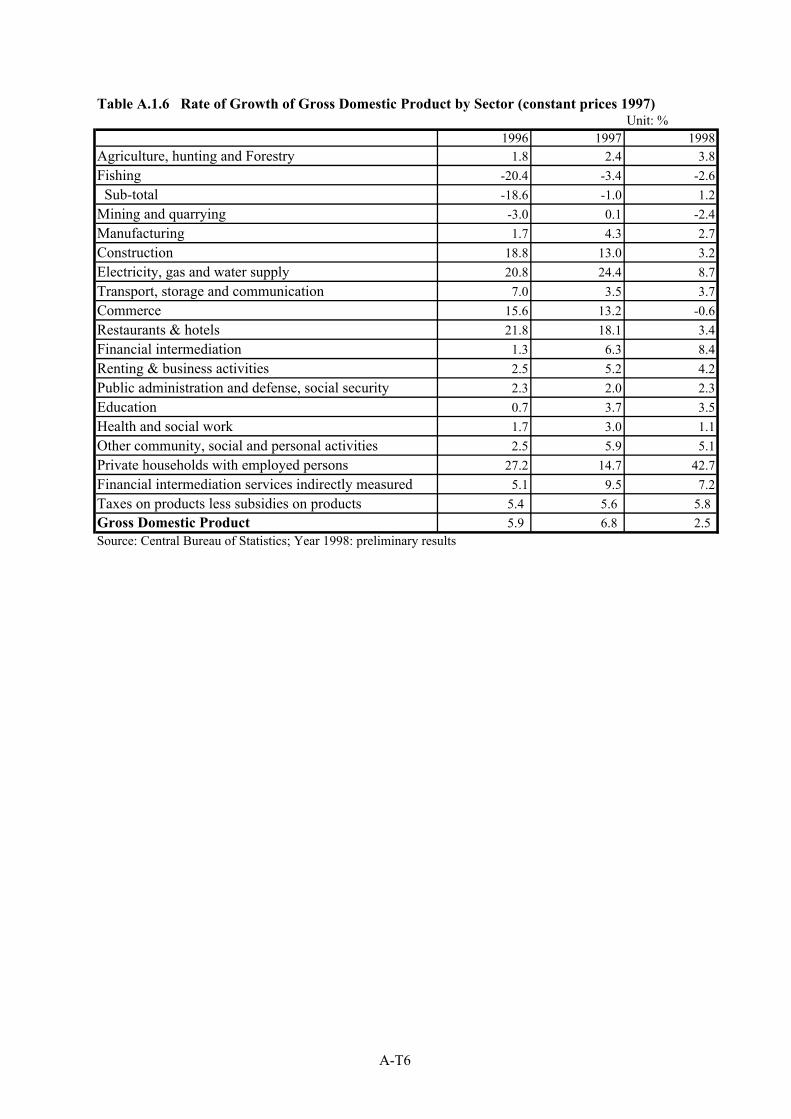
Table A.1.6 Rate of Growth of Gross Domestic Product by Sector (constant prices 1997)Unit: %
1996 1997 1998Agriculture, hunting and Forestry 1.8 2.4 3.8Fishing -20.4 -3.4 -2.6 Sub-total -18.6 -1.0 1.2Mining and quarrying -3.0 0.1 -2.4Manufacturing 1.7 4.3 2.7Construction 18.8 13.0 3.2Electricity, gas and water supply 20.8 24.4 8.7Transport, storage and communication 7.0 3.5 3.7Commerce 15.6 13.2 -0.6Restaurants & hotels 21.8 18.1 3.4Financial intermediation 1.3 6.3 8.4Renting & business activities 2.5 5.2 4.2Public administration and defense, social security 2.3 2.0 2.3Education 0.7 3.7 3.5Health and social work 1.7 3.0 1.1Other community, social and personal activities 2.5 5.9 5.1Private households with employed persons 27.2 14.7 42.7Financial intermediation services indirectly measured 5.1 9.5 7.2Taxes on products less subsidies on products 5.4 5.6 5.8 Gross Domestic Product 5.9 6.8 2.5 Source: Central Bureau of Statistics; Year 1998: preliminary results
A-T6
Tabl
e A
.1.7
Su
mm
ary
of P
rodu
ctio
n V
olum
e by
Sel
ecte
d In
dust
rial
Sec
tors
in C
roat
ia
Ty
pe o
f Ind
ustry
1989
1990
1991
1992
1993
1994
1995
1996
1997
1998
*Rat
e %
Man
ufac
ture
of f
ood
prod
ucts
, ton
s2,
437,
829
2,42
1,23
21,
937,
759
1,75
7,65
41,
626,
995
1,51
2,92
41,
555,
473
1,50
7,83
81,
435,
030
1,64
3,53
1-3
3M
anuf
actu
re o
f bev
erag
es, h
l3,
958,
270
4,64
2,80
83,
786,
877
3,79
0,12
13,
504,
181
4,53
3,81
74,
828,
208
5,22
0,52
05,
447,
952
5,91
9,70
350
Man
ufac
ture
of t
extil
es, t
ons
47,8
9137
,359
22,5
8620
,437
16,8
0516
,785
14,2
759,
365
7,57
27,
018
-85
Man
ufac
ture
of p
etro
leum
pro
duct
s, to
ns6,
412,
302
6,64
6,78
34,
325,
840
3,85
8,79
84,
376,
062
4,34
2,37
24,
999,
495
4,31
3,61
84,
356,
539
4,34
0,80
5-3
2M
anuf
actu
re o
f che
mic
als a
nd c
hem
ical
pro
duct
s1,
109,
678
852,
537
870,
952
1,08
2,60
176
3,63
984
1,11
486
9,97
287
8,68
292
0,97
174
3,91
8-3
3M
anuf
atur
e of
iron
and
stee
l, to
ns1,
145,
912
964,
474
598,
367
421,
559
318,
527
298,
882
195,
624
157,
561
205,
809
278,
939
-76
Man
ufac
ture
of
met
als p
rodu
cts,
tons
26
0,42
621
2,05
612
6,94
992
,820
84,0
0871
,200
72,1
8480
,456
94,3
7596
,542
-63
Man
ufac
ture
of m
achi
nery
and
equ
ipm
ent,
tons
83,9
5064
,606
31,4
4517
,807
15,2
1014
,252
17,1
3716
,087
17,7
8520
,092
-76
Ther
moe
lect
ric, M
Wh
4,01
4,78
94,
942,
876
3,04
3,45
44,
521,
753
4,95
3,06
33,
290,
733
3,53
1,20
63,
326,
602
4,35
3,10
35,
113,
150
27*R
ate
of in
crea
se/d
ecre
ase
in th
e pe
riod
1988
/199
9
A-T7
Tabl
e A
.1.8
Pr
oduc
tion
Vol
ume
by C
ateg
ory
in th
e Se
ctor
of M
anuf
actu
re o
f Bev
erag
esU
nit:
hl
1989
1990
1991
1992
1993
1994
1995
1996
1997
1998
*Rat
e %
1) B
eer
2,29
2,32
92,
800,
703
2,24
8,78
42,
720,
037
2,48
1,34
43,
121,
755
3,16
5,64
53,
291,
593
3,60
6,54
63,
759,
435
642)
Dis
tille
d al
coho
lic b
ever
ages
784,
800
789,
343
757,
233
317,
036
292,
931
287,
988
265,
478
262,
000
260,
366
240,
778
-69
3) S
oft d
rinks
881,
141
1,05
2,76
278
0,86
075
3,04
872
9,90
61,
124,
074
1,39
7,08
51,
666,
927
1,58
1,04
01,
919,
490
118
Tota
l3,
958,
270
4,64
2,80
83,
786,
877
3,79
0,12
13,
504,
181
4,53
3,81
74,
828,
208
5,22
0,52
05,
447,
952
5,91
9,70
350
*Rat
e of
incr
ease
/dec
reas
e in
the
perio
d 19
88/1
999
Tabl
e A
.1.9
Pr
oduc
tion
Vol
ume
by C
ateg
ory
in th
e Se
ctor
of M
anuf
actu
re o
f Pet
role
um P
rodu
cts
Uni
t: to
ns
1989
1990
1991
1992
1993
1994
1995
1996
1997
1998
*Rat
e %
1) M
otor
pet
rol
1,73
3,84
11,
713,
106
1,16
0,84
386
2,18
296
3,52
11,
124,
064
1,35
3,52
61,
057,
784
1,09
6,63
51,
116,
880
-36
2) C
rude
pet
rol f
or p
etro
chem
ical
indu
stry
329,
220
217,
809
171,
079
117,
791
164,
131
230,
941
352,
936
215,
002
210,
648
193,
574
-41
3) W
hite
spiri
t5,
529
5,47
03,
507
3,02
03,
159
2,80
92,
868
2,17
83,
130
3,39
4-3
94)
Mot
or fu
el18
0,84
917
6,28
253
,894
29,0
0888
,007
101,
601
101,
007
84,7
0592
,909
87,8
07-5
15)
Ker
osen
e4,
753
5,20
74,
102
4,97
47,
445
7,76
37,
523
10,3
313,
506
562
-88
6) O
il ga
s1,
488,
079
1,39
8,42
890
2,51
269
6,80
477
2,37
595
1,93
71,
140,
548
832,
450
811,
424
906,
293
-39
7) F
uel o
il2,
217,
361
2,74
7,74
81,
764,
324
1,91
5,65
52,
146,
536
1,65
7,31
71,
817,
445
1,84
1,04
71,
850,
222
1,82
7,64
6-1
88)
Lub
rican
ts, o
il an
d gr
ease
213,
191
163,
823
89,1
2069
,717
89,2
7684
,709
78,1
7675
,321
95,7
5761
,038
-71
9) B
itum
en23
9,47
921
8,91
017
6,45
915
9,64
714
1,61
218
1,23
114
5,46
619
4,80
019
2,30
814
3,61
1-4
0To
tal
6,41
2,30
26,
646,
783
4,32
5,84
03,
858,
798
4,37
6,06
24,
342,
372
4,99
9,49
54,
313,
618
4,35
6,53
94,
340,
805
-32
*Rat
e of
incr
ease
/dec
reas
e in
the
perio
d 19
88/1
999
A-T8
Tabl
e A
.1.1
0 P
rodu
ctio
n V
olum
e by
Cat
egor
y in
the
Sect
or o
f Man
ufac
ture
of C
hem
ical
s and
Che
mic
al P
rodu
cts
Uni
t: to
ns
1989
1990
1991
1992
1993
1994
1995
1996
1997
1998
*Rat
e %
1) P
lant
pes
ticid
es a
nd h
erbi
cide
s15
,599
15,6
6110
,841
9,06
97,
568
7,66
37,
431
8,70
08,
813
7,25
0-5
42)
Ure
a41
5,96
028
0,35
432
8,02
935
6,99
527
3,22
627
8,98
131
4,13
635
3,82
237
5,42
627
9,11
1-3
33)
Com
poun
d fe
rtiliz
ers
678,
119
556,
522
532,
082
716,
537
482,
845
554,
470
548,
405
516,
160
536,
732
457,
557
-33
Tota
l1,
109,
678
852,
537
870,
952
1,08
2,60
176
3,63
984
1,11
486
9,97
287
8,68
292
0,97
174
3,91
8-3
3*R
ate
of in
crea
se/d
ecre
ase
in th
e pe
riod
1988
/199
9
Tabl
e A
.1.1
1 P
rodu
ctio
n V
olum
e by
Cat
egor
y in
the
Sect
or o
f Man
ufac
ture
of I
ron
and
Stee
lU
nit:
tons
19
8919
9019
9119
9219
9319
9419
9519
9619
9719
98*R
ate
%1)
Cru
de st
eel,
Elec
tric
Arc
Fur
nace
189,
852
170,
328
119,
759
101,
942
73,8
1563
,352
45,3
7345
,752
70,6
6010
4,11
4-4
52)
Sem
i-fis
hish
ed ro
lled
prod
ucts
42,0
7831
,881
23,8
165,
666
6,59
12,
430
3,89
32,
842
281
0-1
003)
Con
cret
e re
info
rcer
s and
rolle
d w
ire10
7,58
010
9,12
481
,592
55,2
7535
,543
42,6
0826
,742
21,7
9729
,408
42,5
37-6
04)
Stri
p st
eel
242,
471
183,
774
56,9
6861
,861
51,7
1245
,048
35,1
4422
,283
7,76
40
-100
5) S
eam
less
pip
es16
6,62
212
6,81
996
,131
47,5
6937
,550
26,1
1612
,966
16,9
2331
,904
56,6
73-6
66)
Wel
ded
pipe
s24
7,01
621
2,59
395
,838
67,6
1676
,711
64,9
9145
,425
37,4
0541
,561
63,8
44-7
47)
Fer
ro a
lloys
150,
293
129,
955
124,
263
81,6
3036
,605
54,3
3726
,081
10,5
5924
,231
11,7
71-9
2To
tal
1,14
5,91
296
4,47
459
8,36
742
1,55
931
8,52
729
8,88
219
5,62
415
7,56
120
5,80
927
8,93
9-7
6*R
ate
of in
crea
se/d
ecre
ase
in th
e pe
riod
1988
/199
9
A-T9
Tabl
e A
.1.1
2 P
rodu
ctio
n V
olum
e by
Cat
egor
y in
the
Sect
or o
f Man
ufac
ture
of F
ood
Prod
ucts
Uni
t: to
ns
1989
1990
1991
1992
1993
1994
1995
1996
1997
1998
*Rat
e %
1) W
heat
flou
r48
9,17
446
8,84
442
8,66
341
8,14
234
6,46
732
4,11
432
3,64
431
4,89
630
5,26
329
7,64
3-3
92)
Bre
ad25
5,80
722
7,48
818
4,34
818
8,75
917
7,79
616
4,21
615
6,91
413
9,45
715
5,14
113
9,72
2-4
53)
Pas
ta17
,134
15,8
9316
,301
13,8
299,
849
9,26
78,
884
9,21
47,
145
7,29
0-5
74)
Fru
it ju
ices
14,6
4418
,327
15,3
3212
,309
18,1
2116
,321
22,6
9517
,783
8,78
411
,894
-19
5) C
anne
d ve
geta
bles
24,5
6623
,266
23,0
4325
,574
21,7
6323
,843
22,7
0919
,216
16,5
0822
,735
-76)
Con
dim
ents
20,4
8821
,292
20,1
1017
,203
20,1
4625
,731
27,7
9530
,112
26,4
1424
,824
217)
Fre
sh m
eat
190,
905
188,
520
160,
614
141,
441
130,
817
124,
538
106,
891
105,
421
102,
473
91,4
64-5
28)
Sau
sage
pro
duct
s40
,289
39,8
3932
,748
28,8
1030
,614
31,0
7330
,687
33,4
1436
,553
33,9
38-1
69)
Can
ned
mea
t26
,731
26,8
2021
,262
17,8
9816
,511
17,0
5417
,896
15,6
7816
,328
16,2
56-3
910
) Con
cent
rate
d so
ups
4,43
34,
742
3,28
61,
674
2,61
63,
452
4,13
34,
737
4,77
14,
606
411
) Can
ned
fish
28,5
2926
,437
18,2
2817
,969
13,4
8211
,354
12,4
7714
,778
13,5
1211
,931
-58
12) P
owde
red
milk
7,41
97,
133
3,67
43,
827
3,86
03,
439
3,62
33,
215
2,73
73,
963
-47
13) B
aby
food
6,99
18,
631
6,96
16,
523
5,99
86,
774
6,14
64,
932
4,61
14,
438
-37
14) B
utte
r3,
078
2,85
11,
982
1,72
22,
250
2,40
02,
243
2,58
72,
569
2,41
4-2
215
) Che
ese
25,1
0921
,350
18,5
0715
,644
15,5
2416
,701
17,4
4119
,003
18,6
9818
,540
-26
16) S
ugar
208,
690
200,
645
100,
162
94,6
6678
,847
115,
440
175,
340
195,
316
141,
380
139,
207
-33
17) C
andy
, sw
eets
and
coc
oa p
rodu
cts
45,9
7844
,377
32,4
8822
,473
20,6
4120
,160
20,1
5419
,562
19,9
0519
7,72
733
018
) Bis
cuits
and
rela
ted
prod
ucts
44,0
2240
,848
32,3
3723
,637
21,5
2822
,608
23,7
5224
,479
23,3
7523
,368
-47
19) C
ooki
ng o
il48
,465
44,5
0142
,669
35,7
7024
,626
29,3
0135
,575
35,3
9736
,481
40,9
51-1
620
) Mar
garin
e15
,556
14,7
3012
,762
11,5
199,
779
9,48
810
,320
12,3
7414
,676
15,3
70-1
21) F
resh
and
drie
d ye
ast
13,2
7314
,254
12,5
868,
987
8,52
18,
453
9,56
811
,694
12,1
0912
,098
-922
) Cof
fee
subs
titut
es1,
623
1,36
01,
091
1,15
183
488
676
479
290
783
4-4
923
) Liv
esto
ck fe
ed90
4,92
595
9,08
474
8,60
564
8,12
764
6,40
552
6,31
151
5,82
247
3,78
146
4,69
052
2,31
8-4
2To
tal
2,43
7,82
92,
421,
232
1,93
7,75
91,
757,
654
1,62
6,99
51,
512,
924
1,55
5,47
31,
507,
838
1,43
5,03
01,
643,
531
-33
*Rat
e of
incr
ease
/dec
reas
e in
the
perio
d 19
88/1
999
A-T10
Tabl
e A
.1.1
3 P
rodu
ctio
n V
olum
e by
Cat
egor
y in
the
Sect
or o
f Man
ufac
ture
of T
extil
esU
nit:
tons
19
8919
9019
9119
9219
9319
9419
9519
9619
9719
98*R
ate
%1)
Hem
p fib
re1,
734
1,52
11,
161
1,47
869
855
636
112
70
0-1
002)
Cot
ton
text
ile fi
bre
25,9
8020
,372
12,4
4812
,132
10,3
0110
,587
8,86
75,
276
5,41
55,
088
-80
3) W
ool t
extil
e fib
re13
,046
9,65
05,
553
4,15
94,
079
3,70
43,
333
2,49
067
646
8-9
64)
Hem
p te
xtile
fibr
e2,
019
1,77
21,
075
811
171
116
9968
00
-100
5) R
ope,
cor
d an
d st
raps
1,00
11,
119
570
393
345
306
272
316
364
406
-59
6) T
hrea
d4,
111
2,92
51,
779
1,46
41,
211
1,51
61,
343
1,08
81,
117
1,05
6-7
4To
tal
47,8
9137
,359
22,5
8620
,437
16,8
0516
,785
14,2
759,
365
7,57
27,
018
-85
*Rat
e of
incr
ease
/dec
reas
e in
the
perio
d 19
88/1
999
Tabl
e A
.1.1
4 P
rodu
ctio
n V
olum
e by
Cat
egor
y in
the
Sect
or o
f Man
ufac
ture
of M
etal
Pro
duct
sU
nit:
tons
19
8919
9019
9119
9219
9319
9419
9519
9619
9719
98*R
ate
%1)
Cas
t iro
n an
d st
eel s
emi/f
inis
hed
prod
ucts
and
form
ed
95,3
2781
,054
40,6
5131
,492
33,3
9029
,677
26,0
3527
,832
30,5
5233
,397
-65
2) C
astin
g of
ligh
t met
als
5,70
74,
627
3,36
72,
515
1,42
51,
682
1,70
71,
323
3,87
54,
763
-17
3) C
astin
g of
hea
vy m
etal
s2,
312
1,44
882
584
265
672
555
062
651
555
0-7
64)
Pac
kagi
ng o
f lig
ht m
etal
s17
,420
14,1
9510
,149
8,19
17,
421
6,80
07,
396
6,94
096
369
9-9
65)
Dru
ms a
nd si
mila
r con
tain
ers o
f ste
el a
nd o
ther
met
als
11,7
1911
,054
8,85
27,
415
5,73
95,
885
6,02
56,
168
14,0
4414
,794
266)
Nai
ls, r
ivet
s and
scre
w p
rodu
cts
27,1
8118
,904
12,6
842,
712
1,77
71,
263
1,44
81,
763
2,15
32,
225
-92
7) E
lect
rode
s for
wel
ding
8,00
34,
980
3,11
12,
608
1,75
92,
190
2,75
03,
233
3,31
93,
164
-60
8) M
etal
stru
ctur
e46
,111
35,8
0826
,188
23,3
3115
,820
10,9
8615
,610
18,9
5822
,749
20,5
26-5
59)
Met
al p
rodu
cts f
or c
onst
ruct
ion
6,12
63,
876
1,91
21,
756
1,42
51,
496
1,31
71,
053
1,91
72,
619
-57
10) M
etal
pro
duct
s for
safe
-kee
ping
, met
al h
ouse
hold
arti
cles
a
nd e
quip
men
t for
road
s and
railw
ays
9,60
98,
564
5,10
32,
587
2,78
92,
134
1,92
12,
256
532
440
-95
11) T
anks
and
cis
tern
s6,
994
7,73
73,
714
1,04
72,
860
1,45
298
796
53,
146
2,18
9-6
912
) Met
al e
quip
men
t for
off
ices
, sho
ps a
nd w
ork
shop
s7,
429
6,64
83,
508
1,42
41,
963
1,42
31,
626
1,38
195
51,
102
-85
13) M
etal
equ
ipm
ent f
or h
ospi
tals
6042
2217
012
794
120
7156
51-1
514
) Sto
ves,
rang
es a
nd p
arts
16,4
2813
,119
6,86
36,
730
6,85
75,
393
4,69
27,
887
9,59
910
,023
-39
Tota
l26
0,42
621
2,05
612
6,94
992
,820
84,0
0871
,200
72,1
8480
,456
94,3
7596
,542
-63
*Rat
e of
incr
ease
/dec
reas
e in
the
perio
d 19
88/1
999
A-T11
Tabl
e A
.1.1
5 P
rodu
ctio
n V
olum
e by
Cat
egor
y in
the
Sect
or o
f Man
ufac
ture
of M
achi
nery
and
Equ
ipm
ent
Uni
t: to
ns
1989
1990
1991
1992
1993
1994
1995
1996
1997
1998
Rat
e %
1) S
team
boi
lers
(exc
ludi
ng c
entra
l hea
ting
hot w
ater
boi
3,58
03,
124
1,51
01,
713
2,15
72,
524
2,95
53,
243
3,26
33,
877
82)
Mar
ine
engi
nes
7,94
04,
747
5,32
53,
467
2,85
61,
886
2,91
23,
386
3,25
72,
799
-65
3) O
ther
inte
rnal
com
bust
ion
engi
nes
163
103
7647
3216
1223
913
-92
4) M
achi
nery
for m
inin
g, q
uarr
ying
and
con
stru
ctio
n3,
194
3,98
03,
799
1,65
21,
116
1,15
078
968
61,
622
1,95
2-3
95)
Mac
hine
ry fo
r met
al a
nd w
ood
proc
essi
ng10
,184
10,0
274,
259
3,03
62,
320
1,89
91,
997
1,64
82,
525
2,20
1-7
86)
Mac
hine
ry fo
r foo
d, b
ever
age
and
toba
cco
proc
essi
ng7,
138
7,16
62,
091
1,03
597
186
61,
488
994
760
1,03
0-8
67)
Spe
cial
pur
pose
mac
hine
ry6,
064
5,42
32,
163
1,10
51,
172
504
575
633
358
540
-91
8) M
echa
nica
l and
ele
ctro
mec
hani
cal t
rans
mitt
ers
1,19
51,
228
715
313
231
312
670
252
643
1,37
915
9) L
iftin
g an
d ha
ndlin
g eq
uipm
ent
11,5
388,
134
4,38
72,
797
2,28
93,
034
3,18
82,
980
2,38
62,
443
-79
10) A
gric
ultu
ral m
achi
nery
32,9
5420
,674
7,12
02,
642
2,06
62,
061
2,55
12,
242
2,96
23,
858
-88
Tota
l83
,950
64,6
0631
,445
17,8
0715
,210
14,2
5217
,137
16,0
8717
,785
20,0
92-7
6*R
ate
of in
crea
se/d
ecre
ase
in th
e pe
riod
1988
/199
9
A-T12
Cou
ntie
s
M
ain
Cro
ps
Whe
atB
arle
yR
ape
seed
Mai
zePo
tato
Tota
l Has
Tons
Has
Tons
Has
Tons
Has
Tons
Has
Tons
Has
Zagr
eb55
,704
16,2
02
7,
959
2,98
4
44
0
313
16
1,70
6
38,6
84
50
,612
5,53
3
63
,716
Kar
lova
c14
,803
5,13
0
3,
413
1,22
3
-
-
32,7
57
8,
865
31,9
07
3,
207
18,4
25
Sisa
k-M
osla
vina
36,1
51
9,
229
6,11
1
1,
854
2,20
7
83
2
119,
877
23
,453
19,2
31
2,
565
37,9
33
Kra
pina
-Zag
orge
15,5
32
4,
995
1,63
6
62
0
--
64
,795
19,3
22
14
,350
2,92
2
27
,859
Kop
rivni
ca-K
rizev
ci52
,601
14,8
05
3,
571
1,19
5
87
7
456
13
3,89
1
31,3
80
16
,588
2,36
5
50
,201
Bje
lova
r-B
ilogo
ra68
,441
20,8
22
6,
606
2,20
5
1,
574
684
14
8,99
4
29,1
69
47
,234
5,46
2
58
,342
Prim
orje
-Gor
ski K
otar
101
34
40
13
--
30
3
142
13
,453
1,58
4
1,
773
Poze
ga-S
lavo
nia
56,5
95
12
,027
4,93
8
1,
439
3,06
7
90
4
82,3
38
14
,730
27,5
09
2,
154
31,2
54
Zagr
eb C
ity5,
932
2,17
4
36
6
157
1
5
21
,532
4,88
5
11
,065
1,80
7
9,
028
Tota
l30
5,86
0
85,4
18
34
,640
11,6
90
8,
166
3,19
4
76
6,19
3
170,
630
23
1,94
9
27,5
99
29
8,53
1
Tab
le A
1.16
. A
gric
ultu
re P
rodu
ctio
n in
the
Dra
inag
e B
asin
of t
he S
ava
Riv
er a
s of 1
998
A-T13
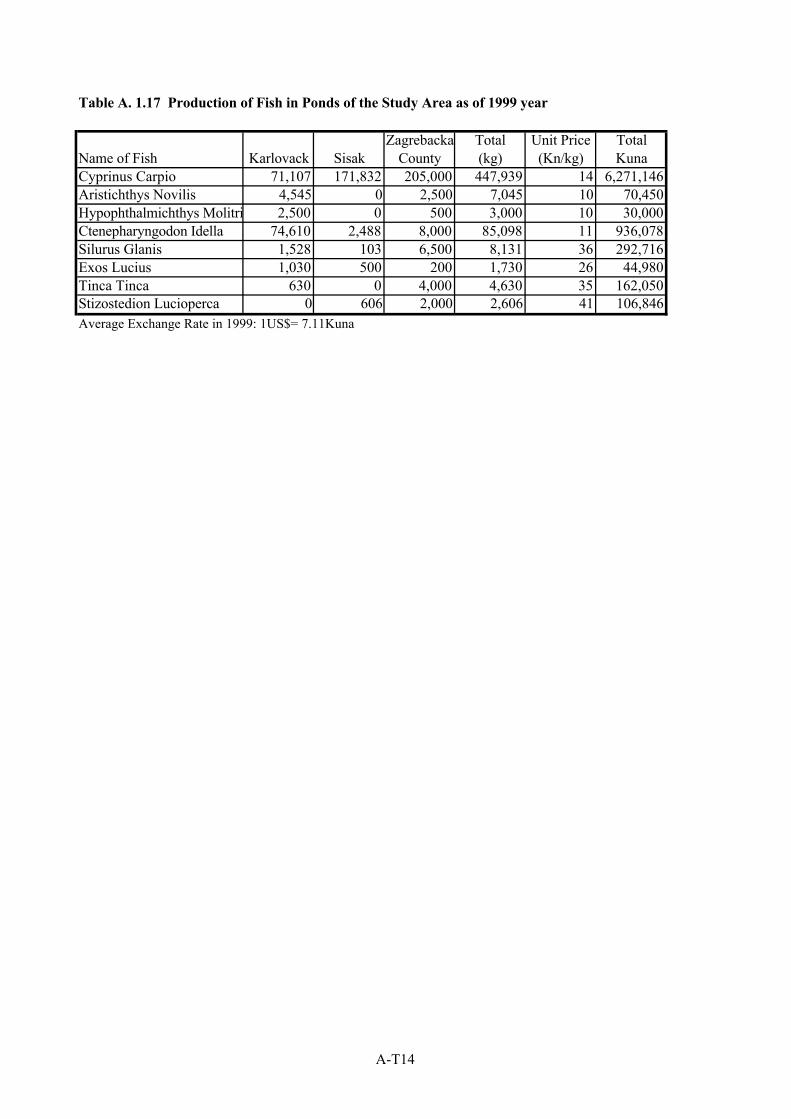
Table A. 1.17 Production of Fish in Ponds of the Study Area as of 1999 year
Zagrebacka Total Unit Price TotalName of Fish Karlovack Sisak County (kg) (Kn/kg) KunaCyprinus Carpio 71,107 171,832 205,000 447,939 14 6,271,146Aristichthys Novilis 4,545 0 2,500 7,045 10 70,450Hypophthalmichthys Molitri 2,500 0 500 3,000 10 30,000Ctenepharyngodon Idella 74,610 2,488 8,000 85,098 11 936,078Silurus Glanis 1,528 103 6,500 8,131 36 292,716Exos Lucius 1,030 500 200 1,730 26 44,980Tinca Tinca 630 0 4,000 4,630 35 162,050Stizostedion Lucioperca 0 606 2,000 2,606 41 106,846Average Exchange Rate in 1999: 1US$= 7.11Kuna
A-T14
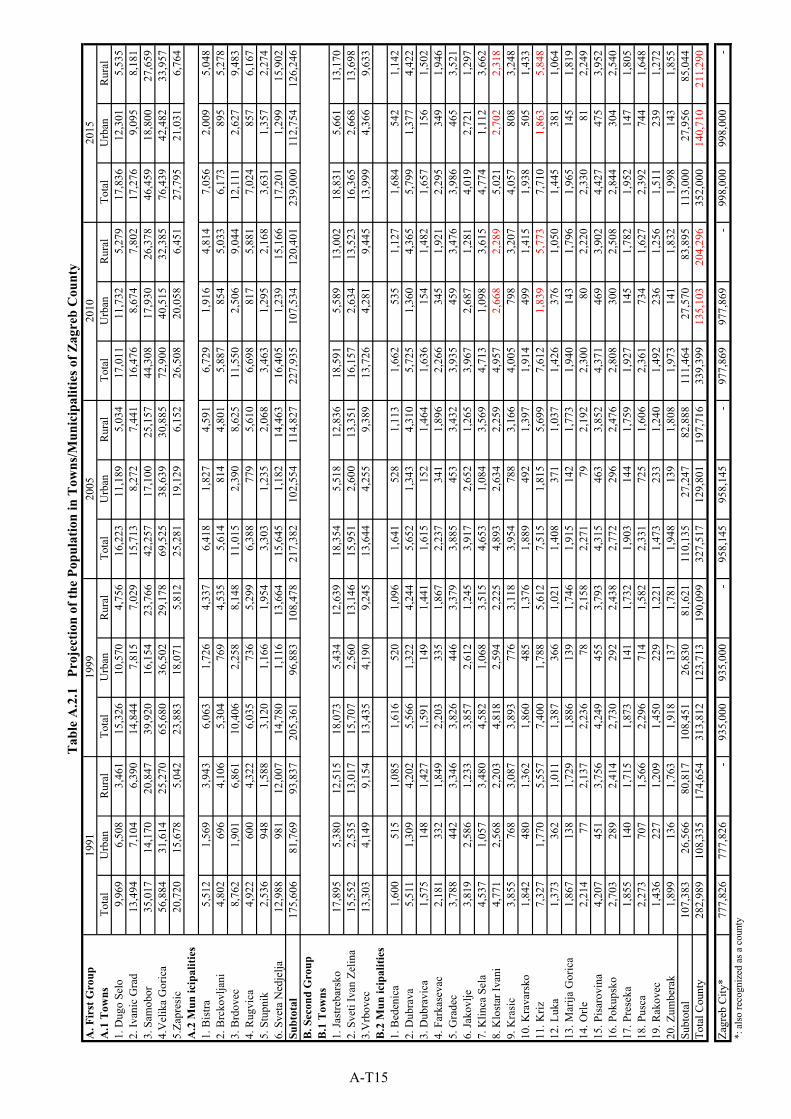
Tab
le A
.2.1
Pr
ojec
tion
of th
e Po
pula
tion
in T
owns
/Mun
icip
aliti
es o
f Zag
reb
Cou
nty
A
. Fir
st G
roup
1991
1999
2005
2010
2015
A.1
Tow
nsTo
tal
Urb
anR
ural
Tota
lU
rban
Rur
alTo
tal
Urb
anR
ural
Tota
lU
rban
Rur
alTo
tal
Urb
anR
ural
1. D
ugo
Selo
9,96
9
6,50
8
3,46
1
15,3
26
10
,570
4,75
6
16,2
23
11
,189
5,03
4
17,0
11
11
,732
5,27
9
17,8
36
12
,301
5,53
5
2. Iv
anic
Gra
d13
,494
7,10
4
6,39
0
14,8
44
7,
815
7,
029
15
,713
8,27
2
7,44
1
16,4
76
8,
674
7,
802
17
,276
9,09
5
8,18
1
3. S
amob
or35
,017
14,1
70
20
,847
39,9
20
16
,154
23,7
66
42
,257
17,1
00
25
,157
44,3
08
17
,930
26,3
78
46
,459
18,8
00
27
,659
4.V
elik
a G
oric
a56
,884
31,6
14
25
,270
65,6
80
36
,502
29,1
78
69
,525
38,6
39
30
,885
72,9
00
40
,515
32,3
85
76
,439
42,4
82
33
,957
5.Za
pres
ic20
,720
15,6
78
5,
042
23
,883
18,0
71
5,
812
25
,281
19,1
29
6,
152
26
,508
20,0
58
6,
451
27
,795
21,0
31
6,
764
A
.2 M
un ic
ipal
ities
1. B
istra
5,51
2
1,56
9
3,94
3
6,06
3
1,72
6
4,33
7
6,41
8
1,82
7
4,59
1
6,72
9
1,91
6
4,81
4
7,05
6
2,00
9
5,04
8
2. B
rcko
vlja
ni4,
802
69
6
4,
106
5,
304
76
9
4,
535
5,
614
81
4
4,
801
5,
887
85
4
5,
033
6,
173
89
5
5,
278
3.
Brd
ovec
8,76
2
1,90
1
6,86
1
10,4
06
2,
258
8,
148
11
,015
2,39
0
8,62
5
11,5
50
2,
506
9,
044
12
,111
2,62
7
9,48
3
4. R
ugvi
ca4,
922
60
0
4,
322
6,
035
73
6
5,
299
6,
388
77
9
5,
610
6,
698
81
7
5,
881
7,
024
85
7
6,
167
5.
Stu
pnik
2,53
6
948
1,58
8
3,12
0
1,16
6
1,95
4
3,30
3
1,23
5
2,06
8
3,46
3
1,29
5
2,16
8
3,63
1
1,35
7
2,27
4
6. S
veta
Ned
jelja
12,9
88
98
1
12
,007
14,7
80
1,
116
13
,664
15,6
45
1,
182
14
,463
16,4
05
1,
239
15
,166
17,2
01
1,
299
15
,902
Subt
otal
175,
606
81,7
69
93
,837
205,
361
96,8
83
10
8,47
8
21
7,38
2
10
2,55
4
11
4,82
7
22
7,93
5
10
7,53
4
12
0,40
1
23
9,00
0
11
2,75
4
12
6,24
6
B
. Sec
ond
Gro
upB
.1 T
owns
1.
Jast
reba
rsko
17,8
95
5,
380
12
,515
18,0
73
5,
434
12
,639
18,3
54
5,
518
12
,836
18,5
91
5,
589
13
,002
18,8
31
5,
661
13
,170
2. S
veti
Ivan
Zel
ina
15,5
52
2,
535
13
,017
15,7
07
2,
560
13
,146
15,9
51
2,
600
13
,351
16,1
57
2,
634
13
,523
16,3
65
2,
668
13
,698
3.V
rbov
ec13
,303
4,14
9
9,15
4
13,4
35
4,
190
9,
245
13
,644
4,25
5
9,38
9
13,7
26
4,
281
9,
445
13
,999
4,36
6
9,63
3
B.2
Mun
icip
aliti
es
1. B
eden
ica
1,60
0
515
1,08
5
1,61
6
520
1,09
6
1,64
1
528
1,11
3
1,66
2
535
1,12
7
1,68
4
542
1,14
2
2. D
ubra
va5,
511
1,
309
4,
202
5,
566
1,
322
4,
244
5,
652
1,
343
4,
310
5,
725
1,
360
4,
365
5,
799
1,
377
4,
422
3.
Dub
ravi
ca1,
575
14
8
1,
427
1,
591
14
9
1,
441
1,
615
15
2
1,
464
1,
636
15
4
1,
482
1,
657
15
6
1,
502
4.
Far
kase
vac
2,18
1
332
1,84
9
2,20
3
335
1,86
7
2,23
7
341
1,89
6
2,26
6
345
1,92
1
2,29
5
349
1,94
6
5. G
rade
c3,
788
44
2
3,
346
3,
826
44
6
3,
379
3,
885
45
3
3,
432
3,
935
45
9
3,
476
3,
986
46
5
3,
521
6.
Jako
vlje
3,81
9
2,58
6
1,23
3
3,85
7
2,61
2
1,24
5
3,91
7
2,65
2
1,26
5
3,96
7
2,68
7
1,28
1
4,01
9
2,72
1
1,29
7
7. K
linca
Sel
a4,
537
1,
057
3,
480
4,
582
1,
068
3,
515
4,
653
1,
084
3,
569
4,
713
1,
098
3,
615
4,
774
1,
112
3,
662
8.
Klo
star
Ivan
i4,
771
2,
568
2,
203
4,
818
2,
594
2,
225
4,
893
2,
634
2,
259
4,
957
2,
668
2,
289
5,
021
2,
702
2,
318
9.
Kra
sic
3,85
5
768
3,08
7
3,89
3
776
3,11
8
3,95
4
788
3,16
6
4,00
5
798
3,20
7
4,05
7
808
3,24
8
10. K
rava
rsko
1,84
2
480
1,36
2
1,86
0
485
1,37
6
1,88
9
492
1,39
7
1,91
4
499
1,41
5
1,93
8
505
1,43
3
11. K
riz7,
327
1,
770
5,
557
7,
400
1,
788
5,
612
7,
515
1,
815
5,
699
7,
612
1,
839
5,
773
7,
710
1,
863
5,
848
12
. Luk
a1,
373
36
2
1,
011
1,
387
36
6
1,
021
1,
408
37
1
1,
037
1,
426
37
6
1,
050
1,
445
38
1
1,
064
13
. Mar
ija G
oric
a1,
867
13
8
1,
729
1,
886
13
9
1,
746
1,
915
14
2
1,
773
1,
940
14
3
1,
796
1,
965
14
5
1,
819
14
. Orle
2,21
4
77
2,13
7
2,23
6
78
2,15
8
2,27
1
79
2,19
2
2,30
0
80
2,22
0
2,33
0
81
2,24
9
15. P
isar
ovin
a4,
207
45
1
3,
756
4,
249
45
5
3,
793
4,
315
46
3
3,
852
4,
371
46
9
3,
902
4,
427
47
5
3,
952
16
. Pok
upsk
o2,
703
28
9
2,
414
2,
730
29
2
2,
438
2,
772
29
6
2,
476
2,
808
30
0
2,
508
2,
844
30
4
2,
540
17
. Pre
seka
1,85
5
140
1,71
5
1,87
3
141
1,73
2
1,90
3
144
1,75
9
1,92
7
145
1,78
2
1,95
2
147
1,80
5
18. P
usca
2,27
3
707
1,56
6
2,29
6
714
1,58
2
2,33
1
725
1,60
6
2,36
1
734
1,62
7
2,39
2
744
1,64
8
19. R
akov
ec1,
436
22
7
1,
209
1,
450
22
9
1,
221
1,
473
23
3
1,
240
1,
492
23
6
1,
256
1,
511
23
9
1,
272
20
. Zum
bera
k1,
899
13
6
1,
763
1,
918
13
7
1,
781
1,
948
13
9
1,
808
1,
973
14
1
1,
832
1,
998
14
3
1,
855
Su
btot
al10
7,38
3
26
,566
80,8
17
10
8,45
1
26
,830
81,6
21
11
0,13
5
27
,247
82,8
88
11
1,46
4
27
,570
83,8
95
11
3,00
0
27
,956
85,0
44
To
tal C
ount
y28
2,98
9
10
8,33
5
17
4,65
4
31
3,81
2
12
3,71
3
19
0,09
9
32
7,51
7
12
9,80
1
19
7,71
6
33
9,39
9
13
5,10
3
20
4,29
6
35
2,00
0
14
0,71
0
21
1,29
0
Zagr
eb C
ity*
777,
826
777,
826
-
93
5,00
0
93
5,00
0
-
958,
145
958,
145
-
97
7,86
9
97
7,86
9
-
998,
000
998,
000
-
*:
als
o re
cogn
ized
as a
cou
nty
A-T15
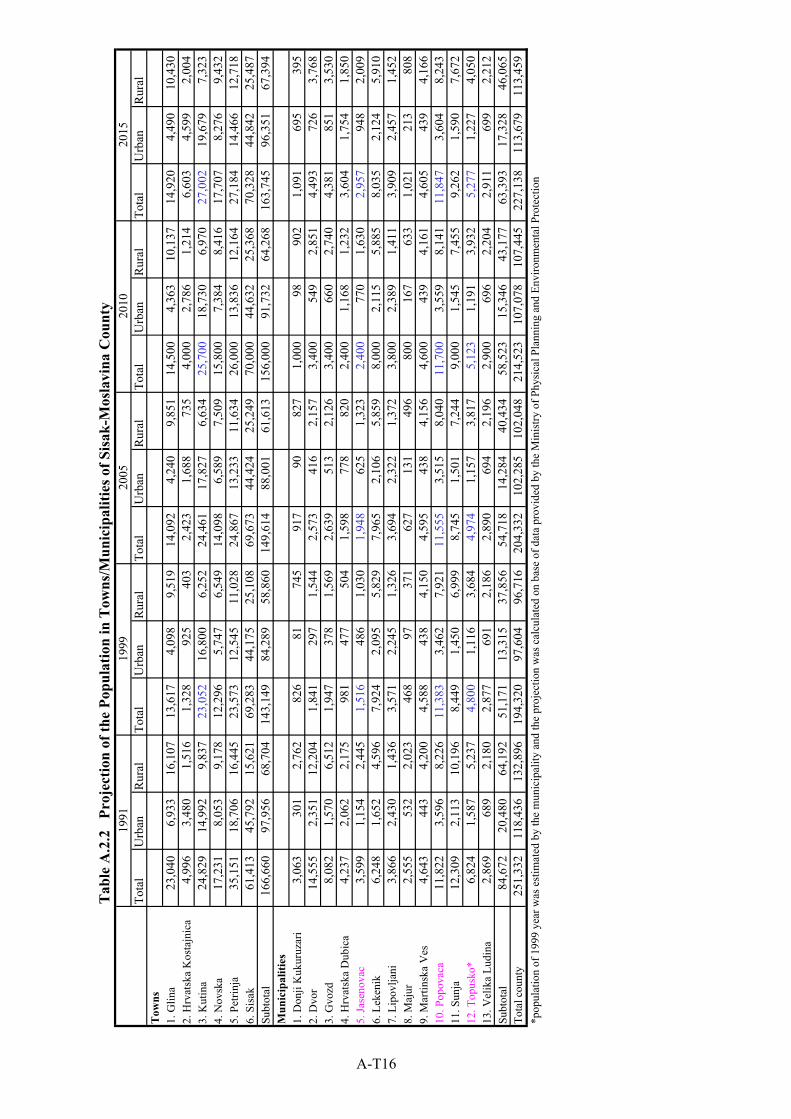
Tab
le A
.2.2
Pr
ojec
tion
of th
e Po
pula
tion
in T
owns
/Mun
icip
aliti
es o
f Sis
ak-M
osla
vina
Cou
nty
1991
1999
2005
2010
2015
Tota
lU
rban
Rur
alTo
tal
Urb
anR
ural
Tota
lU
rban
Rur
alTo
tal
Urb
anR
ural
Tota
lU
rban
Rur
alT
owns
1.
Glin
a23
,040
6,93
3
16
,107
13,6
17
4,
098
9,51
9
14
,092
4,24
0
9,
851
14,5
00
4,
363
10,1
37
14
,920
4,49
0
10
,430
2. H
rvat
ska
Kos
tajn
ica
4,99
6
3,
480
1,51
6
1,
328
925
40
3
2,42
3
1,
688
735
4,
000
2,78
6
1,
214
6,60
3
4,
599
2,00
4
3.
Kut
ina
24,8
29
14
,992
9,83
7
23
,052
16,8
00
6,
252
24,4
61
17
,827
6,63
4
25
,700
18,7
30
6,
970
27,0
02
19
,679
7,32
3
4.
Nov
ska
17,2
31
8,
053
9,17
8
12
,296
5,74
7
6,
549
14,0
98
6,
589
7,50
9
15
,800
7,38
4
8,
416
17,7
07
8,
276
9,43
2
5.
Pet
rinja
35,1
51
18
,706
16,4
45
23
,573
12,5
45
11
,028
24,8
67
13
,233
11,6
34
26
,000
13,8
36
12
,164
27,1
84
14
,466
12,7
18
6.
Sis
ak61
,413
45,7
92
15
,621
69,2
83
44
,175
25,1
08
69
,673
44,4
24
25
,249
70,0
00
44
,632
25,3
68
70
,328
44,8
42
25
,487
Subt
otal
166,
660
97
,956
68,7
04
14
3,14
9
84,2
89
58
,860
149,
614
88
,001
61,6
13
15
6,00
0
91,7
32
64
,268
163,
745
96
,351
67,3
94
M
unic
ipal
ities
1.
Don
ji K
ukur
uzar
i3,
063
301
2,
762
826
81
745
91
7
90
82
7
1,00
0
98
902
1,
091
695
39
5
2. D
vor
14,5
55
2,
351
12,2
04
1,
841
297
1,
544
2,57
3
41
6
2,15
7
3,
400
549
2,
851
4,49
3
72
6
3,76
8
3.
Gvo
zd8,
082
1,57
0
6,
512
1,94
7
37
8
1,56
9
2,
639
513
2,
126
3,40
0
66
0
2,74
0
4,
381
851
3,
530
4. H
rvat
ska
Dub
ica
4,23
7
2,
062
2,17
5
98
1
477
50
4
1,59
8
77
8
820
2,
400
1,16
8
1,
232
3,60
4
1,
754
1,85
0
5.
Jase
nova
c3,
599
1,15
4
2,
445
1,51
6
48
6
1,03
0
1,
948
625
1,
323
2,40
0
77
0
1,63
0
2,
957
948
2,
009
6. L
eken
ik6,
248
1,65
2
4,
596
7,92
4
2,
095
5,82
9
7,
965
2,10
6
5,
859
8,00
0
2,
115
5,88
5
8,
035
2,12
4
5,
910
7. L
ipov
ljani
3,86
6
2,
430
1,43
6
3,
571
2,24
5
1,
326
3,69
4
2,
322
1,37
2
3,
800
2,38
9
1,
411
3,90
9
2,
457
1,45
2
8.
Maj
ur2,
555
532
2,
023
468
97
371
62
7
131
49
6
800
16
7
633
1,
021
213
80
8
9. M
artin
ska
Ves
4,64
3
44
3
4,20
0
4,
588
438
4,
150
4,59
5
43
8
4,15
6
4,
600
439
4,
161
4,60
5
43
9
4,16
6
10
. Pop
ovac
a11
,822
3,59
6
8,
226
11,3
83
3,
462
7,92
1
11
,555
3,51
5
8,
040
11,7
00
3,
559
8,14
1
11
,847
3,60
4
8,
243
11. S
unja
12,3
09
2,
113
10,1
96
8,
449
1,45
0
6,
999
8,74
5
1,
501
7,24
4
9,
000
1,54
5
7,
455
9,26
2
1,
590
7,67
2
12
. Top
usko
*6,
824
1,58
7
5,
237
4,80
0
1,
116
3,68
4
4,
974
1,15
7
3,
817
5,12
3
1,
191
3,93
2
5,
277
1,22
7
4,
050
13. V
elik
a Lu
dina
2,86
9
68
9
2,18
0
2,
877
691
2,
186
2,89
0
69
4
2,19
6
2,
900
696
2,
204
2,91
1
69
9
2,21
2
Su
btot
al84
,672
20,4
80
64
,192
51,1
71
13
,315
37,8
56
54
,718
14,2
84
40
,434
58,5
23
15
,346
43,1
77
63
,393
17,3
28
46
,065
Tota
l cou
nty
251,
332
11
8,43
6
132,
896
19
4,32
0
97,6
04
96
,716
204,
332
10
2,28
5
102,
048
21
4,52
3
107,
078
10
7,44
5
227,
138
11
3,67
9
113,
459
*p
opul
atio
n of
199
9 ye
ar w
as e
stim
ated
by
the
mun
icip
ality
and
the
proj
ectio
n w
as c
alcu
late
d on
bas
e of
dat
a pr
ovid
ed b
y th
e M
inis
try o
f Phy
sica
l Pla
nnin
g an
d En
viro
nmen
tal P
rote
ctio
n
A-T16
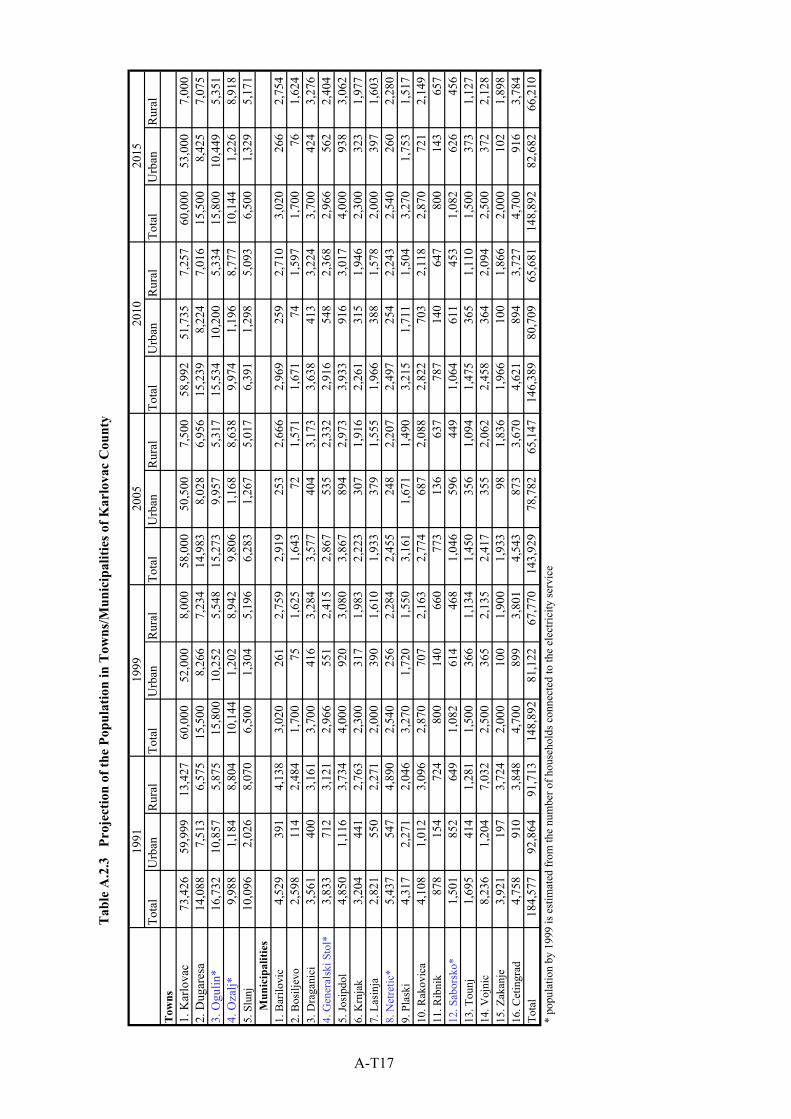
Tab
le A
.2.3
Pr
ojec
tion
of th
e Po
pula
tion
in T
owns
/Mun
icip
aliti
es o
f Kar
lova
c C
ount
y
1991
1999
2005
2010
2015
To
tal
Urb
anR
ural
Tota
lU
rban
Rur
alTo
tal
Urb
anR
ural
Tota
lU
rban
Rur
alTo
tal
Urb
anR
ural
Tow
ns
1. K
arlo
vac
73,4
26
59
,999
13,4
27
60
,000
52,0
00
8,
000
58,0
00
50
,500
7,50
0
58
,992
51,7
35
7,
257
60,0
00
53
,000
7,00
0
2.
Dug
ares
a14
,088
7,51
3
6,
575
15,5
00
8,
266
7,23
4
14
,983
8,02
8
6,
956
15,2
39
8,
224
7,01
6
15
,500
8,42
5
7,
075
3. O
gulin
*16
,732
10,8
57
5,
875
15,8
0010
,252
5,54
8
15
,273
9,95
7
5,
317
15,5
34
10
,200
5,33
4
15
,800
10,4
49
5,
351
4. O
zalj*
9,98
8
1,
184
8,80
4
10
,144
1,20
2
8,
942
9,80
6
1,
168
8,63
8
9,
974
1,19
6
8,
777
10,1
44
1,
226
8,91
8
5.
Slu
nj10
,096
2,02
6
8,
070
6,50
0
1,
304
5,19
6
6,
283
1,26
7
5,
017
6,39
1
1,
298
5,09
3
6,
500
1,32
9
5,
171
Mun
icip
aliti
es1.
Bar
ilovi
c4,
529
391
4,
138
3,02
0
26
1
2,75
9
2,
919
253
2,
666
2,96
9
25
9
2,71
0
3,
020
266
2,
754
2. B
osilj
evo
2,59
8
11
4
2,48
4
1,
700
75
1,
625
1,64
3
72
1,57
1
1,
671
74
1,
597
1,70
0
76
1,62
4
3.
Dra
gani
ci3,
561
400
3,
161
3,70
0
41
6
3,28
4
3,
577
404
3,
173
3,63
8
41
3
3,22
4
3,
700
424
3,
276
4. G
ener
alsk
i Sto
l*3,
833
712
3,
121
2,96
6
55
1
2,41
5
2,
867
535
2,
332
2,91
6
54
8
2,36
8
2,
966
562
2,
404
5. Jo
sipd
ol4,
850
1,11
6
3,
734
4,00
0
92
0
3,08
0
3,
867
894
2,
973
3,93
3
91
6
3,01
7
4,
000
938
3,
062
6. K
rnja
k3,
204
441
2,
763
2,30
0
31
7
1,98
3
2,
223
307
1,
916
2,26
1
31
5
1,94
6
2,
300
323
1,
977
7. L
asin
ja2,
821
550
2,
271
2,00
0
39
0
1,61
0
1,
933
379
1,
555
1,96
6
38
8
1,57
8
2,
000
397
1,
603
8. N
etre
tic*
5,43
7
54
7
4,89
0
2,
540
256
2,
284
2,45
5
24
8
2,20
7
2,
497
254
2,
243
2,54
0
26
0
2,28
0
9.
Pla
ski
4,31
7
2,
271
2,04
6
3,
270
1,72
0
1,
550
3,16
1
1,
671
1,49
0
3,
215
1,71
1
1,
504
3,27
0
1,
753
1,51
7
10
. Rak
ovic
a4,
108
1,01
2
3,
096
2,87
0
70
7
2,16
3
2,
774
687
2,
088
2,82
2
70
3
2,11
8
2,
870
721
2,
149
11. R
ibni
k87
8
154
72
4
800
14
0
660
77
3
136
63
7
787
14
0
647
80
0
143
65
7
12. S
abor
sko*
1,50
1
85
2
649
1,
082
614
46
8
1,04
6
59
6
449
1,
064
611
45
3
1,08
2
62
6
456
13
. Tou
nj1,
695
414
1,
281
1,50
0
36
6
1,13
4
1,
450
356
1,
094
1,47
5
36
5
1,11
0
1,
500
373
1,
127
14. V
ojni
c8,
236
1,20
4
7,
032
2,50
0
36
5
2,13
5
2,
417
355
2,
062
2,45
8
36
4
2,09
4
2,
500
372
2,
128
15. Z
akan
je3,
921
197
3,
724
2,00
0
10
0
1,90
0
1,
933
98
1,
836
1,96
6
10
0
1,86
6
2,
000
102
1,
898
16. C
etin
grad
4,75
8
91
0
3,84
8
4,
700
899
3,
801
4,54
3
87
3
3,67
0
4,
621
894
3,
727
4,70
0
91
6
3,78
4
To
tal
184,
577
92
,864
91,7
13
14
8,89
281
,122
67,7
70
14
3,92
9
78,7
82
65
,147
146,
389
80
,709
65,6
81
14
8,89
2
82,6
82
66
,210
* po
pula
tion
by 1
999
is e
stim
ated
from
the
num
ber o
f hou
seho
lds c
onne
cted
to th
e el
ectri
city
serv
ice
A-T17
APPENDIX B
WATER QUALITY AND POLLUTION MECHANISM
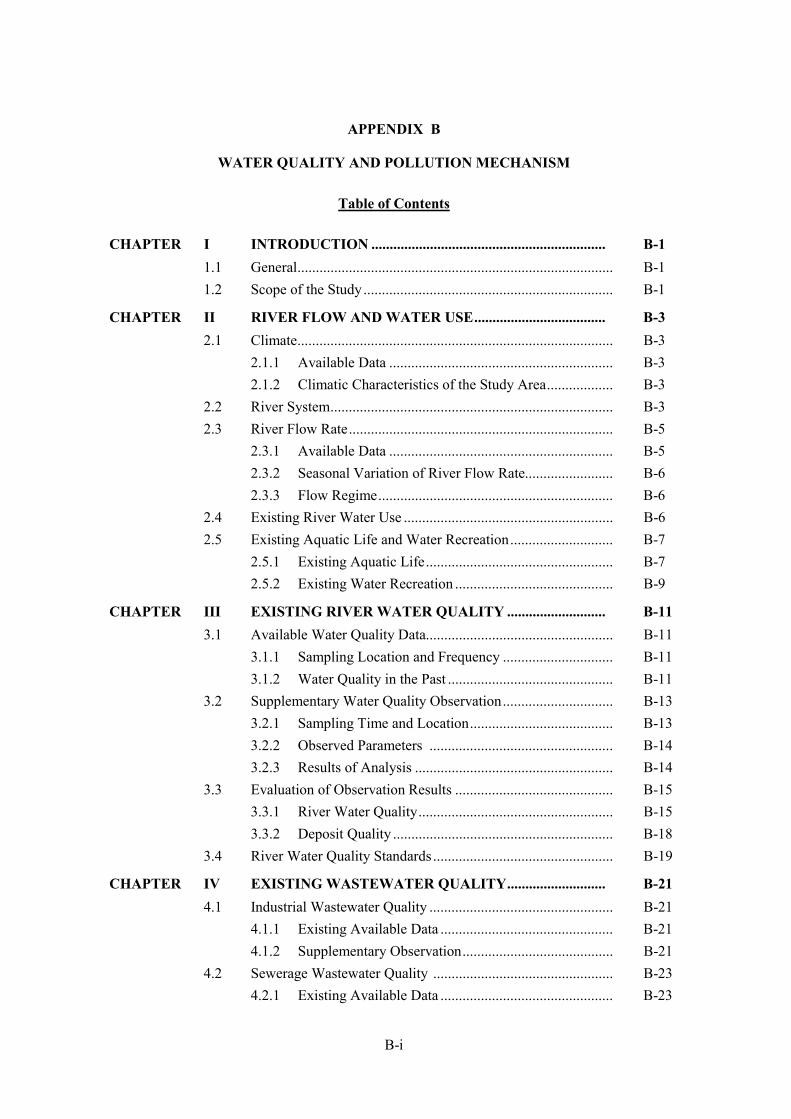
B-i
APPENDIX B
WATER QUALITY AND POLLUTION MECHANISM
Table of Contents
CHAPTER I INTRODUCTION ................................................................ B-1 1.1 General...................................................................................... B-1 1.2 Scope of the Study.................................................................... B-1
CHAPTER II RIVER FLOW AND WATER USE.................................... B-3 2.1 Climate...................................................................................... B-3
2.1.1 Available Data ............................................................. B-3 2.1.2 Climatic Characteristics of the Study Area.................. B-3
2.2 River System............................................................................. B-3 2.3 River Flow Rate........................................................................ B-5
2.3.1 Available Data ............................................................. B-5 2.3.2 Seasonal Variation of River Flow Rate........................ B-6 2.3.3 Flow Regime................................................................ B-6
2.4 Existing River Water Use ......................................................... B-6 2.5 Existing Aquatic Life and Water Recreation............................ B-7
2.5.1 Existing Aquatic Life................................................... B-7 2.5.2 Existing Water Recreation ........................................... B-9
CHAPTER III EXISTING RIVER WATER QUALITY ........................... B-11 3.1 Available Water Quality Data................................................... B-11
3.1.1 Sampling Location and Frequency .............................. B-11 3.1.2 Water Quality in the Past ............................................. B-11
3.2 Supplementary Water Quality Observation.............................. B-13 3.2.1 Sampling Time and Location....................................... B-13 3.2.2 Observed Parameters .................................................. B-14 3.2.3 Results of Analysis ...................................................... B-14
3.3 Evaluation of Observation Results ........................................... B-15 3.3.1 River Water Quality..................................................... B-15 3.3.2 Deposit Quality ............................................................ B-18
3.4 River Water Quality Standards................................................. B-19
CHAPTER IV EXISTING WASTEWATER QUALITY........................... B-21 4.1 Industrial Wastewater Quality .................................................. B-21
4.1.1 Existing Available Data ............................................... B-21 4.1.2 Supplementary Observation......................................... B-21
4.2 Sewerage Wastewater Quality ................................................. B-23 4.2.1 Existing Available Data ............................................... B-23
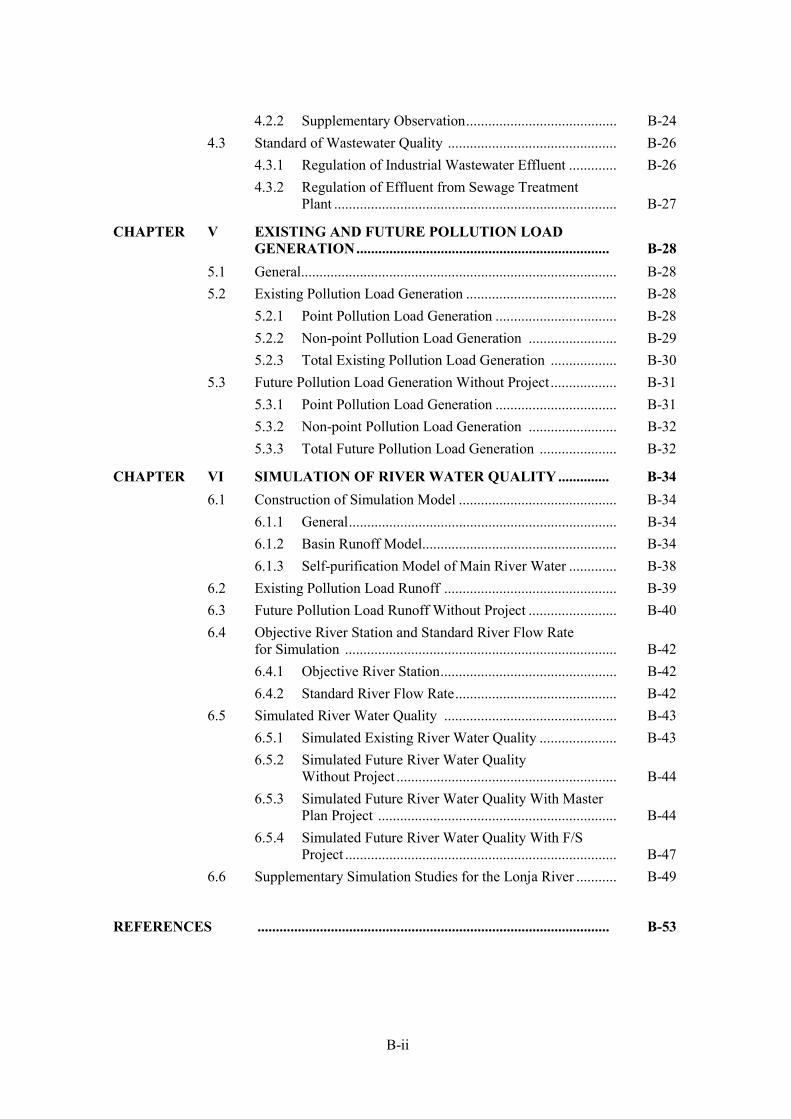
B-ii
4.2.2 Supplementary Observation......................................... B-24 4.3 Standard of Wastewater Quality .............................................. B-26
4.3.1 Regulation of Industrial Wastewater Effluent ............. B-26 4.3.2 Regulation of Effluent from Sewage Treatment
Plant ............................................................................. B-27
CHAPTER V EXISTING AND FUTURE POLLUTION LOAD GENERATION..................................................................... B-28
5.1 General...................................................................................... B-28 5.2 Existing Pollution Load Generation ......................................... B-28
5.2.1 Point Pollution Load Generation ................................. B-28 5.2.2 Non-point Pollution Load Generation ........................ B-29 5.2.3 Total Existing Pollution Load Generation .................. B-30
5.3 Future Pollution Load Generation Without Project .................. B-31 5.3.1 Point Pollution Load Generation ................................. B-31 5.3.2 Non-point Pollution Load Generation ........................ B-32 5.3.3 Total Future Pollution Load Generation ..................... B-32
CHAPTER VI SIMULATION OF RIVER WATER QUALITY .............. B-34 6.1 Construction of Simulation Model ........................................... B-34
6.1.1 General......................................................................... B-34 6.1.2 Basin Runoff Model..................................................... B-34 6.1.3 Self-purification Model of Main River Water ............. B-38
6.2 Existing Pollution Load Runoff ............................................... B-39 6.3 Future Pollution Load Runoff Without Project ........................ B-40 6.4 Objective River Station and Standard River Flow Rate
for Simulation .......................................................................... B-42 6.4.1 Objective River Station................................................ B-42 6.4.2 Standard River Flow Rate............................................ B-42
6.5 Simulated River Water Quality ............................................... B-43 6.5.1 Simulated Existing River Water Quality ..................... B-43 6.5.2 Simulated Future River Water Quality
Without Project ............................................................ B-44 6.5.3 Simulated Future River Water Quality With Master
Plan Project ................................................................. B-44 6.5.4 Simulated Future River Water Quality With F/S
Project .......................................................................... B-47 6.6 Supplementary Simulation Studies for the Lonja River ........... B-49
REFERENCES ................................................................................................ B-53
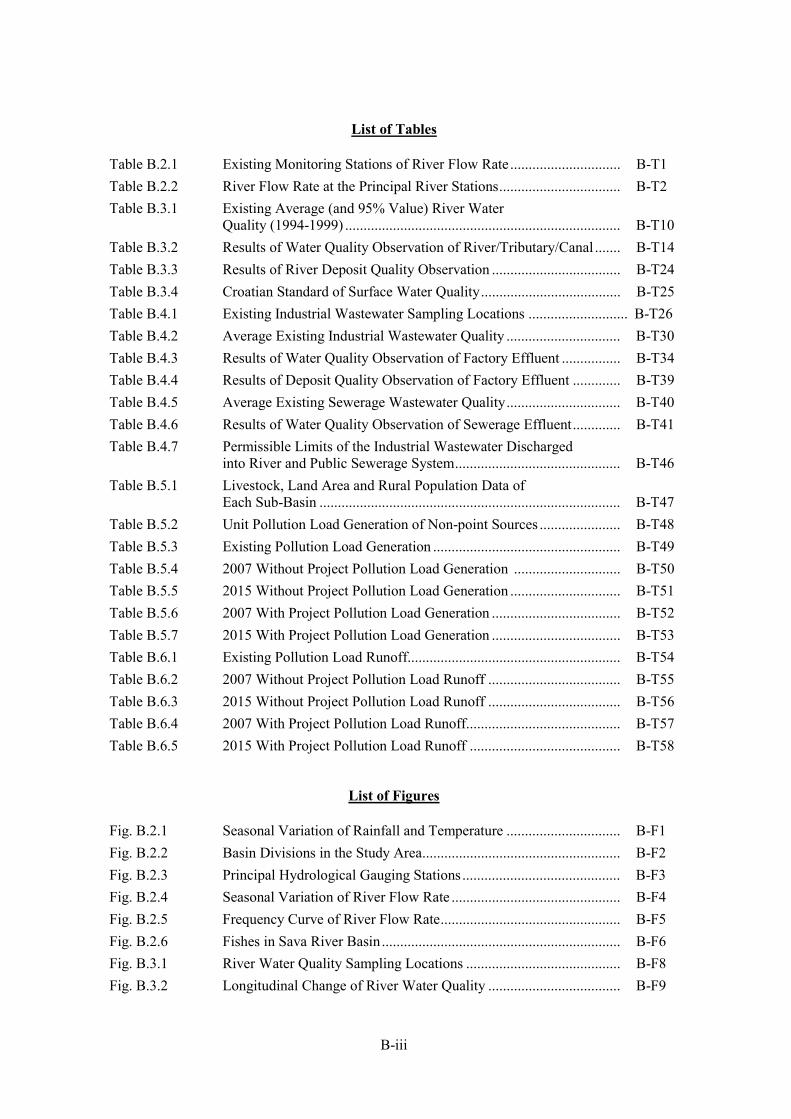
B-iii
List of Tables
Table B.2.1 Existing Monitoring Stations of River Flow Rate.............................. B-T1 Table B.2.2 River Flow Rate at the Principal River Stations................................. B-T2 Table B.3.1 Existing Average (and 95% Value) River Water
Quality (1994-1999) ........................................................................... B-T10 Table B.3.2 Results of Water Quality Observation of River/Tributary/Canal ....... B-T14 Table B.3.3 Results of River Deposit Quality Observation ................................... B-T24 Table B.3.4 Croatian Standard of Surface Water Quality...................................... B-T25 Table B.4.1 Existing Industrial Wastewater Sampling Locations ........................... B-T26 Table B.4.2 Average Existing Industrial Wastewater Quality ............................... B-T30 Table B.4.3 Results of Water Quality Observation of Factory Effluent ................ B-T34 Table B.4.4 Results of Deposit Quality Observation of Factory Effluent ............. B-T39 Table B.4.5 Average Existing Sewerage Wastewater Quality............................... B-T40 Table B.4.6 Results of Water Quality Observation of Sewerage Effluent............. B-T41 Table B.4.7 Permissible Limits of the Industrial Wastewater Discharged
into River and Public Sewerage System............................................. B-T46 Table B.5.1 Livestock, Land Area and Rural Population Data of
Each Sub-Basin .................................................................................. B-T47 Table B.5.2 Unit Pollution Load Generation of Non-point Sources ...................... B-T48 Table B.5.3 Existing Pollution Load Generation ................................................... B-T49 Table B.5.4 2007 Without Project Pollution Load Generation ............................. B-T50 Table B.5.5 2015 Without Project Pollution Load Generation .............................. B-T51 Table B.5.6 2007 With Project Pollution Load Generation ................................... B-T52 Table B.5.7 2015 With Project Pollution Load Generation ................................... B-T53 Table B.6.1 Existing Pollution Load Runoff.......................................................... B-T54 Table B.6.2 2007 Without Project Pollution Load Runoff .................................... B-T55 Table B.6.3 2015 Without Project Pollution Load Runoff .................................... B-T56 Table B.6.4 2007 With Project Pollution Load Runoff.......................................... B-T57 Table B.6.5 2015 With Project Pollution Load Runoff ......................................... B-T58
List of Figures
Fig. B.2.1 Seasonal Variation of Rainfall and Temperature ............................... B-F1 Fig. B.2.2 Basin Divisions in the Study Area...................................................... B-F2 Fig. B.2.3 Principal Hydrological Gauging Stations........................................... B-F3 Fig. B.2.4 Seasonal Variation of River Flow Rate .............................................. B-F4 Fig. B.2.5 Frequency Curve of River Flow Rate................................................. B-F5 Fig. B.2.6 Fishes in Sava River Basin................................................................. B-F6 Fig. B.3.1 River Water Quality Sampling Locations .......................................... B-F8 Fig. B.3.2 Longitudinal Change of River Water Quality .................................... B-F9
B-iv
Fig. B.4.1 Major Factories and Public Sewerage Effluent Locations ................. B-F10 Fig. B.5.1 Divided 20 Sub-basins for Simulation ............................................... B-F11 Fig. B.5.2 Existing Pollution Load Generation of Each Sub-Basin .................... B-F12 Fig. B.5.3 Ratio of Each Existing Pollution Load Generation ............................ B-F13 Fig. B.5.4 Existing Pollution Load Generation in the Objective Sava River
Basin................................................................................................... B-F14 Fig. B.6.1 Schematic Diagram of the Simulation of Pollution Load Runoff
and Water Quality .............................................................................. B-F15 Fig. B.6.2 Existing Pollution Load Runoff of Each Sub-Basin........................... B-F16 Fig. B.6.3 Ratio of Each Existing Pollution Load Runoff................................... B-F17 Fig. B.6.4 Existing Pollution Load Runoff in the Objective Sava River Basin .. B-F18 Fig. B.6.5 2015 Without Project Pollution Load Runoff
in the Objective Sava River Basin...................................................... B-F19 Fig. B.6.6 2015 With Project Pollution Load Runoff
in the Objective Sava River Basin ..................................................... B-F20
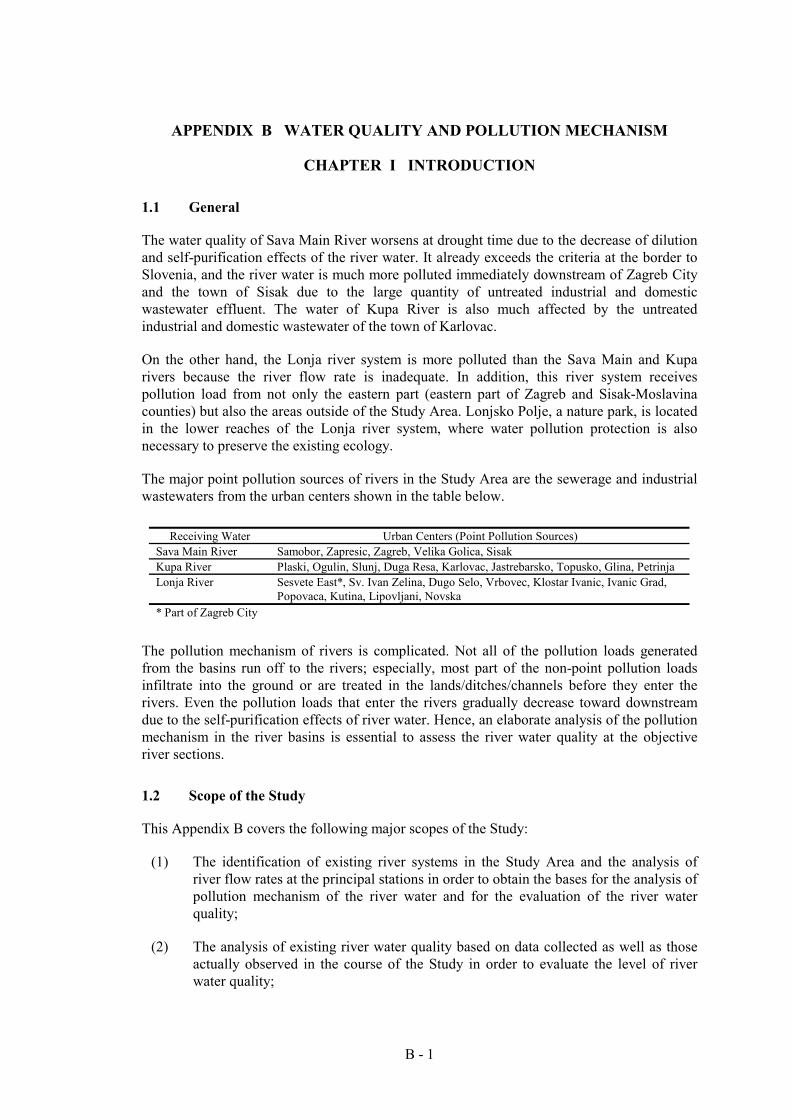
B - 1
APPENDIX B WATER QUALITY AND POLLUTION MECHANISM
CHAPTER I INTRODUCTION
1.1 General
The water quality of Sava Main River worsens at drought time due to the decrease of dilution and self-purification effects of the river water. It already exceeds the criteria at the border to Slovenia, and the river water is much more polluted immediately downstream of Zagreb City and the town of Sisak due to the large quantity of untreated industrial and domestic wastewater effluent. The water of Kupa River is also much affected by the untreated industrial and domestic wastewater of the town of Karlovac.
On the other hand, the Lonja river system is more polluted than the Sava Main and Kupa rivers because the river flow rate is inadequate. In addition, this river system receives pollution load from not only the eastern part (eastern part of Zagreb and Sisak-Moslavina counties) but also the areas outside of the Study Area. Lonjsko Polje, a nature park, is located in the lower reaches of the Lonja river system, where water pollution protection is also necessary to preserve the existing ecology.
The major point pollution sources of rivers in the Study Area are the sewerage and industrial wastewaters from the urban centers shown in the table below.
Receiving Water Urban Centers (Point Pollution Sources) Sava Main River Samobor, Zapresic, Zagreb, Velika Golica, Sisak Kupa River Plaski, Ogulin, Slunj, Duga Resa, Karlovac, Jastrebarsko, Topusko, Glina, Petrinja Lonja River Sesvete East*, Sv. Ivan Zelina, Dugo Selo, Vrbovec, Klostar Ivanic, Ivanic Grad,
Popovaca, Kutina, Lipovljani, Novska * Part of Zagreb City
The pollution mechanism of rivers is complicated. Not all of the pollution loads generated from the basins run off to the rivers; especially, most part of the non-point pollution loads infiltrate into the ground or are treated in the lands/ditches/channels before they enter the rivers. Even the pollution loads that enter the rivers gradually decrease toward downstream due to the self-purification effects of river water. Hence, an elaborate analysis of the pollution mechanism in the river basins is essential to assess the river water quality at the objective river sections.
1.2 Scope of the Study
This Appendix B covers the following major scopes of the Study:
(1) The identification of existing river systems in the Study Area and the analysis of river flow rates at the principal stations in order to obtain the bases for the analysis of pollution mechanism of the river water and for the evaluation of the river water quality;
(2) The analysis of existing river water quality based on data collected as well as those actually observed in the course of the Study in order to evaluate the level of river water quality;
B - 2
(3) The analysis of existing industrial and sewerage wastewater qualities based on the data collected and actually observed in the course of the Study in order to evaluate the point pollution load generation in the basin;
(4) The estimation of existing and future pollution loads generated in the basin, including point (industrial and sewerage wastewater) and non-point (wastewater of rural households, livestock and lands) sources;
(5) The construction of an integrated simulation model covering pollution load runoffs from the basins to the rivers and the dilution/self-purification effects of the river water in order to analyze the existing pollution mechanism of the river water and to predict the future water quality at the principal river sections; and
(6) The estimation of the pollution reduction effects of the proposed industrial and sewerage wastewater treatment schemes.
B - 3
CHAPTER II RIVER FLOW AND WATER USE
2.1 Climate
2.1.1 Available Data
The meteorological conditions in the Study Area are observed by the Meteorological and Hydrological Service of Croatia. The observation data of three (3) stations (Zagreb Center, Karlovac Center and Sisak Center) during the recent five (5) years (1994-1998) are employed in the Study to establish the existing climatic conditions of the Study Area, since these stations represent the northern, southwestern and southeastern parts, respectively 1).
2.1.2 Climatic Characteristics of the Study Area
(1) Temperature
The temperature of the Study Area widely changes throughout the year, recording the highest in July and lowest in December. The monthly mean temperature is in the range of 1.6°C to 22.3°C at the Zagreb Center, 0.0°C to 21.4°C at the Karlovac Center, and 0.5°C to 21.7°C at the Sisak Center. As for the seasonal variation of monthly average temperature, see Fig. B.2.1.
(2) Humidity
The annual average humidity of the Study Area is 69% at the Zagreb Center, 77% at the Karlovac Center and 77% at the Sisak Center.
(3) Rainfall
The average annual rainfall is 921 mm at the Zagreb Center, 1,135 mm at the Karlovac Center and 984 mm at the Sisak Center. Rainfall in the Study Area concentrates in the summer season (June-September); however, severe drought spells also usually occur in this season. The lowest monthly rainfall is recorded in February and March. The monthly average rainfall in the Study Area ranges from approximately 40 mm in February and March to about 120 mm in August and September. As for the seasonal variation of monthly rainfall, see Fig. B.2.1.
(4) Number of Clear/Cloudy/Rainy Days
The average annual number of clear/cloudy/rainy days at the Zagreb, Karlovac and Sisak centers are given below.
Item Zagreb Center Karlovac Center Sisak Center Clear Days 47 57 39 Cloudy Days 131 130 119 Rainy Days 104 89 123
2.2 River System
The Sava River runs a 945 km distance, draining a total area of 95,551 km2 in the countries of Slovenia, Croatia, Bosnia-Herzegovina and Yugoslavia before joining the Donau as a
B - 4
tributary. The river originates in the mountains located in the country boundary between Slovenia and Austria, and flows down for 259 km through Slovenia before crossing the boundary into Croatia. The river length and drainage area within the territory of Croatia are 518 km and 25,100 km2, respectively.
The Sava drainage area within Croatia (from Slovenian border to confluence with Una River) is divided into three (3) main basins; namely, Upper Sava River Basin, Middle Sava River Basin and Lower Sava River Basin, which are further divided into 34 sub-basins. The subdivided drainage basins in the Study Area are shown in Fig. B.2.2. As for the area of each sub-basin (whole and within the Study Area), see Appendix F, Table F.1.2.
On the other hand, considering also the main tributaries of the Sava River in Croatia, the Sava drainage area can be divided into the following six (6) river systems. As for the area of each sub-basin of these river systems, see Appendix F, Table F.2.3.
(1) Upper Sava Main River System
The upper part of the Study Area is drained by the Upper Sava Main River and its tributaries, namely, Sutla River and Krapina River. Starting from the country boundary between Slovenia and Croatia, the Upper Sava Main River flows through Zagreb City and down to the principal river station named Oborovo for a distance of 63 km. This river system has six (6) sub-basins: Sutla, Bregana, Luznica, Gradna-Rakovica, Krapina and Zagreb City.
The Sutla River drains an area of 593 km2 into the Sava River at the country boundary between Slovenia and Croatia. To the west of the Sutla river basin is Slovenia, which has an area of 423 km2. The Krapina River, with a basin area of 1,234 km2, joins the Sava River at the upstream of Zagreb from the north. The sewerage channel in Zagreb joins the Sava River at the downstream of the city.
After the confluence of these rivers and channel, the water flows down the middle stretch of the Sava Main River. Hence, the Upper Sava Main River drains a total area of 2,527 km2 along with its tributaries (Basin upstream of Zagreb: Upper Sava Main River Basin).
(2) Middle Sava Main River System
The Middle Sava Main River is defined as the stretch from the confluence of the channel downstream of Zagreb to the confluence point of the Kupa River at Sisak. No additional tributary discharges into this 58 km stretch until Sisak; the flood plains directly drain into this Middle Sava Main River, which has a total drainage area of 77 km2 (Basin upstream of Sisak: Middle Sava Main River Basin).
(3) Lower Sava Main River System
In the lower part of the Study Area (downstream of Sisak), the Sava River is joined by the Lonja and Veliki-Strug rivers from northeast of the drainage basin. The Lower Sava Main River drains four (4) sub-basins: Sunja-Jastrebica, Lower Una, Ilova-Pakra and Veliki-Strug. A total of 3,807 km2 is drained by this lower 124 km stretch of the river (Basin downstream of Sisak: Lower Sava Main River Basin).
B - 5
(4) Upper Kupa River System
The Upper Kupa River drains four (4) sub-basins: Upper Kupa (2,203 km2), Dobra (1,397 km2), Mreznica (459 km2) and Korana (1,358 km2). The upper part of Kupa River (upstream of Karlovac) is joined by the Dobra, Mreznica and Korana rivers before Karlovac. For a distance of 76 km, this upper part of Kupa River drains a total of 5,417 km2 (Basin upstream of Karlovac: Upper Kupa River Basin).
(5) Lower Kupa River System
The Lower Kupa River drains five (5) sub-basins: Lower Kupa (1,710 km2), Glina (1,453 km2), Utinja-Petrinjcica (261 km2), Moatanica (66 km2) and Odra (763 km2).
The lower part of Kupa River (downstream of Karlovac) is joined by the Glina and Odra rivers before Sisak. For a distance of 146 km, the lower part of Kupa River drains a total of 4,253 km2 (Basin downstream of Karlovac: Lower Kupa River Basin).
(6) Lonja River System
Lonja River can be divided into 12 sub-basins: Upper Lonja, Middle Lonja, Lower Lonja, Upper N. Zelina, Lower N. Zelina, Upper Cesma, Middle Cesma, Lower Cesma, Crnec, Crnec (Lonja), Lonja-Trebez and Glogovnica. Lonja River drains an area of 4,320 km2 in the northern part of the Study Area.
The Lonja River system presents a very complicated structure because of the entangled channels constructed for flood control. The upper part of Lonja River (after Vrbovec) is joined by Zelina River from the northwest, then the Lonja River bifurcates into two (2) rivers, the Lonja and Glogovnica. The Lonja River further flows down southward through Ivanic Grad and then joined by Zelina River after the confluence of Crnec River. On the other hand, Glogovnica Channel and Cesma River flow into each other at Cazma.
The lower part of Lonja River (downstream of Kriz) is met by Cesma River (C.A.: 1,951 km2) from the north after Kriz, drains the lower part of the Lonja River River Basin, and then meets the Lower Sava Main River.
2.3 River Flow Rate
2.3.1 Available Data
The Meteorological and Hydrological Service of Croatia is the principal agency responsible for water level and flow rate measurements in the rivers of the Study Area. As given in Table B.2.1, there are 183 water level and flow rate measurement stations operated by the Service in the Study Area.
Among the above 183 stations, the following eight (8) stations were selected for this Study, taking into account their location and observation periods. As to their location, see Fig. B.2.3.
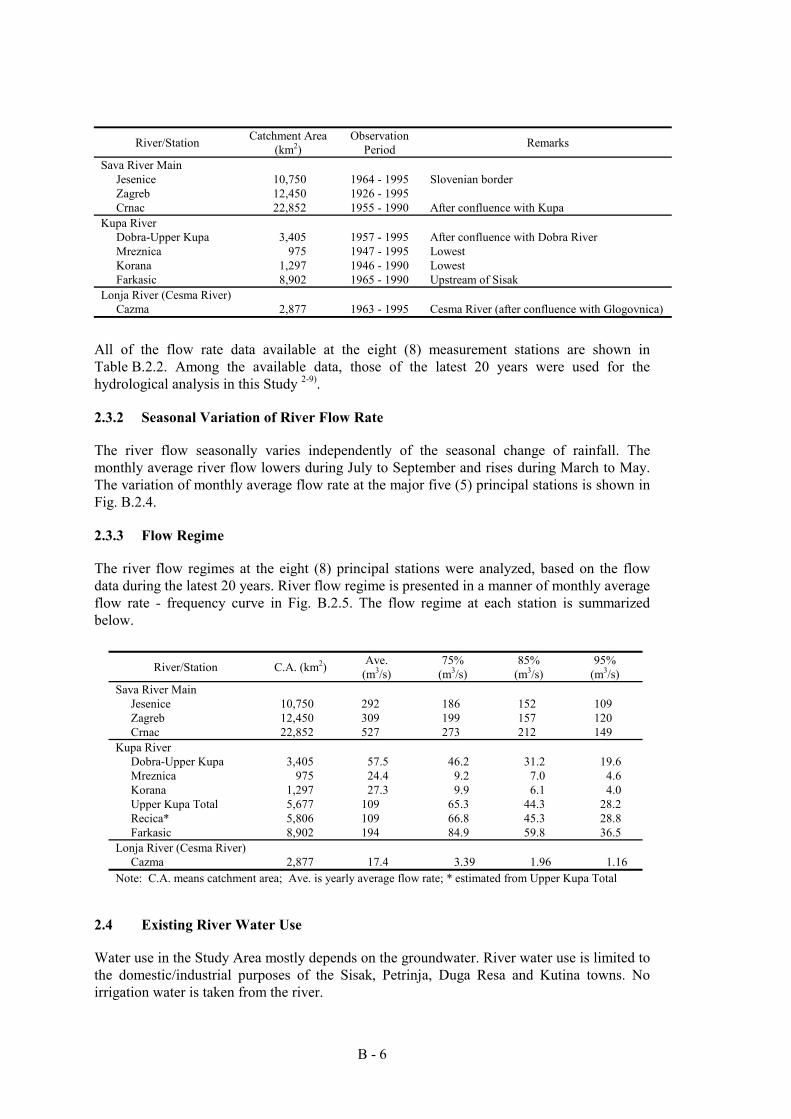
B - 6
River/Station Catchment Area (km2)
Observation Period Remarks
Sava River Main Jesenice 10,750 1964 - 1995 Slovenian border Zagreb 12,450 1926 - 1995 Crnac 22,852 1955 - 1990 After confluence with Kupa
Kupa River Dobra-Upper Kupa 3,405 1957 - 1995 After confluence with Dobra River Mreznica 975 1947 - 1995 Lowest Korana 1,297 1946 - 1990 Lowest Farkasic 8,902 1965 - 1990 Upstream of Sisak
Lonja River (Cesma River) Cazma 2,877 1963 - 1995 Cesma River (after confluence with Glogovnica)
All of the flow rate data available at the eight (8) measurement stations are shown in Table B.2.2. Among the available data, those of the latest 20 years were used for the hydrological analysis in this Study 2-9).
2.3.2 Seasonal Variation of River Flow Rate
The river flow seasonally varies independently of the seasonal change of rainfall. The monthly average river flow lowers during July to September and rises during March to May. The variation of monthly average flow rate at the major five (5) principal stations is shown in Fig. B.2.4.
2.3.3 Flow Regime
The river flow regimes at the eight (8) principal stations were analyzed, based on the flow data during the latest 20 years. River flow regime is presented in a manner of monthly average flow rate - frequency curve in Fig. B.2.5. The flow regime at each station is summarized below.
River/Station C.A. (km2) Ave. (m3/s)
75% (m3/s)
85% (m3/s)
95% (m3/s)
Sava River Main Jesenice 10,750 292 186 152 109 Zagreb 12,450 309 199 157 120 Crnac 22,852 527 273 212 149
Kupa River Dobra-Upper Kupa 3,405 57.5 46.2 31.2 19.6 Mreznica 975 24.4 9.2 7.0 4.6 Korana 1,297 27.3 9.9 6.1 4.0 Upper Kupa Total 5,677 109 65.3 44.3 28.2 Recica* 5,806 109 66.8 45.3 28.8 Farkasic 8,902 194 84.9 59.8 36.5
Lonja River (Cesma River) Cazma 2,877 17.4 3.39 1.96 1.16
Note: C.A. means catchment area; Ave. is yearly average flow rate; * estimated from Upper Kupa Total
2.4 Existing River Water Use
Water use in the Study Area mostly depends on the groundwater. River water use is limited to the domestic/industrial purposes of the Sisak, Petrinja, Duga Resa and Kutina towns. No irrigation water is taken from the river.
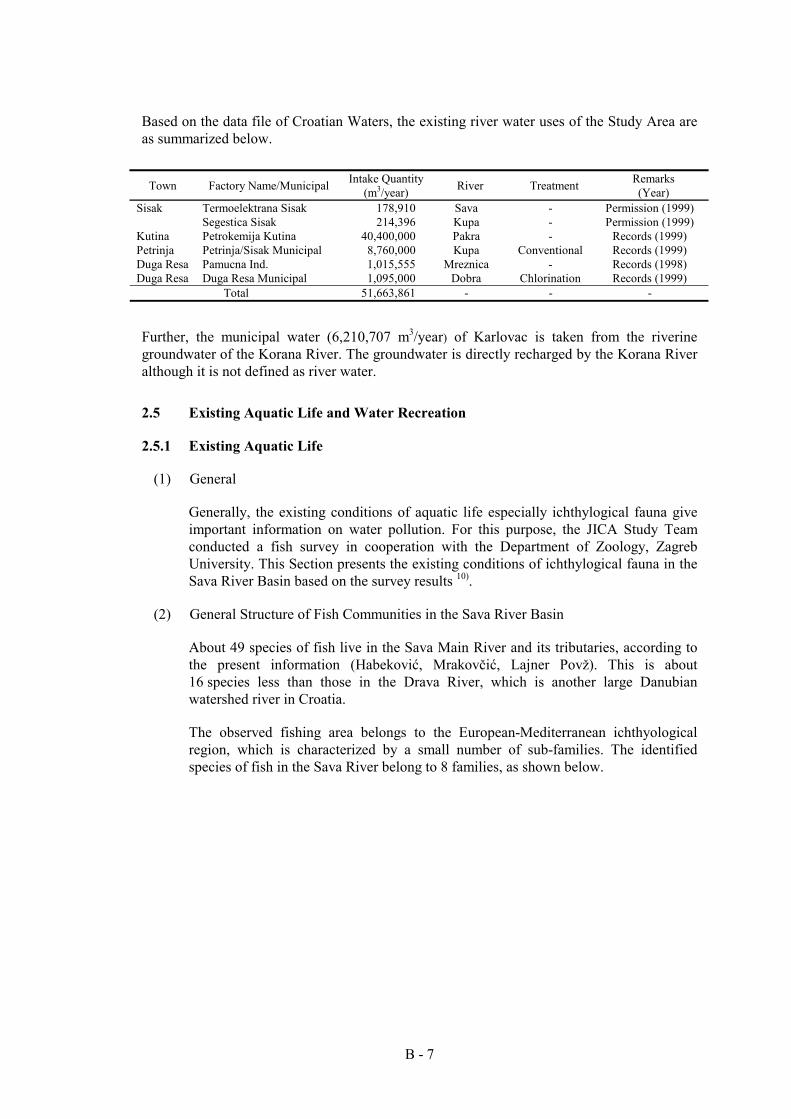
B - 7
Based on the data file of Croatian Waters, the existing river water uses of the Study Area are as summarized below.
Town Factory Name/Municipal Intake Quantity (m3/year) River Treatment Remarks
(Year) Sisak Termoelektrana Sisak 178,910 Sava - Permission (1999) Segestica Sisak 214,396 Kupa - Permission (1999) Kutina Petrokemija Kutina 40,400,000 Pakra - Records (1999) Petrinja Petrinja/Sisak Municipal 8,760,000 Kupa Conventional Records (1999) Duga Resa Pamucna Ind. 1,015,555 Mreznica - Records (1998) Duga Resa Duga Resa Municipal 1,095,000 Dobra Chlorination Records (1999)
Total 51,663,861 - - -
Further, the municipal water (6,210,707 m3/year) of Karlovac is taken from the riverine groundwater of the Korana River. The groundwater is directly recharged by the Korana River although it is not defined as river water.
2.5 Existing Aquatic Life and Water Recreation
2.5.1 Existing Aquatic Life
(1) General
Generally, the existing conditions of aquatic life especially ichthylogical fauna give important information on water pollution. For this purpose, the JICA Study Team conducted a fish survey in cooperation with the Department of Zoology, Zagreb University. This Section presents the existing conditions of ichthylogical fauna in the Sava River Basin based on the survey results 10).
(2) General Structure of Fish Communities in the Sava River Basin
About 49 species of fish live in the Sava Main River and its tributaries, according to the present information (Habeković, Mrakovčić, Lajner Povž). This is about 16 species less than those in the Drava River, which is another large Danubian watershed river in Croatia.
The observed fishing area belongs to the European-Mediterranean ichthyological region, which is characterized by a small number of sub-families. The identified species of fish in the Sava River belong to 8 families, as shown below.
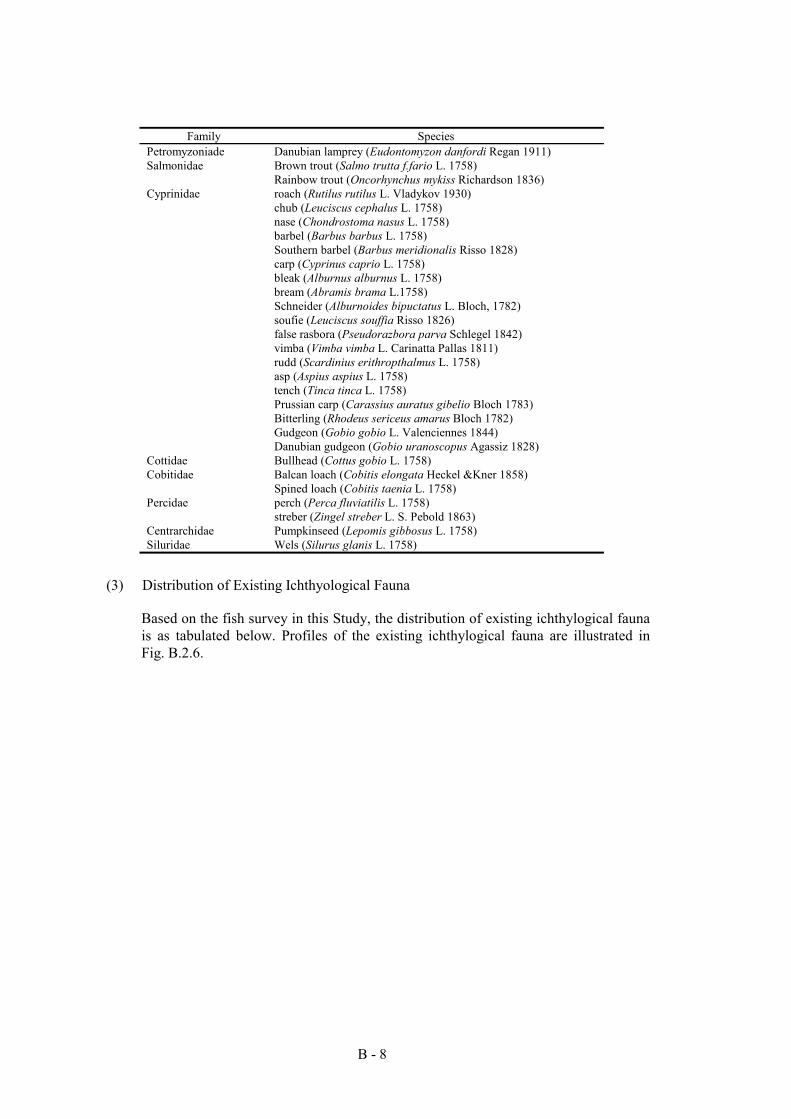
B - 8
Family Species
Petromyzoniade Danubian lamprey (Eudontomyzon danfordi Regan 1911) Salmonidae Brown trout (Salmo trutta f.fario L. 1758) Rainbow trout (Oncorhynchus mykiss Richardson 1836) Cyprinidae roach (Rutilus rutilus L. Vladykov 1930) chub (Leuciscus cephalus L. 1758) nase (Chondrostoma nasus L. 1758) barbel (Barbus barbus L. 1758) Southern barbel (Barbus meridionalis Risso 1828) carp (Cyprinus caprio L. 1758) bleak (Alburnus alburnus L. 1758) bream (Abramis brama L.1758) Schneider (Alburnoides bipuctatus L. Bloch, 1782) soufie (Leuciscus souffia Risso 1826) false rasbora (Pseudorazbora parva Schlegel 1842) vimba (Vimba vimba L. Carinatta Pallas 1811) rudd (Scardinius erithropthalmus L. 1758) asp (Aspius aspius L. 1758) tench (Tinca tinca L. 1758) Prussian carp (Carassius auratus gibelio Bloch 1783) Bitterling (Rhodeus sericeus amarus Bloch 1782) Gudgeon (Gobio gobio L. Valenciennes 1844) Danubian gudgeon (Gobio uranoscopus Agassiz 1828) Cottidae Bullhead (Cottus gobio L. 1758) Cobitidae Balcan loach (Cobitis elongata Heckel &Kner 1858) Spined loach (Cobitis taenia L. 1758) Percidae perch (Perca fluviatilis L. 1758) streber (Zingel streber L. S. Pebold 1863) Centrarchidae Pumpkinseed (Lepomis gibbosus L. 1758) Siluridae Wels (Silurus glanis L. 1758)
(3) Distribution of Existing Ichthyological Fauna
Based on the fish survey in this Study, the distribution of existing ichthylogical fauna is as tabulated below. Profiles of the existing ichthylogical fauna are illustrated in Fig. B.2.6.
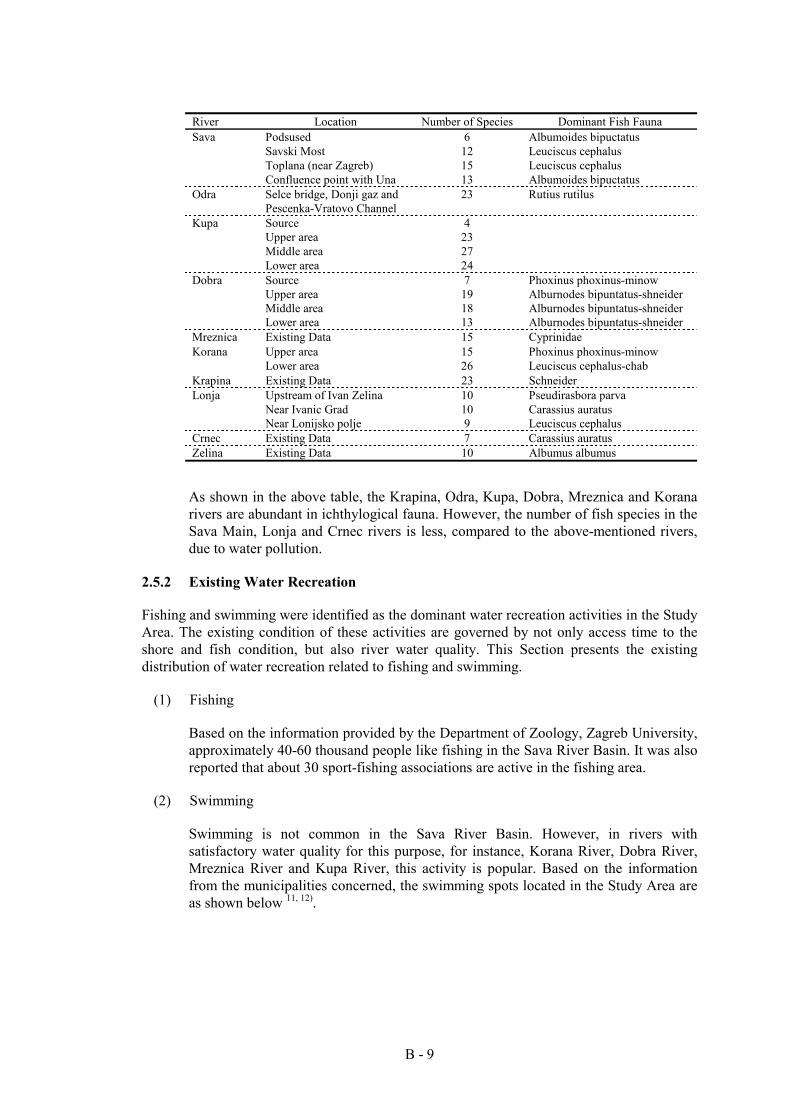
B - 9
River Location Number of Species Dominant Fish Fauna Sava Podsused 6 Albumoides bipuctatus Savski Most 12 Leuciscus cephalus Toplana (near Zagreb) 15 Leuciscus cephalus Confluence point with Una 13 Albumoides bipuctatus Odra Selce bridge, Donji gaz and
Pescenka-Vratovo Channel 23 Rutius rutilus
Kupa Source 4 Upper area 23 Middle area 27 Lower area 24 Dobra Source 7 Phoxinus phoxinus-minow Upper area 19 Alburnodes bipuntatus-shneider Middle area 18 Alburnodes bipuntatus-shneider Lower area 13 Alburnodes bipuntatus-shneider Mreznica Existing Data 15 Cyprinidae Korana Upper area 15 Phoxinus phoxinus-minow Lower area 26 Leuciscus cephalus-chab Krapina Existing Data 23 Schneider Lonja Upstream of Ivan Zelina 10 Pseudirasbora parva Near Ivanic Grad 10 Carassius auratus Near Lonijsko polje 9 Leuciscus cephalus Crnec Existing Data 7 Carassius auratus Zelina Existing Data 10 Albumus albumus
As shown in the above table, the Krapina, Odra, Kupa, Dobra, Mreznica and Korana rivers are abundant in ichthylogical fauna. However, the number of fish species in the Sava Main, Lonja and Crnec rivers is less, compared to the above-mentioned rivers, due to water pollution.
2.5.2 Existing Water Recreation
Fishing and swimming were identified as the dominant water recreation activities in the Study Area. The existing condition of these activities are governed by not only access time to the shore and fish condition, but also river water quality. This Section presents the existing distribution of water recreation related to fishing and swimming.
(1) Fishing
Based on the information provided by the Department of Zoology, Zagreb University, approximately 40-60 thousand people like fishing in the Sava River Basin. It was also reported that about 30 sport-fishing associations are active in the fishing area.
(2) Swimming
Swimming is not common in the Sava River Basin. However, in rivers with satisfactory water quality for this purpose, for instance, Korana River, Dobra River, Mreznica River and Kupa River, this activity is popular. Based on the information from the municipalities concerned, the swimming spots located in the Study Area are as shown below 11, 12).
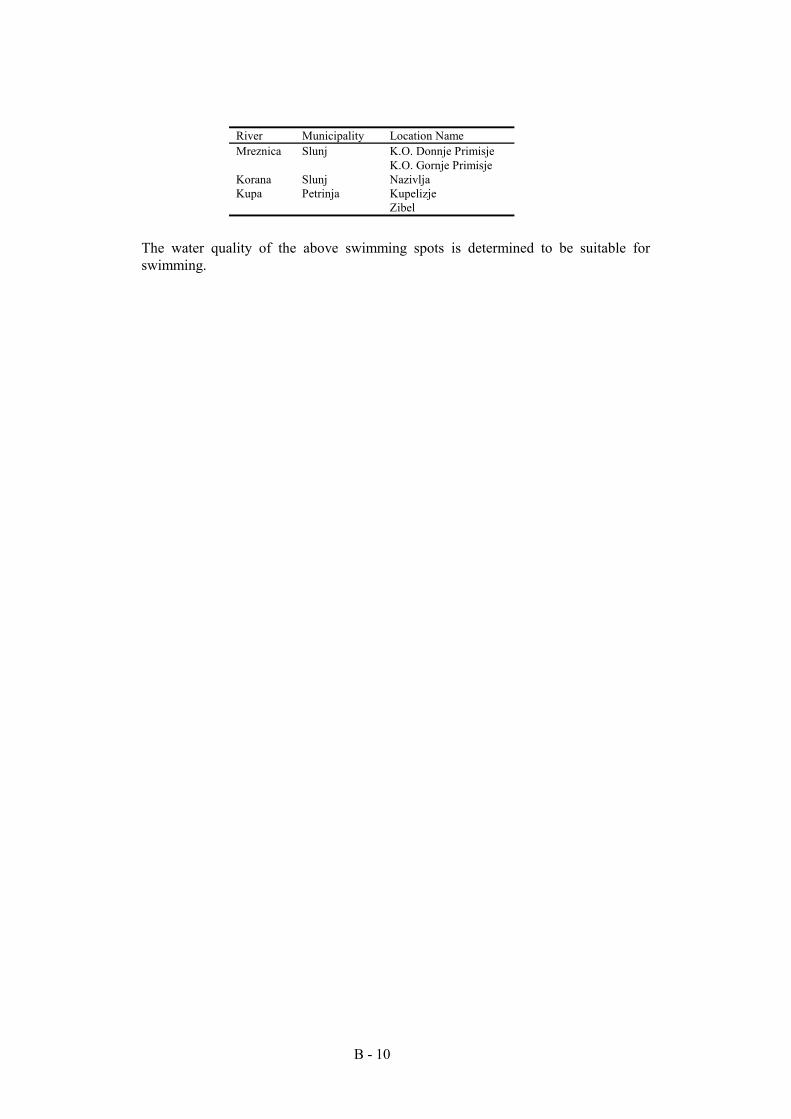
B - 10
River Municipality Location Name Mreznica Slunj K.O. Donnje Primisje K.O. Gornje Primisje Korana Slunj Nazivlja Kupa Petrinja Kupelizje Zibel
The water quality of the above swimming spots is determined to be suitable for swimming.
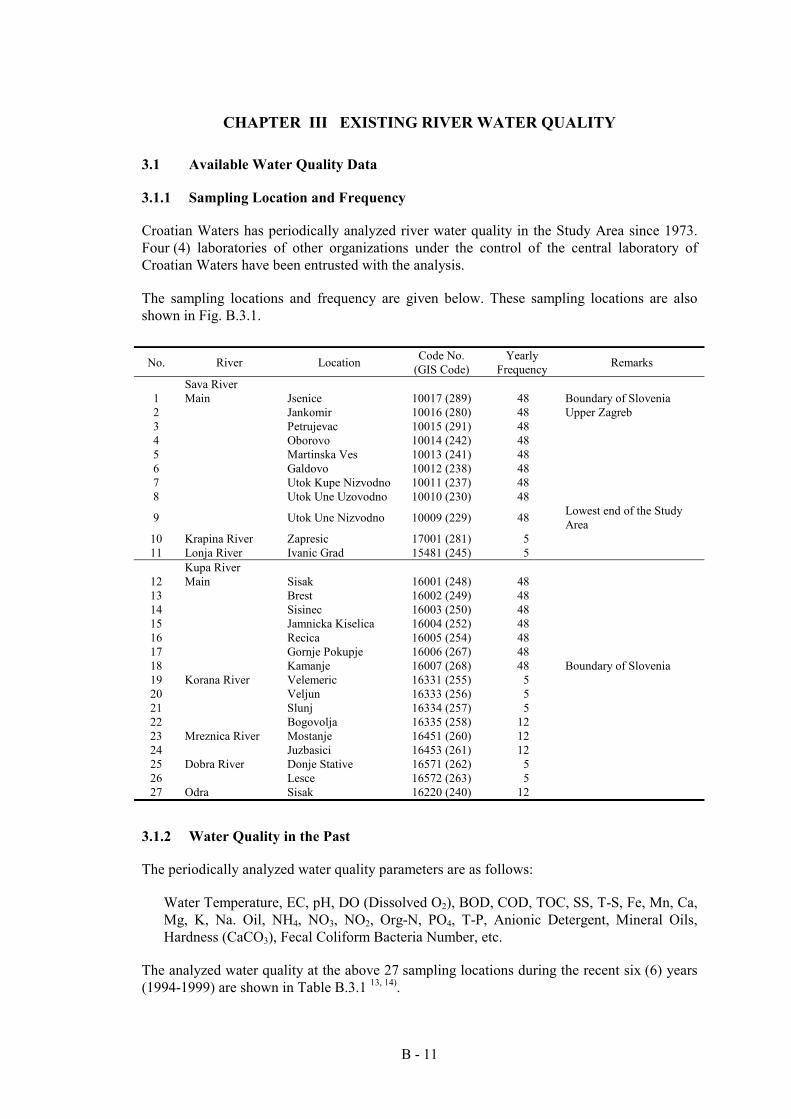
B - 11
CHAPTER III EXISTING RIVER WATER QUALITY
3.1 Available Water Quality Data
3.1.1 Sampling Location and Frequency
Croatian Waters has periodically analyzed river water quality in the Study Area since 1973. Four (4) laboratories of other organizations under the control of the central laboratory of Croatian Waters have been entrusted with the analysis.
The sampling locations and frequency are given below. These sampling locations are also shown in Fig. B.3.1.
No. River Location Code No. (GIS Code)
Yearly Frequency Remarks
Sava River 1 Main Jsenice 10017 (289) 48 Boundary of Slovenia 2 Jankomir 10016 (280) 48 Upper Zagreb 3 Petrujevac 10015 (291) 48 4 Oborovo 10014 (242) 48 5 Martinska Ves 10013 (241) 48 6 Galdovo 10012 (238) 48 7 Utok Kupe Nizvodno 10011 (237) 48 8 Utok Une Uzovodno 10010 (230) 48
9 Utok Une Nizvodno 10009 (229) 48 Lowest end of the Study Area
10 Krapina River Zapresic 17001 (281) 5 11 Lonja River Ivanic Grad 15481 (245) 5
Kupa River 12 Main Sisak 16001 (248) 48 13 Brest 16002 (249) 48 14 Sisinec 16003 (250) 48 15 Jamnicka Kiselica 16004 (252) 48 16 Recica 16005 (254) 48 17 Gornje Pokupje 16006 (267) 48 18 Kamanje 16007 (268) 48 Boundary of Slovenia 19 Korana River Velemeric 16331 (255) 5 20 Veljun 16333 (256) 5 21 Slunj 16334 (257) 5 22 Bogovolja 16335 (258) 12 23 Mreznica River Mostanje 16451 (260) 12 24 Juzbasici 16453 (261) 12 25 Dobra River Donje Stative 16571 (262) 5 26 Lesce 16572 (263) 5 27 Odra Sisak 16220 (240) 12
3.1.2 Water Quality in the Past
The periodically analyzed water quality parameters are as follows:
Water Temperature, EC, pH, DO (Dissolved O2), BOD, COD, TOC, SS, T-S, Fe, Mn, Ca, Mg, K, Na. Oil, NH4, NO3, NO2, Org-N, PO4, T-P, Anionic Detergent, Mineral Oils, Hardness (CaCO3), Fecal Coliform Bacteria Number, etc.
The analyzed water quality at the above 27 sampling locations during the recent six (6) years (1994-1999) are shown in Table B.3.1 13, 14).
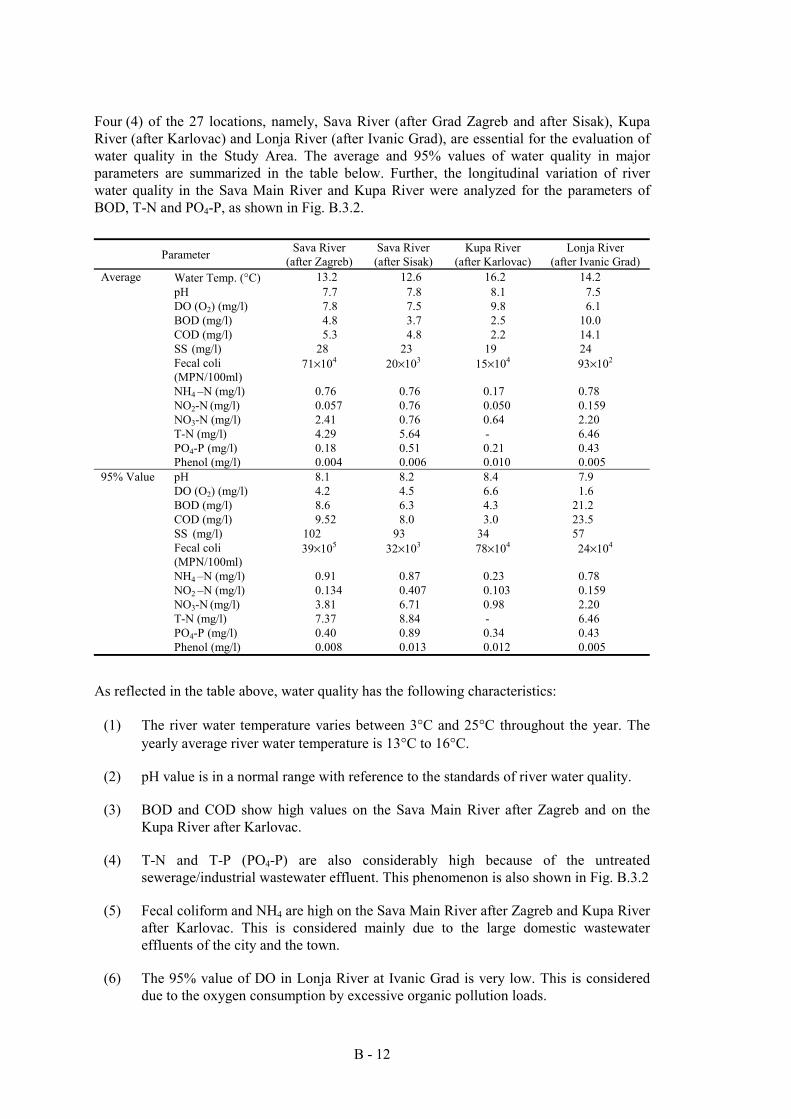
B - 12
Four (4) of the 27 locations, namely, Sava River (after Grad Zagreb and after Sisak), Kupa River (after Karlovac) and Lonja River (after Ivanic Grad), are essential for the evaluation of water quality in the Study Area. The average and 95% values of water quality in major parameters are summarized in the table below. Further, the longitudinal variation of river water quality in the Sava Main River and Kupa River were analyzed for the parameters of BOD, T-N and PO4-P, as shown in Fig. B.3.2.
Parameter Sava River (after Zagreb)
Sava River (after Sisak)
Kupa River (after Karlovac)
Lonja River (after Ivanic Grad)
Average Water Temp. (°C) 13.2 12.6 16.2 14.2 pH 7.7 7.8 8.1 7.5 DO (O2) (mg/l) 7.8 7.5 9.8 6.1 BOD (mg/l) 4.8 3.7 2.5 10.0 COD (mg/l) 5.3 4.8 2.2 14.1 SS (mg/l) 28 23 19 24 Fecal coli
(MPN/100ml) 71×104 20×103 15×104 93×102
NH4 –N (mg/l) 0.76 0.76 0.17 0.78 NO2-N (mg/l) 0.057 0.76 0.050 0.159 NO3-N (mg/l) 2.41 0.76 0.64 2.20 T-N (mg/l) 4.29 5.64 - 6.46 PO4-P (mg/l) 0.18 0.51 0.21 0.43 Phenol (mg/l) 0.004 0.006 0.010 0.005 95% Value pH 8.1 8.2 8.4 7.9 DO (O2) (mg/l) 4.2 4.5 6.6 1.6 BOD (mg/l) 8.6 6.3 4.3 21.2 COD (mg/l) 9.52 8.0 3.0 23.5 SS (mg/l) 102 93 34 57 Fecal coli
(MPN/100ml) 39×105 32×103 78×104 24×104
NH4 –N (mg/l) 0.91 0.87 0.23 0.78 NO2 –N (mg/l) 0.134 0.407 0.103 0.159 NO3-N (mg/l) 3.81 6.71 0.98 2.20 T-N (mg/l) 7.37 8.84 - 6.46 PO4-P (mg/l) 0.40 0.89 0.34 0.43 Phenol (mg/l) 0.008 0.013 0.012 0.005
As reflected in the table above, water quality has the following characteristics:
(1) The river water temperature varies between 3°C and 25°C throughout the year. The yearly average river water temperature is 13°C to 16°C.
(2) pH value is in a normal range with reference to the standards of river water quality.
(3) BOD and COD show high values on the Sava Main River after Zagreb and on the Kupa River after Karlovac.
(4) T-N and T-P (PO4-P) are also considerably high because of the untreated sewerage/industrial wastewater effluent. This phenomenon is also shown in Fig. B.3.2
(5) Fecal coliform and NH4 are high on the Sava Main River after Zagreb and Kupa River after Karlovac. This is considered mainly due to the large domestic wastewater effluents of the city and the town.
(6) The 95% value of DO in Lonja River at Ivanic Grad is very low. This is considered due to the oxygen consumption by excessive organic pollution loads.
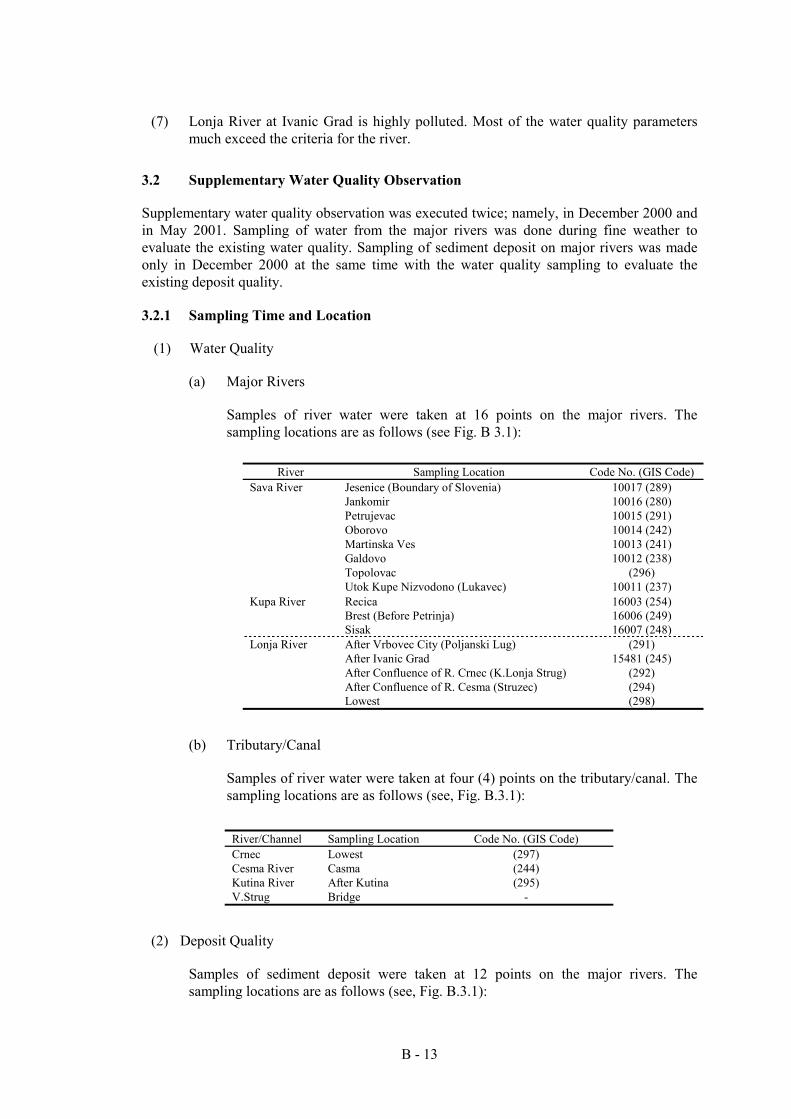
B - 13
(7) Lonja River at Ivanic Grad is highly polluted. Most of the water quality parameters much exceed the criteria for the river.
3.2 Supplementary Water Quality Observation
Supplementary water quality observation was executed twice; namely, in December 2000 and in May 2001. Sampling of water from the major rivers was done during fine weather to evaluate the existing water quality. Sampling of sediment deposit on major rivers was made only in December 2000 at the same time with the water quality sampling to evaluate the existing deposit quality.
3.2.1 Sampling Time and Location
(1) Water Quality
(a) Major Rivers
Samples of river water were taken at 16 points on the major rivers. The sampling locations are as follows (see Fig. B 3.1):
River Sampling Location Code No. (GIS Code)
Sava River Jesenice (Boundary of Slovenia) 10017 (289) Jankomir 10016 (280) Petrujevac 10015 (291) Oborovo 10014 (242) Martinska Ves 10013 (241) Galdovo 10012 (238) Topolovac (296) Utok Kupe Nizvodono (Lukavec) 10011 (237) Kupa River Recica 16003 (254) Brest (Before Petrinja) 16006 (249) Sisak 16007 (248) Lonja River After Vrbovec City (Poljanski Lug) (291) After Ivanic Grad 15481 (245) After Confluence of R. Crnec (K.Lonja Strug) (292) After Confluence of R. Cesma (Struzec) (294) Lowest (298)
(b) Tributary/Canal
Samples of river water were taken at four (4) points on the tributary/canal. The sampling locations are as follows (see, Fig. B.3.1):
River/Channel Sampling Location Code No. (GIS Code) Crnec Lowest (297) Cesma River Casma (244) Kutina River After Kutina (295) V.Strug Bridge -
(2) Deposit Quality
Samples of sediment deposit were taken at 12 points on the major rivers. The sampling locations are as follows (see, Fig. B.3.1):
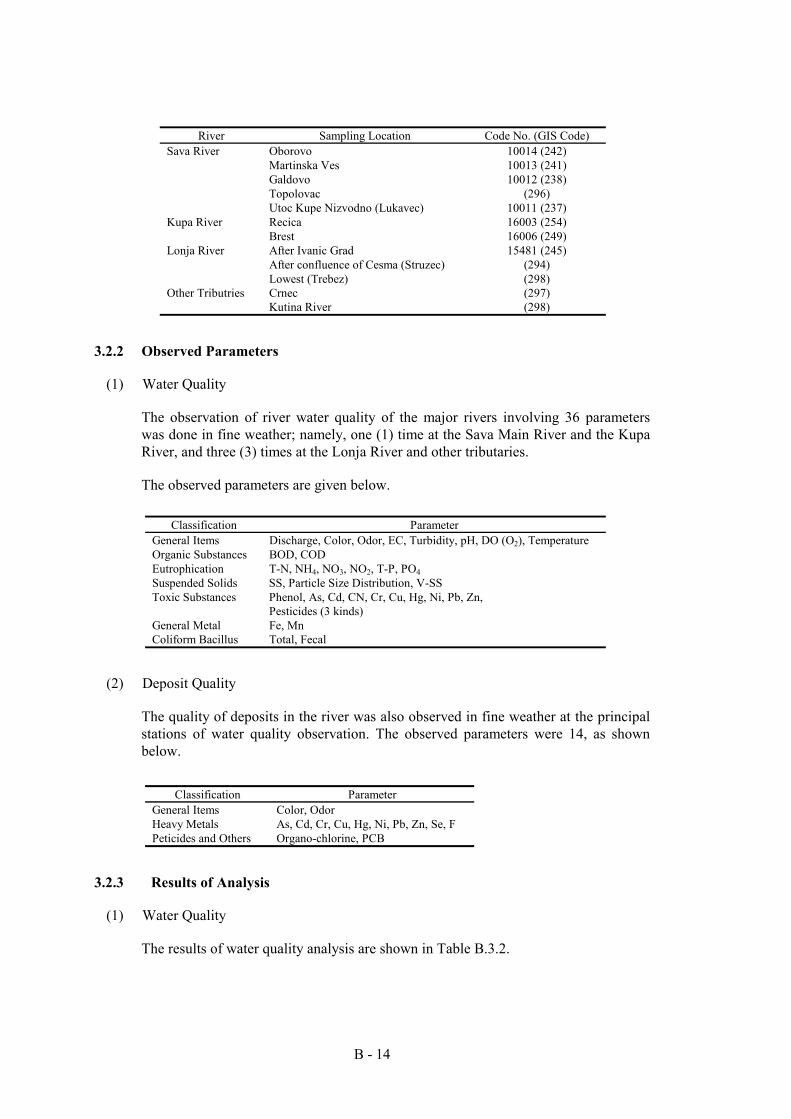
B - 14
River Sampling Location Code No. (GIS Code)
Sava River Oborovo 10014 (242) Martinska Ves 10013 (241) Galdovo 10012 (238) Topolovac (296) Utoc Kupe Nizvodno (Lukavec) 10011 (237) Kupa River Recica 16003 (254) Brest 16006 (249) Lonja River After Ivanic Grad 15481 (245) After confluence of Cesma (Struzec) (294) Lowest (Trebez) (298) Other Tributries Crnec (297) Kutina River (298)
3.2.2 Observed Parameters
(1) Water Quality
The observation of river water quality of the major rivers involving 36 parameters was done in fine weather; namely, one (1) time at the Sava Main River and the Kupa River, and three (3) times at the Lonja River and other tributaries.
The observed parameters are given below.
Classification Parameter General Items Discharge, Color, Odor, EC, Turbidity, pH, DO (O2), Temperature Organic Substances BOD, COD Eutrophication T-N, NH4, NO3, NO2, T-P, PO4 Suspended Solids SS, Particle Size Distribution, V-SS Toxic Substances Phenol, As, Cd, CN, Cr, Cu, Hg, Ni, Pb, Zn,
Pesticides (3 kinds) General Metal Fe, Mn Coliform Bacillus Total, Fecal
(2) Deposit Quality
The quality of deposits in the river was also observed in fine weather at the principal stations of water quality observation. The observed parameters were 14, as shown below.
Classification Parameter General Items Color, Odor Heavy Metals As, Cd, Cr, Cu, Hg, Ni, Pb, Zn, Se, F Peticides and Others Organo-chlorine, PCB
3.2.3 Results of Analysis
(1) Water Quality
The results of water quality analysis are shown in Table B.3.2.
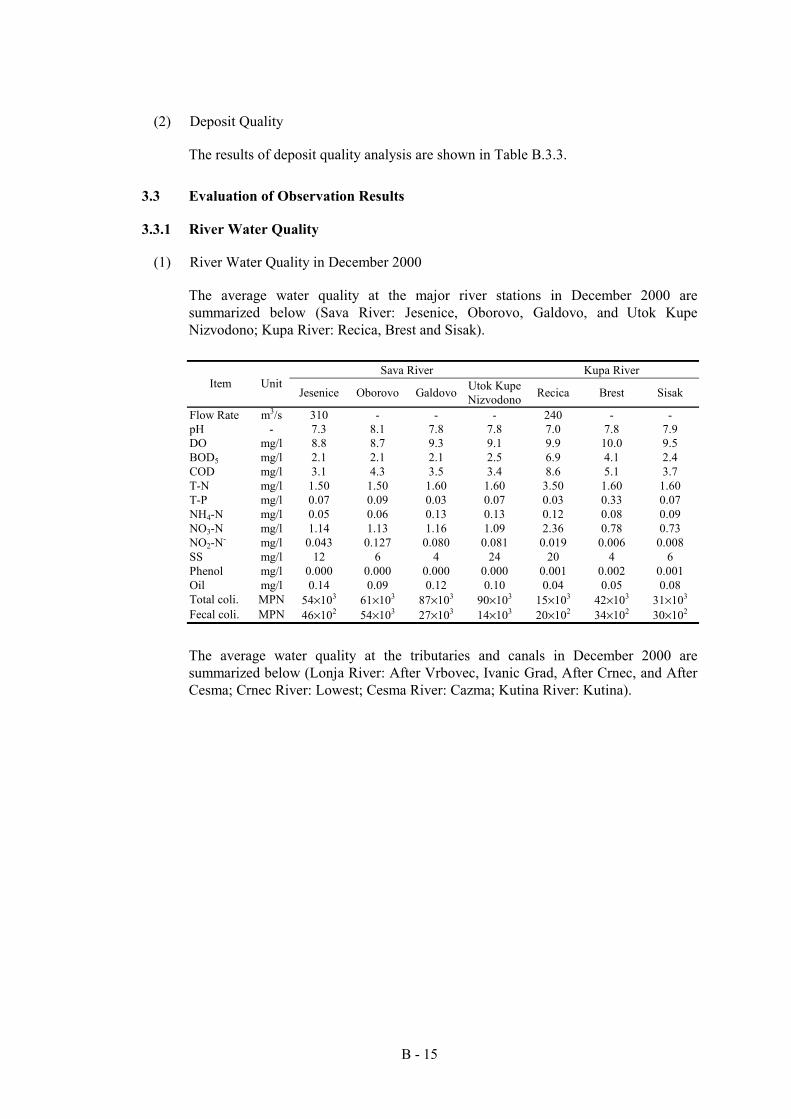
B - 15
(2) Deposit Quality
The results of deposit quality analysis are shown in Table B.3.3.
3.3 Evaluation of Observation Results
3.3.1 River Water Quality
(1) River Water Quality in December 2000
The average water quality at the major river stations in December 2000 are summarized below (Sava River: Jesenice, Oborovo, Galdovo, and Utok Kupe Nizvodono; Kupa River: Recica, Brest and Sisak).
Sava River Kupa River
Item Unit Jesenice Oborovo Galdovo Utok Kupe
Nizvodono Recica Brest Sisak
Flow Rate m3/s 310 - - - 240 - - pH - 7.3 8.1 7.8 7.8 7.0 7.8 7.9 DO mg/l 8.8 8.7 9.3 9.1 9.9 10.0 9.5 BOD5 mg/l 2.1 2.1 2.1 2.5 6.9 4.1 2.4 COD mg/l 3.1 4.3 3.5 3.4 8.6 5.1 3.7 T-N mg/l 1.50 1.50 1.60 1.60 3.50 1.60 1.60 T-P mg/l 0.07 0.09 0.03 0.07 0.03 0.33 0.07 NH4-N mg/l 0.05 0.06 0.13 0.13 0.12 0.08 0.09 NO3-N mg/l 1.14 1.13 1.16 1.09 2.36 0.78 0.73 NO2-N- mg/l 0.043 0.127 0.080 0.081 0.019 0.006 0.008 SS mg/l 12 6 4 24 20 4 6 Phenol mg/l 0.000 0.000 0.000 0.000 0.001 0.002 0.001 Oil mg/l 0.14 0.09 0.12 0.10 0.04 0.05 0.08 Total coli. MPN 54×103 61×103 87×103 90×103 15×103 42×103 31×103
Fecal coli. MPN 46×102 54×103 27×103 14×103 20×102 34×102 30×102
The average water quality at the tributaries and canals in December 2000 are summarized below (Lonja River: After Vrbovec, Ivanic Grad, After Crnec, and After Cesma; Crnec River: Lowest; Cesma River: Cazma; Kutina River: Kutina).
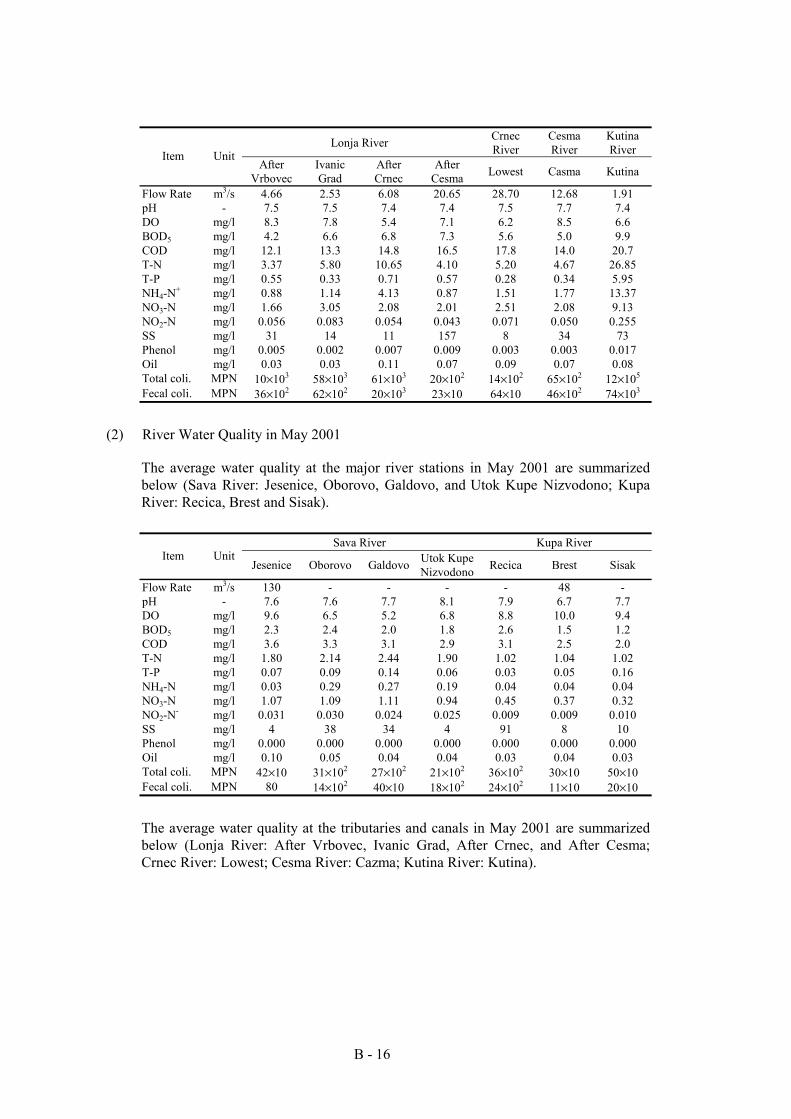
B - 16
Lonja River Crnec River
Cesma River
Kutina River Item Unit
After Vrbovec
Ivanic Grad
After Crnec
After Cesma Lowest Casma Kutina
Flow Rate m3/s 4.66 2.53 6.08 20.65 28.70 12.68 1.91 pH - 7.5 7.5 7.4 7.4 7.5 7.7 7.4 DO mg/l 8.3 7.8 5.4 7.1 6.2 8.5 6.6 BOD5 mg/l 4.2 6.6 6.8 7.3 5.6 5.0 9.9 COD mg/l 12.1 13.3 14.8 16.5 17.8 14.0 20.7 T-N mg/l 3.37 5.80 10.65 4.10 5.20 4.67 26.85 T-P mg/l 0.55 0.33 0.71 0.57 0.28 0.34 5.95 NH4-N+ mg/l 0.88 1.14 4.13 0.87 1.51 1.77 13.37 NO3-N mg/l 1.66 3.05 2.08 2.01 2.51 2.08 9.13 NO2-N mg/l 0.056 0.083 0.054 0.043 0.071 0.050 0.255 SS mg/l 31 14 11 157 8 34 73 Phenol mg/l 0.005 0.002 0.007 0.009 0.003 0.003 0.017 Oil mg/l 0.03 0.03 0.11 0.07 0.09 0.07 0.08 Total coli. MPN 10×103 58×103 61×103 20×102 14×102 65×102 12×105
Fecal coli. MPN 36×102 62×102 20×103 23×10 64×10 46×102 74×103
(2) River Water Quality in May 2001
The average water quality at the major river stations in May 2001 are summarized below (Sava River: Jesenice, Oborovo, Galdovo, and Utok Kupe Nizvodono; Kupa River: Recica, Brest and Sisak).
Sava River Kupa River
Item Unit Jesenice Oborovo Galdovo Utok Kupe
Nizvodono Recica Brest Sisak
Flow Rate m3/s 130 - - - - 48 - pH - 7.6 7.6 7.7 8.1 7.9 6.7 7.7 DO mg/l 9.6 6.5 5.2 6.8 8.8 10.0 9.4 BOD5 mg/l 2.3 2.4 2.0 1.8 2.6 1.5 1.2 COD mg/l 3.6 3.3 3.1 2.9 3.1 2.5 2.0 T-N mg/l 1.80 2.14 2.44 1.90 1.02 1.04 1.02 T-P mg/l 0.07 0.09 0.14 0.06 0.03 0.05 0.16 NH4-N mg/l 0.03 0.29 0.27 0.19 0.04 0.04 0.04 NO3-N mg/l 1.07 1.09 1.11 0.94 0.45 0.37 0.32 NO2-N- mg/l 0.031 0.030 0.024 0.025 0.009 0.009 0.010 SS mg/l 4 38 34 4 91 8 10 Phenol mg/l 0.000 0.000 0.000 0.000 0.000 0.000 0.000 Oil mg/l 0.10 0.05 0.04 0.04 0.03 0.04 0.03 Total coli. MPN 42×10 31×102 27×102 21×102 36×102 30×10 50×10
Fecal coli. MPN 80 14×102 40×10 18×102 24×102 11×10 20×10
The average water quality at the tributaries and canals in May 2001 are summarized below (Lonja River: After Vrbovec, Ivanic Grad, After Crnec, and After Cesma; Crnec River: Lowest; Cesma River: Cazma; Kutina River: Kutina).
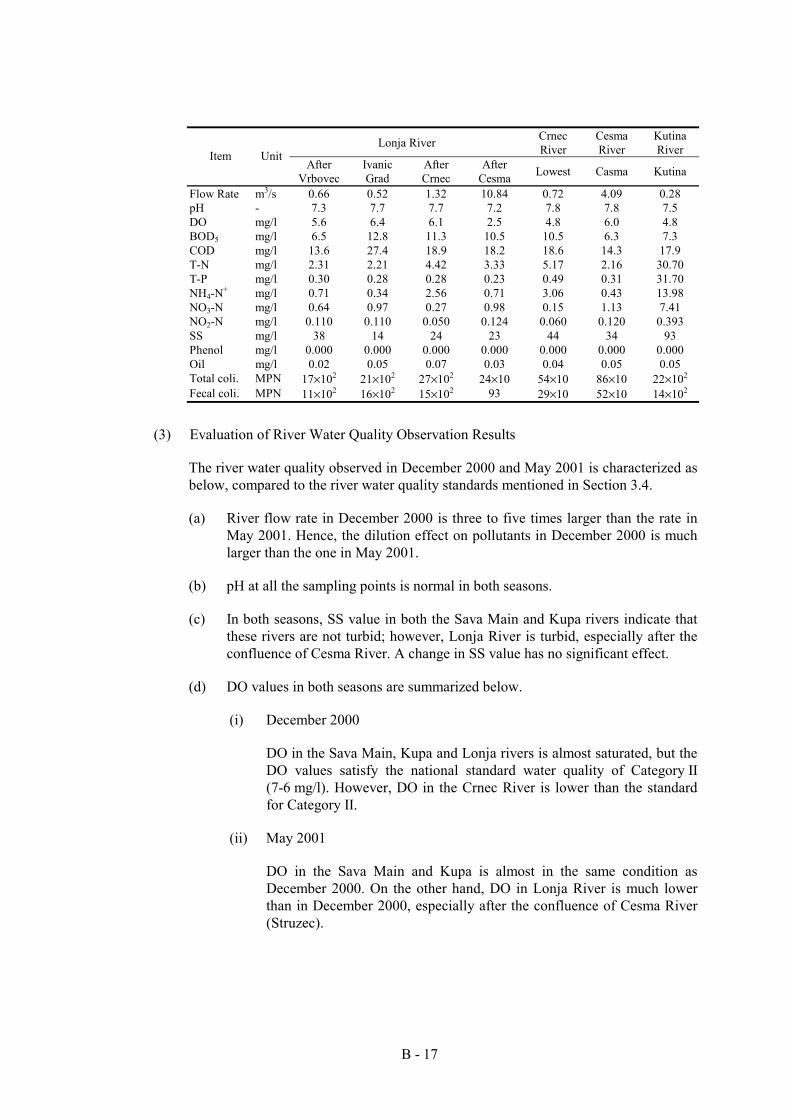
B - 17
Lonja River Crnec River
Cesma River
Kutina River Item Unit
After Vrbovec
Ivanic Grad
After Crnec
After Cesma Lowest Casma Kutina
Flow Rate m3/s 0.66 0.52 1.32 10.84 0.72 4.09 0.28 pH - 7.3 7.7 7.7 7.2 7.8 7.8 7.5 DO mg/l 5.6 6.4 6.1 2.5 4.8 6.0 4.8 BOD5 mg/l 6.5 12.8 11.3 10.5 10.5 6.3 7.3 COD mg/l 13.6 27.4 18.9 18.2 18.6 14.3 17.9 T-N mg/l 2.31 2.21 4.42 3.33 5.17 2.16 30.70 T-P mg/l 0.30 0.28 0.28 0.23 0.49 0.31 31.70 NH4-N+ mg/l 0.71 0.34 2.56 0.71 3.06 0.43 13.98 NO3-N mg/l 0.64 0.97 0.27 0.98 0.15 1.13 7.41 NO2-N mg/l 0.110 0.110 0.050 0.124 0.060 0.120 0.393 SS mg/l 38 14 24 23 44 34 93 Phenol mg/l 0.000 0.000 0.000 0.000 0.000 0.000 0.000 Oil mg/l 0.02 0.05 0.07 0.03 0.04 0.05 0.05 Total coli. MPN 17×102 21×102 27×102 24×10 54×10 86×10 22×102
Fecal coli. MPN 11×102 16×102 15×102 93 29×10 52×10 14×102
(3) Evaluation of River Water Quality Observation Results
The river water quality observed in December 2000 and May 2001 is characterized as below, compared to the river water quality standards mentioned in Section 3.4.
(a) River flow rate in December 2000 is three to five times larger than the rate in May 2001. Hence, the dilution effect on pollutants in December 2000 is much larger than the one in May 2001.
(b) pH at all the sampling points is normal in both seasons.
(c) In both seasons, SS value in both the Sava Main and Kupa rivers indicate that these rivers are not turbid; however, Lonja River is turbid, especially after the confluence of Cesma River. A change in SS value has no significant effect.
(d) DO values in both seasons are summarized below.
(i) December 2000
DO in the Sava Main, Kupa and Lonja rivers is almost saturated, but the DO values satisfy the national standard water quality of Category II (7-6 mg/l). However, DO in the Crnec River is lower than the standard for Category II.
(ii) May 2001
DO in the Sava Main and Kupa is almost in the same condition as December 2000. On the other hand, DO in Lonja River is much lower than in December 2000, especially after the confluence of Cesma River (Struzec).
B - 18
(e) BOD and COD concentration are summarized below.
(i) December 2000
BOD and COD concentrations in the Sava Main River satisfy the river water quality standard for Category II (2-4 mg/l) because of the sufficient river flow rate. On the other hand, Kupa River (except at Sisak), Lonja River, Crnec River, Cesma River and Kutina River are polluted by organic substances, and BOD at the sampling points is higher than the standard for Category II (2-4 mg/l).
(ii) May 2001
The longitudinal change of BOD and COD concentrations in the Sava Main and Kupa rivers are similar to the values in December 2000. As for Lonja River, Crnec River, Cesma River and Kutina River, there is an indication that these rivers are polluted by organic substances, i.e., the BOD values at the sampling points are higher than those in December 2000 due to the small river flow rate.
(f) Regardless of season, high contents of NH4-N were observed in both the Crnec River and the Kutina River. This is considered mainly due to the large sewerage wastewater of the upper area.
(g) Regardless of the sampling season, T-N and T-P concentrations in the Lonja River become higher as the river flow lowers due to a large quantity of untreated wastewater inflow from the basin. Further, T-N and T-P in the Lonja River after the confluence of the Crenec and Cesma rivers far exceed the ordinary criteria of lake eutrophication (T-N>0.2 mg/l, T-P>0.02 mg/l). Since Lonjsko Polje, one of the nature parks in the country, is located in the downstream reaches of the Lonja river system (a flood plain of Sava River), the inflow of river water polluted with T-N and T-P may cause severe eutrophication of Lonjsko Polje.
(h) All of the nine (9) major heavy metals (As, Cd, CN, Cr6+, Cu, Hg, Ni, Pb, Zn) were either not detected or negligible in both sampling seasons.
(i) Oil concentrations at all points were quite low in both sampling seasons.
(j) In both seasons, pesticides were detected at many sampling points. However, the concentration is negligible.
3.3.2 Deposit Quality
The average quality of deposits in the riverbed of the Sava, Kupa, Lonja, Crnec and Kutina rivers are summarized below.
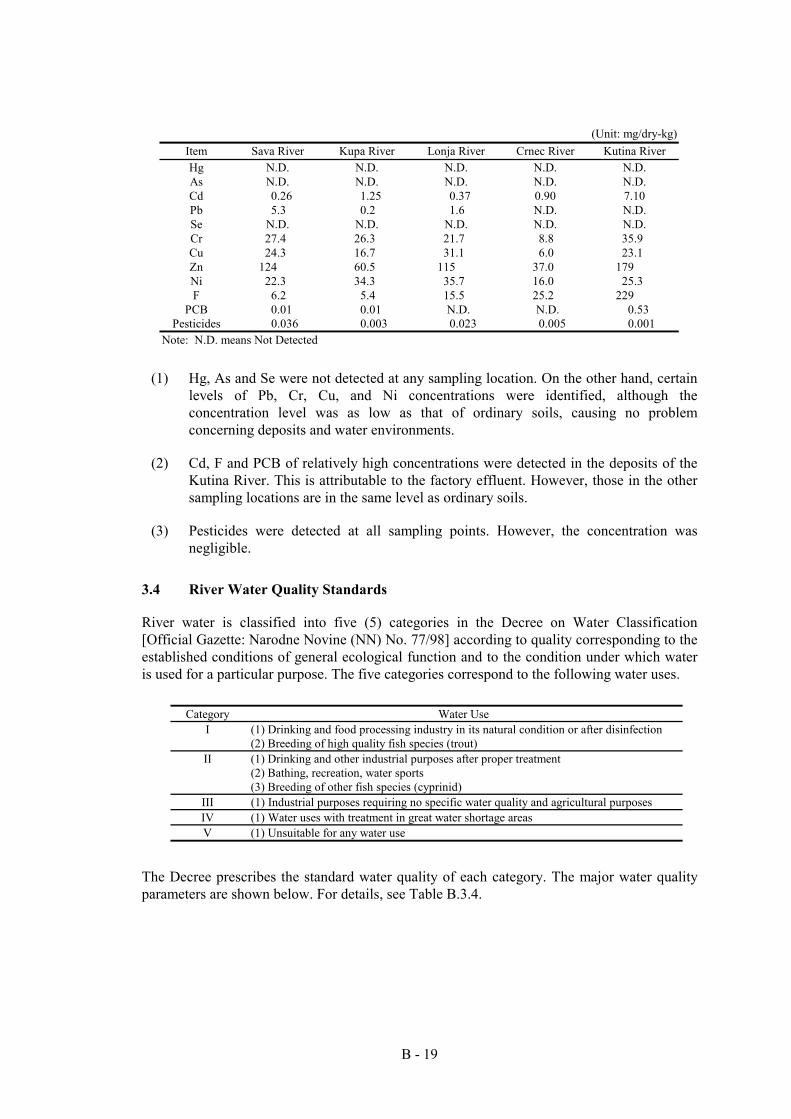
B - 19
(Unit: mg/dry-kg)
Item Sava River Kupa River Lonja River Crnec River Kutina River Hg N.D. N.D. N.D. N.D. N.D. As N.D. N.D. N.D. N.D. N.D. Cd 0.26 1.25 0.37 0.90 7.10 Pb 5.3 0.2 1.6 N.D. N.D. Se N.D. N.D. N.D. N.D. N.D. Cr 27.4 26.3 21.7 8.8 35.9 Cu 24.3 16.7 31.1 6.0 23.1 Zn 124 60.5 115 37.0 179 Ni 22.3 34.3 35.7 16.0 25.3 F 6.2 5.4 15.5 25.2 229
PCB 0.01 0.01 N.D. N.D. 0.53 Pesticides 0.036 0.003 0.023 0.005 0.001
Note: N.D. means Not Detected
(1) Hg, As and Se were not detected at any sampling location. On the other hand, certain levels of Pb, Cr, Cu, and Ni concentrations were identified, although the concentration level was as low as that of ordinary soils, causing no problem concerning deposits and water environments.
(2) Cd, F and PCB of relatively high concentrations were detected in the deposits of the Kutina River. This is attributable to the factory effluent. However, those in the other sampling locations are in the same level as ordinary soils.
(3) Pesticides were detected at all sampling points. However, the concentration was negligible.
3.4 River Water Quality Standards
River water is classified into five (5) categories in the Decree on Water Classification [Official Gazette: Narodne Novine (NN) No. 77/98] according to quality corresponding to the established conditions of general ecological function and to the condition under which water is used for a particular purpose. The five categories correspond to the following water uses.
Category Water Use I (1) Drinking and food processing industry in its natural condition or after disinfection
(2) Breeding of high quality fish species (trout) II (1) Drinking and other industrial purposes after proper treatment
(2) Bathing, recreation, water sports (3) Breeding of other fish species (cyprinid)
III (1) Industrial purposes requiring no specific water quality and agricultural purposes IV (1) Water uses with treatment in great water shortage areas V (1) Unsuitable for any water use
The Decree prescribes the standard water quality of each category. The major water quality parameters are shown below. For details, see Table B.3.4.
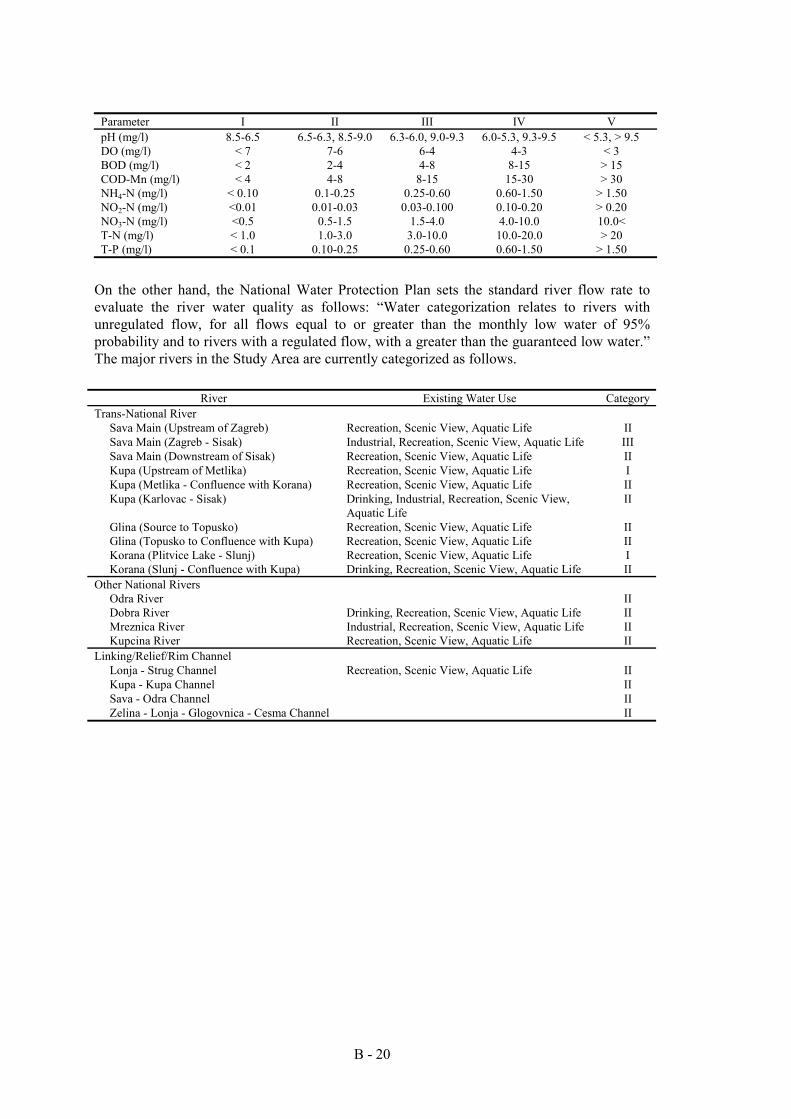
B - 20
Parameter I II III IV V pH (mg/l) 8.5-6.5 6.5-6.3, 8.5-9.0 6.3-6.0, 9.0-9.3 6.0-5.3, 9.3-9.5 < 5.3, > 9.5 DO (mg/l) < 7 7-6 6-4 4-3 < 3 BOD (mg/l) < 2 2-4 4-8 8-15 > 15 COD-Mn (mg/l) < 4 4-8 8-15 15-30 > 30 NH4-N (mg/l) < 0.10 0.1-0.25 0.25-0.60 0.60-1.50 > 1.50 NO2-N (mg/l) <0.01 0.01-0.03 0.03-0.100 0.10-0.20 > 0.20 NO3-N (mg/l) <0.5 0.5-1.5 1.5-4.0 4.0-10.0 10.0< T-N (mg/l) < 1.0 1.0-3.0 3.0-10.0 10.0-20.0 > 20 T-P (mg/l) < 0.1 0.10-0.25 0.25-0.60 0.60-1.50 > 1.50
On the other hand, the National Water Protection Plan sets the standard river flow rate to evaluate the river water quality as follows: “Water categorization relates to rivers with unregulated flow, for all flows equal to or greater than the monthly low water of 95% probability and to rivers with a regulated flow, with a greater than the guaranteed low water.” The major rivers in the Study Area are currently categorized as follows.
River Existing Water Use Category Trans-National River
Sava Main (Upstream of Zagreb) Recreation, Scenic View, Aquatic Life II Sava Main (Zagreb - Sisak) Industrial, Recreation, Scenic View, Aquatic Life III Sava Main (Downstream of Sisak) Recreation, Scenic View, Aquatic Life II Kupa (Upstream of Metlika) Recreation, Scenic View, Aquatic Life I Kupa (Metlika - Confluence with Korana) Recreation, Scenic View, Aquatic Life II Kupa (Karlovac - Sisak) Drinking, Industrial, Recreation, Scenic View,
Aquatic Life II
Glina (Source to Topusko) Recreation, Scenic View, Aquatic Life II Glina (Topusko to Confluence with Kupa) Recreation, Scenic View, Aquatic Life II Korana (Plitvice Lake - Slunj) Recreation, Scenic View, Aquatic Life I Korana (Slunj - Confluence with Kupa) Drinking, Recreation, Scenic View, Aquatic Life II
Other National Rivers Odra River Dobra River Mreznica River Kupcina River
Drinking, Recreation, Scenic View, Aquatic Life Industrial, Recreation, Scenic View, Aquatic Life Recreation, Scenic View, Aquatic Life
II II II II
Linking/Relief/Rim Channel Lonja - Strug Channel Recreation, Scenic View, Aquatic Life II Kupa - Kupa Channel II Sava - Odra Channel II Zelina - Lonja - Glogovnica - Cesma Channel II
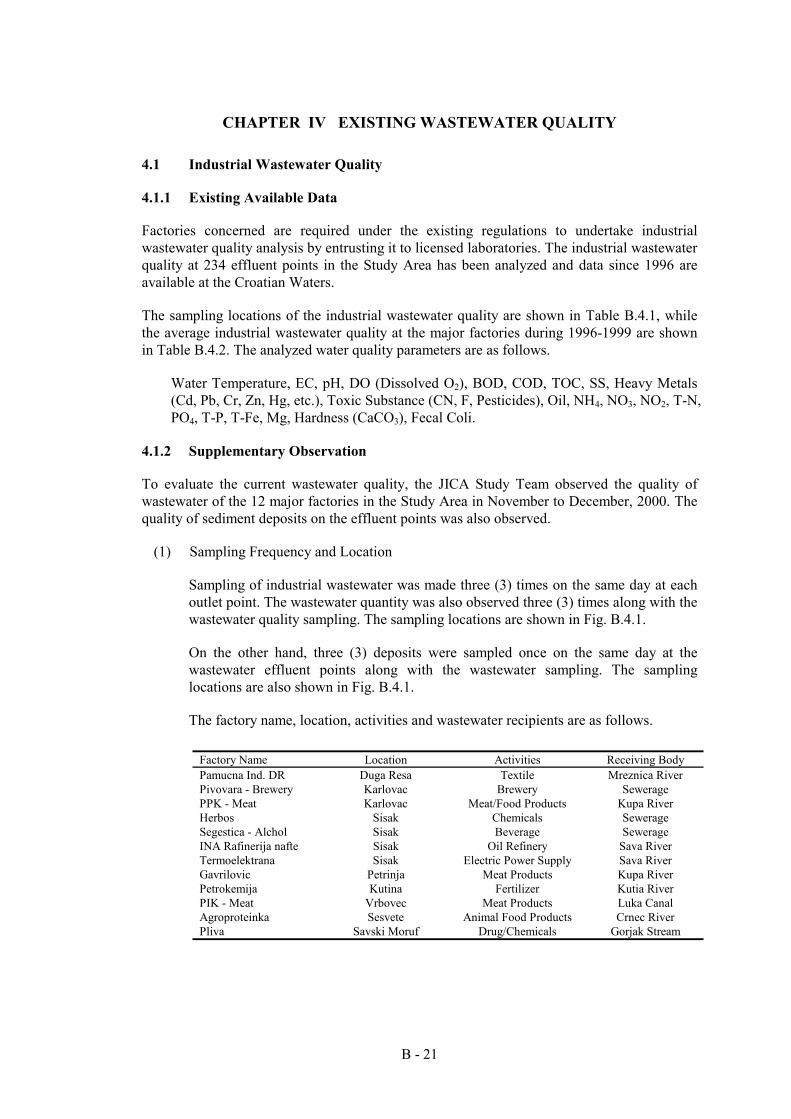
B - 21
CHAPTER IV EXISTING WASTEWATER QUALITY
4.1 Industrial Wastewater Quality
4.1.1 Existing Available Data
Factories concerned are required under the existing regulations to undertake industrial wastewater quality analysis by entrusting it to licensed laboratories. The industrial wastewater quality at 234 effluent points in the Study Area has been analyzed and data since 1996 are available at the Croatian Waters.
The sampling locations of the industrial wastewater quality are shown in Table B.4.1, while the average industrial wastewater quality at the major factories during 1996-1999 are shown in Table B.4.2. The analyzed water quality parameters are as follows.
Water Temperature, EC, pH, DO (Dissolved O2), BOD, COD, TOC, SS, Heavy Metals (Cd, Pb, Cr, Zn, Hg, etc.), Toxic Substance (CN, F, Pesticides), Oil, NH4, NO3, NO2, T-N, PO4, T-P, T-Fe, Mg, Hardness (CaCO3), Fecal Coli.
4.1.2 Supplementary Observation
To evaluate the current wastewater quality, the JICA Study Team observed the quality of wastewater of the 12 major factories in the Study Area in November to December, 2000. The quality of sediment deposits on the effluent points was also observed.
(1) Sampling Frequency and Location
Sampling of industrial wastewater was made three (3) times on the same day at each outlet point. The wastewater quantity was also observed three (3) times along with the wastewater quality sampling. The sampling locations are shown in Fig. B.4.1.
On the other hand, three (3) deposits were sampled once on the same day at the wastewater effluent points along with the wastewater sampling. The sampling locations are also shown in Fig. B.4.1.
The factory name, location, activities and wastewater recipients are as follows.
Factory Name Location Activities Receiving Body Pamucna Ind. DR Duga Resa Textile Mreznica River Pivovara - Brewery Karlovac Brewery Sewerage PPK - Meat Karlovac Meat/Food Products Kupa River Herbos Sisak Chemicals Sewerage Segestica - Alchol Sisak Beverage Sewerage INA Rafinerija nafte Sisak Oil Refinery Sava River Termoelektrana Sisak Electric Power Supply Sava River Gavrilovic Petrinja Meat Products Kupa River Petrokemija Kutina Fertilizer Kutia River PIK - Meat Vrbovec Meat Products Luka Canal Agroproteinka Sesvete Animal Food Products Crnec River Pliva Savski Moruf Drug/Chemicals Gorjak Stream
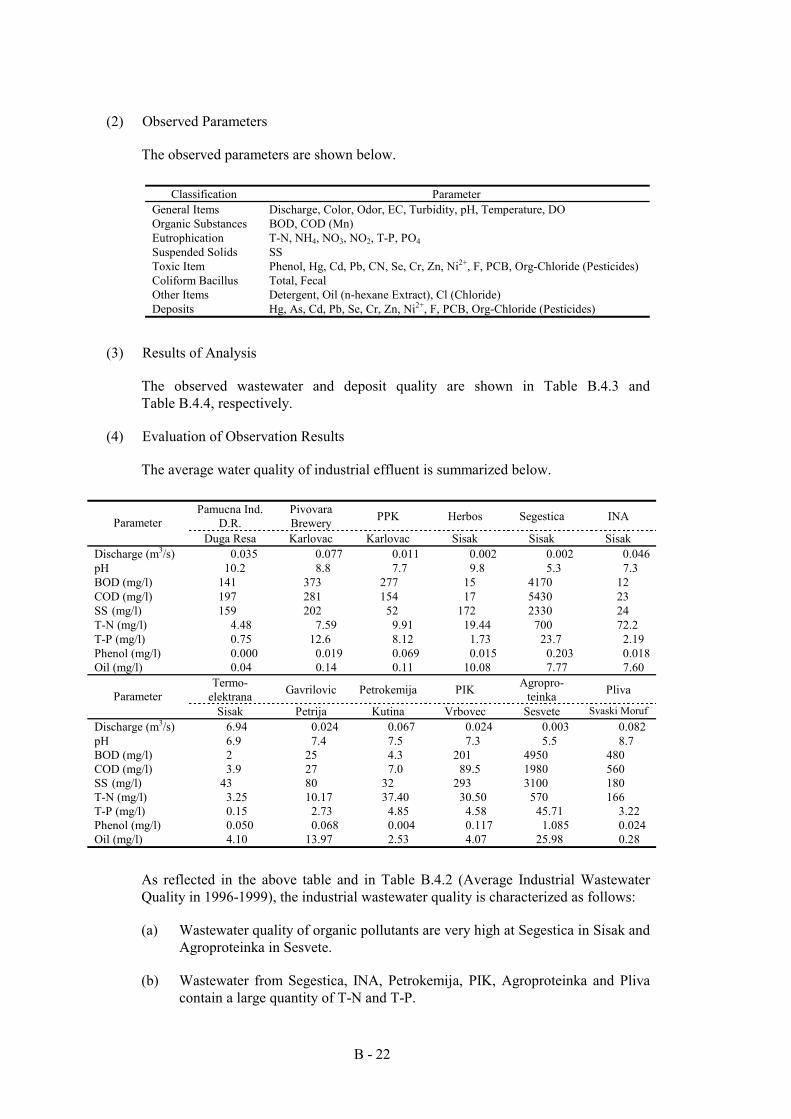
B - 22
(2) Observed Parameters
The observed parameters are shown below.
Classification Parameter General Items Discharge, Color, Odor, EC, Turbidity, pH, Temperature, DO Organic Substances BOD, COD (Mn) Eutrophication T-N, NH4, NO3, NO2, T-P, PO4 Suspended Solids SS Toxic Item Phenol, Hg, Cd, Pb, CN, Se, Cr, Zn, Ni2+, F, PCB, Org-Chloride (Pesticides) Coliform Bacillus Total, Fecal Other Items Detergent, Oil (n-hexane Extract), Cl (Chloride) Deposits Hg, As, Cd, Pb, Se, Cr, Zn, Ni2+, F, PCB, Org-Chloride (Pesticides)
(3) Results of Analysis
The observed wastewater and deposit quality are shown in Table B.4.3 and Table B.4.4, respectively.
(4) Evaluation of Observation Results
The average water quality of industrial effluent is summarized below.
Pamucna Ind. D.R.
Pivovara Brewery PPK Herbos Segestica INA Parameter
Duga Resa Karlovac Karlovac Sisak Sisak Sisak Discharge (m3/s) 0.035 0.077 0.011 0.002 0.002 0.046 pH 10.2 8.8 7.7 9.8 5.3 7.3 BOD (mg/l) 141 373 277 15 4170 12 COD (mg/l) 197 281 154 17 5430 23 SS (mg/l) 159 202 52 172 2330 24 T-N (mg/l) 4.48 7.59 9.91 19.44 700 72.2 T-P (mg/l) 0.75 12.6 8.12 1.73 23.7 2.19 Phenol (mg/l) 0.000 0.019 0.069 0.015 0.203 0.018 Oil (mg/l) 0.04 0.14 0.11 10.08 7.77 7.60
Termo- elektrana Gavrilovic Petrokemija PIK Agropro-
teinka Pliva Parameter Sisak Petrija Kutina Vrbovec Sesvete Svaski Moruf
Discharge (m3/s) 6.94 0.024 0.067 0.024 0.003 0.082 pH 6.9 7.4 7.5 7.3 5.5 8.7 BOD (mg/l) 2 25 4.3 201 4950 480 COD (mg/l) 3.9 27 7.0 89.5 1980 560 SS (mg/l) 43 80 32 293 3100 180 T-N (mg/l) 3.25 10.17 37.40 30.50 570 166 T-P (mg/l) 0.15 2.73 4.85 4.58 45.71 3.22 Phenol (mg/l) 0.050 0.068 0.004 0.117 1.085 0.024 Oil (mg/l) 4.10 13.97 2.53 4.07 25.98 0.28
As reflected in the above table and in Table B.4.2 (Average Industrial Wastewater Quality in 1996-1999), the industrial wastewater quality is characterized as follows:
(a) Wastewater quality of organic pollutants are very high at Segestica in Sisak and Agroproteinka in Sesvete.
(b) Wastewater from Segestica, INA, Petrokemija, PIK, Agroproteinka and Pliva contain a large quantity of T-N and T-P.
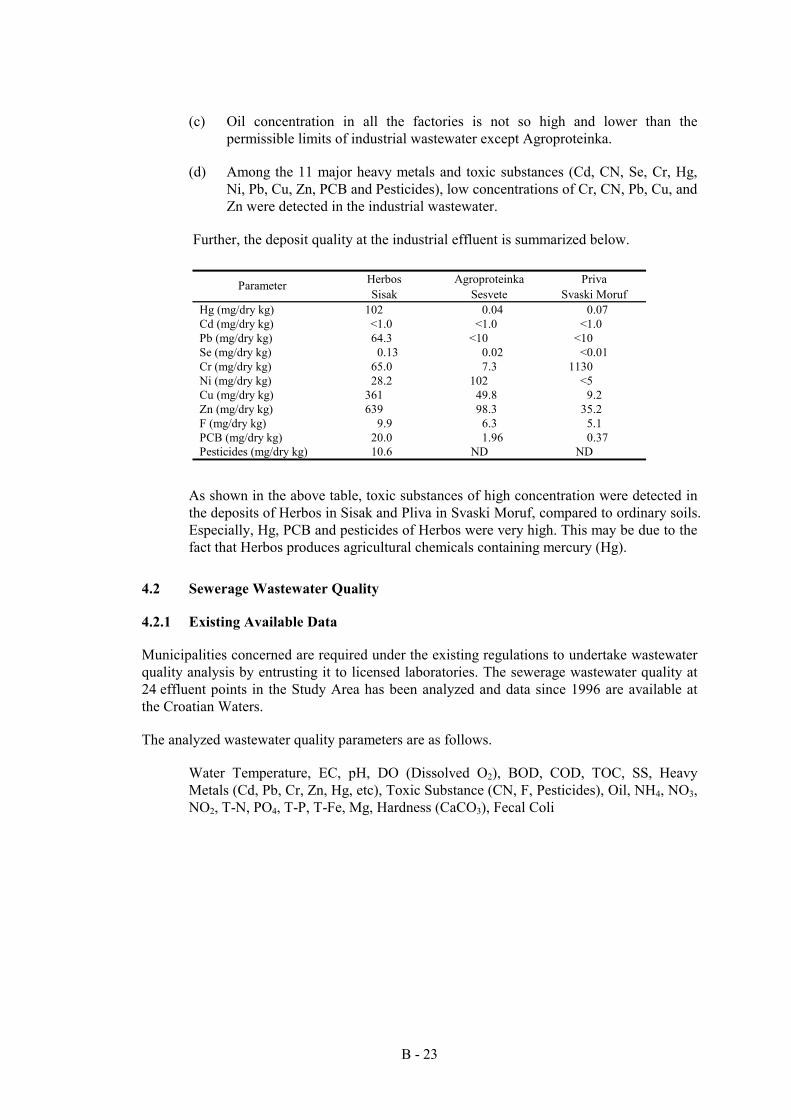
B - 23
(c) Oil concentration in all the factories is not so high and lower than the permissible limits of industrial wastewater except Agroproteinka.
(d) Among the 11 major heavy metals and toxic substances (Cd, CN, Se, Cr, Hg, Ni, Pb, Cu, Zn, PCB and Pesticides), low concentrations of Cr, CN, Pb, Cu, and Zn were detected in the industrial wastewater.
Further, the deposit quality at the industrial effluent is summarized below.
Herbos Agroproteinka Priva Parameter Sisak Sesvete Svaski Moruf
Hg (mg/dry kg) 102 0.04 0.07 Cd (mg/dry kg) <1.0 <1.0 <1.0 Pb (mg/dry kg) 64.3 <10 <10 Se (mg/dry kg) 0.13 0.02 <0.01 Cr (mg/dry kg) 65.0 7.3 1130 Ni (mg/dry kg) 28.2 102 <5 Cu (mg/dry kg) 361 49.8 9.2 Zn (mg/dry kg) 639 98.3 35.2 F (mg/dry kg) 9.9 6.3 5.1 PCB (mg/dry kg) 20.0 1.96 0.37 Pesticides (mg/dry kg) 10.6 ND ND
As shown in the above table, toxic substances of high concentration were detected in the deposits of Herbos in Sisak and Pliva in Svaski Moruf, compared to ordinary soils. Especially, Hg, PCB and pesticides of Herbos were very high. This may be due to the fact that Herbos produces agricultural chemicals containing mercury (Hg).
4.2 Sewerage Wastewater Quality
4.2.1 Existing Available Data
Municipalities concerned are required under the existing regulations to undertake wastewater quality analysis by entrusting it to licensed laboratories. The sewerage wastewater quality at 24 effluent points in the Study Area has been analyzed and data since 1996 are available at the Croatian Waters.
The analyzed wastewater quality parameters are as follows.
Water Temperature, EC, pH, DO (Dissolved O2), BOD, COD, TOC, SS, Heavy Metals (Cd, Pb, Cr, Zn, Hg, etc), Toxic Substance (CN, F, Pesticides), Oil, NH4, NO3, NO2, T-N, PO4, T-P, T-Fe, Mg, Hardness (CaCO3), Fecal Coli
B - 24
The municipalities, sampling locations and receiving bodies are shown below.
Municipality Sampling Location Receiving Body Duga Resa VINICE Mreznica River DOM SPORTOVA Mreznica River MLIN Mreznica River Karlovac Collector DREŽNIK Kupa River Collector BANIJA I Kupa River Collector BANIJA II Kupa River Collector GRAD Kupa River Trska Cesta No. 1 (the old one) Kupa River Ivanic Grad Inlet Ivancic Grad Treatment System Outlet Lonja River Sisak Pump Station - Galdovo Outlet 1 Sava River Žitna Outlet 2 Kupa River MAŽURANIĆEVA Outlet 3 Kupa River Ladjaska Outlet 4 Kupa River Školska Outlet 5 Kupa River Kutina Inlet Kutina Sewerage Treatment System Outlet to Canal Kutina-Ilova Kutina Canal Novska, Brocice Outlet 1 Outlet in Novljancica Novska, Grad Outlet 2 Outlet in Novljancica Vrbovec Livadarska Street Outlet 1 Outlet in Novljancica Kolodvorska Street Outlet 2 Outlet in Luku
Zagrebacka Street Zagrebacka Outlet 3 Outlet in Luku
Ivan Zelina ZAGREBAČKA Street Outlet 1 Outlet in ZELINU
The average sewerage wastewater quality at the above 24 sampling locations in 1996-1999 are shown in Table B.4.5.
4.2.2 Supplementary Observation
The JICA Study Team observed the sewerage wastewater effluent at 14 towns to evaluate the current wastewater quality based on the following sampling specifications:
(1) Sampling Time and Location
(a) Sewerage-1 (Standard Sampling: 11 points)
One (1) sample was taken at each of the 11 sewerage effluent points.
(b) Sewerage-2 (Continuous Sampling: 3 points)
One (1) sample was taken in every three (3) hours, i.e., eight (8) samples a day at each of the three (3) sewerage effluent points (Kutina, Sisak and Vrbovec).
The sampling type, location and receiving body are tabulated below. As for the sampling locations, see also Fig. B.4.1.
B - 25
Type Sampling
Location Receiving Body
Sewerage-1 Zagreb Sava River Sesvete Crnec River Karlovac Kupa River Samobor Sava River Velika Golica Sava River Zapresic Krapina River Dugo Selo Crnec River Jastrebarsko Bresnica Stream Petrija Kupa River Duga Resa Mreznica River Ivanic Grad Lonja River Sewerage-2 Kutina Kutina Channel Sisak Sava River Vrbovec Luka Channel
(2) Observed Parameters
The observed parameters are given below.
Classification Parameter General Items Discharge, Color, Odor, EC, Turbidity, pH, Temperature, DO Organic Substances BOD, COD (Mn) Eutrophication T-N, NH4, NO3, NO2, T-P, PO4 Suspended Solid SS Toxic Item Phenol, Hg, As, Cd, Pb, CN, Se, Cr, Zn, Ni2+, F, PCB, Org-Chloride (Pesticides) Coliform Bacillus Total, Fecal Other Items Detergent, Oil (n-hexane Extract), Cl (Chloride)
(3) Results of Analysis
The observed wastewater quality is shown in Table B.4.6.
(4) Evaluation of Observation Results
The average wastewater quality of sewerage effluent is summarized in the following table.
B - 26
Parameter Zagreb Sesvete Karlovac Samobor Velika Golica Zapresic Dugo
Selo Discharge (m3/s) 4.22 0.017 0.126 0.270 0.139 0.093 0.046 pH 8.0 7.2 7.1 7.5 7.7 7.5 7.5 BOD (mg/l) 190 63.0 460 32.0 15.0 96.0 70.0 COD (mg/l) 68.0 31.0 138 20.0 17.0 50.0 33.0 SS (mg/l) 370 103 111 110 66 126 120 T-N (mg/l) 21.5 27.4 37.7 11.1 35.0 15.6 28.0 T-P (mg/l) 5.60 5.13 8.60 1.73 4.15 4.96 3.91 Phenol (mg/l) 0.033 0.042 0.051 0.013 0.018 0.022 0.024 Oil (mg/l) 3.37 0.33 0.18 0.48 0.14 3.63 0.11
Parameter Jastre-bersko
Petrinja Duga Resa
Ivanic Grad
Kutina Sisak Vrbovec
Discharge (m3/s) 0.025 0.052 0.004 0.082 0.027 0.096 0.029 pH 7.5 7.5 7.1 7.4 7.8 8.3 7.8 BOD (mg/l) 60.0 25.0 31.0 43.0 29.4 30.5 78.5 COD (mg/l) 42.0 28.0 28.0 30.0 37.9 44.6 39.5 SS (mg/l) 73 106 119 102 41 134 82 T-N (mg/l) 25.3 20.0 8.77 19.5 35.1 44.6 25.9 T-P (mg/l) 4.16 4.24 1.19 3.54 6.21 6.14 5.54 Phenol (mg/l) 0.007 0.011 0.004 0.030 0.031 0.053 0.025 Oil (mg/l) 0.217 7.40 0.17 0.47 4.4 30.2 0.23
As shown in the above table and in Table B.4.5 (Average Wastewater Quality in 1996-1999), sewerage wastewater quality is characterized as follows:
(a) Concentrations of organic pollutants vary much among wastewater effluents.
(b) Concentrations of T-N and T-P are moderate, compared with ordinary sewerage wastewater.
(c) Oil concentrations are lower than the permissible limits.
(d) Among the 11 major heavy metals and toxic substances (Cd, CN, Se, Cr, Hg, Ni, Pb, Cu, Zn, PCB and Pesticides), only Cr, CN, Pb, Cu, and Zn were detected, but their concentrations were very small.
4.3 Standard of Wastewater Quality
4.3.1 Regulation of Industrial Wastewater Effluent
The permissible limits of industrial wastewater discharged into rivers and public sewerage systems are prescribed in the Decree (NN No. 40/99, as amended by NN No. 6/01). The values of major parameters are as tabulated below. As for the permissible limits of other parameters, see Table B.4.7. Industrial wastewater discharge into rivers of Category I (Very Sensitive Area) is not allowed.
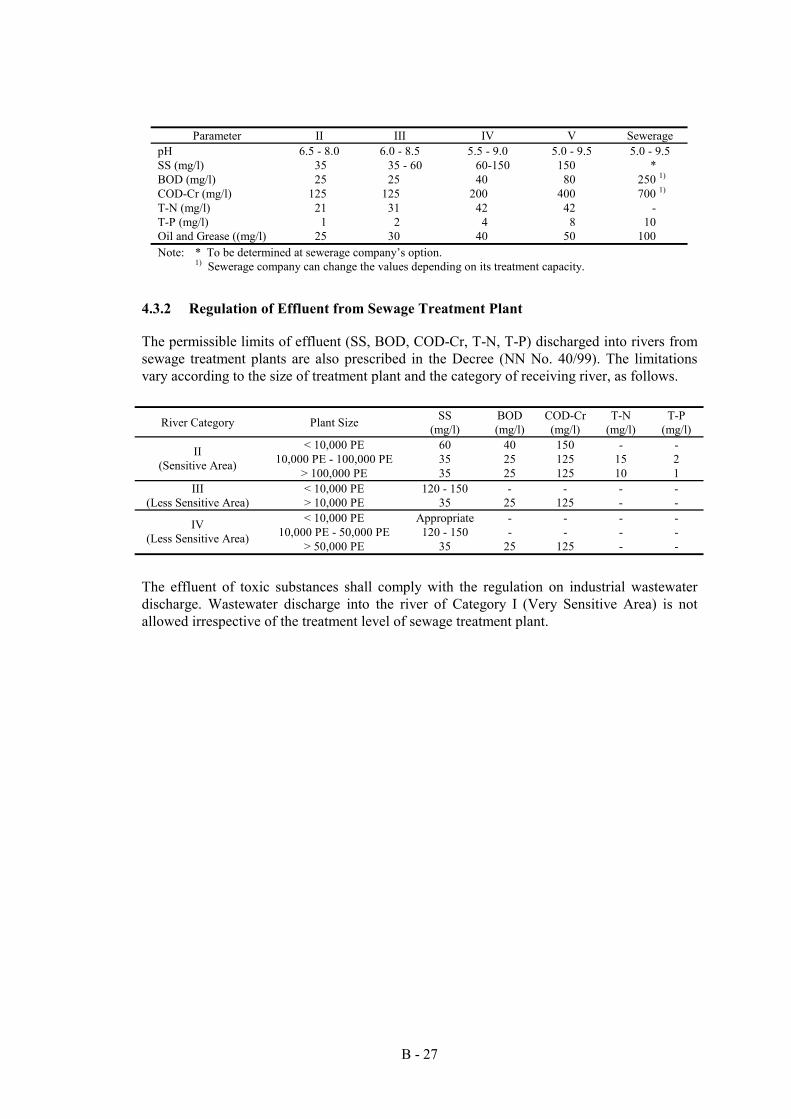
B - 27
Parameter II III IV V Sewerage
pH 6.5 - 8.0 6.0 - 8.5 5.5 - 9.0 5.0 - 9.5 5.0 - 9.5 SS (mg/l) 35 35 - 60 60-150 150 * BOD (mg/l) 25 25 40 80 250 1) COD-Cr (mg/l) 125 125 200 400 700 1) T-N (mg/l) 21 31 42 42 - T-P (mg/l) 1 2 4 8 10 Oil and Grease ((mg/l) 25 30 40 50 100 Note: * To be determined at sewerage company’s option. 1) Sewerage company can change the values depending on its treatment capacity.
4.3.2 Regulation of Effluent from Sewage Treatment Plant
The permissible limits of effluent (SS, BOD, COD-Cr, T-N, T-P) discharged into rivers from sewage treatment plants are also prescribed in the Decree (NN No. 40/99). The limitations vary according to the size of treatment plant and the category of receiving river, as follows.
River Category Plant Size SS (mg/l)
BOD (mg/l)
COD-Cr (mg/l)
T-N (mg/l)
T-P (mg/l)
< 10,000 PE 60 40 150 - - 10,000 PE - 100,000 PE 35 25 125 15 2 II
(Sensitive Area) > 100,000 PE 35 25 125 10 1 III < 10,000 PE 120 - 150 - - - -
(Less Sensitive Area) > 10,000 PE 35 25 125 - - < 10,000 PE Appropriate - - - -
10,000 PE - 50,000 PE 120 - 150 - - - - IV (Less Sensitive Area) > 50,000 PE 35 25 125 - -
The effluent of toxic substances shall comply with the regulation on industrial wastewater discharge. Wastewater discharge into the river of Category I (Very Sensitive Area) is not allowed irrespective of the treatment level of sewage treatment plant.
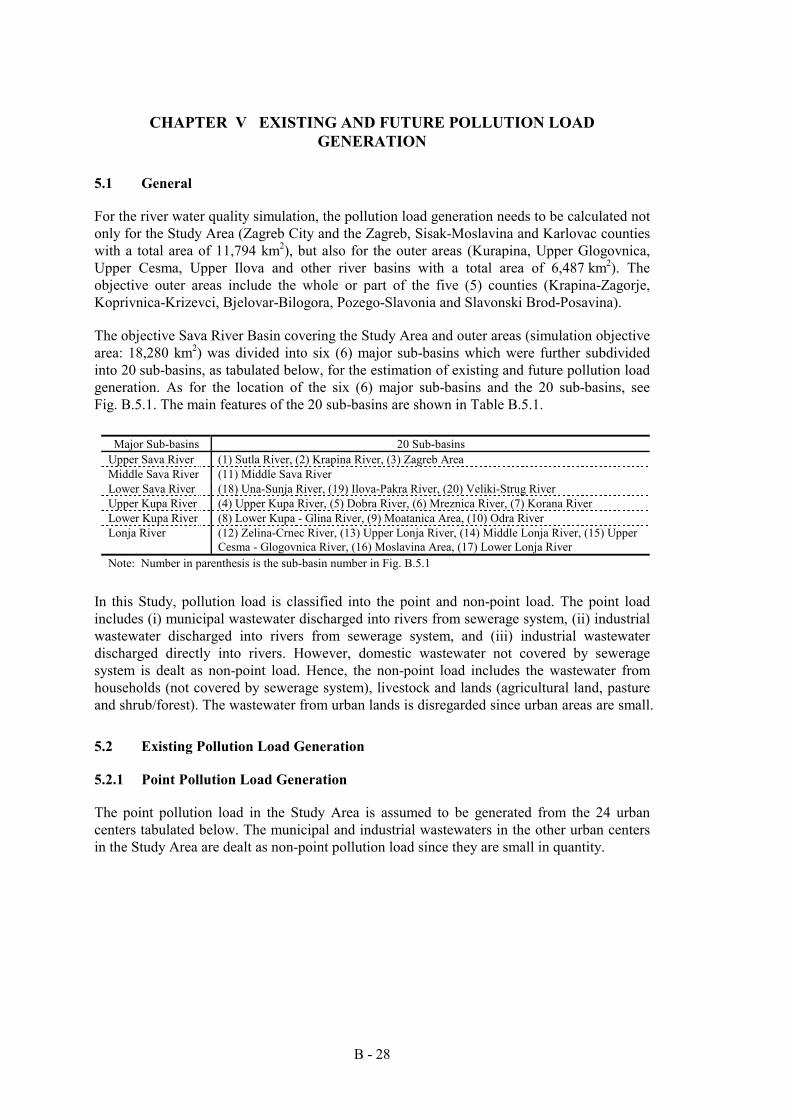
B - 28
CHAPTER V EXISTING AND FUTURE POLLUTION LOAD GENERATION
5.1 General
For the river water quality simulation, the pollution load generation needs to be calculated not only for the Study Area (Zagreb City and the Zagreb, Sisak-Moslavina and Karlovac counties with a total area of 11,794 km2), but also for the outer areas (Kurapina, Upper Glogovnica, Upper Cesma, Upper Ilova and other river basins with a total area of 6,487 km2). The objective outer areas include the whole or part of the five (5) counties (Krapina-Zagorje, Koprivnica-Krizevci, Bjelovar-Bilogora, Pozego-Slavonia and Slavonski Brod-Posavina).
The objective Sava River Basin covering the Study Area and outer areas (simulation objective area: 18,280 km2) was divided into six (6) major sub-basins which were further subdivided into 20 sub-basins, as tabulated below, for the estimation of existing and future pollution load generation. As for the location of the six (6) major sub-basins and the 20 sub-basins, see Fig. B.5.1. The main features of the 20 sub-basins are shown in Table B.5.1.
Major Sub-basins 20 Sub-basins Upper Sava River (1) Sutla River, (2) Krapina River, (3) Zagreb Area Middle Sava River (11) Middle Sava River Lower Sava River (18) Una-Sunja River, (19) Ilova-Pakra River, (20) Veliki-Strug River Upper Kupa River (4) Upper Kupa River, (5) Dobra River, (6) Mreznica River, (7) Korana River Lower Kupa River (8) Lower Kupa - Glina River, (9) Moatanica Area, (10) Odra River Lonja River (12) Zelina-Crnec River, (13) Upper Lonja River, (14) Middle Lonja River, (15) Upper
Cesma - Glogovnica River, (16) Moslavina Area, (17) Lower Lonja River Note: Number in parenthesis is the sub-basin number in Fig. B.5.1
In this Study, pollution load is classified into the point and non-point load. The point load includes (i) municipal wastewater discharged into rivers from sewerage system, (ii) industrial wastewater discharged into rivers from sewerage system, and (iii) industrial wastewater discharged directly into rivers. However, domestic wastewater not covered by sewerage system is dealt as non-point load. Hence, the non-point load includes the wastewater from households (not covered by sewerage system), livestock and lands (agricultural land, pasture and shrub/forest). The wastewater from urban lands is disregarded since urban areas are small.
5.2 Existing Pollution Load Generation
5.2.1 Point Pollution Load Generation
The point pollution load in the Study Area is assumed to be generated from the 24 urban centers tabulated below. The municipal and industrial wastewaters in the other urban centers in the Study Area are dealt as non-point pollution load since they are small in quantity.
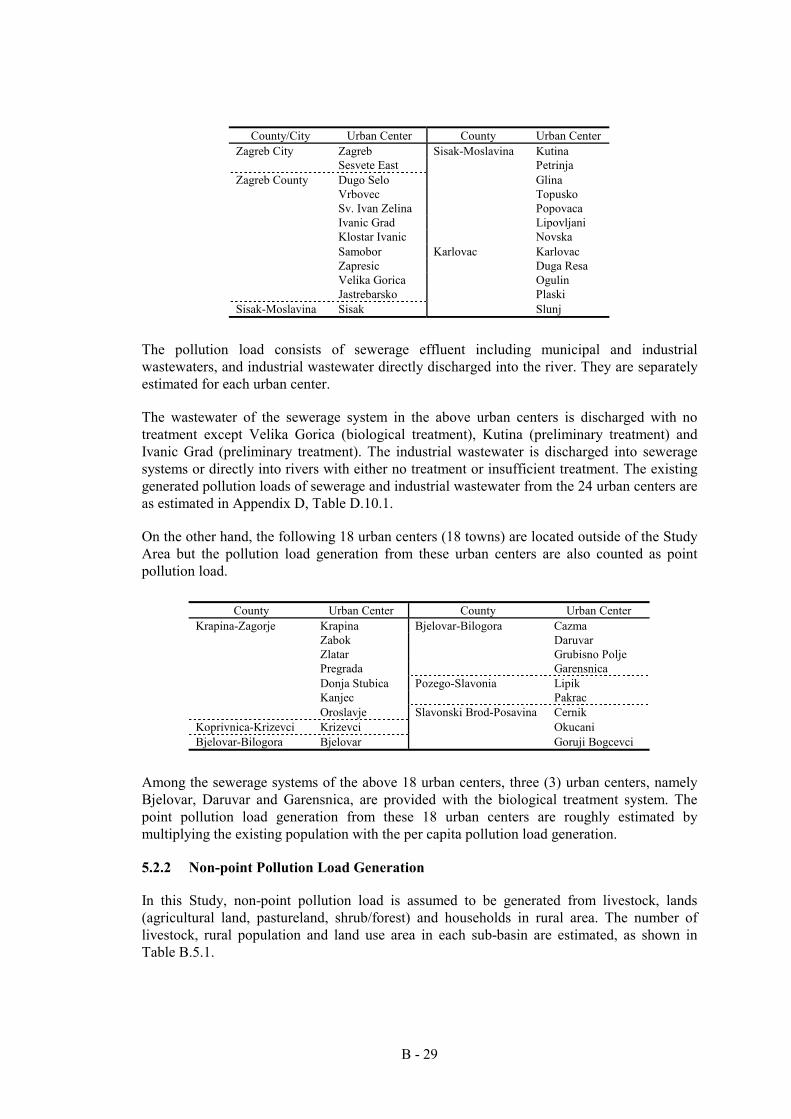
B - 29
County/City Urban Center County Urban Center
Zagreb City Zagreb Sisak-Moslavina Kutina Sesvete East Petrinja Zagreb County Dugo Selo Glina Vrbovec Topusko Sv. Ivan Zelina Popovaca Ivanic Grad Lipovljani Klostar Ivanic Novska Samobor Karlovac Karlovac Zapresic Duga Resa Velika Gorica Ogulin Jastrebarsko Plaski Sisak-Moslavina Sisak Slunj
The pollution load consists of sewerage effluent including municipal and industrial wastewaters, and industrial wastewater directly discharged into the river. They are separately estimated for each urban center.
The wastewater of the sewerage system in the above urban centers is discharged with no treatment except Velika Gorica (biological treatment), Kutina (preliminary treatment) and Ivanic Grad (preliminary treatment). The industrial wastewater is discharged into sewerage systems or directly into rivers with either no treatment or insufficient treatment. The existing generated pollution loads of sewerage and industrial wastewater from the 24 urban centers are as estimated in Appendix D, Table D.10.1.
On the other hand, the following 18 urban centers (18 towns) are located outside of the Study Area but the pollution load generation from these urban centers are also counted as point pollution load.
County Urban Center County Urban Center Krapina-Zagorje Krapina Bjelovar-Bilogora Cazma Zabok Daruvar Zlatar Grubisno Polje Pregrada Garensnica Donja Stubica Pozego-Slavonia Lipik Kanjec Pakrac Oroslavje Slavonski Brod-Posavina Cernik Koprivnica-Krizevci Krizevci Okucani Bjelovar-Bilogora Bjelovar Goruji Bogcevci
Among the sewerage systems of the above 18 urban centers, three (3) urban centers, namely Bjelovar, Daruvar and Garensnica, are provided with the biological treatment system. The point pollution load generation from these 18 urban centers are roughly estimated by multiplying the existing population with the per capita pollution load generation.
5.2.2 Non-point Pollution Load Generation
In this Study, non-point pollution load is assumed to be generated from livestock, lands (agricultural land, pastureland, shrub/forest) and households in rural area. The number of livestock, rural population and land use area in each sub-basin are estimated, as shown in Table B.5.1.
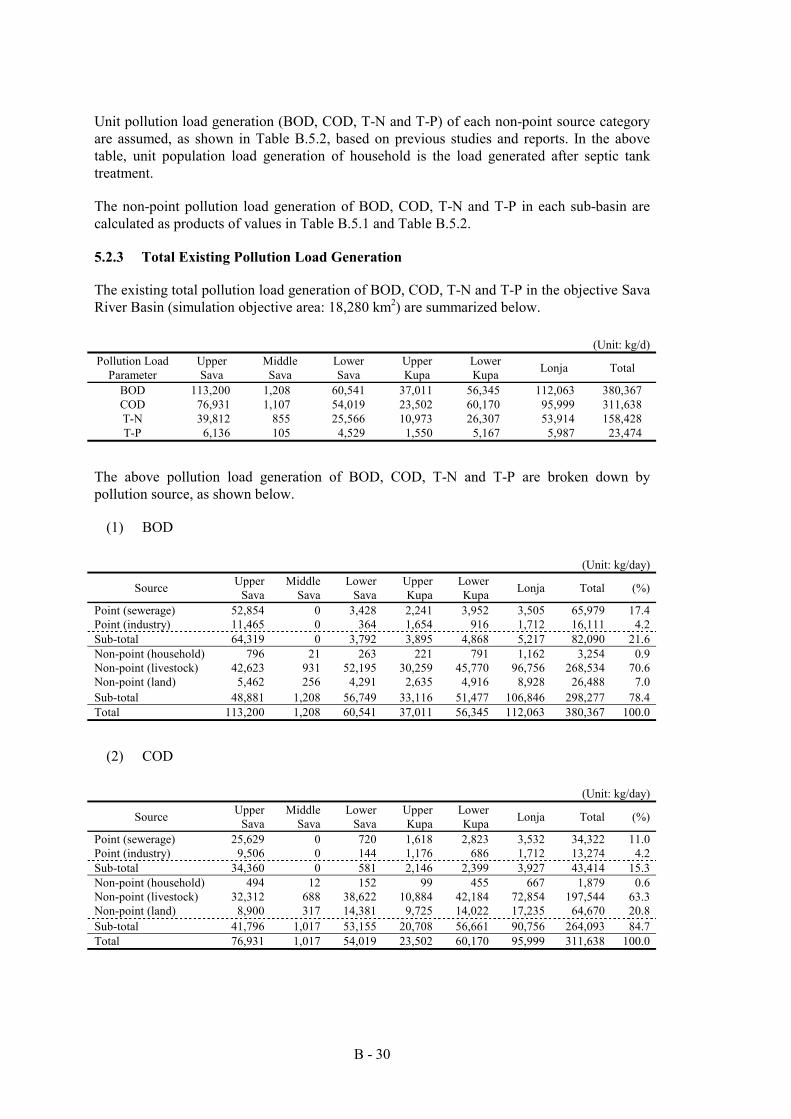
B - 30
Unit pollution load generation (BOD, COD, T-N and T-P) of each non-point source category are assumed, as shown in Table B.5.2, based on previous studies and reports. In the above table, unit population load generation of household is the load generated after septic tank treatment.
The non-point pollution load generation of BOD, COD, T-N and T-P in each sub-basin are calculated as products of values in Table B.5.1 and Table B.5.2.
5.2.3 Total Existing Pollution Load Generation
The existing total pollution load generation of BOD, COD, T-N and T-P in the objective Sava River Basin (simulation objective area: 18,280 km2) are summarized below.
(Unit: kg/d) Pollution Load
Parameter Upper Sava
Middle Sava
Lower Sava
Upper Kupa
Lower Kupa Lonja Total
BOD 113,200 1,208 60,541 37,011 56,345 112,063 380,367 COD 76,931 1,107 54,019 23,502 60,170 95,999 311,638 T-N 39,812 855 25,566 10,973 26,307 53,914 158,428 T-P 6,136 105 4,529 1,550 5,167 5,987 23,474
The above pollution load generation of BOD, COD, T-N and T-P are broken down by pollution source, as shown below.
(1) BOD
(Unit: kg/day)
Source Upper Sava
Middle Sava
Lower Sava
Upper Kupa
Lower Kupa Lonja Total (%)
Point (sewerage) 52,854 0 3,428 2,241 3,952 3,505 65,979 17.4 Point (industry) 11,465 0 364 1,654 916 1,712 16,111 4.2 Sub-total 64,319 0 3,792 3,895 4,868 5,217 82,090 21.6 Non-point (household) 796 21 263 221 791 1,162 3,254 0.9 Non-point (livestock) 42,623 931 52,195 30,259 45,770 96,756 268,534 70.6 Non-point (land) 5,462 256 4,291 2,635 4,916 8,928 26,488 7.0 Sub-total 48,881 1,208 56,749 33,116 51,477 106,846 298,277 78.4 Total 113,200 1,208 60,541 37,011 56,345 112,063 380,367 100.0
(2) COD
(Unit: kg/day)
Source Upper Sava
Middle Sava
Lower Sava
Upper Kupa
Lower Kupa Lonja Total (%)
Point (sewerage) 25,629 0 720 1,618 2,823 3,532 34,322 11.0 Point (industry) 9,506 0 144 1,176 686 1,712 13,274 4.2 Sub-total 34,360 0 581 2,146 2,399 3,927 43,414 15.3 Non-point (household) 494 12 152 99 455 667 1,879 0.6 Non-point (livestock) 32,312 688 38,622 10,884 42,184 72,854 197,544 63.3 Non-point (land) 8,900 317 14,381 9,725 14,022 17,235 64,670 20.8 Sub-total 41,796 1,017 53,155 20,708 56,661 90,756 264,093 84.7 Total 76,931 1,017 54,019 23,502 60,170 95,999 311,638 100.0
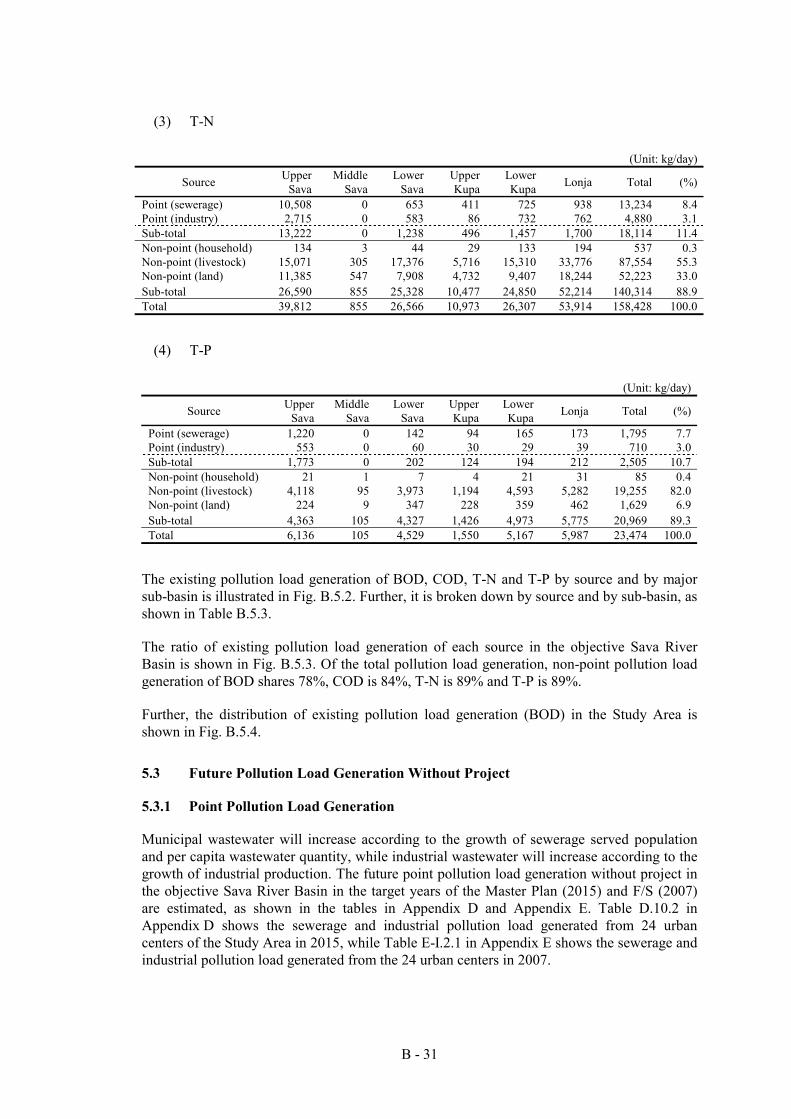
B - 31
(3) T-N
(Unit: kg/day)
Source Upper Sava
Middle Sava
Lower Sava
Upper Kupa
Lower Kupa Lonja Total (%)
Point (sewerage) 10,508 0 653 411 725 938 13,234 8.4 Point (industry) 2,715 0 583 86 732 762 4,880 3.1 Sub-total 13,222 0 1,238 496 1,457 1,700 18,114 11.4 Non-point (household) 134 3 44 29 133 194 537 0.3 Non-point (livestock) 15,071 305 17,376 5,716 15,310 33,776 87,554 55.3 Non-point (land) 11,385 547 7,908 4,732 9,407 18,244 52,223 33.0 Sub-total 26,590 855 25,328 10,477 24,850 52,214 140,314 88.9 Total 39,812 855 26,566 10,973 26,307 53,914 158,428 100.0
(4) T-P
(Unit: kg/day)
Source Upper Sava
Middle Sava
Lower Sava
Upper Kupa
Lower Kupa Lonja Total (%)
Point (sewerage) 1,220 0 142 94 165 173 1,795 7.7 Point (industry) 553 0 60 30 29 39 710 3.0 Sub-total 1,773 0 202 124 194 212 2,505 10.7 Non-point (household) 21 1 7 4 21 31 85 0.4 Non-point (livestock) 4,118 95 3,973 1,194 4,593 5,282 19,255 82.0 Non-point (land) 224 9 347 228 359 462 1,629 6.9 Sub-total 4,363 105 4,327 1,426 4,973 5,775 20,969 89.3 Total 6,136 105 4,529 1,550 5,167 5,987 23,474 100.0
The existing pollution load generation of BOD, COD, T-N and T-P by source and by major sub-basin is illustrated in Fig. B.5.2. Further, it is broken down by source and by sub-basin, as shown in Table B.5.3.
The ratio of existing pollution load generation of each source in the objective Sava River Basin is shown in Fig. B.5.3. Of the total pollution load generation, non-point pollution load generation of BOD shares 78%, COD is 84%, T-N is 89% and T-P is 89%.
Further, the distribution of existing pollution load generation (BOD) in the Study Area is shown in Fig. B.5.4.
5.3 Future Pollution Load Generation Without Project
5.3.1 Point Pollution Load Generation
Municipal wastewater will increase according to the growth of sewerage served population and per capita wastewater quantity, while industrial wastewater will increase according to the growth of industrial production. The future point pollution load generation without project in the objective Sava River Basin in the target years of the Master Plan (2015) and F/S (2007) are estimated, as shown in the tables in Appendix D and Appendix E. Table D.10.2 in Appendix D shows the sewerage and industrial pollution load generated from 24 urban centers of the Study Area in 2015, while Table E-I.2.1 in Appendix E shows the sewerage and industrial pollution load generated from the 24 urban centers in 2007.
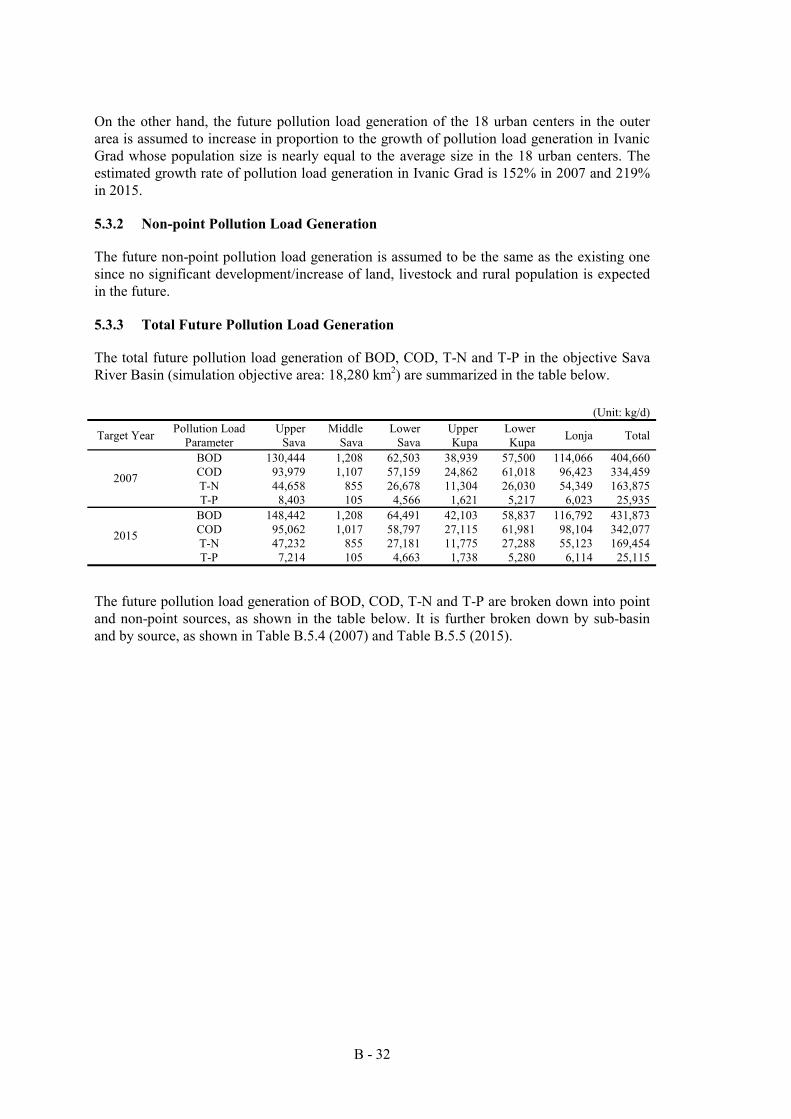
B - 32
On the other hand, the future pollution load generation of the 18 urban centers in the outer area is assumed to increase in proportion to the growth of pollution load generation in Ivanic Grad whose population size is nearly equal to the average size in the 18 urban centers. The estimated growth rate of pollution load generation in Ivanic Grad is 152% in 2007 and 219% in 2015.
5.3.2 Non-point Pollution Load Generation
The future non-point pollution load generation is assumed to be the same as the existing one since no significant development/increase of land, livestock and rural population is expected in the future.
5.3.3 Total Future Pollution Load Generation
The total future pollution load generation of BOD, COD, T-N and T-P in the objective Sava River Basin (simulation objective area: 18,280 km2) are summarized in the table below.
(Unit: kg/d)
Target Year Pollution Load Parameter
Upper Sava
Middle Sava
Lower Sava
Upper Kupa
Lower Kupa Lonja Total
BOD 130,444 1,208 62,503 38,939 57,500 114,066 404,660 COD 93,979 1,107 57,159 24,862 61,018 96,423 334,459 T-N 44,658 855 26,678 11,304 26,030 54,349 163,875 2007
T-P 8,403 105 4,566 1,621 5,217 6,023 25,935 BOD 148,442 1,208 64,491 42,103 58,837 116,792 431,873 COD 95,062 1,017 58,797 27,115 61,981 98,104 342,077 T-N 47,232 855 27,181 11,775 27,288 55,123 169,454 2015
T-P 7,214 105 4,663 1,738 5,280 6,114 25,115
The future pollution load generation of BOD, COD, T-N and T-P are broken down into point and non-point sources, as shown in the table below. It is further broken down by sub-basin and by source, as shown in Table B.5.4 (2007) and Table B.5.5 (2015).
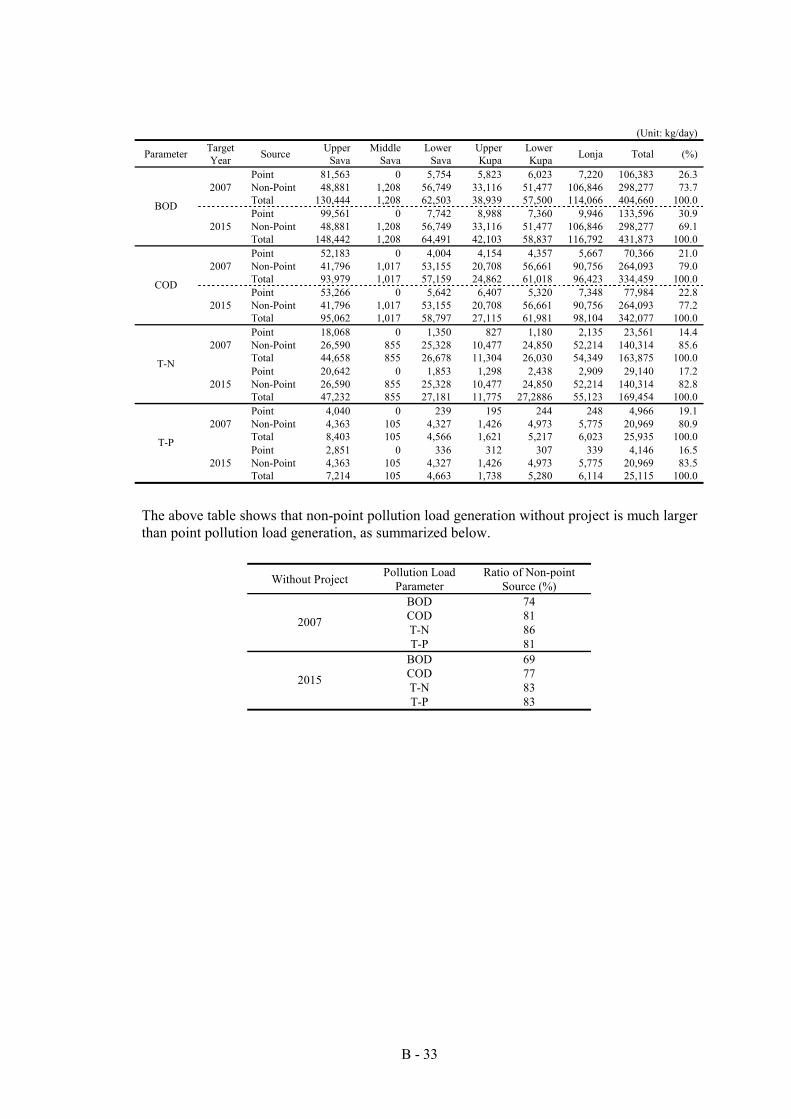
B - 33
(Unit: kg/day)
Parameter Target Year Source Upper
Sava Middle
Sava Lower
Sava Upper Kupa
Lower Kupa Lonja Total (%)
Point 81,563 0 5,754 5,823 6,023 7,220 106,383 26.3 2007 Non-Point 48,881 1,208 56,749 33,116 51,477 106,846 298,277 73.7
Total 130,444 1,208 62,503 38,939 57,500 114,066 404,660 100.0 Point 99,561 0 7,742 8,988 7,360 9,946 133,596 30.9
2015 Non-Point 48,881 1,208 56,749 33,116 51,477 106,846 298,277 69.1
BOD
Total 148,442 1,208 64,491 42,103 58,837 116,792 431,873 100.0 Point 52,183 0 4,004 4,154 4,357 5,667 70,366 21.0
2007 Non-Point 41,796 1,017 53,155 20,708 56,661 90,756 264,093 79.0 Total 93,979 1,017 57,159 24,862 61,018 96,423 334,459 100.0 Point 53,266 0 5,642 6,407 5,320 7,348 77,984 22.8
2015 Non-Point 41,796 1,017 53,155 20,708 56,661 90,756 264,093 77.2
COD
Total 95,062 1,017 58,797 27,115 61,981 98,104 342,077 100.0 Point 18,068 0 1,350 827 1,180 2,135 23,561 14.4
2007 Non-Point 26,590 855 25,328 10,477 24,850 52,214 140,314 85.6 Total 44,658 855 26,678 11,304 26,030 54,349 163,875 100.0 Point 20,642 0 1,853 1,298 2,438 2,909 29,140 17.2
2015 Non-Point 26,590 855 25,328 10,477 24,850 52,214 140,314 82.8
T-N
Total 47,232 855 27,181 11,775 27,2886 55,123 169,454 100.0 Point 4,040 0 239 195 244 248 4,966 19.1
2007 Non-Point 4,363 105 4,327 1,426 4,973 5,775 20,969 80.9 Total 8,403 105 4,566 1,621 5,217 6,023 25,935 100.0 Point 2,851 0 336 312 307 339 4,146 16.5
2015 Non-Point 4,363 105 4,327 1,426 4,973 5,775 20,969 83.5
T-P
Total 7,214 105 4,663 1,738 5,280 6,114 25,115 100.0
The above table shows that non-point pollution load generation without project is much larger than point pollution load generation, as summarized below.
Without Project Pollution Load Parameter
Ratio of Non-point Source (%)
BOD 74 COD 81 T-N 86 2007
T-P 81 BOD 69 COD 77 T-N 83 2015
T-P 83
B - 34
CHAPTER VI SIMULATION OF RIVER WATER QUALITY
6.1 Construction of Simulation Model
6.1.1 General
Non-point pollution loads run off on lands or through small channels/ditches to a tributary. On the other hand, point pollution load is discharged directly into a tributary or a main river either with treatment or without treatment. In case of discharge into a tributary, both point and non-point pollution loads finally flow into the main river.
In the first runoff stage, the non-point pollution load is decreased to a large extent by the natural purification effect of lands and small channels. In the second runoff stage, the point and non-point pollution loads are reduced by the self-purification effect of tributaries until they enter the main river, and are further reduced by the self-purification effect of the main river while flowing down to the objective station of river water quality simulation.
The river water quality at the objective station of the main river is then simulated by combining (i) the basin runoff model and (ii) the self-purification model of main river. In this Study, the term “pollution load runoff” is defined as the pollution load that enters the main river through the above-mentioned first and second runoff stages.
The objective drainage basin for simulation (18,280 km2) is subdivided into 20 sub-basins, each with a representative tributary, and the pollution load runoff is simulated at the downstream end of each representative tributary. The main rivers are the following river courses: Sava Main River (Jesenice – Utok Kupe Nizvodno), Kupa River (Karlovac – Confluence with Sava Main), and Lonja River (Sveti Ivan Zelina – Cazma – Struzec – Trebez and Sesvete East – K. Lonja Strug – Confluence with Cesma River).
The schematic diagram of the simulation of pollution load runoff and river water quality is shown in Fig. B.6.1. In this Study, pollution load runoff is estimated in parameters of BOD, COD, T-N and T-P.
6.1.2 Basin Runoff Model
The pollution load runoff from basin to the main river is estimated for each of the 20 sub-basins by multiplying the generated pollution load by runoff coefficients R1 and R2 as follows:
Pollution Load Runoff = Generated Pollution Load × R1 × R2
Here, R1 is the runoff coefficient of pollution load generated from a sub-basin to its representative tributary, while R2 is the self-purification rate of pollution load in the representative tributary.
(1) Estimation of Runoff Coefficient (R1)
Generally, a large portion of the non-point pollution load runs off from the basin in a rainy time while the amount of runoff decreases in drought time. The runoff coefficient of non-point load then varies according to the variation of river flow rate. On the other hand, the runoff coefficient of pollution load also varies depending on
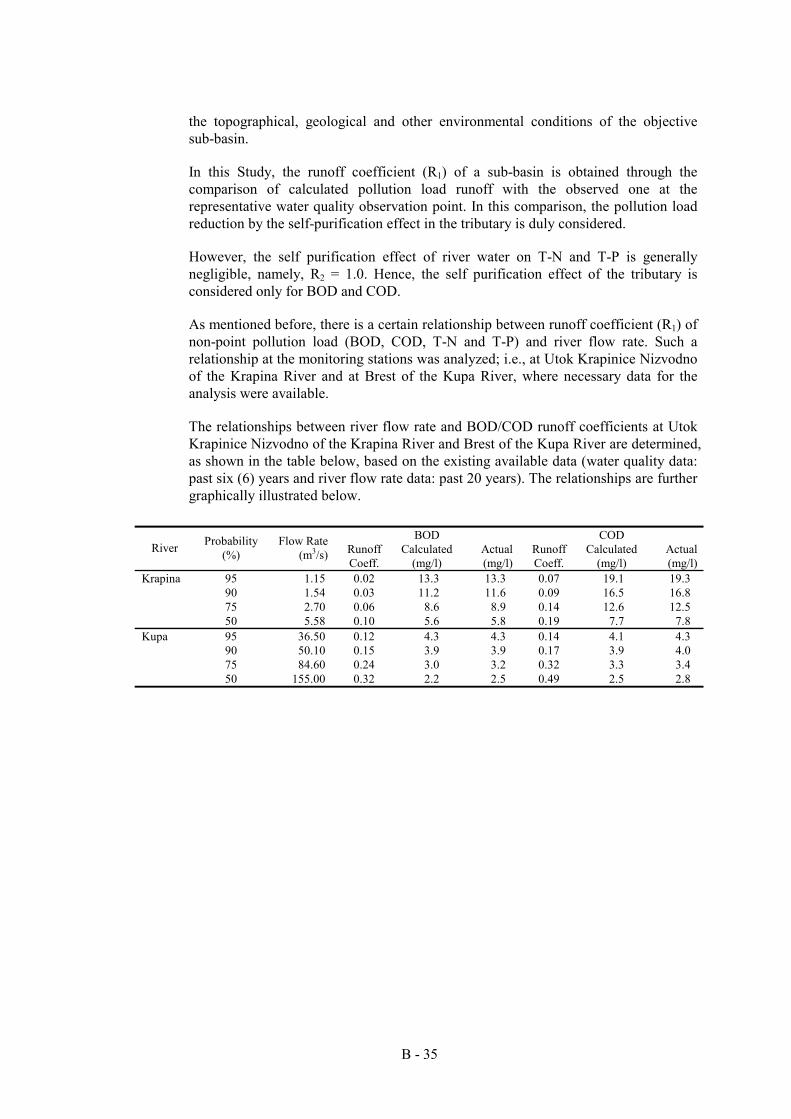
B - 35
the topographical, geological and other environmental conditions of the objective sub-basin.
In this Study, the runoff coefficient (R1) of a sub-basin is obtained through the comparison of calculated pollution load runoff with the observed one at the representative water quality observation point. In this comparison, the pollution load reduction by the self-purification effect in the tributary is duly considered.
However, the self purification effect of river water on T-N and T-P is generally negligible, namely, R2 = 1.0. Hence, the self purification effect of the tributary is considered only for BOD and COD.
As mentioned before, there is a certain relationship between runoff coefficient (R1) of non-point pollution load (BOD, COD, T-N and T-P) and river flow rate. Such a relationship at the monitoring stations was analyzed; i.e., at Utok Krapinice Nizvodno of the Krapina River and at Brest of the Kupa River, where necessary data for the analysis were available.
The relationships between river flow rate and BOD/COD runoff coefficients at Utok Krapinice Nizvodno of the Krapina River and Brest of the Kupa River are determined, as shown in the table below, based on the existing available data (water quality data: past six (6) years and river flow rate data: past 20 years). The relationships are further graphically illustrated below.
BOD COD
River Probability (%)
Flow Rate (m3/s) Runoff
Coeff. Calculated
(mg/l) Actual (mg/l)
Runoff Coeff.
Calculated (mg/l)
Actual (mg/l)
Krapina 95 1.15 0.02 13.3 13.3 0.07 19.1 19.3 90 1.54 0.03 11.2 11.6 0.09 16.5 16.8 75 2.70 0.06 8.6 8.9 0.14 12.6 12.5 50 5.58 0.10 5.6 5.8 0.19 7.7 7.8 Kupa 95 36.50 0.12 4.3 4.3 0.14 4.1 4.3 90 50.10 0.15 3.9 3.9 0.17 3.9 4.0 75 84.60 0.24 3.0 3.2 0.32 3.3 3.4 50 155.00 0.32 2.2 2.5 0.49 2.5 2.8
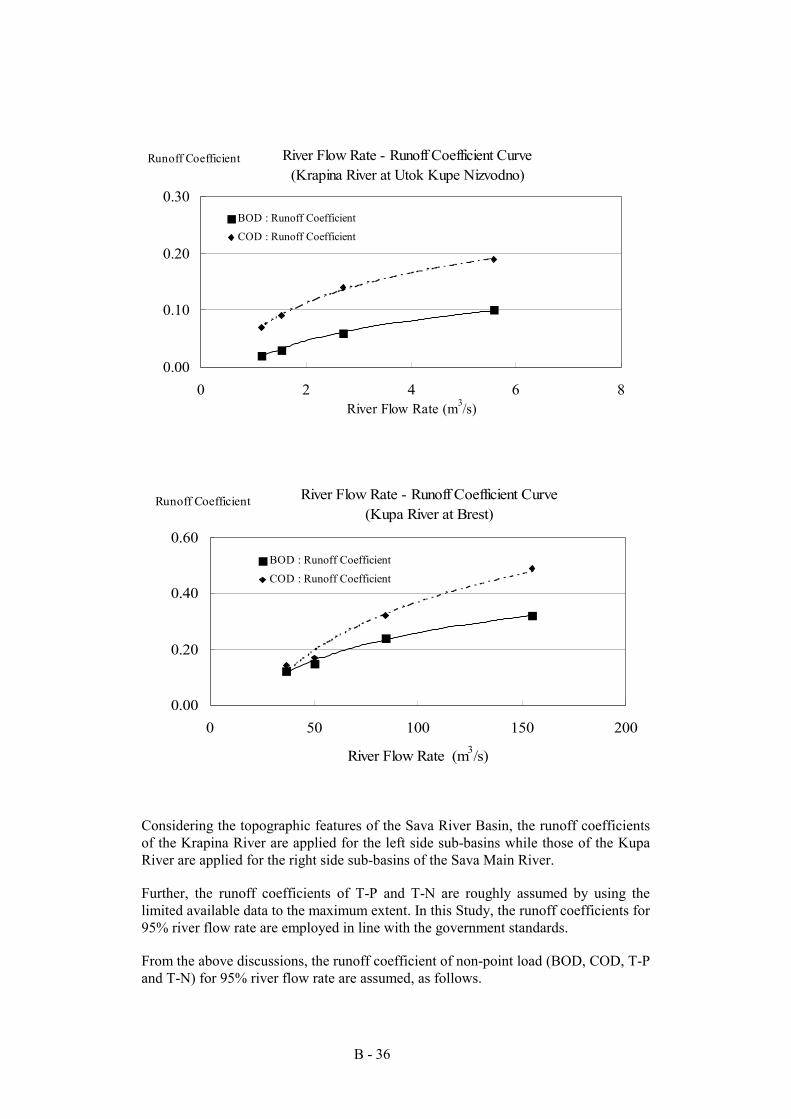
B - 36
Considering the topographic features of the Sava River Basin, the runoff coefficients of the Krapina River are applied for the left side sub-basins while those of the Kupa River are applied for the right side sub-basins of the Sava Main River.
Further, the runoff coefficients of T-P and T-N are roughly assumed by using the limited available data to the maximum extent. In this Study, the runoff coefficients for 95% river flow rate are employed in line with the government standards.
From the above discussions, the runoff coefficient of non-point load (BOD, COD, T-P and T-N) for 95% river flow rate are assumed, as follows.
River Flow Rate - Runoff Coefficient Curve(Krapina River at Utok Kupe Nizvodno)
0.00
0.10
0.20
0.30
0 2 4 6 8River Flow Rate (m3/s)
Runoff Coefficient
BOD : Runoff Coefficient
COD : Runoff Coefficient
River Flow Rate - Runoff Coefficient Curve(Kupa River at Brest)
0.00
0.20
0.40
0.60
0 50 100 150 200
River Flow Rate (m3/s)
Runoff Coefficient
BOD : Runoff Coefficient
COD : Runoff Coefficient
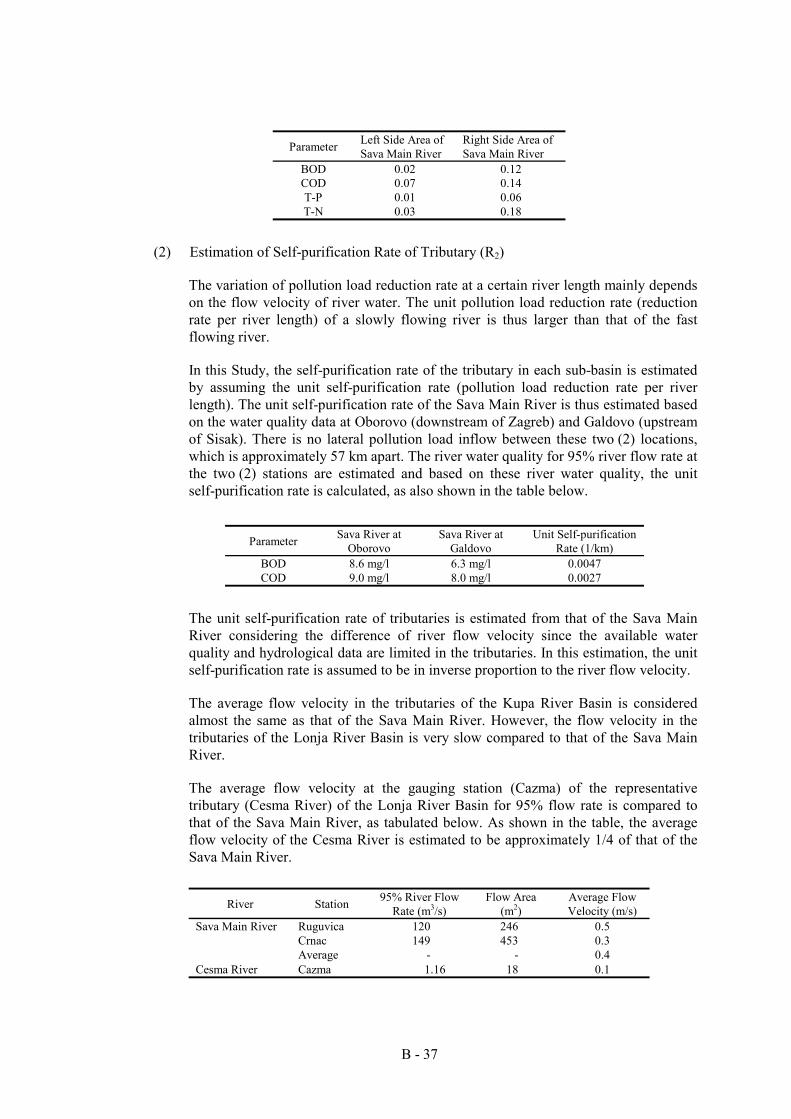
B - 37
Parameter Left Side Area of Sava Main River
Right Side Area of Sava Main River
BOD 0.02 0.12 COD 0.07 0.14 T-P 0.01 0.06 T-N 0.03 0.18
(2) Estimation of Self-purification Rate of Tributary (R2)
The variation of pollution load reduction rate at a certain river length mainly depends on the flow velocity of river water. The unit pollution load reduction rate (reduction rate per river length) of a slowly flowing river is thus larger than that of the fast flowing river.
In this Study, the self-purification rate of the tributary in each sub-basin is estimated by assuming the unit self-purification rate (pollution load reduction rate per river length). The unit self-purification rate of the Sava Main River is thus estimated based on the water quality data at Oborovo (downstream of Zagreb) and Galdovo (upstream of Sisak). There is no lateral pollution load inflow between these two (2) locations, which is approximately 57 km apart. The river water quality for 95% river flow rate at the two (2) stations are estimated and based on these river water quality, the unit self-purification rate is calculated, as also shown in the table below.
Parameter Sava River at Oborovo
Sava River at Galdovo
Unit Self-purification Rate (1/km)
BOD 8.6 mg/l 6.3 mg/l 0.0047 COD 9.0 mg/l 8.0 mg/l 0.0027
The unit self-purification rate of tributaries is estimated from that of the Sava Main River considering the difference of river flow velocity since the available water quality and hydrological data are limited in the tributaries. In this estimation, the unit self-purification rate is assumed to be in inverse proportion to the river flow velocity.
The average flow velocity in the tributaries of the Kupa River Basin is considered almost the same as that of the Sava Main River. However, the flow velocity in the tributaries of the Lonja River Basin is very slow compared to that of the Sava Main River.
The average flow velocity at the gauging station (Cazma) of the representative tributary (Cesma River) of the Lonja River Basin for 95% flow rate is compared to that of the Sava Main River, as tabulated below. As shown in the table, the average flow velocity of the Cesma River is estimated to be approximately 1/4 of that of the Sava Main River.
River Station 95% River Flow Rate (m3/s)
Flow Area (m2)
Average Flow Velocity (m/s)
Sava Main River Ruguvica 120 246 0.5 Crnac 149 453 0.3 Average - - 0.4 Cesma River Cazma 1.16 18 0.1
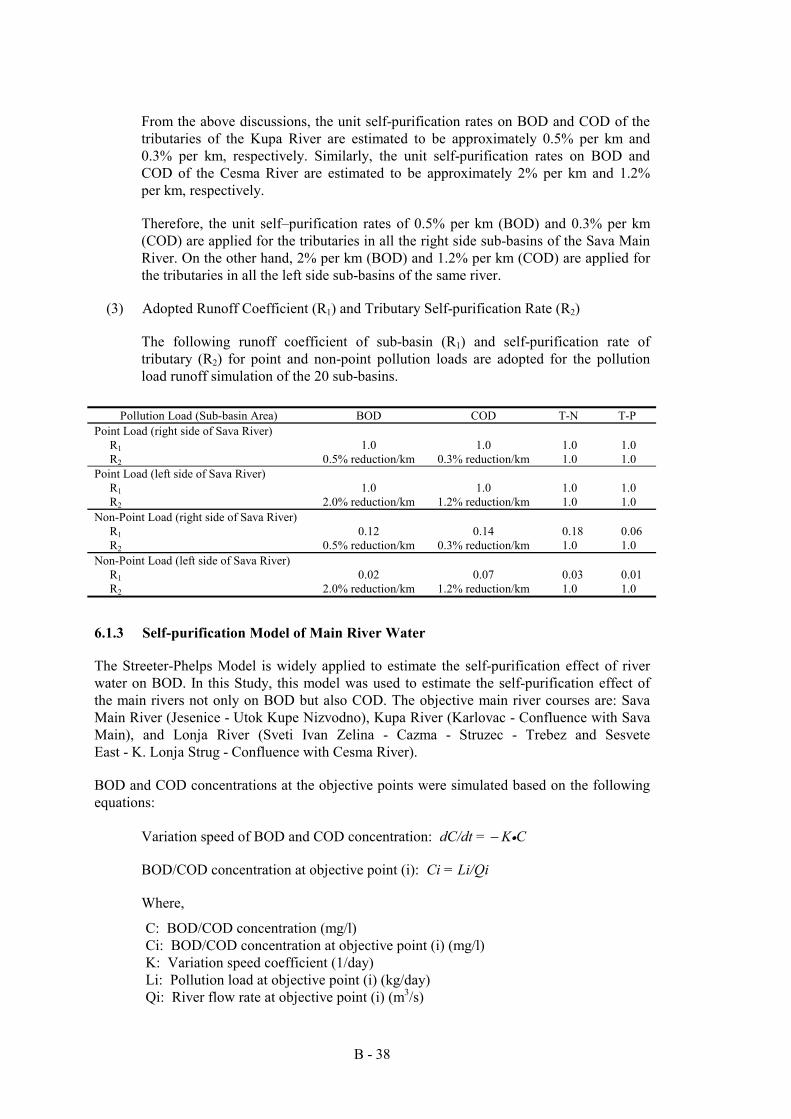
B - 38
From the above discussions, the unit self-purification rates on BOD and COD of the tributaries of the Kupa River are estimated to be approximately 0.5% per km and 0.3% per km, respectively. Similarly, the unit self-purification rates on BOD and COD of the Cesma River are estimated to be approximately 2% per km and 1.2% per km, respectively.
Therefore, the unit self–purification rates of 0.5% per km (BOD) and 0.3% per km (COD) are applied for the tributaries in all the right side sub-basins of the Sava Main River. On the other hand, 2% per km (BOD) and 1.2% per km (COD) are applied for the tributaries in all the left side sub-basins of the same river.
(3) Adopted Runoff Coefficient (R1) and Tributary Self-purification Rate (R2)
The following runoff coefficient of sub-basin (R1) and self-purification rate of tributary (R2) for point and non-point pollution loads are adopted for the pollution load runoff simulation of the 20 sub-basins.
Pollution Load (Sub-basin Area) BOD COD T-N T-P
Point Load (right side of Sava River) R1 1.0 1.0 1.0 1.0 R2 0.5% reduction/km 0.3% reduction/km 1.0 1.0
Point Load (left side of Sava River) R1 1.0 1.0 1.0 1.0 R2 2.0% reduction/km 1.2% reduction/km 1.0 1.0
Non-Point Load (right side of Sava River) R1 0.12 0.14 0.18 0.06 R2 0.5% reduction/km 0.3% reduction/km 1.0 1.0
Non-Point Load (left side of Sava River) R1 0.02 0.07 0.03 0.01 R2 2.0% reduction/km 1.2% reduction/km 1.0 1.0
6.1.3 Self-purification Model of Main River Water
The Streeter-Phelps Model is widely applied to estimate the self-purification effect of river water on BOD. In this Study, this model was used to estimate the self-purification effect of the main rivers not only on BOD but also COD. The objective main river courses are: Sava Main River (Jesenice - Utok Kupe Nizvodno), Kupa River (Karlovac - Confluence with Sava Main), and Lonja River (Sveti Ivan Zelina - Cazma - Struzec - Trebez and Sesvete East - K. Lonja Strug - Confluence with Cesma River).
BOD and COD concentrations at the objective points were simulated based on the following equations:
Variation speed of BOD and COD concentration: dC/dt = − K•C
BOD/COD concentration at objective point (i): Ci = Li/Qi
Where,
C: BOD/COD concentration (mg/l) Ci: BOD/COD concentration at objective point (i) (mg/l) K: Variation speed coefficient (1/day) Li: Pollution load at objective point (i) (kg/day) Qi: River flow rate at objective point (i) (m3/s)
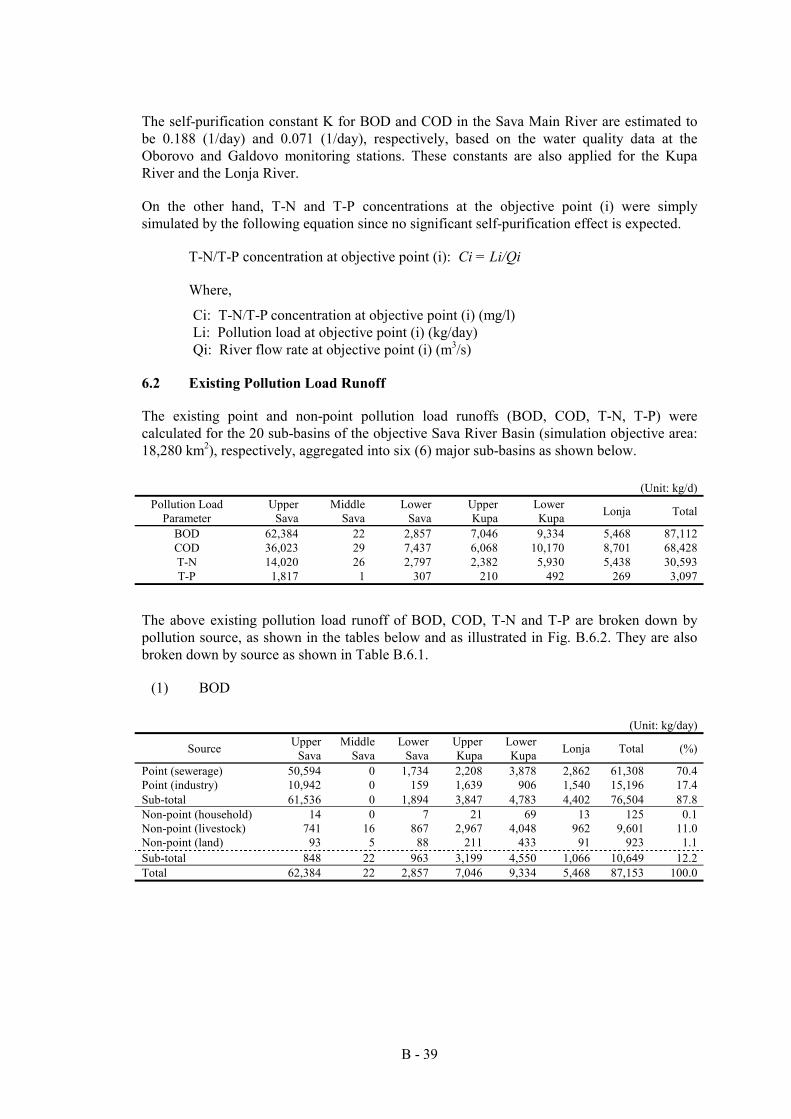
B - 39
The self-purification constant K for BOD and COD in the Sava Main River are estimated to be 0.188 (1/day) and 0.071 (1/day), respectively, based on the water quality data at the Oborovo and Galdovo monitoring stations. These constants are also applied for the Kupa River and the Lonja River.
On the other hand, T-N and T-P concentrations at the objective point (i) were simply simulated by the following equation since no significant self-purification effect is expected.
T-N/T-P concentration at objective point (i): Ci = Li/Qi
Where,
Ci: T-N/T-P concentration at objective point (i) (mg/l) Li: Pollution load at objective point (i) (kg/day) Qi: River flow rate at objective point (i) (m3/s)
6.2 Existing Pollution Load Runoff
The existing point and non-point pollution load runoffs (BOD, COD, T-N, T-P) were calculated for the 20 sub-basins of the objective Sava River Basin (simulation objective area: 18,280 km2), respectively, aggregated into six (6) major sub-basins as shown below.
(Unit: kg/d) Pollution Load
Parameter Upper
Sava Middle
Sava Lower
Sava Upper Kupa
Lower Kupa Lonja Total
BOD 62,384 22 2,857 7,046 9,334 5,468 87,112 COD 36,023 29 7,437 6,068 10,170 8,701 68,428 T-N 14,020 26 2,797 2,382 5,930 5,438 30,593 T-P 1,817 1 307 210 492 269 3,097
The above existing pollution load runoff of BOD, COD, T-N and T-P are broken down by pollution source, as shown in the tables below and as illustrated in Fig. B.6.2. They are also broken down by source as shown in Table B.6.1.
(1) BOD
(Unit: kg/day)
Source Upper Sava
Middle Sava
Lower Sava
Upper Kupa
Lower Kupa Lonja Total (%)
Point (sewerage) 50,594 0 1,734 2,208 3,878 2,862 61,308 70.4 Point (industry) 10,942 0 159 1,639 906 1,540 15,196 17.4 Sub-total 61,536 0 1,894 3,847 4,783 4,402 76,504 87.8 Non-point (household) 14 0 7 21 69 13 125 0.1 Non-point (livestock) 741 16 867 2,967 4,048 962 9,601 11.0 Non-point (land) 93 5 88 211 433 91 923 1.1 Sub-total 848 22 963 3,199 4,550 1,066 10,649 12.2 Total 62,384 22 2,857 7,046 9,334 5,468 87,153 100.0
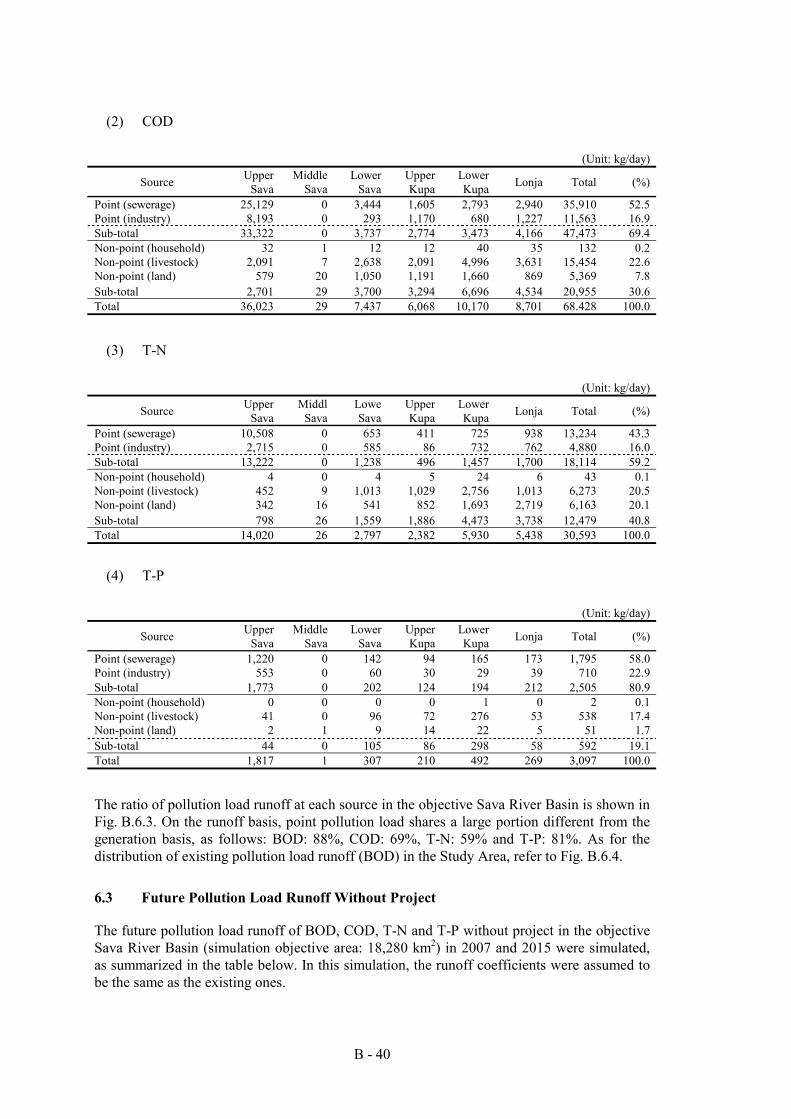
B - 40
(2) COD
(Unit: kg/day)
Source Upper Sava
Middle Sava
Lower Sava
Upper Kupa
Lower Kupa Lonja Total (%)
Point (sewerage) 25,129 0 3,444 1,605 2,793 2,940 35,910 52.5 Point (industry) 8,193 0 293 1,170 680 1,227 11,563 16.9 Sub-total 33,322 0 3,737 2,774 3,473 4,166 47,473 69.4 Non-point (household) 32 1 12 12 40 35 132 0.2 Non-point (livestock) 2,091 7 2,638 2,091 4,996 3,631 15,454 22.6 Non-point (land) 579 20 1,050 1,191 1,660 869 5,369 7.8 Sub-total 2,701 29 3,700 3,294 6,696 4,534 20,955 30.6 Total 36,023 29 7,437 6,068 10,170 8,701 68.428 100.0
(3) T-N
(Unit: kg/day)
Source Upper Sava
Middl Sava
Lowe Sava
Upper Kupa
Lower Kupa Lonja Total (%)
Point (sewerage) 10,508 0 653 411 725 938 13,234 43.3 Point (industry) 2,715 0 585 86 732 762 4,880 16.0 Sub-total 13,222 0 1,238 496 1,457 1,700 18,114 59.2 Non-point (household) 4 0 4 5 24 6 43 0.1 Non-point (livestock) 452 9 1,013 1,029 2,756 1,013 6,273 20.5 Non-point (land) 342 16 541 852 1,693 2,719 6,163 20.1 Sub-total 798 26 1,559 1,886 4,473 3,738 12,479 40.8 Total 14,020 26 2,797 2,382 5,930 5,438 30,593 100.0
(4) T-P
(Unit: kg/day)
Source Upper Sava
Middle Sava
Lower Sava
Upper Kupa
Lower Kupa Lonja Total (%)
Point (sewerage) 1,220 0 142 94 165 173 1,795 58.0 Point (industry) 553 0 60 30 29 39 710 22.9 Sub-total 1,773 0 202 124 194 212 2,505 80.9 Non-point (household) 0 0 0 0 1 0 2 0.1 Non-point (livestock) 41 0 96 72 276 53 538 17.4 Non-point (land) 2 1 9 14 22 5 51 1.7 Sub-total 44 0 105 86 298 58 592 19.1 Total 1,817 1 307 210 492 269 3,097 100.0
The ratio of pollution load runoff at each source in the objective Sava River Basin is shown in Fig. B.6.3. On the runoff basis, point pollution load shares a large portion different from the generation basis, as follows: BOD: 88%, COD: 69%, T-N: 59% and T-P: 81%. As for the distribution of existing pollution load runoff (BOD) in the Study Area, refer to Fig. B.6.4.
6.3 Future Pollution Load Runoff Without Project
The future pollution load runoff of BOD, COD, T-N and T-P without project in the objective Sava River Basin (simulation objective area: 18,280 km2) in 2007 and 2015 were simulated, as summarized in the table below. In this simulation, the runoff coefficients were assumed to be the same as the existing ones.
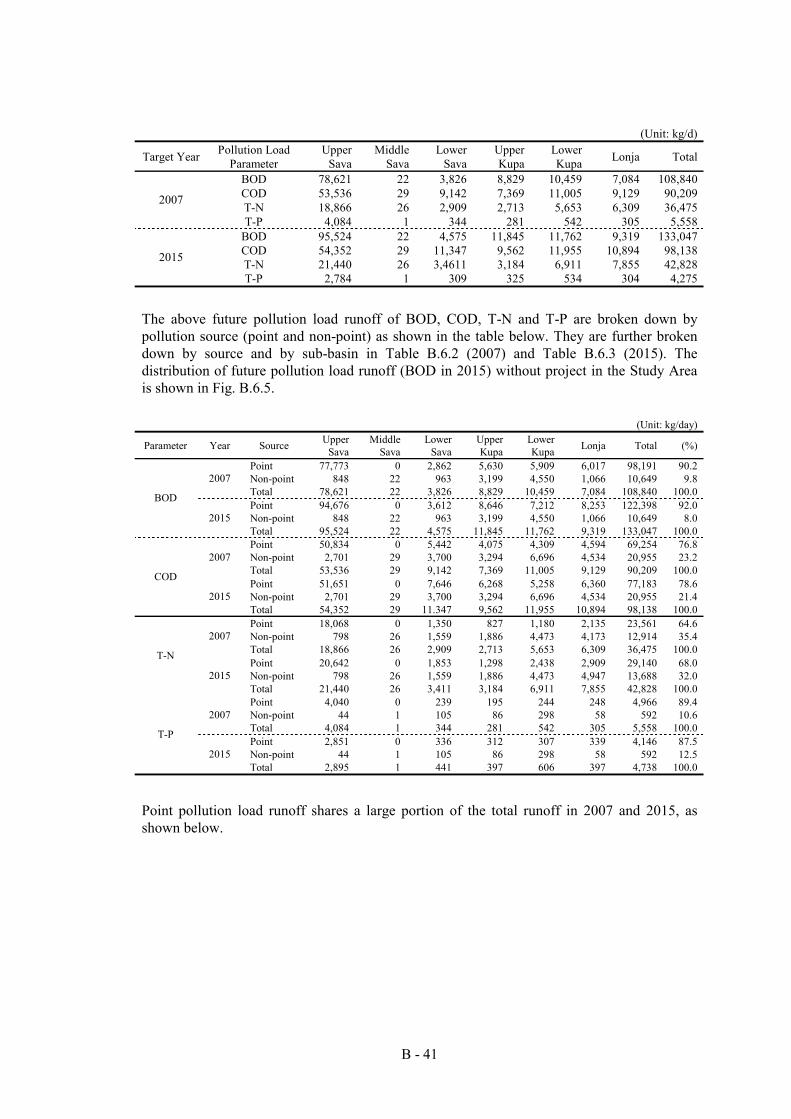
B - 41
(Unit: kg/d)
Target Year Pollution Load Parameter
Upper Sava
Middle Sava
Lower Sava
Upper Kupa
Lower Kupa Lonja Total
BOD 78,621 22 3,826 8,829 10,459 7,084 108,840 COD 53,536 29 9,142 7,369 11,005 9,129 90,209 T-N 18,866 26 2,909 2,713 5,653 6,309 36,475 2007
T-P 4,084 1 344 281 542 305 5,558 BOD 95,524 22 4,575 11,845 11,762 9,319 133,047 COD 54,352 29 11,347 9,562 11,955 10,894 98,138 T-N 21,440 26 3,4611 3,184 6,911 7,855 42,828 2015
T-P 2,784 1 309 325 534 304 4,275
The above future pollution load runoff of BOD, COD, T-N and T-P are broken down by pollution source (point and non-point) as shown in the table below. They are further broken down by source and by sub-basin in Table B.6.2 (2007) and Table B.6.3 (2015). The distribution of future pollution load runoff (BOD in 2015) without project in the Study Area is shown in Fig. B.6.5.
(Unit: kg/day)
Parameter Year Source Upper Sava
Middle Sava
Lower Sava
Upper Kupa
Lower Kupa Lonja Total (%)
Point 77,773 0 2,862 5,630 5,909 6,017 98,191 90.2 Non-point 848 22 963 3,199 4,550 1,066 10,649 9.8 2007 Total 78,621 22 3,826 8,829 10,459 7,084 108,840 100.0 Point 94,676 0 3,612 8,646 7,212 8,253 122,398 92.0 Non-point 848 22 963 3,199 4,550 1,066 10,649 8.0
BOD
2015 Total 95,524 22 4,575 11,845 11,762 9,319 133,047 100.0 Point 50,834 0 5,442 4,075 4,309 4,594 69,254 76.8 Non-point 2,701 29 3,700 3,294 6,696 4,534 20,955 23.2 2007 Total 53,536 29 9,142 7,369 11,005 9,129 90,209 100.0 Point 51,651 0 7,646 6,268 5,258 6,360 77,183 78.6 Non-point 2,701 29 3,700 3,294 6,696 4,534 20,955 21.4
COD
2015 Total 54,352 29 11.347 9,562 11,955 10,894 98,138 100.0 Point 18,068 0 1,350 827 1,180 2,135 23,561 64.6 Non-point 798 26 1,559 1,886 4,473 4,173 12,914 35.4 2007 Total 18,866 26 2,909 2,713 5,653 6,309 36,475 100.0 Point 20,642 0 1,853 1,298 2,438 2,909 29,140 68.0 Non-point 798 26 1,559 1,886 4,473 4,947 13,688 32.0
T-N
2015 Total 21,440 26 3,411 3,184 6,911 7,855 42,828 100.0 Point 4,040 0 239 195 244 248 4,966 89.4 Non-point 44 1 105 86 298 58 592 10.6 2007 Total 4,084 1 344 281 542 305 5,558 100.0 Point 2,851 0 336 312 307 339 4,146 87.5 Non-point 44 1 105 86 298 58 592 12.5
T-P
2015 Total 2,895 1 441 397 606 397 4,738 100.0
Point pollution load runoff shares a large portion of the total runoff in 2007 and 2015, as shown below.
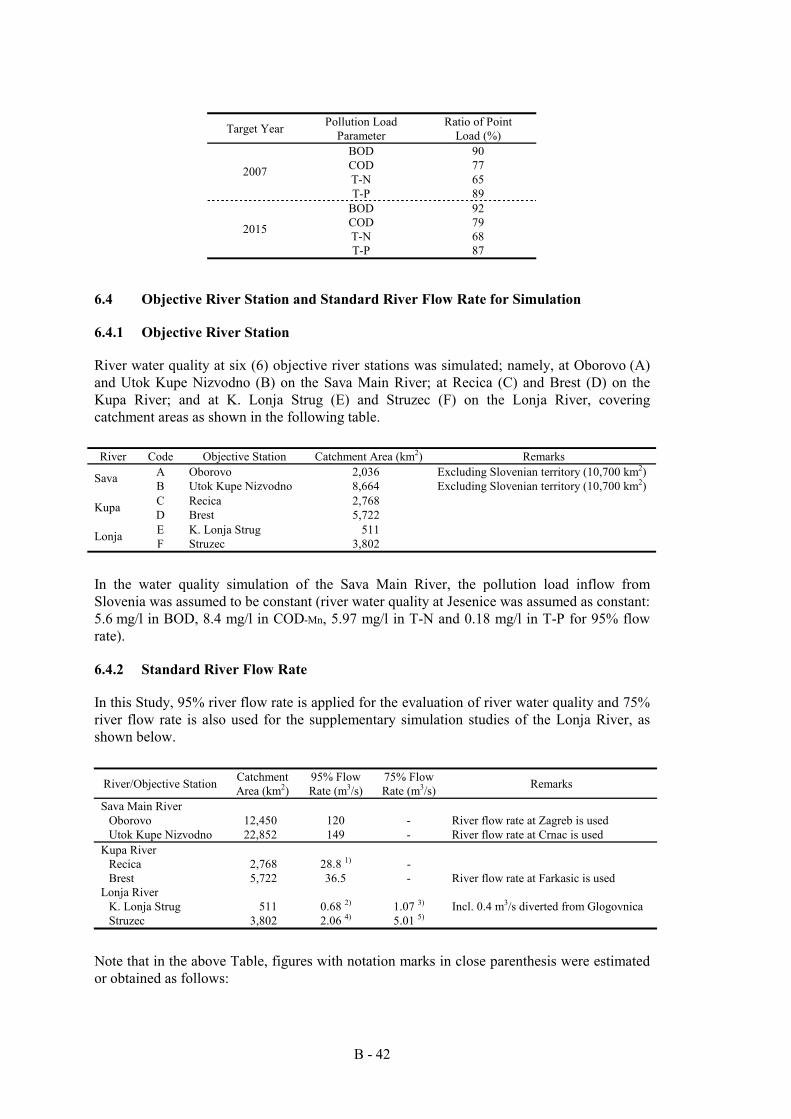
B - 42
Target Year Pollution Load Parameter
Ratio of Point Load (%)
BOD 90 COD 77 T-N 65 2007
T-P 89 BOD 92 COD 79 T-N 68 2015
T-P 87
6.4 Objective River Station and Standard River Flow Rate for Simulation
6.4.1 Objective River Station
River water quality at six (6) objective river stations was simulated; namely, at Oborovo (A) and Utok Kupe Nizvodno (B) on the Sava Main River; at Recica (C) and Brest (D) on the Kupa River; and at K. Lonja Strug (E) and Struzec (F) on the Lonja River, covering catchment areas as shown in the following table. River Code Objective Station Catchment Area (km2) Remarks
A Oborovo 2,036 Excluding Slovenian territory (10,700 km2) Sava B Utok Kupe Nizvodno 8,664 Excluding Slovenian territory (10,700 km2) C Recica 2,768 Kupa D Brest 5,722 E K. Lonja Strug 511 Lonja F Struzec 3,802
In the water quality simulation of the Sava Main River, the pollution load inflow from Slovenia was assumed to be constant (river water quality at Jesenice was assumed as constant: 5.6 mg/l in BOD, 8.4 mg/l in COD-Mn, 5.97 mg/l in T-N and 0.18 mg/l in T-P for 95% flow rate).
6.4.2 Standard River Flow Rate
In this Study, 95% river flow rate is applied for the evaluation of river water quality and 75% river flow rate is also used for the supplementary simulation studies of the Lonja River, as shown below.
River/Objective Station Catchment Area (km2)
95% Flow Rate (m3/s)
75% Flow Rate (m3/s) Remarks
Sava Main River Oborovo 12,450 120 - River flow rate at Zagreb is used Utok Kupe Nizvodno 22,852 149 - River flow rate at Crnac is used
Kupa River Recica 2,768 28.8 1) - Brest 5,722 36.5 - River flow rate at Farkasic is used
Lonja River K. Lonja Strug 511 0.68 2) 1.07 3) Incl. 0.4 m3/s diverted from Glogovnica Struzec 3,802 2.06 4) 5.01 5)
Note that in the above Table, figures with notation marks in close parenthesis were estimated or obtained as follows:
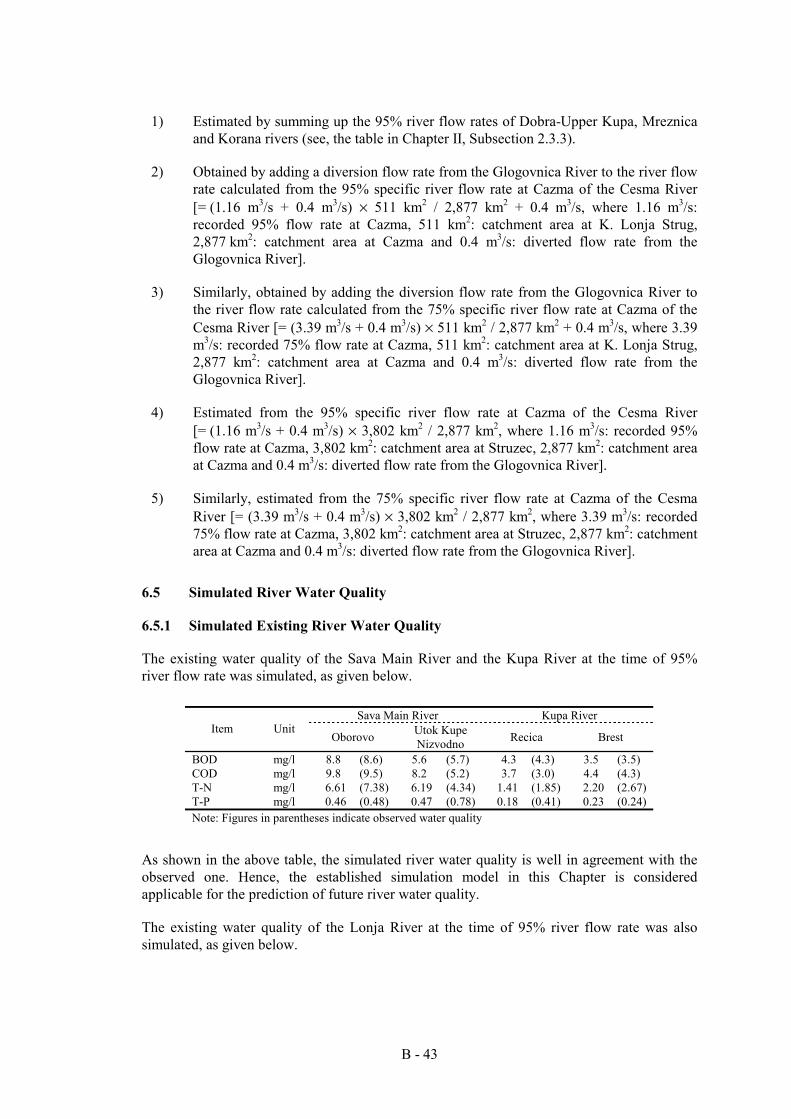
B - 43
1) Estimated by summing up the 95% river flow rates of Dobra-Upper Kupa, Mreznica and Korana rivers (see, the table in Chapter II, Subsection 2.3.3).
2) Obtained by adding a diversion flow rate from the Glogovnica River to the river flow rate calculated from the 95% specific river flow rate at Cazma of the Cesma River [= (1.16 m3/s + 0.4 m3/s) × 511 km2 / 2,877 km2 + 0.4 m3/s, where 1.16 m3/s: recorded 95% flow rate at Cazma, 511 km2: catchment area at K. Lonja Strug, 2,877 km2: catchment area at Cazma and 0.4 m3/s: diverted flow rate from the Glogovnica River].
3) Similarly, obtained by adding the diversion flow rate from the Glogovnica River to the river flow rate calculated from the 75% specific river flow rate at Cazma of the Cesma River [= (3.39 m3/s + 0.4 m3/s) × 511 km2 / 2,877 km2 + 0.4 m3/s, where 3.39 m3/s: recorded 75% flow rate at Cazma, 511 km2: catchment area at K. Lonja Strug, 2,877 km2: catchment area at Cazma and 0.4 m3/s: diverted flow rate from the Glogovnica River].
4) Estimated from the 95% specific river flow rate at Cazma of the Cesma River [= (1.16 m3/s + 0.4 m3/s) × 3,802 km2 / 2,877 km2, where 1.16 m3/s: recorded 95% flow rate at Cazma, 3,802 km2: catchment area at Struzec, 2,877 km2: catchment area at Cazma and 0.4 m3/s: diverted flow rate from the Glogovnica River].
5) Similarly, estimated from the 75% specific river flow rate at Cazma of the Cesma River [= (3.39 m3/s + 0.4 m3/s) × 3,802 km2 / 2,877 km2, where 3.39 m3/s: recorded 75% flow rate at Cazma, 3,802 km2: catchment area at Struzec, 2,877 km2: catchment area at Cazma and 0.4 m3/s: diverted flow rate from the Glogovnica River].
6.5 Simulated River Water Quality
6.5.1 Simulated Existing River Water Quality
The existing water quality of the Sava Main River and the Kupa River at the time of 95% river flow rate was simulated, as given below.
Sava Main River Kupa River Item Unit
Oborovo Utok Kupe Nizvodno Recica Brest
BOD mg/l 8.8 (8.6) 5.6 (5.7) 4.3 (4.3) 3.5 (3.5) COD mg/l 9.8 (9.5) 8.2 (5.2) 3.7 (3.0) 4.4 (4.3) T-N mg/l 6.61 (7.38) 6.19 (4.34) 1.41 (1.85) 2.20 (2.67) T-P mg/l 0.46 (0.48) 0.47 (0.78) 0.18 (0.41) 0.23 (0.24) Note: Figures in parentheses indicate observed water quality
As shown in the above table, the simulated river water quality is well in agreement with the observed one. Hence, the established simulation model in this Chapter is considered applicable for the prediction of future river water quality.
The existing water quality of the Lonja River at the time of 95% river flow rate was also simulated, as given below.
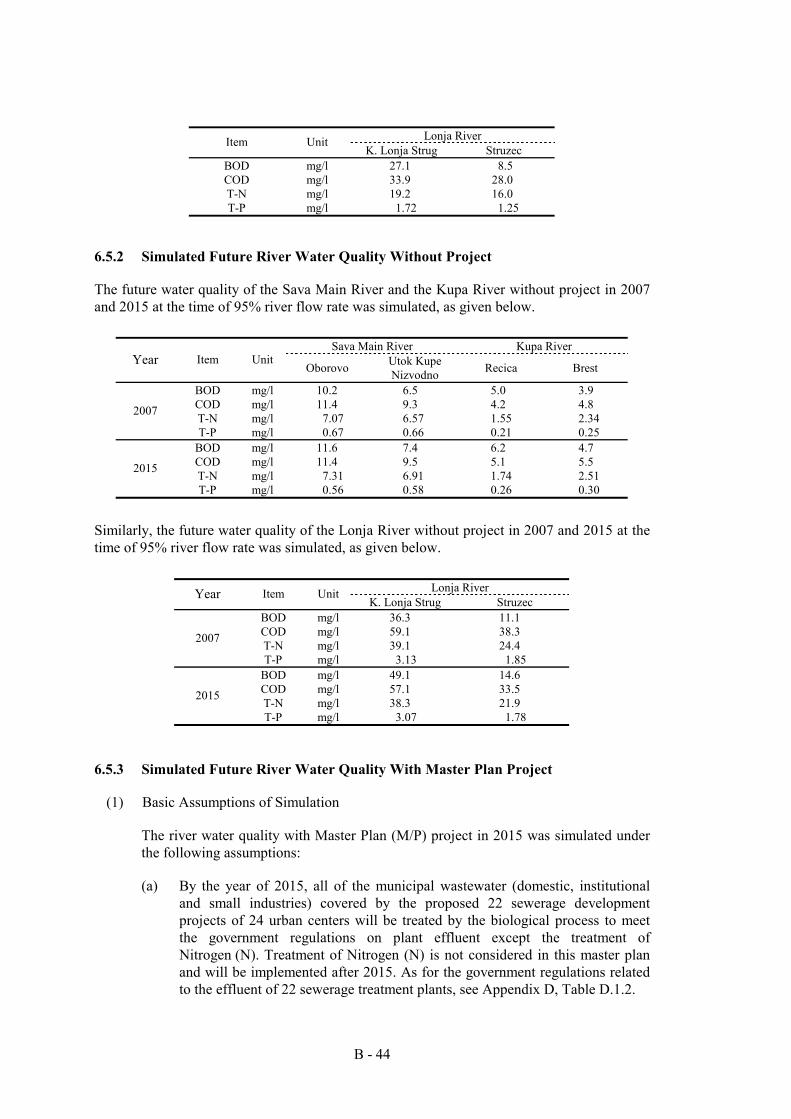
B - 44
Lonja River Item Unit
K. Lonja Strug Struzec BOD mg/l 27.1 8.5 COD mg/l 33.9 28.0 T-N mg/l 19.2 16.0 T-P mg/l 1.72 1.25
6.5.2 Simulated Future River Water Quality Without Project
The future water quality of the Sava Main River and the Kupa River without project in 2007 and 2015 at the time of 95% river flow rate was simulated, as given below.
Sava Main River Kupa River Year Item Unit
Oborovo Utok Kupe Nizvodno Recica Brest
BOD mg/l 10.2 6.5 5.0 3.9 COD mg/l 11.4 9.3 4.2 4.8 T-N mg/l 7.07 6.57 1.55 2.34 2007 T-P mg/l 0.67 0.66 0.21 0.25
BOD mg/l 11.6 7.4 6.2 4.7 COD mg/l 11.4 9.5 5.1 5.5 T-N mg/l 7.31 6.91 1.74 2.51 2015
T-P mg/l 0.56 0.58 0.26 0.30
Similarly, the future water quality of the Lonja River without project in 2007 and 2015 at the time of 95% river flow rate was simulated, as given below.
Lonja River Year Item Unit K. Lonja Strug Struzec
BOD mg/l 36.3 11.1 COD mg/l 59.1 38.3 T-N mg/l 39.1 24.4 2007
T-P mg/l 3.13 1.85 BOD mg/l 49.1 14.6 COD mg/l 57.1 33.5 T-N mg/l 38.3 21.9 2015
T-P mg/l 3.07 1.78
6.5.3 Simulated Future River Water Quality With Master Plan Project
(1) Basic Assumptions of Simulation
The river water quality with Master Plan (M/P) project in 2015 was simulated under the following assumptions:
(a) By the year of 2015, all of the municipal wastewater (domestic, institutional and small industries) covered by the proposed 22 sewerage development projects of 24 urban centers will be treated by the biological process to meet the government regulations on plant effluent except the treatment of Nitrogen (N). Treatment of Nitrogen (N) is not considered in this master plan and will be implemented after 2015. As for the government regulations related to the effluent of 22 sewerage treatment plants, see Appendix D, Table D.1.2.
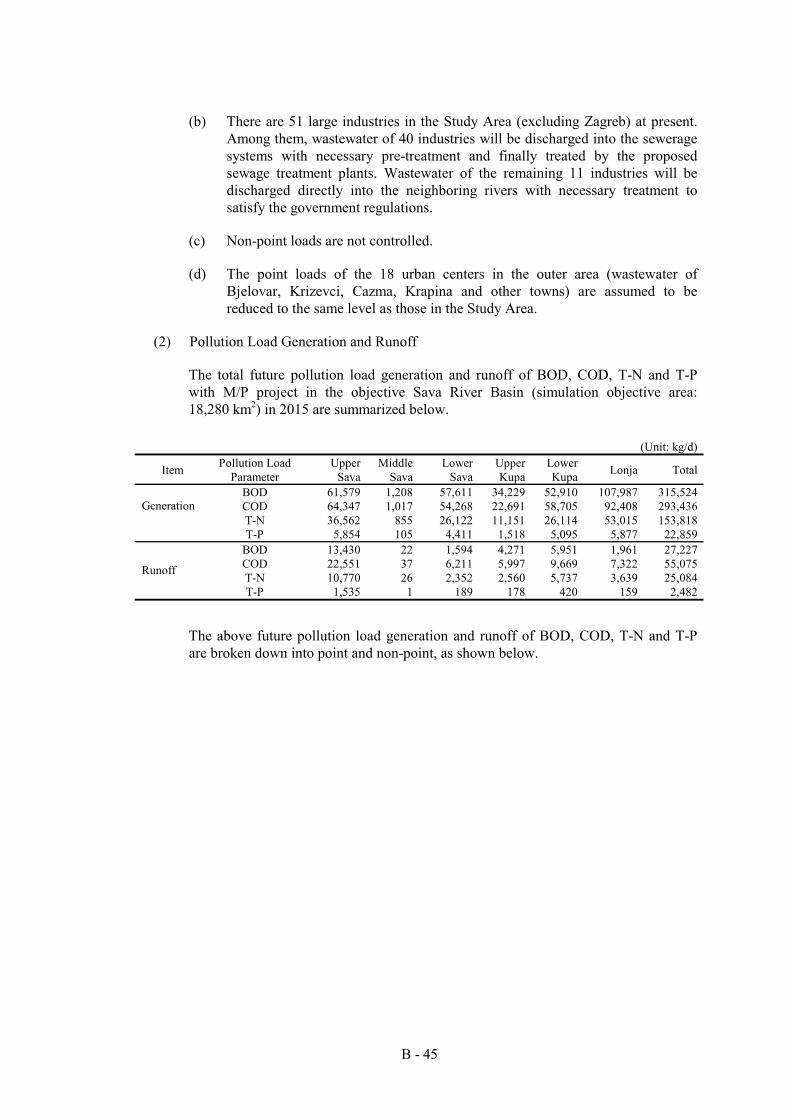
B - 45
(b) There are 51 large industries in the Study Area (excluding Zagreb) at present. Among them, wastewater of 40 industries will be discharged into the sewerage systems with necessary pre-treatment and finally treated by the proposed sewage treatment plants. Wastewater of the remaining 11 industries will be discharged directly into the neighboring rivers with necessary treatment to satisfy the government regulations.
(c) Non-point loads are not controlled.
(d) The point loads of the 18 urban centers in the outer area (wastewater of Bjelovar, Krizevci, Cazma, Krapina and other towns) are assumed to be reduced to the same level as those in the Study Area.
(2) Pollution Load Generation and Runoff
The total future pollution load generation and runoff of BOD, COD, T-N and T-P with M/P project in the objective Sava River Basin (simulation objective area: 18,280 km2) in 2015 are summarized below.
(Unit: kg/d)
Item Pollution Load Parameter
Upper Sava
Middle Sava
Lower Sava
Upper Kupa
Lower Kupa Lonja Total
BOD 61,579 1,208 57,611 34,229 52,910 107,987 315,524 COD 64,347 1,017 54,268 22,691 58,705 92,408 293,436 T-N 36,562 855 26,122 11,151 26,114 53,015 153,818
Generation
T-P 5,854 105 4,411 1,518 5,095 5,877 22,859 BOD 13,430 22 1,594 4,271 5,951 1,961 27,227 COD 22,551 37 6,211 5,997 9,669 7,322 55,075 T-N 10,770 26 2,352 2,560 5,737 3,639 25,084 Runoff
T-P 1,535 1 189 178 420 159 2,482
The above future pollution load generation and runoff of BOD, COD, T-N and T-P are broken down into point and non-point, as shown below.
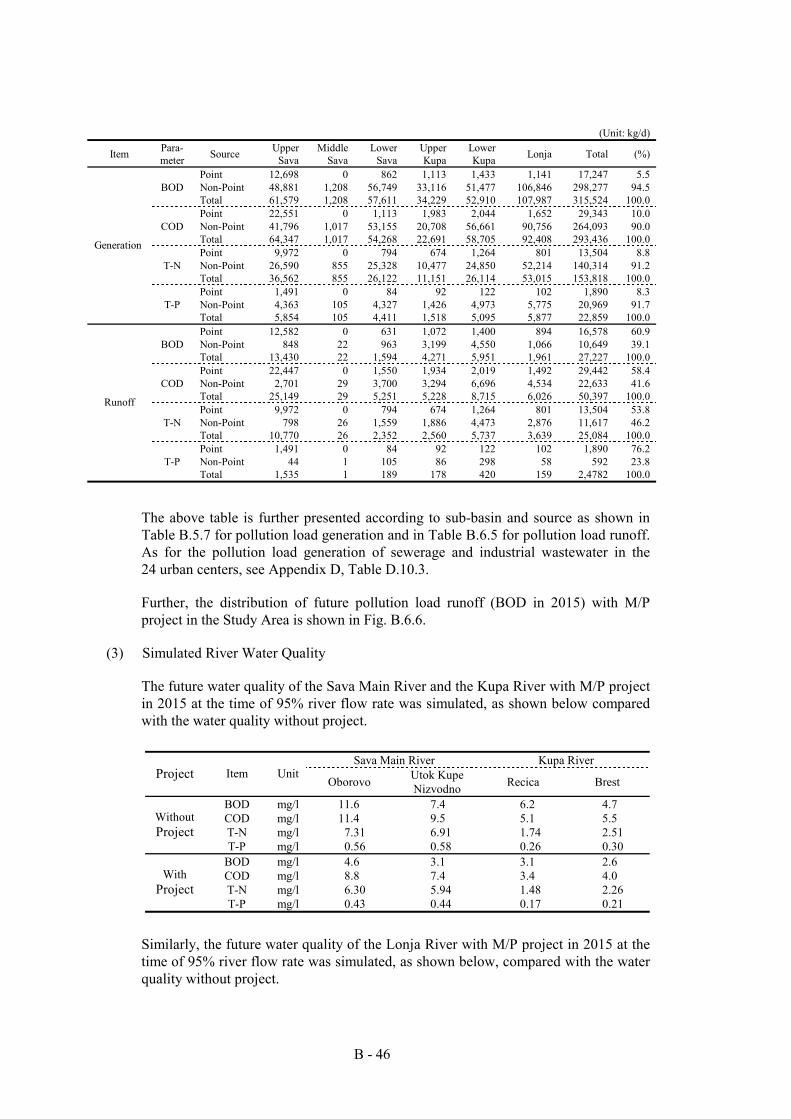
B - 46
(Unit: kg/d)
Item Para- meter Source Upper
Sava Middle
Sava Lower
Sava Upper Kupa
Lower Kupa Lonja Total (%)
Point 12,698 0 862 1,113 1,433 1,141 17,247 5.5 BOD Non-Point 48,881 1,208 56,749 33,116 51,477 106,846 298,277 94.5
Total 61,579 1,208 57,611 34,229 52,910 107,987 315,524 100.0 Point 22,551 0 1,113 1,983 2,044 1,652 29,343 10.0
COD Non-Point 41,796 1,017 53,155 20,708 56,661 90,756 264,093 90.0 Total 64,347 1,017 54,268 22,691 58,705 92,408 293,436 100.0 Point 9,972 0 794 674 1,264 801 13,504 8.8
T-N Non-Point 26,590 855 25,328 10,477 24,850 52,214 140,314 91.2 Total 36,562 855 26,122 11,151 26,114 53,015 153,818 100.0 Point 1,491 0 84 92 122 102 1,890 8.3
T-P Non-Point 4,363 105 4,327 1,426 4,973 5,775 20,969 91.7
Generation
Total 5,854 105 4,411 1,518 5,095 5,877 22,859 100.0 Point 12,582 0 631 1,072 1,400 894 16,578 60.9
BOD Non-Point 848 22 963 3,199 4,550 1,066 10,649 39.1 Total 13,430 22 1,594 4,271 5,951 1,961 27,227 100.0 Point 22,447 0 1,550 1,934 2,019 1,492 29,442 58.4
COD Non-Point 2,701 29 3,700 3,294 6,696 4,534 22,633 41.6 Total 25,149 29 5,251 5,228 8,715 6,026 50,397 100.0 Point 9,972 0 794 674 1,264 801 13,504 53.8
T-N Non-Point 798 26 1,559 1,886 4,473 2,876 11,617 46.2 Total 10,770 26 2,352 2,560 5,737 3,639 25,084 100.0 Point 1,491 0 84 92 122 102 1,890 76.2
T-P Non-Point 44 1 105 86 298 58 592 23.8
Runoff
Total 1,535 1 189 178 420 159 2,4782 100.0
The above table is further presented according to sub-basin and source as shown in Table B.5.7 for pollution load generation and in Table B.6.5 for pollution load runoff. As for the pollution load generation of sewerage and industrial wastewater in the 24 urban centers, see Appendix D, Table D.10.3.
Further, the distribution of future pollution load runoff (BOD in 2015) with M/P project in the Study Area is shown in Fig. B.6.6.
(3) Simulated River Water Quality
The future water quality of the Sava Main River and the Kupa River with M/P project in 2015 at the time of 95% river flow rate was simulated, as shown below compared with the water quality without project.
Sava Main River Kupa River
Project Item Unit Oborovo Utok Kupe
Nizvodno Recica Brest
BOD mg/l 11.6 7.4 6.2 4.7 COD mg/l 11.4 9.5 5.1 5.5 T-N mg/l 7.31 6.91 1.74 2.51
Without Project
T-P mg/l 0.56 0.58 0.26 0.30 BOD mg/l 4.6 3.1 3.1 2.6 COD mg/l 8.8 7.4 3.4 4.0 T-N mg/l 6.30 5.94 1.48 2.26
With Project
T-P mg/l 0.43 0.44 0.17 0.21
Similarly, the future water quality of the Lonja River with M/P project in 2015 at the time of 95% river flow rate was simulated, as shown below, compared with the water quality without project.
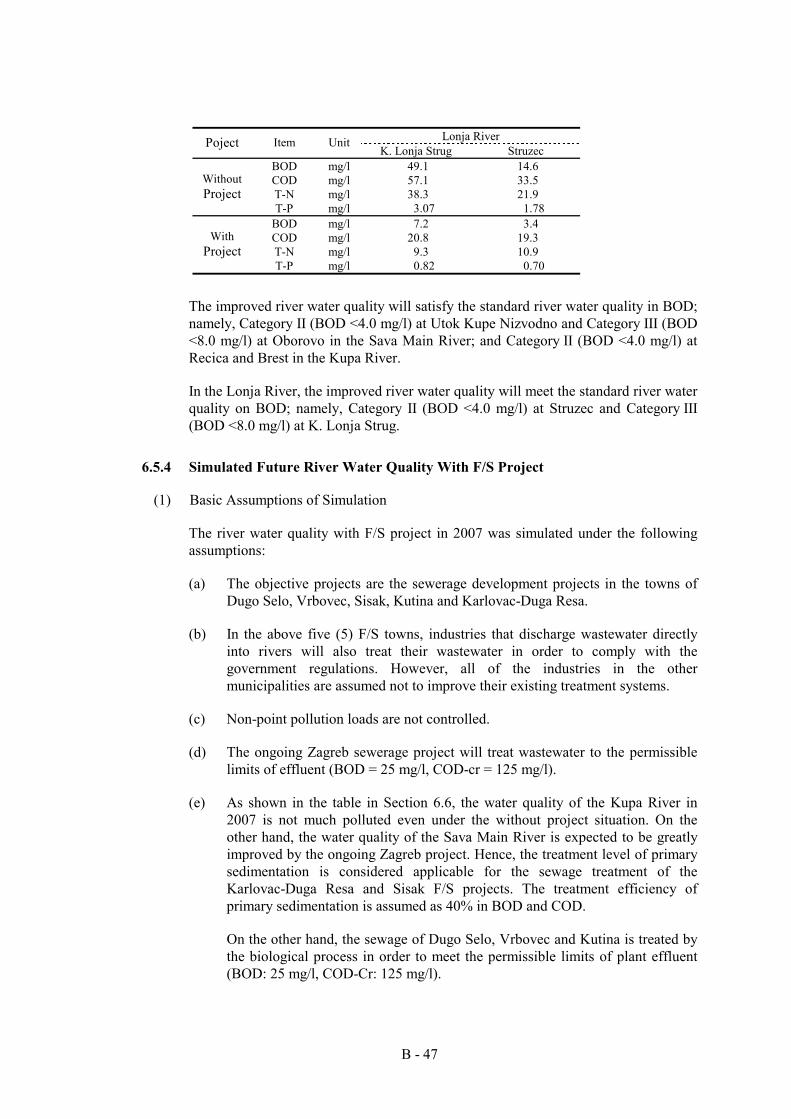
B - 47
Lonja River Poject Item Unit
K. Lonja Strug Struzec BOD mg/l 49.1 14.6 COD mg/l 57.1 33.5 T-N mg/l 38.3 21.9
Without Project
T-P mg/l 3.07 1.78 BOD mg/l 7.2 3.4 COD mg/l 20.8 19.3 T-N mg/l 9.3 10.9
With Project
T-P mg/l 0.82 0.70
The improved river water quality will satisfy the standard river water quality in BOD; namely, Category II (BOD <4.0 mg/l) at Utok Kupe Nizvodno and Category III (BOD <8.0 mg/l) at Oborovo in the Sava Main River; and Category II (BOD <4.0 mg/l) at Recica and Brest in the Kupa River.
In the Lonja River, the improved river water quality will meet the standard river water quality on BOD; namely, Category II (BOD <4.0 mg/l) at Struzec and Category III (BOD <8.0 mg/l) at K. Lonja Strug.
6.5.4 Simulated Future River Water Quality With F/S Project
(1) Basic Assumptions of Simulation
The river water quality with F/S project in 2007 was simulated under the following assumptions:
(a) The objective projects are the sewerage development projects in the towns of Dugo Selo, Vrbovec, Sisak, Kutina and Karlovac-Duga Resa.
(b) In the above five (5) F/S towns, industries that discharge wastewater directly into rivers will also treat their wastewater in order to comply with the government regulations. However, all of the industries in the other municipalities are assumed not to improve their existing treatment systems.
(c) Non-point pollution loads are not controlled.
(d) The ongoing Zagreb sewerage project will treat wastewater to the permissible limits of effluent (BOD = 25 mg/l, COD-cr = 125 mg/l).
(e) As shown in the table in Section 6.6, the water quality of the Kupa River in 2007 is not much polluted even under the without project situation. On the other hand, the water quality of the Sava Main River is expected to be greatly improved by the ongoing Zagreb project. Hence, the treatment level of primary sedimentation is considered applicable for the sewage treatment of the Karlovac-Duga Resa and Sisak F/S projects. The treatment efficiency of primary sedimentation is assumed as 40% in BOD and COD.
On the other hand, the sewage of Dugo Selo, Vrbovec and Kutina is treated by the biological process in order to meet the permissible limits of plant effluent (BOD: 25 mg/l, COD-Cr: 125 mg/l).
B - 48
However, Phosphorus (P) and Nitrogen (N) are not treated by the sewage treatment plants.
(2) Pollution Load Generation and Runoff
The total future pollution load generation and runoff of BOD, COD, T-N and T-P with F/S project in the objective Sava River Basin (simulation objective area: 18,280 km2) in 2007 is summarized below.
(Unit: kg/d)
Item Pollution Load Parameter
Upper Sava
Middle Sava
Lower Sava
Upper Kupa
Lower Kupa Lonja Total
BOD 64,245 1,208 61,113 36,553 56,670 112,368 331,157 COD 63,692 1,017 56,522 22,837 59,484 95,317 298,869 T-N 35,447 855 26,496 11,177 25,854 54,239 154,068 Generation
T-P 5,710 105 4,512 1,545 5,143 5,981 22,997 BOD 15,215 22 2,487 6,466 8,645 5,462 38,297 COD 23,976 29 8,170 5,354 9,479 8,157 55,165 T-N 9.655 26 2,727 2,585 5,477 6.088 26,558 Runoff
T-P 1,391 1 291 205 468 263 2,619
The above future pollution load generation and runoff of BOD, COD, T-N and T-P are broken down into point and non-point, as shown in the table below.
(Unit: kg/d)
Item Para- meter Source Upper
Sava Middle
Sava Lower
Sava Upper Kupa
Lower Kupa Lonja Total (%)
Point 15,364 0 4,364 3,437 4,193 5,522 32,880 9.9 BOD Non-Point 48,881 0 56,749 33,116 51,477 106,846 298,277 90.1
Total 64,245 1,208 61,113 36,553 56,670 112,368 331,157 100.0 Point 21,896 0 3,367 2,129 2,823 4,561 34,776 11.6
COD Non-Point 41,796 1,017 53,155 20,708 56,661 90,756 264,093 88.4 Total 63,692 1,017 56,522 22,837 59,484 95,317 298,869 100.0 Point 8,857 0 1,168 700 1,004 2,025 13,754 8.9
T-N Non-Point 26,590 855 25,328 10,477 24,850 52,214 140,314 85.6 Total 35,447 855 26,496 11,177 25,854 54,259 154,068 100.0 Point 1,347 0 185 119 170 206 2,028 8.8
T-P Non-Point 4,363 95 4,327 1,426 4,973 5,775 20,969 91.8
Genera-tion
Total 5,710 105 4,512 1,545 5,143 5,981 22,997 100.0 Point 14,367 0 1,524 3,267 4,094 4,396 27,648 72.2
BOD Non-Point 848 22 963 3,199 4,550 1,066 10,649 27.8 Total 15,215 22 2,487 6,466 8,645 5,462 38,297 100.0 Point 21,275 0 4,470 2,060 2,783 3,623 34,211 62.0
COD Non-Point 2,701 29 3,700 3,294 6,696 4,534 20,955 38.0 Total 23.976 29 8,170 5,354 9,479 8,157 55,165 100.0 Point 8,857 0 1,168 700 1,004 2,025 13,754 51.8
T-N Non-Point 798 26 1,559 1,886 4,473 4,063 12,804 48.2 Total 9.655 26 2,727 2,585 5,477 6,088 26,558 100.0 Point 1,347 0 185 115 170 206 2,028 77.4
T-P Non-Point 44 1 105 86 298 58 592 22.6
Runoff
Total 1,391 1 291 205 468 263 2,619 100.0
The above table is further presented according to sub-basin and source as shown in Table B.5.6 for pollution load generation and in Table B.6.4 for pollution load runoff. As for the pollution load generation of sewerage and industrial wastewater in the 24 urban centers, see Appendix E, Table E-I.2.2.
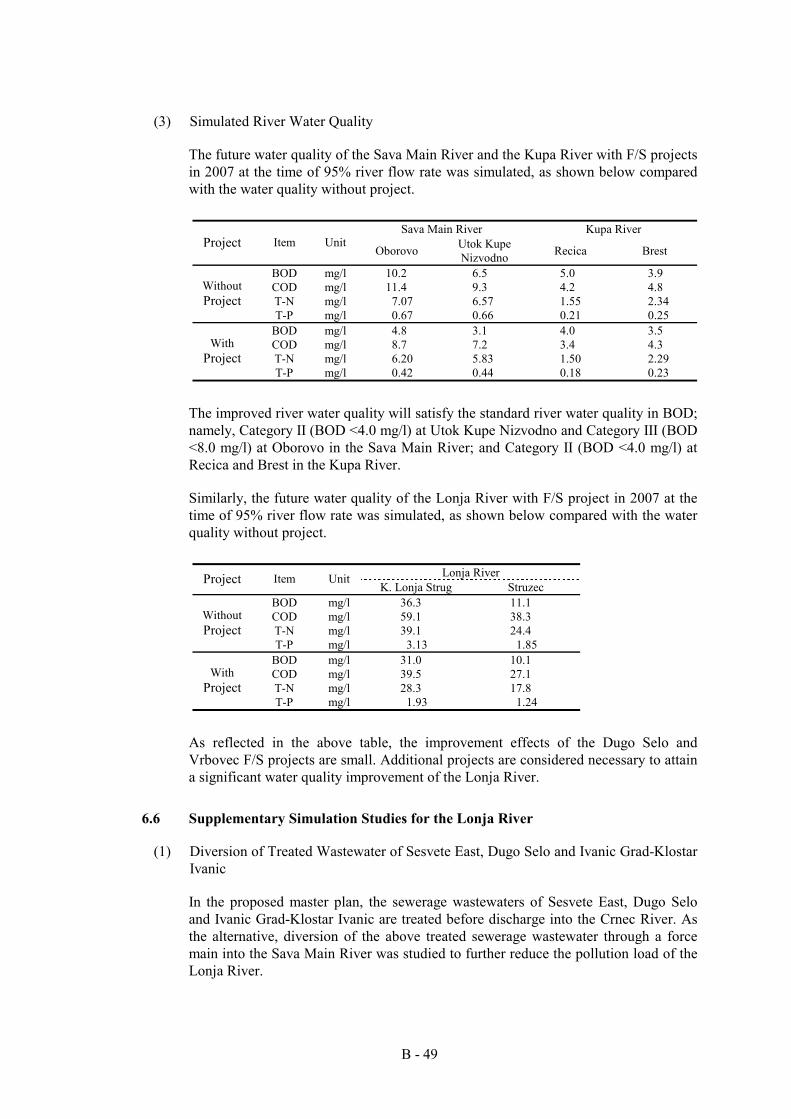
B - 49
(3) Simulated River Water Quality
The future water quality of the Sava Main River and the Kupa River with F/S projects in 2007 at the time of 95% river flow rate was simulated, as shown below compared with the water quality without project.
Sava Main River Kupa River
Project Item Unit Oborovo Utok Kupe
Nizvodno Recica Brest
BOD mg/l 10.2 6.5 5.0 3.9 COD mg/l 11.4 9.3 4.2 4.8 T-N mg/l 7.07 6.57 1.55 2.34
Without Project
T-P mg/l 0.67 0.66 0.21 0.25 BOD mg/l 4.8 3.1 4.0 3.5 COD mg/l 8.7 7.2 3.4 4.3 T-N mg/l 6.20 5.83 1.50 2.29
With Project
T-P mg/l 0.42 0.44 0.18 0.23
The improved river water quality will satisfy the standard river water quality in BOD; namely, Category II (BOD <4.0 mg/l) at Utok Kupe Nizvodno and Category III (BOD <8.0 mg/l) at Oborovo in the Sava Main River; and Category II (BOD <4.0 mg/l) at Recica and Brest in the Kupa River.
Similarly, the future water quality of the Lonja River with F/S project in 2007 at the time of 95% river flow rate was simulated, as shown below compared with the water quality without project.
Lonja River Project Item Unit
K. Lonja Strug Struzec BOD mg/l 36.3 11.1 COD mg/l 59.1 38.3 T-N mg/l 39.1 24.4
Without Project
T-P mg/l 3.13 1.85 BOD mg/l 31.0 10.1 COD mg/l 39.5 27.1 T-N mg/l 28.3 17.8
With Project
T-P mg/l 1.93 1.24
As reflected in the above table, the improvement effects of the Dugo Selo and Vrbovec F/S projects are small. Additional projects are considered necessary to attain a significant water quality improvement of the Lonja River.
6.6 Supplementary Simulation Studies for the Lonja River
(1) Diversion of Treated Wastewater of Sesvete East, Dugo Selo and Ivanic Grad-Klostar Ivanic
In the proposed master plan, the sewerage wastewaters of Sesvete East, Dugo Selo and Ivanic Grad-Klostar Ivanic are treated before discharge into the Crnec River. As the alternative, diversion of the above treated sewerage wastewater through a force main into the Sava Main River was studied to further reduce the pollution load of the Lonja River.
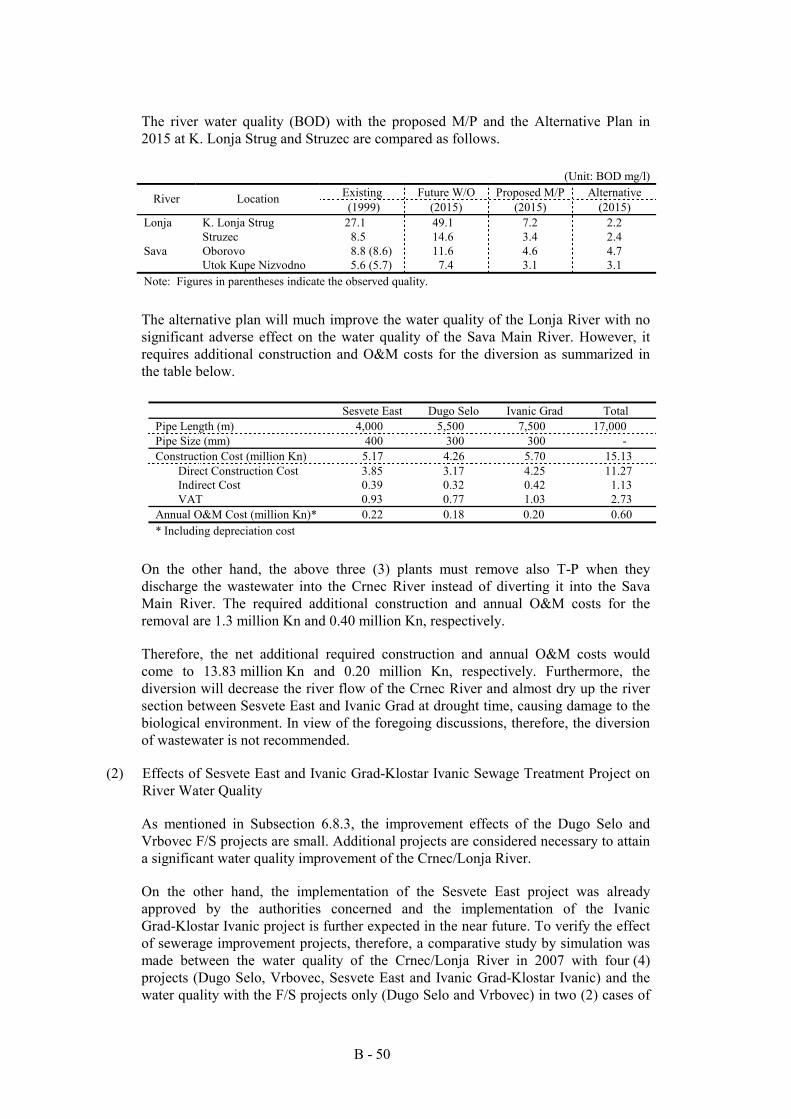
B - 50
The river water quality (BOD) with the proposed M/P and the Alternative Plan in 2015 at K. Lonja Strug and Struzec are compared as follows.
(Unit: BOD mg/l)
Existing Future W/O Proposed M/P Alternative River Location (1999) (2015) (2015) (2015)
Lonja K. Lonja Strug 27.1 49.1 7.2 2.2 Struzec 8.5 14.6 3.4 2.4 Sava Oborovo 8.8 (8.6) 11.6 4.6 4.7 Utok Kupe Nizvodno 5.6 (5.7) 7.4 3.1 3.1 Note: Figures in parentheses indicate the observed quality.
The alternative plan will much improve the water quality of the Lonja River with no significant adverse effect on the water quality of the Sava Main River. However, it requires additional construction and O&M costs for the diversion as summarized in the table below.
Sesvete East Dugo Selo Ivanic Grad Total
Pipe Length (m) 4,000 5,500 7,500 17,000 Pipe Size (mm) 400 300 300 - Construction Cost (million Kn) 5.17 4.26 5.70 15.13
Direct Construction Cost 3.85 3.17 4.25 11.27 Indirect Cost 0.39 0.32 0.42 1.13 VAT 0.93 0.77 1.03 2.73
Annual O&M Cost (million Kn)* 0.22 0.18 0.20 0.60 * Including depreciation cost
On the other hand, the above three (3) plants must remove also T-P when they discharge the wastewater into the Crnec River instead of diverting it into the Sava Main River. The required additional construction and annual O&M costs for the removal are 1.3 million Kn and 0.40 million Kn, respectively.
Therefore, the net additional required construction and annual O&M costs would come to 13.83 million Kn and 0.20 million Kn, respectively. Furthermore, the diversion will decrease the river flow of the Crnec River and almost dry up the river section between Sesvete East and Ivanic Grad at drought time, causing damage to the biological environment. In view of the foregoing discussions, therefore, the diversion of wastewater is not recommended.
(2) Effects of Sesvete East and Ivanic Grad-Klostar Ivanic Sewage Treatment Project on River Water Quality
As mentioned in Subsection 6.8.3, the improvement effects of the Dugo Selo and Vrbovec F/S projects are small. Additional projects are considered necessary to attain a significant water quality improvement of the Crnec/Lonja River.
On the other hand, the implementation of the Sesvete East project was already approved by the authorities concerned and the implementation of the Ivanic Grad-Klostar Ivanic project is further expected in the near future. To verify the effect of sewerage improvement projects, therefore, a comparative study by simulation was made between the water quality of the Crnec/Lonja River in 2007 with four (4) projects (Dugo Selo, Vrbovec, Sesvete East and Ivanic Grad-Klostar Ivanic) and the water quality with the F/S projects only (Dugo Selo and Vrbovec) in two (2) cases of
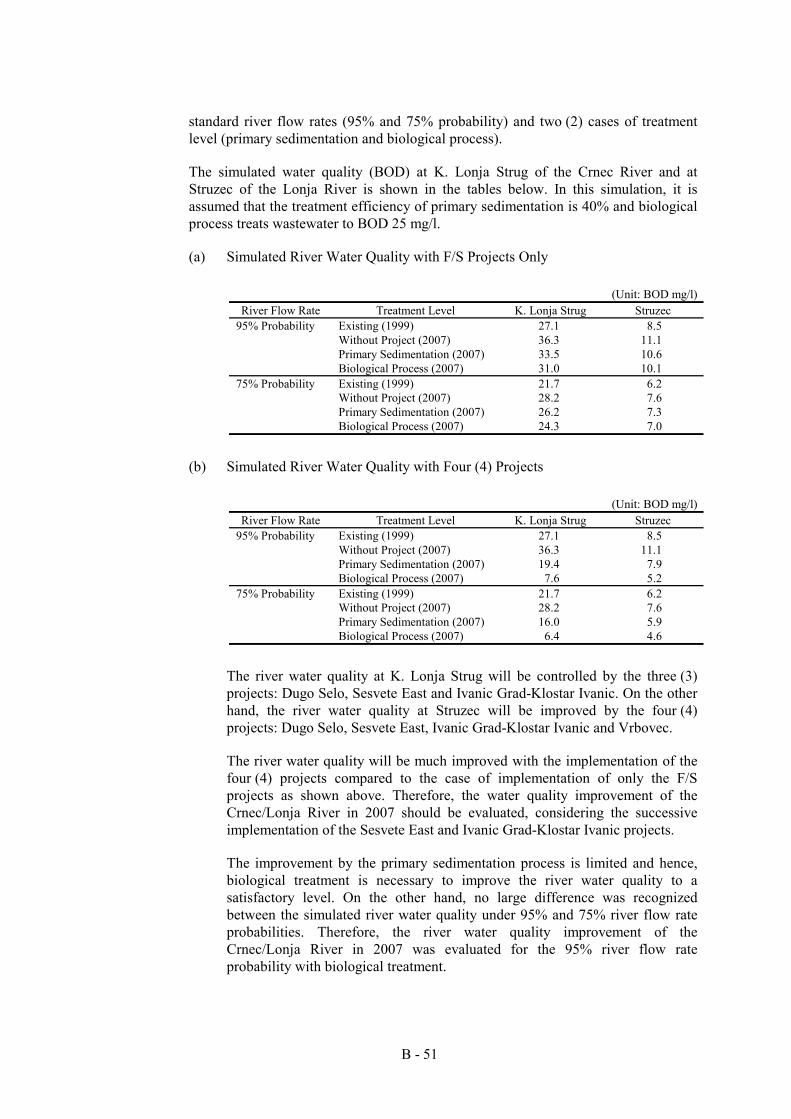
B - 51
standard river flow rates (95% and 75% probability) and two (2) cases of treatment level (primary sedimentation and biological process).
The simulated water quality (BOD) at K. Lonja Strug of the Crnec River and at Struzec of the Lonja River is shown in the tables below. In this simulation, it is assumed that the treatment efficiency of primary sedimentation is 40% and biological process treats wastewater to BOD 25 mg/l.
(a) Simulated River Water Quality with F/S Projects Only
(Unit: BOD mg/l) River Flow Rate Treatment Level K. Lonja Strug Struzec
95% Probability Existing (1999) 27.1 8.5 Without Project (2007) 36.3 11.1 Primary Sedimentation (2007) 33.5 10.6 Biological Process (2007) 31.0 10.1 75% Probability Existing (1999) 21.7 6.2 Without Project (2007) 28.2 7.6 Primary Sedimentation (2007) 26.2 7.3 Biological Process (2007) 24.3 7.0
(b) Simulated River Water Quality with Four (4) Projects
(Unit: BOD mg/l) River Flow Rate Treatment Level K. Lonja Strug Struzec
95% Probability Existing (1999) 27.1 8.5 Without Project (2007) 36.3 11.1 Primary Sedimentation (2007) 19.4 7.9 Biological Process (2007) 7.6 5.2 75% Probability Existing (1999) 21.7 6.2 Without Project (2007) 28.2 7.6 Primary Sedimentation (2007) 16.0 5.9 Biological Process (2007) 6.4 4.6
The river water quality at K. Lonja Strug will be controlled by the three (3) projects: Dugo Selo, Sesvete East and Ivanic Grad-Klostar Ivanic. On the other hand, the river water quality at Struzec will be improved by the four (4) projects: Dugo Selo, Sesvete East, Ivanic Grad-Klostar Ivanic and Vrbovec.
The river water quality will be much improved with the implementation of the four (4) projects compared to the case of implementation of only the F/S projects as shown above. Therefore, the water quality improvement of the Crnec/Lonja River in 2007 should be evaluated, considering the successive implementation of the Sesvete East and Ivanic Grad-Klostar Ivanic projects.
The improvement by the primary sedimentation process is limited and hence, biological treatment is necessary to improve the river water quality to a satisfactory level. On the other hand, no large difference was recognized between the simulated river water quality under 95% and 75% river flow rate probabilities. Therefore, the river water quality improvement of the Crnec/Lonja River in 2007 was evaluated for the 95% river flow rate probability with biological treatment.
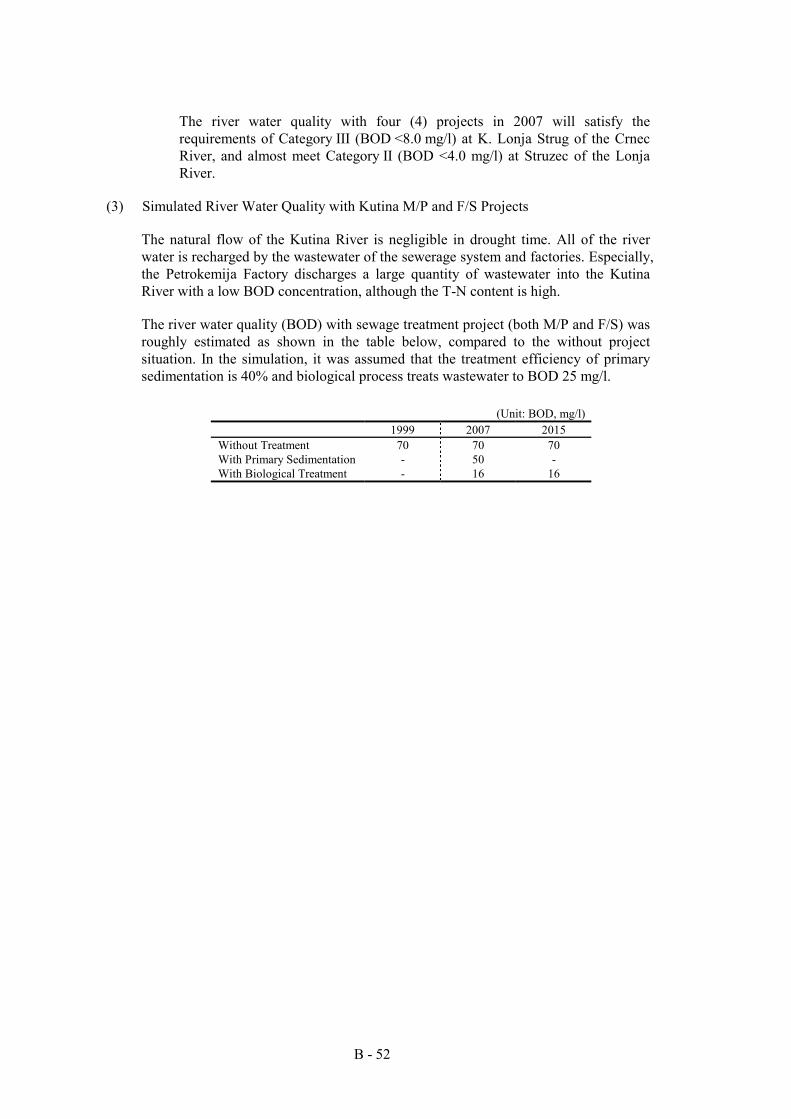
B - 52
The river water quality with four (4) projects in 2007 will satisfy the requirements of Category III (BOD <8.0 mg/l) at K. Lonja Strug of the Crnec River, and almost meet Category II (BOD <4.0 mg/l) at Struzec of the Lonja River.
(3) Simulated River Water Quality with Kutina M/P and F/S Projects
The natural flow of the Kutina River is negligible in drought time. All of the river water is recharged by the wastewater of the sewerage system and factories. Especially, the Petrokemija Factory discharges a large quantity of wastewater into the Kutina River with a low BOD concentration, although the T-N content is high.
The river water quality (BOD) with sewage treatment project (both M/P and F/S) was roughly estimated as shown in the table below, compared to the without project situation. In the simulation, it was assumed that the treatment efficiency of primary sedimentation is 40% and biological process treats wastewater to BOD 25 mg/l.
(Unit: BOD, mg/l)
1999 2007 2015 Without Treatment 70 70 70 With Primary Sedimentation - 50 - With Biological Treatment - 16 16
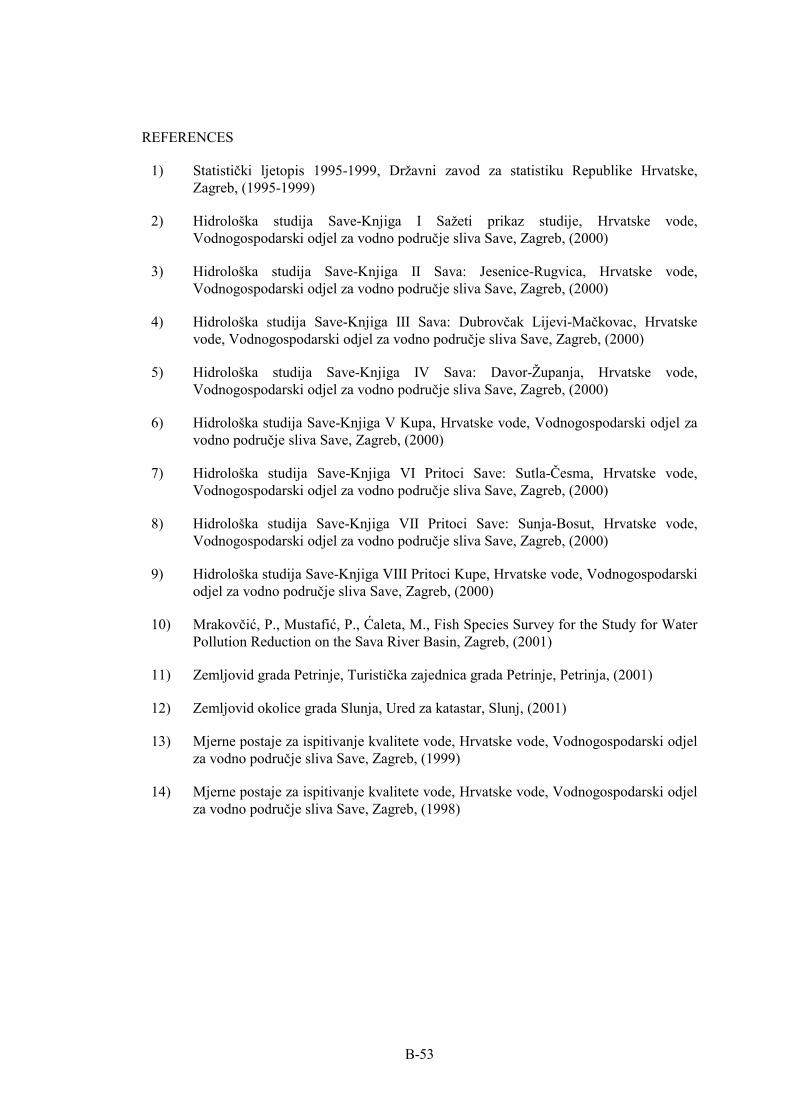
B-53
REFERENCES
1) Statistički ljetopis 1995-1999, Državni zavod za statistiku Republike Hrvatske, Zagreb, (1995-1999)
2) Hidrološka studija Save-Knjiga I Sažeti prikaz studije, Hrvatske vode, Vodnogospodarski odjel za vodno područje sliva Save, Zagreb, (2000)
3) Hidrološka studija Save-Knjiga II Sava: Jesenice-Rugvica, Hrvatske vode, Vodnogospodarski odjel za vodno područje sliva Save, Zagreb, (2000)
4) Hidrološka studija Save-Knjiga III Sava: Dubrovčak Lijevi-Mačkovac, Hrvatske vode, Vodnogospodarski odjel za vodno područje sliva Save, Zagreb, (2000)
5) Hidrološka studija Save-Knjiga IV Sava: Davor-Županja, Hrvatske vode, Vodnogospodarski odjel za vodno područje sliva Save, Zagreb, (2000)
6) Hidrološka studija Save-Knjiga V Kupa, Hrvatske vode, Vodnogospodarski odjel za vodno područje sliva Save, Zagreb, (2000)
7) Hidrološka studija Save-Knjiga VI Pritoci Save: Sutla-Česma, Hrvatske vode, Vodnogospodarski odjel za vodno područje sliva Save, Zagreb, (2000)
8) Hidrološka studija Save-Knjiga VII Pritoci Save: Sunja-Bosut, Hrvatske vode, Vodnogospodarski odjel za vodno područje sliva Save, Zagreb, (2000)
9) Hidrološka studija Save-Knjiga VIII Pritoci Kupe, Hrvatske vode, Vodnogospodarski odjel za vodno područje sliva Save, Zagreb, (2000)
10) Mrakovčić, P., Mustafić, P., Ćaleta, M., Fish Species Survey for the Study for Water Pollution Reduction on the Sava River Basin, Zagreb, (2001)
11) Zemljovid grada Petrinje, Turistička zajednica grada Petrinje, Petrinja, (2001)
12) Zemljovid okolice grada Slunja, Ured za katastar, Slunj, (2001)
13) Mjerne postaje za ispitivanje kvalitete vode, Hrvatske vode, Vodnogospodarski odjel za vodno područje sliva Save, Zagreb, (1999)
14) Mjerne postaje za ispitivanje kvalitete vode, Hrvatske vode, Vodnogospodarski odjel za vodno područje sliva Save, Zagreb, (1998)

TABLES
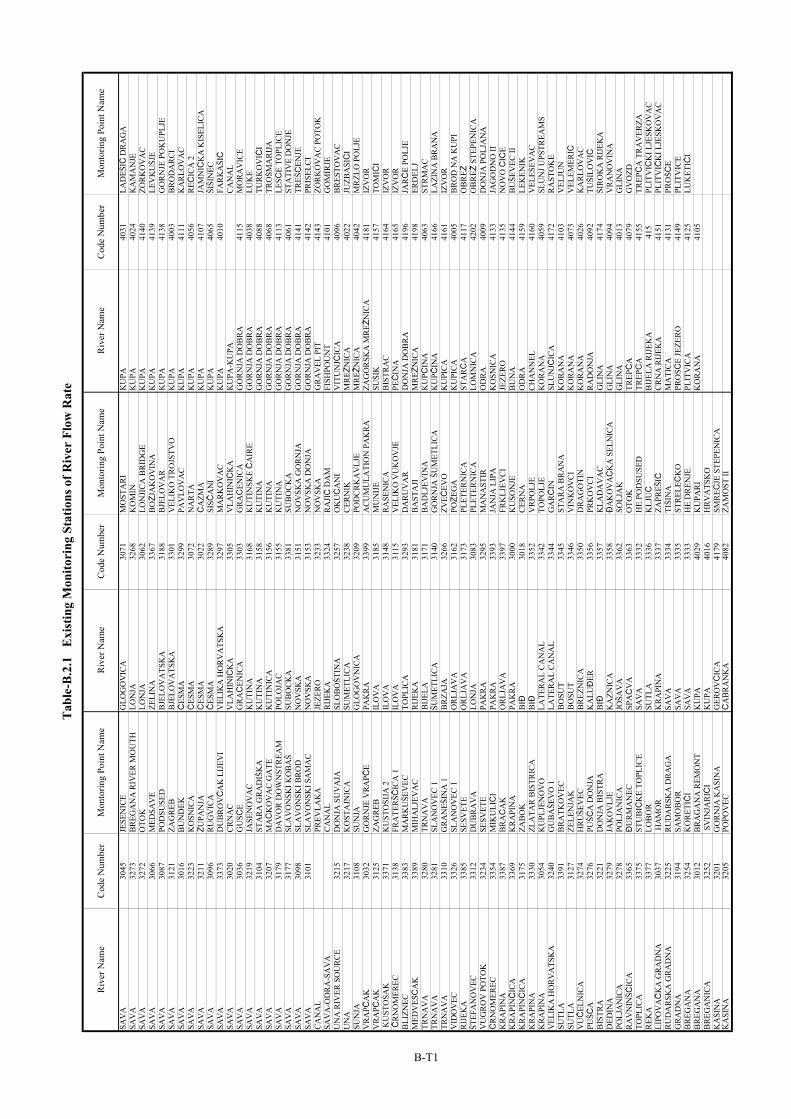
Riv
er N
ame
Cod
e N
umbe
rM
onto
ring
Poin
t Nam
eR
iver
Nam
eC
ode
Num
ber
Mon
torin
g Po
int N
ame
Riv
er N
ame
Cod
e N
umbe
rM
onto
ring
Poin
t Nam
e
SAV
A30
45JE
SEN
ICE
GLO
GO
VIC
A30
71M
OST
AR
IK
UPA
40
31LA
DEŠ
IĆ D
RAG
ASA
VA
3273
BR
EGA
NA
RIV
ER M
OU
THLO
NJA
3268
KO
MIN
KU
PA
4024
KA
MA
NJE
SAV
A32
72O
TOK
LON
JA30
62LO
NJI
CA
BR
IDG
EK
UPA
41
40ZO
RKO
VA
CSA
VA
3066
MED
SAV
EZE
LIN
A33
67B
OŽJ
AK
OV
INA
KU
PA
4139
LEV
KU
ŠJE
SAV
A30
87PO
DSU
SED
BJE
LOV
ATS
KA
3188
BJE
LOV
AR
KU
PA
4138
GO
RN
JE P
OK
UPL
JESA
VA
3121
ZAG
REB
BJE
LOV
ATS
KA
3301
VEL
IKO
TR
OJS
TVO
KU
PA
4003
BR
OD
AR
CI
SAV
A30
16B
UN
DEK
ČES
MA
3299
PAV
LOV
AC
KU
PA
4111
KA
RLO
VA
CSA
VA
3223
KO
SNIC
AČ
ESM
A30
72N
AR
TAK
UPA
40
56R
EČIC
A 2
SAV
A32
11ŽU
PAN
JAČ
ESM
A30
22Č
AZM
AK
UPA
41
07JA
MN
IČK
A K
ISEL
ICA
SAV
A30
96RU
GV
ICA
ČES
MA
3289
SISČ
AN
IK
UPA
40
65ŠI
ŠIN
ECSA
VA
3373
DU
BR
OVČ
AK
LIJ
EVI
VEL
IKA
HO
RVA
TSK
A32
97M
ARK
OV
AC
KU
PA
4010
FARK
AŠIĆ
SAV
A30
20CR
NA
CV
LAH
INIČ
KA
3305
VLA
HIN
IČK
AK
UPA
-KU
PAC
AN
AL
SAV
A30
36G
UŠĆ
EG
RAČ
ENIC
A33
03G
RAČ
ENIC
AG
OR
NJA
DO
BR
A41
15M
ORA
VIC
ESA
VA
3219
JASE
NO
VA
CK
UTI
NA
3168
KU
TIN
SKE Č
AIR
EG
OR
NJA
DO
BR
A40
38LU
KE
SAV
A31
04ST
ARA
GRA
DI Š
KA
KU
TIN
A31
58K
UTI
NA
GO
RN
JA D
OB
RA
4088
TUR
KO
VIĆ
ISA
VA
3207
MAČ
KO
VA
C G
ATE
KU
TIN
ICA
3156
KU
TIN
AG
OR
NJA
DO
BR
A40
68TR
OŠM
AR
IJA
SAV
A31
79D
AV
OR
DO
WN
STR
EAM
POLO
JAC
3155
KU
TIN
AG
OR
NJA
DO
BR
A41
13LE
ŠĆE
TOPL
ICE
SAV
A31
77SL
AV
ON
SKI K
OB
AŠ
SUB
OC
KA
3381
SUB
OC
KA
GO
RN
JA D
OB
RA
4061
STA
TIV
E D
ON
JESA
VA
3098
SLA
VO
NSK
I BR
OD
NO
VSK
A31
51N
OV
SKA
GO
RN
JAG
OR
NJA
DO
BR
A41
41TR
E ŠĆ
ENJE
SAV
A31
01SL
AV
ON
SKI Š
AM
AC
NO
VSK
A31
53N
OV
SKA
DO
NJA
GO
RN
JA D
OB
RA
4142
PRIS
ELC
IC
AN
AL
PREV
LAK
AJE
ZER
O32
33N
OV
SKA
GR
AV
EL P
IT41
43ZO
RK
OV
AC
PO
TOK
SAV
A-O
DRA
-SA
VA
CAN
AL
RIJE
KA
3324
RA
JIĆ
DA
MFI
SHPO
UN
T 41
01G
OM
IRJE
UN
A R
IVER
SO
UR
CE
3215
DO
NJA
SU
VA
JASL
OB
OŠT
INA
3257
OK
UČ
AN
IV
ITU
NJČ
ICA
4096
BR
ESTO
VA
CU
NA
3217
KO
STA
JNIC
AŠU
MET
LIC
A32
38C
ERN
IKM
REŽ
NIC
A40
22JU
ZBA
ŠIĆ
ISU
NJA
3108
SUN
JAG
LOG
OV
NIC
A32
09PO
DC
RK
AV
LJE
MR
E ŽN
ICA
4042
MR
ZLO
PO
LJE
VRA
P ČA
K30
32G
OR
NJE
VR
APČ
EPA
KRA
3399
AC
UM
ULA
TIO
N P
AK
RA
ZAG
OR
SKA
MR
EŽN
ICA
4181
IZV
OR
V
RAP Č
AK
3125
ZAG
REB
ILO
VA
3185
MU
NIJ
ESU
ŠIK
4157
TOM
IĆI
KU
STO
ŠAK
3371
KU
STO
ŠIJA
2IL
OV
A31
48RA
ŠEN
ICA
BIS
TRA
C41
64IZ
VO
R Č
RN
OM
EREC
3138
FRA
TER
ŠČIC
A 1
ILO
VA
3115
VEL
IKO
VU
KO
VJE
PEĆ
INA
4165
IZV
OR
BLI
ZNEC
3383
MA
RK
UŠE
VEC
TOPL
ICA
3293
DA
RU
VA
RD
ON
JA D
OB
RA
4196
JARČ
E PO
LJE
MED
VE ŠČ
AK
3389
MIH
ALJ
EVA
CRI
JEK
A31
81B
AST
AJI
MR
EŽN
ICA
4198
ERD
ELJ
TRN
AV
A32
80TR
NA
VA
BIJ
ELA
3171
BA
DLJ
EVIN
AK
UP Č
INA
4063
STR
MA
CTR
NA
VA
3281
SLA
NO
VEC
1ŠU
MET
LIC
A31
40G
OR
NJA
ŠU
MET
LIC
AK
UPČ
INA
4166
LAZI
NA
BRA
NA
TR
NA
VA
3310
GR
AN
E ŠIN
A 1
BR
ZAJA
3266
ZVEČ
EVO
KU
PIC
A41
61IZ
VO
RV
IDO
VEC
3326
SLA
NO
VEC
1O
RLJA
VA
3162
POŽE
GA
KU
PIC
A40
05B
RO
D N
A K
UPI
RIJ
EKA
3385
SESV
ETE
OR
LJA
VA
3173
PLET
ERN
ICA
STA
RČ
A41
17O
BR
EŽŠT
EFA
NO
VEC
3312
DU
BR
AV
ALO
NJA
3083
PLET
ERN
ICA
LOM
NIC
A42
02O
BR
EŽ S
TEPE
NIC
AV
UG
RO
V P
OTO
K32
34SE
SVET
EPA
KR
A32
95M
AN
AST
IRO
DR
A40
09D
ON
JA P
OLJ
AN
AČ
RN
OM
EREC
3354
MIK
ULIĆ
IPA
KRA
3393
JAN
JA L
IPA
KO
SNIC
A41
33JA
GO
DN
O II
KR
API
NA
3387
BR
AČ
AK
ORL
JAV
A33
97FR
KLJ
EVC
IJE
ZER
O
4135
NO
VO
ČIČ
EK
RA
PINČ
ICA
3369
KR
API
NA
PAK
RA
3000
KU
SON
JEB
UN
A41
44B
UŠE
VEC
IIK
RA
PINČ
ICA
3175
ZAB
OK
BIĐ
3018
CERN
AO
DRA
4159
LEK
ENIK
KR
API
NA
3330
ZLA
TAR
BIS
TRIC
AB
IĐ33
52V
RPO
LJE
CH
AN
NEL
4160
VEL
E ŠEV
AC
KR
API
NA
3054
KU
PLJE
NO
VO
LATE
RA
L C
AN
AL
3342
TOPO
LJE
KO
RAN
A40
59SL
UN
J UPS
TREA
MS
VEL
IKA
HO
RVA
TSK
A32
40G
UB
AŠE
VO
1LA
TER
AL
CA
NA
L33
44G
ARČ
INSL
UN
JČIC
A41
72R
AST
OK
ESU
TLA
3391
BR
ATK
OV
ECB
OSU
T33
45ST
ARA
BRA
NA
KO
RAN
A41
03V
ELJU
NSU
TLA
3127
ZELE
NJA
KB
OSU
T33
46V
INK
OV
CIK
ORA
NA
4073
VEL
EMER
I ĆV
UČ
ELN
ICA
3274
HRU
ŠEV
ECB
REZ
NIC
A
3350
DR
AG
OTI
NK
OR
AN
A40
26K
ARL
OV
AC
PUŠĆ
A32
76PU
ŠĆA
DO
NJA
KA
LUĐ
ER33
56PR
KO
VC
IR
AD
ON
JA40
92TU
ŠILO
VIĆ
BIS
TRA
3221
DO
NJA
BIS
TRA
BIĐ
3357
KLA
DA
VA
CG
LIN
A41
74ŠI
RO
KA
RIJ
EKA
DED
INA
3279
JAK
OV
LJE
KA
ZNIC
A33
58Đ
AK
OV
AČ
KA
SEL
NIC
AG
LIN
A40
94V
RAN
OV
INA
POLJ
AN
ICA
3278
POLJ
AN
ICA
JOŠA
VA
3362
SOLJ
AK
GLI
NA
4013
GLI
NA
RAV
NIN
ŠČIC
A33
65Đ
UR
MA
NEC
SPAČ
VA
3363
OTO
KTR
EPČ
A40
79G
VO
ZDTO
PLIC
A33
75ST
UB
I ČK
E TO
PLIC
ESA
VA
3332
HE
POD
SUSE
DTR
EPČ
A41
55TR
EPČ
A T
RAV
ERZA
REK
A33
77LO
BO
RSU
TLA
3336
KLJ
UČ
BIJ
ELA
RIJ
EKA
415
PLIT
VIČ
KI L
JESK
OV
AC
LIPO
VAČ
KA
GRA
DN
A30
37 H
AM
OR
KRA
PIN
A33
37ZA
PREŠ
IĆC
RN
A R
IJEK
A41
51PL
ITV
IČK
I LJE
SKO
VA
CRU
DA
RSK
A G
RAD
NA
32
25RU
DA
RSK
A D
RAG
ASA
VA
3334
TIŠI
NA
MA
TIC
A41
31PR
OŠĆ
EG
RAD
NA
3194
SAM
OB
OR
SAV
A33
35ST
REL
E ČK
OPR
OŠĆ
E JE
ZER
O41
49PL
ITV
ICE
BR
EGA
NA
3254
KO
RET
I ĆI
SAV
A33
33H
E D
REN
JEPL
ITV
ICA
4125
LUK
ETIĆ
IB
REG
AN
A30
12B
RA
GA
NA
REM
ON
TK
UPA
40
29K
UPA
RI
KO
RA
NA
4105
BR
EGA
NIC
A32
52 S
VIN
JARIĆ
IK
UPA
40
16H
RVA
TSK
OK
AŠI
NA
3201
GO
RN
JA K
AŠI
NA
GER
OVČ
ICA
4179
SMR
EČJE
STE
PEN
ICA
KA
ŠIN
A32
05PO
POV
ECČ
ABR
AN
KA
4082
ZAM
OST
II
Tab
le-B
.2.1
E
xist
ing
Mon
itori
ng S
tatio
ns o
f Riv
er F
low
Rat
e
B-T1
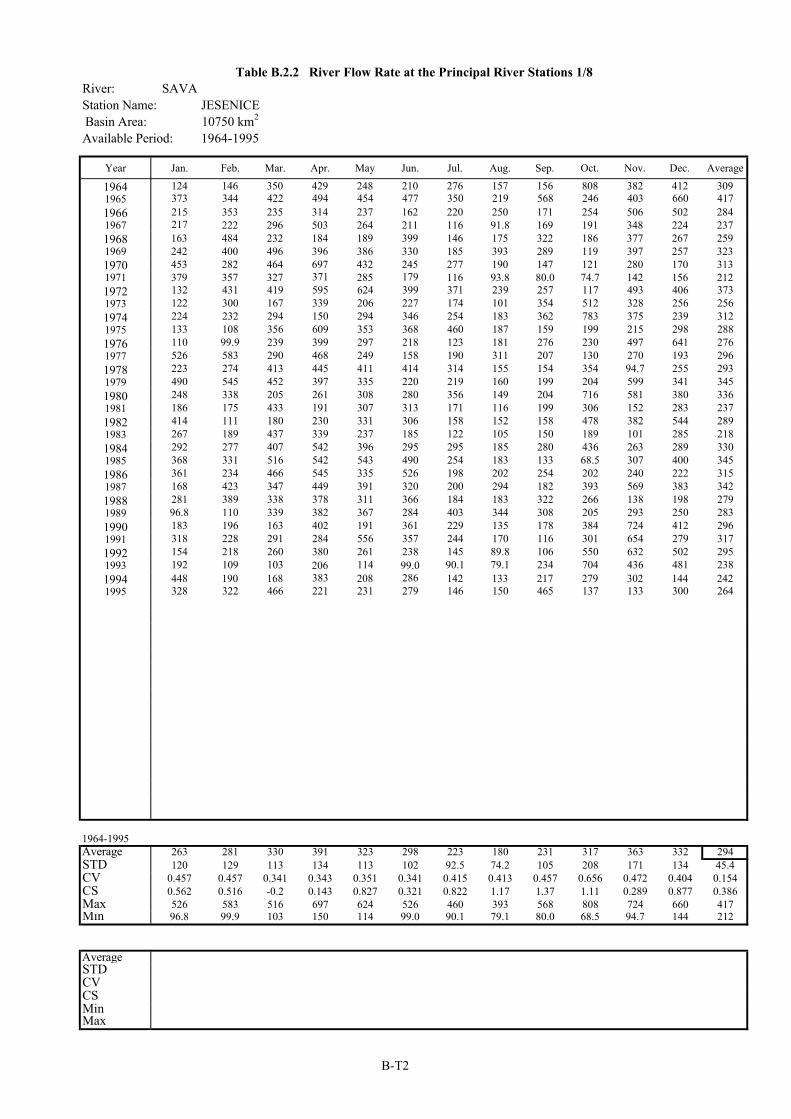
River: SAVAStation Name: JESENICEBasin Area: 10750 km2
Available Period: 1964-1995
Year Jan. Feb. Mar. Apr. May Jun. Jul. Aug. Sep. Oct. Nov. Dec. Average
1964 124 146 350 429 248 210 276 157 156 808 382 412 3091965 373 344 422 494 454 477 350 219 568 246 403 660 4171966 215 353 235 314 237 162 220 250 171 254 506 502 2841967 217 222 296 503 264 211 116 91.8 169 191 348 224 2371968 163 484 232 184 189 399 146 175 322 186 377 267 2591969 242 400 496 396 386 330 185 393 289 119 397 257 3231970 453 282 464 697 432 245 277 190 147 121 280 170 3131971 379 357 327 371 285 179 116 93.8 80.0 74.7 142 156 2121972 132 431 419 595 624 399 371 239 257 117 493 406 3731973 122 300 167 339 206 227 174 101 354 512 328 256 2561974 224 232 294 150 294 346 254 183 362 783 375 239 3121975 133 108 356 609 353 368 460 187 159 199 215 298 2881976 110 99.9 239 399 297 218 123 181 276 230 497 641 2761977 526 583 290 468 249 158 190 311 207 130 270 193 2961978 223 274 413 445 411 414 314 155 154 354 94.7 255 2931979 490 545 452 397 335 220 219 160 199 204 599 341 3451980 248 338 205 261 308 280 356 149 204 716 581 380 3361981 186 175 433 191 307 313 171 116 199 306 152 283 2371982 414 111 180 230 331 306 158 152 158 478 382 544 2891983 267 189 437 339 237 185 122 105 150 189 101 285 2181984 292 277 407 542 396 295 295 185 280 436 263 289 3301985 368 331 516 542 543 490 254 183 133 68.5 307 400 3451986 361 234 466 545 335 526 198 202 254 202 240 222 3151987 168 423 347 449 391 320 200 294 182 393 569 383 3421988 281 389 338 378 311 366 184 183 322 266 138 198 2791989 96.8 110 339 382 367 284 403 344 308 205 293 250 2831990 183 196 163 402 191 361 229 135 178 384 724 412 2961991 318 228 291 284 556 357 244 170 116 301 654 279 3171992 154 218 260 380 261 238 145 89.8 106 550 632 502 2951993 192 109 103 206 114 99.0 90.1 79.1 234 704 436 481 2381994 448 190 168 383 208 286 142 133 217 279 302 144 2421995 328 322 466 221 231 279 146 150 465 137 133 300 264
1964-1995Average 263 281 330 391 323 298 223 180 231 317 363 332 294STD 120 129 113 134 113 102 92.5 74.2 105 208 171 134 45.4CV 0.457 0.457 0.341 0.343 0.351 0.341 0.415 0.413 0.457 0.656 0.472 0.404 0.154CS 0.562 0.516 -0.2 0.143 0.827 0.321 0.822 1.17 1.37 1.11 0.289 0.877 0.386Max 526 583 516 697 624 526 460 393 568 808 724 660 417Min 96.8 99.9 103 150 114 99.0 90.1 79.1 80.0 68.5 94.7 144 212
AverageSTDCVCSMinMax
Table B.2.2 River Flow Rate at the Principal River Stations 1/8
B-T2
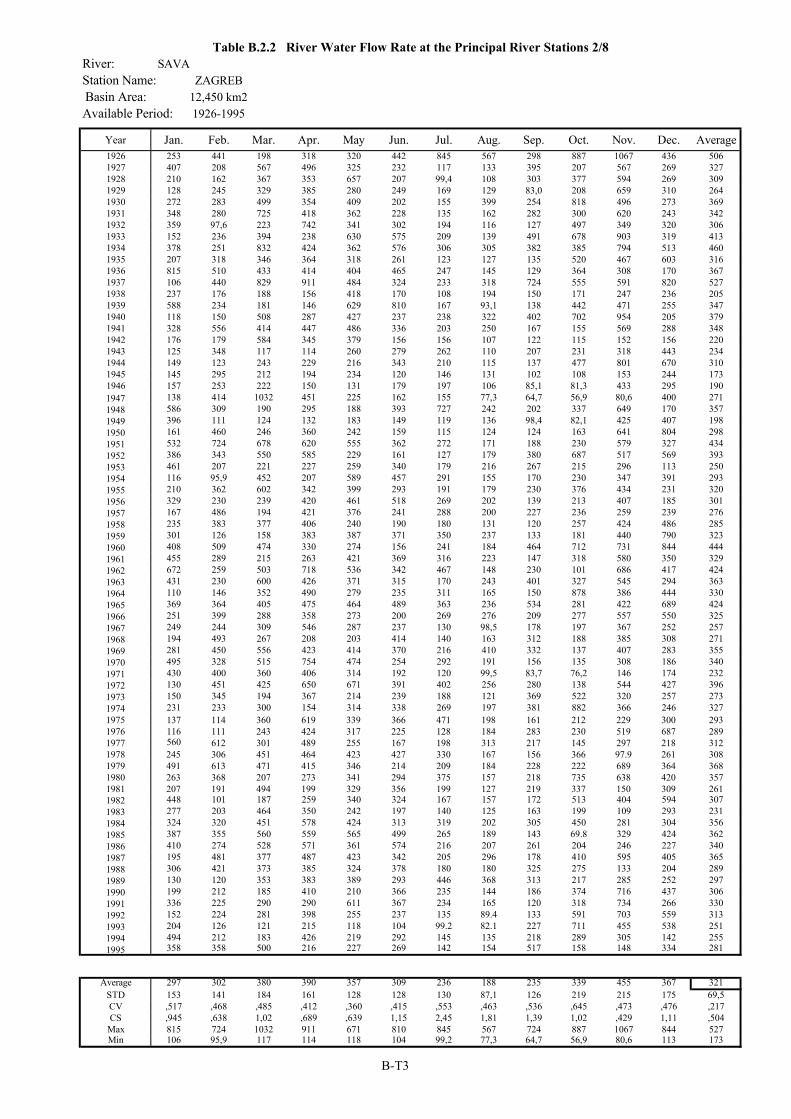
River: SAVAStation Name: ZAGREBBasin Area: 12,450 km2Available Period: 1926-1995
Year Jan. Feb. Mar. Apr. May Jun. Jul. Aug. Sep. Oct. Nov. Dec. Average1926 253 441 198 318 320 442 845 567 298 887 1067 436 5061927 407 208 567 496 325 232 117 133 395 207 567 269 3271928 210 162 367 353 657 207 99,4 108 303 377 594 269 3091929 128 245 329 385 280 249 169 129 83,0 208 659 310 2641930 272 283 499 354 409 202 155 399 254 818 496 273 3691931 348 280 725 418 362 228 135 162 282 300 620 243 3421932 359 97,6 223 742 341 302 194 116 127 497 349 320 3061933 152 236 394 238 630 575 209 139 491 678 903 319 4131934 378 251 832 424 362 576 306 305 382 385 794 513 4601935 207 318 346 364 318 261 123 127 135 520 467 603 3161936 815 510 433 414 404 465 247 145 129 364 308 170 3671937 106 440 829 911 484 324 233 318 724 555 591 820 5271938 237 176 188 156 418 170 108 194 150 171 247 236 2051939 588 234 181 146 629 810 167 93,1 138 442 471 255 3471940 118 150 508 287 427 237 238 322 402 702 954 205 3791941 328 556 414 447 486 336 203 250 167 155 569 288 3481942 176 179 584 345 379 156 156 107 122 115 152 156 2201943 125 348 117 114 260 279 262 110 207 231 318 443 2341944 149 123 243 229 216 343 210 115 137 477 801 670 3101945 145 295 212 194 234 120 146 131 102 108 153 244 1731946 157 253 222 150 131 179 197 106 85,1 81,3 433 295 1901947 138 414 1032 451 225 162 155 77,3 64,7 56,9 80,6 400 2711948 586 309 190 295 188 393 727 242 202 337 649 170 3571949 396 111 124 132 183 149 119 136 98,4 82,1 425 407 1981950 161 460 246 360 242 159 115 124 124 163 641 804 2981951 532 724 678 620 555 362 272 171 188 230 579 327 4341952 386 343 550 585 229 161 127 179 380 687 517 569 3931953 461 207 221 227 259 340 179 216 267 215 296 113 2501954 116 95,9 452 207 589 457 291 155 170 230 347 391 2931955 210 362 602 342 399 293 191 179 230 376 434 231 3201956 329 230 239 420 461 518 269 202 139 213 407 185 3011957 167 486 194 421 376 241 288 200 227 236 259 239 2761958 235 383 377 406 240 190 180 131 120 257 424 486 2851959 301 126 158 383 387 371 350 237 133 181 440 790 3231960 408 509 474 330 274 156 241 184 464 712 731 844 4441961 455 289 215 263 421 369 316 223 147 318 580 350 3291962 672 259 503 718 536 342 467 148 230 101 686 417 4241963 431 230 600 426 371 315 170 243 401 327 545 294 3631964 110 146 352 490 279 235 311 165 150 878 386 444 3301965 369 364 405 475 464 489 363 236 534 281 422 689 4241966 251 399 288 358 273 200 269 276 209 277 557 550 3251967 249 244 309 546 287 237 130 98,5 178 197 367 252 2571968 194 493 267 208 203 414 140 163 312 188 385 308 2711969 281 450 556 423 414 370 216 410 332 137 407 283 3551970 495 328 515 754 474 254 292 191 156 135 308 186 3401971 430 400 360 406 314 192 120 99,5 83,7 76,2 146 174 2321972 130 451 425 650 671 391 402 256 280 138 544 427 3961973 150 345 194 367 214 239 188 121 369 522 320 257 2731974 231 233 300 154 314 338 269 197 381 882 366 246 3271975 137 114 360 619 339 366 471 198 161 212 229 300 2931976 116 111 243 424 317 225 128 184 283 230 519 687 2891977 560 612 301 489 255 167 198 313 217 145 297 218 3121978 245 306 451 464 423 427 330 167 156 366 97.9 261 3081979 491 613 471 415 346 214 209 184 228 222 689 364 3681980 263 368 207 273 341 294 375 157 218 735 638 420 3571981 207 191 494 199 329 356 199 127 219 337 150 309 2611982 448 101 187 259 340 324 167 157 172 513 404 594 3071983 277 203 464 350 242 197 140 125 163 199 109 293 2311984 324 320 451 578 424 313 319 202 305 450 281 304 3561985 387 355 560 559 565 499 265 189 143 69.8 329 424 3621986 410 274 528 571 361 574 216 207 261 204 246 227 3401987 195 481 377 487 423 342 205 296 178 410 595 405 3651988 306 421 373 385 324 378 180 180 325 275 133 204 2891989 130 120 353 383 389 293 446 368 313 217 285 252 2971990 199 212 185 410 210 366 235 144 186 374 716 437 3061991 336 225 290 290 611 367 234 165 120 318 734 266 3301992 152 224 281 398 255 237 135 89.4 133 591 703 559 3131993 204 126 121 215 118 104 99.2 82.1 227 711 455 538 2511994 494 212 183 426 219 292 145 135 218 289 305 142 2551995 358 358 500 216 227 269 142 154 517 158 148 334 281
Average 297 302 380 390 357 309 236 188 235 339 455 367 321STD 153 141 184 161 128 128 130 87,1 126 219 215 175 69,5CV ,517 ,468 ,485 ,412 ,360 ,415 ,553 ,463 ,536 ,645 ,473 ,476 ,217CS ,945 ,638 1,02 ,689 ,639 1,15 2,45 1,81 1,39 1,02 ,429 1,11 ,504
Max 815 724 1032 911 671 810 845 567 724 887 1067 844 527Min 106 95,9 117 114 118 104 99,2 77,3 64,7 56,9 80,6 113 173
Table B.2.2 River Water Flow Rate at the Principal River Stations 2/8
B-T3
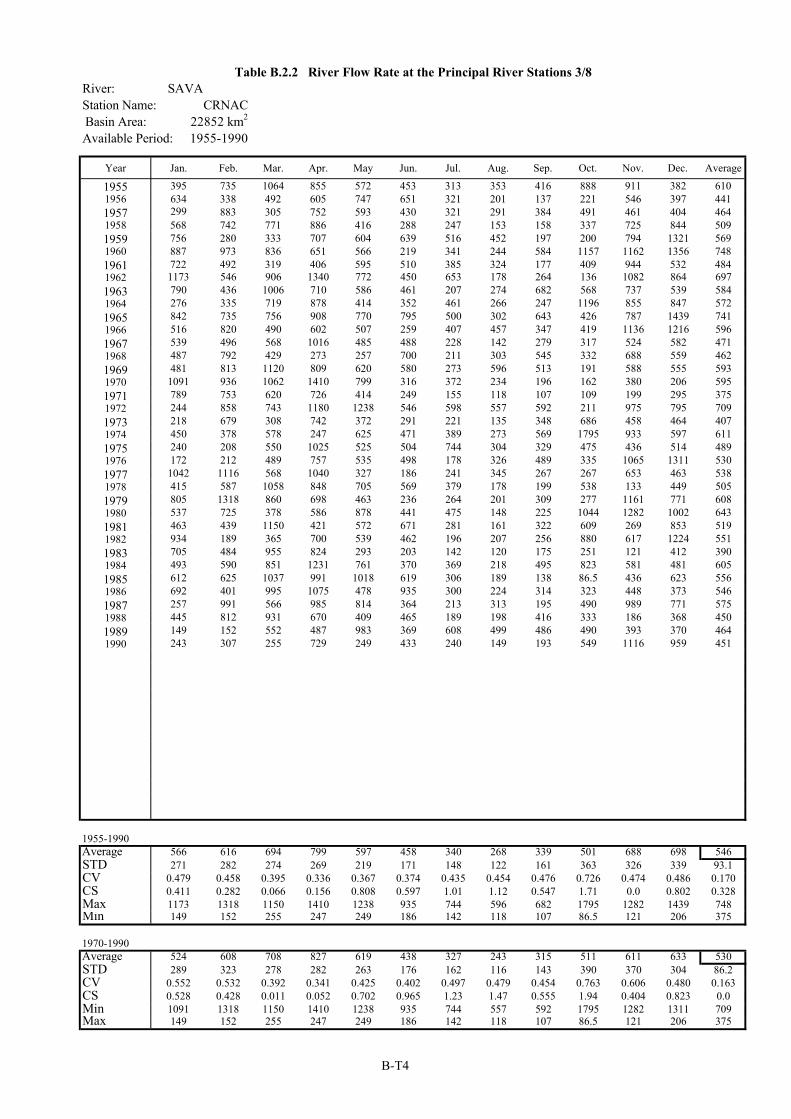
River: SAVAStation Name: CRNACBasin Area: 22852 km2
Available Period: 1955-1990
Year Jan. Feb. Mar. Apr. May Jun. Jul. Aug. Sep. Oct. Nov. Dec. Average
1955 395 735 1064 855 572 453 313 353 416 888 911 382 6101956 634 338 492 605 747 651 321 201 137 221 546 397 4411957 299 883 305 752 593 430 321 291 384 491 461 404 4641958 568 742 771 886 416 288 247 153 158 337 725 844 5091959 756 280 333 707 604 639 516 452 197 200 794 1321 5691960 887 973 836 651 566 219 341 244 584 1157 1162 1356 7481961 722 492 319 406 595 510 385 324 177 409 944 532 4841962 1173 546 906 1340 772 450 653 178 264 136 1082 864 6971963 790 436 1006 710 586 461 207 274 682 568 737 539 5841964 276 335 719 878 414 352 461 266 247 1196 855 847 5721965 842 735 756 908 770 795 500 302 643 426 787 1439 7411966 516 820 490 602 507 259 407 457 347 419 1136 1216 5961967 539 496 568 1016 485 488 228 142 279 317 524 582 4711968 487 792 429 273 257 700 211 303 545 332 688 559 4621969 481 813 1120 809 620 580 273 596 513 191 588 555 5931970 1091 936 1062 1410 799 316 372 234 196 162 380 206 5951971 789 753 620 726 414 249 155 118 107 109 199 295 3751972 244 858 743 1180 1238 546 598 557 592 211 975 795 7091973 218 679 308 742 372 291 221 135 348 686 458 464 4071974 450 378 578 247 625 471 389 273 569 1795 933 597 6111975 240 208 550 1025 525 504 744 304 329 475 436 514 4891976 172 212 489 757 535 498 178 326 489 335 1065 1311 5301977 1042 1116 568 1040 327 186 241 345 267 267 653 463 5381978 415 587 1058 848 705 569 379 178 199 538 133 449 5051979 805 1318 860 698 463 236 264 201 309 277 1161 771 6081980 537 725 378 586 878 441 475 148 225 1044 1282 1002 6431981 463 439 1150 421 572 671 281 161 322 609 269 853 5191982 934 189 365 700 539 462 196 207 256 880 617 1224 5511983 705 484 955 824 293 203 142 120 175 251 121 412 3901984 493 590 851 1231 761 370 369 218 495 823 581 481 6051985 612 625 1037 991 1018 619 306 189 138 86.5 436 623 5561986 692 401 995 1075 478 935 300 224 314 323 448 373 5461987 257 991 566 985 814 364 213 313 195 490 989 771 5751988 445 812 931 670 409 465 189 198 416 333 186 368 4501989 149 152 552 487 983 369 608 499 486 490 393 370 4641990 243 307 255 729 249 433 240 149 193 549 1116 959 451
1955-1990Average 566 616 694 799 597 458 340 268 339 501 688 698 546STD 271 282 274 269 219 171 148 122 161 363 326 339 93.1CV 0.479 0.458 0.395 0.336 0.367 0.374 0.435 0.454 0.476 0.726 0.474 0.486 0.170CS 0.411 0.282 0.066 0.156 0.808 0.597 1.01 1.12 0.547 1.71 0.0 0.802 0.328Max 1173 1318 1150 1410 1238 935 744 596 682 1795 1282 1439 748Min 149 152 255 247 249 186 142 118 107 86.5 121 206 375
1970-1990Average 524 608 708 827 619 438 327 243 315 511 611 633 530STD 289 323 278 282 263 176 162 116 143 390 370 304 86.2CV 0.552 0.532 0.392 0.341 0.425 0.402 0.497 0.479 0.454 0.763 0.606 0.480 0.163CS 0.528 0.428 0.011 0.052 0.702 0.965 1.23 1.47 0.555 1.94 0.404 0.823 0.0Min 1091 1318 1150 1410 1238 935 744 557 592 1795 1282 1311 709Max 149 152 255 247 249 186 142 118 107 86.5 121 206 375
Table B.2.2 River Flow Rate at the Principal River Stations 3/8
B-T4
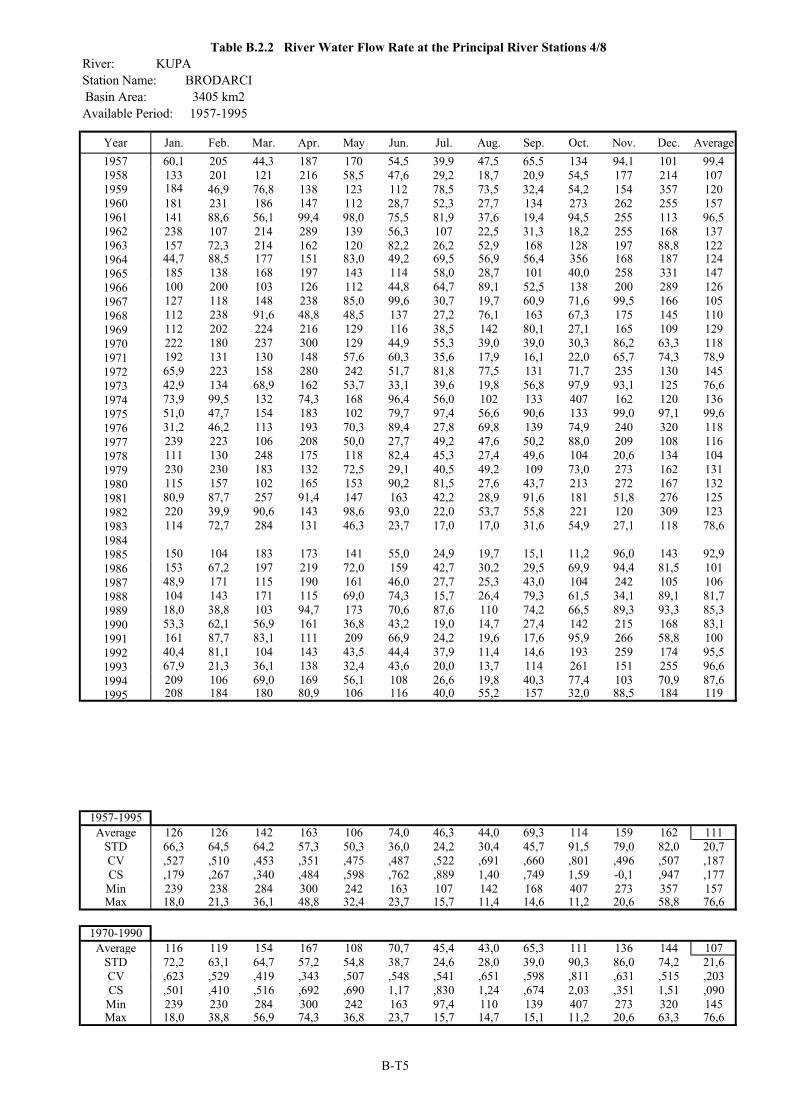
River: KUPAStation Name: BRODARCIBasin Area: 3405 km2Available Period: 1957-1995
Year Jan. Feb. Mar. Apr. May Jun. Jul. Aug. Sep. Oct. Nov. Dec. Average1957 60,1 205 44,3 187 170 54,5 39,9 47,5 65,5 134 94,1 101 99,41958 133 201 121 216 58,5 47,6 29,2 18,7 20,9 54,5 177 214 1071959 184 46,9 76,8 138 123 112 78,5 73,5 32,4 54,2 154 357 1201960 181 231 186 147 112 28,7 52,3 27,7 134 273 262 255 1571961 141 88,6 56,1 99,4 98,0 75,5 81,9 37,6 19,4 94,5 255 113 96,51962 238 107 214 289 139 56,3 107 22,5 31,3 18,2 255 168 1371963 157 72,3 214 162 120 82,2 26,2 52,9 168 128 197 88,8 1221964 44,7 88,5 177 151 83,0 49,2 69,5 56,9 56,4 356 168 187 1241965 185 138 168 197 143 114 58,0 28,7 101 40,0 258 331 1471966 100 200 103 126 112 44,8 64,7 89,1 52,5 138 200 289 1261967 127 118 148 238 85,0 99,6 30,7 19,7 60,9 71,6 99,5 166 1051968 112 238 91,6 48,8 48,5 137 27,2 76,1 163 67,3 175 145 1101969 112 202 224 216 129 116 38,5 142 80,1 27,1 165 109 1291970 222 180 237 300 129 44,9 55,3 39,0 39,0 30,3 86,2 63,3 1181971 192 131 130 148 57,6 60,3 35,6 17,9 16,1 22,0 65,7 74,3 78,91972 65,9 223 158 280 242 51,7 81,8 77,5 131 71,7 235 130 1451973 42,9 134 68,9 162 53,7 33,1 39,6 19,8 56,8 97,9 93,1 125 76,61974 73,9 99,5 132 74,3 168 96,4 56,0 102 133 407 162 120 1361975 51,0 47,7 154 183 102 79,7 97,4 56,6 90,6 133 99,0 97,1 99,61976 31,2 46,2 113 193 70,3 89,4 27,8 69,8 139 74,9 240 320 1181977 239 223 106 208 50,0 27,7 49,2 47,6 50,2 88,0 209 108 1161978 111 130 248 175 118 82,4 45,3 27,4 49,6 104 20,6 134 1041979 230 230 183 132 72,5 29,1 40,5 49,2 109 73,0 273 162 1311980 115 157 102 165 153 90,2 81,5 27,6 43,7 213 272 167 1321981 80,9 87,7 257 91,4 147 163 42,2 28,9 91,6 181 51,8 276 1251982 220 39,9 90,6 143 98,6 93,0 22,0 53,7 55,8 221 120 309 1231983 114 72,7 284 131 46,3 23,7 17,0 17,0 31,6 54,9 27,1 118 78,619841985 150 104 183 173 141 55,0 24,9 19,7 15,1 11,2 96,0 143 92,91986 153 67,2 197 219 72,0 159 42,7 30,2 29,5 69,9 94,4 81,5 1011987 48,9 171 115 190 161 46,0 27,7 25,3 43,0 104 242 105 1061988 104 143 171 115 69,0 74,3 15,7 26,4 79,3 61,5 34,1 89,1 81,71989 18,0 38,8 103 94,7 173 70,6 87,6 110 74,2 66,5 89,3 93,3 85,31990 53,3 62,1 56,9 161 36,8 43,2 19,0 14,7 27,4 142 215 168 83,11991 161 87,7 83,1 111 209 66,9 24,2 19,6 17,6 95,9 266 58,8 1001992 40,4 81,1 104 143 43,5 44,4 37,9 11,4 14,6 193 259 174 95,51993 67,9 21,3 36,1 138 32,4 43,6 20,0 13,7 114 261 151 255 96,61994 209 106 69,0 169 56,1 108 26,6 19,8 40,3 77,4 103 70,9 87,61995 208 184 180 80,9 106 116 40,0 55,2 157 32,0 88,5 184 119
1957-1995Average 126 126 142 163 106 74,0 46,3 44,0 69,3 114 159 162 111
STD 66,3 64,5 64,2 57,3 50,3 36,0 24,2 30,4 45,7 91,5 79,0 82,0 20,7CV ,527 ,510 ,453 ,351 ,475 ,487 ,522 ,691 ,660 ,801 ,496 ,507 ,187CS ,179 ,267 ,340 ,484 ,598 ,762 ,889 1,40 ,749 1,59 -0,1 ,947 ,177Min 239 238 284 300 242 163 107 142 168 407 273 357 157Max 18,0 21,3 36,1 48,8 32,4 23,7 15,7 11,4 14,6 11,2 20,6 58,8 76,6
1970-1990Average 116 119 154 167 108 70,7 45,4 43,0 65,3 111 136 144 107
STD 72,2 63,1 64,7 57,2 54,8 38,7 24,6 28,0 39,0 90,3 86,0 74,2 21,6CV ,623 ,529 ,419 ,343 ,507 ,548 ,541 ,651 ,598 ,811 ,631 ,515 ,203CS ,501 ,410 ,516 ,692 ,690 1,17 ,830 1,24 ,674 2,03 ,351 1,51 ,090Min 239 230 284 300 242 163 97,4 110 139 407 273 320 145Max 18,0 38,8 56,9 74,3 36,8 23,7 15,7 14,7 15,1 11,2 20,6 63,3 76,6
Table B.2.2 River Water Flow Rate at the Principal River Stations 4/8
B-T5
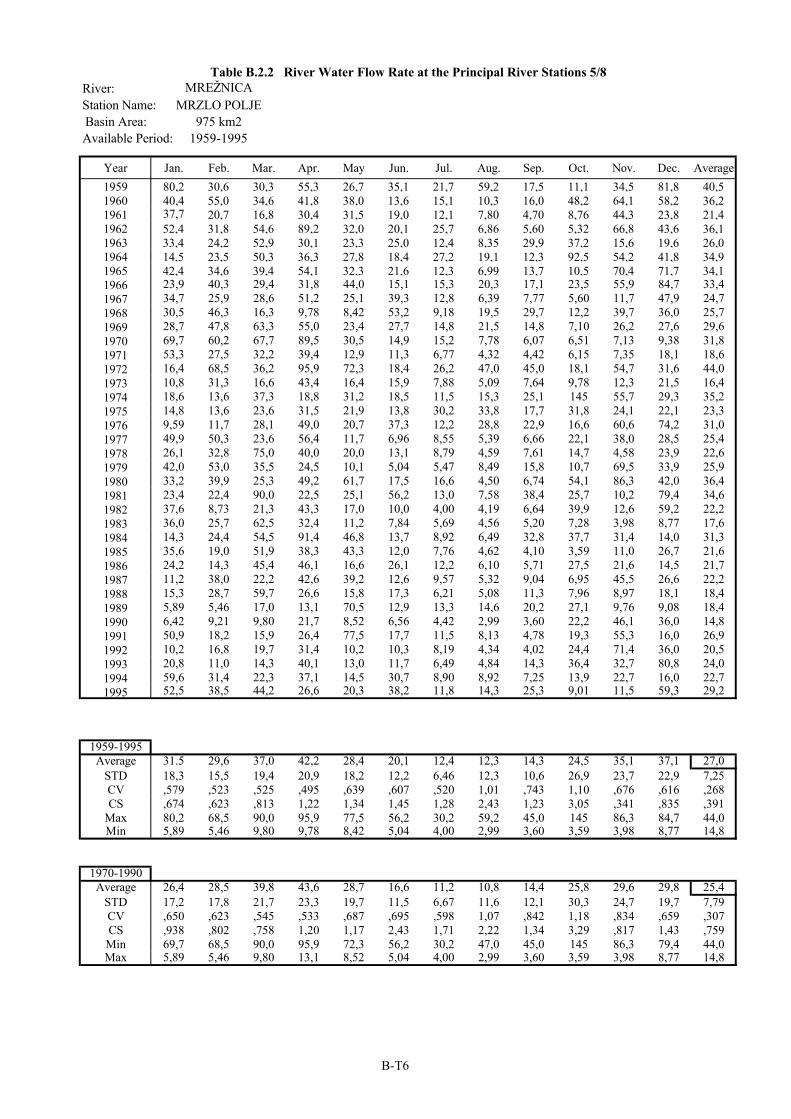
River:Station Name: MRZLO POLJEBasin Area: 975 km2Available Period: 1959-1995
Year Jan. Feb. Mar. Apr. May Jun. Jul. Aug. Sep. Oct. Nov. Dec. Average1959 80,2 30,6 30,3 55,3 26,7 35,1 21,7 59,2 17,5 11,1 34,5 81,8 40,51960 40,4 55,0 34,6 41,8 38,0 13,6 15,1 10,3 16,0 48,2 64,1 58,2 36,21961 37,7 20,7 16,8 30,4 31,5 19,0 12,1 7,80 4,70 8,76 44,3 23,8 21,41962 52,4 31,8 54,6 89,2 32,0 20,1 25,7 6,86 5,60 5,32 66,8 43,6 36,11963 33,4 24,2 52,9 30,1 23,3 25,0 12,4 8,35 29,9 37,2 15,6 19,6 26,01964 14,5 23,5 50,3 36,3 27,8 18,4 27,2 19,1 12,3 92,5 54,2 41,8 34,91965 42,4 34,6 39,4 54,1 32,3 21,6 12,3 6,99 13,7 10,5 70,4 71,7 34,11966 23,9 40,3 29,4 31,8 44,0 15,1 15,3 20,3 17,1 23,5 55,9 84,7 33,41967 34,7 25,9 28,6 51,2 25,1 39,3 12,8 6,39 7,77 5,60 11,7 47,9 24,71968 30,5 46,3 16,3 9,78 8,42 53,2 9,18 19,5 29,7 12,2 39,7 36,0 25,71969 28,7 47,8 63,3 55,0 23,4 27,7 14,8 21,5 14,8 7,10 26,2 27,6 29,61970 69,7 60,2 67,7 89,5 30,5 14,9 15,2 7,78 6,07 6,51 7,13 9,38 31,81971 53,3 27,5 32,2 39,4 12,9 11,3 6,77 4,32 4,42 6,15 7,35 18,1 18,61972 16,4 68,5 36,2 95,9 72,3 18,4 26,2 47,0 45,0 18,1 54,7 31,6 44,01973 10,8 31,3 16,6 43,4 16,4 15,9 7,88 5,09 7,64 9,78 12,3 21,5 16,41974 18,6 13,6 37,3 18,8 31,2 18,5 11,5 15,3 25,1 145 55,7 29,3 35,21975 14,8 13,6 23,6 31,5 21,9 13,8 30,2 33,8 17,7 31,8 24,1 22,1 23,31976 9,59 11,7 28,1 49,0 20,7 37,3 12,2 28,8 22,9 16,6 60,6 74,2 31,01977 49,9 50,3 23,6 56,4 11,7 6,96 8,55 5,39 6,66 22,1 38,0 28,5 25,41978 26,1 32,8 75,0 40,0 20,0 13,1 8,79 4,59 7,61 14,7 4,58 23,9 22,61979 42,0 53,0 35,5 24,5 10,1 5,04 5,47 8,49 15,8 10,7 69,5 33,9 25,91980 33,2 39,9 25,3 49,2 61,7 17,5 16,6 4,50 6,74 54,1 86,3 42,0 36,41981 23,4 22,4 90,0 22,5 25,1 56,2 13,0 7,58 38,4 25,7 10,2 79,4 34,61982 37,6 8,73 21,3 43,3 17,0 10,0 4,00 4,19 6,64 39,9 12,6 59,2 22,21983 36,0 25,7 62,5 32,4 11,2 7,84 5,69 4,56 5,20 7,28 3,98 8,77 17,61984 14,3 24,4 54,5 91,4 46,8 13,7 8,92 6,49 32,8 37,7 31,4 14,0 31,31985 35,6 19,0 51,9 38,3 43,3 12,0 7,76 4,62 4,10 3,59 11,0 26,7 21,61986 24,2 14,3 45,4 46,1 16,6 26,1 12,2 6,10 5,71 27,5 21,6 14,5 21,71987 11,2 38,0 22,2 42,6 39,2 12,6 9,57 5,32 9,04 6,95 45,5 26,6 22,21988 15,3 28,7 59,7 26,6 15,8 17,3 6,21 5,08 11,3 7,96 8,97 18,1 18,41989 5,89 5,46 17,0 13,1 70,5 12,9 13,3 14,6 20,2 27,1 9,76 9,08 18,41990 6,42 9,21 9,80 21,7 8,52 6,56 4,42 2,99 3,60 22,2 46,1 36,0 14,81991 50,9 18,2 15,9 26,4 77,5 17,7 11,5 8,13 4,78 19,3 55,3 16,0 26,91992 10,2 16,8 19,7 31,4 10,2 10,3 8,19 4,34 4,02 24,4 71,4 36,0 20,51993 20,8 11,0 14,3 40,1 13,0 11,7 6,49 4,84 14,3 36,4 32,7 80,8 24,01994 59,6 31,4 22,3 37,1 14,5 30,7 8,90 8,92 7,25 13,9 22,7 16,0 22,71995 52,5 38,5 44,2 26,6 20,3 38,2 11,8 14,3 25,3 9,01 11,5 59,3 29,2
1959-1995Average 31.5 29,6 37,0 42,2 28,4 20,1 12,4 12,3 14,3 24,5 35,1 37,1 27,0
STD 18,3 15,5 19,4 20,9 18,2 12,2 6,46 12,3 10,6 26,9 23,7 22,9 7,25CV ,579 ,523 ,525 ,495 ,639 ,607 ,520 1,01 ,743 1,10 ,676 ,616 ,268CS ,674 ,623 ,813 1,22 1,34 1,45 1,28 2,43 1,23 3,05 ,341 ,835 ,391
Max 80,2 68,5 90,0 95,9 77,5 56,2 30,2 59,2 45,0 145 86,3 84,7 44,0Min 5,89 5,46 9,80 9,78 8,42 5,04 4,00 2,99 3,60 3,59 3,98 8,77 14,8
1970-1990Average 26,4 28,5 39,8 43,6 28,7 16,6 11,2 10,8 14,4 25,8 29,6 29,8 25,4
STD 17,2 17,8 21,7 23,3 19,7 11,5 6,67 11,6 12,1 30,3 24,7 19,7 7,79CV ,650 ,623 ,545 ,533 ,687 ,695 ,598 1,07 ,842 1,18 ,834 ,659 ,307CS ,938 ,802 ,758 1,20 1,17 2,43 1,71 2,22 1,34 3,29 ,817 1,43 ,759Min 69,7 68,5 90,0 95,9 72,3 56,2 30,2 47,0 45,0 145 86,3 79,4 44,0Max 5,89 5,46 9,80 13,1 8,52 5,04 4,00 2,99 3,60 3,59 3,98 8,77 14,8
Table B.2.2 River Water Flow Rate at the Principal River Stations 5/8MREŽNICA
B-T6
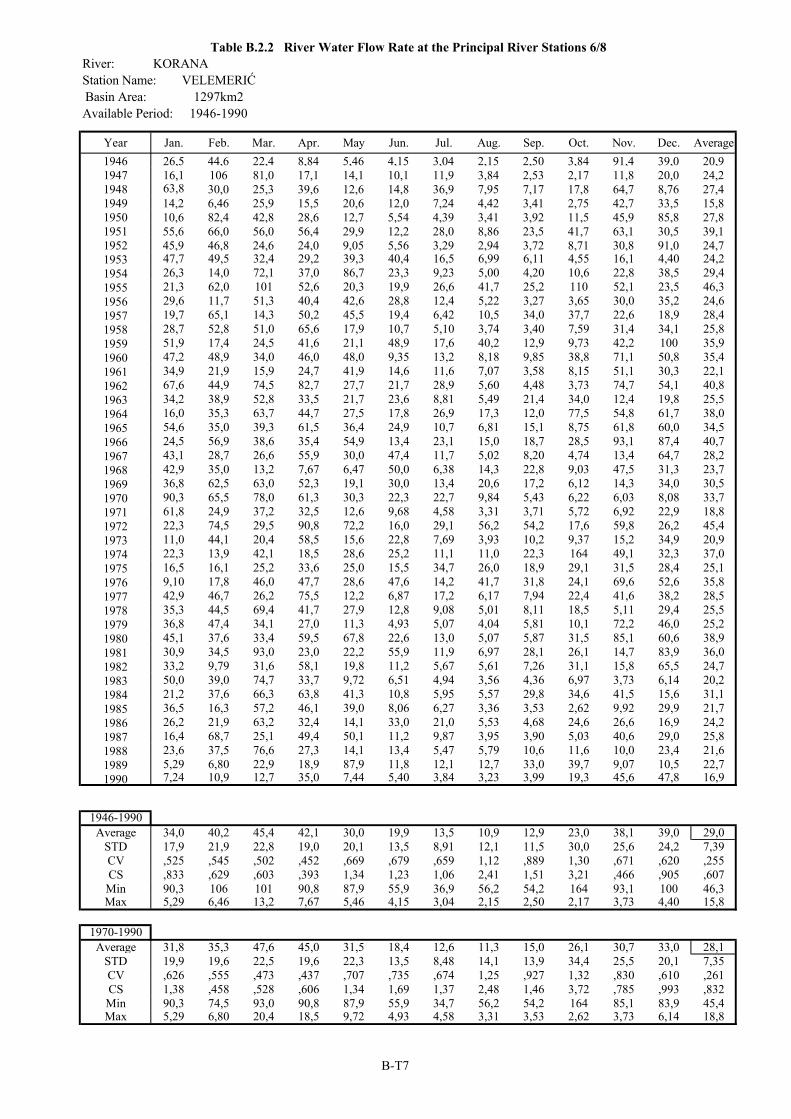
River: KORANAStation Name: VELEMERIĆBasin Area: 1297km2Available Period: 1946-1990
Year Jan. Feb. Mar. Apr. May Jun. Jul. Aug. Sep. Oct. Nov. Dec. Average1946 26,5 44,6 22,4 8,84 5,46 4,15 3,04 2,15 2,50 3,84 91,4 39,0 20,91947 16,1 106 81,0 17,1 14,1 10,1 11,9 3,84 2,53 2,17 11,8 20,0 24,21948 63,8 30,0 25,3 39,6 12,6 14,8 36,9 7,95 7,17 17,8 64,7 8,76 27,41949 14,2 6,46 25,9 15,5 20,6 12,0 7,24 4,42 3,41 2,75 42,7 33,5 15,81950 10,6 82,4 42,8 28,6 12,7 5,54 4,39 3,41 3,92 11,5 45,9 85,8 27,81951 55,6 66,0 56,0 56,4 29,9 12,2 28,0 8,86 23,5 41,7 63,1 30,5 39,11952 45,9 46,8 24,6 24,0 9,05 5,56 3,29 2,94 3,72 8,71 30,8 91,0 24,71953 47,7 49,5 32,4 29,2 39,3 40,4 16,5 6,99 6,11 4,55 16,1 4,40 24,21954 26,3 14,0 72,1 37,0 86,7 23,3 9,23 5,00 4,20 10,6 22,8 38,5 29,41955 21,3 62,0 101 52,6 20,3 19,9 26,6 41,7 25,2 110 52,1 23,5 46,31956 29,6 11,7 51,3 40,4 42,6 28,8 12,4 5,22 3,27 3,65 30,0 35,2 24,61957 19,7 65,1 14,3 50,2 45,5 19,4 6,42 10,5 34,0 37,7 22,6 18,9 28,41958 28,7 52,8 51,0 65,6 17,9 10,7 5,10 3,74 3,40 7,59 31,4 34,1 25,81959 51,9 17,4 24,5 41,6 21,1 48,9 17,6 40,2 12,9 9,73 42,2 100 35,91960 47,2 48,9 34,0 46,0 48,0 9,35 13,2 8,18 9,85 38,8 71,1 50,8 35,41961 34,9 21,9 15,9 24,7 41,9 14,6 11,6 7,07 3,58 8,15 51,1 30,3 22,11962 67,6 44,9 74,5 82,7 27,7 21,7 28,9 5,60 4,48 3,73 74,7 54,1 40,81963 34,2 38,9 52,8 33,5 21,7 23,6 8,81 5,49 21,4 34,0 12,4 19,8 25,51964 16,0 35,3 63,7 44,7 27,5 17,8 26,9 17,3 12,0 77,5 54,8 61,7 38,01965 54,6 35,0 39,3 61,5 36,4 24,9 10,7 6,81 15,1 8,75 61,8 60,0 34,51966 24,5 56,9 38,6 35,4 54,9 13,4 23,1 15,0 18,7 28,5 93,1 87,4 40,71967 43,1 28,7 26,6 55,9 30,0 47,4 11,7 5,02 8,20 4,74 13,4 64,7 28,21968 42,9 35,0 13,2 7,67 6,47 50,0 6,38 14,3 22,8 9,03 47,5 31,3 23,71969 36,8 62,5 63,0 52,3 19,1 30,0 13,4 20,6 17,2 6,12 14,3 34,0 30,51970 90,3 65,5 78,0 61,3 30,3 22,3 22,7 9,84 5,43 6,22 6,03 8,08 33,71971 61,8 24,9 37,2 32,5 12,6 9,68 4,58 3,31 3,71 5,72 6,92 22,9 18,81972 22,3 74,5 29,5 90,8 72,2 16,0 29,1 56,2 54,2 17,6 59,8 26,2 45,41973 11,0 44,1 20,4 58,5 15,6 22,8 7,69 3,93 10,2 9,37 15,2 34,9 20,91974 22,3 13,9 42,1 18,5 28,6 25,2 11,1 11,0 22,3 164 49,1 32,3 37,01975 16,5 16,1 25,2 33,6 25,0 15,5 34,7 26,0 18,9 29,1 31,5 28,4 25,11976 9,10 17,8 46,0 47,7 28,6 47,6 14,2 41,7 31,8 24,1 69,6 52,6 35,81977 42,9 46,7 26,2 75,5 12,2 6,87 17,2 6,17 7,94 22,4 41,6 38,2 28,51978 35,3 44,5 69,4 41,7 27,9 12,8 9,08 5,01 8,11 18,5 5,11 29,4 25,51979 36,8 47,4 34,1 27,0 11,3 4,93 5,07 4,04 5,81 10,1 72,2 46,0 25,21980 45,1 37,6 33,4 59,5 67,8 22,6 13,0 5,07 5,87 31,5 85,1 60,6 38,91981 30,9 34,5 93,0 23,0 22,2 55,9 11,9 6,97 28,1 26,1 14,7 83,9 36,01982 33,2 9,79 31,6 58,1 19,8 11,2 5,67 5,61 7,26 31,1 15,8 65,5 24,71983 50,0 39,0 74,7 33,7 9,72 6,51 4,94 3,56 4,36 6,97 3,73 6,14 20,21984 21,2 37,6 66,3 63,8 41,3 10,8 5,95 5,57 29,8 34,6 41,5 15,6 31,11985 36,5 16,3 57,2 46,1 39,0 8,06 6,27 3,36 3,53 2,62 9,92 29,9 21,71986 26,2 21,9 63,2 32,4 14,1 33,0 21,0 5,53 4,68 24,6 26,6 16,9 24,21987 16,4 68,7 25,1 49,4 50,1 11,2 9,87 3,95 3,90 5,03 40,6 29,0 25,81988 23,6 37,5 76,6 27,3 14,1 13,4 5,47 5,79 10,6 11,6 10,0 23,4 21,61989 5,29 6,80 22,9 18,9 87,9 11,8 12,1 12,7 33,0 39,7 9,07 10,5 22,71990 7,24 10,9 12,7 35,0 7,44 5,40 3,84 3,23 3,99 19,3 45,6 47,8 16,9
1946-1990Average 34,0 40,2 45,4 42,1 30,0 19,9 13,5 10,9 12,9 23,0 38,1 39,0 29,0
STD 17,9 21,9 22,8 19,0 20,1 13,5 8,91 12,1 11,5 30,0 25,6 24,2 7,39CV ,525 ,545 ,502 ,452 ,669 ,679 ,659 1,12 ,889 1,30 ,671 ,620 ,255CS ,833 ,629 ,603 ,393 1,34 1,23 1,06 2,41 1,51 3,21 ,466 ,905 ,607Min 90,3 106 101 90,8 87,9 55,9 36,9 56,2 54,2 164 93,1 100 46,3Max 5,29 6,46 13,2 7,67 5,46 4,15 3,04 2,15 2,50 2,17 3,73 4,40 15,8
1970-1990Average 31,8 35,3 47,6 45,0 31,5 18,4 12,6 11,3 15,0 26,1 30,7 33,0 28,1
STD 19,9 19,6 22,5 19,6 22,3 13,5 8,48 14,1 13,9 34,4 25,5 20,1 7,35CV ,626 ,555 ,473 ,437 ,707 ,735 ,674 1,25 ,927 1,32 ,830 ,610 ,261CS 1,38 ,458 ,528 ,606 1,34 1,69 1,37 2,48 1,46 3,72 ,785 ,993 ,832Min 90,3 74,5 93,0 90,8 87,9 55,9 34,7 56,2 54,2 164 85,1 83,9 45,4Max 5,29 6,80 20,4 18,5 9,72 4,93 4,58 3,31 3,53 2,62 3,73 6,14 18,8
Table B.2.2 River Water Flow Rate at the Principal River Stations 6/8
B-T7
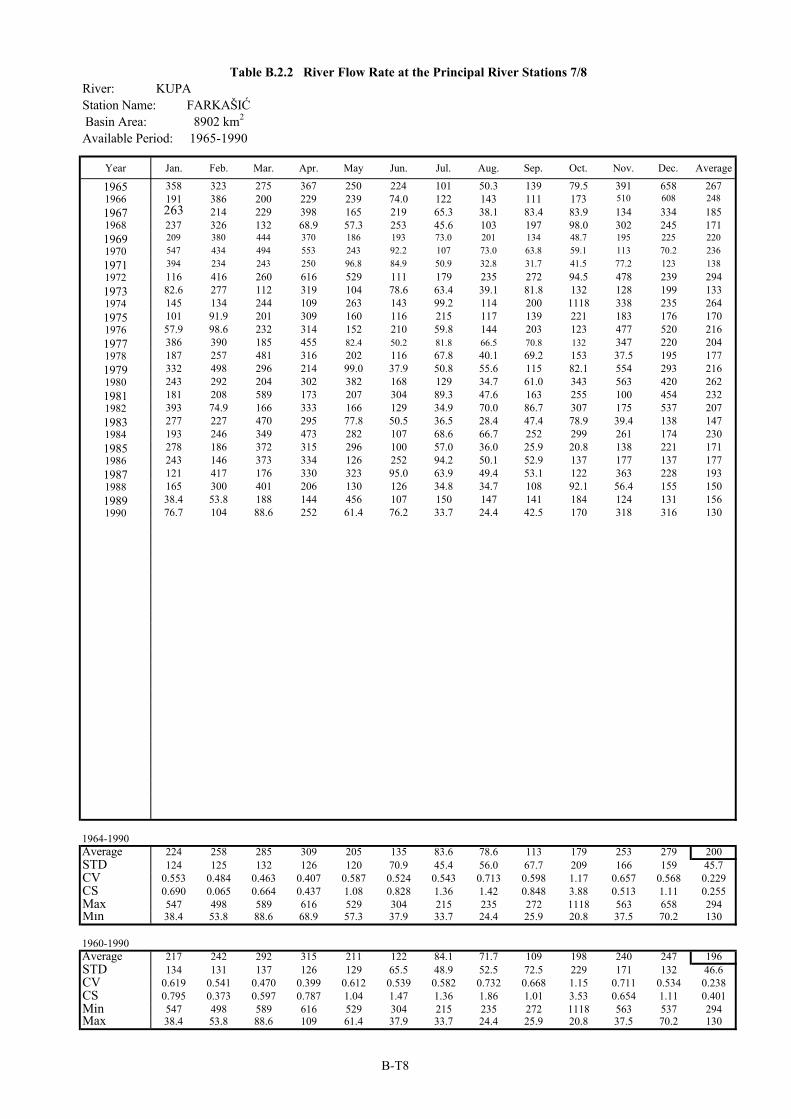
River: KUPAStation Name: FARKAŠIĆBasin Area: 8902 km2
Available Period: 1965-1990
Year Jan. Feb. Mar. Apr. May Jun. Jul. Aug. Sep. Oct. Nov. Dec. Average
1965 358 323 275 367 250 224 101 50.3 139 79.5 391 658 2671966 191 386 200 229 239 74.0 122 143 111 173 510 608 2481967 263 214 229 398 165 219 65.3 38.1 83.4 83.9 134 334 1851968 237 326 132 68.9 57.3 253 45.6 103 197 98.0 302 245 1711969 209 380 444 370 186 193 73.0 201 134 48.7 195 225 2201970 547 434 494 553 243 92.2 107 73.0 63.8 59.1 113 70.2 2361971 394 234 243 250 96.8 84.9 50.9 32.8 31.7 41.5 77.2 123 1381972 116 416 260 616 529 111 179 235 272 94.5 478 239 2941973 82.6 277 112 319 104 78.6 63.4 39.1 81.8 132 128 199 1331974 145 134 244 109 263 143 99.2 114 200 1118 338 235 2641975 101 91.9 201 309 160 116 215 117 139 221 183 176 1701976 57.9 98.6 232 314 152 210 59.8 144 203 123 477 520 2161977 386 390 185 455 82.4 50.2 81.8 66.5 70.8 132 347 220 2041978 187 257 481 316 202 116 67.8 40.1 69.2 153 37.5 195 1771979 332 498 296 214 99.0 37.9 50.8 55.6 115 82.1 554 293 2161980 243 292 204 302 382 168 129 34.7 61.0 343 563 420 2621981 181 208 589 173 207 304 89.3 47.6 163 255 100 454 2321982 393 74.9 166 333 166 129 34.9 70.0 86.7 307 175 537 2071983 277 227 470 295 77.8 50.5 36.5 28.4 47.4 78.9 39.4 138 1471984 193 246 349 473 282 107 68.6 66.7 252 299 261 174 2301985 278 186 372 315 296 100 57.0 36.0 25.9 20.8 138 221 1711986 243 146 373 334 126 252 94.2 50.1 52.9 137 177 137 1771987 121 417 176 330 323 95.0 63.9 49.4 53.1 122 363 228 1931988 165 300 401 206 130 126 34.8 34.7 108 92.1 56.4 155 1501989 38.4 53.8 188 144 456 107 150 147 141 184 124 131 1561990 76.7 104 88.6 252 61.4 76.2 33.7 24.4 42.5 170 318 316 130
1964-1990Average 224 258 285 309 205 135 83.6 78.6 113 179 253 279 200STD 124 125 132 126 120 70.9 45.4 56.0 67.7 209 166 159 45.7CV 0.553 0.484 0.463 0.407 0.587 0.524 0.543 0.713 0.598 1.17 0.657 0.568 0.229CS 0.690 0.065 0.664 0.437 1.08 0.828 1.36 1.42 0.848 3.88 0.513 1.11 0.255Max 547 498 589 616 529 304 215 235 272 1118 563 658 294Min 38.4 53.8 88.6 68.9 57.3 37.9 33.7 24.4 25.9 20.8 37.5 70.2 130
1960-1990Average 217 242 292 315 211 122 84.1 71.7 109 198 240 247 196STD 134 131 137 126 129 65.5 48.9 52.5 72.5 229 171 132 46.6CV 0.619 0.541 0.470 0.399 0.612 0.539 0.582 0.732 0.668 1.15 0.711 0.534 0.238CS 0.795 0.373 0.597 0.787 1.04 1.47 1.36 1.86 1.01 3.53 0.654 1.11 0.401Min 547 498 589 616 529 304 215 235 272 1118 563 537 294Max 38.4 53.8 88.6 109 61.4 37.9 33.7 24.4 25.9 20.8 37.5 70.2 130
Table B.2.2 River Flow Rate at the Principal River Stations 7/8
B-T8
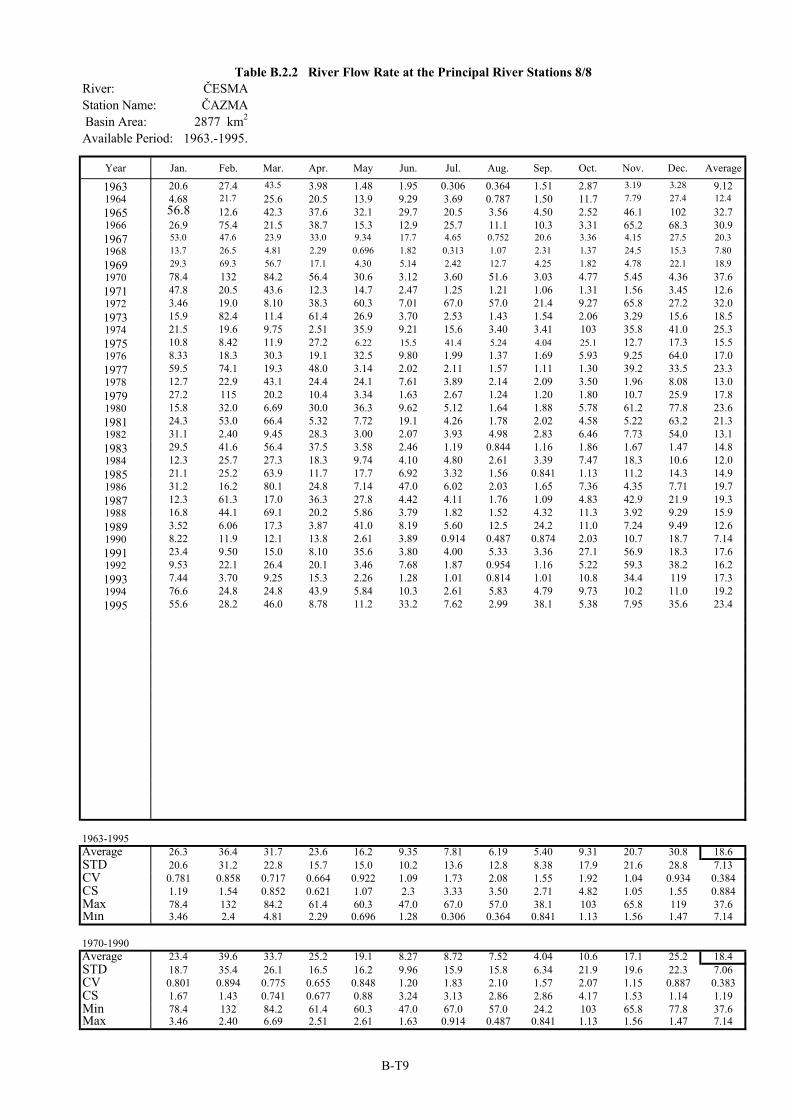
River: ČESMAStation Name: ČAZMABasin Area: 2877 km2
Available Period: 1963.-1995.
Year Jan. Feb. Mar. Apr. May Jun. Jul. Aug. Sep. Oct. Nov. Dec. Average
1963 20.6 27.4 43.5 3.98 1.48 1.95 0.306 0.364 1.51 2.87 3.19 3.28 9.121964 4.68 21.7 25.6 20.5 13.9 9.29 3.69 0.787 1.50 11.7 7.79 27.4 12.41965 56.8 12.6 42.3 37.6 32.1 29.7 20.5 3.56 4.50 2.52 46.1 102 32.71966 26.9 75.4 21.5 38.7 15.3 12.9 25.7 11.1 10.3 3.31 65.2 68.3 30.91967 53.0 47.6 23.9 33.0 9.34 17.7 4.65 0.752 20.6 3.36 4.15 27.5 20.31968 13.7 26.5 4.81 2.29 0.696 1.82 0.313 1.07 2.31 1.37 24.5 15.3 7.801969 29.3 69.3 56.7 17.1 4.30 5.14 2.42 12.7 4.25 1.82 4.78 22.1 18.91970 78.4 132 84.2 56.4 30.6 3.12 3.60 51.6 3.03 4.77 5.45 4.36 37.61971 47.8 20.5 43.6 12.3 14.7 2.47 1.25 1.21 1.06 1.31 1.56 3.45 12.61972 3.46 19.0 8.10 38.3 60.3 7.01 67.0 57.0 21.4 9.27 65.8 27.2 32.01973 15.9 82.4 11.4 61.4 26.9 3.70 2.53 1.43 1.54 2.06 3.29 15.6 18.51974 21.5 19.6 9.75 2.51 35.9 9.21 15.6 3.40 3.41 103 35.8 41.0 25.31975 10.8 8.42 11.9 27.2 6.22 15.5 41.4 5.24 4.04 25.1 12.7 17.3 15.51976 8.33 18.3 30.3 19.1 32.5 9.80 1.99 1.37 1.69 5.93 9.25 64.0 17.01977 59.5 74.1 19.3 48.0 3.14 2.02 2.11 1.57 1.11 1.30 39.2 33.5 23.31978 12.7 22.9 43.1 24.4 24.1 7.61 3.89 2.14 2.09 3.50 1.96 8.08 13.01979 27.2 115 20.2 10.4 3.34 1.63 2.67 1.24 1.20 1.80 10.7 25.9 17.81980 15.8 32.0 6.69 30.0 36.3 9.62 5.12 1.64 1.88 5.78 61.2 77.8 23.61981 24.3 53.0 66.4 5.32 7.72 19.1 4.26 1.78 2.02 4.58 5.22 63.2 21.31982 31.1 2.40 9.45 28.3 3.00 2.07 3.93 4.98 2.83 6.46 7.73 54.0 13.11983 29.5 41.6 56.4 37.5 3.58 2.46 1.19 0.844 1.16 1.86 1.67 1.47 14.81984 12.3 25.7 27.3 18.3 9.74 4.10 4.80 2.61 3.39 7.47 18.3 10.6 12.01985 21.1 25.2 63.9 11.7 17.7 6.92 3.32 1.56 0.841 1.13 11.2 14.3 14.91986 31.2 16.2 80.1 24.8 7.14 47.0 6.02 2.03 1.65 7.36 4.35 7.71 19.71987 12.3 61.3 17.0 36.3 27.8 4.42 4.11 1.76 1.09 4.83 42.9 21.9 19.31988 16.8 44.1 69.1 20.2 5.86 3.79 1.82 1.52 4.32 11.3 3.92 9.29 15.91989 3.52 6.06 17.3 3.87 41.0 8.19 5.60 12.5 24.2 11.0 7.24 9.49 12.61990 8.22 11.9 12.1 13.8 2.61 3.89 0.914 0.487 0.874 2.03 10.7 18.7 7.141991 23.4 9.50 15.0 8.10 35.6 3.80 4.00 5.33 3.36 27.1 56.9 18.3 17.61992 9.53 22.1 26.4 20.1 3.46 7.68 1.87 0.954 1.16 5.22 59.3 38.2 16.21993 7.44 3.70 9.25 15.3 2.26 1.28 1.01 0.814 1.01 10.8 34.4 119 17.31994 76.6 24.8 24.8 43.9 5.84 10.3 2.61 5.83 4.79 9.73 10.2 11.0 19.21995 55.6 28.2 46.0 8.78 11.2 33.2 7.62 2.99 38.1 5.38 7.95 35.6 23.4
1963-1995Average 26.3 36.4 31.7 23.6 16.2 9.35 7.81 6.19 5.40 9.31 20.7 30.8 18.6STD 20.6 31.2 22.8 15.7 15.0 10.2 13.6 12.8 8.38 17.9 21.6 28.8 7.13CV 0.781 0.858 0.717 0.664 0.922 1.09 1.73 2.08 1.55 1.92 1.04 0.934 0.384CS 1.19 1.54 0.852 0.621 1.07 2.3 3.33 3.50 2.71 4.82 1.05 1.55 0.884Max 78.4 132 84.2 61.4 60.3 47.0 67.0 57.0 38.1 103 65.8 119 37.6Min 3.46 2.4 4.81 2.29 0.696 1.28 0.306 0.364 0.841 1.13 1.56 1.47 7.14
1970-1990Average 23.4 39.6 33.7 25.2 19.1 8.27 8.72 7.52 4.04 10.6 17.1 25.2 18.4STD 18.7 35.4 26.1 16.5 16.2 9.96 15.9 15.8 6.34 21.9 19.6 22.3 7.06CV 0.801 0.894 0.775 0.655 0.848 1.20 1.83 2.10 1.57 2.07 1.15 0.887 0.383CS 1.67 1.43 0.741 0.677 0.88 3.24 3.13 2.86 2.86 4.17 1.53 1.14 1.19Min 78.4 132 84.2 61.4 60.3 47.0 67.0 57.0 24.2 103 65.8 77.8 37.6Max 3.46 2.40 6.69 2.51 2.61 1.63 0.914 0.487 0.841 1.13 1.56 1.47 7.14
Table B.2.2 River Flow Rate at the Principal River Stations 8/8
B-T9
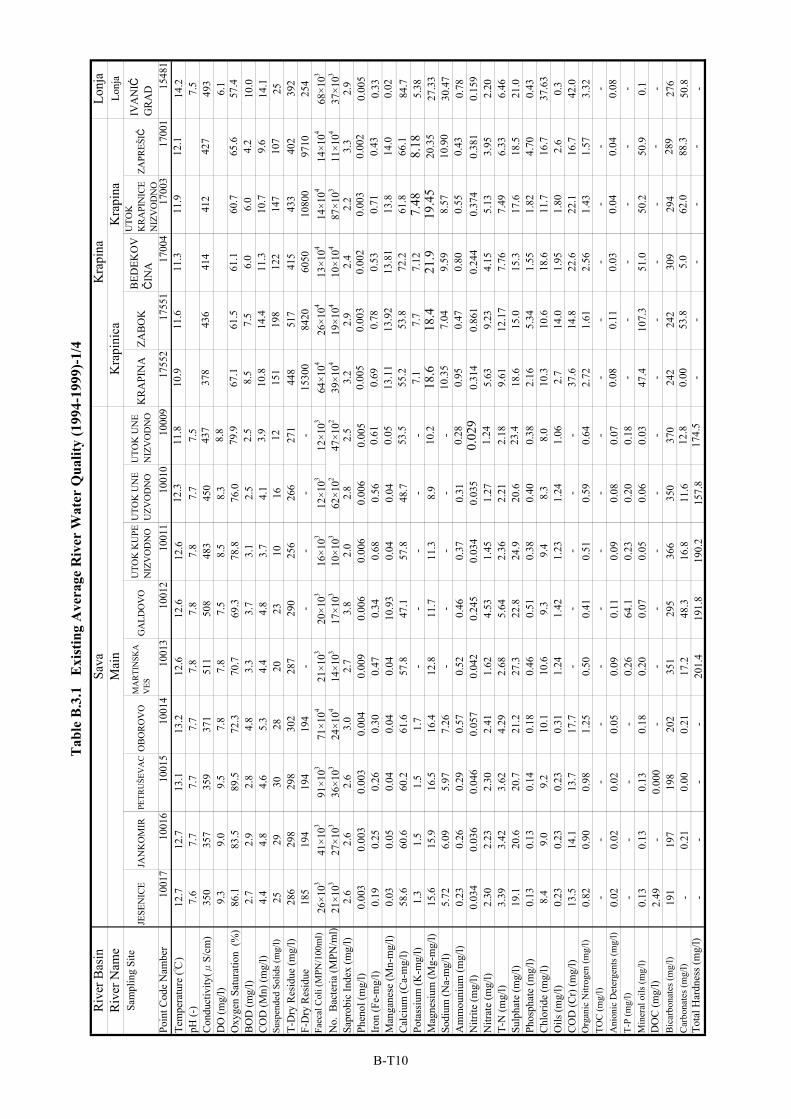
Riv
er B
asin
Lonj
aR
iver
Nam
eLo
nja
Sam
plin
g Si
teJE
SEN
ICE
JAN
KO
MIR
PETR
UŠE
VA
CO
BO
RO
VO
MA
RTI
NSK
AV
ESG
ALD
OV
OU
TOK
KU
PEN
IZV
OD
NO
UTO
K U
NE
UZV
OD
NO
UTO
K U
NE
NIZ
VO
DN
OK
RA
PIN
AZA
BO
KB
EDEK
OV
ČIN
A
UTO
KK
RA
PIN
ICE
NIZ
VO
DN
OZA
PREŠ
IĆIV
AN
IĆG
RA
DPo
int C
ode
Nam
ber
1001
710
016
1001
510
014
1001
310
012
1001
110
010
1000
917
552
1755
117
004
1700
317
001
1548
1Te
mpe
ratu
re (℃
)12
.712
.713
.113
.212
.612
.612
.612
.311
.810
.911
.611
.311
.912
.114
.2pH
(-)
7.6
7.7
7.7
7.7
7.8
7.8
7.8
7.7
7.5
7.5
Con
duct
ivity
(μS/
cm)
350
357
359
371
511
508
483
450
437
378
436
414
412
427
493
DO
(mg/
l)9.
39.
09.
57.
87.
87.
58.
58.
38.
86.
1O
xyge
n Sa
tura
tion
(%)
86.1
83.5
89.5
72.3
70.7
69.3
78.8
76.0
79.9
67.1
61.5
61.1
60.7
65.6
57.4
BO
D (m
g/l)
2.7
2.9
2.8
4.8
3.3
3.7
3.1
2.5
2.5
8.5
7.5
6.0
6.0
4.2
10.0
CO
D (M
n) (m
g/l)
4.4
4.8
4.6
5.3
4.4
4.8
3.7
4.1
3.9
10.8
14.4
11.3
10.7
9.6
14.1
Susp
ende
d So
lids (
mg/
l)25
2930
2820
2310
1612
151
198
122
147
107
25T-
Dry
Res
idue
(mg/
l)28
629
829
830
228
729
025
626
627
144
851
741
543
340
239
2F-
Dry
Res
idue
185
194
194
194
--
--
-15
300
8420
6050
1080
097
1025
4Fa
ecal
Col
i (M
PN/1
00m
l)26
×103
41×1
0391
×103
71×1
0421
×103
20×1
0316
×103
12×1
0312
×103
64×1
0426
×104
13×1
0414
×104
14×1
0468
×103
No.
Bac
teria
(MPN
/ml)
21×1
0327
×103
36×1
0324
×104
14×1
0317
×103
10×1
0362
×102
47×1
0239
×104
19×1
0410
×104
87×1
0311
×104
37×1
03
Sapr
obic
Inde
x (m
g/l)
2.6
2.6
2.6
3.0
2.7
3.8
2.0
2.8
2.5
3.2
2.9
2.4
2.2
3.3
2.9
Phen
ol (m
g/l)
0.00
30.
003
0.00
30.
004
0.00
90.
006
0.00
60.
006
0.00
50.
005
0.00
30.
002
0.00
30.
002
0.00
5Ir
on (F
e-m
g/l)
0.19
0.25
0.26
0.30
0.47
0.34
0.68
0.56
0.61
0.69
0.78
0.53
0.71
0.43
0.33
Man
gane
se (M
n-m
g/l)
0.03
0.05
0.04
0.04
0.04
10.9
30.
040.
040.
0513
.11
13.9
213
.81
13.8
14.0
0.02
Cal
cium
(Ca-
mg/
l)58
.660
.660
.261
.657
.847
.157
.848
.753
.555
.253
.872
.261
.866
.184
.7Po
tass
ium
(K-m
g/l)
1.3
1.5
1.5
1.7
--
--
-7.
17.
77.
127.
488.
185.
38M
agne
sium
(Mg-
mg/
l)15
.615
.916
.516
.412
.811
.711
.38.
910
.218
.618
.421
.919
.45
20.3
527
.33
Sodi
um (N
a-m
g/l)
5.72
6.09
5.97
7.26
--
--
-10
.35
7.04
9.59
8.57
10.9
030
.47
Am
mou
nium
(mg/
l)0.
230.
260.
290.
570.
520.
460.
370.
310.
280.
950.
470.
800.
550.
430.
78N
itrite
(mg/
l)0.
034
0.03
60.
046
0.05
70.
042
0.24
50.
034
0.03
50.
029
0.31
40.
861
0.24
40.
374
0.38
10.
159
Nitr
ate
(mg/
l)2.
302.
232.
302.
411.
624.
531.
451.
271.
245.
639.
234.
155.
133.
952.
20T-
N (m
g/l)
3.39
3.42
3.62
4.29
2.68
5.64
2.36
2.21
2.18
9.61
12.1
77.
767.
496.
336.
46Su
lpha
te (m
g/l)
19.1
20.6
20.7
21.2
27.3
22.8
24.9
20.6
23.4
18.6
15.0
15.3
17.6
18.5
21.0
Phos
phat
e (m
g/l)
0.13
0.13
0.14
0.18
0.46
0.51
0.38
0.40
0.38
2.16
5.34
1.55
1.82
4.70
0.43
Chl
orid
e (m
g/l)
8.4
9.0
9.2
10.1
10.6
9.3
9.4
8.3
8.0
10.3
10.6
18.6
11.7
16.7
37.6
3O
ils (m
g/l)
0.23
0.23
0.23
0.31
1.24
1.42
1.23
1.24
1.06
2.7
14.0
1.95
1.80
2.6
0.3
CO
D (C
r) (m
g/l)
13.5
14.1
13.7
17.7
--
--
-37
.614
.822
.622
.116
.742
.0O
rgan
ic N
itrog
en (m
g/l)
0.82
0.90
0.98
1.25
0.50
0.41
0.51
0.59
0.64
2.72
1.61
2.56
1.43
1.57
3.32
TOC
(mg/
l)-
--
--
--
--
--
--
--
Ani
onic
Det
erge
nts (
mg/
l)0.
020.
020.
020.
050.
090.
110.
090.
080.
070.
080.
110.
030.
040.
040.
08T-
P (m
g/l)
--
--
0.26
64.1
0.23
0.20
0.18
--
--
--
Min
eral
oils
(mg/
l)0.
130.
130.
130.
180.
200.
070.
050.
060.
0347
.410
7.3
51.0
50.2
50.9
0.1
DO
C (m
g/l)
2.49
-0.
000
--
--
--
--
--
--
Bic
arbo
nate
s (m
g/l)
191
197
198
202
351
295
366
350
370
242
242
309
294
289
276
Car
bona
tes (
mg/
l)-
0.21
0.00
0.21
17.2
48.3
16.8
11.6
12.8
0.00
53.8
5.0
62.0
88.3
50.8
Tota
l Har
dnes
s (m
g/l)
--
--
201.
419
1.8
190.
215
7.8
174.
5-
--
--
-
Kra
pina
Kra
pini
ca
Tab
le B
.3.1
E
xist
ing
Ave
rage
Riv
er W
ater
Qua
lity
(199
4-19
99)-
1/4
Sava
Mai
nK
rapi
na
B-T10
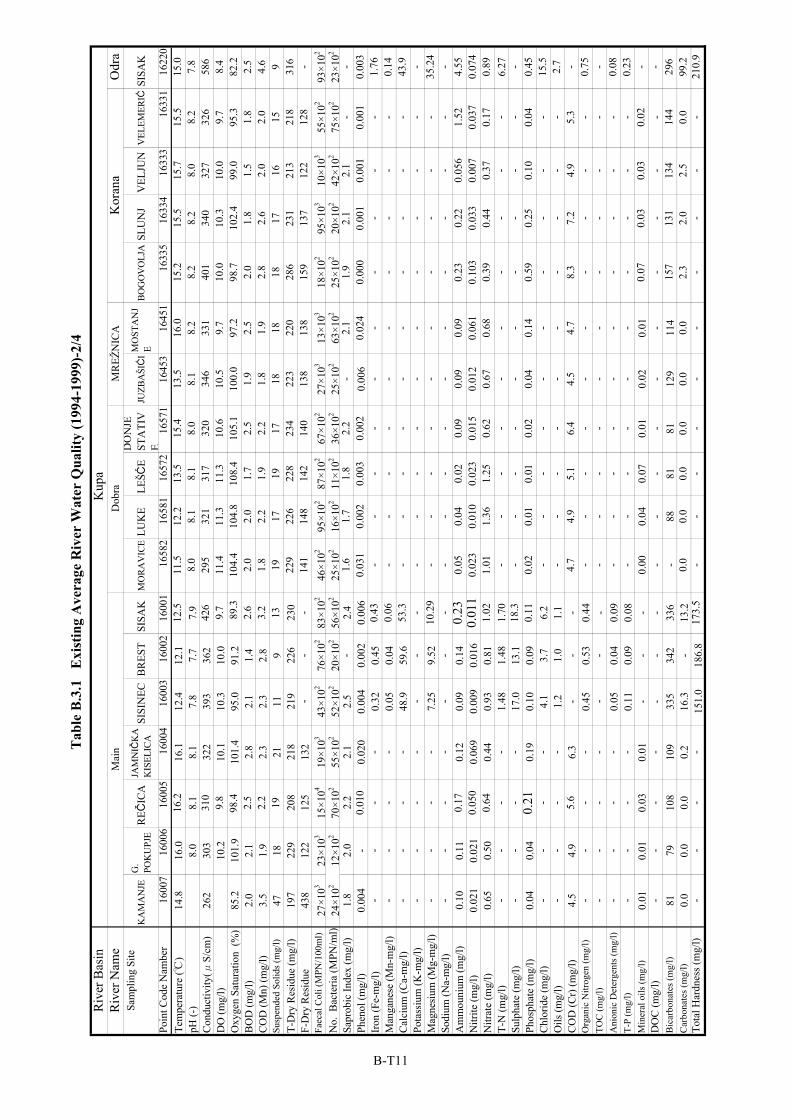
Riv
er B
asin
Riv
er N
ame
Odr
aSa
mpl
ing
Site
KA
MA
NJE
G.
POK
UPJ
ER
EČIC
AJA
MN
IČK
AK
ISEL
ICA
SISI
NEC
BR
EST
SISA
KM
OR
AV
ICE
LUK
ELE
ŠĆE
DO
NJE
STA
TIV
EJU
ZBA
ŠIĆ
IM
OST
AN
JE
BOG
OV
OLJ
ASL
UN
JV
ELJU
NV
ELEM
ERIĆ
SISA
K
Poin
t Cod
e N
ambe
r16
007
1600
616
005
1600
416
003
1600
216
001
1658
216
581
1657
216
571
1645
316
451
1633
516
334
1633
316
331
1622
0Te
mpe
ratu
re (℃
)14
.816
.016
.216
.112
.412
.112
.511
.512
.213
.515
.413
.516
.015
.215
.515
.715
.515
.0pH
(-)
8.0
8.1
8.1
7.8
7.7
7.9
8.0
8.1
8.1
8.0
8.1
8.2
8.2
8.2
8.0
8.2
7.8
Con
duct
ivity
(μS/
cm)
262
303
310
322
393
362
426
295
321
317
320
346
331
401
340
327
326
586
DO
(mg/
l)10
.29.
810
.110
.310
.09.
711
.411
.311
.310
.610
.59.
710
.010
.310
.09.
78.
4O
xyge
n Sa
tura
tion
(%)
85.2
101.
998
.410
1.4
95.0
91.2
89.3
104.
410
4.8
108.
410
5.1
100.
097
.298
.710
2.4
99.0
95.3
82.2
BO
D (m
g/l)
2.0
2.1
2.5
2.8
2.1
1.4
2.6
2.0
2.0
1.7
2.5
1.9
2.5
2.0
1.8
1.5
1.8
2.5
CO
D (M
n) (m
g/l)
3.5
1.9
2.2
2.3
2.3
2.8
3.2
1.8
2.2
1.9
2.2
1.8
1.9
2.8
2.6
2.0
2.0
4.6
Susp
ende
d So
lids (
mg/
l)47
1819
2111
913
1917
1917
1818
1817
1615
9T-
Dry
Res
idue
(mg/
l)19
722
920
821
821
922
623
022
922
622
823
422
322
028
623
121
321
831
6F-
Dry
Res
idue
438
122
125
132
--
-14
114
814
214
013
813
815
913
712
212
8-
Faec
al C
oli (
MPN
/100
ml)
27×1
0323
×103
15×1
0419
×103
43×1
0276
×102
83×1
0246
×102
95×1
0287
×102
67×1
0227
×103
13×1
0318
×102
95×1
0310
×103
55×1
0293
×102
No.
Bac
teria
(MPN
/ml)
24×1
0212
×102
70×1
0255
×102
52×1
0220
×102
56×1
0225
×102
16×1
0211
×102
36×1
0225
×102
63×1
0225
×102
20×1
0242
×102
75×1
0223
×102
Sapr
obic
Inde
x (m
g/l)
1.8
2.0
2.2
2.1
2.5
-2.
41.
61.
71.
82.
2-
2.1
1.9
2.1
2.1
--
Phen
ol (m
g/l)
0.00
4-
0.01
00.
020
0.00
40.
002
0.00
60.
031
0.00
20.
003
0.00
20.
006
0.02
40.
000
0.00
10.
001
0.00
10.
003
Iron
(Fe-
mg/
l)-
--
-0.
320.
450.
43-
--
--
--
--
-1.
76M
anga
nese
(Mn-
mg/
l)-
--
-0.
050.
040.
06-
--
--
--
--
-0.
14C
alci
um (C
a-m
g/l)
--
--
48.9
59.6
53.3
--
--
--
--
--
43.9
Pota
ssiu
m (K
-mg/
l)-
--
--
--
--
--
--
--
--
-M
agne
sium
(Mg-
mg/
l)-
--
-7.
259.
5210
.29
--
--
--
--
--
35.2
4So
dium
(Na-
mg/
l)-
--
--
--
--
--
--
--
--
-A
mm
ouni
um (m
g/l)
0.10
0.11
0.17
0.12
0.09
0.14
0.23
0.05
0.04
0.02
0.09
0.09
0.09
0.23
0.22
0.05
61.
524.
55N
itrite
(mg/
l)0.
021
0.02
10.
050
0.06
90.
009
0.01
60.
011
0.02
30.
010
0.02
30.
015
0.01
20.
061
0.10
30.
033
0.00
70.
037
0.07
4N
itrat
e (m
g/l)
0.65
0.50
0.64
0.44
0.93
0.81
1.02
1.01
1.36
1.25
0.62
0.67
0.68
0.39
0.44
0.37
0.17
0.89
T-N
(mg/
l)-
--
-1.
481.
481.
70-
--
--
--
--
-6.
27Su
lpha
te (m
g/l)
--
--
17.0
13.1
18.3
--
--
--
--
--
-Ph
osph
ate
(mg/
l)0.
040.
040.
210.
190.
100.
090.
110.
020.
010.
010.
020.
040.
140.
590.
250.
100.
040.
45C
hlor
ide
(mg/
l)-
--
-4.
13.
76.
2-
--
--
--
--
-15
.5O
ils (m
g/l)
--
--
1.2
1.0
1.1
--
--
--
--
--
2.7
CO
D (C
r) (m
g/l)
4.5
4.9
5.6
6.3
--
-4.
74.
95.
16.
44.
54.
78.
37.
24.
95.
3-
Org
anic
Nitr
ogen
(mg/
l)-
--
-0.
450.
530.
44-
--
--
--
--
-0.
75TO
C (m
g/l)
--
--
--
--
--
--
--
--
--
Ani
onic
Det
erge
nts (
mg/
l)-
--
-0.
050.
040.
09-
--
--
--
--
-0.
08T-
P (m
g/l)
--
--
0.11
0.09
0.08
--
--
--
--
--
0.23
Min
eral
oils
(mg/
l)0.
010.
010.
030.
01-
--
0.00
0.04
0.07
0.01
0.02
0.01
0.07
0.03
0.03
0.02
-D
OC
(mg/
l)-
--
--
--
--
--
--
--
--
-B
icar
bona
tes (
mg/
l)81
7910
810
933
534
233
6-
8881
8112
911
415
713
113
414
429
6C
arbo
nate
s (m
g/l)
0.0
0.0
0.0
0.2
16.3
-13
.20.
00.
00.
00.
00.
00.
02.
32.
02.
50.
099
.2To
tal H
ardn
ess (
mg/
l)-
--
-15
1.0
186.
817
3.5
--
--
--
--
--
210.
9
Kor
ana
Tab
le B
.3.1
E
xist
ing
Ave
rage
Riv
er W
ater
Qua
lity
(199
4-19
99)-
2/4
Kup
aM
ain
Dob
raM
REŽ
NIC
A
B-T11
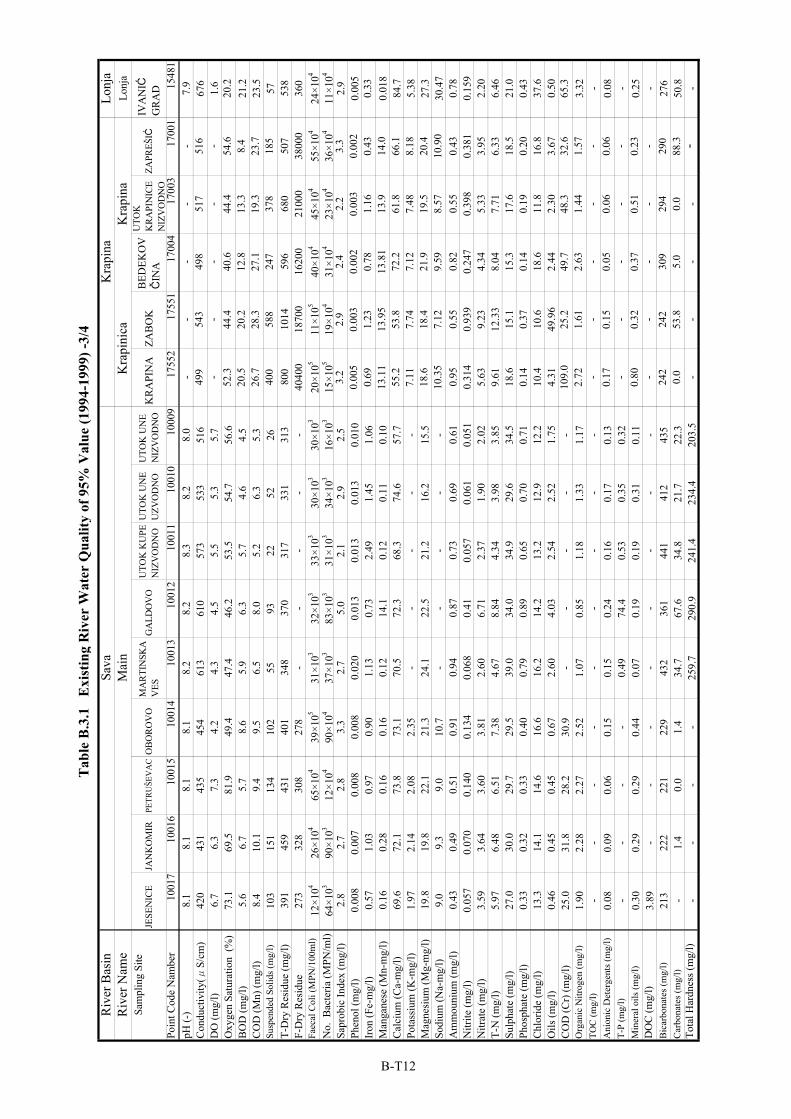
Riv
er B
asin
Lonj
aR
iver
Nam
eLo
nja
Sam
plin
g Si
teJE
SEN
ICE
JAN
KO
MIR
PETR
UŠE
VA
CO
BO
RO
VO
MA
RTIN
SKA
VES
GA
LDO
VO
UTO
K K
UPE
NIZ
VO
DN
OU
TOK
UN
EU
ZVO
DN
OU
TOK
UN
EN
IZV
OD
NO
KR
API
NA
ZAB
OK
BED
EKO
VČ
INA
UTO
KK
RA
PIN
ICE
NIZ
VO
DN
OZA
PREŠ
IĆIV
AN
IĆG
RA
DPo
int C
ode
Nam
ber
1001
710
016
1001
510
014
1001
310
012
1001
110
010
1000
917
552
1755
117
004
1700
317
001
1548
1pH
(-)
8.1
8.1
8.1
8.1
8.2
8.2
8.3
8.2
8.0
--
--
-7.
9C
ondu
ctiv
ity(μ
S/cm
)42
043
143
545
461
361
057
353
351
649
954
349
851
751
667
6D
O (m
g/l)
6.7
6.3
7.3
4.2
4.3
4.5
5.5
5.3
5.7
--
--
-1.
6O
xyge
n Sa
tura
tion
(%)
73.1
69.5
81.9
49.4
47.4
46.2
53.5
54.7
56.6
52.3
44.4
40.6
44.4
54.6
20.2
BO
D (m
g/l)
5.6
6.7
5.7
8.6
5.9
6.3
5.7
4.6
4.5
20.5
20.2
12.8
13.3
8.4
21.2
CO
D (M
n) (m
g/l)
8.4
10.1
9.4
9.5
6.5
8.0
5.2
6.3
5.3
26.7
28.3
27.1
19.3
23.7
23.5
Susp
ende
d So
lids (
mg/
l)10
315
113
410
255
9322
5226
400
588
247
378
185
57T-
Dry
Res
idue
(mg/
l)39
145
943
140
134
837
031
733
131
380
010
1459
668
050
753
8F-
Dry
Res
idue
273
328
308
278
--
--
-40
400
1870
016
200
2100
038
000
360
Faec
al C
oli (
MPN
/100
ml)
12×1
0426
×104
65×1
0439
×105
31×1
0332
×103
33×1
0330
×103
30×1
0320
×105
11×1
0540
×104
45×1
0455
×104
24×1
04
No.
Bac
teria
(MPN
/ml)
64×1
0390
×103
12×1
0490
×104
37×1
0383
×103
31×1
0334
×103
16×1
0315
×105
19×1
0431
×104
23×1
0436
×104
11×1
04
Sapr
obic
Inde
x (m
g/l)
2.8
2.7
2.8
3.3
2.7
5.0
2.1
2.9
2.5
3.2
2.9
2.4
2.2
3.3
2.9
Phen
ol (m
g/l)
0.00
80.
007
0.00
80.
008
0.02
00.
013
0.01
30.
013
0.01
00.
005
0.00
30.
002
0.00
30.
002
0.00
5Ir
on (F
e-m
g/l)
0.57
1.03
0.97
0.90
1.13
0.73
2.49
1.45
1.06
0.69
1.23
0.78
1.16
0.43
0.33
Man
gane
se (M
n-m
g/l)
0.16
0.28
0.16
0.16
0.12
14.1
0.12
0.11
0.10
13.1
113
.95
13.8
113
.914
.00.
018
Cal
cium
(Ca-
mg/
l)69
.672
.173
.873
.170
.572
.368
.374
.657
.755
.253
.872
.261
.866
.184
.7Po
tass
ium
(K-m
g/l)
1.97
2.14
2.08
2.35
--
--
-7.
117.
747.
127.
488.
185.
38M
agne
sium
(Mg-
mg/
l)19
.819
.822
.121
.324
.122
.521
.216
.215
.518
.618
.421
.919
.520
.427
.3So
dium
(Na-
mg/
l)9.
09.
39.
010
.7-
--
--
10.3
57.
129.
598.
5710
.90
30.4
7A
mm
ouni
um (m
g/l)
0.43
0.49
0.51
0.91
0.94
0.87
0.73
0.69
0.61
0.95
0.55
0.82
0.55
0.43
0.78
Nitr
ite (m
g/l)
0.05
70.
070
0.14
00.
134
0.06
80.
410.
057
0.06
10.
051
0.31
40.
939
0.24
70.
398
0.38
10.
159
Nitr
ate
(mg/
l)3.
593.
643.
603.
812.
606.
712.
371.
902.
025.
639.
234.
345.
333.
952.
20T-
N (m
g/l)
5.97
6.48
6.51
7.38
4.67
8.84
4.34
3.98
3.85
9.61
12.3
38.
047.
716.
336.
46Su
lpha
te (m
g/l)
27.0
30.0
29.7
29.5
39.0
34.0
34.9
29.6
34.5
18.6
15.1
15.3
17.6
18.5
21.0
Phos
phat
e (m
g/l)
0.33
0.32
0.33
0.40
0.79
0.89
0.65
0.70
0.71
0.14
0.37
0.14
0.19
0.20
0.43
Chl
orid
e (m
g/l)
13.3
14.1
14.6
16.6
16.2
14.2
13.2
12.9
12.2
10.4
10.6
18.6
11.8
16.8
37.6
Oils
(mg/
l)0.
460.
450.
450.
672.
604.
032.
542.
521.
754.
3149
.96
2.44
2.30
3.67
0.50
CO
D (C
r) (m
g/l)
25.0
31.8
28.2
30.9
--
--
-10
9.0
25.2
49.7
48.3
32.6
65.3
Org
anic
Nitr
ogen
(mg/
l)1.
902.
282.
272.
521.
070.
851.
181.
331.
172.
721.
612.
631.
441.
573.
32TO
C (m
g/l)
--
--
--
--
--
--
--
-A
nion
ic D
eter
gent
s (m
g/l)
0.08
0.09
0.06
0.15
0.15
0.24
0.16
0.17
0.13
0.17
0.15
0.05
0.06
0.06
0.08
T-P
(mg/
l)-
--
-0.
4974
.40.
530.
350.
32-
--
--
-M
iner
al o
ils (m
g/l)
0.30
0.29
0.29
0.44
0.07
0.19
0.19
0.31
0.11
0.80
0.32
0.37
0.51
0.23
0.25
DO
C (m
g/l)
3.89
--
--
--
--
--
--
--
Bic
arbo
nate
s (m
g/l)
213
222
221
229
432
361
441
412
435
242
242
309
294
290
276
Car
bona
tes (
mg/
l)-
1.4
0.0
1.4
34.7
67.6
34.8
21.7
22.3
0.0
53.8
5.0
0.0
88.3
50.8
Tota
l Har
dnes
s (m
g/l)
--
--
259.
729
0.9
241.
423
4.4
203.
5-
--
--
-
Mai
nK
rapi
naK
rapi
naK
rapi
nica
Tab
le B
.3.1
E
xist
ing
Riv
er W
ater
Qua
lity
of 9
5% V
alue
(199
4-19
99) -
3/4
Sava
B-T12
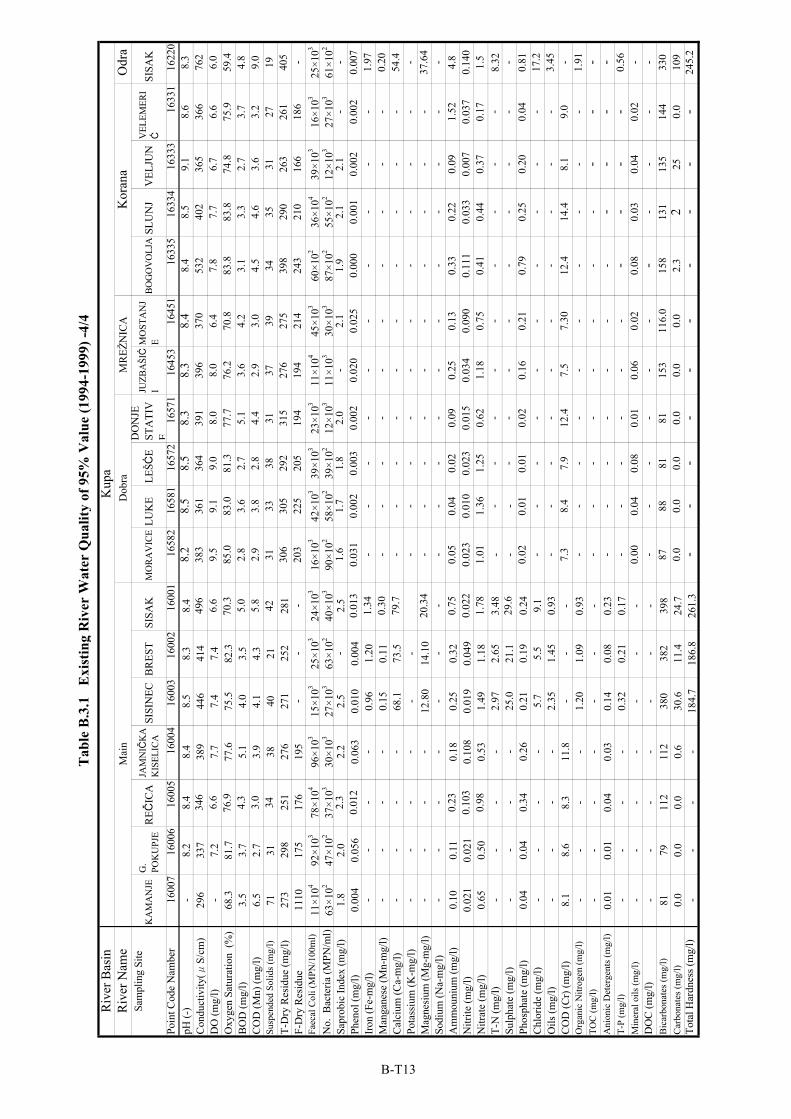
Riv
er B
asin
Riv
er N
ame
Odr
aSa
mpl
ing
Site
KA
MA
NJE
G.
POK
UPJ
ER
EČIC
AJA
MN
IČK
AK
ISEL
ICA
SISI
NEC
BR
EST
SISA
KM
OR
AV
ICE
LUK
ELE
ŠĆE
DO
NJE
STA
TIV
E
JUZB
AŠIĆ
IM
OST
AN
JE
BOG
OV
OLJ
ASL
UN
JV
ELJU
NV
ELEM
ERI
ĆSI
SAK
Poin
t Cod
e N
ambe
r16
007
1600
616
005
1600
416
003
1600
216
001
1658
216
581
1657
216
571
1645
316
451
1633
516
334
1633
316
331
1622
0pH
(-)
-8.
28.
48.
48.
58.
38.
48.
28.
58.
58.
38.
38.
48.
48.
59.
18.
68.
3C
ondu
ctiv
ity(μ
S/cm
)29
633
734
638
944
641
449
638
336
136
439
139
637
053
240
236
536
676
2D
O (m
g/l)
-7.
26.
67.
77.
47.
46.
69.
59.
19.
08.
08.
06.
47.
87.
76.
76.
66.
0O
xyge
n Sa
tura
tion
(%)
68.3
81.7
76.9
77.6
75.5
82.3
70.3
85.0
83.0
81.3
77.7
76.2
70.8
83.8
83.8
74.8
75.9
59.4
BO
D (m
g/l)
3.5
3.7
4.3
5.1
4.0
3.5
5.0
2.8
3.6
2.7
5.1
3.6
4.2
3.1
3.3
2.7
3.7
4.8
CO
D (M
n) (m
g/l)
6.5
2.7
3.0
3.9
4.1
4.3
5.8
2.9
3.8
2.8
4.4
2.9
3.0
4.5
4.6
3.6
3.2
9.0
Susp
ende
d So
lids (
mg/
l)71
3134
3840
2142
3133
3831
3739
3435
3127
19T-
Dry
Res
idue
(mg/
l)27
329
825
127
627
125
228
130
630
529
231
527
627
539
829
026
326
140
5F-
Dry
Res
idue
1110
175
176
195
--
-20
322
520
519
419
421
424
321
016
618
6-
Faec
al C
oli (
MPN
/100
ml)
11×1
0492
×103
78×1
0496
×103
15×1
0325
×103
24×1
0316
×103
42×1
0339
×103
23×1
0311
×104
45×1
0360
×102
36×1
0439
×103
16×1
0325
×103
No.
Bac
teria
(MPN
/ml)
63×1
0247
×102
37×1
0330
×103
27×1
0363
×102
40×1
0390
×102
58×1
0239
×102
12×1
0311
×103
30×1
0387
×102
55×1
0212
×103
27×1
0361
×102
Sapr
obic
Inde
x (m
g/l)
1.8
2.0
2.3
2.2
2.5
-2.
51.
61.
71.
82.
0-
2.1
1.9
2.1
2.1
--
Phen
ol (m
g/l)
0.00
40.
056
0.01
20.
063
0.01
00.
004
0.01
30.
031
0.00
20.
003
0.00
20.
020
0.02
50.
000
0.00
10.
002
0.00
20.
007
Iron
(Fe-
mg/
l)-
--
-0.
961.
201.
34-
--
--
--
--
-1.
97M
anga
nese
(Mn-
mg/
l)-
--
-0.
150.
110.
30-
--
--
--
--
-0.
20C
alci
um (C
a-m
g/l)
--
--
68.1
73.5
79.7
--
--
--
--
--
54.4
Pota
ssiu
m (K
-mg/
l)-
--
--
--
--
--
--
--
--
Mag
nesiu
m (M
g-m
g/l)
--
--
12.8
014
.10
20.3
4-
--
--
--
--
-37
.64
Sodi
um (N
a-m
g/l)
--
--
--
--
--
--
--
--
--
Am
mou
nium
(mg/
l)0.
100.
110.
230.
180.
250.
320.
750.
050.
040.
020.
090.
250.
130.
330.
220.
091.
524.
8N
itrite
(mg/
l)0.
021
0.02
10.
103
0.10
80.
019
0.04
90.
022
0.02
30.
010
0.02
30.
015
0.03
40.
090
0.11
10.
033
0.00
70.
037
0.14
0N
itrat
e (m
g/l)
0.65
0.50
0.98
0.53
1.49
1.18
1.78
1.01
1.36
1.25
0.62
1.18
0.75
0.41
0.44
0.37
0.17
1.5
T-N
(mg/
l)-
--
-2.
972.
653.
48-
--
--
--
--
-8.
32Su
lpha
te (m
g/l)
--
--
25.0
21.1
29.6
--
--
--
--
--
-Ph
osph
ate
(mg/
l)0.
040.
040.
340.
260.
210.
190.
240.
020.
010.
010.
020.
160.
210.
790.
250.
200.
040.
81C
hlor
ide
(mg/
l)-
--
-5.
75.
59.
1-
--
--
--
--
-17
.2O
ils (m
g/l)
--
--
2.35
1.45
0.93
--
--
--
--
--
3.45
CO
D (C
r) (m
g/l)
8.1
8.6
8.3
11.8
--
-7.
38.
47.
912
.47.
57.
3012
.414
.48.
19.
0-
Org
anic
Nitr
ogen
(mg/
l)-
--
-1.
201.
090.
93-
--
--
--
--
-1.
91TO
C (m
g/l)
--
--
--
--
--
--
--
--
--
Ani
onic
Det
erge
nts (
mg/
l)0.
010.
010.
040.
030.
140.
080.
23-
--
--
--
--
--
T-P
(mg/
l)-
--
-0.
320.
210.
17-
--
--
--
--
-0.
56M
iner
al o
ils (m
g/l)
--
--
--
-0.
000.
040.
080.
010.
060.
020.
080.
030.
040.
02-
DO
C (m
g/l)
--
--
--
--
--
--
--
--
--
Bic
arbo
nate
s (m
g/l)
8179
112
112
380
382
398
8788
8181
153
116.
015
813
113
514
433
0C
arbo
nate
s (m
g/l)
0.0
0.0
0.0
0.6
30.6
11.4
24.7
0.0
0.0
0.0
0.0
0.0
0.0
2.3
225
0.0
109
Tota
l Har
dnes
s (m
g/l)
--
--
184.
718
6.8
261.
3-
--
--
--
--
-24
5.2
Tab
le B
.3.1
E
xist
ing
Riv
er W
ater
Qua
lity
of 9
5% V
alue
(199
4-19
99) -
4/4
Kup
aK
oran
aM
ain
Dob
raM
REŽ
NIC
A
B-T13
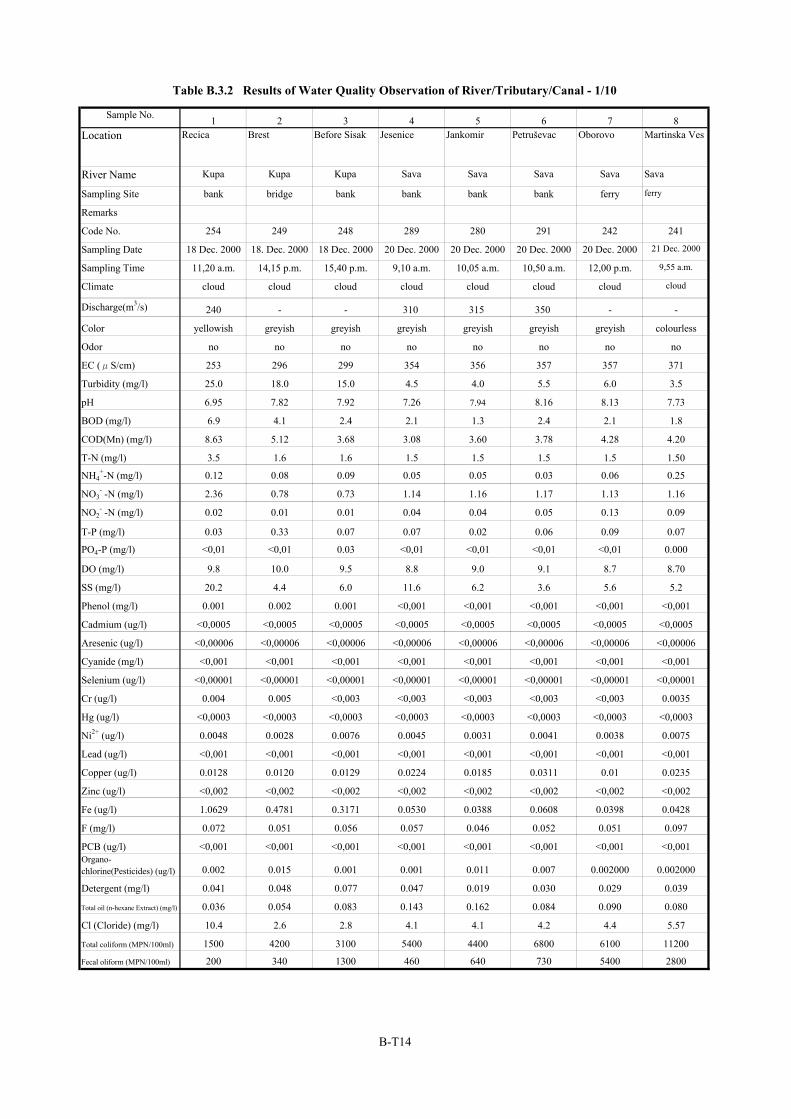
Sample No. 1 2 3 4 5 6 7 8Location Recica Brest Before Sisak Jesenice Jankomir Petruševac Oborovo Martinska Ves
River Name Kupa Kupa Kupa Sava Sava Sava Sava Sava
Sampling Site bank bridge bank bank bank bank ferry ferry
Remarks
Code No. 254 249 248 289 280 291 242 241
Sampling Date 18 Dec. 2000 18. Dec. 2000 18 Dec. 2000 20 Dec. 2000 20 Dec. 2000 20 Dec. 2000 20 Dec. 2000 21 Dec. 2000
Sampling Time 11,20 a.m. 14,15 p.m. 15,40 p.m. 9,10 a.m. 10,05 a.m. 10,50 a.m. 12,00 p.m. 9,55 a.m.
Climate cloud cloud cloud cloud cloud cloud cloud cloud
Discharge(m3/s) 240 - - 310 315 350 - -
Color yellowish greyish greyish greyish greyish greyish greyish colourless
Odor no no no no no no no no
EC (μS/cm) 253 296 299 354 356 357 357 371
Turbidity (mg/l) 25.0 18.0 15.0 4.5 4.0 5.5 6.0 3.5
pH 6.95 7.82 7.92 7.26 7.94 8.16 8.13 7.73
BOD (mg/l) 6.9 4.1 2.4 2.1 1.3 2.4 2.1 1.8
COD(Mn) (mg/l) 8.63 5.12 3.68 3.08 3.60 3.78 4.28 4.20
T-N (mg/l) 3.5 1.6 1.6 1.5 1.5 1.5 1.5 1.50
NH4+-N (mg/l) 0.12 0.08 0.09 0.05 0.05 0.03 0.06 0.25
NO3- -N (mg/l) 2.36 0.78 0.73 1.14 1.16 1.17 1.13 1.16
NO2- -N (mg/l) 0.02 0.01 0.01 0.04 0.04 0.05 0.13 0.09
T-P (mg/l) 0.03 0.33 0.07 0.07 0.02 0.06 0.09 0.07
PO4-P (mg/l) <0,01 <0,01 0.03 <0,01 <0,01 <0,01 <0,01 0.000
DO (mg/l) 9.8 10.0 9.5 8.8 9.0 9.1 8.7 8.70
SS (mg/l) 20.2 4.4 6.0 11.6 6.2 3.6 5.6 5.2
Phenol (mg/l) 0.001 0.002 0.001 <0,001 <0,001 <0,001 <0,001 <0,001
Cadmium (ug/l) <0,0005 <0,0005 <0,0005 <0,0005 <0,0005 <0,0005 <0,0005 <0,0005
Aresenic (ug/l) <0,00006 <0,00006 <0,00006 <0,00006 <0,00006 <0,00006 <0,00006 <0,00006
Cyanide (mg/l) <0,001 <0,001 <0,001 <0,001 <0,001 <0,001 <0,001 <0,001
Selenium (ug/l) <0,00001 <0,00001 <0,00001 <0,00001 <0,00001 <0,00001 <0,00001 <0,00001
Cr (ug/l) 0.004 0.005 <0,003 <0,003 <0,003 <0,003 <0,003 0.0035
Hg (ug/l) <0,0003 <0,0003 <0,0003 <0,0003 <0,0003 <0,0003 <0,0003 <0,0003
Ni2+ (ug/l) 0.0048 0.0028 0.0076 0.0045 0.0031 0.0041 0.0038 0.0075
Lead (ug/l) <0,001 <0,001 <0,001 <0,001 <0,001 <0,001 <0,001 <0,001
Copper (ug/l) 0.0128 0.0120 0.0129 0.0224 0.0185 0.0311 0.01 0.0235
Zinc (ug/l) <0,002 <0,002 <0,002 <0,002 <0,002 <0,002 <0,002 <0,002
Fe (ug/l) 1.0629 0.4781 0.3171 0.0530 0.0388 0.0608 0.0398 0.0428
F (mg/l) 0.072 0.051 0.056 0.057 0.046 0.052 0.051 0.097
PCB (ug/l) <0,001 <0,001 <0,001 <0,001 <0,001 <0,001 <0,001 <0,001Organo-chlorine(Pesticides) (ug/l) 0.002 0.015 0.001 0.001 0.011 0.007 0.002000 0.002000
Detergent (mg/l) 0.041 0.048 0.077 0.047 0.019 0.030 0.029 0.039
Total oil (n-hexane Extract) (mg/l) 0.036 0.054 0.083 0.143 0.162 0.084 0.090 0.080
Cl (Cloride) (mg/l) 10.4 2.6 2.8 4.1 4.1 4.2 4.4 5.57
Total coliform (MPN/100ml) 1500 4200 3100 5400 4400 6800 6100 11200
Fecal oliform (MPN/100ml) 200 340 1300 460 640 730 5400 2800
Table B.3.2 Results of Water Quality Observation of River/Tributary/Canal - 1/10
B-T14
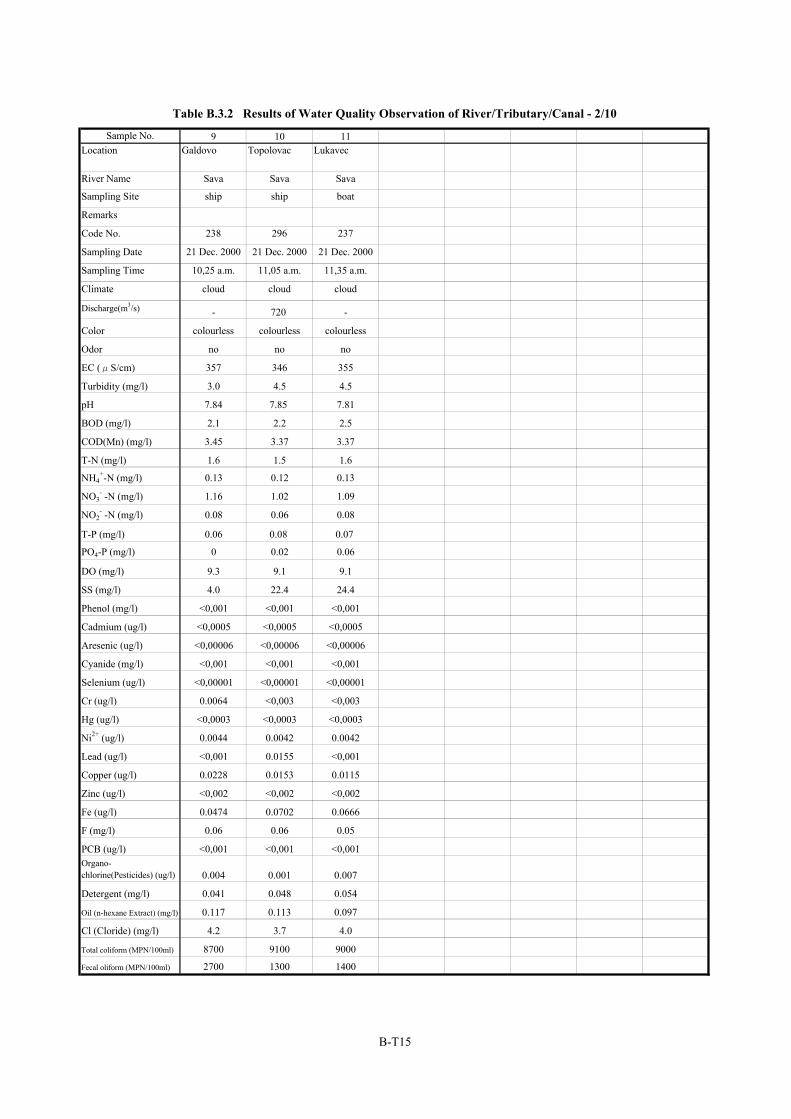
Sample No. 9 10 11Location Galdovo Topolovac Lukavec
River Name Sava Sava Sava
Sampling Site ship ship boat
Remarks
Code No. 238 296 237
Sampling Date 21 Dec. 2000 21 Dec. 2000 21 Dec. 2000
Sampling Time 10,25 a.m. 11,05 a.m. 11,35 a.m.
Climate cloud cloud cloud
Discharge(m3/s) - 720 -
Color colourless colourless colourless
Odor no no no
EC (μS/cm) 357 346 355
Turbidity (mg/l) 3.0 4.5 4.5
pH 7.84 7.85 7.81
BOD (mg/l) 2.1 2.2 2.5
COD(Mn) (mg/l) 3.45 3.37 3.37
T-N (mg/l) 1.6 1.5 1.6
NH4+-N (mg/l) 0.13 0.12 0.13
NO3- -N (mg/l) 1.16 1.02 1.09
NO2- -N (mg/l) 0.08 0.06 0.08
T-P (mg/l) 0.06 0.08 0.07
PO4-P (mg/l) 0 0.02 0.06
DO (mg/l) 9.3 9.1 9.1
SS (mg/l) 4.0 22.4 24.4
Phenol (mg/l) <0,001 <0,001 <0,001
Cadmium (ug/l) <0,0005 <0,0005 <0,0005
Aresenic (ug/l) <0,00006 <0,00006 <0,00006
Cyanide (mg/l) <0,001 <0,001 <0,001
Selenium (ug/l) <0,00001 <0,00001 <0,00001
Cr (ug/l) 0.0064 <0,003 <0,003
Hg (ug/l) <0,0003 <0,0003 <0,0003
Ni2+ (ug/l) 0.0044 0.0042 0.0042
Lead (ug/l) <0,001 0.0155 <0,001
Copper (ug/l) 0.0228 0.0153 0.0115
Zinc (ug/l) <0,002 <0,002 <0,002
Fe (ug/l) 0.0474 0.0702 0.0666
F (mg/l) 0.06 0.06 0.05
PCB (ug/l) <0,001 <0,001 <0,001Organo-chlorine(Pesticides) (ug/l) 0.004 0.001 0.007
Detergent (mg/l) 0.041 0.048 0.054
Oil (n-hexane Extract) (mg/l) 0.117 0.113 0.097
Cl (Cloride) (mg/l) 4.2 3.7 4.0
Total coliform (MPN/100ml) 8700 9100 9000
Fecal oliform (MPN/100ml) 2700 1300 1400
Table B.3.2 Results of Water Quality Observation of River/Tributary/Canal - 2/10
B-T15
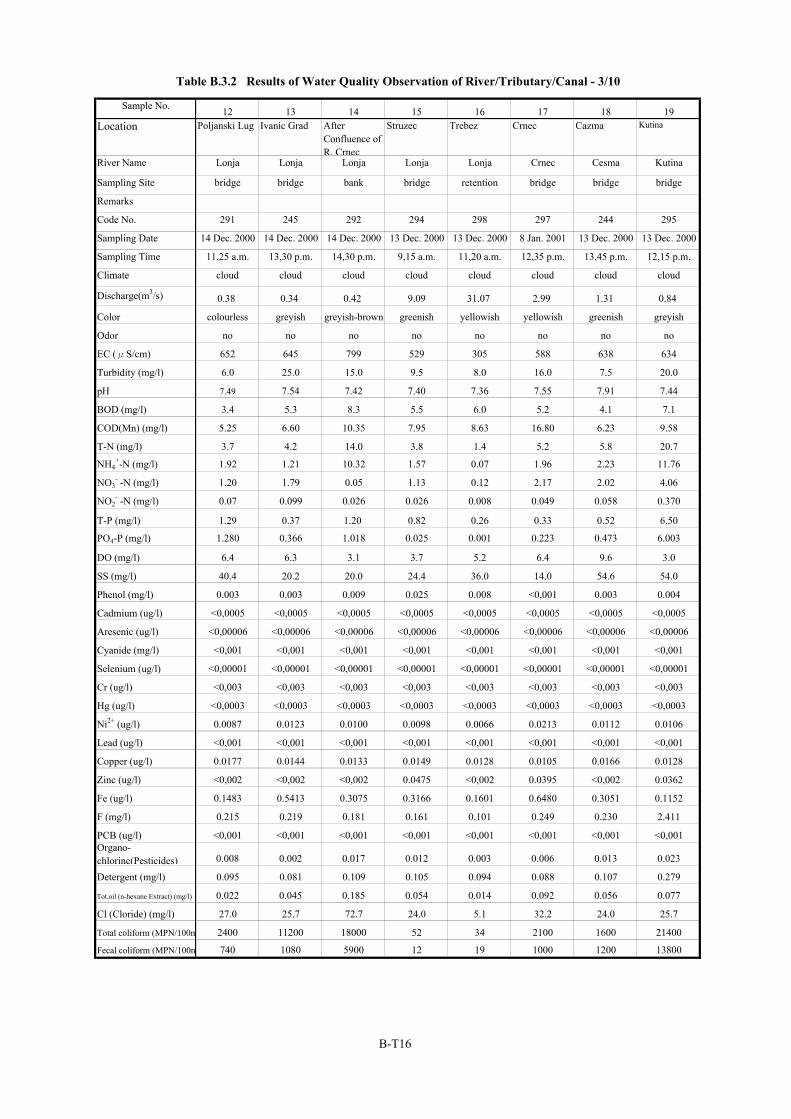
Sample No. 12 13 14 15 16 17 18 19Location Poljanski Lug Ivanic Grad After
Confluence ofR. Crnec
Struzec Trebez Crnec Cazma Kutina
River Name Lonja Lonja Lonja Lonja Lonja Crnec Cesma Kutina
Sampling Site bridge bridge bank bridge retention bridge bridge bridge
Remarks
Code No. 291 245 292 294 298 297 244 295
Sampling Date 14 Dec. 2000 14 Dec. 2000 14 Dec. 2000 13 Dec. 2000 13 Dec. 2000 8 Jan. 2001 13 Dec. 2000 13 Dec. 2000
Sampling Time 11,25 a.m. 13,30 p.m. 14,30 p.m. 9,15 a.m. 11,20 a.m. 12,35 p.m. 13,45 p.m. 12,15 p.m.
Climate cloud cloud cloud cloud cloud cloud cloud cloud
Discharge(m3/s) 0.38 0.34 0.42 9.09 31.07 2.99 1.31 0.84
Color colourless greyish greyish-brown greenish yellowish yellowish greenish greyish
Odor no no no no no no no no
EC (μS/cm) 652 645 799 529 305 588 638 634
Turbidity (mg/l) 6.0 25.0 15.0 9.5 8.0 16.0 7.5 20.0
pH 7.49 7.54 7.42 7.40 7.36 7.55 7.91 7.44
BOD (mg/l) 3.4 5.3 8.3 5.5 6.0 5.2 4.1 7.1
COD(Mn) (mg/l) 5.25 6.60 10.35 7.95 8.63 16.80 6.23 9.58
T-N (mg/l) 3.7 4.2 14.0 3.8 1.4 5.2 5.8 20.7
NH4+-N (mg/l) 1.92 1.21 10.32 1.57 0.07 1.96 2.23 11.76
NO3- -N (mg/l) 1.20 1.79 0.05 1.13 0.12 2.17 2.02 4.06
NO2- -N (mg/l) 0.07 0.099 0.026 0.026 0.008 0.049 0.058 0.370
T-P (mg/l) 1.29 0.37 1.20 0.82 0.26 0.33 0.52 6.50
PO4-P (mg/l) 1.280 0.366 1.018 0.025 0.001 0.223 0.473 6.003
DO (mg/l) 6.4 6.3 3.1 3.7 5.2 6.4 9.6 3.0
SS (mg/l) 40.4 20.2 20.0 24.4 36.0 14.0 54.6 54.0
Phenol (mg/l) 0.003 0.003 0.009 0.025 0.008 <0,001 0.003 0.004
Cadmium (ug/l) <0,0005 <0,0005 <0,0005 <0,0005 <0,0005 <0,0005 <0,0005 <0,0005
Aresenic (ug/l) <0,00006 <0,00006 <0,00006 <0,00006 <0,00006 <0,00006 <0,00006 <0,00006
Cyanide (mg/l) <0,001 <0,001 <0,001 <0,001 <0,001 <0,001 <0,001 <0,001
Selenium (ug/l) <0,00001 <0,00001 <0,00001 <0,00001 <0,00001 <0,00001 <0,00001 <0,00001
Cr (ug/l) <0,003 <0,003 <0,003 <0,003 <0,003 <0,003 <0,003 <0,003
Hg (ug/l) <0,0003 <0,0003 <0,0003 <0,0003 <0,0003 <0,0003 <0,0003 <0,0003
Ni2+ (ug/l) 0.0087 0.0123 0.0100 0.0098 0.0066 0.0213 0.0112 0.0106
Lead (ug/l) <0,001 <0,001 <0,001 <0,001 <0,001 <0,001 <0,001 <0,001
Copper (ug/l) 0.0177 0.0144 0.0133 0.0149 0.0128 0.0105 0.0166 0.0128
Zinc (ug/l) <0,002 <0,002 <0,002 0.0475 <0,002 0.0395 <0,002 0.0362
Fe (ug/l) 0.1483 0.5413 0.3075 0.3166 0.1601 0.6480 0.3051 0.1152
F (mg/l) 0.215 0.219 0.181 0.161 0.101 0.249 0.230 2.411
PCB (ug/l) <0,001 <0,001 <0,001 <0,001 <0,001 <0,001 <0,001 <0,001Organo-chlorine(Pesticides) 0.008 0.002 0.017 0.012 0.003 0.006 0.013 0.023
Detergent (mg/l) 0.095 0.081 0.109 0.105 0.094 0.088 0.107 0.279
Tot.oil (n-hexane Extract) (mg/l) 0.022 0.045 0.185 0.054 0.014 0.092 0.056 0.077
Cl (Cloride) (mg/l) 27.0 25.7 72.7 24.0 5.1 32.2 24.0 25.7
Total coliform (MPN/100m 2400 11200 18000 52 34 2100 1600 21400
Fecal coliform (MPN/100m 740 1080 5900 12 19 1000 1200 13800
Table B.3.2 Results of Water Quality Observation of River/Tributary/Canal - 3/10
B-T16
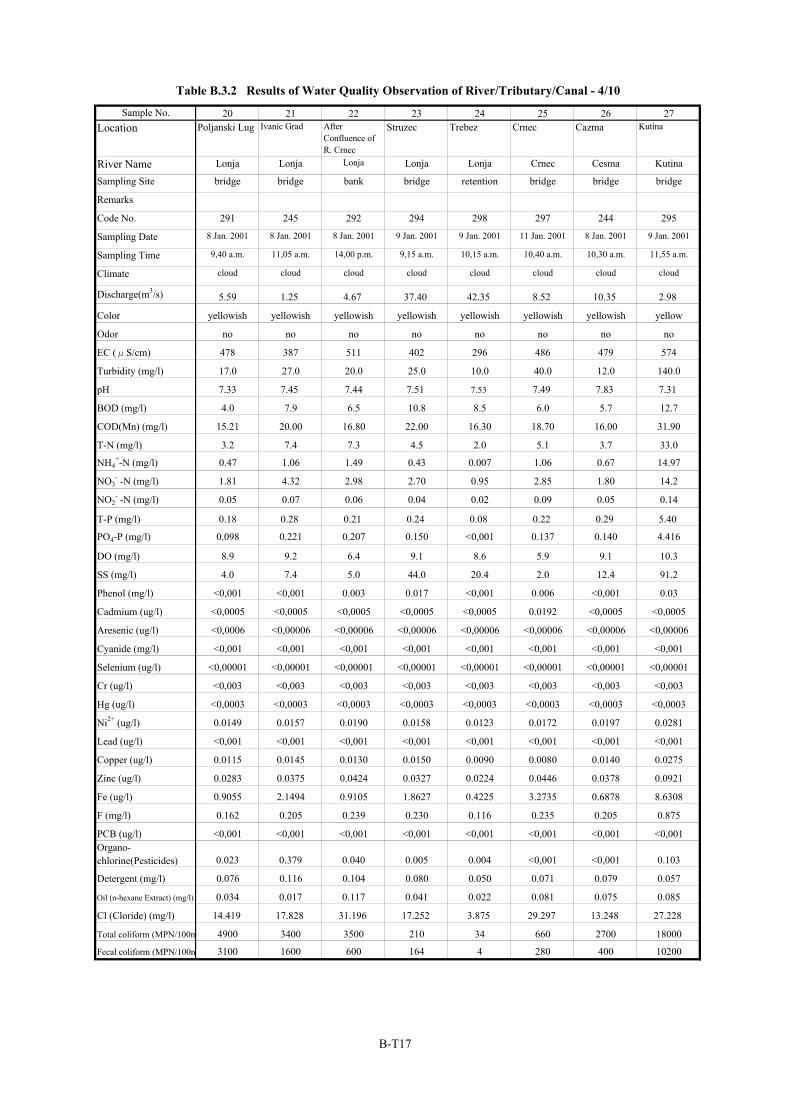
Sample No. 20 21 22 23 24 25 26 27Location Poljanski Lug Ivanic Grad After
Confluence ofR. Crnec
Struzec Trebez Crnec Cazma Kutina
River Name Lonja Lonja Lonja Lonja Lonja Crnec Cesma Kutina
Sampling Site bridge bridge bank bridge retention bridge bridge bridge
Remarks
Code No. 291 245 292 294 298 297 244 295
Sampling Date 8 Jan. 2001 8 Jan. 2001 8 Jan. 2001 9 Jan. 2001 9 Jan. 2001 11 Jan. 2001 8 Jan. 2001 9 Jan. 2001
Sampling Time 9,40 a.m. 11,05 a.m. 14,00 p.m. 9,15 a.m. 10,15 a.m. 10,40 a.m. 10,30 a.m. 11,55 a.m.
Climate cloud cloud cloud cloud cloud cloud cloud cloud
Discharge(m3/s) 5.59 1.25 4.67 37.40 42.35 8.52 10.35 2.98
Color yellowish yellowish yellowish yellowish yellowish yellowish yellowish yellow
Odor no no no no no no no no
EC (μS/cm) 478 387 511 402 296 486 479 574
Turbidity (mg/l) 17.0 27.0 20.0 25.0 10.0 40.0 12.0 140.0
pH 7.33 7.45 7.44 7.51 7.53 7.49 7.83 7.31
BOD (mg/l) 4.0 7.9 6.5 10.8 8.5 6.0 5.7 12.7
COD(Mn) (mg/l) 15.21 20.00 16.80 22.00 16.30 18.70 16.00 31.90
T-N (mg/l) 3.2 7.4 7.3 4.5 2.0 5.1 3.7 33.0
NH4+-N (mg/l) 0.47 1.06 1.49 0.43 0.007 1.06 0.67 14.97
NO3- -N (mg/l) 1.81 4.32 2.98 2.70 0.95 2.85 1.80 14.2
NO2- -N (mg/l) 0.05 0.07 0.06 0.04 0.02 0.09 0.05 0.14
T-P (mg/l) 0.18 0.28 0.21 0.24 0.08 0.22 0.29 5.40
PO4-P (mg/l) 0.098 0.221 0.207 0.150 <0,001 0.137 0.140 4.416
DO (mg/l) 8.9 9.2 6.4 9.1 8.6 5.9 9.1 10.3
SS (mg/l) 4.0 7.4 5.0 44.0 20.4 2.0 12.4 91.2
Phenol (mg/l) <0,001 <0,001 0.003 0.017 <0,001 0.006 <0,001 0.03
Cadmium (ug/l) <0,0005 <0,0005 <0,0005 <0,0005 <0,0005 0.0192 <0,0005 <0,0005
Aresenic (ug/l) <0,0006 <0,00006 <0,00006 <0,00006 <0,00006 <0,00006 <0,00006 <0,00006
Cyanide (mg/l) <0,001 <0,001 <0,001 <0,001 <0,001 <0,001 <0,001 <0,001
Selenium (ug/l) <0,00001 <0,00001 <0,00001 <0,00001 <0,00001 <0,00001 <0,00001 <0,00001
Cr (ug/l) <0,003 <0,003 <0,003 <0,003 <0,003 <0,003 <0,003 <0,003
Hg (ug/l) <0,0003 <0,0003 <0,0003 <0,0003 <0,0003 <0,0003 <0,0003 <0,0003
Ni2+ (ug/l) 0.0149 0.0157 0.0190 0.0158 0.0123 0.0172 0.0197 0.0281
Lead (ug/l) <0,001 <0,001 <0,001 <0,001 <0,001 <0,001 <0,001 <0,001
Copper (ug/l) 0.0115 0.0145 0.0130 0.0150 0.0090 0.0080 0.0140 0.0275
Zinc (ug/l) 0.0283 0.0375 0.0424 0.0327 0.0224 0.0446 0.0378 0.0921
Fe (ug/l) 0.9055 2.1494 0.9105 1.8627 0.4225 3.2735 0.6878 8.6308
F (mg/l) 0.162 0.205 0.239 0.230 0.116 0.235 0.205 0.875
PCB (ug/l) <0,001 <0,001 <0,001 <0,001 <0,001 <0,001 <0,001 <0,001Organo-chlorine(Pesticides) 0.023 0.379 0.040 0.005 0.004 <0,001 <0,001 0.103
Detergent (mg/l) 0.076 0.116 0.104 0.080 0.050 0.071 0.079 0.057
Oil (n-hexane Extract) (mg/l) 0.034 0.017 0.117 0.041 0.022 0.081 0.075 0.085
Cl (Cloride) (mg/l) 14.419 17.828 31.196 17.252 3.875 29.297 13.248 27.228
Total coliform (MPN/100m 4900 3400 3500 210 34 660 2700 18000
Fecal coliform (MPN/100m 3100 1600 600 164 4 280 400 10200
Table B.3.2 Results of Water Quality Observation of River/Tributary/Canal - 4/10
B-T17
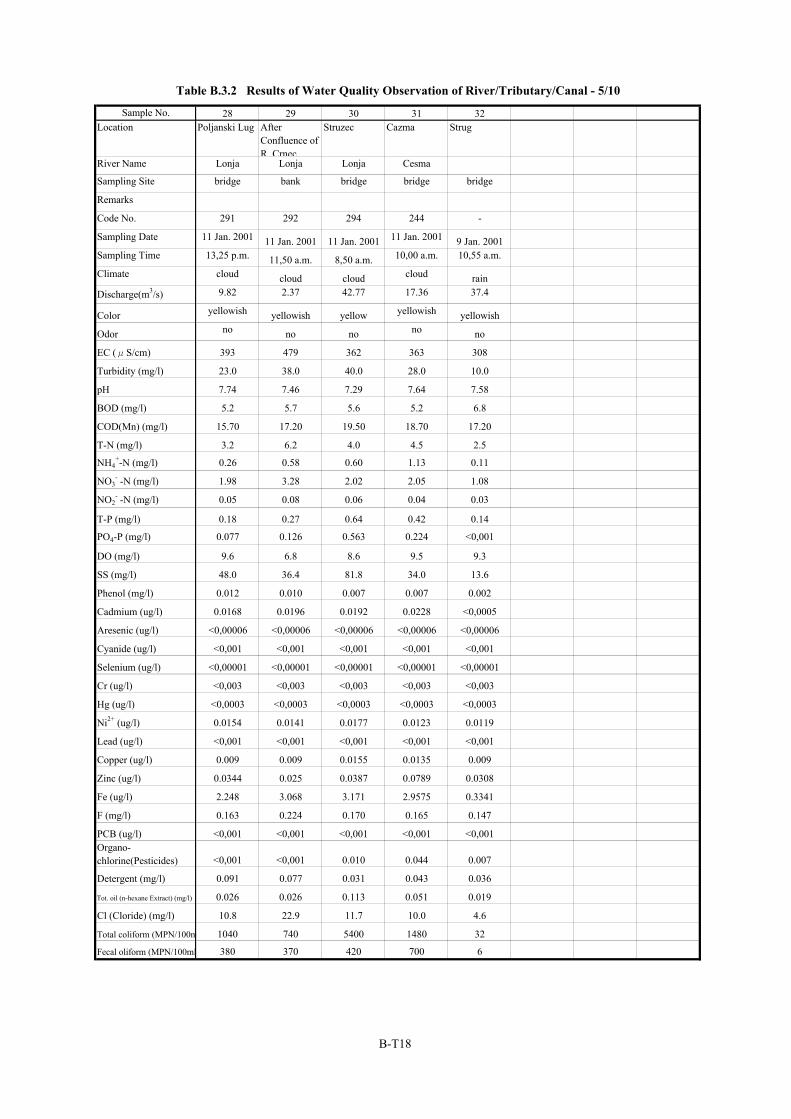
Sample No. 28 29 30 31 32Location Poljanski Lug After
Confluence ofR Crnec
Struzec Cazma Strug
River Name Lonja Lonja Lonja Cesma
Sampling Site bridge bank bridge bridge bridge
Remarks
Code No. 291 292 294 244 -
Sampling Date 11 Jan. 2001 11 Jan. 2001 11 Jan. 2001 11 Jan. 2001 9 Jan. 2001Sampling Time 13,25 p.m. 11,50 a.m. 8,50 a.m. 10,00 a.m. 10,55 a.m.
Climate cloud cloud cloud cloud rainDischarge(m3/s) 9.82 2.37 42.77 17.36 37.4
Color yellowish yellowish yellow yellowish yellowish
Odor no no no no no
EC (μS/cm) 393 479 362 363 308
Turbidity (mg/l) 23.0 38.0 40.0 28.0 10.0
pH 7.74 7.46 7.29 7.64 7.58
BOD (mg/l) 5.2 5.7 5.6 5.2 6.8
COD(Mn) (mg/l) 15.70 17.20 19.50 18.70 17.20
T-N (mg/l) 3.2 6.2 4.0 4.5 2.5
NH4+-N (mg/l) 0.26 0.58 0.60 1.13 0.11
NO3- -N (mg/l) 1.98 3.28 2.02 2.05 1.08
NO2- -N (mg/l) 0.05 0.08 0.06 0.04 0.03
T-P (mg/l) 0.18 0.27 0.64 0.42 0.14
PO4-P (mg/l) 0.077 0.126 0.563 0.224 <0,001
DO (mg/l) 9.6 6.8 8.6 9.5 9.3
SS (mg/l) 48.0 36.4 81.8 34.0 13.6
Phenol (mg/l) 0.012 0.010 0.007 0.007 0.002
Cadmium (ug/l) 0.0168 0.0196 0.0192 0.0228 <0,0005
Aresenic (ug/l) <0,00006 <0,00006 <0,00006 <0,00006 <0,00006
Cyanide (ug/l) <0,001 <0,001 <0,001 <0,001 <0,001
Selenium (ug/l) <0,00001 <0,00001 <0,00001 <0,00001 <0,00001
Cr (ug/l) <0,003 <0,003 <0,003 <0,003 <0,003
Hg (ug/l) <0,0003 <0,0003 <0,0003 <0,0003 <0,0003
Ni2+ (ug/l) 0.0154 0.0141 0.0177 0.0123 0.0119
Lead (ug/l) <0,001 <0,001 <0,001 <0,001 <0,001
Copper (ug/l) 0.009 0.009 0.0155 0.0135 0.009
Zinc (ug/l) 0.0344 0.025 0.0387 0.0789 0.0308
Fe (ug/l) 2.248 3.068 3.171 2.9575 0.3341
F (mg/l) 0.163 0.224 0.170 0.165 0.147
PCB (ug/l) <0,001 <0,001 <0,001 <0,001 <0,001Organo-chlorine(Pesticides) <0,001 <0,001 0.010 0.044 0.007
Detergent (mg/l) 0.091 0.077 0.031 0.043 0.036
Tot. oil (n-hexane Extract) (mg/l) 0.026 0.026 0.113 0.051 0.019
Cl (Cloride) (mg/l) 10.8 22.9 11.7 10.0 4.6
Total coliform (MPN/100m 1040 740 5400 1480 32
Fecal oliform (MPN/100ml 380 370 420 700 6
Table B.3.2 Results of Water Quality Observation of River/Tributary/Canal - 5/10
B-T18
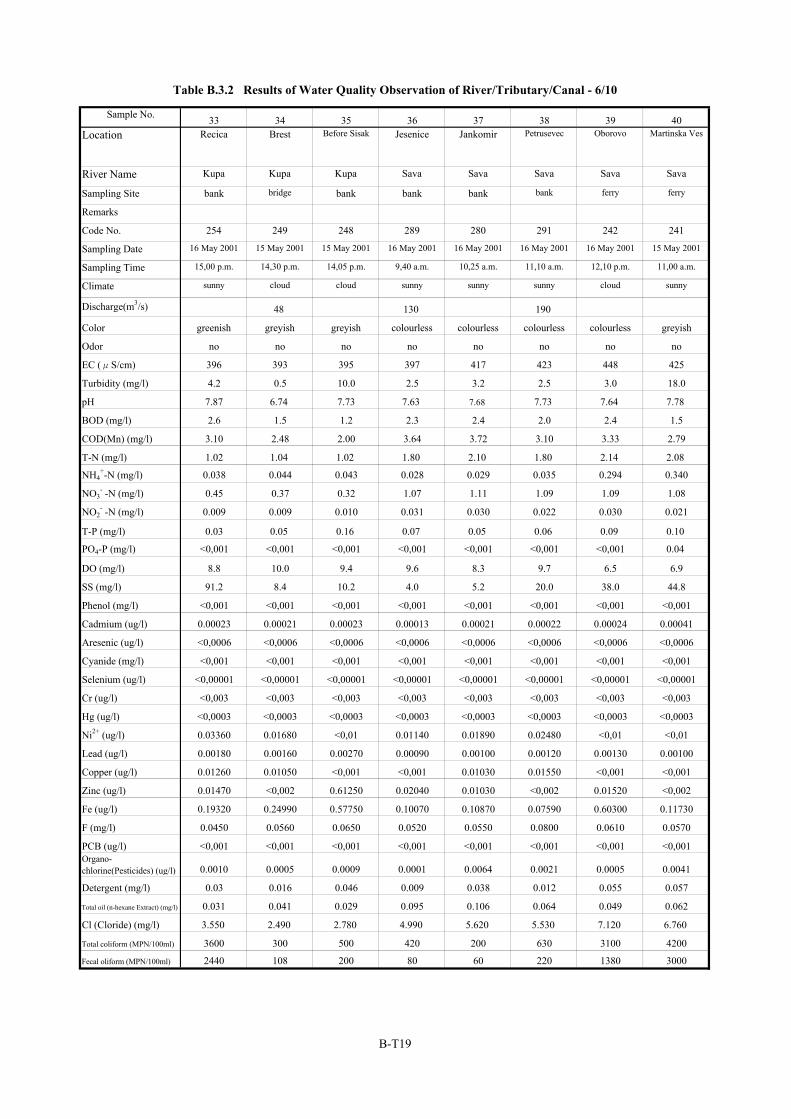
Sample No. 33 34 35 36 37 38 39 40Location Recica Brest Before Sisak Jesenice Jankomir Petrusevec Oborovo Martinska Ves
River Name Kupa Kupa Kupa Sava Sava Sava Sava Sava
Sampling Site bank bridge bank bank bank bank ferry ferry
Remarks
Code No. 254 249 248 289 280 291 242 241
Sampling Date 16 May 2001 15 May 2001 15 May 2001 16 May 2001 16 May 2001 16 May 2001 16 May 2001 15 May 2001
Sampling Time 15,00 p.m. 14,30 p.m. 14,05 p.m. 9,40 a.m. 10,25 a.m. 11,10 a.m. 12,10 p.m. 11,00 a.m.
Climate sunny cloud cloud sunny sunny sunny cloud sunny
Discharge(m3/s) 48 130 190
Color greenish greyish greyish colourless colourless colourless colourless greyish
Odor no no no no no no no no
EC (μS/cm) 396 393 395 397 417 423 448 425
Turbidity (mg/l) 4.2 0.5 10.0 2.5 3.2 2.5 3.0 18.0
pH 7.87 6.74 7.73 7.63 7.68 7.73 7.64 7.78
BOD (mg/l) 2.6 1.5 1.2 2.3 2.4 2.0 2.4 1.5
COD(Mn) (mg/l) 3.10 2.48 2.00 3.64 3.72 3.10 3.33 2.79
T-N (mg/l) 1.02 1.04 1.02 1.80 2.10 1.80 2.14 2.08
NH4+-N (mg/l) 0.038 0.044 0.043 0.028 0.029 0.035 0.294 0.340
NO3- -N (mg/l) 0.45 0.37 0.32 1.07 1.11 1.09 1.09 1.08
NO2- -N (mg/l) 0.009 0.009 0.010 0.031 0.030 0.022 0.030 0.021
T-P (mg/l) 0.03 0.05 0.16 0.07 0.05 0.06 0.09 0.10
PO4-P (mg/l) <0,001 <0,001 <0,001 <0,001 <0,001 <0,001 <0,001 0.04
DO (mg/l) 8.8 10.0 9.4 9.6 8.3 9.7 6.5 6.9
SS (mg/l) 91.2 8.4 10.2 4.0 5.2 20.0 38.0 44.8
Phenol (mg/l) <0,001 <0,001 <0,001 <0,001 <0,001 <0,001 <0,001 <0,001
Cadmium (ug/l) 0.00023 0.00021 0.00023 0.00013 0.00021 0.00022 0.00024 0.00041
Aresenic (ug/l) <0,0006 <0,0006 <0,0006 <0,0006 <0,0006 <0,0006 <0,0006 <0,0006
Cyanide (mg/l) <0,001 <0,001 <0,001 <0,001 <0,001 <0,001 <0,001 <0,001
Selenium (ug/l) <0,00001 <0,00001 <0,00001 <0,00001 <0,00001 <0,00001 <0,00001 <0,00001
Cr (ug/l) <0,003 <0,003 <0,003 <0,003 <0,003 <0,003 <0,003 <0,003
Hg (ug/l) <0,0003 <0,0003 <0,0003 <0,0003 <0,0003 <0,0003 <0,0003 <0,0003
Ni2+ (ug/l) 0.03360 0.01680 <0,01 0.01140 0.01890 0.02480 <0,01 <0,01
Lead (ug/l) 0.00180 0.00160 0.00270 0.00090 0.00100 0.00120 0.00130 0.00100
Copper (ug/l) 0.01260 0.01050 <0,001 <0,001 0.01030 0.01550 <0,001 <0,001
Zinc (ug/l) 0.01470 <0,002 0.61250 0.02040 0.01030 <0,002 0.01520 <0,002
Fe (ug/l) 0.19320 0.24990 0.57750 0.10070 0.10870 0.07590 0.60300 0.11730
F (mg/l) 0.0450 0.0560 0.0650 0.0520 0.0550 0.0800 0.0610 0.0570
PCB (ug/l) <0,001 <0,001 <0,001 <0,001 <0,001 <0,001 <0,001 <0,001Organo-chlorine(Pesticides) (ug/l) 0.0010 0.0005 0.0009 0.0001 0.0064 0.0021 0.0005 0.0041
Detergent (mg/l) 0.03 0.016 0.046 0.009 0.038 0.012 0.055 0.057
Total oil (n-hexane Extract) (mg/l) 0.031 0.041 0.029 0.095 0.106 0.064 0.049 0.062
Cl (Cloride) (mg/l) 3.550 2.490 2.780 4.990 5.620 5.530 7.120 6.760
Total coliform (MPN/100ml) 3600 300 500 420 200 630 3100 4200
Fecal oliform (MPN/100ml) 2440 108 200 80 60 220 1380 3000
Table B.3.2 Results of Water Quality Observation of River/Tributary/Canal - 6/10
B-T19
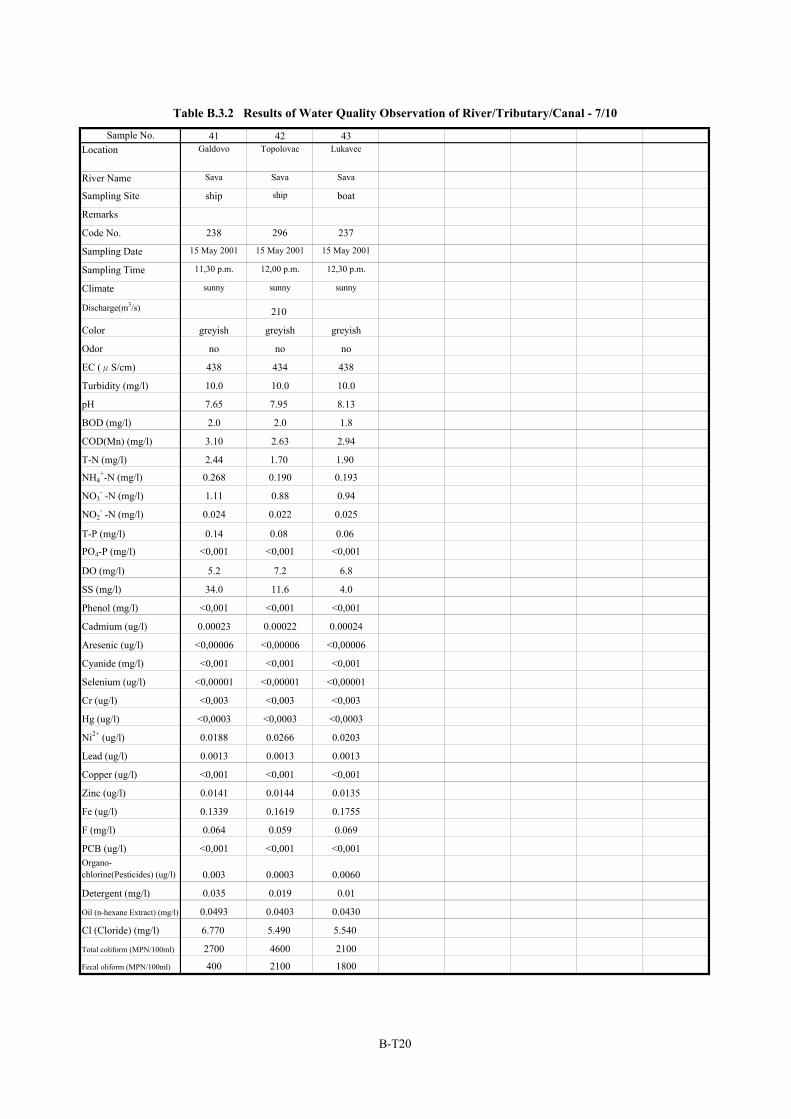
Sample No. 41 42 43Location Galdovo Topolovac Lukavec
River Name Sava Sava Sava
Sampling Site ship ship boat
Remarks
Code No. 238 296 237
Sampling Date 15 May 2001 15 May 2001 15 May 2001
Sampling Time 11,30 p.m. 12,00 p.m. 12,30 p.m.
Climate sunny sunny sunny
Discharge(m3/s) 210
Color greyish greyish greyish
Odor no no no
EC (μS/cm) 438 434 438
Turbidity (mg/l) 10.0 10.0 10.0
pH 7.65 7.95 8.13
BOD (mg/l) 2.0 2.0 1.8
COD(Mn) (mg/l) 3.10 2.63 2.94
T-N (mg/l) 2.44 1.70 1.90
NH4+-N (mg/l) 0.268 0.190 0.193
NO3- -N (mg/l) 1.11 0.88 0.94
NO2- -N (mg/l) 0.024 0.022 0.025
T-P (mg/l) 0.14 0.08 0.06
PO4-P (mg/l) <0,001 <0,001 <0,001
DO (mg/l) 5.2 7.2 6.8
SS (mg/l) 34.0 11.6 4.0
Phenol (mg/l) <0,001 <0,001 <0,001
Cadmium (ug/l) 0.00023 0.00022 0.00024
Aresenic (ug/l) <0,00006 <0,00006 <0,00006
Cyanide (mg/l) <0,001 <0,001 <0,001
Selenium (ug/l) <0,00001 <0,00001 <0,00001
Cr (ug/l) <0,003 <0,003 <0,003
Hg (ug/l) <0,0003 <0,0003 <0,0003
Ni2+ (ug/l) 0.0188 0.0266 0.0203
Lead (ug/l) 0.0013 0.0013 0.0013
Copper (ug/l) <0,001 <0,001 <0,001
Zinc (ug/l) 0.0141 0.0144 0.0135
Fe (ug/l) 0.1339 0.1619 0.1755
F (mg/l) 0.064 0.059 0.069
PCB (ug/l) <0,001 <0,001 <0,001Organo-chlorine(Pesticides) (ug/l) 0.003 0.0003 0.0060
Detergent (mg/l) 0.035 0.019 0.01
Oil (n-hexane Extract) (mg/l) 0.0493 0.0403 0.0430
Cl (Cloride) (mg/l) 6.770 5.490 5.540
Total coliform (MPN/100ml) 2700 4600 2100
Fecal oliform (MPN/100ml) 400 2100 1800
Table B.3.2 Results of Water Quality Observation of River/Tributary/Canal - 7/10
B-T20
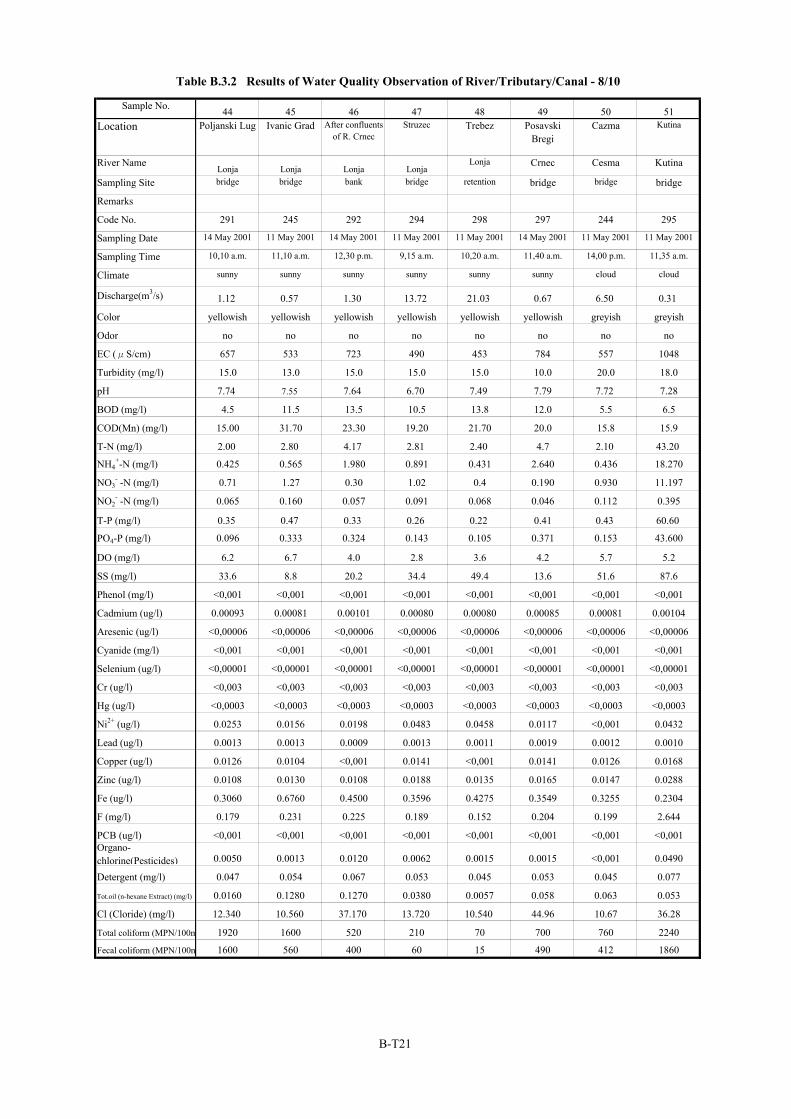
Sample No. 44 45 46 47 48 49 50 51Location Poljanski Lug Ivanic Grad After confluents
of R. CrnecStruzec Trebez Posavski
BregiCazma Kutina
River NameLonja Lonja Lonja Lonja
Lonja Crnec Cesma Kutina
Sampling Site bridge bridge bank bridge retention bridge bridge bridge
Remarks
Code No. 291 245 292 294 298 297 244 295
Sampling Date 14 May 2001 11 May 2001 14 May 2001 11 May 2001 11 May 2001 14 May 2001 11 May 2001 11 May 2001
Sampling Time 10,10 a.m. 11,10 a.m. 12,30 p.m. 9,15 a.m. 10,20 a.m. 11,40 a.m. 14,00 p.m. 11,35 a.m.
Climate sunny sunny sunny sunny sunny sunny cloud cloud
Discharge(m3/s) 1.12 0.57 1.30 13.72 21.03 0.67 6.50 0.31
Color yellowish yellowish yellowish yellowish yellowish yellowish greyish greyish
Odor no no no no no no no no
EC (μS/cm) 657 533 723 490 453 784 557 1048
Turbidity (mg/l) 15.0 13.0 15.0 15.0 15.0 10.0 20.0 18.0
pH 7.74 7.55 7.64 6.70 7.49 7.79 7.72 7.28
BOD (mg/l) 4.5 11.5 13.5 10.5 13.8 12.0 5.5 6.5
COD(Mn) (mg/l) 15.00 31.70 23.30 19.20 21.70 20.0 15.8 15.9
T-N (mg/l) 2.00 2.80 4.17 2.81 2.40 4.7 2.10 43.20
NH4+-N (mg/l) 0.425 0.565 1.980 0.891 0.431 2.640 0.436 18.270
NO3- -N (mg/l) 0.71 1.27 0.30 1.02 0.4 0.190 0.930 11.197
NO2- -N (mg/l) 0.065 0.160 0.057 0.091 0.068 0.046 0.112 0.395
T-P (mg/l) 0.35 0.47 0.33 0.26 0.22 0.41 0.43 60.60
PO4-P (mg/l) 0.096 0.333 0.324 0.143 0.105 0.371 0.153 43.600
DO (mg/l) 6.2 6.7 4.0 2.8 3.6 4.2 5.7 5.2
SS (mg/l) 33.6 8.8 20.2 34.4 49.4 13.6 51.6 87.6
Phenol (mg/l) <0,001 <0,001 <0,001 <0,001 <0,001 <0,001 <0,001 <0,001
Cadmium (ug/l) 0.00093 0.00081 0.00101 0.00080 0.00080 0.00085 0.00081 0.00104
Aresenic (ug/l) <0,00006 <0,00006 <0,00006 <0,00006 <0,00006 <0,00006 <0,00006 <0,00006
Cyanide (mg/l) <0,001 <0,001 <0,001 <0,001 <0,001 <0,001 <0,001 <0,001
Selenium (ug/l) <0,00001 <0,00001 <0,00001 <0,00001 <0,00001 <0,00001 <0,00001 <0,00001
Cr (ug/l) <0,003 <0,003 <0,003 <0,003 <0,003 <0,003 <0,003 <0,003
Hg (ug/l) <0,0003 <0,0003 <0,0003 <0,0003 <0,0003 <0,0003 <0,0003 <0,0003
Ni2+ (ug/l) 0.0253 0.0156 0.0198 0.0483 0.0458 0.0117 <0,001 0.0432
Lead (ug/l) 0.0013 0.0013 0.0009 0.0013 0.0011 0.0019 0.0012 0.0010
Copper (ug/l) 0.0126 0.0104 <0,001 0.0141 <0,001 0.0141 0.0126 0.0168
Zinc (ug/l) 0.0108 0.0130 0.0108 0.0188 0.0135 0.0165 0.0147 0.0288
Fe (ug/l) 0.3060 0.6760 0.4500 0.3596 0.4275 0.3549 0.3255 0.2304
F (mg/l) 0.179 0.231 0.225 0.189 0.152 0.204 0.199 2.644
PCB (ug/l) <0,001 <0,001 <0,001 <0,001 <0,001 <0,001 <0,001 <0,001Organo-chlorine(Pesticides) 0.0050 0.0013 0.0120 0.0062 0.0015 0.0015 <0,001 0.0490
Detergent (mg/l) 0.047 0.054 0.067 0.053 0.045 0.053 0.045 0.077
Tot.oil (n-hexane Extract) (mg/l) 0.0160 0.1280 0.1270 0.0380 0.0057 0.058 0.063 0.053
Cl (Cloride) (mg/l) 12.340 10.560 37.170 13.720 10.540 44.96 10.67 36.28
Total coliform (MPN/100m 1920 1600 520 210 70 700 760 2240
Fecal coliform (MPN/100m 1600 560 400 60 15 490 412 1860
Table B.3.2 Results of Water Quality Observation of River/Tributary/Canal - 8/10
B-T21
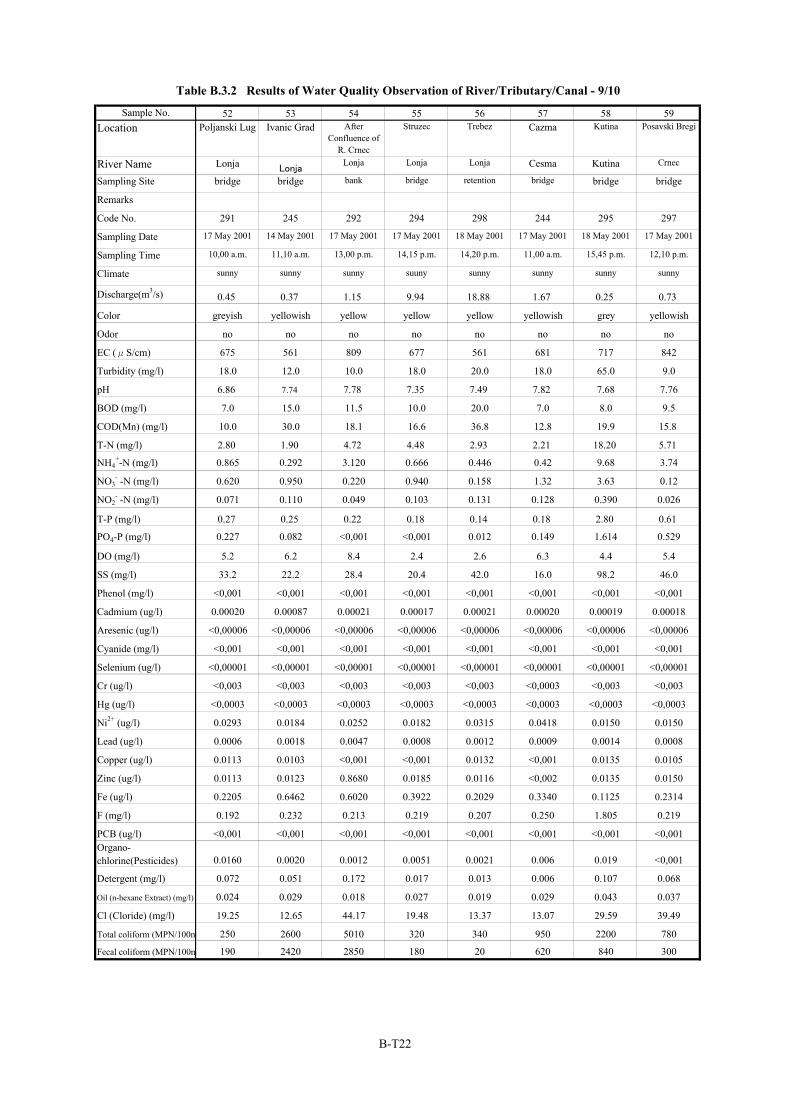
Sample No. 52 53 54 55 56 57 58 59Location Poljanski Lug Ivanic Grad After
Confluence ofR. Crnec
Struzec Trebez Cazma Kutina Posavski Bregi
River Name Lonja LonjaLonja Lonja Lonja Cesma Kutina Crnec
Sampling Site bridge bridge bank bridge retention bridge bridge bridge
Remarks
Code No. 291 245 292 294 298 244 295 297
Sampling Date 17 May 2001 14 May 2001 17 May 2001 17 May 2001 18 May 2001 17 May 2001 18 May 2001 17 May 2001
Sampling Time 10,00 a.m. 11,10 a.m. 13,00 p.m. 14,15 p.m. 14,20 p.m. 11,00 a.m. 15,45 p.m. 12,10 p.m.
Climate sunny sunny sunny suuny sunny sunny sunny sunny
Discharge(m3/s) 0.45 0.37 1.15 9.94 18.88 1.67 0.25 0.73
Color greyish yellowish yellow yellow yellow yellowish grey yellowish
Odor no no no no no no no no
EC (μS/cm) 675 561 809 677 561 681 717 842
Turbidity (mg/l) 18.0 12.0 10.0 18.0 20.0 18.0 65.0 9.0
pH 6.86 7.74 7.78 7.35 7.49 7.82 7.68 7.76
BOD (mg/l) 7.0 15.0 11.5 10.0 20.0 7.0 8.0 9.5
COD(Mn) (mg/l) 10.0 30.0 18.1 16.6 36.8 12.8 19.9 15.8
T-N (mg/l) 2.80 1.90 4.72 4.48 2.93 2.21 18.20 5.71
NH4+-N (mg/l) 0.865 0.292 3.120 0.666 0.446 0.42 9.68 3.74
NO3- -N (mg/l) 0.620 0.950 0.220 0.940 0.158 1.32 3.63 0.12
NO2- -N (mg/l) 0.071 0.110 0.049 0.103 0.131 0.128 0.390 0.026
T-P (mg/l) 0.27 0.25 0.22 0.18 0.14 0.18 2.80 0.61
PO4-P (mg/l) 0.227 0.082 <0,001 <0,001 0.012 0.149 1.614 0.529
DO (mg/l) 5.2 6.2 8.4 2.4 2.6 6.3 4.4 5.4
SS (mg/l) 33.2 22.2 28.4 20.4 42.0 16.0 98.2 46.0
Phenol (mg/l) <0,001 <0,001 <0,001 <0,001 <0,001 <0,001 <0,001 <0,001
Cadmium (ug/l) 0.00020 0.00087 0.00021 0.00017 0.00021 0.00020 0.00019 0.00018
Aresenic (ug/l) <0,00006 <0,00006 <0,00006 <0,00006 <0,00006 <0,00006 <0,00006 <0,00006
Cyanide (mg/l) <0,001 <0,001 <0,001 <0,001 <0,001 <0,001 <0,001 <0,001
Selenium (ug/l) <0,00001 <0,00001 <0,00001 <0,00001 <0,00001 <0,00001 <0,00001 <0,00001
Cr (ug/l) <0,003 <0,003 <0,003 <0,003 <0,003 <0,0003 <0,003 <0,003
Hg (ug/l) <0,0003 <0,0003 <0,0003 <0,0003 <0,0003 <0,0003 <0,0003 <0,0003
Ni2+ (ug/l) 0.0293 0.0184 0.0252 0.0182 0.0315 0.0418 0.0150 0.0150
Lead (ug/l) 0.0006 0.0018 0.0047 0.0008 0.0012 0.0009 0.0014 0.0008
Copper (ug/l) 0.0113 0.0103 <0,001 <0,001 0.0132 <0,001 0.0135 0.0105
Zinc (ug/l) 0.0113 0.0123 0.8680 0.0185 0.0116 <0,002 0.0135 0.0150
Fe (ug/l) 0.2205 0.6462 0.6020 0.3922 0.2029 0.3340 0.1125 0.2314
F (mg/l) 0.192 0.232 0.213 0.219 0.207 0.250 1.805 0.219
PCB (ug/l) <0,001 <0,001 <0,001 <0,001 <0,001 <0,001 <0,001 <0,001Organo-chlorine(Pesticides) 0.0160 0.0020 0.0012 0.0051 0.0021 0.006 0.019 <0,001
Detergent (mg/l) 0.072 0.051 0.172 0.017 0.013 0.006 0.107 0.068
Oil (n-hexane Extract) (mg/l) 0.024 0.029 0.018 0.027 0.019 0.029 0.043 0.037
Cl (Cloride) (mg/l) 19.25 12.65 44.17 19.48 13.37 13.07 29.59 39.49
Total coliform (MPN/100m 250 2600 5010 320 340 950 2200 780
Fecal coliform (MPN/100m 190 2420 2850 180 20 620 840 300
Table B.3.2 Results of Water Quality Observation of River/Tributary/Canal - 9/10
B-T22
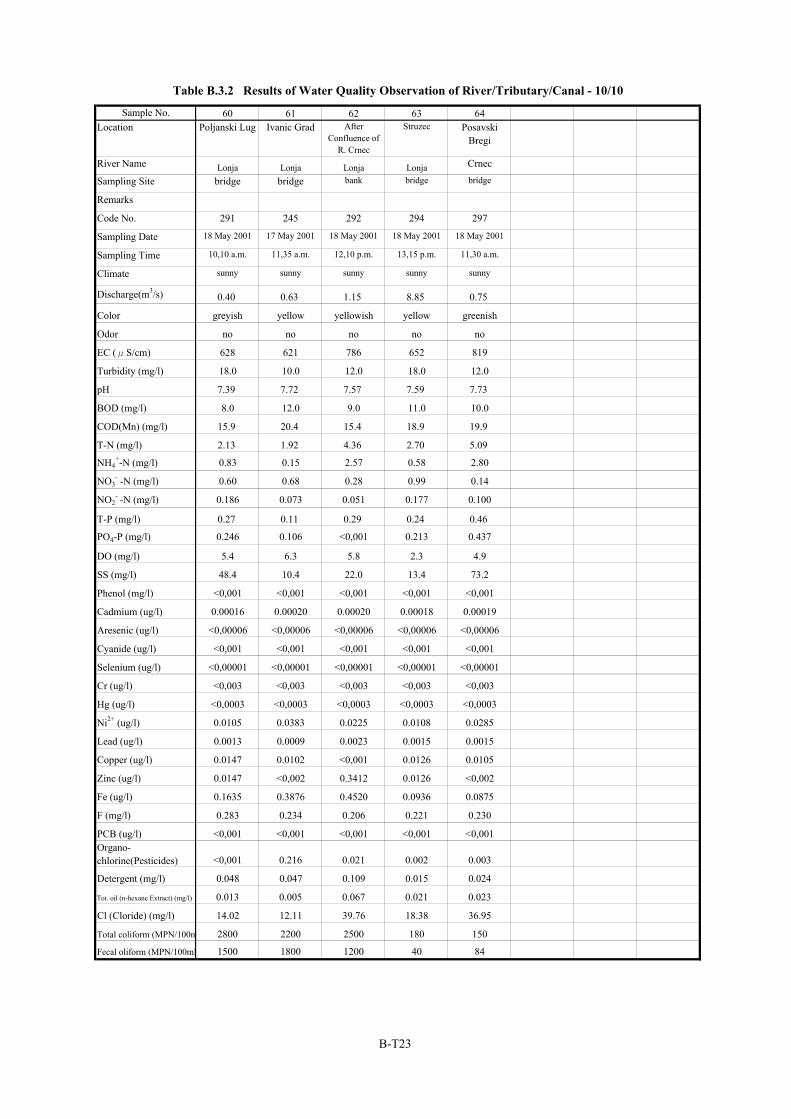
Sample No. 60 61 62 63 64Location Poljanski Lug Ivanic Grad After
Confluence ofR. Crnec
Struzec PosavskiBregi
River Name Lonja Lonja Lonja Lonja Crnec
Sampling Site bridge bridge bank bridge bridge
Remarks
Code No. 291 245 292 294 297
Sampling Date 18 May 2001 17 May 2001 18 May 2001 18 May 2001 18 May 2001
Sampling Time 10,10 a.m. 11,35 a.m. 12,10 p.m. 13,15 p.m. 11,30 a.m.
Climate sunny sunny sunny sunny sunny
Discharge(m3/s) 0.40 0.63 1.15 8.85 0.75
Color greyish yellow yellowish yellow greenish
Odor no no no no no
EC (μS/cm) 628 621 786 652 819
Turbidity (mg/l) 18.0 10.0 12.0 18.0 12.0
pH 7.39 7.72 7.57 7.59 7.73
BOD (mg/l) 8.0 12.0 9.0 11.0 10.0
COD(Mn) (mg/l) 15.9 20.4 15.4 18.9 19.9
T-N (mg/l) 2.13 1.92 4.36 2.70 5.09
NH4+-N (mg/l) 0.83 0.15 2.57 0.58 2.80
NO3- -N (mg/l) 0.60 0.68 0.28 0.99 0.14
NO2- -N (mg/l) 0.186 0.073 0.051 0.177 0.100
T-P (mg/l) 0.27 0.11 0.29 0.24 0.46
PO4-P (mg/l) 0.246 0.106 <0,001 0.213 0.437
DO (mg/l) 5.4 6.3 5.8 2.3 4.9
SS (mg/l) 48.4 10.4 22.0 13.4 73.2
Phenol (mg/l) <0,001 <0,001 <0,001 <0,001 <0,001
Cadmium (ug/l) 0.00016 0.00020 0.00020 0.00018 0.00019
Aresenic (ug/l) <0,00006 <0,00006 <0,00006 <0,00006 <0,00006
Cyanide (ug/l) <0,001 <0,001 <0,001 <0,001 <0,001
Selenium (ug/l) <0,00001 <0,00001 <0,00001 <0,00001 <0,00001
Cr (ug/l) <0,003 <0,003 <0,003 <0,003 <0,003
Hg (ug/l) <0,0003 <0,0003 <0,0003 <0,0003 <0,0003
Ni2+ (ug/l) 0.0105 0.0383 0.0225 0.0108 0.0285
Lead (ug/l) 0.0013 0.0009 0.0023 0.0015 0.0015
Copper (ug/l) 0.0147 0.0102 <0,001 0.0126 0.0105
Zinc (ug/l) 0.0147 <0,002 0.3412 0.0126 <0,002
Fe (ug/l) 0.1635 0.3876 0.4520 0.0936 0.0875
F (mg/l) 0.283 0.234 0.206 0.221 0.230
PCB (ug/l) <0,001 <0,001 <0,001 <0,001 <0,001Organo-chlorine(Pesticides) <0,001 0.216 0.021 0.002 0.003
Detergent (mg/l) 0.048 0.047 0.109 0.015 0.024
Tot. oil (n-hexane Extract) (mg/l) 0.013 0.005 0.067 0.021 0.023
Cl (Cloride) (mg/l) 14.02 12.11 39.76 18.38 36.95
Total coliform (MPN/100m 2800 2200 2500 180 150
Fecal oliform (MPN/100ml 1500 1800 1200 40 84
Table B.3.2 Results of Water Quality Observation of River/Tributary/Canal - 10/10
B-T23
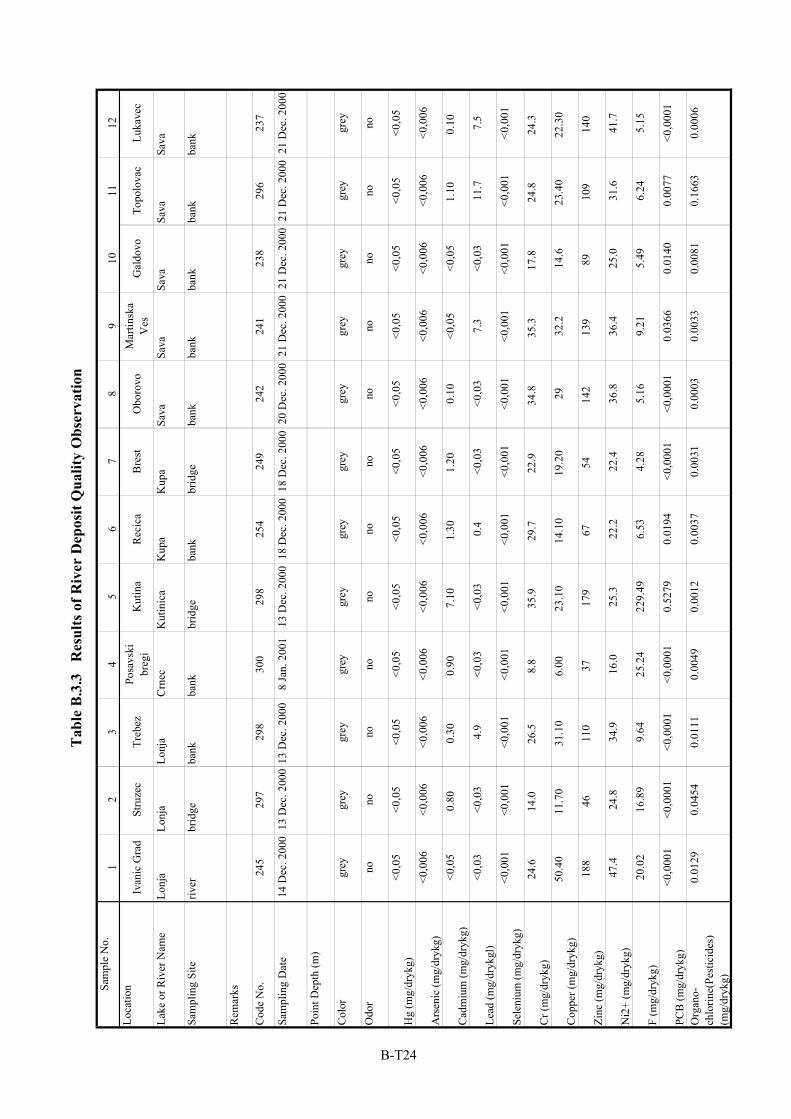
Sam
ple
No.
12
34
56
78
910
1112
Loca
tion
Ivan
ic G
rad
Stru
zec
Treb
ezPo
savs
kibr
egi
Kut
ina
Rec
ica
Bre
stO
boro
voM
artin
ska
Ves
Gal
dovo
Topo
lova
cLu
kave
c
Lake
or R
iver
Nam
eLo
nja
Lonj
aLo
nja
Crn
ecK
utin
ica
Kup
aK
upa
Sava
Sava
Sava
Sava
Sava
Sam
plin
g Si
teriv
erbr
idge
bank
bank
brid
geba
nkbr
idge
bank
bank
bank
bank
bank
Rem
arks
Cod
e N
o.24
529
729
830
029
825
424
924
224
123
829
623
7
Sam
plin
g D
ate
14 D
ec. 2
000
13 D
ec. 2
000
13 D
ec. 2
000
8 Ja
n. 2
001
13 D
ec. 2
000
18 D
ec. 2
000
18 D
ec. 2
000
20 D
ec. 2
000
21 D
ec. 2
000
21 D
ec. 2
000
21 D
ec. 2
000
21 D
ec. 2
000
Poin
t Dep
th (m
)
Col
orgr
eygr
eygr
eygr
eygr
eygr
eygr
eygr
eygr
eygr
eygr
eygr
ey
Odo
rno
nono
nono
nono
nono
nono
no
Hg
(mg/
dryk
g)<0
,05
<0,0
5<0
,05
<0,0
5<0
,05
<0,0
5<0
,05
<0,0
5<0
,05
<0,0
5<0
,05
<0,0
5
Ars
enic
(mg/
dryk
g)<0
,006
<0,0
06<0
,006
<0,0
06<0
,006
<0,0
06<0
,006
<0,0
06<0
,006
<0,0
06<0
,006
<0,0
06
Cad
miu
m (m
g/dr
ykg)
<0,0
50.
800.
300.
907.
101.
301.
200.
10<0
,05
<0,0
51.
100.
10
Lead
(mg/
dryk
gl)
<0,0
3<0
,03
4.9
<0,0
3<0
,03
0.4
<0,0
3<0
,03
7.3
<0,0
311
.77.
5
Sele
nium
(mg/
dryk
g)<0
,001
<0,0
01<0
,001
<0,0
01<0
,001
<0,0
01<0
,001
<0,0
01<0
,001
<0,0
01<0
,001
<0,0
01
Cr (
mg/
dryk
g)24
.614
.026
.58.
835
.929
.722
.934
.835
.317
.824
.824
.3
Cop
per (
mg/
dryk
g)50
.40
11.7
031
.10
6.00
23.1
014
.10
19.2
029
32.2
14.6
23.4
022
.30
Zinc
(mg/
dryk
g)18
846
110
3717
967
5414
213
989
109
140
Ni2
+ (m
g/dr
ykg)
47.4
24.8
34.9
16.0
25.3
22.2
22.4
36.8
36.4
25.0
31.6
41.7
F (m
g/dr
ykg)
20.0
216
.89
9.64
25.2
422
9.49
6.53
4.28
5.16
9.21
5.49
6.24
5.15
PCB
(mg/
dryk
g)<0
,000
1<0
,000
1<0
,000
1<0
,000
10.
5279
0.01
94<0
,000
1<0
,000
10.
0366
0.01
400.
0077
<0,0
001
Org
ano-
chlo
rine(
Pest
icid
es)
(mg/
dryk
g)
0.01
290.
0454
0.01
110.
0049
0.00
120.
0037
0.00
310.
0003
0.00
330.
0081
0.16
630.
0006
Tab
le B
.3.3
R
esul
ts o
f Riv
er D
epos
it Q
ualit
y O
bser
vatio
n
B-T24
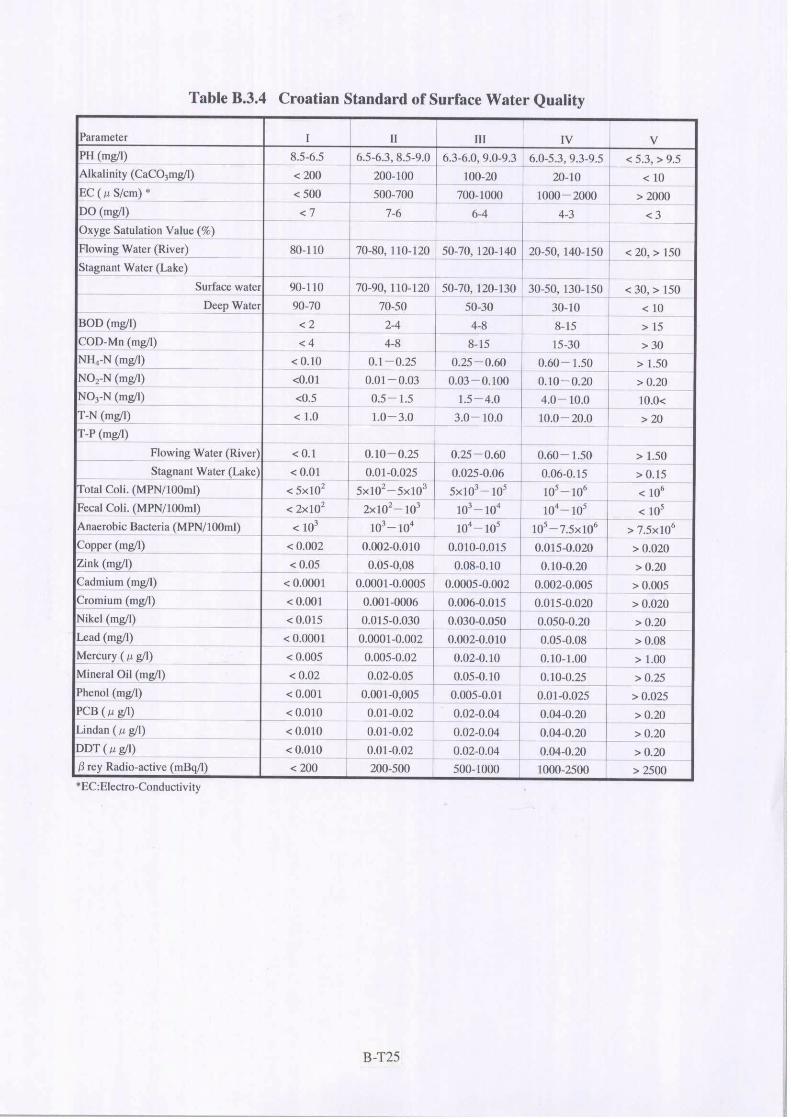

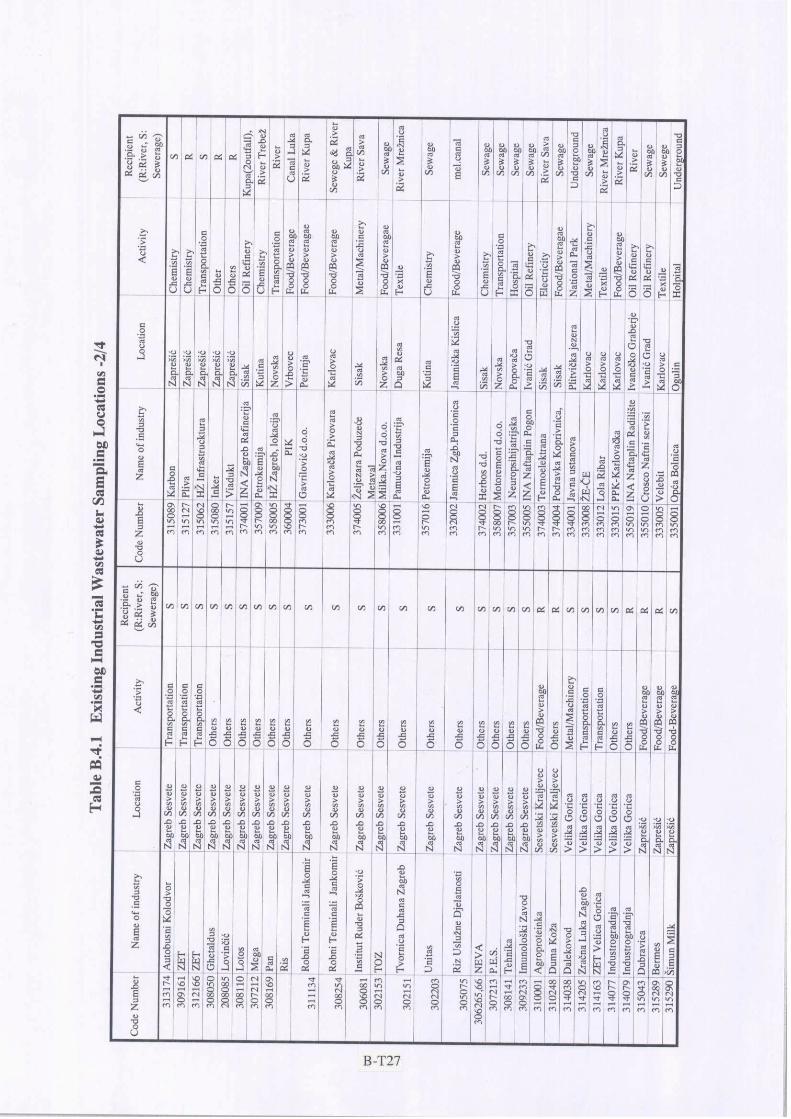
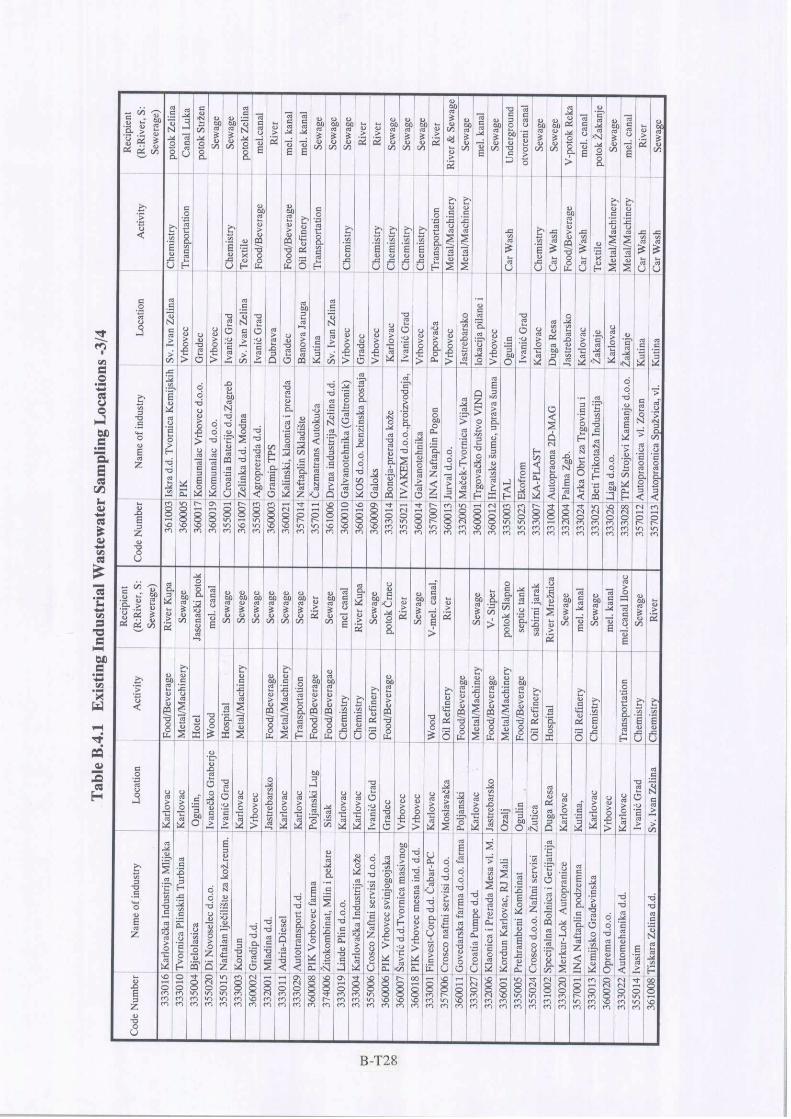
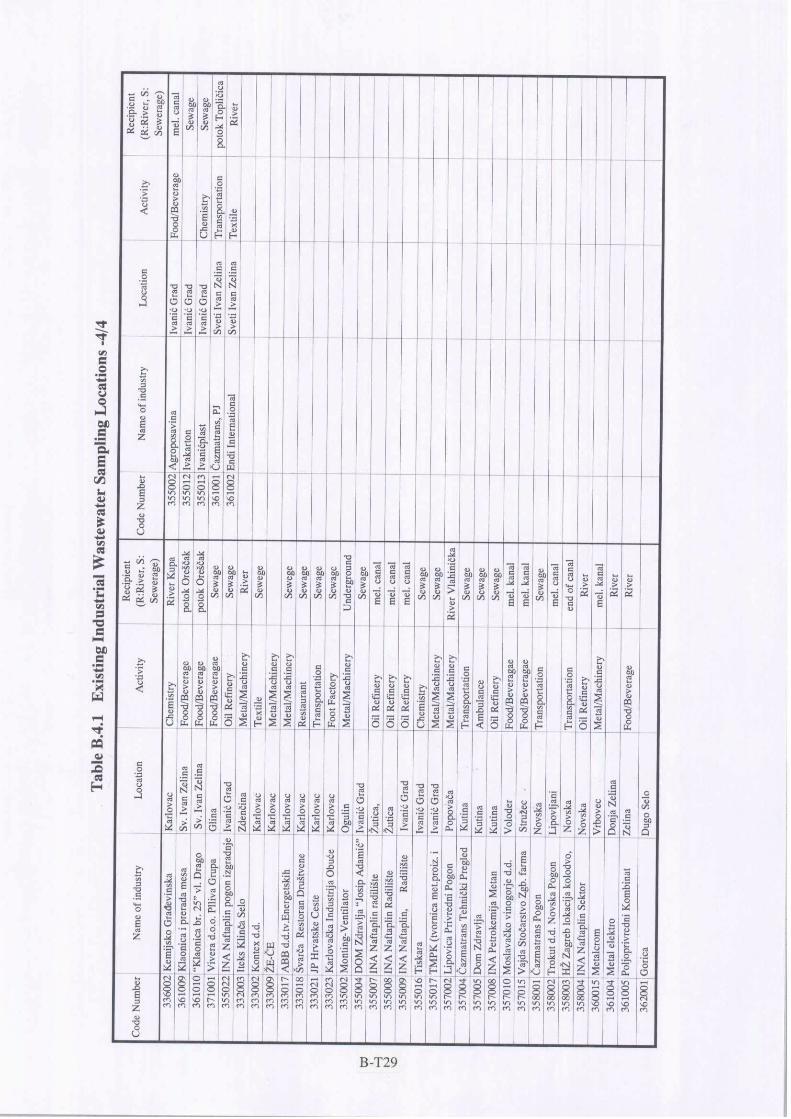
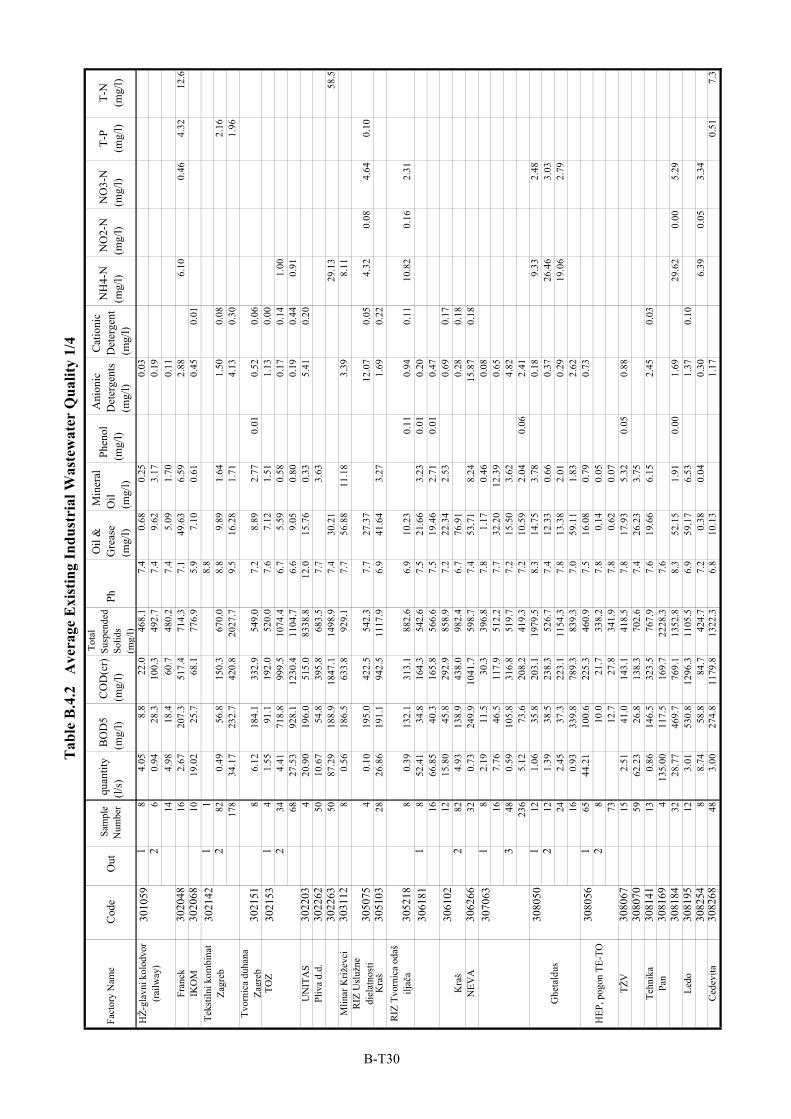
Fac
tory
Nam
eC
ode
Out
Sam
ple
Num
ber
qua
ntity
(l/s)
BO
D5
(mg/
l) C
OD
(cr)
(mg/
l)
Tot
alSu
spen
ded
Solid
s(m
g/l)
Ph
Oil
&G
reas
e(m
g/l)
Min
eral
Oil
(mg/
l)
Phe
nol
(mg/
l)
Ani
onic
Det
erge
nts
(mg/
l)
Cat
ioni
cD
eter
gent
(mg/
l)
NH
4-N
(mg/
l) N
O2-
N(m
g/l)
NO
3-N
(mg/
l)T-
P(m
g/l)
T-N
(mg/
l)
18
4.05
8.8
22.0
468.
17.
40.
680.
250.
032
60.
9428
.310
0.3
492.
77.
49.
623.
170.
1914
4.98
18.4
60.7
480.
27.
45.
091.
700.
11Fr
anck
3020
4816
2.67
207.
351
7.4
714.
37.
149
.63
6.59
2.88
6.10
0.46
4.32
12.6
IKO
M30
2068
1019
.02
25.7
68.1
776.
95.
97.
100.
610.
450.
011
1
8.
8
2
820.
4956
.815
0.3
670.
08.
89.
891.
641.
500.
082.
1617
834
.17
232.
742
0.8
2027
.79.
516
.28
1.71
4.13
0.30
1.96
Tvor
nica
duh
ana
Zagr
eb30
2151
86.
1218
4.1
332.
954
9.0
7.2
8.89
2.77
0.01
0.52
0.06
14
1.55
91.1
192.
052
0.0
7.6
7.12
1.51
1.13
0.00
234
4.41
718.
899
9.5
1074
.46.
75.
590.
580.
170.
141.
0068
27.5
392
8.1
1230
.411
04.7
6.6
9.05
0.80
0.19
0.44
0.91
UN
ITA
S30
2203
420
.90
196.
051
5.0
8338
.812
.015
.76
0.33
5.41
0.20
Pliv
a d.
d.30
2262
5010
.67
54.8
395.
868
3.5
7.7
3.63
3022
6350
87.2
918
8.9
1847
.114
98.9
7.4
30.2
129
.13
58.5
Mlin
ar K
rižev
ci30
3112
80.
5618
6.5
633.
892
9.1
7.7
56.8
811
.18
3.39
8.11
RIZ
Usl
užne
d jel
atno
sti
3050
754
0.10
195.
042
2.5
542.
37.
727
.37
12.0
70.
054.
320.
084.
640.
10K
raš
3051
0328
26.8
619
1.1
942.
511
17.9
6.9
41.6
43.
271.
690.
22R
IZ T
vorn
ica
odaš
iljač
a30
5218
80.
3913
2.1
313.
188
2.6
6.9
10.2
30.
110.
940.
1110
.82
0.16
2.31
18
52.4
134
.816
4.3
542.
67.
521
.66
3.23
0.01
0.20
1666
.85
40.3
165.
856
6.6
7.5
19.4
62.
710.
010.
4712
15.8
045
.829
2.9
858.
97.
222
.34
2.53
0.69
0.17
282
4.93
138.
943
8.0
982.
46.
776
.91
0.28
0.18
NEV
A30
6266
320.
7324
9.9
1041
.759
8.7
7.4
53.7
18.
2415
.87
0.18
18
2.19
11.5
30.3
396.
87.
81.
170.
460.
0816
7.76
46.5
117.
951
2.2
7.7
32.2
012
.39
0.65
348
0.59
105.
831
6.8
519.
77.
215
.50
3.62
4.82
236
5.12
73.6
208.
241
9.3
7.2
10.5
92.
040.
062.
411
121.
0635
.820
3.1
1979
.58.
314
.75
3.78
0.18
9.33
2.48
212
1.39
38.5
238.
352
6.7
7.4
12.3
30.
660.
3726
.46
3.03
242.
4537
.322
3.1
1154
.37.
813
.38
2.01
0.29
19.0
62.
7916
0.93
339.
878
9.3
839.
37.
059
.11
1.83
2.62
165
44.2
110
0.6
225.
346
0.9
7.5
16.0
80.
790.
732
810
.021
.733
8.2
7.8
0.14
0.05
7312
.727
.834
1.9
7.8
0.62
0.07
T ŽV
3080
6715
2.51
41.0
143.
141
8.5
7.8
17.9
35.
320.
050.
8830
8070
5962
.23
26.8
138.
370
2.6
7.4
26.2
33.
75Te
hnik
a30
8141
130.
8614
6.5
323.
576
7.9
7.6
19.6
66.
152.
450.
03Pa
n30
8169
413
5.00
117.
516
9.7
2228
.37.
630
8184
3228
.77
469.
776
9.1
1352
.88.
352
.15
1.91
0.00
1.69
29.6
20.
005.
29Le
do30
8195
123.
0153
0.8
1296
.311
05.5
6.9
59.1
76.
531.
370.
1030
8254
88.
7458
.884
.742
4.7
7.2
0.38
0.04
0.30
6.39
0.05
3.34
Ced
evita
3082
6848
3.00
274.
811
79.8
1322
.36.
810
.13
1.17
0.51
7.3
HŽ-
glav
ni k
olod
vor
(rai
lway
)30
1059
Teks
tilni
kom
bina
tZa
greb
3021
42
3070
63
TOZ
3021
53
3061
81
Tab
le B
.4.2
A
vera
ge E
xist
ing
Indu
stri
al W
aste
wat
er Q
ualit
y 1/
4
3080
50G
heta
ldus
3080
56H
EP, p
ogon
TE-
TO
3061
02K
raš
B-T30
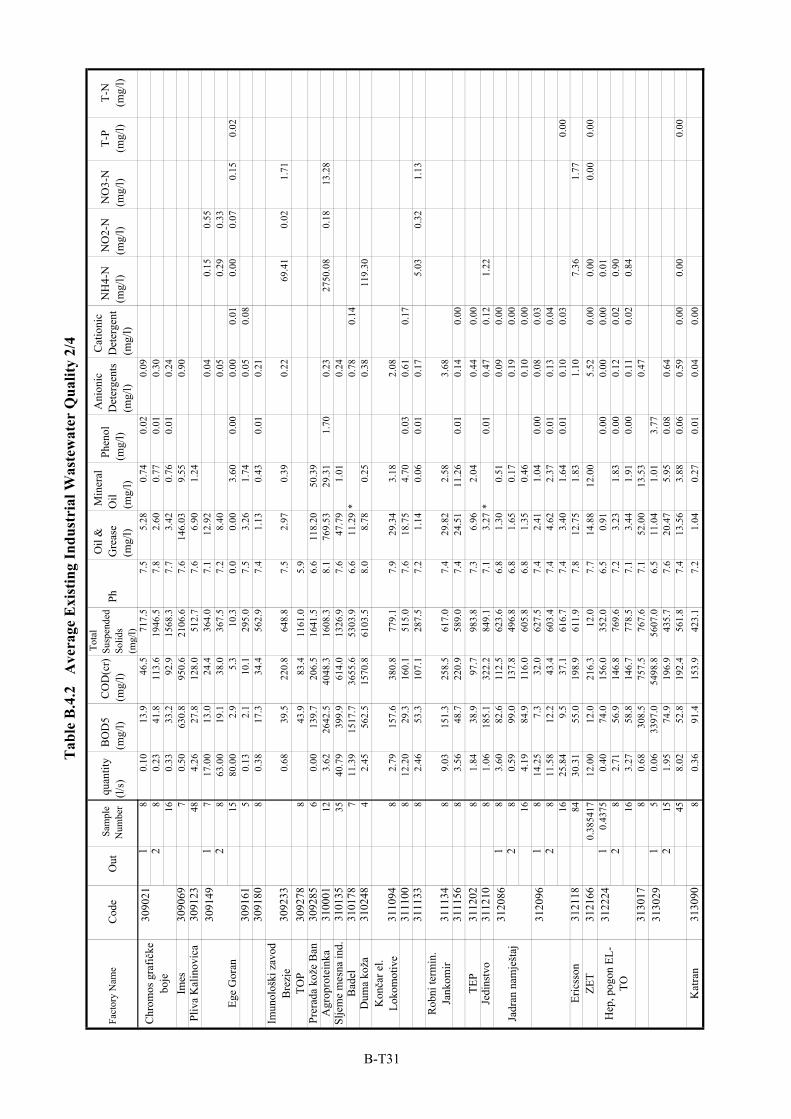
Fac
tory
Nam
eC
ode
Out
Sam
ple
Num
ber
qua
ntity
(l/s)
BO
D5
(mg/
l) C
OD
(cr)
(mg/
l)
Tot
alSu
spen
ded
Solid
s(m
g/l)
Ph
Oil
&G
reas
e(m
g/l)
Min
eral
Oil
(mg/
l)
Phe
nol
(mg/
l)
Ani
onic
Det
erge
nts
(mg/
l)
Cat
ioni
cD
eter
gent
(mg/
l)
NH
4-N
(mg/
l) N
O2-
N(m
g/l)
NO
3-N
(mg/
l)T-
P(m
g/l)
T-N
(mg/
l)
18
0.10
13.9
46.5
717.
57.
55.
280.
740.
020.
092
80.
2341
.811
3.6
1946
.57.
82.
600.
770.
010.
3016
0.33
33.2
92.9
1568
.37.
73.
420.
760.
010.
24Im
es30
9069
70.
5063
0.8
950.
621
06.6
7.6
146.
039.
550.
90Pl
iva
Kal
inov
ica
3091
2348
4.26
27.8
128.
051
2.7
7.6
6.90
1.24
17
17.0
013
.024
.436
4.0
7.1
12.9
20.
040.
150.
552
863
.00
19.1
38.0
367.
57.
28.
400.
050.
290.
3315
80.0
02.
95.
310
.30.
00.
003.
600.
000.
000.
010.
000.
070.
150.
0230
9161
50.
132.
110
.129
5.0
7.5
3.26
1.74
0.05
0.08
3091
808
0.38
17.3
34.4
562.
97.
41.
130.
430.
010.
21Im
unol
oški
zav
odB
rezj
e30
9233
0.68
39.5
220.
864
8.8
7.5
2.97
0.39
0.22
69.4
10.
021.
71TO
P30
9278
843
.983
.411
61.0
5.9
Prer
ada
kože
Ban
3092
856
0.00
139.
720
6.5
1641
.56.
611
8.20
50.3
9A
grop
rote
inka
3100
0112
3.62
2642
.540
48.3
1608
.38.
176
9.53
29.3
11.
700.
2327
50.0
80.
1813
.28
Slje
me
mes
na in
d.31
0135
3540
.79
399.
961
4.0
1326
.97.
647
.79
1.01
0.24
Bad
el31
0178
711
.39
1517
.736
55.6
5303
.96.
611
.29
*0.
780.
14D
uma
koža
3102
484
2.45
562.
515
70.8
6103
.58.
08.
780.
250.
3811
9.30
Konča
r el.
Loko
mot
ive
3110
948
2.79
157.
638
0.8
779.
17.
929
.34
3.18
2.08
3111
008
12.2
029
.316
0.1
515.
07.
618
.75
4.70
0.03
0.61
0.17
3111
338
2.46
53.3
107.
128
7.5
7.2
1.14
0.06
0.01
0.17
5.03
0.32
1.13
Rob
ni te
rmin
.Ja
nkom
ir31
1134
89.
0315
1.3
258.
561
7.0
7.4
29.8
22.
583.
6831
1156
83.
5648
.722
0.9
589.
07.
424
.51
11.2
60.
010.
140.
00TE
P31
1202
81.
8438
.997
.798
3.8
7.3
6.96
2.04
0.44
0.00
Jedi
nstv
o31
1210
81.
0618
5.1
322.
284
9.1
7.1
3.27
*0.
010.
470.
121.
221
83.
6082
.611
2.5
623.
66.
81.
300.
510.
090.
002
80.
5999
.013
7.8
496.
86.
81.
650.
170.
190.
0016
4.19
84.9
116.
060
5.8
6.8
1.35
0.46
0.10
0.00
18
14.2
57.
332
.062
7.5
7.4
2.41
1.04
0.00
0.08
0.03
28
11.5
812
.243
.460
3.4
7.4
4.62
2.37
0.01
0.13
0.04
1625
.84
9.5
37.1
616.
77.
43.
401.
640.
010.
100.
030.
00Er
icss
on31
2118
8430
.31
55.0
198.
961
1.9
7.8
12.7
51.
831.
107.
361.
77ZE
T31
2166
0.38
5417
12.0
012
.021
6.3
12.0
7.7
14.8
812
.00
5.52
0.00
0.00
0.00
0.00
10.
4375
0.40
74.0
156.
035
2.0
6.5
0.91
0.00
0.00
0.00
0.01
28
2.71
56.9
146.
876
9.6
7.2
3.23
1.83
0.00
0.12
0.02
0.90
163.
2758
.814
6.7
778.
57.
13.
441.
910.
000.
110.
020.
8431
3017
80.
6830
8.5
757.
576
7.6
7.1
52.0
013
.53
0.47
15
0.06
3397
.054
98.8
5607
.06.
511
.04
1.01
3.77
215
1.95
74.9
196.
943
5.7
7.6
20.4
75.
950.
080.
6445
8.02
52.8
192.
456
1.8
7.4
13.5
63.
880.
060.
590.
000.
000.
00K
atra
n31
3090
80.
3691
.415
3.9
423.
17.
21.
040.
270.
010.
040.
00
Tab
le B
.4.2
A
vera
ge E
xist
ing
Indu
stri
al W
aste
wat
er Q
ualit
y 2/
4
3090
21C
hrom
os g
rafič
kebo
je
3091
49
Ege
Gor
an
3120
86Ja
dran
nam
ješt
aj
3120
96
3122
24H
ep, p
ogon
EL-
TO
3130
29
B-T31
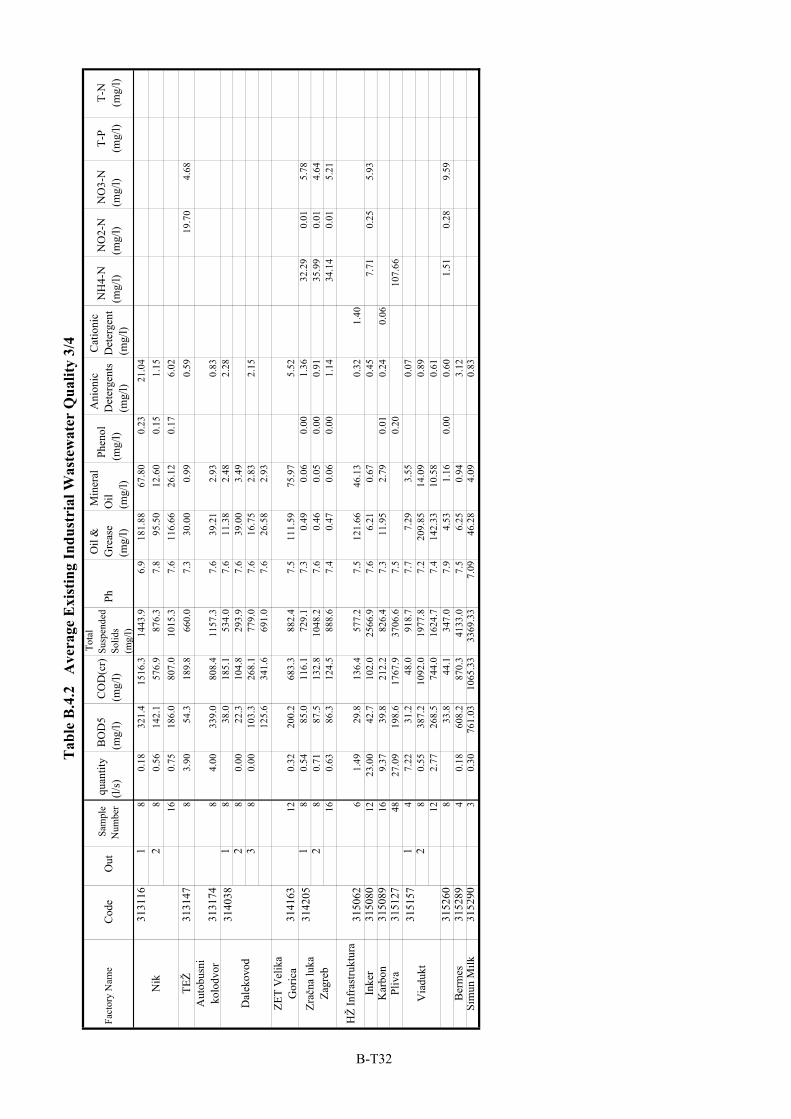
Fac
tory
Nam
eC
ode
Out
Sam
ple
Num
ber
qua
ntity
(l/s)
BO
D5
(mg/
l) C
OD
(cr)
(mg/
l)
Tot
alSu
spen
ded
Solid
s(m
g/l)
Ph
Oil
&G
reas
e(m
g/l)
Min
eral
Oil
(mg/
l)
Phe
nol
(mg/
l)
Ani
onic
Det
erge
nts
(mg/
l)
Cat
ioni
cD
eter
gent
(mg/
l)
NH
4-N
(mg/
l) N
O2-
N(m
g/l)
NO
3-N
(mg/
l)T-
P(m
g/l)
T-N
(mg/
l)
18
0.18
321.
415
16.3
1443
.96.
918
1.88
67.8
00.
2321
.04
28
0.56
142.
157
6.9
876.
37.
895
.50
12.6
00.
151.
1516
0.75
186.
080
7.0
1015
.37.
611
6.66
26.1
20.
176.
02TE
Ž31
3147
83.
9054
.318
9.8
660.
07.
330
.00
0.99
0.59
19.7
04.
68A
utob
usni
kolo
dvor
3131
748
4.00
339.
080
8.4
1157
.37.
639
.21
2.93
0.83
18
38.0
185.
153
4.0
7.6
11.3
82.
482.
282
80.
0022
.310
4.8
293.
97.
639
.00
3.49
38
0.00
103.
326
8.1
779.
07.
616
.75
2.83
2.15
125.
634
1.6
691.
07.
626
.58
2.93
ZET
Vel
ika
Gor
ica
3141
6312
0.32
200.
268
3.3
882.
47.
511
1.59
75.9
75.
521
80.
5485
.011
6.1
729.
17.
30.
490.
060.
001.
3632
.29
0.01
5.78
28
0.71
87.5
132.
810
48.2
7.6
0.46
0.05
0.00
0.91
35.9
90.
014.
6416
0.63
86.3
124.
588
8.6
7.4
0.47
0.06
0.00
1.14
34.1
40.
015.
21
HŽ
Infr
astru
ktur
a31
5062
61.
4929
.813
6.4
577.
27.
512
1.66
46.1
30.
321.
40In
ker
3150
8012
23.0
042
.710
2.0
2566
.97.
66.
210.
670.
457.
710.
255.
93K
arbo
n31
5089
169.
3739
.821
2.2
826.
47.
311
.95
2.79
0.01
0.24
0.06
Pliv
a31
5127
4827
.09
198.
617
67.9
3706
.67.
50.
2010
7.66
14
7.22
31.2
48.0
918.
77.
77.
293.
550.
072
80.
5538
7.2
1092
.019
77.8
7.2
209.
8514
.09
0.89
122.
7726
8.5
744.
016
24.7
7.4
142.
3310
.58
0.61
3152
608
33.8
44.1
347.
07.
94.
531.
160.
000.
601.
510.
289.
59B
erm
es31
5289
40.
1860
8.2
870.
341
33.0
7.5
6.25
0.94
3.12
Šim
un M
ilk31
5290
30.
3076
1.03
1065
.33
3369
.33
7.09
46.2
84.
090.
83
3131
16N
ik
3151
57V
iadu
kt
Tab
le B
.4.2
A
vera
ge E
xist
ing
Indu
stri
al W
aste
wat
er Q
ualit
y 3/
4
3140
38D
alek
ovod
3142
05Zr
ačna
luka
Zagr
eb
B-T32
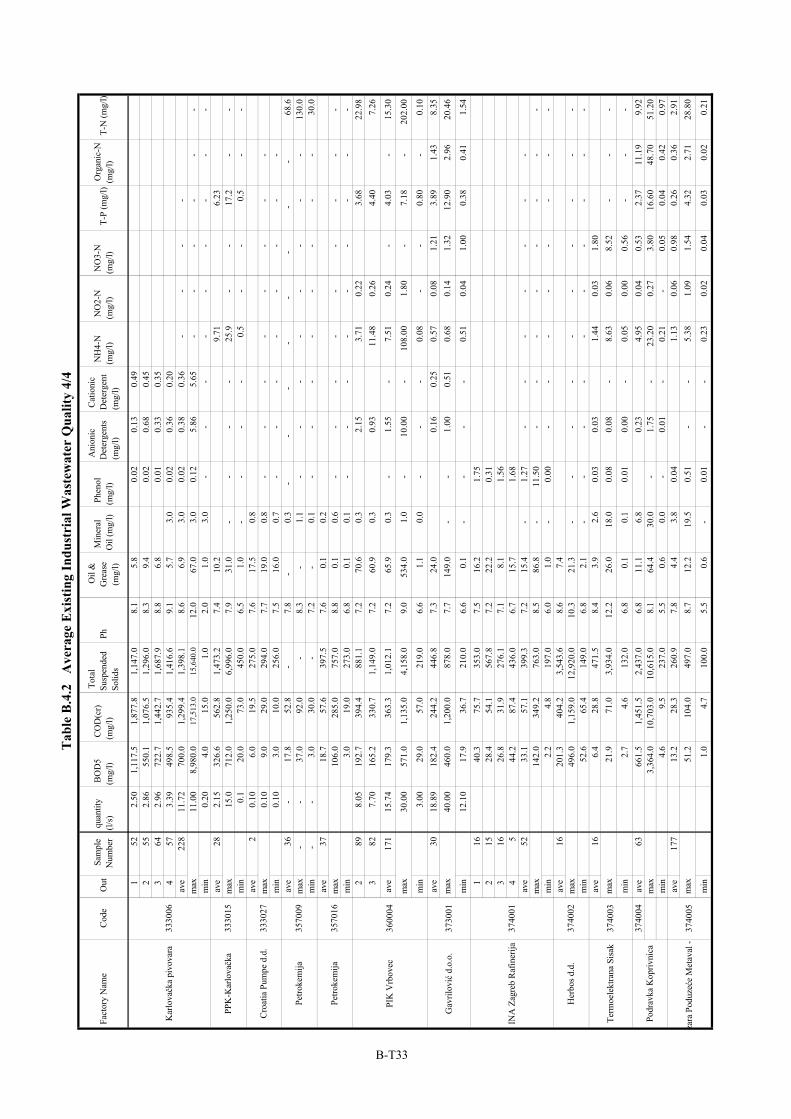
Fac
tory
Nam
eC
ode
Out
Sam
ple
Num
ber
qua
ntity
(l/s)
BO
D5
(mg/
l) C
OD
(cr)
(mg/
l)
Tot
alSu
spen
ded
Solid
s P
h O
il &
Gre
ase
(mg/
l)
Min
eral
Oil
(mg/
l) P
heno
l(m
g/l)
Ani
onic
Det
erge
nts
(mg/
l)
Cat
ioni
cD
eter
gent
(mg/
l)
NH
4-N
(mg/
l) N
O2-
N(m
g/l)
NO
3-N
(mg/
l) T
-P (m
g/l)
Org
anic
-N(m
g/l)
T-N
(mg/
l)
1
52
2.50
1,11
7.5
1,87
7.8
1,14
7.0
8.
1
5.
8
0.
02
0.
13
0.
49
2
55
2.
86
55
0.1
1,
076.
5
1,
296.
0
8.3
9.4
0.02
0.68
0.45
3
64
2.96
722.
7
1,44
2.7
1,68
7.9
8.
8
6.
8
0.
01
0.
33
0.
35
4
57
3.
39
49
8.5
93
5.4
1,
416.
6
9.1
5.7
3.0
0.02
0.36
0.20
ave
228
11.7
2
700.
0
1,29
9.4
1,39
8.1
8.
6
6.
9
3.
0
0.
02
0.
38
0.
36
-
-
-
-
m
ax11
.00
8,
980.
0
17
,513
.0
15,6
40.0
12
.0
67
.0
3.
0
0.
12
5.
86
5.
65
-
-
-
-
-
-
m
in0.
20
4.
0
15
.0
1.
0
2.0
1.0
3.0
-
-
-
-
-
-
-
-
-
ave
28
2.
15
32
6.6
56
2.8
1,
473.
2
7.4
10.2
9.71
6.23
max
15.0
712.
0
1,25
0.0
6,99
6.0
7.
9
31
.0
-
-
-
-
25.9
-
-
17.2
-
-
min
0.1
20.0
73.0
450.
0
6.
5
1.
0
-
-
-
-
0.5
-
-
0.5
-
-
ave
2
0.10
6.0
19.5
275.
0
7.
6
17
.5
0.
8
m
ax0.
10
9.
0
29
.0
29
4.0
7.7
19.0
0.8
-
-
-
-
-
-
-
-
m
in0.
10
3.
0
10
.0
25
6.0
7.5
16.0
0.7
-
-
-
-
-
-
-
-
av
e36
-
17
.8
52
.8
-
7.8
-0.
3
-
--
--
--
-68
.6
m
ax-
-
37
.0
92
.0
-
8.
3
-
1.1
-
-
-
-
-
-
-
-
13
0.0
m
in-
-
3.
0
30
.0
-
7.
2
-
0.1
-
-
-
-
-
-
-
-
30
.0
av
e37
18.7
57.6
397.
5
7.
6
0.
1
0.
2
m
ax10
6.0
28
5.0
75
7.0
8.8
0.1
0.6
-
-
-
-
-
-
-
-
-
min
3.0
19.0
273.
0
6.
8
0.
1
0.
1
-
-
-
-
-
-
-
-
-
2
89
8.
05
19
2.7
39
4.4
88
1.1
7.2
70.6
0.3
2.15
3.71
0.22
3.68
22.9
8
3
82
7.70
165.
2
330.
7
1,14
9.0
7.
2
60
.9
0.
3
0.
93
11
.48
0.
26
4.
40
7.
26
ave
171
15.7
4
179.
3
363.
3
1,01
2.1
7.
2
65
.9
0.
3
-
1.55
-
7.
51
0.
24
-
4.03
-
15
.30
max
30.0
0
571.
0
1,13
5.0
4,15
8.0
9.
0
53
4.0
1.
0
-
10.0
0
-
108.
00
1.
80
-
7.18
-
20
2.00
min
3.00
29.0
57.0
219.
0
6.
6
1.
1
0.
0
-
-
-
0.
08
-
-
0.
80
-
0.10
ave
30
18
.89
18
2.4
24
4.2
44
6.8
7.3
24.0
0.16
0.25
0.57
0.08
1.21
3.89
1.43
8.35
max
40.0
0
460.
0
1,20
0.0
878.
0
7.
7
14
9.0
-
-
1.
00
0.
51
0.
68
0.
14
1.
32
12
.90
2.
96
20
.46
min
12.1
0
17.9
36.7
210.
0
6.
6
0.
1
-
-
-
-
0.51
0.04
1.00
0.38
0.41
1.54
1
16
40.3
75.7
353.
0
7.
5
16
.2
1.
75
2
15
28
.4
54
.1
56
7.8
7.2
22.2
0.31
3
16
26.8
31.9
276.
1
7.
1
8.
1
1.
56
4
5
44.2
87.4
436.
0
6.
7
15
.7
1.
68
av
e52
33.1
57.1
399.
3
7.
2
15
.4
-
1.27
-
-
-
-
-
-
-
max
142.
0
349.
2
763.
0
8.
5
86
.8
-
11.5
0
-
-
-
-
-
-
-
-
m
in2.
2
4.
8
197.
0
6.
0
1.
0
-
0.00
-
-
-
-
-
-
-
-
av
e16
201.
3
404.
2
3,54
3.6
8.
6
7.
4
m
ax49
6.0
1,
159.
0
12
,920
.0
10
.3
21
.3
-
-
-
-
-
-
-
-
-
-
min
52.6
65.4
149.
0
6.
8
2.
1
-
-
-
-
-
-
-
-
-
-
ave
16
6.
4
28
.8
47
1.5
8.4
3.9
2.6
0.03
0.03
1.44
0.03
1.80
max
21.9
71.0
3,93
4.0
12
.2
26
.0
18
.0
0.
08
0.
08
-
8.63
0.06
8.52
-
-
-
min
2.7
4.6
13
2.0
6.8
0.1
0.1
0.01
0.00
-
0.
05
0.
00
0.
56
-
-
-
3740
04av
e63
661.
5
1,45
1.5
2,43
7.0
6.
8
11
.1
6.
8
0.
23
4.
95
0.
04
0.
53
2.
37
11
.19
9.
92
m
ax3,
364.
0
10
,703
.0
10
,615
.0
8.
1
64
.4
30
.0
-
1.75
-
23
.20
0.
27
3.
80
16
.60
48
.70
51
.20
m
in4.
6
9.
5
237.
0
5.
5
0.
6
0.
0
-
0.01
-
0.
21
-
0.05
0.04
0.42
0.97
ave
177
13.2
28.3
260.
9
7.
8
4.
4
3.
8
0.
04
1.
13
0.
06
0.
98
0.
26
0.
36
2.
91
m
ax51
.2
10
4.0
49
7.0
8.7
12.2
19.5
0.51
-
-
5.
38
1.
09
1.
54
4.
32
2.
71
28
.80
min
1.0
4.7
10
0.0
5.5
0.6
-
0.
01
-
-
0.23
0.02
0.04
0.03
0.02
0.21
Petro
kem
ija
Petro
kem
ija
PIK
Vrb
ovec
Gav
rilov
ić d
.o.o
.
Tab
le B
.4.2
A
vera
ge E
xist
ing
Indu
stri
al W
aste
wat
er Q
ualit
y 4/
4
Kar
lovačk
a pi
vova
ra
PPK
-Kar
lovačk
a
Cro
atia
Pum
pe d
.d.
3570
09
3330
06
3330
15
3330
27
3600
04
3730
01
3740
01
3570
16
3740
02
3740
03
3740
05
INA
Zag
reb
Raf
iner
ija
Her
bos d
.d.
Term
oele
ktra
na S
isak
Podr
avka
Kop
rivni
ca
zara
Pod
uzeć
e M
etav
al -
B-T33
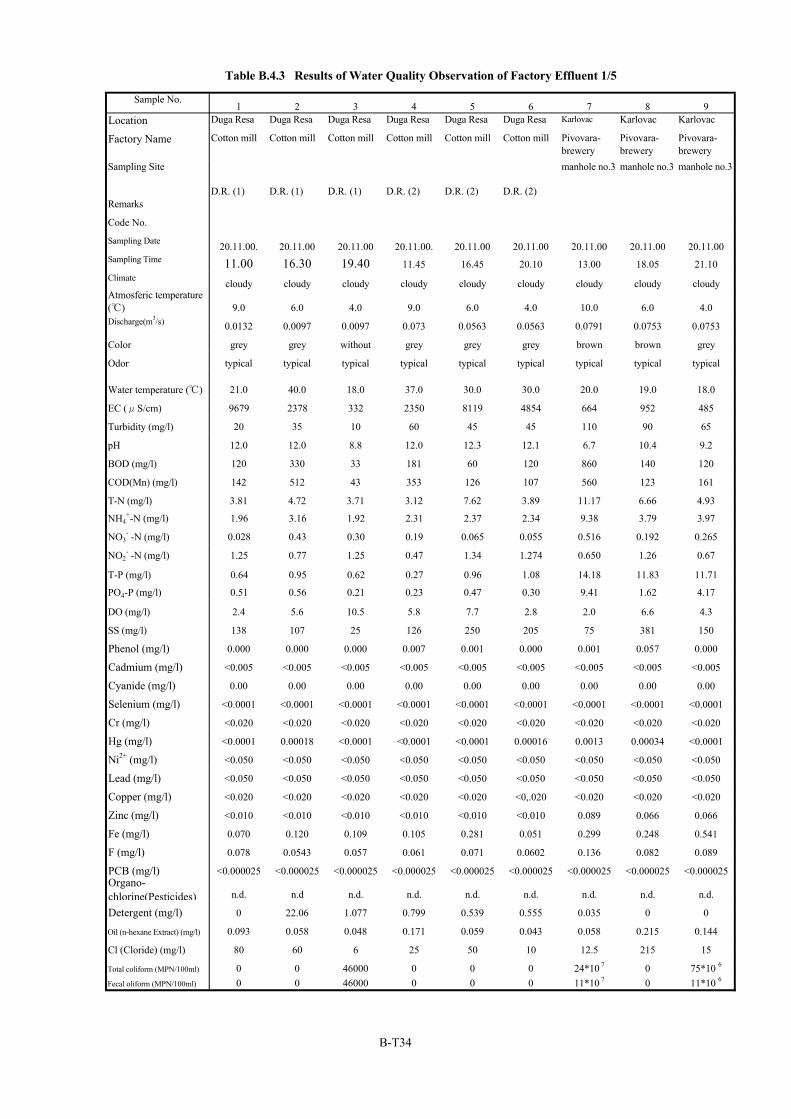
Sample No.1 2 3 4 5 6 7 8 9
Location Duga Resa Duga Resa Duga Resa Duga Resa Duga Resa Duga Resa Karlovac Karlovac Karlovac
Factory Name Cotton mill Cotton mill Cotton mill Cotton mill Cotton mill Cotton mill Pivovara-brewery
Pivovara-brewery
Pivovara-brewery
Sampling Site
D.R. (1) D.R. (1) D.R. (1) D.R. (2) D.R. (2) D.R. (2)
manhole no.3 manhole no.3 manhole no.3
Remarks
Code No.
Sampling Date 20.11.00. 20.11.00 20.11.00 20.11.00. 20.11.00 20.11.00 20.11.00 20.11.00 20.11.00Sampling Time 11.00 16.30 19.40 11.45 16.45 20.10 13.00 18.05 21.10Climate cloudy cloudy cloudy cloudy cloudy cloudy cloudy cloudy cloudyAtmosferic temperature(℃) 9.0 6.0 4.0 9.0 6.0 4.0 10.0 6.0 4.0Discharge(m3/s) 0.0132 0.0097 0.0097 0.073 0.0563 0.0563 0.0791 0.0753 0.0753
Color grey grey without grey grey grey brown brown grey
Odor typical typical typical typical typical typical typical typical typical
Water temperature (℃) 21.0 40.0 18.0 37.0 30.0 30.0 20.0 19.0 18.0
EC (μS/cm) 9679 2378 332 2350 8119 4854 664 952 485
Turbidity (mg/l) 20 35 10 60 45 45 110 90 65
pH 12.0 12.0 8.8 12.0 12.3 12.1 6.7 10.4 9.2
BOD (mg/l) 120 330 33 181 60 120 860 140 120
COD(Mn) (mg/l) 142 512 43 353 126 107 560 123 161
T-N (mg/l) 3.81 4.72 3.71 3.12 7.62 3.89 11.17 6.66 4.93
NH4+-N (mg/l) 1.96 3.16 1.92 2.31 2.37 2.34 9.38 3.79 3.97
NO3- -N (mg/l) 0.028 0.43 0.30 0.19 0.065 0.055 0.516 0.192 0.265
NO2- -N (mg/l) 1.25 0.77 1.25 0.47 1.34 1.274 0.650 1.26 0.67
T-P (mg/l) 0.64 0.95 0.62 0.27 0.96 1.08 14.18 11.83 11.71
PO4-P (mg/l) 0.51 0.56 0.21 0.23 0.47 0.30 9.41 1.62 4.17
DO (mg/l) 2.4 5.6 10.5 5.8 7.7 2.8 2.0 6.6 4.3
SS (mg/l) 138 107 25 126 250 205 75 381 150
Phenol (mg/l) 0.000 0.000 0.000 0.007 0.001 0.000 0.001 0.057 0.000
Cadmium (mg/l) <0.005 <0.005 <0.005 <0.005 <0.005 <0.005 <0.005 <0.005 <0.005
Cyanide (mg/l) 0.00 0.00 0.00 0.00 0.00 0.00 0.00 0.00 0.00
Selenium (mg/l) <0.0001 <0.0001 <0.0001 <0.0001 <0.0001 <0.0001 <0.0001 <0.0001 <0.0001
Cr (mg/l) <0.020 <0.020 <0.020 <0.020 <0.020 <0.020 <0.020 <0.020 <0.020
Hg (mg/l) <0.0001 0.00018 <0.0001 <0.0001 <0.0001 0.00016 0.0013 0.00034 <0.0001
Ni2+ (mg/l) <0.050 <0.050 <0.050 <0.050 <0.050 <0.050 <0.050 <0.050 <0.050
Lead (mg/l) <0.050 <0.050 <0.050 <0.050 <0.050 <0.050 <0.050 <0.050 <0.050
Copper (mg/l) <0.020 <0.020 <0.020 <0.020 <0.020 <0,.020 <0.020 <0.020 <0.020
Zinc (mg/l) <0.010 <0.010 <0.010 <0.010 <0.010 <0.010 0.089 0.066 0.066
Fe (mg/l) 0.070 0.120 0.109 0.105 0.281 0.051 0.299 0.248 0.541
F (mg/l) 0.078 0.0543 0.057 0.061 0.071 0.0602 0.136 0.082 0.089
PCB (mg/l) <0.000025 <0.000025 <0.000025 <0.000025 <0.000025 <0.000025 <0.000025 <0.000025 <0.000025Organo-chlorine(Pesticides) n.d. n.d n.d. n.d. n.d. n.d. n.d. n.d. n.d.
Detergent (mg/l) 0 22.06 1.077 0.799 0.539 0.555 0.035 0 0
Oil (n-hexane Extract) (mg/l) 0.093 0.058 0.048 0.171 0.059 0.043 0.058 0.215 0.144
Cl (Cloride) (mg/l) 80 60 6 25 50 10 12.5 215 15
Total coliform (MPN/100ml) 0 0 46000 0 0 0 24*10 7 0 75*10 6
Fecal oliform (MPN/100ml) 0 0 46000 0 0 0 11*10 7 0 11*10 6
Table B.4.3 Results of Water Quality Observation of Factory Effluent 1/5
B-T34
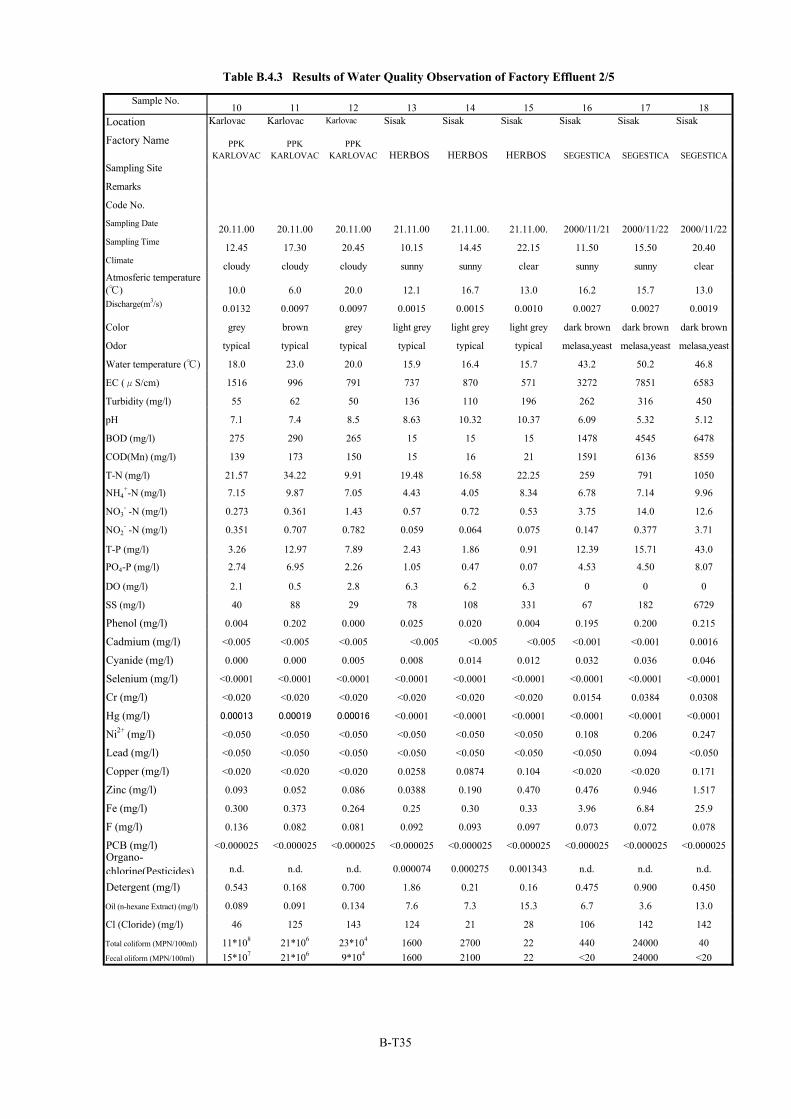
Sample No.10 11 12 13 14 15 16 17 18
Location Karlovac Karlovac Karlovac Sisak Sisak Sisak Sisak Sisak Sisak
Factory Name PPKKARLOVAC
PPKKARLOVAC
PPKKARLOVAC HERBOS HERBOS HERBOS SEGESTICA SEGESTICA SEGESTICA
Sampling Site
Remarks
Code No.
Sampling Date 20.11.00 20.11.00 20.11.00 21.11.00 21.11.00. 21.11.00. 2000/11/21 2000/11/22 2000/11/22Sampling Time 12.45 17.30 20.45 10.15 14.45 22.15 11.50 15.50 20.40Climate cloudy cloudy cloudy sunny sunny clear sunny sunny clearAtmosferic temperature(℃) 10.0 6.0 20.0 12.1 16.7 13.0 16.2 15.7 13.0Discharge(m3/s) 0.0132 0.0097 0.0097 0.0015 0.0015 0.0010 0.0027 0.0027 0.0019
Color grey brown grey light grey light grey light grey dark brown dark brown dark brown
Odor typical typical typical typical typical typical melasa,yeast melasa,yeast melasa,yeast
Water temperature (℃) 18.0 23.0 20.0 15.9 16.4 15.7 43.2 50.2 46.8
EC (μS/cm) 1516 996 791 737 870 571 3272 7851 6583
Turbidity (mg/l) 55 62 50 136 110 196 262 316 450
pH 7.1 7.4 8.5 8.63 10.32 10.37 6.09 5.32 5.12
BOD (mg/l) 275 290 265 15 15 15 1478 4545 6478
COD(Mn) (mg/l) 139 173 150 15 16 21 1591 6136 8559
T-N (mg/l) 21.57 34.22 9.91 19.48 16.58 22.25 259 791 1050
NH4+-N (mg/l) 7.15 9.87 7.05 4.43 4.05 8.34 6.78 7.14 9.96
NO3- -N (mg/l) 0.273 0.361 1.43 0.57 0.72 0.53 3.75 14.0 12.6
NO2- -N (mg/l) 0.351 0.707 0.782 0.059 0.064 0.075 0.147 0.377 3.71
T-P (mg/l) 3.26 12.97 7.89 2.43 1.86 0.91 12.39 15.71 43.0
PO4-P (mg/l) 2.74 6.95 2.26 1.05 0.47 0.07 4.53 4.50 8.07
DO (mg/l) 2.1 0.5 2.8 6.3 6.2 6.3 0 0 0
SS (mg/l) 40 88 29 78 108 331 67 182 6729
Phenol (mg/l) 0.004 0.202 0.000 0.025 0.020 0.004 0.195 0.200 0.215
Cadmium (mg/l) <0.005 <0.005 <0.005 <0.005 <0.005 <0.005 <0.001 <0.001 0.0016
Cyanide (mg/l) 0.000 0.000 0.005 0.008 0.014 0.012 0.032 0.036 0.046
Selenium (mg/l) <0.0001 <0.0001 <0.0001 <0.0001 <0.0001 <0.0001 <0.0001 <0.0001 <0.0001
Cr (mg/l) <0.020 <0.020 <0.020 <0.020 <0.020 <0.020 0.0154 0.0384 0.0308
Hg (mg/l) 0.00013 0.00019 0.00016 <0.0001 <0.0001 <0.0001 <0.0001 <0.0001 <0.0001
Ni2+ (mg/l) <0.050 <0.050 <0.050 <0.050 <0.050 <0.050 0.108 0.206 0.247
Lead (mg/l) <0.050 <0.050 <0.050 <0.050 <0.050 <0.050 <0.050 0.094 <0.050
Copper (mg/l) <0.020 <0.020 <0.020 0.0258 0.0874 0.104 <0.020 <0.020 0.171
Zinc (mg/l) 0.093 0.052 0.086 0.0388 0.190 0.470 0.476 0.946 1.517
Fe (mg/l) 0.300 0.373 0.264 0.25 0.30 0.33 3.96 6.84 25.9
F (mg/l) 0.136 0.082 0.081 0.092 0.093 0.097 0.073 0.072 0.078
PCB (mg/l) <0.000025 <0.000025 <0.000025 <0.000025 <0.000025 <0.000025 <0.000025 <0.000025 <0.000025Organo-chlorine(Pesticides) n.d. n.d. n.d. 0.000074 0.000275 0.001343 n.d. n.d. n.d.
Detergent (mg/l) 0.543 0.168 0.700 1.86 0.21 0.16 0.475 0.900 0.450
Oil (n-hexane Extract) (mg/l) 0.089 0.091 0.134 7.6 7.3 15.3 6.7 3.6 13.0
Cl (Cloride) (mg/l) 46 125 143 124 21 28 106 142 142
Total coliform (MPN/100ml) 11*108 21*106 23*104 1600 2700 22 440 24000 40Fecal oliform (MPN/100ml) 15*107 21*106 9*104 1600 2100 22 <20 24000 <20
Table B.4.3 Results of Water Quality Observation of Factory Effluent 2/5
B-T35
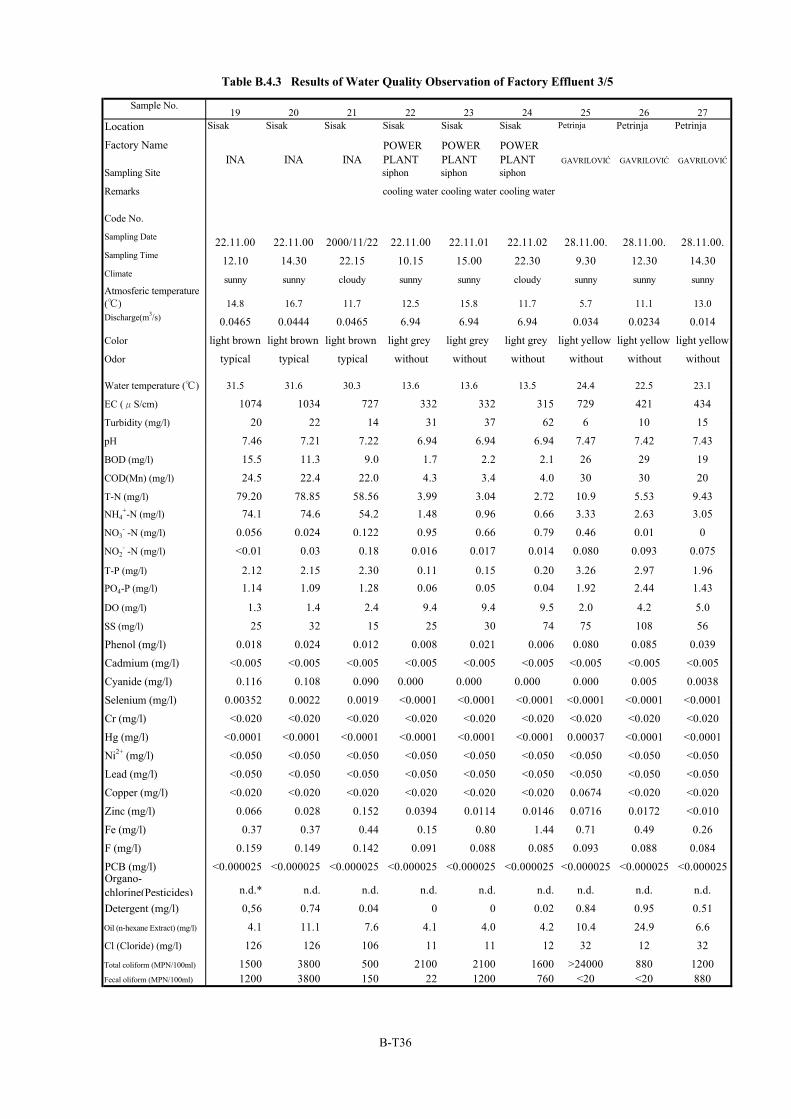
Sample No.19 20 21 22 23 24 25 26 27
Location Sisak Sisak Sisak Sisak Sisak Sisak Petrinja Petrinja Petrinja
Factory NameINA INA INA
POWERPLANT
POWERPLANT
POWERPLANT GAVRILOVIĆ GAVRILOVIĆ GAVRILOVIĆ
Sampling Site siphon siphon siphon
Remarks cooling water cooling water cooling water
Code No.
Sampling Date 22.11.00 22.11.00 2000/11/22 22.11.00 22.11.01 22.11.02 28.11.00. 28.11.00. 28.11.00.Sampling Time 12.10 14.30 22.15 10.15 15.00 22.30 9.30 12.30 14.30Climate sunny sunny cloudy sunny sunny cloudy sunny sunny sunnyAtmosferic temperature(℃) 14.8 16.7 11.7 12.5 15.8 11.7 5.7 11.1 13.0Discharge(m3/s) 0.0465 0.0444 0.0465 6.94 6.94 6.94 0.034 0.0234 0.014
Color light brown light brown light brown light grey light grey light grey light yellow light yellow light yellow
Odor typical typical typical without without without without without without
Water temperature (℃) 31.5 31.6 30.3 13.6 13.6 13.5 24.4 22.5 23.1
EC (μS/cm) 1074 1034 727 332 332 315 729 421 434
Turbidity (mg/l) 20 22 14 31 37 62 6 10 15
pH 7.46 7.21 7.22 6.94 6.94 6.94 7.47 7.42 7.43
BOD (mg/l) 15.5 11.3 9.0 1.7 2.2 2.1 26 29 19
COD(Mn) (mg/l) 24.5 22.4 22.0 4.3 3.4 4.0 30 30 20
T-N (mg/l) 79.20 78.85 58.56 3.99 3.04 2.72 10.9 5.53 9.43NH4
+-N (mg/l) 74.1 74.6 54.2 1.48 0.96 0.66 3.33 2.63 3.05
NO3- -N (mg/l) 0.056 0.024 0.122 0.95 0.66 0.79 0.46 0.01 0
NO2- -N (mg/l) <0.01 0.03 0.18 0.016 0.017 0.014 0.080 0.093 0.075
T-P (mg/l) 2.12 2.15 2.30 0.11 0.15 0.20 3.26 2.97 1.96PO4-P (mg/l) 1.14 1.09 1.28 0.06 0.05 0.04 1.92 2.44 1.43
DO (mg/l) 1.3 1.4 2.4 9.4 9.4 9.5 2.0 4.2 5.0
SS (mg/l) 25 32 15 25 30 74 75 108 56
Phenol (mg/l) 0.018 0.024 0.012 0.008 0.021 0.006 0.080 0.085 0.039
Cadmium (mg/l) <0.005 <0.005 <0.005 <0.005 <0.005 <0.005 <0.005 <0.005 <0.005
Cyanide (mg/l) 0.116 0.108 0.090 0.000 0.000 0.000 0.000 0.005 0.0038
Selenium (mg/l) 0.00352 0.0022 0.0019 <0.0001 <0.0001 <0.0001 <0.0001 <0.0001 <0.0001
Cr (mg/l) <0.020 <0.020 <0.020 <0.020 <0.020 <0.020 <0.020 <0.020 <0.020
Hg (mg/l) <0.0001 <0.0001 <0.0001 <0.0001 <0.0001 <0.0001 0.00037 <0.0001 <0.0001
Ni2+ (mg/l) <0.050 <0.050 <0.050 <0.050 <0.050 <0.050 <0.050 <0.050 <0.050
Lead (mg/l) <0.050 <0.050 <0.050 <0.050 <0.050 <0.050 <0.050 <0.050 <0.050
Copper (mg/l) <0.020 <0.020 <0.020 <0.020 <0.020 <0.020 0.0674 <0.020 <0.020
Zinc (mg/l) 0.066 0.028 0.152 0.0394 0.0114 0.0146 0.0716 0.0172 <0.010
Fe (mg/l) 0.37 0.37 0.44 0.15 0.80 1.44 0.71 0.49 0.26
F (mg/l) 0.159 0.149 0.142 0.091 0.088 0.085 0.093 0.088 0.084
PCB (mg/l) <0.000025 <0.000025 <0.000025 <0.000025 <0.000025 <0.000025 <0.000025 <0.000025 <0.000025Organo-chlorine(Pesticides) n.d.* n.d. n.d. n.d. n.d. n.d. n.d. n.d. n.d.
Detergent (mg/l) 0,56 0.74 0.04 0 0 0.02 0.84 0.95 0.51
Oil (n-hexane Extract) (mg/l) 4.1 11.1 7.6 4.1 4.0 4.2 10.4 24.9 6.6
Cl (Cloride) (mg/l) 126 126 106 11 11 12 32 12 32
Total coliform (MPN/100ml) 1500 3800 500 2100 2100 1600 >24000 880 1200Fecal oliform (MPN/100ml) 1200 3800 150 22 1200 760 <20 <20 880
Table B.4.3 Results of Water Quality Observation of Factory Effluent 3/5
B-T36
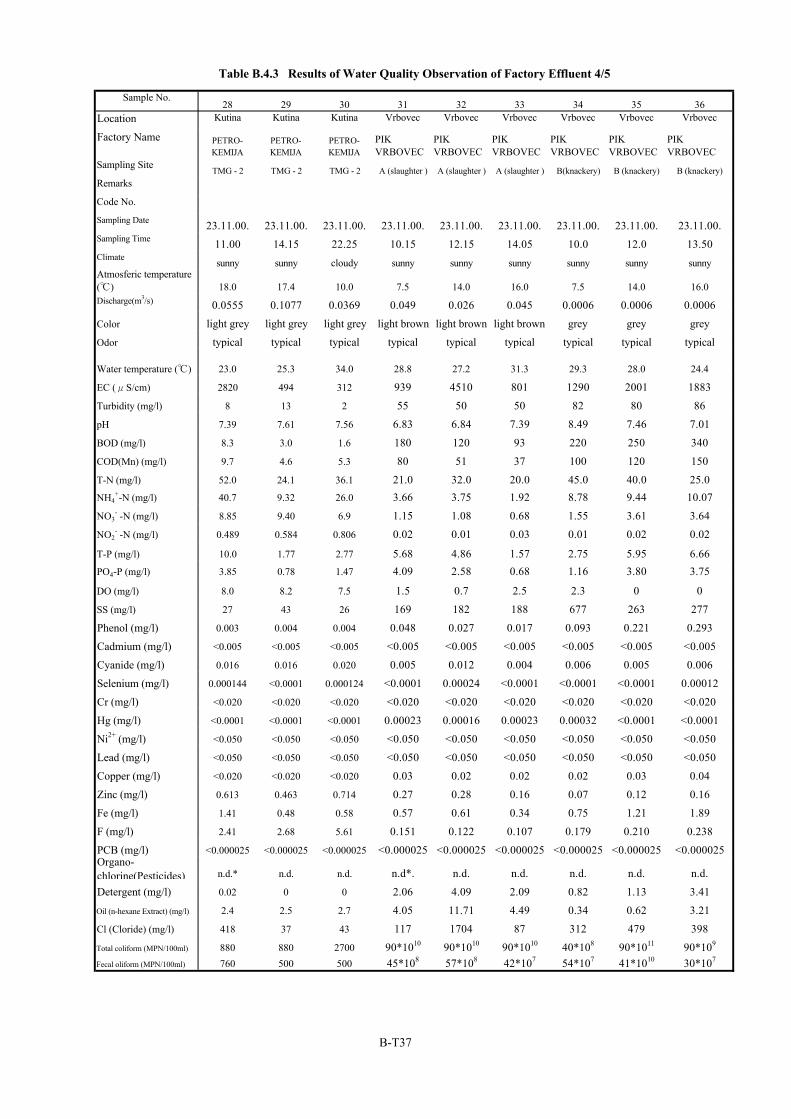
Sample No.28 29 30 31 32 33 34 35 36
Location Kutina Kutina Kutina Vrbovec Vrbovec Vrbovec Vrbovec Vrbovec Vrbovec
Factory Name PETRO-KEMIJA
PETRO-KEMIJA
PETRO-KEMIJA
PIKVRBOVEC
PIKVRBOVEC
PIKVRBOVEC
PIKVRBOVEC
PIKVRBOVEC
PIKVRBOVEC
Sampling Site TMG - 2 TMG - 2 TMG - 2 A (slaughter ) A (slaughter ) A (slaughter ) B(knackery) B (knackery) B (knackery)Remarks
Code No.
Sampling Date 23.11.00. 23.11.00. 23.11.00. 23.11.00. 23.11.00. 23.11.00. 23.11.00. 23.11.00. 23.11.00.Sampling Time 11.00 14.15 22.25 10.15 12.15 14.05 10.0 12.0 13.50Climate sunny sunny cloudy sunny sunny sunny sunny sunny sunnyAtmosferic temperature(℃) 18.0 17.4 10.0 7.5 14.0 16.0 7.5 14.0 16.0Discharge(m3/s) 0.0555 0.1077 0.0369 0.049 0.026 0.045 0.0006 0.0006 0.0006
Color light grey light grey light grey light brown light brown light brown grey grey grey
Odor typical typical typical typical typical typical typical typical typical
Water temperature (℃) 23.0 25.3 34.0 28.8 27.2 31.3 29.3 28.0 24.4
EC (μS/cm) 2820 494 312 939 4510 801 1290 2001 1883
Turbidity (mg/l) 8 13 2 55 50 50 82 80 86
pH 7.39 7.61 7.56 6.83 6.84 7.39 8.49 7.46 7.01
BOD (mg/l) 8.3 3.0 1.6 180 120 93 220 250 340
COD(Mn) (mg/l) 9.7 4.6 5.3 80 51 37 100 120 150
T-N (mg/l) 52.0 24.1 36.1 21.0 32.0 20.0 45.0 40.0 25.0NH4
+-N (mg/l) 40.7 9.32 26.0 3.66 3.75 1.92 8.78 9.44 10.07
NO3- -N (mg/l) 8.85 9.40 6.9 1.15 1.08 0.68 1.55 3.61 3.64
NO2- -N (mg/l) 0.489 0.584 0.806 0.02 0.01 0.03 0.01 0.02 0.02
T-P (mg/l) 10.0 1.77 2.77 5.68 4.86 1.57 2.75 5.95 6.66PO4-P (mg/l) 3.85 0.78 1.47 4.09 2.58 0.68 1.16 3.80 3.75
DO (mg/l) 8.0 8.2 7.5 1.5 0.7 2.5 2.3 0 0
SS (mg/l) 27 43 26 169 182 188 677 263 277
Phenol (mg/l) 0.003 0.004 0.004 0.048 0.027 0.017 0.093 0.221 0.293
Cadmium (mg/l) <0.005 <0.005 <0.005 <0.005 <0.005 <0.005 <0.005 <0.005 <0.005
Cyanide (mg/l) 0.016 0.016 0.020 0.005 0.012 0.004 0.006 0.005 0.006
Selenium (mg/l) 0.000144 <0.0001 0.000124 <0.0001 0.00024 <0.0001 <0.0001 <0.0001 0.00012
Cr (mg/l) <0.020 <0.020 <0.020 <0.020 <0.020 <0.020 <0.020 <0.020 <0.020
Hg (mg/l) <0.0001 <0.0001 <0.0001 0.00023 0.00016 0.00023 0.00032 <0.0001 <0.0001
Ni2+ (mg/l) <0.050 <0.050 <0.050 <0.050 <0.050 <0.050 <0.050 <0.050 <0.050
Lead (mg/l) <0.050 <0.050 <0.050 <0.050 <0.050 <0.050 <0.050 <0.050 <0.050
Copper (mg/l) <0.020 <0.020 <0.020 0.03 0.02 0.02 0.02 0.03 0.04
Zinc (mg/l) 0.613 0.463 0.714 0.27 0.28 0.16 0.07 0.12 0.16
Fe (mg/l) 1.41 0.48 0.58 0.57 0.61 0.34 0.75 1.21 1.89
F (mg/l) 2.41 2.68 5.61 0.151 0.122 0.107 0.179 0.210 0.238
PCB (mg/l) <0.000025 <0.000025 <0.000025 <0.000025 <0.000025 <0.000025 <0.000025 <0.000025 <0.000025Organo-chlorine(Pesticides) n.d.* n.d. n.d. n.d*. n.d. n.d. n.d. n.d. n.d.
Detergent (mg/l) 0.02 0 0 2.06 4.09 2.09 0.82 1.13 3.41
Oil (n-hexane Extract) (mg/l) 2.4 2.5 2.7 4.05 11.71 4.49 0.34 0.62 3.21
Cl (Cloride) (mg/l) 418 37 43 117 1704 87 312 479 398
Total coliform (MPN/100ml) 880 880 2700 90*1010 90*1010 90*1010 40*108 90*1011 90*109
Fecal oliform (MPN/100ml) 760 500 500 45*108 57*108 42*107 54*107 41*1010 30*107
Table B.4.3 Results of Water Quality Observation of Factory Effluent 4/5
B-T37
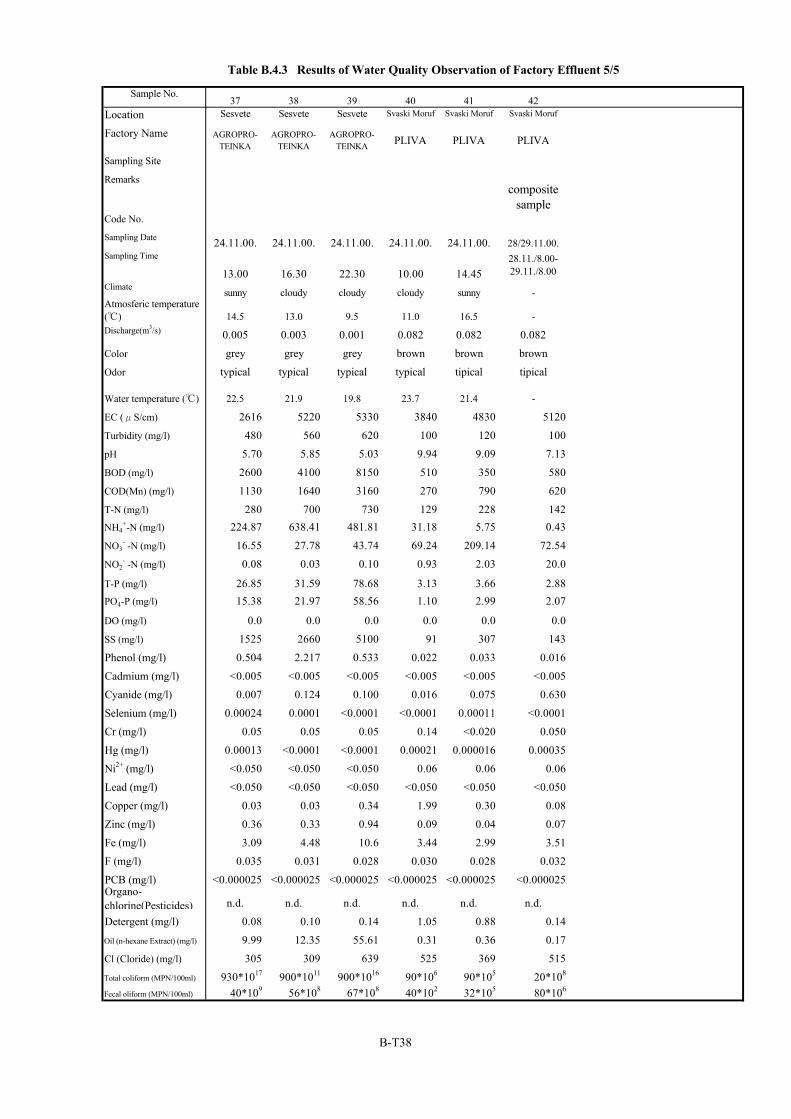
Sample No.37 38 39 40 41 42
Location Sesvete Sesvete Sesvete Svaski Moruf Svaski Moruf Svaski Moruf
Factory Name AGROPRO-TEINKA
AGROPRO-TEINKA
AGROPRO-TEINKA PLIVA PLIVA PLIVA
Sampling Site
Remarkscomposite
sampleCode No.
Sampling Date 24.11.00. 24.11.00. 24.11.00. 24.11.00. 24.11.00. 28/29.11.00.Sampling Time
13.00 16.30 22.30 10.00 14.4528.11./8.00-29.11./8.00
Climate sunny cloudy cloudy cloudy sunny -Atmosferic temperature(℃) 14.5 13.0 9.5 11.0 16.5 -Discharge(m3/s) 0.005 0.003 0.001 0.082 0.082 0.082
Color grey grey grey brown brown brown
Odor typical typical typical typical tipical tipical
Water temperature (℃) 22.5 21.9 19.8 23.7 21.4 -
EC (μS/cm) 2616 5220 5330 3840 4830 5120
Turbidity (mg/l) 480 560 620 100 120 100
pH 5.70 5.85 5.03 9.94 9.09 7.13
BOD (mg/l) 2600 4100 8150 510 350 580
COD(Mn) (mg/l) 1130 1640 3160 270 790 620
T-N (mg/l) 280 700 730 129 228 142NH4
+-N (mg/l) 224.87 638.41 481.81 31.18 5.75 0.43
NO3- -N (mg/l) 16.55 27.78 43.74 69.24 209.14 72.54
NO2- -N (mg/l) 0.08 0.03 0.10 0.93 2.03 20.0
T-P (mg/l) 26.85 31.59 78.68 3.13 3.66 2.88PO4-P (mg/l) 15.38 21.97 58.56 1.10 2.99 2.07
DO (mg/l) 0.0 0.0 0.0 0.0 0.0 0.0
SS (mg/l) 1525 2660 5100 91 307 143
Phenol (mg/l) 0.504 2.217 0.533 0.022 0.033 0.016
Cadmium (mg/l) <0.005 <0.005 <0.005 <0.005 <0.005 <0.005
Cyanide (mg/l) 0.007 0.124 0.100 0.016 0.075 0.630
Selenium (mg/l) 0.00024 0.0001 <0.0001 <0.0001 0.00011 <0.0001
Cr (mg/l) 0.05 0.05 0.05 0.14 <0.020 0.050
Hg (mg/l) 0.00013 <0.0001 <0.0001 0.00021 0.000016 0.00035
Ni2+ (mg/l) <0.050 <0.050 <0.050 0.06 0.06 0.06
Lead (mg/l) <0.050 <0.050 <0.050 <0.050 <0.050 <0.050
Copper (mg/l) 0.03 0.03 0.34 1.99 0.30 0.08
Zinc (mg/l) 0.36 0.33 0.94 0.09 0.04 0.07
Fe (mg/l) 3.09 4.48 10.6 3.44 2.99 3.51
F (mg/l) 0.035 0.031 0.028 0.030 0.028 0.032
PCB (mg/l) <0.000025 <0.000025 <0.000025 <0.000025 <0.000025 <0.000025Organo-chlorine(Pesticides) n.d. n.d. n.d. n.d. n.d. n.d.
Detergent (mg/l) 0.08 0.10 0.14 1.05 0.88 0.14
Oil (n-hexane Extract) (mg/l) 9.99 12.35 55.61 0.31 0.36 0.17
Cl (Cloride) (mg/l) 305 309 639 525 369 515
Total coliform (MPN/100ml) 930*1017 900*1011 900*1016 90*106 90*105 20*108
Fecal oliform (MPN/100ml) 40*109 56*108 67*108 40*102 32*105 80*106
Table B.4.3 Results of Water Quality Observation of Factory Effluent 5/5
B-T38
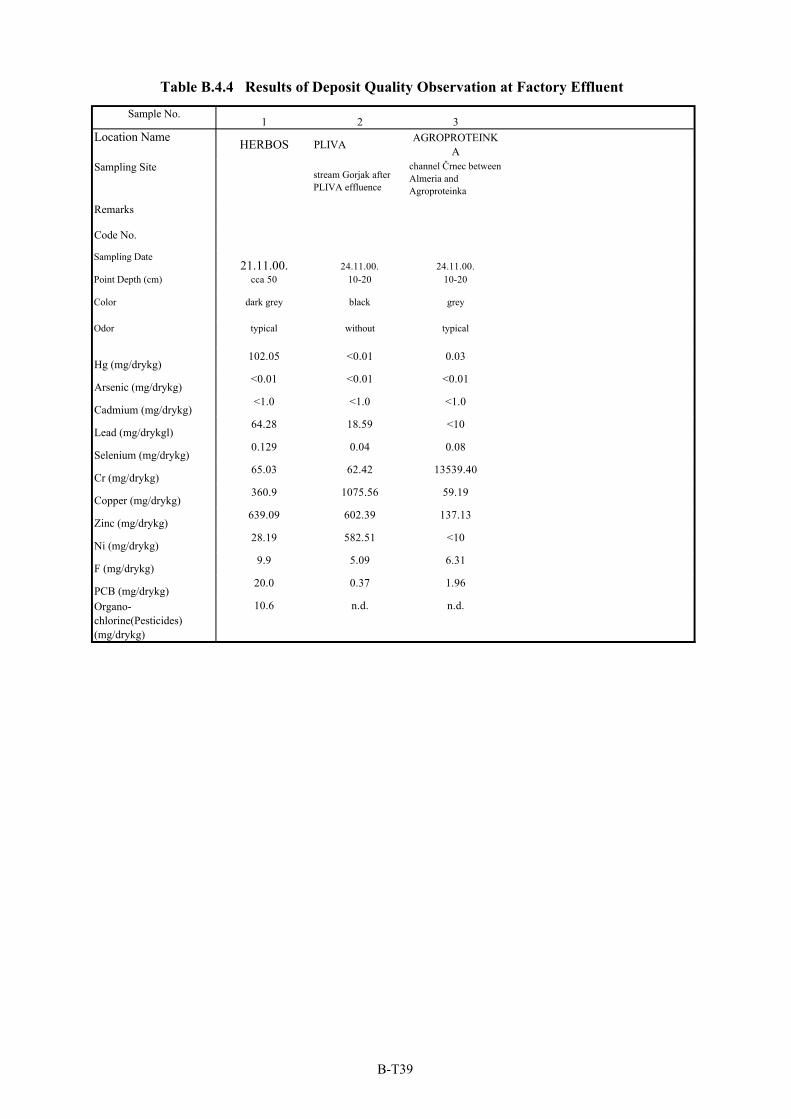
Sample No.1 2 3
Location Name HERBOS PLIVA AGROPROTEINKA
Sampling Site stream Gorjak afterPLIVA effluence
channel Črnec betweenAlmeria andAgroproteinka
Remarks
Code No.
Sampling Date21.11.00. 24.11.00. 24.11.00.
Point Depth (cm) cca 50 10-20 10-20
Color dark grey black grey
Odor typical without typical
Hg (mg/drykg)102.05 <0.01 0.03
Arsenic (mg/drykg)<0.01 <0.01 <0.01
Cadmium (mg/drykg)<1.0 <1.0 <1.0
Lead (mg/drykgl)64.28 18.59 <10
Selenium (mg/drykg)0.129 0.04 0.08
Cr (mg/drykg)65.03 62.42 13539.40
Copper (mg/drykg)360.9 1075.56 59.19
Zinc (mg/drykg)639.09 602.39 137.13
Ni (mg/drykg)28.19 582.51 <10
F (mg/drykg)9.9 5.09 6.31
PCB (mg/drykg)20.0 0.37 1.96
Organo-chlorine(Pesticides)(mg/drykg)
10.6 n.d. n.d.
Table B.4.4 Results of Deposit Quality Observation at Factory Effluent
B-T39
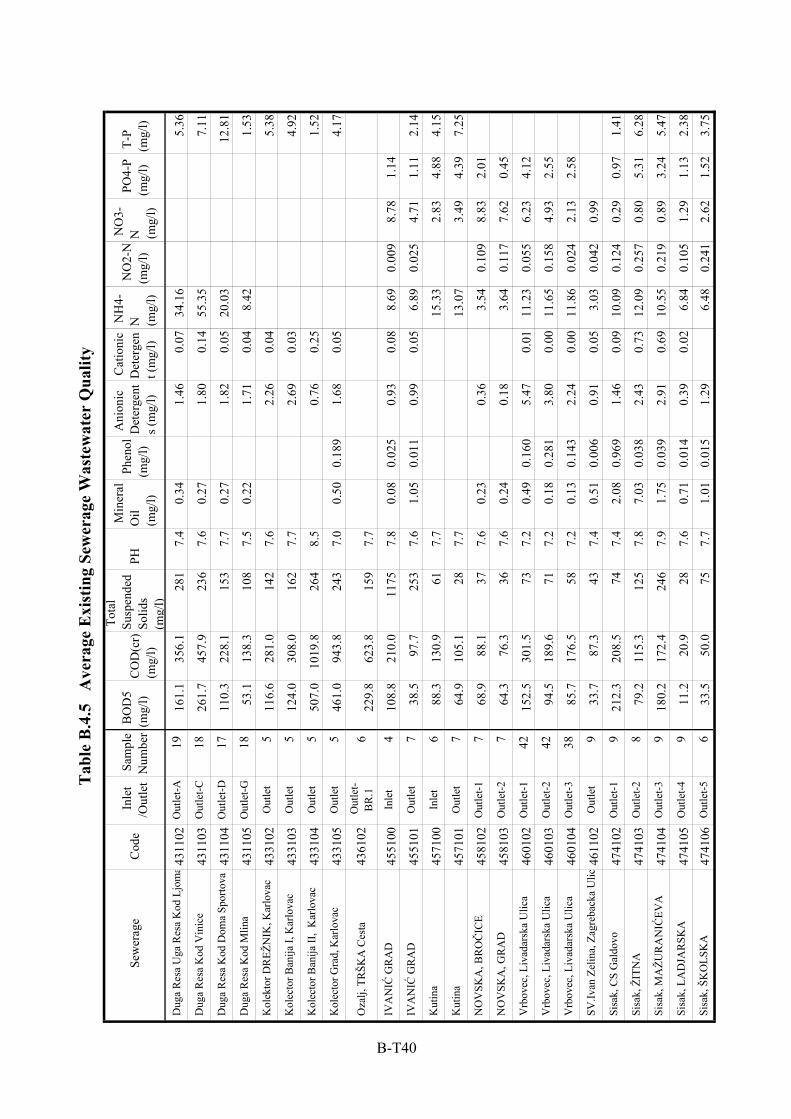
Sew
erag
eC
ode
Inle
t/O
utle
t S
ampl
eN
umbe
r B
OD
5(m
g/l)
CO
D(c
r)(m
g/l)
Tot
alSu
spen
ded
Solid
s(m
g/l)
PH
Min
eral
Oil
(mg/
l)
Phe
nol
(mg/
l)
Ani
onic
Det
erge
nts (
mg/
l)
Cat
ioni
cD
eter
gen
t (m
g/l)
NH
4-N (m
g/l)
NO
2-N
(mg/
l)
NO
3-N (m
g/l)
PO
4-P
(mg/
l) T
-P(m
g/l)
Dug
a R
esa
Uga
Res
a K
od L
jom
a43
1102
Out
let-A
19
161.
135
6.1
281
7.4
0.34
1.46
0.07
34.1
65.
36D
uga
Res
a K
od V
inic
e43
1103
Out
let-C
18
261.
745
7.9
236
7.6
0.27
1.80
0.14
55.3
57.
11D
uga
Res
a K
od D
oma
Spor
tova
4311
04O
utle
t-D17
11
0.3
228.
115
37.
70.
271.
820.
0520
.03
12.8
1D
uga
Res
a K
od M
lina
4311
05O
utle
t-G18
53
.113
8.3
108
7.5
0.22
1.71
0.04
8.42
1.53
Kol
ekto
r DR
EŽN
IK, K
arlo
vac
4331
02O
utle
t5
116.
628
1.0
142
7.6
2.26
0.04
5.38
Kol
ecto
r Ban
ija I,
Kar
lova
c43
3103
Out
let
5
12
4.0
308.
016
27.
72.
690.
034.
92K
olec
tor B
anija
II,
Kar
lova
c43
3104
Out
let
5
50
7.0
1019
.826
48.
50.
760.
251.
52K
olec
tor G
rad,
Kar
lova
c43
3105
Out
let
5
46
1.0
943.
824
37.
00.
500.
189
1.68
0.05
4.17
Oza
lj, T
RŠK
A C
esta
4361
02 O
utle
t-B
R.1
6
22
9.8
623.
815
97.
7IV
AN
IĆ G
RA
D45
5100
Inle
t4
108.
821
0.0
1175
7.8
0.08
0.02
50.
930.
088.
690.
009
8.78
1.14
IVA
NIĆ
GR
AD
4551
01O
utle
t7
38.5
97.7
253
7.6
1.05
0.01
10.
990.
056.
890.
025
4.71
1.11
2.14
Kut
ina
4571
00In
let
6
88
.313
0.9
617.
715
.33
2.83
4.88
4.15
Kut
ina
4571
01O
utle
t7
64.9
105.
128
7.7
13.0
73.
494.
397.
25N
OV
SKA
, BR
OČ
ICE
4581
02O
utle
t-17
68.9
88.1
377.
60.
230.
363.
540.
109
8.83
2.01
NO
VSK
A, G
RA
D45
8103
Out
let-2
7
64
.376
.336
7.6
0.24
0.18
3.64
0.11
77.
620.
45V
rbov
ec, L
ivad
arsk
a U
lica
4601
02O
utle
t-142
15
2.5
301.
573
7.2
0.49
0.16
05.
470.
0111
.23
0.05
56.
234.
12V
rbov
ec, L
ivad
arsk
a U
lica
4601
03O
utle
t-242
94
.518
9.6
717.
20.
180.
281
3.80
0.00
11.6
50.
158
4.93
2.55
Vrb
ovec
, Liv
adar
ska
Ulic
a46
0104
Out
let-3
38
85.7
176.
558
7.2
0.13
0.14
32.
240.
0011
.86
0.02
42.
132.
58SV
.Ivan
Zel
ina,
Zag
reba
cka
Ulic
4611
02O
utle
t9
33.7
87.3
437.
40.
510.
006
0.91
0.05
3.03
0.04
20.
99Si
sak,
CS
Gal
dovo
4741
02O
utle
t-19
212.
320
8.5
747.
42.
080.
969
1.46
0.09
10.0
90.
124
0.29
0.97
1.41
Sisa
k, Ž
ITN
A47
4103
Out
let-2
8
79
.211
5.3
125
7.8
7.03
0.03
82.
430.
7312
.09
0.25
70.
805.
316.
28Si
sak,
MA
ŽUR
AN
IĆEV
A47
4104
Out
let-3
9
18
0.2
172.
424
67.
91.
750.
039
2.91
0.69
10.5
50.
219
0.89
3.24
5.47
Sisa
k, L
AD
JAR
SKA
4741
05O
utle
t-49
11.2
20.9
287.
60.
710.
014
0.39
0.02
6.84
0.10
51.
291.
132.
38Si
sak,
ŠK
OLS
KA
4741
06O
utle
t-56
33.5
50.0
757.
71.
010.
015
1.29
6.48
0.24
12.
621.
523.
75
Tab
le B
.4.5
A
vera
ge E
xist
ing
Sew
erag
e W
aste
wat
er Q
ualit
y
B-T40
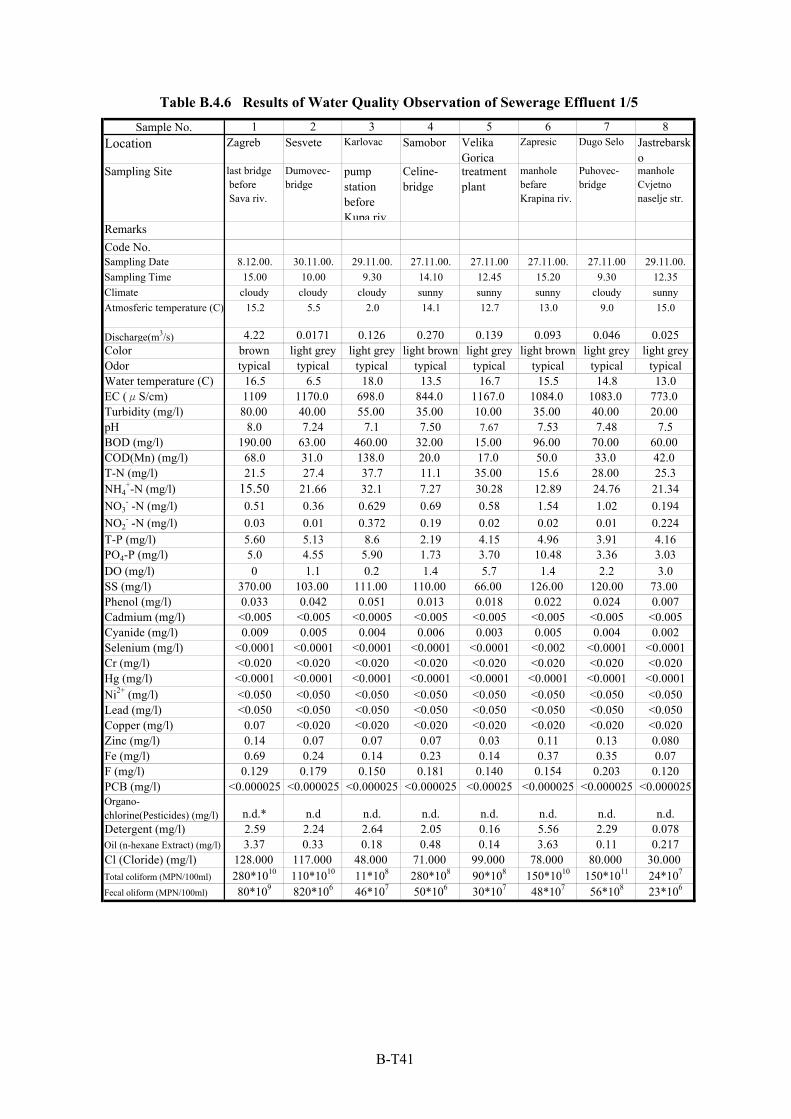
Sample No. 1 2 3 4 5 6 7 8Location Zagreb Sesvete Karlovac Samobor Velika
GoricaZapresic Dugo Selo Jastrebarsk
oSampling Site last bridge
before Sava riv.
Dumovec-bridge
pumpstationbeforeKupa riv.
Celine-bridge
treatmentplant
manholebefareKrapina riv.
Puhovec-bridge
manholeCvjetnonaselje str.
RemarksCode No.Sampling Date 8.12.00. 30.11.00. 29.11.00. 27.11.00. 27.11.00 27.11.00. 27.11.00 29.11.00.Sampling Time 15.00 10.00 9.30 14.10 12.45 15.20 9.30 12.35Climate cloudy cloudy cloudy sunny sunny sunny cloudy sunnyAtmosferic temperature (C) 15.2 5.5 2.0 14.1 12.7 13.0 9.0 15.0
Discharge(m3/s) 4.22 0.0171 0.126 0.270 0.139 0.093 0.046 0.025Color brown light grey light grey light brown light grey light brown light grey light greyOdor typical typical typical typical typical typical typical typicalWater temperature (C) 16.5 6.5 18.0 13.5 16.7 15.5 14.8 13.0EC (μS/cm) 1109 1170.0 698.0 844.0 1167.0 1084.0 1083.0 773.0Turbidity (mg/l) 80.00 40.00 55.00 35.00 10.00 35.00 40.00 20.00pH 8.0 7.24 7.1 7.50 7.67 7.53 7.48 7.5BOD (mg/l) 190.00 63.00 460.00 32.00 15.00 96.00 70.00 60.00COD(Mn) (mg/l) 68.0 31.0 138.0 20.0 17.0 50.0 33.0 42.0T-N (mg/l) 21.5 27.4 37.7 11.1 35.00 15.6 28.00 25.3NH4
+-N (mg/l) 15.50 21.66 32.1 7.27 30.28 12.89 24.76 21.34NO3
- -N (mg/l) 0.51 0.36 0.629 0.69 0.58 1.54 1.02 0.194NO2
- -N (mg/l) 0.03 0.01 0.372 0.19 0.02 0.02 0.01 0.224T-P (mg/l) 5.60 5.13 8.6 2.19 4.15 4.96 3.91 4.16PO4-P (mg/l) 5.0 4.55 5.90 1.73 3.70 10.48 3.36 3.03DO (mg/l) 0 1.1 0.2 1.4 5.7 1.4 2.2 3.0SS (mg/l) 370.00 103.00 111.00 110.00 66.00 126.00 120.00 73.00Phenol (mg/l) 0.033 0.042 0.051 0.013 0.018 0.022 0.024 0.007Cadmium (mg/l) <0.005 <0.005 <0.0005 <0.005 <0.005 <0.005 <0.005 <0.005Cyanide (mg/l) 0.009 0.005 0.004 0.006 0.003 0.005 0.004 0.002Selenium (mg/l) <0.0001 <0.0001 <0.0001 <0.0001 <0.0001 <0.002 <0.0001 <0.0001Cr (mg/l) <0.020 <0.020 <0.020 <0.020 <0.020 <0.020 <0.020 <0.020Hg (mg/l) <0.0001 <0.0001 <0.0001 <0.0001 <0.0001 <0.0001 <0.0001 <0.0001Ni2+ (mg/l) <0.050 <0.050 <0.050 <0.050 <0.050 <0.050 <0.050 <0.050Lead (mg/l) <0.050 <0.050 <0.050 <0.050 <0.050 <0.050 <0.050 <0.050Copper (mg/l) 0.07 <0.020 <0.020 <0.020 <0.020 <0.020 <0.020 <0.020Zinc (mg/l) 0.14 0.07 0.07 0.07 0.03 0.11 0.13 0.080Fe (mg/l) 0.69 0.24 0.14 0.23 0.14 0.37 0.35 0.07F (mg/l) 0.129 0.179 0.150 0.181 0.140 0.154 0.203 0.120PCB (mg/l) <0.000025 <0.000025 <0.000025 <0.000025 <0.00025 <0.000025 <0.000025 <0.000025Organo-chlorine(Pesticides) (mg/l) n.d.* n.d n.d. n.d. n.d. n.d. n.d. n.d.Detergent (mg/l) 2.59 2.24 2.64 2.05 0.16 5.56 2.29 0.078Oil (n-hexane Extract) (mg/l) 3.37 0.33 0.18 0.48 0.14 3.63 0.11 0.217Cl (Cloride) (mg/l) 128.000 117.000 48.000 71.000 99.000 78.000 80.000 30.000Total coliform (MPN/100ml) 280*1010 110*1010 11*108 280*108 90*108 150*1010 150*1011 24*107
Fecal oliform (MPN/100ml) 80*109 820*106 46*107 50*106 30*107 48*107 56*108 23*106
Table B.4.6 Results of Water Quality Observation of Sewerage Effluent 1/5
B-T41
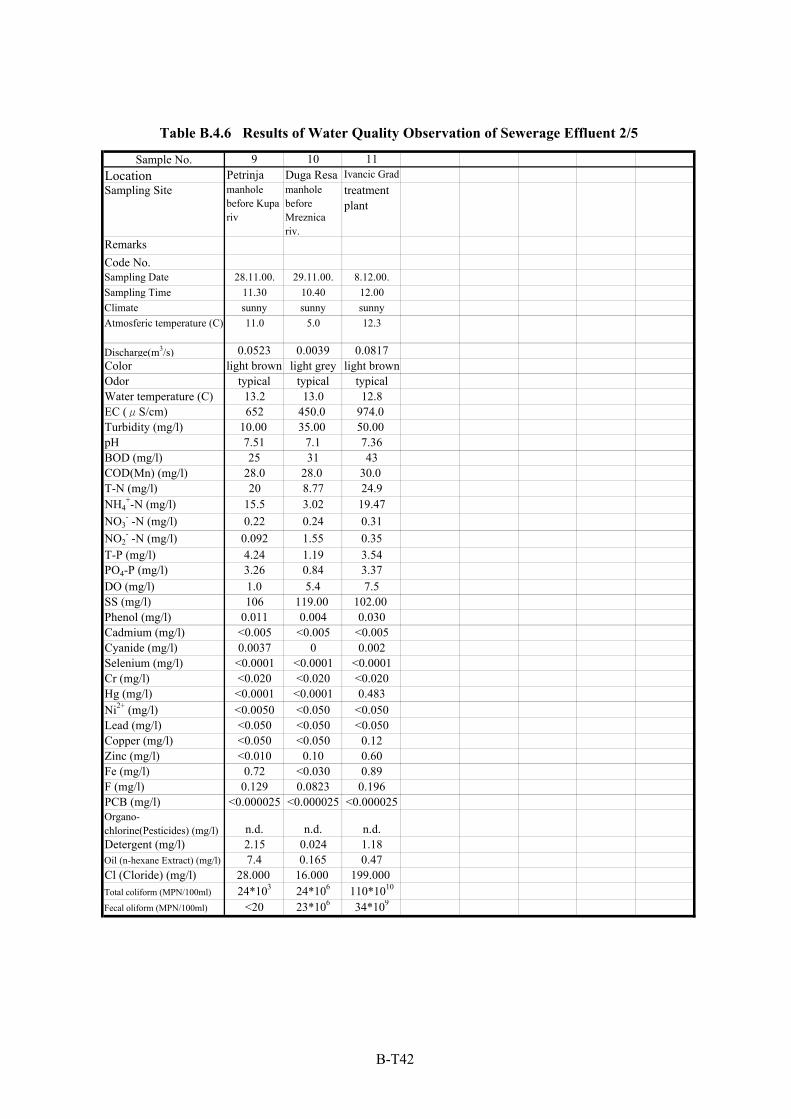
Sample No. 9 10 11Location Petrinja Duga Resa Ivancic GradSampling Site manhole
before Kupariv
manholebeforeMreznicariv.
treatmentplant
RemarksCode No.Sampling Date 28.11.00. 29.11.00. 8.12.00.Sampling Time 11.30 10.40 12.00Climate sunny sunny sunnyAtmosferic temperature (C) 11.0 5.0 12.3
Discharge(m3/s) 0.0523 0.0039 0.0817Color light brown light grey light brownOdor typical typical typicalWater temperature (C) 13.2 13.0 12.8EC (μS/cm) 652 450.0 974.0Turbidity (mg/l) 10.00 35.00 50.00pH 7.51 7.1 7.36BOD (mg/l) 25 31 43COD(Mn) (mg/l) 28.0 28.0 30.0T-N (mg/l) 20 8.77 24.9NH4
+-N (mg/l) 15.5 3.02 19.47NO3
- -N (mg/l) 0.22 0.24 0.31NO2
- -N (mg/l) 0.092 1.55 0.35T-P (mg/l) 4.24 1.19 3.54PO4-P (mg/l) 3.26 0.84 3.37DO (mg/l) 1.0 5.4 7.5SS (mg/l) 106 119.00 102.00Phenol (mg/l) 0.011 0.004 0.030Cadmium (mg/l) <0.005 <0.005 <0.005Cyanide (mg/l) 0.0037 0 0.002Selenium (mg/l) <0.0001 <0.0001 <0.0001Cr (mg/l) <0.020 <0.020 <0.020Hg (mg/l) <0.0001 <0.0001 0.483Ni2+ (mg/l) <0.0050 <0.050 <0.050Lead (mg/l) <0.050 <0.050 <0.050Copper (mg/l) <0.050 <0.050 0.12Zinc (mg/l) <0.010 0.10 0.60Fe (mg/l) 0.72 <0.030 0.89F (mg/l) 0.129 0.0823 0.196PCB (mg/l) <0.000025 <0.000025 <0.000025Organo-chlorine(Pesticides) (mg/l) n.d. n.d. n.d.Detergent (mg/l) 2.15 0.024 1.18Oil (n-hexane Extract) (mg/l) 7.4 0.165 0.47Cl (Cloride) (mg/l) 28.000 16.000 199.000Total coliform (MPN/100ml) 24*103 24*106 110*1010
Fecal oliform (MPN/100ml) <20 23*106 34*109
Table B.4.6 Results of Water Quality Observation of Sewerage Effluent 2/5
B-T42
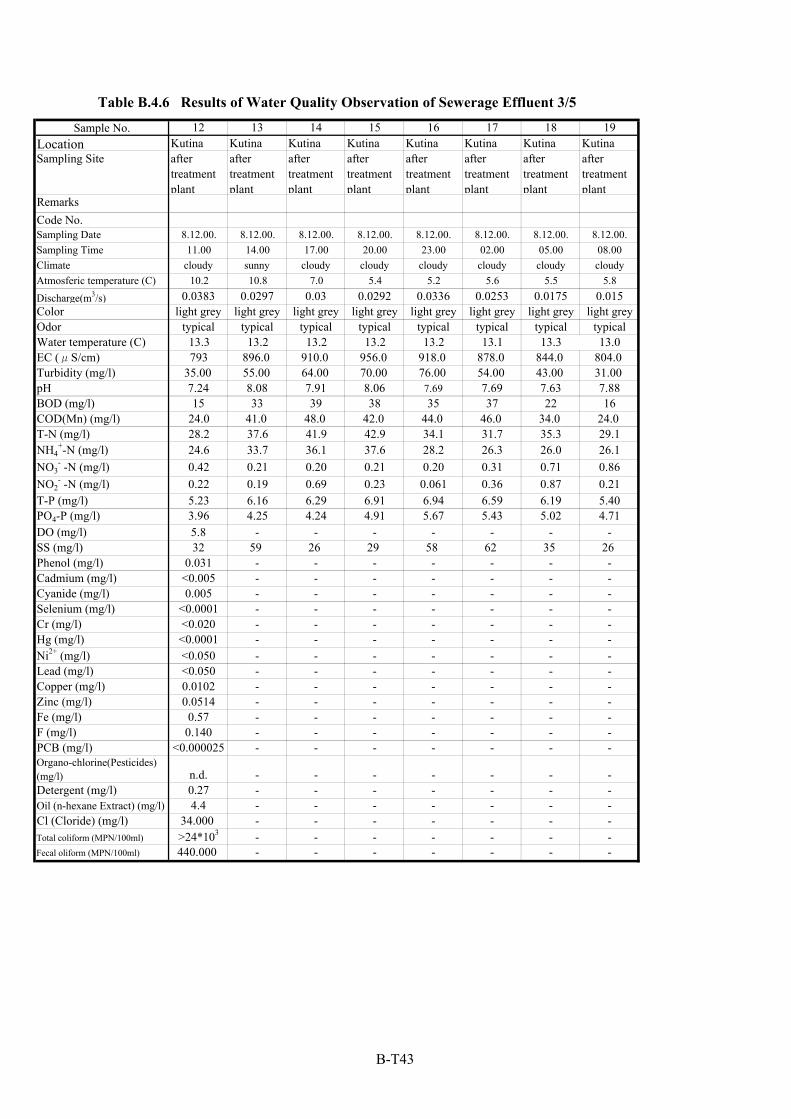
Sample No. 12 13 14 15 16 17 18 19Location Kutina Kutina Kutina Kutina Kutina Kutina Kutina KutinaSampling Site after
treatmentplant
aftertreatmentplant
aftertreatmentplant
aftertreatmentplant
aftertreatmentplant
aftertreatmentplant
aftertreatmentplant
aftertreatmentplant
RemarksCode No.Sampling Date 8.12.00. 8.12.00. 8.12.00. 8.12.00. 8.12.00. 8.12.00. 8.12.00. 8.12.00.Sampling Time 11.00 14.00 17.00 20.00 23.00 02.00 05.00 08.00Climate cloudy sunny cloudy cloudy cloudy cloudy cloudy cloudyAtmosferic temperature (C) 10.2 10.8 7.0 5.4 5.2 5.6 5.5 5.8Discharge(m3/s) 0.0383 0.0297 0.03 0.0292 0.0336 0.0253 0.0175 0.015Color light grey light grey light grey light grey light grey light grey light grey light greyOdor typical typical typical typical typical typical typical typicalWater temperature (C) 13.3 13.2 13.2 13.2 13.2 13.1 13.3 13.0EC (μS/cm) 793 896.0 910.0 956.0 918.0 878.0 844.0 804.0Turbidity (mg/l) 35.00 55.00 64.00 70.00 76.00 54.00 43.00 31.00pH 7.24 8.08 7.91 8.06 7.69 7.69 7.63 7.88BOD (mg/l) 15 33 39 38 35 37 22 16COD(Mn) (mg/l) 24.0 41.0 48.0 42.0 44.0 46.0 34.0 24.0T-N (mg/l) 28.2 37.6 41.9 42.9 34.1 31.7 35.3 29.1NH4
+-N (mg/l) 24.6 33.7 36.1 37.6 28.2 26.3 26.0 26.1NO3
- -N (mg/l) 0.42 0.21 0.20 0.21 0.20 0.31 0.71 0.86NO2
- -N (mg/l) 0.22 0.19 0.69 0.23 0.061 0.36 0.87 0.21T-P (mg/l) 5.23 6.16 6.29 6.91 6.94 6.59 6.19 5.40PO4-P (mg/l) 3.96 4.25 4.24 4.91 5.67 5.43 5.02 4.71DO (mg/l) 5.8 - - - - - - -SS (mg/l) 32 59 26 29 58 62 35 26Phenol (mg/l) 0.031 - - - - - - -Cadmium (mg/l) <0.005 - - - - - - -Cyanide (mg/l) 0.005 - - - - - - -Selenium (mg/l) <0.0001 - - - - - - -Cr (mg/l) <0.020 - - - - - - -Hg (mg/l) <0.0001 - - - - - - -Ni2+ (mg/l) <0.050 - - - - - - -Lead (mg/l) <0.050 - - - - - - -Copper (mg/l) 0.0102 - - - - - - -Zinc (mg/l) 0.0514 - - - - - - -Fe (mg/l) 0.57 - - - - - - -F (mg/l) 0.140 - - - - - - -PCB (mg/l) <0.000025 - - - - - - -Organo-chlorine(Pesticides)(mg/l) n.d. - - - - - - -Detergent (mg/l) 0.27 - - - - - - -Oil (n-hexane Extract) (mg/l) 4.4 - - - - - - -Cl (Cloride) (mg/l) 34.000 - - - - - - -Total coliform (MPN/100ml) >24*103 - - - - - - -Fecal oliform (MPN/100ml) 440.000 - - - - - - -
Table B.4.6 Results of Water Quality Observation of Sewerage Effluent 3/5
B-T43
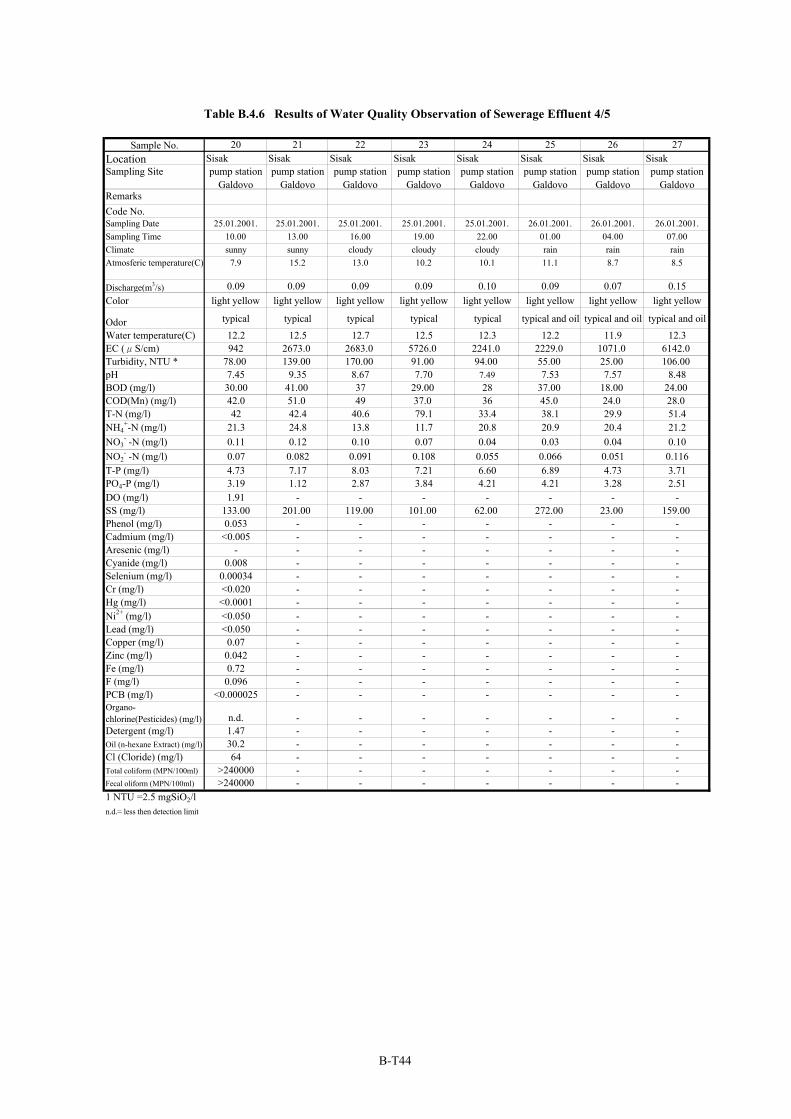
Sample No. 20 21 22 23 24 25 26 27Location Sisak Sisak Sisak Sisak Sisak Sisak Sisak SisakSampling Site pump station
Galdovopump station
Galdovopump station
Galdovopump station
Galdovopump station
Galdovopump station
Galdovopump station
Galdovopump station
GaldovoRemarksCode No.Sampling Date 25.01.2001. 25.01.2001. 25.01.2001. 25.01.2001. 25.01.2001. 26.01.2001. 26.01.2001. 26.01.2001.Sampling Time 10.00 13.00 16.00 19.00 22.00 01.00 04.00 07.00Climate sunny sunny cloudy cloudy cloudy rain rain rainAtmosferic temperature(C) 7.9 15.2 13.0 10.2 10.1 11.1 8.7 8.5
Discharge(m3/s) 0.09 0.09 0.09 0.09 0.10 0.09 0.07 0.15Color light yellow light yellow light yellow light yellow light yellow light yellow light yellow light yellow
Odor typical typical typical typical typical typical and oil typical and oil typical and oilWater temperature(C) 12.2 12.5 12.7 12.5 12.3 12.2 11.9 12.3EC (μS/cm) 942 2673.0 2683.0 5726.0 2241.0 2229.0 1071.0 6142.0Turbidity, NTU * 78.00 139.00 170.00 91.00 94.00 55.00 25.00 106.00pH 7.45 9.35 8.67 7.70 7.49 7.53 7.57 8.48BOD (mg/l) 30.00 41.00 37 29.00 28 37.00 18.00 24.00COD(Mn) (mg/l) 42.0 51.0 49 37.0 36 45.0 24.0 28.0T-N (mg/l) 42 42.4 40.6 79.1 33.4 38.1 29.9 51.4NH4
+-N (mg/l) 21.3 24.8 13.8 11.7 20.8 20.9 20.4 21.2NO3
- -N (mg/l) 0.11 0.12 0.10 0.07 0.04 0.03 0.04 0.10NO2
- -N (mg/l) 0.07 0.082 0.091 0.108 0.055 0.066 0.051 0.116T-P (mg/l) 4.73 7.17 8.03 7.21 6.60 6.89 4.73 3.71PO4-P (mg/l) 3.19 1.12 2.87 3.84 4.21 4.21 3.28 2.51DO (mg/l) 1.91 - - - - - - -SS (mg/l) 133.00 201.00 119.00 101.00 62.00 272.00 23.00 159.00Phenol (mg/l) 0.053 - - - - - - -Cadmium (mg/l) <0.005 - - - - - - -Aresenic (mg/l) - - - - - - - -Cyanide (mg/l) 0.008 - - - - - - -Selenium (mg/l) 0.00034 - - - - - - -Cr (mg/l) <0.020 - - - - - - -Hg (mg/l) <0.0001 - - - - - - -Ni2+ (mg/l) <0.050 - - - - - - -Lead (mg/l) <0.050 - - - - - - -Copper (mg/l) 0.07 - - - - - - -Zinc (mg/l) 0.042 - - - - - - -Fe (mg/l) 0.72 - - - - - - -F (mg/l) 0.096 - - - - - - -PCB (mg/l) <0.000025 - - - - - - -Organo-chlorine(Pesticides) (mg/l) n.d. - - - - - - -Detergent (mg/l) 1.47 - - - - - - -Oil (n-hexane Extract) (mg/l) 30.2 - - - - - - -Cl (Cloride) (mg/l) 64 - - - - - - -Total coliform (MPN/100ml) >240000 - - - - - - -Fecal oliform (MPN/100ml) >240000 - - - - - - -1 NTU =2.5 mgSiO2/ln.d.= less then detection limit
Table B.4.6 Results of Water Quality Observation of Sewerage Effluent 4/5
B-T44
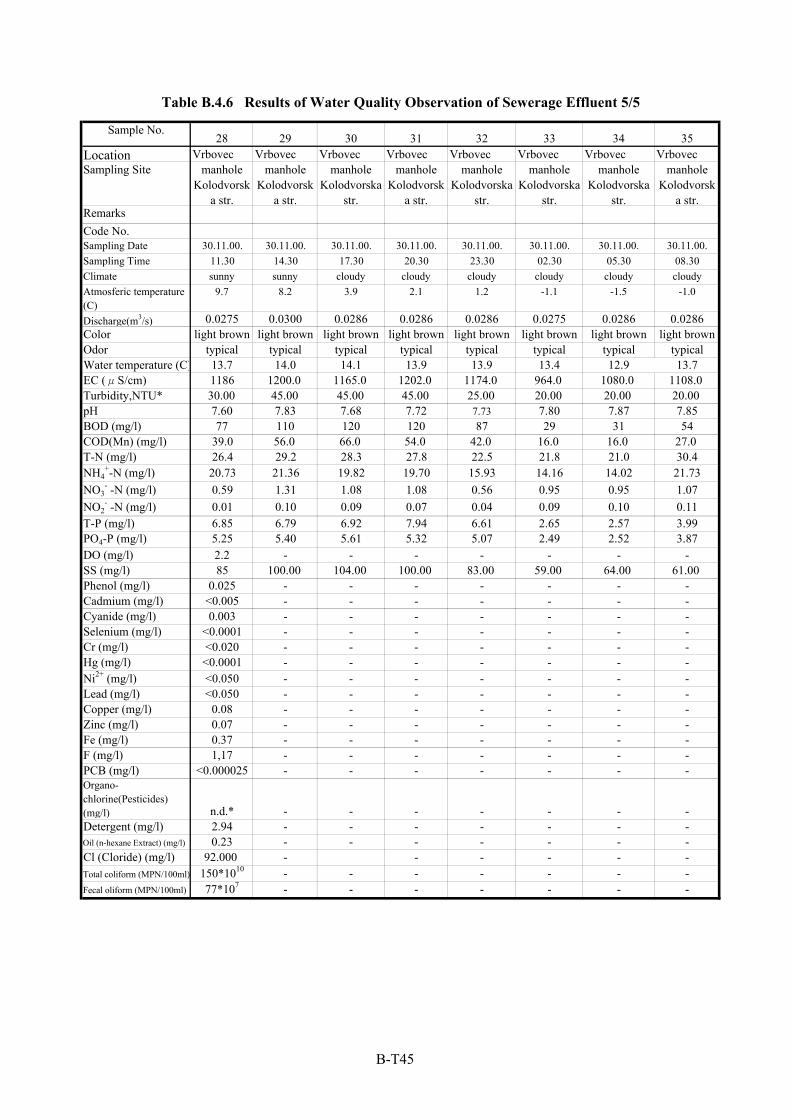
Sample No.28 29 30 31 32 33 34 35
Location Vrbovec Vrbovec Vrbovec Vrbovec Vrbovec Vrbovec Vrbovec VrbovecSampling Site manhole
Kolodvorska str.
manholeKolodvorsk
a str.
manholeKolodvorska
str.
manholeKolodvorsk
a str.
manholeKolodvorska
str.
manholeKolodvorska
str.
manholeKolodvorska
str.
manholeKolodvorsk
a str.RemarksCode No.Sampling Date 30.11.00. 30.11.00. 30.11.00. 30.11.00. 30.11.00. 30.11.00. 30.11.00. 30.11.00.Sampling Time 11.30 14.30 17.30 20.30 23.30 02.30 05.30 08.30Climate sunny sunny cloudy cloudy cloudy cloudy cloudy cloudyAtmosferic temperature(C)
9.7 8.2 3.9 2.1 1.2 -1.1 -1.5 -1.0
Discharge(m3/s) 0.0275 0.0300 0.0286 0.0286 0.0286 0.0275 0.0286 0.0286Color light brown light brown light brown light brown light brown light brown light brown light brownOdor typical typical typical typical typical typical typical typicalWater temperature (C) 13.7 14.0 14.1 13.9 13.9 13.4 12.9 13.7EC (μS/cm) 1186 1200.0 1165.0 1202.0 1174.0 964.0 1080.0 1108.0Turbidity,NTU* 30.00 45.00 45.00 45.00 25.00 20.00 20.00 20.00pH 7.60 7.83 7.68 7.72 7.73 7.80 7.87 7.85BOD (mg/l) 77 110 120 120 87 29 31 54COD(Mn) (mg/l) 39.0 56.0 66.0 54.0 42.0 16.0 16.0 27.0T-N (mg/l) 26.4 29.2 28.3 27.8 22.5 21.8 21.0 30.4NH4
+-N (mg/l) 20.73 21.36 19.82 19.70 15.93 14.16 14.02 21.73NO3
- -N (mg/l) 0.59 1.31 1.08 1.08 0.56 0.95 0.95 1.07NO2
- -N (mg/l) 0.01 0.10 0.09 0.07 0.04 0.09 0.10 0.11T-P (mg/l) 6.85 6.79 6.92 7.94 6.61 2.65 2.57 3.99PO4-P (mg/l) 5.25 5.40 5.61 5.32 5.07 2.49 2.52 3.87DO (mg/l) 2.2 - - - - - - -SS (mg/l) 85 100.00 104.00 100.00 83.00 59.00 64.00 61.00Phenol (mg/l) 0.025 - - - - - - -Cadmium (mg/l) <0.005 - - - - - - -Cyanide (mg/l) 0.003 - - - - - - -Selenium (mg/l) <0.0001 - - - - - - -Cr (mg/l) <0.020 - - - - - - -Hg (mg/l) <0.0001 - - - - - - -Ni2+ (mg/l) <0.050 - - - - - - -Lead (mg/l) <0.050 - - - - - - -Copper (mg/l) 0.08 - - - - - - -Zinc (mg/l) 0.07 - - - - - - -Fe (mg/l) 0.37 - - - - - - -F (mg/l) 1,17 - - - - - - -PCB (mg/l) <0.000025 - - - - - - -Organo-chlorine(Pesticides)(mg/l) n.d.* - - - - - - -Detergent (mg/l) 2.94 - - - - - - -Oil (n-hexane Extract) (mg/l) 0.23 - - - - - - -Cl (Cloride) (mg/l) 92.000 - - - - - -Total coliform (MPN/100ml) 150*1010 - - - - - - -Fecal oliform (MPN/100ml) 77*107 - - - - - - -
Table B.4.6 Results of Water Quality Observation of Sewerage Effluent 5/5
B-T45
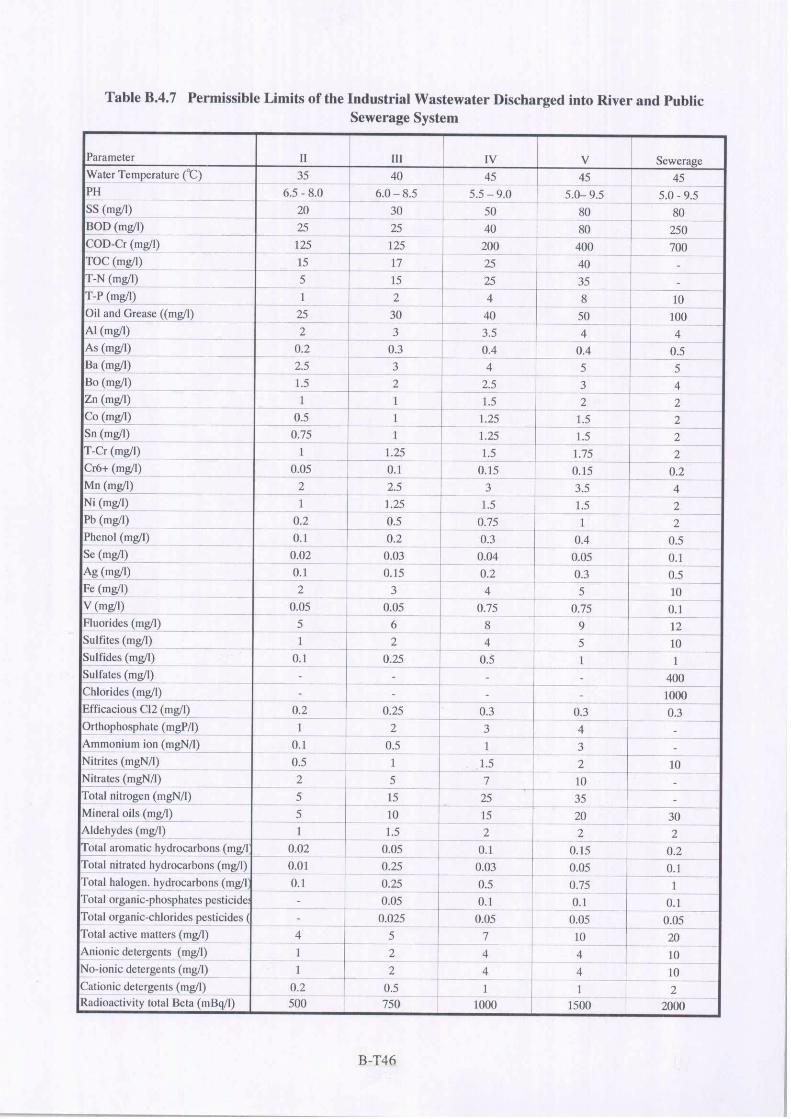
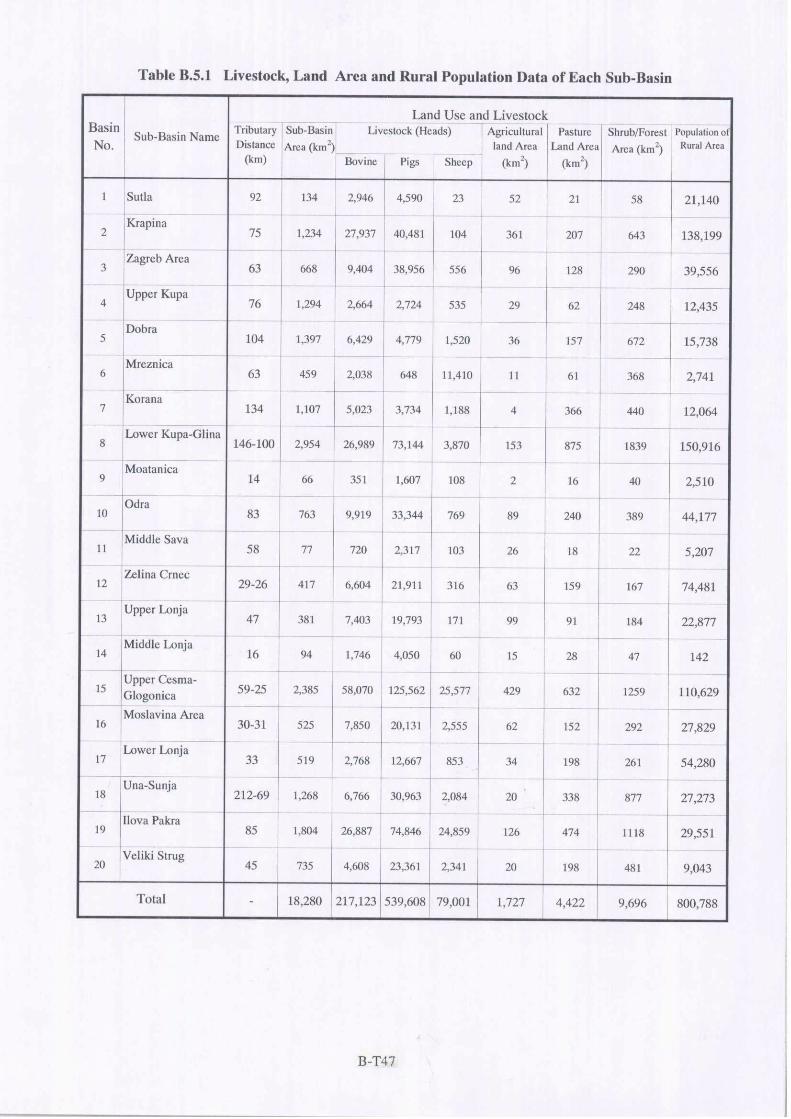
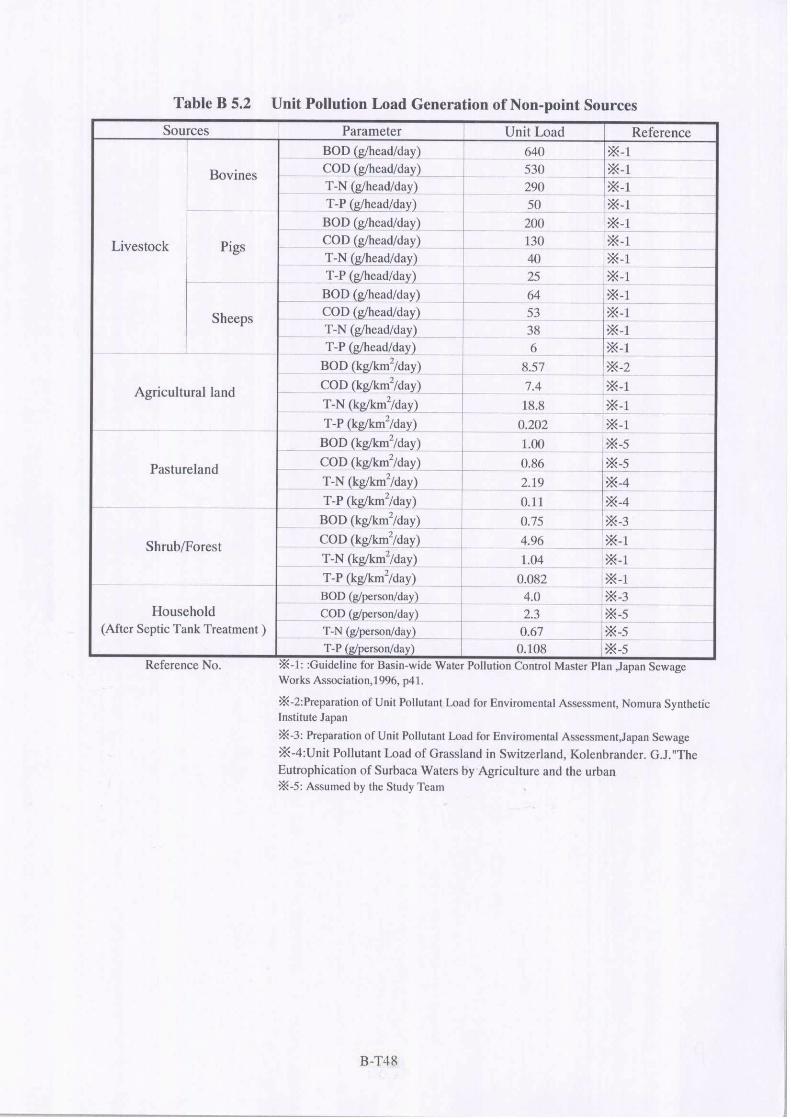
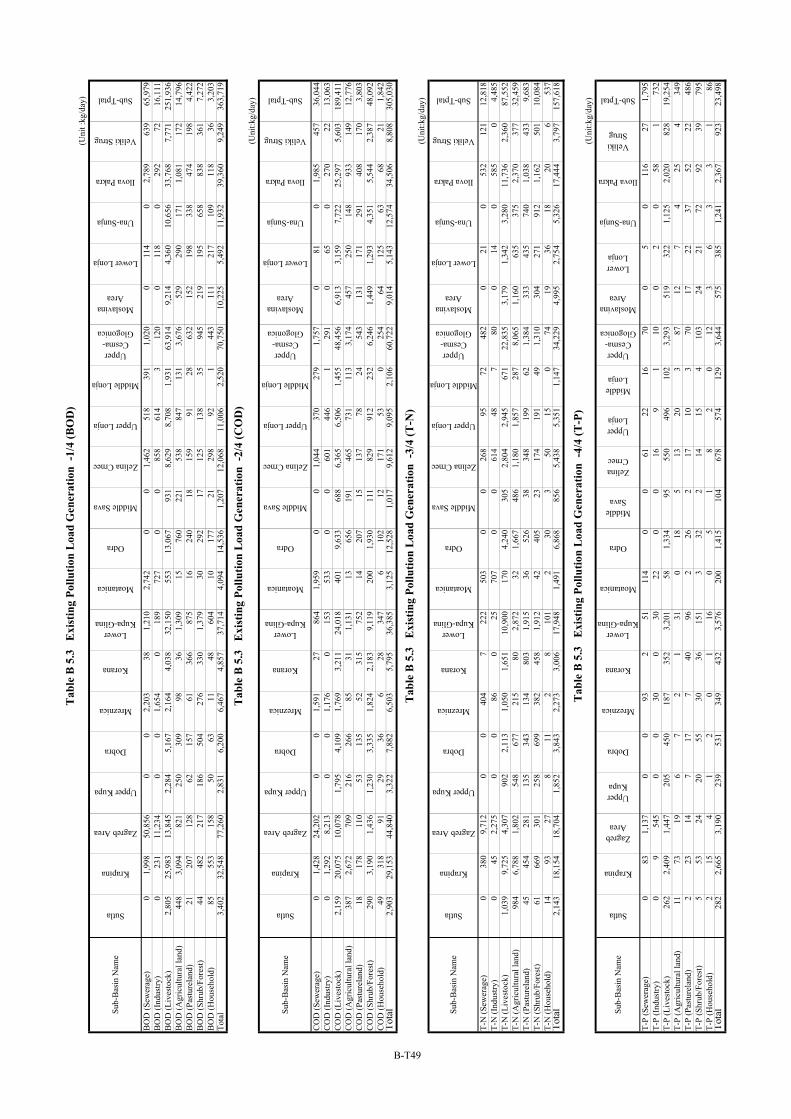
Sub-
Bas
in N
ame
Sutla
Krapina
Zagreb Area
Upper Kupa
Dobra
Mreznica
Korana
LowerKupa-Glina
Moatanica
Odra
Middle Sava
Zelina Crnec
Upper Lonja
Middle Lonja
UpperCesma-
Glogonica
MoslavinaArea
Lower Lonja
Una-Sunja
Ilova Pakra
Veliki Strug
Sub-Tptal
BO
D (S
ewer
age)
01,
998
50,8
560
02,
203
381,
210
2,74
20
01,
462
518
391
1,02
00
114
02,
789
639
65,9
79B
OD
(Ind
ustry
)0
231
11,2
340
01,
654
018
972
70
085
861
43
120
011
80
292
7216
,111
BO
D (L
ives
tock
)2,
805
25,9
8313
,845
2,28
45,
167
2,16
44,
038
32,1
5055
313
,067
931
8,62
98,
708
1,93
163
,914
9,21
44,
360
10,6
5633
,768
7,77
125
1,93
6B
OD
(Agr
icul
tura
l lan
d)44
83,
094
821
250
309
9836
1,30
915
760
221
538
847
131
3,67
652
929
017
11,
081
172
14,7
96B
OD
(Pas
ture
land
)21
207
128
6215
761
366
875
1624
018
159
9128
632
152
198
338
474
198
4,42
2B
OD
(Shr
ub/F
ores
t)44
482
217
186
504
276
330
1,37
930
292
1712
513
835
945
219
195
658
838
361
7,27
2B
OD
(Hou
seho
ld)
8555
315
850
6311
4860
410
177
2129
892
144
311
121
710
911
836
3,20
3To
tal
3,40
232
,548
77,2
602,
831
6,20
06,
467
4,85
737
,714
4,09
414
,536
1,20
712
,068
11,0
062,
520
70,7
5010
,225
5,49
211
,932
39,3
609,
249
363,
719
Sub-
Bas
in N
ame
Sutla
Krapina
Zagreb Area
Upper Kupa
Dobra
Mreznica
Korana
LowerKupa-Glina
Moatanica
Odra
Middle Sava
Zelina Crnec
Upper Lonja
Middle Lonja
UpperCesma-
Glogonica
MoslavinaArea
Lower Lonja
Una-Sunja
Ilova Pakra
Veliki Strug
Sub-Tptal
CO
D (S
ewer
age)
01,
428
24,2
020
01,
591
2786
41,
959
00
1,04
437
027
91,
757
081
01,
985
457
36,0
44C
OD
(Ind
ustry
)0
1,29
28,
213
00
1,17
60
153
533
00
601
446
129
10
650
270
2213
,063
CO
D (L
ives
tock
)2,
159
20,0
7510
,078
1,79
54,
109
1,76
93,
211
24,0
1840
19,
633
688
6,36
56,
506
1,45
548
,456
6,91
33,
159
7,72
225
,297
5,60
318
9,41
1C
OD
(Agr
icul
tura
l lan
d)38
72,
672
709
216
266
8531
1,13
113
656
191
465
731
113
3,17
445
725
014
893
314
912
,776
CO
D (P
astu
rela
nd)
1817
811
053
135
5231
575
214
207
1513
778
2454
313
117
129
140
817
03,
803
CO
D (S
hrub
/For
est)
290
3,19
01,
436
1,23
03,
335
1,82
42,
183
9,11
920
01,
930
111
829
912
232
6,24
61,
449
1,29
34,
351
5,54
42,
387
48,0
92C
OD
(Hou
seho
ld)
4931
891
2936
628
347
610
212
171
530
254
6412
563
6821
1,84
2To
tal
2,90
329
,153
44,8
403,
322
7,88
26,
503
5,79
536
,385
3,12
512
,528
1,01
79,
612
9,09
52,
106
60,7
229,
014
5,14
312
,574
34,5
068,
808
305,
030
Sub-
Bas
in N
ame
Sutla
Krapina
Zagreb Area
Upper Kupa
Dobra
Mreznica
Korana
LowerKupa-Glina
Moatanica
Odra
Middle Sava
Zelina Crnec
Upper Lonja
Middle Lonja
UpperCesma-
Glogonica
MoslavinaArea
Lower Lonja
Una-Sunja
Ilova Pakra
Veliki Strug
Sub-Tptal
T-N
(Sew
erag
e)0
380
9,71
20
040
47
222
503
00
268
9572
482
021
053
212
112
,818
T-N
(Ind
ustry
)0
452,
275
00
860
2570
70
061
448
780
014
058
50
4,48
5T-
N (L
ives
tock
)1,
039
9,72
54,
307
902
2,11
31,
050
1,65
110
,900
170
4,24
030
52,
804
2,94
567
122
,835
3,17
91,
342
3,28
011
,736
2,36
087
,552
T-N
(Agr
icul
tura
l lan
d)98
46,
788
1,80
254
867
721
580
2,87
232
1,66
748
61,
180
1,85
728
78,
065
1,16
063
537
52,
370
377
32,4
59T-
N (P
astu
rela
nd)
4545
428
113
534
313
480
31,
915
3652
638
348
199
621,
384
333
435
740
1,03
843
39,
683
T-N
(Shr
ub/F
ores
t)61
669
301
258
699
382
458
1,91
242
405
2317
419
149
1,31
030
427
191
21,
162
501
10,0
84T-
N (H
ouse
hold
)14
9327
811
28
101
230
350
150
7419
3618
206
537
Tota
l2,
143
18,1
5418
,704
1,85
23,
843
2,27
33,
006
17,9
481,
491
6,86
885
65,
438
5,35
11,
147
34,2
294,
995
2,75
45,
326
17,4
443,
797
157,
618
Sub-
Bas
in N
ame
Sutla
Krapina
ZagrebArea
UpperKupa
Dobra
Mreznica
Korana
LowerKupa-Glina
Moatanica
Odra
MiddleSava
ZelinaCrnec
UpperLonja
MiddleLonja
UpperCesma-
Glogonica
MoslavinaArea
LowerLonja
Una-Sunja
Ilova Pakra
VelikiStrug
Sub-Tptal
T-P
(Sew
erag
e)0
831,
137
00
932
5111
40
061
2216
700
50
116
271,
795
T-P
(Ind
ustry
)0
954
50
030
030
220
016
91
100
20
581
732
T-P
(Liv
esto
ck)
262
2,40
91,
447
205
450
187
352
3,20
158
1,33
495
550
496
102
3,29
351
932
21,
125
2,02
082
819
,254
T-P
(Agr
icul
tura
l lan
d)11
7319
67
21
310
185
1320
387
127
425
434
9T-
P (P
astu
rela
nd)
223
147
177
4096
226
217
103
7017
2237
5222
486
T-P
(Shr
ub/F
ores
t)5
5324
2055
3036
151
332
214
154
103
2421
7292
3979
5T-
P (H
ouse
hold
)2
154
12
01
160
51
82
012
36
33
186
Tota
l28
22,
665
3,19
023
953
134
943
23,
576
200
1,41
510
467
857
412
93,
644
575
385
1,24
12,
367
923
23,4
98
(Uni
t:kg/
day)
(Uni
t :kg
/day
)
(Uni
t:kg/
day)
(Uni
t:kg/
day)
Tab
le B
5.3
E
xist
ing
Pollu
tion
Loa
d G
ener
atio
n -1
/4 (B
OD
)
Tab
le B
5.3
E
xist
ing
Pollu
tion
Loa
d G
ener
atio
n -2
/4 (C
OD
)
Tab
le B
5.3
E
xist
ing
Pollu
tion
Loa
d G
ener
atio
n -3
/4 (T
-N)
Tab
le B
5.3
E
xist
ing
Pollu
tion
Loa
d G
ener
atio
n -4
/4 (T
-P)
B-T49

Sub-
Bas
in N
ame
Sutla
Krapina
Zagreb Area
Upper Kupa
Dobra
Mreznica
Korana
LowerKupa-Glina
Moatanica
Odra
Middle Sava
Zelina Crnec
Upper Lonja
Middle Lonja
UpperCesma-
Glogonica
MoslavinaArea
Lower Lonja
Una-Sunja
Ilova Pakra
Veliki Strug
Sub-Tptal
BO
D (S
ewer
age)
03,
252
53,2
490
406
5,19
897
1,59
73,
881
00
1,84
91,
200
564
1,55
90
174
04,
279
1,01
578
,320
BO
D (I
ndus
try)
028
724
,776
030
920
206
339
00
1,26
227
94
183
014
50
412
4728
,063
BO
D (L
ives
tock
)2,
805
25,9
8313
,845
2,28
45,
167
2,16
44,
038
32,1
5055
313
,067
931
8,62
98,
708
1,93
163
,914
9,21
44,
360
10,6
5633
,768
7,77
125
1,93
6B
OD
(Agr
icul
tura
l lan
d)44
83,
094
821
250
309
9836
1,30
915
760
221
538
847
131
3,67
652
929
017
11,
081
172
14,7
96B
OD
(Pas
ture
land
)21
207
128
6215
761
366
875
1624
018
159
9128
632
152
198
338
474
198
4,42
2B
OD
(Shr
ub/F
ores
t)44
482
217
186
504
276
330
1,37
930
292
1712
513
835
945
219
195
658
838
361
7,27
2B
OD
(Hou
seho
ld)
8555
315
850
6311
4860
410
177
2129
892
144
311
121
710
911
836
3,20
3To
tal
3,40
233
,858
93,1
952,
831
6,63
67,
900
4,91
638
,119
4,84
414
,536
1,20
712
,860
11,3
542,
694
71,3
5210
,225
5,58
011
,932
40,9
709,
600
388,
012
Sub-
Bas
in N
ame
Sutla
Krapina
Zagreb Area
Upper Kupa
Dobra
Mreznica
Korana
LowerKupa-Glina
Moatanica
Odra
Middle Sava
Zelina Crnec
Upper Lonja
Middle Lonja
UpperCesma-
Glogonica
MoslavinaArea
Lower Lonja
Una-Sunja
Ilova Pakra
Veliki Strug
Sub-Tptal
CO
D (S
ewer
age)
02,
324
29,2
480
290
3,70
769
1,14
12,
746
00
1,32
188
941
51,
045
012
50
2,87
572
546
,919
CO
D (I
ndus
try)
01,
712
18,8
990
2167
016
930
10
096
316
91
117
080
037
134
22,9
03C
OD
(Liv
esto
ck)
2,15
920
,075
10,0
781,
795
4,10
91,
769
3,21
124
,018
401
9,63
368
86,
365
6,50
61,
455
48,4
566,
913
3,15
97,
722
25,2
975,
603
189,
411
CO
D (A
gric
ultu
ral l
and)
387
2,67
270
921
626
685
311,
131
1365
619
146
573
111
33,
174
457
250
148
933
149
12,7
76C
OD
(Pas
ture
land
)18
178
110
5313
552
315
752
1420
715
137
7824
543
131
171
291
408
170
3,80
3C
OD
(Shr
ub/F
ores
t)29
03,
190
1,43
61,
230
3,33
51,
824
2,18
39,
119
200
1,93
011
182
991
223
26,
246
1,44
91,
293
4,35
15,
544
2,38
748
,092
CO
D (H
ouse
hold
)49
318
9129
366
2834
76
102
1217
153
025
464
125
6368
211,
842
Tota
l2,
903
30,4
6860
,572
3,32
28,
193
7,51
05,
837
36,6
773,
680
12,5
281,
017
10,2
509,
338
2,24
159
,837
9,01
45,
202
12,5
7435
,496
9,08
932
5,74
6
Sub-
Bas
in N
ame
Sutla
Krapina
Zagreb Area
Upper Kupa
Dobra
Mreznica
Korana
LowerKupa-Glina
Moatanica
Odra
Middle Sava
Zelina Crnec
Upper Lonja
Middle Lonja
UpperCesma-
Glogonica
MoslavinaArea
Lower Lonja
Una-Sunja
Ilova Pakra
Veliki Strug
Sub-Tptal
T-N
(Sew
erag
e)0
617
11,5
380
7462
118
293
520
00
330
130
105
306
032
081
319
215
,588
T-N
(Ind
ustry
)0
462
4,71
20
1110
30
4032
80
01,
084
5937
360
170
322
237,
234
T-N
(Liv
esto
ck)
1,03
99,
725
4,30
790
22,
113
1,05
01,
651
10,9
0017
04,
240
305
2,80
42,
945
671
22,8
353,
179
1,34
23,
280
11,7
362,
360
87,5
52T-
N (A
gric
ultu
ral l
and)
984
6,78
81,
802
548
677
215
802,
872
321,
667
486
1,18
01,
857
287
8,06
51,
160
635
375
2,37
037
732
,459
T-N
(Pas
ture
land
)45
454
281
135
343
134
803
1,91
536
526
3834
819
962
1,38
433
343
574
01,
038
433
9,68
3T-
N (S
hrub
/For
est)
6166
930
125
869
938
245
81,
912
4240
523
174
191
491,
310
304
271
912
1,16
250
110
,084
T-N
(Hou
seho
ld)
1493
278
112
810
12
303
5015
074
1936
1820
653
7To
tal
2,14
318
,808
22,9
671,
852
3,92
92,
508
3,01
718
,033
1,12
96,
868
856
5,96
95,
397
1,21
034
,009
4,99
52,
768
5,32
617
,462
3,89
116
3,13
7
Sub-
Bas
in N
ame
Sutla
Krapina
ZagrebArea
UpperKupa
Dobra
Mreznica
Korana
LowerKupa-Glina
Moatanica
Odra
MiddleSava
ZelinaCrnec
UpperLonja
MiddleLonja
UpperCesma-
Glogonica
MoslavinaArea
LowerLonja
Una-Sunja
Ilova Pakra
VelikiStrug
Sub-Tptal
T-P
(Sew
erag
e)0
135
2,01
10
1717
04
6414
50
077
4030
590
70
170
422,
972
T-P
(Ind
ustry
)0
191,
876
02
20
527
00
221
17
03
024
21,
990
T-P
(Liv
esto
ck)
262
2,40
91,
447
205
450
187
352
3,20
158
1,33
495
550
496
102
3,29
351
932
21,
125
2,02
082
819
,254
T-P
(Agr
icul
tura
l lan
d)11
7319
67
21
310
185
1320
387
127
425
434
9T-
P (P
astu
rela
nd)
223
147
177
4096
226
217
103
7017
2237
5222
486
T-P
(Shr
ub/F
ores
t)5
5324
2055
3036
151
332
214
154
103
2421
7292
3979
5T-
P (H
ouse
hold
)2
154
12
01
160
51
82
012
36
33
186
Tota
l28
22,
727
5,39
523
955
139
843
43,
564
235
1,41
510
470
158
414
33,
630
575
388
1,24
12,
387
939
25,9
32
(Uni
t:kg/
day)
(Uni
t :kg
/day
)
(Uni
t:kg/
day)
(Uni
t:kg/
day)
Tab
le B
5.4
20
07 W
ithou
t Pro
ject
Pol
lutio
n L
oad
Gen
erat
ion
-1/4
(BO
D)
Tab
le B
5.4
20
07 W
ithou
t Pro
ject
Pol
lutio
n L
oad
Gen
erat
ion
-2/4
(CO
D)
Tab
le B
5.4
20
07 W
ithou
t Pro
ject
Pol
lutio
n L
oad
Gen
erat
ion
-3/4
(T-N
)
Tabl
e B
5.4
200
7 W
ithou
t Pro
ject
Pol
lutio
n Lo
ad G
ener
atio
n -4
/4 (T
-P)
B-T50
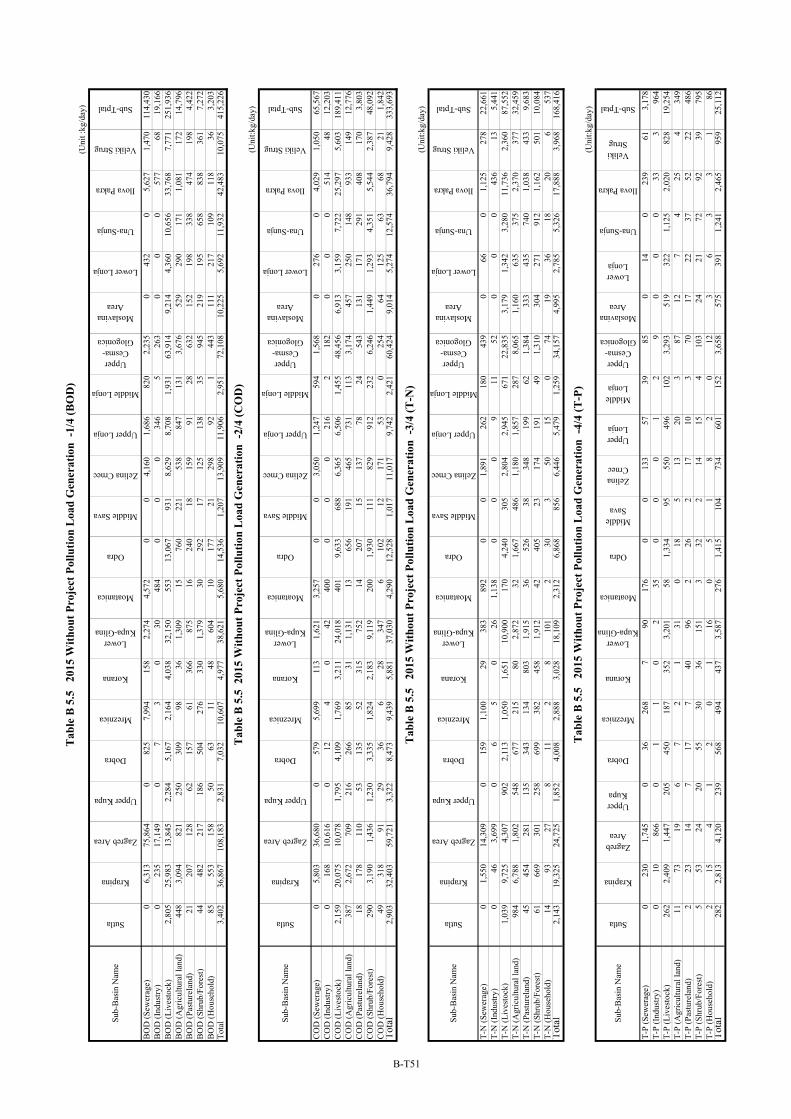
Sub-
Bas
in N
ame
Sutla
Krapina
Zagreb Area
Upper Kupa
Dobra
Mreznica
Korana
LowerKupa-Glina
Moatanica
Odra
Middle Sava
Zelina Crnec
Upper Lonja
Middle Lonja
UpperCesma-
Glogonica
MoslavinaArea
Lower Lonja
Una-Sunja
Ilova Pakra
Veliki Strug
Sub-Tptal
BO
D (S
ewer
age)
06,
313
75,8
640
825
7,99
415
82,
274
4,57
20
04,
160
1,68
682
02,
235
043
20
5,62
71,
470
114,
430
BO
D (I
ndus
try)
023
517
,149
07
30
3048
40
00
346
526
30
00
577
6819
,166
BO
D (L
ives
tock
)2,
805
25,9
8313
,845
2,28
45,
167
2,16
44,
038
32,1
5055
313
,067
931
8,62
98,
708
1,93
163
,914
9,21
44,
360
10,6
5633
,768
7,77
125
1,93
6B
OD
(Agr
icul
tura
l lan
d)44
83,
094
821
250
309
9836
1,30
915
760
221
538
847
131
3,67
652
929
017
11,
081
172
14,7
96B
OD
(Pas
ture
land
)21
207
128
6215
761
366
875
1624
018
159
9128
632
152
198
338
474
198
4,42
2B
OD
(Shr
ub/F
ores
t)44
482
217
186
504
276
330
1,37
930
292
1712
513
835
945
219
195
658
838
361
7,27
2B
OD
(Hou
seho
ld)
8555
315
850
6311
4860
410
177
2129
892
144
311
121
710
911
836
3,20
3To
tal
3,40
236
,867
108,
183
2,83
17,
032
10,6
074,
977
38,6
215,
680
14,5
361,
207
13,9
0911
,906
2,95
172
,108
10,2
255,
692
11,9
3242
,483
10,0
7541
5,22
6
Sub-
Bas
in N
ame
Sutla
Krapina
Zagreb Area
Upper Kupa
Dobra
Mreznica
Korana
LowerKupa-Glina
Moatanica
Odra
Middle Sava
Zelina Crnec
Upper Lonja
Middle Lonja
UpperCesma-
Glogonica
MoslavinaArea
Lower Lonja
Una-Sunja
Ilova Pakra
Veliki Strug
Sub-Tptal
CO
D (S
ewer
age)
05,
803
36,6
800
579
5,69
911
31,
621
3,25
70
03,
050
1,24
759
41,
568
027
60
4,02
91,
050
65,5
67C
OD
(Ind
ustry
)0
168
10,6
160
124
042
400
00
021
62
182
00
051
448
12,2
03C
OD
(Liv
esto
ck)
2,15
920
,075
10,0
781,
795
4,10
91,
769
3,21
124
,018
401
9,63
368
86,
365
6,50
61,
455
48,4
566,
913
3,15
97,
722
25,2
975,
603
189,
411
CO
D (A
gric
ultu
ral l
and)
387
2,67
270
921
626
685
311,
131
1365
619
146
573
111
33,
174
457
250
148
933
149
12,7
76C
OD
(Pas
ture
land
)18
178
110
5313
552
315
752
1420
715
137
7824
543
131
171
291
408
170
3,80
3C
OD
(Shr
ub/F
ores
t)29
03,
190
1,43
61,
230
3,33
51,
824
2,18
39,
119
200
1,93
011
182
991
223
26,
246
1,44
91,
293
4,35
15,
544
2,38
748
,092
CO
D (H
ouse
hold
)49
318
9129
366
2834
76
102
1217
153
025
464
125
6368
211,
842
Tota
l2,
903
32,4
0359
,721
3,32
28,
473
9,43
95,
881
37,0
304,
290
12,5
281,
017
11,0
179,
742
2,42
160
,424
9,01
45,
274
12,5
7436
,794
9,42
833
3,69
3
Sub-
Bas
in N
ame
Sutla
Krapina
Zagreb Area
Upper Kupa
Dobra
Mreznica
Korana
LowerKupa-Glina
Moatanica
Odra
Middle Sava
Zelina Crnec
Upper Lonja
Middle Lonja
UpperCesma-
Glogonica
MoslavinaArea
Lower Lonja
Una-Sunja
Ilova Pakra
Veliki Strug
Sub-Tptal
T-N
(Sew
erag
e)0
1,55
014
,309
015
91,
100
2938
389
20
01,
891
262
180
439
066
01,
125
278
22,6
61T-
N (I
ndus
try)
046
3,69
90
65
026
1,13
80
00
911
520
00
436
135,
441
T-N
(Liv
esto
ck)
1,03
99,
725
4,30
790
22,
113
1,05
01,
651
10,9
0017
04,
240
305
2,80
42,
945
671
22,8
353,
179
1,34
23,
280
11,7
362,
360
87,5
52T-
N (A
gric
ultu
ral l
and)
984
6,78
81,
802
548
677
215
802,
872
321,
667
486
1,18
01,
857
287
8,06
51,
160
635
375
2,37
037
732
,459
T-N
(Pas
ture
land
)45
454
281
135
343
134
803
1,91
536
526
3834
819
962
1,38
433
343
574
01,
038
433
9,68
3T-
N (S
hrub
/For
est)
6166
930
125
869
938
245
81,
912
4240
523
174
191
491,
310
304
271
912
1,16
250
110
,084
T-N
(Hou
seho
ld)
1493
278
112
810
12
303
5015
074
1936
1820
653
7To
tal
2,14
319
,325
24,7
251,
852
4,00
82,
888
3,02
818
,109
2,31
26,
868
856
6,44
65,
479
1,25
934
,157
4,99
52,
785
5,32
617
,888
3,96
816
8,41
6
Sub-
Bas
in N
ame
Sutla
Krapina
ZagrebArea
UpperKupa
Dobra
Mreznica
Korana
LowerKupa-Glina
Moatanica
Odra
MiddleSava
ZelinaCrnec
UpperLonja
MiddleLonja
UpperCesma-
Glogonica
MoslavinaArea
LowerLonja
Una-Sunja
Ilova Pakra
VelikiStrug
Sub-Tptal
T-P
(Sew
erag
e)0
230
1,74
50
3626
87
9017
60
013
357
3985
014
023
961
3,17
8T-
P (I
ndus
try)
010
866
01
10
235
00
01
29
00
033
396
4T-
P (L
ives
tock
)26
22,
409
1,44
720
545
018
735
23,
201
581,
334
9555
049
610
23,
293
519
322
1,12
52,
020
828
19,2
54T-
P (A
gric
ultu
ral l
and)
1173
196
72
131
018
513
203
8712
74
254
349
T-P
(Pas
ture
land
)2
2314
717
740
962
262
1710
370
1722
3752
2248
6T-
P (S
hrub
/For
est)
553
2420
5530
3615
13
322
1415
410
324
2172
9239
795
T-P
(Hou
seho
ld)
215
41
20
116
05
18
20
123
63
31
86To
tal
282
2,81
34,
120
239
568
494
437
3,58
727
61,
415
104
734
601
152
3,65
857
539
11,
241
2,46
595
925
,112
(Uni
t:kg/
day)
(Uni
t :kg
/day
)
(Uni
t:kg/
day)
(Uni
t:kg/
day)
Tab
le B
5.5
20
15 W
ithou
t Pro
ject
Pol
lutio
n L
oad
Gen
erat
ion
-1/4
(BO
D)
Tab
le B
5.5
201
5 W
ithou
t Pro
ject
Pol
lutio
n L
oad
Gen
erat
ion
-2/4
(CO
D)
Tab
le B
5.5
20
15 W
ithou
t Pro
ject
Pol
lutio
n L
oad
Gen
erat
ion
-3/4
(T-N
)
Tabl
e B
5.5
201
5 W
ithou
t Pro
ject
Pol
lutio
n Lo
ad G
ener
atio
n -4
/4 (T
-P)
B-T51
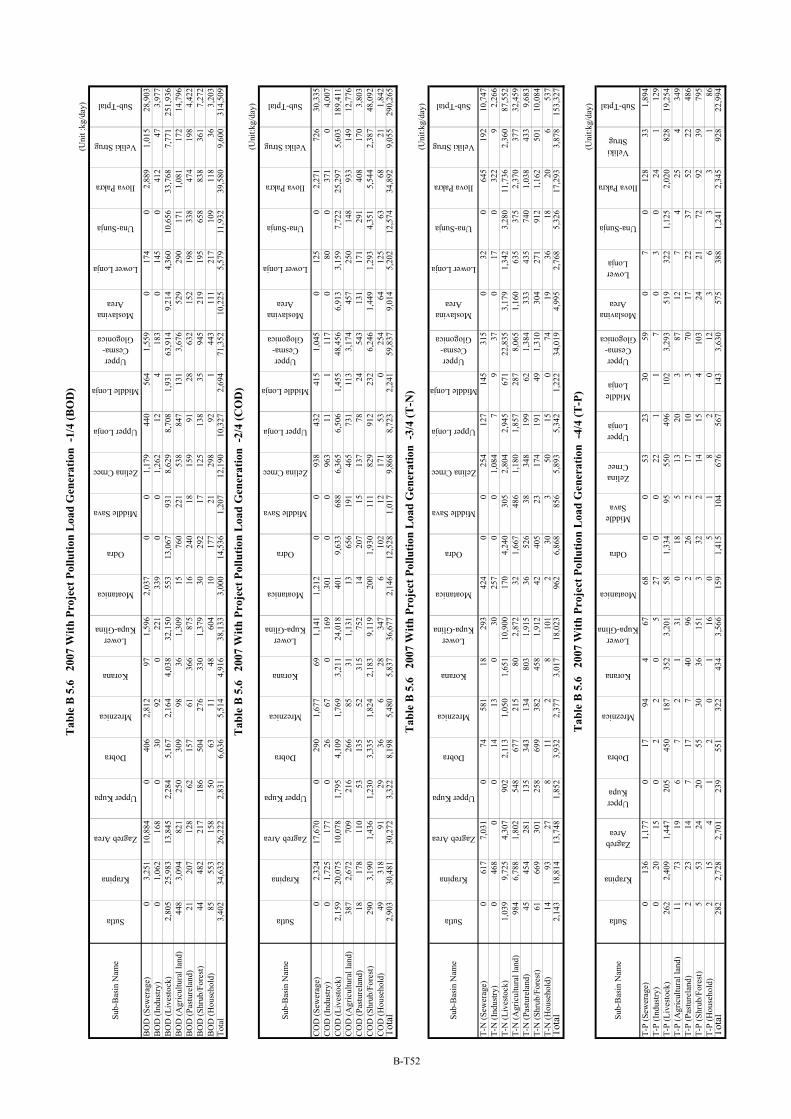
Sub-
Bas
in N
ame
Sutla
Krapina
Zagreb Area
Upper Kupa
Dobra
Mreznica
Korana
LowerKupa-Glina
Moatanica
Odra
Middle Sava
Zelina Crnec
Upper Lonja
Middle Lonja
UpperCesma-
Glogonica
MoslavinaArea
Lower Lonja
Una-Sunja
Ilova Pakra
Veliki Strug
Sub-Tptal
BO
D (S
ewer
age)
03,
251
10,8
840
406
2,81
297
1,59
62,
037
00
1,17
944
056
41,
559
017
40
2,88
91,
015
28,9
03B
OD
(Ind
ustry
)0
1,06
216
80
3092
022
133
90
01,
262
124
183
014
50
412
473,
977
BO
D (L
ives
tock
)2,
805
25,9
8313
,845
2,28
45,
167
2,16
44,
038
32,1
5055
313
,067
931
8,62
98,
708
1,93
163
,914
9,21
44,
360
10,6
5633
,768
7,77
125
1,93
6B
OD
(Agr
icul
tura
l lan
d)44
83,
094
821
250
309
9836
1,30
915
760
221
538
847
131
3,67
652
929
017
11,
081
172
14,7
96B
OD
(Pas
ture
land
)21
207
128
6215
761
366
875
1624
018
159
9128
632
152
198
338
474
198
4,42
2B
OD
(Shr
ub/F
ores
t)44
482
217
186
504
276
330
1,37
930
292
1712
513
835
945
219
195
658
838
361
7,27
2B
OD
(Hou
seho
ld)
8555
315
850
6311
4860
410
177
2129
892
144
311
121
710
911
836
3,20
3To
tal
3,40
234
,632
26,2
222,
831
6,63
65,
514
4,91
638
,133
3,00
014
,536
1,20
712
,190
10,3
272,
694
71,3
5210
,225
5,57
911
,932
39,5
809,
600
314,
509
Sub-
Bas
in N
ame
Sutla
Krapina
Zagreb Area
Upper Kupa
Dobra
Mreznica
Korana
LowerKupa-Glina
Moatanica
Odra
Middle Sava
Zelina Crnec
Upper Lonja
Middle Lonja
UpperCesma-
Glogonica
MoslavinaArea
Lower Lonja
Una-Sunja
Ilova Pakra
Veliki Strug
Sub-Tptal
CO
D (S
ewer
age)
02,
324
17,6
700
290
1,67
769
1,14
11,
212
00
938
432
415
1,04
50
125
02,
271
726
30,3
35C
OD
(Ind
ustry
)0
1,72
517
70
2667
016
930
10
096
311
111
70
800
371
04,
007
CO
D (L
ives
tock
)2,
159
20,0
7510
,078
1,79
54,
109
1,76
93,
211
24,0
1840
19,
633
688
6,36
56,
506
1,45
548
,456
6,91
33,
159
7,72
225
,297
5,60
318
9,41
1C
OD
(Agr
icul
tura
l lan
d)38
72,
672
709
216
266
8531
1,13
113
656
191
465
731
113
3,17
445
725
014
893
314
912
,776
CO
D (P
astu
rela
nd)
1817
811
053
135
5231
575
214
207
1513
778
2454
313
117
129
140
817
03,
803
CO
D (S
hrub
/For
est)
290
3,19
01,
436
1,23
03,
335
1,82
42,
183
9,11
920
01,
930
111
829
912
232
6,24
61,
449
1,29
34,
351
5,54
42,
387
48,0
92C
OD
(Hou
seho
ld)
4931
891
2936
628
347
610
212
171
530
254
6412
563
6821
1,84
2To
tal
2,90
330
,481
30,2
723,
322
8,19
85,
480
5,83
736
,677
2,14
612
,528
1,01
79,
868
8,72
32,
241
59,8
379,
014
5,20
212
,574
34,8
929,
055
290,
265
Sub-
Bas
in N
ame
Sutla
Krapina
Zagreb Area
Upper Kupa
Dobra
Mreznica
Korana
LowerKupa-Glina
Moatanica
Odra
Middle Sava
Zelina Crnec
Upper Lonja
Middle Lonja
UpperCesma-
Glogonica
MoslavinaArea
Lower Lonja
Una-Sunja
Ilova Pakra
Veliki Strug
Sub-Tptal
T-N
(Sew
erag
e)0
617
7,03
10
7458
118
293
424
00
254
127
145
315
032
064
519
210
,747
T-N
(Ind
ustry
)0
468
00
1413
030
257
00
1,08
47
937
017
032
29
2,26
6T-
N (L
ives
tock
)1,
039
9,72
54,
307
902
2,11
31,
050
1,65
110
,900
170
4,24
030
52,
804
2,94
567
122
,835
3,17
91,
342
3,28
011
,736
2,36
087
,552
T-N
(Agr
icul
tura
l lan
d)98
46,
788
1,80
254
867
721
580
2,87
232
1,66
748
61,
180
1,85
728
78,
065
1,16
063
537
52,
370
377
32,4
59T-
N (P
astu
rela
nd)
4545
428
113
534
313
480
31,
915
3652
638
348
199
621,
384
333
435
740
1,03
843
39,
683
T-N
(Shr
ub/F
ores
t)61
669
301
258
699
382
458
1,91
242
405
2317
419
149
1,31
030
427
191
21,
162
501
10,0
84T-
N (H
ouse
hold
)14
9327
811
28
101
230
350
150
7419
3618
206
537
Tota
l2,
143
18,8
1413
,748
1,85
23,
932
2,37
73,
017
18,0
2396
26,
868
856
5,89
35,
342
1,22
234
,019
4,99
52,
768
5,32
617
,293
3,87
815
3,32
7
Sub-
Bas
in N
ame
Sutla
Krapina
ZagrebArea
UpperKupa
Dobra
Mreznica
Korana
LowerKupa-Glina
Moatanica
Odra
MiddleSava
ZelinaCrnec
UpperLonja
MiddleLonja
UpperCesma-
Glogonica
MoslavinaArea
LowerLonja
Una-Sunja
Ilova Pakra
VelikiStrug
Sub-Tptal
T-P
(Sew
erag
e)0
136
1,17
70
1794
467
680
053
2330
590
70
128
331,
894
T-P
(Ind
ustry
)0
2015
02
20
527
00
221
17
03
024
112
9T-
P (L
ives
tock
)26
22,
409
1,44
720
545
018
735
23,
201
581,
334
9555
049
610
23,
293
519
322
1,12
52,
020
828
19,2
54T-
P (A
gric
ultu
ral l
and)
1173
196
72
131
018
513
203
8712
74
254
349
T-P
(Pas
ture
land
)2
2314
717
740
962
262
1710
370
1722
3752
2248
6T-
P (S
hrub
/For
est)
553
2420
5530
3615
13
322
1415
410
324
2172
9239
795
T-P
(Hou
seho
ld)
215
41
20
116
05
18
20
123
63
31
86To
tal
282
2,72
82,
701
239
551
322
434
3,56
615
91,
415
104
676
567
143
3,63
057
538
81,
241
2,34
592
822
,994
Tab
le B
5.6
20
07 W
ith P
roje
ct P
ollu
tion
Loa
d G
ener
atio
n -1
/4 (B
OD
)
Tab
le B
5.6
20
07 W
ith P
roje
ct P
ollu
tion
Loa
d G
ener
atio
n -2
/4 (C
OD
)
Tab
le B
5.6
20
07 W
ith P
roje
ct P
ollu
tion
Loa
d G
ener
atio
n -3
/4 (T
-N)
Tabl
e B
5.6
200
7 W
ith P
roje
ct P
ollu
tion
Load
Gen
erat
ion
-4/4
(T-P
)(U
nit:k
g/da
y)
(Uni
t :kg
/day
)
(Uni
t:kg/
day)
(Uni
t:kg/
day)
B-T52
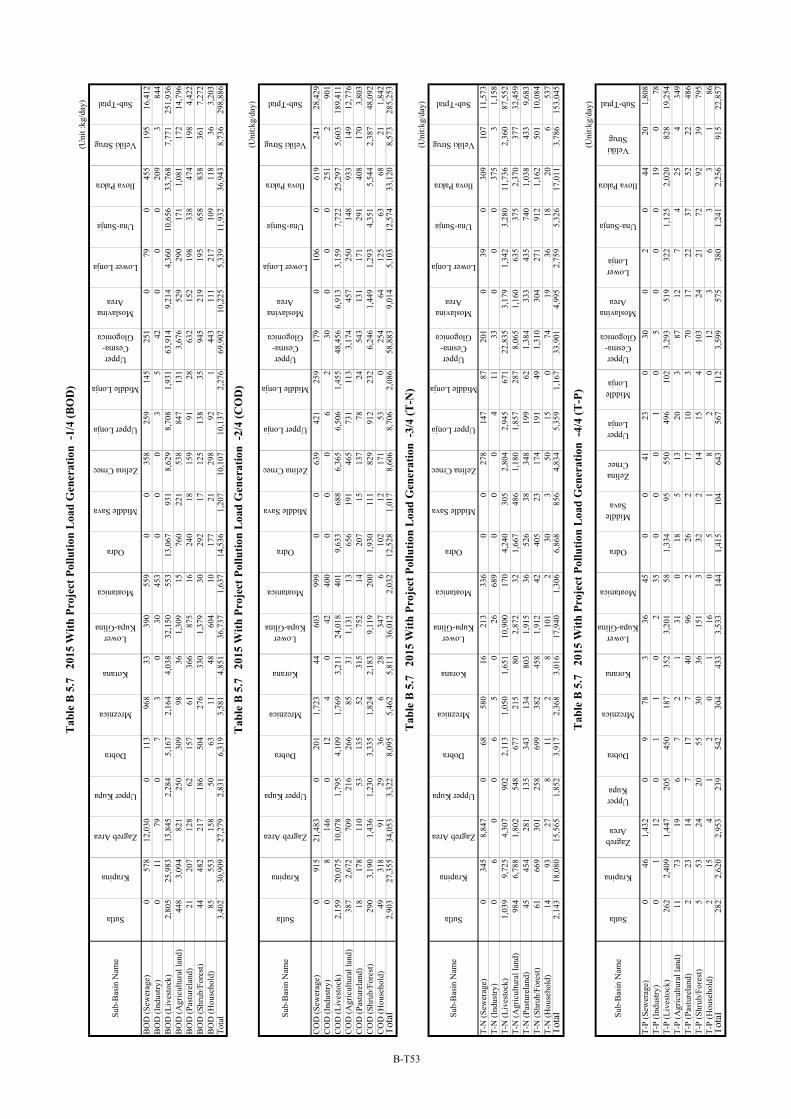
Sub-
Bas
in N
ame
Sutla
Krapina
Zagreb Area
Upper Kupa
Dobra
Mreznica
Korana
LowerKupa-Glina
Moatanica
Odra
Middle Sava
Zelina Crnec
Upper Lonja
Middle Lonja
UpperCesma-
Glogonica
MoslavinaArea
Lower Lonja
Una-Sunja
Ilova Pakra
Veliki Strug
Sub-Tptal
BO
D (S
ewer
age)
057
812
,030
011
396
833
390
559
00
358
259
145
251
079
045
519
516
,412
BO
D (I
ndus
try)
011
790
73
030
453
00
03
542
00
020
93
844
BO
D (L
ives
tock
)2,
805
25,9
8313
,845
2,28
45,
167
2,16
44,
038
32,1
5055
313
,067
931
8,62
98,
708
1,93
163
,914
9,21
44,
360
10,6
5633
,768
7,77
125
1,93
6B
OD
(Agr
icul
tura
l lan
d)44
83,
094
821
250
309
9836
1,30
915
760
221
538
847
131
3,67
652
929
017
11,
081
172
14,7
96B
OD
(Pas
ture
land
)21
207
128
6215
761
366
875
1624
018
159
9128
632
152
198
338
474
198
4,42
2B
OD
(Shr
ub/F
ores
t)44
482
217
186
504
276
330
1,37
930
292
1712
513
835
945
219
195
658
838
361
7,27
2B
OD
(Hou
seho
ld)
8555
315
850
6311
4860
410
177
2129
892
144
311
121
710
911
836
3,20
3To
tal
3,40
230
,909
27,2
792,
831
6,31
93,
581
4,85
136
,737
1,63
714
,536
1,20
710
,107
10,1
372,
276
69,9
0210
,225
5,33
911
,932
36,9
438,
736
298,
886
Sub-
Bas
in N
ame
Sutla
Krapina
Zagreb Area
Upper Kupa
Dobra
Mreznica
Korana
LowerKupa-Glina
Moatanica
Odra
Middle Sava
Zelina Crnec
Upper Lonja
Middle Lonja
UpperCesma-
Glogonica
MoslavinaArea
Lower Lonja
Una-Sunja
Ilova Pakra
Veliki Strug
Sub-Tptal
CO
D (S
ewer
age)
091
521
,483
020
11,
723
4460
399
90
063
942
125
917
90
106
061
924
128
,429
CO
D (I
ndus
try)
08
146
012
40
4240
00
00
62
300
00
251
290
1C
OD
(Liv
esto
ck)
2,15
920
,075
10,0
781,
795
4,10
91,
769
3,21
124
,018
401
9,63
368
86,
365
6,50
61,
455
48,4
566,
913
3,15
97,
722
25,2
975,
603
189,
411
CO
D (A
gric
ultu
ral l
and)
387
2,67
270
921
626
685
311,
131
1365
619
146
573
111
33,
174
457
250
148
933
149
12,7
76C
OD
(Pas
ture
land
)18
178
110
5313
552
315
752
1420
715
137
7824
543
131
171
291
408
170
3,80
3C
OD
(Shr
ub/F
ores
t)29
03,
190
1,43
61,
230
3,33
51,
824
2,18
39,
119
200
1,93
011
182
991
223
26,
246
1,44
91,
293
4,35
15,
544
2,38
748
,092
CO
D (H
ouse
hold
)49
318
9129
366
2834
76
102
1217
153
025
464
125
6368
211,
842
Tota
l2,
903
27,3
5534
,053
3,32
28,
095
5,46
25,
811
36,0
122,
032
12,5
281,
017
8,60
68,
706
2,08
658
,883
9,01
45,
103
12,5
7433
,120
8,57
328
5,25
3
Sub-
Bas
in N
ame
Sutla
Krapina
Zagreb Area
Upper Kupa
Dobra
Mreznica
Korana
LowerKupa-Glina
Moatanica
Odra
Middle Sava
Zelina Crnec
Upper Lonja
Middle Lonja
UpperCesma-
Glogonica
MoslavinaArea
Lower Lonja
Una-Sunja
Ilova Pakra
Veliki Strug
Sub-Tptal
T-N
(Sew
erag
e)0
345
8,84
70
6858
016
213
336
00
278
147
8720
10
390
309
107
11,5
73T-
N (I
ndus
try)
06
00
65
026
689
00
04
1133
00
037
53
1,15
8T-
N (L
ives
tock
)1,
039
9,72
54,
307
902
2,11
31,
050
1,65
110
,900
170
4,24
030
52,
804
2,94
567
122
,835
3,17
91,
342
3,28
011
,736
2,36
087
,552
T-N
(Agr
icul
tura
l lan
d)98
46,
788
1,80
254
867
721
580
2,87
232
1,66
748
61,
180
1,85
728
78,
065
1,16
063
537
52,
370
377
32,4
59T-
N (P
astu
rela
nd)
4545
428
113
534
313
480
31,
915
3652
638
348
199
621,
384
333
435
740
1,03
843
39,
683
T-N
(Shr
ub/F
ores
t)61
669
301
258
699
382
458
1,91
242
405
2317
419
149
1,31
030
427
191
21,
162
501
10,0
84T-
N (H
ouse
hold
)14
9327
811
28
101
230
350
150
7419
3618
206
537
Tota
l2,
143
18,0
8015
,565
1,85
23,
917
2,36
83,
016
17,9
401,
306
6,86
885
64,
834
5,35
91,
167
33,9
014,
995
2,75
95,
326
17,0
113,
786
153,
045
Sub-
Bas
in N
ame
Sutla
Krapina
ZagrebArea
UpperKupa
Dobra
Mreznica
Korana
LowerKupa-Glina
Moatanica
Odra
MiddleSava
ZelinaCrnec
UpperLonja
MiddleLonja
UpperCesma-
Glogonica
MoslavinaArea
LowerLonja
Una-Sunja
Ilova Pakra
VelikiStrug
Sub-Tptal
T-P
(Sew
erag
e)0
461,
432
09
783
3645
00
4123
030
02
044
201,
808
T-P
(Ind
ustry
)0
112
01
10
235
00
01
05
00
019
078
T-P
(Liv
esto
ck)
262
2,40
91,
447
205
450
187
352
3,20
158
1,33
495
550
496
102
3,29
351
932
21,
125
2,02
082
819
,254
T-P
(Agr
icul
tura
l lan
d)11
7319
67
21
310
185
1320
387
127
425
434
9T-
P (P
astu
rela
nd)
223
147
177
4096
226
217
103
7017
2237
5222
486
T-P
(Shr
ub/F
ores
t)5
5324
2055
3036
151
332
214
154
103
2421
7292
3979
5T-
P (H
ouse
hold
)2
154
12
01
160
51
82
012
36
33
186
Tota
l28
22,
620
2,95
323
954
230
443
33,
533
144
1,41
510
464
356
711
23,
599
575
380
1,24
12,
256
915
22,8
57
(Uni
t:kg/
day)
(Uni
t :kg
/day
)
(Uni
t:kg/
day)
(Uni
t:kg/
day)
Tab
le B
5.7
20
15 W
ith P
roje
ct P
ollu
tion
Loa
d G
ener
atio
n -1
/4 (B
OD
)
Tab
le B
5.7
20
15 W
ith P
roje
ct P
ollu
tion
Loa
d G
ener
atio
n -2
/4 (C
OD
)
Tab
le B
5.7
20
15 W
ith P
roje
ct P
ollu
tion
Loa
d G
ener
atio
n -3
/4 (T
-N)
Tabl
e B
5.7
201
5 W
ith P
roje
ct P
ollu
tion
Load
Gen
erat
ion
-4/4
(T-P
)
B-T53
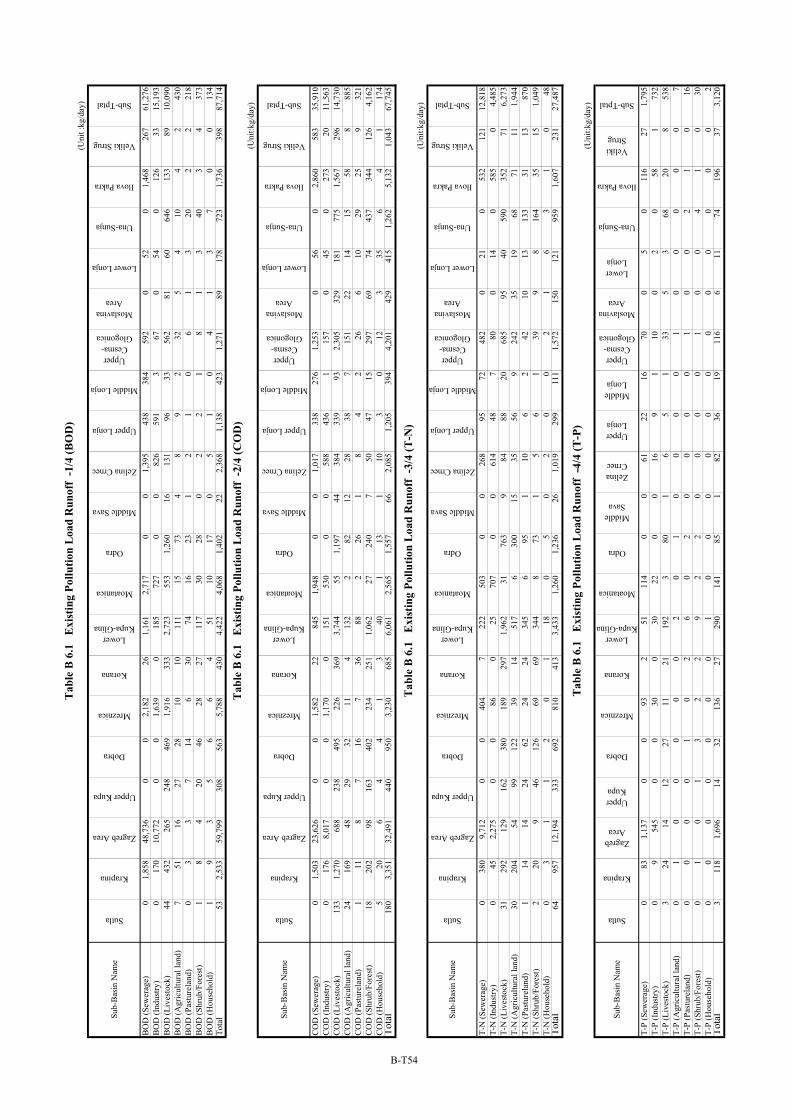
Sub-
Bas
in N
ame
Sutla
Krapina
Zagreb Area
Upper Kupa
Dobra
Mreznica
Korana
LowerKupa-Glina
Moatanica
Odra
Middle Sava
Zelina Crnec
Upper Lonja
Middle Lonja
UpperCesma-
Glogonica
MoslavinaArea
Lower Lonja
Una-Sunja
Ilova Pakra
Veliki Strug
Sub-Tptal
BO
D (S
ewer
age)
01,
858
48,7
360
02,
182
261,
161
2,71
70
01,
395
438
384
592
052
01,
468
267
61,2
76B
OD
(Ind
ustry
)0
170
10,7
720
01,
639
018
572
70
082
659
13
670
540
126
3315
,193
BO
D (L
ives
tock
)44
432
265
248
469
1,91
633
32,
723
553
1,26
016
131
9633
562
8160
646
133
8910
,090
BO
D (A
gric
ultu
ral l
and)
751
1627
2810
1011
115
734
89
232
54
104
243
0B
OD
(Pas
ture
land
)0
33
714
630
7416
231
21
06
13
202
221
8B
OD
(Shr
ub/F
ores
t)1
84
2046
2827
117
3028
02
21
81
340
34
373
BO
D (H
ouse
hold
)1
93
56
64
5110
170
51
04
13
70
013
4To
tal
532,
533
59,7
9930
856
35,
788
430
4,42
24,
068
1,40
222
2,36
81,
138
423
1,27
189
178
723
1,73
639
887
,714
Sub-
Bas
in N
ame
Sutla
Krapina
Zagreb Area
Upper Kupa
Dobra
Mreznica
Korana
LowerKupa-Glina
Moatanica
Odra
Middle Sava
Zelina Crnec
Upper Lonja
Middle Lonja
UpperCesma-
Glogonica
MoslavinaArea
Lower Lonja
Una-Sunja
Ilova Pakra
Veliki Strug
Sub-Tptal
CO
D (S
ewer
age)
01,
503
23,6
260
01,
582
2284
51,
948
00
1,01
733
827
61,
253
056
02,
860
583
35,9
10C
OD
(Ind
ustry
)0
176
8,01
70
01,
170
015
153
00
058
843
61
157
045
027
320
11,5
63C
OD
(Liv
esto
ck)
133
1,27
068
823
849
522
636
93,
744
551,
197
4438
433
993
2,30
532
918
177
51,
567
296
14,7
30C
OD
(Agr
icul
tura
l lan
d)24
169
4829
3211
413
22
8212
2838
715
122
1415
588
885
CO
D (P
astu
rela
nd)
111
87
167
3688
226
18
42
266
1029
259
321
CO
D (S
hrub
/For
est)
1820
298
163
402
234
251
1,06
227
240
750
4715
297
6974
437
344
126
4,16
2C
OD
(Hou
seho
ld)
520
64
41
340
113
110
30
123
356
41
174
Tota
l18
03,
351
32,4
9144
095
03,
230
685
6,06
12,
565
1,55
766
2,08
51,
205
394
4,20
142
941
51,
262
5,13
21,
043
67,7
45
Sub-
Bas
in N
ame
Sutla
Krapina
Zagreb Area
Upper Kupa
Dobra
Mreznica
Korana
LowerKupa-Glina
Moatanica
Odra
Middle Sava
Zelina Crnec
Upper Lonja
Middle Lonja
UpperCesma-
Glogonica
MoslavinaArea
Lower Lonja
Una-Sunja
Ilova Pakra
Veliki Strug
Sub-Tptal
T-N
(Sew
erag
e)0
380
9,71
20
040
47
222
503
00
268
9572
482
021
053
212
112
,818
T-N
(Ind
ustry
)0
452,
275
00
860
2570
70
061
448
780
014
058
50
4,48
5T-
N (L
ives
tock
)31
292
129
162
380
189
297
1,96
231
763
984
8820
685
9540
590
352
716,
273
T-N
(Agr
icul
tura
l lan
d)30
204
5499
122
3914
517
630
015
3556
924
235
1968
7111
1,94
4T-
N (P
astu
rela
nd)
114
1424
6224
2434
56
951
106
242
1013
133
3113
870
T-N
(Shr
ub/F
ores
t)2
209
4612
669
6934
48
731
56
139
98
164
3515
1,04
9T-
N (H
ouse
hold
)0
31
12
01
180
50
20
02
16
31
048
Tota
l64
957
12,1
9433
369
281
041
33,
433
1,26
01,
236
261,
019
299
111
1,57
215
012
195
91,
607
231
27,4
87
Sub-
Bas
in N
ame
Sutla
Krapina
ZagrebArea
UpperKupa
Dobra
Mreznica
Korana
LowerKupa-Glina
Moatanica
Odra
MiddleSava
ZelinaCrnec
UpperLonja
MiddleLonja
UpperCesma-
Glogonica
MoslavinaArea
LowerLonja
Una-Sunja
Ilova Pakra
VelikiStrug
Sub-Tptal
T-P
(Sew
erag
e)0
831,
137
00
932
5111
40
061
2216
700
50
116
271,
795
T-P
(Ind
ustry
)0
954
50
030
030
220
016
91
100
20
581
732
T-P
(Liv
esto
ck)
324
1412
2711
2119
23
801
65
133
53
6820
853
8T-
P (A
gric
ultu
ral l
and)
01
00
00
02
01
00
00
10
00
00
7T-
P (P
astu
rela
nd)
00
00
10
26
02
00
00
10
02
10
16T-
P (S
hrub
/For
est)
01
01
32
29
22
00
00
10
04
10
30T-
P (H
ouse
hold
)0
00
00
00
10
00
00
00
00
00
02
Tota
l3
118
1,69
614
3213
627
290
141
851
8236
1911
66
1174
196
373,
120
Tab
le B
6.1
E
xist
ing
Pollu
tion
Loa
d R
unof
f -1
/4 (B
OD
)
Tab
le B
6.1
E
xist
ing
Pollu
tion
Loa
d R
unof
f -2
/4 (C
OD
)
Tab
le B
6.1
E
xist
ing
Pollu
tion
Loa
d R
unof
f -3
/4 (T
-N)
Tab
le B
6.1
E
xist
ing
Pollu
tion
Loa
d R
unof
f -4
/4 (T
-P)
(Uni
t:kg/
day)
(Uni
t :kg
/day
)
(Uni
t:kg/
day)
(Uni
t:kg/
day)
B-T54
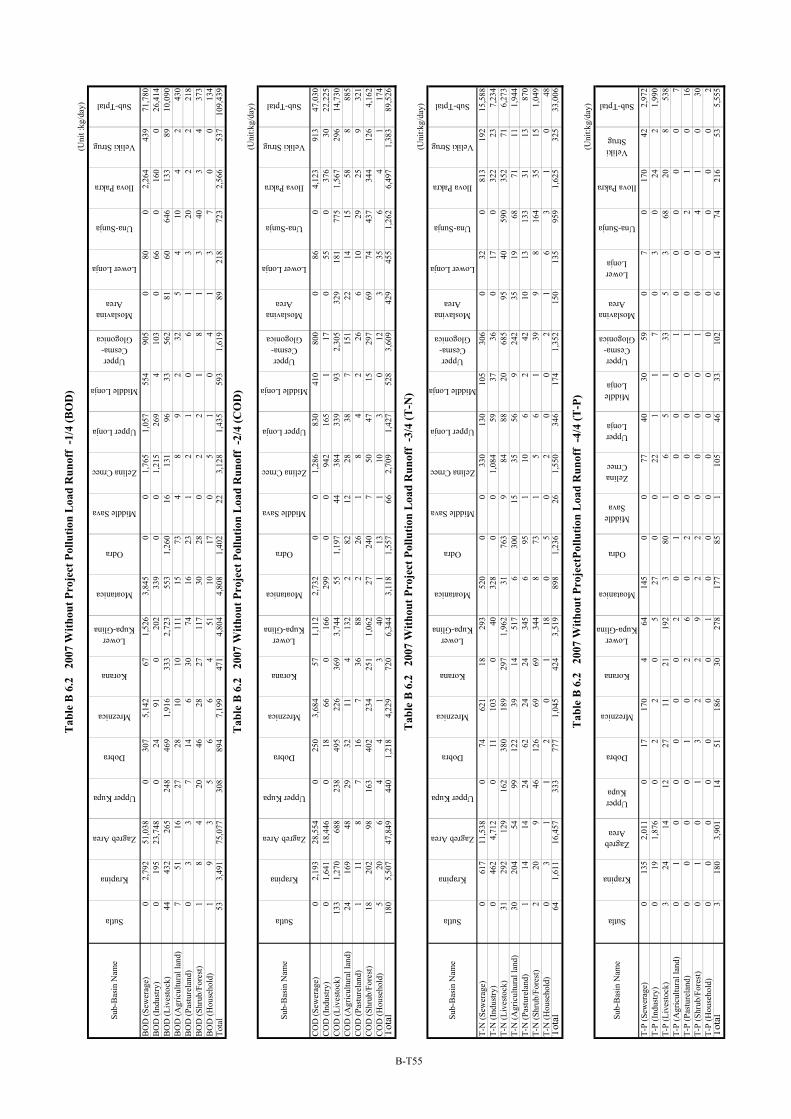
Sub-
Bas
in N
ame
Sutla
Krapina
Zagreb Area
Upper Kupa
Dobra
Mreznica
Korana
LowerKupa-Glina
Moatanica
Odra
Middle Sava
Zelina Crnec
Upper Lonja
Middle Lonja
UpperCesma-
Glogonica
MoslavinaArea
Lower Lonja
Una-Sunja
Ilova Pakra
Veliki Strug
Sub-Tptal
BO
D (S
ewer
age)
02,
792
51,0
380
307
5,14
267
1,52
63,
845
00
1,76
51,
057
554
905
080
02,
264
439
71,7
80B
OD
(Ind
ustry
)0
195
23,7
480
2491
020
233
90
01,
215
269
410
30
660
160
026
,414
BO
D (L
ives
tock
)44
432
265
248
469
1,91
633
32,
723
553
1,26
016
131
9633
562
8160
646
133
8910
,090
BO
D (A
gric
ultu
ral l
and)
751
1627
2810
1011
115
734
89
232
54
104
243
0B
OD
(Pas
ture
land
)0
33
714
630
7416
231
21
06
13
202
221
8B
OD
(Shr
ub/F
ores
t)1
84
2046
2827
117
3028
02
21
81
340
34
373
BO
D (H
ouse
hold
)1
93
56
64
5110
170
51
04
13
70
013
4To
tal
533,
491
75,0
7730
889
47,
199
471
4,80
44,
808
1,40
222
3,12
81,
435
593
1,61
989
218
723
2,56
653
710
9,43
9
Sub-
Bas
in N
ame
Sutla
Krapina
Zagreb Area
Upper Kupa
Dobra
Mreznica
Korana
LowerKupa-Glina
Moatanica
Odra
Middle Sava
Zelina Crnec
Upper Lonja
Middle Lonja
UpperCesma-
Glogonica
MoslavinaArea
Lower Lonja
Una-Sunja
Ilova Pakra
Veliki Strug
Sub-Tptal
CO
D (S
ewer
age)
02,
193
28,5
540
250
3,68
457
1,11
22,
732
00
1,28
683
041
080
00
860
4,12
391
347
,030
CO
D (I
ndus
try)
01,
641
18,4
460
1866
016
629
90
094
216
51
170
550
376
3022
,225
CO
D (L
ives
tock
)13
31,
270
688
238
495
226
369
3,74
455
1,19
744
384
339
932,
305
329
181
775
1,56
729
614
,730
CO
D (A
gric
ultu
ral l
and)
2416
948
2932
114
132
282
1228
387
151
2214
1558
888
5C
OD
(Pas
ture
land
)1
118
716
736
882
261
84
226
610
2925
932
1C
OD
(Shr
ub/F
ores
t)18
202
9816
340
223
425
11,
062
2724
07
5047
1529
769
7443
734
412
64,
162
CO
D (H
ouse
hold
)5
206
44
13
401
131
103
012
335
64
117
4To
tal
180
5,50
747
,849
440
1,21
84,
229
720
6,34
43,
118
1,55
766
2,70
91,
427
528
3,60
942
945
51,
262
6,49
71,
383
89,5
26
Sub-
Bas
in N
ame
Sutla
Krapina
Zagreb Area
Upper Kupa
Dobra
Mreznica
Korana
LowerKupa-Glina
Moatanica
Odra
Middle Sava
Zelina Crnec
Upper Lonja
Middle Lonja
UpperCesma-
Glogonica
MoslavinaArea
Lower Lonja
Una-Sunja
Ilova Pakra
Veliki Strug
Sub-Tptal
T-N
(Sew
erag
e)0
617
11,5
380
7462
118
293
520
00
330
130
105
306
032
081
319
215
,588
T-N
(Ind
ustry
)0
462
4,71
20
1110
30
4032
80
01,
084
5937
360
170
322
237,
234
T-N
(Liv
esto
ck)
3129
212
916
238
018
929
71,
962
3176
39
8488
2068
595
4059
035
271
6,27
3T-
N (A
gric
ultu
ral l
and)
3020
454
9912
239
1451
76
300
1535
569
242
3519
6871
111,
944
T-N
(Pas
ture
land
)1
1414
2462
2424
345
695
110
62
4210
1313
331
1387
0T-
N (S
hrub
/For
est)
220
946
126
6969
344
873
15
61
399
816
435
151,
049
T-N
(Hou
seho
ld)
03
11
20
118
05
02
00
21
63
10
48To
tal
641,
611
16,4
5733
377
71,
045
424
3,51
989
81,
236
261,
550
346
174
1,35
215
013
595
91,
625
325
33,0
06
Sub-
Bas
in N
ame
Sutla
Krapina
ZagrebArea
UpperKupa
Dobra
Mreznica
Korana
LowerKupa-Glina
Moatanica
Odra
MiddleSava
ZelinaCrnec
UpperLonja
MiddleLonja
UpperCesma-
Glogonica
MoslavinaArea
LowerLonja
Una-Sunja
Ilova Pakra
VelikiStrug
Sub-Tptal
T-P
(Sew
erag
e)0
135
2,01
10
1717
04
6414
50
077
4030
590
70
170
422,
972
T-P
(Ind
ustry
)0
191,
876
02
20
527
00
221
17
03
024
21,
990
T-P
(Liv
esto
ck)
324
1412
2711
2119
23
801
65
133
53
6820
853
8T-
P (A
gric
ultu
ral l
and)
01
00
00
02
01
00
00
10
00
00
7T-
P (P
astu
rela
nd)
00
00
10
26
02
00
00
10
02
10
16T-
P (S
hrub
/For
est)
01
01
32
29
22
00
00
10
04
10
30T-
P (H
ouse
hold
)0
00
00
00
10
00
00
00
00
00
02
Tota
l3
180
3,90
114
5118
630
278
177
851
105
4633
102
614
7421
653
5,55
5
Tab
le B
6.2
20
07 W
ithou
t Pro
ject
Pol
lutio
n L
oad
Run
off
-1/4
(BO
D)
Tab
le B
6.2
20
07 W
ithou
t Pro
ject
Pol
lutio
n L
oad
Run
off
-2/4
(CO
D)
Tab
le B
6.2
20
07 W
ithou
t Pro
ject
Pol
lutio
n L
oad
Run
off
-3/4
(T-N
)
Tab
le B
6.2
20
07 W
ithou
t Pro
ject
Pollu
tion
Loa
d R
unof
f -4
/4 (T
-P)
(Uni
t:kg/
day)
(Uni
t :kg
/day
)
(Uni
t:kg/
day)
(Uni
t:kg/
day)
B-T55
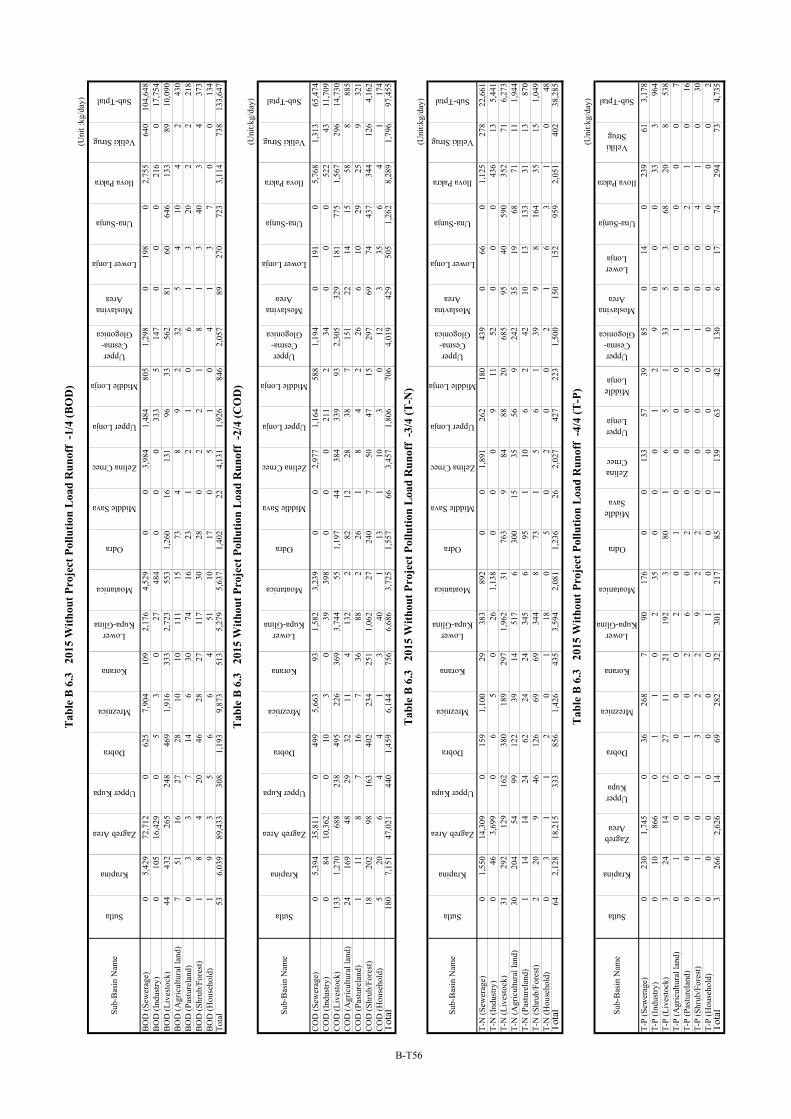
Sub-
Bas
in N
ame
Sutla
Krapina
Zagreb Area
Upper Kupa
Dobra
Mreznica
Korana
LowerKupa-Glina
Moatanica
Odra
Middle Sava
Zelina Crnec
Upper Lonja
Middle Lonja
UpperCesma-
Glogonica
MoslavinaArea
Lower Lonja
Una-Sunja
Ilova Pakra
Veliki Strug
Sub-Tptal
BO
D (S
ewer
age)
05,
429
72,7
120
625
7,90
410
92,
176
4,52
90
03,
984
1,48
480
51,
298
019
80
2,75
564
010
4,64
8B
OD
(Ind
ustry
)0
105
16,4
290
53
027
484
00
033
35
147
00
021
60
17,7
54B
OD
(Liv
esto
ck)
4443
226
524
846
91,
916
333
2,72
355
31,
260
1613
196
3356
281
6064
613
389
10,0
90B
OD
(Agr
icul
tura
l lan
d)7
5116
2728
1010
111
1573
48
92
325
410
42
430
BO
D (P
astu
rela
nd)
03
37
146
3074
1623
12
10
61
320
22
218
BO
D (S
hrub
/For
est)
18
420
4628
2711
730
280
22
18
13
403
437
3B
OD
(Hou
seho
ld)
19
35
66
451
1017
05
10
41
37
00
134
Tota
l53
6,03
989
,433
308
1,19
39,
873
513
5,27
95,
637
1,40
222
4,13
11,
926
846
2,05
789
270
723
3,11
473
813
3,64
7
Sub-
Bas
in N
ame
Sutla
Krapina
Zagreb Area
Upper Kupa
Dobra
Mreznica
Korana
LowerKupa-Glina
Moatanica
Odra
Middle Sava
Zelina Crnec
Upper Lonja
Middle Lonja
UpperCesma-
Glogonica
MoslavinaArea
Lower Lonja
Una-Sunja
Ilova Pakra
Veliki Strug
Sub-Tptal
CO
D (S
ewer
age)
05,
394
35,8
110
499
5,66
393
1,58
23,
239
00
2,97
71,
164
588
1,19
40
191
05,
768
1,31
365
,474
CO
D (I
ndus
try)
084
10,3
620
103
039
398
00
021
12
340
00
522
4311
,709
CO
D (L
ives
tock
)13
31,
270
688
238
495
226
369
3,74
455
1,19
744
384
339
932,
305
329
181
775
1,56
729
614
,730
CO
D (A
gric
ultu
ral l
and)
2416
948
2932
114
132
282
1228
387
151
2214
1558
888
5C
OD
(Pas
ture
land
)1
118
716
736
882
261
84
226
610
2925
932
1C
OD
(Shr
ub/F
ores
t)18
202
9816
340
223
425
11,
062
2724
07
5047
1529
769
7443
734
412
64,
162
CO
D (H
ouse
hold
)5
206
44
13
401
131
103
012
335
64
117
4To
tal
180
7,15
147
,021
440
1,45
96,
144
756
6,68
63,
725
1,55
766
3,45
71,
806
706
4,01
942
950
51,
262
8,28
91,
796
97,4
55
Sub-
Bas
in N
ame
Sutla
Krapina
Zagreb Area
Upper Kupa
Dobra
Mreznica
Korana
LowerKupa-Glina
Moatanica
Odra
Middle Sava
Zelina Crnec
Upper Lonja
Middle Lonja
UpperCesma-
Glogonica
MoslavinaArea
Lower Lonja
Una-Sunja
Ilova Pakra
Veliki Strug
Sub-Tptal
T-N
(Sew
erag
e)0
1,55
014
,309
015
91,
100
2938
389
20
01,
891
262
180
439
066
01,
125
278
22,6
61T-
N (I
ndus
try)
046
3,69
90
65
026
1,13
80
00
911
520
00
436
135,
441
T-N
(Liv
esto
ck)
3129
212
916
238
018
929
71,
962
3176
39
8488
2068
595
4059
035
271
6,27
3T-
N (A
gric
ultu
ral l
and)
3020
454
9912
239
1451
76
300
1535
569
242
3519
6871
111,
944
T-N
(Pas
ture
land
)1
1414
2462
2424
345
695
110
62
4210
1313
331
1387
0T-
N (S
hrub
/For
est)
220
946
126
6969
344
873
15
61
399
816
435
151,
049
T-N
(Hou
seho
ld)
03
11
20
118
05
02
00
21
63
10
48To
tal
642,
128
18,2
1533
385
61,
426
435
3,59
42,
081
1,23
626
2,02
742
722
31,
500
150
152
959
2,05
140
238
,285
Sub-
Bas
in N
ame
Sutla
Krapina
ZagrebArea
UpperKupa
Dobra
Mreznica
Korana
LowerKupa-Glina
Moatanica
Odra
MiddleSava
ZelinaCrnec
UpperLonja
MiddleLonja
UpperCesma-
Glogonica
MoslavinaArea
LowerLonja
Una-Sunja
Ilova Pakra
VelikiStrug
Sub-Tptal
T-P
(Sew
erag
e)0
230
1,74
50
3626
87
9017
60
013
357
3985
014
023
961
3,17
8T-
P (I
ndus
try)
010
866
01
10
235
00
01
29
00
033
396
4T-
P (L
ives
tock
)3
2414
1227
1121
192
380
16
51
335
368
208
538
T-P
(Agr
icul
tura
l lan
d)0
10
00
00
20
10
00
01
00
00
07
T-P
(Pas
ture
land
)0
00
01
02
60
20
00
01
00
21
016
T-P
(Shr
ub/F
ores
t)0
10
13
22
92
20
00
01
00
41
030
T-P
(Hou
seho
ld)
00
00
00
01
00
00
00
00
00
00
2To
tal
326
62,
626
1469
282
3230
121
785
113
963
4213
06
1774
294
734,
735
Tab
le B
6.3
20
15 W
ithou
t Pro
ject
Pol
lutio
n L
oad
Run
off
-1/4
(BO
D)
Tab
le B
6.3
20
15 W
ithou
t Pro
ject
Pol
lutio
n L
oad
Run
off
-2/4
(CO
D)
Tab
le B
6.3
20
15 W
ithou
t Pro
ject
Pol
lutio
n L
oad
Run
off
-3/4
(T-N
)
Tab
le B
6.3
20
15 W
ithou
t Pro
ject
Pol
lutio
n L
oad
Run
off
-4/4
(T-P
)(U
nit:k
g/da
y)
(Uni
t :kg
/day
)
(Uni
t:kg/
day)
(Uni
t:kg/
day)
B-T56

Sub-
Bas
in N
ame
Sutla
Krapina
Zagreb Area
Upper Kupa
Dobra
Mreznica
Korana
LowerKupa-Glina
Moatanica
Odra
Middle Sava
Zelina Crnec
Upper Lonja
Middle Lonja
UpperCesma-
Glogonica
MoslavinaArea
Lower Lonja
Una-Sunja
Ilova Pakra
Veliki Strug
Sub-Tptal
BO
D (S
ewer
age)
02,
791
10,4
530
307
2,77
867
1,52
62,
018
00
1,13
332
555
490
50
800
926
439
24,3
01B
OD
(Ind
ustry
)0
959
164
024
910
215
339
00
1,21
512
410
30
660
160
03,
350
BO
D (L
ives
tock
)44
432
265
248
469
1,91
633
32,
723
553
1,26
016
131
9633
562
8160
646
133
8910
,090
BO
D (A
gric
ultu
ral l
and)
751
1627
2810
1011
115
734
89
232
54
104
243
0B
OD
(Pas
ture
land
)0
33
714
630
7416
231
21
06
13
202
221
8B
OD
(Shr
ub/F
ores
t)1
84
2046
2827
117
3028
02
21
81
340
34
373
BO
D (H
ouse
hold
)1
93
56
64
5110
170
51
04
13
70
013
4To
tal
534,
255
10,9
0830
889
44,
836
471
4,81
72,
981
1,40
222
2,49
544
659
41,
619
8921
872
31,
228
537
38,8
95
Sub-
Bas
in N
ame
Sutla
Krapina
Zagreb Area
Upper Kupa
Dobra
Mreznica
Korana
LowerKupa-Glina
Moatanica
Odra
Middle Sava
Zelina Crnec
Upper Lonja
Middle Lonja
UpperCesma-
Glogonica
MoslavinaArea
Lower Lonja
Una-Sunja
Ilova Pakra
Veliki Strug
Sub-Tptal
CO
D (S
ewer
age)
02,
193
17,2
540
250
1,66
557
1,11
21,
206
00
917
382
410
800
086
03,
181
913
30,4
26C
OD
(Ind
ustry
)0
1,65
317
40
2266
016
629
90
094
211
117
055
037
60
3,78
5C
OD
(Liv
esto
ck)
133
1,27
068
823
849
522
636
93,
744
551,
197
4438
433
993
2,30
532
918
177
51,
567
296
14,7
30C
OD
(Agr
icul
tura
l lan
d)24
169
4829
3211
413
22
8212
2838
715
122
1415
588
885
CO
D (P
astu
rela
nd)
111
87
167
3688
226
18
42
266
1029
259
321
CO
D (S
hrub
/For
est)
1820
298
163
402
234
251
1,06
227
240
750
4715
297
6974
437
344
126
4,16
2C
OD
(Hou
seho
ld)
520
64
41
340
113
110
30
123
356
41
174
Tota
l18
05,
519
18,2
7744
01,
222
2,21
072
06,
344
1,59
21,
557
662,
339
825
528
3,60
942
945
61,
262
5,55
51,
353
54,4
82
Sub-
Bas
in N
ame
Sutla
Krapina
Zagreb Area
Upper Kupa
Dobra
Mreznica
Korana
LowerKupa-Glina
Moatanica
Odra
Middle Sava
Zelina Crnec
Upper Lonja
Middle Lonja
UpperCesma-
Glogonica
MoslavinaArea
Lower Lonja
Una-Sunja
Ilova Pakra
Veliki Strug
Sub-Tptal
T-N
(Sew
erag
e)0
617
7,03
10
7458
118
293
424
00
254
127
145
315
032
064
519
210
,747
T-N
(Ind
ustry
)0
468
00
1413
030
257
00
1,08
47
937
017
032
29
2,26
6T-
N (L
ives
tock
)31
292
129
162
380
189
297
1,96
231
763
984
8820
685
9540
590
352
716,
273
T-N
(Agr
icul
tura
l lan
d)30
204
5499
122
3914
517
630
015
3556
924
235
1968
7111
1,94
4T-
N (P
astu
rela
nd)
114
1424
6224
2434
56
951
106
242
1013
133
3113
870
T-N
(Shr
ub/F
ores
t)2
209
4612
669
6934
48
731
56
139
98
164
3515
1,04
9T-
N (H
ouse
hold
)0
31
12
01
180
50
20
02
16
31
048
Tota
l64
1,61
77,
238
333
780
915
424
3,50
973
21,
236
261,
474
290
186
1,36
215
013
595
91,
457
312
23,1
95
Sub-
Bas
in N
ame
Sutla
Krapina
ZagrebArea
UpperKupa
Dobra
Mreznica
Korana
LowerKupa-Glina
Moatanica
Odra
MiddleSava
ZelinaCrnec
UpperLonja
MiddleLonja
UpperCesma-
Glogonica
MoslavinaArea
LowerLonja
Una-Sunja
Ilova Pakra
VelikiStrug
Sub-Tptal
T-P
(Sew
erag
e)0
136
1,17
70
1794
467
680
053
2330
590
70
128
331,
894
T-P
(Ind
ustry
)0
2015
02
20
527
00
221
17
03
024
112
9T-
P (L
ives
tock
)3
2414
1227
1121
192
380
16
51
335
368
208
538
T-P
(Agr
icul
tura
l lan
d)0
10
00
00
20
10
00
01
00
00
07
T-P
(Pas
ture
land
)0
00
01
02
60
20
00
01
00
21
016
T-P
(Shr
ub/F
ores
t)0
10
13
22
92
20
00
01
00
41
030
T-P
(Hou
seho
ld)
00
00
00
01
00
00
00
00
00
00
2To
tal
318
11,
207
1451
110
3028
110
085
181
2933
102
614
7417
443
2,61
7
(Uni
t:kg/
day)
(Uni
t :kg
/day
)
(Uni
t:kg/
day)
(Uni
t:kg/
day)
Tab
le B
6.4
20
07 W
ith P
roje
ct P
ollu
tion
Loa
d R
unof
f -1
/4 (B
OD
)
Tab
le B
6.4
20
07 W
ith P
roje
ct P
ollu
tion
Loa
d R
unof
f -2
/4 (C
OD
)
Tab
le B
6.4
20
07 W
ith P
roje
ct P
ollu
tion
Loa
d R
unof
f -3
/4 (T
-N)
Tab
le B
6.4
20
07 W
ith P
roje
ctPo
llutio
n L
oad
Run
off
-4/4
(T-P
)
B-T57
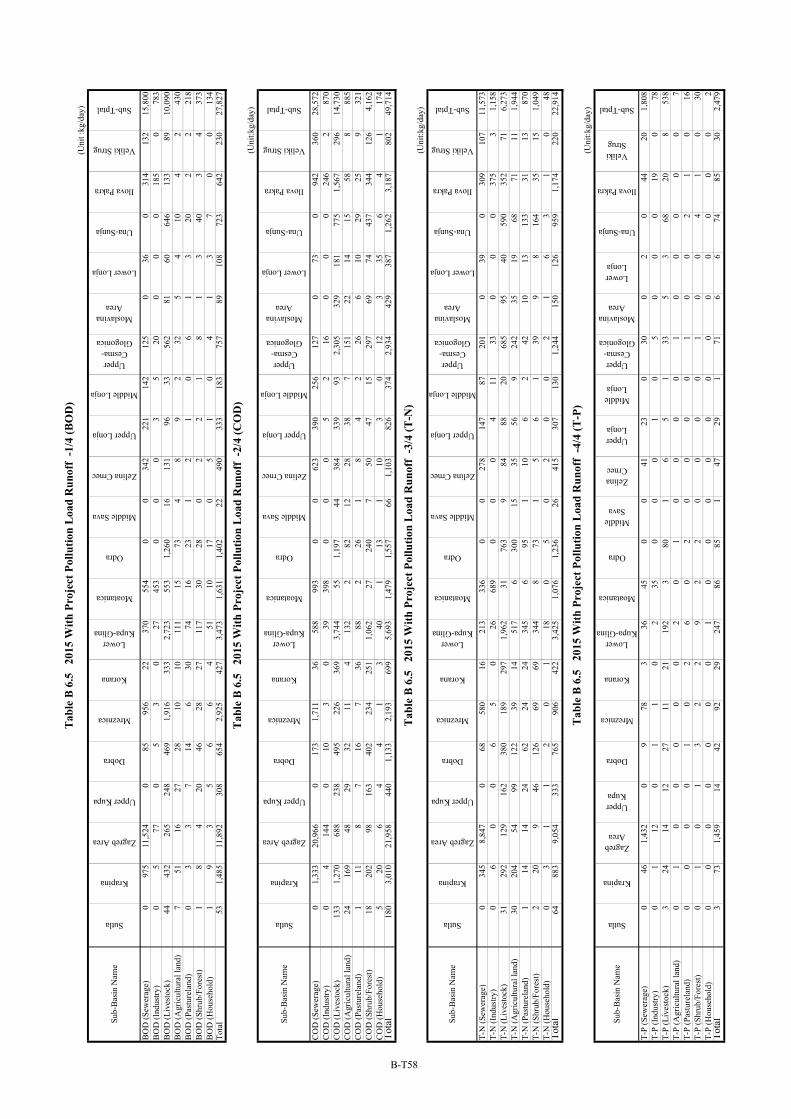
Sub-
Bas
in N
ame
Sutla
Krapina
Zagreb Area
Upper Kupa
Dobra
Mreznica
Korana
LowerKupa-Glina
Moatanica
Odra
Middle Sava
Zelina Crnec
Upper Lonja
Middle Lonja
UpperCesma-
Glogonica
MoslavinaArea
Lower Lonja
Una-Sunja
Ilova Pakra
Veliki Strug
Sub-Tptal
BO
D (S
ewer
age)
097
511
,524
085
956
2237
055
40
034
222
114
212
50
360
314
132
15,8
00B
OD
(Ind
ustry
)0
577
05
30
2745
30
00
35
200
00
185
078
3B
OD
(Liv
esto
ck)
4443
226
524
846
91,
916
333
2,72
355
31,
260
1613
196
3356
281
6064
613
389
10,0
90B
OD
(Agr
icul
tura
l lan
d)7
5116
2728
1010
111
1573
48
92
325
410
42
430
BO
D (P
astu
rela
nd)
03
37
146
3074
1623
12
10
61
320
22
218
BO
D (S
hrub
/For
est)
18
420
4628
2711
730
280
22
18
13
403
437
3B
OD
(Hou
seho
ld)
19
35
66
451
1017
05
10
41
37
00
134
Tota
l53
1,48
511
,892
308
654
2,92
542
73,
473
1,63
11,
402
2249
033
318
375
789
108
723
642
230
27,8
27
Sub-
Bas
in N
ame
Sutla
Krapina
Zagreb Area
Upper Kupa
Dobra
Mreznica
Korana
LowerKupa-Glina
Moatanica
Odra
Middle Sava
Zelina Crnec
Upper Lonja
Middle Lonja
UpperCesma-
Glogonica
MoslavinaArea
Lower Lonja
Una-Sunja
Ilova Pakra
Veliki Strug
Sub-Tptal
CO
D (S
ewer
age)
01,
333
20,9
660
173
1,71
136
588
993
00
623
390
256
127
073
094
236
028
,572
CO
D (I
ndus
try)
04
144
010
30
3939
80
00
52
160
00
246
287
0C
OD
(Liv
esto
ck)
133
1,27
068
823
849
522
636
93,
744
551,
197
4438
433
993
2,30
532
918
177
51,
567
296
14,7
30C
OD
(Agr
icul
tura
l lan
d)24
169
4829
3211
413
22
8212
2838
715
122
1415
588
885
CO
D (P
astu
rela
nd)
111
87
167
3688
226
18
42
266
1029
259
321
CO
D (S
hrub
/For
est)
1820
298
163
402
234
251
1,06
227
240
750
4715
297
6974
437
344
126
4,16
2C
OD
(Hou
seho
ld)
520
64
41
340
113
110
30
123
356
41
174
Tota
l18
03,
010
21,9
5844
01,
133
2,19
369
95,
693
1,47
91,
557
661,
103
826
374
2,93
442
938
71,
262
3,18
780
249
,714
Sub-
Bas
in N
ame
Sutla
Krapina
Zagreb Area
Upper Kupa
Dobra
Mreznica
Korana
LowerKupa-Glina
Moatanica
Odra
Middle Sava
Zelina Crnec
Upper Lonja
Middle Lonja
UpperCesma-
Glogonica
MoslavinaArea
Lower Lonja
Una-Sunja
Ilova Pakra
Veliki Strug
Sub-Tptal
T-N
(Sew
erag
e)0
345
8,84
70
6858
016
213
336
00
278
147
8720
10
390
309
107
11,5
73T-
N (I
ndus
try)
06
00
65
026
689
00
04
1133
00
037
53
1,15
8T-
N (L
ives
tock
)31
292
129
162
380
189
297
1,96
231
763
984
8820
685
9540
590
352
716,
273
T-N
(Agr
icul
tura
l lan
d)30
204
5499
122
3914
517
630
015
3556
924
235
1968
7111
1,94
4T-
N (P
astu
rela
nd)
114
1424
6224
2434
56
951
106
242
1013
133
3113
870
T-N
(Shr
ub/F
ores
t)2
209
4612
669
6934
48
731
56
139
98
164
3515
1,04
9T-
N (H
ouse
hold
)0
31
12
01
180
50
20
02
16
31
048
Tota
l64
883
9,05
433
376
590
642
23,
425
1,07
61,
236
2641
530
713
01,
244
150
126
959
1,17
422
022
,914
Sub-
Bas
in N
ame
Sutla
Krapina
ZagrebArea
UpperKupa
Dobra
Mreznica
Korana
LowerKupa-Glina
Moatanica
Odra
MiddleSava
ZelinaCrnec
UpperLonja
MiddleLonja
UpperCesma-
Glogonica
MoslavinaArea
LowerLonja
Una-Sunja
Ilova Pakra
VelikiStrug
Sub-Tptal
T-P
(Sew
erag
e)0
461,
432
09
783
3645
00
4123
030
02
044
201,
808
T-P
(Ind
ustry
)0
112
01
10
235
00
01
05
00
019
078
T-P
(Liv
esto
ck)
324
1412
2711
2119
23
801
65
133
53
6820
853
8T-
P (A
gric
ultu
ral l
and)
01
00
00
02
01
00
00
10
00
00
7T-
P (P
astu
rela
nd)
00
00
10
26
02
00
00
10
02
10
16T-
P (S
hrub
/For
est)
01
01
32
29
22
00
00
10
04
10
30T-
P (H
ouse
hold
)0
00
00
00
10
00
00
00
00
00
02
Tota
l3
731,
459
1442
9229
247
8685
147
291
716
674
8530
2,47
9
Tab
le B
6.5
20
15 W
ith P
roje
ct P
ollu
tion
Loa
d R
unof
f -1
/4 (B
OD
)
Tab
le B
6.5
20
15 W
ith P
roje
ct P
ollu
tion
Loa
d R
unof
f -2
/4 (C
OD
)
Tab
le B
6.5
20
15 W
ith P
roje
ct P
ollu
tion
Loa
d R
unof
f -3
/4 (T
-N)
Tab
le B
6.5
20
15 W
ith P
roje
ct P
ollu
tion
Loa
d R
unof
f -4
/4 (T
-P)
(Uni
t:kg/
day)
(Uni
t :kg
/day
)
(Uni
t:kg/
day)
(Uni
t:kg/
day)
B-T58
FIGURES
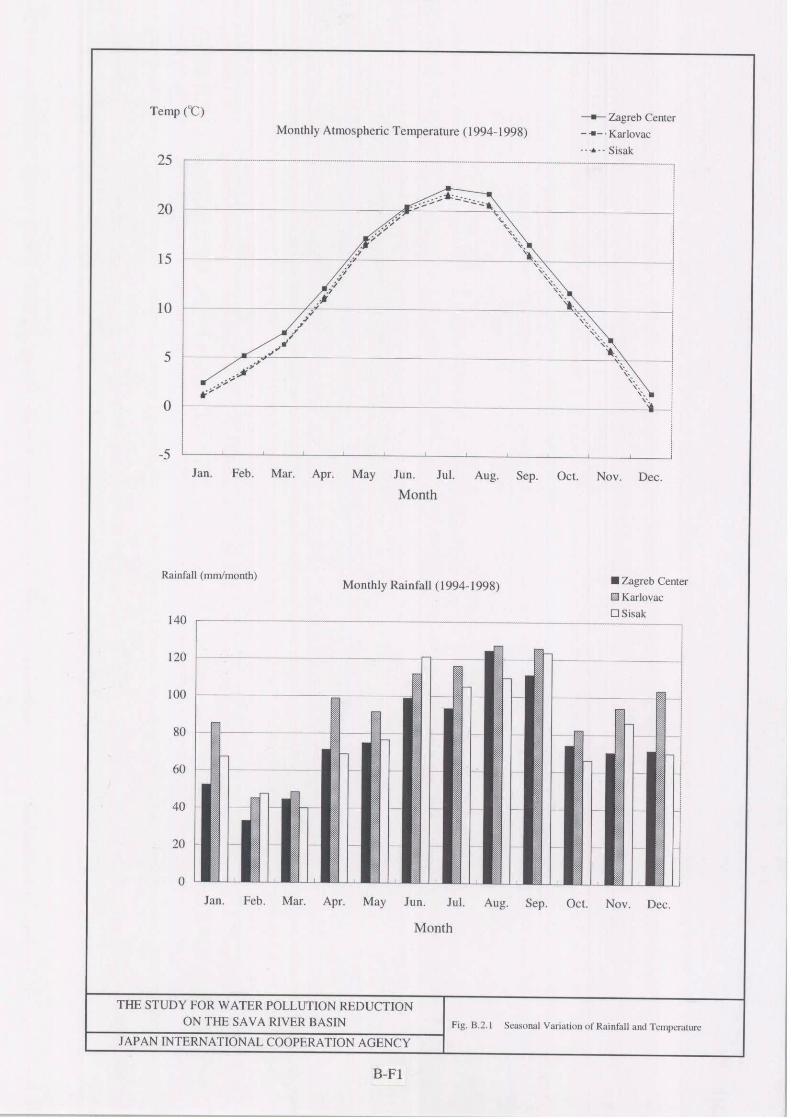
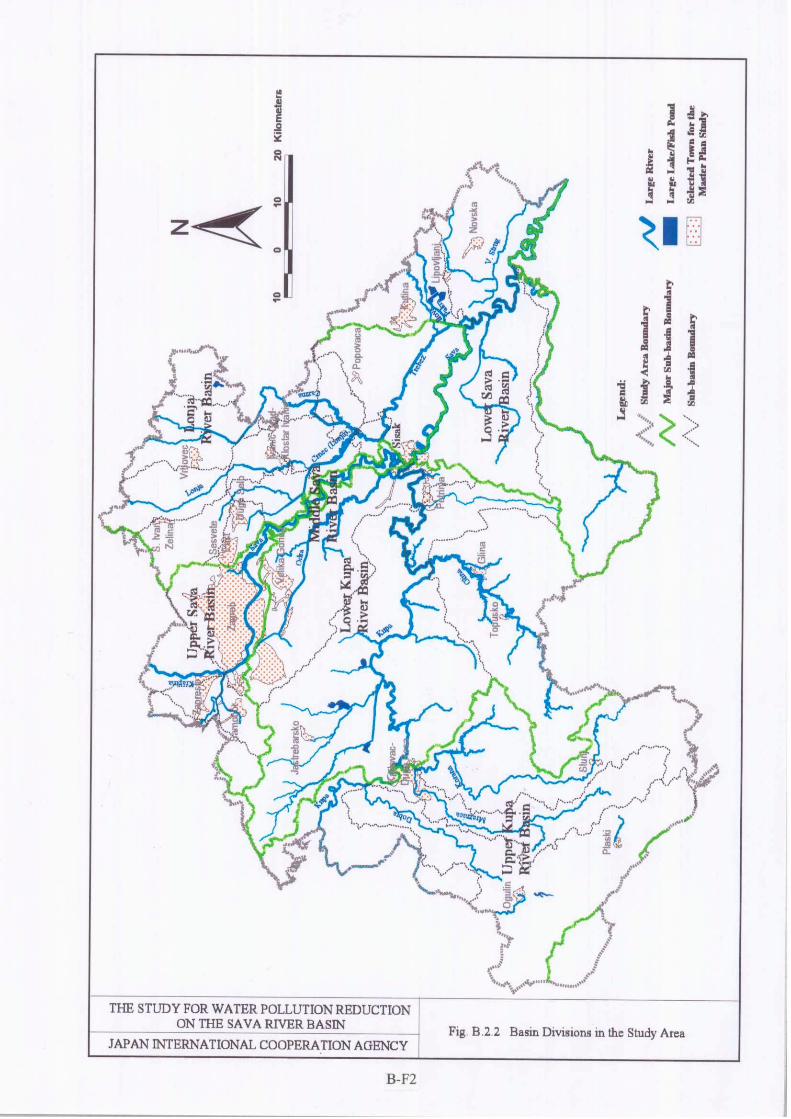
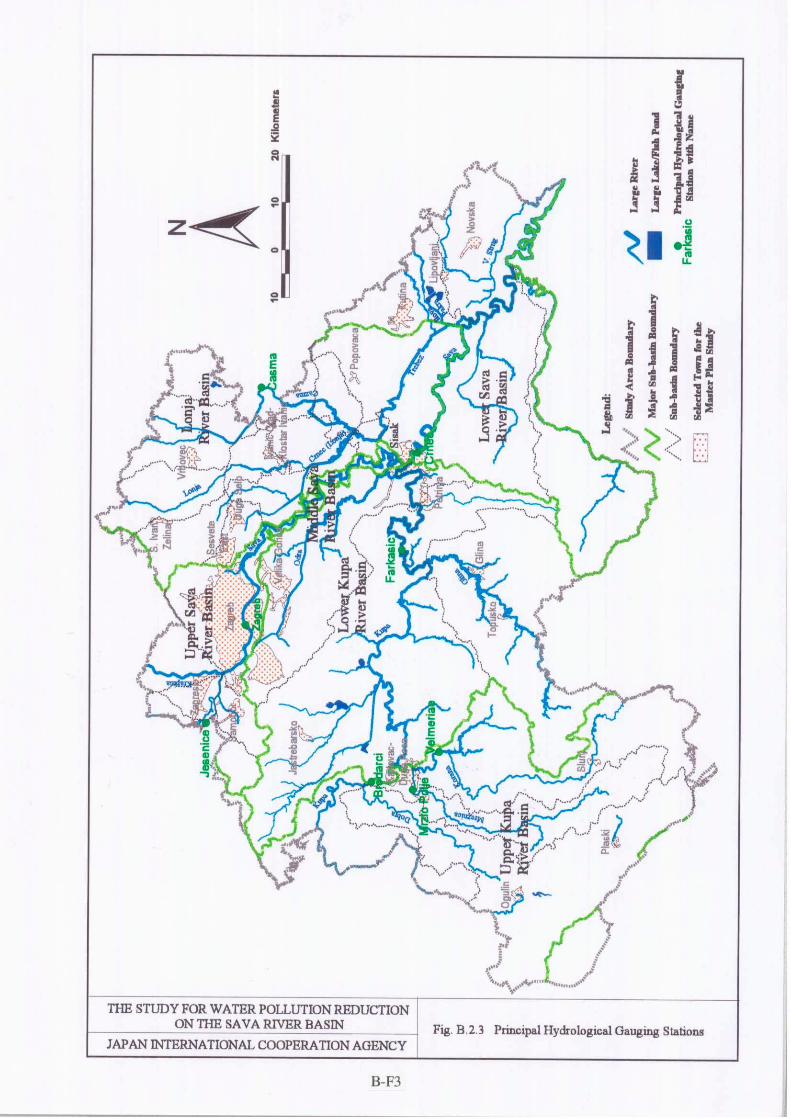
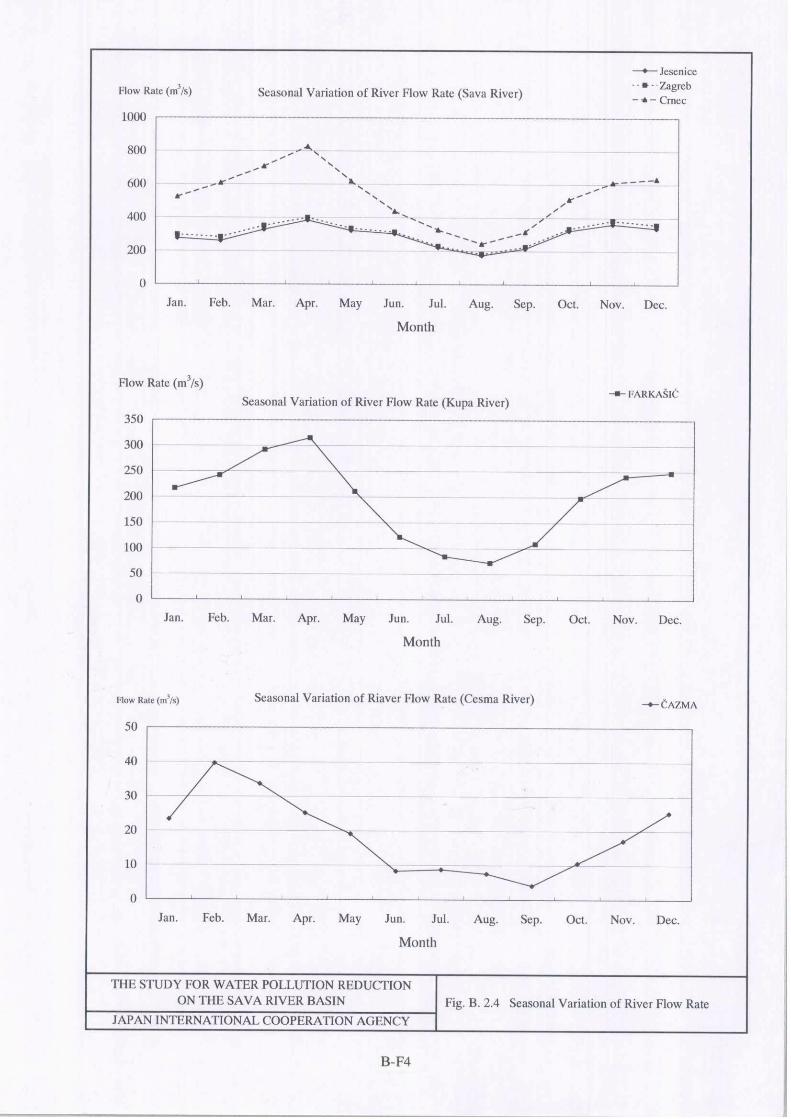
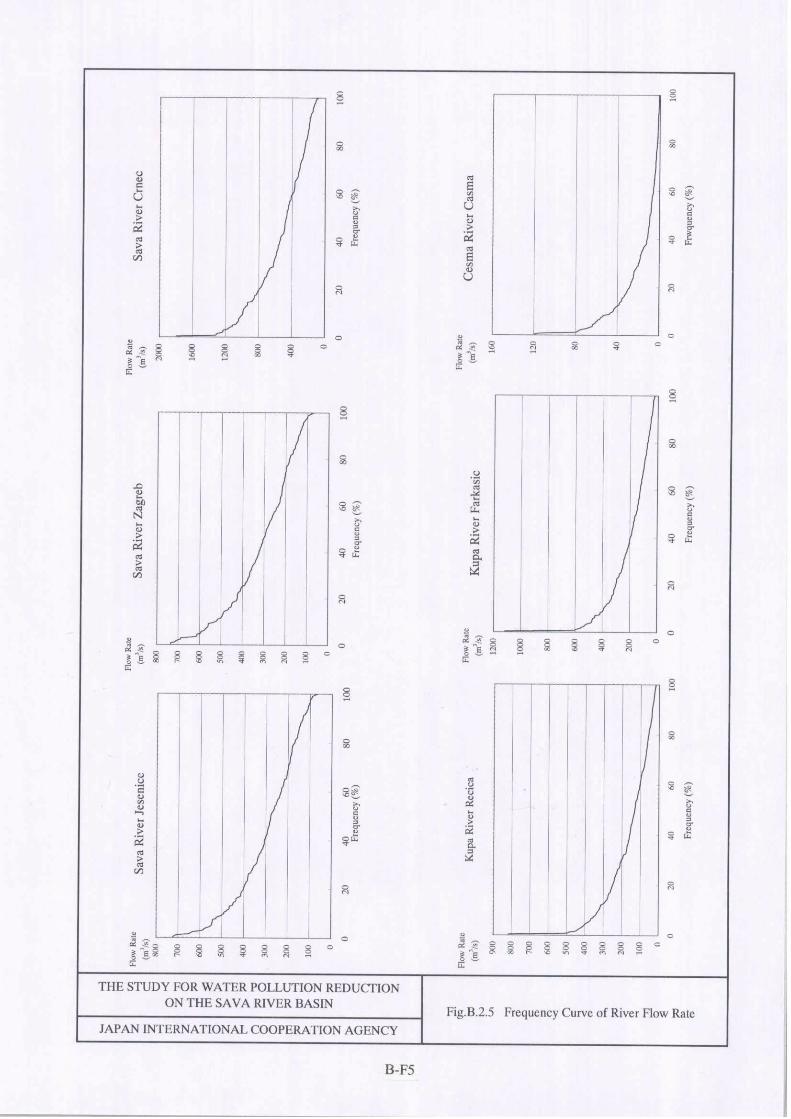
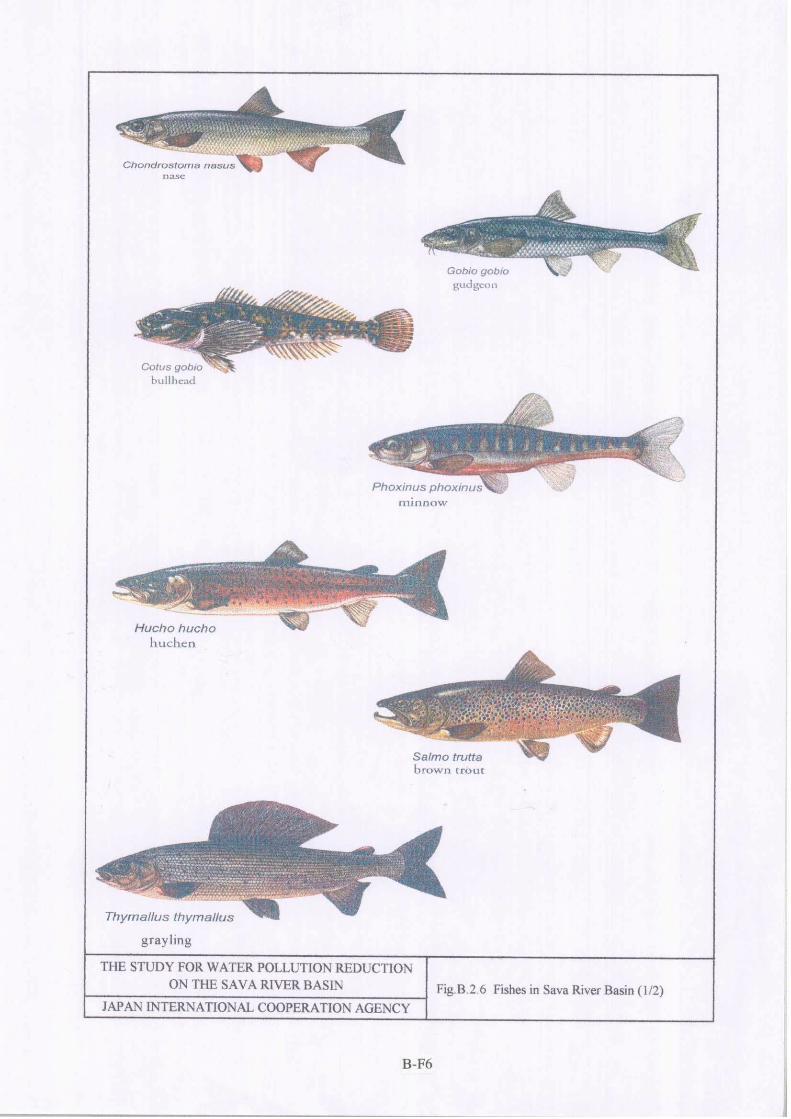
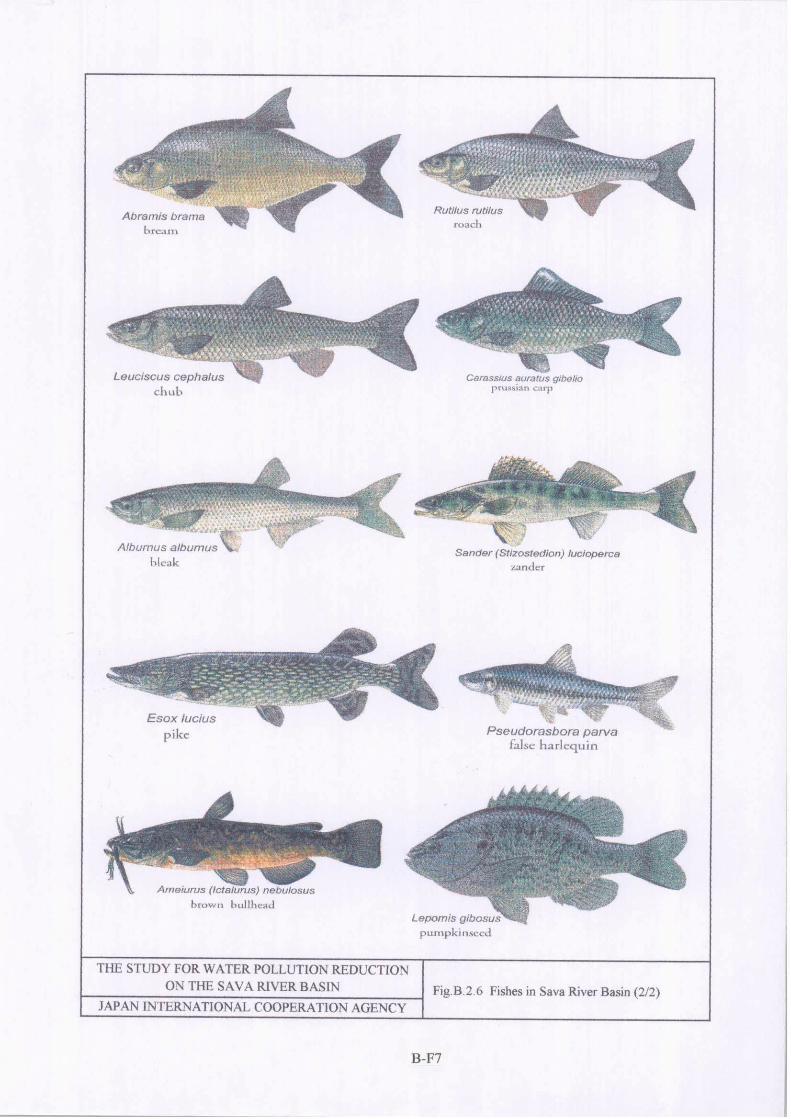
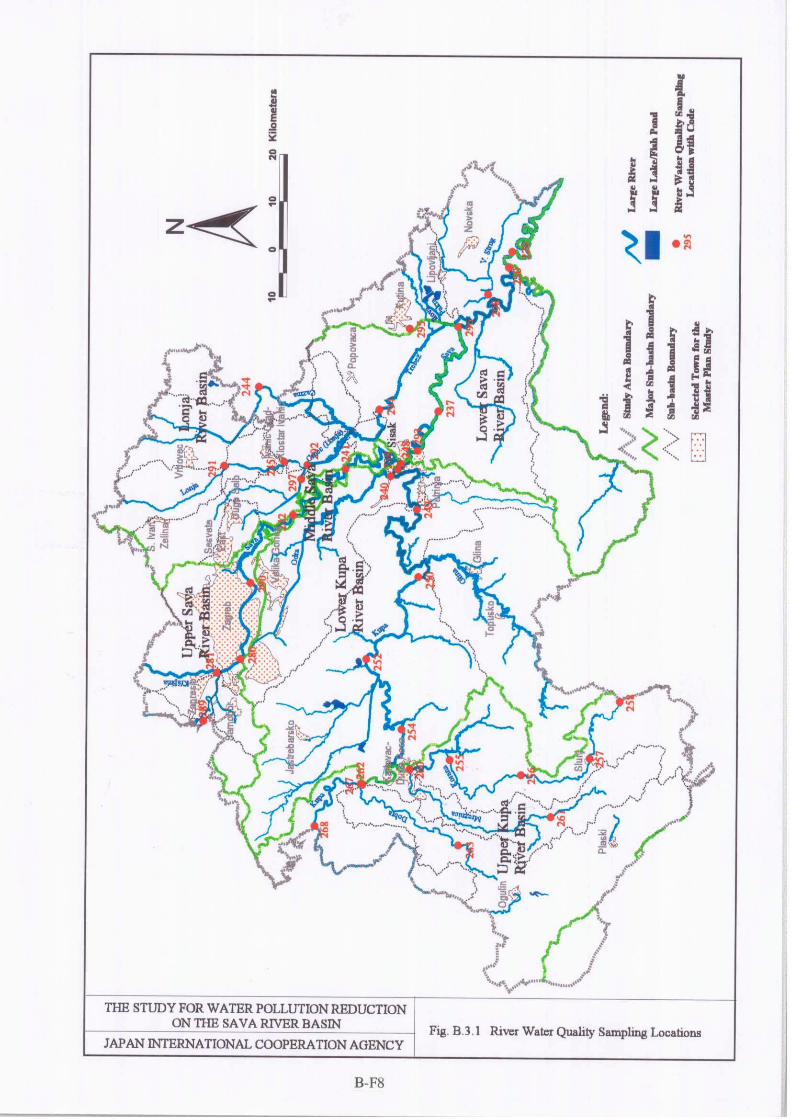
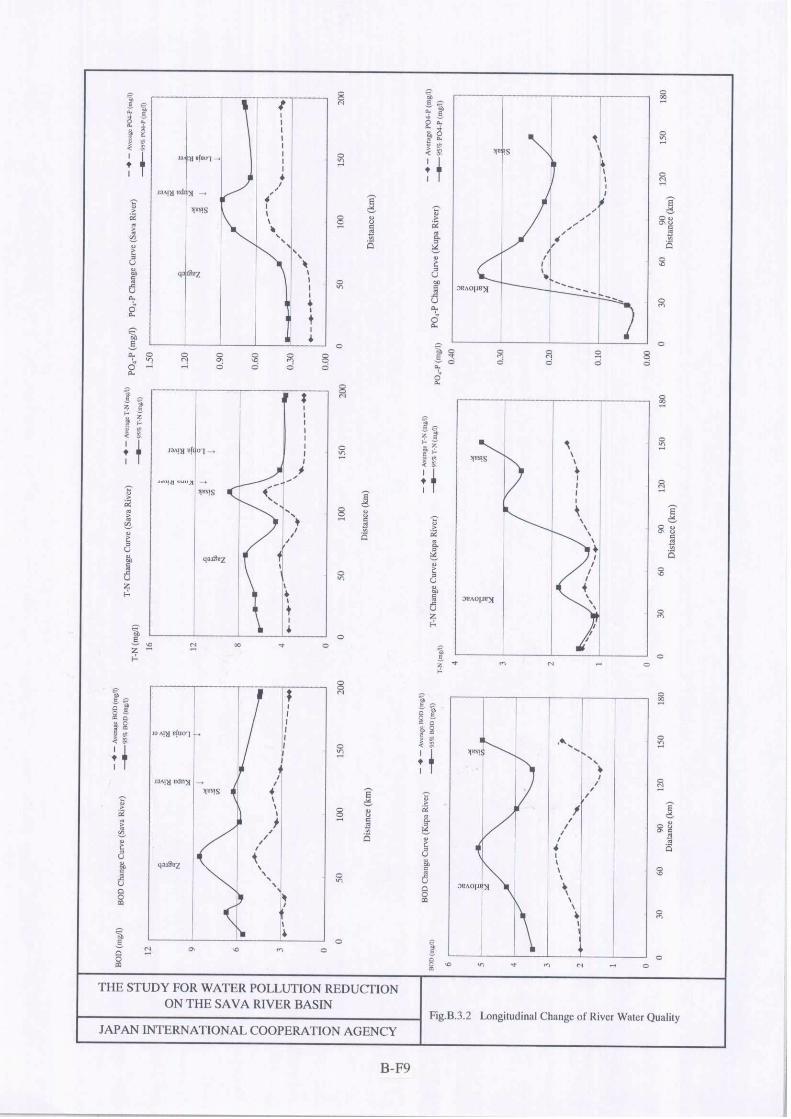
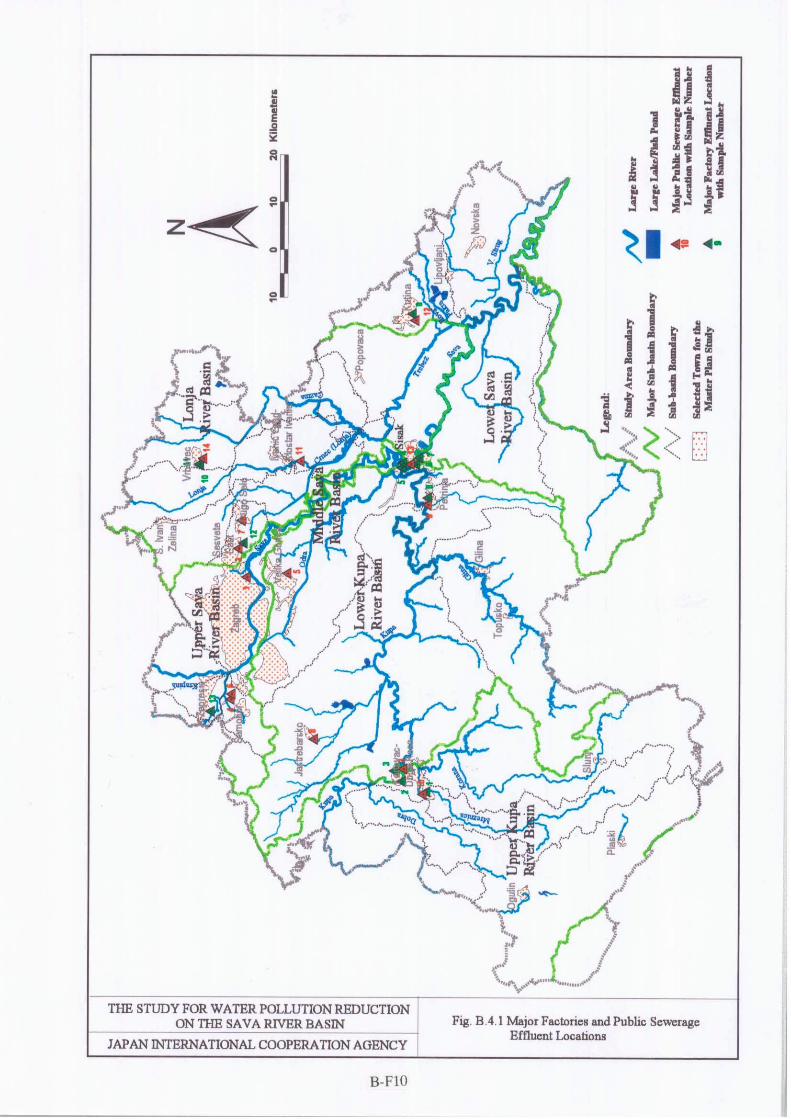
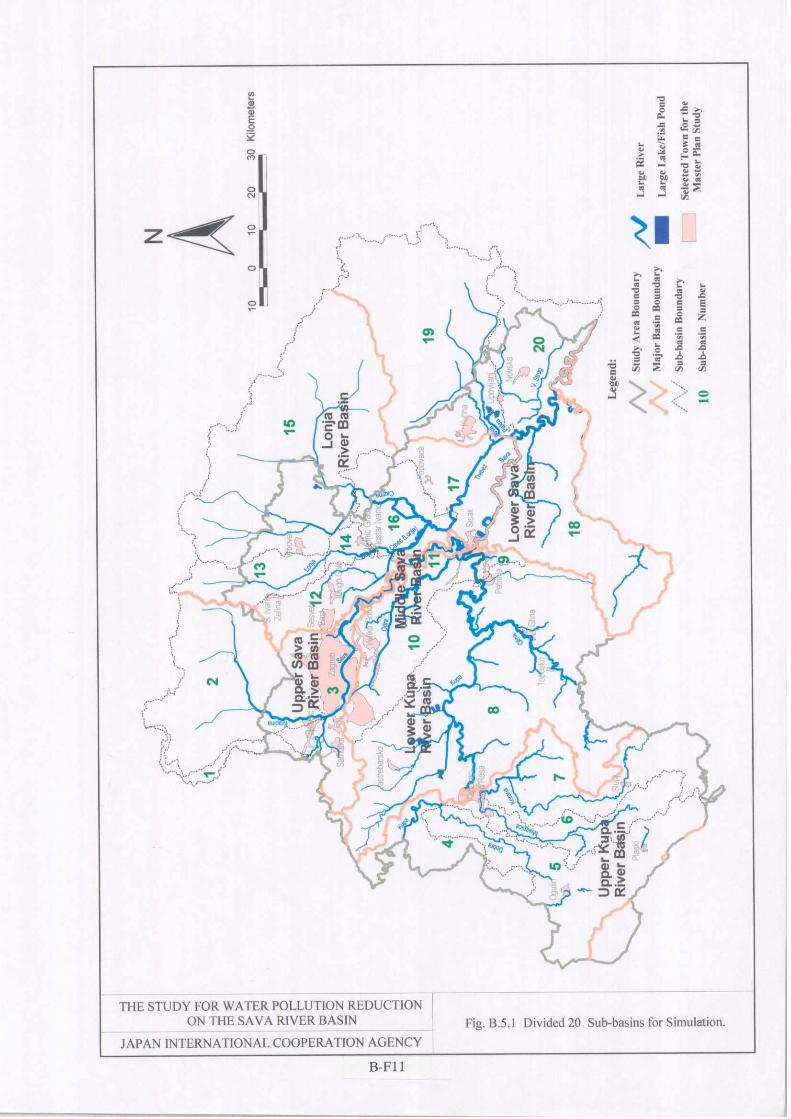
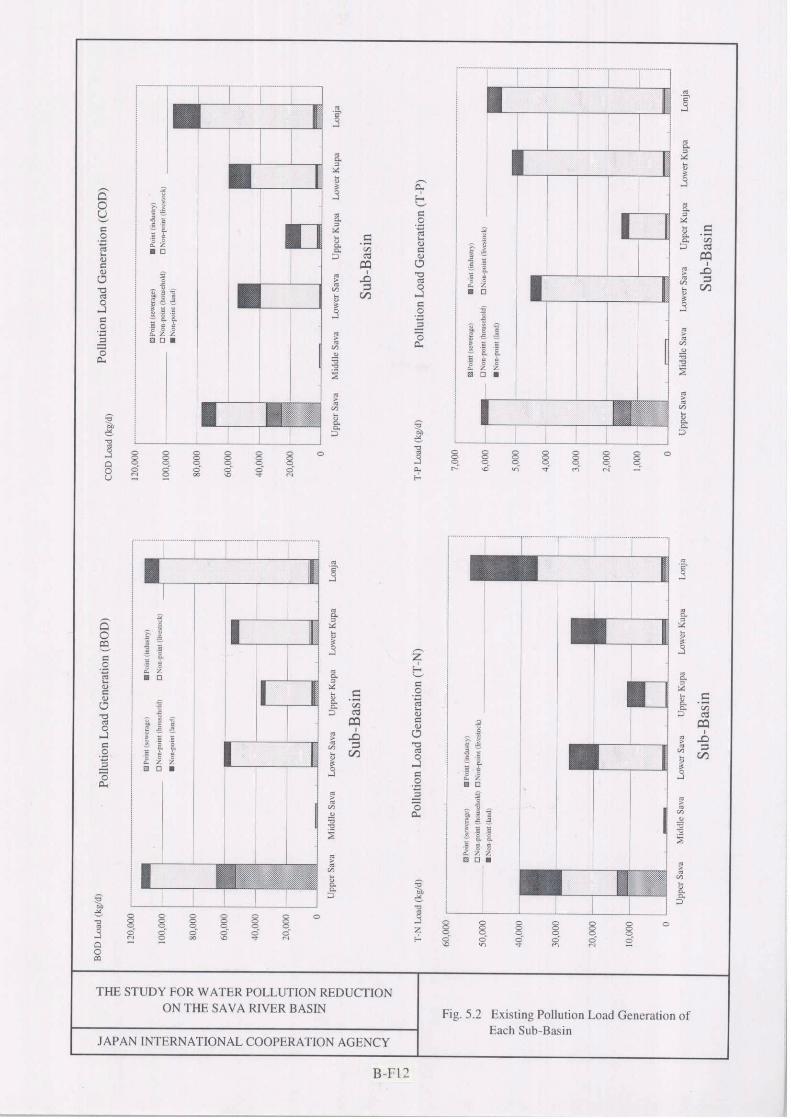
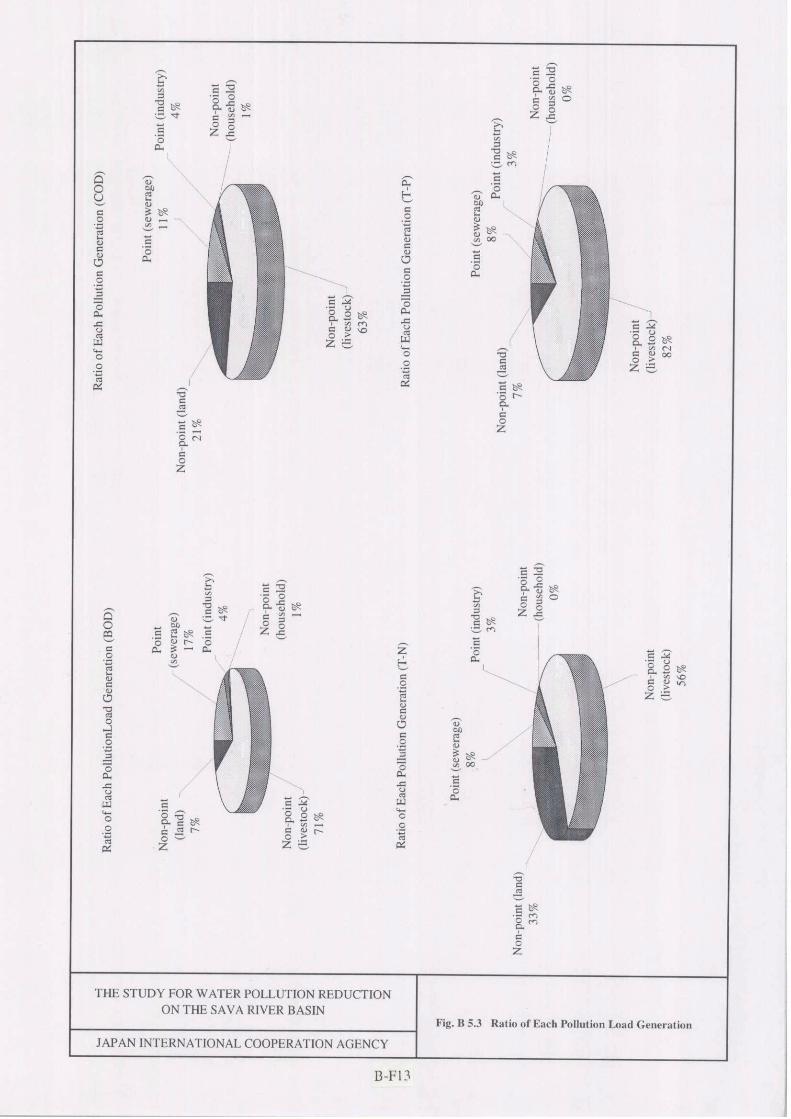
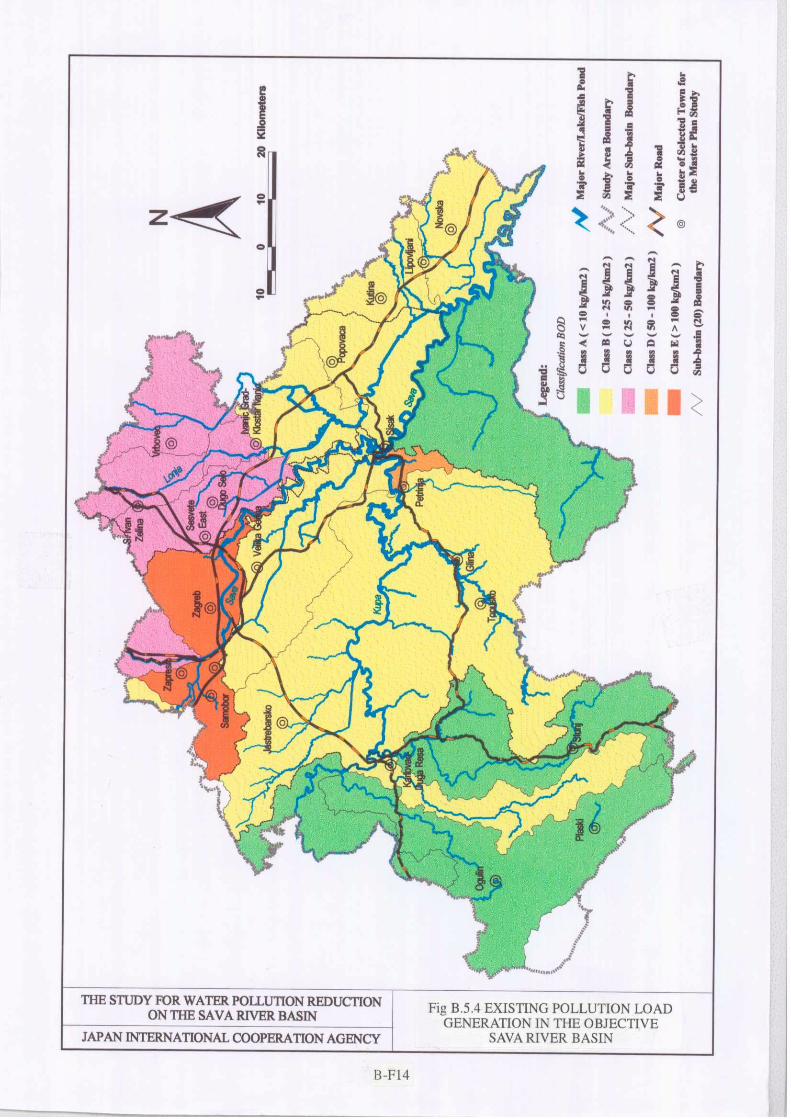
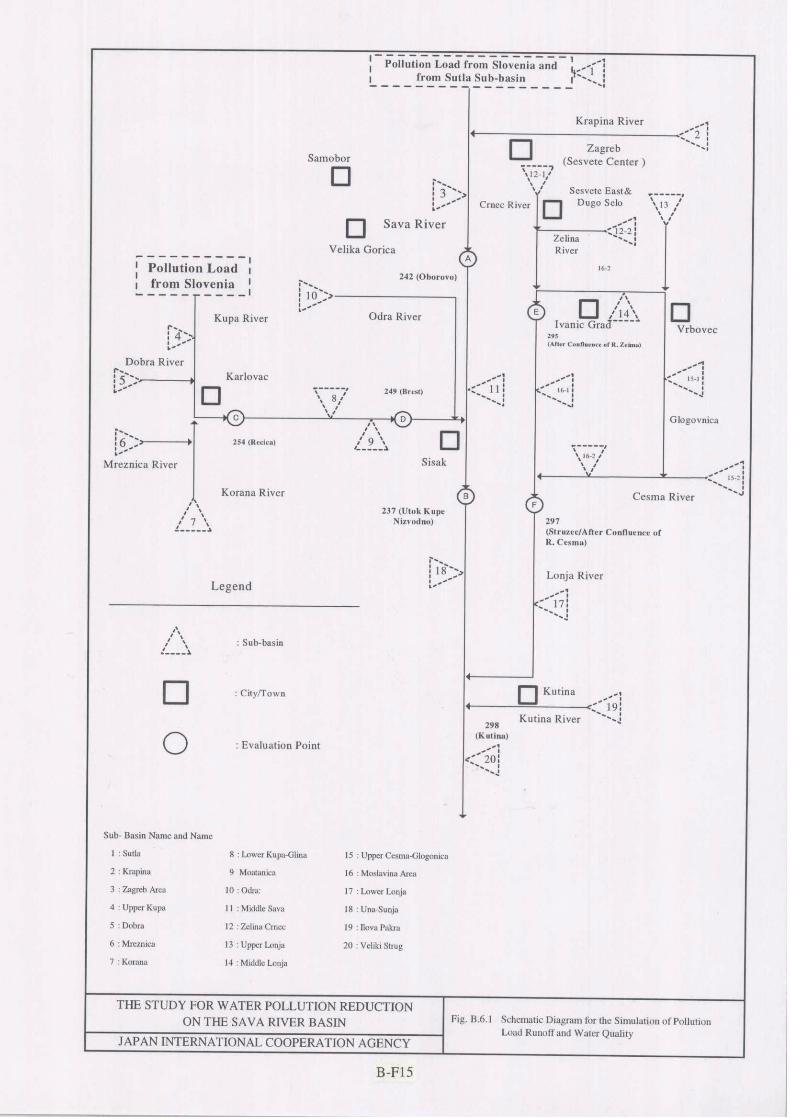
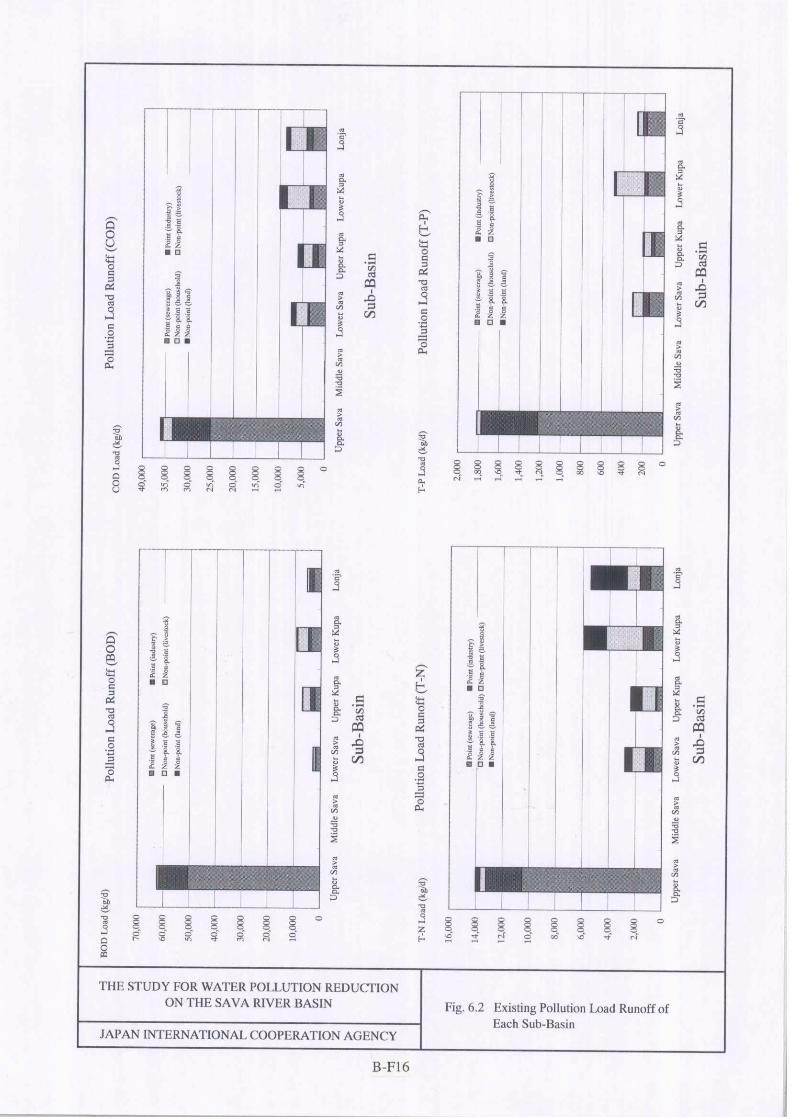
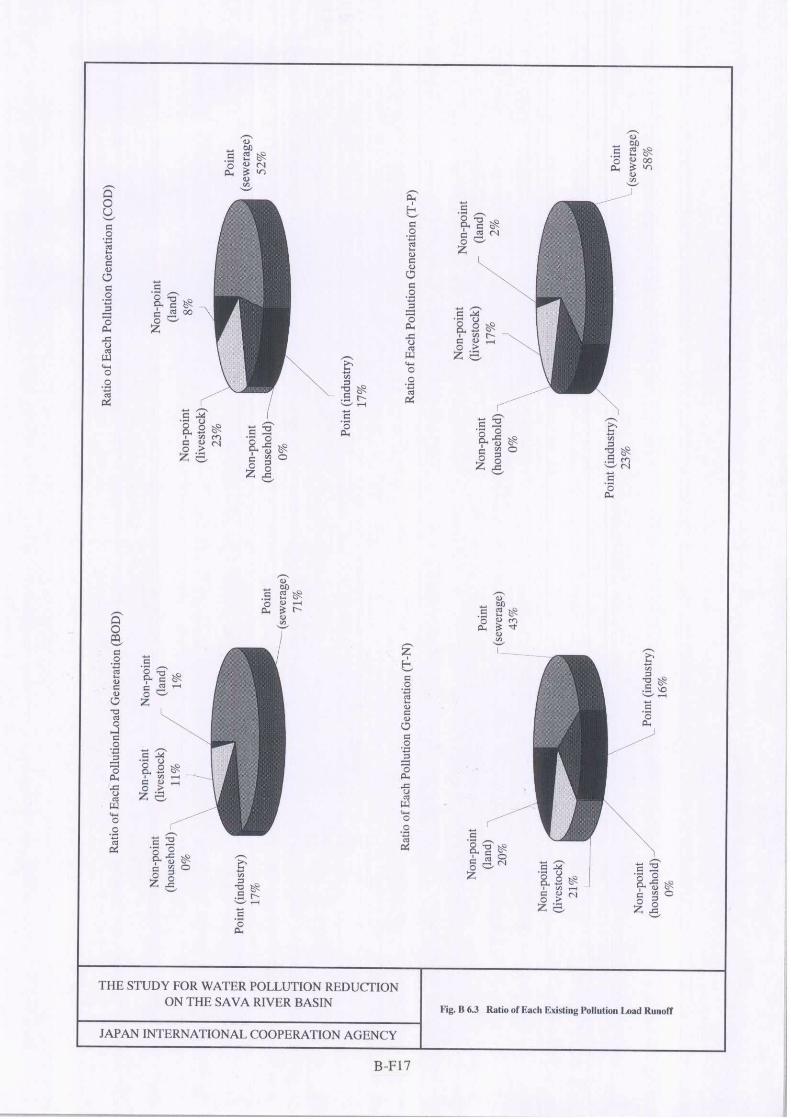
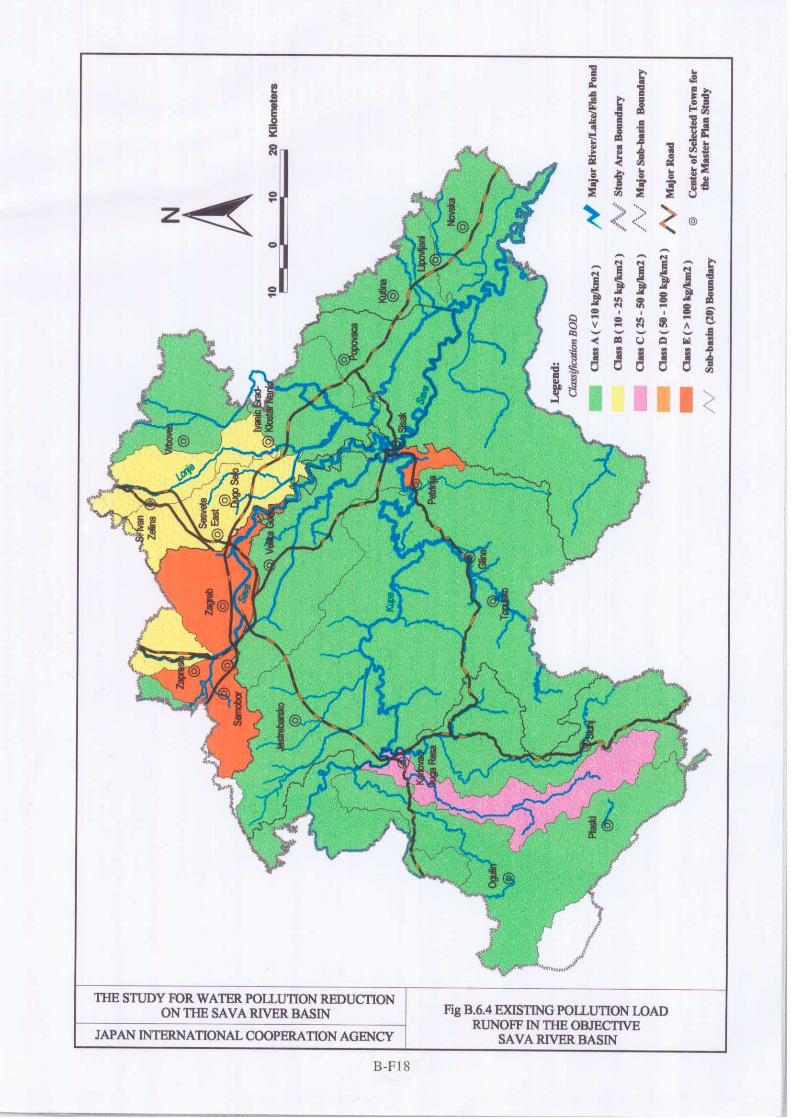
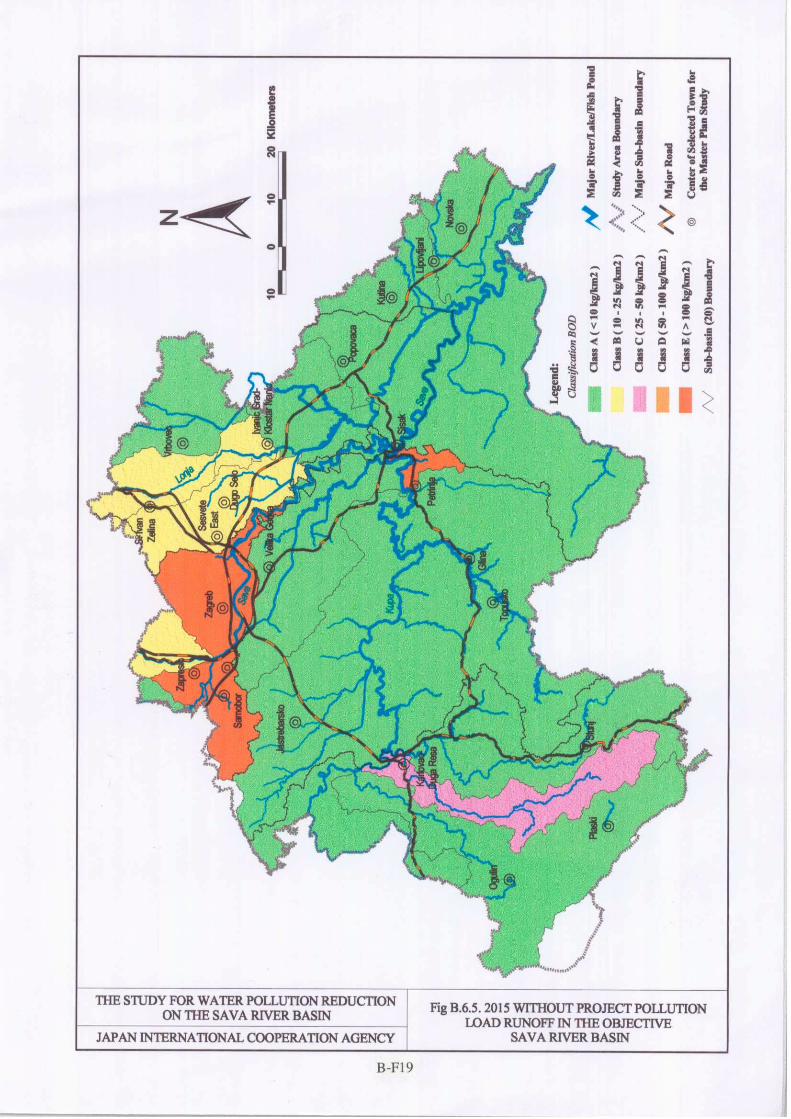
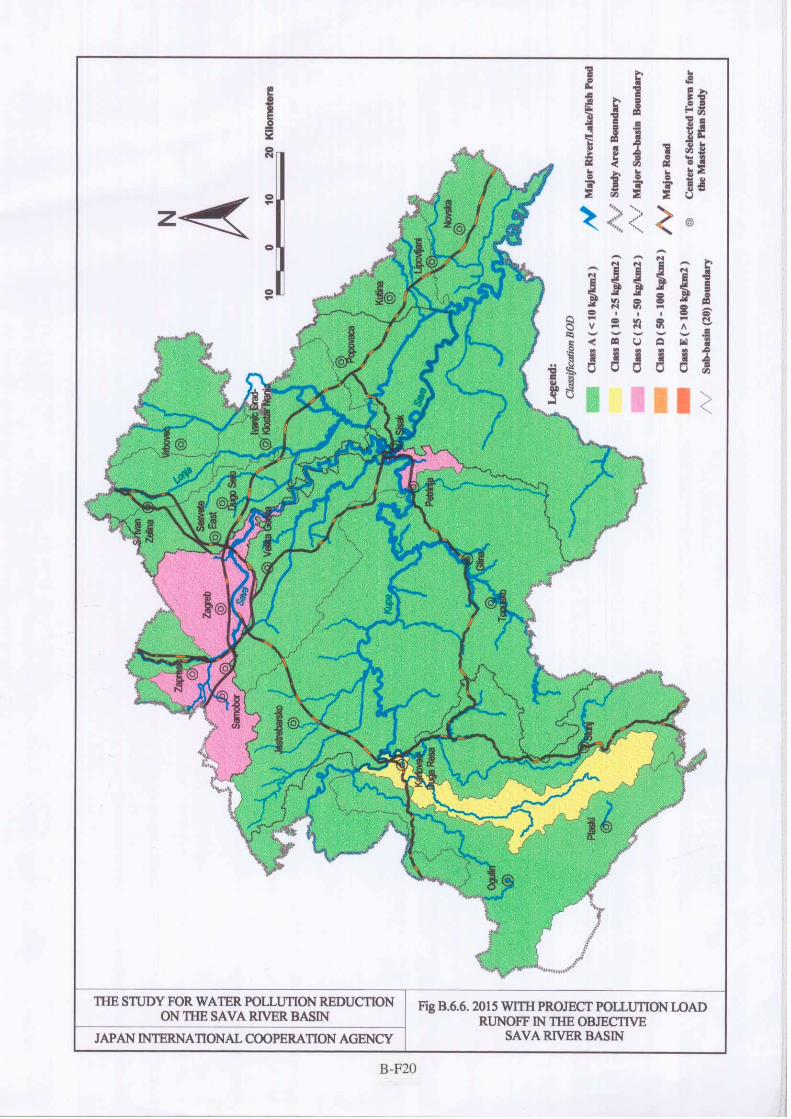
APPENDIX C
INDUSTRIAL WASTEWATER TREATMENT
C - i
APPENDIX C
INDUSTRIAL WASTEWATER TREATMENT
Table of Contents
CHAPTER I PLANNING BASIS............................................................... C-1 1.1 Objective of the Study ............................................................ C-1 1.2 Permissible Limits of Industrial Effluent................................ C-1 1.3 Selection of the Objective Large Industries for the Study ..… C-2 1.4 Estimation of Existing and Future Wastewater
Quantity and Quality............................................................... C-4 1.4.1 Existing Wastewater Quantity and Quality................ C-4 1.4.2 Future Wastewater Quantity and Quality................... C-4
1.5 Selection of Wastewater Recipient ......................................... C-5 1.6 Design Concept of Wastewater Treatment System.....……… C-6 1.7 Cost Estimate .......................................................................... C-7
CHAPTER II WASTEWATER TREATMENT OF LARGE POLLUTANT INDUSTRIES IN SESVETE EAST .......... C-8
2.1 General.................................................................................... C-8 2.2 AGROPROTEINKA d.d......................................................... C-8
2.2.1 Outline of the Factory ................................................ C-8 2.2.2 Existing Water Use .................................................... C-8 2.2.3 Existing Wastewater Discharge System..................... C-8 2.2.4 Existing Wastewater Quantity and Quality................ C-9 2.2.5 Development of Wastewater Treatment System........ C-9
2.3 DUMA KOŽE d.o.o (former name: ALMERIA) ................... C-11 2.3.1 Outline of the Factory ................................................ C-11 2.3.2 Existing Water Use .................................................... C-11 2.3.3 Existing Wastewater Discharge System..................... C-11 2.3.4 Existing Wastewater Quantity and Quality................ C-12 2.3.5 Development of Wastewater Treatment System........ C-13
CHAPTER III WASTEWATER TREATMENT OF LARGE POLLUTANT INDUSTRY IN VRBOVEC ....................... C-15
3.1 General.................................................................................... C-15 3.2 PIK VRBOVEC MESNA INDUSTRIJA. .............................. C-15
3.2.1 Outline of the Factory ................................................ C-15 3.2.2 Existing Water Use .................................................... C-15 3.2.3 Existing Wastewater Discharge System..................... C-16
C - ii
3.2.4 Existing Wastewater Quantity and Quality................ C-16 3.2.5 Development of Wastewater Treatment System........ C-16
CHAPTER IV WASTEWATER TREATMENT OF LARGE POLLUTANT INDUSTRIES IN SISAK ........................... C-18
4.1 General.................................................................................... C-18 4.2 INDUSTRIJA NAFTE d.d. ZAGREB RAFINERIJA
NAFTE SISAK. ...................................................................... C-18 4.2.1 Outline of the Factory ................................................ C-18 4.2.2 Existing Water Use .................................................... C-18 4.2.3 Existing Wastewater Discharge System .................... C-18 4.2.4 Existing Wastewater Quantity and Quality................ C-19 4.2.5 Development of Wastewater Treatment System........ C-20
4.3 HERBOS d.d........................................................................... C-22 4.3.1 Outline of the Factory ................................................ C-22 4.3.2 Existing Water Use .................................................... C-22 4.3.3 Existing Wastewater Discharge System .................... C-22 4.3.4 Existing Wastewater Quantity and Quality................ C-23 4.3.5 Development of Wastewater Treatment System........ C-23
4.4 TERMOELEKTRANA SISAK..........................................… C-24 4.4.1 Outline of the Factory ................................................ C-24 4.4.2 Existing Water Use .................................................... C-24 4.4.3 Existing Wastewater Discharge System .................... C-25 4.4.4 Existing Wastewater Quantity and Quality................ C-25 4.4.5 Development of Wastewater Treatment System........ C-25
4.5 SEGESTICA (Segestica Proizvodnja Alkohola, Pića I Octa d.o.o.) ............................................................................. C-26 4.5.1 Outline of the Factory ................................................ C-26 4.5.2 Existing Water Use .................................................... C-26 4.5.3 Existing Wastewater Discharge System .................... C-27 4.5.4 Existing Wastewater Quantity and Quality................ C-27 4.5.5 Development of Wastewater Treatment System........ C-27
4.6 ŽELJEZARA SISAK d.d. Poduzeće Metaval ........................ C-29 4.6.1 Outline of the Factory ................................................ C-29 4.6.2 Existing Water Use .................................................... C-30 4.6.3 Existing Wastewater Discharge System .................... C-30 4.6.4 Existing Wastewater Quantity and Quality................ C-30 4.6.5 Development of Wastewater Treatment System........ C-31
4.7 LJUDEVIT POSAVSK MLIN i PEKARE............................. C-31 4.7.1 Outline of the Factory ................................................ C-31 4.7.2 Existing Water Use .................................................... C-31
C - iii
4.7.3 Existing Wastewater Discharge System..................... C-32 4.7.4 Existing Wastewater Quantity and Quality................ C-32 4.7.5 Development of Wastewater Treatment System........ C-32
CHAPTER V WASTEWATER TREATMENT OF LARGE POLLUTANT INDUSTRY IN KUTINA ........................... C-35
5.1 General.................................................................................... C-35 5.2 PETROKEMIJA KUTINA..................................................... C-35
5.2.1 Outline of the Factory ................................................ C-35 5.2.2 Existing Water Use .................................................... C-35 5.2.3 Existing Wastewater Discharge System..................... C-35 5.2.4 Existing Wastewater Quantity and Quality................ C-36 5.2.5 Development of Wastewater Treatment System........ C-37
CHAPTER VI WASTEWATER TREATMENT OF LARGE POLLUTANT INDUSTRIES IN KARLOVAC - DUGA RESA .............................................. C-39
6.1 General.................................................................................... C-39 6.2 KARLOVAČKA PIVOVARA d.d.. ....................................... C-39
6.2.1 Outline of the Factory ................................................ C-39 6.2.2 Existing Water Use .................................................... C-39 6.2.3 Existing Wastewater Discharge System..................... C-40 6.2.4 Existing Wastewater Quantity and Quality................ C-40 6.2.5 Development of Wastewater Treatment System........ C-40
6.3 PPK KARLOVĆKA MESNA INDUSTRIJA d.d .................. C-42 6.3.1 Outline of the Factory ................................................ C-42 6.3.2 Existing Water Use .................................................... C-42 6.3.3 Existing Wastewater Discharge System..................... C-42 6.3.4 Existing Wastewater Quantity and Quality................ C-43 6.3.5 Development of Wastewater Treatment System........ C-43
6.4 VELEBIT…………………………........................................ C-45 6.4.1 Outline of the Factory ................................................ C-45 6.4.2 Existing Water Use .................................................... C-45 6.4.3 Existing Wastewater Discharge System..................... C-45 6.4.4 Existing Wastewater Quantity and Quality................ C-45 6.4.5 Development of Wastewater Treatment System........ C-46
6.5 LOLA RIBAR.....................................................................… C-46 6.5.1 Outline of the Factory ................................................ C-46 6.5.2 Existing Water Use .................................................... C-46 6.5.3 Existing Wastewater Discharge System..................... C-46
C - iv
6.5.4 Existing Wastewater Quantity and Quality................ C-47 6.5.5 Development of Wastewater Treatment System........ C-47
6.6 KARLOVAĆKA INDUSTRIJA MLIJEKA .......................... C-48 6.6.1 Outline of the Factory ................................................ C-48 6.6.2 Existing Water Use .................................................... C-48 6.6.3 Existing Wastewater Discharge System .................... C-48 6.6.4 Existing Wastewater Quantity and Quality................ C-48 6.6.5 Development of Wastewater Treatment System........ C-49
6.7 PAMUČNA INDUSTRIJA DUGA RESA d.d....................... C-49 6.7.1 Outline of the Factory ................................................ C-49 6.7.2 Existing Water Use .................................................... C-50 6.7.3 Existing Wastewater Discharge System .................... C-50 6.7.4 Existing Wastewater Quantity and Quality................ C-50 6.7.5 Development of Wastewater Treatment System........ C-50
CHAPTER VII WASTEWATER TREATMENT OF LARGE POLLUTANT INDUSTRY IN OTHER TOWNS............. C-52
7.1 General.................................................................................... C-52 7.2 PLIVA..................................................................................... C-52
7.2.1 Outline of the Factory ................................................ C-52 7.2.2 Existing Water Use .................................................... C-52 7.2.3 Existing Wastewater Discharge System .................... C-52 7.2.4 Existing Wastewater Quantity and Quality................ C-53 7.2.5 Development of Wastewater Treatment System........ C-53
7.3 GAVRILOVIĆ d.o.o............................................................... C-54 7.3.1 Outline of the Factory ................................................ C-54 7.3.2 Existing Water Use .................................................... C-54 7.3.3 Existing Wastewater Discharge System .................... C-54 7.3.4 Existing Wastewater Quantity and Quality................ C-54 7.3.5 Development of Wastewater Treatment System........ C-55
CHAPTER VIII WASTEWATER TREATMENT OF OTHER LARGE INDUSTRIES........................................................................ C-56
8.1 General.................................................................................... C-56 8.1.1 Objective Industry...................................................... C-56 8.1.2 Planning Basis............................................................ C-56
8.2 Other Large Industries in Vrbovec .......................................... C-57 8.2.1 GRADIP..................................................................... C-57 8.2.2 PIK VRBOVEC FARMA POLJASKI LUG ............. C-57
8.3 Other Large Industries in Karlovac......................................... C-58 8.3.1 KORDUN Karlovac................................................... C-58
C - v
8.3.2 Že-Če.......................................................................... C-59 8.3.3 TVORNICA PLINSKIH TURBINA ......................... C-60 8.3.4 ADRIA-DIESEL........................................................ C-60 8.3.5 ABB ALSTOM POWER (former name: ABB
Power Plants Ltd.)...................................................... C-61 8.3.6 LINDE PLIN d.o.o..................................................... C-62 8.3.7 AUTOTRANSPORT d.d ........................................... C-63
8.4 Other Large Industries in Ivanić Grad and Kloštar Ivanić ...... C-63 8.4.1 INA NAFTAPLIN POGON ETAN........................... C-63 8.4.2 CROSCO NAFTINI SERVISI d.o.o.......................... C-64 8.4.3 NAFTALAN LJEĆILIŠTE........................................ C-65 8.4.4 INA NAFTAPLIN RADILIŠTE OROI..................... C-66
8.5 Other Large Industries in Samobor......................................... C-67 8.5.1 CHROMOS GRAFIĆKE BOJE ................................ C-67 8.5.2 FOTOKEMIKA ......................................................... C-68 8.5.3 IMES .......................................................................... C-69 8.5.4 PLIVA KALINOVICA.............................................. C-70 8.5.5 CHROMOS GRAFIĆKE BOJE ................................ C-71 8.5.6 IMUNOLOŠKI ZAVOD BREZJE ............................ C-71 8.5.7 TOP............................................................................ C-72
8.6 Other Large Industries in Zaprešić ......................................... C-73 8.6.1 HŽ INFRASTRUCKTURA....................................... C-73 8.6.2 INKER ....................................................................... C-74 8.6.3 KARBON................................................................... C-75 8.6.4 VIADUKT ................................................................. C-76
8.7 Other Large Industries in Velika Gorica................................. C-77 8.7.1 DALEKOVOD........................................................... C-77 8.7.2 INDUSTROGRADNJA (314077) ............................. C-77 8.7.3 INDUSTROGRADNJA (314079) ............................. C-78 8.7.4 ZRAĆNA LUKA Zagreb........................................... C-79
8.8 Other Large Industries in Jastrebarsko.................................... C-80 8.8.1 MLADINA d.d........................................................... C-80 8.8.2 JAMNICA ZAGREB, Jamnika Kiselica.................... C-80
8.9 Other Large Industry in Popovača .......................................... C-82 8.9.1 NEUTROPSIHIJATRIJSKA BOLNICA .................. C-82
8.10 Other Large Industries in Ogulin ............................................ C-83 8.10.1 OPĆA BOLNICA OGLIN......................................... C-83 8.10.2 BJELOLASICA ......................................................... C-84
C - vi
List of Tables
Table C.1.1 Industrial Effluent Regulation ................................................... C-T1 Table C.1.2 (1) Wastewater Quantity and Quality in Sesvete East .................... C-T2 Table C.1.2 (2) Wastewater Quantity and Quality in Vrbovec........................... C-T2 Table C.1.2 (3) Wastewater Quantity and Quality in Sisak................................ C-T3 Table C.1.2 (4) Wastewater Quantity and Quality in Kutina.............................. C-T3 Table C.1.2 (5) Wastewater Quantity and Quality in Karlovac ........................ C-T4 Table C.1.2 (5a) Wastewater Quantity and Quality in Duga Resa ....................... C-T5 Table C.1.2 (5 & 5a) Wastewater Quantity and Quality in Karlovac and Duga Resa. C-T5 Table C.1.2 (6) Wastewater Quantity and Quality in Sveti Ivan Zelina............. C-T5 Table C.1.2 (7) Wastewater Quantity and Quality in Ivanić Grad and
Kloštar Ivanić ............................................................................ C-T6 Table C.1.2 (8) Wastewater Quantity and Quality in Samobor .......................... C-T7 Table C.1.2 (9) Wastewater Quantity and Quality in Zaprešić........................... C-T7 Table C.1.2 (10) Wastewater Quantity and Quality in Velika Gorica.................. C-T8 Table C.1.2 (11) Wastewater Quantity and Quality in Jastrebarsko..................... C-T8 Table C.1.2 (12) Wastewater Quantity and Quality in Petrinja ............................ C-T8 Table C.1.2 (13) Wastewater Quantity and Quality in Popovača......................... C-T9 Table C.1.2 (14) Wastewater Quantity and Quality in Ogulin ............................. C-T9 Table C.1.2 (15) Wastewater Quantity and Quality in Novska ............................ C-T9 Table C.1.2 (16) Wastewater Quantity and Quality in Glina................................ C-T9
C - vii
List of Figures
Fig. C.1.1 (1) Flow Diagram of Conventional Activated Sludge Treatment (CASE-1) [AS] ......................................................................... C-F1
Fig. C.1.1 (2) Flow Diagram of Conventional Activated Sludge Treatment (CASE-1A) [AS-A] ................................................................. C-F2
Fig. C.1.2 Flow Diagram of 2 Stage Activated Sludge Treatment (CASE-2) [2-AS] ..................................................................... C-F3
Fig. C.1.3 (1) Flow Diagram of Chemical Clarification System (CASE-3) [CT] ......................................................................... C-F4
Fig. C.1.3 (2) Flow Diagram of Chemical Clarification System (CASE-3A) [CT + A] ............................................................... C-F5
Fig. C.1.4 Flow Diagram of Activated Sludge + Chemical Clarification Treatment (CASE-4) [AS + CT] .............................................. C-F6
Fig. C.2.1 Flow Diagram of WWTP of AGROPROTEINKA .................. C-F7 Fig. C.2.2 Layout of WWTP of AGROPROTEINKA ............................... C-F8 Fig. C.2.3 Flow Diagram of WWTP of SEGESTICA................................ C-F9 Fig. C.2.4 Layout of WWTP of SEGESTICA .......................................... C-F10 Fig. C.2.5 Flow Diagram of WWTP of LJUDEVIT POSAVSKI
MLIN i PEKARE ...................................................................... C-F11 Fig. C.2.6 Layout of WWTP of LJUDEVIT POSAVSKI
MLIN i PEKARE ...................................................................... C-F12 Fig. C.2.7 Flow Diagram of WWTP of Karlovačka PIVOVARA ............. C-F13 Fig. C.2.8 Layout of WWTP of Karlovačka PIVOVARA......................... C-F14 Fig. C.2.9 Flow Diagram of WWTP of PPK Karlovačka Ind. Mesna ....... C-F15 Fig. C.2.10 Layout of WWTP of PPK Karlovačka Ind. Mesna ................... C-F16 Fig. C.2.11 Flow Diagram of WWTP of JAMNICA Zagreb ....................... C-F17 Fig. C.2.12 Layout of WWTP of JAMNICA Zagreb ................................... C-F18
C - 1
CHAPTER I PLANNING BASIS
1.1 Objective of the Study
There are a number of large and small industries in the Study Area. Among the large industries in the 24 objective municipalities of the sewerage development master plan study, those found in Zagreb City, Vrbobec, Sisak, Kutina and Karlovac, as well as in other towns, may cause significant river water pollution.
The above-mentioned large industries mostly discharge their wastewaters into the public sewerage systems or the rivers either without or with insufficient treatment. Among the industries in Zagreb City, those located in the service area of the ongoing Zagreb Sewerage Development Project are, however, excluded from this Study because all of them are covered by this project. Only the industries located in the Sesvete East area, a part of Zagreb City, are included.
The study on the wastewater treatment of large industries is presented hereinafter. The major objectives of the study in Appendix C are as follows:
(1) To identify the existing industrial wastewater discharge system;
(2) To estimate the existing and future wastewater quantity and quality, and to evaluate the pollution loads to the public sewerage system and river;
(3) To propose optimum wastewater discharge system through a comparative study on alternatives; namely, (a) Discharge into public sewerage with necessary pre-treatment, and (b) Direct discharge into river with necessary treatment; and
(4) To propose the necessary improvement of existing treatment system, including installation of new treatment system, with the required construction cost roughly estimated for the preparation of a financial policy on the promotion of industrial wastewater treatment.
1.2 Permissible Limits of Industrial Effluent
The permissible limits of major parameters of industrial wastewater effluent into public sewerage or natural recipient (river, brook, canal, lake, etc.) are prescribed in the Decree (NN No. 40/99, as amended by NN No. 6/01). The discharge of industrial wastewater into a Category I natural recipient is not allowed.
The limits of major parameters relevant to the industrial wastewater treatment in this Study are given in the following table. As for the other parameters including heavy metals and other toxic materials, see Table C.1.1.
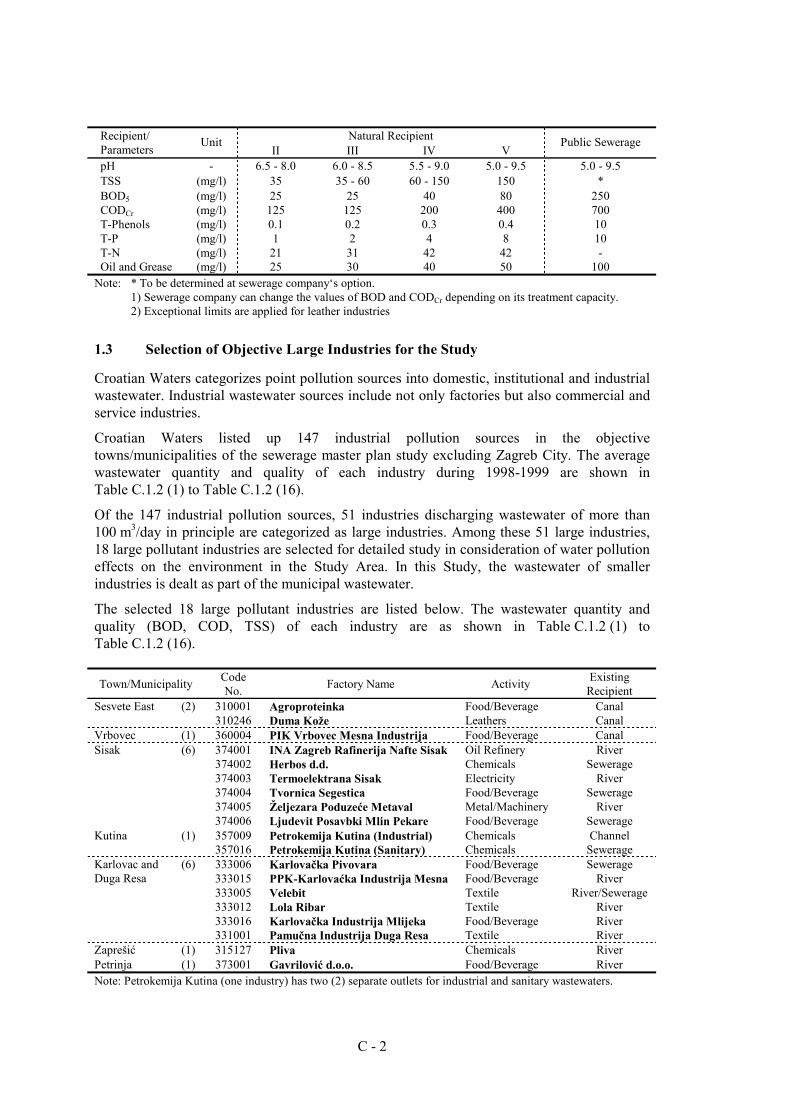
C - 2
Natural Recipient Recipient/
Parameters Unit II III IV V
Public Sewerage
pH - 6.5 - 8.0 6.0 - 8.5 5.5 - 9.0 5.0 - 9.5 5.0 - 9.5 TSS (mg/l) 35 35 - 60 60 - 150 150 * BOD5 (mg/l) 25 25 40 80 250 CODCr (mg/l) 125 125 200 400 700 T-Phenols (mg/l) 0.1 0.2 0.3 0.4 10 T-P (mg/l) 1 2 4 8 10 T-N (mg/l) 21 31 42 42 - Oil and Grease (mg/l) 25 30 40 50 100 Note: * To be determined at sewerage company‘s option. 1) Sewerage company can change the values of BOD and CODCr depending on its treatment capacity. 2) Exceptional limits are applied for leather industries
1.3 Selection of Objective Large Industries for the Study
Croatian Waters categorizes point pollution sources into domestic, institutional and industrial wastewater. Industrial wastewater sources include not only factories but also commercial and service industries.
Croatian Waters listed up 147 industrial pollution sources in the objective towns/municipalities of the sewerage master plan study excluding Zagreb City. The average wastewater quantity and quality of each industry during 1998-1999 are shown in Table C.1.2 (1) to Table C.1.2 (16).
Of the 147 industrial pollution sources, 51 industries discharging wastewater of more than 100 m3/day in principle are categorized as large industries. Among these 51 large industries, 18 large pollutant industries are selected for detailed study in consideration of water pollution effects on the environment in the Study Area. In this Study, the wastewater of smaller industries is dealt as part of the municipal wastewater.
The selected 18 large pollutant industries are listed below. The wastewater quantity and quality (BOD, COD, TSS) of each industry are as shown in Table C.1.2 (1) to Table C.1.2 (16).
Town/Municipality Code No. Factory Name Activity Existing
Recipient (2) 310001 Agroproteinka Food/Beverage Canal Sesvete East 310246 Duma Kože Leathers Canal
Vrbovec (1) 360004 PIK Vrbovec Mesna Industrija Food/Beverage Canal (6) 374001 INA Zagreb Rafinerija Nafte Sisak Oil Refinery River 374002 Herbos d.d. Chemicals Sewerage 374003 Termoelektrana Sisak Electricity River 374004 Tvornica Segestica Food/Beverage Sewerage 374005 Željezara Poduzeće Metaval Metal/Machinery River
Sisak
374006 Ljudevit Posavbki Mlin Pekare Food/Beverage Sewerage Kutina (1) 357009 Petrokemija Kutina (Industrial) Chemicals Channel 357016 Petrokemija Kutina (Sanitary) Chemicals Sewerage
(6) 333006 Karlovačka Pivovara Food/Beverage Sewerage 333015 PPK-Karlovaćka Industrija Mesna Food/Beverage River 333005 Velebit Textile River/Sewerage
Karlovac and Duga Resa
333012 Lola Ribar Textile River 333016 Karlovačka Industrija Mlijeka Food/Beverage River 331001 Pamučna Industrija Duga Resa Textile River Zaprešić (1) 315127 Pliva Chemicals River Petrinja (1) 373001 Gavrilović d.o.o. Food/Beverage River Note: Petrokemija Kutina (one industry) has two (2) separate outlets for industrial and sanitary wastewaters.
C - 3
The other 33 large industries are listed below. The wastewater quantity and quality (BOD, COD, TSS) of each industry are also shown in Table C.1.2 (1) to Table C.1.2 (16).
Town/Municipality Code No. Factory Name Activity Existing
Recipient (2) 360002 Gradip Clay Sewerage Vrbovec 360008 PIK Vrbovec Farma Polijanski Farm Lagoon/Land (7) 333003 Kordun Karlovac Metal/Machinery Sewerage 333008 Že-Če Metal/Machinery Sewerage 333010 Tvornica Plinskih Turbuna Gas Service Sewerage 333011 Adria-Diesel Metal/Machinery Sewerage 333017 ABB Alstom Metal/Machinery Sewerage 333019 Linde Plin d.o.o. Gas Service Canal
Karlovac
333029 Autotransport d.d. Transportation Sewerage (4) 355005 INA Naftaplin Pogon Etan Oil Refinary Sewerage 355010 Crosco Naftini Servisi Shopping Center Sewerage
Ivanić Grad and Kloštar Ivanić 355015 Naftaplin Lječilište Hospital Sewerage 355019 INA Naftaplin Radilišt Oroi Oil & Gas Service Brook Samobor (7) 309021 Chromos Grafičke Boje Chemicals Sewerage 309047 Fotokemika Photography Sewerage 309069 Imes Food-Beverage Sewerage 309123 Pliva Kalinovica Chemicals River 309180 Chromos Grafičke Boje Chemiicals Sewerage 309233 Imunološki Zavod Brezje Others Sewerage 309278 TOP Chemicals River Zaprešić (4) 315062 HŽ Infrastrucktura Transportation Sewerage 315080 Inker Ceramic River 315089 Karbon Chemicals Sewerage 315157 Viadukt Others River Velika Gorica (4) 314038 Dalekovod Metal/Machinery Sewerage 314077 Industrogradnja Concrete Sewerage 314079 Industrogradnja Concrete River 314205 Zraćna Luka Zagreb Transportation Sewerage Jastrebarsko (2) 332001 Mladina d.d. Food/Beverage Sewerage 332002 Jamnica Zagreb, Jamnička Kiselica Hospital Canal Popovača (1) 335003 Neutropsihijatrijska Bolnica Food/Beverage Sewerage Ogulin (2) 335001 Opća Bolnica Oglin Hospital Underground 335004 Bjelolasic Hotel Brook
The existing wastewater quantity and pollution load (BOD, COD, TSS) of the 51 large industries are summarized below from the database of Croatian Waters. [See, Table C.1.2 (1) to Table C.1.2 (16)]
Quantity BOD COD TSS Industry (m3/d) (%) (kg/d) (%) (kg/d) (%) (kg/d) (%)
Large Pollutant Industries (18) 37,515.5 82.0 5,123.8 86.9 12,814.0 88.1 27,204.9 79.9
Other Large Industries (33) 8,220.6 18.0 774.1 13.1 1,727.5 11.9 6,843.4 20.1 Total (51) 45,736.1 100.0 5,897.9 100.0 14,541.5 100.0 34,048.3 100.0
As shown in the above table, the wastewater quantity and pollution load of the 18 large pollutant industries represent about 80% to 90% of the total for the 51 large industries.
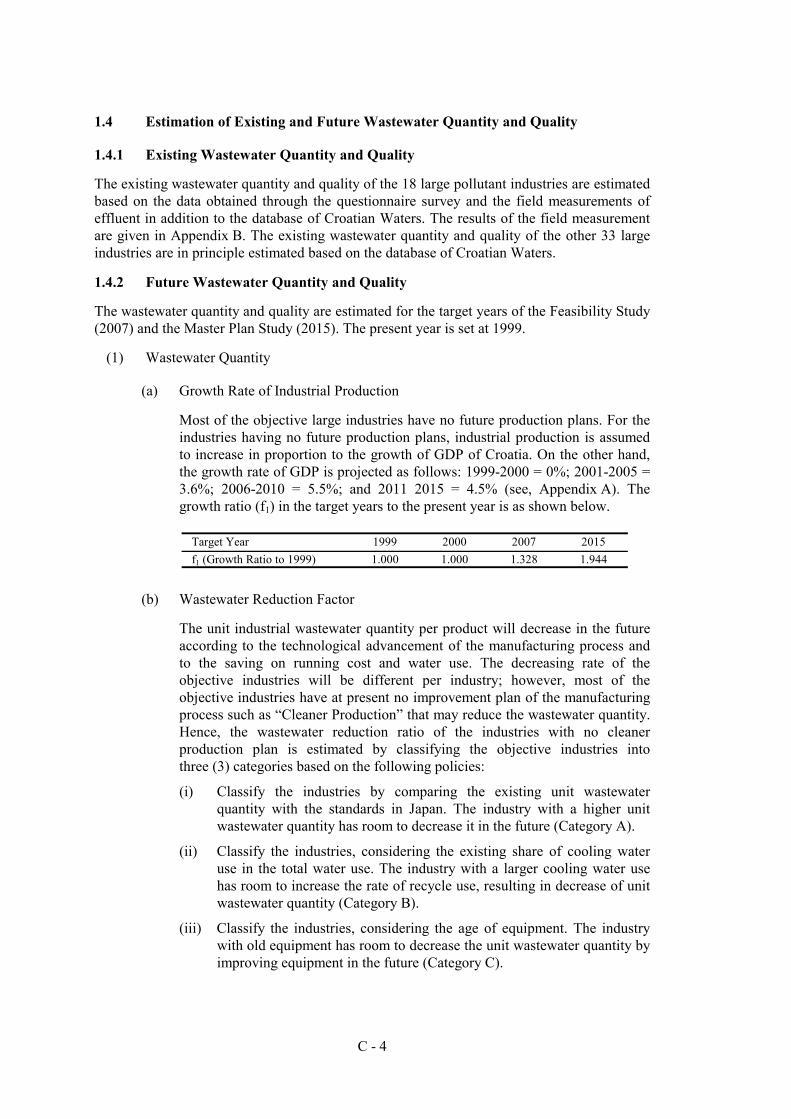
C - 4
1.4 Estimation of Existing and Future Wastewater Quantity and Quality
1.4.1 Existing Wastewater Quantity and Quality
The existing wastewater quantity and quality of the 18 large pollutant industries are estimated based on the data obtained through the questionnaire survey and the field measurements of effluent in addition to the database of Croatian Waters. The results of the field measurement are given in Appendix B. The existing wastewater quantity and quality of the other 33 large industries are in principle estimated based on the database of Croatian Waters.
1.4.2 Future Wastewater Quantity and Quality
The wastewater quantity and quality are estimated for the target years of the Feasibility Study (2007) and the Master Plan Study (2015). The present year is set at 1999.
(1) Wastewater Quantity
(a) Growth Rate of Industrial Production
Most of the objective large industries have no future production plans. For the industries having no future production plans, industrial production is assumed to increase in proportion to the growth of GDP of Croatia. On the other hand, the growth rate of GDP is projected as follows: 1999-2000 = 0%; 2001-2005 = 3.6%; 2006-2010 = 5.5%; and 2011 2015 = 4.5% (see, Appendix A). The growth ratio (f1) in the target years to the present year is as shown below.
Target Year 1999 2000 2007 2015 f1 (Growth Ratio to 1999) 1.000 1.000 1.328 1.944
(b) Wastewater Reduction Factor
The unit industrial wastewater quantity per product will decrease in the future according to the technological advancement of the manufacturing process and to the saving on running cost and water use. The decreasing rate of the objective industries will be different per industry; however, most of the objective industries have at present no improvement plan of the manufacturing process such as “Cleaner Production” that may reduce the wastewater quantity. Hence, the wastewater reduction ratio of the industries with no cleaner production plan is estimated by classifying the objective industries into three (3) categories based on the following policies:
(i) Classify the industries by comparing the existing unit wastewater quantity with the standards in Japan. The industry with a higher unit wastewater quantity has room to decrease it in the future (Category A).
(ii) Classify the industries, considering the existing share of cooling water use in the total water use. The industry with a larger cooling water use has room to increase the rate of recycle use, resulting in decrease of unit wastewater quantity (Category B).
(iii) Classify the industries, considering the age of equipment. The industry with old equipment has room to decrease the unit wastewater quantity by improving equipment in the future (Category C).
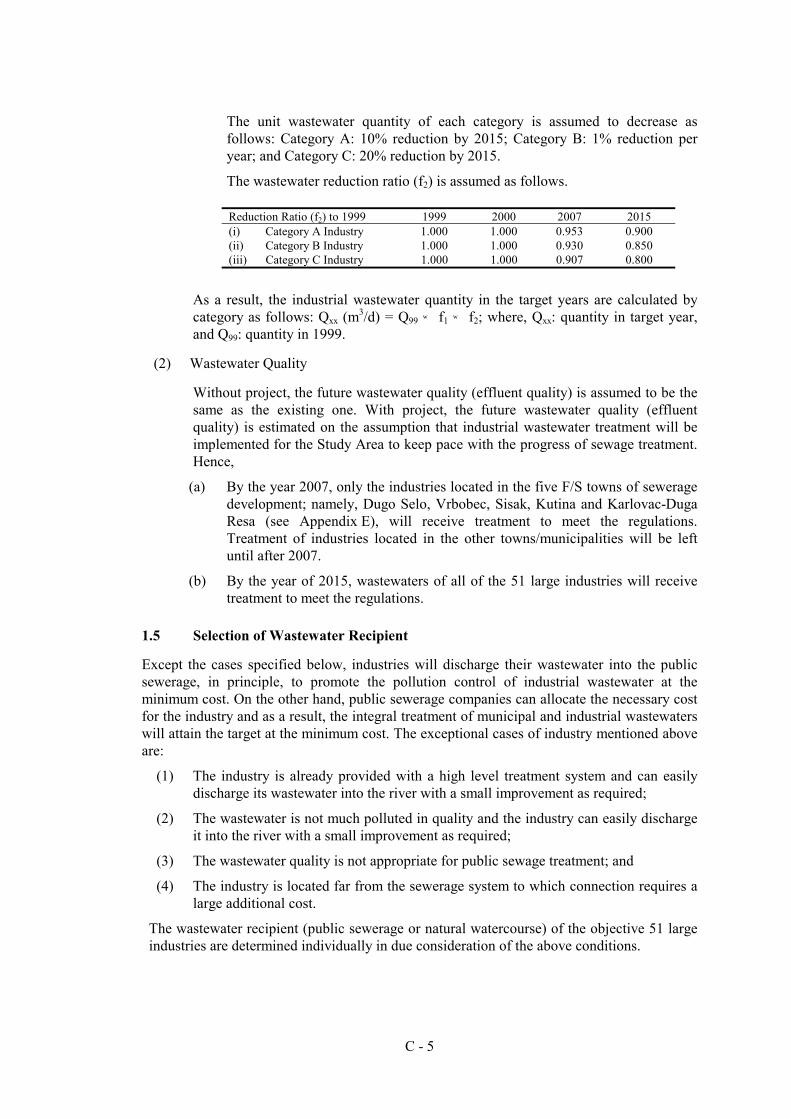
C - 5
The unit wastewater quantity of each category is assumed to decrease as follows: Category A: 10% reduction by 2015; Category B: 1% reduction per year; and Category C: 20% reduction by 2015.
The wastewater reduction ratio (f2) is assumed as follows.
Reduction Ratio (f2) to 1999 1999 2000 2007 2015 (i) Category A Industry 1.000 1.000 0.953 0.900 (ii) Category B Industry 1.000 1.000 0.930 0.850 (iii) Category C Industry 1.000 1.000 0.907 0.800
As a result, the industrial wastewater quantity in the target years are calculated by category as follows: Qxx (m3/d) = Q99 × f1 × f2; where, Qxx: quantity in target year, and Q99: quantity in 1999.
(2) Wastewater Quality
Without project, the future wastewater quality (effluent quality) is assumed to be the same as the existing one. With project, the future wastewater quality (effluent quality) is estimated on the assumption that industrial wastewater treatment will be implemented for the Study Area to keep pace with the progress of sewage treatment. Hence,
(a) By the year 2007, only the industries located in the five F/S towns of sewerage development; namely, Dugo Selo, Vrbobec, Sisak, Kutina and Karlovac-Duga Resa (see Appendix E), will receive treatment to meet the regulations. Treatment of industries located in the other towns/municipalities will be left until after 2007.
(b) By the year of 2015, wastewaters of all of the 51 large industries will receive treatment to meet the regulations.
1.5 Selection of Wastewater Recipient
Except the cases specified below, industries will discharge their wastewater into the public sewerage, in principle, to promote the pollution control of industrial wastewater at the minimum cost. On the other hand, public sewerage companies can allocate the necessary cost for the industry and as a result, the integral treatment of municipal and industrial wastewaters will attain the target at the minimum cost. The exceptional cases of industry mentioned above are:
(1) The industry is already provided with a high level treatment system and can easily discharge its wastewater into the river with a small improvement as required;
(2) The wastewater is not much polluted in quality and the industry can easily discharge it into the river with a small improvement as required;
(3) The wastewater quality is not appropriate for public sewage treatment; and
(4) The industry is located far from the sewerage system to which connection requires a large additional cost.
The wastewater recipient (public sewerage or natural watercourse) of the objective 51 large industries are determined individually in due consideration of the above conditions.
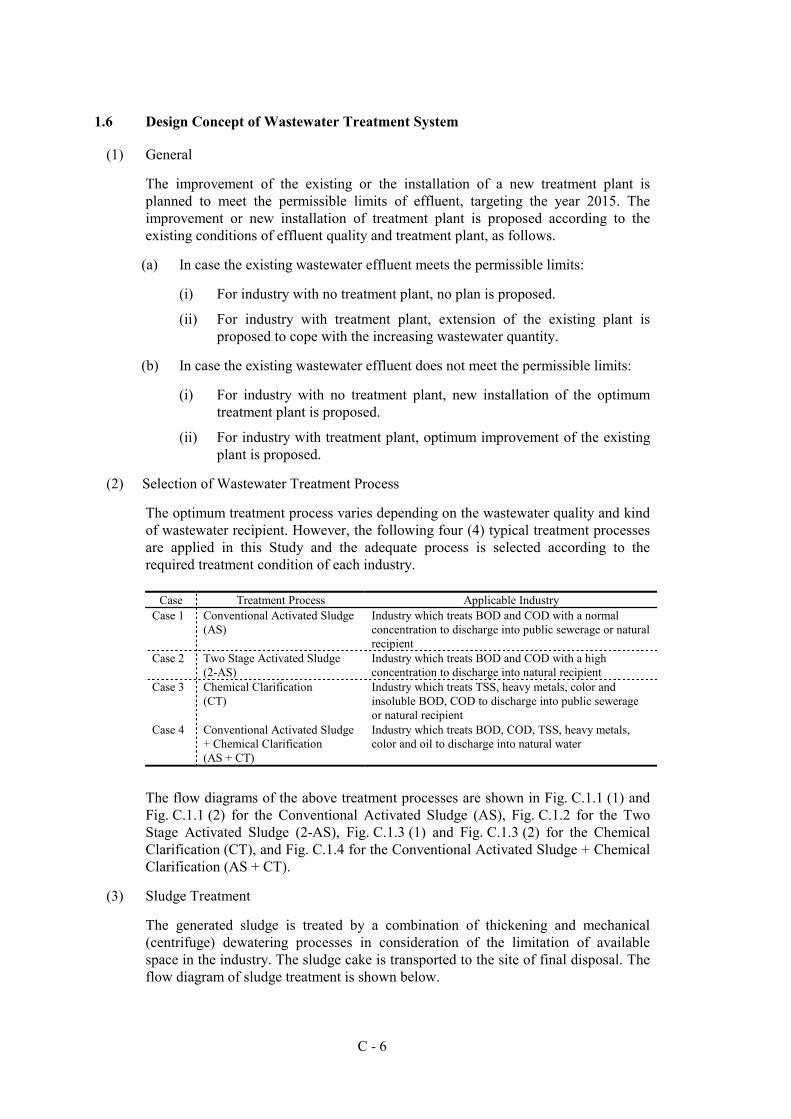
C - 6
1.6 Design Concept of Wastewater Treatment System
(1) General
The improvement of the existing or the installation of a new treatment plant is planned to meet the permissible limits of effluent, targeting the year 2015. The improvement or new installation of treatment plant is proposed according to the existing conditions of effluent quality and treatment plant, as follows.
(a) In case the existing wastewater effluent meets the permissible limits:
(i) For industry with no treatment plant, no plan is proposed.
(ii) For industry with treatment plant, extension of the existing plant is proposed to cope with the increasing wastewater quantity.
(b) In case the existing wastewater effluent does not meet the permissible limits:
(i) For industry with no treatment plant, new installation of the optimum treatment plant is proposed.
(ii) For industry with treatment plant, optimum improvement of the existing plant is proposed.
(2) Selection of Wastewater Treatment Process
The optimum treatment process varies depending on the wastewater quality and kind of wastewater recipient. However, the following four (4) typical treatment processes are applied in this Study and the adequate process is selected according to the required treatment condition of each industry.
Case Treatment Process Applicable Industry
Case 1 Conventional Activated Sludge (AS)
Industry which treats BOD and COD with a normal concentration to discharge into public sewerage or natural recipient
Case 2 Two Stage Activated Sludge (2-AS)
Industry which treats BOD and COD with a high concentration to discharge into natural recipient
Case 3 Chemical Clarification (CT)
Industry which treats TSS, heavy metals, color and insoluble BOD, COD to discharge into public sewerage or natural recipient
Case 4 Conventional Activated Sludge + Chemical Clarification (AS + CT)
Industry which treats BOD, COD, TSS, heavy metals, color and oil to discharge into natural water
The flow diagrams of the above treatment processes are shown in Fig. C.1.1 (1) and Fig. C.1.1 (2) for the Conventional Activated Sludge (AS), Fig. C.1.2 for the Two Stage Activated Sludge (2-AS), Fig. C.1.3 (1) and Fig. C.1.3 (2) for the Chemical Clarification (CT), and Fig. C.1.4 for the Conventional Activated Sludge + Chemical Clarification (AS + CT).
(3) Sludge Treatment
The generated sludge is treated by a combination of thickening and mechanical (centrifuge) dewatering processes in consideration of the limitation of available space in the industry. The sludge cake is transported to the site of final disposal. The flow diagram of sludge treatment is shown below.
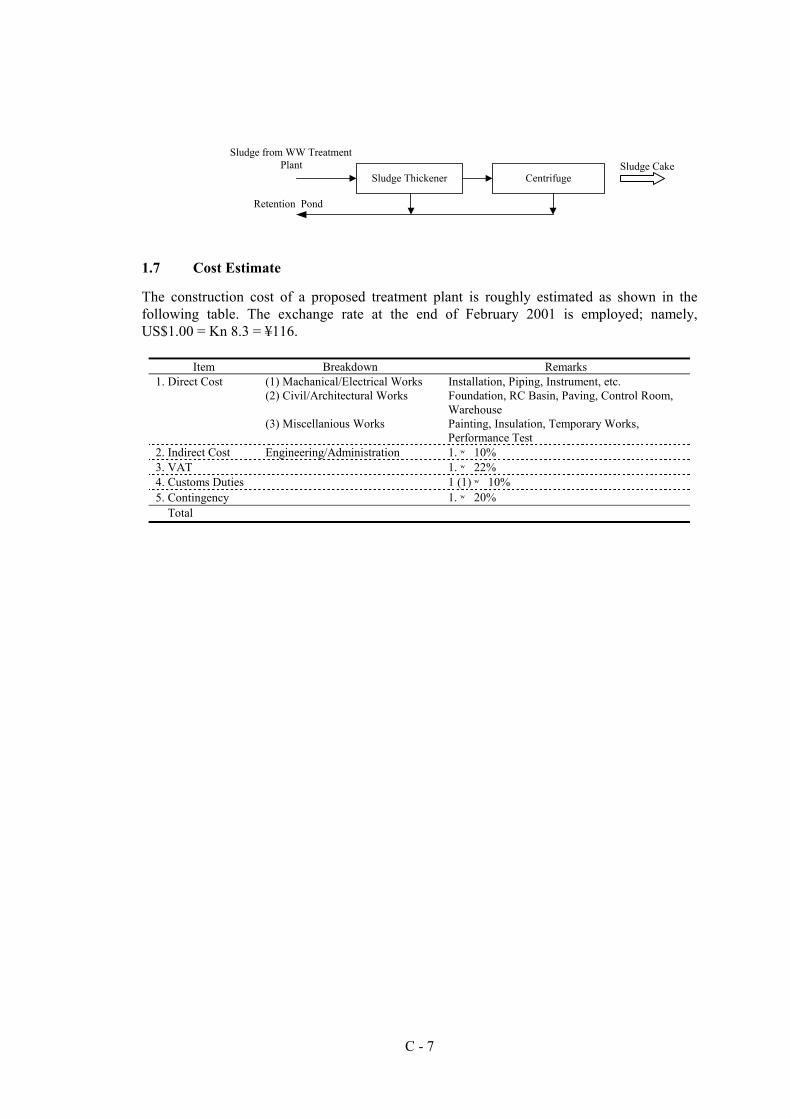
C - 7
1.7 Cost Estimate
The construction cost of a proposed treatment plant is roughly estimated as shown in the following table. The exchange rate at the end of February 2001 is employed; namely, US$1.00 = Kn 8.3 = ¥116.
Item Breakdown Remarks 1. Direct Cost (1) Machanical/Electrical Works Installation, Piping, Instrument, etc. (2) Civil/Architectural Works Foundation, RC Basin, Paving, Control Room,
Warehouse (3) Miscellanious Works Painting, Insulation, Temporary Works,
Performance Test 2. Indirect Cost Engineering/Administration 1. × 10% 3. VAT 1. × 22% 4. Customs Duties 1 (1) × 10% 5. Contingency 1. × 20% Total
Sludge from WW TreatmentPlant
Sludge Thickener CentrifugeSludge Cake
Retention Pond
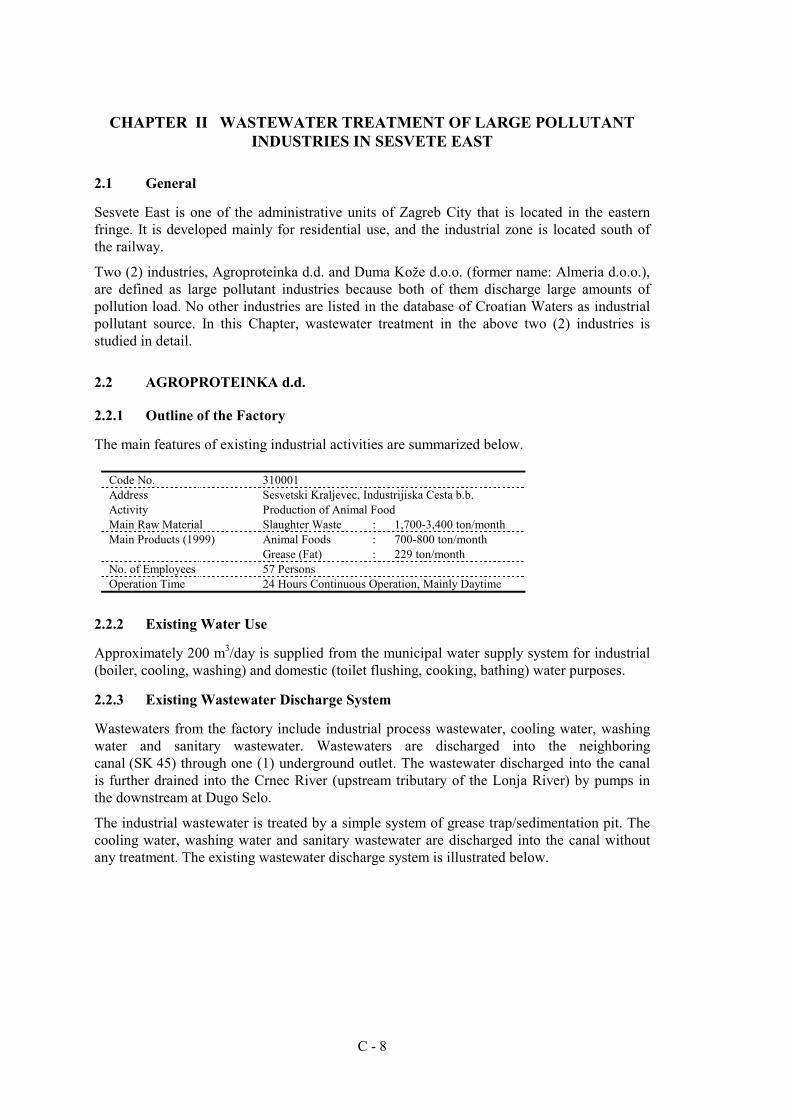
C - 8
CHAPTER II WASTEWATER TREATMENT OF LARGE POLLUTANT INDUSTRIES IN SESVETE EAST
2.1 General
Sesvete East is one of the administrative units of Zagreb City that is located in the eastern fringe. It is developed mainly for residential use, and the industrial zone is located south of the railway.
Two (2) industries, Agroproteinka d.d. and Duma Kože d.o.o. (former name: Almeria d.o.o.), are defined as large pollutant industries because both of them discharge large amounts of pollution load. No other industries are listed in the database of Croatian Waters as industrial pollutant source. In this Chapter, wastewater treatment in the above two (2) industries is studied in detail.
2.2 AGROPROTEINKA d.d.
2.2.1 Outline of the Factory
The main features of existing industrial activities are summarized below.
Code No. 310001 Address Sesvetski Kraljevec, Industrijiska Cesta b.b. Activity Production of Animal Food Main Raw Material Slaughter Waste : 1,700-3,400 ton/month
Animal Foods : 700-800 ton/month Main Products (1999) Grease (Fat) : 229 ton/month
No. of Employees 57 Persons Operation Time 24 Hours Continuous Operation, Mainly Daytime
2.2.2 Existing Water Use
Approximately 200 m3/day is supplied from the municipal water supply system for industrial (boiler, cooling, washing) and domestic (toilet flushing, cooking, bathing) water purposes.
2.2.3 Existing Wastewater Discharge System
Wastewaters from the factory include industrial process wastewater, cooling water, washing water and sanitary wastewater. Wastewaters are discharged into the neighboring canal (SK 45) through one (1) underground outlet. The wastewater discharged into the canal is further drained into the Crnec River (upstream tributary of the Lonja River) by pumps in the downstream at Dugo Selo.
The industrial wastewater is treated by a simple system of grease trap/sedimentation pit. The cooling water, washing water and sanitary wastewater are discharged into the canal without any treatment. The existing wastewater discharge system is illustrated below.
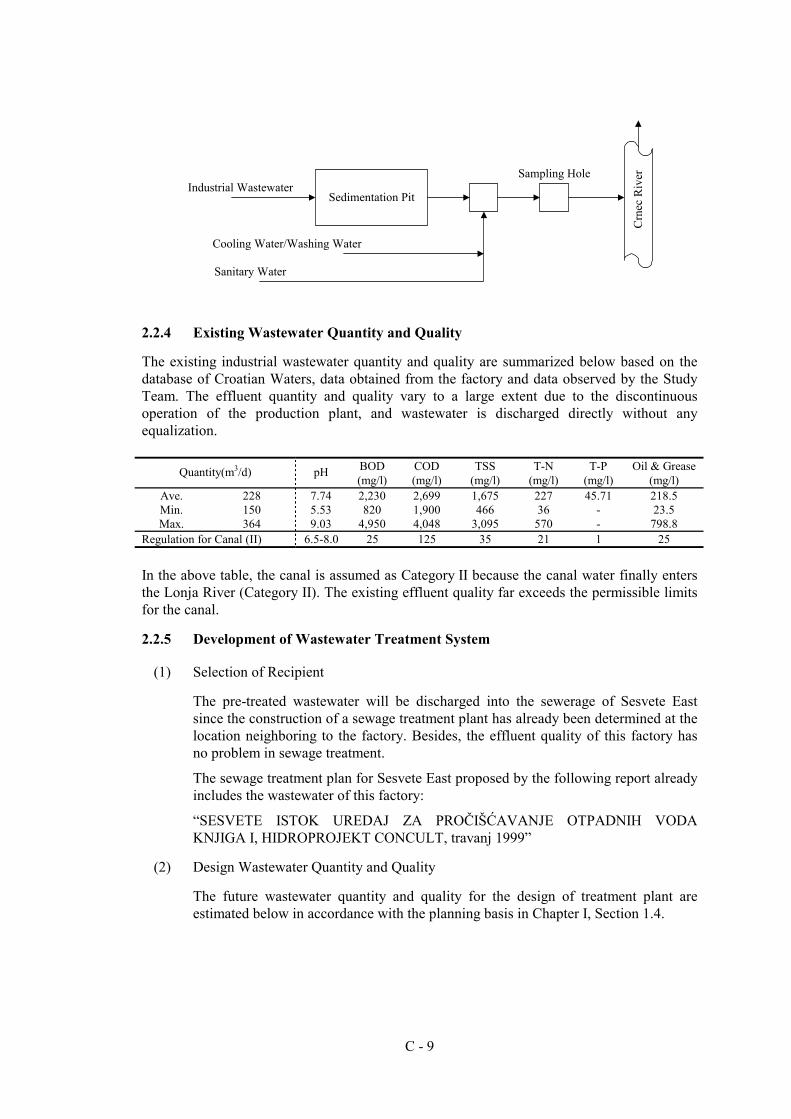
C - 9
2.2.4 Existing Wastewater Quantity and Quality
The existing industrial wastewater quantity and quality are summarized below based on the database of Croatian Waters, data obtained from the factory and data observed by the Study Team. The effluent quantity and quality vary to a large extent due to the discontinuous operation of the production plant, and wastewater is discharged directly without any equalization.
BOD COD TSS T-N T-P Oil & Grease Quantity(m3/d) pH (mg/l) (mg/l) (mg/l) (mg/l) (mg/l) (mg/l)
Ave. Min. Max.
228 150 364
7.74 5.53 9.03
2,230 820
4,950
2,699 1,900 4,048
1,675 466
3,095
227 36
570
45.71 - -
218.5 23.5
798.8 Regulation for Canal (II) 6.5-8.0 25 125 35 21 1 25
In the above table, the canal is assumed as Category II because the canal water finally enters the Lonja River (Category II). The existing effluent quality far exceeds the permissible limits for the canal.
2.2.5 Development of Wastewater Treatment System
(1) Selection of Recipient
The pre-treated wastewater will be discharged into the sewerage of Sesvete East since the construction of a sewage treatment plant has already been determined at the location neighboring to the factory. Besides, the effluent quality of this factory has no problem in sewage treatment.
The sewage treatment plan for Sesvete East proposed by the following report already includes the wastewater of this factory:
“SESVETE ISTOK UREDAJ ZA PROČIŠĆAVANJE OTPADNIH VODA KNJIGA I, HIDROPROJEKT CONCULT, travanj 1999”
(2) Design Wastewater Quantity and Quality
The future wastewater quantity and quality for the design of treatment plant are estimated below in accordance with the planning basis in Chapter I, Section 1.4.
Sedimentation Pit
Sampling Hole
Cooling Water/Washing Water
Sanitary Water
Industrial Wastewater
Crn
ec R
iver
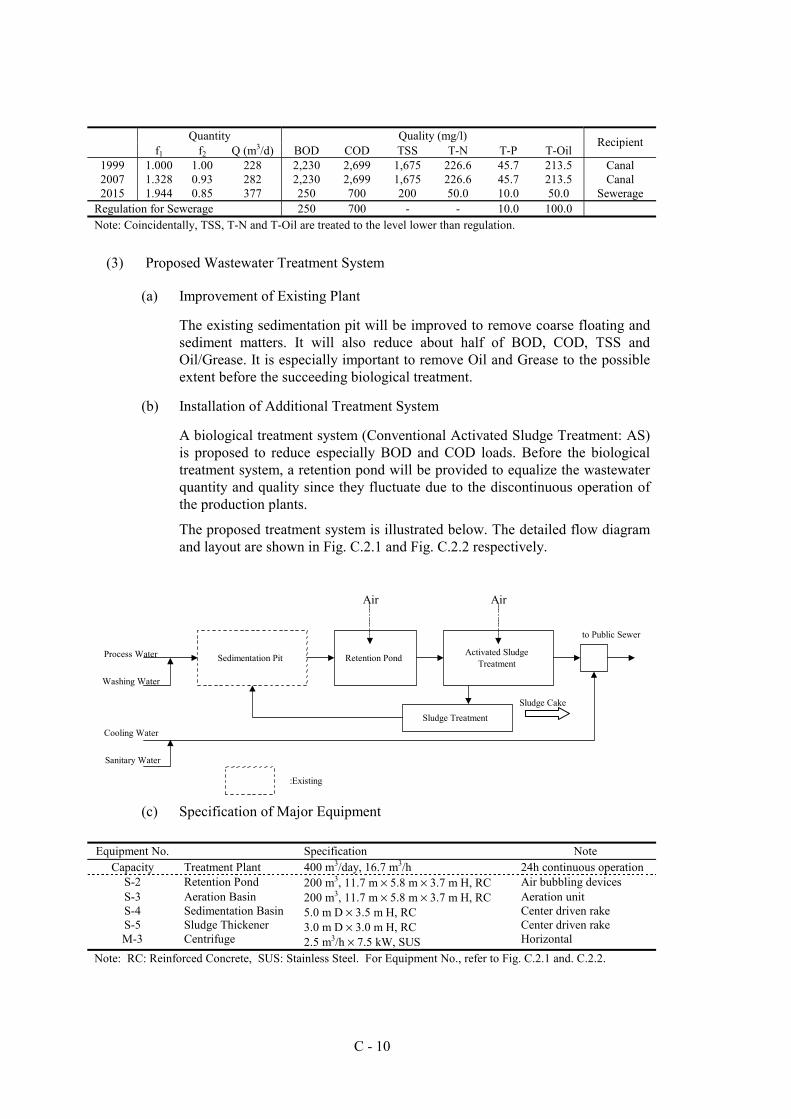
C - 10
Quantity Quality (mg/l)
f1 f2 Q (m3/d) BOD COD TSS T-N T-P T-Oil Recipient
1999 1.000 1.00 228 2,230 2,699 1,675 226.6 45.7 213.5 Canal 2007 1.328 0.93 282 2,230 2,699 1,675 226.6 45.7 213.5 Canal 2015 1.944 0.85 377 250 700 200 50.0 10.0 50.0 Sewerage
Regulation for Sewerage 250 700 - - 10.0 100.0 Note: Coincidentally, TSS, T-N and T-Oil are treated to the level lower than regulation.
(3) Proposed Wastewater Treatment System
(a) Improvement of Existing Plant
The existing sedimentation pit will be improved to remove coarse floating and sediment matters. It will also reduce about half of BOD, COD, TSS and Oil/Grease. It is especially important to remove Oil and Grease to the possible extent before the succeeding biological treatment.
(b) Installation of Additional Treatment System
A biological treatment system (Conventional Activated Sludge Treatment: AS) is proposed to reduce especially BOD and COD loads. Before the biological treatment system, a retention pond will be provided to equalize the wastewater quantity and quality since they fluctuate due to the discontinuous operation of the production plants.
The proposed treatment system is illustrated below. The detailed flow diagram and layout are shown in Fig. C.2.1 and Fig. C.2.2 respectively.
(c) Specification of Major Equipment Equipment No. Specification Note
Capacity Treatment Plant 400 m3/day, 16.7 m3/h 24h continuous operation S-2 Retention Pond 200 m3, 11.7 m × 5.8 m × 3.7 m H, RC Air bubbling devices S-3 S-4 S-5 M-3
Aeration Basin Sedimentation Basin Sludge Thickener Centrifuge
200 m3, 11.7 m × 5.8 m × 3.7 m H, RC 5.0 m D × 3.5 m H, RC 3.0 m D × 3.0 m H, RC 2.5 m3/h × 7.5 kW, SUS
Aeration unit Center driven rake Center driven rake Horizontal
Note: RC: Reinforced Concrete, SUS: Stainless Steel. For Equipment No., refer to Fig. C.2.1 and. C.2.2.
to Public Sewer Sedimentation Pit Retention Pond Activated Sludge
Treatment
Sludge Treatment
Air Air
Process Water
Washing Water
Cooling Water
Sanitary Water
Sludge Cake
:Existing
C - 11
(d) Required Area
The required area is approx. 24 m × 24 m (576 m2). (See Fig. C.2.2.)
(4) Estimated Construction Cost
The required construction cost is estimated to be Kn 9.91 million, broken down as follows.
Item Cost (103 Kn) Remarks
1. Direct Cost (1) Mechanical/Electrical Works (2) Civil/Architectural Works (3) Miscellaneous Works
4,550 1,630
320
Sub-Total 6,500 2. Indirect Cost 650 1 × 10% 3. VAT 1,000 1 × 22% 4. Customs Duties 460 1(1) × 10% 5. Contingency 1,300 1 × 20%
Total 9,910
2.3 DUMA KOŽE d.o.o (former name: ALMERIA)
2.3.1 Outline of the Factory
The main features of the existing industrial activities are summarized below.
Code No 310248 Activity Leather Processing
Raw Leather : 30 t/day Lime (85 t/year) Enzyme (10 t/year) Na2S (10 t/year)
Chemicals (for Buckling) :
Salt (10 t/year) Ammonium Sulfate (52 t/year) Lactic Acid (11 t/year) Salt (70 t/year) Formic Acid (13 t/year)
Main Raw Material
Chemicals (for Tanning) :
Sulfuric Acid (25 t/year) Main Products Leather : 200 - 250 t/m (10 t/day) No. of Employees 36 Persons Operation Time 16 Hours (6:00 - 22:00)
2.3.2 Existing Water Use
The industrial water of 500 m3/d to 800 m3/d including office use is supplied from the municipal water supply system. The quantity is measured daily by a flow meter equipped in the underground pit.
2.3.3 Existing Wastewater Discharge System
The wastewater of the factory including industrial process and sanitary wastewater is discharged into the neighboring canal through one (1) outlet. Rainwater is separately discharged into the same canal. The wastewater discharged into the canal is further drained
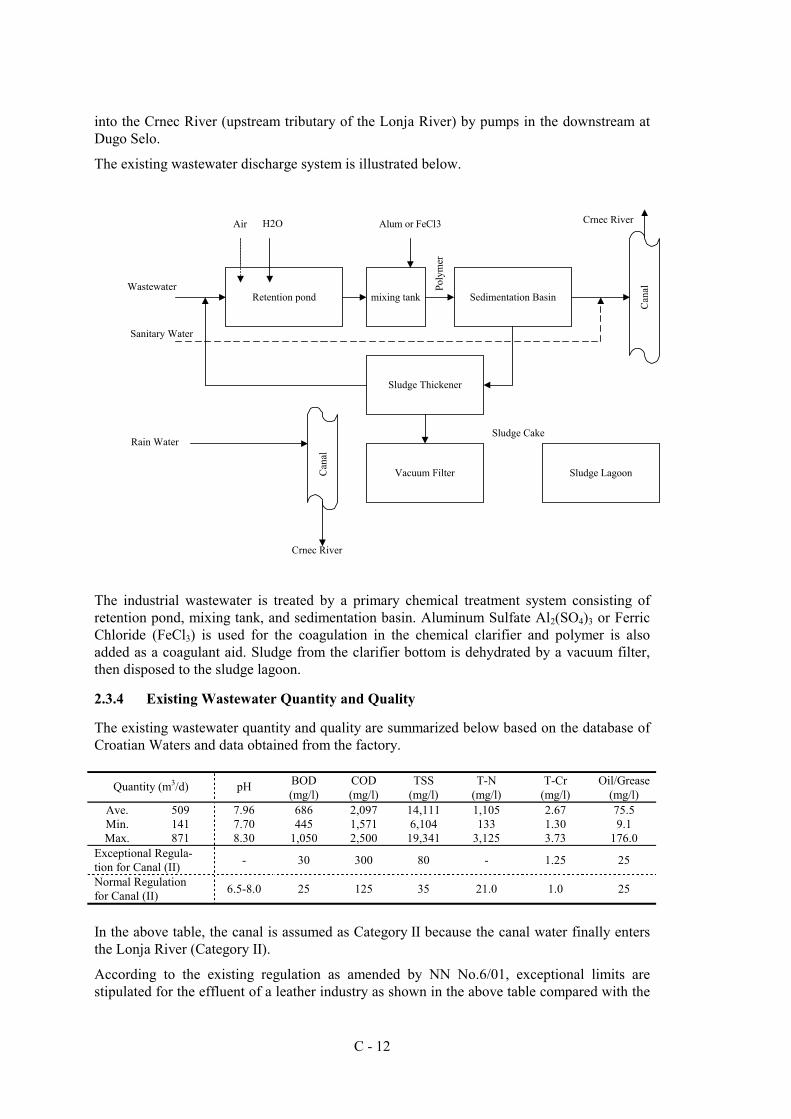
C - 12
into the Crnec River (upstream tributary of the Lonja River) by pumps in the downstream at Dugo Selo.
The existing wastewater discharge system is illustrated below.
The industrial wastewater is treated by a primary chemical treatment system consisting of retention pond, mixing tank, and sedimentation basin. Aluminum Sulfate Al2(SO4)3 or Ferric Chloride (FeCl3) is used for the coagulation in the chemical clarifier and polymer is also added as a coagulant aid. Sludge from the clarifier bottom is dehydrated by a vacuum filter, then disposed to the sludge lagoon.
2.3.4 Existing Wastewater Quantity and Quality
The existing wastewater quantity and quality are summarized below based on the database of Croatian Waters and data obtained from the factory.
BOD COD TSS T-N T-Cr Oil/Grease Quantity (m3/d) pH (mg/l) (mg/l) (mg/l) (mg/l) (mg/l) (mg/l)
Ave. 509 7.96 686 2,097 14,111 1,105 2.67 75.5 Min. 141 7.70 445 1,571 6,104 133 1.30 9.1 Max. 871 8.30 1,050 2,500 19,341 3,125 3.73 176.0
Exceptional Regula- tion for Canal (II) - 30 300 80 - 1.25 25
Normal Regulation for Canal (II) 6.5-8.0 25 125 35 21.0 1.0 25
In the above table, the canal is assumed as Category II because the canal water finally enters the Lonja River (Category II).
According to the existing regulation as amended by NN No.6/01, exceptional limits are stipulated for the effluent of a leather industry as shown in the above table compared with the
WastewaterRetention pond mixing tank Sedimentation Basin
Sludge Thickener
Air H2O Alum or FeCl3
Poly
mer
Rain Water
Can
al
Crnec River
Vacuum Filter Sludge Lagoon
Sludge Cake
Crnec River
Can
al
Sanitary Water
C - 13
normal limits of industrial wastewater. In addition, the exceptional limits of Al (4.0 mg/l) and Cr+6 (0.2 mg/l) are further stipulated.
2.3.5 Development of Wastewater Treatment System
(1) Selection of Recipient
The pre-treated wastewater will be discharged into the sewerage of Sesvete East since the construction of a sewage treatment plant has already been determined at the location neighboring to the factory. Besides, the effluent quality of this factory has no problem in sewage treatment. In addition, the previous sewage treatment plan for Sesvete East includes the wastewater of this factory as well as Agroproteinka.
(2) Design Wastewater Quantity and Quality
The factory already has approximately three (3) times the production capacity of the current operation. Industrial production is assumed to increase to two (2) times in 2007 and three (3) times in 2015 of the existing one. On the other hand, the unit wastewater reduction factor in the future is assumed at Category C as defined in the planning basis in Chapter I, Section 1.4.
The normal permissible limits are applied for BOD, COD, TSS and T-N; however, the exceptional limits are applied for Al, T-Cr and Cr+6 for the design of the wastewater treatment plant in this leather factory. The future wastewater quantity and quality for the design of treatment plant are as estimated below.
Quantity Quality (mg/l)
f1 f2
Q (m3/d) BOD COD TSS T-N T-Cr T-Oil
Recipient
1999 1.000 1.00 509 686 2,097 14,111 1,105 2.67 75.5 Canal 2007 2.000 0.907 923 686 2,097 14,111 1,105 2.67 75.5 Canal 2015 3.000 0.800 1,222 250 700 200 300 2.67 50.0 Sewerage
Exceptional Regulation for Sewerage - - - - 4.0 100 Normal Regulation for Sewerage 250 700 - - 2.0 100 Note: Coincidentally, TSS, T-N and T-Oil are treated to the level lower than regulation.
In addition to the above, the design wastewater quality in 2015 is set at 4.0 mg/l for Al and 0.2 mg/l for Cr+6.
(3) Proposed Wastewater Treatment System
The existing wastewater quality of T-Cr and Cr+6 satisfies the permissible limits. No data are available for the existing quality of Al; however, it can be removed easily by chemical treatment. In addition, the existing quality of T-Oil is lower than the regulation. Hence, the study focuses on the treatment of BOD, COD, TSS and T-N. The existing treatment system of chemical clarifier removes TSS very efficiently when operated with the proper dosage of coagulant under the proper pH condition. The concentrations of BOD, COD and T-N decrease coincidentally to less than 1/3 with the removal of TSS. The existing treatment plant has a sufficient capacity to treat TSS to the target level in 2015, as verified below. Moreover, the factory is planning to install a chemical feeding unit at the plant.
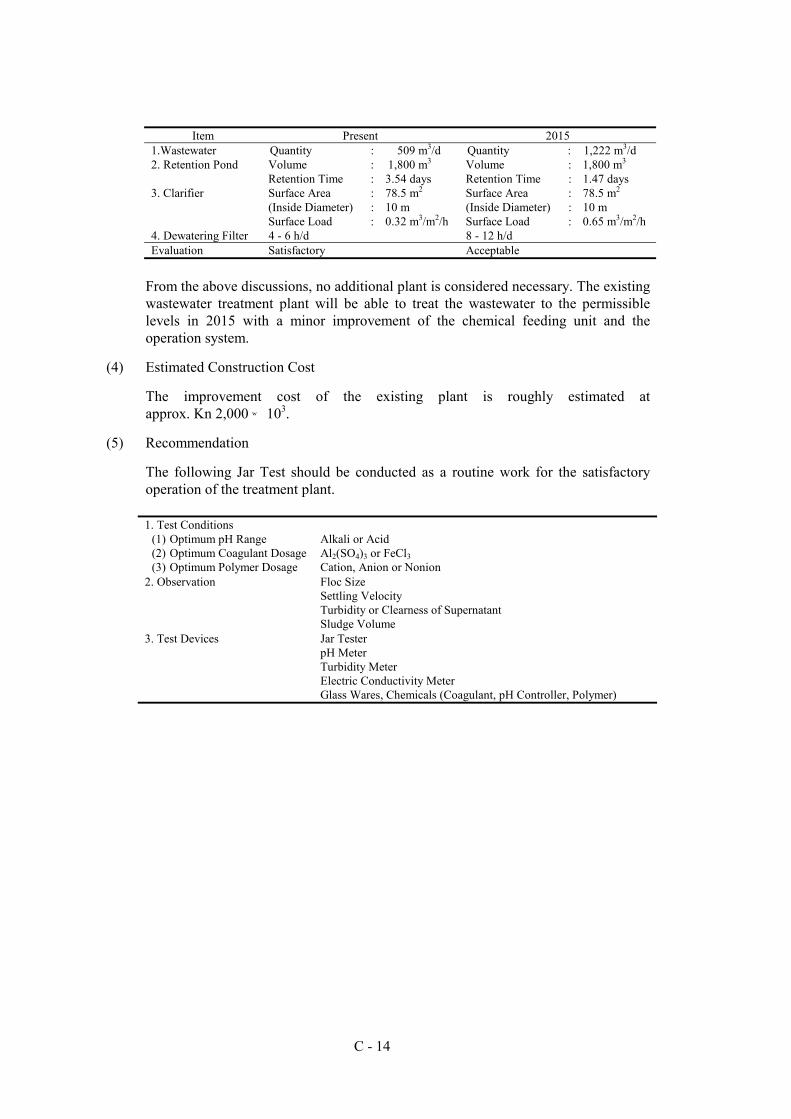
C - 14
Item Present 2015
1.Wastewater Quantity : 509 m3/d Quantity : 1,222 m3/d Volume : 1,800 m3 Volume : 1,800 m3 2. Retention Pond Retention Time : 3.54 days Retention Time : 1.47 days Surface Area : 78.5 m2 Surface Area : 78.5 m2 (Inside Diameter) : 10 m (Inside Diameter) : 10 m
3. Clarifier
Surface Load : 0.32 m3/m2/h Surface Load : 0.65 m3/m2/h 4. Dewatering Filter 4 - 6 h/d 8 - 12 h/d Evaluation Satisfactory Acceptable
From the above discussions, no additional plant is considered necessary. The existing wastewater treatment plant will be able to treat the wastewater to the permissible levels in 2015 with a minor improvement of the chemical feeding unit and the operation system.
(4) Estimated Construction Cost
The improvement cost of the existing plant is roughly estimated at approx. Kn 2,000 × 103.
(5) Recommendation
The following Jar Test should be conducted as a routine work for the satisfactory operation of the treatment plant.
1. Test Conditions
(1) Optimum pH Range (2) Optimum Coagulant Dosage (3) Optimum Polymer Dosage
Alkali or Acid Al2(SO4)3 or FeCl3 Cation, Anion or Nonion
2. Observation Floc Size Settling Velocity Turbidity or Clearness of Supernatant Sludge Volume
3. Test Devices Jar Tester pH Meter Turbidity Meter Electric Conductivity Meter Glass Wares, Chemicals (Coagulant, pH Controller, Polymer)
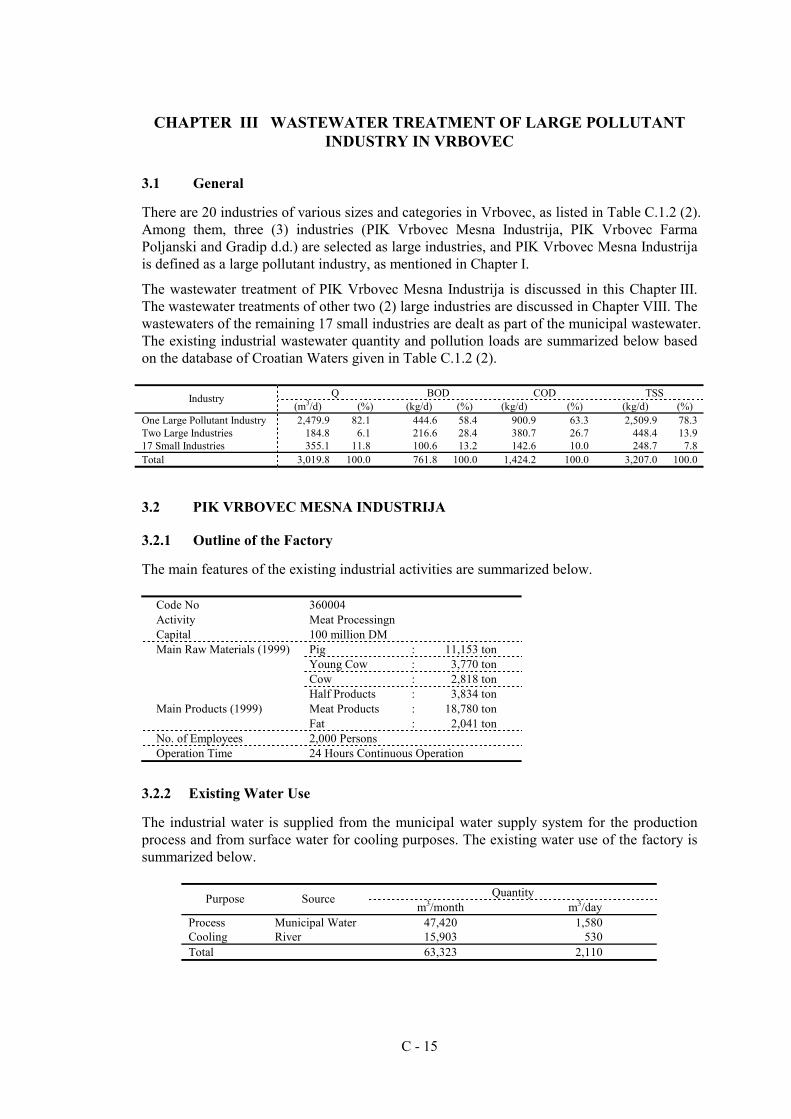
C - 15
CHAPTER III WASTEWATER TREATMENT OF LARGE POLLUTANT INDUSTRY IN VRBOVEC
3.1 General
There are 20 industries of various sizes and categories in Vrbovec, as listed in Table C.1.2 (2). Among them, three (3) industries (PIK Vrbovec Mesna Industrija, PIK Vrbovec Farma Poljanski and Gradip d.d.) are selected as large industries, and PIK Vrbovec Mesna Industrija is defined as a large pollutant industry, as mentioned in Chapter I.
The wastewater treatment of PIK Vrbovec Mesna Industrija is discussed in this Chapter III. The wastewater treatments of other two (2) large industries are discussed in Chapter VIII. The wastewaters of the remaining 17 small industries are dealt as part of the municipal wastewater. The existing industrial wastewater quantity and pollution loads are summarized below based on the database of Croatian Waters given in Table C.1.2 (2).
Q BOD COD TSS Industry (m3/d) (%) (kg/d) (%) (kg/d) (%) (kg/d) (%)
One Large Pollutant Industry 2,479.9 82.1 444.6 58.4 900.9 63.3 2,509.9 78.3 Two Large Industries 184.8 6.1 216.6 28.4 380.7 26.7 448.4 13.9 17 Small Industries 355.1 11.8 100.6 13.2 142.6 10.0 248.7 7.8 Total 3,019.8 100.0 761.8 100.0 1,424.2 100.0 3,207.0 100.0
3.2 PIK VRBOVEC MESNA INDUSTRIJA
3.2.1 Outline of the Factory
The main features of the existing industrial activities are summarized below.
Code No 360004 Activity Meat Processingn Capital 100 million DM
Pig : 11,153 ton Young Cow : 3,770 ton Cow : 2,818 ton
Main Raw Materials (1999)
Half Products : 3,834 ton Meat Products : 18,780 ton Main Products (1999) Fat : 2,041 ton
No. of Employees 2,000 Persons Operation Time 24 Hours Continuous Operation
3.2.2 Existing Water Use
The industrial water is supplied from the municipal water supply system for the production process and from surface water for cooling purposes. The existing water use of the factory is summarized below.
Quantity Purpose Source m3/month m3/day
Process Municipal Water 47,420 1,580 Cooling River 15,903 530 Total 63,323 2,110
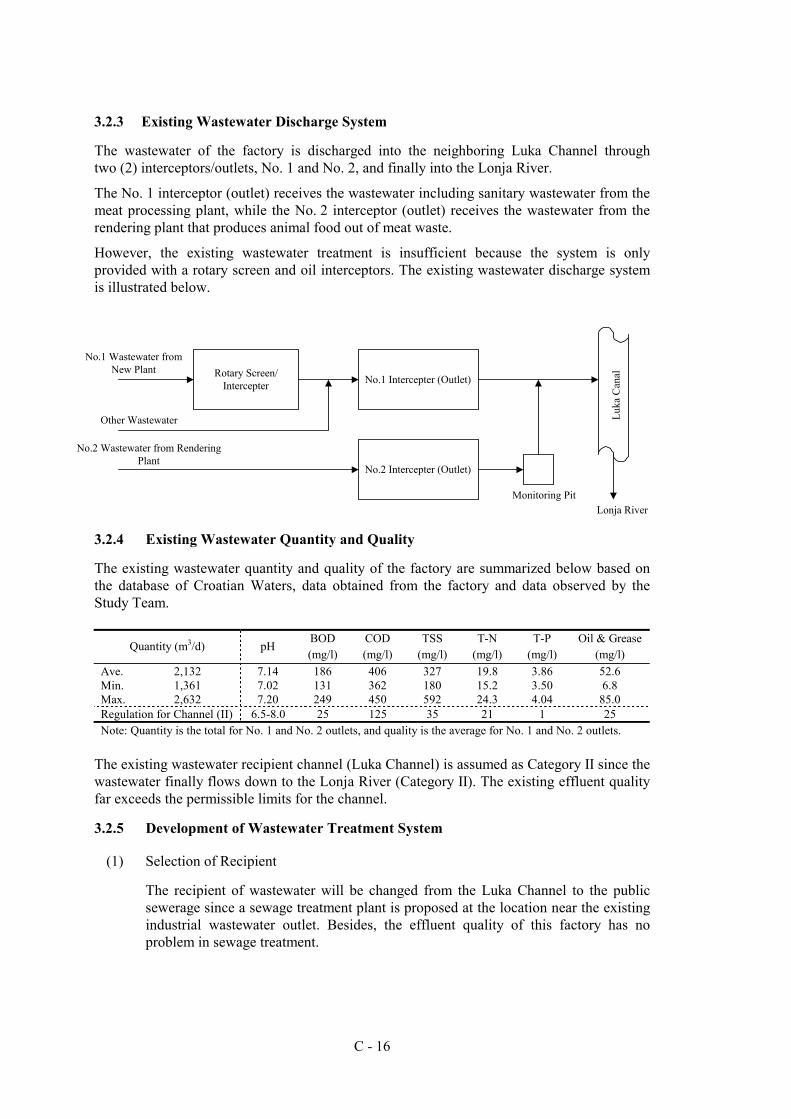
C - 16
3.2.3 Existing Wastewater Discharge System
The wastewater of the factory is discharged into the neighboring Luka Channel through two (2) interceptors/outlets, No. 1 and No. 2, and finally into the Lonja River.
The No. 1 interceptor (outlet) receives the wastewater including sanitary wastewater from the meat processing plant, while the No. 2 interceptor (outlet) receives the wastewater from the rendering plant that produces animal food out of meat waste.
However, the existing wastewater treatment is insufficient because the system is only provided with a rotary screen and oil interceptors. The existing wastewater discharge system is illustrated below.
3.2.4 Existing Wastewater Quantity and Quality
The existing wastewater quantity and quality of the factory are summarized below based on the database of Croatian Waters, data obtained from the factory and data observed by the Study Team.
BOD COD TSS T-N T-P Oil & Grease Quantity (m3/d) pH
(mg/l) (mg/l) (mg/l) (mg/l) (mg/l) (mg/l) Ave. Min. Max.
2,132 1,361 2,632
7.14 7.02 7.20
186 131 249
406 362 450
327 180 592
19.8 15.2 24.3
3.86 3.50 4.04
52.6 6.8
85.0 Regulation for Channel (II) 6.5-8.0 25 125 35 21 1 25 Note: Quantity is the total for No. 1 and No. 2 outlets, and quality is the average for No. 1 and No. 2 outlets.
The existing wastewater recipient channel (Luka Channel) is assumed as Category II since the wastewater finally flows down to the Lonja River (Category II). The existing effluent quality far exceeds the permissible limits for the channel.
3.2.5 Development of Wastewater Treatment System
(1) Selection of Recipient
The recipient of wastewater will be changed from the Luka Channel to the public sewerage since a sewage treatment plant is proposed at the location near the existing industrial wastewater outlet. Besides, the effluent quality of this factory has no problem in sewage treatment.
Rotary Screen/Intercepter No.1 Intercepter (Outlet)
No.2 Intercepter (Outlet)
Lonja RiverMonitoring Pit
No.1 Wastewater fromNew Plant
Other Wastewater
No.2 Wastewater from RenderingPlant
Luka
Can
al
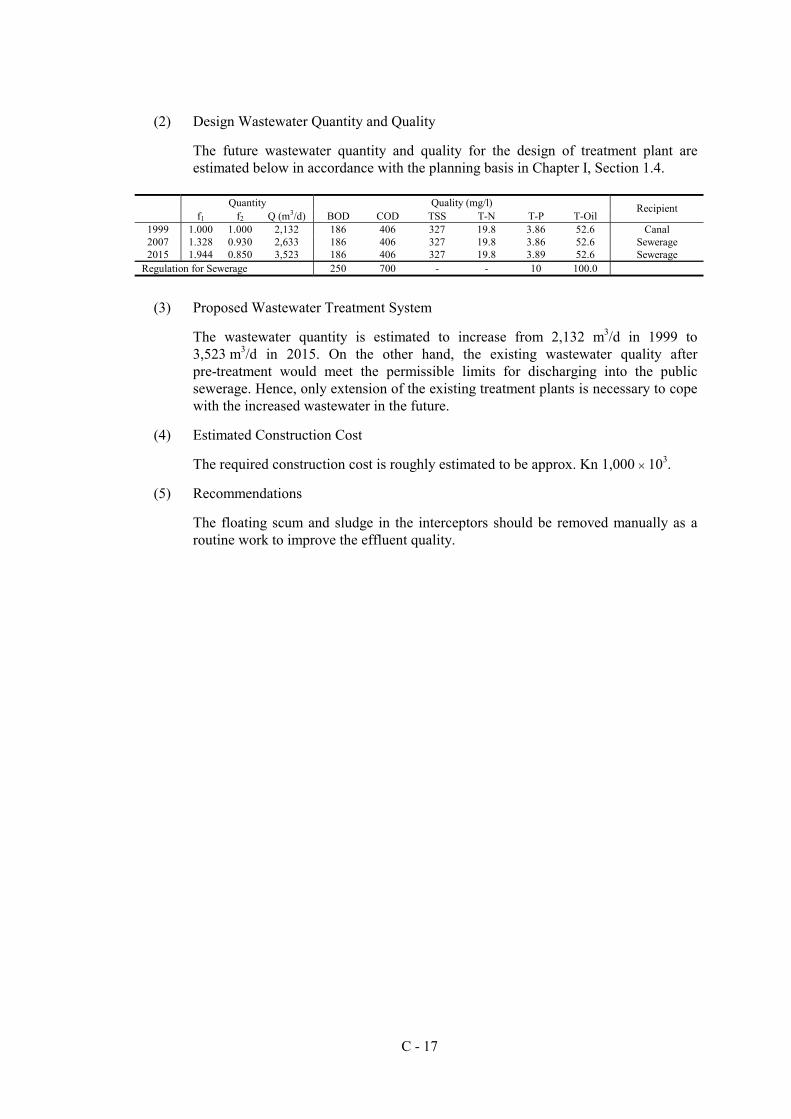
C - 17
(2) Design Wastewater Quantity and Quality
The future wastewater quantity and quality for the design of treatment plant are estimated below in accordance with the planning basis in Chapter I, Section 1.4.
Quantity Quality (mg/l)
f1 f2 Q (m3/d) BOD COD TSS T-N T-P T-Oil Recipient
1999 1.000 1.000 2,132 186 406 327 19.8 3.86 52.6 Canal 2007 1.328 0.930 2,633 186 406 327 19.8 3.86 52.6 Sewerage 2015 1.944 0.850 3,523 186 406 327 19.8 3.89 52.6 Sewerage
Regulation for Sewerage 250 700 - - 10 100.0
(3) Proposed Wastewater Treatment System
The wastewater quantity is estimated to increase from 2,132 m3/d in 1999 to 3,523 m3/d in 2015. On the other hand, the existing wastewater quality after pre-treatment would meet the permissible limits for discharging into the public sewerage. Hence, only extension of the existing treatment plants is necessary to cope with the increased wastewater in the future.
(4) Estimated Construction Cost
The required construction cost is roughly estimated to be approx. Kn 1,000 × 103.
(5) Recommendations
The floating scum and sludge in the interceptors should be removed manually as a routine work to improve the effluent quality.
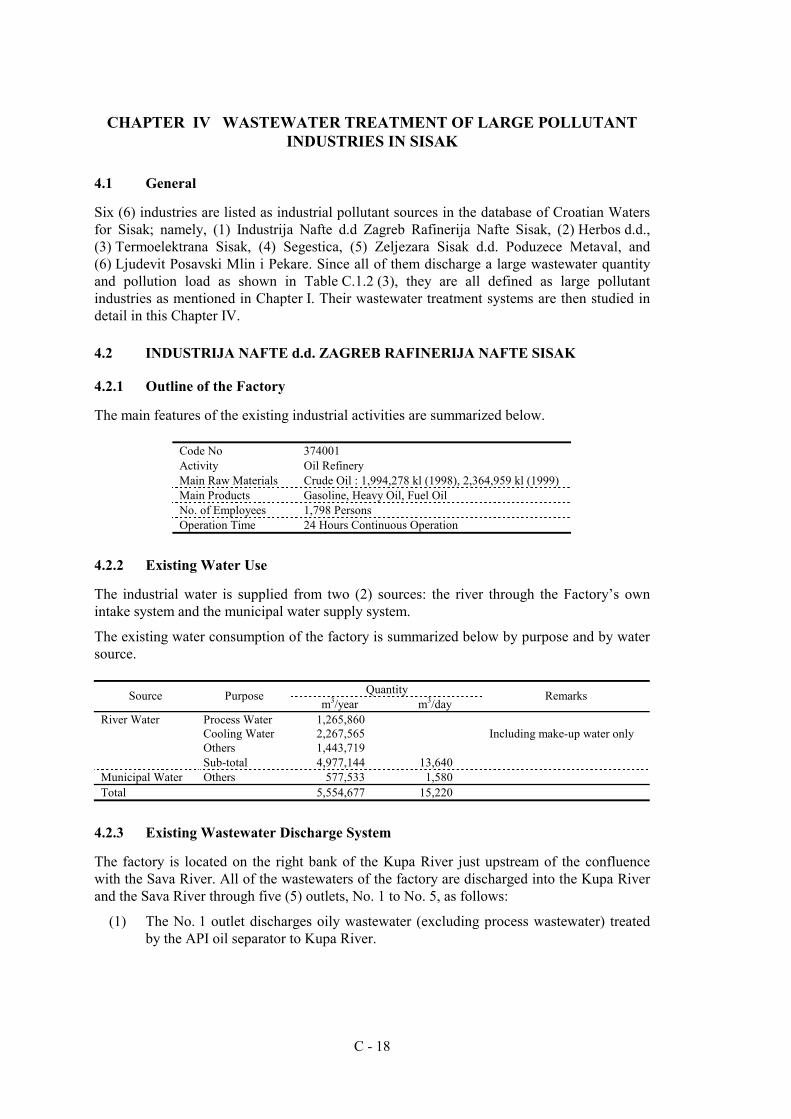
C - 18
CHAPTER IV WASTEWATER TREATMENT OF LARGE POLLUTANT INDUSTRIES IN SISAK
4.1 General
Six (6) industries are listed as industrial pollutant sources in the database of Croatian Waters for Sisak; namely, (1) Industrija Nafte d.d Zagreb Rafinerija Nafte Sisak, (2) Herbos d.d., (3) Termoelektrana Sisak, (4) Segestica, (5) Zeljezara Sisak d.d. Poduzece Metaval, and (6) Ljudevit Posavski Mlin i Pekare. Since all of them discharge a large wastewater quantity and pollution load as shown in Table C.1.2 (3), they are all defined as large pollutant industries as mentioned in Chapter I. Their wastewater treatment systems are then studied in detail in this Chapter IV.
4.2 INDUSTRIJA NAFTE d.d. ZAGREB RAFINERIJA NAFTE SISAK
4.2.1 Outline of the Factory
The main features of the existing industrial activities are summarized below.
Code No 374001 Activity Oil Refinery Main Raw Materials Crude Oil : 1,994,278 kl (1998), 2,364,959 kl (1999) Main Products Gasoline, Heavy Oil, Fuel Oil No. of Employees 1,798 Persons Operation Time 24 Hours Continuous Operation
4.2.2 Existing Water Use
The industrial water is supplied from two (2) sources: the river through the Factory’s own intake system and the municipal water supply system.
The existing water consumption of the factory is summarized below by purpose and by water source.
Quantity Source Purpose m3/year m3/day
Remarks
River Water Process Water 1,265,860 Cooling Water 2,267,565 Including make-up water only Others 1,443,719 Sub-total 4,977,144 13,640 Municipal Water Others 577,533 1,580 Total 5,554,677 15,220
4.2.3 Existing Wastewater Discharge System
The factory is located on the right bank of the Kupa River just upstream of the confluence with the Sava River. All of the wastewaters of the factory are discharged into the Kupa River and the Sava River through five (5) outlets, No. 1 to No. 5, as follows:
(1) The No. 1 outlet discharges oily wastewater (excluding process wastewater) treated by the API oil separator to Kupa River.
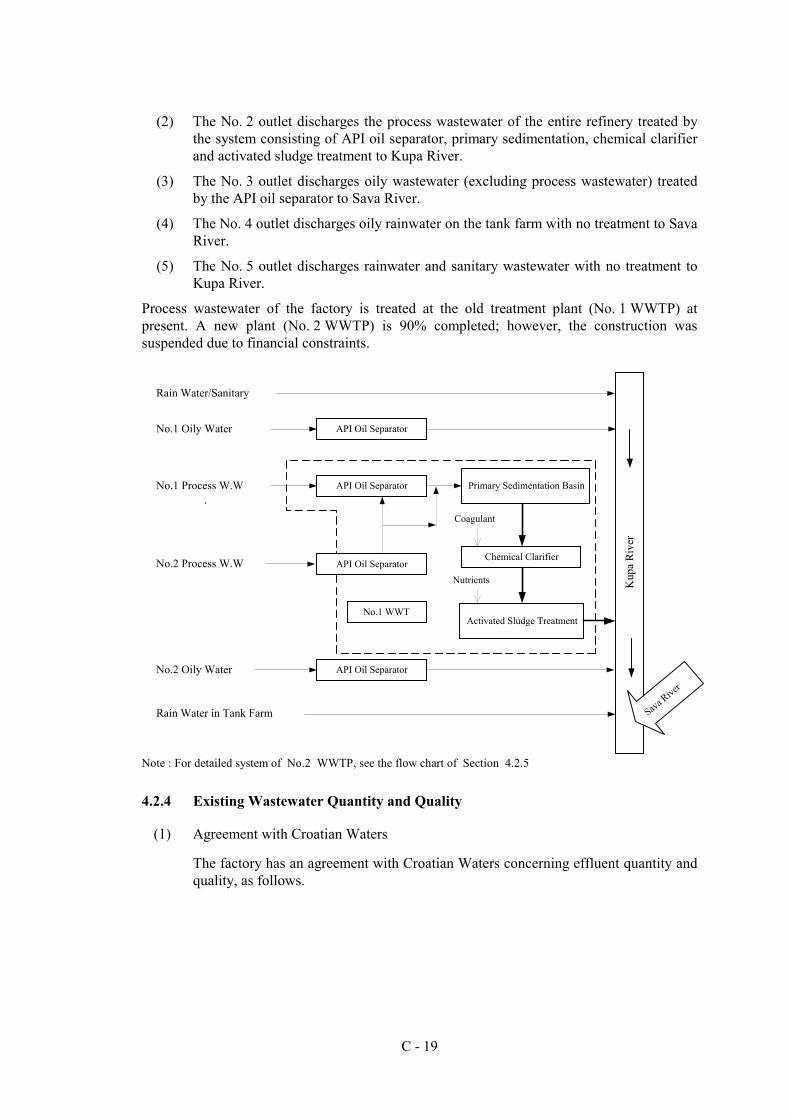
C - 19
(2) The No. 2 outlet discharges the process wastewater of the entire refinery treated by the system consisting of API oil separator, primary sedimentation, chemical clarifier and activated sludge treatment to Kupa River.
(3) The No. 3 outlet discharges oily wastewater (excluding process wastewater) treated by the API oil separator to Sava River.
(4) The No. 4 outlet discharges oily rainwater on the tank farm with no treatment to Sava River.
(5) The No. 5 outlet discharges rainwater and sanitary wastewater with no treatment to Kupa River.
Process wastewater of the factory is treated at the old treatment plant (No. 1 WWTP) at present. A new plant (No. 2 WWTP) is 90% completed; however, the construction was suspended due to financial constraints.
Note : For detailed system of No.2 WWTP, see the flow chart of Section 4.2.5
4.2.4 Existing Wastewater Quantity and Quality
(1) Agreement with Croatian Waters
The factory has an agreement with Croatian Waters concerning effluent quantity and quality, as follows.
Rain Water/Sanitary
No.1 Oily Water
No.1 Process W.W
No.2 Process W.W
No.2 Oily Water
Rain Water in Tank Farm
Kup
a R
iver
API Oil Separator
API Oil Separator Primary Sedimentation Basin
API Oil Separator
API Oil Separator
Chemical Clarifier
Activated Sludge TreatmentNo.1 WWT
Sava River
Coagulant
Nutrients
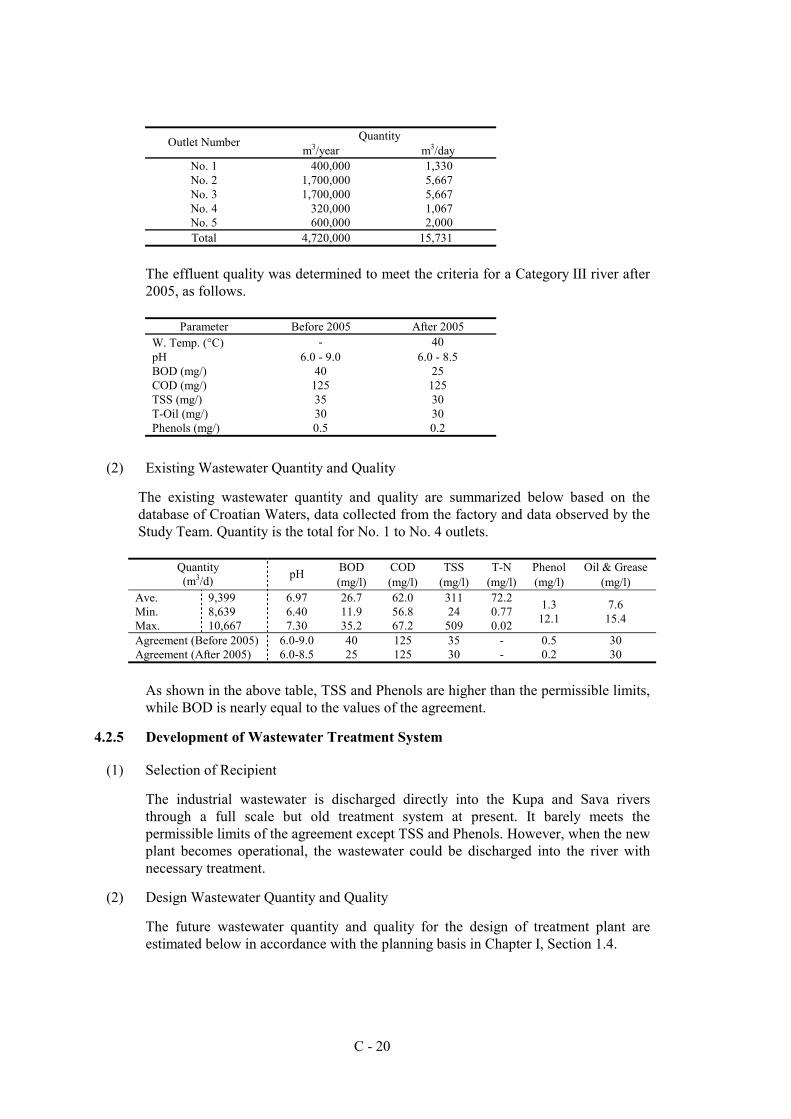
C - 20
Quantity Outlet Number
m3/year m3/day No. 1 400,000 1,330 No. 2 1,700,000 5,667 No. 3 1,700,000 5,667 No. 4 320,000 1,067 No. 5 600,000 2,000 Total 4,720,000 15,731
The effluent quality was determined to meet the criteria for a Category III river after 2005, as follows.
Parameter Before 2005 After 2005
W. Temp. (°C) - 40 pH 6.0 - 9.0 6.0 - 8.5 BOD (mg/) 40 25 COD (mg/) 125 125 TSS (mg/) 35 30 T-Oil (mg/) 30 30 Phenols (mg/) 0.5 0.2
(2) Existing Wastewater Quantity and Quality
The existing wastewater quantity and quality are summarized below based on the database of Croatian Waters, data collected from the factory and data observed by the Study Team. Quantity is the total for No. 1 to No. 4 outlets.
BOD COD TSS T-N Phenol Oil & Grease Quantity
(m3/d) pH (mg/l) (mg/l) (mg/l) (mg/l) (mg/l) (mg/l)
Ave. Min. Max.
9,399 8,639 10,667
6.97 6.40 7.30
26.7 11.9 35.2
62.0 56.8 67.2
311 24
509
72.2 0.77 0.02
1.3 12.1
7.6 15.4
Agreement (Before 2005) Agreement (After 2005)
6.0-9.0 6.0-8.5
40 25
125 125
35 30
- -
0.5 0.2
30 30
As shown in the above table, TSS and Phenols are higher than the permissible limits, while BOD is nearly equal to the values of the agreement.
4.2.5 Development of Wastewater Treatment System
(1) Selection of Recipient
The industrial wastewater is discharged directly into the Kupa and Sava rivers through a full scale but old treatment system at present. It barely meets the permissible limits of the agreement except TSS and Phenols. However, when the new plant becomes operational, the wastewater could be discharged into the river with necessary treatment.
(2) Design Wastewater Quantity and Quality
The future wastewater quantity and quality for the design of treatment plant are estimated below in accordance with the planning basis in Chapter I, Section 1.4.
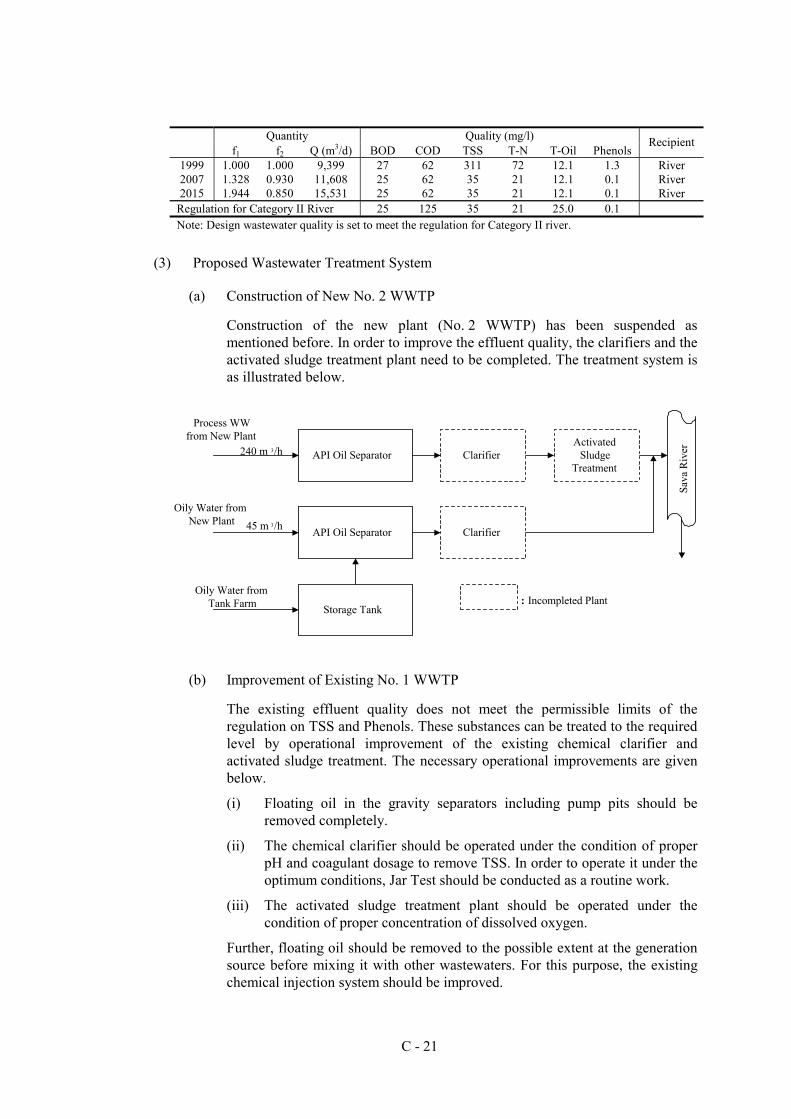
C - 21
Quantity Quality (mg/l)
f1 f2 Q (m3/d) BOD COD TSS T-N T-Oil Phenols Recipient
1999 1.000 1.000 9,399 27 62 311 72 12.1 1.3 River 2007 1.328 0.930 11,608 25 62 35 21 12.1 0.1 River 2015 1.944 0.850 15,531 25 62 35 21 12.1 0.1 River
Regulation for Category II River 25 125 35 21 25.0 0.1 Note: Design wastewater quality is set to meet the regulation for Category II river.
(3) Proposed Wastewater Treatment System
(a) Construction of New No. 2 WWTP
Construction of the new plant (No. 2 WWTP) has been suspended as mentioned before. In order to improve the effluent quality, the clarifiers and the activated sludge treatment plant need to be completed. The treatment system is as illustrated below.
(b) Improvement of Existing No. 1 WWTP
The existing effluent quality does not meet the permissible limits of the regulation on TSS and Phenols. These substances can be treated to the required level by operational improvement of the existing chemical clarifier and activated sludge treatment. The necessary operational improvements are given below.
(i) Floating oil in the gravity separators including pump pits should be removed completely.
(ii) The chemical clarifier should be operated under the condition of proper pH and coagulant dosage to remove TSS. In order to operate it under the optimum conditions, Jar Test should be conducted as a routine work.
(iii) The activated sludge treatment plant should be operated under the condition of proper concentration of dissolved oxygen.
Further, floating oil should be removed to the possible extent at the generation source before mixing it with other wastewaters. For this purpose, the existing chemical injection system should be improved.
API Oil Separator
API Oil Separator
Storage Tank
Clarifier
Clarifier
ActivatedSludge
Treatment
Process WWfrom New Plant
Oily Water fromNew Plant
Oily Water fromTank Farm
240 m 3/h
45 m 3/h
: Incompleted Plant
Sava
Riv
er
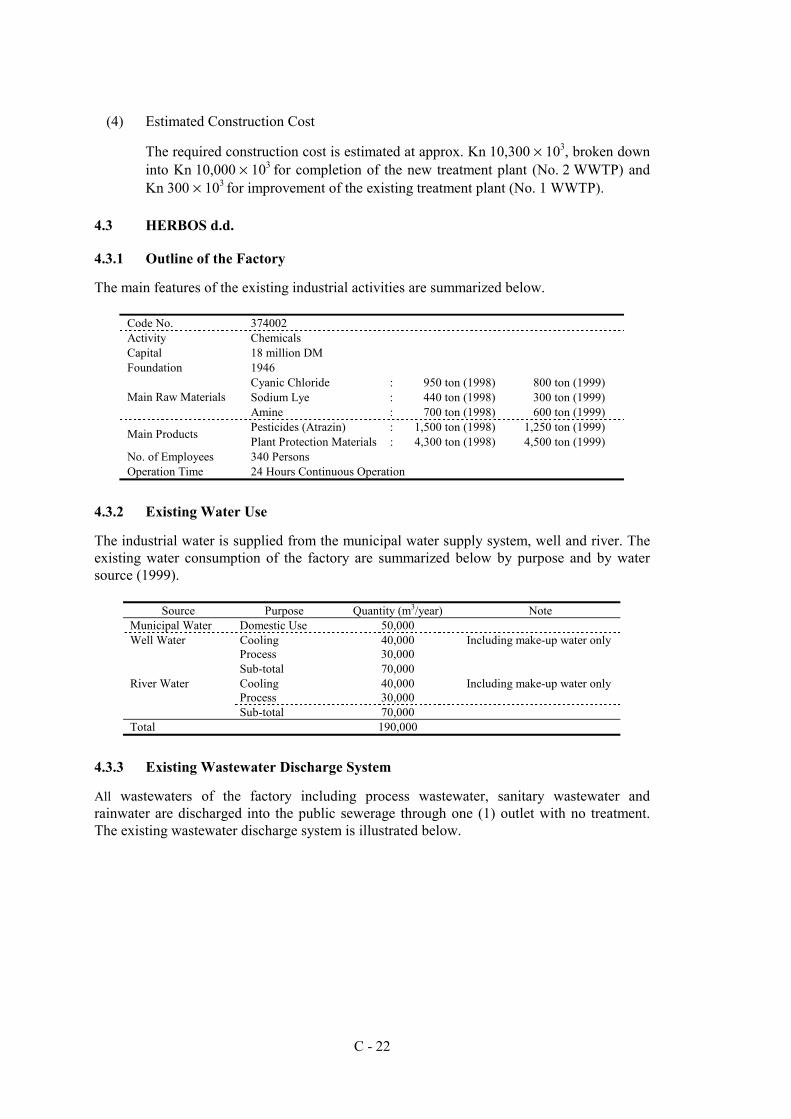
C - 22
(4) Estimated Construction Cost
The required construction cost is estimated at approx. Kn 10,300 × 103, broken down into Kn 10,000 × 103 for completion of the new treatment plant (No. 2 WWTP) and Kn 300 × 103 for improvement of the existing treatment plant (No. 1 WWTP).
4.3 HERBOS d.d.
4.3.1 Outline of the Factory
The main features of the existing industrial activities are summarized below.
Code No. 374002 Activity Chemicals Capital 18 million DM Foundation 1946
Cyanic Chloride : 950 ton (1998) 800 ton (1999) Sodium Lye : 440 ton (1998) 300 ton (1999) Main Raw Materials Amine : 700 ton (1998) 600 ton (1999) Pesticides (Atrazin) : 1,500 ton (1998) 1,250 ton (1999) Main Products Plant Protection Materials : 4,300 ton (1998) 4,500 ton (1999)
No. of Employees 340 Persons Operation Time 24 Hours Continuous Operation
4.3.2 Existing Water Use
The industrial water is supplied from the municipal water supply system, well and river. The existing water consumption of the factory are summarized below by purpose and by water source (1999).
Source Purpose Quantity (m3/year) Note Municipal Water Domestic Use 50,000 Well Water Cooling 40,000 Including make-up water only Process 30,000 Sub-total 70,000 River Water Cooling 40,000 Including make-up water only Process 30,000 Sub-total 70,000 Total 190,000
4.3.3 Existing Wastewater Discharge System
All wastewaters of the factory including process wastewater, sanitary wastewater and rainwater are discharged into the public sewerage through one (1) outlet with no treatment. The existing wastewater discharge system is illustrated below.
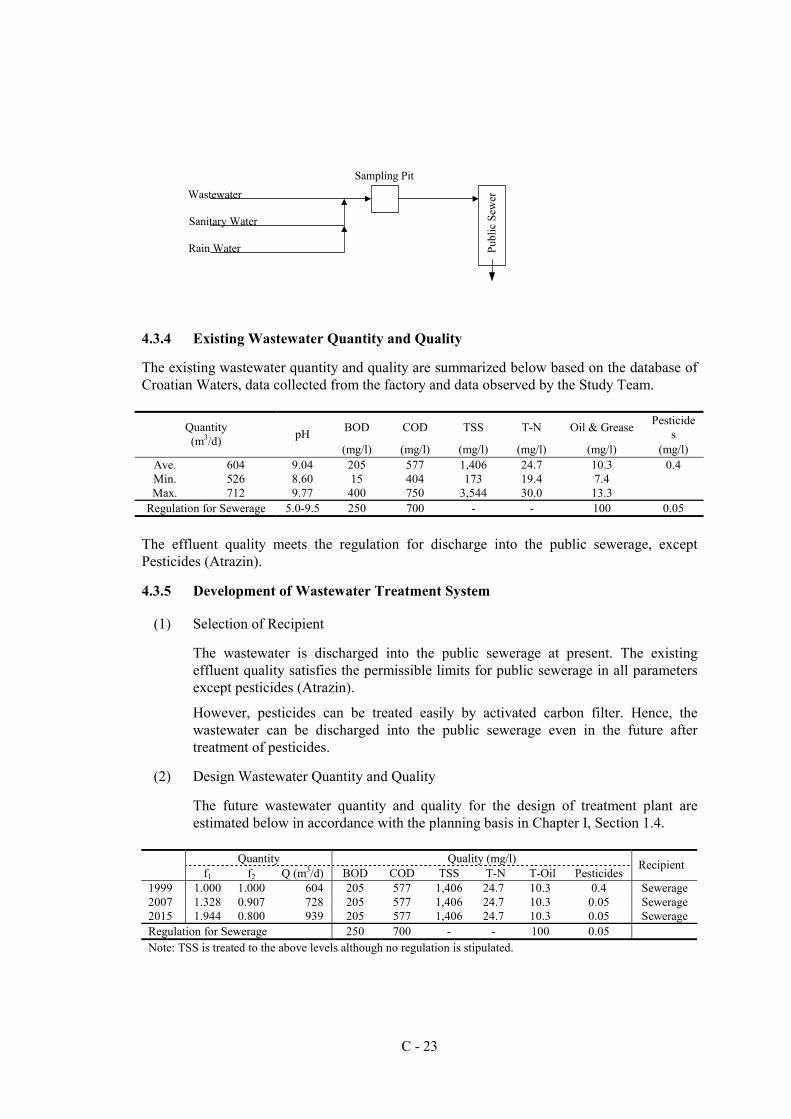
C - 23
4.3.4 Existing Wastewater Quantity and Quality
The existing wastewater quantity and quality are summarized below based on the database of Croatian Waters, data collected from the factory and data observed by the Study Team.
BOD COD TSS T-N Oil & Grease Pesticides Quantity
(m3/d) pH (mg/l) (mg/l) (mg/l) (mg/l) (mg/l) (mg/l)
Ave. Min. Max.
604 526 712
9.04 8.60 9.77
205 15
400
577 404 750
1,406 173
3,544
24.7 19.4 30.0
10.3 7.4
13.3
0.4
Regulation for Sewerage 5.0-9.5 250 700 - - 100 0.05
The effluent quality meets the regulation for discharge into the public sewerage, except Pesticides (Atrazin).
4.3.5 Development of Wastewater Treatment System
(1) Selection of Recipient
The wastewater is discharged into the public sewerage at present. The existing effluent quality satisfies the permissible limits for public sewerage in all parameters except pesticides (Atrazin).
However, pesticides can be treated easily by activated carbon filter. Hence, the wastewater can be discharged into the public sewerage even in the future after treatment of pesticides.
(2) Design Wastewater Quantity and Quality
The future wastewater quantity and quality for the design of treatment plant are estimated below in accordance with the planning basis in Chapter I, Section 1.4.
Quantity Quality (mg/l)
f1 f2 Q (m3/d) BOD COD TSS T-N T-Oil Pesticides Recipient
1999 1.000 1.000 604 205 577 1,406 24.7 10.3 0.4 Sewerage 2007 1.328 0.907 728 205 577 1,406 24.7 10.3 0.05 Sewerage 2015 1.944 0.800 939 205 577 1,406 24.7 10.3 0.05 Sewerage Regulation for Sewerage 250 700 - - 100 0.05 Note: TSS is treated to the above levels although no regulation is stipulated.
Wastewater
Sanitary Water
Rain Water
Sampling Pit
Publ
ic S
ewer
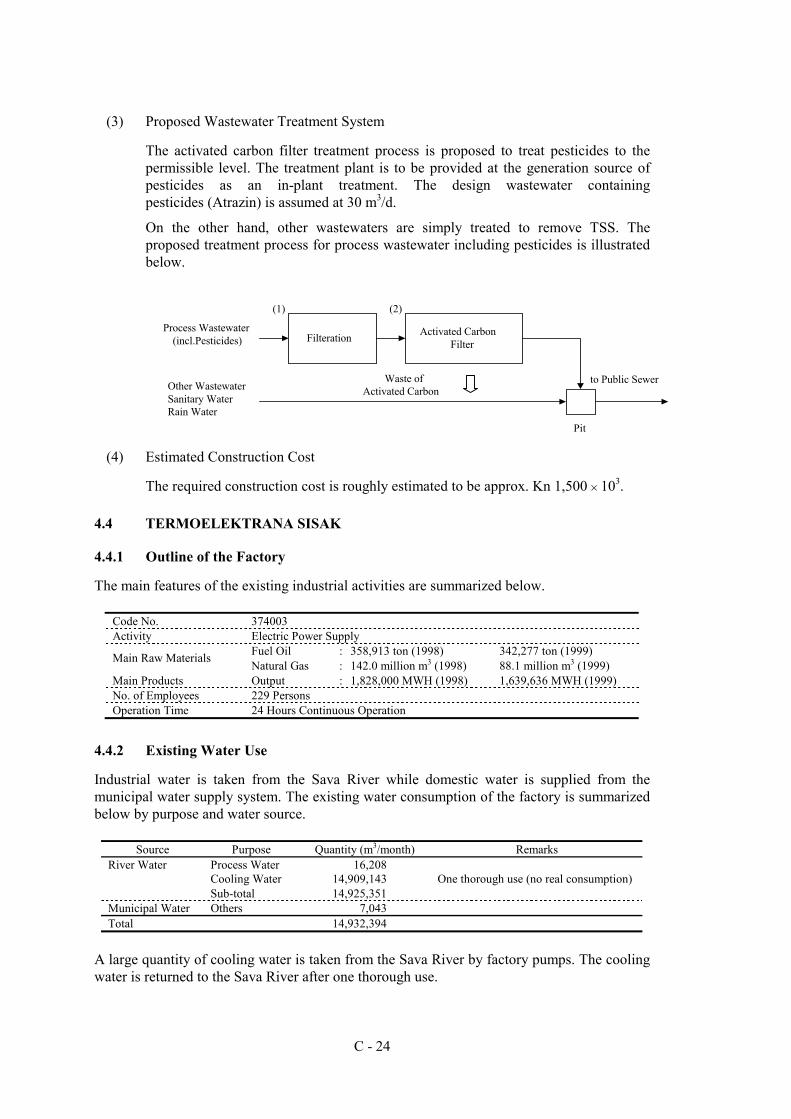
C - 24
(3) Proposed Wastewater Treatment System
The activated carbon filter treatment process is proposed to treat pesticides to the permissible level. The treatment plant is to be provided at the generation source of pesticides as an in-plant treatment. The design wastewater containing pesticides (Atrazin) is assumed at 30 m3/d.
On the other hand, other wastewaters are simply treated to remove TSS. The proposed treatment process for process wastewater including pesticides is illustrated below.
(4) Estimated Construction Cost
The required construction cost is roughly estimated to be approx. Kn 1,500 × 103.
4.4 TERMOELEKTRANA SISAK
4.4.1 Outline of the Factory
The main features of the existing industrial activities are summarized below.
Code No. 374003 Activity Electric Power Supply
Fuel Oil : 358,913 ton (1998) 342,277 ton (1999) Main Raw Materials Natural Gas : 142.0 million m3 (1998) 88.1 million m3 (1999) Main Products Output : 1,828,000 MWH (1998) 1,639,636 MWH (1999) No. of Employees 229 Persons Operation Time 24 Hours Continuous Operation
4.4.2 Existing Water Use
Industrial water is taken from the Sava River while domestic water is supplied from the municipal water supply system. The existing water consumption of the factory is summarized below by purpose and water source.
Source Purpose Quantity (m3/month) Remarks River Water Process Water 16,208 Cooling Water 14,909,143 One thorough use (no real consumption) Sub-total 14,925,351 Municipal Water Others 7,043 Total 14,932,394
A large quantity of cooling water is taken from the Sava River by factory pumps. The cooling water is returned to the Sava River after one thorough use.
Filteration Activated CarbonFilter
Process Wastewater(incl.Pesticides)
Other WastewaterSanitary WaterRain Water
to Public SewerWaste ofActivated Carbon
(1) (2)
Pit
C - 25
4.4.3 Existing Wastewater Discharge System
The power station is located on the right bank of the Sava River just downstream of the confluence with the Kupa River. All wastewaters of the power station are discharged into the Sava River through one (1) outlet. The existing wastewater discharge system is illustrated below.
4.4.4 Existing Wastewater Quantity and Quality
The existing wastewater quantity and quality excluding cooling water are summarized below based on the database of Croatian Waters, data collected from the factory and data observed by the Study Team.
BOD COD TSS T-N T-P Oil & Grease Quantity (m3/d)
pH (mg/l) (mg/l) (mg/l) (mg/l) (mg/l) (mg/l)
Ave. Min. Max.
451 - -
7.61 6.94 8.40
4.5 2.0 6.4
25.5 22.2 28.8
178 20
472
2.3 1.5 3.3
0.14 0.13 0.15
3.0 0.9 4.1
Regulation for River (II) 6.5 - 8.0 25 125 35 21 1 25 In addition to the above wastewater, cooling water of 490,325 m3/d on average is discharged into the river. As shown in the above table, the wastewater quality exceeds the regulation in only TSS.
4.4.5 Development of Wastewater Treatment System
(1) Selection of Recipient
The wastewater is at present discharged directly into the Sava River with pre-treatment and the effluent quality satisfies the permissible limits of the river in all
CPI Oil Separator
Neutralization Pond
Neutralization Pond
Recovered Oil
Cooling Water
Oily Water
Ca(OH) 2
Washing Water
Acid, Alkali
Demineralized WW
Outlet Well
Air
Sava
Riv
er
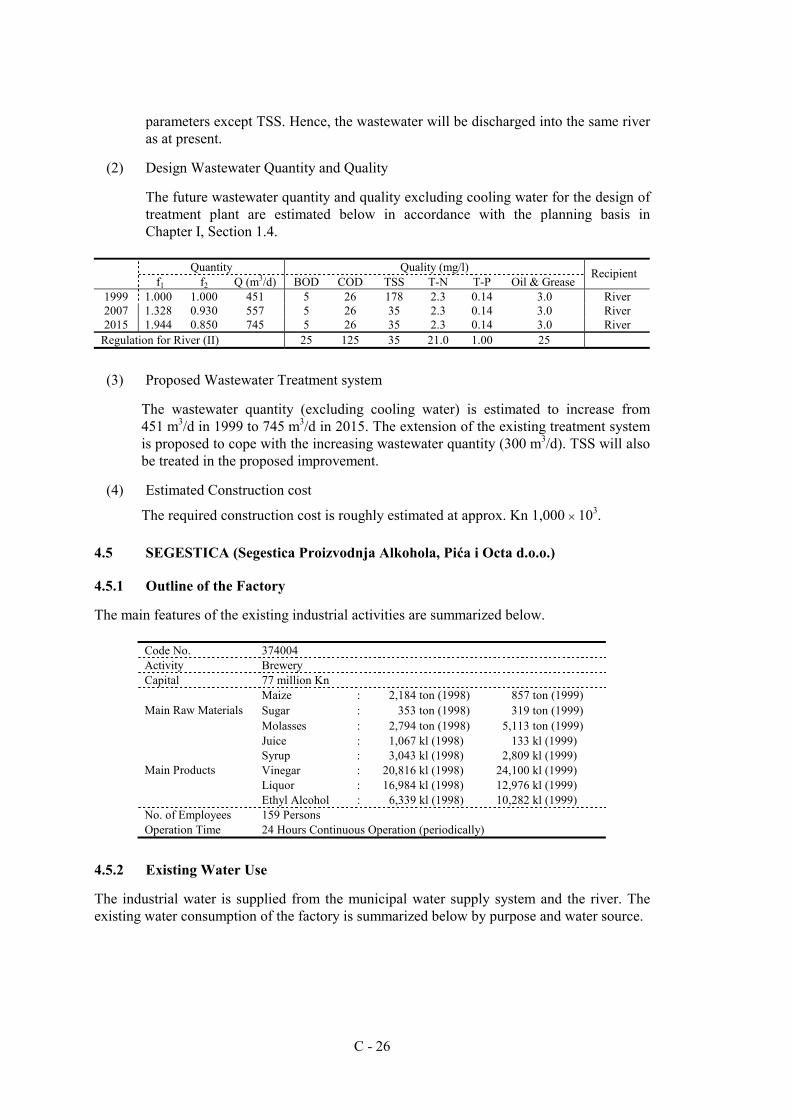
C - 26
parameters except TSS. Hence, the wastewater will be discharged into the same river as at present.
(2) Design Wastewater Quantity and Quality
The future wastewater quantity and quality excluding cooling water for the design of treatment plant are estimated below in accordance with the planning basis in Chapter I, Section 1.4.
Quantity Quality (mg/l)
f1 f2 Q (m3/d) BOD COD TSS T-N T-P Oil & Grease Recipient
1999 1.000 1.000 451 5 26 178 2.3 0.14 3.0 River 2007 1.328 0.930 557 5 26 35 2.3 0.14 3.0 River 2015 1.944 0.850 745 5 26 35 2.3 0.14 3.0 River
Regulation for River (II) 25 125 35 21.0 1.00 25
(3) Proposed Wastewater Treatment system
The wastewater quantity (excluding cooling water) is estimated to increase from 451 m3/d in 1999 to 745 m3/d in 2015. The extension of the existing treatment system is proposed to cope with the increasing wastewater quantity (300 m3/d). TSS will also be treated in the proposed improvement.
(4) Estimated Construction cost
The required construction cost is roughly estimated at approx. Kn 1,000 × 103.
4.5 SEGESTICA (Segestica Proizvodnja Alkohola, Pića i Octa d.o.o.)
4.5.1 Outline of the Factory
The main features of the existing industrial activities are summarized below.
Code No. 374004 Activity Brewery Capital 77 million Kn
Maize : 2,184 ton (1998) 857 ton (1999) Sugar : 353 ton (1998) 319 ton (1999) Main Raw Materials Molasses : 2,794 ton (1998) 5,113 ton (1999) Juice : 1,067 kl (1998) 133 kl (1999) Syrup : 3,043 kl (1998) 2,809 kl (1999) Vinegar : 20,816 kl (1998) 24,100 kl (1999) Liquor : 16,984 kl (1998) 12,976 kl (1999)
Main Products
Ethyl Alcohol : 6,339 kl (1998) 10,282 kl (1999) No. of Employees 159 Persons Operation Time 24 Hours Continuous Operation (periodically)
4.5.2 Existing Water Use
The industrial water is supplied from the municipal water supply system and the river. The existing water consumption of the factory is summarized below by purpose and water source.
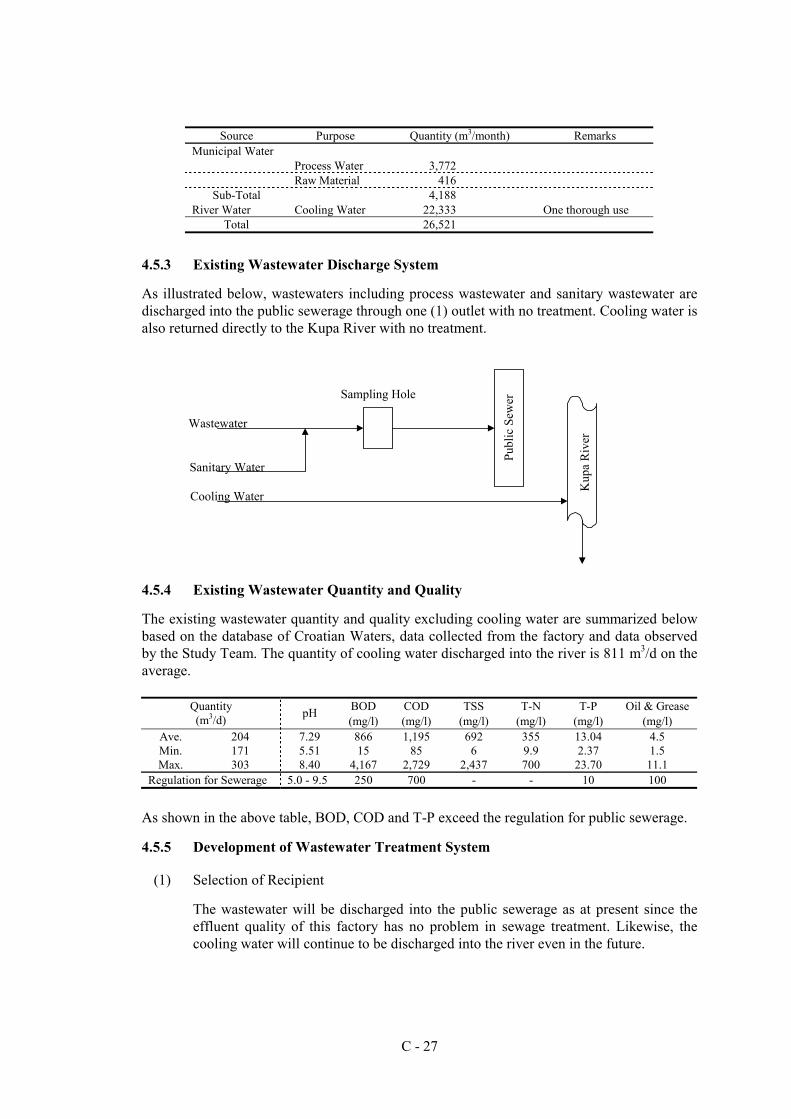
C - 27
Source Purpose Quantity (m3/month) Remarks
Municipal Water Process Water 3,772 Raw Material 416
Sub-Total 4,188 River Water Cooling Water 22,333 One thorough use
Total 26,521
4.5.3 Existing Wastewater Discharge System
As illustrated below, wastewaters including process wastewater and sanitary wastewater are discharged into the public sewerage through one (1) outlet with no treatment. Cooling water is also returned directly to the Kupa River with no treatment.
4.5.4 Existing Wastewater Quantity and Quality
The existing wastewater quantity and quality excluding cooling water are summarized below based on the database of Croatian Waters, data collected from the factory and data observed by the Study Team. The quantity of cooling water discharged into the river is 811 m3/d on the average.
BOD COD TSS T-N T-P Oil & Grease Quantity (m3/d) pH
(mg/l) (mg/l) (mg/l) (mg/l) (mg/l) (mg/l) Ave. Min. Max.
204 171 303
7.29 5.51 8.40
866 15
4,167
1,195 85
2,729
692 6
2,437
355 9.9 700
13.04 2.37
23.70
4.5 1.5
11.1 Regulation for Sewerage 5.0 - 9.5 250 700 - - 10 100
As shown in the above table, BOD, COD and T-P exceed the regulation for public sewerage.
4.5.5 Development of Wastewater Treatment System
(1) Selection of Recipient
The wastewater will be discharged into the public sewerage as at present since the effluent quality of this factory has no problem in sewage treatment. Likewise, the cooling water will continue to be discharged into the river even in the future.
Sampling Hole
Publ
ic S
ewer
Wastewater
Sanitary Water
Cooling Water
Kup
a R
iver
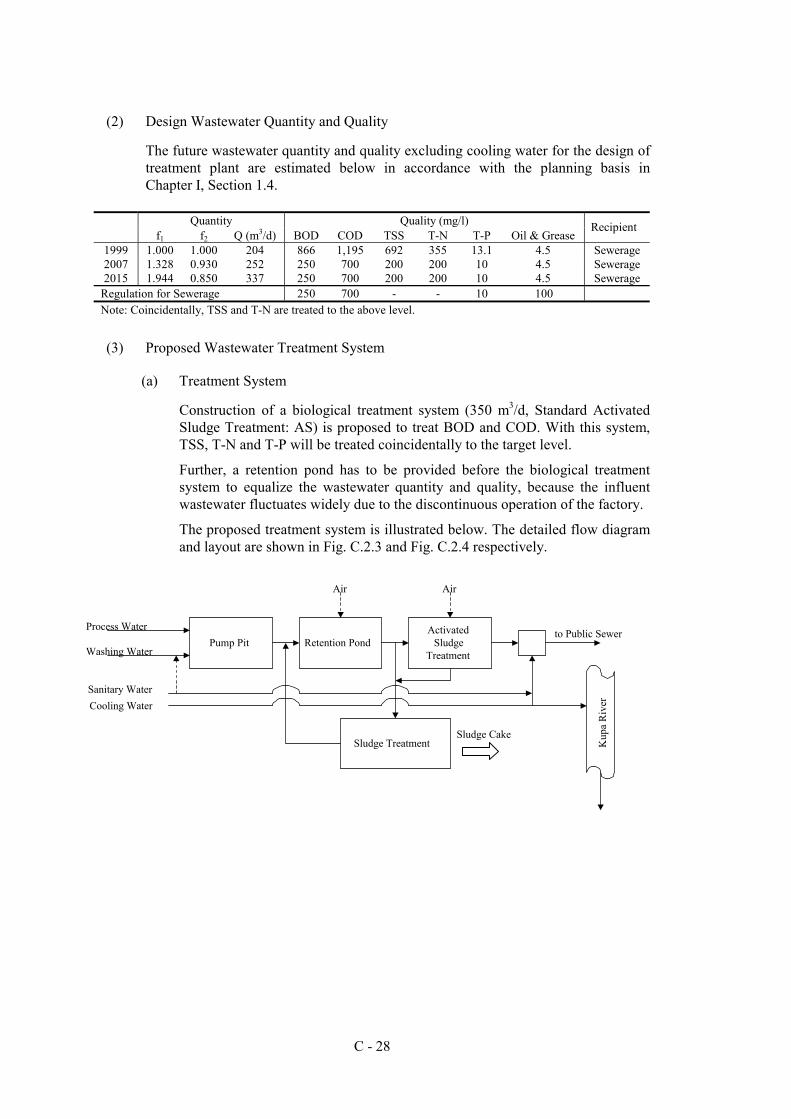
C - 28
(2) Design Wastewater Quantity and Quality
The future wastewater quantity and quality excluding cooling water for the design of treatment plant are estimated below in accordance with the planning basis in Chapter I, Section 1.4.
Quantity Quality (mg/l)
f1 f2 Q (m3/d) BOD COD TSS T-N T-P Oil & Grease Recipient
1999 1.000 1.000 204 866 1,195 692 355 13.1 4.5 Sewerage 2007 1.328 0.930 252 250 700 200 200 10 4.5 Sewerage 2015 1.944 0.850 337 250 700 200 200 10 4.5 Sewerage
Regulation for Sewerage 250 700 - - 10 100 Note: Coincidentally, TSS and T-N are treated to the above level.
(3) Proposed Wastewater Treatment System
(a) Treatment System
Construction of a biological treatment system (350 m3/d, Standard Activated Sludge Treatment: AS) is proposed to treat BOD and COD. With this system, TSS, T-N and T-P will be treated coincidentally to the target level.
Further, a retention pond has to be provided before the biological treatment system to equalize the wastewater quantity and quality, because the influent wastewater fluctuates widely due to the discontinuous operation of the factory.
The proposed treatment system is illustrated below. The detailed flow diagram and layout are shown in Fig. C.2.3 and Fig. C.2.4 respectively.
Pump Pit Retention PondActivated
SludgeTreatment
Sludge Treatment Kup
a R
iver
to Public SewerProcess Water
Washing Water
Sanitary WaterCooling Water
Air Air
Sludge Cake
C - 29
(b) Specification of Major Equipment
Equipment No. Name Specification Note Capacity Treatment Plant 350 m3/day, 15 m3/h 24 h Continuous operation
S-2 Retention Pond 175 m3, 12 m × 6 m × 3.2 m H, RC Air bubbling devices S-3 S-4 S-5 M-3
Aeration Basin Sedimentation Basin Sludge Thickener Centrifuge
45 m3, 8 m × 4 m × 3.2 m H, RC 4.5 m D × 3.0 m H, RC 2.5 m D × 2.5 m H, CS 1.5 m3/h × 3.7 kW, SUS
Aeration unit Center driven rake Center driven rake Horizontal
Note: RC: Reinforced Concrete, CS: Carbon Steel, SUS: Stainless Steel. For Equipment No., see Fig. C.2.3 and Fig. C.2.4
(c) Required Area
The required area is approx. 22m × 23m (506 m2). (Refer to Fig. C.2.4.)
(4) Estimated Construction Cost
The required construction cost is estimated to be Kn 7.16 million, broken down as follows.
Item Cost (103 Kn) Remarks
1. Direct Cost (1) Mechanical/Electrical Works (2) Civil/Architectural Works (3) Miscellaneous Work
3,150 1,130
230
Sub-Total 4,500 2. Indirect Cost 450 1 × 10% 3. VAT 990 1 × 22% 4. Customs Duties 320 1 (1) × 10% 5. Contingency 900 1 × 20%
Total 7,160
4.6 ŽELJEZARA SISAK d.d. Poduzeće Metaval
4.6.1 Outline of the Factory
The main features of the existing industrial activities are summarized below.
Code No. 374005 Activity Production of Iron and Steel Capital 668.6 million Kn Foundation 1984
Steel Ingot : 61,076 ton (1998) 34,878 ton (1999) Steel Band : 54,420 ton (1998) 31,228 ton (1999) Main Raw Materials Imported Steel : 25,510 ton (1998) 24,236 ton (1999) Seamless Tube : 52,375 ton (1998) 37,838 ton (1999) Seam Tube : 35,540 ton (1998) 23,918 ton (1999) Main Products Proof Seam Tube : 16,754 ton (1998) 14,799 ton (1999)
No. of Employees 2,056 Persons Operation Time 24 Hours Continuous Operation (partly)
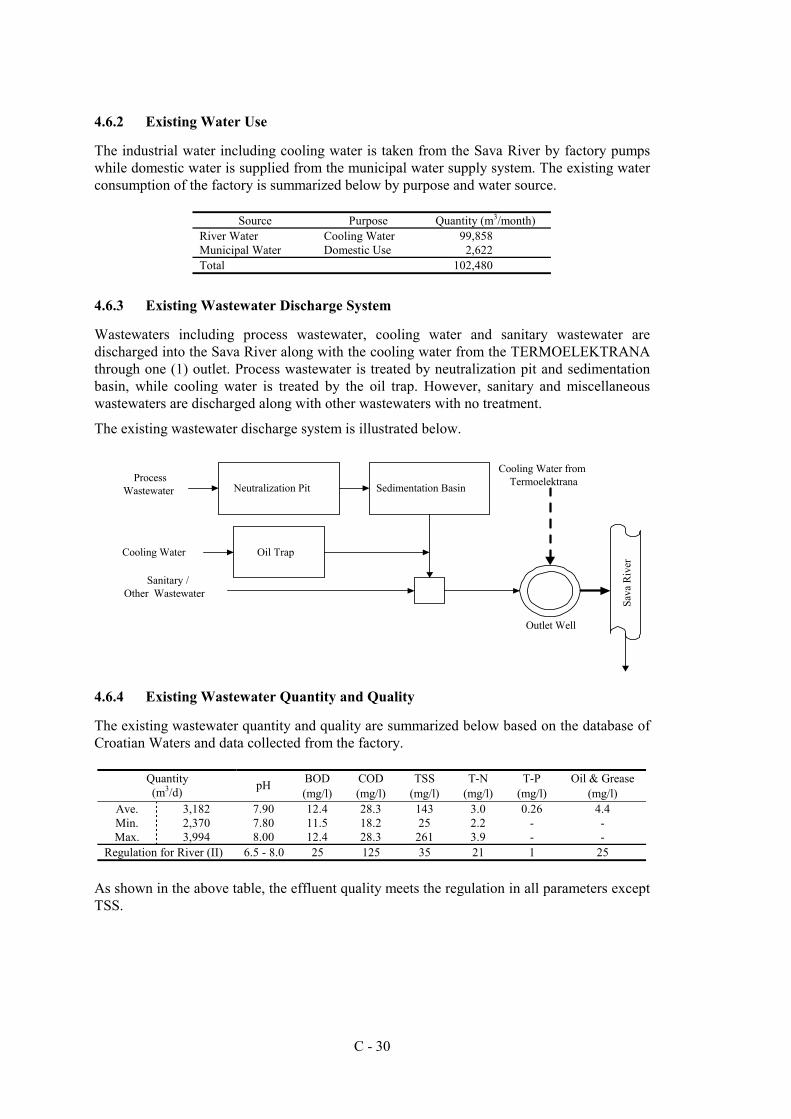
C - 30
4.6.2 Existing Water Use
The industrial water including cooling water is taken from the Sava River by factory pumps while domestic water is supplied from the municipal water supply system. The existing water consumption of the factory is summarized below by purpose and water source.
Source Purpose Quantity (m3/month) River Water Cooling Water 99,858 Municipal Water Domestic Use 2,622 Total 102,480
4.6.3 Existing Wastewater Discharge System
Wastewaters including process wastewater, cooling water and sanitary wastewater are discharged into the Sava River along with the cooling water from the TERMOELEKTRANA through one (1) outlet. Process wastewater is treated by neutralization pit and sedimentation basin, while cooling water is treated by the oil trap. However, sanitary and miscellaneous wastewaters are discharged along with other wastewaters with no treatment.
The existing wastewater discharge system is illustrated below.
4.6.4 Existing Wastewater Quantity and Quality
The existing wastewater quantity and quality are summarized below based on the database of Croatian Waters and data collected from the factory.
BOD COD TSS T-N T-P Oil & Grease Quantity (m3/d) pH
(mg/l) (mg/l) (mg/l) (mg/l) (mg/l) (mg/l) Ave. Min. Max.
3,182 2,370 3,994
7.90 7.80 8.00
12.4 11.5 12.4
28.3 18.2 28.3
143 25
261
3.0 2.2 3.9
0.26 - -
4.4 - -
Regulation for River (II) 6.5 - 8.0 25 125 35 21 1 25
As shown in the above table, the effluent quality meets the regulation in all parameters except TSS.
Neutralization Pit Sedimentation Basin
Oil Trap
Sava
Riv
er
ProcessWastewater
Cooling Water
Sanitary /Other Wastewater
Cooling Water fromTermoelektrana
Outlet Well
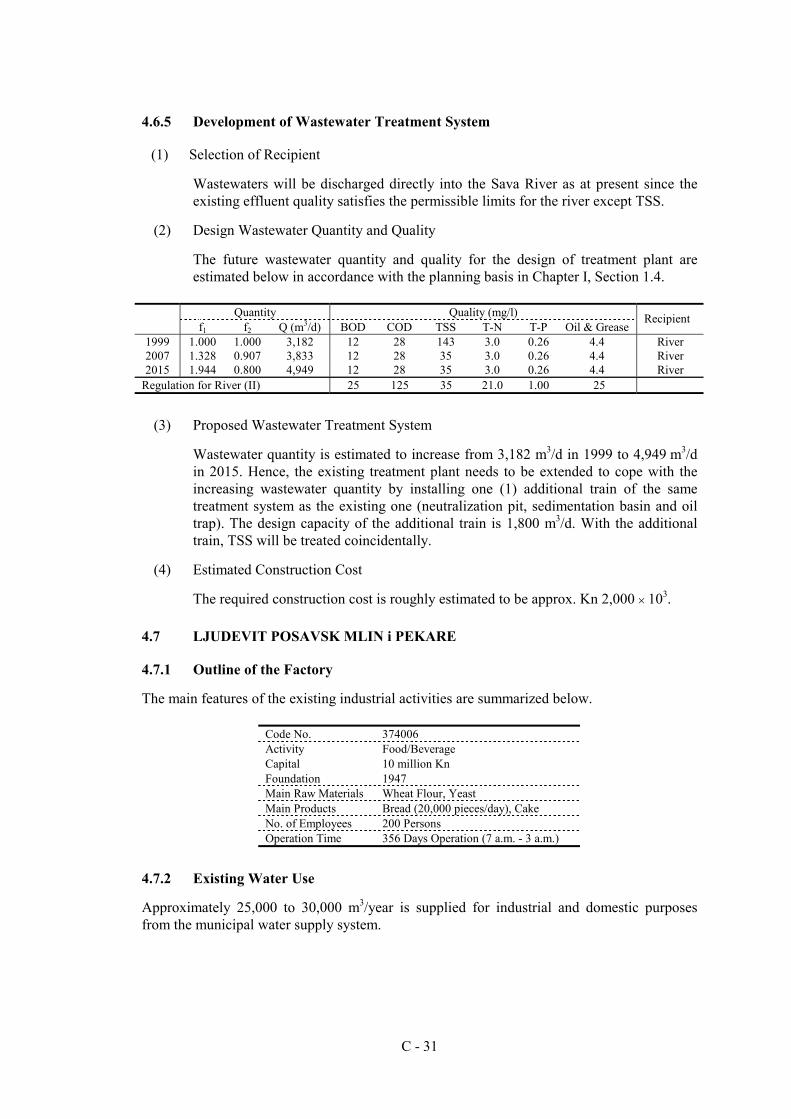
C - 31
4.6.5 Development of Wastewater Treatment System
(1) Selection of Recipient
Wastewaters will be discharged directly into the Sava River as at present since the existing effluent quality satisfies the permissible limits for the river except TSS.
(2) Design Wastewater Quantity and Quality
The future wastewater quantity and quality for the design of treatment plant are estimated below in accordance with the planning basis in Chapter I, Section 1.4.
Quantity Quality (mg/l)
f1 f2 Q (m3/d) BOD COD TSS T-N T-P Oil & Grease Recipient
1999 1.000 1.000 3,182 12 28 143 3.0 0.26 4.4 River 2007 1.328 0.907 3,833 12 28 35 3.0 0.26 4.4 River 2015 1.944 0.800 4,949 12 28 35 3.0 0.26 4.4 River
Regulation for River (II) 25 125 35 21.0 1.00 25
(3) Proposed Wastewater Treatment System
Wastewater quantity is estimated to increase from 3,182 m3/d in 1999 to 4,949 m3/d in 2015. Hence, the existing treatment plant needs to be extended to cope with the increasing wastewater quantity by installing one (1) additional train of the same treatment system as the existing one (neutralization pit, sedimentation basin and oil trap). The design capacity of the additional train is 1,800 m3/d. With the additional train, TSS will be treated coincidentally.
(4) Estimated Construction Cost
The required construction cost is roughly estimated to be approx. Kn 2,000 × 103.
4.7 LJUDEVIT POSAVSK MLIN i PEKARE
4.7.1 Outline of the Factory
The main features of the existing industrial activities are summarized below.
Code No. 374006 Activity Food/Beverage Capital 10 million Kn Foundation 1947 Main Raw Materials Wheat Flour, Yeast Main Products Bread (20,000 pieces/day), Cake No. of Employees 200 Persons Operation Time 356 Days Operation (7 a.m. - 3 a.m.)
4.7.2 Existing Water Use
Approximately 25,000 to 30,000 m3/year is supplied for industrial and domestic purposes from the municipal water supply system.
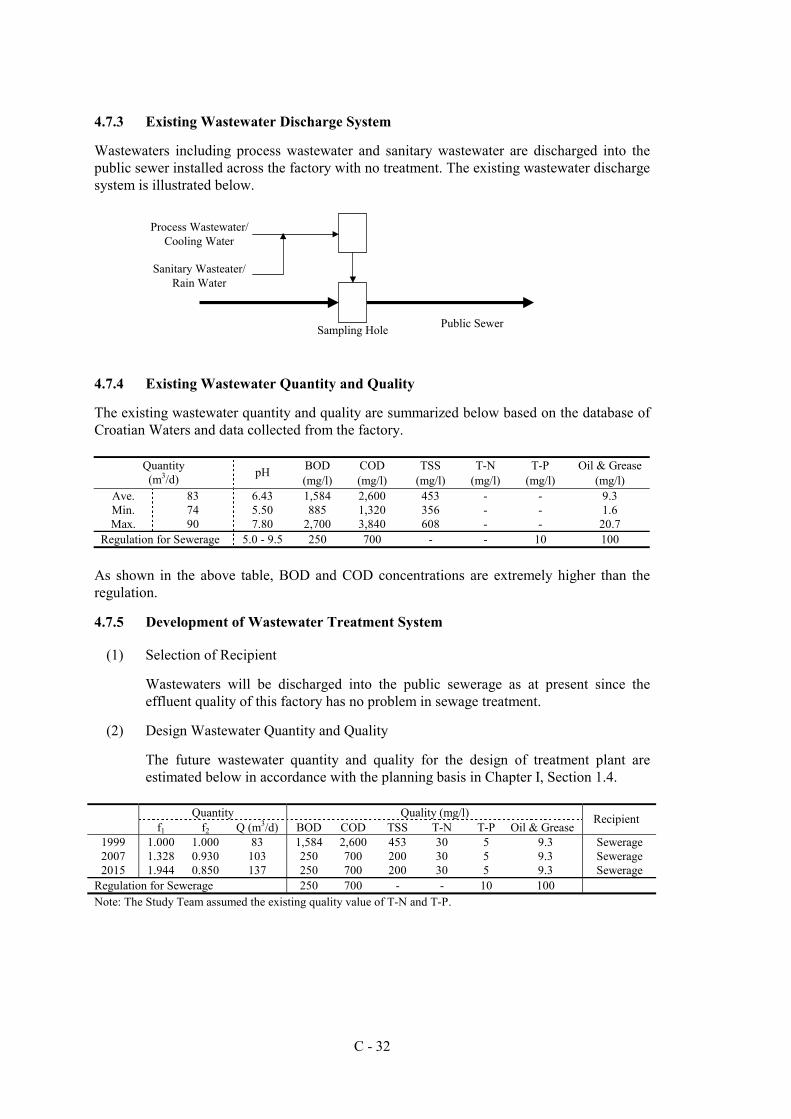
C - 32
4.7.3 Existing Wastewater Discharge System
Wastewaters including process wastewater and sanitary wastewater are discharged into the public sewer installed across the factory with no treatment. The existing wastewater discharge system is illustrated below.
4.7.4 Existing Wastewater Quantity and Quality
The existing wastewater quantity and quality are summarized below based on the database of Croatian Waters and data collected from the factory.
BOD COD TSS T-N T-P Oil & Grease Quantity (m3/d) pH
(mg/l) (mg/l) (mg/l) (mg/l) (mg/l) (mg/l) Ave. Min. Max.
83 74 90
6.43 5.50 7.80
1,584 885
2,700
2,600 1,320 3,840
453 356 608
- - -
- - -
9.3 1.6
20.7 Regulation for Sewerage 5.0 - 9.5 250 700 - - 10 100
As shown in the above table, BOD and COD concentrations are extremely higher than the regulation.
4.7.5 Development of Wastewater Treatment System
(1) Selection of Recipient
Wastewaters will be discharged into the public sewerage as at present since the effluent quality of this factory has no problem in sewage treatment.
(2) Design Wastewater Quantity and Quality
The future wastewater quantity and quality for the design of treatment plant are estimated below in accordance with the planning basis in Chapter I, Section 1.4.
Quantity Quality (mg/l)
f1 f2 Q (m3/d) BOD COD TSS T-N T-P Oil & Grease Recipient
1999 1.000 1.000 83 1,584 2,600 453 30 5 9.3 Sewerage 2007 1.328 0.930 103 250 700 200 30 5 9.3 Sewerage 2015 1.944 0.850 137 250 700 200 30 5 9.3 Sewerage
Regulation for Sewerage 250 700 - - 10 100 Note: The Study Team assumed the existing quality value of T-N and T-P.
Sampling Hole
Process Wastewater/Cooling Water
Sanitary Wasteater/Rain Water
Public Sewer
C - 33
(3) Proposed Wastewater Treatment System
(a) Treatment System
A new biological treatment plant (Standard Activated Sludge Treatment: AS) with a capacity of 150 m3/d is proposed to treat BOD and COD, as illustrated below. The detailed flow diagram and layout of the proposed treatment system are shown in Fig. C.2.5 and Fig. C.2.6 respectively.
(b) Specification of Major Equipment Equipment No. Name Specification Note
Capacity Treatment Plant 150 m3/day, 6.5 m3/h 24h continuous Operation S-2 Retention Pond 75 m3, 8 m × 4.0 m × 3.2 m H, RC Air bubbling devices S-3 S-4 S-5 M-3
Aeration Basin Sedimentation Basin Sludge Thickener Centrifuge
52 m3, 6.5 m × 3.2 m × 3.2 m H, RC 3.0 m D × 3.0 m H, RC 1.5m D × 2.5m H, CS 1.0 m3/h × 3.7 kW, SUS
Aeration unit Center driven rake Center driven rake Screw Decanter
Note: RC: Reinforced Concrete, CS: Carbon Steel, SUS: Stainless Steel. For Equipment No., see Fig. C.2.5 and Fig. C.2.6.
(c) Required Area
The required area is approx. 19m × 17m (323 m2). (Refer to Fig. C.2.6.)
(4) Estimated Construction Cost
The required construction cost is estimated to be Kn 5.91 million, broken down as follows.
Pump Pit Retention PondActivatedSludge
Treatment
Sludge Treatment
to Public Sewer
Process WastewaterWashing Water
Sanitary WaterCooling Water
Air Air
Sludge Cake
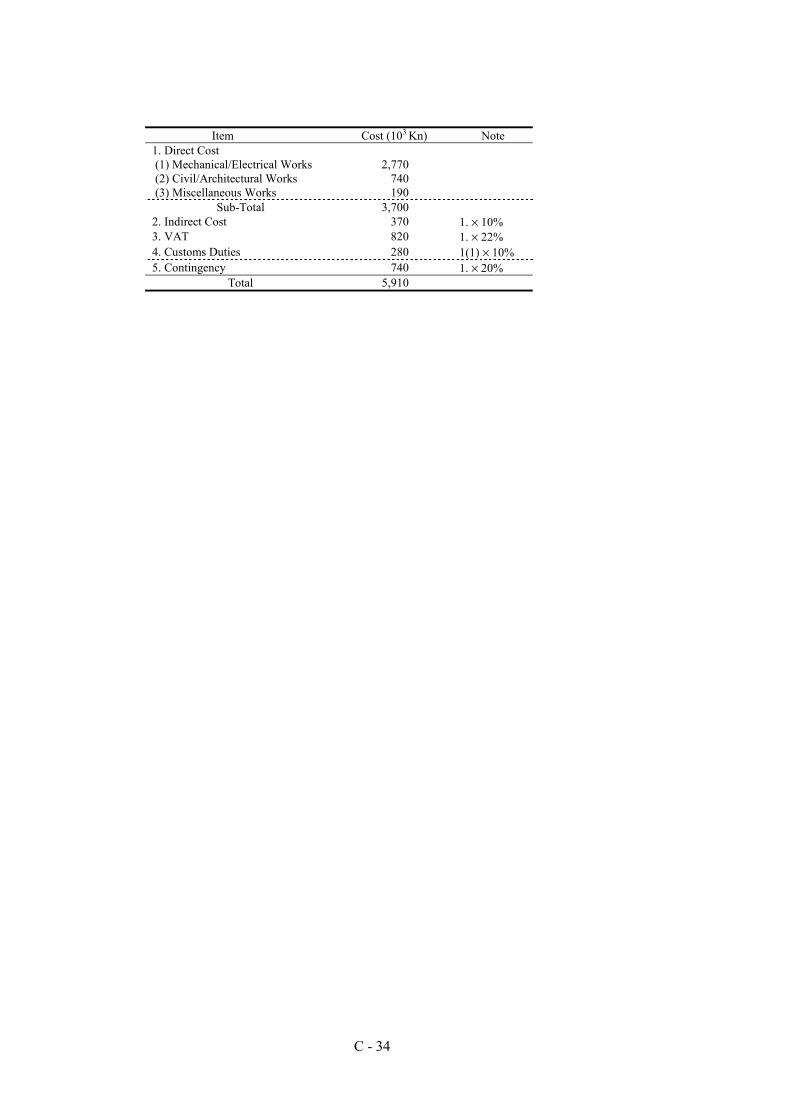
C - 34
Item Cost (103 Kn) Note
1. Direct Cost (1) Mechanical/Electrical Works (2) Civil/Architectural Works (3) Miscellaneous Works
2,770 740 190
Sub-Total 3,700 2. Indirect Cost 370 1. × 10% 3. VAT 820 1. × 22% 4. Customs Duties 280 1(1) × 10% 5. Contingency 740 1. × 20%
Total 5,910
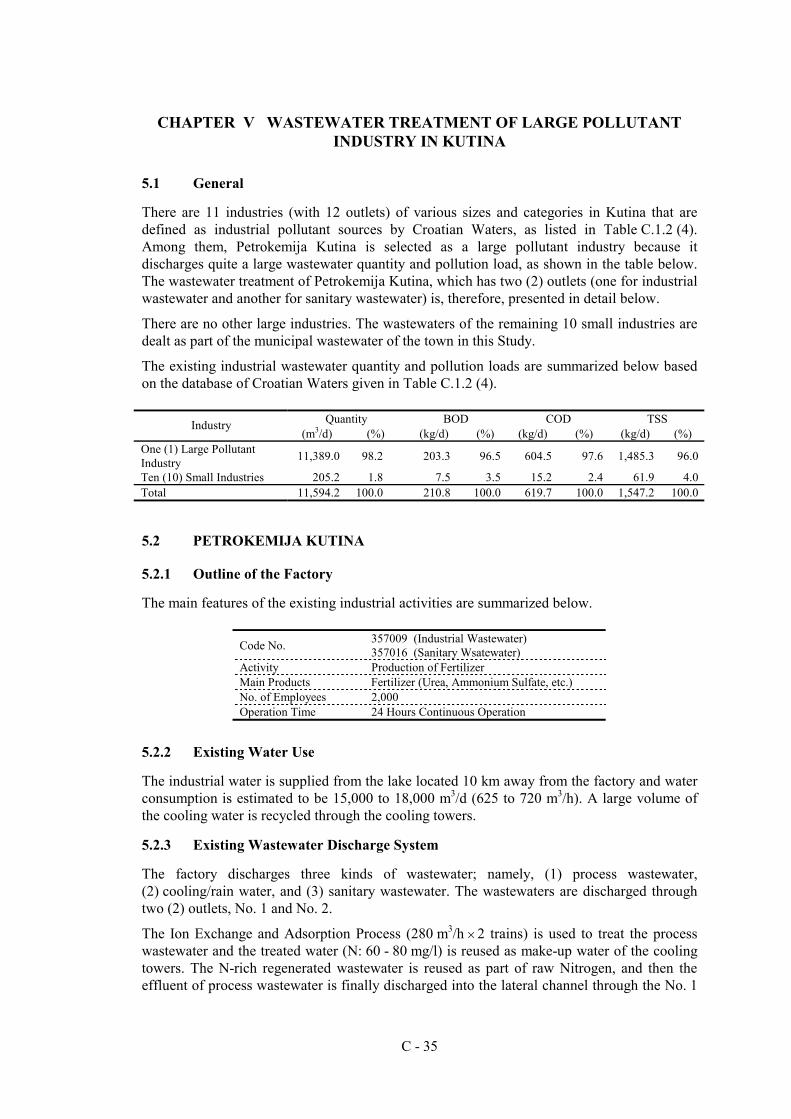
C - 35
CHAPTER V WASTEWATER TREATMENT OF LARGE POLLUTANT INDUSTRY IN KUTINA
5.1 General
There are 11 industries (with 12 outlets) of various sizes and categories in Kutina that are defined as industrial pollutant sources by Croatian Waters, as listed in Table C.1.2 (4). Among them, Petrokemija Kutina is selected as a large pollutant industry because it discharges quite a large wastewater quantity and pollution load, as shown in the table below. The wastewater treatment of Petrokemija Kutina, which has two (2) outlets (one for industrial wastewater and another for sanitary wastewater) is, therefore, presented in detail below.
There are no other large industries. The wastewaters of the remaining 10 small industries are dealt as part of the municipal wastewater of the town in this Study.
The existing industrial wastewater quantity and pollution loads are summarized below based on the database of Croatian Waters given in Table C.1.2 (4).
Quantity BOD COD TSS Industry (m3/d) (%) (kg/d) (%) (kg/d) (%) (kg/d) (%)
One (1) Large Pollutant Industry 11,389.0 98.2 203.3 96.5 604.5 97.6 1,485.3 96.0
Ten (10) Small Industries 205.2 1.8 7.5 3.5 15.2 2.4 61.9 4.0 Total 11,594.2 100.0 210.8 100.0 619.7 100.0 1,547.2 100.0
5.2 PETROKEMIJA KUTINA
5.2.1 Outline of the Factory
The main features of the existing industrial activities are summarized below.
Code No. 357009 (Industrial Wastewater) 357016 (Sanitary Wsatewater)
Activity Production of Fertilizer Main Products Fertilizer (Urea, Ammonium Sulfate, etc.) No. of Employees 2,000 Operation Time 24 Hours Continuous Operation
5.2.2 Existing Water Use
The industrial water is supplied from the lake located 10 km away from the factory and water consumption is estimated to be 15,000 to 18,000 m3/d (625 to 720 m3/h). A large volume of the cooling water is recycled through the cooling towers.
5.2.3 Existing Wastewater Discharge System
The factory discharges three kinds of wastewater; namely, (1) process wastewater, (2) cooling/rain water, and (3) sanitary wastewater. The wastewaters are discharged through two (2) outlets, No. 1 and No. 2.
The Ion Exchange and Adsorption Process (280 m3/h × 2 trains) is used to treat the process wastewater and the treated water (N: 60 - 80 mg/l) is reused as make-up water of the cooling towers. The N-rich regenerated wastewater is reused as part of raw Nitrogen, and then the effluent of process wastewater is finally discharged into the lateral channel through the No. 1
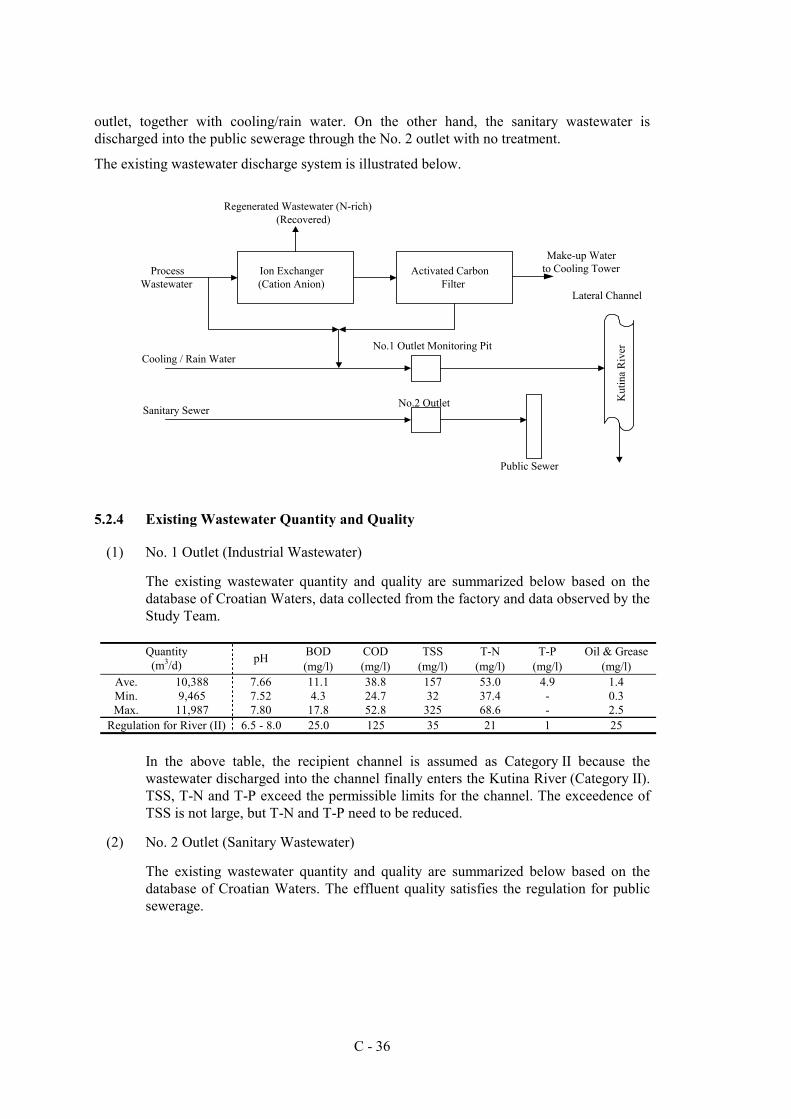
C - 36
outlet, together with cooling/rain water. On the other hand, the sanitary wastewater is discharged into the public sewerage through the No. 2 outlet with no treatment.
The existing wastewater discharge system is illustrated below.
5.2.4 Existing Wastewater Quantity and Quality
(1) No. 1 Outlet (Industrial Wastewater)
The existing wastewater quantity and quality are summarized below based on the database of Croatian Waters, data collected from the factory and data observed by the Study Team.
BOD COD TSS T-N T-P Oil & Grease Quantity
(m3/d) pH (mg/l) (mg/l) (mg/l) (mg/l) (mg/l) (mg/l)
Ave. Min. Max.
10,388 9,465
11,987
7.66 7.52 7.80
11.1 4.3
17.8
38.8 24.7 52.8
157 32
325
53.0 37.4 68.6
4.9 - -
1.4 0.3 2.5
Regulation for River (II) 6.5 - 8.0 25.0 125 35 21 1 25
In the above table, the recipient channel is assumed as Category II because the wastewater discharged into the channel finally enters the Kutina River (Category II). TSS, T-N and T-P exceed the permissible limits for the channel. The exceedence of TSS is not large, but T-N and T-P need to be reduced.
(2) No. 2 Outlet (Sanitary Wastewater)
The existing wastewater quantity and quality are summarized below based on the database of Croatian Waters. The effluent quality satisfies the regulation for public sewerage.
Ion Exchanger(Cation Anion)
Activated CarbonFilter
Regenerated Wastewater (N-rich)(Recovered)
Make-up Waterto Cooling Tower
Lateral Channel
No.1 Outlet Monitoring Pit
No.2 Outlet
Public Sewer
ProcessWastewater
Cooling / Rain Water
Sanitary Sewer
Kut
ina
Riv
er
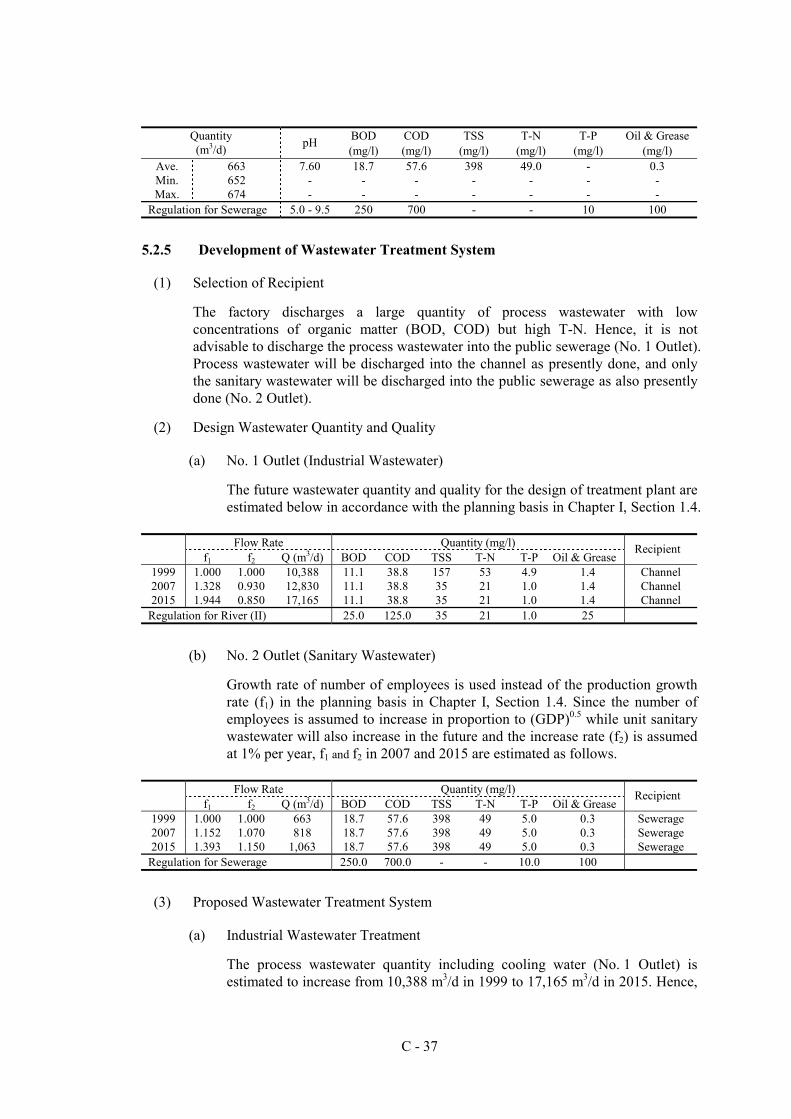
C - 37
BOD COD TSS T-N T-P Oil & Grease Quantity
(m3/d) pH (mg/l) (mg/l) (mg/l) (mg/l) (mg/l) (mg/l)
Ave. Min. Max.
663 652 674
7.60 - -
18.7 - -
57.6 - -
398 - -
49.0 - -
- - -
0.3 - -
Regulation for Sewerage 5.0 - 9.5 250 700 - - 10 100
5.2.5 Development of Wastewater Treatment System
(1) Selection of Recipient
The factory discharges a large quantity of process wastewater with low concentrations of organic matter (BOD, COD) but high T-N. Hence, it is not advisable to discharge the process wastewater into the public sewerage (No. 1 Outlet). Process wastewater will be discharged into the channel as presently done, and only the sanitary wastewater will be discharged into the public sewerage as also presently done (No. 2 Outlet).
(2) Design Wastewater Quantity and Quality
(a) No. 1 Outlet (Industrial Wastewater)
The future wastewater quantity and quality for the design of treatment plant are estimated below in accordance with the planning basis in Chapter I, Section 1.4.
Flow Rate Quantity (mg/l)
f1 f2 Q (m3/d) BOD COD TSS T-N T-P Oil & Grease Recipient
1999 1.000 1.000 10,388 11.1 38.8 157 53 4.9 1.4 Channel 2007 1.328 0.930 12,830 11.1 38.8 35 21 1.0 1.4 Channel 2015 1.944 0.850 17,165 11.1 38.8 35 21 1.0 1.4 Channel
Regulation for River (II) 25.0 125.0 35 21 1.0 25
(b) No. 2 Outlet (Sanitary Wastewater)
Growth rate of number of employees is used instead of the production growth rate (f1) in the planning basis in Chapter I, Section 1.4. Since the number of employees is assumed to increase in proportion to (GDP)0.5 while unit sanitary wastewater will also increase in the future and the increase rate (f2) is assumed at 1% per year, f1 and f2 in 2007 and 2015 are estimated as follows.
Flow Rate Quantity (mg/l)
f1 f2 Q (m3/d) BOD COD TSS T-N T-P Oil & Grease Recipient
1999 1.000 1.000 663 18.7 57.6 398 49 5.0 0.3 Sewerage 2007 1.152 1.070 818 18.7 57.6 398 49 5.0 0.3 Sewerage 2015 1.393 1.150 1,063 18.7 57.6 398 49 5.0 0.3 Sewerage
Regulation for Sewerage 250.0 700.0 - - 10.0 100
(3) Proposed Wastewater Treatment System
(a) Industrial Wastewater Treatment
The process wastewater quantity including cooling water (No. 1 Outlet) is estimated to increase from 10,388 m3/d in 1999 to 17,165 m3/d in 2015. Hence,
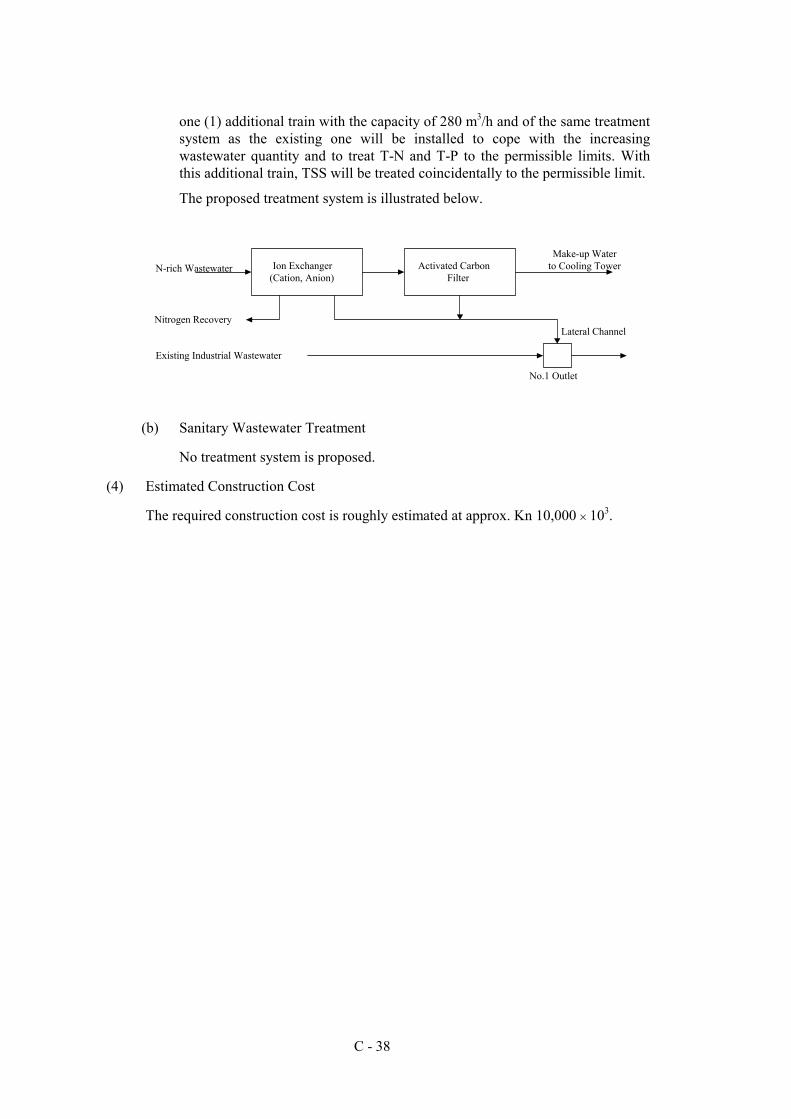
C - 38
one (1) additional train with the capacity of 280 m3/h and of the same treatment system as the existing one will be installed to cope with the increasing wastewater quantity and to treat T-N and T-P to the permissible limits. With this additional train, TSS will be treated coincidentally to the permissible limit.
The proposed treatment system is illustrated below.
(b) Sanitary Wastewater Treatment
No treatment system is proposed.
(4) Estimated Construction Cost
The required construction cost is roughly estimated at approx. Kn 10,000 × 103.
Ion Exchanger(Cation, Anion)
Activated CarbonFilter
N-rich Wastewater
Nitrogen Recovery
Make-up Waterto Cooling Tower
Lateral Channel
No.1 Outlet
Existing Industrial Wastewater
C - 39
CHAPTER VI WASTEWATER TREATMENT OF LARGE POLLUTANT INDUSTRIES IN KARLOVAC-DUGA RESA
6.1 General
The industrial wastewater treatment of Karlovac and Duga Resa are studied together in this Study since the municipal wastewaters of both towns are planned to be collected into the treatment plant proposed at the eastern fringe of Karlovac.
There are 32 industries of various sizes and categories in Karlovac and Duga Resa that are defined as industrial pollutant sources by Croatian Waters (see, Table C.1.2 (5) and Table C.1.2 (5a). Among them, 13 industries are selected as large industries and six (6) of these are further selected as large pollutant industries as listed in Chapter I, Section 1.3.
The wastewater treatment of the six (6) large pollutant industries are presented in detail in this Chapter VI, while the wastewater treatment of the other seven (7) large industries are discussed in Chapter VIII. The wastewater of the remaining 19 small industries is dealt as part of the municipal wastewater.
The existing industrial wastewater quantity and pollution loads are summarized below based on the database of Croatian Water given in Table C.1.2 (5) and Table C.1.2 (5a).
Quantity BOD COD TSS Industry (m3/d) (%) (kg/d) (%) (kg/d) (%) (kg/d) (%)
Six Large Pollutant Industries 5,372.5 75.8 2,202.5 97.0 4,236.4 96.0 4,630.2 86.2 Seven Large Industries 1,138.3 16.1 23.4 1.0 77.0 1.7 369.2 6.9 19 Small Industries 574.2 8.1 46.1 2.0 100.5 2.3 374.7 6.9 Total 7,085.0 100.0 2,272.0 100.0 4,413.9 100.0 5,374.1 100.0
6.2 KARLOVAČKA PIVOVARA d.d.
6.2.1 Outline of the Factory
The main features of the existing industrial activities are summarized below.
Code No. 333015 Activity Production of Beer Factory Area 11 ha
Malt and Substitute : 15,000 ton Main Raw Materials Malt and Ferment : 780,000 kl Beer : 770,000 kl Sugar : 1,000 ton Condensate : 150 ton Masut (fat) : 4,000,000 ton Glycol : 70 m3
Main Products
NH3 : 25 ton No. of Employees 707 Persons Operation Time 24 Hours Continuous Operation
6.2.2 Existing Water Use
The factory uses approximately 819,000 m3 annually of the municipal water supply and 17,000 m3 of this amount is consumed for cooling use.
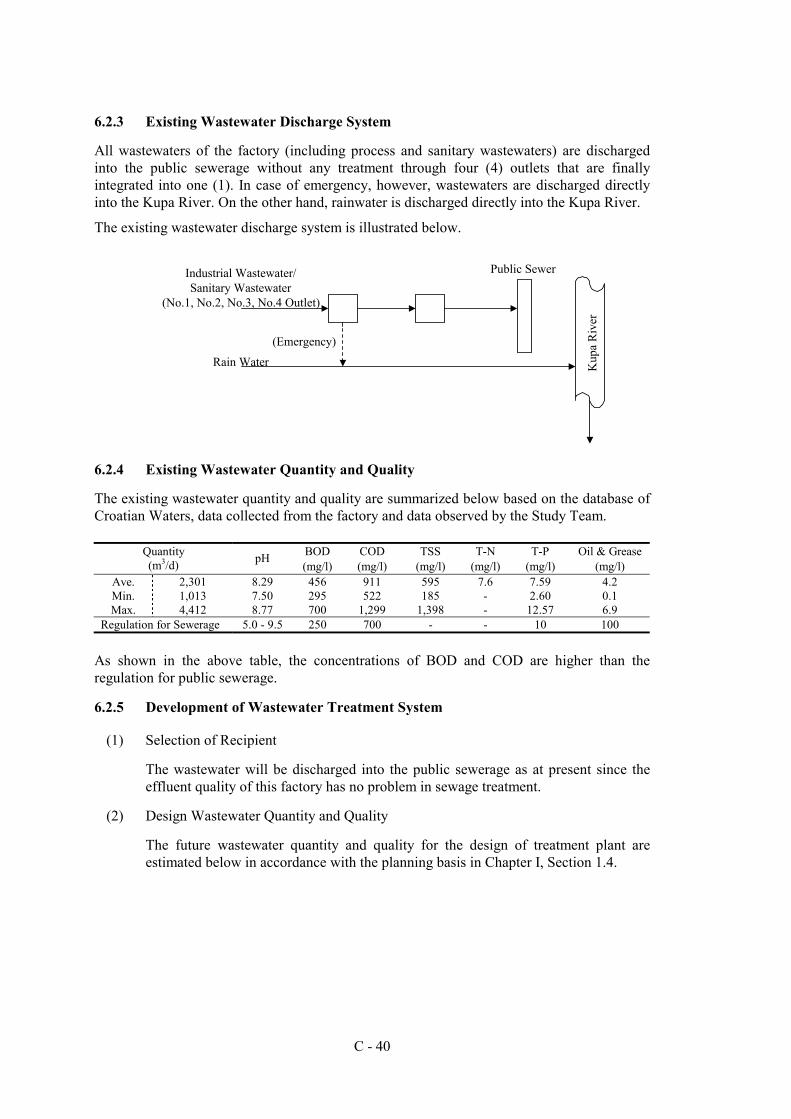
C - 40
6.2.3 Existing Wastewater Discharge System
All wastewaters of the factory (including process and sanitary wastewaters) are discharged into the public sewerage without any treatment through four (4) outlets that are finally integrated into one (1). In case of emergency, however, wastewaters are discharged directly into the Kupa River. On the other hand, rainwater is discharged directly into the Kupa River.
The existing wastewater discharge system is illustrated below.
6.2.4 Existing Wastewater Quantity and Quality
The existing wastewater quantity and quality are summarized below based on the database of Croatian Waters, data collected from the factory and data observed by the Study Team.
BOD COD TSS T-N T-P Oil & Grease Quantity (m3/d) pH
(mg/l) (mg/l) (mg/l) (mg/l) (mg/l) (mg/l) Ave. Min. Max.
2,301 1,013 4,412
8.29 7.50 8.77
456 295 700
911 522
1,299
595 185
1,398
7.6 - -
7.59 2.60
12.57
4.2 0.1 6.9
Regulation for Sewerage 5.0 - 9.5 250 700 - - 10 100
As shown in the above table, the concentrations of BOD and COD are higher than the regulation for public sewerage.
6.2.5 Development of Wastewater Treatment System
(1) Selection of Recipient
The wastewater will be discharged into the public sewerage as at present since the effluent quality of this factory has no problem in sewage treatment.
(2) Design Wastewater Quantity and Quality
The future wastewater quantity and quality for the design of treatment plant are estimated below in accordance with the planning basis in Chapter I, Section 1.4.
Kup
a R
iver
Public SewerIndustrial Wastewater/Sanitary Wastewater
(No.1, No.2, No.3, No.4 Outlet)
Rain Water
(Emergency)
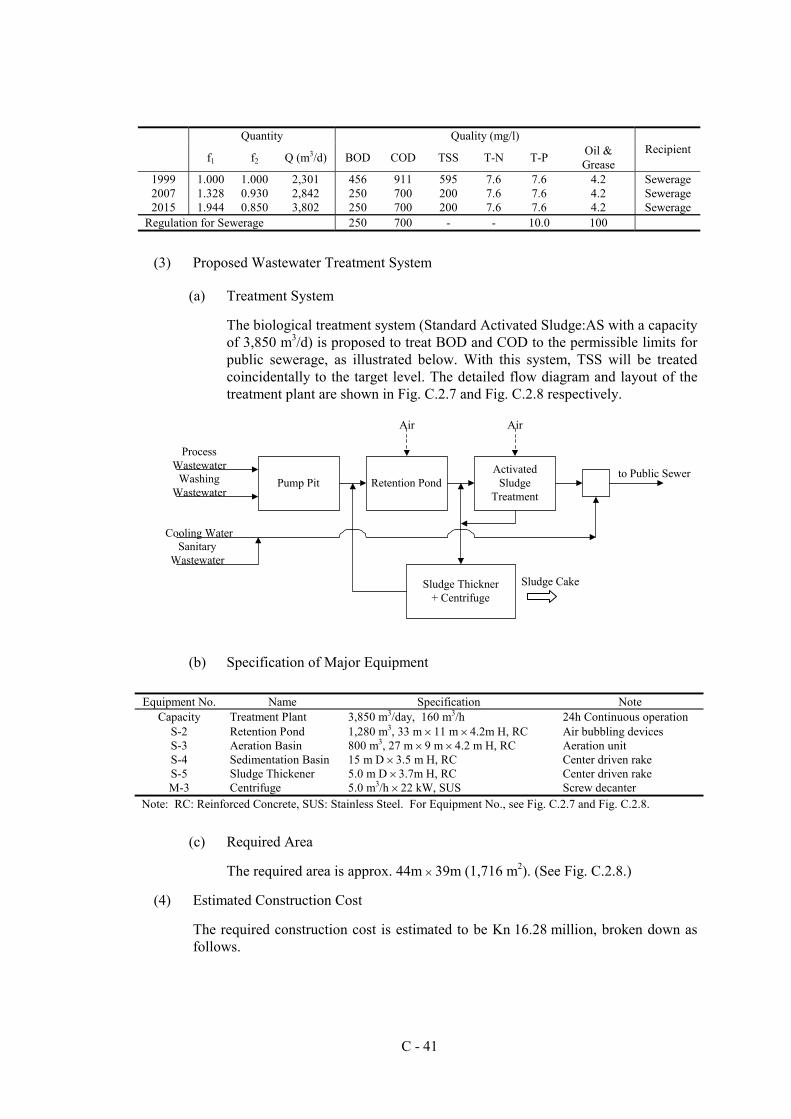
C - 41
Quantity Quality (mg/l)
f1 f2 Q (m3/d) BOD COD TSS T-N T-P Oil &
Grease Recipient
1999 1.000 1.000 2,301 456 911 595 7.6 7.6 4.2 Sewerage 2007 1.328 0.930 2,842 250 700 200 7.6 7.6 4.2 Sewerage 2015 1.944 0.850 3,802 250 700 200 7.6 7.6 4.2 Sewerage
Regulation for Sewerage 250 700 - - 10.0 100
(3) Proposed Wastewater Treatment System
(a) Treatment System
The biological treatment system (Standard Activated Sludge:AS with a capacity of 3,850 m3/d) is proposed to treat BOD and COD to the permissible limits for public sewerage, as illustrated below. With this system, TSS will be treated coincidentally to the target level. The detailed flow diagram and layout of the treatment plant are shown in Fig. C.2.7 and Fig. C.2.8 respectively.
(b) Specification of Major Equipment Equipment No. Name Specification Note
Capacity Treatment Plant 3,850 m3/day, 160 m3/h 24h Continuous operation S-2 Retention Pond 1,280 m3, 33 m × 11 m × 4.2m H, RC Air bubbling devices S-3 S-4 S-5 M-3
Aeration Basin Sedimentation Basin Sludge Thickener Centrifuge
800 m3, 27 m × 9 m × 4.2 m H, RC 15 m D × 3.5 m H, RC 5.0 m D × 3.7m H, RC 5.0 m3/h × 22 kW, SUS
Aeration unit Center driven rake Center driven rake Screw decanter
Note: RC: Reinforced Concrete, SUS: Stainless Steel. For Equipment No., see Fig. C.2.7 and Fig. C.2.8.
(c) Required Area
The required area is approx. 44m × 39m (1,716 m2). (See Fig. C.2.8.)
(4) Estimated Construction Cost
The required construction cost is estimated to be Kn 16.28 million, broken down as follows.
Pump Pit Retention PondActivated
SludgeTreatment
Sludge Thickner+ Centrifuge
to Public Sewer
ProcessWastewater
WashingWastewater
SanitaryWastewater
Cooling Water
Air Air
Sludge Cake
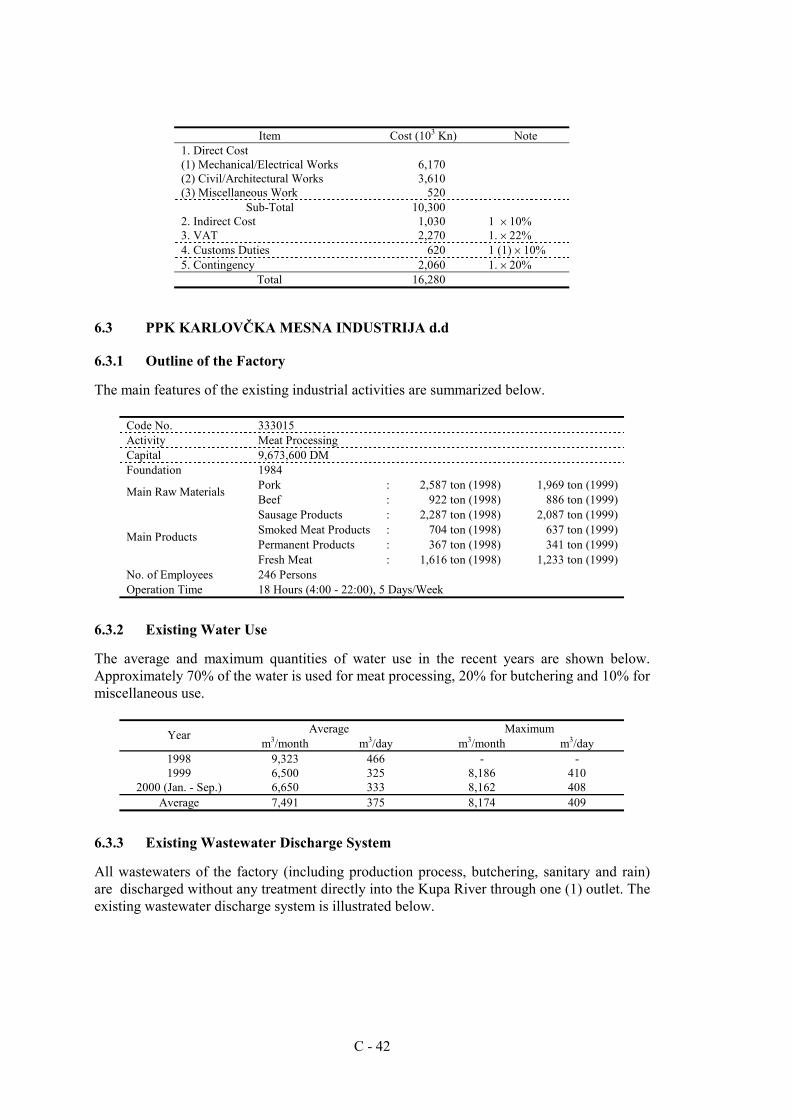
C - 42
Item Cost (103 Kn) Note
1. Direct Cost (1) Mechanical/Electrical Works (2) Civil/Architectural Works (3) Miscellaneous Work
6,170 3,610
520
Sub-Total 10,300 2. Indirect Cost 1,030 1 × 10% 3. VAT 2,270 1. × 22% 4. Customs Duties 620 1 (1) × 10% 5. Contingency 2,060 1. × 20%
Total 16,280
6.3 PPK KARLOVČKA MESNA INDUSTRIJA d.d
6.3.1 Outline of the Factory
The main features of the existing industrial activities are summarized below.
Code No. 333015 Activity Meat Processing Capital 9,673,600 DM Foundation 1984
Pork : 2,587 ton (1998) 1,969 ton (1999) Main Raw Materials Beef : 922 ton (1998) 886 ton (1999) Sausage Products : 2,287 ton (1998) 2,087 ton (1999) Smoked Meat Products : 704 ton (1998) 637 ton (1999) Permanent Products : 367 ton (1998) 341 ton (1999) Main Products
Fresh Meat : 1,616 ton (1998) 1,233 ton (1999) No. of Employees 246 Persons Operation Time 18 Hours (4:00 - 22:00), 5 Days/Week
6.3.2 Existing Water Use
The average and maximum quantities of water use in the recent years are shown below. Approximately 70% of the water is used for meat processing, 20% for butchering and 10% for miscellaneous use.
Average Maximum Year m3/month m3/day m3/month m3/day
1998 9,323 466 - - 1999 6,500 325 8,186 410
2000 (Jan. - Sep.) 6,650 333 8,162 408 Average 7,491 375 8,174 409
6.3.3 Existing Wastewater Discharge System
All wastewaters of the factory (including production process, butchering, sanitary and rain) are discharged without any treatment directly into the Kupa River through one (1) outlet. The existing wastewater discharge system is illustrated below.
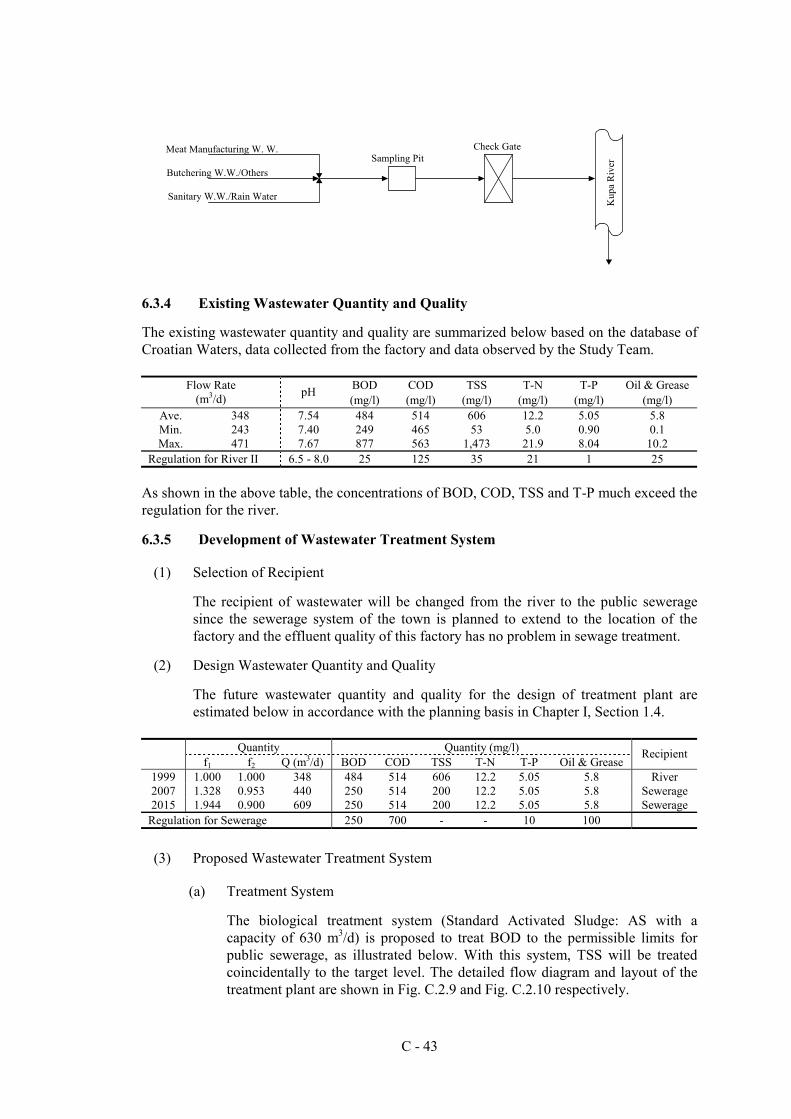
C - 43
6.3.4 Existing Wastewater Quantity and Quality
The existing wastewater quantity and quality are summarized below based on the database of Croatian Waters, data collected from the factory and data observed by the Study Team.
BOD COD TSS T-N T-P Oil & Grease Flow Rate (m3/d) pH
(mg/l) (mg/l) (mg/l) (mg/l) (mg/l) (mg/l) Ave. Min. Max.
348 243 471
7.54 7.40 7.67
484 249 877
514 465 563
606 53
1,473
12.2 5.0
21.9
5.05 0.90 8.04
5.8 0.1
10.2 Regulation for River II 6.5 - 8.0 25 125 35 21 1 25
As shown in the above table, the concentrations of BOD, COD, TSS and T-P much exceed the regulation for the river.
6.3.5 Development of Wastewater Treatment System
(1) Selection of Recipient
The recipient of wastewater will be changed from the river to the public sewerage since the sewerage system of the town is planned to extend to the location of the factory and the effluent quality of this factory has no problem in sewage treatment.
(2) Design Wastewater Quantity and Quality
The future wastewater quantity and quality for the design of treatment plant are estimated below in accordance with the planning basis in Chapter I, Section 1.4.
Quantity Quantity (mg/l)
f1 f2 Q (m3/d) BOD COD TSS T-N T-P Oil & Grease Recipient
1999 1.000 1.000 348 484 514 606 12.2 5.05 5.8 River 2007 1.328 0.953 440 250 514 200 12.2 5.05 5.8 Sewerage 2015 1.944 0.900 609 250 514 200 12.2 5.05 5.8 Sewerage
Regulation for Sewerage 250 700 - - 10 100
(3) Proposed Wastewater Treatment System
(a) Treatment System
The biological treatment system (Standard Activated Sludge: AS with a capacity of 630 m3/d) is proposed to treat BOD to the permissible limits for public sewerage, as illustrated below. With this system, TSS will be treated coincidentally to the target level. The detailed flow diagram and layout of the treatment plant are shown in Fig. C.2.9 and Fig. C.2.10 respectively.
Kup
a R
iver
Meat Manufacturing W. W.
Butchering W.W./Others
Sanitary W.W./Rain Water
Sampling PitCheck Gate
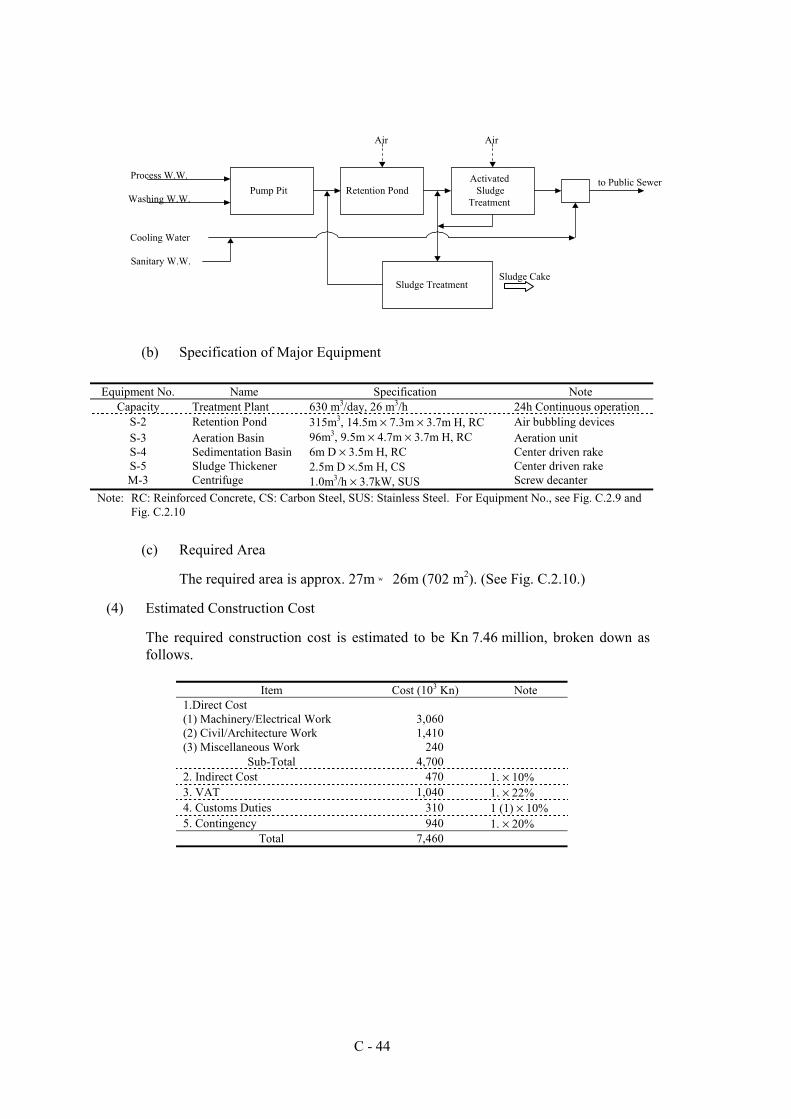
C - 44
(b) Specification of Major Equipment
Equipment No. Name Specification Note Capacity Treatment Plant 630 m3/day, 26 m3/h 24h Continuous operation
S-2 Retention Pond 315m3, 14.5m × 7.3m × 3.7m H, RC Air bubbling devices S-3 S-4 S-5 M-3
Aeration Basin Sedimentation Basin Sludge Thickener Centrifuge
96m3, 9.5m × 4.7m × 3.7m H, RC 6m D × 3.5m H, RC 2.5m D ×.5m H, CS 1.0m3/h × 3.7kW, SUS
Aeration unit Center driven rake Center driven rake Screw decanter
Note: RC: Reinforced Concrete, CS: Carbon Steel, SUS: Stainless Steel. For Equipment No., see Fig. C.2.9 and Fig. C.2.10
(c) Required Area
The required area is approx. 27m × 26m (702 m2). (See Fig. C.2.10.)
(4) Estimated Construction Cost
The required construction cost is estimated to be Kn 7.46 million, broken down as follows.
Item Cost (103 Kn) Note
1.Direct Cost (1) Machinery/Electrical Work (2) Civil/Architecture Work (3) Miscellaneous Work
3,060 1,410
240
Sub-Total 4,700 2. Indirect Cost 470 1. × 10% 3. VAT 1,040 1. × 22% 4. Customs Duties 310 1 (1) × 10% 5. Contingency 940 1. × 20%
Total 7,460
Pump Pit Retention PondActivated
SludgeTreatment
Sludge Treatment
to Public SewerProcess W.W.
Washing W.W.
Sanitary W.W.
Cooling Water
Air Air
Sludge Cake
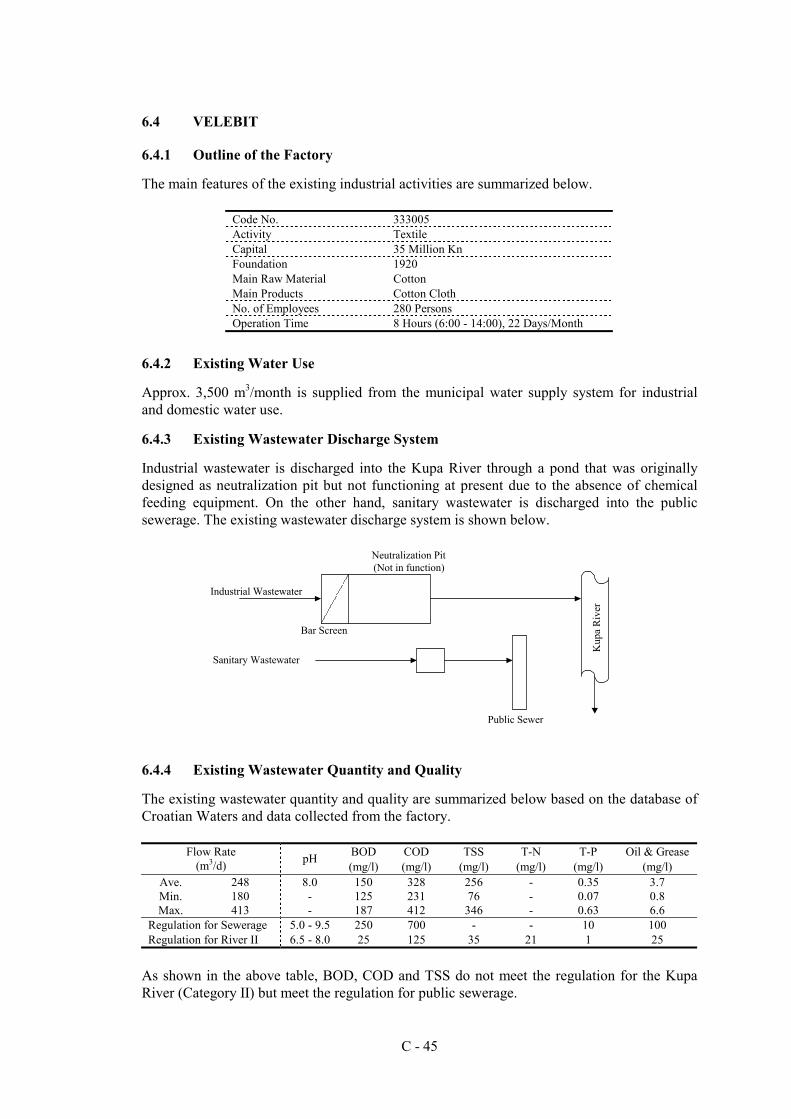
C - 45
6.4 VELEBIT
6.4.1 Outline of the Factory
The main features of the existing industrial activities are summarized below.
Code No. 333005 Activity Textile Capital 35 Million Kn Foundation 1920 Main Raw Material Cotton Main Products Cotton Cloth No. of Employees 280 Persons Operation Time 8 Hours (6:00 - 14:00), 22 Days/Month
6.4.2 Existing Water Use
Approx. 3,500 m3/month is supplied from the municipal water supply system for industrial and domestic water use.
6.4.3 Existing Wastewater Discharge System
Industrial wastewater is discharged into the Kupa River through a pond that was originally designed as neutralization pit but not functioning at present due to the absence of chemical feeding equipment. On the other hand, sanitary wastewater is discharged into the public sewerage. The existing wastewater discharge system is shown below.
6.4.4 Existing Wastewater Quantity and Quality
The existing wastewater quantity and quality are summarized below based on the database of Croatian Waters and data collected from the factory.
BOD COD TSS T-N T-P Oil & Grease Flow Rate (m3/d) pH
(mg/l) (mg/l) (mg/l) (mg/l) (mg/l) (mg/l) Ave. Min. Max.
248 180 413
8.0 - -
150 125 187
328 231 412
256 76
346
- - -
0.35 0.07 0.63
3.7 0.8 6.6
Regulation for Sewerage 5.0 - 9.5 250 700 - - 10 100 Regulation for River II 6.5 - 8.0 25 125 35 21 1 25
As shown in the above table, BOD, COD and TSS do not meet the regulation for the Kupa River (Category II) but meet the regulation for public sewerage.
Kup
a R
iver
Industrial Wastewater
Sanitary Wastewater
Neutralization Pit(Not in function)
Public Sewer
Bar Screen
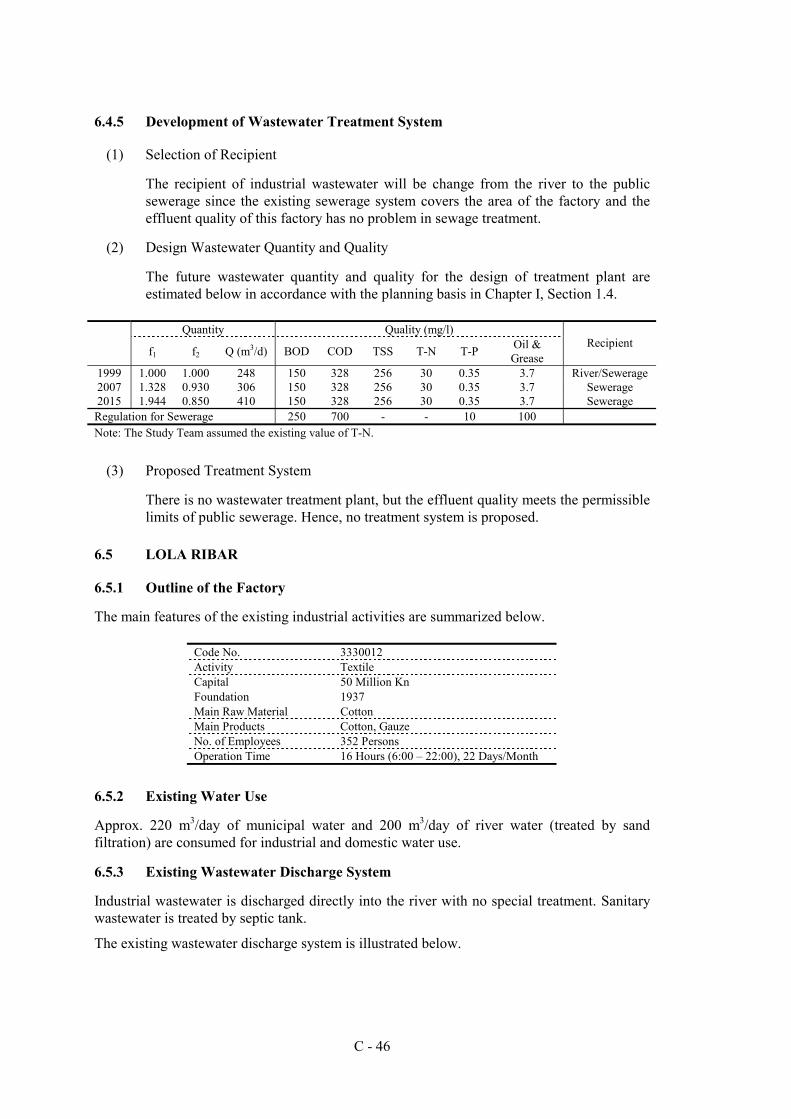
C - 46
6.4.5 Development of Wastewater Treatment System
(1) Selection of Recipient
The recipient of industrial wastewater will be change from the river to the public sewerage since the existing sewerage system covers the area of the factory and the effluent quality of this factory has no problem in sewage treatment.
(2) Design Wastewater Quantity and Quality
The future wastewater quantity and quality for the design of treatment plant are estimated below in accordance with the planning basis in Chapter I, Section 1.4.
Quantity Quality (mg/l)
f1 f2 Q (m3/d) BOD COD TSS T-N T-P Oil &
Grease Recipient
1999 1.000 1.000 248 150 328 256 30 0.35 3.7 River/Sewerage 2007 1.328 0.930 306 150 328 256 30 0.35 3.7 Sewerage 2015 1.944 0.850 410 150 328 256 30 0.35 3.7 Sewerage Regulation for Sewerage 250 700 - - 10 100 Note: The Study Team assumed the existing value of T-N.
(3) Proposed Treatment System
There is no wastewater treatment plant, but the effluent quality meets the permissible limits of public sewerage. Hence, no treatment system is proposed.
6.5 LOLA RIBAR
6.5.1 Outline of the Factory
The main features of the existing industrial activities are summarized below.
Code No. 3330012 Activity Textile Capital 50 Million Kn Foundation 1937 Main Raw Material Cotton Main Products Cotton, Gauze No. of Employees 352 Persons Operation Time 16 Hours (6:00 – 22:00), 22 Days/Month
6.5.2 Existing Water Use
Approx. 220 m3/day of municipal water and 200 m3/day of river water (treated by sand filtration) are consumed for industrial and domestic water use.
6.5.3 Existing Wastewater Discharge System
Industrial wastewater is discharged directly into the river with no special treatment. Sanitary wastewater is treated by septic tank.
The existing wastewater discharge system is illustrated below.
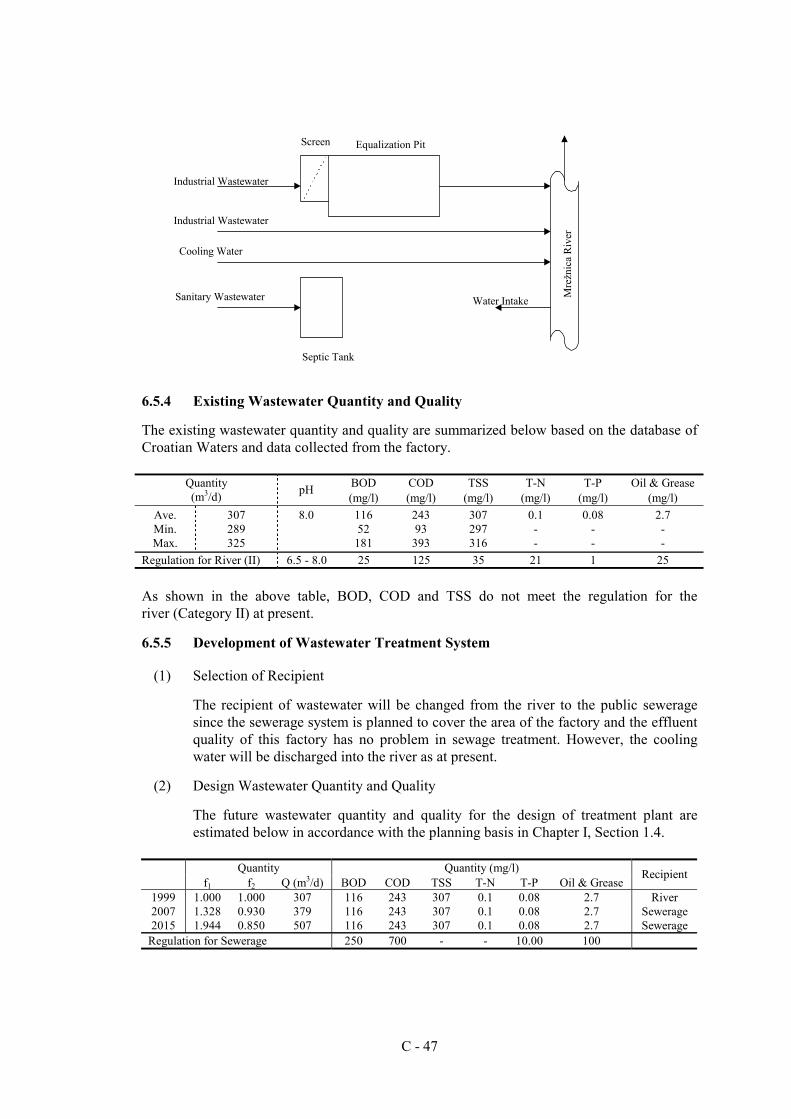
C - 47
Mre
žnic
a R
iver
Equalization Pit
Septic Tank
Water Intake
Industrial Wastewater
Industrial Wastewater
Sanitary Wastewater
Screen
Cooling Water
6.5.4 Existing Wastewater Quantity and Quality
The existing wastewater quantity and quality are summarized below based on the database of Croatian Waters and data collected from the factory.
BOD COD TSS T-N T-P Oil & Grease Quantity (m3/d) pH
(mg/l) (mg/l) (mg/l) (mg/l) (mg/l) (mg/l) Ave. Min. Max.
307 289 325
8.0
116 52
181
243 93
393
307 297 316
0.1 - -
0.08 - -
2.7 - -
Regulation for River (II) 6.5 - 8.0 25 125 35 21 1 25
As shown in the above table, BOD, COD and TSS do not meet the regulation for the river (Category II) at present.
6.5.5 Development of Wastewater Treatment System
(1) Selection of Recipient
The recipient of wastewater will be changed from the river to the public sewerage since the sewerage system is planned to cover the area of the factory and the effluent quality of this factory has no problem in sewage treatment. However, the cooling water will be discharged into the river as at present.
(2) Design Wastewater Quantity and Quality
The future wastewater quantity and quality for the design of treatment plant are estimated below in accordance with the planning basis in Chapter I, Section 1.4.
Quantity Quantity (mg/l)
f1 f2 Q (m3/d) BOD COD TSS T-N T-P Oil & Grease Recipient
1999 1.000 1.000 307 116 243 307 0.1 0.08 2.7 River 2007 1.328 0.930 379 116 243 307 0.1 0.08 2.7 Sewerage 2015 1.944 0.850 507 116 243 307 0.1 0.08 2.7 Sewerage
Regulation for Sewerage 250 700 - - 10.00 100
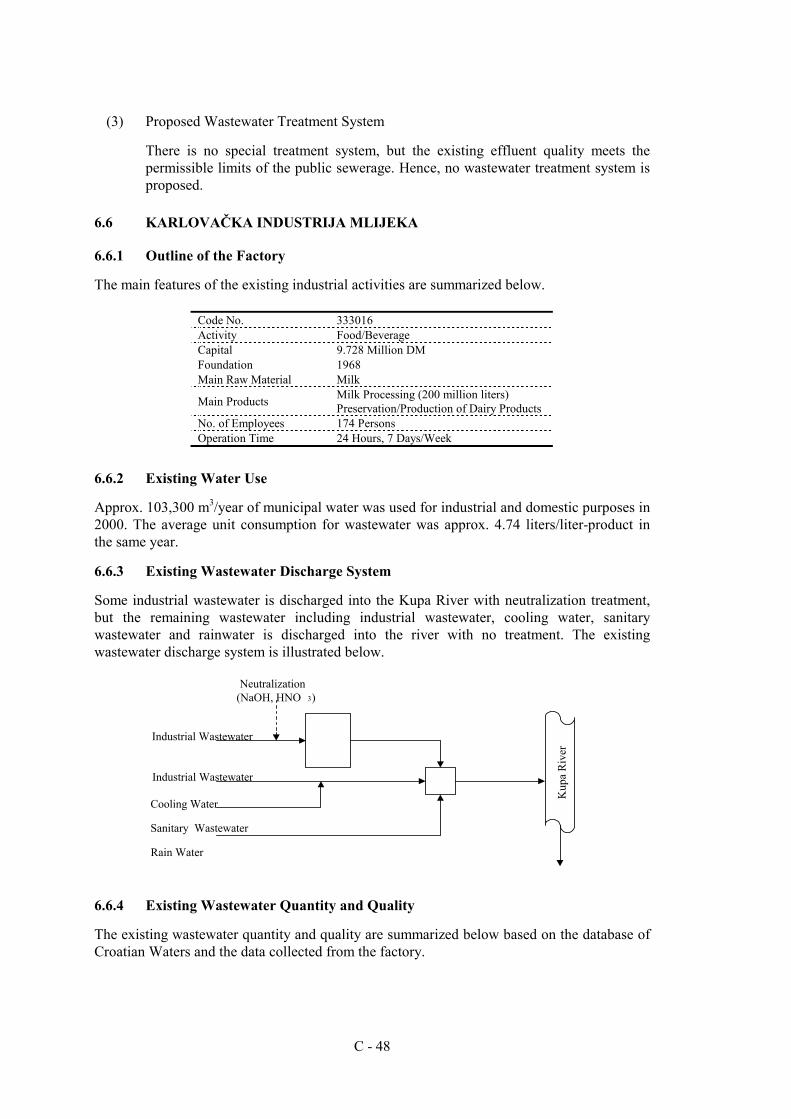
C - 48
(3) Proposed Wastewater Treatment System
There is no special treatment system, but the existing effluent quality meets the permissible limits of the public sewerage. Hence, no wastewater treatment system is proposed.
6.6 KARLOVAČKA INDUSTRIJA MLIJEKA
6.6.1 Outline of the Factory
The main features of the existing industrial activities are summarized below.
Code No. 333016 Activity Food/Beverage Capital 9.728 Million DM Foundation 1968 Main Raw Material Milk
Main Products Milk Processing (200 million liters) Preservation/Production of Dairy Products
No. of Employees 174 Persons Operation Time 24 Hours, 7 Days/Week
6.6.2 Existing Water Use
Approx. 103,300 m3/year of municipal water was used for industrial and domestic purposes in 2000. The average unit consumption for wastewater was approx. 4.74 liters/liter-product in the same year.
6.6.3 Existing Wastewater Discharge System
Some industrial wastewater is discharged into the Kupa River with neutralization treatment, but the remaining wastewater including industrial wastewater, cooling water, sanitary wastewater and rainwater is discharged into the river with no treatment. The existing wastewater discharge system is illustrated below.
6.6.4 Existing Wastewater Quantity and Quality
The existing wastewater quantity and quality are summarized below based on the database of Croatian Waters and the data collected from the factory.
Kup
a R
iver
Industrial Wastewater
Industrial Wastewater
Cooling Water
Rain Water
Neutralization(NaOH, HNO 3)
Sanitary Wastewater
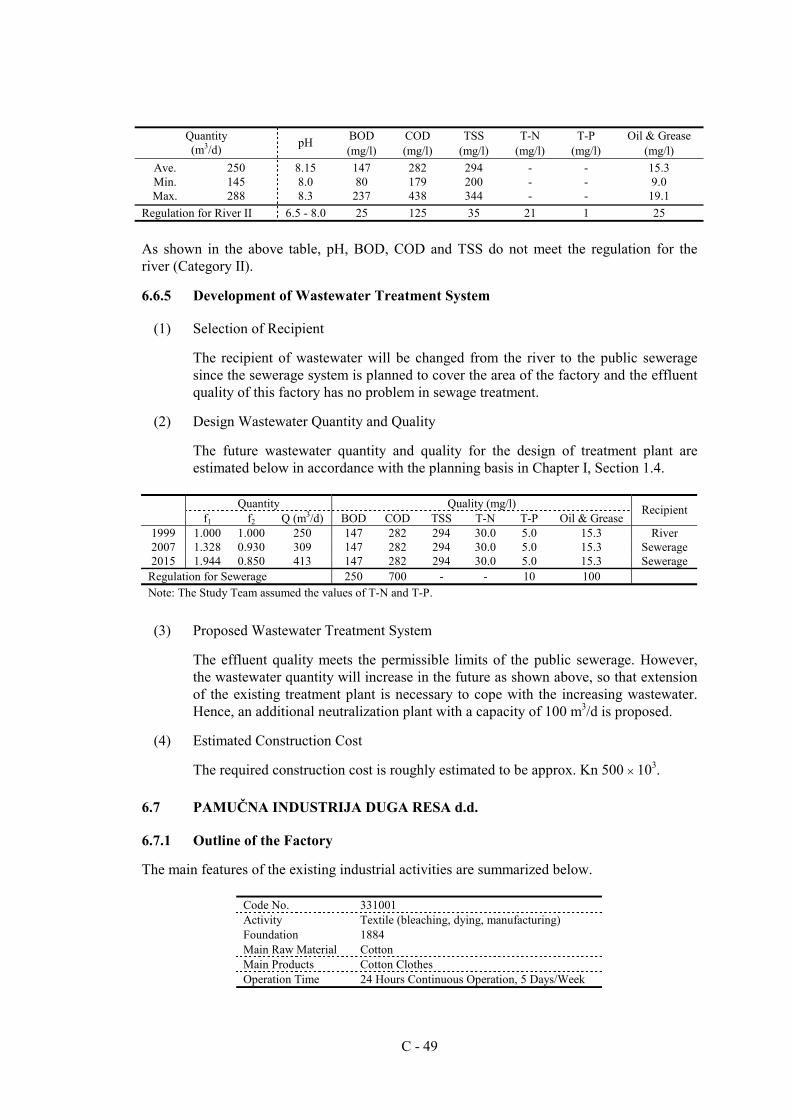
C - 49
BOD COD TSS T-N T-P Oil & Grease Quantity
(m3/d) pH (mg/l) (mg/l) (mg/l) (mg/l) (mg/l) (mg/l)
Ave. Min. Max.
250 145 288
8.15 8.0 8.3
147 80
237
282 179 438
294 200 344
- - -
- - -
15.3 9.0
19.1 Regulation for River II 6.5 - 8.0 25 125 35 21 1 25
As shown in the above table, pH, BOD, COD and TSS do not meet the regulation for the river (Category II).
6.6.5 Development of Wastewater Treatment System
(1) Selection of Recipient
The recipient of wastewater will be changed from the river to the public sewerage since the sewerage system is planned to cover the area of the factory and the effluent quality of this factory has no problem in sewage treatment.
(2) Design Wastewater Quantity and Quality
The future wastewater quantity and quality for the design of treatment plant are estimated below in accordance with the planning basis in Chapter I, Section 1.4.
Quantity Quality (mg/l)
f1 f2 Q (m3/d) BOD COD TSS T-N T-P Oil & Grease Recipient
1999 1.000 1.000 250 147 282 294 30.0 5.0 15.3 River 2007 1.328 0.930 309 147 282 294 30.0 5.0 15.3 Sewerage 2015 1.944 0.850 413 147 282 294 30.0 5.0 15.3 Sewerage
Regulation for Sewerage 250 700 - - 10 100 Note: The Study Team assumed the values of T-N and T-P.
(3) Proposed Wastewater Treatment System
The effluent quality meets the permissible limits of the public sewerage. However, the wastewater quantity will increase in the future as shown above, so that extension of the existing treatment plant is necessary to cope with the increasing wastewater. Hence, an additional neutralization plant with a capacity of 100 m3/d is proposed.
(4) Estimated Construction Cost
The required construction cost is roughly estimated to be approx. Kn 500 × 103.
6.7 PAMUČNA INDUSTRIJA DUGA RESA d.d.
6.7.1 Outline of the Factory
The main features of the existing industrial activities are summarized below.
Code No. 331001 Activity Textile (bleaching, dying, manufacturing) Foundation 1884 Main Raw Material Cotton Main Products Cotton Clothes Operation Time 24 Hours Continuous Operation, 5 Days/Week
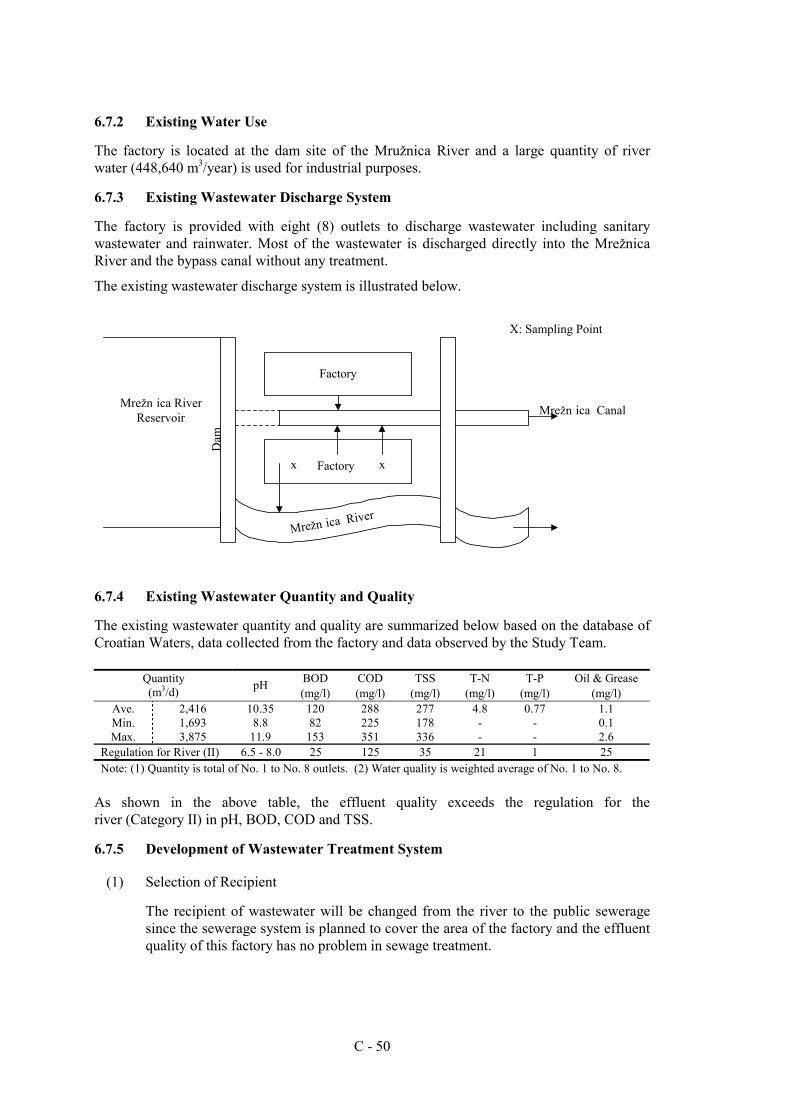
C - 50
6.7.2 Existing Water Use
The factory is located at the dam site of the Mružnica River and a large quantity of river water (448,640 m3/year) is used for industrial purposes.
6.7.3 Existing Wastewater Discharge System
The factory is provided with eight (8) outlets to discharge wastewater including sanitary wastewater and rainwater. Most of the wastewater is discharged directly into the Mrežnica River and the bypass canal without any treatment.
The existing wastewater discharge system is illustrated below.
6.7.4 Existing Wastewater Quantity and Quality
The existing wastewater quantity and quality are summarized below based on the database of Croatian Waters, data collected from the factory and data observed by the Study Team.
BOD COD TSS T-N T-P Oil & Grease Quantity (m3/d) pH
(mg/l) (mg/l) (mg/l) (mg/l) (mg/l) (mg/l) Ave. Min. Max.
2,416 1,693 3,875
10.35 8.8
11.9
120 82
153
288 225 351
277 178 336
4.8 - -
0.77 - -
1.1 0.1 2.6
Regulation for River (II) 6.5 - 8.0 25 125 35 21 1 25 Note: (1) Quantity is total of No. 1 to No. 8 outlets. (2) Water quality is weighted average of No. 1 to No. 8.
As shown in the above table, the effluent quality exceeds the regulation for the river (Category II) in pH, BOD, COD and TSS.
6.7.5 Development of Wastewater Treatment System
(1) Selection of Recipient
The recipient of wastewater will be changed from the river to the public sewerage since the sewerage system is planned to cover the area of the factory and the effluent quality of this factory has no problem in sewage treatment.
Factory
Mrežn ica RiverReservoir
Dam
Mrežn ica Canal
Mrežn ica River
X: Sampling Point
Factoryx x
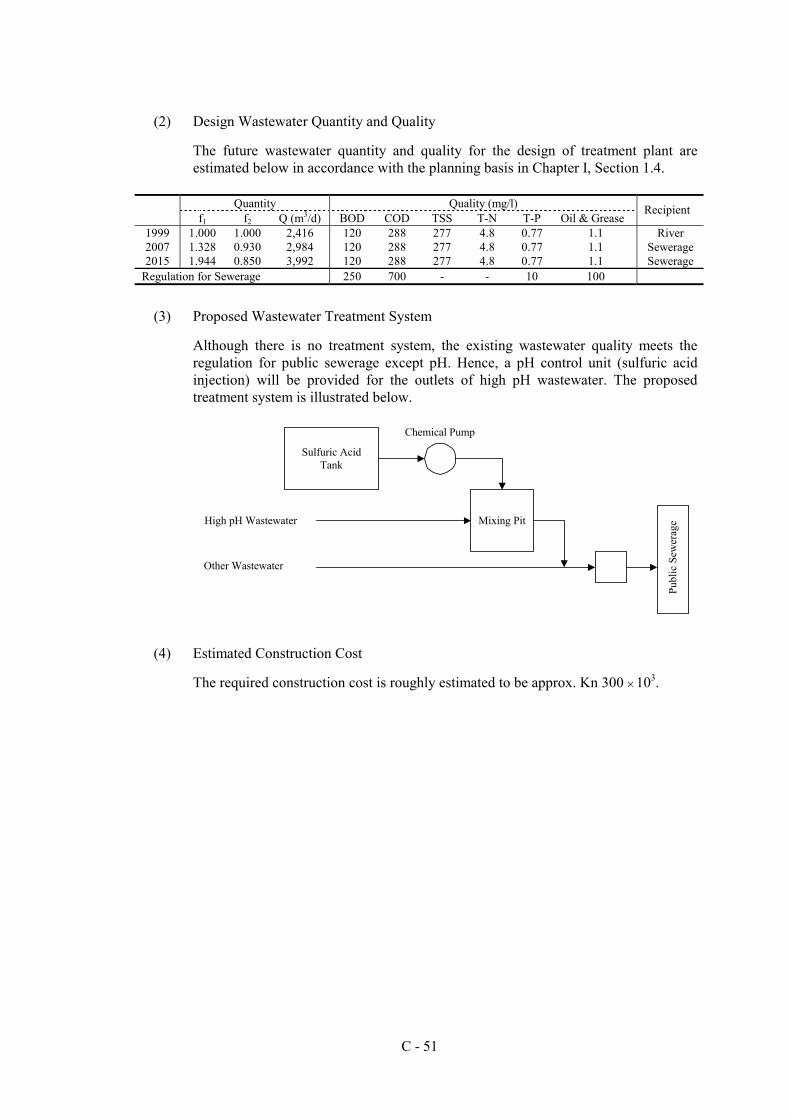
C - 51
(2) Design Wastewater Quantity and Quality
The future wastewater quantity and quality for the design of treatment plant are estimated below in accordance with the planning basis in Chapter I, Section 1.4.
Quantity Quality (mg/l)
f1 f2 Q (m3/d) BOD COD TSS T-N T-P Oil & Grease Recipient
1999 1.000 1.000 2,416 120 288 277 4.8 0.77 1.1 River 2007 1.328 0.930 2,984 120 288 277 4.8 0.77 1.1 Sewerage 2015 1.944 0.850 3,992 120 288 277 4.8 0.77 1.1 Sewerage
Regulation for Sewerage 250 700 - - 10 100
(3) Proposed Wastewater Treatment System
Although there is no treatment system, the existing wastewater quality meets the regulation for public sewerage except pH. Hence, a pH control unit (sulfuric acid injection) will be provided for the outlets of high pH wastewater. The proposed treatment system is illustrated below.
(4) Estimated Construction Cost
The required construction cost is roughly estimated to be approx. Kn 300 × 103.
Sulfuric AcidTank
Mixing Pit
Chemical Pump
Publ
ic S
ewer
ageHigh pH Wastewater
Other Wastewater
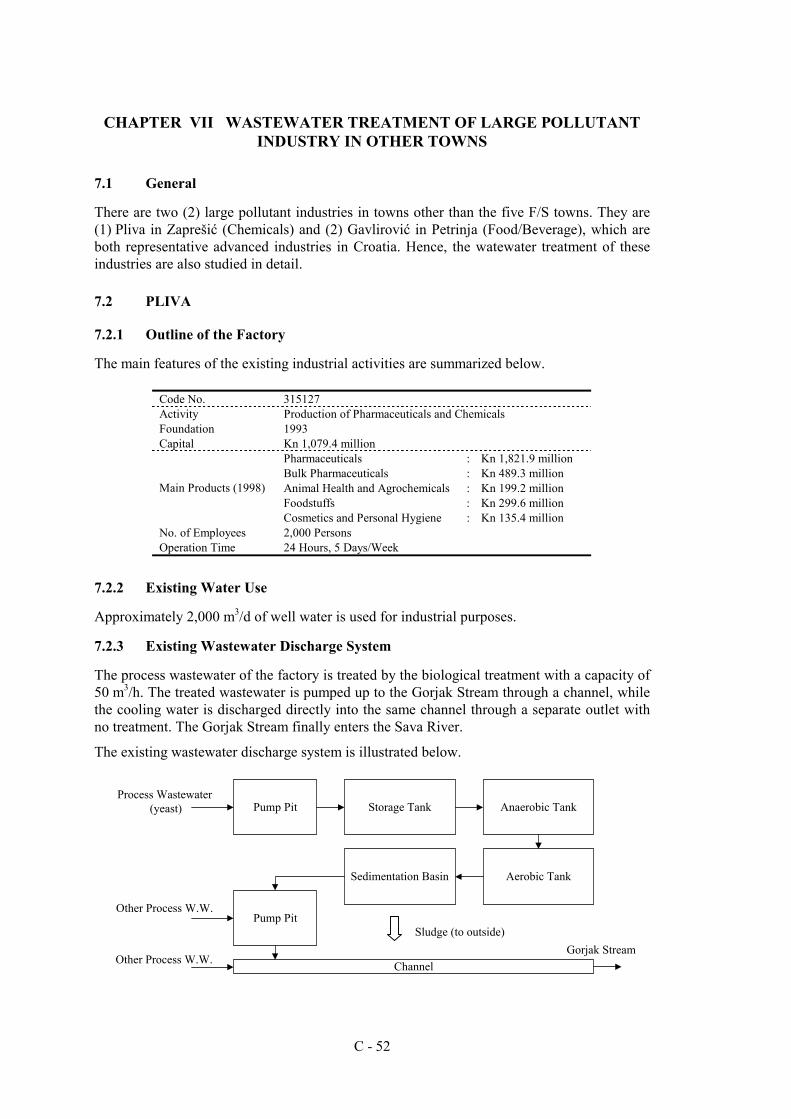
C - 52
CHAPTER VII WASTEWATER TREATMENT OF LARGE POLLUTANT INDUSTRY IN OTHER TOWNS
7.1 General
There are two (2) large pollutant industries in towns other than the five F/S towns. They are (1) Pliva in Zaprešić (Chemicals) and (2) Gavlirović in Petrinja (Food/Beverage), which are both representative advanced industries in Croatia. Hence, the watewater treatment of these industries are also studied in detail.
7.2 PLIVA
7.2.1 Outline of the Factory
The main features of the existing industrial activities are summarized below.
Code No. 315127 Activity Production of Pharmaceuticals and Chemicals Foundation 1993 Capital Kn 1,079.4 million
Pharmaceuticals : Kn 1,821.9 million Bulk Pharmaceuticals : Kn 489.3 million Animal Health and Agrochemicals : Kn 199.2 million Foodstuffs : Kn 299.6 million
Main Products (1998)
Cosmetics and Personal Hygiene : Kn 135.4 million No. of Employees 2,000 Persons Operation Time 24 Hours, 5 Days/Week
7.2.2 Existing Water Use
Approximately 2,000 m3/d of well water is used for industrial purposes.
7.2.3 Existing Wastewater Discharge System
The process wastewater of the factory is treated by the biological treatment with a capacity of 50 m3/h. The treated wastewater is pumped up to the Gorjak Stream through a channel, while the cooling water is discharged directly into the same channel through a separate outlet with no treatment. The Gorjak Stream finally enters the Sava River.
The existing wastewater discharge system is illustrated below.
Pump Pit Storage Tank Anaerobic Tank
Aerobic TankSedimentation Basin
Pump Pit
Channel
Process Wastewater (yeast)
Other Process W.W.
Other Process W.W.
Sludge (to outside)Gorjak Stream
C - 53
7.2.4 Existing Wastewater Quantity and Quality
The existing wastewater quantity and quality excluding cooling water are summarized below based on the database of Croatian Waters, data collected from the factory and data observed by the Study Team. In addition to the process wastewater, cooling water of 4,680 m3/day is discharged directly into the channel as mentioned before.
BOD COD TSS T-N T-P Oil & Grease Quantity (m3/d) pH
(mg/l) (mg/l) (mg/l) (mg/l) (mg/l) (mg/l) Ave. Min. Max.
1,928 1,210 2,362
8.11 7.50 8.72
339 199 480
1,768 - -
1,944 180
3,707
166.3 - -
3.22 - -
0.2 0.2 0.3
Regulation for Stream (II) 6.5 - 8.0 25 125 35 21 1 25
As shown in the above table, BOD, COD, TSS and T-N of the process wastewater far exceed the regulation for the stream (Category II).
7.2.5 Development of Wastewater Treatment System
(1) Selection of Recipient
The recipient of wastewater (process wastewater) will be changed from the stream to the public sewerage since the sewerage system of Zagrešić is planned to receive also the industrial wastewater from the surrounding areas and to treat it by a central sewage treatment plant. Moreover, the effluent quality of this factory has no problem in sewage treatment. However, cooling water will be discharged into the Gorjak Stream as at present.
(2) Design Wastewater Quantity and Quality
The future wastewater quantity and quality (excluding cooling water) for the design of treatment plant are estimated below in accordance with the planning basis in Chapter I, Section 1.4.
Quantity Quantity (mg/l)
f1 f2 Q (m3/d) BOD COD TSS T-N T-P Oil & Grease Recipient
1999 1.000 1.000 1,928 339 1,768 1,944 166 3.2 0.2 Stream 2007 1.328 0.930 2,381 339 1,768 1,944 166 3.2 0.2 Stream 2015 1.944 0.850 3,186 250 700 200 100 3.2 0.2 Sewerage
Regulation for Sewerage 250 700 - - 10.0 100 Note: TSS and T-N are coincidentally treated although no regulation is stipulated.
(3) Proposed Wastewater Treatment System
The existing treatment plant will be able to treat BOD and COD of the existing wastewater quantity to the permissible limits for the public sewerage by improving the treatment system. With the improvement, TSS and T-N will be treated coincidentally to the target level.
However, the wastewater quantity (excluding cooling water) is estimated to increase from 1,928 m3/d in 1999 to 3,186m3/d in 2015. Hence, an additional treatment plant of the existing type with a capacity of 1,260 m3/d (approx. 50 m3/h) is proposed to cope with the increasing quantity of wastewater.
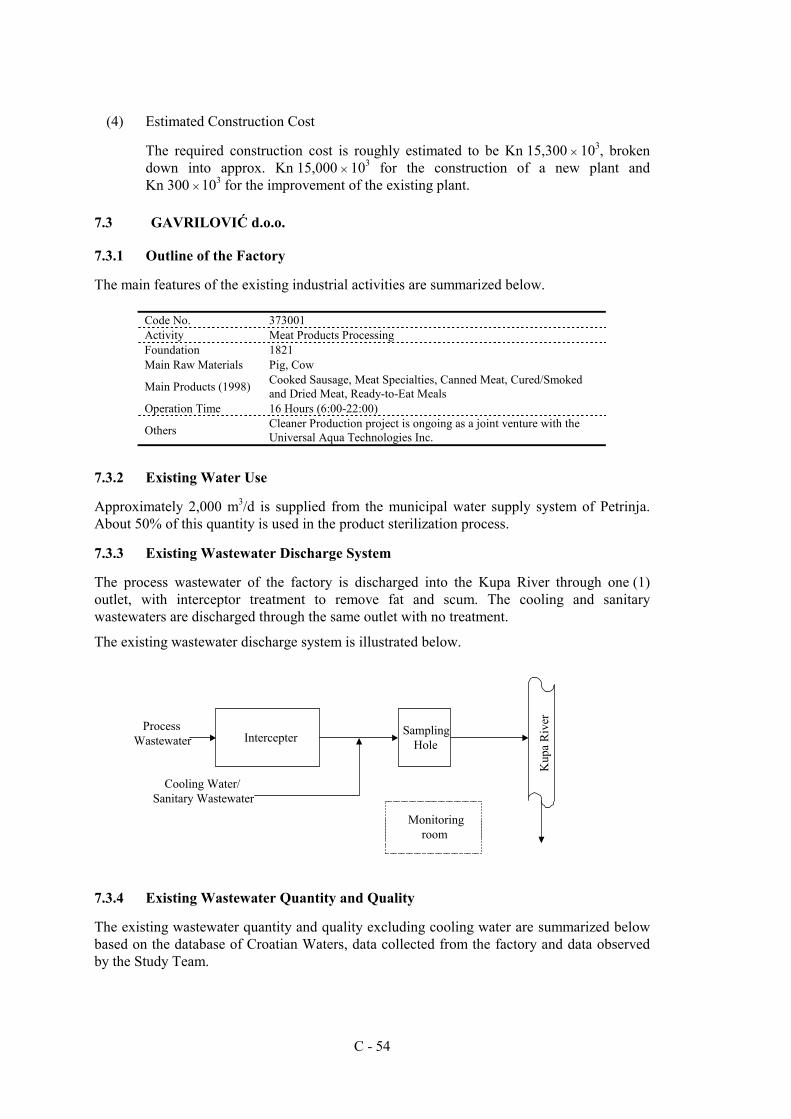
C - 54
(4) Estimated Construction Cost
The required construction cost is roughly estimated to be Kn 15,300 × 103, broken down into approx. Kn 15,000 × 103 for the construction of a new plant and Kn 300 × 103 for the improvement of the existing plant.
7.3 GAVRILOVIĆ d.o.o.
7.3.1 Outline of the Factory
The main features of the existing industrial activities are summarized below.
Code No. 373001 Activity Meat Products Processing Foundation 1821 Main Raw Materials Pig, Cow
Main Products (1998) Cooked Sausage, Meat Specialties, Canned Meat, Cured/Smoked and Dried Meat, Ready-to-Eat Meals
Operation Time 16 Hours (6:00-22:00)
Others Cleaner Production project is ongoing as a joint venture with the Universal Aqua Technologies Inc.
7.3.2 Existing Water Use
Approximately 2,000 m3/d is supplied from the municipal water supply system of Petrinja. About 50% of this quantity is used in the product sterilization process.
7.3.3 Existing Wastewater Discharge System
The process wastewater of the factory is discharged into the Kupa River through one (1) outlet, with interceptor treatment to remove fat and scum. The cooling and sanitary wastewaters are discharged through the same outlet with no treatment.
The existing wastewater discharge system is illustrated below.
7.3.4 Existing Wastewater Quantity and Quality
The existing wastewater quantity and quality excluding cooling water are summarized below based on the database of Croatian Waters, data collected from the factory and data observed by the Study Team.
Intercepter SamplingHole
Kup
a R
iverProcess
Wastewater
Cooling Water/Sanitary Wastewater
Monitoringroom
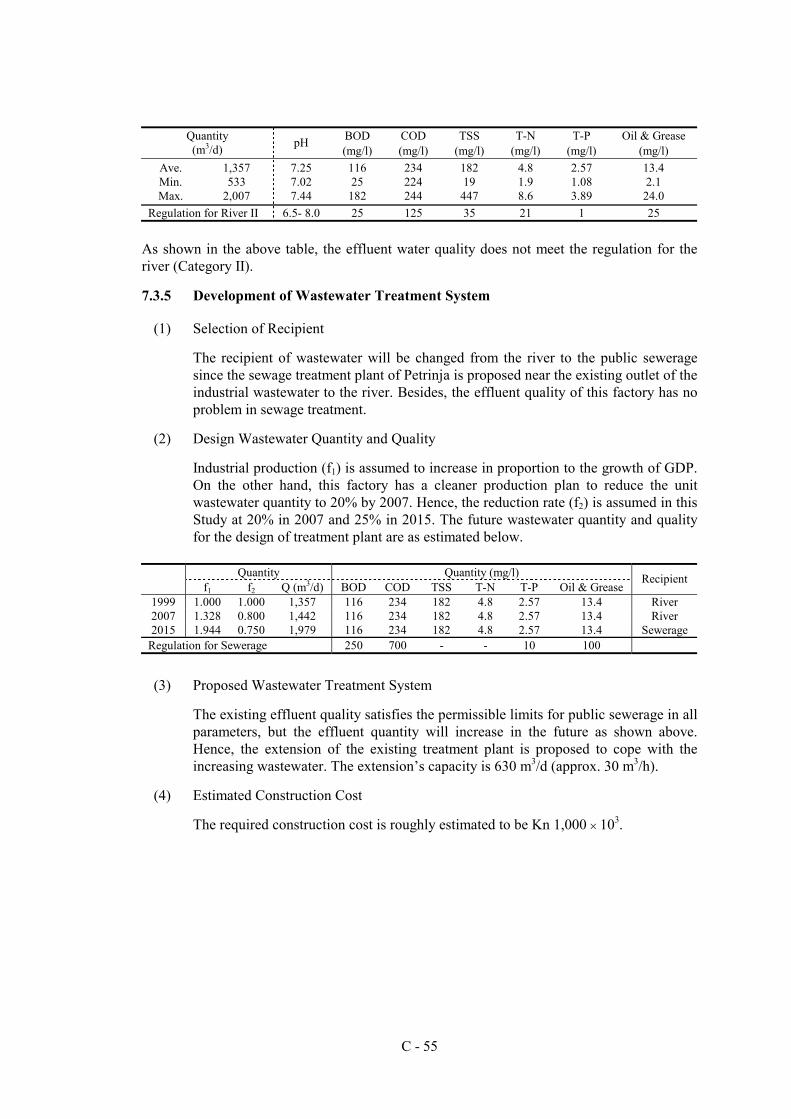
C - 55
BOD COD TSS T-N T-P Oil & Grease Quantity
(m3/d) pH (mg/l) (mg/l) (mg/l) (mg/l) (mg/l) (mg/l)
Ave. Min. Max.
1,357 533
2,007
7.25 7.02 7.44
116 25
182
234 224 244
182 19
447
4.8 1.9 8.6
2.57 1.08 3.89
13.4 2.1
24.0 Regulation for River II 6.5- 8.0 25 125 35 21 1 25
As shown in the above table, the effluent water quality does not meet the regulation for the river (Category II).
7.3.5 Development of Wastewater Treatment System
(1) Selection of Recipient
The recipient of wastewater will be changed from the river to the public sewerage since the sewage treatment plant of Petrinja is proposed near the existing outlet of the industrial wastewater to the river. Besides, the effluent quality of this factory has no problem in sewage treatment.
(2) Design Wastewater Quantity and Quality
Industrial production (f1) is assumed to increase in proportion to the growth of GDP. On the other hand, this factory has a cleaner production plan to reduce the unit wastewater quantity to 20% by 2007. Hence, the reduction rate (f2) is assumed in this Study at 20% in 2007 and 25% in 2015. The future wastewater quantity and quality for the design of treatment plant are as estimated below.
Quantity Quantity (mg/l)
f1 f2 Q (m3/d) BOD COD TSS T-N T-P Oil & Grease Recipient
1999 1.000 1.000 1,357 116 234 182 4.8 2.57 13.4 River 2007 1.328 0.800 1,442 116 234 182 4.8 2.57 13.4 River 2015 1.944 0.750 1,979 116 234 182 4.8 2.57 13.4 Sewerage
Regulation for Sewerage 250 700 - - 10 100
(3) Proposed Wastewater Treatment System
The existing effluent quality satisfies the permissible limits for public sewerage in all parameters, but the effluent quantity will increase in the future as shown above. Hence, the extension of the existing treatment plant is proposed to cope with the increasing wastewater. The extension’s capacity is 630 m3/d (approx. 30 m3/h).
(4) Estimated Construction Cost
The required construction cost is roughly estimated to be Kn 1,000 × 103.
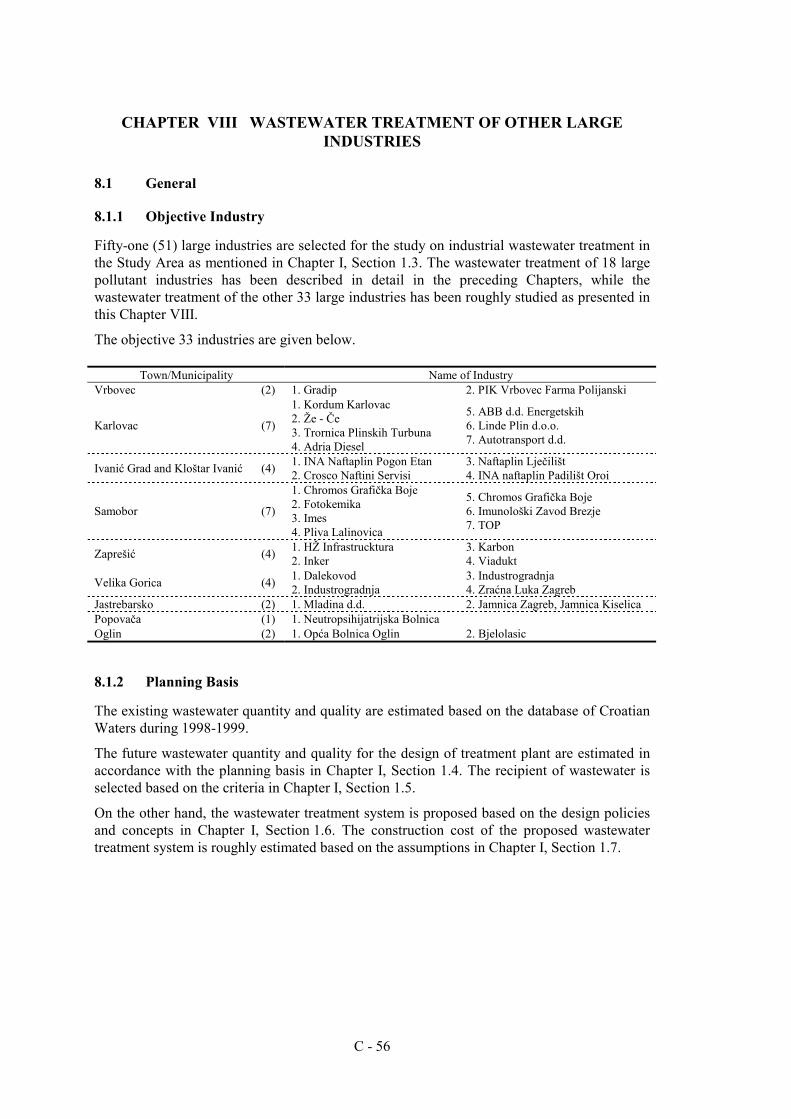
C - 56
CHAPTER VIII WASTEWATER TREATMENT OF OTHER LARGE INDUSTRIES
8.1 General
8.1.1 Objective Industry
Fifty-one (51) large industries are selected for the study on industrial wastewater treatment in the Study Area as mentioned in Chapter I, Section 1.3. The wastewater treatment of 18 large pollutant industries has been described in detail in the preceding Chapters, while the wastewater treatment of the other 33 large industries has been roughly studied as presented in this Chapter VIII.
The objective 33 industries are given below.
Town/Municipality Name of Industry Vrbovec (2) 1. Gradip 2. PIK Vrbovec Farma Polijanski
Karlovac (7)
1. Kordum Karlovac 2. Že - Če 3. Trornica Plinskih Turbuna 4. Adria Diesel
5. ABB d.d. Energetskih 6. Linde Plin d.o.o. 7. Autotransport d.d.
Ivanić Grad and Kloštar Ivanić (4) 1. INA Naftaplin Pogon Etan 2. Crosco Naftini Servisi
3. Naftaplin Lječilišt 4. INA naftaplin Padilišt Oroi
Samobor (7)
1. Chromos Grafička Boje 2. Fotokemika 3. Imes 4. Pliva Lalinovica
5. Chromos Grafička Boje 6. Imunološki Zavod Brezje 7. TOP
Zaprešić (4) 1. HŽ Infrastrucktura 2. Inker
3. Karbon 4. Viadukt
Velika Gorica (4) 1. Dalekovod 2. Industrogradnja
3. Industrogradnja 4. Zraćna Luka Zagreb
Jastrebarsko (2) 1. Mladina d.d. 2. Jamnica Zagreb, Jamnica Kiselica Popovača (1) 1. Neutropsihijatrijska Bolnica Oglin (2) 1. Opća Bolnica Oglin 2. Bjelolasic
8.1.2 Planning Basis
The existing wastewater quantity and quality are estimated based on the database of Croatian Waters during 1998-1999.
The future wastewater quantity and quality for the design of treatment plant are estimated in accordance with the planning basis in Chapter I, Section 1.4. The recipient of wastewater is selected based on the criteria in Chapter I, Section 1.5.
On the other hand, the wastewater treatment system is proposed based on the design policies and concepts in Chapter I, Section 1.6. The construction cost of the proposed wastewater treatment system is roughly estimated based on the assumptions in Chapter I, Section 1.7.
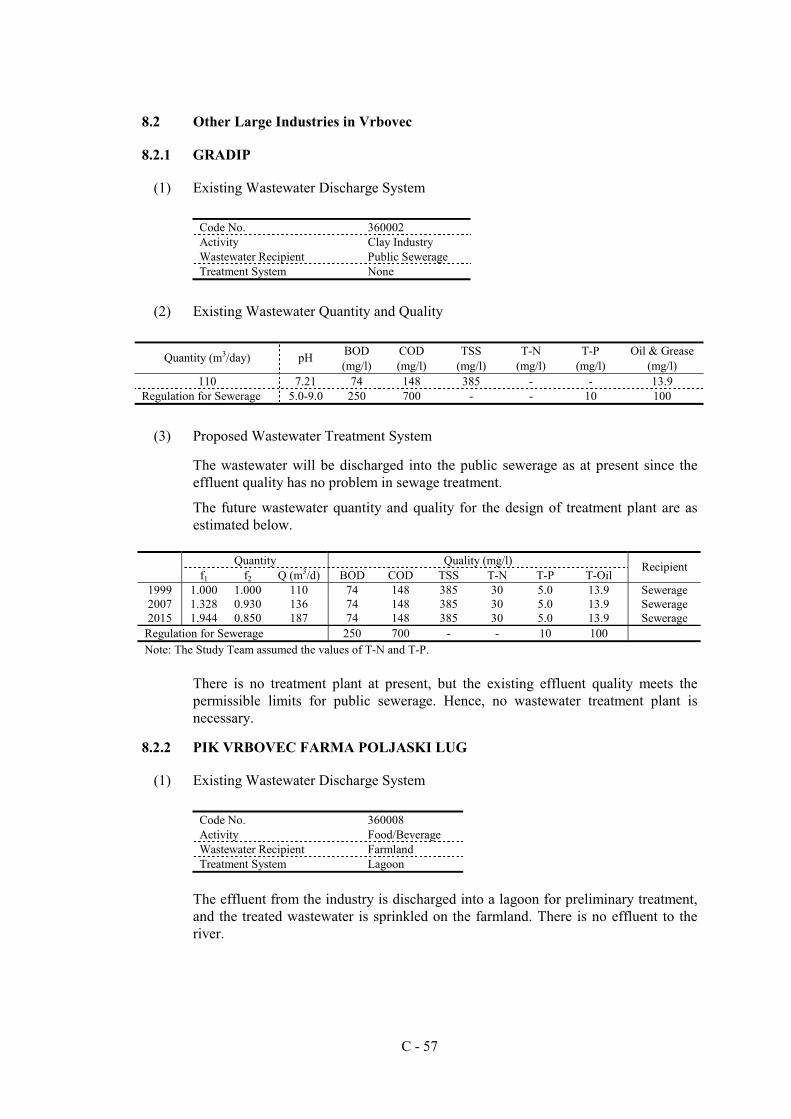
C - 57
8.2 Other Large Industries in Vrbovec
8.2.1 GRADIP
(1) Existing Wastewater Discharge System
Code No. 360002 Activity Clay Industry Wastewater Recipient Public Sewerage Treatment System None
(2) Existing Wastewater Quantity and Quality
BOD COD TSS T-N T-P Oil & Grease Quantity (m3/day) pH (mg/l) (mg/l) (mg/l) (mg/l) (mg/l) (mg/l)
110 7.21 74 148 385 - - 13.9 Regulation for Sewerage 5.0-9.0 250 700 - - 10 100
(3) Proposed Wastewater Treatment System
The wastewater will be discharged into the public sewerage as at present since the effluent quality has no problem in sewage treatment.
The future wastewater quantity and quality for the design of treatment plant are as estimated below.
Quantity Quality (mg/l)
f1 f2 Q (m3/d) BOD COD TSS T-N T-P T-Oil Recipient
1999 1.000 1.000 110 74 148 385 30 5.0 13.9 Sewerage 2007 1.328 0.930 136 74 148 385 30 5.0 13.9 Sewerage 2015 1.944 0.850 187 74 148 385 30 5.0 13.9 Sewerage
Regulation for Sewerage 250 700 - - 10 100 Note: The Study Team assumed the values of T-N and T-P.
There is no treatment plant at present, but the existing effluent quality meets the permissible limits for public sewerage. Hence, no wastewater treatment plant is necessary.
8.2.2 PIK VRBOVEC FARMA POLJASKI LUG
(1) Existing Wastewater Discharge System
Code No. 360008 Activity Food/Beverage Wastewater Recipient Farmland Treatment System Lagoon
The effluent from the industry is discharged into a lagoon for preliminary treatment, and the treated wastewater is sprinkled on the farmland. There is no effluent to the river.
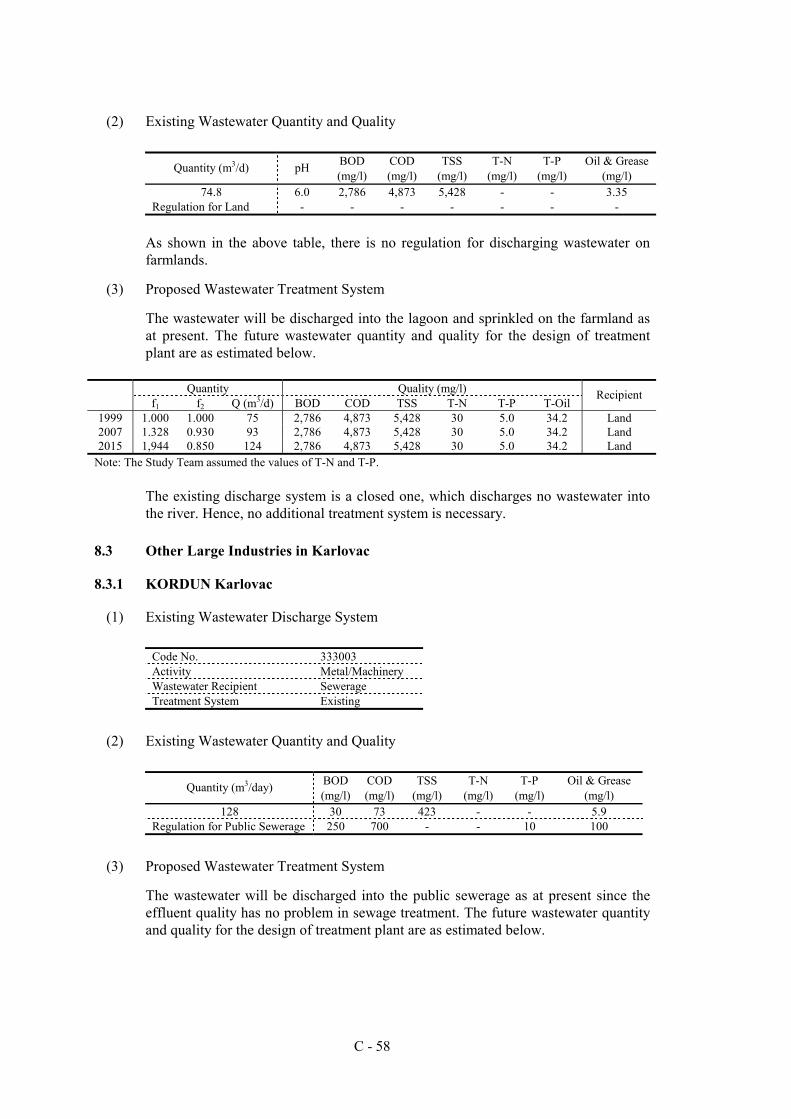
C - 58
(2) Existing Wastewater Quantity and Quality
BOD COD TSS T-N T-P Oil & Grease Quantity (m3/d) pH (mg/l) (mg/l) (mg/l) (mg/l) (mg/l) (mg/l)
74.8 6.0 2,786 4,873 5,428 - - 3.35 Regulation for Land - - - - - - -
As shown in the above table, there is no regulation for discharging wastewater on farmlands.
(3) Proposed Wastewater Treatment System
The wastewater will be discharged into the lagoon and sprinkled on the farmland as at present. The future wastewater quantity and quality for the design of treatment plant are as estimated below.
Quantity Quality (mg/l)
f1 f2 Q (m3/d) BOD COD TSS T-N T-P T-Oil Recipient
1999 1.000 1.000 75 2,786 4,873 5,428 30 5.0 34.2 Land 2007 1.328 0.930 93 2,786 4,873 5,428 30 5.0 34.2 Land 2015 1,944 0.850 124 2,786 4,873 5,428 30 5.0 34.2 Land
Note: The Study Team assumed the values of T-N and T-P.
The existing discharge system is a closed one, which discharges no wastewater into the river. Hence, no additional treatment system is necessary.
8.3 Other Large Industries in Karlovac
8.3.1 KORDUN Karlovac
(1) Existing Wastewater Discharge System
Code No. 333003 Activity Metal/Machinery Wastewater Recipient Sewerage Treatment System Existing
(2) Existing Wastewater Quantity and Quality
BOD COD TSS T-N T-P Oil & Grease Quantity (m3/day) (mg/l) (mg/l) (mg/l) (mg/l) (mg/l) (mg/l)
128 30 73 423 - - 5.9 Regulation for Public Sewerage 250 700 - - 10 100
(3) Proposed Wastewater Treatment System
The wastewater will be discharged into the public sewerage as at present since the effluent quality has no problem in sewage treatment. The future wastewater quantity and quality for the design of treatment plant are as estimated below.
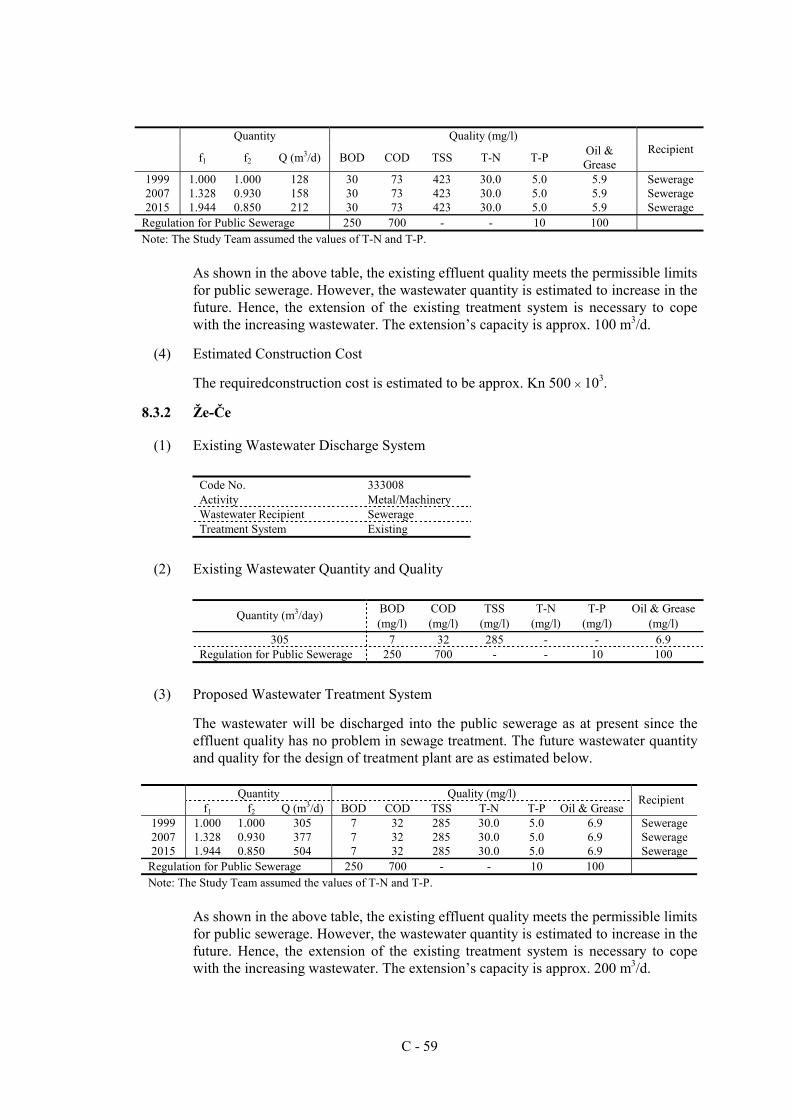
C - 59
Quantity Quality (mg/l)
f1 f2 Q (m3/d) BOD COD TSS T-N T-P Oil &
Grease Recipient
1999 1.000 1.000 128 30 73 423 30.0 5.0 5.9 Sewerage 2007 1.328 0.930 158 30 73 423 30.0 5.0 5.9 Sewerage 2015 1.944 0.850 212 30 73 423 30.0 5.0 5.9 Sewerage
Regulation for Public Sewerage 250 700 - - 10 100 Note: The Study Team assumed the values of T-N and T-P.
As shown in the above table, the existing effluent quality meets the permissible limits for public sewerage. However, the wastewater quantity is estimated to increase in the future. Hence, the extension of the existing treatment system is necessary to cope with the increasing wastewater. The extension’s capacity is approx. 100 m3/d.
(4) Estimated Construction Cost
The requiredconstruction cost is estimated to be approx. Kn 500 × 103.
8.3.2 Že-Če
(1) Existing Wastewater Discharge System
Code No. 333008 Activity Metal/Machinery Wastewater Recipient Sewerage Treatment System Existing
(2) Existing Wastewater Quantity and Quality
BOD COD TSS T-N T-P Oil & Grease Quantity (m3/day) (mg/l) (mg/l) (mg/l) (mg/l) (mg/l) (mg/l)
305 7 32 285 - - 6.9 Regulation for Public Sewerage 250 700 - - 10 100
(3) Proposed Wastewater Treatment System
The wastewater will be discharged into the public sewerage as at present since the effluent quality has no problem in sewage treatment. The future wastewater quantity and quality for the design of treatment plant are as estimated below.
Quantity Quality (mg/l)
f1 f2 Q (m3/d) BOD COD TSS T-N T-P Oil & Grease Recipient
1999 1.000 1.000 305 7 32 285 30.0 5.0 6.9 Sewerage 2007 1.328 0.930 377 7 32 285 30.0 5.0 6.9 Sewerage 2015 1.944 0.850 504 7 32 285 30.0 5.0 6.9 Sewerage
Regulation for Public Sewerage 250 700 - - 10 100 Note: The Study Team assumed the values of T-N and T-P.
As shown in the above table, the existing effluent quality meets the permissible limits for public sewerage. However, the wastewater quantity is estimated to increase in the future. Hence, the extension of the existing treatment system is necessary to cope with the increasing wastewater. The extension’s capacity is approx. 200 m3/d.
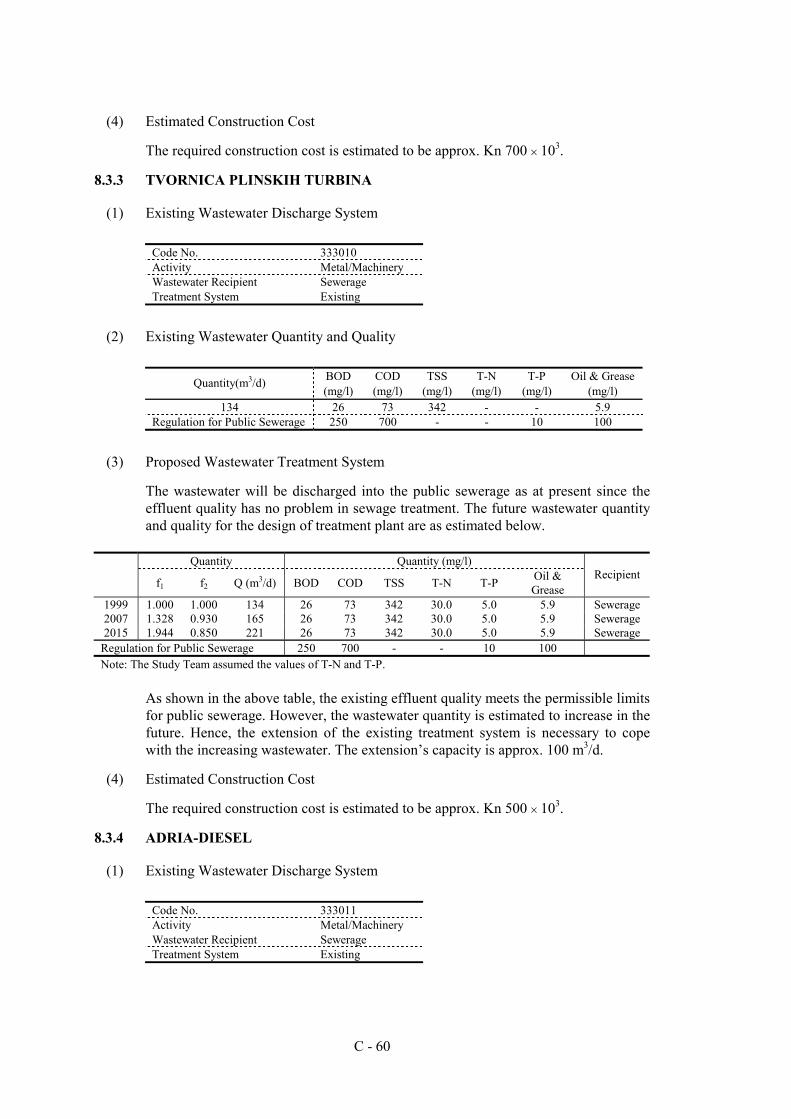
C - 60
(4) Estimated Construction Cost
The required construction cost is estimated to be approx. Kn 700 × 103.
8.3.3 TVORNICA PLINSKIH TURBINA
(1) Existing Wastewater Discharge System
Code No. 333010 Activity Metal/Machinery Wastewater Recipient Sewerage Treatment System Existing
(2) Existing Wastewater Quantity and Quality
BOD COD TSS T-N T-P Oil & Grease Quantity(m3/d) (mg/l) (mg/l) (mg/l) (mg/l) (mg/l) (mg/l)
134 26 73 342 - - 5.9 Regulation for Public Sewerage 250 700 - - 10 100
(3) Proposed Wastewater Treatment System
The wastewater will be discharged into the public sewerage as at present since the effluent quality has no problem in sewage treatment. The future wastewater quantity and quality for the design of treatment plant are as estimated below.
Quantity Quantity (mg/l)
f1 f2 Q (m3/d) BOD COD TSS T-N T-P Oil &
Grease Recipient
1999 1.000 1.000 134 26 73 342 30.0 5.0 5.9 Sewerage 2007 1.328 0.930 165 26 73 342 30.0 5.0 5.9 Sewerage 2015 1.944 0.850 221 26 73 342 30.0 5.0 5.9 Sewerage
Regulation for Public Sewerage 250 700 - - 10 100 Note: The Study Team assumed the values of T-N and T-P.
As shown in the above table, the existing effluent quality meets the permissible limits for public sewerage. However, the wastewater quantity is estimated to increase in the future. Hence, the extension of the existing treatment system is necessary to cope with the increasing wastewater. The extension’s capacity is approx. 100 m3/d.
(4) Estimated Construction Cost
The required construction cost is estimated to be approx. Kn 500 × 103.
8.3.4 ADRIA-DIESEL
(1) Existing Wastewater Discharge System
Code No. 333011 Activity Metal/Machinery Wastewater Recipient Sewerage Treatment System Existing
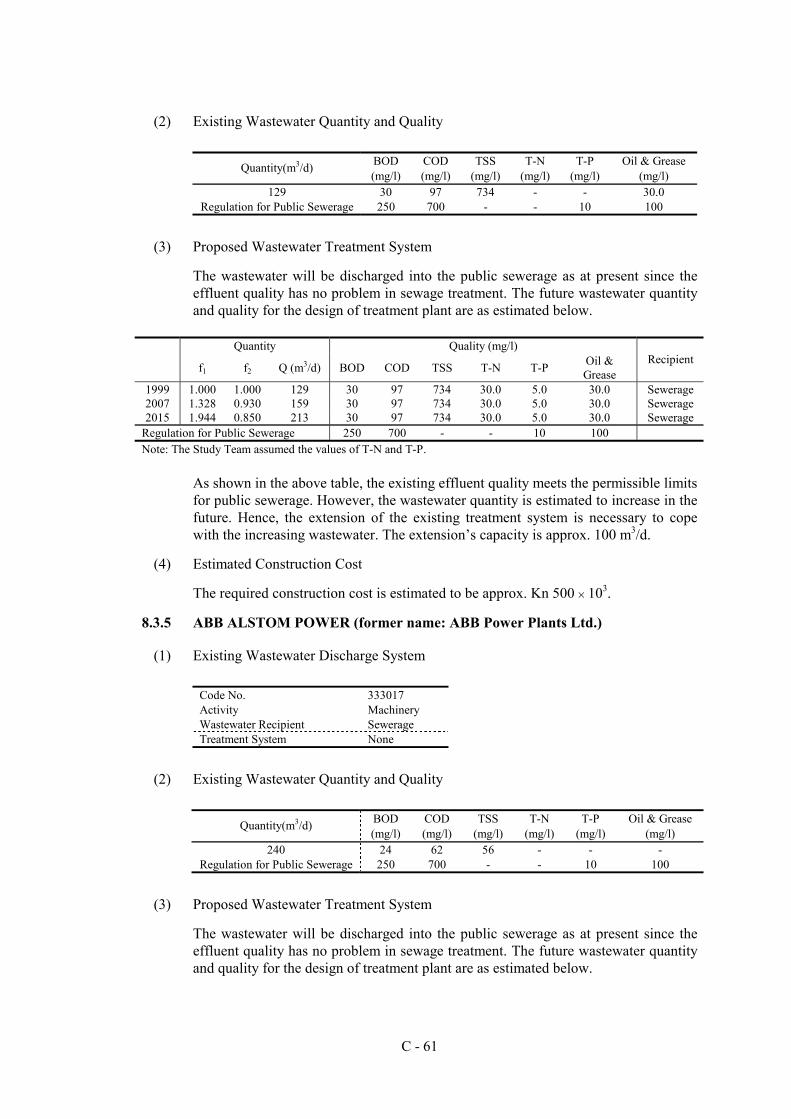
C - 61
(2) Existing Wastewater Quantity and Quality
BOD COD TSS T-N T-P Oil & Grease Quantity(m3/d) (mg/l) (mg/l) (mg/l) (mg/l) (mg/l) (mg/l)
129 30 97 734 - - 30.0 Regulation for Public Sewerage 250 700 - - 10 100
(3) Proposed Wastewater Treatment System
The wastewater will be discharged into the public sewerage as at present since the effluent quality has no problem in sewage treatment. The future wastewater quantity and quality for the design of treatment plant are as estimated below.
Quantity Quality (mg/l)
f1 f2 Q (m3/d) BOD COD TSS T-N T-P Oil &
Grease Recipient
1999 1.000 1.000 129 30 97 734 30.0 5.0 30.0 Sewerage 2007 1.328 0.930 159 30 97 734 30.0 5.0 30.0 Sewerage 2015 1.944 0.850 213 30 97 734 30.0 5.0 30.0 Sewerage
Regulation for Public Sewerage 250 700 - - 10 100 Note: The Study Team assumed the values of T-N and T-P.
As shown in the above table, the existing effluent quality meets the permissible limits for public sewerage. However, the wastewater quantity is estimated to increase in the future. Hence, the extension of the existing treatment system is necessary to cope with the increasing wastewater. The extension’s capacity is approx. 100 m3/d.
(4) Estimated Construction Cost
The required construction cost is estimated to be approx. Kn 500 × 103.
8.3.5 ABB ALSTOM POWER (former name: ABB Power Plants Ltd.)
(1) Existing Wastewater Discharge System
Code No. 333017 Activity Machinery Wastewater Recipient Sewerage Treatment System None
(2) Existing Wastewater Quantity and Quality
BOD COD TSS T-N T-P Oil & Grease Quantity(m3/d) (mg/l) (mg/l) (mg/l) (mg/l) (mg/l) (mg/l)
240 24 62 56 - - - Regulation for Public Sewerage 250 700 - - 10 100
(3) Proposed Wastewater Treatment System
The wastewater will be discharged into the public sewerage as at present since the effluent quality has no problem in sewage treatment. The future wastewater quantity and quality for the design of treatment plant are as estimated below.
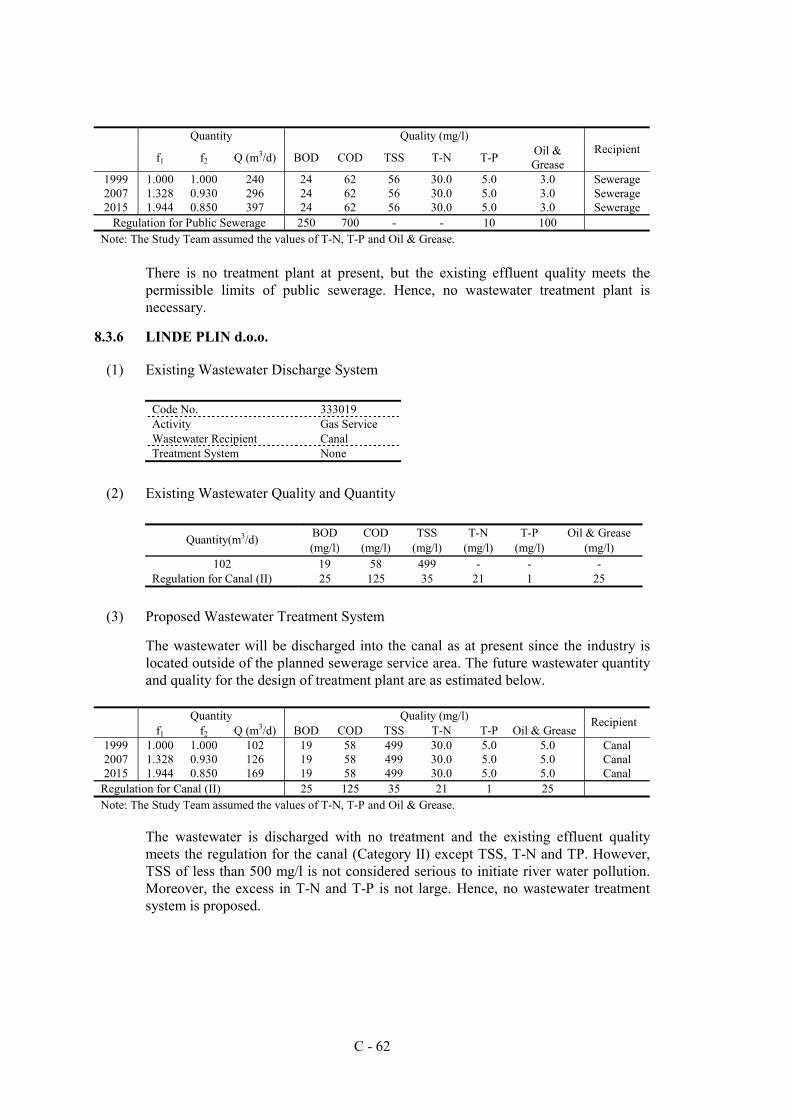
C - 62
Quantity Quality (mg/l)
f1 f2 Q (m3/d) BOD COD TSS T-N T-P Oil &
Grease Recipient
1999 1.000 1.000 240 24 62 56 30.0 5.0 3.0 Sewerage 2007 1.328 0.930 296 24 62 56 30.0 5.0 3.0 Sewerage 2015 1.944 0.850 397 24 62 56 30.0 5.0 3.0 Sewerage
Regulation for Public Sewerage 250 700 - - 10 100 Note: The Study Team assumed the values of T-N, T-P and Oil & Grease.
There is no treatment plant at present, but the existing effluent quality meets the permissible limits of public sewerage. Hence, no wastewater treatment plant is necessary.
8.3.6 LINDE PLIN d.o.o.
(1) Existing Wastewater Discharge System
Code No. 333019 Activity Gas Service Wastewater Recipient Canal Treatment System None
(2) Existing Wastewater Quality and Quantity
BOD COD TSS T-N T-P Oil & Grease Quantity(m3/d) (mg/l) (mg/l) (mg/l) (mg/l) (mg/l) (mg/l)
102 19 58 499 - - - Regulation for Canal (II) 25 125 35 21 1 25
(3) Proposed Wastewater Treatment System
The wastewater will be discharged into the canal as at present since the industry is located outside of the planned sewerage service area. The future wastewater quantity and quality for the design of treatment plant are as estimated below.
Quantity Quality (mg/l)
f1 f2 Q (m3/d) BOD COD TSS T-N T-P Oil & Grease Recipient
1999 1.000 1.000 102 19 58 499 30.0 5.0 5.0 Canal 2007 1.328 0.930 126 19 58 499 30.0 5.0 5.0 Canal 2015 1.944 0.850 169 19 58 499 30.0 5.0 5.0 Canal
Regulation for Canal (II) 25 125 35 21 1 25 Note: The Study Team assumed the values of T-N, T-P and Oil & Grease.
The wastewater is discharged with no treatment and the existing effluent quality meets the regulation for the canal (Category II) except TSS, T-N and TP. However, TSS of less than 500 mg/l is not considered serious to initiate river water pollution. Moreover, the excess in T-N and T-P is not large. Hence, no wastewater treatment system is proposed.
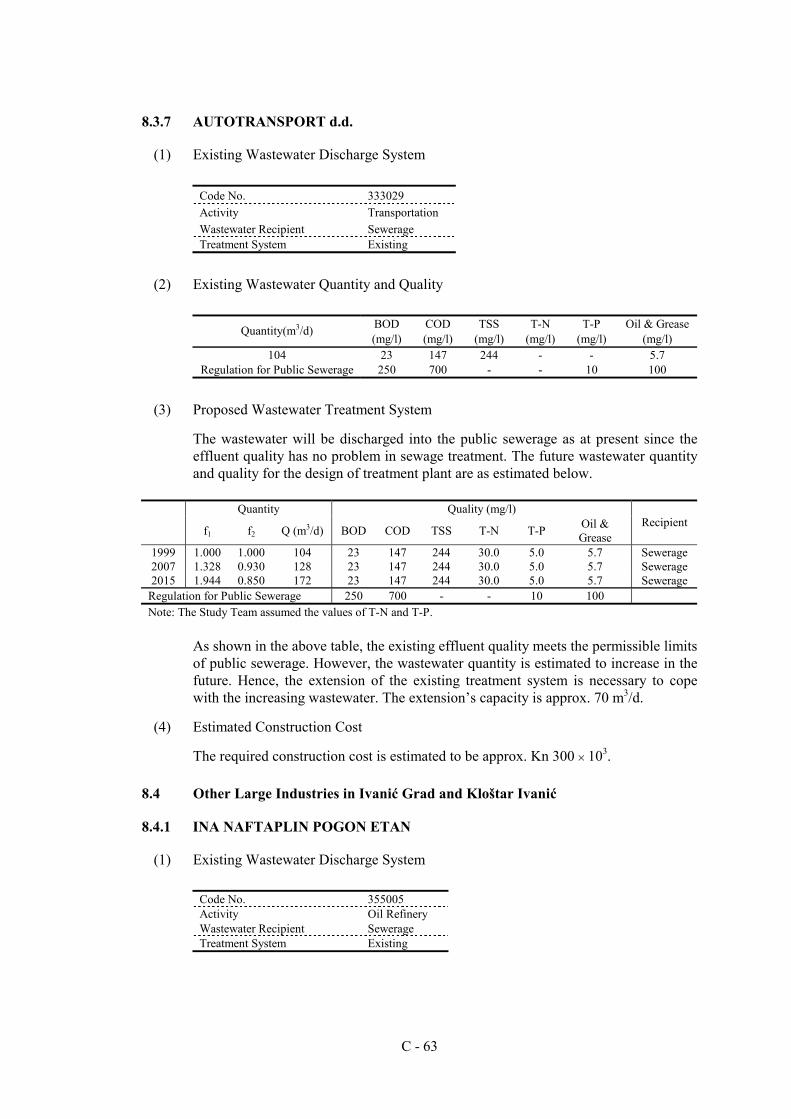
C - 63
8.3.7 AUTOTRANSPORT d.d.
(1) Existing Wastewater Discharge System
Code No. 333029 Activity Transportation Wastewater Recipient Sewerage Treatment System Existing
(2) Existing Wastewater Quantity and Quality
BOD COD TSS T-N T-P Oil & Grease Quantity(m3/d) (mg/l) (mg/l) (mg/l) (mg/l) (mg/l) (mg/l)
104 23 147 244 - - 5.7 Regulation for Public Sewerage 250 700 - - 10 100
(3) Proposed Wastewater Treatment System
The wastewater will be discharged into the public sewerage as at present since the effluent quality has no problem in sewage treatment. The future wastewater quantity and quality for the design of treatment plant are as estimated below.
Quantity Quality (mg/l)
f1 f2 Q (m3/d) BOD COD TSS T-N T-P Oil &
Grease Recipient
1999 1.000 1.000 104 23 147 244 30.0 5.0 5.7 Sewerage 2007 1.328 0.930 128 23 147 244 30.0 5.0 5.7 Sewerage 2015 1.944 0.850 172 23 147 244 30.0 5.0 5.7 Sewerage
Regulation for Public Sewerage 250 700 - - 10 100 Note: The Study Team assumed the values of T-N and T-P.
As shown in the above table, the existing effluent quality meets the permissible limits of public sewerage. However, the wastewater quantity is estimated to increase in the future. Hence, the extension of the existing treatment system is necessary to cope with the increasing wastewater. The extension’s capacity is approx. 70 m3/d.
(4) Estimated Construction Cost
The required construction cost is estimated to be approx. Kn 300 × 103.
8.4 Other Large Industries in Ivanić Grad and Kloštar Ivanić
8.4.1 INA NAFTAPLIN POGON ETAN
(1) Existing Wastewater Discharge System
Code No. 355005 Activity Oil Refinery Wastewater Recipient Sewerage Treatment System Existing
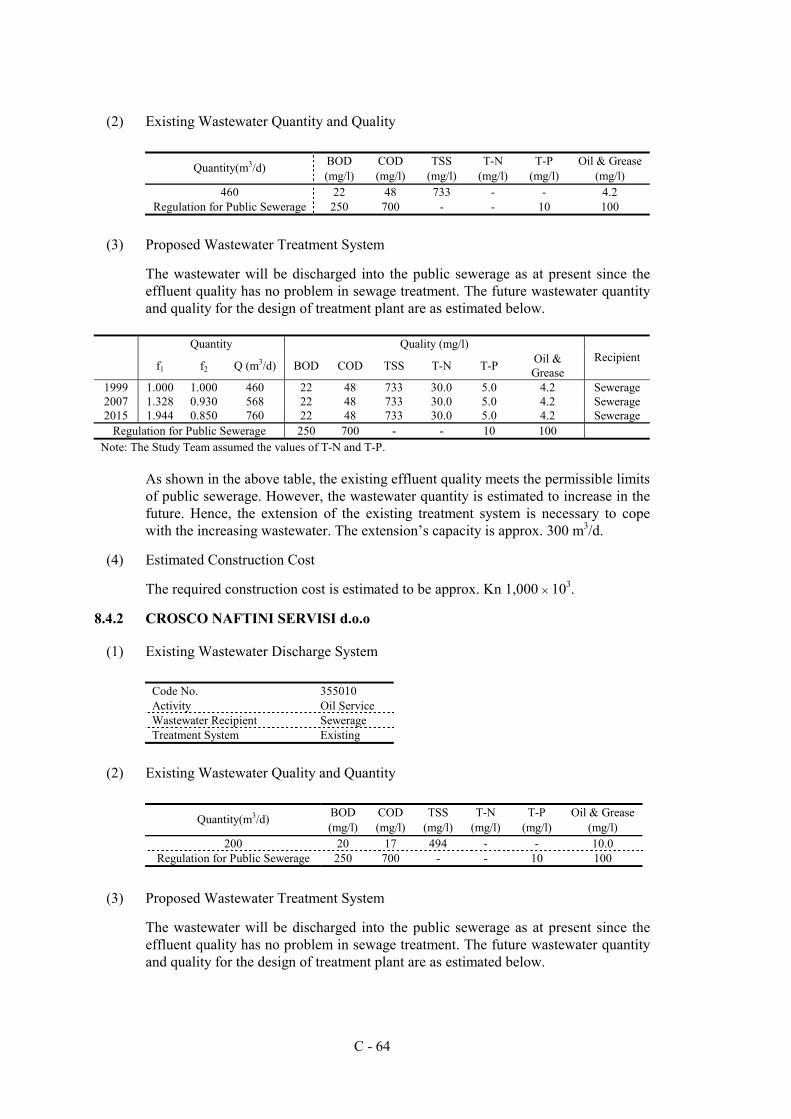
C - 64
(2) Existing Wastewater Quantity and Quality
BOD COD TSS T-N T-P Oil & Grease Quantity(m3/d) (mg/l) (mg/l) (mg/l) (mg/l) (mg/l) (mg/l)
460 22 48 733 - - 4.2 Regulation for Public Sewerage 250 700 - - 10 100
(3) Proposed Wastewater Treatment System
The wastewater will be discharged into the public sewerage as at present since the effluent quality has no problem in sewage treatment. The future wastewater quantity and quality for the design of treatment plant are as estimated below.
Quantity Quality (mg/l)
f1 f2 Q (m3/d) BOD COD TSS T-N T-P Oil &
Grease Recipient
1999 1.000 1.000 460 22 48 733 30.0 5.0 4.2 Sewerage 2007 1.328 0.930 568 22 48 733 30.0 5.0 4.2 Sewerage 2015 1.944 0.850 760 22 48 733 30.0 5.0 4.2 Sewerage
Regulation for Public Sewerage 250 700 - - 10 100 Note: The Study Team assumed the values of T-N and T-P.
As shown in the above table, the existing effluent quality meets the permissible limits of public sewerage. However, the wastewater quantity is estimated to increase in the future. Hence, the extension of the existing treatment system is necessary to cope with the increasing wastewater. The extension’s capacity is approx. 300 m3/d.
(4) Estimated Construction Cost
The required construction cost is estimated to be approx. Kn 1,000 × 103.
8.4.2 CROSCO NAFTINI SERVISI d.o.o
(1) Existing Wastewater Discharge System
Code No. 355010 Activity Oil Service Wastewater Recipient Sewerage Treatment System Existing
(2) Existing Wastewater Quality and Quantity
BOD COD TSS T-N T-P Oil & Grease Quantity(m3/d) (mg/l) (mg/l) (mg/l) (mg/l) (mg/l) (mg/l)
200 20 17 494 - - 10.0 Regulation for Public Sewerage 250 700 - - 10 100
(3) Proposed Wastewater Treatment System
The wastewater will be discharged into the public sewerage as at present since the effluent quality has no problem in sewage treatment. The future wastewater quantity and quality for the design of treatment plant are as estimated below.
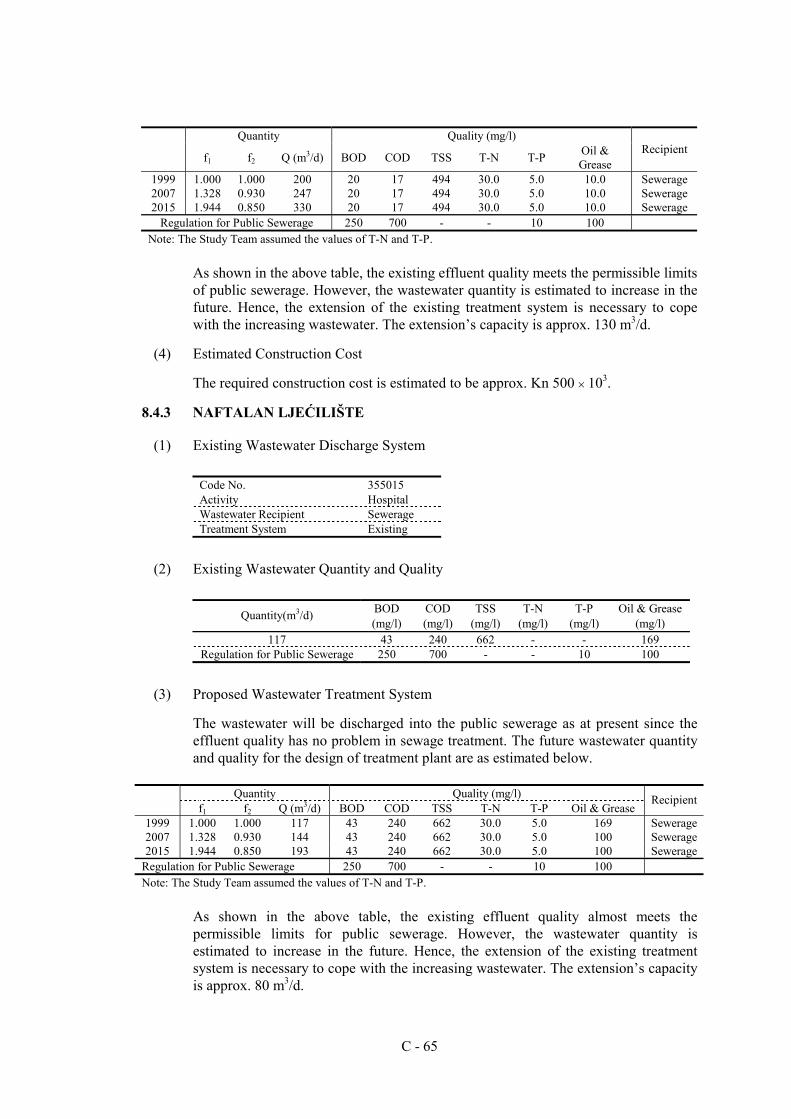
C - 65
Quantity Quality (mg/l)
f1 f2 Q (m3/d) BOD COD TSS T-N T-P Oil &
Grease Recipient
1999 1.000 1.000 200 20 17 494 30.0 5.0 10.0 Sewerage 2007 1.328 0.930 247 20 17 494 30.0 5.0 10.0 Sewerage 2015 1.944 0.850 330 20 17 494 30.0 5.0 10.0 Sewerage
Regulation for Public Sewerage 250 700 - - 10 100 Note: The Study Team assumed the values of T-N and T-P.
As shown in the above table, the existing effluent quality meets the permissible limits of public sewerage. However, the wastewater quantity is estimated to increase in the future. Hence, the extension of the existing treatment system is necessary to cope with the increasing wastewater. The extension’s capacity is approx. 130 m3/d.
(4) Estimated Construction Cost
The required construction cost is estimated to be approx. Kn 500 × 103.
8.4.3 NAFTALAN LJEĆILIŠTE
(1) Existing Wastewater Discharge System
Code No. 355015 Activity Hospital Wastewater Recipient Sewerage Treatment System Existing
(2) Existing Wastewater Quantity and Quality
BOD COD TSS T-N T-P Oil & Grease Quantity(m3/d) (mg/l) (mg/l) (mg/l) (mg/l) (mg/l) (mg/l)
117 43 240 662 - - 169 Regulation for Public Sewerage 250 700 - - 10 100
(3) Proposed Wastewater Treatment System
The wastewater will be discharged into the public sewerage as at present since the effluent quality has no problem in sewage treatment. The future wastewater quantity and quality for the design of treatment plant are as estimated below.
Quantity Quality (mg/l)
f1 f2 Q (m3/d) BOD COD TSS T-N T-P Oil & Grease Recipient
1999 1.000 1.000 117 43 240 662 30.0 5.0 169 Sewerage 2007 1.328 0.930 144 43 240 662 30.0 5.0 100 Sewerage 2015 1.944 0.850 193 43 240 662 30.0 5.0 100 Sewerage
Regulation for Public Sewerage 250 700 - - 10 100 Note: The Study Team assumed the values of T-N and T-P.
As shown in the above table, the existing effluent quality almost meets the permissible limits for public sewerage. However, the wastewater quantity is estimated to increase in the future. Hence, the extension of the existing treatment system is necessary to cope with the increasing wastewater. The extension’s capacity is approx. 80 m3/d.
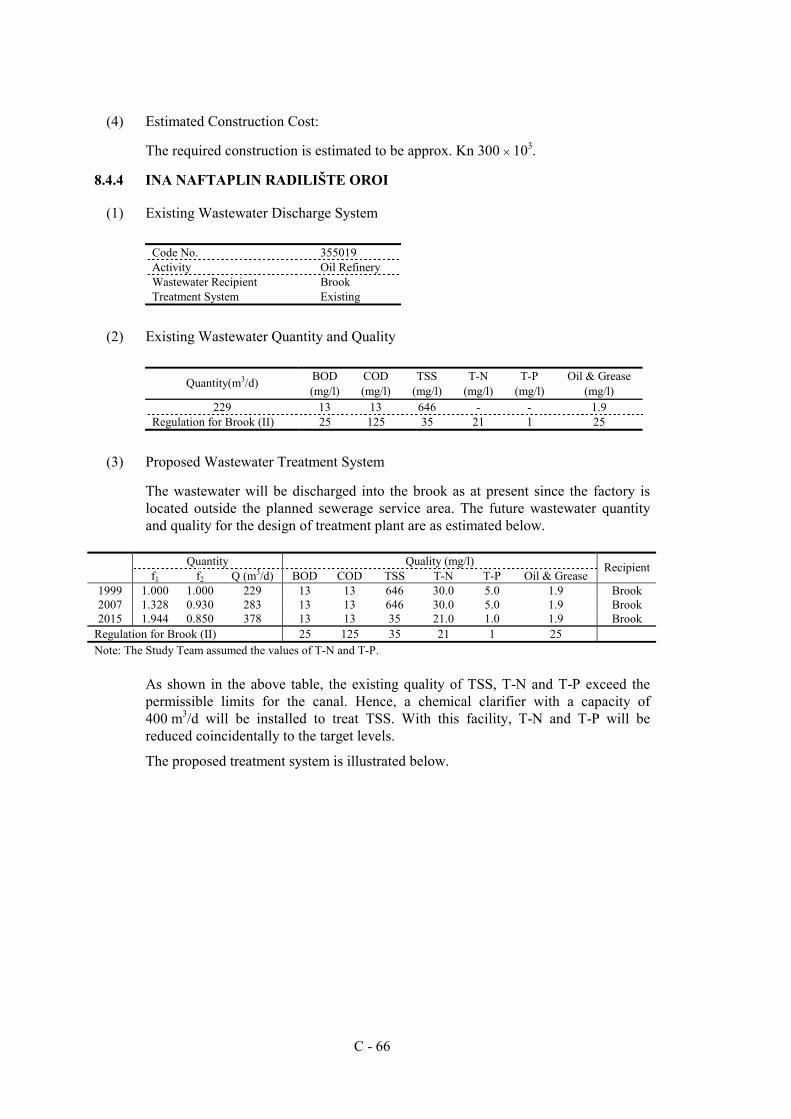
C - 66
(4) Estimated Construction Cost:
The required construction is estimated to be approx. Kn 300 × 103.
8.4.4 INA NAFTAPLIN RADILIŠTE OROI
(1) Existing Wastewater Discharge System
Code No. 355019 Activity Oil Refinery Wastewater Recipient Brook Treatment System Existing
(2) Existing Wastewater Quantity and Quality
BOD COD TSS T-N T-P Oil & Grease Quantity(m3/d) (mg/l) (mg/l) (mg/l) (mg/l) (mg/l) (mg/l)
229 13 13 646 - - 1.9 Regulation for Brook (II) 25 125 35 21 1 25
(3) Proposed Wastewater Treatment System
The wastewater will be discharged into the brook as at present since the factory is located outside the planned sewerage service area. The future wastewater quantity and quality for the design of treatment plant are as estimated below.
Quantity Quality (mg/l)
f1 f2 Q (m3/d) BOD COD TSS T-N T-P Oil & Grease Recipient
1999 1.000 1.000 229 13 13 646 30.0 5.0 1.9 Brook 2007 1.328 0.930 283 13 13 646 30.0 5.0 1.9 Brook 2015 1.944 0.850 378 13 13 35 21.0 1.0 1.9 Brook
Regulation for Brook (II) 25 125 35 21 1 25 Note: The Study Team assumed the values of T-N and T-P.
As shown in the above table, the existing quality of TSS, T-N and T-P exceed the permissible limits for the canal. Hence, a chemical clarifier with a capacity of 400 m3/d will be installed to treat TSS. With this facility, T-N and T-P will be reduced coincidentally to the target levels.
The proposed treatment system is illustrated below.
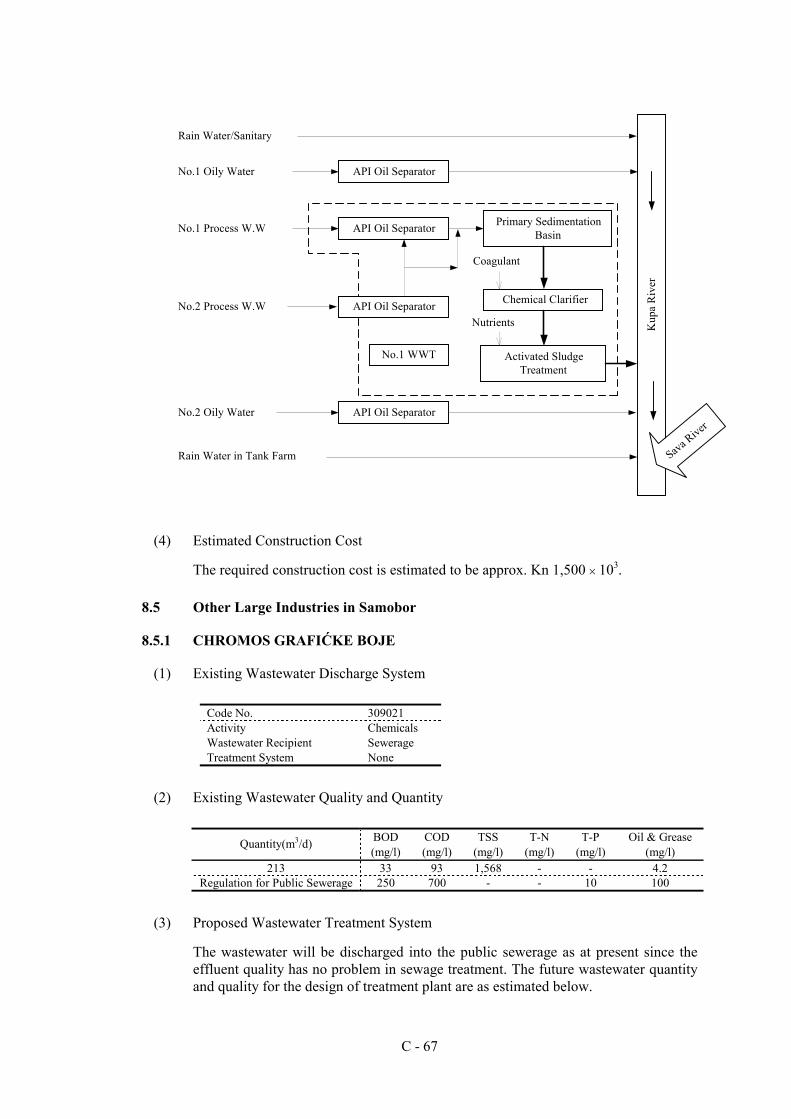
C - 67
(4) Estimated Construction Cost
The required construction cost is estimated to be approx. Kn 1,500 × 103.
8.5 Other Large Industries in Samobor
8.5.1 CHROMOS GRAFIĆKE BOJE
(1) Existing Wastewater Discharge System
Code No. 309021 Activity Chemicals Wastewater Recipient Sewerage Treatment System None
(2) Existing Wastewater Quality and Quantity
BOD COD TSS T-N T-P Oil & Grease Quantity(m3/d) (mg/l) (mg/l) (mg/l) (mg/l) (mg/l) (mg/l)
213 33 93 1,568 - - 4.2 Regulation for Public Sewerage 250 700 - - 10 100
(3) Proposed Wastewater Treatment System
The wastewater will be discharged into the public sewerage as at present since the effluent quality has no problem in sewage treatment. The future wastewater quantity and quality for the design of treatment plant are as estimated below.
Rain Water/Sanitary
No.1 Oily Water
No.1 Process W.W
No.2 Process W.W
No.2 Oily Water
Rain Water in Tank Farm
Kup
a R
iver
API Oil Separator
API Oil Separator Primary SedimentationBasin
API Oil Separator
API Oil Separator
Chemical Clarifier
Activated SludgeTreatment
No.1 WWT
Sava River
Coagulant
Nutrients
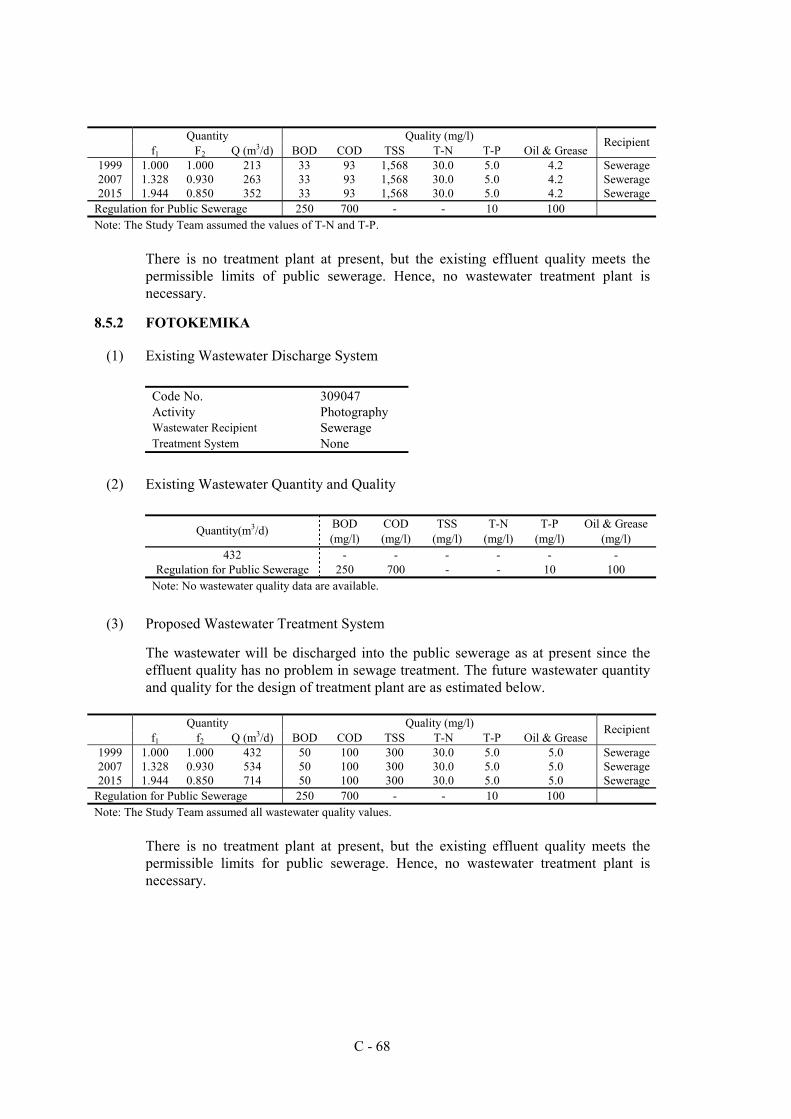
C - 68
Quantity Quality (mg/l)
f1 F2 Q (m3/d) BOD COD TSS T-N T-P Oil & Grease Recipient
1999 1.000 1.000 213 33 93 1,568 30.0 5.0 4.2 Sewerage 2007 1.328 0.930 263 33 93 1,568 30.0 5.0 4.2 Sewerage 2015 1.944 0.850 352 33 93 1,568 30.0 5.0 4.2 Sewerage
Regulation for Public Sewerage 250 700 - - 10 100 Note: The Study Team assumed the values of T-N and T-P.
There is no treatment plant at present, but the existing effluent quality meets the permissible limits of public sewerage. Hence, no wastewater treatment plant is necessary.
8.5.2 FOTOKEMIKA
(1) Existing Wastewater Discharge System
Code No. 309047 Activity Photography Wastewater Recipient Sewerage Treatment System None
(2) Existing Wastewater Quantity and Quality
BOD COD TSS T-N T-P Oil & Grease Quantity(m3/d) (mg/l) (mg/l) (mg/l) (mg/l) (mg/l) (mg/l)
432 - - - - - - Regulation for Public Sewerage 250 700 - - 10 100
Note: No wastewater quality data are available.
(3) Proposed Wastewater Treatment System
The wastewater will be discharged into the public sewerage as at present since the effluent quality has no problem in sewage treatment. The future wastewater quantity and quality for the design of treatment plant are as estimated below.
Quantity Quality (mg/l)
f1 f2 Q (m3/d) BOD COD TSS T-N T-P Oil & Grease Recipient
1999 1.000 1.000 432 50 100 300 30.0 5.0 5.0 Sewerage 2007 1.328 0.930 534 50 100 300 30.0 5.0 5.0 Sewerage 2015 1.944 0.850 714 50 100 300 30.0 5.0 5.0 Sewerage
Regulation for Public Sewerage 250 700 - - 10 100 Note: The Study Team assumed all wastewater quality values.
There is no treatment plant at present, but the existing effluent quality meets the permissible limits for public sewerage. Hence, no wastewater treatment plant is necessary.
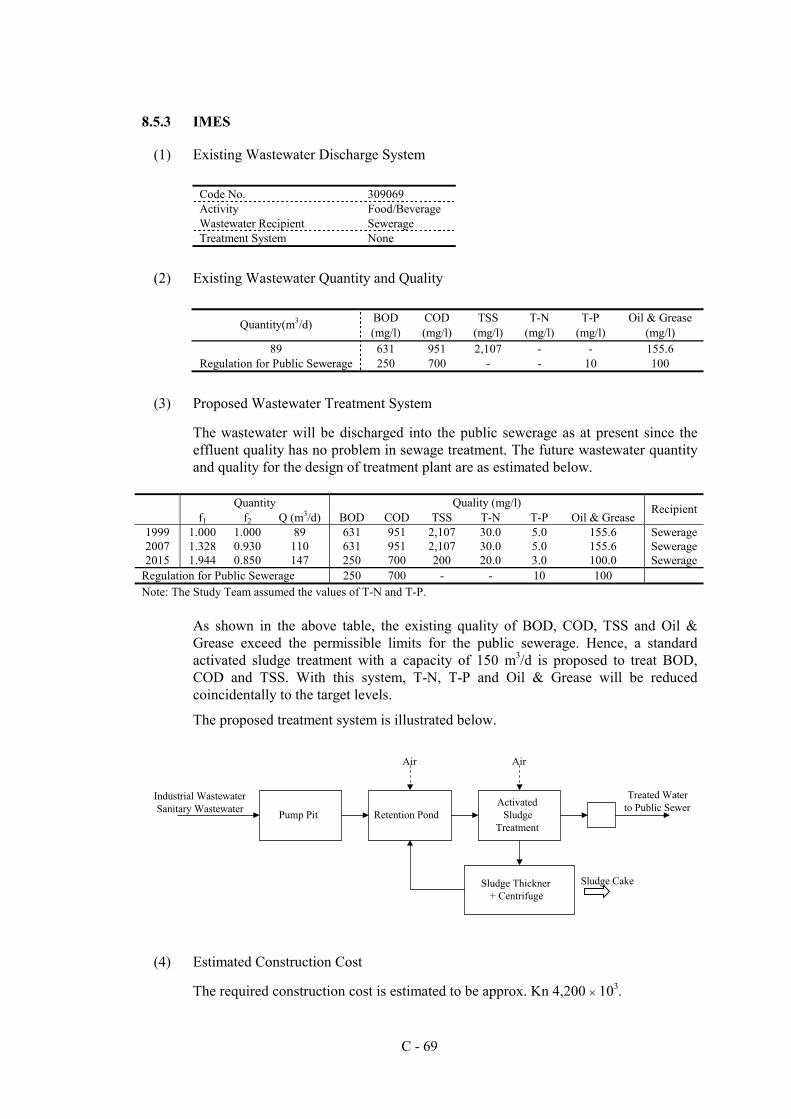
C - 69
8.5.3 IMES
(1) Existing Wastewater Discharge System
Code No. 309069 Activity Food/Beverage Wastewater Recipient Sewerage Treatment System None
(2) Existing Wastewater Quantity and Quality
BOD COD TSS T-N T-P Oil & Grease Quantity(m3/d) (mg/l) (mg/l) (mg/l) (mg/l) (mg/l) (mg/l)
89 631 951 2,107 - - 155.6 Regulation for Public Sewerage 250 700 - - 10 100
(3) Proposed Wastewater Treatment System
The wastewater will be discharged into the public sewerage as at present since the effluent quality has no problem in sewage treatment. The future wastewater quantity and quality for the design of treatment plant are as estimated below.
Quantity Quality (mg/l)
f1 f2 Q (m3/d) BOD COD TSS T-N T-P Oil & Grease Recipient
1999 1.000 1.000 89 631 951 2,107 30.0 5.0 155.6 Sewerage 2007 1.328 0.930 110 631 951 2,107 30.0 5.0 155.6 Sewerage 2015 1.944 0.850 147 250 700 200 20.0 3.0 100.0 Sewerage
Regulation for Public Sewerage 250 700 - - 10 100 Note: The Study Team assumed the values of T-N and T-P.
As shown in the above table, the existing quality of BOD, COD, TSS and Oil & Grease exceed the permissible limits for the public sewerage. Hence, a standard activated sludge treatment with a capacity of 150 m3/d is proposed to treat BOD, COD and TSS. With this system, T-N, T-P and Oil & Grease will be reduced coincidentally to the target levels.
The proposed treatment system is illustrated below.
(4) Estimated Construction Cost
The required construction cost is estimated to be approx. Kn 4,200 × 103.
Pump Pit Retention PondActivated
SludgeTreatment
Sludge Thickner+ Centrifuge
Treated Waterto Public Sewer
Industrial WastewaterSanitary Wastewater
Air Air
Sludge Cake
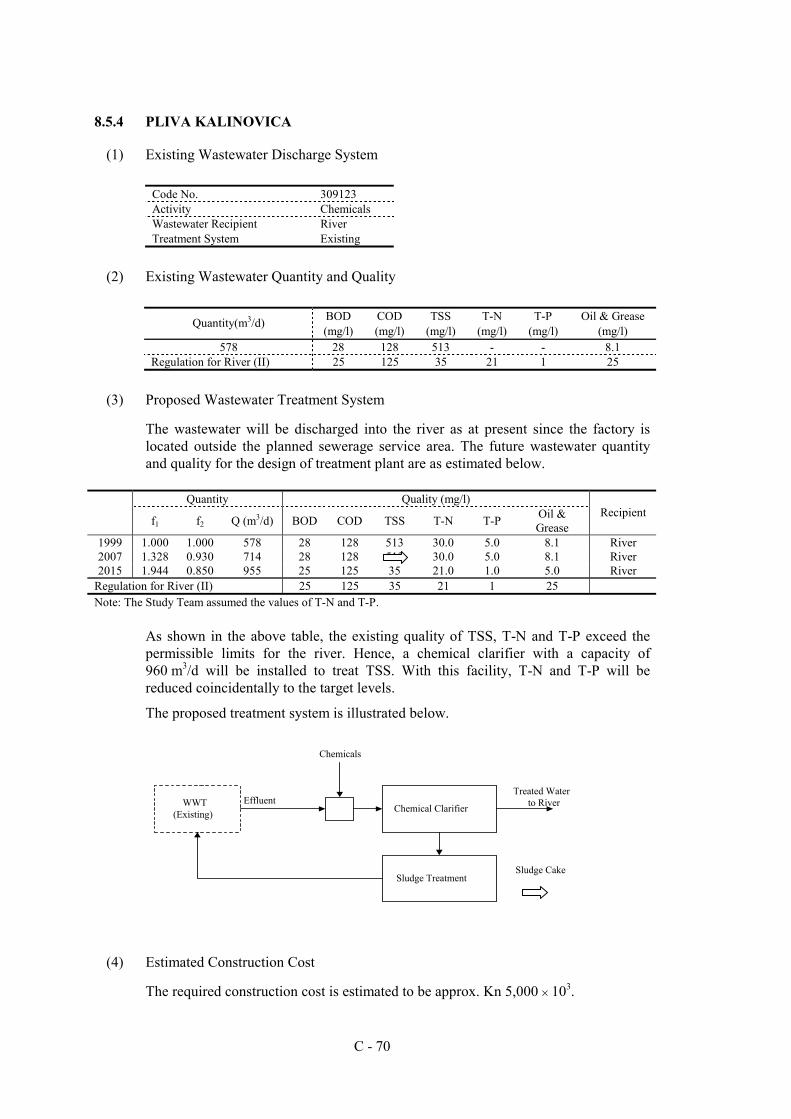
C - 70
8.5.4 PLIVA KALINOVICA
(1) Existing Wastewater Discharge System
Code No. 309123 Activity Chemicals Wastewater Recipient River Treatment System Existing
(2) Existing Wastewater Quantity and Quality
BOD COD TSS T-N T-P Oil & Grease Quantity(m3/d) (mg/l) (mg/l) (mg/l) (mg/l) (mg/l) (mg/l)
578 28 128 513 - - 8.1 Regulation for River (II) 25 125 35 21 1 25
(3) Proposed Wastewater Treatment System
The wastewater will be discharged into the river as at present since the factory is located outside the planned sewerage service area. The future wastewater quantity and quality for the design of treatment plant are as estimated below.
Quantity Quality (mg/l)
f1 f2 Q (m3/d) BOD COD TSS T-N T-P Oil &
Grease Recipient
1999 1.000 1.000 578 28 128 513 30.0 5.0 8.1 River 2007 1.328 0.930 714 28 128 513 30.0 5.0 8.1 River 2015 1.944 0.850 955 25 125 35 21.0 1.0 5.0 River
Regulation for River (II) 25 125 35 21 1 25 Note: The Study Team assumed the values of T-N and T-P.
As shown in the above table, the existing quality of TSS, T-N and T-P exceed the permissible limits for the river. Hence, a chemical clarifier with a capacity of 960 m3/d will be installed to treat TSS. With this facility, T-N and T-P will be reduced coincidentally to the target levels.
The proposed treatment system is illustrated below.
(4) Estimated Construction Cost
The required construction cost is estimated to be approx. Kn 5,000 × 103.
WWT(Existing) Chemical Clarifier
Sludge Treatment
Chemicals
Treated Waterto River
Sludge Cake
Effluent
C - 71
8.5.5 CHROMOS GRAFIĆKE BOJE
(1) Existing Wastewater Discharge System
Code No. 309180 Activity Chemicals Wastewater Recipient Sewerage Treatment System None
(2) Existing Wastewater Quantity and Quality
BOD COD TSS T-N T-P Oil & Grease Quantity(m3/d) (mg/l) (mg/l) (mg/l) (mg/l) (mg/l) (mg/l)
189 18 35 563 - - 1.5 Regulation for Public Sewerage 250 700 - - 10 100
(3) Proposed Wastewater Treatment System
The wastewater will be discharged into the public sewerage as at present since the effluent quality has no problem in sewage treatment. The future wastewater quantity and quality for the design of treatment plant are as estimated below.
Quantity Quality (mg/l)
f1 f2 Q (m3/d) BOD COD TSS T-N T-P Oil &
Grease Recipient
1999 1.000 1.000 189 18 35 563 30.0 5.0 1.5 Sewerage 2007 1.328 0.930 233 18 35 563 30.0 5.0 1.5 Sewerage 2015 1.944 0.850 312 18 35 563 30.0 5.0 1.5 Sewerage
Regulation for Public Sewerage 250 700 - - 10 100 Note: The Study Team assumed the values of T-N and T-P.
There is no treatment plant at present, but the existing effluent quality meets the permissible limits for public sewerage. Hence, no wastewater treatment plant is necessary.
8.5.6 IMUNOLOŠKI ZAVOD BREZJE
(1) Existing Wastewater Discharge System
Code No. 309233 Activity Chemicals Wastewater Recipient Sewerage Treatment System None
(2) Existing Wastewater Quantity and Quality
BOD COD TSS T-N T-P Oil & Grease Quantity(m3/d) (mg/l) (mg/l) (mg/l) (mg/l) (mg/l) (mg/l)
682 40 221 649 - - 3.4 Regulation for Public Sewerage 250 700 - - 10 100
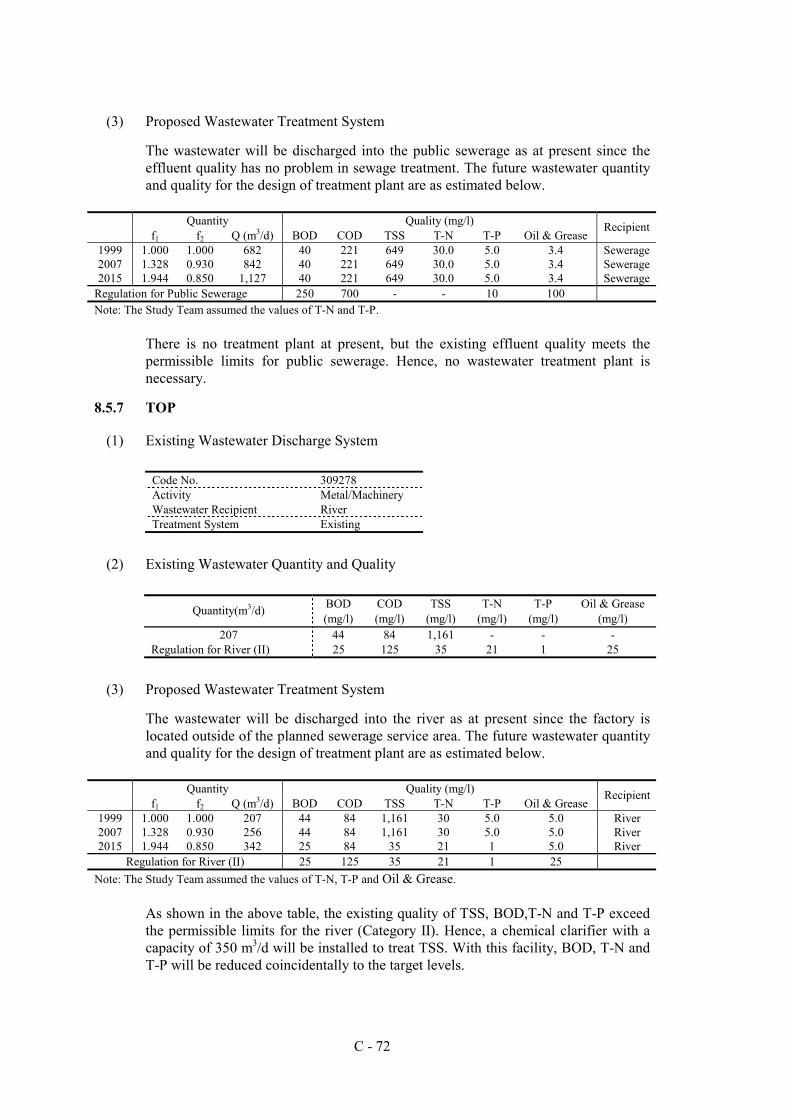
C - 72
(3) Proposed Wastewater Treatment System
The wastewater will be discharged into the public sewerage as at present since the effluent quality has no problem in sewage treatment. The future wastewater quantity and quality for the design of treatment plant are as estimated below.
Quantity Quality (mg/l)
f1 f2 Q (m3/d) BOD COD TSS T-N T-P Oil & Grease Recipient
1999 1.000 1.000 682 40 221 649 30.0 5.0 3.4 Sewerage 2007 1.328 0.930 842 40 221 649 30.0 5.0 3.4 Sewerage 2015 1.944 0.850 1,127 40 221 649 30.0 5.0 3.4 Sewerage
Regulation for Public Sewerage 250 700 - - 10 100 Note: The Study Team assumed the values of T-N and T-P.
There is no treatment plant at present, but the existing effluent quality meets the permissible limits for public sewerage. Hence, no wastewater treatment plant is necessary.
8.5.7 TOP
(1) Existing Wastewater Discharge System
Code No. 309278 Activity Metal/Machinery Wastewater Recipient River Treatment System Existing
(2) Existing Wastewater Quantity and Quality
BOD COD TSS T-N T-P Oil & Grease Quantity(m3/d) (mg/l) (mg/l) (mg/l) (mg/l) (mg/l) (mg/l)
207 44 84 1,161 - - - Regulation for River (II) 25 125 35 21 1 25
(3) Proposed Wastewater Treatment System
The wastewater will be discharged into the river as at present since the factory is located outside of the planned sewerage service area. The future wastewater quantity and quality for the design of treatment plant are as estimated below.
Quantity Quality (mg/l)
f1 f2 Q (m3/d) BOD COD TSS T-N T-P Oil & Grease Recipient
1999 1.000 1.000 207 44 84 1,161 30 5.0 5.0 River 2007 1.328 0.930 256 44 84 1,161 30 5.0 5.0 River 2015 1.944 0.850 342 25 84 35 21 1 5.0 River
Regulation for River (II) 25 125 35 21 1 25 Note: The Study Team assumed the values of T-N, T-P and Oil & Grease.
As shown in the above table, the existing quality of TSS, BOD,T-N and T-P exceed the permissible limits for the river (Category II). Hence, a chemical clarifier with a capacity of 350 m3/d will be installed to treat TSS. With this facility, BOD, T-N and T-P will be reduced coincidentally to the target levels.
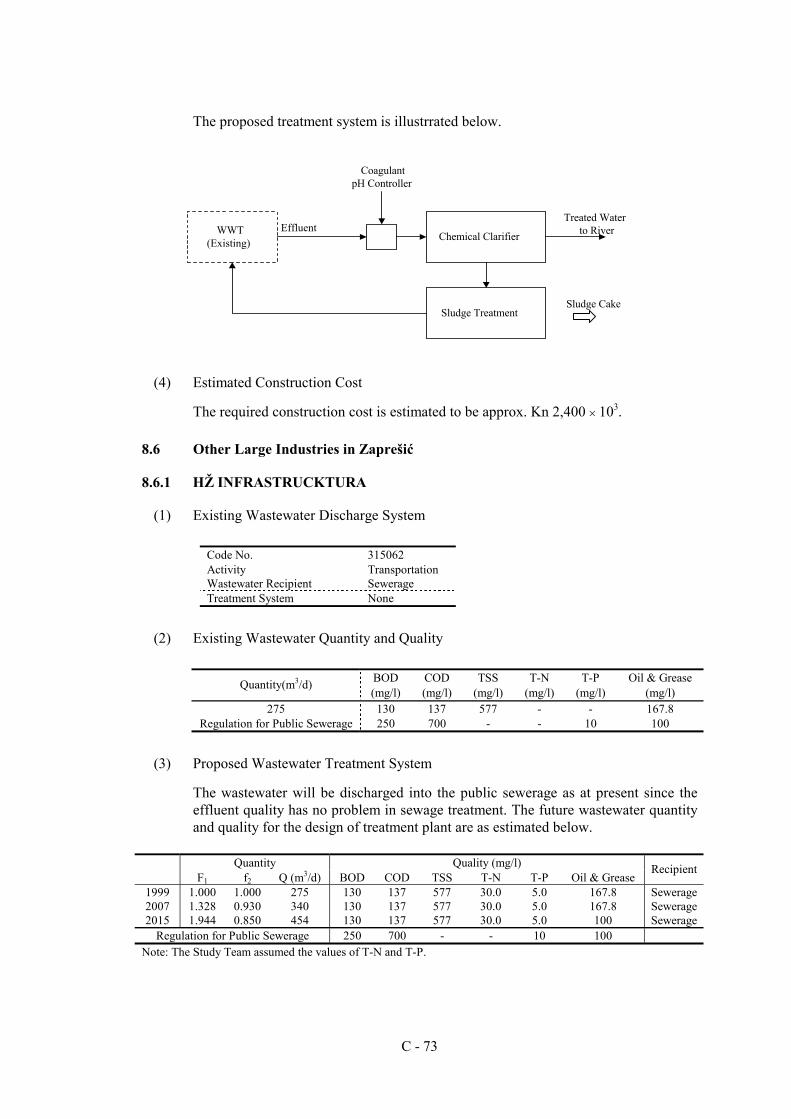
C - 73
The proposed treatment system is illustrrated below.
(4) Estimated Construction Cost
The required construction cost is estimated to be approx. Kn 2,400 × 103.
8.6 Other Large Industries in Zaprešić
8.6.1 HŽ INFRASTRUCKTURA
(1) Existing Wastewater Discharge System
Code No. 315062 Activity Transportation Wastewater Recipient Sewerage Treatment System None
(2) Existing Wastewater Quantity and Quality
BOD COD TSS T-N T-P Oil & Grease Quantity(m3/d) (mg/l) (mg/l) (mg/l) (mg/l) (mg/l) (mg/l)
275 130 137 577 - - 167.8 Regulation for Public Sewerage 250 700 - - 10 100
(3) Proposed Wastewater Treatment System
The wastewater will be discharged into the public sewerage as at present since the effluent quality has no problem in sewage treatment. The future wastewater quantity and quality for the design of treatment plant are as estimated below.
Quantity Quality (mg/l)
F1 f2 Q (m3/d) BOD COD TSS T-N T-P Oil & Grease Recipient
1999 1.000 1.000 275 130 137 577 30.0 5.0 167.8 Sewerage 2007 1.328 0.930 340 130 137 577 30.0 5.0 167.8 Sewerage 2015 1.944 0.850 454 130 137 577 30.0 5.0 100 Sewerage
Regulation for Public Sewerage 250 700 - - 10 100 Note: The Study Team assumed the values of T-N and T-P.
WWT(Existing) Chemical Clarifier
Sludge Treatment
CoagulantpH Controller
Treated Waterto River
Sludge Cake
Effluent
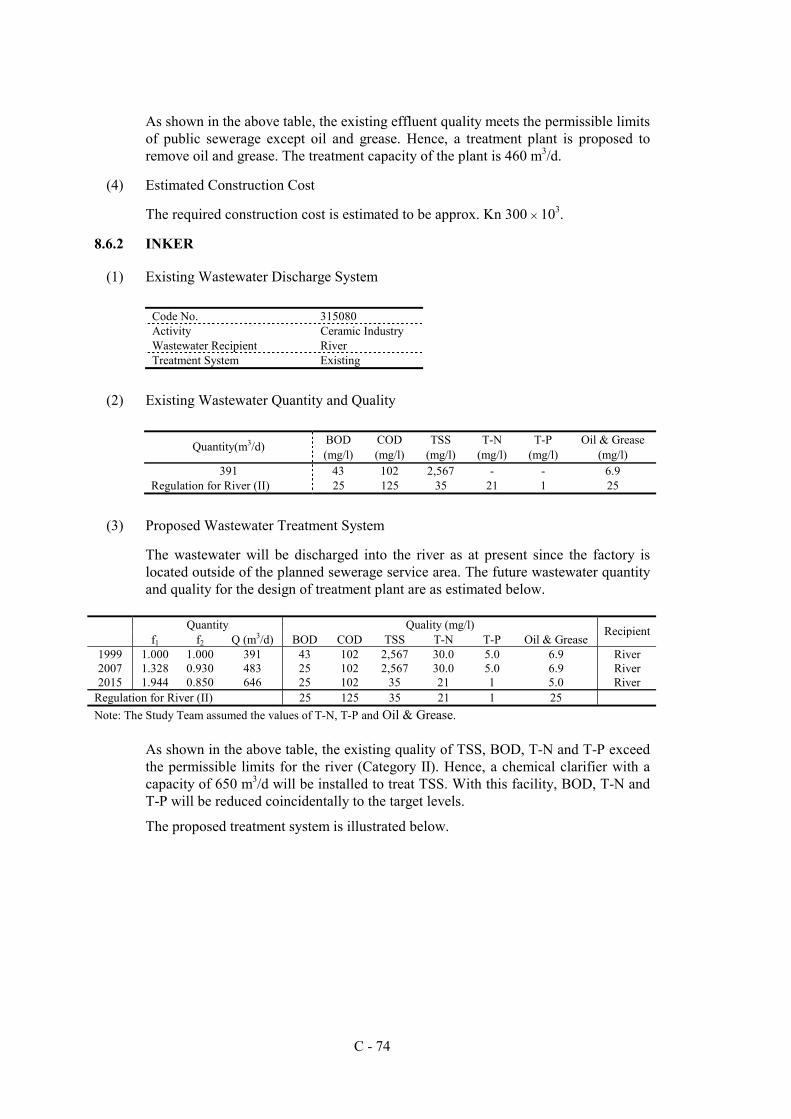
C - 74
As shown in the above table, the existing effluent quality meets the permissible limits of public sewerage except oil and grease. Hence, a treatment plant is proposed to remove oil and grease. The treatment capacity of the plant is 460 m3/d.
(4) Estimated Construction Cost
The required construction cost is estimated to be approx. Kn 300 × 103.
8.6.2 INKER
(1) Existing Wastewater Discharge System
Code No. 315080 Activity Ceramic Industry Wastewater Recipient River Treatment System Existing
(2) Existing Wastewater Quantity and Quality
BOD COD TSS T-N T-P Oil & Grease Quantity(m3/d) (mg/l) (mg/l) (mg/l) (mg/l) (mg/l) (mg/l)
391 43 102 2,567 - - 6.9 Regulation for River (II) 25 125 35 21 1 25
(3) Proposed Wastewater Treatment System
The wastewater will be discharged into the river as at present since the factory is located outside of the planned sewerage service area. The future wastewater quantity and quality for the design of treatment plant are as estimated below.
Quantity Quality (mg/l)
f1 f2 Q (m3/d) BOD COD TSS T-N T-P Oil & Grease Recipient
1999 1.000 1.000 391 43 102 2,567 30.0 5.0 6.9 River 2007 1.328 0.930 483 25 102 2,567 30.0 5.0 6.9 River 2015 1.944 0.850 646 25 102 35 21 1 5.0 River
Regulation for River (II) 25 125 35 21 1 25 Note: The Study Team assumed the values of T-N, T-P and Oil & Grease.
As shown in the above table, the existing quality of TSS, BOD, T-N and T-P exceed the permissible limits for the river (Category II). Hence, a chemical clarifier with a capacity of 650 m3/d will be installed to treat TSS. With this facility, BOD, T-N and T-P will be reduced coincidentally to the target levels.
The proposed treatment system is illustrated below.
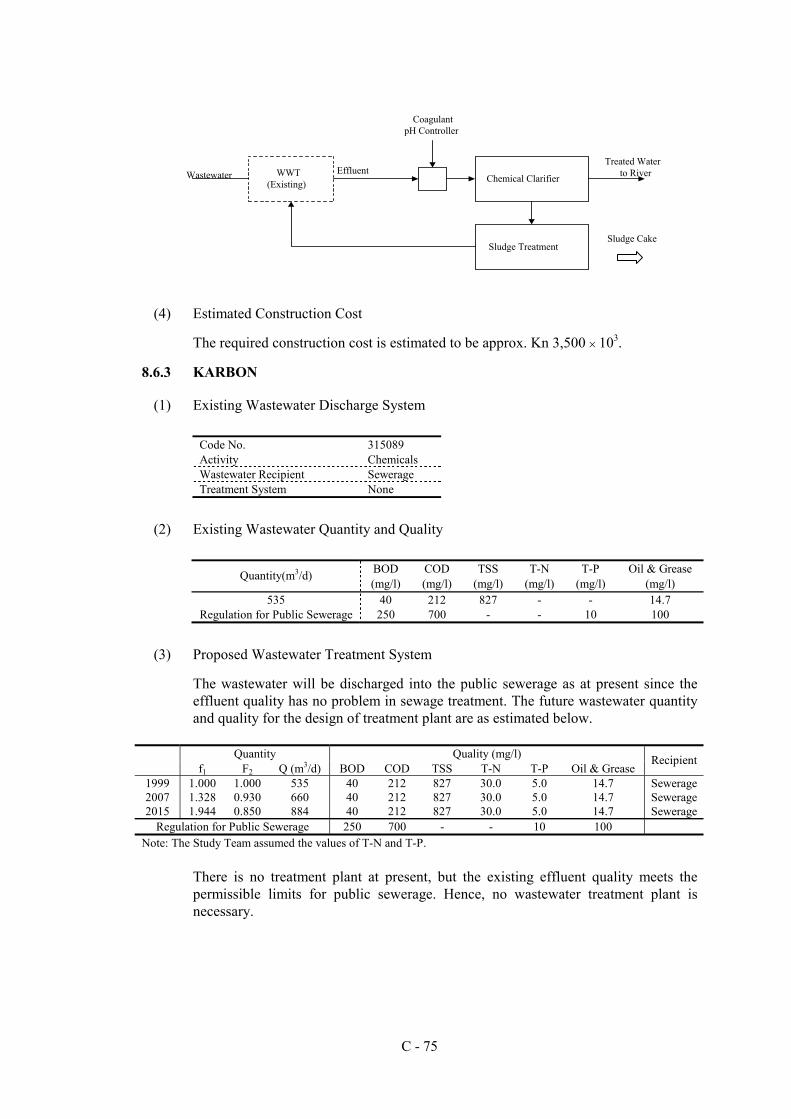
C - 75
(4) Estimated Construction Cost
The required construction cost is estimated to be approx. Kn 3,500 × 103.
8.6.3 KARBON
(1) Existing Wastewater Discharge System
Code No. 315089 Activity Chemicals Wastewater Recipient Sewerage Treatment System None
(2) Existing Wastewater Quantity and Quality
BOD COD TSS T-N T-P Oil & Grease Quantity(m3/d) (mg/l) (mg/l) (mg/l) (mg/l) (mg/l) (mg/l)
535 40 212 827 - - 14.7 Regulation for Public Sewerage 250 700 - - 10 100
(3) Proposed Wastewater Treatment System
The wastewater will be discharged into the public sewerage as at present since the effluent quality has no problem in sewage treatment. The future wastewater quantity and quality for the design of treatment plant are as estimated below.
Quantity Quality (mg/l)
f1 F2 Q (m3/d) BOD COD TSS T-N T-P Oil & Grease Recipient
1999 1.000 1.000 535 40 212 827 30.0 5.0 14.7 Sewerage 2007 1.328 0.930 660 40 212 827 30.0 5.0 14.7 Sewerage 2015 1.944 0.850 884 40 212 827 30.0 5.0 14.7 Sewerage
Regulation for Public Sewerage 250 700 - - 10 100 Note: The Study Team assumed the values of T-N and T-P.
There is no treatment plant at present, but the existing effluent quality meets the permissible limits for public sewerage. Hence, no wastewater treatment plant is necessary.
WWT(Existing) Chemical Clarifier
Sludge Treatment
CoagulantpH Controller
Treated Waterto River
Sludge Cake
EffluentWastewater
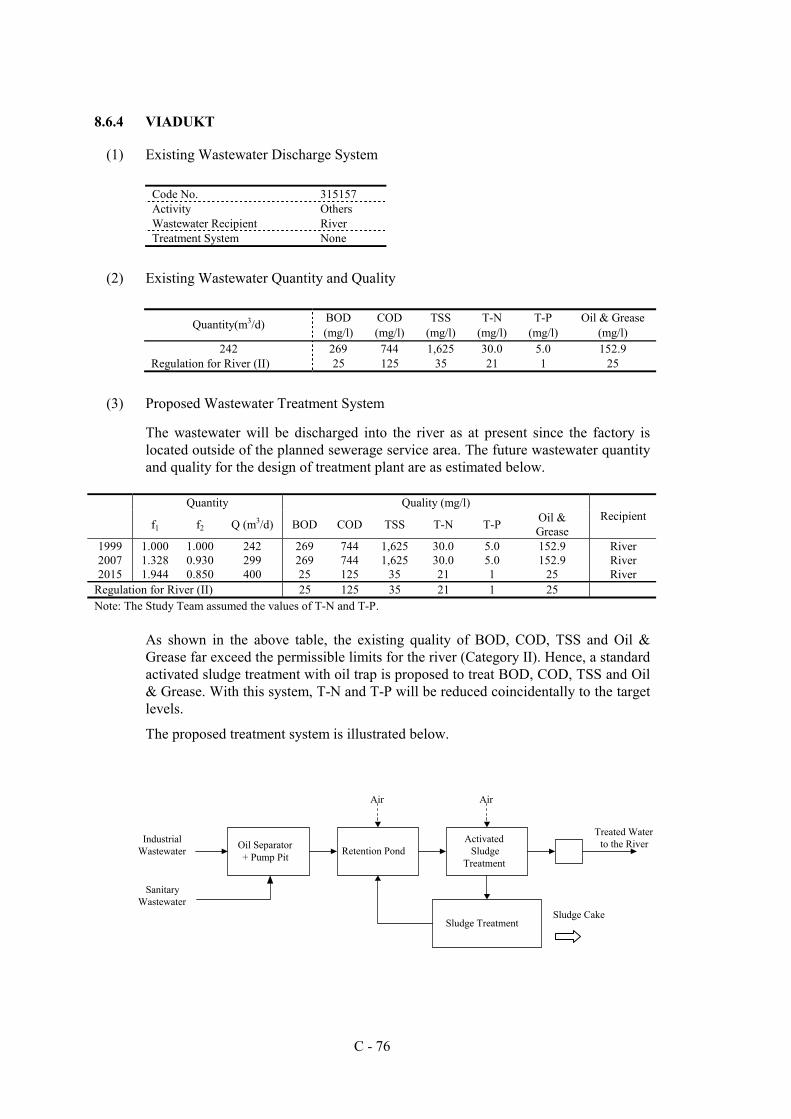
C - 76
8.6.4 VIADUKT
(1) Existing Wastewater Discharge System
Code No. 315157 Activity Others Wastewater Recipient River Treatment System None
(2) Existing Wastewater Quantity and Quality
BOD COD TSS T-N T-P Oil & Grease Quantity(m3/d) (mg/l) (mg/l) (mg/l) (mg/l) (mg/l) (mg/l)
242 269 744 1,625 30.0 5.0 152.9 Regulation for River (II) 25 125 35 21 1 25
(3) Proposed Wastewater Treatment System
The wastewater will be discharged into the river as at present since the factory is located outside of the planned sewerage service area. The future wastewater quantity and quality for the design of treatment plant are as estimated below.
Quantity Quality (mg/l)
f1 f2 Q (m3/d) BOD COD TSS T-N T-P Oil &
Grease Recipient
1999 1.000 1.000 242 269 744 1,625 30.0 5.0 152.9 River 2007 1.328 0.930 299 269 744 1,625 30.0 5.0 152.9 River 2015 1.944 0.850 400 25 125 35 21 1 25 River
Regulation for River (II) 25 125 35 21 1 25 Note: The Study Team assumed the values of T-N and T-P.
As shown in the above table, the existing quality of BOD, COD, TSS and Oil & Grease far exceed the permissible limits for the river (Category II). Hence, a standard activated sludge treatment with oil trap is proposed to treat BOD, COD, TSS and Oil & Grease. With this system, T-N and T-P will be reduced coincidentally to the target levels.
The proposed treatment system is illustrated below.
Oil Separator+ Pump Pit Retention Pond
ActivatedSludge
Treatment
Sludge Treatment
Treated Waterto the RiverIndustrial
Wastewater
Air Air
Sludge Cake
SanitaryWastewater
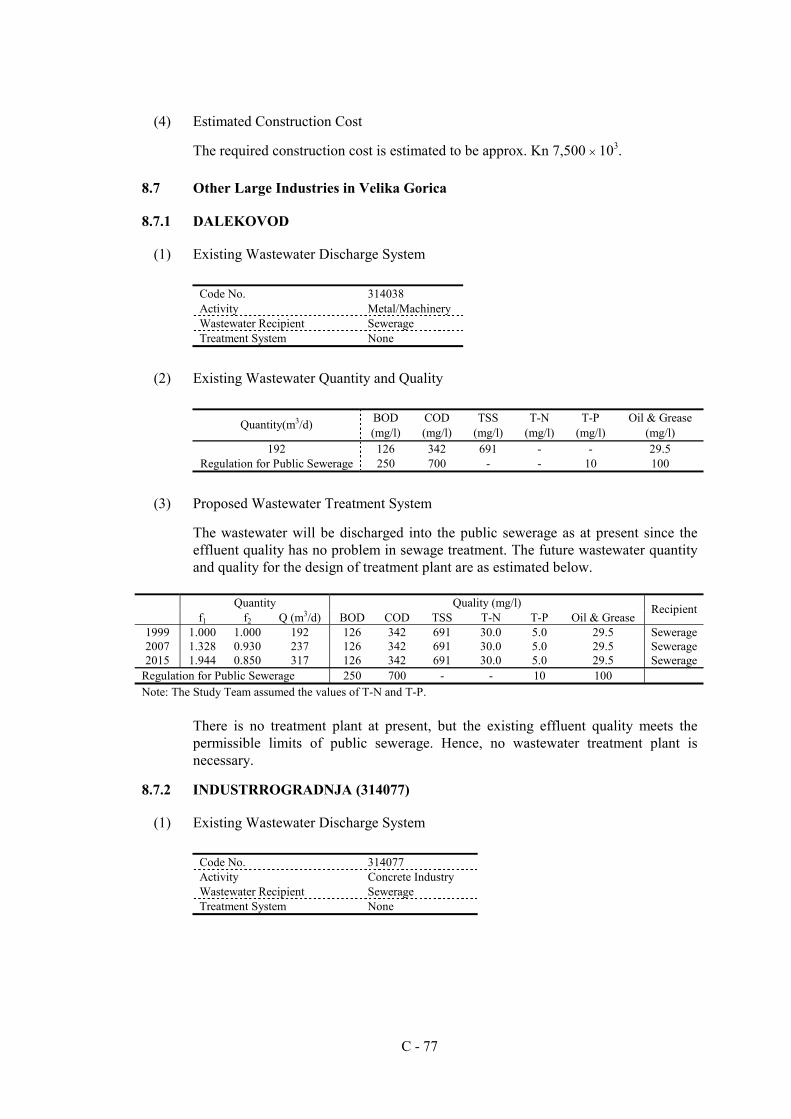
C - 77
(4) Estimated Construction Cost
The required construction cost is estimated to be approx. Kn 7,500 × 103.
8.7 Other Large Industries in Velika Gorica
8.7.1 DALEKOVOD
(1) Existing Wastewater Discharge System
Code No. 314038 Activity Metal/Machinery Wastewater Recipient Sewerage Treatment System None
(2) Existing Wastewater Quantity and Quality
BOD COD TSS T-N T-P Oil & Grease Quantity(m3/d) (mg/l) (mg/l) (mg/l) (mg/l) (mg/l) (mg/l)
192 126 342 691 - - 29.5 Regulation for Public Sewerage 250 700 - - 10 100
(3) Proposed Wastewater Treatment System
The wastewater will be discharged into the public sewerage as at present since the effluent quality has no problem in sewage treatment. The future wastewater quantity and quality for the design of treatment plant are as estimated below.
Quantity Quality (mg/l)
f1 f2 Q (m3/d) BOD COD TSS T-N T-P Oil & Grease Recipient
1999 1.000 1.000 192 126 342 691 30.0 5.0 29.5 Sewerage 2007 1.328 0.930 237 126 342 691 30.0 5.0 29.5 Sewerage 2015 1.944 0.850 317 126 342 691 30.0 5.0 29.5 Sewerage
Regulation for Public Sewerage 250 700 - - 10 100 Note: The Study Team assumed the values of T-N and T-P.
There is no treatment plant at present, but the existing effluent quality meets the permissible limits of public sewerage. Hence, no wastewater treatment plant is necessary.
8.7.2 INDUSTRROGRADNJA (314077)
(1) Existing Wastewater Discharge System
Code No. 314077 Activity Concrete Industry Wastewater Recipient Sewerage Treatment System None
C - 78
(2) Existing Wastewater Quantity and Quality
BOD COD TSS T-N T-P Oil & Grease Quantity(m3/d) (mg/l) (mg/l) (mg/l) (mg/l) (mg/l) (mg/l)
101 - - - - - - Regulation for Public Sewerage 250 700 - - 10 100
(3) Proposed Wastewater Treatment System
The wastewater will be discharged into the public sewerage as at present since the effluent quality has no problem in sewage treatment. The future wastewater quantity and quality for the design of treatment plant are as estimated below.
Quantity Quality (mg/l)
f1 f2 Q (m3/d) BOD COD TSS T-N T-P Oil & Grease Recipient
1999 1.000 1.000 101 50 100 300 30.0 5.0 5.0 Sewerage 2007 1.328 0.930 125 50 100 300 30.0 5.0 5.0 Sewerage 2015 1.944 0.850 167 50 100 300 30.0 5.0 5.0 Sewerage
Regulation for Public Sewerage 250 700 - - 10 100 Note: The Study Team assumed all wastewater quality values.
There is no treatment plant at present, but the existing effluent quality meets the permissible limits of public sewerage. Hence, no wastewater treatment plant is necessary.
8.7.3 INDUSTROGRADNJA (314079)
(1) Existing Wastewater Discharge System
Code No. 314079 Activity Concrete Industry Wastewater Recipient River Treatment System None
(2) Existing Wastewater Quantity and Quality
BOD COD TSS T-N T-P Oil & Grease Quantity(m3/d) (mg/l) (mg/l) (mg/l) (mg/l) (mg/l) (mg/l)
240 - - - - - - Regulation for River (III) 25 125 35 31 2 30
Note: No water quality values are available.
(3) Proposed Wastewater Treatment System
The wastewater will be discharged into the river as at present since the factory is located outside the planned sewerage service area. The future wastewater quantity and quality for the design of treatment plant are as estimated below.
C - 79
Quantity Quality (mg/l)
f1 f2 Q (m3/d) BOD COD TSS T-N T-P Oil &
Grease Recipient
1999 1.000 1.000 240 50 100 300 30.0 5.0 5 River 2007 1.328 0.930 296 50 100 300 30.0 5.0 5 River 2015 1.944 0.850 397 50 100 300 30.0 5.0 5 River
Regulation for River (III) 25 125 35 31 2 30 Note: The Study Team assumed all wastewater quality values.
All wastewater qualities are assumed since no data are available. However, the industry is considered to cause no serious water pollution judging from its activities. Hence, no wastewater treatment plant is proposed.
8.7.4 ZRAĆNA LUKA Zagreb
(1) Existing Wastewater Discharge System
Code No. 314205 Activity Transportation Wastewater Recipient Sewerage Treatment System None
(2) Existing Wastewater Quantity and Quality
BOD COD TSS T-N T-P Oil & Grease Quantity(m3/d) (mg/l) (mg/l) (mg/l) (mg/l) (mg/l) (mg/l)
108 - - - - - - Regulation for Public Sewerage 250 700 - - 10 100 Note: No water quality values are available.
(3) Proposed Wastewater Treatment System
The wastewater will be discharged into the public sewerage as at present since the effluent quality has no problem in sewage treatment. The future wastewater quantity and quality for the design of treatment plant are as estimated below.
Quantity Quality (mg/l)
f1 f2 Q (m3/d) BOD COD TSS T-N T-P Oil & Grease Recipient
1999 1.000 1.000 108 87 125 889 30.0 5.0 0.6 Sewerage 2007 1.328 0.930 133 87 125 889 30.0 5.0 0.6 Sewerage 2015 1.944 0.850 178 87 125 889 30.0 5.0 0.6 Sewerage
Regulation for Public Sewerage 250 700 - - 10 100 Note: The Study Team assumed all wastewater quality values.
There is no treatment plant at present, but the existing effluent quality meets the permissible limits of public sewerage. Hence, no wastewater treatment plant is necessary.
C - 80
8.8 Other Large Industries in Jastrebarsko
8.8.1 MLADINA d.d.
(1) Existing Wastewater Discharge System
Code No. 332001 Activity Food/.Beverage Wastewater Recipient Sewerage Treatment System Existing
(2) Existing Wastewater Quantity and Quality
BOD COD TSS T-N T-P Oil & Grease Quantity(m3/d) (mg/l) (mg/l) (mg/l) (mg/l) (mg/l) (mg/l)
109 - - - - - - Regulation for Public Sewerage 250 700 - - 10 100
(3) Proposed Wastewater Treatment System
The wastewater will be discharged into the public sewerage as at present since the effluent quality has no problem in sewage treatment. The future wastewater quantity and quality for the design of treatment plant are as estimated below.
Quantity Quality (mg/l)
f1 f2 Q (m3/d) BOD COD TSS T-N T-P Oil &
Grease Recipient
1999 1.000 1.000 109 230 369 300 30.0 5.0 5 Sewerage 2007 1.328 0.930 135 230 369 300 30.0 5.0 5 Sewerage 2015 1.944 0.850 180 230 369 300 30.0 5.0 5 Sewerage
Regulation for Public Sewerage 250 700 - - 10 100 Note: The Study Team assumed all wastewater quality values.
As shown in the above table, the existing effluent quality meets the permissible limits for public sewerage. However, the wastewater is estimated to increase in the future. Hence, the extension of the existing treatment system is necessary to cope with the increasing wastewater. The extension’s capacity is approx. 70 m3/d.
(4) Estimated Construction Cost
The required construction cost is estimated to be approx. Kn 300 × 103.
8.8.2 JAMNICA ZAGREB, Jamnika Kiselica
(1) Existing Wastewater Discharge System
Code No. 332002 Activity Food/Beverage Wastewater Recipient Canal Treatment System Existing
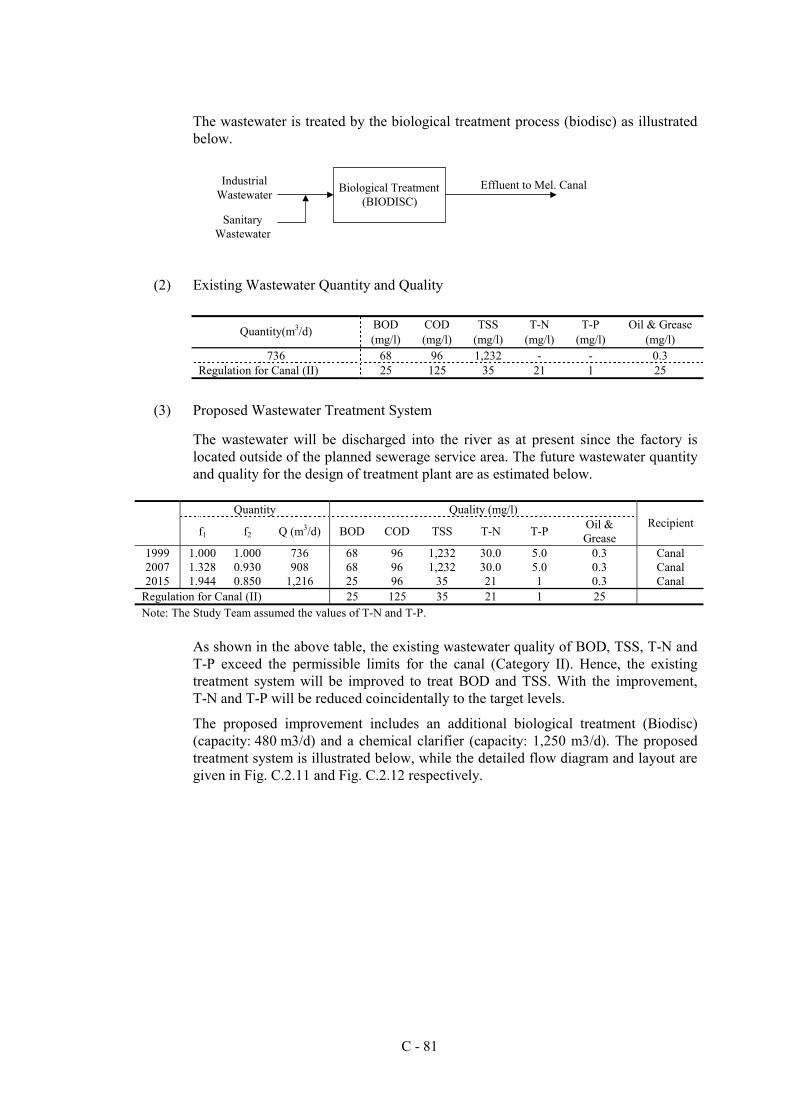
C - 81
The wastewater is treated by the biological treatment process (biodisc) as illustrated below.
(2) Existing Wastewater Quantity and Quality
BOD COD TSS T-N T-P Oil & Grease Quantity(m3/d) (mg/l) (mg/l) (mg/l) (mg/l) (mg/l) (mg/l)
736 68 96 1,232 - - 0.3 Regulation for Canal (II) 25 125 35 21 1 25
(3) Proposed Wastewater Treatment System
The wastewater will be discharged into the river as at present since the factory is located outside of the planned sewerage service area. The future wastewater quantity and quality for the design of treatment plant are as estimated below.
Quantity Quality (mg/l)
f1 f2 Q (m3/d) BOD COD TSS T-N T-P Oil &
Grease Recipient
1999 1.000 1.000 736 68 96 1,232 30.0 5.0 0.3 Canal 2007 1.328 0.930 908 68 96 1,232 30.0 5.0 0.3 Canal 2015 1.944 0.850 1,216 25 96 35 21 1 0.3 Canal
Regulation for Canal (II) 25 125 35 21 1 25 Note: The Study Team assumed the values of T-N and T-P.
As shown in the above table, the existing wastewater quality of BOD, TSS, T-N and T-P exceed the permissible limits for the canal (Category II). Hence, the existing treatment system will be improved to treat BOD and TSS. With the improvement, T-N and T-P will be reduced coincidentally to the target levels.
The proposed improvement includes an additional biological treatment (Biodisc) (capacity: 480 m3/d) and a chemical clarifier (capacity: 1,250 m3/d). The proposed treatment system is illustrated below, while the detailed flow diagram and layout are given in Fig. C.2.11 and Fig. C.2.12 respectively.
Biological Treatment(BIODISC)
IndustrialWastewater
SanitaryWastewater
Effluent to Mel. Canal
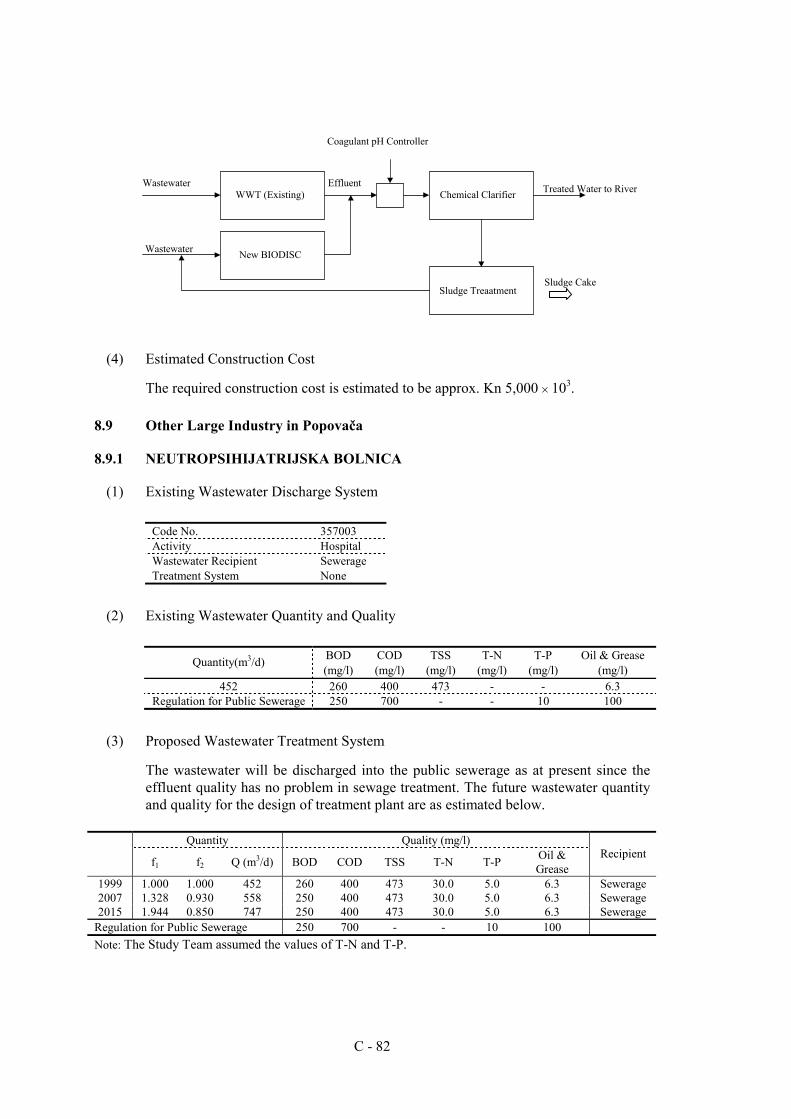
C - 82
(4) Estimated Construction Cost
The required construction cost is estimated to be approx. Kn 5,000 × 103.
8.9 Other Large Industry in Popovača
8.9.1 NEUTROPSIHIJATRIJSKA BOLNICA
(1) Existing Wastewater Discharge System
Code No. 357003 Activity Hospital Wastewater Recipient Sewerage Treatment System None
(2) Existing Wastewater Quantity and Quality
BOD COD TSS T-N T-P Oil & Grease Quantity(m3/d) (mg/l) (mg/l) (mg/l) (mg/l) (mg/l) (mg/l)
452 260 400 473 - - 6.3 Regulation for Public Sewerage 250 700 - - 10 100
(3) Proposed Wastewater Treatment System
The wastewater will be discharged into the public sewerage as at present since the effluent quality has no problem in sewage treatment. The future wastewater quantity and quality for the design of treatment plant are as estimated below.
Quantity Quality (mg/l)
f1 f2 Q (m3/d) BOD COD TSS T-N T-P Oil &
Grease Recipient
1999 1.000 1.000 452 260 400 473 30.0 5.0 6.3 Sewerage 2007 1.328 0.930 558 250 400 473 30.0 5.0 6.3 Sewerage 2015 1.944 0.850 747 250 400 473 30.0 5.0 6.3 Sewerage
Regulation for Public Sewerage 250 700 - - 10 100 Note: The Study Team assumed the values of T-N and T-P.
WWT (Existing)
New BIODISC
Chemical Clarifier
Sludge Treaatment
Wastewater
Wastewater
Coagulant pH Controller
Effluent
Sludge Cake
Treated Water to River
C - 83
There is no treatment plant at present, but the existing effluent quality almost meets the permissible limits for public sewerage. Hence, no wastewater treatment plant is necessary.
8.10 Other Large Industries in Ogulin
8.10.1 OPĆA BOLNICA OGLIN
(1) Existing Wastewater Discharge System
Code No. 335001 Activity Hospital Wastewater Recipient Groundsoil Treatment System Existing
(2) Existing Wastewater Quantity and Quality
BOD COD TSS T-N T-P Oil & Grease Quantity(m3/d) (mg/l) (mg/l) (mg/l) (mg/l) (mg/l) (mg/l)
206 41 126 553 - - 7.1 Regulation for Groundsoil - - - - - -
Note: Wastewater discharge into the ground is not allowed in this sensitive area.
(3) Proposed Wastewater Treatment System
The wastewater is discharged into the ground with treatment at present. However, this area is designated as a sensitive area where no wastewater discharge into the ground is allowed. Hence, the wastewater will be discharged into the public sewerage because this hospital will be included in the sewerage service area of Ogulin and the effluent quality has no problem in sewage treatment.
The future wastewater quantity and quality for the design of treatment plant are as estimated below.
Quantity Quality (mg/l)
f1 f2 Q (m3/d) BOD COD TSS T-N T-P Oil & Grease Recipient
1999 1.000 1.000 206 41 126 553 30.0 5.0 7.1 Groundsoil 2007 1.328 0.930 254 41 126 553 30.0 5.0 7.1 Sewerage 2015 1.944 0.850 340 41 126 553 30.0 5.0 7.1 Sewerage
Regulation for Sewerage 250 700 - - 10 100 Note: The Study Team assumed the values of T-N and T-P.
The existing effluent quality meets the permissible limits of public sewerage. However, the wastewater is estimated to increase in the future as shown above. Hence, the extension of the existing treatment system is necessary to cope with the increasing wastewater. The extension’s capacity is approx. 135 m3/d.
(4) Estimated Construction Cost
The required construction cost is estimated to be approx. Kn. 500 × 103.
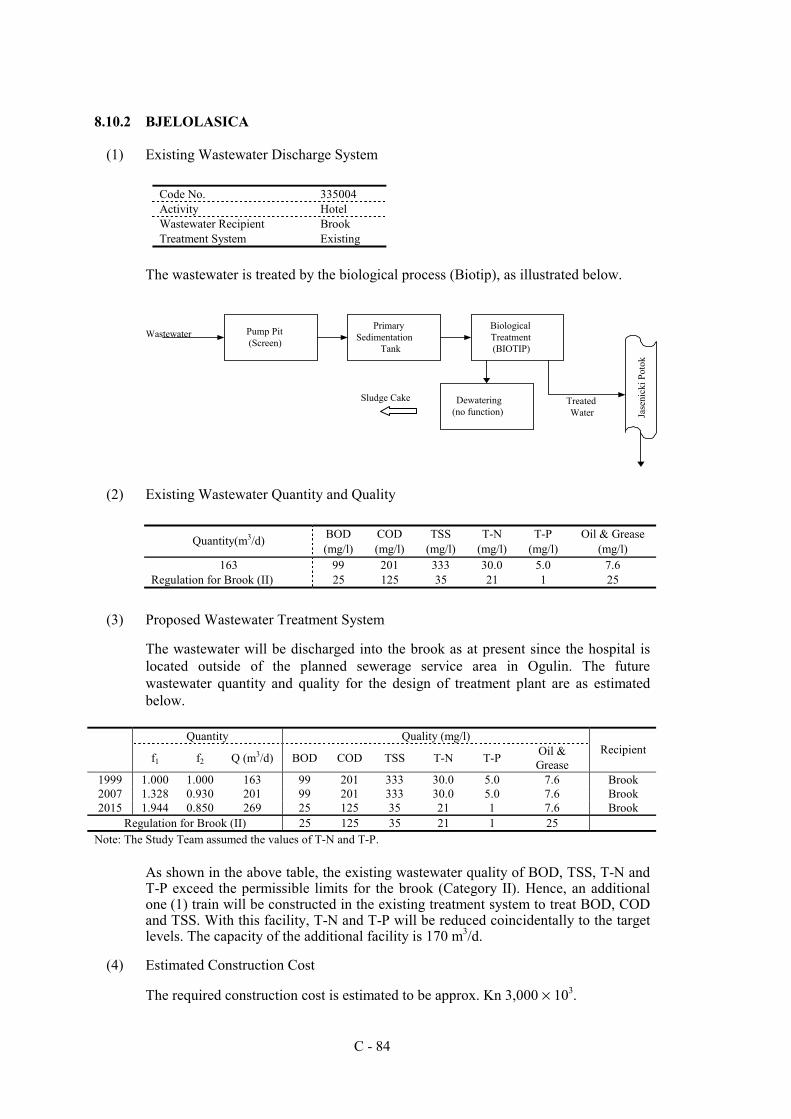
C - 84
8.10.2 BJELOLASICA
(1) Existing Wastewater Discharge System
Code No. 335004 Activity Hotel Wastewater Recipient Brook Treatment System Existing
The wastewater is treated by the biological process (Biotip), as illustrated below.
(2) Existing Wastewater Quantity and Quality
BOD COD TSS T-N T-P Oil & Grease Quantity(m3/d) (mg/l) (mg/l) (mg/l) (mg/l) (mg/l) (mg/l)
163 99 201 333 30.0 5.0 7.6 Regulation for Brook (II) 25 125 35 21 1 25
(3) Proposed Wastewater Treatment System
The wastewater will be discharged into the brook as at present since the hospital is located outside of the planned sewerage service area in Ogulin. The future wastewater quantity and quality for the design of treatment plant are as estimated below.
Quantity Quality (mg/l)
f1 f2 Q (m3/d) BOD COD TSS T-N T-P Oil &
Grease Recipient
1999 1.000 1.000 163 99 201 333 30.0 5.0 7.6 Brook 2007 1.328 0.930 201 99 201 333 30.0 5.0 7.6 Brook 2015 1.944 0.850 269 25 125 35 21 1 7.6 Brook
Regulation for Brook (II) 25 125 35 21 1 25 Note: The Study Team assumed the values of T-N and T-P.
As shown in the above table, the existing wastewater quality of BOD, TSS, T-N and T-P exceed the permissible limits for the brook (Category II). Hence, an additional one (1) train will be constructed in the existing treatment system to treat BOD, COD and TSS. With this facility, T-N and T-P will be reduced coincidentally to the target levels. The capacity of the additional facility is 170 m3/d.
(4) Estimated Construction Cost
The required construction cost is estimated to be approx. Kn 3,000 × 103.
Pump Pit(Screen)
PrimarySedimentation
Tank
BiologicalTreatment(BIOTIP)
Jase
nick
i Pot
ok
Dewatering(no function)
Wastewater
TreatedWater
Sludge Cake

TABLES
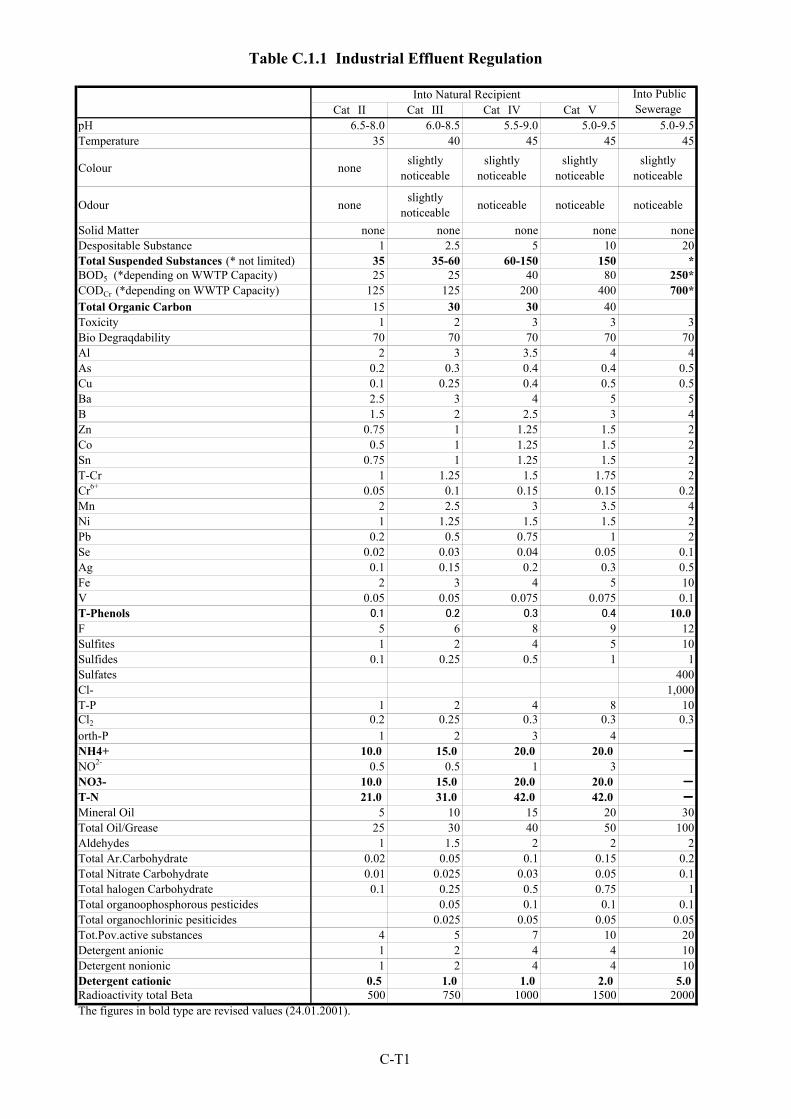
Table C.1.1 Industrial Effluent Regulation
Cat II Cat III Cat IV Cat VpH 6.5-8.0 6.0-8.5 5.5-9.0 5.0-9.5 5.0-9.5Temperature 35 40 45 45 45
Colour none slightlynoticeable
slightlynoticeable
slightlynoticeable
slightlynoticeable
Odour none slightlynoticeable noticeable noticeable noticeable
Solid Matter none none none none noneDespositable Substance 1 2.5 5 10 20Total Suspended Substances (* not limited) 35 35-60 60-150 150 *BOD5 (*depending on WWTP Capacity) 25 25 40 80 250*CODCr (*depending on WWTP Capacity) 125 125 200 400 700*Total Organic Carbon 15 30 30 40Toxicity 1 2 3 3 3Bio Degraqdability 70 70 70 70 70Al 2 3 3.5 4 4As 0.2 0.3 0.4 0.4 0.5Cu 0.1 0.25 0.4 0.5 0.5Ba 2.5 3 4 5 5B 1.5 2 2.5 3 4Zn 0.75 1 1.25 1.5 2Co 0.5 1 1.25 1.5 2Sn 0.75 1 1.25 1.5 2T-Cr 1 1.25 1.5 1.75 2Cr6+ 0.05 0.1 0.15 0.15 0.2Mn 2 2.5 3 3.5 4Ni 1 1.25 1.5 1.5 2Pb 0.2 0.5 0.75 1 2Se 0.02 0.03 0.04 0.05 0.1Ag 0.1 0.15 0.2 0.3 0.5Fe 2 3 4 5 10V 0.05 0.05 0.075 0.075 0.1T-Phenols 0.1 0.2 0.3 0.4 10.0F 5 6 8 9 12Sulfites 1 2 4 5 10Sulfides 0.1 0.25 0.5 1 1Sulfates 400Cl- 1,000T-P 1 2 4 8 10Cl2 0.2 0.25 0.3 0.3 0.3orth-P 1 2 3 4NH4+ 10.0 15.0 20.0 20.0 ----
NO2- 0.5 0.5 1 3NO3- 10.0 15.0 20.0 20.0 ----
T-N 21.0 31.0 42.0 42.0 ----
Mineral Oil 5 10 15 20 30Total Oil/Grease 25 30 40 50 100Aldehydes 1 1.5 2 2 2Total Ar.Carbohydrate 0.02 0.05 0.1 0.15 0.2Total Nitrate Carbohydrate 0.01 0.025 0.03 0.05 0.1Total halogen Carbohydrate 0.1 0.25 0.5 0.75 1Total organoophosphorous pesticides 0.05 0.1 0.1 0.1Total organochlorinic pesiticides 0.025 0.05 0.05 0.05Tot.Pov.active substances 4 5 7 10 20Detergent anionic 1 2 4 4 10Detergent nonionic 1 2 4 4 10Detergent cationic 0.5 1.0 1.0 2.0 5.0Radioactivity total Beta 500 750 1000 1500 2000The figures in bold type are revised values (24.01.2001).
Into PublicSewerage
Into Natural Recipient
C-T1
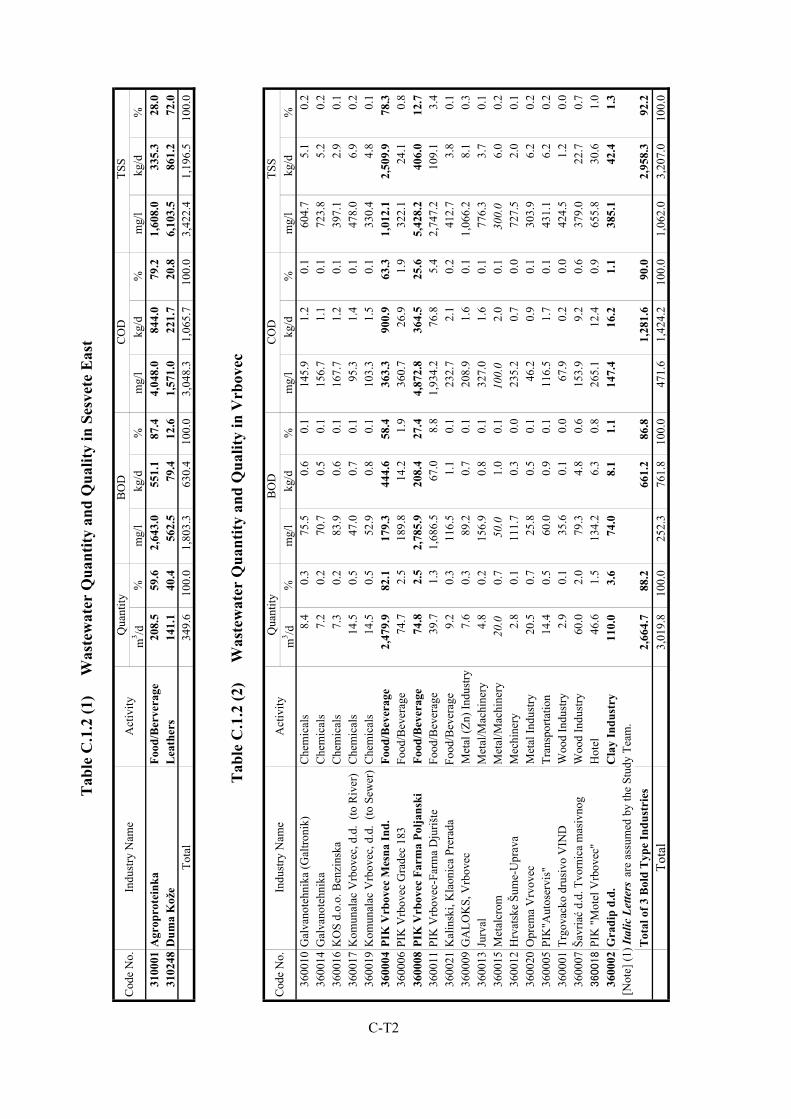
m3 /d
%m
g/l
kg/d
%m
g/l
kg/d
%m
g/l
kg/d
%31
0001
Agr
opro
tein
kaFo
od/B
erve
rage
208.
559
.62,
643.
055
1.1
87.4
4,04
8.0
844.
079
.21,
608.
033
5.3
28.0
3102
48D
uma
Kož
eL
eath
ers
141.
140
.456
2.5
79.4
12.6
1,57
1.0
221.
720
.86,
103.
586
1.2
72.0
Tota
l34
9.6
100.
01,
803.
363
0.4
100.
03,
048.
31,
065.
710
0.0
3,42
2.4
1,19
6.5
100.
0
m3 /d
%m
g/l
kg/d
%m
g/l
kg/d
%m
g/l
kg/d
%36
0010
Gal
vano
tehn
ika
(Gal
troni
k)C
hem
ical
s8.
40.
375
.50.
60.
114
5.9
1.2
0.1
604.
75.
10.
236
0014
Gal
vano
tehn
ika
Che
mic
als
7.2
0.2
70.7
0.5
0.1
156.
71.
10.
172
3.8
5.2
0.2
3600
16K
OS
d.o.
o. B
enzi
nska
Che
mic
als
7.3
0.2
83.9
0.6
0.1
167.
71.
20.
139
7.1
2.9
0.1
3600
17K
omun
alac
Vrb
ovec
, d.d
. (to
Riv
er)
Che
mic
als
14.5
0.5
47.0
0.7
0.1
95.3
1.4
0.1
478.
06.
90.
236
0019
Kom
unal
ac V
rbov
ec, d
.d.
(to S
ewer
)C
hem
ical
s14
.50.
552
.90.
80.
110
3.3
1.5
0.1
330.
44.
80.
136
0004
PIK
Vrb
ovec
Mes
na In
d.Fo
od/B
ever
age
2,47
9.9
82.1
179.
344
4.6
58.4
363.
390
0.9
63.3
1,01
2.1
2,50
9.9
78.3
3600
06PI
K V
rbov
ec G
rade
c 18
3Fo
od/B
ever
age
74.7
2.5
189.
814
.21.
936
0.7
26.9
1.9
322.
124
.10.
836
0008
PIK
Vrb
ovec
Far
ma
Polja
nski
Food
/Bev
erag
e74
.82.
52,
785.
920
8.4
27.4
4,87
2.8
364.
525
.65,
428.
240
6.0
12.7
3600
11PI
K V
rbov
ec-F
arm
a D
juriš
teFo
od/B
ever
age
39.7
1.3
1,68
6.5
67.0
8.8
1,93
4.2
76.8
5.4
2,74
7.2
109.
13.
436
0021
Kal
insk
i, K
laon
ica
Prer
ada
Food
/Bev
erag
e9.
20.
311
6.5
1.1
0.1
232.
72.
10.
241
2.7
3.8
0.1
3600
09G
ALO
KS,
Vrb
ovec
Met
al (Z
n) In
dust
ry7.
60.
389
.20.
70.
120
8.9
1.6
0.1
1,06
6.2
8.1
0.3
3600
13Ju
rval
Met
al/M
achi
nery
4.8
0.2
156.
90.
80.
132
7.0
1.6
0.1
776.
33.
70.
136
0015
Met
alcr
omM
etal
/Mac
hine
ry20
.00.
750
.01.
00.
110
0.0
2.0
0.1
300.
06.
00.
236
0012
Hrv
atsk
e Šu
me-
Upr
ava
Mec
hine
ry2.
80.
111
1.7
0.3
0.0
235.
20.
70.
072
7.5
2.0
0.1
3600
20O
prem
a V
rvov
ecM
etal
Indu
stry
20.5
0.7
25.8
0.5
0.1
46.2
0.9
0.1
303.
96.
20.
236
0005
PIK
"Aut
oser
vis"
Tran
spor
tatio
n14
.40.
560
.00.
90.
111
6.5
1.7
0.1
431.
16.
20.
236
0001
Trgo
vack
o dr
usiv
o V
IND
Woo
d In
dust
ry2.
90.
135
.60.
10.
067
.90.
20.
042
4.5
1.2
0.0
3600
07Ša
vriać
d.d.
Tvo
rnic
a m
asiv
nog
Woo
d In
dust
ry60
.02.
079
.34.
80.
615
3.9
9.2
0.6
379.
022
.70.
7360018
PIK
"Mot
el V
rbov
ec"
Hot
el46
.61.
513
4.2
6.3
0.8
265.
112
.40.
965
5.8
30.6
1.0
3600
02G
radi
p d.
d.
Cla
y In
dust
ry11
0.0
3.6
74.0
8.1
1.1
147.
416
.21.
138
5.1
42.4
1.3
[Not
e] (1
) Ita
lic L
ette
rs a
re a
ssum
ed b
y th
e St
udy
Team
.T
otal
of 3
Bol
d T
ype
Indu
stri
es2,
664.
788
.266
1.2
86.8
1,28
1.6
90.0
2,95
8.3
92.2
Tota
l3,
019.
810
0.0
252.
376
1.8
100.
047
1.6
1,42
4.2
100.
01,
062.
03,
207.
010
0.0
Cod
e N
o.
Tab
le C
.1.2
(2)
W
aste
wat
er Q
uant
ity a
nd Q
ualit
y in
Vrb
ovec
Qua
ntity
TSS
CO
D B
OD
Indu
stry
Nam
eA
ctiv
ity
Tab
le C
.1.2
(1)
W
aste
wat
er Q
uant
ity a
nd Q
ualit
y in
Ses
vete
Eas
t
Qua
ntity
BO
DC
OD
TSS
Cod
e N
o.In
dust
ry N
ame
Act
ivity
C-T2
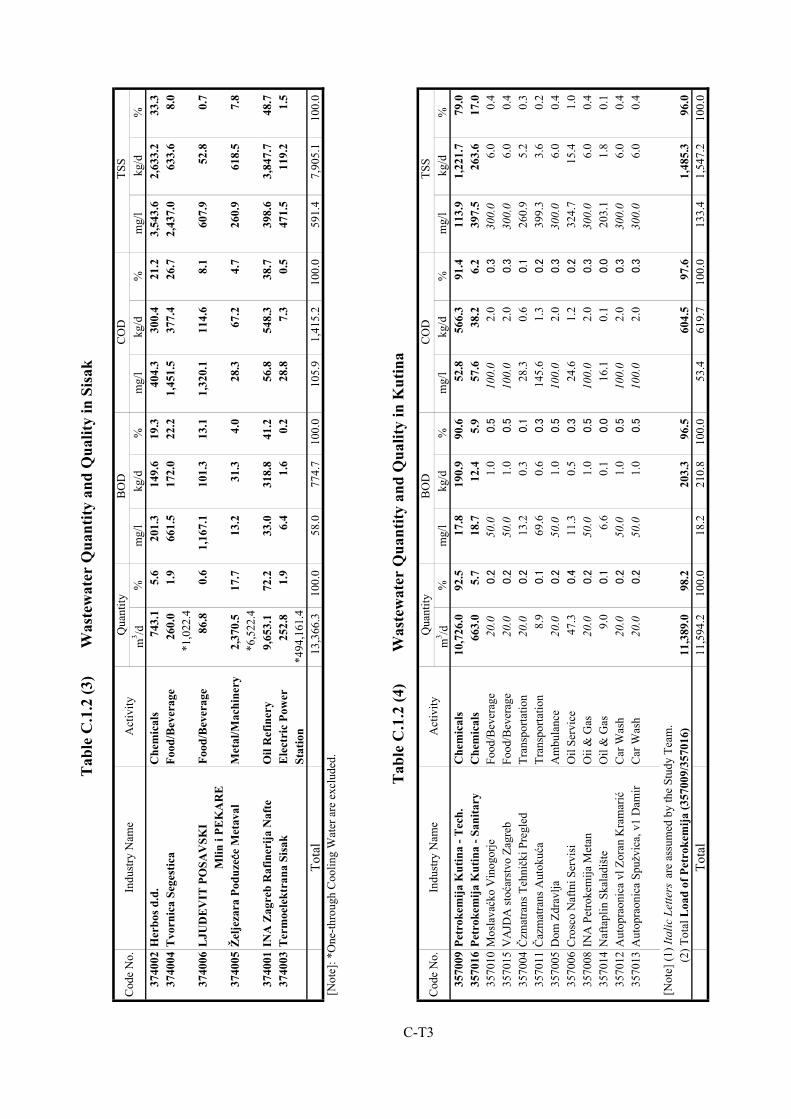
m3 /d
%m
g/l
kg/d
%m
g/l
kg/d
%m
g/l
kg/d
%37
4002
Her
bos d
.d.
Che
mic
als
743.
15.
620
1.3
149.
619
.340
4.3
300.
421
.23,
543.
62,
633.
233
.337
4004
Tvo
rnic
a Se
gest
ica
Food
/Bev
erag
e26
0.0
1.9
661.
517
2.0
22.2
1,45
1.5
377.
426
.72,
437.
063
3.6
8.0
*1,0
22.4
3740
06L
JUD
EV
IT P
OSA
VSK
IFo
od/B
ever
age
86.8
0.6
1,16
7.1
101.
313
.11,
320.
111
4.6
8.1
607.
952
.80.
7
M
lin i
PEK
AR
E37
4005
Žel
jeza
ra P
oduz
eć ććće
Met
aval
Met
al/M
achi
nery
2,37
0.5
17.7
13.2
31.3
4.0
28.3
67.2
4.7
260.
961
8.5
7.8
*6,5
22.4
3740
01IN
A Z
agre
b R
afin
erija
Naf
teO
il R
efin
ery
9,65
3.1
72.2
33.0
318.
841
.256
.854
8.3
38.7
398.
63,
847.
748
.737
4003
Ter
moe
lekt
rana
Sis
akE
lect
ric
Pow
er
252.
81.
96.
41.
60.
228
.87.
30.
547
1.5
119.
21.
5St
atio
n*4
94,1
61.4
Tota
l13
,366
.310
0.0
58.0
774.
710
0.0
105.
91,
415.
210
0.0
591.
47,
905.
110
0.0
[Not
e]: *
One
-thro
ugh
Coo
ling
Wat
er a
re e
xclu
ded.
m3 /d
%m
g/l
kg/d
%m
g/l
kg/d
%m
g/l
kg/d
%35
7009
Petr
okem
ija K
utin
a - T
ech.
Che
mic
als
10,7
26.0
92.5
17.8
190.
990
.652
.856
6.3
91.4
113.
91,
221.
779
.035
7016
Petr
okem
ija K
utin
a - S
anita
ryC
hem
ical
s66
3.0
5.7
18.7
12.4
5.9
57.6
38.2
6.2
397.
526
3.6
17.0
3570
10M
osla
vaćk
o V
inog
orje
Food
/Bev
erag
e20
.00.2
50.0
1.0
0.5
100.
02.
00.3
300.
06.
00.
435
7015
VA
JDA
stoć
arst
vo Z
agre
bFo
od/B
ever
age
20.0
0.2
50.0
1.0
0.5
100.
02.
00.3
300.
06.
00.
435
7004
Čzm
atra
ns T
ehničk
i Pre
gled
Tran
spor
tatio
n20
.00.2
13.2
0.3
0.1
28.3
0.6
0.1
260.
95.
20.
335
7011
Čaz
mat
rans
Aut
okuć
aTr
ansp
orta
tion
8.9
0.1
69.6
0.6
0.3
145.
61.
30.2
399.
33.
60.
235
7005
Dom
Zdr
avlja
Am
bula
nce
20.0
0.2
50.0
1.0
0.5
100.
02.
00.3
300.
06.
00.
435
7006
Cro
sco
Naf
tni S
ervi
siO
il Se
rvic
e47
.30.4
11.3
0.5
0.3
24.6
1.2
0.2
324.
715
.41.
035
7008
INA
Pet
roke
mija
Met
anO
ii &
Gas
20.0
0.2
50.0
1.0
0.5
100.
02.
00.3
300.
06.
00.
435
7014
Naf
tapl
in S
kala
dišt
eO
il &
Gas
9.0
0.1
6.6
0.1
0.0
16.1
0.1
0.0
203.
11.
80.
135
7012
Aut
opra
onic
a vl
Zor
an K
ram
arić
Car
Was
h20
.00.2
50.0
1.0
0.5
100.
02.
00.3
300.
06.
00.
435
7013
Aut
opra
onic
a Sp
užvi
ca, v
1 D
amir
Car
Was
h20
.00.2
50.0
1.0
0.5
100.
02.
00.3
300.
06.
00.
4
[Not
e] (1
) Ita
lic L
ette
rs a
re a
ssum
ed b
y th
e St
udy
Team
.
(2
) Tot
al L
oad
of P
etro
kem
ija (3
5700
9/35
7016
)11
,389
.098
.220
3.3
96.5
604.
597
.61,
485.
396
.0To
tal
11,5
94.2
100.
018
.221
0.8
100.
053
.461
9.7
100.
013
3.4
1,54
7.2
100.
0
Cod
e N
o.
Cod
e N
o.
Tab
le C
.1.2
(3)
W
aste
wat
er Q
uant
ity a
nd Q
ualit
y in
Sis
ak
BO
DC
OD
BO
D T
SSIn
dust
ry N
ame
Act
ivity
Tab
le C
.1.2
(4)
Was
tew
ater
Qua
ntity
and
Qua
lity
in K
utin
aQ
uant
ityC
OD
TSS
Qua
ntity
Indu
stry
Nam
eA
ctiv
ity
C-T3
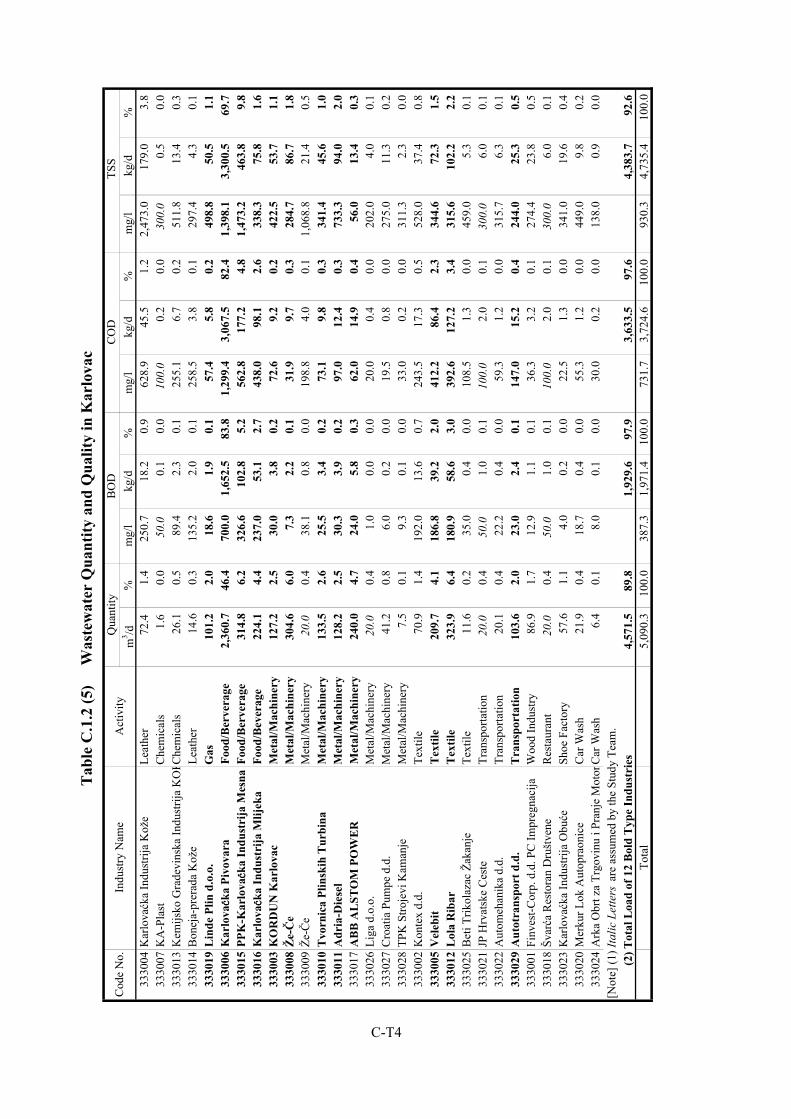
m3 /d
%m
g/l
kg/d
%m
g/l
kg/d
%m
g/l
kg/d
%33
3004
Kar
lovaćk
a In
dust
rija
Kož
eLe
athe
r72
.41.
425
0.7
18.2
0.9
628.
945
.51.
22,
473.
017
9.0
3.8
3330
07K
A-P
last
Che
mic
als
1.6
0.0
50.0
0.1
0.0
100.
00.
20.
030
0.0
0.5
0.0
3330
13K
emijs
ko G
rade
vins
ka In
dust
rija
KO
KChe
mic
als
26.1
0.5
89.4
2.3
0.1
255.
16.
70.
251
1.8
13.4
0.3
3330
14B
onej
a-pr
erad
a K
ože
Leat
her
14.6
0.3
135.
22.
00.
125
8.5
3.8
0.1
297.
44.
30.
133
3019
Lin
de P
lin d
.o.o
.G
as10
1.2
2.0
18.6
1.9
0.1
57.4
5.8
0.2
498.
850
.51.
133
3006
Kar
lova
ć ćććka
Pivo
vara
Food
/Ber
vera
ge2,
360.
746
.470
0.0
1,65
2.5
83.8
1,29
9.4
3,06
7.5
82.4
1,39
8.1
3,30
0.5
69.7
3330
15PP
K-K
arlo
vać ćććk
a In
dust
rija
Mes
naFo
od/B
erve
rage
314.
86.
232
6.6
102.
85.
256
2.8
177.
24.
81,
473.
246
3.8
9.8
3330
16K
arlo
vać ćććk
a In
dust
rija
Mlij
eka
Food
/Bev
erag
e22
4.1
4.4
237.
053
.12.
743
8.0
98.1
2.6
338.
375
.81.
633
3003
KO
RD
UN
Kar
lova
cM
etal
/Mac
hine
ry12
7.2
2.5
30.0
3.8
0.2
72.6
9.2
0.2
422.
553
.71.
133
3008
Že-Č
eM
etal
/Mac
hine
ry30
4.6
6.0
7.3
2.2
0.1
31.9
9.7
0.3
284.
786
.71.
833
3009
Že-Č
eM
etal
/Mac
hine
ry20
.00.
438
.10.
80.
019
8.8
4.0
0.1
1,06
8.8
21.4
0.5
3330
10T
vorn
ica
Plin
skih
Tur
bina
Met
al/M
achi
nery
133.
52.
625
.53.
40.
273
.19.
80.
334
1.4
45.6
1.0
3330
11A
dria
-Die
sel
Met
al/M
achi
nery
128.
22.
530
.33.
90.
297
.012
.40.
373
3.3
94.0
2.0
3330
17A
BB
AL
STO
M P
OW
ER
Met
al/M
achi
nery
240.
04.
724
.05.
80.
362
.014
.90.
456
.013
.40.
333
3026
Liga
d.o
.o.
Met
al/M
achi
nery
20.0
0.4
1.0
0.0
0.0
20.0
0.4
0.0
202.
04.
00.
133
3027
Cro
atia
Pum
pe d
.d.
Met
al/M
achi
nery
41.2
0.8
6.0
0.2
0.0
19.5
0.8
0.0
275.
011
.30.
233
3028
TPK
Stro
jevi
Kam
anje
Met
al/M
achi
nery
7.5
0.1
9.3
0.1
0.0
33.0
0.2
0.0
311.
32.
30.
033
3002
Kon
tex
d.d.
Text
ile70
.91.
419
2.0
13.6
0.7
243.
517
.30.
552
8.0
37.4
0.8
3330
05V
eleb
itT
extil
e20
9.7
4.1
186.
839
.22.
041
2.2
86.4
2.3
344.
672
.31.
533
3012
Lol
a R
ibar
Tex
tile
323.
96.
418
0.9
58.6
3.0
392.
612
7.2
3.4
315.
610
2.2
2.2
3330
25B
eti T
rikol
azac
Žak
anje
Text
ile11
.60.
235
.00.
40.
010
8.5
1.3
0.0
459.
05.
30.
133
3021
JP H
rvat
ske
Ces
teTr
ansp
orta
tion
20.0
0.4
50.0
1.0
0.1
100.
02.
00.
130
0.0
6.0
0.1
3330
22A
utom
ehan
ika
d.d.
Tran
spor
tatio
n20
.10.
422
.20.
40.
059
.31.
20.
031
5.7
6.3
0.1
3330
29A
utot
rans
port
d.d
.T
rans
port
atio
n10
3.6
2.0
23.0
2.4
0.1
147.
015
.20.
424
4.0
25.3
0.5
3330
01Fi
nves
t-Cor
p. d
.d. P
C Im
preg
naci
jaW
ood
Indu
stry
86.9
1.7
12.9
1.1
0.1
36.3
3.2
0.1
274.
423
.80.
533
3018
Švarća
Res
tora
n D
rušt
vene
Res
taur
ant
20.0
0.4
50.0
1.0
0.1
100.
02.
00.
130
0.0
6.0
0.1
3330
23K
arlo
vaćk
a In
dust
rija
Obuće
Shoe
Fac
tory
57.6
1.1
4.0
0.2
0.0
22.5
1.3
0.0
341.
019
.60.
433
3020
Mer
kur L
ok A
utop
raon
ice
Car
Was
h21
.90.
418
.70.
40.
055
.31.
20.
044
9.0
9.8
0.2
3330
24A
rka
Obr
t za
Trgo
vinu
i Pr
anje
Mot
orC
ar W
ash
6.4
0.1
8.0
0.1
0.0
30.0
0.2
0.0
138.
00.
90.
0[N
ote]
(1) I
talic
Let
ters
are
ass
umed
by
the
Stud
y Te
am.
(
2) T
otal
Loa
d of
12
Bol
d T
ype
Indu
stri
es4,
571.
589
.81,
929.
697
.93,
633.
597
.64,
383.
792
.6To
tal
5,09
0.3
100.
038
7.3
1,97
1.4
100.
073
1.7
3,72
4.6
100.
093
0.3
4,73
5.4
100.
0
Cod
e N
o.A
ctiv
ityIn
dust
ry N
ame
Tab
le C
.1.2
(5)
W
aste
wat
er Q
uant
ity a
nd Q
ualit
y in
Kar
lova
cQ
uant
ity B
OD
CO
D T
SS
C-T4
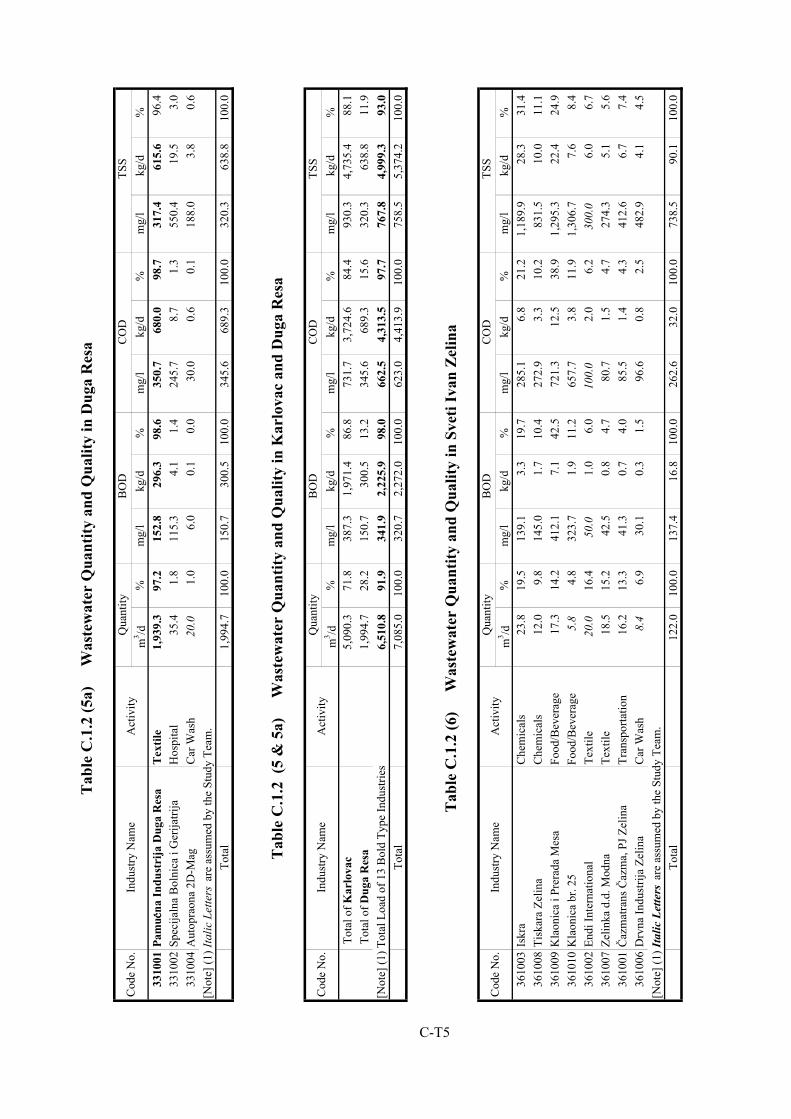
m3 /d
%m
g/l
kg/d
%m
g/l
kg/d
%m
g/l
kg/d
%33
1001
Pam
uć ćććna
Indu
stri
ja D
uga
Res
aT
extil
e1,
939.
397
.215
2.8
296.
398
.635
0.7
680.
098
.731
7.4
615.
696
.433
1002
Spec
ijaln
a B
olni
ca i
Ger
ijatri
jaH
ospi
tal
35.4
1.8
115.
34.
11.
424
5.7
8.7
1.3
550.
419
.53.
033
1004
Aut
opra
ona
2D-M
agC
ar W
ash
20.0
1.0
6.0
0.1
0.0
30.0
0.6
0.1
188.
03.
80.
6[N
ote]
(1) I
talic
Let
ters
are
ass
umed
by
the
Stud
y Te
am.
Tota
l1,
994.
710
0.0
150.
730
0.5
100.
034
5.6
689.
310
0.0
320.
363
8.8
100.
0
m3 /d
%m
g/l
kg/d
%m
g/l
kg/d
%m
g/l
kg/d
% T
otal
of K
arlo
vac
5,09
0.3
71.8
387.
31,
971.
486
.873
1.7
3,72
4.6
84.4
930.
34,
735.
488
.1 T
otal
of D
uga
Res
a1,
994.
728
.215
0.7
300.
513
.234
5.6
689.
315
.632
0.3
638.
811
.9[N
ote]
(1) T
otal
Loa
d of
13
Bol
d Ty
pe In
dust
ries
6,51
0.8
91.9
341.
92,
225.
998
.066
2.5
4,31
3.5
97.7
767.
84,
999.
393
.0To
tal
7,08
5.0
100.
032
0.7
2,27
2.0
100.
062
3.0
4,41
3.9
100.
075
8.5
5,37
4.2
100.
0
m3 /d
%m
g/l
kg/d
%m
g/l
kg/d
%m
g/l
kg/d
%36
1003
Iskr
aC
hem
ical
s23
.819
.513
9.1
3.3
19.7
285.
16.
821
.21,
189.
928
.331
.436
1008
Tisk
ara
Zelin
aC
hem
ical
s12
.09.
814
5.0
1.7
10.4
272.
93.
310
.283
1.5
10.0
11.1
3610
09K
laon
ica
i Pre
rada
Mes
aFo
od/B
ever
age
17.3
14.2
412.
17.
142
.572
1.3
12.5
38.9
1,29
5.3
22.4
24.9
3610
10K
laon
ica
br. 2
5Fo
od/B
ever
age
5.8
4.8
323.
71.
911
.265
7.7
3.8
11.9
1,30
6.7
7.6
8.4
3610
02En
di In
tern
atio
nal
Text
ile20
.016
.450
.01.
06.
010
0.0
2.0
6.2
300.
06.
06.
736
1007
Zelin
ka d
.d. M
odna
Text
ile18
.515
.242
.50.
84.
780
.71.
54.
727
4.3
5.1
5.6
3610
01Č
azm
atra
ns Č
azm
a, P
J Zel
ina
Tran
spor
tatio
n16
.213
.341
.30.
74.
085
.51.
44.
341
2.6
6.7
7.4
3610
06D
rvna
Indu
strij
a Ze
lina
Car
Was
h8.
46.
930
.10.
31.
596
.60.
82.
548
2.9
4.1
4.5
[Not
e] (1
) Ita
lic L
ette
rs a
re a
ssum
ed b
y th
e St
udy
Team
.To
tal
122.
010
0.0
137.
416
.810
0.0
262.
632
.010
0.0
738.
590
.110
0.0
Cod
e N
o.
Tab
le C
.1.2
(5a)
W
aste
wat
er Q
uant
ity a
nd Q
ualit
y in
Dug
a R
esa
Qua
ntity
Tab
le C
.1.2
(5
& 5
a)
Was
tew
ater
Qua
ntity
and
Qua
lity
in K
arlo
vac
and
Dug
a R
esa
Qua
ntity
BO
DC
OD
TSS
Indu
stry
Nam
eA
ctiv
ity
TSS
Cod
e N
o.
Indu
stry
Nam
eA
ctiv
ityC
ode
No.
Tab
le C
.1.2
(6)
W
aste
wat
er Q
uant
ity a
nd Q
ualit
y in
Sve
ti Iv
an Z
elin
a
Qua
ntity
BO
DC
OD
TSS
Indu
stry
Nam
eA
ctiv
ity
BO
DC
OD
C-T5
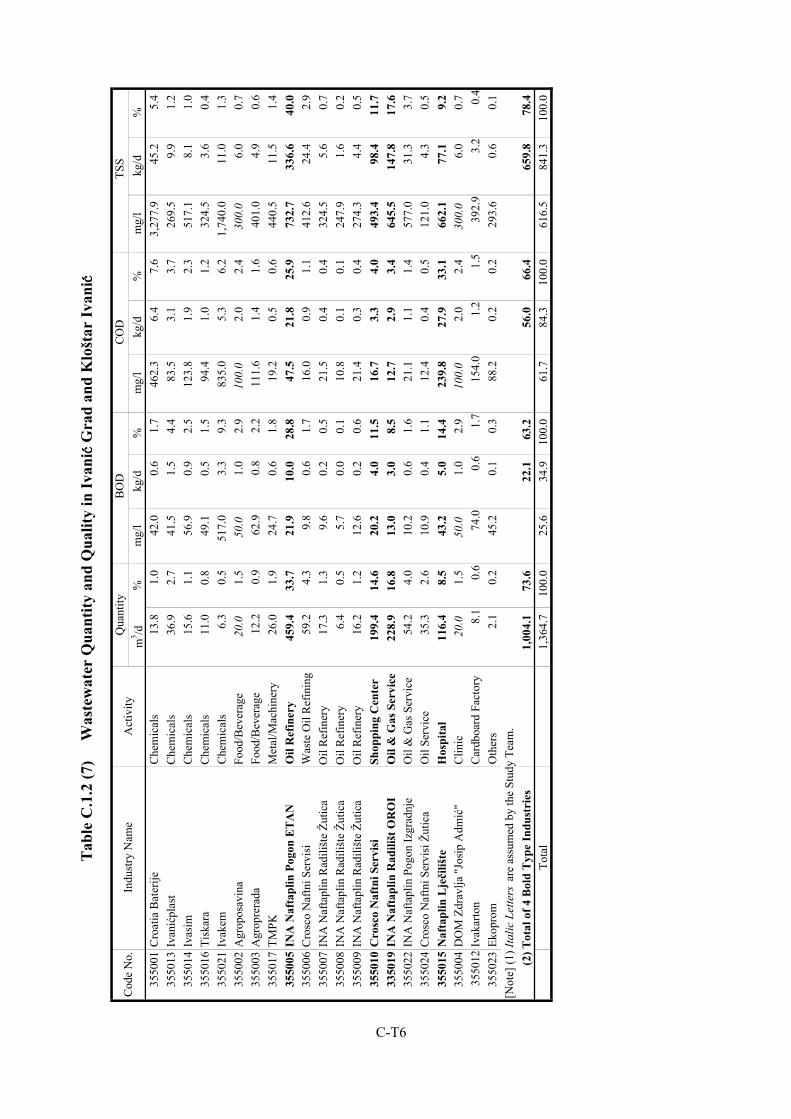
m3 /d
%m
g/l
kg/d
%m
g/l
kg/d
%m
g/l
kg/d
%35
5001
Cro
atia
Bat
erije
Che
mic
als
13.8
1.0
42.0
0.6
1.7
462.
36.
47.
63,
277.
945
.25.
435
5013
Ivan
ićpl
ast
Che
mic
als
36.9
2.7
41.5
1.5
4.4
83.5
3.1
3.7
269.
59.
91.
235
5014
Ivas
imC
hem
ical
s15
.61.
156
.90.
92.
512
3.8
1.9
2.3
517.
18.
11.
035
5016
Tisk
ara
Che
mic
als
11.0
0.8
49.1
0.5
1.5
94.4
1.0
1.2
324.
53.
60.
435
5021
Ivak
emC
hem
ical
s6.
30.
551
7.0
3.3
9.3
835.
05.
36.
21,
740.
011
.01.
335
5002
Agr
opos
avin
aFo
od/B
ever
age
20.0
1.5
50.0
1.0
2.9
100.
02.
02.
430
0.0
6.0
0.7
3550
03A
grop
rera
daFo
od/B
ever
age
12.2
0.9
62.9
0.8
2.2
111.
61.
41.
640
1.0
4.9
0.6
3550
17TM
PKM
etal
/Mac
hine
ry26
.01.
924
.70.
61.
819
.20.
50.
644
0.5
11.5
1.4
3550
05IN
A N
afta
plin
Pog
on E
TA
NO
il R
efin
ery
459.
433
.721
.910
.028
.847
.521
.825
.973
2.7
336.
640
.035
5006
Cro
sco
Naf
tni S
ervi
siW
aste
Oil
Ref
inin
g59
.24.
39.
80.
61.
716
.00.
91.
141
2.6
24.4
2.9
3550
07IN
A N
afta
plin
Rad
ilišt
e Žu
tica
Oil
Ref
iner
y17
.31.
39.
60.
20.
521
.50.
40.
432
4.5
5.6
0.7
3550
08IN
A N
afta
plin
Rad
ilišt
e Žu
tica
Oil
Ref
iner
y6.
40.
55.
70.
00.
110
.80.
10.
124
7.9
1.6
0.2
3550
09IN
A N
afta
plin
Rad
ilišt
e Žu
tica
Oil
Ref
iner
y16
.21.
212
.60.
20.
621
.40.
30.
427
4.3
4.4
0.5
3550
10C
rosc
o N
aftn
i Ser
visi
Shop
ping
Cen
ter
199.
414
.620
.24.
011
.516
.73.
34.
049
3.4
98.4
11.7
3350
19IN
A N
afta
plin
Rad
ilišt
OR
OI
Oil
& G
as S
ervi
ce22
8.9
16.8
13.0
3.0
8.5
12.7
2.9
3.4
645.
514
7.8
17.6
3550
22IN
A N
afta
plin
Pog
on Iz
grad
nje
Oil
& G
as S
ervi
ce54
.24.
010
.20.
61.
621
.11.
11.
457
7.0
31.3
3.7
3550
24C
rosc
o N
aftn
i Ser
visi
Žut
ica
Oil
Serv
ice
35.3
2.6
10.9
0.4
1.1
12.4
0.4
0.5
121.
04.
30.
535
5015
Naf
tapl
in L
ječi
lište
Hos
pita
l11
6.4
8.5
43.2
5.0
14.4
239.
827
.933
.166
2.1
77.1
9.2
3550
04D
OM
Zdr
avlja
"Jo
sip
Adm
ić"
Clin
ic20
.01.
550
.01.
02.
910
0.0
2.0
2.4
300.
06.
00.
735
5012
Ivak
arto
nC
ardb
oard
Fac
tory
8.1
0.6
74.0
0.6
1.7
154.
01.
21.
539
2.9
3.2
0.4
3550
23Ek
opro
mO
ther
s2.
10.
245
.20.
10.
388
.20.
20.
229
3.6
0.6
0.1
[Not
e] (1
) Ita
lic L
ette
rs a
re a
ssum
ed b
y th
e St
udy
Team
.
(2)
Tot
al o
f 4 B
old
Typ
e In
dust
ries
1,00
4.1
73.6
22.1
63.2
56.0
66.4
659.
878
.4To
tal
1,36
4.7
100.
025
.634
.910
0.0
61.7
84.3
100.
061
6.5
841.
310
0.0
Cod
e N
o.
Tab
le C
.1.2
(7)
W
aste
wat
er Q
uant
ity a
nd Q
ualit
y in
Ivan
ić ććć G
rad
and
Klo
štar
Ivan
ić ććć
CO
D T
SSIn
dust
ry N
ame
Act
ivity
Qua
ntity
BO
D
C-T6
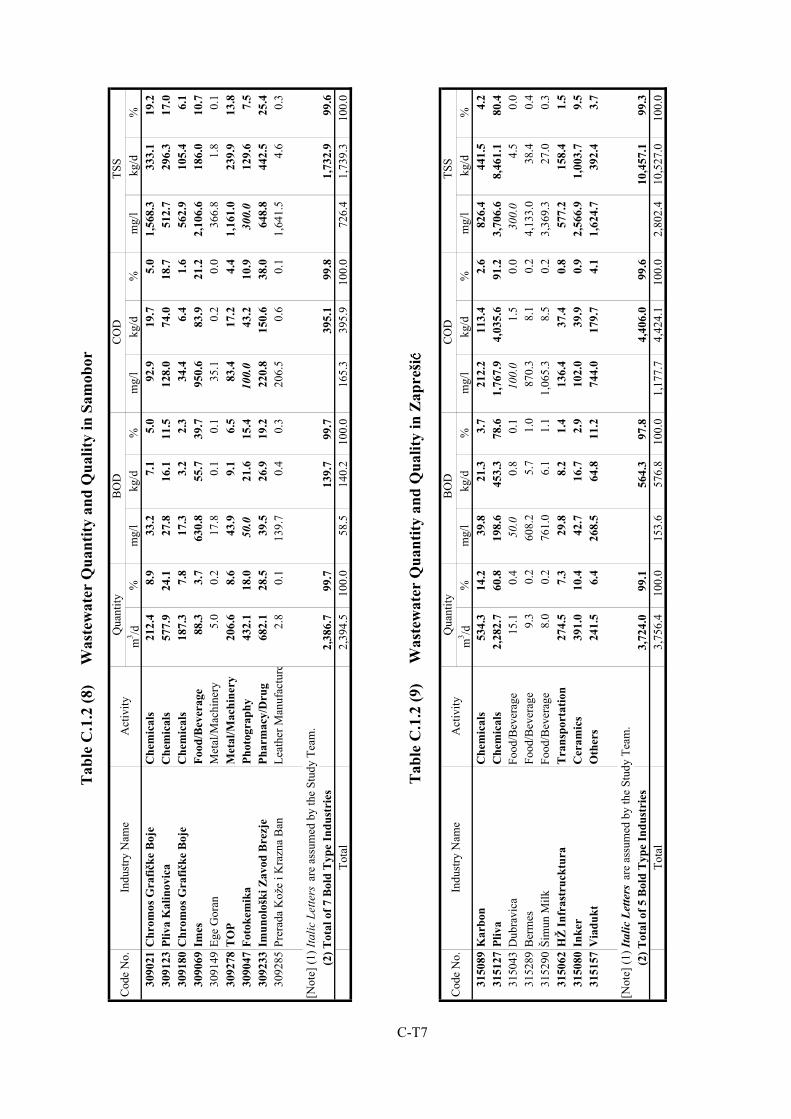
m3 /d
%m
g/l
kg/d
%m
g/l
kg/d
%m
g/l
kg/d
%30
9021
Chr
omos
Gra
fičke
Boj
eC
hem
ical
s21
2.4
8.9
33.2
7.1
5.0
92.9
19.7
5.0
1,56
8.3
333.
119
.230
9123
Pliv
a K
alin
ovic
aC
hem
ical
s57
7.9
24.1
27.8
16.1
11.5
128.
074
.018
.751
2.7
296.
317
.030
9180
Chr
omos
Gra
fičke
Boj
eC
hem
ical
s18
7.3
7.8
17.3
3.2
2.3
34.4
6.4
1.6
562.
910
5.4
6.1
3090
69Im
esFo
od/B
ever
age
88.3
3.7
630.
855
.739
.795
0.6
83.9
21.2
2,10
6.6
186.
010
.730
9149
Ege
Gor
anM
etal
/Mac
hine
ry5.
00.
217
.80.
10.
135
.10.
20.
036
6.8
1.8
0.1
3092
78TO
PM
etal
/Mac
hine
ry20
6.6
8.6
43.9
9.1
6.5
83.4
17.2
4.4
1,16
1.0
239.
913
.830
9047
Foto
kem
ika
Phot
ogra
phy
432.
118
.050
.021
.615
.410
0.0
43.2
10.9
300.
012
9.6
7.5
3092
33Im
unol
oški
Zav
od B
rezj
ePh
arm
acy/
Dru
g68
2.1
28.5
39.5
26.9
19.2
220.
815
0.6
38.0
648.
844
2.5
25.4
3092
85Pr
erad
a K
ože
i Kra
zna
Ban
Leat
her M
anuf
actu
re2.
80.
113
9.7
0.4
0.3
206.
50.
60.
11,
641.
54.
60.
3
[Not
e] (1
) Ita
lic L
ette
rs a
re a
ssum
ed b
y th
e St
udy
Team
.
(2)
Tot
al o
f 7 B
old
Typ
e In
dust
ries
2,38
6.7
99.7
139.
799
.739
5.1
99.8
1,73
2.9
99.6
Tota
l2,
394.
510
0.0
58.5
140.
210
0.0
165.
339
5.9
100.
072
6.4
1,73
9.3
100.
0
m3 /d
%m
g/l
kg/d
%m
g/l
kg/d
%m
g/l
kg/d
%31
5089
Kar
bon
Che
mic
als
534.
314
.239
.821
.33.
721
2.2
113.
42.
682
6.4
441.
54.
231
5127
Pliv
aC
hem
ical
s2,
282.
760
.819
8.6
453.
378
.61,
767.
94,
035.
691
.23,
706.
68,
461.
180
.431
5043
Dub
ravi
caFo
od/B
ever
age
15.1
0.4
50.0
0.8
0.1
100.
01.
50.
030
0.0
4.5
0.0
3152
89B
erm
esFo
od/B
ever
age
9.3
0.2
608.
25.
71.
087
0.3
8.1
0.2
4,13
3.0
38.4
0.4
3152
90Ši
mun
Milk
Food
/Bev
erag
e8.
00.
276
1.0
6.1
1.1
1,06
5.3
8.5
0.2
3,36
9.3
27.0
0.3
3150
62H
Ž In
fras
truc
ktur
aT
rans
port
atio
n27
4.5
7.3
29.8
8.2
1.4
136.
437
.40.
857
7.2
158.
41.
531
5080
Inke
rC
eram
ics
391.
010
.442
.716
.72.
910
2.0
39.9
0.9
2,56
6.9
1,00
3.7
9.5
3151
57V
iadu
ktO
ther
s24
1.5
6.4
268.
564
.811
.274
4.0
179.
74.
11,
624.
739
2.4
3.7
[Not
e] (1
) Ita
lic L
ette
rs a
re a
ssum
ed b
y th
e St
udy
Team
.
(2)
Tot
al o
f 5 B
old
Typ
e In
dust
ries
3,72
4.0
99.1
564.
397
.84,
406.
099
.610
,457
.199
.3To
tal
3,75
6.4
100.
015
3.6
576.
810
0.0
1,17
7.7
4,42
4.1
100.
02,
802.
410
,527
.010
0.0
Cod
e N
o.
Cod
e N
o.
CO
D T
SS
Tab
le C
.1.2
(9)
W
aste
wat
er Q
uant
ity a
nd Q
ualit
y in
Zap
rešić ććć
Qua
ntity
BO
DC
OD
TSS
Indu
stry
Nam
eA
ctiv
ity
Tab
le C
.1.2
(8)
W
aste
wat
er Q
uant
ity a
nd Q
ualit
y in
Sam
obor
Qua
ntity
BO
DIn
dust
ry N
ame
Act
ivity
C-T7
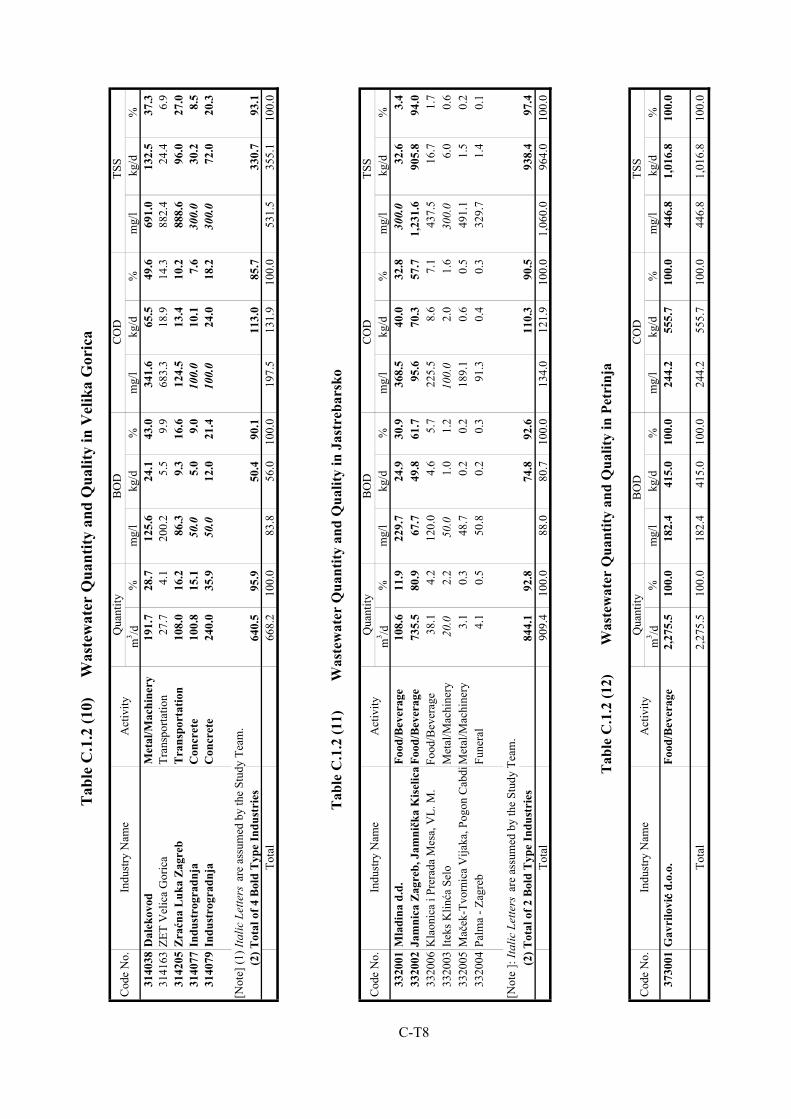
m3 /d
%m
g/l
kg/d
%m
g/l
kg/d
%m
g/l
kg/d
%31
4038
Dal
ekov
odM
etal
/Mac
hine
ry19
1.7
28.7
125.
624
.143
.034
1.6
65.5
49.6
691.
013
2.5
37.3
3141
63ZE
T V
elic
a G
oric
aTr
ansp
orta
tion
27.7
4.1
200.
25.
59.
968
3.3
18.9
14.3
882.
424
.46.
931
4205
Zraćn
a L
uka
Zag
reb
Tra
nspo
rtat
ion
108.
016
.286
.39.
316
.612
4.5
13.4
10.2
888.
696
.027
.031
4077
Indu
stro
grad
nja
Con
cret
e10
0.8
15.1
50.0
5.0
9.0
100.
010
.17.
630
0.0
30.2
8.5
3140
79In
dust
rogr
adnj
aC
oncr
ete
240.
035
.950
.012
.021
.410
0.0
24.0
18.2
300.
072
.020
.3
[Not
e] (1
) Ita
lic L
ette
rs a
re a
ssum
ed b
y th
e St
udy
Team
.
(2)
Tot
al o
f 4 B
old
Typ
e In
dust
ries
640.
595
.950
.490
.111
3.0
85.7
330.
793
.1To
tal
668.
210
0.0
83.8
56.0
100.
019
7.5
131.
910
0.0
531.
535
5.1
100.
0
m3 /d
%m
g/l
kg/d
%m
g/l
kg/d
%m
g/l
kg/d
%33
2001
Mla
dina
d.d
.Fo
od/B
ever
age
108.
611
.922
9.7
24.9
30.9
368.
540
.032
.830
0.0
32.6
3.4
3320
02Ja
mni
ca Z
agre
b, J
amničk
a K
isel
ica
Food
/Bev
erag
e73
5.5
80.9
67.7
49.8
61.7
95.6
70.3
57.7
1,23
1.6
905.
894
.033
2006
Kla
onic
a i P
rera
da M
esa,
VL.
M.
Food
/Bev
erag
e38
.14.
212
0.0
4.6
5.7
225.
58.
67.
143
7.5
16.7
1.7
3320
03Ite
ks K
linća
Sel
oM
etal
/Mac
hine
ry20
.02.
250
.01.
01.
210
0.0
2.0
1.6
300.
06.
00.
633
2005
Mač
ek-T
vorn
ica
Vija
ka, P
ogon
Cab
diM
etal
/Mac
hine
ry3.
10.
348
.70.
20.
218
9.1
0.6
0.5
491.
11.
50.
233
2004
Palm
a - Z
agre
bFu
nera
l4.
10.
550
.80.
20.
391
.30.
40.
332
9.7
1.4
0.1
[Not
e ]:
Italic
Let
ters
are
ass
umed
by
the
Stud
y Te
am.
(
2) T
otal
of 2
Bol
d T
ype
Indu
stri
es84
4.1
92.8
74.8
92.6
110.
390
.593
8.4
97.4
Tota
l90
9.4
100.
088
.080
.710
0.0
134.
012
1.9
100.
01,
060.
096
4.0
100.
0
m3 /d
%m
g/l
kg/d
%m
g/l
kg/d
%m
g/l
kg/d
%37
3001
Gav
rilo
vić ććć
d.o.
o.Fo
od/B
ever
age
2,27
5.5
100.
018
2.4
415.
010
0.0
244.
255
5.7
100.
044
6.8
1,01
6.8
100.
0
Tota
l2,
275.
510
0.0
182.
441
5.0
100.
024
4.2
555.
710
0.0
446.
81,
016.
810
0.0
Cod
e N
o.
Cod
e N
o.
Cod
e N
o.
CO
D
Tab
le C
.1.2
(12)
Was
tew
ater
Qua
ntity
and
Qua
lity
in P
etri
nja
Qua
ntity
BO
D
TSS
Qua
ntity
Indu
stry
Nam
eA
ctiv
ity
Indu
stry
Nam
e
CO
D T
SS
Tab
le C
.1.2
(10)
W
aste
wat
er Q
uant
ity a
nd Q
ualit
y in
Vel
ika
Gor
ica
Act
ivity
Act
ivity
Tab
le C
.1.2
(11)
Was
tew
ater
Qua
ntity
and
Qua
lity
in J
astr
ebar
sko
Qua
ntity
BO
D
BO
D
Indu
stry
Nam
eC
OD
TSS
C-T8
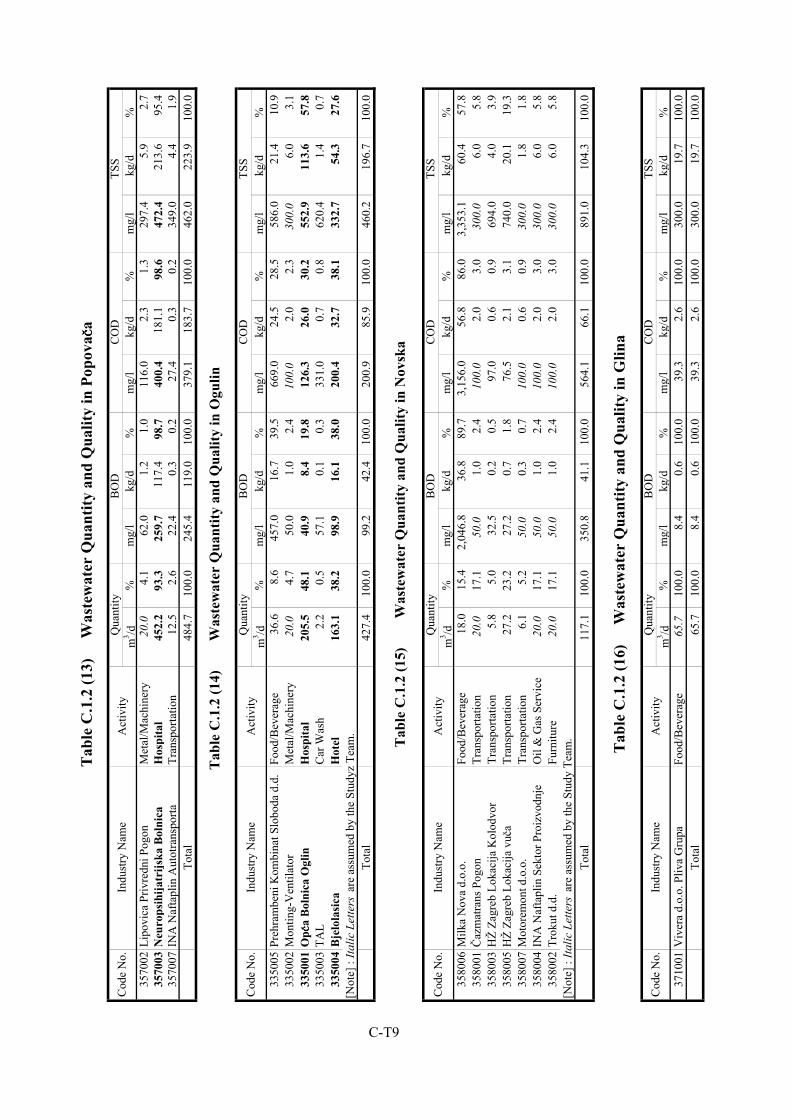
m3 /d
%m
g/l
kg/d
%m
g/l
kg/d
%m
g/l
kg/d
%35
7002
Lipo
vica
Priv
redn
i Pog
onM
etal
/Mac
hine
ry20
.04.
162
.01.
21.
011
6.0
2.3
1.3
297.
45.
92.
735
7003
Neu
rops
ihija
trijs
ka B
olni
caH
ospi
tal
452.
293
.325
9.7
117.
498
.740
0.4
181.
198
.647
2.4
213.
695
.435
7007
INA
Naf
tapl
in A
utot
rans
porta
Tran
spor
tatio
n12
.52.
622
.40.
30.
227
.40.
30.
234
9.0
4.4
1.9
Tota
l48
4.7
100.
024
5.4
119.
010
0.0
379.
118
3.7
100.
046
2.0
223.
910
0.0
m3 /d
%m
g/l
kg/d
%m
g/l
kg/d
%m
g/l
kg/d
%33
5005
Preh
ram
beni
Kom
bina
t Slo
boda
d.d
.Fo
od/B
ever
age
36.6
8.6
457.
016
.739
.566
9.0
24.5
28.5
586.
021
.410
.933
5002
Mon
ting-
Ven
tilat
orM
etal
/Mac
hine
ry20
.04.
750
.01.
02.
410
0.0
2.0
2.3
300.
06.
03.
133
5001
Opć ććć
a B
olni
ca O
glin
Hos
pita
l20
5.5
48.1
40.9
8.4
19.8
126.
326
.030
.255
2.9
113.
657
.833
5003
TAL
Car
Was
h2.
20.
557
.10.
10.
333
1.0
0.7
0.8
620.
41.
40.
733
5004
Bje
lola
sica
Hot
el16
3.1
38.2
98.9
16.1
38.0
200.
432
.738
.133
2.7
54.3
27.6
[Not
e] :
Italic
Let
ters
are
ass
umed
by
the
Stud
yz T
eam
.To
tal
427.
410
0.0
99.2
42.4
100.
020
0.9
85.9
100.
046
0.2
196.
710
0.0
m3 /d
%m
g/l
kg/d
%m
g/l
kg/d
%m
g/l
kg/d
%35
8006
Milk
a N
ova
d.o.
o.Fo
od/B
ever
age
18.0
15.4
2,04
6.8
36.8
89.7
3,15
6.0
56.8
86.0
3,35
3.1
60.4
57.8
3580
01Č
azm
atra
ns P
ogon
Tran
spor
tatio
n20
.017
.150
.01.
02.
410
0.0
2.0
3.0
300.
06.
05.
835
8003
HŽ
Zagr
eb L
okac
ija K
olod
vor
Tran
spor
tatio
n5.
85.
032
.50.
20.
597
.00.
60.
969
4.0
4.0
3.9
3580
05H
Ž Za
greb
Lok
acija
vuč
aTr
ansp
orta
tion
27.2
23.2
27.2
0.7
1.8
76.5
2.1
3.1
740.
020
.119
.335
8007
Mot
orem
ont d
.o.o
.Tr
ansp
orta
tion
6.1
5.2
50.0
0.3
0.7
100.
00.
60.
930
0.0
1.8
1.8
3580
04IN
A N
afta
plin
Sek
tor P
roiz
vodn
jeO
il &
Gas
Ser
vice
20.0
17.1
50.0
1.0
2.4
100.
02.
03.
030
0.0
6.0
5.8
3580
02Tr
okut
d.d
.Fu
rnitu
re20
.017
.150
.01.
02.
410
0.0
2.0
3.0
300.
06.
05.
8[N
ote]
: Ita
lic L
ette
rs a
re a
ssum
ed b
y th
e St
udy
Team
.To
tal
117.
110
0.0
350.
841
.110
0.0
564.
166
.110
0.0
891.
010
4.3
100.
0
m3 /d
%m
g/l
kg/d
%m
g/l
kg/d
%m
g/l
kg/d
%37
1001
Viv
era
d.o.
o. P
liva
Gru
paFo
od/B
ever
age
65.7
100.
08.
40.
610
0.0
39.3
2.6
100.
030
0.0
19.7
100.
0To
tal
65.7
100.
08.
40.
610
0.0
39.3
2.6
100.
030
0.0
19.7
100.
0
Cod
e N
o.
Cod
e N
o.
Indu
stry
Nam
e
BO
D
Indu
stry
Nam
eA
ctiv
ity
Tab
le C
.1.2
(16)
W
aste
wat
er Q
uant
ity a
nd Q
ualit
y in
Glin
a
TSS
Cod
e N
o.Q
uant
ity B
OD
CO
D
Act
ivity
CO
D
CO
D
Tab
le C
.1.2
(13)
W
aste
wat
er Q
uant
ity a
nd Q
ualit
y in
Pop
ovač ččč
a
Cod
e N
o.Q
uant
ity
Indu
stry
Nam
eA
ctiv
ity
TSS
Tab
le C
.1.2
(15)
Was
tew
ater
Qua
ntity
and
Qua
lity
in N
ovsk
a
Qua
ntity
BO
DC
OD
TSS
Tab
le C
.1.2
(14)
Was
tew
ater
Qua
ntity
and
Qua
lity
in O
gulin
Act
ivity
Indu
stry
Nam
e
Qua
ntity
BO
D T
SS
C-T9

FIGURES
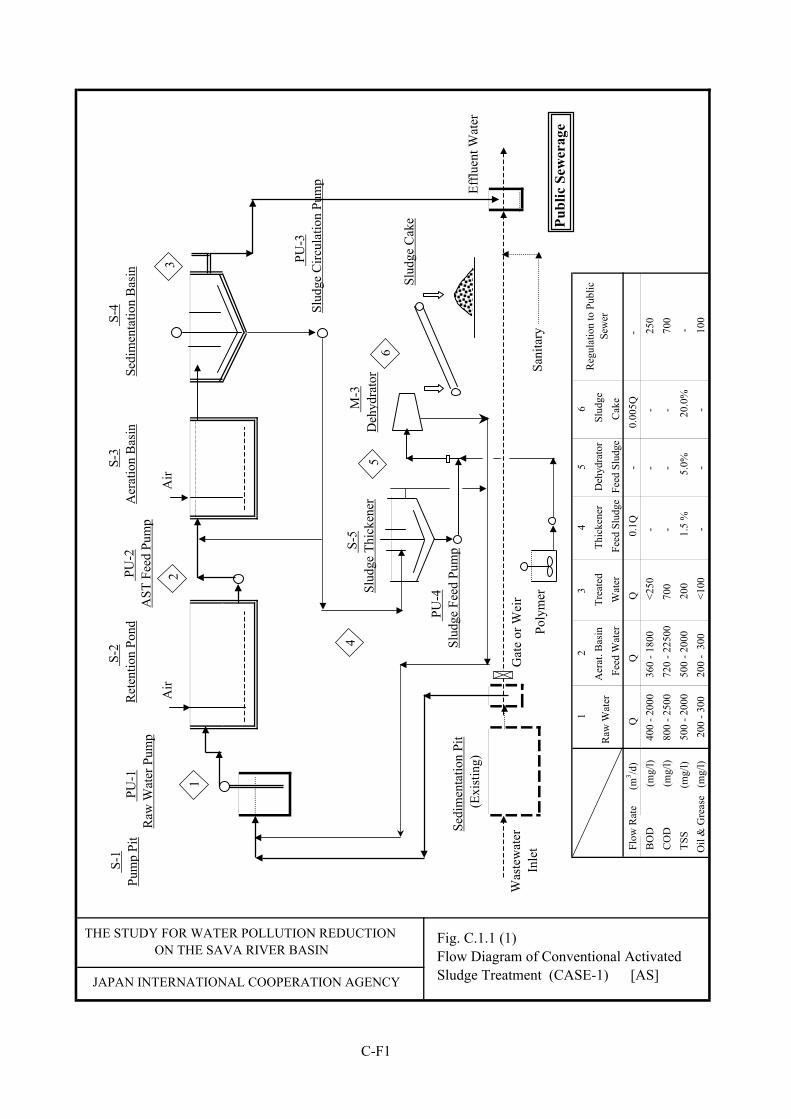
12
34
56
Flo
w R
ate
(
m3 /d
)Q
0.1Q
-
0.00
5Q -
BO
D
(mg/
l) 4
00 -
2000
360
- 18
00
<250
- -
-25
0 C
OD
(m
g/l)
800
- 25
00 7
20 -
2250
070
0 -
- -
700
TSS
(m
g/l)
500
- 20
00 5
00 -
2000
200
1.5
%5.
0%20
.0%
-
Oil
& G
reas
e (
mg/
l)
200
- 300
200
- 3
00<1
00 -
- -
100
Slu
dge
Cak
e
Reg
ulat
ion
to P
ublic
Sew
erTh
icke
ner
Fee
d Sl
udge
Deh
ydra
tor
Feed
Slu
dge
Raw
Wat
er F
eed
Wat
erA
erat
. Bas
in
Tre
ated
W
ater
Fig. C.1.1 (1)Flow Diagram of Conventional ActivatedSludge Treatment (CASE-1) [AS]JAPAN INTERNATIONAL COOPERATION AGENCY
THE STUDY FOR WATER POLLUTION REDUCTION ON THE SAVA RIVER BASIN
S
-1Pu
mp
Pit
S-5
Slud
ge T
hick
ener
S-2
Ret
entio
n Po
nd
M-3
Deh
ydra
tor
S-4
Sedi
men
tatio
n B
asin
PU
-1R
aw W
ater
Pum
p
PU
-3Sl
udge
Circ
ulat
ion
Pum
p
PU
-4Sl
udge
Fee
d Pu
mp
Sedi
men
tatio
n Pi
t
(E
xist
ing)
Was
tew
ater
Inle
tSa
nita
ry
Efflu
ent W
ater
21
4
32
56
5
S
-3A
erat
ion
Bas
in
PU-2
AST
Fee
d Pu
mp
Air
Air
Slud
ge C
ake
Poly
mer
Publ
ic S
ewer
age
Gat
e or
Wei
r
C-F1
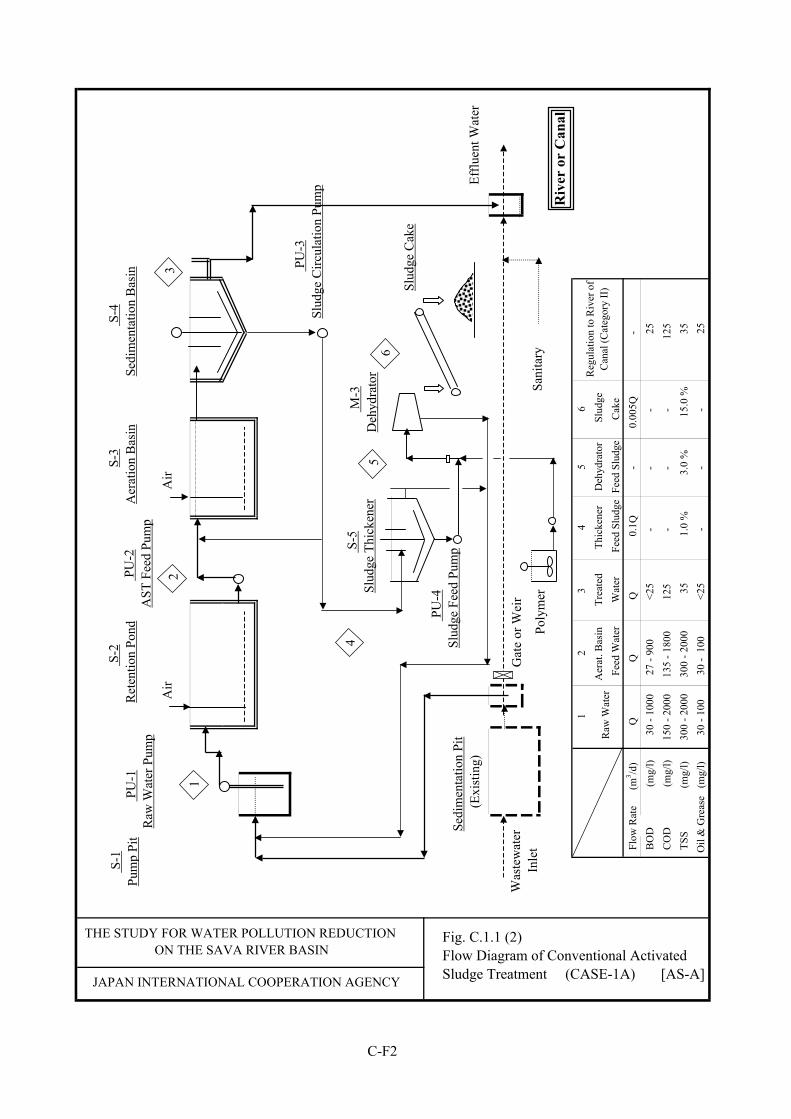
12
34
56
Flo
w R
ate
(
m3 /d
)Q
0.1Q
-
0.00
5Q -
BO
D
(mg/
l)
30
- 100
0
27 -
900
<25
- -
-25
CO
D
(mg/
l) 1
50 -
2000
135
- 18
0012
5 -
- -
125
TSS
(m
g/l)
300
- 20
00 3
00 -
2000
351.
0 %
3.0
%15
.0 %
35 O
il &
Gre
ase
(m
g/l)
3
0 - 1
00
30 -
100
<25
- -
-25
Slu
dge
Cak
e
Reg
ulat
ion
to R
iver
of
Can
al (C
ateg
ory
II) R
aw W
ater
Thic
kene
r F
eed
Slud
geD
ehyd
rato
rFe
ed S
ludg
e T
reat
ed
Wat
er F
eed
Wat
erA
erat
. Bas
in
Fig. C.1.1 (2)Flow Diagram of Conventional ActivatedSludge Treatment (CASE-1A) [AS-A]JAPAN INTERNATIONAL COOPERATION AGENCY
THE STUDY FOR WATER POLLUTION REDUCTION ON THE SAVA RIVER BASIN
S
-1Pu
mp
Pit
S-5
Slud
ge T
hick
ener
S-2
Ret
entio
n Po
nd
M-3
Deh
ydra
tor
S-4
Sedi
men
tatio
n B
asin
PU
-1R
aw W
ater
Pum
p
PU
-3Sl
udge
Circ
ulat
ion
Pum
p
PU
-4Sl
udge
Fee
d Pu
mp
Sedi
men
tatio
n Pi
t
(E
xist
ing)
Was
tew
ater
Inle
tSa
nita
ry
Efflu
ent W
ater
21
4
32
56
5
S
-3A
erat
ion
Bas
in
PU-2
AST
Fee
d Pu
mp
Air
Air
Slud
ge C
ake
Poly
mer
Riv
er o
r C
anal
Gat
e or
Wei
r
C-F2
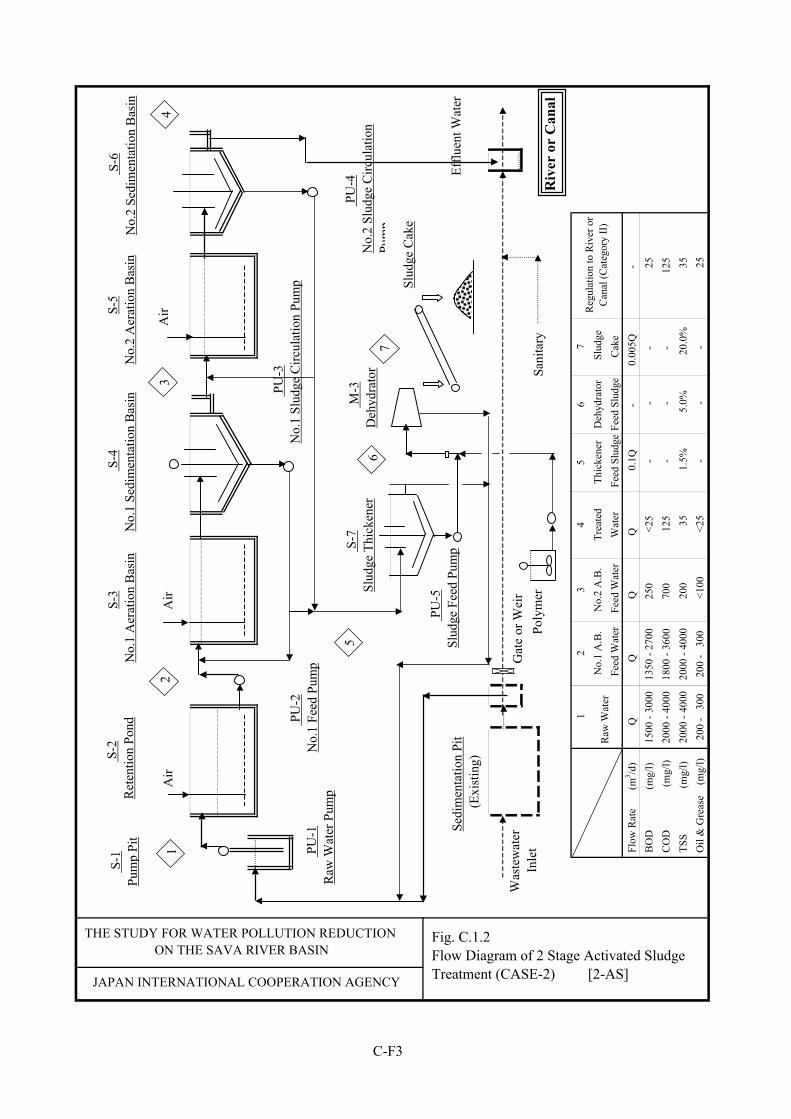
12
34
56
7
Flo
w R
ate
(m3 /d
)Q
Q0.
1Q -
0.
005Q
- B
OD
(m
g/l)
150
0 - 3
000
135
0 - 2
700
250
<25
-
-
- 2
5 C
OD
(m
g/l)
200
0 - 4
000
180
0 - 3
600
700
125
-
-
-12
5 T
SS
(m
g/l)
200
0 - 4
000
200
0 - 4
000
200
351.
5%5.
0%20
.0%
35
Oil
& G
reas
e
(mg/
l) 2
00 -
300
200
- 3
00<1
00<2
5
-
- -
25
Raw
Wat
erN
o.1
A.B
. F
eed
Wat
erN
o.2
A.B
. F
eed
Wat
erTr
eate
dW
ater
Thic
kene
r F
eed
Slud
ge
Reg
ulat
ion
to R
iver
or
Can
al (C
ateg
ory
II)D
ehyd
rato
rFe
ed S
ludg
e S
ludg
eC
ake
Fig. C.1.2Flow Diagram of 2 Stage Activated SludgeTreatment (CASE-2) [2-AS]JAPAN INTERNATIONAL COOPERATION AGENCY
THE STUDY FOR WATER POLLUTION REDUCTION ON THE SAVA RIVER BASIN
S
-1Pu
mp
Pit
S-7
Slud
ge T
hick
ener
S-2
Ret
entio
n Po
nd
M-3
Deh
ydra
tor
S-4
No.
1 Se
dim
enta
tion
Bas
in
PU
-1R
aw W
ater
Pum
p
PU
-4N
o.2
Slud
ge C
ircul
atio
nPu
mp
PU
-5Sl
udge
Fee
d Pu
mp
Sedi
men
tatio
n Pi
t
(E
xist
ing)
Was
tew
ater
Inle
tSa
nita
ry
Efflu
ent W
ater
2
1
5
2
57
6
S
-3N
o.1
Aer
atio
n B
asin
PU
-2N
o.1
Feed
Pum
p
Air
Air
Slud
ge C
ake
Poly
mer
S-
5N
o.2
Aer
atio
n B
asin
S-6
No.
2 Se
dim
enta
tion
Bas
in
PU
-3N
o.1
Slud
ge C
ircul
atio
n Pu
mp
34
Gat
e or
Wei
r
Riv
er o
r C
anal
Air
C-F3

12
34
56
Flo
w R
ate
(
m3 /d
)Q
0.1Q
0.0
05Q
- B
OD
(mg/
l) 4
00 -
2000
360
- 18
00<2
50
-
- -
250
CO
D
(
mg/
l) 8
00 -
2500
720
- 22
5070
0
-
- -
700
TSS
(m
g/l)
500
- 20
00 5
00 -
2000
200
1.5%
5.0%
20.0
% -
Oil
& G
reas
e (m
g/l)
200
- 30
0 2
00 -
300
<100
-
-
-10
0
Slu
dge
Cak
e
Reg
ulat
ion
to P
ublic
Sew
erTh
icke
ner
Fee
d Sl
udge
Deh
ydra
tor
Feed
Slu
dge
Raw
Wat
erC
larif
ier
Fee
d W
ater
Tre
ated
W
ater
Fig. C.1.3 (1)Flow Diagram of Chemical Clarification System(CASE-3) [CT]JAPAN INTERNATIONAL COOPERATION AGENCY
THE STUDY FOR WATER POLLUTION REDUCTION ON THE SAVA RIVER BASIN
S
-1Pu
mp
Pit
S-5
Slud
ge T
hick
ener
S-2
Ret
entio
n Po
nd
M-3
Deh
ydra
tor
S-
4C
larif
ier B
asin
PU
-1R
aw W
ater
Pum
p
PU
-3Sl
udge
Fee
ding
Pum
p
PU
-4Sl
udge
Fee
d Pu
mp
Sedi
men
tatio
n Pi
t
(E
xist
ing)
Was
tew
ater
Inle
tSa
nita
ry
Efflu
ent W
ater
21
4
32
56
5
S
-3Fl
occu
latio
n Ta
nk
PU-2
Cla
rifie
r Fee
d Pu
mp
Che
mic
al F
eedi
ng E
quip
men
t
Air
Poly
mer
Publ
ic S
ewer
age
Gat
e or
Wei
r
C-F4
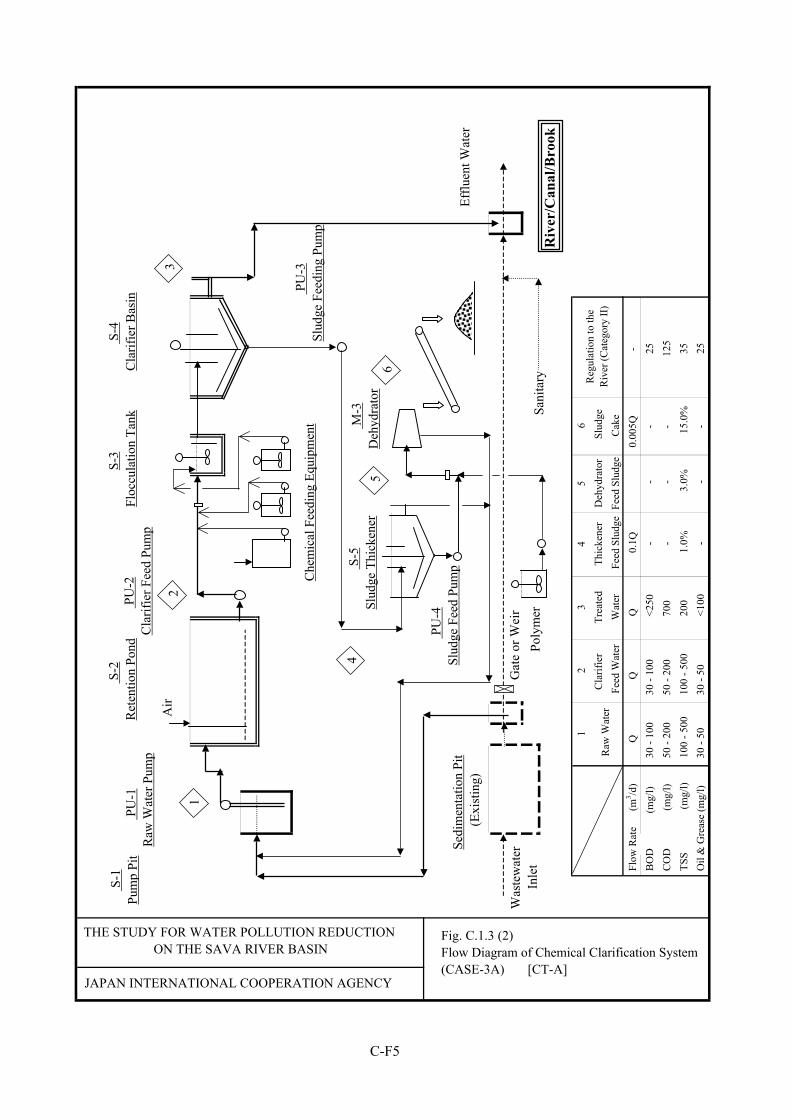
12
34
56
Flo
w R
ate
(
m3 /d
)Q
0.1Q
0.0
05Q
- B
OD
(mg/
l) 3
0 - 1
00 3
0 - 1
00<2
50
-
- -
25
CO
D
(
mg/
l) 5
0 - 2
00 5
0 - 2
0070
0
-
- -
125
TSS
(m
g/l)
100
- 50
0 1
00 -
500
200
1.0%
3.0%
15.0
% 3
5 O
il &
Gre
ase
(mg/
l) 3
0 - 5
0 3
0 - 5
0<1
00
-
- -
25
Slu
dge
Cak
e
Reg
ulat
ion
to th
eR
iver
(Cat
egor
y II)
Thic
kene
r F
eed
Slud
geD
ehyd
rato
rFe
ed S
ludg
e R
aw W
ater
Cla
rifie
r F
eed
Wat
er T
reat
ed
Wat
er
Fig. C.1.3 (2)Flow Diagram of Chemical Clarification System(CASE-3A) [CT-A]
JAPAN INTERNATIONAL COOPERATION AGENCY
THE STUDY FOR WATER POLLUTION REDUCTION ON THE SAVA RIVER BASIN
S
-1Pu
mp
Pit
S-5
Slud
ge T
hick
ener
S-2
Ret
entio
n Po
nd
M-3
Deh
ydra
tor
S-
4C
larif
ier B
asin
PU
-1R
aw W
ater
Pum
p
PU
-3Sl
udge
Fee
ding
Pum
p
PU
-4Sl
udge
Fee
d Pu
mp
Sedi
men
tatio
n Pi
t
(E
xist
ing)
Was
tew
ater
Inle
tSa
nita
ry
Efflu
ent W
ater
21
4
32
56
5
S
-3Fl
occu
latio
n Ta
nk
PU-2
Cla
rifie
r Fee
d Pu
mp
Che
mic
al F
eedi
ng E
quip
men
t
Air
Poly
mer
Riv
er/C
anal
/Bro
ok
Gat
e or
Wei
r
C-F5
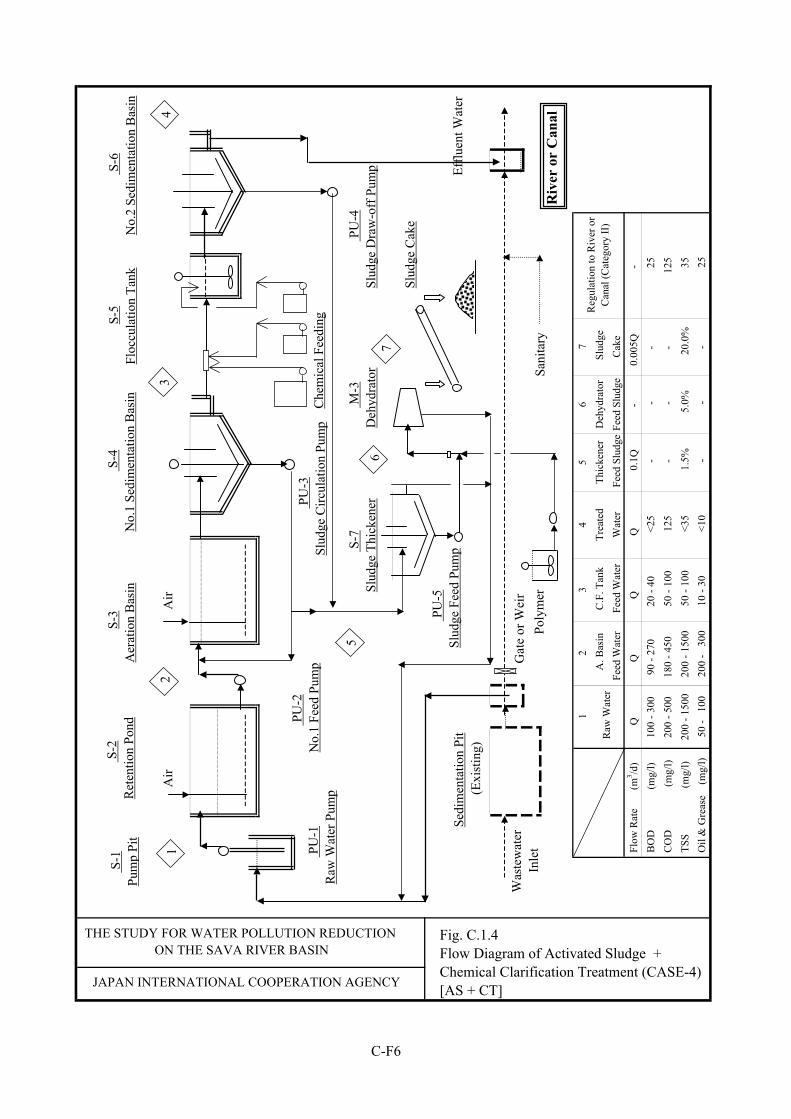
12
34
56
7
Fee
d W
ater
Flo
w R
ate
(m3 /d
)Q
Q0.
1Q -
0.
005Q
- B
OD
(m
g/l)
10
0 - 3
00
90 -
270
2
0 - 4
0<2
5
-
- -
25
CO
D
(mg/
l)
200
- 500
180
- 45
0
50
- 100
125
-
-
-12
5 T
SS
(m
g/l)
200
- 15
00 2
00 -
1500
5
0 - 1
00<3
51.
5%5.
0%20
.0%
35
Oil
& G
reas
e
(mg/
l)
50 -
100
200
- 3
00
10
- 30
<10
-
-
-25
Raw
Wat
er A
. Bas
in C
.F. T
ank
Fee
d W
ater
Trea
ted
Wat
erTh
icke
ner
Fee
d Sl
udge
Reg
ulat
ion
to R
iver
or
Can
al (C
ateg
ory
II)D
ehyd
rato
rFe
ed S
ludg
e S
ludg
eC
ake
Fig. C.1.4Flow Diagram of Activated Sludge +Chemical Clarification Treatment (CASE-4)[AS + CT]JAPAN INTERNATIONAL COOPERATION AGENCY
THE STUDY FOR WATER POLLUTION REDUCTION ON THE SAVA RIVER BASIN
S
-1Pu
mp
Pit
S-7
Slud
ge T
hick
ener
S-2
Ret
entio
n Po
nd
M-3
Deh
ydra
tor
S-4
No.
1 Se
dim
enta
tion
Bas
in
PU
-1R
aw W
ater
Pum
p
PU
-4Sl
udge
Dra
w-o
ff P
ump
PU
-5Sl
udge
Fee
d Pu
mp
Sedi
men
tatio
n Pi
t
(E
xist
ing)
Was
tew
ater
Inle
tSa
nita
ry
Efflu
ent W
ater
2
1
5
2
57
6
S
-3A
erat
ion
Bas
in
PU
-2N
o.1
Feed
Pum
p
Air
Slud
ge C
ake
Poly
mer
S-5
Floc
cula
tion
Tank
S-6
No.
2 Se
dim
enta
tion
Bas
in
34
Gat
e or
Wei
r
Riv
er o
r C
anal
Air
PU
-3Sl
udge
Circ
ulat
ion
Pum
pC
hem
ical
Fee
ding
C-F6
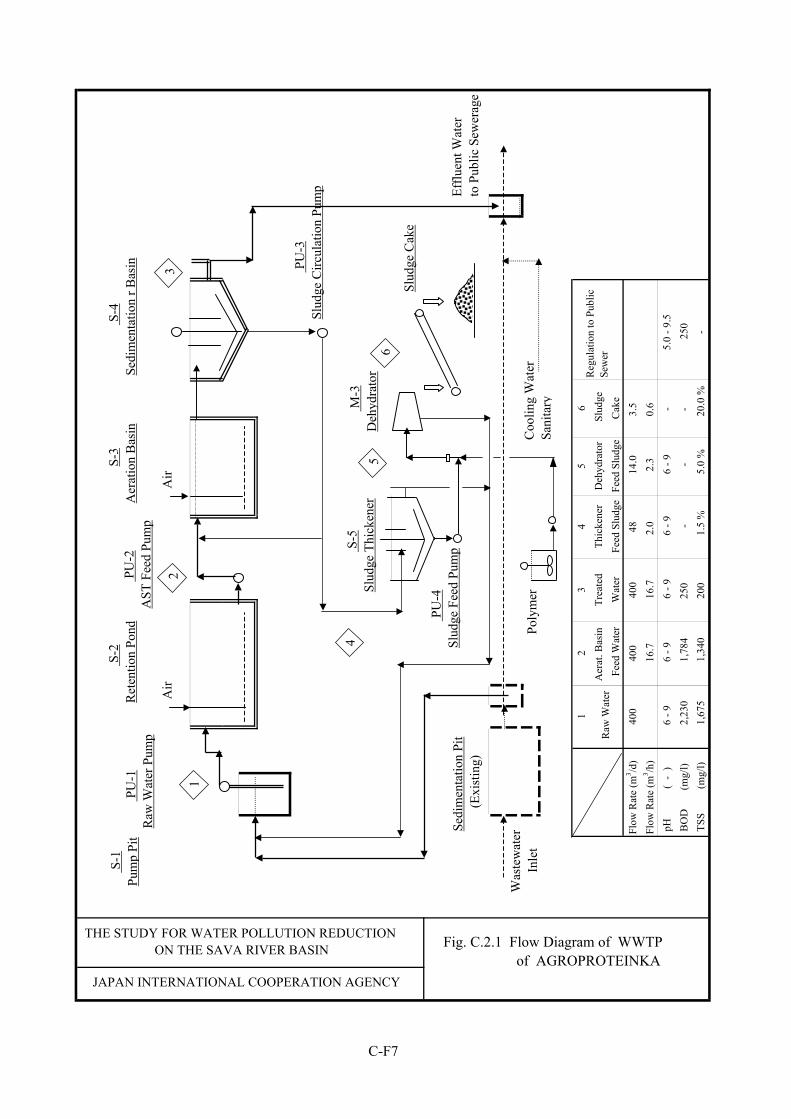
12
34
56
Flow
Rat
e (m
3 /d)
400
400
400
4814
.03.
5Fl
ow R
ate
(m3 /h
)16
.716
.72.
0 2
.30.
6 p
H
( -
)6
- 96
- 96
- 96
- 96
- 9 -
5.
0 - 9
.5 B
OD
(mg/
l)2,
230
1,78
425
0
-
- -
250
TSS
(m
g/l)
1,67
51,
340
200
1.5
%5.
0 %
20.0
% -
Slu
dge
Cak
e
Reg
ulat
ion
to P
ublic
Sew
erTh
icke
ner
Feed
Slu
dge
Deh
ydra
tor
Feed
Slu
dge
Raw
Wat
erA
erat
. Bas
in
Fee
d W
ater
Tre
ated
W
ater
Fig. C.2.1 Flow Diagram of WWTP of AGROPROTEINKA
JAPAN INTERNATIONAL COOPERATION AGENCY
THE STUDY FOR WATER POLLUTION REDUCTION ON THE SAVA RIVER BASIN
S
-1Pu
mp
Pit
S-5
Slud
ge T
hick
ener
S-2
Ret
entio
n Po
nd
M-3
Deh
ydra
tor
S-4
Sedi
men
tatio
n r B
asin
PU
-1R
aw W
ater
Pum
p
PU
-3Sl
udge
Circ
ulat
ion
Pum
p
PU
-4Sl
udge
Fee
d Pu
mp
Sedi
men
tatio
n Pi
t
(E
xist
ing)
Was
tew
ater
Inle
tC
oolin
g W
ater
Sani
tar y
Efflu
ent W
ater
to P
ublic
Sew
erag
e
21
4
32
56
5
S
-3A
erat
ion
Bas
in
PU-2
AST
Fee
d Pu
mp
Air
Air
Slud
ge C
ake
Poly
mer
C-F7
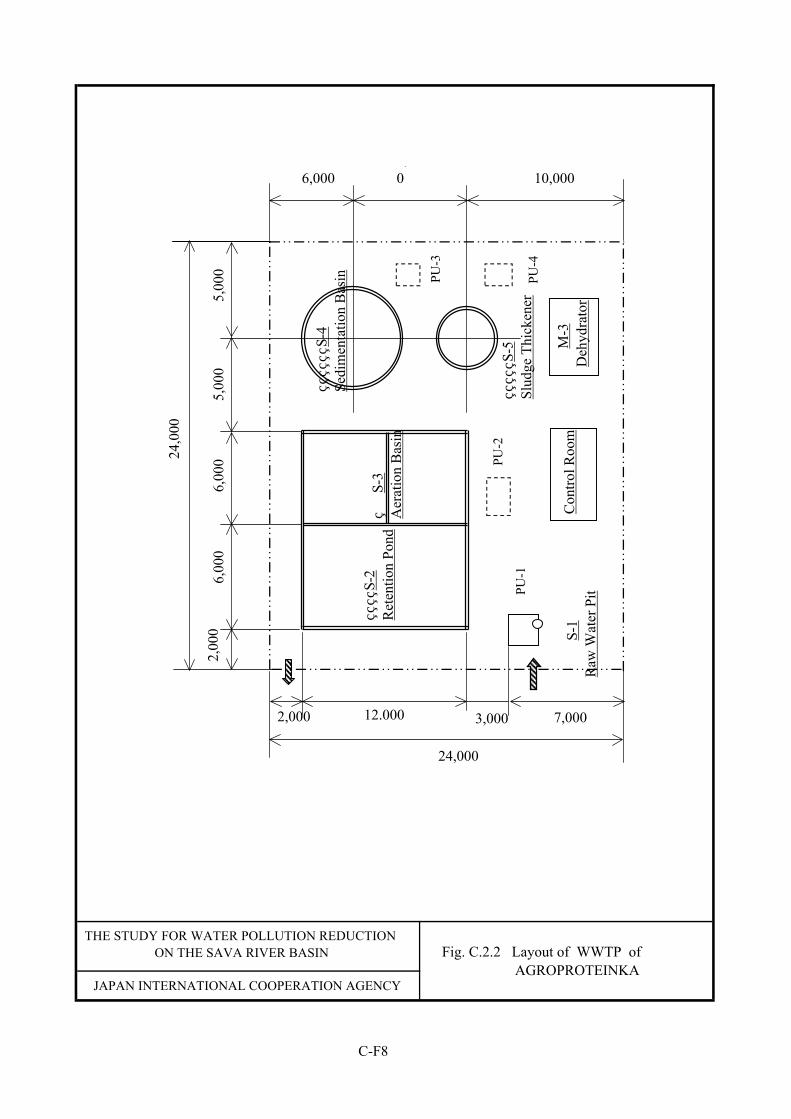
Fig. C.2.2 Layout of WWTP of AGROPROTEINKA
JAPAN INTERNATIONAL COOPERATION AGENCY
THE STUDY FOR WATER POLLUTION REDUCTION ON THE SAVA RIVER BASIN
S-2
Ret
entio
n Po
nd
S
-3A
erat
ion
Bas
in
S-4
Sedi
men
tatio
n B
asin
S
-5Sl
udge
Thi
cken
er
S
-1R
aw W
ater
Pit
Con
trol R
oom
M
-3D
ehyd
rato
r
6,00
06,
000
5,00
0
24,0
00
5,00
0
24,000
2,00
0
12.000 7,000
10,000,
06,000
2,000 3,000
PU-1
PU-2
PU-3
PU-4
C-F8
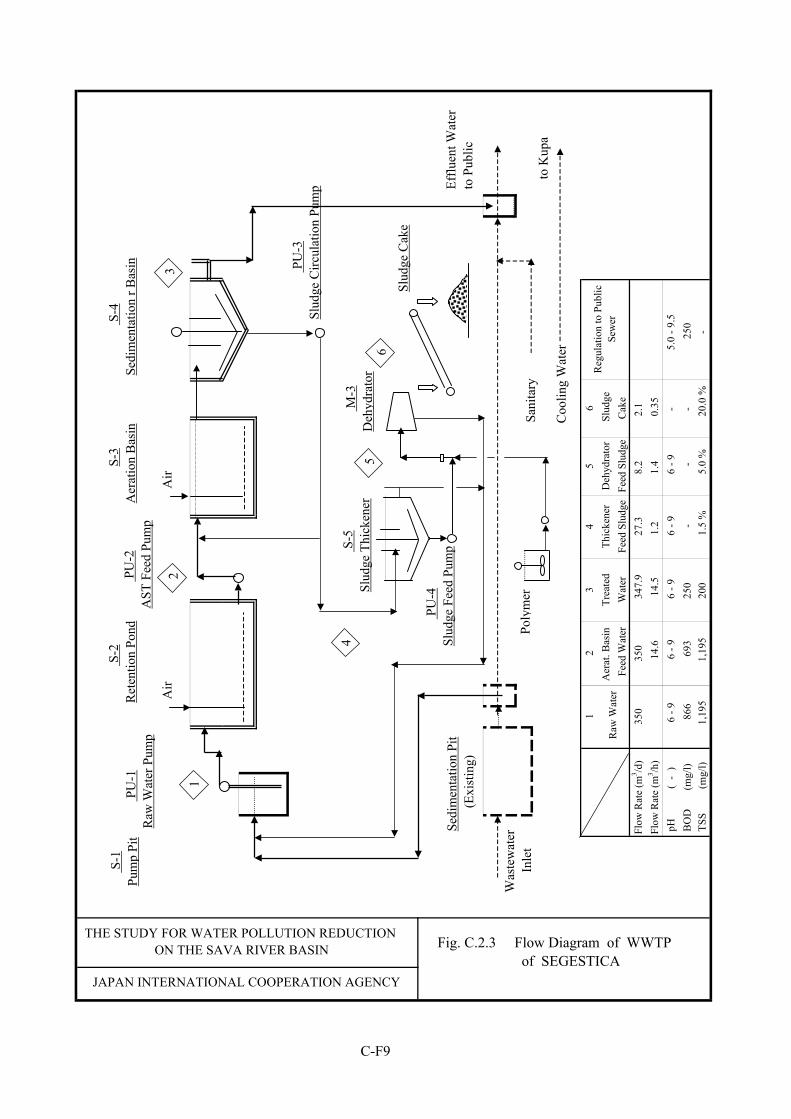
12
34
56
Flow
Rat
e (m
3 /d)
350
350
347.
927
.38.
22.
1Fl
ow R
ate
(m3 /h
) 1
4.6
14.
51.
21.
40.
35 p
H
( -
) 6
- 9
6 -
96
- 96
- 96
- 9 -
5.
0 - 9
.5 B
OD
(mg/
l) 8
66 6
9325
0
-
- -
250
TSS
(m
g/l)
1,19
51,
195
200
1.5
%5.
0 %
20.0
% -
Raw
Wat
erA
erat
. Bas
in
Fee
d W
ater
Tre
ated
W
ater
Slu
dge
Cak
e
Reg
ulat
ion
to P
ublic
Sew
erTh
icke
ner
Feed
Slu
dge
Deh
ydra
tor
Feed
Slu
dge
Fig. C.2.3 Flow Diagram of WWTP of SEGESTICA
JAPAN INTERNATIONAL COOPERATION AGENCY
THE STUDY FOR WATER POLLUTION REDUCTION ON THE SAVA RIVER BASIN
S
-1Pu
mp
Pit
S-5
Slud
ge T
hick
ener
S-2
Ret
entio
n Po
nd
M-3
Deh
ydra
tor
S-4
Sedi
men
tatio
n r B
asin
PU
-1R
aw W
ater
Pum
p
PU
-3Sl
udge
Circ
ulat
ion
Pum
p
PU
-4Sl
udge
Fee
d Pu
mp
Sedi
men
tatio
n Pi
t
(E
xist
ing)
Was
tew
ater
Inle
t
Coo
ling
Wat
er
Efflu
ent W
ater
to P
ublic
21
4
32
56
5
S
-3A
erat
ion
Bas
in
PU-2
AST
Fee
d Pu
mp
Air
Air
Slud
ge C
ake
Poly
mer
Sani
tary
to K
upa
C-F9
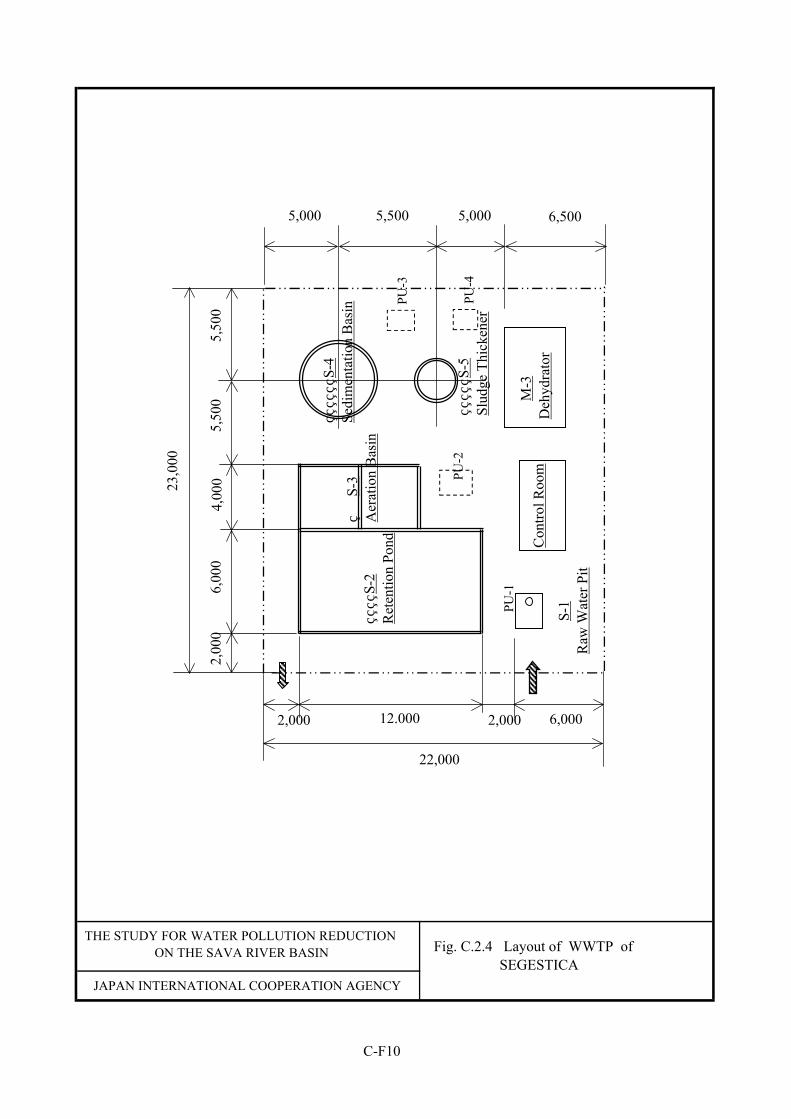
Fig. C.2.4 Layout of WWTP of SEGESTICA
JAPAN INTERNATIONAL COOPERATION AGENCY
THE STUDY FOR WATER POLLUTION REDUCTION ON THE SAVA RIVER BASIN
S-2
Ret
entio
n Po
nd
S-3
Aer
atio
n B
asin
S-4
Sedi
men
tatio
n B
asin
S
-5Sl
udge
Thi
cken
er
S-
1R
aw W
ater
Pit
Con
trol R
oom
M
-3D
ehyd
rato
r
6,00
04,
000
5,50
0
23,0
00
5,50
0
22,000
2,00
0
12.000 6,000
6,5005,5005,000
2,000 2,000
5,000
PU-1
PU-3
PU-4
PU-2
C-F10
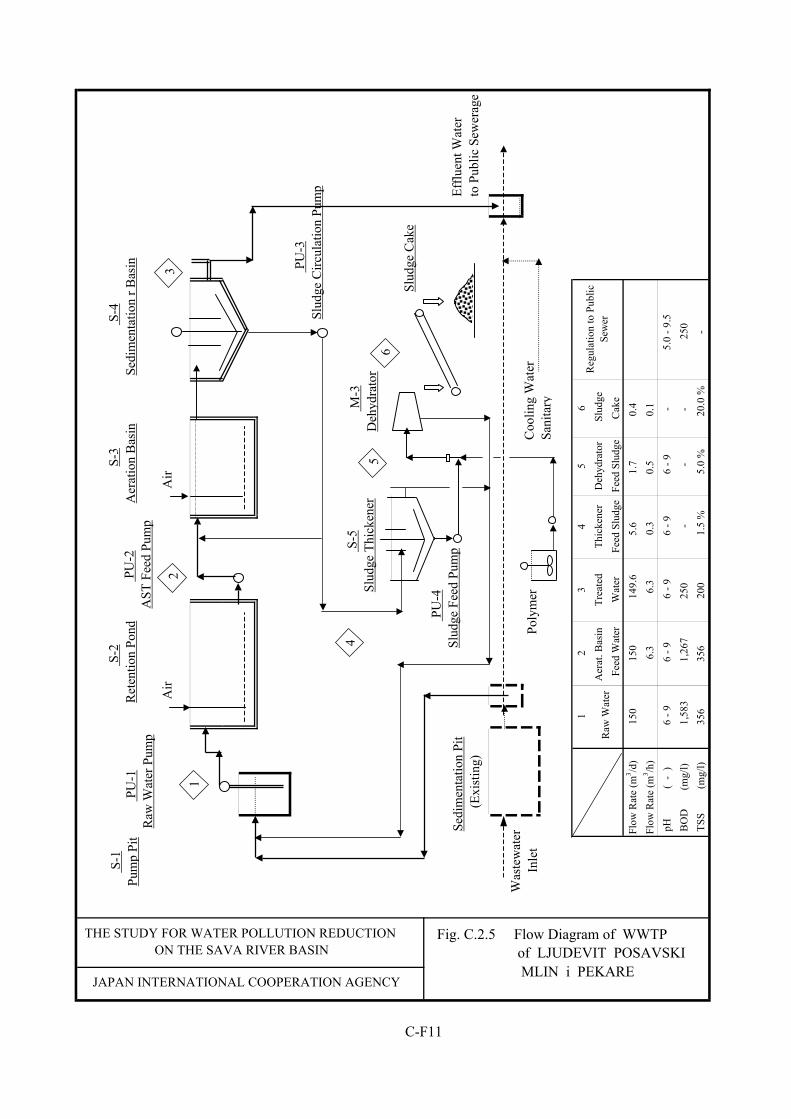
12
34
56
Flow
Rat
e (m
3 /d)
150
150
149.
65.
61.
70.
4Fl
ow R
ate
(m3 /h
) 6
.3 6
.30.
30.
50.
1 p
H
( -
)6
- 96
- 96
- 96
- 96
- 9 -
5.
0 - 9
.5 B
OD
(mg/
l)1,
583
1,26
725
0
-
- -
250
TSS
(m
g/l)
356
356
200
1.5
%5.
0 %
20.0
% -
Reg
ulat
ion
to P
ublic
Sew
erD
ehyd
rato
rFe
ed S
ludg
e S
ludg
eC
ake
Tre
ated
W
ater
Thic
kene
rFe
ed S
ludg
e
C-F11
Raw
Wat
erA
erat
. Bas
in
Fee
d W
ater
Fig. C.2.5 Flow Diagram of WWTP of LJUDEVIT POSAVSKI MLIN i PEKARE
JAPAN INTERNATIONAL COOPERATION AGENCY
THE STUDY FOR WATER POLLUTION REDUCTION ON THE SAVA RIVER BASIN
S
-1Pu
mp
Pit
S-5
Slud
ge T
hick
ener
S-2
Ret
entio
n Po
nd
M-3
Deh
ydra
tor
S-4
Sedi
men
tatio
n r B
asin
PU
-1R
aw W
ater
Pum
p
PU
-3Sl
udge
Circ
ulat
ion
Pum
p
PU
-4Sl
udge
Fee
d Pu
mp
Sedi
men
tatio
n Pi
t
(E
xist
ing)
Was
tew
ater
Inle
tC
oolin
g W
ater
Sani
tar y
Efflu
ent W
ater
to P
ublic
Sew
erag
e
21
4
32
56
5
S
-3A
erat
ion
Bas
in
PU-2
AST
Fee
d Pu
mp
Air
Air
Slud
ge C
ake
Poly
mer
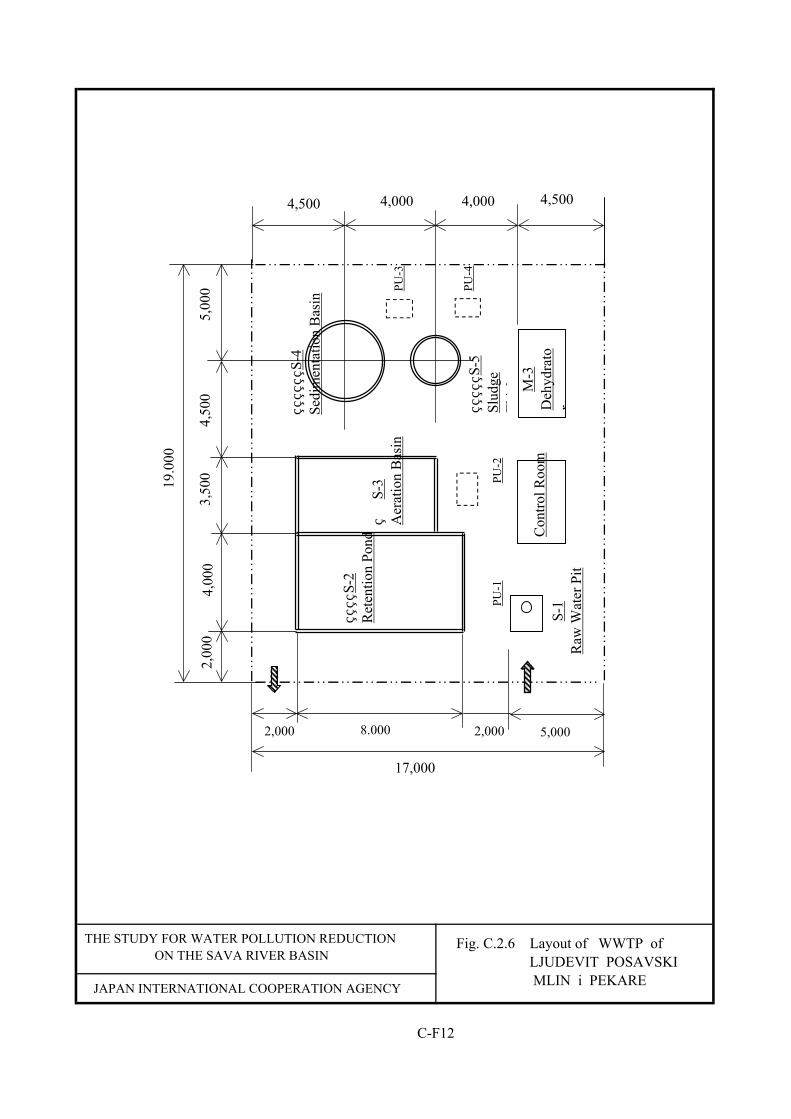
C-F12
Fig. C.2.6 Layout of WWTP of LJUDEVIT POSAVSKI MLIN i PEKAREJAPAN INTERNATIONAL COOPERATION AGENCY
THE STUDY FOR WATER POLLUTION REDUCTION ON THE SAVA RIVER BASIN
S-2
Ret
entio
n Po
nd
S
-3A
erat
ion
Bas
in
S-4
Sedi
men
tatio
n B
asin
S
-5Sl
udge
Thi
k
S-
1R
aw W
ater
Pit
Con
trol R
oom
M
-3D
ehyd
rato
r
4,00
03,
500
4,50
0
19.0
00
5,00
0
17,000
2,00
0
8.000 5,000
4,5004,0004,500
2,000 2,000
4,000
PU-1
PU-2
PU-3
PU-4

12
34
56
Flow
Rat
e (m
3 /d)
3,84
03,
840
2,99
312
236
.79.
2Fl
ow R
ate
(m3 /h
) 1
6.0
125
5.1
4.6
1.2
pH
(
- )
4 - 1
06
- 96
- 96
- 96
- 9 -
5.
0 - 9
.5 B
OD
(mg/
l)45
641
025
0
-
- -
250
TSS
(m
g/l)
595
536
200
1.5
%5.
0 %
20.0
% -
Slu
dge
Cak
e
Reg
ulat
ion
to P
ublic
Sew
erTh
icke
ner
Feed
Slu
dge
Deh
ydra
tor
Feed
Slu
dge
Raw
Wat
erA
erat
. Bas
in
Fee
d W
ater
Tre
ated
W
ater
Fig. C.2.7 Flow Diagram of WWTP of Karlovačka PIVOVARA
JAPAN INTERNATIONAL COOPERATION AGENCY
THE STUDY FOR WATER POLLUTION REDUCTION ON THE SAVA RIVER BASIN
S
-1Pu
mp
Pit
S-5
Slud
ge T
hick
ener
S-2
Ret
entio
n Po
nd
M-3
Deh
ydra
tor
S-4
Sedi
men
tatio
n r B
asin
PU
-1R
aw W
ater
Pum
p
PU
-3Sl
udge
Circ
ulat
ion
Pum
p
PU
-4Sl
udge
Fee
d Pu
mp
Sedi
men
tatio
n Pi
t
(E
xist
ing)
Was
tew
ater
Inle
tC
oolin
g W
ater
Sani
tar y
Efflu
ent W
ater
to P
ublic
Sew
erag
e
21
4
32
56
5
S
-3A
erat
ion
Bas
in
PU-2
AST
Fee
d Pu
mp
Air
Air
Slud
ge C
ake
Poly
mer
C-F13
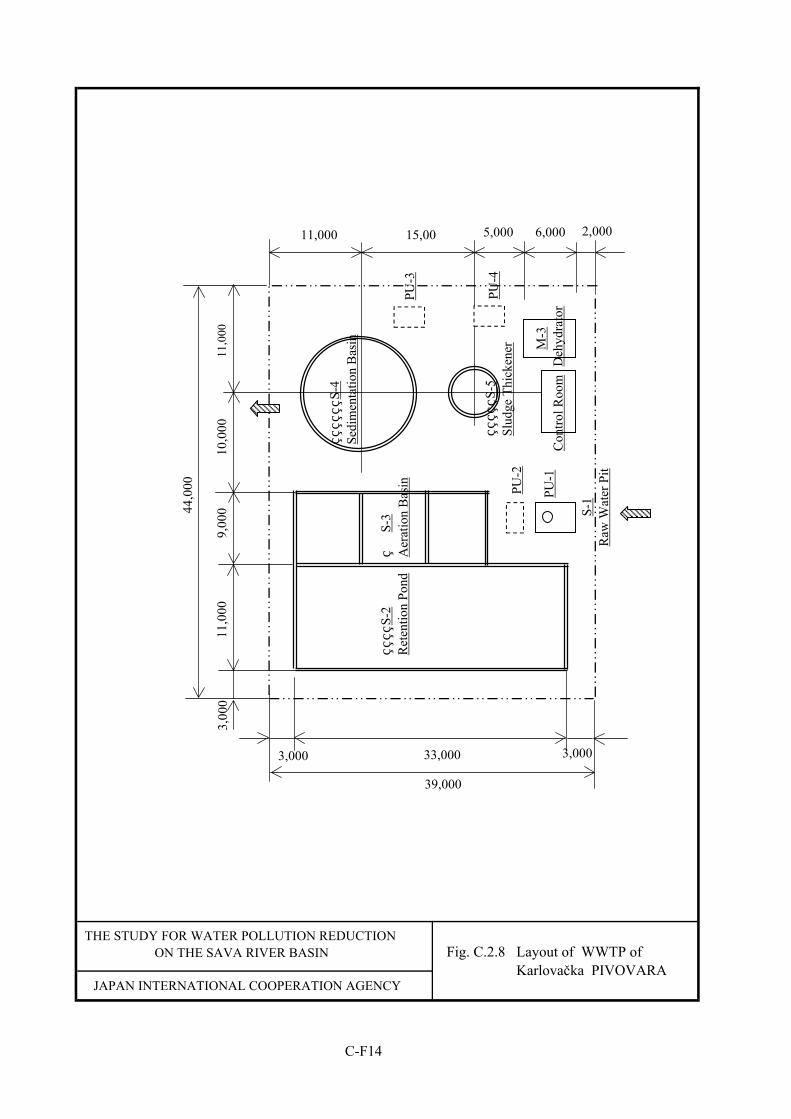
Fig. C.2.8 Layout of WWTP of Karlovačka PIVOVARA
JAPAN INTERNATIONAL COOPERATION AGENCY
THE STUDY FOR WATER POLLUTION REDUCTION ON THE SAVA RIVER BASIN
S-2
Ret
entio
n Po
nd
S
-3A
erat
ion
Bas
in
S-4
Sedi
men
tatio
n B
asin
S
-5Sl
udge
Thi
cken
er
S-1
Raw
Wat
er P
it
Con
trol R
oom
M
-3D
ehyd
rato
r
11,0
0010
,000
11,0
00
44,0
00
9,00
0
33,000
3,00
0
39,000
2,0006,00015,0011,000
3,000 3,000
5,000
PU-1
PU-2
PU-3
PU-4
C-F14
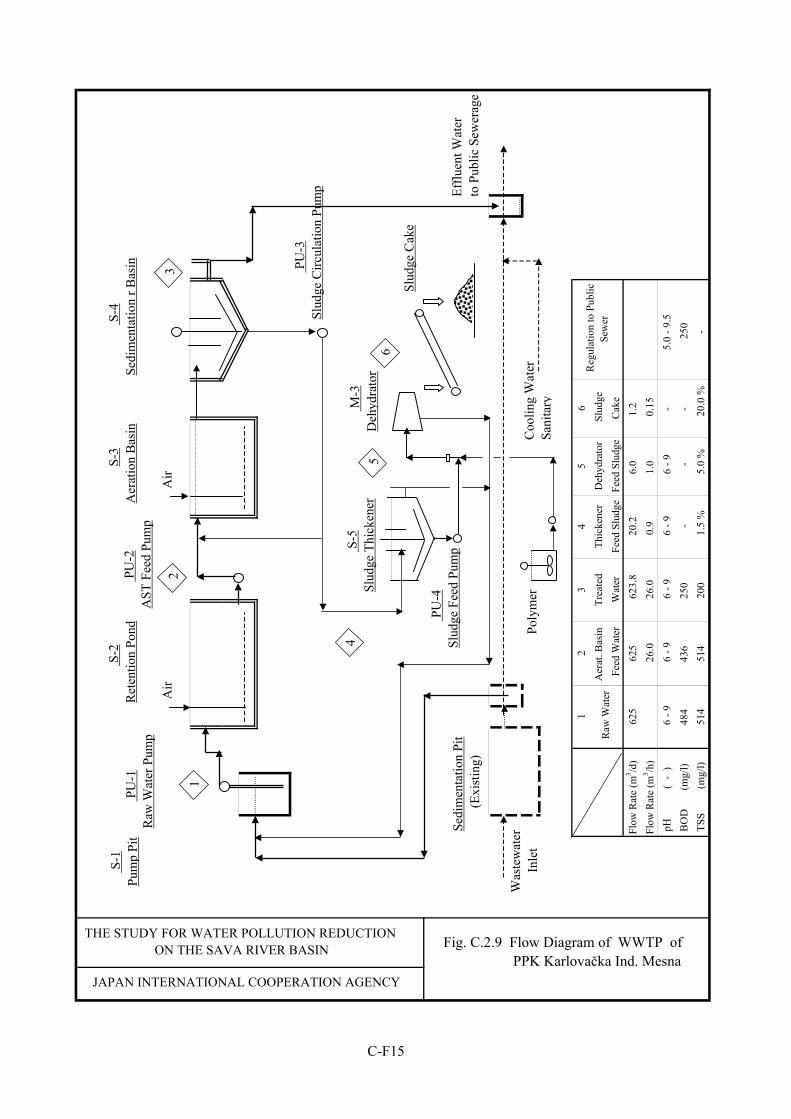
12
34
56
Flow
Rat
e (m
3 /d)
625
625
623.
820
.26.
01.
2Fl
ow R
ate
(m3 /h
)26
.026
.00.
91.
00.
15 p
H
( -
)6
- 96
- 96
- 96
- 96
- 9 -
5.
0 - 9
.5 B
OD
(mg/
l)48
443
625
0
-
- -
250
TSS
(m
g/l)
514
514
200
1.5
%5.
0 %
20.0
% -
Raw
Wat
erA
erat
. Bas
in
Fee
d W
ater
Tre
ated
W
ater
Slu
dge
Cak
e
Reg
ulat
ion
to P
ublic
Sew
erTh
icke
ner
Feed
Slu
dge
Deh
ydra
tor
Feed
Slu
dge
Fig. C.2.9 Flow Diagram of WWTP of PPK Karlovačka Ind. Mesna
JAPAN INTERNATIONAL COOPERATION AGENCY
THE STUDY FOR WATER POLLUTION REDUCTION ON THE SAVA RIVER BASIN
S
-1Pu
mp
Pit
S-5
Slud
ge T
hick
ener
S-2
Ret
entio
n Po
nd
M-3
Deh
ydra
tor
S-4
Sedi
men
tatio
n r B
asin
PU
-1R
aw W
ater
Pum
p
PU
-3Sl
udge
Circ
ulat
ion
Pum
p
PU
-4Sl
udge
Fee
d Pu
mp
Sedi
men
tatio
n Pi
t
(E
xist
ing)
Was
tew
ater
Inle
tC
oolin
g W
ater
Sani
tar y
Efflu
ent W
ater
to P
ublic
Sew
erag
e
21
4
32
56
5
S
-3A
erat
ion
Bas
in
PU-2
AST
Fee
d Pu
mp
Air
Air
Slud
ge C
ake
Poly
mer
C-F15
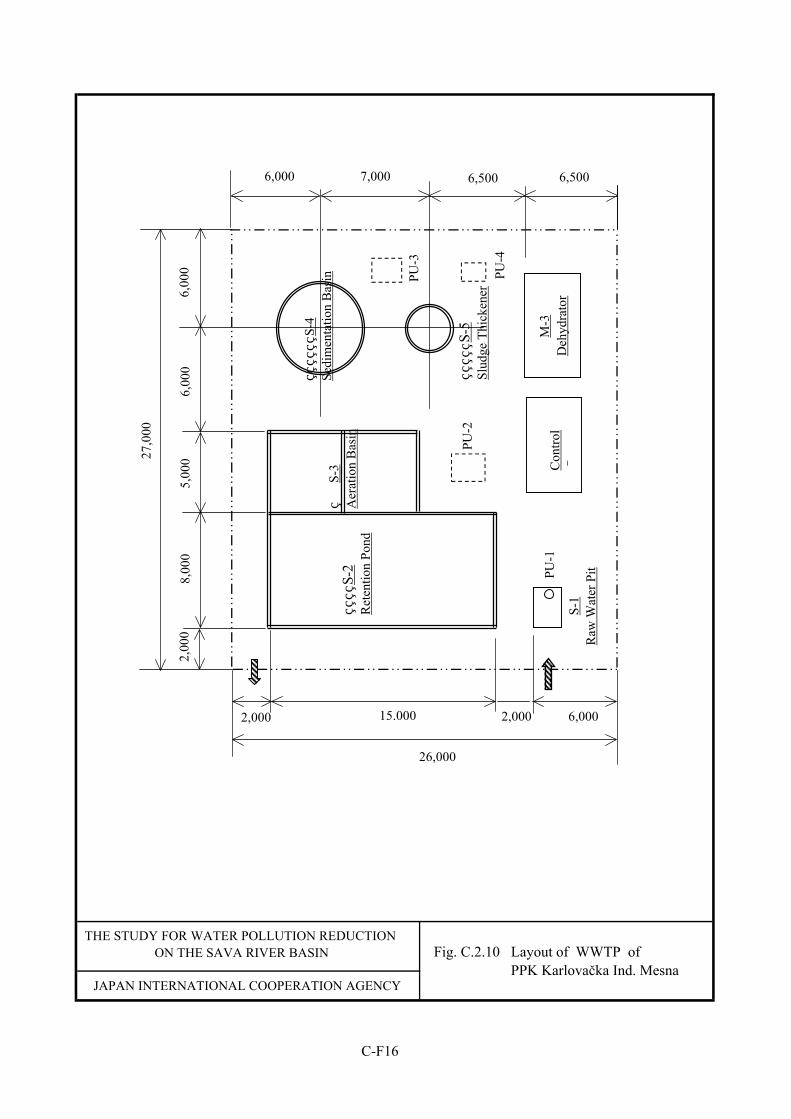
Fig. C.2.10 Layout of WWTP of PPK Karlovačka Ind. Mesna
JAPAN INTERNATIONAL COOPERATION AGENCY
THE STUDY FOR WATER POLLUTION REDUCTION ON THE SAVA RIVER BASIN
S-2
Ret
entio
n Po
nd
S-3
Aer
atio
n B
asin
S-4
Sedi
men
tatio
n B
asin
S
-5Sl
udge
Thi
cken
er
S-
1R
aw W
ater
Pit
Con
trol
R
M
-3D
ehyd
rato
r
8,00
05,
000
6,00
0
27,0
00
6,00
0
26,000
2,00
0
15.000 6,000
6,5007,0006,000
2,000 2,000
PU-2
PU-3
PU-4
PU-1
6,500
C-F16
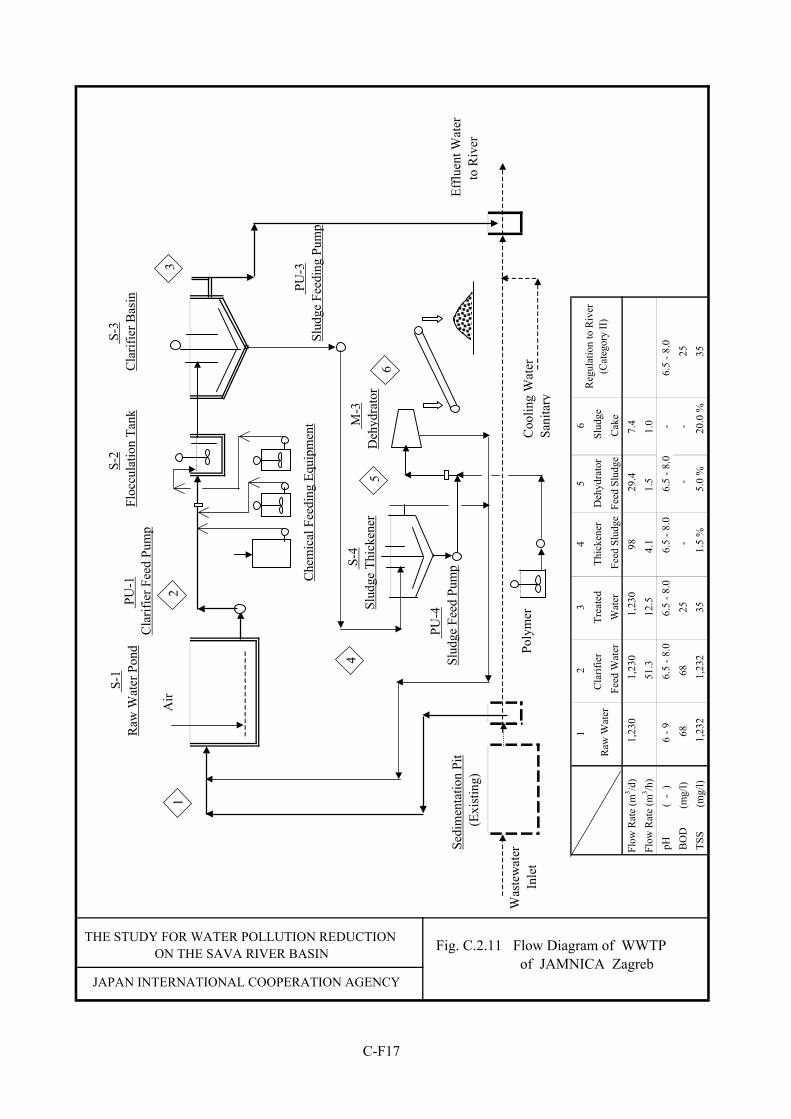
12
34
56
Flow
Rat
e (m
3 /d)
1,23
01,
230
1,23
098
29.4
7.4
Flow
Rat
e (m
3 /h)
51.3
12.5
4.1
1.5
1.0
pH
(
- )
6 - 9
6.5
- 8.0
6.5
- 8.0
6.5
- 8.0
6.5
- 8.0
-6.
5 - 8
.0 B
OD
(mg/
l)68
6825
-
-
-25
TSS
(m
g/l)
1,23
21,
232
351.
5 %
5.0
%20
.0 %
35
Raw
Wat
erC
larif
ier
Fee
d W
ater
Tre
ated
W
ater
Slu
dge
Cak
e
Reg
ulat
ion
to R
iver
(Cat
egor
y II)
Thic
kene
r F
eed
Slud
geD
ehyd
rato
rFe
ed S
ludg
e
Fig. C.2.11 Flow Diagram of WWTP of JAMNICA Zagreb
JAPAN INTERNATIONAL COOPERATION AGENCY
THE STUDY FOR WATER POLLUTION REDUCTION ON THE SAVA RIVER BASIN
S-1
Raw
Wat
er P
ond
S-4
Slud
ge T
hick
ener
M-3
Deh
ydra
tor
S-
3C
larif
ier B
asin
PU
-3Sl
udge
Fee
ding
Pum
p
PU
-4Sl
udge
Fee
d Pu
mp
Sedi
men
tatio
n Pi
t
(E
xist
ing)
Was
tew
ater
Inle
tC
oolin
g W
ater
Sani
tar y
Efflu
ent W
ater
t
o R
iver
21
4
32
56
5
S
-2Fl
occu
latio
n Ta
nk
PU-1
Cla
rifie
r Fee
d Pu
mp
Che
mic
al F
eedi
ng E
quip
men
t
Poly
mer
Air
C-F17
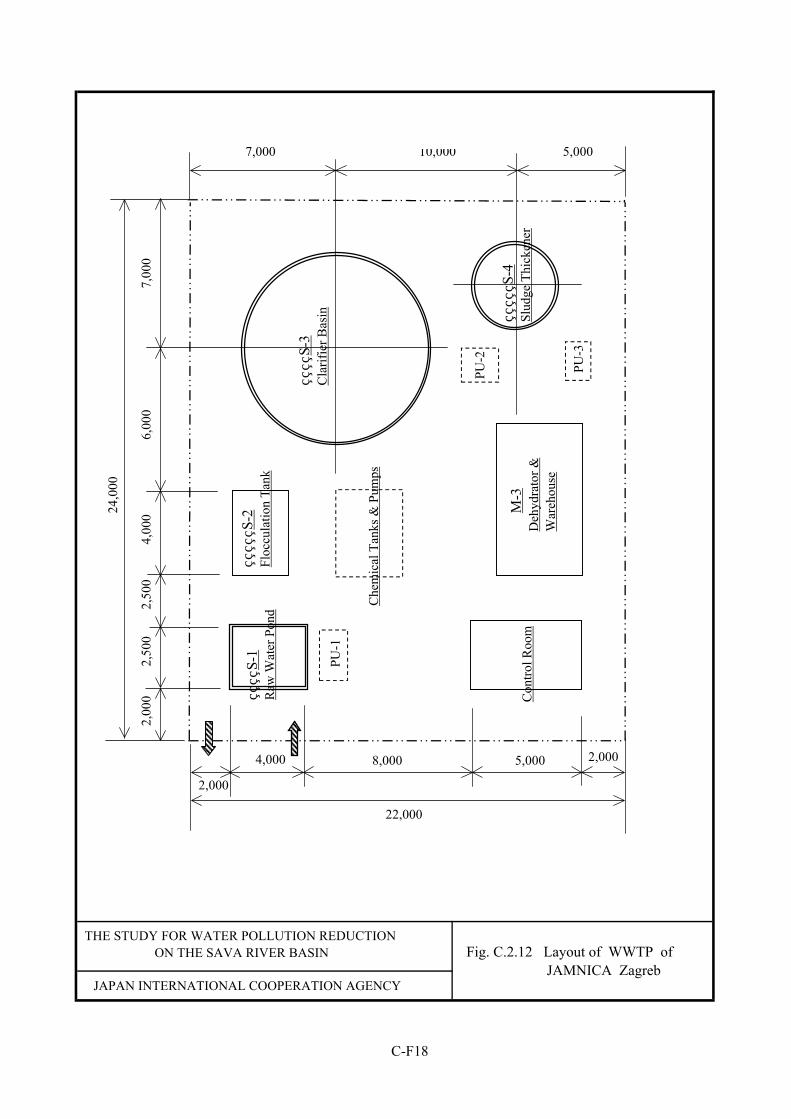
Fig. C.2.12 Layout of WWTP of JAMNICA Zagreb
JAPAN INTERNATIONAL COOPERATION AGENCY
THE STUDY FOR WATER POLLUTION REDUCTION ON THE SAVA RIVER BASIN
S-3
Cla
rifie
r Bas
in S
-4Sl
udge
Thi
cken
er
M-3
Deh
ydra
tor &
War
ehou
se
2,50
04,
00024
,000
7,00
0
22,000
2,00
0
8,000 5,000
5,00010,0007,000
2,000
2,000
S-1
Raw
Wat
er P
ond2,
500
6,00
0
S
-2Fl
occu
latio
n Ta
nk
Con
trol R
oom
Che
mic
al T
anks
& P
umps
PU-3
PU-1
PU-2
4,000
C-F18
APPENDIX D
SEWERAGE DEVELOPMENT (MASTER PLAN STUDY)
D-i
APPENDIX D
SEWERAGE DEVELOPMENT
Table of Contents
CHAPTER I PLANNING BASIS........................................................... D-1 1.1 Planning Basis..................................................................... D-1
1.1.1 Objectives and Target Year.................................... D-1 1.1.2 National Policy on Sewerage Development........... D-1 1.1.3 Objective Urban Centers ........................................ D-1 1.1.4 Permissible Limits of Wastewater Quality ............ D-1
1.2 Sewerage Service Area and Population Projection............. D-2 1.2.1 Sewerage Service Area .......................................... D-2 1.2.2 Population Projection............................................. D-3
1.3 Wastewater Quantity and Pollution Load ........................... D-3 1.3.1 Design Wastewater Quantity.................................. D-3 1.3.2 Pollution Load........................................................ D-7 1.3.3 Collection and Transportation System................... D-8
1.4 Selection of Treatment Process........................................... D-8 1.4.1 Permissible Limits of Treatment Plant Effluent..... D-8 1.4.2 Removal of Nutrients ............................................. D-9 1.4.3 Applicable Treatment Process................................ D-10 1.4.4 Selection of Optimum Treatment Process.............. D-13 1.4.5 Selection of Optimum Sludge Treatment ............. D-15
1.5 Cost Estimate ...................................................................... D-17 1.5.1 General ................................................................... D-17 1.5.2 Cost Items .............................................................. D-17 1.5.3 Foreign and Local Currency................................... D-17 1.5.4 Direct Construction Cost........................................ D-18 1.5.5 Other Costs Associated with Construction .......... D-20
CHAPTER II SEWERAGE IMPROVEMENT OF ZAGREB............. D-22 2.1 Existing Sewerage System.................................................. D-22
2.1.1 Service Area, Population and Industries ................ D-22 2.1.2 Sewer Network....................................................... D-22 2.1.3 Wastewater Flow and Quality................................ D-23
2.2 Ongoing Sewerage Improvement Project ........................... D-23 2.2.1 Summary of Proposed Improvement Works.......... D-23 2.2.2 Sewerage Development Plan.................................. D-24 2.2.3 Wastewater Treatment Plant .................................. D-25
D-ii
2.2.4 Construction Cost................................................... D-26 2.2.5 Schedule................................................................. D-26
CHAPTER III SEWERAGE IMPROVEMENT OF SESVETE EAST D-27 3.1 Existing Sewerage System.................................................. D-27
3.1.1 Service Area and Population.................................. D-27 3.1.2 Existing Industries ................................................. D-27 3.1.3 Sewer Network....................................................... D-27 3.1.4 Wastewater Flow and Quality................................ D-27
3.2 Planning Basis .................................................................... D-28 3.2.1 Service Area, Population and Industries ................ D-28 3.2.2 Wastewater Flow and Quality................................ D-28
3.3 Proposed Structural Plan..................................................... D-29 3.3.1 Transport Collector ................................................ D-29 3.3.2 Secondary/Tertiary Sewer...................................... D-29 3.3.3 Treatment Plant...................................................... D-30
3.4 Cost Estimate ...................................................................... D-31
CHAPTER IV SEWERAGE IMPROVEMENT OF DUGO SELO...... D-32 4.1 Existing Sewerage System.................................................. D-32
4.1.1 Service Area and Population.................................. D-32 4.1.2 Existing Industries ................................................. D-32 4.1.3 Sewer Network....................................................... D-32 4.1.4 Wastewater Flow and Quality................................ D-32
4.2 Planning Basis .................................................................... D-32 4.2.1 Service Area, Population and Industries ................ D-32 4.2.2 Wastewater Flow and Quality................................ D-33
4.3 Proposed Structural Plan..................................................... D-33 4.3.1 Transport Collector ................................................ D-33 4.3.2 Secondary/Tertiary Sewer...................................... D-34 4.3.3 Treatment Plant...................................................... D-34
4.4 Cost Estimate ...................................................................... D-35
CHAPTER V SEWERAGE IMPROVEMENT OF VRBOVEC.......... D-36 5.1 Existing Sewerage System.................................................. D-36
5.1.1 Service Area and Population.................................. D-36 5.1.2 Existing Industries ................................................. D-36 5.1.3 Sewer Network....................................................... D-37 5.1.4 Wastewater Flow and Quality................................ D-37
5.2 Planning Basis .................................................................... D-38 5.2.1 Service Area, Population and Industries ................ D-38 5.2.2 Wastewater Flow and Quality................................ D-38
D-iii
5.3 Proposed Structural Plan..................................................... D-39 5.3.1 Transport Collector ................................................ D-39 5.3.2 Secondary/Tertiary Sewer...................................... D-40 5.3.3 Treatment Plant ...................................................... D-40
5.4 Cost Estimate ...................................................................... D-41
CHAPTER VI SEWERAGE IMPROVEMENT OF SISAK.................. D-42 6.1 Existing Sewerage System.................................................. D-42
6.1.1 Service Area and Population.................................. D-42 6.1.2 Existing Industries.................................................. D-42 6.1.3 Sewer Network....................................................... D-43 6.1.4 Wastewater Flow and Quality................................ D-44
6.2 Planning Basis..................................................................... D-45 6.2.1 Service Area, Population and Industries ................ D-45 6.2.2 Wastewater Flow and Quality................................ D-46
6.3 Proposed Structural Plan..................................................... D-47 6.3.1 Transport Collector/Main Sewer............................ D-47 6.3.2 Secondary/Tertiary Sewer...................................... D-49 6.3.3 Treatment Plant ...................................................... D-49
6.4 Cost Estimate ...................................................................... D-50
CHAPTER VII SEWERAGE IMPROVEMENT OF KUTINA.............. D-51 7.1 Existing Sewerage System.................................................. D-51
7.1.1 Service Area and Population.................................. D-51 7.1.2 Existing Industries.................................................. D-51 7.1.3 Sewerage System ................................................... D-52 7.1.4 Wastewater Flow and Quality................................ D-53
7.2 Planning Basis..................................................................... D-54 7.2.1 Served Area, Population and Industries ................. D-54 7.2.2 Wastewater Flow and Quality................................ D-54
7.3 Proposed Structural Plan..................................................... D-55 7.3.1 Main Sewer ............................................................ D-55 7.3.2 Secondary/Tertiary Sewer...................................... D-55 7.3.3 Treatment Plant ...................................................... D-56
7.4 Cost Estimate ...................................................................... D-57
CHAPTER VIII SEWERAGE IMPROVEMENT OF KARLOVAC AND DUGA RESA ........................................................... D-58
8.1 Existing Sewerage System.................................................. D-58 8.1.1 Service Area and Population.................................. D-58 8.1.2 Existing Industries.................................................. D-59
D-iv
8.1.3 Sewer Network....................................................... D-60 8.1.4 Wastewater Flow and Quality................................ D-62
8.2 Planning Basis .................................................................... D-63 8.2.1 Service Area, Population and Industries ................ D-63 8.2.2 Wastewater Flow and Quality................................ D-65
8.3 Proposed Structural Plan..................................................... D-66 8.3.1 Transport Collector/Main Sewer............................ D-66 8.3.2 Secondary/Tertiary Sewer...................................... D-69 8.3.3 Treatment Plant...................................................... D-70
8.4 Cost Estimate ...................................................................... D-71 8.5 Replacement Cost of Major Damaged Sewer..................... D-71
CHAPTER IX SEWERAGE IMPROVEMENT OF LOCAL URBAN CENTERS .......................................................... D-72
9.1 Sveti Ivan Zelina............................................................. D-72 9.1.1 Existing Sewerage System..................................... D-72 9.1.2 Planning Basis........................................................ D-73 9.1.3 Proposed Structural Plan........................................ D-74 9.1.4 Cost Estimate ......................................................... D-75
9.2 Ivanić Grad and Kloštar Ivanić ........................................... D-75 9.2.1 Existing Sewerage System..................................... D-75 9.2.2 Planning Basis........................................................ D-78 9.2.3 Proposed Structural Plan ...................................... D-79 9.2.4 Cost Estimate ......................................................... D-81
9.3 Samobor .............................................................................. D-81 9.3.1 Existing Sewerage System..................................... D-81 9.3.2 Planning Basis........................................................ D-83 9.3.3 Proposed Structural Plan ...................................... D-84 9.3.4 Cost Estimate ......................................................... D-86
9.4 Zaprešić............................................................................... D-86 9.4.1 Existing Sewerage System..................................... D-86 9.4.2 Planning Basis........................................................ D-87 9.4.3 Proposed Structural Plan........................................ D-89 9.4.4 Cost Estimate ......................................................... D-90
9.5 Velika Gorica...................................................................... D-91 9.5.1 Existing Sewerage System..................................... D-91 9.5.2 Planning Basis........................................................ D-92 9.5.3 Proposed Structural Plan........................................ D-94 9.5.4 Cost Estimate ......................................................... D-95
D-v
9.6 Jastrebarsko......................................................................... D-96 9.6.1 Existing Sewerage System..................................... D-96 9.6.2 Planning Basis........................................................ D-97 9.6.3 Proposed Structural Plan........................................ D-98 9.6.4 Cost Estimate ......................................................... D-99
9.7 Petrinja ................................................................................ D-100 9.7.1 Existing Sewerage System..................................... D-100 9.7.2 Planning Basis........................................................ D-101 9.7.3 Proposed Structural Plan........................................ D-103 9.7.4 Cost Estimate ......................................................... D-104
9.8 Glina.................................................................................... D-104 9.8.1 Existing Sewerage System..................................... D-104 9.8.2 Planning Basis........................................................ D-105 9.8.3 Proposed Structural Plan........................................ D-105 9.8.4 Cost Estimate ......................................................... D-106
9.9 Topusko .............................................................................. D-107 9.9.1 Existing Sewerage System..................................... D-107 9.9.2 Planning Basis........................................................ D-108 9.9.3 Proposed Structural Plan........................................ D-109 9.9.4 Cost Estimate ......................................................... D-110
9.10 Popovača............................................................................. D-110 9.10.1 Existing Sewerage System ................................... D-110 9.10.2 Planning Basis........................................................ D-111 9.10.3 Proposed Structural Plan........................................ D-113 9.10.4 Cost Estimate ......................................................... D-114
9.11 Lipovljani............................................................................ D-114 9.11.1 Existing Sewerage System..................................... D-114 9.11.2 Planning Basis........................................................ D-115 9.11.3 Proposed Structural Plan........................................ D-115 9.11.4 Cost Estimate ......................................................... D-117
9.12 Novska ................................................................................ D-117 9.12.1 Existing Sewerage System..................................... D-117 9.12.2 Planning Basis........................................................ D-118 9.12.3 Proposed Structural Plan........................................ D-119 9.12.4 Cost Estimate ......................................................... D-120
9.13 Ogulin ................................................................................. D-120 9.13.1 Existing Sewerage System..................................... D-120 9.13.2 Planning Basis........................................................ D-121 9.13.3 Proposed Structural Plan........................................ D-123 9.13.4 Cost Estimate ......................................................... D-124
D-vi
9.14 Plaški................................................................................... D-124 9.14.1 Existing Sewerage System..................................... D-124 9.14.2 Planning Basis........................................................ D-125 9.14.3 Proposed Structural Plan........................................ D-126 9.14.4 Cost Estimate ......................................................... D-127
9.15 Slunj.................................................................................... D-127 9.15.1 Existing Sewerage System..................................... D-127 9.15.2 Planning Basis........................................................ D-128 9.15.3 Proposed Structural Plan........................................ D-128 9.15.4 Cost Estimate ......................................................... D-130
CHAPTER IX SUMMARY OF WASTEWATER AND POLLUTION LOAD ....................................................... D-131
10.1 Wastewater Quantity........................................................... D-131 10.2 Discharge of BOD Load ..................................................... D-132
10.2.1 Discharge Without Project ..................................... D-132 10.2.2 Discharge With Project .......................................... D-132
10.3 Total Cost of Municipal Sewerage System......................... D-133
REFERENCES ............................................................................................ D-135
D-vii
List of Tables
Table D.1.1 Selected Objective Urban Centers for Master Plan Study on Sewerage Development .............................................................. D-T1
Table D.1.2 Permissible Limits of Effluent Quality of Objective Sewage Treatment Plant ............................................................. D-T2
Table D.1.3 Treatment Process with Removing Nutrients ............................. D-T3 Table D.1.4 Comparison of Each Wastewater Treatment Process ................. D-T4 Table D.1.5 Comparison of Each Sludge Treatment Process......................... D-T4 Table D.6.1 Comparison of Alternatives in Sisak by Present Value.............. D-T5 Table D.8.1 Comparison of Alternatives in Karlovac and Duga Resa
by Present Value......................................................................... D-T5 Table D.10.1 Wastewater Quantity and Pollution Load in 1999...................... D-T6 Table D.10.2 Wastewater Quantity and Pollution Load in 2015
(Without Project) ........................................................................ D-T7 Table D.10.3 Wastewater Quantity and Pollution Load in 2015
(With Project) ............................................................................. D-T8 Table D.10.4 Construction Cost of Sewerage System in Master Plan ............. D-T9
List of Figures
Fig. D.1.1 Objective Urban Centers for M/P and F/S ................................ D-F1 Fig. D.1.2 Treatment Process for Removal of Nutrient............................... D-F2 Fig. D.1.3 Alternatives of Treatment Process.............................................. D-F3 Fig. D.1.4 Dewatering Mechanism of Belt Press Filter and Centrifuge ...... D-F4 Fig. D.2.1 Sewerage Development System in Zagreb ................................. D-F5 Fig. D.3.1 Sewerage Development System in Sesvete East ........................ D-F6 Fig. D.3.2 Layout of Wastewater Treatment Plant in Sesvete East ............. D-F7 Fig. D.4.1 Sewerage Development System in Dugo Selo ........................... D-F8 Fig. D.4.2 Layout of Wastewater Treatment Plant in Dugo Selo ................ D-F9 Fig. D.5.1 Sewerage Development System in Vrbovec............................... D-F10 Fig. D.5.2 Layout of Wastewater Treatment Plant in Vrbovec ................... D-F11 Fig. D.6.1 Sewerage Development System in Sisak.................................... D-F12 Fig. D.6.2 Alternatives of Collectors in Sisak ............................................. D-F13 Fig. D.6.3 Layout of Wastewater Treatment Plant in Sisak ........................ D-F14 Fig. D.7.1 Sewerage Development System in Kutina ................................. D-F15 Fig. D.7.2 Layout of Wastewater Treatment Plant in Kutina ...................... D-F16 Fig. D.8.1 Sewerage Development System in Karlovac and Duga Resa..... D-F17 Fig. D.8.2 Alternatives of Collectors in Karlovac and Duga Resa .............. D-F18 Fig. D.8.3 Layout of Wastewater Treatment Plant in Karlovac and
Duga Resa................................................................................... D-F19 Fig. D.9.1 Sewerage Development System in Sveti Ivan Zelina................. D-F20
D-viii
Fig. D.9.2 Layout of Wastewater Treatment Plant in Sveti Ivan Zelina ..... D-F21 Fig. D.9.3 Sewerage Development System in Ivanić Grad and
Kloštar Ivanić ............................................................................. D-F22 Fig. D.9.4 Layout of Wastewater Treatment Plant in Ivanić Grad and
Kloštar Ivanić ............................................................................. D-F23 Fig. D.9.5 Sewerage Development System in Samobor.............................. D-F24 Fig. D.9.6 Layout of Wastewater Treatment Plant in Samobor................... D-F25 Fig. D.9.7 Sewerage Development System in Zaprešić .............................. D-F26 Fig. D.9.8 Layout of Wastewater Treatment Plant in Zaprešić ................... D-F27 Fig. D.9.9 Sewerage Development System in Velika Gorica...................... D-F28 Fig. D.9.10 Layout of Wastewater Treatment Plant in Velika Gorica .......... D-F29 Fig. D.9.11 Sewerage Development System in Jastrebarsko......................... D-F30 Fig. D.9.12 Layout of Wastewater Treatment Plant in Jastrebarsko ............. D-F31 Fig. D.9.13 Sewerage Development System in Petrinja................................ D-F32 Fig. D.9.14 Layout of Wastewater Treatment Plant in Petrinja..................... D-F33 Fig. D.9.15 Sewerage Development System in Glina ................................... D-F34 Fig. D.9.16 Layout of Wastewater Treatment Plant in Glina ........................ D-F35 Fig. D.9.17 Sewerage Development System in Topusko .............................. D-F36 Fig. D.9.18 Layout of Wastewater Treatment Plant in Topusko................... D-F37 Fig. D.9.19 Sewerage Development System in Popovača............................. D-F38 Fig. D.9.20 Layout of Wastewater Treatment Plant in Popovača ................. D-F39 Fig. D.9.21 Sewerage Development System in Lipovljani............................ D-F40 Fig. D.9.22 Layout of Wastewater Treatment Plant in Lipovljani ................ D-F41 Fig. D.9.23 Sewerage Development System in Novska ................................ D-F42 Fig. D.9.24 Layout of Wastewater Treatment Plant in Novska..................... D-F43 Fig. D.9.25 Sewerage Development System in Ogulin ................................. D-F44 Fig. D.9.26 Layout of Wastewater Treatment Plant in Ogulin...................... D-F45 Fig. D.9.27 Sewerage Development System in Plaški .................................. D-F46 Fig. D.9.28 Layout of Wastewater Treatment Plant in Plaški ....................... D-F47 Fig. D.9.29 Sewerage Development System in Slunj.................................... D-F48 Fig. D.9.30 Layout of Wastewater Treatment Plant in Slunj......................... D-F49
D - 1
CHAPTER I PLANNING BASIS
1.1 Planning Basis 1.1.1 Objectives and Target Year The Master Plan of Sewerage Improvement in the Sava River Basin aims to reduce pollution load, targeting the year 2015. 1.1.2 National Policy on Sewerage Improvement The government had established a national sewerage improvement program under the National Water Protection Plan [Decree (NN) No. 8/99]. In this program, the construction of public sewerage systems and wastewater treatment plants are to be implemented in three (3) stages: short term program up to 2005, medium term program up to 2010, and long term program up to 2025, as stated below. The discharge of sewerage wastewater into a Category I watercourse is not permitted irrespective of the treatment level.
(1) The construction of public sewerage systems from which wastewater is to be discharged into the watercourse should be completed by: (a) 2005, for facilities greater than 15,000 PE (person equivalent) that discharge
wastewater into either a Category III or Category watercourse; (b) 2010, for facilities of between 2,000 PE and 15,000 PE that discharge wastewater
into either a Category III or Category IV watercourse; and (c) 2005, for facilities of over 10,000 PE that discharge wastewater into a Category II
watercourse. In connection with the above stipulations, however, the target year for facilities smaller than 10,000 PE that discharge wastewater into a Category II watercourse has not been determined yet.
(2) As regards the construction of a wastewater treatment plant, it can go ahead when the construction of at least 70% of the total capacity of the sewerage system is completed.
(3) The construction of secondary treatment plants (biological treatment) from which wastewater is to be discharged into the water course should be completed by: (a) 2010, for facilities greater than 15,000 PE that discharge effluent into either a
Category III or Category IV watercourse; (b) 2025, for facilities of between 2,000 PE and 15,000 PE that discharge effluent
into either a Category III or Category IV water course; and (c) 2005, for facilities of over 10,000 PE that discharge effluent into a Category II
watercourse. In connection with the above stipulations, however, the target year of facilities smaller than 10,000 PE that discharge effluent into a Category II watercourse has not been determined yet.
1.1.3 Objective Urban Centers Twenty-four (24) urban centers consisting of 22 sewerage systems had been selected for the Master Plan study on sewerage improvement based on the National Water Protection Plan (see, Fig. D.1.1 and Table D.1.1). These urban centers meet either of the following criteria:
(1) Urban centers are expected to discharge the wastewater of over 2,000 PE in 2015. (2) Urban centers are located in areas that may affect drinking water sources.
1.1.4 Permissible Limits of Wastewater Quality (1) Industrial Wastewater Discharging into Sewerage
The permissible limits of major parameters of industrial wastewater discharged into public sewerage systems are shown below as prescribed in NN No. 40/99, as amended
D - 2
by NN No. 4/01. For the other parameters including heavy metals and other toxic materials, see Appendix C.
Parameter/Category Sewerage
pH 5.0 - 9.5 TSS (mg/l) * BOD (mg/l) 250 1) CODCr (mg/l) 700 1) T-P (mg/l) 10 T-N (mg/l) - Oil and Grease (mg/l) 100 * To be determined at sewerage company’s option. 1) Sewerage company can change the values depending on its
treatment capacity.
(2) Sewerage Effluent into Natural Recipient The permissible limits of effluent (TSS, BOD, CODCr, T-N, T-P) discharged from the sewage treatment plant into watercourses are prescribed NN No. 40/99. They vary according to the size of treatment plant and the category of receiving water, as follows.
(Unit: mg/l)
Category Plant Size TSS BOD CODCr T-P T-N < 10,000 PE 60 40 150 - - 10,000 PE - 100,000 PE 35 25 125 2 15
Water Course II (Sensitive)
≥ 100,000 PE 35 25 125 1 10 Water Course III < 10,000 PE 120-150 - - - - (Less sensitive area) ≥ 10,000 PE 35 25 125 - -
< 10,000 PE Appropriate 10,000 PE - 50,000 PE 120-150 - - - -
Water Course IV (Less sensitive)
≥ 50,000 PE 35 25 125 - - Lake V (Sensitive area) All Plant Sizes 35 25 125 1 10
As mentioned before, wastewater discharge into a Category I watercourse (very sensitive area) is not allowed irrespective of the treatment level. In line with the above-mentioned regulations and the National Water Protection Plan, the permissible limits of effluent of the objective wastewater treatment plants are as shown in Table D.1.2.
1.2 Sewerage Service Area and Population Projection 1.2.1 Sewerage Service Area The Master Plan includes the extension of secondary/tertiary sewer networks and the construction of transport collectors/mains and sewerage treatment plants. A realistic plan is formulated so that it can be completed by 2015 and a high priority is given to urban centers with high population densities. The design service areas of the 22 sewerage systems in the 24 urban centers in the Master Plan are prepared based on the conclusions of meetings with the local governments concerned and Croatian Waters from the 3rd to the 23rd of January 2001. The design sewerage service areas are delineated based on the following principles:
(1) Urban centers with sewer networks already provided are included. (2) Areas neighboring urban centers and with sufficient population densities are included,
in principle.
D - 3
(3) Areas located along a proposed transport collector are included, even if they are sparsely populated.
1.2.2 Population Projection Populations of the Master Plan towns/municipalities are projected based on the recent studies of relevant organizations of Zagreb City and the three counties covered by the Study (refer to Tables A.2.1, A.2.2 and A2.3 in Appendix A).
1.3 Wastewater Quantity and Pollution Load 1.3.1 Design Wastewater Quantity Most wastewaters are generated from human activities including those in business, schools/institutions and factories. Wastewater quantities are estimated, in principle, using the data on water consumption or the measured discharge wastewater amount, if possible. The quantity of wastewater is measured as the sum of domestic, institutional and industrial wastewaters, and groundwater that infiltrate into the sewer. There are various sizes of industries in the Study Area. In this Study, the wastewater of large industries mentioned in Appendix C is counted as industrial wastewater and individually estimated. As for the wastewater of small industries, it is counted as municipal wastewater, which is defined as the total of domestic, commercial, institutional and industrial wastewater.
(1) Municipal Water per Capita
(a) Present Domestic Water Consumption
At present, water consumption in municipalities consists of water used for domestic, institutional and industrial purposes. Water supply is generally categorized into domestic and industrial water supply to establishment including institutional and industrial ones. The daily average domestic water consumption in the Study Area at present ranges from 80 to 170 l/capita/day (hereinafter, lcd) or mostly less than 150 lcd, as illustrated in the figure below. It is nearly constant irrespective of population size. The water supply service area may cover not only the urban center of the municipality but also the surrounding rural area. Therefore, the average per capita water consumption in the urban center may be larger than the values shown in the figure. However, the sewerage service area in this figure is limited to the urban center and thus the existing average per capita water consumption is assumed at 170 lcd.
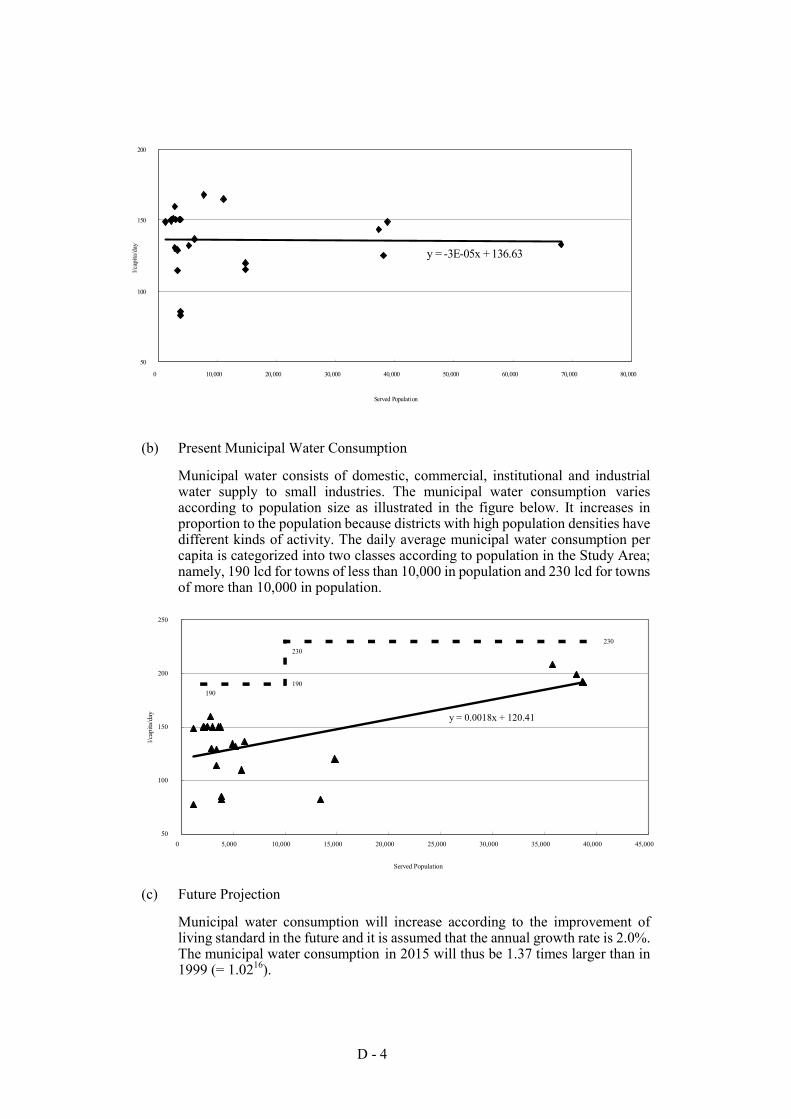
D - 4
(b) Present Municipal Water Consumption
Municipal water consists of domestic, commercial, institutional and industrial water supply to small industries. The municipal water consumption varies according to population size as illustrated in the figure below. It increases in proportion to the population because districts with high population densities have different kinds of activity. The daily average municipal water consumption per capita is categorized into two classes according to population in the Study Area; namely, 190 lcd for towns of less than 10,000 in population and 230 lcd for towns of more than 10,000 in population.
(c) Future Projection
Municipal water consumption will increase according to the improvement of living standard in the future and it is assumed that the annual growth rate is 2.0%. The municipal water consumption in 2015 will thus be 1.37 times larger than in 1999 (= 1.0216).
190
230230
190
y = 0.0018x + 120.41
50
100
150
200
250
0 5,000 10,000 15,000 20,000 25,000 30,000 35,000 40,000 45,000
Served Population
l/cap
ita/d
ay
y = -3E-05x + 136.63
50
100
150
200
0 10,000 20,000 30,000 40,000 50,000 60,000 70,000 80,000
Served Population
l/cap
ita/d
ay
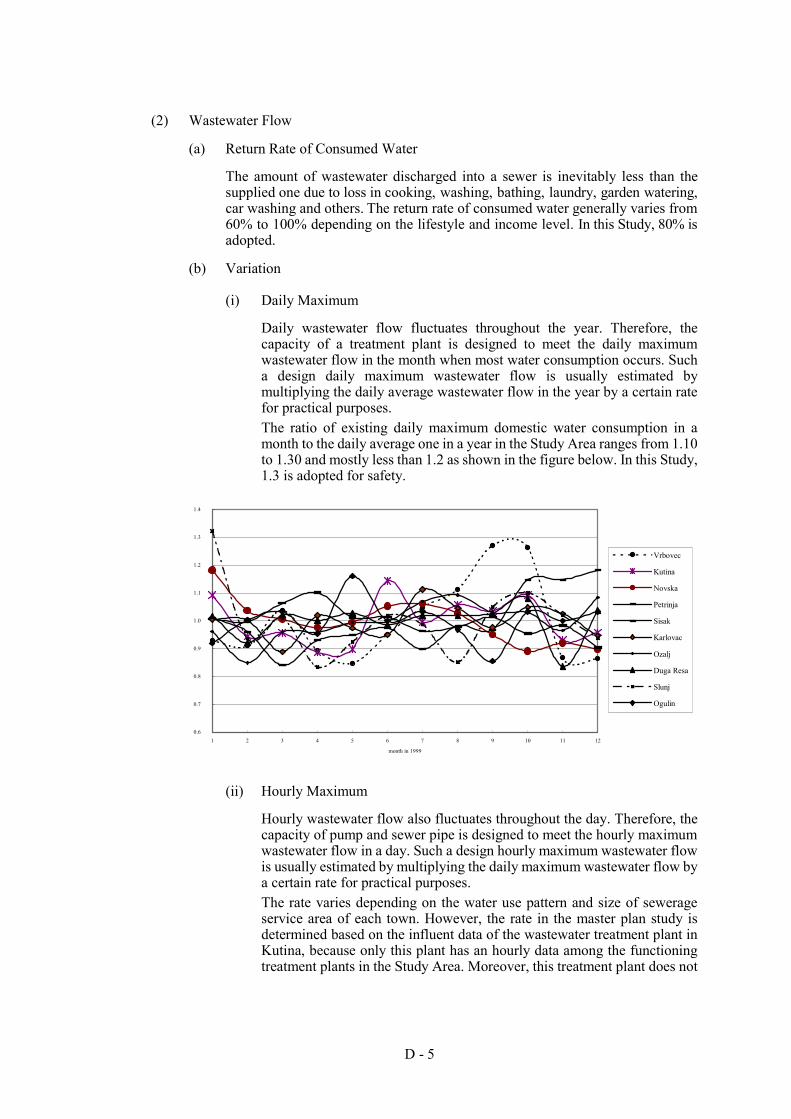
D - 5
(2) Wastewater Flow
(a) Return Rate of Consumed Water
The amount of wastewater discharged into a sewer is inevitably less than the supplied one due to loss in cooking, washing, bathing, laundry, garden watering, car washing and others. The return rate of consumed water generally varies from 60% to 100% depending on the lifestyle and income level. In this Study, 80% is adopted.
(b) Variation
(i) Daily Maximum
Daily wastewater flow fluctuates throughout the year. Therefore, the capacity of a treatment plant is designed to meet the daily maximum wastewater flow in the month when most water consumption occurs. Such a design daily maximum wastewater flow is usually estimated by multiplying the daily average wastewater flow in the year by a certain rate for practical purposes. The ratio of existing daily maximum domestic water consumption in a month to the daily average one in a year in the Study Area ranges from 1.10 to 1.30 and mostly less than 1.2 as shown in the figure below. In this Study, 1.3 is adopted for safety.
(ii) Hourly Maximum
Hourly wastewater flow also fluctuates throughout the day. Therefore, the capacity of pump and sewer pipe is designed to meet the hourly maximum wastewater flow in a day. Such a design hourly maximum wastewater flow is usually estimated by multiplying the daily maximum wastewater flow by a certain rate for practical purposes. The rate varies depending on the water use pattern and size of sewerage service area of each town. However, the rate in the master plan study is determined based on the influent data of the wastewater treatment plant in Kutina, because only this plant has an hourly data among the functioning treatment plants in the Study Area. Moreover, this treatment plant does not
0.6
0.7
0.8
0.9
1.0
1.1
1.2
1.3
1.4
1 2 3 4 5 6 7 8 9 10 11 12
month in 1999
Vrbovec
Kutina
Novska
Petrinja
Sisak
Karlovac
Ozalj
Duga Resa
Slunj
Ogulin
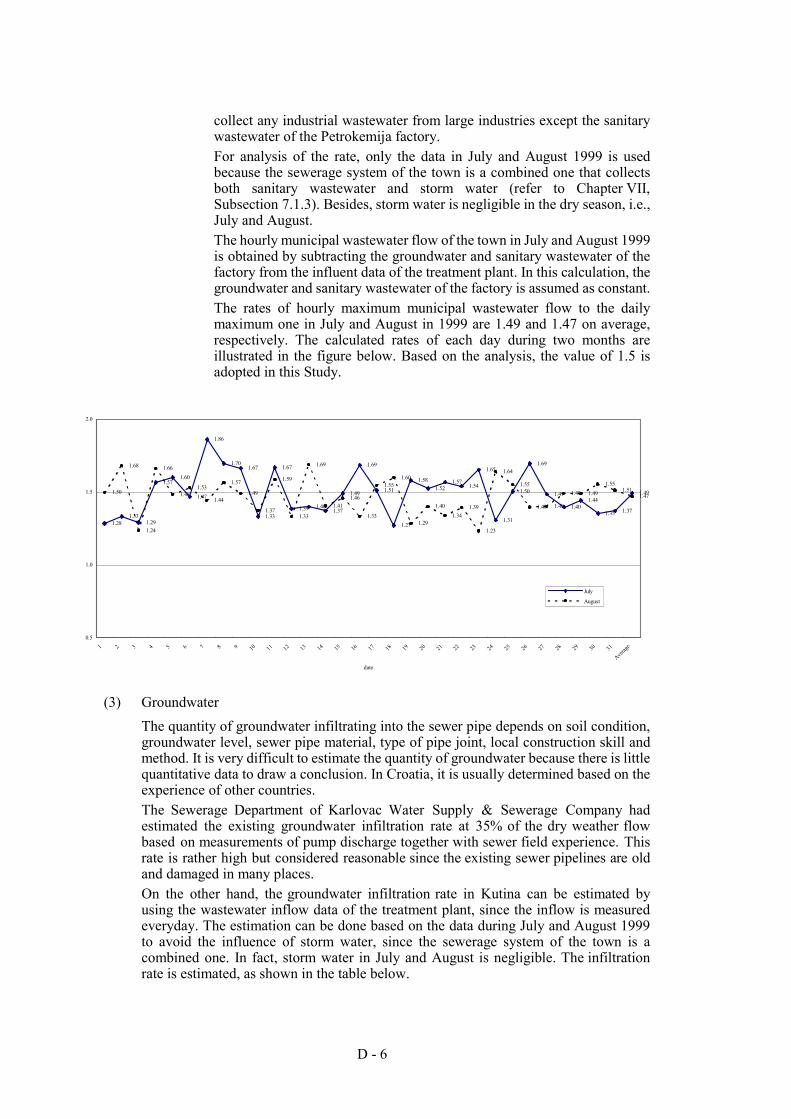
D - 6
collect any industrial wastewater from large industries except the sanitary wastewater of the Petrokemija factory. For analysis of the rate, only the data in July and August 1999 is used because the sewerage system of the town is a combined one that collects both sanitary wastewater and storm water (refer to Chapter VII, Subsection 7.1.3). Besides, storm water is negligible in the dry season, i.e., July and August. The hourly municipal wastewater flow of the town in July and August 1999 is obtained by subtracting the groundwater and sanitary wastewater of the factory from the influent data of the treatment plant. In this calculation, the groundwater and sanitary wastewater of the factory is assumed as constant. The rates of hourly maximum municipal wastewater flow to the daily maximum one in July and August in 1999 are 1.49 and 1.47 on average, respectively. The calculated rates of each day during two months are illustrated in the figure below. Based on the analysis, the value of 1.5 is adopted in this Study.
(3) Groundwater The quantity of groundwater infiltrating into the sewer pipe depends on soil condition, groundwater level, sewer pipe material, type of pipe joint, local construction skill and method. It is very difficult to estimate the quantity of groundwater because there is little quantitative data to draw a conclusion. In Croatia, it is usually determined based on the experience of other countries. The Sewerage Department of Karlovac Water Supply & Sewerage Company had estimated the existing groundwater infiltration rate at 35% of the dry weather flow based on measurements of pump discharge together with sewer field experience. This rate is rather high but considered reasonable since the existing sewer pipelines are old and damaged in many places. On the other hand, the groundwater infiltration rate in Kutina can be estimated by using the wastewater inflow data of the treatment plant, since the inflow is measured everyday. The estimation can be done based on the data during July and August 1999 to avoid the influence of storm water, since the sewerage system of the town is a combined one. In fact, storm water in July and August is negligible. The infiltration rate is estimated, as shown in the table below.
1.281.33
1.29
1.571.60
1.47
1.86
1.701.67
1.33
1.67
1.39 1.401.37
1.49
1.69
1.51
1.27
1.581.52
1.571.54
1.65
1.31
1.50
1.69
1.49
1.401.44
1.35 1.37
1.491.50
1.68
1.24
1.66
1.481.53
1.44
1.57
1.49
1.37
1.59
1.33
1.69
1.411.46
1.33
1.551.60
1.29
1.40
1.341.39
1.23
1.64
1.55
1.40 1.40
1.49 1.49
1.551.51
1.47
0.5
1.0
1.5
2.0
1 2 3 4 5 6 7 8 9 10 11 12 13 14 15 16 17 18 19 20 21 22 23 24 25 26 27 28 29 30 31
Average
date
July
August
D - 7
Items Unit July August Remarks
Actual Inflow into the Treatment Plant (1) m3/month 84,337 88,788 Water Consumption (2) m3/month 93,971 99,849 Wastewater Estimation (3) m3/month 65,268 69,351 (3) = (2)×0.8 Infiltration Estimation (4) m3/month 19,069 19,437 (4) = (1)-(3) Infiltration Rate (5) % 29.2 28.0 (5) = (4)/(3)
In this Study, the infiltration rate of 30% is applied for all the objective municipalities, based on the above analysis for Kutina. It is assumed as constant irrespective of the passage of time.
(4) Summary of Municipal Wastewater Projection per Capita The projected municipal wastewater quantity per capita including groundwater in 2015 is summarized as follows.
(Unit: l/capita/day)
<10,000 ≥10,000 Domestic Wastewater (1) 190 190 Institutional/Industrial Wastewater in Small Factory (2) 30 70 Municipal (3)=(1)+(2) 220 260 Infiltration (4) 70 70
Daily Average
Total (5)=(3)+(4) 290 330 Domestic Wastewater (1) 240 240 Institutional/Industrial Wastewater in Small Factory (2) 30 90 Municipal (3)=(1)+(2) 270 330 Infiltration (4) 70 70
Daily Maximum
Total (5)=(3)+(4) 340 400 Domestic Wastewater (1) 370 370 Institutional/Industrial Wastewater in Small Factory (2) 40 130 Municipal (3)=(1)+(2) 410 500 Infiltration (4) 70 70
Hourly Maximum
Total (5)=(3)+(4) 480 570
(5) Industrial Wastewater There are various sizes of industries in the Study Area. In this Study, the industrial wastewater in the large industries mentioned in Appendix C is counted individually. The quantity for the small industries is included in the municipal wastewater.
1.3.2 Pollution Load (1) Domestic Wastewater
BOD load is used as a representative index of organic substances. There are several reports on the unit BOD load of domestic wastewater stemming from field investigations. The unit generated BOD load reported by previous studies ranges between 32 and 60 g/capita/day. In this Study, 60 g/capita/day is adopted since this value is adopted widely in Croatia and it is the value prescribed in the ATV Standard. With regard to CODCr, TSS, T-N and T-P loads, 120 g/capita/day, 70 g/capita/day, 11 g/capita/day and 2.5 g/capita/day are adopted for the same reason, respectively.
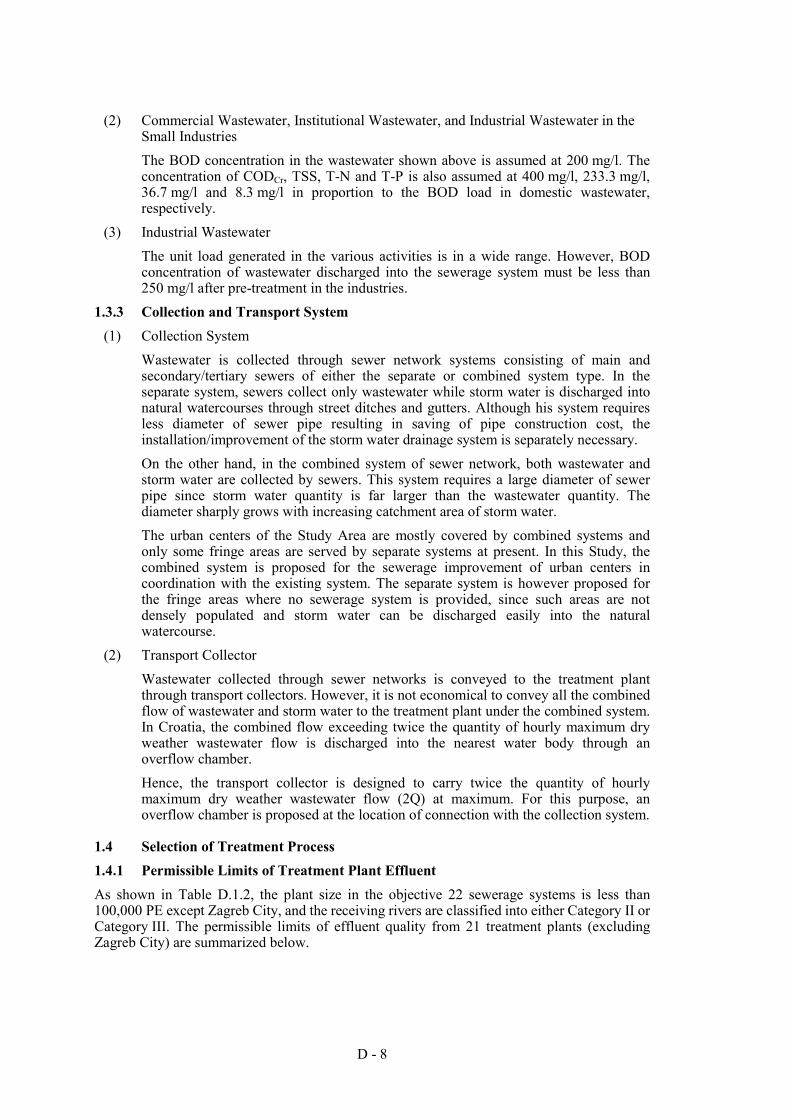
D - 8
(2) Commercial Wastewater, Institutional Wastewater, and Industrial Wastewater in the Small Industries The BOD concentration in the wastewater shown above is assumed at 200 mg/l. The concentration of CODCr, TSS, T-N and T-P is also assumed at 400 mg/l, 233.3 mg/l, 36.7 mg/l and 8.3 mg/l in proportion to the BOD load in domestic wastewater, respectively.
(3) Industrial Wastewater The unit load generated in the various activities is in a wide range. However, BOD concentration of wastewater discharged into the sewerage system must be less than 250 mg/l after pre-treatment in the industries.
1.3.3 Collection and Transport System (1) Collection System
Wastewater is collected through sewer network systems consisting of main and secondary/tertiary sewers of either the separate or combined system type. In the separate system, sewers collect only wastewater while storm water is discharged into natural watercourses through street ditches and gutters. Although his system requires less diameter of sewer pipe resulting in saving of pipe construction cost, the installation/improvement of the storm water drainage system is separately necessary. On the other hand, in the combined system of sewer network, both wastewater and storm water are collected by sewers. This system requires a large diameter of sewer pipe since storm water quantity is far larger than the wastewater quantity. The diameter sharply grows with increasing catchment area of storm water. The urban centers of the Study Area are mostly covered by combined systems and only some fringe areas are served by separate systems at present. In this Study, the combined system is proposed for the sewerage improvement of urban centers in coordination with the existing system. The separate system is however proposed for the fringe areas where no sewerage system is provided, since such areas are not densely populated and storm water can be discharged easily into the natural watercourse.
(2) Transport Collector Wastewater collected through sewer networks is conveyed to the treatment plant through transport collectors. However, it is not economical to convey all the combined flow of wastewater and storm water to the treatment plant under the combined system. In Croatia, the combined flow exceeding twice the quantity of hourly maximum dry weather wastewater flow is discharged into the nearest water body through an overflow chamber. Hence, the transport collector is designed to carry twice the quantity of hourly maximum dry weather wastewater flow (2Q) at maximum. For this purpose, an overflow chamber is proposed at the location of connection with the collection system.
1.4 Selection of Treatment Process 1.4.1 Permissible Limits of Treatment Plant Effluent As shown in Table D.1.2, the plant size in the objective 22 sewerage systems is less than 100,000 PE except Zagreb City, and the receiving rivers are classified into either Category II or Category III. The permissible limits of effluent quality from 21 treatment plants (excluding Zagreb City) are summarized below.
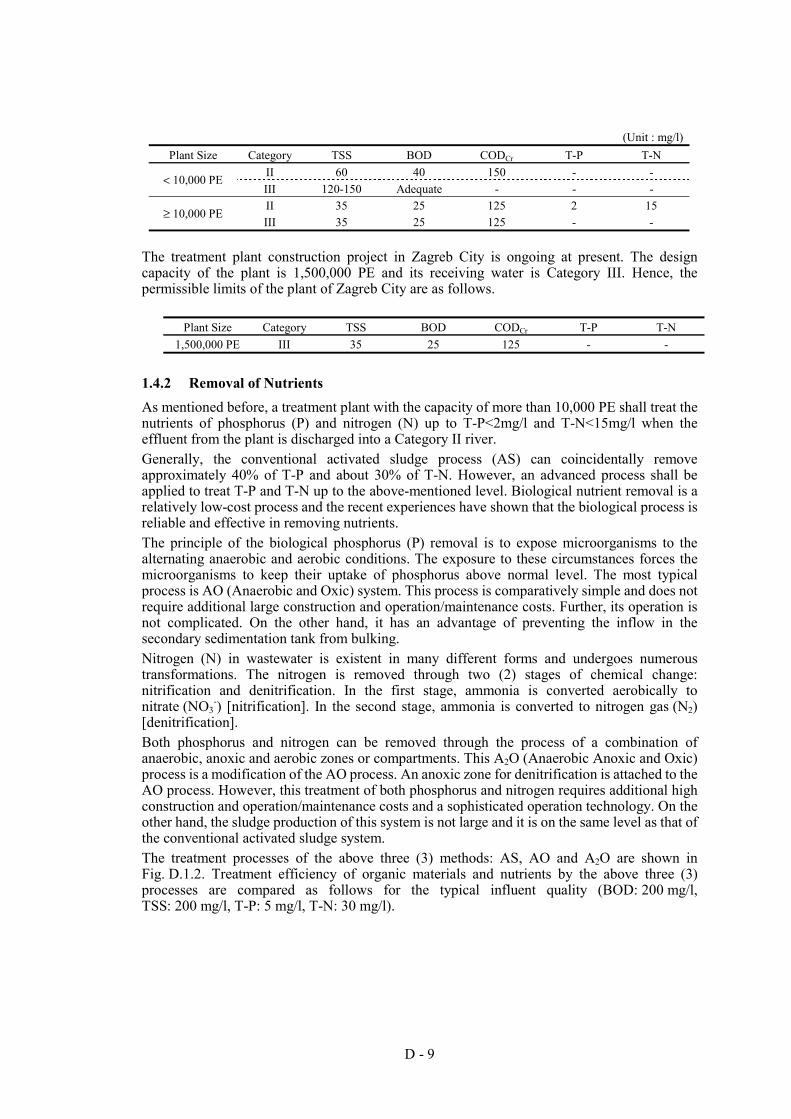
D - 9
(Unit : mg/l)
Plant Size Category TSS BOD CODCr T-P T-N II 60 40 150 - - < 10,000 PE III 120-150 Adequate - - - II 35 25 125 2 15
≥ 10,000 PE III 35 25 125 - -
The treatment plant construction project in Zagreb City is ongoing at present. The design capacity of the plant is 1,500,000 PE and its receiving water is Category III. Hence, the permissible limits of the plant of Zagreb City are as follows.
Plant Size Category TSS BOD CODCr T-P T-N 1,500,000 PE III 35 25 125 - -
1.4.2 Removal of Nutrients As mentioned before, a treatment plant with the capacity of more than 10,000 PE shall treat the nutrients of phosphorus (P) and nitrogen (N) up to T-P<2mg/l and T-N<15mg/l when the effluent from the plant is discharged into a Category II river. Generally, the conventional activated sludge process (AS) can coincidentally remove approximately 40% of T-P and about 30% of T-N. However, an advanced process shall be applied to treat T-P and T-N up to the above-mentioned level. Biological nutrient removal is a relatively low-cost process and the recent experiences have shown that the biological process is reliable and effective in removing nutrients. The principle of the biological phosphorus (P) removal is to expose microorganisms to the alternating anaerobic and aerobic conditions. The exposure to these circumstances forces the microorganisms to keep their uptake of phosphorus above normal level. The most typical process is AO (Anaerobic and Oxic) system. This process is comparatively simple and does not require additional large construction and operation/maintenance costs. Further, its operation is not complicated. On the other hand, it has an advantage of preventing the inflow in the secondary sedimentation tank from bulking. Nitrogen (N) in wastewater is existent in many different forms and undergoes numerous transformations. The nitrogen is removed through two (2) stages of chemical change: nitrification and denitrification. In the first stage, ammonia is converted aerobically to nitrate (NO3
-) [nitrification]. In the second stage, ammonia is converted to nitrogen gas (N2) [denitrification]. Both phosphorus and nitrogen can be removed through the process of a combination of anaerobic, anoxic and aerobic zones or compartments. This A2O (Anaerobic Anoxic and Oxic) process is a modification of the AO process. An anoxic zone for denitrification is attached to the AO process. However, this treatment of both phosphorus and nitrogen requires additional high construction and operation/maintenance costs and a sophisticated operation technology. On the other hand, the sludge production of this system is not large and it is on the same level as that of the conventional activated sludge system. The treatment processes of the above three (3) methods: AS, AO and A2O are shown in Fig. D.1.2. Treatment efficiency of organic materials and nutrients by the above three (3) processes are compared as follows for the typical influent quality (BOD: 200 mg/l, TSS: 200 mg/l, T-P: 5 mg/l, T-N: 30 mg/l).
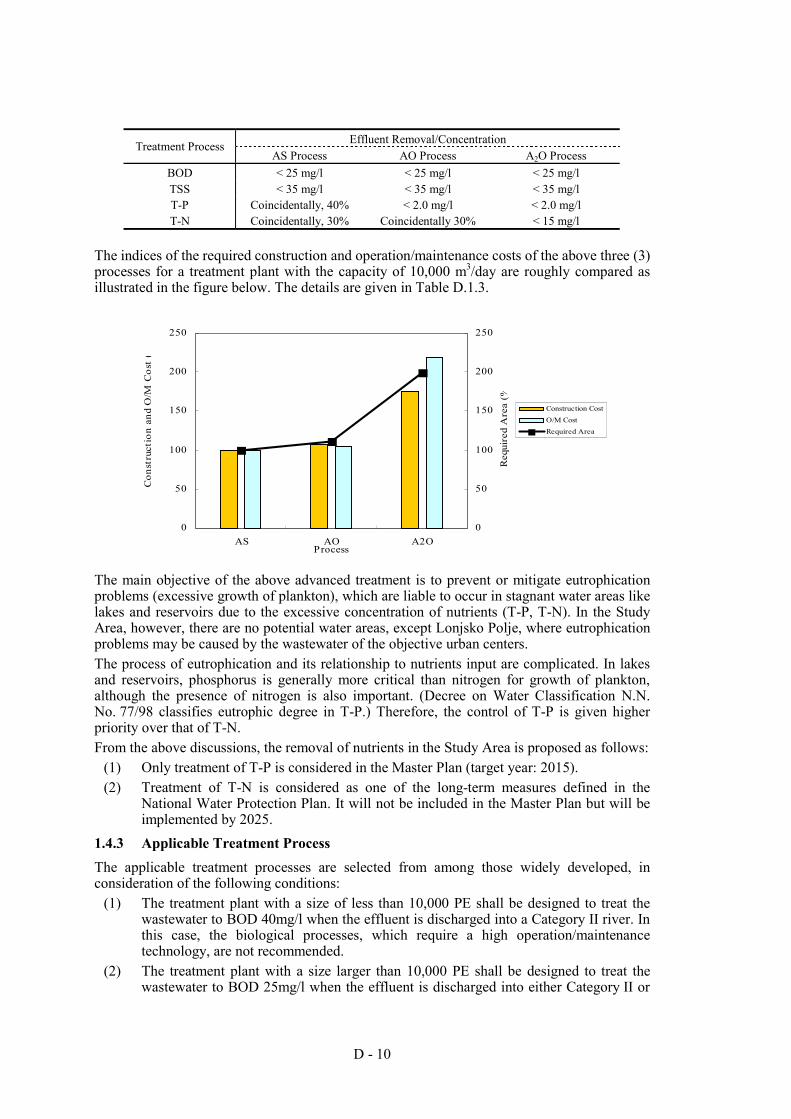
D - 10
Effluent Removal/Concentration Treatment Process
AS Process AO Process A2O Process BOD < 25 mg/l < 25 mg/l < 25 mg/l TSS < 35 mg/l < 35 mg/l < 35 mg/l T-P Coincidentally, 40% < 2.0 mg/l < 2.0 mg/l T-N Coincidentally, 30% Coincidentally 30% < 15 mg/l
The indices of the required construction and operation/maintenance costs of the above three (3) processes for a treatment plant with the capacity of 10,000 m3/day are roughly compared as illustrated in the figure below. The details are given in Table D.1.3. The main objective of the above advanced treatment is to prevent or mitigate eutrophication problems (excessive growth of plankton), which are liable to occur in stagnant water areas like lakes and reservoirs due to the excessive concentration of nutrients (T-P, T-N). In the Study Area, however, there are no potential water areas, except Lonjsko Polje, where eutrophication problems may be caused by the wastewater of the objective urban centers. The process of eutrophication and its relationship to nutrients input are complicated. In lakes and reservoirs, phosphorus is generally more critical than nitrogen for growth of plankton, although the presence of nitrogen is also important. (Decree on Water Classification N.N. No. 77/98 classifies eutrophic degree in T-P.) Therefore, the control of T-P is given higher priority over that of T-N. From the above discussions, the removal of nutrients in the Study Area is proposed as follows:
(1) Only treatment of T-P is considered in the Master Plan (target year: 2015). (2) Treatment of T-N is considered as one of the long-term measures defined in the
National Water Protection Plan. It will not be included in the Master Plan but will be implemented by 2025.
1.4.3 Applicable Treatment Process The applicable treatment processes are selected from among those widely developed, in consideration of the following conditions:
(1) The treatment plant with a size of less than 10,000 PE shall be designed to treat the wastewater to BOD 40mg/l when the effluent is discharged into a Category II river. In this case, the biological processes, which require a high operation/maintenance technology, are not recommended.
(2) The treatment plant with a size larger than 10,000 PE shall be designed to treat the wastewater to BOD 25mg/l when the effluent is discharged into either Category II or
0
50
100
150
200
250
AS AO A2OProcess
Con
stru
ctio
n an
d O
/M C
ost
(
0
50
100
150
200
250
Req
uire
d A
rea
(%
Construction CostO/M CostRequired Area
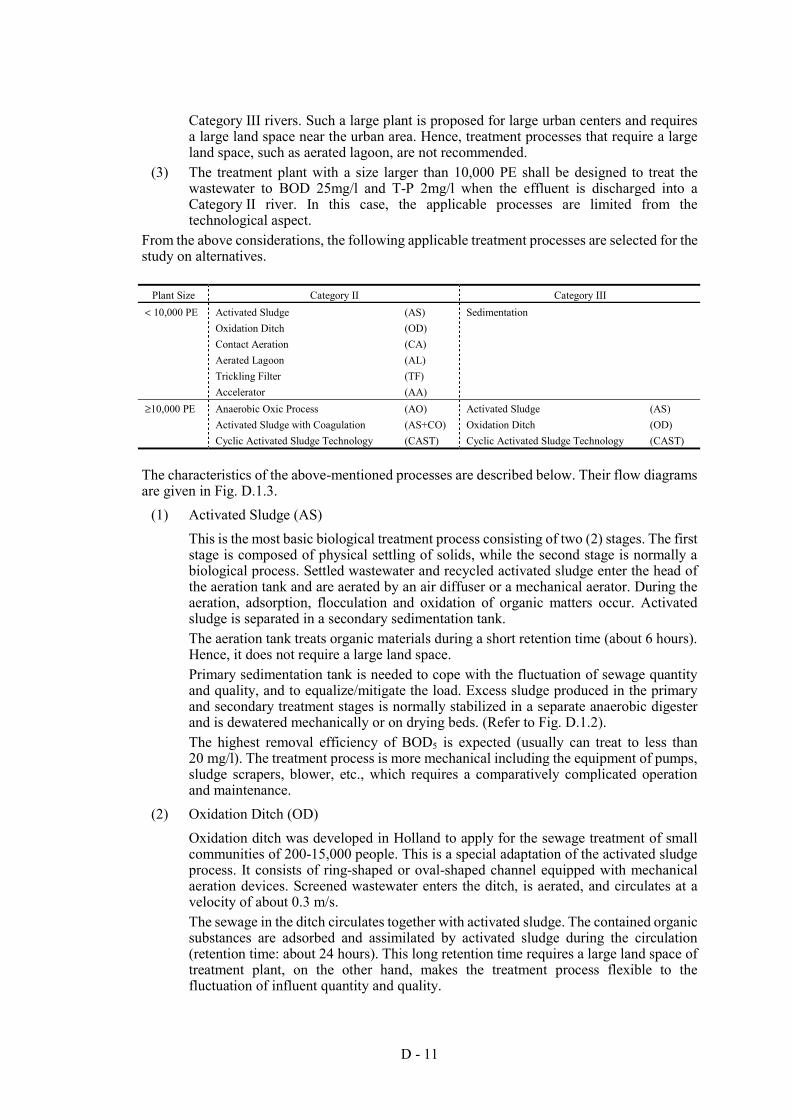
D - 11
Category III rivers. Such a large plant is proposed for large urban centers and requires a large land space near the urban area. Hence, treatment processes that require a large land space, such as aerated lagoon, are not recommended.
(3) The treatment plant with a size larger than 10,000 PE shall be designed to treat the wastewater to BOD 25mg/l and T-P 2mg/l when the effluent is discharged into a Category II river. In this case, the applicable processes are limited from the technological aspect.
From the above considerations, the following applicable treatment processes are selected for the study on alternatives.
Plant Size Category II Category III < 10,000 PE Activated Sludge
Oxidation Ditch Contact Aeration Aerated Lagoon Trickling Filter Accelerator
(AS) (OD) (CA) (AL) (TF) (AA)
Sedimentation
≥10,000 PE Anaerobic Oxic Process Activated Sludge with Coagulation Cyclic Activated Sludge Technology
(AO) (AS+CO) (CAST)
Activated Sludge Oxidation Ditch Cyclic Activated Sludge Technology
(AS) (OD) (CAST)
The characteristics of the above-mentioned processes are described below. Their flow diagrams are given in Fig. D.1.3.
(1) Activated Sludge (AS) This is the most basic biological treatment process consisting of two (2) stages. The first stage is composed of physical settling of solids, while the second stage is normally a biological process. Settled wastewater and recycled activated sludge enter the head of the aeration tank and are aerated by an air diffuser or a mechanical aerator. During the aeration, adsorption, flocculation and oxidation of organic matters occur. Activated sludge is separated in a secondary sedimentation tank. The aeration tank treats organic materials during a short retention time (about 6 hours). Hence, it does not require a large land space. Primary sedimentation tank is needed to cope with the fluctuation of sewage quantity and quality, and to equalize/mitigate the load. Excess sludge produced in the primary and secondary treatment stages is normally stabilized in a separate anaerobic digester and is dewatered mechanically or on drying beds. (Refer to Fig. D.1.2). The highest removal efficiency of BOD5 is expected (usually can treat to less than 20 mg/l). The treatment process is more mechanical including the equipment of pumps, sludge scrapers, blower, etc., which requires a comparatively complicated operation and maintenance.
(2) Oxidation Ditch (OD) Oxidation ditch was developed in Holland to apply for the sewage treatment of small communities of 200-15,000 people. This is a special adaptation of the activated sludge process. It consists of ring-shaped or oval-shaped channel equipped with mechanical aeration devices. Screened wastewater enters the ditch, is aerated, and circulates at a velocity of about 0.3 m/s. The sewage in the ditch circulates together with activated sludge. The contained organic substances are adsorbed and assimilated by activated sludge during the circulation (retention time: about 24 hours). This long retention time requires a large land space of treatment plant, on the other hand, makes the treatment process flexible to the fluctuation of influent quantity and quality.
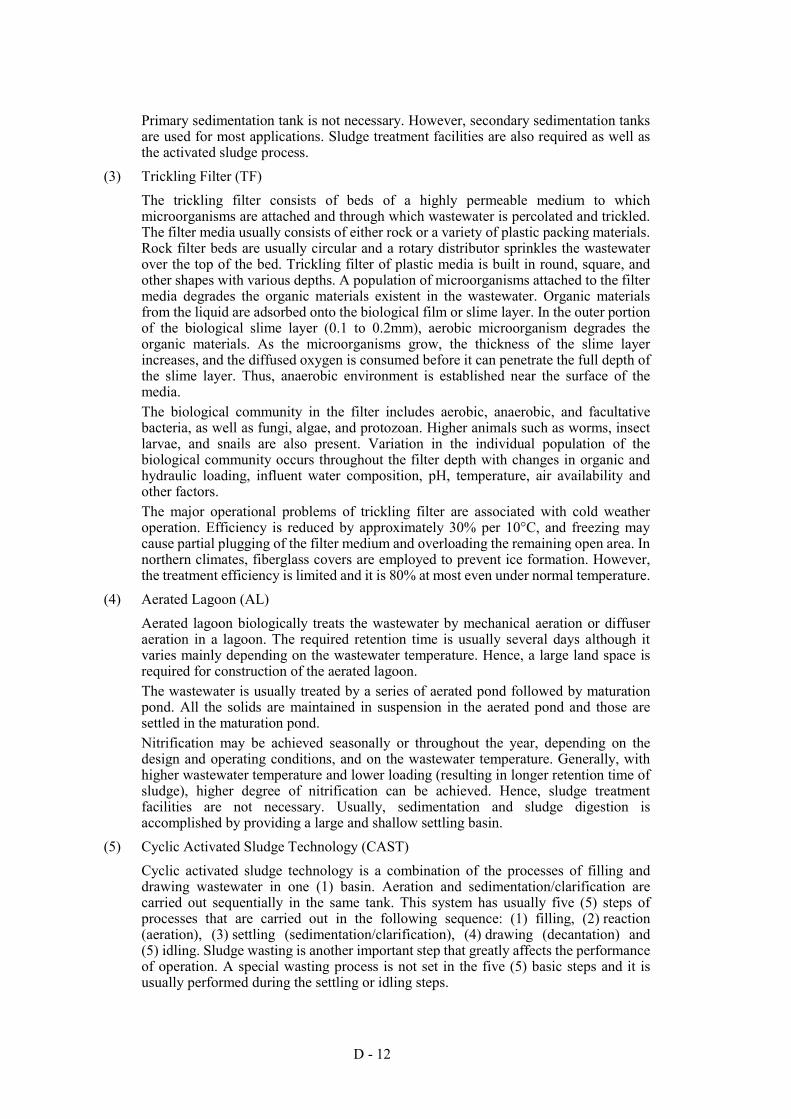
D - 12
Primary sedimentation tank is not necessary. However, secondary sedimentation tanks are used for most applications. Sludge treatment facilities are also required as well as the activated sludge process.
(3) Trickling Filter (TF) The trickling filter consists of beds of a highly permeable medium to which microorganisms are attached and through which wastewater is percolated and trickled. The filter media usually consists of either rock or a variety of plastic packing materials. Rock filter beds are usually circular and a rotary distributor sprinkles the wastewater over the top of the bed. Trickling filter of plastic media is built in round, square, and other shapes with various depths. A population of microorganisms attached to the filter media degrades the organic materials existent in the wastewater. Organic materials from the liquid are adsorbed onto the biological film or slime layer. In the outer portion of the biological slime layer (0.1 to 0.2mm), aerobic microorganism degrades the organic materials. As the microorganisms grow, the thickness of the slime layer increases, and the diffused oxygen is consumed before it can penetrate the full depth of the slime layer. Thus, anaerobic environment is established near the surface of the media. The biological community in the filter includes aerobic, anaerobic, and facultative bacteria, as well as fungi, algae, and protozoan. Higher animals such as worms, insect larvae, and snails are also present. Variation in the individual population of the biological community occurs throughout the filter depth with changes in organic and hydraulic loading, influent water composition, pH, temperature, air availability and other factors. The major operational problems of trickling filter are associated with cold weather operation. Efficiency is reduced by approximately 30% per 10°C, and freezing may cause partial plugging of the filter medium and overloading the remaining open area. In northern climates, fiberglass covers are employed to prevent ice formation. However, the treatment efficiency is limited and it is 80% at most even under normal temperature.
(4) Aerated Lagoon (AL) Aerated lagoon biologically treats the wastewater by mechanical aeration or diffuser aeration in a lagoon. The required retention time is usually several days although it varies mainly depending on the wastewater temperature. Hence, a large land space is required for construction of the aerated lagoon. The wastewater is usually treated by a series of aerated pond followed by maturation pond. All the solids are maintained in suspension in the aerated pond and those are settled in the maturation pond. Nitrification may be achieved seasonally or throughout the year, depending on the design and operating conditions, and on the wastewater temperature. Generally, with higher wastewater temperature and lower loading (resulting in longer retention time of sludge), higher degree of nitrification can be achieved. Hence, sludge treatment facilities are not necessary. Usually, sedimentation and sludge digestion is accomplished by providing a large and shallow settling basin.
(5) Cyclic Activated Sludge Technology (CAST) Cyclic activated sludge technology is a combination of the processes of filling and drawing wastewater in one (1) basin. Aeration and sedimentation/clarification are carried out sequentially in the same tank. This system has usually five (5) steps of processes that are carried out in the following sequence: (1) filling, (2) reaction (aeration), (3) settling (sedimentation/clarification), (4) drawing (decantation) and (5) idling. Sludge wasting is another important step that greatly affects the performance of operation. A special wasting process is not set in the five (5) basic steps and it is usually performed during the settling or idling steps.
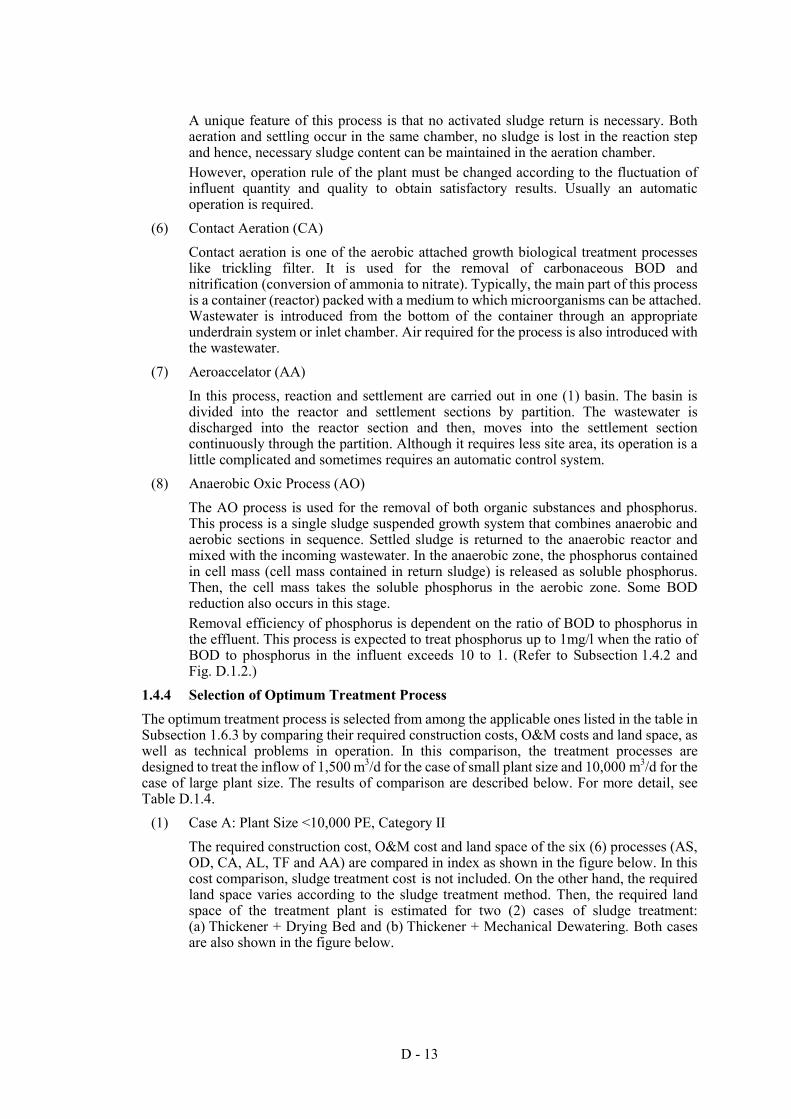
D - 13
A unique feature of this process is that no activated sludge return is necessary. Both aeration and settling occur in the same chamber, no sludge is lost in the reaction step and hence, necessary sludge content can be maintained in the aeration chamber. However, operation rule of the plant must be changed according to the fluctuation of influent quantity and quality to obtain satisfactory results. Usually an automatic operation is required.
(6) Contact Aeration (CA) Contact aeration is one of the aerobic attached growth biological treatment processes like trickling filter. It is used for the removal of carbonaceous BOD and nitrification (conversion of ammonia to nitrate). Typically, the main part of this process is a container (reactor) packed with a medium to which microorganisms can be attached. Wastewater is introduced from the bottom of the container through an appropriate underdrain system or inlet chamber. Air required for the process is also introduced with the wastewater.
(7) Aeroaccelator (AA) In this process, reaction and settlement are carried out in one (1) basin. The basin is divided into the reactor and settlement sections by partition. The wastewater is discharged into the reactor section and then, moves into the settlement section continuously through the partition. Although it requires less site area, its operation is a little complicated and sometimes requires an automatic control system.
(8) Anaerobic Oxic Process (AO) The AO process is used for the removal of both organic substances and phosphorus. This process is a single sludge suspended growth system that combines anaerobic and aerobic sections in sequence. Settled sludge is returned to the anaerobic reactor and mixed with the incoming wastewater. In the anaerobic zone, the phosphorus contained in cell mass (cell mass contained in return sludge) is released as soluble phosphorus. Then, the cell mass takes the soluble phosphorus in the aerobic zone. Some BOD reduction also occurs in this stage. Removal efficiency of phosphorus is dependent on the ratio of BOD to phosphorus in the effluent. This process is expected to treat phosphorus up to 1mg/l when the ratio of BOD to phosphorus in the influent exceeds 10 to 1. (Refer to Subsection 1.4.2 and Fig. D.1.2.)
1.4.4 Selection of Optimum Treatment Process The optimum treatment process is selected from among the applicable ones listed in the table in Subsection 1.6.3 by comparing their required construction costs, O&M costs and land space, as well as technical problems in operation. In this comparison, the treatment processes are designed to treat the inflow of 1,500 m3/d for the case of small plant size and 10,000 m3/d for the case of large plant size. The results of comparison are described below. For more detail, see Table D.1.4.
(1) Case A: Plant Size <10,000 PE, Category II The required construction cost, O&M cost and land space of the six (6) processes (AS, OD, CA, AL, TF and AA) are compared in index as shown in the figure below. In this cost comparison, sludge treatment cost is not included. On the other hand, the required land space varies according to the sludge treatment method. Then, the required land space of the treatment plant is estimated for two (2) cases of sludge treatment: (a) Thickener + Drying Bed and (b) Thickener + Mechanical Dewatering. Both cases are also shown in the figure below.
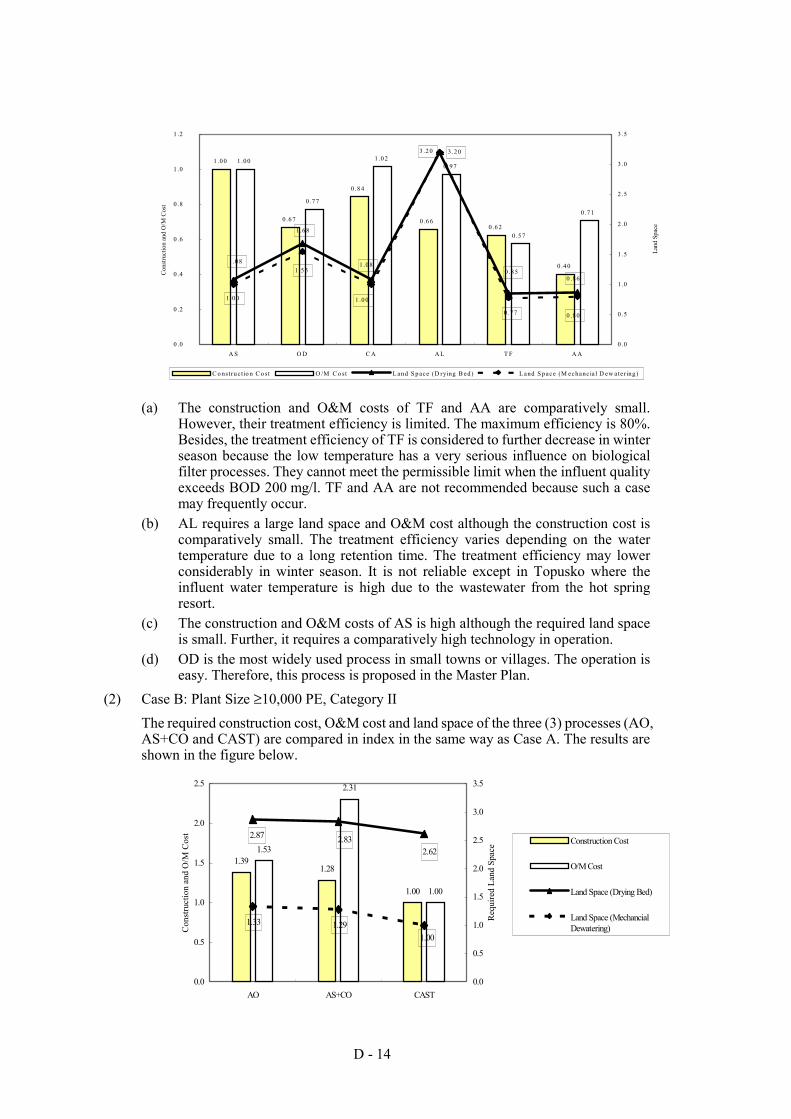
D - 14
(a) The construction and O&M costs of TF and AA are comparatively small. However, their treatment efficiency is limited. The maximum efficiency is 80%. Besides, the treatment efficiency of TF is considered to further decrease in winter season because the low temperature has a very serious influence on biological filter processes. They cannot meet the permissible limit when the influent quality exceeds BOD 200 mg/l. TF and AA are not recommended because such a case may frequently occur.
(b) AL requires a large land space and O&M cost although the construction cost is comparatively small. The treatment efficiency varies depending on the water temperature due to a long retention time. The treatment efficiency may lower considerably in winter season. It is not reliable except in Topusko where the influent water temperature is high due to the wastewater from the hot spring resort.
(c) The construction and O&M costs of AS is high although the required land space is small. Further, it requires a comparatively high technology in operation.
(d) OD is the most widely used process in small towns or villages. The operation is easy. Therefore, this process is proposed in the Master Plan.
(2) Case B: Plant Size ≥10,000 PE, Category II The required construction cost, O&M cost and land space of the three (3) processes (AO, AS+CO and CAST) are compared in index in the same way as Case A. The results are shown in the figure below.
1.00
0 .67
0 .84
0 .660 .62
0 .40
1 .00
0 .77
1 .020 .97
0 .57
0 .71
3 .20
1 .08
1 .68
3 .20
0 .850 .86
1 .08
1 .00
1 .55
1 .00
0 .77 0 .80
0 .0
0 .2
0 .4
0 .6
0 .8
1 .0
1 .2
A S O D C A A L T F A A
Con
stru
ctio
n an
d O
/M C
ost
0 .0
0 .5
1 .0
1 .5
2 .0
2 .5
3 .0
3 .5
Lan
d Sp
ace
C o nstruct io n C o st O /M C o st L and S pace (D rying B ed ) L and S pace (M echancia l D ew atering )
1.391.28
1.00
1.53
2.31
1.00
2.87 2.832.62
1.001.291.33
0.0
0.5
1.0
1.5
2.0
2.5
AO AS+CO CAST
Con
stru
ctio
n an
d O
/M C
ost
0.0
0.5
1.0
1.5
2.0
2.5
3.0
3.5
Req
uire
d La
nd S
pace
Construction Cost
O/M Cost
Land Space (Drying Bed)
Land Space (MechancialDewatering)
D - 15
(a) The construction and O&M costs of CAST are both the smallest. However, it requires a high level technology in its operation, especially in the case of combined sewer system. The plant operation rule must be changed according to the fluctuation of the influent quantity and quality. Usually, an automatic control system must be installed for a satisfactory operation. However, experienced operators are also necessary to operate the automatic control system corresponding to the fluctuation of the influent. Therefore, this system is not recommended.
(b) AS+CO requires a higher O&M cost due to the additive input. Further, it produces a large quantity of sludge. On the other hand, AO is the most widely used process for removal of T-P. Therefore, AO is proposed in the Master Plan.
(c) In operating the Anaerobic Oxic Process, it is better that the sludge from the primary sedimentation tank is treated by gravity and excess sludge is treated by the mechanical thickening process. Besides, the supernatant from the sludge treatment process such as thickener and dewatering facilities must be treated by coagulation process before returning to the primary sedimentation tank because the supernatant from these facilities has a high concentration of phosphorus due to the release in the anaerobic condition.
(3) Case C: Plant Size ≥10,000 PE, Category III The required construction cost, O&M cost and land space of the three (3) processes (AS, OD and CAST) are compared in index in the same way as Case A. The results are shown in the figure below.
(a) CAST is not recommended from the reasons mentioned above. (b) OD cannot meet the future requirement of T-P removal. On the other hand, AS
can easily meet the requirement only by construction of a partition in the biological reactor tank. Besides, OD requires a larger land space. It is usually not suitable in urban areas.
(c) AS is the most prevailing process for the treatment plant of a larger capacity. Therefore, AS is proposed in the Master Plan.
1.4.5 Selection of Optimum Sludge Treatment The wastewater treatment produces a large quantity of sludge every day. Since the supernatant from the sludge treatment facilities like the thickener and the digestion tank is returned to the wastewater treatment process, the efficiency of sludge treatment process has a close relationship with that of the wastewater one.
1.27
1.091.00
1.42
1.071.00
2.83
4.00
1.29
2.432.62
1.00
0.0
0.2
0.4
0.6
0.8
1.0
1.2
1.4
1.6
AS OD CAST
Con
stru
ctio
n an
d O
/M C
ost
0.0
0.5
1.0
1.5
2.0
2.5
3.0
3.5
4.0
4.5
Req
uire
d La
nd S
pace
Construction Cost
O/M Cost
Land Space (Drying Bed)
Land Space (MechancialDewatering)
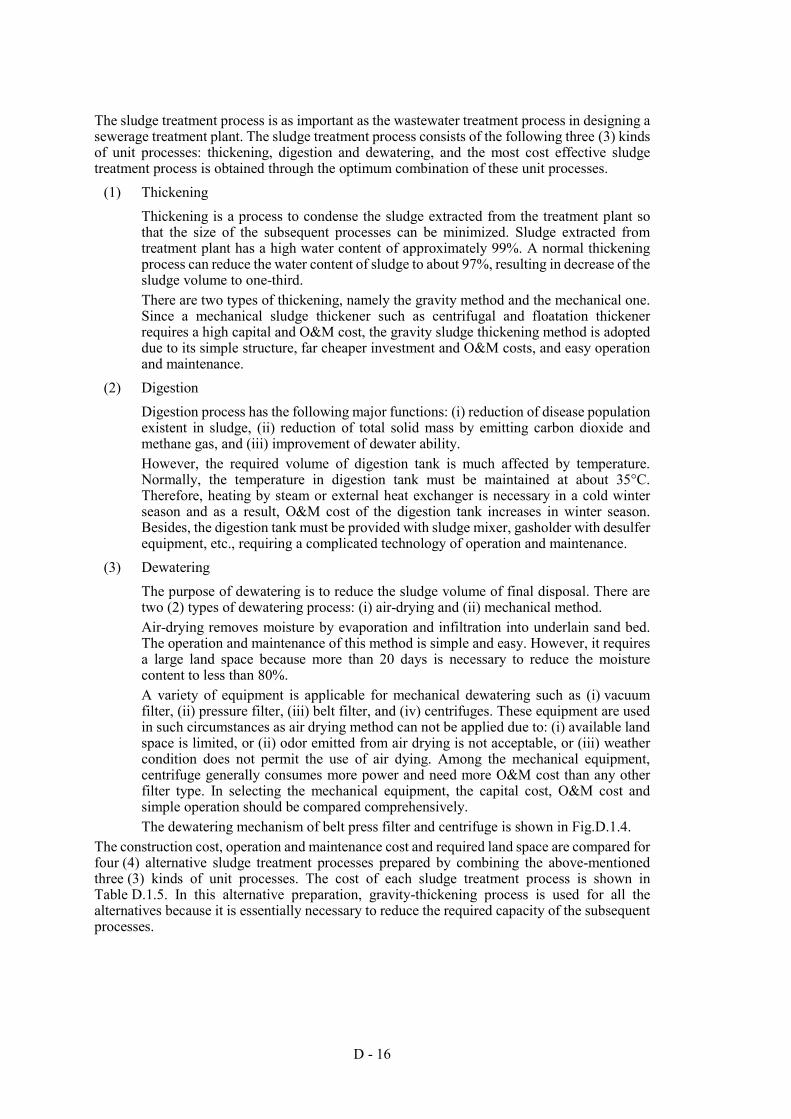
D - 16
The sludge treatment process is as important as the wastewater treatment process in designing a sewerage treatment plant. The sludge treatment process consists of the following three (3) kinds of unit processes: thickening, digestion and dewatering, and the most cost effective sludge treatment process is obtained through the optimum combination of these unit processes.
(1) Thickening Thickening is a process to condense the sludge extracted from the treatment plant so that the size of the subsequent processes can be minimized. Sludge extracted from treatment plant has a high water content of approximately 99%. A normal thickening process can reduce the water content of sludge to about 97%, resulting in decrease of the sludge volume to one-third. There are two types of thickening, namely the gravity method and the mechanical one. Since a mechanical sludge thickener such as centrifugal and floatation thickener requires a high capital and O&M cost, the gravity sludge thickening method is adopted due to its simple structure, far cheaper investment and O&M costs, and easy operation and maintenance.
(2) Digestion Digestion process has the following major functions: (i) reduction of disease population existent in sludge, (ii) reduction of total solid mass by emitting carbon dioxide and methane gas, and (iii) improvement of dewater ability. However, the required volume of digestion tank is much affected by temperature. Normally, the temperature in digestion tank must be maintained at about 35°C. Therefore, heating by steam or external heat exchanger is necessary in a cold winter season and as a result, O&M cost of the digestion tank increases in winter season. Besides, the digestion tank must be provided with sludge mixer, gasholder with desulfer equipment, etc., requiring a complicated technology of operation and maintenance.
(3) Dewatering The purpose of dewatering is to reduce the sludge volume of final disposal. There are two (2) types of dewatering process: (i) air-drying and (ii) mechanical method. Air-drying removes moisture by evaporation and infiltration into underlain sand bed. The operation and maintenance of this method is simple and easy. However, it requires a large land space because more than 20 days is necessary to reduce the moisture content to less than 80%. A variety of equipment is applicable for mechanical dewatering such as (i) vacuum filter, (ii) pressure filter, (iii) belt filter, and (iv) centrifuges. These equipment are used in such circumstances as air drying method can not be applied due to: (i) available land space is limited, or (ii) odor emitted from air drying is not acceptable, or (iii) weather condition does not permit the use of air dying. Among the mechanical equipment, centrifuge generally consumes more power and need more O&M cost than any other filter type. In selecting the mechanical equipment, the capital cost, O&M cost and simple operation should be compared comprehensively. The dewatering mechanism of belt press filter and centrifuge is shown in Fig.D.1.4.
The construction cost, operation and maintenance cost and required land space are compared for four (4) alternative sludge treatment processes prepared by combining the above-mentioned three (3) kinds of unit processes. The cost of each sludge treatment process is shown in Table D.1.5. In this alternative preparation, gravity-thickening process is used for all the alternatives because it is essentially necessary to reduce the required capacity of the subsequent processes.
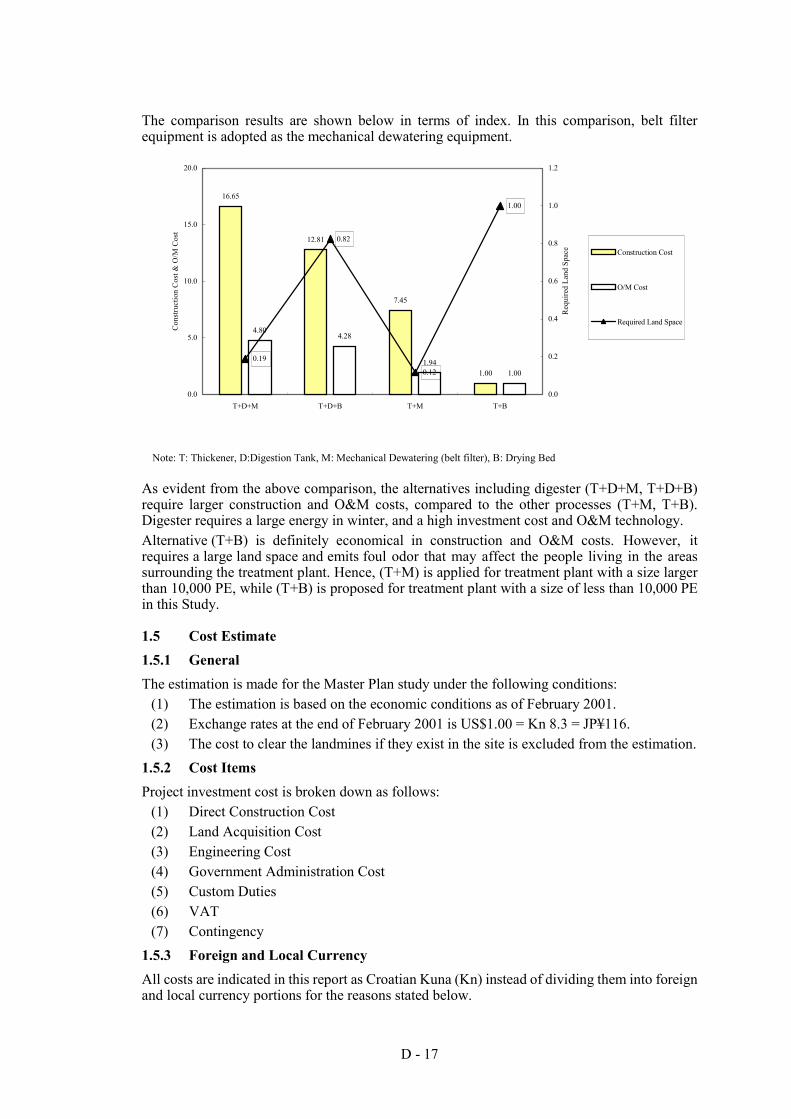
D - 17
The comparison results are shown below in terms of index. In this comparison, belt filter equipment is adopted as the mechanical dewatering equipment.
Note: T: Thickener, D:Digestion Tank, M: Mechanical Dewatering (belt filter), B: Drying Bed
As evident from the above comparison, the alternatives including digester (T+D+M, T+D+B) require larger construction and O&M costs, compared to the other processes (T+M, T+B). Digester requires a large energy in winter, and a high investment cost and O&M technology. Alternative (T+B) is definitely economical in construction and O&M costs. However, it requires a large land space and emits foul odor that may affect the people living in the areas surrounding the treatment plant. Hence, (T+M) is applied for treatment plant with a size larger than 10,000 PE, while (T+B) is proposed for treatment plant with a size of less than 10,000 PE in this Study.
1.5 Cost Estimate 1.5.1 General The estimation is made for the Master Plan study under the following conditions:
(1) The estimation is based on the economic conditions as of February 2001. (2) Exchange rates at the end of February 2001 is US$1.00 = Kn 8.3 = JP¥116. (3) The cost to clear the landmines if they exist in the site is excluded from the estimation.
1.5.2 Cost Items Project investment cost is broken down as follows:
(1) Direct Construction Cost (2) Land Acquisition Cost (3) Engineering Cost (4) Government Administration Cost (5) Custom Duties (6) VAT (7) Contingency
1.5.3 Foreign and Local Currency All costs are indicated in this report as Croatian Kuna (Kn) instead of dividing them into foreign and local currency portions for the reasons stated below.
16.65
12.81
7.45
1.00
4.804.28
1.941.00
0.19
0.12
1.00
0.82
0.0
5.0
10.0
15.0
20.0
T+D+M T+D+B T+M T+B
Con
stru
ctio
n C
ost &
O/M
Cos
t
0.0
0.2
0.4
0.6
0.8
1.0
1.2
Req
uire
d La
nd S
pace Construction Cost
O/M Cost
Required Land Space
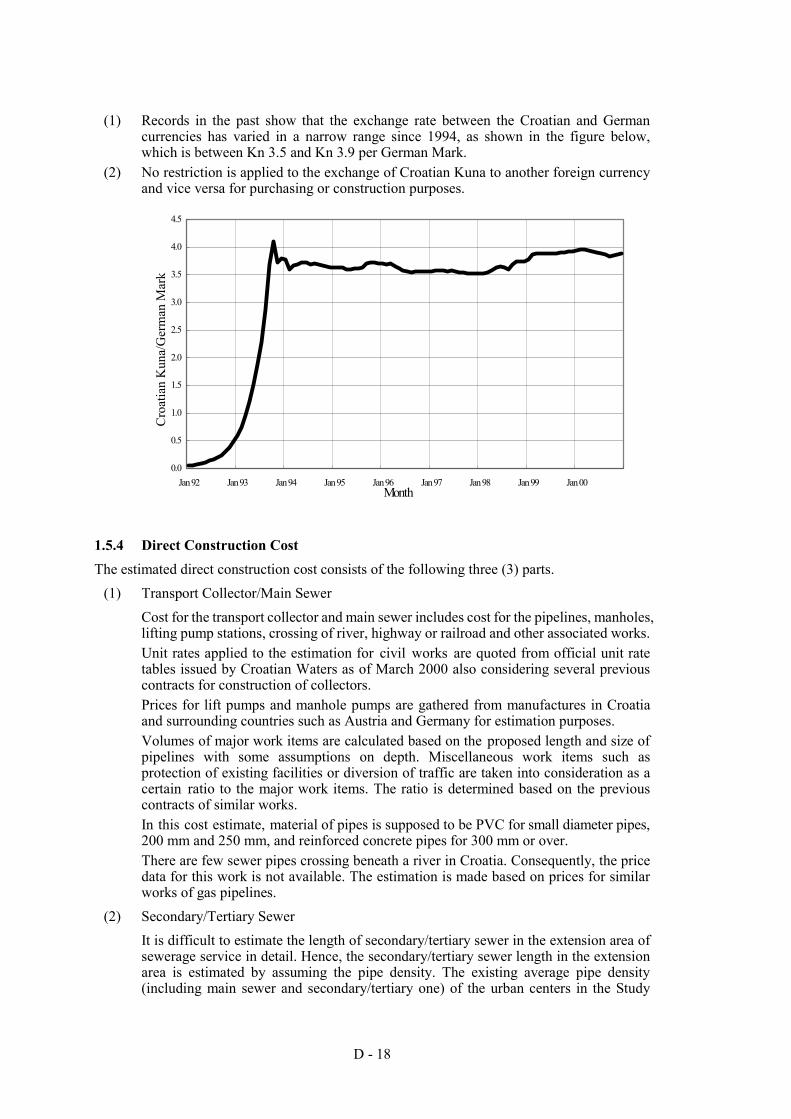
D - 18
(1) Records in the past show that the exchange rate between the Croatian and German currencies has varied in a narrow range since 1994, as shown in the figure below, which is between Kn 3.5 and Kn 3.9 per German Mark.
(2) No restriction is applied to the exchange of Croatian Kuna to another foreign currency and vice versa for purchasing or construction purposes.
1.5.4 Direct Construction Cost The estimated direct construction cost consists of the following three (3) parts.
(1) Transport Collector/Main Sewer Cost for the transport collector and main sewer includes cost for the pipelines, manholes, lifting pump stations, crossing of river, highway or railroad and other associated works. Unit rates applied to the estimation for civil works are quoted from official unit rate tables issued by Croatian Waters as of March 2000 also considering several previous contracts for construction of collectors. Prices for lift pumps and manhole pumps are gathered from manufactures in Croatia and surrounding countries such as Austria and Germany for estimation purposes. Volumes of major work items are calculated based on the proposed length and size of pipelines with some assumptions on depth. Miscellaneous work items such as protection of existing facilities or diversion of traffic are taken into consideration as a certain ratio to the major work items. The ratio is determined based on the previous contracts of similar works. In this cost estimate, material of pipes is supposed to be PVC for small diameter pipes, 200 mm and 250 mm, and reinforced concrete pipes for 300 mm or over. There are few sewer pipes crossing beneath a river in Croatia. Consequently, the price data for this work is not available. The estimation is made based on prices for similar works of gas pipelines.
(2) Secondary/Tertiary Sewer It is difficult to estimate the length of secondary/tertiary sewer in the extension area of sewerage service in detail. Hence, the secondary/tertiary sewer length in the extension area is estimated by assuming the pipe density. The existing average pipe density (including main sewer and secondary/tertiary one) of the urban centers in the Study
0.0
0.5
1.0
1.5
2.0
2.5
3.0
3.5
4.0
4.5
Jan 92 Jan 93 Jan 94 Jan 95 Jan 96 Jan 97 Jan 98 Jan 99 Jan 00Month
Cro
atia
n K
una/
Ger
man
Mar
k
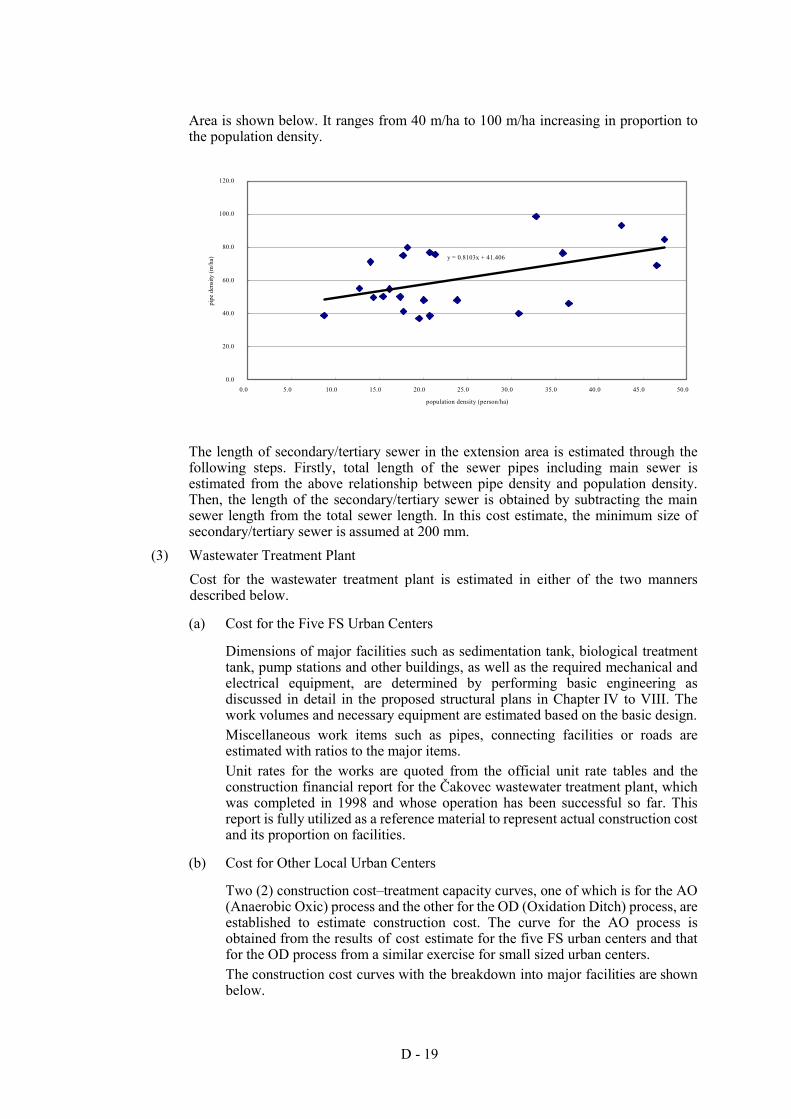
D - 19
Area is shown below. It ranges from 40 m/ha to 100 m/ha increasing in proportion to the population density.
The length of secondary/tertiary sewer in the extension area is estimated through the following steps. Firstly, total length of the sewer pipes including main sewer is estimated from the above relationship between pipe density and population density. Then, the length of the secondary/tertiary sewer is obtained by subtracting the main sewer length from the total sewer length. In this cost estimate, the minimum size of secondary/tertiary sewer is assumed at 200 mm.
(3) Wastewater Treatment Plant Cost for the wastewater treatment plant is estimated in either of the two manners described below.
(a) Cost for the Five FS Urban Centers
Dimensions of major facilities such as sedimentation tank, biological treatment tank, pump stations and other buildings, as well as the required mechanical and electrical equipment, are determined by performing basic engineering as discussed in detail in the proposed structural plans in Chapter IV to VIII. The work volumes and necessary equipment are estimated based on the basic design. Miscellaneous work items such as pipes, connecting facilities or roads are estimated with ratios to the major items. Unit rates for the works are quoted from the official unit rate tables and the construction financial report for the Čakovec wastewater treatment plant, which was completed in 1998 and whose operation has been successful so far. This report is fully utilized as a reference material to represent actual construction cost and its proportion on facilities.
(b) Cost for Other Local Urban Centers
Two (2) construction cost–treatment capacity curves, one of which is for the AO (Anaerobic Oxic) process and the other for the OD (Oxidation Ditch) process, are established to estimate construction cost. The curve for the AO process is obtained from the results of cost estimate for the five FS urban centers and that for the OD process from a similar exercise for small sized urban centers. The construction cost curves with the breakdown into major facilities are shown below.
y = 0.8103x + 41.406
0.0
20.0
40.0
60.0
80.0
100.0
120.0
0.0 5.0 10.0 15.0 20.0 25.0 30.0 35.0 40.0 45.0 50.0
population density (person/ha)
pipe
den
sity
(m/h
a)
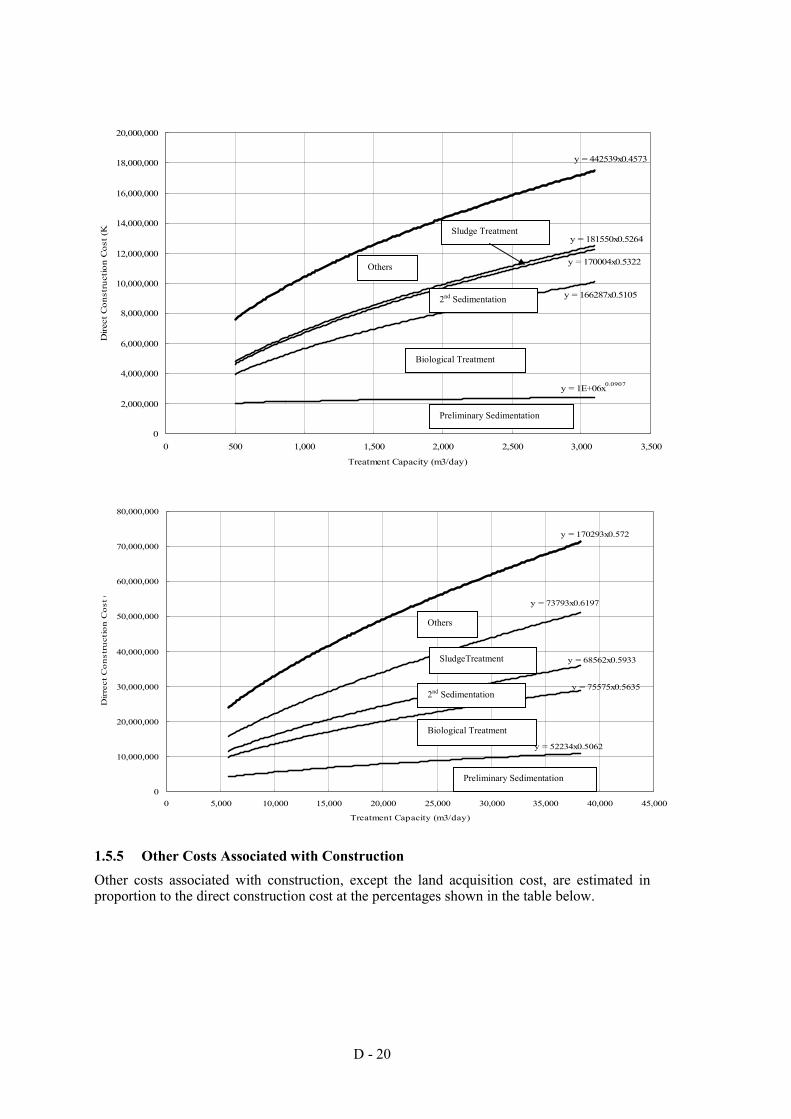
D - 20
Construction Cost for OD Process 1.5.5 Other Costs Associated with Construction Other costs associated with construction, except the land acquisition cost, are estimated in proportion to the direct construction cost at the percentages shown in the table below.
y = 442539x0.4573
y = 181550x0.5264
y = 170004x0.5322
y = 166287x0.5105
y = 1E+06x0.0907
0
2,000,000
4,000,000
6,000,000
8,000,000
10,000,000
12,000,000
14,000,000
16,000,000
18,000,000
20,000,000
0 500 1,000 1,500 2,000 2,500 3,000 3,500
Treatment Capacity (m3/day)
Dire
ct C
onst
ruct
ion
Cos
t (K
u
Sludge Treatment
Others
Biological Treatment
Preliminary Sedimentation
2nd Sedimentation
y = 170293x0.572
y = 73793x0.6197
y = 68562x0.5933
y = 75575x0.5635
y = 52234x0.5062
0
10,000,000
20,000,000
30,000,000
40,000,000
50,000,000
60,000,000
70,000,000
80,000,000
0 5,000 10,000 15,000 20,000 25,000 30,000 35,000 40,000 45,000
Treatment Capacity (m3/day)
Dir
rect
Co
nst
ruct
ion
Co
st (
SludgeTreatment
Others
Biological Treatment
Preliminary Sedimentation
2nd Sedimentation
D - 21
Cost Item Ratio Engineering Cost 10% of Direct Construction Cost Government Administration Cost 3% of Direct Construction Cost Customs Duties 10% of Mechanical/Electrical Items and Works VAT 22% of Direct Construction and Engineering Cost Contingency 20% of Direct Construction Cost
The ratios for Engineering Cost and Government Administration Cost are determined based on experiences of similar projects and the local practice, respectively. Customs duties of 20% are applied to imported goods not produced in Croatia. Supposing that customs duties are applied to half of the mechanical and electrical works, the rate of 10% is applied to all mechanical and electrical works. The rate of 22% for VAT, which is applied as of February 2001, is taken into account. Land acquisition costs are estimated based on interview with local water supply & sewerage companies to the extent that information is available.
D - 22
CHAPTER II SEWERAGE IMPROVEMENT OF ZAGREB
2.1 Existing Sewerage System 2.1.1 Service Area, Population and Industries The City of Zagreb consisting of 70 settlements is the capital of the Republic of Croatia. The administrative area, as well as the existing population (1991, 1999) and future projection (2015) are shown below.
Item Urban Center Rural Area Total Area (ha) 64,003.5 - 64,003.5 Population (1991) 777,826 - 777,826 (1999) 935,000 - 935,000 (2015) 998,000 - 998,000
Public sewerage services started in 1892 when the city had a population of 40,000. At present, the sewer network covers 75% of the city and the service area is about 25,600 ha including 235 ha of industrial zone. The total population in the above service area is, however, approximately 825,000 (household number is about 250,000), of which 25,000 inhabitants are still using the septic tank. About 230 industries are connected to the existing sewerage system. However, most of the industries are not provided with the appropriate pre-treatment system. 2.1.2 Sewer Network Grad Zagreb is divided into two (2) areas by the Sava River, the left and right side areas. The sewerage system on the left bank discharges into the Sava River south of the settlement of Ivanja Reka, while that on the right bank discharges into the Sava River at the settlement of Jakuševac. There is no treatment plant on the sewerage system. The main sewers in both areas are given below. The existing sewerage system is shown in Fig. D.2.1.
Area Coverage Main Sewers
Left Side of River
North Zagreb and Western Part of Sesvete
Kostanjek-Dolec-Sigetje, Medpotoki-Dubje, Veliki Potok-Črnomerec, Kraljevac-Donje Prekrižje, Branovec-Jelševec, Savica-Šanci, Struge-Bogdani and Jelkovec
Right Side of River
New Zagreb
Main sewer (collector) from Remetinec to collecting canals of Rajtarićeva - Rainfall and sewage in the town area is discharged through the existing sewerage system and Črnec canal into Sava River without any treatment. Main sewer onNaletelićeva Street and areas of Brezovica-Obrež (with 3 pump stations: Botinec, Obrež and Dupci), Blato, Hrvatski Leskovac, Lučko, Ježdovec and Stupnik with pump station “Blato”.
The combined drainage system has been designed and constructed in the last few decades for 140 l/sec/ha of rainfall with 25 minutes of duration time and a 3-year return period. The total length of the existing pipes is approximately 1,500 km, broken down into 1,000 km of primary/secondary collectors and 500 km of tertiary sewers (constructed by the local government). In 1999, a new sewer of 37 km was built. The maximum and minimum diameters of pipe are 800-540 cm and 20 cm, respectively. All sewers are made of either concrete or reinforced concrete. The outfalls of the existing sewerage system are GOK Gruščina and collector Južni Zagreb Jakuševac. There are 12 pumping stations on the existing system, which are located at Jakznševec, Zaprude, Klara, Buzin 1, Buzin 2, Petruševac, Ivanja Reka, Kajzerica, Miramarska,
D - 23
Struge, Dubli and Botinec. The capacity of pumps is from 72 m3/h to 300 m3/h, and all pump heads are nearly 10 m. 2.1.3 Wastewater Flow and Quality The sewerage system has been receiving a large quantity of industrial wastewater in addition to the domestic one. However, the domestic ratio has increased while the industrial ratio decreased due to changes economic structure in recent years. At present, the ratio of domestic and industrial wastewater is nearly 1:1 with a rising trend of the domestic one. The domestic and industrial wastewater discharged into the sewerage system in 1999 is estimated to be 121,620 m3/day and 114,480 m3/day, respectively. The historical changes of domestic and industrial wastewater discharges during the recent 11 years (1987–1999) is shown in the following table.
(Unit:103×m3/day) 1987 1988 1989 1990 1991 1994 1995 1996 1997 1998 1999 Domestic 92.84 81.74 107.77 89.16 66.47 121.79 130.15 124.60 126.30 127.30 121.62 Industrial 172.23 178.92 173.18 163.39 187.60 175.61 172.54 167.97 171.60 122.38 114.48 Total 265.07 260.66 280.95 252.55 254.07 297.39 302.68 292.57 297.90 249.68 236.10 The observation of wastewater quality was made at the sewerage outfall of South Zagreb, which is located at Jakuševac. The receiving river of the wastewater (Zagreb-Sisak of Sava River) is Category III. There is no important water use in the downstream of the sewage effluent. The average, maximum and minimum values in 1998, 1999 and 2000 are given below.
Temperature (°C) CODCr BOD SO4 NH4 NO2 NO3 PO4 Cl Year No. Quantity (l/s) Air Water
pH (mg/l) (mg/l) (mg/l) (mg/l) (mg/l) (mg/l) (mg/l) (mg/l)
0.325 25.9 23.2 7.7 441.2 141.2 84.6 23.4 0.1 0.2 5.9 37.5 0.353 38.0 25.0 7.9 802.0 261.0 110.0 40.7 0.3 0.7 10.2 56.0 1998 26 0.284 16.0 21.0 7.3 261.0 67.0 28.0 4.7 0.0 0.0 1.5 12.0 0.337 25.3 22.5 7.8 697.1 281.2 89.2 28.2 0.1 0.8 6.2 48.9 0.602 34.0 24.0 8.4 3,124.0 1,202.0 138.0 47.3 0.6 5.2 11.0 105.0 1999 39 0.306 18.0 20.0 7.1 200.0 62.0 23.0 11.4 0.0 0.0 2.5 18.0 0.270 25.8 22.8 7.7 421.6 183.7 60.7 29.4 0.3 0.5 5.5 49.6 0.710 34.0 25.0 8.0 772.0 368.0 133.0 42.4 0.3 1.2 9.4 73.0 2000 43 0.213 19.0 18.0 7.4 150.0 87.0 25.0 15.8 0.3 0.0 2.0 22.0
Note: “No.” is sampling number; Upper row values are average, Middle row are maximum, and Lower row are minimum. The JICA Study team also analyzed the quantity and quality of wastewater at the last bridge before the Sava River on December 8, 2000. The results for major parameters are shown below. For other parameters, see Table B.4.3 in Appendix B.
Parameter Unit Value Parameter Unit Value Sampling Time 15:00 CODMn mg/l 68.0 Flow m3/sec 0.0275 TSS mg/l 370.0 pH 4.22 T-N mg/l 21.5 BOD mg/l 190.0 T-P mg/l 5.6
2.2 Ongoing Sewerage Improvement Project 2.2.1 Summary of Proposed Improvement Works The sewerage improvement system project of Zagreb City is also reflected in Fig. D.2.1. Improvement works include the following in consideration of the existing system conditions.
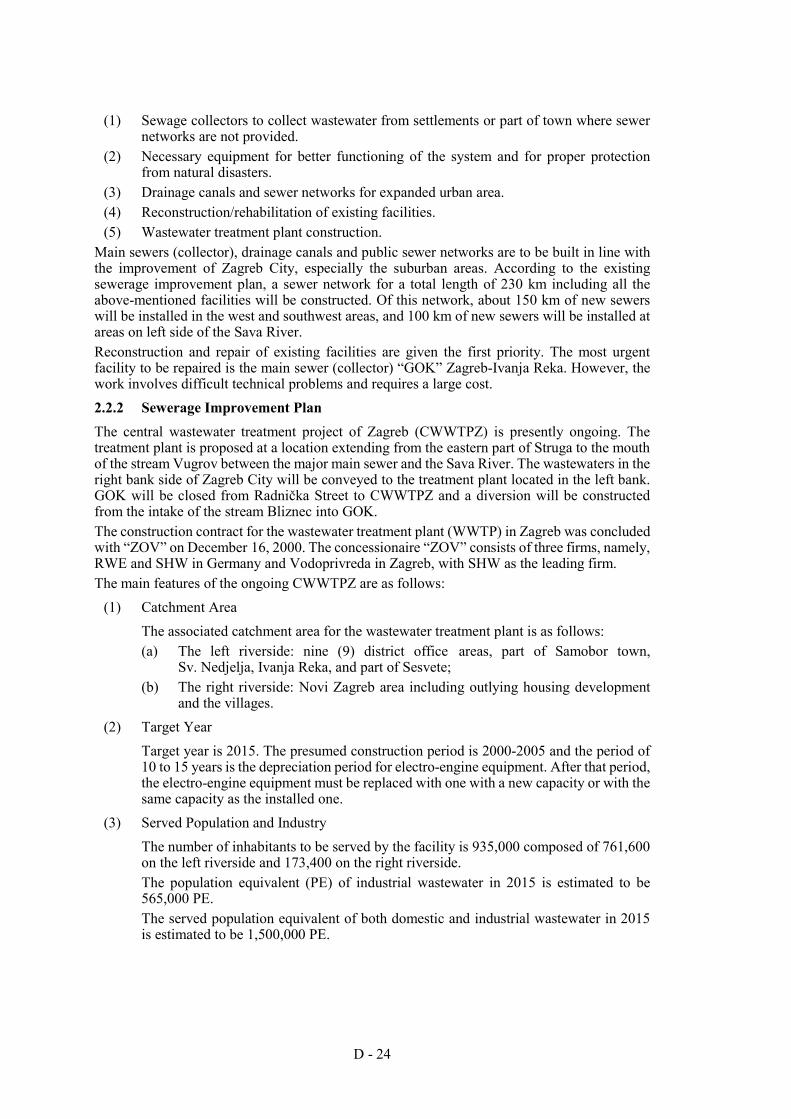
D - 24
(1) Sewage collectors to collect wastewater from settlements or part of town where sewer networks are not provided.
(2) Necessary equipment for better functioning of the system and for proper protection from natural disasters.
(3) Drainage canals and sewer networks for expanded urban area. (4) Reconstruction/rehabilitation of existing facilities. (5) Wastewater treatment plant construction.
Main sewers (collector), drainage canals and public sewer networks are to be built in line with the improvement of Zagreb City, especially the suburban areas. According to the existing sewerage improvement plan, a sewer network for a total length of 230 km including all the above-mentioned facilities will be constructed. Of this network, about 150 km of new sewers will be installed in the west and southwest areas, and 100 km of new sewers will be installed at areas on left side of the Sava River. Reconstruction and repair of existing facilities are given the first priority. The most urgent facility to be repaired is the main sewer (collector) “GOK” Zagreb-Ivanja Reka. However, the work involves difficult technical problems and requires a large cost. 2.2.2 Sewerage Improvement Plan The central wastewater treatment project of Zagreb (CWWTPZ) is presently ongoing. The treatment plant is proposed at a location extending from the eastern part of Struga to the mouth of the stream Vugrov between the major main sewer and the Sava River. The wastewaters in the right bank side of Zagreb City will be conveyed to the treatment plant located in the left bank. GOK will be closed from Radnička Street to CWWTPZ and a diversion will be constructed from the intake of the stream Bliznec into GOK. The construction contract for the wastewater treatment plant (WWTP) in Zagreb was concluded with “ZOV” on December 16, 2000. The concessionaire “ZOV” consists of three firms, namely, RWE and SHW in Germany and Vodoprivreda in Zagreb, with SHW as the leading firm. The main features of the ongoing CWWTPZ are as follows:
(1) Catchment Area The associated catchment area for the wastewater treatment plant is as follows: (a) The left riverside: nine (9) district office areas, part of Samobor town,
Sv. Nedjelja, Ivanja Reka, and part of Sesvete; (b) The right riverside: Novi Zagreb area including outlying housing development
and the villages. (2) Target Year
Target year is 2015. The presumed construction period is 2000-2005 and the period of 10 to 15 years is the depreciation period for electro-engine equipment. After that period, the electro-engine equipment must be replaced with one with a new capacity or with the same capacity as the installed one.
(3) Served Population and Industry The number of inhabitants to be served by the facility is 935,000 composed of 761,600 on the left riverside and 173,400 on the right riverside. The population equivalent (PE) of industrial wastewater in 2015 is estimated to be 565,000 PE. The served population equivalent of both domestic and industrial wastewater in 2015 is estimated to be 1,500,000 PE.

D - 25
(4) Hydraulic load Hydraulic load is estimated based on water consumption in Zagreb area in 1989 and 1995. According to the “Izmjene i dopune vodnogospodarske osnove grada Zagreba” (modifications and supplementations of water management of Zagreb town), daily water consumption in 2015 is 283,040 m3, consisting of 228,480 m3 on the left riverside and 54,560 m3 on the right riverside of Sava River. The quantity of wastewater is summarized as follows:
Unit Present (1997) Future (2015-2020) Water Consumption/Household m3/day 208,000 283,000 Water Consumption/Industry m3/day 90,000 172,500 Population Served Per Capita 750,000 935,000 Wastewater Flow m3/day 238,000 442,370 Population Equivalent PE 1,000,000 1,500,000
(5) Pollution Load The organic pollution load into the treatment plant is as follows:
Future (2015-2010)
Item Present Load (1997)
(kg/day) Load (kg/day)
Medium Daily Concentration (mg/l)
BOD5 60,000 90,000 203 CODCr 103,050 191,540 433 TSS 91,000 136,430 308 T-N 13,000 19,640 44 T-P 3,000 4,500 10
(6) Main Facilities The main facilities given below are required.
Type Name/Location Diameter (cm) Length (m)
Collector 1 Collector Culinecka - 1,200 Collector 2 Inlet Pipe to Spillway 600/200 - 1000/400 5,950 Collector 3 Spillway 1200/400 - 1400/400 4,200 Collector 4 Inlet Pipe to Pumping Station 160 - 300/200 4,200 Collector 5 Collector II Paralelna 200/210 4,100 Collector 6 Force Main 100 4,200 Collector 7 Force Main - WWTP 140 2,200 Drainage Channel to Sava River (Open) 2,150 Mičevac Pump Station Capacity: 1.5 m3/sec Wastewater Treatment Plant Biological Treatment Process
2.2.3 Wastewater Treatment Plant (1) Surface Area
The treatment site has been approved under Location Permit UP/1-350-05/96-02/36. The site covers a total area of 100.3 ha as given in the following table. However, the land has not been acquired yet. A transmission line of 110 kV will cross over Plot P1 and no construction is allowed under the line. The area covered by the transmission line is approximately 2.5 ha.
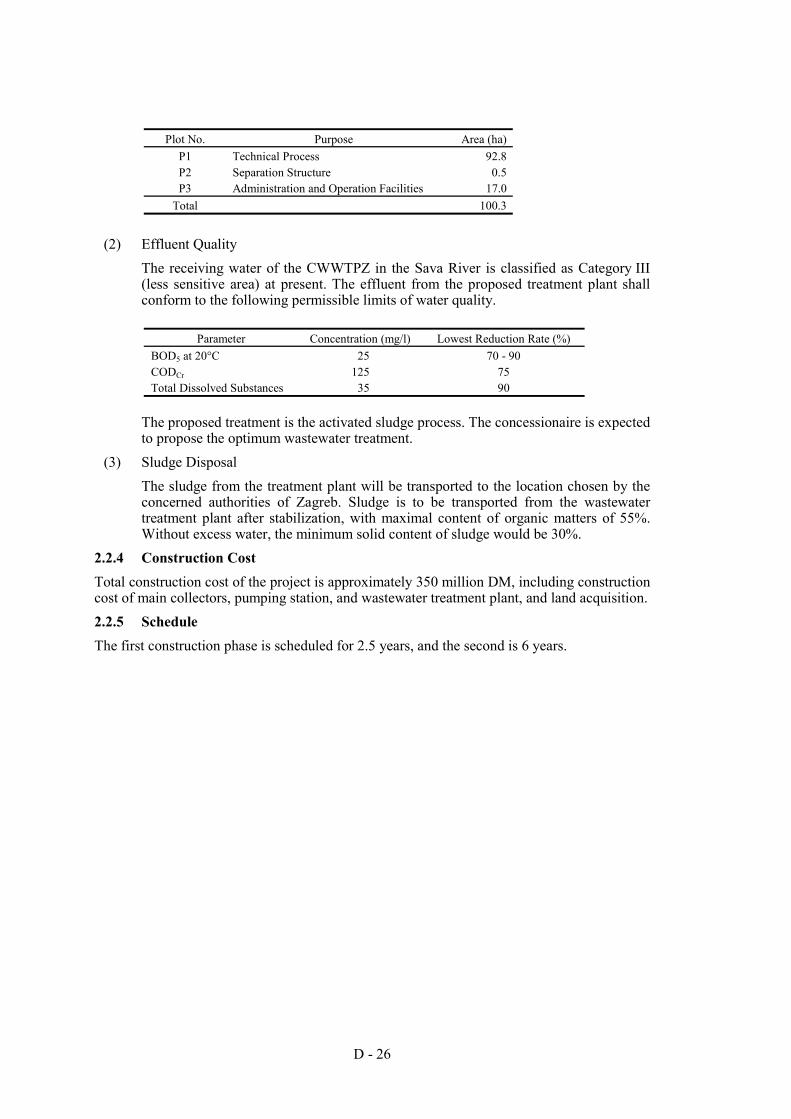
D - 26
Plot No. Purpose Area (ha)
P1 Technical Process 92.8 P2 Separation Structure 0.5 P3 Administration and Operation Facilities 17.0
Total 100.3
(2) Effluent Quality The receiving water of the CWWTPZ in the Sava River is classified as Category III (less sensitive area) at present. The effluent from the proposed treatment plant shall conform to the following permissible limits of water quality.
Parameter Concentration (mg/l) Lowest Reduction Rate (%)
BOD5 at 20°C 25 70 - 90 CODCr 125 75 Total Dissolved Substances 35 90
The proposed treatment is the activated sludge process. The concessionaire is expected to propose the optimum wastewater treatment.
(3) Sludge Disposal The sludge from the treatment plant will be transported to the location chosen by the concerned authorities of Zagreb. Sludge is to be transported from the wastewater treatment plant after stabilization, with maximal content of organic matters of 55%. Without excess water, the minimum solid content of sludge would be 30%.
2.2.4 Construction Cost Total construction cost of the project is approximately 350 million DM, including construction cost of main collectors, pumping station, and wastewater treatment plant, and land acquisition. 2.2.5 Schedule The first construction phase is scheduled for 2.5 years, and the second is 6 years.
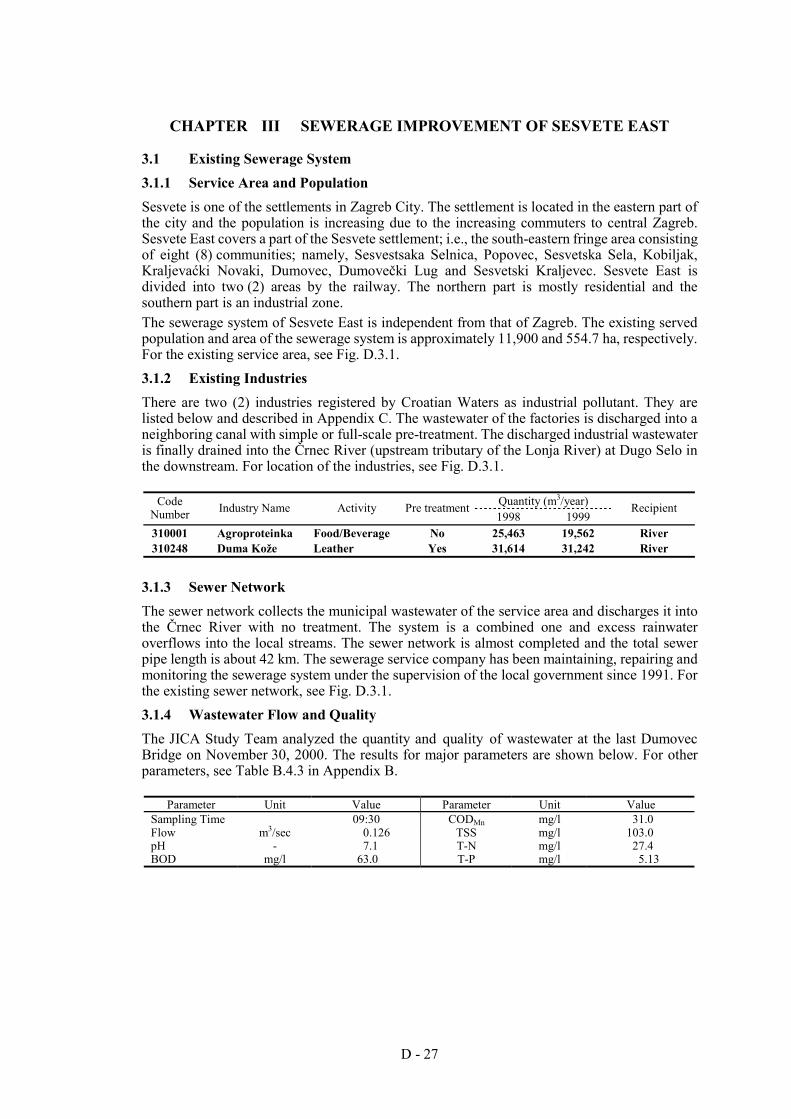
D - 27
CHAPTER III SEWERAGE IMPROVEMENT OF SESVETE EAST
3.1 Existing Sewerage System 3.1.1 Service Area and Population Sesvete is one of the settlements in Zagreb City. The settlement is located in the eastern part of the city and the population is increasing due to the increasing commuters to central Zagreb. Sesvete East covers a part of the Sesvete settlement; i.e., the south-eastern fringe area consisting of eight (8) communities; namely, Sesvestsaka Selnica, Popovec, Sesvetska Sela, Kobiljak, Kraljevaćki Novaki, Dumovec, Dumovečki Lug and Sesvetski Kraljevec. Sesvete East is divided into two (2) areas by the railway. The northern part is mostly residential and the southern part is an industrial zone. The sewerage system of Sesvete East is independent from that of Zagreb. The existing served population and area of the sewerage system is approximately 11,900 and 554.7 ha, respectively. For the existing service area, see Fig. D.3.1. 3.1.2 Existing Industries There are two (2) industries registered by Croatian Waters as industrial pollutant. They are listed below and described in Appendix C. The wastewater of the factories is discharged into a neighboring canal with simple or full-scale pre-treatment. The discharged industrial wastewater is finally drained into the Črnec River (upstream tributary of the Lonja River) at Dugo Selo in the downstream. For location of the industries, see Fig. D.3.1.
Quantity (m3/year) Code Number Industry Name Activity Pre treatment
1998 1999 Recipient
310001 Agroproteinka Food/Beverage No 25,463 19,562 River 310248 Duma Kože Leather Yes 31,614 31,242 River
3.1.3 Sewer Network The sewer network collects the municipal wastewater of the service area and discharges it into the Črnec River with no treatment. The system is a combined one and excess rainwater overflows into the local streams. The sewer network is almost completed and the total sewer pipe length is about 42 km. The sewerage service company has been maintaining, repairing and monitoring the sewerage system under the supervision of the local government since 1991. For the existing sewer network, see Fig. D.3.1. 3.1.4 Wastewater Flow and Quality The JICA Study Team analyzed the quantity and quality of wastewater at the last Dumovec Bridge on November 30, 2000. The results for major parameters are shown below. For other parameters, see Table B.4.3 in Appendix B.
Parameter Unit Value Parameter Unit Value Sampling Time 09:30 CODMn mg/l 31.0 Flow m3/sec 0.126 TSS mg/l 103.0 pH - 7.1 T-N mg/l 27.4 BOD mg/l 63.0 T-P mg/l 5.13
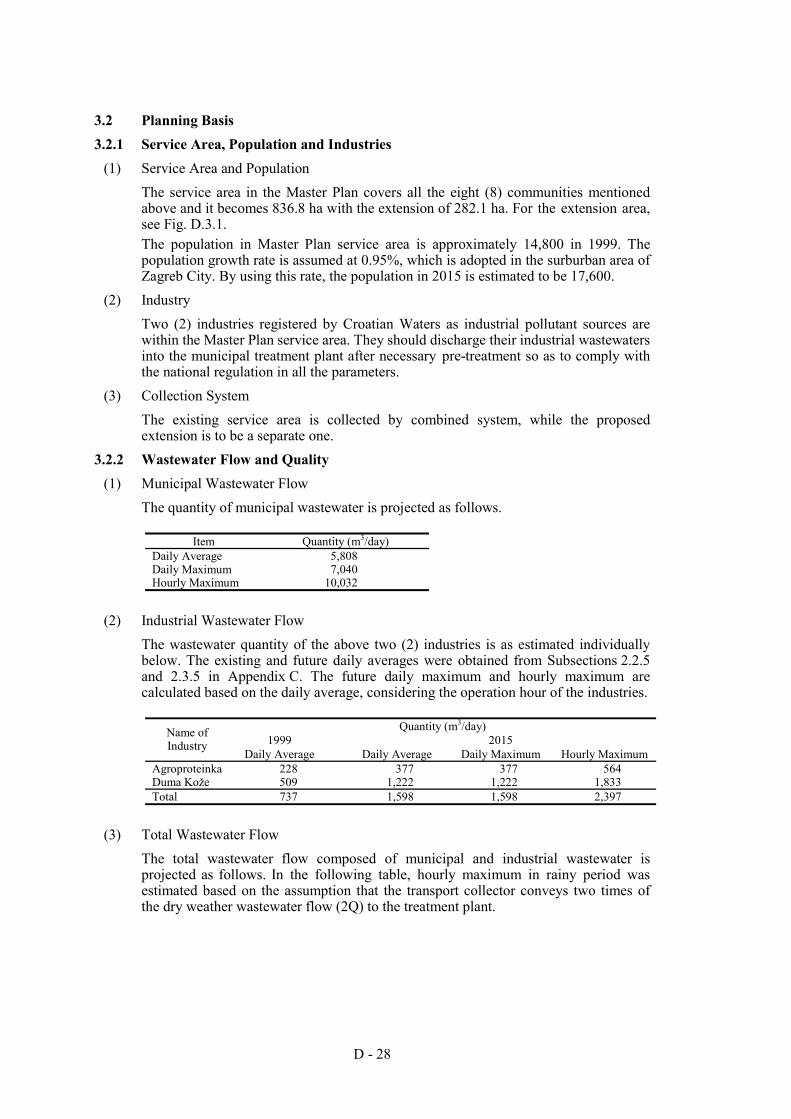
D - 28
3.2 Planning Basis 3.2.1 Service Area, Population and Industries
(1) Service Area and Population The service area in the Master Plan covers all the eight (8) communities mentioned above and it becomes 836.8 ha with the extension of 282.1 ha. For the extension area, see Fig. D.3.1. The population in Master Plan service area is approximately 14,800 in 1999. The population growth rate is assumed at 0.95%, which is adopted in the surburban area of Zagreb City. By using this rate, the population in 2015 is estimated to be 17,600.
(2) Industry Two (2) industries registered by Croatian Waters as industrial pollutant sources are within the Master Plan service area. They should discharge their industrial wastewaters into the municipal treatment plant after necessary pre-treatment so as to comply with the national regulation in all the parameters.
(3) Collection System The existing service area is collected by combined system, while the proposed extension is to be a separate one.
3.2.2 Wastewater Flow and Quality (1) Municipal Wastewater Flow
The quantity of municipal wastewater is projected as follows.
Item Quantity (m3/day) Daily Average 5,808 Daily Maximum 7,040 Hourly Maximum 10,032
(2) Industrial Wastewater Flow The wastewater quantity of the above two (2) industries is as estimated individually below. The existing and future daily averages were obtained from Subsections 2.2.5 and 2.3.5 in Appendix C. The future daily maximum and hourly maximum are calculated based on the daily average, considering the operation hour of the industries.
Quantity (m3/day)
1999 2015 Name of Industry
Daily Average Daily Average Daily Maximum Hourly Maximum Agroproteinka 228 377 377 564 Duma Kože 509 1,222 1,222 1,833 Total 737 1,598 1,598 2,397
(3) Total Wastewater Flow The total wastewater flow composed of municipal and industrial wastewater is projected as follows. In the following table, hourly maximum in rainy period was estimated based on the assumption that the transport collector conveys two times of the dry weather wastewater flow (2Q) to the treatment plant.
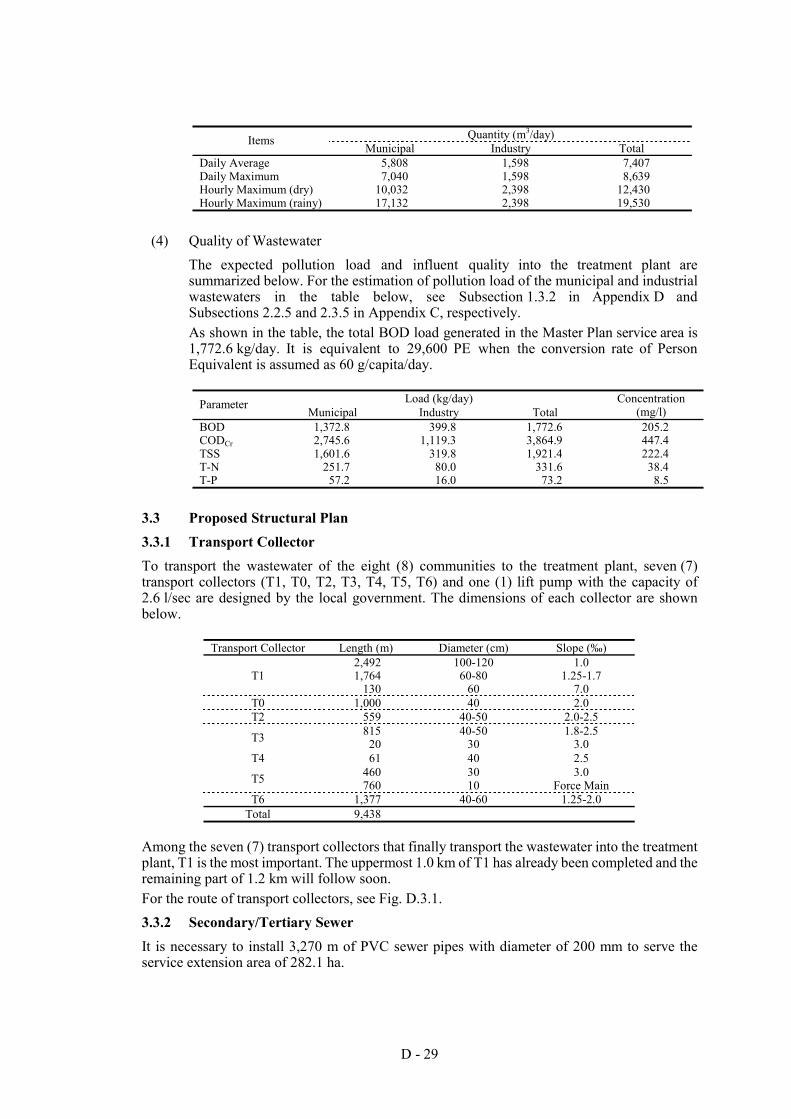
D - 29
Quantity (m3/day) Items
Municipal Industry Total Daily Average 5,808 1,598 7,407 Daily Maximum 7,040 1,598 8,639 Hourly Maximum (dry) 10,032 2,398 12,430 Hourly Maximum (rainy) 17,132 2,398 19,530
(4) Quality of Wastewater The expected pollution load and influent quality into the treatment plant are summarized below. For the estimation of pollution load of the municipal and industrial wastewaters in the table below, see Subsection 1.3.2 in Appendix D and Subsections 2.2.5 and 2.3.5 in Appendix C, respectively. As shown in the table, the total BOD load generated in the Master Plan service area is 1,772.6 kg/day. It is equivalent to 29,600 PE when the conversion rate of Person Equivalent is assumed as 60 g/capita/day.
Load (kg/day) Parameter
Municipal Industry Total Concentration
(mg/l) BOD 1,372.8 399.8 1,772.6 205.2 CODCr 2,745.6 1,119.3 3,864.9 447.4 TSS 1,601.6 319.8 1,921.4 222.4 T-N 251.7 80.0 331.6 38.4 T-P 57.2 16.0 73.2 8.5
3.3 Proposed Structural Plan 3.3.1 Transport Collector To transport the wastewater of the eight (8) communities to the treatment plant, seven (7) transport collectors (T1, T0, T2, T3, T4, T5, T6) and one (1) lift pump with the capacity of 2.6 l/sec are designed by the local government. The dimensions of each collector are shown below.
Transport Collector Length (m) Diameter (cm) Slope (‰)
T1 2,492 1,764
130
100-120 60-80
60
1.0 1.25-1.7
7.0 T0 1,000 40 2.0 T2 559 40-50 2.0-2.5
T3 815 20
40-50 30
1.8-2.5 3.0
T4 61 40 2.5
T5 460 760
30 10
3.0 Force Main
T6 1,377 40-60 1.25-2.0 Total 9,438
Among the seven (7) transport collectors that finally transport the wastewater into the treatment plant, T1 is the most important. The uppermost 1.0 km of T1 has already been completed and the remaining part of 1.2 km will follow soon. For the route of transport collectors, see Fig. D.3.1. 3.3.2 Secondary/Tertiary Sewer It is necessary to install 3,270 m of PVC sewer pipes with diameter of 200 mm to serve the service extension area of 282.1 ha.
D - 30
3.3.3 Treatment Plant (1) Location
The construction of a wastewater treatment plant is proposed at the left bank of the Črnec River by the local government. The required surface area of the treatment plant is 36,190 m2, for which environmental impact assessment (EIA) has been completed. For location of the treatment plant, see Fig. D.3.1.
(2) Treatment Process Since the capacity of the treatment plant is 29,600 PE and the recipient of effluent from the treatment plant is Lonja-Strug (Category II), Anaerobic Oxic treatment with thickener and mechanical sludge dewatering is proposed based on the selection criteria of the treatment process discussed in Sections 1.4.4 and 1.4.5. The required surface area is approximately 2.45 ha.
(3) Main Facilities The main facilities with specification and number are shown below. The effluent is discharged into the Črnec River. The layout of wastewater treatment plant is shown in Fig. D.3.2.
Facilities Specification No. of Units
Coarse Screen 2m W 1 Fine Screen 1m W 1 Influent Pumping Station and
Screen Archimedical Screw Pump 5.0 m3/min × 6m H × 8kw 3
Grit Oil/Sand Removal 2m W × 10m L 2 Parshall Flume 0.3048m (1 ft) 1 Primary Sedimentation Tank 3.0m W × 19.0m L × 3.0m D (Effective Depth) 4 Aeration Tank 5m W × 32.0m L × 5m D 4 Secondary Sedimentation Tank ∅15m × 3.5m D (Effective Depth) 2 Sludge Thickener ∅7m × 4.0m D 1
Belt Press Filter 1.5m W × 1.5kw Mechanical Dewatering Polymer Mixing 0.4kw
2
Roots Blower 14m3/min × 18.5kw Blower (Building: 8m × 15m)
3
Archimedical Screw Pump Return Sludge 3m3/min × 3m H × 3.5kw
3
Administration Building 10m W × 10m L 1
D - 31
3.4 Cost Estimate The total construction cost is estimated at approx. Kn 66.5 million, broken down as follows.
Cost Facilities Cost (×103 Kn) Rate (%) Direct Cost Pipe Transport Collector/Main Sewer 9,349.6 14.1 22.6 Secondary/Tertiary Sewer 1,612.2 2.4 3.9 Sub-Total 10,961.8 16.5 26.5 Treatment Plant Preliminary Treatment 5,135.2 7.7 12.4 Biological Reactor 7,342.9 11.0 17.8 Secondary Sedimentation 2,335.7 3.5 5.6 Sludge Treatment 5,453.2 8.2 13.2 Others 10,131.6 15.2 24.5 Sub-total 30,398.6 45.7 73.5 Sub-total 41,360.4 62.2 100.0 Land Acquisition 0.0 0.0 - Indirect Cost Engineering 4,136.0 6.2 - Administration 1,240.8 1.9 - Customs Duty 1,521.7 2.3 - VAT 10,009.2 15.0 - Sub-total 16,907.8 25.4 - Contingency 8,272.1 12.4 -
Total 66,540.3 100.0 -
D - 32
CHAPTER IV SEWERAGE IMPROVEMENT OF DUGO SELO
4.1 Existing Sewerage System 4.1.1 Service Area and Population Dugo Selo belongs to Zagreb County and consists of nine (9) settlements. The total administrative area and existing population (1999) and future projection (2015) are shown below compared with the population in 1991.
Item Urban Center Rural Area Total Area (ha) 299.6 4,922.3 5,221.9 Population (1991) 6,508 3,461 9,969 (1999) 10,570 4,756 15,326 (2015) 12,301 5,535 17,836
The town is divided into two parts by the railway. The part north of the railway is highly developed and the existing sewerage system serves not only the densely populated central urban area (299.6 ha) but also the western settlement of Kopčevec and some surrounding areas. Hence, the existing service area and population of the sewerage system covers approximately 515.9 ha and 9,100, respectively. For the existing service area, see Fig. D.4.1. 4.1.2 Existing Industries There is no industry registered by Croatian Waters as industrial pollutant in the town. 4.1.3 Sewer Network The existing sewer network is of the combined type (see Fig. D.4.1). Construction started in 1950 and in the recent four (4) years, 4,000 m of sewer pipe had been installed. With diameters ranging from 30 cm to 120 cm, the total length of the sewer network is 16,541 m. The unit pipe length is 2.5 m with rubber ring. The sewer network collecting municipal wastewater in the service area discharges the wastewater into the neighboring canals at six (6) outfalls and finally into the Črnec River with no treatment. All wastewaters of the sewerage area are discharged by gravity with no pump. The sewer network is not in good condition; the pipes and manholes are choked with mud here and there in lowland areas. As for storm water drainage, the sewer is designed to cope with rainfall of 20 minutes duration and two-year return period. There are two (2) overflow chambers of rainwater. 4.1.4 Wastewater Flow and Quality The JICA Study team analyzed the quantity and quality of wastewater at the Puhovec Bridge on November 27, 2000. The results for major parameters are shown below. For other parameters, see Table B.4.3 in Appendix B.
Parameter Unit Value Parameter Unit Value Sampling Time - 09:30 CODMn mg/l 33.0 Flow m3/sec 0.046 TSS mg/l - PH - 7.48 T-N mg/l 28.0 BOD mg/l 70.0 T-P mg/l 3.91
4.2 Planning Basis 4.2.1 Service Area, Population and Industries
(1) Service Area and Population The extension area is near the fringe of the existing service area where future improvement is expected. It consists of the northeastern settlement of Kozinščak, the
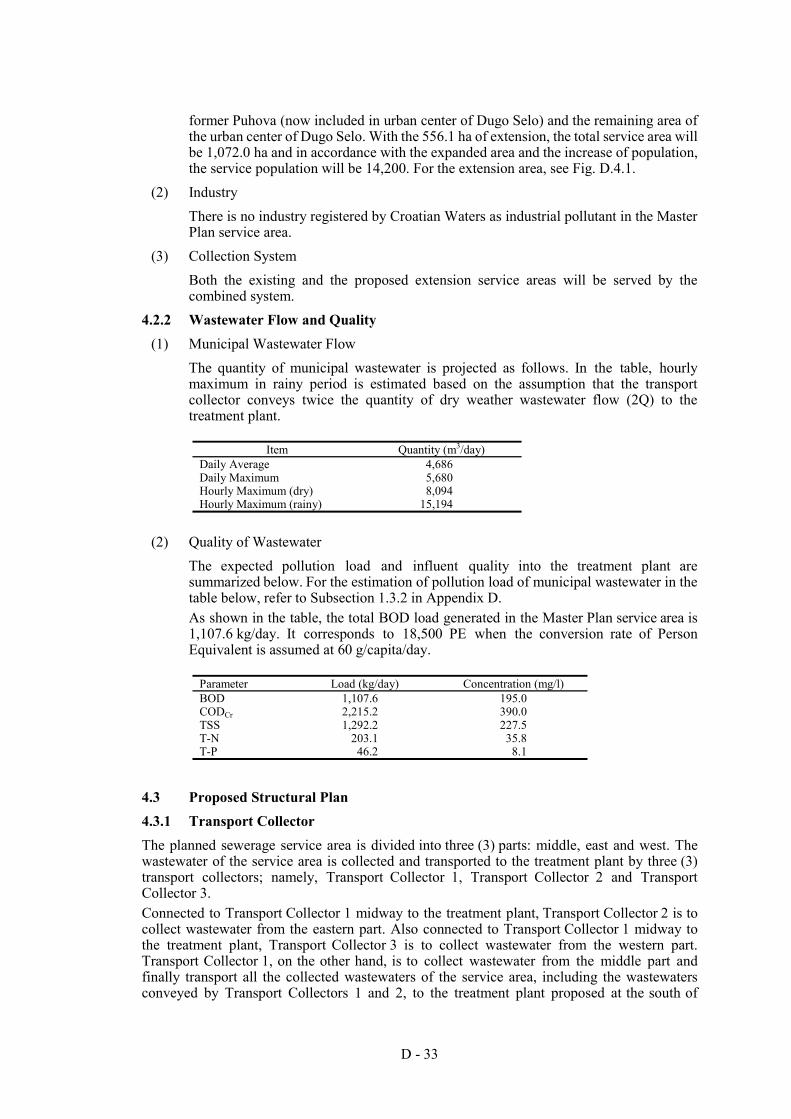
D - 33
former Puhova (now included in urban center of Dugo Selo) and the remaining area of the urban center of Dugo Selo. With the 556.1 ha of extension, the total service area will be 1,072.0 ha and in accordance with the expanded area and the increase of population, the service population will be 14,200. For the extension area, see Fig. D.4.1.
(2) Industry There is no industry registered by Croatian Waters as industrial pollutant in the Master Plan service area.
(3) Collection System Both the existing and the proposed extension service areas will be served by the combined system.
4.2.2 Wastewater Flow and Quality (1) Municipal Wastewater Flow
The quantity of municipal wastewater is projected as follows. In the table, hourly maximum in rainy period is estimated based on the assumption that the transport collector conveys twice the quantity of dry weather wastewater flow (2Q) to the treatment plant.
Item Quantity (m3/day)
Daily Average 4,686 Daily Maximum 5,680 Hourly Maximum (dry) 8,094 Hourly Maximum (rainy) 15,194
(2) Quality of Wastewater The expected pollution load and influent quality into the treatment plant are summarized below. For the estimation of pollution load of municipal wastewater in the table below, refer to Subsection 1.3.2 in Appendix D. As shown in the table, the total BOD load generated in the Master Plan service area is 1,107.6 kg/day. It corresponds to 18,500 PE when the conversion rate of Person Equivalent is assumed at 60 g/capita/day.
Parameter Load (kg/day) Concentration (mg/l) BOD 1,107.6 195.0 CODCr 2,215.2 390.0 TSS 1,292.2 227.5 T-N 203.1 35.8 T-P 46.2 8.1
4.3 Proposed Structural Plan 4.3.1 Transport Collector The planned sewerage service area is divided into three (3) parts: middle, east and west. The wastewater of the service area is collected and transported to the treatment plant by three (3) transport collectors; namely, Transport Collector 1, Transport Collector 2 and Transport Collector 3. Connected to Transport Collector 1 midway to the treatment plant, Transport Collector 2 is to collect wastewater from the eastern part. Also connected to Transport Collector 1 midway to the treatment plant, Transport Collector 3 is to collect wastewater from the western part. Transport Collector 1, on the other hand, is to collect wastewater from the middle part and finally transport all the collected wastewaters of the service area, including the wastewaters conveyed by Transport Collectors 1 and 2, to the treatment plant proposed at the south of
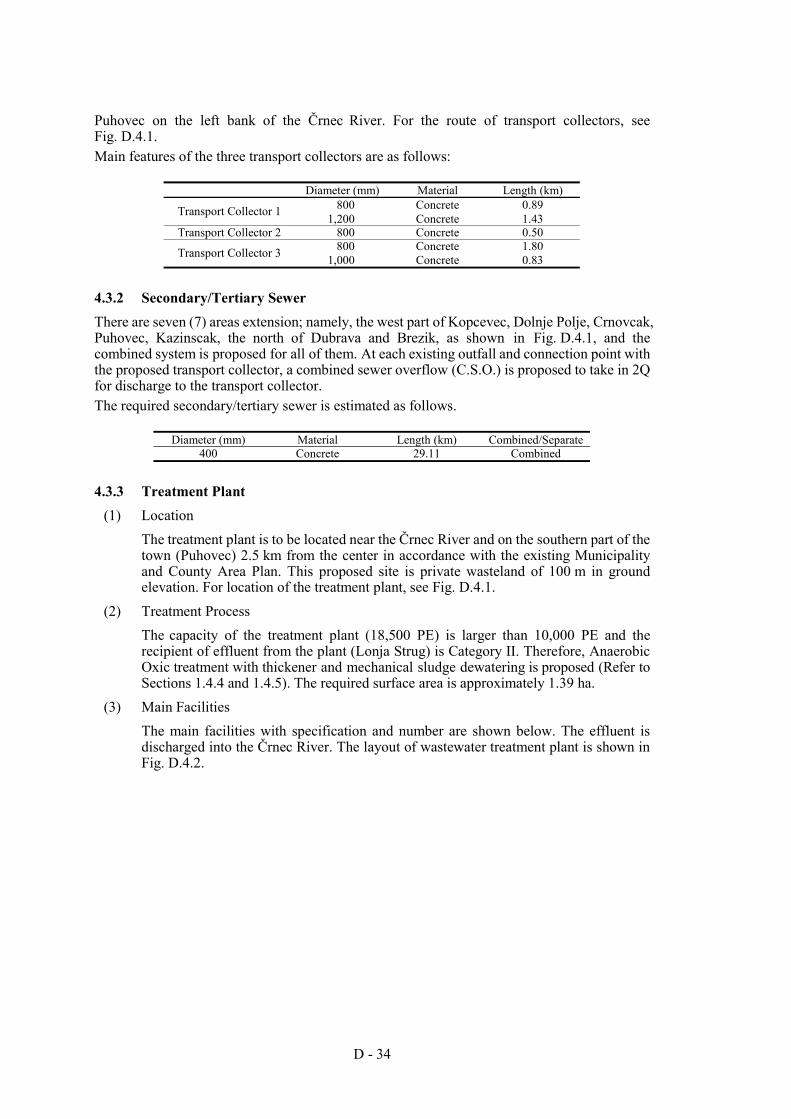
D - 34
Puhovec on the left bank of the Črnec River. For the route of transport collectors, see Fig. D.4.1. Main features of the three transport collectors are as follows:
Diameter (mm) Material Length (km) 800 Concrete 0.89 Transport Collector 1 1,200 Concrete 1.43
Transport Collector 2 800 Concrete 0.50 800 Concrete 1.80 Transport Collector 3 1,000 Concrete 0.83
4.3.2 Secondary/Tertiary Sewer There are seven (7) areas extension; namely, the west part of Kopcevec, Dolnje Polje, Crnovcak, Puhovec, Kazinscak, the north of Dubrava and Brezik, as shown in Fig. D.4.1, and the combined system is proposed for all of them. At each existing outfall and connection point with the proposed transport collector, a combined sewer overflow (C.S.O.) is proposed to take in 2Q for discharge to the transport collector. The required secondary/tertiary sewer is estimated as follows.
Diameter (mm) Material Length (km) Combined/Separate 400 Concrete 29.11 Combined
4.3.3 Treatment Plant (1) Location
The treatment plant is to be located near the Črnec River and on the southern part of the town (Puhovec) 2.5 km from the center in accordance with the existing Municipality and County Area Plan. This proposed site is private wasteland of 100 m in ground elevation. For location of the treatment plant, see Fig. D.4.1.
(2) Treatment Process The capacity of the treatment plant (18,500 PE) is larger than 10,000 PE and the recipient of effluent from the plant (Lonja Strug) is Category II. Therefore, Anaerobic Oxic treatment with thickener and mechanical sludge dewatering is proposed (Refer to Sections 1.4.4 and 1.4.5). The required surface area is approximately 1.39 ha.
(3) Main Facilities The main facilities with specification and number are shown below. The effluent is discharged into the Črnec River. The layout of wastewater treatment plant is shown in Fig. D.4.2.
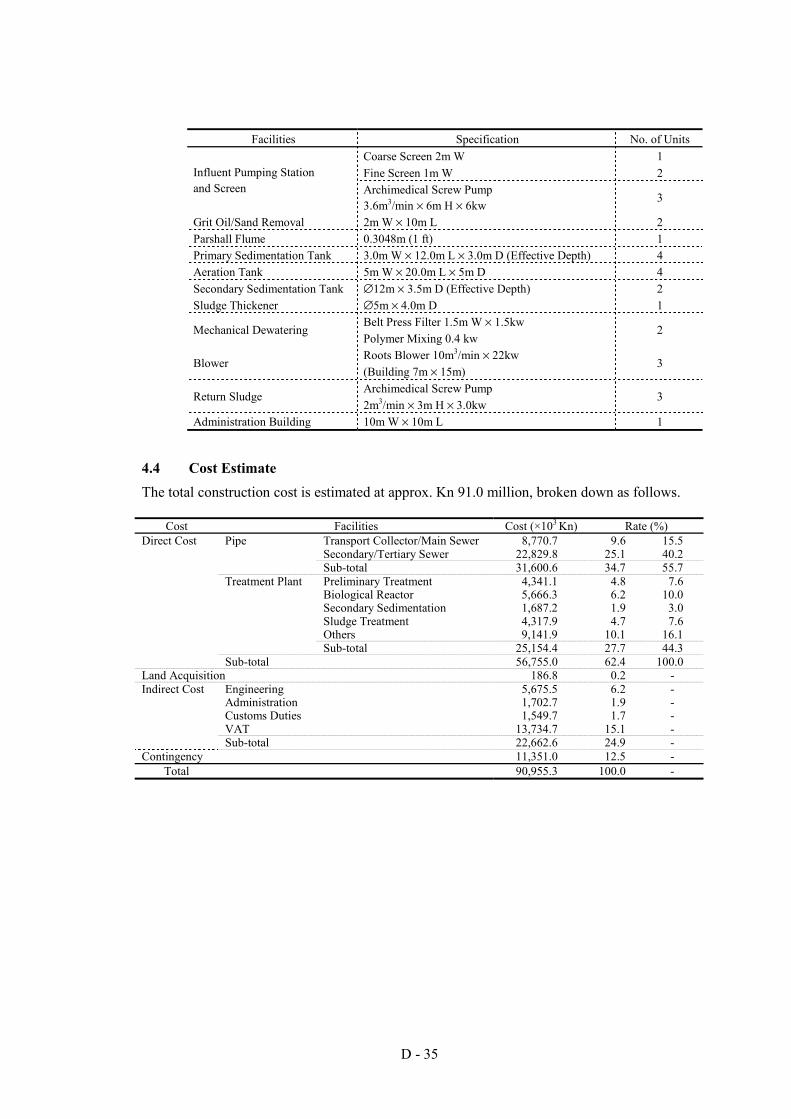
D - 35
Facilities Specification No. of Units
Coarse Screen 2m W 1 Fine Screen 1m W 2 Influent Pumping Station
and Screen Archimedical Screw Pump 3.6m3/min × 6m H × 6kw
3
Grit Oil/Sand Removal 2m W × 10m L 2 Parshall Flume 0.3048m (1 ft) 1 Primary Sedimentation Tank 3.0m W × 12.0m L × 3.0m D (Effective Depth) 4 Aeration Tank 5m W × 20.0m L × 5m D 4 Secondary Sedimentation Tank ∅12m × 3.5m D (Effective Depth) 2 Sludge Thickener ∅5m × 4.0m D 1
Belt Press Filter 1.5m W × 1.5kw Mechanical Dewatering
Polymer Mixing 0.4 kw 2
Roots Blower 10m3/min × 22kw Blower
(Building 7m × 15m) 3
Archimedical Screw Pump Return Sludge
2m3/min × 3m H × 3.0kw 3
Administration Building 10m W × 10m L 1
4.4 Cost Estimate The total construction cost is estimated at approx. Kn 91.0 million, broken down as follows.
Cost Facilities Cost (×103 Kn) Rate (%) Direct Cost Pipe Transport Collector/Main Sewer 8,770.7 9.6 15.5 Secondary/Tertiary Sewer 22,829.8 25.1 40.2 Sub-total 31,600.6 34.7 55.7 Treatment Plant Preliminary Treatment 4,341.1 4.8 7.6 Biological Reactor 5,666.3 6.2 10.0 Secondary Sedimentation 1,687.2 1.9 3.0 Sludge Treatment 4,317.9 4.7 7.6 Others 9,141.9 10.1 16.1 Sub-total 25,154.4 27.7 44.3 Sub-total 56,755.0 62.4 100.0 Land Acquisition 186.8 0.2 - Indirect Cost Engineering 5,675.5 6.2 - Administration 1,702.7 1.9 - Customs Duties 1,549.7 1.7 - VAT 13,734.7 15.1 - Sub-total 22,662.6 24.9 - Contingency 11,351.0 12.5 -
Total 90,955.3 100.0 -
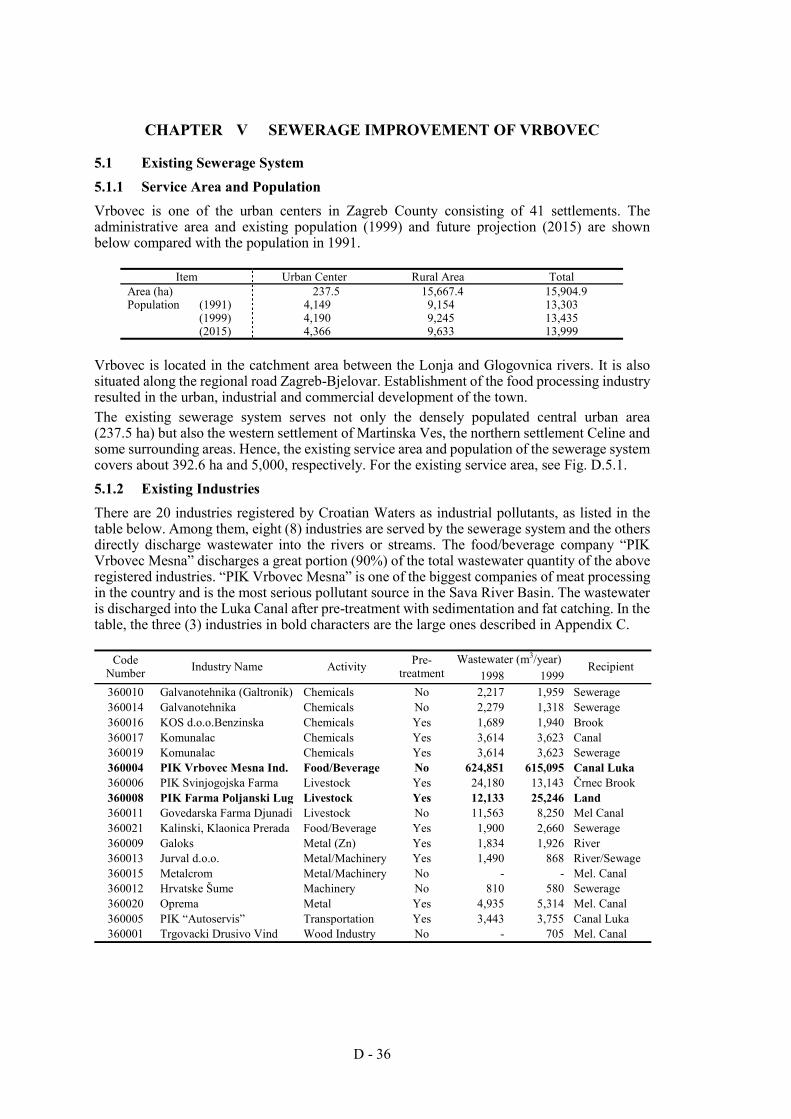
D - 36
CHAPTER V SEWERAGE IMPROVEMENT OF VRBOVEC
5.1 Existing Sewerage System 5.1.1 Service Area and Population Vrbovec is one of the urban centers in Zagreb County consisting of 41 settlements. The administrative area and existing population (1999) and future projection (2015) are shown below compared with the population in 1991.
Item Urban Center Rural Area Total Area (ha) 237.5 15,667.4 15,904.9 Population (1991) 4,149 9,154 13,303 (1999) 4,190 9,245 13,435 (2015) 4,366 9,633 13,999
Vrbovec is located in the catchment area between the Lonja and Glogovnica rivers. It is also situated along the regional road Zagreb-Bjelovar. Establishment of the food processing industry resulted in the urban, industrial and commercial development of the town. The existing sewerage system serves not only the densely populated central urban area (237.5 ha) but also the western settlement of Martinska Ves, the northern settlement Celine and some surrounding areas. Hence, the existing service area and population of the sewerage system covers about 392.6 ha and 5,000, respectively. For the existing service area, see Fig. D.5.1. 5.1.2 Existing Industries There are 20 industries registered by Croatian Waters as industrial pollutants, as listed in the table below. Among them, eight (8) industries are served by the sewerage system and the others directly discharge wastewater into the rivers or streams. The food/beverage company “PIK Vrbovec Mesna” discharges a great portion (90%) of the total wastewater quantity of the above registered industries. “PIK Vrbovec Mesna” is one of the biggest companies of meat processing in the country and is the most serious pollutant source in the Sava River Basin. The wastewater is discharged into the Luka Canal after pre-treatment with sedimentation and fat catching. In the table, the three (3) industries in bold characters are the large ones described in Appendix C.
Wastewater (m3/year) Code Number Industry Name Activity Pre-
treatment 1998 1999 Recipient
360010 Galvanotehnika (Galtronik) Chemicals No 2,217 1,959 Sewerage 360014 Galvanotehnika Chemicals No 2,279 1,318 Sewerage 360016 KOS d.o.o.Benzinska Chemicals Yes 1,689 1,940 Brook 360017 Komunalac Chemicals Yes 3,614 3,623 Canal 360019 Komunalac Chemicals Yes 3,614 3,623 Sewerage 360004 PIK Vrbovec Mesna Ind. Food/Beverage No 624,851 615,095 Canal Luka 360006 PIK Svinjogojska Farma Livestock Yes 24,180 13,143 Črnec Brook 360008 PIK Farma Poljanski Lug Livestock Yes 12,133 25,246 Land 360011 Govedarska Farma Djunadi Livestock No 11,563 8,250 Mel Canal 360021 Kalinski, Klaonica Prerada Food/Beverage Yes 1,900 2,660 Sewerage 360009 Galoks Metal (Zn) Yes 1,834 1,926 River 360013 Jurval d.o.o. Metal/Machinery Yes 1,490 868 River/Sewage 360015 Metalcrom Metal/Machinery No - - Mel. Canal 360012 Hrvatske Šume Machinery No 810 580 Sewerage 360020 Oprema Metal Yes 4,935 5,314 Mel. Canal 360005 PIK “Autoservis” Transportation Yes 3,443 3,755 Canal Luka 360001 Trgovacki Drusivo Vind Wood Industry No - 705 Mel. Canal
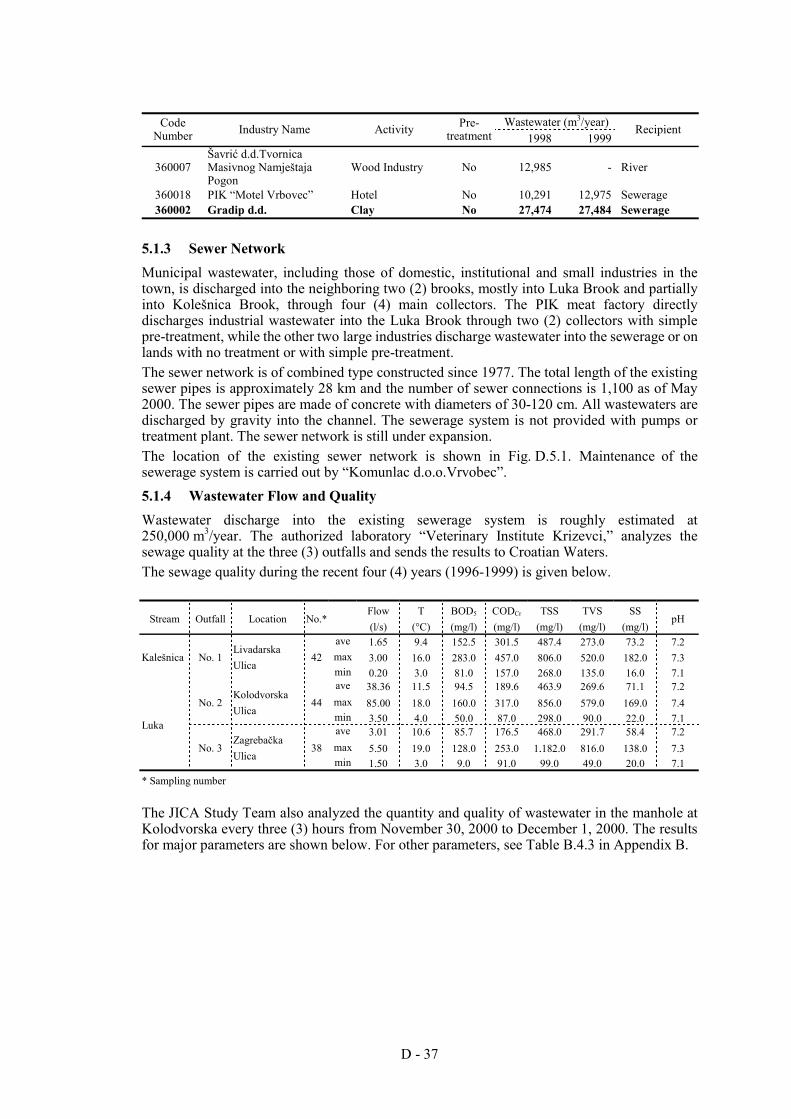
D - 37
Wastewater (m3/year) Code Number Industry Name Activity Pre-
treatment 1998 1999 Recipient
360007 Šavrić d.d.Tvornica Masivnog Namještaja Pogon
Wood Industry No 12,985 - River
360018 PIK “Motel Vrbovec” Hotel No 10,291 12,975 Sewerage 360002 Gradip d.d. Clay No 27,474 27,484 Sewerage
5.1.3 Sewer Network Municipal wastewater, including those of domestic, institutional and small industries in the town, is discharged into the neighboring two (2) brooks, mostly into Luka Brook and partially into Kolešnica Brook, through four (4) main collectors. The PIK meat factory directly discharges industrial wastewater into the Luka Brook through two (2) collectors with simple pre-treatment, while the other two large industries discharge wastewater into the sewerage or on lands with no treatment or with simple pre-treatment. The sewer network is of combined type constructed since 1977. The total length of the existing sewer pipes is approximately 28 km and the number of sewer connections is 1,100 as of May 2000. The sewer pipes are made of concrete with diameters of 30-120 cm. All wastewaters are discharged by gravity into the channel. The sewerage system is not provided with pumps or treatment plant. The sewer network is still under expansion. The location of the existing sewer network is shown in Fig. D.5.1. Maintenance of the sewerage system is carried out by “Komunlac d.o.o.Vrvobec”. 5.1.4 Wastewater Flow and Quality Wastewater discharge into the existing sewerage system is roughly estimated at 250,000 m3/year. The authorized laboratory “Veterinary Institute Krizevci,” analyzes the sewage quality at the three (3) outfalls and sends the results to Croatian Waters. The sewage quality during the recent four (4) years (1996-1999) is given below.
Stream Outfall Location No.* Flow (l/s)
T (°C)
BOD5 (mg/l)
CODCr (mg/l)
TSS (mg/l)
TVS (mg/l)
SS (mg/l)
pH
ave 1.65 9.4 152.5 301.5 487.4 273.0 73.2 7.2 max 3.00 16.0 283.0 457.0 806.0 520.0 182.0 7.3 Kalešnica No. 1
Livadarska Ulica
42 min 0.20 3.0 81.0 157.0 268.0 135.0 16.0 7.1 ave 38.36 11.5 94.5 189.6 463.9 269.6 71.1 7.2 max 85.00 18.0 160.0 317.0 856.0 579.0 169.0 7.4 No. 2
Kolodvorska Ulica
44 min 3.50 4.0 50.0 87.0 298.0 90.0 22.0 7.1 ave 3.01 10.6 85.7 176.5 468.0 291.7 58.4 7.2 max 5.50 19.0 128.0 253.0 1,182.0 816.0 138.0 7.3
Luka
No. 3 Zagrebačka Ulica
38 min 1.50 3.0 9.0 91.0 99.0 49.0 20.0 7.1
* Sampling number The JICA Study Team also analyzed the quantity and quality of wastewater in the manhole at Kolodvorska every three (3) hours from November 30, 2000 to December 1, 2000. The results for major parameters are shown below. For other parameters, see Table B.4.3 in Appendix B.
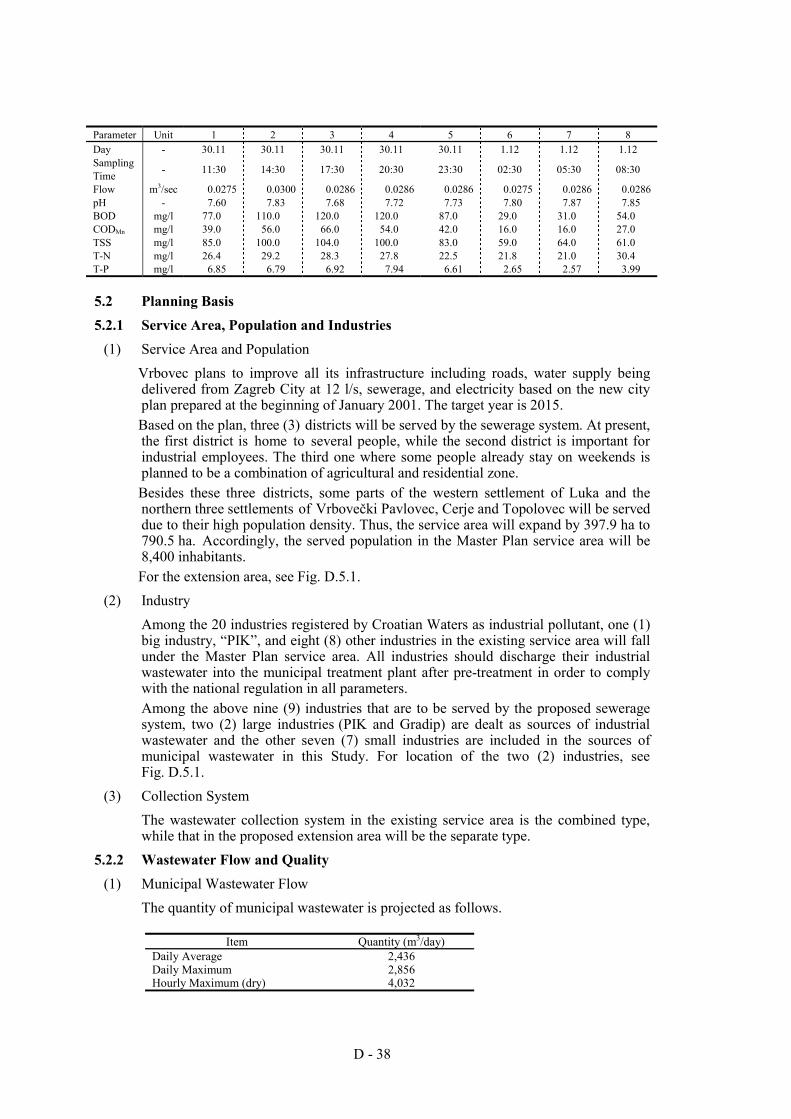
D - 38
Parameter Unit 1 2 3 4 5 6 7 8 Day - 30.11 30.11 30.11 30.11 30.11 1.12 1.12 1.12 Sampling Time - 11:30 14:30 17:30 20:30 23:30 02:30 05:30 08:30
Flow m3/sec 0.0275 0.0300 0.0286 0.0286 0.0286 0.0275 0.0286 0.0286 pH - 7.60 7.83 7.68 7.72 7.73 7.80 7.87 7.85 BOD mg/l 77.0 110.0 120.0 120.0 87.0 29.0 31.0 54.0 CODMn mg/l 39.0 56.0 66.0 54.0 42.0 16.0 16.0 27.0 TSS mg/l 85.0 100.0 104.0 100.0 83.0 59.0 64.0 61.0 T-N mg/l 26.4 29.2 28.3 27.8 22.5 21.8 21.0 30.4 T-P mg/l 6.85 6.79 6.92 7.94 6.61 2.65 2.57 3.99 5.2 Planning Basis 5.2.1 Service Area, Population and Industries
(1) Service Area and Population Vrbovec plans to improve all its infrastructure including roads, water supply being delivered from Zagreb City at 12 l/s, sewerage, and electricity based on the new city plan prepared at the beginning of January 2001. The target year is 2015. Based on the plan, three (3) districts will be served by the sewerage system. At present, the first district is home to several people, while the second district is important for industrial employees. The third one where some people already stay on weekends is planned to be a combination of agricultural and residential zone. Besides these three districts, some parts of the western settlement of Luka and the northern three settlements of Vrbovečki Pavlovec, Cerje and Topolovec will be served due to their high population density. Thus, the service area will expand by 397.9 ha to 790.5 ha. Accordingly, the served population in the Master Plan service area will be 8,400 inhabitants. For the extension area, see Fig. D.5.1.
(2) Industry Among the 20 industries registered by Croatian Waters as industrial pollutant, one (1) big industry, “PIK”, and eight (8) other industries in the existing service area will fall under the Master Plan service area. All industries should discharge their industrial wastewater into the municipal treatment plant after pre-treatment in order to comply with the national regulation in all parameters. Among the above nine (9) industries that are to be served by the proposed sewerage system, two (2) large industries (PIK and Gradip) are dealt as sources of industrial wastewater and the other seven (7) small industries are included in the sources of municipal wastewater in this Study. For location of the two (2) industries, see Fig. D.5.1.
(3) Collection System The wastewater collection system in the existing service area is the combined type, while that in the proposed extension area will be the separate type.
5.2.2 Wastewater Flow and Quality (1) Municipal Wastewater Flow
The quantity of municipal wastewater is projected as follows.
Item Quantity (m3/day) Daily Average 2,436 Daily Maximum 2,856 Hourly Maximum (dry) 4,032
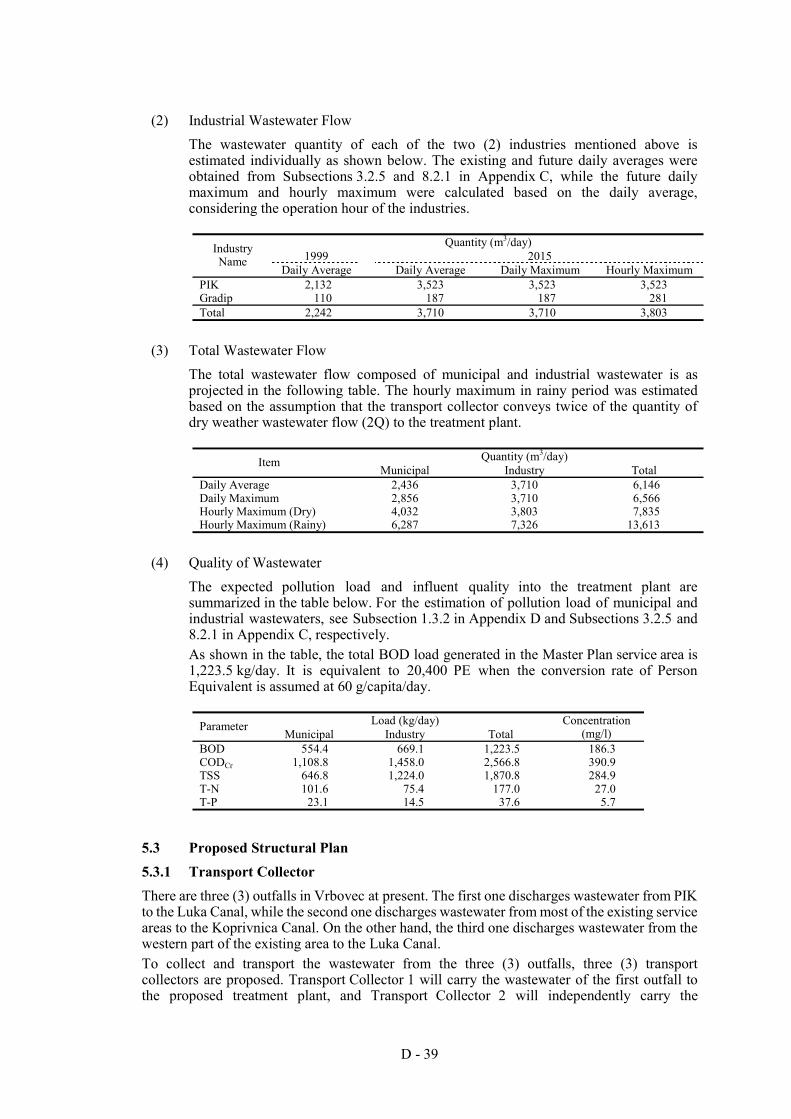
D - 39
(2) Industrial Wastewater Flow The wastewater quantity of each of the two (2) industries mentioned above is estimated individually as shown below. The existing and future daily averages were obtained from Subsections 3.2.5 and 8.2.1 in Appendix C, while the future daily maximum and hourly maximum were calculated based on the daily average, considering the operation hour of the industries.
Quantity (m3/day)
1999 2015 Industry Name
Daily Average Daily Average Daily Maximum Hourly Maximum PIK 2,132 3,523 3,523 3,523 Gradip 110 187 187 281 Total 2,242 3,710 3,710 3,803
(3) Total Wastewater Flow The total wastewater flow composed of municipal and industrial wastewater is as projected in the following table. The hourly maximum in rainy period was estimated based on the assumption that the transport collector conveys twice of the quantity of dry weather wastewater flow (2Q) to the treatment plant.
Quantity (m3/day) Item
Municipal Industry Total Daily Average 2,436 3,710 6,146 Daily Maximum 2,856 3,710 6,566 Hourly Maximum (Dry) 4,032 3,803 7,835 Hourly Maximum (Rainy) 6,287 7,326 13,613
(4) Quality of Wastewater The expected pollution load and influent quality into the treatment plant are summarized in the table below. For the estimation of pollution load of municipal and industrial wastewaters, see Subsection 1.3.2 in Appendix D and Subsections 3.2.5 and 8.2.1 in Appendix C, respectively. As shown in the table, the total BOD load generated in the Master Plan service area is 1,223.5 kg/day. It is equivalent to 20,400 PE when the conversion rate of Person Equivalent is assumed at 60 g/capita/day.
Load (kg/day) Parameter
Municipal Industry Total Concentration
(mg/l) BOD 554.4 669.1 1,223.5 186.3 CODCr 1,108.8 1,458.0 2,566.8 390.9 TSS 646.8 1,224.0 1,870.8 284.9 T-N 101.6 75.4 177.0 27.0 T-P 23.1 14.5 37.6 5.7
5.3 Proposed Structural Plan 5.3.1 Transport Collector There are three (3) outfalls in Vrbovec at present. The first one discharges wastewater from PIK to the Luka Canal, while the second one discharges wastewater from most of the existing service areas to the Koprivnica Canal. On the other hand, the third one discharges wastewater from the western part of the existing area to the Luka Canal. To collect and transport the wastewater from the three (3) outfalls, three (3) transport collectors are proposed. Transport Collector 1 will carry the wastewater of the first outfall to the proposed treatment plant, and Transport Collector 2 will independently carry the
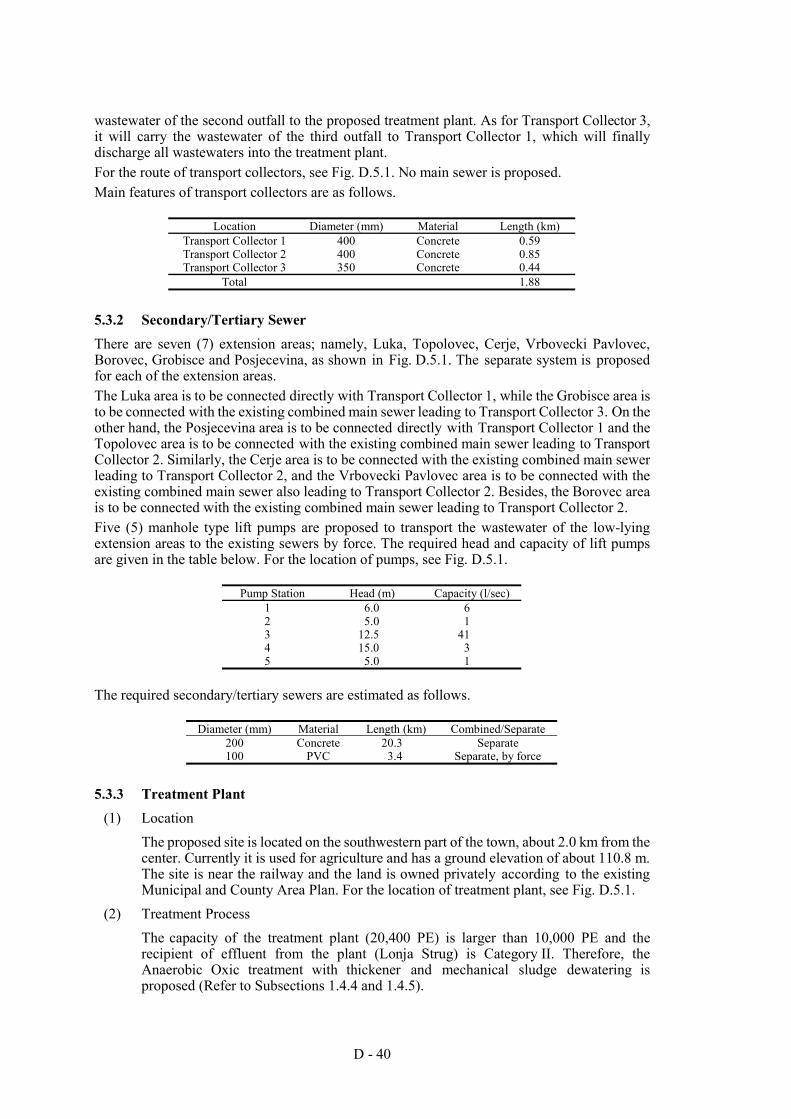
D - 40
wastewater of the second outfall to the proposed treatment plant. As for Transport Collector 3, it will carry the wastewater of the third outfall to Transport Collector 1, which will finally discharge all wastewaters into the treatment plant. For the route of transport collectors, see Fig. D.5.1. No main sewer is proposed. Main features of transport collectors are as follows.
Location Diameter (mm) Material Length (km) Transport Collector 1 400 Concrete 0.59 Transport Collector 2 400 Concrete 0.85 Transport Collector 3 350 Concrete 0.44
Total 1.88
5.3.2 Secondary/Tertiary Sewer There are seven (7) extension areas; namely, Luka, Topolovec, Cerje, Vrbovecki Pavlovec, Borovec, Grobisce and Posjecevina, as shown in Fig. D.5.1. The separate system is proposed for each of the extension areas. The Luka area is to be connected directly with Transport Collector 1, while the Grobisce area is to be connected with the existing combined main sewer leading to Transport Collector 3. On the other hand, the Posjecevina area is to be connected directly with Transport Collector 1 and the Topolovec area is to be connected with the existing combined main sewer leading to Transport Collector 2. Similarly, the Cerje area is to be connected with the existing combined main sewer leading to Transport Collector 2, and the Vrbovecki Pavlovec area is to be connected with the existing combined main sewer also leading to Transport Collector 2. Besides, the Borovec area is to be connected with the existing combined main sewer leading to Transport Collector 2. Five (5) manhole type lift pumps are proposed to transport the wastewater of the low-lying extension areas to the existing sewers by force. The required head and capacity of lift pumps are given in the table below. For the location of pumps, see Fig. D.5.1.
Pump Station Head (m) Capacity (l/sec) 1 6.0 6 2 5.0 1 3 12.5 41 4 15.0 3 5 5.0 1
The required secondary/tertiary sewers are estimated as follows.
Diameter (mm) Material Length (km) Combined/Separate 200 Concrete 20.3 Separate 100 PVC 3.4 Separate, by force
5.3.3 Treatment Plant (1) Location
The proposed site is located on the southwestern part of the town, about 2.0 km from the center. Currently it is used for agriculture and has a ground elevation of about 110.8 m. The site is near the railway and the land is owned privately according to the existing Municipal and County Area Plan. For the location of treatment plant, see Fig. D.5.1.
(2) Treatment Process The capacity of the treatment plant (20,400 PE) is larger than 10,000 PE and the recipient of effluent from the plant (Lonja Strug) is Category II. Therefore, the Anaerobic Oxic treatment with thickener and mechanical sludge dewatering is proposed (Refer to Subsections 1.4.4 and 1.4.5).
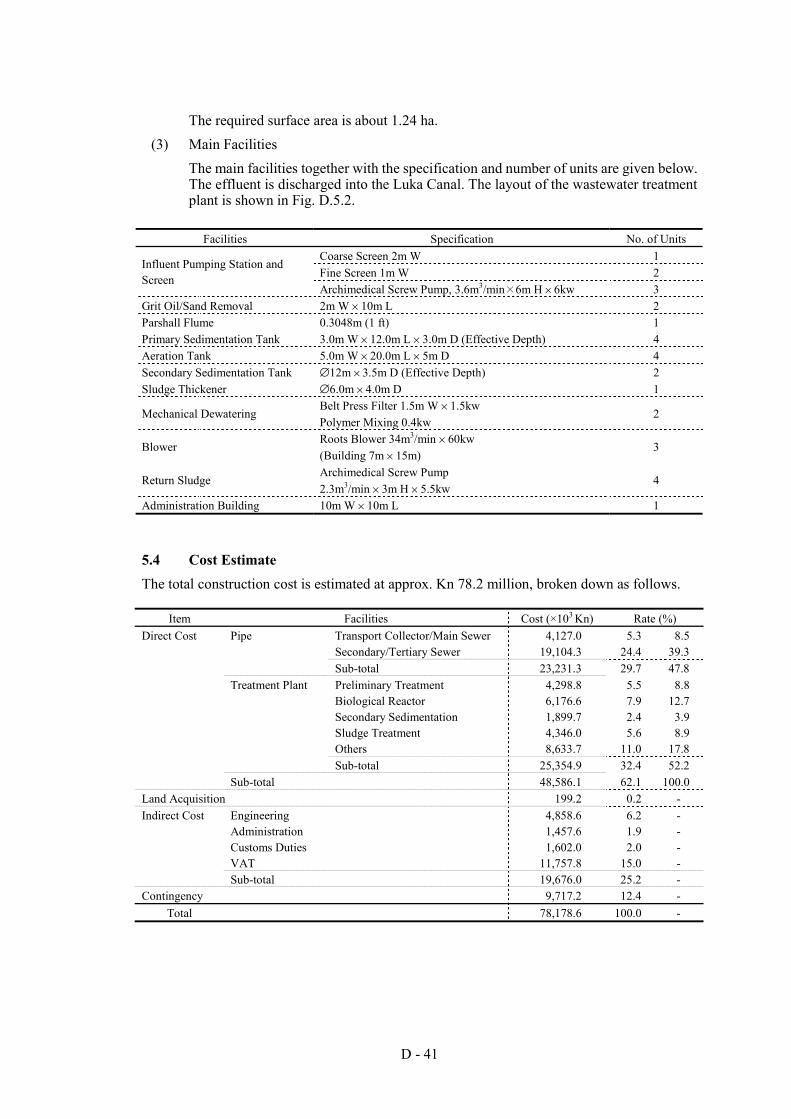
D - 41
The required surface area is about 1.24 ha. (3) Main Facilities
The main facilities together with the specification and number of units are given below. The effluent is discharged into the Luka Canal. The layout of the wastewater treatment plant is shown in Fig. D.5.2.
Facilities Specification No. of Units
Coarse Screen 2m W 1 Fine Screen 1m W 2
Influent Pumping Station and Screen
Archimedical Screw Pump, 3.6m3/min×6m H × 6kw 3 Grit Oil/Sand Removal 2m W × 10m L 2 Parshall Flume 0.3048m (1 ft) 1 Primary Sedimentation Tank 3.0m W × 12.0m L × 3.0m D (Effective Depth) 4 Aeration Tank 5.0m W × 20.0m L × 5m D 4 Secondary Sedimentation Tank ∅12m × 3.5m D (Effective Depth) 2 Sludge Thickener ∅6.0m × 4.0m D 1
Belt Press Filter 1.5m W × 1.5kw Mechanical Dewatering
Polymer Mixing 0.4kw 2
Roots Blower 34m3/min × 60kw Blower
(Building 7m × 15m) 3
Archimedical Screw Pump Return Sludge
2.3m3/min × 3m H × 5.5kw 4
Administration Building 10m W × 10m L 1
5.4 Cost Estimate The total construction cost is estimated at approx. Kn 78.2 million, broken down as follows.
Item Facilities Cost (×103 Kn) Rate (%) Direct Cost Pipe Transport Collector/Main Sewer 4,127.0 5.3 8.5 Secondary/Tertiary Sewer 19,104.3 24.4 39.3 Sub-total 23,231.3 29.7 47.8 Treatment Plant Preliminary Treatment 4,298.8 5.5 8.8 Biological Reactor 6,176.6 7.9 12.7 Secondary Sedimentation 1,899.7 2.4 3.9 Sludge Treatment 4,346.0 5.6 8.9 Others 8,633.7 11.0 17.8 Sub-total 25,354.9 32.4 52.2 Sub-total 48,586.1 62.1 100.0 Land Acquisition 199.2 0.2 - Indirect Cost Engineering 4,858.6 6.2 - Administration 1,457.6 1.9 - Customs Duties 1,602.0 2.0 - VAT 11,757.8 15.0 - Sub-total 19,676.0 25.2 - Contingency 9,717.2 12.4 -
Total 78,178.6 100.0 -
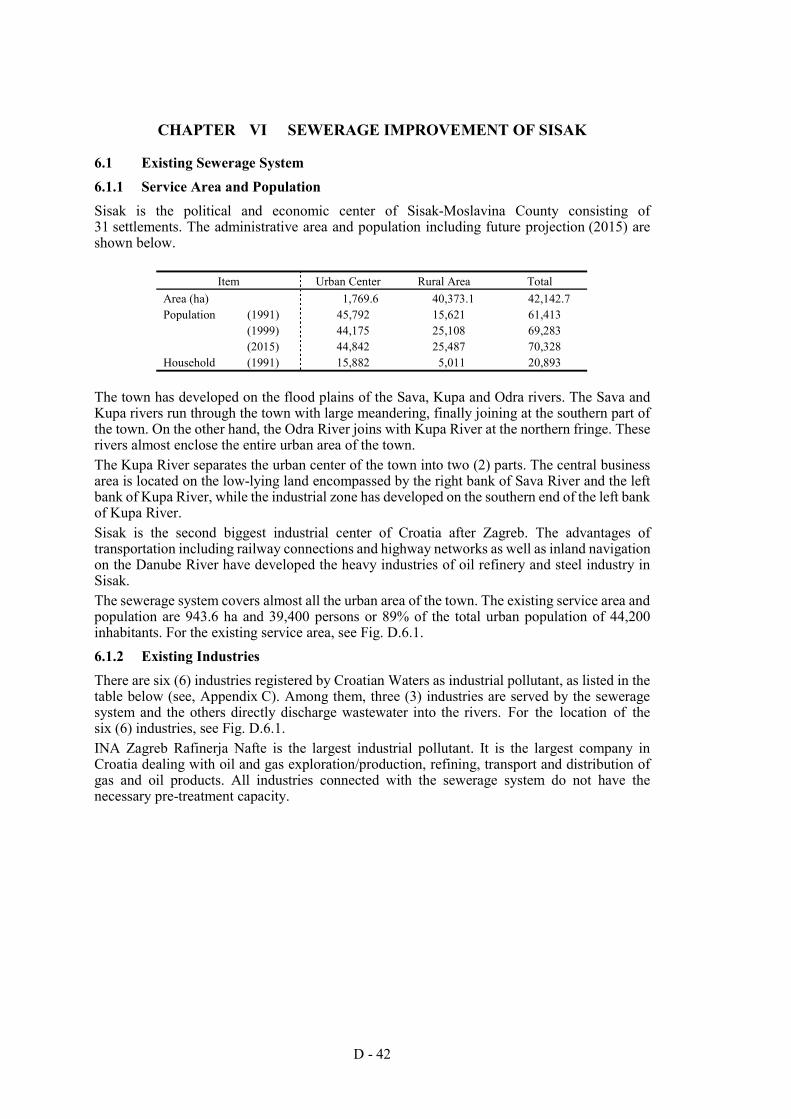
D - 42
CHAPTER VI SEWERAGE IMPROVEMENT OF SISAK
6.1 Existing Sewerage System 6.1.1 Service Area and Population Sisak is the political and economic center of Sisak-Moslavina County consisting of 31 settlements. The administrative area and population including future projection (2015) are shown below.
Item Urban Center Rural Area Total Area (ha) 1,769.6 40,373.1 42,142.7 Population (1991) 45,792 15,621 61,413 (1999) 44,175 25,108 69,283 (2015) 44,842 25,487 70,328 Household (1991) 15,882 5,011 20,893
The town has developed on the flood plains of the Sava, Kupa and Odra rivers. The Sava and Kupa rivers run through the town with large meandering, finally joining at the southern part of the town. On the other hand, the Odra River joins with Kupa River at the northern fringe. These rivers almost enclose the entire urban area of the town. The Kupa River separates the urban center of the town into two (2) parts. The central business area is located on the low-lying land encompassed by the right bank of Sava River and the left bank of Kupa River, while the industrial zone has developed on the southern end of the left bank of Kupa River. Sisak is the second biggest industrial center of Croatia after Zagreb. The advantages of transportation including railway connections and highway networks as well as inland navigation on the Danube River have developed the heavy industries of oil refinery and steel industry in Sisak. The sewerage system covers almost all the urban area of the town. The existing service area and population are 943.6 ha and 39,400 persons or 89% of the total urban population of 44,200 inhabitants. For the existing service area, see Fig. D.6.1. 6.1.2 Existing Industries There are six (6) industries registered by Croatian Waters as industrial pollutant, as listed in the table below (see, Appendix C). Among them, three (3) industries are served by the sewerage system and the others directly discharge wastewater into the rivers. For the location of the six (6) industries, see Fig. D.6.1. INA Zagreb Rafinerja Nafte is the largest industrial pollutant. It is the largest company in Croatia dealing with oil and gas exploration/production, refining, transport and distribution of gas and oil products. All industries connected with the sewerage system do not have the necessary pre-treatment capacity.
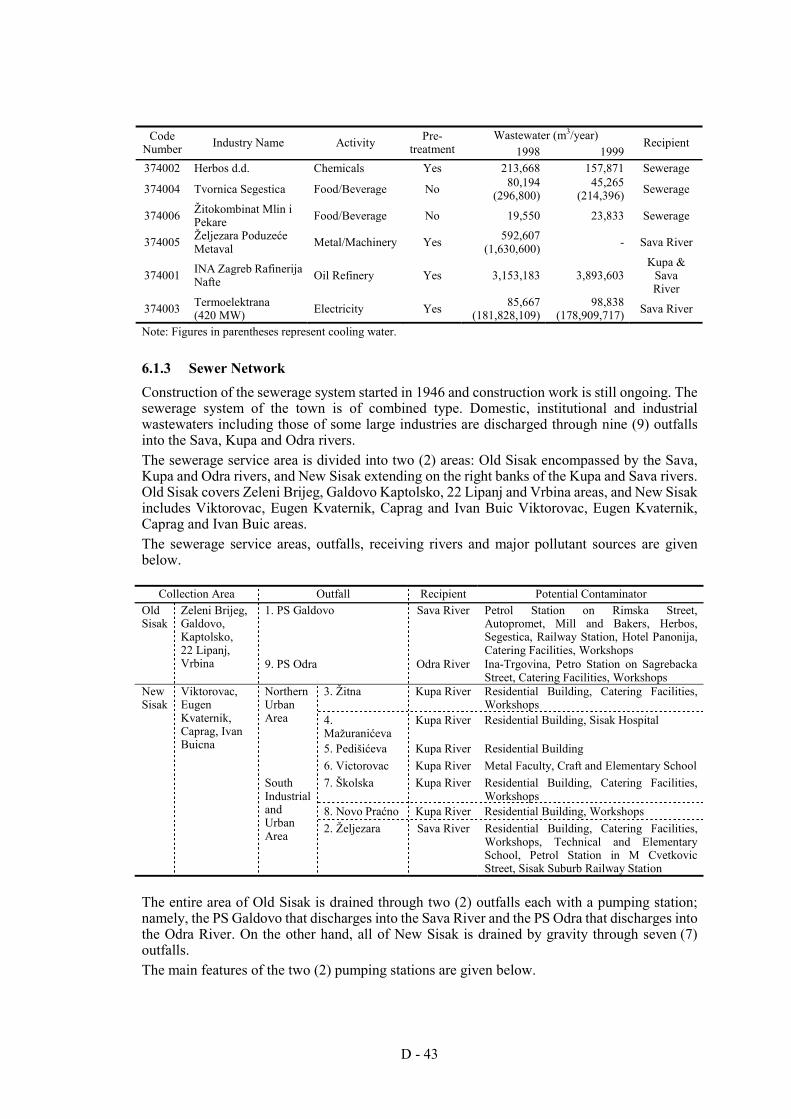
D - 43
Wastewater (m3/year) Code
Number Industry Name Activity Pre- treatment 1998 1999
Recipient
374002 Herbos d.d. Chemicals Yes 213,668 157,871 Sewerage
374004 Tvornica Segestica Food/Beverage No 80,194 (296,800)
45,265 (214,396) Sewerage
374006 Žitokombinat Mlin i Pekare Food/Beverage No 19,550 23,833 Sewerage
374005 Željezara Poduzeće Metaval Metal/Machinery Yes 592,607
(1,630,600) - Sava River
374001 INA Zagreb Rafinerija Nafte Oil Refinery Yes 3,153,183 3,893,603
Kupa & Sava River
374003 Termoelektrana (420 MW) Electricity Yes 85,667
(181,828,109) 98,838
(178,909,717) Sava River
Note: Figures in parentheses represent cooling water.
6.1.3 Sewer Network Construction of the sewerage system started in 1946 and construction work is still ongoing. The sewerage system of the town is of combined type. Domestic, institutional and industrial wastewaters including those of some large industries are discharged through nine (9) outfalls into the Sava, Kupa and Odra rivers. The sewerage service area is divided into two (2) areas: Old Sisak encompassed by the Sava, Kupa and Odra rivers, and New Sisak extending on the right banks of the Kupa and Sava rivers. Old Sisak covers Zeleni Brijeg, Galdovo Kaptolsko, 22 Lipanj and Vrbina areas, and New Sisak includes Viktorovac, Eugen Kvaternik, Caprag and Ivan Buic Viktorovac, Eugen Kvaternik, Caprag and Ivan Buic areas. The sewerage service areas, outfalls, receiving rivers and major pollutant sources are given below.
Collection Area Outfall Recipient Potential Contaminator 1. PS Galdovo Sava River Petrol Station on Rimska Street,
Autopromet, Mill and Bakers, Herbos, Segestica, Railway Station, Hotel Panonija, Catering Facilities, Workshops
Old Sisak
Zeleni Brijeg, Galdovo, Kaptolsko, 22 Lipanj, Vrbina 9. PS Odra Odra River Ina-Trgovina, Petro Station on Sagrebacka
Street, Catering Facilities, Workshops 3. Žitna Kupa River Residential Building, Catering Facilities,
Workshops 4. Mažuranićeva
Kupa River Residential Building, Sisak Hospital
5. Pedišićeva Kupa River Residential Building
Northern Urban Area
6. Victorovac Kupa River Metal Faculty, Craft and Elementary School 7. Školska Kupa River Residential Building, Catering Facilities,
Workshops 8. Novo Praćno Kupa River Residential Building, Workshops
New Sisak
Viktorovac, Eugen Kvaternik, Caprag, Ivan Buicna
South Industrial and Urban Area 2. Željezara Sava River Residential Building, Catering Facilities,
Workshops, Technical and Elementary School, Petrol Station in M Cvetkovic Street, Sisak Suburb Railway Station
The entire area of Old Sisak is drained through two (2) outfalls each with a pumping station; namely, the PS Galdovo that discharges into the Sava River and the PS Odra that discharges into the Odra River. On the other hand, all of New Sisak is drained by gravity through seven (7) outfalls. The main features of the two (2) pumping stations are given below.
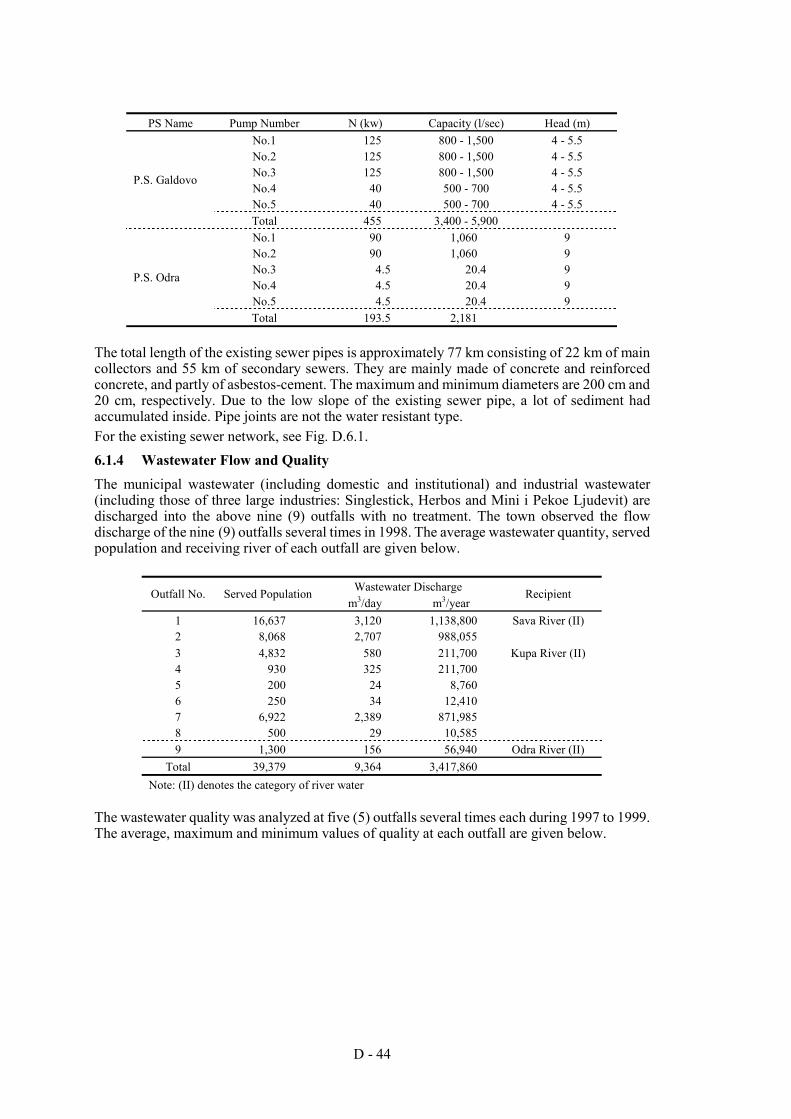
D - 44
PS Name Pump Number N (kw) Capacity (l/sec) Head (m) No.1 125 800 - 1,500 4 - 5.5 No.2 125 800 - 1,500 4 - 5.5 No.3 125 800 - 1,500 4 - 5.5 No.4 40 500 - 700 4 - 5.5 No.5 40 500 - 700 4 - 5.5
P.S. Galdovo
Total 455 3,400 - 5,900 No.1 90 1,060 9 No.2 90 1,060 9 No.3 4.5 20.4 9 No.4 4.5 20.4 9 No.5 4.5 20.4 9
P.S. Odra
Total 193.5 2,181 The total length of the existing sewer pipes is approximately 77 km consisting of 22 km of main collectors and 55 km of secondary sewers. They are mainly made of concrete and reinforced concrete, and partly of asbestos-cement. The maximum and minimum diameters are 200 cm and 20 cm, respectively. Due to the low slope of the existing sewer pipe, a lot of sediment had accumulated inside. Pipe joints are not the water resistant type. For the existing sewer network, see Fig. D.6.1. 6.1.4 Wastewater Flow and Quality The municipal wastewater (including domestic and institutional) and industrial wastewater (including those of three large industries: Singlestick, Herbos and Mini i Pekoe Ljudevit) are discharged into the above nine (9) outfalls with no treatment. The town observed the flow discharge of the nine (9) outfalls several times in 1998. The average wastewater quantity, served population and receiving river of each outfall are given below.
Wastewater Discharge Outfall No. Served Population m3/day m3/year
Recipient
1 16,637 3,120 1,138,800 Sava River (II) 2 8,068 2,707 988,055 3 4,832 580 211,700 Kupa River (II) 4 930 325 211,700 5 200 24 8,760 6 250 34 12,410 7 6,922 2,389 871,985 8 500 29 10,585 9 1,300 156 56,940 Odra River (II)
Total 39,379 9,364 3,417,860 Note: (II) denotes the category of river water
The wastewater quality was analyzed at five (5) outfalls several times each during 1997 to 1999. The average, maximum and minimum values of quality at each outfall are given below.
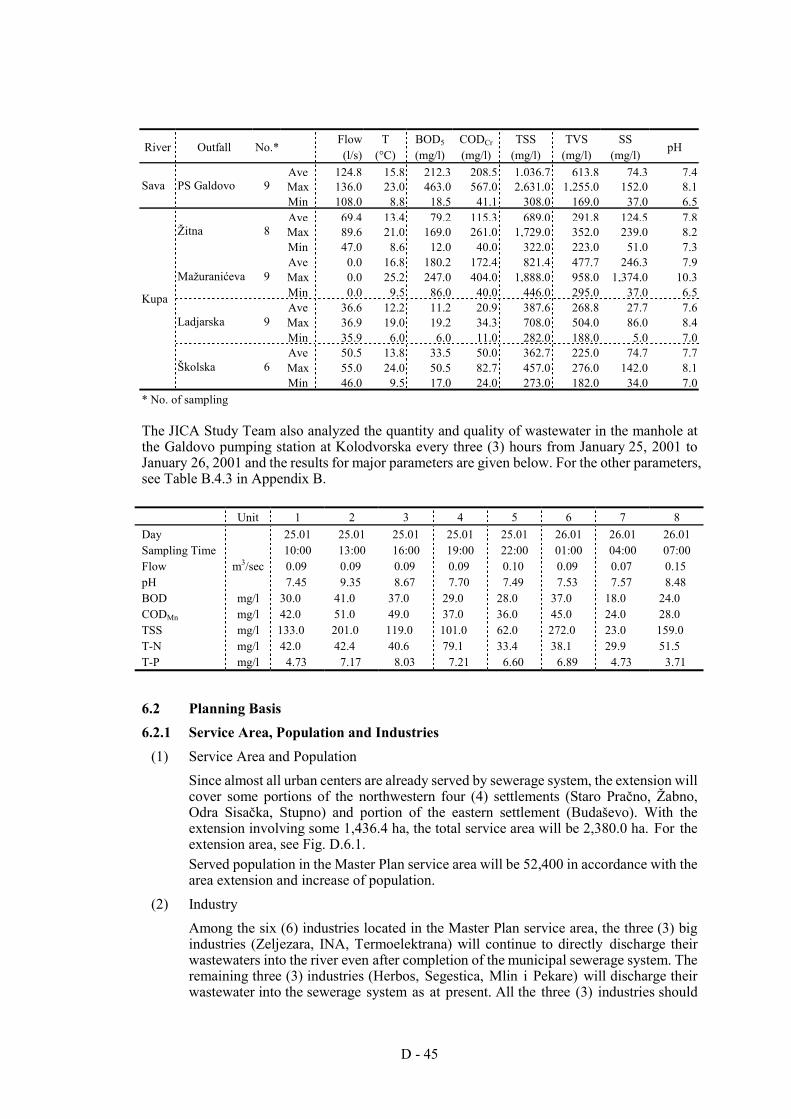
D - 45
River Outfall No.* Flow (l/s)
T (°C)
BOD5 (mg/l)
CODCr (mg/l)
TSS (mg/l)
TVS (mg/l)
SS (mg/l)
pH
Ave 124.8 15.8 212.3 208.5 1,036.7 613.8 74.3 7.4Max 136.0 23.0 463.0 567.0 2,631.0 1,255.0 152.0 8.1 Sava PS Galdovo 9 Min 108.0 8.8 18.5 41.1 308.0 169.0 37.0 6.5 Ave 69.4 13.4 79.2 115.3 689.0 291.8 124.5 7.8Max 89.6 21.0 169.0 261.0 1,729.0 352.0 239.0 8.2 Žitna 8 Min 47.0 8.6 12.0 40.0 322.0 223.0 51.0 7.3 Ave 0.0 16.8 180.2 172.4 821.4 477.7 246.3 7.9 Max 0.0 25.2 247.0 404.0 1,888.0 958.0 1,374.0 10.3 Mažuranićeva 9 Min 0.0 9.5 86.0 40.0 446.0 295.0 37.0 6.5 Ave 36.6 12.2 11.2 20.9 387.6 268.8 27.7 7.6 Max 36.9 19.0 19.2 34.3 708.0 504.0 86.0 8.4 Ladjarska 9 Min 35.9 6.0 6.0 11.0 282.0 188.0 5.0 7.0 Ave 50.5 13.8 33.5 50.0 362.7 225.0 74.7 7.7 Max 55.0 24.0 50.5 82.7 457.0 276.0 142.0 8.1
Kupa
Školska 6 Min 46.0 9.5 17.0 24.0 273.0 182.0 34.0 7.0
* No. of sampling The JICA Study Team also analyzed the quantity and quality of wastewater in the manhole at the Galdovo pumping station at Kolodvorska every three (3) hours from January 25, 2001 to January 26, 2001 and the results for major parameters are given below. For the other parameters, see Table B.4.3 in Appendix B. Unit 1 2 3 4 5 6 7 8 Day 25.01 25.01 25.01 25.01 25.01 26.01 26.01 26.01 Sampling Time 10:00 13:00 16:00 19:00 22:00 01:00 04:00 07:00 Flow m3/sec 0.09 0.09 0.09 0.09 0.10 0.09 0.07 0.15 pH 7.45 9.35 8.67 7.70 7.49 7.53 7.57 8.48 BOD mg/l 30.0 41.0 37.0 29.0 28.0 37.0 18.0 24.0 CODMn mg/l 42.0 51.0 49.0 37.0 36.0 45.0 24.0 28.0 TSS mg/l 133.0 201.0 119.0 101.0 62.0 272.0 23.0 159.0 T-N mg/l 42.0 42.4 40.6 79.1 33.4 38.1 29.9 51.5 T-P mg/l 4.73 7.17 8.03 7.21 6.60 6.89 4.73 3.71
6.2 Planning Basis 6.2.1 Service Area, Population and Industries
(1) Service Area and Population Since almost all urban centers are already served by sewerage system, the extension will cover some portions of the northwestern four (4) settlements (Staro Pračno, Žabno, Odra Sisačka, Stupno) and portion of the eastern settlement (Budaševo). With the extension involving some 1,436.4 ha, the total service area will be 2,380.0 ha. For the extension area, see Fig. D.6.1. Served population in the Master Plan service area will be 52,400 in accordance with the area extension and increase of population.
(2) Industry Among the six (6) industries located in the Master Plan service area, the three (3) big industries (Zeljezara, INA, Termoelektrana) will continue to directly discharge their wastewaters into the river even after completion of the municipal sewerage system. The remaining three (3) industries (Herbos, Segestica, Mlin i Pekare) will discharge their wastewater into the sewerage system as at present. All the three (3) industries should
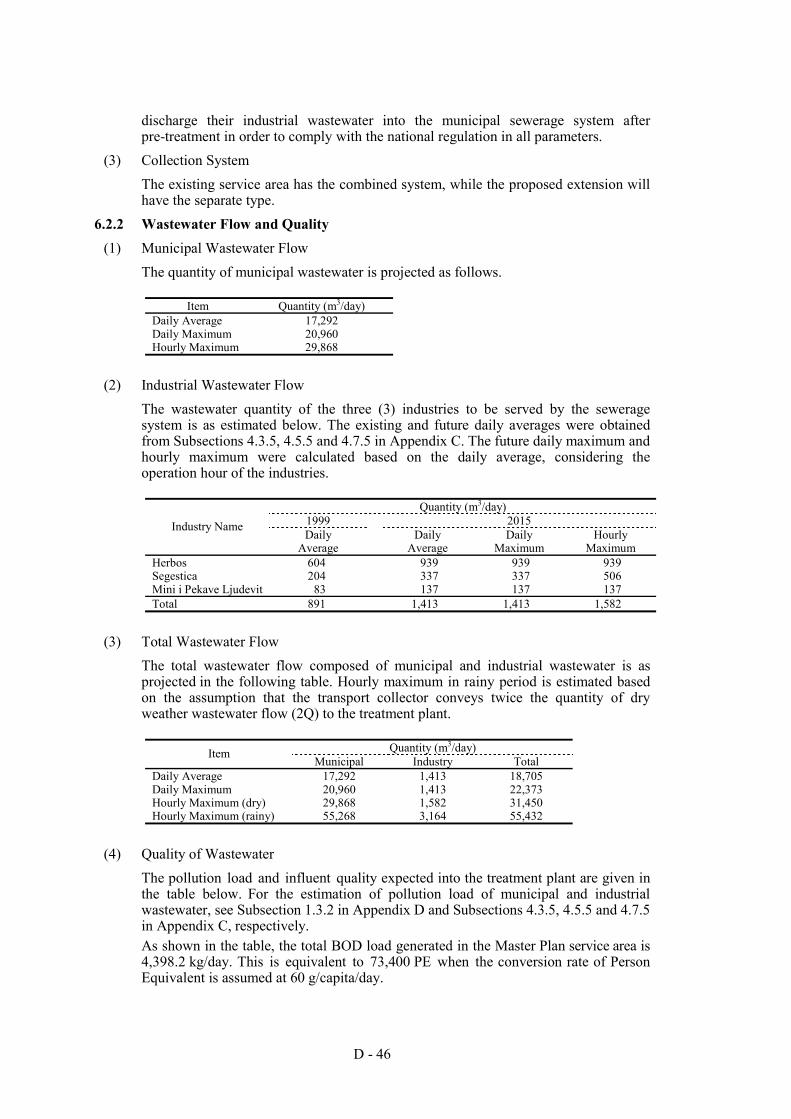
D - 46
discharge their industrial wastewater into the municipal sewerage system after pre-treatment in order to comply with the national regulation in all parameters.
(3) Collection System The existing service area has the combined system, while the proposed extension will have the separate type.
6.2.2 Wastewater Flow and Quality (1) Municipal Wastewater Flow
The quantity of municipal wastewater is projected as follows.
Item Quantity (m3/day) Daily Average 17,292 Daily Maximum 20,960 Hourly Maximum 29,868
(2) Industrial Wastewater Flow The wastewater quantity of the three (3) industries to be served by the sewerage system is as estimated below. The existing and future daily averages were obtained from Subsections 4.3.5, 4.5.5 and 4.7.5 in Appendix C. The future daily maximum and hourly maximum were calculated based on the daily average, considering the operation hour of the industries.
Quantity (m3/day)
1999 2015 Industry Name Daily
Average Daily Average
Daily Maximum
Hourly Maximum
Herbos 604 939 939 939 Segestica 204 337 337 506 Mini i Pekave Ljudevit 83 137 137 137 Total 891 1,413 1,413 1,582
(3) Total Wastewater Flow The total wastewater flow composed of municipal and industrial wastewater is as projected in the following table. Hourly maximum in rainy period is estimated based on the assumption that the transport collector conveys twice the quantity of dry weather wastewater flow (2Q) to the treatment plant.
Quantity (m3/day) Item
Municipal Industry Total Daily Average 17,292 1,413 18,705 Daily Maximum 20,960 1,413 22,373 Hourly Maximum (dry) 29,868 1,582 31,450 Hourly Maximum (rainy) 55,268 3,164 55,432
(4) Quality of Wastewater The pollution load and influent quality expected into the treatment plant are given in the table below. For the estimation of pollution load of municipal and industrial wastewater, see Subsection 1.3.2 in Appendix D and Subsections 4.3.5, 4.5.5 and 4.7.5 in Appendix C, respectively. As shown in the table, the total BOD load generated in the Master Plan service area is 4,398.2 kg/day. This is equivalent to 73,400 PE when the conversion rate of Person Equivalent is assumed at 60 g/capita/day.
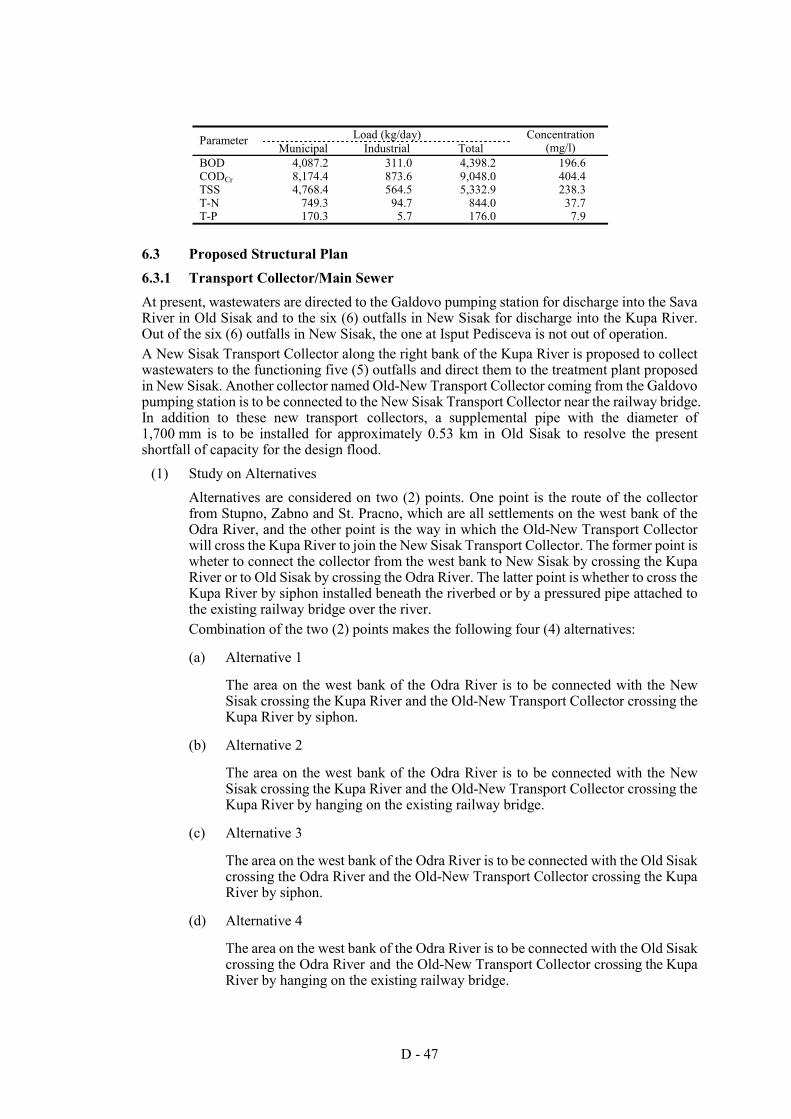
D - 47
Load (kg/day) Parameter
Municipal Industrial Total Concentration
(mg/l) BOD 4,087.2 311.0 4,398.2 196.6 CODCr 8,174.4 873.6 9,048.0 404.4 TSS 4,768.4 564.5 5,332.9 238.3 T-N 749.3 94.7 844.0 37.7 T-P 170.3 5.7 176.0 7.9
6.3 Proposed Structural Plan 6.3.1 Transport Collector/Main Sewer At present, wastewaters are directed to the Galdovo pumping station for discharge into the Sava River in Old Sisak and to the six (6) outfalls in New Sisak for discharge into the Kupa River. Out of the six (6) outfalls in New Sisak, the one at Isput Pedisceva is not out of operation. A New Sisak Transport Collector along the right bank of the Kupa River is proposed to collect wastewaters to the functioning five (5) outfalls and direct them to the treatment plant proposed in New Sisak. Another collector named Old-New Transport Collector coming from the Galdovo pumping station is to be connected to the New Sisak Transport Collector near the railway bridge. In addition to these new transport collectors, a supplemental pipe with the diameter of 1,700 mm is to be installed for approximately 0.53 km in Old Sisak to resolve the present shortfall of capacity for the design flood.
(1) Study on Alternatives Alternatives are considered on two (2) points. One point is the route of the collector from Stupno, Zabno and St. Pracno, which are all settlements on the west bank of the Odra River, and the other point is the way in which the Old-New Transport Collector will cross the Kupa River to join the New Sisak Transport Collector. The former point is wheter to connect the collector from the west bank to New Sisak by crossing the Kupa River or to Old Sisak by crossing the Odra River. The latter point is whether to cross the Kupa River by siphon installed beneath the riverbed or by a pressured pipe attached to the existing railway bridge over the river. Combination of the two (2) points makes the following four (4) alternatives:
(a) Alternative 1
The area on the west bank of the Odra River is to be connected with the New Sisak crossing the Kupa River and the Old-New Transport Collector crossing the Kupa River by siphon.
(b) Alternative 2
The area on the west bank of the Odra River is to be connected with the New Sisak crossing the Kupa River and the Old-New Transport Collector crossing the Kupa River by hanging on the existing railway bridge.
(c) Alternative 3
The area on the west bank of the Odra River is to be connected with the Old Sisak crossing the Odra River and the Old-New Transport Collector crossing the Kupa River by siphon.
(d) Alternative 4
The area on the west bank of the Odra River is to be connected with the Old Sisak crossing the Odra River and the Old-New Transport Collector crossing the Kupa River by hanging on the existing railway bridge.
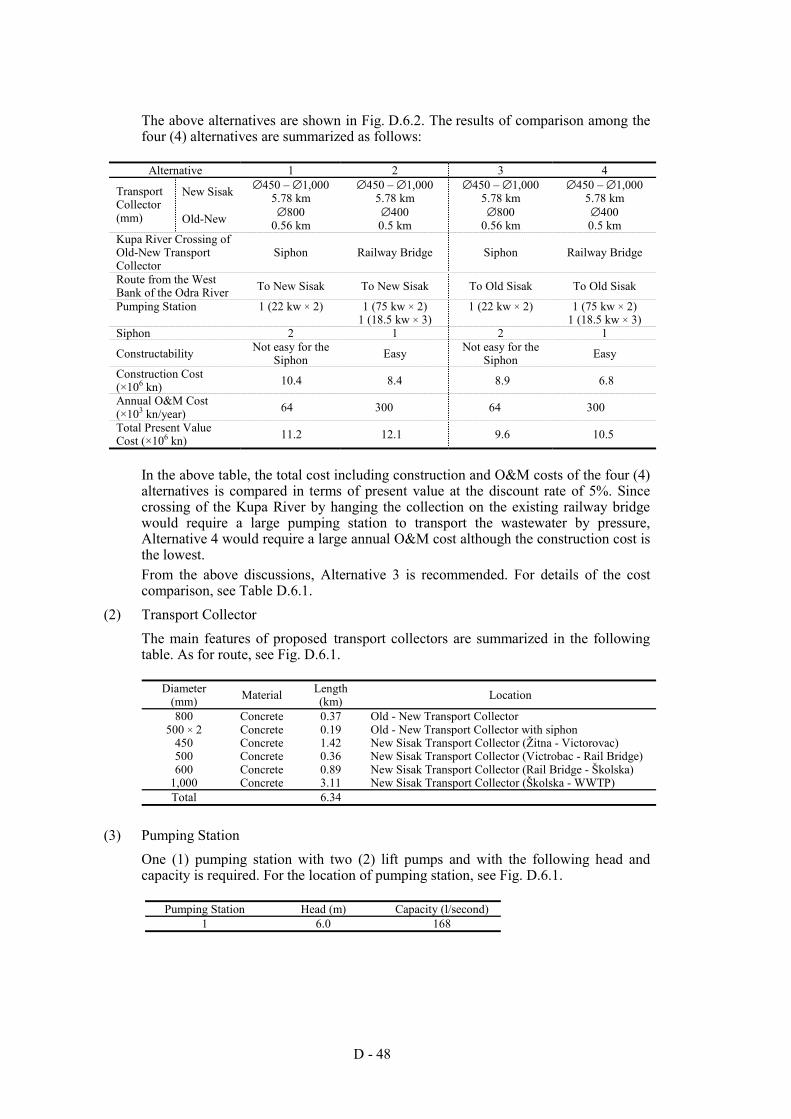
D - 48
The above alternatives are shown in Fig. D.6.2. The results of comparison among the four (4) alternatives are summarized as follows:
Alternative 1 2 3 4
New Sisak ∅450 – ∅1,000 5.78 km
∅450 – ∅1,000 5.78 km
∅450 – ∅1,000 5.78 km
∅450 – ∅1,000 5.78 km Transport
Collector (mm) Old-New ∅800
0.56 km ∅400 0.5 km
∅800 0.56 km
∅400 0.5 km
Kupa River Crossing of Old-New Transport Collector
Siphon Railway Bridge Siphon Railway Bridge
Route from the West Bank of the Odra River To New Sisak To New Sisak To Old Sisak To Old Sisak
Pumping Station 1 (22 kw × 2) 1 (75 kw × 2) 1 (22 kw × 2) 1 (75 kw × 2) 1 (18.5 kw × 3) 1 (18.5 kw × 3) Siphon 2 1 2 1
Constructability Not easy for the Siphon Easy Not easy for the
Siphon Easy
Construction Cost (×106 kn) 10.4 8.4 8.9 6.8
Annual O&M Cost (×103 kn/year) 64 300 64 300
Total Present Value Cost (×106 kn) 11.2 12.1 9.6 10.5
In the above table, the total cost including construction and O&M costs of the four (4) alternatives is compared in terms of present value at the discount rate of 5%. Since crossing of the Kupa River by hanging the collection on the existing railway bridge would require a large pumping station to transport the wastewater by pressure, Alternative 4 would require a large annual O&M cost although the construction cost is the lowest. From the above discussions, Alternative 3 is recommended. For details of the cost comparison, see Table D.6.1.
(2) Transport Collector The main features of proposed transport collectors are summarized in the following table. As for route, see Fig. D.6.1.
Diameter
(mm) Material Length (km) Location
800 Concrete 0.37 Old - New Transport Collector 500 × 2 Concrete 0.19 Old - New Transport Collector with siphon
450 Concrete 1.42 New Sisak Transport Collector (Žitna - Victorovac) 500 Concrete 0.36 New Sisak Transport Collector (Victrobac - Rail Bridge) 600 Concrete 0.89 New Sisak Transport Collector (Rail Bridge - Školska)
1,000 Concrete 3.11 New Sisak Transport Collector (Školska - WWTP) Total 6.34
(3) Pumping Station One (1) pumping station with two (2) lift pumps and with the following head and capacity is required. For the location of pumping station, see Fig. D.6.1.
Pumping Station Head (m) Capacity (l/second)
1 6.0 168
D - 49
(4) Main Sewer A main sanitary sewer in the Stupno, Zabno, and St. Pracno areas is proposed to connect with the “Old Sisak Transport Collector” crossing the Odra River. Its diameter ranges from 250 mm to 450 mm and its length is 3.8 km. A sanitary sewer in Pogorelac is also proposed to connect with the “New Sisak Transport Collector”. A pressured main sanitary sewer in the Galdovo and Goricica areas is proposed to connect with the proposed treatment plant by running along a bridge near Crnac. Its diameter ranges from 250 mm to 300 mm and its length is 4.93 km. A pressured sanitary sewer in Moscenica is also proposed to connect the proposed manhole type pumping station and discharge into the existing combined main. The main features of main sewers for the extension are as shown in the following table. As for routes, see Fig. D.6.1.
Diameter (mm) Material Length (km) Combined/Separate
250 Concrete 3.10 Main Sewer in Stupno 400 Concrete 0.40 Main Sewer in Stupno – Old Sisak
150 × 2 Concrete 0.10 Main Sewer with Siphon in the Odra River Sub-total 3.60
250 Concrete 1.50 Main Sewer in Galdovo 300 Concrete 2.00 Main Sewer in Galdovo 150 PVC 0.73 Main Sewer (Pressured) in Galdovo
Sub-total 4.23 Total 7.83
6.3.2 Secondary/Tertiary Sewer There are eight (8) sewer extension areas; namely, Stupno, Zabno, St. Pracno, Galdovo, Goricica, Crnac, Pogorelac and Moscenica, and a separate system is proposed for all of them. The length and diameter of sewer is 36.55 km and 200 mm, respectively. Furthermore, six (6) manhole lift pumps with the following head and capacity are required. For the location of manhole lift pumps, see Fig. D.6.1.
Pump Station Head (m) Capacity (l/sec) 1 6 32 2 6 47 3 5 16 4 5 16 5 28 16 6 10 5
6.3.3 Treatment Plant (1) Location
The proposed location of the treatment plant is on the southeastern part of Sisak nearby the oil refinery “INA” on the right side of the Sava River. Presently, it is wasteland with the ground elevation of about 98.5 m. Since the town owns the treatment plant site of 9 ha, no cost for land acquisition will be required. Floods sometimes occur in this area. For the location of treatment plant, see Fig. D.6.1.
(2) Treatment Process The capacity of the treatment plant (73,400 PE) is larger than 10,000 PE and the recipient of effluent from the plant (the Lower Sava) is Category II. Therefore, Anaerobic Oxic treatment with thickener and mechanical sludge dewatering is proposed (refer to Subsections 1.4.4 and 1.4.5). The required surface area is 6.34 ha.
D - 50
(3) Main Facilities The main facilities together with specification and number of units are shown below. Effluent of the wastewater treatment plant is discharged into the Kutina River. The layout of the plant is shown in Fig. D.6.3.
Facilities Specification No. of Units
Coarse Screen, 2m W 1 Fine Screen, 1m W 2 Influent Pumping Station
and Screen Archimedical Screw Pump, 12.0m3/min × 10m H × 19kw 5
Grit Oil/Sand Removal 5m W × 17m L 2 Parshall Flume 0.3048m (1 ft) 1 Primary Sedimentation Tank 4.0m W × 18.0m L × 3.0m D (Effective Depth) 8 Aeration Tank 5m W × 39.0m L × 5m D 8 Secondary Sedimentation Tank ∅17m × 3.5m D (Effective Depth) 4
Effluent Pumping Station Vertical Axial Flow Pump, 10.0m3/min × 6m H × 15kw (Building, 10m × 13m) 5
Sludge Thickener ∅10m × 4.0m D 2 Belt Press Filter, 2.0m W × 2.2kw Mechanical Dewatering Polymer Mixing, 0.75kw 4
Roots Blower 20m3/min × 60kw Blower (Building, 10m × 25m)
3
Return Sludge Archimedical Screw Pump, 6m3/min × 3m H × 5.5kw 4 Administration Building 10m W × 15m L 1
6.4 Cost Estimate The total construction cost is estimated at approx. Kn 159.8 million, broken down as follows.
Cost Facilities Cost (×103 Kn) Rate (%) Direct Cost Pipe Transport Collector/Main Sewer 17,751.1 11.1 17.8 Secondary/Tertiary Sewer 25,398.0 15.9 25.5 Sub-Total 43,149.1 27.0 43.3 Treatment Plant Preliminary Treatment 8,202.3 5.1 8.2 Biological Reactor 13,923.3 8.7 14.0 Secondary Sedimentation 5,136.3 3.2 5.2 Sludge Treatment 10,055.3 6.3 10.1 Others 19,179.4 12.0 19.2 Sub-Total 56,496.7 35.4 56.7 Sub-total 99,645.8 62.4 100.0 Land Acquisition 0.0 0.0 - Indirect Cost Engineering 9,964.6 6.2 - Administration 2,989.4 1.9 - Customs Duties 3,151.2 2.0 - VAT 24,114.3 15.1 - Sub-total 40,219.4 25.2 Contingency 19,929.2 12.5 -
Total 159,794.4 100.0 -
D - 51
CHAPTER VII SEWERAGE IMPROVEMENT OF KUTINA
7.1 Existing Sewerage System 7.1.1 Service Area and Population Kutina, consisting of 23 settlements is situated in the Moslavina region of Sisak-Moslavina County midway of the main railway between Zagreb and Vinkovci. The establishment of the industrial complexes of Petrokemija, Čajara and Glinara resulted in the urbanization of the town whose administrative area and population including future projection (2015), are shown below.
Item Urban Center Rural Area Total Area (ha) 901.9 28,615.9 29,517.8 Population (1991) 14,992 9,837 24,829 (1999) 16,800 6,252 23,052 (2015) 19,679 7,323 27,002
The sewerage system serves 548.9 ha covering the central urban area, the western settlement Repušnica and some surrounding areas. The existing served population is 16,100. The wastewater of the town is discharged into a lateral canal of the Kutina river system with preliminary treatment. The Kutina River runs through the town from the northern hilly areas to the southern lowlands and finally empties into the Sava River through the Lonjsko Polje reserved areas. For the existing service area, see Fig. D.7.1. 7.1.2 Existing Industries There are 12 industries registered by Croatian Waters as industrial pollutants, as given in the table below. Six (6) of them discharge wastewater into the public sewerage, and the others discharge it directly into the rivers and canals. The wastewater quantity of “Petrokemija” is enormous compared to the others. Most of the registered industries are provided with pre-treatment plant, but plant capacity is insufficient and hence, the wastewater quality does not meet the permissible limits of the government regulation. The industries in bold characters are the large ones described in Appendix C.
Wastewater (m3/year) Code Number
Industry Name Activity Pre- treatment 1998 1999
Recipient
357009 Petrokemija Kutina - Tech. Chemicals Yes 4,375,377 3,454,549 Trebež River 357016 Petrokemija Kutina - Sanitary Chemicals Yes 245,817 238,120 Sewerage 357010 Moslavačko Vinogorje Food/Beverage Yes - - Mel. Canal 357015 VAJDA Stočarstvo Zgb Food/Beverage Yes - - Mel. Canal 357004 Čazmatrans Tehnički Pregled Transportation Yes - - Sewerage 357011 Čazmatrans Autokuća Transportation Yes 2,223 - Sewerage 357005 Dom Zdravlja Ambulance Yes - - Sewerage 357006 Crosco Naftni Servisi Oil Service Yes 11,804 - Brook 357008 INA Petrokemija Metan Oil & Gas - - - Sewerage 357014 Naftaplin Skaladište Oil & Gas Yes 2,252 - Mel. Canal 357012 Autopraonica vl. Zoran Kramarić Car Wash Yes - - River
357013 Autopraonica Spužvica, vl. Damir Korica Car Wash Yes - - Sewerage
“Petrokemija” is one of the biggest chemical industries in Croatia. It produces chemical fertilizer (about 1 million ton/year), carbon black and bentonite clays. Most of the raw materials are imported and the fertilizers are produced from raw phosphates, sulphur, and natural gas. The plant also produces ammonia, nitric acid, sulphuric acid, phosphoric acid, urea and nitrogen. The consumption of fertilizers for agriculture in the country decreased by more than 40% in 1998 compared with that in 1988. Due to this negative trend, the industry is not in full operation. Almost all of the industrial wastewaters of the town come from this industry.
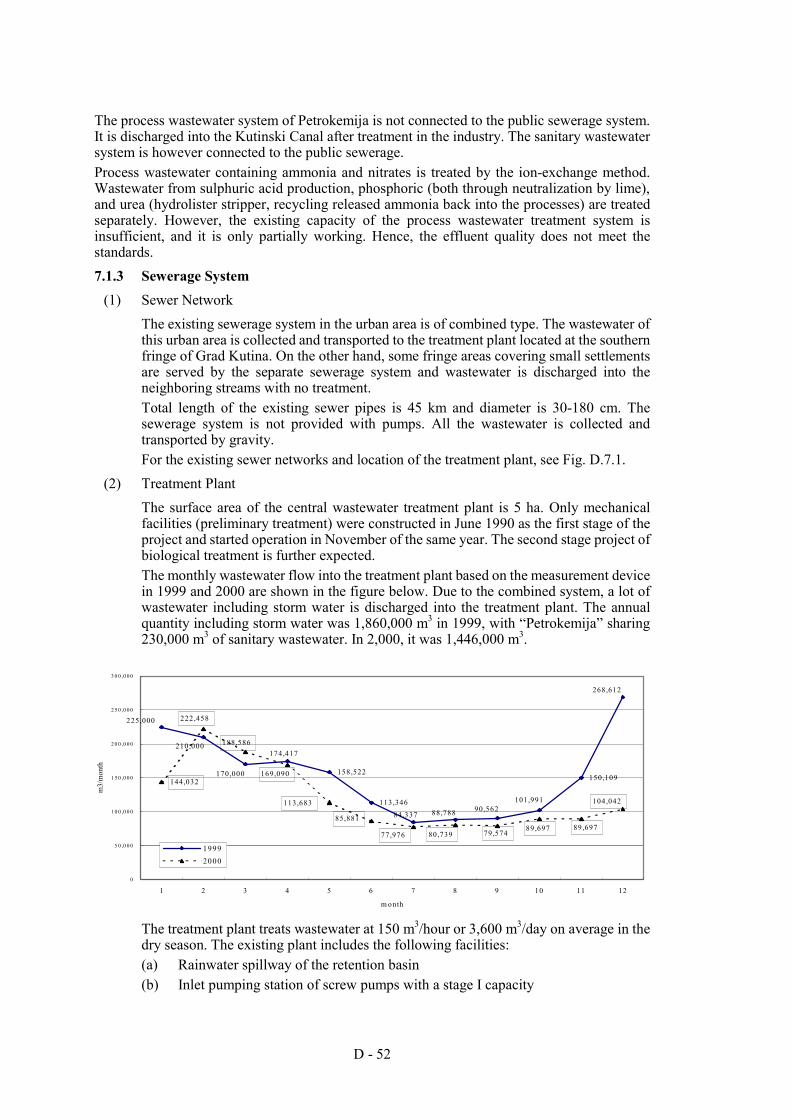
D - 52
The process wastewater system of Petrokemija is not connected to the public sewerage system. It is discharged into the Kutinski Canal after treatment in the industry. The sanitary wastewater system is however connected to the public sewerage. Process wastewater containing ammonia and nitrates is treated by the ion-exchange method. Wastewater from sulphuric acid production, phosphoric (both through neutralization by lime), and urea (hydrolister stripper, recycling released ammonia back into the processes) are treated separately. However, the existing capacity of the process wastewater treatment system is insufficient, and it is only partially working. Hence, the effluent quality does not meet the standards. 7.1.3 Sewerage System
(1) Sewer Network The existing sewerage system in the urban area is of combined type. The wastewater of this urban area is collected and transported to the treatment plant located at the southern fringe of Grad Kutina. On the other hand, some fringe areas covering small settlements are served by the separate sewerage system and wastewater is discharged into the neighboring streams with no treatment. Total length of the existing sewer pipes is 45 km and diameter is 30-180 cm. The sewerage system is not provided with pumps. All the wastewater is collected and transported by gravity. For the existing sewer networks and location of the treatment plant, see Fig. D.7.1.
(2) Treatment Plant The surface area of the central wastewater treatment plant is 5 ha. Only mechanical facilities (preliminary treatment) were constructed in June 1990 as the first stage of the project and started operation in November of the same year. The second stage project of biological treatment is further expected. The monthly wastewater flow into the treatment plant based on the measurement device in 1999 and 2000 are shown in the figure below. Due to the combined system, a lot of wastewater including storm water is discharged into the treatment plant. The annual quantity including storm water was 1,860,000 m3 in 1999, with “Petrokemija” sharing 230,000 m3 of sanitary wastewater. In 2,000, it was 1,446,000 m3.
The treatment plant treats wastewater at 150 m3/hour or 3,600 m3/day on average in the dry season. The existing plant includes the following facilities: (a) Rainwater spillway of the retention basin (b) Inlet pumping station of screw pumps with a stage I capacity
158,522 150,109
225,000
210,000
170,000
174,417
101,991 90,562
84,337 88,788 113,346
268,612
222,458
188,586
169,090
113,683
85,881
79,57477,976 80,739
104,042
89,69789,697
144,032
0
5 0 ,0 0 0
1 0 0 ,0 0 0
1 5 0 ,0 0 0
2 0 0 ,0 0 0
2 5 0 ,0 0 0
3 0 0 ,0 0 0
1 2 3 4 5 6 7 8 9 10 11 12
m onth
m3/
mon
th
19992000
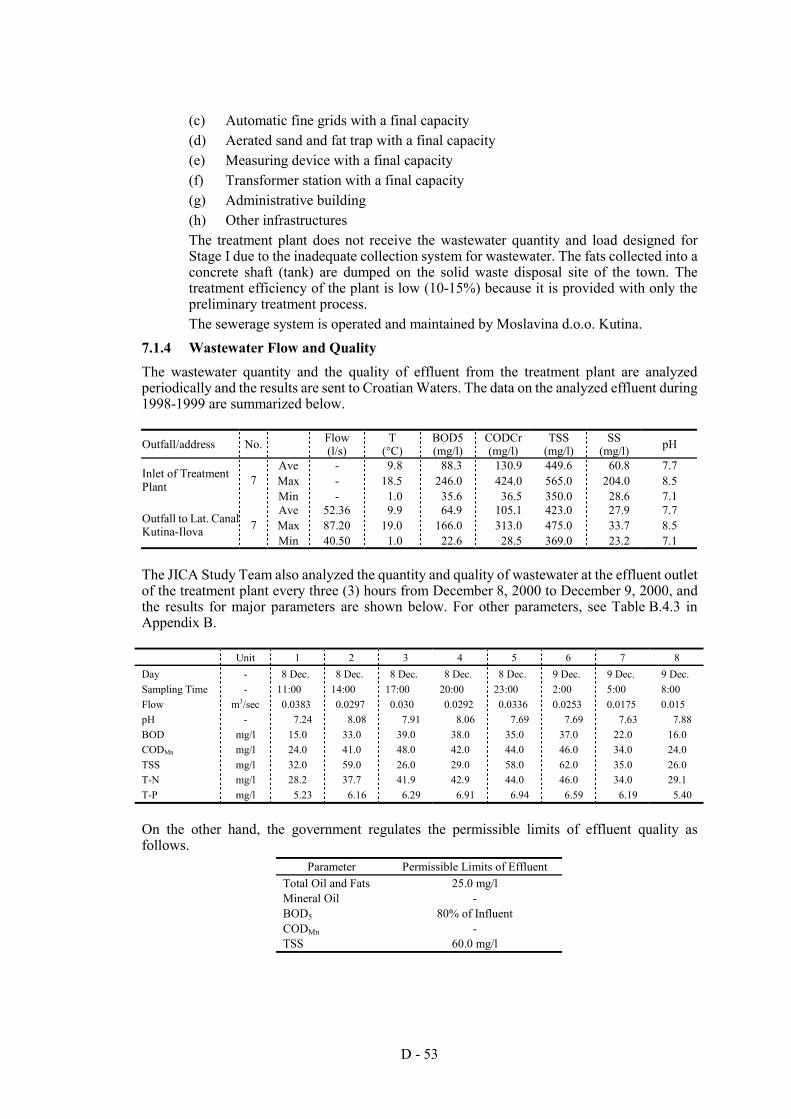
D - 53
(c) Automatic fine grids with a final capacity (d) Aerated sand and fat trap with a final capacity (e) Measuring device with a final capacity (f) Transformer station with a final capacity (g) Administrative building (h) Other infrastructures The treatment plant does not receive the wastewater quantity and load designed for Stage I due to the inadequate collection system for wastewater. The fats collected into a concrete shaft (tank) are dumped on the solid waste disposal site of the town. The treatment efficiency of the plant is low (10-15%) because it is provided with only the preliminary treatment process. The sewerage system is operated and maintained by Moslavina d.o.o. Kutina.
7.1.4 Wastewater Flow and Quality The wastewater quantity and the quality of effluent from the treatment plant are analyzed periodically and the results are sent to Croatian Waters. The data on the analyzed effluent during 1998-1999 are summarized below.
Outfall/address No. Flow (l/s)
T (°C)
BOD5 (mg/l)
CODCr (mg/l)
TSS (mg/l)
SS (mg/l) pH
Ave - 9.8 88.3 130.9 449.6 60.8 7.7 Max - 18.5 246.0 424.0 565.0 204.0 8.5 Inlet of Treatment
Plant 7 Min - 1.0 35.6 36.5 350.0 28.6 7.1 Ave 52.36 9.9 64.9 105.1 423.0 27.9 7.7 Max 87.20 19.0 166.0 313.0 475.0 33.7 8.5 Outfall to Lat. Canal
Kutina-Ilova 7 Min 40.50 1.0 22.6 28.5 369.0 23.2 7.1
The JICA Study Team also analyzed the quantity and quality of wastewater at the effluent outlet of the treatment plant every three (3) hours from December 8, 2000 to December 9, 2000, and the results for major parameters are shown below. For other parameters, see Table B.4.3 in Appendix B. Unit 1 2 3 4 5 6 7 8 Day - 8 Dec. 8 Dec. 8 Dec. 8 Dec. 8 Dec. 9 Dec. 9 Dec. 9 Dec. Sampling Time - 11:00 14:00 17:00 20:00 23:00 2:00 5:00 8:00 Flow m3/sec 0.0383 0.0297 0.030 0.0292 0.0336 0.0253 0.0175 0.015 pH - 7.24 8.08 7.91 8.06 7.69 7.69 7.63 7.88 BOD mg/l 15.0 33.0 39.0 38.0 35.0 37.0 22.0 16.0 CODMn mg/l 24.0 41.0 48.0 42.0 44.0 46.0 34.0 24.0 TSS mg/l 32.0 59.0 26.0 29.0 58.0 62.0 35.0 26.0 T-N mg/l 28.2 37.7 41.9 42.9 44.0 46.0 34.0 29.1 T-P mg/l 5.23 6.16 6.29 6.91 6.94 6.59 6.19 5.40 On the other hand, the government regulates the permissible limits of effluent quality as follows.
Parameter Permissible Limits of Effluent Total Oil and Fats 25.0 mg/l Mineral Oil - BOD5 80% of Influent CODMn - TSS 60.0 mg/l
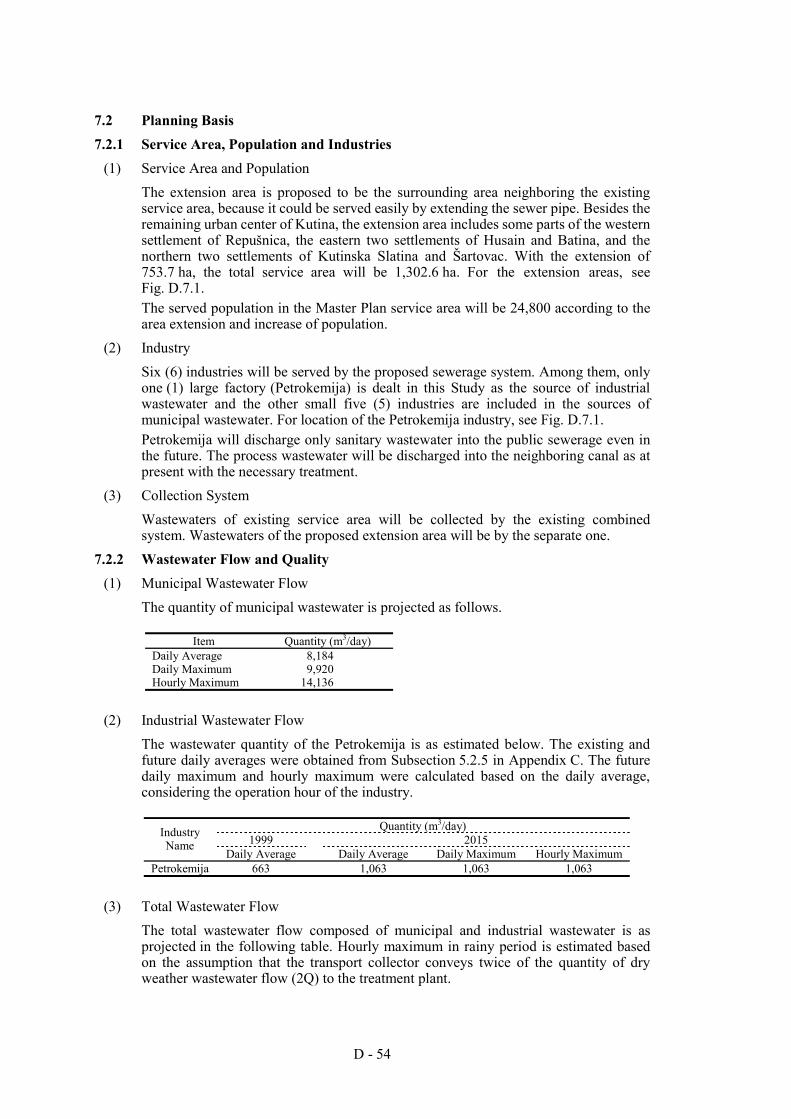
D - 54
7.2 Planning Basis 7.2.1 Service Area, Population and Industries
(1) Service Area and Population The extension area is proposed to be the surrounding area neighboring the existing service area, because it could be served easily by extending the sewer pipe. Besides the remaining urban center of Kutina, the extension area includes some parts of the western settlement of Repušnica, the eastern two settlements of Husain and Batina, and the northern two settlements of Kutinska Slatina and Šartovac. With the extension of 753.7 ha, the total service area will be 1,302.6 ha. For the extension areas, see Fig. D.7.1. The served population in the Master Plan service area will be 24,800 according to the area extension and increase of population.
(2) Industry Six (6) industries will be served by the proposed sewerage system. Among them, only one (1) large factory (Petrokemija) is dealt in this Study as the source of industrial wastewater and the other small five (5) industries are included in the sources of municipal wastewater. For location of the Petrokemija industry, see Fig. D.7.1. Petrokemija will discharge only sanitary wastewater into the public sewerage even in the future. The process wastewater will be discharged into the neighboring canal as at present with the necessary treatment.
(3) Collection System Wastewaters of existing service area will be collected by the existing combined system. Wastewaters of the proposed extension area will be by the separate one.
7.2.2 Wastewater Flow and Quality (1) Municipal Wastewater Flow
The quantity of municipal wastewater is projected as follows.
Item Quantity (m3/day) Daily Average 8,184 Daily Maximum 9,920 Hourly Maximum 14,136
(2) Industrial Wastewater Flow The wastewater quantity of the Petrokemija is as estimated below. The existing and future daily averages were obtained from Subsection 5.2.5 in Appendix C. The future daily maximum and hourly maximum were calculated based on the daily average, considering the operation hour of the industry.
Quantity (m3/day)
1999 2015 Industry Name
Daily Average Daily Average Daily Maximum Hourly Maximum Petrokemija 663 1,063 1,063 1,063
(3) Total Wastewater Flow The total wastewater flow composed of municipal and industrial wastewater is as projected in the following table. Hourly maximum in rainy period is estimated based on the assumption that the transport collector conveys twice of the quantity of dry weather wastewater flow (2Q) to the treatment plant.
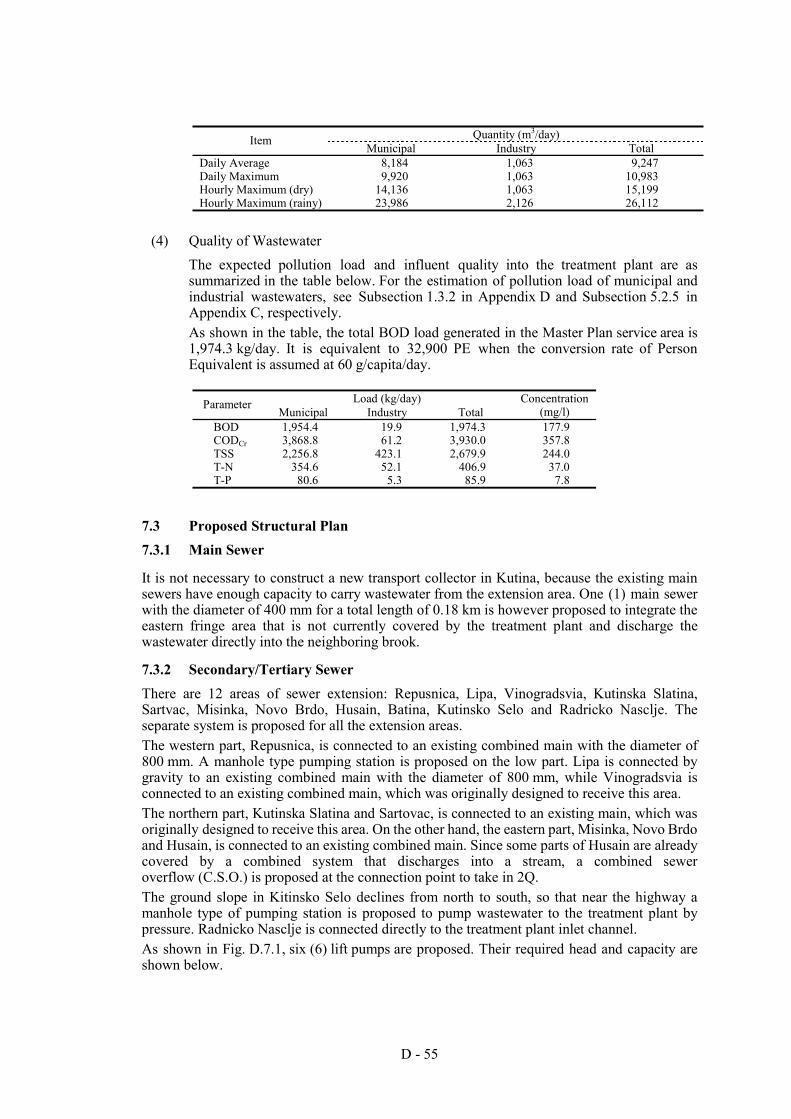
D - 55
Quantity (m3/day) Item
Municipal Industry Total Daily Average 8,184 1,063 9,247 Daily Maximum 9,920 1,063 10,983 Hourly Maximum (dry) 14,136 1,063 15,199 Hourly Maximum (rainy) 23,986 2,126 26,112
(4) Quality of Wastewater The expected pollution load and influent quality into the treatment plant are as summarized in the table below. For the estimation of pollution load of municipal and industrial wastewaters, see Subsection 1.3.2 in Appendix D and Subsection 5.2.5 in Appendix C, respectively. As shown in the table, the total BOD load generated in the Master Plan service area is 1,974.3 kg/day. It is equivalent to 32,900 PE when the conversion rate of Person Equivalent is assumed at 60 g/capita/day.
Load (kg/day) Parameter
Municipal Industry Total Concentration
(mg/l) BOD 1,954.4 19.9 1,974.3 177.9 CODCr 3,868.8 61.2 3,930.0 357.8 TSS 2,256.8 423.1 2,679.9 244.0 T-N 354.6 52.1 406.9 37.0 T-P 80.6 5.3 85.9 7.8
7.3 Proposed Structural Plan 7.3.1 Main Sewer
It is not necessary to construct a new transport collector in Kutina, because the existing main sewers have enough capacity to carry wastewater from the extension area. One (1) main sewer with the diameter of 400 mm for a total length of 0.18 km is however proposed to integrate the eastern fringe area that is not currently covered by the treatment plant and discharge the wastewater directly into the neighboring brook.
7.3.2 Secondary/Tertiary Sewer There are 12 areas of sewer extension: Repusnica, Lipa, Vinogradsvia, Kutinska Slatina, Sartvac, Misinka, Novo Brdo, Husain, Batina, Kutinsko Selo and Radricko Nasclje. The separate system is proposed for all the extension areas. The western part, Repusnica, is connected to an existing combined main with the diameter of 800 mm. A manhole type pumping station is proposed on the low part. Lipa is connected by gravity to an existing combined main with the diameter of 800 mm, while Vinogradsvia is connected to an existing combined main, which was originally designed to receive this area. The northern part, Kutinska Slatina and Sartovac, is connected to an existing main, which was originally designed to receive this area. On the other hand, the eastern part, Misinka, Novo Brdo and Husain, is connected to an existing combined main. Since some parts of Husain are already covered by a combined system that discharges into a stream, a combined sewer overflow (C.S.O.) is proposed at the connection point to take in 2Q. The ground slope in Kitinsko Selo declines from north to south, so that near the highway a manhole type of pumping station is proposed to pump wastewater to the treatment plant by pressure. Radnicko Nasclje is connected directly to the treatment plant inlet channel. As shown in Fig. D.7.1, six (6) lift pumps are proposed. Their required head and capacity are shown below.
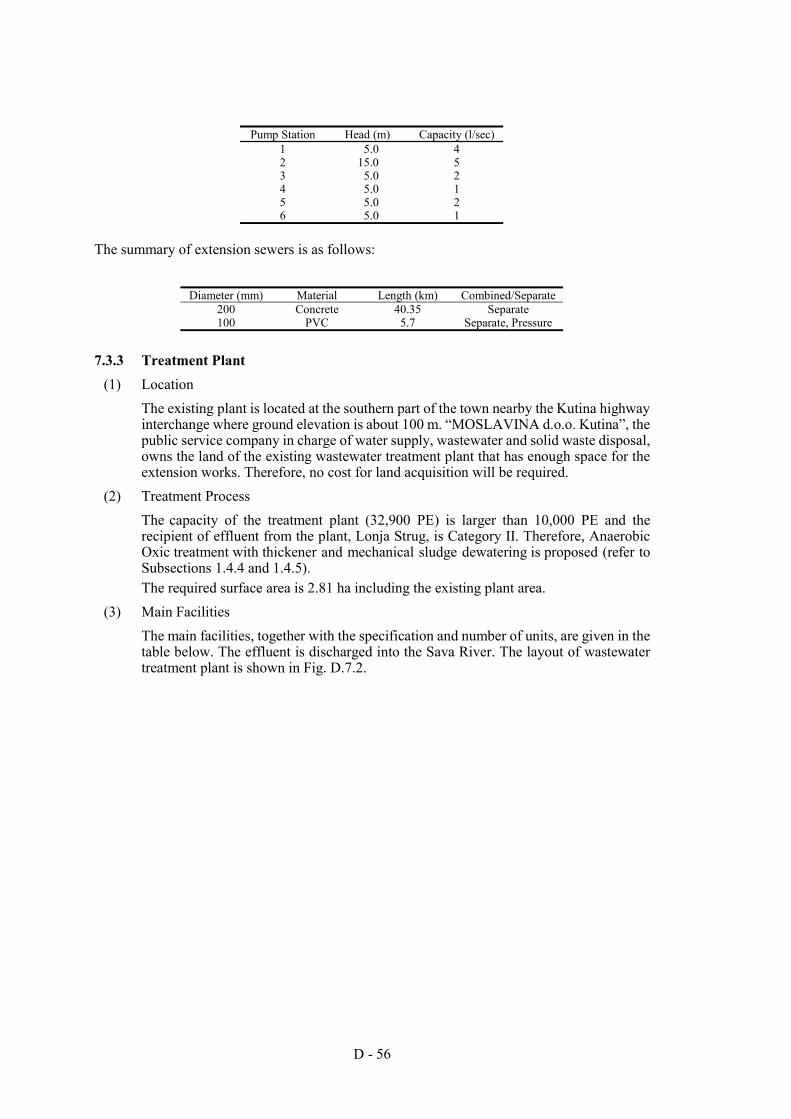
D - 56
Pump Station Head (m) Capacity (l/sec)
1 5.0 4 2 15.0 5 3 5.0 2 4 5.0 1 5 5.0 2 6 5.0 1
The summary of extension sewers is as follows:
Diameter (mm) Material Length (km) Combined/Separate
200 Concrete 40.35 Separate 100 PVC 5.7 Separate, Pressure
7.3.3 Treatment Plant (1) Location
The existing plant is located at the southern part of the town nearby the Kutina highway interchange where ground elevation is about 100 m. “MOSLAVINA d.o.o. Kutina”, the public service company in charge of water supply, wastewater and solid waste disposal, owns the land of the existing wastewater treatment plant that has enough space for the extension works. Therefore, no cost for land acquisition will be required.
(2) Treatment Process The capacity of the treatment plant (32,900 PE) is larger than 10,000 PE and the recipient of effluent from the plant, Lonja Strug, is Category II. Therefore, Anaerobic Oxic treatment with thickener and mechanical sludge dewatering is proposed (refer to Subsections 1.4.4 and 1.4.5). The required surface area is 2.81 ha including the existing plant area.
(3) Main Facilities The main facilities, together with the specification and number of units, are given in the table below. The effluent is discharged into the Sava River. The layout of wastewater treatment plant is shown in Fig. D.7.2.
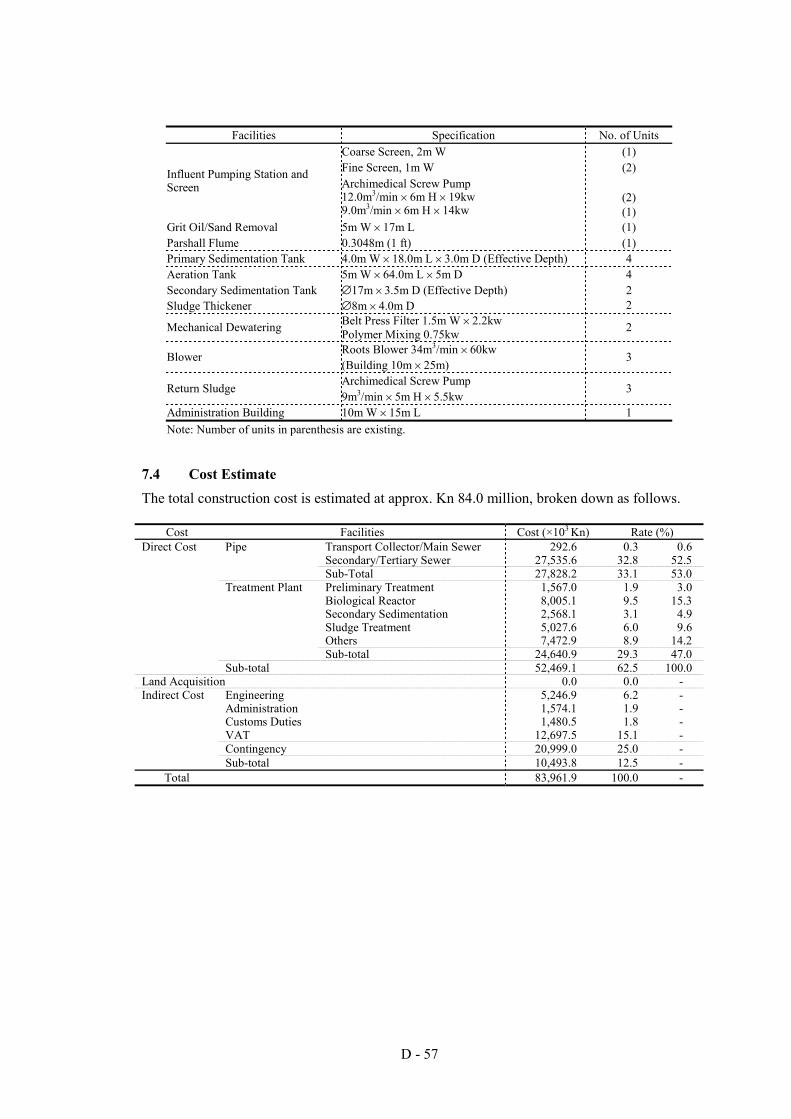
D - 57
Facilities Specification No. of Units
Coarse Screen, 2m W (1) Fine Screen, 1m W (2)
(2)
Influent Pumping Station and Screen Archimedical Screw Pump
12.0m3/min × 6m H × 19kw 9.0m3/min × 6m H × 14kw (1)
Grit Oil/Sand Removal 5m W × 17m L (1) Parshall Flume 0.3048m (1 ft) (1) Primary Sedimentation Tank 4.0m W × 18.0m L × 3.0m D (Effective Depth) 4 Aeration Tank 5m W × 64.0m L × 5m D 4 Secondary Sedimentation Tank ∅17m × 3.5m D (Effective Depth) 2 Sludge Thickener ∅8m × 4.0m D 2
Belt Press Filter 1.5m W × 2.2kw Mechanical Dewatering Polymer Mixing 0.75kw 2
Roots Blower 34m3/min × 60kw Blower (Building 10m × 25m)
3
Archimedical Screw Pump Return Sludge 9m3/min × 5m H × 5.5kw
3
Administration Building 10m W × 15m L 1 Note: Number of units in parenthesis are existing.
7.4 Cost Estimate The total construction cost is estimated at approx. Kn 84.0 million, broken down as follows.
Cost Facilities Cost (×103 Kn) Rate (%) Direct Cost Pipe Transport Collector/Main Sewer 292.6 0.3 0.6 Secondary/Tertiary Sewer 27,535.6 32.8 52.5 Sub-Total 27,828.2 33.1 53.0 Treatment Plant Preliminary Treatment 1,567.0 1.9 3.0 Biological Reactor 8,005.1 9.5 15.3 Secondary Sedimentation 2,568.1 3.1 4.9 Sludge Treatment 5,027.6 6.0 9.6 Others 7,472.9 8.9 14.2 Sub-total 24,640.9 29.3 47.0 Sub-total 52,469.1 62.5 100.0 Land Acquisition 0.0 0.0 - Indirect Cost Engineering 5,246.9 6.2 - Administration 1,574.1 1.9 - Customs Duties 1,480.5 1.8 - VAT 12,697.5 15.1 - Contingency 20,999.0 25.0 - Sub-total 10,493.8 12.5 -
Total 83,961.9 100.0 -
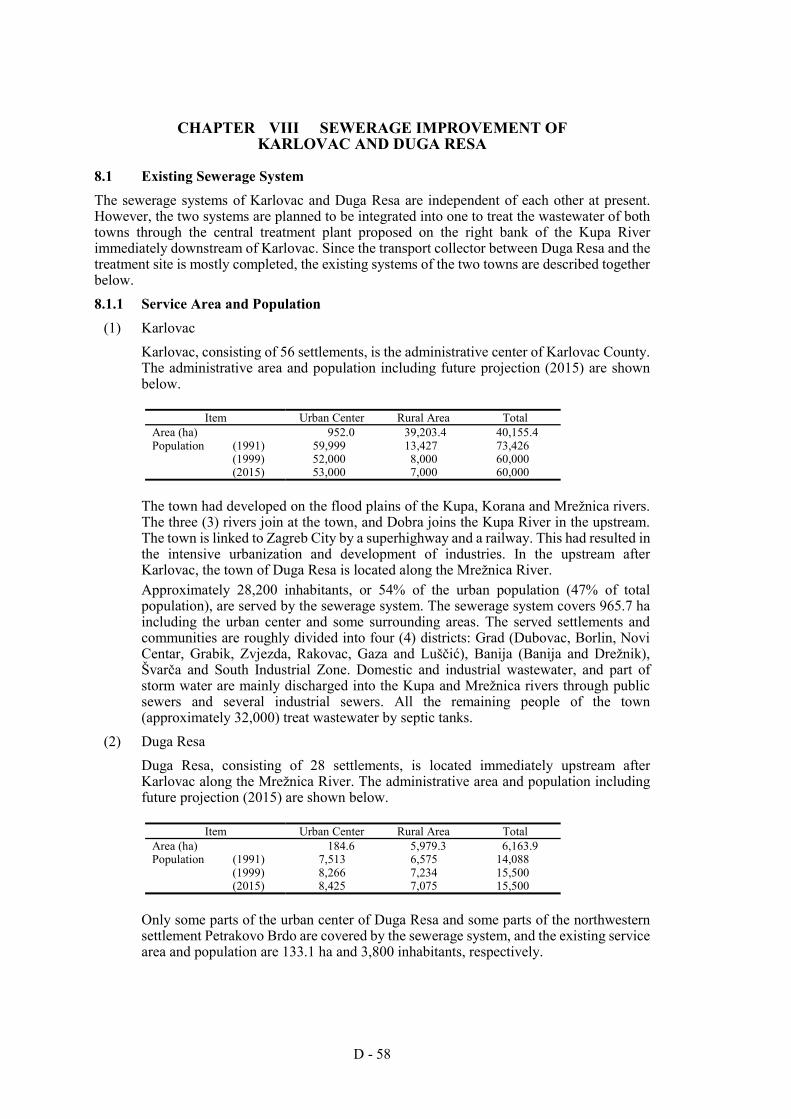
D - 58
CHAPTER VIII SEWERAGE IMPROVEMENT OF KARLOVAC AND DUGA RESA
8.1 Existing Sewerage System The sewerage systems of Karlovac and Duga Resa are independent of each other at present. However, the two systems are planned to be integrated into one to treat the wastewater of both towns through the central treatment plant proposed on the right bank of the Kupa River immediately downstream of Karlovac. Since the transport collector between Duga Resa and the treatment site is mostly completed, the existing systems of the two towns are described together below. 8.1.1 Service Area and Population
(1) Karlovac Karlovac, consisting of 56 settlements, is the administrative center of Karlovac County. The administrative area and population including future projection (2015) are shown below.
Item Urban Center Rural Area Total
Area (ha) 952.0 39,203.4 40,155.4 Population (1991) 59,999 13,427 73,426 (1999) 52,000 8,000 60,000 (2015) 53,000 7,000 60,000
The town had developed on the flood plains of the Kupa, Korana and Mrežnica rivers. The three (3) rivers join at the town, and Dobra joins the Kupa River in the upstream. The town is linked to Zagreb City by a superhighway and a railway. This had resulted in the intensive urbanization and development of industries. In the upstream after Karlovac, the town of Duga Resa is located along the Mrežnica River. Approximately 28,200 inhabitants, or 54% of the urban population (47% of total population), are served by the sewerage system. The sewerage system covers 965.7 ha including the urban center and some surrounding areas. The served settlements and communities are roughly divided into four (4) districts: Grad (Dubovac, Borlin, Novi Centar, Grabik, Zvjezda, Rakovac, Gaza and Luščić), Banija (Banija and Drežnik), Švarča and South Industrial Zone. Domestic and industrial wastewater, and part of storm water are mainly discharged into the Kupa and Mrežnica rivers through public sewers and several industrial sewers. All the remaining people of the town (approximately 32,000) treat wastewater by septic tanks.
(2) Duga Resa Duga Resa, consisting of 28 settlements, is located immediately upstream after Karlovac along the Mrežnica River. The administrative area and population including future projection (2015) are shown below.
Item Urban Center Rural Area Total
Area (ha) 184.6 5,979.3 6,163.9 Population (1991) 7,513 6,575 14,088 (1999) 8,266 7,234 15,500 (2015) 8,425 7,075 15,500
Only some parts of the urban center of Duga Resa and some parts of the northwestern settlement Petrakovo Brdo are covered by the sewerage system, and the existing service area and population are 133.1 ha and 3,800 inhabitants, respectively.
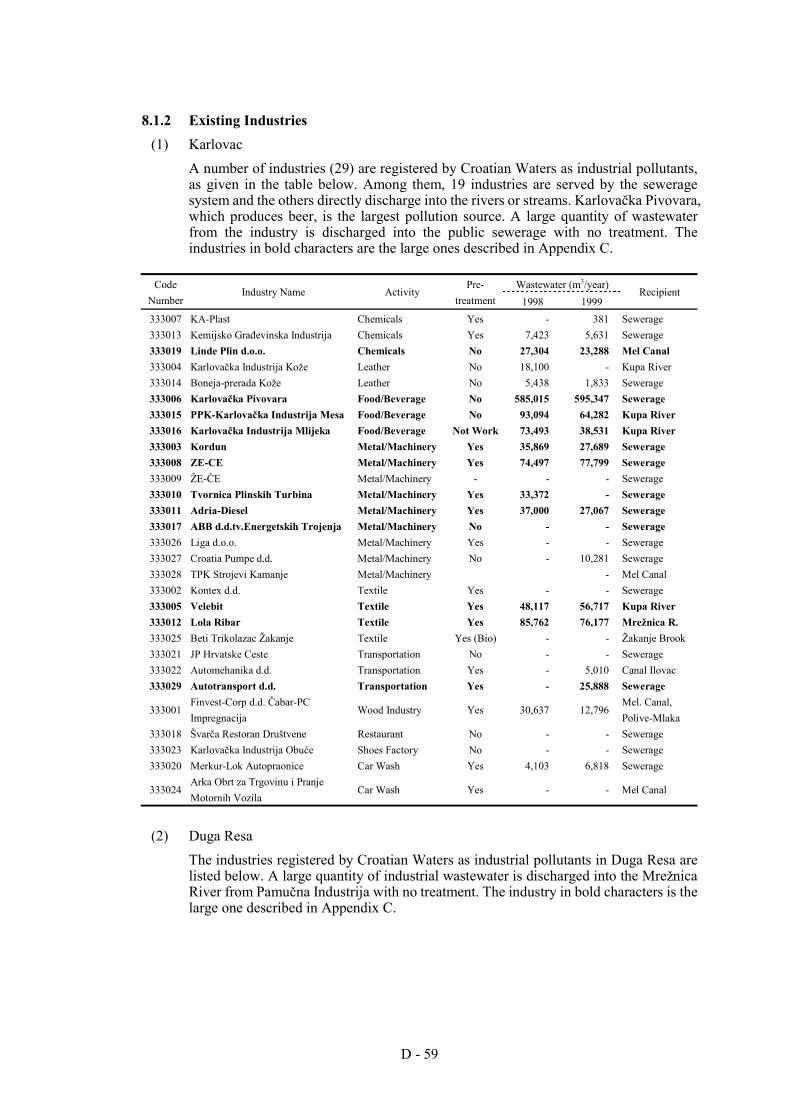
D - 59
8.1.2 Existing Industries (1) Karlovac
A number of industries (29) are registered by Croatian Waters as industrial pollutants, as given in the table below. Among them, 19 industries are served by the sewerage system and the others directly discharge into the rivers or streams. Karlovačka Pivovara, which produces beer, is the largest pollution source. A large quantity of wastewater from the industry is discharged into the public sewerage with no treatment. The industries in bold characters are the large ones described in Appendix C.
Wastewater (m3/year) Code
Number Industry Name Activity
Pre- treatment 1998 1999
Recipient
333007 KA-Plast Chemicals Yes - 381 Sewerage 333013 Kemijsko Građevinska Industrija Chemicals Yes 7,423 5,631 Sewerage 333019 Linde Plin d.o.o. Chemicals No 27,304 23,288 Mel Canal 333004 Karlovačka Industrija Kože Leather No 18,100 - Kupa River 333014 Boneja-prerada Kože Leather No 5,438 1,833 Sewerage 333006 Karlovačka Pivovara Food/Beverage No 585,015 595,347 Sewerage 333015 PPK-Karlovačka Industrija Mesa Food/Beverage No 93,094 64,282 Kupa River 333016 Karlovačka Industrija Mlijeka Food/Beverage Not Work 73,493 38,531 Kupa River 333003 Kordun Metal/Machinery Yes 35,869 27,689 Sewerage 333008 ZE-CE Metal/Machinery Yes 74,497 77,799 Sewerage 333009 ŽE-ČE Metal/Machinery - - - Sewerage 333010 Tvornica Plinskih Turbina Metal/Machinery Yes 33,372 - Sewerage 333011 Adria-Diesel Metal/Machinery Yes 37,000 27,067 Sewerage 333017 ABB d.d.tv.Energetskih Trojenja Metal/Machinery No - - Sewerage 333026 Liga d.o.o. Metal/Machinery Yes - - Sewerage 333027 Croatia Pumpe d.d. Metal/Machinery No - 10,281 Sewerage 333028 TPK Strojevi Kamanje Metal/Machinery - Mel Canal 333002 Kontex d.d. Textile Yes - - Sewerage 333005 Velebit Textile Yes 48,117 56,717 Kupa River 333012 Lola Ribar Textile Yes 85,762 76,177 Mrežnica R. 333025 Beti Trikolazac Žakanje Textile Yes (Bio) - - Žakanje Brook 333021 JP Hrvatske Ceste Transportation No - - Sewerage 333022 Automehanika d.d. Transportation Yes - 5,010 Canal Ilovac 333029 Autotransport d.d. Transportation Yes - 25,888 Sewerage
333001 Finvest-Corp d.d. Čabar-PC Impregnacija
Wood Industry Yes 30,637 12,796 Mel. Canal, Polive-Mlaka
333018 Švarča Restoran Društvene Restaurant No - - Sewerage 333023 Karlovačka Industrija Obuće Shoes Factory No - - Sewerage 333020 Merkur-Lok Autopraonice Car Wash Yes 4,103 6,818 Sewerage
333024 Arka Obrt za Trgovinu i Pranje Motornih Vozila
Car Wash Yes - - Mel Canal
(2) Duga Resa The industries registered by Croatian Waters as industrial pollutants in Duga Resa are listed below. A large quantity of industrial wastewater is discharged into the Mrežnica River from Pamučna Industrija with no treatment. The industry in bold characters is the large one described in Appendix C.
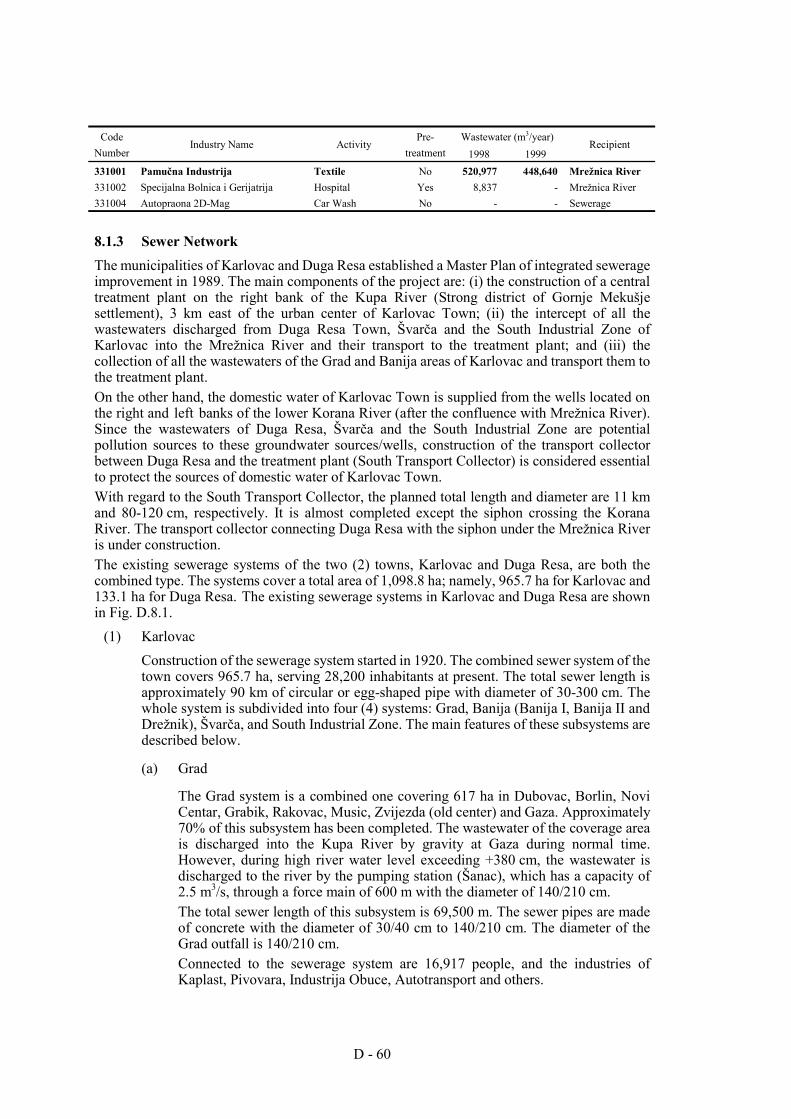
D - 60
Wastewater (m3/year) Code
Number Industry Name Activity
Pre- treatment 1998 1999
Recipient
331001 Pamučna Industrija Textile No 520,977 448,640 Mrežnica River 331002 Specijalna Bolnica i Gerijatrija Hospital Yes 8,837 - Mrežnica River 331004 Autopraona 2D-Mag Car Wash No - - Sewerage
8.1.3 Sewer Network The municipalities of Karlovac and Duga Resa established a Master Plan of integrated sewerage improvement in 1989. The main components of the project are: (i) the construction of a central treatment plant on the right bank of the Kupa River (Strong district of Gornje Mekušje settlement), 3 km east of the urban center of Karlovac Town; (ii) the intercept of all the wastewaters discharged from Duga Resa Town, Švarča and the South Industrial Zone of Karlovac into the Mrežnica River and their transport to the treatment plant; and (iii) the collection of all the wastewaters of the Grad and Banija areas of Karlovac and transport them to the treatment plant. On the other hand, the domestic water of Karlovac Town is supplied from the wells located on the right and left banks of the lower Korana River (after the confluence with Mrežnica River). Since the wastewaters of Duga Resa, Švarča and the South Industrial Zone are potential pollution sources to these groundwater sources/wells, construction of the transport collector between Duga Resa and the treatment plant (South Transport Collector) is considered essential to protect the sources of domestic water of Karlovac Town. With regard to the South Transport Collector, the planned total length and diameter are 11 km and 80-120 cm, respectively. It is almost completed except the siphon crossing the Korana River. The transport collector connecting Duga Resa with the siphon under the Mrežnica River is under construction. The existing sewerage systems of the two (2) towns, Karlovac and Duga Resa, are both the combined type. The systems cover a total area of 1,098.8 ha; namely, 965.7 ha for Karlovac and 133.1 ha for Duga Resa. The existing sewerage systems in Karlovac and Duga Resa are shown in Fig. D.8.1.
(1) Karlovac Construction of the sewerage system started in 1920. The combined sewer system of the town covers 965.7 ha, serving 28,200 inhabitants at present. The total sewer length is approximately 90 km of circular or egg-shaped pipe with diameter of 30-300 cm. The whole system is subdivided into four (4) systems: Grad, Banija (Banija I, Banija II and Drežnik), Švarča, and South Industrial Zone. The main features of these subsystems are described below.
(a) Grad
The Grad system is a combined one covering 617 ha in Dubovac, Borlin, Novi Centar, Grabik, Rakovac, Music, Zvijezda (old center) and Gaza. Approximately 70% of this subsystem has been completed. The wastewater of the coverage area is discharged into the Kupa River by gravity at Gaza during normal time. However, during high river water level exceeding +380 cm, the wastewater is discharged to the river by the pumping station (Šanac), which has a capacity of 2.5 m3/s, through a force main of 600 m with the diameter of 140/210 cm. The total sewer length of this subsystem is 69,500 m. The sewer pipes are made of concrete with the diameter of 30/40 cm to 140/210 cm. The diameter of the Grad outfall is 140/210 cm. Connected to the sewerage system are 16,917 people, and the industries of Kaplast, Pivovara, Industrija Obuce, Autotransport and others.
D - 61
(b) Banija
The Banija subsystem covers 113.5 ha on the left bank of the Kupa River. The wastewater is drained by gravity into the Kupa River through the outfalls of Banija I, Banija II and Drežnik during normal time. A lower part of the sewer network is affected by backwater during high river water level.
(i) Banija I
The total sewer length of Banija I is 4,285 m; namely, 305 m of main sewer and 3,980 m of secondary/tertiary sewer. The sewer pipes are made of concrete with diameters of 40 cm, 40/60 cm, 30/45 cm and 50/75 cm. The diameter of the outfall is 50/75 cm. Connected to the sewerage system are 3,511 inhabitants, and the industries of Kemijsko Gradevinska Industrija, Kordun and others.
(ii) Banija II
The total sewer length of Banija II is 4,719 m; namely, 299 m of main sewer and 4,420 m of secondary/tertiary sewer. The sewer pipes are made of concrete with diameters of 40 cm to 60/90 cm. The diameter of the outfall is 90/130 cm. Connected to the sewerage system are 2,629 inhabitants, and the industries of Kontex and others.
(iii) Drežnik
The total sewer length of Drežnik is 2,710 m including 20 m of main sewer. The sewer pipes are made of concrete with diameters of 40 cm, 50 cm and 60 cm. The diameter of the outfall is 60/90 cm. Connected to the system are 1,143 inhabitants. No industry is connected.
(c) Švarča
The total sewer pipe of Švarča is 4,064 m long; namely, 1,080 m of main sewer and 2,984 m of secondary/tertiary sewer. The sewerage system serves 4,000 inhabitants.
(d) South Industrial Zone
The South Industrial Zone has seven (7) subsystems mostly serving industries. Every subsystem has its own outfall into the Mrežnica River. The industries of ABB, Adria-Diesel, Croatia Pumpe, Tvornica Plinskih Turbina, ZE -ČE, Švarča Restaurant Drustvene Prehrane and others are connected to these subsystems.
Since most of the trunk sewers of the town are old and not sealed, caving of roads often occur resulting in unpredictable and high expenses for restoration. The reconstruction of sewage pipe in the Grad area is urgent. The major problems in the sewer maintenance are as follows: (a) Groundwater infiltration into sewers and foul water dispersion into groundwater
during dry time. (b) Excess water inflow from the external catchments that causes flooding in the
urban areas. (c) Risk of groundwater pollution in the Mekušje area by the wastewater discharge
into the Mrežnica River. The wells existing in the Mekušje area supply the drinking water of Karlovac.
D - 62
(2) Duga Resa Duga Resa Town is served by the combined sewerage system with a total sewer length of 9,200 m at present. The Duga Resa sewerage system that connects with the South Transport Collector is under construction. The wastewater of the town is at present directly discharged through outfalls into the Mrežnica River because the siphon crossing the Korana River in the South Transport Collector is not yet completed.
8.1.4 Wastewater Flow and Quality (1) Karlovac
There are five (5) major sewage outfalls in the town; namely, Grad, Drežnik, Banija I, Banija II and Švarča. The outfalls of Grad, Banija I and Banija II discharge both domestic and industrial wastewater. However, Drežnik and Švarča drain only domestic wastewater. The town observed the wastewater discharge of the above outfalls several times in 1999. The wastewater quantity, served population and served industries of each outfall are given below.
Average Wastewater Served Population Outfall m3/day m3/year Household Population
Served Industries
Grad 11,012 3,549,087 4,229 16,917 Kaplast, Pivovara, Industrija Obuce, Autotransport and Others
Banija I 1,223 336,960 878 3,511 Kemijsko Gradevinska Industrija, Kordun and Others
Banija II 533 141,299 657 2,629 Kontex and Others Drežnik 166 60,653 286 1,143 None Švarča 584 213,408 1,000 4,000 None Total 13,518 4,301,407 7,050 28,200 Source: Croatian Waters
The authorized laboratory periodically analyzes the wastewater quality of the above outfalls, and the results are sent to Croatian Waters. The quality of wastewater discharged by the outfalls (Grad, Banija I, Banija II and Drežnik) into the KupaRiver (Category II) during 1998 to 1999 is summarized below.
Outfall No.* Flow (l/s) Flow (l/s)
T (°C)
BOD5 (mg/l)
CODCr (mg/l)
TSS (mg/l)
TVS (mg/l)
SS (mg/l)
pH
Ave 231.0 17.0 461.0 943.8 762.0 415.2 242.6 49.2 7.0 max 399.0 20.3 554.0 1,546.0 1,116.0 650.0 371.0 90.0 7.3 Grad 5 min 158.0 14.0 423.0 615.0 548.0 230.0 134.0 13.0 6.6 Ave 14.8 16.7 124.0 308.0 579.2 352.4 162.0 35.8 7.7 max 16.1 19.1 222.0 547.0 850.0 574.0 202.0 61.0 8.2 Banija I 5 min 12.3 11.5 43.0 139.0 320.0 148.0 75.0 19.0 7.4 Ave 8.0 19.1 507.0 1,019.8 2,095.0 1,438.4 263.6 71.4 8.5 max 12.8 28.0 950.0 2,490.0 4,776.0 3,340.0 418.0 141.0 9.2
Banija II
7 min 3.3 5.6 82.0 275.0 1,122.0 682.0 101.0 33.0 7.6 Ave 3.5 15.9 116.6 281.0 523.2 319.6 142.4 29.6 7.6 max 5.7 19.0 214.0 498.0 806.0 518.0 249.0 73.0 7.8 Drežnik 5 min 2.6 10.4 37.0 99.0 312.0 162.0 55.0 9.0 7.5
* Sampling number
D - 63
The JICA Study Team also analyzed the quantity and quality of wastewater at the pumping station before the Kupa River on November 29, 2000. The results for major parameters are shown below. For other parameters, see Table B.4.3 in Appendix B.
Parameter Unit Value Parameter Unit Value
Sampling Time 09:30 CODMn mg/l 138.0 Flow m3/sec 0.126 TSS mg/l 111.0 pH 7.1 T-N mg/l 37.7 BOD mg/l 460.0 T-P mg/l 8.6
(2) Duga Resa (1996-1999) The authorized laboratory periodically analyzes the wastewater quality at outfalls, and the results are sent to Croatian Waters. The quality of wastewater discharged by the four (4) outfalls (A, C, D and G) into the Mrežnica River (Category II) during 1996 to 1999 is summarized below.
Outlet
(Location) No.* Flow (l/s)
T (°C)
BOD5 (mg/l)
CODCr (mg/l)
TSS (mg/l)
TVS (mg/l)
SS (mg/l)
VS (mg/l) pH
Ave 0.12 15.3 154.3 356.1 1,138.2 318.3 281.4 41.0 7.4 Max 0.20 21.0 493.0 758.0 3,278.0 628.0 1,117.0 152.0 7.9 A
(Kod Ljoma) 19 Min 0.10 10.0 28.0 94.0 368.0 156.0 30.0 9.0 7.1 Ave 0.11 13.6 261.7 457.9 1,124.5 358.3 235.8 44.5 7.6 Max 0.20 20.0 477.0 812.0 7,998.0 832.0 443.0 204.0 8.3 (Kod Vinice) 19 Min 0.10 6.0 64.0 158.0 360.0 172.0 60.0 12.0 7.1 Ave 0.41 13.5 110.3 228.1 457.2 261.4 153.2 34.9 7.7 Max 4.00 17.0 295.0 528.0 740.0 390.0 305.0 121.0 8.2 (Kod Doma
Sportova) 19 Min 0.10 8.0 11.0 26.0 200.0 74.0 13.0 5.0 7.0 Ave 0.15 12.9 53.1 138.3 453.9 295.6 108.4 19.4 7.5 Max 0.30 19.0 293.0 627.0 1,000.0 600.0 210.0 41.0 8.1 (Kod Mlina) 19 Min 0.10 8.0 14.0 26.0 324.0 182.0 23.0 3.0 7.1
* Sampling number
The JICA Study Team also analyzed the quantity and quality of wastewater in the manhole before the Mrežnica River on November 29, 2000. The results for major parameters are shown below. For other parameters, see Table B.4.3 in Appendix B.
Parameter Unit Value Parameter Unit Value
Sampling Time 10:40 CODMn mg/l 28.0 Flow m3/sec 0.0039 TSS mg/l 119.0 pH 7.1 T-N mg/l 8.77 BOD mg/l 31.0 T-P mg/l 1.19
8.2 Planning Basis 8.2.1 Service Area, Population and Industries
(1) Service Area and Population
(a) Karlovac
The first priority is given to the pollution control of the Mrežnica River. Almost all of the areas along both sides of the Mrežnica River are residential zones and some industries are located at the right bank in the southwestern settlement of Mala Švarča. Due to this situation, the southwestern three (3) settlements of Turanj, Mala Švarča and Lugorište on the right bank and the remaining area in Švarča on the left bank will be covered by the sewerage system.
D - 64
The Gornje Mekušje settlement near the treatment site will also be served since it is located along the route of the South Transport Collector. A meat factory, “PPK”, is located along the Kupa River and discharges wastewater with high organic load directly into the Kupa River at present. The district of 42.8 ha including this factory and the surrounding area will be covered by the Master Plan service area since it is near the existing service area and can be covered easily by extending the existing sewer pipe. Further, there is a plan to construct an industrial zone in the northern suburbs of Banija located on the left bank of the Kupa River. The surface area is 322.2 ha and the quantity generated in this area will be included in designing only the transport collector/main sewer and not the treatment plant because the construction of industrial zone will start only after 2015. With the extension of 1,012.6 ha, the total service area in Karlovac will be 1978.3 ha and served population in the Master Plan service area will be 55,800 according to the extension of service area and increase of population. This area does not include the future industrial zone mentioned above.
(b) Duga Resa
The urban center of Duga Resa, together with the suburban northern two (2) settlements of Gornje Mrzlo Polje and Donje Mrzlo Polje, the northwestern settlement of Petrakovo Brdo, and the southeastern settlement of Mrežnički Varoš, will be included in the Master Plan service area. With the extension of 71.9 ha, the total service area in Duga Resa will be 205.1 ha. Service population in the Master Plan service area will be 10,900 according to the area extension and increase of population.
For the extension areas of Karlovac and Duga Resa, see Fig. D.8.1. (2) Industry
All industries to be served by the proposed Master Plan sewerage system should discharge their wastewaters into sewerage system after pre-treatment in compliance with the national regulation in all the quality parameters. For the location of the 12 large industries in Karlovac and Duga Resa, see Fig. D.8.1.
(a) Karlovac
In addition to the 19 industries in the existing service area, three (3) other industries in the extension service area, which are registered by Croatian Waters among the industrial pollutants, will be covered. Among the above 22 industries to be covered by the proposed Master Plan service area, 11 large industries (Kordun, Pivovara, PPK, KIM, ABB, Ze-Če, TPT, Adria Diesel, Velebit, Lola Ribar and Autotransport) are dealt in this Study as sources of industrial wastewater, and the other smaller industries are included in the sources of municipal wastewater.
(b) Duga Resa
Among the three (3) industries registered by Croatian Waters as industrial pollutant, only one (1) industry, “Pamučna Industrija,” which discharges wastewater into the Mrežnica River at present, will be served under the Master Plan service area. This is a large industry and it is dealt as a source of industrial wastewater.
(3) Collection System Wastewaters of the existing service areas are collected by the combined system, while the proposed extension is by the separate one in principle.
D - 65
8.2.2 Wastewater Flow and Quality (1) Municipal Wastewater Flow
The quantity of municipal wastewater is projected as follows.
Quantity (m3/day) Item Karlovac Duga Resa Total
Daily Average 18,414 3,597 22,011 Daily Maximum 22,320 4,360 26,680 Hourly Maximum 31,806 6,213 38,019
(2) Industrial Wastewater Flow The wastewater quantity of the 12 large industries is estimated as shown below. The existing and future daily averages were obtained from Chapter 6 and Section 8.3 in Appendix C. The future daily maximum and hourly maximum were calculated based on the daily average, considering the operation hour of the industries.
Quantity (m3/day)
1999 2015 Town Industry Name Daily
Average Daily
Average Daily
Maximum Hourly
Maximum Karlovac Kordun 128 212 212 318 Pivovara 2,301 3,802 3,802 3,802 PPK 348 609 609 914 KIM 250 510 510 765 ABB 240 397 397 596 Ze-Če 305 504 504 756 TPT 134 221 221 332 Adria Diesel 129 213 213 320 Velebit 248 410 410 615 Lola Ribar 307 507 507 760 Autotransport 104 172 172 258 Duga Resa Pamučna Industrija 2,417 3,992 3,992 3,992 Total 6,911 11,595 11,595 13,427
(3) Total Wastewater Flow The total wastewater flow composed of municipal and industrial wastewater is as projected in the following table. Hourly maximum in rainy period is estimated based on the assumption that the transport collector conveys two (2) times of the dry weather wastewater flow (2Q) to the treatment plant.
Quantity (m3/day)
Municipal Industry Item Karlovac Duga Resa Karlovac Duga Resa Total
Daily Average 18,414 3,597 7,603 3,992 33,606 Daily Maximum 22,320 4,360 7,603 3,992 38,275 Hourly Maximum (Dry) 31,806 6,213 9,435 3,992 51,446 Hourly Maximum (Rainy) 52,356 9,313 15,766 7,984 85,419
(4) Quality of Wastewater The expected pollution load and influent quality into the treatment plant are summarized in the table below. For the estimation of pollution load of municipal and industrial wastewaters, see Subsection 1.3.2 in Appendix D, and Chapter 6 and Section 8.3 in Appendix C, respectively.
D - 66
As shown in the table, the total BOD load generated in the Master Plan service area is 7,015.5 kg/day. It is equivalent to 117,000 PE when the conversion rate of Person Equivalent is assumed at 60 g/capita/day.
Load (kg/day)
Municipal Industry Parameter Karlovac Duga Resa Karlovac Duga Resa Total
Concent- ration (mg/l)
BOD 4,352.4 850.2 1,333.9 479.0 7,015.5 183.3 CODCr 8,704.8 1,700.4 3,495.3 1,149.7 15,050.1 393.2 TSS 5,077.8 991.9 1,829.3 1,105.8 9,004.7 235.3 T-N 797.9 155.9 117.3 19.2 1,090.3 28.5 T-P 181.4 35.4 43.5 3.1 263.3 6.9
8.3 Proposed Structural Plan 8.3.1 Transport Collector/Main Sewer
(1) General The proposed integrated sewerage system for Karlovac and Duga Resa is divided into three (3) parts; namely, the Grad area, the Banija area and the Karlovac-Duga Resa area. Wastewaters of the three (3) areas are to be transported through the respective transport collectors to a central treatment plant proposed at a site east of Karlovac Town (settlement Gornje Mekušje).
(a) Karlovac-Duga Resa
The wastewater of Karlovac-Duga Resa area is to be conveyed through the South Transport Collector to the treatment plant. The South Transport Collector is almost complete except the siphon that will cross the Korana River. The remaining works should be completed and, in addition, some sub-transport collectors and main sewers are necessary in order to connect the proposed service area to the South Transport Collector. Wastewater in the left bank area of Duga Resa is discharged into the Mrežnica River through several outfalls at present. Hence a sub-transport collector is proposed to intercept the wastewater and to discharge it into the South Transport Collector. On the other hand, the right bank area of Duga Resa is provided with no sewer at present. Hence, a main sewer is proposed to connect the area to the South Transport Collector. Wastewater in the Švarča area on the left bank of the Mrežnica River is discharged into the river through an outfall at present. A sub-transport collector is thus proposed to connect the Švarča area to the South Transport Collector. For crossing the Mrežnica River, a siphon is also proposed.
(b) Grad
Wastewater in the Grad area on the right bank of the Kupa River is discharged into the river through an outfall located at Gaza area at present. A transport collector (Grad Transport Collector) is thus proposed to intercept the wastewater and to transport it to the treatment plant.
(c) Banija
Wastewater in the Banija area on the left bank of the Kupa River is discharged into the river through four (4) outfalls at present. A transport collector (Banija Transport Collector) with a sub-transport collector (covering part of Banija area: Drežnik) is thus proposed to intercept the wastewater and to transport it to the treatment plant.
D - 67
(2) Alternative Study on Banija and Grad Transport Collectors Alternatives are considered for the route of Banija Transport Collector and the method of transport (with or without lift pump) of Grad Transport Collector. The following four (4) alternatives are prepared by combining the route and method of transport.
(a) Alternative 1
The Banija Transport Collector is to be connected to the Grad Transport Collector after crossing the Kupa River by siphon. Then the wastewater of both areas is to be transported to the treatment plant through the Grad Transport Collector, which will be provided with siphon to cross the Korana River but without a lift pump at the midway.
(b) Alternative 2
Wastewater of the two (2) areas is to be separately transported to the treatment plant. The Banija Transport Collector will run along the left bank of the Kupa River to bypass the urban center of the town, and cross the river by siphon in the downstream near the treatment plant. A lift pump is provided in the midway. The Grad Transport Collector will be the same as Alternative 1 although the discharge capacity is to be different.
(c) Alternative 3
The route of Banija Transport Collector will be the same as Alternative 1. However, a lift pump is to be installed on the Grad Transport Collector immediately after the connection with Banija Transport Collector.
(d) Alternative 4
The route of Banija Transport Collector is the same as Alternative 2. A lift pump is to be constructed in the midway. On the other hand, the Grad Transport Collector is to be provided with a lift pump.
For the routes of the Banija-Grad alternative transport collectors, see Fig. D.8.2. The main features, constructivity and required total cost (including construction and O&M costs) of the above four (4) alternatives are compared in the following table.
Item Alt. 1 Alt. 2 Alt. 3 Alt. 4 Pipe Diameter (mm) 300 - 1,700 300 - 1,700 300 - 1,700 300 - 1,700 Pipe Length (m) 8,120 10,950 8,120 10,950 Number of Pumping Stations 0 1 1 2 Number of Siphons 2 2 2 2
Constructivity Not easy in the Urban Center
Easy Not easy in the Urban Center
Easy
Construction Cost (×106 Kn) 46.5 59.0 23.2 41.8 Annual O&M Cost (×103 Kn) 111 175 175 216 Total Present Value Cost (×106 Kn)
47.9 61.2 25.3 44.5
In this cost comparison, the total cost is estimated in terms of present value at 5% discount rate. For the calculation of present cost values, see Table D.8.1. As evident in the above table, Alternative 3 is recommendable.
(3) Proposed Transport Collector and Main Sewer As mentioned before, five (5) transport collectors/sub transport collectors/main sewer are proposed to transport the wastewater of Banija, Grad, Švarča and Duga Resa to the
D - 68
central treatment plant in the settlement Gornje Mekušje. The proposal is as elaborated further below. Transport collectors and sub-transport collectors are planned to discharge two (2) times of the design dry weather wastewater flow (2Q), as mentioned in Chapter I Subsection 1.3.3. The design dry weather wastewater flow is estimated for each sewerage service area, targeting the year 2015. On the other hand, the north suburban area of Banija is expected to develop for industrial purposes in the future after 2015. The relevant three (3) transport collectors: Drežnik Sub-Transport Collector, Banija Transport Collector and Grad Transport Collector will then be designed to include an additional wastewater flow generated from the suburban areas based on the request of the local government. The additional design wastewater flow is assumed at a quantity equivalent to 30,000 people or 15,000 m3/day in hourly maximum. The Drežnik Sub-Transport Collector will collect the wastewater of Drežnik area (part of Banija area) at two (2) outfalls. It will be connected with the Banija Transport Collector, and the diameter of pipes would range from 300 mm to 350 mm for a length of 2.88 km. The Banija Transport Collector will collect the wastewater of Banija area at two (2) outfalls (Banija 1 and Banija 2) and further receive the wastewater from the Drežnik Sub-Transport Collector. Thereafter, it will cross the Mrežnica River by siphon in order to connect with the Grad Transport Collector. The diameter of pipes would range from 700 mm to 800 mm for a length of 2.46 km. The Grad Transport Collector will collect the wastewater of Grad area at the Šanac pumping station and is to be connected with the Banija Transport Collector from that location. It will run to the wastewater treatment plant, crossing the Korana River by siphon in the midway. The diameter of pipes would range from 1,300 to 1,700 mm for a length of 2.48 km. The Švarča Sub-Transport Collector will run along the left bank of the Mrežnica River, collecting the wastewater of Švarča area at the existing outfall and the future connection points of sewer networks. It will cross the Kupa River by siphon in order to connect with the existing South Transport Collector at Turanj. The Duga Resa Sub-Transport Collector will collect wastewater from the left bank of the Mrežnica River in Duga Resa Town at the existing outfalls and connect with the existing South Transport Collector. The diameter of pipes would range from 400 to 1,200 mm for a length of 1.83 km. The right bank of the Mrežnica River in Duga Resa will be served by the separate system. The main sewer, with diameter and length of 300 mm and 1.25 km, is proposed to connect with the existing South Transport Collector. The proposed transport collectors, sub-transport collectors and main sewer are summarized below. For their routes, see Fig. D.8.1.
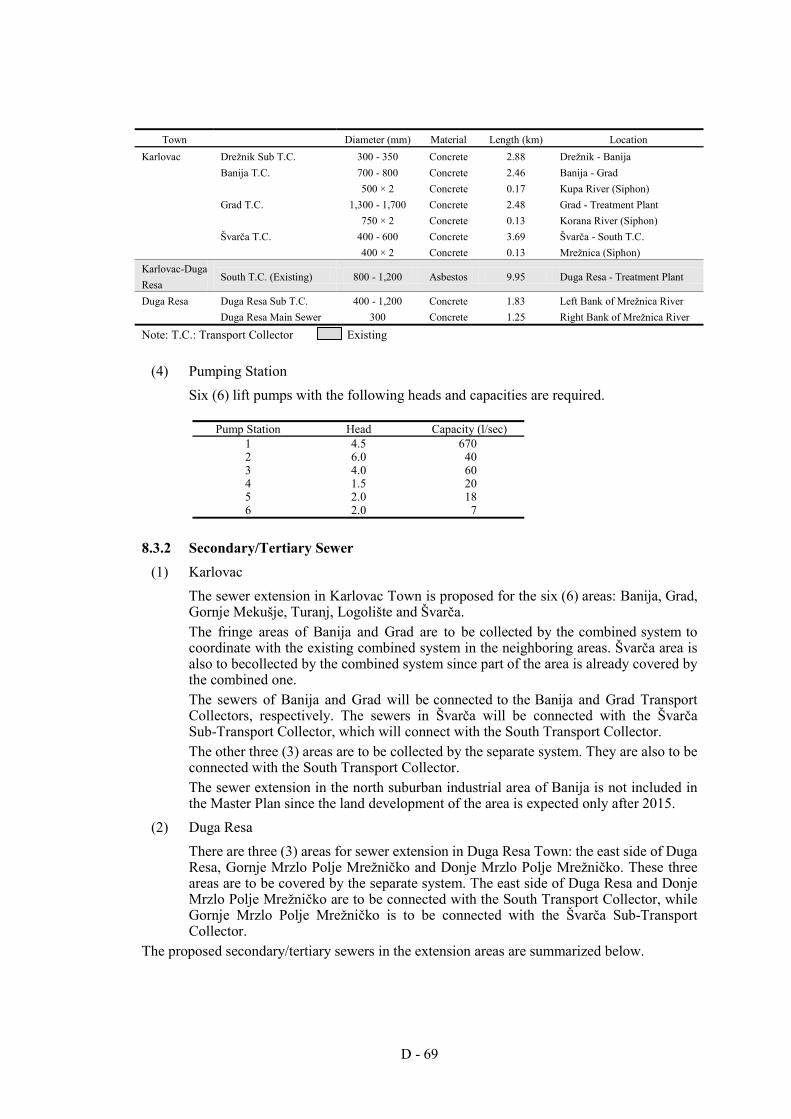
D - 69
Town Diameter (mm) Material Length (km) Location
Karlovac Drežnik Sub T.C. 300 - 350 Concrete 2.88 Drežnik - Banija Banija T.C. 700 - 800 Concrete 2.46 Banija - Grad 500 × 2 Concrete 0.17 Kupa River (Siphon) Grad T.C. 1,300 - 1,700 Concrete 2.48 Grad - Treatment Plant 750 × 2 Concrete 0.13 Korana River (Siphon) Švarča T.C. 400 - 600 Concrete 3.69 Švarča - South T.C. 400 × 2 Concrete 0.13 Mrežnica (Siphon) Karlovac-Duga Resa
South T.C. (Existing) 800 - 1,200 Asbestos 9.95 Duga Resa - Treatment Plant
Duga Resa Duga Resa Sub T.C. 400 - 1,200 Concrete 1.83 Left Bank of Mrežnica River Duga Resa Main Sewer 300 Concrete 1.25 Right Bank of Mrežnica River
Note: T.C.: Transport Collector Existing
(4) Pumping Station Six (6) lift pumps with the following heads and capacities are required.
Pump Station Head Capacity (l/sec)
1 4.5 670 2 6.0 40 3 4.0 60 4 1.5 20 5 2.0 18 6 2.0 7
8.3.2 Secondary/Tertiary Sewer (1) Karlovac
The sewer extension in Karlovac Town is proposed for the six (6) areas: Banija, Grad, Gornje Mekušje, Turanj, Logolište and Švarča. The fringe areas of Banija and Grad are to be collected by the combined system to coordinate with the existing combined system in the neighboring areas. Švarča area is also to becollected by the combined system since part of the area is already covered by the combined one. The sewers of Banija and Grad will be connected to the Banija and Grad Transport Collectors, respectively. The sewers in Švarča will be connected with the Švarča Sub-Transport Collector, which will connect with the South Transport Collector. The other three (3) areas are to be collected by the separate system. They are also to be connected with the South Transport Collector. The sewer extension in the north suburban industrial area of Banija is not included in the Master Plan since the land development of the area is expected only after 2015.
(2) Duga Resa There are three (3) areas for sewer extension in Duga Resa Town: the east side of Duga Resa, Gornje Mrzlo Polje Mrežničko and Donje Mrzlo Polje Mrežničko. These three areas are to be covered by the separate system. The east side of Duga Resa and Donje Mrzlo Polje Mrežničko are to be connected with the South Transport Collector, while Gornje Mrzlo Polje Mrežničko is to be connected with the Švarča Sub-Transport Collector.
The proposed secondary/tertiary sewers in the extension areas are summarized below.
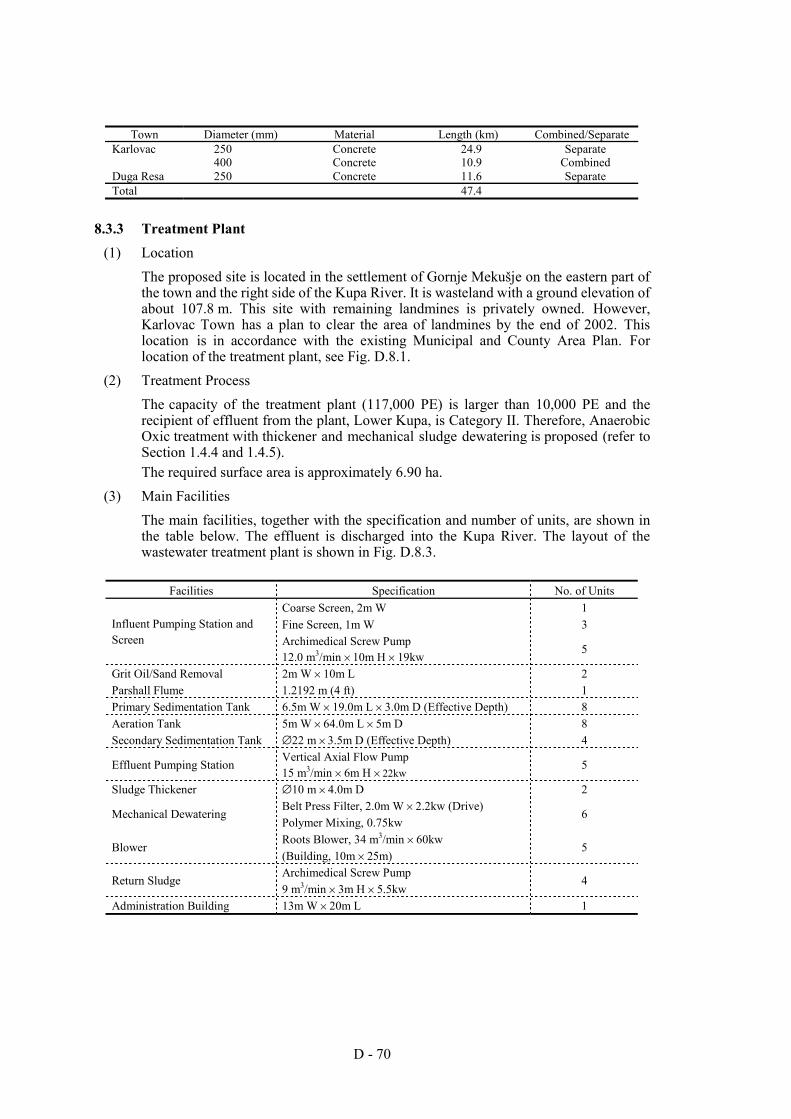
D - 70
Town Diameter (mm) Material Length (km) Combined/Separate
Karlovac 250 Concrete 24.9 Separate 400 Concrete 10.9 Combined Duga Resa 250 Concrete 11.6 Separate Total 47.4
8.3.3 Treatment Plant (1) Location
The proposed site is located in the settlement of Gornje Mekušje on the eastern part of the town and the right side of the Kupa River. It is wasteland with a ground elevation of about 107.8 m. This site with remaining landmines is privately owned. However, Karlovac Town has a plan to clear the area of landmines by the end of 2002. This location is in accordance with the existing Municipal and County Area Plan. For location of the treatment plant, see Fig. D.8.1.
(2) Treatment Process The capacity of the treatment plant (117,000 PE) is larger than 10,000 PE and the recipient of effluent from the plant, Lower Kupa, is Category II. Therefore, Anaerobic Oxic treatment with thickener and mechanical sludge dewatering is proposed (refer to Section 1.4.4 and 1.4.5). The required surface area is approximately 6.90 ha.
(3) Main Facilities The main facilities, together with the specification and number of units, are shown in the table below. The effluent is discharged into the Kupa River. The layout of the wastewater treatment plant is shown in Fig. D.8.3.
Facilities Specification No. of Units
Coarse Screen, 2m W 1 Fine Screen, 1m W 3 Influent Pumping Station and
Screen Archimedical Screw Pump 12.0 m3/min × 10m H × 19kw
5
Grit Oil/Sand Removal 2m W × 10m L 2 Parshall Flume 1.2192 m (4 ft) 1 Primary Sedimentation Tank 6.5m W × 19.0m L × 3.0m D (Effective Depth) 8 Aeration Tank 5m W × 64.0m L × 5m D 8 Secondary Sedimentation Tank ∅22 m × 3.5m D (Effective Depth) 4
Effluent Pumping Station Vertical Axial Flow Pump 15 m3/min × 6m H × 22kw
5
Sludge Thickener ∅10 m × 4.0m D 2 Belt Press Filter, 2.0m W × 2.2kw (Drive)
Mechanical Dewatering Polymer Mixing, 0.75kw
6
Roots Blower, 34 m3/min × 60kw Blower
(Building, 10m × 25m) 5
Archimedical Screw Pump Return Sludge
9 m3/min × 3m H × 5.5kw 4
Administration Building 13m W × 20m L 1
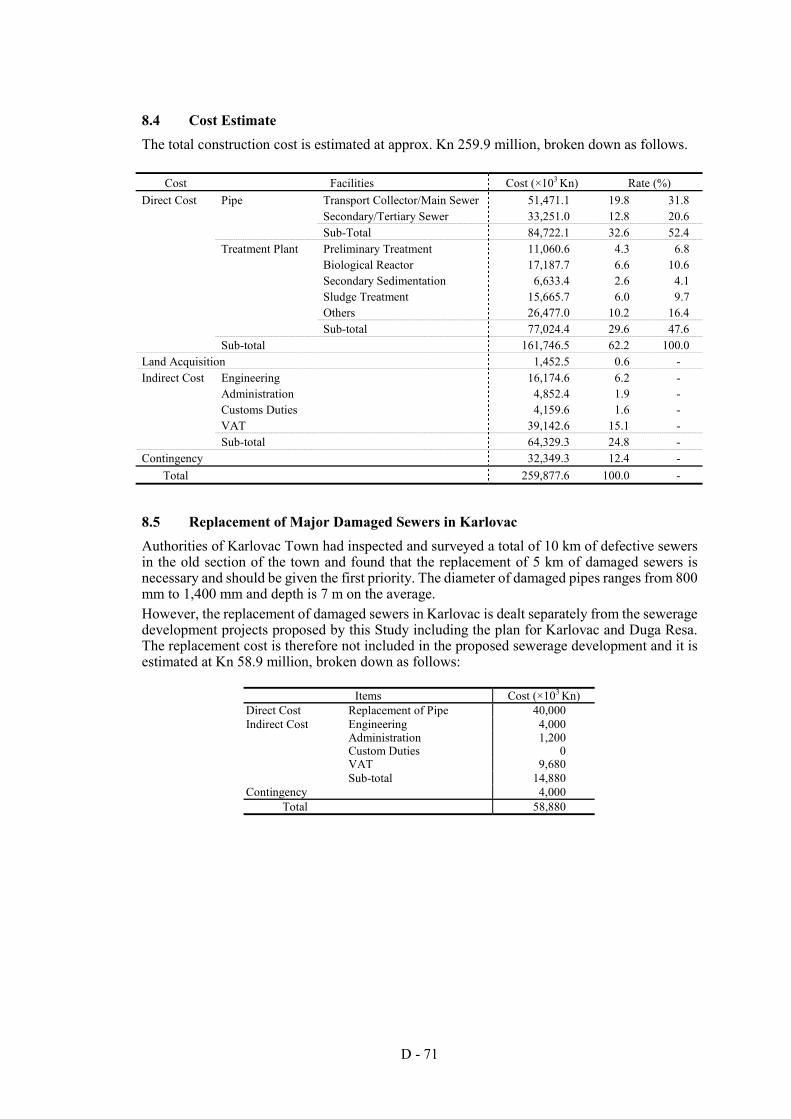
D - 71
8.4 Cost Estimate The total construction cost is estimated at approx. Kn 259.9 million, broken down as follows.
Cost Facilities Cost (×103 Kn) Rate (%) Direct Cost Pipe Transport Collector/Main Sewer 51,471.1 19.8 31.8 Secondary/Tertiary Sewer 33,251.0 12.8 20.6 Sub-Total 84,722.1 32.6 52.4 Treatment Plant Preliminary Treatment 11,060.6 4.3 6.8 Biological Reactor 17,187.7 6.6 10.6 Secondary Sedimentation 6,633.4 2.6 4.1 Sludge Treatment 15,665.7 6.0 9.7 Others 26,477.0 10.2 16.4 Sub-total 77,024.4 29.6 47.6 Sub-total 161,746.5 62.2 100.0 Land Acquisition 1,452.5 0.6 - Indirect Cost Engineering 16,174.6 6.2 - Administration 4,852.4 1.9 - Customs Duties 4,159.6 1.6 - VAT 39,142.6 15.1 - Sub-total 64,329.3 24.8 - Contingency 32,349.3 12.4 -
Total 259,877.6 100.0 -
8.5 Replacement of Major Damaged Sewers in Karlovac Authorities of Karlovac Town had inspected and surveyed a total of 10 km of defective sewers in the old section of the town and found that the replacement of 5 km of damaged sewers is necessary and should be given the first priority. The diameter of damaged pipes ranges from 800 mm to 1,400 mm and depth is 7 m on the average. However, the replacement of damaged sewers in Karlovac is dealt separately from the sewerage development projects proposed by this Study including the plan for Karlovac and Duga Resa. The replacement cost is therefore not included in the proposed sewerage development and it is estimated at Kn 58.9 million, broken down as follows:
Items Cost (×103 Kn) Direct Cost Replacement of Pipe 40,000 Indirect Cost Engineering 4,000 Administration 1,200 Custom Duties 0 VAT 9,680 Sub-total 14,880 Contingency 4,000
Total 58,880
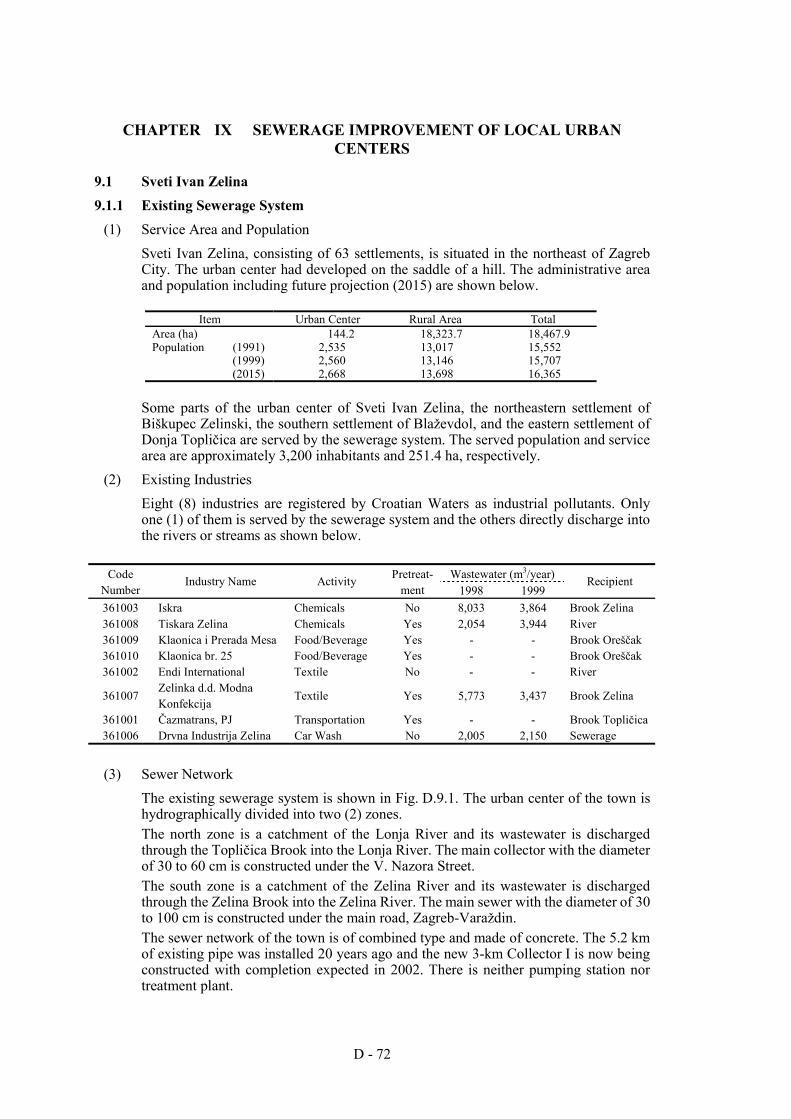
D - 72
CHAPTER IX SEWERAGE IMPROVEMENT OF LOCAL URBAN CENTERS
9.1 Sveti Ivan Zelina 9.1.1 Existing Sewerage System
(1) Service Area and Population Sveti Ivan Zelina, consisting of 63 settlements, is situated in the northeast of Zagreb City. The urban center had developed on the saddle of a hill. The administrative area and population including future projection (2015) are shown below.
Item Urban Center Rural Area Total
Area (ha) 144.2 18,323.7 18,467.9 Population (1991) 2,535 13,017 15,552 (1999) 2,560 13,146 15,707 (2015) 2,668 13,698 16,365
Some parts of the urban center of Sveti Ivan Zelina, the northeastern settlement of Biškupec Zelinski, the southern settlement of Blaževdol, and the eastern settlement of Donja Topličica are served by the sewerage system. The served population and service area are approximately 3,200 inhabitants and 251.4 ha, respectively.
(2) Existing Industries Eight (8) industries are registered by Croatian Waters as industrial pollutants. Only one (1) of them is served by the sewerage system and the others directly discharge into the rivers or streams as shown below.
Wastewater (m3/year) Code
Number Industry Name Activity Pretreat-
ment 1998 1999 Recipient
361003 Iskra Chemicals No 8,033 3,864 Brook Zelina 361008 Tiskara Zelina Chemicals Yes 2,054 3,944 River 361009 Klaonica i Prerada Mesa Food/Beverage Yes - - Brook Oreščak 361010 Klaonica br. 25 Food/Beverage Yes - - Brook Oreščak 361002 Endi International Textile No - - River
361007 Zelinka d.d. Modna Konfekcija
Textile Yes 5,773 3,437 Brook Zelina
361001 Čazmatrans, PJ Transportation Yes - - Brook Topličica 361006 Drvna Industrija Zelina Car Wash No 2,005 2,150 Sewerage
(3) Sewer Network The existing sewerage system is shown in Fig. D.9.1. The urban center of the town is hydrographically divided into two (2) zones. The north zone is a catchment of the Lonja River and its wastewater is discharged through the Topličica Brook into the Lonja River. The main collector with the diameter of 30 to 60 cm is constructed under the V. Nazora Street. The south zone is a catchment of the Zelina River and its wastewater is discharged through the Zelina Brook into the Zelina River. The main sewer with the diameter of 30 to 100 cm is constructed under the main road, Zagreb-Varaždin. The sewer network of the town is of combined type and made of concrete. The 5.2 km of existing pipe was installed 20 years ago and the new 3-km Collector I is now being constructed with completion expected in 2002. There is neither pumping station nor treatment plant.
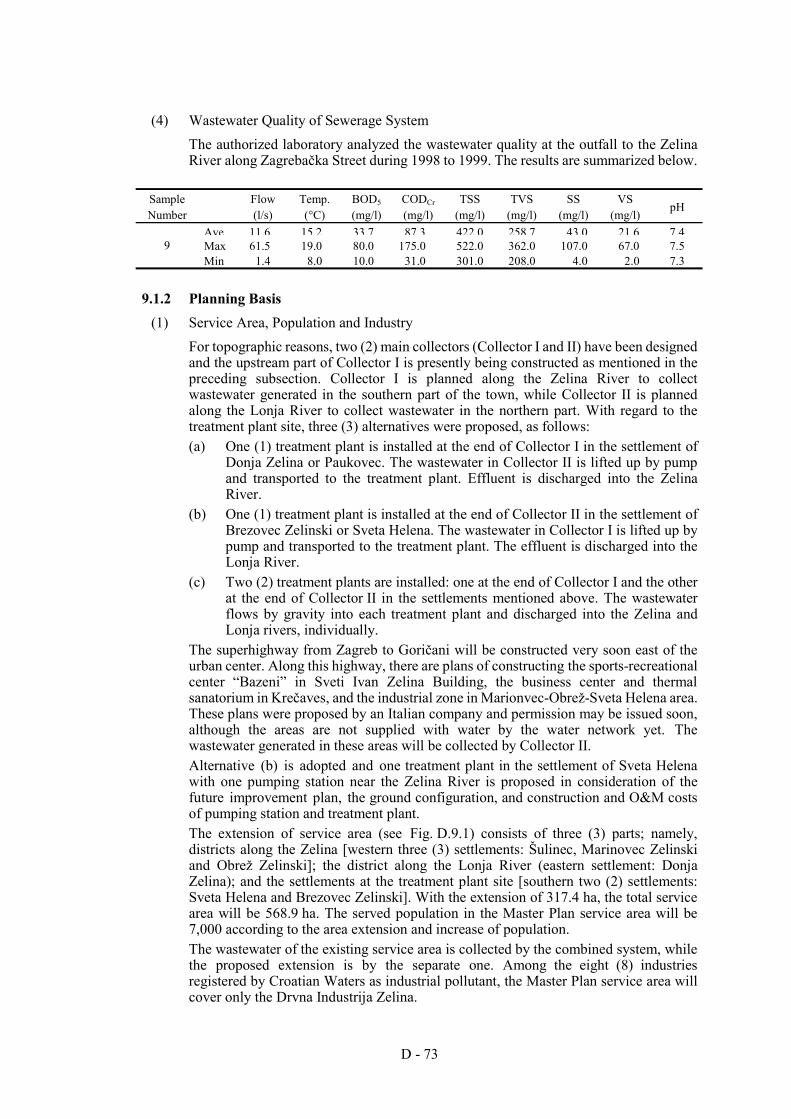
D - 73
(4) Wastewater Quality of Sewerage System The authorized laboratory analyzed the wastewater quality at the outfall to the Zelina River along Zagrebačka Street during 1998 to 1999. The results are summarized below.
Sample Number
Flow (l/s)
Temp. (°C)
BOD5 (mg/l)
CODCr
(mg/l) TSS
(mg/l) TVS
(mg/l) SS
(mg/l) VS
(mg/l) pH
Ave 11.6 15.2 33.7 87.3 422.0 258.7 43.0 21.6 7.4Max 61.5 19.0 80.0 175.0 522.0 362.0 107.0 67.0 7.5 9 Min 1.4 8.0 10.0 31.0 301.0 208.0 4.0 2.0 7.3
9.1.2 Planning Basis (1) Service Area, Population and Industry
For topographic reasons, two (2) main collectors (Collector I and II) have been designed and the upstream part of Collector I is presently being constructed as mentioned in the preceding subsection. Collector I is planned along the Zelina River to collect wastewater generated in the southern part of the town, while Collector II is planned along the Lonja River to collect wastewater in the northern part. With regard to the treatment plant site, three (3) alternatives were proposed, as follows: (a) One (1) treatment plant is installed at the end of Collector I in the settlement of
Donja Zelina or Paukovec. The wastewater in Collector II is lifted up by pump and transported to the treatment plant. Effluent is discharged into the Zelina River.
(b) One (1) treatment plant is installed at the end of Collector II in the settlement of Brezovec Zelinski or Sveta Helena. The wastewater in Collector I is lifted up by pump and transported to the treatment plant. The effluent is discharged into the Lonja River.
(c) Two (2) treatment plants are installed: one at the end of Collector I and the other at the end of Collector II in the settlements mentioned above. The wastewater flows by gravity into each treatment plant and discharged into the Zelina and Lonja rivers, individually.
The superhighway from Zagreb to Goričani will be constructed very soon east of the urban center. Along this highway, there are plans of constructing the sports-recreational center “Bazeni” in Sveti Ivan Zelina Building, the business center and thermal sanatorium in Krečaves, and the industrial zone in Marionvec-Obrež-Sveta Helena area. These plans were proposed by an Italian company and permission may be issued soon, although the areas are not supplied with water by the water network yet. The wastewater generated in these areas will be collected by Collector II. Alternative (b) is adopted and one treatment plant in the settlement of Sveta Helena with one pumping station near the Zelina River is proposed in consideration of the future improvement plan, the ground configuration, and construction and O&M costs of pumping station and treatment plant. The extension of service area (see Fig. D.9.1) consists of three (3) parts; namely, districts along the Zelina [western three (3) settlements: Šulinec, Marinovec Zelinski and Obrež Zelinski]; the district along the Lonja River (eastern settlement: Donja Zelina); and the settlements at the treatment plant site [southern two (2) settlements: Sveta Helena and Brezovec Zelinski]. With the extension of 317.4 ha, the total service area will be 568.9 ha. The served population in the Master Plan service area will be 7,000 according to the area extension and increase of population. The wastewater of the existing service area is collected by the combined system, while the proposed extension is by the separate one. Among the eight (8) industries registered by Croatian Waters as industrial pollutant, the Master Plan service area will cover only the Drvna Industrija Zelina.
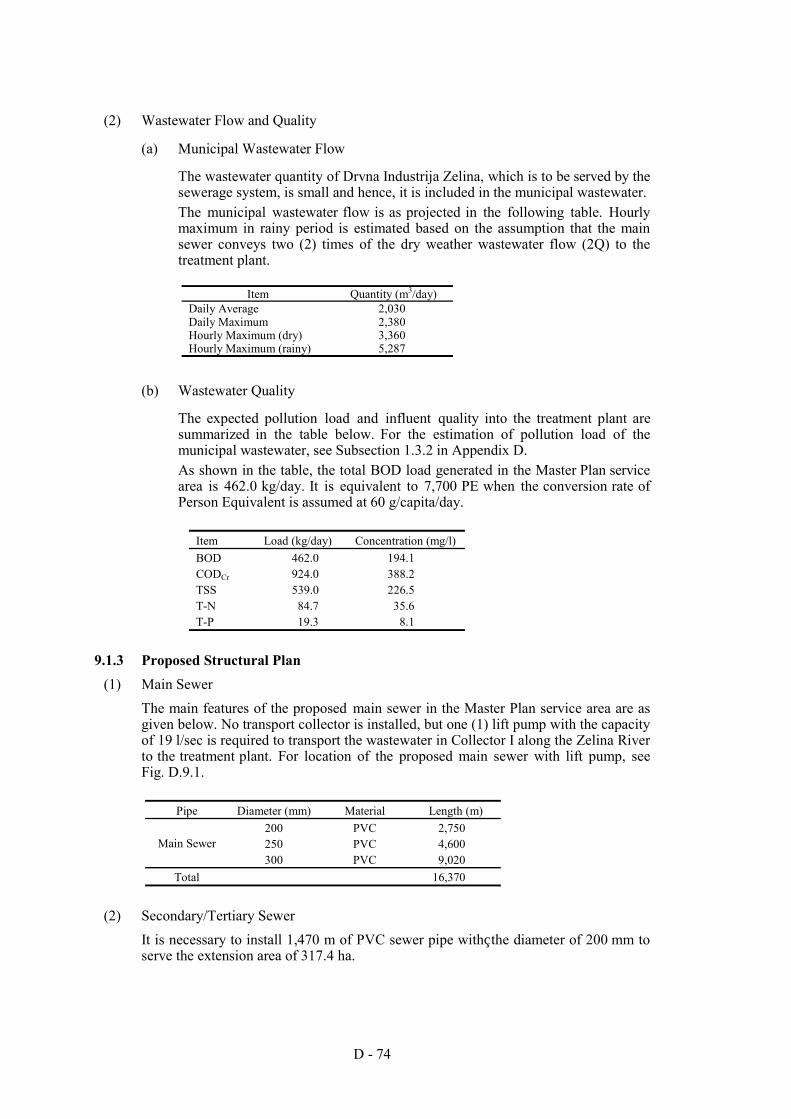
D - 74
(2) Wastewater Flow and Quality
(a) Municipal Wastewater Flow
The wastewater quantity of Drvna Industrija Zelina, which is to be served by the sewerage system, is small and hence, it is included in the municipal wastewater. The municipal wastewater flow is as projected in the following table. Hourly maximum in rainy period is estimated based on the assumption that the main sewer conveys two (2) times of the dry weather wastewater flow (2Q) to the treatment plant.
Item Quantity (m3/day)
Daily Average 2,030 Daily Maximum 2,380 Hourly Maximum (dry) 3,360 Hourly Maximum (rainy) 5,287
(b) Wastewater Quality
The expected pollution load and influent quality into the treatment plant are summarized in the table below. For the estimation of pollution load of the municipal wastewater, see Subsection 1.3.2 in Appendix D. As shown in the table, the total BOD load generated in the Master Plan service area is 462.0 kg/day. It is equivalent to 7,700 PE when the conversion rate of Person Equivalent is assumed at 60 g/capita/day.
Item Load (kg/day) Concentration (mg/l) BOD 462.0 194.1 CODCr 924.0 388.2 TSS 539.0 226.5 T-N 84.7 35.6 T-P 19.3 8.1
9.1.3 Proposed Structural Plan (1) Main Sewer
The main features of the proposed main sewer in the Master Plan service area are as given below. No transport collector is installed, but one (1) lift pump with the capacity of 19 l/sec is required to transport the wastewater in Collector I along the Zelina River to the treatment plant. For location of the proposed main sewer with lift pump, see Fig. D.9.1.
Pipe Diameter (mm) Material Length (m)
200 PVC 2,750 250 PVC 4,600 Main Sewer 300 PVC 9,020
Total 16,370
(2) Secondary/Tertiary Sewer It is necessary to install 1,470 m of PVC sewer pipe with the diameter of 200 mm to serve the extension area of 317.4 ha.
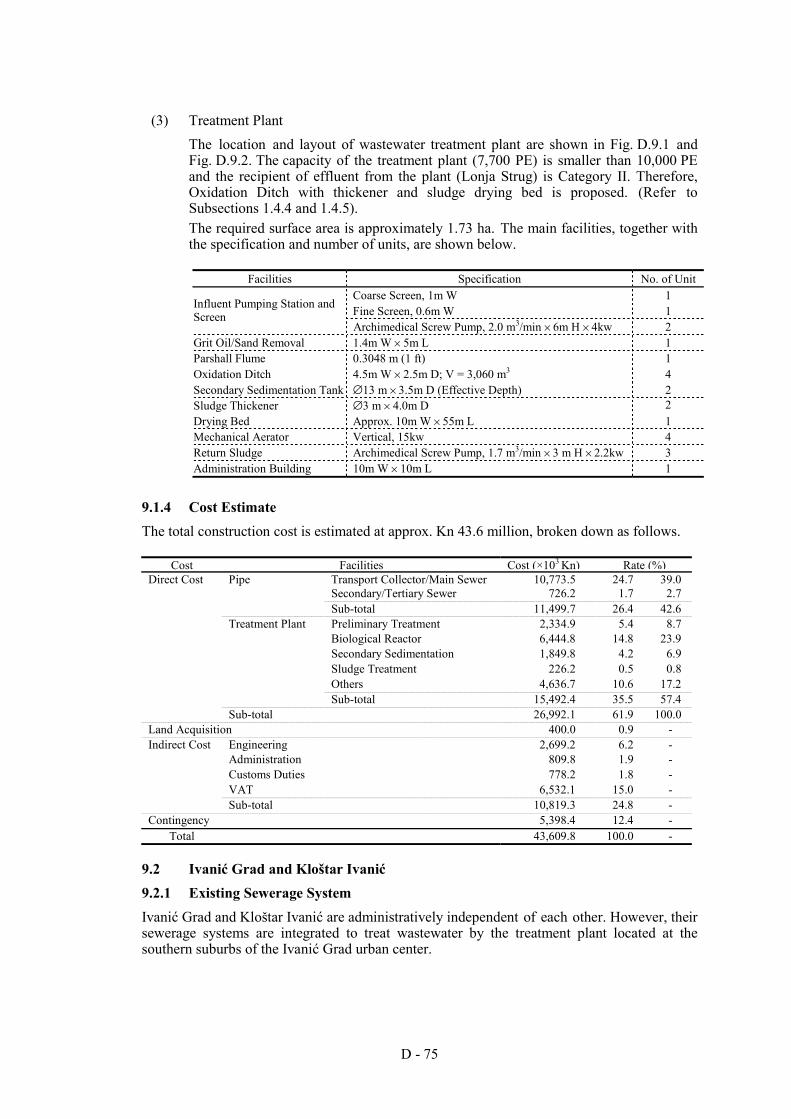
D - 75
(3) Treatment Plant The location and layout of wastewater treatment plant are shown in Fig. D.9.1 and Fig. D.9.2. The capacity of the treatment plant (7,700 PE) is smaller than 10,000 PE and the recipient of effluent from the plant (Lonja Strug) is Category II. Therefore, Oxidation Ditch with thickener and sludge drying bed is proposed. (Refer to Subsections 1.4.4 and 1.4.5). The required surface area is approximately 1.73 ha. The main facilities, together with the specification and number of units, are shown below.
Facilities Specification No. of Unit
Coarse Screen, 1m W 1 Fine Screen, 0.6m W 1 Influent Pumping Station and
Screen Archimedical Screw Pump, 2.0 m3/min × 6m H × 4kw 2
Grit Oil/Sand Removal 1.4m W × 5m L 1 Parshall Flume 0.3048 m (1 ft) 1 Oxidation Ditch 4.5m W × 2.5m D; V = 3,060 m3 4 Secondary Sedimentation Tank ∅13 m × 3.5m D (Effective Depth) 2 Sludge Thickener ∅3 m × 4.0m D 2 Drying Bed Approx. 10m W × 55m L 1 Mechanical Aerator Vertical, 15kw 4 Return Sludge Archimedical Screw Pump, 1.7 m3/min × 3 m H × 2.2kw 3 Administration Building 10m W × 10m L 1
9.1.4 Cost Estimate The total construction cost is estimated at approx. Kn 43.6 million, broken down as follows.
Cost Facilities Cost (×103 Kn) Rate (%) Direct Cost Pipe Transport Collector/Main Sewer 10,773.5 24.7 39.0 Secondary/Tertiary Sewer 726.2 1.7 2.7 Sub-total 11,499.7 26.4 42.6 Treatment Plant Preliminary Treatment 2,334.9 5.4 8.7 Biological Reactor 6,444.8 14.8 23.9 Secondary Sedimentation 1,849.8 4.2 6.9 Sludge Treatment 226.2 0.5 0.8 Others 4,636.7 10.6 17.2 Sub-total 15,492.4 35.5 57.4 Sub-total 26,992.1 61.9 100.0 Land Acquisition 400.0 0.9 - Indirect Cost Engineering 2,699.2 6.2 - Administration 809.8 1.9 - Customs Duties 778.2 1.8 - VAT 6,532.1 15.0 - Sub-total 10,819.3 24.8 - Contingency 5,398.4 12.4 -
Total 43,609.8 100.0 -
9.2 Ivanić Grad and Kloštar Ivanić 9.2.1 Existing Sewerage System Ivanić Grad and Kloštar Ivanić are administratively independent of each other. However, their sewerage systems are integrated to treat wastewater by the treatment plant located at the southern suburbs of the Ivanić Grad urban center.
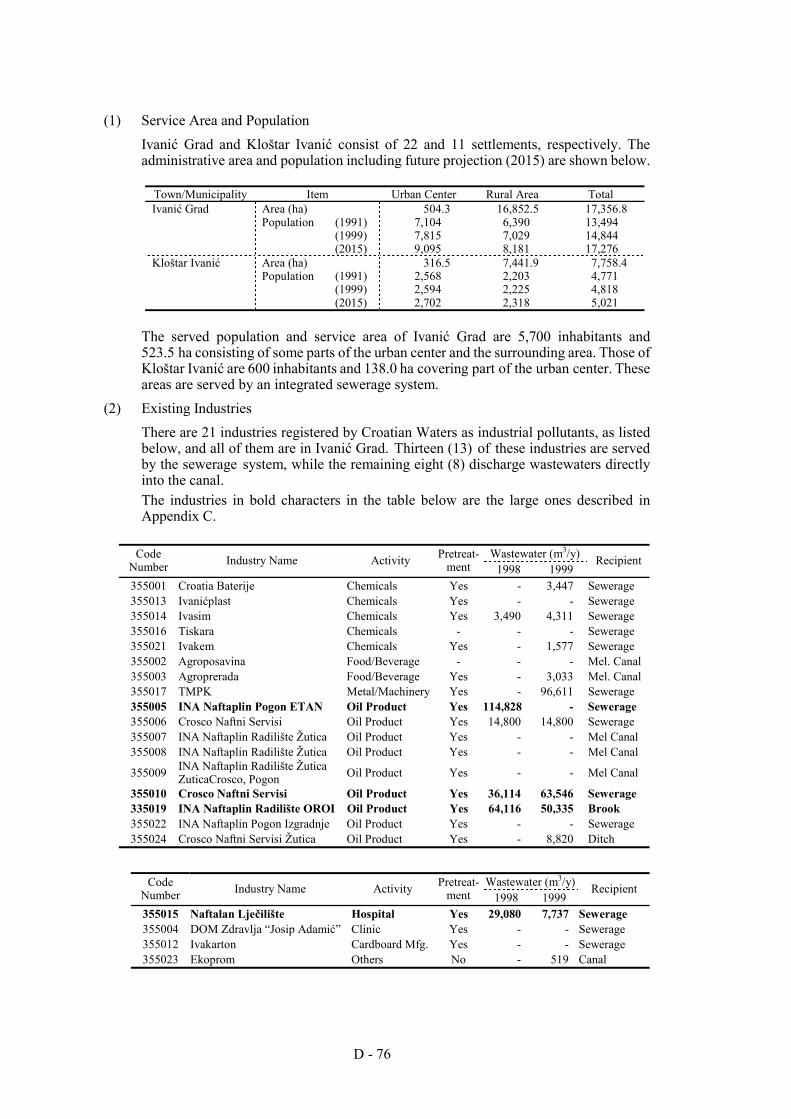
D - 76
(1) Service Area and Population Ivanić Grad and Kloštar Ivanić consist of 22 and 11 settlements, respectively. The administrative area and population including future projection (2015) are shown below.
Town/Municipality Item Urban Center Rural Area Total Ivanić Grad Area (ha) 504.3 16,852.5 17,356.8 Population (1991) 7,104 6,390 13,494 (1999) 7,815 7,029 14,844 (2015) 9,095 8,181 17,276 Kloštar Ivanić Area (ha) 316.5 7,441.9 7,758.4 Population (1991) 2,568 2,203 4,771 (1999) 2,594 2,225 4,818 (2015) 2,702 2,318 5,021
The served population and service area of Ivanić Grad are 5,700 inhabitants and 523.5 ha consisting of some parts of the urban center and the surrounding area. Those of Kloštar Ivanić are 600 inhabitants and 138.0 ha covering part of the urban center. These areas are served by an integrated sewerage system.
(2) Existing Industries There are 21 industries registered by Croatian Waters as industrial pollutants, as listed below, and all of them are in Ivanić Grad. Thirteen (13) of these industries are served by the sewerage system, while the remaining eight (8) discharge wastewaters directly into the canal. The industries in bold characters in the table below are the large ones described in Appendix C.
Wastewater (m3/y) Code
Number Industry Name Activity Pretreat-ment 1998 1999
Recipient
355001 Croatia Baterije Chemicals Yes - 3,447 Sewerage 355013 Ivanićplast Chemicals Yes - - Sewerage 355014 Ivasim Chemicals Yes 3,490 4,311 Sewerage 355016 Tiskara Chemicals - - - Sewerage 355021 Ivakem Chemicals Yes - 1,577 Sewerage 355002 Agroposavina Food/Beverage - - - Mel. Canal 355003 Agroprerada Food/Beverage Yes - 3,033 Mel. Canal 355017 TMPK Metal/Machinery Yes - 96,611 Sewerage 355005 INA Naftaplin Pogon ETAN Oil Product Yes 114,828 - Sewerage 355006 Crosco Naftni Servisi Oil Product Yes 14,800 14,800 Sewerage 355007 INA Naftaplin Radilište Žutica Oil Product Yes - - Mel Canal 355008 INA Naftaplin Radilište Žutica Oil Product Yes - - Mel Canal
355009 INA Naftaplin Radilište Žutica ZuticaCrosco, Pogon Oil Product Yes - - Mel Canal
355010 Crosco Naftni Servisi Oil Product Yes 36,114 63,546 Sewerage 335019 INA Naftaplin Radilište OROI Oil Product Yes 64,116 50,335 Brook 355022 INA Naftaplin Pogon Izgradnje Oil Product Yes - - Sewerage 355024 Crosco Naftni Servisi Žutica Oil Product Yes - 8,820 Ditch
Wastewater (m3/y) Code
Number Industry Name Activity Pretreat-ment 1998 1999
Recipient
355015 Naftalan Lječilište Hospital Yes 29,080 7,737 Sewerage 355004 DOM Zdravlja “Josip Adamić” Clinic Yes - - Sewerage 355012 Ivakarton Cardboard Mfg. Yes - - Sewerage 355023 Ekoprom Others No - 519 Canal
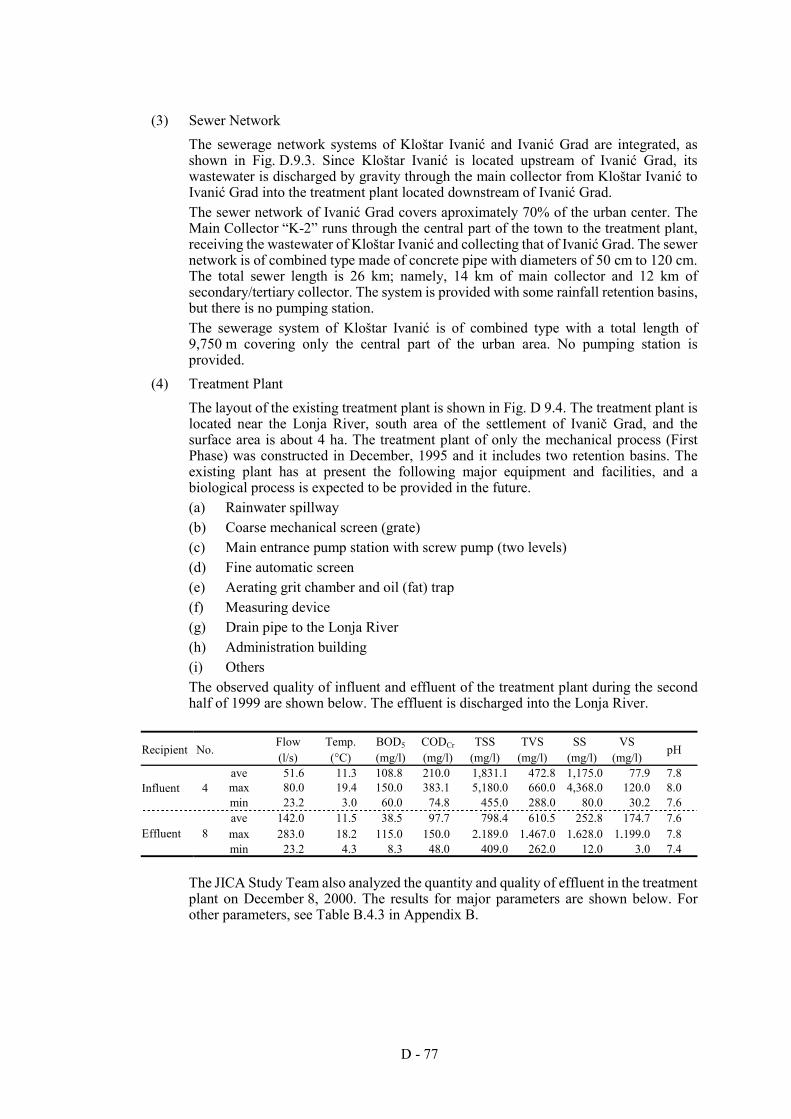
D - 77
(3) Sewer Network The sewerage network systems of Kloštar Ivanić and Ivanić Grad are integrated, as shown in Fig. D.9.3. Since Kloštar Ivanić is located upstream of Ivanić Grad, its wastewater is discharged by gravity through the main collector from Kloštar Ivanić to Ivanić Grad into the treatment plant located downstream of Ivanić Grad. The sewer network of Ivanić Grad covers aproximately 70% of the urban center. The Main Collector “K-2” runs through the central part of the town to the treatment plant, receiving the wastewater of Kloštar Ivanić and collecting that of Ivanić Grad. The sewer network is of combined type made of concrete pipe with diameters of 50 cm to 120 cm. The total sewer length is 26 km; namely, 14 km of main collector and 12 km of secondary/tertiary collector. The system is provided with some rainfall retention basins, but there is no pumping station. The sewerage system of Kloštar Ivanić is of combined type with a total length of 9,750 m covering only the central part of the urban area. No pumping station is provided.
(4) Treatment Plant The layout of the existing treatment plant is shown in Fig. D 9.4. The treatment plant is located near the Lonja River, south area of the settlement of Ivanič Grad, and the surface area is about 4 ha. The treatment plant of only the mechanical process (First Phase) was constructed in December, 1995 and it includes two retention basins. The existing plant has at present the following major equipment and facilities, and a biological process is expected to be provided in the future. (a) Rainwater spillway (b) Coarse mechanical screen (grate) (c) Main entrance pump station with screw pump (two levels) (d) Fine automatic screen (e) Aerating grit chamber and oil (fat) trap (f) Measuring device (g) Drain pipe to the Lonja River (h) Administration building (i) Others The observed quality of influent and effluent of the treatment plant during the second half of 1999 are shown below. The effluent is discharged into the Lonja River.
Recipient No. Flow (l/s)
Temp. (°C)
BOD5
(mg/l) CODCr
(mg/l) TSS
(mg/l) TVS
(mg/l) SS
(mg/l) VS
(mg/l) pH
ave 51.6 11.3 108.8 210.0 1,831.1 472.8 1,175.0 77.9 7.8 max 80.0 19.4 150.0 383.1 5,180.0 660.0 4,368.0 120.0 8.0 Influent 4 min 23.2 3.0 60.0 74.8 455.0 288.0 80.0 30.2 7.6 ave 142.0 11.5 38.5 97.7 798.4 610.5 252.8 174.7 7.6 max 283.0 18.2 115.0 150.0 2,189.0 1,467.0 1,628.0 1,199.0 7.8 Effluent 8 min 23.2 4.3 8.3 48.0 409.0 262.0 12.0 3.0 7.4
The JICA Study Team also analyzed the quantity and quality of effluent in the treatment plant on December 8, 2000. The results for major parameters are shown below. For other parameters, see Table B.4.3 in Appendix B.
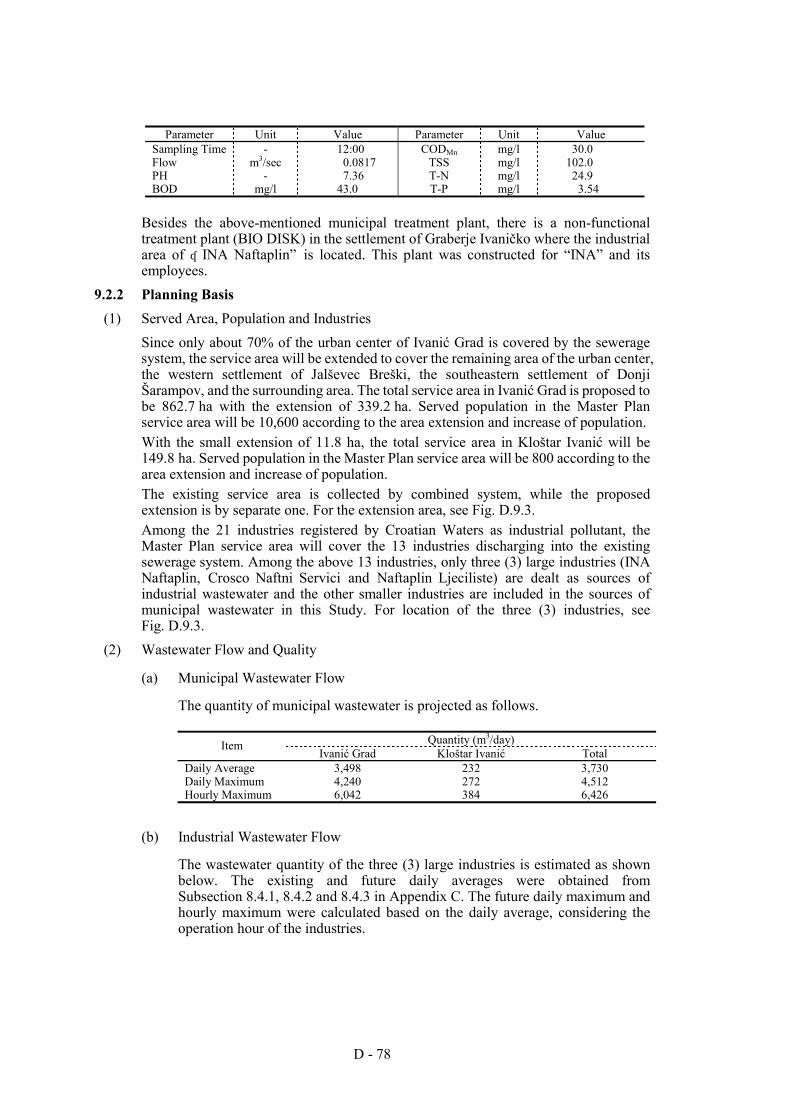
D - 78
Parameter Unit Value Parameter Unit Value
Sampling Time - 12:00 CODMn mg/l 30.0 Flow m3/sec 0.0817 TSS mg/l 102.0 PH - 7.36 T-N mg/l 24.9 BOD mg/l 43.0 T-P mg/l 3.54
Besides the above-mentioned municipal treatment plant, there is a non-functional treatment plant (BIO DISK) in the settlement of Graberje Ivaničko where the industrial area of “INA Naftaplin” is located. This plant was constructed for “INA” and its employees.
9.2.2 Planning Basis (1) Served Area, Population and Industries
Since only about 70% of the urban center of Ivanić Grad is covered by the sewerage system, the service area will be extended to cover the remaining area of the urban center, the western settlement of Jalševec Breški, the southeastern settlement of Donji Šarampov, and the surrounding area. The total service area in Ivanić Grad is proposed to be 862.7 ha with the extension of 339.2 ha. Served population in the Master Plan service area will be 10,600 according to the area extension and increase of population. With the small extension of 11.8 ha, the total service area in Kloštar Ivanić will be 149.8 ha. Served population in the Master Plan service area will be 800 according to the area extension and increase of population. The existing service area is collected by combined system, while the proposed extension is by separate one. For the extension area, see Fig. D.9.3. Among the 21 industries registered by Croatian Waters as industrial pollutant, the Master Plan service area will cover the 13 industries discharging into the existing sewerage system. Among the above 13 industries, only three (3) large industries (INA Naftaplin, Crosco Naftni Servici and Naftaplin Ljeciliste) are dealt as sources of industrial wastewater and the other smaller industries are included in the sources of municipal wastewater in this Study. For location of the three (3) industries, see Fig. D.9.3.
(2) Wastewater Flow and Quality
(a) Municipal Wastewater Flow
The quantity of municipal wastewater is projected as follows.
Quantity (m3/day) Item Ivanić Grad Kloštar Ivanić Total
Daily Average 3,498 232 3,730 Daily Maximum 4,240 272 4,512 Hourly Maximum 6,042 384 6,426
(b) Industrial Wastewater Flow
The wastewater quantity of the three (3) large industries is estimated as shown below. The existing and future daily averages were obtained from Subsection 8.4.1, 8.4.2 and 8.4.3 in Appendix C. The future daily maximum and hourly maximum were calculated based on the daily average, considering the operation hour of the industries.
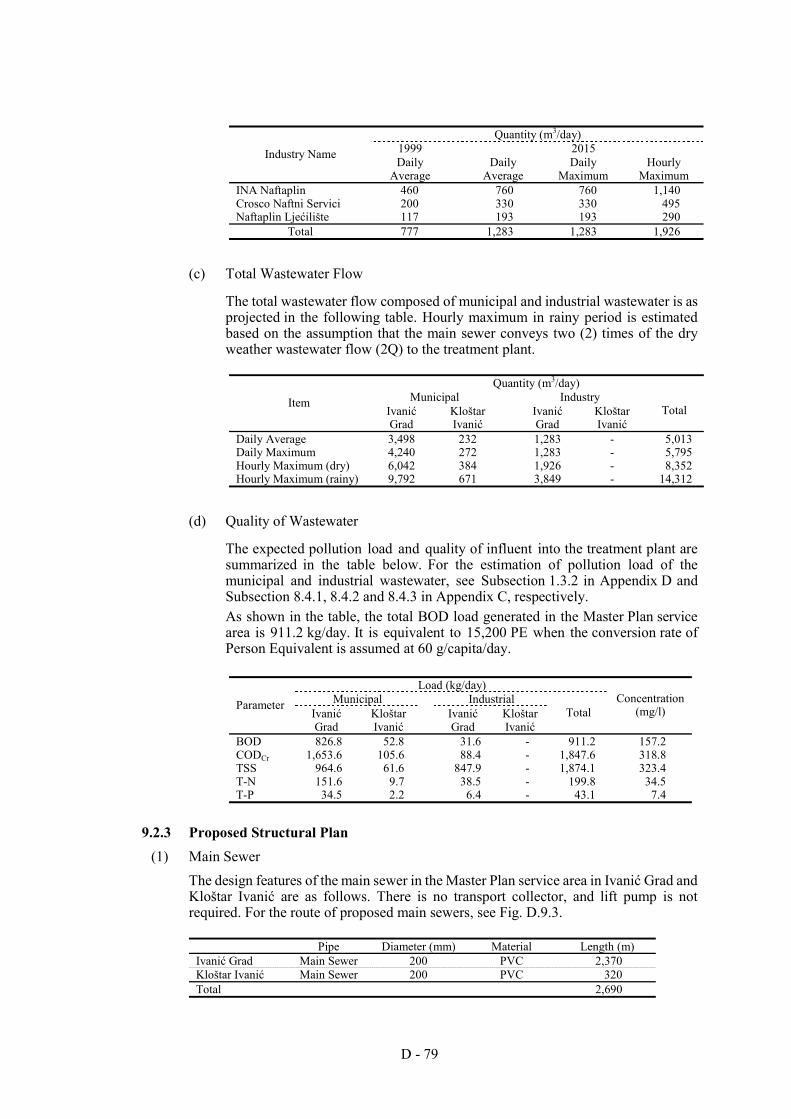
D - 79
Quantity (m3/day)
1999 2015 Industry Name Daily
Average Daily Average
Daily Maximum
Hourly Maximum
INA Naftaplin 460 760 760 1,140 Crosco Naftni Servici 200 330 330 495 Naftaplin Ljećilište 117 193 193 290
Total 777 1,283 1,283 1,926
(c) Total Wastewater Flow
The total wastewater flow composed of municipal and industrial wastewater is as projected in the following table. Hourly maximum in rainy period is estimated based on the assumption that the main sewer conveys two (2) times of the dry weather wastewater flow (2Q) to the treatment plant.
Quantity (m3/day)
Municipal Industry Item Ivanić Grad
Kloštar Ivanić
Ivanić Grad
Kloštar Ivanić
Total
Daily Average 3,498 232 1,283 - 5,013 Daily Maximum 4,240 272 1,283 - 5,795 Hourly Maximum (dry) 6,042 384 1,926 - 8,352 Hourly Maximum (rainy) 9,792 671 3,849 - 14,312
(d) Quality of Wastewater
The expected pollution load and quality of influent into the treatment plant are summarized in the table below. For the estimation of pollution load of the municipal and industrial wastewater, see Subsection 1.3.2 in Appendix D and Subsection 8.4.1, 8.4.2 and 8.4.3 in Appendix C, respectively. As shown in the table, the total BOD load generated in the Master Plan service area is 911.2 kg/day. It is equivalent to 15,200 PE when the conversion rate of Person Equivalent is assumed at 60 g/capita/day.
Load (kg/day)
Municipal Industrial Parameter Ivanić Grad
Kloštar Ivanić Ivanić
Grad Kloštar Ivanić
Total Concentration
(mg/l)
BOD 826.8 52.8 31.6 - 911.2 157.2 CODCr 1,653.6 105.6 88.4 - 1,847.6 318.8 TSS 964.6 61.6 847.9 - 1,874.1 323.4 T-N 151.6 9.7 38.5 - 199.8 34.5 T-P 34.5 2.2 6.4 - 43.1 7.4
9.2.3 Proposed Structural Plan (1) Main Sewer
The design features of the main sewer in the Master Plan service area in Ivanić Grad and Kloštar Ivanić are as follows. There is no transport collector, and lift pump is not required. For the route of proposed main sewers, see Fig. D.9.3.
Pipe Diameter (mm) Material Length (m) Ivanić Grad Main Sewer 200 PVC 2,370 Kloštar Ivanić Main Sewer 200 PVC 320 Total 2,690
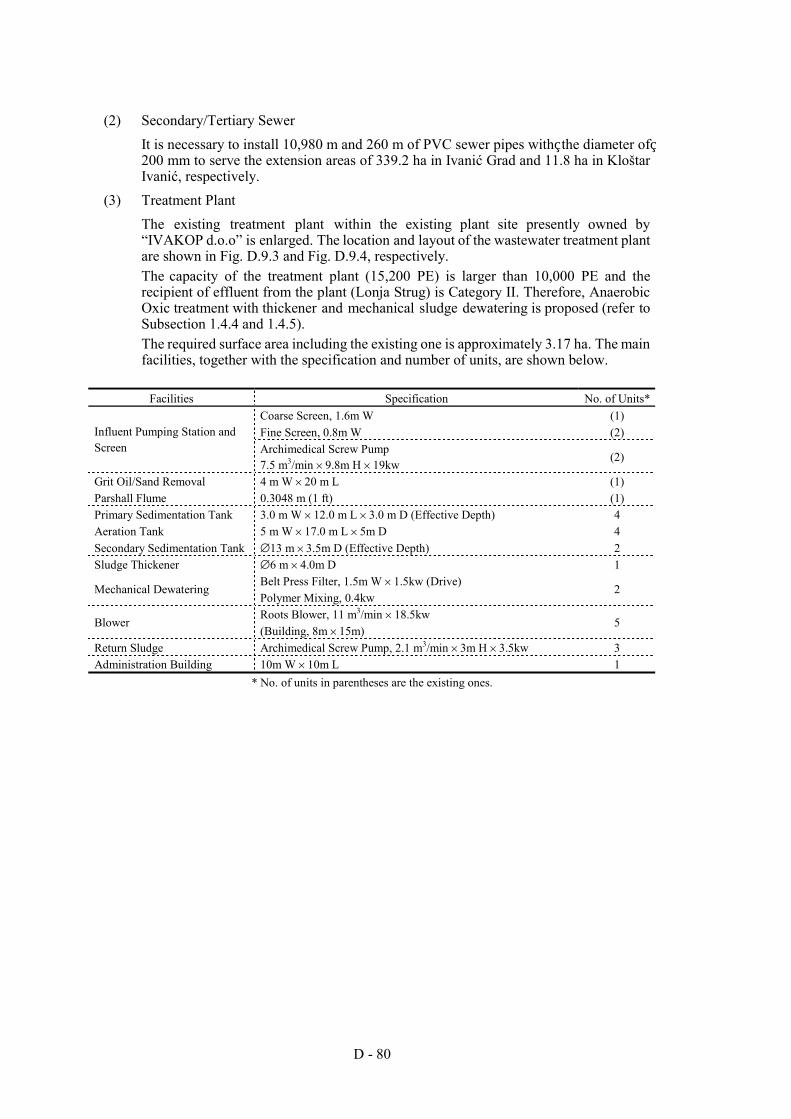
D - 80
(2) Secondary/Tertiary Sewer It is necessary to install 10,980 m and 260 m of PVC sewer pipes with the diameter of 200 mm to serve the extension areas of 339.2 ha in Ivanić Grad and 11.8 ha in Kloštar Ivanić, respectively.
(3) Treatment Plant The existing treatment plant within the existing plant site presently owned by “IVAKOP d.o.o” is enlarged. The location and layout of the wastewater treatment plant are shown in Fig. D.9.3 and Fig. D.9.4, respectively. The capacity of the treatment plant (15,200 PE) is larger than 10,000 PE and the recipient of effluent from the plant (Lonja Strug) is Category II. Therefore, Anaerobic Oxic treatment with thickener and mechanical sludge dewatering is proposed (refer to Subsection 1.4.4 and 1.4.5). The required surface area including the existing one is approximately 3.17 ha. The main facilities, together with the specification and number of units, are shown below.
Facilities Specification No. of Units*
Coarse Screen, 1.6m W (1) Fine Screen, 0.8m W (2) Influent Pumping Station and
Screen Archimedical Screw Pump 7.5 m3/min × 9.8m H × 19kw
(2)
Grit Oil/Sand Removal 4 m W × 20 m L (1) Parshall Flume 0.3048 m (1 ft) (1) Primary Sedimentation Tank 3.0 m W × 12.0 m L × 3.0 m D (Effective Depth) 4 Aeration Tank 5 m W × 17.0 m L × 5m D 4 Secondary Sedimentation Tank ∅13 m × 3.5m D (Effective Depth) 2 Sludge Thickener ∅6 m × 4.0m D 1
Belt Press Filter, 1.5m W × 1.5kw (Drive) Mechanical Dewatering
Polymer Mixing, 0.4kw 2
Roots Blower, 11 m3/min × 18.5kw Blower
(Building, 8m × 15m) 5
Return Sludge Archimedical Screw Pump, 2.1 m3/min × 3m H × 3.5kw 3 Administration Building 10m W × 10m L 1
* No. of units in parentheses are the existing ones.
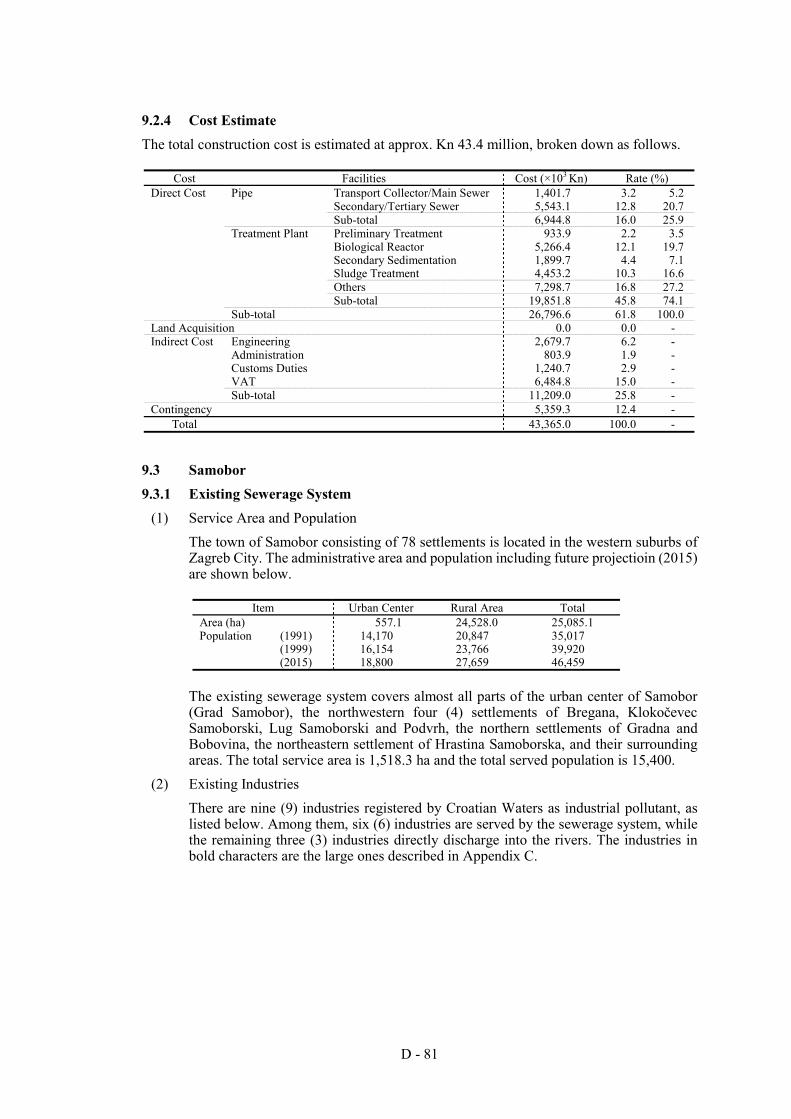
D - 81
9.2.4 Cost Estimate The total construction cost is estimated at approx. Kn 43.4 million, broken down as follows.
Cost Facilities Cost (×103 Kn) Rate (%) Direct Cost Pipe Transport Collector/Main Sewer 1,401.7 3.2 5.2 Secondary/Tertiary Sewer 5,543.1 12.8 20.7 Sub-total 6,944.8 16.0 25.9 Treatment Plant Preliminary Treatment 933.9 2.2 3.5 Biological Reactor 5,266.4 12.1 19.7 Secondary Sedimentation 1,899.7 4.4 7.1 Sludge Treatment 4,453.2 10.3 16.6 Others 7,298.7 16.8 27.2 Sub-total 19,851.8 45.8 74.1 Sub-total 26,796.6 61.8 100.0 Land Acquisition 0.0 0.0 - Indirect Cost Engineering 2,679.7 6.2 - Administration 803.9 1.9 - Customs Duties 1,240.7 2.9 - VAT 6,484.8 15.0 - Sub-total 11,209.0 25.8 - Contingency 5,359.3 12.4 -
Total 43,365.0 100.0 -
9.3 Samobor 9.3.1 Existing Sewerage System
(1) Service Area and Population The town of Samobor consisting of 78 settlements is located in the western suburbs of Zagreb City. The administrative area and population including future projectioin (2015) are shown below.
Item Urban Center Rural Area Total
Area (ha) 557.1 24,528.0 25,085.1 Population (1991) 14,170 20,847 35,017 (1999) 16,154 23,766 39,920 (2015) 18,800 27,659 46,459
The existing sewerage system covers almost all parts of the urban center of Samobor (Grad Samobor), the northwestern four (4) settlements of Bregana, Klokočevec Samoborski, Lug Samoborski and Podvrh, the northern settlements of Gradna and Bobovina, the northeastern settlement of Hrastina Samoborska, and their surrounding areas. The total service area is 1,518.3 ha and the total served population is 15,400.
(2) Existing Industries There are nine (9) industries registered by Croatian Waters as industrial pollutant, as listed below. Among them, six (6) industries are served by the sewerage system, while the remaining three (3) industries directly discharge into the rivers. The industries in bold characters are the large ones described in Appendix C.
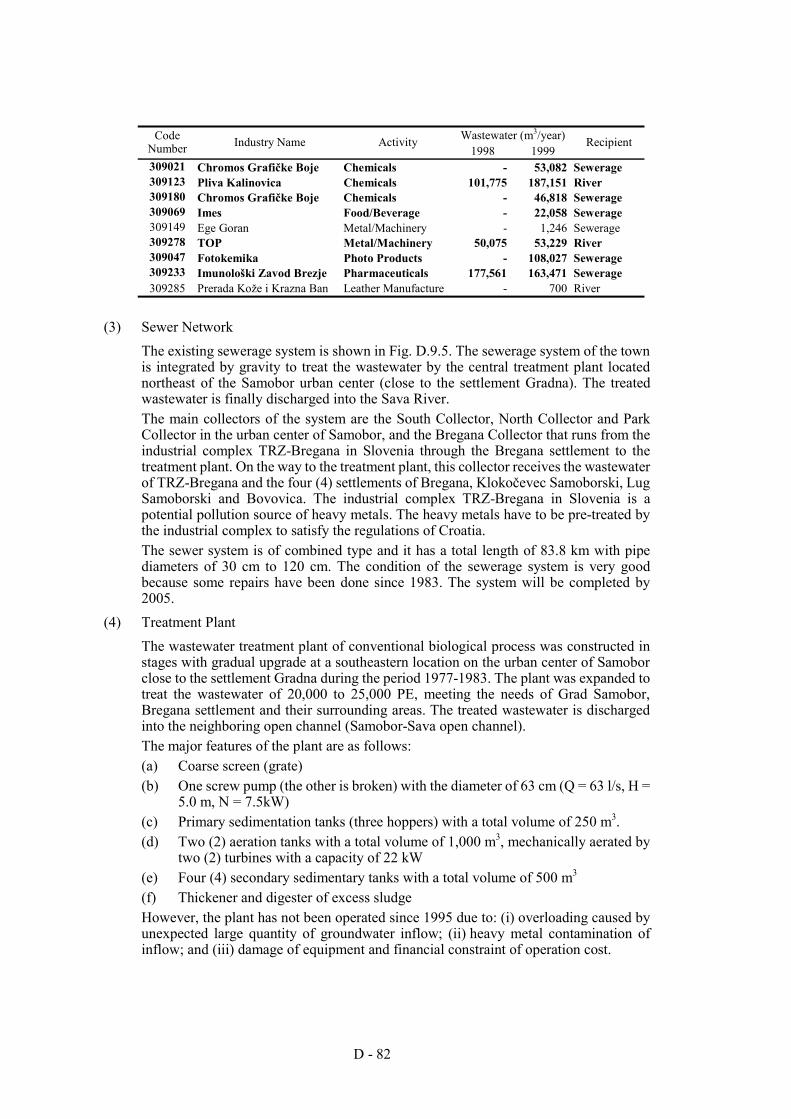
D - 82
Wastewater (m3/year) Code
Number Industry Name Activity 1998 1999
Recipient
309021 Chromos Grafičke Boje Chemicals - 53,082 Sewerage 309123 Pliva Kalinovica Chemicals 101,775 187,151 River 309180 Chromos Grafičke Boje Chemicals - 46,818 Sewerage 309069 Imes Food/Beverage - 22,058 Sewerage 309149 Ege Goran Metal/Machinery - 1,246 Sewerage 309278 TOP Metal/Machinery 50,075 53,229 River 309047 Fotokemika Photo Products - 108,027 Sewerage 309233 Imunološki Zavod Brezje Pharmaceuticals 177,561 163,471 Sewerage 309285 Prerada Kože i Krazna Ban Leather Manufacture - 700 River
(3) Sewer Network The existing sewerage system is shown in Fig. D.9.5. The sewerage system of the town is integrated by gravity to treat the wastewater by the central treatment plant located northeast of the Samobor urban center (close to the settlement Gradna). The treated wastewater is finally discharged into the Sava River. The main collectors of the system are the South Collector, North Collector and Park Collector in the urban center of Samobor, and the Bregana Collector that runs from the industrial complex TRZ-Bregana in Slovenia through the Bregana settlement to the treatment plant. On the way to the treatment plant, this collector receives the wastewater of TRZ-Bregana and the four (4) settlements of Bregana, Klokočevec Samoborski, Lug Samoborski and Bovovica. The industrial complex TRZ-Bregana in Slovenia is a potential pollution source of heavy metals. The heavy metals have to be pre-treated by the industrial complex to satisfy the regulations of Croatia. The sewer system is of combined type and it has a total length of 83.8 km with pipe diameters of 30 cm to 120 cm. The condition of the sewerage system is very good because some repairs have been done since 1983. The system will be completed by 2005.
(4) Treatment Plant The wastewater treatment plant of conventional biological process was constructed in stages with gradual upgrade at a southeastern location on the urban center of Samobor close to the settlement Gradna during the period 1977-1983. The plant was expanded to treat the wastewater of 20,000 to 25,000 PE, meeting the needs of Grad Samobor, Bregana settlement and their surrounding areas. The treated wastewater is discharged into the neighboring open channel (Samobor-Sava open channel). The major features of the plant are as follows: (a) Coarse screen (grate) (b) One screw pump (the other is broken) with the diameter of 63 cm (Q = 63 l/s, H =
5.0 m, N = 7.5kW) (c) Primary sedimentation tanks (three hoppers) with a total volume of 250 m3. (d) Two (2) aeration tanks with a total volume of 1,000 m3, mechanically aerated by
two (2) turbines with a capacity of 22 kW (e) Four (4) secondary sedimentary tanks with a total volume of 500 m3 (f) Thickener and digester of excess sludge However, the plant has not been operated since 1995 due to: (i) overloading caused by unexpected large quantity of groundwater inflow; (ii) heavy metal contamination of inflow; and (iii) damage of equipment and financial constraint of operation cost.
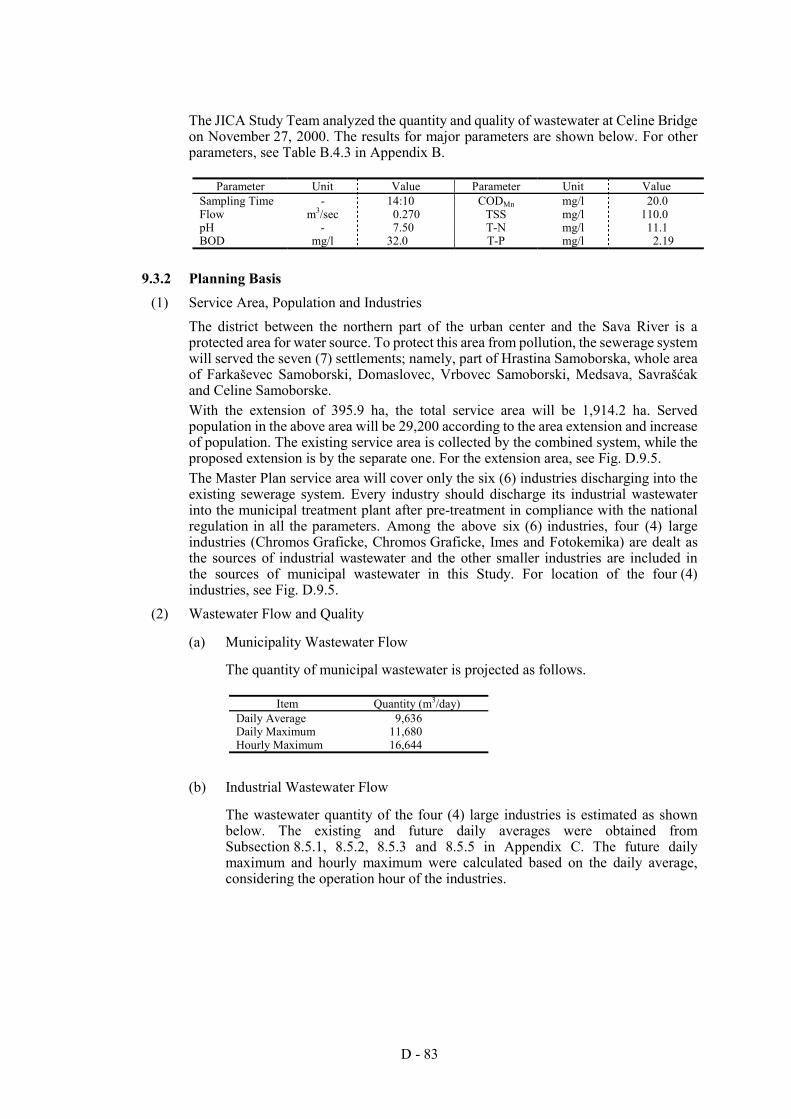
D - 83
The JICA Study Team analyzed the quantity and quality of wastewater at Celine Bridge on November 27, 2000. The results for major parameters are shown below. For other parameters, see Table B.4.3 in Appendix B.
Parameter Unit Value Parameter Unit Value
Sampling Time - 14:10 CODMn mg/l 20.0 Flow m3/sec 0.270 TSS mg/l 110.0 pH - 7.50 T-N mg/l 11.1 BOD mg/l 32.0 T-P mg/l 2.19
9.3.2 Planning Basis (1) Service Area, Population and Industries
The district between the northern part of the urban center and the Sava River is a protected area for water source. To protect this area from pollution, the sewerage system will served the seven (7) settlements; namely, part of Hrastina Samoborska, whole area of Farkaševec Samoborski, Domaslovec, Vrbovec Samoborski, Medsava, Savrašćak and Celine Samoborske. With the extension of 395.9 ha, the total service area will be 1,914.2 ha. Served population in the above area will be 29,200 according to the area extension and increase of population. The existing service area is collected by the combined system, while the proposed extension is by the separate one. For the extension area, see Fig. D.9.5. The Master Plan service area will cover only the six (6) industries discharging into the existing sewerage system. Every industry should discharge its industrial wastewater into the municipal treatment plant after pre-treatment in compliance with the national regulation in all the parameters. Among the above six (6) industries, four (4) large industries (Chromos Graficke, Chromos Graficke, Imes and Fotokemika) are dealt as the sources of industrial wastewater and the other smaller industries are included in the sources of municipal wastewater in this Study. For location of the four (4) industries, see Fig. D.9.5.
(2) Wastewater Flow and Quality
(a) Municipality Wastewater Flow
The quantity of municipal wastewater is projected as follows.
Item Quantity (m3/day) Daily Average 9,636 Daily Maximum 11,680 Hourly Maximum 16,644
(b) Industrial Wastewater Flow
The wastewater quantity of the four (4) large industries is estimated as shown below. The existing and future daily averages were obtained from Subsection 8.5.1, 8.5.2, 8.5.3 and 8.5.5 in Appendix C. The future daily maximum and hourly maximum were calculated based on the daily average, considering the operation hour of the industries.
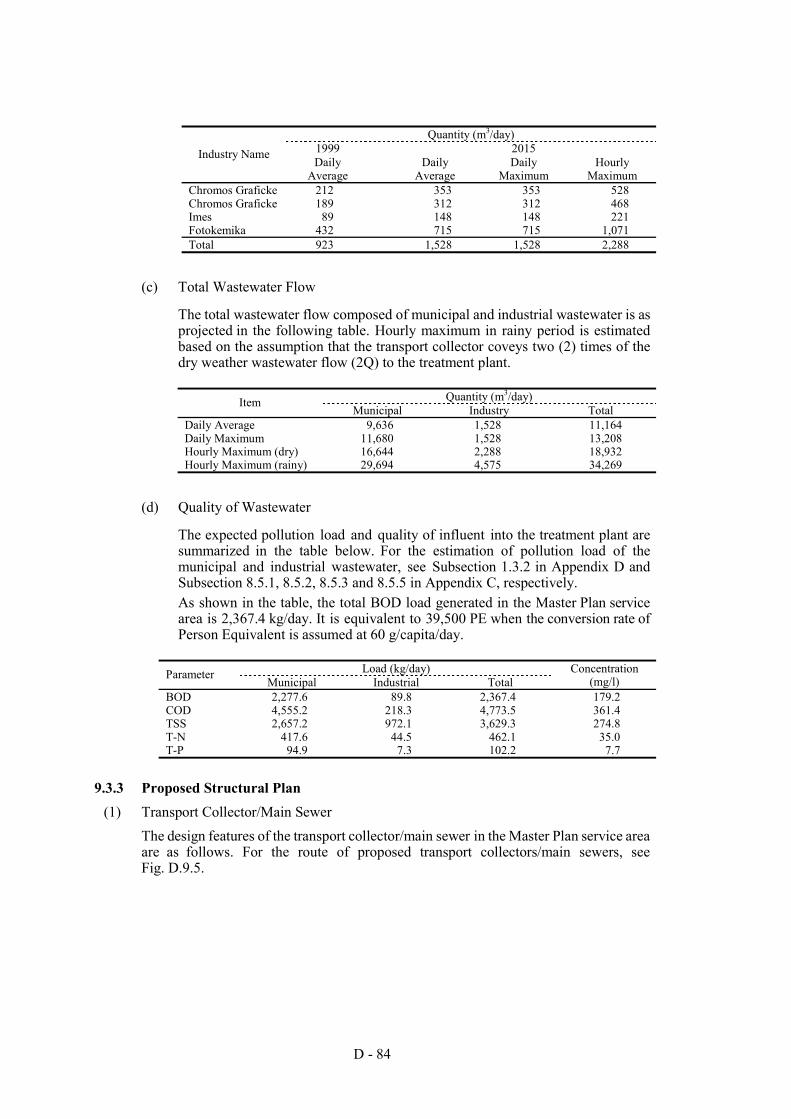
D - 84
Quantity (m3/day)
1999 2015 Industry Name Daily
Average Daily
Average Daily
Maximum Hourly
Maximum Chromos Graficke 212 353 353 528 Chromos Graficke 189 312 312 468 Imes 89 148 148 221 Fotokemika 432 715 715 1,071 Total 923 1,528 1,528 2,288
(c) Total Wastewater Flow
The total wastewater flow composed of municipal and industrial wastewater is as projected in the following table. Hourly maximum in rainy period is estimated based on the assumption that the transport collector coveys two (2) times of the dry weather wastewater flow (2Q) to the treatment plant.
Quantity (m3/day) Item
Municipal Industry Total Daily Average 9,636 1,528 11,164 Daily Maximum 11,680 1,528 13,208 Hourly Maximum (dry) 16,644 2,288 18,932 Hourly Maximum (rainy) 29,694 4,575 34,269
(d) Quality of Wastewater
The expected pollution load and quality of influent into the treatment plant are summarized in the table below. For the estimation of pollution load of the municipal and industrial wastewater, see Subsection 1.3.2 in Appendix D and Subsection 8.5.1, 8.5.2, 8.5.3 and 8.5.5 in Appendix C, respectively. As shown in the table, the total BOD load generated in the Master Plan service area is 2,367.4 kg/day. It is equivalent to 39,500 PE when the conversion rate of Person Equivalent is assumed at 60 g/capita/day.
Load (kg/day) Parameter
Municipal Industrial Total Concentration
(mg/l) BOD 2,277.6 89.8 2,367.4 179.2 COD 4,555.2 218.3 4,773.5 361.4 TSS 2,657.2 972.1 3,629.3 274.8 T-N 417.6 44.5 462.1 35.0 T-P 94.9 7.3 102.2 7.7
9.3.3 Proposed Structural Plan (1) Transport Collector/Main Sewer
The design features of the transport collector/main sewer in the Master Plan service area are as follows. For the route of proposed transport collectors/main sewers, see Fig. D.9.5.
D - 85
Pipe Diameter (mm) Material Length (m)
Transport Collector 700 Concrete 2,020 800 Concrete 220 Main Sewer 200 PVC 4,300 250 PVC 1,460 300 PVC 1,230 Total 9,230
Four (4) lift pumps with the following capacity are required.
Pump Station Capacity (l/sec)
A1 4.1 A2 10 B2 5 D 21
(2) Secondary/Tertiary Sewer It is necessary to install 10,540 m of PVC sewer pipes with the diameter of 200 mm to serve the extension area of 395.9 ha.
(3) Treatment Plant The existing treatment plant is improved and its capacity will increase from 22,000 PE to 39,500 PE. To accommodate the proposed treatment plant, land of 1.31 ha is required including the existing site. The necessary land could be made available by extending the existing site, and the extension area is privately owned. The location and layout of wastewater treatment plant are shown in Fig. D.9.5 and Fig. D.9.6 respectively. The capacity of the treatment plant (39,500 PE) is larger than 10,000 PE and the recipient of effluent from the plant (Upper Sava) is Category II. Therefore, Anaerobic Oxic treatment with thickener and mechanical sludge dewatering is proposed (refer to Subsection 1.4.4 and 1.4.5). The main facilities, together with the specification and number of units, are shown below. The effluent is discharged into the Sava River through an open channel.
Facilities Specification No. of Units*
Coarse Screen 2m W 1 Fine Screen, 1m W 1 Influent Pumping Station and
Screen Archimedical Screw Pump 6 m3/min × 6m H × 8kw 4
Grit Oil/Sand Removal 1m W × 11m L 2 Parshall Flume 0.6096 m (2 ft) 1 Primary Sedimentation Tank 8.8m W × 11.8m L × 3.0m D (Effective Depth) (1) Aeration Tank 5m W × 21.0m L × 5m D 8 Secondary Sedimentation Tank ∅19 m × 3.5m D (Effective Depth) 2 Sludge Thickener 8.8m W × 11.8m L × 3.0m D (1)
Belt Press Filter, 1.5m W × 1.5kw Mechanical Dewatering Polymer Mixing, 0.4kw 3
Roots Blower, 16 m3/min × 22kw Blower (Building, 8m × 17m) 4
Return Sludge Archimedical Screw Pump, 5 m3/min × 3m H × 5.0kw 4 Administration Building 10m W × 10m L 1 Retention Basin 11.8m W × 10.9m L × 4.0m D (2) Digestion Tank as by Pass Line V1 = 750 m3, V2 = 200 m3 (1 each) * Number of Units in parentheses are the existing ones.
D - 86
9.3.4 Cost Estimate The total construction cost is estimated at approx. Kn 58.5 million, broken down as follows.
Cost Facilities Cost (×103 Kn) Rate (%) Direct Cost Pipe Transport Collector/Main Sewer 3,997.0 6.8 11.0 Secondary/Tertiary Sewer 5,193.5 8.9 14.4 Sub-total 9,190.4 15.7 25.4 Treatment Plant Preliminary Treatment 2,661.8 4.6 7.4 Biological Reactor 8,737.3 14.9 24.1 Secondary Sedimentation 2,886.3 4.9 8.0 Sludge Treatment 4,886.6 8.4 13.5 Others 7,822.0 13.4 21.6 Sub-total 26,994.0 46.2 74.6 Sub-total 36,184.5 61.9 100.0 Land Acquisition 0.0 0.0 - Indirect Cost Engineering 3,618.4 6.2 - Administration 1,085.5 1.9 - Customs Duties 1,603.5 2.7 - VAT 8,756.6 15.0 - Sub-total 15,064.1 25.8 - Contingency 7,236.9 12.4 -
Total 58,485.4 100.0 -
9.4 Zaprešić 9.4.1 Existing Sewerage System
(1) Service Area and Population The wastewaters of Zaprešić and Brdovec are discharged by an integrated sewerage system although they are administratively independent of each other. The town and municipality are located in the northwestern suburbs of Zagreb City and they consist of 9 and 13 settlements, respectively. The sewerage system is managed by one (1) management organization. The administrative area and population of the town and municipality are shown below.
Town/Municipality Item Urban Center Rural Area Total Zaprešić Area (ha) 319.7 4,940.4 5,260.1 Population (1991) 15,678 5,042 20,720 (1999) 18,071 5,812 23,883 (2015) 21,031 6,764 27,795 Brdovec Area (ha) 142.4 3,615.0 3,757.4 Population (1991) 1,901 6,861 8,762 (1999) 2,258 8,148 10,406 (2015) 2,627 9,483 12,111
The total served population and area of Zaprešić and Brdovec are 13,300 inhabitants and 948.9 ha, including the entire area of the urban center of Zaprešić and Brdovec and the western suburb settlements of Lužnica, Šibice and Savski Marof.
(2) Existing Industries There are eight (8) industries registered by Croatian Waters as industrial pollutant in Zaprešić and Brdovec, as listed below. Among them, three (3) industries are served by the sewerage system, while the remaining five (5) discharge directly into the rivers. The industries in bold characters are the large ones described in Appendix C.
D - 87
Wastewater (m3/year) Code Number Industry Name Activity
1998 1999 Recipient
315043 Dubravica Food/Beverage 3,776 735 River 315289 Bermes Food/Beverage - 2,305 River 315290 Šimun Milk Food/Beverage - 1,991 Sewerage 315089 Karbon Chemicals 162,140 105,007 Sewerage 315127 Pliva Chemicals 532,472 608,883 River 315062 HŽ Infrastrucktura Transportation 63,781 73,444 Sewerage 315080 Inker Ceramics 85,677 109,792 River 315157 Viadukt Others 53,761 66,955 River
Among the above industries, Pliva is the largest pollution source. Pliva is one of the biggest chemical companies in Croatia, producing bulk pharmaceuticals, animal health products, agrochemicals, foodstuff, cosmetics and hygiene products. Health care products account for 82% of the total turnover. It is an international company with affiliated companies in Bosnia-Herzegovina, Poland, Slovenia, Switzerland and the United States of America. A large quantity of wastewater is generated in the production process at each location.
(3) Sewer Networks The existing sewerage system is shown in Fig. D.9.7. The urban centers of the town and municipality are served by the combined sewerage systems, while separate ones serve the surrounding areas. Three (3) main collectors, Zaprešić Collector, Harmica-Zaprešić Collector and East Transport Collector, along with secondary/ tertiary ones, collect the sewage of the service area. All of the main collectors converge at a location in the southeast fringe of the urban center of the town to discharge the wastewater into the lower end of the Krapina River (immediately upstream of the confluence with the Sava River) with neither treatment nor pumping station. The wastewater of Pliva used to be discharged into the Krapina River through the Harmica-Zaprešić Collector. At present, however, wastewater is discharged with pre-treatment into the Sava River (upstream of the confluence with Krapina River) through the neighboring stream due to lack of capacity of the Harmica-Zaprešić Collector. This collector also collects the wastewater of the settlements along it. There are some troubles with the existing sewerage system, which is only about 70% waterproof. The total sewer length is 47.5 km with diameters of 20 cm to 130/195 cm.
(4) Wastewater Flow and Quality The JICA Study Team also analyzed the quantity and quality of wastewater in the manhole before Krapina River on November 27, 2000. The results for major parameters are shown below. For other parameters, see Table B.4.3 in Appendix B.
Parameter Unit Value Parameter Unit Value
Sampling Time 15:20 CODMn mg/l 50.0 Flow m3/sec 0.093 TSS mg/l 126 pH 7.53 T-N mg/l 15.6 BOD mg/l 96.0 T-P mg/l 4.96
9.4.2 Planning Basis (1) Service Area, Population and Industries
The southern settlements along the main collector such as Jaborje, Brdovecki, Prudnice and the surrounding areas will be served by the sewerage system. The chemical industry Pliva had requested the municipality to allow it to discharge its wastewater into the sewerage system and the municipality had agreed. Since the Harmica-Zaprešić
D - 88
Collector is in bad condition and the capacity is too small, it will be necessary to install a new main collector from the industry to the treatment plant. In addition, there is a plan to construct the Shopping Center (City) Zagreb-Zaprešić, to be financed by an Italian company, on the left side of the Krapina River. A sports/physical fitness center and a business center are set up as annexes to the Shopping Center Zagreb-Zaprešić and the total area is 98.7 ha consisting of 35.5 ha of buildings, 35.0 ha of car park, 11.9 ha of road, and 16.3 ha of green space. The designed water supply is 48.4 l/sec. The land area has been purchased and the construction permit may be issued this summer of 2001. Completion of construction is expected by 2008. The Master Plan service area will cover Pliva and Shopping City Zagreb – Zaprešić. With the extension of 542.4 ha, the total service area will be 1,491.2 ha. Service population in the Master Plan service area will be 30,500 according to the area extension and increase of population. The existing service area is collected by the combined system in principle, while the proposed extension is by the separate one. For the extension area, see Fig. D.9.7. Among the above five (5) industries to be served by the proposed sewerage system, three (3) large industries (Kardon, Pliva, HZ Inflastructura) are dealt as the sources of industrial wastewater and the remaining two (2) industries (Šimun Milk and Shopping Center) are included in the sources of municipal wastewater in this Study. Every industry should discharge its industrial wastewater into the municipal treatment plant after pre-treatment to comply with the national regulation in all the parameters. For location of the three (3) large industries and shopping center, see Fig. D.9.7.
(2) Wastewater Flow and Quality
(a) Municipal Wastewater Flow
The quantity of municipal wastewater is projected as follows.
Item Quantity (m3/day) Daily Average 12,009 Daily Maximum 14,144 Hourly Maximum 21,273
(b) Industrial Wastewater Flow
The wastewater quantity of the four (4) large industries is estimated as shown below. The existing and future daily averages are obtained from Subsection 7.2.5, 8,6,1 and 8.6.3 in Appendix C. The future daily maximum and hourly maximum are calculated based on the daily average, considering the operation hour of the industries.
Quantity (m3/day)
1999 2015 Industry Name Daily
Average Daily
Average Daily
Maximum Hourly
Maximum Karbon 535 884 884 1,326 Pliva 1,928 3,262 3,262 3,262 HZ Inflastructura 275 454 454 681 Total 2,738 4,600 4,600 5,269
(c) Total Wastewater Flow
The total wastewater flow composed of municipal and industrial wastewater is as projected in the following table. Hourly maximum in rainy period is estimated
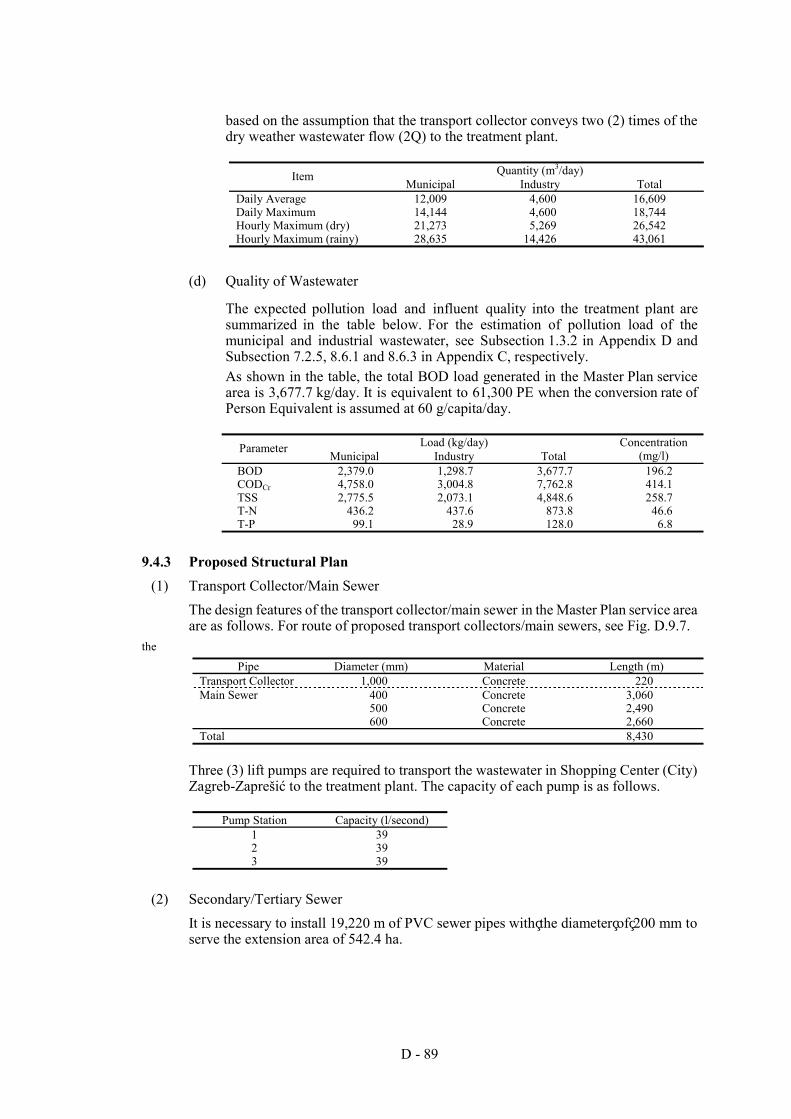
D - 89
based on the assumption that the transport collector conveys two (2) times of the dry weather wastewater flow (2Q) to the treatment plant.
Quantity (m3/day) Item
Municipal Industry Total Daily Average 12,009 4,600 16,609 Daily Maximum 14,144 4,600 18,744 Hourly Maximum (dry) 21,273 5,269 26,542 Hourly Maximum (rainy) 28,635 14,426 43,061
(d) Quality of Wastewater
The expected pollution load and influent quality into the treatment plant are summarized in the table below. For the estimation of pollution load of the municipal and industrial wastewater, see Subsection 1.3.2 in Appendix D and Subsection 7.2.5, 8.6.1 and 8.6.3 in Appendix C, respectively. As shown in the table, the total BOD load generated in the Master Plan service area is 3,677.7 kg/day. It is equivalent to 61,300 PE when the conversion rate of Person Equivalent is assumed at 60 g/capita/day.
Load (kg/day) Parameter
Municipal Industry Total Concentration
(mg/l) BOD 2,379.0 1,298.7 3,677.7 196.2 CODCr 4,758.0 3,004.8 7,762.8 414.1 TSS 2,775.5 2,073.1 4,848.6 258.7 T-N 436.2 437.6 873.8 46.6 T-P 99.1 28.9 128.0 6.8
9.4.3 Proposed Structural Plan (1) Transport Collector/Main Sewer
The design features of the transport collector/main sewer in the Master Plan service area are as follows. For route of proposed transport collectors/main sewers, see Fig. D.9.7.
the Pipe Diameter (mm) Material Length (m)
Transport Collector 1,000 Concrete 220 Main Sewer 400 Concrete 3,060 500 Concrete 2,490 600 Concrete 2,660 Total 8,430
Three (3) lift pumps are required to transport the wastewater in Shopping Center (City) Zagreb-Zaprešić to the treatment plant. The capacity of each pump is as follows.
Pump Station Capacity (l/second)
1 39 2 39 3 39
(2) Secondary/Tertiary Sewer It is necessary to install 19,220 m of PVC sewer pipes with the diameter of 200 mm to serve the extension area of 542.4 ha.
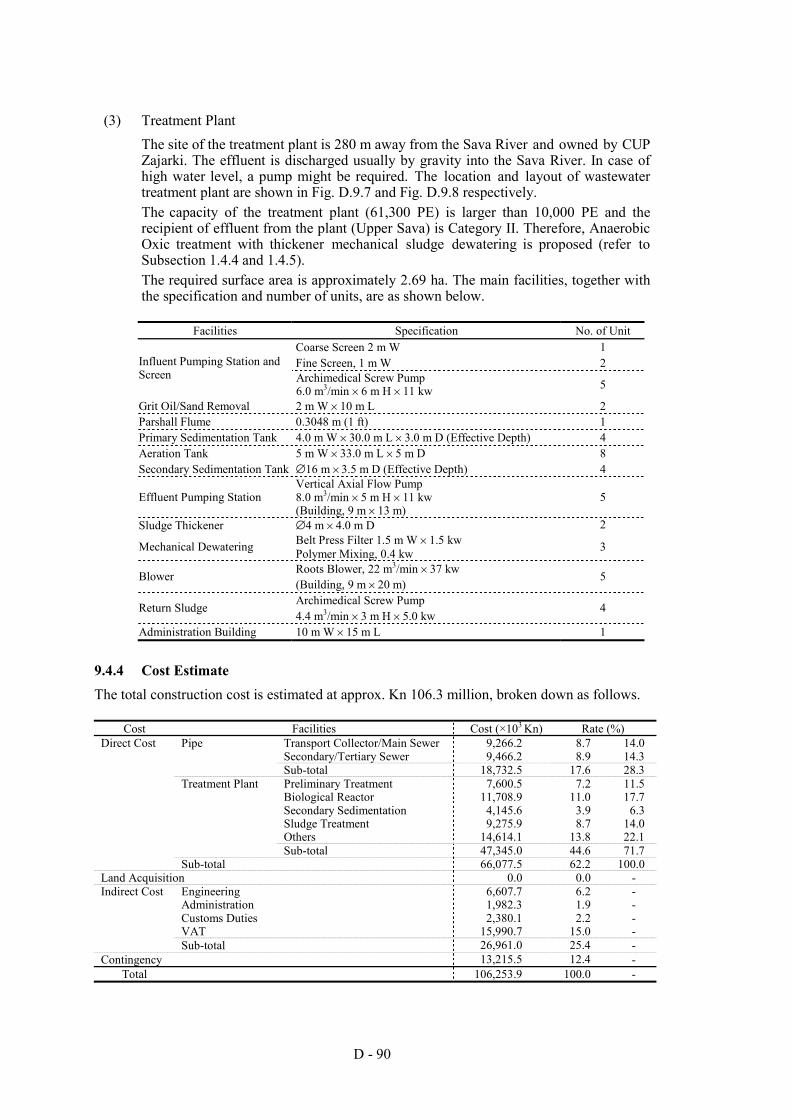
D - 90
(3) Treatment Plant The site of the treatment plant is 280 m away from the Sava River and owned by CUP Zajarki. The effluent is discharged usually by gravity into the Sava River. In case of high water level, a pump might be required. The location and layout of wastewater treatment plant are shown in Fig. D.9.7 and Fig. D.9.8 respectively. The capacity of the treatment plant (61,300 PE) is larger than 10,000 PE and the recipient of effluent from the plant (Upper Sava) is Category II. Therefore, Anaerobic Oxic treatment with thickener mechanical sludge dewatering is proposed (refer to Subsection 1.4.4 and 1.4.5). The required surface area is approximately 2.69 ha. The main facilities, together with the specification and number of units, are as shown below.
Facilities Specification No. of Unit
Coarse Screen 2 m W 1 Fine Screen, 1 m W 2 Influent Pumping Station and
Screen Archimedical Screw Pump 6.0 m3/min × 6 m H × 11 kw 5
Grit Oil/Sand Removal 2 m W × 10 m L 2 Parshall Flume 0.3048 m (1 ft) 1 Primary Sedimentation Tank 4.0 m W × 30.0 m L × 3.0 m D (Effective Depth) 4 Aeration Tank 5 m W × 33.0 m L × 5 m D 8 Secondary Sedimentation Tank ∅16 m × 3.5 m D (Effective Depth) 4
Effluent Pumping Station Vertical Axial Flow Pump 8.0 m3/min × 5 m H × 11 kw (Building, 9 m × 13 m)
5
Sludge Thickener ∅4 m × 4.0 m D 2 Belt Press Filter 1.5 m W × 1.5 kw Mechanical Dewatering Polymer Mixing, 0.4 kw 3
Roots Blower, 22 m3/min × 37 kw Blower (Building, 9 m × 20 m)
5
Archimedical Screw Pump Return Sludge 4.4 m3/min × 3 m H × 5.0 kw
4
Administration Building 10 m W × 15 m L 1
9.4.4 Cost Estimate The total construction cost is estimated at approx. Kn 106.3 million, broken down as follows.
Cost Facilities Cost (×103 Kn) Rate (%) Direct Cost Pipe Transport Collector/Main Sewer 9,266.2 8.7 14.0 Secondary/Tertiary Sewer 9,466.2 8.9 14.3 Sub-total 18,732.5 17.6 28.3 Treatment Plant Preliminary Treatment 7,600.5 7.2 11.5 Biological Reactor 11,708.9 11.0 17.7 Secondary Sedimentation 4,145.6 3.9 6.3 Sludge Treatment 9,275.9 8.7 14.0 Others 14,614.1 13.8 22.1 Sub-total 47,345.0 44.6 71.7 Sub-total 66,077.5 62.2 100.0 Land Acquisition 0.0 0.0 - Indirect Cost Engineering 6,607.7 6.2 - Administration 1,982.3 1.9 - Customs Duties 2,380.1 2.2 - VAT 15,990.7 15.0 - Sub-total 26,961.0 25.4 - Contingency 13,215.5 12.4 -
Total 106,253.9 100.0 -
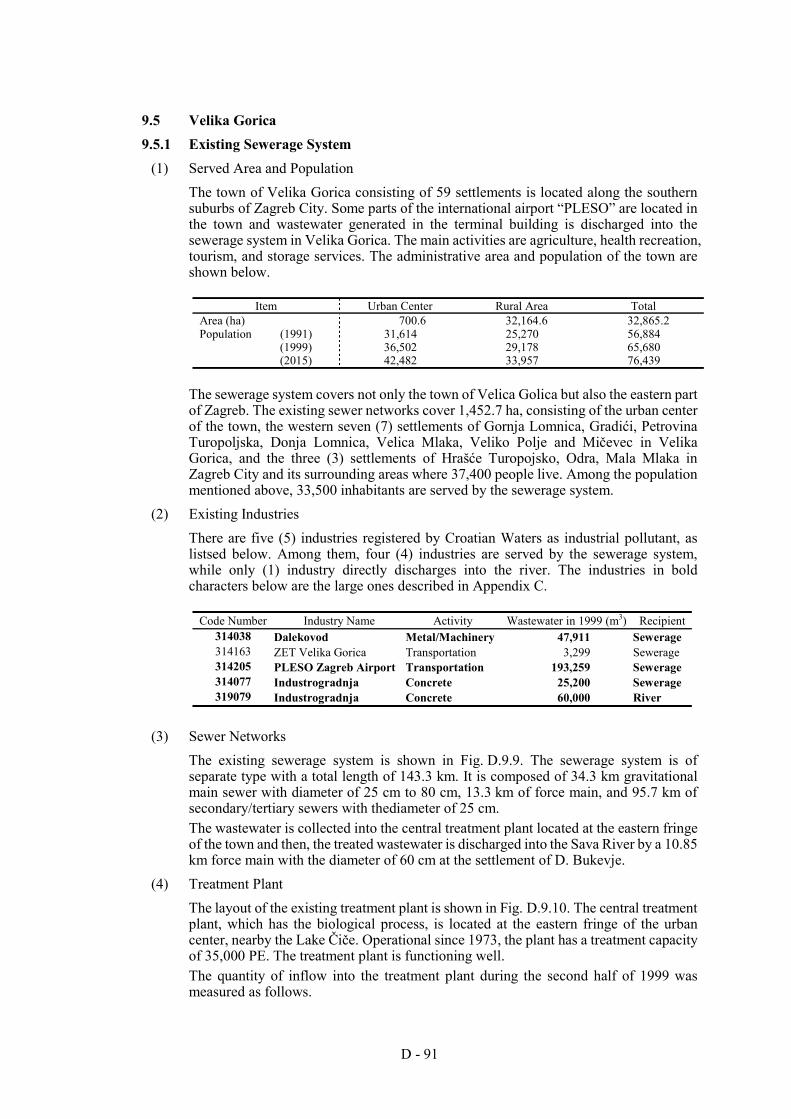
D - 91
9.5 Velika Gorica 9.5.1 Existing Sewerage System
(1) Served Area and Population The town of Velika Gorica consisting of 59 settlements is located along the southern suburbs of Zagreb City. Some parts of the international airport “PLESO” are located in the town and wastewater generated in the terminal building is discharged into the sewerage system in Velika Gorica. The main activities are agriculture, health recreation, tourism, and storage services. The administrative area and population of the town are shown below.
Item Urban Center Rural Area Total
Area (ha) 700.6 32,164.6 32,865.2 Population (1991) 31,614 25,270 56,884 (1999) 36,502 29,178 65,680 (2015) 42,482 33,957 76,439
The sewerage system covers not only the town of Velica Golica but also the eastern part of Zagreb. The existing sewer networks cover 1,452.7 ha, consisting of the urban center of the town, the western seven (7) settlements of Gornja Lomnica, Gradići, Petrovina Turopoljska, Donja Lomnica, Velica Mlaka, Veliko Polje and Mičevec in Velika Gorica, and the three (3) settlements of Hrašće Turopojsko, Odra, Mala Mlaka in Zagreb City and its surrounding areas where 37,400 people live. Among the population mentioned above, 33,500 inhabitants are served by the sewerage system.
(2) Existing Industries There are five (5) industries registered by Croatian Waters as industrial pollutant, as listsed below. Among them, four (4) industries are served by the sewerage system, while only (1) industry directly discharges into the river. The industries in bold characters below are the large ones described in Appendix C.
Code Number Industry Name Activity Wastewater in 1999 (m3) Recipient
314038 Dalekovod Metal/Machinery 47,911 Sewerage 314163 ZET Velika Gorica Transportation 3,299 Sewerage 314205 PLESO Zagreb Airport Transportation 193,259 Sewerage 314077 Industrogradnja Concrete 25,200 Sewerage 319079 Industrogradnja Concrete 60,000 River
(3) Sewer Networks The existing sewerage system is shown in Fig. D.9.9. The sewerage system is of separate type with a total length of 143.3 km. It is composed of 34.3 km gravitational main sewer with diameter of 25 cm to 80 cm, 13.3 km of force main, and 95.7 km of secondary/tertiary sewers with thediameter of 25 cm. The wastewater is collected into the central treatment plant located at the eastern fringe of the town and then, the treated wastewater is discharged into the Sava River by a 10.85 km force main with the diameter of 60 cm at the settlement of D. Bukevje.
(4) Treatment Plant The layout of the existing treatment plant is shown in Fig. D.9.10. The central treatment plant, which has the biological process, is located at the eastern fringe of the urban center, nearby the Lake Čiče. Operational since 1973, the plant has a treatment capacity of 35,000 PE. The treatment plant is functioning well. The quantity of inflow into the treatment plant during the second half of 1999 was measured as follows.
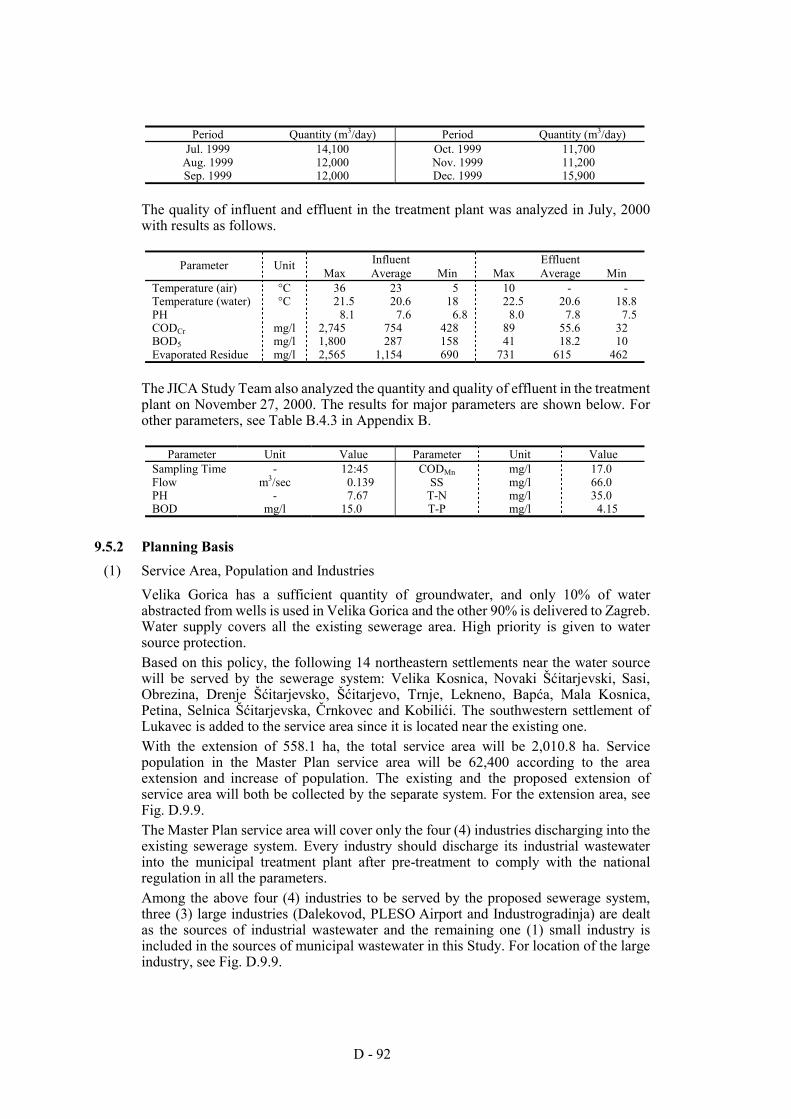
D - 92
Period Quantity (m3/day) Period Quantity (m3/day)
Jul. 1999 14,100 Oct. 1999 11,700 Aug. 1999 12,000 Nov. 1999 11,200 Sep. 1999 12,000 Dec. 1999 15,900
The quality of influent and effluent in the treatment plant was analyzed in July, 2000 with results as follows.
Influent Effluent Parameter Unit
Max Average Min Max Average Min Temperature (air) °C 36 23 5 10 - - Temperature (water) °C 21.5 20.6 18 22.5 20.6 18.8 PH 8.1 7.6 6.8 8.0 7.8 7.5 CODCr mg/l 2,745 754 428 89 55.6 32 BOD5 mg/l 1,800 287 158 41 18.2 10 Evaporated Residue mg/l 2,565 1,154 690 731 615 462
The JICA Study Team also analyzed the quantity and quality of effluent in the treatment plant on November 27, 2000. The results for major parameters are shown below. For other parameters, see Table B.4.3 in Appendix B.
Parameter Unit Value Parameter Unit Value
Sampling Time - 12:45 CODMn mg/l 17.0 Flow m3/sec 0.139 SS mg/l 66.0 PH - 7.67 T-N mg/l 35.0 BOD mg/l 15.0 T-P mg/l 4.15
9.5.2 Planning Basis (1) Service Area, Population and Industries
Velika Gorica has a sufficient quantity of groundwater, and only 10% of water abstracted from wells is used in Velika Gorica and the other 90% is delivered to Zagreb. Water supply covers all the existing sewerage area. High priority is given to water source protection. Based on this policy, the following 14 northeastern settlements near the water source will be served by the sewerage system: Velika Kosnica, Novaki Šćitarjevski, Sasi, Obrezina, Drenje Šćitarjevsko, Šćitarjevo, Trnje, Lekneno, Bapća, Mala Kosnica, Petina, Selnica Šćitarjevska, Črnkovec and Kobilići. The southwestern settlement of Lukavec is added to the service area since it is located near the existing one. With the extension of 558.1 ha, the total service area will be 2,010.8 ha. Service population in the Master Plan service area will be 62,400 according to the area extension and increase of population. The existing and the proposed extension of service area will both be collected by the separate system. For the extension area, see Fig. D.9.9. The Master Plan service area will cover only the four (4) industries discharging into the existing sewerage system. Every industry should discharge its industrial wastewater into the municipal treatment plant after pre-treatment to comply with the national regulation in all the parameters. Among the above four (4) industries to be served by the proposed sewerage system, three (3) large industries (Dalekovod, PLESO Airport and Industrogradinja) are dealt as the sources of industrial wastewater and the remaining one (1) small industry is included in the sources of municipal wastewater in this Study. For location of the large industry, see Fig. D.9.9.
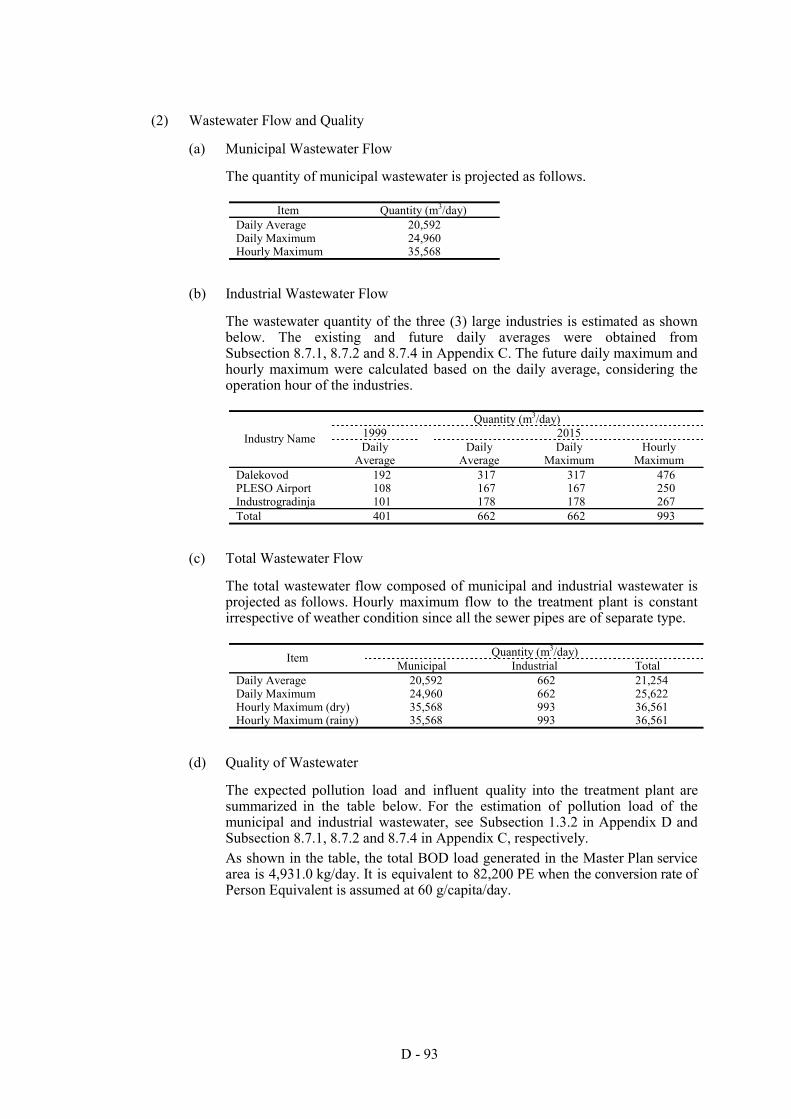
D - 93
(2) Wastewater Flow and Quality
(a) Municipal Wastewater Flow
The quantity of municipal wastewater is projected as follows.
Item Quantity (m3/day) Daily Average 20,592 Daily Maximum 24,960 Hourly Maximum 35,568
(b) Industrial Wastewater Flow
The wastewater quantity of the three (3) large industries is estimated as shown below. The existing and future daily averages were obtained from Subsection 8.7.1, 8.7.2 and 8.7.4 in Appendix C. The future daily maximum and hourly maximum were calculated based on the daily average, considering the operation hour of the industries.
Quantity (m3/day)
1999 2015 Industry Name Daily
Average Daily
Average Daily
Maximum Hourly
Maximum Dalekovod 192 317 317 476 PLESO Airport 108 167 167 250 Industrogradinja 101 178 178 267 Total 401 662 662 993
(c) Total Wastewater Flow
The total wastewater flow composed of municipal and industrial wastewater is projected as follows. Hourly maximum flow to the treatment plant is constant irrespective of weather condition since all the sewer pipes are of separate type.
Quantity (m3/day) Item
Municipal Industrial Total Daily Average 20,592 662 21,254 Daily Maximum 24,960 662 25,622 Hourly Maximum (dry) 35,568 993 36,561 Hourly Maximum (rainy) 35,568 993 36,561
(d) Quality of Wastewater
The expected pollution load and influent quality into the treatment plant are summarized in the table below. For the estimation of pollution load of the municipal and industrial wastewater, see Subsection 1.3.2 in Appendix D and Subsection 8.7.1, 8.7.2 and 8.7.4 in Appendix C, respectively. As shown in the table, the total BOD load generated in the Master Plan service area is 4,931.0 kg/day. It is equivalent to 82,200 PE when the conversion rate of Person Equivalent is assumed at 60 g/capita/day.
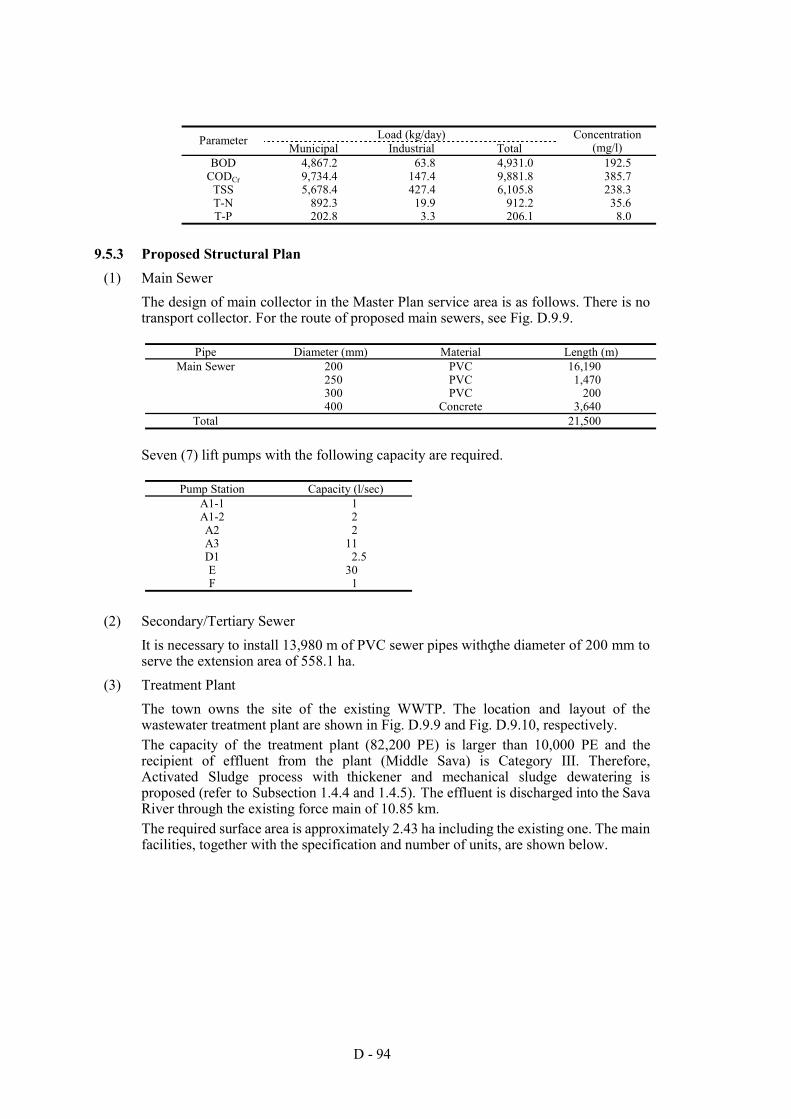
D - 94
Load (kg/day) Parameter
Municipal Industrial Total Concentration
(mg/l) BOD 4,867.2 63.8 4,931.0 192.5
CODCr 9,734.4 147.4 9,881.8 385.7 TSS 5,678.4 427.4 6,105.8 238.3 T-N 892.3 19.9 912.2 35.6 T-P 202.8 3.3 206.1 8.0
9.5.3 Proposed Structural Plan (1) Main Sewer
The design of main collector in the Master Plan service area is as follows. There is no transport collector. For the route of proposed main sewers, see Fig. D.9.9.
Pipe Diameter (mm) Material Length (m)
Main Sewer 200 PVC 16,190 250 PVC 1,470 300 PVC 200 400 Concrete 3,640
Total 21,500
Seven (7) lift pumps with the following capacity are required.
Pump Station Capacity (l/sec) A1-1 1 A1-2 2 A2 2 A3 11 D1 2.5 E 30 F 1
(2) Secondary/Tertiary Sewer It is necessary to install 13,980 m of PVC sewer pipes with the diameter of 200 mm to serve the extension area of 558.1 ha.
(3) Treatment Plant The town owns the site of the existing WWTP. The location and layout of the wastewater treatment plant are shown in Fig. D.9.9 and Fig. D.9.10, respectively. The capacity of the treatment plant (82,200 PE) is larger than 10,000 PE and the recipient of effluent from the plant (Middle Sava) is Category III. Therefore, Activated Sludge process with thickener and mechanical sludge dewatering is proposed (refer to Subsection 1.4.4 and 1.4.5). The effluent is discharged into the Sava River through the existing force main of 10.85 km. The required surface area is approximately 2.43 ha including the existing one. The main facilities, together with the specification and number of units, are shown below.
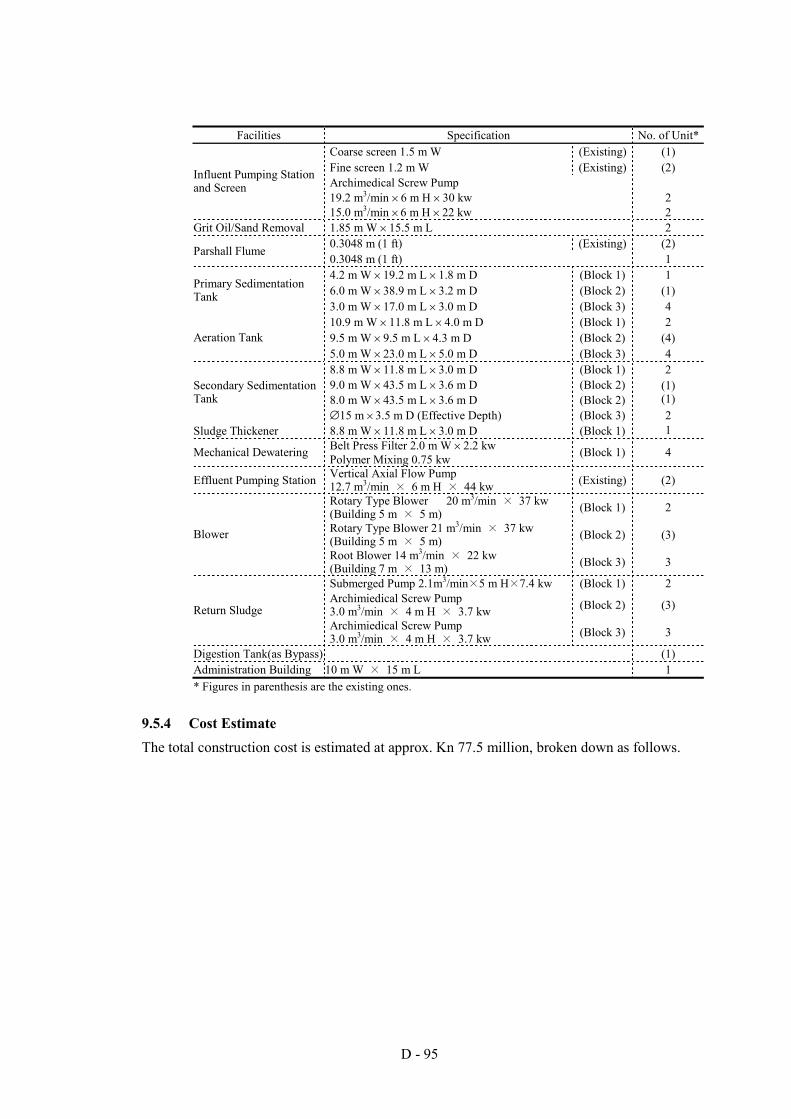
D - 95
Facilities Specification No. of Unit*
Coarse screen 1.5 m W (Existing) (1) Fine screen 1.2 m W (Existing) (2) Archimedical Screw Pump 19.2 m3/min × 6 m H × 30 kw 2
Influent Pumping Station and Screen
15.0 m3/min × 6 m H × 22 kw 2 Grit Oil/Sand Removal 1.85 m W × 15.5 m L 2
0.3048 m (1 ft) (Existing) (2) Parshall Flume 0.3048 m (1 ft) 1 4.2 m W × 19.2 m L × 1.8 m D (Block 1) 1 6.0 m W × 38.9 m L × 3.2 m D (Block 2) (1) Primary Sedimentation
Tank 3.0 m W × 17.0 m L × 3.0 m D (Block 3) 4 10.9 m W × 11.8 m L × 4.0 m D (Block 1) 2 9.5 m W × 9.5 m L × 4.3 m D (Block 2) (4) Aeration Tank 5.0 m W × 23.0 m L × 5.0 m D (Block 3) 4 8.8 m W × 11.8 m L × 3.0 m D (Block 1) 2 9.0 m W × 43.5 m L × 3.6 m D (Block 2) 8.0 m W × 43.5 m L × 3.6 m D (Block 2)
(1) (1)
Secondary Sedimentation Tank
∅15 m × 3.5 m D (Effective Depth) (Block 3) 2 Sludge Thickener 8.8 m W × 11.8 m L × 3.0 m D (Block 1) 1
Belt Press Filter 2.0 m W × 2.2 kw Mechanical Dewatering Polymer Mixing 0.75 kw (Block 1) 4
Effluent Pumping Station Vertical Axial Flow Pump 12.7 m3/min × 6 m H × 44 kw (Existing) (2)
Rotary Type Blower 20 m3/min × 37 kw (Building 5 m × 5 m) (Block 1) 2
Rotary Type Blower 21 m3/min × 37 kw (Building 5 m × 5 m) (Block 2) (3) Blower
Root Blower 14 m3/min × 22 kw (Building 7 m × 13 m) (Block 3) 3
Submerged Pump 2.1m3/min×5 m H×7.4 kw (Block 1) 2 Archimiedical Screw Pump 3.0 m3/min × 4 m H × 3.7 kw (Block 2) (3) Return Sludge Archimiedical Screw Pump 3.0 m3/min × 4 m H × 3.7 kw (Block 3) 3
Digestion Tank(as Bypass) (1) Administration Building 10 m W × 15 m L 1 * Figures in parenthesis are the existing ones.
9.5.4 Cost Estimate The total construction cost is estimated at approx. Kn 77.5 million, broken down as follows.
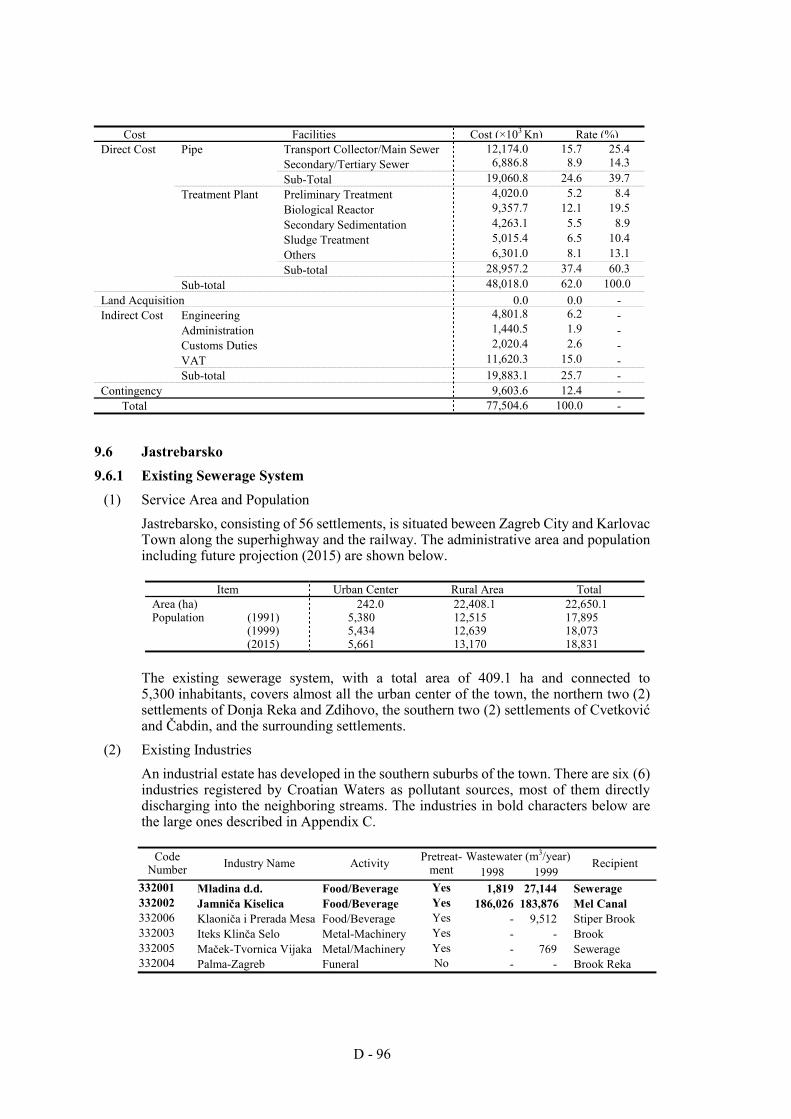
D - 96
Cost Facilities Cost (×103 Kn) Rate (%)
Direct Cost Pipe Transport Collector/Main Sewer 12,174.0 15.7 25.4 Secondary/Tertiary Sewer 6,886.8 8.9 14.3 Sub-Total 19,060.8 24.6 39.7 Treatment Plant Preliminary Treatment 4,020.0 5.2 8.4 Biological Reactor 9,357.7 12.1 19.5 Secondary Sedimentation 4,263.1 5.5 8.9 Sludge Treatment 5,015.4 6.5 10.4 Others 6,301.0 8.1 13.1 Sub-total 28,957.2 37.4 60.3 Sub-total 48,018.0 62.0 100.0 Land Acquisition 0.0 0.0 - Indirect Cost Engineering 4,801.8 6.2 - Administration 1,440.5 1.9 - Customs Duties 2,020.4 2.6 - VAT 11,620.3 15.0 - Sub-total 19,883.1 25.7 - Contingency 9,603.6 12.4 -
Total 77,504.6 100.0 -
9.6 Jastrebarsko 9.6.1 Existing Sewerage System
(1) Service Area and Population Jastrebarsko, consisting of 56 settlements, is situated beween Zagreb City and Karlovac Town along the superhighway and the railway. The administrative area and population including future projection (2015) are shown below.
Item Urban Center Rural Area Total
Area (ha) 242.0 22,408.1 22,650.1 Population (1991) 5,380 12,515 17,895 (1999) 5,434 12,639 18,073 (2015) 5,661 13,170 18,831
The existing sewerage system, with a total area of 409.1 ha and connected to 5,300 inhabitants, covers almost all the urban center of the town, the northern two (2) settlements of Donja Reka and Zdihovo, the southern two (2) settlements of Cvetković and Čabdin, and the surrounding settlements.
(2) Existing Industries An industrial estate has developed in the southern suburbs of the town. There are six (6) industries registered by Croatian Waters as pollutant sources, most of them directly discharging into the neighboring streams. The industries in bold characters below are the large ones described in Appendix C.
Wastewater (m3/year) Code
Number Industry Name Activity Pretreat- ment 1998 1999
Recipient
332001 Mladina d.d. Food/Beverage Yes 1,819 27,144 Sewerage 332002 Jamniča Kiselica Food/Beverage Yes 186,026 183,876 Mel Canal 332006 Klaoniča i Prerada Mesa Food/Beverage Yes - 9,512 Stiper Brook 332003 Iteks Klinča Selo Metal-Machinery Yes - - Brook 332005 Maček-Tvornica Vijaka Metal/Machinery Yes - 769 Sewerage 332004 Palma-Zagreb Funeral No - - Brook Reka
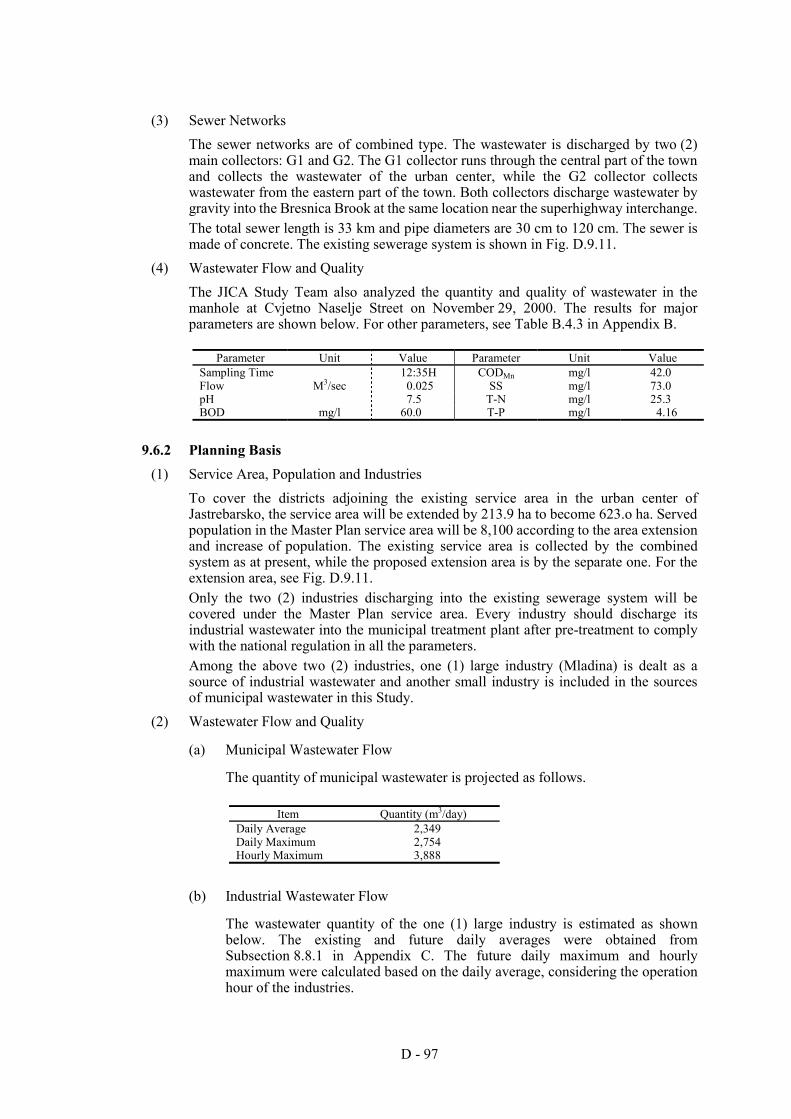
D - 97
(3) Sewer Networks The sewer networks are of combined type. The wastewater is discharged by two (2) main collectors: G1 and G2. The G1 collector runs through the central part of the town and collects the wastewater of the urban center, while the G2 collector collects wastewater from the eastern part of the town. Both collectors discharge wastewater by gravity into the Bresnica Brook at the same location near the superhighway interchange. The total sewer length is 33 km and pipe diameters are 30 cm to 120 cm. The sewer is made of concrete. The existing sewerage system is shown in Fig. D.9.11.
(4) Wastewater Flow and Quality The JICA Study Team also analyzed the quantity and quality of wastewater in the manhole at Cvjetno Naselje Street on November 29, 2000. The results for major parameters are shown below. For other parameters, see Table B.4.3 in Appendix B.
Parameter Unit Value Parameter Unit Value
Sampling Time 12:35H CODMn mg/l 42.0 Flow M3/sec 0.025 SS mg/l 73.0 pH 7.5 T-N mg/l 25.3 BOD mg/l 60.0 T-P mg/l 4.16
9.6.2 Planning Basis (1) Service Area, Population and Industries
To cover the districts adjoining the existing service area in the urban center of Jastrebarsko, the service area will be extended by 213.9 ha to become 623.o ha. Served population in the Master Plan service area will be 8,100 according to the area extension and increase of population. The existing service area is collected by the combined system as at present, while the proposed extension area is by the separate one. For the extension area, see Fig. D.9.11. Only the two (2) industries discharging into the existing sewerage system will be covered under the Master Plan service area. Every industry should discharge its industrial wastewater into the municipal treatment plant after pre-treatment to comply with the national regulation in all the parameters. Among the above two (2) industries, one (1) large industry (Mladina) is dealt as a source of industrial wastewater and another small industry is included in the sources of municipal wastewater in this Study.
(2) Wastewater Flow and Quality
(a) Municipal Wastewater Flow
The quantity of municipal wastewater is projected as follows.
Item Quantity (m3/day) Daily Average 2,349 Daily Maximum 2,754 Hourly Maximum 3,888
(b) Industrial Wastewater Flow
The wastewater quantity of the one (1) large industry is estimated as shown below. The existing and future daily averages were obtained from Subsection 8.8.1 in Appendix C. The future daily maximum and hourly maximum were calculated based on the daily average, considering the operation hour of the industries.
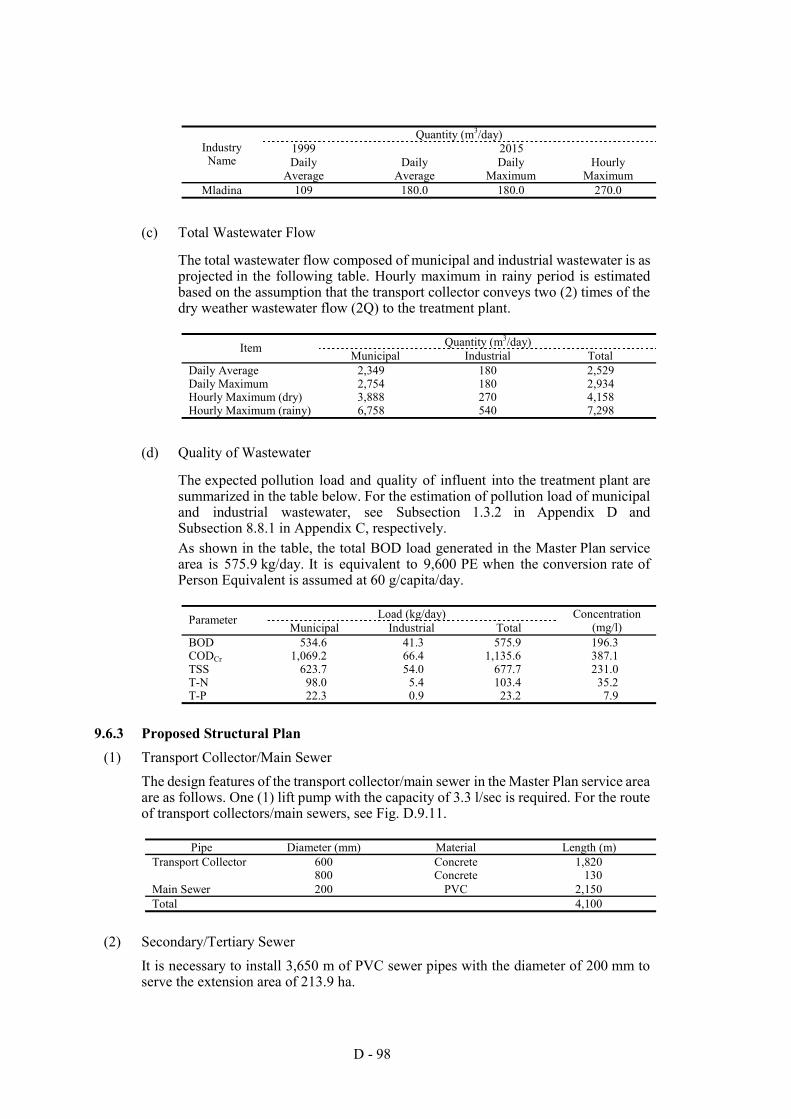
D - 98
Quantity (m3/day)
1999 2015 Industry Name Daily
Average Daily
Average Daily
Maximum Hourly
Maximum Mladina 109 180.0 180.0 270.0
(c) Total Wastewater Flow
The total wastewater flow composed of municipal and industrial wastewater is as projected in the following table. Hourly maximum in rainy period is estimated based on the assumption that the transport collector conveys two (2) times of the dry weather wastewater flow (2Q) to the treatment plant.
Quantity (m3/day) Item
Municipal Industrial Total Daily Average 2,349 180 2,529 Daily Maximum 2,754 180 2,934 Hourly Maximum (dry) 3,888 270 4,158 Hourly Maximum (rainy) 6,758 540 7,298
(d) Quality of Wastewater
The expected pollution load and quality of influent into the treatment plant are summarized in the table below. For the estimation of pollution load of municipal and industrial wastewater, see Subsection 1.3.2 in Appendix D and Subsection 8.8.1 in Appendix C, respectively. As shown in the table, the total BOD load generated in the Master Plan service area is 575.9 kg/day. It is equivalent to 9,600 PE when the conversion rate of Person Equivalent is assumed at 60 g/capita/day.
Load (kg/day) Parameter
Municipal Industrial Total Concentration
(mg/l) BOD 534.6 41.3 575.9 196.3 CODCr 1,069.2 66.4 1,135.6 387.1 TSS 623.7 54.0 677.7 231.0 T-N 98.0 5.4 103.4 35.2 T-P 22.3 0.9 23.2 7.9
9.6.3 Proposed Structural Plan (1) Transport Collector/Main Sewer
The design features of the transport collector/main sewer in the Master Plan service area are as follows. One (1) lift pump with the capacity of 3.3 l/sec is required. For the route of transport collectors/main sewers, see Fig. D.9.11.
Pipe Diameter (mm) Material Length (m)
Transport Collector 600 Concrete 1,820 800 Concrete 130 Main Sewer 200 PVC 2,150 Total 4,100
(2) Secondary/Tertiary Sewer It is necessary to install 3,650 m of PVC sewer pipes with the diameter of 200 mm to serve the extension area of 213.9 ha.
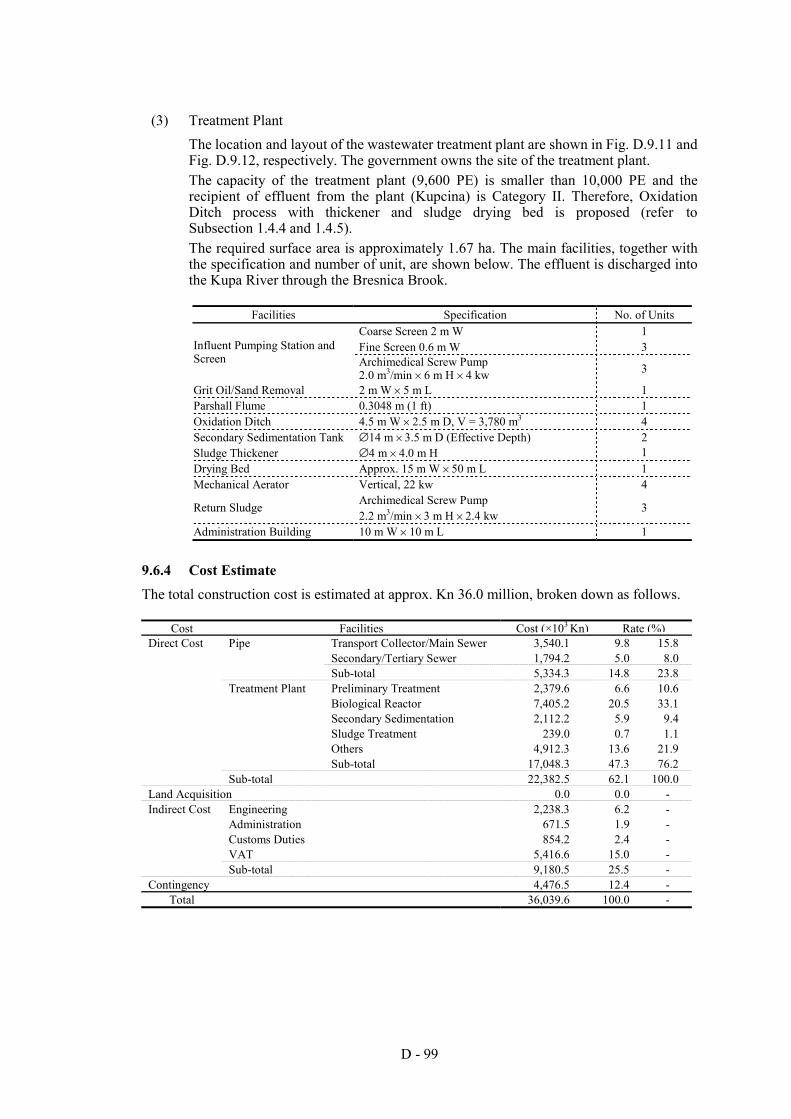
D - 99
(3) Treatment Plant The location and layout of the wastewater treatment plant are shown in Fig. D.9.11 and Fig. D.9.12, respectively. The government owns the site of the treatment plant. The capacity of the treatment plant (9,600 PE) is smaller than 10,000 PE and the recipient of effluent from the plant (Kupcina) is Category II. Therefore, Oxidation Ditch process with thickener and sludge drying bed is proposed (refer to Subsection 1.4.4 and 1.4.5). The required surface area is approximately 1.67 ha. The main facilities, together with the specification and number of unit, are shown below. The effluent is discharged into the Kupa River through the Bresnica Brook.
Facilities Specification No. of Units
Coarse Screen 2 m W 1 Fine Screen 0.6 m W 3 Influent Pumping Station and
Screen Archimedical Screw Pump 2.0 m3/min × 6 m H × 4 kw 3
Grit Oil/Sand Removal 2 m W × 5 m L 1 Parshall Flume 0.3048 m (1 ft) 1 Oxidation Ditch 4.5 m W × 2.5 m D, V = 3,780 m3 4 Secondary Sedimentation Tank ∅14 m × 3.5 m D (Effective Depth) 2 Sludge Thickener ∅4 m × 4.0 m H 1 Drying Bed Approx. 15 m W × 50 m L 1 Mechanical Aerator Vertical, 22 kw 4
Archimedical Screw Pump Return Sludge 2.2 m3/min × 3 m H × 2.4 kw
3
Administration Building 10 m W × 10 m L 1
9.6.4 Cost Estimate The total construction cost is estimated at approx. Kn 36.0 million, broken down as follows.
Cost Facilities Cost (×103 Kn) Rate (%) Direct Cost Pipe Transport Collector/Main Sewer 3,540.1 9.8 15.8 Secondary/Tertiary Sewer 1,794.2 5.0 8.0 Sub-total 5,334.3 14.8 23.8 Treatment Plant Preliminary Treatment 2,379.6 6.6 10.6 Biological Reactor 7,405.2 20.5 33.1 Secondary Sedimentation 2,112.2 5.9 9.4 Sludge Treatment 239.0 0.7 1.1 Others 4,912.3 13.6 21.9 Sub-total 17,048.3 47.3 76.2 Sub-total 22,382.5 62.1 100.0 Land Acquisition 0.0 0.0 - Indirect Cost Engineering 2,238.3 6.2 - Administration 671.5 1.9 - Customs Duties 854.2 2.4 - VAT 5,416.6 15.0 - Sub-total 9,180.5 25.5 - Contingency 4,476.5 12.4 -
Total 36,039.6 100.0 -
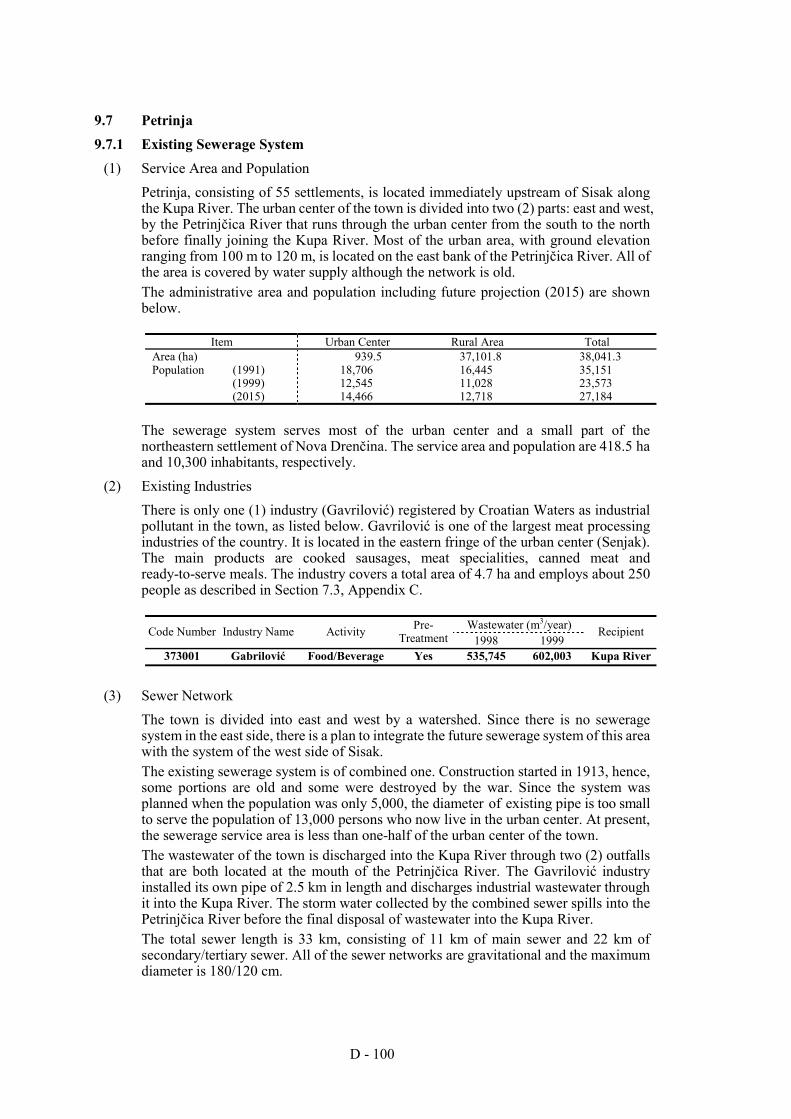
D - 100
9.7 Petrinja 9.7.1 Existing Sewerage System
(1) Service Area and Population Petrinja, consisting of 55 settlements, is located immediately upstream of Sisak along the Kupa River. The urban center of the town is divided into two (2) parts: east and west, by the Petrinjčica River that runs through the urban center from the south to the north before finally joining the Kupa River. Most of the urban area, with ground elevation ranging from 100 m to 120 m, is located on the east bank of the Petrinjčica River. All of the area is covered by water supply although the network is old. The administrative area and population including future projection (2015) are shown below.
Item Urban Center Rural Area Total
Area (ha) 939.5 37,101.8 38,041.3 Population (1991) 18,706 16,445 35,151 (1999) 12,545 11,028 23,573 (2015) 14,466 12,718 27,184
The sewerage system serves most of the urban center and a small part of the northeastern settlement of Nova Drenčina. The service area and population are 418.5 ha and 10,300 inhabitants, respectively.
(2) Existing Industries There is only one (1) industry (Gavrilović) registered by Croatian Waters as industrial pollutant in the town, as listed below. Gavrilović is one of the largest meat processing industries of the country. It is located in the eastern fringe of the urban center (Senjak). The main products are cooked sausages, meat specialities, canned meat and ready-to-serve meals. The industry covers a total area of 4.7 ha and employs about 250 people as described in Section 7.3, Appendix C.
Wastewater (m3/year) Code Number Industry Name Activity Pre-
Treatment 1998 1999 Recipient
373001 Gabrilović Food/Beverage Yes 535,745 602,003 Kupa River
(3) Sewer Network The town is divided into east and west by a watershed. Since there is no sewerage system in the east side, there is a plan to integrate the future sewerage system of this area with the system of the west side of Sisak. The existing sewerage system is of combined one. Construction started in 1913, hence, some portions are old and some were destroyed by the war. Since the system was planned when the population was only 5,000, the diameter of existing pipe is too small to serve the population of 13,000 persons who now live in the urban center. At present, the sewerage service area is less than one-half of the urban center of the town. The wastewater of the town is discharged into the Kupa River through two (2) outfalls that are both located at the mouth of the Petrinjčica River. The Gavrilović industry installed its own pipe of 2.5 km in length and discharges industrial wastewater through it into the Kupa River. The storm water collected by the combined sewer spills into the Petrinjčica River before the final disposal of wastewater into the Kupa River. The total sewer length is 33 km, consisting of 11 km of main sewer and 22 km of secondary/tertiary sewer. All of the sewer networks are gravitational and the maximum diameter is 180/120 cm.
D - 101
The existing condition of the sewer network is not satisfactory. The wastewater quantity sometimes exceeds the capacity of the sewer pipes in the core area of the town when it rains heavily. The water supply and sewerage company Puro Privreda manages the sewerage system, which consists of three (3) major sub-systems as described below. The existing sewerage system is shown in Fig. D.9.13.
(a) Right Bank of the Petrinjčica River
The main collector of this sub-system is installed along the Petrinjčica River and the secondary collectors are provided beneath the Matija Gubec Street, the Ljudevit Gaj Street, the Katarina Zrinski Street and the Stjepan Radić Street. The discharging point of the main collector is located at the mouth of the Petrinjčica River. The sewer network of approximately 16.5 km in total length is made up of finished round sections of concrete pipe with diameter of 30 cm to 60 cm, egg-shaped sections of 40/60 cm and 50/75 cm, and egg-shaped sections with a bigger diameter of 120/180 cm. The sewer network is provided with about 300 manholes.
(b) Southern Left Bank of the Petrinjčica River
The southern part of the left bank of the Petrinjčica River is connected with the main collector of the Right Bank of Petrinjčica River sub-system. There are approximately 2 km of sewers with about 50 manholes. The sewers are made of concretes pipes with the diameter of 30/80 cm.
(c) Northern Left Bank of the Petrinjčica River
The main collector of this sub-system is placed beneath the Kupska Street and it crosses under the Petrinjčica River to discharge into the Kupa River at the right side river mouth of the Petrinjčica River. Approximately 2.5 km of sewers are made up of concrete pipe with diameters of 20/50 cm, 40/60 cm and 50/75 cm. The sewer networks are provided with about 50 manholes.
(4) Wastewater Flow and Quality The JICA Study Team also analyzed the quantity and quality of wastewater in the manhole before Kupa River on November 28, 2000. The results for major parameters are shown below. For other parameters, see Table B.4.3 in Appendix B.
Parameter Unit Value Parameter Unit Value
Sampling Time - 11:30 CODMn mg/l 28.0 Flow m3/sec 0.0523 TSS mg/l 106.0 PH - 7.51 T-N mg/l 20.0
BOD mg/l 25.0 T-P mg/l 4.24
9.7.2 Planning Basis (1) Service Area, Population and Industries
Since only less than one-half of the urban center is being served by the existing sewerage system, the service area will be extended to cover the east side of the urban center. With an extension of 231.3 ha, the service area will thus cover a total area of 649.8 ha and service population in the Master Plan service area will be 13,100 according to the area extension and increase of population. The existing service area is collected by the combined system, while the proposed extension area is by the separate one. For the extension area, see Fig. D.9.13.
D - 102
The meat-processing factory Gabrilović, which is registered by Croatian Waters as industrial pollutant, will be covered under the Master Plan service area. The factory should discharge its industrial wastewater into the municipal treatment plant after pre-treatment in compliance with the national regulation in all the parameters. For location of the industry, see Fig. D.9.13.
(2) Wastewater Flow and Quality
(a) Municipal Wastewater Flow
The quantity of municipal wastewater is projected as follows.
Item Quantity (m3/day) Daily Average 4,323 Daily Maximum 5,240 Hourly Maximum 7,467
(b) Industrial Wastewater Flow
The wastewater quantity of the Gabrilović factory is estimated as shown below. The existing and future daily averages were obtained from Subsection 7.3.5 in Appendix C. The future daily maximum and hourly maximum were calculated based on the daily average, considering the operation hour of the factories.
Quantity (m3/day)
1999 2015 Industry Name Daily
Average Daily
Average Daily
Maximum Hourly
Maximum Gavrilović 1,357 1,979 1,979 2,969
(c) Total Wastewater Flow
The total wastewater flow composed of municipal and industrial wastewater is projected as follows. In the following table, hourly maximum in rainy period is estimated based on the assumption that the transport collector conveys two (2) times of the dry weather wastewater flow (2Q) to the treatment plant.
Quantity (m3/day) Item
Municipal Industrial Total Daily Average 4,323 1,979 6,302 Daily Maximum 5,240 1,979 7,219 Hourly Maximum (dry) 7,467 2,969 10,436 Hourly Maximum (rainy) 13,417 2,969 16,386
(d) Quality of Wastewater
The expected pollution load and quality of influent into the treatment plant are summarized in the table below. For the estimation of pollution load of municipal and industrial wastewater, see Subsection 1.3.2 of this Appendix D and Subsection 7.3.5 in Appendix C, respectively. As shown in the table, the total BOD load generated in the Master Plan service area is 1,249.4 kg/day. It is equivalent to 20,900 PE when the conversion rate of Person Equivalent is assumed at 60 g/capita/day.
D - 103
Load (kg/day) Parameter Municipal Industrial Total
Concentration (mg/l)
BOD 1,021.8 227.6 1,249.4 173.1 CODCr 2,043.6 463.1 2,506.7 342.7 TSS 1,192.1 360.2 1,552.3 215.0 T-N 187.3 9.5 196.8 27.3 T-P 42.6 5.7 47.7 6.6
9.7.3 Proposed Structural Plan (1) Transport Collector/Main Sewer
The design features of the transport collector/main sewer in the Master Plan service area are as follows. A lift pump is not required. For route of the transport collectors/main sewers, see Fig. D.9.13.
Pipe Diameter (mm) Material Length (m)
Transport Collector 600 Concrete 1,120 Main Sewer 200 PVC 2,770 Total 3,890
(2) Secondary/Tertiary Sewer It is necessary to install 7,130 m of PVC sewer pipe with the diameter of 200 mm to serve the extension area of 231.3 ha.
(3) Treatment Plant The proposed wastewater treatment site is a privately owned with remaining landmines. The location and layout of the wastewater treatment plant are shown in Fig. D.9.13 and Fig. D.9.14, respectively. The capacity of the treatment plant (20,900 PE) is larger than 10,000 PE and the recipient of effluent from the plant (Lower Kupa) is Category II. Therefore, Anaerobic Oxic process with thickener and mechanical sludge dewatering is proposed (refer to Subsection 1.4.4 and 1.4.5). The required surface area is approximately 1.48 ha. The main facilities, together with the specification and number of units, are shown below. The effluent is discharged into the Kupa River.
Facilities Specification No. of Unit
Coarse Screen, 2 m W 1 Fine Screen, 1 m W 1 Influent Pumping Station and
Screen Archimedical Screw Pump 4.0 m3/min × 6 m H × 7 kw 3
Grit Oil/Sand Removal 2 m W × 10 m L 1 Parshall Flume 0.3048 m (1 ft) 1 Primary Sedimentation Tank 3.0 m W × 16.0 m L × 3.0 m D (Effective Depth) 4 Aeration Tank 5 m W × 24.0 m L × 5 m D 4 Secondary Sedimentation Tank ∅14 m × 3.5 m D (Effective Depth) 2 Sludge Thickener ∅6 m × 4.0 m D 1
Belt Press Filter, 1.5 m W × 1.5 kw Mechanical Dewatering Polymer Mixing, 0.4 kw 2
Roots Blower, 13 m3/min × 22 kw Blower (Building, 7 m × 15 m)
3
Archimedical Screw Pump Return Sludge 2.6 m3/min × 3 m H × 7.2 kw
3
Administration Building 10 m W × 10 m L 1
D - 104
9.7.4 Cost Estimate The total construction cost is estimated at approx. Kn 55.6 million, broken down as follows.
Cost Facilities Cost (×103 Kn) Rate (%) Direct Cost Pipe Transport Collector/Main Sewer 3,089.4 5.6 9.1 Secondary/Tertiary Sewer 3,507.2 6.3 10.3 Sub-total 6,596.6 11.9 19.4 Treatment Plant Preliminary Treatment 4,689.0 8.4 13.8 Biological Reacto 6,590.1 11.9 19.4 Secondary Sedimentation 2,044.8 3.7 6.0 Sludge Treatment 4,821.4 8.7 14.2 Others 9,286.0 16.7 27.3 Sub-total 27,431.3 49.3 80.6 Sub-total 34,027.9 61.2 100.0 Land Acquisition 722.0 1.3 - Indirect Cost Engineering 3,402.8 6.1 - Administration 1,020.8 1.8 - Custom Duties 1,371.6 2.5 - VAT 8,234.8 14.8 - Sub-total 14,029.9 25.2 Contingency 6,805.6 12.2 -
Total 55,585.4 100.0 -
9.8 Glina 9.8.1 Existing Sewerage System
(1) Service Area and Population Glina, consisting of 67 settlements, is located in the middle reaches of the Glina River that joins the Kupa River upstream of Petrinja. The administrative area and population including future projection (2015) are shown below. Due to enormous damage caused by the recent war, population decreased from 23,000 to 14,000 and employee number from 3,000 and 2,000 people.
Item Urban Center Rural Area Total
Area (ha) 458.5 53,975.2 54,433.7 Population (1991) 6,933 16,107 23,040 (1999) 4,098 9,519 13,617 (2015) 4,490 10,430 14,920
The sewerage system covers the central urban area of the town and has a total area of 175.2 ha. The served population is 2,000 inhabitants.
(2) Existing Industries There is only one (1) industry, Vivera d.o.o. Pliva Grupa, registered by Croatian Waters as industrial pollutant in the town, as listed below.
Wastewater (m3/year) Code
Number Industry Name Activity Pre- Treatment 1998 1999
Recipient
37100011 Vivera d.o.o. Pliva Grupa Food/Beverage Yes - - Sewerage
(3) Sewer Network The existing sewerage system is shown in Fig. D.9.15. The wastewater of the town is discharged by gravity into the Glina River through two (2) major outfalls. The sewerage system is of combined type with a total sewer length of 38.4 km. The sewer pipes are mostly made of concrete pipe with the diameter of 100 cm.
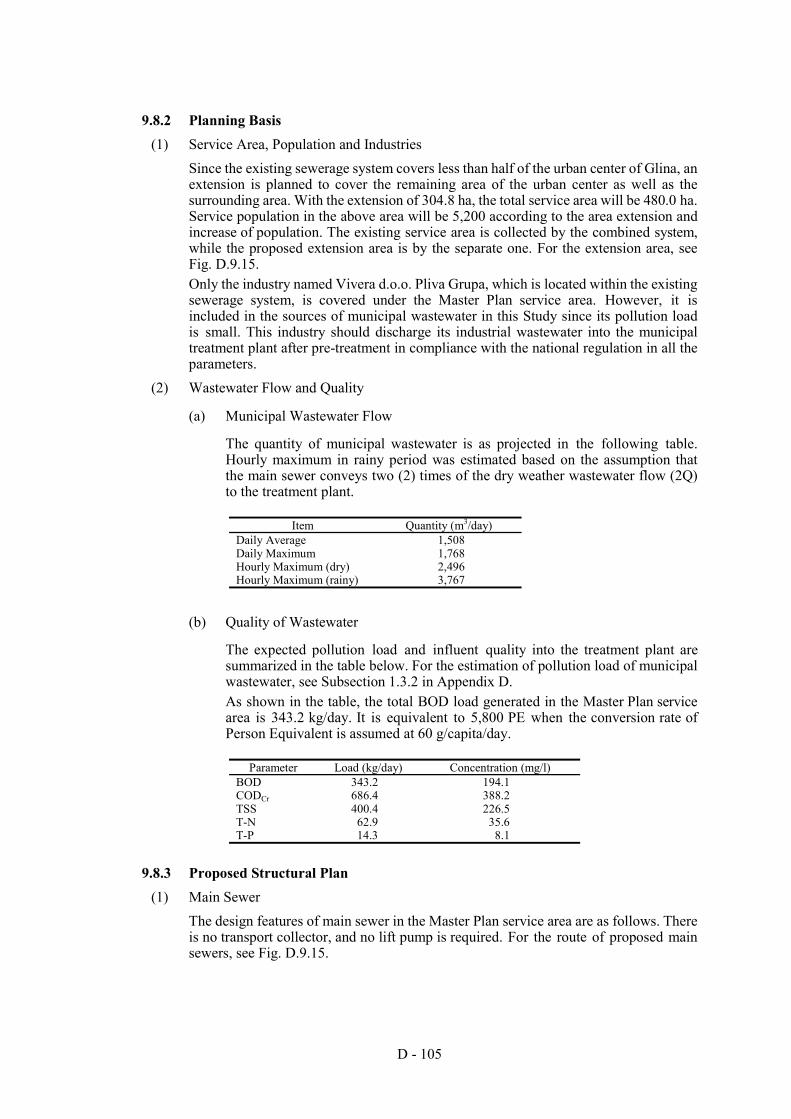
D - 105
9.8.2 Planning Basis (1) Service Area, Population and Industries
Since the existing sewerage system covers less than half of the urban center of Glina, an extension is planned to cover the remaining area of the urban center as well as the surrounding area. With the extension of 304.8 ha, the total service area will be 480.0 ha. Service population in the above area will be 5,200 according to the area extension and increase of population. The existing service area is collected by the combined system, while the proposed extension area is by the separate one. For the extension area, see Fig. D.9.15. Only the industry named Vivera d.o.o. Pliva Grupa, which is located within the existing sewerage system, is covered under the Master Plan service area. However, it is included in the sources of municipal wastewater in this Study since its pollution load is small. This industry should discharge its industrial wastewater into the municipal treatment plant after pre-treatment in compliance with the national regulation in all the parameters.
(2) Wastewater Flow and Quality
(a) Municipal Wastewater Flow
The quantity of municipal wastewater is as projected in the following table. Hourly maximum in rainy period was estimated based on the assumption that the main sewer conveys two (2) times of the dry weather wastewater flow (2Q) to the treatment plant.
Item Quantity (m3/day)
Daily Average 1,508 Daily Maximum 1,768 Hourly Maximum (dry) 2,496 Hourly Maximum (rainy) 3,767
(b) Quality of Wastewater
The expected pollution load and influent quality into the treatment plant are summarized in the table below. For the estimation of pollution load of municipal wastewater, see Subsection 1.3.2 in Appendix D. As shown in the table, the total BOD load generated in the Master Plan service area is 343.2 kg/day. It is equivalent to 5,800 PE when the conversion rate of Person Equivalent is assumed at 60 g/capita/day.
Parameter Load (kg/day) Concentration (mg/l)
BOD 343.2 194.1 CODCr 686.4 388.2 TSS 400.4 226.5 T-N 62.9 35.6 T-P 14.3 8.1
9.8.3 Proposed Structural Plan (1) Main Sewer
The design features of main sewer in the Master Plan service area are as follows. There is no transport collector, and no lift pump is required. For the route of proposed main sewers, see Fig. D.9.15.
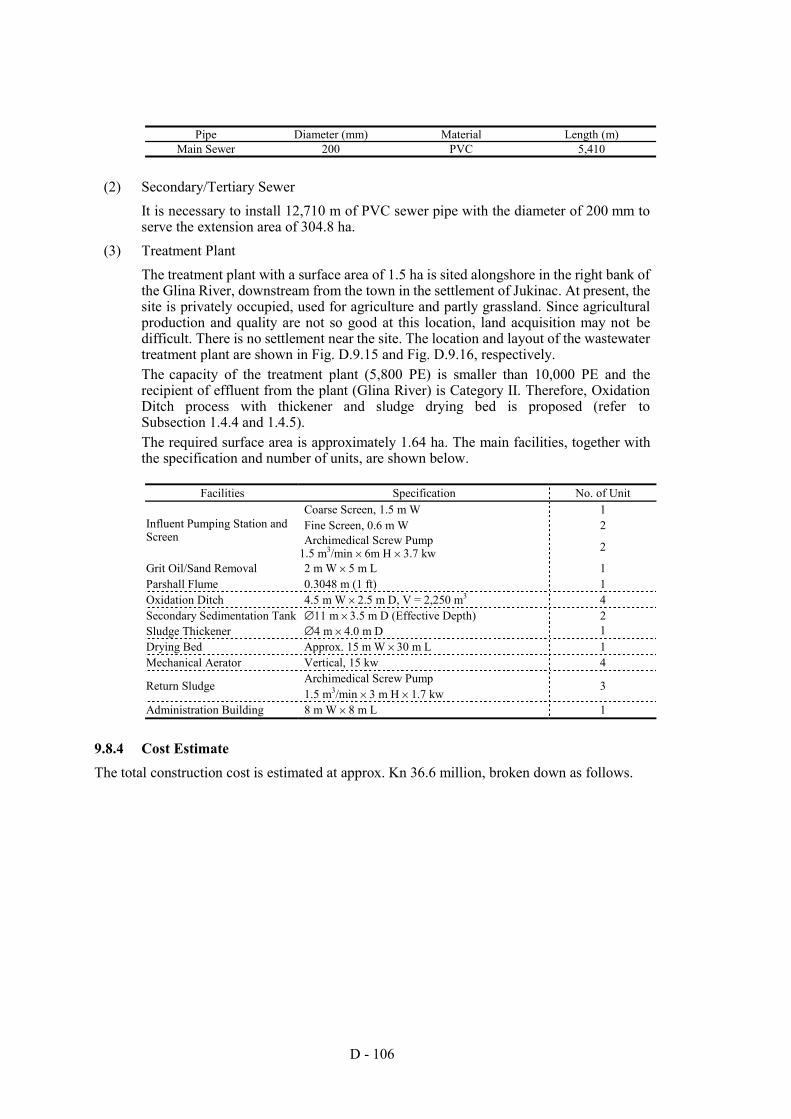
D - 106
Pipe Diameter (mm) Material Length (m)
Main Sewer 200 PVC 5,410
(2) Secondary/Tertiary Sewer It is necessary to install 12,710 m of PVC sewer pipe with the diameter of 200 mm to serve the extension area of 304.8 ha.
(3) Treatment Plant The treatment plant with a surface area of 1.5 ha is sited alongshore in the right bank of the Glina River, downstream from the town in the settlement of Jukinac. At present, the site is privately occupied, used for agriculture and partly grassland. Since agricultural production and quality are not so good at this location, land acquisition may not be difficult. There is no settlement near the site. The location and layout of the wastewater treatment plant are shown in Fig. D.9.15 and Fig. D.9.16, respectively. The capacity of the treatment plant (5,800 PE) is smaller than 10,000 PE and the recipient of effluent from the plant (Glina River) is Category II. Therefore, Oxidation Ditch process with thickener and sludge drying bed is proposed (refer to Subsection 1.4.4 and 1.4.5). The required surface area is approximately 1.64 ha. The main facilities, together with the specification and number of units, are shown below.
Facilities Specification No. of Unit
Coarse Screen, 1.5 m W 1 Fine Screen, 0.6 m W 2 Influent Pumping Station and
Screen Archimedical Screw Pump 1.5 m3/min × 6m H × 3.7 kw 2
Grit Oil/Sand Removal 2 m W × 5 m L 1 Parshall Flume 0.3048 m (1 ft) 1 Oxidation Ditch 4.5 m W × 2.5 m D, V = 2,250 m3 4 Secondary Sedimentation Tank ∅11 m × 3.5 m D (Effective Depth) 2 Sludge Thickener ∅4 m × 4.0 m D 1 Drying Bed Approx. 15 m W × 30 m L 1 Mechanical Aerator Vertical, 15 kw 4
Archimedical Screw Pump Return Sludge 1.5 m3/min × 3 m H × 1.7 kw
3
Administration Building 8 m W × 8 m L 1
9.8.4 Cost Estimate The total construction cost is estimated at approx. Kn 36.6 million, broken down as follows.
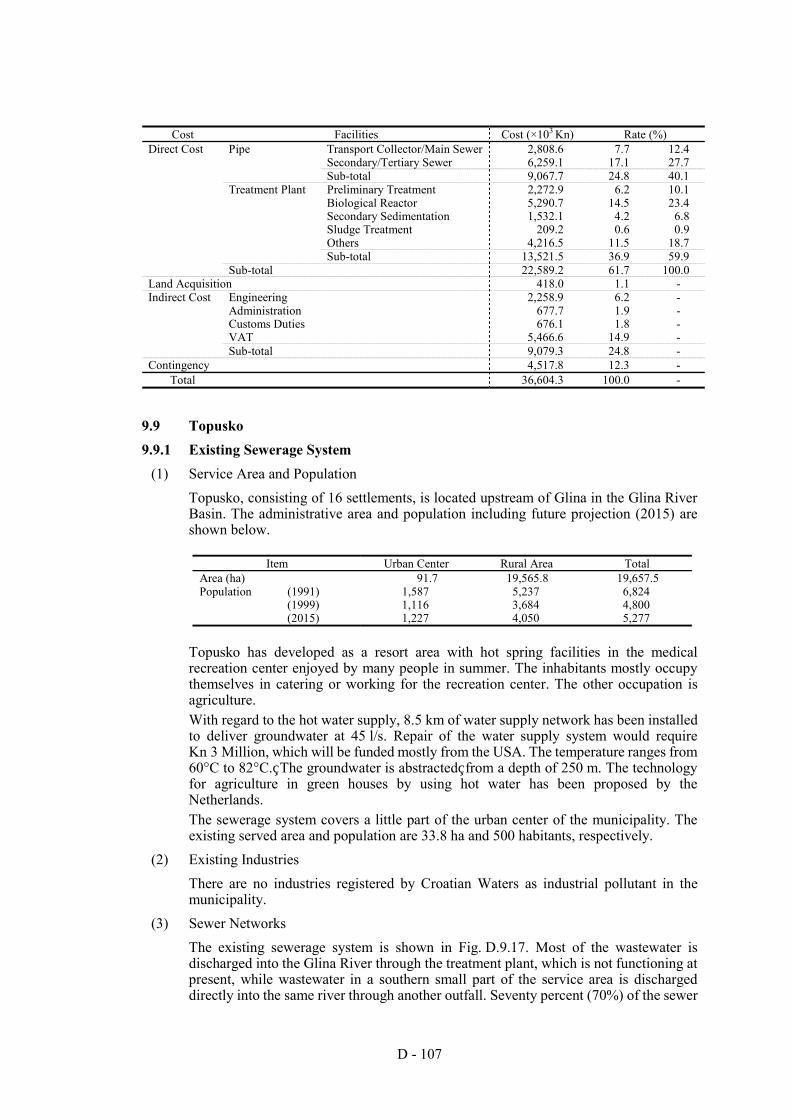
D - 107
Cost Facilities Cost (×103 Kn) Rate (%)
Direct Cost Pipe Transport Collector/Main Sewer 2,808.6 7.7 12.4 Secondary/Tertiary Sewer 6,259.1 17.1 27.7 Sub-total 9,067.7 24.8 40.1 Treatment Plant Preliminary Treatment 2,272.9 6.2 10.1 Biological Reactor 5,290.7 14.5 23.4 Secondary Sedimentation 1,532.1 4.2 6.8 Sludge Treatment 209.2 0.6 0.9 Others 4,216.5 11.5 18.7 Sub-total 13,521.5 36.9 59.9 Sub-total 22,589.2 61.7 100.0 Land Acquisition 418.0 1.1 - Indirect Cost Engineering 2,258.9 6.2 - Administration 677.7 1.9 - Customs Duties 676.1 1.8 - VAT 5,466.6 14.9 - Sub-total 9,079.3 24.8 - Contingency 4,517.8 12.3 -
Total 36,604.3 100.0 -
9.9 Topusko 9.9.1 Existing Sewerage System
(1) Service Area and Population Topusko, consisting of 16 settlements, is located upstream of Glina in the Glina River Basin. The administrative area and population including future projection (2015) are shown below.
Item Urban Center Rural Area Total
Area (ha) 91.7 19,565.8 19,657.5 Population (1991) 1,587 5,237 6,824 (1999) 1,116 3,684 4,800 (2015) 1,227 4,050 5,277
Topusko has developed as a resort area with hot spring facilities in the medical recreation center enjoyed by many people in summer. The inhabitants mostly occupy themselves in catering or working for the recreation center. The other occupation is agriculture. With regard to the hot water supply, 8.5 km of water supply network has been installed to deliver groundwater at 45 l/s. Repair of the water supply system would require Kn 3 Million, which will be funded mostly from the USA. The temperature ranges from 60°C to 82°C. The groundwater is abstracted from a depth of 250 m. The technology for agriculture in green houses by using hot water has been proposed by the Netherlands. The sewerage system covers a little part of the urban center of the municipality. The existing served area and population are 33.8 ha and 500 habitants, respectively.
(2) Existing Industries There are no industries registered by Croatian Waters as industrial pollutant in the municipality.
(3) Sewer Networks The existing sewerage system is shown in Fig. D.9.17. Most of the wastewater is discharged into the Glina River through the treatment plant, which is not functioning at present, while wastewater in a southern small part of the service area is discharged directly into the same river through another outfall. Seventy percent (70%) of the sewer
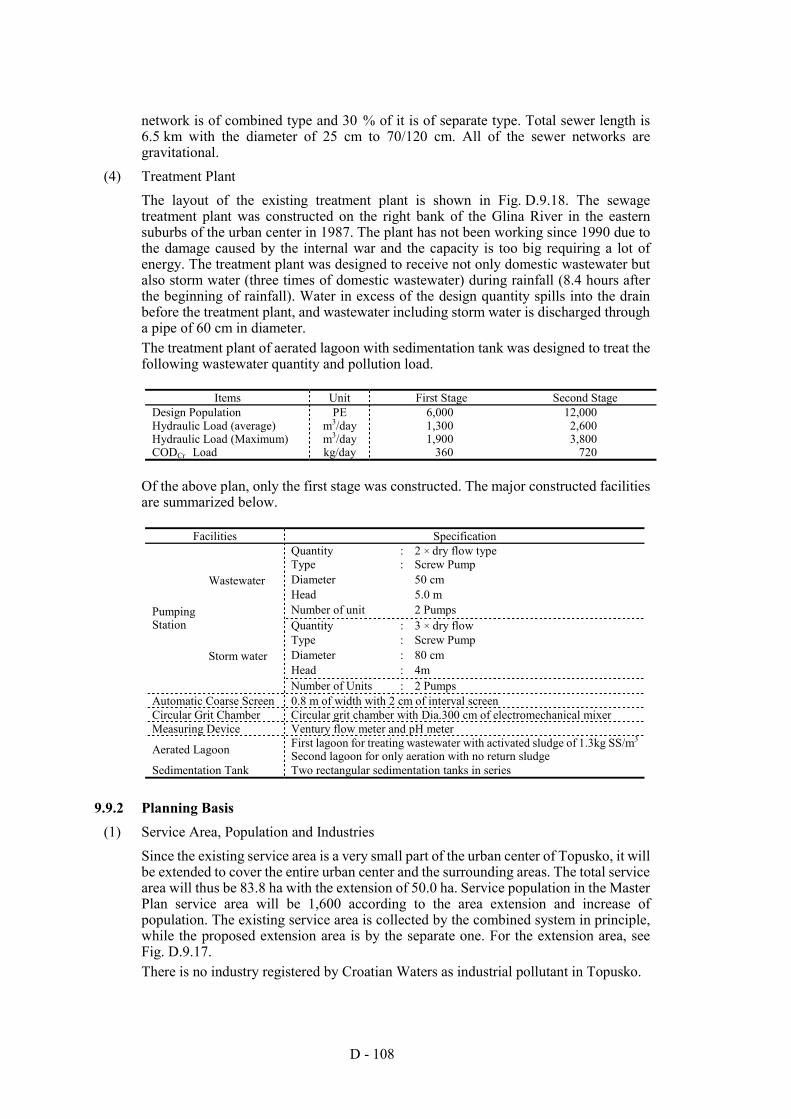
D - 108
network is of combined type and 30 % of it is of separate type. Total sewer length is 6.5 km with the diameter of 25 cm to 70/120 cm. All of the sewer networks are gravitational.
(4) Treatment Plant The layout of the existing treatment plant is shown in Fig. D.9.18. The sewage treatment plant was constructed on the right bank of the Glina River in the eastern suburbs of the urban center in 1987. The plant has not been working since 1990 due to the damage caused by the internal war and the capacity is too big requiring a lot of energy. The treatment plant was designed to receive not only domestic wastewater but also storm water (three times of domestic wastewater) during rainfall (8.4 hours after the beginning of rainfall). Water in excess of the design quantity spills into the drain before the treatment plant, and wastewater including storm water is discharged through a pipe of 60 cm in diameter. The treatment plant of aerated lagoon with sedimentation tank was designed to treat the following wastewater quantity and pollution load.
Items Unit First Stage Second Stage
Design Population PE 6,000 12,000 Hydraulic Load (average) m3/day 1,300 2,600 Hydraulic Load (Maximum) m3/day 1,900 3,800 CODCr Load kg/day 360 720
Of the above plan, only the first stage was constructed. The major constructed facilities are summarized below.
Facilities Specification
Quantity : 2 × dry flow type Type : Screw Pump Diameter 50 cm Head 5.0 m
Wastewater
Number of unit 2 Pumps Quantity : 3 × dry flow Type : Screw Pump Diameter : 80 cm Head : 4m
Pumping Station
Storm water
Number of Units : 2 Pumps Automatic Coarse Screen 0.8 m of width with 2 cm of interval screen Circular Grit Chamber Circular grit chamber with Dia.300 cm of electromechanical mixer Measuring Device Ventury flow meter and pH meter
Aerated Lagoon First lagoon for treating wastewater with activated sludge of 1.3kg SS/m3 Second lagoon for only aeration with no return sludge
Sedimentation Tank Two rectangular sedimentation tanks in series
9.9.2 Planning Basis (1) Service Area, Population and Industries
Since the existing service area is a very small part of the urban center of Topusko, it will be extended to cover the entire urban center and the surrounding areas. The total service area will thus be 83.8 ha with the extension of 50.0 ha. Service population in the Master Plan service area will be 1,600 according to the area extension and increase of population. The existing service area is collected by the combined system in principle, while the proposed extension area is by the separate one. For the extension area, see Fig. D.9.17. There is no industry registered by Croatian Waters as industrial pollutant in Topusko.
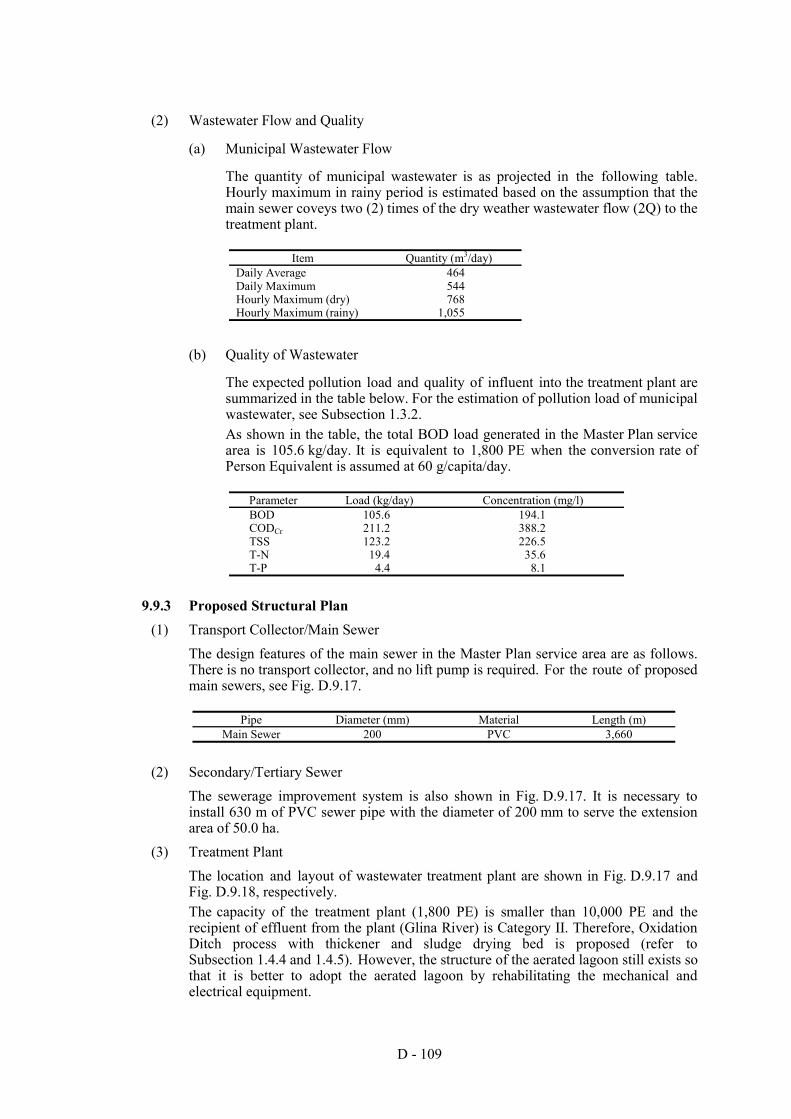
D - 109
(2) Wastewater Flow and Quality
(a) Municipal Wastewater Flow
The quantity of municipal wastewater is as projected in the following table. Hourly maximum in rainy period is estimated based on the assumption that the main sewer coveys two (2) times of the dry weather wastewater flow (2Q) to the treatment plant.
Item Quantity (m3/day)
Daily Average 464 Daily Maximum 544 Hourly Maximum (dry) 768 Hourly Maximum (rainy) 1,055
(b) Quality of Wastewater
The expected pollution load and quality of influent into the treatment plant are summarized in the table below. For the estimation of pollution load of municipal wastewater, see Subsection 1.3.2. As shown in the table, the total BOD load generated in the Master Plan service area is 105.6 kg/day. It is equivalent to 1,800 PE when the conversion rate of Person Equivalent is assumed at 60 g/capita/day.
Parameter Load (kg/day) Concentration (mg/l) BOD 105.6 194.1 CODCr 211.2 388.2 TSS 123.2 226.5 T-N 19.4 35.6 T-P 4.4 8.1
9.9.3 Proposed Structural Plan (1) Transport Collector/Main Sewer
The design features of the main sewer in the Master Plan service area are as follows. There is no transport collector, and no lift pump is required. For the route of proposed main sewers, see Fig. D.9.17.
Pipe Diameter (mm) Material Length (m)
Main Sewer 200 PVC 3,660
(2) Secondary/Tertiary Sewer The sewerage improvement system is also shown in Fig. D.9.17. It is necessary to install 630 m of PVC sewer pipe with the diameter of 200 mm to serve the extension area of 50.0 ha.
(3) Treatment Plant The location and layout of wastewater treatment plant are shown in Fig. D.9.17 and Fig. D.9.18, respectively. The capacity of the treatment plant (1,800 PE) is smaller than 10,000 PE and the recipient of effluent from the plant (Glina River) is Category II. Therefore, Oxidation Ditch process with thickener and sludge drying bed is proposed (refer to Subsection 1.4.4 and 1.4.5). However, the structure of the aerated lagoon still exists so that it is better to adopt the aerated lagoon by rehabilitating the mechanical and electrical equipment.
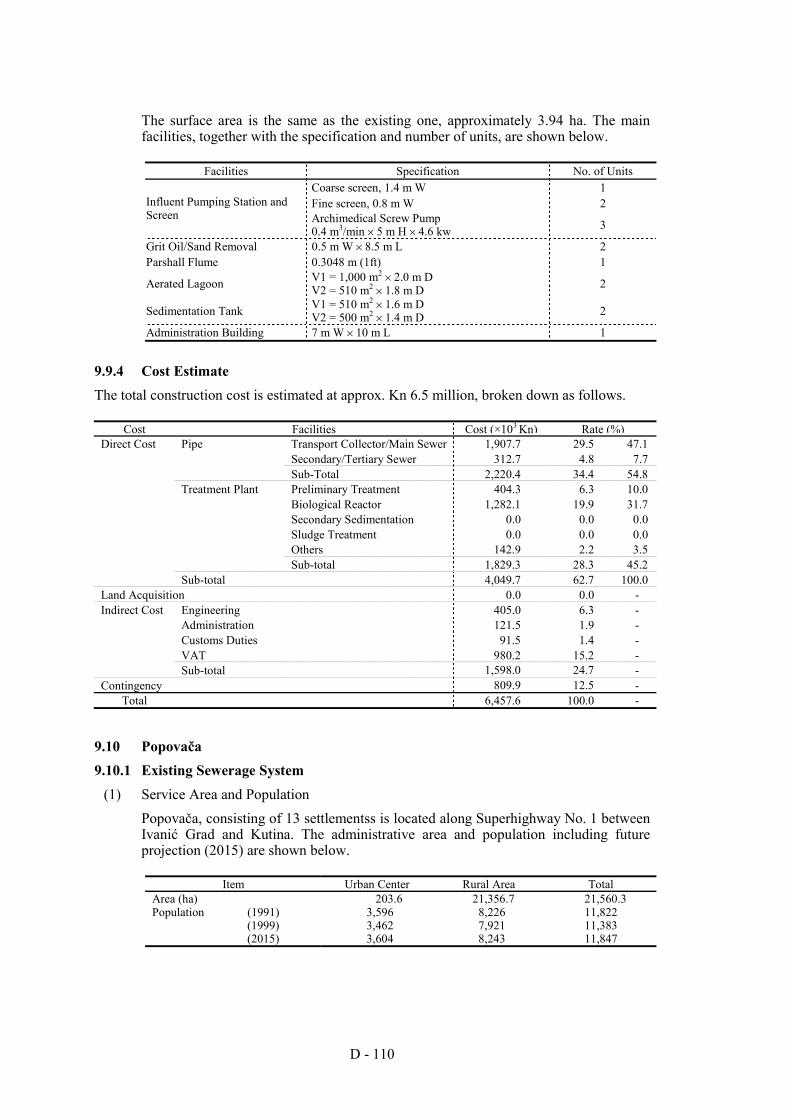
D - 110
The surface area is the same as the existing one, approximately 3.94 ha. The main facilities, together with the specification and number of units, are shown below.
Facilities Specification No. of Units
Coarse screen, 1.4 m W 1 Fine screen, 0.8 m W 2 Influent Pumping Station and
Screen Archimedical Screw Pump 0.4 m3/min × 5 m H × 4.6 kw 3
Grit Oil/Sand Removal 0.5 m W × 8.5 m L 2 Parshall Flume 0.3048 m (1ft) 1
Aerated Lagoon V1 = 1,000 m2 × 2.0 m D V2 = 510 m2 × 1.8 m D 2
Sedimentation Tank V1 = 510 m2 × 1.6 m D V2 = 500 m2 × 1.4 m D 2
Administration Building 7 m W × 10 m L 1
9.9.4 Cost Estimate The total construction cost is estimated at approx. Kn 6.5 million, broken down as follows.
Cost Facilities Cost (×103 Kn) Rate (%) Direct Cost Pipe Transport Collector/Main Sewer 1,907.7 29.5 47.1 Secondary/Tertiary Sewer 312.7 4.8 7.7 Sub-Total 2,220.4 34.4 54.8 Treatment Plant Preliminary Treatment 404.3 6.3 10.0 Biological Reactor 1,282.1 19.9 31.7 Secondary Sedimentation 0.0 0.0 0.0 Sludge Treatment 0.0 0.0 0.0 Others 142.9 2.2 3.5 Sub-total 1,829.3 28.3 45.2 Sub-total 4,049.7 62.7 100.0 Land Acquisition 0.0 0.0 - Indirect Cost Engineering 405.0 6.3 - Administration 121.5 1.9 - Customs Duties 91.5 1.4 - VAT 980.2 15.2 - Sub-total 1,598.0 24.7 - Contingency 809.9 12.5 -
Total 6,457.6 100.0 -
9.10 Popovača 9.10.1 Existing Sewerage System
(1) Service Area and Population Popovača, consisting of 13 settlementss is located along Superhighway No. 1 between Ivanić Grad and Kutina. The administrative area and population including future projection (2015) are shown below.
Item Urban Center Rural Area Total
Area (ha) 203.6 21,356.7 21,560.3 Population (1991) 3,596 8,226 11,822 (1999) 3,462 7,921 11,383 (2015) 3,604 8,243 11,847
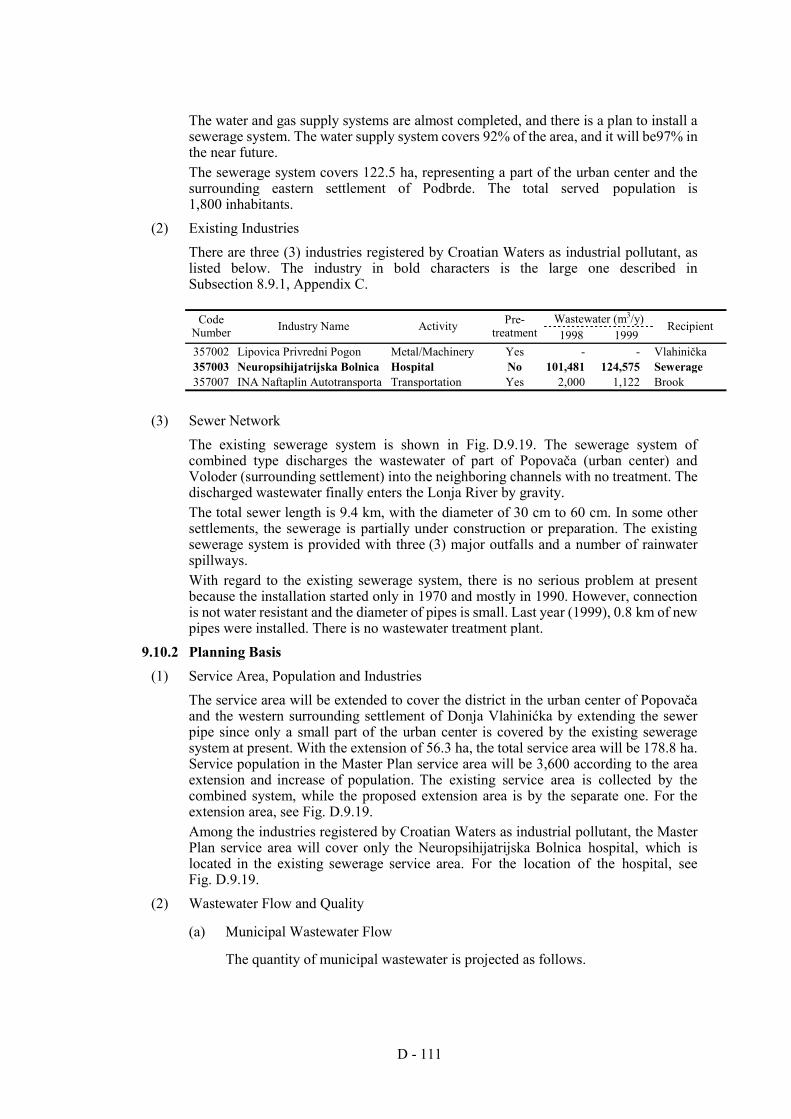
D - 111
The water and gas supply systems are almost completed, and there is a plan to install a sewerage system. The water supply system covers 92% of the area, and it will be97% in the near future. The sewerage system covers 122.5 ha, representing a part of the urban center and the surrounding eastern settlement of Podbrde. The total served population is 1,800 inhabitants.
(2) Existing Industries There are three (3) industries registered by Croatian Waters as industrial pollutant, as listed below. The industry in bold characters is the large one described in Subsection 8.9.1, Appendix C.
Wastewater (m3/y) Code
Number Industry Name Activity Pre- treatment 1998 1999
Recipient
357002 Lipovica Privredni Pogon Metal/Machinery Yes - - Vlahinička 357003 Neuropsihijatrijska Bolnica Hospital No 101,481 124,575 Sewerage 357007 INA Naftaplin Autotransporta Transportation Yes 2,000 1,122 Brook
(3) Sewer Network The existing sewerage system is shown in Fig. D.9.19. The sewerage system of combined type discharges the wastewater of part of Popovača (urban center) and Voloder (surrounding settlement) into the neighboring channels with no treatment. The discharged wastewater finally enters the Lonja River by gravity. The total sewer length is 9.4 km, with the diameter of 30 cm to 60 cm. In some other settlements, the sewerage is partially under construction or preparation. The existing sewerage system is provided with three (3) major outfalls and a number of rainwater spillways. With regard to the existing sewerage system, there is no serious problem at present because the installation started only in 1970 and mostly in 1990. However, connection is not water resistant and the diameter of pipes is small. Last year (1999), 0.8 km of new pipes were installed. There is no wastewater treatment plant.
9.10.2 Planning Basis (1) Service Area, Population and Industries
The service area will be extended to cover the district in the urban center of Popovača and the western surrounding settlement of Donja Vlahinićka by extending the sewer pipe since only a small part of the urban center is covered by the existing sewerage system at present. With the extension of 56.3 ha, the total service area will be 178.8 ha. Service population in the Master Plan service area will be 3,600 according to the area extension and increase of population. The existing service area is collected by the combined system, while the proposed extension area is by the separate one. For the extension area, see Fig. D.9.19. Among the industries registered by Croatian Waters as industrial pollutant, the Master Plan service area will cover only the Neuropsihijatrijska Bolnica hospital, which is located in the existing sewerage service area. For the location of the hospital, see Fig. D.9.19.
(2) Wastewater Flow and Quality
(a) Municipal Wastewater Flow
The quantity of municipal wastewater is projected as follows.
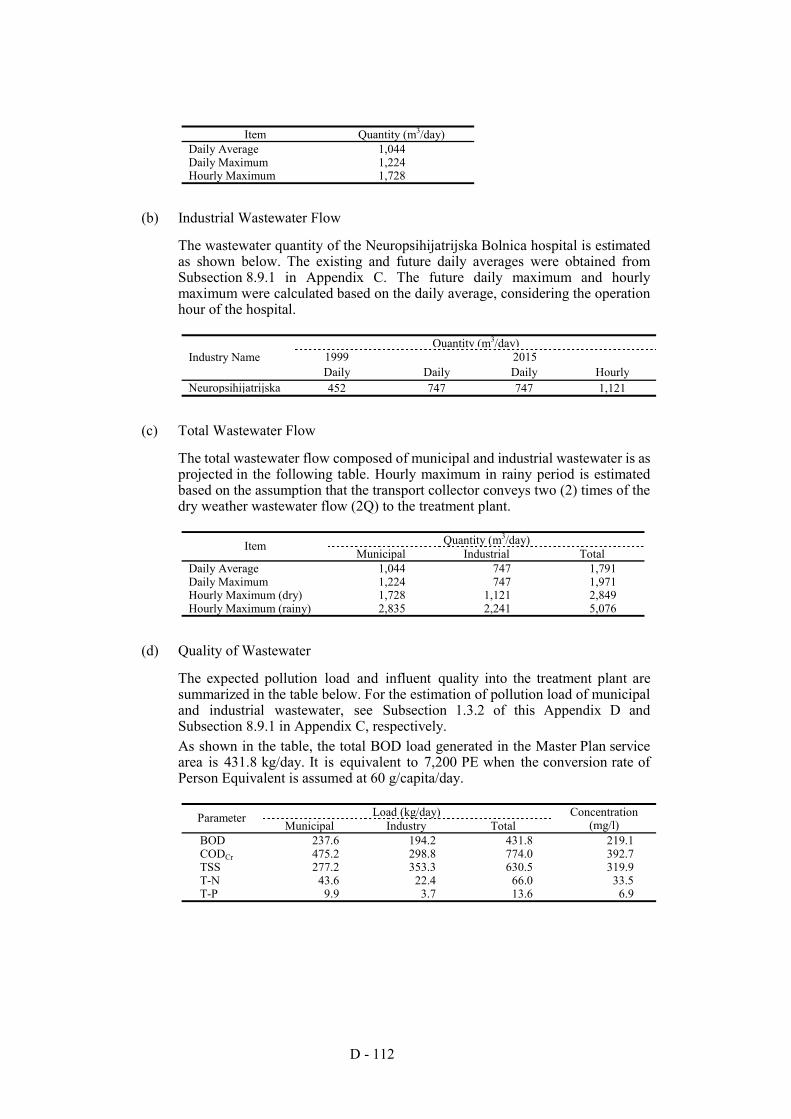
D - 112
Item Quantity (m3/day)
Daily Average 1,044 Daily Maximum 1,224 Hourly Maximum 1,728
(b) Industrial Wastewater Flow
The wastewater quantity of the Neuropsihijatrijska Bolnica hospital is estimated as shown below. The existing and future daily averages were obtained from Subsection 8.9.1 in Appendix C. The future daily maximum and hourly maximum were calculated based on the daily average, considering the operation hour of the hospital.
Quantity (m3/day)
1999 2015 Industry Name Daily Daily Daily Hourly
Neuropsihijatrijska 452 747 747 1,121
(c) Total Wastewater Flow
The total wastewater flow composed of municipal and industrial wastewater is as projected in the following table. Hourly maximum in rainy period is estimated based on the assumption that the transport collector conveys two (2) times of the dry weather wastewater flow (2Q) to the treatment plant.
Quantity (m3/day) Item
Municipal Industrial Total Daily Average 1,044 747 1,791 Daily Maximum 1,224 747 1,971 Hourly Maximum (dry) 1,728 1,121 2,849 Hourly Maximum (rainy) 2,835 2,241 5,076
(d) Quality of Wastewater
The expected pollution load and influent quality into the treatment plant are summarized in the table below. For the estimation of pollution load of municipal and industrial wastewater, see Subsection 1.3.2 of this Appendix D and Subsection 8.9.1 in Appendix C, respectively. As shown in the table, the total BOD load generated in the Master Plan service area is 431.8 kg/day. It is equivalent to 7,200 PE when the conversion rate of Person Equivalent is assumed at 60 g/capita/day.
Load (kg/day) Parameter
Municipal Industry Total Concentration
(mg/l) BOD 237.6 194.2 431.8 219.1 CODCr 475.2 298.8 774.0 392.7 TSS 277.2 353.3 630.5 319.9 T-N 43.6 22.4 66.0 33.5 T-P 9.9 3.7 13.6 6.9
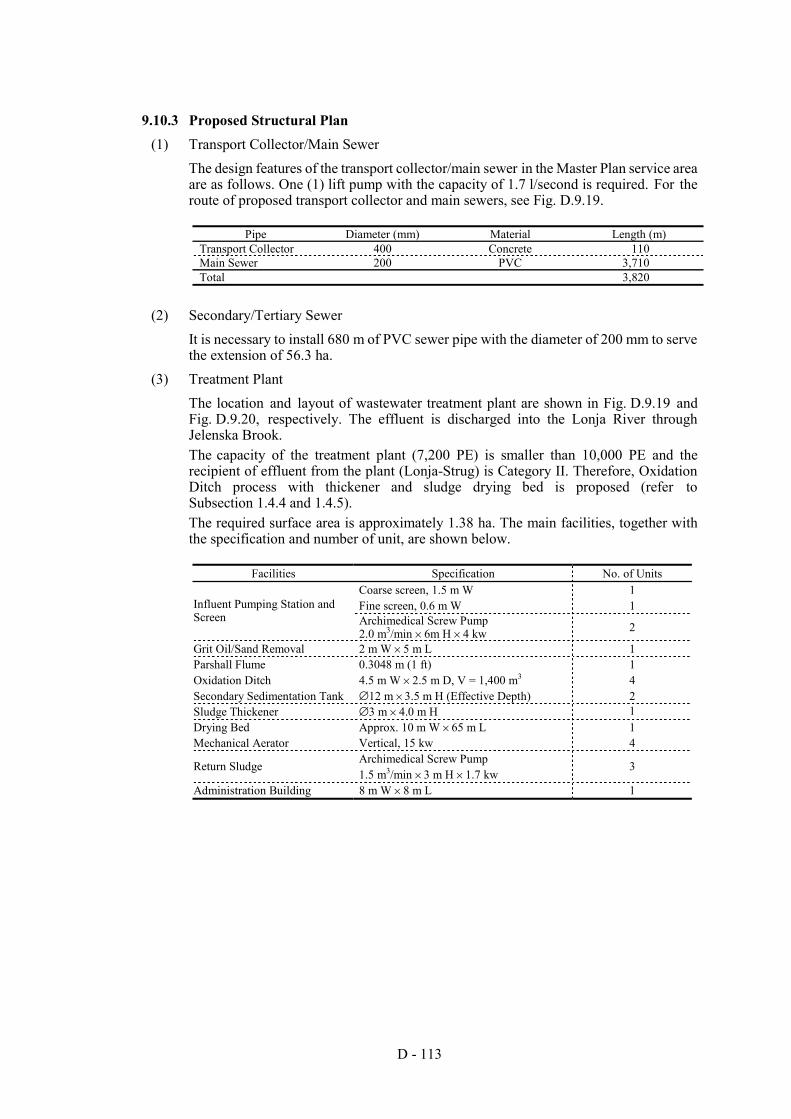
D - 113
9.10.3 Proposed Structural Plan (1) Transport Collector/Main Sewer
The design features of the transport collector/main sewer in the Master Plan service area are as follows. One (1) lift pump with the capacity of 1.7 l/second is required. For the route of proposed transport collector and main sewers, see Fig. D.9.19.
Pipe Diameter (mm) Material Length (m)
Transport Collector 400 Concrete 110 Main Sewer 200 PVC 3,710 Total 3,820
(2) Secondary/Tertiary Sewer It is necessary to install 680 m of PVC sewer pipe with the diameter of 200 mm to serve the extension of 56.3 ha.
(3) Treatment Plant The location and layout of wastewater treatment plant are shown in Fig. D.9.19 and Fig. D.9.20, respectively. The effluent is discharged into the Lonja River through Jelenska Brook. The capacity of the treatment plant (7,200 PE) is smaller than 10,000 PE and the recipient of effluent from the plant (Lonja-Strug) is Category II. Therefore, Oxidation Ditch process with thickener and sludge drying bed is proposed (refer to Subsection 1.4.4 and 1.4.5). The required surface area is approximately 1.38 ha. The main facilities, together with the specification and number of unit, are shown below.
Facilities Specification No. of Units
Coarse screen, 1.5 m W 1 Fine screen, 0.6 m W 1 Influent Pumping Station and
Screen Archimedical Screw Pump 2.0 m3/min × 6m H × 4 kw 2
Grit Oil/Sand Removal 2 m W × 5 m L 1 Parshall Flume 0.3048 m (1 ft) 1 Oxidation Ditch 4.5 m W × 2.5 m D, V = 1,400 m3 4 Secondary Sedimentation Tank ∅12 m × 3.5 m H (Effective Depth) 2 Sludge Thickener ∅3 m × 4.0 m H 1 Drying Bed Approx. 10 m W × 65 m L 1 Mechanical Aerator Vertical, 15 kw 4
Archimedical Screw Pump Return Sludge 1.5 m3/min × 3 m H × 1.7 kw
3
Administration Building 8 m W × 8 m L 1
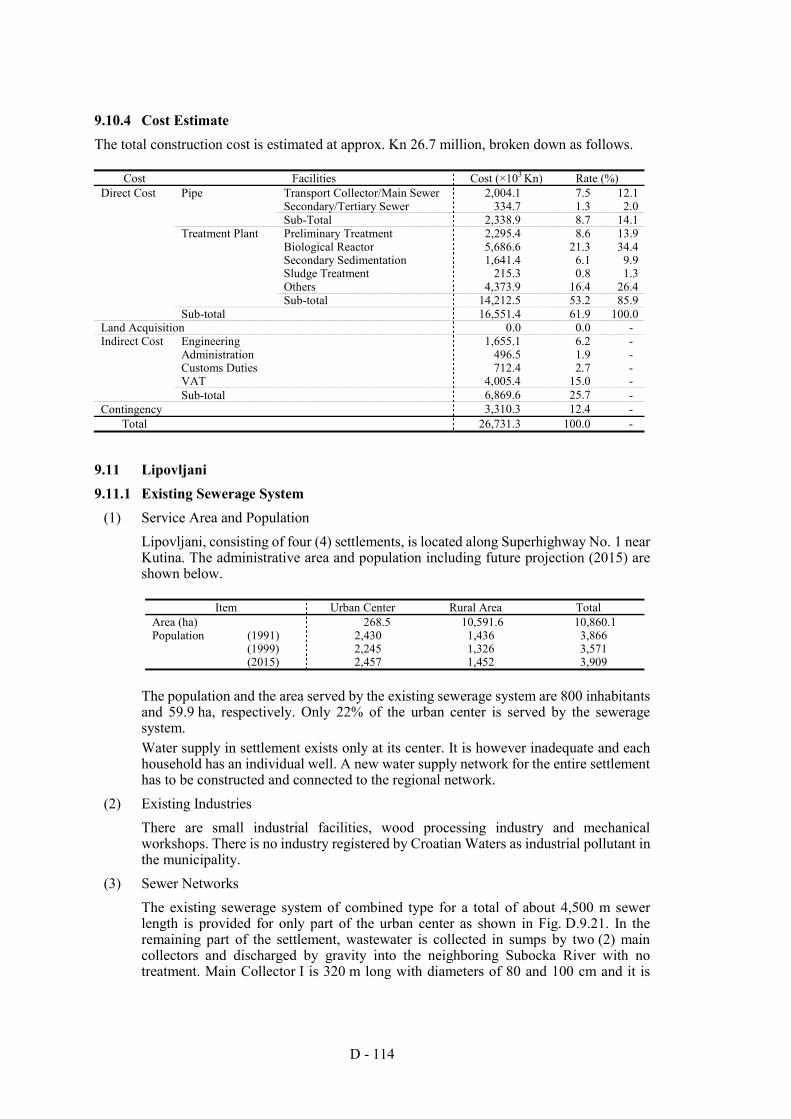
D - 114
9.10.4 Cost Estimate The total construction cost is estimated at approx. Kn 26.7 million, broken down as follows.
Cost Facilities Cost (×103 Kn) Rate (%) Direct Cost Pipe Transport Collector/Main Sewer 2,004.1 7.5 12.1 Secondary/Tertiary Sewer 334.7 1.3 2.0 Sub-Total 2,338.9 8.7 14.1 Treatment Plant Preliminary Treatment 2,295.4 8.6 13.9 Biological Reactor 5,686.6 21.3 34.4 Secondary Sedimentation 1,641.4 6.1 9.9 Sludge Treatment 215.3 0.8 1.3 Others 4,373.9 16.4 26.4 Sub-total 14,212.5 53.2 85.9 Sub-total 16,551.4 61.9 100.0 Land Acquisition 0.0 0.0 - Indirect Cost Engineering 1,655.1 6.2 - Administration 496.5 1.9 - Customs Duties 712.4 2.7 - VAT 4,005.4 15.0 - Sub-total 6,869.6 25.7 - Contingency 3,310.3 12.4 -
Total 26,731.3 100.0 -
9.11 Lipovljani 9.11.1 Existing Sewerage System
(1) Service Area and Population Lipovljani, consisting of four (4) settlements, is located along Superhighway No. 1 near Kutina. The administrative area and population including future projection (2015) are shown below.
Item Urban Center Rural Area Total
Area (ha) 268.5 10,591.6 10,860.1 Population (1991) 2,430 1,436 3,866 (1999) 2,245 1,326 3,571 (2015) 2,457 1,452 3,909
The population and the area served by the existing sewerage system are 800 inhabitants and 59.9 ha, respectively. Only 22% of the urban center is served by the sewerage system. Water supply in settlement exists only at its center. It is however inadequate and each household has an individual well. A new water supply network for the entire settlement has to be constructed and connected to the regional network.
(2) Existing Industries There are small industrial facilities, wood processing industry and mechanical workshops. There is no industry registered by Croatian Waters as industrial pollutant in the municipality.
(3) Sewer Networks The existing sewerage system of combined type for a total of about 4,500 m sewer length is provided for only part of the urban center as shown in Fig. D.9.21. In the remaining part of the settlement, wastewater is collected in sumps by two (2) main collectors and discharged by gravity into the neighboring Subocka River with no treatment. Main Collector I is 320 m long with diameters of 80 and 100 cm and it is
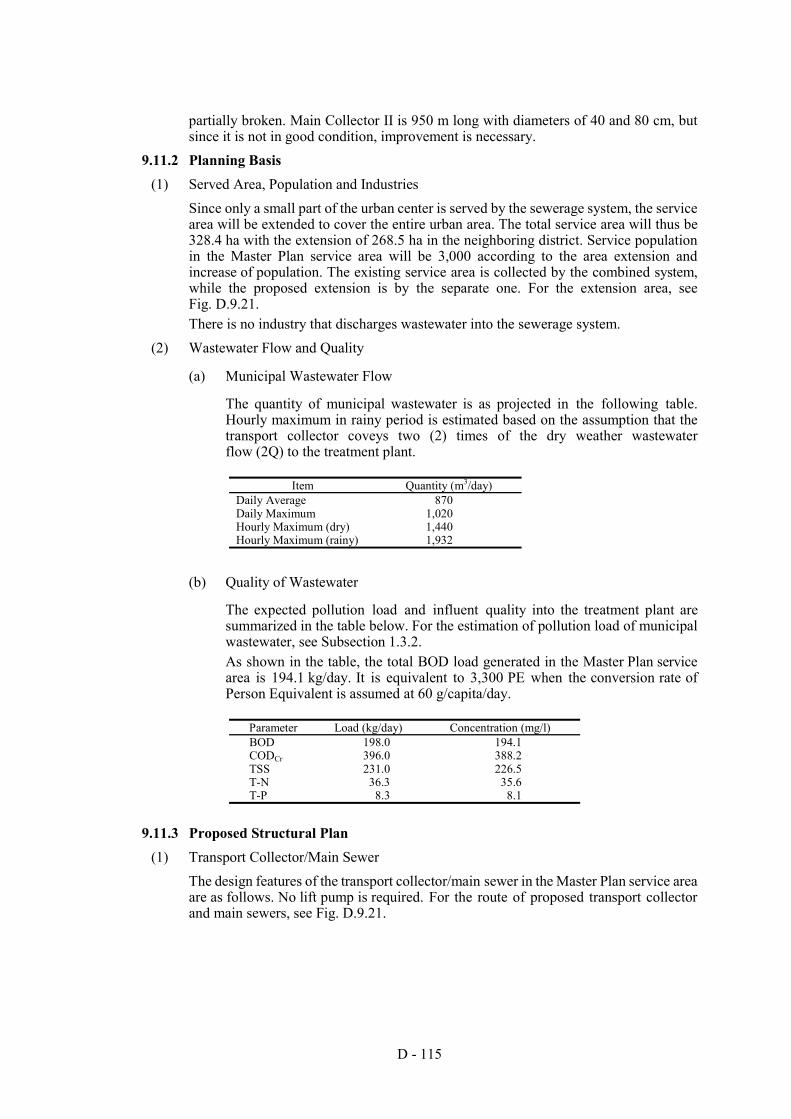
D - 115
partially broken. Main Collector II is 950 m long with diameters of 40 and 80 cm, but since it is not in good condition, improvement is necessary.
9.11.2 Planning Basis (1) Served Area, Population and Industries
Since only a small part of the urban center is served by the sewerage system, the service area will be extended to cover the entire urban area. The total service area will thus be 328.4 ha with the extension of 268.5 ha in the neighboring district. Service population in the Master Plan service area will be 3,000 according to the area extension and increase of population. The existing service area is collected by the combined system, while the proposed extension is by the separate one. For the extension area, see Fig. D.9.21. There is no industry that discharges wastewater into the sewerage system.
(2) Wastewater Flow and Quality
(a) Municipal Wastewater Flow
The quantity of municipal wastewater is as projected in the following table. Hourly maximum in rainy period is estimated based on the assumption that the transport collector coveys two (2) times of the dry weather wastewater flow (2Q) to the treatment plant.
Item Quantity (m3/day)
Daily Average 870 Daily Maximum 1,020 Hourly Maximum (dry) 1,440 Hourly Maximum (rainy) 1,932
(b) Quality of Wastewater
The expected pollution load and influent quality into the treatment plant are summarized in the table below. For the estimation of pollution load of municipal wastewater, see Subsection 1.3.2. As shown in the table, the total BOD load generated in the Master Plan service area is 194.1 kg/day. It is equivalent to 3,300 PE when the conversion rate of Person Equivalent is assumed at 60 g/capita/day.
Parameter Load (kg/day) Concentration (mg/l) BOD 198.0 194.1 CODCr 396.0 388.2 TSS 231.0 226.5 T-N 36.3 35.6 T-P 8.3 8.1
9.11.3 Proposed Structural Plan (1) Transport Collector/Main Sewer
The design features of the transport collector/main sewer in the Master Plan service area are as follows. No lift pump is required. For the route of proposed transport collector and main sewers, see Fig. D.9.21.
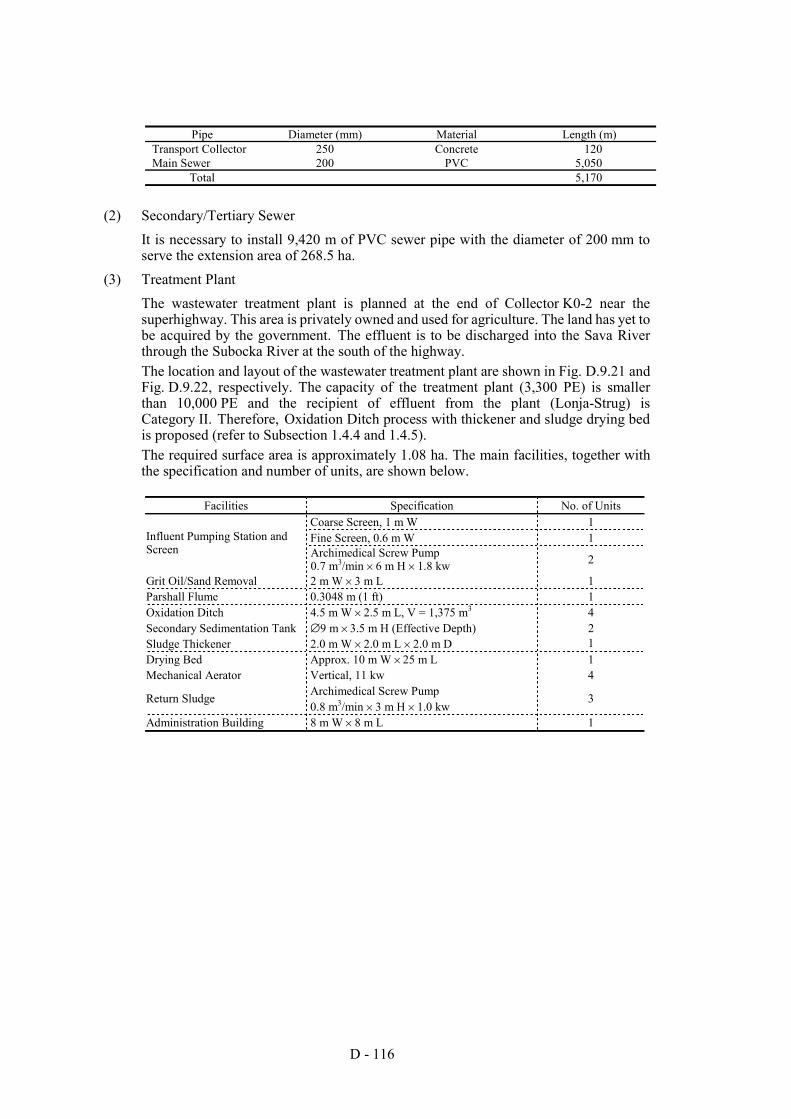
D - 116
Pipe Diameter (mm) Material Length (m)
Transport Collector 250 Concrete 120 Main Sewer 200 PVC 5,050
Total 5,170
(2) Secondary/Tertiary Sewer It is necessary to install 9,420 m of PVC sewer pipe with the diameter of 200 mm to serve the extension area of 268.5 ha.
(3) Treatment Plant The wastewater treatment plant is planned at the end of Collector K0-2 near the superhighway. This area is privately owned and used for agriculture. The land has yet to be acquired by the government. The effluent is to be discharged into the Sava River through the Subocka River at the south of the highway. The location and layout of the wastewater treatment plant are shown in Fig. D.9.21 and Fig. D.9.22, respectively. The capacity of the treatment plant (3,300 PE) is smaller than 10,000 PE and the recipient of effluent from the plant (Lonja-Strug) is Category II. Therefore, Oxidation Ditch process with thickener and sludge drying bed is proposed (refer to Subsection 1.4.4 and 1.4.5). The required surface area is approximately 1.08 ha. The main facilities, together with the specification and number of units, are shown below.
Facilities Specification No. of Units
Coarse Screen, 1 m W 1 Fine Screen, 0.6 m W 1 Influent Pumping Station and
Screen Archimedical Screw Pump 0.7 m3/min × 6 m H × 1.8 kw 2
Grit Oil/Sand Removal 2 m W × 3 m L 1 Parshall Flume 0.3048 m (1 ft) 1 Oxidation Ditch 4.5 m W × 2.5 m L, V = 1,375 m3 4 Secondary Sedimentation Tank ∅9 m × 3.5 m H (Effective Depth) 2 Sludge Thickener 2.0 m W × 2.0 m L × 2.0 m D 1 Drying Bed Approx. 10 m W × 25 m L 1 Mechanical Aerator Vertical, 11 kw 4
Archimedical Screw Pump Return Sludge 0.8 m3/min × 3 m H × 1.0 kw
3
Administration Building 8 m W × 8 m L 1
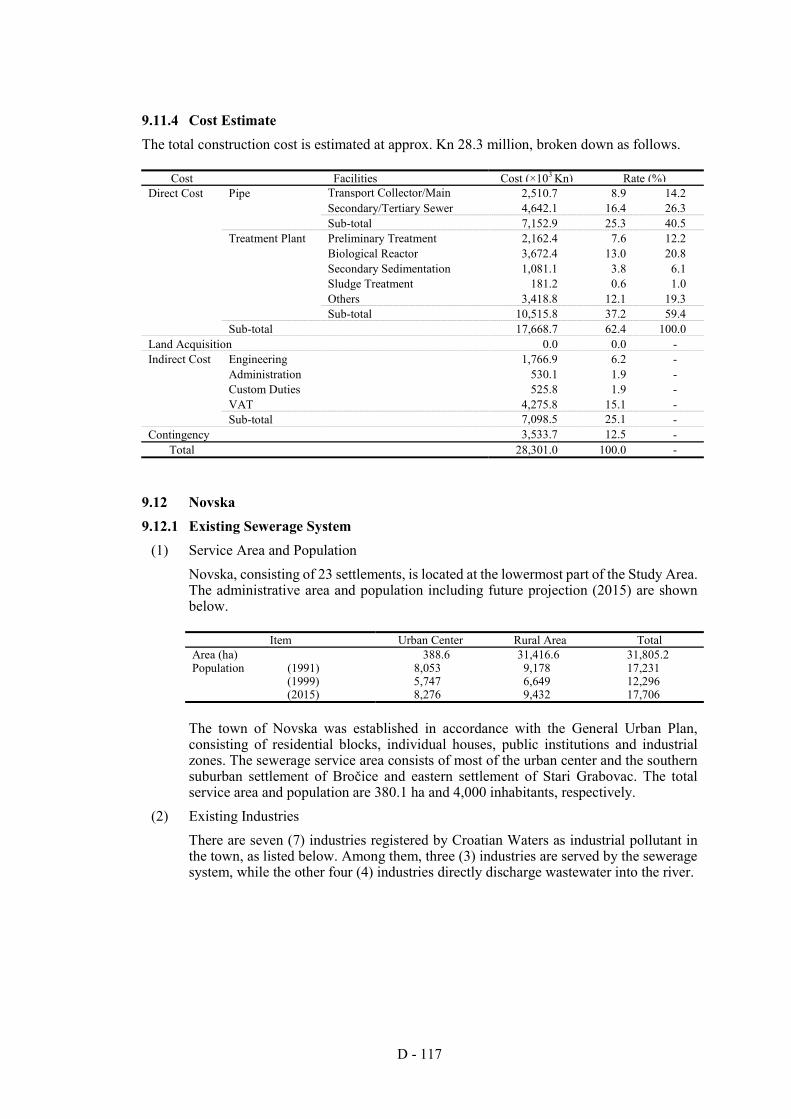
D - 117
9.11.4 Cost Estimate The total construction cost is estimated at approx. Kn 28.3 million, broken down as follows.
Cost Facilities Cost (×103 Kn) Rate (%) Direct Cost Pipe Transport Collector/Main 2,510.7 8.9 14.2 Secondary/Tertiary Sewer 4,642.1 16.4 26.3 Sub-total 7,152.9 25.3 40.5 Treatment Plant Preliminary Treatment 2,162.4 7.6 12.2 Biological Reactor 3,672.4 13.0 20.8 Secondary Sedimentation 1,081.1 3.8 6.1 Sludge Treatment 181.2 0.6 1.0 Others 3,418.8 12.1 19.3 Sub-total 10,515.8 37.2 59.4 Sub-total 17,668.7 62.4 100.0 Land Acquisition 0.0 0.0 - Indirect Cost Engineering 1,766.9 6.2 - Administration 530.1 1.9 - Custom Duties 525.8 1.9 - VAT 4,275.8 15.1 - Sub-total 7,098.5 25.1 - Contingency 3,533.7 12.5 -
Total 28,301.0 100.0 -
9.12 Novska 9.12.1 Existing Sewerage System
(1) Service Area and Population Novska, consisting of 23 settlements, is located at the lowermost part of the Study Area. The administrative area and population including future projection (2015) are shown below.
Item Urban Center Rural Area Total
Area (ha) 388.6 31,416.6 31,805.2 Population (1991) 8,053 9,178 17,231 (1999) 5,747 6,649 12,296 (2015) 8,276 9,432 17,706
The town of Novska was established in accordance with the General Urban Plan, consisting of residential blocks, individual houses, public institutions and industrial zones. The sewerage service area consists of most of the urban center and the southern suburban settlement of Bročice and eastern settlement of Stari Grabovac. The total service area and population are 380.1 ha and 4,000 inhabitants, respectively.
(2) Existing Industries There are seven (7) industries registered by Croatian Waters as industrial pollutant in the town, as listed below. Among them, three (3) industries are served by the sewerage system, while the other four (4) industries directly discharge wastewater into the river.
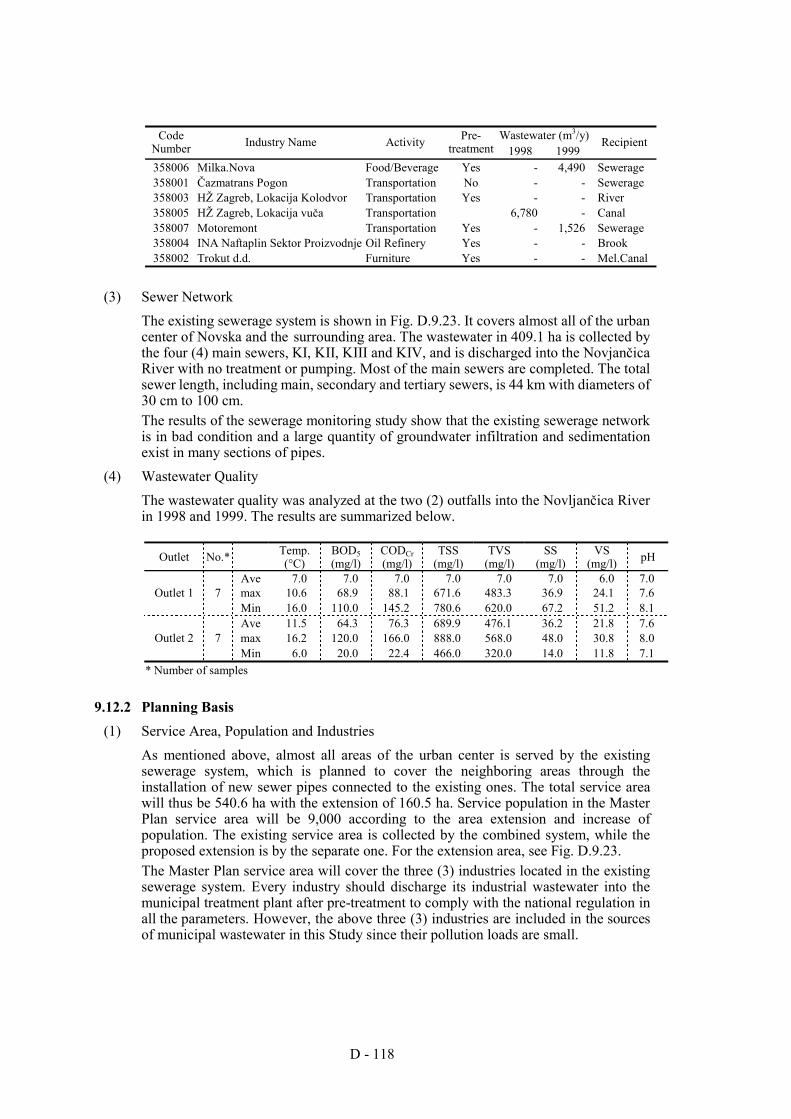
D - 118
Wastewater (m3/y) Code
Number Industry Name Activity Pre- treatment 1998 1999
Recipient
358006 Milka.Nova Food/Beverage Yes - 4,490 Sewerage 358001 Čazmatrans Pogon Transportation No - - Sewerage 358003 HŽ Zagreb, Lokacija Kolodvor Transportation Yes - - River 358005 HŽ Zagreb, Lokacija vuča Transportation 6,780 - Canal 358007 Motoremont Transportation Yes - 1,526 Sewerage 358004 INA Naftaplin Sektor Proizvodnje Oil Refinery Yes - - Brook 358002 Trokut d.d. Furniture Yes - - Mel.Canal
(3) Sewer Network The existing sewerage system is shown in Fig. D.9.23. It covers almost all of the urban center of Novska and the surrounding area. The wastewater in 409.1 ha is collected by the four (4) main sewers, KI, KII, KIII and KIV, and is discharged into the Novjančica River with no treatment or pumping. Most of the main sewers are completed. The total sewer length, including main, secondary and tertiary sewers, is 44 km with diameters of 30 cm to 100 cm. The results of the sewerage monitoring study show that the existing sewerage network is in bad condition and a large quantity of groundwater infiltration and sedimentation exist in many sections of pipes.
(4) Wastewater Quality The wastewater quality was analyzed at the two (2) outfalls into the Novljančica River in 1998 and 1999. The results are summarized below.
Outlet No.* Temp. (°C)
BOD5 (mg/l)
CODCr (mg/l)
TSS (mg/l)
TVS (mg/l)
SS (mg/l)
VS (mg/l) pH
Ave 7.0 7.0 7.0 7.0 7.0 7.0 6.0 7.0 max 10.6 68.9 88.1 671.6 483.3 36.9 24.1 7.6 Outlet 1 7 Min 16.0 110.0 145.2 780.6 620.0 67.2 51.2 8.1 Ave 11.5 64.3 76.3 689.9 476.1 36.2 21.8 7.6 max 16.2 120.0 166.0 888.0 568.0 48.0 30.8 8.0 Outlet 2 7 Min 6.0 20.0 22.4 466.0 320.0 14.0 11.8 7.1
* Number of samples
9.12.2 Planning Basis (1) Service Area, Population and Industries
As mentioned above, almost all areas of the urban center is served by the existing sewerage system, which is planned to cover the neighboring areas through the installation of new sewer pipes connected to the existing ones. The total service area will thus be 540.6 ha with the extension of 160.5 ha. Service population in the Master Plan service area will be 9,000 according to the area extension and increase of population. The existing service area is collected by the combined system, while the proposed extension is by the separate one. For the extension area, see Fig. D.9.23. The Master Plan service area will cover the three (3) industries located in the existing sewerage system. Every industry should discharge its industrial wastewater into the municipal treatment plant after pre-treatment to comply with the national regulation in all the parameters. However, the above three (3) industries are included in the sources of municipal wastewater in this Study since their pollution loads are small.
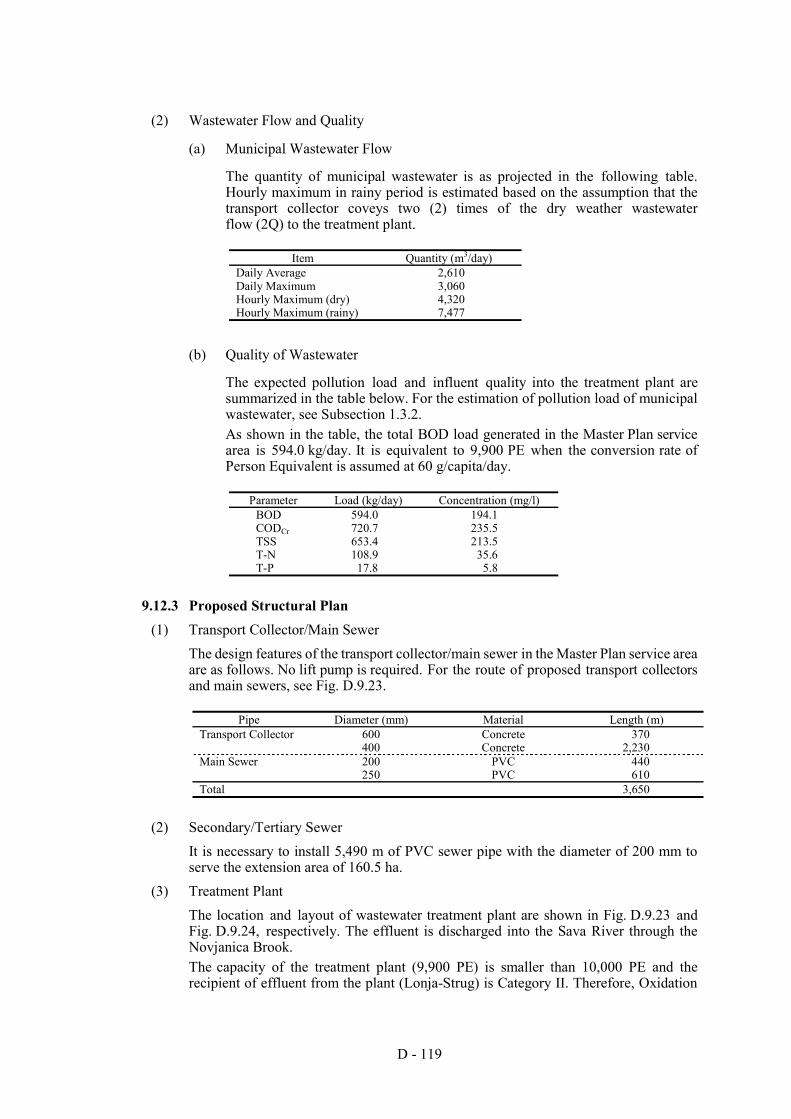
D - 119
(2) Wastewater Flow and Quality
(a) Municipal Wastewater Flow
The quantity of municipal wastewater is as projected in the following table. Hourly maximum in rainy period is estimated based on the assumption that the transport collector coveys two (2) times of the dry weather wastewater flow (2Q) to the treatment plant.
Item Quantity (m3/day)
Daily Average 2,610 Daily Maximum 3,060 Hourly Maximum (dry) 4,320 Hourly Maximum (rainy) 7,477
(b) Quality of Wastewater
The expected pollution load and influent quality into the treatment plant are summarized in the table below. For the estimation of pollution load of municipal wastewater, see Subsection 1.3.2. As shown in the table, the total BOD load generated in the Master Plan service area is 594.0 kg/day. It is equivalent to 9,900 PE when the conversion rate of Person Equivalent is assumed at 60 g/capita/day.
Parameter Load (kg/day) Concentration (mg/l)
BOD 594.0 194.1 CODCr 720.7 235.5 TSS 653.4 213.5 T-N 108.9 35.6 T-P 17.8 5.8
9.12.3 Proposed Structural Plan (1) Transport Collector/Main Sewer
The design features of the transport collector/main sewer in the Master Plan service area are as follows. No lift pump is required. For the route of proposed transport collectors and main sewers, see Fig. D.9.23.
Pipe Diameter (mm) Material Length (m)
Transport Collector 600 Concrete 370 400 Concrete 2,230 Main Sewer 200 PVC 440 250 PVC 610 Total 3,650
(2) Secondary/Tertiary Sewer It is necessary to install 5,490 m of PVC sewer pipe with the diameter of 200 mm to serve the extension area of 160.5 ha.
(3) Treatment Plant The location and layout of wastewater treatment plant are shown in Fig. D.9.23 and Fig. D.9.24, respectively. The effluent is discharged into the Sava River through the Novjanica Brook. The capacity of the treatment plant (9,900 PE) is smaller than 10,000 PE and the recipient of effluent from the plant (Lonja-Strug) is Category II. Therefore, Oxidation
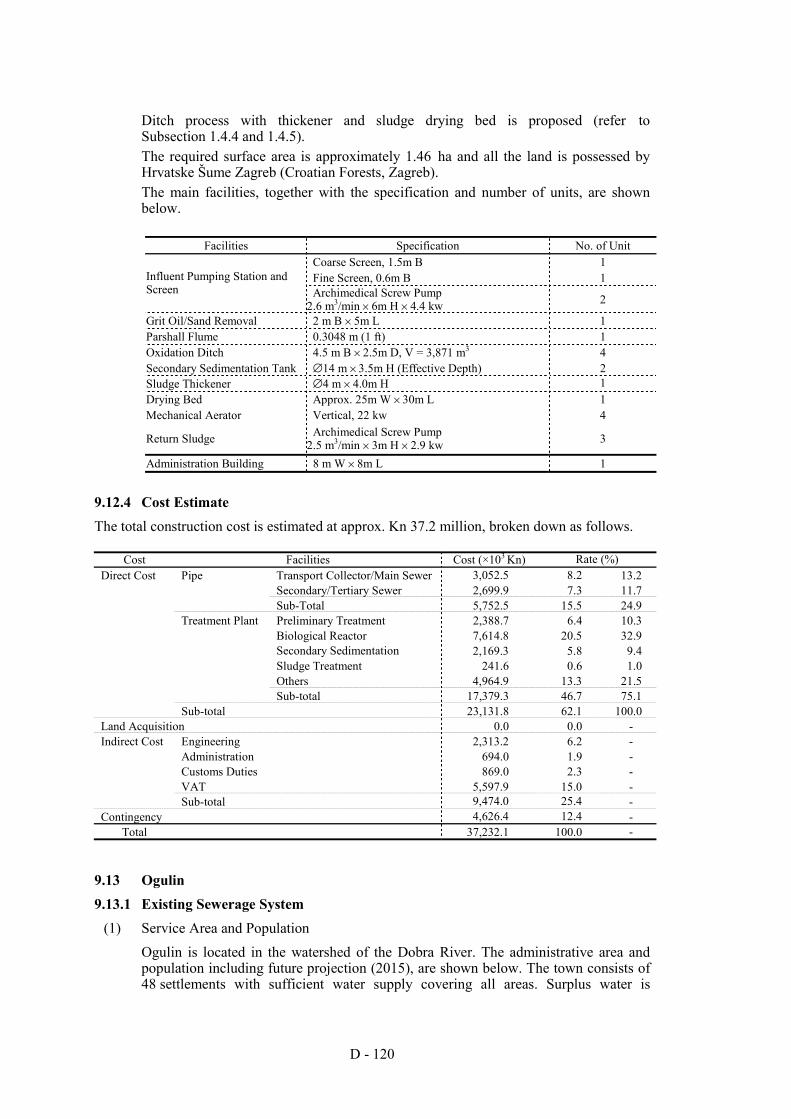
D - 120
Ditch process with thickener and sludge drying bed is proposed (refer to Subsection 1.4.4 and 1.4.5). The required surface area is approximately 1.46 ha and all the land is possessed by Hrvatske Šume Zagreb (Croatian Forests, Zagreb). The main facilities, together with the specification and number of units, are shown below.
Facilities Specification No. of Unit
Coarse Screen, 1.5m B 1 Fine Screen, 0.6m B 1 Influent Pumping Station and
Screen Archimedical Screw Pump 2.6 m3/min × 6m H × 4.4 kw 2
Grit Oil/Sand Removal 2 m B × 5m L 1 Parshall Flume 0.3048 m (1 ft) 1 Oxidation Ditch 4.5 m B × 2.5m D, V = 3,871 m3 4 Secondary Sedimentation Tank ∅14 m × 3.5m H (Effective Depth) 2 Sludge Thickener ∅4 m × 4.0m H 1 Drying Bed Approx. 25m W × 30m L 1 Mechanical Aerator Vertical, 22 kw 4
Return Sludge Archimedical Screw Pump 2.5 m3/min × 3m H × 2.9 kw 3
Administration Building 8 m W × 8m L 1
9.12.4 Cost Estimate The total construction cost is estimated at approx. Kn 37.2 million, broken down as follows.
Cost Facilities Cost (×103 Kn) Rate (%) Direct Cost Pipe Transport Collector/Main Sewer 3,052.5 8.2 13.2 Secondary/Tertiary Sewer 2,699.9 7.3 11.7 Sub-Total 5,752.5 15.5 24.9 Treatment Plant Preliminary Treatment 2,388.7 6.4 10.3 Biological Reactor 7,614.8 20.5 32.9 Secondary Sedimentation 2,169.3 5.8 9.4 Sludge Treatment 241.6 0.6 1.0 Others 4,964.9 13.3 21.5 Sub-total 17,379.3 46.7 75.1 Sub-total 23,131.8 62.1 100.0 Land Acquisition 0.0 0.0 - Indirect Cost Engineering 2,313.2 6.2 - Administration 694.0 1.9 - Customs Duties 869.0 2.3 - VAT 5,597.9 15.0 - Sub-total 9,474.0 25.4 - Contingency 4,626.4 12.4 -
Total 37,232.1 100.0 -
9.13 Ogulin 9.13.1 Existing Sewerage System
(1) Service Area and Population Ogulin is located in the watershed of the Dobra River. The administrative area and population including future projection (2015), are shown below. The town consists of 48 settlements with sufficient water supply covering all areas. Surplus water is
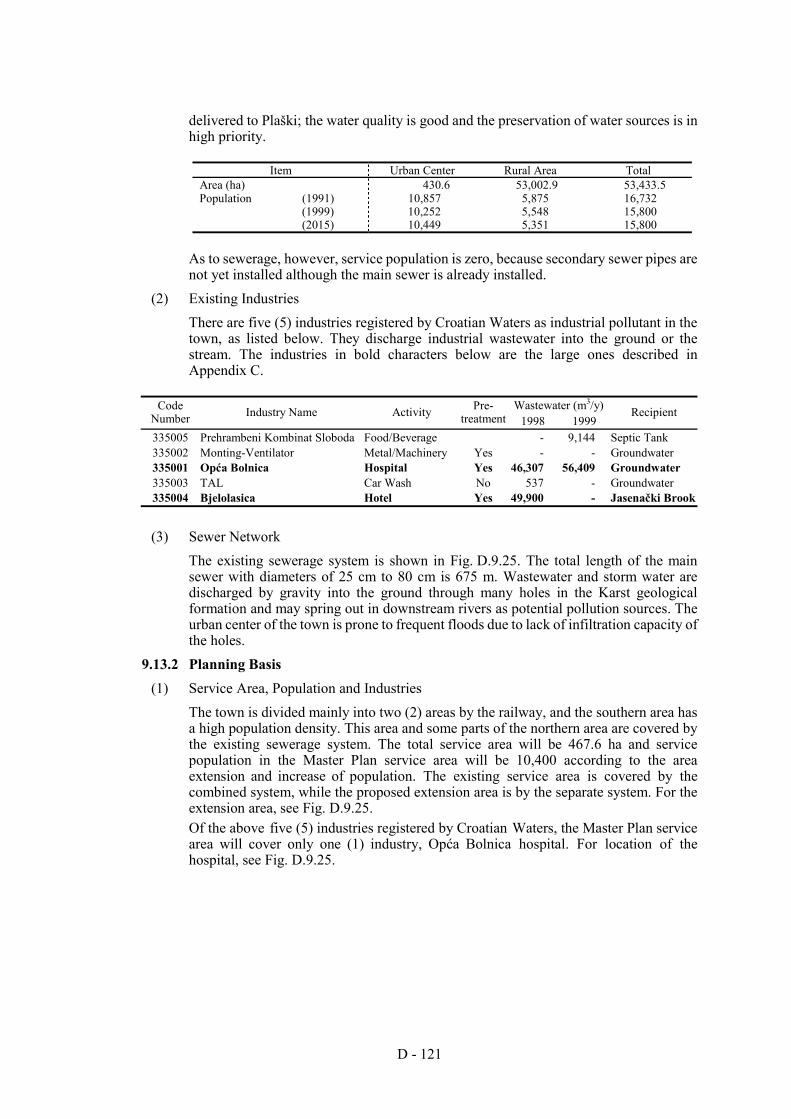
D - 121
delivered to Plaški; the water quality is good and the preservation of water sources is in high priority.
Item Urban Center Rural Area Total
Area (ha) 430.6 53,002.9 53,433.5 Population (1991) 10,857 5,875 16,732 (1999) 10,252 5,548 15,800 (2015) 10,449 5,351 15,800
As to sewerage, however, service population is zero, because secondary sewer pipes are not yet installed although the main sewer is already installed.
(2) Existing Industries There are five (5) industries registered by Croatian Waters as industrial pollutant in the town, as listed below. They discharge industrial wastewater into the ground or the stream. The industries in bold characters below are the large ones described in Appendix C.
Wastewater (m3/y) Code
Number Industry Name Activity Pre- treatment 1998 1999
Recipient
335005 Prehrambeni Kombinat Sloboda Food/Beverage - 9,144 Septic Tank 335002 Monting-Ventilator Metal/Machinery Yes - - Groundwater 335001 Opća Bolnica Hospital Yes 46,307 56,409 Groundwater 335003 TAL Car Wash No 537 - Groundwater 335004 Bjelolasica Hotel Yes 49,900 - Jasenački Brook
(3) Sewer Network The existing sewerage system is shown in Fig. D.9.25. The total length of the main sewer with diameters of 25 cm to 80 cm is 675 m. Wastewater and storm water are discharged by gravity into the ground through many holes in the Karst geological formation and may spring out in downstream rivers as potential pollution sources. The urban center of the town is prone to frequent floods due to lack of infiltration capacity of the holes.
9.13.2 Planning Basis (1) Service Area, Population and Industries
The town is divided mainly into two (2) areas by the railway, and the southern area has a high population density. This area and some parts of the northern area are covered by the existing sewerage system. The total service area will be 467.6 ha and service population in the Master Plan service area will be 10,400 according to the area extension and increase of population. The existing service area is covered by the combined system, while the proposed extension area is by the separate system. For the extension area, see Fig. D.9.25. Of the above five (5) industries registered by Croatian Waters, the Master Plan service area will cover only one (1) industry, Opća Bolnica hospital. For location of the hospital, see Fig. D.9.25.
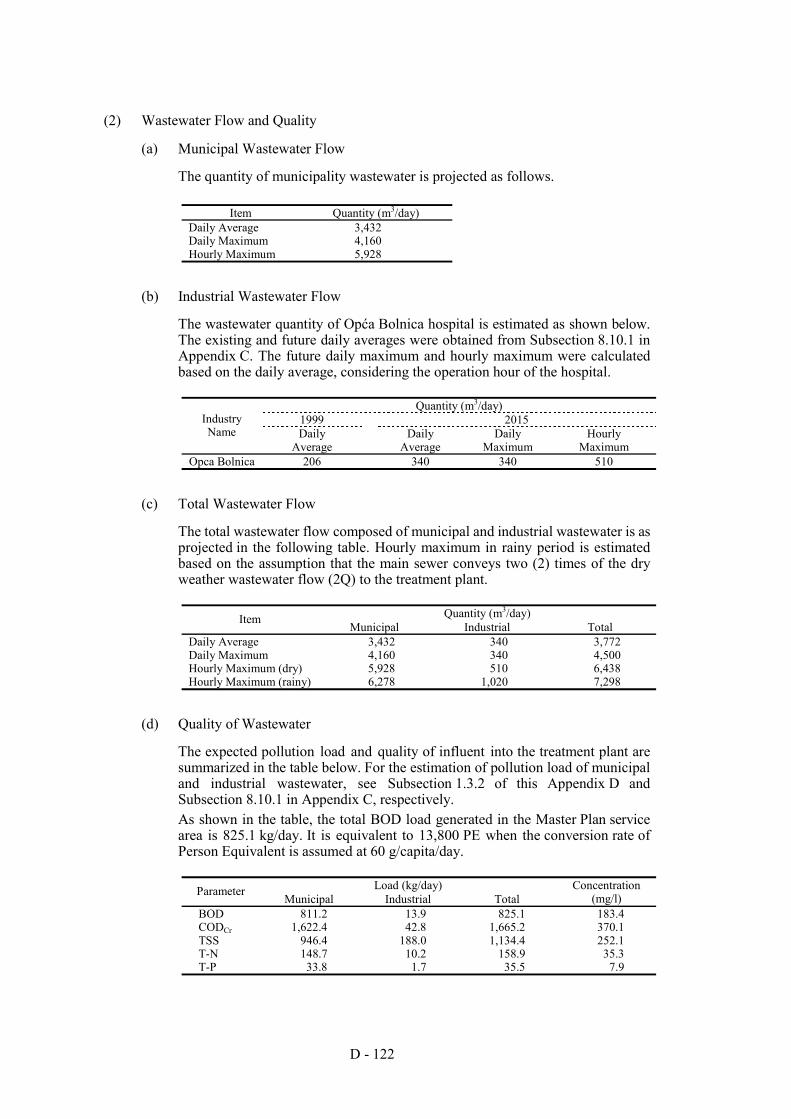
D - 122
(2) Wastewater Flow and Quality
(a) Municipal Wastewater Flow
The quantity of municipality wastewater is projected as follows.
Item Quantity (m3/day) Daily Average 3,432 Daily Maximum 4,160 Hourly Maximum 5,928
(b) Industrial Wastewater Flow
The wastewater quantity of Opća Bolnica hospital is estimated as shown below. The existing and future daily averages were obtained from Subsection 8.10.1 in Appendix C. The future daily maximum and hourly maximum were calculated based on the daily average, considering the operation hour of the hospital.
Quantity (m3/day)
1999 2015 Industry Name Daily
Average Daily
Average Daily
Maximum Hourly
Maximum Opca Bolnica 206 340 340 510
(c) Total Wastewater Flow
The total wastewater flow composed of municipal and industrial wastewater is as projected in the following table. Hourly maximum in rainy period is estimated based on the assumption that the main sewer conveys two (2) times of the dry weather wastewater flow (2Q) to the treatment plant.
Quantity (m3/day) Item
Municipal Industrial Total Daily Average 3,432 340 3,772 Daily Maximum 4,160 340 4,500 Hourly Maximum (dry) 5,928 510 6,438 Hourly Maximum (rainy) 6,278 1,020 7,298
(d) Quality of Wastewater
The expected pollution load and quality of influent into the treatment plant are summarized in the table below. For the estimation of pollution load of municipal and industrial wastewater, see Subsection 1.3.2 of this Appendix D and Subsection 8.10.1 in Appendix C, respectively. As shown in the table, the total BOD load generated in the Master Plan service area is 825.1 kg/day. It is equivalent to 13,800 PE when the conversion rate of Person Equivalent is assumed at 60 g/capita/day.
Load (kg/day) Parameter
Municipal Industrial Total Concentration
(mg/l) BOD 811.2 13.9 825.1 183.4 CODCr 1,622.4 42.8 1,665.2 370.1 TSS 946.4 188.0 1,134.4 252.1 T-N 148.7 10.2 158.9 35.3 T-P 33.8 1.7 35.5 7.9
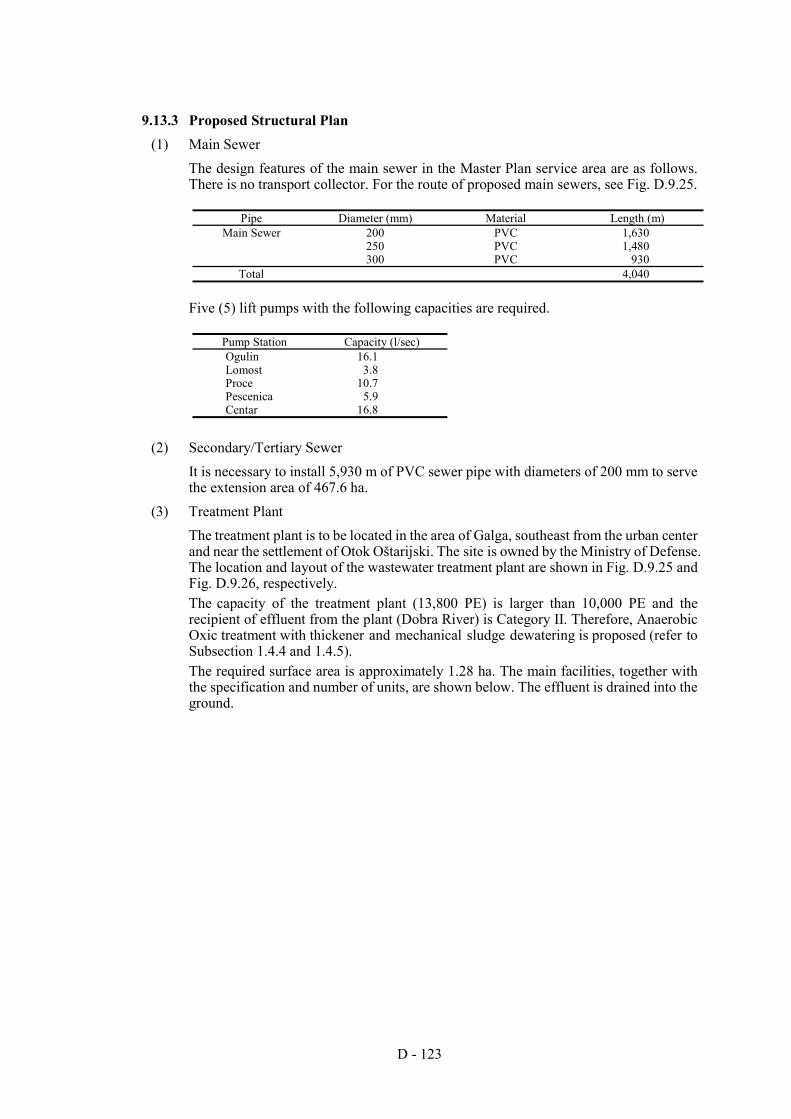
D - 123
9.13.3 Proposed Structural Plan (1) Main Sewer
The design features of the main sewer in the Master Plan service area are as follows. There is no transport collector. For the route of proposed main sewers, see Fig. D.9.25.
Pipe Diameter (mm) Material Length (m)
Main Sewer 200 PVC 1,630 250 PVC 1,480 300 PVC 930
Total 4,040
Five (5) lift pumps with the following capacities are required.
Pump Station Capacity (l/sec) Ogulin 16.1 Lomost 3.8 Proce 10.7 Pescenica 5.9 Centar 16.8
(2) Secondary/Tertiary Sewer It is necessary to install 5,930 m of PVC sewer pipe with diameters of 200 mm to serve the extension area of 467.6 ha.
(3) Treatment Plant The treatment plant is to be located in the area of Galga, southeast from the urban center and near the settlement of Otok Oštarijski. The site is owned by the Ministry of Defense. The location and layout of the wastewater treatment plant are shown in Fig. D.9.25 and Fig. D.9.26, respectively. The capacity of the treatment plant (13,800 PE) is larger than 10,000 PE and the recipient of effluent from the plant (Dobra River) is Category II. Therefore, Anaerobic Oxic treatment with thickener and mechanical sludge dewatering is proposed (refer to Subsection 1.4.4 and 1.4.5). The required surface area is approximately 1.28 ha. The main facilities, together with the specification and number of units, are shown below. The effluent is drained into the ground.
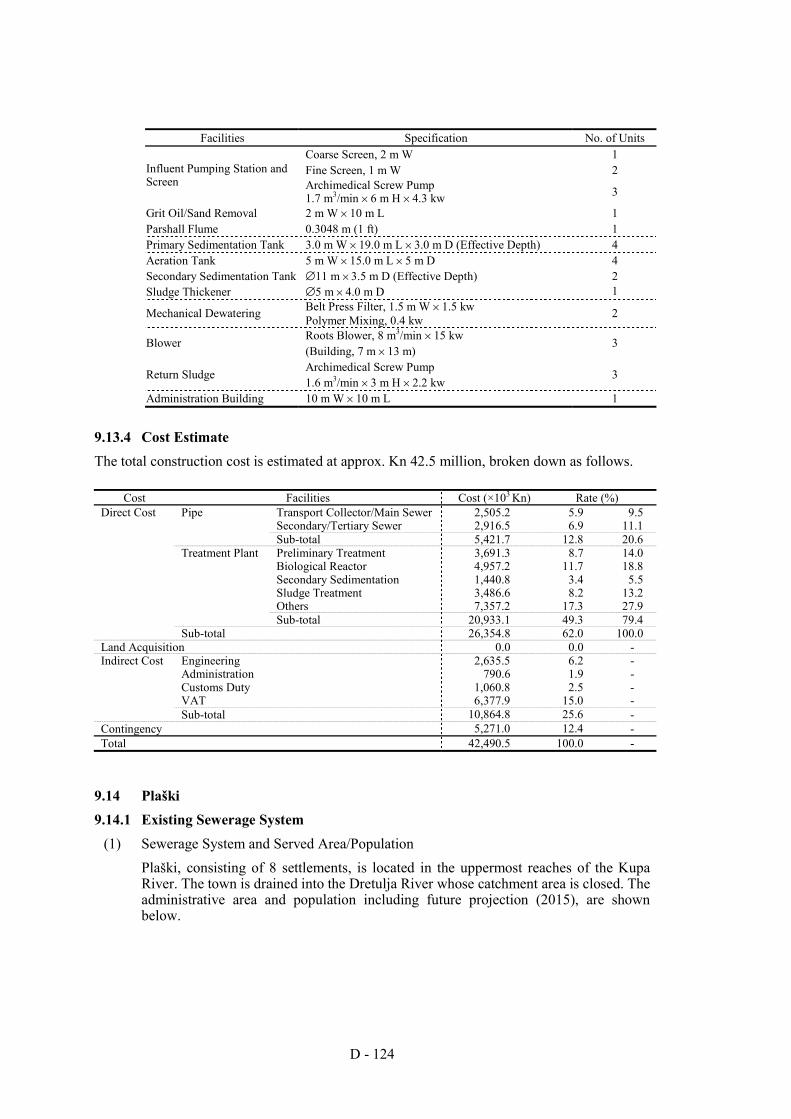
D - 124
Facilities Specification No. of Units
Coarse Screen, 2 m W 1 Fine Screen, 1 m W 2 Influent Pumping Station and
Screen Archimedical Screw Pump 1.7 m3/min × 6 m H × 4.3 kw 3
Grit Oil/Sand Removal 2 m W × 10 m L 1 Parshall Flume 0.3048 m (1 ft) 1 Primary Sedimentation Tank 3.0 m W × 19.0 m L × 3.0 m D (Effective Depth) 4 Aeration Tank 5 m W × 15.0 m L × 5 m D 4 Secondary Sedimentation Tank ∅11 m × 3.5 m D (Effective Depth) 2 Sludge Thickener ∅5 m × 4.0 m D 1
Belt Press Filter, 1.5 m W × 1.5 kw Mechanical Dewatering Polymer Mixing, 0.4 kw 2
Roots Blower, 8 m3/min × 15 kw Blower (Building, 7 m × 13 m)
3
Archimedical Screw Pump Return Sludge 1.6 m3/min × 3 m H × 2.2 kw
3
Administration Building 10 m W × 10 m L 1
9.13.4 Cost Estimate The total construction cost is estimated at approx. Kn 42.5 million, broken down as follows.
Cost Facilities Cost (×103 Kn) Rate (%) Direct Cost Pipe Transport Collector/Main Sewer 2,505.2 5.9 9.5 Secondary/Tertiary Sewer 2,916.5 6.9 11.1 Sub-total 5,421.7 12.8 20.6 Treatment Plant Preliminary Treatment 3,691.3 8.7 14.0 Biological Reactor 4,957.2 11.7 18.8 Secondary Sedimentation 1,440.8 3.4 5.5 Sludge Treatment 3,486.6 8.2 13.2 Others 7,357.2 17.3 27.9 Sub-total 20,933.1 49.3 79.4 Sub-total 26,354.8 62.0 100.0 Land Acquisition 0.0 0.0 - Indirect Cost Engineering 2,635.5 6.2 - Administration 790.6 1.9 - Customs Duty 1,060.8 2.5 - VAT 6,377.9 15.0 - Sub-total 10,864.8 25.6 - Contingency 5,271.0 12.4 - Total 42,490.5 100.0 -
9.14 Plaški 9.14.1 Existing Sewerage System
(1) Sewerage System and Served Area/Population Plaški, consisting of 8 settlements, is located in the uppermost reaches of the Kupa River. The town is drained into the Dretulja River whose catchment area is closed. The administrative area and population including future projection (2015), are shown below.
D - 125
Item Urban Center Rural Area Total
Area (ha) 195.4 15,546.7 15,742.1 Population (1991) 2,271 2,046 4,317 (1999) 1,720 1,550 3,270 (2015) 1,753 1,517 3,270
Plaški has approximately 600 m of drainage pipe used only for storm water. All households use the septic tank.
(2) Existing Industries The main activities in the municipality are wood industry, agriculture, tourism and hunting. There was a big paper industry that stopped operating in 1989. There are no industries registered by Croatian Waters as industrial pollutant in the municipality.
9.14.2 Planning Basis (1) Service Area, Population and Industries
The district with high population density in the urban center of Plaški will be given priority in the sewerage system services. No industry will be served by the proposed sewerage system. The total service area will be 51.8 ha. Served population in the Master Plan service area will be 800 according to the area extension and increase of population. All the area is covered by the separate system. For the proposed service area, see Fig. D.9.27.
(2) Wastewater Flow and Quality
(a) Municipality Wastewater Flow
The quantity of municipal wastewater is projected as follows. Hourly maximum flow to the treatment plant is constant irrespective of weather condition since all the area is served by the separate system.
Item Quantity (m3/day)
Daily Average 232 Daily Maximum 272 Hourly Maximum (dry) 384 Hourly Maximum (rainy) 384
(b) Quality of Wastewater
The expected pollution load and quality of influent into the treatment plant are summarized in the table below. For the estimation of pollution load of municipal wastewater, see Subsection 1.3.2. As shown in the table, the total BOD load generated in the Master Plan service area is 52.8 kg/day. It is equivalent to 900 PE when the conversion rate of Person Equivalent is assumed at 60 g/capita/day.
Parameter Load (kg/day) Concentration (mg/l) BOD 52.8 194.1 CODCr 105.6 388.2 TSS 61.6 226.5 T-N 9.7 35.6 T-P 2.2 8.1
D - 126
9.14.3 Proposed Structural Plan (1) Main Sewer
The design features of the main sewer in the Master Plan service area are as follows. No lift pump is required, and there is no transport collector. For the route of proposed main sewers, see Fig. D.9.27.
Pipe Diameter (mm) Material Length (m)
Main Sewer 200 PVC 2,380
(2) Secondary/Tertiary Sewer It is necessary to install 1,610 m of PVC sewer pipe with the diameter of 200 mm to serve the extension area of 51.8 ha.
(3) Treatment Plant The church owns the proposed site of the treatment plant, which has a total area of 2.4 ha. There is no settlement near the site, and in spring and rainy season, some parts are flooded due to melted snow and storm water. The location and layout of wastewater treatment plant are shown in Fig. D.9.27 and Fig. D.9.28, respectively. The capacity of the treatment plant (900 PE) is smaller than 10,000 PE and the recipient of effluent from the plant (Dretulja River) is category II. Therefore, Oxidation Ditch process with thickener and sludge drying bed is proposed (refer to Subsection 1.4.4 and 1.4.5). The required surface area is approximately 0.19 ha. The main facilities, together with the specification and number of units, are shown below.
Facilities Specification No. of Unit
Coarse screen, 0.6 m W 1 Fine screen, 0.6 m W 1 Influent Pumping Station and
Screen Submerged Pump 0.5 m3/min × 6m H × 1.5 kw 2
Grit Oil/Sand Removal 0.6 m W × 1 m L 1 Parshall Flume 0.0762 m (0.3 ft) 1 Oxidation Ditch 3.0 m W × 2.5 m L, V = 359 m3 1 Secondary Sedimentation Tank ∅6 m × 3.5 m H (Effective Depth) 1 Sludge Thickener 1.0 m W × 1.0 m L × 2.0 m D 1 Drying Bed Approx. 6 m W × 10 m L 1 Mechanical Aerator Vertical, 7.5 kw 1
Submerged Pump Return Sludge 0.5 m3/min × 3 m H × 0.75 kw
3
Administration Building 5 m W × 5 m L 1
D - 127
9.14.4 Cost Estimate The total construction cost is estimated at approx. Kn 12.4 million, broken down as follows.
Cost Facilities Cost (×103 Kn) Rate (%) Direct Cost Pipe Transport Collector/Main Sewer 1,150.2 9.3 15.0 Secondary/Tertiary Sewer 790.0 6.4 10.3 Sub-total 1,940.2 15.7 25.2 Treatment Plant Preliminary Treatment 1,918.4 15.5 25.0 Biological Reactor 1,527.2 12.3 19.9 Secondary Sedimentation 467.7 3.8 6.1 Sludge Treatment 128.1 1.0 1.7 Others 1,703.4 13.8 22.2 Sub-total 5,744.9 46.4 74.8 Sub-total 7,685.1 62.1 100.0 Land Acquisition 0.0 0.0 - Indirect Cost Engineering 768.5 6.2 - Administration 230.6 1.9 - Customs Duties 287.2 2.3 - VAT 1,859.8 15.0 - Sub-total 3,146.1 25.4 - Contingency 1,537.0 12.4 - Total 12,368.2 100.0 -
9.15 Slunj 9.15.1 Existing Sewerage System
(1) Service Area and Population Slunj, consisting of 25 settlements, has developed on the riverbank in the upstream reaches of the Korana River. This town has a well where much groundwater of superior quality is abstracted so that protection of the groundwater is given high priority. There is a plan to construct a new highway across the town, which is expected to develop tourism and other activities. The administrative area and population, including future projection (2015), are shown below.
Item Urban Center Rural Area Total Area (ha) 126.9 39,127.5 39,254.4 Population (1991) 2,026 8,070 10,096 (1999) 1,304 5,196 6,500 (2015) 1,329 5,171 6,500
The sewerage system of combined type covers a small part of the urban center and some parts of the northern two (2) settlements, Donje Taborište and Gornje Taborište. The total service area is 62.2 ha and the served population is 600 inhabitants.
(2) Existing Industries There are some industries engaged in electrical, metal, textile and other activities that do not require a lot of water. There are no industries registered by Croatian Waters as industrial pollutant in the town.
(3) Sewer Network The existing sewerage system is shown in Fig. D.9.29. The wastewater from the left bank at the lower end of the urban center is discharged with no treatment into the Korana River. On the other hand, the wastewater from the catchment of the two (2) retention basins at the right bank is also discharged with no treatment into the Korana River. The Korana River is the source of potable water of Karlovac Town.
D - 128
The sewerage system is of combined type. The total sewer length is 2.3 km with diameters of 30 cm to 100 cm. All the wastewater is drained by gravity, but the diameter of sewer pipe is too small. There is a plan to install a bypass pipe.
9.15.2 Planning Basis (1) Service Area, Population and Industries
Slunj is located upstream of the Korana River and water pollution control is given high priority as stated above. At present, sewer pipes are installed in only a small part of the urban center so that the sewerage service area will be extended to cover the entire area of the urban center and the southern settlement of Podmelnica near the water source. The northern settlement of Rastoke is also included in the service area because it has a famous landscape, which is has a potential for tourism. The total service area will be 219.1 ha with the extension of 156.9 ha. Service population in the Master Plan service area will be 2,400 according to the area extension and the increase of population. There is no industry that discharges wastewater with high pollution load. The existing service area is collected by the combined system, while the proposed extension area is by the separate one. For the extension area, see Fig. D.9.29.
(2) Wastewater Flow and Quality
(a) Municipal Wastewater Flow
The quantity of municipal wastewater is as projected in the following table. Hourly maximum in rainy period is estimated based on the assumption that the transport collector conveys two (2) times of the dry weather wastewater flow to the treatment plant.
Item Quantity (m3/day)
Daily Average 696 Daily Maximum 816 Hourly Maximum (dry) 1,152 Hourly Maximum (rainy) 1,480
(b) Quality of Wastewater
The expected pollution load and quality of influent into the treatment plant are summarized in the table below. For the estimation of pollution load of municipal wastewater, see Subsection 1.3.2. As shown in the table, the total BOD load generated in the Master Plan service area is 158.4 kg/day. It is equivalent to 2,700 PE when the conversion rate of Person Equivalent is assumed at 60 g/capita/day.
Parameter Load (kg/day) Concentration (mg/l) BOD 158.4 194.1 CODCr 316.8 388.2 TSS 184.8 226.5 T-N 29.0 35.6 T-P 6.6 8.1
9.15.3 Proposed Structural Plan (1) Transport Collector/Main Sewer
The design features of the transport collector/main sewer in the Master Plan service area are as follows. One lift pump with the capacity of 2 l/sec is required. For the route of proposed transport collector and main sewers, see Fig. D.9.29.
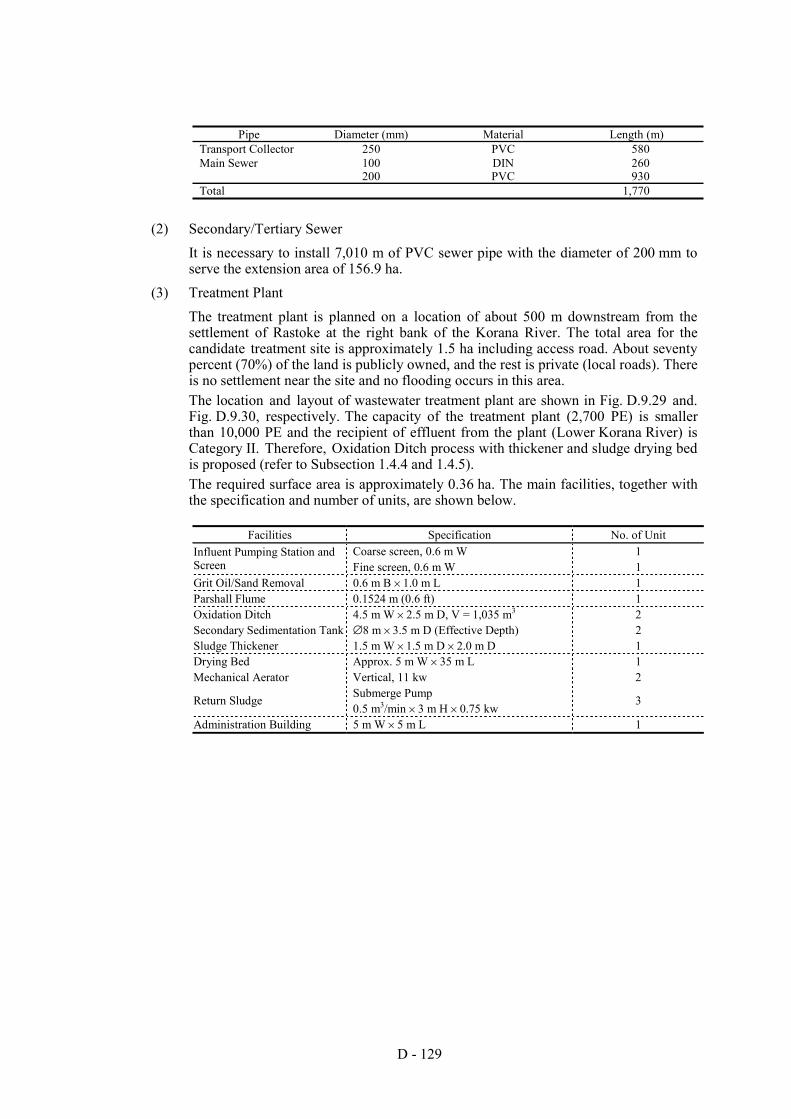
D - 129
Pipe Diameter (mm) Material Length (m)
Transport Collector 250 PVC 580 Main Sewer 100 DIN 260 200 PVC 930 Total 1,770
(2) Secondary/Tertiary Sewer It is necessary to install 7,010 m of PVC sewer pipe with the diameter of 200 mm to serve the extension area of 156.9 ha.
(3) Treatment Plant The treatment plant is planned on a location of about 500 m downstream from the settlement of Rastoke at the right bank of the Korana River. The total area for the candidate treatment site is approximately 1.5 ha including access road. About seventy percent (70%) of the land is publicly owned, and the rest is private (local roads). There is no settlement near the site and no flooding occurs in this area. The location and layout of wastewater treatment plant are shown in Fig. D.9.29 and. Fig. D.9.30, respectively. The capacity of the treatment plant (2,700 PE) is smaller than 10,000 PE and the recipient of effluent from the plant (Lower Korana River) is Category II. Therefore, Oxidation Ditch process with thickener and sludge drying bed is proposed (refer to Subsection 1.4.4 and 1.4.5). The required surface area is approximately 0.36 ha. The main facilities, together with the specification and number of units, are shown below.
Facilities Specification No. of Unit
Coarse screen, 0.6 m W 1 Influent Pumping Station and Screen Fine screen, 0.6 m W 1 Grit Oil/Sand Removal 0.6 m B × 1.0 m L 1 Parshall Flume 0.1524 m (0.6 ft) 1 Oxidation Ditch 4.5 m W × 2.5 m D, V = 1,035 m3 2 Secondary Sedimentation Tank ∅8 m × 3.5 m D (Effective Depth) 2 Sludge Thickener 1.5 m W × 1.5 m D × 2.0 m D 1 Drying Bed Approx. 5 m W × 35 m L 1 Mechanical Aerator Vertical, 11 kw 2
Submerge Pump Return Sludge 0.5 m3/min × 3 m H × 0.75 kw
3
Administration Building 5 m W × 5 m L 1
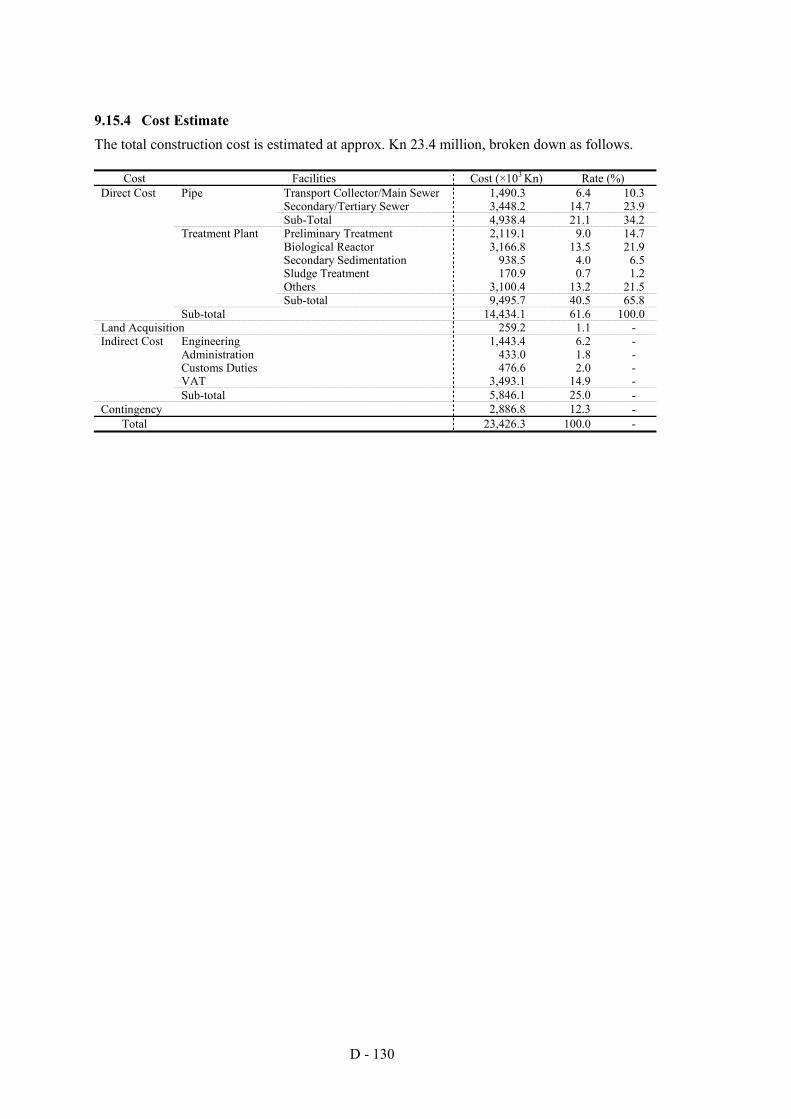
D - 130
9.15.4 Cost Estimate The total construction cost is estimated at approx. Kn 23.4 million, broken down as follows.
Cost Facilities Cost (×103 Kn) Rate (%) Direct Cost Pipe Transport Collector/Main Sewer 1,490.3 6.4 10.3 Secondary/Tertiary Sewer 3,448.2 14.7 23.9 Sub-Total 4,938.4 21.1 34.2 Treatment Plant Preliminary Treatment 2,119.1 9.0 14.7 Biological Reactor 3,166.8 13.5 21.9 Secondary Sedimentation 938.5 4.0 6.5 Sludge Treatment 170.9 0.7 1.2 Others 3,100.4 13.2 21.5 Sub-total 9,495.7 40.5 65.8 Sub-total 14,434.1 61.6 100.0 Land Acquisition 259.2 1.1 - Indirect Cost Engineering 1,443.4 6.2 - Administration 433.0 1.8 - Customs Duties 476.6 2.0 - VAT 3,493.1 14.9 - Sub-total 5,846.1 25.0 - Contingency 2,886.8 12.3 -
Total 23,426.3 100.0 -
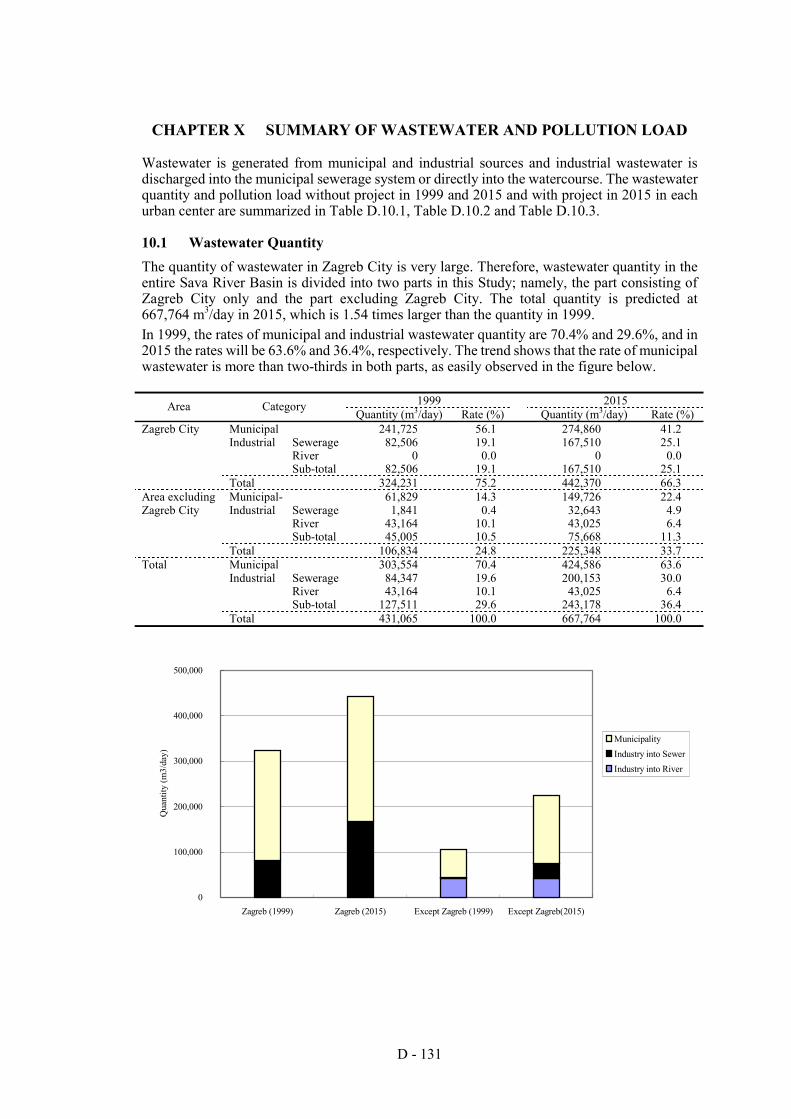
D - 131
CHAPTER X SUMMARY OF WASTEWATER AND POLLUTION LOAD
Wastewater is generated from municipal and industrial sources and industrial wastewater is discharged into the municipal sewerage system or directly into the watercourse. The wastewater quantity and pollution load without project in 1999 and 2015 and with project in 2015 in each urban center are summarized in Table D.10.1, Table D.10.2 and Table D.10.3.
10.1 Wastewater Quantity The quantity of wastewater in Zagreb City is very large. Therefore, wastewater quantity in the entire Sava River Basin is divided into two parts in this Study; namely, the part consisting of Zagreb City only and the part excluding Zagreb City. The total quantity is predicted at 667,764 m3/day in 2015, which is 1.54 times larger than the quantity in 1999. In 1999, the rates of municipal and industrial wastewater quantity are 70.4% and 29.6%, and in 2015 the rates will be 63.6% and 36.4%, respectively. The trend shows that the rate of municipal wastewater is more than two-thirds in both parts, as easily observed in the figure below.
1999 2015 Area Category Quantity (m3/day) Rate (%) Quantity (m3/day) Rate (%)
Municipal 241,725 56.1 274,860 41.2 Sewerage 82,506 19.1 167,510 25.1 River 0 0.0 0 0.0
Industrial
Sub-total 82,506 19.1 167,510 25.1
Zagreb City
Total 324,231 75.2 442,370 66.3 Municipal- 61,829 14.3 149,726 22.4
Sewerage 1,841 0.4 32,643 4.9 River 43,164 10.1 43,025 6.4
Industrial
Sub-total 45,005 10.5 75,668 11.3
Area excluding Zagreb City
Total 106,834 24.8 225,348 33.7 Municipal 303,554 70.4 424,586 63.6
Sewerage 84,347 19.6 200,153 30.0 River 43,164 10.1 43,025 6.4
Industrial
Sub-total 127,511 29.6 243,178 36.4
Total
Total 431,065 100.0 667,764 100.0
0
100,000
200,000
300,000
400,000
500,000
Zagreb (1999) Zagreb (2015) Except Zagreb (1999) Except Zagreb(2015)
Qua
ntity
(m3/
day)
MunicipalityIndustry into SewerIndustry into River
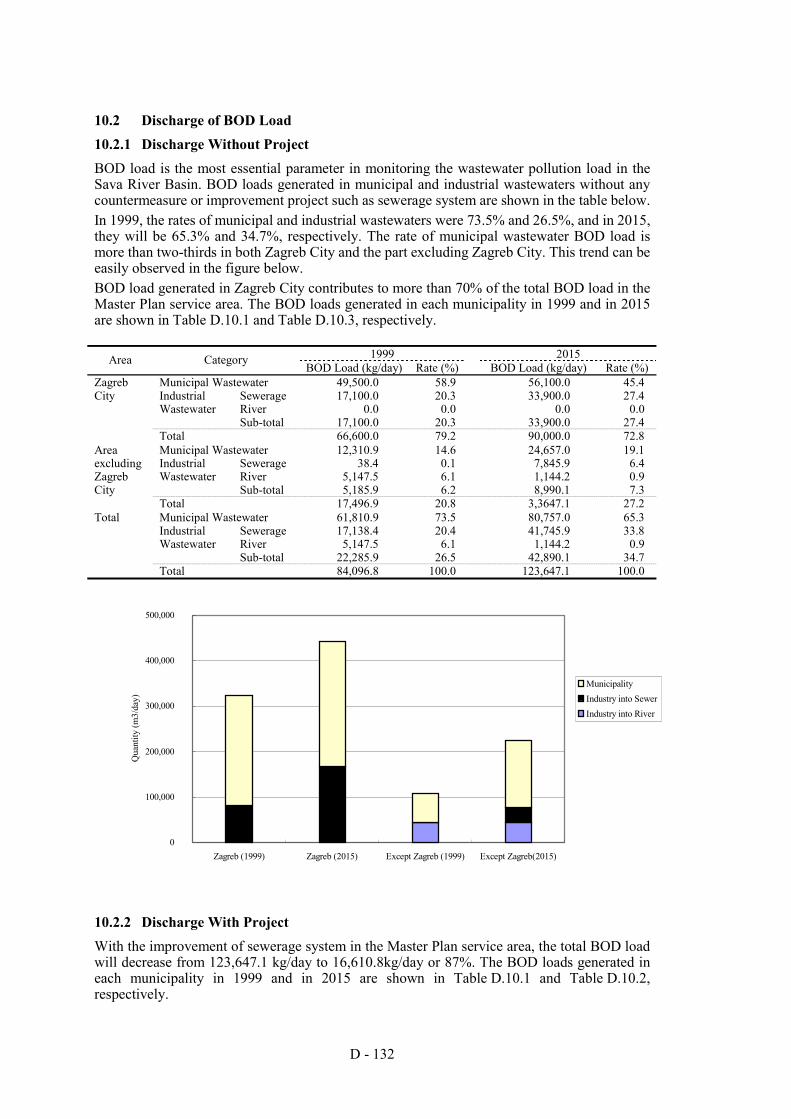
D - 132
10.2 Discharge of BOD Load 10.2.1 Discharge Without Project BOD load is the most essential parameter in monitoring the wastewater pollution load in the Sava River Basin. BOD loads generated in municipal and industrial wastewaters without any countermeasure or improvement project such as sewerage system are shown in the table below. In 1999, the rates of municipal and industrial wastewaters were 73.5% and 26.5%, and in 2015, they will be 65.3% and 34.7%, respectively. The rate of municipal wastewater BOD load is more than two-thirds in both Zagreb City and the part excluding Zagreb City. This trend can be easily observed in the figure below. BOD load generated in Zagreb City contributes to more than 70% of the total BOD load in the Master Plan service area. The BOD loads generated in each municipality in 1999 and in 2015 are shown in Table D.10.1 and Table D.10.3, respectively.
1999 2015 Area Category BOD Load (kg/day) Rate (%) BOD Load (kg/day) Rate (%)
Municipal Wastewater 49,500.0 58.9 56,100.0 45.4 Sewerage 17,100.0 20.3 33,900.0 27.4 River 0.0 0.0 0.0 0.0
Industrial Wastewater
Sub-total 17,100.0 20.3 33,900.0 27.4
Zagreb City
Total 66,600.0 79.2 90,000.0 72.8 Municipal Wastewater 12,310.9 14.6 24,657.0 19.1
Sewerage 38.4 0.1 7,845.9 6.4 River 5,147.5 6.1 1,144.2 0.9
Industrial Wastewater
Sub-total 5,185.9 6.2 8,990.1 7.3
Area excludingZagreb City
Total 17,496.9 20.8 3,3647.1 27.2 Municipal Wastewater 61,810.9 73.5 80,757.0 65.3
Sewerage 17,138.4 20.4 41,745.9 33.8 River 5,147.5 6.1 1,144.2 0.9
Industrial Wastewater
Sub-total 22,285.9 26.5 42,890.1 34.7
Total
Total 84,096.8 100.0 123,647.1 100.0
10.2.2 Discharge With Project With the improvement of sewerage system in the Master Plan service area, the total BOD load will decrease from 123,647.1 kg/day to 16,610.8kg/day or 87%. The BOD loads generated in each municipality in 1999 and in 2015 are shown in Table D.10.1 and Table D.10.2, respectively.
0
100,000
200,000
300,000
400,000
500,000
Zagreb (1999) Zagreb (2015) Except Zagreb (1999) Except Zagreb(2015)
Qua
ntity
(m3/
day)
MunicipalityIndustry into SewerIndustry into River
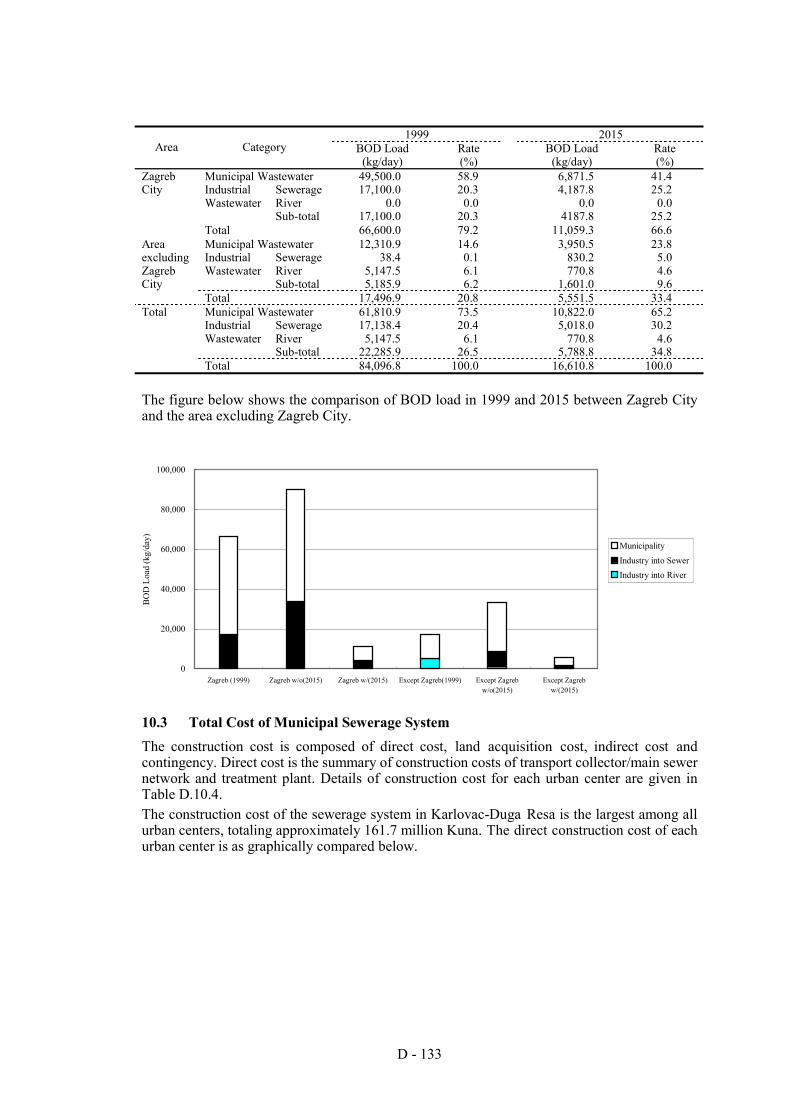
D - 133
1999 2015
Area Category BOD Load (kg/day)
Rate (%)
BOD Load (kg/day)
Rate (%)
Municipal Wastewater 49,500.0 58.9 6,871.5 41.4 Sewerage 17,100.0 20.3 4,187.8 25.2 River 0.0 0.0 0.0 0.0
Industrial Wastewater
Sub-total 17,100.0 20.3 4187.8 25.2
Zagreb City
Total 66,600.0 79.2 11,059.3 66.6 Municipal Wastewater 12,310.9 14.6 3,950.5 23.8
Sewerage 38.4 0.1 830.2 5.0 River 5,147.5 6.1 770.8 4.6
Industrial Wastewater
Sub-total 5,185.9 6.2 1,601.0 9.6
Area excluding Zagreb City
Total 17,496.9 20.8 5,551.5 33.4 Municipal Wastewater 61,810.9 73.5 10,822.0 65.2
Sewerage 17,138.4 20.4 5,018.0 30.2 River 5,147.5 6.1 770.8 4.6
Industrial Wastewater
Sub-total 22,285.9 26.5 5,788.8 34.8
Total
Total 84,096.8 100.0 16,610.8 100.0 The figure below shows the comparison of BOD load in 1999 and 2015 between Zagreb City and the area excluding Zagreb City.
10.3 Total Cost of Municipal Sewerage System The construction cost is composed of direct cost, land acquisition cost, indirect cost and contingency. Direct cost is the summary of construction costs of transport collector/main sewer network and treatment plant. Details of construction cost for each urban center are given in Table D.10.4. The construction cost of the sewerage system in Karlovac-Duga Resa is the largest among all urban centers, totaling approximately 161.7 million Kuna. The direct construction cost of each urban center is as graphically compared below.
0
20,000
40,000
60,000
80,000
100,000
Zagreb (1999) Zagreb w/o(2015) Zagreb w/(2015) Except Zagreb(1999) Except Zagrebw/o(2015)
Except Zagrebw/(2015)
BO
D L
oad
(kg/
day)
Municipality
Industry into SewerIndustry into River
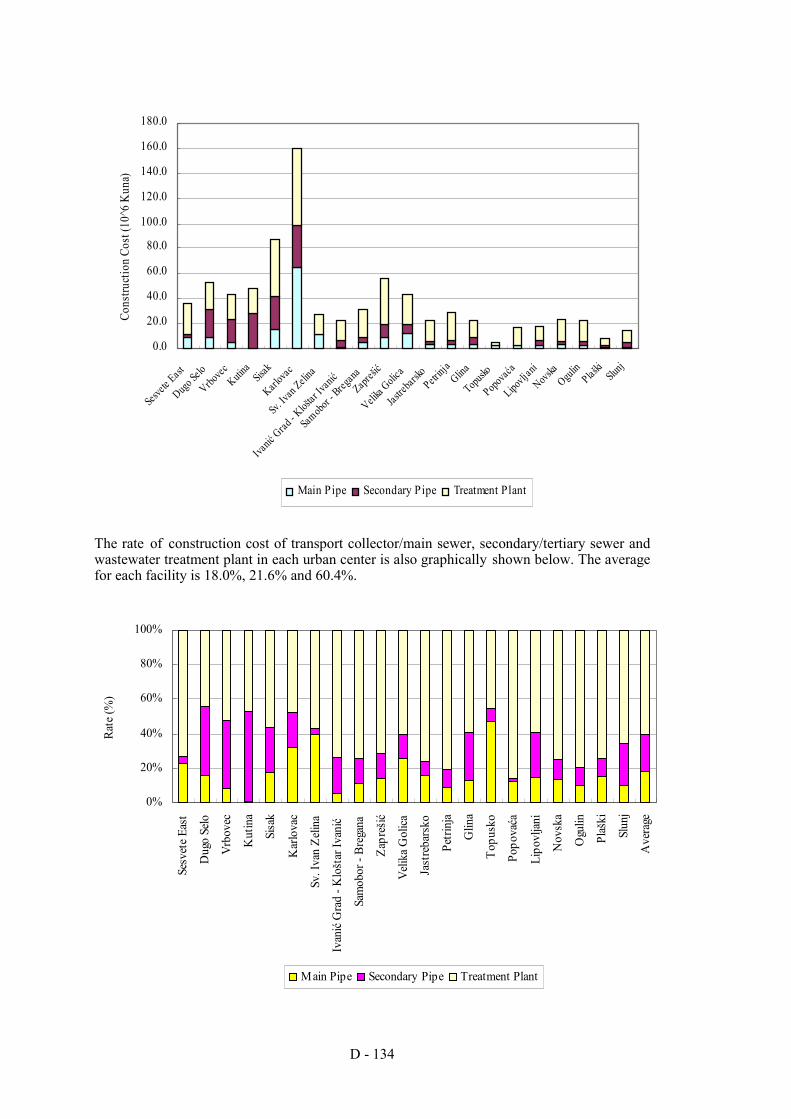
D - 134
The rate of construction cost of transport collector/main sewer, secondary/tertiary sewer and wastewater treatment plant in each urban center is also graphically shown below. The average for each facility is 18.0%, 21.6% and 60.4%.
0.0
20.0
40.0
60.0
80.0
100.0
120.0
140.0
160.0
180.0
Sesvet
e East
Dugo Se
lo
Vrbovec
Kutina
Sisak
Karlova
c
Sv. Iv
an Zelin
a
Ivanić
Grad - K
loštar
Ivanić
Samobo
r - Breg
anaZapr
ešić
Velika G
olica
Jastre
barsko
Petrinj
aGlina
Topusko
Popovać
a
Lipovlj
ani
Novska
Ogulin
Plaški
Slunj
Cons
truct
ion
Cost
(10^
6 K
una)
Main Pipe Secondary Pipe Treatment Plant
0%
20%
40%
60%
80%
100%
Sesv
ete E
ast
Dug
o Se
lo
Vrbo
vec
Kut
ina
Sisa
k
Kar
lova
c
Sv. I
van
Zelin
a
Ivan
ić G
rad
- Klo
štar
Ivan
ić
Sam
obor
- Br
egan
a
Zapr
ešić
Velik
a Gol
ica
Jast
reba
rsko
Petri
nja
Glin
a
Topu
sko
Popo
vaća
Lipo
vljan
i
Nov
ska
Ogu
lin
Plaš
ki
Slun
j
Ave
rage
Rate
(%)
Main Pipe Secondary Pipe Treatment Plant
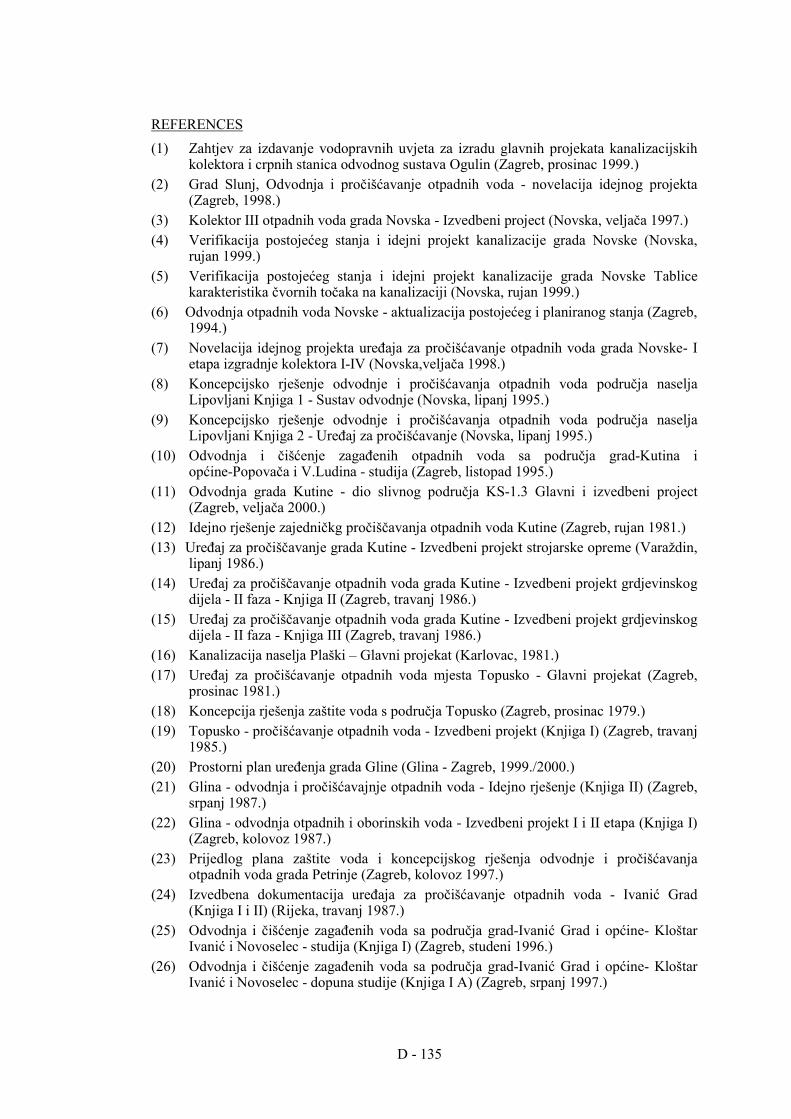
D - 135
REFERENCES (1) Zahtjev za izdavanje vodopravnih uvjeta za izradu glavnih projekata kanalizacijskih
kolektora i crpnih stanica odvodnog sustava Ogulin (Zagreb, prosinac 1999.) (2) Grad Slunj, Odvodnja i pročišćavanje otpadnih voda - novelacija idejnog projekta
(Zagreb, 1998.) (3) Kolektor III otpadnih voda grada Novska - Izvedbeni project (Novska, veljača 1997.) (4) Verifikacija postojećeg stanja i idejni projekt kanalizacije grada Novske (Novska,
rujan 1999.) (5) Verifikacija postojećeg stanja i idejni projekt kanalizacije grada Novske Tablice
karakteristika čvornih točaka na kanalizaciji (Novska, rujan 1999.) (6) Odvodnja otpadnih voda Novske - aktualizacija postojećeg i planiranog stanja (Zagreb,
1994.) (7) Novelacija idejnog projekta uređaja za pročišćavanje otpadnih voda grada Novske- I
etapa izgradnje kolektora I-IV (Novska,veljača 1998.) (8) Koncepcijsko rješenje odvodnje i pročišćavanja otpadnih voda područja naselja
Lipovljani Knjiga 1 - Sustav odvodnje (Novska, lipanj 1995.) (9) Koncepcijsko rješenje odvodnje i pročišćavanja otpadnih voda područja naselja
Lipovljani Knjiga 2 - Uređaj za pročišćavanje (Novska, lipanj 1995.) (10) Odvodnja i čišćenje zagađenih otpadnih voda sa područja grad-Kutina i
općine-Popovača i V.Ludina - studija (Zagreb, listopad 1995.) (11) Odvodnja grada Kutine - dio slivnog područja KS-1.3 Glavni i izvedbeni project
(Zagreb, veljača 2000.) (12) Idejno rješenje zajedničkg pročiščavanja otpadnih voda Kutine (Zagreb, rujan 1981.) (13) Uređaj za pročiščavanje grada Kutine - Izvedbeni projekt strojarske opreme (Varaždin,
lipanj 1986.) (14) Uređaj za pročiščavanje otpadnih voda grada Kutine - Izvedbeni projekt grdjevinskog
dijela - II faza - Knjiga II (Zagreb, travanj 1986.) (15) Uređaj za pročiščavanje otpadnih voda grada Kutine - Izvedbeni projekt grdjevinskog
dijela - II faza - Knjiga III (Zagreb, travanj 1986.) (16) Kanalizacija naselja Plaški – Glavni projekat (Karlovac, 1981.) (17) Uređaj za pročišćavanje otpadnih voda mjesta Topusko - Glavni projekat (Zagreb,
prosinac 1981.) (18) Koncepcija rješenja zaštite voda s područja Topusko (Zagreb, prosinac 1979.) (19) Topusko - pročišćavanje otpadnih voda - Izvedbeni projekt (Knjiga I) (Zagreb, travanj
1985.) (20) Prostorni plan uređenja grada Gline (Glina - Zagreb, 1999./2000.) (21) Glina - odvodnja i pročišćavajnje otpadnih voda - Idejno rješenje (Knjiga II) (Zagreb,
srpanj 1987.) (22) Glina - odvodnja otpadnih i oborinskih voda - Izvedbeni projekt I i II etapa (Knjiga I)
(Zagreb, kolovoz 1987.) (23) Prijedlog plana zaštite voda i koncepcijskog rješenja odvodnje i pročišćavanja
otpadnih voda grada Petrinje (Zagreb, kolovoz 1997.) (24) Izvedbena dokumentacija uređaja za pročišćavanje otpadnih voda - Ivanić Grad
(Knjiga I i II) (Rijeka, travanj 1987.) (25) Odvodnja i čišćenje zagađenih voda sa područja grad-Ivanić Grad i općine- Kloštar
Ivanić i Novoselec - studija (Knjiga I) (Zagreb, studeni 1996.) (26) Odvodnja i čišćenje zagađenih voda sa područja grad-Ivanić Grad i općine- Kloštar
Ivanić i Novoselec - dopuna studije (Knjiga I A) (Zagreb, srpanj 1997.)
D - 136
(27) Grad Jastrebarsko - Idejno rješennje odvodnje i pročišćavanja otpadnih i oborinskih voda (Knjiga 1 i Knjiga 2) (Zagreb, studeni 1990.)
(28) Uređaj za pročišćavanje otpadnih voda grada Vrbovca i industrijske zone Idejno rješenje (Zagreb, siječanj 1993.)
(29) Studija utjecaja na okolinu Centralnog uređaja za pročišćavanje otpadnih voda grada i industrije: Vrbovec Prethodna studija
(30) Studija odvodnje i pročišćavanja otpadnih voda grada Vrbovca (Zagreb, prosinac 1999.)
(31) Uvijeti uređenja prostora za izgradnju uređaja za pročišćavanje otpadnih voda grada i industrije Vrbovec (Zagreb, ožujak 1993.)
(32) Projekt upravljanja kanalizacijskim sustavom grada Samobora I etapa projekta: Novelacija sustava odvodnje grada Samobra - Idejno rješenje (Zagreb, kolovoz 2000.)
(33) Projekt sanacije i rekonstrukcije uređaja za pročišćavnje otpadnih voda grada Samobora I etapa projekta: Snimka postojećeg stanja i idejno rješenje sanacije (Zagreb, siječanj 2000.)
(34) Kanalizacija dijela naselja Hrastina i Farkaševac - 1. faza (Samobor, rujan 1999.) (35) Idejno rješenje odvodnje naselja Hrastina, Farkaševac i Domaslovec (Samobor,
travanj 1997.) (36) Fekalna kanalizacija naselja Vrbovec, Medsave Građevinski project (Zagreb, rujan
1999.) (37) Fekalna kanalizacija naselja Celine, Savrščak Građevinski project (Zagreb, rujan
1999.) (38) Idejni projekt odvodnje naselja Vrbovec, Medsave, Savrščak, Celine i Otok -
novelacija (Zagreb, studeni 1998.) (39) Studija odvodnje naselja Zelina i kontaktnih industrijskih zona Biškupec i Donja
Zelina (Varaždin, ožujak 1987.) (40) Kanalizacija Zelina - Izvedbeni projekt (Knjiga I) (Varaždin, travanj 1990.) (41) Kanalizacija Zelina - Izvedbeni projekt (Knjiga II) (Varaždin, travanj 1990.) (42) Sanacija centralnog uređaja za čišćenje otpadnih voda Velika Gorica Idejno rješenje -
Građevinski objekti ( Zagreb, ožujak 1996.) (43) Uređaj za pročišćavanje otpadnih voda grada Velika Gorica Strojarski dio -
Plinifikacija trulišta, detalji razvoda plina (Ljubljana, februar 1985.) (44) Uredjaj za prečiščavanje Velika Gorica, proširenje taložnice i biološkog djela
(Ljubljana, februar 1982.) (45) C.U.P. Velika Gorica - Strojarska oprema (Ljubljana, januar 1987.) (46) Uredjaj za prečiščavanje Velika Gorica, mehaničko biološko prečišćavanje (Ljubljana,
mart 1982.) (47) Uređaj za pročišćavanje otpadnih voda Velika Gorica Sanacija, rekonstrukcija i
dogradnja - I ETAPA Glavni i izvedbeni projekti za građevinske objekte, ugradbu strojarske i hidrotehničke opreme (Zagreb, 1998.)
(48) Kanalizacija Dugo Selo - Kolektor II - Istok Odvodnja - Glavni project (Zagreb, 1997.)
(49) Kanalizacija Dugog Sela - Nonelacija koncepcijskog rješenja (Knjiga I) (Zagreb, 1994.)
(50) Kanalizacija Dugog Sela - Nonelacija koncepcijskog rješenja (Knjiga II) (Zagreb, 1994.)
(51) Kanalizacija Dugo Selo - Kolektor II - Istok (dodatak) Odvodnja - Glavni project (Zagreb, 1998.)
(52) Centralni komunalni uređaj za pročišćavanje otpadnih voda Karlovac - Duga Resa -
D - 137
Idejno rješenje (Zagreb, lipanj 1988.) (53) Karlovac - Duga Resa , pročišćavanje otpadnih voda Idejno rješenje (Zagreb, travanj
1988.) (54) Idejno rješenje elektro dijela centralnog uređaja za pročišćavanje Karlovac - Duga
Resa (Karlovac, juni 1988.) (55) Odvodnja otpadnih voda grada Duga Resa Elaborat za ishođenje vodoprivredne
dozvole (Karlovac, rujan 1995.) (56) Izvedbeni projekt kanalskog sustava Banija - Karlovac (Knjiga 1) I. faza izgradnje
(Zagreb, studeni 1994.) (57) Izvedbeni projekt kanalskog sustava Banija - Karlovac (Knjiga 2) I. faza izgradnje
(Zagreb, studeni 1994.) (58) Optimalizacija kanalskog sustava Duga Resa - Karlovac - CUP (Centralni uređaj za
pročišćavanje otpadnih voda Karlovac - Duga Resa) (Zagreb, svibanj 1995.) (59) Optimalizacija idejnog projekta odvodnje otpadnih voda grad Karlovac (Zagreb,
1993.) (60) Kanalizacija grada Karlovca - Kolektor Banija Optimalizacija idejnog projekta
odvodnje otpadnih voda Banija (Zagreb, 1993.) (61) Transportni kolektor "Karlovac - Duga Resa" Novelacija hidrološko - hidrauličkog
opterećenja s prijedlogom korištenja u odvodnom sustavu (62) Sesvete Istok - Uređaj za pročišćavanje otpadnih voda (Knjiga I) (Zagreb, travanj
1999.) (63) Sesvete Istok - Uređaj za pročišćavanje otpadnih voda (Knjiga III) (Zagreb, travanj
1999.) (64) Sesvete Istok - Uređaj za pročišćavanje otpadnih voda (Zagreb, srpanj 1999.) (65) Izvedbeni projekt Transportnih kolektora odvodnje otpadnih voda naselja područja -
Sesvete Istok (Zagreb, srpanj 1998.) (66) Glavničica - Uređaj za pročišćavanje otpadnih voda Sesvete sjeveroistok Izvedbeno -
tehnička dokumentacija I faza izgradnje (Knjiga I) (Zagreb, svibanj 2000.) (67) Glavničica - Uređaj za pročišćavanje otpadnih voda Sesvete sjeveroistok Izvedbeno -
tehnička dokumentacija I faza izgradnje (Knjiga III) (Zagreb, svibanj 2000.) (68) Glavničica - Uređaj za pročišćavanje otpadnih voda Sesvete sjeveroistok Izvedbeno -
tehnička dokumentacija I faza izgradnje (Knjiga IV) (Zagreb, svibanj 2000.) (69) Tehnički plan kanalske mreže GIS - Sesvete (70) Koncepcijsko rješenje prioritetnih faza razvitka vodoopskrbe na području Sisačko -
moslavačke županije (Zagreb, lipanj 1998.) (71) Idejno rješenje odvodnje i pročišćavanje otpadnih voda naselja Općine Rugvica
(Knjiga 1) (Zagreb, prosinac 1999.) (72) Idejno rješenje odvodnje i pročišćavanje otpadnih voda naselja Općine Rugvica
(Sažetak projekta) (Zagreb, prosinac 1999.) (73) Mogućnosti primjene biljnih uređaja za pročišćavanje otpadnih voda u Hrvatskoj - na
vodnom području rijeke Save - (Zagreb, prosinac 1998.) (74) Odvodnja i pročišćavanje otpadnih voda Sesvete - sjeveroistok Idejni projektOdvodnja
otpadnih voda (Knjiga I) (75) Odvodnja i pročišćavanje otpadnih voda Sesvete - sjeveroistok Idejni project
Odvodnja otpadnih voda (Knjiga II) (76) Odvodnja i pročišćavanje otpadnih voda Sesvete - sjeveroistok Idejni project
Odvodnja otpadnih voda (Knjiga III) (77) Standaradna Kalkulacija Radova u Vodogradnji Bilten III - 2000 (Zagreb 3.2000)
Centralni Uređaj za Čišćenje otpadnih Voda Čakovec

TABLES
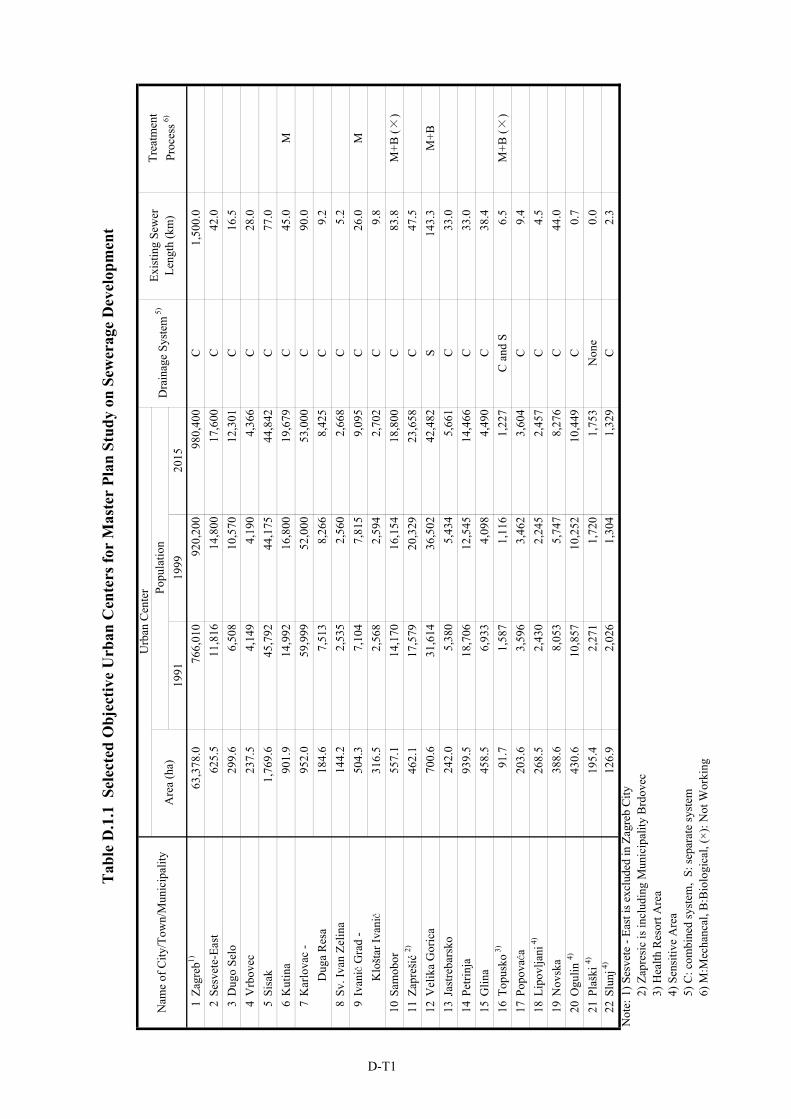
1991
1999
2015
1Za
greb
1)63
,378
.0
766,
010
920,
200
980,
400
C1,
500.
0 2
Sesv
ete-
East
625.
5 11
,816
14,8
0017
,600
C42
.0
3D
ugo
Selo
29
9.6
6,50
810
,570
12,3
01C
16.5
4
Vrb
ovec
237.
5 4,
149
4,19
04,
366
C28
.0
5Si
sak
1,76
9.6
45,7
9244
,175
44,8
42C
77.0
6
Kut
ina
901.
9 14
,992
16,8
0019
,679
C45
.0
M7
Kar
lova
c -
952.
0 59
,999
52,0
0053
,000
C90
.0
D
uga
Res
a18
4.6
7,51
38,
266
8,42
5C
9.2
8Sv
. Iva
n Ze
lina
144.
2 2,
535
2,56
02,
668
C5.
2 9
Ivan
ić G
rad
-50
4.3
7,10
47,
815
9,09
5C
26.0
M
K
lošt
ar Iv
anić
316.
5 2,
568
2,59
42,
702
C9.
8 10
Sam
obor
55
7.1
14,1
7016
,154
18,8
00C
83.8
M
+B (×
)11
Zapr
ešić
2)46
2.1
17,5
7920
,329
23,6
58C
47.5
12
Vel
ika
Gor
ica
700.
6 31
,614
36,5
0242
,482
S14
3.3
M+B
13Ja
stre
bars
ko24
2.0
5,38
05,
434
5,66
1C
33.0
14
Petri
nja
939.
5 18
,706
12,5
4514
,466
C33
.0
15G
lina
458.
5 6,
933
4,09
84,
490
C38
.4
16To
pusk
o 3)
91.7
1,
587
1,11
61,
227
C a
nd S
6.5
M+B
(×)
17Po
povaća
203.
6 3,
596
3,46
23,
604
C9.
4 18
Lipo
vlja
ni 4
)26
8.5
2,43
02,
245
2,45
7C
4.5
19N
ovsk
a38
8.6
8,05
35,
747
8,27
6C
44.0
20
430.
6 10
,857
10,2
5210
,449
C0.
7 21
195.
4 2,
271
1,72
01,
753
Non
e0.
0 22
Slun
j 4)
126.
9 2,
026
1,30
41,
329
C2.
3 N
ote:
1) S
esve
te -
East
is e
xclu
ded
in Z
agre
b C
ity2)
Zap
resi
c is
incl
udin
g M
unic
ipal
ity B
rdov
ec
5) C
: com
bine
d sy
stem
, S:
sepa
rate
syst
em6)
M:M
echa
ncal
, B:B
iolo
gica
l, (×
): N
ot W
orki
ng
3) H
ealth
Res
ort A
rea
Exis
ting
Sew
erLe
ngth
(km
)D
rain
age
Syst
em 5
)
Ogu
lin 4)
Plaš
ki 4)
Tabl
e D
.1.1
Sel
ecte
d O
bjec
tive
Urb
an C
ente
rs fo
r M
aste
r Pl
an S
tudy
on
Sew
erag
e D
evel
opm
ent
4) S
ensi
tive
Are
a
Are
a (h
a)N
ame
of C
ity/T
own/
Mun
icip
ality
Trea
tmen
tPr
oces
s 6)
Urb
an C
ente
r Popu
latio
n
D-T1
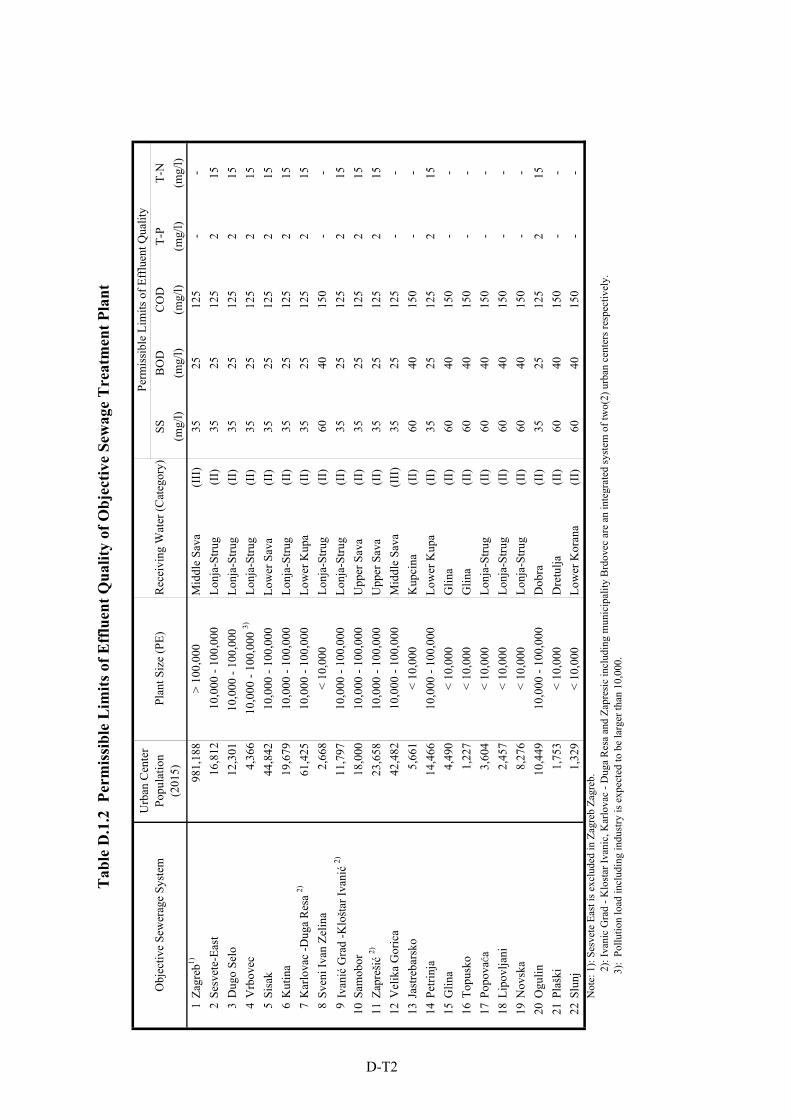
SSB
OD
CO
DT-
PT-
N(m
g/l)
(mg/
l)(m
g/l)
(mg/
l)(m
g/l)
1Za
greb
1)98
1,18
8>
100,
000
Mid
dle
Sava
(I
II)
3525
125
--
2Se
svet
e-Ea
st16
,812
10,0
00 -
100,
000
Lonj
a-St
rug
(II)
3525
125
215
3D
ugo
Selo
12,3
0110
,000
- 10
0,00
0 Lo
nja-
Stru
g(I
I)35
2512
52
154
Vrb
ovec
4,36
610
,000
- 10
0,00
0 3)
Lonj
a-St
rug
(II)
3525
125
215
5Si
sak
44,8
4210
,000
- 10
0,00
0Lo
wer
Sav
a(I
I)35
2512
52
156
Kut
ina
19,6
7910
,000
- 10
0,00
0Lo
nja-
Stru
g (I
I)35
2512
52
157
Kar
lova
c -D
uga
Res
a 2)
61,4
2510
,000
- 10
0,00
0Lo
wer
Kup
a (I
I)35
2512
52
158
Sven
i Iva
n Ze
lina
2,66
8<
10,0
00Lo
nja-
Stru
g (I
I)60
4015
0-
-9
Ivan
ić G
rad
-Klo
štar
Ivan
ić 2)
11,7
9710
,000
- 10
0,00
0Lo
nja-
Stru
g (I
I)35
2512
52
1510
Sam
obor
18,0
0010
,000
- 10
0,00
0U
pper
Sav
a
(II)
3525
125
215
11Za
preš
ić 2)
23,6
5810
,000
- 10
0,00
0U
pper
Sav
a
(II)
3525
125
215
12V
elik
a G
oric
a42
,482
10,0
00 -
100,
000
Mid
dle
Sava
(I
II)
3525
125
--
13Ja
stre
bars
ko5,
661
< 10
,000
Kup
cina
(I
I)60
4015
0-
-14
Petri
nja
14,4
6610
,000
- 10
0,00
0Lo
wer
Kup
a(I
I)35
2512
52
1515
Glin
a4,
490
< 10
,000
Glin
a (I
I)60
4015
0-
-16
Topu
sko
1,22
7<
10,0
00G
lina
(II)
6040
150
--
17Po
povaća
3,60
4<
10,0
00Lo
nja-
Stru
g (I
I)60
4015
0-
-18
Lipo
vlja
ni2,
457
< 10
,000
Lonj
a-St
rug
(II)
6040
150
--
19N
ovsk
a8,
276
< 10
,000
Lonj
a-St
rug
(II)
6040
150
--
20O
gulin
10,4
4910
,000
- 10
0,00
0D
obra
(I
I)35
2512
52
1521
Plaš
ki1,
753
< 10
,000
Dre
tulja
(I
I)60
4015
0-
-22
Slun
j1,
329
< 10
,000
Low
er K
oran
a (I
I)60
4015
0-
-N
ote:
1):
Sesv
ete
East
is e
xclu
ded
in Z
agre
b Za
greb
.
2):
Ivan
ic G
rad
- Klo
star
Ivan
ic, K
arlo
vac
- Dug
a R
esa
and
Zapr
esic
incl
udin
g m
unic
ipal
ity B
rdov
ec a
re a
n in
tegr
ated
syst
em o
f tw
o(2)
urb
an c
ente
rs re
spec
tivel
y.
3):
Pollu
tion
load
incl
udin
g in
dust
ry is
exp
ecte
d to
be
larg
er th
an 1
0,00
0.
Tab
le D
.1.2
Per
miss
ible
Lim
its o
f Effl
uent
Qua
lity
of O
bjec
tive
Sew
age
Tre
atm
ent P
lant
Obj
ectiv
e Se
wer
age
Syst
emPe
rmis
sibl
e Li
mits
of E
fflu
ent Q
ualit
yPl
ant S
ize
(PE)
Urb
an C
ente
rPo
pula
tion
(201
5)R
ecei
ving
Wat
er (C
ateg
ory)
D-T2
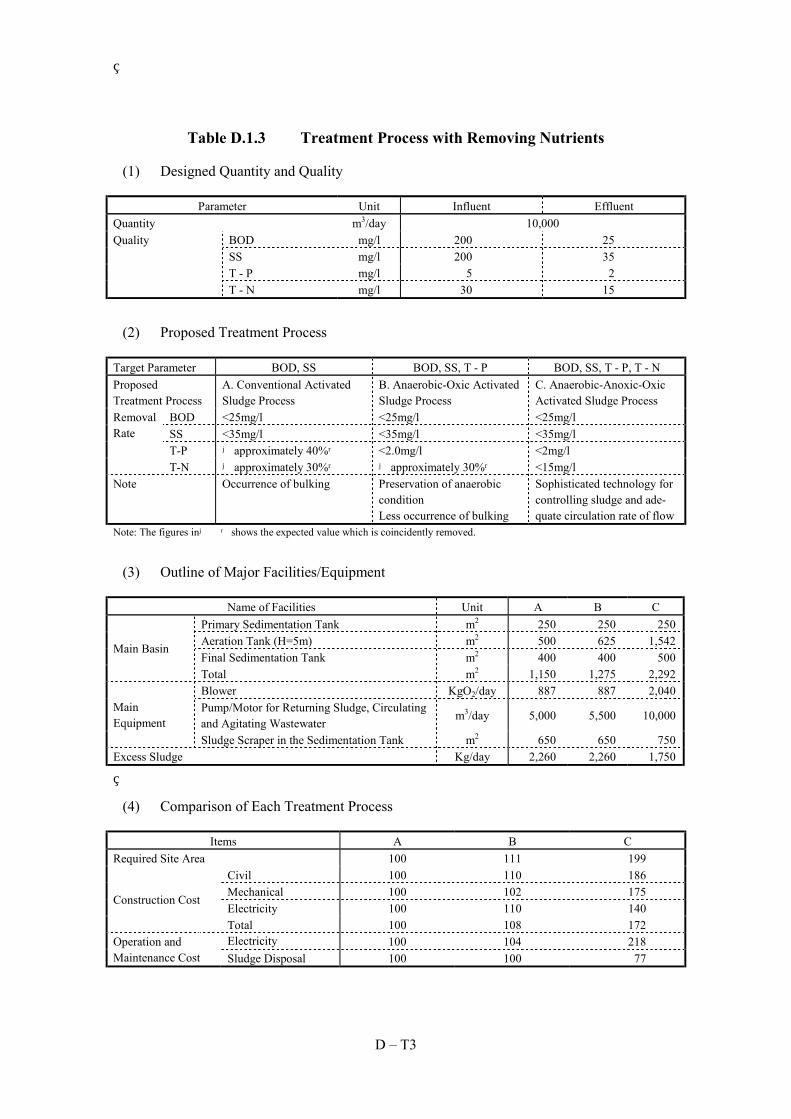
D – T3
Table D.1.3 Treatment Process with Removing Nutrients
(1) Designed Quantity and Quality
Parameter Unit Influent Effluent Quantity m3/day 10,000
BOD mg/l 200 25 SS mg/l 200 35 T - P mg/l 5 2
Quality
T - N mg/l 30 15
(2) Proposed Treatment Process
Target Parameter BOD, SS BOD, SS, T - P BOD, SS, T - P, T - N Proposed Treatment Process
A. Conventional Activated Sludge Process
B. Anaerobic-Oxic Activated Sludge Process
C. Anaerobic-Anoxic-Oxic Activated Sludge Process
BOD <25mg/l <25mg/l <25mg/l SS <35mg/l <35mg/l <35mg/l T-P 【approximately 40%】 <2.0mg/l <2mg/l
Removal Rate
T-N 【approximately 30%】 【approximately 30%】 <15mg/l Note Occurrence of bulking Preservation of anaerobic
condition Less occurrence of bulking
Sophisticated technology for controlling sludge and ade- quate circulation rate of flow
Note: The figures in【 】shows the expected value which is coincidently removed.
(3) Outline of Major Facilities/Equipment
Name of Facilities Unit A B C Primary Sedimentation Tank m2 250 250 250 Aeration Tank (H=5m) m2 500 625 1,542 Final Sedimentation Tank m2 400 400 500
Main Basin
Total m2 1,150 1,275 2,292 Blower KgO2/day 887 887 2,040 Pump/Motor for Returning Sludge, Circulating and Agitating Wastewater
m3/day 5,000 5,500 10,000 Main Equipment
Sludge Scraper in the Sedimentation Tank m2 650 650 750 Excess Sludge Kg/day 2,260 2,260 1,750
(4) Comparison of Each Treatment Process
Items A B C Required Site Area 100 111 199
Civil 100 110 186 Mechanical 100 102 175 Electricity 100 110 140
Construction Cost
Total 100 108 172 Electricity 100 104 218 Operation and
Maintenance Cost Sludge Disposal 100 100 77
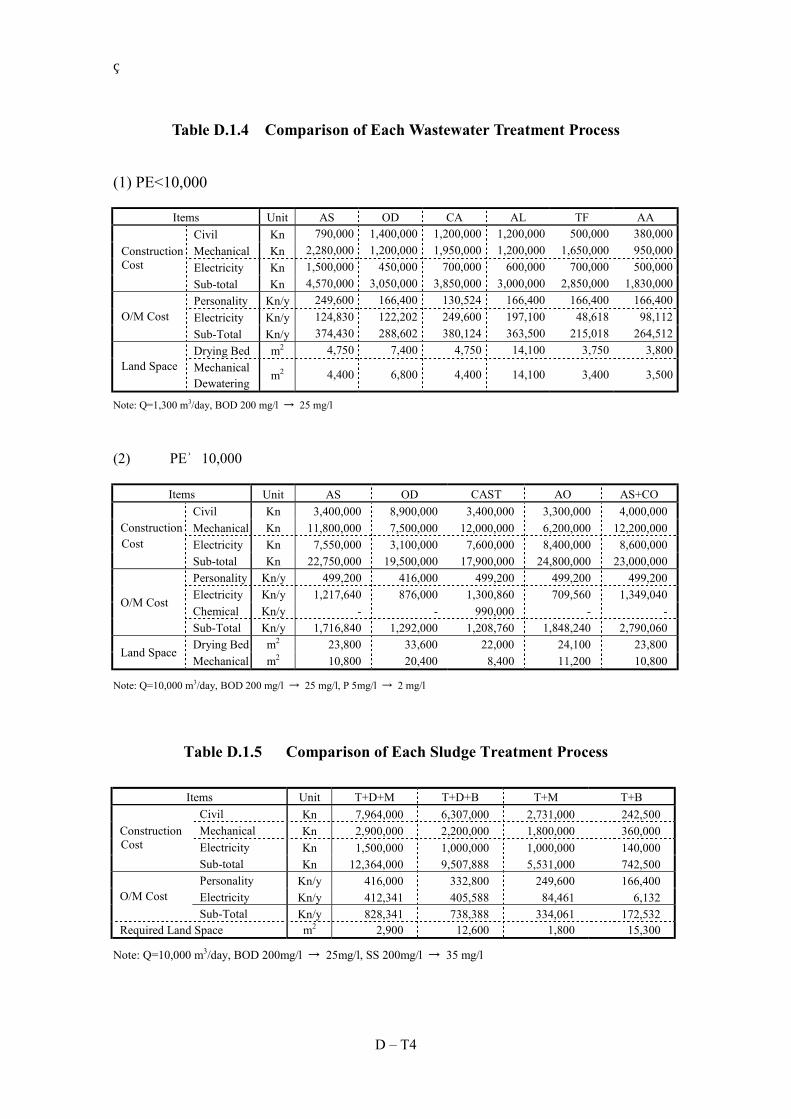
D – T4
Table D.1.4 Comparison of Each Wastewater Treatment Process
(1) PE<10,000
Items Unit AS OD CA AL TF AA Civil Kn 790,000 1,400,000 1,200,000 1,200,000 500,000 380,000 Mechanical Kn 2,280,000 1,200,000 1,950,000 1,200,000 1,650,000 950,000 Electricity Kn 1,500,000 450,000 700,000 600,000 700,000 500,000
Construction Cost
Sub-total Kn 4,570,000 3,050,000 3,850,000 3,000,000 2,850,000 1,830,000 Personality Kn/y 249,600 166,400 130,524 166,400 166,400 166,400 Electricity Kn/y 124,830 122,202 249,600 197,100 48,618 98,112 O/M Cost Sub-Total Kn/y 374,430 288,602 380,124 363,500 215,018 264,512 Drying Bed m2 4,750 7,400 4,750 14,100 3,750 3,800
Land Space Mechanical Dewatering
m2 4,400 6,800 4,400 14,100 3,400 3,500
Note: Q=1,300 m3/day, BOD 200 mg/l → 25 mg/l
(2) PE≧10,000
Items Unit AS OD CAST AO AS+CO Civil Kn 3,400,000 8,900,000 3,400,000 3,300,000 4,000,000 Mechanical Kn 11,800,000 7,500,000 12,000,000 6,200,000 12,200,000 Electricity Kn 7,550,000 3,100,000 7,600,000 8,400,000 8,600,000
Construction Cost
Sub-total Kn 22,750,000 19,500,000 17,900,000 24,800,000 23,000,000 Personality Kn/y 499,200 416,000 499,200 499,200 499,200 Electricity Kn/y 1,217,640 876,000 1,300,860 709,560 1,349,040 Chemical Kn/y - - 990,000 - -
O/M Cost
Sub-Total Kn/y 1,716,840 1,292,000 1,208,760 1,848,240 2,790,060 Drying Bed m2 23,800 33,600 22,000 24,100 23,800
Land Space Mechanical m2 10,800 20,400 8,400 11,200 10,800
Note: Q=10,000 m3/day, BOD 200 mg/l → 25 mg/l, P 5mg/l → 2 mg/l
Table D.1.5 Comparison of Each Sludge Treatment Process
Items Unit T+D+M T+D+B T+M T+B Civil Kn 7,964,000 6,307,000 2,731,000 242,500 Mechanical Kn 2,900,000 2,200,000 1,800,000 360,000 Electricity Kn 1,500,000 1,000,000 1,000,000 140,000
Construction Cost
Sub-total Kn 12,364,000 9,507,888 5,531,000 742,500 Personality Kn/y 416,000 332,800 249,600 166,400 Electricity Kn/y 412,341 405,588 84,461 6,132 O/M Cost Sub-Total Kn/y 828,341 738,388 334,061 172,532
Required Land Space m2 2,900 12,600 1,800 15,300
Note: Q=10,000 m3/day, BOD 200mg/l → 25mg/l, SS 200mg/l → 35 mg/l
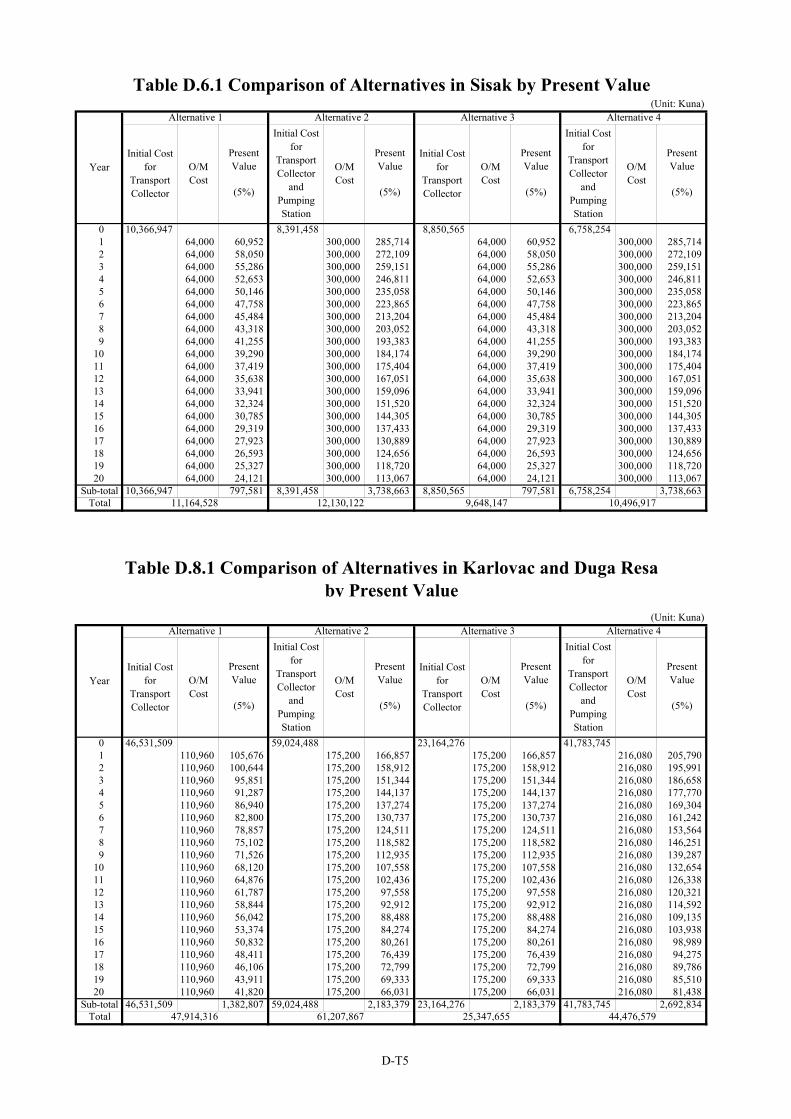
(Unit: Kuna)
(5%) (5%) (5%) (5%)
0 10,366,947 8,391,458 8,850,565 6,758,2541 64,000 60,952 300,000 285,714 64,000 60,952 300,000 285,7142 64,000 58,050 300,000 272,109 64,000 58,050 300,000 272,1093 64,000 55,286 300,000 259,151 64,000 55,286 300,000 259,1514 64,000 52,653 300,000 246,811 64,000 52,653 300,000 246,8115 64,000 50,146 300,000 235,058 64,000 50,146 300,000 235,0586 64,000 47,758 300,000 223,865 64,000 47,758 300,000 223,8657 64,000 45,484 300,000 213,204 64,000 45,484 300,000 213,2048 64,000 43,318 300,000 203,052 64,000 43,318 300,000 203,0529 64,000 41,255 300,000 193,383 64,000 41,255 300,000 193,383
10 64,000 39,290 300,000 184,174 64,000 39,290 300,000 184,17411 64,000 37,419 300,000 175,404 64,000 37,419 300,000 175,40412 64,000 35,638 300,000 167,051 64,000 35,638 300,000 167,05113 64,000 33,941 300,000 159,096 64,000 33,941 300,000 159,09614 64,000 32,324 300,000 151,520 64,000 32,324 300,000 151,52015 64,000 30,785 300,000 144,305 64,000 30,785 300,000 144,30516 64,000 29,319 300,000 137,433 64,000 29,319 300,000 137,43317 64,000 27,923 300,000 130,889 64,000 27,923 300,000 130,88918 64,000 26,593 300,000 124,656 64,000 26,593 300,000 124,65619 64,000 25,327 300,000 118,720 64,000 25,327 300,000 118,72020 64,000 24,121 300,000 113,067 64,000 24,121 300,000 113,067
10,366,947 797,581 8,391,458 3,738,663 8,850,565 797,581 6,758,254 3,738,663
(Unit: Kuna)
(5%) (5%) (5%) (5%)
0 46,531,509 59,024,488 23,164,276 41,783,7451 110,960 105,676 175,200 166,857 175,200 166,857 216,080 205,7902 110,960 100,644 175,200 158,912 175,200 158,912 216,080 195,9913 110,960 95,851 175,200 151,344 175,200 151,344 216,080 186,6584 110,960 91,287 175,200 144,137 175,200 144,137 216,080 177,7705 110,960 86,940 175,200 137,274 175,200 137,274 216,080 169,3046 110,960 82,800 175,200 130,737 175,200 130,737 216,080 161,2427 110,960 78,857 175,200 124,511 175,200 124,511 216,080 153,5648 110,960 75,102 175,200 118,582 175,200 118,582 216,080 146,2519 110,960 71,526 175,200 112,935 175,200 112,935 216,080 139,287
10 110,960 68,120 175,200 107,558 175,200 107,558 216,080 132,65411 110,960 64,876 175,200 102,436 175,200 102,436 216,080 126,33812 110,960 61,787 175,200 97,558 175,200 97,558 216,080 120,32113 110,960 58,844 175,200 92,912 175,200 92,912 216,080 114,59214 110,960 56,042 175,200 88,488 175,200 88,488 216,080 109,13515 110,960 53,374 175,200 84,274 175,200 84,274 216,080 103,93816 110,960 50,832 175,200 80,261 175,200 80,261 216,080 98,98917 110,960 48,411 175,200 76,439 175,200 76,439 216,080 94,27518 110,960 46,106 175,200 72,799 175,200 72,799 216,080 89,78619 110,960 43,911 175,200 69,333 175,200 69,333 216,080 85,51020 110,960 41,820 175,200 66,031 175,200 66,031 216,080 81,438
46,531,509 1,382,807 59,024,488 2,183,379 23,164,276 2,183,379 41,783,745 2,692,834
Table D.8.1 Comparison of Alternatives in Karlovac and Duga Resaby Present Value
Year
Alternative 1 Alternative 2 Alternative 3 Alternative 4
Initial Costfor
TransportCollector
O/MCost
Initial Costfor
TransportCollector
andPumpingStation
O/MCost
PresentValue
PresentValue
PresentValue
PresentValue
Initial Costfor
TransportCollector
O/MCost
Initial Costfor
TransportCollector
andPumpingStation
O/MCost
25,347,655 44,476,579Sub-total
Total 47,914,316 61,207,867
Year
Alternative 1 Alternative 2
Table D.6.1 Comparison of Alternatives in Sisak by Present ValueAlternative 3 Alternative 4
O/MCost
O/MCost
O/MCost
O/MCost
Sub-totalTotal 11,164,528 12,130,122 9,648,147 10,496,917
Initial Costfor
TransportCollector
Initial Costfor
TransportCollector
andPumpingStation
Initial Costfor
TransportCollector
andPumpingStation
Initial Costfor
TransportCollector
PresentValue
PresentValue
PresentValue
PresentValue
D-T5
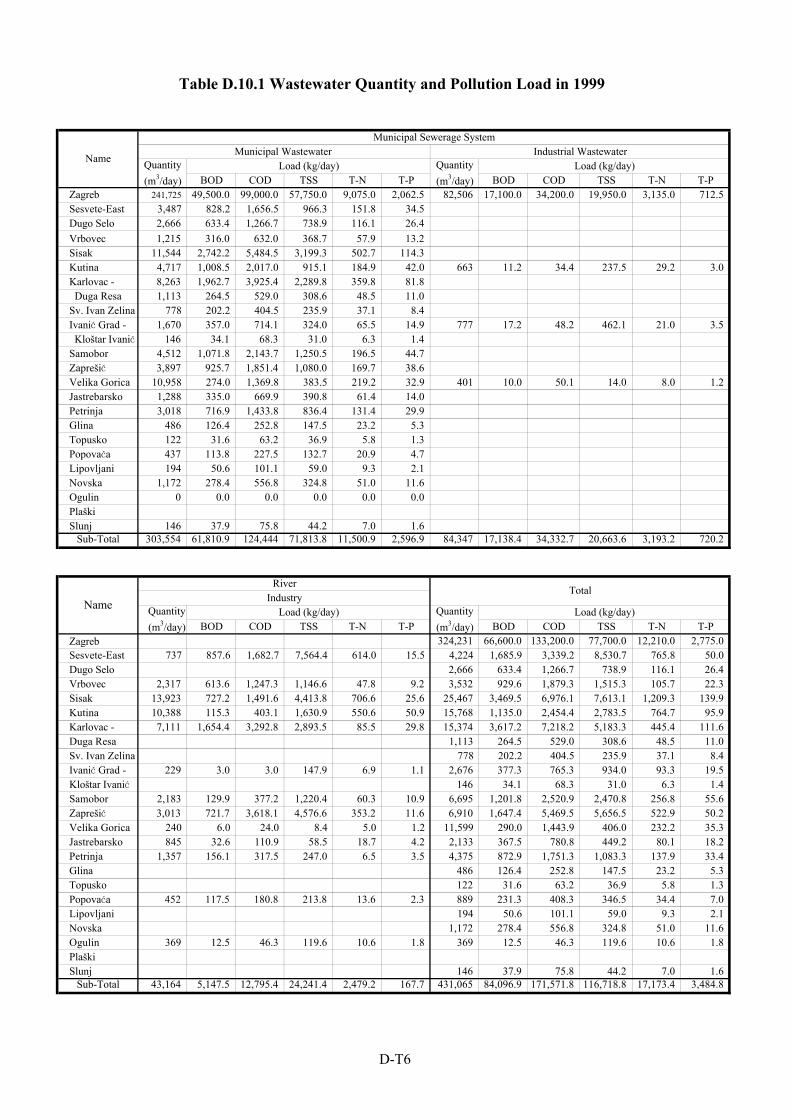
BOD COD TSS T-N T-P BOD COD TSS T-N T-PZagreb 241,725 49,500.0 99,000.0 57,750.0 9,075.0 2,062.5 82,506 17,100.0 34,200.0 19,950.0 3,135.0 712.5Sesvete-East 3,487 828.2 1,656.5 966.3 151.8 34.5Dugo Selo 2,666 633.4 1,266.7 738.9 116.1 26.4Vrbovec 1,215 316.0 632.0 368.7 57.9 13.2Sisak 11,544 2,742.2 5,484.5 3,199.3 502.7 114.3Kutina 4,717 1,008.5 2,017.0 915.1 184.9 42.0 663 11.2 34.4 237.5 29.2 3.0Karlovac - 8,263 1,962.7 3,925.4 2,289.8 359.8 81.8 Duga Resa 1,113 264.5 529.0 308.6 48.5 11.0Sv. Ivan Zelina 778 202.2 404.5 235.9 37.1 8.4Ivanić Grad - 1,670 357.0 714.1 324.0 65.5 14.9 777 17.2 48.2 462.1 21.0 3.5 Kloštar Ivanić 146 34.1 68.3 31.0 6.3 1.4Samobor 4,512 1,071.8 2,143.7 1,250.5 196.5 44.7Zaprešić 3,897 925.7 1,851.4 1,080.0 169.7 38.6Velika Gorica 10,958 274.0 1,369.8 383.5 219.2 32.9 401 10.0 50.1 14.0 8.0 1.2Jastrebarsko 1,288 335.0 669.9 390.8 61.4 14.0Petrinja 3,018 716.9 1,433.8 836.4 131.4 29.9Glina 486 126.4 252.8 147.5 23.2 5.3Topusko 122 31.6 63.2 36.9 5.8 1.3Popovaća 437 113.8 227.5 132.7 20.9 4.7Lipovljani 194 50.6 101.1 59.0 9.3 2.1Novska 1,172 278.4 556.8 324.8 51.0 11.6Ogulin 0 0.0 0.0 0.0 0.0 0.0Plaški Slunj 146 37.9 75.8 44.2 7.0 1.6
303,554 61,810.9 124,444 71,813.8 11,500.9 2,596.9 84,347 17,138.4 34,332.7 20,663.6 3,193.2 720.2
BOD COD TSS T-N T-P BOD COD TSS T-N T-PZagreb 324,231 66,600.0 133,200.0 77,700.0 12,210.0 2,775.0Sesvete-East 737 857.6 1,682.7 7,564.4 614.0 15.5 4,224 1,685.9 3,339.2 8,530.7 765.8 50.0Dugo Selo 2,666 633.4 1,266.7 738.9 116.1 26.4Vrbovec 2,317 613.6 1,247.3 1,146.6 47.8 9.2 3,532 929.6 1,879.3 1,515.3 105.7 22.3Sisak 13,923 727.2 1,491.6 4,413.8 706.6 25.6 25,467 3,469.5 6,976.1 7,613.1 1,209.3 139.9Kutina 10,388 115.3 403.1 1,630.9 550.6 50.9 15,768 1,135.0 2,454.4 2,783.5 764.7 95.9Karlovac - 7,111 1,654.4 3,292.8 2,893.5 85.5 29.8 15,374 3,617.2 7,218.2 5,183.3 445.4 111.6Duga Resa 1,113 264.5 529.0 308.6 48.5 11.0Sv. Ivan Zelina 778 202.2 404.5 235.9 37.1 8.4Ivanić Grad - 229 3.0 3.0 147.9 6.9 1.1 2,676 377.3 765.3 934.0 93.3 19.5Kloštar Ivanić 146 34.1 68.3 31.0 6.3 1.4Samobor 2,183 129.9 377.2 1,220.4 60.3 10.9 6,695 1,201.8 2,520.9 2,470.8 256.8 55.6Zaprešić 3,013 721.7 3,618.1 4,576.6 353.2 11.6 6,910 1,647.4 5,469.5 5,656.5 522.9 50.2Velika Gorica 240 6.0 24.0 8.4 5.0 1.2 11,599 290.0 1,443.9 406.0 232.2 35.3Jastrebarsko 845 32.6 110.9 58.5 18.7 4.2 2,133 367.5 780.8 449.2 80.1 18.2Petrinja 1,357 156.1 317.5 247.0 6.5 3.5 4,375 872.9 1,751.3 1,083.3 137.9 33.4Glina 486 126.4 252.8 147.5 23.2 5.3Topusko 122 31.6 63.2 36.9 5.8 1.3Popovaća 452 117.5 180.8 213.8 13.6 2.3 889 231.3 408.3 346.5 34.4 7.0Lipovljani 194 50.6 101.1 59.0 9.3 2.1Novska 1,172 278.4 556.8 324.8 51.0 11.6Ogulin 369 12.5 46.3 119.6 10.6 1.8 369 12.5 46.3 119.6 10.6 1.8Plaški Slunj 146 37.9 75.8 44.2 7.0 1.6
43,164 5,147.5 12,795.4 24,241.4 2,479.2 167.7 431,065 84,096.9 171,571.8 116,718.8 17,173.4 3,484.8
Industrial WastewaterQuantity(m3/day)
Load (kg/day)Quantity(m3/day)
Municipal Wastewater Municipal Sewerage System
Sub-Total
Sub-Total
RiverIndustry
Total
Quantity(m3/day)
Load (kg/day)Quantity(m3/day)
Load (kg/day)
Table D.10.1 Wastewater Quantity and Pollution Load in 1999
Load (kg/day)
Name
Name
D-T6
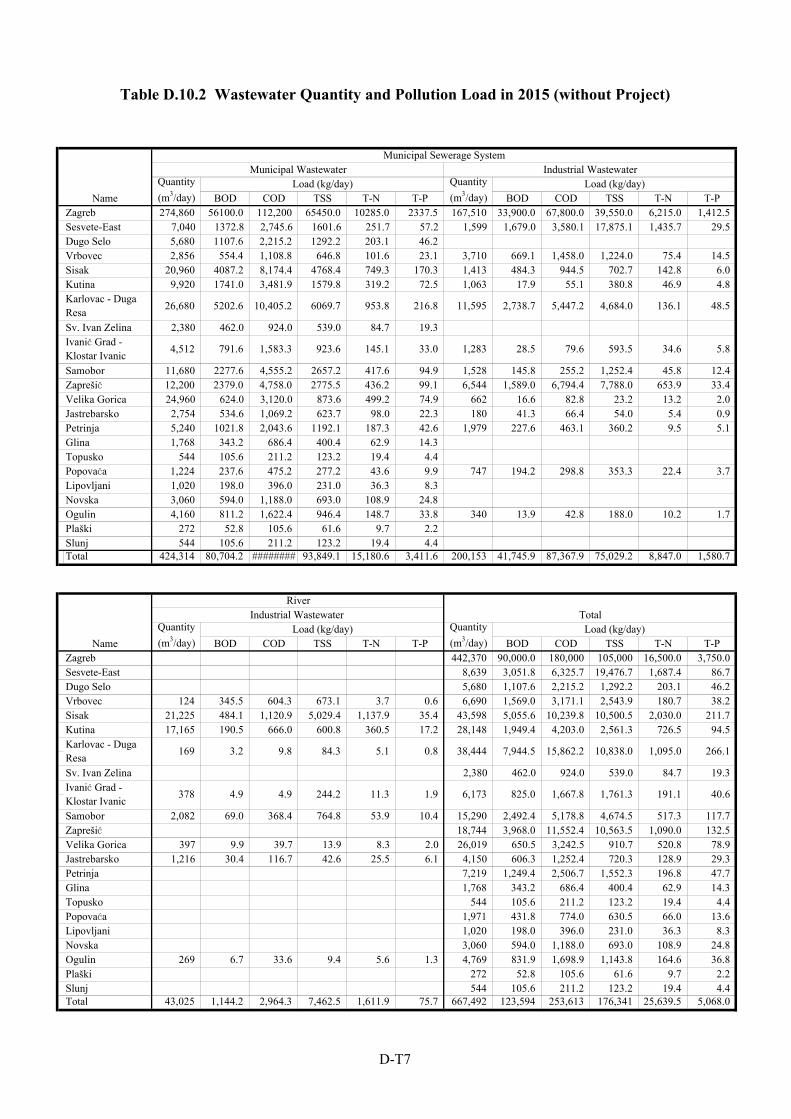
BOD COD TSS T-N T-P BOD COD TSS T-N T-PZagreb 274,860 56100.0 112,200 65450.0 10285.0 2337.5 167,510 33,900.0 67,800.0 39,550.0 6,215.0 1,412.5Sesvete-East 7,040 1372.8 2,745.6 1601.6 251.7 57.2 1,599 1,679.0 3,580.1 17,875.1 1,435.7 29.5Dugo Selo 5,680 1107.6 2,215.2 1292.2 203.1 46.2Vrbovec 2,856 554.4 1,108.8 646.8 101.6 23.1 3,710 669.1 1,458.0 1,224.0 75.4 14.5Sisak 20,960 4087.2 8,174.4 4768.4 749.3 170.3 1,413 484.3 944.5 702.7 142.8 6.0Kutina 9,920 1741.0 3,481.9 1579.8 319.2 72.5 1,063 17.9 55.1 380.8 46.9 4.8
Sv. Ivan Zelina 2,380 462.0 924.0 539.0 84.7 19.3
Samobor 11,680 2277.6 4,555.2 2657.2 417.6 94.9 1,528 145.8 255.2 1,252.4 45.8 12.4Zaprešić 12,200 2379.0 4,758.0 2775.5 436.2 99.1 6,544 1,589.0 6,794.4 7,788.0 653.9 33.4Velika Gorica 24,960 624.0 3,120.0 873.6 499.2 74.9 662 16.6 82.8 23.2 13.2 2.0Jastrebarsko 2,754 534.6 1,069.2 623.7 98.0 22.3 180 41.3 66.4 54.0 5.4 0.9Petrinja 5,240 1021.8 2,043.6 1192.1 187.3 42.6 1,979 227.6 463.1 360.2 9.5 5.1Glina 1,768 343.2 686.4 400.4 62.9 14.3Topusko 544 105.6 211.2 123.2 19.4 4.4Popovaća 1,224 237.6 475.2 277.2 43.6 9.9 747 194.2 298.8 353.3 22.4 3.7Lipovljani 1,020 198.0 396.0 231.0 36.3 8.3Novska 3,060 594.0 1,188.0 693.0 108.9 24.8Ogulin 4,160 811.2 1,622.4 946.4 148.7 33.8 340 13.9 42.8 188.0 10.2 1.7Plaški 272 52.8 105.6 61.6 9.7 2.2Slunj 544 105.6 211.2 123.2 19.4 4.4Total 424,314 80,704.2 ######## 93,849.1 15,180.6 3,411.6 200,153 41,745.9 87,367.9 75,029.2 8,847.0 1,580.7
BOD COD TSS T-N T-P BOD COD TSS T-N T-PZagreb 442,370 90,000.0 180,000 105,000 16,500.0 3,750.0Sesvete-East 8,639 3,051.8 6,325.7 19,476.7 1,687.4 86.7Dugo Selo 5,680 1,107.6 2,215.2 1,292.2 203.1 46.2Vrbovec 124 345.5 604.3 673.1 3.7 0.6 6,690 1,569.0 3,171.1 2,543.9 180.7 38.2Sisak 21,225 484.1 1,120.9 5,029.4 1,137.9 35.4 43,598 5,055.6 10,239.8 10,500.5 2,030.0 211.7Kutina 17,165 190.5 666.0 600.8 360.5 17.2 28,148 1,949.4 4,203.0 2,561.3 726.5 94.5
Sv. Ivan Zelina 2,380 462.0 924.0 539.0 84.7 19.3
Samobor 2,082 69.0 368.4 764.8 53.9 10.4 15,290 2,492.4 5,178.8 4,674.5 517.3 117.7Zaprešić 18,744 3,968.0 11,552.4 10,563.5 1,090.0 132.5Velika Gorica 397 9.9 39.7 13.9 8.3 2.0 26,019 650.5 3,242.5 910.7 520.8 78.9Jastrebarsko 1,216 30.4 116.7 42.6 25.5 6.1 4,150 606.3 1,252.4 720.3 128.9 29.3Petrinja 7,219 1,249.4 2,506.7 1,552.3 196.8 47.7Glina 1,768 343.2 686.4 400.4 62.9 14.3Topusko 544 105.6 211.2 123.2 19.4 4.4Popovaća 1,971 431.8 774.0 630.5 66.0 13.6Lipovljani 1,020 198.0 396.0 231.0 36.3 8.3Novska 3,060 594.0 1,188.0 693.0 108.9 24.8Ogulin 269 6.7 33.6 9.4 5.6 1.3 4,769 831.9 1,698.9 1,143.8 164.6 36.8Plaški 272 52.8 105.6 61.6 9.7 2.2Slunj 544 105.6 211.2 123.2 19.4 4.4Total 43,025 1,144.2 2,964.3 7,462.5 1,611.9 75.7 667,492 123,594 253,613 176,341 25,639.5 5,068.0
34.6
River
Ivanić Grad -Klostar Ivanic 378 4.9 4.9 244.2
Name
TotalIndustrial Wastewater Quantity(m3/day)
Load (kg/day) Quantity(m3/day)
Load (kg/day)
33.0
953.8Karlovac - DugaResa 26,680 5202.6 10,405.2
5.8
Quantity(m3/day)
Load (kg/day)
11,595 48.52,738.7 5,447.2 4,684.0 136.1
593.5
Load (kg/day)Quantity(m3/day)
145.1
216.86069.7
Municipal Sewerage System
Name
Municipal Wastewater Industrial Wastewater
Table D.10.2 Wastewater Quantity and Pollution Load in 2015 (without Project)
1,283 28.5 79.6Ivanić Grad -Klostar Ivanic 4,512 791.6 1,583.3 923.6
11.3 1.9 6,173 825.0 1,667.8 1,761.3 191.1 40.6
Karlovac - DugaResa 169 3.2 9.8 84.3 5.1 0.8 38,444 266.17,944.5 15,862.2 10,838.0 1,095.0
D-T7
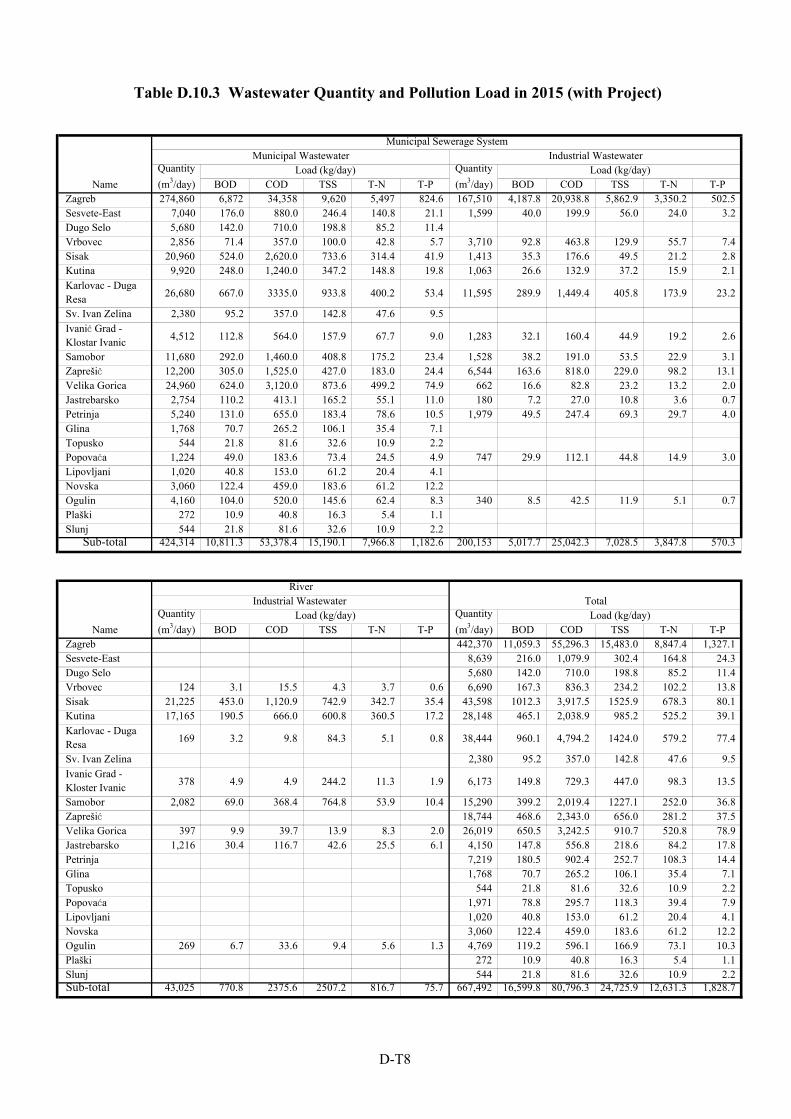
BOD COD TSS T-N T-P BOD COD TSS T-N T-PZagreb 274,860 6,872 34,358 9,620 5,497 824.6 167,510 4,187.8 20,938.8 5,862.9 3,350.2 502.5Sesvete-East 7,040 176.0 880.0 246.4 140.8 21.1 1,599 40.0 199.9 56.0 24.0 3.2Dugo Selo 5,680 142.0 710.0 198.8 85.2 11.4Vrbovec 2,856 71.4 357.0 100.0 42.8 5.7 3,710 92.8 463.8 129.9 55.7 7.4Sisak 20,960 524.0 2,620.0 733.6 314.4 41.9 1,413 35.3 176.6 49.5 21.2 2.8Kutina 9,920 248.0 1,240.0 347.2 148.8 19.8 1,063 26.6 132.9 37.2 15.9 2.1
Sv. Ivan Zelina 2,380 95.2 357.0 142.8 47.6 9.5
Samobor 11,680 292.0 1,460.0 408.8 175.2 23.4 1,528 38.2 191.0 53.5 22.9 3.1Zaprešić 12,200 305.0 1,525.0 427.0 183.0 24.4 6,544 163.6 818.0 229.0 98.2 13.1Velika Gorica 24,960 624.0 3,120.0 873.6 499.2 74.9 662 16.6 82.8 23.2 13.2 2.0Jastrebarsko 2,754 110.2 413.1 165.2 55.1 11.0 180 7.2 27.0 10.8 3.6 0.7Petrinja 5,240 131.0 655.0 183.4 78.6 10.5 1,979 49.5 247.4 69.3 29.7 4.0Glina 1,768 70.7 265.2 106.1 35.4 7.1Topusko 544 21.8 81.6 32.6 10.9 2.2Popovaća 1,224 49.0 183.6 73.4 24.5 4.9 747 29.9 112.1 44.8 14.9 3.0Lipovljani 1,020 40.8 153.0 61.2 20.4 4.1Novska 3,060 122.4 459.0 183.6 61.2 12.2Ogulin 4,160 104.0 520.0 145.6 62.4 8.3 340 8.5 42.5 11.9 5.1 0.7Plaški 272 10.9 40.8 16.3 5.4 1.1Slunj 544 21.8 81.6 32.6 10.9 2.2
424,314 10,811.3 53,378.4 15,190.1 7,966.8 1,182.6 200,153 5,017.7 25,042.3 7,028.5 3,847.8 570.3
BOD COD TSS T-N T-P BOD COD TSS T-N T-PZagreb 442,370 11,059.3 55,296.3 15,483.0 8,847.4 1,327.1Sesvete-East 8,639 216.0 1,079.9 302.4 164.8 24.3Dugo Selo 5,680 142.0 710.0 198.8 85.2 11.4Vrbovec 124 3.1 15.5 4.3 3.7 0.6 6,690 167.3 836.3 234.2 102.2 13.8Sisak 21,225 453.0 1,120.9 742.9 342.7 35.4 43,598 1012.3 3,917.5 1525.9 678.3 80.1Kutina 17,165 190.5 666.0 600.8 360.5 17.2 28,148 465.1 2,038.9 985.2 525.2 39.1
Sv. Ivan Zelina 2,380 95.2 357.0 142.8 47.6 9.5
Samobor 2,082 69.0 368.4 764.8 53.9 10.4 15,290 399.2 2,019.4 1227.1 252.0 36.8Zaprešić 18,744 468.6 2,343.0 656.0 281.2 37.5Velika Gorica 397 9.9 39.7 13.9 8.3 2.0 26,019 650.5 3,242.5 910.7 520.8 78.9Jastrebarsko 1,216 30.4 116.7 42.6 25.5 6.1 4,150 147.8 556.8 218.6 84.2 17.8Petrinja 7,219 180.5 902.4 252.7 108.3 14.4Glina 1,768 70.7 265.2 106.1 35.4 7.1Topusko 544 21.8 81.6 32.6 10.9 2.2Popovaća 1,971 78.8 295.7 118.3 39.4 7.9Lipovljani 1,020 40.8 153.0 61.2 20.4 4.1Novska 3,060 122.4 459.0 183.6 61.2 12.2Ogulin 269 6.7 33.6 9.4 5.6 1.3 4,769 119.2 596.1 166.9 73.1 10.3Plaški 272 10.9 40.8 16.3 5.4 1.1Slunj 544 21.8 81.6 32.6 10.9 2.2Sub-total 43,025 770.8 2375.6 2507.2 816.7 75.7 667,492 16,599.8 80,796.3 24,725.9 12,631.3 1,828.7
77.4Karlovac - DugaResa 960.1 4,794.2 1424.0 579.2
447.0 98.3 13.5
169 3.2 9.8 84.3 5.1 0.8 38,444
405.8 173.9 23.2
4.9 244.2 11.3 1.9 6,173 149.8 729.3
2.6
26,680 667.0 3335.0 933.8 400.2 53.4 11,595 289.9 1,449.4Karlovac - DugaResa
378 4.9
Name
Sub-total
River
Ivanic Grad -Kloster Ivanic
Ivanić Grad -Klostar Ivanic 4,512 112.8
Name
Table D.10.3 Wastewater Quantity and Pollution Load in 2015 (with Project)
564.0 157.9 67.7 9.0 1,283 32.1
Quantity(m3/day)
160.4 44.9
Municipal Sewerage SystemMunicipal Wastewater Industrial Wastewater
Load (kg/day) Load (kg/day)Quantity(m3/day)
TotalIndustrial Wastewater Quantity(m3/day)
Load (kg/day) Quantity(m3/day)
Load (kg/day)
19.2
D-T8
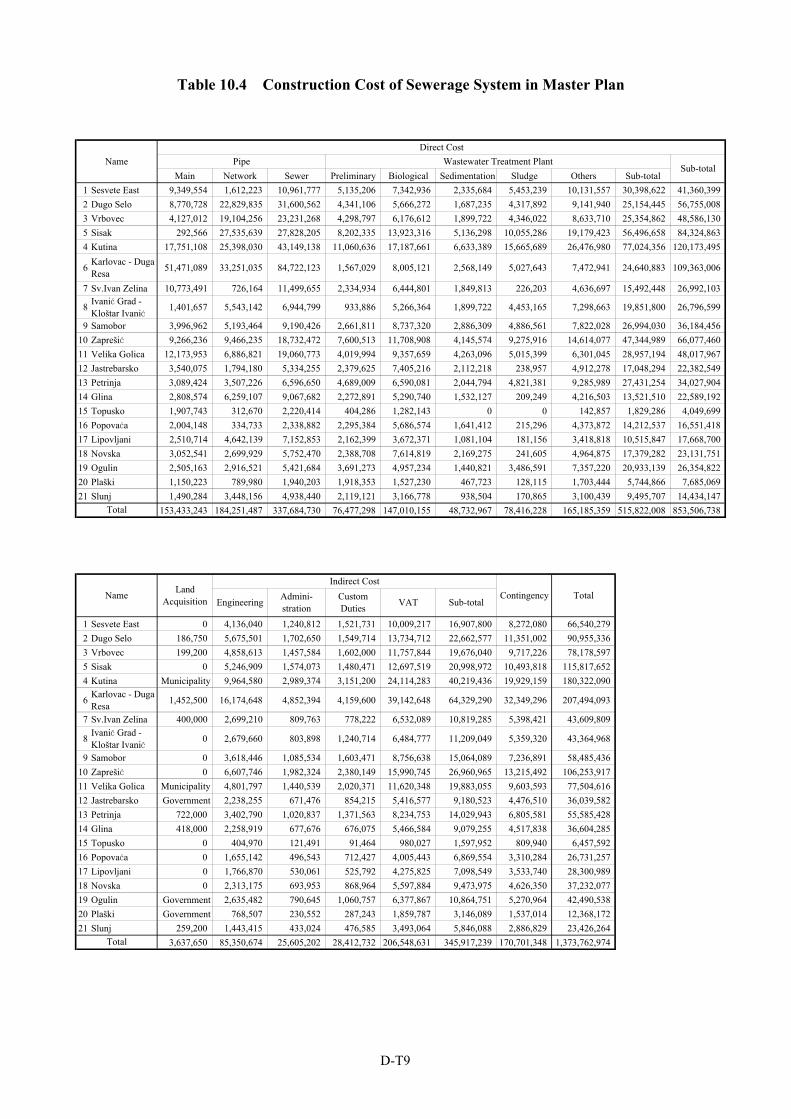
Main Network Sewer Preliminary Biological Sedimentation Sludge Others Sub-total1 Sesvete East 9,349,554 1,612,223 10,961,777 5,135,206 7,342,936 2,335,684 5,453,239 10,131,557 30,398,622 41,360,3992 Dugo Selo 8,770,728 22,829,835 31,600,562 4,341,106 5,666,272 1,687,235 4,317,892 9,141,940 25,154,445 56,755,0083 Vrbovec 4,127,012 19,104,256 23,231,268 4,298,797 6,176,612 1,899,722 4,346,022 8,633,710 25,354,862 48,586,1305 Sisak 292,566 27,535,639 27,828,205 8,202,335 13,923,316 5,136,298 10,055,286 19,179,423 56,496,658 84,324,8634 Kutina 17,751,108 25,398,030 43,149,138 11,060,636 17,187,661 6,633,389 15,665,689 26,476,980 77,024,356 120,173,495
6 Karlovac - DugaResa 51,471,089 33,251,035 84,722,123 1,567,029 8,005,121 2,568,149 5,027,643 7,472,941 24,640,883 109,363,006
7 Sv.Ivan Zelina 10,773,491 726,164 11,499,655 2,334,934 6,444,801 1,849,813 226,203 4,636,697 15,492,448 26,992,103
8 Ivanić Grad -Kloštar Ivanić 1,401,657 5,543,142 6,944,799 933,886 5,266,364 1,899,722 4,453,165 7,298,663 19,851,800 26,796,599
9 Samobor 3,996,962 5,193,464 9,190,426 2,661,811 8,737,320 2,886,309 4,886,561 7,822,028 26,994,030 36,184,45610 Zaprešić 9,266,236 9,466,235 18,732,472 7,600,513 11,708,908 4,145,574 9,275,916 14,614,077 47,344,989 66,077,46011 Velika Golica 12,173,953 6,886,821 19,060,773 4,019,994 9,357,659 4,263,096 5,015,399 6,301,045 28,957,194 48,017,96712 Jastrebarsko 3,540,075 1,794,180 5,334,255 2,379,625 7,405,216 2,112,218 238,957 4,912,278 17,048,294 22,382,54913 Petrinja 3,089,424 3,507,226 6,596,650 4,689,009 6,590,081 2,044,794 4,821,381 9,285,989 27,431,254 34,027,90414 Glina 2,808,574 6,259,107 9,067,682 2,272,891 5,290,740 1,532,127 209,249 4,216,503 13,521,510 22,589,19215 Topusko 1,907,743 312,670 2,220,414 404,286 1,282,143 0 0 142,857 1,829,286 4,049,69916 Popovaća 2,004,148 334,733 2,338,882 2,295,384 5,686,574 1,641,412 215,296 4,373,872 14,212,537 16,551,41817 Lipovljani 2,510,714 4,642,139 7,152,853 2,162,399 3,672,371 1,081,104 181,156 3,418,818 10,515,847 17,668,70018 Novska 3,052,541 2,699,929 5,752,470 2,388,708 7,614,819 2,169,275 241,605 4,964,875 17,379,282 23,131,75119 Ogulin 2,505,163 2,916,521 5,421,684 3,691,273 4,957,234 1,440,821 3,486,591 7,357,220 20,933,139 26,354,82220 Plaški 1,150,223 789,980 1,940,203 1,918,353 1,527,230 467,723 128,115 1,703,444 5,744,866 7,685,06921 Slunj 1,490,284 3,448,156 4,938,440 2,119,121 3,166,778 938,504 170,865 3,100,439 9,495,707 14,434,147
153,433,243 184,251,487 337,684,730 76,477,298 147,010,155 48,732,967 78,416,228 165,185,359 515,822,008 853,506,738
1 Sesvete East 0 4,136,040 1,240,812 1,521,731 10,009,217 16,907,800 8,272,080 66,540,2792 Dugo Selo 186,750 5,675,501 1,702,650 1,549,714 13,734,712 22,662,577 11,351,002 90,955,3363 Vrbovec 199,200 4,858,613 1,457,584 1,602,000 11,757,844 19,676,040 9,717,226 78,178,5975 Sisak 0 5,246,909 1,574,073 1,480,471 12,697,519 20,998,972 10,493,818 115,817,6524 Kutina Municipality 9,964,580 2,989,374 3,151,200 24,114,283 40,219,436 19,929,159 180,322,090
6 Karlovac - DugaResa 1,452,500 16,174,648 4,852,394 4,159,600 39,142,648 64,329,290 32,349,296 207,494,093
7 Sv.Ivan Zelina 400,000 2,699,210 809,763 778,222 6,532,089 10,819,285 5,398,421 43,609,809
8 Ivanić Grad -Kloštar Ivanić 0 2,679,660 803,898 1,240,714 6,484,777 11,209,049 5,359,320 43,364,968
9 Samobor 0 3,618,446 1,085,534 1,603,471 8,756,638 15,064,089 7,236,891 58,485,43610 Zaprešić 0 6,607,746 1,982,324 2,380,149 15,990,745 26,960,965 13,215,492 106,253,91711 Velika Golica Municipality 4,801,797 1,440,539 2,020,371 11,620,348 19,883,055 9,603,593 77,504,61612 Jastrebarsko Government 2,238,255 671,476 854,215 5,416,577 9,180,523 4,476,510 36,039,58213 Petrinja 722,000 3,402,790 1,020,837 1,371,563 8,234,753 14,029,943 6,805,581 55,585,42814 Glina 418,000 2,258,919 677,676 676,075 5,466,584 9,079,255 4,517,838 36,604,28515 Topusko 0 404,970 121,491 91,464 980,027 1,597,952 809,940 6,457,59216 Popovaća 0 1,655,142 496,543 712,427 4,005,443 6,869,554 3,310,284 26,731,25717 Lipovljani 0 1,766,870 530,061 525,792 4,275,825 7,098,549 3,533,740 28,300,98918 Novska 0 2,313,175 693,953 868,964 5,597,884 9,473,975 4,626,350 37,232,07719 Ogulin Government 2,635,482 790,645 1,060,757 6,377,867 10,864,751 5,270,964 42,490,53820 Plaški Government 768,507 230,552 287,243 1,859,787 3,146,089 1,537,014 12,368,17221 Slunj 259,200 1,443,415 433,024 476,585 3,493,064 5,846,088 2,886,829 23,426,264
3,637,650 85,350,674 25,605,202 28,412,732 206,548,631 345,917,239 170,701,348 1,373,762,974
Sub-total
Table 10.4 Construction Cost of Sewerage System in Master Plan
Sub-total
Total
VAT
NameDirect Cost
Total
Pipe Wastewater Treatment Plant
ContingencyIndirect Cost
LandAcquisition
Total
Engineering Admini-stration
CustomDuties
Name
D-T9

FIGURES
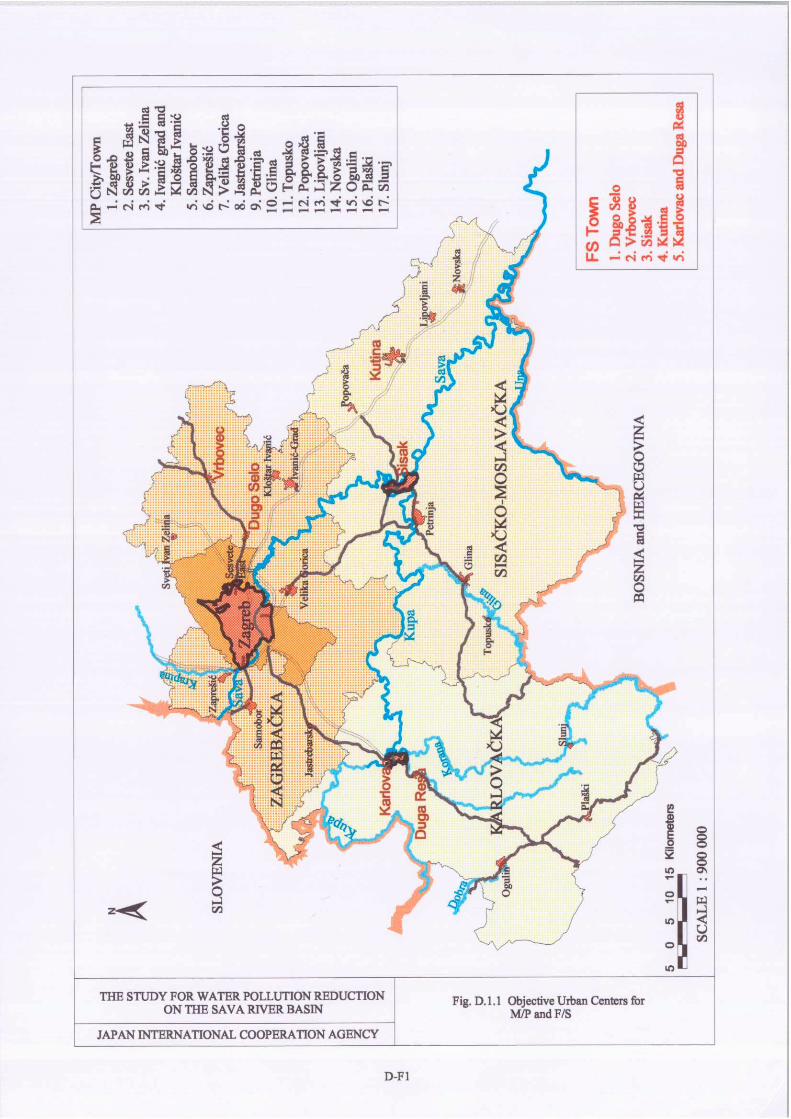
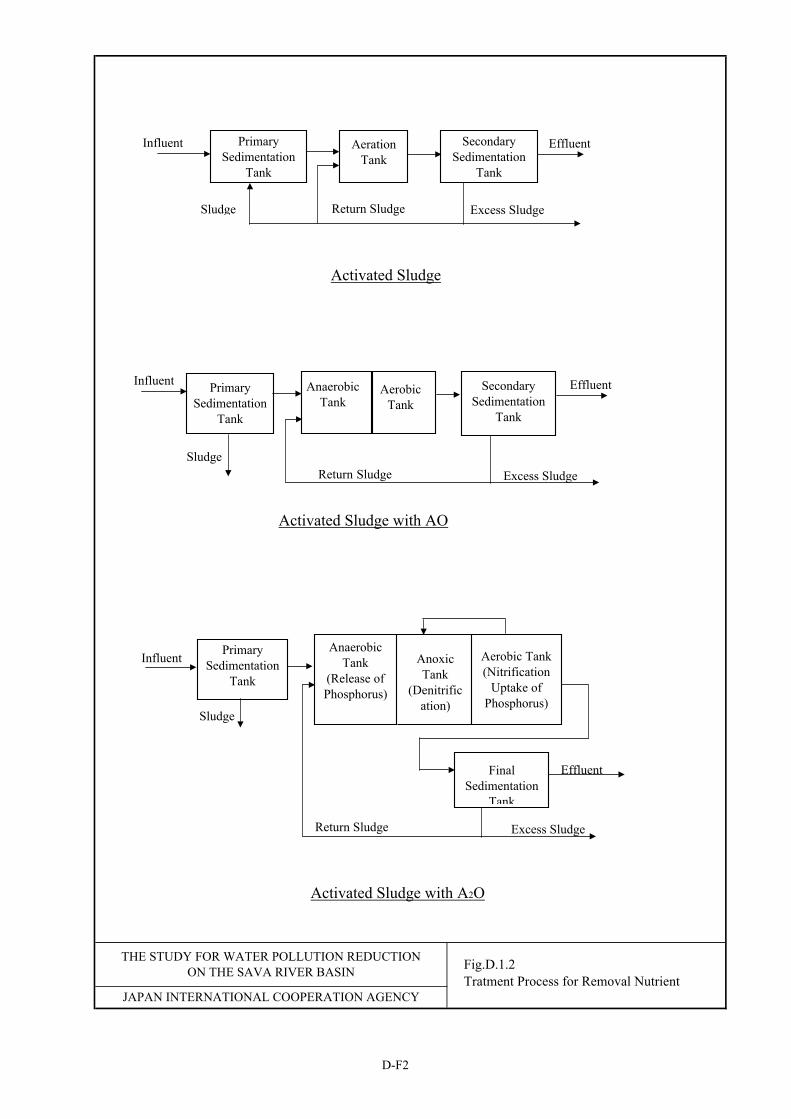
THE STUDY FOR WATER POLLUTION REDUCTIONON THE SAVA RIVER BASIN
JAPAN INTERNATIONAL COOPERATION AGENCY
Fig.D.1.2Tratment Process for Removal Nutrient
Influent
Return Sludge Excess Sludge
PrimarySedimentation
Tank
SecondarySedimentation
Tank
Sludge
EffluentAerobicTank
AnaerobicTank
Activated Sludge with AO
Influent PrimarySedimentation
Tank
AnaerobicTank
(Release ofPhosphorus)
AnoxicTank
(Denitrification)
Aerobic Tank(Nitrification
Uptake ofPhosphorus)
FinalSedimentation
Tank
Sludge
Return Sludge Excess Sludge
Activated Sludge with A2O
Effluent
Sludge
PrimarySedimentation
Tank
AerationTank
SecondarySedimentation
Tank
Return Sludge Excess Sludge
Influent Effluent
Activated Sludge
D-F2
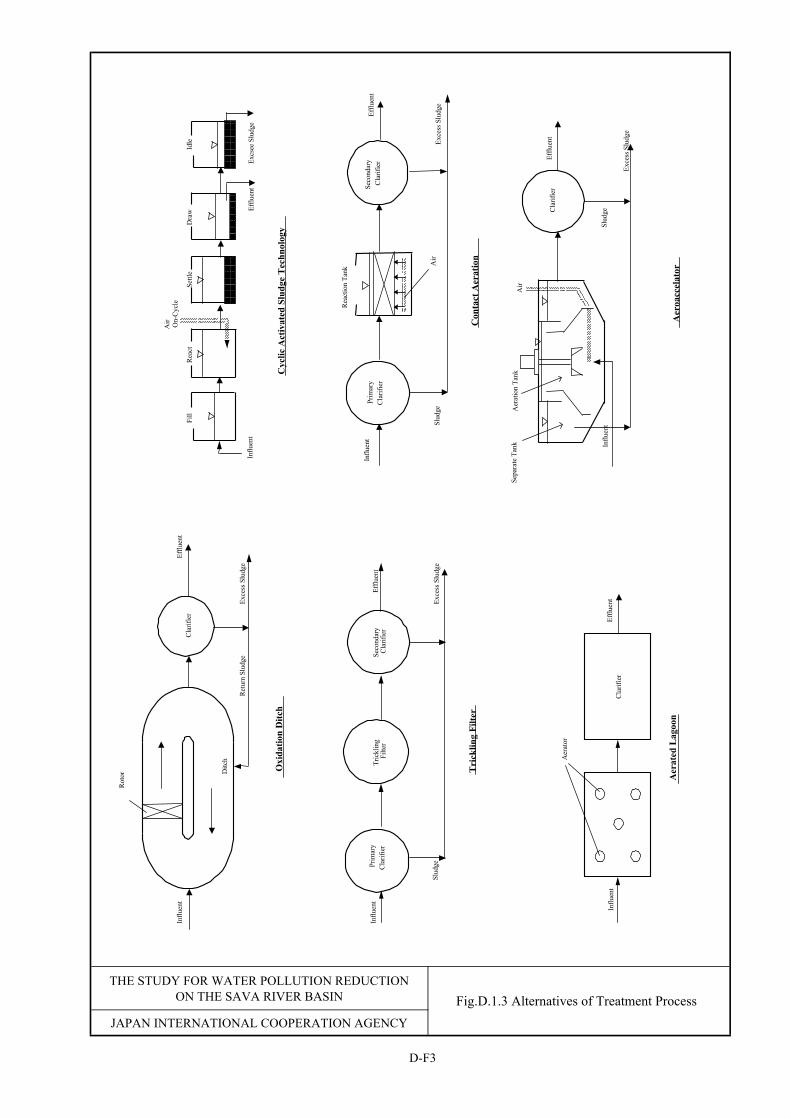
JAPAN INTERNATIONAL COOPERATION AGENCY
THE STUDY FOR WATER POLLUTION REDUCTIONON THE SAVA RIVER BASIN Fig.D.1.3 Alternatives of Treatment Process
Aer
ated
Lag
oon
Influ
ent
Cla
rifie
rEf
fluen
t
Aer
ator
Cyc
lic A
ctiv
ated
Slu
dge
Tec
hnol
ogy
Influ
ent
Fill
Rea
ctSe
ttle
Dra
wId
le
Air
On-
Cyc
le
Efflu
ent
Excs
ee S
ludg
e
Con
tact
Aer
atio
n
Prim
ary
Cla
rifie
r
Slud
geEx
cess
Slu
dge
Influ
ent
Efflu
ent
Air
Rea
ctio
n Ta
nk
Seco
ndar
yC
larif
ier
Aer
oacc
elat
or
Cla
rifie
r
Slud
ge
Exce
ss S
ludg
e
Efflu
ent
Influ
ent
Air
Sepa
rate
Tan
kA
erat
ion
Tank
D-F3
Rot
or Ditc
h
Ret
urn
Slud
geEx
cess
Slu
dge
Oxi
datio
n D
itch
Influ
ent
Efflu
ent
Cla
rifie
r
Tri
cklin
g Fi
lter
Prim
ary
Cla
rifie
r
Slud
geEx
cess
Slu
dge
Influ
ent
Efflu
ent
Tric
klin
gFi
lter
Seco
ndar
yC
larif
ier
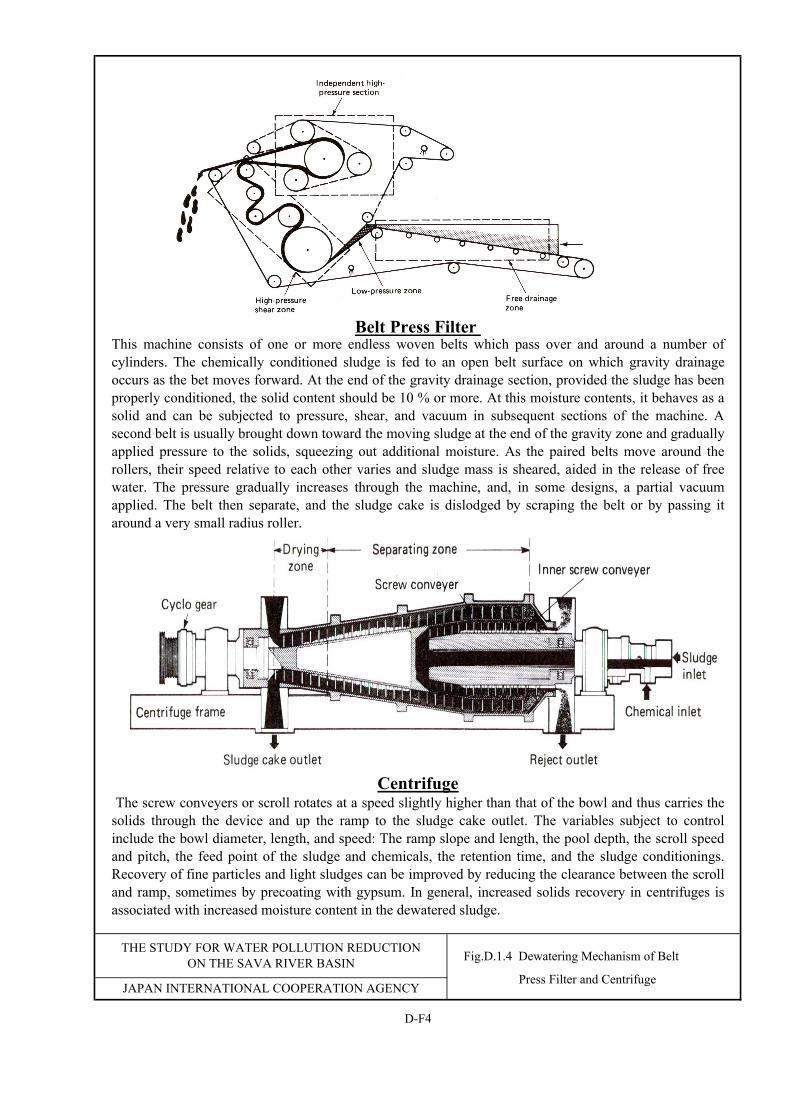
THE STUDY FOR WATER POLLUTION REDUCTIONON THE SAVA RIVER BASIN
JAPAN INTERNATIONAL COOPERATION AGENCY
D-F4
This machine consists of one or more endless woven belts which pass over and around a number ofcylinders. The chemically conditioned sludge is fed to an open belt surface on which gravity drainageoccurs as the bet moves forward. At the end of the gravity drainage section, provided the sludge has beenproperly conditioned, the solid content should be 10 % or more. At this moisture contents, it behaves as asolid and can be subjected to pressure, shear, and vacuum in subsequent sections of the machine. Asecond belt is usually brought down toward the moving sludge at the end of the gravity zone and graduallyapplied pressure to the solids, squeezing out additional moisture. As the paired belts move around therollers, their speed relative to each other varies and sludge mass is sheared, aided in the release of freewater. The pressure gradually increases through the machine, and, in some designs, a partial vacuumapplied. The belt then separate, and the sludge cake is dislodged by scraping the belt or by passing itaround a very small radius roller.
The screw conveyers or scroll rotates at a speed slightly higher than that of the bowl and thus carries thesolids through the device and up the ramp to the sludge cake outlet. The variables subject to controlinclude the bowl diameter, length, and speed: The ramp slope and length, the pool depth, the scroll speedand pitch, the feed point of the sludge and chemicals, the retention time, and the sludge conditionings.Recovery of fine particles and light sludges can be improved by reducing the clearance between the scrolland ramp, sometimes by precoating with gypsum. In general, increased solids recovery in centrifuges isassociated with increased moisture content in the dewatered sludge.
Belt Press Filter
Centrifuge
Fig.D.1.4 Dewatering Mechanism of Belt
Press Filter and Centrifuge
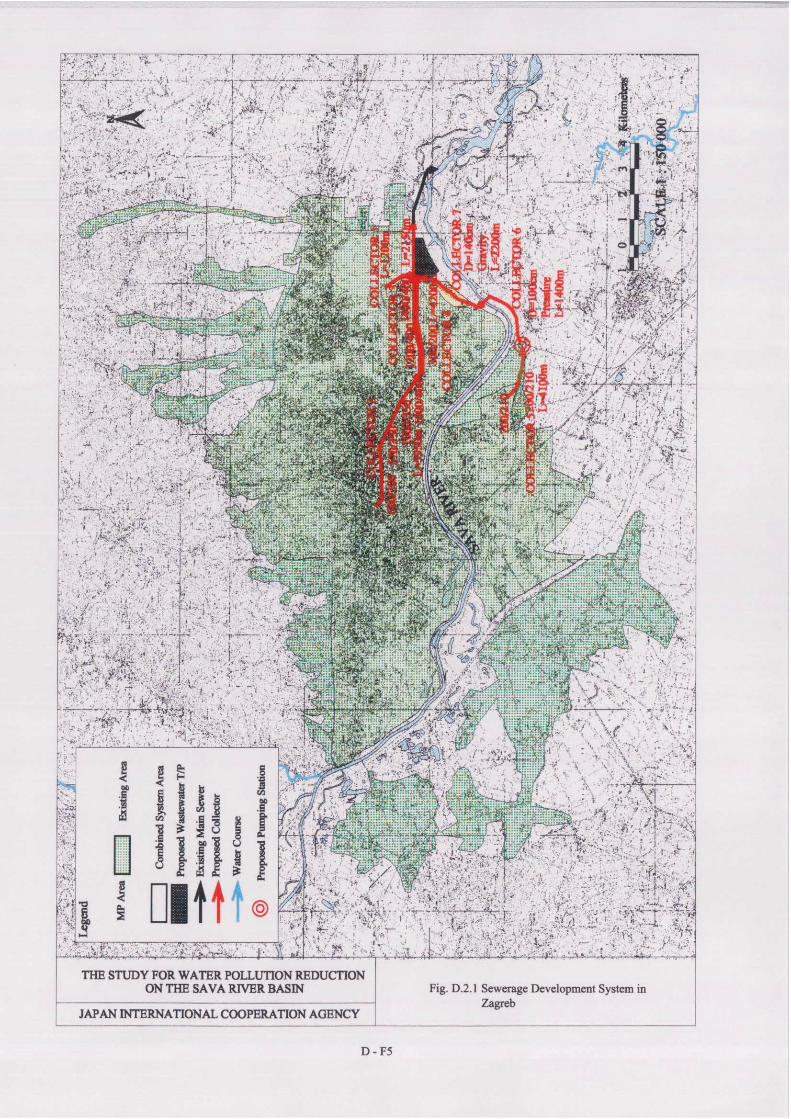
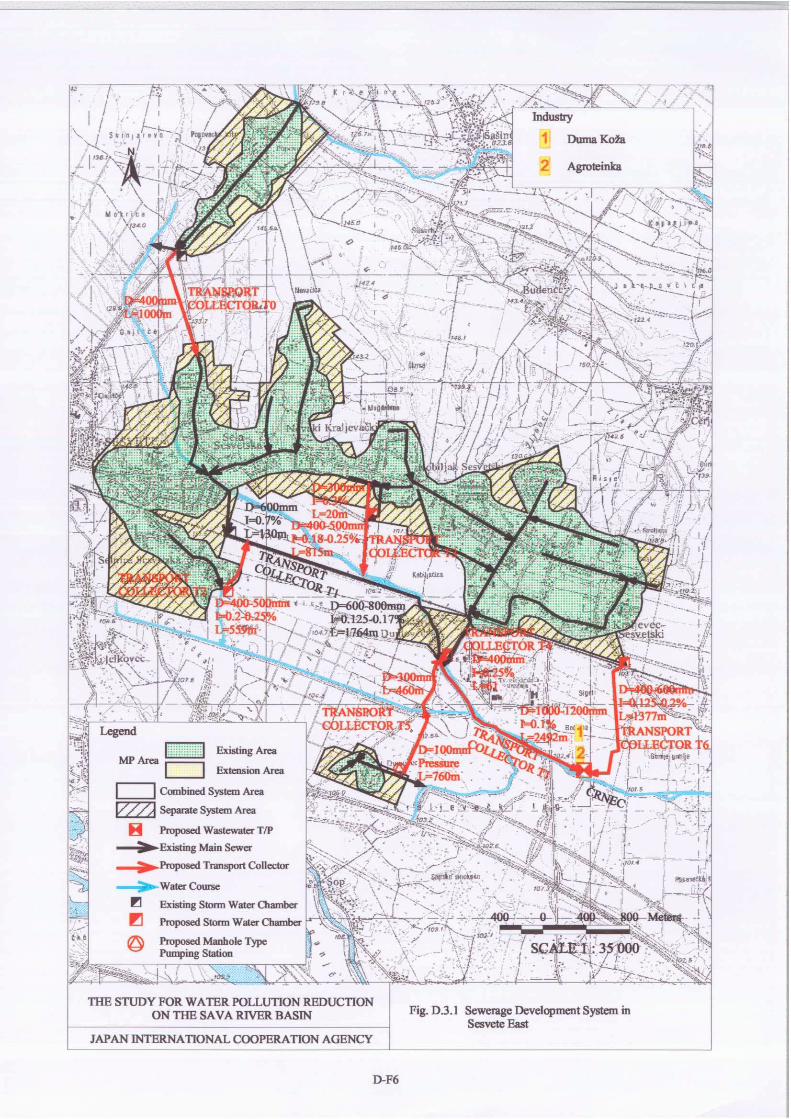
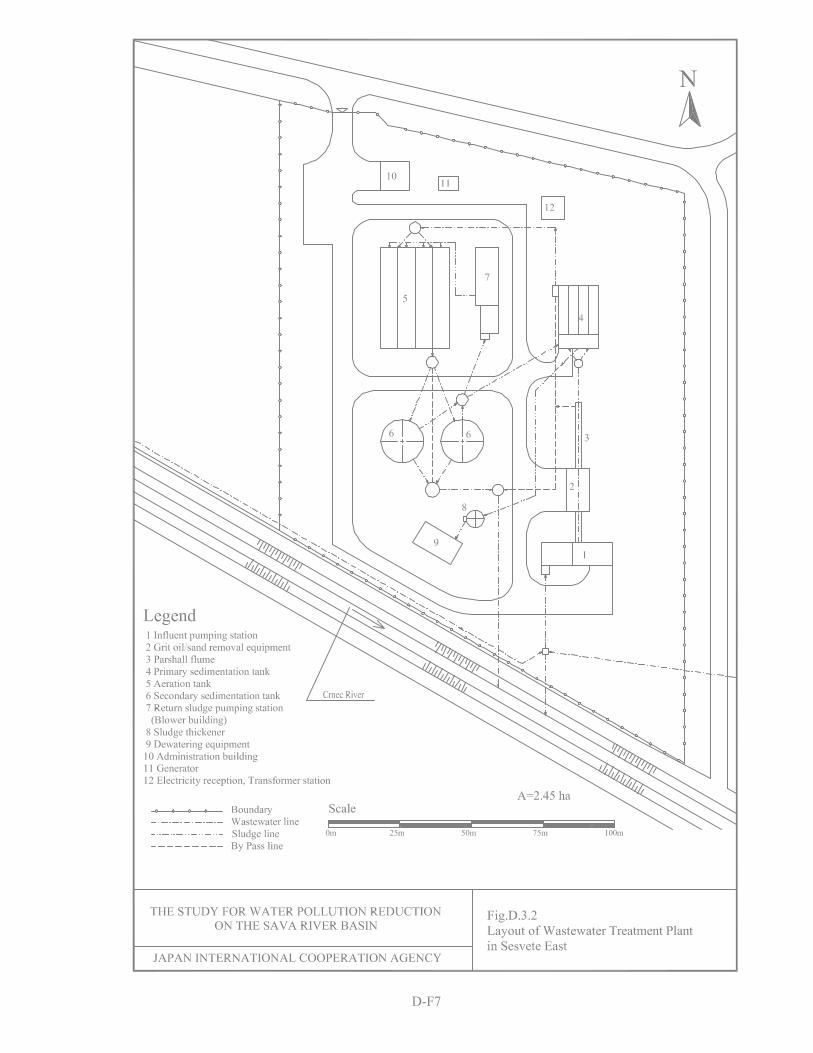
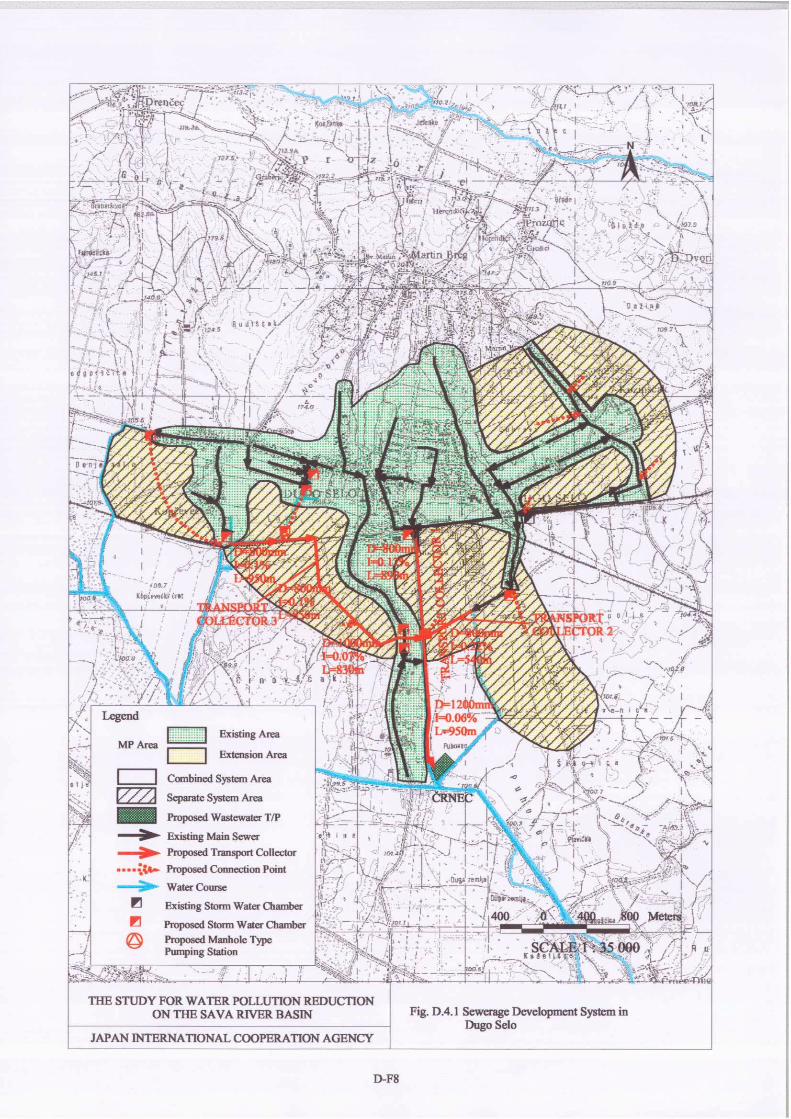
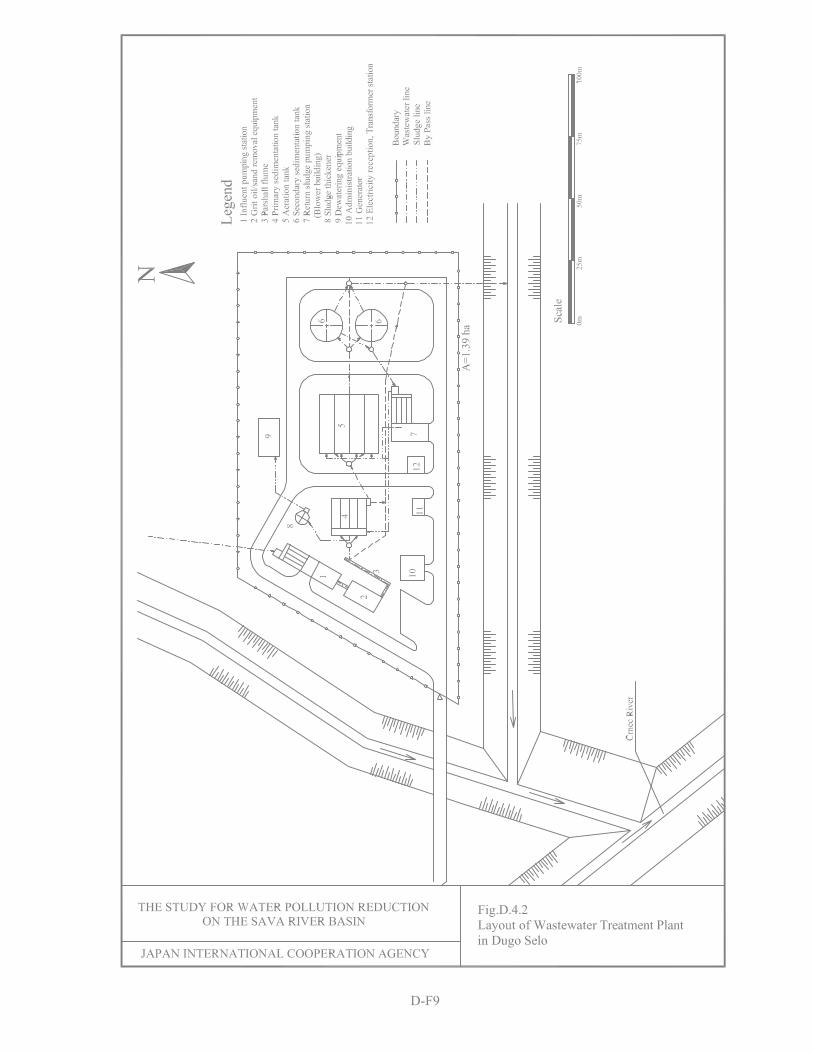
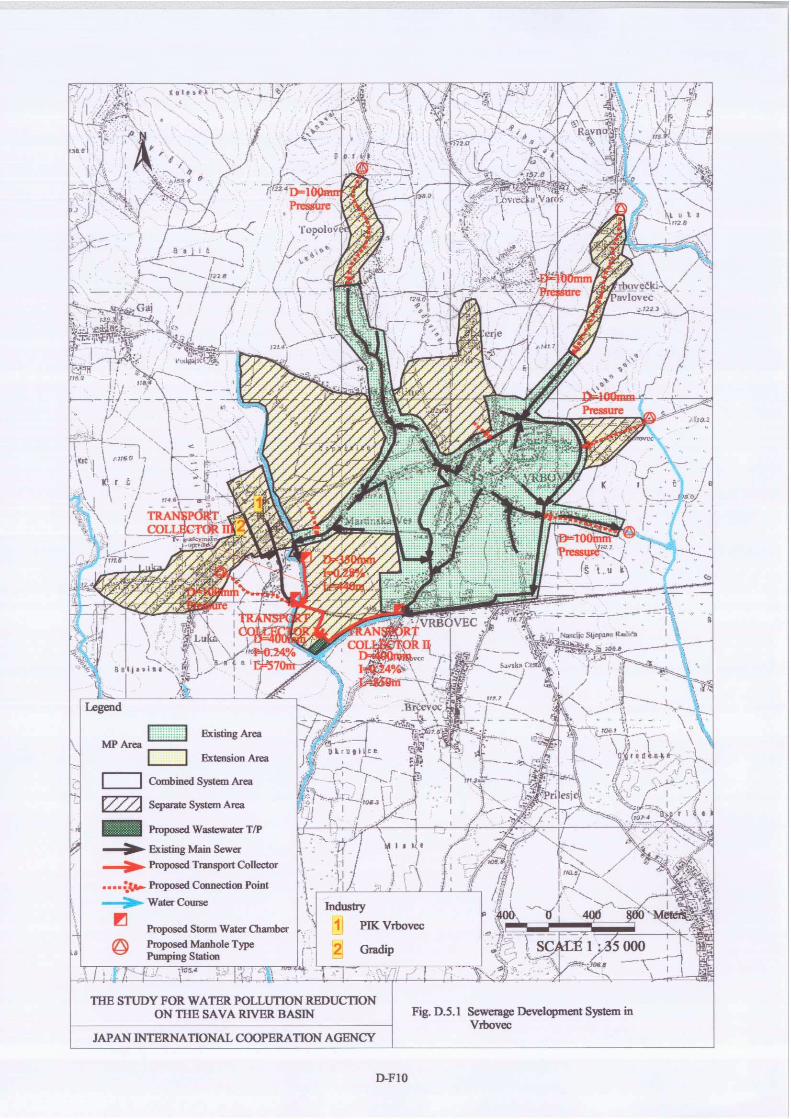
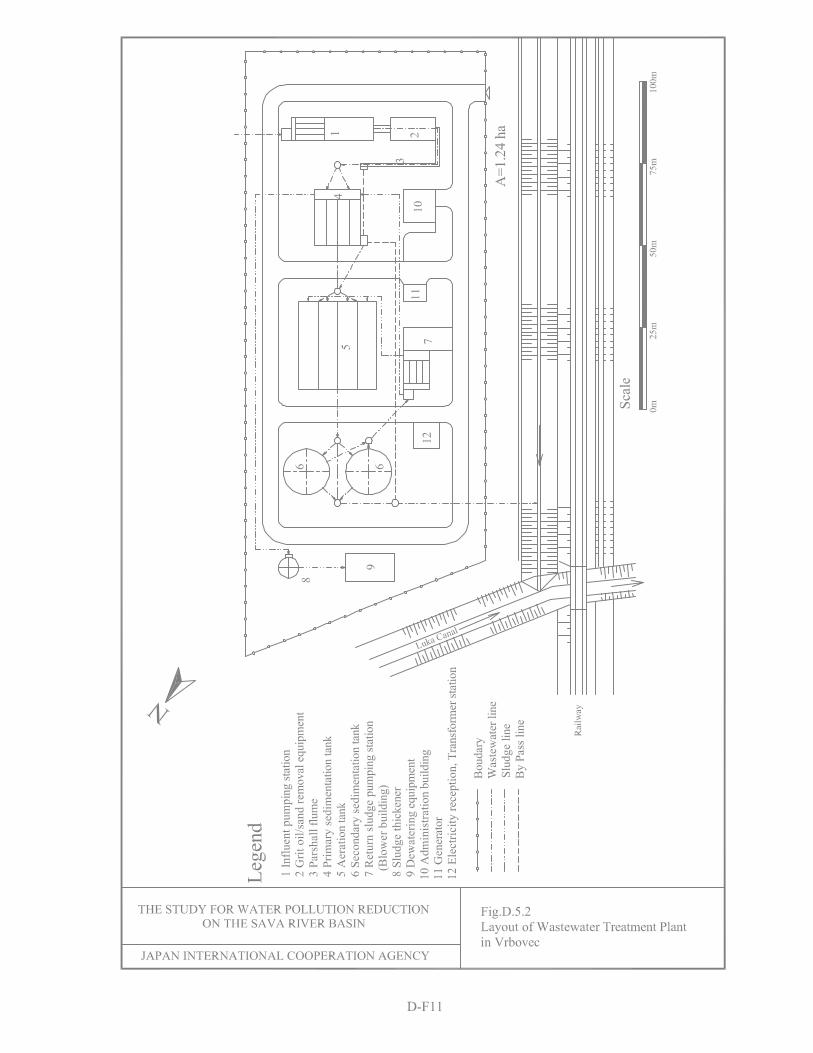
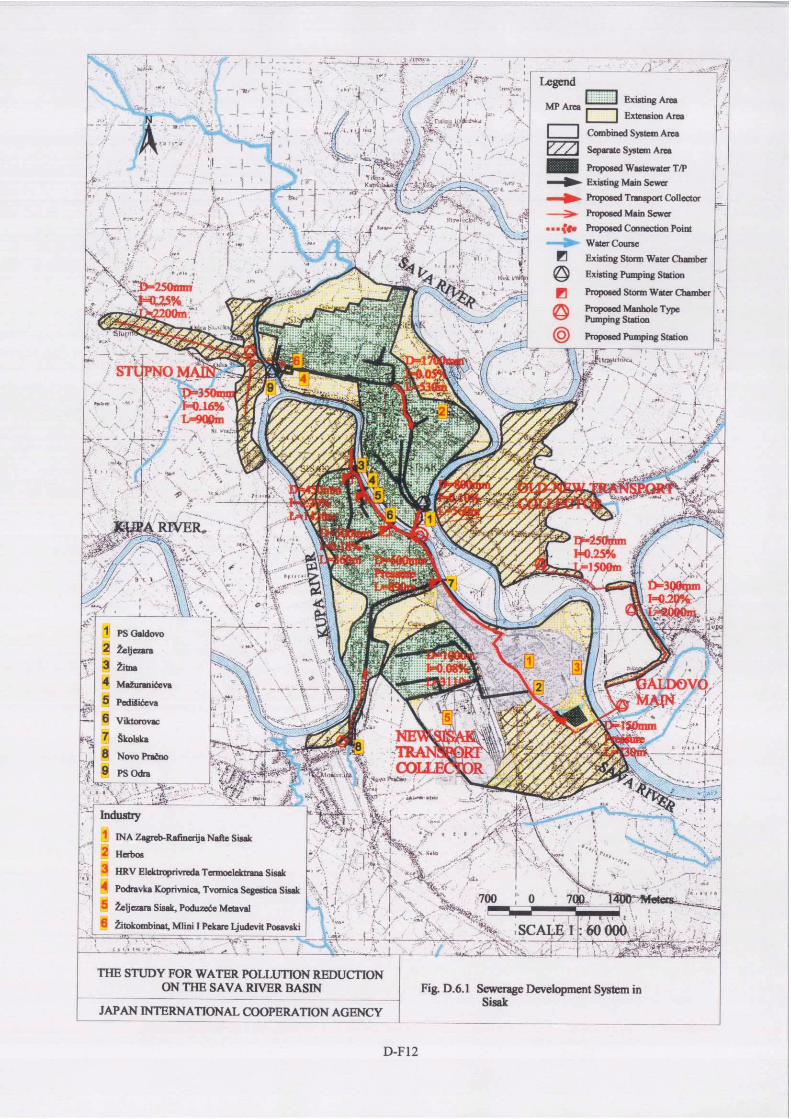
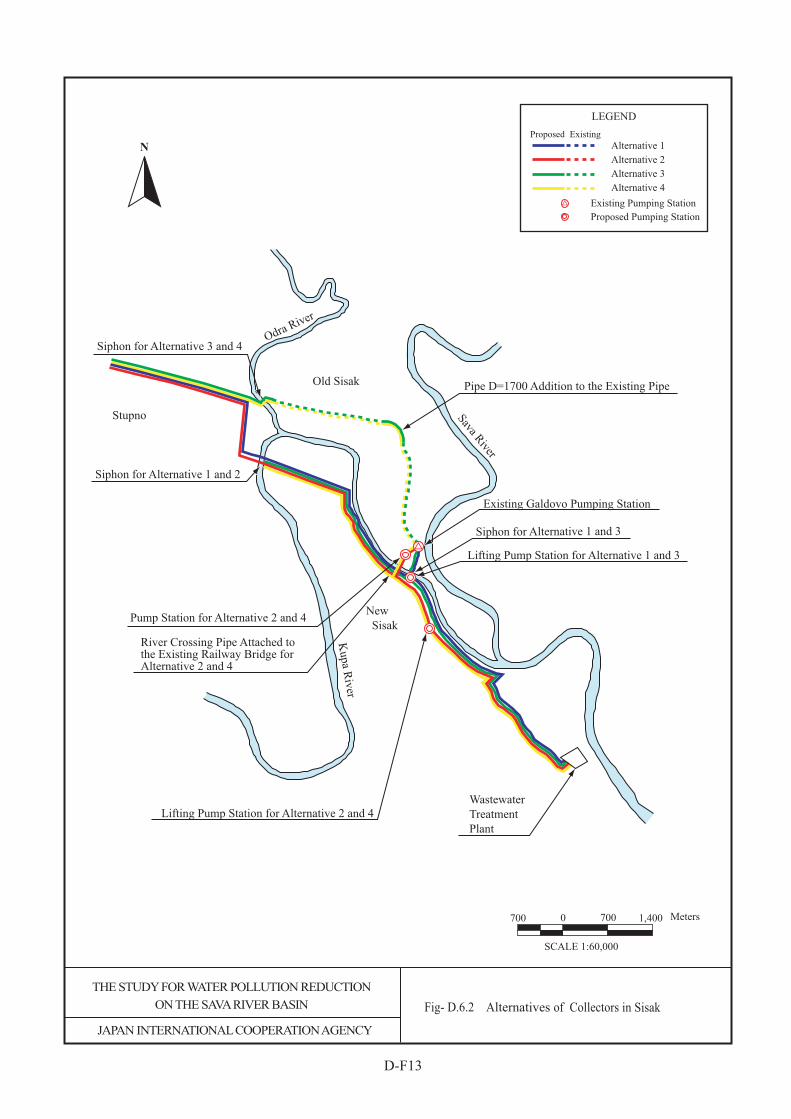
SCALE 1:60,000
700 0 700 1,400 Meters
N
D-F13
Existing Galdovo Pumping Station
LEGEND
Proposed Existing
Alternative 1
Alternative 3
Alternative 4
Alternative 2
Existing Pumping Station
Proposed Pumping Station
Lifting Pump Station for Alternative 1 and 3
Lifting Pump Station for Alternative 2 and 4
Pump Station for Alternative 2 and 4
Wastewater
Treatment
Plant
Pipe D=1700 Addition to the Existing Pipe
Kupa R
iver
Sava River
THE STUDY FOR WATER POLLUTION REDUCTION
ON THE SAVA RIVER BASIN Fig- D.6.2 Alternatives of Collectors in Sisak
JAPAN INTERNATIONAL COOPERATION AGENCY
Old Sisak
New
Sisak
Stupno
Siphon for Alternative 1 and 3
Odra River
Siphon for Alternative 3 and 4
Siphon for Alternative 1 and 2
River Crossing Pipe Attached tothe Existing Railway Bridge forAlternative 2 and 4
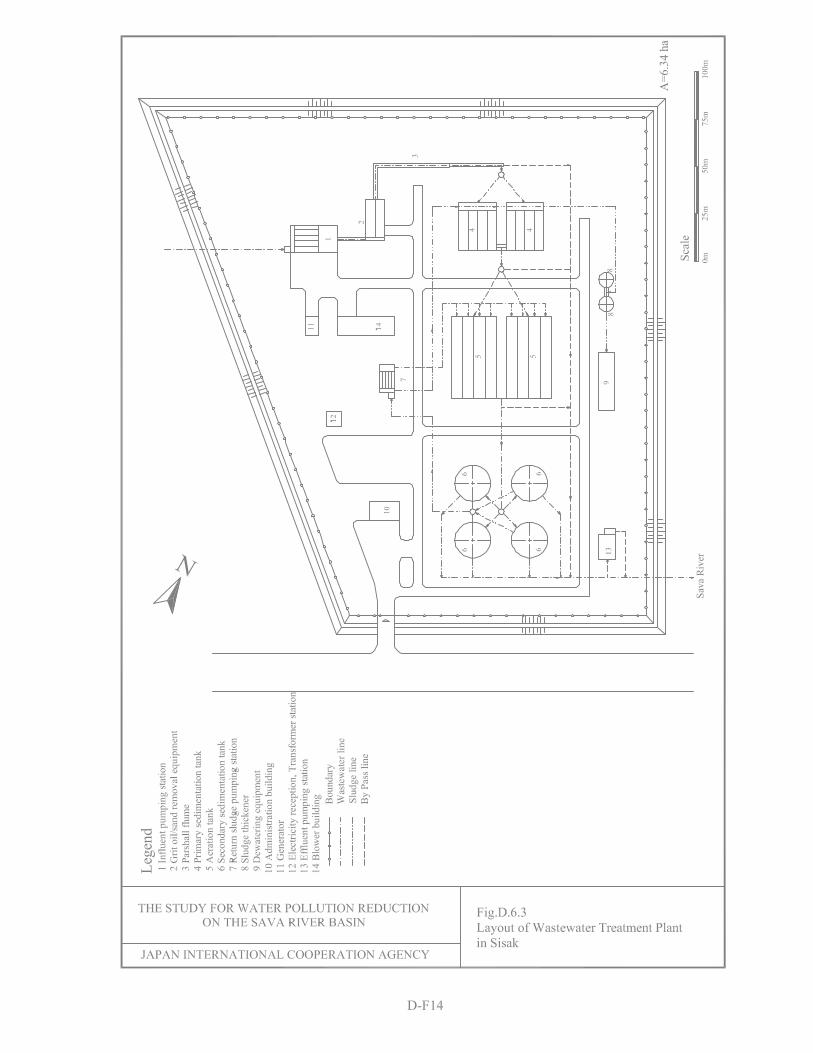
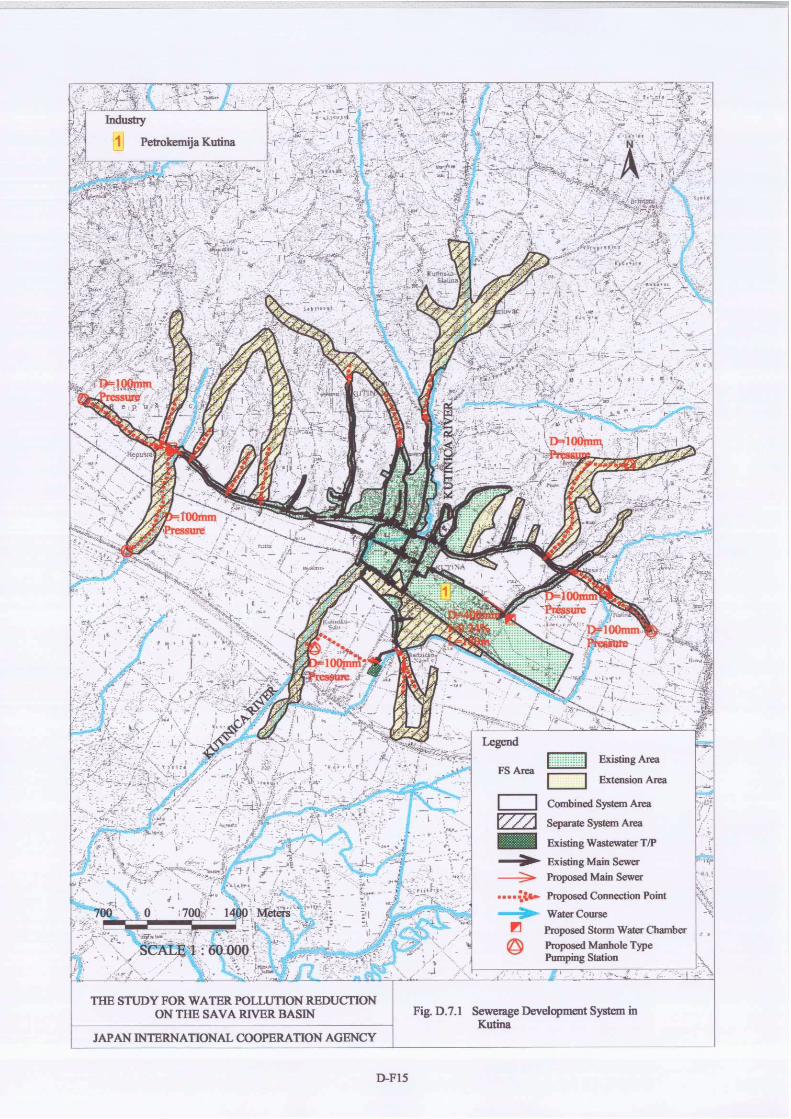
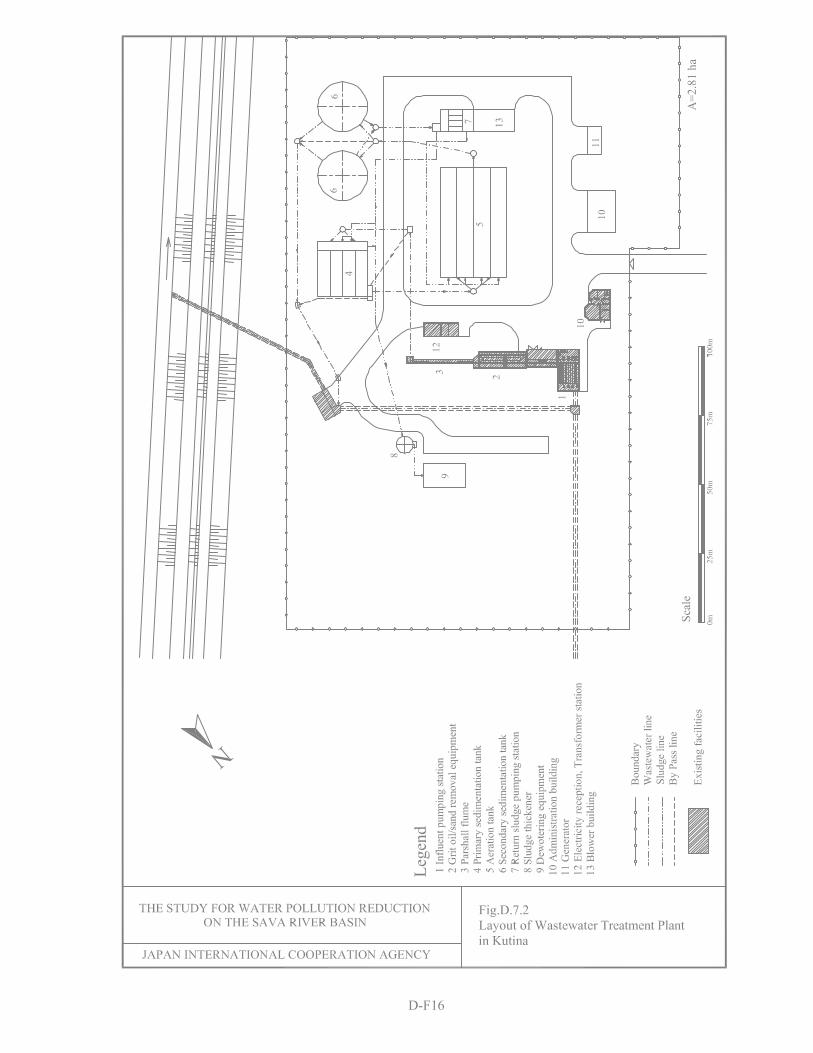
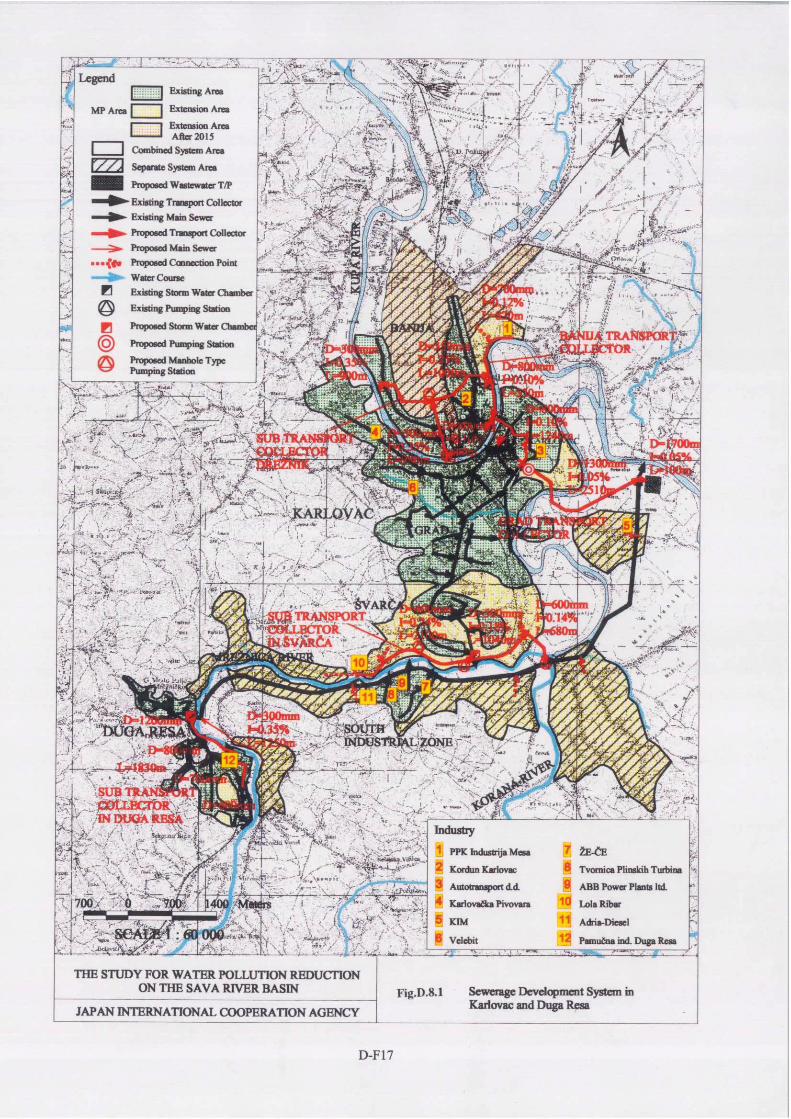
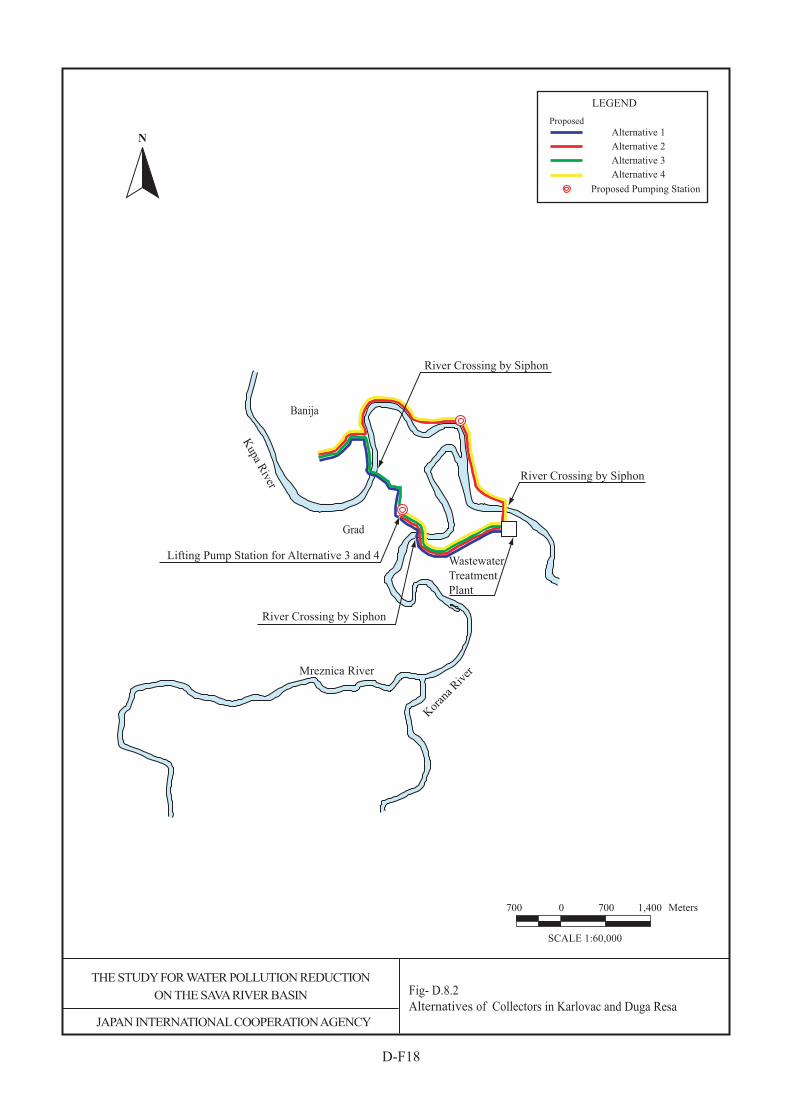
SCALE 1:60,000
700 0 700 1,400 Meters
N
D-F18
Kor
ana Riv
er
Kupa R
iver
Mreznica River
Wastewater
Treatment
Plant
River Crossing by Siphon
River Crossing by Siphon
River Crossing by Siphon
THE STUDY FOR WATER POLLUTION REDUCTION
ON THE SAVA RIVER BASIN
JAPAN INTERNATIONAL COOPERATION AGENCY
LEGEND
Proposed
Alternative 1
Alternative 4
Alternative 3
Alternative 2
Proposed Pumping Station
Fig- D.8.2
Alternatives of Collectors in Karlovac and Duga Resa
Banija
Grad
Lifting Pump Station for Alternative 3 and 4