Embed Size (px)
Citation preview

No. 14-09 2014
The superstar quest: Does youth talent predict professional success for female and male tennis players? Grove, Wayne A.; Jetter, Michael
The superstar quest: Does youth talent predict professional success for
female and male tennis players?∗
Wayne A. Grove† Michael Jetter‡
April 14, 2014
Abstract
We estimate the relationship between international youth and professional tennis rankings.We find no difference between the predictiveness of rankings from age 14 & Under versus age16 & Under competitions. The most persistent predictor of professional success is beatingolder top ranked juniors. Our results reveal stark gender differences. For example, ordinaljunior rankings are more strongly associated with professional success for males than forfemales. In addition, future tennis stars are better signaled by U14 competition outcomesfor females, but by U16 results for males.
JEL Classification: D82, D91, J16, J22, J24Keywords: productivity measures, labor supply, career outcomes, tennis
∗We are thankful to Konstantin Harle (Tour Manager for the ATP) for helpful conversations.†Department of Economics, LeMoyne College, Syracuse, NY, USA; phone: +1 (315) 445.4235; email:
[email protected]‡Department of Economics, School of Economics and Finance, Universidad EAFIT, Medellın, Colombia; phone:
+57 (317) 433.7003; email: [email protected]; web: www.michaeljetter.com
1 Introduction
Among the most universal dilemmas faced by individuals and organizations is the uncertain
link between the information used to make career choices or hiring decisions and individuals’
future productivity. At least three major bodies of related scholarship have investigated the
following relationships: (1) the predictive values of information about high school and college
aged individuals and career outcomes, (2) professional sports teams’ draft choices and personnel
decisions, and (3) expertise studies. Collectively, these related research areas document the
tremendous uncertainty about the predictive value of early life outcomes.
We contribute to these literatures by assembling a novel data set consisting of world rankings
that simplifies the relationship between youth and adult outcomes to measure success, and doing
so for tennis, an individual sport. Our question is whether and how being a female or male
superstar at age 16 or younger predicts success as a professional tennis player. We investigate
the role of ordinal junior rankings, being ranked in the U14 (age 14 & Under) and U16 (age 16
& Under) categories, age differences within these categories, and gender differences. We test the
hypotheses put forward by prominent tennis coaches that performances at age 12 do not provide
useful information for future success on the professional tour (Unierzyski, 2003, and MacCurdy,
2006). Also, we test the findings by Brouwers et al. (2012) that top ranked players younger than
their competitors are not more likely to have successful professional careers (p. 417).
2 Data and Methodology
The most comprehensive sample of young potential tennis professionals are the players ranked in
the U14 and U16 competitions of the Tennis Europe Junior Tour. We collect data for all female
and male players born between 1977 and 1988, who were ranked at least once in the top 50 of
these elite year-end rankings in the U14 or U16 categories. Our dataset contains 1,527 players
(750 females). We match each player to their subsequent highest professional ranking achieved
on the Women’s Tennis Association (WTA) or the Association of Tennis Professionals (ATP)
Tours.1 With a birth year cut-off of 1988 at the end of the 2013 season, all sample players were
1Data from http://www.tenniseurope.org/page.aspx?id=16384. For players, who never earned points onthe professional tour, we set a career high ranking of 1600, which corresponds to less than one point on theprofessional tour. Excluding players who never earned professional points returns qualitatively identical results.
1
at least 25 years of age at the time of data collection.
We apply a logit regression framework, estimating the probability p of player i to achieve,
say, a top 10 professional ranking:
logit(p)i = α0 + α1Xi + α2Zi + α3Controlsi + εi, (1)
where Xi includes indicators for the player’s best youth ranking (reached the top 3, top 4 to 10,
etc.). We also estimate this equation using the continuous variable of the player’s highest ranking
in the U14 and U16 competitions and the respective squared terms to allow for nonlinearities.
Zi contains dummy variables for whether the player was younger than the age category in which
they competed. Controlsi include a gender dummy and the birth year of the player.
3 Estimating Career Success from Youth Rankings
Panel A of Table 1 shows the likelihood of youth players reaching professional rankings of the
top 10, 50, 100, and 200. While the U16 players are slightly more indicative of future success,
the outcomes of the U14 players do not significantly differ. About 30 percent of each sample
achieved a professional ranking among the top 200, 21 percent among the top 100, 14 percent in
the top 50, and 4 percent in the top 10. Panels B and C investigate potential gender differences
within the U14 and the U16 samples. Note that U14 rankings predict success significantly better
for females than for males, other than the top 10; U16 junior male rankings are more strongly
associated with becoming a top 10 professional.
Table 2 displays the results from estimating equation 1. First, we note the importance of
ordinal rankings. For example, a top 3 U14 player has a 6.8 percent chance of reaching the top
10 on the professional circuit, relative to those ranked between 4 and 50 in that youth category.
This coefficient then gradually increases when estimating the probabilities to reach the top 50,
100, and 200. We observe a similar pattern for players ranked 4 to 10 in the U14 category. In
the U14 sample the coefficients of top 3 and top 4 to 10 are not statistically different from each
other at the 10 percent level for any of the definitions of professional success. After that, we see
a drop in magnitudes for players ranked 11 to 20, however their chances are still significantly
increased, compared to players ranked 21 to 50. These relationships are roughly comparable for
2
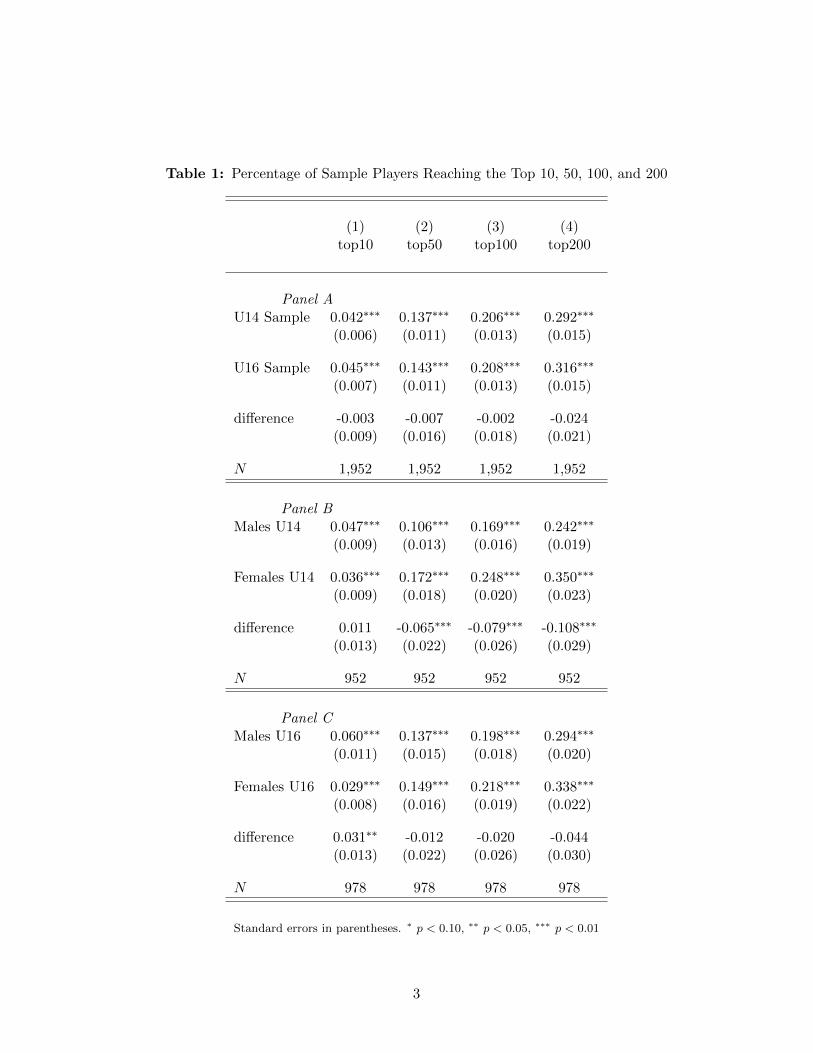
Table 1: Percentage of Sample Players Reaching the Top 10, 50, 100, and 200
(1) (2) (3) (4)top10 top50 top100 top200
Panel AU14 Sample 0.042∗∗∗ 0.137∗∗∗ 0.206∗∗∗ 0.292∗∗∗
(0.006) (0.011) (0.013) (0.015)
U16 Sample 0.045∗∗∗ 0.143∗∗∗ 0.208∗∗∗ 0.316∗∗∗
(0.007) (0.011) (0.013) (0.015)
difference -0.003 -0.007 -0.002 -0.024(0.009) (0.016) (0.018) (0.021)
N 1,952 1,952 1,952 1,952
Panel BMales U14 0.047∗∗∗ 0.106∗∗∗ 0.169∗∗∗ 0.242∗∗∗
(0.009) (0.013) (0.016) (0.019)
Females U14 0.036∗∗∗ 0.172∗∗∗ 0.248∗∗∗ 0.350∗∗∗
(0.009) (0.018) (0.020) (0.023)
difference 0.011 -0.065∗∗∗ -0.079∗∗∗ -0.108∗∗∗
(0.013) (0.022) (0.026) (0.029)
N 952 952 952 952
Panel CMales U16 0.060∗∗∗ 0.137∗∗∗ 0.198∗∗∗ 0.294∗∗∗
(0.011) (0.015) (0.018) (0.020)
Females U16 0.029∗∗∗ 0.149∗∗∗ 0.218∗∗∗ 0.338∗∗∗
(0.008) (0.016) (0.019) (0.022)
difference 0.031∗∗ -0.012 -0.020 -0.044(0.013) (0.022) (0.026) (0.030)
N 978 978 978 978
Standard errors in parentheses. ∗ p < 0.10, ∗∗ p < 0.05, ∗∗∗ p < 0.01
3
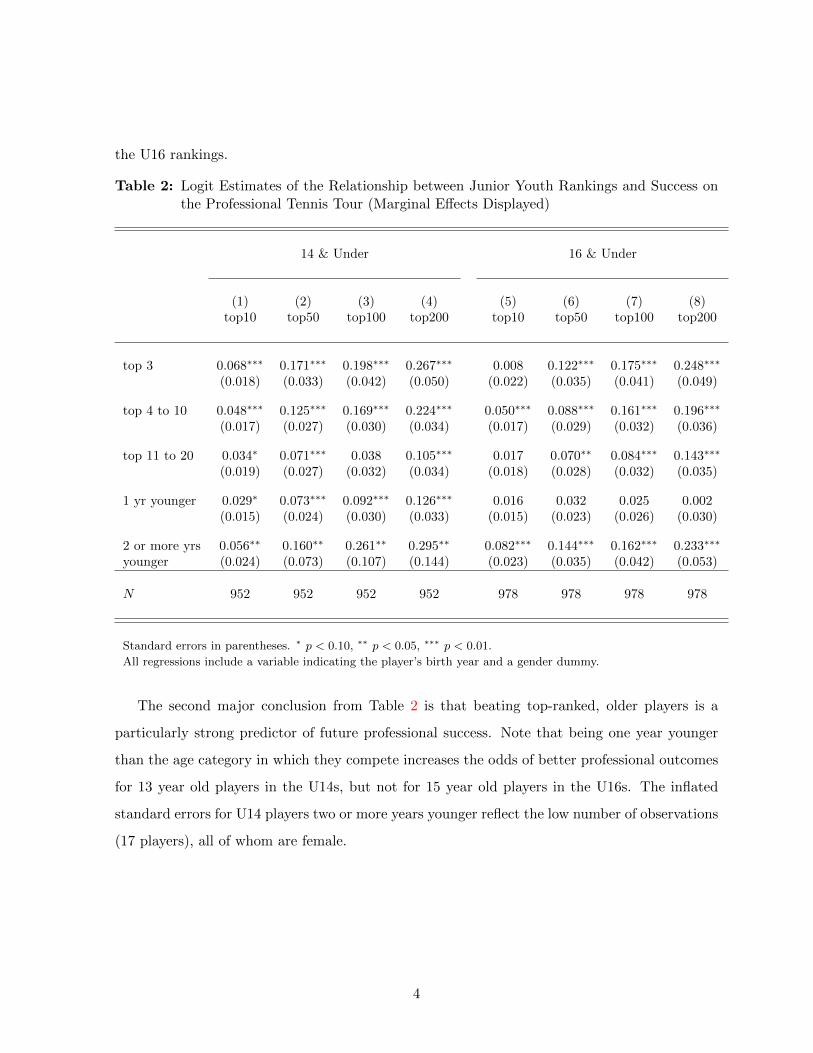
the U16 rankings.
Table 2: Logit Estimates of the Relationship between Junior Youth Rankings and Success onthe Professional Tennis Tour (Marginal Effects Displayed)
14 & Under 16 & Under
(1) (2) (3) (4) (5) (6) (7) (8)top10 top50 top100 top200 top10 top50 top100 top200
top 3 0.068∗∗∗ 0.171∗∗∗ 0.198∗∗∗ 0.267∗∗∗ 0.008 0.122∗∗∗ 0.175∗∗∗ 0.248∗∗∗
(0.018) (0.033) (0.042) (0.050) (0.022) (0.035) (0.041) (0.049)
top 4 to 10 0.048∗∗∗ 0.125∗∗∗ 0.169∗∗∗ 0.224∗∗∗ 0.050∗∗∗ 0.088∗∗∗ 0.161∗∗∗ 0.196∗∗∗
(0.017) (0.027) (0.030) (0.034) (0.017) (0.029) (0.032) (0.036)
top 11 to 20 0.034∗ 0.071∗∗∗ 0.038 0.105∗∗∗ 0.017 0.070∗∗ 0.084∗∗∗ 0.143∗∗∗
(0.019) (0.027) (0.032) (0.034) (0.018) (0.028) (0.032) (0.035)
1 yr younger 0.029∗ 0.073∗∗∗ 0.092∗∗∗ 0.126∗∗∗ 0.016 0.032 0.025 0.002(0.015) (0.024) (0.030) (0.033) (0.015) (0.023) (0.026) (0.030)
2 or more yrs 0.056∗∗ 0.160∗∗ 0.261∗∗ 0.295∗∗ 0.082∗∗∗ 0.144∗∗∗ 0.162∗∗∗ 0.233∗∗∗
younger (0.024) (0.073) (0.107) (0.144) (0.023) (0.035) (0.042) (0.053)
N 952 952 952 952 978 978 978 978
Standard errors in parentheses. ∗ p < 0.10, ∗∗ p < 0.05, ∗∗∗ p < 0.01.
All regressions include a variable indicating the player’s birth year and a gender dummy.
The second major conclusion from Table 2 is that beating top-ranked, older players is a
particularly strong predictor of future professional success. Note that being one year younger
than the age category in which they compete increases the odds of better professional outcomes
for 13 year old players in the U14s, but not for 15 year old players in the U16s. The inflated
standard errors for U14 players two or more years younger reflect the low number of observations
(17 players), all of whom are female.
4
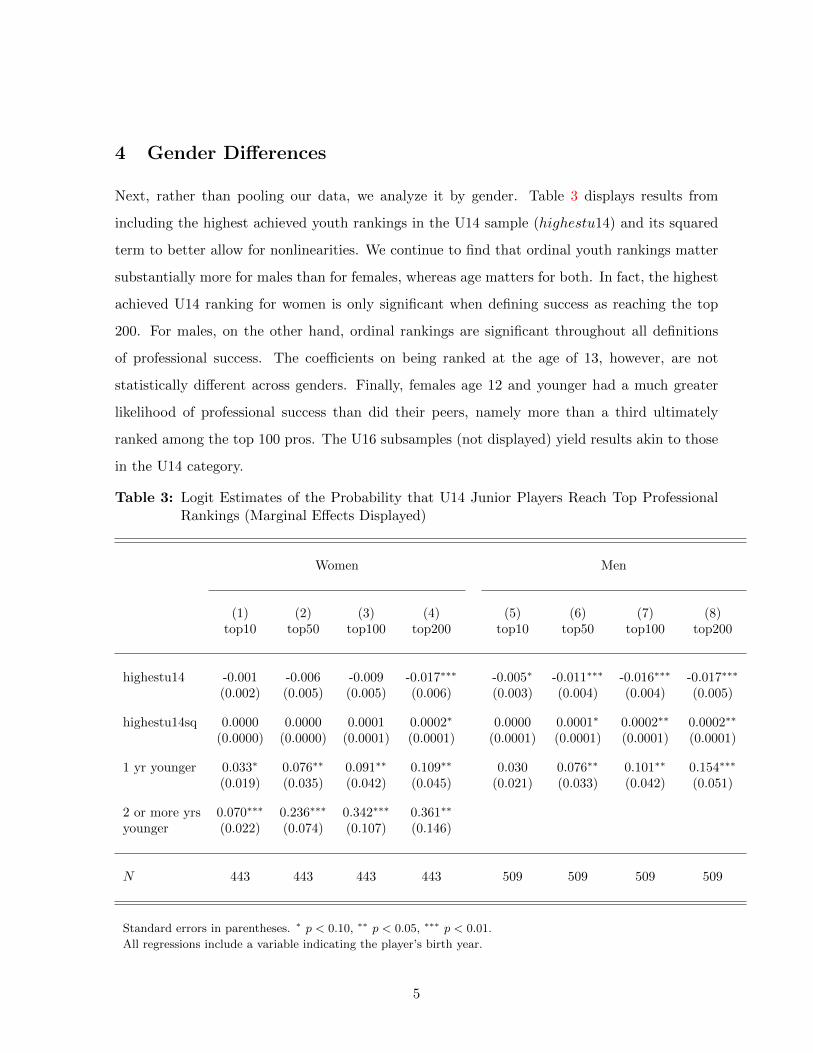
4 Gender Differences
Next, rather than pooling our data, we analyze it by gender. Table 3 displays results from
including the highest achieved youth rankings in the U14 sample (highestu14) and its squared
term to better allow for nonlinearities. We continue to find that ordinal youth rankings matter
substantially more for males than for females, whereas age matters for both. In fact, the highest
achieved U14 ranking for women is only significant when defining success as reaching the top
200. For males, on the other hand, ordinal rankings are significant throughout all definitions
of professional success. The coefficients on being ranked at the age of 13, however, are not
statistically different across genders. Finally, females age 12 and younger had a much greater
likelihood of professional success than did their peers, namely more than a third ultimately
ranked among the top 100 pros. The U16 subsamples (not displayed) yield results akin to those
in the U14 category.
Table 3: Logit Estimates of the Probability that U14 Junior Players Reach Top ProfessionalRankings (Marginal Effects Displayed)
Women Men
(1) (2) (3) (4) (5) (6) (7) (8)top10 top50 top100 top200 top10 top50 top100 top200
highestu14 -0.001 -0.006 -0.009 -0.017∗∗∗ -0.005∗ -0.011∗∗∗ -0.016∗∗∗ -0.017∗∗∗
(0.002) (0.005) (0.005) (0.006) (0.003) (0.004) (0.004) (0.005)
highestu14sq 0.0000 0.0000 0.0001 0.0002∗ 0.0000 0.0001∗ 0.0002∗∗ 0.0002∗∗
(0.0000) (0.0000) (0.0001) (0.0001) (0.0001) (0.0001) (0.0001) (0.0001)
1 yr younger 0.033∗ 0.076∗∗ 0.091∗∗ 0.109∗∗ 0.030 0.076∗∗ 0.101∗∗ 0.154∗∗∗
(0.019) (0.035) (0.042) (0.045) (0.021) (0.033) (0.042) (0.051)
2 or more yrs 0.070∗∗∗ 0.236∗∗∗ 0.342∗∗∗ 0.361∗∗
younger (0.022) (0.074) (0.107) (0.146)
N 443 443 443 443 509 509 509 509
Standard errors in parentheses. ∗ p < 0.10, ∗∗ p < 0.05, ∗∗∗ p < 0.01.
All regressions include a variable indicating the player’s birth year.
5
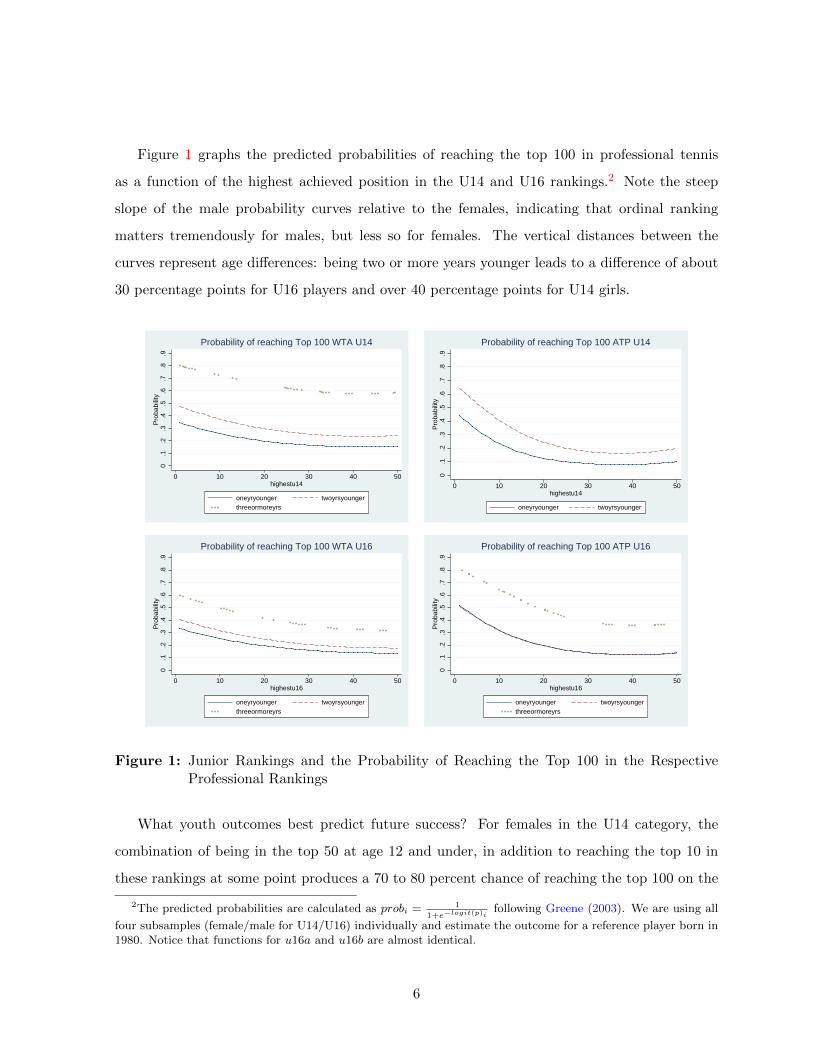
Figure 1 graphs the predicted probabilities of reaching the top 100 in professional tennis
as a function of the highest achieved position in the U14 and U16 rankings.2 Note the steep
slope of the male probability curves relative to the females, indicating that ordinal ranking
matters tremendously for males, but less so for females. The vertical distances between the
curves represent age differences: being two or more years younger leads to a difference of about
30 percentage points for U16 players and over 40 percentage points for U14 girls.
0.1
.2.3
.4.5
.6.7
.8.9
Pro
babi
lity
0 10 20 30 40 50highestu14
oneyryounger twoyrsyoungerthreeormoreyrs
Probability of reaching Top 100 WTA U14
0.1
.2.3
.4.5
.6.7
.8.9
Pro
babi
lity
0 10 20 30 40 50highestu14
oneyryounger twoyrsyounger
Probability of reaching Top 100 ATP U14
0.1
.2.3
.4.5
.6.7
.8.9
Pro
babi
lity
0 10 20 30 40 50highestu16
oneyryounger twoyrsyoungerthreeormoreyrs
Probability of reaching Top 100 WTA U16
0.1
.2.3
.4.5
.6.7
.8.9
Pro
babi
lity
0 10 20 30 40 50highestu16
oneyryounger twoyrsyoungerthreeormoreyrs
Probability of reaching Top 100 ATP U16
Figure 1: Junior Rankings and the Probability of Reaching the Top 100 in the RespectiveProfessional Rankings
What youth outcomes best predict future success? For females in the U14 category, the
combination of being in the top 50 at age 12 and under, in addition to reaching the top 10 in
these rankings at some point produces a 70 to 80 percent chance of reaching the top 100 on the
2The predicted probabilities are calculated as probi = 1
1+e−logit(p)ifollowing Greene (2003). We are using all
four subsamples (female/male for U14/U16) individually and estimate the outcome for a reference player born in1980. Notice that functions for u16a and u16b are almost identical.
6
professional tour. In fact, three of the precocious 12 and under girls in our U14 sample became
the top players in the world: Kim Clijsters, Justine Henin, and Martina Hingis. For males, these
odds hold for somebody who reached the top 50 U16 at the age of 14 and is ranked in the top
spot in those rankings at some point.
5 Conclusions
We estimate the relationship between international youth tennis rankings and professional ten-
nis success. In contrast to some coaches’ claims and researchers results, we find strong evidence
of the predictiveness of ordinal rankings and of being younger than one’s competitors. In addi-
tion, our results reveal stark gender differences, namely being younger than the age category is
particularly predictive for U14 girls and ordinal rankings matter more for males.
References
Brouwers, J., De Bosscher, V., and Sotiriadou, P. (2012). An examination of the importance of
performances in youth and junior competition as an indicator of later success in tennis. Sport
Management Review, 15(4):461–475.
Greene, W. H. (2003). Econometric analysis–international edition. New York University.
MacCurdy, D. (2006). Talent identification around the world and recommendations for the
chinese tennis association. ITF Coaching Website: www. itftennis.com/shared/medialibrar
y/pdf/original/IO 18455 original. PDF. Downloaded.
Unierzyski, P. (2003). Why some talents were lost and why some not: Results of research with
practical propositions. Proceedings of IFT worldwide coaches symposium ITF.
7


