Embed Size (px)
Citation preview
This article appeared in a journal published by Elsevier. The attachedcopy is furnished to the author for internal non-commercial researchand education use, including for instruction at the authors institution
and sharing with colleagues.
Other uses, including reproduction and distribution, or selling orlicensing copies, or posting to personal, institutional or third party
websites are prohibited.
In most cases authors are permitted to post their version of thearticle (e.g. in Word or Tex form) to their personal website orinstitutional repository. Authors requiring further information
regarding Elsevier’s archiving and manuscript policies areencouraged to visit:
http://www.elsevier.com/copyright
Author's personal copy
The techno-economic potential of renewable energy through the anaerobicdigestion of microalgae
Carlos Zamalloa a, Elien Vulsteke b, Johan Albrecht b, Willy Verstraete a,⇑a Laboratory of Microbial Ecology and Technology (LabMET), Faculty of Bioscience Engineering, Ghent University, Coupure Links 653, B-9000 Gent, Belgiumb Faculty of Economics and Business Administration, Centre for Environmental Economics and Management (CEEM), Ghent University, Tweekerkenstraat 2, 9000 Ghent, Belgium
a r t i c l e i n f o
Article history:Received 1 June 2010Received in revised form 2 September 2010Accepted 4 September 2010Available online 15 September 2010
Keywords:AlgaeBiogasAnaerobic digestionBiofuelsTechno-economic analysis
a b s t r a c t
The potential of microalgae as feedstock for methane production is evaluated from a process technicaland economic point of view. Production of mixed culture algae in raceway ponds on non-agriculturalsites, such as landfills, was identified as a preferred approach. The potential of straightforward bio-methanation, which includes pre-concentration of microalgae and utilization of a high rate anaerobicreactor was examined based on the premises of achievable up-concentration from 0.2–0.6 kg m�3 to20–60 kg dry matter (DM) m�3 and an effective bio-methanation of the concentrate at a loading rateof 20 kg DM m�3 d�1. The costs of biomass available for bio-methanation under such conditions were cal-culated to be in the range of €86–€124 ton�1 DM. The levelized cost of energy by means of the processline ‘‘algae biomass – biogas – total energy module” would be in the order of €0.170–0.087 kWh�1, takinginto account a carbon credit of about €30 ton�1 CO2(eq).
� 2010 Elsevier Ltd. All rights reserved.
1. Introduction
Energy generation from fossil fuels accounts for about 60% ofthe total worldwide anthropogenic greenhouse gas emissions(IEA, 2009). Therefore, potential alternatives for energy generationare intensively studied. One option is the use of biomass feedstockfor the production of biogas through anaerobic digestion. Biogascan be produced from a wide range of solid or liquid residues, aswell as from biomass crops. Microalgae for instance are a well-sui-ted biomass due to their relatively high lipid, starch and proteincontents and the lack of lignin (Schenk et al., 2008; Sialve et al.,2009).
Microalgae biomass has several advantages over conventionalenergy crops. They are able to double their biomass within 24 hand the land area needed to cultivate microalgae can be non-fertilewhich decreases the competition of land for human food crops(Chisti, 2007). Furthermore, algae do not necessarily need freshwater but can also be cultivated in salt water or wastewater. Theydo not require herbicides or pesticides and, although microalgaegrow in an aquatic medium, they use less water than terrestrial
crops (Rodolfi et al., 2009). In addition, microalgae share with ter-restrial crops the quality that their conversion to biogas can be per-formed without net production of greenhouse gas. CO2 releasedduring biogas combustion is taken from the atmosphere throughphotosynthesis. On the other hand, the major disadvantage of mic-roalgae biomass is the high expenditure for infrastructure and theconsiderable energy requirement of the harvesting and dewateringof the relatively diluted algae cultures (Uduman et al., 2010).
The main objective of this article is to propose an alternative ap-proach through the pre-concentration of algae solution in order todecrease the cost and energy requirement of harvesting and to usethis pre-concentrated solution in a high rate anaerobic digester toproduce biogas that can be further converted to electrical and ther-mal energy. A comprehensive technological and economic assess-ment of this approach is carried out in order to estimate the costof producing energy using microalgae as feedstock in a full scaleopen pond.
1.1. Microalgae as feedstock for biogas production
The term algae refers to both macroalgae and microalgae. Mac-roalgae are algae which form a multi cellular thallus, i.e. seaweeds(Andersen, 2005; Richmond, 2004). Microalgae, as the name sug-gests, are microscopic algae (5–50 lm) as well as oxygenic photo-synthetic bacteria such as cyanobacteria which grow in salt orfresh water (Richmond, 2004). For the purpose of this paper, theterm algae will refer to microalgae from this point onwards.
0960-8524/$ - see front matter � 2010 Elsevier Ltd. All rights reserved.doi:10.1016/j.biortech.2010.09.017
Abbreviations: AD, anaerobic digestion; CHP, combined heat and power; CO2(eq),carbon dioxide equivalents; DAF, dissolved air flotation; DM, dry matter; kWhel,kilowatt hour electricity; kWhth, kilowatt hour thermal energy; kWh, kilowatt hourenergy.⇑ Corresponding author. Tel.: +32 (0) 9 264 59 76; fax: +32 (0) 9 264 62 48.
E-mail address: [email protected] (W. Verstraete)URL: http://www.LabMET.UGent.be
Bioresource Technology 102 (2011) 1149–1158
Contents lists available at ScienceDirect
Bioresource Technology
journal homepage: www.elsevier .com/locate /bior tech
Author's personal copy
The maximum theoretical algae biomass productivities (at 8–10% photosynthetic conversion efficiency) are estimated to be inthe order of 77–96 g of dry matter (DM) per square meter perday (280–350 ton DM ha�1 a�1) while reasonable target produc-tions are projected as in the order of 27–62 g DM m�2 d�1 (100–227 ton DM ha�1 a�1) (Schenk et al., 2008; Stephens et al., 2010).In practice however, productivities are lower than projected. Inraceway ponds, which is the mass culture system most commonlyused for commercial applications, the peak productivities canrange from 12–40 g DM m�2 d�1(44–146 ton DM ha�1 a�1) and awell-managed pond might only achieve average productivities be-tween 19–25 g DM m�2 d�1 (70–90 ton DM ha�1 a�1) (Richmond,2004; Sheehan et al., 1998). Considering a water depth of 20 cm,a value of about 100 g DM m�3 mixed liquid d�1 is a fair numberto keep in mind.
The gross chemical composition of microalgae is highly depen-dent on environmental factors such as light intensity, temperatureand nutrients availability (Becker, 1994; Rodolfi et al., 2009). Gen-erally, microalgae contain varying proportions of proteins, lipids,carbohydrates, nucleic acids, pigments and vitamins (Becker,1994). Proteins and lipids are found in higher quantities, i.e. pro-teins ranging 10–60% DM and lipids within the range of 2% up to90% DM (Becker, 1994; Chisti, 2007; Spolaore et al., 2006). Carbo-hydrates in microalgae in the form of starch, glucose, sugars andother polysaccharides are present in concentrations ranging from5% to 50% DM (Spolaore et al., 2006). In addition, microalgae con-tain highly valuable substances such as pigments, long-chain poly-unsaturated fatty acids (LC-PUFAs), such as eicosapentaenoic (EPA)and decosahexaenoic (DHA) and vitamins such as A, B1, B2, B6, B12,C, E, nicotinate, biotin, folic acid and pantothenic acid (Becker,1994; Spolaore et al., 2006).
Lipids are an attractive substrate for anaerobic digestion (AD)due to the high theoretical methane yield, expressed as normal li-ters of methane per gram volatile solids (LCH4g�1VS), comparedwith proteins and carbohydrates i.e. 1.0 LCH4g�1VS for lipids,0.85 LCH4g�1VS for proteins and 0.42 LCH4g�1VS for carbohydrates(Li et al., 2002; Sialve et al., 2009). Practical methane yields arewithin the range of 0.09–0.34 LCH4 g�1 VS (about 0.5 L biogasg�1VS) submitted to digestion (De Schamphelaire and Verstraete,2009; Sialve et al., 2009). Unfortunately, the retention times re-quired for this degree of digestibility are in the order of 20–30 dayson average, which poses important costs in case of large scaleapplication. Different researchers have pointed out that the mainproblem of digesting microalgae biomass without pretreatmentis the resistance of the cell wall of the algae, even though the cellitself may no longer be living (Golueke et al., 1957; Sánchez Her-nández and Travieso Córdoba, 1993; Sialve et al., 2009). Thus, itseems that anaerobic microorganisms in conventional bio-metha-nation reactors do not have sufficient time to hydrolyze the lipidsand the algal cell wall.
The positive aspect of the digestibility of microalgae is the factthat the biogas has a high energy content i.e. over 60% methane (DeSchamphelaire and Verstraete, 2009; Sialve et al., 2009). In addi-tion, the biogas does normally not contain sulfur which causes cor-rosion in engine generators (Sialve et al., 2009). Finally, thepotential enrichment of the biogas by using algae to remove CO2
from the biogas seems to be plausible (Converti et al., 2009; Sialveet al., 2009).
So far very little work has been done on the anaerobic digestionof fresh-water microalgae and almost none for marine microalgae.Only small-scale lab-tests are reported and the loading rates aremostly in the order of a few 2 g VS L�1 d�1 and efficiencies in therange of 20–80%. From this, it can be noted that there is a needto improve the conversion efficiencies. Research has so far focusedon few algae species. Taking the total number of algae species intoaccount, a search for highly digestible species is warranted.
2. Methods
2.1. Technical aspects of the model
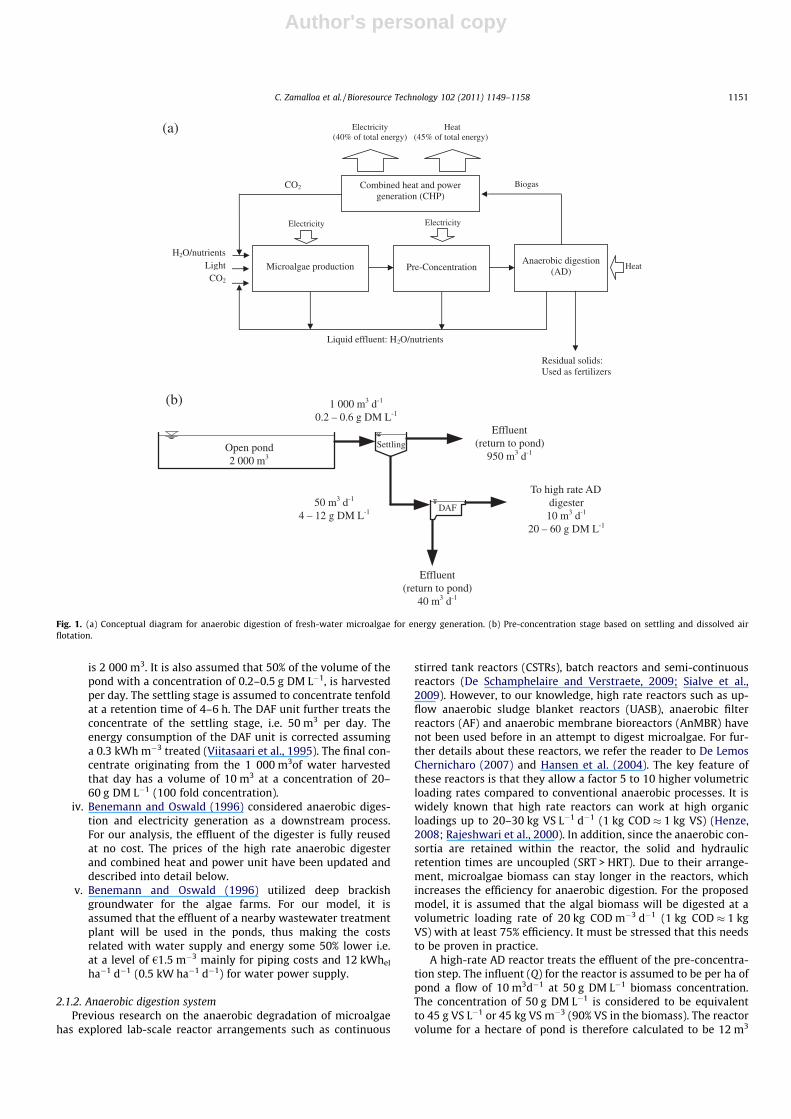
For the model discussed in this paper, algae biomass is used toproduce energy (electrical and thermal) through anaerobic diges-tion as described in Fig. 1a. The microalgae biomass is first culti-vated in a 400 ha (4 km2) raceway pond with inputs of water,nutrients and sunlight. Production of algae biomass on non-agri-cultural sites, such as landfills, was identified as a preferred ap-proach. The harvesting of the algae biomass comprises a pre-concentration stage carried out in a two stage process which is amodified version of Benemann and Oswald‘s (1996) proposal (seeFig. 1b). In the first stage, the settling stage, organic flocculantsare added and the concentration factor is about 20. In the secondstage, the dissolved air flotation (DAF), the biomass is flotated witha concentration factor of 5. The pre-concentration process dewa-ters a diluted solution of about 0.2–0.6 g DM L�1 to a slurry ofabout 20–60 g DM L�1. This process allows to feed a high-rate ADreactor with a liquor which has sufficient COD (chemical oxygendemand) to support the operation of the AD process at 30 �C. In-deed, at COD levels above 5 g L�1, the energy content generatessufficient residual heat to warm the liquor with some 10 �C. Notethat the process is designed to reutilize its mineral resources.Water and nutrients from the pre-concentration and AD stageare recirculated and the CO2 from the flue gas is used for algae cul-tivation. Clearly, this renewable generation of energy is aimed tobe carbon neutral.
2.1.1. Microalgae production and pre-concentration systemsOpen systems, in particular raceway ponds, are already a well-
established technology (Becker, 1994; Borowitzka, 1999; Rich-mond, 2004). In this work, raceway ponds equipped with a low-le-vel mixing system (velocity of 15 cm s�1) will be considered. Ourtechnical and economic aspects of microalgae mass production insuch recirculation ponds are largely based on the techno-economicanalysis carried out by Benemann and Oswald (1996). We proposethe following adjustments:
i. Capital costs related with the percolation system are nottaken into account since our aim is to use landfill sites thathave been conceived with on top a liner system. Hence, itis assumed that costs for building a pond on top of the land-fills are minimal. However, costs associated with gas diffus-ers, distribution and mixing (paddle wheels) are taken intoaccount. In addition, all costs for harvesting and digestingthe algae are taken into consideration.
ii. For the CO2 supply, Benemann and Oswald (1996) pro-vided two options; using flue gas from a power plantlocated 2.5 km from the algae farm or using pure CO2 sup-plied by a farm from tank storages. Using flue gas bringsabout high costs for piping and energy for blowingwhereas pure CO2 does not require energy since it is deliv-ered under pressure from a pipeline or a storage systemlocated on-site. In addition, the pure CO2 piping systemdescribed in Benemann and Oswald (1996) is relativelysimple and inexpensive. For our work, since the flue gasis generated on-site by the gas engine operating on thealgae-to-biogas fuel, no specific costs for CO2 supply aretaken into account.
iii. Benemann and Oswald (1996) considered a three stage har-vesting process: primary settling, dissolved air flotation(DAF) and centrifugation. In our analysis, the economic andenergy cost of the centrifugation and processing (oil extrac-tion) are omitted. The raceway pond is assumed to have adepth of 0.2 m; therefore for one hectare the total volume
1150 C. Zamalloa et al. / Bioresource Technology 102 (2011) 1149–1158
Author's personal copy
is 2 000 m3. It is also assumed that 50% of the volume of thepond with a concentration of 0.2–0.5 g DM L�1, is harvestedper day. The settling stage is assumed to concentrate tenfoldat a retention time of 4–6 h. The DAF unit further treats theconcentrate of the settling stage, i.e. 50 m3 per day. Theenergy consumption of the DAF unit is corrected assuminga 0.3 kWh m�3 treated (Viitasaari et al., 1995). The final con-centrate originating from the 1 000 m3of water harvestedthat day has a volume of 10 m3 at a concentration of 20–60 g DM L�1 (100 fold concentration).
iv. Benemann and Oswald (1996) considered anaerobic diges-tion and electricity generation as a downstream process.For our analysis, the effluent of the digester is fully reusedat no cost. The prices of the high rate anaerobic digesterand combined heat and power unit have been updated anddescribed into detail below.
v. Benemann and Oswald (1996) utilized deep brackishgroundwater for the algae farms. For our model, it isassumed that the effluent of a nearby wastewater treatmentplant will be used in the ponds, thus making the costsrelated with water supply and energy some 50% lower i.e.at a level of €1.5 m�3 mainly for piping costs and 12 kWhel
ha�1 d�1 (0.5 kW ha�1 d�1) for water power supply.
2.1.2. Anaerobic digestion systemPrevious research on the anaerobic degradation of microalgae
has explored lab-scale reactor arrangements such as continuous
stirred tank reactors (CSTRs), batch reactors and semi-continuousreactors (De Schamphelaire and Verstraete, 2009; Sialve et al.,2009). However, to our knowledge, high rate reactors such as up-flow anaerobic sludge blanket reactors (UASB), anaerobic filterreactors (AF) and anaerobic membrane bioreactors (AnMBR) havenot been used before in an attempt to digest microalgae. For fur-ther details about these reactors, we refer the reader to De LemosChernicharo (2007) and Hansen et al. (2004). The key feature ofthese reactors is that they allow a factor 5 to 10 higher volumetricloading rates compared to conventional anaerobic processes. It iswidely known that high rate reactors can work at high organicloadings up to 20–30 kg VS L�1 d�1 (1 kg COD � 1 kg VS) (Henze,2008; Rajeshwari et al., 2000). In addition, since the anaerobic con-sortia are retained within the reactor, the solid and hydraulicretention times are uncoupled (SRT > HRT). Due to their arrange-ment, microalgae biomass can stay longer in the reactors, whichincreases the efficiency for anaerobic digestion. For the proposedmodel, it is assumed that the algal biomass will be digested at avolumetric loading rate of 20 kg COD m�3 d�1 (1 kg COD � 1 kgVS) with at least 75% efficiency. It must be stressed that this needsto be proven in practice.
A high-rate AD reactor treats the effluent of the pre-concentra-tion step. The influent (Q) for the reactor is assumed to be per ha ofpond a flow of 10 m3d�1 at 50 g DM L�1 biomass concentration.The concentration of 50 g DM L�1 is considered to be equivalentto 45 g VS L�1 or 45 kg VS m�3 (90% VS in the biomass). The reactorvolume for a hectare of pond is therefore calculated to be 12 m3
1 000 m3 d-1
0.2 – 0.6 g DM L-1
Effluent (return to pond)
950 m3 d-1
50 m3 d-1
4 – 12 g DM L-1
To high rate AD digester10 m3 d-1
20 – 60 g DM L-1
Effluent (return to pond)
40 m3 d-1
Open pond 2 000 m3
DAF
Settling
Electricity
Heat
Liquid effluent: H2O/nutrients
Biogas
Microalgae production
H2O/nutrients Light CO2
Residual solids: Used as fertilizers
Pre-Concentration Anaerobic digestion
(AD)
Electricity
Heat (45% of total energy)
Electricity (40% of total energy)
Combined heat and power generation (CHP)
CO2
(a)
(b)
Fig. 1. (a) Conceptual diagram for anaerobic digestion of fresh-water microalgae for energy generation. (b) Pre-concentration stage based on settling and dissolved airflotation.
C. Zamalloa et al. / Bioresource Technology 102 (2011) 1149–1158 1151
Author's personal copy
and the HRT to be 2.3 days for an organic loading rate (Bv) of 20 kgVS m�3 d�1. Finally, the high-rate AD reactor will be operating un-der mesophilic conditions (30 �C).
2.1.3. Combined heat and power (CHP) cogeneration systemCHP is a highly efficient approach to produce electricity and
heat in a single thermodynamic process (Streckiene et al., 2009)from different sources of fuels such as biogas. The assumed effi-ciencies for the CHP in our model are 40% electric energy conver-sion and 45% thermal energy conversion (Pöschl et al., 2010;Streckiene et al., 2009). Therefore, the energy losses are assumedto be around 15%. No other losses are included in this analysis.
2.2. Economic aspects of the model
2.2.1. Net present value (NPV), internal rate of return (IRR) andpayback period
To generate insight in the profitability of electricity productionthrough methanisation of algae, the net present value (NPV) of theproject was calculated, in tandem with the internal rate of return(IRR) and the payback period.
The NPV indicates whether the project is profitable, taking intoaccount the time value of the cash flows, i.e. revenue streams, cap-ital investments and operational costs. The IRR is the discount ratethat produces a zero NPV. The payback period refers to the numberof years it takes to generate enough revenues to pay the invest-ment back, without taking into account the time value of money.For further details on the method of investment analysis, we referto Brealey et al. (2009).
In calculating the NPV, no interests and taxes were taken intoaccount. Interests were not taken account, because including thepotential costs of financing would give a distorted picture of theactual NPV, as financing costs are dependent on the mood of thefinancial market. Taxes were also not considered, because com-pany taxes are calculated on the total of the profits or losses ofall the company’s projects and including taxes on this one projectwould again not reflect the actual revenue generating potential ofthe bio-electricity project.
2.2.2. Levelized cost of energy (LCOE)The cost per kWh is calculated via the levelized cost of energy
(LCOE) - methodology of the IEA (2010). The LCOE is a widely usedtool for comparing the costs of different energy generation tech-nologies over their economic life. The calculation of the LCOE isbased on the equivalence of the present value of the sum of the dis-counted revenues and the present value of the sum of the dis-counted costs. The LCOE is, in fact, equal to the present value ofthe sum of discounted costs divided by the total production ad-justed for its economic time value (see Eq. (1)).
LCOE ¼ RtððIt þ O&Mt þ At � Ct þ DtÞ � ð1þ rÞ�tÞRtðEt � ð1þ rÞ�tÞÞ
ð1Þ
where It stands for the investment costs in year ‘t’ and O&Mt standsfor the operations and maintenance costs in year ‘t’. At signifies thealgae biomass production costs in year ‘t’. The annual revenues fromcarbon credits in year ‘t’, noted as Ct, are subtracted from the elec-tricity production costs. The decommissioning costs at the end ofthe lifetime of the plant, Dt, are in this paper assumed to be zero.The factor (1 + r)�t stands for the discount factor for year ‘t’ and Et
signifies the amount of energy produced in year ‘t’. In other words,if the electricity price is equal to the levelized average lifetime costs,and investor would precisely break even on the project (IEA, 2010).The innovative aspect to this approach, is that it takes into accountthe environmental costs of an energy technology by incorporating
the cost to emit CO2, or the revenues from avoiding CO2 emissions(see Section 2.6).
2.2.3. Discount ratesThe LCOE and NPV were calculated using a discount rate of 5%
for our base model. The discount rate reflects the risk an investorfaces. The higher the investor’s risk, the larger the discount ratehas to be, to compensate for this risk.
2.2.4. Carbon creditsTo take into account the environmental (dis)advantages of an
energy technology, the IEA puts a price on the emitted CO2. We as-sume a carbon price of €30 ton�1 CO2 in our base case, in analogywith the basic assumption of the IEA (2010). Thus, CO2-intensivetechnologies are penalized as they carry a cost of €30 per tonCO2 emitted. Producing biogas from algae grown with CO2 fromwaste streams (i.e. flue gas) implies that using CO2-neutral biogasavoids the CO2 emissions resulting from the use of (fossil) naturalgas. The revenues from carbon credits are calculated as the avoidedamount of CO2 that would be emitted producing the same amountsof MWh via fossil natural gas (i.e. 0.33 ton CO2 MWhel
-1 accordingto the IEA (2010)), multiplied by the carbon price of €30 tonCO2(eq)
-1. When referring to the LCOE we always take into accountthe revenues from the carbon credit revenues, as shown by Eq. (1).
2.2.5. Feed-in-tariffRenewable energy technologies are in almost all cases more
expensive than fossil fuel-based energy technologies. To stimulateinvestments in radically new renewable energy technologies, somegovernments subsidize the production of renewable energy byintroducing feed-in-tariffs. The feed-in or minimum price systemsguarantee fixed tariffs for the feed-in of green electricity into thegrid. The two leading EU biogas producers are Germany and theUK. The success of Germany is attributable to its attractive feed-in-tariff. Germany’s Renewable energies Act of 2009 gives a basictariff of €91.8 MWhel
-1 for electricity generated from biogas (for acapacity between 150 and 500 kWel). In the case of CHP cogenera-tion, that produces both heat and power, the actual practice is toassign to power generation the total costs of generation minusthe value of the heat produced (IEA, 2010). In the UK for instance,NERA Economic Consulting (2010) concludes that, in the context ofbiogas combustion, an optimal feed-in tariff for renewable heat of0.063 kWhth
-1 should be installed in the proposal for a RenewableHeat Incentive program as of 2011. This tariff is approximately halfof the feed-in tariff of renewable electricity ð€0:133 kWh�1
el Þ.In this paper we will assume a fixed feed-in-tariff of
€0.133 kWh�1 for both electricity and thermal energy for the entirelifetime of the project, when assessing the profitability of the algaeto electricity project. To bring a radically new technology and feed-stock, like biogas production from algae to the market, (temporar-ily) higher incentives and thus higher feed-in tariffs than the abovementioned ones, are needed to establish a market for these newtechnologies. To assess the impact of the remuneration of thermalenergy on the LCOE, we calculated the LCOE allotting all generationcosts to electricity in the sensitivity analysis.
2.2.6. Number of operational days and plant lifetimeIn our base case the number of operational days was set to
330 days per year for all three scenarios. These scenarios will befurther described in chapter 2.3. The LCOE and NPV are calculatedfor project lifetimes of 20 and 30 years. Plant lifetime of about 20and 30 years are commonly used lifetime assumptions for pondsin the context of algae production (Stephens et al., 2010), irrigationwater storage (Mushtaq et al., 2007) and waste stabilisation ponds(Khalil et al., 2008). Experiences with high-rate AD reactors in Indiafound that the lifetime of an UASB reactor is 30 years (Khalil et al.,
1152 C. Zamalloa et al. / Bioresource Technology 102 (2011) 1149–1158
Author's personal copy
2008). As a conservative approach, we assume the lifetime of theentire plant to be 20 years in the base case, keeping maintenancecosts constant (at 5% of the total pond costs) throughout the pro-ject lifetime.
2.2.7. Revenues and costsRevenues and costs are considered for a 400 ha size pond
(4 km2). It is assumed that the biomass production is constantthroughout the project lifetime, thus leading to a constant yearlyproduction of thermal and electrical energy. The production ofboth electrical and thermal kWh’s is rewarded on an equal basisby the feed-in tariff. The values for the costs of algae biomass pro-duction reported by Benemann and Oswald (1996) were adjustedfor this economic analysis taking inflation at an interest rate of2.5% for 14 years into account. It was assumed that other costs con-sidered here have not changed. The currency chosen is Euros (€)and the currency rate exchange applied is US$1 = €0.7 (averagefor March 2010). The costs of the high-rate AD reactor and CHPare based on current market values.
It is assumed that the capital cost of the algae pond is notdependent on productivity whereas the capital cost of the algaedigestion and the energy production are dependent on the levelof algae biomass productivity. The capital cost of a high-rate ADreactor depends upon the volume of the reactor and the capitalcost of CHP is dependent on biogas production. Since the gas pro-duced by microalgae does not contain high levels of sulphur (Sialveet al., 2009), costs associated with the cleaning of gas are not takeninto account. The capital cost of the CHP unit is calculated for a500 kWel (kilowatt electricity) biogas plant.
Operational costs are productivity dependent due to differentrequirements concerning nutrients and flocculants. It is assumedthat 70% of nitrogen (N) and 50% of phosphorus (P) are recycled.Furthermore, energy consumption was not taken into account forthe overall operational cost but instead considered as parasiticdemand. A potential alternative nutrient source for algae cultiva-tion, which has not been taken into account for the discussed model,is the use of wastewater (Chisti, 2007; Rodolfi et al., 2009). The useof N and P from wastewater can have a positive impact on theeconomics of the model. In a conventional wastewater treatmentplant, the biological removal of N and P have an average costof about €3.5 kg�1 N removed and about €2.4 kg�1 P removed(Baetens, 2000; Fux and Siegrist, 2004). For instance, producing70–110 ton DM ha�1 a�1 of algae using nutrients from wastewatercan save about €11000–17000 ha�1 a�1 N removed and €1500–2500 ha�1 a�1 P removed (assuming 46 g of N kg�1algae and 10 gof P kg�1 algae). Therefore, it can be seen that using wastewaternot only can decrease costs associated with the supply of inorganicnutrients (estimated at €600 ha�1 a�1, Table 3), but can also have apositive influence on the economics of a model such as ours. Indeed,nutrient removal, i.e. from the concentrated AD digestate, mightgenerate a nutrient capture revenue (i.e. avoided cost of nutrient re-moval from wastewater), which under optimal conditions could beof the order of €15000 ha�1 a�1; the latter would be almost equal tothe revenues obtained by the energy production (Table 4).
2.3. Studied scenarios
The techno-economic analysis is carried out for three differentmicroalgae productivities. Productivities for well-managed race-ways ponds were reported between 20 and 25 g DM m�2 d�1 (Rich-mond, 2004; Sheehan et al., 1998). In addition, a reasonableprojected productivity is assumed here to be 30 g DM m�2 d�1.The summary of the base case scenarios is:
� Scenario 1: 20 g DM m�2 d-1 (70 ton DM ha�1 a�1) productivity.� Scenario 2: 25 g DM m�2 d�1 (90 ton DM ha�1 a�1) productivity.
� Scenario 3: 30 g DM m�2 d�1 (110 ton DM ha�1 a�1)productivity.
3. Results and discussion
3.1. Technical analysis
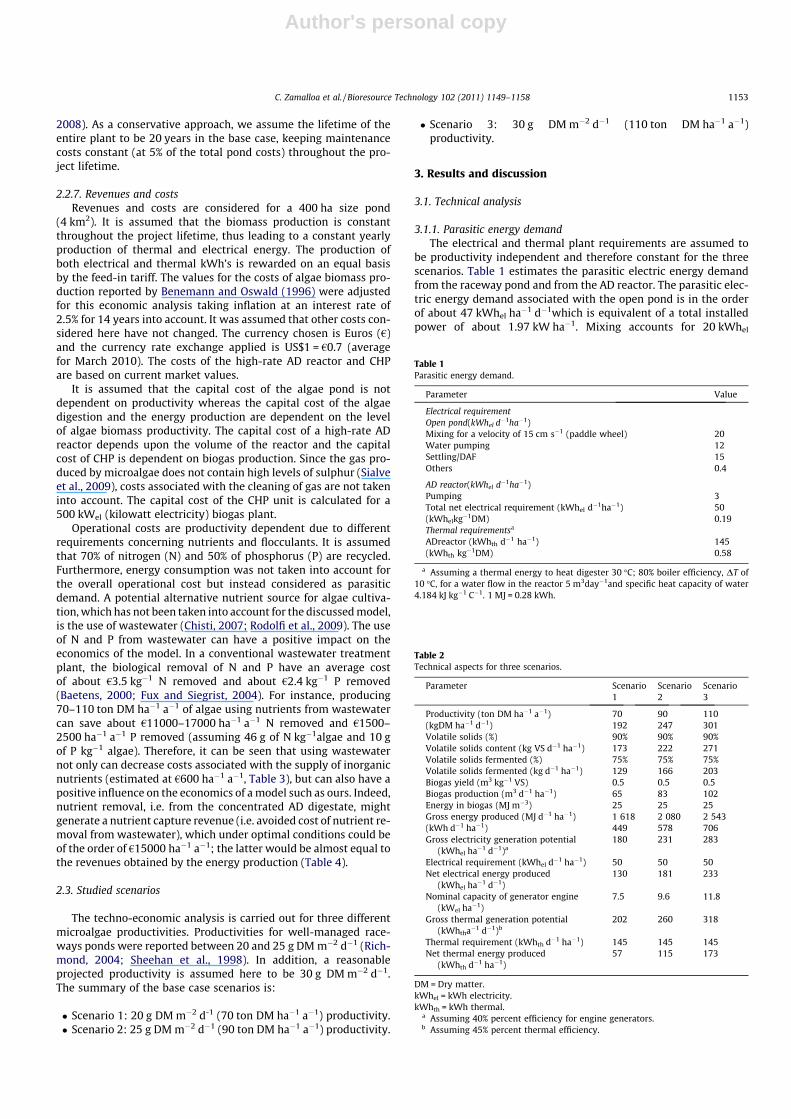
3.1.1. Parasitic energy demandThe electrical and thermal plant requirements are assumed to
be productivity independent and therefore constant for the threescenarios. Table 1 estimates the parasitic electric energy demandfrom the raceway pond and from the AD reactor. The parasitic elec-tric energy demand associated with the open pond is in the orderof about 47 kWhel ha�1 d�1which is equivalent of a total installedpower of about 1.97 kW ha�1. Mixing accounts for 20 kWhel
Table 1Parasitic energy demand.
Parameter Value
Electrical requirementOpen pond(kWhel d�1ha�1)Mixing for a velocity of 15 cm s�1 (paddle wheel) 20Water pumping 12Settling/DAF 15Others 0.4
AD reactor(kWhel d�1ha�1)Pumping 3Total net electrical requirement (kWhel d�1ha�1) 50(kWhelkg�1DM) 0.19Thermal requirementsa
ADreactor (kWhth d�1 ha�1) 145(kWhth kg�1DM) 0.58
a Assuming a thermal energy to heat digester 30 �C; 80% boiler efficiency, DT of10 �C, for a water flow in the reactor 5 m3day�1and specific heat capacity of water4.184 kJ kg�1 C�1. 1 MJ = 0.28 kWh.
Table 2Technical aspects for three scenarios.
Parameter Scenario1
Scenario2
Scenario3
Productivity (ton DM ha�1 a�1) 70 90 110(kgDM ha�1 d�1) 192 247 301Volatile solids (%) 90% 90% 90%Volatile solids content (kg VS d�1 ha�1) 173 222 271Volatile solids fermented (%) 75% 75% 75%Volatile solids fermented (kg d�1 ha�1) 129 166 203Biogas yield (m3 kg�1 VS) 0.5 0.5 0.5Biogas production (m3 d�1 ha�1) 65 83 102Energy in biogas (MJ m�3) 25 25 25Gross energy produced (MJ d�1 ha�1) 1 618 2 080 2 543(kWh d�1 ha�1) 449 578 706Gross electricity generation potential
(kWhel ha�1 d�1)a180 231 283
Electrical requirement (kWhel d�1 ha�1) 50 50 50Net electrical energy produced
(kWhel ha�1 d�1)130 181 233
Nominal capacity of generator engine(kWel ha�1)
7.5 9.6 11.8
Gross thermal generation potential(kWhtha�1 d�1)b
202 260 318
Thermal requirement (kWhth d�1 ha�1) 145 145 145Net thermal energy produced
(kWhth d�1 ha�1)57 115 173
DM = Dry matter.kWhel = kWh electricity.kWhth = kWh thermal.
a Assuming 40% percent efficiency for engine generators.b Assuming 45% percent thermal efficiency.
C. Zamalloa et al. / Bioresource Technology 102 (2011) 1149–1158 1153
Author's personal copy
ha�1 d�1(0.83 kWel ha�1), water pumping for 12 kWhel ha�1
d�1(0.5 kWel ha�1), and settling and dissolved air flotation (DAF)for 15 kWhel ha�1 d�1(0.63 kWel ha�1). Electricity for buildings isincluded in ‘others’ and accounts for 0.4 kWhel ha�1 d�1(0.02kWel ha�1). The electric energy demand for the AD reactor iscalculated to be 3 kWhel ha�1 d�1, which is mainly for pumping.The total electric energy required for both systems is about50 kWhel ha�1 d�1(2.1 kWel ha�1). The thermal demand for heatingthe AD reactor from 20 to 30 �C (assuming the specific heat capac-ity of water of 4.184 kJ kg�1�C�1) is about 145 kWhth ha�1 d�1. Itcan be seen that the mixing, the pre-concentration, mainly DAF,and the water pumping are the major energy inputs of the system.
3.1.2. Biogas and energy potentialTable 2 depicts an estimation of the biogas production and its
gross energy potential for the three scenarios. It is assumed that90% of the algae biomass is VS. The biogas is produced and theVS is fermented at a biogas yield of 0.5 m3 kg�1 VS. The VS removalis assumed to be 75% for all scenarios. The produced biogas isburned and converted into electrical and thermal energy by a com-bined heat and power (CHP) unit.
Scenario 3 produces the largest quantities of biogas, followed byScenario 2 and Scenario 1, respectively. Scenario 3 produces about102 m3 biogas ha�1 d�1, which amounts to about 23% more biogasthan Scenario 2 (83 m3 biogas ha�1 d�1) and about 60% more thanScenario 1 (65 m3 biogas ha�1 d�1). This is not surprising becausehigher productivities per hectare, allow to recover more net energy.
The gross electric generation potential is 180, 231 and283 kWhel ha�1 d�1 for a biomass productivity of 70, 90 and110 ton DM ha�1 a�1, respectively (see Table 2). The gross thermalgeneration potential is 202, 260 and 318 kWhth ha�1 d�1, respec-tively. Amon et al. (2007) calculated the biogas production of en-ergy crops such as maize (whole crop silage) and sunflower(whole crop silage). The maximal potential energy of these cropsthrough anaerobic digestion is 162 kWhel ha�1 d�1for maize and90 kWhel ha�1 d�1for sunflower. From this, it appears that microal-gae biomass at productivities of about 70 ton DM ha�1 a�1 has ahigher bio-methanation potential than sunflower and about thesame as maize. For productivities between 90 and 110 tonDM ha�1 a�1, the electrical energy potential is 2–3 orders of mag-nitude higher than that of maize and sunflower.
Scenario 1 has the lowest electrical and thermal energy net pro-duction; whereas Scenario 3 has the highest (see Table 2). Scenario1 has a net electrical energy production potential of about130 kWhel ha�1 d�1 and a thermal production potential of about57 kWhth ha�1 d�1. Scenario 2 has a net electrical energy produc-tion potential of about 181 kWhel ha�1 d�1 and a thermal produc-tion potential of about 151 kWhth ha�1 d�1. Scenario 3 has a netelectrical energy production potential of about 233 kWhth ha�1 d�1
and a thermal production potential of about 173 kWhth ha�1 d�1.Scenario 1 utilizes about 28% of the electric energy and 72% ofthe thermal energy produced. Scenario 2 consumes 22% and 56%of electric and thermal energy respectively. Scenario 3 only uses18% and 46%. The nominal capacity of the generator engine is
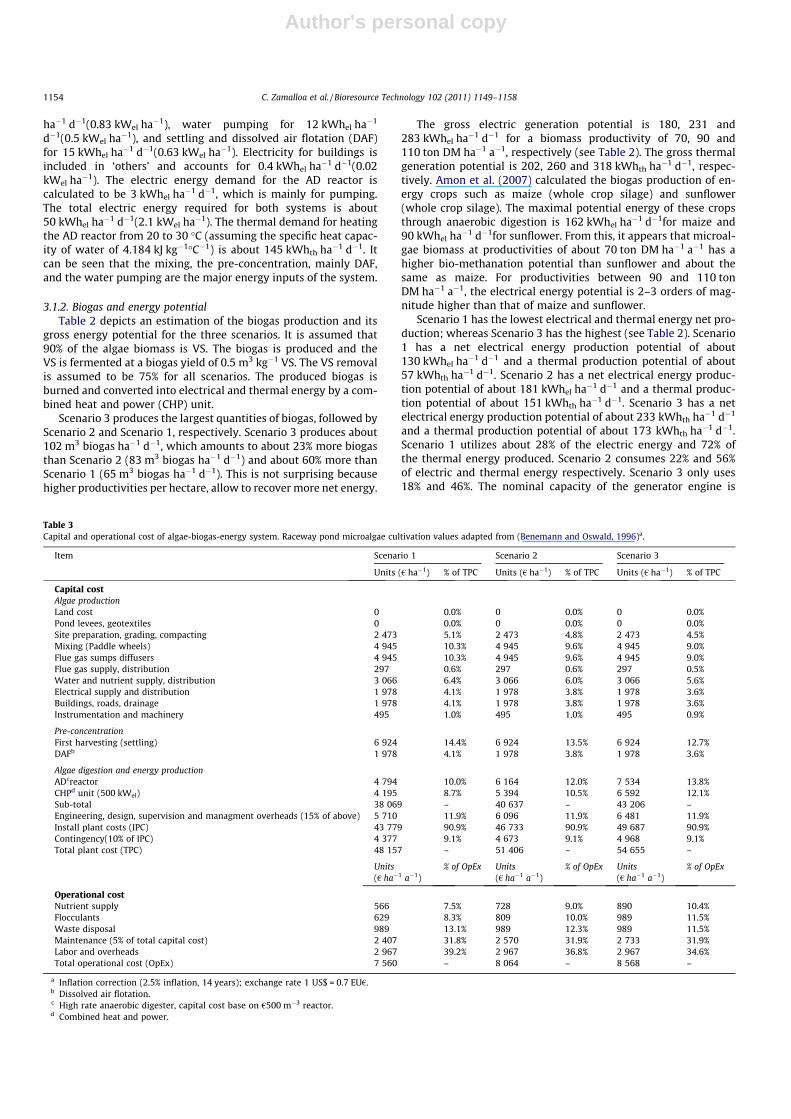
Table 3Capital and operational cost of algae-biogas-energy system. Raceway pond microalgae cultivation values adapted from (Benemann and Oswald, 1996)a.
Item Scenario 1 Scenario 2 Scenario 3
Units (€ ha�1) % of TPC Units (€ ha�1) % of TPC Units (€ ha�1) % of TPC
Capital costAlgae productionLand cost 0 0.0% 0 0.0% 0 0.0%Pond levees, geotextiles 0 0.0% 0 0.0% 0 0.0%Site preparation, grading, compacting 2 473 5.1% 2 473 4.8% 2 473 4.5%Mixing (Paddle wheels) 4 945 10.3% 4 945 9.6% 4 945 9.0%Flue gas sumps diffusers 4 945 10.3% 4 945 9.6% 4 945 9.0%Flue gas supply, distribution 297 0.6% 297 0.6% 297 0.5%Water and nutrient supply, distribution 3 066 6.4% 3 066 6.0% 3 066 5.6%Electrical supply and distribution 1 978 4.1% 1 978 3.8% 1 978 3.6%Buildings, roads, drainage 1 978 4.1% 1 978 3.8% 1 978 3.6%Instrumentation and machinery 495 1.0% 495 1.0% 495 0.9%
Pre-concentrationFirst harvesting (settling) 6 924 14.4% 6 924 13.5% 6 924 12.7%DAFb 1 978 4.1% 1 978 3.8% 1 978 3.6%
Algae digestion and energy productionADcreactor 4 794 10.0% 6 164 12.0% 7 534 13.8%CHPd unit (500 kWel) 4 195 8.7% 5 394 10.5% 6 592 12.1%Sub-total 38 069 – 40 637 – 43 206 –Engineering, design, supervision and managment overheads (15% of above) 5 710 11.9% 6 096 11.9% 6 481 11.9%Install plant costs (IPC) 43 779 90.9% 46 733 90.9% 49 687 90.9%Contingency(10% of IPC) 4 377 9.1% 4 673 9.1% 4 968 9.1%Total plant cost (TPC) 48 157 – 51 406 – 54 655 –
Units(€ ha�1 a�1)
% of OpEx Units(€ ha�1 a�1)
% of OpEx Units(€ ha�1 a�1)
% of OpEx
Operational costNutrient supply 566 7.5% 728 9.0% 890 10.4%Flocculants 629 8.3% 809 10.0% 989 11.5%Waste disposal 989 13.1% 989 12.3% 989 11.5%Maintenance (5% of total capital cost) 2 407 31.8% 2 570 31.9% 2 733 31.9%Labor and overheads 2 967 39.2% 2 967 36.8% 2 967 34.6%Total operational cost (OpEx) 7 560 – 8 064 – 8 568 –
a Inflation correction (2.5% inflation, 14 years); exchange rate 1 US$ = 0.7 EU€.b Dissolved air flotation.c High rate anaerobic digester, capital cost base on €500 m�3 reactor.d Combined heat and power.
1154 C. Zamalloa et al. / Bioresource Technology 102 (2011) 1149–1158
Author's personal copy
estimated to be 7.5, 9.6 and 11.8 kWel ha�1for scenarios 1, 2 and 3,respectively.
3.2. Economic analysis
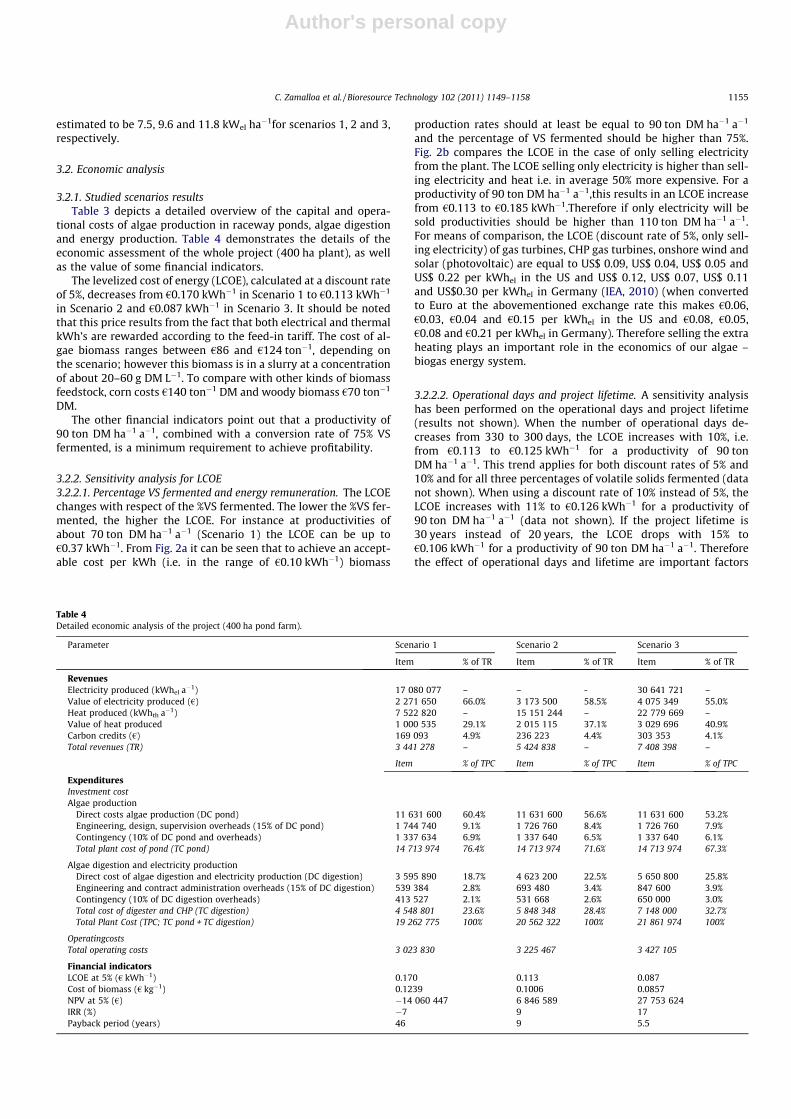
3.2.1. Studied scenarios resultsTable 3 depicts a detailed overview of the capital and opera-
tional costs of algae production in raceway ponds, algae digestionand energy production. Table 4 demonstrates the details of theeconomic assessment of the whole project (400 ha plant), as wellas the value of some financial indicators.
The levelized cost of energy (LCOE), calculated at a discount rateof 5%, decreases from €0.170 kWh�1 in Scenario 1 to €0.113 kWh�1
in Scenario 2 and €0.087 kWh�1 in Scenario 3. It should be notedthat this price results from the fact that both electrical and thermalkWh’s are rewarded according to the feed-in tariff. The cost of al-gae biomass ranges between €86 and €124 ton�1, depending onthe scenario; however this biomass is in a slurry at a concentrationof about 20–60 g DM L�1. To compare with other kinds of biomassfeedstock, corn costs €140 ton�1 DM and woody biomass €70 ton�1
DM.The other financial indicators point out that a productivity of
90 ton DM ha�1 a�1, combined with a conversion rate of 75% VSfermented, is a minimum requirement to achieve profitability.
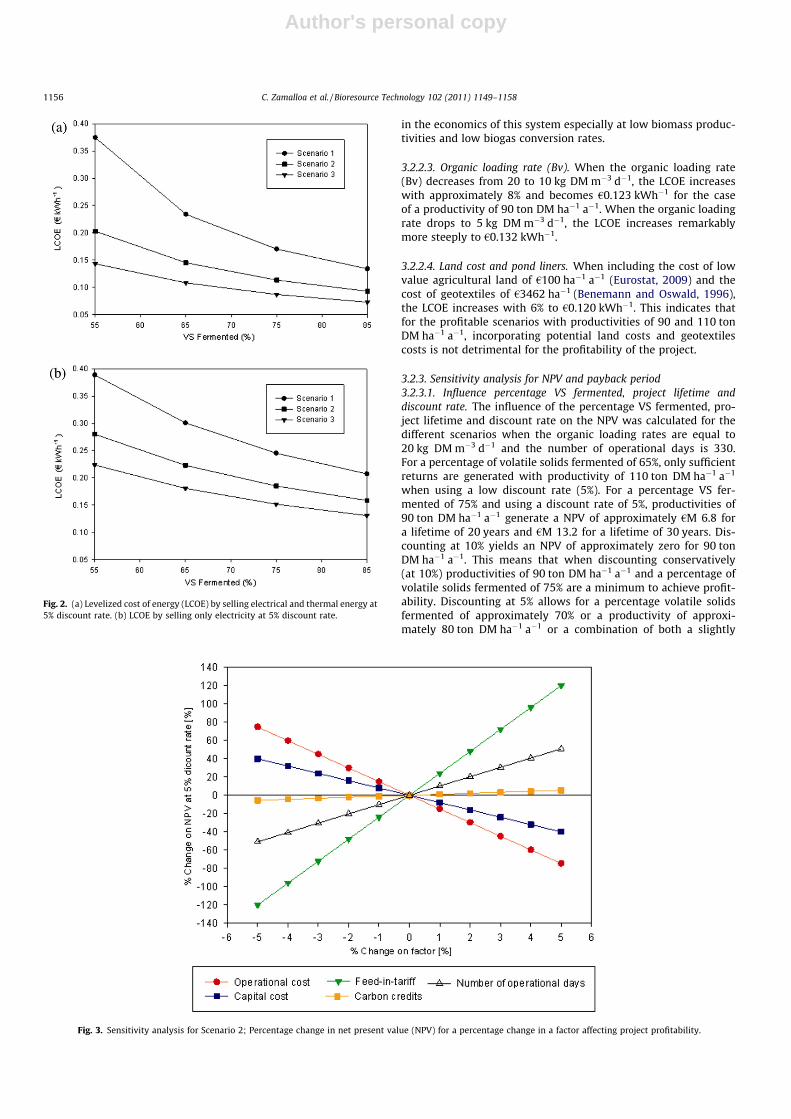
3.2.2. Sensitivity analysis for LCOE3.2.2.1. Percentage VS fermented and energy remuneration. The LCOEchanges with respect of the %VS fermented. The lower the %VS fer-mented, the higher the LCOE. For instance at productivities ofabout 70 ton DM ha�1 a�1 (Scenario 1) the LCOE can be up to€0.37 kWh�1. From Fig. 2a it can be seen that to achieve an accept-able cost per kWh (i.e. in the range of €0.10 kWh�1) biomass
production rates should at least be equal to 90 ton DM ha�1 a�1
and the percentage of VS fermented should be higher than 75%.Fig. 2b compares the LCOE in the case of only selling electricityfrom the plant. The LCOE selling only electricity is higher than sell-ing electricity and heat i.e. in average 50% more expensive. For aproductivity of 90 ton DM ha�1 a�1,this results in an LCOE increasefrom €0.113 to €0.185 kWh�1.Therefore if only electricity will besold productivities should be higher than 110 ton DM ha�1 a�1.For means of comparison, the LCOE (discount rate of 5%, only sell-ing electricity) of gas turbines, CHP gas turbines, onshore wind andsolar (photovoltaic) are equal to US$ 0.09, US$ 0.04, US$ 0.05 andUS$ 0.22 per kWhel in the US and US$ 0.12, US$ 0.07, US$ 0.11and US$0.30 per kWhel in Germany (IEA, 2010) (when convertedto Euro at the abovementioned exchange rate this makes €0.06,€0.03, €0.04 and €0.15 per kWhel in the US and €0.08, €0.05,€0.08 and €0.21 per kWhel in Germany). Therefore selling the extraheating plays an important role in the economics of our algae –biogas energy system.
3.2.2.2. Operational days and project lifetime. A sensitivity analysishas been performed on the operational days and project lifetime(results not shown). When the number of operational days de-creases from 330 to 300 days, the LCOE increases with 10%, i.e.from €0.113 to €0.125 kWh�1 for a productivity of 90 tonDM ha�1 a�1. This trend applies for both discount rates of 5% and10% and for all three percentages of volatile solids fermented (datanot shown). When using a discount rate of 10% instead of 5%, theLCOE increases with 11% to €0.126 kWh�1 for a productivity of90 ton DM ha�1 a�1 (data not shown). If the project lifetime is30 years instead of 20 years, the LCOE drops with 15% to€0.106 kWh�1 for a productivity of 90 ton DM ha�1 a�1. Thereforethe effect of operational days and lifetime are important factors
Table 4Detailed economic analysis of the project (400 ha pond farm).
Parameter Scenario 1 Scenario 2 Scenario 3
Item % of TR Item % of TR Item % of TR
RevenuesElectricity produced (kWhel a�1) 17 080 077 – – - 30 641 721 –Value of electricity produced (€) 2 271 650 66.0% 3 173 500 58.5% 4 075 349 55.0%Heat produced (kWhth a�1) 7 522 820 – 15 151 244 – 22 779 669 –Value of heat produced 1 000 535 29.1% 2 015 115 37.1% 3 029 696 40.9%Carbon credits (€) 169 093 4.9% 236 223 4.4% 303 353 4.1%Total revenues (TR) 3 441 278 – 5 424 838 – 7 408 398 –
Item % of TPC Item % of TPC Item % of TPC
ExpendituresInvestment costAlgae production
Direct costs algae production (DC pond) 11 631 600 60.4% 11 631 600 56.6% 11 631 600 53.2%Engineering, design, supervision overheads (15% of DC pond) 1 744 740 9.1% 1 726 760 8.4% 1 726 760 7.9%Contingency (10% of DC pond and overheads) 1 337 634 6.9% 1 337 640 6.5% 1 337 640 6.1%Total plant cost of pond (TC pond) 14 713 974 76.4% 14 713 974 71.6% 14 713 974 67.3%
Algae digestion and electricity productionDirect cost of algae digestion and electricity production (DC digestion) 3 595 890 18.7% 4 623 200 22.5% 5 650 800 25.8%Engineering and contract administration overheads (15% of DC digestion) 539 384 2.8% 693 480 3.4% 847 600 3.9%Contingency (10% of DC digestion overheads) 413 527 2.1% 531 668 2.6% 650 000 3.0%Total cost of digester and CHP (TC digestion) 4 548 801 23.6% 5 848 348 28.4% 7 148 000 32.7%Total Plant Cost (TPC; TC pond + TC digestion) 19 262 775 100% 20 562 322 100% 21 861 974 100%
OperatingcostsTotal operating costs 3 023 830 3 225 467 3 427 105
Financial indicatorsLCOE at 5% (€ kWh�1) 0.170 0.113 0.087Cost of biomass (€ kg�1) 0.1239 0.1006 0.0857NPV at 5% (€) �14 060 447 6 846 589 27 753 624IRR (%) �7 9 17Payback period (years) 46 9 5.5
C. Zamalloa et al. / Bioresource Technology 102 (2011) 1149–1158 1155
Author's personal copy
in the economics of this system especially at low biomass produc-tivities and low biogas conversion rates.
3.2.2.3. Organic loading rate (Bv). When the organic loading rate(Bv) decreases from 20 to 10 kg DM m�3 d�1, the LCOE increaseswith approximately 8% and becomes €0.123 kWh�1 for the caseof a productivity of 90 ton DM ha�1 a�1. When the organic loadingrate drops to 5 kg DM m�3 d�1, the LCOE increases remarkablymore steeply to €0.132 kWh�1.
3.2.2.4. Land cost and pond liners. When including the cost of lowvalue agricultural land of €100 ha�1 a�1 (Eurostat, 2009) and thecost of geotextiles of €3462 ha�1 (Benemann and Oswald, 1996),the LCOE increases with 6% to €0.120 kWh�1. This indicates thatfor the profitable scenarios with productivities of 90 and 110 tonDM ha�1 a�1, incorporating potential land costs and geotextilescosts is not detrimental for the profitability of the project.
3.2.3. Sensitivity analysis for NPV and payback period3.2.3.1. Influence percentage VS fermented, project lifetime anddiscount rate. The influence of the percentage VS fermented, pro-ject lifetime and discount rate on the NPV was calculated for thedifferent scenarios when the organic loading rates are equal to20 kg DM m�3 d�1 and the number of operational days is 330.For a percentage of volatile solids fermented of 65%, only sufficientreturns are generated with productivity of 110 ton DM ha�1 a�1
when using a low discount rate (5%). For a percentage VS fer-mented of 75% and using a discount rate of 5%, productivities of90 ton DM ha�1 a�1 generate a NPV of approximately €M 6.8 fora lifetime of 20 years and €M 13.2 for a lifetime of 30 years. Dis-counting at 10% yields an NPV of approximately zero for 90 tonDM ha�1 a�1. This means that when discounting conservatively(at 10%) productivities of 90 ton DM ha�1 a�1 and a percentage ofvolatile solids fermented of 75% are a minimum to achieve profit-ability. Discounting at 5% allows for a percentage volatile solidsfermented of approximately 70% or a productivity of approxi-mately 80 ton DM ha�1 a�1 or a combination of both a slightly
Fig. 2. (a) Levelized cost of energy (LCOE) by selling electrical and thermal energy at5% discount rate. (b) LCOE by selling only electricity at 5% discount rate.
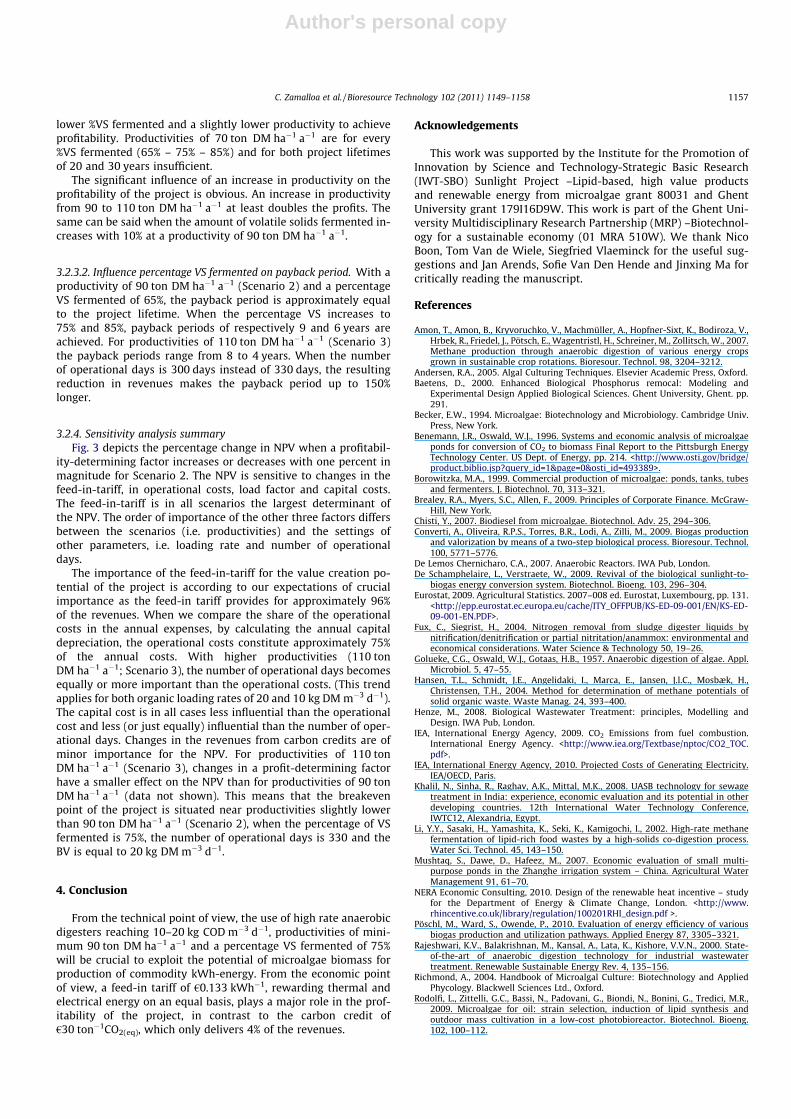
Fig. 3. Sensitivity analysis for Scenario 2; Percentage change in net present value (NPV) for a percentage change in a factor affecting project profitability.
1156 C. Zamalloa et al. / Bioresource Technology 102 (2011) 1149–1158
Author's personal copy
lower %VS fermented and a slightly lower productivity to achieveprofitability. Productivities of 70 ton DM ha�1 a�1 are for every%VS fermented (65% – 75% – 85%) and for both project lifetimesof 20 and 30 years insufficient.
The significant influence of an increase in productivity on theprofitability of the project is obvious. An increase in productivityfrom 90 to 110 ton DM ha�1 a�1 at least doubles the profits. Thesame can be said when the amount of volatile solids fermented in-creases with 10% at a productivity of 90 ton DM ha�1 a�1.
3.2.3.2. Influence percentage VS fermented on payback period. With aproductivity of 90 ton DM ha�1 a�1 (Scenario 2) and a percentageVS fermented of 65%, the payback period is approximately equalto the project lifetime. When the percentage VS increases to75% and 85%, payback periods of respectively 9 and 6 years areachieved. For productivities of 110 ton DM ha�1 a�1 (Scenario 3)the payback periods range from 8 to 4 years. When the numberof operational days is 300 days instead of 330 days, the resultingreduction in revenues makes the payback period up to 150%longer.
3.2.4. Sensitivity analysis summaryFig. 3 depicts the percentage change in NPV when a profitabil-
ity-determining factor increases or decreases with one percent inmagnitude for Scenario 2. The NPV is sensitive to changes in thefeed-in-tariff, in operational costs, load factor and capital costs.The feed-in-tariff is in all scenarios the largest determinant ofthe NPV. The order of importance of the other three factors differsbetween the scenarios (i.e. productivities) and the settings ofother parameters, i.e. loading rate and number of operationaldays.
The importance of the feed-in-tariff for the value creation po-tential of the project is according to our expectations of crucialimportance as the feed-in tariff provides for approximately 96%of the revenues. When we compare the share of the operationalcosts in the annual expenses, by calculating the annual capitaldepreciation, the operational costs constitute approximately 75%of the annual costs. With higher productivities (110 tonDM ha�1 a�1; Scenario 3), the number of operational days becomesequally or more important than the operational costs. (This trendapplies for both organic loading rates of 20 and 10 kg DM m�3 d�1).The capital cost is in all cases less influential than the operationalcost and less (or just equally) influential than the number of oper-ational days. Changes in the revenues from carbon credits are ofminor importance for the NPV. For productivities of 110 tonDM ha�1 a�1 (Scenario 3), changes in a profit-determining factorhave a smaller effect on the NPV than for productivities of 90 tonDM ha�1 a�1 (data not shown). This means that the breakevenpoint of the project is situated near productivities slightly lowerthan 90 ton DM ha�1 a�1 (Scenario 2), when the percentage of VSfermented is 75%, the number of operational days is 330 and theBV is equal to 20 kg DM m�3 d�1.
4. Conclusion
From the technical point of view, the use of high rate anaerobicdigesters reaching 10–20 kg COD m�3 d�1, productivities of mini-mum 90 ton DM ha�1 a�1 and a percentage VS fermented of 75%will be crucial to exploit the potential of microalgae biomass forproduction of commodity kWh-energy. From the economic pointof view, a feed-in tariff of €0.133 kWh�1, rewarding thermal andelectrical energy on an equal basis, plays a major role in the prof-itability of the project, in contrast to the carbon credit of€30 ton�1CO2(eq), which only delivers 4% of the revenues.
Acknowledgements
This work was supported by the Institute for the Promotion ofInnovation by Science and Technology-Strategic Basic Research(IWT-SBO) Sunlight Project –Lipid-based, high value productsand renewable energy from microalgae grant 80031 and GhentUniversity grant 179I16D9W. This work is part of the Ghent Uni-versity Multidisciplinary Research Partnership (MRP) –Biotechnol-ogy for a sustainable economy (01 MRA 510W). We thank NicoBoon, Tom Van de Wiele, Siegfried Vlaeminck for the useful sug-gestions and Jan Arends, Sofie Van Den Hende and Jinxing Ma forcritically reading the manuscript.
References
Amon, T., Amon, B., Kryvoruchko, V., Machmüller, A., Hopfner-Sixt, K., Bodiroza, V.,Hrbek, R., Friedel, J., Pötsch, E., Wagentristl, H., Schreiner, M., Zollitsch, W., 2007.Methane production through anaerobic digestion of various energy cropsgrown in sustainable crop rotations. Bioresour. Technol. 98, 3204–3212.
Andersen, R.A., 2005. Algal Culturing Techniques. Elsevier Academic Press, Oxford.Baetens, D., 2000. Enhanced Biological Phosphorus remocal: Modeling and
Experimental Design Applied Biological Sciences. Ghent University, Ghent. pp.291.
Becker, E.W., 1994. Microalgae: Biotechnology and Microbiology. Cambridge Univ.Press, New York.
Benemann, J.R., Oswald, W.J., 1996. Systems and economic analysis of microalgaeponds for conversion of CO2 to biomass Final Report to the Pittsburgh EnergyTechnology Center. US Dept. of Energy, pp. 214. <http://www.osti.gov/bridge/product.biblio.jsp?query_id=1&page=0&osti_id=493389>.
Borowitzka, M.A., 1999. Commercial production of microalgae: ponds, tanks, tubesand fermenters. J. Biotechnol. 70, 313–321.
Brealey, R.A., Myers, S.C., Allen, F., 2009. Principles of Corporate Finance. McGraw-Hill, New York.
Chisti, Y., 2007. Biodiesel from microalgae. Biotechnol. Adv. 25, 294–306.Converti, A., Oliveira, R.P.S., Torres, B.R., Lodi, A., Zilli, M., 2009. Biogas production
and valorization by means of a two-step biological process. Bioresour. Technol.100, 5771–5776.
De Lemos Chernicharo, C.A., 2007. Anaerobic Reactors. IWA Pub, London.De Schamphelaire, L., Verstraete, W., 2009. Revival of the biological sunlight-to-
biogas energy conversion system. Biotechnol. Bioeng. 103, 296–304.Eurostat, 2009. Agricultural Statistics. 2007–008 ed. Eurostat, Luxembourg, pp. 131.
<http://epp.eurostat.ec.europa.eu/cache/ITY_OFFPUB/KS-ED-09-001/EN/KS-ED-09-001-EN.PDF>.
Fux, C., Siegrist, H., 2004. Nitrogen removal from sludge digester liquids bynitrification/denitrification or partial nitritation/anammox: environmental andeconomical considerations. Water Science & Technology 50, 19–26.
Golueke, C.G., Oswald, W.J., Gotaas, H.B., 1957. Anaerobic digestion of algae. Appl.Microbiol. 5, 47–55.
Hansen, T.L., Schmidt, J.E., Angelidaki, I., Marca, E., Jansen, J.l.C., Mosbæk, H.,Christensen, T.H., 2004. Method for determination of methane potentials ofsolid organic waste. Waste Manag. 24, 393–400.
Henze, M., 2008. Biological Wastewater Treatment: principles, Modelling andDesign. IWA Pub, London.
IEA, International Energy Agency, 2009. CO2 Emissions from fuel combustion.International Energy Agency. <http://www.iea.org/Textbase/nptoc/CO2_TOC.pdf>.
IEA, International Energy Agency, 2010. Projected Costs of Generating Electricity.IEA/OECD, Paris.
Khalil, N., Sinha, R., Raghav, A.K., Mittal, M.K., 2008. UASB technology for sewagetreatment in India: experience, economic evaluation and its potential in otherdeveloping countries. 12th International Water Technology Conference,IWTC12, Alexandria, Egypt.
Li, Y.Y., Sasaki, H., Yamashita, K., Seki, K., Kamigochi, I., 2002. High-rate methanefermentation of lipid-rich food wastes by a high-solids co-digestion process.Water Sci. Technol. 45, 143–150.
Mushtaq, S., Dawe, D., Hafeez, M., 2007. Economic evaluation of small multi-purpose ponds in the Zhanghe irrigation system – China. Agricultural WaterManagement 91, 61–70.
NERA Economic Consulting, 2010. Design of the renewable heat incentive – studyfor the Department of Energy & Climate Change, London. <http://www.rhincentive.co.uk/library/regulation/100201RHI_design.pdf >.
Pöschl, M., Ward, S., Owende, P., 2010. Evaluation of energy efficiency of variousbiogas production and utilization pathways. Applied Energy 87, 3305–3321.
Rajeshwari, K.V., Balakrishnan, M., Kansal, A., Lata, K., Kishore, V.V.N., 2000. State-of-the-art of anaerobic digestion technology for industrial wastewatertreatment. Renewable Sustainable Energy Rev. 4, 135–156.
Richmond, A., 2004. Handbook of Microalgal Culture: Biotechnology and AppliedPhycology. Blackwell Sciences Ltd., Oxford.
Rodolfi, L., Zittelli, G.C., Bassi, N., Padovani, G., Biondi, N., Bonini, G., Tredici, M.R.,2009. Microalgae for oil: strain selection, induction of lipid synthesis andoutdoor mass cultivation in a low-cost photobioreactor. Biotechnol. Bioeng.102, 100–112.
C. Zamalloa et al. / Bioresource Technology 102 (2011) 1149–1158 1157

Author's personal copy
Sánchez Hernández, E.P., Travieso Córdoba, L., 1993. Anaerobic digestion of Chlorellavulgaris for energy production. Resour. Conserv. Recycl. 9, 127–132.
Schenk, P.M., Thomas-Hall, S.R., Stephens, E., Marx, U.C., Mussgnug, J.H., Posten, C.,Kruse, O., Hankamer, B., 2008. Second generation biofuels: high-efficiencymicroalgae for biodiesel production. Bioenergy Res. 1, 20–43.
Sheehan, J., Dunahay, T., Benemann, J., 1998. A look back at the U.S. Department ofEnergy’s Aquatic Species Program: biodiesel from algae. US Department ofEnergy Golden, Colorado. <http://www.nrel.gov/docs/legosti/fy98/24190.pdf>.
Sialve, B., Bernet, N., Bernard, O., 2009. Anaerobic digestion of microalgae as anecessary step to make microalgal biodiesel sustainable. Biotechnol. Adv. 27,409–416.
Spolaore, P., Joannis-Cassan, C., Duran, E., Isambert, A., 2006. Commercial appli-cations of microalgae. J. Biosci. Bioeng. 101, 87–96.
Stephens, E., Ross, I.L., King, Z., Mussgnug, J.H., Kruse, O., Posten, C., Borowitzka,M.A., Hankamer, B., 2010. An economic and technical evaluation of microalgalbiofuels. Nat. Biotechnol. 28, 126–128.
Streckiene, G., Martinaitis, V., Andersen, A.N., Katz, J., 2009. Feasibility of CHP-plants with thermal stores in the German spot market. Applied Energy 86,2308–2316.
Uduman, N., Qi, Y., Danquah, M.K., Forde, G.M., Hoadley, A., 2010. Dewatering ofmicroalgal cultures: a major bottleneck to algae-based fuels. J. RenewableSustainable Energy 2, 0127011–0127015.
Viitasaari, M., Jokela, P., Heinänen, J., 1995. Dissolved air flotation in the treatmentof industrial wastewaters with a special emphasis on forest and foodstuffindustries. Water Sci. Technol. 31, 299–313.
1158 C. Zamalloa et al. / Bioresource Technology 102 (2011) 1149–1158


