Embed Size (px)
Citation preview

This article appeared in a journal published by Elsevier. The attachedcopy is furnished to the author for internal non-commercial researchand education use, including for instruction at the authors institution
and sharing with colleagues.
Other uses, including reproduction and distribution, or selling orlicensing copies, or posting to personal, institutional or third party
websites are prohibited.
In most cases authors are permitted to post their version of thearticle (e.g. in Word or Tex form) to their personal website orinstitutional repository. Authors requiring further information
regarding Elsevier’s archiving and manuscript policies areencouraged to visit:
http://www.elsevier.com/copyright

Author's personal copy
The use of Bassia indica for salt phytoremediationin constructed wetlands
Oren Shelef a,1, Amit Gross b, Shimon Rachmilevitch a,*a French Associates Institute for Agriculture & Biotechnology of Drylands, The Jacob Blaustein Institutes for Desert Research,
Ben-Gurion University of the Negev, Midreshet Ben Gurion 84990, IsraelbZuckerberg Institute for Water Research, The Jacob Blaustein Institutes for Desert Research, Ben-Gurion University of the Negev,
Midreshet Ben Gurion 84990, Israel
a r t i c l e i n f o
Article history:
Received 7 December 2011
Received in revised form
22 April 2012
Accepted 13 May 2012
Available online 23 May 2012
Keywords:
Constructed wetland
Salt phytoremediation
Bassia indica
Desert
a b s t r a c t
The treatment and reuse of wastewater in constructed wetlands offers a low-cost, envi-
ronmentally-friendly alternative for common engineered systems. Salinity in treated
wastewater is often increased, especially in arid and semi-arid areas, and may harm crops
irrigated from wetlands. We have strong evidence that halophyte plants are able to reduce
the salinity of wastewater by accumulating salts in their tissues. Bassia indica is an annual
halophyte with unique adaptations for salt tolerance. We performed three experiments to
evaluate the capability of B. indica for salt phytoremediation as follows: a hydroponic
system with mixed salt solutions, a recirculated vertical flow constructed wetland (RVFCW)
with domestic wastewater, and a vertical flow constructed wetland (VFCW) for treating
goat farm effluents. B. Indica plants developed successfully in all three systems and reduced
the effluent salinity by 20e60% in comparison with unplanted systems or systems planted
with other wetland plants. Salinity reduction was attributed to the accumulation of salts,
mainly Na and K, in the leaves. Our experiments were carried out on an operative scale,
suggesting a novel treatment for green desalination in constructed wetlands by salt phy-
toremediation in desert regions and other ecosystems.
ª 2012 Elsevier Ltd. All rights reserved.
1. Introduction
1.1. Wastewater treatment
Water scarcity has led to the search for alternative water
resources. One solution is the recycling of wastewater (WW)
for irrigation. In Israel, for example, wide areas are irrigated
with treated wastewater, and more than 70% of sewage water
is recycled for agricultural use. Treated wastewater is rich in
nutrients for plants, but is also characterized by a higher
salinity than fresh water. The use of wastewater for irrigation
may reinforce soil salinization since the concentrations of the
dominant ions (Na, Ca, K and Cl) which create the overall
salinity are not reduced (Hillel, 2000).
The salinization of soil and water is a major global envi-
ronmental problem that may cause land degradation, reduc-
tion of water quality and detrimental effects to vegetation
(Schofield et al., 2001). Estimations by the United Nations
Environment Program suggest that 20% of agricultural land
and 50% of cropland in the world is salt-stressed (Flowers and
Yeo, 1995). Salinity in drylands is accelerated by strong sun
radiation and increased evapotranspiration. Larcher (1995)
* Corresponding author. Tel.: þ972 8 6563435; fax: þ972 8 6596742.E-mail addresses: [email protected] (O. Shelef), [email protected] (A. Gross), [email protected] (S. Rachmilevitch).
1 Albert Katz International School for Desert Studies.
Available online at www.sciencedirect.com
journal homepage: www.elsevier .com/locate/watres
wat e r r e s e a r c h 4 6 ( 2 0 1 2 ) 3 9 6 7e3 9 7 6
0043-1354/$ e see front matter ª 2012 Elsevier Ltd. All rights reserved.doi:10.1016/j.watres.2012.05.020

Author's personal copy
suggested that the salinity rate of irrigated crops should not
exceed EC (electric conductivity) values of 2 dSm�1. The Israeli
Ministry of Environmental Protection determined, through
the Inbar committee, a level of 1.4 dS m�1 as the threshold for
unlimited use of water (Inbar, 2007).
Wastewater treatment is often based on biological systems
such as activated sludge or other engineered units in urban
areas. In rural areas, low-cost, environmentally-friendly
alternative treatments such as constructedwetlands (CW), are
more common. CWs are man-made planted systems that
utilize natural processes to improve water quality for human
benefit (Kadlec and Knight, 1996).
1.2. Role of plants in CWs
Most treatment processes that occur in CWs are driven by
chemical, physical and biological mechanisms. These mech-
anisms include oxidation, fragmentation, desorption, sedi-
mentation, microbial biodegradation and uptake (Vymazal,
2007). The role of plants in the CW cleaning process is not
clear (Imfeld et al., 2009; Stottmeister et al., 2003). Brix (1997)
suggested the following potential attributes of plants in
CWs: (1) increasing retention time by reducing water veloci-
ties; (2) improving hydraulic conductivity by root growth, and
(3) root activity. By utilizing elements such as (N) and phos-
phorus (P), plants may affect the elemental composition of
WW. In addition, plants can prevent odor nuisances, enhance
aesthetic appearance, provide surface area for microbial
growth, and be used as bioindicators for CW management
(Shelef et al., 2011). Plant involvement in nutrient cycling and
the exchange between water and sediment affects the water
and sediment quality (Barko et al., 1991; Biernacki and Doust,
1997; Catling et al., 1994; Petticrew and Kalff, 1992).
1.3. Phytoremediation
Phytoremediation is the use of plants for remedyingwater and
soil pollution. The treatment of heavymetals in contaminated
lands or water reservoirs has attracted most of the research
attention as it seems to be a promising technology to mitigate
pollution without excavation of the contaminants for
mechanical disposal (Salt et al., 1995a; Weis and Weis, 2004).
Another important target for phytoremediation is the treat-
ment of nutrients, mainly N and P (Singh et al., 2010). Raskin
et al. (1994) suggested the following three types of applica-
tion: 1) phytoextraction e when plants transport and
concentrate pollutants from the media to aboveground
harvestable shoots; 2) rhizofiltration - when plant roots store
elements used for the accumulation, precipitation and
concentration of contaminants; and 3) phytostabilization e
elimination of toxins through the stabilization of the growth
media by plants, without necessarily involving bio-
accumulation in plant tissues.
Several studies have offered means of reducing heavy
metal or other toxic contaminant concentrations (Chaney
et al., 1997; Rascio and Navari-Izzo, 2011; Schwitzguebel
et al., 2009). However, the volumes in which the experi-
ments were carried out were often too small to have any
implications in the practical world (Salt et al., 1995b; Weis and
Weis, 2004). Sklarz et al. (2009) showed that nutrient uptake
may not be significant in relation to water loads in a recircu-
lating vertical flow CW. In the last several years, attempts
have been made to use phytoremediation techniques to find
solutions for soil and water salinization.
1.4. Salt phytoremediation
This approach is based on plants that are especially tolerant to
salt environments. Around 1% of all plant species are halo-
phytes that can complete their life cycle in relatively high
saline environments, as much as 200 mM NaCl or more
(Flowers and Colmer, 2008; Waisel, 1972). Breckle (2002) clas-
sified halophytes as salt-excluders, salt-includers (i.e., Tam-
arix spp.) and salt-accumulators (as Atriplex spp.).
Phytostabilization can be practiced by all these classifications,
e.g., by growing halophytes on salt affected soils to halt soil
degradation (Keiffer and Ungar, 2002; Young et al., 2011).
However, for the purpose of water phytodesalination, salt-
includers are more suitable if they are able to accumulate
sodium in their tissues and reduce the media’s sodium
content and overall salinity. This amelioration of salinity has
been reported in soils (Carty et al., 1997; Hbirkou et al., 2011;
Rabhi et al., 2009; Ravindran et al., 2007; Zhao, 1991).
Bassia indica (Wight) A.J. Scott is an annual halophyte,
widespread on disturbed lands throughout Israel. B. indica
plants exhibit a unique phenomenon of “halotropism” in
which the root seems to search for high salinity in the soil to
enable better conditions for enhanced growth (Shelef et al.,
2010). B. indica was our candidate for salt phytoremediation
due to its following advantages: 1) tolerance for a wide
gradient of salinities; 2) fast growth rate in the summer (up to
9 kg DW (dry weight) in less than a year) that enables a high
uptake under increased evaporation (which increases soil
salinity); 3) accumulation of ions within tissues and not in
specified glands that can be washed easily by water; and 4) B.
indica can be easily removed at the beginning of the blooming
season to avoid seed dispersal.
In the current study, we addressed the problem of soil
salinization due to the use of treated WW that is often more
saline than freshwater, especially in desert environments.We
aimed at testing the potential to recruit halophyte plants for
salt phytoremediation in constructed wetlands. Our main
hypothesis was that halophyte plants can accumulate salts in
their leaves to a level that is high enough to reduce water
salinity in treated WW from CWs. More specifically, we asked
whether B. indica plants can be recruited for salt phytor-
emediation in constructed wetlands; how tolerable B. indica
plants are for the CW environment for differentWW solutions
and for salt solutions; and which elements are accumulated
and in which tissues of the plant.
2. Materials & methods
2.1. Establishment
B. indica seeds were collected in the central Negev highlands
near Midreshet Ben Gurion (30�510N, 34�470E), Israel. Seeds
were sprouted inside pots in a greenhouse, and then seedlings
were moved to hydroponic containers or to a growing
wat e r r e s e a r c h 4 6 ( 2 0 1 2 ) 3 9 6 7e3 9 7 63968
Author's personal copy
medium. Established seedlings were planted in the CWs.
Initial DW/height of seedlings was w0.04 g/5 cm in the
hydroponic experiment and w1 g/25 cm in the CWs. The day
of planting was considered the first day of the experiment.
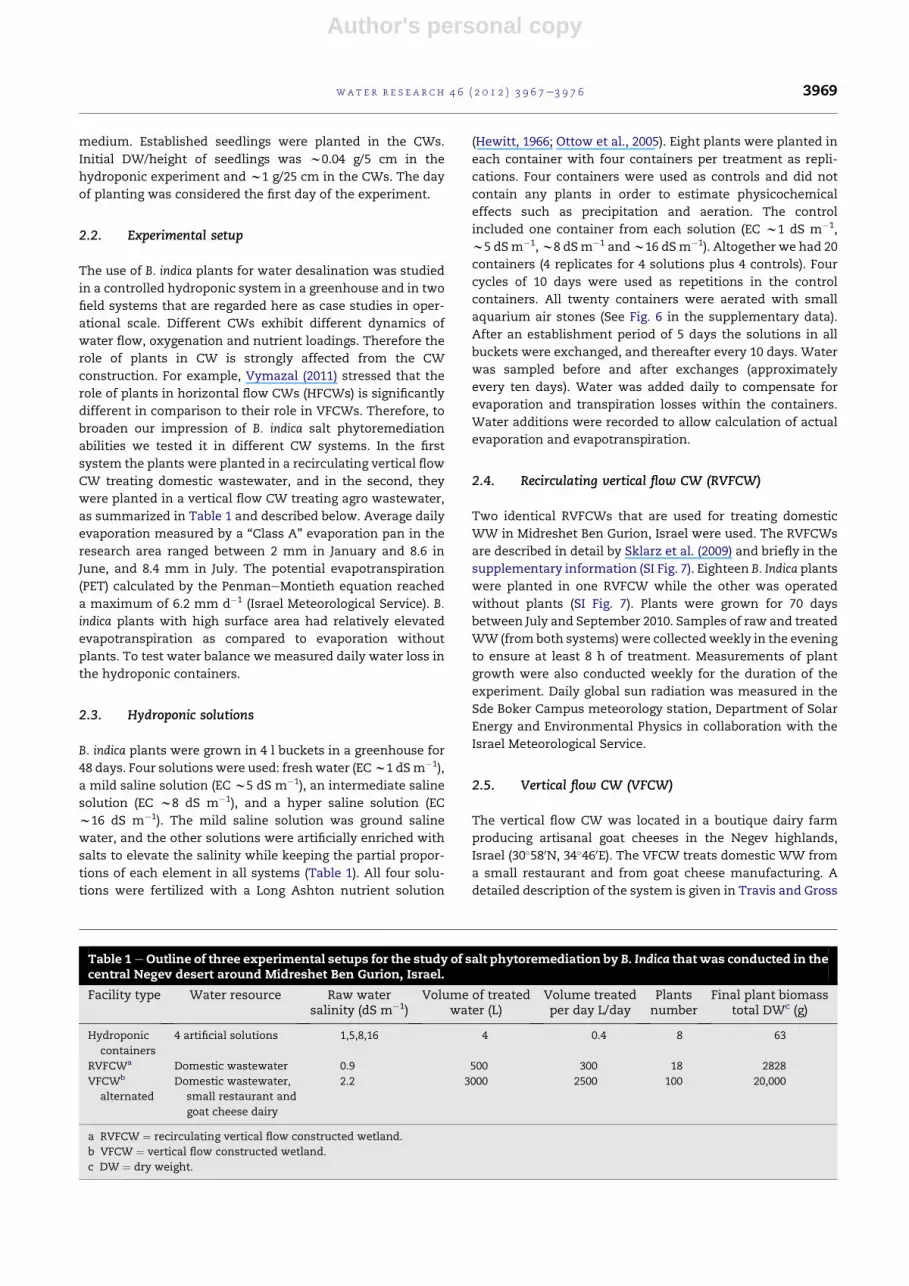
2.2. Experimental setup
The use of B. indica plants for water desalination was studied
in a controlled hydroponic system in a greenhouse and in two
field systems that are regarded here as case studies in oper-
ational scale. Different CWs exhibit different dynamics of
water flow, oxygenation and nutrient loadings. Therefore the
role of plants in CW is strongly affected from the CW
construction. For example, Vymazal (2011) stressed that the
role of plants in horizontal flow CWs (HFCWs) is significantly
different in comparison to their role in VFCWs. Therefore, to
broaden our impression of B. indica salt phytoremediation
abilities we tested it in different CW systems. In the first
system the plants were planted in a recirculating vertical flow
CW treating domestic wastewater, and in the second, they
were planted in a vertical flow CW treating agro wastewater,
as summarized in Table 1 and described below. Average daily
evaporation measured by a “Class A” evaporation pan in the
research area ranged between 2 mm in January and 8.6 in
June, and 8.4 mm in July. The potential evapotranspiration
(PET) calculated by the PenmaneMontieth equation reached
a maximum of 6.2 mm d�1 (Israel Meteorological Service). B.
indica plants with high surface area had relatively elevated
evapotranspiration as compared to evaporation without
plants. To test water balance we measured daily water loss in
the hydroponic containers.
2.3. Hydroponic solutions
B. indica plants were grown in 4 l buckets in a greenhouse for
48 days. Four solutions were used: freshwater (ECw1 dSm�1),
a mild saline solution (EC w5 dS m�1), an intermediate saline
solution (EC w8 dS m�1), and a hyper saline solution (EC
w16 dS m�1). The mild saline solution was ground saline
water, and the other solutions were artificially enriched with
salts to elevate the salinity while keeping the partial propor-
tions of each element in all systems (Table 1). All four solu-
tions were fertilized with a Long Ashton nutrient solution
(Hewitt, 1966; Ottow et al., 2005). Eight plants were planted in
each container with four containers per treatment as repli-
cations. Four containers were used as controls and did not
contain any plants in order to estimate physicochemical
effects such as precipitation and aeration. The control
included one container from each solution (EC w1 dS m�1,
w5 dSm�1,w8 dSm�1 andw16 dSm�1). Altogether we had 20
containers (4 replicates for 4 solutions plus 4 controls). Four
cycles of 10 days were used as repetitions in the control
containers. All twenty containers were aerated with small
aquarium air stones (See Fig. 6 in the supplementary data).
After an establishment period of 5 days the solutions in all
buckets were exchanged, and thereafter every 10 days. Water
was sampled before and after exchanges (approximately
every ten days). Water was added daily to compensate for
evaporation and transpiration losses within the containers.
Water additions were recorded to allow calculation of actual
evaporation and evapotranspiration.
2.4. Recirculating vertical flow CW (RVFCW)
Two identical RVFCWs that are used for treating domestic
WW in Midreshet Ben Gurion, Israel were used. The RVFCWs
are described in detail by Sklarz et al. (2009) and briefly in the
supplementary information (SI Fig. 7). Eighteen B. Indica plants
were planted in one RVFCW while the other was operated
without plants (SI Fig. 7). Plants were grown for 70 days
between July and September 2010. Samples of raw and treated
WW (from both systems) were collectedweekly in the evening
to ensure at least 8 h of treatment. Measurements of plant
growth were also conducted weekly for the duration of the
experiment. Daily global sun radiation was measured in the
Sde Boker Campus meteorology station, Department of Solar
Energy and Environmental Physics in collaboration with the
Israel Meteorological Service.
2.5. Vertical flow CW (VFCW)
The vertical flow CW was located in a boutique dairy farm
producing artisanal goat cheeses in the Negev highlands,
Israel (30�580N, 34�460E). The VFCW treats domestic WW from
a small restaurant and from goat cheese manufacturing. A
detailed description of the system is given in Travis and Gross
Table 1eOutline of three experimental setups for the study of salt phytoremediation by B. Indica that was conducted in thecentral Negev desert around Midreshet Ben Gurion, Israel.
Facility type Water resource Raw watersalinity (dS m�1)
Volume of treatedwater (L)
Volume treatedper day L/day
Plantsnumber
Final plant biomasstotal DWc (g)
Hydroponic
containers
4 artificial solutions 1,5,8,16 4 0.4 8 63
RVFCWa Domestic wastewater 0.9 500 300 18 2828
VFCWb
alternated
Domestic wastewater,
small restaurant and
goat cheese dairy
2.2 3000 2500 100 20,000
a RVFCW ¼ recirculating vertical flow constructed wetland.
b VFCW ¼ vertical flow constructed wetland.
c DW ¼ dry weight.
wat e r r e s e a r c h 4 6 ( 2 0 1 2 ) 3 9 6 7e3 9 7 6 3969

Author's personal copy
(2012). Briefly, following an initial anaerobic treatment stage
WW flowed to one of two similar beds. Feed was alternated
between the two beds every seven days to allow periodic
drying to prevent clogging, control biomass growth, and
maintain aerobic conditions. Average flow to the VFCW was
2.6 m3 per day, fed in approximately 250e300 l batches
throughout the day. The size of each bed was 30 m2, and they
were constructed with locally available crushed limestone
sand and gravel with a total depth of 60 cm: an upper layer
(30 cm) of coarse sand and gravel mix (d10 0.4 mm; d60 3 mm),
underlain by two 15 cm layers of 1 and 3 cm diameter gravel,
respectively (SI Fig. 8). Both beds contained the water plants
Cana sp., Salvia ‘Indigo Spires’ andWedelia trilobata. In the first
experiment over 100 plants of B. indica were planted in March
2010 in the eastern bed and grown for 89 days until June 2010.
In the second experiment 100 seedlings of B. indica were
planted in the western bed for 92 days between July and
October 2010. Plant growth measurements and WW sampling
were carried out weekly. WW samples were taken from the
VFCW inlet and outlet (after treatment). Since only one bed
waswatered everyweek, the comparison between the B. indica
treatment and the control alternated accordingly.
2.6. Plant growth
To estimate plant growth, we used four different measures: 1)
shoot and root dry weight (DW) which was determined after
drying at 65 �C for 48 h; 2) shoot and root surface area (SA) was
measured by preparing digital images with a flat-bed scanner
(Epson Expression 10000 XL, Seiko Epson Corporation, Japan);
the images were analyzed using WinRhizo (WinRhizo Pro
v.2005b, Regent Instruments, Quebec, Canada); 3) basal stem
diameter; and 4) height. The first two measures were
destructive and, therefore, were used only in the hydroponic
experiment. Two plants were harvested from each container
periodically so that at the end of the experiment only two
plants grew in each bucket. Stem diameter and height were
measured weekly in the RVFCW and VFCW systems.
2.7. EC and elemental analysis
Water was sampled periodically before and after the treat-
ments. Electrical conductivity (EC) was measured in the lab in
50 ml centrifuge tubes (Corning inc., USA). 10 ml of WW were
kept at 4 �C for elemental analysis.
Samples were analyzed for EC using two EC meters (CON
510 conductivity/TDS bench meter, EUTECH Instruments,
Singapore, and a portable Multimeter MM 40, CRISON instru-
ments SA, Barcelona), and the averaged results were used.
Elemental analyses for both water and plant extracts were
carried out using an inductively coupled plasma (ICP) optical
emission spectrometer (Varian ICP720-OES, (Eaton et al.,
2005)). To execute elemental analysis on B. indica, we used
dry plants (65 �C for 48 h). The dried plant tissuewas ground to
powder and samples (0.25 g) were digested in a 5 ml acid
mixture of HClO4 and HNO3 (15:85% v/v) in digestion glass
tubes overnight. Digestion was completed by a gradual
increase of temperature from 60 �C to 195 �C according to Zhao
et al. (1994). The resulting extracts were then analyzed by
an ICP.
To estimate the element distribution in plant tissues, we
compared roots and shoots from hydroponic solutions. The
results were the averages of 80 measurements e 40 plants, 2
periods of w10 days of treatment (18e27 and 27e38 days). In
addition, we compared leaves and branches after 40 and 63
days of growth in the VFCW. These results represent an
average of 10 plants (5 plants from each date). Values for EC
and total dissolved solids (TDS) were converted using the
following equation (Lewis, 1980).
S ¼0:012� 0:2174$
0B@�SC=1000
�
53:087
1CA
0:5
þ 25:3283$
0B@�SC=1000
�
53:087
1CA
1
þ13:7714$
0B@�SC=1000
�
53:087
1CA
1:5
� 6:4788$
0B@�SC=1000
�
53:087
1CA
2
þ2:5842$
0B@�SC=1000
�
53:087
1CA
2:5
:
2.8. Data analysis
The study was made up of three separate experiments with
different types of data sets. The data sets that fit the
requirements of statistical analysis were tested for a Gaussian
distribution with a ShapiroeWilk test. We used a parametric
Tukey procedure to test for significant differences if
a Gaussian distribution was detected. A nonparametric Man-
neWhitney U-test was used whenever the data set did not fit
the requirements of normal distribution. Calculations were
conducted with SAS 9.1 (SAS Institute, Cary, NC). We mention
the number of repetitions (n) and the statistical procedure that
was performed for each measurement.
3. Results
3.1. Plant growth
In the hydroponic system plants developed successfully in all
measured salinities, which ranged from an EC of 1 dS m�1 up
to 16 dS m1 (Fig. 1). Shoot and root biomass and surface area
were similar among all treatments. Overall, the average shoot
growth rate in the hydroponic system was 0.48 g/day with
a root: shoot ratio of 0.26 � 0.04.
Plants also developed successfully in the RVFCW with an
average shoot growth rate of 0.9 g/day. Average height was
150 cm, stem diameter 9.4 mm (Fig. 2), and average plant
biomass of 157 g DW. In the VFCW B. Indica plants grew
continuously, reaching an average of 226 cm height, 13.4 mm
stem diameter (Fig. 3), and average plant biomass of 244 g DW
(average shoot growth rate of 0.33 g/day). Since plant growth
was similar in both experiments in the VFCW, the results of
only the first experiment are given (Fig. 3). We measured six
developed plants in the field and found they can reach
a maximum of 9 kg DW, with an average of 4.7 kg DW per
shoot.
wat e r r e s e a r c h 4 6 ( 2 0 1 2 ) 3 9 6 7e3 9 7 63970

Author's personal copy
3.2. Element distribution in plant tissues
Element accumulation in shoot was measured in all systems
(hydroponic, VFCW and RVFCW) to allow mass balance
calculations. However, since it was similar (Na 30e50 mg/
g DW; K 17e30mg/g DW; Ca 10e22mg/g DW) in all systemswe
relate here only to the hydroponic systems, where roots could
be analyzed and to VFCW where leaves were separated from
branches. Based on the results from the hydroponic system,
over 80% of the K, Ca and Na accumulated in the shoots and
less than 20% in the roots (Fig. 4A). These proportions were
similar over time from 27 to 48 days after the beginning of the
experiment (data not shown). Among shoot organs, more
accumulation was measured in the leaves as compared with
the branches (Fig. 4B). Nonetheless, these differences were
much smaller in comparison with the differences between
roots and shoots. Accumulation of Ca and Na in the shoots
branch tissues were 27 and 18%, respectively. Potassium was
distributed evenly between branches (48%) and leaves (52%).
Overall, it was estimated that 80% of the total Na
Fig. 2 e Shoot growth of B. indica grown in a recirculating
vertical flow constructed wetland (n [ 10 at a time). Full
circles and solid lines denote basal stem diameter; dashed
lines with empty triangles represent shoot height.
Fig. 1 e Shoot growth of B. indica in a hydroponic system;
dashed lines and empty symbols represent surface area;
full symbols and solid lines stand for dry weight. Plant
growth was similar in all salinities (n [ 8, p < 0.05).
Fig. 3 e Shoot growth of B. indica in a vertical flow
constructed wetland (n [ 10). Full circles and solid lines
denote basal stem diameter; dashed lines with empty
triangles represent shoot height.
Fig. 4 e A) Element distribution in plant tissues in the
hydroponic system; n [ 80 for each element; B) Element
distribution in plant tissues in the VFCW; n [ 10 for each
element.
wat e r r e s e a r c h 4 6 ( 2 0 1 2 ) 3 9 6 7e3 9 7 6 3971

Author's personal copy
accumulation was allocated in the leaves, 13% in the woody
tissues of the canopy and only 7% in the roots. Regarding Ca,
64% was allocated in the leaves, 24% in the woody tissues and
12% in the roots. Potassium was distributed evenly in both
leaves and branches (80% accumulation) and only 17% in the
roots.
3.3. Effect of plants on salinity of inspected solution
The EC of water treated by B. indica was significantly reduced
comparedwith untreatedwater (Fig. 5AeC). In the hydroponic
system treatment with B. indica resulted in an EC decrease of
61.8% in tap water, 22.2% in saline water of 5 dS m�1 and
a decrease of 12.9% in the remaining two hyper saline solu-
tions (Fig. 5A). The average daily water loss was 110 ml in
occupied buckets, 28% higher than empty buckets with an
average of 86 ml daily evaporation. Unexpectedly, we noticed
a reduction in the EC in the control treatment ranging on
average from 6% to 9% in the different salinities, possibly due
to precipitation of some ions. Nevertheless, this reductionwas
significantly smaller than in the treated solutions.
In the RVFCW the effluent EC in the bed planted with B.
indica was lower (mean 0.84 dS m�1) than the inlet EC (mean
0.9 dSm�1), and usually higher in the control bed (0.95 dSm�1,
Fig. 5B). The maximal difference between the EC measured in
the control bed and in the treatment bed was on September
20. We thenmeasured an EC of 1.05 dS m�1 in the control bed,
28% higher than in the raw WW (0.82 dS m�1). At the same
time the EC in the B. indica treated WW was 0.75 dS m�1, 9%
lower than the inflow. Similar differences between treatments
were measured between the 4th and the 8th weeks of the
experiment where the EC of the control bed exceeded the
inflow EC and the salinity of the B. indica treated WW was
lower than the inflow salinity. At this time the growth of green
tissues of B. indica was at maximum (Fig. 2) and global radia-
tion was high (26e20 MJ per square meter).
A reduction in EC wasmeasured in the VFCW (Fig. 5C). The
reduction in EC was higher in the bed that was enriched with
B. indica plants, in comparison with the control bed that con-
tained only other plant species. The maximal EC reduction
(19.9%) was observed at the end of September, seven weeks
after planting. As described in themethods section, since each
week one bed was active and the other was resting, sampling
took place with a week’s difference between the control and
the B. indica planted bed.
3.4. Accumulation of elements in plants and their effectson water quality
The effect of B. indica plants on element concentrations in four
hydroponic solutions is presented in Table 2. To make sure
Fig. 5 e A) Average (±SE) change of electrical conductivity
(EC) in four different saline growing solutions after 10 d of
treatment with B. indica plants as compared with a control
where no plants were present (n [ 16). *denotes significant
differences ( p < 0.05) between values before and after
treatment. B) The percent EC change in the recirculating
vertical flow constructed wetland (RVFCW) effluent (of the
influent) treated by B. indica over time as compared with
the EC change in unplanted RVFCW (control). Daily global
sun radiation on the sampling days is given in the upper
graph in MJ/m2. C) The percent EC change in the VFCW
effluent (of the influent) treated by B. indica over time as
compared with the EC change in VFCW without B. indica
(control).
wat e r r e s e a r c h 4 6 ( 2 0 1 2 ) 3 9 6 7e3 9 7 63972

Author's personal copy
that EC measurements were related to TDS (as determined by
the elemental analysis), we calculated TDS from themeasured
EC (Lewis, 1980) and found that it was similar. For example the
average TDS concentrations measured in the empty buckets
were 429, 2445, 4520 and 10939 mg/l compared to 442, 2581,
4378 and 9885 mg/l average calculated TDS. In the tap water
solution (EC ¼ 1 dS m�1), the plants reduced concentrations of
all the measured elements by 12e85%. P was an exception e it
was reduced by 91%, but taking into account a similar reduc-
tion in the control buckets resulted in an insignificant effect of
the plants in all solutions. Concentrations of Na, Ca, Mg, Fe, S
and microelements were also reduced in the high salinities
(EC ¼ 8 and 16 dS m�1), but to a smaller magnitude (only
w10%). K and P were reduced by 50e90% in all four solutions.
Table 3 presents the total accumulation of elements in B.
indica shoots at the end of the experiment. Accumulation of
Na per g DW was 3.1 higher in the most hyper saline solution
(EC ¼ 16 dS m�1) in comparison with the tap water. For K and
Mg the accumulation increased by 1.7 fold. Ca, Fe, P and S
accumulation reached tissue capacity under tap water and
remained the same with higher salinities.
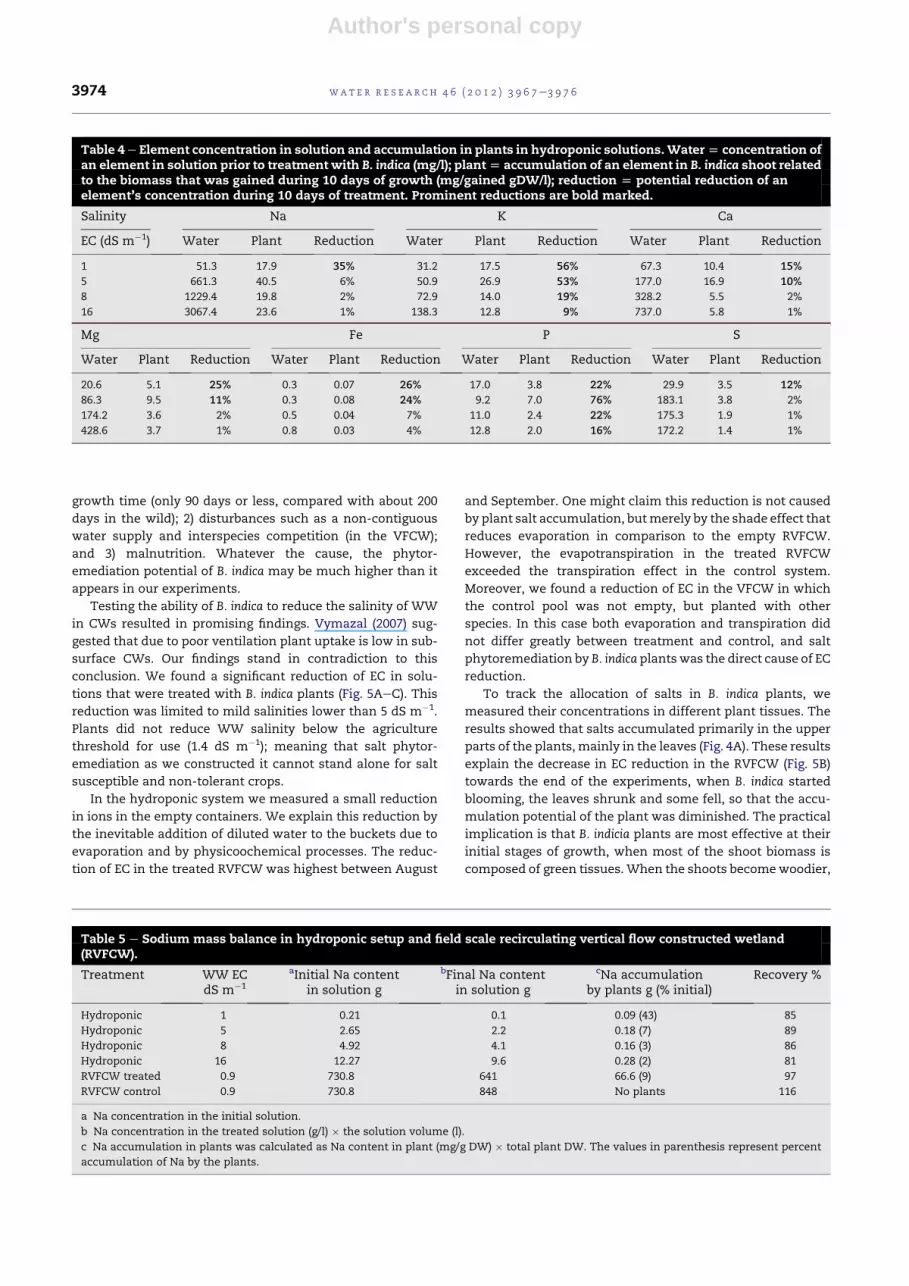
Table 4 presents the concentration of elements per gained
shoot biomass in comparison with the pretreated solution.
During 10 days of growth plants gained a total of 3.2 g shoot
biomass in the fresh water treatment, 3.5 g 1.7 g and 1.4 g in
the 5, 8 and 16 dS m�1 solutions, respectively. This gained
biomass times the measured concentration per gram DW
shoot (Table 4) is the framework for our estimations of the
capability of B. indica to reduce element concentration in
solutions of different salinity. The most prominent effects
include 35% reduction of Na concentration in the tap water
solution within 10 days, 56% reduction of K, 25% of Mg and
reductions of P and K in all solutions.
3.5. Sodium mass balance
Sodiummass balance in the hydroponic solutions and RVFCW
was conducted and recoveries were acceptable, ranging from
81 to 116% (Table 5). In the hydroponic experiment, accumu-
lation of Na in plants ranged from 2% in the highest salinity to
43% in the lowest. In the RVFCW it was estimated that 730.8 g
Na was introduced into the CW during the experiment and B.
indica plants accumulated in total 66.6 g of Na suggesting over
a 9% reduction. In the control RVFCW, Na concentration was
increased most likely because of evaporation in the summer
time (Fig. 5B). This coincidewith the observations of enhanced
evapotranspiration from the hydroponic study in which the
total water loss measured in the planted containers was up to
30% greater in comparison to evaporation from the empty
containers (controls).
4. Discussion
Seedlings of B. indica exhibited tolerance for a wide range of
mixed salt solutions, completing their life cycle in all solutions
in all three systems (Figs. 1e3). The growth of a xerophyte in
hydroponic systems and particularly in a CW is not obvious,
as this environment is extremely different from their natural
habitat. This wide range of tolerance may be attributed to the
firmness of halophytes that are especially adapted to extreme
environments (Manousaki and Kalogerakis, 2011). Our exper-
iments showed that not only can water plants be used as
macrophytes in CWs, but also other terrestrial plants,
provided that they survive the specific conditions. This may
broaden the services that plants provide in CWs. B. indica grew
to a maximum of 244 g DW in a VFCW in 89 days. However,
potentially they can grow as much as 30 times more. This
limited growth may be explained by: 1) a relatively short
Table 2 e Concentrations of elements in hydroponic solutions. Raw and treated represent concentration in solution beforeand after treatment with B. indica (mg/l); D [ change of concentration during treatment (%) after compensating for thebackground change that was measured in the control buckets. All significant changes are marked in bold.
Salinity of growingsolution EC (dS m�1)
Na K Ca Mg
Raw Treated D Raw Treated D Raw Treated D Raw Treated D
1 51.3 25.4 L51% 31.2 0.9 L85% 67.3 27.2 L12% 20.6 6.4 L57%
5 661.3 545.5 L12% 50.9 13.6 L66% 177.0 180.7 24% 86.3 99.1 24%
8 1229.4 1022.9 L9% 72.9 19.5 L64% 328.2 255.8 L2% 174.2 140.1 L11%
16 3067.4 2409.9 L13% 138.3 65.0 L42% 737.0 570.0 L8% 428.6 320.6 L18%
Fe P S
Raw Treated D Raw Treated D Raw Treated D
1 0.3 0.1 L24% 17.0 1.5 L1% 29.9 18.3 L21%
5 0.3 0.2 L15% 9.2 4.4 37% 183.1 144.7 L10%
8 0.5 0.4 L11% 11.0 3.1 22% 175.3 133.7 L8%
16 0.8 0.6 L10% 12.8 4.5 30% 172.2 134.5 L6%
Table 3 e Element accumulation in shoots of B. indicagrowing in hydroponic solutions. Values in mg per g DWof plant shoot ±se (n [ 24).
Salinity of growingsolution EC (dS m�1)
Na K Ca
1 22.2 � 0.7 21.7 � 0.8 12.9 � 0.5
5 46.6 � 2.6 31 � 0.7 19.4 � 0.8
8 47.2 � 1.5 33.6 � 1.1 13.2 � 0.5
16 69.2 � 1.4 37.5 � 1.3 16.9 � 0.5
wat e r r e s e a r c h 4 6 ( 2 0 1 2 ) 3 9 6 7e3 9 7 6 3973
Author's personal copy
growth time (only 90 days or less, compared with about 200
days in the wild); 2) disturbances such as a non-contiguous
water supply and interspecies competition (in the VFCW);
and 3) malnutrition. Whatever the cause, the phytor-
emediation potential of B. indica may be much higher than it
appears in our experiments.
Testing the ability of B. indica to reduce the salinity of WW
in CWs resulted in promising findings. Vymazal (2007) sug-
gested that due to poor ventilation plant uptake is low in sub-
surface CWs. Our findings stand in contradiction to this
conclusion. We found a significant reduction of EC in solu-
tions that were treated with B. indica plants (Fig. 5AeC). This
reduction was limited to mild salinities lower than 5 dS m�1.
Plants did not reduce WW salinity below the agriculture
threshold for use (1.4 dS m�1); meaning that salt phytor-
emediation as we constructed it cannot stand alone for salt
susceptible and non-tolerant crops.
In the hydroponic system we measured a small reduction
in ions in the empty containers. We explain this reduction by
the inevitable addition of diluted water to the buckets due to
evaporation and by physicoochemical processes. The reduc-
tion of EC in the treated RVFCW was highest between August
and September. One might claim this reduction is not caused
by plant salt accumulation, butmerely by the shade effect that
reduces evaporation in comparison to the empty RVFCW.
However, the evapotranspiration in the treated RVFCW
exceeded the transpiration effect in the control system.
Moreover, we found a reduction of EC in the VFCW in which
the control pool was not empty, but planted with other
species. In this case both evaporation and transpiration did
not differ greatly between treatment and control, and salt
phytoremediation by B. indica plantswas the direct cause of EC
reduction.
To track the allocation of salts in B. indica plants, we
measured their concentrations in different plant tissues. The
results showed that salts accumulated primarily in the upper
parts of the plants,mainly in the leaves (Fig. 4A). These results
explain the decrease in EC reduction in the RVFCW (Fig. 5B)
towards the end of the experiments, when B. indica started
blooming, the leaves shrunk and some fell, so that the accu-
mulation potential of the plant was diminished. The practical
implication is that B. indicia plants are most effective at their
initial stages of growth, when most of the shoot biomass is
composed of green tissues.When the shoots becomewoodier,
Table 4e Element concentration in solution and accumulation in plants in hydroponic solutions.Water[ concentration ofan element in solution prior to treatment with B. indica (mg/l); plant[ accumulation of an element in B. indica shoot relatedto the biomass that was gained during 10 days of growth (mg/gained gDW/l); reduction [ potential reduction of anelement’s concentration during 10 days of treatment. Prominent reductions are bold marked.
Salinity Na K Ca
EC (dS m�1) Water Plant Reduction Water Plant Reduction Water Plant Reduction
1 51.3 17.9 35% 31.2 17.5 56% 67.3 10.4 15%
5 661.3 40.5 6% 50.9 26.9 53% 177.0 16.9 10%
8 1229.4 19.8 2% 72.9 14.0 19% 328.2 5.5 2%
16 3067.4 23.6 1% 138.3 12.8 9% 737.0 5.8 1%
Mg Fe P S
Water Plant Reduction Water Plant Reduction Water Plant Reduction Water Plant Reduction
20.6 5.1 25% 0.3 0.07 26% 17.0 3.8 22% 29.9 3.5 12%
86.3 9.5 11% 0.3 0.08 24% 9.2 7.0 76% 183.1 3.8 2%
174.2 3.6 2% 0.5 0.04 7% 11.0 2.4 22% 175.3 1.9 1%
428.6 3.7 1% 0.8 0.03 4% 12.8 2.0 16% 172.2 1.4 1%
Table 5 e Sodium mass balance in hydroponic setup and field scale recirculating vertical flow constructed wetland(RVFCW).
Treatment WW ECdS m�1
aInitial Na contentin solution g
bFinal Na contentin solution g
cNa accumulationby plants g (% initial)
Recovery %
Hydroponic 1 0.21 0.1 0.09 (43) 85
Hydroponic 5 2.65 2.2 0.18 (7) 89
Hydroponic 8 4.92 4.1 0.16 (3) 86
Hydroponic 16 12.27 9.6 0.28 (2) 81
RVFCW treated 0.9 730.8 641 66.6 (9) 97
RVFCW control 0.9 730.8 848 No plants 116
a Na concentration in the initial solution.
b Na concentration in the treated solution (g/l) � the solution volume (l).
c Na accumulation in plants was calculated as Na content in plant (mg/g DW) � total plant DW. The values in parenthesis represent percent
accumulation of Na by the plants.
wat e r r e s e a r c h 4 6 ( 2 0 1 2 ) 3 9 6 7e3 9 7 63974

Author's personal copy
they lose their main accumulative tissues, so in the blooming
period plants should be removed.
Another practical question that arises regards what
a farmer should dowith the removed plants. Although beyond
the scope of this article, it would beworth considering B. indica
as an energy source as it produces a significant biomass in
a short time. Several authors showed that B. indica or its
relatives Kochia spp. are a fine food additive resource for sheep
and lambs with regard to palatability and nutrition (Kafi et al.,
2010; Kafi and Jami Al Ahmadi, 2008).
Concentrations of Na per g DW of shoot increased with the
higher salinity of the hydroponic solution (Table 3). This
increase was not high enough to create a significant accu-
mulation effect in relation to Na reduction in the high salin-
ities (Table 4). We conclude that the B. indica effects on Na
reduction are limited to medium and low salinities. K
concentrations in the shoots increased two fold with higher
salinities (Table 3), yet the impact of B. indica on K in hyper
salinity decreased (Table 2). It seems that the high salinities
are beyond B. indica’s capacity to create a significant accu-
mulation effect for salt phytoremediation. Yet the accumu-
lative potential of B. indica is very high.
Summing up the accumulation of the dominant elements
(Table 3 and other elements) showed that in solutions of 1, 5, 8
and 16 dSm�1, B. indica plants accumulated salts up to 7, 11, 12
and 14%, of their DW, respectively. These amounts are
expected to be even higher since our results do not include
important elements such as Cl. Given that B. indica plants can
grow to about 1 kg DW in the first stages of their growth and
potentially accumulate salts to about 10% of their DW, we
estimate that a single plant can remove during its lifetime
approximately 100 g of salts. Based on our experience with
different volumes and salinities, we estimate that accumula-
tion of salts by B. indica can reduce salinities up to 20% of the
initial EC in low salinities (up to 2 dS m�1). An individual plant
can treat approximately 500 L of WW during its growth. Our
results showed that a high leaf: woody tissue ratio is corre-
lated to improved salt phytoremediation by B. indica. There-
fore, plants can be cultivated for a high leaf index. The
preferred time for recruiting B. indica for salt phytor-
emediation in CWs is during the early summer (MayeJuly).
Further research is needed to improve this use by agricultural
management, including subjects such as pruning, re-
plantation, cultivation, fertilization and synergism with
additional species.
5. Conclusions
The current study has demonstrated a novel strategy for green
desalination through salt phytoremediation in CWs. B. Indica
plants tolerated a wide range of salinities and accumulated
salts. Accumulation occurred mainly in leaves and branches,
making B. Indica fit for the phytoextraction of Na and other
elements. Na and Kwere the dominant accumulated elements
driving the salinity reduction. B. indica is a good candidate for
salt phytoremediation in CWs due to its rapid and large
annual growth. Optimization of the plant performance in
terms of growth and salt accumulation is needed to further
improve its efficiency.
Acknowledgments
The authors would like to thank Ms. Tanya Gendler for
assisting with the laboratory and field work, Dr. Ludmila Katz
for her part in the elemental analysis, Daniel & Anat Korn-
mehl for letting us work in their farm, Dr. Menahem Sklarz for
his help in the operation of the RVFCW and Dr. Micheal Travis
for the collaboration in the VFCWandmanuscript editing. The
research was partly supported by the Koshland Foundation.
Appendix A. Supplementary material
Supplementary data associated with this article can be found,
in the online version, at doi:10.1016/j.watres.2012.05.020.
r e f e r e n c e s
Barko, J.W., Gunnison, D., Carpenter, S.R., 1991. Sedimentinteractions with submersed macrophyte growth andcommunity dynamics. Aquatic Botany 41, 41e65.
Biernacki, M., Doust, J.L., 1997. Vallisneria americana(Hydrocharitaceae) as a biomonitor of aquatic ecosystems:comparison of cloned genotypes. American Journal of Botany84, 1743e1751.
Breckle, S.W., 2002. Salinity, halophytes and salt affected naturalecosystems. In: Salinity: Environment e Plants e Molecules.Kluwer Academic Publishers, The Netherlands, pp. 53e77.
Brix, H., 1997. Do macrophytes play a role in constructedtreatment wetlands? Water Science and Technology 35,11e17.
Carty, D.T., Swetish, S.M., Crawley, W.W., Priebe, W.F., 1997.Major variables influencing technology solution forremediation of salt affected soils. In: Proceedings of the RockyMountain Symposium of Environmental Issues in Oil and GasOperations; Cost Effective Strategies. olorado School of Mines,Golden, CO, pp. 145e152.
Catling, P.M., Spicer, K.W., Biernacki, M., Doust, J.L., 1994. Thebiology of Canadian weeds.103. Vallisneria americana Michx.Canadian Journal of Plant Science 74, 883e897.
Chaney, R.L., Malik, M., Li, Y.M., Brown, S.L., Brewer, E.P.,Angle, J.S., Baker, A.J.M., 1997. Phytoremediation of soilmetals. Current Opinion in Biotechnology 8, 279e284.
Eaton, A.D., Clesceri, L.S., Rice, E.W., Greenberg, A.E.,Franson, M.A.H.A., 2005. American Public Health Association(APHA) 2005, Standard Methods for the Examination of Water& Wastewater, twenty first ed. American Public HealthAssociation, American Water Works Association, WaterEnvironment Federation, USA, Washington.
Flowers, T.J., Colmer, T.D., 2008. Salinity tolerance in halophytes.New Phytologist 179, 945e963.
Flowers, T.J., Yeo, A.R., 1995. Breeding for salinity resistance incrop plants: where next? Australian Journal of PlantPhysiology 22, 875e884.
Hbirkou, C., Martius, C., Khamzina, A., Lamers, J.P.A., Welp, G.,Amelung, W., 2011. Reducing topsoil salinity and raisingcarbon stocks through afforestation in Khorezm, Uzbekistan.Journal of Arid Environments 75, 146e155.
Hewitt, E.J., 1966. Sand and Water Culture Methods Used in theStudy of Plant Nutrition. In: Technical Communication No. 22.Commonwealth Bureau, London.
wat e r r e s e a r c h 4 6 ( 2 0 1 2 ) 3 9 6 7e3 9 7 6 3975

Author's personal copy
Hillel, D.S., 2000. Salinity Management for Sustainable Irrigation:Integrating Science, Environment, and Economics. WorldBank Publications, Washington, D.C., USA.
Imfeld, G., Braeckevelt, M., Kuschk, P., Richnow, H.H., 2009.Monitoring and assessing processes of organic chemicalsremoval in constructed wetlands. Chemosphere 74, 349e362.
Inbar, Y., 2007. New standards for treated wastewater reuse inIsrael. In: Zaidi, M. (Ed.), Wastewater ReuseeRisk Assessment,Decision-Making and Environmental Security. Springer,Dordrecht, The Netherlands,, pp. 291e296.
Kadlec, R.H., Knight, R.L., 1996. Treatment Wetlands. CRC Press,Boca Raton, Florida.
Kafi, M., Asadi, H., Ganjeali, A., 2010. Possible utilization of high-salinity waters and application of low amounts of water forproduction of the halophyte Kochia scoparia as alternativefodder in saline agroecosystems. Agricultural WaterManagement 97, 139e147.
Kafi, M., Jami Al Ahmadi, M., 2008. Study of Kochia (Kochiascoparia) as a forage crop. In: Abdelly, C., Ozturk, M.,Ashraf, M., Grignon, C. (Eds.), Biosaline Agriculture and HighSalinity Tolerance. Birkhauser, Basel, Switzerland,pp. 177e195.
Keiffer, C.H., Ungar, I.A., 2002. Germination and establishment ofhalophytes on brine-affected soils. Journal of Applied Ecology39, 402e415.
Larcher, W., 1995. Plants under stress. In: Larcher, W. (Ed.),Physiological Plant Ecology, third ed. Springer-Verlag, Berlin,Germany, pp. 321e432.
Lewis, E.L., 1980. The practical salinity scale 1978 and itsantecedents. IEEE Journal of Oceanic Engineering 5, 3e8.
Manousaki, E., Kalogerakis, N., 2011. Halophytes present newopportunities in phytoremediation of heavy metals and salinesoils. Industrial & Engineering Chemistry Research 50,656e660.
Ottow, E.A., Brinker, M., Teichmann, T., Fritz, E., Kaiser, W.,Brosche, M., Kangasjarvi, J., Jiang, X.N., Polle, A., 2005. Populuseuphratica displays apoplastic sodium accumulation, osmoticadjustment by decreases in calcium and solublecarbohydrates, and develops leaf succulence under salt stress.Plant Physiology 139, 1762e1772.
Petticrew, E.L., Kalff, J., 1992. Water-flow and clay retention insubmerged macrophyte beds. Canadian Journal of Fisheriesand Aquatic Sciences 49, 2483e2489.
Rabhi, M., Hafsi, C., Lakhdar, A., Hajji, S., Barhoumi, Z.,Hamrouni, M.H., Abdelly, C., Smaoui, A., 2009. Evaluation ofthe capacity of three halophytes to desalinize theirrhizosphere as grown on saline soils under nonleachingconditions. African Journal of Ecology 47, 463e468.
Rascio, N., Navari-Izzo, F., 2011. Heavy metal hyperaccumulatingplants: how and why do they do it? And what makes them sointeresting? Plant Science 180, 169e181.
Raskin, I., Kumar, P.N., Dushenkov, S., Salt, D.E., 1994.Bioconcentration of heavy metals by plants. Current Opinionin Biotechnology 5, 285e290.
Ravindran, K.C., Venkatesan, K., Balakrishnan, V.,Chellappan, K.P., Balasubramanian, T., 2007. Restoration ofsaline land by halophytes for Indian soils. Soil Biology &Biochemistry 39, 2661e2664.
Salt, D.E., Blaylock, M., Kumar, N.P.B.A., Dushenkov, V.,Ensley, B.D., Chet, I., Raskin, I., 1995a. Phytoremediation e
a novel strategy for the removal of toxic metals from theenvironment using plants. Bio-Technology 13, 468e474.
Salt, D.E., Prince, R.C., Pickering, I.J., Raskin, I., 1995b.Mechanisms of cadmiummobility and accumulation in Indianmustard. Plant Physiology 109, 1427e1433.
Schofield, R., Thomas, D.S.G., Kirkby, M.J., 2001. Causal processesof soil salinization in Tunisia, Spain and Hungary. LandDegradation & Development 12, 163e181.
Schwitzguebel, J.P., Kumpiene, J., Comino, E., Vanek, T., 2009.From green to clean: a promising and sustainable approachtowards environmental remediation and human health forthe 21(st) century. Agrochimica 53, 209e237.
Shelef, O., Golan-Goldhirsh, A., Gendler, T., Rachmilevitch, S.,2011. Physiological parameters of plants as indicators of waterquality in a constructed wetland. Environmental Science andPollution Research.
Shelef, O., Lazarovitch, N., Rewald, B., Golan-Goldhirsh, A.,Rachmilevitch, S., 2010. Root halotropism: salinity effects onBassia indica root. Plant Biosystems 144, 471e478.
Singh, G., Bhati, M., Rathod, T., 2010. Use of tree seedlings for thephytoremediation of a municipal effluent used in dry areas ofnorth-western India: plant growth and nutrient uptake.Ecological Engineering 36, 1299e1306.
Sklarz, M.Y., Gross, A., Yakirevich, A., Soares, M.I.M., 2009. Arecirculating vertical flow constructed wetland for thetreatment of domestic wastewater. Desalination 246, 617e624.
Stottmeister, U., Wiessner, A., Kuschk, P., Kappelmeyer, U.,Kastner, M., Bederski, O., Muller, R.A., Moormann, H., 2003.Effects of plants and microorganisms in constructed wetlandsfor wastewater treatment. Biotechnology Advances 22,93e117.
Travis, M.J.N.W., Gross, A., 2012. Decentralized wetland-basedtreatment of oil-rich farm wastewater for reuse in an aridenvironment. Ecological Engineering 39, 81e89.
Vymazal, J., 2007. Removal of nutrients in various types ofconstructed wetlands. Science of the Total Environment 380,48e65.
Vymazal, J., 2011. Plants used in constructed wetlands withhorizontal subsurface flow: a review. Hydrobiologia 674,133e156.
Waisel, Y., 1972. Biology of Halophytes. Academic Press, NewYork.Weis, J.S., Weis, P., 2004. Metal uptake, transport and release by
wetland plants: implications for phytoremediation andrestoration. Environment International 30, 685e700.
Young, M.A., Rancier, D.G., Roy, J.L., Lunn, S.R., Armstrong, S.A.,Headley, J.V., 2011. Technical note: seeding conditions of thehalophyte Atriplex patula for optimal growth on a saltimpacted site. International Journal of Phytoremediation 13,674e680.
Zhao, F., Mcgrath, S.P., Crosland, A.R., 1994. Comparison of 3 wetdigestion methods for the determination of plant sulfur byinductively-coupled plasma-atomic emission-spectroscopy(Icpaes). Communications in Soil Science and Plant Analysis25, 407e418.
Zhao, K.F., 1991. Desalinization of saline soils by Suaeda-Salsa.Plant and Soil 135, 303e305.
wat e r r e s e a r c h 4 6 ( 2 0 1 2 ) 3 9 6 7e3 9 7 63976


