Embed Size (px)
Citation preview

MARINE ECOLOGY PROGRESS SERIESMar Ecol Prog Ser
Vol 485 259ndash273 2013doi 103354meps10334
Published June 27
INTRODUCTION
The ability to accurately describe and understandprocesses that determine the distribution of species iscentral to the development and implementation of ef -fective measures for conservation and managementIncreasing the availability of biogeographic data and
knowledge of speciesrsquo ecological requirements canfacilitate the identification of biodiversity hotspots(Nur et al 2011) assessment of the impacts of climatechange (Olivier amp Wotherspoon 2006) establishmentof conservation priorities (Maxwell et al 2009) anddesign of reserve networks at large spatial scales(Airameacute et al 2003)
copy Inter-Research 2013 middot wwwint-rescomEmail hwatson1researchglaacuk
The utility of relative environmental suitability(RES) modelling for predicting distributions of
seabirds in the North Atlantic
Hannah Watson15 Jan G Hiddink1 Matthew J Hobbs2 Tom M Brereton3 Michael J Tetley4
1School of Ocean Sciences Bangor University Menai Bridge Anglesey LL59 5AB UK2BSG Ecology Wyastone Business Park Wyastone Leys Monmouth NP25 3SR UK
3MARINElife 12 St Andrews Road Bridport Dorset DT6 3BG UK4Ecology and Marine Sciences Consultant Montague House Durham DH1 2LF UK
5Present address Institute of Biodiversity Animal Health and Comparative Medicine Graham Kerr Building University of Glasgow Glasgow G12 8QQ UK
ABSTRACT Understanding spatial and temporal variability in the distribution of seabirds is funda-mental for the conservation and management of marine ecosystems In the absence of large-scalesystematic survey data the application of standard habitat modelling techniques to predict the at-sea distributions of seabirds at large spatial scales has been limited In this study we examine theutility of relative environmental suitability (RES) modelling to predict large-scale distributions andhabitat suitability for 6 seabirds in the North Atlantic An index of habitat suitability was derived byrelating niche characteristics to environmental attributes Predictive performance of models wasevaluated with Receiver Operating Characteristic plots using independent survey data from theBay of Biscay RES models performed significantly better than null models at predicting relativelikelihood of occurrence for 5 out of 6 species Qualitative assessment showed that model outputscorresponded well with published range maps though a common discrepancy was the inclusion ofenclosed seas in which species are not known to regularly occur This study de monstrates that RESmodelling can be used to predict large-scale habitat suitability for wide- ranging marine animals forwhich occurrence data are limited and biased in geographical extent RES predictions representsimple testable hypotheses concerning a speciesrsquo potential niche in respect of a few environmentalpredictors RES modelling can help to identify biodiversity hotspots predict effects of climatechange and develop criteria for designating marine protected areas
KEY WORDS Ecological niche modelling middot Habitat suitability middot Seabird middot Relative environmentalsuitability middot Geographic range middot Distribution middot AquaMaps middot Species distribution model middot SDM
Resale or republication not permitted without written consent of the publisher
Mar Ecol Prog Ser 485 259ndash273 2013
Predictive habitat modelling offers a range of toolsto quantitatively delineate range extents based onspeciesminusenvironment relationships (for reviews seeGuisan amp Zimmermann 2000 Guisan et al 2002Redfern et al 2006 Zimmermann et al 2010) Stan-dard techniques typically employ records of speciesoccurrence and associated environmental factorswhich may determine mdash directly or indirectly mdash aspeciesrsquo distribution within an area Species distribu-tion models (SDMs) have been widely applied in ter-restrial systems yet their application for predictingoccurrences of marine organisms remained limiteduntil the last 10 yr (Elith amp Leathwick 2009 Robinsonet al 2011) Many SDMs in marine systems havebeen applied in conservation planning (eg Guinotteet al 2006 Oppel et al 2012) and are typically biasedtowards commercially harvested animals (eg Max -well et al 2009 Hardy et al 2011) and mammals (egRedfern et al 2006 Gregr amp Trites 2008 Ready et al2010) The most widely used models require largepresenceminusabsence data sets (Guisan et al 2002) andare therefore unsuitable for generating accurate pre-dictions about species for which occurrence data arelimited in spatial and temporal extent which charac-terises the situation for many marine animals (Readyet al 2010 Robinson et al 2011) While occurrencedata of marine animals are becoming increasinglyavailable through online databases such as theOcean Biogeographic Information System (OBISwwwiobisorg) and the Global Biodiversity Informa-tion Facility (GBIF wwwgbiforg) there is little pub-lished quantitative information concerning large-scale patterns of diversity and distribution in themarine environment
In the absence of point data spanning large spatialand temporal scales Kaschner et al (2006) proposedthat the synthesis of available knowledge concerningspeciesminushabitat relationships could approximate alarge-scale representative sampling scheme Theydeveloped a novel rule-based envelope model tomap global distributions of marine mammals andgenerate large-scale predictions of relative environ-mental suitability (RES) without the need for a hugeinput of presenceminusabsence data mdash the limiting factorof standard modelling techniques RES underlies theAquaMaps modelling system which compared withtraditional methods of presence-only distributionmodelling was found to perform very well for a suiteof marine taxa (Ready et al 2010) AquaMaps is nowused extensively for generating distribution maps inFishBase (wwwfishbaseorg) Gregr amp Trites (2008)also demonstrated that speciesminushabitat relationshipscan be accurately defined for wide-ranging marine
top predators when limited observation data preventthe use of more common correlative approaches
The behaviour and ecology of marine birds at sea ispoorly understood largely due to the practical and lo-gistical difficulties associated with studying seabirds(Tasker amp Reid 1997) Most data come from oppor-tunistic sampling and sparse non-systematic recordsof occurrence (eg Huettmann amp Diamond 2001)Sampling typically covers only a fraction of a speciesrsquorange (eg Hobbs et al 2003) and transects at sea canunderestimate seabird distribution and abundancedue to low detection rates and vast geographic ranges(Ostrand et al 1998) Traditional range maps are gen-erated subjectively on the basis of limited occurrencerecords and expert opinion (Cramp amp Simmons 1980del Hoyo et al 1992) and they do not provide quanti-tative information on the relative suitability of differ-ent areas Predictive modelling of seabird distributionshas been largely restricted to studies of waters within200 km of the coast (eg Yen et al 2004 Louzao et al2006 Oppel et al 2012) and nesting habitat (egOlivier amp Wotherspoon 2006) A few larger-scale stud-ies however have encompassed extensive areas ofpelagic waters such as the Southern Indian Ocean(Raymond amp Woehler 2003) and the Arctic Circle(Huett mann et al 2011)
The aims of the present study are to (1) predict RESand geographic range extent for 6 seabirds in theNorth Atlantic and (2) evaluate these models usingindependent point data Using published informationon speciesrsquo distributions foraging behaviour and lifehistories species were assigned to broad-scale nichecategories defined by environmental parametersknown to be key predictors of distribution We buildupon the approach developed by Kaschner et al(2006 2010) incorporating temporal variability inenvironmental variables and speciesminus habitat rela-tionships mdash pertinent to wide-ranging migratorymarine animals mdash into models Model performancewas evaluated using observation data collected byMARINElife in the English Channel and Bay of Bis-cay The approach is designed to inform our under-standing of seabird distributions and the develop-ment and evaluation of predictive habitat modelsrelevant to the at-sea distribution of seabirds
MATERIALS AND METHODS
Study species
RES modelling was applied to 6 species of seabirdsbelonging to the order Procellariiformes that are all
260
Watson et al Modelling seabird distributions and habitat suitability
abundant and widely distributed in the North At lan -tic during part or all of their annual life cycle north-ern fulmar Fulmarus glacialis (hereafter fulmar)Coryrsquos shearwater Calonectris diomedea greatshearwater Puffinus gravis sooty shearwater P gri -seus Manx shearwater P puffinus and Europeanstorm petrel Hydrobates pelagicus (hereafter stormpetrel) The selection of species was determined bythe availability of data concerning speciesminushabitatrelationships and the availability of test data formodel evaluation The fulmar is restricted to theNorthern Hemisphere during its breeding and non-breeding seasons and has a circumpolar distribution(del Hoyo et al 1992) Coryrsquos shearwater Manxshear water and storm petrel breed in the NorthAtlantic during the boreal summer dispersing intothe southern Atlantic during migration and the non-breeding season (del Hoyo et al 1992) Great shear-water and sooty shearwater breed in the SouthernHemisphere during the austral summer and disperseinto the Northern Hemisphere during their non-breeding season minus the boreal summer (del Hoyo et al1992)
Quantifying speciesrsquo ecological niches
Qualitative and quantitative data concerning speciesrsquo habitat preferences were gathered from anextensive range of primary and secondary literaturesources A total of 35 sources of literature informedthe quantification of speciesrsquo ecological niches(see Table S1 in Supplement 1 at wwwint-rescomarticlessupplm485p259_supppdf) Of these 26 rep-resented primary sources and 9 were secondarysources of literature Not all species were repre-sented equally in the literature with the number ofrelevant data sources ranging from 4 (Coryrsquos shear-water) to 17 (fulmar) There was high reliance on 8sources of literature (5 primary 3 secondary) for in -forming parameterisation of models These sourceshowever represent comprehensive pieces of litera-ture based on substantial quantities of data collectedover large temporal and spatial scales
This information was used to assign each species toan ecological niche defined by 4 ecogeographicalvariables (EGVs) depth sea-surface temperature(SST) chlorophyll a (chl a) concentration (indicatingphytoplankton biomass a proxy for ocean productiv-ity) and distance to land Most available data werequalitative and habitat categories were consequentlydeveloped to facilitate quantification of a speciesrsquoniche (Table 1) EGVs were selected on the basis of
wide evidence in the literature of their significance indetermining the distribution and abundance of sea-birds at sea (Schneider 1997 Huettmann amp Diamond2001 Oedekoven et al 2001 Louzao et al 2006Wakefield et al 2009) and the availability of environ-mental data at appropriate scales
Ecological niches were described by resourceselection functions (RSFs) describing the relativesuitability of an environment (Fig 1) While trueRSFs express the probability of use of a resource orarea by an organism (Boyce et al 2002) the RSFsapplied here express the relative likelihood of use ofan area predicting probability of presence requiresthe incorporation of reliable information on preva-lence (Elith et al 2006) After Kaschner et al (2006)it was assumed that the relative suitability of theenvironment is uniformly highest throughout a pre-ferred parameter range bounded by a minimum(MinP) and maximum (MaxP) value Outside of thispreferred range suitability was assumed to decrease
261
Variable Habitat category
Depth (m) (after Ross 1988)lt10 Coastal waters11minus200 Coastal waters to edge of continental
shelf201minus1000 Edge of continental shelf to upper
continental slope1001minus2000 Continental slope2001minus6000 Abyssal plains6001minus8000 Very deep waters
Sea-surface temperature (degC) (adapted from Sverdrup et al 1942 Ashmole 1971)
minus2minus5 Polar0minus10 Sub-polar5minus15 Cold temperate10minus20 Warm temperate15minus25 Subtropical25minus35 Tropical
Distance to land (km) (after Ashmole 1971)lt6 Inshore waters6minus50 Offshoregt50 Pelagic
Chlorophyll a (mg mminus3) (after Louzao et al 2006)lt01 Oligotrophic01minus029 Mesotrophic03minus1 Eutrophicgt1 Enriched waters
Table 1 Quantitative and qualitative definitions of habitatcategories in respect of 4 ecogeographical variables (depthsea-surface temperature distance to land and chlorophyll a
concentration) used to quantify speciesrsquo ecological niches
Mar Ecol Prog Ser 485 259ndash273 2013
linearly towards an absolute minimum (MinA) andmaximum (MaxA) being equal to 0 outside of thosethresholds
The availability of information concerning speciesrsquoassociations with chl a concentration was limited (seeTable S1) and largely restricted to qualitative state-ments such as lsquoaggregates in productive watersrsquo orlsquoattracted to frontsrsquo Procellariiformes occur in watersof all productivity but prefer eutrophic and enrichedwaters (Warham 1990 Louzao et al 2006 Hedd et al2012) Insufficient information was available at thespecies level to distinguish different relationshipsconsequently all species were assigned to identicalniches with respect to chl a concentration
Distinct niches were defined for a speciesrsquo breed-ing andor non-breeding season as opposed to char-acterising an annual average niche This accountedfor the variability in speciesminushabitat associations thatis a typical feature within the annual life cycle ofmigratory marine birds Breeding niches were quan-tified for fulmar Coryrsquos shearwater Manx shear -water and storm petrel and non-breeding nicheswere quantified for fulmar great shearwater andsooty shearwater in the North Atlantic The breedingniche (and subsequent modelled range) describesthe habitat associations of breeding adults whileoccupying nest sites the non-breeding niche is thatoccupied by non-breeding adults and the subse-quent modelled range comprises both lsquowinteringrsquoareas and migratory range Note that non-breedingbirds may be present within the non-breeding rangethroughout the year
Environmental data
The study area covered the North Atlanticbounded by the coordinates 680deg N 850deg W 00deg S120deg E A regular grid with the cell dimensions 025 times025deg was constructed in ArcGIS 92 (EnvironmentalSystems Research Institute) and displayed using theWGS-1984 coordinate system A landmask wasapplied using ArcWorld Supplementrsquos lsquocontinentsrsquolayer Bathymetric data were obtained from GEBCO(IOC et al 2003) providing elevation in 1 min(0016deg) intervals and interpolated using inverse dis-tance weighting at a scale of 025deg SST and chl adata were provided by the NERC Earth ObservationData Acquisition and Analysis Service SST datawere collected by the Advanced Very High Resolu-tion Radiometer (AVHRR) and have a resolution of4 km (0036deg) Chl a data were collected by the Sea-viewing Wide Field-of-view Sensor (SeaWiFS) andhave a resolution of 9 km (0081deg)
Seasonal averages were derived for dynamic pa-rameters (ie SST and chl a) from data collected be-tween 1995 and 2005 corresponding with the periodover which the test data were collected lsquoSummerrsquo(AprilminusSeptember) and lsquowinterrsquo (OctoberminusMarch) sea-sons were defined to correspond with speciesrsquo phe-nology lsquoSummerrsquo corresponds closely with the breed-ing season of fulmar Coryrsquos shearwater Manxshearwater and storm petrel and the non-breedingseason of great shearwater and sooty shearwaterwhich breed in the Southern Hemisphere lsquoWinterrsquocorresponds with the non-breeding season of fulmarSeasonal averages of SST and chl a were subsequentlyimported and averaged across grid cells within theraster using bilinear interpolation The shortest dis-tance to land was calculated for each grid cell usingthe Euclidean Distance function in ArcGIS
Model structure
An index of RES was derived for each grid celldepending on how the environmental attributes of acell corresponded with the parameters quantitativelydefining a speciesrsquo ecological niche After Kaschneret al (2006) RES was measured on a scale from 0 to1 and was based on a product of the suitability of theenvironment in relation to each individual EGVEach EGV was afforded equal weighting in modelsThe overall RES for each cell was calculated usingthe formula
RESoverall = RESdepth times RESSST times RESdistance times RESchl (1)
262
0
1
MinA MinP MaxP MaxA Rel
ativ
e en
viro
nmen
tal s
uita
bili
ty
Ecogeographical variable
Fig 1 Resource selection function describing a speciesrsquo eco-logical niche as a function of likelihood of relative environ-mental suitability throughout the range of an ecogeographi-cal variable MinA and MaxA absolute minimum andmaximum values MinP and MaxP preferred minimum and
maximum values of individual niche parameters
Watson et al Modelling seabird distributions and habitat suitability
The multiplicative approach means that if any onevariable within a cell fell outside of a speciesrsquo ab -solute range the overall suitability was equal to 0This is based on the assumption that an animal wouldnot be expected to occur within an environment thatis unsuitable in respect of one or more variables thatare key determinants of distribution RES valueswere imported into the GIS grid and displayed usinga continuous colour scale Model outputs delineate aspeciesrsquo predicted geographic range and illustratethe relative suitability of the environment (equatingto likelihood of occurrence) throughout that range
Observation data
MARINElife provided point data collected frommonthly seabird surveys carried out in the EnglishChannel and Bay of Biscay (Fig 2) between 1995 and2005 (though data from 2003 and 2004 were notavailable) Surveys were carried out aboard a com-mercial ferry liner within a restricted transect routeinvolving repeated sampling of grid cells A total of2696 h of observations collected across 156 gridcells provided data for the model evaluation Thedata set comprises a large number of observationsrepresenting a high diversity of species collectedover a decade and employing consistent methodol-ogy across space and time The sampling area coversa wide spectrum of environmental strata Observa-tions were binned within grid cells (025 times 025deg) tomatch the spatial resolution of environmental data
Cells were assigned a binary value of 1 or 0 indica-ting lsquopresencersquo and lsquobackgroundrsquo respectively
Species occurrence data typically exhibit spatialautocorrelation which arises when the probability ofoccurrence in one sampling unit is not independentof the probability of occurrence in neighbouringunits (Legendre 1993 Dormann et al 2007) If unac-counted for spatial autocorrelation can increase thefrequency of Type I errors (ie identifying a non- significant relationship as significant Dormann et al2007) We checked for spatial autocorrelation in spe-cies observation data and residuals of generalisedlinear models (with Poisson error structures) fitted todata on the number of observations as a function ofRES Clustering of observations may be driven byspatially autocorrelated environmental variables ifpredictors (here RES) explain most of the variation inspecies occurrences (ie a model is correctly speci-fied) there should be minimal spatial autocorrelationin the residuals (Dormann et al 2007 Elith amp Leath-wick 2009) We calculated Moranrsquos I values for the50 nearest neighbouring grid cells using the functionmorantest in the spdep package in R 2140 MoranrsquosI values range from minus1 (negative autocorrelation) to+1 (positive autocorrelation) with values around 0in di cative of a completely random spatial patternSmall positive values of Moranrsquos I were yielded fromspecies observation data (range 0004minus0254) andmodel residuals (range 0012minus0024) indicatingweak spatial clustering at the spatial scale of models(025 times 025deg) Analysis of correlograms showed nosignificant spatial autocorrelation in either observa-tions data or residuals and revealed irregular patchi-ness Subsequently we did not incorporate measuresto account for spatial autocorrelation into models
Model evaluation
Using independent point data collected byMARINE life in a subset of the model area (Fig 2) wetested the predictive performance of models usingReceiver Operating Characteristic (ROC) plots andcomparing the resulting area under the curve (AUC)against that of a null model (see Olden et al 2002Raes amp ter Steege 2007) ROC analyses offer a me -thod of assessing model accuracy that is threshold-independent by evaluating the proportion of cor-rectly and incorrectly classified predictions across acontinuous range of threshold values (Fielding amp Bell1997) The ROC plot is obtained by plotting sensitiv-ity (the true positive rate) as a function of 1-specificity(the false positive rate) at every possible threshold
263
Fig 2 Area where MARINElife conducted monthly seabirdsurveys between 1995 and 2005 in the English Channel andBay of Biscay Data collected served as independent obser-vation data for evaluation of relative environmental suitabil-ity (RES) models Grey squares delineate grid cells (025deg times
025deg) covered by sampling effort
Mar Ecol Prog Ser 485 259ndash273 2013
value The resulting AUC provides a measure of pre-dictive ability the higher the AUC the greater thepredictive accuracy of a model An AUC value of10 indicates a perfect model while a value of 05 isusually considered to be equivalent to performing nobetter than random (Fielding amp Bell 1997)
The use of null models has been demonstrated forimproving testing for statistical significance in AUCvalues (Raes amp ter Steege 2007) and addressing theissue of spatial sorting bias (Hijmans 2012) Spatialsorting bias can inflate AUC values of both empiricaland null models meaning an AUC of 05 might notnecessarily be indicative of random performance (Hijmans 2012) Predictions of RES models weretested by comparing the AUC value of actual modelsagainst a null distribution (a lsquonull modelrsquo) of AUC values derived from randomised data This testedwhether model predictive performance was signifi-cantly different from what would be expected bychance alone We generated a null distribution ofAUC values corresponding with each RES model byrandomly distributing the species observations (pre sence background) among the grid cells coveredby survey effort By generating random data onlyfrom the survey area we aim to minimise spatial sort-ing bias by ensuring that the null model only reflectsthe environmental conditions where sampling wascarried out (Hijmans 2012) The resulting ROC plotwas generated and the AUC was calculated using theROCR package in R 2140 This procedure was re-peated 10 000 times to generate a random frequencydistribution of AUC values that would be expected ifthe RES model did not perform better than expecteddue to chance If the AUC of the empirical model ex-ceeded the 95 quantile of the ranked AUC valuesof the corresponding null model the model was con-sidered to perform significantly better than chancewould dictate (Olden et al 2002) and the relationshipbetween RES and speciesrsquo presence can be consid-ered to be stronger than would be expected bychance We used 1-sided testing since it was only ofinterest whether models performed significantly better than expected by chance not whether theyperformed significantly worse The significance levelwas calculated as the proportion of random AUCsthat were equal to or greater than the observed AUC
The model evaluation has 2 main assumptions (1)there are sufficient records within the test data set toaccurately describe a speciesrsquo distribution within thesurvey area and (2) the range of possible RES valuesis represented within the survey area (ie there isheterogeneity of habitat suitability) To assess theseassumptions we calculated and considered the total
number of speciesrsquo observations number of lsquopres-encersquo cells and percentiles of the ranked RES valueswithin the survey area for each model
Model outputs were also visually compared withpublished range maps (del Hoyo et al 1992 Onley ampSchofield 2007) allowing detection of any large-scale geographical discrepancies in the predictionsof models While qualitative in nature this compari-son provides a useful additional evaluation of modelsat a much larger geographical scale than the morequantitative evaluation described above
RESULTS
Quantifying and modelling speciesrsquo ecological niches
Ecological niches of 6 seabird species mdash fulmarCoryrsquos shearwater great shearwater sooty shearwa-ter Manx shearwater and storm petrel mdash were quan-tified in relation to 4 EGVs mdash depth SST chl a con-centration and distance to land mdash and are describedin Table 2 The 6 species all occupy different eco -logical niches with varying degrees of overlapNiches were subsequently modelled using the RESapproach which resulted in a spatial visualisation ofniches into potential distributions (Fig 3) and illus-trated the relative suitability of the environmentthroughout ranges Manx shearwater and stormpetrel share similar niches during their concurrentbreeding seasons both species occur in cold temper-ate to subtropical waters (5minus25degC) and primarilyrange within a few hundred kilometres of land How-ever while the Manx shearwater prefers depths ofless than 200 m mdash from coastal waters to the edge ofthe continental shelf mdash the storm petrel prefersdeeper waters between 100 and 1000 m Breedingseabirds occur closer to land (all MinP = 0 km) thannon-breeding birds (MinP ranges from 6 to 50 km)
The fulmar occupies a similar niche in the breedingand non-breeding seasons the absolute minimumand maximum values of each EGV do not changebetween the 2 seasons but the preferred range of allenvironmental variables (except chl a) differs Duringthe non-breeding season the fulmarrsquos preferredniche encompasses cooler deeper waters furtherfrom land compared with when breeding Non-breeding great shearwater and sooty shearwateroccupy the widest niches with respect to SST span-ning a range of 37 and 30degC respectively The preferred niche of great shearwater extends furtheroffshore (lt2000 km) than that of sooty shearwaterwhich tends to range closer to land (lt200 km)
264
Watson et al Modelling seabird distributions and habitat suitability
Qualitative comparison with published range maps
From visual qualitative assessment it can be seenthat model outputs (Fig 3) illustrate variability inpredicted range extents of the 6 seabird species inthe North Atlantic Relative environmental suitabilityvaries throughout ranges reflecting niche segrega-tion between species Predicted range extents vary intotal surface area and geographical coverage Com-paring between species non-breeding birds (withthe exception of fulmar) occupy a larger range andlatitudinal extent than breeding birds
Predicted range extents closely corresponded withpublished distribution maps for all species Howeverall ranges comprised a wider extent than maps in theliterature A common discrepancy was the predictionof suitable habitat in enclosed seas when such areasare excluded from published ranges for several spe-cies for example the inclusion of the MediterraneanSea in model outputs for great shearwater and Manxshearwater the Caribbean Sea and Gulf of Mexicofor great shearwater and sooty shearwater and Hud-son Bay for great shearwater Elsewhere modelscaptured areas of known absence well for examplethe absence of breeding Manx shearwater from thewestern central Atlantic and Caribbean Sea theabsence of sooty shearwater from Hudson Bay andthe low habitat suitability in the central Atlantic forthe sooty shearwater
The model output for storm petrel predicted amuch wider range across the North Atlantic thanpublished range maps the latter define the speciesrsquorange as restricted to the northeast Atlantic extend-ing no further west than 30degW Areas of high environ-mental suitability were separated by a large area oflow RES in the central Atlantic Similarly a smallarea of suitable habitat was predicted for fulmar in
the north Mediterranean Sea but separated from thecore range by a large area of unsuitable habitat
Statistical model evaluation
RES models for 5 out of 6 species performed signifi-cantly better than expected by chance when testedwith independent observation data from the Bay ofBiscay (p lt 005 Table 3) The AUC of empirical mod-els was significantly higher than that of correspondingnull models revealing a significant relationship be-tween RES and species occurrences for 6 out of 7models In the case of 4 out of a total of 7 models lessthan 01 of random samples had a higher AUC thanthe actual model (p lt 0001) The model for sootyshearwater did not perform significantly better thanrandom (p = 0260) with 26 of random AUCs ex-ceeding the observed AUC While the model for greatshearwater performed significantly better than ex-pected by chance (p = 0041) the model AUC wasonly very slightly higher than the 95 quantile of theranked null AUC values indicating that the model didnot perform much better than random
The number of speciesrsquo encounters ranged from115 to 590 (mean 3531 plusmn 653 Table 4) The rangeand frequency distribution of habitat suitabilityacross the model evaluation area for each species isillustrated by percentiles of ranked RES values(Table 4) The distribution of RES in the survey areavaries between species and is strongly skewed mdashindicating reduced heterogeneity of habitat suita -bility mdash for 3 models fulmar (breeding) sooty shear -water and Manx shearwater The majority of habitatwithin the sampling area is of low suitability forbreeding fulmars but of homogenously high suitabil-ity for sooty and Manx shearwaters
265
Species Status Depth (m) SST (degC) Distance (m)MinA MinP MaxP MaxA MinA MinP MaxP MaxA MinA MinP Max P MaxA
Northern fulmar B 0 100 1000 8000 minus2 0 15 15 0 0 320 2364N 0 100 2000 8000 minus2 0 10 15 0 50 2364 2364
Coryrsquos shearwater B 0 100 1000 8000 10 20 20 25 0 0 200 2364Great shearwater N 0100 200 8000 minus2 0 20 35 0 6 2000 2364Sooty shearwater N 0 10 1000 8000 5 10 20 35 0 15 200 2364Manx shearwater B 0 10 200 8000 5 10 20 25 0 0 360 2364European storm petrel B 0 100 2000 8000 5 10 20 25 0 0 200 2364
Table 2 Quantitative descriptions of speciesrsquo ecological niches in respect of 4 ecogeographical variables depth sea-surfacetemperature (SST) distance to land and chlorophyll a (chl a) concentration Niches were defined for 6 procellariiform seabirdsduring the breeding andor non-breeding season MinA and MaxA absolute minimum and maximum values of the resourceselection function MinP and MaxP preferred minimum and maximum values (see Fig 1) Chl a (mg mminus3 identical for eachspecies and status) MinA MinP = 0 03 MaxP MaxA = 60 60 Status B = breeding N = non-breeding See Table S1 in
Supplement 1 (wwwint-rescomarticlessupplm485p259_supplpdf) for data sources
Mar Ecol Prog Ser 485 259ndash273 2013266
Fig 3 Model outputs illustrating predicted geographicrange and relative environmental suitability (RES) for 6procellariiform seabirds in the North Atlantic duringtheir breeding (yellowminusbrown) andor non-breedingseasons (blue) (A) northern fulmar Fulmarus glacialisbreeding (B) northern fulmar non-breeding (C) Coryrsquosshearwater Calonectris diomedea breeding (D) greatshearwater Puffinus gravis non-breeding (E) sootyshearwater P griseus non-breeding (F) Manx shear -water P puffinus breeding and (G) European stormpetrel Hydrobates pelagicus breeding Predicted RES ison a scale from 0 (least suitable white) to 1 (highly suit-
able dark)
Watson et al Modelling seabird distributions and habitat suitability
DISCUSSION
RES predictions
When compared with simulated random data RESmodels performed significantly better for 5 out of6 seabird species (and 6 out of 7 models) at predicting
relative likelihood of occurrence in a subset of thestudy area Model outputs provide more informationon speciesrsquo distributions than published range mapssince they provide indices of relative environmentalsuitability throughout a speciesrsquo range RES predic-tions represent simple testable hypotheses concern-ing a speciesrsquo potential niche in respect of a few envi-ronmental predictors Visualisation of hypotheses ina spatial context facilitates our understanding of speciesminushabitat relationships inference of areas ofpotentially high seabird abundance and identifica-tion of regions to be targeted for future research andconservation planning
Observed versus predicted distributions
RES modelling of the potential niche resulted inpredictions of occurrence outside of known (or ob -served) ranges for several species when comparedwith published range maps indicating that distribu-tions are influenced by additional biological andorphysical parameters besides those included in mod-els Indeed modelling of the realised niche mdash thepart of the potential niche that a species actuallyuses mdash requires the incorporation of biotic interac-tions (Soberoacuten amp Nakamura 2009) and physiologicalconstraints (Kearney amp Porter 2009) Qualitative com-parison of RES model outputs with observed distribu-tions thus allows the assessment of the importance ofother factors that may influence the at-sea distribu-tion of seabirds
Distributions of pelagic animals are ultimately con-strained by the abundance and distribution of prey(Pahl-Wostl 1997) but scales of association betweenmobile predators and prey are highly variable(Schneider amp Piatt 1986) and prey indices are consid-ered inappropriate for predicting global distributionsof many highly mobile marine organisms (Torres etal 2008) Karpouzi et al (2007) incorporated informa-tion on prey distributions in mapping at-sea foragingdistributions of seabirds however they found little orno information concerning the diet of many seabirdsand detected high spatial variability in associationsbetween seabirds and prey Habitat modelling istherefore largely reliant on predictor variables thatindirectly affect species distribution
Evidence from energetic and physiological studieshighlights the significance of wind speed (Furness ampBryant 1996) and area of available ocean extent (Da -vies et al 2010) in influencing the foraging behaviourand life-history strategies of procellariiform seabirdsThe Strait of Gibraltar (Friesen et al 2007) and the
267
Species AUCm AUCn p
Northern fulmarBreeding 0735 0568 lt0001Non-breeding 0774 0583 lt0001Coryrsquos shearwaterBreeding 0712 0580 lt0001Great shearwaterNon-breeding 0587 0583 0041Sooty shearwaterNon-breeding 0530 0575 0260Manx shearwaterBreeding 0614 0572 0004European storm petrelBreeding 0704 0582 lt0001
Table 3 Evaluation of predictive performance of relative en-vironmental suitability (RES) models A model was consid-ered to perform significantly better than chance if the areaunder the curve of the empirical model (AUCm) exceededthe 95 quantile of the ranked AUC values of a correspon-ding null model (AUCn) p-values indicate the proportion of
AUCn that were equal to or greater than AUCm
Species No of No of Percentiles of ranked records lsquopresencersquo RES in survey area
cells 10 50 90
Northern fulmarBreeding 590 71 00 00 10Non-breeding 248 45 012 036 056Coryrsquos shearwaterBreeding 527 51 015 043 062Great shearwaterNon-breeding 452 48 037 069 10Sooty shearwaterNon-breeding 115 46 055 10 10Manx shearwaterBreeding 245 60 050 10 10European storm petrelBreeding 295 46 045 086 10
Table 4 Summary of test data used for evaluating the pre-dictive performance of relative environmental suitability(RES) models Independent observation data were collectedfrom repeated sampling of 156 grid cells (025deg times 025deg) byMARINElife in the Bay of Biscay (Fig 2) The number of spe-cies records number of lsquopresencersquo cells and variation in RESwithin the model evaluation area (percentiles of ranked
RES) are presented
Mar Ecol Prog Ser 485 259ndash273 2013
Almeria-Oran Oceanographic Front (Goacutemez-Diacuteaz etal 2006) have both been proposed as barriers limit-ing dispersal of and genetic exchange between sea-birds in the Atlantic Ocean and the MediterraneanSea Such physical and geographical factors mayexplain why despite the prediction of suitable habitat the observed distributions of some species donot extend into enclosed seas eg the absence ofgreat shearwater from the Mediterranean Sea andHudson Bay
Biotic interactions may play a significant role indetermining distributions across smaller spatial andtemporal scales (Furness amp Birkhead 1984) and theirincorporation into SDMs is widely recognised as akey challenge in both terrestrial (Arauacutejo amp Guisan2006) and marine environments (Robinson et al2011) Shearwaters do not typically form mixed- species colonies (Warham 1990) suggesting thatinterspecific competition and niche segregation mayinfluence the breeding distributions of some procel-lariiform seabirds While the observed range of Manxshearwater does not extend into the MediterraneanSea the breeding ranges of the Balearic shearwaterPuffinus mauretanicus and the Yelkoaun shearwaterP yelkoauni which occupy similar ecological nichesto the Manx shearwater (and were until recentlyconsidered to be subspecies of Manx shearwaterSangster et al 2002) are restricted to the Mediter-ranean Sea (Onley amp Schofield 2007) A combinationof evolutionary history and biotic interactions mayexplain the reduced niche overlap that is observed(compared with predicted overlap) between these 3ecologically similar species Depending on the objec-tives it may be a more useful approach to applyniche modelling to a species complex when there areseveral closely related species
Despite their ability to traverse large sections ofocean many procellariiform seabirds show limiteddispersal (the lsquoseabird paradoxrsquo proposed by Milot etal 2008) Their philopatric habits are expected tolimit colonisation by long-distance dispersal and sub-sequent range expansion (Matthiopoulos et al 2005Brown et al 2010) Despite the prediction of highRES in the northwest Atlantic for the storm petrelhigh breeding-site fidelity and the large area of pre-dicted low habitat suitability in the central Atlanticmay explain why the speciesrsquo observed distribution(from published range maps) is restricted to thenortheast Atlantic (del Hoyo et al 1992) Addition-ally the niche is already filled by another pelagicseabird Leachrsquos petrel Oceanodroma leucorhoa inthe northwest Atlantic (del Hoyo et al 1992) In theinterpretation of RES model outputs consideration
should thus be afforded to a speciesrsquo evolutionaryhistory as well as areas of low RES separating areasof high RES both of which may act to restrict ranges
The availability of suitable nest sites is a funda-mental constraint on the current breeding distribu-tion of seabirds (Brown et al 2010) Procellariiformseabirds are largely restricted to remote islands freeof mammalian predators which are within range ofsuitable foraging areas (Warham 1990) If all occu-pied breeding colonies could be accurately identifiedand niche envelopes constrained by maximum forag-ing range from colonies models could yield moreaccurate predictions of range extent during thebreeding season However given the difficulties ofsurveying and monitoring remote locations ourknowledge of breeding sites is likely to be incom-plete particularly for less well-studied speciesRestricting distribution to within species-specific for-aging range of all land therefore represents a moreconservative approach
Where suitable habitat is predicted outside of cur-rent observed distributions this may indicate areasthat are used by a species but for which there are nodata or areas that could be suitable for colonisationFuture colonisation or range shifts could be driven bychanges in environmental suitability as a result ofnatural changes (eg Gaston amp Woo 2008) andoranthropogenic-induced changes such as by meansof active conservation management (Miskelly et al2009) By identifying areas of potentially suitable at-sea habitat the RES modelling approach may thusoffer insight into the effects of future changes in cli-mate and anthropogenic activities on speciesrsquo distri-butions Further model development could be basedon different scenarios for climate or nest-site avail-ability to generate predictions of future changes indistributions
Model evaluation
Statistical evaluation demonstrates that the genericapproach of RES modelling can accurately describehabitat suitability for wide-ranging seabirds RESpredictions were more strongly related to speciespresence for 6 out of 7 models than expected due tochance While qualitative assessment of the modeloutput for non-breeding sooty shearwater suggestedreasonable consistency with published distributiondata the model did not perform significantly betterthan a null model Poor model performance could beexplained by the low quality of data used for modelparameterisation (see Table S1) resulting in an inac-
268
Watson et al Modelling seabird distributions and habitat suitability
curate description of a speciesrsquo ecological niche It iswell established that speciesminusenvironment relation-ships can change with scale (Manly et al 2002) andthere is evidence for intraspecific spatial variation inspeciesminushabitat relationships in seabirds (Huettmannamp Diamond 2001) Most information on the at-seahabitat associations of the sooty shearwater comesfrom studies in the Pacific Ocean (Briggs amp Chu 1986Vermeer et al 1989 but see Hedd et al 2012) There-fore we cannot be certain of the spatial stability ofthe speciesrsquo niche across distinct ocean basins Theavailability and quality of ecological data may limitthe wider application of RES modelling to other spe-cies of seabird if insufficient data are available toaccurately quantify speciesrsquo ecological niches
Rigorous evaluation of models requires that the testdata set accurately reflects the distribution andoccurrence of a species within the evaluation areaThe test data comprised far fewer observations ofsooty shearwater than the other study species andthe sampling area was characterised by low variationin RES ie highly homogeneous habitat suitability(Table 4) However despite highly skewed distribu-tions of RES the models for fulmar (breeding) andManx shearwater showed highly significant predic-tive accuracy when compared to null models Thisindicates these models must be performing very wellif they can perform significantly better than randomeven under less favourable conditions for the evalua-tion Rigorous model evaluation relies on representa-tive observation data collected across broad spatialand temporal scales to compliment the macro-scalemodelling approach While lsquoregularrsquo and lsquoequal-stratifiedrsquo sampling strategies are the most accurateand robust (Hirzel amp Guisan 2002) these are not typ-ically features of opportunistically collected data mdashthe source of most at-sea seabird observations Theincreasing availability of large-scale point data (egOBIS GBIF) and range maps such as those availablethrough the IUCN Red List (wwwiucnredlistorg)presents opportunities for further testing of RESmodels However the availability of representativetest data may limit the application of RES modellingfor scarcer and under-recorded species
Biases in model parameters
A frequent obstacle encountered in predictive distribution modelling of marine animals is the lackof reliable and comprehensive occurrence datafrom which to define species-habitat relationships(Robinson et al 2011) The issue of environmental
bias mdash spatial andor temporal bias in collection ofoccurrence data mdash is widely recognised in speciesdis tribution modelling (Arauacutejo amp Guisan 2006Phillips et al 2009 Ready et al 2010) It mainly arisesfrom limitations in data accessibility and samplingstrategies preventing representative coverage of theentire environmental range of species (Phillips et al2009) The biases inherent to most observation datacan easily lead to incorrect interpretation of habitatpreferences of wide-ranging species (Hirzel ampGuisan 2002)
RES modelling provides a technique for predictinglarge-scale distributions which does not rely on pointdata The niche hypotheses underlying RES modelsstill ultimately depend on the quality and amount ofavailable ecological information Quantitative dataon the relationships between seabirds and oceanproductivity are lacking and large areas of theoceans remain under-studied eg the central At -lantic (but see Skov et al 1994) However the abilityfor RES modelling to incorporate a range of qualita-tive and quantitative data collected from differentparts of speciesrsquo ranges at different times of yearbroadens the scope of environmental coverage Con-sequently the outputs may represent more balancedand robust predictions for many marine animalsthan the more commonly used predictive modellingtechniques When previously tested against a rangeof marine taxa RES modelling was shown to performvery well compared with traditional presence-onlymodelling methods (Ready et al 2010)
Accounting for temporal variability
Temporal variability in ecological niches and envi-ronmental parameters is frequently overlooked inspecies distribution modelling (Dambach amp Roumldder2011) Previous applications of RES modelling tomarine top predators did not account for temporalvariability in speciesminushabitat relationships or EGVs(Kaschner et al 2006 Ready et al 2010) In this studywe have accounted for the seasonal shifts in habitatassociations that occur within the annual life cycle bydistinguishing between a speciesrsquo breeding and non-breeding niche and subsequently relating niches toseasonally averaged data for dynamic EGVsAccounting for temporal variation in both speciesminusenvironment relationships and dynamic environ-mental variables is expected to increase the reliabil-ity of RES predictions particularly in areas whereenvironmental conditions fluctuate greatly betweenseasons Consequently our seasonal RES predictions
269
Mar Ecol Prog Ser 485 259ndash273 2013
can provide greater insight into speciesrsquo behaviourand ecology than those based on an annual averageniche envelope
Applications and recommendations for future research
RES modelling could prove a valuable tool forinforming the development and implementation ofeffective conservation and management practices Inthe absence of comprehensive occurrence data forwide-ranging species RES models can identify criti-cally important areas and biodiversity hotspots inpelagic marine ecosystems This is of direct rele-vance to the development of quantifiable criteria forthe designation of marine Important Bird Areas(IBAs BirdLife International 2004) The modellingapproach could be used to direct observation effort toareas where under-recorded seabirds are predictedto occur and inform sampling strategies to incorpo-rate a range of environmental suitability Matchingdata on seabird distribution as revealed by RESmodel outputs with data on fishing effort couldinform the responsibilities of Regional FisheriesManagement Organisations (RFMOs) and the devel-opment of suitable monitoring and mitigation meas-ures to reduce negative interactions between sea-birds and fisheries (eg Le Corre et al 2012)
Application of RES modelling to a greater variety ofspecies demonstrating variable niche characteris-tics will allow further examination of the broad-scaleapplicability of the approach Expanding the RESapproach to wider geographic areas incorporatingall of a speciesrsquo range would offer greater insightinto understanding distribution dispersal and migra-tory behaviour An iterative approach to the develop-ment of models (as recommended by Elith et al 2006)will improve the robustness of predictions by consid-ering the effects of a wider range of predictor vari-ables on model performance Additional factors thathave been shown to influence the at-sea distributionof seabirds and could be incorporated into futuremodels include sea-surface salinity (eg Huettmannamp Diamond 2001) horizontal (eg Louzao et al 2009)and vertical gradients in SST (eg Spear et al 2001)and fishing effort (eg Karpouzi et al 2007)
Wider application of RES modelling requires simultaneous developments in at-sea sampling andlarge-scale studies of speciesminushabitat relationshipswhich inform one another and offer direction forfuture research The increasing use of trackingdevices for recording movements of seabirds pro-
vides opportunities for quantification of habitat useand preference (Wakefield et al 2009 Le Corre et al2012) Increasing the public availability of trackingdata will facilitate further development of SDMs(Skov et al 2008) Further studies are required toimprove quantitative understanding of speciesminushabi-tat relationships across a variety of spatio-temporalscales and integration of data across scales is neces-sary to enhance the predictive ability of RES modelsHaving demonstrated RES is a robust modellingapproach predictions could be improved by the useof ensemble model averaging (Arauacutejo amp New 2007)
CONCLUSIONS
Based on quantitative definitions of speciesrsquo eco-logical requirements RES maps offer a robust alter-native to subjectively generated traditional rangemaps We have shown that RES modelling can ade-quately describe habitat suitability across largescales for wide-ranging pelagic seabirds RES model-ling presents a generic and objective approach forpredicting distributions of wide-ranging marine ani-mals across large spatial scales when the absence ofrepresentative point data precludes the applicationof traditional modelling techniques Model outputsrepresent an alternative to the conventional and sub-jective approach of delineating range extents basedon limited records of occurrence The approach isbased on clear assumptions concerning speciesrsquohabitat preferences which can be easily modifiedand tested
RES predictions are limited by the extent of pub-lished data and the subsequent ability to accuratelyquantify speciesrsquo ecological niches While some gapsin the literature are evident the synthesis of knowl-edge concerning speciesminushabitat relationships canadequately describe ecological niches for the pur-poses of building predictive distribution models Thisoffers a more robust approach for answering broad-scale questions about speciesrsquo distributions thanderiving niches from limited and biased samplingdata Of greater significance is the limited availabil-ity of representative at-sea observations data to rig-orously evaluate models which may prove to be thekey limiting factor in the wider application of RESmodelling for wide-ranging marine animals
Acknowledgements Thanks to the NERC Earth Observa-tion Data Acquisition and Analysis Service (NEODAAS) forsupplying data for this study MARINElifersquos contribution tothis research was part-funded by the EU as part of the Chan-
270
Watson et al Modelling seabird distributions and habitat suitability
nel Integrated Approach for Marine Resource Management(CHARM) Phase 3 project We thank MARINElife volun-teers for collection of observation data and PampO Ferries forsponsoring surveys aboard the lsquoPride of Bilbaorsquo
LITERATURE CITED
Airameacute S Dugan JE Lafferty KD Leslie H McArdle DAWarner RR (2003) Applying ecological criteria to marinereserve design a case study from the California ChannelIslands Ecol Appl 13 170minus184
Arauacutejo MB Guisan A (2006) Five (or so) challenges for spe-cies distribution modelling J Biogeogr 33 1677minus1688
Arauacutejo MB New M (2007) Ensemble forecasting of speciesdistributions Trends Ecol Evol 22 42minus47
Ashmole N (1971) Sea bird ecology and the marine environ-ment In Farner DS King JR (eds) Avian biology Vol 1Academic Press New York NY p 223minus286
BirdLife International (2004) Tracking ocean wanderers the global distribution of albatrosses and petrels Resultsfrom the Global Procellariiform Tracking Workshop1minus5 September 2003 Gordonrsquos Bay South Africa BirdlifeInternational Cambridge
Boyce MS Vernier PR Nielsen SE Schmiegelow FKA(2002) Evaluating resource selection functions EcolModel 157 281minus300
Briggs KT Chu EW (1986) Sooty shearwaters off California distribution abundance and habitat use Condor 88 355minus364
Brown RM Nichols RA Faulkes CG Jones CG and others(2010) Range expansion and hybridization in RoundIsland petrels (Pterodroma spp) evidence from micro -satellite genotypes Mol Ecol 19 3157minus3170
Cramp S Simmons K (1980) Handbook of the birds ofEurope the Middle East and north Africa The birds ofthe western Palearctic Vol 1 Ostrich to ducks OxfordUniversity Press Oxford
Dambach J Roumldder D (2011) Applications and future chal-lenges in marine species distribution modeling AquatConserv 21 92minus100
Davies RG Irlich UM Chown SL Gaston KJ (2010) Ambi-ent productive and wind energy and ocean extent pre-dict global species richness of procellariiform seabirdsGlob Ecol Biogeogr 19 98minus110
del Hoyo J Elliott A Sargatal J (1992) Handbook of thebirds of the world Vol 1 Ostrich to ducks Lynx EdicionsBarcelona
Dormann CF McPherson JM Arauacutejo MB Bivand R and oth-ers (2007) Methods to account for spatial autocorrelationin the analysis of species distributional data a reviewEcography 30 609minus628
Elith J Leathwick JR (2009) Species distribution models ecological explanation and prediction across space andtime Annu Rev Ecol Evol Syst 40 677minus697
Elith J Graham H Anderson P Dudiacutek M and others (2006)Novel methods improve prediction of species distribu-tions from occurrence data Ecography 29 129minus151
Fielding AH Bell JF (1997) A review of methods for theassessment of prediction errors in conservation pres-enceabsence models Environ Conserv 24 38minus49
Friesen VL Burg TM McCoy KD (2007) Mechanisms ofpopulation differentiation in seabirds Mol Ecol 16 1765minus1785
Furness RW Birkhead TR (1984) Seabird colony distribu-
tions suggest competition for food supplies during thebreeding-season Nature 311 655minus656
Furness RW Bryant DM (1996) Effect of wind on field meta-bolic rates of breeding northern fulmars Ecology 77 1181minus1188
Gaston AJ Woo K (2008) Razorbills (Alca torda) follow sub-arctic prey into the Canadian Arctic colonization resultsfrom climate change Auk 125 939minus942
Goacutemez-Diacuteaz E Gonzaacutelez-Soliacutes J Peinado MA Page RDM(2006) Phylogeography of the Calonectris shearwatersusing molecular and morphometric data Mol PhylogenetEvol 41 322minus332
Gregr EJ Trites AW (2008) A novel presence-only validationtechnique for improved Steller sea lion Eumetopias juba-tus critical habitat descriptions Mar Ecol Prog Ser 365 247minus261
Guinotte JM Bartley JD Iqbal A Fautin DG BuddemeierRW (2006) Modeling habitat distribution from organismoccurrences and environmental data case study usinganemonefishes and their sea anemone hosts Mar EcolProg Ser 316 269minus283
Guisan A Zimmermann NE (2000) Predictive habitat distri-bution models in ecology Ecol Model 135 147minus186
Guisan A Edwards TC Hastie T (2002) Generalized linearand generalized additive models in studies of speciesdistributions setting the scene Ecol Model 157 89minus100
Hardy SM Lindgren M Konakanchi H Huettmann F (2011)Predicting the distribution and ecological niche of unex-ploited snow crab (Chionoecetes opilio) populations inAlaskan waters a first open-access ensemble modelIntegr Comp Biol 51 608minus622
Hedd A Montevecchi WA Otley H Phillips RA Fifield DA(2012) Trans-equatorial migration and habitat use bysooty shearwaters Puffinus griseus from the SouthAtlantic during the nonbreeding season Mar Ecol ProgSer 449 277minus290
Hijmans RJ (2012) Cross-validation of species distributionmodels removing spatial sorting bias and calibrationwith a null model Ecology 93 679minus688
Hirzel AH Guisan A (2002) Which is the optimal samplingstrategy for habitat suitability modelling Ecol Model157 331minus341
Hobbs M Brereton T Weir C Williams A (2003) Baselinemonitoring data on Procellariformes [Procellariiformes](shearwaters) in the Bay of Biscay Ornis Hungarica12ndash13 115minus125
Huettmann F Diamond AW (2001) Seabird colony locationsand environmental determination of seabird distribution a spatially explicit breeding seabird model for the North-west Atlantic Ecol Model 141 261minus298
Huettmann F Artukhin Y Gilg O Humphries G (2011) Pre-dictions of 27 Arctic pelagic seabird distributions usingpublic environmental variables assessed with colonydata a first digital IPY and GBIF open access synthesisplatform Mar Biodivers 41 141minus179
Intergovernmental Oceanographic Commission (IOC) Inter -national Hydrographic Organization (IHO) and BritishOceanographic Data Centre (BODC) (2003) Centenaryedition of the GEBCO Digital Atlas published on CD-ROM on behalf of the Intergovernmental OceanographicCommission and the International Hydrographic Organi-zation as part of the General Bathymetric Chart of theOceans BODC Liverpool
Karpouzi VS Watson R Pauly D (2007) Modelling and map-ping resource overlap between seabirds and fisheries on
271
Mar Ecol Prog Ser 485 259ndash273 2013
a global scale a preliminary assessment Mar Ecol ProgSer 343 87minus99
Kaschner K Watson R Trites AW Pauly D (2006) Mappingworld-wide distributions of marine mammal speciesusing a relative environmental suitability (RES) modelMar Ecol Prog Ser 316 285minus310
Kaschner K Tittensor DP Ready J Gerrodette T Worm B(2010) Current and future patterns of global marinemammal biodiversity PLoS ONE 6 e19653
Kearney M Porter W (2009) Mechanistic niche modelling combining physiological and spatial data to predict spe-ciesrsquo ranges Ecol Lett 12 334minus350
Le Corre M Jaeger A Pinet P Kappes MA and others (2012)Tracking seabirds to identify potential Marine ProtectedAreas in the tropical western Indian Ocean Biol Conserv156 83minus93
Legendre P (1993) Spatial autocorrelation trouble or newparadigm Ecology 74 1659minus1673
Louzao M Hyrenbach KD Arcos JM Abelloacute P De Sola LGOro D (2006) Oceanographic habitat of an endangeredMediterranean procellariiform implications for marineprotected areas Ecol Appl 16 1683minus1695
Louzao M Beacutecares J Rodriacuteguez B Hyrenbach KD Ruiz AArcos JM (2009) Combining vessel-based surveys andtracking data to identify key marine areas for seabirdsMar Ecol Prog Ser 391 183minus197
Manly BF McDonald LL Thomas DL McDonald TL Erick-son WP (2002) Resource selection by animals statisticaldesign and analysis for field studies Springer New YorkNY
Matthiopoulos J Harwood J Thomas L (2005) Metapopula-tion consequences of site fidelity for colonially breedingmammals and birds J Anim Ecol 74 716minus727
Maxwell DL Stelzenmuumlller V Eastwood PD Rogers SI(2009) Modelling the spatial distribution of plaice (Pleu-ronectes platessa) sole (Solea solea) and thornback ray(Raja clavata) in UK waters for marine management andplanning J Sea Res 61 258minus267
Milot E Weimerskirch H Bernatchez L (2008) The seabirdparadox dispersal genetic structure and populationdynamics in a highly mobile but philopatric albatrossspecies Mol Ecol 17 1658minus1673
Miskelly CM Taylor GA Gummer H Williams R (2009)Translocations of eight species of burrow-nesting sea-birds (genera Pterodroma Pelecanoides Pachyptila andPuffinus Family Procellariidae) Biol Conserv 142 1965minus1980
Nur N Jahncke J Herzog MP Howar J and others (2011)Where the wild things are predicting hotspots of seabirdaggregations in the California Current System EcolAppl 21 2241minus2257
Oedekoven CS Ainley DG Spear LB (2001) Variable res -ponses of seabirds to change in marine climate Califor-nia Current 1985ndash1994 Mar Ecol Prog Ser 212 265minus281
Olden JD Jackson DA Peres-Neto PR (2002) Predictivemodels of fish species distributions a note on proper val-idation and chance predictions Trans Am Fish Soc 131 329minus336
Olivier F Wotherspoon SJ (2006) Modelling habitat selec-tion using presence-only data case study of a colonialhollow nesting bird the snow petrel Ecol Model 195 187minus204
Onley D Schofield P (2007) Field guide to the albatrossespetrels and shearwaters of the world Christopher HelmLondon
Oppel S Meirinho A Ramiacuterez I Gardner B OrsquoConnell AFMiller PI Louzao M (2012) Comparison of five modellingtechniques to predict the spatial distribution and abun-dance of seabirds Biol Conserv 156 94minus104
Ostrand WD Drew GS Suryan RM McDonald LL (1998)Evaluation of radio-tracking and strip transect methodsfor determining foraging ranges of black-legged kitti-wakes Condor 100 709minus718
Pahl-Wostl C (1997) Dynamic structure of a food web model comparison with a food chain model Ecol Model 100 103minus123
Phillips SJ Dudiacutek M Elith J Graham CH Lehmann ALeathwick J Ferrier S (2009) Sample selection bias andpresence-only distribution models implications for back-ground and pseudo-absence data Ecol Appl 19 181minus197
Raes N ter Steege H (2007) A null-model for significancetesting of presence-only species distribution modelsEcography 30 727minus736
Raymond B Woehler EJ (2003) Predicting seabirds at sea inthe Southern Indian Ocean Mar Ecol Prog Ser 263 275minus285
Ready J Kaschner K South AB Eastwood PD and others(2010) Predicting the distributions of marine organismsat the global scale Ecol Model 221 467minus478
Redfern JV Ferguson MC Becker EA Hyrenbach KD andothers (2006) Techniques for cetaceanminushabitat modelingMar Ecol Prog Ser 310 271minus295
Robinson LM Elith J Hobday AJ Pearson RG Kendall BEPossingham HP Richardson AJ (2011) Pushing the limitsin marine species distribution modelling lessons fromthe land present challenges and opportunities Glob EcolBiogeogr 20 789minus802
Ross DA (1988) An introduction to oceanography PrenticeHall Englewood Cliffs NJ
Sangster G Knox AG Helbig AJ Parkin DT (2002) Taxo-nomic recommendations for European birds Ibis 144 153minus159
Schneider DC (1997) Habitat selection by marine birds inrelation to water depth Ibis 139 175minus178
Schneider DC Piatt JF (1986) Scale-dependent correlationof seabirds with schooling fish in a coastal ecosystemMar Ecol Prog Ser 32 237minus246
Skov H Durinck J Danielsen F Bloch D (1994) The summerdistribution of Procellariiformes in the central NorthAtlantic Ocean Vogelwarte 37 270minus289
Skov H Humphreys E Garthe S Geitner K and others(2008) Application of habitat suitability modelling totracking data of marine animals as a means of analyzingtheir feeding habitats Ecol Model 212 504minus512
Soberoacuten J Nakamura M (2009) Niches and distributionalareas concepts methods and assumptions Proc NatlAcad Sci USA 106 19644minus19650
Spear LB Ballance LT Ainley DG (2001) Response of sea-birds to thermal boundaries in the tropical Pacific thethermocline versus the Equatorial Front Mar Ecol ProgSer 219 275minus289
Sverdrup H Johnston MW Fleming RH (1942) The oceans their physics chemistry and general biology PrenticeHall New York NY
Tasker ML Reid JB (1997) Seabirds in the marine environ-ment mdash introduction ICES J Mar Sci 54 505minus506
Torres LG Read AJ Halpin P (2008) Fine-scale habitat modeling of a top marine predator Do prey data improvepredictive capacity Ecol Appl 18 1702minus1717
Vermeer K Morgan KH Smith GEJ Hay R (1989) Fall distri-
272
Watson et al Modelling seabird distributions and habitat suitability 273
bution of pelagic birds over the shelf off SW VancouverIsland Colon Waterbirds 12 207minus214
Wakefield ED Phillips RA Matthiopoulos J (2009) Quantify-ing habitat use and preferences of pelagic seabirds usingindividual movement data a review Mar Ecol Prog Ser391 165minus182
Warham J (1990) The petrels their ecology and breedingsystems Academic Press New York NY
Yen PPW Huettmann F Cooke F (2004) A large-scale modelfor the at-sea distribution and abundance of marbledmurrelets (Brachyramphus marmoratus) during the bree -ding season in coastal British Columbia Canada EcolModel 171 395minus413
Zimmermann NE Edwards TC Graham CH Pearman PBSvenning JC (2010) New trends in species distributionmodelling Ecography 33 985minus989
Editorial responsibility Rory Wilson Swansea UK
Submitted June 7 2012 Accepted March 7 2013Proofs received from author(s) June 11 2013

Mar Ecol Prog Ser 485 259ndash273 2013
Predictive habitat modelling offers a range of toolsto quantitatively delineate range extents based onspeciesminusenvironment relationships (for reviews seeGuisan amp Zimmermann 2000 Guisan et al 2002Redfern et al 2006 Zimmermann et al 2010) Stan-dard techniques typically employ records of speciesoccurrence and associated environmental factorswhich may determine mdash directly or indirectly mdash aspeciesrsquo distribution within an area Species distribu-tion models (SDMs) have been widely applied in ter-restrial systems yet their application for predictingoccurrences of marine organisms remained limiteduntil the last 10 yr (Elith amp Leathwick 2009 Robinsonet al 2011) Many SDMs in marine systems havebeen applied in conservation planning (eg Guinotteet al 2006 Oppel et al 2012) and are typically biasedtowards commercially harvested animals (eg Max -well et al 2009 Hardy et al 2011) and mammals (egRedfern et al 2006 Gregr amp Trites 2008 Ready et al2010) The most widely used models require largepresenceminusabsence data sets (Guisan et al 2002) andare therefore unsuitable for generating accurate pre-dictions about species for which occurrence data arelimited in spatial and temporal extent which charac-terises the situation for many marine animals (Readyet al 2010 Robinson et al 2011) While occurrencedata of marine animals are becoming increasinglyavailable through online databases such as theOcean Biogeographic Information System (OBISwwwiobisorg) and the Global Biodiversity Informa-tion Facility (GBIF wwwgbiforg) there is little pub-lished quantitative information concerning large-scale patterns of diversity and distribution in themarine environment
In the absence of point data spanning large spatialand temporal scales Kaschner et al (2006) proposedthat the synthesis of available knowledge concerningspeciesminushabitat relationships could approximate alarge-scale representative sampling scheme Theydeveloped a novel rule-based envelope model tomap global distributions of marine mammals andgenerate large-scale predictions of relative environ-mental suitability (RES) without the need for a hugeinput of presenceminusabsence data mdash the limiting factorof standard modelling techniques RES underlies theAquaMaps modelling system which compared withtraditional methods of presence-only distributionmodelling was found to perform very well for a suiteof marine taxa (Ready et al 2010) AquaMaps is nowused extensively for generating distribution maps inFishBase (wwwfishbaseorg) Gregr amp Trites (2008)also demonstrated that speciesminushabitat relationshipscan be accurately defined for wide-ranging marine
top predators when limited observation data preventthe use of more common correlative approaches
The behaviour and ecology of marine birds at sea ispoorly understood largely due to the practical and lo-gistical difficulties associated with studying seabirds(Tasker amp Reid 1997) Most data come from oppor-tunistic sampling and sparse non-systematic recordsof occurrence (eg Huettmann amp Diamond 2001)Sampling typically covers only a fraction of a speciesrsquorange (eg Hobbs et al 2003) and transects at sea canunderestimate seabird distribution and abundancedue to low detection rates and vast geographic ranges(Ostrand et al 1998) Traditional range maps are gen-erated subjectively on the basis of limited occurrencerecords and expert opinion (Cramp amp Simmons 1980del Hoyo et al 1992) and they do not provide quanti-tative information on the relative suitability of differ-ent areas Predictive modelling of seabird distributionshas been largely restricted to studies of waters within200 km of the coast (eg Yen et al 2004 Louzao et al2006 Oppel et al 2012) and nesting habitat (egOlivier amp Wotherspoon 2006) A few larger-scale stud-ies however have encompassed extensive areas ofpelagic waters such as the Southern Indian Ocean(Raymond amp Woehler 2003) and the Arctic Circle(Huett mann et al 2011)
The aims of the present study are to (1) predict RESand geographic range extent for 6 seabirds in theNorth Atlantic and (2) evaluate these models usingindependent point data Using published informationon speciesrsquo distributions foraging behaviour and lifehistories species were assigned to broad-scale nichecategories defined by environmental parametersknown to be key predictors of distribution We buildupon the approach developed by Kaschner et al(2006 2010) incorporating temporal variability inenvironmental variables and speciesminus habitat rela-tionships mdash pertinent to wide-ranging migratorymarine animals mdash into models Model performancewas evaluated using observation data collected byMARINElife in the English Channel and Bay of Bis-cay The approach is designed to inform our under-standing of seabird distributions and the develop-ment and evaluation of predictive habitat modelsrelevant to the at-sea distribution of seabirds
MATERIALS AND METHODS
Study species
RES modelling was applied to 6 species of seabirdsbelonging to the order Procellariiformes that are all
260
Watson et al Modelling seabird distributions and habitat suitability
abundant and widely distributed in the North At lan -tic during part or all of their annual life cycle north-ern fulmar Fulmarus glacialis (hereafter fulmar)Coryrsquos shearwater Calonectris diomedea greatshearwater Puffinus gravis sooty shearwater P gri -seus Manx shearwater P puffinus and Europeanstorm petrel Hydrobates pelagicus (hereafter stormpetrel) The selection of species was determined bythe availability of data concerning speciesminushabitatrelationships and the availability of test data formodel evaluation The fulmar is restricted to theNorthern Hemisphere during its breeding and non-breeding seasons and has a circumpolar distribution(del Hoyo et al 1992) Coryrsquos shearwater Manxshear water and storm petrel breed in the NorthAtlantic during the boreal summer dispersing intothe southern Atlantic during migration and the non-breeding season (del Hoyo et al 1992) Great shear-water and sooty shearwater breed in the SouthernHemisphere during the austral summer and disperseinto the Northern Hemisphere during their non-breeding season minus the boreal summer (del Hoyo et al1992)
Quantifying speciesrsquo ecological niches
Qualitative and quantitative data concerning speciesrsquo habitat preferences were gathered from anextensive range of primary and secondary literaturesources A total of 35 sources of literature informedthe quantification of speciesrsquo ecological niches(see Table S1 in Supplement 1 at wwwint-rescomarticlessupplm485p259_supppdf) Of these 26 rep-resented primary sources and 9 were secondarysources of literature Not all species were repre-sented equally in the literature with the number ofrelevant data sources ranging from 4 (Coryrsquos shear-water) to 17 (fulmar) There was high reliance on 8sources of literature (5 primary 3 secondary) for in -forming parameterisation of models These sourceshowever represent comprehensive pieces of litera-ture based on substantial quantities of data collectedover large temporal and spatial scales
This information was used to assign each species toan ecological niche defined by 4 ecogeographicalvariables (EGVs) depth sea-surface temperature(SST) chlorophyll a (chl a) concentration (indicatingphytoplankton biomass a proxy for ocean productiv-ity) and distance to land Most available data werequalitative and habitat categories were consequentlydeveloped to facilitate quantification of a speciesrsquoniche (Table 1) EGVs were selected on the basis of
wide evidence in the literature of their significance indetermining the distribution and abundance of sea-birds at sea (Schneider 1997 Huettmann amp Diamond2001 Oedekoven et al 2001 Louzao et al 2006Wakefield et al 2009) and the availability of environ-mental data at appropriate scales
Ecological niches were described by resourceselection functions (RSFs) describing the relativesuitability of an environment (Fig 1) While trueRSFs express the probability of use of a resource orarea by an organism (Boyce et al 2002) the RSFsapplied here express the relative likelihood of use ofan area predicting probability of presence requiresthe incorporation of reliable information on preva-lence (Elith et al 2006) After Kaschner et al (2006)it was assumed that the relative suitability of theenvironment is uniformly highest throughout a pre-ferred parameter range bounded by a minimum(MinP) and maximum (MaxP) value Outside of thispreferred range suitability was assumed to decrease
261
Variable Habitat category
Depth (m) (after Ross 1988)lt10 Coastal waters11minus200 Coastal waters to edge of continental
shelf201minus1000 Edge of continental shelf to upper
continental slope1001minus2000 Continental slope2001minus6000 Abyssal plains6001minus8000 Very deep waters
Sea-surface temperature (degC) (adapted from Sverdrup et al 1942 Ashmole 1971)
minus2minus5 Polar0minus10 Sub-polar5minus15 Cold temperate10minus20 Warm temperate15minus25 Subtropical25minus35 Tropical
Distance to land (km) (after Ashmole 1971)lt6 Inshore waters6minus50 Offshoregt50 Pelagic
Chlorophyll a (mg mminus3) (after Louzao et al 2006)lt01 Oligotrophic01minus029 Mesotrophic03minus1 Eutrophicgt1 Enriched waters
Table 1 Quantitative and qualitative definitions of habitatcategories in respect of 4 ecogeographical variables (depthsea-surface temperature distance to land and chlorophyll a
concentration) used to quantify speciesrsquo ecological niches
Mar Ecol Prog Ser 485 259ndash273 2013
linearly towards an absolute minimum (MinA) andmaximum (MaxA) being equal to 0 outside of thosethresholds
The availability of information concerning speciesrsquoassociations with chl a concentration was limited (seeTable S1) and largely restricted to qualitative state-ments such as lsquoaggregates in productive watersrsquo orlsquoattracted to frontsrsquo Procellariiformes occur in watersof all productivity but prefer eutrophic and enrichedwaters (Warham 1990 Louzao et al 2006 Hedd et al2012) Insufficient information was available at thespecies level to distinguish different relationshipsconsequently all species were assigned to identicalniches with respect to chl a concentration
Distinct niches were defined for a speciesrsquo breed-ing andor non-breeding season as opposed to char-acterising an annual average niche This accountedfor the variability in speciesminushabitat associations thatis a typical feature within the annual life cycle ofmigratory marine birds Breeding niches were quan-tified for fulmar Coryrsquos shearwater Manx shear -water and storm petrel and non-breeding nicheswere quantified for fulmar great shearwater andsooty shearwater in the North Atlantic The breedingniche (and subsequent modelled range) describesthe habitat associations of breeding adults whileoccupying nest sites the non-breeding niche is thatoccupied by non-breeding adults and the subse-quent modelled range comprises both lsquowinteringrsquoareas and migratory range Note that non-breedingbirds may be present within the non-breeding rangethroughout the year
Environmental data
The study area covered the North Atlanticbounded by the coordinates 680deg N 850deg W 00deg S120deg E A regular grid with the cell dimensions 025 times025deg was constructed in ArcGIS 92 (EnvironmentalSystems Research Institute) and displayed using theWGS-1984 coordinate system A landmask wasapplied using ArcWorld Supplementrsquos lsquocontinentsrsquolayer Bathymetric data were obtained from GEBCO(IOC et al 2003) providing elevation in 1 min(0016deg) intervals and interpolated using inverse dis-tance weighting at a scale of 025deg SST and chl adata were provided by the NERC Earth ObservationData Acquisition and Analysis Service SST datawere collected by the Advanced Very High Resolu-tion Radiometer (AVHRR) and have a resolution of4 km (0036deg) Chl a data were collected by the Sea-viewing Wide Field-of-view Sensor (SeaWiFS) andhave a resolution of 9 km (0081deg)
Seasonal averages were derived for dynamic pa-rameters (ie SST and chl a) from data collected be-tween 1995 and 2005 corresponding with the periodover which the test data were collected lsquoSummerrsquo(AprilminusSeptember) and lsquowinterrsquo (OctoberminusMarch) sea-sons were defined to correspond with speciesrsquo phe-nology lsquoSummerrsquo corresponds closely with the breed-ing season of fulmar Coryrsquos shearwater Manxshearwater and storm petrel and the non-breedingseason of great shearwater and sooty shearwaterwhich breed in the Southern Hemisphere lsquoWinterrsquocorresponds with the non-breeding season of fulmarSeasonal averages of SST and chl a were subsequentlyimported and averaged across grid cells within theraster using bilinear interpolation The shortest dis-tance to land was calculated for each grid cell usingthe Euclidean Distance function in ArcGIS
Model structure
An index of RES was derived for each grid celldepending on how the environmental attributes of acell corresponded with the parameters quantitativelydefining a speciesrsquo ecological niche After Kaschneret al (2006) RES was measured on a scale from 0 to1 and was based on a product of the suitability of theenvironment in relation to each individual EGVEach EGV was afforded equal weighting in modelsThe overall RES for each cell was calculated usingthe formula
RESoverall = RESdepth times RESSST times RESdistance times RESchl (1)
262
0
1
MinA MinP MaxP MaxA Rel
ativ
e en
viro
nmen
tal s
uita
bili
ty
Ecogeographical variable
Fig 1 Resource selection function describing a speciesrsquo eco-logical niche as a function of likelihood of relative environ-mental suitability throughout the range of an ecogeographi-cal variable MinA and MaxA absolute minimum andmaximum values MinP and MaxP preferred minimum and
maximum values of individual niche parameters
Watson et al Modelling seabird distributions and habitat suitability
The multiplicative approach means that if any onevariable within a cell fell outside of a speciesrsquo ab -solute range the overall suitability was equal to 0This is based on the assumption that an animal wouldnot be expected to occur within an environment thatis unsuitable in respect of one or more variables thatare key determinants of distribution RES valueswere imported into the GIS grid and displayed usinga continuous colour scale Model outputs delineate aspeciesrsquo predicted geographic range and illustratethe relative suitability of the environment (equatingto likelihood of occurrence) throughout that range
Observation data
MARINElife provided point data collected frommonthly seabird surveys carried out in the EnglishChannel and Bay of Biscay (Fig 2) between 1995 and2005 (though data from 2003 and 2004 were notavailable) Surveys were carried out aboard a com-mercial ferry liner within a restricted transect routeinvolving repeated sampling of grid cells A total of2696 h of observations collected across 156 gridcells provided data for the model evaluation Thedata set comprises a large number of observationsrepresenting a high diversity of species collectedover a decade and employing consistent methodol-ogy across space and time The sampling area coversa wide spectrum of environmental strata Observa-tions were binned within grid cells (025 times 025deg) tomatch the spatial resolution of environmental data
Cells were assigned a binary value of 1 or 0 indica-ting lsquopresencersquo and lsquobackgroundrsquo respectively
Species occurrence data typically exhibit spatialautocorrelation which arises when the probability ofoccurrence in one sampling unit is not independentof the probability of occurrence in neighbouringunits (Legendre 1993 Dormann et al 2007) If unac-counted for spatial autocorrelation can increase thefrequency of Type I errors (ie identifying a non- significant relationship as significant Dormann et al2007) We checked for spatial autocorrelation in spe-cies observation data and residuals of generalisedlinear models (with Poisson error structures) fitted todata on the number of observations as a function ofRES Clustering of observations may be driven byspatially autocorrelated environmental variables ifpredictors (here RES) explain most of the variation inspecies occurrences (ie a model is correctly speci-fied) there should be minimal spatial autocorrelationin the residuals (Dormann et al 2007 Elith amp Leath-wick 2009) We calculated Moranrsquos I values for the50 nearest neighbouring grid cells using the functionmorantest in the spdep package in R 2140 MoranrsquosI values range from minus1 (negative autocorrelation) to+1 (positive autocorrelation) with values around 0in di cative of a completely random spatial patternSmall positive values of Moranrsquos I were yielded fromspecies observation data (range 0004minus0254) andmodel residuals (range 0012minus0024) indicatingweak spatial clustering at the spatial scale of models(025 times 025deg) Analysis of correlograms showed nosignificant spatial autocorrelation in either observa-tions data or residuals and revealed irregular patchi-ness Subsequently we did not incorporate measuresto account for spatial autocorrelation into models
Model evaluation
Using independent point data collected byMARINE life in a subset of the model area (Fig 2) wetested the predictive performance of models usingReceiver Operating Characteristic (ROC) plots andcomparing the resulting area under the curve (AUC)against that of a null model (see Olden et al 2002Raes amp ter Steege 2007) ROC analyses offer a me -thod of assessing model accuracy that is threshold-independent by evaluating the proportion of cor-rectly and incorrectly classified predictions across acontinuous range of threshold values (Fielding amp Bell1997) The ROC plot is obtained by plotting sensitiv-ity (the true positive rate) as a function of 1-specificity(the false positive rate) at every possible threshold
263
Fig 2 Area where MARINElife conducted monthly seabirdsurveys between 1995 and 2005 in the English Channel andBay of Biscay Data collected served as independent obser-vation data for evaluation of relative environmental suitabil-ity (RES) models Grey squares delineate grid cells (025deg times
025deg) covered by sampling effort
Mar Ecol Prog Ser 485 259ndash273 2013
value The resulting AUC provides a measure of pre-dictive ability the higher the AUC the greater thepredictive accuracy of a model An AUC value of10 indicates a perfect model while a value of 05 isusually considered to be equivalent to performing nobetter than random (Fielding amp Bell 1997)
The use of null models has been demonstrated forimproving testing for statistical significance in AUCvalues (Raes amp ter Steege 2007) and addressing theissue of spatial sorting bias (Hijmans 2012) Spatialsorting bias can inflate AUC values of both empiricaland null models meaning an AUC of 05 might notnecessarily be indicative of random performance (Hijmans 2012) Predictions of RES models weretested by comparing the AUC value of actual modelsagainst a null distribution (a lsquonull modelrsquo) of AUC values derived from randomised data This testedwhether model predictive performance was signifi-cantly different from what would be expected bychance alone We generated a null distribution ofAUC values corresponding with each RES model byrandomly distributing the species observations (pre sence background) among the grid cells coveredby survey effort By generating random data onlyfrom the survey area we aim to minimise spatial sort-ing bias by ensuring that the null model only reflectsthe environmental conditions where sampling wascarried out (Hijmans 2012) The resulting ROC plotwas generated and the AUC was calculated using theROCR package in R 2140 This procedure was re-peated 10 000 times to generate a random frequencydistribution of AUC values that would be expected ifthe RES model did not perform better than expecteddue to chance If the AUC of the empirical model ex-ceeded the 95 quantile of the ranked AUC valuesof the corresponding null model the model was con-sidered to perform significantly better than chancewould dictate (Olden et al 2002) and the relationshipbetween RES and speciesrsquo presence can be consid-ered to be stronger than would be expected bychance We used 1-sided testing since it was only ofinterest whether models performed significantly better than expected by chance not whether theyperformed significantly worse The significance levelwas calculated as the proportion of random AUCsthat were equal to or greater than the observed AUC
The model evaluation has 2 main assumptions (1)there are sufficient records within the test data set toaccurately describe a speciesrsquo distribution within thesurvey area and (2) the range of possible RES valuesis represented within the survey area (ie there isheterogeneity of habitat suitability) To assess theseassumptions we calculated and considered the total
number of speciesrsquo observations number of lsquopres-encersquo cells and percentiles of the ranked RES valueswithin the survey area for each model
Model outputs were also visually compared withpublished range maps (del Hoyo et al 1992 Onley ampSchofield 2007) allowing detection of any large-scale geographical discrepancies in the predictionsof models While qualitative in nature this compari-son provides a useful additional evaluation of modelsat a much larger geographical scale than the morequantitative evaluation described above
RESULTS
Quantifying and modelling speciesrsquo ecological niches
Ecological niches of 6 seabird species mdash fulmarCoryrsquos shearwater great shearwater sooty shearwa-ter Manx shearwater and storm petrel mdash were quan-tified in relation to 4 EGVs mdash depth SST chl a con-centration and distance to land mdash and are describedin Table 2 The 6 species all occupy different eco -logical niches with varying degrees of overlapNiches were subsequently modelled using the RESapproach which resulted in a spatial visualisation ofniches into potential distributions (Fig 3) and illus-trated the relative suitability of the environmentthroughout ranges Manx shearwater and stormpetrel share similar niches during their concurrentbreeding seasons both species occur in cold temper-ate to subtropical waters (5minus25degC) and primarilyrange within a few hundred kilometres of land How-ever while the Manx shearwater prefers depths ofless than 200 m mdash from coastal waters to the edge ofthe continental shelf mdash the storm petrel prefersdeeper waters between 100 and 1000 m Breedingseabirds occur closer to land (all MinP = 0 km) thannon-breeding birds (MinP ranges from 6 to 50 km)
The fulmar occupies a similar niche in the breedingand non-breeding seasons the absolute minimumand maximum values of each EGV do not changebetween the 2 seasons but the preferred range of allenvironmental variables (except chl a) differs Duringthe non-breeding season the fulmarrsquos preferredniche encompasses cooler deeper waters furtherfrom land compared with when breeding Non-breeding great shearwater and sooty shearwateroccupy the widest niches with respect to SST span-ning a range of 37 and 30degC respectively The preferred niche of great shearwater extends furtheroffshore (lt2000 km) than that of sooty shearwaterwhich tends to range closer to land (lt200 km)
264
Watson et al Modelling seabird distributions and habitat suitability
Qualitative comparison with published range maps
From visual qualitative assessment it can be seenthat model outputs (Fig 3) illustrate variability inpredicted range extents of the 6 seabird species inthe North Atlantic Relative environmental suitabilityvaries throughout ranges reflecting niche segrega-tion between species Predicted range extents vary intotal surface area and geographical coverage Com-paring between species non-breeding birds (withthe exception of fulmar) occupy a larger range andlatitudinal extent than breeding birds
Predicted range extents closely corresponded withpublished distribution maps for all species Howeverall ranges comprised a wider extent than maps in theliterature A common discrepancy was the predictionof suitable habitat in enclosed seas when such areasare excluded from published ranges for several spe-cies for example the inclusion of the MediterraneanSea in model outputs for great shearwater and Manxshearwater the Caribbean Sea and Gulf of Mexicofor great shearwater and sooty shearwater and Hud-son Bay for great shearwater Elsewhere modelscaptured areas of known absence well for examplethe absence of breeding Manx shearwater from thewestern central Atlantic and Caribbean Sea theabsence of sooty shearwater from Hudson Bay andthe low habitat suitability in the central Atlantic forthe sooty shearwater
The model output for storm petrel predicted amuch wider range across the North Atlantic thanpublished range maps the latter define the speciesrsquorange as restricted to the northeast Atlantic extend-ing no further west than 30degW Areas of high environ-mental suitability were separated by a large area oflow RES in the central Atlantic Similarly a smallarea of suitable habitat was predicted for fulmar in
the north Mediterranean Sea but separated from thecore range by a large area of unsuitable habitat
Statistical model evaluation
RES models for 5 out of 6 species performed signifi-cantly better than expected by chance when testedwith independent observation data from the Bay ofBiscay (p lt 005 Table 3) The AUC of empirical mod-els was significantly higher than that of correspondingnull models revealing a significant relationship be-tween RES and species occurrences for 6 out of 7models In the case of 4 out of a total of 7 models lessthan 01 of random samples had a higher AUC thanthe actual model (p lt 0001) The model for sootyshearwater did not perform significantly better thanrandom (p = 0260) with 26 of random AUCs ex-ceeding the observed AUC While the model for greatshearwater performed significantly better than ex-pected by chance (p = 0041) the model AUC wasonly very slightly higher than the 95 quantile of theranked null AUC values indicating that the model didnot perform much better than random
The number of speciesrsquo encounters ranged from115 to 590 (mean 3531 plusmn 653 Table 4) The rangeand frequency distribution of habitat suitabilityacross the model evaluation area for each species isillustrated by percentiles of ranked RES values(Table 4) The distribution of RES in the survey areavaries between species and is strongly skewed mdashindicating reduced heterogeneity of habitat suita -bility mdash for 3 models fulmar (breeding) sooty shear -water and Manx shearwater The majority of habitatwithin the sampling area is of low suitability forbreeding fulmars but of homogenously high suitabil-ity for sooty and Manx shearwaters
265
Species Status Depth (m) SST (degC) Distance (m)MinA MinP MaxP MaxA MinA MinP MaxP MaxA MinA MinP Max P MaxA
Northern fulmar B 0 100 1000 8000 minus2 0 15 15 0 0 320 2364N 0 100 2000 8000 minus2 0 10 15 0 50 2364 2364
Coryrsquos shearwater B 0 100 1000 8000 10 20 20 25 0 0 200 2364Great shearwater N 0100 200 8000 minus2 0 20 35 0 6 2000 2364Sooty shearwater N 0 10 1000 8000 5 10 20 35 0 15 200 2364Manx shearwater B 0 10 200 8000 5 10 20 25 0 0 360 2364European storm petrel B 0 100 2000 8000 5 10 20 25 0 0 200 2364
Table 2 Quantitative descriptions of speciesrsquo ecological niches in respect of 4 ecogeographical variables depth sea-surfacetemperature (SST) distance to land and chlorophyll a (chl a) concentration Niches were defined for 6 procellariiform seabirdsduring the breeding andor non-breeding season MinA and MaxA absolute minimum and maximum values of the resourceselection function MinP and MaxP preferred minimum and maximum values (see Fig 1) Chl a (mg mminus3 identical for eachspecies and status) MinA MinP = 0 03 MaxP MaxA = 60 60 Status B = breeding N = non-breeding See Table S1 in
Supplement 1 (wwwint-rescomarticlessupplm485p259_supplpdf) for data sources
Mar Ecol Prog Ser 485 259ndash273 2013266
Fig 3 Model outputs illustrating predicted geographicrange and relative environmental suitability (RES) for 6procellariiform seabirds in the North Atlantic duringtheir breeding (yellowminusbrown) andor non-breedingseasons (blue) (A) northern fulmar Fulmarus glacialisbreeding (B) northern fulmar non-breeding (C) Coryrsquosshearwater Calonectris diomedea breeding (D) greatshearwater Puffinus gravis non-breeding (E) sootyshearwater P griseus non-breeding (F) Manx shear -water P puffinus breeding and (G) European stormpetrel Hydrobates pelagicus breeding Predicted RES ison a scale from 0 (least suitable white) to 1 (highly suit-
able dark)
Watson et al Modelling seabird distributions and habitat suitability
DISCUSSION
RES predictions
When compared with simulated random data RESmodels performed significantly better for 5 out of6 seabird species (and 6 out of 7 models) at predicting
relative likelihood of occurrence in a subset of thestudy area Model outputs provide more informationon speciesrsquo distributions than published range mapssince they provide indices of relative environmentalsuitability throughout a speciesrsquo range RES predic-tions represent simple testable hypotheses concern-ing a speciesrsquo potential niche in respect of a few envi-ronmental predictors Visualisation of hypotheses ina spatial context facilitates our understanding of speciesminushabitat relationships inference of areas ofpotentially high seabird abundance and identifica-tion of regions to be targeted for future research andconservation planning
Observed versus predicted distributions
RES modelling of the potential niche resulted inpredictions of occurrence outside of known (or ob -served) ranges for several species when comparedwith published range maps indicating that distribu-tions are influenced by additional biological andorphysical parameters besides those included in mod-els Indeed modelling of the realised niche mdash thepart of the potential niche that a species actuallyuses mdash requires the incorporation of biotic interac-tions (Soberoacuten amp Nakamura 2009) and physiologicalconstraints (Kearney amp Porter 2009) Qualitative com-parison of RES model outputs with observed distribu-tions thus allows the assessment of the importance ofother factors that may influence the at-sea distribu-tion of seabirds
Distributions of pelagic animals are ultimately con-strained by the abundance and distribution of prey(Pahl-Wostl 1997) but scales of association betweenmobile predators and prey are highly variable(Schneider amp Piatt 1986) and prey indices are consid-ered inappropriate for predicting global distributionsof many highly mobile marine organisms (Torres etal 2008) Karpouzi et al (2007) incorporated informa-tion on prey distributions in mapping at-sea foragingdistributions of seabirds however they found little orno information concerning the diet of many seabirdsand detected high spatial variability in associationsbetween seabirds and prey Habitat modelling istherefore largely reliant on predictor variables thatindirectly affect species distribution
Evidence from energetic and physiological studieshighlights the significance of wind speed (Furness ampBryant 1996) and area of available ocean extent (Da -vies et al 2010) in influencing the foraging behaviourand life-history strategies of procellariiform seabirdsThe Strait of Gibraltar (Friesen et al 2007) and the
267
Species AUCm AUCn p
Northern fulmarBreeding 0735 0568 lt0001Non-breeding 0774 0583 lt0001Coryrsquos shearwaterBreeding 0712 0580 lt0001Great shearwaterNon-breeding 0587 0583 0041Sooty shearwaterNon-breeding 0530 0575 0260Manx shearwaterBreeding 0614 0572 0004European storm petrelBreeding 0704 0582 lt0001
Table 3 Evaluation of predictive performance of relative en-vironmental suitability (RES) models A model was consid-ered to perform significantly better than chance if the areaunder the curve of the empirical model (AUCm) exceededthe 95 quantile of the ranked AUC values of a correspon-ding null model (AUCn) p-values indicate the proportion of
AUCn that were equal to or greater than AUCm
Species No of No of Percentiles of ranked records lsquopresencersquo RES in survey area
cells 10 50 90
Northern fulmarBreeding 590 71 00 00 10Non-breeding 248 45 012 036 056Coryrsquos shearwaterBreeding 527 51 015 043 062Great shearwaterNon-breeding 452 48 037 069 10Sooty shearwaterNon-breeding 115 46 055 10 10Manx shearwaterBreeding 245 60 050 10 10European storm petrelBreeding 295 46 045 086 10
Table 4 Summary of test data used for evaluating the pre-dictive performance of relative environmental suitability(RES) models Independent observation data were collectedfrom repeated sampling of 156 grid cells (025deg times 025deg) byMARINElife in the Bay of Biscay (Fig 2) The number of spe-cies records number of lsquopresencersquo cells and variation in RESwithin the model evaluation area (percentiles of ranked
RES) are presented
Mar Ecol Prog Ser 485 259ndash273 2013
Almeria-Oran Oceanographic Front (Goacutemez-Diacuteaz etal 2006) have both been proposed as barriers limit-ing dispersal of and genetic exchange between sea-birds in the Atlantic Ocean and the MediterraneanSea Such physical and geographical factors mayexplain why despite the prediction of suitable habitat the observed distributions of some species donot extend into enclosed seas eg the absence ofgreat shearwater from the Mediterranean Sea andHudson Bay
Biotic interactions may play a significant role indetermining distributions across smaller spatial andtemporal scales (Furness amp Birkhead 1984) and theirincorporation into SDMs is widely recognised as akey challenge in both terrestrial (Arauacutejo amp Guisan2006) and marine environments (Robinson et al2011) Shearwaters do not typically form mixed- species colonies (Warham 1990) suggesting thatinterspecific competition and niche segregation mayinfluence the breeding distributions of some procel-lariiform seabirds While the observed range of Manxshearwater does not extend into the MediterraneanSea the breeding ranges of the Balearic shearwaterPuffinus mauretanicus and the Yelkoaun shearwaterP yelkoauni which occupy similar ecological nichesto the Manx shearwater (and were until recentlyconsidered to be subspecies of Manx shearwaterSangster et al 2002) are restricted to the Mediter-ranean Sea (Onley amp Schofield 2007) A combinationof evolutionary history and biotic interactions mayexplain the reduced niche overlap that is observed(compared with predicted overlap) between these 3ecologically similar species Depending on the objec-tives it may be a more useful approach to applyniche modelling to a species complex when there areseveral closely related species
Despite their ability to traverse large sections ofocean many procellariiform seabirds show limiteddispersal (the lsquoseabird paradoxrsquo proposed by Milot etal 2008) Their philopatric habits are expected tolimit colonisation by long-distance dispersal and sub-sequent range expansion (Matthiopoulos et al 2005Brown et al 2010) Despite the prediction of highRES in the northwest Atlantic for the storm petrelhigh breeding-site fidelity and the large area of pre-dicted low habitat suitability in the central Atlanticmay explain why the speciesrsquo observed distribution(from published range maps) is restricted to thenortheast Atlantic (del Hoyo et al 1992) Addition-ally the niche is already filled by another pelagicseabird Leachrsquos petrel Oceanodroma leucorhoa inthe northwest Atlantic (del Hoyo et al 1992) In theinterpretation of RES model outputs consideration
should thus be afforded to a speciesrsquo evolutionaryhistory as well as areas of low RES separating areasof high RES both of which may act to restrict ranges
The availability of suitable nest sites is a funda-mental constraint on the current breeding distribu-tion of seabirds (Brown et al 2010) Procellariiformseabirds are largely restricted to remote islands freeof mammalian predators which are within range ofsuitable foraging areas (Warham 1990) If all occu-pied breeding colonies could be accurately identifiedand niche envelopes constrained by maximum forag-ing range from colonies models could yield moreaccurate predictions of range extent during thebreeding season However given the difficulties ofsurveying and monitoring remote locations ourknowledge of breeding sites is likely to be incom-plete particularly for less well-studied speciesRestricting distribution to within species-specific for-aging range of all land therefore represents a moreconservative approach
Where suitable habitat is predicted outside of cur-rent observed distributions this may indicate areasthat are used by a species but for which there are nodata or areas that could be suitable for colonisationFuture colonisation or range shifts could be driven bychanges in environmental suitability as a result ofnatural changes (eg Gaston amp Woo 2008) andoranthropogenic-induced changes such as by meansof active conservation management (Miskelly et al2009) By identifying areas of potentially suitable at-sea habitat the RES modelling approach may thusoffer insight into the effects of future changes in cli-mate and anthropogenic activities on speciesrsquo distri-butions Further model development could be basedon different scenarios for climate or nest-site avail-ability to generate predictions of future changes indistributions
Model evaluation
Statistical evaluation demonstrates that the genericapproach of RES modelling can accurately describehabitat suitability for wide-ranging seabirds RESpredictions were more strongly related to speciespresence for 6 out of 7 models than expected due tochance While qualitative assessment of the modeloutput for non-breeding sooty shearwater suggestedreasonable consistency with published distributiondata the model did not perform significantly betterthan a null model Poor model performance could beexplained by the low quality of data used for modelparameterisation (see Table S1) resulting in an inac-
268
Watson et al Modelling seabird distributions and habitat suitability
curate description of a speciesrsquo ecological niche It iswell established that speciesminusenvironment relation-ships can change with scale (Manly et al 2002) andthere is evidence for intraspecific spatial variation inspeciesminushabitat relationships in seabirds (Huettmannamp Diamond 2001) Most information on the at-seahabitat associations of the sooty shearwater comesfrom studies in the Pacific Ocean (Briggs amp Chu 1986Vermeer et al 1989 but see Hedd et al 2012) There-fore we cannot be certain of the spatial stability ofthe speciesrsquo niche across distinct ocean basins Theavailability and quality of ecological data may limitthe wider application of RES modelling to other spe-cies of seabird if insufficient data are available toaccurately quantify speciesrsquo ecological niches
Rigorous evaluation of models requires that the testdata set accurately reflects the distribution andoccurrence of a species within the evaluation areaThe test data comprised far fewer observations ofsooty shearwater than the other study species andthe sampling area was characterised by low variationin RES ie highly homogeneous habitat suitability(Table 4) However despite highly skewed distribu-tions of RES the models for fulmar (breeding) andManx shearwater showed highly significant predic-tive accuracy when compared to null models Thisindicates these models must be performing very wellif they can perform significantly better than randomeven under less favourable conditions for the evalua-tion Rigorous model evaluation relies on representa-tive observation data collected across broad spatialand temporal scales to compliment the macro-scalemodelling approach While lsquoregularrsquo and lsquoequal-stratifiedrsquo sampling strategies are the most accurateand robust (Hirzel amp Guisan 2002) these are not typ-ically features of opportunistically collected data mdashthe source of most at-sea seabird observations Theincreasing availability of large-scale point data (egOBIS GBIF) and range maps such as those availablethrough the IUCN Red List (wwwiucnredlistorg)presents opportunities for further testing of RESmodels However the availability of representativetest data may limit the application of RES modellingfor scarcer and under-recorded species
Biases in model parameters
A frequent obstacle encountered in predictive distribution modelling of marine animals is the lackof reliable and comprehensive occurrence datafrom which to define species-habitat relationships(Robinson et al 2011) The issue of environmental
bias mdash spatial andor temporal bias in collection ofoccurrence data mdash is widely recognised in speciesdis tribution modelling (Arauacutejo amp Guisan 2006Phillips et al 2009 Ready et al 2010) It mainly arisesfrom limitations in data accessibility and samplingstrategies preventing representative coverage of theentire environmental range of species (Phillips et al2009) The biases inherent to most observation datacan easily lead to incorrect interpretation of habitatpreferences of wide-ranging species (Hirzel ampGuisan 2002)
RES modelling provides a technique for predictinglarge-scale distributions which does not rely on pointdata The niche hypotheses underlying RES modelsstill ultimately depend on the quality and amount ofavailable ecological information Quantitative dataon the relationships between seabirds and oceanproductivity are lacking and large areas of theoceans remain under-studied eg the central At -lantic (but see Skov et al 1994) However the abilityfor RES modelling to incorporate a range of qualita-tive and quantitative data collected from differentparts of speciesrsquo ranges at different times of yearbroadens the scope of environmental coverage Con-sequently the outputs may represent more balancedand robust predictions for many marine animalsthan the more commonly used predictive modellingtechniques When previously tested against a rangeof marine taxa RES modelling was shown to performvery well compared with traditional presence-onlymodelling methods (Ready et al 2010)
Accounting for temporal variability
Temporal variability in ecological niches and envi-ronmental parameters is frequently overlooked inspecies distribution modelling (Dambach amp Roumldder2011) Previous applications of RES modelling tomarine top predators did not account for temporalvariability in speciesminushabitat relationships or EGVs(Kaschner et al 2006 Ready et al 2010) In this studywe have accounted for the seasonal shifts in habitatassociations that occur within the annual life cycle bydistinguishing between a speciesrsquo breeding and non-breeding niche and subsequently relating niches toseasonally averaged data for dynamic EGVsAccounting for temporal variation in both speciesminusenvironment relationships and dynamic environ-mental variables is expected to increase the reliabil-ity of RES predictions particularly in areas whereenvironmental conditions fluctuate greatly betweenseasons Consequently our seasonal RES predictions
269
Mar Ecol Prog Ser 485 259ndash273 2013
can provide greater insight into speciesrsquo behaviourand ecology than those based on an annual averageniche envelope
Applications and recommendations for future research
RES modelling could prove a valuable tool forinforming the development and implementation ofeffective conservation and management practices Inthe absence of comprehensive occurrence data forwide-ranging species RES models can identify criti-cally important areas and biodiversity hotspots inpelagic marine ecosystems This is of direct rele-vance to the development of quantifiable criteria forthe designation of marine Important Bird Areas(IBAs BirdLife International 2004) The modellingapproach could be used to direct observation effort toareas where under-recorded seabirds are predictedto occur and inform sampling strategies to incorpo-rate a range of environmental suitability Matchingdata on seabird distribution as revealed by RESmodel outputs with data on fishing effort couldinform the responsibilities of Regional FisheriesManagement Organisations (RFMOs) and the devel-opment of suitable monitoring and mitigation meas-ures to reduce negative interactions between sea-birds and fisheries (eg Le Corre et al 2012)
Application of RES modelling to a greater variety ofspecies demonstrating variable niche characteris-tics will allow further examination of the broad-scaleapplicability of the approach Expanding the RESapproach to wider geographic areas incorporatingall of a speciesrsquo range would offer greater insightinto understanding distribution dispersal and migra-tory behaviour An iterative approach to the develop-ment of models (as recommended by Elith et al 2006)will improve the robustness of predictions by consid-ering the effects of a wider range of predictor vari-ables on model performance Additional factors thathave been shown to influence the at-sea distributionof seabirds and could be incorporated into futuremodels include sea-surface salinity (eg Huettmannamp Diamond 2001) horizontal (eg Louzao et al 2009)and vertical gradients in SST (eg Spear et al 2001)and fishing effort (eg Karpouzi et al 2007)
Wider application of RES modelling requires simultaneous developments in at-sea sampling andlarge-scale studies of speciesminushabitat relationshipswhich inform one another and offer direction forfuture research The increasing use of trackingdevices for recording movements of seabirds pro-
vides opportunities for quantification of habitat useand preference (Wakefield et al 2009 Le Corre et al2012) Increasing the public availability of trackingdata will facilitate further development of SDMs(Skov et al 2008) Further studies are required toimprove quantitative understanding of speciesminushabi-tat relationships across a variety of spatio-temporalscales and integration of data across scales is neces-sary to enhance the predictive ability of RES modelsHaving demonstrated RES is a robust modellingapproach predictions could be improved by the useof ensemble model averaging (Arauacutejo amp New 2007)
CONCLUSIONS
Based on quantitative definitions of speciesrsquo eco-logical requirements RES maps offer a robust alter-native to subjectively generated traditional rangemaps We have shown that RES modelling can ade-quately describe habitat suitability across largescales for wide-ranging pelagic seabirds RES model-ling presents a generic and objective approach forpredicting distributions of wide-ranging marine ani-mals across large spatial scales when the absence ofrepresentative point data precludes the applicationof traditional modelling techniques Model outputsrepresent an alternative to the conventional and sub-jective approach of delineating range extents basedon limited records of occurrence The approach isbased on clear assumptions concerning speciesrsquohabitat preferences which can be easily modifiedand tested
RES predictions are limited by the extent of pub-lished data and the subsequent ability to accuratelyquantify speciesrsquo ecological niches While some gapsin the literature are evident the synthesis of knowl-edge concerning speciesminushabitat relationships canadequately describe ecological niches for the pur-poses of building predictive distribution models Thisoffers a more robust approach for answering broad-scale questions about speciesrsquo distributions thanderiving niches from limited and biased samplingdata Of greater significance is the limited availabil-ity of representative at-sea observations data to rig-orously evaluate models which may prove to be thekey limiting factor in the wider application of RESmodelling for wide-ranging marine animals
Acknowledgements Thanks to the NERC Earth Observa-tion Data Acquisition and Analysis Service (NEODAAS) forsupplying data for this study MARINElifersquos contribution tothis research was part-funded by the EU as part of the Chan-
270
Watson et al Modelling seabird distributions and habitat suitability
nel Integrated Approach for Marine Resource Management(CHARM) Phase 3 project We thank MARINElife volun-teers for collection of observation data and PampO Ferries forsponsoring surveys aboard the lsquoPride of Bilbaorsquo
LITERATURE CITED
Airameacute S Dugan JE Lafferty KD Leslie H McArdle DAWarner RR (2003) Applying ecological criteria to marinereserve design a case study from the California ChannelIslands Ecol Appl 13 170minus184
Arauacutejo MB Guisan A (2006) Five (or so) challenges for spe-cies distribution modelling J Biogeogr 33 1677minus1688
Arauacutejo MB New M (2007) Ensemble forecasting of speciesdistributions Trends Ecol Evol 22 42minus47
Ashmole N (1971) Sea bird ecology and the marine environ-ment In Farner DS King JR (eds) Avian biology Vol 1Academic Press New York NY p 223minus286
BirdLife International (2004) Tracking ocean wanderers the global distribution of albatrosses and petrels Resultsfrom the Global Procellariiform Tracking Workshop1minus5 September 2003 Gordonrsquos Bay South Africa BirdlifeInternational Cambridge
Boyce MS Vernier PR Nielsen SE Schmiegelow FKA(2002) Evaluating resource selection functions EcolModel 157 281minus300
Briggs KT Chu EW (1986) Sooty shearwaters off California distribution abundance and habitat use Condor 88 355minus364
Brown RM Nichols RA Faulkes CG Jones CG and others(2010) Range expansion and hybridization in RoundIsland petrels (Pterodroma spp) evidence from micro -satellite genotypes Mol Ecol 19 3157minus3170
Cramp S Simmons K (1980) Handbook of the birds ofEurope the Middle East and north Africa The birds ofthe western Palearctic Vol 1 Ostrich to ducks OxfordUniversity Press Oxford
Dambach J Roumldder D (2011) Applications and future chal-lenges in marine species distribution modeling AquatConserv 21 92minus100
Davies RG Irlich UM Chown SL Gaston KJ (2010) Ambi-ent productive and wind energy and ocean extent pre-dict global species richness of procellariiform seabirdsGlob Ecol Biogeogr 19 98minus110
del Hoyo J Elliott A Sargatal J (1992) Handbook of thebirds of the world Vol 1 Ostrich to ducks Lynx EdicionsBarcelona
Dormann CF McPherson JM Arauacutejo MB Bivand R and oth-ers (2007) Methods to account for spatial autocorrelationin the analysis of species distributional data a reviewEcography 30 609minus628
Elith J Leathwick JR (2009) Species distribution models ecological explanation and prediction across space andtime Annu Rev Ecol Evol Syst 40 677minus697
Elith J Graham H Anderson P Dudiacutek M and others (2006)Novel methods improve prediction of species distribu-tions from occurrence data Ecography 29 129minus151
Fielding AH Bell JF (1997) A review of methods for theassessment of prediction errors in conservation pres-enceabsence models Environ Conserv 24 38minus49
Friesen VL Burg TM McCoy KD (2007) Mechanisms ofpopulation differentiation in seabirds Mol Ecol 16 1765minus1785
Furness RW Birkhead TR (1984) Seabird colony distribu-
tions suggest competition for food supplies during thebreeding-season Nature 311 655minus656
Furness RW Bryant DM (1996) Effect of wind on field meta-bolic rates of breeding northern fulmars Ecology 77 1181minus1188
Gaston AJ Woo K (2008) Razorbills (Alca torda) follow sub-arctic prey into the Canadian Arctic colonization resultsfrom climate change Auk 125 939minus942
Goacutemez-Diacuteaz E Gonzaacutelez-Soliacutes J Peinado MA Page RDM(2006) Phylogeography of the Calonectris shearwatersusing molecular and morphometric data Mol PhylogenetEvol 41 322minus332
Gregr EJ Trites AW (2008) A novel presence-only validationtechnique for improved Steller sea lion Eumetopias juba-tus critical habitat descriptions Mar Ecol Prog Ser 365 247minus261
Guinotte JM Bartley JD Iqbal A Fautin DG BuddemeierRW (2006) Modeling habitat distribution from organismoccurrences and environmental data case study usinganemonefishes and their sea anemone hosts Mar EcolProg Ser 316 269minus283
Guisan A Zimmermann NE (2000) Predictive habitat distri-bution models in ecology Ecol Model 135 147minus186
Guisan A Edwards TC Hastie T (2002) Generalized linearand generalized additive models in studies of speciesdistributions setting the scene Ecol Model 157 89minus100
Hardy SM Lindgren M Konakanchi H Huettmann F (2011)Predicting the distribution and ecological niche of unex-ploited snow crab (Chionoecetes opilio) populations inAlaskan waters a first open-access ensemble modelIntegr Comp Biol 51 608minus622
Hedd A Montevecchi WA Otley H Phillips RA Fifield DA(2012) Trans-equatorial migration and habitat use bysooty shearwaters Puffinus griseus from the SouthAtlantic during the nonbreeding season Mar Ecol ProgSer 449 277minus290
Hijmans RJ (2012) Cross-validation of species distributionmodels removing spatial sorting bias and calibrationwith a null model Ecology 93 679minus688
Hirzel AH Guisan A (2002) Which is the optimal samplingstrategy for habitat suitability modelling Ecol Model157 331minus341
Hobbs M Brereton T Weir C Williams A (2003) Baselinemonitoring data on Procellariformes [Procellariiformes](shearwaters) in the Bay of Biscay Ornis Hungarica12ndash13 115minus125
Huettmann F Diamond AW (2001) Seabird colony locationsand environmental determination of seabird distribution a spatially explicit breeding seabird model for the North-west Atlantic Ecol Model 141 261minus298
Huettmann F Artukhin Y Gilg O Humphries G (2011) Pre-dictions of 27 Arctic pelagic seabird distributions usingpublic environmental variables assessed with colonydata a first digital IPY and GBIF open access synthesisplatform Mar Biodivers 41 141minus179
Intergovernmental Oceanographic Commission (IOC) Inter -national Hydrographic Organization (IHO) and BritishOceanographic Data Centre (BODC) (2003) Centenaryedition of the GEBCO Digital Atlas published on CD-ROM on behalf of the Intergovernmental OceanographicCommission and the International Hydrographic Organi-zation as part of the General Bathymetric Chart of theOceans BODC Liverpool
Karpouzi VS Watson R Pauly D (2007) Modelling and map-ping resource overlap between seabirds and fisheries on
271
Mar Ecol Prog Ser 485 259ndash273 2013
a global scale a preliminary assessment Mar Ecol ProgSer 343 87minus99
Kaschner K Watson R Trites AW Pauly D (2006) Mappingworld-wide distributions of marine mammal speciesusing a relative environmental suitability (RES) modelMar Ecol Prog Ser 316 285minus310
Kaschner K Tittensor DP Ready J Gerrodette T Worm B(2010) Current and future patterns of global marinemammal biodiversity PLoS ONE 6 e19653
Kearney M Porter W (2009) Mechanistic niche modelling combining physiological and spatial data to predict spe-ciesrsquo ranges Ecol Lett 12 334minus350
Le Corre M Jaeger A Pinet P Kappes MA and others (2012)Tracking seabirds to identify potential Marine ProtectedAreas in the tropical western Indian Ocean Biol Conserv156 83minus93
Legendre P (1993) Spatial autocorrelation trouble or newparadigm Ecology 74 1659minus1673
Louzao M Hyrenbach KD Arcos JM Abelloacute P De Sola LGOro D (2006) Oceanographic habitat of an endangeredMediterranean procellariiform implications for marineprotected areas Ecol Appl 16 1683minus1695
Louzao M Beacutecares J Rodriacuteguez B Hyrenbach KD Ruiz AArcos JM (2009) Combining vessel-based surveys andtracking data to identify key marine areas for seabirdsMar Ecol Prog Ser 391 183minus197
Manly BF McDonald LL Thomas DL McDonald TL Erick-son WP (2002) Resource selection by animals statisticaldesign and analysis for field studies Springer New YorkNY
Matthiopoulos J Harwood J Thomas L (2005) Metapopula-tion consequences of site fidelity for colonially breedingmammals and birds J Anim Ecol 74 716minus727
Maxwell DL Stelzenmuumlller V Eastwood PD Rogers SI(2009) Modelling the spatial distribution of plaice (Pleu-ronectes platessa) sole (Solea solea) and thornback ray(Raja clavata) in UK waters for marine management andplanning J Sea Res 61 258minus267
Milot E Weimerskirch H Bernatchez L (2008) The seabirdparadox dispersal genetic structure and populationdynamics in a highly mobile but philopatric albatrossspecies Mol Ecol 17 1658minus1673
Miskelly CM Taylor GA Gummer H Williams R (2009)Translocations of eight species of burrow-nesting sea-birds (genera Pterodroma Pelecanoides Pachyptila andPuffinus Family Procellariidae) Biol Conserv 142 1965minus1980
Nur N Jahncke J Herzog MP Howar J and others (2011)Where the wild things are predicting hotspots of seabirdaggregations in the California Current System EcolAppl 21 2241minus2257
Oedekoven CS Ainley DG Spear LB (2001) Variable res -ponses of seabirds to change in marine climate Califor-nia Current 1985ndash1994 Mar Ecol Prog Ser 212 265minus281
Olden JD Jackson DA Peres-Neto PR (2002) Predictivemodels of fish species distributions a note on proper val-idation and chance predictions Trans Am Fish Soc 131 329minus336
Olivier F Wotherspoon SJ (2006) Modelling habitat selec-tion using presence-only data case study of a colonialhollow nesting bird the snow petrel Ecol Model 195 187minus204
Onley D Schofield P (2007) Field guide to the albatrossespetrels and shearwaters of the world Christopher HelmLondon
Oppel S Meirinho A Ramiacuterez I Gardner B OrsquoConnell AFMiller PI Louzao M (2012) Comparison of five modellingtechniques to predict the spatial distribution and abun-dance of seabirds Biol Conserv 156 94minus104
Ostrand WD Drew GS Suryan RM McDonald LL (1998)Evaluation of radio-tracking and strip transect methodsfor determining foraging ranges of black-legged kitti-wakes Condor 100 709minus718
Pahl-Wostl C (1997) Dynamic structure of a food web model comparison with a food chain model Ecol Model 100 103minus123
Phillips SJ Dudiacutek M Elith J Graham CH Lehmann ALeathwick J Ferrier S (2009) Sample selection bias andpresence-only distribution models implications for back-ground and pseudo-absence data Ecol Appl 19 181minus197
Raes N ter Steege H (2007) A null-model for significancetesting of presence-only species distribution modelsEcography 30 727minus736
Raymond B Woehler EJ (2003) Predicting seabirds at sea inthe Southern Indian Ocean Mar Ecol Prog Ser 263 275minus285
Ready J Kaschner K South AB Eastwood PD and others(2010) Predicting the distributions of marine organismsat the global scale Ecol Model 221 467minus478
Redfern JV Ferguson MC Becker EA Hyrenbach KD andothers (2006) Techniques for cetaceanminushabitat modelingMar Ecol Prog Ser 310 271minus295
Robinson LM Elith J Hobday AJ Pearson RG Kendall BEPossingham HP Richardson AJ (2011) Pushing the limitsin marine species distribution modelling lessons fromthe land present challenges and opportunities Glob EcolBiogeogr 20 789minus802
Ross DA (1988) An introduction to oceanography PrenticeHall Englewood Cliffs NJ
Sangster G Knox AG Helbig AJ Parkin DT (2002) Taxo-nomic recommendations for European birds Ibis 144 153minus159
Schneider DC (1997) Habitat selection by marine birds inrelation to water depth Ibis 139 175minus178
Schneider DC Piatt JF (1986) Scale-dependent correlationof seabirds with schooling fish in a coastal ecosystemMar Ecol Prog Ser 32 237minus246
Skov H Durinck J Danielsen F Bloch D (1994) The summerdistribution of Procellariiformes in the central NorthAtlantic Ocean Vogelwarte 37 270minus289
Skov H Humphreys E Garthe S Geitner K and others(2008) Application of habitat suitability modelling totracking data of marine animals as a means of analyzingtheir feeding habitats Ecol Model 212 504minus512
Soberoacuten J Nakamura M (2009) Niches and distributionalareas concepts methods and assumptions Proc NatlAcad Sci USA 106 19644minus19650
Spear LB Ballance LT Ainley DG (2001) Response of sea-birds to thermal boundaries in the tropical Pacific thethermocline versus the Equatorial Front Mar Ecol ProgSer 219 275minus289
Sverdrup H Johnston MW Fleming RH (1942) The oceans their physics chemistry and general biology PrenticeHall New York NY
Tasker ML Reid JB (1997) Seabirds in the marine environ-ment mdash introduction ICES J Mar Sci 54 505minus506
Torres LG Read AJ Halpin P (2008) Fine-scale habitat modeling of a top marine predator Do prey data improvepredictive capacity Ecol Appl 18 1702minus1717
Vermeer K Morgan KH Smith GEJ Hay R (1989) Fall distri-
272
Watson et al Modelling seabird distributions and habitat suitability 273
bution of pelagic birds over the shelf off SW VancouverIsland Colon Waterbirds 12 207minus214
Wakefield ED Phillips RA Matthiopoulos J (2009) Quantify-ing habitat use and preferences of pelagic seabirds usingindividual movement data a review Mar Ecol Prog Ser391 165minus182
Warham J (1990) The petrels their ecology and breedingsystems Academic Press New York NY
Yen PPW Huettmann F Cooke F (2004) A large-scale modelfor the at-sea distribution and abundance of marbledmurrelets (Brachyramphus marmoratus) during the bree -ding season in coastal British Columbia Canada EcolModel 171 395minus413
Zimmermann NE Edwards TC Graham CH Pearman PBSvenning JC (2010) New trends in species distributionmodelling Ecography 33 985minus989
Editorial responsibility Rory Wilson Swansea UK
Submitted June 7 2012 Accepted March 7 2013Proofs received from author(s) June 11 2013
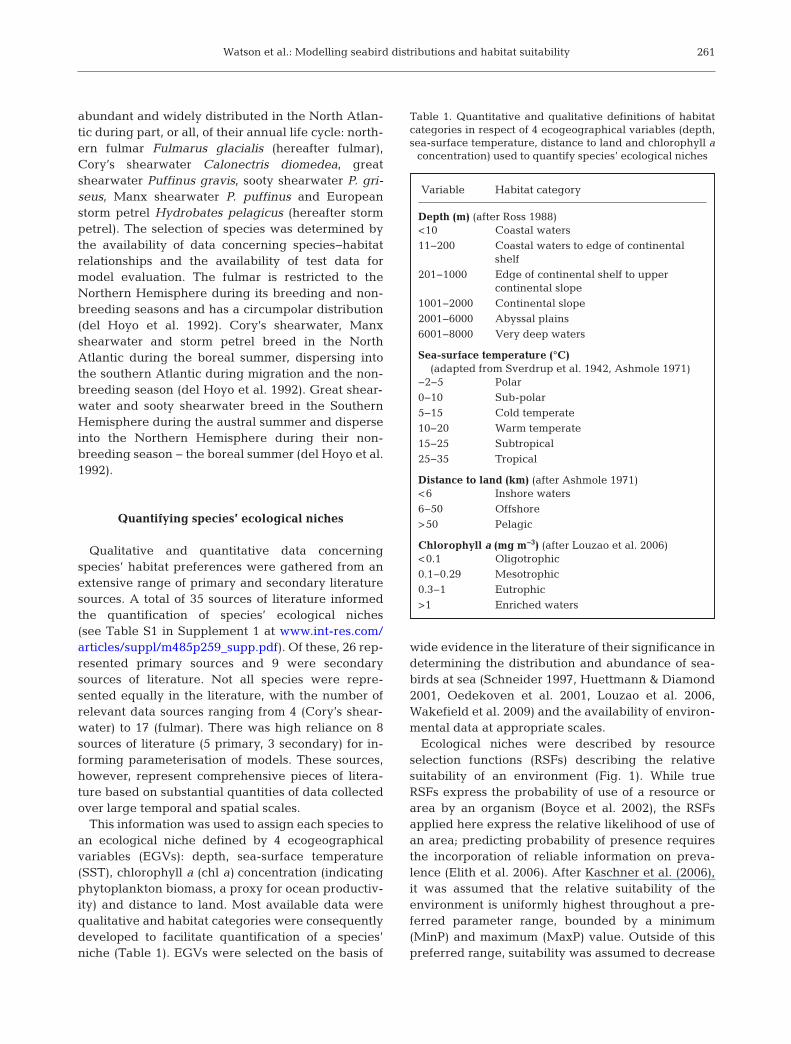
Watson et al Modelling seabird distributions and habitat suitability
abundant and widely distributed in the North At lan -tic during part or all of their annual life cycle north-ern fulmar Fulmarus glacialis (hereafter fulmar)Coryrsquos shearwater Calonectris diomedea greatshearwater Puffinus gravis sooty shearwater P gri -seus Manx shearwater P puffinus and Europeanstorm petrel Hydrobates pelagicus (hereafter stormpetrel) The selection of species was determined bythe availability of data concerning speciesminushabitatrelationships and the availability of test data formodel evaluation The fulmar is restricted to theNorthern Hemisphere during its breeding and non-breeding seasons and has a circumpolar distribution(del Hoyo et al 1992) Coryrsquos shearwater Manxshear water and storm petrel breed in the NorthAtlantic during the boreal summer dispersing intothe southern Atlantic during migration and the non-breeding season (del Hoyo et al 1992) Great shear-water and sooty shearwater breed in the SouthernHemisphere during the austral summer and disperseinto the Northern Hemisphere during their non-breeding season minus the boreal summer (del Hoyo et al1992)
Quantifying speciesrsquo ecological niches
Qualitative and quantitative data concerning speciesrsquo habitat preferences were gathered from anextensive range of primary and secondary literaturesources A total of 35 sources of literature informedthe quantification of speciesrsquo ecological niches(see Table S1 in Supplement 1 at wwwint-rescomarticlessupplm485p259_supppdf) Of these 26 rep-resented primary sources and 9 were secondarysources of literature Not all species were repre-sented equally in the literature with the number ofrelevant data sources ranging from 4 (Coryrsquos shear-water) to 17 (fulmar) There was high reliance on 8sources of literature (5 primary 3 secondary) for in -forming parameterisation of models These sourceshowever represent comprehensive pieces of litera-ture based on substantial quantities of data collectedover large temporal and spatial scales
This information was used to assign each species toan ecological niche defined by 4 ecogeographicalvariables (EGVs) depth sea-surface temperature(SST) chlorophyll a (chl a) concentration (indicatingphytoplankton biomass a proxy for ocean productiv-ity) and distance to land Most available data werequalitative and habitat categories were consequentlydeveloped to facilitate quantification of a speciesrsquoniche (Table 1) EGVs were selected on the basis of
wide evidence in the literature of their significance indetermining the distribution and abundance of sea-birds at sea (Schneider 1997 Huettmann amp Diamond2001 Oedekoven et al 2001 Louzao et al 2006Wakefield et al 2009) and the availability of environ-mental data at appropriate scales
Ecological niches were described by resourceselection functions (RSFs) describing the relativesuitability of an environment (Fig 1) While trueRSFs express the probability of use of a resource orarea by an organism (Boyce et al 2002) the RSFsapplied here express the relative likelihood of use ofan area predicting probability of presence requiresthe incorporation of reliable information on preva-lence (Elith et al 2006) After Kaschner et al (2006)it was assumed that the relative suitability of theenvironment is uniformly highest throughout a pre-ferred parameter range bounded by a minimum(MinP) and maximum (MaxP) value Outside of thispreferred range suitability was assumed to decrease
261
Variable Habitat category
Depth (m) (after Ross 1988)lt10 Coastal waters11minus200 Coastal waters to edge of continental
shelf201minus1000 Edge of continental shelf to upper
continental slope1001minus2000 Continental slope2001minus6000 Abyssal plains6001minus8000 Very deep waters
Sea-surface temperature (degC) (adapted from Sverdrup et al 1942 Ashmole 1971)
minus2minus5 Polar0minus10 Sub-polar5minus15 Cold temperate10minus20 Warm temperate15minus25 Subtropical25minus35 Tropical
Distance to land (km) (after Ashmole 1971)lt6 Inshore waters6minus50 Offshoregt50 Pelagic
Chlorophyll a (mg mminus3) (after Louzao et al 2006)lt01 Oligotrophic01minus029 Mesotrophic03minus1 Eutrophicgt1 Enriched waters
Table 1 Quantitative and qualitative definitions of habitatcategories in respect of 4 ecogeographical variables (depthsea-surface temperature distance to land and chlorophyll a
concentration) used to quantify speciesrsquo ecological niches
Mar Ecol Prog Ser 485 259ndash273 2013
linearly towards an absolute minimum (MinA) andmaximum (MaxA) being equal to 0 outside of thosethresholds
The availability of information concerning speciesrsquoassociations with chl a concentration was limited (seeTable S1) and largely restricted to qualitative state-ments such as lsquoaggregates in productive watersrsquo orlsquoattracted to frontsrsquo Procellariiformes occur in watersof all productivity but prefer eutrophic and enrichedwaters (Warham 1990 Louzao et al 2006 Hedd et al2012) Insufficient information was available at thespecies level to distinguish different relationshipsconsequently all species were assigned to identicalniches with respect to chl a concentration
Distinct niches were defined for a speciesrsquo breed-ing andor non-breeding season as opposed to char-acterising an annual average niche This accountedfor the variability in speciesminushabitat associations thatis a typical feature within the annual life cycle ofmigratory marine birds Breeding niches were quan-tified for fulmar Coryrsquos shearwater Manx shear -water and storm petrel and non-breeding nicheswere quantified for fulmar great shearwater andsooty shearwater in the North Atlantic The breedingniche (and subsequent modelled range) describesthe habitat associations of breeding adults whileoccupying nest sites the non-breeding niche is thatoccupied by non-breeding adults and the subse-quent modelled range comprises both lsquowinteringrsquoareas and migratory range Note that non-breedingbirds may be present within the non-breeding rangethroughout the year
Environmental data
The study area covered the North Atlanticbounded by the coordinates 680deg N 850deg W 00deg S120deg E A regular grid with the cell dimensions 025 times025deg was constructed in ArcGIS 92 (EnvironmentalSystems Research Institute) and displayed using theWGS-1984 coordinate system A landmask wasapplied using ArcWorld Supplementrsquos lsquocontinentsrsquolayer Bathymetric data were obtained from GEBCO(IOC et al 2003) providing elevation in 1 min(0016deg) intervals and interpolated using inverse dis-tance weighting at a scale of 025deg SST and chl adata were provided by the NERC Earth ObservationData Acquisition and Analysis Service SST datawere collected by the Advanced Very High Resolu-tion Radiometer (AVHRR) and have a resolution of4 km (0036deg) Chl a data were collected by the Sea-viewing Wide Field-of-view Sensor (SeaWiFS) andhave a resolution of 9 km (0081deg)
Seasonal averages were derived for dynamic pa-rameters (ie SST and chl a) from data collected be-tween 1995 and 2005 corresponding with the periodover which the test data were collected lsquoSummerrsquo(AprilminusSeptember) and lsquowinterrsquo (OctoberminusMarch) sea-sons were defined to correspond with speciesrsquo phe-nology lsquoSummerrsquo corresponds closely with the breed-ing season of fulmar Coryrsquos shearwater Manxshearwater and storm petrel and the non-breedingseason of great shearwater and sooty shearwaterwhich breed in the Southern Hemisphere lsquoWinterrsquocorresponds with the non-breeding season of fulmarSeasonal averages of SST and chl a were subsequentlyimported and averaged across grid cells within theraster using bilinear interpolation The shortest dis-tance to land was calculated for each grid cell usingthe Euclidean Distance function in ArcGIS
Model structure
An index of RES was derived for each grid celldepending on how the environmental attributes of acell corresponded with the parameters quantitativelydefining a speciesrsquo ecological niche After Kaschneret al (2006) RES was measured on a scale from 0 to1 and was based on a product of the suitability of theenvironment in relation to each individual EGVEach EGV was afforded equal weighting in modelsThe overall RES for each cell was calculated usingthe formula
RESoverall = RESdepth times RESSST times RESdistance times RESchl (1)
262
0
1
MinA MinP MaxP MaxA Rel
ativ
e en
viro
nmen
tal s
uita
bili
ty
Ecogeographical variable
Fig 1 Resource selection function describing a speciesrsquo eco-logical niche as a function of likelihood of relative environ-mental suitability throughout the range of an ecogeographi-cal variable MinA and MaxA absolute minimum andmaximum values MinP and MaxP preferred minimum and
maximum values of individual niche parameters
Watson et al Modelling seabird distributions and habitat suitability
The multiplicative approach means that if any onevariable within a cell fell outside of a speciesrsquo ab -solute range the overall suitability was equal to 0This is based on the assumption that an animal wouldnot be expected to occur within an environment thatis unsuitable in respect of one or more variables thatare key determinants of distribution RES valueswere imported into the GIS grid and displayed usinga continuous colour scale Model outputs delineate aspeciesrsquo predicted geographic range and illustratethe relative suitability of the environment (equatingto likelihood of occurrence) throughout that range
Observation data
MARINElife provided point data collected frommonthly seabird surveys carried out in the EnglishChannel and Bay of Biscay (Fig 2) between 1995 and2005 (though data from 2003 and 2004 were notavailable) Surveys were carried out aboard a com-mercial ferry liner within a restricted transect routeinvolving repeated sampling of grid cells A total of2696 h of observations collected across 156 gridcells provided data for the model evaluation Thedata set comprises a large number of observationsrepresenting a high diversity of species collectedover a decade and employing consistent methodol-ogy across space and time The sampling area coversa wide spectrum of environmental strata Observa-tions were binned within grid cells (025 times 025deg) tomatch the spatial resolution of environmental data
Cells were assigned a binary value of 1 or 0 indica-ting lsquopresencersquo and lsquobackgroundrsquo respectively
Species occurrence data typically exhibit spatialautocorrelation which arises when the probability ofoccurrence in one sampling unit is not independentof the probability of occurrence in neighbouringunits (Legendre 1993 Dormann et al 2007) If unac-counted for spatial autocorrelation can increase thefrequency of Type I errors (ie identifying a non- significant relationship as significant Dormann et al2007) We checked for spatial autocorrelation in spe-cies observation data and residuals of generalisedlinear models (with Poisson error structures) fitted todata on the number of observations as a function ofRES Clustering of observations may be driven byspatially autocorrelated environmental variables ifpredictors (here RES) explain most of the variation inspecies occurrences (ie a model is correctly speci-fied) there should be minimal spatial autocorrelationin the residuals (Dormann et al 2007 Elith amp Leath-wick 2009) We calculated Moranrsquos I values for the50 nearest neighbouring grid cells using the functionmorantest in the spdep package in R 2140 MoranrsquosI values range from minus1 (negative autocorrelation) to+1 (positive autocorrelation) with values around 0in di cative of a completely random spatial patternSmall positive values of Moranrsquos I were yielded fromspecies observation data (range 0004minus0254) andmodel residuals (range 0012minus0024) indicatingweak spatial clustering at the spatial scale of models(025 times 025deg) Analysis of correlograms showed nosignificant spatial autocorrelation in either observa-tions data or residuals and revealed irregular patchi-ness Subsequently we did not incorporate measuresto account for spatial autocorrelation into models
Model evaluation
Using independent point data collected byMARINE life in a subset of the model area (Fig 2) wetested the predictive performance of models usingReceiver Operating Characteristic (ROC) plots andcomparing the resulting area under the curve (AUC)against that of a null model (see Olden et al 2002Raes amp ter Steege 2007) ROC analyses offer a me -thod of assessing model accuracy that is threshold-independent by evaluating the proportion of cor-rectly and incorrectly classified predictions across acontinuous range of threshold values (Fielding amp Bell1997) The ROC plot is obtained by plotting sensitiv-ity (the true positive rate) as a function of 1-specificity(the false positive rate) at every possible threshold
263
Fig 2 Area where MARINElife conducted monthly seabirdsurveys between 1995 and 2005 in the English Channel andBay of Biscay Data collected served as independent obser-vation data for evaluation of relative environmental suitabil-ity (RES) models Grey squares delineate grid cells (025deg times
025deg) covered by sampling effort
Mar Ecol Prog Ser 485 259ndash273 2013
value The resulting AUC provides a measure of pre-dictive ability the higher the AUC the greater thepredictive accuracy of a model An AUC value of10 indicates a perfect model while a value of 05 isusually considered to be equivalent to performing nobetter than random (Fielding amp Bell 1997)
The use of null models has been demonstrated forimproving testing for statistical significance in AUCvalues (Raes amp ter Steege 2007) and addressing theissue of spatial sorting bias (Hijmans 2012) Spatialsorting bias can inflate AUC values of both empiricaland null models meaning an AUC of 05 might notnecessarily be indicative of random performance (Hijmans 2012) Predictions of RES models weretested by comparing the AUC value of actual modelsagainst a null distribution (a lsquonull modelrsquo) of AUC values derived from randomised data This testedwhether model predictive performance was signifi-cantly different from what would be expected bychance alone We generated a null distribution ofAUC values corresponding with each RES model byrandomly distributing the species observations (pre sence background) among the grid cells coveredby survey effort By generating random data onlyfrom the survey area we aim to minimise spatial sort-ing bias by ensuring that the null model only reflectsthe environmental conditions where sampling wascarried out (Hijmans 2012) The resulting ROC plotwas generated and the AUC was calculated using theROCR package in R 2140 This procedure was re-peated 10 000 times to generate a random frequencydistribution of AUC values that would be expected ifthe RES model did not perform better than expecteddue to chance If the AUC of the empirical model ex-ceeded the 95 quantile of the ranked AUC valuesof the corresponding null model the model was con-sidered to perform significantly better than chancewould dictate (Olden et al 2002) and the relationshipbetween RES and speciesrsquo presence can be consid-ered to be stronger than would be expected bychance We used 1-sided testing since it was only ofinterest whether models performed significantly better than expected by chance not whether theyperformed significantly worse The significance levelwas calculated as the proportion of random AUCsthat were equal to or greater than the observed AUC
The model evaluation has 2 main assumptions (1)there are sufficient records within the test data set toaccurately describe a speciesrsquo distribution within thesurvey area and (2) the range of possible RES valuesis represented within the survey area (ie there isheterogeneity of habitat suitability) To assess theseassumptions we calculated and considered the total
number of speciesrsquo observations number of lsquopres-encersquo cells and percentiles of the ranked RES valueswithin the survey area for each model
Model outputs were also visually compared withpublished range maps (del Hoyo et al 1992 Onley ampSchofield 2007) allowing detection of any large-scale geographical discrepancies in the predictionsof models While qualitative in nature this compari-son provides a useful additional evaluation of modelsat a much larger geographical scale than the morequantitative evaluation described above
RESULTS
Quantifying and modelling speciesrsquo ecological niches
Ecological niches of 6 seabird species mdash fulmarCoryrsquos shearwater great shearwater sooty shearwa-ter Manx shearwater and storm petrel mdash were quan-tified in relation to 4 EGVs mdash depth SST chl a con-centration and distance to land mdash and are describedin Table 2 The 6 species all occupy different eco -logical niches with varying degrees of overlapNiches were subsequently modelled using the RESapproach which resulted in a spatial visualisation ofniches into potential distributions (Fig 3) and illus-trated the relative suitability of the environmentthroughout ranges Manx shearwater and stormpetrel share similar niches during their concurrentbreeding seasons both species occur in cold temper-ate to subtropical waters (5minus25degC) and primarilyrange within a few hundred kilometres of land How-ever while the Manx shearwater prefers depths ofless than 200 m mdash from coastal waters to the edge ofthe continental shelf mdash the storm petrel prefersdeeper waters between 100 and 1000 m Breedingseabirds occur closer to land (all MinP = 0 km) thannon-breeding birds (MinP ranges from 6 to 50 km)
The fulmar occupies a similar niche in the breedingand non-breeding seasons the absolute minimumand maximum values of each EGV do not changebetween the 2 seasons but the preferred range of allenvironmental variables (except chl a) differs Duringthe non-breeding season the fulmarrsquos preferredniche encompasses cooler deeper waters furtherfrom land compared with when breeding Non-breeding great shearwater and sooty shearwateroccupy the widest niches with respect to SST span-ning a range of 37 and 30degC respectively The preferred niche of great shearwater extends furtheroffshore (lt2000 km) than that of sooty shearwaterwhich tends to range closer to land (lt200 km)
264
Watson et al Modelling seabird distributions and habitat suitability
Qualitative comparison with published range maps
From visual qualitative assessment it can be seenthat model outputs (Fig 3) illustrate variability inpredicted range extents of the 6 seabird species inthe North Atlantic Relative environmental suitabilityvaries throughout ranges reflecting niche segrega-tion between species Predicted range extents vary intotal surface area and geographical coverage Com-paring between species non-breeding birds (withthe exception of fulmar) occupy a larger range andlatitudinal extent than breeding birds
Predicted range extents closely corresponded withpublished distribution maps for all species Howeverall ranges comprised a wider extent than maps in theliterature A common discrepancy was the predictionof suitable habitat in enclosed seas when such areasare excluded from published ranges for several spe-cies for example the inclusion of the MediterraneanSea in model outputs for great shearwater and Manxshearwater the Caribbean Sea and Gulf of Mexicofor great shearwater and sooty shearwater and Hud-son Bay for great shearwater Elsewhere modelscaptured areas of known absence well for examplethe absence of breeding Manx shearwater from thewestern central Atlantic and Caribbean Sea theabsence of sooty shearwater from Hudson Bay andthe low habitat suitability in the central Atlantic forthe sooty shearwater
The model output for storm petrel predicted amuch wider range across the North Atlantic thanpublished range maps the latter define the speciesrsquorange as restricted to the northeast Atlantic extend-ing no further west than 30degW Areas of high environ-mental suitability were separated by a large area oflow RES in the central Atlantic Similarly a smallarea of suitable habitat was predicted for fulmar in
the north Mediterranean Sea but separated from thecore range by a large area of unsuitable habitat
Statistical model evaluation
RES models for 5 out of 6 species performed signifi-cantly better than expected by chance when testedwith independent observation data from the Bay ofBiscay (p lt 005 Table 3) The AUC of empirical mod-els was significantly higher than that of correspondingnull models revealing a significant relationship be-tween RES and species occurrences for 6 out of 7models In the case of 4 out of a total of 7 models lessthan 01 of random samples had a higher AUC thanthe actual model (p lt 0001) The model for sootyshearwater did not perform significantly better thanrandom (p = 0260) with 26 of random AUCs ex-ceeding the observed AUC While the model for greatshearwater performed significantly better than ex-pected by chance (p = 0041) the model AUC wasonly very slightly higher than the 95 quantile of theranked null AUC values indicating that the model didnot perform much better than random
The number of speciesrsquo encounters ranged from115 to 590 (mean 3531 plusmn 653 Table 4) The rangeand frequency distribution of habitat suitabilityacross the model evaluation area for each species isillustrated by percentiles of ranked RES values(Table 4) The distribution of RES in the survey areavaries between species and is strongly skewed mdashindicating reduced heterogeneity of habitat suita -bility mdash for 3 models fulmar (breeding) sooty shear -water and Manx shearwater The majority of habitatwithin the sampling area is of low suitability forbreeding fulmars but of homogenously high suitabil-ity for sooty and Manx shearwaters
265
Species Status Depth (m) SST (degC) Distance (m)MinA MinP MaxP MaxA MinA MinP MaxP MaxA MinA MinP Max P MaxA
Northern fulmar B 0 100 1000 8000 minus2 0 15 15 0 0 320 2364N 0 100 2000 8000 minus2 0 10 15 0 50 2364 2364
Coryrsquos shearwater B 0 100 1000 8000 10 20 20 25 0 0 200 2364Great shearwater N 0100 200 8000 minus2 0 20 35 0 6 2000 2364Sooty shearwater N 0 10 1000 8000 5 10 20 35 0 15 200 2364Manx shearwater B 0 10 200 8000 5 10 20 25 0 0 360 2364European storm petrel B 0 100 2000 8000 5 10 20 25 0 0 200 2364
Table 2 Quantitative descriptions of speciesrsquo ecological niches in respect of 4 ecogeographical variables depth sea-surfacetemperature (SST) distance to land and chlorophyll a (chl a) concentration Niches were defined for 6 procellariiform seabirdsduring the breeding andor non-breeding season MinA and MaxA absolute minimum and maximum values of the resourceselection function MinP and MaxP preferred minimum and maximum values (see Fig 1) Chl a (mg mminus3 identical for eachspecies and status) MinA MinP = 0 03 MaxP MaxA = 60 60 Status B = breeding N = non-breeding See Table S1 in
Supplement 1 (wwwint-rescomarticlessupplm485p259_supplpdf) for data sources
Mar Ecol Prog Ser 485 259ndash273 2013266
Fig 3 Model outputs illustrating predicted geographicrange and relative environmental suitability (RES) for 6procellariiform seabirds in the North Atlantic duringtheir breeding (yellowminusbrown) andor non-breedingseasons (blue) (A) northern fulmar Fulmarus glacialisbreeding (B) northern fulmar non-breeding (C) Coryrsquosshearwater Calonectris diomedea breeding (D) greatshearwater Puffinus gravis non-breeding (E) sootyshearwater P griseus non-breeding (F) Manx shear -water P puffinus breeding and (G) European stormpetrel Hydrobates pelagicus breeding Predicted RES ison a scale from 0 (least suitable white) to 1 (highly suit-
able dark)
Watson et al Modelling seabird distributions and habitat suitability
DISCUSSION
RES predictions
When compared with simulated random data RESmodels performed significantly better for 5 out of6 seabird species (and 6 out of 7 models) at predicting
relative likelihood of occurrence in a subset of thestudy area Model outputs provide more informationon speciesrsquo distributions than published range mapssince they provide indices of relative environmentalsuitability throughout a speciesrsquo range RES predic-tions represent simple testable hypotheses concern-ing a speciesrsquo potential niche in respect of a few envi-ronmental predictors Visualisation of hypotheses ina spatial context facilitates our understanding of speciesminushabitat relationships inference of areas ofpotentially high seabird abundance and identifica-tion of regions to be targeted for future research andconservation planning
Observed versus predicted distributions
RES modelling of the potential niche resulted inpredictions of occurrence outside of known (or ob -served) ranges for several species when comparedwith published range maps indicating that distribu-tions are influenced by additional biological andorphysical parameters besides those included in mod-els Indeed modelling of the realised niche mdash thepart of the potential niche that a species actuallyuses mdash requires the incorporation of biotic interac-tions (Soberoacuten amp Nakamura 2009) and physiologicalconstraints (Kearney amp Porter 2009) Qualitative com-parison of RES model outputs with observed distribu-tions thus allows the assessment of the importance ofother factors that may influence the at-sea distribu-tion of seabirds
Distributions of pelagic animals are ultimately con-strained by the abundance and distribution of prey(Pahl-Wostl 1997) but scales of association betweenmobile predators and prey are highly variable(Schneider amp Piatt 1986) and prey indices are consid-ered inappropriate for predicting global distributionsof many highly mobile marine organisms (Torres etal 2008) Karpouzi et al (2007) incorporated informa-tion on prey distributions in mapping at-sea foragingdistributions of seabirds however they found little orno information concerning the diet of many seabirdsand detected high spatial variability in associationsbetween seabirds and prey Habitat modelling istherefore largely reliant on predictor variables thatindirectly affect species distribution
Evidence from energetic and physiological studieshighlights the significance of wind speed (Furness ampBryant 1996) and area of available ocean extent (Da -vies et al 2010) in influencing the foraging behaviourand life-history strategies of procellariiform seabirdsThe Strait of Gibraltar (Friesen et al 2007) and the
267
Species AUCm AUCn p
Northern fulmarBreeding 0735 0568 lt0001Non-breeding 0774 0583 lt0001Coryrsquos shearwaterBreeding 0712 0580 lt0001Great shearwaterNon-breeding 0587 0583 0041Sooty shearwaterNon-breeding 0530 0575 0260Manx shearwaterBreeding 0614 0572 0004European storm petrelBreeding 0704 0582 lt0001
Table 3 Evaluation of predictive performance of relative en-vironmental suitability (RES) models A model was consid-ered to perform significantly better than chance if the areaunder the curve of the empirical model (AUCm) exceededthe 95 quantile of the ranked AUC values of a correspon-ding null model (AUCn) p-values indicate the proportion of
AUCn that were equal to or greater than AUCm
Species No of No of Percentiles of ranked records lsquopresencersquo RES in survey area
cells 10 50 90
Northern fulmarBreeding 590 71 00 00 10Non-breeding 248 45 012 036 056Coryrsquos shearwaterBreeding 527 51 015 043 062Great shearwaterNon-breeding 452 48 037 069 10Sooty shearwaterNon-breeding 115 46 055 10 10Manx shearwaterBreeding 245 60 050 10 10European storm petrelBreeding 295 46 045 086 10
Table 4 Summary of test data used for evaluating the pre-dictive performance of relative environmental suitability(RES) models Independent observation data were collectedfrom repeated sampling of 156 grid cells (025deg times 025deg) byMARINElife in the Bay of Biscay (Fig 2) The number of spe-cies records number of lsquopresencersquo cells and variation in RESwithin the model evaluation area (percentiles of ranked
RES) are presented
Mar Ecol Prog Ser 485 259ndash273 2013
Almeria-Oran Oceanographic Front (Goacutemez-Diacuteaz etal 2006) have both been proposed as barriers limit-ing dispersal of and genetic exchange between sea-birds in the Atlantic Ocean and the MediterraneanSea Such physical and geographical factors mayexplain why despite the prediction of suitable habitat the observed distributions of some species donot extend into enclosed seas eg the absence ofgreat shearwater from the Mediterranean Sea andHudson Bay
Biotic interactions may play a significant role indetermining distributions across smaller spatial andtemporal scales (Furness amp Birkhead 1984) and theirincorporation into SDMs is widely recognised as akey challenge in both terrestrial (Arauacutejo amp Guisan2006) and marine environments (Robinson et al2011) Shearwaters do not typically form mixed- species colonies (Warham 1990) suggesting thatinterspecific competition and niche segregation mayinfluence the breeding distributions of some procel-lariiform seabirds While the observed range of Manxshearwater does not extend into the MediterraneanSea the breeding ranges of the Balearic shearwaterPuffinus mauretanicus and the Yelkoaun shearwaterP yelkoauni which occupy similar ecological nichesto the Manx shearwater (and were until recentlyconsidered to be subspecies of Manx shearwaterSangster et al 2002) are restricted to the Mediter-ranean Sea (Onley amp Schofield 2007) A combinationof evolutionary history and biotic interactions mayexplain the reduced niche overlap that is observed(compared with predicted overlap) between these 3ecologically similar species Depending on the objec-tives it may be a more useful approach to applyniche modelling to a species complex when there areseveral closely related species
Despite their ability to traverse large sections ofocean many procellariiform seabirds show limiteddispersal (the lsquoseabird paradoxrsquo proposed by Milot etal 2008) Their philopatric habits are expected tolimit colonisation by long-distance dispersal and sub-sequent range expansion (Matthiopoulos et al 2005Brown et al 2010) Despite the prediction of highRES in the northwest Atlantic for the storm petrelhigh breeding-site fidelity and the large area of pre-dicted low habitat suitability in the central Atlanticmay explain why the speciesrsquo observed distribution(from published range maps) is restricted to thenortheast Atlantic (del Hoyo et al 1992) Addition-ally the niche is already filled by another pelagicseabird Leachrsquos petrel Oceanodroma leucorhoa inthe northwest Atlantic (del Hoyo et al 1992) In theinterpretation of RES model outputs consideration
should thus be afforded to a speciesrsquo evolutionaryhistory as well as areas of low RES separating areasof high RES both of which may act to restrict ranges
The availability of suitable nest sites is a funda-mental constraint on the current breeding distribu-tion of seabirds (Brown et al 2010) Procellariiformseabirds are largely restricted to remote islands freeof mammalian predators which are within range ofsuitable foraging areas (Warham 1990) If all occu-pied breeding colonies could be accurately identifiedand niche envelopes constrained by maximum forag-ing range from colonies models could yield moreaccurate predictions of range extent during thebreeding season However given the difficulties ofsurveying and monitoring remote locations ourknowledge of breeding sites is likely to be incom-plete particularly for less well-studied speciesRestricting distribution to within species-specific for-aging range of all land therefore represents a moreconservative approach
Where suitable habitat is predicted outside of cur-rent observed distributions this may indicate areasthat are used by a species but for which there are nodata or areas that could be suitable for colonisationFuture colonisation or range shifts could be driven bychanges in environmental suitability as a result ofnatural changes (eg Gaston amp Woo 2008) andoranthropogenic-induced changes such as by meansof active conservation management (Miskelly et al2009) By identifying areas of potentially suitable at-sea habitat the RES modelling approach may thusoffer insight into the effects of future changes in cli-mate and anthropogenic activities on speciesrsquo distri-butions Further model development could be basedon different scenarios for climate or nest-site avail-ability to generate predictions of future changes indistributions
Model evaluation
Statistical evaluation demonstrates that the genericapproach of RES modelling can accurately describehabitat suitability for wide-ranging seabirds RESpredictions were more strongly related to speciespresence for 6 out of 7 models than expected due tochance While qualitative assessment of the modeloutput for non-breeding sooty shearwater suggestedreasonable consistency with published distributiondata the model did not perform significantly betterthan a null model Poor model performance could beexplained by the low quality of data used for modelparameterisation (see Table S1) resulting in an inac-
268
Watson et al Modelling seabird distributions and habitat suitability
curate description of a speciesrsquo ecological niche It iswell established that speciesminusenvironment relation-ships can change with scale (Manly et al 2002) andthere is evidence for intraspecific spatial variation inspeciesminushabitat relationships in seabirds (Huettmannamp Diamond 2001) Most information on the at-seahabitat associations of the sooty shearwater comesfrom studies in the Pacific Ocean (Briggs amp Chu 1986Vermeer et al 1989 but see Hedd et al 2012) There-fore we cannot be certain of the spatial stability ofthe speciesrsquo niche across distinct ocean basins Theavailability and quality of ecological data may limitthe wider application of RES modelling to other spe-cies of seabird if insufficient data are available toaccurately quantify speciesrsquo ecological niches
Rigorous evaluation of models requires that the testdata set accurately reflects the distribution andoccurrence of a species within the evaluation areaThe test data comprised far fewer observations ofsooty shearwater than the other study species andthe sampling area was characterised by low variationin RES ie highly homogeneous habitat suitability(Table 4) However despite highly skewed distribu-tions of RES the models for fulmar (breeding) andManx shearwater showed highly significant predic-tive accuracy when compared to null models Thisindicates these models must be performing very wellif they can perform significantly better than randomeven under less favourable conditions for the evalua-tion Rigorous model evaluation relies on representa-tive observation data collected across broad spatialand temporal scales to compliment the macro-scalemodelling approach While lsquoregularrsquo and lsquoequal-stratifiedrsquo sampling strategies are the most accurateand robust (Hirzel amp Guisan 2002) these are not typ-ically features of opportunistically collected data mdashthe source of most at-sea seabird observations Theincreasing availability of large-scale point data (egOBIS GBIF) and range maps such as those availablethrough the IUCN Red List (wwwiucnredlistorg)presents opportunities for further testing of RESmodels However the availability of representativetest data may limit the application of RES modellingfor scarcer and under-recorded species
Biases in model parameters
A frequent obstacle encountered in predictive distribution modelling of marine animals is the lackof reliable and comprehensive occurrence datafrom which to define species-habitat relationships(Robinson et al 2011) The issue of environmental
bias mdash spatial andor temporal bias in collection ofoccurrence data mdash is widely recognised in speciesdis tribution modelling (Arauacutejo amp Guisan 2006Phillips et al 2009 Ready et al 2010) It mainly arisesfrom limitations in data accessibility and samplingstrategies preventing representative coverage of theentire environmental range of species (Phillips et al2009) The biases inherent to most observation datacan easily lead to incorrect interpretation of habitatpreferences of wide-ranging species (Hirzel ampGuisan 2002)
RES modelling provides a technique for predictinglarge-scale distributions which does not rely on pointdata The niche hypotheses underlying RES modelsstill ultimately depend on the quality and amount ofavailable ecological information Quantitative dataon the relationships between seabirds and oceanproductivity are lacking and large areas of theoceans remain under-studied eg the central At -lantic (but see Skov et al 1994) However the abilityfor RES modelling to incorporate a range of qualita-tive and quantitative data collected from differentparts of speciesrsquo ranges at different times of yearbroadens the scope of environmental coverage Con-sequently the outputs may represent more balancedand robust predictions for many marine animalsthan the more commonly used predictive modellingtechniques When previously tested against a rangeof marine taxa RES modelling was shown to performvery well compared with traditional presence-onlymodelling methods (Ready et al 2010)
Accounting for temporal variability
Temporal variability in ecological niches and envi-ronmental parameters is frequently overlooked inspecies distribution modelling (Dambach amp Roumldder2011) Previous applications of RES modelling tomarine top predators did not account for temporalvariability in speciesminushabitat relationships or EGVs(Kaschner et al 2006 Ready et al 2010) In this studywe have accounted for the seasonal shifts in habitatassociations that occur within the annual life cycle bydistinguishing between a speciesrsquo breeding and non-breeding niche and subsequently relating niches toseasonally averaged data for dynamic EGVsAccounting for temporal variation in both speciesminusenvironment relationships and dynamic environ-mental variables is expected to increase the reliabil-ity of RES predictions particularly in areas whereenvironmental conditions fluctuate greatly betweenseasons Consequently our seasonal RES predictions
269
Mar Ecol Prog Ser 485 259ndash273 2013
can provide greater insight into speciesrsquo behaviourand ecology than those based on an annual averageniche envelope
Applications and recommendations for future research
RES modelling could prove a valuable tool forinforming the development and implementation ofeffective conservation and management practices Inthe absence of comprehensive occurrence data forwide-ranging species RES models can identify criti-cally important areas and biodiversity hotspots inpelagic marine ecosystems This is of direct rele-vance to the development of quantifiable criteria forthe designation of marine Important Bird Areas(IBAs BirdLife International 2004) The modellingapproach could be used to direct observation effort toareas where under-recorded seabirds are predictedto occur and inform sampling strategies to incorpo-rate a range of environmental suitability Matchingdata on seabird distribution as revealed by RESmodel outputs with data on fishing effort couldinform the responsibilities of Regional FisheriesManagement Organisations (RFMOs) and the devel-opment of suitable monitoring and mitigation meas-ures to reduce negative interactions between sea-birds and fisheries (eg Le Corre et al 2012)
Application of RES modelling to a greater variety ofspecies demonstrating variable niche characteris-tics will allow further examination of the broad-scaleapplicability of the approach Expanding the RESapproach to wider geographic areas incorporatingall of a speciesrsquo range would offer greater insightinto understanding distribution dispersal and migra-tory behaviour An iterative approach to the develop-ment of models (as recommended by Elith et al 2006)will improve the robustness of predictions by consid-ering the effects of a wider range of predictor vari-ables on model performance Additional factors thathave been shown to influence the at-sea distributionof seabirds and could be incorporated into futuremodels include sea-surface salinity (eg Huettmannamp Diamond 2001) horizontal (eg Louzao et al 2009)and vertical gradients in SST (eg Spear et al 2001)and fishing effort (eg Karpouzi et al 2007)
Wider application of RES modelling requires simultaneous developments in at-sea sampling andlarge-scale studies of speciesminushabitat relationshipswhich inform one another and offer direction forfuture research The increasing use of trackingdevices for recording movements of seabirds pro-
vides opportunities for quantification of habitat useand preference (Wakefield et al 2009 Le Corre et al2012) Increasing the public availability of trackingdata will facilitate further development of SDMs(Skov et al 2008) Further studies are required toimprove quantitative understanding of speciesminushabi-tat relationships across a variety of spatio-temporalscales and integration of data across scales is neces-sary to enhance the predictive ability of RES modelsHaving demonstrated RES is a robust modellingapproach predictions could be improved by the useof ensemble model averaging (Arauacutejo amp New 2007)
CONCLUSIONS
Based on quantitative definitions of speciesrsquo eco-logical requirements RES maps offer a robust alter-native to subjectively generated traditional rangemaps We have shown that RES modelling can ade-quately describe habitat suitability across largescales for wide-ranging pelagic seabirds RES model-ling presents a generic and objective approach forpredicting distributions of wide-ranging marine ani-mals across large spatial scales when the absence ofrepresentative point data precludes the applicationof traditional modelling techniques Model outputsrepresent an alternative to the conventional and sub-jective approach of delineating range extents basedon limited records of occurrence The approach isbased on clear assumptions concerning speciesrsquohabitat preferences which can be easily modifiedand tested
RES predictions are limited by the extent of pub-lished data and the subsequent ability to accuratelyquantify speciesrsquo ecological niches While some gapsin the literature are evident the synthesis of knowl-edge concerning speciesminushabitat relationships canadequately describe ecological niches for the pur-poses of building predictive distribution models Thisoffers a more robust approach for answering broad-scale questions about speciesrsquo distributions thanderiving niches from limited and biased samplingdata Of greater significance is the limited availabil-ity of representative at-sea observations data to rig-orously evaluate models which may prove to be thekey limiting factor in the wider application of RESmodelling for wide-ranging marine animals
Acknowledgements Thanks to the NERC Earth Observa-tion Data Acquisition and Analysis Service (NEODAAS) forsupplying data for this study MARINElifersquos contribution tothis research was part-funded by the EU as part of the Chan-
270
Watson et al Modelling seabird distributions and habitat suitability
nel Integrated Approach for Marine Resource Management(CHARM) Phase 3 project We thank MARINElife volun-teers for collection of observation data and PampO Ferries forsponsoring surveys aboard the lsquoPride of Bilbaorsquo
LITERATURE CITED
Airameacute S Dugan JE Lafferty KD Leslie H McArdle DAWarner RR (2003) Applying ecological criteria to marinereserve design a case study from the California ChannelIslands Ecol Appl 13 170minus184
Arauacutejo MB Guisan A (2006) Five (or so) challenges for spe-cies distribution modelling J Biogeogr 33 1677minus1688
Arauacutejo MB New M (2007) Ensemble forecasting of speciesdistributions Trends Ecol Evol 22 42minus47
Ashmole N (1971) Sea bird ecology and the marine environ-ment In Farner DS King JR (eds) Avian biology Vol 1Academic Press New York NY p 223minus286
BirdLife International (2004) Tracking ocean wanderers the global distribution of albatrosses and petrels Resultsfrom the Global Procellariiform Tracking Workshop1minus5 September 2003 Gordonrsquos Bay South Africa BirdlifeInternational Cambridge
Boyce MS Vernier PR Nielsen SE Schmiegelow FKA(2002) Evaluating resource selection functions EcolModel 157 281minus300
Briggs KT Chu EW (1986) Sooty shearwaters off California distribution abundance and habitat use Condor 88 355minus364
Brown RM Nichols RA Faulkes CG Jones CG and others(2010) Range expansion and hybridization in RoundIsland petrels (Pterodroma spp) evidence from micro -satellite genotypes Mol Ecol 19 3157minus3170
Cramp S Simmons K (1980) Handbook of the birds ofEurope the Middle East and north Africa The birds ofthe western Palearctic Vol 1 Ostrich to ducks OxfordUniversity Press Oxford
Dambach J Roumldder D (2011) Applications and future chal-lenges in marine species distribution modeling AquatConserv 21 92minus100
Davies RG Irlich UM Chown SL Gaston KJ (2010) Ambi-ent productive and wind energy and ocean extent pre-dict global species richness of procellariiform seabirdsGlob Ecol Biogeogr 19 98minus110
del Hoyo J Elliott A Sargatal J (1992) Handbook of thebirds of the world Vol 1 Ostrich to ducks Lynx EdicionsBarcelona
Dormann CF McPherson JM Arauacutejo MB Bivand R and oth-ers (2007) Methods to account for spatial autocorrelationin the analysis of species distributional data a reviewEcography 30 609minus628
Elith J Leathwick JR (2009) Species distribution models ecological explanation and prediction across space andtime Annu Rev Ecol Evol Syst 40 677minus697
Elith J Graham H Anderson P Dudiacutek M and others (2006)Novel methods improve prediction of species distribu-tions from occurrence data Ecography 29 129minus151
Fielding AH Bell JF (1997) A review of methods for theassessment of prediction errors in conservation pres-enceabsence models Environ Conserv 24 38minus49
Friesen VL Burg TM McCoy KD (2007) Mechanisms ofpopulation differentiation in seabirds Mol Ecol 16 1765minus1785
Furness RW Birkhead TR (1984) Seabird colony distribu-
tions suggest competition for food supplies during thebreeding-season Nature 311 655minus656
Furness RW Bryant DM (1996) Effect of wind on field meta-bolic rates of breeding northern fulmars Ecology 77 1181minus1188
Gaston AJ Woo K (2008) Razorbills (Alca torda) follow sub-arctic prey into the Canadian Arctic colonization resultsfrom climate change Auk 125 939minus942
Goacutemez-Diacuteaz E Gonzaacutelez-Soliacutes J Peinado MA Page RDM(2006) Phylogeography of the Calonectris shearwatersusing molecular and morphometric data Mol PhylogenetEvol 41 322minus332
Gregr EJ Trites AW (2008) A novel presence-only validationtechnique for improved Steller sea lion Eumetopias juba-tus critical habitat descriptions Mar Ecol Prog Ser 365 247minus261
Guinotte JM Bartley JD Iqbal A Fautin DG BuddemeierRW (2006) Modeling habitat distribution from organismoccurrences and environmental data case study usinganemonefishes and their sea anemone hosts Mar EcolProg Ser 316 269minus283
Guisan A Zimmermann NE (2000) Predictive habitat distri-bution models in ecology Ecol Model 135 147minus186
Guisan A Edwards TC Hastie T (2002) Generalized linearand generalized additive models in studies of speciesdistributions setting the scene Ecol Model 157 89minus100
Hardy SM Lindgren M Konakanchi H Huettmann F (2011)Predicting the distribution and ecological niche of unex-ploited snow crab (Chionoecetes opilio) populations inAlaskan waters a first open-access ensemble modelIntegr Comp Biol 51 608minus622
Hedd A Montevecchi WA Otley H Phillips RA Fifield DA(2012) Trans-equatorial migration and habitat use bysooty shearwaters Puffinus griseus from the SouthAtlantic during the nonbreeding season Mar Ecol ProgSer 449 277minus290
Hijmans RJ (2012) Cross-validation of species distributionmodels removing spatial sorting bias and calibrationwith a null model Ecology 93 679minus688
Hirzel AH Guisan A (2002) Which is the optimal samplingstrategy for habitat suitability modelling Ecol Model157 331minus341
Hobbs M Brereton T Weir C Williams A (2003) Baselinemonitoring data on Procellariformes [Procellariiformes](shearwaters) in the Bay of Biscay Ornis Hungarica12ndash13 115minus125
Huettmann F Diamond AW (2001) Seabird colony locationsand environmental determination of seabird distribution a spatially explicit breeding seabird model for the North-west Atlantic Ecol Model 141 261minus298
Huettmann F Artukhin Y Gilg O Humphries G (2011) Pre-dictions of 27 Arctic pelagic seabird distributions usingpublic environmental variables assessed with colonydata a first digital IPY and GBIF open access synthesisplatform Mar Biodivers 41 141minus179
Intergovernmental Oceanographic Commission (IOC) Inter -national Hydrographic Organization (IHO) and BritishOceanographic Data Centre (BODC) (2003) Centenaryedition of the GEBCO Digital Atlas published on CD-ROM on behalf of the Intergovernmental OceanographicCommission and the International Hydrographic Organi-zation as part of the General Bathymetric Chart of theOceans BODC Liverpool
Karpouzi VS Watson R Pauly D (2007) Modelling and map-ping resource overlap between seabirds and fisheries on
271
Mar Ecol Prog Ser 485 259ndash273 2013
a global scale a preliminary assessment Mar Ecol ProgSer 343 87minus99
Kaschner K Watson R Trites AW Pauly D (2006) Mappingworld-wide distributions of marine mammal speciesusing a relative environmental suitability (RES) modelMar Ecol Prog Ser 316 285minus310
Kaschner K Tittensor DP Ready J Gerrodette T Worm B(2010) Current and future patterns of global marinemammal biodiversity PLoS ONE 6 e19653
Kearney M Porter W (2009) Mechanistic niche modelling combining physiological and spatial data to predict spe-ciesrsquo ranges Ecol Lett 12 334minus350
Le Corre M Jaeger A Pinet P Kappes MA and others (2012)Tracking seabirds to identify potential Marine ProtectedAreas in the tropical western Indian Ocean Biol Conserv156 83minus93
Legendre P (1993) Spatial autocorrelation trouble or newparadigm Ecology 74 1659minus1673
Louzao M Hyrenbach KD Arcos JM Abelloacute P De Sola LGOro D (2006) Oceanographic habitat of an endangeredMediterranean procellariiform implications for marineprotected areas Ecol Appl 16 1683minus1695
Louzao M Beacutecares J Rodriacuteguez B Hyrenbach KD Ruiz AArcos JM (2009) Combining vessel-based surveys andtracking data to identify key marine areas for seabirdsMar Ecol Prog Ser 391 183minus197
Manly BF McDonald LL Thomas DL McDonald TL Erick-son WP (2002) Resource selection by animals statisticaldesign and analysis for field studies Springer New YorkNY
Matthiopoulos J Harwood J Thomas L (2005) Metapopula-tion consequences of site fidelity for colonially breedingmammals and birds J Anim Ecol 74 716minus727
Maxwell DL Stelzenmuumlller V Eastwood PD Rogers SI(2009) Modelling the spatial distribution of plaice (Pleu-ronectes platessa) sole (Solea solea) and thornback ray(Raja clavata) in UK waters for marine management andplanning J Sea Res 61 258minus267
Milot E Weimerskirch H Bernatchez L (2008) The seabirdparadox dispersal genetic structure and populationdynamics in a highly mobile but philopatric albatrossspecies Mol Ecol 17 1658minus1673
Miskelly CM Taylor GA Gummer H Williams R (2009)Translocations of eight species of burrow-nesting sea-birds (genera Pterodroma Pelecanoides Pachyptila andPuffinus Family Procellariidae) Biol Conserv 142 1965minus1980
Nur N Jahncke J Herzog MP Howar J and others (2011)Where the wild things are predicting hotspots of seabirdaggregations in the California Current System EcolAppl 21 2241minus2257
Oedekoven CS Ainley DG Spear LB (2001) Variable res -ponses of seabirds to change in marine climate Califor-nia Current 1985ndash1994 Mar Ecol Prog Ser 212 265minus281
Olden JD Jackson DA Peres-Neto PR (2002) Predictivemodels of fish species distributions a note on proper val-idation and chance predictions Trans Am Fish Soc 131 329minus336
Olivier F Wotherspoon SJ (2006) Modelling habitat selec-tion using presence-only data case study of a colonialhollow nesting bird the snow petrel Ecol Model 195 187minus204
Onley D Schofield P (2007) Field guide to the albatrossespetrels and shearwaters of the world Christopher HelmLondon
Oppel S Meirinho A Ramiacuterez I Gardner B OrsquoConnell AFMiller PI Louzao M (2012) Comparison of five modellingtechniques to predict the spatial distribution and abun-dance of seabirds Biol Conserv 156 94minus104
Ostrand WD Drew GS Suryan RM McDonald LL (1998)Evaluation of radio-tracking and strip transect methodsfor determining foraging ranges of black-legged kitti-wakes Condor 100 709minus718
Pahl-Wostl C (1997) Dynamic structure of a food web model comparison with a food chain model Ecol Model 100 103minus123
Phillips SJ Dudiacutek M Elith J Graham CH Lehmann ALeathwick J Ferrier S (2009) Sample selection bias andpresence-only distribution models implications for back-ground and pseudo-absence data Ecol Appl 19 181minus197
Raes N ter Steege H (2007) A null-model for significancetesting of presence-only species distribution modelsEcography 30 727minus736
Raymond B Woehler EJ (2003) Predicting seabirds at sea inthe Southern Indian Ocean Mar Ecol Prog Ser 263 275minus285
Ready J Kaschner K South AB Eastwood PD and others(2010) Predicting the distributions of marine organismsat the global scale Ecol Model 221 467minus478
Redfern JV Ferguson MC Becker EA Hyrenbach KD andothers (2006) Techniques for cetaceanminushabitat modelingMar Ecol Prog Ser 310 271minus295
Robinson LM Elith J Hobday AJ Pearson RG Kendall BEPossingham HP Richardson AJ (2011) Pushing the limitsin marine species distribution modelling lessons fromthe land present challenges and opportunities Glob EcolBiogeogr 20 789minus802
Ross DA (1988) An introduction to oceanography PrenticeHall Englewood Cliffs NJ
Sangster G Knox AG Helbig AJ Parkin DT (2002) Taxo-nomic recommendations for European birds Ibis 144 153minus159
Schneider DC (1997) Habitat selection by marine birds inrelation to water depth Ibis 139 175minus178
Schneider DC Piatt JF (1986) Scale-dependent correlationof seabirds with schooling fish in a coastal ecosystemMar Ecol Prog Ser 32 237minus246
Skov H Durinck J Danielsen F Bloch D (1994) The summerdistribution of Procellariiformes in the central NorthAtlantic Ocean Vogelwarte 37 270minus289
Skov H Humphreys E Garthe S Geitner K and others(2008) Application of habitat suitability modelling totracking data of marine animals as a means of analyzingtheir feeding habitats Ecol Model 212 504minus512
Soberoacuten J Nakamura M (2009) Niches and distributionalareas concepts methods and assumptions Proc NatlAcad Sci USA 106 19644minus19650
Spear LB Ballance LT Ainley DG (2001) Response of sea-birds to thermal boundaries in the tropical Pacific thethermocline versus the Equatorial Front Mar Ecol ProgSer 219 275minus289
Sverdrup H Johnston MW Fleming RH (1942) The oceans their physics chemistry and general biology PrenticeHall New York NY
Tasker ML Reid JB (1997) Seabirds in the marine environ-ment mdash introduction ICES J Mar Sci 54 505minus506
Torres LG Read AJ Halpin P (2008) Fine-scale habitat modeling of a top marine predator Do prey data improvepredictive capacity Ecol Appl 18 1702minus1717
Vermeer K Morgan KH Smith GEJ Hay R (1989) Fall distri-
272
Watson et al Modelling seabird distributions and habitat suitability 273
bution of pelagic birds over the shelf off SW VancouverIsland Colon Waterbirds 12 207minus214
Wakefield ED Phillips RA Matthiopoulos J (2009) Quantify-ing habitat use and preferences of pelagic seabirds usingindividual movement data a review Mar Ecol Prog Ser391 165minus182
Warham J (1990) The petrels their ecology and breedingsystems Academic Press New York NY
Yen PPW Huettmann F Cooke F (2004) A large-scale modelfor the at-sea distribution and abundance of marbledmurrelets (Brachyramphus marmoratus) during the bree -ding season in coastal British Columbia Canada EcolModel 171 395minus413
Zimmermann NE Edwards TC Graham CH Pearman PBSvenning JC (2010) New trends in species distributionmodelling Ecography 33 985minus989
Editorial responsibility Rory Wilson Swansea UK
Submitted June 7 2012 Accepted March 7 2013Proofs received from author(s) June 11 2013
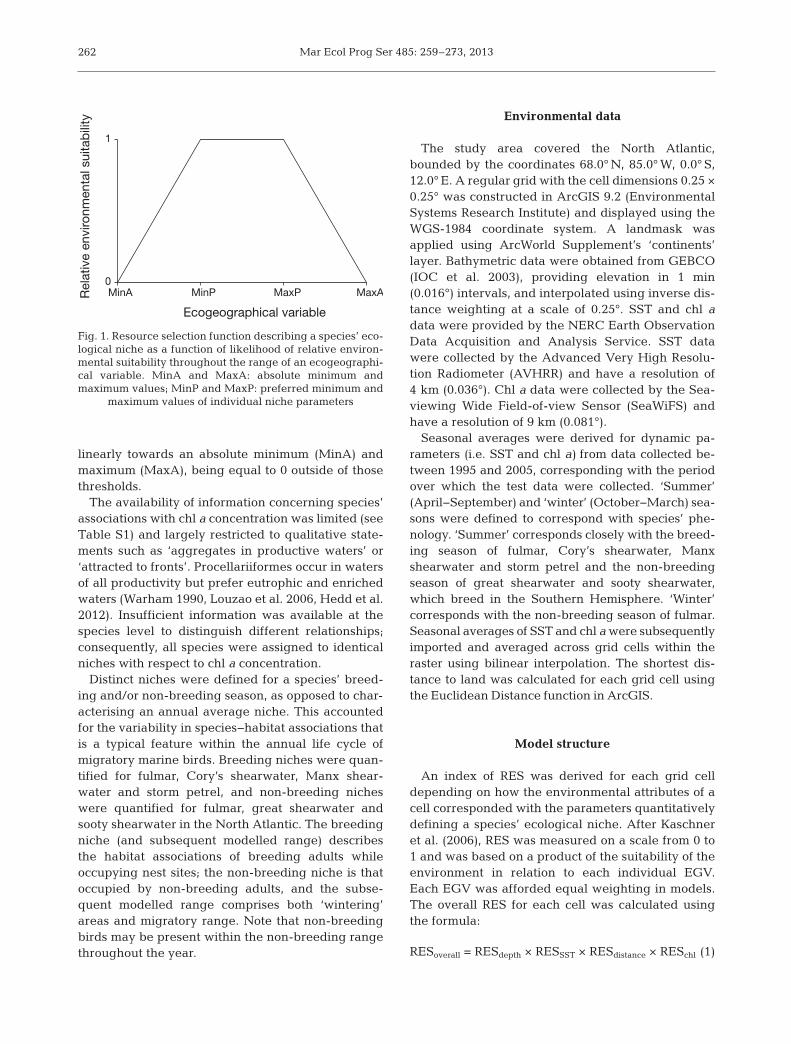
Mar Ecol Prog Ser 485 259ndash273 2013
linearly towards an absolute minimum (MinA) andmaximum (MaxA) being equal to 0 outside of thosethresholds
The availability of information concerning speciesrsquoassociations with chl a concentration was limited (seeTable S1) and largely restricted to qualitative state-ments such as lsquoaggregates in productive watersrsquo orlsquoattracted to frontsrsquo Procellariiformes occur in watersof all productivity but prefer eutrophic and enrichedwaters (Warham 1990 Louzao et al 2006 Hedd et al2012) Insufficient information was available at thespecies level to distinguish different relationshipsconsequently all species were assigned to identicalniches with respect to chl a concentration
Distinct niches were defined for a speciesrsquo breed-ing andor non-breeding season as opposed to char-acterising an annual average niche This accountedfor the variability in speciesminushabitat associations thatis a typical feature within the annual life cycle ofmigratory marine birds Breeding niches were quan-tified for fulmar Coryrsquos shearwater Manx shear -water and storm petrel and non-breeding nicheswere quantified for fulmar great shearwater andsooty shearwater in the North Atlantic The breedingniche (and subsequent modelled range) describesthe habitat associations of breeding adults whileoccupying nest sites the non-breeding niche is thatoccupied by non-breeding adults and the subse-quent modelled range comprises both lsquowinteringrsquoareas and migratory range Note that non-breedingbirds may be present within the non-breeding rangethroughout the year
Environmental data
The study area covered the North Atlanticbounded by the coordinates 680deg N 850deg W 00deg S120deg E A regular grid with the cell dimensions 025 times025deg was constructed in ArcGIS 92 (EnvironmentalSystems Research Institute) and displayed using theWGS-1984 coordinate system A landmask wasapplied using ArcWorld Supplementrsquos lsquocontinentsrsquolayer Bathymetric data were obtained from GEBCO(IOC et al 2003) providing elevation in 1 min(0016deg) intervals and interpolated using inverse dis-tance weighting at a scale of 025deg SST and chl adata were provided by the NERC Earth ObservationData Acquisition and Analysis Service SST datawere collected by the Advanced Very High Resolu-tion Radiometer (AVHRR) and have a resolution of4 km (0036deg) Chl a data were collected by the Sea-viewing Wide Field-of-view Sensor (SeaWiFS) andhave a resolution of 9 km (0081deg)
Seasonal averages were derived for dynamic pa-rameters (ie SST and chl a) from data collected be-tween 1995 and 2005 corresponding with the periodover which the test data were collected lsquoSummerrsquo(AprilminusSeptember) and lsquowinterrsquo (OctoberminusMarch) sea-sons were defined to correspond with speciesrsquo phe-nology lsquoSummerrsquo corresponds closely with the breed-ing season of fulmar Coryrsquos shearwater Manxshearwater and storm petrel and the non-breedingseason of great shearwater and sooty shearwaterwhich breed in the Southern Hemisphere lsquoWinterrsquocorresponds with the non-breeding season of fulmarSeasonal averages of SST and chl a were subsequentlyimported and averaged across grid cells within theraster using bilinear interpolation The shortest dis-tance to land was calculated for each grid cell usingthe Euclidean Distance function in ArcGIS
Model structure
An index of RES was derived for each grid celldepending on how the environmental attributes of acell corresponded with the parameters quantitativelydefining a speciesrsquo ecological niche After Kaschneret al (2006) RES was measured on a scale from 0 to1 and was based on a product of the suitability of theenvironment in relation to each individual EGVEach EGV was afforded equal weighting in modelsThe overall RES for each cell was calculated usingthe formula
RESoverall = RESdepth times RESSST times RESdistance times RESchl (1)
262
0
1
MinA MinP MaxP MaxA Rel
ativ
e en
viro
nmen
tal s
uita
bili
ty
Ecogeographical variable
Fig 1 Resource selection function describing a speciesrsquo eco-logical niche as a function of likelihood of relative environ-mental suitability throughout the range of an ecogeographi-cal variable MinA and MaxA absolute minimum andmaximum values MinP and MaxP preferred minimum and
maximum values of individual niche parameters
Watson et al Modelling seabird distributions and habitat suitability
The multiplicative approach means that if any onevariable within a cell fell outside of a speciesrsquo ab -solute range the overall suitability was equal to 0This is based on the assumption that an animal wouldnot be expected to occur within an environment thatis unsuitable in respect of one or more variables thatare key determinants of distribution RES valueswere imported into the GIS grid and displayed usinga continuous colour scale Model outputs delineate aspeciesrsquo predicted geographic range and illustratethe relative suitability of the environment (equatingto likelihood of occurrence) throughout that range
Observation data
MARINElife provided point data collected frommonthly seabird surveys carried out in the EnglishChannel and Bay of Biscay (Fig 2) between 1995 and2005 (though data from 2003 and 2004 were notavailable) Surveys were carried out aboard a com-mercial ferry liner within a restricted transect routeinvolving repeated sampling of grid cells A total of2696 h of observations collected across 156 gridcells provided data for the model evaluation Thedata set comprises a large number of observationsrepresenting a high diversity of species collectedover a decade and employing consistent methodol-ogy across space and time The sampling area coversa wide spectrum of environmental strata Observa-tions were binned within grid cells (025 times 025deg) tomatch the spatial resolution of environmental data
Cells were assigned a binary value of 1 or 0 indica-ting lsquopresencersquo and lsquobackgroundrsquo respectively
Species occurrence data typically exhibit spatialautocorrelation which arises when the probability ofoccurrence in one sampling unit is not independentof the probability of occurrence in neighbouringunits (Legendre 1993 Dormann et al 2007) If unac-counted for spatial autocorrelation can increase thefrequency of Type I errors (ie identifying a non- significant relationship as significant Dormann et al2007) We checked for spatial autocorrelation in spe-cies observation data and residuals of generalisedlinear models (with Poisson error structures) fitted todata on the number of observations as a function ofRES Clustering of observations may be driven byspatially autocorrelated environmental variables ifpredictors (here RES) explain most of the variation inspecies occurrences (ie a model is correctly speci-fied) there should be minimal spatial autocorrelationin the residuals (Dormann et al 2007 Elith amp Leath-wick 2009) We calculated Moranrsquos I values for the50 nearest neighbouring grid cells using the functionmorantest in the spdep package in R 2140 MoranrsquosI values range from minus1 (negative autocorrelation) to+1 (positive autocorrelation) with values around 0in di cative of a completely random spatial patternSmall positive values of Moranrsquos I were yielded fromspecies observation data (range 0004minus0254) andmodel residuals (range 0012minus0024) indicatingweak spatial clustering at the spatial scale of models(025 times 025deg) Analysis of correlograms showed nosignificant spatial autocorrelation in either observa-tions data or residuals and revealed irregular patchi-ness Subsequently we did not incorporate measuresto account for spatial autocorrelation into models
Model evaluation
Using independent point data collected byMARINE life in a subset of the model area (Fig 2) wetested the predictive performance of models usingReceiver Operating Characteristic (ROC) plots andcomparing the resulting area under the curve (AUC)against that of a null model (see Olden et al 2002Raes amp ter Steege 2007) ROC analyses offer a me -thod of assessing model accuracy that is threshold-independent by evaluating the proportion of cor-rectly and incorrectly classified predictions across acontinuous range of threshold values (Fielding amp Bell1997) The ROC plot is obtained by plotting sensitiv-ity (the true positive rate) as a function of 1-specificity(the false positive rate) at every possible threshold
263
Fig 2 Area where MARINElife conducted monthly seabirdsurveys between 1995 and 2005 in the English Channel andBay of Biscay Data collected served as independent obser-vation data for evaluation of relative environmental suitabil-ity (RES) models Grey squares delineate grid cells (025deg times
025deg) covered by sampling effort
Mar Ecol Prog Ser 485 259ndash273 2013
value The resulting AUC provides a measure of pre-dictive ability the higher the AUC the greater thepredictive accuracy of a model An AUC value of10 indicates a perfect model while a value of 05 isusually considered to be equivalent to performing nobetter than random (Fielding amp Bell 1997)
The use of null models has been demonstrated forimproving testing for statistical significance in AUCvalues (Raes amp ter Steege 2007) and addressing theissue of spatial sorting bias (Hijmans 2012) Spatialsorting bias can inflate AUC values of both empiricaland null models meaning an AUC of 05 might notnecessarily be indicative of random performance (Hijmans 2012) Predictions of RES models weretested by comparing the AUC value of actual modelsagainst a null distribution (a lsquonull modelrsquo) of AUC values derived from randomised data This testedwhether model predictive performance was signifi-cantly different from what would be expected bychance alone We generated a null distribution ofAUC values corresponding with each RES model byrandomly distributing the species observations (pre sence background) among the grid cells coveredby survey effort By generating random data onlyfrom the survey area we aim to minimise spatial sort-ing bias by ensuring that the null model only reflectsthe environmental conditions where sampling wascarried out (Hijmans 2012) The resulting ROC plotwas generated and the AUC was calculated using theROCR package in R 2140 This procedure was re-peated 10 000 times to generate a random frequencydistribution of AUC values that would be expected ifthe RES model did not perform better than expecteddue to chance If the AUC of the empirical model ex-ceeded the 95 quantile of the ranked AUC valuesof the corresponding null model the model was con-sidered to perform significantly better than chancewould dictate (Olden et al 2002) and the relationshipbetween RES and speciesrsquo presence can be consid-ered to be stronger than would be expected bychance We used 1-sided testing since it was only ofinterest whether models performed significantly better than expected by chance not whether theyperformed significantly worse The significance levelwas calculated as the proportion of random AUCsthat were equal to or greater than the observed AUC
The model evaluation has 2 main assumptions (1)there are sufficient records within the test data set toaccurately describe a speciesrsquo distribution within thesurvey area and (2) the range of possible RES valuesis represented within the survey area (ie there isheterogeneity of habitat suitability) To assess theseassumptions we calculated and considered the total
number of speciesrsquo observations number of lsquopres-encersquo cells and percentiles of the ranked RES valueswithin the survey area for each model
Model outputs were also visually compared withpublished range maps (del Hoyo et al 1992 Onley ampSchofield 2007) allowing detection of any large-scale geographical discrepancies in the predictionsof models While qualitative in nature this compari-son provides a useful additional evaluation of modelsat a much larger geographical scale than the morequantitative evaluation described above
RESULTS
Quantifying and modelling speciesrsquo ecological niches
Ecological niches of 6 seabird species mdash fulmarCoryrsquos shearwater great shearwater sooty shearwa-ter Manx shearwater and storm petrel mdash were quan-tified in relation to 4 EGVs mdash depth SST chl a con-centration and distance to land mdash and are describedin Table 2 The 6 species all occupy different eco -logical niches with varying degrees of overlapNiches were subsequently modelled using the RESapproach which resulted in a spatial visualisation ofniches into potential distributions (Fig 3) and illus-trated the relative suitability of the environmentthroughout ranges Manx shearwater and stormpetrel share similar niches during their concurrentbreeding seasons both species occur in cold temper-ate to subtropical waters (5minus25degC) and primarilyrange within a few hundred kilometres of land How-ever while the Manx shearwater prefers depths ofless than 200 m mdash from coastal waters to the edge ofthe continental shelf mdash the storm petrel prefersdeeper waters between 100 and 1000 m Breedingseabirds occur closer to land (all MinP = 0 km) thannon-breeding birds (MinP ranges from 6 to 50 km)
The fulmar occupies a similar niche in the breedingand non-breeding seasons the absolute minimumand maximum values of each EGV do not changebetween the 2 seasons but the preferred range of allenvironmental variables (except chl a) differs Duringthe non-breeding season the fulmarrsquos preferredniche encompasses cooler deeper waters furtherfrom land compared with when breeding Non-breeding great shearwater and sooty shearwateroccupy the widest niches with respect to SST span-ning a range of 37 and 30degC respectively The preferred niche of great shearwater extends furtheroffshore (lt2000 km) than that of sooty shearwaterwhich tends to range closer to land (lt200 km)
264
Watson et al Modelling seabird distributions and habitat suitability
Qualitative comparison with published range maps
From visual qualitative assessment it can be seenthat model outputs (Fig 3) illustrate variability inpredicted range extents of the 6 seabird species inthe North Atlantic Relative environmental suitabilityvaries throughout ranges reflecting niche segrega-tion between species Predicted range extents vary intotal surface area and geographical coverage Com-paring between species non-breeding birds (withthe exception of fulmar) occupy a larger range andlatitudinal extent than breeding birds
Predicted range extents closely corresponded withpublished distribution maps for all species Howeverall ranges comprised a wider extent than maps in theliterature A common discrepancy was the predictionof suitable habitat in enclosed seas when such areasare excluded from published ranges for several spe-cies for example the inclusion of the MediterraneanSea in model outputs for great shearwater and Manxshearwater the Caribbean Sea and Gulf of Mexicofor great shearwater and sooty shearwater and Hud-son Bay for great shearwater Elsewhere modelscaptured areas of known absence well for examplethe absence of breeding Manx shearwater from thewestern central Atlantic and Caribbean Sea theabsence of sooty shearwater from Hudson Bay andthe low habitat suitability in the central Atlantic forthe sooty shearwater
The model output for storm petrel predicted amuch wider range across the North Atlantic thanpublished range maps the latter define the speciesrsquorange as restricted to the northeast Atlantic extend-ing no further west than 30degW Areas of high environ-mental suitability were separated by a large area oflow RES in the central Atlantic Similarly a smallarea of suitable habitat was predicted for fulmar in
the north Mediterranean Sea but separated from thecore range by a large area of unsuitable habitat
Statistical model evaluation
RES models for 5 out of 6 species performed signifi-cantly better than expected by chance when testedwith independent observation data from the Bay ofBiscay (p lt 005 Table 3) The AUC of empirical mod-els was significantly higher than that of correspondingnull models revealing a significant relationship be-tween RES and species occurrences for 6 out of 7models In the case of 4 out of a total of 7 models lessthan 01 of random samples had a higher AUC thanthe actual model (p lt 0001) The model for sootyshearwater did not perform significantly better thanrandom (p = 0260) with 26 of random AUCs ex-ceeding the observed AUC While the model for greatshearwater performed significantly better than ex-pected by chance (p = 0041) the model AUC wasonly very slightly higher than the 95 quantile of theranked null AUC values indicating that the model didnot perform much better than random
The number of speciesrsquo encounters ranged from115 to 590 (mean 3531 plusmn 653 Table 4) The rangeand frequency distribution of habitat suitabilityacross the model evaluation area for each species isillustrated by percentiles of ranked RES values(Table 4) The distribution of RES in the survey areavaries between species and is strongly skewed mdashindicating reduced heterogeneity of habitat suita -bility mdash for 3 models fulmar (breeding) sooty shear -water and Manx shearwater The majority of habitatwithin the sampling area is of low suitability forbreeding fulmars but of homogenously high suitabil-ity for sooty and Manx shearwaters
265
Species Status Depth (m) SST (degC) Distance (m)MinA MinP MaxP MaxA MinA MinP MaxP MaxA MinA MinP Max P MaxA
Northern fulmar B 0 100 1000 8000 minus2 0 15 15 0 0 320 2364N 0 100 2000 8000 minus2 0 10 15 0 50 2364 2364
Coryrsquos shearwater B 0 100 1000 8000 10 20 20 25 0 0 200 2364Great shearwater N 0100 200 8000 minus2 0 20 35 0 6 2000 2364Sooty shearwater N 0 10 1000 8000 5 10 20 35 0 15 200 2364Manx shearwater B 0 10 200 8000 5 10 20 25 0 0 360 2364European storm petrel B 0 100 2000 8000 5 10 20 25 0 0 200 2364
Table 2 Quantitative descriptions of speciesrsquo ecological niches in respect of 4 ecogeographical variables depth sea-surfacetemperature (SST) distance to land and chlorophyll a (chl a) concentration Niches were defined for 6 procellariiform seabirdsduring the breeding andor non-breeding season MinA and MaxA absolute minimum and maximum values of the resourceselection function MinP and MaxP preferred minimum and maximum values (see Fig 1) Chl a (mg mminus3 identical for eachspecies and status) MinA MinP = 0 03 MaxP MaxA = 60 60 Status B = breeding N = non-breeding See Table S1 in
Supplement 1 (wwwint-rescomarticlessupplm485p259_supplpdf) for data sources
Mar Ecol Prog Ser 485 259ndash273 2013266
Fig 3 Model outputs illustrating predicted geographicrange and relative environmental suitability (RES) for 6procellariiform seabirds in the North Atlantic duringtheir breeding (yellowminusbrown) andor non-breedingseasons (blue) (A) northern fulmar Fulmarus glacialisbreeding (B) northern fulmar non-breeding (C) Coryrsquosshearwater Calonectris diomedea breeding (D) greatshearwater Puffinus gravis non-breeding (E) sootyshearwater P griseus non-breeding (F) Manx shear -water P puffinus breeding and (G) European stormpetrel Hydrobates pelagicus breeding Predicted RES ison a scale from 0 (least suitable white) to 1 (highly suit-
able dark)
Watson et al Modelling seabird distributions and habitat suitability
DISCUSSION
RES predictions
When compared with simulated random data RESmodels performed significantly better for 5 out of6 seabird species (and 6 out of 7 models) at predicting
relative likelihood of occurrence in a subset of thestudy area Model outputs provide more informationon speciesrsquo distributions than published range mapssince they provide indices of relative environmentalsuitability throughout a speciesrsquo range RES predic-tions represent simple testable hypotheses concern-ing a speciesrsquo potential niche in respect of a few envi-ronmental predictors Visualisation of hypotheses ina spatial context facilitates our understanding of speciesminushabitat relationships inference of areas ofpotentially high seabird abundance and identifica-tion of regions to be targeted for future research andconservation planning
Observed versus predicted distributions
RES modelling of the potential niche resulted inpredictions of occurrence outside of known (or ob -served) ranges for several species when comparedwith published range maps indicating that distribu-tions are influenced by additional biological andorphysical parameters besides those included in mod-els Indeed modelling of the realised niche mdash thepart of the potential niche that a species actuallyuses mdash requires the incorporation of biotic interac-tions (Soberoacuten amp Nakamura 2009) and physiologicalconstraints (Kearney amp Porter 2009) Qualitative com-parison of RES model outputs with observed distribu-tions thus allows the assessment of the importance ofother factors that may influence the at-sea distribu-tion of seabirds
Distributions of pelagic animals are ultimately con-strained by the abundance and distribution of prey(Pahl-Wostl 1997) but scales of association betweenmobile predators and prey are highly variable(Schneider amp Piatt 1986) and prey indices are consid-ered inappropriate for predicting global distributionsof many highly mobile marine organisms (Torres etal 2008) Karpouzi et al (2007) incorporated informa-tion on prey distributions in mapping at-sea foragingdistributions of seabirds however they found little orno information concerning the diet of many seabirdsand detected high spatial variability in associationsbetween seabirds and prey Habitat modelling istherefore largely reliant on predictor variables thatindirectly affect species distribution
Evidence from energetic and physiological studieshighlights the significance of wind speed (Furness ampBryant 1996) and area of available ocean extent (Da -vies et al 2010) in influencing the foraging behaviourand life-history strategies of procellariiform seabirdsThe Strait of Gibraltar (Friesen et al 2007) and the
267
Species AUCm AUCn p
Northern fulmarBreeding 0735 0568 lt0001Non-breeding 0774 0583 lt0001Coryrsquos shearwaterBreeding 0712 0580 lt0001Great shearwaterNon-breeding 0587 0583 0041Sooty shearwaterNon-breeding 0530 0575 0260Manx shearwaterBreeding 0614 0572 0004European storm petrelBreeding 0704 0582 lt0001
Table 3 Evaluation of predictive performance of relative en-vironmental suitability (RES) models A model was consid-ered to perform significantly better than chance if the areaunder the curve of the empirical model (AUCm) exceededthe 95 quantile of the ranked AUC values of a correspon-ding null model (AUCn) p-values indicate the proportion of
AUCn that were equal to or greater than AUCm
Species No of No of Percentiles of ranked records lsquopresencersquo RES in survey area
cells 10 50 90
Northern fulmarBreeding 590 71 00 00 10Non-breeding 248 45 012 036 056Coryrsquos shearwaterBreeding 527 51 015 043 062Great shearwaterNon-breeding 452 48 037 069 10Sooty shearwaterNon-breeding 115 46 055 10 10Manx shearwaterBreeding 245 60 050 10 10European storm petrelBreeding 295 46 045 086 10
Table 4 Summary of test data used for evaluating the pre-dictive performance of relative environmental suitability(RES) models Independent observation data were collectedfrom repeated sampling of 156 grid cells (025deg times 025deg) byMARINElife in the Bay of Biscay (Fig 2) The number of spe-cies records number of lsquopresencersquo cells and variation in RESwithin the model evaluation area (percentiles of ranked
RES) are presented
Mar Ecol Prog Ser 485 259ndash273 2013
Almeria-Oran Oceanographic Front (Goacutemez-Diacuteaz etal 2006) have both been proposed as barriers limit-ing dispersal of and genetic exchange between sea-birds in the Atlantic Ocean and the MediterraneanSea Such physical and geographical factors mayexplain why despite the prediction of suitable habitat the observed distributions of some species donot extend into enclosed seas eg the absence ofgreat shearwater from the Mediterranean Sea andHudson Bay
Biotic interactions may play a significant role indetermining distributions across smaller spatial andtemporal scales (Furness amp Birkhead 1984) and theirincorporation into SDMs is widely recognised as akey challenge in both terrestrial (Arauacutejo amp Guisan2006) and marine environments (Robinson et al2011) Shearwaters do not typically form mixed- species colonies (Warham 1990) suggesting thatinterspecific competition and niche segregation mayinfluence the breeding distributions of some procel-lariiform seabirds While the observed range of Manxshearwater does not extend into the MediterraneanSea the breeding ranges of the Balearic shearwaterPuffinus mauretanicus and the Yelkoaun shearwaterP yelkoauni which occupy similar ecological nichesto the Manx shearwater (and were until recentlyconsidered to be subspecies of Manx shearwaterSangster et al 2002) are restricted to the Mediter-ranean Sea (Onley amp Schofield 2007) A combinationof evolutionary history and biotic interactions mayexplain the reduced niche overlap that is observed(compared with predicted overlap) between these 3ecologically similar species Depending on the objec-tives it may be a more useful approach to applyniche modelling to a species complex when there areseveral closely related species
Despite their ability to traverse large sections ofocean many procellariiform seabirds show limiteddispersal (the lsquoseabird paradoxrsquo proposed by Milot etal 2008) Their philopatric habits are expected tolimit colonisation by long-distance dispersal and sub-sequent range expansion (Matthiopoulos et al 2005Brown et al 2010) Despite the prediction of highRES in the northwest Atlantic for the storm petrelhigh breeding-site fidelity and the large area of pre-dicted low habitat suitability in the central Atlanticmay explain why the speciesrsquo observed distribution(from published range maps) is restricted to thenortheast Atlantic (del Hoyo et al 1992) Addition-ally the niche is already filled by another pelagicseabird Leachrsquos petrel Oceanodroma leucorhoa inthe northwest Atlantic (del Hoyo et al 1992) In theinterpretation of RES model outputs consideration
should thus be afforded to a speciesrsquo evolutionaryhistory as well as areas of low RES separating areasof high RES both of which may act to restrict ranges
The availability of suitable nest sites is a funda-mental constraint on the current breeding distribu-tion of seabirds (Brown et al 2010) Procellariiformseabirds are largely restricted to remote islands freeof mammalian predators which are within range ofsuitable foraging areas (Warham 1990) If all occu-pied breeding colonies could be accurately identifiedand niche envelopes constrained by maximum forag-ing range from colonies models could yield moreaccurate predictions of range extent during thebreeding season However given the difficulties ofsurveying and monitoring remote locations ourknowledge of breeding sites is likely to be incom-plete particularly for less well-studied speciesRestricting distribution to within species-specific for-aging range of all land therefore represents a moreconservative approach
Where suitable habitat is predicted outside of cur-rent observed distributions this may indicate areasthat are used by a species but for which there are nodata or areas that could be suitable for colonisationFuture colonisation or range shifts could be driven bychanges in environmental suitability as a result ofnatural changes (eg Gaston amp Woo 2008) andoranthropogenic-induced changes such as by meansof active conservation management (Miskelly et al2009) By identifying areas of potentially suitable at-sea habitat the RES modelling approach may thusoffer insight into the effects of future changes in cli-mate and anthropogenic activities on speciesrsquo distri-butions Further model development could be basedon different scenarios for climate or nest-site avail-ability to generate predictions of future changes indistributions
Model evaluation
Statistical evaluation demonstrates that the genericapproach of RES modelling can accurately describehabitat suitability for wide-ranging seabirds RESpredictions were more strongly related to speciespresence for 6 out of 7 models than expected due tochance While qualitative assessment of the modeloutput for non-breeding sooty shearwater suggestedreasonable consistency with published distributiondata the model did not perform significantly betterthan a null model Poor model performance could beexplained by the low quality of data used for modelparameterisation (see Table S1) resulting in an inac-
268
Watson et al Modelling seabird distributions and habitat suitability
curate description of a speciesrsquo ecological niche It iswell established that speciesminusenvironment relation-ships can change with scale (Manly et al 2002) andthere is evidence for intraspecific spatial variation inspeciesminushabitat relationships in seabirds (Huettmannamp Diamond 2001) Most information on the at-seahabitat associations of the sooty shearwater comesfrom studies in the Pacific Ocean (Briggs amp Chu 1986Vermeer et al 1989 but see Hedd et al 2012) There-fore we cannot be certain of the spatial stability ofthe speciesrsquo niche across distinct ocean basins Theavailability and quality of ecological data may limitthe wider application of RES modelling to other spe-cies of seabird if insufficient data are available toaccurately quantify speciesrsquo ecological niches
Rigorous evaluation of models requires that the testdata set accurately reflects the distribution andoccurrence of a species within the evaluation areaThe test data comprised far fewer observations ofsooty shearwater than the other study species andthe sampling area was characterised by low variationin RES ie highly homogeneous habitat suitability(Table 4) However despite highly skewed distribu-tions of RES the models for fulmar (breeding) andManx shearwater showed highly significant predic-tive accuracy when compared to null models Thisindicates these models must be performing very wellif they can perform significantly better than randomeven under less favourable conditions for the evalua-tion Rigorous model evaluation relies on representa-tive observation data collected across broad spatialand temporal scales to compliment the macro-scalemodelling approach While lsquoregularrsquo and lsquoequal-stratifiedrsquo sampling strategies are the most accurateand robust (Hirzel amp Guisan 2002) these are not typ-ically features of opportunistically collected data mdashthe source of most at-sea seabird observations Theincreasing availability of large-scale point data (egOBIS GBIF) and range maps such as those availablethrough the IUCN Red List (wwwiucnredlistorg)presents opportunities for further testing of RESmodels However the availability of representativetest data may limit the application of RES modellingfor scarcer and under-recorded species
Biases in model parameters
A frequent obstacle encountered in predictive distribution modelling of marine animals is the lackof reliable and comprehensive occurrence datafrom which to define species-habitat relationships(Robinson et al 2011) The issue of environmental
bias mdash spatial andor temporal bias in collection ofoccurrence data mdash is widely recognised in speciesdis tribution modelling (Arauacutejo amp Guisan 2006Phillips et al 2009 Ready et al 2010) It mainly arisesfrom limitations in data accessibility and samplingstrategies preventing representative coverage of theentire environmental range of species (Phillips et al2009) The biases inherent to most observation datacan easily lead to incorrect interpretation of habitatpreferences of wide-ranging species (Hirzel ampGuisan 2002)
RES modelling provides a technique for predictinglarge-scale distributions which does not rely on pointdata The niche hypotheses underlying RES modelsstill ultimately depend on the quality and amount ofavailable ecological information Quantitative dataon the relationships between seabirds and oceanproductivity are lacking and large areas of theoceans remain under-studied eg the central At -lantic (but see Skov et al 1994) However the abilityfor RES modelling to incorporate a range of qualita-tive and quantitative data collected from differentparts of speciesrsquo ranges at different times of yearbroadens the scope of environmental coverage Con-sequently the outputs may represent more balancedand robust predictions for many marine animalsthan the more commonly used predictive modellingtechniques When previously tested against a rangeof marine taxa RES modelling was shown to performvery well compared with traditional presence-onlymodelling methods (Ready et al 2010)
Accounting for temporal variability
Temporal variability in ecological niches and envi-ronmental parameters is frequently overlooked inspecies distribution modelling (Dambach amp Roumldder2011) Previous applications of RES modelling tomarine top predators did not account for temporalvariability in speciesminushabitat relationships or EGVs(Kaschner et al 2006 Ready et al 2010) In this studywe have accounted for the seasonal shifts in habitatassociations that occur within the annual life cycle bydistinguishing between a speciesrsquo breeding and non-breeding niche and subsequently relating niches toseasonally averaged data for dynamic EGVsAccounting for temporal variation in both speciesminusenvironment relationships and dynamic environ-mental variables is expected to increase the reliabil-ity of RES predictions particularly in areas whereenvironmental conditions fluctuate greatly betweenseasons Consequently our seasonal RES predictions
269
Mar Ecol Prog Ser 485 259ndash273 2013
can provide greater insight into speciesrsquo behaviourand ecology than those based on an annual averageniche envelope
Applications and recommendations for future research
RES modelling could prove a valuable tool forinforming the development and implementation ofeffective conservation and management practices Inthe absence of comprehensive occurrence data forwide-ranging species RES models can identify criti-cally important areas and biodiversity hotspots inpelagic marine ecosystems This is of direct rele-vance to the development of quantifiable criteria forthe designation of marine Important Bird Areas(IBAs BirdLife International 2004) The modellingapproach could be used to direct observation effort toareas where under-recorded seabirds are predictedto occur and inform sampling strategies to incorpo-rate a range of environmental suitability Matchingdata on seabird distribution as revealed by RESmodel outputs with data on fishing effort couldinform the responsibilities of Regional FisheriesManagement Organisations (RFMOs) and the devel-opment of suitable monitoring and mitigation meas-ures to reduce negative interactions between sea-birds and fisheries (eg Le Corre et al 2012)
Application of RES modelling to a greater variety ofspecies demonstrating variable niche characteris-tics will allow further examination of the broad-scaleapplicability of the approach Expanding the RESapproach to wider geographic areas incorporatingall of a speciesrsquo range would offer greater insightinto understanding distribution dispersal and migra-tory behaviour An iterative approach to the develop-ment of models (as recommended by Elith et al 2006)will improve the robustness of predictions by consid-ering the effects of a wider range of predictor vari-ables on model performance Additional factors thathave been shown to influence the at-sea distributionof seabirds and could be incorporated into futuremodels include sea-surface salinity (eg Huettmannamp Diamond 2001) horizontal (eg Louzao et al 2009)and vertical gradients in SST (eg Spear et al 2001)and fishing effort (eg Karpouzi et al 2007)
Wider application of RES modelling requires simultaneous developments in at-sea sampling andlarge-scale studies of speciesminushabitat relationshipswhich inform one another and offer direction forfuture research The increasing use of trackingdevices for recording movements of seabirds pro-
vides opportunities for quantification of habitat useand preference (Wakefield et al 2009 Le Corre et al2012) Increasing the public availability of trackingdata will facilitate further development of SDMs(Skov et al 2008) Further studies are required toimprove quantitative understanding of speciesminushabi-tat relationships across a variety of spatio-temporalscales and integration of data across scales is neces-sary to enhance the predictive ability of RES modelsHaving demonstrated RES is a robust modellingapproach predictions could be improved by the useof ensemble model averaging (Arauacutejo amp New 2007)
CONCLUSIONS
Based on quantitative definitions of speciesrsquo eco-logical requirements RES maps offer a robust alter-native to subjectively generated traditional rangemaps We have shown that RES modelling can ade-quately describe habitat suitability across largescales for wide-ranging pelagic seabirds RES model-ling presents a generic and objective approach forpredicting distributions of wide-ranging marine ani-mals across large spatial scales when the absence ofrepresentative point data precludes the applicationof traditional modelling techniques Model outputsrepresent an alternative to the conventional and sub-jective approach of delineating range extents basedon limited records of occurrence The approach isbased on clear assumptions concerning speciesrsquohabitat preferences which can be easily modifiedand tested
RES predictions are limited by the extent of pub-lished data and the subsequent ability to accuratelyquantify speciesrsquo ecological niches While some gapsin the literature are evident the synthesis of knowl-edge concerning speciesminushabitat relationships canadequately describe ecological niches for the pur-poses of building predictive distribution models Thisoffers a more robust approach for answering broad-scale questions about speciesrsquo distributions thanderiving niches from limited and biased samplingdata Of greater significance is the limited availabil-ity of representative at-sea observations data to rig-orously evaluate models which may prove to be thekey limiting factor in the wider application of RESmodelling for wide-ranging marine animals
Acknowledgements Thanks to the NERC Earth Observa-tion Data Acquisition and Analysis Service (NEODAAS) forsupplying data for this study MARINElifersquos contribution tothis research was part-funded by the EU as part of the Chan-
270
Watson et al Modelling seabird distributions and habitat suitability
nel Integrated Approach for Marine Resource Management(CHARM) Phase 3 project We thank MARINElife volun-teers for collection of observation data and PampO Ferries forsponsoring surveys aboard the lsquoPride of Bilbaorsquo
LITERATURE CITED
Airameacute S Dugan JE Lafferty KD Leslie H McArdle DAWarner RR (2003) Applying ecological criteria to marinereserve design a case study from the California ChannelIslands Ecol Appl 13 170minus184
Arauacutejo MB Guisan A (2006) Five (or so) challenges for spe-cies distribution modelling J Biogeogr 33 1677minus1688
Arauacutejo MB New M (2007) Ensemble forecasting of speciesdistributions Trends Ecol Evol 22 42minus47
Ashmole N (1971) Sea bird ecology and the marine environ-ment In Farner DS King JR (eds) Avian biology Vol 1Academic Press New York NY p 223minus286
BirdLife International (2004) Tracking ocean wanderers the global distribution of albatrosses and petrels Resultsfrom the Global Procellariiform Tracking Workshop1minus5 September 2003 Gordonrsquos Bay South Africa BirdlifeInternational Cambridge
Boyce MS Vernier PR Nielsen SE Schmiegelow FKA(2002) Evaluating resource selection functions EcolModel 157 281minus300
Briggs KT Chu EW (1986) Sooty shearwaters off California distribution abundance and habitat use Condor 88 355minus364
Brown RM Nichols RA Faulkes CG Jones CG and others(2010) Range expansion and hybridization in RoundIsland petrels (Pterodroma spp) evidence from micro -satellite genotypes Mol Ecol 19 3157minus3170
Cramp S Simmons K (1980) Handbook of the birds ofEurope the Middle East and north Africa The birds ofthe western Palearctic Vol 1 Ostrich to ducks OxfordUniversity Press Oxford
Dambach J Roumldder D (2011) Applications and future chal-lenges in marine species distribution modeling AquatConserv 21 92minus100
Davies RG Irlich UM Chown SL Gaston KJ (2010) Ambi-ent productive and wind energy and ocean extent pre-dict global species richness of procellariiform seabirdsGlob Ecol Biogeogr 19 98minus110
del Hoyo J Elliott A Sargatal J (1992) Handbook of thebirds of the world Vol 1 Ostrich to ducks Lynx EdicionsBarcelona
Dormann CF McPherson JM Arauacutejo MB Bivand R and oth-ers (2007) Methods to account for spatial autocorrelationin the analysis of species distributional data a reviewEcography 30 609minus628
Elith J Leathwick JR (2009) Species distribution models ecological explanation and prediction across space andtime Annu Rev Ecol Evol Syst 40 677minus697
Elith J Graham H Anderson P Dudiacutek M and others (2006)Novel methods improve prediction of species distribu-tions from occurrence data Ecography 29 129minus151
Fielding AH Bell JF (1997) A review of methods for theassessment of prediction errors in conservation pres-enceabsence models Environ Conserv 24 38minus49
Friesen VL Burg TM McCoy KD (2007) Mechanisms ofpopulation differentiation in seabirds Mol Ecol 16 1765minus1785
Furness RW Birkhead TR (1984) Seabird colony distribu-
tions suggest competition for food supplies during thebreeding-season Nature 311 655minus656
Furness RW Bryant DM (1996) Effect of wind on field meta-bolic rates of breeding northern fulmars Ecology 77 1181minus1188
Gaston AJ Woo K (2008) Razorbills (Alca torda) follow sub-arctic prey into the Canadian Arctic colonization resultsfrom climate change Auk 125 939minus942
Goacutemez-Diacuteaz E Gonzaacutelez-Soliacutes J Peinado MA Page RDM(2006) Phylogeography of the Calonectris shearwatersusing molecular and morphometric data Mol PhylogenetEvol 41 322minus332
Gregr EJ Trites AW (2008) A novel presence-only validationtechnique for improved Steller sea lion Eumetopias juba-tus critical habitat descriptions Mar Ecol Prog Ser 365 247minus261
Guinotte JM Bartley JD Iqbal A Fautin DG BuddemeierRW (2006) Modeling habitat distribution from organismoccurrences and environmental data case study usinganemonefishes and their sea anemone hosts Mar EcolProg Ser 316 269minus283
Guisan A Zimmermann NE (2000) Predictive habitat distri-bution models in ecology Ecol Model 135 147minus186
Guisan A Edwards TC Hastie T (2002) Generalized linearand generalized additive models in studies of speciesdistributions setting the scene Ecol Model 157 89minus100
Hardy SM Lindgren M Konakanchi H Huettmann F (2011)Predicting the distribution and ecological niche of unex-ploited snow crab (Chionoecetes opilio) populations inAlaskan waters a first open-access ensemble modelIntegr Comp Biol 51 608minus622
Hedd A Montevecchi WA Otley H Phillips RA Fifield DA(2012) Trans-equatorial migration and habitat use bysooty shearwaters Puffinus griseus from the SouthAtlantic during the nonbreeding season Mar Ecol ProgSer 449 277minus290
Hijmans RJ (2012) Cross-validation of species distributionmodels removing spatial sorting bias and calibrationwith a null model Ecology 93 679minus688
Hirzel AH Guisan A (2002) Which is the optimal samplingstrategy for habitat suitability modelling Ecol Model157 331minus341
Hobbs M Brereton T Weir C Williams A (2003) Baselinemonitoring data on Procellariformes [Procellariiformes](shearwaters) in the Bay of Biscay Ornis Hungarica12ndash13 115minus125
Huettmann F Diamond AW (2001) Seabird colony locationsand environmental determination of seabird distribution a spatially explicit breeding seabird model for the North-west Atlantic Ecol Model 141 261minus298
Huettmann F Artukhin Y Gilg O Humphries G (2011) Pre-dictions of 27 Arctic pelagic seabird distributions usingpublic environmental variables assessed with colonydata a first digital IPY and GBIF open access synthesisplatform Mar Biodivers 41 141minus179
Intergovernmental Oceanographic Commission (IOC) Inter -national Hydrographic Organization (IHO) and BritishOceanographic Data Centre (BODC) (2003) Centenaryedition of the GEBCO Digital Atlas published on CD-ROM on behalf of the Intergovernmental OceanographicCommission and the International Hydrographic Organi-zation as part of the General Bathymetric Chart of theOceans BODC Liverpool
Karpouzi VS Watson R Pauly D (2007) Modelling and map-ping resource overlap between seabirds and fisheries on
271
Mar Ecol Prog Ser 485 259ndash273 2013
a global scale a preliminary assessment Mar Ecol ProgSer 343 87minus99
Kaschner K Watson R Trites AW Pauly D (2006) Mappingworld-wide distributions of marine mammal speciesusing a relative environmental suitability (RES) modelMar Ecol Prog Ser 316 285minus310
Kaschner K Tittensor DP Ready J Gerrodette T Worm B(2010) Current and future patterns of global marinemammal biodiversity PLoS ONE 6 e19653
Kearney M Porter W (2009) Mechanistic niche modelling combining physiological and spatial data to predict spe-ciesrsquo ranges Ecol Lett 12 334minus350
Le Corre M Jaeger A Pinet P Kappes MA and others (2012)Tracking seabirds to identify potential Marine ProtectedAreas in the tropical western Indian Ocean Biol Conserv156 83minus93
Legendre P (1993) Spatial autocorrelation trouble or newparadigm Ecology 74 1659minus1673
Louzao M Hyrenbach KD Arcos JM Abelloacute P De Sola LGOro D (2006) Oceanographic habitat of an endangeredMediterranean procellariiform implications for marineprotected areas Ecol Appl 16 1683minus1695
Louzao M Beacutecares J Rodriacuteguez B Hyrenbach KD Ruiz AArcos JM (2009) Combining vessel-based surveys andtracking data to identify key marine areas for seabirdsMar Ecol Prog Ser 391 183minus197
Manly BF McDonald LL Thomas DL McDonald TL Erick-son WP (2002) Resource selection by animals statisticaldesign and analysis for field studies Springer New YorkNY
Matthiopoulos J Harwood J Thomas L (2005) Metapopula-tion consequences of site fidelity for colonially breedingmammals and birds J Anim Ecol 74 716minus727
Maxwell DL Stelzenmuumlller V Eastwood PD Rogers SI(2009) Modelling the spatial distribution of plaice (Pleu-ronectes platessa) sole (Solea solea) and thornback ray(Raja clavata) in UK waters for marine management andplanning J Sea Res 61 258minus267
Milot E Weimerskirch H Bernatchez L (2008) The seabirdparadox dispersal genetic structure and populationdynamics in a highly mobile but philopatric albatrossspecies Mol Ecol 17 1658minus1673
Miskelly CM Taylor GA Gummer H Williams R (2009)Translocations of eight species of burrow-nesting sea-birds (genera Pterodroma Pelecanoides Pachyptila andPuffinus Family Procellariidae) Biol Conserv 142 1965minus1980
Nur N Jahncke J Herzog MP Howar J and others (2011)Where the wild things are predicting hotspots of seabirdaggregations in the California Current System EcolAppl 21 2241minus2257
Oedekoven CS Ainley DG Spear LB (2001) Variable res -ponses of seabirds to change in marine climate Califor-nia Current 1985ndash1994 Mar Ecol Prog Ser 212 265minus281
Olden JD Jackson DA Peres-Neto PR (2002) Predictivemodels of fish species distributions a note on proper val-idation and chance predictions Trans Am Fish Soc 131 329minus336
Olivier F Wotherspoon SJ (2006) Modelling habitat selec-tion using presence-only data case study of a colonialhollow nesting bird the snow petrel Ecol Model 195 187minus204
Onley D Schofield P (2007) Field guide to the albatrossespetrels and shearwaters of the world Christopher HelmLondon
Oppel S Meirinho A Ramiacuterez I Gardner B OrsquoConnell AFMiller PI Louzao M (2012) Comparison of five modellingtechniques to predict the spatial distribution and abun-dance of seabirds Biol Conserv 156 94minus104
Ostrand WD Drew GS Suryan RM McDonald LL (1998)Evaluation of radio-tracking and strip transect methodsfor determining foraging ranges of black-legged kitti-wakes Condor 100 709minus718
Pahl-Wostl C (1997) Dynamic structure of a food web model comparison with a food chain model Ecol Model 100 103minus123
Phillips SJ Dudiacutek M Elith J Graham CH Lehmann ALeathwick J Ferrier S (2009) Sample selection bias andpresence-only distribution models implications for back-ground and pseudo-absence data Ecol Appl 19 181minus197
Raes N ter Steege H (2007) A null-model for significancetesting of presence-only species distribution modelsEcography 30 727minus736
Raymond B Woehler EJ (2003) Predicting seabirds at sea inthe Southern Indian Ocean Mar Ecol Prog Ser 263 275minus285
Ready J Kaschner K South AB Eastwood PD and others(2010) Predicting the distributions of marine organismsat the global scale Ecol Model 221 467minus478
Redfern JV Ferguson MC Becker EA Hyrenbach KD andothers (2006) Techniques for cetaceanminushabitat modelingMar Ecol Prog Ser 310 271minus295
Robinson LM Elith J Hobday AJ Pearson RG Kendall BEPossingham HP Richardson AJ (2011) Pushing the limitsin marine species distribution modelling lessons fromthe land present challenges and opportunities Glob EcolBiogeogr 20 789minus802
Ross DA (1988) An introduction to oceanography PrenticeHall Englewood Cliffs NJ
Sangster G Knox AG Helbig AJ Parkin DT (2002) Taxo-nomic recommendations for European birds Ibis 144 153minus159
Schneider DC (1997) Habitat selection by marine birds inrelation to water depth Ibis 139 175minus178
Schneider DC Piatt JF (1986) Scale-dependent correlationof seabirds with schooling fish in a coastal ecosystemMar Ecol Prog Ser 32 237minus246
Skov H Durinck J Danielsen F Bloch D (1994) The summerdistribution of Procellariiformes in the central NorthAtlantic Ocean Vogelwarte 37 270minus289
Skov H Humphreys E Garthe S Geitner K and others(2008) Application of habitat suitability modelling totracking data of marine animals as a means of analyzingtheir feeding habitats Ecol Model 212 504minus512
Soberoacuten J Nakamura M (2009) Niches and distributionalareas concepts methods and assumptions Proc NatlAcad Sci USA 106 19644minus19650
Spear LB Ballance LT Ainley DG (2001) Response of sea-birds to thermal boundaries in the tropical Pacific thethermocline versus the Equatorial Front Mar Ecol ProgSer 219 275minus289
Sverdrup H Johnston MW Fleming RH (1942) The oceans their physics chemistry and general biology PrenticeHall New York NY
Tasker ML Reid JB (1997) Seabirds in the marine environ-ment mdash introduction ICES J Mar Sci 54 505minus506
Torres LG Read AJ Halpin P (2008) Fine-scale habitat modeling of a top marine predator Do prey data improvepredictive capacity Ecol Appl 18 1702minus1717
Vermeer K Morgan KH Smith GEJ Hay R (1989) Fall distri-
272
Watson et al Modelling seabird distributions and habitat suitability 273
bution of pelagic birds over the shelf off SW VancouverIsland Colon Waterbirds 12 207minus214
Wakefield ED Phillips RA Matthiopoulos J (2009) Quantify-ing habitat use and preferences of pelagic seabirds usingindividual movement data a review Mar Ecol Prog Ser391 165minus182
Warham J (1990) The petrels their ecology and breedingsystems Academic Press New York NY
Yen PPW Huettmann F Cooke F (2004) A large-scale modelfor the at-sea distribution and abundance of marbledmurrelets (Brachyramphus marmoratus) during the bree -ding season in coastal British Columbia Canada EcolModel 171 395minus413
Zimmermann NE Edwards TC Graham CH Pearman PBSvenning JC (2010) New trends in species distributionmodelling Ecography 33 985minus989
Editorial responsibility Rory Wilson Swansea UK
Submitted June 7 2012 Accepted March 7 2013Proofs received from author(s) June 11 2013

Watson et al Modelling seabird distributions and habitat suitability
The multiplicative approach means that if any onevariable within a cell fell outside of a speciesrsquo ab -solute range the overall suitability was equal to 0This is based on the assumption that an animal wouldnot be expected to occur within an environment thatis unsuitable in respect of one or more variables thatare key determinants of distribution RES valueswere imported into the GIS grid and displayed usinga continuous colour scale Model outputs delineate aspeciesrsquo predicted geographic range and illustratethe relative suitability of the environment (equatingto likelihood of occurrence) throughout that range
Observation data
MARINElife provided point data collected frommonthly seabird surveys carried out in the EnglishChannel and Bay of Biscay (Fig 2) between 1995 and2005 (though data from 2003 and 2004 were notavailable) Surveys were carried out aboard a com-mercial ferry liner within a restricted transect routeinvolving repeated sampling of grid cells A total of2696 h of observations collected across 156 gridcells provided data for the model evaluation Thedata set comprises a large number of observationsrepresenting a high diversity of species collectedover a decade and employing consistent methodol-ogy across space and time The sampling area coversa wide spectrum of environmental strata Observa-tions were binned within grid cells (025 times 025deg) tomatch the spatial resolution of environmental data
Cells were assigned a binary value of 1 or 0 indica-ting lsquopresencersquo and lsquobackgroundrsquo respectively
Species occurrence data typically exhibit spatialautocorrelation which arises when the probability ofoccurrence in one sampling unit is not independentof the probability of occurrence in neighbouringunits (Legendre 1993 Dormann et al 2007) If unac-counted for spatial autocorrelation can increase thefrequency of Type I errors (ie identifying a non- significant relationship as significant Dormann et al2007) We checked for spatial autocorrelation in spe-cies observation data and residuals of generalisedlinear models (with Poisson error structures) fitted todata on the number of observations as a function ofRES Clustering of observations may be driven byspatially autocorrelated environmental variables ifpredictors (here RES) explain most of the variation inspecies occurrences (ie a model is correctly speci-fied) there should be minimal spatial autocorrelationin the residuals (Dormann et al 2007 Elith amp Leath-wick 2009) We calculated Moranrsquos I values for the50 nearest neighbouring grid cells using the functionmorantest in the spdep package in R 2140 MoranrsquosI values range from minus1 (negative autocorrelation) to+1 (positive autocorrelation) with values around 0in di cative of a completely random spatial patternSmall positive values of Moranrsquos I were yielded fromspecies observation data (range 0004minus0254) andmodel residuals (range 0012minus0024) indicatingweak spatial clustering at the spatial scale of models(025 times 025deg) Analysis of correlograms showed nosignificant spatial autocorrelation in either observa-tions data or residuals and revealed irregular patchi-ness Subsequently we did not incorporate measuresto account for spatial autocorrelation into models
Model evaluation
Using independent point data collected byMARINE life in a subset of the model area (Fig 2) wetested the predictive performance of models usingReceiver Operating Characteristic (ROC) plots andcomparing the resulting area under the curve (AUC)against that of a null model (see Olden et al 2002Raes amp ter Steege 2007) ROC analyses offer a me -thod of assessing model accuracy that is threshold-independent by evaluating the proportion of cor-rectly and incorrectly classified predictions across acontinuous range of threshold values (Fielding amp Bell1997) The ROC plot is obtained by plotting sensitiv-ity (the true positive rate) as a function of 1-specificity(the false positive rate) at every possible threshold
263
Fig 2 Area where MARINElife conducted monthly seabirdsurveys between 1995 and 2005 in the English Channel andBay of Biscay Data collected served as independent obser-vation data for evaluation of relative environmental suitabil-ity (RES) models Grey squares delineate grid cells (025deg times
025deg) covered by sampling effort
Mar Ecol Prog Ser 485 259ndash273 2013
value The resulting AUC provides a measure of pre-dictive ability the higher the AUC the greater thepredictive accuracy of a model An AUC value of10 indicates a perfect model while a value of 05 isusually considered to be equivalent to performing nobetter than random (Fielding amp Bell 1997)
The use of null models has been demonstrated forimproving testing for statistical significance in AUCvalues (Raes amp ter Steege 2007) and addressing theissue of spatial sorting bias (Hijmans 2012) Spatialsorting bias can inflate AUC values of both empiricaland null models meaning an AUC of 05 might notnecessarily be indicative of random performance (Hijmans 2012) Predictions of RES models weretested by comparing the AUC value of actual modelsagainst a null distribution (a lsquonull modelrsquo) of AUC values derived from randomised data This testedwhether model predictive performance was signifi-cantly different from what would be expected bychance alone We generated a null distribution ofAUC values corresponding with each RES model byrandomly distributing the species observations (pre sence background) among the grid cells coveredby survey effort By generating random data onlyfrom the survey area we aim to minimise spatial sort-ing bias by ensuring that the null model only reflectsthe environmental conditions where sampling wascarried out (Hijmans 2012) The resulting ROC plotwas generated and the AUC was calculated using theROCR package in R 2140 This procedure was re-peated 10 000 times to generate a random frequencydistribution of AUC values that would be expected ifthe RES model did not perform better than expecteddue to chance If the AUC of the empirical model ex-ceeded the 95 quantile of the ranked AUC valuesof the corresponding null model the model was con-sidered to perform significantly better than chancewould dictate (Olden et al 2002) and the relationshipbetween RES and speciesrsquo presence can be consid-ered to be stronger than would be expected bychance We used 1-sided testing since it was only ofinterest whether models performed significantly better than expected by chance not whether theyperformed significantly worse The significance levelwas calculated as the proportion of random AUCsthat were equal to or greater than the observed AUC
The model evaluation has 2 main assumptions (1)there are sufficient records within the test data set toaccurately describe a speciesrsquo distribution within thesurvey area and (2) the range of possible RES valuesis represented within the survey area (ie there isheterogeneity of habitat suitability) To assess theseassumptions we calculated and considered the total
number of speciesrsquo observations number of lsquopres-encersquo cells and percentiles of the ranked RES valueswithin the survey area for each model
Model outputs were also visually compared withpublished range maps (del Hoyo et al 1992 Onley ampSchofield 2007) allowing detection of any large-scale geographical discrepancies in the predictionsof models While qualitative in nature this compari-son provides a useful additional evaluation of modelsat a much larger geographical scale than the morequantitative evaluation described above
RESULTS
Quantifying and modelling speciesrsquo ecological niches
Ecological niches of 6 seabird species mdash fulmarCoryrsquos shearwater great shearwater sooty shearwa-ter Manx shearwater and storm petrel mdash were quan-tified in relation to 4 EGVs mdash depth SST chl a con-centration and distance to land mdash and are describedin Table 2 The 6 species all occupy different eco -logical niches with varying degrees of overlapNiches were subsequently modelled using the RESapproach which resulted in a spatial visualisation ofniches into potential distributions (Fig 3) and illus-trated the relative suitability of the environmentthroughout ranges Manx shearwater and stormpetrel share similar niches during their concurrentbreeding seasons both species occur in cold temper-ate to subtropical waters (5minus25degC) and primarilyrange within a few hundred kilometres of land How-ever while the Manx shearwater prefers depths ofless than 200 m mdash from coastal waters to the edge ofthe continental shelf mdash the storm petrel prefersdeeper waters between 100 and 1000 m Breedingseabirds occur closer to land (all MinP = 0 km) thannon-breeding birds (MinP ranges from 6 to 50 km)
The fulmar occupies a similar niche in the breedingand non-breeding seasons the absolute minimumand maximum values of each EGV do not changebetween the 2 seasons but the preferred range of allenvironmental variables (except chl a) differs Duringthe non-breeding season the fulmarrsquos preferredniche encompasses cooler deeper waters furtherfrom land compared with when breeding Non-breeding great shearwater and sooty shearwateroccupy the widest niches with respect to SST span-ning a range of 37 and 30degC respectively The preferred niche of great shearwater extends furtheroffshore (lt2000 km) than that of sooty shearwaterwhich tends to range closer to land (lt200 km)
264
Watson et al Modelling seabird distributions and habitat suitability
Qualitative comparison with published range maps
From visual qualitative assessment it can be seenthat model outputs (Fig 3) illustrate variability inpredicted range extents of the 6 seabird species inthe North Atlantic Relative environmental suitabilityvaries throughout ranges reflecting niche segrega-tion between species Predicted range extents vary intotal surface area and geographical coverage Com-paring between species non-breeding birds (withthe exception of fulmar) occupy a larger range andlatitudinal extent than breeding birds
Predicted range extents closely corresponded withpublished distribution maps for all species Howeverall ranges comprised a wider extent than maps in theliterature A common discrepancy was the predictionof suitable habitat in enclosed seas when such areasare excluded from published ranges for several spe-cies for example the inclusion of the MediterraneanSea in model outputs for great shearwater and Manxshearwater the Caribbean Sea and Gulf of Mexicofor great shearwater and sooty shearwater and Hud-son Bay for great shearwater Elsewhere modelscaptured areas of known absence well for examplethe absence of breeding Manx shearwater from thewestern central Atlantic and Caribbean Sea theabsence of sooty shearwater from Hudson Bay andthe low habitat suitability in the central Atlantic forthe sooty shearwater
The model output for storm petrel predicted amuch wider range across the North Atlantic thanpublished range maps the latter define the speciesrsquorange as restricted to the northeast Atlantic extend-ing no further west than 30degW Areas of high environ-mental suitability were separated by a large area oflow RES in the central Atlantic Similarly a smallarea of suitable habitat was predicted for fulmar in
the north Mediterranean Sea but separated from thecore range by a large area of unsuitable habitat
Statistical model evaluation
RES models for 5 out of 6 species performed signifi-cantly better than expected by chance when testedwith independent observation data from the Bay ofBiscay (p lt 005 Table 3) The AUC of empirical mod-els was significantly higher than that of correspondingnull models revealing a significant relationship be-tween RES and species occurrences for 6 out of 7models In the case of 4 out of a total of 7 models lessthan 01 of random samples had a higher AUC thanthe actual model (p lt 0001) The model for sootyshearwater did not perform significantly better thanrandom (p = 0260) with 26 of random AUCs ex-ceeding the observed AUC While the model for greatshearwater performed significantly better than ex-pected by chance (p = 0041) the model AUC wasonly very slightly higher than the 95 quantile of theranked null AUC values indicating that the model didnot perform much better than random
The number of speciesrsquo encounters ranged from115 to 590 (mean 3531 plusmn 653 Table 4) The rangeand frequency distribution of habitat suitabilityacross the model evaluation area for each species isillustrated by percentiles of ranked RES values(Table 4) The distribution of RES in the survey areavaries between species and is strongly skewed mdashindicating reduced heterogeneity of habitat suita -bility mdash for 3 models fulmar (breeding) sooty shear -water and Manx shearwater The majority of habitatwithin the sampling area is of low suitability forbreeding fulmars but of homogenously high suitabil-ity for sooty and Manx shearwaters
265
Species Status Depth (m) SST (degC) Distance (m)MinA MinP MaxP MaxA MinA MinP MaxP MaxA MinA MinP Max P MaxA
Northern fulmar B 0 100 1000 8000 minus2 0 15 15 0 0 320 2364N 0 100 2000 8000 minus2 0 10 15 0 50 2364 2364
Coryrsquos shearwater B 0 100 1000 8000 10 20 20 25 0 0 200 2364Great shearwater N 0100 200 8000 minus2 0 20 35 0 6 2000 2364Sooty shearwater N 0 10 1000 8000 5 10 20 35 0 15 200 2364Manx shearwater B 0 10 200 8000 5 10 20 25 0 0 360 2364European storm petrel B 0 100 2000 8000 5 10 20 25 0 0 200 2364
Table 2 Quantitative descriptions of speciesrsquo ecological niches in respect of 4 ecogeographical variables depth sea-surfacetemperature (SST) distance to land and chlorophyll a (chl a) concentration Niches were defined for 6 procellariiform seabirdsduring the breeding andor non-breeding season MinA and MaxA absolute minimum and maximum values of the resourceselection function MinP and MaxP preferred minimum and maximum values (see Fig 1) Chl a (mg mminus3 identical for eachspecies and status) MinA MinP = 0 03 MaxP MaxA = 60 60 Status B = breeding N = non-breeding See Table S1 in
Supplement 1 (wwwint-rescomarticlessupplm485p259_supplpdf) for data sources
Mar Ecol Prog Ser 485 259ndash273 2013266
Fig 3 Model outputs illustrating predicted geographicrange and relative environmental suitability (RES) for 6procellariiform seabirds in the North Atlantic duringtheir breeding (yellowminusbrown) andor non-breedingseasons (blue) (A) northern fulmar Fulmarus glacialisbreeding (B) northern fulmar non-breeding (C) Coryrsquosshearwater Calonectris diomedea breeding (D) greatshearwater Puffinus gravis non-breeding (E) sootyshearwater P griseus non-breeding (F) Manx shear -water P puffinus breeding and (G) European stormpetrel Hydrobates pelagicus breeding Predicted RES ison a scale from 0 (least suitable white) to 1 (highly suit-
able dark)
Watson et al Modelling seabird distributions and habitat suitability
DISCUSSION
RES predictions
When compared with simulated random data RESmodels performed significantly better for 5 out of6 seabird species (and 6 out of 7 models) at predicting
relative likelihood of occurrence in a subset of thestudy area Model outputs provide more informationon speciesrsquo distributions than published range mapssince they provide indices of relative environmentalsuitability throughout a speciesrsquo range RES predic-tions represent simple testable hypotheses concern-ing a speciesrsquo potential niche in respect of a few envi-ronmental predictors Visualisation of hypotheses ina spatial context facilitates our understanding of speciesminushabitat relationships inference of areas ofpotentially high seabird abundance and identifica-tion of regions to be targeted for future research andconservation planning
Observed versus predicted distributions
RES modelling of the potential niche resulted inpredictions of occurrence outside of known (or ob -served) ranges for several species when comparedwith published range maps indicating that distribu-tions are influenced by additional biological andorphysical parameters besides those included in mod-els Indeed modelling of the realised niche mdash thepart of the potential niche that a species actuallyuses mdash requires the incorporation of biotic interac-tions (Soberoacuten amp Nakamura 2009) and physiologicalconstraints (Kearney amp Porter 2009) Qualitative com-parison of RES model outputs with observed distribu-tions thus allows the assessment of the importance ofother factors that may influence the at-sea distribu-tion of seabirds
Distributions of pelagic animals are ultimately con-strained by the abundance and distribution of prey(Pahl-Wostl 1997) but scales of association betweenmobile predators and prey are highly variable(Schneider amp Piatt 1986) and prey indices are consid-ered inappropriate for predicting global distributionsof many highly mobile marine organisms (Torres etal 2008) Karpouzi et al (2007) incorporated informa-tion on prey distributions in mapping at-sea foragingdistributions of seabirds however they found little orno information concerning the diet of many seabirdsand detected high spatial variability in associationsbetween seabirds and prey Habitat modelling istherefore largely reliant on predictor variables thatindirectly affect species distribution
Evidence from energetic and physiological studieshighlights the significance of wind speed (Furness ampBryant 1996) and area of available ocean extent (Da -vies et al 2010) in influencing the foraging behaviourand life-history strategies of procellariiform seabirdsThe Strait of Gibraltar (Friesen et al 2007) and the
267
Species AUCm AUCn p
Northern fulmarBreeding 0735 0568 lt0001Non-breeding 0774 0583 lt0001Coryrsquos shearwaterBreeding 0712 0580 lt0001Great shearwaterNon-breeding 0587 0583 0041Sooty shearwaterNon-breeding 0530 0575 0260Manx shearwaterBreeding 0614 0572 0004European storm petrelBreeding 0704 0582 lt0001
Table 3 Evaluation of predictive performance of relative en-vironmental suitability (RES) models A model was consid-ered to perform significantly better than chance if the areaunder the curve of the empirical model (AUCm) exceededthe 95 quantile of the ranked AUC values of a correspon-ding null model (AUCn) p-values indicate the proportion of
AUCn that were equal to or greater than AUCm
Species No of No of Percentiles of ranked records lsquopresencersquo RES in survey area
cells 10 50 90
Northern fulmarBreeding 590 71 00 00 10Non-breeding 248 45 012 036 056Coryrsquos shearwaterBreeding 527 51 015 043 062Great shearwaterNon-breeding 452 48 037 069 10Sooty shearwaterNon-breeding 115 46 055 10 10Manx shearwaterBreeding 245 60 050 10 10European storm petrelBreeding 295 46 045 086 10
Table 4 Summary of test data used for evaluating the pre-dictive performance of relative environmental suitability(RES) models Independent observation data were collectedfrom repeated sampling of 156 grid cells (025deg times 025deg) byMARINElife in the Bay of Biscay (Fig 2) The number of spe-cies records number of lsquopresencersquo cells and variation in RESwithin the model evaluation area (percentiles of ranked
RES) are presented
Mar Ecol Prog Ser 485 259ndash273 2013
Almeria-Oran Oceanographic Front (Goacutemez-Diacuteaz etal 2006) have both been proposed as barriers limit-ing dispersal of and genetic exchange between sea-birds in the Atlantic Ocean and the MediterraneanSea Such physical and geographical factors mayexplain why despite the prediction of suitable habitat the observed distributions of some species donot extend into enclosed seas eg the absence ofgreat shearwater from the Mediterranean Sea andHudson Bay
Biotic interactions may play a significant role indetermining distributions across smaller spatial andtemporal scales (Furness amp Birkhead 1984) and theirincorporation into SDMs is widely recognised as akey challenge in both terrestrial (Arauacutejo amp Guisan2006) and marine environments (Robinson et al2011) Shearwaters do not typically form mixed- species colonies (Warham 1990) suggesting thatinterspecific competition and niche segregation mayinfluence the breeding distributions of some procel-lariiform seabirds While the observed range of Manxshearwater does not extend into the MediterraneanSea the breeding ranges of the Balearic shearwaterPuffinus mauretanicus and the Yelkoaun shearwaterP yelkoauni which occupy similar ecological nichesto the Manx shearwater (and were until recentlyconsidered to be subspecies of Manx shearwaterSangster et al 2002) are restricted to the Mediter-ranean Sea (Onley amp Schofield 2007) A combinationof evolutionary history and biotic interactions mayexplain the reduced niche overlap that is observed(compared with predicted overlap) between these 3ecologically similar species Depending on the objec-tives it may be a more useful approach to applyniche modelling to a species complex when there areseveral closely related species
Despite their ability to traverse large sections ofocean many procellariiform seabirds show limiteddispersal (the lsquoseabird paradoxrsquo proposed by Milot etal 2008) Their philopatric habits are expected tolimit colonisation by long-distance dispersal and sub-sequent range expansion (Matthiopoulos et al 2005Brown et al 2010) Despite the prediction of highRES in the northwest Atlantic for the storm petrelhigh breeding-site fidelity and the large area of pre-dicted low habitat suitability in the central Atlanticmay explain why the speciesrsquo observed distribution(from published range maps) is restricted to thenortheast Atlantic (del Hoyo et al 1992) Addition-ally the niche is already filled by another pelagicseabird Leachrsquos petrel Oceanodroma leucorhoa inthe northwest Atlantic (del Hoyo et al 1992) In theinterpretation of RES model outputs consideration
should thus be afforded to a speciesrsquo evolutionaryhistory as well as areas of low RES separating areasof high RES both of which may act to restrict ranges
The availability of suitable nest sites is a funda-mental constraint on the current breeding distribu-tion of seabirds (Brown et al 2010) Procellariiformseabirds are largely restricted to remote islands freeof mammalian predators which are within range ofsuitable foraging areas (Warham 1990) If all occu-pied breeding colonies could be accurately identifiedand niche envelopes constrained by maximum forag-ing range from colonies models could yield moreaccurate predictions of range extent during thebreeding season However given the difficulties ofsurveying and monitoring remote locations ourknowledge of breeding sites is likely to be incom-plete particularly for less well-studied speciesRestricting distribution to within species-specific for-aging range of all land therefore represents a moreconservative approach
Where suitable habitat is predicted outside of cur-rent observed distributions this may indicate areasthat are used by a species but for which there are nodata or areas that could be suitable for colonisationFuture colonisation or range shifts could be driven bychanges in environmental suitability as a result ofnatural changes (eg Gaston amp Woo 2008) andoranthropogenic-induced changes such as by meansof active conservation management (Miskelly et al2009) By identifying areas of potentially suitable at-sea habitat the RES modelling approach may thusoffer insight into the effects of future changes in cli-mate and anthropogenic activities on speciesrsquo distri-butions Further model development could be basedon different scenarios for climate or nest-site avail-ability to generate predictions of future changes indistributions
Model evaluation
Statistical evaluation demonstrates that the genericapproach of RES modelling can accurately describehabitat suitability for wide-ranging seabirds RESpredictions were more strongly related to speciespresence for 6 out of 7 models than expected due tochance While qualitative assessment of the modeloutput for non-breeding sooty shearwater suggestedreasonable consistency with published distributiondata the model did not perform significantly betterthan a null model Poor model performance could beexplained by the low quality of data used for modelparameterisation (see Table S1) resulting in an inac-
268
Watson et al Modelling seabird distributions and habitat suitability
curate description of a speciesrsquo ecological niche It iswell established that speciesminusenvironment relation-ships can change with scale (Manly et al 2002) andthere is evidence for intraspecific spatial variation inspeciesminushabitat relationships in seabirds (Huettmannamp Diamond 2001) Most information on the at-seahabitat associations of the sooty shearwater comesfrom studies in the Pacific Ocean (Briggs amp Chu 1986Vermeer et al 1989 but see Hedd et al 2012) There-fore we cannot be certain of the spatial stability ofthe speciesrsquo niche across distinct ocean basins Theavailability and quality of ecological data may limitthe wider application of RES modelling to other spe-cies of seabird if insufficient data are available toaccurately quantify speciesrsquo ecological niches
Rigorous evaluation of models requires that the testdata set accurately reflects the distribution andoccurrence of a species within the evaluation areaThe test data comprised far fewer observations ofsooty shearwater than the other study species andthe sampling area was characterised by low variationin RES ie highly homogeneous habitat suitability(Table 4) However despite highly skewed distribu-tions of RES the models for fulmar (breeding) andManx shearwater showed highly significant predic-tive accuracy when compared to null models Thisindicates these models must be performing very wellif they can perform significantly better than randomeven under less favourable conditions for the evalua-tion Rigorous model evaluation relies on representa-tive observation data collected across broad spatialand temporal scales to compliment the macro-scalemodelling approach While lsquoregularrsquo and lsquoequal-stratifiedrsquo sampling strategies are the most accurateand robust (Hirzel amp Guisan 2002) these are not typ-ically features of opportunistically collected data mdashthe source of most at-sea seabird observations Theincreasing availability of large-scale point data (egOBIS GBIF) and range maps such as those availablethrough the IUCN Red List (wwwiucnredlistorg)presents opportunities for further testing of RESmodels However the availability of representativetest data may limit the application of RES modellingfor scarcer and under-recorded species
Biases in model parameters
A frequent obstacle encountered in predictive distribution modelling of marine animals is the lackof reliable and comprehensive occurrence datafrom which to define species-habitat relationships(Robinson et al 2011) The issue of environmental
bias mdash spatial andor temporal bias in collection ofoccurrence data mdash is widely recognised in speciesdis tribution modelling (Arauacutejo amp Guisan 2006Phillips et al 2009 Ready et al 2010) It mainly arisesfrom limitations in data accessibility and samplingstrategies preventing representative coverage of theentire environmental range of species (Phillips et al2009) The biases inherent to most observation datacan easily lead to incorrect interpretation of habitatpreferences of wide-ranging species (Hirzel ampGuisan 2002)
RES modelling provides a technique for predictinglarge-scale distributions which does not rely on pointdata The niche hypotheses underlying RES modelsstill ultimately depend on the quality and amount ofavailable ecological information Quantitative dataon the relationships between seabirds and oceanproductivity are lacking and large areas of theoceans remain under-studied eg the central At -lantic (but see Skov et al 1994) However the abilityfor RES modelling to incorporate a range of qualita-tive and quantitative data collected from differentparts of speciesrsquo ranges at different times of yearbroadens the scope of environmental coverage Con-sequently the outputs may represent more balancedand robust predictions for many marine animalsthan the more commonly used predictive modellingtechniques When previously tested against a rangeof marine taxa RES modelling was shown to performvery well compared with traditional presence-onlymodelling methods (Ready et al 2010)
Accounting for temporal variability
Temporal variability in ecological niches and envi-ronmental parameters is frequently overlooked inspecies distribution modelling (Dambach amp Roumldder2011) Previous applications of RES modelling tomarine top predators did not account for temporalvariability in speciesminushabitat relationships or EGVs(Kaschner et al 2006 Ready et al 2010) In this studywe have accounted for the seasonal shifts in habitatassociations that occur within the annual life cycle bydistinguishing between a speciesrsquo breeding and non-breeding niche and subsequently relating niches toseasonally averaged data for dynamic EGVsAccounting for temporal variation in both speciesminusenvironment relationships and dynamic environ-mental variables is expected to increase the reliabil-ity of RES predictions particularly in areas whereenvironmental conditions fluctuate greatly betweenseasons Consequently our seasonal RES predictions
269
Mar Ecol Prog Ser 485 259ndash273 2013
can provide greater insight into speciesrsquo behaviourand ecology than those based on an annual averageniche envelope
Applications and recommendations for future research
RES modelling could prove a valuable tool forinforming the development and implementation ofeffective conservation and management practices Inthe absence of comprehensive occurrence data forwide-ranging species RES models can identify criti-cally important areas and biodiversity hotspots inpelagic marine ecosystems This is of direct rele-vance to the development of quantifiable criteria forthe designation of marine Important Bird Areas(IBAs BirdLife International 2004) The modellingapproach could be used to direct observation effort toareas where under-recorded seabirds are predictedto occur and inform sampling strategies to incorpo-rate a range of environmental suitability Matchingdata on seabird distribution as revealed by RESmodel outputs with data on fishing effort couldinform the responsibilities of Regional FisheriesManagement Organisations (RFMOs) and the devel-opment of suitable monitoring and mitigation meas-ures to reduce negative interactions between sea-birds and fisheries (eg Le Corre et al 2012)
Application of RES modelling to a greater variety ofspecies demonstrating variable niche characteris-tics will allow further examination of the broad-scaleapplicability of the approach Expanding the RESapproach to wider geographic areas incorporatingall of a speciesrsquo range would offer greater insightinto understanding distribution dispersal and migra-tory behaviour An iterative approach to the develop-ment of models (as recommended by Elith et al 2006)will improve the robustness of predictions by consid-ering the effects of a wider range of predictor vari-ables on model performance Additional factors thathave been shown to influence the at-sea distributionof seabirds and could be incorporated into futuremodels include sea-surface salinity (eg Huettmannamp Diamond 2001) horizontal (eg Louzao et al 2009)and vertical gradients in SST (eg Spear et al 2001)and fishing effort (eg Karpouzi et al 2007)
Wider application of RES modelling requires simultaneous developments in at-sea sampling andlarge-scale studies of speciesminushabitat relationshipswhich inform one another and offer direction forfuture research The increasing use of trackingdevices for recording movements of seabirds pro-
vides opportunities for quantification of habitat useand preference (Wakefield et al 2009 Le Corre et al2012) Increasing the public availability of trackingdata will facilitate further development of SDMs(Skov et al 2008) Further studies are required toimprove quantitative understanding of speciesminushabi-tat relationships across a variety of spatio-temporalscales and integration of data across scales is neces-sary to enhance the predictive ability of RES modelsHaving demonstrated RES is a robust modellingapproach predictions could be improved by the useof ensemble model averaging (Arauacutejo amp New 2007)
CONCLUSIONS
Based on quantitative definitions of speciesrsquo eco-logical requirements RES maps offer a robust alter-native to subjectively generated traditional rangemaps We have shown that RES modelling can ade-quately describe habitat suitability across largescales for wide-ranging pelagic seabirds RES model-ling presents a generic and objective approach forpredicting distributions of wide-ranging marine ani-mals across large spatial scales when the absence ofrepresentative point data precludes the applicationof traditional modelling techniques Model outputsrepresent an alternative to the conventional and sub-jective approach of delineating range extents basedon limited records of occurrence The approach isbased on clear assumptions concerning speciesrsquohabitat preferences which can be easily modifiedand tested
RES predictions are limited by the extent of pub-lished data and the subsequent ability to accuratelyquantify speciesrsquo ecological niches While some gapsin the literature are evident the synthesis of knowl-edge concerning speciesminushabitat relationships canadequately describe ecological niches for the pur-poses of building predictive distribution models Thisoffers a more robust approach for answering broad-scale questions about speciesrsquo distributions thanderiving niches from limited and biased samplingdata Of greater significance is the limited availabil-ity of representative at-sea observations data to rig-orously evaluate models which may prove to be thekey limiting factor in the wider application of RESmodelling for wide-ranging marine animals
Acknowledgements Thanks to the NERC Earth Observa-tion Data Acquisition and Analysis Service (NEODAAS) forsupplying data for this study MARINElifersquos contribution tothis research was part-funded by the EU as part of the Chan-
270
Watson et al Modelling seabird distributions and habitat suitability
nel Integrated Approach for Marine Resource Management(CHARM) Phase 3 project We thank MARINElife volun-teers for collection of observation data and PampO Ferries forsponsoring surveys aboard the lsquoPride of Bilbaorsquo
LITERATURE CITED
Airameacute S Dugan JE Lafferty KD Leslie H McArdle DAWarner RR (2003) Applying ecological criteria to marinereserve design a case study from the California ChannelIslands Ecol Appl 13 170minus184
Arauacutejo MB Guisan A (2006) Five (or so) challenges for spe-cies distribution modelling J Biogeogr 33 1677minus1688
Arauacutejo MB New M (2007) Ensemble forecasting of speciesdistributions Trends Ecol Evol 22 42minus47
Ashmole N (1971) Sea bird ecology and the marine environ-ment In Farner DS King JR (eds) Avian biology Vol 1Academic Press New York NY p 223minus286
BirdLife International (2004) Tracking ocean wanderers the global distribution of albatrosses and petrels Resultsfrom the Global Procellariiform Tracking Workshop1minus5 September 2003 Gordonrsquos Bay South Africa BirdlifeInternational Cambridge
Boyce MS Vernier PR Nielsen SE Schmiegelow FKA(2002) Evaluating resource selection functions EcolModel 157 281minus300
Briggs KT Chu EW (1986) Sooty shearwaters off California distribution abundance and habitat use Condor 88 355minus364
Brown RM Nichols RA Faulkes CG Jones CG and others(2010) Range expansion and hybridization in RoundIsland petrels (Pterodroma spp) evidence from micro -satellite genotypes Mol Ecol 19 3157minus3170
Cramp S Simmons K (1980) Handbook of the birds ofEurope the Middle East and north Africa The birds ofthe western Palearctic Vol 1 Ostrich to ducks OxfordUniversity Press Oxford
Dambach J Roumldder D (2011) Applications and future chal-lenges in marine species distribution modeling AquatConserv 21 92minus100
Davies RG Irlich UM Chown SL Gaston KJ (2010) Ambi-ent productive and wind energy and ocean extent pre-dict global species richness of procellariiform seabirdsGlob Ecol Biogeogr 19 98minus110
del Hoyo J Elliott A Sargatal J (1992) Handbook of thebirds of the world Vol 1 Ostrich to ducks Lynx EdicionsBarcelona
Dormann CF McPherson JM Arauacutejo MB Bivand R and oth-ers (2007) Methods to account for spatial autocorrelationin the analysis of species distributional data a reviewEcography 30 609minus628
Elith J Leathwick JR (2009) Species distribution models ecological explanation and prediction across space andtime Annu Rev Ecol Evol Syst 40 677minus697
Elith J Graham H Anderson P Dudiacutek M and others (2006)Novel methods improve prediction of species distribu-tions from occurrence data Ecography 29 129minus151
Fielding AH Bell JF (1997) A review of methods for theassessment of prediction errors in conservation pres-enceabsence models Environ Conserv 24 38minus49
Friesen VL Burg TM McCoy KD (2007) Mechanisms ofpopulation differentiation in seabirds Mol Ecol 16 1765minus1785
Furness RW Birkhead TR (1984) Seabird colony distribu-
tions suggest competition for food supplies during thebreeding-season Nature 311 655minus656
Furness RW Bryant DM (1996) Effect of wind on field meta-bolic rates of breeding northern fulmars Ecology 77 1181minus1188
Gaston AJ Woo K (2008) Razorbills (Alca torda) follow sub-arctic prey into the Canadian Arctic colonization resultsfrom climate change Auk 125 939minus942
Goacutemez-Diacuteaz E Gonzaacutelez-Soliacutes J Peinado MA Page RDM(2006) Phylogeography of the Calonectris shearwatersusing molecular and morphometric data Mol PhylogenetEvol 41 322minus332
Gregr EJ Trites AW (2008) A novel presence-only validationtechnique for improved Steller sea lion Eumetopias juba-tus critical habitat descriptions Mar Ecol Prog Ser 365 247minus261
Guinotte JM Bartley JD Iqbal A Fautin DG BuddemeierRW (2006) Modeling habitat distribution from organismoccurrences and environmental data case study usinganemonefishes and their sea anemone hosts Mar EcolProg Ser 316 269minus283
Guisan A Zimmermann NE (2000) Predictive habitat distri-bution models in ecology Ecol Model 135 147minus186
Guisan A Edwards TC Hastie T (2002) Generalized linearand generalized additive models in studies of speciesdistributions setting the scene Ecol Model 157 89minus100
Hardy SM Lindgren M Konakanchi H Huettmann F (2011)Predicting the distribution and ecological niche of unex-ploited snow crab (Chionoecetes opilio) populations inAlaskan waters a first open-access ensemble modelIntegr Comp Biol 51 608minus622
Hedd A Montevecchi WA Otley H Phillips RA Fifield DA(2012) Trans-equatorial migration and habitat use bysooty shearwaters Puffinus griseus from the SouthAtlantic during the nonbreeding season Mar Ecol ProgSer 449 277minus290
Hijmans RJ (2012) Cross-validation of species distributionmodels removing spatial sorting bias and calibrationwith a null model Ecology 93 679minus688
Hirzel AH Guisan A (2002) Which is the optimal samplingstrategy for habitat suitability modelling Ecol Model157 331minus341
Hobbs M Brereton T Weir C Williams A (2003) Baselinemonitoring data on Procellariformes [Procellariiformes](shearwaters) in the Bay of Biscay Ornis Hungarica12ndash13 115minus125
Huettmann F Diamond AW (2001) Seabird colony locationsand environmental determination of seabird distribution a spatially explicit breeding seabird model for the North-west Atlantic Ecol Model 141 261minus298
Huettmann F Artukhin Y Gilg O Humphries G (2011) Pre-dictions of 27 Arctic pelagic seabird distributions usingpublic environmental variables assessed with colonydata a first digital IPY and GBIF open access synthesisplatform Mar Biodivers 41 141minus179
Intergovernmental Oceanographic Commission (IOC) Inter -national Hydrographic Organization (IHO) and BritishOceanographic Data Centre (BODC) (2003) Centenaryedition of the GEBCO Digital Atlas published on CD-ROM on behalf of the Intergovernmental OceanographicCommission and the International Hydrographic Organi-zation as part of the General Bathymetric Chart of theOceans BODC Liverpool
Karpouzi VS Watson R Pauly D (2007) Modelling and map-ping resource overlap between seabirds and fisheries on
271
Mar Ecol Prog Ser 485 259ndash273 2013
a global scale a preliminary assessment Mar Ecol ProgSer 343 87minus99
Kaschner K Watson R Trites AW Pauly D (2006) Mappingworld-wide distributions of marine mammal speciesusing a relative environmental suitability (RES) modelMar Ecol Prog Ser 316 285minus310
Kaschner K Tittensor DP Ready J Gerrodette T Worm B(2010) Current and future patterns of global marinemammal biodiversity PLoS ONE 6 e19653
Kearney M Porter W (2009) Mechanistic niche modelling combining physiological and spatial data to predict spe-ciesrsquo ranges Ecol Lett 12 334minus350
Le Corre M Jaeger A Pinet P Kappes MA and others (2012)Tracking seabirds to identify potential Marine ProtectedAreas in the tropical western Indian Ocean Biol Conserv156 83minus93
Legendre P (1993) Spatial autocorrelation trouble or newparadigm Ecology 74 1659minus1673
Louzao M Hyrenbach KD Arcos JM Abelloacute P De Sola LGOro D (2006) Oceanographic habitat of an endangeredMediterranean procellariiform implications for marineprotected areas Ecol Appl 16 1683minus1695
Louzao M Beacutecares J Rodriacuteguez B Hyrenbach KD Ruiz AArcos JM (2009) Combining vessel-based surveys andtracking data to identify key marine areas for seabirdsMar Ecol Prog Ser 391 183minus197
Manly BF McDonald LL Thomas DL McDonald TL Erick-son WP (2002) Resource selection by animals statisticaldesign and analysis for field studies Springer New YorkNY
Matthiopoulos J Harwood J Thomas L (2005) Metapopula-tion consequences of site fidelity for colonially breedingmammals and birds J Anim Ecol 74 716minus727
Maxwell DL Stelzenmuumlller V Eastwood PD Rogers SI(2009) Modelling the spatial distribution of plaice (Pleu-ronectes platessa) sole (Solea solea) and thornback ray(Raja clavata) in UK waters for marine management andplanning J Sea Res 61 258minus267
Milot E Weimerskirch H Bernatchez L (2008) The seabirdparadox dispersal genetic structure and populationdynamics in a highly mobile but philopatric albatrossspecies Mol Ecol 17 1658minus1673
Miskelly CM Taylor GA Gummer H Williams R (2009)Translocations of eight species of burrow-nesting sea-birds (genera Pterodroma Pelecanoides Pachyptila andPuffinus Family Procellariidae) Biol Conserv 142 1965minus1980
Nur N Jahncke J Herzog MP Howar J and others (2011)Where the wild things are predicting hotspots of seabirdaggregations in the California Current System EcolAppl 21 2241minus2257
Oedekoven CS Ainley DG Spear LB (2001) Variable res -ponses of seabirds to change in marine climate Califor-nia Current 1985ndash1994 Mar Ecol Prog Ser 212 265minus281
Olden JD Jackson DA Peres-Neto PR (2002) Predictivemodels of fish species distributions a note on proper val-idation and chance predictions Trans Am Fish Soc 131 329minus336
Olivier F Wotherspoon SJ (2006) Modelling habitat selec-tion using presence-only data case study of a colonialhollow nesting bird the snow petrel Ecol Model 195 187minus204
Onley D Schofield P (2007) Field guide to the albatrossespetrels and shearwaters of the world Christopher HelmLondon
Oppel S Meirinho A Ramiacuterez I Gardner B OrsquoConnell AFMiller PI Louzao M (2012) Comparison of five modellingtechniques to predict the spatial distribution and abun-dance of seabirds Biol Conserv 156 94minus104
Ostrand WD Drew GS Suryan RM McDonald LL (1998)Evaluation of radio-tracking and strip transect methodsfor determining foraging ranges of black-legged kitti-wakes Condor 100 709minus718
Pahl-Wostl C (1997) Dynamic structure of a food web model comparison with a food chain model Ecol Model 100 103minus123
Phillips SJ Dudiacutek M Elith J Graham CH Lehmann ALeathwick J Ferrier S (2009) Sample selection bias andpresence-only distribution models implications for back-ground and pseudo-absence data Ecol Appl 19 181minus197
Raes N ter Steege H (2007) A null-model for significancetesting of presence-only species distribution modelsEcography 30 727minus736
Raymond B Woehler EJ (2003) Predicting seabirds at sea inthe Southern Indian Ocean Mar Ecol Prog Ser 263 275minus285
Ready J Kaschner K South AB Eastwood PD and others(2010) Predicting the distributions of marine organismsat the global scale Ecol Model 221 467minus478
Redfern JV Ferguson MC Becker EA Hyrenbach KD andothers (2006) Techniques for cetaceanminushabitat modelingMar Ecol Prog Ser 310 271minus295
Robinson LM Elith J Hobday AJ Pearson RG Kendall BEPossingham HP Richardson AJ (2011) Pushing the limitsin marine species distribution modelling lessons fromthe land present challenges and opportunities Glob EcolBiogeogr 20 789minus802
Ross DA (1988) An introduction to oceanography PrenticeHall Englewood Cliffs NJ
Sangster G Knox AG Helbig AJ Parkin DT (2002) Taxo-nomic recommendations for European birds Ibis 144 153minus159
Schneider DC (1997) Habitat selection by marine birds inrelation to water depth Ibis 139 175minus178
Schneider DC Piatt JF (1986) Scale-dependent correlationof seabirds with schooling fish in a coastal ecosystemMar Ecol Prog Ser 32 237minus246
Skov H Durinck J Danielsen F Bloch D (1994) The summerdistribution of Procellariiformes in the central NorthAtlantic Ocean Vogelwarte 37 270minus289
Skov H Humphreys E Garthe S Geitner K and others(2008) Application of habitat suitability modelling totracking data of marine animals as a means of analyzingtheir feeding habitats Ecol Model 212 504minus512
Soberoacuten J Nakamura M (2009) Niches and distributionalareas concepts methods and assumptions Proc NatlAcad Sci USA 106 19644minus19650
Spear LB Ballance LT Ainley DG (2001) Response of sea-birds to thermal boundaries in the tropical Pacific thethermocline versus the Equatorial Front Mar Ecol ProgSer 219 275minus289
Sverdrup H Johnston MW Fleming RH (1942) The oceans their physics chemistry and general biology PrenticeHall New York NY
Tasker ML Reid JB (1997) Seabirds in the marine environ-ment mdash introduction ICES J Mar Sci 54 505minus506
Torres LG Read AJ Halpin P (2008) Fine-scale habitat modeling of a top marine predator Do prey data improvepredictive capacity Ecol Appl 18 1702minus1717
Vermeer K Morgan KH Smith GEJ Hay R (1989) Fall distri-
272
Watson et al Modelling seabird distributions and habitat suitability 273
bution of pelagic birds over the shelf off SW VancouverIsland Colon Waterbirds 12 207minus214
Wakefield ED Phillips RA Matthiopoulos J (2009) Quantify-ing habitat use and preferences of pelagic seabirds usingindividual movement data a review Mar Ecol Prog Ser391 165minus182
Warham J (1990) The petrels their ecology and breedingsystems Academic Press New York NY
Yen PPW Huettmann F Cooke F (2004) A large-scale modelfor the at-sea distribution and abundance of marbledmurrelets (Brachyramphus marmoratus) during the bree -ding season in coastal British Columbia Canada EcolModel 171 395minus413
Zimmermann NE Edwards TC Graham CH Pearman PBSvenning JC (2010) New trends in species distributionmodelling Ecography 33 985minus989
Editorial responsibility Rory Wilson Swansea UK
Submitted June 7 2012 Accepted March 7 2013Proofs received from author(s) June 11 2013

Mar Ecol Prog Ser 485 259ndash273 2013
value The resulting AUC provides a measure of pre-dictive ability the higher the AUC the greater thepredictive accuracy of a model An AUC value of10 indicates a perfect model while a value of 05 isusually considered to be equivalent to performing nobetter than random (Fielding amp Bell 1997)
The use of null models has been demonstrated forimproving testing for statistical significance in AUCvalues (Raes amp ter Steege 2007) and addressing theissue of spatial sorting bias (Hijmans 2012) Spatialsorting bias can inflate AUC values of both empiricaland null models meaning an AUC of 05 might notnecessarily be indicative of random performance (Hijmans 2012) Predictions of RES models weretested by comparing the AUC value of actual modelsagainst a null distribution (a lsquonull modelrsquo) of AUC values derived from randomised data This testedwhether model predictive performance was signifi-cantly different from what would be expected bychance alone We generated a null distribution ofAUC values corresponding with each RES model byrandomly distributing the species observations (pre sence background) among the grid cells coveredby survey effort By generating random data onlyfrom the survey area we aim to minimise spatial sort-ing bias by ensuring that the null model only reflectsthe environmental conditions where sampling wascarried out (Hijmans 2012) The resulting ROC plotwas generated and the AUC was calculated using theROCR package in R 2140 This procedure was re-peated 10 000 times to generate a random frequencydistribution of AUC values that would be expected ifthe RES model did not perform better than expecteddue to chance If the AUC of the empirical model ex-ceeded the 95 quantile of the ranked AUC valuesof the corresponding null model the model was con-sidered to perform significantly better than chancewould dictate (Olden et al 2002) and the relationshipbetween RES and speciesrsquo presence can be consid-ered to be stronger than would be expected bychance We used 1-sided testing since it was only ofinterest whether models performed significantly better than expected by chance not whether theyperformed significantly worse The significance levelwas calculated as the proportion of random AUCsthat were equal to or greater than the observed AUC
The model evaluation has 2 main assumptions (1)there are sufficient records within the test data set toaccurately describe a speciesrsquo distribution within thesurvey area and (2) the range of possible RES valuesis represented within the survey area (ie there isheterogeneity of habitat suitability) To assess theseassumptions we calculated and considered the total
number of speciesrsquo observations number of lsquopres-encersquo cells and percentiles of the ranked RES valueswithin the survey area for each model
Model outputs were also visually compared withpublished range maps (del Hoyo et al 1992 Onley ampSchofield 2007) allowing detection of any large-scale geographical discrepancies in the predictionsof models While qualitative in nature this compari-son provides a useful additional evaluation of modelsat a much larger geographical scale than the morequantitative evaluation described above
RESULTS
Quantifying and modelling speciesrsquo ecological niches
Ecological niches of 6 seabird species mdash fulmarCoryrsquos shearwater great shearwater sooty shearwa-ter Manx shearwater and storm petrel mdash were quan-tified in relation to 4 EGVs mdash depth SST chl a con-centration and distance to land mdash and are describedin Table 2 The 6 species all occupy different eco -logical niches with varying degrees of overlapNiches were subsequently modelled using the RESapproach which resulted in a spatial visualisation ofniches into potential distributions (Fig 3) and illus-trated the relative suitability of the environmentthroughout ranges Manx shearwater and stormpetrel share similar niches during their concurrentbreeding seasons both species occur in cold temper-ate to subtropical waters (5minus25degC) and primarilyrange within a few hundred kilometres of land How-ever while the Manx shearwater prefers depths ofless than 200 m mdash from coastal waters to the edge ofthe continental shelf mdash the storm petrel prefersdeeper waters between 100 and 1000 m Breedingseabirds occur closer to land (all MinP = 0 km) thannon-breeding birds (MinP ranges from 6 to 50 km)
The fulmar occupies a similar niche in the breedingand non-breeding seasons the absolute minimumand maximum values of each EGV do not changebetween the 2 seasons but the preferred range of allenvironmental variables (except chl a) differs Duringthe non-breeding season the fulmarrsquos preferredniche encompasses cooler deeper waters furtherfrom land compared with when breeding Non-breeding great shearwater and sooty shearwateroccupy the widest niches with respect to SST span-ning a range of 37 and 30degC respectively The preferred niche of great shearwater extends furtheroffshore (lt2000 km) than that of sooty shearwaterwhich tends to range closer to land (lt200 km)
264
Watson et al Modelling seabird distributions and habitat suitability
Qualitative comparison with published range maps
From visual qualitative assessment it can be seenthat model outputs (Fig 3) illustrate variability inpredicted range extents of the 6 seabird species inthe North Atlantic Relative environmental suitabilityvaries throughout ranges reflecting niche segrega-tion between species Predicted range extents vary intotal surface area and geographical coverage Com-paring between species non-breeding birds (withthe exception of fulmar) occupy a larger range andlatitudinal extent than breeding birds
Predicted range extents closely corresponded withpublished distribution maps for all species Howeverall ranges comprised a wider extent than maps in theliterature A common discrepancy was the predictionof suitable habitat in enclosed seas when such areasare excluded from published ranges for several spe-cies for example the inclusion of the MediterraneanSea in model outputs for great shearwater and Manxshearwater the Caribbean Sea and Gulf of Mexicofor great shearwater and sooty shearwater and Hud-son Bay for great shearwater Elsewhere modelscaptured areas of known absence well for examplethe absence of breeding Manx shearwater from thewestern central Atlantic and Caribbean Sea theabsence of sooty shearwater from Hudson Bay andthe low habitat suitability in the central Atlantic forthe sooty shearwater
The model output for storm petrel predicted amuch wider range across the North Atlantic thanpublished range maps the latter define the speciesrsquorange as restricted to the northeast Atlantic extend-ing no further west than 30degW Areas of high environ-mental suitability were separated by a large area oflow RES in the central Atlantic Similarly a smallarea of suitable habitat was predicted for fulmar in
the north Mediterranean Sea but separated from thecore range by a large area of unsuitable habitat
Statistical model evaluation
RES models for 5 out of 6 species performed signifi-cantly better than expected by chance when testedwith independent observation data from the Bay ofBiscay (p lt 005 Table 3) The AUC of empirical mod-els was significantly higher than that of correspondingnull models revealing a significant relationship be-tween RES and species occurrences for 6 out of 7models In the case of 4 out of a total of 7 models lessthan 01 of random samples had a higher AUC thanthe actual model (p lt 0001) The model for sootyshearwater did not perform significantly better thanrandom (p = 0260) with 26 of random AUCs ex-ceeding the observed AUC While the model for greatshearwater performed significantly better than ex-pected by chance (p = 0041) the model AUC wasonly very slightly higher than the 95 quantile of theranked null AUC values indicating that the model didnot perform much better than random
The number of speciesrsquo encounters ranged from115 to 590 (mean 3531 plusmn 653 Table 4) The rangeand frequency distribution of habitat suitabilityacross the model evaluation area for each species isillustrated by percentiles of ranked RES values(Table 4) The distribution of RES in the survey areavaries between species and is strongly skewed mdashindicating reduced heterogeneity of habitat suita -bility mdash for 3 models fulmar (breeding) sooty shear -water and Manx shearwater The majority of habitatwithin the sampling area is of low suitability forbreeding fulmars but of homogenously high suitabil-ity for sooty and Manx shearwaters
265
Species Status Depth (m) SST (degC) Distance (m)MinA MinP MaxP MaxA MinA MinP MaxP MaxA MinA MinP Max P MaxA
Northern fulmar B 0 100 1000 8000 minus2 0 15 15 0 0 320 2364N 0 100 2000 8000 minus2 0 10 15 0 50 2364 2364
Coryrsquos shearwater B 0 100 1000 8000 10 20 20 25 0 0 200 2364Great shearwater N 0100 200 8000 minus2 0 20 35 0 6 2000 2364Sooty shearwater N 0 10 1000 8000 5 10 20 35 0 15 200 2364Manx shearwater B 0 10 200 8000 5 10 20 25 0 0 360 2364European storm petrel B 0 100 2000 8000 5 10 20 25 0 0 200 2364
Table 2 Quantitative descriptions of speciesrsquo ecological niches in respect of 4 ecogeographical variables depth sea-surfacetemperature (SST) distance to land and chlorophyll a (chl a) concentration Niches were defined for 6 procellariiform seabirdsduring the breeding andor non-breeding season MinA and MaxA absolute minimum and maximum values of the resourceselection function MinP and MaxP preferred minimum and maximum values (see Fig 1) Chl a (mg mminus3 identical for eachspecies and status) MinA MinP = 0 03 MaxP MaxA = 60 60 Status B = breeding N = non-breeding See Table S1 in
Supplement 1 (wwwint-rescomarticlessupplm485p259_supplpdf) for data sources
Mar Ecol Prog Ser 485 259ndash273 2013266
Fig 3 Model outputs illustrating predicted geographicrange and relative environmental suitability (RES) for 6procellariiform seabirds in the North Atlantic duringtheir breeding (yellowminusbrown) andor non-breedingseasons (blue) (A) northern fulmar Fulmarus glacialisbreeding (B) northern fulmar non-breeding (C) Coryrsquosshearwater Calonectris diomedea breeding (D) greatshearwater Puffinus gravis non-breeding (E) sootyshearwater P griseus non-breeding (F) Manx shear -water P puffinus breeding and (G) European stormpetrel Hydrobates pelagicus breeding Predicted RES ison a scale from 0 (least suitable white) to 1 (highly suit-
able dark)
Watson et al Modelling seabird distributions and habitat suitability
DISCUSSION
RES predictions
When compared with simulated random data RESmodels performed significantly better for 5 out of6 seabird species (and 6 out of 7 models) at predicting
relative likelihood of occurrence in a subset of thestudy area Model outputs provide more informationon speciesrsquo distributions than published range mapssince they provide indices of relative environmentalsuitability throughout a speciesrsquo range RES predic-tions represent simple testable hypotheses concern-ing a speciesrsquo potential niche in respect of a few envi-ronmental predictors Visualisation of hypotheses ina spatial context facilitates our understanding of speciesminushabitat relationships inference of areas ofpotentially high seabird abundance and identifica-tion of regions to be targeted for future research andconservation planning
Observed versus predicted distributions
RES modelling of the potential niche resulted inpredictions of occurrence outside of known (or ob -served) ranges for several species when comparedwith published range maps indicating that distribu-tions are influenced by additional biological andorphysical parameters besides those included in mod-els Indeed modelling of the realised niche mdash thepart of the potential niche that a species actuallyuses mdash requires the incorporation of biotic interac-tions (Soberoacuten amp Nakamura 2009) and physiologicalconstraints (Kearney amp Porter 2009) Qualitative com-parison of RES model outputs with observed distribu-tions thus allows the assessment of the importance ofother factors that may influence the at-sea distribu-tion of seabirds
Distributions of pelagic animals are ultimately con-strained by the abundance and distribution of prey(Pahl-Wostl 1997) but scales of association betweenmobile predators and prey are highly variable(Schneider amp Piatt 1986) and prey indices are consid-ered inappropriate for predicting global distributionsof many highly mobile marine organisms (Torres etal 2008) Karpouzi et al (2007) incorporated informa-tion on prey distributions in mapping at-sea foragingdistributions of seabirds however they found little orno information concerning the diet of many seabirdsand detected high spatial variability in associationsbetween seabirds and prey Habitat modelling istherefore largely reliant on predictor variables thatindirectly affect species distribution
Evidence from energetic and physiological studieshighlights the significance of wind speed (Furness ampBryant 1996) and area of available ocean extent (Da -vies et al 2010) in influencing the foraging behaviourand life-history strategies of procellariiform seabirdsThe Strait of Gibraltar (Friesen et al 2007) and the
267
Species AUCm AUCn p
Northern fulmarBreeding 0735 0568 lt0001Non-breeding 0774 0583 lt0001Coryrsquos shearwaterBreeding 0712 0580 lt0001Great shearwaterNon-breeding 0587 0583 0041Sooty shearwaterNon-breeding 0530 0575 0260Manx shearwaterBreeding 0614 0572 0004European storm petrelBreeding 0704 0582 lt0001
Table 3 Evaluation of predictive performance of relative en-vironmental suitability (RES) models A model was consid-ered to perform significantly better than chance if the areaunder the curve of the empirical model (AUCm) exceededthe 95 quantile of the ranked AUC values of a correspon-ding null model (AUCn) p-values indicate the proportion of
AUCn that were equal to or greater than AUCm
Species No of No of Percentiles of ranked records lsquopresencersquo RES in survey area
cells 10 50 90
Northern fulmarBreeding 590 71 00 00 10Non-breeding 248 45 012 036 056Coryrsquos shearwaterBreeding 527 51 015 043 062Great shearwaterNon-breeding 452 48 037 069 10Sooty shearwaterNon-breeding 115 46 055 10 10Manx shearwaterBreeding 245 60 050 10 10European storm petrelBreeding 295 46 045 086 10
Table 4 Summary of test data used for evaluating the pre-dictive performance of relative environmental suitability(RES) models Independent observation data were collectedfrom repeated sampling of 156 grid cells (025deg times 025deg) byMARINElife in the Bay of Biscay (Fig 2) The number of spe-cies records number of lsquopresencersquo cells and variation in RESwithin the model evaluation area (percentiles of ranked
RES) are presented
Mar Ecol Prog Ser 485 259ndash273 2013
Almeria-Oran Oceanographic Front (Goacutemez-Diacuteaz etal 2006) have both been proposed as barriers limit-ing dispersal of and genetic exchange between sea-birds in the Atlantic Ocean and the MediterraneanSea Such physical and geographical factors mayexplain why despite the prediction of suitable habitat the observed distributions of some species donot extend into enclosed seas eg the absence ofgreat shearwater from the Mediterranean Sea andHudson Bay
Biotic interactions may play a significant role indetermining distributions across smaller spatial andtemporal scales (Furness amp Birkhead 1984) and theirincorporation into SDMs is widely recognised as akey challenge in both terrestrial (Arauacutejo amp Guisan2006) and marine environments (Robinson et al2011) Shearwaters do not typically form mixed- species colonies (Warham 1990) suggesting thatinterspecific competition and niche segregation mayinfluence the breeding distributions of some procel-lariiform seabirds While the observed range of Manxshearwater does not extend into the MediterraneanSea the breeding ranges of the Balearic shearwaterPuffinus mauretanicus and the Yelkoaun shearwaterP yelkoauni which occupy similar ecological nichesto the Manx shearwater (and were until recentlyconsidered to be subspecies of Manx shearwaterSangster et al 2002) are restricted to the Mediter-ranean Sea (Onley amp Schofield 2007) A combinationof evolutionary history and biotic interactions mayexplain the reduced niche overlap that is observed(compared with predicted overlap) between these 3ecologically similar species Depending on the objec-tives it may be a more useful approach to applyniche modelling to a species complex when there areseveral closely related species
Despite their ability to traverse large sections ofocean many procellariiform seabirds show limiteddispersal (the lsquoseabird paradoxrsquo proposed by Milot etal 2008) Their philopatric habits are expected tolimit colonisation by long-distance dispersal and sub-sequent range expansion (Matthiopoulos et al 2005Brown et al 2010) Despite the prediction of highRES in the northwest Atlantic for the storm petrelhigh breeding-site fidelity and the large area of pre-dicted low habitat suitability in the central Atlanticmay explain why the speciesrsquo observed distribution(from published range maps) is restricted to thenortheast Atlantic (del Hoyo et al 1992) Addition-ally the niche is already filled by another pelagicseabird Leachrsquos petrel Oceanodroma leucorhoa inthe northwest Atlantic (del Hoyo et al 1992) In theinterpretation of RES model outputs consideration
should thus be afforded to a speciesrsquo evolutionaryhistory as well as areas of low RES separating areasof high RES both of which may act to restrict ranges
The availability of suitable nest sites is a funda-mental constraint on the current breeding distribu-tion of seabirds (Brown et al 2010) Procellariiformseabirds are largely restricted to remote islands freeof mammalian predators which are within range ofsuitable foraging areas (Warham 1990) If all occu-pied breeding colonies could be accurately identifiedand niche envelopes constrained by maximum forag-ing range from colonies models could yield moreaccurate predictions of range extent during thebreeding season However given the difficulties ofsurveying and monitoring remote locations ourknowledge of breeding sites is likely to be incom-plete particularly for less well-studied speciesRestricting distribution to within species-specific for-aging range of all land therefore represents a moreconservative approach
Where suitable habitat is predicted outside of cur-rent observed distributions this may indicate areasthat are used by a species but for which there are nodata or areas that could be suitable for colonisationFuture colonisation or range shifts could be driven bychanges in environmental suitability as a result ofnatural changes (eg Gaston amp Woo 2008) andoranthropogenic-induced changes such as by meansof active conservation management (Miskelly et al2009) By identifying areas of potentially suitable at-sea habitat the RES modelling approach may thusoffer insight into the effects of future changes in cli-mate and anthropogenic activities on speciesrsquo distri-butions Further model development could be basedon different scenarios for climate or nest-site avail-ability to generate predictions of future changes indistributions
Model evaluation
Statistical evaluation demonstrates that the genericapproach of RES modelling can accurately describehabitat suitability for wide-ranging seabirds RESpredictions were more strongly related to speciespresence for 6 out of 7 models than expected due tochance While qualitative assessment of the modeloutput for non-breeding sooty shearwater suggestedreasonable consistency with published distributiondata the model did not perform significantly betterthan a null model Poor model performance could beexplained by the low quality of data used for modelparameterisation (see Table S1) resulting in an inac-
268
Watson et al Modelling seabird distributions and habitat suitability
curate description of a speciesrsquo ecological niche It iswell established that speciesminusenvironment relation-ships can change with scale (Manly et al 2002) andthere is evidence for intraspecific spatial variation inspeciesminushabitat relationships in seabirds (Huettmannamp Diamond 2001) Most information on the at-seahabitat associations of the sooty shearwater comesfrom studies in the Pacific Ocean (Briggs amp Chu 1986Vermeer et al 1989 but see Hedd et al 2012) There-fore we cannot be certain of the spatial stability ofthe speciesrsquo niche across distinct ocean basins Theavailability and quality of ecological data may limitthe wider application of RES modelling to other spe-cies of seabird if insufficient data are available toaccurately quantify speciesrsquo ecological niches
Rigorous evaluation of models requires that the testdata set accurately reflects the distribution andoccurrence of a species within the evaluation areaThe test data comprised far fewer observations ofsooty shearwater than the other study species andthe sampling area was characterised by low variationin RES ie highly homogeneous habitat suitability(Table 4) However despite highly skewed distribu-tions of RES the models for fulmar (breeding) andManx shearwater showed highly significant predic-tive accuracy when compared to null models Thisindicates these models must be performing very wellif they can perform significantly better than randomeven under less favourable conditions for the evalua-tion Rigorous model evaluation relies on representa-tive observation data collected across broad spatialand temporal scales to compliment the macro-scalemodelling approach While lsquoregularrsquo and lsquoequal-stratifiedrsquo sampling strategies are the most accurateand robust (Hirzel amp Guisan 2002) these are not typ-ically features of opportunistically collected data mdashthe source of most at-sea seabird observations Theincreasing availability of large-scale point data (egOBIS GBIF) and range maps such as those availablethrough the IUCN Red List (wwwiucnredlistorg)presents opportunities for further testing of RESmodels However the availability of representativetest data may limit the application of RES modellingfor scarcer and under-recorded species
Biases in model parameters
A frequent obstacle encountered in predictive distribution modelling of marine animals is the lackof reliable and comprehensive occurrence datafrom which to define species-habitat relationships(Robinson et al 2011) The issue of environmental
bias mdash spatial andor temporal bias in collection ofoccurrence data mdash is widely recognised in speciesdis tribution modelling (Arauacutejo amp Guisan 2006Phillips et al 2009 Ready et al 2010) It mainly arisesfrom limitations in data accessibility and samplingstrategies preventing representative coverage of theentire environmental range of species (Phillips et al2009) The biases inherent to most observation datacan easily lead to incorrect interpretation of habitatpreferences of wide-ranging species (Hirzel ampGuisan 2002)
RES modelling provides a technique for predictinglarge-scale distributions which does not rely on pointdata The niche hypotheses underlying RES modelsstill ultimately depend on the quality and amount ofavailable ecological information Quantitative dataon the relationships between seabirds and oceanproductivity are lacking and large areas of theoceans remain under-studied eg the central At -lantic (but see Skov et al 1994) However the abilityfor RES modelling to incorporate a range of qualita-tive and quantitative data collected from differentparts of speciesrsquo ranges at different times of yearbroadens the scope of environmental coverage Con-sequently the outputs may represent more balancedand robust predictions for many marine animalsthan the more commonly used predictive modellingtechniques When previously tested against a rangeof marine taxa RES modelling was shown to performvery well compared with traditional presence-onlymodelling methods (Ready et al 2010)
Accounting for temporal variability
Temporal variability in ecological niches and envi-ronmental parameters is frequently overlooked inspecies distribution modelling (Dambach amp Roumldder2011) Previous applications of RES modelling tomarine top predators did not account for temporalvariability in speciesminushabitat relationships or EGVs(Kaschner et al 2006 Ready et al 2010) In this studywe have accounted for the seasonal shifts in habitatassociations that occur within the annual life cycle bydistinguishing between a speciesrsquo breeding and non-breeding niche and subsequently relating niches toseasonally averaged data for dynamic EGVsAccounting for temporal variation in both speciesminusenvironment relationships and dynamic environ-mental variables is expected to increase the reliabil-ity of RES predictions particularly in areas whereenvironmental conditions fluctuate greatly betweenseasons Consequently our seasonal RES predictions
269
Mar Ecol Prog Ser 485 259ndash273 2013
can provide greater insight into speciesrsquo behaviourand ecology than those based on an annual averageniche envelope
Applications and recommendations for future research
RES modelling could prove a valuable tool forinforming the development and implementation ofeffective conservation and management practices Inthe absence of comprehensive occurrence data forwide-ranging species RES models can identify criti-cally important areas and biodiversity hotspots inpelagic marine ecosystems This is of direct rele-vance to the development of quantifiable criteria forthe designation of marine Important Bird Areas(IBAs BirdLife International 2004) The modellingapproach could be used to direct observation effort toareas where under-recorded seabirds are predictedto occur and inform sampling strategies to incorpo-rate a range of environmental suitability Matchingdata on seabird distribution as revealed by RESmodel outputs with data on fishing effort couldinform the responsibilities of Regional FisheriesManagement Organisations (RFMOs) and the devel-opment of suitable monitoring and mitigation meas-ures to reduce negative interactions between sea-birds and fisheries (eg Le Corre et al 2012)
Application of RES modelling to a greater variety ofspecies demonstrating variable niche characteris-tics will allow further examination of the broad-scaleapplicability of the approach Expanding the RESapproach to wider geographic areas incorporatingall of a speciesrsquo range would offer greater insightinto understanding distribution dispersal and migra-tory behaviour An iterative approach to the develop-ment of models (as recommended by Elith et al 2006)will improve the robustness of predictions by consid-ering the effects of a wider range of predictor vari-ables on model performance Additional factors thathave been shown to influence the at-sea distributionof seabirds and could be incorporated into futuremodels include sea-surface salinity (eg Huettmannamp Diamond 2001) horizontal (eg Louzao et al 2009)and vertical gradients in SST (eg Spear et al 2001)and fishing effort (eg Karpouzi et al 2007)
Wider application of RES modelling requires simultaneous developments in at-sea sampling andlarge-scale studies of speciesminushabitat relationshipswhich inform one another and offer direction forfuture research The increasing use of trackingdevices for recording movements of seabirds pro-
vides opportunities for quantification of habitat useand preference (Wakefield et al 2009 Le Corre et al2012) Increasing the public availability of trackingdata will facilitate further development of SDMs(Skov et al 2008) Further studies are required toimprove quantitative understanding of speciesminushabi-tat relationships across a variety of spatio-temporalscales and integration of data across scales is neces-sary to enhance the predictive ability of RES modelsHaving demonstrated RES is a robust modellingapproach predictions could be improved by the useof ensemble model averaging (Arauacutejo amp New 2007)
CONCLUSIONS
Based on quantitative definitions of speciesrsquo eco-logical requirements RES maps offer a robust alter-native to subjectively generated traditional rangemaps We have shown that RES modelling can ade-quately describe habitat suitability across largescales for wide-ranging pelagic seabirds RES model-ling presents a generic and objective approach forpredicting distributions of wide-ranging marine ani-mals across large spatial scales when the absence ofrepresentative point data precludes the applicationof traditional modelling techniques Model outputsrepresent an alternative to the conventional and sub-jective approach of delineating range extents basedon limited records of occurrence The approach isbased on clear assumptions concerning speciesrsquohabitat preferences which can be easily modifiedand tested
RES predictions are limited by the extent of pub-lished data and the subsequent ability to accuratelyquantify speciesrsquo ecological niches While some gapsin the literature are evident the synthesis of knowl-edge concerning speciesminushabitat relationships canadequately describe ecological niches for the pur-poses of building predictive distribution models Thisoffers a more robust approach for answering broad-scale questions about speciesrsquo distributions thanderiving niches from limited and biased samplingdata Of greater significance is the limited availabil-ity of representative at-sea observations data to rig-orously evaluate models which may prove to be thekey limiting factor in the wider application of RESmodelling for wide-ranging marine animals
Acknowledgements Thanks to the NERC Earth Observa-tion Data Acquisition and Analysis Service (NEODAAS) forsupplying data for this study MARINElifersquos contribution tothis research was part-funded by the EU as part of the Chan-
270
Watson et al Modelling seabird distributions and habitat suitability
nel Integrated Approach for Marine Resource Management(CHARM) Phase 3 project We thank MARINElife volun-teers for collection of observation data and PampO Ferries forsponsoring surveys aboard the lsquoPride of Bilbaorsquo
LITERATURE CITED
Airameacute S Dugan JE Lafferty KD Leslie H McArdle DAWarner RR (2003) Applying ecological criteria to marinereserve design a case study from the California ChannelIslands Ecol Appl 13 170minus184
Arauacutejo MB Guisan A (2006) Five (or so) challenges for spe-cies distribution modelling J Biogeogr 33 1677minus1688
Arauacutejo MB New M (2007) Ensemble forecasting of speciesdistributions Trends Ecol Evol 22 42minus47
Ashmole N (1971) Sea bird ecology and the marine environ-ment In Farner DS King JR (eds) Avian biology Vol 1Academic Press New York NY p 223minus286
BirdLife International (2004) Tracking ocean wanderers the global distribution of albatrosses and petrels Resultsfrom the Global Procellariiform Tracking Workshop1minus5 September 2003 Gordonrsquos Bay South Africa BirdlifeInternational Cambridge
Boyce MS Vernier PR Nielsen SE Schmiegelow FKA(2002) Evaluating resource selection functions EcolModel 157 281minus300
Briggs KT Chu EW (1986) Sooty shearwaters off California distribution abundance and habitat use Condor 88 355minus364
Brown RM Nichols RA Faulkes CG Jones CG and others(2010) Range expansion and hybridization in RoundIsland petrels (Pterodroma spp) evidence from micro -satellite genotypes Mol Ecol 19 3157minus3170
Cramp S Simmons K (1980) Handbook of the birds ofEurope the Middle East and north Africa The birds ofthe western Palearctic Vol 1 Ostrich to ducks OxfordUniversity Press Oxford
Dambach J Roumldder D (2011) Applications and future chal-lenges in marine species distribution modeling AquatConserv 21 92minus100
Davies RG Irlich UM Chown SL Gaston KJ (2010) Ambi-ent productive and wind energy and ocean extent pre-dict global species richness of procellariiform seabirdsGlob Ecol Biogeogr 19 98minus110
del Hoyo J Elliott A Sargatal J (1992) Handbook of thebirds of the world Vol 1 Ostrich to ducks Lynx EdicionsBarcelona
Dormann CF McPherson JM Arauacutejo MB Bivand R and oth-ers (2007) Methods to account for spatial autocorrelationin the analysis of species distributional data a reviewEcography 30 609minus628
Elith J Leathwick JR (2009) Species distribution models ecological explanation and prediction across space andtime Annu Rev Ecol Evol Syst 40 677minus697
Elith J Graham H Anderson P Dudiacutek M and others (2006)Novel methods improve prediction of species distribu-tions from occurrence data Ecography 29 129minus151
Fielding AH Bell JF (1997) A review of methods for theassessment of prediction errors in conservation pres-enceabsence models Environ Conserv 24 38minus49
Friesen VL Burg TM McCoy KD (2007) Mechanisms ofpopulation differentiation in seabirds Mol Ecol 16 1765minus1785
Furness RW Birkhead TR (1984) Seabird colony distribu-
tions suggest competition for food supplies during thebreeding-season Nature 311 655minus656
Furness RW Bryant DM (1996) Effect of wind on field meta-bolic rates of breeding northern fulmars Ecology 77 1181minus1188
Gaston AJ Woo K (2008) Razorbills (Alca torda) follow sub-arctic prey into the Canadian Arctic colonization resultsfrom climate change Auk 125 939minus942
Goacutemez-Diacuteaz E Gonzaacutelez-Soliacutes J Peinado MA Page RDM(2006) Phylogeography of the Calonectris shearwatersusing molecular and morphometric data Mol PhylogenetEvol 41 322minus332
Gregr EJ Trites AW (2008) A novel presence-only validationtechnique for improved Steller sea lion Eumetopias juba-tus critical habitat descriptions Mar Ecol Prog Ser 365 247minus261
Guinotte JM Bartley JD Iqbal A Fautin DG BuddemeierRW (2006) Modeling habitat distribution from organismoccurrences and environmental data case study usinganemonefishes and their sea anemone hosts Mar EcolProg Ser 316 269minus283
Guisan A Zimmermann NE (2000) Predictive habitat distri-bution models in ecology Ecol Model 135 147minus186
Guisan A Edwards TC Hastie T (2002) Generalized linearand generalized additive models in studies of speciesdistributions setting the scene Ecol Model 157 89minus100
Hardy SM Lindgren M Konakanchi H Huettmann F (2011)Predicting the distribution and ecological niche of unex-ploited snow crab (Chionoecetes opilio) populations inAlaskan waters a first open-access ensemble modelIntegr Comp Biol 51 608minus622
Hedd A Montevecchi WA Otley H Phillips RA Fifield DA(2012) Trans-equatorial migration and habitat use bysooty shearwaters Puffinus griseus from the SouthAtlantic during the nonbreeding season Mar Ecol ProgSer 449 277minus290
Hijmans RJ (2012) Cross-validation of species distributionmodels removing spatial sorting bias and calibrationwith a null model Ecology 93 679minus688
Hirzel AH Guisan A (2002) Which is the optimal samplingstrategy for habitat suitability modelling Ecol Model157 331minus341
Hobbs M Brereton T Weir C Williams A (2003) Baselinemonitoring data on Procellariformes [Procellariiformes](shearwaters) in the Bay of Biscay Ornis Hungarica12ndash13 115minus125
Huettmann F Diamond AW (2001) Seabird colony locationsand environmental determination of seabird distribution a spatially explicit breeding seabird model for the North-west Atlantic Ecol Model 141 261minus298
Huettmann F Artukhin Y Gilg O Humphries G (2011) Pre-dictions of 27 Arctic pelagic seabird distributions usingpublic environmental variables assessed with colonydata a first digital IPY and GBIF open access synthesisplatform Mar Biodivers 41 141minus179
Intergovernmental Oceanographic Commission (IOC) Inter -national Hydrographic Organization (IHO) and BritishOceanographic Data Centre (BODC) (2003) Centenaryedition of the GEBCO Digital Atlas published on CD-ROM on behalf of the Intergovernmental OceanographicCommission and the International Hydrographic Organi-zation as part of the General Bathymetric Chart of theOceans BODC Liverpool
Karpouzi VS Watson R Pauly D (2007) Modelling and map-ping resource overlap between seabirds and fisheries on
271
Mar Ecol Prog Ser 485 259ndash273 2013
a global scale a preliminary assessment Mar Ecol ProgSer 343 87minus99
Kaschner K Watson R Trites AW Pauly D (2006) Mappingworld-wide distributions of marine mammal speciesusing a relative environmental suitability (RES) modelMar Ecol Prog Ser 316 285minus310
Kaschner K Tittensor DP Ready J Gerrodette T Worm B(2010) Current and future patterns of global marinemammal biodiversity PLoS ONE 6 e19653
Kearney M Porter W (2009) Mechanistic niche modelling combining physiological and spatial data to predict spe-ciesrsquo ranges Ecol Lett 12 334minus350
Le Corre M Jaeger A Pinet P Kappes MA and others (2012)Tracking seabirds to identify potential Marine ProtectedAreas in the tropical western Indian Ocean Biol Conserv156 83minus93
Legendre P (1993) Spatial autocorrelation trouble or newparadigm Ecology 74 1659minus1673
Louzao M Hyrenbach KD Arcos JM Abelloacute P De Sola LGOro D (2006) Oceanographic habitat of an endangeredMediterranean procellariiform implications for marineprotected areas Ecol Appl 16 1683minus1695
Louzao M Beacutecares J Rodriacuteguez B Hyrenbach KD Ruiz AArcos JM (2009) Combining vessel-based surveys andtracking data to identify key marine areas for seabirdsMar Ecol Prog Ser 391 183minus197
Manly BF McDonald LL Thomas DL McDonald TL Erick-son WP (2002) Resource selection by animals statisticaldesign and analysis for field studies Springer New YorkNY
Matthiopoulos J Harwood J Thomas L (2005) Metapopula-tion consequences of site fidelity for colonially breedingmammals and birds J Anim Ecol 74 716minus727
Maxwell DL Stelzenmuumlller V Eastwood PD Rogers SI(2009) Modelling the spatial distribution of plaice (Pleu-ronectes platessa) sole (Solea solea) and thornback ray(Raja clavata) in UK waters for marine management andplanning J Sea Res 61 258minus267
Milot E Weimerskirch H Bernatchez L (2008) The seabirdparadox dispersal genetic structure and populationdynamics in a highly mobile but philopatric albatrossspecies Mol Ecol 17 1658minus1673
Miskelly CM Taylor GA Gummer H Williams R (2009)Translocations of eight species of burrow-nesting sea-birds (genera Pterodroma Pelecanoides Pachyptila andPuffinus Family Procellariidae) Biol Conserv 142 1965minus1980
Nur N Jahncke J Herzog MP Howar J and others (2011)Where the wild things are predicting hotspots of seabirdaggregations in the California Current System EcolAppl 21 2241minus2257
Oedekoven CS Ainley DG Spear LB (2001) Variable res -ponses of seabirds to change in marine climate Califor-nia Current 1985ndash1994 Mar Ecol Prog Ser 212 265minus281
Olden JD Jackson DA Peres-Neto PR (2002) Predictivemodels of fish species distributions a note on proper val-idation and chance predictions Trans Am Fish Soc 131 329minus336
Olivier F Wotherspoon SJ (2006) Modelling habitat selec-tion using presence-only data case study of a colonialhollow nesting bird the snow petrel Ecol Model 195 187minus204
Onley D Schofield P (2007) Field guide to the albatrossespetrels and shearwaters of the world Christopher HelmLondon
Oppel S Meirinho A Ramiacuterez I Gardner B OrsquoConnell AFMiller PI Louzao M (2012) Comparison of five modellingtechniques to predict the spatial distribution and abun-dance of seabirds Biol Conserv 156 94minus104
Ostrand WD Drew GS Suryan RM McDonald LL (1998)Evaluation of radio-tracking and strip transect methodsfor determining foraging ranges of black-legged kitti-wakes Condor 100 709minus718
Pahl-Wostl C (1997) Dynamic structure of a food web model comparison with a food chain model Ecol Model 100 103minus123
Phillips SJ Dudiacutek M Elith J Graham CH Lehmann ALeathwick J Ferrier S (2009) Sample selection bias andpresence-only distribution models implications for back-ground and pseudo-absence data Ecol Appl 19 181minus197
Raes N ter Steege H (2007) A null-model for significancetesting of presence-only species distribution modelsEcography 30 727minus736
Raymond B Woehler EJ (2003) Predicting seabirds at sea inthe Southern Indian Ocean Mar Ecol Prog Ser 263 275minus285
Ready J Kaschner K South AB Eastwood PD and others(2010) Predicting the distributions of marine organismsat the global scale Ecol Model 221 467minus478
Redfern JV Ferguson MC Becker EA Hyrenbach KD andothers (2006) Techniques for cetaceanminushabitat modelingMar Ecol Prog Ser 310 271minus295
Robinson LM Elith J Hobday AJ Pearson RG Kendall BEPossingham HP Richardson AJ (2011) Pushing the limitsin marine species distribution modelling lessons fromthe land present challenges and opportunities Glob EcolBiogeogr 20 789minus802
Ross DA (1988) An introduction to oceanography PrenticeHall Englewood Cliffs NJ
Sangster G Knox AG Helbig AJ Parkin DT (2002) Taxo-nomic recommendations for European birds Ibis 144 153minus159
Schneider DC (1997) Habitat selection by marine birds inrelation to water depth Ibis 139 175minus178
Schneider DC Piatt JF (1986) Scale-dependent correlationof seabirds with schooling fish in a coastal ecosystemMar Ecol Prog Ser 32 237minus246
Skov H Durinck J Danielsen F Bloch D (1994) The summerdistribution of Procellariiformes in the central NorthAtlantic Ocean Vogelwarte 37 270minus289
Skov H Humphreys E Garthe S Geitner K and others(2008) Application of habitat suitability modelling totracking data of marine animals as a means of analyzingtheir feeding habitats Ecol Model 212 504minus512
Soberoacuten J Nakamura M (2009) Niches and distributionalareas concepts methods and assumptions Proc NatlAcad Sci USA 106 19644minus19650
Spear LB Ballance LT Ainley DG (2001) Response of sea-birds to thermal boundaries in the tropical Pacific thethermocline versus the Equatorial Front Mar Ecol ProgSer 219 275minus289
Sverdrup H Johnston MW Fleming RH (1942) The oceans their physics chemistry and general biology PrenticeHall New York NY
Tasker ML Reid JB (1997) Seabirds in the marine environ-ment mdash introduction ICES J Mar Sci 54 505minus506
Torres LG Read AJ Halpin P (2008) Fine-scale habitat modeling of a top marine predator Do prey data improvepredictive capacity Ecol Appl 18 1702minus1717
Vermeer K Morgan KH Smith GEJ Hay R (1989) Fall distri-
272
Watson et al Modelling seabird distributions and habitat suitability 273
bution of pelagic birds over the shelf off SW VancouverIsland Colon Waterbirds 12 207minus214
Wakefield ED Phillips RA Matthiopoulos J (2009) Quantify-ing habitat use and preferences of pelagic seabirds usingindividual movement data a review Mar Ecol Prog Ser391 165minus182
Warham J (1990) The petrels their ecology and breedingsystems Academic Press New York NY
Yen PPW Huettmann F Cooke F (2004) A large-scale modelfor the at-sea distribution and abundance of marbledmurrelets (Brachyramphus marmoratus) during the bree -ding season in coastal British Columbia Canada EcolModel 171 395minus413
Zimmermann NE Edwards TC Graham CH Pearman PBSvenning JC (2010) New trends in species distributionmodelling Ecography 33 985minus989
Editorial responsibility Rory Wilson Swansea UK
Submitted June 7 2012 Accepted March 7 2013Proofs received from author(s) June 11 2013

Watson et al Modelling seabird distributions and habitat suitability
Qualitative comparison with published range maps
From visual qualitative assessment it can be seenthat model outputs (Fig 3) illustrate variability inpredicted range extents of the 6 seabird species inthe North Atlantic Relative environmental suitabilityvaries throughout ranges reflecting niche segrega-tion between species Predicted range extents vary intotal surface area and geographical coverage Com-paring between species non-breeding birds (withthe exception of fulmar) occupy a larger range andlatitudinal extent than breeding birds
Predicted range extents closely corresponded withpublished distribution maps for all species Howeverall ranges comprised a wider extent than maps in theliterature A common discrepancy was the predictionof suitable habitat in enclosed seas when such areasare excluded from published ranges for several spe-cies for example the inclusion of the MediterraneanSea in model outputs for great shearwater and Manxshearwater the Caribbean Sea and Gulf of Mexicofor great shearwater and sooty shearwater and Hud-son Bay for great shearwater Elsewhere modelscaptured areas of known absence well for examplethe absence of breeding Manx shearwater from thewestern central Atlantic and Caribbean Sea theabsence of sooty shearwater from Hudson Bay andthe low habitat suitability in the central Atlantic forthe sooty shearwater
The model output for storm petrel predicted amuch wider range across the North Atlantic thanpublished range maps the latter define the speciesrsquorange as restricted to the northeast Atlantic extend-ing no further west than 30degW Areas of high environ-mental suitability were separated by a large area oflow RES in the central Atlantic Similarly a smallarea of suitable habitat was predicted for fulmar in
the north Mediterranean Sea but separated from thecore range by a large area of unsuitable habitat
Statistical model evaluation
RES models for 5 out of 6 species performed signifi-cantly better than expected by chance when testedwith independent observation data from the Bay ofBiscay (p lt 005 Table 3) The AUC of empirical mod-els was significantly higher than that of correspondingnull models revealing a significant relationship be-tween RES and species occurrences for 6 out of 7models In the case of 4 out of a total of 7 models lessthan 01 of random samples had a higher AUC thanthe actual model (p lt 0001) The model for sootyshearwater did not perform significantly better thanrandom (p = 0260) with 26 of random AUCs ex-ceeding the observed AUC While the model for greatshearwater performed significantly better than ex-pected by chance (p = 0041) the model AUC wasonly very slightly higher than the 95 quantile of theranked null AUC values indicating that the model didnot perform much better than random
The number of speciesrsquo encounters ranged from115 to 590 (mean 3531 plusmn 653 Table 4) The rangeand frequency distribution of habitat suitabilityacross the model evaluation area for each species isillustrated by percentiles of ranked RES values(Table 4) The distribution of RES in the survey areavaries between species and is strongly skewed mdashindicating reduced heterogeneity of habitat suita -bility mdash for 3 models fulmar (breeding) sooty shear -water and Manx shearwater The majority of habitatwithin the sampling area is of low suitability forbreeding fulmars but of homogenously high suitabil-ity for sooty and Manx shearwaters
265
Species Status Depth (m) SST (degC) Distance (m)MinA MinP MaxP MaxA MinA MinP MaxP MaxA MinA MinP Max P MaxA
Northern fulmar B 0 100 1000 8000 minus2 0 15 15 0 0 320 2364N 0 100 2000 8000 minus2 0 10 15 0 50 2364 2364
Coryrsquos shearwater B 0 100 1000 8000 10 20 20 25 0 0 200 2364Great shearwater N 0100 200 8000 minus2 0 20 35 0 6 2000 2364Sooty shearwater N 0 10 1000 8000 5 10 20 35 0 15 200 2364Manx shearwater B 0 10 200 8000 5 10 20 25 0 0 360 2364European storm petrel B 0 100 2000 8000 5 10 20 25 0 0 200 2364
Table 2 Quantitative descriptions of speciesrsquo ecological niches in respect of 4 ecogeographical variables depth sea-surfacetemperature (SST) distance to land and chlorophyll a (chl a) concentration Niches were defined for 6 procellariiform seabirdsduring the breeding andor non-breeding season MinA and MaxA absolute minimum and maximum values of the resourceselection function MinP and MaxP preferred minimum and maximum values (see Fig 1) Chl a (mg mminus3 identical for eachspecies and status) MinA MinP = 0 03 MaxP MaxA = 60 60 Status B = breeding N = non-breeding See Table S1 in
Supplement 1 (wwwint-rescomarticlessupplm485p259_supplpdf) for data sources
Mar Ecol Prog Ser 485 259ndash273 2013266
Fig 3 Model outputs illustrating predicted geographicrange and relative environmental suitability (RES) for 6procellariiform seabirds in the North Atlantic duringtheir breeding (yellowminusbrown) andor non-breedingseasons (blue) (A) northern fulmar Fulmarus glacialisbreeding (B) northern fulmar non-breeding (C) Coryrsquosshearwater Calonectris diomedea breeding (D) greatshearwater Puffinus gravis non-breeding (E) sootyshearwater P griseus non-breeding (F) Manx shear -water P puffinus breeding and (G) European stormpetrel Hydrobates pelagicus breeding Predicted RES ison a scale from 0 (least suitable white) to 1 (highly suit-
able dark)
Watson et al Modelling seabird distributions and habitat suitability
DISCUSSION
RES predictions
When compared with simulated random data RESmodels performed significantly better for 5 out of6 seabird species (and 6 out of 7 models) at predicting
relative likelihood of occurrence in a subset of thestudy area Model outputs provide more informationon speciesrsquo distributions than published range mapssince they provide indices of relative environmentalsuitability throughout a speciesrsquo range RES predic-tions represent simple testable hypotheses concern-ing a speciesrsquo potential niche in respect of a few envi-ronmental predictors Visualisation of hypotheses ina spatial context facilitates our understanding of speciesminushabitat relationships inference of areas ofpotentially high seabird abundance and identifica-tion of regions to be targeted for future research andconservation planning
Observed versus predicted distributions
RES modelling of the potential niche resulted inpredictions of occurrence outside of known (or ob -served) ranges for several species when comparedwith published range maps indicating that distribu-tions are influenced by additional biological andorphysical parameters besides those included in mod-els Indeed modelling of the realised niche mdash thepart of the potential niche that a species actuallyuses mdash requires the incorporation of biotic interac-tions (Soberoacuten amp Nakamura 2009) and physiologicalconstraints (Kearney amp Porter 2009) Qualitative com-parison of RES model outputs with observed distribu-tions thus allows the assessment of the importance ofother factors that may influence the at-sea distribu-tion of seabirds
Distributions of pelagic animals are ultimately con-strained by the abundance and distribution of prey(Pahl-Wostl 1997) but scales of association betweenmobile predators and prey are highly variable(Schneider amp Piatt 1986) and prey indices are consid-ered inappropriate for predicting global distributionsof many highly mobile marine organisms (Torres etal 2008) Karpouzi et al (2007) incorporated informa-tion on prey distributions in mapping at-sea foragingdistributions of seabirds however they found little orno information concerning the diet of many seabirdsand detected high spatial variability in associationsbetween seabirds and prey Habitat modelling istherefore largely reliant on predictor variables thatindirectly affect species distribution
Evidence from energetic and physiological studieshighlights the significance of wind speed (Furness ampBryant 1996) and area of available ocean extent (Da -vies et al 2010) in influencing the foraging behaviourand life-history strategies of procellariiform seabirdsThe Strait of Gibraltar (Friesen et al 2007) and the
267
Species AUCm AUCn p
Northern fulmarBreeding 0735 0568 lt0001Non-breeding 0774 0583 lt0001Coryrsquos shearwaterBreeding 0712 0580 lt0001Great shearwaterNon-breeding 0587 0583 0041Sooty shearwaterNon-breeding 0530 0575 0260Manx shearwaterBreeding 0614 0572 0004European storm petrelBreeding 0704 0582 lt0001
Table 3 Evaluation of predictive performance of relative en-vironmental suitability (RES) models A model was consid-ered to perform significantly better than chance if the areaunder the curve of the empirical model (AUCm) exceededthe 95 quantile of the ranked AUC values of a correspon-ding null model (AUCn) p-values indicate the proportion of
AUCn that were equal to or greater than AUCm
Species No of No of Percentiles of ranked records lsquopresencersquo RES in survey area
cells 10 50 90
Northern fulmarBreeding 590 71 00 00 10Non-breeding 248 45 012 036 056Coryrsquos shearwaterBreeding 527 51 015 043 062Great shearwaterNon-breeding 452 48 037 069 10Sooty shearwaterNon-breeding 115 46 055 10 10Manx shearwaterBreeding 245 60 050 10 10European storm petrelBreeding 295 46 045 086 10
Table 4 Summary of test data used for evaluating the pre-dictive performance of relative environmental suitability(RES) models Independent observation data were collectedfrom repeated sampling of 156 grid cells (025deg times 025deg) byMARINElife in the Bay of Biscay (Fig 2) The number of spe-cies records number of lsquopresencersquo cells and variation in RESwithin the model evaluation area (percentiles of ranked
RES) are presented
Mar Ecol Prog Ser 485 259ndash273 2013
Almeria-Oran Oceanographic Front (Goacutemez-Diacuteaz etal 2006) have both been proposed as barriers limit-ing dispersal of and genetic exchange between sea-birds in the Atlantic Ocean and the MediterraneanSea Such physical and geographical factors mayexplain why despite the prediction of suitable habitat the observed distributions of some species donot extend into enclosed seas eg the absence ofgreat shearwater from the Mediterranean Sea andHudson Bay
Biotic interactions may play a significant role indetermining distributions across smaller spatial andtemporal scales (Furness amp Birkhead 1984) and theirincorporation into SDMs is widely recognised as akey challenge in both terrestrial (Arauacutejo amp Guisan2006) and marine environments (Robinson et al2011) Shearwaters do not typically form mixed- species colonies (Warham 1990) suggesting thatinterspecific competition and niche segregation mayinfluence the breeding distributions of some procel-lariiform seabirds While the observed range of Manxshearwater does not extend into the MediterraneanSea the breeding ranges of the Balearic shearwaterPuffinus mauretanicus and the Yelkoaun shearwaterP yelkoauni which occupy similar ecological nichesto the Manx shearwater (and were until recentlyconsidered to be subspecies of Manx shearwaterSangster et al 2002) are restricted to the Mediter-ranean Sea (Onley amp Schofield 2007) A combinationof evolutionary history and biotic interactions mayexplain the reduced niche overlap that is observed(compared with predicted overlap) between these 3ecologically similar species Depending on the objec-tives it may be a more useful approach to applyniche modelling to a species complex when there areseveral closely related species
Despite their ability to traverse large sections ofocean many procellariiform seabirds show limiteddispersal (the lsquoseabird paradoxrsquo proposed by Milot etal 2008) Their philopatric habits are expected tolimit colonisation by long-distance dispersal and sub-sequent range expansion (Matthiopoulos et al 2005Brown et al 2010) Despite the prediction of highRES in the northwest Atlantic for the storm petrelhigh breeding-site fidelity and the large area of pre-dicted low habitat suitability in the central Atlanticmay explain why the speciesrsquo observed distribution(from published range maps) is restricted to thenortheast Atlantic (del Hoyo et al 1992) Addition-ally the niche is already filled by another pelagicseabird Leachrsquos petrel Oceanodroma leucorhoa inthe northwest Atlantic (del Hoyo et al 1992) In theinterpretation of RES model outputs consideration
should thus be afforded to a speciesrsquo evolutionaryhistory as well as areas of low RES separating areasof high RES both of which may act to restrict ranges
The availability of suitable nest sites is a funda-mental constraint on the current breeding distribu-tion of seabirds (Brown et al 2010) Procellariiformseabirds are largely restricted to remote islands freeof mammalian predators which are within range ofsuitable foraging areas (Warham 1990) If all occu-pied breeding colonies could be accurately identifiedand niche envelopes constrained by maximum forag-ing range from colonies models could yield moreaccurate predictions of range extent during thebreeding season However given the difficulties ofsurveying and monitoring remote locations ourknowledge of breeding sites is likely to be incom-plete particularly for less well-studied speciesRestricting distribution to within species-specific for-aging range of all land therefore represents a moreconservative approach
Where suitable habitat is predicted outside of cur-rent observed distributions this may indicate areasthat are used by a species but for which there are nodata or areas that could be suitable for colonisationFuture colonisation or range shifts could be driven bychanges in environmental suitability as a result ofnatural changes (eg Gaston amp Woo 2008) andoranthropogenic-induced changes such as by meansof active conservation management (Miskelly et al2009) By identifying areas of potentially suitable at-sea habitat the RES modelling approach may thusoffer insight into the effects of future changes in cli-mate and anthropogenic activities on speciesrsquo distri-butions Further model development could be basedon different scenarios for climate or nest-site avail-ability to generate predictions of future changes indistributions
Model evaluation
Statistical evaluation demonstrates that the genericapproach of RES modelling can accurately describehabitat suitability for wide-ranging seabirds RESpredictions were more strongly related to speciespresence for 6 out of 7 models than expected due tochance While qualitative assessment of the modeloutput for non-breeding sooty shearwater suggestedreasonable consistency with published distributiondata the model did not perform significantly betterthan a null model Poor model performance could beexplained by the low quality of data used for modelparameterisation (see Table S1) resulting in an inac-
268
Watson et al Modelling seabird distributions and habitat suitability
curate description of a speciesrsquo ecological niche It iswell established that speciesminusenvironment relation-ships can change with scale (Manly et al 2002) andthere is evidence for intraspecific spatial variation inspeciesminushabitat relationships in seabirds (Huettmannamp Diamond 2001) Most information on the at-seahabitat associations of the sooty shearwater comesfrom studies in the Pacific Ocean (Briggs amp Chu 1986Vermeer et al 1989 but see Hedd et al 2012) There-fore we cannot be certain of the spatial stability ofthe speciesrsquo niche across distinct ocean basins Theavailability and quality of ecological data may limitthe wider application of RES modelling to other spe-cies of seabird if insufficient data are available toaccurately quantify speciesrsquo ecological niches
Rigorous evaluation of models requires that the testdata set accurately reflects the distribution andoccurrence of a species within the evaluation areaThe test data comprised far fewer observations ofsooty shearwater than the other study species andthe sampling area was characterised by low variationin RES ie highly homogeneous habitat suitability(Table 4) However despite highly skewed distribu-tions of RES the models for fulmar (breeding) andManx shearwater showed highly significant predic-tive accuracy when compared to null models Thisindicates these models must be performing very wellif they can perform significantly better than randomeven under less favourable conditions for the evalua-tion Rigorous model evaluation relies on representa-tive observation data collected across broad spatialand temporal scales to compliment the macro-scalemodelling approach While lsquoregularrsquo and lsquoequal-stratifiedrsquo sampling strategies are the most accurateand robust (Hirzel amp Guisan 2002) these are not typ-ically features of opportunistically collected data mdashthe source of most at-sea seabird observations Theincreasing availability of large-scale point data (egOBIS GBIF) and range maps such as those availablethrough the IUCN Red List (wwwiucnredlistorg)presents opportunities for further testing of RESmodels However the availability of representativetest data may limit the application of RES modellingfor scarcer and under-recorded species
Biases in model parameters
A frequent obstacle encountered in predictive distribution modelling of marine animals is the lackof reliable and comprehensive occurrence datafrom which to define species-habitat relationships(Robinson et al 2011) The issue of environmental
bias mdash spatial andor temporal bias in collection ofoccurrence data mdash is widely recognised in speciesdis tribution modelling (Arauacutejo amp Guisan 2006Phillips et al 2009 Ready et al 2010) It mainly arisesfrom limitations in data accessibility and samplingstrategies preventing representative coverage of theentire environmental range of species (Phillips et al2009) The biases inherent to most observation datacan easily lead to incorrect interpretation of habitatpreferences of wide-ranging species (Hirzel ampGuisan 2002)
RES modelling provides a technique for predictinglarge-scale distributions which does not rely on pointdata The niche hypotheses underlying RES modelsstill ultimately depend on the quality and amount ofavailable ecological information Quantitative dataon the relationships between seabirds and oceanproductivity are lacking and large areas of theoceans remain under-studied eg the central At -lantic (but see Skov et al 1994) However the abilityfor RES modelling to incorporate a range of qualita-tive and quantitative data collected from differentparts of speciesrsquo ranges at different times of yearbroadens the scope of environmental coverage Con-sequently the outputs may represent more balancedand robust predictions for many marine animalsthan the more commonly used predictive modellingtechniques When previously tested against a rangeof marine taxa RES modelling was shown to performvery well compared with traditional presence-onlymodelling methods (Ready et al 2010)
Accounting for temporal variability
Temporal variability in ecological niches and envi-ronmental parameters is frequently overlooked inspecies distribution modelling (Dambach amp Roumldder2011) Previous applications of RES modelling tomarine top predators did not account for temporalvariability in speciesminushabitat relationships or EGVs(Kaschner et al 2006 Ready et al 2010) In this studywe have accounted for the seasonal shifts in habitatassociations that occur within the annual life cycle bydistinguishing between a speciesrsquo breeding and non-breeding niche and subsequently relating niches toseasonally averaged data for dynamic EGVsAccounting for temporal variation in both speciesminusenvironment relationships and dynamic environ-mental variables is expected to increase the reliabil-ity of RES predictions particularly in areas whereenvironmental conditions fluctuate greatly betweenseasons Consequently our seasonal RES predictions
269
Mar Ecol Prog Ser 485 259ndash273 2013
can provide greater insight into speciesrsquo behaviourand ecology than those based on an annual averageniche envelope
Applications and recommendations for future research
RES modelling could prove a valuable tool forinforming the development and implementation ofeffective conservation and management practices Inthe absence of comprehensive occurrence data forwide-ranging species RES models can identify criti-cally important areas and biodiversity hotspots inpelagic marine ecosystems This is of direct rele-vance to the development of quantifiable criteria forthe designation of marine Important Bird Areas(IBAs BirdLife International 2004) The modellingapproach could be used to direct observation effort toareas where under-recorded seabirds are predictedto occur and inform sampling strategies to incorpo-rate a range of environmental suitability Matchingdata on seabird distribution as revealed by RESmodel outputs with data on fishing effort couldinform the responsibilities of Regional FisheriesManagement Organisations (RFMOs) and the devel-opment of suitable monitoring and mitigation meas-ures to reduce negative interactions between sea-birds and fisheries (eg Le Corre et al 2012)
Application of RES modelling to a greater variety ofspecies demonstrating variable niche characteris-tics will allow further examination of the broad-scaleapplicability of the approach Expanding the RESapproach to wider geographic areas incorporatingall of a speciesrsquo range would offer greater insightinto understanding distribution dispersal and migra-tory behaviour An iterative approach to the develop-ment of models (as recommended by Elith et al 2006)will improve the robustness of predictions by consid-ering the effects of a wider range of predictor vari-ables on model performance Additional factors thathave been shown to influence the at-sea distributionof seabirds and could be incorporated into futuremodels include sea-surface salinity (eg Huettmannamp Diamond 2001) horizontal (eg Louzao et al 2009)and vertical gradients in SST (eg Spear et al 2001)and fishing effort (eg Karpouzi et al 2007)
Wider application of RES modelling requires simultaneous developments in at-sea sampling andlarge-scale studies of speciesminushabitat relationshipswhich inform one another and offer direction forfuture research The increasing use of trackingdevices for recording movements of seabirds pro-
vides opportunities for quantification of habitat useand preference (Wakefield et al 2009 Le Corre et al2012) Increasing the public availability of trackingdata will facilitate further development of SDMs(Skov et al 2008) Further studies are required toimprove quantitative understanding of speciesminushabi-tat relationships across a variety of spatio-temporalscales and integration of data across scales is neces-sary to enhance the predictive ability of RES modelsHaving demonstrated RES is a robust modellingapproach predictions could be improved by the useof ensemble model averaging (Arauacutejo amp New 2007)
CONCLUSIONS
Based on quantitative definitions of speciesrsquo eco-logical requirements RES maps offer a robust alter-native to subjectively generated traditional rangemaps We have shown that RES modelling can ade-quately describe habitat suitability across largescales for wide-ranging pelagic seabirds RES model-ling presents a generic and objective approach forpredicting distributions of wide-ranging marine ani-mals across large spatial scales when the absence ofrepresentative point data precludes the applicationof traditional modelling techniques Model outputsrepresent an alternative to the conventional and sub-jective approach of delineating range extents basedon limited records of occurrence The approach isbased on clear assumptions concerning speciesrsquohabitat preferences which can be easily modifiedand tested
RES predictions are limited by the extent of pub-lished data and the subsequent ability to accuratelyquantify speciesrsquo ecological niches While some gapsin the literature are evident the synthesis of knowl-edge concerning speciesminushabitat relationships canadequately describe ecological niches for the pur-poses of building predictive distribution models Thisoffers a more robust approach for answering broad-scale questions about speciesrsquo distributions thanderiving niches from limited and biased samplingdata Of greater significance is the limited availabil-ity of representative at-sea observations data to rig-orously evaluate models which may prove to be thekey limiting factor in the wider application of RESmodelling for wide-ranging marine animals
Acknowledgements Thanks to the NERC Earth Observa-tion Data Acquisition and Analysis Service (NEODAAS) forsupplying data for this study MARINElifersquos contribution tothis research was part-funded by the EU as part of the Chan-
270
Watson et al Modelling seabird distributions and habitat suitability
nel Integrated Approach for Marine Resource Management(CHARM) Phase 3 project We thank MARINElife volun-teers for collection of observation data and PampO Ferries forsponsoring surveys aboard the lsquoPride of Bilbaorsquo
LITERATURE CITED
Airameacute S Dugan JE Lafferty KD Leslie H McArdle DAWarner RR (2003) Applying ecological criteria to marinereserve design a case study from the California ChannelIslands Ecol Appl 13 170minus184
Arauacutejo MB Guisan A (2006) Five (or so) challenges for spe-cies distribution modelling J Biogeogr 33 1677minus1688
Arauacutejo MB New M (2007) Ensemble forecasting of speciesdistributions Trends Ecol Evol 22 42minus47
Ashmole N (1971) Sea bird ecology and the marine environ-ment In Farner DS King JR (eds) Avian biology Vol 1Academic Press New York NY p 223minus286
BirdLife International (2004) Tracking ocean wanderers the global distribution of albatrosses and petrels Resultsfrom the Global Procellariiform Tracking Workshop1minus5 September 2003 Gordonrsquos Bay South Africa BirdlifeInternational Cambridge
Boyce MS Vernier PR Nielsen SE Schmiegelow FKA(2002) Evaluating resource selection functions EcolModel 157 281minus300
Briggs KT Chu EW (1986) Sooty shearwaters off California distribution abundance and habitat use Condor 88 355minus364
Brown RM Nichols RA Faulkes CG Jones CG and others(2010) Range expansion and hybridization in RoundIsland petrels (Pterodroma spp) evidence from micro -satellite genotypes Mol Ecol 19 3157minus3170
Cramp S Simmons K (1980) Handbook of the birds ofEurope the Middle East and north Africa The birds ofthe western Palearctic Vol 1 Ostrich to ducks OxfordUniversity Press Oxford
Dambach J Roumldder D (2011) Applications and future chal-lenges in marine species distribution modeling AquatConserv 21 92minus100
Davies RG Irlich UM Chown SL Gaston KJ (2010) Ambi-ent productive and wind energy and ocean extent pre-dict global species richness of procellariiform seabirdsGlob Ecol Biogeogr 19 98minus110
del Hoyo J Elliott A Sargatal J (1992) Handbook of thebirds of the world Vol 1 Ostrich to ducks Lynx EdicionsBarcelona
Dormann CF McPherson JM Arauacutejo MB Bivand R and oth-ers (2007) Methods to account for spatial autocorrelationin the analysis of species distributional data a reviewEcography 30 609minus628
Elith J Leathwick JR (2009) Species distribution models ecological explanation and prediction across space andtime Annu Rev Ecol Evol Syst 40 677minus697
Elith J Graham H Anderson P Dudiacutek M and others (2006)Novel methods improve prediction of species distribu-tions from occurrence data Ecography 29 129minus151
Fielding AH Bell JF (1997) A review of methods for theassessment of prediction errors in conservation pres-enceabsence models Environ Conserv 24 38minus49
Friesen VL Burg TM McCoy KD (2007) Mechanisms ofpopulation differentiation in seabirds Mol Ecol 16 1765minus1785
Furness RW Birkhead TR (1984) Seabird colony distribu-
tions suggest competition for food supplies during thebreeding-season Nature 311 655minus656
Furness RW Bryant DM (1996) Effect of wind on field meta-bolic rates of breeding northern fulmars Ecology 77 1181minus1188
Gaston AJ Woo K (2008) Razorbills (Alca torda) follow sub-arctic prey into the Canadian Arctic colonization resultsfrom climate change Auk 125 939minus942
Goacutemez-Diacuteaz E Gonzaacutelez-Soliacutes J Peinado MA Page RDM(2006) Phylogeography of the Calonectris shearwatersusing molecular and morphometric data Mol PhylogenetEvol 41 322minus332
Gregr EJ Trites AW (2008) A novel presence-only validationtechnique for improved Steller sea lion Eumetopias juba-tus critical habitat descriptions Mar Ecol Prog Ser 365 247minus261
Guinotte JM Bartley JD Iqbal A Fautin DG BuddemeierRW (2006) Modeling habitat distribution from organismoccurrences and environmental data case study usinganemonefishes and their sea anemone hosts Mar EcolProg Ser 316 269minus283
Guisan A Zimmermann NE (2000) Predictive habitat distri-bution models in ecology Ecol Model 135 147minus186
Guisan A Edwards TC Hastie T (2002) Generalized linearand generalized additive models in studies of speciesdistributions setting the scene Ecol Model 157 89minus100
Hardy SM Lindgren M Konakanchi H Huettmann F (2011)Predicting the distribution and ecological niche of unex-ploited snow crab (Chionoecetes opilio) populations inAlaskan waters a first open-access ensemble modelIntegr Comp Biol 51 608minus622
Hedd A Montevecchi WA Otley H Phillips RA Fifield DA(2012) Trans-equatorial migration and habitat use bysooty shearwaters Puffinus griseus from the SouthAtlantic during the nonbreeding season Mar Ecol ProgSer 449 277minus290
Hijmans RJ (2012) Cross-validation of species distributionmodels removing spatial sorting bias and calibrationwith a null model Ecology 93 679minus688
Hirzel AH Guisan A (2002) Which is the optimal samplingstrategy for habitat suitability modelling Ecol Model157 331minus341
Hobbs M Brereton T Weir C Williams A (2003) Baselinemonitoring data on Procellariformes [Procellariiformes](shearwaters) in the Bay of Biscay Ornis Hungarica12ndash13 115minus125
Huettmann F Diamond AW (2001) Seabird colony locationsand environmental determination of seabird distribution a spatially explicit breeding seabird model for the North-west Atlantic Ecol Model 141 261minus298
Huettmann F Artukhin Y Gilg O Humphries G (2011) Pre-dictions of 27 Arctic pelagic seabird distributions usingpublic environmental variables assessed with colonydata a first digital IPY and GBIF open access synthesisplatform Mar Biodivers 41 141minus179
Intergovernmental Oceanographic Commission (IOC) Inter -national Hydrographic Organization (IHO) and BritishOceanographic Data Centre (BODC) (2003) Centenaryedition of the GEBCO Digital Atlas published on CD-ROM on behalf of the Intergovernmental OceanographicCommission and the International Hydrographic Organi-zation as part of the General Bathymetric Chart of theOceans BODC Liverpool
Karpouzi VS Watson R Pauly D (2007) Modelling and map-ping resource overlap between seabirds and fisheries on
271
Mar Ecol Prog Ser 485 259ndash273 2013
a global scale a preliminary assessment Mar Ecol ProgSer 343 87minus99
Kaschner K Watson R Trites AW Pauly D (2006) Mappingworld-wide distributions of marine mammal speciesusing a relative environmental suitability (RES) modelMar Ecol Prog Ser 316 285minus310
Kaschner K Tittensor DP Ready J Gerrodette T Worm B(2010) Current and future patterns of global marinemammal biodiversity PLoS ONE 6 e19653
Kearney M Porter W (2009) Mechanistic niche modelling combining physiological and spatial data to predict spe-ciesrsquo ranges Ecol Lett 12 334minus350
Le Corre M Jaeger A Pinet P Kappes MA and others (2012)Tracking seabirds to identify potential Marine ProtectedAreas in the tropical western Indian Ocean Biol Conserv156 83minus93
Legendre P (1993) Spatial autocorrelation trouble or newparadigm Ecology 74 1659minus1673
Louzao M Hyrenbach KD Arcos JM Abelloacute P De Sola LGOro D (2006) Oceanographic habitat of an endangeredMediterranean procellariiform implications for marineprotected areas Ecol Appl 16 1683minus1695
Louzao M Beacutecares J Rodriacuteguez B Hyrenbach KD Ruiz AArcos JM (2009) Combining vessel-based surveys andtracking data to identify key marine areas for seabirdsMar Ecol Prog Ser 391 183minus197
Manly BF McDonald LL Thomas DL McDonald TL Erick-son WP (2002) Resource selection by animals statisticaldesign and analysis for field studies Springer New YorkNY
Matthiopoulos J Harwood J Thomas L (2005) Metapopula-tion consequences of site fidelity for colonially breedingmammals and birds J Anim Ecol 74 716minus727
Maxwell DL Stelzenmuumlller V Eastwood PD Rogers SI(2009) Modelling the spatial distribution of plaice (Pleu-ronectes platessa) sole (Solea solea) and thornback ray(Raja clavata) in UK waters for marine management andplanning J Sea Res 61 258minus267
Milot E Weimerskirch H Bernatchez L (2008) The seabirdparadox dispersal genetic structure and populationdynamics in a highly mobile but philopatric albatrossspecies Mol Ecol 17 1658minus1673
Miskelly CM Taylor GA Gummer H Williams R (2009)Translocations of eight species of burrow-nesting sea-birds (genera Pterodroma Pelecanoides Pachyptila andPuffinus Family Procellariidae) Biol Conserv 142 1965minus1980
Nur N Jahncke J Herzog MP Howar J and others (2011)Where the wild things are predicting hotspots of seabirdaggregations in the California Current System EcolAppl 21 2241minus2257
Oedekoven CS Ainley DG Spear LB (2001) Variable res -ponses of seabirds to change in marine climate Califor-nia Current 1985ndash1994 Mar Ecol Prog Ser 212 265minus281
Olden JD Jackson DA Peres-Neto PR (2002) Predictivemodels of fish species distributions a note on proper val-idation and chance predictions Trans Am Fish Soc 131 329minus336
Olivier F Wotherspoon SJ (2006) Modelling habitat selec-tion using presence-only data case study of a colonialhollow nesting bird the snow petrel Ecol Model 195 187minus204
Onley D Schofield P (2007) Field guide to the albatrossespetrels and shearwaters of the world Christopher HelmLondon
Oppel S Meirinho A Ramiacuterez I Gardner B OrsquoConnell AFMiller PI Louzao M (2012) Comparison of five modellingtechniques to predict the spatial distribution and abun-dance of seabirds Biol Conserv 156 94minus104
Ostrand WD Drew GS Suryan RM McDonald LL (1998)Evaluation of radio-tracking and strip transect methodsfor determining foraging ranges of black-legged kitti-wakes Condor 100 709minus718
Pahl-Wostl C (1997) Dynamic structure of a food web model comparison with a food chain model Ecol Model 100 103minus123
Phillips SJ Dudiacutek M Elith J Graham CH Lehmann ALeathwick J Ferrier S (2009) Sample selection bias andpresence-only distribution models implications for back-ground and pseudo-absence data Ecol Appl 19 181minus197
Raes N ter Steege H (2007) A null-model for significancetesting of presence-only species distribution modelsEcography 30 727minus736
Raymond B Woehler EJ (2003) Predicting seabirds at sea inthe Southern Indian Ocean Mar Ecol Prog Ser 263 275minus285
Ready J Kaschner K South AB Eastwood PD and others(2010) Predicting the distributions of marine organismsat the global scale Ecol Model 221 467minus478
Redfern JV Ferguson MC Becker EA Hyrenbach KD andothers (2006) Techniques for cetaceanminushabitat modelingMar Ecol Prog Ser 310 271minus295
Robinson LM Elith J Hobday AJ Pearson RG Kendall BEPossingham HP Richardson AJ (2011) Pushing the limitsin marine species distribution modelling lessons fromthe land present challenges and opportunities Glob EcolBiogeogr 20 789minus802
Ross DA (1988) An introduction to oceanography PrenticeHall Englewood Cliffs NJ
Sangster G Knox AG Helbig AJ Parkin DT (2002) Taxo-nomic recommendations for European birds Ibis 144 153minus159
Schneider DC (1997) Habitat selection by marine birds inrelation to water depth Ibis 139 175minus178
Schneider DC Piatt JF (1986) Scale-dependent correlationof seabirds with schooling fish in a coastal ecosystemMar Ecol Prog Ser 32 237minus246
Skov H Durinck J Danielsen F Bloch D (1994) The summerdistribution of Procellariiformes in the central NorthAtlantic Ocean Vogelwarte 37 270minus289
Skov H Humphreys E Garthe S Geitner K and others(2008) Application of habitat suitability modelling totracking data of marine animals as a means of analyzingtheir feeding habitats Ecol Model 212 504minus512
Soberoacuten J Nakamura M (2009) Niches and distributionalareas concepts methods and assumptions Proc NatlAcad Sci USA 106 19644minus19650
Spear LB Ballance LT Ainley DG (2001) Response of sea-birds to thermal boundaries in the tropical Pacific thethermocline versus the Equatorial Front Mar Ecol ProgSer 219 275minus289
Sverdrup H Johnston MW Fleming RH (1942) The oceans their physics chemistry and general biology PrenticeHall New York NY
Tasker ML Reid JB (1997) Seabirds in the marine environ-ment mdash introduction ICES J Mar Sci 54 505minus506
Torres LG Read AJ Halpin P (2008) Fine-scale habitat modeling of a top marine predator Do prey data improvepredictive capacity Ecol Appl 18 1702minus1717
Vermeer K Morgan KH Smith GEJ Hay R (1989) Fall distri-
272
Watson et al Modelling seabird distributions and habitat suitability 273
bution of pelagic birds over the shelf off SW VancouverIsland Colon Waterbirds 12 207minus214
Wakefield ED Phillips RA Matthiopoulos J (2009) Quantify-ing habitat use and preferences of pelagic seabirds usingindividual movement data a review Mar Ecol Prog Ser391 165minus182
Warham J (1990) The petrels their ecology and breedingsystems Academic Press New York NY
Yen PPW Huettmann F Cooke F (2004) A large-scale modelfor the at-sea distribution and abundance of marbledmurrelets (Brachyramphus marmoratus) during the bree -ding season in coastal British Columbia Canada EcolModel 171 395minus413
Zimmermann NE Edwards TC Graham CH Pearman PBSvenning JC (2010) New trends in species distributionmodelling Ecography 33 985minus989
Editorial responsibility Rory Wilson Swansea UK
Submitted June 7 2012 Accepted March 7 2013Proofs received from author(s) June 11 2013

Watson et al Modelling seabird distributions and habitat suitability
DISCUSSION
RES predictions
When compared with simulated random data RESmodels performed significantly better for 5 out of6 seabird species (and 6 out of 7 models) at predicting
relative likelihood of occurrence in a subset of thestudy area Model outputs provide more informationon speciesrsquo distributions than published range mapssince they provide indices of relative environmentalsuitability throughout a speciesrsquo range RES predic-tions represent simple testable hypotheses concern-ing a speciesrsquo potential niche in respect of a few envi-ronmental predictors Visualisation of hypotheses ina spatial context facilitates our understanding of speciesminushabitat relationships inference of areas ofpotentially high seabird abundance and identifica-tion of regions to be targeted for future research andconservation planning
Observed versus predicted distributions
RES modelling of the potential niche resulted inpredictions of occurrence outside of known (or ob -served) ranges for several species when comparedwith published range maps indicating that distribu-tions are influenced by additional biological andorphysical parameters besides those included in mod-els Indeed modelling of the realised niche mdash thepart of the potential niche that a species actuallyuses mdash requires the incorporation of biotic interac-tions (Soberoacuten amp Nakamura 2009) and physiologicalconstraints (Kearney amp Porter 2009) Qualitative com-parison of RES model outputs with observed distribu-tions thus allows the assessment of the importance ofother factors that may influence the at-sea distribu-tion of seabirds
Distributions of pelagic animals are ultimately con-strained by the abundance and distribution of prey(Pahl-Wostl 1997) but scales of association betweenmobile predators and prey are highly variable(Schneider amp Piatt 1986) and prey indices are consid-ered inappropriate for predicting global distributionsof many highly mobile marine organisms (Torres etal 2008) Karpouzi et al (2007) incorporated informa-tion on prey distributions in mapping at-sea foragingdistributions of seabirds however they found little orno information concerning the diet of many seabirdsand detected high spatial variability in associationsbetween seabirds and prey Habitat modelling istherefore largely reliant on predictor variables thatindirectly affect species distribution
Evidence from energetic and physiological studieshighlights the significance of wind speed (Furness ampBryant 1996) and area of available ocean extent (Da -vies et al 2010) in influencing the foraging behaviourand life-history strategies of procellariiform seabirdsThe Strait of Gibraltar (Friesen et al 2007) and the
267
Species AUCm AUCn p
Northern fulmarBreeding 0735 0568 lt0001Non-breeding 0774 0583 lt0001Coryrsquos shearwaterBreeding 0712 0580 lt0001Great shearwaterNon-breeding 0587 0583 0041Sooty shearwaterNon-breeding 0530 0575 0260Manx shearwaterBreeding 0614 0572 0004European storm petrelBreeding 0704 0582 lt0001
Table 3 Evaluation of predictive performance of relative en-vironmental suitability (RES) models A model was consid-ered to perform significantly better than chance if the areaunder the curve of the empirical model (AUCm) exceededthe 95 quantile of the ranked AUC values of a correspon-ding null model (AUCn) p-values indicate the proportion of
AUCn that were equal to or greater than AUCm
Species No of No of Percentiles of ranked records lsquopresencersquo RES in survey area
cells 10 50 90
Northern fulmarBreeding 590 71 00 00 10Non-breeding 248 45 012 036 056Coryrsquos shearwaterBreeding 527 51 015 043 062Great shearwaterNon-breeding 452 48 037 069 10Sooty shearwaterNon-breeding 115 46 055 10 10Manx shearwaterBreeding 245 60 050 10 10European storm petrelBreeding 295 46 045 086 10
Table 4 Summary of test data used for evaluating the pre-dictive performance of relative environmental suitability(RES) models Independent observation data were collectedfrom repeated sampling of 156 grid cells (025deg times 025deg) byMARINElife in the Bay of Biscay (Fig 2) The number of spe-cies records number of lsquopresencersquo cells and variation in RESwithin the model evaluation area (percentiles of ranked
RES) are presented
Mar Ecol Prog Ser 485 259ndash273 2013
Almeria-Oran Oceanographic Front (Goacutemez-Diacuteaz etal 2006) have both been proposed as barriers limit-ing dispersal of and genetic exchange between sea-birds in the Atlantic Ocean and the MediterraneanSea Such physical and geographical factors mayexplain why despite the prediction of suitable habitat the observed distributions of some species donot extend into enclosed seas eg the absence ofgreat shearwater from the Mediterranean Sea andHudson Bay
Biotic interactions may play a significant role indetermining distributions across smaller spatial andtemporal scales (Furness amp Birkhead 1984) and theirincorporation into SDMs is widely recognised as akey challenge in both terrestrial (Arauacutejo amp Guisan2006) and marine environments (Robinson et al2011) Shearwaters do not typically form mixed- species colonies (Warham 1990) suggesting thatinterspecific competition and niche segregation mayinfluence the breeding distributions of some procel-lariiform seabirds While the observed range of Manxshearwater does not extend into the MediterraneanSea the breeding ranges of the Balearic shearwaterPuffinus mauretanicus and the Yelkoaun shearwaterP yelkoauni which occupy similar ecological nichesto the Manx shearwater (and were until recentlyconsidered to be subspecies of Manx shearwaterSangster et al 2002) are restricted to the Mediter-ranean Sea (Onley amp Schofield 2007) A combinationof evolutionary history and biotic interactions mayexplain the reduced niche overlap that is observed(compared with predicted overlap) between these 3ecologically similar species Depending on the objec-tives it may be a more useful approach to applyniche modelling to a species complex when there areseveral closely related species
Despite their ability to traverse large sections ofocean many procellariiform seabirds show limiteddispersal (the lsquoseabird paradoxrsquo proposed by Milot etal 2008) Their philopatric habits are expected tolimit colonisation by long-distance dispersal and sub-sequent range expansion (Matthiopoulos et al 2005Brown et al 2010) Despite the prediction of highRES in the northwest Atlantic for the storm petrelhigh breeding-site fidelity and the large area of pre-dicted low habitat suitability in the central Atlanticmay explain why the speciesrsquo observed distribution(from published range maps) is restricted to thenortheast Atlantic (del Hoyo et al 1992) Addition-ally the niche is already filled by another pelagicseabird Leachrsquos petrel Oceanodroma leucorhoa inthe northwest Atlantic (del Hoyo et al 1992) In theinterpretation of RES model outputs consideration
should thus be afforded to a speciesrsquo evolutionaryhistory as well as areas of low RES separating areasof high RES both of which may act to restrict ranges
The availability of suitable nest sites is a funda-mental constraint on the current breeding distribu-tion of seabirds (Brown et al 2010) Procellariiformseabirds are largely restricted to remote islands freeof mammalian predators which are within range ofsuitable foraging areas (Warham 1990) If all occu-pied breeding colonies could be accurately identifiedand niche envelopes constrained by maximum forag-ing range from colonies models could yield moreaccurate predictions of range extent during thebreeding season However given the difficulties ofsurveying and monitoring remote locations ourknowledge of breeding sites is likely to be incom-plete particularly for less well-studied speciesRestricting distribution to within species-specific for-aging range of all land therefore represents a moreconservative approach
Where suitable habitat is predicted outside of cur-rent observed distributions this may indicate areasthat are used by a species but for which there are nodata or areas that could be suitable for colonisationFuture colonisation or range shifts could be driven bychanges in environmental suitability as a result ofnatural changes (eg Gaston amp Woo 2008) andoranthropogenic-induced changes such as by meansof active conservation management (Miskelly et al2009) By identifying areas of potentially suitable at-sea habitat the RES modelling approach may thusoffer insight into the effects of future changes in cli-mate and anthropogenic activities on speciesrsquo distri-butions Further model development could be basedon different scenarios for climate or nest-site avail-ability to generate predictions of future changes indistributions
Model evaluation
Statistical evaluation demonstrates that the genericapproach of RES modelling can accurately describehabitat suitability for wide-ranging seabirds RESpredictions were more strongly related to speciespresence for 6 out of 7 models than expected due tochance While qualitative assessment of the modeloutput for non-breeding sooty shearwater suggestedreasonable consistency with published distributiondata the model did not perform significantly betterthan a null model Poor model performance could beexplained by the low quality of data used for modelparameterisation (see Table S1) resulting in an inac-
268
Watson et al Modelling seabird distributions and habitat suitability
curate description of a speciesrsquo ecological niche It iswell established that speciesminusenvironment relation-ships can change with scale (Manly et al 2002) andthere is evidence for intraspecific spatial variation inspeciesminushabitat relationships in seabirds (Huettmannamp Diamond 2001) Most information on the at-seahabitat associations of the sooty shearwater comesfrom studies in the Pacific Ocean (Briggs amp Chu 1986Vermeer et al 1989 but see Hedd et al 2012) There-fore we cannot be certain of the spatial stability ofthe speciesrsquo niche across distinct ocean basins Theavailability and quality of ecological data may limitthe wider application of RES modelling to other spe-cies of seabird if insufficient data are available toaccurately quantify speciesrsquo ecological niches
Rigorous evaluation of models requires that the testdata set accurately reflects the distribution andoccurrence of a species within the evaluation areaThe test data comprised far fewer observations ofsooty shearwater than the other study species andthe sampling area was characterised by low variationin RES ie highly homogeneous habitat suitability(Table 4) However despite highly skewed distribu-tions of RES the models for fulmar (breeding) andManx shearwater showed highly significant predic-tive accuracy when compared to null models Thisindicates these models must be performing very wellif they can perform significantly better than randomeven under less favourable conditions for the evalua-tion Rigorous model evaluation relies on representa-tive observation data collected across broad spatialand temporal scales to compliment the macro-scalemodelling approach While lsquoregularrsquo and lsquoequal-stratifiedrsquo sampling strategies are the most accurateand robust (Hirzel amp Guisan 2002) these are not typ-ically features of opportunistically collected data mdashthe source of most at-sea seabird observations Theincreasing availability of large-scale point data (egOBIS GBIF) and range maps such as those availablethrough the IUCN Red List (wwwiucnredlistorg)presents opportunities for further testing of RESmodels However the availability of representativetest data may limit the application of RES modellingfor scarcer and under-recorded species
Biases in model parameters
A frequent obstacle encountered in predictive distribution modelling of marine animals is the lackof reliable and comprehensive occurrence datafrom which to define species-habitat relationships(Robinson et al 2011) The issue of environmental
bias mdash spatial andor temporal bias in collection ofoccurrence data mdash is widely recognised in speciesdis tribution modelling (Arauacutejo amp Guisan 2006Phillips et al 2009 Ready et al 2010) It mainly arisesfrom limitations in data accessibility and samplingstrategies preventing representative coverage of theentire environmental range of species (Phillips et al2009) The biases inherent to most observation datacan easily lead to incorrect interpretation of habitatpreferences of wide-ranging species (Hirzel ampGuisan 2002)
RES modelling provides a technique for predictinglarge-scale distributions which does not rely on pointdata The niche hypotheses underlying RES modelsstill ultimately depend on the quality and amount ofavailable ecological information Quantitative dataon the relationships between seabirds and oceanproductivity are lacking and large areas of theoceans remain under-studied eg the central At -lantic (but see Skov et al 1994) However the abilityfor RES modelling to incorporate a range of qualita-tive and quantitative data collected from differentparts of speciesrsquo ranges at different times of yearbroadens the scope of environmental coverage Con-sequently the outputs may represent more balancedand robust predictions for many marine animalsthan the more commonly used predictive modellingtechniques When previously tested against a rangeof marine taxa RES modelling was shown to performvery well compared with traditional presence-onlymodelling methods (Ready et al 2010)
Accounting for temporal variability
Temporal variability in ecological niches and envi-ronmental parameters is frequently overlooked inspecies distribution modelling (Dambach amp Roumldder2011) Previous applications of RES modelling tomarine top predators did not account for temporalvariability in speciesminushabitat relationships or EGVs(Kaschner et al 2006 Ready et al 2010) In this studywe have accounted for the seasonal shifts in habitatassociations that occur within the annual life cycle bydistinguishing between a speciesrsquo breeding and non-breeding niche and subsequently relating niches toseasonally averaged data for dynamic EGVsAccounting for temporal variation in both speciesminusenvironment relationships and dynamic environ-mental variables is expected to increase the reliabil-ity of RES predictions particularly in areas whereenvironmental conditions fluctuate greatly betweenseasons Consequently our seasonal RES predictions
269
Mar Ecol Prog Ser 485 259ndash273 2013
can provide greater insight into speciesrsquo behaviourand ecology than those based on an annual averageniche envelope
Applications and recommendations for future research
RES modelling could prove a valuable tool forinforming the development and implementation ofeffective conservation and management practices Inthe absence of comprehensive occurrence data forwide-ranging species RES models can identify criti-cally important areas and biodiversity hotspots inpelagic marine ecosystems This is of direct rele-vance to the development of quantifiable criteria forthe designation of marine Important Bird Areas(IBAs BirdLife International 2004) The modellingapproach could be used to direct observation effort toareas where under-recorded seabirds are predictedto occur and inform sampling strategies to incorpo-rate a range of environmental suitability Matchingdata on seabird distribution as revealed by RESmodel outputs with data on fishing effort couldinform the responsibilities of Regional FisheriesManagement Organisations (RFMOs) and the devel-opment of suitable monitoring and mitigation meas-ures to reduce negative interactions between sea-birds and fisheries (eg Le Corre et al 2012)
Application of RES modelling to a greater variety ofspecies demonstrating variable niche characteris-tics will allow further examination of the broad-scaleapplicability of the approach Expanding the RESapproach to wider geographic areas incorporatingall of a speciesrsquo range would offer greater insightinto understanding distribution dispersal and migra-tory behaviour An iterative approach to the develop-ment of models (as recommended by Elith et al 2006)will improve the robustness of predictions by consid-ering the effects of a wider range of predictor vari-ables on model performance Additional factors thathave been shown to influence the at-sea distributionof seabirds and could be incorporated into futuremodels include sea-surface salinity (eg Huettmannamp Diamond 2001) horizontal (eg Louzao et al 2009)and vertical gradients in SST (eg Spear et al 2001)and fishing effort (eg Karpouzi et al 2007)
Wider application of RES modelling requires simultaneous developments in at-sea sampling andlarge-scale studies of speciesminushabitat relationshipswhich inform one another and offer direction forfuture research The increasing use of trackingdevices for recording movements of seabirds pro-
vides opportunities for quantification of habitat useand preference (Wakefield et al 2009 Le Corre et al2012) Increasing the public availability of trackingdata will facilitate further development of SDMs(Skov et al 2008) Further studies are required toimprove quantitative understanding of speciesminushabi-tat relationships across a variety of spatio-temporalscales and integration of data across scales is neces-sary to enhance the predictive ability of RES modelsHaving demonstrated RES is a robust modellingapproach predictions could be improved by the useof ensemble model averaging (Arauacutejo amp New 2007)
CONCLUSIONS
Based on quantitative definitions of speciesrsquo eco-logical requirements RES maps offer a robust alter-native to subjectively generated traditional rangemaps We have shown that RES modelling can ade-quately describe habitat suitability across largescales for wide-ranging pelagic seabirds RES model-ling presents a generic and objective approach forpredicting distributions of wide-ranging marine ani-mals across large spatial scales when the absence ofrepresentative point data precludes the applicationof traditional modelling techniques Model outputsrepresent an alternative to the conventional and sub-jective approach of delineating range extents basedon limited records of occurrence The approach isbased on clear assumptions concerning speciesrsquohabitat preferences which can be easily modifiedand tested
RES predictions are limited by the extent of pub-lished data and the subsequent ability to accuratelyquantify speciesrsquo ecological niches While some gapsin the literature are evident the synthesis of knowl-edge concerning speciesminushabitat relationships canadequately describe ecological niches for the pur-poses of building predictive distribution models Thisoffers a more robust approach for answering broad-scale questions about speciesrsquo distributions thanderiving niches from limited and biased samplingdata Of greater significance is the limited availabil-ity of representative at-sea observations data to rig-orously evaluate models which may prove to be thekey limiting factor in the wider application of RESmodelling for wide-ranging marine animals
Acknowledgements Thanks to the NERC Earth Observa-tion Data Acquisition and Analysis Service (NEODAAS) forsupplying data for this study MARINElifersquos contribution tothis research was part-funded by the EU as part of the Chan-
270
Watson et al Modelling seabird distributions and habitat suitability
nel Integrated Approach for Marine Resource Management(CHARM) Phase 3 project We thank MARINElife volun-teers for collection of observation data and PampO Ferries forsponsoring surveys aboard the lsquoPride of Bilbaorsquo
LITERATURE CITED
Airameacute S Dugan JE Lafferty KD Leslie H McArdle DAWarner RR (2003) Applying ecological criteria to marinereserve design a case study from the California ChannelIslands Ecol Appl 13 170minus184
Arauacutejo MB Guisan A (2006) Five (or so) challenges for spe-cies distribution modelling J Biogeogr 33 1677minus1688
Arauacutejo MB New M (2007) Ensemble forecasting of speciesdistributions Trends Ecol Evol 22 42minus47
Ashmole N (1971) Sea bird ecology and the marine environ-ment In Farner DS King JR (eds) Avian biology Vol 1Academic Press New York NY p 223minus286
BirdLife International (2004) Tracking ocean wanderers the global distribution of albatrosses and petrels Resultsfrom the Global Procellariiform Tracking Workshop1minus5 September 2003 Gordonrsquos Bay South Africa BirdlifeInternational Cambridge
Boyce MS Vernier PR Nielsen SE Schmiegelow FKA(2002) Evaluating resource selection functions EcolModel 157 281minus300
Briggs KT Chu EW (1986) Sooty shearwaters off California distribution abundance and habitat use Condor 88 355minus364
Brown RM Nichols RA Faulkes CG Jones CG and others(2010) Range expansion and hybridization in RoundIsland petrels (Pterodroma spp) evidence from micro -satellite genotypes Mol Ecol 19 3157minus3170
Cramp S Simmons K (1980) Handbook of the birds ofEurope the Middle East and north Africa The birds ofthe western Palearctic Vol 1 Ostrich to ducks OxfordUniversity Press Oxford
Dambach J Roumldder D (2011) Applications and future chal-lenges in marine species distribution modeling AquatConserv 21 92minus100
Davies RG Irlich UM Chown SL Gaston KJ (2010) Ambi-ent productive and wind energy and ocean extent pre-dict global species richness of procellariiform seabirdsGlob Ecol Biogeogr 19 98minus110
del Hoyo J Elliott A Sargatal J (1992) Handbook of thebirds of the world Vol 1 Ostrich to ducks Lynx EdicionsBarcelona
Dormann CF McPherson JM Arauacutejo MB Bivand R and oth-ers (2007) Methods to account for spatial autocorrelationin the analysis of species distributional data a reviewEcography 30 609minus628
Elith J Leathwick JR (2009) Species distribution models ecological explanation and prediction across space andtime Annu Rev Ecol Evol Syst 40 677minus697
Elith J Graham H Anderson P Dudiacutek M and others (2006)Novel methods improve prediction of species distribu-tions from occurrence data Ecography 29 129minus151
Fielding AH Bell JF (1997) A review of methods for theassessment of prediction errors in conservation pres-enceabsence models Environ Conserv 24 38minus49
Friesen VL Burg TM McCoy KD (2007) Mechanisms ofpopulation differentiation in seabirds Mol Ecol 16 1765minus1785
Furness RW Birkhead TR (1984) Seabird colony distribu-
tions suggest competition for food supplies during thebreeding-season Nature 311 655minus656
Furness RW Bryant DM (1996) Effect of wind on field meta-bolic rates of breeding northern fulmars Ecology 77 1181minus1188
Gaston AJ Woo K (2008) Razorbills (Alca torda) follow sub-arctic prey into the Canadian Arctic colonization resultsfrom climate change Auk 125 939minus942
Goacutemez-Diacuteaz E Gonzaacutelez-Soliacutes J Peinado MA Page RDM(2006) Phylogeography of the Calonectris shearwatersusing molecular and morphometric data Mol PhylogenetEvol 41 322minus332
Gregr EJ Trites AW (2008) A novel presence-only validationtechnique for improved Steller sea lion Eumetopias juba-tus critical habitat descriptions Mar Ecol Prog Ser 365 247minus261
Guinotte JM Bartley JD Iqbal A Fautin DG BuddemeierRW (2006) Modeling habitat distribution from organismoccurrences and environmental data case study usinganemonefishes and their sea anemone hosts Mar EcolProg Ser 316 269minus283
Guisan A Zimmermann NE (2000) Predictive habitat distri-bution models in ecology Ecol Model 135 147minus186
Guisan A Edwards TC Hastie T (2002) Generalized linearand generalized additive models in studies of speciesdistributions setting the scene Ecol Model 157 89minus100
Hardy SM Lindgren M Konakanchi H Huettmann F (2011)Predicting the distribution and ecological niche of unex-ploited snow crab (Chionoecetes opilio) populations inAlaskan waters a first open-access ensemble modelIntegr Comp Biol 51 608minus622
Hedd A Montevecchi WA Otley H Phillips RA Fifield DA(2012) Trans-equatorial migration and habitat use bysooty shearwaters Puffinus griseus from the SouthAtlantic during the nonbreeding season Mar Ecol ProgSer 449 277minus290
Hijmans RJ (2012) Cross-validation of species distributionmodels removing spatial sorting bias and calibrationwith a null model Ecology 93 679minus688
Hirzel AH Guisan A (2002) Which is the optimal samplingstrategy for habitat suitability modelling Ecol Model157 331minus341
Hobbs M Brereton T Weir C Williams A (2003) Baselinemonitoring data on Procellariformes [Procellariiformes](shearwaters) in the Bay of Biscay Ornis Hungarica12ndash13 115minus125
Huettmann F Diamond AW (2001) Seabird colony locationsand environmental determination of seabird distribution a spatially explicit breeding seabird model for the North-west Atlantic Ecol Model 141 261minus298
Huettmann F Artukhin Y Gilg O Humphries G (2011) Pre-dictions of 27 Arctic pelagic seabird distributions usingpublic environmental variables assessed with colonydata a first digital IPY and GBIF open access synthesisplatform Mar Biodivers 41 141minus179
Intergovernmental Oceanographic Commission (IOC) Inter -national Hydrographic Organization (IHO) and BritishOceanographic Data Centre (BODC) (2003) Centenaryedition of the GEBCO Digital Atlas published on CD-ROM on behalf of the Intergovernmental OceanographicCommission and the International Hydrographic Organi-zation as part of the General Bathymetric Chart of theOceans BODC Liverpool
Karpouzi VS Watson R Pauly D (2007) Modelling and map-ping resource overlap between seabirds and fisheries on
271
Mar Ecol Prog Ser 485 259ndash273 2013
a global scale a preliminary assessment Mar Ecol ProgSer 343 87minus99
Kaschner K Watson R Trites AW Pauly D (2006) Mappingworld-wide distributions of marine mammal speciesusing a relative environmental suitability (RES) modelMar Ecol Prog Ser 316 285minus310
Kaschner K Tittensor DP Ready J Gerrodette T Worm B(2010) Current and future patterns of global marinemammal biodiversity PLoS ONE 6 e19653
Kearney M Porter W (2009) Mechanistic niche modelling combining physiological and spatial data to predict spe-ciesrsquo ranges Ecol Lett 12 334minus350
Le Corre M Jaeger A Pinet P Kappes MA and others (2012)Tracking seabirds to identify potential Marine ProtectedAreas in the tropical western Indian Ocean Biol Conserv156 83minus93
Legendre P (1993) Spatial autocorrelation trouble or newparadigm Ecology 74 1659minus1673
Louzao M Hyrenbach KD Arcos JM Abelloacute P De Sola LGOro D (2006) Oceanographic habitat of an endangeredMediterranean procellariiform implications for marineprotected areas Ecol Appl 16 1683minus1695
Louzao M Beacutecares J Rodriacuteguez B Hyrenbach KD Ruiz AArcos JM (2009) Combining vessel-based surveys andtracking data to identify key marine areas for seabirdsMar Ecol Prog Ser 391 183minus197
Manly BF McDonald LL Thomas DL McDonald TL Erick-son WP (2002) Resource selection by animals statisticaldesign and analysis for field studies Springer New YorkNY
Matthiopoulos J Harwood J Thomas L (2005) Metapopula-tion consequences of site fidelity for colonially breedingmammals and birds J Anim Ecol 74 716minus727
Maxwell DL Stelzenmuumlller V Eastwood PD Rogers SI(2009) Modelling the spatial distribution of plaice (Pleu-ronectes platessa) sole (Solea solea) and thornback ray(Raja clavata) in UK waters for marine management andplanning J Sea Res 61 258minus267
Milot E Weimerskirch H Bernatchez L (2008) The seabirdparadox dispersal genetic structure and populationdynamics in a highly mobile but philopatric albatrossspecies Mol Ecol 17 1658minus1673
Miskelly CM Taylor GA Gummer H Williams R (2009)Translocations of eight species of burrow-nesting sea-birds (genera Pterodroma Pelecanoides Pachyptila andPuffinus Family Procellariidae) Biol Conserv 142 1965minus1980
Nur N Jahncke J Herzog MP Howar J and others (2011)Where the wild things are predicting hotspots of seabirdaggregations in the California Current System EcolAppl 21 2241minus2257
Oedekoven CS Ainley DG Spear LB (2001) Variable res -ponses of seabirds to change in marine climate Califor-nia Current 1985ndash1994 Mar Ecol Prog Ser 212 265minus281
Olden JD Jackson DA Peres-Neto PR (2002) Predictivemodels of fish species distributions a note on proper val-idation and chance predictions Trans Am Fish Soc 131 329minus336
Olivier F Wotherspoon SJ (2006) Modelling habitat selec-tion using presence-only data case study of a colonialhollow nesting bird the snow petrel Ecol Model 195 187minus204
Onley D Schofield P (2007) Field guide to the albatrossespetrels and shearwaters of the world Christopher HelmLondon
Oppel S Meirinho A Ramiacuterez I Gardner B OrsquoConnell AFMiller PI Louzao M (2012) Comparison of five modellingtechniques to predict the spatial distribution and abun-dance of seabirds Biol Conserv 156 94minus104
Ostrand WD Drew GS Suryan RM McDonald LL (1998)Evaluation of radio-tracking and strip transect methodsfor determining foraging ranges of black-legged kitti-wakes Condor 100 709minus718
Pahl-Wostl C (1997) Dynamic structure of a food web model comparison with a food chain model Ecol Model 100 103minus123
Phillips SJ Dudiacutek M Elith J Graham CH Lehmann ALeathwick J Ferrier S (2009) Sample selection bias andpresence-only distribution models implications for back-ground and pseudo-absence data Ecol Appl 19 181minus197
Raes N ter Steege H (2007) A null-model for significancetesting of presence-only species distribution modelsEcography 30 727minus736
Raymond B Woehler EJ (2003) Predicting seabirds at sea inthe Southern Indian Ocean Mar Ecol Prog Ser 263 275minus285
Ready J Kaschner K South AB Eastwood PD and others(2010) Predicting the distributions of marine organismsat the global scale Ecol Model 221 467minus478
Redfern JV Ferguson MC Becker EA Hyrenbach KD andothers (2006) Techniques for cetaceanminushabitat modelingMar Ecol Prog Ser 310 271minus295
Robinson LM Elith J Hobday AJ Pearson RG Kendall BEPossingham HP Richardson AJ (2011) Pushing the limitsin marine species distribution modelling lessons fromthe land present challenges and opportunities Glob EcolBiogeogr 20 789minus802
Ross DA (1988) An introduction to oceanography PrenticeHall Englewood Cliffs NJ
Sangster G Knox AG Helbig AJ Parkin DT (2002) Taxo-nomic recommendations for European birds Ibis 144 153minus159
Schneider DC (1997) Habitat selection by marine birds inrelation to water depth Ibis 139 175minus178
Schneider DC Piatt JF (1986) Scale-dependent correlationof seabirds with schooling fish in a coastal ecosystemMar Ecol Prog Ser 32 237minus246
Skov H Durinck J Danielsen F Bloch D (1994) The summerdistribution of Procellariiformes in the central NorthAtlantic Ocean Vogelwarte 37 270minus289
Skov H Humphreys E Garthe S Geitner K and others(2008) Application of habitat suitability modelling totracking data of marine animals as a means of analyzingtheir feeding habitats Ecol Model 212 504minus512
Soberoacuten J Nakamura M (2009) Niches and distributionalareas concepts methods and assumptions Proc NatlAcad Sci USA 106 19644minus19650
Spear LB Ballance LT Ainley DG (2001) Response of sea-birds to thermal boundaries in the tropical Pacific thethermocline versus the Equatorial Front Mar Ecol ProgSer 219 275minus289
Sverdrup H Johnston MW Fleming RH (1942) The oceans their physics chemistry and general biology PrenticeHall New York NY
Tasker ML Reid JB (1997) Seabirds in the marine environ-ment mdash introduction ICES J Mar Sci 54 505minus506
Torres LG Read AJ Halpin P (2008) Fine-scale habitat modeling of a top marine predator Do prey data improvepredictive capacity Ecol Appl 18 1702minus1717
Vermeer K Morgan KH Smith GEJ Hay R (1989) Fall distri-
272
Watson et al Modelling seabird distributions and habitat suitability 273
bution of pelagic birds over the shelf off SW VancouverIsland Colon Waterbirds 12 207minus214
Wakefield ED Phillips RA Matthiopoulos J (2009) Quantify-ing habitat use and preferences of pelagic seabirds usingindividual movement data a review Mar Ecol Prog Ser391 165minus182
Warham J (1990) The petrels their ecology and breedingsystems Academic Press New York NY
Yen PPW Huettmann F Cooke F (2004) A large-scale modelfor the at-sea distribution and abundance of marbledmurrelets (Brachyramphus marmoratus) during the bree -ding season in coastal British Columbia Canada EcolModel 171 395minus413
Zimmermann NE Edwards TC Graham CH Pearman PBSvenning JC (2010) New trends in species distributionmodelling Ecography 33 985minus989
Editorial responsibility Rory Wilson Swansea UK
Submitted June 7 2012 Accepted March 7 2013Proofs received from author(s) June 11 2013

Mar Ecol Prog Ser 485 259ndash273 2013
Almeria-Oran Oceanographic Front (Goacutemez-Diacuteaz etal 2006) have both been proposed as barriers limit-ing dispersal of and genetic exchange between sea-birds in the Atlantic Ocean and the MediterraneanSea Such physical and geographical factors mayexplain why despite the prediction of suitable habitat the observed distributions of some species donot extend into enclosed seas eg the absence ofgreat shearwater from the Mediterranean Sea andHudson Bay
Biotic interactions may play a significant role indetermining distributions across smaller spatial andtemporal scales (Furness amp Birkhead 1984) and theirincorporation into SDMs is widely recognised as akey challenge in both terrestrial (Arauacutejo amp Guisan2006) and marine environments (Robinson et al2011) Shearwaters do not typically form mixed- species colonies (Warham 1990) suggesting thatinterspecific competition and niche segregation mayinfluence the breeding distributions of some procel-lariiform seabirds While the observed range of Manxshearwater does not extend into the MediterraneanSea the breeding ranges of the Balearic shearwaterPuffinus mauretanicus and the Yelkoaun shearwaterP yelkoauni which occupy similar ecological nichesto the Manx shearwater (and were until recentlyconsidered to be subspecies of Manx shearwaterSangster et al 2002) are restricted to the Mediter-ranean Sea (Onley amp Schofield 2007) A combinationof evolutionary history and biotic interactions mayexplain the reduced niche overlap that is observed(compared with predicted overlap) between these 3ecologically similar species Depending on the objec-tives it may be a more useful approach to applyniche modelling to a species complex when there areseveral closely related species
Despite their ability to traverse large sections ofocean many procellariiform seabirds show limiteddispersal (the lsquoseabird paradoxrsquo proposed by Milot etal 2008) Their philopatric habits are expected tolimit colonisation by long-distance dispersal and sub-sequent range expansion (Matthiopoulos et al 2005Brown et al 2010) Despite the prediction of highRES in the northwest Atlantic for the storm petrelhigh breeding-site fidelity and the large area of pre-dicted low habitat suitability in the central Atlanticmay explain why the speciesrsquo observed distribution(from published range maps) is restricted to thenortheast Atlantic (del Hoyo et al 1992) Addition-ally the niche is already filled by another pelagicseabird Leachrsquos petrel Oceanodroma leucorhoa inthe northwest Atlantic (del Hoyo et al 1992) In theinterpretation of RES model outputs consideration
should thus be afforded to a speciesrsquo evolutionaryhistory as well as areas of low RES separating areasof high RES both of which may act to restrict ranges
The availability of suitable nest sites is a funda-mental constraint on the current breeding distribu-tion of seabirds (Brown et al 2010) Procellariiformseabirds are largely restricted to remote islands freeof mammalian predators which are within range ofsuitable foraging areas (Warham 1990) If all occu-pied breeding colonies could be accurately identifiedand niche envelopes constrained by maximum forag-ing range from colonies models could yield moreaccurate predictions of range extent during thebreeding season However given the difficulties ofsurveying and monitoring remote locations ourknowledge of breeding sites is likely to be incom-plete particularly for less well-studied speciesRestricting distribution to within species-specific for-aging range of all land therefore represents a moreconservative approach
Where suitable habitat is predicted outside of cur-rent observed distributions this may indicate areasthat are used by a species but for which there are nodata or areas that could be suitable for colonisationFuture colonisation or range shifts could be driven bychanges in environmental suitability as a result ofnatural changes (eg Gaston amp Woo 2008) andoranthropogenic-induced changes such as by meansof active conservation management (Miskelly et al2009) By identifying areas of potentially suitable at-sea habitat the RES modelling approach may thusoffer insight into the effects of future changes in cli-mate and anthropogenic activities on speciesrsquo distri-butions Further model development could be basedon different scenarios for climate or nest-site avail-ability to generate predictions of future changes indistributions
Model evaluation
Statistical evaluation demonstrates that the genericapproach of RES modelling can accurately describehabitat suitability for wide-ranging seabirds RESpredictions were more strongly related to speciespresence for 6 out of 7 models than expected due tochance While qualitative assessment of the modeloutput for non-breeding sooty shearwater suggestedreasonable consistency with published distributiondata the model did not perform significantly betterthan a null model Poor model performance could beexplained by the low quality of data used for modelparameterisation (see Table S1) resulting in an inac-
268
Watson et al Modelling seabird distributions and habitat suitability
curate description of a speciesrsquo ecological niche It iswell established that speciesminusenvironment relation-ships can change with scale (Manly et al 2002) andthere is evidence for intraspecific spatial variation inspeciesminushabitat relationships in seabirds (Huettmannamp Diamond 2001) Most information on the at-seahabitat associations of the sooty shearwater comesfrom studies in the Pacific Ocean (Briggs amp Chu 1986Vermeer et al 1989 but see Hedd et al 2012) There-fore we cannot be certain of the spatial stability ofthe speciesrsquo niche across distinct ocean basins Theavailability and quality of ecological data may limitthe wider application of RES modelling to other spe-cies of seabird if insufficient data are available toaccurately quantify speciesrsquo ecological niches
Rigorous evaluation of models requires that the testdata set accurately reflects the distribution andoccurrence of a species within the evaluation areaThe test data comprised far fewer observations ofsooty shearwater than the other study species andthe sampling area was characterised by low variationin RES ie highly homogeneous habitat suitability(Table 4) However despite highly skewed distribu-tions of RES the models for fulmar (breeding) andManx shearwater showed highly significant predic-tive accuracy when compared to null models Thisindicates these models must be performing very wellif they can perform significantly better than randomeven under less favourable conditions for the evalua-tion Rigorous model evaluation relies on representa-tive observation data collected across broad spatialand temporal scales to compliment the macro-scalemodelling approach While lsquoregularrsquo and lsquoequal-stratifiedrsquo sampling strategies are the most accurateand robust (Hirzel amp Guisan 2002) these are not typ-ically features of opportunistically collected data mdashthe source of most at-sea seabird observations Theincreasing availability of large-scale point data (egOBIS GBIF) and range maps such as those availablethrough the IUCN Red List (wwwiucnredlistorg)presents opportunities for further testing of RESmodels However the availability of representativetest data may limit the application of RES modellingfor scarcer and under-recorded species
Biases in model parameters
A frequent obstacle encountered in predictive distribution modelling of marine animals is the lackof reliable and comprehensive occurrence datafrom which to define species-habitat relationships(Robinson et al 2011) The issue of environmental
bias mdash spatial andor temporal bias in collection ofoccurrence data mdash is widely recognised in speciesdis tribution modelling (Arauacutejo amp Guisan 2006Phillips et al 2009 Ready et al 2010) It mainly arisesfrom limitations in data accessibility and samplingstrategies preventing representative coverage of theentire environmental range of species (Phillips et al2009) The biases inherent to most observation datacan easily lead to incorrect interpretation of habitatpreferences of wide-ranging species (Hirzel ampGuisan 2002)
RES modelling provides a technique for predictinglarge-scale distributions which does not rely on pointdata The niche hypotheses underlying RES modelsstill ultimately depend on the quality and amount ofavailable ecological information Quantitative dataon the relationships between seabirds and oceanproductivity are lacking and large areas of theoceans remain under-studied eg the central At -lantic (but see Skov et al 1994) However the abilityfor RES modelling to incorporate a range of qualita-tive and quantitative data collected from differentparts of speciesrsquo ranges at different times of yearbroadens the scope of environmental coverage Con-sequently the outputs may represent more balancedand robust predictions for many marine animalsthan the more commonly used predictive modellingtechniques When previously tested against a rangeof marine taxa RES modelling was shown to performvery well compared with traditional presence-onlymodelling methods (Ready et al 2010)
Accounting for temporal variability
Temporal variability in ecological niches and envi-ronmental parameters is frequently overlooked inspecies distribution modelling (Dambach amp Roumldder2011) Previous applications of RES modelling tomarine top predators did not account for temporalvariability in speciesminushabitat relationships or EGVs(Kaschner et al 2006 Ready et al 2010) In this studywe have accounted for the seasonal shifts in habitatassociations that occur within the annual life cycle bydistinguishing between a speciesrsquo breeding and non-breeding niche and subsequently relating niches toseasonally averaged data for dynamic EGVsAccounting for temporal variation in both speciesminusenvironment relationships and dynamic environ-mental variables is expected to increase the reliabil-ity of RES predictions particularly in areas whereenvironmental conditions fluctuate greatly betweenseasons Consequently our seasonal RES predictions
269
Mar Ecol Prog Ser 485 259ndash273 2013
can provide greater insight into speciesrsquo behaviourand ecology than those based on an annual averageniche envelope
Applications and recommendations for future research
RES modelling could prove a valuable tool forinforming the development and implementation ofeffective conservation and management practices Inthe absence of comprehensive occurrence data forwide-ranging species RES models can identify criti-cally important areas and biodiversity hotspots inpelagic marine ecosystems This is of direct rele-vance to the development of quantifiable criteria forthe designation of marine Important Bird Areas(IBAs BirdLife International 2004) The modellingapproach could be used to direct observation effort toareas where under-recorded seabirds are predictedto occur and inform sampling strategies to incorpo-rate a range of environmental suitability Matchingdata on seabird distribution as revealed by RESmodel outputs with data on fishing effort couldinform the responsibilities of Regional FisheriesManagement Organisations (RFMOs) and the devel-opment of suitable monitoring and mitigation meas-ures to reduce negative interactions between sea-birds and fisheries (eg Le Corre et al 2012)
Application of RES modelling to a greater variety ofspecies demonstrating variable niche characteris-tics will allow further examination of the broad-scaleapplicability of the approach Expanding the RESapproach to wider geographic areas incorporatingall of a speciesrsquo range would offer greater insightinto understanding distribution dispersal and migra-tory behaviour An iterative approach to the develop-ment of models (as recommended by Elith et al 2006)will improve the robustness of predictions by consid-ering the effects of a wider range of predictor vari-ables on model performance Additional factors thathave been shown to influence the at-sea distributionof seabirds and could be incorporated into futuremodels include sea-surface salinity (eg Huettmannamp Diamond 2001) horizontal (eg Louzao et al 2009)and vertical gradients in SST (eg Spear et al 2001)and fishing effort (eg Karpouzi et al 2007)
Wider application of RES modelling requires simultaneous developments in at-sea sampling andlarge-scale studies of speciesminushabitat relationshipswhich inform one another and offer direction forfuture research The increasing use of trackingdevices for recording movements of seabirds pro-
vides opportunities for quantification of habitat useand preference (Wakefield et al 2009 Le Corre et al2012) Increasing the public availability of trackingdata will facilitate further development of SDMs(Skov et al 2008) Further studies are required toimprove quantitative understanding of speciesminushabi-tat relationships across a variety of spatio-temporalscales and integration of data across scales is neces-sary to enhance the predictive ability of RES modelsHaving demonstrated RES is a robust modellingapproach predictions could be improved by the useof ensemble model averaging (Arauacutejo amp New 2007)
CONCLUSIONS
Based on quantitative definitions of speciesrsquo eco-logical requirements RES maps offer a robust alter-native to subjectively generated traditional rangemaps We have shown that RES modelling can ade-quately describe habitat suitability across largescales for wide-ranging pelagic seabirds RES model-ling presents a generic and objective approach forpredicting distributions of wide-ranging marine ani-mals across large spatial scales when the absence ofrepresentative point data precludes the applicationof traditional modelling techniques Model outputsrepresent an alternative to the conventional and sub-jective approach of delineating range extents basedon limited records of occurrence The approach isbased on clear assumptions concerning speciesrsquohabitat preferences which can be easily modifiedand tested
RES predictions are limited by the extent of pub-lished data and the subsequent ability to accuratelyquantify speciesrsquo ecological niches While some gapsin the literature are evident the synthesis of knowl-edge concerning speciesminushabitat relationships canadequately describe ecological niches for the pur-poses of building predictive distribution models Thisoffers a more robust approach for answering broad-scale questions about speciesrsquo distributions thanderiving niches from limited and biased samplingdata Of greater significance is the limited availabil-ity of representative at-sea observations data to rig-orously evaluate models which may prove to be thekey limiting factor in the wider application of RESmodelling for wide-ranging marine animals
Acknowledgements Thanks to the NERC Earth Observa-tion Data Acquisition and Analysis Service (NEODAAS) forsupplying data for this study MARINElifersquos contribution tothis research was part-funded by the EU as part of the Chan-
270
Watson et al Modelling seabird distributions and habitat suitability
nel Integrated Approach for Marine Resource Management(CHARM) Phase 3 project We thank MARINElife volun-teers for collection of observation data and PampO Ferries forsponsoring surveys aboard the lsquoPride of Bilbaorsquo
LITERATURE CITED
Airameacute S Dugan JE Lafferty KD Leslie H McArdle DAWarner RR (2003) Applying ecological criteria to marinereserve design a case study from the California ChannelIslands Ecol Appl 13 170minus184
Arauacutejo MB Guisan A (2006) Five (or so) challenges for spe-cies distribution modelling J Biogeogr 33 1677minus1688
Arauacutejo MB New M (2007) Ensemble forecasting of speciesdistributions Trends Ecol Evol 22 42minus47
Ashmole N (1971) Sea bird ecology and the marine environ-ment In Farner DS King JR (eds) Avian biology Vol 1Academic Press New York NY p 223minus286
BirdLife International (2004) Tracking ocean wanderers the global distribution of albatrosses and petrels Resultsfrom the Global Procellariiform Tracking Workshop1minus5 September 2003 Gordonrsquos Bay South Africa BirdlifeInternational Cambridge
Boyce MS Vernier PR Nielsen SE Schmiegelow FKA(2002) Evaluating resource selection functions EcolModel 157 281minus300
Briggs KT Chu EW (1986) Sooty shearwaters off California distribution abundance and habitat use Condor 88 355minus364
Brown RM Nichols RA Faulkes CG Jones CG and others(2010) Range expansion and hybridization in RoundIsland petrels (Pterodroma spp) evidence from micro -satellite genotypes Mol Ecol 19 3157minus3170
Cramp S Simmons K (1980) Handbook of the birds ofEurope the Middle East and north Africa The birds ofthe western Palearctic Vol 1 Ostrich to ducks OxfordUniversity Press Oxford
Dambach J Roumldder D (2011) Applications and future chal-lenges in marine species distribution modeling AquatConserv 21 92minus100
Davies RG Irlich UM Chown SL Gaston KJ (2010) Ambi-ent productive and wind energy and ocean extent pre-dict global species richness of procellariiform seabirdsGlob Ecol Biogeogr 19 98minus110
del Hoyo J Elliott A Sargatal J (1992) Handbook of thebirds of the world Vol 1 Ostrich to ducks Lynx EdicionsBarcelona
Dormann CF McPherson JM Arauacutejo MB Bivand R and oth-ers (2007) Methods to account for spatial autocorrelationin the analysis of species distributional data a reviewEcography 30 609minus628
Elith J Leathwick JR (2009) Species distribution models ecological explanation and prediction across space andtime Annu Rev Ecol Evol Syst 40 677minus697
Elith J Graham H Anderson P Dudiacutek M and others (2006)Novel methods improve prediction of species distribu-tions from occurrence data Ecography 29 129minus151
Fielding AH Bell JF (1997) A review of methods for theassessment of prediction errors in conservation pres-enceabsence models Environ Conserv 24 38minus49
Friesen VL Burg TM McCoy KD (2007) Mechanisms ofpopulation differentiation in seabirds Mol Ecol 16 1765minus1785
Furness RW Birkhead TR (1984) Seabird colony distribu-
tions suggest competition for food supplies during thebreeding-season Nature 311 655minus656
Furness RW Bryant DM (1996) Effect of wind on field meta-bolic rates of breeding northern fulmars Ecology 77 1181minus1188
Gaston AJ Woo K (2008) Razorbills (Alca torda) follow sub-arctic prey into the Canadian Arctic colonization resultsfrom climate change Auk 125 939minus942
Goacutemez-Diacuteaz E Gonzaacutelez-Soliacutes J Peinado MA Page RDM(2006) Phylogeography of the Calonectris shearwatersusing molecular and morphometric data Mol PhylogenetEvol 41 322minus332
Gregr EJ Trites AW (2008) A novel presence-only validationtechnique for improved Steller sea lion Eumetopias juba-tus critical habitat descriptions Mar Ecol Prog Ser 365 247minus261
Guinotte JM Bartley JD Iqbal A Fautin DG BuddemeierRW (2006) Modeling habitat distribution from organismoccurrences and environmental data case study usinganemonefishes and their sea anemone hosts Mar EcolProg Ser 316 269minus283
Guisan A Zimmermann NE (2000) Predictive habitat distri-bution models in ecology Ecol Model 135 147minus186
Guisan A Edwards TC Hastie T (2002) Generalized linearand generalized additive models in studies of speciesdistributions setting the scene Ecol Model 157 89minus100
Hardy SM Lindgren M Konakanchi H Huettmann F (2011)Predicting the distribution and ecological niche of unex-ploited snow crab (Chionoecetes opilio) populations inAlaskan waters a first open-access ensemble modelIntegr Comp Biol 51 608minus622
Hedd A Montevecchi WA Otley H Phillips RA Fifield DA(2012) Trans-equatorial migration and habitat use bysooty shearwaters Puffinus griseus from the SouthAtlantic during the nonbreeding season Mar Ecol ProgSer 449 277minus290
Hijmans RJ (2012) Cross-validation of species distributionmodels removing spatial sorting bias and calibrationwith a null model Ecology 93 679minus688
Hirzel AH Guisan A (2002) Which is the optimal samplingstrategy for habitat suitability modelling Ecol Model157 331minus341
Hobbs M Brereton T Weir C Williams A (2003) Baselinemonitoring data on Procellariformes [Procellariiformes](shearwaters) in the Bay of Biscay Ornis Hungarica12ndash13 115minus125
Huettmann F Diamond AW (2001) Seabird colony locationsand environmental determination of seabird distribution a spatially explicit breeding seabird model for the North-west Atlantic Ecol Model 141 261minus298
Huettmann F Artukhin Y Gilg O Humphries G (2011) Pre-dictions of 27 Arctic pelagic seabird distributions usingpublic environmental variables assessed with colonydata a first digital IPY and GBIF open access synthesisplatform Mar Biodivers 41 141minus179
Intergovernmental Oceanographic Commission (IOC) Inter -national Hydrographic Organization (IHO) and BritishOceanographic Data Centre (BODC) (2003) Centenaryedition of the GEBCO Digital Atlas published on CD-ROM on behalf of the Intergovernmental OceanographicCommission and the International Hydrographic Organi-zation as part of the General Bathymetric Chart of theOceans BODC Liverpool
Karpouzi VS Watson R Pauly D (2007) Modelling and map-ping resource overlap between seabirds and fisheries on
271
Mar Ecol Prog Ser 485 259ndash273 2013
a global scale a preliminary assessment Mar Ecol ProgSer 343 87minus99
Kaschner K Watson R Trites AW Pauly D (2006) Mappingworld-wide distributions of marine mammal speciesusing a relative environmental suitability (RES) modelMar Ecol Prog Ser 316 285minus310
Kaschner K Tittensor DP Ready J Gerrodette T Worm B(2010) Current and future patterns of global marinemammal biodiversity PLoS ONE 6 e19653
Kearney M Porter W (2009) Mechanistic niche modelling combining physiological and spatial data to predict spe-ciesrsquo ranges Ecol Lett 12 334minus350
Le Corre M Jaeger A Pinet P Kappes MA and others (2012)Tracking seabirds to identify potential Marine ProtectedAreas in the tropical western Indian Ocean Biol Conserv156 83minus93
Legendre P (1993) Spatial autocorrelation trouble or newparadigm Ecology 74 1659minus1673
Louzao M Hyrenbach KD Arcos JM Abelloacute P De Sola LGOro D (2006) Oceanographic habitat of an endangeredMediterranean procellariiform implications for marineprotected areas Ecol Appl 16 1683minus1695
Louzao M Beacutecares J Rodriacuteguez B Hyrenbach KD Ruiz AArcos JM (2009) Combining vessel-based surveys andtracking data to identify key marine areas for seabirdsMar Ecol Prog Ser 391 183minus197
Manly BF McDonald LL Thomas DL McDonald TL Erick-son WP (2002) Resource selection by animals statisticaldesign and analysis for field studies Springer New YorkNY
Matthiopoulos J Harwood J Thomas L (2005) Metapopula-tion consequences of site fidelity for colonially breedingmammals and birds J Anim Ecol 74 716minus727
Maxwell DL Stelzenmuumlller V Eastwood PD Rogers SI(2009) Modelling the spatial distribution of plaice (Pleu-ronectes platessa) sole (Solea solea) and thornback ray(Raja clavata) in UK waters for marine management andplanning J Sea Res 61 258minus267
Milot E Weimerskirch H Bernatchez L (2008) The seabirdparadox dispersal genetic structure and populationdynamics in a highly mobile but philopatric albatrossspecies Mol Ecol 17 1658minus1673
Miskelly CM Taylor GA Gummer H Williams R (2009)Translocations of eight species of burrow-nesting sea-birds (genera Pterodroma Pelecanoides Pachyptila andPuffinus Family Procellariidae) Biol Conserv 142 1965minus1980
Nur N Jahncke J Herzog MP Howar J and others (2011)Where the wild things are predicting hotspots of seabirdaggregations in the California Current System EcolAppl 21 2241minus2257
Oedekoven CS Ainley DG Spear LB (2001) Variable res -ponses of seabirds to change in marine climate Califor-nia Current 1985ndash1994 Mar Ecol Prog Ser 212 265minus281
Olden JD Jackson DA Peres-Neto PR (2002) Predictivemodels of fish species distributions a note on proper val-idation and chance predictions Trans Am Fish Soc 131 329minus336
Olivier F Wotherspoon SJ (2006) Modelling habitat selec-tion using presence-only data case study of a colonialhollow nesting bird the snow petrel Ecol Model 195 187minus204
Onley D Schofield P (2007) Field guide to the albatrossespetrels and shearwaters of the world Christopher HelmLondon
Oppel S Meirinho A Ramiacuterez I Gardner B OrsquoConnell AFMiller PI Louzao M (2012) Comparison of five modellingtechniques to predict the spatial distribution and abun-dance of seabirds Biol Conserv 156 94minus104
Ostrand WD Drew GS Suryan RM McDonald LL (1998)Evaluation of radio-tracking and strip transect methodsfor determining foraging ranges of black-legged kitti-wakes Condor 100 709minus718
Pahl-Wostl C (1997) Dynamic structure of a food web model comparison with a food chain model Ecol Model 100 103minus123
Phillips SJ Dudiacutek M Elith J Graham CH Lehmann ALeathwick J Ferrier S (2009) Sample selection bias andpresence-only distribution models implications for back-ground and pseudo-absence data Ecol Appl 19 181minus197
Raes N ter Steege H (2007) A null-model for significancetesting of presence-only species distribution modelsEcography 30 727minus736
Raymond B Woehler EJ (2003) Predicting seabirds at sea inthe Southern Indian Ocean Mar Ecol Prog Ser 263 275minus285
Ready J Kaschner K South AB Eastwood PD and others(2010) Predicting the distributions of marine organismsat the global scale Ecol Model 221 467minus478
Redfern JV Ferguson MC Becker EA Hyrenbach KD andothers (2006) Techniques for cetaceanminushabitat modelingMar Ecol Prog Ser 310 271minus295
Robinson LM Elith J Hobday AJ Pearson RG Kendall BEPossingham HP Richardson AJ (2011) Pushing the limitsin marine species distribution modelling lessons fromthe land present challenges and opportunities Glob EcolBiogeogr 20 789minus802
Ross DA (1988) An introduction to oceanography PrenticeHall Englewood Cliffs NJ
Sangster G Knox AG Helbig AJ Parkin DT (2002) Taxo-nomic recommendations for European birds Ibis 144 153minus159
Schneider DC (1997) Habitat selection by marine birds inrelation to water depth Ibis 139 175minus178
Schneider DC Piatt JF (1986) Scale-dependent correlationof seabirds with schooling fish in a coastal ecosystemMar Ecol Prog Ser 32 237minus246
Skov H Durinck J Danielsen F Bloch D (1994) The summerdistribution of Procellariiformes in the central NorthAtlantic Ocean Vogelwarte 37 270minus289
Skov H Humphreys E Garthe S Geitner K and others(2008) Application of habitat suitability modelling totracking data of marine animals as a means of analyzingtheir feeding habitats Ecol Model 212 504minus512
Soberoacuten J Nakamura M (2009) Niches and distributionalareas concepts methods and assumptions Proc NatlAcad Sci USA 106 19644minus19650
Spear LB Ballance LT Ainley DG (2001) Response of sea-birds to thermal boundaries in the tropical Pacific thethermocline versus the Equatorial Front Mar Ecol ProgSer 219 275minus289
Sverdrup H Johnston MW Fleming RH (1942) The oceans their physics chemistry and general biology PrenticeHall New York NY
Tasker ML Reid JB (1997) Seabirds in the marine environ-ment mdash introduction ICES J Mar Sci 54 505minus506
Torres LG Read AJ Halpin P (2008) Fine-scale habitat modeling of a top marine predator Do prey data improvepredictive capacity Ecol Appl 18 1702minus1717
Vermeer K Morgan KH Smith GEJ Hay R (1989) Fall distri-
272
Watson et al Modelling seabird distributions and habitat suitability 273
bution of pelagic birds over the shelf off SW VancouverIsland Colon Waterbirds 12 207minus214
Wakefield ED Phillips RA Matthiopoulos J (2009) Quantify-ing habitat use and preferences of pelagic seabirds usingindividual movement data a review Mar Ecol Prog Ser391 165minus182
Warham J (1990) The petrels their ecology and breedingsystems Academic Press New York NY
Yen PPW Huettmann F Cooke F (2004) A large-scale modelfor the at-sea distribution and abundance of marbledmurrelets (Brachyramphus marmoratus) during the bree -ding season in coastal British Columbia Canada EcolModel 171 395minus413
Zimmermann NE Edwards TC Graham CH Pearman PBSvenning JC (2010) New trends in species distributionmodelling Ecography 33 985minus989
Editorial responsibility Rory Wilson Swansea UK
Submitted June 7 2012 Accepted March 7 2013Proofs received from author(s) June 11 2013

Watson et al Modelling seabird distributions and habitat suitability
curate description of a speciesrsquo ecological niche It iswell established that speciesminusenvironment relation-ships can change with scale (Manly et al 2002) andthere is evidence for intraspecific spatial variation inspeciesminushabitat relationships in seabirds (Huettmannamp Diamond 2001) Most information on the at-seahabitat associations of the sooty shearwater comesfrom studies in the Pacific Ocean (Briggs amp Chu 1986Vermeer et al 1989 but see Hedd et al 2012) There-fore we cannot be certain of the spatial stability ofthe speciesrsquo niche across distinct ocean basins Theavailability and quality of ecological data may limitthe wider application of RES modelling to other spe-cies of seabird if insufficient data are available toaccurately quantify speciesrsquo ecological niches
Rigorous evaluation of models requires that the testdata set accurately reflects the distribution andoccurrence of a species within the evaluation areaThe test data comprised far fewer observations ofsooty shearwater than the other study species andthe sampling area was characterised by low variationin RES ie highly homogeneous habitat suitability(Table 4) However despite highly skewed distribu-tions of RES the models for fulmar (breeding) andManx shearwater showed highly significant predic-tive accuracy when compared to null models Thisindicates these models must be performing very wellif they can perform significantly better than randomeven under less favourable conditions for the evalua-tion Rigorous model evaluation relies on representa-tive observation data collected across broad spatialand temporal scales to compliment the macro-scalemodelling approach While lsquoregularrsquo and lsquoequal-stratifiedrsquo sampling strategies are the most accurateand robust (Hirzel amp Guisan 2002) these are not typ-ically features of opportunistically collected data mdashthe source of most at-sea seabird observations Theincreasing availability of large-scale point data (egOBIS GBIF) and range maps such as those availablethrough the IUCN Red List (wwwiucnredlistorg)presents opportunities for further testing of RESmodels However the availability of representativetest data may limit the application of RES modellingfor scarcer and under-recorded species
Biases in model parameters
A frequent obstacle encountered in predictive distribution modelling of marine animals is the lackof reliable and comprehensive occurrence datafrom which to define species-habitat relationships(Robinson et al 2011) The issue of environmental
bias mdash spatial andor temporal bias in collection ofoccurrence data mdash is widely recognised in speciesdis tribution modelling (Arauacutejo amp Guisan 2006Phillips et al 2009 Ready et al 2010) It mainly arisesfrom limitations in data accessibility and samplingstrategies preventing representative coverage of theentire environmental range of species (Phillips et al2009) The biases inherent to most observation datacan easily lead to incorrect interpretation of habitatpreferences of wide-ranging species (Hirzel ampGuisan 2002)
RES modelling provides a technique for predictinglarge-scale distributions which does not rely on pointdata The niche hypotheses underlying RES modelsstill ultimately depend on the quality and amount ofavailable ecological information Quantitative dataon the relationships between seabirds and oceanproductivity are lacking and large areas of theoceans remain under-studied eg the central At -lantic (but see Skov et al 1994) However the abilityfor RES modelling to incorporate a range of qualita-tive and quantitative data collected from differentparts of speciesrsquo ranges at different times of yearbroadens the scope of environmental coverage Con-sequently the outputs may represent more balancedand robust predictions for many marine animalsthan the more commonly used predictive modellingtechniques When previously tested against a rangeof marine taxa RES modelling was shown to performvery well compared with traditional presence-onlymodelling methods (Ready et al 2010)
Accounting for temporal variability
Temporal variability in ecological niches and envi-ronmental parameters is frequently overlooked inspecies distribution modelling (Dambach amp Roumldder2011) Previous applications of RES modelling tomarine top predators did not account for temporalvariability in speciesminushabitat relationships or EGVs(Kaschner et al 2006 Ready et al 2010) In this studywe have accounted for the seasonal shifts in habitatassociations that occur within the annual life cycle bydistinguishing between a speciesrsquo breeding and non-breeding niche and subsequently relating niches toseasonally averaged data for dynamic EGVsAccounting for temporal variation in both speciesminusenvironment relationships and dynamic environ-mental variables is expected to increase the reliabil-ity of RES predictions particularly in areas whereenvironmental conditions fluctuate greatly betweenseasons Consequently our seasonal RES predictions
269
Mar Ecol Prog Ser 485 259ndash273 2013
can provide greater insight into speciesrsquo behaviourand ecology than those based on an annual averageniche envelope
Applications and recommendations for future research
RES modelling could prove a valuable tool forinforming the development and implementation ofeffective conservation and management practices Inthe absence of comprehensive occurrence data forwide-ranging species RES models can identify criti-cally important areas and biodiversity hotspots inpelagic marine ecosystems This is of direct rele-vance to the development of quantifiable criteria forthe designation of marine Important Bird Areas(IBAs BirdLife International 2004) The modellingapproach could be used to direct observation effort toareas where under-recorded seabirds are predictedto occur and inform sampling strategies to incorpo-rate a range of environmental suitability Matchingdata on seabird distribution as revealed by RESmodel outputs with data on fishing effort couldinform the responsibilities of Regional FisheriesManagement Organisations (RFMOs) and the devel-opment of suitable monitoring and mitigation meas-ures to reduce negative interactions between sea-birds and fisheries (eg Le Corre et al 2012)
Application of RES modelling to a greater variety ofspecies demonstrating variable niche characteris-tics will allow further examination of the broad-scaleapplicability of the approach Expanding the RESapproach to wider geographic areas incorporatingall of a speciesrsquo range would offer greater insightinto understanding distribution dispersal and migra-tory behaviour An iterative approach to the develop-ment of models (as recommended by Elith et al 2006)will improve the robustness of predictions by consid-ering the effects of a wider range of predictor vari-ables on model performance Additional factors thathave been shown to influence the at-sea distributionof seabirds and could be incorporated into futuremodels include sea-surface salinity (eg Huettmannamp Diamond 2001) horizontal (eg Louzao et al 2009)and vertical gradients in SST (eg Spear et al 2001)and fishing effort (eg Karpouzi et al 2007)
Wider application of RES modelling requires simultaneous developments in at-sea sampling andlarge-scale studies of speciesminushabitat relationshipswhich inform one another and offer direction forfuture research The increasing use of trackingdevices for recording movements of seabirds pro-
vides opportunities for quantification of habitat useand preference (Wakefield et al 2009 Le Corre et al2012) Increasing the public availability of trackingdata will facilitate further development of SDMs(Skov et al 2008) Further studies are required toimprove quantitative understanding of speciesminushabi-tat relationships across a variety of spatio-temporalscales and integration of data across scales is neces-sary to enhance the predictive ability of RES modelsHaving demonstrated RES is a robust modellingapproach predictions could be improved by the useof ensemble model averaging (Arauacutejo amp New 2007)
CONCLUSIONS
Based on quantitative definitions of speciesrsquo eco-logical requirements RES maps offer a robust alter-native to subjectively generated traditional rangemaps We have shown that RES modelling can ade-quately describe habitat suitability across largescales for wide-ranging pelagic seabirds RES model-ling presents a generic and objective approach forpredicting distributions of wide-ranging marine ani-mals across large spatial scales when the absence ofrepresentative point data precludes the applicationof traditional modelling techniques Model outputsrepresent an alternative to the conventional and sub-jective approach of delineating range extents basedon limited records of occurrence The approach isbased on clear assumptions concerning speciesrsquohabitat preferences which can be easily modifiedand tested
RES predictions are limited by the extent of pub-lished data and the subsequent ability to accuratelyquantify speciesrsquo ecological niches While some gapsin the literature are evident the synthesis of knowl-edge concerning speciesminushabitat relationships canadequately describe ecological niches for the pur-poses of building predictive distribution models Thisoffers a more robust approach for answering broad-scale questions about speciesrsquo distributions thanderiving niches from limited and biased samplingdata Of greater significance is the limited availabil-ity of representative at-sea observations data to rig-orously evaluate models which may prove to be thekey limiting factor in the wider application of RESmodelling for wide-ranging marine animals
Acknowledgements Thanks to the NERC Earth Observa-tion Data Acquisition and Analysis Service (NEODAAS) forsupplying data for this study MARINElifersquos contribution tothis research was part-funded by the EU as part of the Chan-
270
Watson et al Modelling seabird distributions and habitat suitability
nel Integrated Approach for Marine Resource Management(CHARM) Phase 3 project We thank MARINElife volun-teers for collection of observation data and PampO Ferries forsponsoring surveys aboard the lsquoPride of Bilbaorsquo
LITERATURE CITED
Airameacute S Dugan JE Lafferty KD Leslie H McArdle DAWarner RR (2003) Applying ecological criteria to marinereserve design a case study from the California ChannelIslands Ecol Appl 13 170minus184
Arauacutejo MB Guisan A (2006) Five (or so) challenges for spe-cies distribution modelling J Biogeogr 33 1677minus1688
Arauacutejo MB New M (2007) Ensemble forecasting of speciesdistributions Trends Ecol Evol 22 42minus47
Ashmole N (1971) Sea bird ecology and the marine environ-ment In Farner DS King JR (eds) Avian biology Vol 1Academic Press New York NY p 223minus286
BirdLife International (2004) Tracking ocean wanderers the global distribution of albatrosses and petrels Resultsfrom the Global Procellariiform Tracking Workshop1minus5 September 2003 Gordonrsquos Bay South Africa BirdlifeInternational Cambridge
Boyce MS Vernier PR Nielsen SE Schmiegelow FKA(2002) Evaluating resource selection functions EcolModel 157 281minus300
Briggs KT Chu EW (1986) Sooty shearwaters off California distribution abundance and habitat use Condor 88 355minus364
Brown RM Nichols RA Faulkes CG Jones CG and others(2010) Range expansion and hybridization in RoundIsland petrels (Pterodroma spp) evidence from micro -satellite genotypes Mol Ecol 19 3157minus3170
Cramp S Simmons K (1980) Handbook of the birds ofEurope the Middle East and north Africa The birds ofthe western Palearctic Vol 1 Ostrich to ducks OxfordUniversity Press Oxford
Dambach J Roumldder D (2011) Applications and future chal-lenges in marine species distribution modeling AquatConserv 21 92minus100
Davies RG Irlich UM Chown SL Gaston KJ (2010) Ambi-ent productive and wind energy and ocean extent pre-dict global species richness of procellariiform seabirdsGlob Ecol Biogeogr 19 98minus110
del Hoyo J Elliott A Sargatal J (1992) Handbook of thebirds of the world Vol 1 Ostrich to ducks Lynx EdicionsBarcelona
Dormann CF McPherson JM Arauacutejo MB Bivand R and oth-ers (2007) Methods to account for spatial autocorrelationin the analysis of species distributional data a reviewEcography 30 609minus628
Elith J Leathwick JR (2009) Species distribution models ecological explanation and prediction across space andtime Annu Rev Ecol Evol Syst 40 677minus697
Elith J Graham H Anderson P Dudiacutek M and others (2006)Novel methods improve prediction of species distribu-tions from occurrence data Ecography 29 129minus151
Fielding AH Bell JF (1997) A review of methods for theassessment of prediction errors in conservation pres-enceabsence models Environ Conserv 24 38minus49
Friesen VL Burg TM McCoy KD (2007) Mechanisms ofpopulation differentiation in seabirds Mol Ecol 16 1765minus1785
Furness RW Birkhead TR (1984) Seabird colony distribu-
tions suggest competition for food supplies during thebreeding-season Nature 311 655minus656
Furness RW Bryant DM (1996) Effect of wind on field meta-bolic rates of breeding northern fulmars Ecology 77 1181minus1188
Gaston AJ Woo K (2008) Razorbills (Alca torda) follow sub-arctic prey into the Canadian Arctic colonization resultsfrom climate change Auk 125 939minus942
Goacutemez-Diacuteaz E Gonzaacutelez-Soliacutes J Peinado MA Page RDM(2006) Phylogeography of the Calonectris shearwatersusing molecular and morphometric data Mol PhylogenetEvol 41 322minus332
Gregr EJ Trites AW (2008) A novel presence-only validationtechnique for improved Steller sea lion Eumetopias juba-tus critical habitat descriptions Mar Ecol Prog Ser 365 247minus261
Guinotte JM Bartley JD Iqbal A Fautin DG BuddemeierRW (2006) Modeling habitat distribution from organismoccurrences and environmental data case study usinganemonefishes and their sea anemone hosts Mar EcolProg Ser 316 269minus283
Guisan A Zimmermann NE (2000) Predictive habitat distri-bution models in ecology Ecol Model 135 147minus186
Guisan A Edwards TC Hastie T (2002) Generalized linearand generalized additive models in studies of speciesdistributions setting the scene Ecol Model 157 89minus100
Hardy SM Lindgren M Konakanchi H Huettmann F (2011)Predicting the distribution and ecological niche of unex-ploited snow crab (Chionoecetes opilio) populations inAlaskan waters a first open-access ensemble modelIntegr Comp Biol 51 608minus622
Hedd A Montevecchi WA Otley H Phillips RA Fifield DA(2012) Trans-equatorial migration and habitat use bysooty shearwaters Puffinus griseus from the SouthAtlantic during the nonbreeding season Mar Ecol ProgSer 449 277minus290
Hijmans RJ (2012) Cross-validation of species distributionmodels removing spatial sorting bias and calibrationwith a null model Ecology 93 679minus688
Hirzel AH Guisan A (2002) Which is the optimal samplingstrategy for habitat suitability modelling Ecol Model157 331minus341
Hobbs M Brereton T Weir C Williams A (2003) Baselinemonitoring data on Procellariformes [Procellariiformes](shearwaters) in the Bay of Biscay Ornis Hungarica12ndash13 115minus125
Huettmann F Diamond AW (2001) Seabird colony locationsand environmental determination of seabird distribution a spatially explicit breeding seabird model for the North-west Atlantic Ecol Model 141 261minus298
Huettmann F Artukhin Y Gilg O Humphries G (2011) Pre-dictions of 27 Arctic pelagic seabird distributions usingpublic environmental variables assessed with colonydata a first digital IPY and GBIF open access synthesisplatform Mar Biodivers 41 141minus179
Intergovernmental Oceanographic Commission (IOC) Inter -national Hydrographic Organization (IHO) and BritishOceanographic Data Centre (BODC) (2003) Centenaryedition of the GEBCO Digital Atlas published on CD-ROM on behalf of the Intergovernmental OceanographicCommission and the International Hydrographic Organi-zation as part of the General Bathymetric Chart of theOceans BODC Liverpool
Karpouzi VS Watson R Pauly D (2007) Modelling and map-ping resource overlap between seabirds and fisheries on
271
Mar Ecol Prog Ser 485 259ndash273 2013
a global scale a preliminary assessment Mar Ecol ProgSer 343 87minus99
Kaschner K Watson R Trites AW Pauly D (2006) Mappingworld-wide distributions of marine mammal speciesusing a relative environmental suitability (RES) modelMar Ecol Prog Ser 316 285minus310
Kaschner K Tittensor DP Ready J Gerrodette T Worm B(2010) Current and future patterns of global marinemammal biodiversity PLoS ONE 6 e19653
Kearney M Porter W (2009) Mechanistic niche modelling combining physiological and spatial data to predict spe-ciesrsquo ranges Ecol Lett 12 334minus350
Le Corre M Jaeger A Pinet P Kappes MA and others (2012)Tracking seabirds to identify potential Marine ProtectedAreas in the tropical western Indian Ocean Biol Conserv156 83minus93
Legendre P (1993) Spatial autocorrelation trouble or newparadigm Ecology 74 1659minus1673
Louzao M Hyrenbach KD Arcos JM Abelloacute P De Sola LGOro D (2006) Oceanographic habitat of an endangeredMediterranean procellariiform implications for marineprotected areas Ecol Appl 16 1683minus1695
Louzao M Beacutecares J Rodriacuteguez B Hyrenbach KD Ruiz AArcos JM (2009) Combining vessel-based surveys andtracking data to identify key marine areas for seabirdsMar Ecol Prog Ser 391 183minus197
Manly BF McDonald LL Thomas DL McDonald TL Erick-son WP (2002) Resource selection by animals statisticaldesign and analysis for field studies Springer New YorkNY
Matthiopoulos J Harwood J Thomas L (2005) Metapopula-tion consequences of site fidelity for colonially breedingmammals and birds J Anim Ecol 74 716minus727
Maxwell DL Stelzenmuumlller V Eastwood PD Rogers SI(2009) Modelling the spatial distribution of plaice (Pleu-ronectes platessa) sole (Solea solea) and thornback ray(Raja clavata) in UK waters for marine management andplanning J Sea Res 61 258minus267
Milot E Weimerskirch H Bernatchez L (2008) The seabirdparadox dispersal genetic structure and populationdynamics in a highly mobile but philopatric albatrossspecies Mol Ecol 17 1658minus1673
Miskelly CM Taylor GA Gummer H Williams R (2009)Translocations of eight species of burrow-nesting sea-birds (genera Pterodroma Pelecanoides Pachyptila andPuffinus Family Procellariidae) Biol Conserv 142 1965minus1980
Nur N Jahncke J Herzog MP Howar J and others (2011)Where the wild things are predicting hotspots of seabirdaggregations in the California Current System EcolAppl 21 2241minus2257
Oedekoven CS Ainley DG Spear LB (2001) Variable res -ponses of seabirds to change in marine climate Califor-nia Current 1985ndash1994 Mar Ecol Prog Ser 212 265minus281
Olden JD Jackson DA Peres-Neto PR (2002) Predictivemodels of fish species distributions a note on proper val-idation and chance predictions Trans Am Fish Soc 131 329minus336
Olivier F Wotherspoon SJ (2006) Modelling habitat selec-tion using presence-only data case study of a colonialhollow nesting bird the snow petrel Ecol Model 195 187minus204
Onley D Schofield P (2007) Field guide to the albatrossespetrels and shearwaters of the world Christopher HelmLondon
Oppel S Meirinho A Ramiacuterez I Gardner B OrsquoConnell AFMiller PI Louzao M (2012) Comparison of five modellingtechniques to predict the spatial distribution and abun-dance of seabirds Biol Conserv 156 94minus104
Ostrand WD Drew GS Suryan RM McDonald LL (1998)Evaluation of radio-tracking and strip transect methodsfor determining foraging ranges of black-legged kitti-wakes Condor 100 709minus718
Pahl-Wostl C (1997) Dynamic structure of a food web model comparison with a food chain model Ecol Model 100 103minus123
Phillips SJ Dudiacutek M Elith J Graham CH Lehmann ALeathwick J Ferrier S (2009) Sample selection bias andpresence-only distribution models implications for back-ground and pseudo-absence data Ecol Appl 19 181minus197
Raes N ter Steege H (2007) A null-model for significancetesting of presence-only species distribution modelsEcography 30 727minus736
Raymond B Woehler EJ (2003) Predicting seabirds at sea inthe Southern Indian Ocean Mar Ecol Prog Ser 263 275minus285
Ready J Kaschner K South AB Eastwood PD and others(2010) Predicting the distributions of marine organismsat the global scale Ecol Model 221 467minus478
Redfern JV Ferguson MC Becker EA Hyrenbach KD andothers (2006) Techniques for cetaceanminushabitat modelingMar Ecol Prog Ser 310 271minus295
Robinson LM Elith J Hobday AJ Pearson RG Kendall BEPossingham HP Richardson AJ (2011) Pushing the limitsin marine species distribution modelling lessons fromthe land present challenges and opportunities Glob EcolBiogeogr 20 789minus802
Ross DA (1988) An introduction to oceanography PrenticeHall Englewood Cliffs NJ
Sangster G Knox AG Helbig AJ Parkin DT (2002) Taxo-nomic recommendations for European birds Ibis 144 153minus159
Schneider DC (1997) Habitat selection by marine birds inrelation to water depth Ibis 139 175minus178
Schneider DC Piatt JF (1986) Scale-dependent correlationof seabirds with schooling fish in a coastal ecosystemMar Ecol Prog Ser 32 237minus246
Skov H Durinck J Danielsen F Bloch D (1994) The summerdistribution of Procellariiformes in the central NorthAtlantic Ocean Vogelwarte 37 270minus289
Skov H Humphreys E Garthe S Geitner K and others(2008) Application of habitat suitability modelling totracking data of marine animals as a means of analyzingtheir feeding habitats Ecol Model 212 504minus512
Soberoacuten J Nakamura M (2009) Niches and distributionalareas concepts methods and assumptions Proc NatlAcad Sci USA 106 19644minus19650
Spear LB Ballance LT Ainley DG (2001) Response of sea-birds to thermal boundaries in the tropical Pacific thethermocline versus the Equatorial Front Mar Ecol ProgSer 219 275minus289
Sverdrup H Johnston MW Fleming RH (1942) The oceans their physics chemistry and general biology PrenticeHall New York NY
Tasker ML Reid JB (1997) Seabirds in the marine environ-ment mdash introduction ICES J Mar Sci 54 505minus506
Torres LG Read AJ Halpin P (2008) Fine-scale habitat modeling of a top marine predator Do prey data improvepredictive capacity Ecol Appl 18 1702minus1717
Vermeer K Morgan KH Smith GEJ Hay R (1989) Fall distri-
272
Watson et al Modelling seabird distributions and habitat suitability 273
bution of pelagic birds over the shelf off SW VancouverIsland Colon Waterbirds 12 207minus214
Wakefield ED Phillips RA Matthiopoulos J (2009) Quantify-ing habitat use and preferences of pelagic seabirds usingindividual movement data a review Mar Ecol Prog Ser391 165minus182
Warham J (1990) The petrels their ecology and breedingsystems Academic Press New York NY
Yen PPW Huettmann F Cooke F (2004) A large-scale modelfor the at-sea distribution and abundance of marbledmurrelets (Brachyramphus marmoratus) during the bree -ding season in coastal British Columbia Canada EcolModel 171 395minus413
Zimmermann NE Edwards TC Graham CH Pearman PBSvenning JC (2010) New trends in species distributionmodelling Ecography 33 985minus989
Editorial responsibility Rory Wilson Swansea UK
Submitted June 7 2012 Accepted March 7 2013Proofs received from author(s) June 11 2013

Mar Ecol Prog Ser 485 259ndash273 2013
can provide greater insight into speciesrsquo behaviourand ecology than those based on an annual averageniche envelope
Applications and recommendations for future research
RES modelling could prove a valuable tool forinforming the development and implementation ofeffective conservation and management practices Inthe absence of comprehensive occurrence data forwide-ranging species RES models can identify criti-cally important areas and biodiversity hotspots inpelagic marine ecosystems This is of direct rele-vance to the development of quantifiable criteria forthe designation of marine Important Bird Areas(IBAs BirdLife International 2004) The modellingapproach could be used to direct observation effort toareas where under-recorded seabirds are predictedto occur and inform sampling strategies to incorpo-rate a range of environmental suitability Matchingdata on seabird distribution as revealed by RESmodel outputs with data on fishing effort couldinform the responsibilities of Regional FisheriesManagement Organisations (RFMOs) and the devel-opment of suitable monitoring and mitigation meas-ures to reduce negative interactions between sea-birds and fisheries (eg Le Corre et al 2012)
Application of RES modelling to a greater variety ofspecies demonstrating variable niche characteris-tics will allow further examination of the broad-scaleapplicability of the approach Expanding the RESapproach to wider geographic areas incorporatingall of a speciesrsquo range would offer greater insightinto understanding distribution dispersal and migra-tory behaviour An iterative approach to the develop-ment of models (as recommended by Elith et al 2006)will improve the robustness of predictions by consid-ering the effects of a wider range of predictor vari-ables on model performance Additional factors thathave been shown to influence the at-sea distributionof seabirds and could be incorporated into futuremodels include sea-surface salinity (eg Huettmannamp Diamond 2001) horizontal (eg Louzao et al 2009)and vertical gradients in SST (eg Spear et al 2001)and fishing effort (eg Karpouzi et al 2007)
Wider application of RES modelling requires simultaneous developments in at-sea sampling andlarge-scale studies of speciesminushabitat relationshipswhich inform one another and offer direction forfuture research The increasing use of trackingdevices for recording movements of seabirds pro-
vides opportunities for quantification of habitat useand preference (Wakefield et al 2009 Le Corre et al2012) Increasing the public availability of trackingdata will facilitate further development of SDMs(Skov et al 2008) Further studies are required toimprove quantitative understanding of speciesminushabi-tat relationships across a variety of spatio-temporalscales and integration of data across scales is neces-sary to enhance the predictive ability of RES modelsHaving demonstrated RES is a robust modellingapproach predictions could be improved by the useof ensemble model averaging (Arauacutejo amp New 2007)
CONCLUSIONS
Based on quantitative definitions of speciesrsquo eco-logical requirements RES maps offer a robust alter-native to subjectively generated traditional rangemaps We have shown that RES modelling can ade-quately describe habitat suitability across largescales for wide-ranging pelagic seabirds RES model-ling presents a generic and objective approach forpredicting distributions of wide-ranging marine ani-mals across large spatial scales when the absence ofrepresentative point data precludes the applicationof traditional modelling techniques Model outputsrepresent an alternative to the conventional and sub-jective approach of delineating range extents basedon limited records of occurrence The approach isbased on clear assumptions concerning speciesrsquohabitat preferences which can be easily modifiedand tested
RES predictions are limited by the extent of pub-lished data and the subsequent ability to accuratelyquantify speciesrsquo ecological niches While some gapsin the literature are evident the synthesis of knowl-edge concerning speciesminushabitat relationships canadequately describe ecological niches for the pur-poses of building predictive distribution models Thisoffers a more robust approach for answering broad-scale questions about speciesrsquo distributions thanderiving niches from limited and biased samplingdata Of greater significance is the limited availabil-ity of representative at-sea observations data to rig-orously evaluate models which may prove to be thekey limiting factor in the wider application of RESmodelling for wide-ranging marine animals
Acknowledgements Thanks to the NERC Earth Observa-tion Data Acquisition and Analysis Service (NEODAAS) forsupplying data for this study MARINElifersquos contribution tothis research was part-funded by the EU as part of the Chan-
270
Watson et al Modelling seabird distributions and habitat suitability
nel Integrated Approach for Marine Resource Management(CHARM) Phase 3 project We thank MARINElife volun-teers for collection of observation data and PampO Ferries forsponsoring surveys aboard the lsquoPride of Bilbaorsquo
LITERATURE CITED
Airameacute S Dugan JE Lafferty KD Leslie H McArdle DAWarner RR (2003) Applying ecological criteria to marinereserve design a case study from the California ChannelIslands Ecol Appl 13 170minus184
Arauacutejo MB Guisan A (2006) Five (or so) challenges for spe-cies distribution modelling J Biogeogr 33 1677minus1688
Arauacutejo MB New M (2007) Ensemble forecasting of speciesdistributions Trends Ecol Evol 22 42minus47
Ashmole N (1971) Sea bird ecology and the marine environ-ment In Farner DS King JR (eds) Avian biology Vol 1Academic Press New York NY p 223minus286
BirdLife International (2004) Tracking ocean wanderers the global distribution of albatrosses and petrels Resultsfrom the Global Procellariiform Tracking Workshop1minus5 September 2003 Gordonrsquos Bay South Africa BirdlifeInternational Cambridge
Boyce MS Vernier PR Nielsen SE Schmiegelow FKA(2002) Evaluating resource selection functions EcolModel 157 281minus300
Briggs KT Chu EW (1986) Sooty shearwaters off California distribution abundance and habitat use Condor 88 355minus364
Brown RM Nichols RA Faulkes CG Jones CG and others(2010) Range expansion and hybridization in RoundIsland petrels (Pterodroma spp) evidence from micro -satellite genotypes Mol Ecol 19 3157minus3170
Cramp S Simmons K (1980) Handbook of the birds ofEurope the Middle East and north Africa The birds ofthe western Palearctic Vol 1 Ostrich to ducks OxfordUniversity Press Oxford
Dambach J Roumldder D (2011) Applications and future chal-lenges in marine species distribution modeling AquatConserv 21 92minus100
Davies RG Irlich UM Chown SL Gaston KJ (2010) Ambi-ent productive and wind energy and ocean extent pre-dict global species richness of procellariiform seabirdsGlob Ecol Biogeogr 19 98minus110
del Hoyo J Elliott A Sargatal J (1992) Handbook of thebirds of the world Vol 1 Ostrich to ducks Lynx EdicionsBarcelona
Dormann CF McPherson JM Arauacutejo MB Bivand R and oth-ers (2007) Methods to account for spatial autocorrelationin the analysis of species distributional data a reviewEcography 30 609minus628
Elith J Leathwick JR (2009) Species distribution models ecological explanation and prediction across space andtime Annu Rev Ecol Evol Syst 40 677minus697
Elith J Graham H Anderson P Dudiacutek M and others (2006)Novel methods improve prediction of species distribu-tions from occurrence data Ecography 29 129minus151
Fielding AH Bell JF (1997) A review of methods for theassessment of prediction errors in conservation pres-enceabsence models Environ Conserv 24 38minus49
Friesen VL Burg TM McCoy KD (2007) Mechanisms ofpopulation differentiation in seabirds Mol Ecol 16 1765minus1785
Furness RW Birkhead TR (1984) Seabird colony distribu-
tions suggest competition for food supplies during thebreeding-season Nature 311 655minus656
Furness RW Bryant DM (1996) Effect of wind on field meta-bolic rates of breeding northern fulmars Ecology 77 1181minus1188
Gaston AJ Woo K (2008) Razorbills (Alca torda) follow sub-arctic prey into the Canadian Arctic colonization resultsfrom climate change Auk 125 939minus942
Goacutemez-Diacuteaz E Gonzaacutelez-Soliacutes J Peinado MA Page RDM(2006) Phylogeography of the Calonectris shearwatersusing molecular and morphometric data Mol PhylogenetEvol 41 322minus332
Gregr EJ Trites AW (2008) A novel presence-only validationtechnique for improved Steller sea lion Eumetopias juba-tus critical habitat descriptions Mar Ecol Prog Ser 365 247minus261
Guinotte JM Bartley JD Iqbal A Fautin DG BuddemeierRW (2006) Modeling habitat distribution from organismoccurrences and environmental data case study usinganemonefishes and their sea anemone hosts Mar EcolProg Ser 316 269minus283
Guisan A Zimmermann NE (2000) Predictive habitat distri-bution models in ecology Ecol Model 135 147minus186
Guisan A Edwards TC Hastie T (2002) Generalized linearand generalized additive models in studies of speciesdistributions setting the scene Ecol Model 157 89minus100
Hardy SM Lindgren M Konakanchi H Huettmann F (2011)Predicting the distribution and ecological niche of unex-ploited snow crab (Chionoecetes opilio) populations inAlaskan waters a first open-access ensemble modelIntegr Comp Biol 51 608minus622
Hedd A Montevecchi WA Otley H Phillips RA Fifield DA(2012) Trans-equatorial migration and habitat use bysooty shearwaters Puffinus griseus from the SouthAtlantic during the nonbreeding season Mar Ecol ProgSer 449 277minus290
Hijmans RJ (2012) Cross-validation of species distributionmodels removing spatial sorting bias and calibrationwith a null model Ecology 93 679minus688
Hirzel AH Guisan A (2002) Which is the optimal samplingstrategy for habitat suitability modelling Ecol Model157 331minus341
Hobbs M Brereton T Weir C Williams A (2003) Baselinemonitoring data on Procellariformes [Procellariiformes](shearwaters) in the Bay of Biscay Ornis Hungarica12ndash13 115minus125
Huettmann F Diamond AW (2001) Seabird colony locationsand environmental determination of seabird distribution a spatially explicit breeding seabird model for the North-west Atlantic Ecol Model 141 261minus298
Huettmann F Artukhin Y Gilg O Humphries G (2011) Pre-dictions of 27 Arctic pelagic seabird distributions usingpublic environmental variables assessed with colonydata a first digital IPY and GBIF open access synthesisplatform Mar Biodivers 41 141minus179
Intergovernmental Oceanographic Commission (IOC) Inter -national Hydrographic Organization (IHO) and BritishOceanographic Data Centre (BODC) (2003) Centenaryedition of the GEBCO Digital Atlas published on CD-ROM on behalf of the Intergovernmental OceanographicCommission and the International Hydrographic Organi-zation as part of the General Bathymetric Chart of theOceans BODC Liverpool
Karpouzi VS Watson R Pauly D (2007) Modelling and map-ping resource overlap between seabirds and fisheries on
271
Mar Ecol Prog Ser 485 259ndash273 2013
a global scale a preliminary assessment Mar Ecol ProgSer 343 87minus99
Kaschner K Watson R Trites AW Pauly D (2006) Mappingworld-wide distributions of marine mammal speciesusing a relative environmental suitability (RES) modelMar Ecol Prog Ser 316 285minus310
Kaschner K Tittensor DP Ready J Gerrodette T Worm B(2010) Current and future patterns of global marinemammal biodiversity PLoS ONE 6 e19653
Kearney M Porter W (2009) Mechanistic niche modelling combining physiological and spatial data to predict spe-ciesrsquo ranges Ecol Lett 12 334minus350
Le Corre M Jaeger A Pinet P Kappes MA and others (2012)Tracking seabirds to identify potential Marine ProtectedAreas in the tropical western Indian Ocean Biol Conserv156 83minus93
Legendre P (1993) Spatial autocorrelation trouble or newparadigm Ecology 74 1659minus1673
Louzao M Hyrenbach KD Arcos JM Abelloacute P De Sola LGOro D (2006) Oceanographic habitat of an endangeredMediterranean procellariiform implications for marineprotected areas Ecol Appl 16 1683minus1695
Louzao M Beacutecares J Rodriacuteguez B Hyrenbach KD Ruiz AArcos JM (2009) Combining vessel-based surveys andtracking data to identify key marine areas for seabirdsMar Ecol Prog Ser 391 183minus197
Manly BF McDonald LL Thomas DL McDonald TL Erick-son WP (2002) Resource selection by animals statisticaldesign and analysis for field studies Springer New YorkNY
Matthiopoulos J Harwood J Thomas L (2005) Metapopula-tion consequences of site fidelity for colonially breedingmammals and birds J Anim Ecol 74 716minus727
Maxwell DL Stelzenmuumlller V Eastwood PD Rogers SI(2009) Modelling the spatial distribution of plaice (Pleu-ronectes platessa) sole (Solea solea) and thornback ray(Raja clavata) in UK waters for marine management andplanning J Sea Res 61 258minus267
Milot E Weimerskirch H Bernatchez L (2008) The seabirdparadox dispersal genetic structure and populationdynamics in a highly mobile but philopatric albatrossspecies Mol Ecol 17 1658minus1673
Miskelly CM Taylor GA Gummer H Williams R (2009)Translocations of eight species of burrow-nesting sea-birds (genera Pterodroma Pelecanoides Pachyptila andPuffinus Family Procellariidae) Biol Conserv 142 1965minus1980
Nur N Jahncke J Herzog MP Howar J and others (2011)Where the wild things are predicting hotspots of seabirdaggregations in the California Current System EcolAppl 21 2241minus2257
Oedekoven CS Ainley DG Spear LB (2001) Variable res -ponses of seabirds to change in marine climate Califor-nia Current 1985ndash1994 Mar Ecol Prog Ser 212 265minus281
Olden JD Jackson DA Peres-Neto PR (2002) Predictivemodels of fish species distributions a note on proper val-idation and chance predictions Trans Am Fish Soc 131 329minus336
Olivier F Wotherspoon SJ (2006) Modelling habitat selec-tion using presence-only data case study of a colonialhollow nesting bird the snow petrel Ecol Model 195 187minus204
Onley D Schofield P (2007) Field guide to the albatrossespetrels and shearwaters of the world Christopher HelmLondon
Oppel S Meirinho A Ramiacuterez I Gardner B OrsquoConnell AFMiller PI Louzao M (2012) Comparison of five modellingtechniques to predict the spatial distribution and abun-dance of seabirds Biol Conserv 156 94minus104
Ostrand WD Drew GS Suryan RM McDonald LL (1998)Evaluation of radio-tracking and strip transect methodsfor determining foraging ranges of black-legged kitti-wakes Condor 100 709minus718
Pahl-Wostl C (1997) Dynamic structure of a food web model comparison with a food chain model Ecol Model 100 103minus123
Phillips SJ Dudiacutek M Elith J Graham CH Lehmann ALeathwick J Ferrier S (2009) Sample selection bias andpresence-only distribution models implications for back-ground and pseudo-absence data Ecol Appl 19 181minus197
Raes N ter Steege H (2007) A null-model for significancetesting of presence-only species distribution modelsEcography 30 727minus736
Raymond B Woehler EJ (2003) Predicting seabirds at sea inthe Southern Indian Ocean Mar Ecol Prog Ser 263 275minus285
Ready J Kaschner K South AB Eastwood PD and others(2010) Predicting the distributions of marine organismsat the global scale Ecol Model 221 467minus478
Redfern JV Ferguson MC Becker EA Hyrenbach KD andothers (2006) Techniques for cetaceanminushabitat modelingMar Ecol Prog Ser 310 271minus295
Robinson LM Elith J Hobday AJ Pearson RG Kendall BEPossingham HP Richardson AJ (2011) Pushing the limitsin marine species distribution modelling lessons fromthe land present challenges and opportunities Glob EcolBiogeogr 20 789minus802
Ross DA (1988) An introduction to oceanography PrenticeHall Englewood Cliffs NJ
Sangster G Knox AG Helbig AJ Parkin DT (2002) Taxo-nomic recommendations for European birds Ibis 144 153minus159
Schneider DC (1997) Habitat selection by marine birds inrelation to water depth Ibis 139 175minus178
Schneider DC Piatt JF (1986) Scale-dependent correlationof seabirds with schooling fish in a coastal ecosystemMar Ecol Prog Ser 32 237minus246
Skov H Durinck J Danielsen F Bloch D (1994) The summerdistribution of Procellariiformes in the central NorthAtlantic Ocean Vogelwarte 37 270minus289
Skov H Humphreys E Garthe S Geitner K and others(2008) Application of habitat suitability modelling totracking data of marine animals as a means of analyzingtheir feeding habitats Ecol Model 212 504minus512
Soberoacuten J Nakamura M (2009) Niches and distributionalareas concepts methods and assumptions Proc NatlAcad Sci USA 106 19644minus19650
Spear LB Ballance LT Ainley DG (2001) Response of sea-birds to thermal boundaries in the tropical Pacific thethermocline versus the Equatorial Front Mar Ecol ProgSer 219 275minus289
Sverdrup H Johnston MW Fleming RH (1942) The oceans their physics chemistry and general biology PrenticeHall New York NY
Tasker ML Reid JB (1997) Seabirds in the marine environ-ment mdash introduction ICES J Mar Sci 54 505minus506
Torres LG Read AJ Halpin P (2008) Fine-scale habitat modeling of a top marine predator Do prey data improvepredictive capacity Ecol Appl 18 1702minus1717
Vermeer K Morgan KH Smith GEJ Hay R (1989) Fall distri-
272
Watson et al Modelling seabird distributions and habitat suitability 273
bution of pelagic birds over the shelf off SW VancouverIsland Colon Waterbirds 12 207minus214
Wakefield ED Phillips RA Matthiopoulos J (2009) Quantify-ing habitat use and preferences of pelagic seabirds usingindividual movement data a review Mar Ecol Prog Ser391 165minus182
Warham J (1990) The petrels their ecology and breedingsystems Academic Press New York NY
Yen PPW Huettmann F Cooke F (2004) A large-scale modelfor the at-sea distribution and abundance of marbledmurrelets (Brachyramphus marmoratus) during the bree -ding season in coastal British Columbia Canada EcolModel 171 395minus413
Zimmermann NE Edwards TC Graham CH Pearman PBSvenning JC (2010) New trends in species distributionmodelling Ecography 33 985minus989
Editorial responsibility Rory Wilson Swansea UK
Submitted June 7 2012 Accepted March 7 2013Proofs received from author(s) June 11 2013


