Embed Size (px)
Citation preview
THE VALUE LINEFund Advisor Plus
www.valueline.com
Which funds are right for you?
®
The Value Line Fund Advisor PlusVolume XXVII, Number 1
Customer Service: 1-800-VALUELINEThe Value Line Fund Advisor Plus(USPS# 012-951) is published monthly by Value Line Pub-lishing LLC, 551 Fifth Avenue, New York, NY 10176. Sub-scription rate for 12 issues in the United States and US pos-sessions: $199.00. Foreign rates upon request. Periodicalspostage paid at New York, NY.Canadian GST #127621837.
POSTMASTER: Send address changes toTHE VALUE LINE FUND ADVISOR PLUS551 Fifth Avenue, New York, NY 10176.
© 2021 Value Line, Inc. All rights reserved. Factual materialis obtained from sources believed to be reliable and is pro-vided without warranties of any kind. THE PUBLISHER ISNOT RESPONSIBLE FOR ANY ERRORS OR OMISSIONSHEREIN OR ANY DAMAGES OR LOSSES ARISING FROMANY USE OF THE INFORMATION CONTAINED HEREIN.This publication is strictly for subscriber's own, non-com-mercial, internal use. No part of it may be reproduced, storedor transmitted in any printed, electronic or other form, orused for generating or marketing any printed or electronicpublication, service or product. Officers, directors, or em-ployees of Value Line, Inc. and its affiliates and subsidiar-ies, and EULAV Asset Management, may own stocks thatare featured in this publication. Nothing herein should beconstrued as an offer to buy or sell securities or to giveindividual investment advice. Value Line, the Value Line logo,The Value Line Investment Survey, Value Line Select, Time-liness and Safety are trademarks or registered trademarksof Value Line Inc. and/or its affiliates in the United Statesand other countries. All other trademarks are the propertyof their respective owners. Value Line Geometric and Arith-metic Indices calculated by Thomson Reuters. Informationsupplied by Thomson Reuters.
Certain data items provided by CDA Wiesenberger.
Volume XXVII, Number 1 January 2021
In This IssueFund Highlights and Discussion 2
Short-List Picks:Large-Cap Growth 7
Mutual Fund Short List 8
The ETF Model Portfolio 9
The Value Line Fund Advisor PlusModel Portfolio 9
Fund Index 10
Fund Screens 38
Benchmark PerformanceAverages 48
Wall Street entered 2021 on an ebullienthigh, having set one record after another as2020 drew to a close. In sum, it was a re-markable year, not necessarily for the gainsthat were tallied—which aside from theNASDAQ’s 43.6% surge were fairly ordi-nary—but rather for the fact that there wasany improvement at all given the tumultuousbackdrop and the upheavals to our economycaused by COVID-19. Hopes for a vaccineto combat this pandemic (since realized) andthe further infusion of liquidity into theeconomy by the Federal Reserve get muchof the credit for the stock market’s overallstrength in 2020.
Optimism is still afoot, with some marketparticipants predicting further gains in themarket notwithstanding the high price-to-earnings ratios in place and the uncertaineconomic setting that figures to greet in-vestors as the year gets under way. Oursense is that the bull market will be sus-tained in 2021. However, the margin for er-ror is small and stocks could be vulnerableto troubling economic or political develop-ments. Indeed,
Concerns as 2021 begins continue to cen-ter on COVID-19. Not only is the pandemicstill problematic, with hospitalizations and
Economic and Stock Market Commentarydeaths setting daily records, but the rolloutof the vaccines is frustratingly slow whilepredicted mutations currently are in thenews.
Meanwhile, the coming months will be achallenge, with business closures, curfews,and reduced operating flexibility expected tohold economic activity down early in 2021,and the timing of meaningful distribution ofvaccines is uncertain. We could still see afurther diminution in business gains in theopening period after what appears to be aslowdown of growth in late 2020.
Nevertheless, 2021 should be an improv-ing year for the economy as the monthsclick by. It will take some time before thecoronavirus is fully in the rearview mirrorand the nation is operating on all cylinders.
What does this mean for investors? GivenWall Street’s penchant for looking ahead byseveral months, it is reasonable to expectstocks to hang in there as long as the recov-ery timetable is not unduly extended.
Conclusion: We think investors should re-tain a healthy weighting in stocks of compa-nies likely to do well as the economyrecovers as 2021 begins.
Dear Subscribers,
In an effort to enhance your experience with our product, we have expanded the number of
mutual funds on which you can receive fund-specific reports. While we were once con-
strained by print, we have used the power of the Internet to allow you to quickly screen
through thousands of mutual funds to locate those that you find most interesting—not just
those we have space to print—with information that is updated as often as daily. Moreover,
each fund has a report that can be printed for your future reference. Simply log on to
www.valueline.com with your user name and password to print reports on thousands of
mutual funds. We hope you enjoy this major product enhancement.
Thank you
© 2021 Value Line, Inc. All rights reserved. Factual material is obtained from sources believed to be reliable and is provided without warranties of any kind. THE PUBLISHER IS NOT RESPONSIBLE FORANY ERRORS OR OMISSIONS HEREIN. This publication is strictly for subscriber's own, non-commercial, internal use. No part of it may be reproduced, resold, stored or transmitted in any printed,electronic or other form, or used for generating or marketing any printed or electronic publication, service or product. All investors must read applicable prospectuses before investing.
2 J A N U A R Y 2 0 2 1
T H E V A L U E L I N E F U N D A D V I S O R P L U S
80
20
10
40
81.20
1.00
.80
Rising Line − Stronger Than Objective
Declining Line − Weaker Than Objective
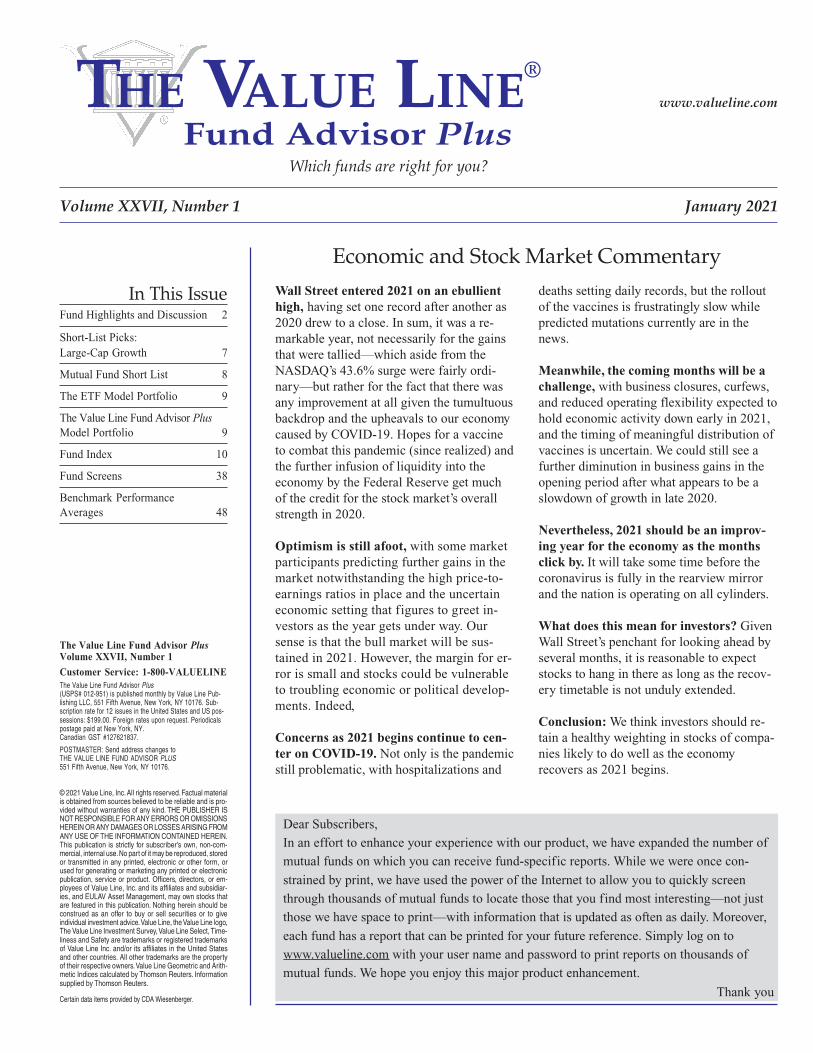
Total ReturnPerformance of $10K InvestmentInitial Investment 6/30/2009: $9,425.Value at 12/31/2020: $41,255.FundS&P500▼ Manager Change▲ Major Policy ChangeBottom Graph is Relative Strength ofFund Versus Objective.Recessions occurred 6/90−3/91, 3/01−11/01.
NEUBERGER BERMAN SUSTAINABLE EQ A NRAAX Growth LV 0.3% 42.34 98.0 page
2(Above Avg.)
3(Average Risk)
12.8%
Fund Obj. S&P 500Bull 2/09 - 12/20 - +419.0% +551.7%Bear 10/07 - 2/09 - -50.7% -51.0%Bull 9/02 - 10/07 - +113.1% +108.3%
Address: 605 3rd Ave, 2nd Fl, New York, NY 10158Advisor: Neuberger Berman Investment Advisers LLCSub-Advisor: NoneWeb Site: www.nb.com
Fiscal Year-End: AugustMin. Initial Invest: $1,000Min. Subsequent Invest: $100Min. IRA Invest: $0Telephone Exchanges: YesTel. Redemption: YesInternet Investing: No
Telephone: 877 877-9700Began Operations: 6/1/09# Funds in Family: 34Syst. Withdrawal: YesAuto. Investing: YesLast Capital Gain: 12/14/20Dividends Paid: Annually
8/31/20 5/31/20Port. Rel. Port. Rel.
% S&P500 % S&P500Consumer Durables ▲ 2.8 1.56 2.5 1.48Energy - - - -Finance ▼13.3 1.02 14.0 1.06Industrial Cyclical ▼ 8.1 1.05 12.6 1.74Non-Durable ▼11.7 1.13 13.7 1.34Retail Trade 12.6 1.08 13.1 1.26Health ▲ 8.2 1.11 7.2 0.94Services ▲ 5.4 1.88 4.9 1.78Technology ▲26.9 0.70 25.5 0.64Utilities ▲ 2.7 0.84 2.3 0.68
COMPOSITION as of 9/30/20
Stock 99Preferreds -Cash -
Convts. -Bonds -Other 1
%Foreign 20%Hedged -# Stocks 37
As of 8/31/20 Port. Avg. % Stock Rel. S&P 500 Rel. Obj.
Price/Earnings 28.02 64 1.07 0.98Price/Book 4.06 62 0.91 0.955-Yr.Earn.Growth % 11.55 51 0.96 0.89Avg.Mkt.Cap.($Mil.) 273,479 83 0.59 1.43
Top 25 Equity Holdings VL Shares Value %Net
As of 8/31/20 Rank* Held ($000) Assets
MICROSOFT CORP 2 426620 96216 5.86
TEXAS INSTRUMENTS INC 3 509549 72432 4.41
VESTAS WIND SYSTEMS AS - 474429 72134 4.39
ALPHABET INC - 41568 67736 4.12
COMCAST CORP 3 1336541 59890 3.65
MASTERCARD INC 2 164410 58890 3.59
ZEBRA TECHNOLOGIES CORP 2 183797 52663 3.21
UNITED RENTALS INC 2 294900 52212 3.18
INTERCONTINENTAL EXCHANGE INC - 472488 50192 3.06
CIGNA CORP - 279168 49516 3.01
ROCHE HOLDINGS AG - 138384 48330 2.94
JPMORGAN CHASE & CO 2 480995 48191 2.93
UNILEVER NV CVA - 830299 48157 2.93
STANLEY BLACK & DECKER INC 2 285068 45981 2.80
DANAHER CORP - 222342 45907 2.80
ADVANCE AUTO PARTS 3 276421 43207 2.63
PROGRESSIVE CORP 1 451180 42880 2.61
INTUIT INC 2 120575 41645 2.54
WW GRAINGER INC 1 112245 41018 2.50
BECTON DICKINSON & COMPANY 2 167392 40638 2.47
MEDTRONIC PLC 3 351992 37829 2.30
ACCENTURE PLC 3 149372 35839 2.18
AMERISOURCEBERGEN CORP 2 366883 35599 2.17
APTIV PLC - 396644 34159 2.08
COGNIZANT TECH SOLUTIONS 2 501498 33530 2.04
*Latest available Timeliness ™ rank from Value Line Investment Survey.
Ingrid Dyott 6/09 3.3Sajjad Ladiwala 6/09 3.3
■2
TAX STATUS 8/31/20
Unrealized Apprec. % 38
Year 1st Q 2nd Q 3rd Q 4th Q
2016 0.5 0.7 4.9 3.52017 6.6 2.6 2.7 5.42018 0.4 3.6 4.6 -13.62019 11.7 1.8 2.4 7.92020 -21.6 19.2 9.6 16.3
2006 2007 2008 2009 2010 2011 2012 2013 2014 2015 2016 2017 2018 2019 12/20 HISTORICAL ARRAY25.25 30.85 29.66 32.57 40.40 37.52 33.60 34.20 38.19 32.74 37.72 42.34 Bid Price (NAV)0.16 0.11 0.23 0.28 0.42 0.44 0.39 0.40 0.17 0.11 0.20 0.16 Dividends ($)0.60 0.34 0.72 0.79 0.90 0.96 1.00 1.04 0.40 0.28 0.46 0.34 12-Mo. Div. Yield (%)0.00 0.00 0.00 0.00 3.92 6.39 3.29 2.34 2.10 3.12 3.17 2.35 Cap. Gains ($)1.11 1.11 1.11 1.11 1.09 1.05 1.05 1.05 1.03 1.04 1.05 1.05 Expense Ratio (%)0.80 0.82 0.84 0.86 0.86 0.86 0.88 0.90 0.90 0.94 0.99 0.99 Exp.Ratio Rel. to Obj.
36 41 20 28 35 36 28 25 26 12 20 21 Turnover (%)1.1 12.4 75.9 83.1 109.6 134.0 140.9 131.6 118.0 126.4 95.1 98.0 Net Assets ($Mil.)
- 22.6 -3.1 10.8 37.9 10.3 -0.6 9.9 18.4 -6.0 25.6 19.1 Total Return (%)- 7.5 -5.2 -5.2 5.5 -3.3 -2.0 -2.1 -3.4 -1.6 -5.9 0.7 +/- S&P 500 (%)- 5.8 -0.1 -3.5 7.2 2.1 1.0 2.1 -2.3 0.9 -2.8 -0.8 +/- to Obj. (%)- 10.4 0.6 -3.7 12.1 5.1 3.7 -0.3 1.8 3.9 2.6 14.9 +/- to Peer (%)
- ■2 ■4 ■5 ■1 ■3 ■3 ■3 ■4 ■3 ■4 ■3 Quintile Perf. Rel. to Obj.
PERFORMANCE (12/31/20)
Value Est. Taxes ValueTotal +/- % +/- % Percentile +/- % $10,000 on $10,000 $10,000
Return* S&P 500 Obj. Rank Obj. Peer Investment Investment +$100/Mo.
3 MONTHS 16.3 4.2 1.3 37 1.2 10,964 130 11,1726 MONTHS 27.5 5.3 3.0 28 7.1 12,012 143 12,5501 YEAR 19.1 0.7 -0.8 48 14.9 11,229 134 12,5183 YEAR 12.1 -2.1 -0.7 53 7.1 13,261 515 17,5695 YEAR 12.8 -2.4 -0.4 57 4.6 17,245 992 25,28010 YEAR 11.5 -2.4 0.3 57 4.0 27,977 2,798 49,42615 YEAR - - - - - - - -20 YEAR - - - - - - - -* Annualized for three years and beyond.
Fund Obj.Beta 0.99 1.02
Alpha -1.7 -1.4
R2 96 98
Std. Dev. 19.03 20.65
1 (best) to 5 (worst) Fund Obj.Overall 2.3 2.9Risk 3.5 3.8Growth 10Yr. 2.2 2.6Persistence 5Yr. 2.5 2.7
1Yr. 1.7 3.0
LOAD-ADJ RET 12/20
10 YEAR 10.9%5 YEAR 11.6%1 YEAR 12.7%Since inception 13.1%
Management Fee 0.74%
12b-1 Fee 0.25%Red. Fee None
Front-End Load Pct.Maximum 5.75at $25K 5.75at $100K 3.75at $500K 2.00Minimum 0.00
Management Style: The fund seeks to achievethe objective of long-term capital appreciation byinvesting at least 80% of the fund’s net assets inthe equity securities of mid-cap and large compa-nies that meet the fund’s social policy. Manage-ment prefers to invest in companies that showleadership in envrionmental concerns and progres-sive workplace practices. It tends to avoid com-panies that derive revenue from gambling, or theproduction of alcohol, tobacco, weapons, ornuclear power. Fundamental research is used tofind companies with solid balance sheets, a quali-
ty management team with a good track record,good cash flow, and have above-average earningsgrowth. A value-oriented approach is used to findfirms that are trading at prices below their histor-ical average based on earnings, cash flow, andother financial measures. It may also invest infirms that are fully priced in accordance withWall Street consensus earnings estimates, but stillunderpriced relative to management’s estimates. Itwill sell an issue once it has realized the targetprice (set by management), or when the issuefails to meet expectations.
THE VALUE LINE MUTUAL FUND SURVEY OBJECTIVE PEER DIV YLD NAV TNA(Mil) VALUELINE
OVERALL RANK RISK RANK 5-YR RETURN
(Annualized)
PAST MARKET CYCLE PERFORMANCE
FUND INFORMATION
PORTFOLIO INFORMATION
PORT. MGR. %RATING
Style/Perf. QuintileLarge
Cap.
SmallCap.
Value Growth
QUARTERLY TOTAL RETURN (%)
ISSUE DATE
EXPENSE STRUCTURE
MPT vs. S&P 500 RANKINGS
SECTOR WEIGHTINGS
STATISTICS
PORTFOLIO HOLDINGS
© 2021 Value Line, Inc. All rights reserved. Factual material is obtained from sources believed to be reliable and is provided without warranties of any kind. THE PUBLISHER IS NOT RESPONSIBLE FORANY ERRORS OR OMISSIONS HEREIN. This publication is strictly for subscriber's own, non-commercial, internal use. No part of it may be reproduced, resold, stored or transmitted in any printed,electronic or other form, or used for generating or marketing any printed or electronic publication, service or product. All investors must read applicable prospectuses before investing.
J A N U A R Y 2 0 2 1 3
T H E V A L U E L I N E F U N D A D V I S O R P L U S
120
80
20
10
40
31.40
1.00
.60
Rising Line − Stronger Than Objective
Declining Line − Weaker Than Objective
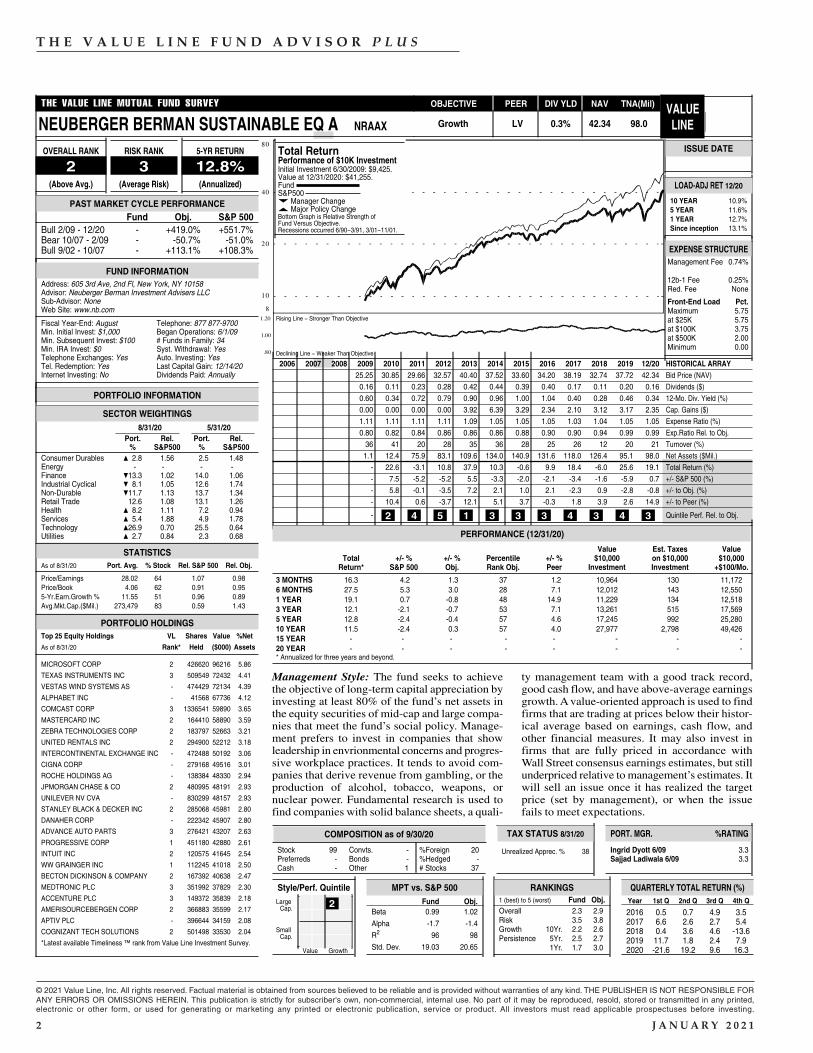
Total ReturnPerformance of $10K InvestmentInitial Investment 12/31/2005: $10,000.Value at 12/31/2020: $39,920.FundS&P500▼ Manager Change▲ Major Policy ChangeBottom Graph is Relative Strength ofFund Versus Objective.Recessions occurred 6/90−3/91, 3/01−11/01.
NICHOLAS FUND NICSX Growth LB 0.4% 77.09 3280.0 page
2(Above Avg.)
3(Average Risk)
13.1%
Fund Obj. S&P 500Bull 2/09 - 12/20 +572.4% +419.0% +551.7%Bear 10/07 - 2/09 -48.8% -50.7% -51.0%Bull 9/02 - 10/07 +77.8% +113.1% +108.3%
Address: 615 E Michigan Street, 3rd Floor, Milwaukee, WI 5320Advisor: Nicholas Co., Inc.Sub-Advisor: NoneWeb Site: www.nicholasfunds.com
Fiscal Year-End: MarchMin. Initial Invest: $500Min. Subsequent Invest: $100Min. IRA Invest: $0Telephone Exchanges: YesTel. Redemption: YesInternet Investing: Yes
Telephone: 800 544-6547Began Operations: 7/14/69# Funds in Family: 4Syst. Withdrawal: YesAuto. Investing: YesLast Capital Gain: 12/29/20Dividends Paid: Semiannually
9/30/20 6/30/20Port. Rel. Port. Rel.
% S&P500 % S&P500Consumer Durables ▲ 2.8 1.40 2.4 1.45Energy ▼ 0.9 0.57 1.1 0.54Finance 14.4 1.10 14.7 1.14Industrial Cyclical ▲ 5.0 0.61 3.7 0.50Non-Durable ▲ 9.1 0.85 8.6 0.86Retail Trade 14.8 1.25 14.5 1.36Health ▼ 9.1 1.19 10.6 1.45Services 4.7 1.61 4.9 1.71Technology 36.3 0.98 35.3 0.87Utilities - - - -
COMPOSITION as of 9/30/20
Stock 98Preferreds -Cash -
Convts. -Bonds -Other -
%Foreign 6%Hedged -# Stocks 61
As of 9/30/20 Port. Avg. % Stock Rel. S&P 500 Rel. Obj.
Price/Earnings 30.93 68 1.22 1.08Price/Book 4.58 65 1.01 1.075-Yr.Earn.Growth % 13.82 60 1.15 1.06Avg.Mkt.Cap.($Mil.) 251,856 88 0.62 1.31
Top 25 Equity Holdings VL Shares Value %Net
As of 9/30/20 Rank* Held ($000) Assets
MICROSOFT CORP 2 647500 136189 4.51
APPLE INC 2 1165660 134995 4.47
ALPHABET INC - 71000 104342 3.46
THERMO FISHER SCIENTIFIC INC 1 233188 102957 3.41
AON PLC - 415000 85615 2.84
CINTAS CORP 2 252500 84040 2.78
VISA INC 3 415000 82988 2.75
HOME DEPOT INC 1 270000 74982 2.48
AMAZON COM INC - 21500 67698 2.24
O’ REILLY AUTOMOTIVE INC 2 144976 66846 2.21
BALL CORP 2 790802 65731 2.18
MASTERCARD INC 2 180000 60871 2.02
S&P GLOBAL INC 2 160000 57696 1.91
LABORATORY CORP OF AMERICA - 300100 56500 1.87
CBRE GROUP INC 3 1140000 53546 1.77
GLOBAL PAYMENTS INC - 299737 53227 1.76
COPART INC 2 506000 53211 1.76
FORTIVE CORPORATION - 650000 49537 1.64
SKYWORKS SOLUTIONS INC 3 340000 49470 1.64
STARBUCK’S CORP 2 575000 49404 1.64
ADOBE SYSTEMS INC 2 100000 49043 1.62
FASTENAL CO 1 1080000 48697 1.61
TJX COMPANIES INC 2 850000 47303 1.57
MEDTRONIC PLC 3 450000 46764 1.55
FISERV INC 2 450000 46373 1.54
*Latest available Timeliness ™ rank from Value Line Investment Survey.
David O. Nicholas 4/11 4.4Michael Shelton 8/16
■3
TAX STATUS 9/30/20
Unrealized Apprec. % 45
Year 1st Q 2nd Q 3rd Q 4th Q
2016 -1.5 1.9 0.6 -0.12017 7.3 2.2 2.5 4.62018 0.5 2.5 8.8 -12.12019 15.4 5.3 1.4 8.42020 -18.7 20.1 9.6 11.1
2006 2007 2008 2009 2010 2011 2012 2013 2014 2015 2016 2017 2018 2019 12/20 HISTORICAL ARRAY58.38 49.39 30.45 40.78 45.15 43.58 48.47 64.62 68.36 62.71 61.09 61.81 56.44 69.51 77.09 Bid Price (NAV)0.82 0.23 0.17 0.09 0.03 0.18 0.01 0.33 0.21 0.39 0.44 0.41 0.39 0.34 0.34 Dividends ($)1.23 0.36 0.53 0.21 0.05 0.37 0.02 0.45 0.26 0.56 0.66 0.54 0.61 0.42 0.39 12-Mo. Div. Yield (%)4.33 9.95 0.00 0.00 3.75 3.35 2.61 2.77 5.66 3.49 1.78 9.20 4.12 5.24 4.88 Cap. Gains ($).77 .75 .75 .77 .78 .76 .74 .74 .73 .72 .72 .72 .72 .72 .72 Expense Ratio (%)
0.53 0.53 0.55 0.56 0.58 0.58 0.57 0.58 0.60 0.60 0.61 0.63 0.65 0.68 0.68 Exp.Ratio Rel. to Obj.32 30 31 32 28 22 21 25 25 22 29 41 18 13 15 Turnover (%)
2314.9 2089.9 1500.2 1384.8 1453.9 1400.2 1679.6 2380.4 2782.7 3789.1 2831.2 2772.3 2430.2 2979.6 3280.0 Net Assets ($Mil.)9.3 1.7 -38.0 34.3 20.9 4.4 17.6 40.2 15.3 -3.0 0.9 17.5 -1.5 33.5 18.9 Total Return (%)
-6.5 -3.8 -1.0 7.9 5.9 2.3 1.6 7.8 1.7 -4.3 -11.0 -4.3 2.9 2.0 0.5 +/- S&P 500 (%)-1.4 -6.5 1.1 2.4 4.1 7.4 3.3 9.5 7.1 -1.4 -6.9 -3.1 5.3 5.1 -1.0 +/- to Obj. (%)-5.9 -6.4 -2.1 5.7 8.1 8.6 3.1 19.3 10.9 -0.5 -5.7 -0.3 7.2 10.9 7.8 +/- to Peer (%)
■4 ■5 ■3 ■3 ■2 ■1 ■2 ■1 ■1 ■4 ■5 ■4 ■1 ■2 ■3 Quintile Perf. Rel. to Obj.
PERFORMANCE (12/31/20)
Value Est. Taxes ValueTotal +/- % +/- % Percentile +/- % $10,000 on $10,000 $10,000
Return* S&P 500 Obj. Rank Obj. Peer Investment Investment +$100/Mo.
3 MONTHS 11.1 -1.1 -3.9 78 -1.3 11,108 108 11,3266 MONTHS 21.7 -0.5 -2.7 70 2.5 12,171 118 12,7231 YEAR 18.9 0.5 -1.0 48 7.8 11,890 162 13,2053 YEAR 16.1 1.9 3.3 36 8.5 15,629 583 20,3195 YEAR 13.1 -2.1 -0.2 55 3.8 18,540 1,120 27,46510 YEAR 13.6 -0.3 2.4 35 5.8 35,693 3,207 59,85515 YEAR 9.7 -0.2 1.5 39 3.5 39,921 4,398 89,56820 YEAR 7.5 0.0 1.2 46 2.2 42,196 4,894 121,069* Annualized for three years and beyond.
Fund Obj.Beta 0.96 1.02
Alpha 2.1 -1.4
R2 97 98
Std. Dev. 18.36 20.65
1 (best) to 5 (worst) Fund Obj.Overall 2.5 2.9Risk 3.3 3.8Growth 10Yr. 2.9 2.6Persistence 5Yr. 2.9 2.7
1Yr. 3.0 3.0
LOAD-ADJ RET 12/20
10 YEAR 13.6%5 YEAR 13.1%1 YEAR 18.9%Since inception 11.3%
Management Fee 0.65%
12b-1 Fee NoneRed. Fee None
Sales Load Pct.Maximum Noneat $25K Noneat $100K Noneat $500K NoneMinimum None
Management Style: The fund strives to provideshareholders with long-term capital growth. Man-agement attempts to achieve this goal by invest-ing primarily in equity securities issued by com-panies from a wide spectrum of industries. Al-though traditionally mid- to large-cap-oriented,management may make investments in small-capstocks. When selecting issues for the fund’s port-folio, it performs fundamental analysis to identifyreasonably-priced companies with growth poten-tial. Management will look at issues where theP/E ratio is low relative to earnings growth, or
where the price is reasonable in relation to bookvalue. High secular earnings growth and strongcurrent-earnings momentum are also importantfactors. In addition, management will focus onother factors that is considered a good indicatorof valuable firms, such as the company’s positionin a particular industry, its product, the quality ofits management, as well as its overall businessprospects. It may sell a security for reasons, in-cluding when an offering’s fundamentals have de-teriorated, or if there are other more attractive in-vestment opportunities available.
THE VALUE LINE MUTUAL FUND SURVEY OBJECTIVE PEER DIV YLD NAV TNA(Mil) VALUELINE
OVERALL RANK RISK RANK 5-YR RETURN
(Annualized)
PAST MARKET CYCLE PERFORMANCE
FUND INFORMATION
PORTFOLIO INFORMATION
PORT. MGR. %RATING
Style/Perf. QuintileLarge
Cap.
SmallCap.
Value Growth
QUARTERLY TOTAL RETURN (%)
ISSUE DATE
EXPENSE STRUCTURE
MPT vs. S&P 500 RANKINGS
SECTOR WEIGHTINGS
STATISTICS
PORTFOLIO HOLDINGS
© 2021 Value Line, Inc. All rights reserved. Factual material is obtained from sources believed to be reliable and is provided without warranties of any kind. THE PUBLISHER IS NOT RESPONSIBLE FORANY ERRORS OR OMISSIONS HEREIN. This publication is strictly for subscriber's own, non-commercial, internal use. No part of it may be reproduced, resold, stored or transmitted in any printed,electronic or other form, or used for generating or marketing any printed or electronic publication, service or product. All investors must read applicable prospectuses before investing.
4 J A N U A R Y 2 0 2 1
T H E V A L U E L I N E F U N D A D V I S O R P L U S
60
20
10
40
62.00
1.00
.50
Rising Line − Stronger Than Objective
Declining Line − Weaker Than Objective
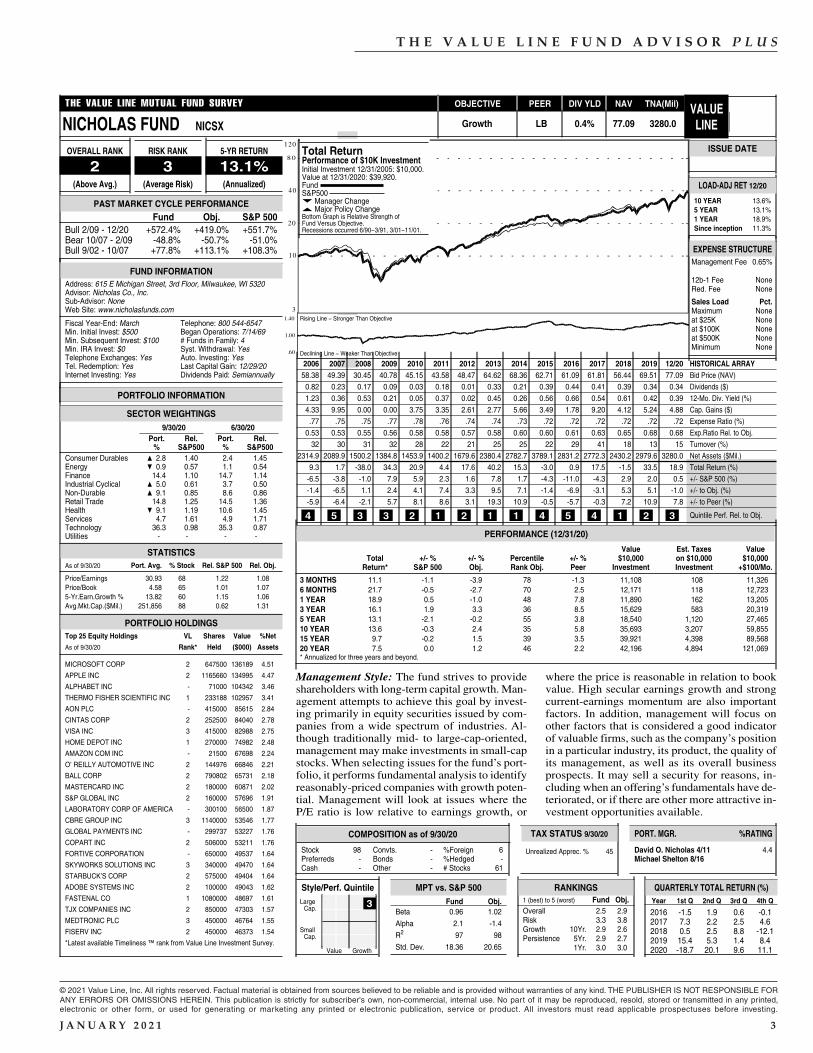
Total ReturnPerformance of $10K InvestmentInitial Investment 12/31/2005: $10,000.Value at 12/31/2020: $32,881.FundS&P500▼ Manager Change▲ Major Policy ChangeBottom Graph is Relative Strength ofFund Versus Objective.Recessions occurred 6/90−3/91, 3/01−11/01.
T. ROWE PRICE SPECTRUM MODERATE GR TRSGX Asset Alloc LG 0.8% 40.79 2639.0 page
2(Above Avg.)
2(Lower Risk)
12.0%
Fund Obj. S&P 500Bull 2/09 - 12/20 +392.5% +193.9% +551.7%Bear 10/07 - 2/09 -48.2% -39.2% -51.0%Bull 9/02 - 10/07 +119.7% +74.2% +108.3%
Address: 100 E Pratt Street, Baltimore, MD 21202Advisor: T. Rowe Price, Inc.Sub-Advisor: NoneWeb Site: www.troweprice.com
Fiscal Year-End: MayMin. Initial Invest: $2,500Min. Subsequent Invest: $100Min. IRA Invest: $1,000Telephone Exchanges: YesTel. Redemption: YesInternet Investing: Yes
Telephone: 800 225-5132Began Operations: 7/29/94# Funds in Family: 150Syst. Withdrawal: YesAuto. Investing: YesLast Capital Gain: 12/11/20Dividends Paid: Quarterly
8/31/20 5/31/20Port. Rel. Port. Rel.
% S&P500 % S&P500Consumer Durables ▲ 1.8 0.99 1.5 0.91Energy ▼ 0.8 0.43 1.2 0.57Finance ▼23.8 1.82 30.9 2.34Industrial Cyclical ▲ 8.0 1.02 7.3 1.00Non-Durable ▲ 4.9 0.47 4.5 0.43Retail Trade ▲ 7.3 0.62 6.6 0.63Health 5.4 0.72 5.3 0.69Services 2.6 0.92 2.5 0.91Technology ▲20.5 0.53 18.3 0.46Utilities ▼ 3.4 1.07 4.3 1.28
COMPOSITION as of 12/31/20
Stock 79Preferreds -Cash 3
Convts. -Bonds 13Other 5
%Foreign 7%Hedged -# Stocks 524
As of 8/31/20 Port. Avg. % Stock Rel. S&P 500 Rel. Obj.
Price/Earnings 27.77 36 1.06 1.33Price/Book 3.93 34 0.88 1.235-Yr.Earn.Growth % 10.65 27 0.88 1.17Avg.Mkt.Cap.($Mil.) 237,786 81 0.52 1.74
Top 25 Equity Holdings VL Shares Value %Net
As of 8/31/20 Rank* Held ($000) Assets
T ROWE PRICE EMERGING MARKE MU - 1 188244 5.97
BLACKSTONE PARTNERS OFFSHORE M - 100359 120077 3.81
AMAZON COM INC - 27496 94887 3.01
MICROSOFT CORP 2 304296 68628 2.18
ALPHABET INC 1 41751 68229 2.17
T ROWE PRICE REAL ASSETS FD MU - 1 56055 1.78
FACEBOOK INC 1 182908 53629 1.70
APPLE INC 2 371344 47918 1.52
ALIBABA GROUP HOLDING LTD - 131712 37805 1.20
EDWARDS LIFESCIENCES CORP 1 179337 37028 1.18
QUALCOMM INC 1 219646 26160 0.83
MORGAN STANLEY 2 492214 25723 0.82
NEXTERA ENERGY INC 3 87979 24561 0.78
SALESFORCE.COM INC 1 89256 24336 0.77
THERMO FISHER SCIENTIFIC INC 1 56281 24143 0.77
PROLOGIS INC 3 236260 24066 0.76
VISA INC 3 112630 23876 0.76
TENCENT HOLDINGS LTD - 321700 21978 0.70
LINDE PLC - 86383 21573 0.68
MASTERCARD INC 2 59398 21276 0.68
NVIDIA CORP 2 37896 20274 0.64
BANK OF AMERICA CORPORATION 4 776108 19977 0.63
PAYPAL HOLDINGS INC 3 97135 19829 0.63
NESTLE SA SPONS ADR FOR REG 3 161936 19505 0.62
UNITEDHEALTH GROUP INC 3 59403 18566 0.59
*Latest available Timeliness ™ rank from Value Line Investment Survey.
Charles M. Shriver 5/11 -0.5Toby M. Thompson 3/20
■−
TAX STATUS 8/31/20
Unrealized Apprec. % 31
Year 1st Q 2nd Q 3rd Q 4th Q
2016 -0.1 1.3 5.4 0.42017 6.4 4.8 4.8 4.32018 0.9 0.9 2.4 -9.82019 11.3 3.6 0.5 6.42020 -18.3 17.9 7.3 12.8
2006 2007 2008 2009 2010 2011 2012 2013 2014 2015 2016 2017 2018 2019 12/20 HISTORICAL ARRAY25.36 24.44 14.90 20.18 22.91 22.10 25.58 30.47 29.65 27.83 29.15 33.94 29.83 35.89 40.79 Bid Price (NAV)0.36 0.40 0.34 0.30 0.36 0.34 0.40 0.32 0.46 0.46 0.41 0.38 0.48 0.48 0.34 Dividends ($)1.31 1.41 2.15 1.40 1.48 1.45 1.47 0.95 1.37 1.48 1.31 1.02 1.44 1.25 0.77 12-Mo. Div. Yield (%)0.63 2.46 0.00 0.00 0.01 0.03 0.01 1.11 2.13 1.43 0.23 1.21 1.64 0.39 0.72 Cap. Gains ($).92 .84 .81 .87 .79 .77 .69 .69 .68 .67 .67 .66 .66 .65 .63 Expense Ratio (%)
0.90 0.78 0.94 1.01 0.89 0.84 0.71 0.51 0.87 0.83 0.81 0.82 0.84 0.83 0.81 Exp.Ratio Rel. to Obj.37 50 58 56 44 49 51 46 46 53 64 58 56 56 74 Turnover (%)
1058.3 1261.0 755.0 1033.0 1079.0 1087.0 1166.0 1467.0 1592.0 1660.0 1667.0 2082.0 2083.0 2639.0 2639.0 Net Assets ($Mil.)14.1 7.8 -37.6 37.5 15.4 -1.9 17.6 24.9 5.9 0.3 7.0 21.9 -6.1 23.3 16.7 Total Return (%)-1.7 2.3 -0.6 11.1 0.3 -4.0 1.6 -7.5 -7.8 -1.1 -4.9 0.1 -1.7 -8.2 -1.7 +/- S&P 500 (%)3.6 1.8 -9.0 13.0 3.0 -0.1 5.9 11.1 1.8 2.7 0.7 8.5 0.4 6.1 6.0 +/- to Obj. (%)7.0 -4.2 1.4 5.0 0.8 1.6 3.6 -0.5 -0.1 0.3 2.5 -2.5 0.1 -6.0 -11.3 +/- to Peer (%)
■2 ■2 ■4 ■1 ■1 ■3 ■1 ■1 ■2 ■1 ■3 ■1 ■3 ■2 ■1 Quintile Perf. Rel. to Obj.
PERFORMANCE (12/31/20)
Value Est. Taxes ValueTotal +/- % +/- % Percentile +/- % $10,000 on $10,000 $10,000
Return* S&P 500 Obj. Rank Obj. Peer Investment Investment +$100/Mo.
3 MONTHS 12.8 0.7 3.1 28 -0.1 11,280 75 11,4976 MONTHS 21.1 -1.1 6.1 22 -2.6 12,109 80 12,6641 YEAR 16.7 -1.7 6.0 13 -11.3 11,667 77 12,9823 YEAR 10.5 -3.6 3.9 9 -5.2 13,510 325 17,9355 YEAR 12.0 -3.2 4.1 8 -3.1 17,626 641 25,88010 YEAR 10.4 -3.4 4.1 3 -1.0 26,985 1,794 48,14715 YEAR 8.3 -1.6 2.9 3 0.0 32,881 2,794 73,12520 YEAR 7.6 0.2 3.0 3 2.6 43,337 3,977 109,648* Annualized for three years and beyond.
Fund Obj.Beta 0.80 0.61
Alpha -1.1 -2.6
R2 95 94
Std. Dev. 15.44 12.59
1 (best) to 5 (worst) Fund Obj.Overall 2.2 3.4Risk 2.7 2.2Growth 10Yr. 1.3 4.0Persistence 5Yr. 2.2 3.7
1Yr. 3.0 3.9
LOAD-ADJ RET 12/20
10 YEAR 10.4%5 YEAR 12.0%1 YEAR 16.7%Since inception 9.6%
Management Fee 0.59%
12b-1 Fee NoneRed. Fee None
Sales Load Pct.Maximum Noneat $25K Noneat $100K Noneat $500K NoneMinimum None
Management Style: The fund seeks the highesttotal return that is consistent with capital appreci-ation and income, secondarily. In pursuit of thisgoal, management invests at least 80% of thefund’s assets in stocks and 20% in fixed-incomesecurities and cash reserves. It may invest in se-curities issued by US and foreign countries, pri-marily in firms domiciled in developed markets.It may invest in firms from the emerging mar-kets, but to a lesser extent. Typically, the fund’sportfolio is allocated as follows: 70%-90% tostocks, while 10%-30% are comprised of bonds,
and money market securities. When selectingstocks, management tends to favor well-established companies that have the potential forappreciation and attractive values. On the fixed-income side, it may invest in government andcorporate bonds that have investment-graderatings, along with mortgage-backed securities. Itwill also consider such factors as corporate earn-ings, movements in the interest rates, currencyvaluations, and the outlook for the inflation leveland economy. It may rebalance the fund’s assetallocation based on market/economic events.
THE VALUE LINE MUTUAL FUND SURVEY OBJECTIVE PEER DIV YLD NAV TNA(Mil) VALUELINE
OVERALL RANK RISK RANK 5-YR RETURN
(Annualized)
PAST MARKET CYCLE PERFORMANCE
FUND INFORMATION
PORTFOLIO INFORMATION
PORT. MGR. %RATING
Style/Perf. QuintileLarge
Cap.
SmallCap.
Value Growth
QUARTERLY TOTAL RETURN (%)
ISSUE DATE
EXPENSE STRUCTURE
MPT vs. S&P 500 RANKINGS
SECTOR WEIGHTINGS
STATISTICS
PORTFOLIO HOLDINGS
© 2021 Value Line, Inc. All rights reserved. Factual material is obtained from sources believed to be reliable and is provided without warranties of any kind. THE PUBLISHER IS NOT RESPONSIBLE FORANY ERRORS OR OMISSIONS HEREIN. This publication is strictly for subscriber's own, non-commercial, internal use. No part of it may be reproduced, resold, stored or transmitted in any printed,electronic or other form, or used for generating or marketing any printed or electronic publication, service or product. All investors must read applicable prospectuses before investing.
J A N U A R Y 2 0 2 1 5
T H E V A L U E L I N E F U N D A D V I S O R P L U S
Neuberger Berman Sustainable Equity Fund
When saving for major lifegoals, such as retirement, it isimportant to think long term
and focus on compounding little wins asoppose to immediate gains. Investorsconsidering an investment vehicle that in-stills this idea may want to consider theNicholas Fund.
The fund is managed by David O.Nicholas (CFA) and Michael L. Shelton(CFA & CPA). Together, managementstrives to achieve the fund’s objective oflong-term capital growth by investingprimarily in the common stocks of UScompanies. There are no market-cap re-strictions. Management employs a bot-tom-up approach in which it will focuson companies that have the potential forsuperior growth in sales and earnings.Management is also able to examine acompany’s worth by focusing on suchfactors as product development,company’s competitive position within
Today, many investors are not onlyconcerned about saving for thefuture but also making sure that
their future environment is pleasant. Indi-viduals who are interested in integratingenvironmental, social, and governmentalstocks into their investment portfolio maywant consider Neuberger Berman Sustain-able Equity Fund.
The fund’s management team includes:Ingrid S. Dyott and Sajjad Ladiwala (CFA).Management seeks long-term capital appre-ciation by investing primarily in the commonstocks of mid- and large-cap companies thatmeet the fund’s quality oriented financialand ESG criteria. Management will performfundamental research to identify high-qual-ity companies that are trading below their in-trinsic value. The selection process beginswith management focusing on a company’sfundamentals. It will typically invest in acompany with robust balance sheets, good
its respective industry, and its price-to-earnings ratio.
According to management, Apple Inc. wasone bright spot in the model portfolio.Apple, a multinational company that de-signs, develops, and sells consumer elec-tronics, computer software and onlineservices, ended its fiscal fourth quarter(through September 26, 2020) with an all-time high revenue of $64.7 billion. Its inter-national sales accounted for 59% of thequarter’s revenue. In spite of theCoronavirus pandemic, Apple’s good perfor-mance was helped by many individualsworking or studying remotely using Appleproducts. Moreover, the introduction of its5-G iPhone, which became popular amongits customers, drove sales for Apple. Thefund also held shares of financial servicescompany Visa Inc. For its fiscal fourth quar-ter ended September 30, 2020, Visa reporteda net revenue of $5.1 B, which decreased17% year-over-year, due to a decline in prior
cash flow, display above-average earningsgrowth that are sustainable, good businessmodel, as well as effective executives tocarry out business operations. Further, man-agement will look at companies that areleaders when it comes to being the changefor a better world. In this case, the compa-nies would have already incorporated pro-gressive workplace practices and worked onimproving community relations. It tends toavoid companies involved in gambling andproducing alcohol and tobacco.
By management, the fund’s performancewas buoyed by its holding of Vestas WindSystems for its third quarter ended Septem-ber 30, 2020. Vestas Wind is a wind turbinemanufacturer that also provides wind powersolutions and services. Vestas generated arevenue EUR 4,770 million for the thirdquarter, which was up 31% year-over-year.Vestas’s revenue is set to increase with it re-porting that its wind turbine order backlog
is worth EUR 14.6 billion (for September2020). Furthermore, Vestas has serviceagreements with expected contractual fu-ture revenue of EUR19.3 billion. Anothercontributor was Comcast, a telecommuni-cations conglomerate. Comcast benefittedfrom subscribers of its high-speed internetservice. For its third quarter, some ofComcast’s revenue was derived from itshigh-speed internet service that brought in$5,198.0M in revenue, up from the samequarter in 2019 by 10%. Also, its totalhigh-speed internet customer net additionswere 633,000 during the quarter.
For the year-to-date period throughDecember 31, 2020, the fund posted a to-tal return of 19.1%. Furthermore, its annu-alized total returns have performedroughly in line with the Growth objectivegroup over the trailing five- and 10-yearperiods. The fund also has an Overall rankof 2 and risk rank of 3.
quarter payments volume. With many busi-nesses forced to shutdown to stave off thecoronavirus, many individuals found them-selves unemployed or cancelling travelplans, thus decreasing consumer spending.As with other companies, Visa had to adaptand make changes during the pandemic inorder to grow. Visa has upgraded its plat-form to enable eCommerce and tap to pay toaccelerate cash digitization, as well as ex-panded its Visa Direct and B2B partnershipsto take advantage of the market as it movestowards digital payments.
For the year-to-date period through De-cember 31, 2020, the fund posted a totalreturn of 18.9%. In addition, its annual-ized total returns have outpaced theGrowth objective group over the trailingthree-, 10-, and 20-year periods by three,two, one percentage point(s), respectively.It also received Value Line’s Overall rankof 2 and its level of volatility is below theobjective group’s average.
At press time, the authors did not have a position in the funds mentioned.
Nicholas Fund
© 2021 Value Line, Inc. All rights reserved. Factual material is obtained from sources believed to be reliable and is provided without warranties of any kind. THE PUBLISHER IS NOT RESPONSIBLE FORANY ERRORS OR OMISSIONS HEREIN. This publication is strictly for subscriber's own, non-commercial, internal use. No part of it may be reproduced, resold, stored or transmitted in any printed,electronic or other form, or used for generating or marketing any printed or electronic publication, service or product. All investors must read applicable prospectuses before investing.
6 J A N U A R Y 2 0 2 1
T H E V A L U E L I N E F U N D A D V I S O R P L U S
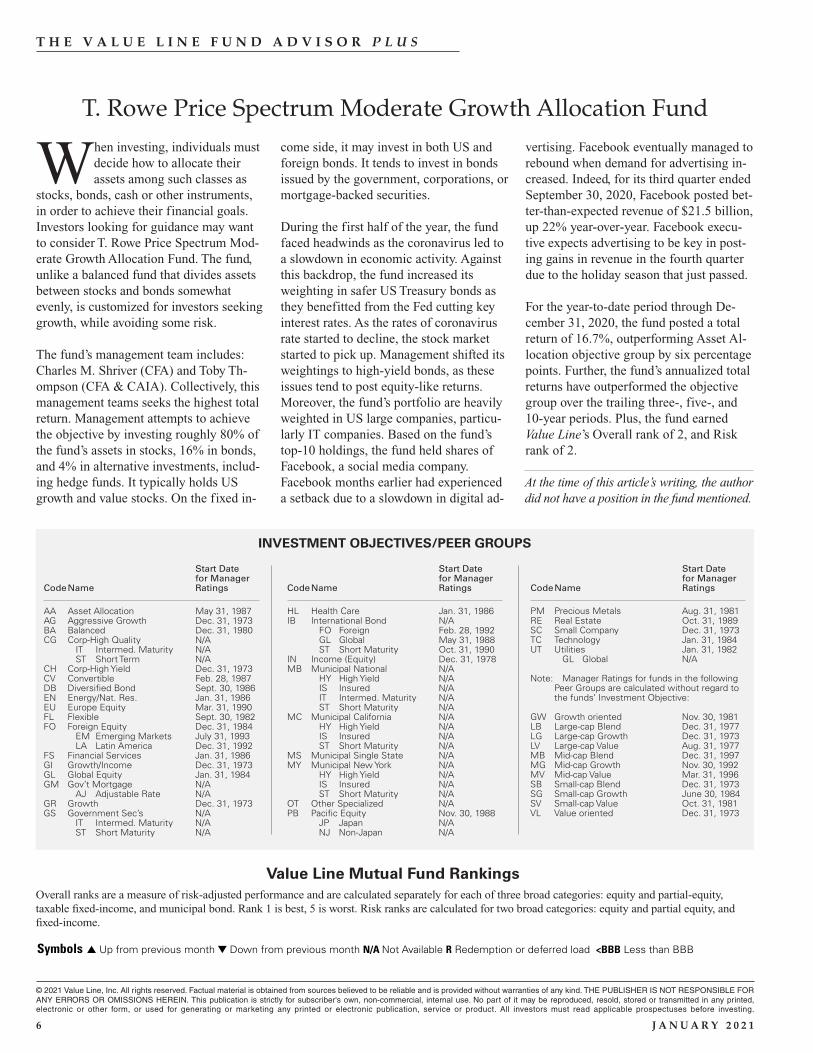
AA Asset Allocation May 31, 1987AG Aggressive Growth Dec. 31, 1973BA Balanced Dec. 31, 1980CG Corp-High Quality N/A IT Intermed. Maturity N/A ST Short Term N/ACH Corp-High Yield Dec. 31, 1973CV Convertible Feb. 28, 1987DB Diversified Bond Sept. 30, 1986EN Energy/Nat. Res. Jan. 31, 1986EU Europe Equity Mar. 31, 1990FL Flexible Sept. 30, 1982FO Foreign Equity Dec. 31, 1984 EM Emerging Markets July 31, 1993 LA Latin America Dec. 31, 1992FS Financial Services Jan. 31, 1986GI Growth/Income Dec. 31, 1973GL Global Equity Jan. 31, 1984GM Gov’t Mortgage N/A AJ Adjustable Rate N/AGR Growth Dec. 31, 1973GS Government Sec’s N/A IT Intermed. Maturity N/A ST Short Maturity N/A
INVESTMENT OBJECTIVES/PEER GROUPS
Start Date for Manager Code Name Ratings
HL Health Care Jan. 31, 1986IB International Bond N/A FO Foreign Feb. 28, 1992 GL Global May 31, 1988 ST Short Maturity Oct. 31, 1990IN Income (Equity) Dec. 31, 1978MB Municipal National N/A HY High Yield N/A IS Insured N/A IT Intermed. Maturity N/A ST Short Maturity N/AMC Municipal California N/A HY High Yield N/A IS Insured N/A ST Short Maturity N/AMS Municipal Single State N/AMY Municipal New York N/A HY High Yield N/A IS Insured N/A ST Short Maturity N/AOT Other Specialized N/APB Pacific Equity Nov. 30, 1988 JP Japan N/A NJ Non-Japan N/A
PM Precious Metals Aug. 31, 1981RE Real Estate Oct. 31, 1989SC Small Company Dec. 31, 1973TC Technology Jan. 31, 1984UT Utilities Jan. 31, 1982 GL Global N/A
Note: Manager Ratings for funds in the following Peer Groups are calculated without regard to the funds’ Investment Objective:
GW Growth oriented Nov. 30, 1981LB Large-cap Blend Dec. 31, 1977LG Large-cap Growth Dec. 31, 1973LV Large-cap Value Aug. 31, 1977MB Mid-cap Blend Dec. 31, 1997MG Mid-cap Growth Nov. 30, 1992MV Mid-cap Value Mar. 31, 1996SB Small-cap Blend Dec. 31, 1973SG Small-cap Growth June 30, 1984SV Small-cap Value Oct. 31, 1981VL Value oriented Dec. 31, 1973
Start Date for Manager Code Name Ratings
Start Date for Manager Code Name Ratings
Value Line Mutual Fund RankingsOverall ranks are a measure of risk-adjusted performance and are calculated separately for each of three broad categories: equity and partial-equity, taxable fixed-income, and municipal bond. Rank 1 is best, 5 is worst. Risk ranks are calculated for two broad categories: equity and partial equity, and fixed-income.
Symbols � Up from previous month � Down from previous month N/A Not Available R Redemption or deferred load <BBB Less than BBB
T. Rowe Price Spectrum Moderate Growth Allocation Fund
When investing, individuals mustdecide how to allocate theirassets among such classes as
stocks, bonds, cash or other instruments,in order to achieve their financial goals.Investors looking for guidance may wantto consider T. Rowe Price Spectrum Mod-erate Growth Allocation Fund. The fund,unlike a balanced fund that divides assetsbetween stocks and bonds somewhatevenly, is customized for investors seekinggrowth, while avoiding some risk.
The fund’s management team includes:Charles M. Shriver (CFA) and Toby Th-ompson (CFA & CAIA). Collectively, thismanagement teams seeks the highest totalreturn. Management attempts to achievethe objective by investing roughly 80% ofthe fund’s assets in stocks, 16% in bonds,and 4% in alternative investments, includ-ing hedge funds. It typically holds USgrowth and value stocks. On the fixed in-
come side, it may invest in both US andforeign bonds. It tends to invest in bondsissued by the government, corporations, ormortgage-backed securities.
During the first half of the year, the fundfaced headwinds as the coronavirus led toa slowdown in economic activity. Againstthis backdrop, the fund increased itsweighting in safer US Treasury bonds asthey benefitted from the Fed cutting keyinterest rates. As the rates of coronavirusrate started to decline, the stock marketstarted to pick up. Management shifted itsweightings to high-yield bonds, as theseissues tend to post equity-like returns.Moreover, the fund’s portfolio are heavilyweighted in US large companies, particu-larly IT companies. Based on the fund’stop-10 holdings, the fund held shares ofFacebook, a social media company.Facebook months earlier had experienceda setback due to a slowdown in digital ad-
vertising. Facebook eventually managed torebound when demand for advertising in-creased. Indeed, for its third quarter endedSeptember 30, 2020, Facebook posted bet-ter-than-expected revenue of $21.5 billion,up 22% year-over-year. Facebook execu-tive expects advertising to be key in post-ing gains in revenue in the fourth quarterdue to the holiday season that just passed.
For the year-to-date period through De-cember 31, 2020, the fund posted a totalreturn of 16.7%, outperforming Asset Al-location objective group by six percentagepoints. Further, the fund’s annualized totalreturns have outperformed the objectivegroup over the trailing three-, five-, and10-year periods. Plus, the fund earnedValue Line’s Overall rank of 2, and Riskrank of 2.
At the time of this article’s writing, the authordid not have a position in the fund mentioned.
© 2021 Value Line, Inc. All rights reserved. Factual material is obtained from sources believed to be reliable and is provided without warranties of any kind. THE PUBLISHER IS NOT RESPONSIBLE FORANY ERRORS OR OMISSIONS HEREIN. This publication is strictly for subscriber's own, non-commercial, internal use. No part of it may be reproduced, resold, stored or transmitted in any printed,electronic or other form, or used for generating or marketing any printed or electronic publication, service or product. All investors must read applicable prospectuses before investing.
J A N U A R Y 2 0 2 1 7
T H E V A L U E L I N E F U N D A D V I S O R P L U S
At the time of this article’s writing, theauthor did not have a position in the fundsmentioned.
As fast as stocks took a dive in thefirst quarter of 2020, stocks wereable to rebound quickly by the
second half of 2020. Investor sentimentimproved with reports of the coronavirusrate flattening that in turn led to non-es-sential businesses reopening in late springinto the summer. Specifically, restaurantand airline businesses saw an increase inactivity although not operating at full ca-pacity due to social distancing rules beingenforced to prevent infections. In light ofthese events, the unemployment rate de-creased and a record number of jobs wereadded in the months of June and July.
By the fourth quarter, investors werespooked once again as signs of secondwave of the coronavirus showed itself andbusinesses started closing. Fortunately, in-vestors were able to shrug off their worrieson news that the coronavirus vaccines intheir final clinical trials were effectiveagainst the coronavirus. Indeed, Modernaand Pfizer reported their vaccines are94.1% and 95% effective, in that order.With the first people already receiving oneof the vaccines, major indexes advancedand posted gains, these shots signal thatthe end of the pandemic is in sight. For theyear-to-date period through December 31,2020, the Large-Cap Growth objectivegroup posted a total return of 28%. Thismonth, we will be highlighting funds fromthis asset class that may interest you.
Marsico Growth Fund (MGRIX) remainsin the high-risk section of our highlightedfunds. Management strives to achievelong-term capital appreciation by invest-ing primarily in the common stocks oflarge-cap companies. Management em-ploys a combination of top-down and bot-tom-up approaches to identify attractivecompanies. The selection process beginswith management evaluating the economicbackdrop and industries, specifically suchfactors as the US GDP, interest rates, infla-tionary and deflationary forces, creditconditions, and the global competitivelandscape. Based on its research, manage-
Short-List Picks: Large-Cap Growth
ment will focus on the companies that arepart of the sectors experiencing growth.Management tends to invest in well-estab-lished companies with above-averageearnings growth potential. Also, the in-vested firms should stand out amongst itsindustrial peers; have a strong brand fran-chise, durability and pricing power; robustbalance sheets; improving profit marginsand returns on equity; the ability to gener-ate free cash flow; solid managementteam; and have a reasonable current valua-tion in the context of projected growthrates and peer group comparisons. Fur-thermore, it may invest in companies thatstand to benefit from catalysts such as apositive in change in their business mod-els, introduction of innovative products,and merger and acquisitions.
For the year-to-date period through De-cember 31, 2020, the fund advanced by57.1%, outdistancing the Large-CapGrowth objective group by 29 percentagepoints. Also, the fund’s annualized total re-turns have outpaced the objective groupover the trailing three-, five-, and 10-yearperiods. The fund earned Value Line’sHighest Overall rank of 1, and a Risk rankof 3. To get the latest information aboutthis fund, please call (888) 860-8686 orvisit www.marsicofunds.com.
Ivy Large-Cap Growth Fund (WLGAX) ispart of the moderate-risk section of ourhighlighted funds. The fund’s objective isgrowth of capital. Management attemptsto achieve this goal by investing at least80% of the fund’s net assets in the equitysecurities, such as common stocks, issuedby large companies. Management employsa growth-oriented approach, in which itwill focus on a firm’s profitability andearnings growth and sales. Moreover, thepreferred companies should have solidfundamentals, as shown by their durablemarket position and competitive position,as result of the strong following for theirrespective brand and product; the ability tosustain unit growth and high profitability;have healthy balance sheets and cash
flows; and bargaining power when inter-acting with their respective customers,suppliers, and competitors.
For the 12-month period through Decem-ber 31, 2020, the fund posted a total returnof 30.8%, outperforming the Large-CapGrowth objective group by three percent-age points. Additionally, its annualized to-tal returns have bested the objective groupover the trailing three-year period by threepercentage points, and four percentagepoints over the trailing five- and 10-yearperiods. The fund has an Overall rank of1, and its level of volatility is roughly inline with the objective group’s average.For more information about this fund,please call (888) 923-3355, or visitwww.ivyinvestments.com.
Lastly, in the low-risk section of our high-lighted funds is AB Large Cap GrowthFund (APGAX). Management strives toachieve long-term capital appreciation byinvesting at least 80% of the fund’s net as-sets in the common stocks of US largecompanies. The invested large companiesnormally have market capitalizations thatare within the same market-cap size as thefirms listed on the Russell 1000 GrowthIndex. Management performs fundamentalresearch by focusing on firms with above-average earnings growth potential, high orimproving return on invested capital, solidbusiness models, as well as have a com-petitive edge over their peers.
The fund gained 34% for the 12-month pe-riod ended in December 31, 2020, outpac-ing the Large-Cap Growth objective groupby six percentage points. Its annualized to-tal returns have also outdistanced the objec-tive group over the trailing three-, five- and10-year periods. Additionally, it receivedValue Line’s Overall rank of 1 and a Riskrank of 3. Interested investors can obtain aprospectus by calling (800) 962-2134, orvisiting www.alliancebernstein.com.
© 2021 Value Line, Inc. All rights reserved. Factual material is obtained from sources believed to be reliable and is provided without warranties of any kind. THE PUBLISHER IS NOT RESPONSIBLE FORANY ERRORS OR OMISSIONS HEREIN. This publication is strictly for subscriber's own, non-commercial, internal use. No part of it may be reproduced, resold, stored or transmitted in any printed,electronic or other form, or used for generating or marketing any printed or electronic publication, service or product. All investors must read applicable prospectuses before investing.
8 J A N U A R Y 2 0 2 1
T H E V A L U E L I N E F U N D A D V I S O R P L U S
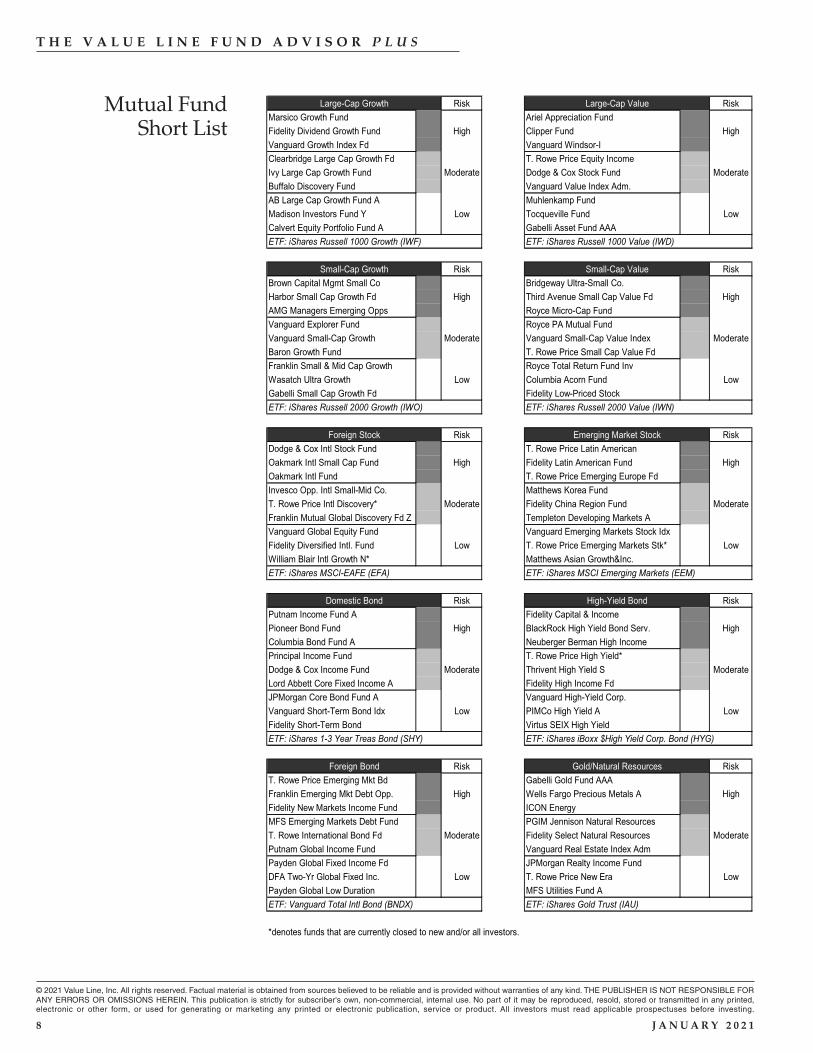
Mutual FundShort List
Risk RiskMarsico Growth Fund Ariel Appreciation FundFidelity Dividend Growth Fund High Clipper Fund HighVanguard Growth Index Fd Vanguard Windsor-IClearbridge Large Cap Growth Fd T. Rowe Price Equity IncomeIvy Large Cap Growth Fund Moderate Dodge & Cox Stock Fund ModerateBuffalo Discovery Fund Vanguard Value Index Adm.AB Large Cap Growth Fund A Muhlenkamp FundMadison Investors Fund Y Low Tocqueville Fund LowCalvert Equity Portfolio Fund A Gabelli Asset Fund AAAETF: iShares Russell 1000 Growth (IWF) ETF: iShares Russell 1000 Value (IWD)
Risk RiskBrown Capital Mgmt Small Co Bridgeway Ultra-Small Co.Harbor Small Cap Growth Fd High Third Avenue Small Cap Value Fd HighAMG Managers Emerging Opps Royce Micro-Cap FundVanguard Explorer Fund Royce PA Mutual FundVanguard Small-Cap Growth Moderate Vanguard Small-Cap Value Index ModerateBaron Growth Fund T. Rowe Price Small Cap Value FdFranklin Small & Mid Cap Growth Royce Total Return Fund InvWasatch Ultra Growth Low Columbia Acorn Fund LowGabelli Small Cap Growth Fd Fidelity Low-Priced StockETF: iShares Russell 2000 Growth (IWO) ETF: iShares Russell 2000 Value (IWN)
Risk RiskDodge & Cox Intl Stock Fund T. Rowe Price Latin AmericanOakmark Intl Small Cap Fund High Fidelity Latin American Fund HighOakmark Intl Fund T. Rowe Price Emerging Europe FdInvesco Opp. Intl Small-Mid Co. Matthews Korea FundT. Rowe Price Intl Discovery* Moderate Fidelity China Region Fund ModerateFranklin Mutual Global Discovery Fd Z Templeton Developing Markets AVanguard Global Equity Fund Vanguard Emerging Markets Stock IdxFidelity Diversified Intl. Fund Low T. Rowe Price Emerging Markets Stk* LowWilliam Blair Intl Growth N* Matthews Asian Growth&Inc.ETF: iShares MSCI-EAFE (EFA) ETF: iShares MSCI Emerging Markets (EEM)
Risk RiskPutnam Income Fund A Fidelity Capital & IncomePioneer Bond Fund High BlackRock High Yield Bond Serv. HighColumbia Bond Fund A Neuberger Berman High IncomePrincipal Income Fund T. Rowe Price High Yield*Dodge & Cox Income Fund Moderate Thrivent High Yield S ModerateLord Abbett Core Fixed Income A Fidelity High Income FdJPMorgan Core Bond Fund A Vanguard High-Yield Corp.Vanguard Short-Term Bond Idx Low PIMCo High Yield A LowFidelity Short-Term Bond Virtus SEIX High YieldETF: iShares 1-3 Year Treas Bond (SHY) ETF: iShares iBoxx $High Yield Corp. Bond (HYG)
Risk RiskT. Rowe Price Emerging Mkt Bd Gabelli Gold Fund AAAFranklin Emerging Mkt Debt Opp. High Wells Fargo Precious Metals A HighFidelity New Markets Income Fund ICON EnergyMFS Emerging Markets Debt Fund PGIM Jennison Natural ResourcesT. Rowe International Bond Fd Moderate Fidelity Select Natural Resources ModeratePutnam Global Income Fund Vanguard Real Estate Index AdmPayden Global Fixed Income Fd JPMorgan Realty Income FundDFA Two-Yr Global Fixed Inc. Low T. Rowe Price New Era LowPayden Global Low Duration MFS Utilities Fund AETF: Vanguard Total Intl Bond (BNDX) ETF: iShares Gold Trust (IAU)
Large-Cap Growth Large-Cap Value
Small-Cap Growth Small-Cap Value
Domestic Bond High-Yield Bond
*denotes funds that are currently closed to new and/or all investors.
Foreign Bond Gold/Natural Resources
Foreign Stock Emerging Market Stock
© 2021 Value Line, Inc. All rights reserved. Factual material is obtained from sources believed to be reliable and is provided without warranties of any kind. THE PUBLISHER IS NOT RESPONSIBLE FORANY ERRORS OR OMISSIONS HEREIN. This publication is strictly for subscriber's own, non-commercial, internal use. No part of it may be reproduced, resold, stored or transmitted in any printed,electronic or other form, or used for generating or marketing any printed or electronic publication, service or product. All investors must read applicable prospectuses before investing.
J A N U A R Y 2 0 2 1 9
T H E V A L U E L I N E F U N D A D V I S O R P L U S
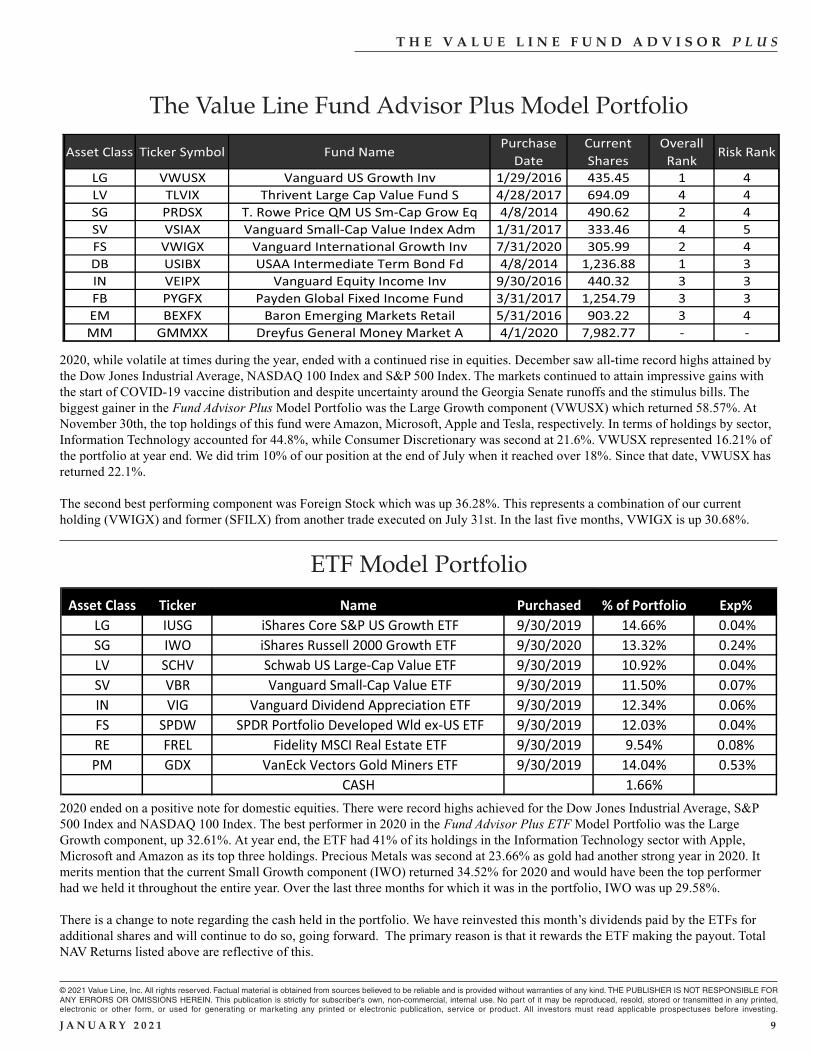
2020, while volatile at times during the year, ended with a continued rise in equities. December saw all-time record highs attained bythe Dow Jones Industrial Average, NASDAQ 100 Index and S&P 500 Index. The markets continued to attain impressive gains withthe start of COVID-19 vaccine distribution and despite uncertainty around the Georgia Senate runoffs and the stimulus bills. Thebiggest gainer in the Fund Advisor Plus Model Portfolio was the Large Growth component (VWUSX) which returned 58.57%. AtNovember 30th, the top holdings of this fund were Amazon, Microsoft, Apple and Tesla, respectively. In terms of holdings by sector,Information Technology accounted for 44.8%, while Consumer Discretionary was second at 21.6%. VWUSX represented 16.21% ofthe portfolio at year end. We did trim 10% of our position at the end of July when it reached over 18%. Since that date, VWUSX hasreturned 22.1%.
The second best performing component was Foreign Stock which was up 36.28%. This represents a combination of our currentholding (VWIGX) and former (SFILX) from another trade executed on July 31st. In the last five months, VWIGX is up 30.68%.
Asset Class Ticker Symbol Fund NamePurchase
Date
Current
Shares
Overall
RankRisk Rank
LG VWUSX Vanguard US Growth Inv 1/29/2016 435.45 1 4
LV TLVIX Thrivent Large Cap Value Fund S 4/28/2017 694.09 4 4
SG PRDSX T. Rowe Price QM US Sm-Cap Grow Eq 4/8/2014 490.62 2 4
SV VSIAX Vanguard Small-Cap Value Index Adm 1/31/2017 333.46 4 5
FS VWIGX Vanguard International Growth Inv 7/31/2020 305.99 2 4
DB USIBX USAA Intermediate Term Bond Fd 4/8/2014 1,236.88 1 3
IN VEIPX Vanguard Equity Income Inv 9/30/2016 440.32 3 3
FB PYGFX Payden Global Fixed Income Fund 3/31/2017 1,254.79 3 3
EM BEXFX Baron Emerging Markets Retail 5/31/2016 903.22 3 4
MM GMMXX Dreyfus General Money Market A 4/1/2020 7,982.77 - -
The Value Line Fund Advisor Plus Model Portfolio
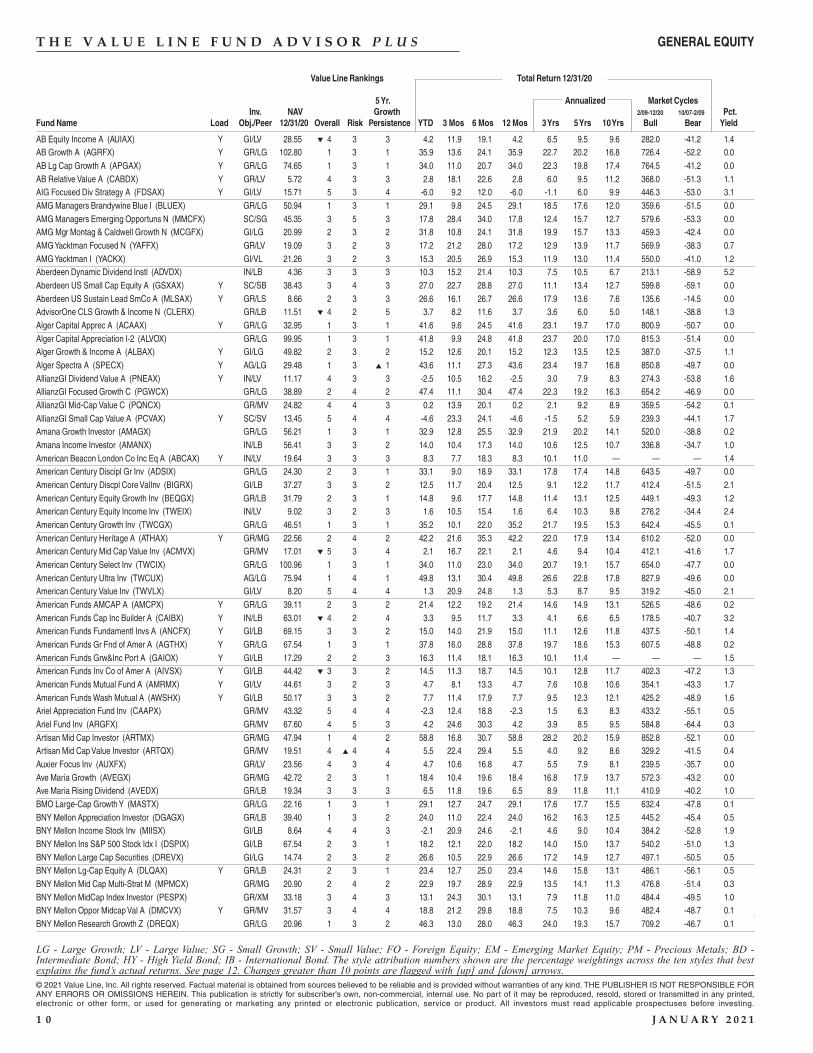
2020 ended on a positive note for domestic equities. There were record highs achieved for the Dow Jones Industrial Average, S&P500 Index and NASDAQ 100 Index. The best performer in 2020 in the Fund Advisor Plus ETF Model Portfolio was the LargeGrowth component, up 32.61%. At year end, the ETF had 41% of its holdings in the Information Technology sector with Apple,Microsoft and Amazon as its top three holdings. Precious Metals was second at 23.66% as gold had another strong year in 2020. Itmerits mention that the current Small Growth component (IWO) returned 34.52% for 2020 and would have been the top performerhad we held it throughout the entire year. Over the last three months for which it was in the portfolio, IWO was up 29.58%.
There is a change to note regarding the cash held in the portfolio. We have reinvested this month’s dividends paid by the ETFs foradditional shares and will continue to do so, going forward. The primary reason is that it rewards the ETF making the payout. TotalNAV Returns listed above are reflective of this.
Asset Class Ticker Name Purchased % of Portfolio Exp%
LG IUSG iShares Core S&P US Growth ETF 9/30/2019 14.66% 0.04%
SG IWO iShares Russell 2000 Growth ETF 9/30/2020 13.32% 0.24%
LV SCHV Schwab US Large-Cap Value ETF 9/30/2019 10.92% 0.04%
SV VBR Vanguard Small-Cap Value ETF 9/30/2019 11.50% 0.07%
IN VIG Vanguard Dividend Appreciation ETF 9/30/2019 12.34% 0.06%
FS SPDW SPDR Portfolio Developed Wld ex-US ETF 9/30/2019 12.03% 0.04%
RE FREL Fidelity MSCI Real Estate ETF 9/30/2019 9.54% 0.08%
PM GDX VanEck Vectors Gold Miners ETF 9/30/2019 14.04% 0.53%
CASH 1.66%
ETF Model Portfolio
T H E V A L U E L I N E F U N D A D V I S O R P L U S
Value Line Rankings Total Return 12/31/20
5 Yr. Annualized Market CyclesInv. NAV Growth 2/09-12/20 10/07-2/09 Pct.
Fund Name Load Obj./Peer 12/31/20 Overall Risk Persistence YTD 3 Mos 6 Mos 12 Mos 3 Yrs 5 Yrs 10 Yrs Bull Bear Yield
© 2021 Value Line, Inc. All rights reserved. Factual material is obtained from sources believed to be reliable and is provided without warranties of any kind. THE PUBLISHER IS NOT RESPONSIBLE FORANY ERRORS OR OMISSIONS HEREIN. This publication is strictly for subscriber's own, non-commercial, internal use. No part of it may be reproduced, resold, stored or transmitted in any printed,electronic or other form, or used for generating or marketing any printed or electronic publication, service or product. All investors must read applicable prospectuses before investing.
1 0 J A N U A R Y 2 0 2 1
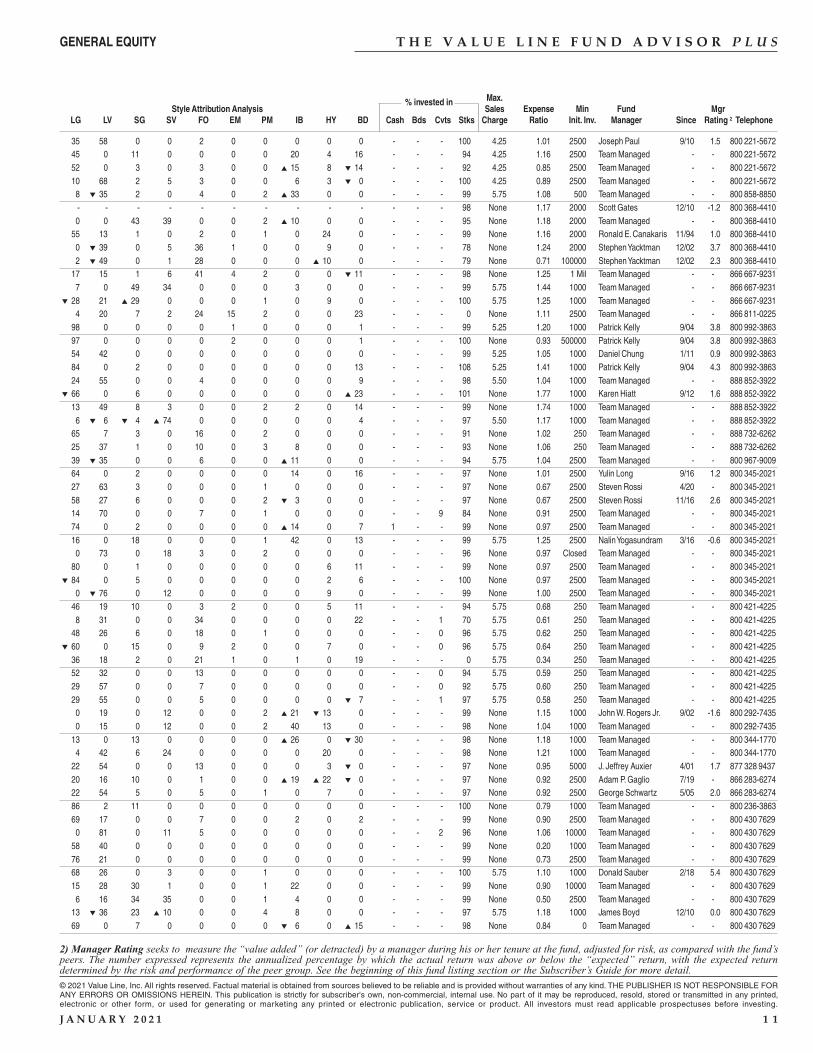
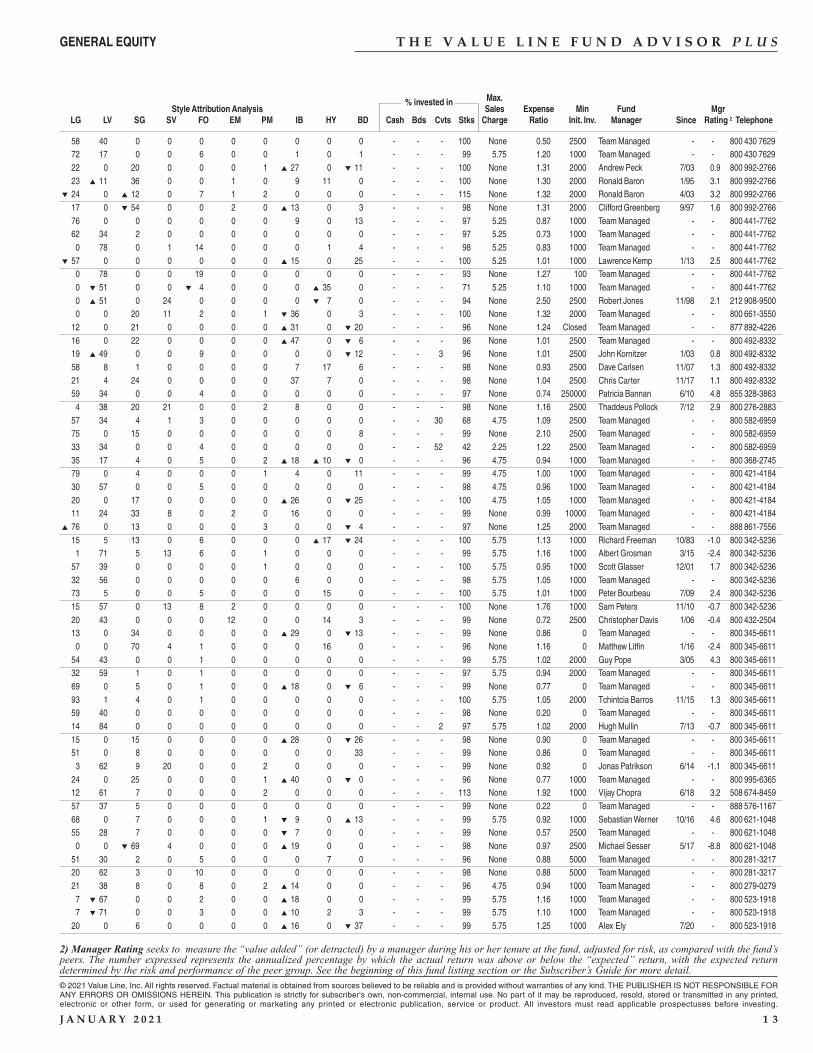
LG - Large Growth; LV - Large Value; SG - Small Growth; SV - Small Value; FO - Foreign Equity; EM - Emerging Market Equity; PM - Precious Metals; BD -Intermediate Bond; HY - High Yield Bond; IB - International Bond. The style attribution numbers shown are the percentage weightings across the ten styles that bestexplains the fund’s actual returns. See page 12. Changes greater than 10 points are flagged with [up] and [down] arrows.
AB Equity Income A (AUIAX) Y GI/LV 28.55 ▼ 4 3 3 4.2 11.9 19.1 4.2 6.5 9.5 9.6 282.0 -41.2 1.4AB Growth A (AGRFX) Y GR/LG 102.80 1 3 1 35.9 13.6 24.1 35.9 22.7 20.2 16.8 726.4 -52.2 0.0AB Lg Cap Growth A (APGAX) Y GR/LG 74.65 1 3 1 34.0 11.0 20.7 34.0 22.3 19.8 17.4 764.5 -41.2 0.0AB Relative Value A (CABDX) Y GR/LV 5.72 4 3 3 2.8 18.1 22.6 2.8 6.0 9.5 11.2 368.0 -51.3 1.1AIG Focused Div Strategy A (FDSAX) Y GI/LV 15.71 5 3 4 -6.0 9.2 12.0 -6.0 -1.1 6.0 9.9 446.3 -53.0 3.1AMG Managers Brandywine Blue I (BLUEX) GR/LG 50.94 1 3 1 29.1 9.8 24.5 29.1 18.5 17.6 12.0 359.6 -51.5 0.0AMG Managers Emerging Opportuns N (MMCFX) SC/SG 45.35 3 5 3 17.8 28.4 34.0 17.8 12.4 15.7 12.7 579.6 -53.3 0.0AMG Mgr Montag & Caldwell Growth N (MCGFX) GI/LG 20.99 2 3 2 31.8 10.8 24.1 31.8 19.9 15.7 13.3 459.3 -42.4 0.0AMG Yacktman Focused N (YAFFX) GR/LV 19.09 3 2 3 17.2 21.2 28.0 17.2 12.9 13.9 11.7 569.9 -38.3 0.7AMG Yacktman I (YACKX) GI/VL 21.26 3 2 3 15.3 20.5 26.9 15.3 11.9 13.0 11.4 550.0 -41.0 1.2Aberdeen Dynamic Dividend Instl (ADVDX) IN/LB 4.36 3 3 3 10.3 15.2 21.4 10.3 7.5 10.5 6.7 213.1 -58.9 5.2Aberdeen US Small Cap Equity A (GSXAX) Y SC/SB 38.43 3 4 3 27.0 22.7 28.8 27.0 11.1 13.4 12.7 599.8 -59.1 0.0Aberdeen US Sustain Lead SmCo A (MLSAX) Y GR/LS 8.66 2 3 3 26.6 16.1 26.7 26.6 17.9 13.6 7.6 135.6 -14.5 0.0AdvisorOne CLS Growth & Income N (CLERX) GR/LB 11.51 ▼ 4 2 5 3.7 8.2 11.6 3.7 3.6 6.0 5.0 148.1 -38.8 1.3Alger Capital Apprec A (ACAAX) Y GR/LG 32.95 1 3 1 41.6 9.6 24.5 41.6 23.1 19.7 17.0 800.9 -50.7 0.0Alger Capital Appreciation I-2 (ALVOX) GR/LG 99.95 1 3 1 41.8 9.9 24.8 41.8 23.7 20.0 17.0 815.3 -51.4 0.0Alger Growth & Income A (ALBAX) Y GI/LG 49.82 2 3 2 15.2 12.6 20.1 15.2 12.3 13.5 12.5 387.0 -37.5 1.1Alger Spectra A (SPECX) Y AG/LG 29.48 1 3 ▲ 1 43.6 11.1 27.3 43.6 23.4 19.7 16.8 850.8 -49.7 0.0AllianzGI Dividend Value A (PNEAX) Y IN/LV 11.17 4 3 3 -2.5 10.5 16.2 -2.5 3.0 7.9 8.3 274.3 -53.8 1.6AllianzGI Focused Growth C (PGWCX) GR/LG 38.89 2 4 2 47.4 11.1 30.4 47.4 22.3 19.2 16.3 654.2 -46.9 0.0AllianzGI Mid-Cap Value C (PQNCX) GR/MV 24.82 4 4 3 0.2 13.9 20.1 0.2 2.1 9.2 8.9 359.5 -54.2 0.1AllianzGI Small Cap Value A (PCVAX) Y SC/SV 13.45 5 4 4 -4.6 23.3 24.1 -4.6 -1.5 5.2 5.9 239.3 -44.1 1.7Amana Growth Investor (AMAGX) GR/LG 56.21 1 3 1 32.9 12.8 25.5 32.9 21.9 20.2 14.1 520.0 -38.8 0.2Amana Income Investor (AMANX) IN/LB 56.41 3 3 2 14.0 10.4 17.3 14.0 10.6 12.5 10.7 336.8 -34.7 1.0American Beacon London Co Inc Eq A (ABCAX) Y IN/LV 19.64 3 3 3 8.3 7.7 18.3 8.3 10.1 11.0 — — — 1.4American Century Discipl Gr Inv (ADSIX) GR/LG 24.30 2 3 1 33.1 9.0 18.9 33.1 17.8 17.4 14.8 643.5 -49.7 0.0American Century Discpl Core ValInv (BIGRX) GI/LB 37.27 3 3 2 12.5 11.7 20.4 12.5 9.1 12.2 11.7 412.4 -51.5 2.1American Century Equity Growth Inv (BEQGX) GR/LB 31.79 2 3 1 14.8 9.6 17.7 14.8 11.4 13.1 12.5 449.1 -49.3 1.2American Century Equity Income Inv (TWEIX) IN/LV 9.02 3 2 3 1.6 10.5 15.4 1.6 6.4 10.3 9.8 276.2 -34.4 2.4American Century Growth Inv (TWCGX) GR/LG 46.51 1 3 1 35.2 10.1 22.0 35.2 21.7 19.5 15.3 642.4 -45.5 0.1American Century Heritage A (ATHAX) Y GR/MG 22.56 2 4 2 42.2 21.6 35.3 42.2 22.0 17.9 13.4 610.2 -52.0 0.0American Century Mid Cap Value Inv (ACMVX) GR/MV 17.01 ▼ 5 3 4 2.1 16.7 22.1 2.1 4.6 9.4 10.4 412.1 -41.6 1.7American Century Select Inv (TWCIX) GR/LG 100.96 1 3 1 34.0 11.0 23.0 34.0 20.7 19.1 15.7 654.0 -47.7 0.0American Century Ultra Inv (TWCUX) AG/LG 75.94 1 4 1 49.8 13.1 30.4 49.8 26.6 22.8 17.8 827.9 -49.6 0.0American Century Value Inv (TWVLX) GI/LV 8.20 5 4 4 1.3 20.9 24.8 1.3 5.3 8.7 9.5 319.2 -45.0 2.1American Funds AMCAP A (AMCPX) Y GR/LG 39.11 2 3 2 21.4 12.2 19.2 21.4 14.6 14.9 13.1 526.5 -48.6 0.2American Funds Cap Inc Builder A (CAIBX) Y IN/LB 63.01 ▼ 4 2 4 3.3 9.5 11.7 3.3 4.1 6.6 6.5 178.5 -40.7 3.2American Funds Fundamentl Invs A (ANCFX) Y GI/LB 69.15 3 3 2 15.0 14.0 21.9 15.0 11.1 12.6 11.8 437.5 -50.1 1.4American Funds Gr Fnd of Amer A (AGTHX) Y GR/LG 67.54 1 3 1 37.8 16.0 28.8 37.8 19.7 18.6 15.3 607.5 -48.8 0.2American Funds Grw&Inc Port A (GAIOX) Y GI/LB 17.29 2 2 3 16.3 11.4 18.1 16.3 10.1 11.4 — — — 1.5American Funds Inv Co of Amer A (AIVSX) Y GI/LB 44.42 ▼ 3 3 2 14.5 11.3 18.7 14.5 10.1 12.8 11.7 402.3 -47.2 1.3American Funds Mutual Fund A (AMRMX) Y GI/LV 44.61 3 2 3 4.7 8.1 13.3 4.7 7.6 10.8 10.6 354.1 -43.3 1.7American Funds Wash Mutual A (AWSHX) Y GI/LB 50.17 3 3 2 7.7 11.4 17.9 7.7 9.5 12.3 12.1 425.2 -48.9 1.6Ariel Appreciation Fund Inv (CAAPX) GR/MV 43.32 5 4 4 -2.3 12.4 18.8 -2.3 1.5 6.3 8.3 433.2 -55.1 0.5Ariel Fund Inv (ARGFX) GR/MV 67.60 4 5 3 4.2 24.6 30.3 4.2 3.9 8.5 9.5 584.8 -64.4 0.3Artisan Mid Cap Investor (ARTMX) GR/MG 47.94 1 4 2 58.8 16.8 30.7 58.8 28.2 20.2 15.9 852.8 -52.1 0.0Artisan Mid Cap Value Investor (ARTQX) GR/MV 19.51 4 ▲ 4 4 5.5 22.4 29.4 5.5 4.0 9.2 8.6 329.2 -41.5 0.4Auxier Focus Inv (AUXFX) GR/LV 23.56 4 3 4 4.7 10.6 16.8 4.7 5.5 7.9 8.1 239.5 -35.7 0.0Ave Maria Growth (AVEGX) GR/MG 42.72 2 3 1 18.4 10.4 19.6 18.4 16.8 17.9 13.7 572.3 -43.2 0.0Ave Maria Rising Dividend (AVEDX) GR/LB 19.34 3 3 3 6.5 11.8 19.6 6.5 8.9 11.8 11.1 410.9 -40.2 1.0BMO Large-Cap Growth Y (MASTX) GR/LG 22.16 1 3 1 29.1 12.7 24.7 29.1 17.6 17.7 15.5 632.4 -47.8 0.1BNY Mellon Appreciation Investor (DGAGX) GR/LB 39.40 1 3 2 24.0 11.0 22.4 24.0 16.2 16.3 12.5 445.2 -45.4 0.5BNY Mellon Income Stock Inv (MIISX) GI/LB 8.64 4 4 3 -2.1 20.9 24.6 -2.1 4.6 9.0 10.4 384.2 -52.8 1.9BNY Mellon Ins S&P 500 Stock Idx I (DSPIX) GI/LB 67.54 2 3 1 18.2 12.1 22.0 18.2 14.0 15.0 13.7 540.2 -51.0 1.3BNY Mellon Large Cap Securities (DREVX) GI/LG 14.74 2 3 2 26.6 10.5 22.9 26.6 17.2 14.9 12.7 497.1 -50.5 0.5BNY Mellon Lg-Cap Equity A (DLQAX) Y GR/LB 24.31 2 3 1 23.4 12.7 25.0 23.4 14.6 15.8 13.1 486.1 -56.1 0.5BNY Mellon Mid Cap Multi-Strat M (MPMCX) GR/MG 20.90 2 4 2 22.9 19.7 28.9 22.9 13.5 14.1 11.3 476.8 -51.4 0.3BNY Mellon MidCap Index Investor (PESPX) GR/XM 33.18 3 4 3 13.1 24.3 30.1 13.1 7.9 11.8 11.0 484.4 -49.5 1.0BNY Mellon Oppor Midcap Val A (DMCVX) Y GR/MV 31.57 3 4 4 18.8 21.2 29.8 18.8 7.5 10.3 9.6 482.4 -48.7 0.1BNY Mellon Research Growth Z (DREQX) GR/LG 20.96 1 3 2 46.3 13.0 28.0 46.3 24.0 19.3 15.7 709.2 -46.7 0.1
GENERAL EQUITY
T H E V A L U E L I N E F U N D A D V I S O R P L U S
Max.Style Attribution Analysis
% invested inSales Expense Min Fund Mgr
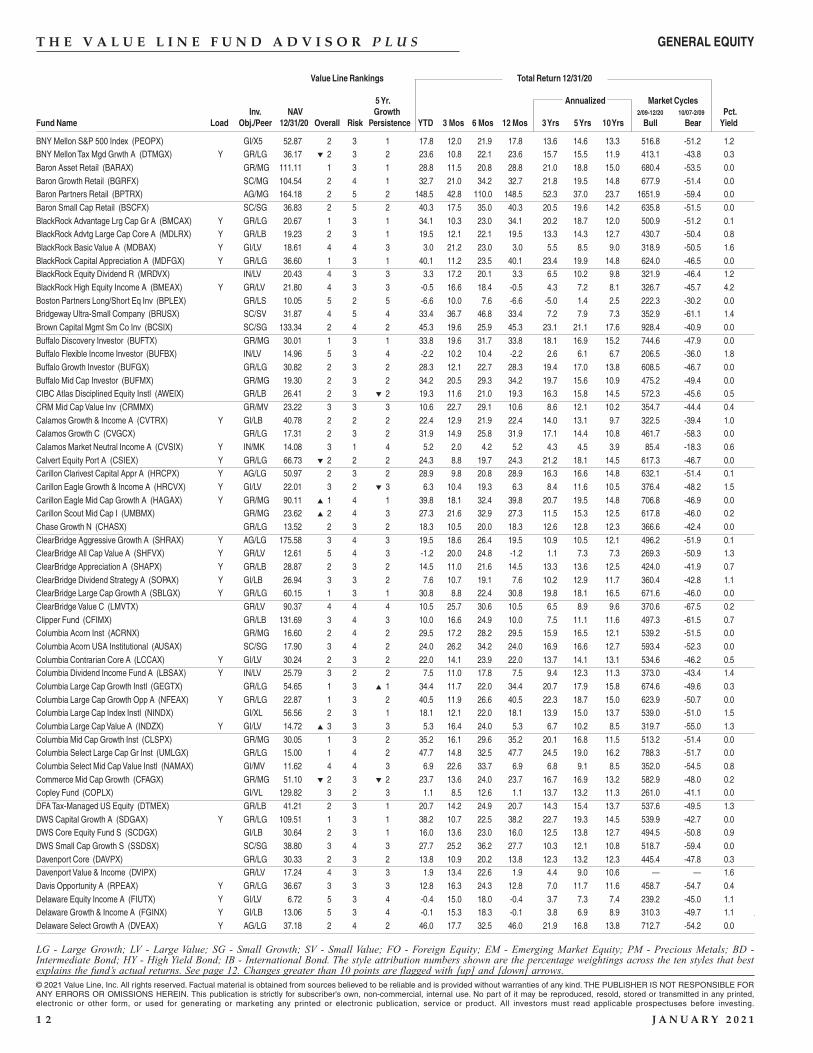
LG LV SG SV FO EM PM IB HY BD Cash Bds Cvts Stks Charge Ratio Init. Inv. Manager Since Rating 2 Telephone
2) Manager Rating seeks to measure the “value added” (or detracted) by a manager during his or her tenure at the fund, adjusted for risk, as compared with the fund’speers. The number expressed represents the annualized percentage by which the actual return was above or below the “expected” return, with the expected returndetermined by the risk and performance of the peer group. See the beginning of this fund listing section or the Subscriber’s Guide for more detail.
© 2021 Value Line, Inc. All rights reserved. Factual material is obtained from sources believed to be reliable and is provided without warranties of any kind. THE PUBLISHER IS NOT RESPONSIBLE FORANY ERRORS OR OMISSIONS HEREIN. This publication is strictly for subscriber's own, non-commercial, internal use. No part of it may be reproduced, resold, stored or transmitted in any printed,electronic or other form, or used for generating or marketing any printed or electronic publication, service or product. All investors must read applicable prospectuses before investing.
J A N U A R Y 2 0 2 1 1 1
35 58 0 0 2 0 0 0 0 0 - - - 100 4.25 1.01 2500 Joseph Paul 9/10 1.5 800 221-5672 45 0 11 0 0 0 0 20 4 16 - - - 94 4.25 1.16 2500 Team Managed - - 800 221-5672 52 0 3 0 3 0 0 ▲ 15 8 ▼ 14 - - - 92 4.25 0.85 2500 Team Managed - - 800 221-5672 10 68 2 5 3 0 0 6 3 ▼ 0 - - - 100 4.25 0.89 2500 Team Managed - - 800 221-5672 8 ▼ 35 2 0 4 0 2 ▲ 33 0 0 - - - 99 5.75 1.08 500 Team Managed - - 800 858-8850
- - - - - - - - - - - - - 98 None 1.17 2000 Scott Gates 12/10 -1.2 800 368-4410 0 0 43 39 0 0 2 ▲ 10 0 0 - - - 95 None 1.18 2000 Team Managed - - 800 368-4410 55 13 1 0 2 0 1 0 24 0 - - - 99 None 1.16 2000 Ronald E. Canakaris 11/94 1.0 800 368-4410 0 ▼ 39 0 5 36 1 0 0 9 0 - - - 78 None 1.24 2000 Stephen Yacktman 12/02 3.7 800 368-4410 2 ▼ 49 0 1 28 0 0 0 ▲ 10 0 - - - 79 None 0.71 100000 Stephen Yacktman 12/02 2.3 800 368-4410 17 15 1 6 41 4 2 0 0 ▼ 11 - - - 98 None 1.25 1 Mil Team Managed - - 866 667-9231 7 0 49 34 0 0 0 3 0 0 - - - 99 5.75 1.44 1000 Team Managed - - 866 667-9231
▼ 28 21 ▲ 29 0 0 0 1 0 9 0 - - - 100 5.75 1.25 1000 Team Managed - - 866 667-9231 4 20 7 2 24 15 2 0 0 23 - - - 0 None 1.11 2500 Team Managed - - 866 811-0225 98 0 0 0 0 1 0 0 0 1 - - - 99 5.25 1.20 1000 Patrick Kelly 9/04 3.8 800 992-3863 97 0 0 0 0 2 0 0 0 1 - - - 100 None 0.93 500000 Patrick Kelly 9/04 3.8 800 992-3863 54 42 0 0 0 0 0 0 0 0 - - - 99 5.25 1.05 1000 Daniel Chung 1/11 0.9 800 992-3863 84 0 2 0 0 0 0 0 0 13 - - - 108 5.25 1.41 1000 Patrick Kelly 9/04 4.3 800 992-3863 24 55 0 0 4 0 0 0 0 9 - - - 98 5.50 1.04 1000 Team Managed - - 888 852-3922
▼ 66 0 6 0 0 0 0 0 0 ▲ 23 - - - 101 None 1.77 1000 Karen Hiatt 9/12 1.6 888 852-3922 13 49 8 3 0 0 2 2 0 14 - - - 99 None 1.74 1000 Team Managed - - 888 852-3922 6 ▼ 6 ▼ 4 ▲ 74 0 0 0 0 0 4 - - - 97 5.50 1.17 1000 Team Managed - - 888 852-3922 65 7 3 0 16 0 2 0 0 0 - - - 91 None 1.02 250 Team Managed - - 888 732-6262 25 37 1 0 10 0 3 8 0 0 - - - 93 None 1.06 250 Team Managed - - 888 732-6262 39 ▼ 35 0 0 6 0 0 ▲ 11 0 0 - - - 94 5.75 1.04 2500 Team Managed - - 800 967-9009 64 0 2 0 0 0 0 14 0 16 - - - 97 None 1.01 2500 Yulin Long 9/16 1.2 800 345-2021 27 63 3 0 0 0 1 0 0 0 - - - 97 None 0.67 2500 Steven Rossi 4/20 - 800 345-2021 58 27 6 0 0 0 2 ▼ 3 0 0 - - - 97 None 0.67 2500 Steven Rossi 11/16 2.6 800 345-2021 14 70 0 0 7 0 1 0 0 0 - - 9 84 None 0.91 2500 Team Managed - - 800 345-2021 74 0 2 0 0 0 0 ▲ 14 0 7 1 - - 99 None 0.97 2500 Team Managed - - 800 345-2021 16 0 18 0 0 0 1 42 0 13 - - - 99 5.75 1.25 2500 Nalin Yogasundram 3/16 -0.6 800 345-2021 0 73 0 18 3 0 2 0 0 0 - - - 96 None 0.97 Closed Team Managed - - 800 345-2021 80 0 1 0 0 0 0 0 6 11 - - - 99 None 0.97 2500 Team Managed - - 800 345-2021
▼ 84 0 5 0 0 0 0 0 2 6 - - - 100 None 0.97 2500 Team Managed - - 800 345-2021 0 ▼ 76 0 12 0 0 0 0 9 0 - - - 99 None 1.00 2500 Team Managed - - 800 345-2021 46 19 10 0 3 2 0 0 5 11 - - - 94 5.75 0.68 250 Team Managed - - 800 421-4225 8 31 0 0 34 0 0 0 0 22 - - 1 70 5.75 0.61 250 Team Managed - - 800 421-4225 48 26 6 0 18 0 1 0 0 0 - - 0 96 5.75 0.62 250 Team Managed - - 800 421-4225
▼ 60 0 15 0 9 2 0 0 7 0 - - 0 96 5.75 0.64 250 Team Managed - - 800 421-4225 36 18 2 0 21 1 0 1 0 19 - - - 0 5.75 0.34 250 Team Managed - - 800 421-4225 52 32 0 0 13 0 0 0 0 0 - - 0 94 5.75 0.59 250 Team Managed - - 800 421-4225 29 57 0 0 7 0 0 0 0 0 - - 0 92 5.75 0.60 250 Team Managed - - 800 421-4225 29 55 0 0 5 0 0 0 0 ▼ 7 - - 1 97 5.75 0.58 250 Team Managed - - 800 421-4225 0 19 0 12 0 0 2 ▲ 21 ▼ 13 0 - - - 99 None 1.15 1000 John W. Rogers Jr. 9/02 -1.6 800 292-7435 0 15 0 12 0 0 2 40 13 0 - - - 98 None 1.04 1000 Team Managed - - 800 292-7435 13 0 13 0 0 0 0 ▲ 26 0 ▼ 30 - - - 98 None 1.18 1000 Team Managed - - 800 344-1770 4 42 6 24 0 0 0 0 20 0 - - - 98 None 1.21 1000 Team Managed - - 800 344-1770 22 54 0 0 13 0 0 0 3 ▼ 0 - - - 97 None 0.95 5000 J. Jeffrey Auxier 4/01 1.7 877 328 9437 20 16 10 0 1 0 0 ▲ 19 ▲ 22 ▼ 0 - - - 97 None 0.92 2500 Adam P. Gaglio 7/19 - 866 283-6274 22 54 5 0 5 0 1 0 7 0 - - - 97 None 0.92 2500 George Schwartz 5/05 2.0 866 283-6274 86 2 11 0 0 0 0 0 0 0 - - - 100 None 0.79 1000 Team Managed - - 800 236-3863 69 17 0 0 7 0 0 2 0 2 - - - 99 None 0.90 2500 Team Managed - - 800 430 7629 0 81 0 11 5 0 0 0 0 0 - - 2 96 None 1.06 10000 Team Managed - - 800 430 7629 58 40 0 0 0 0 0 0 0 0 - - - 99 None 0.20 1000 Team Managed - - 800 430 7629 76 21 0 0 0 0 0 0 0 0 - - - 99 None 0.73 2500 Team Managed - - 800 430 7629 68 26 0 3 0 0 1 0 0 0 - - - 100 5.75 1.10 1000 Donald Sauber 2/18 5.4 800 430 7629 15 28 30 1 0 0 1 22 0 0 - - - 99 None 0.90 10000 Team Managed - - 800 430 7629 6 16 34 35 0 0 1 4 0 0 - - - 99 None 0.50 2500 Team Managed - - 800 430 7629 13 ▼ 36 23 ▲ 10 0 0 4 8 0 0 - - - 97 5.75 1.18 1000 James Boyd 12/10 0.0 800 430 7629 69 0 7 0 0 0 0 ▼ 6 0 ▲ 15 - - - 98 None 0.84 0 Team Managed - - 800 430 7629
GENERAL EQUITY
T H E V A L U E L I N E F U N D A D V I S O R P L U S
Value Line Rankings Total Return 12/31/20
5 Yr. Annualized Market CyclesInv. NAV Growth 2/09-12/20 10/07-2/09 Pct.
Fund Name Load Obj./Peer 12/31/20 Overall Risk Persistence YTD 3 Mos 6 Mos 12 Mos 3 Yrs 5 Yrs 10 Yrs Bull Bear Yield
© 2021 Value Line, Inc. All rights reserved. Factual material is obtained from sources believed to be reliable and is provided without warranties of any kind. THE PUBLISHER IS NOT RESPONSIBLE FORANY ERRORS OR OMISSIONS HEREIN. This publication is strictly for subscriber's own, non-commercial, internal use. No part of it may be reproduced, resold, stored or transmitted in any printed,electronic or other form, or used for generating or marketing any printed or electronic publication, service or product. All investors must read applicable prospectuses before investing.
1 2 J A N U A R Y 2 0 2 1
LG - Large Growth; LV - Large Value; SG - Small Growth; SV - Small Value; FO - Foreign Equity; EM - Emerging Market Equity; PM - Precious Metals; BD -Intermediate Bond; HY - High Yield Bond; IB - International Bond. The style attribution numbers shown are the percentage weightings across the ten styles that bestexplains the fund’s actual returns. See page 12. Changes greater than 10 points are flagged with [up] and [down] arrows.
GENERAL EQUITY
BNY Mellon S&P 500 Index (PEOPX) GI/X5 52.87 2 3 1 17.8 12.0 21.9 17.8 13.6 14.6 13.3 516.8 -51.2 1.2BNY Mellon Tax Mgd Grwth A (DTMGX) Y GR/LG 36.17 ▼ 2 3 2 23.6 10.8 22.1 23.6 15.7 15.5 11.9 413.1 -43.8 0.3Baron Asset Retail (BARAX) GR/MG 111.11 1 3 1 28.8 11.5 20.8 28.8 21.0 18.8 15.0 680.4 -53.5 0.0Baron Growth Retail (BGRFX) SC/MG 104.54 2 4 1 32.7 21.0 34.2 32.7 21.8 19.5 14.8 677.9 -51.4 0.0Baron Partners Retail (BPTRX) AG/MG 164.18 2 5 2 148.5 42.8 110.0 148.5 52.3 37.0 23.7 1651.9 -59.4 0.0Baron Small Cap Retail (BSCFX) SC/SG 36.83 2 5 2 40.3 17.5 35.0 40.3 20.5 19.6 14.2 635.8 -51.5 0.0BlackRock Advantage Lrg Cap Gr A (BMCAX) Y GR/LG 20.67 1 3 1 34.1 10.3 23.0 34.1 20.2 18.7 12.0 500.9 -51.2 0.1BlackRock Advtg Large Cap Core A (MDLRX) Y GR/LB 19.23 2 3 1 19.5 12.1 22.1 19.5 13.3 14.3 12.7 430.7 -50.4 0.8BlackRock Basic Value A (MDBAX) Y GI/LV 18.61 4 4 3 3.0 21.2 23.0 3.0 5.5 8.5 9.0 318.9 -50.5 1.6BlackRock Capital Appreciation A (MDFGX) Y GR/LG 36.60 1 3 1 40.1 11.2 23.5 40.1 23.4 19.9 14.8 624.0 -46.5 0.0BlackRock Equity Dividend R (MRDVX) IN/LV 20.43 4 3 3 3.3 17.2 20.1 3.3 6.5 10.2 9.8 321.9 -46.4 1.2BlackRock High Equity Income A (BMEAX) Y GR/LV 21.80 4 3 3 -0.5 16.6 18.4 -0.5 4.3 7.2 8.1 326.7 -45.7 4.2Boston Partners Long/Short Eq Inv (BPLEX) GR/LS 10.05 5 2 5 -6.6 10.0 7.6 -6.6 -5.0 1.4 2.5 222.3 -30.2 0.0Bridgeway Ultra-Small Company (BRUSX) SC/SV 31.87 4 5 4 33.4 36.7 46.8 33.4 7.2 7.9 7.3 352.9 -61.1 1.4Brown Capital Mgmt Sm Co Inv (BCSIX) SC/SG 133.34 2 4 2 45.3 19.6 25.9 45.3 23.1 21.1 17.6 928.4 -40.9 0.0Buffalo Discovery Investor (BUFTX) GR/MG 30.01 1 3 1 33.8 19.6 31.7 33.8 18.1 16.9 15.2 744.6 -47.9 0.0Buffalo Flexible Income Investor (BUFBX) IN/LV 14.96 5 3 4 -2.2 10.2 10.4 -2.2 2.6 6.1 6.7 206.5 -36.0 1.8Buffalo Growth Investor (BUFGX) GR/LG 30.82 2 3 2 28.3 12.1 22.7 28.3 19.4 17.0 13.8 608.5 -46.7 0.0Buffalo Mid Cap Investor (BUFMX) GR/MG 19.30 2 3 2 34.2 20.5 29.3 34.2 19.7 15.6 10.9 475.2 -49.4 0.0CIBC Atlas Disciplined Equity Instl (AWEIX) GR/LB 26.41 2 3 ▼ 2 19.3 11.6 21.0 19.3 16.3 15.8 14.5 572.3 -45.6 0.5CRM Mid Cap Value Inv (CRMMX) GR/MV 23.22 3 3 3 10.6 22.7 29.1 10.6 8.6 12.1 10.2 354.7 -44.4 0.4Calamos Growth & Income A (CVTRX) Y GI/LB 40.78 2 2 2 22.4 12.9 21.9 22.4 14.0 13.1 9.7 322.5 -39.4 1.0Calamos Growth C (CVGCX) GR/LG 17.31 2 3 2 31.9 14.9 25.8 31.9 17.1 14.4 10.8 461.7 -58.3 0.0Calamos Market Neutral Income A (CVSIX) Y IN/MK 14.08 3 1 4 5.2 2.0 4.2 5.2 4.3 4.5 3.9 85.4 -18.3 0.6Calvert Equity Port A (CSIEX) Y GR/LG 66.73 ▼ 2 2 2 24.3 8.8 19.7 24.3 21.2 18.1 14.5 617.3 -46.7 0.0Carillon Clarivest Capital Appr A (HRCPX) Y AG/LG 50.97 2 3 2 28.9 9.8 20.8 28.9 16.3 16.6 14.8 632.1 -51.4 0.1Carillon Eagle Growth & Income A (HRCVX) Y GI/LV 22.01 3 2 ▼ 3 6.3 10.4 19.3 6.3 8.4 11.6 10.5 376.4 -48.2 1.5Carillon Eagle Mid Cap Growth A (HAGAX) Y GR/MG 90.11 ▲ 1 4 1 39.8 18.1 32.4 39.8 20.7 19.5 14.8 706.8 -46.9 0.0Carillon Scout Mid Cap I (UMBMX) GR/MG 23.62 ▲ 2 4 3 27.3 21.6 32.9 27.3 11.5 15.3 12.5 617.8 -46.0 0.2Chase Growth N (CHASX) GR/LG 13.52 2 3 2 18.3 10.5 20.0 18.3 12.6 12.8 12.3 366.6 -42.4 0.0ClearBridge Aggressive Growth A (SHRAX) Y AG/LG 175.58 3 4 3 19.5 18.6 26.4 19.5 10.9 10.5 12.1 496.2 -51.9 0.1ClearBridge All Cap Value A (SHFVX) Y GR/LV 12.61 5 4 3 -1.2 20.0 24.8 -1.2 1.1 7.3 7.3 269.3 -50.9 1.3ClearBridge Appreciation A (SHAPX) Y GR/LB 28.87 2 3 2 14.5 11.0 21.6 14.5 13.3 13.6 12.5 424.0 -41.9 0.7ClearBridge Dividend Strategy A (SOPAX) Y GI/LB 26.94 3 3 2 7.6 10.7 19.1 7.6 10.2 12.9 11.7 360.4 -42.8 1.1ClearBridge Large Cap Growth A (SBLGX) Y GR/LG 60.15 1 3 1 30.8 8.8 22.4 30.8 19.8 18.1 16.5 671.6 -46.0 0.0ClearBridge Value C (LMVTX) GR/LV 90.37 4 4 4 10.5 25.7 30.6 10.5 6.5 8.9 9.6 370.6 -67.5 0.2Clipper Fund (CFIMX) GR/LB 131.69 3 4 3 10.0 16.6 24.9 10.0 7.5 11.1 11.6 497.3 -61.5 0.7Columbia Acorn Inst (ACRNX) GR/MG 16.60 2 4 2 29.5 17.2 28.2 29.5 15.9 16.5 12.1 539.2 -51.5 0.0Columbia Acorn USA Institutional (AUSAX) SC/SG 17.90 3 4 2 24.0 26.2 34.2 24.0 16.9 16.6 12.7 593.4 -52.3 0.0Columbia Contrarian Core A (LCCAX) Y GI/LV 30.24 2 3 2 22.0 14.1 23.9 22.0 13.7 14.1 13.1 534.6 -46.2 0.5Columbia Dividend Income Fund A (LBSAX) Y IN/LV 25.79 3 2 2 7.5 11.0 17.8 7.5 9.4 12.3 11.3 373.0 -43.4 1.4Columbia Large Cap Growth Instl (GEGTX) GR/LG 54.65 1 3 ▲ 1 34.4 11.7 22.0 34.4 20.7 17.9 15.8 674.6 -49.6 0.3Columbia Large Cap Growth Opp A (NFEAX) Y GR/LG 22.87 1 3 2 40.5 11.9 26.6 40.5 22.3 18.7 15.0 623.9 -50.7 0.0Columbia Large Cap Index Instl (NINDX) GI/XL 56.56 2 3 1 18.1 12.1 22.0 18.1 13.9 15.0 13.7 539.0 -51.0 1.5Columbia Large Cap Value A (INDZX) Y GI/LV 14.72 ▲ 3 3 3 5.3 16.4 24.0 5.3 6.7 10.2 8.5 319.7 -55.0 1.3Columbia Mid Cap Growth Inst (CLSPX) GR/MG 30.05 1 3 2 35.2 16.1 29.6 35.2 20.1 16.8 11.5 513.2 -51.4 0.0Columbia Select Large Cap Gr Inst (UMLGX) GR/LG 15.00 1 4 2 47.7 14.8 32.5 47.7 24.5 19.0 16.2 788.3 -51.7 0.0Columbia Select Mid Cap Value Instl (NAMAX) GI/MV 11.62 4 4 3 6.9 22.6 33.7 6.9 6.8 9.1 8.5 352.0 -54.5 0.8Commerce Mid Cap Growth (CFAGX) GR/MG 51.10 ▼ 2 3 ▼ 2 23.7 13.6 24.0 23.7 16.7 16.9 13.2 582.9 -48.0 0.2Copley Fund (COPLX) GI/VL 129.82 3 2 3 1.1 8.5 12.6 1.1 13.7 13.2 11.3 261.0 -41.1 0.0DFA Tax-Managed US Equity (DTMEX) GR/LB 41.21 2 3 1 20.7 14.2 24.9 20.7 14.3 15.4 13.7 537.6 -49.5 1.3DWS Capital Growth A (SDGAX) Y GR/LG 109.51 1 3 1 38.2 10.7 22.5 38.2 22.7 19.3 14.5 539.9 -42.7 0.0DWS Core Equity Fund S (SCDGX) GI/LB 30.64 2 3 1 16.0 13.6 23.0 16.0 12.5 13.8 12.7 494.5 -50.8 0.9DWS Small Cap Growth S (SSDSX) SC/SG 38.80 3 4 3 27.7 25.2 36.2 27.7 10.3 12.1 10.8 518.7 -59.4 0.0Davenport Core (DAVPX) GR/LG 30.33 2 3 2 13.8 10.9 20.2 13.8 12.3 13.2 12.3 445.4 -47.8 0.3Davenport Value & Income (DVIPX) GR/LV 17.24 4 3 3 1.9 13.4 22.6 1.9 4.4 9.0 10.6 — — 1.6Davis Opportunity A (RPEAX) Y GR/LG 36.67 3 3 3 12.8 16.3 24.3 12.8 7.0 11.7 11.6 458.7 -54.7 0.4Delaware Equity Income A (FIUTX) Y GI/LV 6.72 5 3 4 -0.4 15.0 18.0 -0.4 3.7 7.3 7.4 239.2 -45.0 1.1Delaware Growth & Income A (FGINX) Y GI/LB 13.06 5 3 4 -0.1 15.3 18.3 -0.1 3.8 6.9 8.9 310.3 -49.7 1.1Delaware Select Growth A (DVEAX) Y AG/LG 37.18 2 4 2 46.0 17.7 32.5 46.0 21.9 16.8 13.8 712.7 -54.2 0.0
T H E V A L U E L I N E F U N D A D V I S O R P L U S
Max.Style Attribution Analysis
% invested inSales Expense Min Fund Mgr
LG LV SG SV FO EM PM IB HY BD Cash Bds Cvts Stks Charge Ratio Init. Inv. Manager Since Rating 2 Telephone
2) Manager Rating seeks to measure the “value added” (or detracted) by a manager during his or her tenure at the fund, adjusted for risk, as compared with the fund’speers. The number expressed represents the annualized percentage by which the actual return was above or below the “expected” return, with the expected returndetermined by the risk and performance of the peer group. See the beginning of this fund listing section or the Subscriber’s Guide for more detail.
© 2021 Value Line, Inc. All rights reserved. Factual material is obtained from sources believed to be reliable and is provided without warranties of any kind. THE PUBLISHER IS NOT RESPONSIBLE FORANY ERRORS OR OMISSIONS HEREIN. This publication is strictly for subscriber's own, non-commercial, internal use. No part of it may be reproduced, resold, stored or transmitted in any printed,electronic or other form, or used for generating or marketing any printed or electronic publication, service or product. All investors must read applicable prospectuses before investing.
J A N U A R Y 2 0 2 1 1 3
GENERAL EQUITY
58 40 0 0 0 0 0 0 0 0 - - - 100 None 0.50 2500 Team Managed - - 800 430 7629 72 17 0 0 6 0 0 1 0 1 - - - 99 5.75 1.20 1000 Team Managed - - 800 430 7629 22 0 20 0 0 0 1 ▲ 27 0 ▼ 11 - - - 100 None 1.31 2000 Andrew Peck 7/03 0.9 800 992-2766 23 ▲ 11 36 0 0 1 0 9 11 0 - - - 100 None 1.30 2000 Ronald Baron 1/95 3.1 800 992-2766
▼ 24 0 ▲ 12 0 7 1 2 0 0 0 - - - 115 None 1.32 2000 Ronald Baron 4/03 3.2 800 992-2766 17 0 ▼ 54 0 0 2 0 ▲ 13 0 3 - - - 98 None 1.31 2000 Clifford Greenberg 9/97 1.6 800 992-2766 76 0 0 0 0 0 0 9 0 13 - - - 97 5.25 0.87 1000 Team Managed - - 800 441-7762 62 34 2 0 0 0 0 0 0 0 - - - 97 5.25 0.73 1000 Team Managed - - 800 441-7762 0 78 0 1 14 0 0 0 1 4 - - - 98 5.25 0.83 1000 Team Managed - - 800 441-7762
▼ 57 0 0 0 0 0 0 ▲ 15 0 25 - - - 100 5.25 1.01 1000 Lawrence Kemp 1/13 2.5 800 441-7762 0 78 0 0 19 0 0 0 0 0 - - - 93 None 1.27 100 Team Managed - - 800 441-7762 0 ▼ 51 0 0 ▼ 4 0 0 0 ▲ 35 0 - - - 71 5.25 1.10 1000 Team Managed - - 800 441-7762 0 ▲ 51 0 24 0 0 0 0 ▼ 7 0 - - - 94 None 2.50 2500 Robert Jones 11/98 2.1 212 908-9500 0 0 20 11 2 0 1 ▼ 36 0 3 - - - 100 None 1.32 2000 Team Managed - - 800 661-3550 12 0 21 0 0 0 0 ▲ 31 0 ▼ 20 - - - 96 None 1.24 Closed Team Managed - - 877 892-4226 16 0 22 0 0 0 0 ▲ 47 0 ▼ 6 - - - 96 None 1.01 2500 Team Managed - - 800 492-8332 19 ▲ 49 0 0 9 0 0 0 0 ▼ 12 - - 3 96 None 1.01 2500 John Kornitzer 1/03 0.8 800 492-8332 58 8 1 0 0 0 0 7 17 6 - - - 98 None 0.93 2500 Dave Carlsen 11/07 1.3 800 492-8332 21 4 24 0 0 0 0 37 7 0 - - - 98 None 1.04 2500 Chris Carter 11/17 1.1 800 492-8332 59 34 0 0 4 0 0 0 0 0 - - - 97 None 0.74 250000 Patricia Bannan 6/10 4.8 855 328-3863 4 38 20 21 0 0 2 8 0 0 - - - 98 None 1.16 2500 Thaddeus Pollock 7/12 2.9 800 276-2883 57 34 4 1 3 0 0 0 0 0 - - 30 68 4.75 1.09 2500 Team Managed - - 800 582-6959 75 0 15 0 0 0 0 0 0 8 - - - 99 None 2.10 2500 Team Managed - - 800 582-6959 33 34 0 0 4 0 0 0 0 0 - - 52 42 2.25 1.22 2500 Team Managed - - 800 582-6959 35 17 4 0 5 0 2 ▲ 18 ▲ 10 ▼ 0 - - - 96 4.75 0.94 1000 Team Managed - - 800 368-2745 79 0 4 0 0 0 1 4 0 11 - - - 99 4.75 1.00 1000 Team Managed - - 800 421-4184 30 57 0 0 5 0 0 0 0 0 - - - 98 4.75 0.96 1000 Team Managed - - 800 421-4184 20 0 17 0 0 0 0 ▲ 26 0 ▼ 25 - - - 100 4.75 1.05 1000 Team Managed - - 800 421-4184 11 24 33 8 0 2 0 16 0 0 - - - 99 None 0.99 10000 Team Managed - - 800 421-4184
▲ 76 0 13 0 0 0 3 0 0 ▼ 4 - - - 97 None 1.25 2000 Team Managed - - 888 861-7556 15 5 13 0 6 0 0 0 ▲ 17 ▼ 24 - - - 100 5.75 1.13 1000 Richard Freeman 10/83 -1.0 800 342-5236 1 71 5 13 6 0 1 0 0 0 - - - 99 5.75 1.16 1000 Albert Grosman 3/15 -2.4 800 342-5236 57 39 0 0 0 0 1 0 0 0 - - - 100 5.75 0.95 1000 Scott Glasser 12/01 1.7 800 342-5236 32 56 0 0 0 0 0 6 0 0 - - - 98 5.75 1.05 1000 Team Managed - - 800 342-5236 73 5 0 0 5 0 0 0 15 0 - - - 100 5.75 1.01 1000 Peter Bourbeau 7/09 2.4 800 342-5236 15 57 0 13 8 2 0 0 0 0 - - - 100 None 1.76 1000 Sam Peters 11/10 -0.7 800 342-5236 20 43 0 0 0 12 0 0 14 3 - - - 99 None 0.72 2500 Christopher Davis 1/06 -0.4 800 432-2504 13 0 34 0 0 0 0 ▲ 29 0 ▼ 13 - - - 99 None 0.86 0 Team Managed - - 800 345-6611 0 0 70 4 1 0 0 0 16 0 - - - 96 None 1.16 0 Matthew Litfin 1/16 -2.4 800 345-6611 54 43 0 0 1 0 0 0 0 0 - - - 99 5.75 1.02 2000 Guy Pope 3/05 4.3 800 345-6611 32 59 1 0 1 0 0 0 0 0 - - - 97 5.75 0.94 2000 Team Managed - - 800 345-6611 69 0 5 0 1 0 0 ▲ 18 0 ▼ 6 - - - 99 None 0.77 0 Team Managed - - 800 345-6611 93 1 4 0 1 0 0 0 0 0 - - - 100 5.75 1.05 2000 Tchintcia Barros 11/15 1.3 800 345-6611 59 40 0 0 0 0 0 0 0 0 - - - 98 None 0.20 0 Team Managed - - 800 345-6611 14 84 0 0 0 0 0 0 0 0 - - 2 97 5.75 1.02 2000 Hugh Mullin 7/13 -0.7 800 345-6611 15 0 15 0 0 0 0 ▲ 28 0 ▼ 26 - - - 98 None 0.90 0 Team Managed - - 800 345-6611 51 0 8 0 0 0 0 0 0 33 - - - 99 None 0.86 0 Team Managed - - 800 345-6611 3 62 9 20 0 0 2 0 0 0 - - - 99 None 0.92 0 Jonas Patrikson 6/14 -1.1 800 345-6611 24 0 25 0 0 0 1 ▲ 40 0 ▼ 0 - - - 96 None 0.77 1000 Team Managed - - 800 995-6365 12 61 7 0 0 0 2 0 0 0 - - - 113 None 1.92 1000 Vijay Chopra 6/18 3.2 508 674-8459 57 37 5 0 0 0 0 0 0 0 - - - 99 None 0.22 0 Team Managed - - 888 576-1167 68 0 7 0 0 0 1 ▼ 9 0 ▲ 13 - - - 99 5.75 0.92 1000 Sebastian Werner 10/16 4.6 800 621-1048 55 28 7 0 0 0 0 ▼ 7 0 0 - - - 99 None 0.57 2500 Team Managed - - 800 621-1048 0 0 ▼ 69 4 0 0 0 ▲ 19 0 0 - - - 98 None 0.97 2500 Michael Sesser 5/17 -8.8 800 621-1048 51 30 2 0 5 0 0 0 7 0 - - - 96 None 0.88 5000 Team Managed - - 800 281-3217 20 62 3 0 10 0 0 0 0 0 - - - 98 None 0.88 5000 Team Managed - - 800 281-3217 21 38 8 0 8 0 2 ▲ 14 0 0 - - - 96 4.75 0.94 1000 Team Managed - - 800 279-0279 7 ▼ 67 0 0 2 0 0 ▲ 18 0 0 - - - 99 5.75 1.16 1000 Team Managed - - 800 523-1918 7 ▼ 71 0 0 3 0 0 ▲ 10 2 3 - - - 99 5.75 1.10 1000 Team Managed - - 800 523-1918 20 0 6 0 0 0 0 ▲ 16 0 ▼ 37 - - - 99 5.75 1.25 1000 Alex Ely 7/20 - 800 523-1918
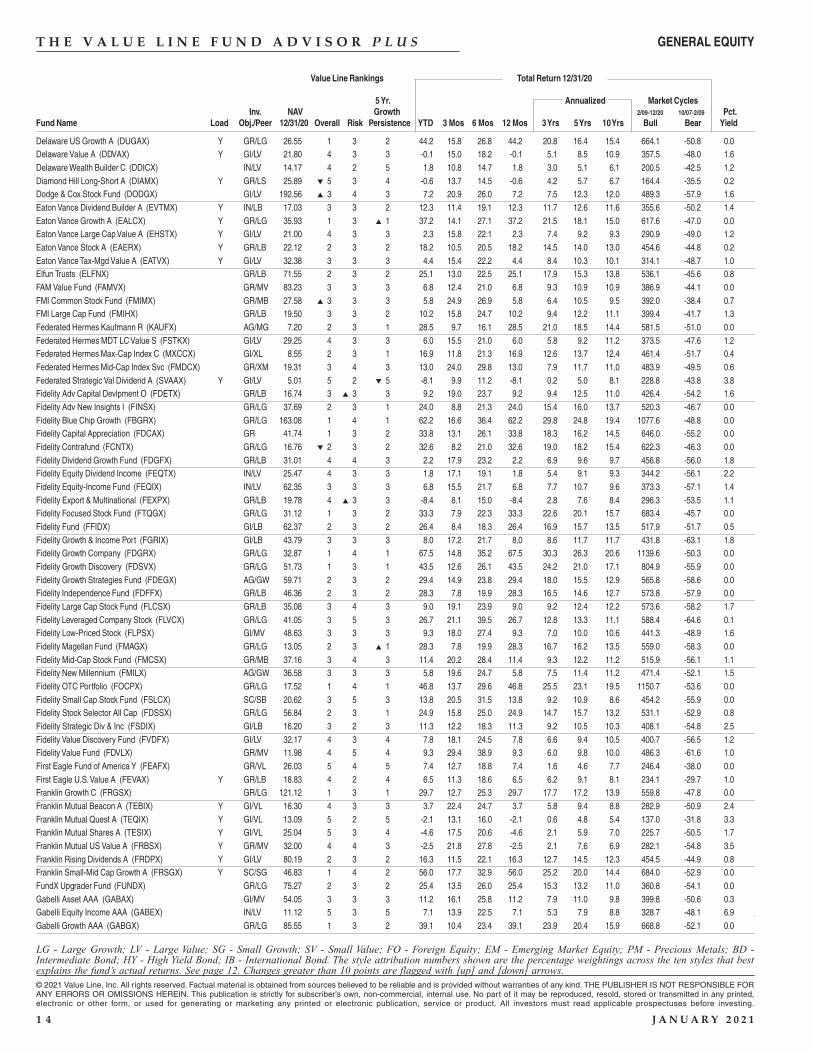
T H E V A L U E L I N E F U N D A D V I S O R P L U S
Value Line Rankings Total Return 12/31/20
5 Yr. Annualized Market CyclesInv. NAV Growth 2/09-12/20 10/07-2/09 Pct.
Fund Name Load Obj./Peer 12/31/20 Overall Risk Persistence YTD 3 Mos 6 Mos 12 Mos 3 Yrs 5 Yrs 10 Yrs Bull Bear Yield
© 2021 Value Line, Inc. All rights reserved. Factual material is obtained from sources believed to be reliable and is provided without warranties of any kind. THE PUBLISHER IS NOT RESPONSIBLE FORANY ERRORS OR OMISSIONS HEREIN. This publication is strictly for subscriber's own, non-commercial, internal use. No part of it may be reproduced, resold, stored or transmitted in any printed,electronic or other form, or used for generating or marketing any printed or electronic publication, service or product. All investors must read applicable prospectuses before investing.
1 4 J A N U A R Y 2 0 2 1
LG - Large Growth; LV - Large Value; SG - Small Growth; SV - Small Value; FO - Foreign Equity; EM - Emerging Market Equity; PM - Precious Metals; BD -Intermediate Bond; HY - High Yield Bond; IB - International Bond. The style attribution numbers shown are the percentage weightings across the ten styles that bestexplains the fund’s actual returns. See page 12. Changes greater than 10 points are flagged with [up] and [down] arrows.
GENERAL EQUITY
Delaware US Growth A (DUGAX) Y GR/LG 26.55 1 3 2 44.2 15.8 26.8 44.2 20.8 16.4 15.4 664.1 -50.8 0.0Delaware Value A (DDVAX) Y GI/LV 21.80 4 3 3 -0.1 15.0 18.2 -0.1 5.1 8.5 10.9 357.5 -48.0 1.6Delaware Wealth Builder C (DDICX) IN/LV 14.17 4 2 5 1.8 10.8 14.7 1.8 3.0 5.1 6.1 200.5 -42.5 1.2Diamond Hill Long-Short A (DIAMX) Y GR/LS 25.89 ▼ 5 3 4 -0.6 13.7 14.5 -0.6 4.2 5.7 6.7 164.4 -35.5 0.2Dodge & Cox Stock Fund (DODGX) GI/LV 192.56 ▲ 3 4 3 7.2 20.9 26.0 7.2 7.5 12.3 12.0 489.3 -57.9 1.6Eaton Vance Dividend Builder A (EVTMX) Y IN/LB 17.03 3 3 2 12.3 11.4 19.1 12.3 11.7 12.6 11.6 355.6 -50.2 1.4Eaton Vance Growth A (EALCX) Y GR/LG 35.93 1 3 ▲ 1 37.2 14.1 27.1 37.2 21.5 18.1 15.0 617.6 -47.0 0.0Eaton Vance Large Cap Value A (EHSTX) Y GI/LV 21.00 4 3 3 2.3 15.8 22.1 2.3 7.4 9.2 9.3 290.9 -49.0 1.2Eaton Vance Stock A (EAERX) Y GR/LB 22.12 2 3 2 18.2 10.5 20.5 18.2 14.5 14.0 13.0 454.6 -44.8 0.2Eaton Vance Tax-Mgd Value A (EATVX) Y GI/LV 32.38 3 3 3 4.4 15.4 22.2 4.4 8.4 10.3 10.1 314.1 -48.7 1.0Elfun Trusts (ELFNX) GR/LB 71.55 2 3 2 25.1 13.0 22.5 25.1 17.9 15.3 13.8 536.1 -45.6 0.8FAM Value Fund (FAMVX) GR/MV 83.23 3 3 3 6.8 12.4 21.0 6.8 9.3 10.9 10.9 386.9 -44.1 0.0FMI Common Stock Fund (FMIMX) GR/MB 27.58 ▲ 3 3 3 5.8 24.9 26.9 5.8 6.4 10.5 9.5 392.0 -38.4 0.7FMI Large Cap Fund (FMIHX) GR/LB 19.50 3 3 2 10.2 15.8 24.7 10.2 9.4 12.2 11.1 399.4 -41.7 1.3Federated Hermes Kaufmann R (KAUFX) AG/MG 7.20 2 3 1 28.5 9.7 16.1 28.5 21.0 18.5 14.4 581.5 -51.0 0.0Federated Hermes MDT LC Value S (FSTKX) GI/LV 29.25 4 3 3 6.0 15.5 21.0 6.0 5.8 9.2 11.2 373.5 -47.6 1.2Federated Hermes Max-Cap Index C (MXCCX) GI/XL 8.55 2 3 1 16.9 11.8 21.3 16.9 12.6 13.7 12.4 461.4 -51.7 0.4Federated Hermes Mid-Cap Index Svc (FMDCX) GR/XM 19.31 3 4 3 13.0 24.0 29.8 13.0 7.9 11.7 11.0 483.9 -49.5 0.6Federated Strategic Val Dividend A (SVAAX) Y GI/LV 5.01 5 2 ▼ 5 -8.1 9.9 11.2 -8.1 0.2 5.0 8.1 228.8 -43.8 3.8Fidelity Adv Capital Devlpment O (FDETX) GR/LB 16.74 3 ▲ 3 3 9.2 19.0 23.7 9.2 9.4 12.5 11.0 426.4 -54.2 1.6Fidelity Adv New Insights I (FINSX) GR/LG 37.69 2 3 1 24.0 8.8 21.3 24.0 15.4 16.0 13.7 520.3 -46.7 0.0Fidelity Blue Chip Growth (FBGRX) GR/LG 163.08 1 4 1 62.2 16.6 36.4 62.2 29.8 24.8 19.4 1077.6 -48.8 0.0Fidelity Capital Appreciation (FDCAX) GR 41.74 1 3 2 33.8 13.1 26.1 33.8 18.3 16.2 14.5 646.0 -55.2 0.0Fidelity Contrafund (FCNTX) GR/LG 16.76 ▼ 2 3 2 32.6 8.2 21.0 32.6 19.0 18.2 15.4 622.3 -46.3 0.0Fidelity Dividend Growth Fund (FDGFX) GR/LB 31.01 4 4 3 2.2 17.9 23.2 2.2 6.9 9.6 9.7 456.8 -56.0 1.8Fidelity Equity Dividend Income (FEQTX) IN/LV 25.47 4 3 3 1.8 17.1 19.1 1.8 5.4 9.1 9.3 344.2 -56.1 2.2Fidelity Equity-Income Fund (FEQIX) IN/LV 62.35 3 3 3 6.8 15.5 21.7 6.8 7.7 10.7 9.6 373.3 -57.1 1.4Fidelity Export & Multinational (FEXPX) GR/LB 19.78 4 ▲ 3 3 -8.4 8.1 15.0 -8.4 2.8 7.6 8.4 296.3 -53.5 1.1Fidelity Focused Stock Fund (FTQGX) GR/LG 31.12 1 3 2 33.3 7.9 22.3 33.3 22.6 20.1 15.7 683.4 -45.7 0.0Fidelity Fund (FFIDX) GI/LB 62.37 2 3 2 26.4 8.4 18.3 26.4 16.9 15.7 13.5 517.9 -51.7 0.5Fidelity Growth & Income Port (FGRIX) GI/LB 43.79 3 3 3 8.0 17.2 21.7 8.0 8.6 11.7 11.7 431.8 -63.1 1.8Fidelity Growth Company (FDGRX) GR/LG 32.87 1 4 1 67.5 14.8 35.2 67.5 30.3 26.3 20.6 1139.6 -50.3 0.0Fidelity Growth Discovery (FDSVX) GR/LG 51.73 1 3 1 43.5 12.6 26.1 43.5 24.2 21.0 17.1 804.9 -55.9 0.0Fidelity Growth Strategies Fund (FDEGX) AG/GW 59.71 2 3 2 29.4 14.9 23.8 29.4 18.0 15.5 12.9 565.8 -58.6 0.0Fidelity Independence Fund (FDFFX) GR/LB 46.36 2 3 2 28.3 7.8 19.9 28.3 16.5 14.6 12.7 573.8 -57.9 0.0Fidelity Large Cap Stock Fund (FLCSX) GR/LB 35.08 3 4 3 9.0 19.1 23.9 9.0 9.2 12.4 12.2 573.6 -58.2 1.7Fidelity Leveraged Company Stock (FLVCX) GR/LG 41.05 3 5 3 26.7 21.1 39.5 26.7 12.8 13.3 11.1 588.4 -64.6 0.1Fidelity Low-Priced Stock (FLPSX) GI/MV 48.63 3 3 3 9.3 18.0 27.4 9.3 7.0 10.0 10.6 441.3 -48.9 1.6Fidelity Magellan Fund (FMAGX) GR/LG 13.05 2 3 ▲ 1 28.3 7.8 19.9 28.3 16.7 16.2 13.5 559.0 -58.3 0.0Fidelity Mid-Cap Stock Fund (FMCSX) GR/MB 37.16 3 4 3 11.4 20.2 28.4 11.4 9.3 12.2 11.2 515.9 -56.1 1.1Fidelity New Millennium (FMILX) AG/GW 36.58 3 3 3 5.8 19.6 24.7 5.8 7.5 11.4 11.2 471.4 -52.1 1.5Fidelity OTC Portfolio (FOCPX) GR/LG 17.52 1 4 1 46.8 13.7 29.6 46.8 25.5 23.1 19.5 1150.7 -53.6 0.0Fidelity Small Cap Stock Fund (FSLCX) SC/SB 20.62 3 5 3 13.8 20.5 31.5 13.8 9.2 10.9 8.6 454.2 -55.9 0.0Fidelity Stock Selector All Cap (FDSSX) GR/LG 56.84 2 3 1 24.9 15.8 25.0 24.9 14.7 15.7 13.2 531.1 -52.9 0.8Fidelity Strategic Div & Inc (FSDIX) GI/LB 16.20 3 2 3 11.3 12.2 18.3 11.3 9.2 10.5 10.3 408.1 -54.8 2.5Fidelity Value Discovery Fund (FVDFX) GI/LV 32.17 4 3 4 7.8 18.1 24.5 7.8 6.6 9.4 10.5 400.7 -56.5 1.2Fidelity Value Fund (FDVLX) GR/MV 11.98 4 5 4 9.3 29.4 38.9 9.3 6.0 9.8 10.0 486.3 -61.6 1.0First Eagle Fund of America Y (FEAFX) GR/VL 26.03 5 4 5 7.4 12.7 18.8 7.4 1.6 4.6 7.7 246.4 -38.0 0.0First Eagle U.S. Value A (FEVAX) Y GR/LB 18.83 4 2 4 6.5 11.3 18.6 6.5 6.2 9.1 8.1 234.1 -29.7 1.0Franklin Growth C (FRGSX) GR/LG 121.12 1 3 1 29.7 12.7 25.3 29.7 17.7 17.2 13.9 559.8 -47.8 0.0Franklin Mutual Beacon A (TEBIX) Y GI/VL 16.30 4 3 3 3.7 22.4 24.7 3.7 5.8 9.4 8.8 282.9 -50.9 2.4Franklin Mutual Quest A (TEQIX) Y GI/VL 13.09 5 2 5 -2.1 13.1 16.0 -2.1 0.6 4.8 5.4 137.0 -31.8 3.3Franklin Mutual Shares A (TESIX) Y GI/VL 25.04 5 3 4 -4.6 17.5 20.6 -4.6 2.1 5.9 7.0 225.7 -50.5 1.7Franklin Mutual US Value A (FRBSX) Y GR/MV 32.00 4 4 3 -2.5 21.8 27.8 -2.5 2.1 7.6 6.9 282.1 -54.8 3.5Franklin Rising Dividends A (FRDPX) Y GI/LV 80.19 2 3 2 16.3 11.5 22.1 16.3 12.7 14.5 12.3 454.5 -44.9 0.8Franklin Small-Mid Cap Growth A (FRSGX) Y SC/SG 46.83 1 4 2 56.0 17.7 32.9 56.0 25.2 20.0 14.4 684.0 -52.9 0.0FundX Upgrader Fund (FUNDX) GR/LG 75.27 2 3 2 25.4 13.5 26.0 25.4 15.3 13.2 11.0 360.8 -54.1 0.0Gabelli Asset AAA (GABAX) GI/MV 54.05 3 3 3 11.2 16.1 25.8 11.2 7.9 11.0 9.8 399.8 -50.6 0.3Gabelli Equity Income AAA (GABEX) IN/LV 11.12 5 3 5 7.1 13.9 22.5 7.1 5.3 7.9 8.8 328.7 -48.1 6.9Gabelli Growth AAA (GABGX) GR/LG 85.55 1 3 2 39.1 10.4 23.4 39.1 23.9 20.4 15.9 668.8 -52.1 0.0
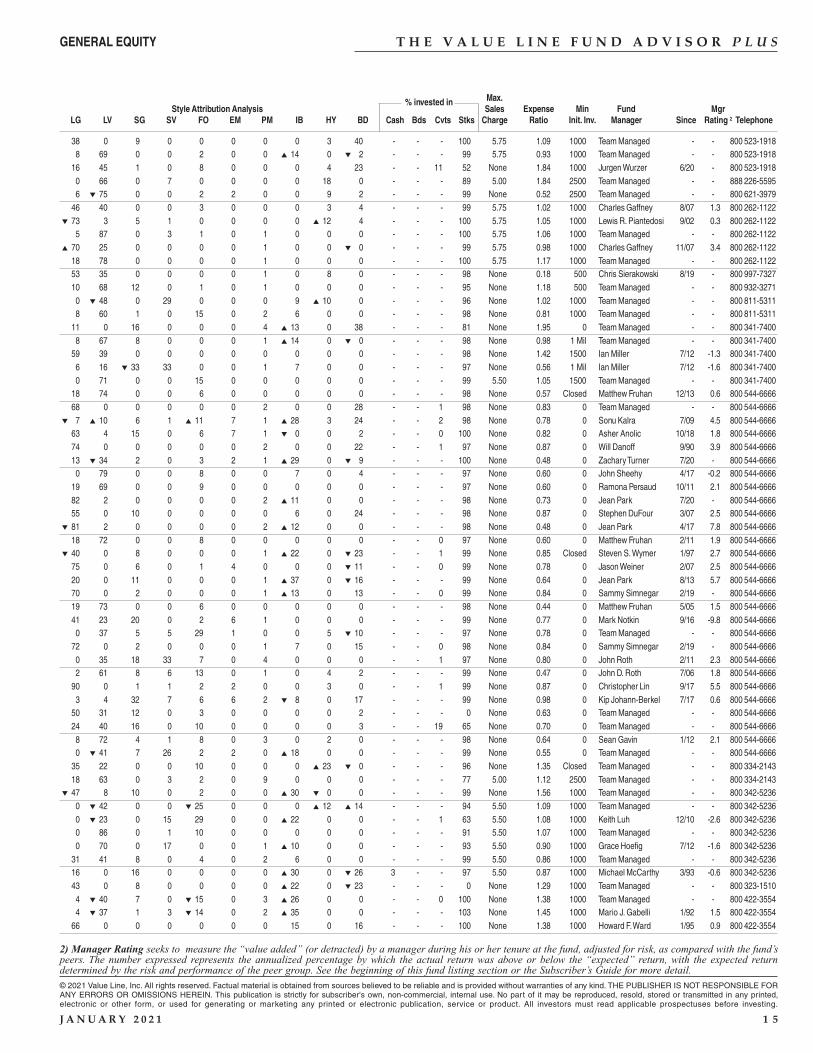
T H E V A L U E L I N E F U N D A D V I S O R P L U S
Max.Style Attribution Analysis
% invested inSales Expense Min Fund Mgr
LG LV SG SV FO EM PM IB HY BD Cash Bds Cvts Stks Charge Ratio Init. Inv. Manager Since Rating 2 Telephone
2) Manager Rating seeks to measure the “value added” (or detracted) by a manager during his or her tenure at the fund, adjusted for risk, as compared with the fund’speers. The number expressed represents the annualized percentage by which the actual return was above or below the “expected” return, with the expected returndetermined by the risk and performance of the peer group. See the beginning of this fund listing section or the Subscriber’s Guide for more detail.
© 2021 Value Line, Inc. All rights reserved. Factual material is obtained from sources believed to be reliable and is provided without warranties of any kind. THE PUBLISHER IS NOT RESPONSIBLE FORANY ERRORS OR OMISSIONS HEREIN. This publication is strictly for subscriber's own, non-commercial, internal use. No part of it may be reproduced, resold, stored or transmitted in any printed,electronic or other form, or used for generating or marketing any printed or electronic publication, service or product. All investors must read applicable prospectuses before investing.
J A N U A R Y 2 0 2 1 1 5
GENERAL EQUITY
38 0 9 0 0 0 0 0 3 40 - - - 100 5.75 1.09 1000 Team Managed - - 800 523-1918 8 69 0 0 2 0 0 ▲ 14 0 ▼ 2 - - - 99 5.75 0.93 1000 Team Managed - - 800 523-1918 16 45 1 0 8 0 0 0 4 23 - - 11 52 None 1.84 1000 Jurgen Wurzer 6/20 - 800 523-1918 0 66 0 7 0 0 0 0 18 0 - - - 89 5.00 1.84 2500 Team Managed - - 888 226-5595 6 ▼ 75 0 0 2 2 0 0 9 2 - - - 99 None 0.52 2500 Team Managed - - 800 621-3979 46 40 0 0 3 0 0 0 3 4 - - - 99 5.75 1.02 1000 Charles Gaffney 8/07 1.3 800 262-1122
▼ 73 3 5 1 0 0 0 0 ▲ 12 4 - - - 100 5.75 1.05 1000 Lewis R. Piantedosi 9/02 0.3 800 262-1122 5 87 0 3 1 0 1 0 0 0 - - - 100 5.75 1.06 1000 Team Managed - - 800 262-1122
▲ 70 25 0 0 0 0 1 0 0 ▼ 0 - - - 99 5.75 0.98 1000 Charles Gaffney 11/07 3.4 800 262-1122 18 78 0 0 0 0 1 0 0 0 - - - 100 5.75 1.17 1000 Team Managed - - 800 262-1122 53 35 0 0 0 0 1 0 8 0 - - - 98 None 0.18 500 Chris Sierakowski 8/19 - 800 997-7327 10 68 12 0 1 0 1 0 0 0 - - - 95 None 1.18 500 Team Managed - - 800 932-3271 0 ▼ 48 0 29 0 0 0 9 ▲ 10 0 - - - 96 None 1.02 1000 Team Managed - - 800 811-5311 8 60 1 0 15 0 2 6 0 0 - - - 98 None 0.81 1000 Team Managed - - 800 811-5311 11 0 16 0 0 0 4 ▲ 13 0 38 - - - 81 None 1.95 0 Team Managed - - 800 341-7400 8 67 8 0 0 0 1 ▲ 14 0 ▼ 0 - - - 98 None 0.98 1 Mil Team Managed - - 800 341-7400 59 39 0 0 0 0 0 0 0 0 - - - 98 None 1.42 1500 Ian Miller 7/12 -1.3 800 341-7400 6 16 ▼ 33 33 0 0 1 7 0 0 - - - 97 None 0.56 1 Mil Ian Miller 7/12 -1.6 800 341-7400 0 71 0 0 15 0 0 0 0 0 - - - 99 5.50 1.05 1500 Team Managed - - 800 341-7400 18 74 0 0 6 0 0 0 0 0 - - - 98 None 0.57 Closed Matthew Fruhan 12/13 0.6 800 544-6666 68 0 0 0 0 0 2 0 0 28 - - 1 98 None 0.83 0 Team Managed - - 800 544-6666
▼ 7 ▲ 10 6 1 ▲ 11 7 1 ▲ 28 3 24 - - 2 98 None 0.78 0 Sonu Kalra 7/09 4.5 800 544-6666 63 4 15 0 6 7 1 ▼ 0 0 2 - - 0 100 None 0.82 0 Asher Anolic 10/18 1.8 800 544-6666 74 0 0 0 0 0 2 0 0 22 - - 1 97 None 0.87 0 Will Danoff 9/90 3.9 800 544-6666 13 ▼ 34 2 0 3 2 1 ▲ 29 0 ▼ 9 - - - 100 None 0.48 0 Zachary Turner 7/20 - 800 544-6666 0 79 0 0 8 0 0 7 0 4 - - - 97 None 0.60 0 John Sheehy 4/17 -0.2 800 544-6666 19 69 0 0 9 0 0 0 0 0 - - - 97 None 0.60 0 Ramona Persaud 10/11 2.1 800 544-6666 82 2 0 0 0 0 2 ▲ 11 0 0 - - - 98 None 0.73 0 Jean Park 7/20 - 800 544-6666 55 0 10 0 0 0 0 6 0 24 - - - 98 None 0.87 0 Stephen DuFour 3/07 2.5 800 544-6666
▼ 81 2 0 0 0 0 2 ▲ 12 0 0 - - - 98 None 0.48 0 Jean Park 4/17 7.8 800 544-6666 18 72 0 0 8 0 0 0 0 0 - - 0 97 None 0.60 0 Matthew Fruhan 2/11 1.9 800 544-6666
▼ 40 0 8 0 0 0 1 ▲ 22 0 ▼ 23 - - 1 99 None 0.85 Closed Steven S. Wymer 1/97 2.7 800 544-6666 75 0 6 0 1 4 0 0 0 ▼ 11 - - 0 99 None 0.78 0 Jason Weiner 2/07 2.5 800 544-6666 20 0 11 0 0 0 1 ▲ 37 0 ▼ 16 - - - 99 None 0.64 0 Jean Park 8/13 5.7 800 544-6666 70 0 2 0 0 0 1 ▲ 13 0 13 - - 0 99 None 0.84 0 Sammy Simnegar 2/19 - 800 544-6666 19 73 0 0 6 0 0 0 0 0 - - - 98 None 0.44 0 Matthew Fruhan 5/05 1.5 800 544-6666 41 23 20 0 2 6 1 0 0 0 - - - 99 None 0.77 0 Mark Notkin 9/16 -9.8 800 544-6666 0 37 5 5 29 1 0 0 5 ▼ 10 - - - 97 None 0.78 0 Team Managed - - 800 544-6666 72 0 2 0 0 0 1 7 0 15 - - 0 98 None 0.84 0 Sammy Simnegar 2/19 - 800 544-6666 0 35 18 33 7 0 4 0 0 0 - - 1 97 None 0.80 0 John Roth 2/11 2.3 800 544-6666 2 61 8 6 13 0 1 0 4 2 - - - 99 None 0.47 0 John D. Roth 7/06 1.8 800 544-6666 90 0 1 1 2 2 0 0 3 0 - - 1 99 None 0.87 0 Christopher Lin 9/17 5.5 800 544-6666 3 4 32 7 6 6 2 ▼ 8 0 17 - - - 99 None 0.98 0 Kip Johann-Berkel 7/17 0.6 800 544-6666 50 31 12 0 3 0 0 0 0 2 - - - 0 None 0.63 0 Team Managed - - 800 544-6666 24 40 16 0 10 0 0 0 0 3 - - 19 65 None 0.70 0 Team Managed - - 800 544-6666 8 72 4 1 8 0 3 0 2 0 - - - 98 None 0.64 0 Sean Gavin 1/12 2.1 800 544-6666 0 ▼ 41 7 26 2 2 0 ▲ 18 0 0 - - - 99 None 0.55 0 Team Managed - - 800 544-6666 35 22 0 0 10 0 0 0 ▲ 23 ▼ 0 - - - 96 None 1.35 Closed Team Managed - - 800 334-2143 18 63 0 3 2 0 9 0 0 0 - - - 77 5.00 1.12 2500 Team Managed - - 800 334-2143
▼ 47 8 10 0 2 0 0 ▲ 30 ▼ 0 0 - - - 99 None 1.56 1000 Team Managed - - 800 342-5236 0 ▼ 42 0 0 ▼ 25 0 0 0 ▲ 12 ▲ 14 - - - 94 5.50 1.09 1000 Team Managed - - 800 342-5236 0 ▼ 23 0 15 29 0 0 ▲ 22 0 0 - - 1 63 5.50 1.08 1000 Keith Luh 12/10 -2.6 800 342-5236 0 86 0 1 10 0 0 0 0 0 - - - 91 5.50 1.07 1000 Team Managed - - 800 342-5236 0 70 0 17 0 0 1 ▲ 10 0 0 - - - 93 5.50 0.90 1000 Grace Hoefig 7/12 -1.6 800 342-5236 31 41 8 0 4 0 2 6 0 0 - - - 99 5.50 0.86 1000 Team Managed - - 800 342-5236 16 0 16 0 0 0 0 ▲ 30 0 ▼ 26 3 - - 97 5.50 0.87 1000 Michael McCarthy 3/93 -0.6 800 342-5236 43 0 8 0 0 0 0 ▲ 22 0 ▼ 23 - - - 0 None 1.29 1000 Team Managed - - 800 323-1510 4 ▼ 40 7 0 ▼ 15 0 3 ▲ 26 0 0 - - 0 100 None 1.38 1000 Team Managed - - 800 422-3554 4 ▼ 37 1 3 ▼ 14 0 2 ▲ 35 0 0 - - - 103 None 1.45 1000 Mario J. Gabelli 1/92 1.5 800 422-3554 66 0 0 0 0 0 0 15 0 16 - - - 100 None 1.38 1000 Howard F. Ward 1/95 0.9 800 422-3554
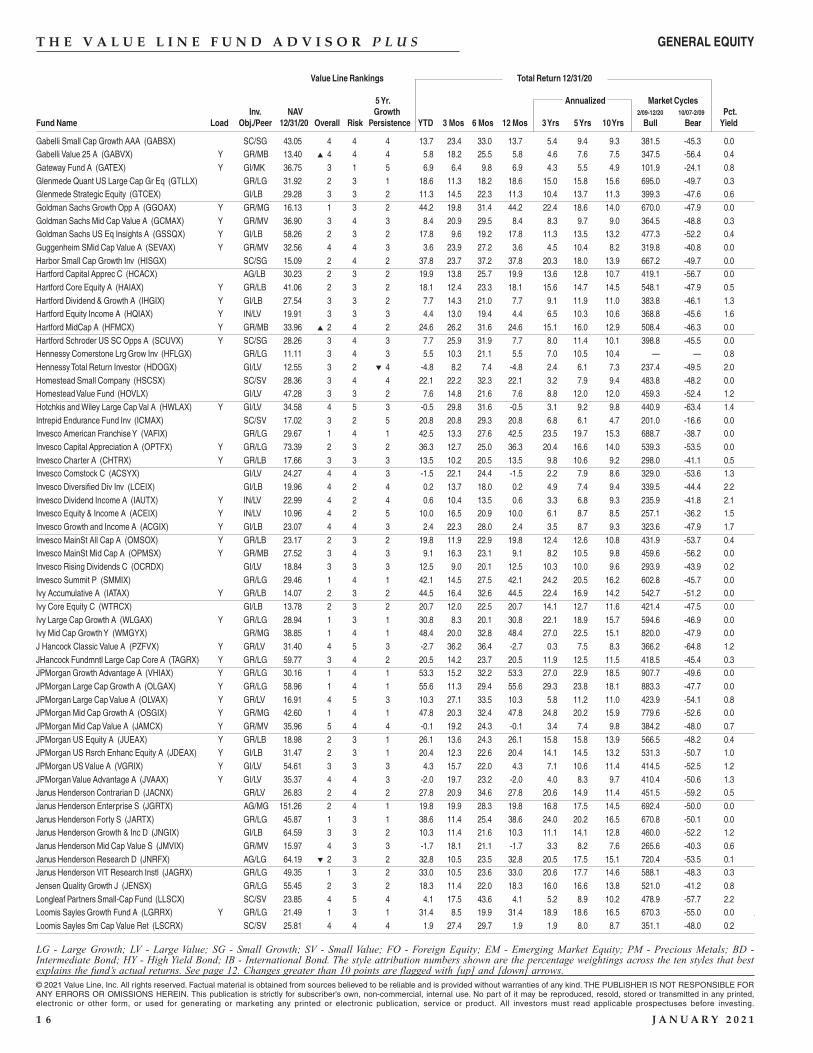
T H E V A L U E L I N E F U N D A D V I S O R P L U S
Value Line Rankings Total Return 12/31/20
5 Yr. Annualized Market CyclesInv. NAV Growth 2/09-12/20 10/07-2/09 Pct.
Fund Name Load Obj./Peer 12/31/20 Overall Risk Persistence YTD 3 Mos 6 Mos 12 Mos 3 Yrs 5 Yrs 10 Yrs Bull Bear Yield
© 2021 Value Line, Inc. All rights reserved. Factual material is obtained from sources believed to be reliable and is provided without warranties of any kind. THE PUBLISHER IS NOT RESPONSIBLE FORANY ERRORS OR OMISSIONS HEREIN. This publication is strictly for subscriber's own, non-commercial, internal use. No part of it may be reproduced, resold, stored or transmitted in any printed,electronic or other form, or used for generating or marketing any printed or electronic publication, service or product. All investors must read applicable prospectuses before investing.
1 6 J A N U A R Y 2 0 2 1
LG - Large Growth; LV - Large Value; SG - Small Growth; SV - Small Value; FO - Foreign Equity; EM - Emerging Market Equity; PM - Precious Metals; BD -Intermediate Bond; HY - High Yield Bond; IB - International Bond. The style attribution numbers shown are the percentage weightings across the ten styles that bestexplains the fund’s actual returns. See page 12. Changes greater than 10 points are flagged with [up] and [down] arrows.
GENERAL EQUITY
Gabelli Small Cap Growth AAA (GABSX) SC/SG 43.05 4 4 4 13.7 23.4 33.0 13.7 5.4 9.4 9.3 381.5 -45.3 0.0Gabelli Value 25 A (GABVX) Y GR/MB 13.40 ▲ 4 4 4 5.8 18.2 25.5 5.8 4.6 7.6 7.5 347.5 -56.4 0.4Gateway Fund A (GATEX) Y GI/MK 36.75 3 1 5 6.9 6.4 9.8 6.9 4.3 5.5 4.9 101.9 -24.1 0.8Glenmede Quant US Large Cap Gr Eq (GTLLX) GR/LG 31.92 2 3 1 18.6 11.3 18.2 18.6 15.0 15.8 15.6 695.0 -49.7 0.3Glenmede Strategic Equity (GTCEX) GI/LB 29.28 3 3 2 11.3 14.5 22.3 11.3 10.4 13.7 11.3 399.3 -47.6 0.6Goldman Sachs Growth Opp A (GGOAX) Y GR/MG 16.13 1 3 2 44.2 19.8 31.4 44.2 22.4 18.6 14.0 670.0 -47.9 0.0Goldman Sachs Mid Cap Value A (GCMAX) Y GR/MV 36.90 3 4 3 8.4 20.9 29.5 8.4 8.3 9.7 9.0 364.5 -48.8 0.3Goldman Sachs US Eq Insights A (GSSQX) Y GI/LB 58.26 2 3 2 17.8 9.6 19.2 17.8 11.3 13.5 13.2 477.3 -52.2 0.4Guggenheim SMid Cap Value A (SEVAX) Y GR/MV 32.56 4 4 3 3.6 23.9 27.2 3.6 4.5 10.4 8.2 319.8 -40.8 0.0Harbor Small Cap Growth Inv (HISGX) SC/SG 15.09 2 4 2 37.8 23.7 37.2 37.8 20.3 18.0 13.9 667.2 -49.7 0.0Hartford Capital Apprec C (HCACX) AG/LB 30.23 2 3 2 19.9 13.8 25.7 19.9 13.6 12.8 10.7 419.1 -56.7 0.0Hartford Core Equity A (HAIAX) Y GR/LB 41.06 2 3 2 18.1 12.4 23.3 18.1 15.6 14.7 14.5 548.1 -47.9 0.5Hartford Dividend & Growth A (IHGIX) Y GI/LB 27.54 3 3 2 7.7 14.3 21.0 7.7 9.1 11.9 11.0 383.8 -46.1 1.3Hartford Equity Income A (HQIAX) Y IN/LV 19.91 3 3 3 4.4 13.0 19.4 4.4 6.5 10.3 10.6 368.8 -45.6 1.6Hartford MidCap A (HFMCX) Y GR/MB 33.96 ▲ 2 4 2 24.6 26.2 31.6 24.6 15.1 16.0 12.9 508.4 -46.3 0.0Hartford Schroder US SC Opps A (SCUVX) Y SC/SG 28.26 3 4 3 7.7 25.9 31.9 7.7 8.0 11.4 10.1 398.8 -45.5 0.0Hennessy Cornerstone Lrg Grow Inv (HFLGX) GR/LG 11.11 3 4 3 5.5 10.3 21.1 5.5 7.0 10.5 10.4 — — 0.8Hennessy Total Return Investor (HDOGX) GI/LV 12.55 3 2 ▼ 4 -4.8 8.2 7.4 -4.8 2.4 6.1 7.3 237.4 -49.5 2.0Homestead Small Company (HSCSX) SC/SV 28.36 3 4 4 22.1 22.2 32.3 22.1 3.2 7.9 9.4 483.8 -48.2 0.0Homestead Value Fund (HOVLX) GI/LV 47.28 3 3 2 7.6 14.8 21.6 7.6 8.8 12.0 12.0 459.3 -52.4 1.2Hotchkis and Wiley Large Cap Val A (HWLAX) Y GI/LV 34.58 4 5 3 -0.5 29.8 31.6 -0.5 3.1 9.2 9.8 440.9 -63.4 1.4Intrepid Endurance Fund Inv (ICMAX) SC/SV 17.02 3 2 5 20.8 20.8 29.3 20.8 6.8 6.1 4.7 201.0 -16.6 0.0Invesco American Franchise Y (VAFIX) GR/LG 29.67 1 4 1 42.5 13.3 27.6 42.5 23.5 19.7 15.3 688.7 -38.7 0.0Invesco Capital Appreciation A (OPTFX) Y GR/LG 73.39 2 3 2 36.3 12.7 25.0 36.3 20.4 16.6 14.0 539.3 -53.5 0.0Invesco Charter A (CHTRX) Y GR/LB 17.66 3 3 3 13.5 10.2 20.5 13.5 9.8 10.6 9.2 298.0 -41.1 0.5Invesco Comstock C (ACSYX) GI/LV 24.27 4 4 3 -1.5 22.1 24.4 -1.5 2.2 7.9 8.6 329.0 -53.6 1.3Invesco Diversified Div Inv (LCEIX) GI/LB 19.96 4 2 4 0.2 13.7 18.0 0.2 4.9 7.4 9.4 339.5 -44.4 2.2Invesco Dividend Income A (IAUTX) Y IN/LV 22.99 4 2 4 0.6 10.4 13.5 0.6 3.3 6.8 9.3 235.9 -41.8 2.1Invesco Equity & Income A (ACEIX) Y IN/LV 10.96 4 2 5 10.0 16.5 20.9 10.0 6.1 8.7 8.5 257.1 -36.2 1.5Invesco Growth and Income A (ACGIX) Y GI/LB 23.07 4 4 3 2.4 22.3 28.0 2.4 3.5 8.7 9.3 323.6 -47.9 1.7Invesco MainSt All Cap A (OMSOX) Y GR/LB 23.17 2 3 2 19.8 11.9 22.9 19.8 12.4 12.6 10.8 431.9 -53.7 0.4Invesco MainSt Mid Cap A (OPMSX) Y GR/MB 27.52 3 4 3 9.1 16.3 23.1 9.1 8.2 10.5 9.8 459.6 -56.2 0.0Invesco Rising Dividends C (OCRDX) GI/LV 18.84 3 3 3 12.5 9.0 20.1 12.5 10.3 10.0 9.6 293.9 -43.9 0.2Invesco Summit P (SMMIX) GR/LG 29.46 1 4 1 42.1 14.5 27.5 42.1 24.2 20.5 16.2 602.8 -45.7 0.0Ivy Accumulative A (IATAX) Y GR/LB 14.07 2 3 2 44.5 16.4 32.6 44.5 22.4 16.9 14.2 542.7 -51.2 0.0Ivy Core Equity C (WTRCX) GI/LB 13.78 2 3 2 20.7 12.0 22.5 20.7 14.1 12.7 11.6 421.4 -47.5 0.0Ivy Large Cap Growth A (WLGAX) Y GR/LG 28.94 1 3 1 30.8 8.3 20.1 30.8 22.1 18.9 15.7 594.6 -46.9 0.0Ivy Mid Cap Growth Y (WMGYX) GR/MG 38.85 1 4 1 48.4 20.0 32.8 48.4 27.0 22.5 15.1 820.0 -47.9 0.0J Hancock Classic Value A (PZFVX) Y GR/LV 31.40 4 5 3 -2.7 36.2 36.4 -2.7 0.3 7.5 8.3 366.2 -64.8 1.2JHancock Fundmntl Large Cap Core A (TAGRX) Y GR/LG 59.77 3 4 2 20.5 14.2 23.7 20.5 11.9 12.5 11.5 418.5 -45.4 0.3JPMorgan Growth Advantage A (VHIAX) Y GR/LG 30.16 1 4 1 53.3 15.2 32.2 53.3 27.0 22.9 18.5 907.7 -49.6 0.0JPMorgan Large Cap Growth A (OLGAX) Y GR/LG 58.96 1 4 1 55.6 11.3 29.4 55.6 29.3 23.8 18.1 883.3 -47.7 0.0JPMorgan Large Cap Value A (OLVAX) Y GR/LV 16.91 4 5 3 10.3 27.1 33.5 10.3 5.8 11.2 11.0 423.9 -54.1 0.8JPMorgan Mid Cap Growth A (OSGIX) Y GR/MG 42.60 1 4 1 47.8 20.3 32.4 47.8 24.8 20.2 15.9 779.6 -52.6 0.0JPMorgan Mid Cap Value A (JAMCX) Y GR/MV 35.96 5 4 4 -0.1 19.2 24.3 -0.1 3.4 7.4 9.8 384.2 -48.0 0.7JPMorgan US Equity A (JUEAX) Y GR/LB 18.98 2 3 1 26.1 13.6 24.3 26.1 15.8 15.8 13.9 566.5 -48.2 0.4JPMorgan US Rsrch Enhanc Equity A (JDEAX) Y GI/LB 31.47 2 3 1 20.4 12.3 22.6 20.4 14.1 14.5 13.2 531.3 -50.7 1.0JPMorgan US Value A (VGRIX) Y GI/LV 54.61 3 3 3 4.3 15.7 22.0 4.3 7.1 10.6 11.4 414.5 -52.5 1.2JPMorgan Value Advantage A (JVAAX) Y GI/LV 35.37 4 4 3 -2.0 19.7 23.2 -2.0 4.0 8.3 9.7 410.4 -50.6 1.3Janus Henderson Contrarian D (JACNX) GR/LV 26.83 2 4 2 27.8 20.9 34.6 27.8 20.6 14.9 11.4 451.5 -59.2 0.5Janus Henderson Enterprise S (JGRTX) AG/MG 151.26 2 4 1 19.8 19.9 28.3 19.8 16.8 17.5 14.5 692.4 -50.0 0.0Janus Henderson Forty S (JARTX) GR/LG 45.87 1 3 1 38.6 11.4 25.4 38.6 24.0 20.2 16.5 670.8 -50.1 0.0Janus Henderson Growth & Inc D (JNGIX) GI/LB 64.59 3 3 2 10.3 11.4 21.6 10.3 11.1 14.1 12.8 460.0 -52.2 1.2Janus Henderson Mid Cap Value S (JMVIX) GR/MV 15.97 4 3 3 -1.7 18.1 21.1 -1.7 3.3 8.2 7.6 265.6 -40.3 0.6Janus Henderson Research D (JNRFX) AG/LG 64.19 ▼ 2 3 2 32.8 10.5 23.5 32.8 20.5 17.5 15.1 720.4 -53.5 0.1Janus Henderson VIT Research Instl (JAGRX) GR/LG 49.35 1 3 2 33.0 10.5 23.6 33.0 20.6 17.7 14.6 588.1 -48.3 0.3Jensen Quality Growth J (JENSX) GR/LG 55.45 2 3 2 18.3 11.4 22.0 18.3 16.0 16.6 13.8 521.0 -41.2 0.8Longleaf Partners Small-Cap Fund (LLSCX) SC/SV 23.85 4 5 4 4.1 17.5 43.6 4.1 5.2 8.9 10.2 478.9 -57.7 2.2Loomis Sayles Growth Fund A (LGRRX) Y GR/LG 21.49 1 3 1 31.4 8.5 19.9 31.4 18.9 18.6 16.5 670.3 -55.0 0.0Loomis Sayles Sm Cap Value Ret (LSCRX) SC/SV 25.81 4 4 4 1.9 27.4 29.7 1.9 1.9 8.0 8.7 351.1 -48.0 0.2
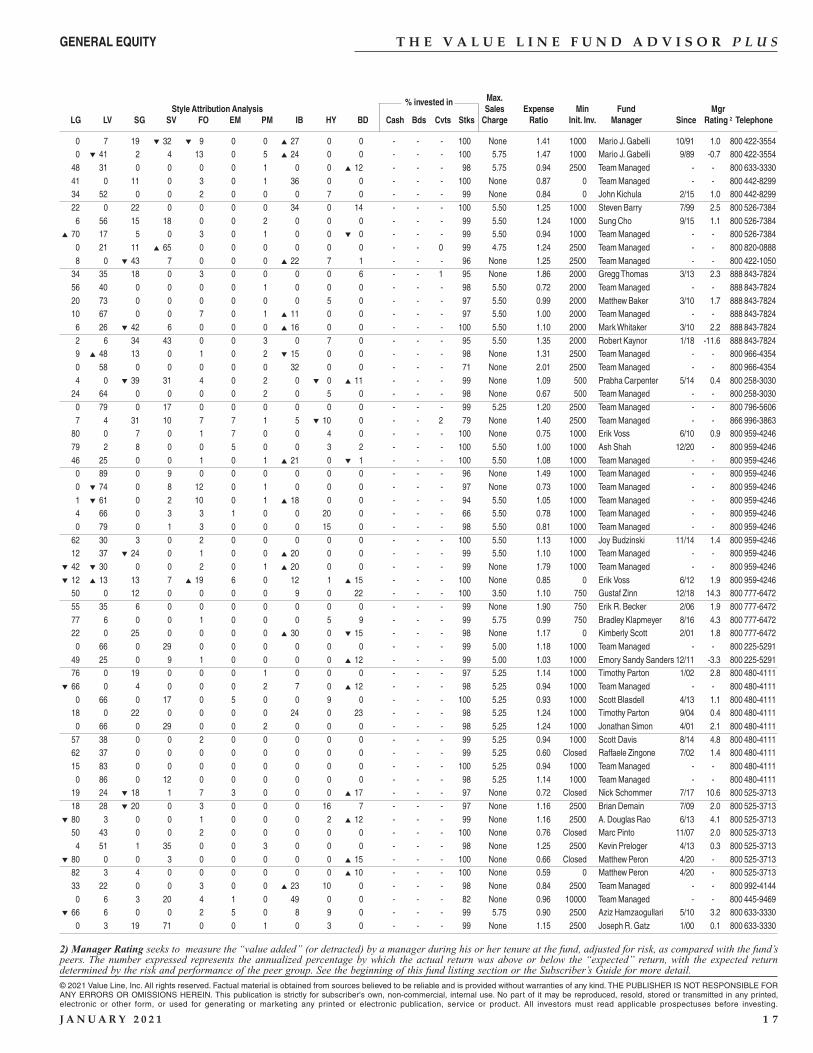
T H E V A L U E L I N E F U N D A D V I S O R P L U S
Max.Style Attribution Analysis
% invested inSales Expense Min Fund Mgr
LG LV SG SV FO EM PM IB HY BD Cash Bds Cvts Stks Charge Ratio Init. Inv. Manager Since Rating 2 Telephone
2) Manager Rating seeks to measure the “value added” (or detracted) by a manager during his or her tenure at the fund, adjusted for risk, as compared with the fund’speers. The number expressed represents the annualized percentage by which the actual return was above or below the “expected” return, with the expected returndetermined by the risk and performance of the peer group. See the beginning of this fund listing section or the Subscriber’s Guide for more detail.
© 2021 Value Line, Inc. All rights reserved. Factual material is obtained from sources believed to be reliable and is provided without warranties of any kind. THE PUBLISHER IS NOT RESPONSIBLE FORANY ERRORS OR OMISSIONS HEREIN. This publication is strictly for subscriber's own, non-commercial, internal use. No part of it may be reproduced, resold, stored or transmitted in any printed,electronic or other form, or used for generating or marketing any printed or electronic publication, service or product. All investors must read applicable prospectuses before investing.
J A N U A R Y 2 0 2 1 1 7
GENERAL EQUITY
0 7 19 ▼ 32 ▼ 9 0 0 ▲ 27 0 0 - - - 100 None 1.41 1000 Mario J. Gabelli 10/91 1.0 800 422-3554 0 ▼ 41 2 4 13 0 5 ▲ 24 0 0 - - - 100 5.75 1.47 1000 Mario J. Gabelli 9/89 -0.7 800 422-3554 48 31 0 0 0 0 1 0 0 ▲ 12 - - - 98 5.75 0.94 2500 Team Managed - - 800 633-3330 41 0 11 0 3 0 1 36 0 0 - - - 100 None 0.87 0 Team Managed - - 800 442-8299 34 52 0 0 2 0 0 0 7 0 - - - 99 None 0.84 0 John Kichula 2/15 1.0 800 442-8299 22 0 22 0 0 0 0 34 0 14 - - - 100 5.50 1.25 1000 Steven Barry 7/99 2.5 800 526-7384 6 56 15 18 0 0 2 0 0 0 - - - 99 5.50 1.24 1000 Sung Cho 9/15 1.1 800 526-7384
▲ 70 17 5 0 3 0 1 0 0 ▼ 0 - - - 99 5.50 0.94 1000 Team Managed - - 800 526-7384 0 21 11 ▲ 65 0 0 0 0 0 0 - - 0 99 4.75 1.24 2500 Team Managed - - 800 820-0888 8 0 ▼ 43 7 0 0 0 ▲ 22 7 1 - - - 96 None 1.25 2500 Team Managed - - 800 422-1050 34 35 18 0 3 0 0 0 0 6 - - 1 95 None 1.86 2000 Gregg Thomas 3/13 2.3 888 843-7824 56 40 0 0 0 0 1 0 0 0 - - - 98 5.50 0.72 2000 Team Managed - - 888 843-7824 20 73 0 0 0 0 0 0 5 0 - - - 97 5.50 0.99 2000 Matthew Baker 3/10 1.7 888 843-7824 10 67 0 0 7 0 1 ▲ 11 0 0 - - - 97 5.50 1.00 2000 Team Managed - - 888 843-7824 6 26 ▼ 42 6 0 0 0 ▲ 16 0 0 - - - 100 5.50 1.10 2000 Mark Whitaker 3/10 2.2 888 843-7824 2 6 34 43 0 0 3 0 7 0 - - - 95 5.50 1.35 2000 Robert Kaynor 1/18 -11.6 888 843-7824 9 ▲ 48 13 0 1 0 2 ▼ 15 0 0 - - - 98 None 1.31 2500 Team Managed - - 800 966-4354 0 58 0 0 0 0 0 32 0 0 - - - 71 None 2.01 2500 Team Managed - - 800 966-4354 4 0 ▼ 39 31 4 0 2 0 ▼ 0 ▲ 11 - - - 99 None 1.09 500 Prabha Carpenter 5/14 0.4 800 258-3030 24 64 0 0 0 0 2 0 5 0 - - - 98 None 0.67 500 Team Managed - - 800 258-3030 0 79 0 17 0 0 0 0 0 0 - - - 99 5.25 1.20 2500 Team Managed - - 800 796-5606 7 4 31 10 7 7 1 5 ▼ 10 0 - - 2 79 None 1.40 2500 Team Managed - - 866 996-3863 80 0 7 0 1 7 0 0 4 0 - - - 100 None 0.75 1000 Erik Voss 6/10 0.9 800 959-4246 79 2 8 0 0 5 0 0 3 2 - - - 100 5.50 1.00 1000 Ash Shah 12/20 - 800 959-4246 46 25 0 0 1 0 1 ▲ 21 0 ▼ 1 - - - 100 5.50 1.08 1000 Team Managed - - 800 959-4246 0 89 0 9 0 0 0 0 0 0 - - - 96 None 1.49 1000 Team Managed - - 800 959-4246 0 ▼ 74 0 8 12 0 1 0 0 0 - - - 97 None 0.73 1000 Team Managed - - 800 959-4246 1 ▼ 61 0 2 10 0 1 ▲ 18 0 0 - - - 94 5.50 1.05 1000 Team Managed - - 800 959-4246 4 66 0 3 3 1 0 0 20 0 - - - 66 5.50 0.78 1000 Team Managed - - 800 959-4246 0 79 0 1 3 0 0 0 15 0 - - - 98 5.50 0.81 1000 Team Managed - - 800 959-4246 62 30 3 0 2 0 0 0 0 0 - - - 100 5.50 1.13 1000 Joy Budzinski 11/14 1.4 800 959-4246 12 37 ▼ 24 0 1 0 0 ▲ 20 0 0 - - - 99 5.50 1.10 1000 Team Managed - - 800 959-4246
▼ 42 ▼ 30 0 0 2 0 1 ▲ 20 0 0 - - - 99 None 1.79 1000 Team Managed - - 800 959-4246▼ 12 ▲ 13 13 7 ▲ 19 6 0 12 1 ▲ 15 - - - 100 None 0.85 0 Erik Voss 6/12 1.9 800 959-4246
50 0 12 0 0 0 0 9 0 22 - - - 100 3.50 1.10 750 Gustaf Zinn 12/18 14.3 800 777-6472 55 35 6 0 0 0 0 0 0 0 - - - 99 None 1.90 750 Erik R. Becker 2/06 1.9 800 777-6472 77 6 0 0 1 0 0 0 5 9 - - - 99 5.75 0.99 750 Bradley Klapmeyer 8/16 4.3 800 777-6472 22 0 25 0 0 0 0 ▲ 30 0 ▼ 15 - - - 98 None 1.17 0 Kimberly Scott 2/01 1.8 800 777-6472 0 66 0 29 0 0 0 0 0 0 - - - 99 5.00 1.18 1000 Team Managed - - 800 225-5291 49 25 0 9 1 0 0 0 0 ▲ 12 - - - 99 5.00 1.03 1000 Emory Sandy Sanders 12/11 -3.3 800 225-5291 76 0 19 0 0 0 1 0 0 0 - - - 97 5.25 1.14 1000 Timothy Parton 1/02 2.8 800 480-4111
▼ 66 0 4 0 0 0 2 7 0 ▲ 12 - - - 98 5.25 0.94 1000 Team Managed - - 800 480-4111 0 66 0 17 0 5 0 0 9 0 - - - 100 5.25 0.93 1000 Scott Blasdell 4/13 1.1 800 480-4111 18 0 22 0 0 0 0 24 0 23 - - - 98 5.25 1.24 1000 Timothy Parton 9/04 0.4 800 480-4111 0 66 0 29 0 0 2 0 0 0 - - - 98 5.25 1.24 1000 Jonathan Simon 4/01 2.1 800 480-4111 57 38 0 0 2 0 0 0 0 0 - - - 99 5.25 0.94 1000 Scott Davis 8/14 4.8 800 480-4111 62 37 0 0 0 0 0 0 0 0 - - - 99 5.25 0.60 Closed Raffaele Zingone 7/02 1.4 800 480-4111 15 83 0 0 0 0 0 0 0 0 - - - 100 5.25 0.94 1000 Team Managed - - 800 480-4111 0 86 0 12 0 0 0 0 0 0 - - - 98 5.25 1.14 1000 Team Managed - - 800 480-4111 19 24 ▼ 18 1 7 3 0 0 0 ▲ 17 - - - 97 None 0.72 Closed Nick Schommer 7/17 10.6 800 525-3713 18 28 ▼ 20 0 3 0 0 0 16 7 - - - 97 None 1.16 2500 Brian Demain 7/09 2.0 800 525-3713
▼ 80 3 0 0 1 0 0 0 2 ▲ 12 - - - 99 None 1.16 2500 A. Douglas Rao 6/13 4.1 800 525-3713 50 43 0 0 2 0 0 0 0 0 - - - 100 None 0.76 Closed Marc Pinto 11/07 2.0 800 525-3713 4 51 1 35 0 0 3 0 0 0 - - - 98 None 1.25 2500 Kevin Preloger 4/13 0.3 800 525-3713
▼ 80 0 0 3 0 0 0 0 0 ▲ 15 - - - 100 None 0.66 Closed Matthew Peron 4/20 - 800 525-3713 82 3 4 0 0 0 0 0 0 ▲ 10 - - - 100 None 0.59 0 Matthew Peron 4/20 - 800 525-3713 33 22 0 0 3 0 0 ▲ 23 10 0 - - - 98 None 0.84 2500 Team Managed - - 800 992-4144 0 6 3 20 4 1 0 49 0 0 - - - 82 None 0.96 10000 Team Managed - - 800 445-9469
▼ 66 6 0 0 2 5 0 8 9 0 - - - 99 5.75 0.90 2500 Aziz Hamzaogullari 5/10 3.2 800 633-3330 0 3 19 71 0 0 1 0 3 0 - - - 99 None 1.15 2500 Joseph R. Gatz 1/00 0.1 800 633-3330
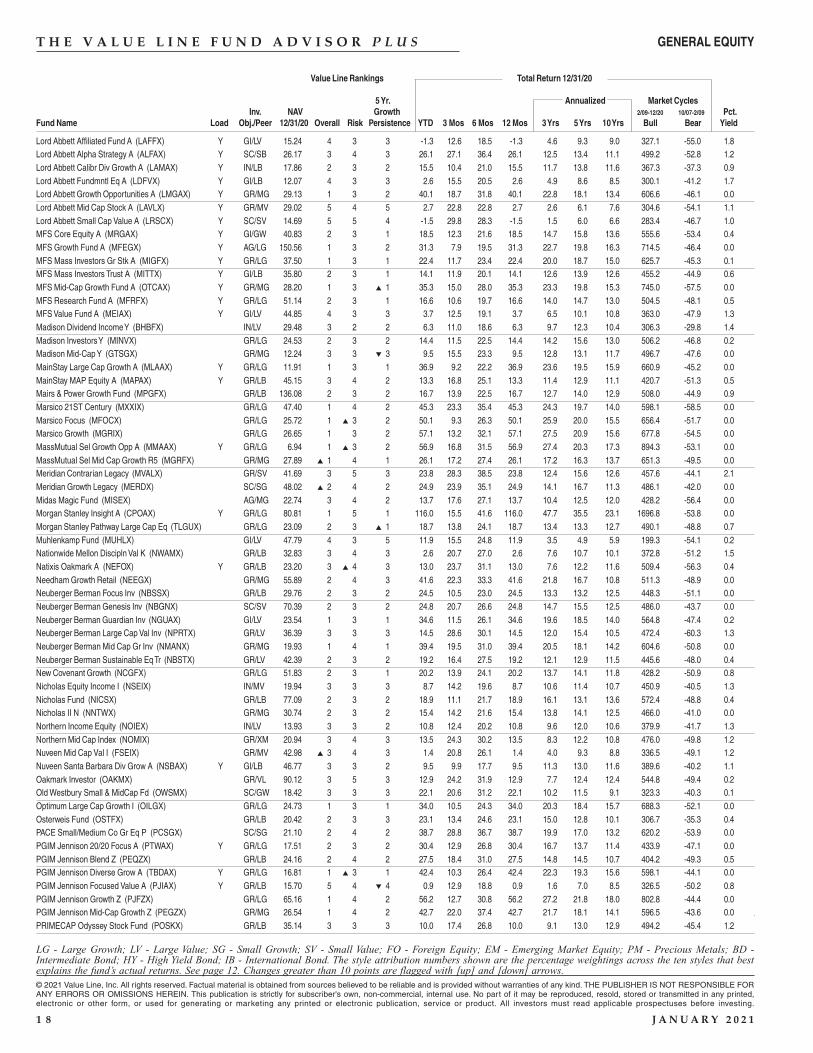
T H E V A L U E L I N E F U N D A D V I S O R P L U S
Value Line Rankings Total Return 12/31/20
5 Yr. Annualized Market CyclesInv. NAV Growth 2/09-12/20 10/07-2/09 Pct.
Fund Name Load Obj./Peer 12/31/20 Overall Risk Persistence YTD 3 Mos 6 Mos 12 Mos 3 Yrs 5 Yrs 10 Yrs Bull Bear Yield
© 2021 Value Line, Inc. All rights reserved. Factual material is obtained from sources believed to be reliable and is provided without warranties of any kind. THE PUBLISHER IS NOT RESPONSIBLE FORANY ERRORS OR OMISSIONS HEREIN. This publication is strictly for subscriber's own, non-commercial, internal use. No part of it may be reproduced, resold, stored or transmitted in any printed,electronic or other form, or used for generating or marketing any printed or electronic publication, service or product. All investors must read applicable prospectuses before investing.
1 8 J A N U A R Y 2 0 2 1
LG - Large Growth; LV - Large Value; SG - Small Growth; SV - Small Value; FO - Foreign Equity; EM - Emerging Market Equity; PM - Precious Metals; BD -Intermediate Bond; HY - High Yield Bond; IB - International Bond. The style attribution numbers shown are the percentage weightings across the ten styles that bestexplains the fund’s actual returns. See page 12. Changes greater than 10 points are flagged with [up] and [down] arrows.
GENERAL EQUITY
Lord Abbett Affiliated Fund A (LAFFX) Y GI/LV 15.24 4 3 3 -1.3 12.6 18.5 -1.3 4.6 9.3 9.0 327.1 -55.0 1.8Lord Abbett Alpha Strategy A (ALFAX) Y SC/SB 26.17 3 4 3 26.1 27.1 36.4 26.1 12.5 13.4 11.1 499.2 -52.8 1.2Lord Abbett Calibr Div Growth A (LAMAX) Y IN/LB 17.86 2 3 2 15.5 10.4 21.0 15.5 11.7 13.8 11.6 367.3 -37.3 0.9Lord Abbett Fundmntl Eq A (LDFVX) Y GI/LB 12.07 4 3 3 2.6 15.5 20.5 2.6 4.9 8.6 8.5 300.1 -41.2 1.7Lord Abbett Growth Opportunities A (LMGAX) Y GR/MG 29.13 1 3 2 40.1 18.7 31.8 40.1 22.8 18.1 13.4 606.6 -46.1 0.0Lord Abbett Mid Cap Stock A (LAVLX) Y GR/MV 29.02 5 4 5 2.7 22.8 22.8 2.7 2.6 6.1 7.6 304.6 -54.1 1.1Lord Abbett Small Cap Value A (LRSCX) Y SC/SV 14.69 5 5 4 -1.5 29.8 28.3 -1.5 1.5 6.0 6.6 283.4 -46.7 1.0MFS Core Equity A (MRGAX) Y GI/GW 40.83 2 3 1 18.5 12.3 21.6 18.5 14.7 15.8 13.6 555.6 -53.4 0.4MFS Growth Fund A (MFEGX) Y AG/LG 150.56 1 3 2 31.3 7.9 19.5 31.3 22.7 19.8 16.3 714.5 -46.4 0.0MFS Mass Investors Gr Stk A (MIGFX) Y GR/LG 37.50 1 3 1 22.4 11.7 23.4 22.4 20.0 18.7 15.0 625.7 -45.3 0.1MFS Mass Investors Trust A (MITTX) Y GI/LB 35.80 2 3 1 14.1 11.9 20.1 14.1 12.6 13.9 12.6 455.2 -44.9 0.6MFS Mid-Cap Growth Fund A (OTCAX) Y GR/MG 28.20 1 3 ▲ 1 35.3 15.0 28.0 35.3 23.3 19.8 15.3 745.0 -57.5 0.0MFS Research Fund A (MFRFX) Y GR/LG 51.14 2 3 1 16.6 10.6 19.7 16.6 14.0 14.7 13.0 504.5 -48.1 0.5MFS Value Fund A (MEIAX) Y GI/LV 44.85 4 3 3 3.7 12.5 19.1 3.7 6.5 10.1 10.8 363.0 -47.9 1.3Madison Dividend Income Y (BHBFX) IN/LV 29.48 3 2 2 6.3 11.0 18.6 6.3 9.7 12.3 10.4 306.3 -29.8 1.4Madison Investors Y (MINVX) GR/LG 24.53 2 3 2 14.4 11.5 22.5 14.4 14.2 15.6 13.0 506.2 -46.8 0.2Madison Mid-Cap Y (GTSGX) GR/MG 12.24 3 3 ▼ 3 9.5 15.5 23.3 9.5 12.8 13.1 11.7 496.7 -47.6 0.0MainStay Large Cap Growth A (MLAAX) Y GR/LG 11.91 1 3 1 36.9 9.2 22.2 36.9 23.6 19.5 15.9 660.9 -45.2 0.0MainStay MAP Equity A (MAPAX) Y GR/LB 45.15 3 4 2 13.3 16.8 25.1 13.3 11.4 12.9 11.1 420.7 -51.3 0.5Mairs & Power Growth Fund (MPGFX) GR/LB 136.08 2 3 2 16.7 13.9 22.5 16.7 12.7 14.0 12.9 508.0 -44.9 0.9Marsico 21ST Century (MXXIX) GR/LG 47.40 1 4 2 45.3 23.3 35.4 45.3 24.3 19.7 14.0 598.1 -58.5 0.0Marsico Focus (MFOCX) GR/LG 25.72 1 ▲ 3 2 50.1 9.3 26.3 50.1 25.9 20.0 15.5 656.4 -51.7 0.0Marsico Growth (MGRIX) GR/LG 26.65 1 3 2 57.1 13.2 32.1 57.1 27.5 20.9 15.6 677.8 -54.5 0.0MassMutual Sel Growth Opp A (MMAAX) Y GR/LG 6.94 1 ▲ 3 2 56.9 16.8 31.5 56.9 27.4 20.3 17.3 894.3 -53.1 0.0MassMutual Sel Mid Cap Growth R5 (MGRFX) GR/MG 27.89 ▲ 1 4 1 26.1 17.2 27.4 26.1 17.2 16.3 13.7 651.3 -49.5 0.0Meridian Contrarian Legacy (MVALX) GR/SV 41.69 3 5 3 23.8 28.3 38.5 23.8 12.4 15.6 12.6 457.6 -44.1 2.1Meridian Growth Legacy (MERDX) SC/SG 48.02 ▲ 2 4 2 24.9 23.9 35.1 24.9 14.1 16.7 11.3 486.1 -42.0 0.0Midas Magic Fund (MISEX) AG/MG 22.74 3 4 2 13.7 17.6 27.1 13.7 10.4 12.5 12.0 428.2 -56.4 0.0Morgan Stanley Insight A (CPOAX) Y GR/LG 80.81 1 5 1 116.0 15.5 41.6 116.0 47.7 35.5 23.1 1696.8 -53.8 0.0Morgan Stanley Pathway Large Cap Eq (TLGUX) GR/LG 23.09 2 3 ▲ 1 18.7 13.8 24.1 18.7 13.4 13.3 12.7 490.1 -48.8 0.7Muhlenkamp Fund (MUHLX) GI/LV 47.79 4 3 5 11.9 15.5 24.8 11.9 3.5 4.9 5.9 199.3 -54.1 0.2Nationwide Mellon Discipln Val K (NWAMX) GR/LB 32.83 3 4 3 2.6 20.7 27.0 2.6 7.6 10.7 10.1 372.8 -51.2 1.5Natixis Oakmark A (NEFOX) Y GR/LB 23.20 3 ▲ 4 3 13.0 23.7 31.1 13.0 7.6 12.2 11.6 509.4 -56.3 0.4Needham Growth Retail (NEEGX) GR/MG 55.89 2 4 3 41.6 22.3 33.3 41.6 21.8 16.7 10.8 511.3 -48.9 0.0Neuberger Berman Focus Inv (NBSSX) GR/LB 29.76 2 3 2 24.5 10.5 23.0 24.5 13.3 13.2 12.5 448.3 -51.1 0.0Neuberger Berman Genesis Inv (NBGNX) SC/SV 70.39 2 3 2 24.8 20.7 26.6 24.8 14.7 15.5 12.5 486.0 -43.7 0.0Neuberger Berman Guardian Inv (NGUAX) GI/LV 23.54 1 3 1 34.6 11.5 26.1 34.6 19.6 18.5 14.0 564.8 -47.4 0.2Neuberger Berman Large Cap Val Inv (NPRTX) GR/LV 36.39 3 3 3 14.5 28.6 30.1 14.5 12.0 15.4 10.5 472.4 -60.3 1.3Neuberger Berman Mid Cap Gr Inv (NMANX) GR/MG 19.93 1 4 1 39.4 19.5 31.0 39.4 20.5 18.1 14.2 604.6 -50.8 0.0Neuberger Berman Sustainable Eq Tr (NBSTX) GR/LV 42.39 2 3 2 19.2 16.4 27.5 19.2 12.1 12.9 11.5 445.6 -48.0 0.4New Covenant Growth (NCGFX) GR/LG 51.83 2 3 1 20.2 13.9 24.1 20.2 13.7 14.1 11.8 428.2 -50.9 0.8Nicholas Equity Income I (NSEIX) IN/MV 19.94 3 3 3 8.7 14.2 19.6 8.7 10.6 11.4 10.7 450.9 -40.5 1.3Nicholas Fund (NICSX) GR/LB 77.09 2 3 2 18.9 11.1 21.7 18.9 16.1 13.1 13.6 572.4 -48.8 0.4Nicholas II N (NNTWX) GR/MG 30.74 2 3 2 15.4 14.2 21.6 15.4 13.8 14.1 12.5 466.0 -41.0 0.0Northern Income Equity (NOIEX) IN/LV 13.93 3 3 2 10.8 12.4 20.2 10.8 9.6 12.0 10.6 379.9 -41.7 1.3Northern Mid Cap Index (NOMIX) GR/XM 20.94 3 4 3 13.5 24.3 30.2 13.5 8.3 12.2 10.8 476.0 -49.8 1.2Nuveen Mid Cap Val I (FSEIX) GR/MV 42.98 ▲ 3 4 3 1.4 20.8 26.1 1.4 4.0 9.3 8.8 336.5 -49.1 1.2Nuveen Santa Barbara Div Grow A (NSBAX) Y GI/LB 46.77 3 3 2 9.5 9.9 17.7 9.5 11.3 13.0 11.6 389.6 -40.2 1.1Oakmark Investor (OAKMX) GR/VL 90.12 3 5 3 12.9 24.2 31.9 12.9 7.7 12.4 12.4 544.8 -49.4 0.2Old Westbury Small & MidCap Fd (OWSMX) SC/GW 18.42 3 3 3 22.1 20.6 31.2 22.1 10.2 11.5 9.1 323.3 -40.3 0.1Optimum Large Cap Growth I (OILGX) GR/LG 24.73 1 3 1 34.0 10.5 24.3 34.0 20.3 18.4 15.7 688.3 -52.1 0.0Osterweis Fund (OSTFX) GR/LB 20.42 2 3 3 23.1 13.4 24.6 23.1 15.0 12.8 10.1 306.7 -35.3 0.4PACE Small/Medium Co Gr Eq P (PCSGX) SC/SG 21.10 2 4 2 38.7 28.8 36.7 38.7 19.9 17.0 13.2 620.2 -53.9 0.0PGIM Jennison 20/20 Focus A (PTWAX) Y GR/LG 17.51 2 3 2 30.4 12.9 26.8 30.4 16.7 13.7 11.4 433.9 -47.1 0.0PGIM Jennison Blend Z (PEQZX) GR/LB 24.16 2 4 2 27.5 18.4 31.0 27.5 14.8 14.5 10.7 404.2 -49.3 0.5PGIM Jennison Diverse Grow A (TBDAX) Y GR/LG 16.81 1 ▲ 3 1 42.4 10.3 26.4 42.4 22.3 19.3 15.6 598.1 -44.1 0.0PGIM Jennison Focused Value A (PJIAX) Y GR/LB 15.70 5 4 ▼ 4 0.9 12.9 18.8 0.9 1.6 7.0 8.5 326.5 -50.2 0.8PGIM Jennison Growth Z (PJFZX) GR/LG 65.16 1 4 2 56.2 12.7 30.8 56.2 27.2 21.8 18.0 802.8 -44.4 0.0PGIM Jennison Mid-Cap Growth Z (PEGZX) GR/MG 26.54 1 4 2 42.7 22.0 37.4 42.7 21.7 18.1 14.1 596.5 -43.6 0.0PRIMECAP Odyssey Stock Fund (POSKX) GR/LB 35.14 3 3 3 10.0 17.4 26.8 10.0 9.1 13.0 12.9 494.2 -45.4 1.2
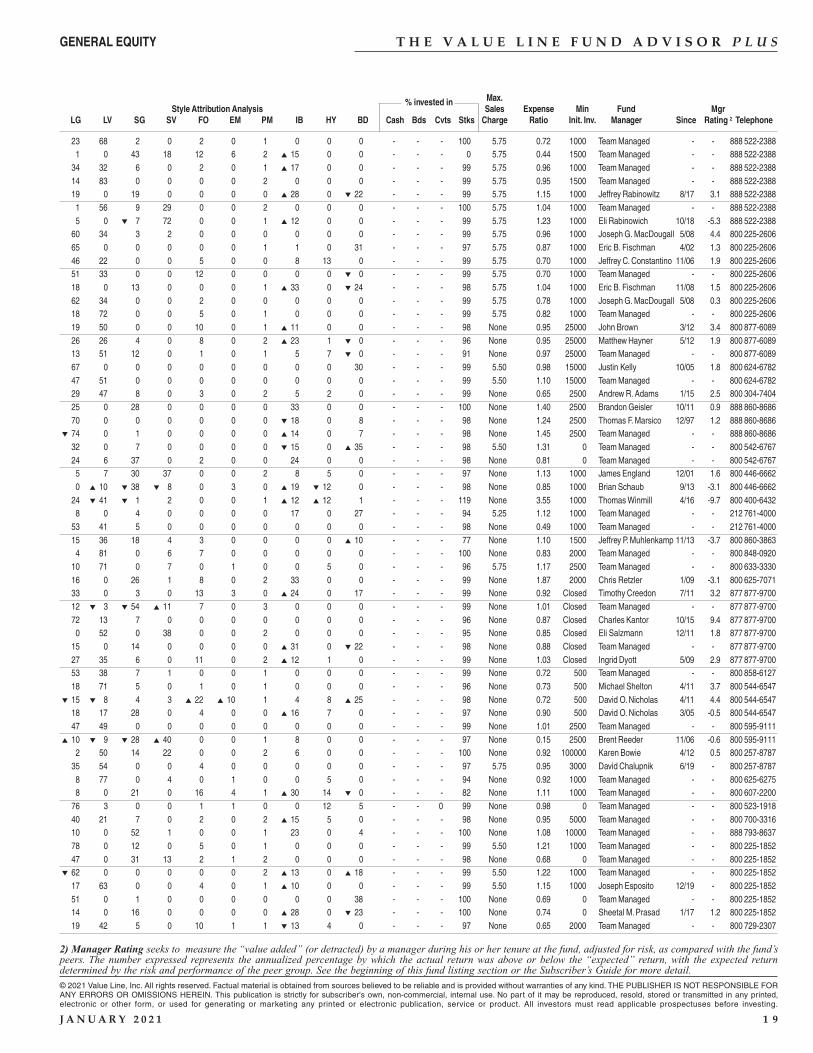
T H E V A L U E L I N E F U N D A D V I S O R P L U S
Max.Style Attribution Analysis
% invested inSales Expense Min Fund Mgr
LG LV SG SV FO EM PM IB HY BD Cash Bds Cvts Stks Charge Ratio Init. Inv. Manager Since Rating 2 Telephone
2) Manager Rating seeks to measure the “value added” (or detracted) by a manager during his or her tenure at the fund, adjusted for risk, as compared with the fund’speers. The number expressed represents the annualized percentage by which the actual return was above or below the “expected” return, with the expected returndetermined by the risk and performance of the peer group. See the beginning of this fund listing section or the Subscriber’s Guide for more detail.
© 2021 Value Line, Inc. All rights reserved. Factual material is obtained from sources believed to be reliable and is provided without warranties of any kind. THE PUBLISHER IS NOT RESPONSIBLE FORANY ERRORS OR OMISSIONS HEREIN. This publication is strictly for subscriber's own, non-commercial, internal use. No part of it may be reproduced, resold, stored or transmitted in any printed,electronic or other form, or used for generating or marketing any printed or electronic publication, service or product. All investors must read applicable prospectuses before investing.
J A N U A R Y 2 0 2 1 1 9
GENERAL EQUITY
23 68 2 0 2 0 1 0 0 0 - - - 100 5.75 0.72 1000 Team Managed - - 888 522-2388 1 0 43 18 12 6 2 ▲ 15 0 0 - - - 0 5.75 0.44 1500 Team Managed - - 888 522-2388 34 32 6 0 2 0 1 ▲ 17 0 0 - - - 99 5.75 0.96 1000 Team Managed - - 888 522-2388 14 83 0 0 0 0 2 0 0 0 - - - 99 5.75 0.95 1500 Team Managed - - 888 522-2388 19 0 19 0 0 0 0 ▲ 28 0 ▼ 22 - - - 99 5.75 1.15 1000 Jeffrey Rabinowitz 8/17 3.1 888 522-2388 1 56 9 29 0 0 2 0 0 0 - - - 100 5.75 1.04 1000 Team Managed - - 888 522-2388 5 0 ▼ 7 72 0 0 1 ▲ 12 0 0 - - - 99 5.75 1.23 1000 Eli Rabinowich 10/18 -5.3 888 522-2388 60 34 3 2 0 0 0 0 0 0 - - - 99 5.75 0.96 1000 Joseph G. MacDougall 5/08 4.4 800 225-2606 65 0 0 0 0 0 1 1 0 31 - - - 97 5.75 0.87 1000 Eric B. Fischman 4/02 1.3 800 225-2606 46 22 0 0 5 0 0 8 13 0 - - - 99 5.75 0.70 1000 Jeffrey C. Constantino 11/06 1.9 800 225-2606 51 33 0 0 12 0 0 0 0 ▼ 0 - - - 99 5.75 0.70 1000 Team Managed - - 800 225-2606 18 0 13 0 0 0 1 ▲ 33 0 ▼ 24 - - - 98 5.75 1.04 1000 Eric B. Fischman 11/08 1.5 800 225-2606 62 34 0 0 2 0 0 0 0 0 - - - 99 5.75 0.78 1000 Joseph G. MacDougall 5/08 0.3 800 225-2606 18 72 0 0 5 0 1 0 0 0 - - - 99 5.75 0.82 1000 Team Managed - - 800 225-2606 19 50 0 0 10 0 1 ▲ 11 0 0 - - - 98 None 0.95 25000 John Brown 3/12 3.4 800 877-6089 26 26 4 0 8 0 2 ▲ 23 1 ▼ 0 - - - 96 None 0.95 25000 Matthew Hayner 5/12 1.9 800 877-6089 13 51 12 0 1 0 1 5 7 ▼ 0 - - - 91 None 0.97 25000 Team Managed - - 800 877-6089 67 0 0 0 0 0 0 0 0 30 - - - 99 5.50 0.98 15000 Justin Kelly 10/05 1.8 800 624-6782 47 51 0 0 0 0 0 0 0 0 - - - 99 5.50 1.10 15000 Team Managed - - 800 624-6782 29 47 8 0 3 0 2 5 2 0 - - - 99 None 0.65 2500 Andrew R. Adams 1/15 2.5 800 304-7404 25 0 28 0 0 0 0 33 0 0 - - - 100 None 1.40 2500 Brandon Geisler 10/11 0.9 888 860-8686 70 0 0 0 0 0 0 ▼ 18 0 8 - - - 98 None 1.24 2500 Thomas F. Marsico 12/97 1.2 888 860-8686
▼ 74 0 1 0 0 0 0 ▲ 14 0 7 - - - 98 None 1.45 2500 Team Managed - - 888 860-8686 32 0 7 0 0 0 0 ▼ 15 0 ▲ 35 - - - 98 5.50 1.31 0 Team Managed - - 800 542-6767 24 6 37 0 2 0 0 24 0 0 - - - 98 None 0.81 0 Team Managed - - 800 542-6767 5 7 30 37 0 0 2 8 5 0 - - - 97 None 1.13 1000 James England 12/01 1.6 800 446-6662 0 ▲ 10 ▼ 38 ▼ 8 0 3 0 ▲ 19 ▼ 12 0 - - - 98 None 0.85 1000 Brian Schaub 9/13 -3.1 800 446-6662 24 ▼ 41 ▼ 1 2 0 0 1 ▲ 12 ▲ 12 1 - - - 119 None 3.55 1000 Thomas Winmill 4/16 -9.7 800 400-6432 8 0 4 0 0 0 0 17 0 27 - - - 94 5.25 1.12 1000 Team Managed - - 212 761-4000 53 41 5 0 0 0 0 0 0 0 - - - 98 None 0.49 1000 Team Managed - - 212 761-4000 15 36 18 4 3 0 0 0 0 ▲ 10 - - - 77 None 1.10 1500 Jeffrey P. Muhlenkamp 11/13 -3.7 800 860-3863 4 81 0 6 7 0 0 0 0 0 - - - 100 None 0.83 2000 Team Managed - - 800 848-0920 10 71 0 7 0 1 0 0 5 0 - - - 96 5.75 1.17 2500 Team Managed - - 800 633-3330 16 0 26 1 8 0 2 33 0 0 - - - 99 None 1.87 2000 Chris Retzler 1/09 -3.1 800 625-7071 33 0 3 0 13 3 0 ▲ 24 0 17 - - - 99 None 0.92 Closed Timothy Creedon 7/11 3.2 877 877-9700 12 ▼ 3 ▼ 54 ▲ 11 7 0 3 0 0 0 - - - 99 None 1.01 Closed Team Managed - - 877 877-9700 72 13 7 0 0 0 0 0 0 0 - - - 96 None 0.87 Closed Charles Kantor 10/15 9.4 877 877-9700 0 52 0 38 0 0 2 0 0 0 - - - 95 None 0.85 Closed Eli Salzmann 12/11 1.8 877 877-9700 15 0 14 0 0 0 0 ▲ 31 0 ▼ 22 - - - 98 None 0.88 Closed Team Managed - - 877 877-9700 27 35 6 0 11 0 2 ▲ 12 1 0 - - - 99 None 1.03 Closed Ingrid Dyott 5/09 2.9 877 877-9700 53 38 7 1 0 0 1 0 0 0 - - - 99 None 0.72 500 Team Managed - - 800 858-6127 18 71 5 0 1 0 1 0 0 0 - - - 96 None 0.73 500 Michael Shelton 4/11 3.7 800 544-6547
▼ 15 ▼ 8 4 3 ▲ 22 ▲ 10 1 4 8 ▲ 25 - - - 98 None 0.72 500 David O. Nicholas 4/11 4.4 800 544-6547 18 17 28 0 4 0 0 ▲ 16 7 0 - - - 97 None 0.90 500 David O. Nicholas 3/05 -0.5 800 544-6547 47 49 0 0 0 0 0 0 0 0 - - - 99 None 1.01 2500 Team Managed - - 800 595-9111
▲ 10 ▼ 9 ▼ 28 ▲ 40 0 0 1 8 0 0 - - - 97 None 0.15 2500 Brent Reeder 11/06 -0.6 800 595-9111 2 50 14 22 0 0 2 6 0 0 - - - 100 None 0.92 100000 Karen Bowie 4/12 0.5 800 257-8787 35 54 0 0 4 0 0 0 0 0 - - - 97 5.75 0.95 3000 David Chalupnik 6/19 - 800 257-8787 8 77 0 4 0 1 0 0 5 0 - - - 94 None 0.92 1000 Team Managed - - 800 625-6275 8 0 21 0 16 4 1 ▲ 30 14 ▼ 0 - - - 82 None 1.11 1000 Team Managed - - 800 607-2200 76 3 0 0 1 1 0 0 12 5 - - 0 99 None 0.98 0 Team Managed - - 800 523-1918 40 21 7 0 2 0 2 ▲ 15 5 0 - - - 98 None 0.95 5000 Team Managed - - 800 700-3316 10 0 52 1 0 0 1 23 0 4 - - - 100 None 1.08 10000 Team Managed - - 888 793-8637 78 0 12 0 5 0 1 0 0 0 - - - 99 5.50 1.21 1000 Team Managed - - 800 225-1852 47 0 31 13 2 1 2 0 0 0 - - - 98 None 0.68 0 Team Managed - - 800 225-1852
▼ 62 0 0 0 0 0 2 ▲ 13 0 ▲ 18 - - - 99 5.50 1.22 1000 Team Managed - - 800 225-1852 17 63 0 0 4 0 1 ▲ 10 0 0 - - - 99 5.50 1.15 1000 Joseph Esposito 12/19 - 800 225-1852 51 0 1 0 0 0 0 0 0 38 - - - 100 None 0.69 0 Team Managed - - 800 225-1852 14 0 16 0 0 0 0 ▲ 28 0 ▼ 23 - - - 100 None 0.74 0 Sheetal M. Prasad 1/17 1.2 800 225-1852 19 42 5 0 10 1 1 ▼ 13 4 0 - - - 97 None 0.65 2000 Team Managed - - 800 729-2307
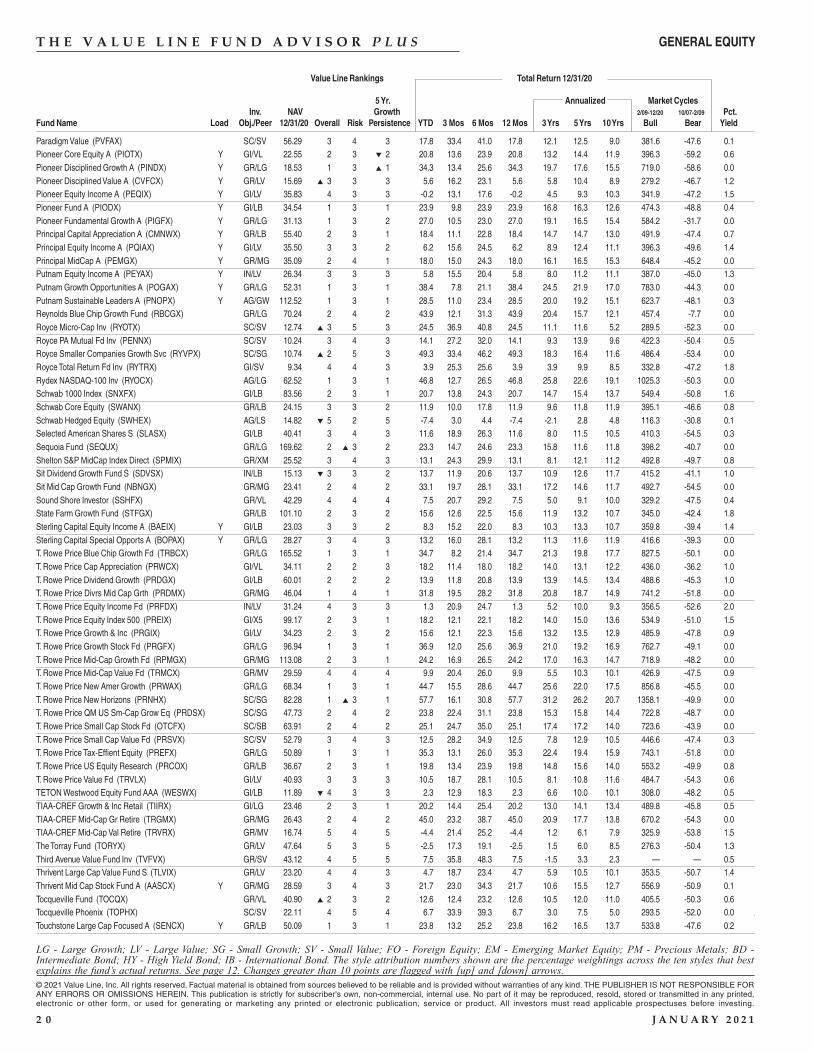
T H E V A L U E L I N E F U N D A D V I S O R P L U S
Value Line Rankings Total Return 12/31/20
5 Yr. Annualized Market CyclesInv. NAV Growth 2/09-12/20 10/07-2/09 Pct.
Fund Name Load Obj./Peer 12/31/20 Overall Risk Persistence YTD 3 Mos 6 Mos 12 Mos 3 Yrs 5 Yrs 10 Yrs Bull Bear Yield
© 2021 Value Line, Inc. All rights reserved. Factual material is obtained from sources believed to be reliable and is provided without warranties of any kind. THE PUBLISHER IS NOT RESPONSIBLE FORANY ERRORS OR OMISSIONS HEREIN. This publication is strictly for subscriber's own, non-commercial, internal use. No part of it may be reproduced, resold, stored or transmitted in any printed,electronic or other form, or used for generating or marketing any printed or electronic publication, service or product. All investors must read applicable prospectuses before investing.
2 0 J A N U A R Y 2 0 2 1
LG - Large Growth; LV - Large Value; SG - Small Growth; SV - Small Value; FO - Foreign Equity; EM - Emerging Market Equity; PM - Precious Metals; BD -Intermediate Bond; HY - High Yield Bond; IB - International Bond. The style attribution numbers shown are the percentage weightings across the ten styles that bestexplains the fund’s actual returns. See page 12. Changes greater than 10 points are flagged with [up] and [down] arrows.
GENERAL EQUITY
Paradigm Value (PVFAX) SC/SV 56.29 3 4 3 17.8 33.4 41.0 17.8 12.1 12.5 9.0 381.6 -47.6 0.1Pioneer Core Equity A (PIOTX) Y GI/VL 22.55 2 3 ▼ 2 20.8 13.6 23.9 20.8 13.2 14.4 11.9 396.3 -59.2 0.6Pioneer Disciplined Growth A (PINDX) Y GR/LG 18.53 1 3 ▲ 1 34.3 13.4 25.6 34.3 19.7 17.6 15.5 719.0 -58.6 0.0Pioneer Disciplined Value A (CVFCX) Y GR/LV 15.69 ▲ 3 3 3 5.6 16.2 23.1 5.6 5.8 10.4 8.9 279.2 -46.7 1.2Pioneer Equity Income A (PEQIX) Y GI/LV 35.83 4 3 3 -0.2 13.1 17.6 -0.2 4.5 9.3 10.3 341.9 -47.2 1.5Pioneer Fund A (PIODX) Y GI/LB 34.54 1 3 1 23.9 9.8 23.9 23.9 16.8 16.3 12.6 474.3 -48.8 0.4Pioneer Fundamental Growth A (PIGFX) Y GR/LG 31.13 1 3 2 27.0 10.5 23.0 27.0 19.1 16.5 15.4 584.2 -31.7 0.0Principal Capital Appreciation A (CMNWX) Y GR/LB 55.40 2 3 1 18.4 11.1 22.8 18.4 14.7 14.7 13.0 491.9 -47.4 0.7Principal Equity Income A (PQIAX) Y GI/LV 35.50 3 3 2 6.2 15.6 24.5 6.2 8.9 12.4 11.1 396.3 -49.6 1.4Principal MidCap A (PEMGX) Y GR/MG 35.09 2 4 1 18.0 15.0 24.3 18.0 16.1 16.5 15.3 648.4 -45.2 0.0Putnam Equity Income A (PEYAX) Y IN/LV 26.34 3 3 3 5.8 15.5 20.4 5.8 8.0 11.2 11.1 387.0 -45.0 1.3Putnam Growth Opportunities A (POGAX) Y GR/LG 52.31 1 3 1 38.4 7.8 21.1 38.4 24.5 21.9 17.0 783.0 -44.3 0.0Putnam Sustainable Leaders A (PNOPX) Y AG/GW 112.52 1 3 1 28.5 11.0 23.4 28.5 20.0 19.2 15.1 623.7 -48.1 0.3Reynolds Blue Chip Growth Fund (RBCGX) GR/LG 70.24 2 4 2 43.9 12.1 31.3 43.9 20.4 15.7 12.1 457.4 -7.7 0.0Royce Micro-Cap Inv (RYOTX) SC/SV 12.74 ▲ 3 5 3 24.5 36.9 40.8 24.5 11.1 11.6 5.2 289.5 -52.3 0.0Royce PA Mutual Fd Inv (PENNX) SC/SV 10.24 3 4 3 14.1 27.2 32.0 14.1 9.3 13.9 9.6 422.3 -50.4 0.5Royce Smaller Companies Growth Svc (RYVPX) SC/SG 10.74 ▲ 2 5 3 49.3 33.4 46.2 49.3 18.3 16.4 11.6 486.4 -53.4 0.0Royce Total Return Fd Inv (RYTRX) GI/SV 9.34 4 4 3 3.9 25.3 25.6 3.9 3.9 9.9 8.5 332.8 -47.2 1.8Rydex NASDAQ-100 Inv (RYOCX) AG/LG 62.52 1 3 1 46.8 12.7 26.5 46.8 25.8 22.6 19.1 1025.3 -50.3 0.0Schwab 1000 Index (SNXFX) GI/LB 83.56 2 3 1 20.7 13.8 24.3 20.7 14.7 15.4 13.7 549.4 -50.8 1.6Schwab Core Equity (SWANX) GR/LB 24.15 3 3 2 11.9 10.0 17.8 11.9 9.6 11.8 11.9 395.1 -46.6 0.8Schwab Hedged Equity (SWHEX) AG/LS 14.82 ▼ 5 2 5 -7.4 3.0 4.4 -7.4 -2.1 2.8 4.8 116.3 -30.8 0.1Selected American Shares S (SLASX) GI/LB 40.41 3 4 3 11.6 18.9 26.3 11.6 8.0 11.5 10.5 410.3 -54.5 0.3Sequoia Fund (SEQUX) GR/LG 169.62 2 ▲ 3 2 23.3 14.7 24.6 23.3 15.8 11.6 11.8 398.2 -40.7 0.0Shelton S&P MidCap Index Direct (SPMIX) GR/XM 25.52 3 4 3 13.1 24.3 29.9 13.1 8.1 12.1 11.2 492.8 -49.7 0.8Sit Dividend Growth Fund S (SDVSX) IN/LB 15.13 ▼ 3 3 2 13.7 11.9 20.6 13.7 10.9 12.6 11.7 415.2 -41.1 1.0Sit Mid Cap Growth Fund (NBNGX) GR/MG 23.41 2 4 2 33.1 19.7 28.1 33.1 17.2 14.6 11.7 492.7 -54.5 0.0Sound Shore Investor (SSHFX) GR/VL 42.29 4 4 4 7.5 20.7 29.2 7.5 5.0 9.1 10.0 329.2 -47.5 0.4State Farm Growth Fund (STFGX) GR/LB 101.10 2 3 2 15.6 12.6 22.5 15.6 11.9 13.2 10.7 345.0 -42.4 1.8Sterling Capital Equity Income A (BAEIX) Y GI/LB 23.03 3 3 2 8.3 15.2 22.0 8.3 10.3 13.3 10.7 359.8 -39.4 1.4Sterling Capital Special Opports A (BOPAX) Y GR/LG 28.27 3 4 3 13.2 16.0 28.1 13.2 11.3 11.6 11.9 416.6 -39.3 0.0T. Rowe Price Blue Chip Growth Fd (TRBCX) GR/LG 165.52 1 3 1 34.7 8.2 21.4 34.7 21.3 19.8 17.7 827.5 -50.1 0.0T. Rowe Price Cap Appreciation (PRWCX) GI/VL 34.11 2 2 3 18.2 11.4 18.0 18.2 14.0 13.1 12.2 436.0 -36.2 1.0T. Rowe Price Dividend Growth (PRDGX) GI/LB 60.01 2 2 2 13.9 11.8 20.8 13.9 13.9 14.5 13.4 488.6 -45.3 1.0T. Rowe Price Divrs Mid Cap Grth (PRDMX) GR/MG 46.04 1 4 1 31.8 19.5 28.2 31.8 20.8 18.7 14.9 741.2 -51.8 0.0T. Rowe Price Equity Income Fd (PRFDX) IN/LV 31.24 4 3 3 1.3 20.9 24.7 1.3 5.2 10.0 9.3 356.5 -52.6 2.0T. Rowe Price Equity Index 500 (PREIX) GI/X5 99.17 2 3 1 18.2 12.1 22.1 18.2 14.0 15.0 13.6 534.9 -51.0 1.5T. Rowe Price Growth & Inc (PRGIX) GI/LV 34.23 2 3 2 15.6 12.1 22.3 15.6 13.2 13.5 12.9 485.9 -47.8 0.9T. Rowe Price Growth Stock Fd (PRGFX) GR/LG 96.94 1 3 1 36.9 12.0 25.6 36.9 21.0 19.2 16.9 762.7 -49.1 0.0T. Rowe Price Mid-Cap Growth Fd (RPMGX) GR/MG 113.08 2 3 1 24.2 16.9 26.5 24.2 17.0 16.3 14.7 718.9 -48.2 0.0T. Rowe Price Mid-Cap Value Fd (TRMCX) GR/MV 29.59 4 4 4 9.9 20.4 26.0 9.9 5.5 10.3 10.1 426.9 -47.5 0.9T. Rowe Price New Amer Growth (PRWAX) GR/LG 68.34 1 3 1 44.7 15.5 28.6 44.7 25.6 22.0 17.5 856.8 -45.5 0.0T. Rowe Price New Horizons (PRNHX) SC/SG 82.28 1 ▲ 3 1 57.7 16.1 30.8 57.7 31.2 26.2 20.7 1358.1 -49.9 0.0T. Rowe Price QM US Sm-Cap Grow Eq (PRDSX) SC/SG 47.73 2 4 2 23.8 22.4 31.1 23.8 15.3 15.8 14.4 722.8 -48.7 0.0T. Rowe Price Small Cap Stock Fd (OTCFX) SC/SB 63.91 2 4 2 25.1 24.7 35.0 25.1 17.4 17.2 14.0 723.6 -43.9 0.0T. Rowe Price Small Cap Value Fd (PRSVX) SC/SV 52.79 3 4 3 12.5 28.2 34.9 12.5 7.8 12.9 10.5 446.6 -47.4 0.3T. Rowe Price Tax-Effient Equity (PREFX) GR/LG 50.89 1 3 1 35.3 13.1 26.0 35.3 22.4 19.4 15.9 743.1 -51.8 0.0T. Rowe Price US Equity Research (PRCOX) GR/LB 36.67 2 3 1 19.8 13.4 23.9 19.8 14.8 15.6 14.0 553.2 -49.9 0.8T. Rowe Price Value Fd (TRVLX) GI/LV 40.93 3 3 3 10.5 18.7 28.1 10.5 8.1 10.8 11.6 484.7 -54.3 0.6TETON Westwood Equity Fund AAA (WESWX) GI/LB 11.89 ▼ 4 3 3 2.3 12.9 18.3 2.3 6.6 10.0 10.1 308.0 -48.2 0.5TIAA-CREF Growth & Inc Retail (TIIRX) GI/LG 23.46 2 3 1 20.2 14.4 25.4 20.2 13.0 14.1 13.4 489.8 -45.8 0.5TIAA-CREF Mid-Cap Gr Retire (TRGMX) GR/MG 26.43 2 4 2 45.0 23.2 38.7 45.0 20.9 17.7 13.8 670.2 -54.3 0.0TIAA-CREF Mid-Cap Val Retire (TRVRX) GR/MV 16.74 5 4 5 -4.4 21.4 25.2 -4.4 1.2 6.1 7.9 325.9 -53.8 1.5The Torray Fund (TORYX) GR/LV 47.64 5 3 5 -2.5 17.3 19.1 -2.5 1.5 6.0 8.5 276.3 -50.4 1.3Third Avenue Value Fund Inv (TVFVX) GR/SV 43.12 4 5 5 7.5 35.8 48.3 7.5 -1.5 3.3 2.3 — — 0.5Thrivent Large Cap Value Fund S (TLVIX) GR/LV 23.20 4 4 3 4.7 18.7 23.4 4.7 5.9 10.5 10.1 353.5 -50.7 1.4Thrivent Mid Cap Stock Fund A (AASCX) Y GR/MG 28.59 3 4 3 21.7 23.0 34.3 21.7 10.6 15.5 12.7 556.9 -50.9 0.1Tocqueville Fund (TOCQX) GR/VL 40.90 ▲ 2 3 2 12.6 12.4 23.2 12.6 10.5 12.0 11.0 405.5 -50.3 0.6Tocqueville Phoenix (TOPHX) SC/SV 22.11 4 5 4 6.7 33.9 39.3 6.7 3.0 7.5 5.0 293.5 -52.0 0.0Touchstone Large Cap Focused A (SENCX) Y GR/LB 50.09 1 3 1 23.8 13.2 25.2 23.8 16.2 16.5 13.7 533.8 -47.6 0.2
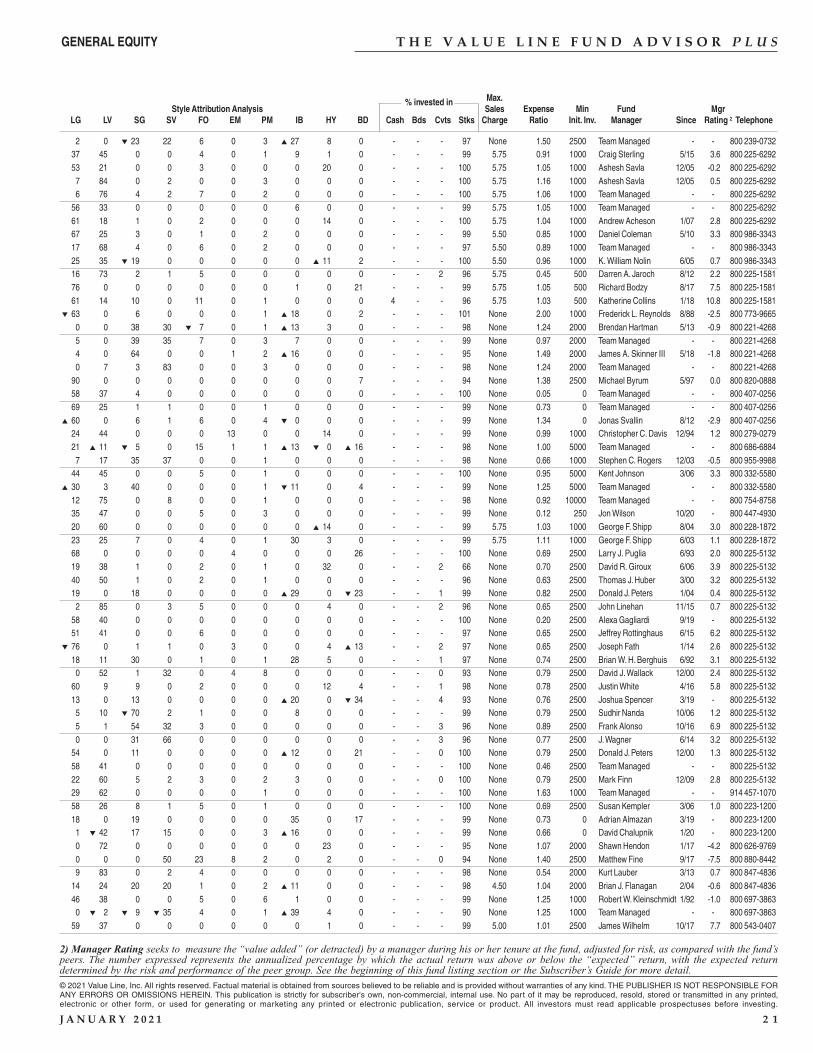
T H E V A L U E L I N E F U N D A D V I S O R P L U S
Max.Style Attribution Analysis
% invested inSales Expense Min Fund Mgr
LG LV SG SV FO EM PM IB HY BD Cash Bds Cvts Stks Charge Ratio Init. Inv. Manager Since Rating 2 Telephone
2) Manager Rating seeks to measure the “value added” (or detracted) by a manager during his or her tenure at the fund, adjusted for risk, as compared with the fund’speers. The number expressed represents the annualized percentage by which the actual return was above or below the “expected” return, with the expected returndetermined by the risk and performance of the peer group. See the beginning of this fund listing section or the Subscriber’s Guide for more detail.
© 2021 Value Line, Inc. All rights reserved. Factual material is obtained from sources believed to be reliable and is provided without warranties of any kind. THE PUBLISHER IS NOT RESPONSIBLE FORANY ERRORS OR OMISSIONS HEREIN. This publication is strictly for subscriber's own, non-commercial, internal use. No part of it may be reproduced, resold, stored or transmitted in any printed,electronic or other form, or used for generating or marketing any printed or electronic publication, service or product. All investors must read applicable prospectuses before investing.
J A N U A R Y 2 0 2 1 2 1
GENERAL EQUITY
2 0 ▼ 23 22 6 0 3 ▲ 27 8 0 - - - 97 None 1.50 2500 Team Managed - - 800 239-0732 37 45 0 0 4 0 1 9 1 0 - - - 99 5.75 0.91 1000 Craig Sterling 5/15 3.6 800 225-6292 53 21 0 0 3 0 0 0 20 0 - - - 100 5.75 1.05 1000 Ashesh Savla 12/05 -0.2 800 225-6292 7 84 0 2 0 0 3 0 0 0 - - - 100 5.75 1.16 1000 Ashesh Savla 12/05 0.5 800 225-6292 6 76 4 2 7 0 2 0 0 0 - - - 100 5.75 1.06 1000 Team Managed - - 800 225-6292 56 33 0 0 0 0 0 6 0 0 - - - 99 5.75 1.05 1000 Team Managed - - 800 225-6292 61 18 1 0 2 0 0 0 14 0 - - - 100 5.75 1.04 1000 Andrew Acheson 1/07 2.8 800 225-6292 67 25 3 0 1 0 2 0 0 0 - - - 99 5.50 0.85 1000 Daniel Coleman 5/10 3.3 800 986-3343 17 68 4 0 6 0 2 0 0 0 - - - 97 5.50 0.89 1000 Team Managed - - 800 986-3343 25 35 ▼ 19 0 0 0 0 0 ▲ 11 2 - - - 100 5.50 0.96 1000 K. William Nolin 6/05 0.7 800 986-3343 16 73 2 1 5 0 0 0 0 0 - - 2 96 5.75 0.45 500 Darren A. Jaroch 8/12 2.2 800 225-1581 76 0 0 0 0 0 0 1 0 21 - - - 99 5.75 1.05 500 Richard Bodzy 8/17 7.5 800 225-1581 61 14 10 0 11 0 1 0 0 0 4 - - 96 5.75 1.03 500 Katherine Collins 1/18 10.8 800 225-1581
▼ 63 0 6 0 0 0 1 ▲ 18 0 2 - - - 101 None 2.00 1000 Frederick L. Reynolds 8/88 -2.5 800 773-9665 0 0 38 30 ▼ 7 0 1 ▲ 13 3 0 - - - 98 None 1.24 2000 Brendan Hartman 5/13 -0.9 800 221-4268 5 0 39 35 7 0 3 7 0 0 - - - 99 None 0.97 2000 Team Managed - - 800 221-4268 4 0 64 0 0 1 2 ▲ 16 0 0 - - - 95 None 1.49 2000 James A. Skinner III 5/18 -1.8 800 221-4268 0 7 3 83 0 0 3 0 0 0 - - - 98 None 1.24 2000 Team Managed - - 800 221-4268 90 0 0 0 0 0 0 0 0 7 - - - 94 None 1.38 2500 Michael Byrum 5/97 0.0 800 820-0888 58 37 4 0 0 0 0 0 0 0 - - - 100 None 0.05 0 Team Managed - - 800 407-0256 69 25 1 1 0 0 1 0 0 0 - - - 99 None 0.73 0 Team Managed - - 800 407-0256
▲ 60 0 6 1 6 0 4 ▼ 0 0 0 - - - 99 None 1.34 0 Jonas Svallin 8/12 -2.9 800 407-0256 24 44 0 0 0 13 0 0 14 0 - - - 99 None 0.99 1000 Christopher C. Davis 12/94 1.2 800 279-0279 21 ▲ 11 ▼ 5 0 15 1 1 ▲ 13 ▼ 0 ▲ 16 - - - 98 None 1.00 5000 Team Managed - - 800 686-6884 7 17 35 37 0 0 1 0 0 0 - - - 98 None 0.66 1000 Stephen C. Rogers 12/03 -0.5 800 955-9988 44 45 0 0 5 0 1 0 0 0 - - - 100 None 0.95 5000 Kent Johnson 3/06 3.3 800 332-5580
▲ 30 3 40 0 0 0 1 ▼ 11 0 4 - - - 99 None 1.25 5000 Team Managed - - 800 332-5580 12 75 0 8 0 0 1 0 0 0 - - - 98 None 0.92 10000 Team Managed - - 800 754-8758 35 47 0 0 5 0 3 0 0 0 - - - 99 None 0.12 250 Jon Wilson 10/20 - 800 447-4930 20 60 0 0 0 0 0 0 ▲ 14 0 - - - 99 5.75 1.03 1000 George F. Shipp 8/04 3.0 800 228-1872 23 25 7 0 4 0 1 30 3 0 - - - 99 5.75 1.11 1000 George F. Shipp 6/03 1.1 800 228-1872 68 0 0 0 0 4 0 0 0 26 - - - 100 None 0.69 2500 Larry J. Puglia 6/93 2.0 800 225-5132 19 38 1 0 2 0 1 0 32 0 - - 2 66 None 0.70 2500 David R. Giroux 6/06 3.9 800 225-5132 40 50 1 0 2 0 1 0 0 0 - - - 96 None 0.63 2500 Thomas J. Huber 3/00 3.2 800 225-5132 19 0 18 0 0 0 0 ▲ 29 0 ▼ 23 - - 1 99 None 0.82 2500 Donald J. Peters 1/04 0.4 800 225-5132 2 85 0 3 5 0 0 0 4 0 - - 2 96 None 0.65 2500 John Linehan 11/15 0.7 800 225-5132 58 40 0 0 0 0 0 0 0 0 - - - 100 None 0.20 2500 Alexa Gagliardi 9/19 - 800 225-5132 51 41 0 0 6 0 0 0 0 0 - - - 97 None 0.65 2500 Jeffrey Rottinghaus 6/15 6.2 800 225-5132
▼ 76 0 1 1 0 3 0 0 4 ▲ 13 - - 2 97 None 0.65 2500 Joseph Fath 1/14 2.6 800 225-5132 18 11 30 0 1 0 1 28 5 0 - - 1 97 None 0.74 2500 Brian W. H. Berghuis 6/92 3.1 800 225-5132 0 52 1 32 0 4 8 0 0 0 - - 0 93 None 0.79 2500 David J. Wallack 12/00 2.4 800 225-5132 60 9 9 0 2 0 0 0 12 4 - - 1 98 None 0.78 2500 Justin White 4/16 5.8 800 225-5132 13 0 13 0 0 0 0 ▲ 20 0 ▼ 34 - - 4 93 None 0.76 2500 Joshua Spencer 3/19 - 800 225-5132 5 10 ▼ 70 2 1 0 0 8 0 0 - - - 99 None 0.79 2500 Sudhir Nanda 10/06 1.2 800 225-5132 5 1 54 32 3 0 0 0 0 0 - - 3 96 None 0.89 2500 Frank Alonso 10/16 6.9 800 225-5132 0 0 31 66 0 0 0 0 0 0 - - 3 96 None 0.77 2500 J. Wagner 6/14 3.2 800 225-5132 54 0 11 0 0 0 0 ▲ 12 0 21 - - 0 100 None 0.79 2500 Donald J. Peters 12/00 1.3 800 225-5132 58 41 0 0 0 0 0 0 0 0 - - - 100 None 0.46 2500 Team Managed - - 800 225-5132 22 60 5 2 3 0 2 3 0 0 - - 0 100 None 0.79 2500 Mark Finn 12/09 2.8 800 225-5132 29 62 0 0 0 0 1 0 0 0 - - - 100 None 1.63 1000 Team Managed - - 914 457-1070 58 26 8 1 5 0 1 0 0 0 - - - 100 None 0.69 2500 Susan Kempler 3/06 1.0 800 223-1200 18 0 19 0 0 0 0 35 0 17 - - - 99 None 0.73 0 Adrian Almazan 3/19 - 800 223-1200 1 ▼ 42 17 15 0 0 3 ▲ 16 0 0 - - - 99 None 0.66 0 David Chalupnik 1/20 - 800 223-1200 0 72 0 0 0 0 0 0 23 0 - - - 95 None 1.07 2000 Shawn Hendon 1/17 -4.2 800 626-9769 0 0 0 50 23 8 2 0 2 0 - - 0 94 None 1.40 2500 Matthew Fine 9/17 -7.5 800 880-8442 9 83 0 2 4 0 0 0 0 0 - - - 98 None 0.54 2000 Kurt Lauber 3/13 0.7 800 847-4836 14 24 20 20 1 0 2 ▲ 11 0 0 - - - 98 4.50 1.04 2000 Brian J. Flanagan 2/04 -0.6 800 847-4836 46 38 0 0 5 0 6 1 0 0 - - - 99 None 1.25 1000 Robert W. Kleinschmidt 1/92 -1.0 800 697-3863 0 ▼ 2 ▼ 9 ▼ 35 4 0 1 ▲ 39 4 0 - - - 90 None 1.25 1000 Team Managed - - 800 697-3863 59 37 0 0 0 0 0 0 1 0 - - - 99 5.00 1.01 2500 James Wilhelm 10/17 7.7 800 543-0407
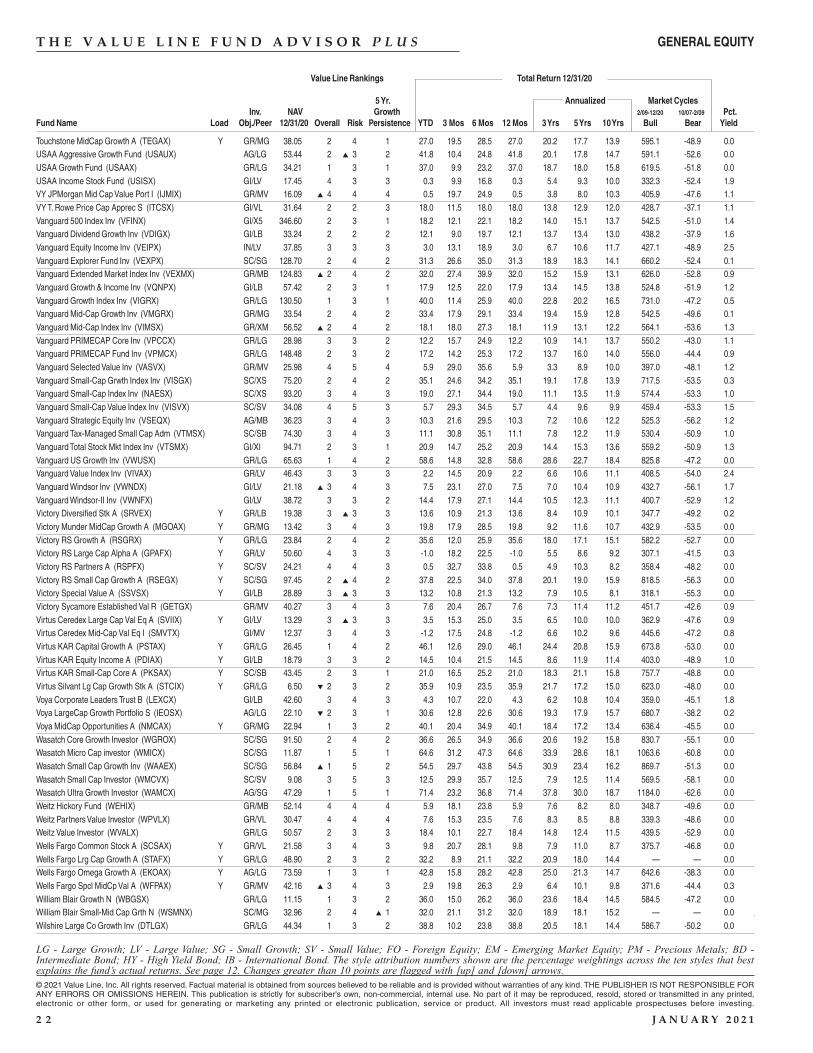
T H E V A L U E L I N E F U N D A D V I S O R P L U S
Value Line Rankings Total Return 12/31/20
5 Yr. Annualized Market CyclesInv. NAV Growth 2/09-12/20 10/07-2/09 Pct.
Fund Name Load Obj./Peer 12/31/20 Overall Risk Persistence YTD 3 Mos 6 Mos 12 Mos 3 Yrs 5 Yrs 10 Yrs Bull Bear Yield
© 2021 Value Line, Inc. All rights reserved. Factual material is obtained from sources believed to be reliable and is provided without warranties of any kind. THE PUBLISHER IS NOT RESPONSIBLE FORANY ERRORS OR OMISSIONS HEREIN. This publication is strictly for subscriber's own, non-commercial, internal use. No part of it may be reproduced, resold, stored or transmitted in any printed,electronic or other form, or used for generating or marketing any printed or electronic publication, service or product. All investors must read applicable prospectuses before investing.
2 2 J A N U A R Y 2 0 2 1
LG - Large Growth; LV - Large Value; SG - Small Growth; SV - Small Value; FO - Foreign Equity; EM - Emerging Market Equity; PM - Precious Metals; BD -Intermediate Bond; HY - High Yield Bond; IB - International Bond. The style attribution numbers shown are the percentage weightings across the ten styles that bestexplains the fund’s actual returns. See page 12. Changes greater than 10 points are flagged with [up] and [down] arrows.
GENERAL EQUITY
Touchstone MidCap Growth A (TEGAX) Y GR/MG 38.05 2 4 1 27.0 19.5 28.5 27.0 20.2 17.7 13.9 595.1 -48.9 0.0USAA Aggressive Growth Fund (USAUX) AG/LG 53.44 2 ▲ 3 2 41.8 10.4 24.8 41.8 20.1 17.8 14.7 591.1 -52.6 0.0USAA Growth Fund (USAAX) GR/LG 34.21 1 3 1 37.0 9.9 23.2 37.0 18.7 18.0 15.8 619.5 -51.8 0.0USAA Income Stock Fund (USISX) GI/LV 17.45 4 3 3 0.3 9.9 16.8 0.3 5.4 9.3 10.0 332.3 -52.4 1.9VY JPMorgan Mid Cap Value Port I (IJMIX) GR/MV 16.09 ▲ 4 4 4 0.5 19.7 24.9 0.5 3.8 8.0 10.3 405.9 -47.6 1.1VY T. Rowe Price Cap Apprec S (ITCSX) GI/VL 31.64 2 2 3 18.0 11.5 18.0 18.0 13.8 12.9 12.0 428.7 -37.1 1.1Vanguard 500 Index Inv (VFINX) GI/X5 346.60 2 3 1 18.2 12.1 22.1 18.2 14.0 15.1 13.7 542.5 -51.0 1.4Vanguard Dividend Growth Inv (VDIGX) GI/LB 33.24 2 2 2 12.1 9.0 19.7 12.1 13.7 13.4 13.0 438.2 -37.9 1.6Vanguard Equity Income Inv (VEIPX) IN/LV 37.85 3 3 3 3.0 13.1 18.9 3.0 6.7 10.6 11.7 427.1 -48.9 2.5Vanguard Explorer Fund Inv (VEXPX) SC/SG 128.70 2 4 2 31.3 26.6 35.0 31.3 18.9 18.3 14.1 660.2 -52.4 0.1Vanguard Extended Market Index Inv (VEXMX) GR/MB 124.83 ▲ 2 4 2 32.0 27.4 39.9 32.0 15.2 15.9 13.1 626.0 -52.8 0.9Vanguard Growth & Income Inv (VQNPX) GI/LB 57.42 2 3 1 17.9 12.5 22.0 17.9 13.4 14.5 13.8 524.8 -51.9 1.2Vanguard Growth Index Inv (VIGRX) GR/LG 130.50 1 3 1 40.0 11.4 25.9 40.0 22.8 20.2 16.5 731.0 -47.2 0.5Vanguard Mid-Cap Growth Inv (VMGRX) GR/MG 33.54 2 4 2 33.4 17.9 29.1 33.4 19.4 15.9 12.8 542.5 -49.6 0.1Vanguard Mid-Cap Index Inv (VIMSX) GR/XM 56.52 ▲ 2 4 2 18.1 18.0 27.3 18.1 11.9 13.1 12.2 564.1 -53.6 1.3Vanguard PRIMECAP Core Inv (VPCCX) GR/LG 28.98 3 3 2 12.2 15.7 24.9 12.2 10.9 14.1 13.7 550.2 -43.0 1.1Vanguard PRIMECAP Fund Inv (VPMCX) GR/LG 148.48 2 3 2 17.2 14.2 25.3 17.2 13.7 16.0 14.0 556.0 -44.4 0.9Vanguard Selected Value Inv (VASVX) GR/MV 25.98 4 5 4 5.9 29.0 35.6 5.9 3.3 8.9 10.0 397.0 -48.1 1.2Vanguard Small-Cap Grwth Index Inv (VISGX) SC/XS 75.20 2 4 2 35.1 24.6 34.2 35.1 19.1 17.8 13.9 717.5 -53.5 0.3Vanguard Small-Cap Index Inv (NAESX) SC/XS 93.20 3 4 3 19.0 27.1 34.4 19.0 11.1 13.5 11.9 574.4 -53.3 1.0Vanguard Small-Cap Value Index Inv (VISVX) SC/SV 34.08 4 5 3 5.7 29.3 34.5 5.7 4.4 9.6 9.9 459.4 -53.3 1.5Vanguard Strategic Equity Inv (VSEQX) AG/MB 36.23 3 4 3 10.3 21.6 29.5 10.3 7.2 10.6 12.2 525.3 -56.2 1.2Vanguard Tax-Managed Small Cap Adm (VTMSX) SC/SB 74.30 3 4 3 11.1 30.8 35.1 11.1 7.8 12.2 11.9 530.4 -50.9 1.0Vanguard Total Stock Mkt Index Inv (VTSMX) GI/XI 94.71 2 3 1 20.9 14.7 25.2 20.9 14.4 15.3 13.6 559.2 -50.9 1.3Vanguard US Growth Inv (VWUSX) GR/LG 65.63 1 4 2 58.6 14.8 32.8 58.6 28.6 22.7 18.4 825.8 -47.2 0.0Vanguard Value Index Inv (VIVAX) GR/LV 46.43 3 3 3 2.2 14.5 20.9 2.2 6.6 10.6 11.1 408.5 -54.0 2.4Vanguard Windsor Inv (VWNDX) GI/LV 21.18 ▲ 3 4 3 7.5 23.1 27.0 7.5 7.0 10.4 10.9 432.7 -56.1 1.7Vanguard Windsor-II Inv (VWNFX) GI/LV 38.72 3 3 2 14.4 17.9 27.1 14.4 10.5 12.3 11.1 400.7 -52.9 1.2Victory Diversified Stk A (SRVEX) Y GR/LB 19.38 3 ▲ 3 3 13.6 10.9 21.3 13.6 8.4 10.9 10.1 347.7 -49.2 0.2Victory Munder MidCap Growth A (MGOAX) Y GR/MG 13.42 3 4 3 19.8 17.9 28.5 19.8 9.2 11.6 10.7 432.9 -53.5 0.0Victory RS Growth A (RSGRX) Y GR/LG 23.84 2 4 2 35.6 12.0 25.9 35.6 18.0 17.1 15.1 582.2 -52.7 0.0Victory RS Large Cap Alpha A (GPAFX) Y GR/LV 50.60 4 3 3 -1.0 18.2 22.5 -1.0 5.5 8.6 9.2 307.1 -41.5 0.3Victory RS Partners A (RSPFX) Y SC/SV 24.21 4 4 3 0.5 32.7 33.8 0.5 4.9 10.3 8.2 358.4 -48.2 0.0Victory RS Small Cap Growth A (RSEGX) Y SC/SG 97.45 2 ▲ 4 2 37.8 22.5 34.0 37.8 20.1 19.0 15.9 818.5 -56.3 0.0Victory Special Value A (SSVSX) Y GI/LB 28.89 3 ▲ 3 3 13.2 10.8 21.3 13.2 7.9 10.5 8.1 318.1 -55.3 0.0Victory Sycamore Established Val R (GETGX) GR/MV 40.27 3 4 3 7.6 20.4 26.7 7.6 7.3 11.4 11.2 451.7 -42.6 0.9Virtus Ceredex Large Cap Val Eq A (SVIIX) Y GI/LV 13.29 3 ▲ 3 3 3.5 15.3 25.0 3.5 6.5 10.0 10.0 362.9 -47.6 0.9Virtus Ceredex Mid-Cap Val Eq I (SMVTX) GI/MV 12.37 3 4 3 -1.2 17.5 24.8 -1.2 6.6 10.2 9.6 445.6 -47.2 0.8Virtus KAR Capital Growth A (PSTAX) Y GR/LG 26.45 1 4 2 46.1 12.6 29.0 46.1 24.4 20.8 15.9 673.8 -53.0 0.0Virtus KAR Equity Income A (PDIAX) Y GI/LB 18.79 3 3 2 14.5 10.4 21.5 14.5 8.6 11.9 11.4 403.0 -48.9 1.0Virtus KAR Small-Cap Core A (PKSAX) Y SC/SB 43.45 2 3 1 21.0 16.5 25.2 21.0 18.3 21.1 15.8 757.7 -48.8 0.0Virtus Silvant Lg Cap Growth Stk A (STCIX) Y GR/LG 6.50 ▼ 2 3 2 35.9 10.9 23.5 35.9 21.7 17.2 15.0 623.0 -48.0 0.0Voya Corporate Leaders Trust B (LEXCX) GI/LB 42.60 3 4 3 4.3 10.7 22.0 4.3 6.2 10.8 10.4 359.0 -45.1 1.8Voya LargeCap Growth Portfolio S (IEOSX) AG/LG 22.10 ▼ 2 3 1 30.6 12.8 22.6 30.6 19.3 17.9 15.7 680.7 -38.2 0.2Voya MidCap Opportunities A (NMCAX) Y GR/MG 22.94 1 3 2 40.1 20.4 34.9 40.1 18.4 17.2 13.4 636.4 -45.5 0.0Wasatch Core Growth Investor (WGROX) SC/SG 91.50 2 4 2 36.6 26.5 34.9 36.6 20.6 19.2 15.8 830.7 -55.1 0.0Wasatch Micro Cap investor (WMICX) SC/SG 11.87 1 5 1 64.6 31.2 47.3 64.6 33.9 28.6 18.1 1063.6 -60.8 0.0Wasatch Small Cap Growth Inv (WAAEX) SC/SG 56.84 ▲ 1 5 2 54.5 29.7 43.8 54.5 30.9 23.4 16.2 869.7 -51.3 0.0Wasatch Small Cap Investor (WMCVX) SC/SV 9.08 3 5 3 12.5 29.9 35.7 12.5 7.9 12.5 11.4 569.5 -58.1 0.0Wasatch Ultra Growth Investor (WAMCX) AG/SG 47.29 1 5 1 71.4 23.2 36.8 71.4 37.8 30.0 18.7 1184.0 -62.6 0.0Weitz Hickory Fund (WEHIX) GR/MB 52.14 4 4 4 5.9 18.1 23.8 5.9 7.6 8.2 8.0 348.7 -49.6 0.0Weitz Partners Value Investor (WPVLX) GR/VL 30.47 4 4 4 7.6 15.3 23.5 7.6 8.3 8.5 8.8 339.3 -48.6 0.0Weitz Value Investor (WVALX) GR/LG 50.57 2 3 3 18.4 10.1 22.7 18.4 14.8 12.4 11.5 439.5 -52.9 0.0Wells Fargo Common Stock A (SCSAX) Y GR/VL 21.58 3 4 3 9.8 20.7 28.1 9.8 7.9 11.0 8.7 375.7 -46.8 0.0Wells Fargo Lrg Cap Growth A (STAFX) Y GR/LG 48.90 2 3 2 32.2 8.9 21.1 32.2 20.9 18.0 14.4 — — 0.0Wells Fargo Omega Growth A (EKOAX) Y AG/LG 73.59 1 3 1 42.8 15.8 28.2 42.8 25.0 21.3 14.7 642.6 -38.3 0.0Wells Fargo Spcl MidCp Val A (WFPAX) Y GR/MV 42.16 ▲ 3 4 3 2.9 19.8 26.3 2.9 6.4 10.1 9.8 371.6 -44.4 0.3William Blair Growth N (WBGSX) GR/LG 11.15 1 3 2 36.0 15.0 26.2 36.0 23.6 18.4 14.5 584.5 -47.2 0.0William Blair Small-Mid Cap Grth N (WSMNX) SC/MG 32.96 2 4 ▲ 1 32.0 21.1 31.2 32.0 18.9 18.1 15.2 — — 0.0Wilshire Large Co Growth Inv (DTLGX) GR/LG 44.34 1 3 2 38.8 10.2 23.8 38.8 20.5 18.1 14.4 586.7 -50.2 0.0
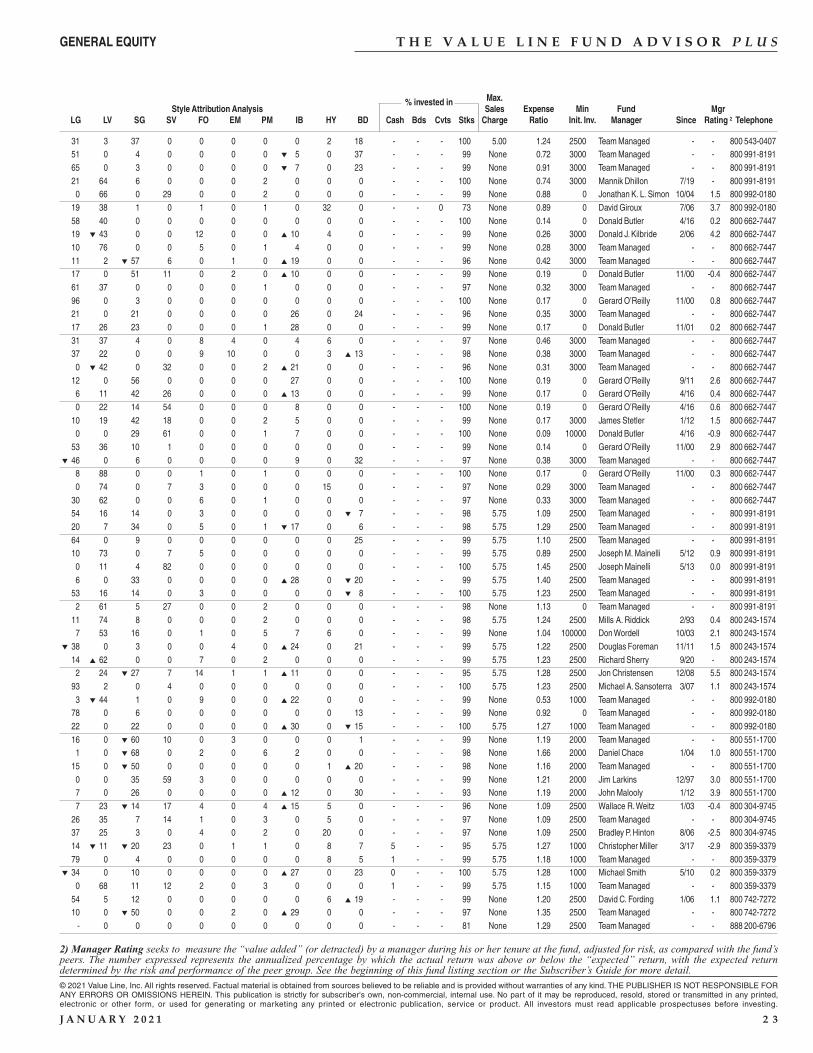
T H E V A L U E L I N E F U N D A D V I S O R P L U S
Max.Style Attribution Analysis
% invested inSales Expense Min Fund Mgr
LG LV SG SV FO EM PM IB HY BD Cash Bds Cvts Stks Charge Ratio Init. Inv. Manager Since Rating 2 Telephone
2) Manager Rating seeks to measure the “value added” (or detracted) by a manager during his or her tenure at the fund, adjusted for risk, as compared with the fund’speers. The number expressed represents the annualized percentage by which the actual return was above or below the “expected” return, with the expected returndetermined by the risk and performance of the peer group. See the beginning of this fund listing section or the Subscriber’s Guide for more detail.
© 2021 Value Line, Inc. All rights reserved. Factual material is obtained from sources believed to be reliable and is provided without warranties of any kind. THE PUBLISHER IS NOT RESPONSIBLE FORANY ERRORS OR OMISSIONS HEREIN. This publication is strictly for subscriber's own, non-commercial, internal use. No part of it may be reproduced, resold, stored or transmitted in any printed,electronic or other form, or used for generating or marketing any printed or electronic publication, service or product. All investors must read applicable prospectuses before investing.
J A N U A R Y 2 0 2 1 2 3
GENERAL EQUITY
31 3 37 0 0 0 0 0 2 18 - - - 100 5.00 1.24 2500 Team Managed - - 800 543-0407 51 0 4 0 0 0 0 ▼ 5 0 37 - - - 99 None 0.72 3000 Team Managed - - 800 991-8191 65 0 3 0 0 0 0 ▼ 7 0 23 - - - 99 None 0.91 3000 Team Managed - - 800 991-8191 21 64 6 0 0 0 2 0 0 0 - - - 100 None 0.74 3000 Mannik Dhillon 7/19 - 800 991-8191 0 66 0 29 0 0 2 0 0 0 - - - 99 None 0.88 0 Jonathan K. L. Simon 10/04 1.5 800 992-0180 19 38 1 0 1 0 1 0 32 0 - - 0 73 None 0.89 0 David Giroux 7/06 3.7 800 992-0180 58 40 0 0 0 0 0 0 0 0 - - - 100 None 0.14 0 Donald Butler 4/16 0.2 800 662-7447 19 ▼ 43 0 0 12 0 0 ▲ 10 4 0 - - - 99 None 0.26 3000 Donald J. Kilbride 2/06 4.2 800 662-7447 10 76 0 0 5 0 1 4 0 0 - - - 99 None 0.28 3000 Team Managed - - 800 662-7447 11 2 ▼ 57 6 0 1 0 ▲ 19 0 0 - - - 96 None 0.42 3000 Team Managed - - 800 662-7447 17 0 51 11 0 2 0 ▲ 10 0 0 - - - 99 None 0.19 0 Donald Butler 11/00 -0.4 800 662-7447 61 37 0 0 0 0 1 0 0 0 - - - 97 None 0.32 3000 Team Managed - - 800 662-7447 96 0 3 0 0 0 0 0 0 0 - - - 100 None 0.17 0 Gerard O’Reilly 11/00 0.8 800 662-7447 21 0 21 0 0 0 0 26 0 24 - - - 96 None 0.35 3000 Team Managed - - 800 662-7447 17 26 23 0 0 0 1 28 0 0 - - - 99 None 0.17 0 Donald Butler 11/01 0.2 800 662-7447 31 37 4 0 8 4 0 4 6 0 - - - 97 None 0.46 3000 Team Managed - - 800 662-7447 37 22 0 0 9 10 0 0 3 ▲ 13 - - - 98 None 0.38 3000 Team Managed - - 800 662-7447 0 ▼ 42 0 32 0 0 2 ▲ 21 0 0 - - - 96 None 0.31 3000 Team Managed - - 800 662-7447 12 0 56 0 0 0 0 27 0 0 - - - 100 None 0.19 0 Gerard O’Reilly 9/11 2.6 800 662-7447 6 11 42 26 0 0 0 ▲ 13 0 0 - - - 99 None 0.17 0 Gerard O’Reilly 4/16 0.4 800 662-7447 0 22 14 54 0 0 0 8 0 0 - - - 100 None 0.19 0 Gerard O’Reilly 4/16 0.6 800 662-7447 10 19 42 18 0 0 2 5 0 0 - - - 99 None 0.17 3000 James Stetler 1/12 1.5 800 662-7447 0 0 29 61 0 0 1 7 0 0 - - - 100 None 0.09 10000 Donald Butler 4/16 -0.9 800 662-7447 53 36 10 1 0 0 0 0 0 0 - - - 99 None 0.14 0 Gerard O’Reilly 11/00 2.9 800 662-7447
▼ 46 0 6 0 0 0 0 9 0 32 - - - 97 None 0.38 3000 Team Managed - - 800 662-7447 8 88 0 0 1 0 1 0 0 0 - - - 100 None 0.17 0 Gerard O’Reilly 11/00 0.3 800 662-7447 0 74 0 7 3 0 0 0 15 0 - - - 97 None 0.29 3000 Team Managed - - 800 662-7447 30 62 0 0 6 0 1 0 0 0 - - - 97 None 0.33 3000 Team Managed - - 800 662-7447 54 16 14 0 3 0 0 0 0 ▼ 7 - - - 98 5.75 1.09 2500 Team Managed - - 800 991-8191 20 7 34 0 5 0 1 ▼ 17 0 6 - - - 98 5.75 1.29 2500 Team Managed - - 800 991-8191 64 0 9 0 0 0 0 0 0 25 - - - 99 5.75 1.10 2500 Team Managed - - 800 991-8191 10 73 0 7 5 0 0 0 0 0 - - - 99 5.75 0.89 2500 Joseph M. Mainelli 5/12 0.9 800 991-8191 0 11 4 82 0 0 0 0 0 0 - - - 100 5.75 1.45 2500 Joseph Mainelli 5/13 0.0 800 991-8191 6 0 33 0 0 0 0 ▲ 28 0 ▼ 20 - - - 99 5.75 1.40 2500 Team Managed - - 800 991-8191 53 16 14 0 3 0 0 0 0 ▼ 8 - - - 100 5.75 1.23 2500 Team Managed - - 800 991-8191 2 61 5 27 0 0 2 0 0 0 - - - 98 None 1.13 0 Team Managed - - 800 991-8191 11 74 8 0 0 0 2 0 0 0 - - - 98 5.75 1.24 2500 Mills A. Riddick 2/93 0.4 800 243-1574 7 53 16 0 1 0 5 7 6 0 - - - 99 None 1.04 100000 Don Wordell 10/03 2.1 800 243-1574
▼ 38 0 3 0 0 4 0 ▲ 24 0 21 - - - 99 5.75 1.22 2500 Douglas Foreman 11/11 1.5 800 243-1574 14 ▲ 62 0 0 7 0 2 0 0 0 - - - 99 5.75 1.23 2500 Richard Sherry 9/20 - 800 243-1574 2 24 ▼ 27 7 14 1 1 ▲ 11 0 0 - - - 95 5.75 1.28 2500 Jon Christensen 12/08 5.5 800 243-1574 93 2 0 4 0 0 0 0 0 0 - - - 100 5.75 1.23 2500 Michael A. Sansoterra 3/07 1.1 800 243-1574 3 ▼ 44 1 0 9 0 0 ▲ 22 0 0 - - - 99 None 0.53 1000 Team Managed - - 800 992-0180 78 0 6 0 0 0 0 0 0 13 - - - 99 None 0.92 0 Team Managed - - 800 992-0180 22 0 22 0 0 0 0 ▲ 30 0 ▼ 15 - - - 100 5.75 1.27 1000 Team Managed - - 800 992-0180 16 0 ▼ 60 10 0 3 0 0 0 1 - - - 99 None 1.19 2000 Team Managed - - 800 551-1700 1 0 ▼ 68 0 2 0 6 2 0 0 - - - 98 None 1.66 2000 Daniel Chace 1/04 1.0 800 551-1700 15 0 ▼ 50 0 0 0 0 0 1 ▲ 20 - - - 98 None 1.16 2000 Team Managed - - 800 551-1700 0 0 35 59 3 0 0 0 0 0 - - - 99 None 1.21 2000 Jim Larkins 12/97 3.0 800 551-1700 7 0 26 0 0 0 0 ▲ 12 0 30 - - - 93 None 1.19 2000 John Malooly 1/12 3.9 800 551-1700 7 23 ▼ 14 17 4 0 4 ▲ 15 5 0 - - - 96 None 1.09 2500 Wallace R. Weitz 1/03 -0.4 800 304-9745 26 35 7 14 1 0 3 0 5 0 - - - 97 None 1.09 2500 Team Managed - - 800 304-9745 37 25 3 0 4 0 2 0 20 0 - - - 97 None 1.09 2500 Bradley P. Hinton 8/06 -2.5 800 304-9745 14 ▼ 11 ▼ 20 23 0 1 1 0 8 7 5 - - 95 5.75 1.27 1000 Christopher Miller 3/17 -2.9 800 359-3379 79 0 4 0 0 0 0 0 8 5 1 - - 99 5.75 1.18 1000 Team Managed - - 800 359-3379
▼ 34 0 10 0 0 0 0 ▲ 27 0 23 0 - - 100 5.75 1.28 1000 Michael Smith 5/10 0.2 800 359-3379 0 68 11 12 2 0 3 0 0 0 1 - - 99 5.75 1.15 1000 Team Managed - - 800 359-3379 54 5 12 0 0 0 0 0 6 ▲ 19 - - - 99 None 1.20 2500 David C. Fording 1/06 1.1 800 742-7272 10 0 ▼ 50 0 0 2 0 ▲ 29 0 0 - - - 97 None 1.35 2500 Team Managed - - 800 742-7272
- 0 0 0 0 0 0 0 0 0 - - - 81 None 1.29 2500 Team Managed - - 888 200-6796
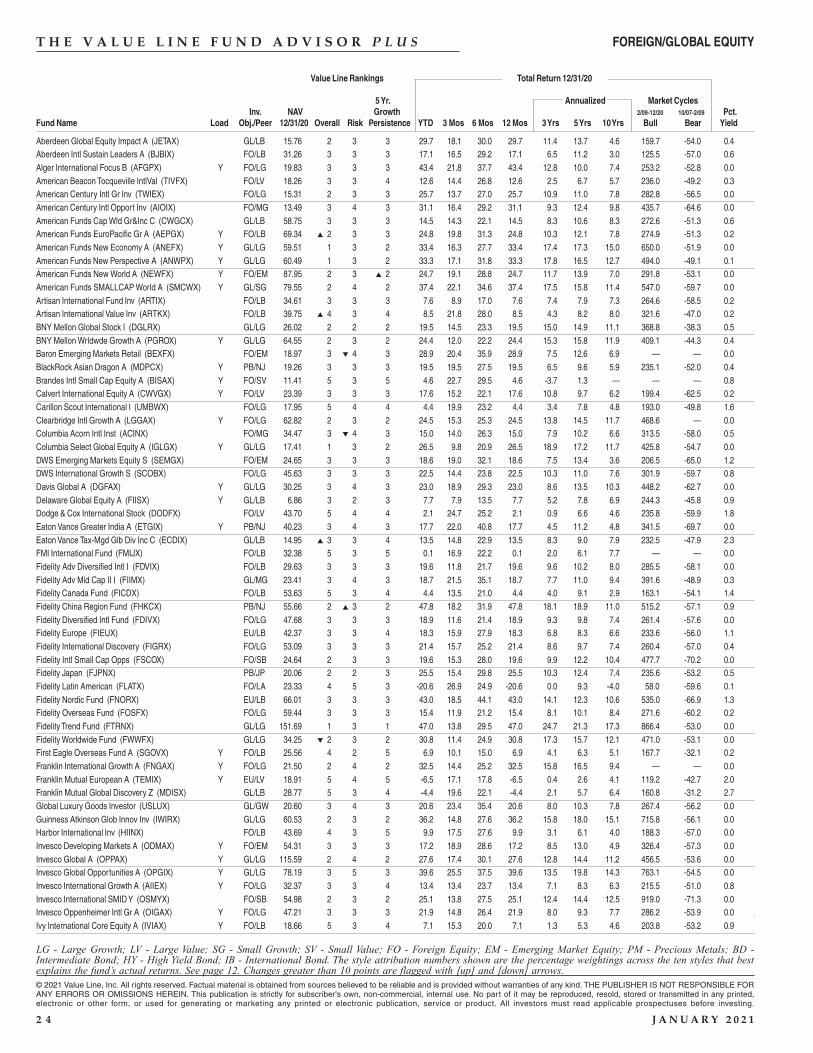
T H E V A L U E L I N E F U N D A D V I S O R P L U S
Value Line Rankings Total Return 12/31/20
5 Yr. Annualized Market CyclesInv. NAV Growth 2/09-12/20 10/07-2/09 Pct.
Fund Name Load Obj./Peer 12/31/20 Overall Risk Persistence YTD 3 Mos 6 Mos 12 Mos 3 Yrs 5 Yrs 10 Yrs Bull Bear Yield
© 2021 Value Line, Inc. All rights reserved. Factual material is obtained from sources believed to be reliable and is provided without warranties of any kind. THE PUBLISHER IS NOT RESPONSIBLE FORANY ERRORS OR OMISSIONS HEREIN. This publication is strictly for subscriber's own, non-commercial, internal use. No part of it may be reproduced, resold, stored or transmitted in any printed,electronic or other form, or used for generating or marketing any printed or electronic publication, service or product. All investors must read applicable prospectuses before investing.
2 4 J A N U A R Y 2 0 2 1
LG - Large Growth; LV - Large Value; SG - Small Growth; SV - Small Value; FO - Foreign Equity; EM - Emerging Market Equity; PM - Precious Metals; BD -Intermediate Bond; HY - High Yield Bond; IB - International Bond. The style attribution numbers shown are the percentage weightings across the ten styles that bestexplains the fund’s actual returns. See page 12. Changes greater than 10 points are flagged with [up] and [down] arrows.
FOREIGN/GLOBAL EQUITY
Aberdeen Global Equity Impact A (JETAX) GL/LB 15.76 2 3 3 29.7 18.1 30.0 29.7 11.4 13.7 4.6 159.7 -54.0 0.4Aberdeen Intl Sustain Leaders A (BJBIX) FO/LB 31.26 3 3 3 17.1 16.5 29.2 17.1 6.5 11.2 3.0 125.5 -57.0 0.6Alger International Focus B (AFGPX) Y FO/LG 19.83 3 3 3 43.4 21.8 37.7 43.4 12.8 10.0 7.4 253.2 -52.8 0.0American Beacon Tocqueville IntlVal (TIVFX) FO/LV 18.26 3 3 4 12.6 14.4 26.8 12.6 2.5 6.7 5.7 236.0 -49.2 0.3American Century Intl Gr Inv (TWIEX) FO/LG 15.31 2 3 3 25.7 13.7 27.0 25.7 10.9 11.0 7.8 282.8 -56.5 0.0American Century Intl Opport Inv (AIOIX) FO/MG 13.49 3 4 3 31.1 16.4 29.2 31.1 9.3 12.4 9.8 435.7 -64.6 0.0American Funds Cap Wld Gr&Inc C (CWGCX) GL/LB 58.75 3 3 3 14.5 14.3 22.1 14.5 8.3 10.6 8.3 272.6 -51.3 0.6American Funds EuroPacific Gr A (AEPGX) Y FO/LB 69.34 ▲ 2 3 3 24.8 19.8 31.3 24.8 10.3 12.1 7.8 274.9 -51.3 0.2American Funds New Economy A (ANEFX) Y GL/LG 59.51 1 3 2 33.4 16.3 27.7 33.4 17.4 17.3 15.0 650.0 -51.9 0.0American Funds New Perspective A (ANWPX) Y GL/LG 60.49 1 3 2 33.3 17.1 31.8 33.3 17.8 16.5 12.7 494.0 -49.1 0.1American Funds New World A (NEWFX) Y FO/EM 87.95 2 3 ▲ 2 24.7 19.1 28.8 24.7 11.7 13.9 7.0 291.8 -53.1 0.0American Funds SMALLCAP World A (SMCWX) Y GL/SG 79.55 2 4 2 37.4 22.1 34.6 37.4 17.5 15.8 11.4 547.0 -59.7 0.0Artisan International Fund Inv (ARTIX) FO/LB 34.61 3 3 3 7.6 8.9 17.0 7.6 7.4 7.9 7.3 264.6 -58.5 0.2Artisan International Value Inv (ARTKX) FO/LB 39.75 ▲ 4 3 4 8.5 21.8 28.0 8.5 4.3 8.2 8.0 321.6 -47.0 0.2BNY Mellon Global Stock I (DGLRX) GL/LG 26.02 2 2 2 19.5 14.5 23.3 19.5 15.0 14.9 11.1 368.8 -38.3 0.5BNY Mellon Wrldwde Growth A (PGROX) Y GL/LG 64.55 2 3 2 24.4 12.0 22.2 24.4 15.3 15.8 11.9 409.1 -44.3 0.4Baron Emerging Markets Retail (BEXFX) FO/EM 18.97 3 ▼ 4 3 28.9 20.4 35.9 28.9 7.5 12.6 6.9 — — 0.0BlackRock Asian Dragon A (MDPCX) Y PB/NJ 19.26 3 3 3 19.5 19.5 27.5 19.5 6.5 9.6 5.9 235.1 -52.0 0.4Brandes Intl Small Cap Equity A (BISAX) Y FO/SV 11.41 5 3 5 4.6 22.7 29.5 4.6 -3.7 1.3 — — — 0.8Calvert International Equity A (CWVGX) Y FO/LV 23.39 3 3 3 17.6 15.2 22.1 17.6 10.8 9.7 6.2 199.4 -62.5 0.2Carillon Scout International I (UMBWX) FO/LG 17.95 5 4 4 4.4 19.9 23.2 4.4 3.4 7.8 4.8 193.0 -49.8 1.6Clearbridge Intl Growth A (LGGAX) Y FO/LG 62.82 2 3 2 24.5 15.3 25.3 24.5 13.8 14.5 11.7 468.6 — 0.0Columbia Acorn Intl Inst (ACINX) FO/MG 34.47 3 ▼ 4 3 15.0 14.0 26.3 15.0 7.9 10.2 6.6 313.5 -58.0 0.5Columbia Select Global Equity A (IGLGX) Y GL/LG 17.41 1 3 2 26.5 9.8 20.9 26.5 18.9 17.2 11.7 425.8 -54.7 0.0DWS Emerging Markets Equity S (SEMGX) FO/EM 24.65 3 3 3 18.6 19.0 32.1 18.6 7.5 13.4 3.6 206.5 -65.0 1.2DWS International Growth S (SCOBX) FO/LG 45.63 3 3 3 22.5 14.4 23.8 22.5 10.3 11.0 7.6 301.9 -59.7 0.8Davis Global A (DGFAX) Y GL/LG 30.25 3 4 3 23.0 18.9 29.3 23.0 8.6 13.5 10.3 448.2 -62.7 0.0Delaware Global Equity A (FIISX) Y GL/LB 6.86 3 2 3 7.7 7.9 13.5 7.7 5.2 7.8 6.9 244.3 -45.8 0.9Dodge & Cox International Stock (DODFX) FO/LV 43.70 5 4 4 2.1 24.7 25.2 2.1 0.9 6.6 4.6 235.8 -59.9 1.8Eaton Vance Greater India A (ETGIX) Y PB/NJ 40.23 3 4 3 17.7 22.0 40.8 17.7 4.5 11.2 4.8 341.5 -69.7 0.0Eaton Vance Tax-Mgd Glb Div Inc C (ECDIX) GL/LB 14.95 ▲ 3 3 4 13.5 14.8 22.9 13.5 8.3 9.0 7.9 232.5 -47.9 2.3FMI International Fund (FMIJX) FO/LB 32.38 5 3 5 0.1 16.9 22.2 0.1 2.0 6.1 7.7 — — 0.0Fidelity Adv Diversified Intl I (FDVIX) FO/LB 29.63 3 3 3 19.6 11.8 21.7 19.6 9.6 10.2 8.0 285.5 -58.1 0.0Fidelity Adv Mid Cap II I (FIIMX) GL/MG 23.41 3 4 3 18.7 21.5 35.1 18.7 7.7 11.0 9.4 391.6 -48.9 0.3Fidelity Canada Fund (FICDX) FO/LB 53.63 5 3 4 4.4 13.5 21.0 4.4 4.0 9.1 2.9 163.1 -54.1 1.4Fidelity China Region Fund (FHKCX) PB/NJ 55.66 2 ▲ 3 2 47.8 18.2 31.9 47.8 18.1 18.9 11.0 515.2 -57.1 0.9Fidelity Diversified Intl Fund (FDIVX) FO/LG 47.68 3 3 3 18.9 11.6 21.4 18.9 9.3 9.8 7.4 261.4 -57.6 0.0Fidelity Europe (FIEUX) EU/LB 42.37 3 3 4 18.3 15.9 27.9 18.3 6.8 8.3 6.6 233.6 -56.0 1.1Fidelity International Discovery (FIGRX) FO/LG 53.09 3 3 3 21.4 15.7 25.2 21.4 8.6 9.7 7.4 260.4 -57.0 0.4Fidelity Intl Small Cap Opps (FSCOX) FO/SB 24.64 2 3 3 19.6 15.3 28.0 19.6 9.9 12.2 10.4 477.7 -70.2 0.0Fidelity Japan (FJPNX) PB/JP 20.06 2 2 3 25.5 15.4 29.8 25.5 10.3 12.4 7.4 235.6 -53.2 0.5Fidelity Latin American (FLATX) FO/LA 23.33 4 5 3 -20.6 26.9 24.9 -20.6 0.0 9.3 -4.0 58.0 -59.6 0.1Fidelity Nordic Fund (FNORX) EU/LB 66.01 3 3 3 43.0 18.5 44.1 43.0 14.1 12.3 10.6 535.0 -66.9 1.3Fidelity Overseas Fund (FOSFX) FO/LG 59.44 3 3 3 15.4 11.9 21.2 15.4 8.1 10.1 8.4 271.6 -60.2 0.2Fidelity Trend Fund (FTRNX) GL/LG 151.69 1 3 1 47.0 13.8 29.5 47.0 24.7 21.3 17.3 866.4 -53.0 0.0Fidelity Worldwide Fund (FWWFX) GL/LG 34.25 ▼ 2 3 2 30.8 11.4 24.9 30.8 17.3 15.7 12.1 471.0 -53.1 0.0First Eagle Overseas Fund A (SGOVX) Y FO/LB 25.56 4 2 5 6.9 10.1 15.0 6.9 4.1 6.3 5.1 167.7 -32.1 0.2Franklin International Growth A (FNGAX) Y FO/LG 21.50 2 4 2 32.5 14.4 25.2 32.5 15.8 16.5 9.4 — — 0.0Franklin Mutual European A (TEMIX) Y EU/LV 18.91 5 4 5 -6.5 17.1 17.8 -6.5 0.4 2.6 4.1 119.2 -42.7 2.0Franklin Mutual Global Discovery Z (MDISX) GL/LB 28.77 5 3 4 -4.4 19.6 22.1 -4.4 2.1 5.7 6.4 160.8 -31.2 2.7Global Luxury Goods Investor (USLUX) GL/GW 20.60 3 4 3 20.6 23.4 35.4 20.6 8.0 10.3 7.8 267.4 -56.2 0.0Guinness Atkinson Glob Innov Inv (IWIRX) GL/LG 60.53 2 3 2 36.2 14.8 27.6 36.2 15.8 18.0 15.1 715.8 -56.1 0.0Harbor International Inv (HIINX) FO/LB 43.69 4 3 5 9.9 17.5 27.6 9.9 3.1 6.1 4.0 188.3 -57.0 0.0Invesco Developing Markets A (ODMAX) Y FO/EM 54.31 3 3 3 17.2 18.9 28.6 17.2 8.5 13.0 4.9 326.4 -57.3 0.0Invesco Global A (OPPAX) Y GL/LG 115.59 2 4 2 27.6 17.4 30.1 27.6 12.8 14.4 11.2 456.5 -53.6 0.0Invesco Global Opportunities A (OPGIX) Y GL/LG 78.19 3 5 3 39.6 25.5 37.5 39.6 13.5 19.8 14.3 763.1 -54.5 0.0Invesco International Growth A (AIIEX) Y FO/LG 32.37 3 3 4 13.4 13.4 23.7 13.4 7.1 8.3 6.3 215.5 -51.0 0.8Invesco International SMID Y (OSMYX) FO/SB 54.98 2 3 2 25.1 13.8 27.5 25.1 12.4 14.4 12.5 919.0 -71.3 0.0Invesco Oppenheimer Intl Gr A (OIGAX) Y FO/LG 47.21 3 3 3 21.9 14.8 26.4 21.9 8.0 9.3 7.7 286.2 -53.9 0.0Ivy International Core Equity A (IVIAX) Y FO/LB 18.66 5 3 4 7.1 15.3 20.0 7.1 1.3 5.3 4.6 203.8 -53.2 0.9
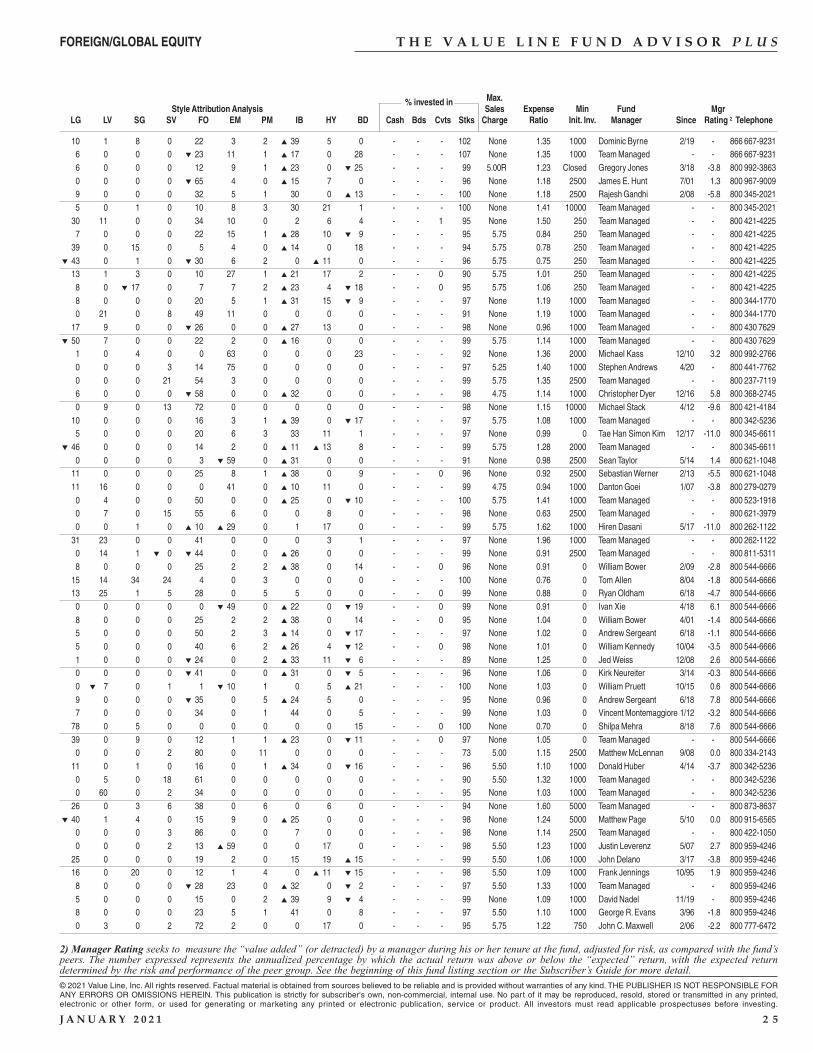
T H E V A L U E L I N E F U N D A D V I S O R P L U S
Max.Style Attribution Analysis
% invested inSales Expense Min Fund Mgr
LG LV SG SV FO EM PM IB HY BD Cash Bds Cvts Stks Charge Ratio Init. Inv. Manager Since Rating 2 Telephone
2) Manager Rating seeks to measure the “value added” (or detracted) by a manager during his or her tenure at the fund, adjusted for risk, as compared with the fund’speers. The number expressed represents the annualized percentage by which the actual return was above or below the “expected” return, with the expected returndetermined by the risk and performance of the peer group. See the beginning of this fund listing section or the Subscriber’s Guide for more detail.
© 2021 Value Line, Inc. All rights reserved. Factual material is obtained from sources believed to be reliable and is provided without warranties of any kind. THE PUBLISHER IS NOT RESPONSIBLE FORANY ERRORS OR OMISSIONS HEREIN. This publication is strictly for subscriber's own, non-commercial, internal use. No part of it may be reproduced, resold, stored or transmitted in any printed,electronic or other form, or used for generating or marketing any printed or electronic publication, service or product. All investors must read applicable prospectuses before investing.
J A N U A R Y 2 0 2 1 2 5
FOREIGN/GLOBAL EQUITY
10 1 8 0 22 3 2 ▲ 39 5 0 - - - 102 None 1.35 1000 Dominic Byrne 2/19 - 866 667-9231 6 0 0 0 ▼ 23 11 1 ▲ 17 0 28 - - - 107 None 1.35 1000 Team Managed - - 866 667-9231 6 0 0 0 12 9 1 ▲ 23 0 ▼ 25 - - - 99 5.00R 1.23 Closed Gregory Jones 3/18 -3.8 800 992-3863 0 0 0 0 ▼ 65 4 0 ▲ 15 7 0 - - - 96 None 1.18 2500 James E. Hunt 7/01 1.3 800 967-9009 9 0 0 0 32 5 1 30 0 ▲ 13 - - - 100 None 1.18 2500 Rajesh Gandhi 2/08 -5.8 800 345-2021 5 0 1 0 10 8 3 30 21 1 - - - 100 None 1.41 10000 Team Managed - - 800 345-2021 30 11 0 0 34 10 0 2 6 4 - - 1 95 None 1.50 250 Team Managed - - 800 421-4225 7 0 0 0 22 15 1 ▲ 28 10 ▼ 9 - - - 95 5.75 0.84 250 Team Managed - - 800 421-4225 39 0 15 0 5 4 0 ▲ 14 0 18 - - - 94 5.75 0.78 250 Team Managed - - 800 421-4225
▼ 43 0 1 0 ▼ 30 6 2 0 ▲ 11 0 - - - 96 5.75 0.75 250 Team Managed - - 800 421-4225 13 1 3 0 10 27 1 ▲ 21 17 2 - - 0 90 5.75 1.01 250 Team Managed - - 800 421-4225 8 0 ▼ 17 0 7 7 2 ▲ 23 4 ▼ 18 - - 0 95 5.75 1.06 250 Team Managed - - 800 421-4225 8 0 0 0 20 5 1 ▲ 31 15 ▼ 9 - - - 97 None 1.19 1000 Team Managed - - 800 344-1770 0 21 0 8 49 11 0 0 0 0 - - - 91 None 1.19 1000 Team Managed - - 800 344-1770 17 9 0 0 ▼ 26 0 0 ▲ 27 13 0 - - - 98 None 0.96 1000 Team Managed - - 800 430 7629
▼ 50 7 0 0 22 2 0 ▲ 16 0 0 - - - 99 5.75 1.14 1000 Team Managed - - 800 430 7629 1 0 4 0 0 63 0 0 0 23 - - - 92 None 1.36 2000 Michael Kass 12/10 3.2 800 992-2766 0 0 0 3 14 75 0 0 0 0 - - - 97 5.25 1.40 1000 Stephen Andrews 4/20 - 800 441-7762 0 0 0 21 54 3 0 0 0 0 - - - 99 5.75 1.35 2500 Team Managed - - 800 237-7119 6 0 0 0 ▼ 58 0 0 ▲ 32 0 0 - - - 98 4.75 1.14 1000 Christopher Dyer 12/16 5.8 800 368-2745 0 9 0 13 72 0 0 0 0 0 - - - 98 None 1.15 10000 Michael Stack 4/12 -9.6 800 421-4184 10 0 0 0 16 3 1 ▲ 39 0 ▼ 17 - - - 97 5.75 1.08 1000 Team Managed - - 800 342-5236 5 0 0 0 20 6 3 33 11 1 - - - 97 None 0.99 0 Tae Han Simon Kim 12/17 -11.0 800 345-6611
▼ 46 0 0 0 14 2 0 ▲ 11 ▲ 13 8 - - - 99 5.75 1.28 2000 Team Managed - - 800 345-6611 0 0 0 0 3 ▼ 59 0 ▲ 31 0 0 - - - 91 None 0.98 2500 Sean Taylor 5/14 1.4 800 621-1048 11 0 0 0 25 8 1 ▲ 38 0 9 - - 0 96 None 0.92 2500 Sebastian Werner 2/13 -5.5 800 621-1048 11 16 0 0 0 41 0 ▲ 10 11 0 - - - 99 4.75 0.94 1000 Danton Goei 1/07 -3.8 800 279-0279 0 4 0 0 50 0 0 ▲ 25 0 ▼ 10 - - - 100 5.75 1.41 1000 Team Managed - - 800 523-1918 0 7 0 15 55 6 0 0 8 0 - - - 98 None 0.63 2500 Team Managed - - 800 621-3979 0 0 1 0 ▲ 10 ▲ 29 0 1 17 0 - - - 99 5.75 1.62 1000 Hiren Dasani 5/17 -11.0 800 262-1122 31 23 0 0 41 0 0 0 3 1 - - - 97 None 1.96 1000 Team Managed - - 800 262-1122 0 14 1 ▼ 0 ▼ 44 0 0 ▲ 26 0 0 - - - 99 None 0.91 2500 Team Managed - - 800 811-5311 8 0 0 0 25 2 2 ▲ 38 0 14 - - 0 96 None 0.91 0 William Bower 2/09 -2.8 800 544-6666 15 14 34 24 4 0 3 0 0 0 - - - 100 None 0.76 0 Tom Allen 8/04 -1.8 800 544-6666 13 25 1 5 28 0 5 5 0 0 - - 0 99 None 0.88 0 Ryan Oldham 6/18 -4.7 800 544-6666 0 0 0 0 0 ▼ 49 0 ▲ 22 0 ▼ 19 - - 0 99 None 0.91 0 Ivan Xie 4/18 6.1 800 544-6666 8 0 0 0 25 2 2 ▲ 38 0 14 - - 0 95 None 1.04 0 William Bower 4/01 -1.4 800 544-6666 5 0 0 0 50 2 3 ▲ 14 0 ▼ 17 - - - 97 None 1.02 0 Andrew Sergeant 6/18 -1.1 800 544-6666 5 0 0 0 40 6 2 ▲ 26 4 ▼ 12 - - 0 98 None 1.01 0 William Kennedy 10/04 -3.5 800 544-6666 1 0 0 0 ▼ 24 0 2 ▲ 33 11 ▼ 6 - - - 89 None 1.25 0 Jed Weiss 12/08 2.6 800 544-6666 0 0 0 0 ▼ 41 0 0 ▲ 31 0 ▼ 5 - - - 96 None 1.06 0 Kirk Neureiter 3/14 -0.3 800 544-6666 0 ▼ 7 0 1 1 ▼ 10 1 0 5 ▲ 21 - - - 100 None 1.03 0 William Pruett 10/15 0.6 800 544-6666 9 0 0 0 ▼ 35 0 5 ▲ 24 5 0 - - - 95 None 0.96 0 Andrew Sergeant 6/18 7.8 800 544-6666 7 0 0 0 34 0 1 44 0 5 - - - 99 None 1.03 0 Vincent Montemaggiore 1/12 -3.2 800 544-6666 78 0 5 0 0 0 0 0 0 15 - - 0 100 None 0.70 0 Shilpa Mehra 8/18 7.6 800 544-6666 39 0 9 0 12 1 1 ▲ 23 0 ▼ 11 - - 0 97 None 1.05 0 Team Managed - - 800 544-6666 0 0 0 2 80 0 11 0 0 0 - - - 73 5.00 1.15 2500 Matthew McLennan 9/08 0.0 800 334-2143 11 0 1 0 16 0 1 ▲ 34 0 ▼ 16 - - - 96 5.50 1.10 1000 Donald Huber 4/14 -3.7 800 342-5236 0 5 0 18 61 0 0 0 0 0 - - - 90 5.50 1.32 1000 Team Managed - - 800 342-5236 0 60 0 2 34 0 0 0 0 0 - - - 95 None 1.03 1000 Team Managed - - 800 342-5236 26 0 3 6 38 0 6 0 6 0 - - - 94 None 1.60 5000 Team Managed - - 800 873-8637
▼ 40 1 4 0 15 9 0 ▲ 25 0 0 - - - 98 None 1.24 5000 Matthew Page 5/10 0.0 800 915-6565 0 0 0 3 86 0 0 7 0 0 - - - 98 None 1.14 2500 Team Managed - - 800 422-1050 0 0 0 2 13 ▲ 59 0 0 17 0 - - - 98 5.50 1.23 1000 Justin Leverenz 5/07 2.7 800 959-4246 25 0 0 0 19 2 0 15 19 ▲ 15 - - - 99 5.50 1.06 1000 John Delano 3/17 -3.8 800 959-4246 16 0 20 0 12 1 4 0 ▲ 11 ▼ 15 - - - 98 5.50 1.09 1000 Frank Jennings 10/95 1.9 800 959-4246 8 0 0 0 ▼ 28 23 0 ▲ 32 0 ▼ 2 - - - 97 5.50 1.33 1000 Team Managed - - 800 959-4246 5 0 0 0 15 0 2 ▲ 39 9 ▼ 4 - - - 99 None 1.09 1000 David Nadel 11/19 - 800 959-4246 8 0 0 0 23 5 1 41 0 8 - - - 97 5.50 1.10 1000 George R. Evans 3/96 -1.8 800 959-4246 0 3 0 2 72 2 0 0 17 0 - - - 95 5.75 1.22 750 John C. Maxwell 2/06 -2.2 800 777-6472
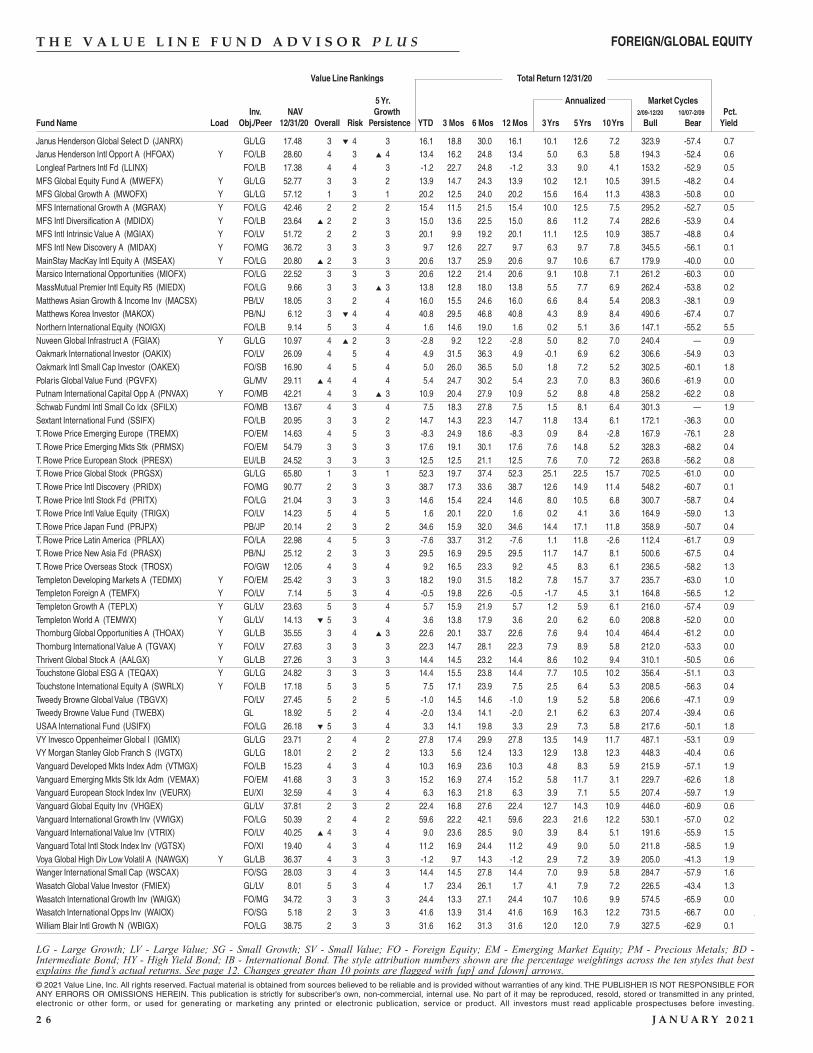
T H E V A L U E L I N E F U N D A D V I S O R P L U S
Value Line Rankings Total Return 12/31/20
5 Yr. Annualized Market CyclesInv. NAV Growth 2/09-12/20 10/07-2/09 Pct.
Fund Name Load Obj./Peer 12/31/20 Overall Risk Persistence YTD 3 Mos 6 Mos 12 Mos 3 Yrs 5 Yrs 10 Yrs Bull Bear Yield
© 2021 Value Line, Inc. All rights reserved. Factual material is obtained from sources believed to be reliable and is provided without warranties of any kind. THE PUBLISHER IS NOT RESPONSIBLE FORANY ERRORS OR OMISSIONS HEREIN. This publication is strictly for subscriber's own, non-commercial, internal use. No part of it may be reproduced, resold, stored or transmitted in any printed,electronic or other form, or used for generating or marketing any printed or electronic publication, service or product. All investors must read applicable prospectuses before investing.
2 6 J A N U A R Y 2 0 2 1
LG - Large Growth; LV - Large Value; SG - Small Growth; SV - Small Value; FO - Foreign Equity; EM - Emerging Market Equity; PM - Precious Metals; BD -Intermediate Bond; HY - High Yield Bond; IB - International Bond. The style attribution numbers shown are the percentage weightings across the ten styles that bestexplains the fund’s actual returns. See page 12. Changes greater than 10 points are flagged with [up] and [down] arrows.
FOREIGN/GLOBAL EQUITY
Janus Henderson Global Select D (JANRX) GL/LG 17.48 3 ▼ 4 3 16.1 18.8 30.0 16.1 10.1 12.6 7.2 323.9 -57.4 0.7Janus Henderson Intl Opport A (HFOAX) Y FO/LB 28.60 4 3 ▲ 4 13.4 16.2 24.8 13.4 5.0 6.3 5.8 194.3 -52.4 0.6Longleaf Partners Intl Fd (LLINX) FO/LB 17.38 4 4 3 -1.2 22.7 24.8 -1.2 3.3 9.0 4.1 153.2 -52.9 0.5MFS Global Equity Fund A (MWEFX) Y GL/LG 52.77 3 3 2 13.9 14.7 24.3 13.9 10.2 12.1 10.5 391.5 -48.2 0.4MFS Global Growth A (MWOFX) Y GL/LG 57.12 1 3 1 20.2 12.5 24.0 20.2 15.6 16.4 11.3 438.3 -50.8 0.0MFS International Growth A (MGRAX) Y FO/LG 42.46 2 2 2 15.4 11.5 21.5 15.4 10.0 12.5 7.5 295.2 -52.7 0.5MFS Intl Diversification A (MDIDX) Y FO/LB 23.64 ▲ 2 2 3 15.0 13.6 22.5 15.0 8.6 11.2 7.4 282.6 -53.9 0.4MFS Intl Intrinsic Value A (MGIAX) Y FO/LV 51.72 2 2 3 20.1 9.9 19.2 20.1 11.1 12.5 10.9 385.7 -48.8 0.4MFS Intl New Discovery A (MIDAX) Y FO/MG 36.72 3 3 3 9.7 12.6 22.7 9.7 6.3 9.7 7.8 345.5 -56.1 0.1MainStay MacKay Intl Equity A (MSEAX) Y FO/LG 20.80 ▲ 2 3 3 20.6 13.7 25.9 20.6 9.7 10.6 6.7 179.9 -40.0 0.0Marsico International Opportunities (MIOFX) FO/LG 22.52 3 3 3 20.6 12.2 21.4 20.6 9.1 10.8 7.1 261.2 -60.3 0.0MassMutual Premier Intl Equity R5 (MIEDX) FO/LG 9.66 3 3 ▲ 3 13.8 12.8 18.0 13.8 5.5 7.7 6.9 262.4 -53.8 0.2Matthews Asian Growth & Income Inv (MACSX) PB/LV 18.05 3 2 4 16.0 15.5 24.6 16.0 6.6 8.4 5.4 208.3 -38.1 0.9Matthews Korea Investor (MAKOX) PB/NJ 6.12 3 ▼ 4 4 40.8 29.5 46.8 40.8 4.3 8.9 8.4 490.6 -67.4 0.7Northern International Equity (NOIGX) FO/LB 9.14 5 3 4 1.6 14.6 19.0 1.6 0.2 5.1 3.6 147.1 -55.2 5.5Nuveen Global Infrastruct A (FGIAX) Y GL/LG 10.97 4 ▲ 2 3 -2.8 9.2 12.2 -2.8 5.0 8.2 7.0 240.4 — 0.9Oakmark International Investor (OAKIX) FO/LV 26.09 4 5 4 4.9 31.5 36.3 4.9 -0.1 6.9 6.2 306.6 -54.9 0.3Oakmark Intl Small Cap Investor (OAKEX) FO/SB 16.90 4 5 4 5.0 26.0 36.5 5.0 1.8 7.2 5.2 302.5 -60.1 1.8Polaris Global Value Fund (PGVFX) GL/MV 29.11 ▲ 4 4 4 5.4 24.7 30.2 5.4 2.3 7.0 8.3 360.6 -61.9 0.0Putnam International Capital Opp A (PNVAX) Y FO/MB 42.21 4 3 ▲ 3 10.9 20.4 27.9 10.9 5.2 8.8 4.8 258.2 -62.2 0.8Schwab Fundml Intl Small Co Idx (SFILX) FO/MB 13.67 4 3 4 7.5 18.3 27.8 7.5 1.5 8.1 6.4 301.3 — 1.9Sextant International Fund (SSIFX) FO/LB 20.95 3 3 2 14.7 14.3 22.3 14.7 11.8 13.4 6.1 172.1 -36.3 0.0T. Rowe Price Emerging Europe (TREMX) FO/EM 14.63 4 5 3 -8.3 24.9 18.6 -8.3 0.9 8.4 -2.8 167.9 -76.1 2.8T. Rowe Price Emerging Mkts Stk (PRMSX) FO/EM 54.79 3 3 3 17.6 19.1 30.1 17.6 7.6 14.8 5.2 328.3 -68.2 0.4T. Rowe Price European Stock (PRESX) EU/LB 24.52 3 3 3 12.5 12.5 21.1 12.5 7.6 7.0 7.2 263.8 -56.2 0.8T. Rowe Price Global Stock (PRGSX) GL/LG 65.80 1 3 1 52.3 19.7 37.4 52.3 25.1 22.5 15.7 702.5 -61.0 0.0T. Rowe Price Intl Discovery (PRIDX) FO/MG 90.77 2 3 3 38.7 17.3 33.6 38.7 12.6 14.9 11.4 548.2 -60.7 0.1T. Rowe Price Intl Stock Fd (PRITX) FO/LG 21.04 3 3 3 14.6 15.4 22.4 14.6 8.0 10.5 6.8 300.7 -58.7 0.4T. Rowe Price Intl Value Equity (TRIGX) FO/LV 14.23 5 4 5 1.6 20.1 22.0 1.6 0.2 4.1 3.6 164.9 -59.0 1.3T. Rowe Price Japan Fund (PRJPX) PB/JP 20.14 2 3 2 34.6 15.9 32.0 34.6 14.4 17.1 11.8 358.9 -50.7 0.4T. Rowe Price Latin America (PRLAX) FO/LA 22.98 4 5 3 -7.6 33.7 31.2 -7.6 1.1 11.8 -2.6 112.4 -61.7 0.9T. Rowe Price New Asia Fd (PRASX) PB/NJ 25.12 2 3 3 29.5 16.9 29.5 29.5 11.7 14.7 8.1 500.6 -67.5 0.4T. Rowe Price Overseas Stock (TROSX) FO/GW 12.05 4 3 4 9.2 16.5 23.3 9.2 4.5 8.3 6.1 236.5 -58.2 1.3Templeton Developing Markets A (TEDMX) Y FO/EM 25.42 3 3 3 18.2 19.0 31.5 18.2 7.8 15.7 3.7 235.7 -63.0 1.0Templeton Foreign A (TEMFX) Y FO/LV 7.14 5 3 4 -0.5 19.8 22.6 -0.5 -1.7 4.5 3.1 164.8 -56.5 1.2Templeton Growth A (TEPLX) Y GL/LV 23.63 5 3 4 5.7 15.9 21.9 5.7 1.2 5.9 6.1 216.0 -57.4 0.9Templeton World A (TEMWX) Y GL/LV 14.13 ▼ 5 3 4 3.6 13.8 17.9 3.6 2.0 6.2 6.0 208.8 -52.0 0.0Thornburg Global Opportunities A (THOAX) Y GL/LB 35.55 3 4 ▲ 3 22.6 20.1 33.7 22.6 7.6 9.4 10.4 464.4 -61.2 0.0Thornburg International Value A (TGVAX) Y FO/LV 27.63 3 3 3 22.3 14.7 28.1 22.3 7.9 8.9 5.8 212.0 -53.3 0.0Thrivent Global Stock A (AALGX) Y GL/LB 27.26 3 3 3 14.4 14.5 23.2 14.4 8.6 10.2 9.4 310.1 -50.5 0.6Touchstone Global ESG A (TEQAX) Y GL/LG 24.82 3 3 3 14.4 15.5 23.8 14.4 7.7 10.5 10.2 356.4 -51.1 0.3Touchstone International Equity A (SWRLX) Y FO/LB 17.18 5 3 5 7.5 17.1 23.9 7.5 2.5 6.4 5.3 208.5 -56.3 0.4Tweedy Browne Global Value (TBGVX) FO/LV 27.45 5 2 5 -1.0 14.5 14.6 -1.0 1.9 5.2 5.8 206.6 -47.1 0.9Tweedy Browne Value Fund (TWEBX) GL 18.92 5 2 4 -2.0 13.4 14.1 -2.0 2.1 6.2 6.3 207.4 -39.4 0.6USAA International Fund (USIFX) FO/LG 26.18 ▼ 5 3 4 3.3 14.1 19.8 3.3 2.9 7.3 5.8 217.6 -50.1 1.8VY Invesco Oppenheimer Global I (IGMIX) GL/LG 23.71 2 4 2 27.8 17.4 29.9 27.8 13.5 14.9 11.7 487.1 -53.1 0.9VY Morgan Stanley Glob Franch S (IVGTX) GL/LG 18.01 2 2 2 13.3 5.6 12.4 13.3 12.9 13.8 12.3 448.3 -40.4 0.6Vanguard Developed Mkts Index Adm (VTMGX) FO/LB 15.23 4 3 4 10.3 16.9 23.6 10.3 4.8 8.3 5.9 215.9 -57.1 1.9Vanguard Emerging Mkts Stk Idx Adm (VEMAX) FO/EM 41.68 3 3 3 15.2 16.9 27.4 15.2 5.8 11.7 3.1 229.7 -62.6 1.8Vanguard European Stock Index Inv (VEURX) EU/XI 32.59 4 3 4 6.3 16.3 21.8 6.3 3.9 7.1 5.5 207.4 -59.7 1.9Vanguard Global Equity Inv (VHGEX) GL/LV 37.81 2 3 2 22.4 16.8 27.6 22.4 12.7 14.3 10.9 446.0 -60.9 0.6Vanguard International Growth Inv (VWIGX) FO/LG 50.39 2 4 2 59.6 22.2 42.1 59.6 22.3 21.6 12.2 530.1 -57.0 0.2Vanguard International Value Inv (VTRIX) FO/LV 40.25 ▲ 4 3 4 9.0 23.6 28.5 9.0 3.9 8.4 5.1 191.6 -55.9 1.5Vanguard Total Intl Stock Index Inv (VGTSX) FO/XI 19.40 4 3 4 11.2 16.9 24.4 11.2 4.9 9.0 5.0 211.8 -58.5 1.9Voya Global High Div Low Volatil A (NAWGX) Y GL/LB 36.37 4 3 3 -1.2 9.7 14.3 -1.2 2.9 7.2 3.9 205.0 -41.3 1.9Wanger International Small Cap (WSCAX) FO/SG 28.03 3 4 3 14.4 14.5 27.8 14.4 7.0 9.9 5.8 284.7 -57.9 1.6Wasatch Global Value Investor (FMIEX) GL/LV 8.01 5 3 4 1.7 23.4 26.1 1.7 4.1 7.9 7.2 226.5 -43.4 1.3Wasatch International Growth Inv (WAIGX) FO/MG 34.72 3 3 3 24.4 13.3 27.1 24.4 10.7 10.6 9.9 574.5 -65.9 0.0Wasatch International Opps Inv (WAIOX) FO/SG 5.18 2 3 3 41.6 13.9 31.4 41.6 16.9 16.3 12.2 731.5 -66.7 0.0William Blair Intl Growth N (WBIGX) FO/LG 38.75 2 3 3 31.6 16.2 31.3 31.6 12.0 12.0 7.9 327.5 -62.9 0.1
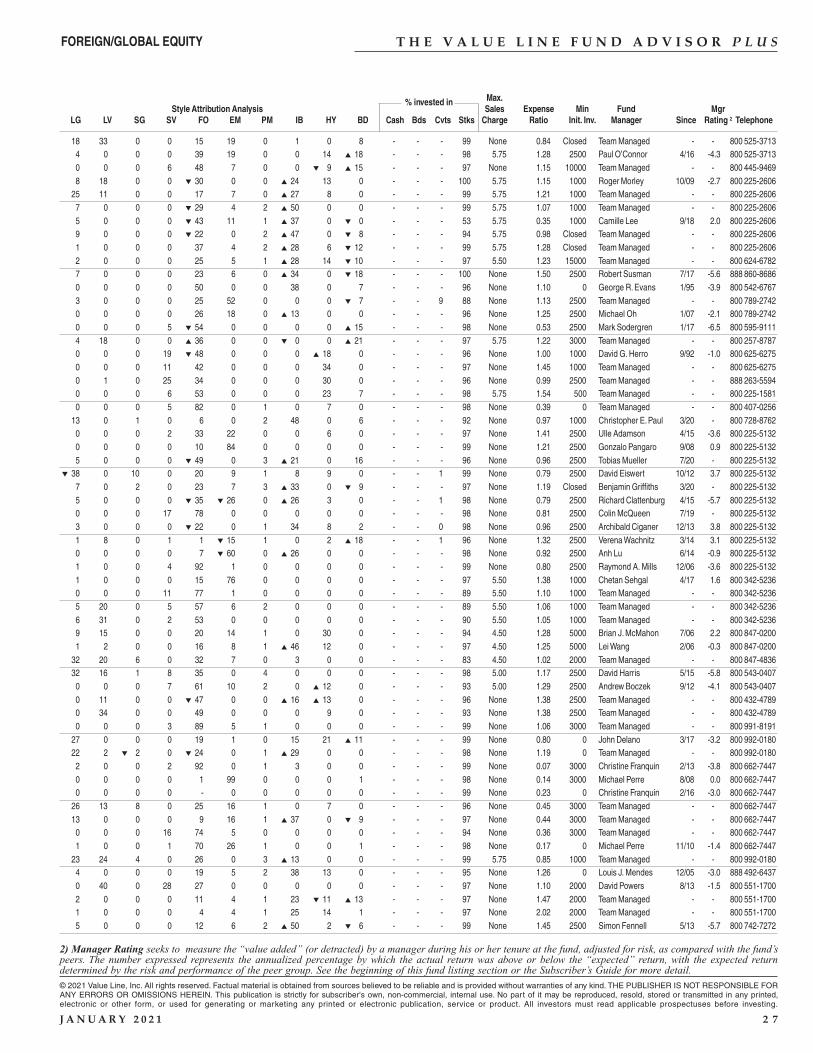
T H E V A L U E L I N E F U N D A D V I S O R P L U S
Max.Style Attribution Analysis
% invested inSales Expense Min Fund Mgr
LG LV SG SV FO EM PM IB HY BD Cash Bds Cvts Stks Charge Ratio Init. Inv. Manager Since Rating 2 Telephone
2) Manager Rating seeks to measure the “value added” (or detracted) by a manager during his or her tenure at the fund, adjusted for risk, as compared with the fund’speers. The number expressed represents the annualized percentage by which the actual return was above or below the “expected” return, with the expected returndetermined by the risk and performance of the peer group. See the beginning of this fund listing section or the Subscriber’s Guide for more detail.
© 2021 Value Line, Inc. All rights reserved. Factual material is obtained from sources believed to be reliable and is provided without warranties of any kind. THE PUBLISHER IS NOT RESPONSIBLE FORANY ERRORS OR OMISSIONS HEREIN. This publication is strictly for subscriber's own, non-commercial, internal use. No part of it may be reproduced, resold, stored or transmitted in any printed,electronic or other form, or used for generating or marketing any printed or electronic publication, service or product. All investors must read applicable prospectuses before investing.
J A N U A R Y 2 0 2 1 2 7
FOREIGN/GLOBAL EQUITY
18 33 0 0 15 19 0 1 0 8 - - - 99 None 0.84 Closed Team Managed - - 800 525-3713 4 0 0 0 39 19 0 0 14 ▲ 18 - - - 98 5.75 1.28 2500 Paul O’Connor 4/16 -4.3 800 525-3713 0 0 0 6 48 7 0 0 ▼ 9 ▲ 15 - - - 97 None 1.15 10000 Team Managed - - 800 445-9469 8 18 0 0 ▼ 30 0 0 ▲ 24 13 0 - - - 100 5.75 1.15 1000 Roger Morley 10/09 -2.7 800 225-2606 25 11 0 0 17 7 0 ▲ 27 8 0 - - - 99 5.75 1.21 1000 Team Managed - - 800 225-2606 7 0 0 0 ▼ 29 4 2 ▲ 50 0 0 - - - 99 5.75 1.07 1000 Team Managed - - 800 225-2606 5 0 0 0 ▼ 43 11 1 ▲ 37 0 ▼ 0 - - - 53 5.75 0.35 1000 Camille Lee 9/18 2.0 800 225-2606 9 0 0 0 ▼ 22 0 2 ▲ 47 0 ▼ 8 - - - 94 5.75 0.98 Closed Team Managed - - 800 225-2606 1 0 0 0 37 4 2 ▲ 28 6 ▼ 12 - - - 99 5.75 1.28 Closed Team Managed - - 800 225-2606 2 0 0 0 25 5 1 ▲ 28 14 ▼ 10 - - - 97 5.50 1.23 15000 Team Managed - - 800 624-6782 7 0 0 0 23 6 0 ▲ 34 0 ▼ 18 - - - 100 None 1.50 2500 Robert Susman 7/17 -5.6 888 860-8686 0 0 0 0 50 0 0 38 0 7 - - - 96 None 1.10 0 George R. Evans 1/95 -3.9 800 542-6767 3 0 0 0 25 52 0 0 0 ▼ 7 - - 9 88 None 1.13 2500 Team Managed - - 800 789-2742 0 0 0 0 26 18 0 ▲ 13 0 0 - - - 96 None 1.25 2500 Michael Oh 1/07 -2.1 800 789-2742 0 0 0 5 ▼ 54 0 0 0 0 ▲ 15 - - - 98 None 0.53 2500 Mark Sodergren 1/17 -6.5 800 595-9111 4 18 0 0 ▲ 36 0 0 ▼ 0 0 ▲ 21 - - - 97 5.75 1.22 3000 Team Managed - - 800 257-8787 0 0 0 19 ▼ 48 0 0 0 ▲ 18 0 - - - 96 None 1.00 1000 David G. Herro 9/92 -1.0 800 625-6275 0 0 0 11 42 0 0 0 34 0 - - - 97 None 1.45 1000 Team Managed - - 800 625-6275 0 1 0 25 34 0 0 0 30 0 - - - 96 None 0.99 2500 Team Managed - - 888 263-5594 0 0 0 6 53 0 0 0 23 7 - - - 98 5.75 1.54 500 Team Managed - - 800 225-1581 0 0 0 5 82 0 1 0 7 0 - - - 98 None 0.39 0 Team Managed - - 800 407-0256 13 0 1 0 6 0 2 48 0 6 - - - 92 None 0.97 1000 Christopher E. Paul 3/20 - 800 728-8762 0 0 0 2 33 22 0 0 6 0 - - - 97 None 1.41 2500 Ulle Adamson 4/15 -3.6 800 225-5132 0 0 0 0 10 84 0 0 0 0 - - - 99 None 1.21 2500 Gonzalo Pangaro 9/08 0.9 800 225-5132 5 0 0 0 ▼ 49 0 3 ▲ 21 0 16 - - - 96 None 0.96 2500 Tobias Mueller 7/20 - 800 225-5132
▼ 38 0 10 0 20 9 1 8 9 0 - - 1 99 None 0.79 2500 David Eiswert 10/12 3.7 800 225-5132 7 0 2 0 23 7 3 ▲ 33 0 ▼ 9 - - - 97 None 1.19 Closed Benjamin Griffiths 3/20 - 800 225-5132 5 0 0 0 ▼ 35 ▼ 26 0 ▲ 26 3 0 - - 1 98 None 0.79 2500 Richard Clattenburg 4/15 -5.7 800 225-5132 0 0 0 17 78 0 0 0 0 0 - - - 98 None 0.81 2500 Colin McQueen 7/19 - 800 225-5132 3 0 0 0 ▼ 22 0 1 34 8 2 - - 0 98 None 0.96 2500 Archibald Ciganer 12/13 3.8 800 225-5132 1 8 0 1 1 ▼ 15 1 0 2 ▲ 18 - - 1 96 None 1.32 2500 Verena Wachnitz 3/14 3.1 800 225-5132 0 0 0 0 7 ▼ 60 0 ▲ 26 0 0 - - - 98 None 0.92 2500 Anh Lu 6/14 -0.9 800 225-5132 1 0 0 4 92 1 0 0 0 0 - - - 99 None 0.80 2500 Raymond A. Mills 12/06 -3.6 800 225-5132 1 0 0 0 15 76 0 0 0 0 - - - 97 5.50 1.38 1000 Chetan Sehgal 4/17 1.6 800 342-5236 0 0 0 11 77 1 0 0 0 0 - - - 89 5.50 1.10 1000 Team Managed - - 800 342-5236 5 20 0 5 57 6 2 0 0 0 - - - 89 5.50 1.06 1000 Team Managed - - 800 342-5236 6 31 0 2 53 0 0 0 0 0 - - - 90 5.50 1.05 1000 Team Managed - - 800 342-5236 9 15 0 0 20 14 1 0 30 0 - - - 94 4.50 1.28 5000 Brian J. McMahon 7/06 2.2 800 847-0200 1 2 0 0 16 8 1 ▲ 46 12 0 - - - 97 4.50 1.25 5000 Lei Wang 2/06 -0.3 800 847-0200 32 20 6 0 32 7 0 3 0 0 - - - 83 4.50 1.02 2000 Team Managed - - 800 847-4836 32 16 1 8 35 0 4 0 0 0 - - - 98 5.00 1.17 2500 David Harris 5/15 -5.8 800 543-0407 0 0 0 7 61 10 2 0 ▲ 12 0 - - - 93 5.00 1.29 2500 Andrew Boczek 9/12 -4.1 800 543-0407 0 11 0 0 ▼ 47 0 0 ▲ 16 ▲ 13 0 - - - 96 None 1.38 2500 Team Managed - - 800 432-4789 0 34 0 0 49 0 0 0 9 0 - - - 93 None 1.38 2500 Team Managed - - 800 432-4789 0 0 0 3 89 5 1 0 0 0 - - - 99 None 1.06 3000 Team Managed - - 800 991-8191 27 0 0 0 19 1 0 15 21 ▲ 11 - - - 99 None 0.80 0 John Delano 3/17 -3.2 800 992-0180 22 2 ▼ 2 0 ▼ 24 0 1 ▲ 29 0 0 - - - 98 None 1.19 0 Team Managed - - 800 992-0180 2 0 0 2 92 0 1 3 0 0 - - - 99 None 0.07 3000 Christine Franquin 2/13 -3.8 800 662-7447 0 0 0 0 1 99 0 0 0 1 - - - 98 None 0.14 3000 Michael Perre 8/08 0.0 800 662-7447 0 0 0 0 - 0 0 0 0 0 - - - 99 None 0.23 0 Christine Franquin 2/16 -3.0 800 662-7447 26 13 8 0 25 16 1 0 7 0 - - - 96 None 0.45 3000 Team Managed - - 800 662-7447 13 0 0 0 9 16 1 ▲ 37 0 ▼ 9 - - - 97 None 0.44 3000 Team Managed - - 800 662-7447 0 0 0 16 74 5 0 0 0 0 - - - 94 None 0.36 3000 Team Managed - - 800 662-7447 1 0 0 1 70 26 1 0 0 1 - - - 98 None 0.17 0 Michael Perre 11/10 -1.4 800 662-7447 23 24 4 0 26 0 3 ▲ 13 0 0 - - - 99 5.75 0.85 1000 Team Managed - - 800 992-0180 4 0 0 0 19 5 2 38 13 0 - - - 95 None 1.26 0 Louis J. Mendes 12/05 -3.0 888 492-6437 0 40 0 28 27 0 0 0 0 0 - - - 97 None 1.10 2000 David Powers 8/13 -1.5 800 551-1700 2 0 0 0 11 4 1 23 ▼ 11 ▲ 13 - - - 97 None 1.47 2000 Team Managed - - 800 551-1700 1 0 0 0 4 4 1 25 14 1 - - - 97 None 2.02 2000 Team Managed - - 800 551-1700 5 0 0 0 12 6 2 ▲ 50 2 ▼ 6 - - - 99 None 1.45 2500 Simon Fennell 5/13 -5.7 800 742-7272
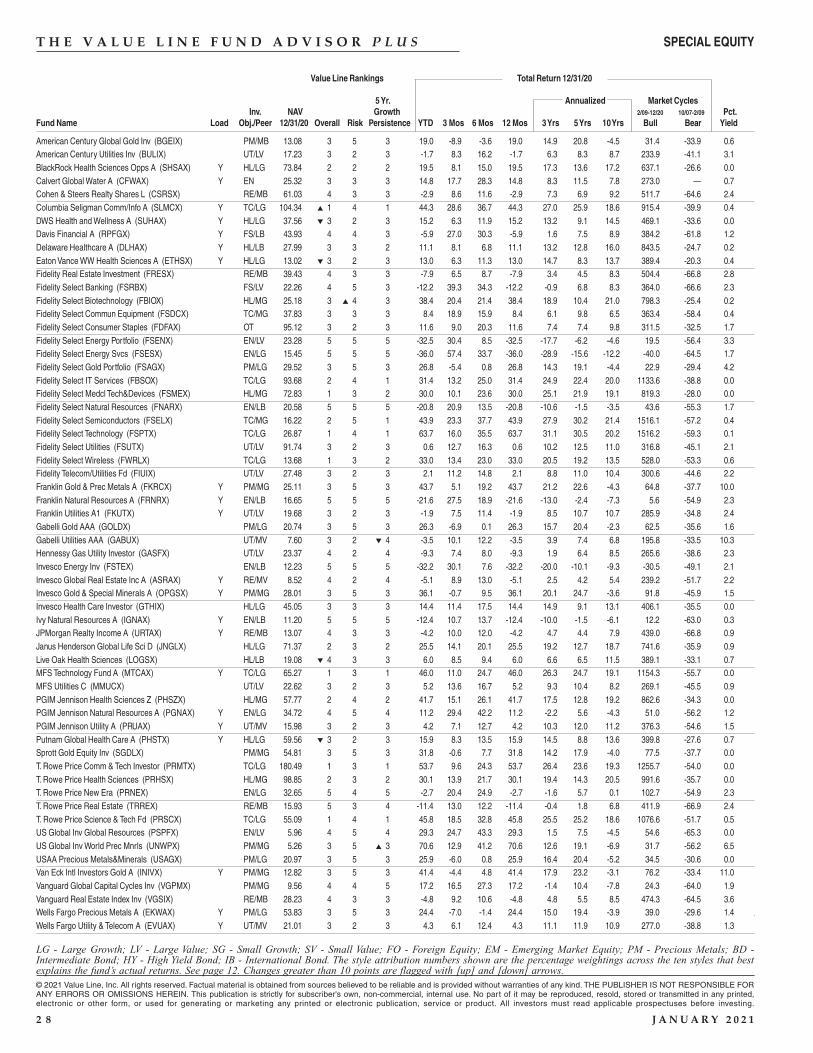
T H E V A L U E L I N E F U N D A D V I S O R P L U S
Value Line Rankings Total Return 12/31/20
5 Yr. Annualized Market CyclesInv. NAV Growth 2/09-12/20 10/07-2/09 Pct.
Fund Name Load Obj./Peer 12/31/20 Overall Risk Persistence YTD 3 Mos 6 Mos 12 Mos 3 Yrs 5 Yrs 10 Yrs Bull Bear Yield
© 2021 Value Line, Inc. All rights reserved. Factual material is obtained from sources believed to be reliable and is provided without warranties of any kind. THE PUBLISHER IS NOT RESPONSIBLE FORANY ERRORS OR OMISSIONS HEREIN. This publication is strictly for subscriber's own, non-commercial, internal use. No part of it may be reproduced, resold, stored or transmitted in any printed,electronic or other form, or used for generating or marketing any printed or electronic publication, service or product. All investors must read applicable prospectuses before investing.
2 8 J A N U A R Y 2 0 2 1
LG - Large Growth; LV - Large Value; SG - Small Growth; SV - Small Value; FO - Foreign Equity; EM - Emerging Market Equity; PM - Precious Metals; BD -Intermediate Bond; HY - High Yield Bond; IB - International Bond. The style attribution numbers shown are the percentage weightings across the ten styles that bestexplains the fund’s actual returns. See page 12. Changes greater than 10 points are flagged with [up] and [down] arrows.
American Century Global Gold Inv (BGEIX) PM/MB 13.08 3 5 3 19.0 -8.9 -3.6 19.0 14.9 20.8 -4.5 31.4 -33.9 0.6American Century Utilities Inv (BULIX) UT/LV 17.23 3 2 3 -1.7 8.3 16.2 -1.7 6.3 8.3 8.7 233.9 -41.1 3.1BlackRock Health Sciences Opps A (SHSAX) Y HL/LG 73.84 2 2 2 19.5 8.1 15.0 19.5 17.3 13.6 17.2 637.1 -26.6 0.0Calvert Global Water A (CFWAX) Y EN 25.32 3 3 3 14.8 17.7 28.3 14.8 8.3 11.5 7.8 273.0 — 0.7Cohen & Steers Realty Shares L (CSRSX) RE/MB 61.03 4 3 3 -2.9 8.6 11.6 -2.9 7.3 6.9 9.2 511.7 -64.6 2.4Columbia Seligman Comm/Info A (SLMCX) Y TC/LG 104.34 ▲ 1 4 1 44.3 28.6 36.7 44.3 27.0 25.9 18.6 915.4 -39.9 0.4DWS Health and Wellness A (SUHAX) Y HL/LG 37.56 ▼ 3 2 3 15.2 6.3 11.9 15.2 13.2 9.1 14.5 469.1 -33.6 0.0Davis Financial A (RPFGX) Y FS/LB 43.93 4 4 3 -5.9 27.0 30.3 -5.9 1.6 7.5 8.9 384.2 -61.8 1.2Delaware Healthcare A (DLHAX) Y HL/LB 27.99 3 3 2 11.1 8.1 6.8 11.1 13.2 12.8 16.0 843.5 -24.7 0.2Eaton Vance WW Health Sciences A (ETHSX) Y HL/LG 13.02 ▼ 3 2 3 13.0 6.3 11.3 13.0 14.7 8.3 13.7 389.4 -20.3 0.4Fidelity Real Estate Investment (FRESX) RE/MB 39.43 4 3 3 -7.9 6.5 8.7 -7.9 3.4 4.5 8.3 504.4 -66.8 2.8Fidelity Select Banking (FSRBX) FS/LV 22.26 4 5 3 -12.2 39.3 34.3 -12.2 -0.9 6.8 8.3 364.0 -66.6 2.3Fidelity Select Biotechnology (FBIOX) HL/MG 25.18 3 ▲ 4 3 38.4 20.4 21.4 38.4 18.9 10.4 21.0 798.3 -25.4 0.2Fidelity Select Commun Equipment (FSDCX) TC/MG 37.83 3 3 3 8.4 18.9 15.9 8.4 6.1 9.8 6.5 363.4 -58.4 0.4Fidelity Select Consumer Staples (FDFAX) OT 95.12 3 2 3 11.6 9.0 20.3 11.6 7.4 7.4 9.8 311.5 -32.5 1.7Fidelity Select Energy Portfolio (FSENX) EN/LV 23.28 5 5 5 -32.5 30.4 8.5 -32.5 -17.7 -6.2 -4.6 19.5 -56.4 3.3Fidelity Select Energy Svcs (FSESX) EN/LG 15.45 5 5 5 -36.0 57.4 33.7 -36.0 -28.9 -15.6 -12.2 -40.0 -64.5 1.7Fidelity Select Gold Portfolio (FSAGX) PM/LG 29.52 3 5 3 26.8 -5.4 0.8 26.8 14.3 19.1 -4.4 22.9 -29.4 4.2Fidelity Select IT Services (FBSOX) TC/LG 93.68 2 4 1 31.4 13.2 25.0 31.4 24.9 22.4 20.0 1133.6 -38.8 0.0Fidelity Select Medcl Tech&Devices (FSMEX) HL/MG 72.83 1 3 2 30.0 10.1 23.6 30.0 25.1 21.9 19.1 819.3 -28.0 0.0Fidelity Select Natural Resources (FNARX) EN/LB 20.58 5 5 5 -20.8 20.9 13.5 -20.8 -10.6 -1.5 -3.5 43.6 -55.3 1.7Fidelity Select Semiconductors (FSELX) TC/MG 16.22 2 5 1 43.9 23.3 37.7 43.9 27.9 30.2 21.4 1516.1 -57.2 0.4Fidelity Select Technology (FSPTX) TC/LG 26.87 1 4 1 63.7 16.0 35.5 63.7 31.1 30.5 20.2 1516.2 -59.3 0.1Fidelity Select Utilities (FSUTX) UT/LV 91.74 3 2 3 0.6 12.7 16.3 0.6 10.2 12.5 11.0 316.8 -45.1 2.1Fidelity Select Wireless (FWRLX) TC/LG 13.68 1 3 2 33.0 13.4 23.0 33.0 20.5 19.2 13.5 528.0 -53.3 0.6Fidelity Telecom/Utilities Fd (FIUIX) UT/LV 27.48 3 2 3 2.1 11.2 14.8 2.1 8.8 11.0 10.4 300.6 -44.6 2.2Franklin Gold & Prec Metals A (FKRCX) Y PM/MG 25.11 3 5 3 43.7 5.1 19.2 43.7 21.2 22.6 -4.3 64.8 -37.7 10.0Franklin Natural Resources A (FRNRX) Y EN/LB 16.65 5 5 5 -21.6 27.5 18.9 -21.6 -13.0 -2.4 -7.3 5.6 -54.9 2.3Franklin Utilities A1 (FKUTX) Y UT/LV 19.68 3 2 3 -1.9 7.5 11.4 -1.9 8.5 10.7 10.7 285.9 -34.8 2.4Gabelli Gold AAA (GOLDX) PM/LG 20.74 3 5 3 26.3 -6.9 0.1 26.3 15.7 20.4 -2.3 62.5 -35.6 1.6Gabelli Utilities AAA (GABUX) UT/MV 7.60 3 2 ▼ 4 -3.5 10.1 12.2 -3.5 3.9 7.4 6.8 195.8 -33.5 10.3Hennessy Gas Utility Investor (GASFX) UT/LV 23.37 4 2 4 -9.3 7.4 8.0 -9.3 1.9 6.4 8.5 265.6 -38.6 2.3Invesco Energy Inv (FSTEX) EN/LB 12.23 5 5 5 -32.2 30.1 7.6 -32.2 -20.0 -10.1 -9.3 -30.5 -49.1 2.1Invesco Global Real Estate Inc A (ASRAX) Y RE/MV 8.52 4 2 4 -5.1 8.9 13.0 -5.1 2.5 4.2 5.4 239.2 -51.7 2.2Invesco Gold & Special Minerals A (OPGSX) Y PM/MG 28.01 3 5 3 36.1 -0.7 9.5 36.1 20.1 24.7 -3.6 91.8 -45.9 1.5Invesco Health Care Investor (GTHIX) HL/LG 45.05 3 3 3 14.4 11.4 17.5 14.4 14.9 9.1 13.1 406.1 -35.5 0.0Ivy Natural Resources A (IGNAX) Y EN/LB 11.20 5 5 5 -12.4 10.7 13.7 -12.4 -10.0 -1.5 -6.1 12.2 -63.0 0.3JPMorgan Realty Income A (URTAX) Y RE/MB 13.07 4 3 3 -4.2 10.0 12.0 -4.2 4.7 4.4 7.9 439.0 -66.8 0.9Janus Henderson Global Life Sci D (JNGLX) HL/LG 71.37 2 3 2 25.5 14.1 20.1 25.5 19.2 12.7 18.7 741.6 -35.9 0.9Live Oak Health Sciences (LOGSX) HL/LB 19.08 ▼ 4 3 3 6.0 8.5 9.4 6.0 6.6 6.5 11.5 389.1 -33.1 0.7MFS Technology Fund A (MTCAX) Y TC/LG 65.27 1 3 1 46.0 11.0 24.7 46.0 26.3 24.7 19.1 1154.3 -55.7 0.0MFS Utilities C (MMUCX) UT/LV 22.62 3 2 3 5.2 13.6 16.7 5.2 9.3 10.4 8.2 269.1 -45.5 0.9PGIM Jennison Health Sciences Z (PHSZX) HL/MG 57.77 2 4 2 41.7 15.1 26.1 41.7 17.5 12.8 19.2 862.6 -34.3 0.0PGIM Jennison Natural Resources A (PGNAX) Y EN/LG 34.72 4 5 4 11.2 29.4 42.2 11.2 -2.2 5.6 -4.3 51.0 -56.2 1.2PGIM Jennison Utility A (PRUAX) Y UT/MV 15.98 3 2 3 4.2 7.1 12.7 4.2 10.3 12.0 11.2 376.3 -54.6 1.5Putnam Global Health Care A (PHSTX) Y HL/LG 59.56 ▼ 3 2 3 15.9 8.3 13.5 15.9 14.5 8.8 13.6 399.8 -27.6 0.7Sprott Gold Equity Inv (SGDLX) PM/MG 54.81 3 5 3 31.8 -0.6 7.7 31.8 14.2 17.9 -4.0 77.5 -37.7 0.0T. Rowe Price Comm & Tech Investor (PRMTX) TC/LG 180.49 1 3 1 53.7 9.6 24.3 53.7 26.4 23.6 19.3 1255.7 -54.0 0.0T. Rowe Price Health Sciences (PRHSX) HL/MG 98.85 2 3 2 30.1 13.9 21.7 30.1 19.4 14.3 20.5 991.6 -35.7 0.0T. Rowe Price New Era (PRNEX) EN/LG 32.65 5 4 5 -2.7 20.4 24.9 -2.7 -1.6 5.7 0.1 102.7 -54.9 2.3T. Rowe Price Real Estate (TRREX) RE/MB 15.93 5 3 4 -11.4 13.0 12.2 -11.4 -0.4 1.8 6.8 411.9 -66.9 2.4T. Rowe Price Science & Tech Fd (PRSCX) TC/LG 55.09 1 4 1 45.8 18.5 32.8 45.8 25.5 25.2 18.6 1076.6 -51.7 0.5US Global Inv Global Resources (PSPFX) EN/LV 5.96 4 5 4 29.3 24.7 43.3 29.3 1.5 7.5 -4.5 54.6 -65.3 0.0US Global Inv World Prec Mnrls (UNWPX) PM/MG 5.26 3 5 ▲ 3 70.6 12.9 41.2 70.6 12.6 19.1 -6.9 31.7 -56.2 6.5USAA Precious Metals&Minerals (USAGX) PM/LG 20.97 3 5 3 25.9 -6.0 0.8 25.9 16.4 20.4 -5.2 34.5 -30.6 0.0Van Eck Intl Investors Gold A (INIVX) Y PM/MG 12.82 3 5 3 41.4 -4.4 4.8 41.4 17.9 23.2 -3.1 76.2 -33.4 11.0Vanguard Global Capital Cycles Inv (VGPMX) PM/MG 9.56 4 4 5 17.2 16.5 27.3 17.2 -1.4 10.4 -7.8 24.3 -64.0 1.9Vanguard Real Estate Index Inv (VGSIX) RE/MB 28.23 4 3 3 -4.8 9.2 10.6 -4.8 4.8 5.5 8.5 474.3 -64.5 3.6Wells Fargo Precious Metals A (EKWAX) Y PM/LG 53.83 3 5 3 24.4 -7.0 -1.4 24.4 15.0 19.4 -3.9 39.0 -29.6 1.4Wells Fargo Utility & Telecom A (EVUAX) Y UT/MV 21.01 3 2 3 4.3 6.1 12.4 4.3 11.1 11.9 10.9 277.0 -38.8 1.3
SPECIAL EQUITY
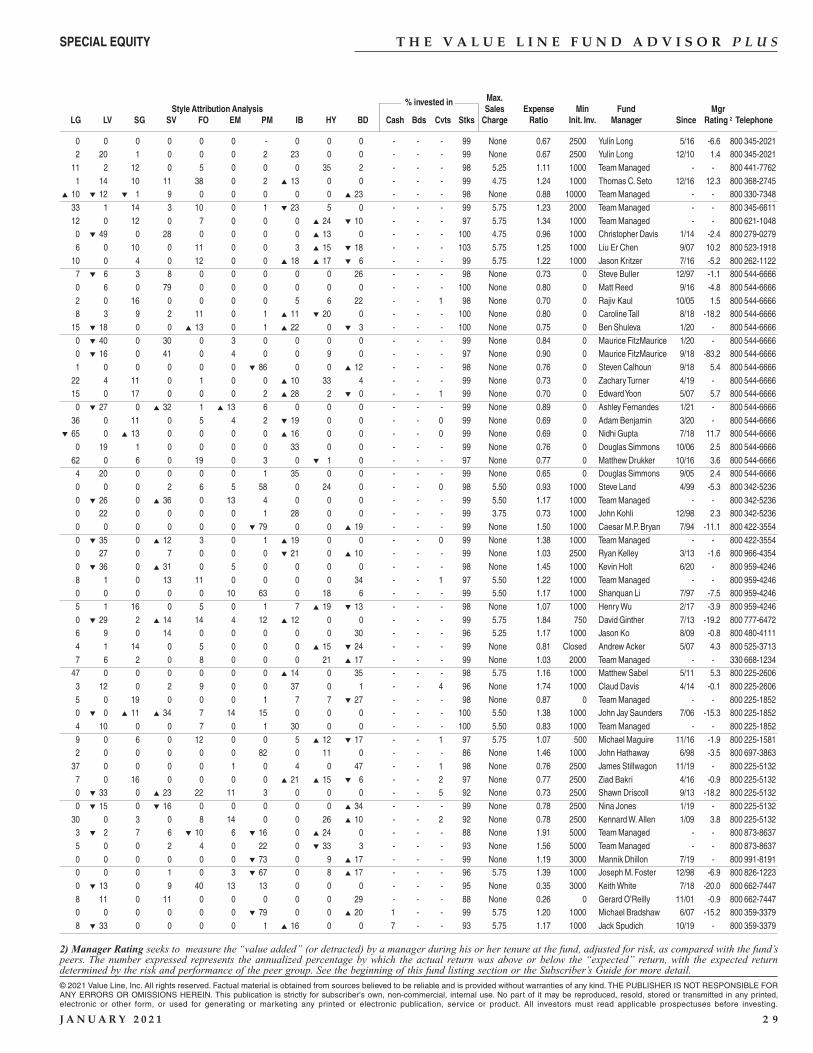
T H E V A L U E L I N E F U N D A D V I S O R P L U S
Max.Style Attribution Analysis
% invested inSales Expense Min Fund Mgr
LG LV SG SV FO EM PM IB HY BD Cash Bds Cvts Stks Charge Ratio Init. Inv. Manager Since Rating 2 Telephone
2) Manager Rating seeks to measure the “value added” (or detracted) by a manager during his or her tenure at the fund, adjusted for risk, as compared with the fund’speers. The number expressed represents the annualized percentage by which the actual return was above or below the “expected” return, with the expected returndetermined by the risk and performance of the peer group. See the beginning of this fund listing section or the Subscriber’s Guide for more detail.
© 2021 Value Line, Inc. All rights reserved. Factual material is obtained from sources believed to be reliable and is provided without warranties of any kind. THE PUBLISHER IS NOT RESPONSIBLE FORANY ERRORS OR OMISSIONS HEREIN. This publication is strictly for subscriber's own, non-commercial, internal use. No part of it may be reproduced, resold, stored or transmitted in any printed,electronic or other form, or used for generating or marketing any printed or electronic publication, service or product. All investors must read applicable prospectuses before investing.
J A N U A R Y 2 0 2 1 2 9
0 0 0 0 0 0 - 0 0 0 - - - 99 None 0.67 2500 Yulin Long 5/16 -6.6 800 345-2021 2 20 1 0 0 0 2 23 0 0 - - - 99 None 0.67 2500 Yulin Long 12/10 1.4 800 345-2021 11 2 12 0 5 0 0 0 35 2 - - - 98 5.25 1.11 1000 Team Managed - - 800 441-7762 1 14 10 11 38 0 2 ▲ 13 0 0 - - - 99 4.75 1.24 1000 Thomas C. Seto 12/16 12.3 800 368-2745
▲ 10 ▼ 12 ▼ 1 9 0 0 0 0 0 ▲ 23 - - - 98 None 0.88 10000 Team Managed - - 800 330-7348 33 1 14 3 10 0 1 ▼ 23 5 0 - - - 99 5.75 1.23 2000 Team Managed - - 800 345-6611 12 0 12 0 7 0 0 0 ▲ 24 ▼ 10 - - - 97 5.75 1.34 1000 Team Managed - - 800 621-1048 0 ▼ 49 0 28 0 0 0 0 ▲ 13 0 - - - 100 4.75 0.96 1000 Christopher Davis 1/14 -2.4 800 279-0279 6 0 10 0 11 0 0 3 ▲ 15 ▼ 18 - - - 103 5.75 1.25 1000 Liu Er Chen 9/07 10.2 800 523-1918 10 0 4 0 12 0 0 ▲ 18 ▲ 17 ▼ 6 - - - 99 5.75 1.22 1000 Jason Kritzer 7/16 -5.2 800 262-1122 7 ▼ 6 3 8 0 0 0 0 0 26 - - - 98 None 0.73 0 Steve Buller 12/97 -1.1 800 544-6666 0 6 0 79 0 0 0 0 0 0 - - - 100 None 0.80 0 Matt Reed 9/16 -4.8 800 544-6666 2 0 16 0 0 0 0 5 6 22 - - 1 98 None 0.70 0 Rajiv Kaul 10/05 1.5 800 544-6666 8 3 9 2 11 0 1 ▲ 11 ▼ 20 0 - - - 100 None 0.80 0 Caroline Tall 8/18 -18.2 800 544-6666 15 ▼ 18 0 0 ▲ 13 0 1 ▲ 22 0 ▼ 3 - - - 100 None 0.75 0 Ben Shuleva 1/20 - 800 544-6666 0 ▼ 40 0 30 0 3 0 0 0 0 - - - 99 None 0.84 0 Maurice FitzMaurice 1/20 - 800 544-6666 0 ▼ 16 0 41 0 4 0 0 9 0 - - - 97 None 0.90 0 Maurice FitzMaurice 9/18 -83.2 800 544-6666 1 0 0 0 0 0 ▼ 86 0 0 ▲ 12 - - - 98 None 0.76 0 Steven Calhoun 9/18 5.4 800 544-6666 22 4 11 0 1 0 0 ▲ 10 33 4 - - - 99 None 0.73 0 Zachary Turner 4/19 - 800 544-6666 15 0 17 0 0 0 2 ▲ 28 2 ▼ 0 - - 1 99 None 0.70 0 Edward Yoon 5/07 5.7 800 544-6666 0 ▼ 27 0 ▲ 32 1 ▲ 13 6 0 0 0 - - - 99 None 0.89 0 Ashley Fernandes 1/21 - 800 544-6666 36 0 11 0 5 4 2 ▼ 19 0 0 - - 0 99 None 0.69 0 Adam Benjamin 3/20 - 800 544-6666
▼ 65 0 ▲ 13 0 0 0 0 ▲ 16 0 0 - - 0 99 None 0.69 0 Nidhi Gupta 7/18 11.7 800 544-6666 0 19 1 0 0 0 0 33 0 0 - - - 99 None 0.76 0 Douglas Simmons 10/06 2.5 800 544-6666 62 0 6 0 19 0 3 0 ▼ 1 0 - - - 97 None 0.77 0 Matthew Drukker 10/16 3.6 800 544-6666 4 20 0 0 0 0 1 35 0 0 - - - 99 None 0.65 0 Douglas Simmons 9/05 2.4 800 544-6666 0 0 0 2 6 5 58 0 24 0 - - 0 98 5.50 0.93 1000 Steve Land 4/99 -5.3 800 342-5236 0 ▼ 26 0 ▲ 36 0 13 4 0 0 0 - - - 99 5.50 1.17 1000 Team Managed - - 800 342-5236 0 22 0 0 0 0 1 28 0 0 - - - 99 3.75 0.73 1000 John Kohli 12/98 2.3 800 342-5236 0 0 0 0 0 0 ▼ 79 0 0 ▲ 19 - - - 99 None 1.50 1000 Caesar M.P. Bryan 7/94 -11.1 800 422-3554 0 ▼ 35 0 ▲ 12 3 0 1 ▲ 19 0 0 - - 0 99 None 1.38 1000 Team Managed - - 800 422-3554 0 27 0 7 0 0 0 ▼ 21 0 ▲ 10 - - - 99 None 1.03 2500 Ryan Kelley 3/13 -1.6 800 966-4354 0 ▼ 36 0 ▲ 31 0 5 0 0 0 0 - - - 98 None 1.45 1000 Kevin Holt 6/20 - 800 959-4246 8 1 0 13 11 0 0 0 0 34 - - 1 97 5.50 1.22 1000 Team Managed - - 800 959-4246 0 0 0 0 0 10 63 0 18 6 - - - 99 5.50 1.17 1000 Shanquan Li 7/97 -7.5 800 959-4246 5 1 16 0 5 0 1 7 ▲ 19 ▼ 13 - - - 98 None 1.07 1000 Henry Wu 2/17 -3.9 800 959-4246 0 ▼ 29 2 ▲ 14 14 4 12 ▲ 12 0 0 - - - 99 5.75 1.84 750 David Ginther 7/13 -19.2 800 777-6472 6 9 0 14 0 0 0 0 0 30 - - - 96 5.25 1.17 1000 Jason Ko 8/09 -0.8 800 480-4111 4 1 14 0 5 0 0 0 ▲ 15 ▼ 24 - - - 99 None 0.81 Closed Andrew Acker 5/07 4.3 800 525-3713 7 6 2 0 8 0 0 0 21 ▲ 17 - - - 99 None 1.03 2000 Team Managed - - 330 668-1234 47 0 0 0 0 0 0 ▲ 14 0 35 - - - 98 5.75 1.16 1000 Matthew Sabel 5/11 5.3 800 225-2606 3 12 0 2 9 0 0 37 0 1 - - 4 96 None 1.74 1000 Claud Davis 4/14 -0.1 800 225-2606 5 0 19 0 0 0 1 7 7 ▼ 27 - - - 98 None 0.87 0 Team Managed - - 800 225-1852 0 ▼ 0 ▲ 11 ▲ 34 7 14 15 0 0 0 - - - 100 5.50 1.38 1000 John Jay Saunders 7/06 -15.3 800 225-1852 4 10 0 0 7 0 1 30 0 0 - - - 100 5.50 0.83 1000 Team Managed - - 800 225-1852 9 0 6 0 12 0 0 5 ▲ 12 ▼ 17 - - 1 97 5.75 1.07 500 Michael Maguire 11/16 -1.9 800 225-1581 2 0 0 0 0 0 82 0 11 0 - - - 86 None 1.46 1000 John Hathaway 6/98 -3.5 800 697-3863 37 0 0 0 0 1 0 4 0 47 - - 1 98 None 0.76 2500 James Stillwagon 11/19 - 800 225-5132 7 0 16 0 0 0 0 ▲ 21 ▲ 15 ▼ 6 - - 2 97 None 0.77 2500 Ziad Bakri 4/16 -0.9 800 225-5132 0 ▼ 33 0 ▲ 23 22 11 3 0 0 0 - - 5 92 None 0.73 2500 Shawn Driscoll 9/13 -18.2 800 225-5132 0 ▼ 15 0 ▼ 16 0 0 0 0 0 ▲ 34 - - - 99 None 0.78 2500 Nina Jones 1/19 - 800 225-5132 30 0 3 0 8 14 0 0 26 ▲ 10 - - 2 92 None 0.78 2500 Kennard W. Allen 1/09 3.8 800 225-5132 3 ▼ 2 7 6 ▼ 10 6 ▼ 16 0 ▲ 24 0 - - - 88 None 1.91 5000 Team Managed - - 800 873-8637 5 0 0 2 4 0 22 0 ▼ 33 3 - - - 93 None 1.56 5000 Team Managed - - 800 873-8637 0 0 0 0 0 0 ▼ 73 0 9 ▲ 17 - - - 99 None 1.19 3000 Mannik Dhillon 7/19 - 800 991-8191 0 0 0 1 0 3 ▼ 67 0 8 ▲ 17 - - - 96 5.75 1.39 1000 Joseph M. Foster 12/98 -6.9 800 826-1223 0 ▼ 13 0 9 40 13 13 0 0 0 - - - 95 None 0.35 3000 Keith White 7/18 -20.0 800 662-7447 8 11 0 11 0 0 0 0 0 29 - - - 88 None 0.26 0 Gerard O’Reilly 11/01 -0.9 800 662-7447 0 0 0 0 0 0 ▼ 79 0 0 ▲ 20 1 - - 99 5.75 1.20 1000 Michael Bradshaw 6/07 -15.2 800 359-3379 8 ▼ 33 0 0 0 0 1 ▲ 16 0 0 7 - - 93 5.75 1.17 1000 Jack Spudich 10/19 - 800 359-3379
SPECIAL EQUITY
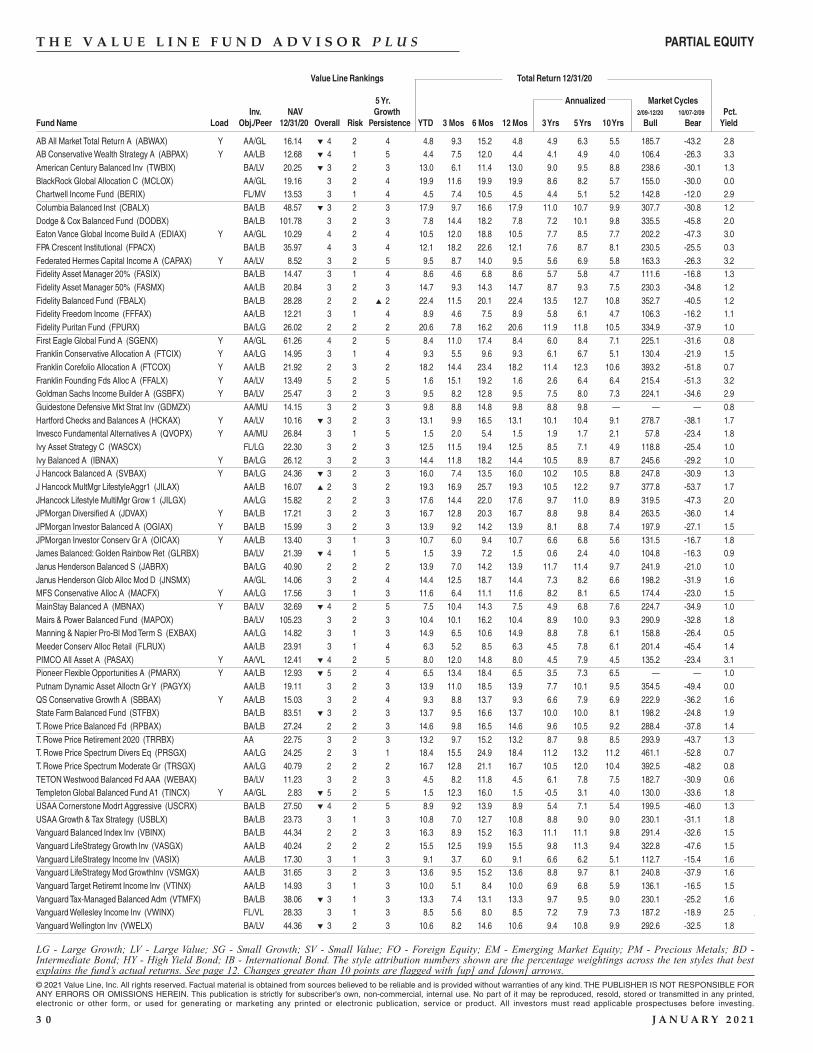
T H E V A L U E L I N E F U N D A D V I S O R P L U S
Value Line Rankings Total Return 12/31/20
5 Yr. Annualized Market CyclesInv. NAV Growth 2/09-12/20 10/07-2/09 Pct.
Fund Name Load Obj./Peer 12/31/20 Overall Risk Persistence YTD 3 Mos 6 Mos 12 Mos 3 Yrs 5 Yrs 10 Yrs Bull Bear Yield
© 2021 Value Line, Inc. All rights reserved. Factual material is obtained from sources believed to be reliable and is provided without warranties of any kind. THE PUBLISHER IS NOT RESPONSIBLE FORANY ERRORS OR OMISSIONS HEREIN. This publication is strictly for subscriber's own, non-commercial, internal use. No part of it may be reproduced, resold, stored or transmitted in any printed,electronic or other form, or used for generating or marketing any printed or electronic publication, service or product. All investors must read applicable prospectuses before investing.
3 0 J A N U A R Y 2 0 2 1
LG - Large Growth; LV - Large Value; SG - Small Growth; SV - Small Value; FO - Foreign Equity; EM - Emerging Market Equity; PM - Precious Metals; BD -Intermediate Bond; HY - High Yield Bond; IB - International Bond. The style attribution numbers shown are the percentage weightings across the ten styles that bestexplains the fund’s actual returns. See page 12. Changes greater than 10 points are flagged with [up] and [down] arrows.
AB All Market Total Return A (ABWAX) Y AA/GL 16.14 ▼ 4 2 4 4.8 9.3 15.2 4.8 4.9 6.3 5.5 185.7 -43.2 2.8AB Conservative Wealth Strategy A (ABPAX) Y AA/LB 12.68 ▼ 4 1 5 4.4 7.5 12.0 4.4 4.1 4.9 4.0 106.4 -26.3 3.3American Century Balanced Inv (TWBIX) BA/LV 20.25 ▼ 3 2 3 13.0 6.1 11.4 13.0 9.0 9.5 8.8 238.6 -30.1 1.3BlackRock Global Allocation C (MCLOX) AA/GL 19.16 3 2 4 19.9 11.6 19.9 19.9 8.6 8.2 5.7 155.0 -30.0 0.0Chartwell Income Fund (BERIX) FL/MV 13.53 3 1 4 4.5 7.4 10.5 4.5 4.4 5.1 5.2 142.8 -12.0 2.9Columbia Balanced Inst (CBALX) BA/LB 48.57 ▼ 3 2 3 17.9 9.7 16.6 17.9 11.0 10.7 9.9 307.7 -30.8 1.2Dodge & Cox Balanced Fund (DODBX) BA/LB 101.78 3 2 3 7.8 14.4 18.2 7.8 7.2 10.1 9.8 335.5 -45.8 2.0Eaton Vance Global Income Build A (EDIAX) Y AA/GL 10.29 4 2 4 10.5 12.0 18.8 10.5 7.7 8.5 7.7 202.2 -47.3 3.0FPA Crescent Institutional (FPACX) BA/LB 35.97 4 3 4 12.1 18.2 22.6 12.1 7.6 8.7 8.1 230.5 -25.5 0.3Federated Hermes Capital Income A (CAPAX) Y AA/LV 8.52 3 2 5 9.5 8.7 14.0 9.5 5.6 6.9 5.8 163.3 -26.3 3.2Fidelity Asset Manager 20% (FASIX) BA/LB 14.47 3 1 4 8.6 4.6 6.8 8.6 5.7 5.8 4.7 111.6 -16.8 1.3Fidelity Asset Manager 50% (FASMX) AA/LB 20.84 3 2 3 14.7 9.3 14.3 14.7 8.7 9.3 7.5 230.3 -34.8 1.2Fidelity Balanced Fund (FBALX) BA/LB 28.28 2 2 ▲ 2 22.4 11.5 20.1 22.4 13.5 12.7 10.8 352.7 -40.5 1.2Fidelity Freedom Income (FFFAX) AA/LB 12.21 3 1 4 8.9 4.6 7.5 8.9 5.8 6.1 4.7 106.3 -16.2 1.1Fidelity Puritan Fund (FPURX) BA/LG 26.02 2 2 2 20.6 7.8 16.2 20.6 11.9 11.8 10.5 334.9 -37.9 1.0First Eagle Global Fund A (SGENX) Y AA/GL 61.26 4 2 5 8.4 11.0 17.4 8.4 6.0 8.4 7.1 225.1 -31.6 0.8Franklin Conservative Allocation A (FTCIX) Y AA/LG 14.95 3 1 4 9.3 5.5 9.6 9.3 6.1 6.7 5.1 130.4 -21.9 1.5Franklin Corefolio Allocation A (FTCOX) Y AA/LB 21.92 2 3 2 18.2 14.4 23.4 18.2 11.4 12.3 10.6 393.2 -51.8 0.7Franklin Founding Fds Alloc A (FFALX) Y AA/LV 13.49 5 2 5 1.6 15.1 19.2 1.6 2.6 6.4 6.4 215.4 -51.3 3.2Goldman Sachs Income Builder A (GSBFX) Y BA/LV 25.47 3 2 3 9.5 8.2 12.8 9.5 7.5 8.0 7.3 224.1 -34.6 2.9Guidestone Defensive Mkt Strat Inv (GDMZX) AA/MU 14.15 3 2 3 9.8 8.8 14.8 9.8 8.8 9.8 — — — 0.8Hartford Checks and Balances A (HCKAX) Y AA/LV 10.16 ▼ 3 2 3 13.1 9.9 16.5 13.1 10.1 10.4 9.1 278.7 -38.1 1.7Invesco Fundamental Alternatives A (QVOPX) Y AA/MU 26.84 3 1 5 1.5 2.0 5.4 1.5 1.9 1.7 2.1 57.8 -23.4 1.8Ivy Asset Strategy C (WASCX) FL/LG 22.30 3 2 3 12.5 11.5 19.4 12.5 8.5 7.1 4.9 118.8 -25.4 1.0Ivy Balanced A (IBNAX) Y BA/LG 26.12 3 2 3 14.4 11.8 18.2 14.4 10.5 8.9 8.7 245.6 -29.2 1.0J Hancock Balanced A (SVBAX) Y BA/LG 24.36 ▼ 3 2 3 16.0 7.4 13.5 16.0 10.2 10.5 8.8 247.8 -30.9 1.3J Hancock MultMgr LifestyleAggr1 (JILAX) AA/LB 16.07 ▲ 2 3 2 19.3 16.9 25.7 19.3 10.5 12.2 9.7 377.8 -53.7 1.7JHancock Lifestyle MultiMgr Grow 1 (JILGX) AA/LG 15.82 2 2 3 17.6 14.4 22.0 17.6 9.7 11.0 8.9 319.5 -47.3 2.0JPMorgan Diversified A (JDVAX) Y BA/LB 17.21 3 2 3 16.7 12.8 20.3 16.7 8.8 9.8 8.4 263.5 -36.0 1.4JPMorgan Investor Balanced A (OGIAX) Y BA/LB 15.99 3 2 3 13.9 9.2 14.2 13.9 8.1 8.8 7.4 197.9 -27.1 1.5JPMorgan Investor Conserv Gr A (OICAX) Y AA/LB 13.40 3 1 3 10.7 6.0 9.4 10.7 6.6 6.8 5.6 131.5 -16.7 1.8James Balanced: Golden Rainbow Ret (GLRBX) BA/LV 21.39 ▼ 4 1 5 1.5 3.9 7.2 1.5 0.6 2.4 4.0 104.8 -16.3 0.9Janus Henderson Balanced S (JABRX) BA/LG 40.90 2 2 2 13.9 7.0 14.2 13.9 11.7 11.4 9.7 241.9 -21.0 1.0Janus Henderson Glob Alloc Mod D (JNSMX) AA/GL 14.06 3 2 4 14.4 12.5 18.7 14.4 7.3 8.2 6.6 198.2 -31.9 1.6MFS Conservative Alloc A (MACFX) Y AA/LG 17.56 3 1 3 11.6 6.4 11.1 11.6 8.2 8.1 6.5 174.4 -23.0 1.5MainStay Balanced A (MBNAX) Y BA/LV 32.69 ▼ 4 2 5 7.5 10.4 14.3 7.5 4.9 6.8 7.6 224.7 -34.9 1.0Mairs & Power Balanced Fund (MAPOX) BA/LV 105.23 3 2 3 10.4 10.1 16.2 10.4 8.9 10.0 9.3 290.9 -32.8 1.8Manning & Napier Pro-Bl Mod Term S (EXBAX) AA/LG 14.82 3 1 3 14.9 6.5 10.6 14.9 8.8 7.8 6.1 158.8 -26.4 0.5Meeder Conserv Alloc Retail (FLRUX) AA/LB 23.91 3 1 4 6.3 5.2 8.5 6.3 4.5 7.8 6.1 201.4 -45.4 1.4PIMCO All Asset A (PASAX) Y AA/VL 12.41 ▼ 4 2 5 8.0 12.0 14.8 8.0 4.5 7.9 4.5 135.2 -23.4 3.1Pioneer Flexible Opportunities A (PMARX) Y AA/LB 12.93 ▼ 5 2 4 6.5 13.4 18.4 6.5 3.5 7.3 6.5 — — 1.0Putnam Dynamic Asset Alloctn Gr Y (PAGYX) AA/LB 19.11 3 2 3 13.9 11.0 18.5 13.9 7.7 10.1 9.5 354.5 -49.4 0.0QS Conservative Growth A (SBBAX) Y AA/LB 15.03 3 2 4 9.3 8.8 13.7 9.3 6.6 7.9 6.9 222.9 -36.2 1.6State Farm Balanced Fund (STFBX) BA/LB 83.51 ▼ 3 2 3 13.7 9.5 16.6 13.7 10.0 10.0 8.1 198.2 -24.8 1.9T. Rowe Price Balanced Fd (RPBAX) BA/LB 27.24 2 2 3 14.6 9.8 16.5 14.6 9.6 10.5 9.2 288.4 -37.8 1.4T. Rowe Price Retirement 2020 (TRRBX) AA 22.75 3 2 3 13.2 9.7 15.2 13.2 8.7 9.8 8.5 293.9 -43.7 1.3T. Rowe Price Spectrum Divers Eq (PRSGX) AA/LG 24.25 2 3 1 18.4 15.5 24.9 18.4 11.2 13.2 11.2 461.1 -52.8 0.7T. Rowe Price Spectrum Moderate Gr (TRSGX) AA/LG 40.79 2 2 2 16.7 12.8 21.1 16.7 10.5 12.0 10.4 392.5 -48.2 0.8TETON Westwood Balanced Fd AAA (WEBAX) BA/LV 11.23 3 2 3 4.5 8.2 11.8 4.5 6.1 7.8 7.5 182.7 -30.9 0.6Templeton Global Balanced Fund A1 (TINCX) Y AA/GL 2.83 ▼ 5 2 5 1.5 12.3 16.0 1.5 -0.5 3.1 4.0 130.0 -33.6 1.8USAA Cornerstone Modrt Aggressive (USCRX) BA/LB 27.50 ▼ 4 2 5 8.9 9.2 13.9 8.9 5.4 7.1 5.4 199.5 -46.0 1.3USAA Growth & Tax Strategy (USBLX) BA/LB 23.73 3 1 3 10.8 7.0 12.7 10.8 8.8 9.0 9.0 230.1 -31.1 1.8Vanguard Balanced Index Inv (VBINX) BA/LB 44.34 2 2 3 16.3 8.9 15.2 16.3 11.1 11.1 9.8 291.4 -32.6 1.5Vanguard LifeStrategy Growth Inv (VASGX) AA/LB 40.24 2 2 2 15.5 12.5 19.9 15.5 9.8 11.3 9.4 322.8 -47.6 1.5Vanguard LifeStrategy Income Inv (VASIX) AA/LB 17.30 3 1 3 9.1 3.7 6.0 9.1 6.6 6.2 5.1 112.7 -15.4 1.6Vanguard LifeStrategy Mod GrowthInv (VSMGX) AA/LB 31.65 3 2 3 13.6 9.5 15.2 13.6 8.8 9.7 8.1 240.8 -37.9 1.6Vanguard Target Retiremt Income Inv (VTINX) AA/LB 14.93 3 1 3 10.0 5.1 8.4 10.0 6.9 6.8 5.9 136.1 -16.5 1.5Vanguard Tax-Managed Balanced Adm (VTMFX) BA/LB 38.06 ▼ 3 1 3 13.3 7.4 13.1 13.3 9.7 9.5 9.0 230.1 -25.2 1.6Vanguard Wellesley Income Inv (VWINX) FL/VL 28.33 3 1 3 8.5 5.6 8.0 8.5 7.2 7.9 7.3 187.2 -18.9 2.5Vanguard Wellington Inv (VWELX) BA/LV 44.36 ▼ 3 2 3 10.6 8.2 14.6 10.6 9.4 10.8 9.9 292.6 -32.5 1.8
PARTIAL EQUITY
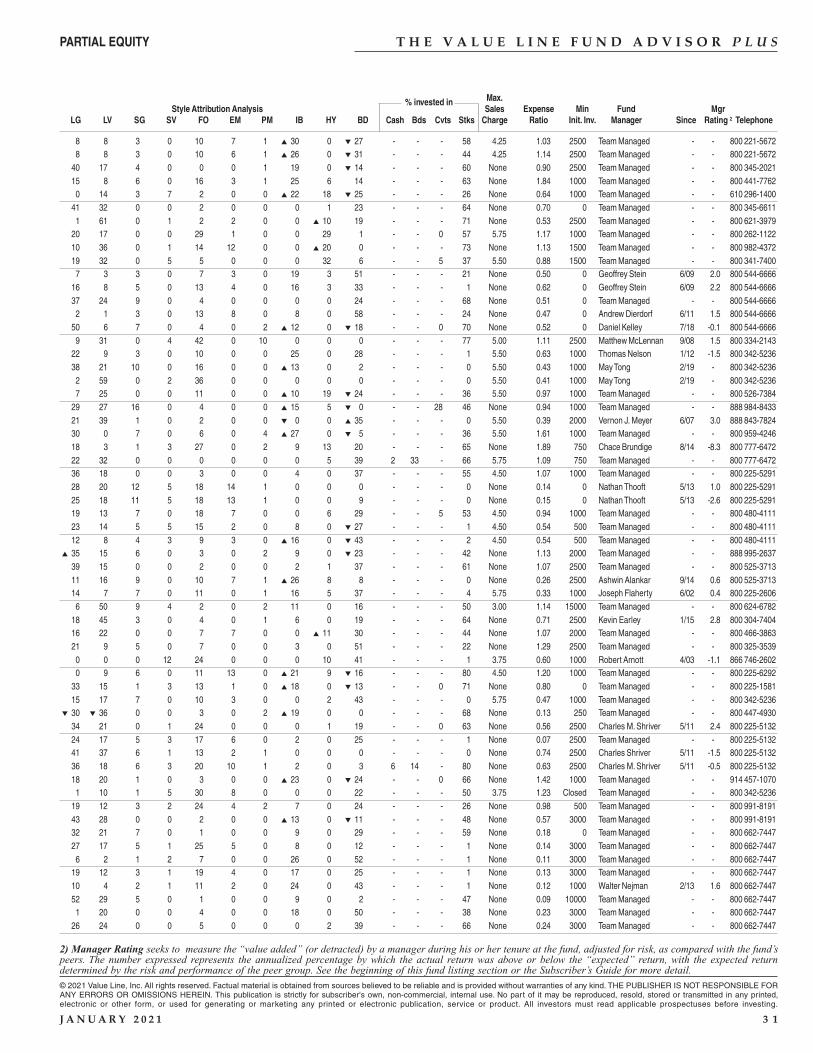
T H E V A L U E L I N E F U N D A D V I S O R P L U S
Max.Style Attribution Analysis
% invested inSales Expense Min Fund Mgr
LG LV SG SV FO EM PM IB HY BD Cash Bds Cvts Stks Charge Ratio Init. Inv. Manager Since Rating 2 Telephone
2) Manager Rating seeks to measure the “value added” (or detracted) by a manager during his or her tenure at the fund, adjusted for risk, as compared with the fund’speers. The number expressed represents the annualized percentage by which the actual return was above or below the “expected” return, with the expected returndetermined by the risk and performance of the peer group. See the beginning of this fund listing section or the Subscriber’s Guide for more detail.
© 2021 Value Line, Inc. All rights reserved. Factual material is obtained from sources believed to be reliable and is provided without warranties of any kind. THE PUBLISHER IS NOT RESPONSIBLE FORANY ERRORS OR OMISSIONS HEREIN. This publication is strictly for subscriber's own, non-commercial, internal use. No part of it may be reproduced, resold, stored or transmitted in any printed,electronic or other form, or used for generating or marketing any printed or electronic publication, service or product. All investors must read applicable prospectuses before investing.
J A N U A R Y 2 0 2 1 3 1
8 8 3 0 10 7 1 ▲ 30 0 ▼ 27 - - - 58 4.25 1.03 2500 Team Managed - - 800 221-5672 8 8 3 0 10 6 1 ▲ 26 0 ▼ 31 - - - 44 4.25 1.14 2500 Team Managed - - 800 221-5672 40 17 4 0 0 0 1 19 0 ▼ 14 - - - 60 None 0.90 2500 Team Managed - - 800 345-2021 15 8 6 0 16 3 1 25 6 14 - - - 63 None 1.84 1000 Team Managed - - 800 441-7762 0 14 3 7 2 0 0 ▲ 22 18 ▼ 25 - - - 26 None 0.64 1000 Team Managed - - 610 296-1400 41 32 0 0 2 0 0 0 1 23 - - - 64 None 0.70 0 Team Managed - - 800 345-6611 1 61 0 1 2 2 0 0 ▲ 10 19 - - - 71 None 0.53 2500 Team Managed - - 800 621-3979 20 17 0 0 29 1 0 0 29 1 - - 0 57 5.75 1.17 1000 Team Managed - - 800 262-1122 10 36 0 1 14 12 0 0 ▲ 20 0 - - - 73 None 1.13 1500 Team Managed - - 800 982-4372 19 32 0 5 5 0 0 0 32 6 - - 5 37 5.50 0.88 1500 Team Managed - - 800 341-7400 7 3 3 0 7 3 0 19 3 51 - - - 21 None 0.50 0 Geoffrey Stein 6/09 2.0 800 544-6666 16 8 5 0 13 4 0 16 3 33 - - - 1 None 0.62 0 Geoffrey Stein 6/09 2.2 800 544-6666 37 24 9 0 4 0 0 0 0 24 - - - 68 None 0.51 0 Team Managed - - 800 544-6666 2 1 3 0 13 8 0 8 0 58 - - - 24 None 0.47 0 Andrew Dierdorf 6/11 1.5 800 544-6666 50 6 7 0 4 0 2 ▲ 12 0 ▼ 18 - - 0 70 None 0.52 0 Daniel Kelley 7/18 -0.1 800 544-6666 9 31 0 4 42 0 10 0 0 0 - - - 77 5.00 1.11 2500 Matthew McLennan 9/08 1.5 800 334-2143 22 9 3 0 10 0 0 25 0 28 - - - 1 5.50 0.63 1000 Thomas Nelson 1/12 -1.5 800 342-5236 38 21 10 0 16 0 0 ▲ 13 0 2 - - - 0 5.50 0.43 1000 May Tong 2/19 - 800 342-5236 2 59 0 2 36 0 0 0 0 0 - - - 0 5.50 0.41 1000 May Tong 2/19 - 800 342-5236 7 25 0 0 11 0 0 ▲ 10 19 ▼ 24 - - - 36 5.50 0.97 1000 Team Managed - - 800 526-7384 29 27 16 0 4 0 0 ▲ 15 5 ▼ 0 - - 28 46 None 0.94 1000 Team Managed - - 888 984-8433 21 39 1 0 2 0 0 ▼ 0 0 ▲ 35 - - - 0 5.50 0.39 2000 Vernon J. Meyer 6/07 3.0 888 843-7824 30 0 7 0 6 0 4 ▲ 27 0 ▼ 5 - - - 36 5.50 1.61 1000 Team Managed - - 800 959-4246 18 3 1 3 27 0 2 9 13 20 - - - 65 None 1.89 750 Chace Brundige 8/14 -8.3 800 777-6472 22 32 0 0 0 0 0 0 5 39 2 33 - 66 5.75 1.09 750 Team Managed - - 800 777-6472 36 18 0 0 3 0 0 4 0 37 - - - 55 4.50 1.07 1000 Team Managed - - 800 225-5291 28 20 12 5 18 14 1 0 0 0 - - - 0 None 0.14 0 Nathan Thooft 5/13 1.0 800 225-5291 25 18 11 5 18 13 1 0 0 9 - - - 0 None 0.15 0 Nathan Thooft 5/13 -2.6 800 225-5291 19 13 7 0 18 7 0 0 6 29 - - 5 53 4.50 0.94 1000 Team Managed - - 800 480-4111 23 14 5 5 15 2 0 8 0 ▼ 27 - - - 1 4.50 0.54 500 Team Managed - - 800 480-4111 12 8 4 3 9 3 0 ▲ 16 0 ▼ 43 - - - 2 4.50 0.54 500 Team Managed - - 800 480-4111
▲ 35 15 6 0 3 0 2 9 0 ▼ 23 - - - 42 None 1.13 2000 Team Managed - - 888 995-2637 39 15 0 0 2 0 0 2 1 37 - - - 61 None 1.07 2500 Team Managed - - 800 525-3713 11 16 9 0 10 7 1 ▲ 26 8 8 - - - 0 None 0.26 2500 Ashwin Alankar 9/14 0.6 800 525-3713 14 7 7 0 11 0 1 16 5 37 - - - 4 5.75 0.33 1000 Joseph Flaherty 6/02 0.4 800 225-2606 6 50 9 4 2 0 2 11 0 16 - - - 50 3.00 1.14 15000 Team Managed - - 800 624-6782 18 45 3 0 4 0 1 6 0 19 - - - 64 None 0.71 2500 Kevin Earley 1/15 2.8 800 304-7404 16 22 0 0 7 7 0 0 ▲ 11 30 - - - 44 None 1.07 2000 Team Managed - - 800 466-3863 21 9 5 0 7 0 0 3 0 51 - - - 22 None 1.29 2500 Team Managed - - 800 325-3539 0 0 0 12 24 0 0 0 10 41 - - - 1 3.75 0.60 1000 Robert Arnott 4/03 -1.1 866 746-2602 0 9 6 0 11 13 0 ▲ 21 9 ▼ 16 - - - 80 4.50 1.20 1000 Team Managed - - 800 225-6292 33 15 1 3 13 1 0 ▲ 18 0 ▼ 13 - - 0 71 None 0.80 0 Team Managed - - 800 225-1581 15 17 7 0 10 3 0 0 2 43 - - - 0 5.75 0.47 1000 Team Managed - - 800 342-5236
▼ 30 ▼ 36 0 0 3 0 2 ▲ 19 0 0 - - - 68 None 0.13 250 Team Managed - - 800 447-4930 34 21 0 1 24 0 0 0 1 19 - - 0 63 None 0.56 2500 Charles M. Shriver 5/11 2.4 800 225-5132 24 17 5 3 17 6 0 2 0 25 - - - 1 None 0.07 2500 Team Managed - - 800 225-5132 41 37 6 1 13 2 1 0 0 0 - - - 0 None 0.74 2500 Charles Shriver 5/11 -1.5 800 225-5132 36 18 6 3 20 10 1 2 0 3 6 14 - 80 None 0.63 2500 Charles M. Shriver 5/11 -0.5 800 225-5132 18 20 1 0 3 0 0 ▲ 23 0 ▼ 24 - - 0 66 None 1.42 1000 Team Managed - - 914 457-1070 1 10 1 5 30 8 0 0 0 22 - - - 50 3.75 1.23 Closed Team Managed - - 800 342-5236 19 12 3 2 24 4 2 7 0 24 - - - 26 None 0.98 500 Team Managed - - 800 991-8191 43 28 0 0 2 0 0 ▲ 13 0 ▼ 11 - - - 48 None 0.57 3000 Team Managed - - 800 991-8191 32 21 7 0 1 0 0 9 0 29 - - - 59 None 0.18 0 Team Managed - - 800 662-7447 27 17 5 1 25 5 0 8 0 12 - - - 1 None 0.14 3000 Team Managed - - 800 662-7447 6 2 1 2 7 0 0 26 0 52 - - - 1 None 0.11 3000 Team Managed - - 800 662-7447 19 12 3 1 19 4 0 17 0 25 - - - 1 None 0.13 3000 Team Managed - - 800 662-7447 10 4 2 1 11 2 0 24 0 43 - - - 1 None 0.12 1000 Walter Nejman 2/13 1.6 800 662-7447 52 29 5 0 1 0 0 9 0 2 - - - 47 None 0.09 10000 Team Managed - - 800 662-7447 1 20 0 0 4 0 0 18 0 50 - - - 38 None 0.23 3000 Team Managed - - 800 662-7447 26 24 0 0 5 0 0 0 2 39 - - - 66 None 0.24 3000 Team Managed - - 800 662-7447
PARTIAL EQUITY
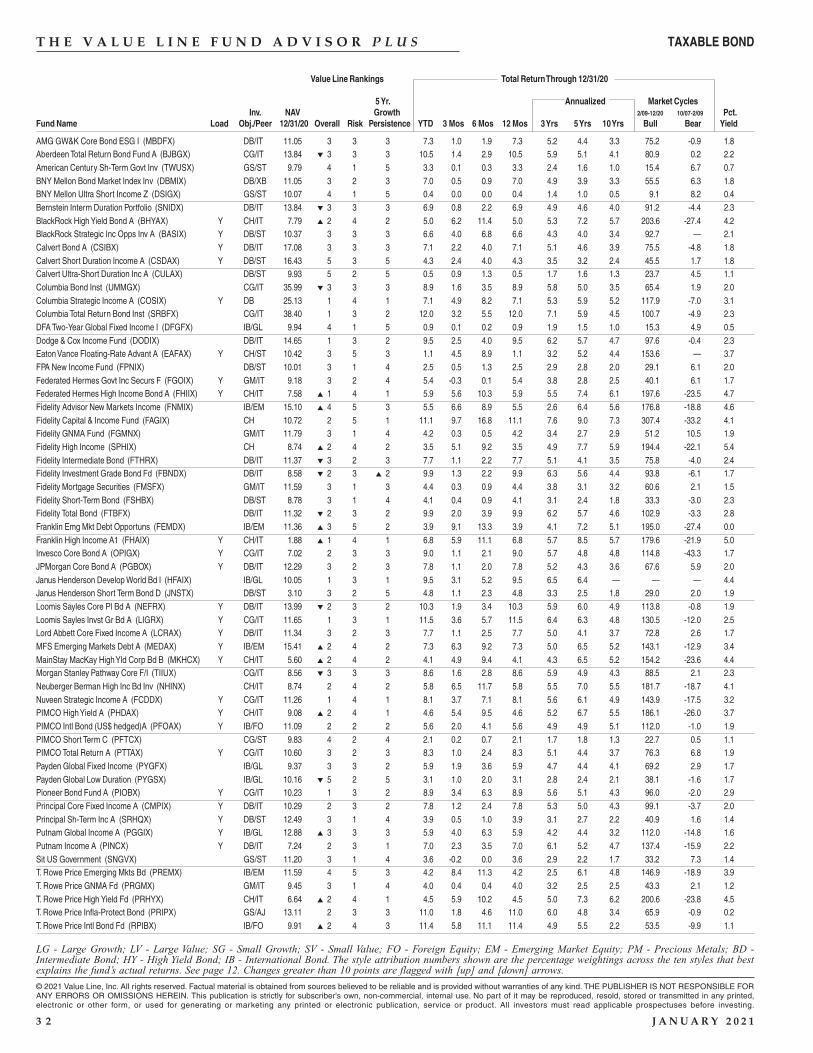
Value Line Rankings Total Return Through 12/31/20
5 Yr. Annualized Market CyclesInv. NAV Growth 2/09-12/20 10/07-2/09 Pct.
Fund Name Load Obj./Peer 12/31/20 Overall Risk Persistence YTD 3 Mos 6 Mos 12 Mos 3 Yrs 5 Yrs 10 Yrs Bull Bear Yield
LG - Large Growth; LV - Large Value; SG - Small Growth; SV - Small Value; FO - Foreign Equity; EM - Emerging Market Equity; PM - Precious Metals; BD -Intermediate Bond; HY - High Yield Bond; IB - International Bond. The style attribution numbers shown are the percentage weightings across the ten styles that bestexplains the fund’s actual returns. See page 12. Changes greater than 10 points are flagged with [up] and [down] arrows.
© 2021 Value Line, Inc. All rights reserved. Factual material is obtained from sources believed to be reliable and is provided without warranties of any kind. THE PUBLISHER IS NOT RESPONSIBLE FORANY ERRORS OR OMISSIONS HEREIN. This publication is strictly for subscriber's own, non-commercial, internal use. No part of it may be reproduced, resold, stored or transmitted in any printed,electronic or other form, or used for generating or marketing any printed or electronic publication, service or product. All investors must read applicable prospectuses before investing.
3 2 J A N U A R Y 2 0 2 1
T H E V A L U E L I N E F U N D A D V I S O R P L U S TAXABLE BOND
AMG GW&K Core Bond ESG I (MBDFX) DB/IT 11.05 3 3 3 7.3 1.0 1.9 7.3 5.2 4.4 3.3 75.2 -0.9 1.8Aberdeen Total Return Bond Fund A (BJBGX) CG/IT 13.84 ▼ 3 3 3 10.5 1.4 2.9 10.5 5.9 5.1 4.1 80.9 0.2 2.2American Century Sh-Term Govt Inv (TWUSX) GS/ST 9.79 4 1 5 3.3 0.1 0.3 3.3 2.4 1.6 1.0 15.4 6.7 0.7BNY Mellon Bond Market Index Inv (DBMIX) DB/XB 11.05 3 2 3 7.0 0.5 0.9 7.0 4.9 3.9 3.3 55.5 6.3 1.8BNY Mellon Ultra Short Income Z (DSIGX) GS/ST 10.07 4 1 5 0.4 0.0 0.0 0.4 1.4 1.0 0.5 9.1 8.2 0.4Bernstein Interm Duration Portfolio (SNIDX) DB/IT 13.84 ▼ 3 3 3 6.9 0.8 2.2 6.9 4.9 4.6 4.0 91.2 -4.4 2.3BlackRock High Yield Bond A (BHYAX) Y CH/IT 7.79 ▲ 2 4 2 5.0 6.2 11.4 5.0 5.3 7.2 5.7 203.6 -27.4 4.2BlackRock Strategic Inc Opps Inv A (BASIX) Y DB/ST 10.37 3 3 3 6.6 4.0 6.8 6.6 4.3 4.0 3.4 92.7 — 2.1Calvert Bond A (CSIBX) Y DB/IT 17.08 3 3 3 7.1 2.2 4.0 7.1 5.1 4.6 3.9 75.5 -4.8 1.8Calvert Short Duration Income A (CSDAX) Y DB/ST 16.43 5 3 5 4.3 2.4 4.0 4.3 3.5 3.2 2.4 45.5 1.7 1.8Calvert Ultra-Short Duration Inc A (CULAX) DB/ST 9.93 5 2 5 0.5 0.9 1.3 0.5 1.7 1.6 1.3 23.7 4.5 1.1Columbia Bond Inst (UMMGX) CG/IT 35.99 ▼ 3 3 3 8.9 1.6 3.5 8.9 5.8 5.0 3.5 65.4 1.9 2.0Columbia Strategic Income A (COSIX) Y DB 25.13 1 4 1 7.1 4.9 8.2 7.1 5.3 5.9 5.2 117.9 -7.0 3.1Columbia Total Return Bond Inst (SRBFX) CG/IT 38.40 1 3 2 12.0 3.2 5.5 12.0 7.1 5.9 4.5 100.7 -4.9 2.3DFA Two-Year Global Fixed Income I (DFGFX) IB/GL 9.94 4 1 5 0.9 0.1 0.2 0.9 1.9 1.5 1.0 15.3 4.9 0.5Dodge & Cox Income Fund (DODIX) DB/IT 14.65 1 3 2 9.5 2.5 4.0 9.5 6.2 5.7 4.7 97.6 -0.4 2.3Eaton Vance Floating-Rate Advant A (EAFAX) Y CH/ST 10.42 3 5 3 1.1 4.5 8.9 1.1 3.2 5.2 4.4 153.6 — 3.7FPA New Income Fund (FPNIX) DB/ST 10.01 3 1 4 2.5 0.5 1.3 2.5 2.9 2.8 2.0 29.1 6.1 2.0Federated Hermes Govt Inc Securs F (FGOIX) Y GM/IT 9.18 3 2 4 5.4 -0.3 0.1 5.4 3.8 2.8 2.5 40.1 6.1 1.7Federated Hermes High Income Bond A (FHIIX) Y CH/IT 7.58 ▲ 1 4 1 5.9 5.6 10.3 5.9 5.5 7.4 6.1 197.6 -23.5 4.7Fidelity Advisor New Markets Income (FNMIX) IB/EM 15.10 ▲ 4 5 3 5.5 6.6 8.9 5.5 2.6 6.4 5.6 176.8 -18.8 4.6Fidelity Capital & Income Fund (FAGIX) CH 10.72 2 5 1 11.1 9.7 16.8 11.1 7.6 9.0 7.3 307.4 -33.2 4.1Fidelity GNMA Fund (FGMNX) GM/IT 11.79 3 1 4 4.2 0.3 0.5 4.2 3.4 2.7 2.9 51.2 10.5 1.9Fidelity High Income (SPHIX) CH 8.74 ▲ 2 4 2 3.5 5.1 9.2 3.5 4.9 7.7 5.9 194.4 -22.1 5.4Fidelity Intermediate Bond (FTHRX) DB/IT 11.37 ▼ 3 2 3 7.7 1.1 2.2 7.7 5.1 4.1 3.5 75.8 -4.0 2.4Fidelity Investment Grade Bond Fd (FBNDX) DB/IT 8.58 ▼ 2 3 ▲ 2 9.9 1.3 2.2 9.9 6.3 5.6 4.4 93.8 -6.1 1.7Fidelity Mortgage Securities (FMSFX) GM/IT 11.59 3 1 3 4.4 0.3 0.9 4.4 3.8 3.1 3.2 60.6 2.1 1.5Fidelity Short-Term Bond (FSHBX) DB/ST 8.78 3 1 4 4.1 0.4 0.9 4.1 3.1 2.4 1.8 33.3 -3.0 2.3Fidelity Total Bond (FTBFX) DB/IT 11.32 ▼ 2 3 2 9.9 2.0 3.9 9.9 6.2 5.7 4.6 102.9 -3.3 2.8Franklin Emg Mkt Debt Opportuns (FEMDX) IB/EM 11.36 ▲ 3 5 2 3.9 9.1 13.3 3.9 4.1 7.2 5.1 195.0 -27.4 0.0Franklin High Income A1 (FHAIX) Y CH/IT 1.88 ▲ 1 4 1 6.8 5.9 11.1 6.8 5.7 8.5 5.7 179.6 -21.9 5.0Invesco Core Bond A (OPIGX) Y CG/IT 7.02 2 3 3 9.0 1.1 2.1 9.0 5.7 4.8 4.8 114.8 -43.3 1.7JPMorgan Core Bond A (PGBOX) Y DB/IT 12.29 3 2 3 7.8 1.1 2.0 7.8 5.2 4.3 3.6 67.6 5.9 2.0Janus Henderson Develop World Bd I (HFAIX) IB/GL 10.05 1 3 1 9.5 3.1 5.2 9.5 6.5 6.4 — — — 4.4Janus Henderson Short Term Bond D (JNSTX) DB/ST 3.10 3 2 5 4.8 1.1 2.3 4.8 3.3 2.5 1.8 29.0 2.0 1.9Loomis Sayles Core Pl Bd A (NEFRX) Y DB/IT 13.99 ▼ 2 3 2 10.3 1.9 3.4 10.3 5.9 6.0 4.9 113.8 -0.8 1.9Loomis Sayles Invst Gr Bd A (LIGRX) Y CG/IT 11.65 1 3 1 11.5 3.6 5.7 11.5 6.4 6.3 4.8 130.5 -12.0 2.5Lord Abbett Core Fixed Income A (LCRAX) Y DB/IT 11.34 3 2 3 7.7 1.1 2.5 7.7 5.0 4.1 3.7 72.8 2.6 1.7MFS Emerging Markets Debt A (MEDAX) Y IB/EM 15.41 ▲ 2 4 2 7.3 6.3 9.2 7.3 5.0 6.5 5.2 143.1 -12.9 3.4MainStay MacKay High Yld Corp Bd B (MKHCX) Y CH/IT 5.60 ▲ 2 4 2 4.1 4.9 9.4 4.1 4.3 6.5 5.2 154.2 -23.6 4.4Morgan Stanley Pathway Core F/I (TIIUX) CG/IT 8.56 ▼ 3 3 3 8.6 1.6 2.8 8.6 5.9 4.9 4.3 88.5 2.1 2.3Neuberger Berman High Inc Bd Inv (NHINX) CH/IT 8.74 2 4 2 5.8 6.5 11.7 5.8 5.5 7.0 5.5 181.7 -18.7 4.1Nuveen Strategic Income A (FCDDX) Y CG/IT 11.26 1 4 1 8.1 3.7 7.1 8.1 5.6 6.1 4.9 143.9 -17.5 3.2PIMCO High Yield A (PHDAX) Y CH/IT 9.08 ▲ 2 4 1 4.6 5.4 9.5 4.6 5.2 6.7 5.5 186.1 -26.0 3.7PIMCO Intl Bond (US$ hedged)A (PFOAX) Y IB/FO 11.09 2 2 2 5.6 2.0 4.1 5.6 4.9 4.9 5.1 112.0 -1.0 1.9PIMCO Short Term C (PFTCX) CG/ST 9.83 4 2 4 2.1 0.2 0.7 2.1 1.7 1.8 1.3 22.7 0.5 1.1PIMCO Total Return A (PTTAX) Y CG/IT 10.60 3 2 3 8.3 1.0 2.4 8.3 5.1 4.4 3.7 76.3 6.8 1.9Payden Global Fixed Income (PYGFX) IB/GL 9.37 3 3 2 5.9 1.9 3.6 5.9 4.7 4.4 4.1 69.2 2.9 1.7Payden Global Low Duration (PYGSX) IB/GL 10.16 ▼ 5 2 5 3.1 1.0 2.0 3.1 2.8 2.4 2.1 38.1 -1.6 1.7Pioneer Bond Fund A (PIOBX) Y CG/IT 10.23 1 3 2 8.9 3.4 6.3 8.9 5.6 5.1 4.3 96.0 -2.0 2.9Principal Core Fixed Income A (CMPIX) Y DB/IT 10.29 2 3 2 7.8 1.2 2.4 7.8 5.3 5.0 4.3 99.1 -3.7 2.0Principal Sh-Term Inc A (SRHQX) Y DB/ST 12.49 3 1 4 3.9 0.5 1.0 3.9 3.1 2.7 2.2 40.9 1.6 1.4Putnam Global Income A (PGGIX) Y IB/GL 12.88 ▲ 3 3 3 5.9 4.0 6.3 5.9 4.2 4.4 3.2 112.0 -14.8 1.6Putnam Income A (PINCX) Y DB/IT 7.24 2 3 1 7.0 2.3 3.5 7.0 6.1 5.2 4.7 137.4 -15.9 2.2Sit US Government (SNGVX) GS/ST 11.20 3 1 4 3.6 -0.2 0.0 3.6 2.9 2.2 1.7 33.2 7.3 1.4T. Rowe Price Emerging Mkts Bd (PREMX) IB/EM 11.59 4 5 3 4.2 8.4 11.3 4.2 2.5 6.1 4.8 146.9 -18.9 3.9T. Rowe Price GNMA Fd (PRGMX) GM/IT 9.45 3 1 4 4.0 0.4 0.4 4.0 3.2 2.5 2.5 43.3 2.1 1.2T. Rowe Price High Yield Fd (PRHYX) CH/IT 6.64 ▲ 2 4 1 4.5 5.9 10.2 4.5 5.0 7.3 6.2 200.6 -23.8 4.5T. Rowe Price Infla-Protect Bond (PRIPX) GS/AJ 13.11 2 3 3 11.0 1.8 4.6 11.0 6.0 4.8 3.4 65.9 -0.9 0.2T. Rowe Price Intl Bond Fd (RPIBX) IB/FO 9.91 ▲ 2 4 3 11.4 5.8 11.1 11.4 4.9 5.5 2.2 53.5 -9.9 1.1
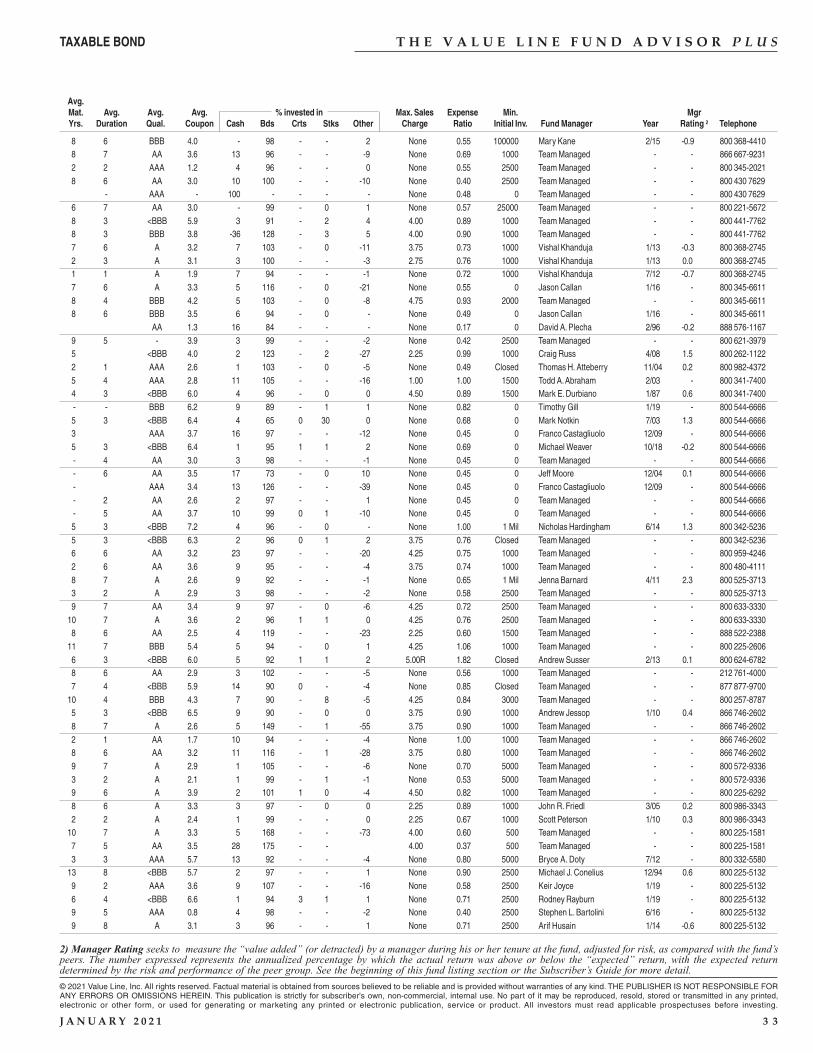
2) Manager Rating seeks to measure the “value added” (or detracted) by a manager during his or her tenure at the fund, adjusted for risk, as compared with the fund’speers. The number expressed represents the annualized percentage by which the actual return was above or below the “expected” return, with the expected returndetermined by the risk and performance of the peer group. See the beginning of this fund listing section or the Subscriber’s Guide for more detail.
Avg.Mat. Avg. Avg. Avg. % invested in Max. Sales Expense Min. MgrYrs. Duration Qual. Coupon Cash Bds Crts Stks Other Charge Ratio Initial Inv. Fund Manager Year Rating 2 Telephone
© 2021 Value Line, Inc. All rights reserved. Factual material is obtained from sources believed to be reliable and is provided without warranties of any kind. THE PUBLISHER IS NOT RESPONSIBLE FORANY ERRORS OR OMISSIONS HEREIN. This publication is strictly for subscriber's own, non-commercial, internal use. No part of it may be reproduced, resold, stored or transmitted in any printed,electronic or other form, or used for generating or marketing any printed or electronic publication, service or product. All investors must read applicable prospectuses before investing.
J A N U A R Y 2 0 2 1 3 3
T H E V A L U E L I N E F U N D A D V I S O R P L U STAXABLE BOND
8 6 BBB 4.0 - 98 - - 2 None 0.55 100000 Mary Kane 2/15 -0.9 800 368-4410 8 7 AA 3.6 13 96 - - -9 None 0.69 1000 Team Managed - - 866 667-9231 2 2 AAA 1.2 4 96 - - 0 None 0.55 2500 Team Managed - - 800 345-2021 8 6 AA 3.0 10 100 - - -10 None 0.40 2500 Team Managed - - 800 430 7629
- AAA - 100 - - - - None 0.48 0 Team Managed - - 800 430 7629 6 7 AA 3.0 - 99 - 0 1 None 0.57 25000 Team Managed - - 800 221-5672 8 3 <BBB 5.9 3 91 - 2 4 4.00 0.89 1000 Team Managed - - 800 441-7762 8 3 BBB 3.8 -36 128 - 3 5 4.00 0.90 1000 Team Managed - - 800 441-7762 7 6 A 3.2 7 103 - 0 -11 3.75 0.73 1000 Vishal Khanduja 1/13 -0.3 800 368-2745 2 3 A 3.1 3 100 - - -3 2.75 0.76 1000 Vishal Khanduja 1/13 0.0 800 368-2745 1 1 A 1.9 7 94 - - -1 None 0.72 1000 Vishal Khanduja 7/12 -0.7 800 368-2745 7 6 A 3.3 5 116 - 0 -21 None 0.55 0 Jason Callan 1/16 - 800 345-6611 8 4 BBB 4.2 5 103 - 0 -8 4.75 0.93 2000 Team Managed - - 800 345-6611 8 6 BBB 3.5 6 94 - 0 - None 0.49 0 Jason Callan 1/16 - 800 345-6611
AA 1.3 16 84 - - - None 0.17 0 David A. Plecha 2/96 -0.2 888 576-1167 9 5 - 3.9 3 99 - - -2 None 0.42 2500 Team Managed - - 800 621-3979 5 <BBB 4.0 2 123 - 2 -27 2.25 0.99 1000 Craig Russ 4/08 1.5 800 262-1122 2 1 AAA 2.6 1 103 - 0 -5 None 0.49 Closed Thomas H. Atteberry 11/04 0.2 800 982-4372 5 4 AAA 2.8 11 105 - - -16 1.00 1.00 1500 Todd A. Abraham 2/03 - 800 341-7400 4 3 <BBB 6.0 4 96 - 0 0 4.50 0.89 1500 Mark E. Durbiano 1/87 0.6 800 341-7400 - - BBB 6.2 9 89 - 1 1 None 0.82 0 Timothy Gill 1/19 - 800 544-6666 5 3 <BBB 6.4 4 65 0 30 0 None 0.68 0 Mark Notkin 7/03 1.3 800 544-6666 3 AAA 3.7 16 97 - - -12 None 0.45 0 Franco Castagliuolo 12/09 - 800 544-6666 5 3 <BBB 6.4 1 95 1 1 2 None 0.69 0 Michael Weaver 10/18 -0.2 800 544-6666 - 4 AA 3.0 3 98 - - -1 None 0.45 0 Team Managed - - 800 544-6666 - 6 AA 3.5 17 73 - 0 10 None 0.45 0 Jeff Moore 12/04 0.1 800 544-6666 - AAA 3.4 13 126 - - -39 None 0.45 0 Franco Castagliuolo 12/09 - 800 544-6666 - 2 AA 2.6 2 97 - - 1 None 0.45 0 Team Managed - - 800 544-6666 - 5 AA 3.7 10 99 0 1 -10 None 0.45 0 Team Managed - - 800 544-6666 5 3 <BBB 7.2 4 96 - 0 - None 1.00 1 Mil Nicholas Hardingham 6/14 1.3 800 342-5236 5 3 <BBB 6.3 2 96 0 1 2 3.75 0.76 Closed Team Managed - - 800 342-5236 6 6 AA 3.2 23 97 - - -20 4.25 0.75 1000 Team Managed - - 800 959-4246 2 6 AA 3.6 9 95 - - -4 3.75 0.74 1000 Team Managed - - 800 480-4111 8 7 A 2.6 9 92 - - -1 None 0.65 1 Mil Jenna Barnard 4/11 2.3 800 525-3713 3 2 A 2.9 3 98 - - -2 None 0.58 2500 Team Managed - - 800 525-3713 9 7 AA 3.4 9 97 - 0 -6 4.25 0.72 2500 Team Managed - - 800 633-3330 10 7 A 3.6 2 96 1 1 0 4.25 0.76 2500 Team Managed - - 800 633-3330 8 6 AA 2.5 4 119 - - -23 2.25 0.60 1500 Team Managed - - 888 522-2388 11 7 BBB 5.4 5 94 - 0 1 4.25 1.06 1000 Team Managed - - 800 225-2606 6 3 <BBB 6.0 5 92 1 1 2 5.00R 1.82 Closed Andrew Susser 2/13 0.1 800 624-6782 8 6 AA 2.9 3 102 - - -5 None 0.56 1000 Team Managed - - 212 761-4000 7 4 <BBB 5.9 14 90 0 - -4 None 0.85 Closed Team Managed - - 877 877-9700 10 4 BBB 4.3 7 90 - 8 -5 4.25 0.84 3000 Team Managed - - 800 257-8787 5 3 <BBB 6.5 9 90 - 0 0 3.75 0.90 1000 Andrew Jessop 1/10 0.4 866 746-2602 8 7 A 2.6 5 149 - 1 -55 3.75 0.90 1000 Team Managed - - 866 746-2602 2 1 AA 1.7 10 94 - - -4 None 1.00 1000 Team Managed - - 866 746-2602 8 6 AA 3.2 11 116 - 1 -28 3.75 0.80 1000 Team Managed - - 866 746-2602 9 7 A 2.9 1 105 - - -6 None 0.70 5000 Team Managed - - 800 572-9336 3 2 A 2.1 1 99 - 1 -1 None 0.53 5000 Team Managed - - 800 572-9336 9 6 A 3.9 2 101 1 0 -4 4.50 0.82 1000 Team Managed - - 800 225-6292 8 6 A 3.3 3 97 - 0 0 2.25 0.89 1000 John R. Friedl 3/05 0.2 800 986-3343 2 2 A 2.4 1 99 - - 0 2.25 0.67 1000 Scott Peterson 1/10 0.3 800 986-3343 10 7 A 3.3 5 168 - - -73 4.00 0.60 500 Team Managed - - 800 225-1581 7 5 AA 3.5 28 175 - - 4.00 0.37 500 Team Managed - - 800 225-1581 3 3 AAA 5.7 13 92 - - -4 None 0.80 5000 Bryce A. Doty 7/12 - 800 332-5580 13 8 <BBB 5.7 2 97 - - 1 None 0.90 2500 Michael J. Conelius 12/94 0.6 800 225-5132 9 2 AAA 3.6 9 107 - - -16 None 0.58 2500 Keir Joyce 1/19 - 800 225-5132 6 4 <BBB 6.6 1 94 3 1 1 None 0.71 2500 Rodney Rayburn 1/19 - 800 225-5132 9 5 AAA 0.8 4 98 - - -2 None 0.40 2500 Stephen L. Bartolini 6/16 - 800 225-5132 9 8 A 3.1 3 96 - - 1 None 0.71 2500 Arif Husain 1/14 -0.6 800 225-5132
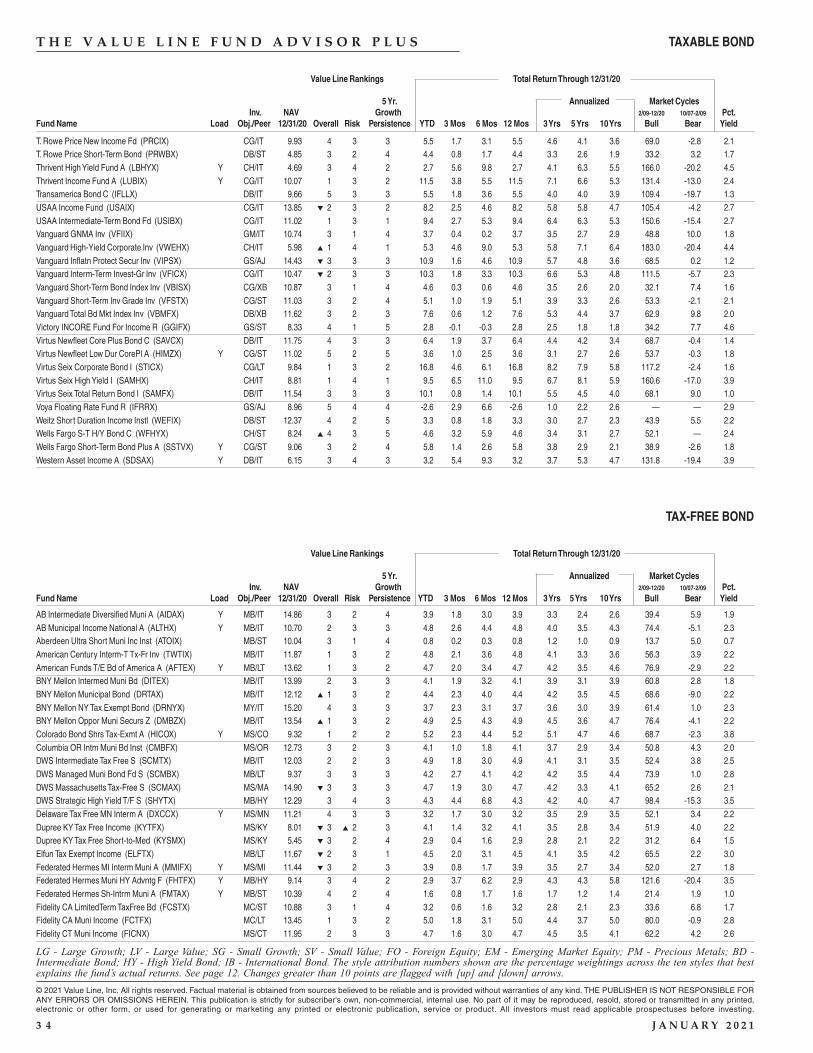
LG - Large Growth; LV - Large Value; SG - Small Growth; SV - Small Value; FO - Foreign Equity; EM - Emerging Market Equity; PM - Precious Metals; BD -Intermediate Bond; HY - High Yield Bond; IB - International Bond. The style attribution numbers shown are the percentage weightings across the ten styles that bestexplains the fund’s actual returns. See page 12. Changes greater than 10 points are flagged with [up] and [down] arrows.
© 2021 Value Line, Inc. All rights reserved. Factual material is obtained from sources believed to be reliable and is provided without warranties of any kind. THE PUBLISHER IS NOT RESPONSIBLE FORANY ERRORS OR OMISSIONS HEREIN. This publication is strictly for subscriber's own, non-commercial, internal use. No part of it may be reproduced, resold, stored or transmitted in any printed,electronic or other form, or used for generating or marketing any printed or electronic publication, service or product. All investors must read applicable prospectuses before investing.
3 4 J A N U A R Y 2 0 2 1
Value Line Rankings Total Return Through 12/31/20
5 Yr. Annualized Market CyclesInv. NAV Growth 2/09-12/20 10/07-2/09 Pct.
Fund Name Load Obj./Peer 12/31/20 Overall Risk Persistence YTD 3 Mos 6 Mos 12 Mos 3 Yrs 5 Yrs 10 Yrs Bull Bear Yield
Value Line Rankings Total Return Through 12/31/20
5 Yr. Annualized Market CyclesInv. NAV Growth 2/09-12/20 10/07-2/09 Pct.
Fund Name Load Obj./Peer 12/31/20 Overall Risk Persistence YTD 3 Mos 6 Mos 12 Mos 3 Yrs 5 Yrs 10 Yrs Bull Bear Yield
T H E V A L U E L I N E F U N D A D V I S O R P L U S TAXABLE BOND
TAX-FREE BOND
AB Intermediate Diversified Muni A (AIDAX) Y MB/IT 14.86 3 2 4 3.9 1.8 3.0 3.9 3.3 2.4 2.6 39.4 5.9 1.9AB Municipal Income National A (ALTHX) Y MB/IT 10.70 2 3 3 4.8 2.6 4.4 4.8 4.0 3.5 4.3 74.4 -5.1 2.3Aberdeen Ultra Short Muni Inc Inst (ATOIX) MB/ST 10.04 3 1 4 0.8 0.2 0.3 0.8 1.2 1.0 0.9 13.7 5.0 0.7American Century Interm-T Tx-Fr Inv (TWTIX) MB/IT 11.87 1 3 2 4.8 2.1 3.6 4.8 4.1 3.3 3.6 56.3 3.9 2.2American Funds T/E Bd of America A (AFTEX) Y MB/LT 13.62 1 3 2 4.7 2.0 3.4 4.7 4.2 3.5 4.6 76.9 -2.9 2.2BNY Mellon Intermed Muni Bd (DITEX) MB/IT 13.99 2 3 3 4.1 1.9 3.2 4.1 3.9 3.1 3.9 60.8 2.8 1.8BNY Mellon Municipal Bond (DRTAX) MB/IT 12.12 ▲ 1 3 2 4.4 2.3 4.0 4.4 4.2 3.5 4.5 68.6 -9.0 2.2BNY Mellon NY Tax Exempt Bond (DRNYX) MY/IT 15.20 4 3 3 3.7 2.3 3.1 3.7 3.6 3.0 3.9 61.4 1.0 2.3BNY Mellon Oppor Muni Securs Z (DMBZX) MB/IT 13.54 ▲ 1 3 2 4.9 2.5 4.3 4.9 4.5 3.6 4.7 76.4 -4.1 2.2Colorado Bond Shrs Tax-Exmt A (HICOX) Y MS/CO 9.32 1 2 2 5.2 2.3 4.4 5.2 5.1 4.7 4.6 68.7 -2.3 3.8Columbia OR Intm Muni Bd Inst (CMBFX) MS/OR 12.73 3 2 3 4.1 1.0 1.8 4.1 3.7 2.9 3.4 50.8 4.3 2.0DWS Intermediate Tax Free S (SCMTX) MB/IT 12.03 2 2 3 4.9 1.8 3.0 4.9 4.1 3.1 3.5 52.4 3.8 2.5DWS Managed Muni Bond Fd S (SCMBX) MB/LT 9.37 3 3 3 4.2 2.7 4.1 4.2 4.2 3.5 4.4 73.9 1.0 2.8DWS Massachusetts Tax-Free S (SCMAX) MS/MA 14.90 ▼ 3 3 3 4.7 1.9 3.0 4.7 4.2 3.3 4.1 65.2 2.6 2.1DWS Strategic High Yield T/F S (SHYTX) MB/HY 12.29 3 4 3 4.3 4.4 6.8 4.3 4.2 4.0 4.7 98.4 -15.3 3.5Delaware Tax Free MN Interm A (DXCCX) Y MS/MN 11.21 4 3 3 3.2 1.7 3.0 3.2 3.5 2.9 3.5 52.1 3.4 2.2Dupree KY Tax Free Income (KYTFX) MS/KY 8.01 ▼ 3 ▲ 2 3 4.1 1.4 3.2 4.1 3.5 2.8 3.4 51.9 4.0 2.2Dupree KY Tax Free Short-to-Med (KYSMX) MS/KY 5.45 ▼ 3 2 4 2.9 0.4 1.6 2.9 2.8 2.1 2.2 31.2 6.4 1.5Elfun Tax Exempt Income (ELFTX) MB/LT 11.67 ▼ 2 3 1 4.5 2.0 3.1 4.5 4.1 3.5 4.2 65.5 2.2 3.0Federated Hermes MI Interm Muni A (MMIFX) Y MS/MI 11.44 ▼ 3 2 3 3.9 0.8 1.7 3.9 3.5 2.7 3.4 52.0 2.7 1.8Federated Hermes Muni HY Advntg F (FHTFX) Y MB/HY 9.14 3 4 2 2.9 3.7 6.2 2.9 4.3 4.3 5.8 121.6 -20.4 3.5Federated Hermes Sh-Intrm Muni A (FMTAX) Y MB/ST 10.39 4 2 4 1.6 0.8 1.7 1.6 1.7 1.2 1.4 21.4 1.9 1.0Fidelity CA LimitedTerm TaxFree Bd (FCSTX) MC/ST 10.88 3 1 4 3.2 0.6 1.6 3.2 2.8 2.1 2.3 33.6 6.8 1.7Fidelity CA Muni Income (FCTFX) MC/LT 13.45 1 3 2 5.0 1.8 3.1 5.0 4.4 3.7 5.0 80.0 -0.9 2.8Fidelity CT Muni Income (FICNX) MS/CT 11.95 2 3 3 4.7 1.6 3.0 4.7 4.5 3.5 4.1 62.2 4.2 2.6
T. Rowe Price New Income Fd (PRCIX) CG/IT 9.93 4 3 3 5.5 1.7 3.1 5.5 4.6 4.1 3.6 69.0 -2.8 2.1T. Rowe Price Short-Term Bond (PRWBX) DB/ST 4.85 3 2 4 4.4 0.8 1.7 4.4 3.3 2.6 1.9 33.2 3.2 1.7Thrivent High Yield Fund A (LBHYX) Y CH/IT 4.69 3 4 2 2.7 5.6 9.8 2.7 4.1 6.3 5.5 166.0 -20.2 4.5Thrivent Income Fund A (LUBIX) Y CG/IT 10.07 1 3 2 11.5 3.8 5.5 11.5 7.1 6.6 5.3 131.4 -13.0 2.4Transamerica Bond C (IFLLX) DB/IT 9.66 5 3 3 5.5 1.8 3.6 5.5 4.0 4.0 3.9 109.4 -19.7 1.3USAA Income Fund (USAIX) CG/IT 13.85 ▼ 2 3 2 8.2 2.5 4.6 8.2 5.8 5.8 4.7 105.4 -4.2 2.7USAA Intermediate-Term Bond Fd (USIBX) CG/IT 11.02 1 3 1 9.4 2.7 5.3 9.4 6.4 6.3 5.3 150.6 -15.4 2.7Vanguard GNMA Inv (VFIIX) GM/IT 10.74 3 1 4 3.7 0.4 0.2 3.7 3.5 2.7 2.9 48.8 10.0 1.8Vanguard High-Yield Corporate Inv (VWEHX) CH/IT 5.98 ▲ 1 4 1 5.3 4.6 9.0 5.3 5.8 7.1 6.4 183.0 -20.4 4.4Vanguard Inflatn Protect Secur Inv (VIPSX) GS/AJ 14.43 ▼ 3 3 3 10.9 1.6 4.6 10.9 5.7 4.8 3.6 68.5 0.2 1.2Vanguard Interm-Term Invest-Gr Inv (VFICX) CG/IT 10.47 ▼ 2 3 3 10.3 1.8 3.3 10.3 6.6 5.3 4.8 111.5 -5.7 2.3Vanguard Short-Term Bond Index Inv (VBISX) CG/XB 10.87 3 1 4 4.6 0.3 0.6 4.6 3.5 2.6 2.0 32.1 7.4 1.6Vanguard Short-Term Inv Grade Inv (VFSTX) CG/ST 11.03 3 2 4 5.1 1.0 1.9 5.1 3.9 3.3 2.6 53.3 -2.1 2.1Vanguard Total Bd Mkt Index Inv (VBMFX) DB/XB 11.62 3 2 3 7.6 0.6 1.2 7.6 5.3 4.4 3.7 62.9 9.8 2.0Victory INCORE Fund For Income R (GGIFX) GS/ST 8.33 4 1 5 2.8 -0.1 -0.3 2.8 2.5 1.8 1.8 34.2 7.7 4.6Virtus Newfleet Core Plus Bond C (SAVCX) DB/IT 11.75 4 3 3 6.4 1.9 3.7 6.4 4.4 4.2 3.4 68.7 -0.4 1.4Virtus Newfleet Low Dur CorePl A (HIMZX) Y CG/ST 11.02 5 2 5 3.6 1.0 2.5 3.6 3.1 2.7 2.6 53.7 -0.3 1.8Virtus Seix Corporate Bond I (STICX) CG/LT 9.84 1 3 2 16.8 4.6 6.1 16.8 8.2 7.9 5.8 117.2 -2.4 1.6Virtus Seix High Yield I (SAMHX) CH/IT 8.81 1 4 1 9.5 6.5 11.0 9.5 6.7 8.1 5.9 160.6 -17.0 3.9Virtus Seix Total Return Bond I (SAMFX) DB/IT 11.54 3 3 3 10.1 0.8 1.4 10.1 5.5 4.5 4.0 68.1 9.0 1.0Voya Floating Rate Fund R (IFRRX) GS/AJ 8.96 5 4 4 -2.6 2.9 6.6 -2.6 1.0 2.2 2.6 — — 2.9Weitz Short Duration Income Instl (WEFIX) DB/ST 12.37 4 2 5 3.3 0.8 1.8 3.3 3.0 2.7 2.3 43.9 5.5 2.2Wells Fargo S-T H/Y Bond C (WFHYX) CH/ST 8.24 ▲ 4 3 5 4.6 3.2 5.9 4.6 3.4 3.1 2.7 52.1 — 2.4Wells Fargo Short-Term Bond Plus A (SSTVX) Y CG/ST 9.06 3 2 4 5.8 1.4 2.6 5.8 3.8 2.9 2.1 38.9 -2.6 1.8Western Asset Income A (SDSAX) Y DB/IT 6.15 3 4 3 3.2 5.4 9.3 3.2 3.7 5.3 4.7 131.8 -19.4 3.9
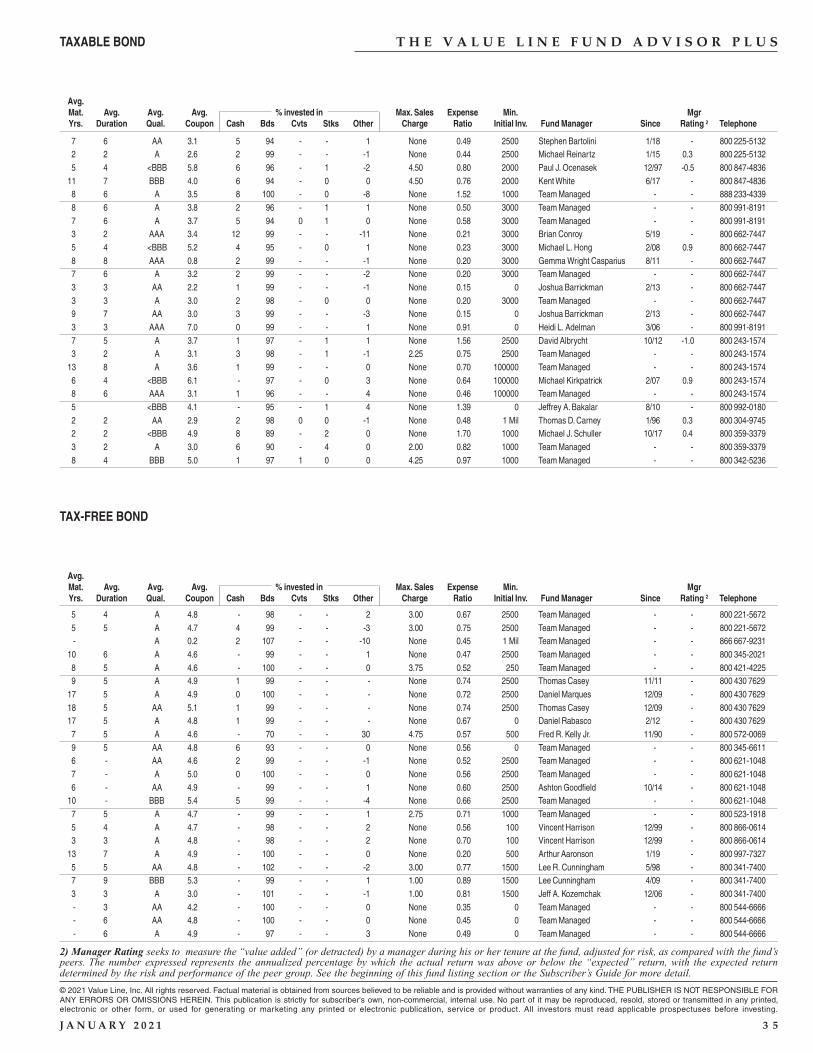
2) Manager Rating seeks to measure the “value added” (or detracted) by a manager during his or her tenure at the fund, adjusted for risk, as compared with the fund’speers. The number expressed represents the annualized percentage by which the actual return was above or below the “expected” return, with the expected returndetermined by the risk and performance of the peer group. See the beginning of this fund listing section or the Subscriber’s Guide for more detail.
© 2021 Value Line, Inc. All rights reserved. Factual material is obtained from sources believed to be reliable and is provided without warranties of any kind. THE PUBLISHER IS NOT RESPONSIBLE FORANY ERRORS OR OMISSIONS HEREIN. This publication is strictly for subscriber's own, non-commercial, internal use. No part of it may be reproduced, resold, stored or transmitted in any printed,electronic or other form, or used for generating or marketing any printed or electronic publication, service or product. All investors must read applicable prospectuses before investing.
J A N U A R Y 2 0 2 1 3 5
Avg.Mat. Avg. Avg. Avg. % invested in Max. Sales Expense Min. MgrYrs. Duration Qual. Coupon Cash Bds Cvts Stks Other Charge Ratio Initial Inv. Fund Manager Since Rating 2 Telephone
Avg.Mat. Avg. Avg. Avg. % invested in Max. Sales Expense Min. MgrYrs. Duration Qual. Coupon Cash Bds Cvts Stks Other Charge Ratio Initial Inv. Fund Manager Since Rating 2 Telephone
T H E V A L U E L I N E F U N D A D V I S O R P L U STAXABLE BOND
TAX-FREE BOND
5 4 A 4.8 - 98 - - 2 3.00 0.67 2500 Team Managed - - 800 221-5672 5 5 A 4.7 4 99 - - -3 3.00 0.75 2500 Team Managed - - 800 221-5672 - A 0.2 2 107 - - -10 None 0.45 1 Mil Team Managed - - 866 667-9231
10 6 A 4.6 - 99 - - 1 None 0.47 2500 Team Managed - - 800 345-2021 8 5 A 4.6 - 100 - - 0 3.75 0.52 250 Team Managed - - 800 421-4225 9 5 A 4.9 1 99 - - - None 0.74 2500 Thomas Casey 11/11 - 800 430 7629 17 5 A 4.9 0 100 - - - None 0.72 2500 Daniel Marques 12/09 - 800 430 7629 18 5 AA 5.1 1 99 - - - None 0.74 2500 Thomas Casey 12/09 - 800 430 7629 17 5 A 4.8 1 99 - - - None 0.67 0 Daniel Rabasco 2/12 - 800 430 7629 7 5 A 4.6 - 70 - - 30 4.75 0.57 500 Fred R. Kelly Jr. 11/90 - 800 572-0069 9 5 AA 4.8 6 93 - - 0 None 0.56 0 Team Managed - - 800 345-6611 6 - AA 4.6 2 99 - - -1 None 0.52 2500 Team Managed - - 800 621-1048 7 - A 5.0 0 100 - - 0 None 0.56 2500 Team Managed - - 800 621-1048 6 - AA 4.9 - 99 - - 1 None 0.60 2500 Ashton Goodfield 10/14 - 800 621-1048 10 - BBB 5.4 5 99 - - -4 None 0.66 2500 Team Managed - - 800 621-1048 7 5 A 4.7 - 99 - - 1 2.75 0.71 1000 Team Managed - - 800 523-1918 5 4 A 4.7 - 98 - - 2 None 0.56 100 Vincent Harrison 12/99 - 800 866-0614 3 3 A 4.8 - 98 - - 2 None 0.70 100 Vincent Harrison 12/99 - 800 866-0614 13 7 A 4.9 - 100 - - 0 None 0.20 500 Arthur Aaronson 1/19 - 800 997-7327 5 5 AA 4.8 - 102 - - -2 3.00 0.77 1500 Lee R. Cunningham 5/98 - 800 341-7400 7 9 BBB 5.3 - 99 - - 1 1.00 0.89 1500 Lee Cunningham 4/09 - 800 341-7400 3 3 A 3.0 - 101 - - -1 1.00 0.81 1500 Jeff A. Kozemchak 12/06 - 800 341-7400 - 3 AA 4.2 - 100 - - 0 None 0.35 0 Team Managed - - 800 544-6666 - 6 AA 4.8 - 100 - - 0 None 0.45 0 Team Managed - - 800 544-6666 - 6 A 4.9 - 97 - - 3 None 0.49 0 Team Managed - - 800 544-6666
7 6 AA 3.1 5 94 - - 1 None 0.49 2500 Stephen Bartolini 1/18 - 800 225-5132 2 2 A 2.6 2 99 - - -1 None 0.44 2500 Michael Reinartz 1/15 0.3 800 225-5132 5 4 <BBB 5.8 6 96 - 1 -2 4.50 0.80 2000 Paul J. Ocenasek 12/97 -0.5 800 847-4836 11 7 BBB 4.0 6 94 - 0 0 4.50 0.76 2000 Kent White 6/17 - 800 847-4836 8 6 A 3.5 8 100 - 0 -8 None 1.52 1000 Team Managed - - 888 233-4339 8 6 A 3.8 2 96 - 1 1 None 0.50 3000 Team Managed - - 800 991-8191 7 6 A 3.7 5 94 0 1 0 None 0.58 3000 Team Managed - - 800 991-8191 3 2 AAA 3.4 12 99 - - -11 None 0.21 3000 Brian Conroy 5/19 - 800 662-7447 5 4 <BBB 5.2 4 95 - 0 1 None 0.23 3000 Michael L. Hong 2/08 0.9 800 662-7447 8 8 AAA 0.8 2 99 - - -1 None 0.20 3000 Gemma Wright Casparius 8/11 - 800 662-7447 7 6 A 3.2 2 99 - - -2 None 0.20 3000 Team Managed - - 800 662-7447 3 3 AA 2.2 1 99 - - -1 None 0.15 0 Joshua Barrickman 2/13 - 800 662-7447 3 3 A 3.0 2 98 - 0 0 None 0.20 3000 Team Managed - - 800 662-7447 9 7 AA 3.0 3 99 - - -3 None 0.15 0 Joshua Barrickman 2/13 - 800 662-7447 3 3 AAA 7.0 0 99 - - 1 None 0.91 0 Heidi L. Adelman 3/06 - 800 991-8191 7 5 A 3.7 1 97 - 1 1 None 1.56 2500 David Albrycht 10/12 -1.0 800 243-1574 3 2 A 3.1 3 98 - 1 -1 2.25 0.75 2500 Team Managed - - 800 243-1574 13 8 A 3.6 1 99 - - 0 None 0.70 100000 Team Managed - - 800 243-1574 6 4 <BBB 6.1 - 97 - 0 3 None 0.64 100000 Michael Kirkpatrick 2/07 0.9 800 243-1574 8 6 AAA 3.1 1 96 - - 4 None 0.46 100000 Team Managed - - 800 243-1574 5 <BBB 4.1 - 95 - 1 4 None 1.39 0 Jeffrey A. Bakalar 8/10 - 800 992-0180 2 2 AA 2.9 2 98 0 0 -1 None 0.48 1 Mil Thomas D. Carney 1/96 0.3 800 304-9745 2 2 <BBB 4.9 8 89 - 2 0 None 1.70 1000 Michael J. Schuller 10/17 0.4 800 359-3379 3 2 A 3.0 6 90 - 4 0 2.00 0.82 1000 Team Managed - - 800 359-3379 8 4 BBB 5.0 1 97 1 0 0 4.25 0.97 1000 Team Managed - - 800 342-5236
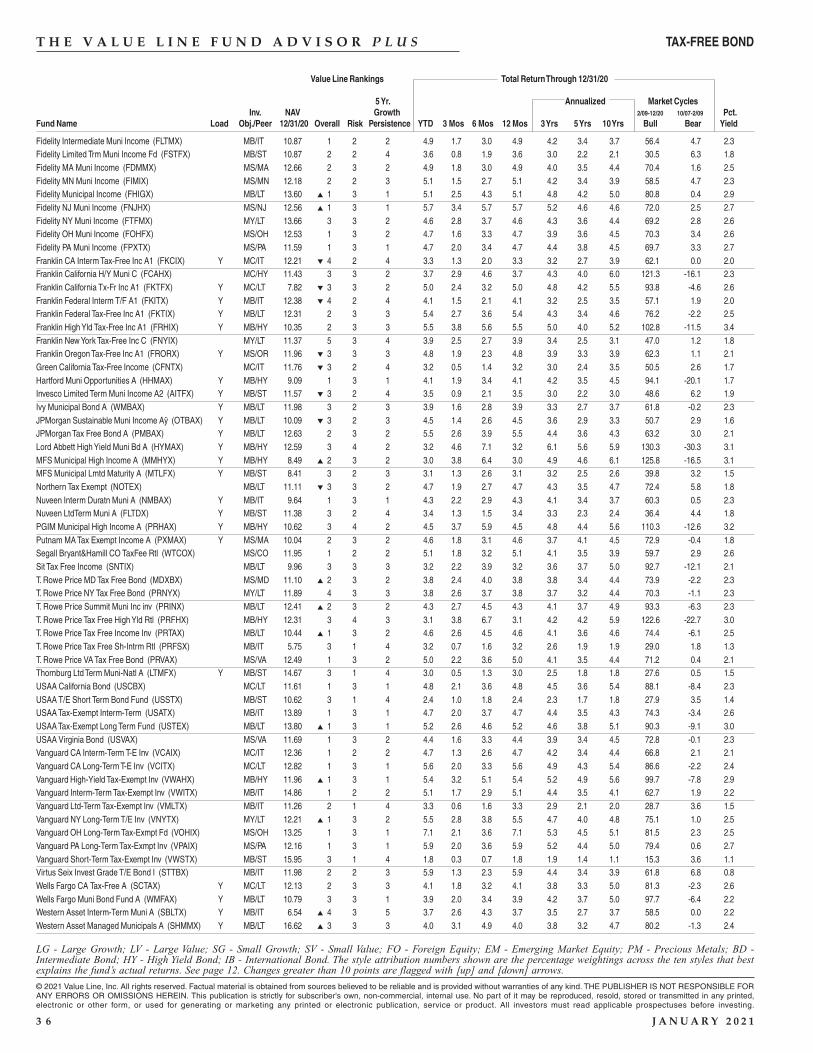
Value Line Rankings Total Return Through 12/31/20
5 Yr. Annualized Market CyclesInv. NAV Growth 2/09-12/20 10/07-2/09 Pct.
Fund Name Load Obj./Peer 12/31/20 Overall Risk Persistence YTD 3 Mos 6 Mos 12 Mos 3 Yrs 5 Yrs 10 Yrs Bull Bear Yield
LG - Large Growth; LV - Large Value; SG - Small Growth; SV - Small Value; FO - Foreign Equity; EM - Emerging Market Equity; PM - Precious Metals; BD -Intermediate Bond; HY - High Yield Bond; IB - International Bond. The style attribution numbers shown are the percentage weightings across the ten styles that bestexplains the fund’s actual returns. See page 12. Changes greater than 10 points are flagged with [up] and [down] arrows.
© 2021 Value Line, Inc. All rights reserved. Factual material is obtained from sources believed to be reliable and is provided without warranties of any kind. THE PUBLISHER IS NOT RESPONSIBLE FORANY ERRORS OR OMISSIONS HEREIN. This publication is strictly for subscriber's own, non-commercial, internal use. No part of it may be reproduced, resold, stored or transmitted in any printed,electronic or other form, or used for generating or marketing any printed or electronic publication, service or product. All investors must read applicable prospectuses before investing.
3 6 J A N U A R Y 2 0 2 1
T H E V A L U E L I N E F U N D A D V I S O R P L U S
Fidelity Intermediate Muni Income (FLTMX) MB/IT 10.87 1 2 2 4.9 1.7 3.0 4.9 4.2 3.4 3.7 56.4 4.7 2.3Fidelity Limited Trm Muni Income Fd (FSTFX) MB/ST 10.87 2 2 4 3.6 0.8 1.9 3.6 3.0 2.2 2.1 30.5 6.3 1.8Fidelity MA Muni Income (FDMMX) MS/MA 12.66 2 3 2 4.9 1.8 3.0 4.9 4.0 3.5 4.4 70.4 1.6 2.5Fidelity MN Muni Income (FIMIX) MS/MN 12.18 2 2 3 5.1 1.5 2.7 5.1 4.2 3.4 3.9 58.5 4.7 2.3Fidelity Municipal Income (FHIGX) MB/LT 13.60 ▲ 1 3 1 5.1 2.5 4.3 5.1 4.8 4.2 5.0 80.8 0.4 2.9Fidelity NJ Muni Income (FNJHX) MS/NJ 12.56 ▲ 1 3 1 5.7 3.4 5.7 5.7 5.2 4.6 4.6 72.0 2.5 2.7Fidelity NY Muni Income (FTFMX) MY/LT 13.66 3 3 2 4.6 2.8 3.7 4.6 4.3 3.6 4.4 69.2 2.8 2.6Fidelity OH Muni Income (FOHFX) MS/OH 12.53 1 3 2 4.7 1.6 3.3 4.7 3.9 3.6 4.5 70.3 3.4 2.6Fidelity PA Muni Income (FPXTX) MS/PA 11.59 1 3 1 4.7 2.0 3.4 4.7 4.4 3.8 4.5 69.7 3.3 2.7Franklin CA Interm Tax-Free Inc A1 (FKCIX) Y MC/IT 12.21 ▼ 4 2 4 3.3 1.3 2.0 3.3 3.2 2.7 3.9 62.1 0.0 2.0Franklin California H/Y Muni C (FCAHX) MC/HY 11.43 3 3 2 3.7 2.9 4.6 3.7 4.3 4.0 6.0 121.3 -16.1 2.3Franklin California Tx-Fr Inc A1 (FKTFX) Y MC/LT 7.82 ▼ 3 3 2 5.0 2.4 3.2 5.0 4.8 4.2 5.5 93.8 -4.6 2.6Franklin Federal Interm T/F A1 (FKITX) Y MB/IT 12.38 ▼ 4 2 4 4.1 1.5 2.1 4.1 3.2 2.5 3.5 57.1 1.9 2.0Franklin Federal Tax-Free Inc A1 (FKTIX) Y MB/LT 12.31 2 3 3 5.4 2.7 3.6 5.4 4.3 3.4 4.6 76.2 -2.2 2.5Franklin High Yld Tax-Free Inc A1 (FRHIX) Y MB/HY 10.35 2 3 3 5.5 3.8 5.6 5.5 5.0 4.0 5.2 102.8 -11.5 3.4Franklin New York Tax-Free Inc C (FNYIX) MY/LT 11.37 5 3 4 3.9 2.5 2.7 3.9 3.4 2.5 3.1 47.0 1.2 1.8Franklin Oregon Tax-Free Inc A1 (FRORX) Y MS/OR 11.96 ▼ 3 3 3 4.8 1.9 2.3 4.8 3.9 3.3 3.9 62.3 1.1 2.1Green California Tax-Free Income (CFNTX) MC/IT 11.76 ▼ 3 2 4 3.2 0.5 1.4 3.2 3.0 2.4 3.5 50.5 2.6 1.7Hartford Muni Opportunities A (HHMAX) Y MB/HY 9.09 1 3 1 4.1 1.9 3.4 4.1 4.2 3.5 4.5 94.1 -20.1 1.7Invesco Limited Term Muni Income A2 (AITFX) Y MB/ST 11.57 ▼ 3 2 4 3.5 0.9 2.1 3.5 3.0 2.2 3.0 48.6 6.2 1.9Ivy Municipal Bond A (WMBAX) Y MB/LT 11.98 3 2 3 3.9 1.6 2.8 3.9 3.3 2.7 3.7 61.8 -0.2 2.3JPMorgan Sustainable Muni Income Aÿ (OTBAX) Y MB/LT 10.09 ▼ 3 2 3 4.5 1.4 2.6 4.5 3.6 2.9 3.3 50.7 2.9 1.6JPMorgan Tax Free Bond A (PMBAX) Y MB/LT 12.63 2 3 2 5.5 2.6 3.9 5.5 4.4 3.6 4.3 63.2 3.0 2.1Lord Abbett High Yield Muni Bd A (HYMAX) Y MB/HY 12.59 3 4 2 3.2 4.6 7.1 3.2 6.1 5.6 5.9 130.3 -30.3 3.1MFS Municipal High Income A (MMHYX) Y MB/HY 8.49 ▲ 2 3 2 3.0 3.8 6.4 3.0 4.9 4.6 6.1 125.8 -16.5 3.1MFS Municipal Lmtd Maturity A (MTLFX) Y MB/ST 8.41 3 2 3 3.1 1.3 2.6 3.1 3.2 2.5 2.6 39.8 3.2 1.5Northern Tax Exempt (NOTEX) MB/LT 11.11 ▼ 3 3 2 4.7 1.9 2.7 4.7 4.3 3.5 4.7 72.4 5.8 1.8Nuveen Interm Duratn Muni A (NMBAX) Y MB/IT 9.64 1 3 1 4.3 2.2 2.9 4.3 4.1 3.4 3.7 60.3 0.5 2.3Nuveen LtdTerm Muni A (FLTDX) Y MB/ST 11.38 3 2 4 3.4 1.3 1.5 3.4 3.3 2.3 2.4 36.4 4.4 1.8PGIM Municipal High Income A (PRHAX) Y MB/HY 10.62 3 4 2 4.5 3.7 5.9 4.5 4.8 4.4 5.6 110.3 -12.6 3.2Putnam MA Tax Exempt Income A (PXMAX) Y MS/MA 10.04 2 3 2 4.6 1.8 3.1 4.6 3.7 4.1 4.5 72.9 -0.4 1.8Segall Bryant&Hamill CO TaxFee Rtl (WTCOX) MS/CO 11.95 1 2 2 5.1 1.8 3.2 5.1 4.1 3.5 3.9 59.7 2.9 2.6Sit Tax Free Income (SNTIX) MB/LT 9.96 3 3 3 3.2 2.2 3.9 3.2 3.6 3.7 5.0 92.7 -12.1 2.1T. Rowe Price MD Tax Free Bond (MDXBX) MS/MD 11.10 ▲ 2 3 2 3.8 2.4 4.0 3.8 3.8 3.4 4.4 73.9 -2.2 2.3T. Rowe Price NY Tax Free Bond (PRNYX) MY/LT 11.89 4 3 3 3.8 2.6 3.7 3.8 3.7 3.2 4.4 70.3 -1.1 2.3T. Rowe Price Summit Muni Inc inv (PRINX) MB/LT 12.41 ▲ 2 3 2 4.3 2.7 4.5 4.3 4.1 3.7 4.9 93.3 -6.3 2.3T. Rowe Price Tax Free High Yld Rtl (PRFHX) MB/HY 12.31 3 4 3 3.1 3.8 6.7 3.1 4.2 4.2 5.9 122.6 -22.7 3.0T. Rowe Price Tax Free Income Inv (PRTAX) MB/LT 10.44 ▲ 1 3 2 4.6 2.6 4.5 4.6 4.1 3.6 4.6 74.4 -6.1 2.5T. Rowe Price Tax Free Sh-Intrm Rtl (PRFSX) MB/IT 5.75 3 1 4 3.2 0.7 1.6 3.2 2.6 1.9 1.9 29.0 1.8 1.3T. Rowe Price VA Tax Free Bond (PRVAX) MS/VA 12.49 1 3 2 5.0 2.2 3.6 5.0 4.1 3.5 4.4 71.2 0.4 2.1Thornburg Ltd Term Muni-Natl A (LTMFX) Y MB/ST 14.67 3 1 4 3.0 0.5 1.3 3.0 2.5 1.8 1.8 27.6 0.5 1.5USAA California Bond (USCBX) MC/LT 11.61 1 3 1 4.8 2.1 3.6 4.8 4.5 3.6 5.4 88.1 -8.4 2.3USAA T/E Short Term Bond Fund (USSTX) MB/ST 10.62 3 1 4 2.4 1.0 1.8 2.4 2.3 1.7 1.8 27.9 3.5 1.4USAA Tax-Exempt Interm-Term (USATX) MB/IT 13.89 1 3 1 4.7 2.0 3.7 4.7 4.4 3.5 4.3 74.3 -3.4 2.6USAA Tax-Exempt Long Term Fund (USTEX) MB/LT 13.80 ▲ 1 3 1 5.2 2.6 4.6 5.2 4.6 3.8 5.1 90.3 -9.1 3.0USAA Virginia Bond (USVAX) MS/VA 11.69 1 3 2 4.4 1.6 3.3 4.4 3.9 3.4 4.5 72.8 -0.1 2.3Vanguard CA Interm-Term T-E Inv (VCAIX) MC/IT 12.36 1 2 2 4.7 1.3 2.6 4.7 4.2 3.4 4.4 66.8 2.1 2.1Vanguard CA Long-Term T-E Inv (VCITX) MC/LT 12.82 1 3 1 5.6 2.0 3.3 5.6 4.9 4.3 5.4 86.6 -2.2 2.4Vanguard High-Yield Tax-Exempt Inv (VWAHX) MB/HY 11.96 ▲ 1 3 1 5.4 3.2 5.1 5.4 5.2 4.9 5.6 99.7 -7.8 2.9Vanguard Interm-Term Tax-Exempt Inv (VWITX) MB/IT 14.86 1 2 2 5.1 1.7 2.9 5.1 4.4 3.5 4.1 62.7 1.9 2.2Vanguard Ltd-Term Tax-Exempt Inv (VMLTX) MB/IT 11.26 2 1 4 3.3 0.6 1.6 3.3 2.9 2.1 2.0 28.7 3.6 1.5Vanguard NY Long-Term T/E Inv (VNYTX) MY/LT 12.21 ▲ 1 3 2 5.5 2.8 3.8 5.5 4.7 4.0 4.8 75.1 1.0 2.5Vanguard OH Long-Term Tax-Exmpt Fd (VOHIX) MS/OH 13.25 1 3 1 7.1 2.1 3.6 7.1 5.3 4.5 5.1 81.5 2.3 2.5Vanguard PA Long-Term Tax-Exmpt Inv (VPAIX) MS/PA 12.16 1 3 1 5.9 2.0 3.6 5.9 5.2 4.4 5.0 79.4 0.6 2.7Vanguard Short-Term Tax-Exempt Inv (VWSTX) MB/ST 15.95 3 1 4 1.8 0.3 0.7 1.8 1.9 1.4 1.1 15.3 3.6 1.1Virtus Seix Invest Grade T/E Bond I (STTBX) MB/IT 11.98 2 2 3 5.9 1.3 2.3 5.9 4.4 3.4 3.9 61.8 6.8 0.8Wells Fargo CA Tax-Free A (SCTAX) Y MC/LT 12.13 2 3 3 4.1 1.8 3.2 4.1 3.8 3.3 5.0 81.3 -2.3 2.6Wells Fargo Muni Bond Fund A (WMFAX) Y MB/LT 10.79 3 3 1 3.9 2.0 3.4 3.9 4.2 3.7 5.0 97.7 -6.4 2.2Western Asset Interm-Term Muni A (SBLTX) Y MB/IT 6.54 ▲ 4 3 5 3.7 2.6 4.3 3.7 3.5 2.7 3.7 58.5 0.0 2.2Western Asset Managed Municipals A (SHMMX) Y MB/LT 16.62 ▲ 3 3 3 4.0 3.1 4.9 4.0 3.8 3.2 4.7 80.2 -1.3 2.4
TAX-FREE BOND
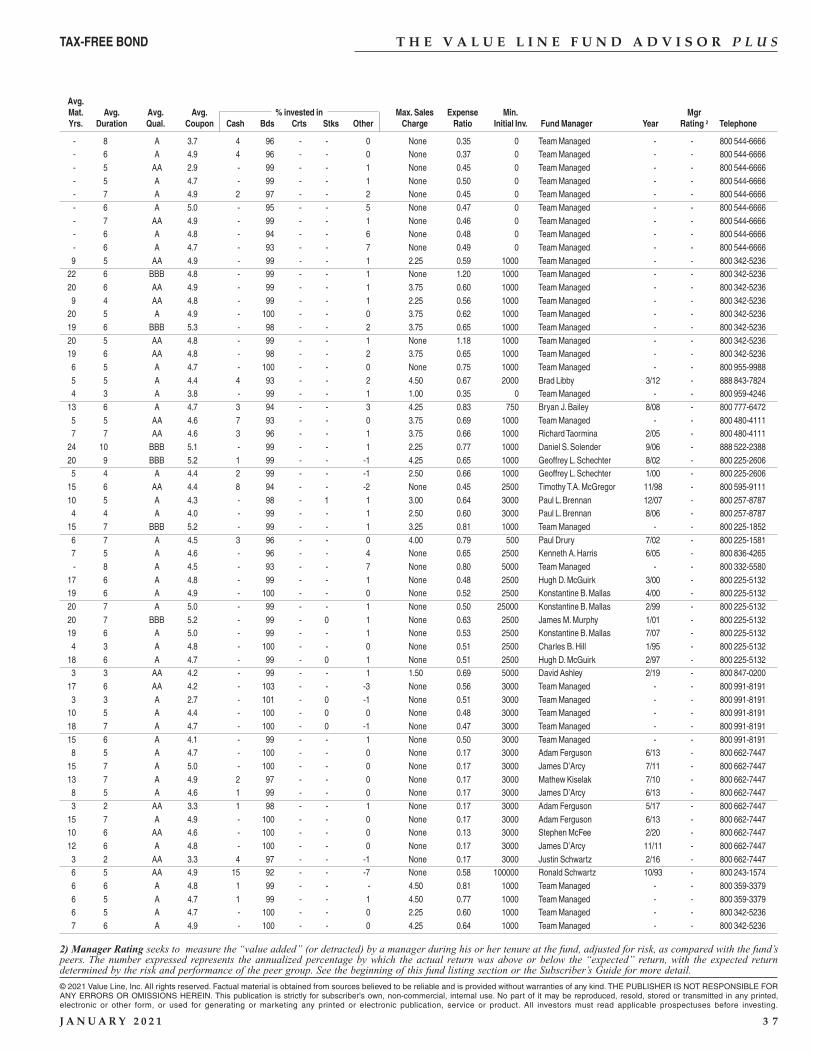
2) Manager Rating seeks to measure the “value added” (or detracted) by a manager during his or her tenure at the fund, adjusted for risk, as compared with the fund’speers. The number expressed represents the annualized percentage by which the actual return was above or below the “expected” return, with the expected returndetermined by the risk and performance of the peer group. See the beginning of this fund listing section or the Subscriber’s Guide for more detail.
Avg.Mat. Avg. Avg. Avg. % invested in Max. Sales Expense Min. MgrYrs. Duration Qual. Coupon Cash Bds Crts Stks Other Charge Ratio Initial Inv. Fund Manager Year Rating 2 Telephone
© 2021 Value Line, Inc. All rights reserved. Factual material is obtained from sources believed to be reliable and is provided without warranties of any kind. THE PUBLISHER IS NOT RESPONSIBLE FORANY ERRORS OR OMISSIONS HEREIN. This publication is strictly for subscriber's own, non-commercial, internal use. No part of it may be reproduced, resold, stored or transmitted in any printed,electronic or other form, or used for generating or marketing any printed or electronic publication, service or product. All investors must read applicable prospectuses before investing.
J A N U A R Y 2 0 2 1 3 7
T H E V A L U E L I N E F U N D A D V I S O R P L U S
- 8 A 3.7 4 96 - - 0 None 0.35 0 Team Managed - - 800 544-6666 - 6 A 4.9 4 96 - - 0 None 0.37 0 Team Managed - - 800 544-6666 - 5 AA 2.9 - 99 - - 1 None 0.45 0 Team Managed - - 800 544-6666 - 5 A 4.7 - 99 - - 1 None 0.50 0 Team Managed - - 800 544-6666 - 7 A 4.9 2 97 - - 2 None 0.45 0 Team Managed - - 800 544-6666 - 6 A 5.0 - 95 - - 5 None 0.47 0 Team Managed - - 800 544-6666 - 7 AA 4.9 - 99 - - 1 None 0.46 0 Team Managed - - 800 544-6666 - 6 A 4.8 - 94 - - 6 None 0.48 0 Team Managed - - 800 544-6666 - 6 A 4.7 - 93 - - 7 None 0.49 0 Team Managed - - 800 544-6666 9 5 AA 4.9 - 99 - - 1 2.25 0.59 1000 Team Managed - - 800 342-5236 22 6 BBB 4.8 - 99 - - 1 None 1.20 1000 Team Managed - - 800 342-5236 20 6 AA 4.9 - 99 - - 1 3.75 0.60 1000 Team Managed - - 800 342-5236 9 4 AA 4.8 - 99 - - 1 2.25 0.56 1000 Team Managed - - 800 342-5236 20 5 A 4.9 - 100 - - 0 3.75 0.62 1000 Team Managed - - 800 342-5236 19 6 BBB 5.3 - 98 - - 2 3.75 0.65 1000 Team Managed - - 800 342-5236 20 5 AA 4.8 - 99 - - 1 None 1.18 1000 Team Managed - - 800 342-5236 19 6 AA 4.8 - 98 - - 2 3.75 0.65 1000 Team Managed - - 800 342-5236 6 5 A 4.7 - 100 - - 0 None 0.75 1000 Team Managed - - 800 955-9988 5 5 A 4.4 4 93 - - 2 4.50 0.67 2000 Brad Libby 3/12 - 888 843-7824 4 3 A 3.8 - 99 - - 1 1.00 0.35 0 Team Managed - - 800 959-4246 13 6 A 4.7 3 94 - - 3 4.25 0.83 750 Bryan J. Bailey 8/08 - 800 777-6472 5 5 AA 4.6 7 93 - - 0 3.75 0.69 1000 Team Managed - - 800 480-4111 7 7 AA 4.6 3 96 - - 1 3.75 0.66 1000 Richard Taormina 2/05 - 800 480-4111 24 10 BBB 5.1 - 99 - - 1 2.25 0.77 1000 Daniel S. Solender 9/06 - 888 522-2388 20 9 BBB 5.2 1 99 - - -1 4.25 0.65 1000 Geoffrey L. Schechter 8/02 - 800 225-2606 5 4 A 4.4 2 99 - - -1 2.50 0.66 1000 Geoffrey L. Schechter 1/00 - 800 225-2606 15 6 AA 4.4 8 94 - - -2 None 0.45 2500 Timothy T.A. McGregor 11/98 - 800 595-9111 10 5 A 4.3 - 98 - 1 1 3.00 0.64 3000 Paul L. Brennan 12/07 - 800 257-8787 4 4 A 4.0 - 99 - - 1 2.50 0.60 3000 Paul L. Brennan 8/06 - 800 257-8787 15 7 BBB 5.2 - 99 - - 1 3.25 0.81 1000 Team Managed - - 800 225-1852 6 7 A 4.5 3 96 - - 0 4.00 0.79 500 Paul Drury 7/02 - 800 225-1581 7 5 A 4.6 - 96 - - 4 None 0.65 2500 Kenneth A. Harris 6/05 - 800 836-4265 - 8 A 4.5 - 93 - - 7 None 0.80 5000 Team Managed - - 800 332-5580
17 6 A 4.8 - 99 - - 1 None 0.48 2500 Hugh D. McGuirk 3/00 - 800 225-5132 19 6 A 4.9 - 100 - - 0 None 0.52 2500 Konstantine B. Mallas 4/00 - 800 225-5132 20 7 A 5.0 - 99 - - 1 None 0.50 25000 Konstantine B. Mallas 2/99 - 800 225-5132 20 7 BBB 5.2 - 99 - 0 1 None 0.63 2500 James M. Murphy 1/01 - 800 225-5132 19 6 A 5.0 - 99 - - 1 None 0.53 2500 Konstantine B. Mallas 7/07 - 800 225-5132 4 3 A 4.8 - 100 - - 0 None 0.51 2500 Charles B. Hill 1/95 - 800 225-5132 18 6 A 4.7 - 99 - 0 1 None 0.51 2500 Hugh D. McGuirk 2/97 - 800 225-5132 3 3 AA 4.2 - 99 - - 1 1.50 0.69 5000 David Ashley 2/19 - 800 847-0200 17 6 AA 4.2 - 103 - - -3 None 0.56 3000 Team Managed - - 800 991-8191 3 3 A 2.7 - 101 - 0 -1 None 0.51 3000 Team Managed - - 800 991-8191 10 5 A 4.4 - 100 - 0 0 None 0.48 3000 Team Managed - - 800 991-8191 18 7 A 4.7 - 100 - 0 -1 None 0.47 3000 Team Managed - - 800 991-8191 15 6 A 4.1 - 99 - - 1 None 0.50 3000 Team Managed - - 800 991-8191 8 5 A 4.7 - 100 - - 0 None 0.17 3000 Adam Ferguson 6/13 - 800 662-7447 15 7 A 5.0 - 100 - - 0 None 0.17 3000 James D’Arcy 7/11 - 800 662-7447 13 7 A 4.9 2 97 - - 0 None 0.17 3000 Mathew Kiselak 7/10 - 800 662-7447 8 5 A 4.6 1 99 - - 0 None 0.17 3000 James D’Arcy 6/13 - 800 662-7447 3 2 AA 3.3 1 98 - - 1 None 0.17 3000 Adam Ferguson 5/17 - 800 662-7447 15 7 A 4.9 - 100 - - 0 None 0.17 3000 Adam Ferguson 6/13 - 800 662-7447 10 6 AA 4.6 - 100 - - 0 None 0.13 3000 Stephen McFee 2/20 - 800 662-7447 12 6 A 4.8 - 100 - - 0 None 0.17 3000 James D’Arcy 11/11 - 800 662-7447 3 2 AA 3.3 4 97 - - -1 None 0.17 3000 Justin Schwartz 2/16 - 800 662-7447 6 5 AA 4.9 15 92 - - -7 None 0.58 100000 Ronald Schwartz 10/93 - 800 243-1574 6 6 A 4.8 1 99 - - - 4.50 0.81 1000 Team Managed - - 800 359-3379 6 5 A 4.7 1 99 - - 1 4.50 0.77 1000 Team Managed - - 800 359-3379 6 5 A 4.7 - 100 - - 0 2.25 0.60 1000 Team Managed - - 800 342-5236 7 6 A 4.9 - 100 - - 0 4.25 0.64 1000 Team Managed - - 800 342-5236
TAX-FREE BOND
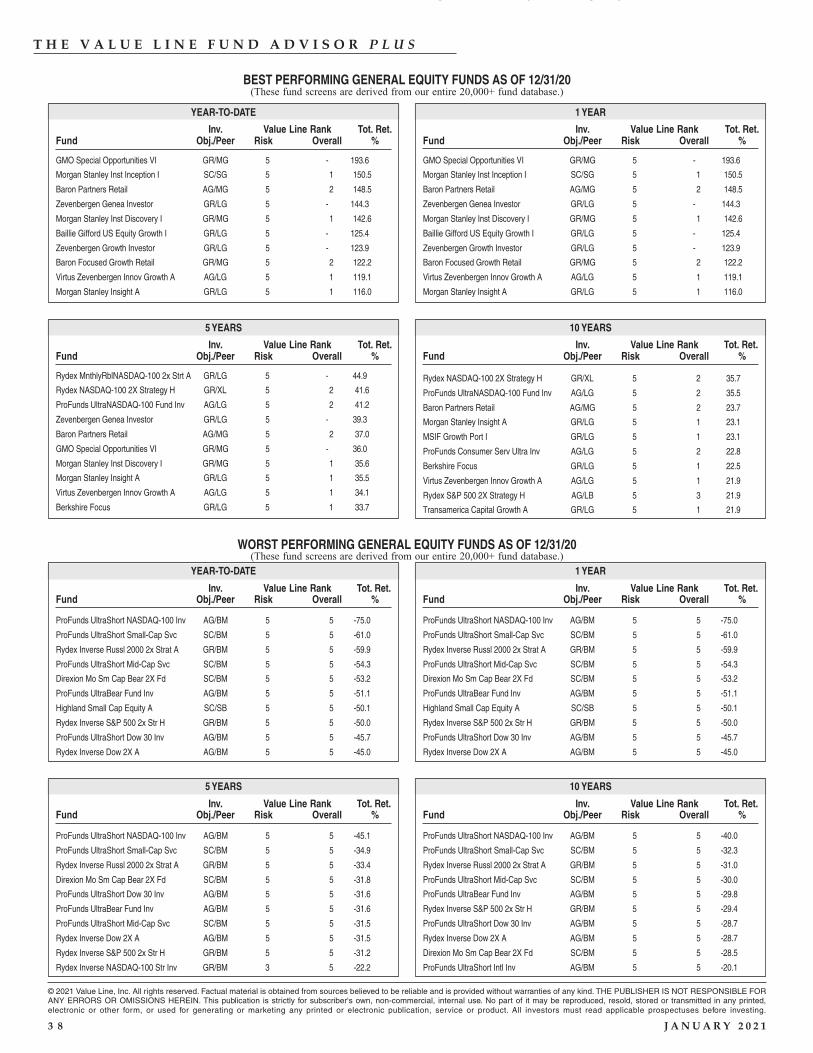
© 2021 Value Line, Inc. All rights reserved. Factual material is obtained from sources believed to be reliable and is provided without warranties of any kind. THE PUBLISHER IS NOT RESPONSIBLE FORANY ERRORS OR OMISSIONS HEREIN. This publication is strictly for subscriber's own, non-commercial, internal use. No part of it may be reproduced, resold, stored or transmitted in any printed,electronic or other form, or used for generating or marketing any printed or electronic publication, service or product. All investors must read applicable prospectuses before investing.
3 8 J A N U A R Y 2 0 2 1
T H E V A L U E L I N E F U N D A D V I S O R P L U S
YEAR-TO-DATE
BEST PERFORMING GENERAL EQUITY FUNDS AS OF 12/31/20
Inv. Value Line Rank Tot. Ret.Fund Obj./Peer Risk Overall %
GMO Special Opportunities VI GR/MG 5 - 193.6
Morgan Stanley Inst Inception I SC/SG 5 1 150.5
Baron Partners Retail AG/MG 5 2 148.5
Zevenbergen Genea Investor GR/LG 5 - 144.3
Morgan Stanley Inst Discovery I GR/MG 5 1 142.6
Baillie Gifford US Equity Growth I GR/LG 5 - 125.4
Zevenbergen Growth Investor GR/LG 5 - 123.9
Baron Focused Growth Retail GR/MG 5 2 122.2
Virtus Zevenbergen Innov Growth A AG/LG 5 1 119.1
Morgan Stanley Insight A GR/LG 5 1 116.0
1 YEAR
Inv. Value Line Rank Tot. Ret.Fund Obj./Peer Risk Overall %
5 YEARS
Inv. Value Line Rank Tot. Ret.Fund Obj./Peer Risk Overall %
10 YEARS
Inv. Value Line Rank Tot. Ret.Fund Obj./Peer Risk Overall %
GMO Special Opportunities VI GR/MG 5 - 193.6
Morgan Stanley Inst Inception I SC/SG 5 1 150.5
Baron Partners Retail AG/MG 5 2 148.5
Zevenbergen Genea Investor GR/LG 5 - 144.3
Morgan Stanley Inst Discovery I GR/MG 5 1 142.6
Baillie Gifford US Equity Growth I GR/LG 5 - 125.4
Zevenbergen Growth Investor GR/LG 5 - 123.9
Baron Focused Growth Retail GR/MG 5 2 122.2
Virtus Zevenbergen Innov Growth A AG/LG 5 1 119.1
Morgan Stanley Insight A GR/LG 5 1 116.0
Rydex MnthlyRblNASDAQ-100 2x Strt A GR/LG 5 - 44.9
Rydex NASDAQ-100 2X Strategy H GR/XL 5 2 41.6
ProFunds UltraNASDAQ-100 Fund Inv AG/LG 5 2 41.2
Zevenbergen Genea Investor GR/LG 5 - 39.3
Baron Partners Retail AG/MG 5 2 37.0
GMO Special Opportunities VI GR/MG 5 - 36.0
Morgan Stanley Inst Discovery I GR/MG 5 1 35.6
Morgan Stanley Insight A GR/LG 5 1 35.5
Virtus Zevenbergen Innov Growth A AG/LG 5 1 34.1
Berkshire Focus GR/LG 5 1 33.7
YEAR-TO-DATE
WORST PERFORMING GENERAL EQUITY FUNDS AS OF 12/31/20
Inv. Value Line Rank Tot. Ret.Fund Obj./Peer Risk Overall %
1 YEAR
Inv. Value Line Rank Tot. Ret.Fund Obj./Peer Risk Overall %
5 YEARS
Inv. Value Line Rank Tot. Ret.Fund Obj./Peer Risk Overall %
10 YEARS
Inv. Value Line Rank Tot. Ret.Fund Obj./Peer Risk Overall %
Rydex NASDAQ-100 2X Strategy H GR/XL 5 2 35.7
ProFunds UltraNASDAQ-100 Fund Inv AG/LG 5 2 35.5
Baron Partners Retail AG/MG 5 2 23.7
Morgan Stanley Insight A GR/LG 5 1 23.1
MSIF Growth Port I GR/LG 5 1 23.1
ProFunds Consumer Serv Ultra Inv AG/LG 5 2 22.8
Berkshire Focus GR/LG 5 1 22.5
Virtus Zevenbergen Innov Growth A AG/LG 5 1 21.9
Rydex S&P 500 2X Strategy H AG/LB 5 3 21.9
Transamerica Capital Growth A GR/LG 5 1 21.9
ProFunds UltraShort NASDAQ-100 Inv AG/BM 5 5 -75.0
ProFunds UltraShort Small-Cap Svc SC/BM 5 5 -61.0
Rydex Inverse Russl 2000 2x Strat A GR/BM 5 5 -59.9
ProFunds UltraShort Mid-Cap Svc SC/BM 5 5 -54.3
Direxion Mo Sm Cap Bear 2X Fd SC/BM 5 5 -53.2
ProFunds UltraBear Fund Inv AG/BM 5 5 -51.1
Highland Small Cap Equity A SC/SB 5 5 -50.1
Rydex Inverse S&P 500 2x Str H GR/BM 5 5 -50.0
ProFunds UltraShort Dow 30 Inv AG/BM 5 5 -45.7
Rydex Inverse Dow 2X A AG/BM 5 5 -45.0
ProFunds UltraShort NASDAQ-100 Inv AG/BM 5 5 -45.1
ProFunds UltraShort Small-Cap Svc SC/BM 5 5 -34.9
Rydex Inverse Russl 2000 2x Strat A GR/BM 5 5 -33.4
Direxion Mo Sm Cap Bear 2X Fd SC/BM 5 5 -31.8
ProFunds UltraShort Dow 30 Inv AG/BM 5 5 -31.6
ProFunds UltraBear Fund Inv AG/BM 5 5 -31.6
ProFunds UltraShort Mid-Cap Svc SC/BM 5 5 -31.5
Rydex Inverse Dow 2X A AG/BM 5 5 -31.5
Rydex Inverse S&P 500 2x Str H GR/BM 5 5 -31.2
Rydex Inverse NASDAQ-100 Str Inv GR/BM 3 5 -22.2
ProFunds UltraShort NASDAQ-100 Inv AG/BM 5 5 -40.0
ProFunds UltraShort Small-Cap Svc SC/BM 5 5 -32.3
Rydex Inverse Russl 2000 2x Strat A GR/BM 5 5 -31.0
ProFunds UltraShort Mid-Cap Svc SC/BM 5 5 -30.0
ProFunds UltraBear Fund Inv AG/BM 5 5 -29.8
Rydex Inverse S&P 500 2x Str H GR/BM 5 5 -29.4
ProFunds UltraShort Dow 30 Inv AG/BM 5 5 -28.7
Rydex Inverse Dow 2X A AG/BM 5 5 -28.7
Direxion Mo Sm Cap Bear 2X Fd SC/BM 5 5 -28.5
ProFunds UltraShort Intl Inv AG/BM 5 5 -20.1
g y g y
(These fund screens are derived from our entire 20,000+ fund database.)
(These fund screens are derived from our entire 20,000+ fund database.)
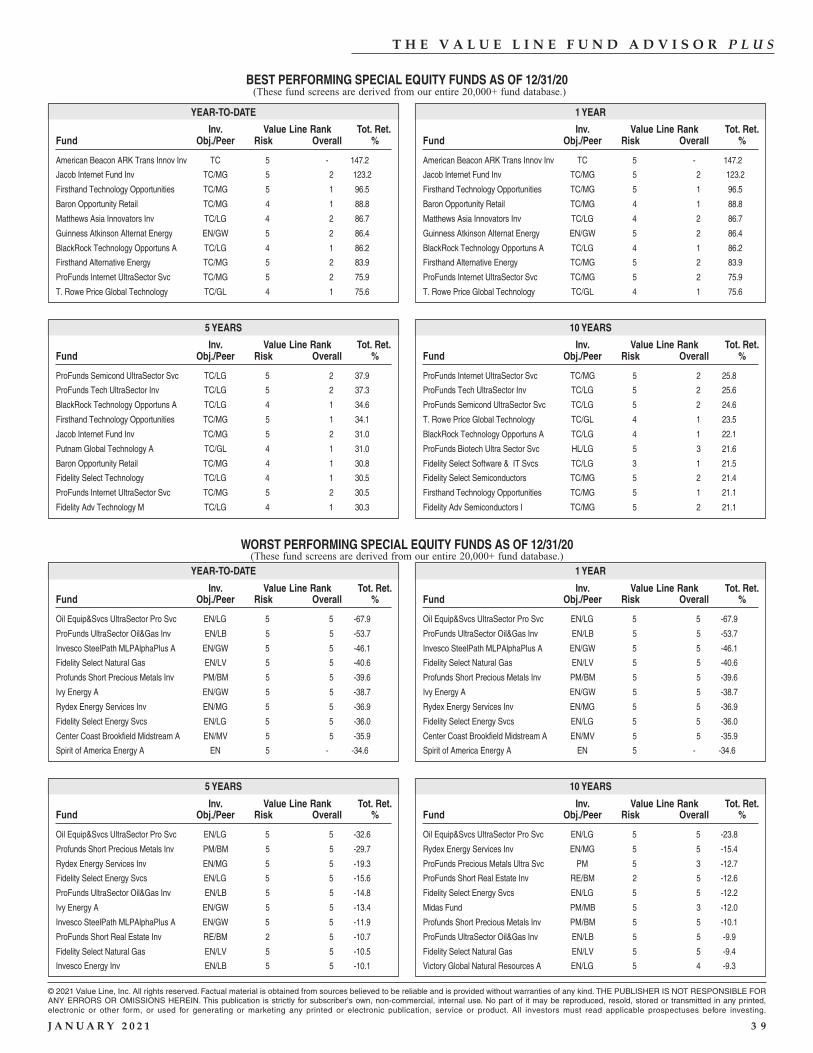
© 2021 Value Line, Inc. All rights reserved. Factual material is obtained from sources believed to be reliable and is provided without warranties of any kind. THE PUBLISHER IS NOT RESPONSIBLE FORANY ERRORS OR OMISSIONS HEREIN. This publication is strictly for subscriber's own, non-commercial, internal use. No part of it may be reproduced, resold, stored or transmitted in any printed,electronic or other form, or used for generating or marketing any printed or electronic publication, service or product. All investors must read applicable prospectuses before investing.
J A N U A R Y 2 0 2 1 3 9
T H E V A L U E L I N E F U N D A D V I S O R P L U S
YEAR-TO-DATE
BEST PERFORMING SPECIAL EQUITY FUNDS AS OF 12/31/20
Inv. Value Line Rank Tot. Ret.Fund Obj./Peer Risk Overall %
American Beacon ARK Trans Innov Inv TC 5 - 147.2
Jacob Internet Fund Inv TC/MG 5 2 123.2
Firsthand Technology Opportunities TC/MG 5 1 96.5
Baron Opportunity Retail TC/MG 4 1 88.8
Matthews Asia Innovators Inv TC/LG 4 2 86.7
Guinness Atkinson Alternat Energy EN/GW 5 2 86.4
BlackRock Technology Opportuns A TC/LG 4 1 86.2
Firsthand Alternative Energy TC/MG 5 2 83.9
ProFunds Internet UltraSector Svc TC/MG 5 2 75.9
T. Rowe Price Global Technology TC/GL 4 1 75.6
1 YEAR
Inv. Value Line Rank Tot. Ret.Fund Obj./Peer Risk Overall %
5 YEARS
Inv. Value Line Rank Tot. Ret.Fund Obj./Peer Risk Overall %
10 YEARS
Inv. Value Line Rank Tot. Ret.Fund Obj./Peer Risk Overall %
American Beacon ARK Trans Innov Inv TC 5 - 147.2
Jacob Internet Fund Inv TC/MG 5 2 123.2
Firsthand Technology Opportunities TC/MG 5 1 96.5
Baron Opportunity Retail TC/MG 4 1 88.8
Matthews Asia Innovators Inv TC/LG 4 2 86.7
Guinness Atkinson Alternat Energy EN/GW 5 2 86.4
BlackRock Technology Opportuns A TC/LG 4 1 86.2
Firsthand Alternative Energy TC/MG 5 2 83.9
ProFunds Internet UltraSector Svc TC/MG 5 2 75.9
T. Rowe Price Global Technology TC/GL 4 1 75.6
ProFunds Semicond UltraSector Svc TC/LG 5 2 37.9
ProFunds Tech UltraSector Inv TC/LG 5 2 37.3
BlackRock Technology Opportuns A TC/LG 4 1 34.6
Firsthand Technology Opportunities TC/MG 5 1 34.1
Jacob Internet Fund Inv TC/MG 5 2 31.0
Putnam Global Technology A TC/GL 4 1 31.0
Baron Opportunity Retail TC/MG 4 1 30.8
Fidelity Select Technology TC/LG 4 1 30.5
ProFunds Internet UltraSector Svc TC/MG 5 2 30.5
Fidelity Adv Technology M TC/LG 4 1 30.3
YEAR-TO-DATE
WORST PERFORMING SPECIAL EQUITY FUNDS AS OF 12/31/20
Inv. Value Line Rank Tot. Ret.Fund Obj./Peer Risk Overall %
1 YEAR
Inv. Value Line Rank Tot. Ret.Fund Obj./Peer Risk Overall %
5 YEARS
Inv. Value Line Rank Tot. Ret.Fund Obj./Peer Risk Overall %
10 YEARS
Inv. Value Line Rank Tot. Ret.Fund Obj./Peer Risk Overall %
ProFunds Internet UltraSector Svc TC/MG 5 2 25.8
ProFunds Tech UltraSector Inv TC/LG 5 2 25.6
ProFunds Semicond UltraSector Svc TC/LG 5 2 24.6
T. Rowe Price Global Technology TC/GL 4 1 23.5
BlackRock Technology Opportuns A TC/LG 4 1 22.1
ProFunds Biotech Ultra Sector Svc HL/LG 5 3 21.6
Fidelity Select Software & IT Svcs TC/LG 3 1 21.5
Fidelity Select Semiconductors TC/MG 5 2 21.4
Firsthand Technology Opportunities TC/MG 5 1 21.1
Fidelity Adv Semiconductors I TC/MG 5 2 21.1
Oil Equip&Svcs UltraSector Pro Svc EN/LG 5 5 -67.9
ProFunds UltraSector Oil&Gas Inv EN/LB 5 5 -53.7
Invesco SteelPath MLPAlphaPlus A EN/GW 5 5 -46.1
Fidelity Select Natural Gas EN/LV 5 5 -40.6
Profunds Short Precious Metals Inv PM/BM 5 5 -39.6
Ivy Energy A EN/GW 5 5 -38.7
Rydex Energy Services Inv EN/MG 5 5 -36.9
Fidelity Select Energy Svcs EN/LG 5 5 -36.0
Center Coast Brookfield Midstream A EN/MV 5 5 -35.9
Spirit of America Energy A EN 5 - -34.6
Oil Equip&Svcs UltraSector Pro Svc EN/LG 5 5 -32.6
Profunds Short Precious Metals Inv PM/BM 5 5 -29.7
Rydex Energy Services Inv EN/MG 5 5 -19.3
Fidelity Select Energy Svcs EN/LG 5 5 -15.6
ProFunds UltraSector Oil&Gas Inv EN/LB 5 5 -14.8
Ivy Energy A EN/GW 5 5 -13.4
Invesco SteelPath MLPAlphaPlus A EN/GW 5 5 -11.9
ProFunds Short Real Estate Inv RE/BM 2 5 -10.7
Fidelity Select Natural Gas EN/LV 5 5 -10.5
Invesco Energy Inv EN/LB 5 5 -10.1
Oil Equip&Svcs UltraSector Pro Svc EN/LG 5 5 -23.8
Rydex Energy Services Inv EN/MG 5 5 -15.4
ProFunds Precious Metals Ultra Svc PM 5 3 -12.7
ProFunds Short Real Estate Inv RE/BM 2 5 -12.6
Fidelity Select Energy Svcs EN/LG 5 5 -12.2
Midas Fund PM/MB 5 3 -12.0
Profunds Short Precious Metals Inv PM/BM 5 5 -10.1
ProFunds UltraSector Oil&Gas Inv EN/LB 5 5 -9.9
Fidelity Select Natural Gas EN/LV 5 5 -9.4
Victory Global Natural Resources A EN/LG 5 4 -9.3
(These fund screens are derived from our entire 20,000+ fund database.)
(These fund screens are derived from our entire 20,000+ fund database.)
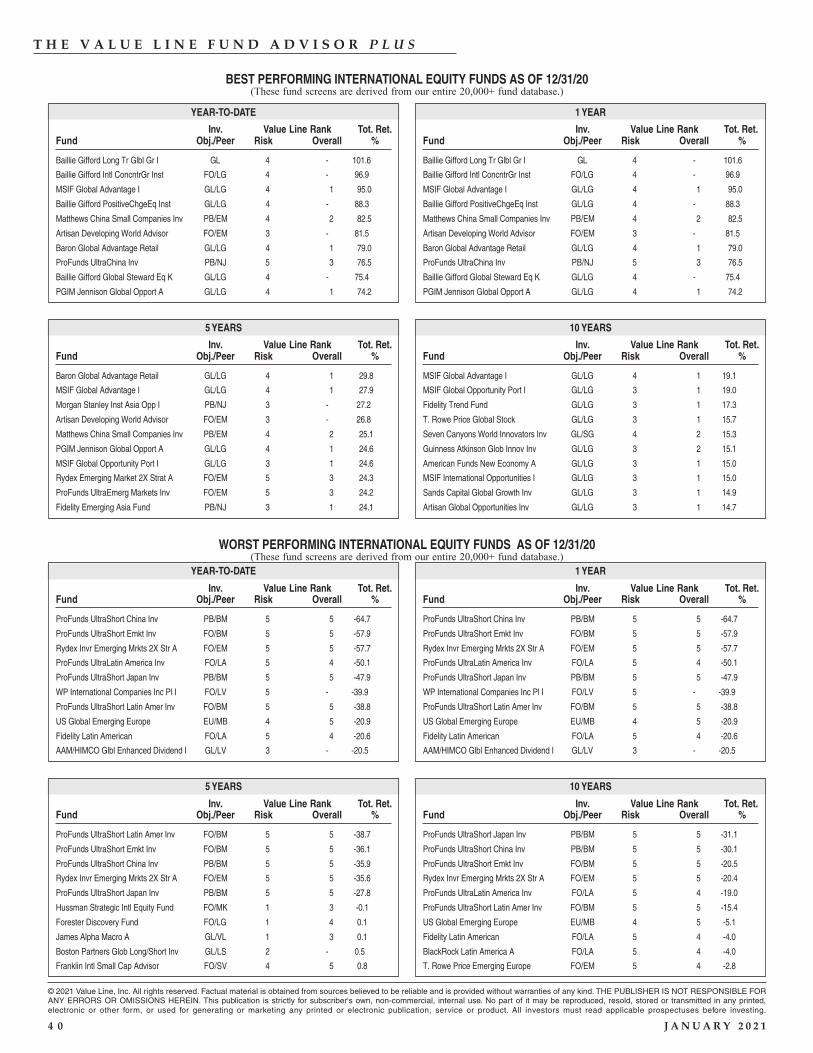
© 2021 Value Line, Inc. All rights reserved. Factual material is obtained from sources believed to be reliable and is provided without warranties of any kind. THE PUBLISHER IS NOT RESPONSIBLE FORANY ERRORS OR OMISSIONS HEREIN. This publication is strictly for subscriber's own, non-commercial, internal use. No part of it may be reproduced, resold, stored or transmitted in any printed,electronic or other form, or used for generating or marketing any printed or electronic publication, service or product. All investors must read applicable prospectuses before investing.
4 0 J A N U A R Y 2 0 2 1
T H E V A L U E L I N E F U N D A D V I S O R P L U S
YEAR-TO-DATE
BEST PERFORMING INTERNATIONAL EQUITY FUNDS AS OF 12/31/20
Inv. Value Line Rank Tot. Ret.Fund Obj./Peer Risk Overall %
Baillie Gifford Long Tr Glbl Gr I GL 4 - 101.6
Baillie Gifford Intl ConcntrGr Inst FO/LG 4 - 96.9
MSIF Global Advantage I GL/LG 4 1 95.0
Baillie Gifford PositiveChgeEq Inst GL/LG 4 - 88.3
Matthews China Small Companies Inv PB/EM 4 2 82.5
Artisan Developing World Advisor FO/EM 3 - 81.5
Baron Global Advantage Retail GL/LG 4 1 79.0
ProFunds UltraChina Inv PB/NJ 5 3 76.5
Baillie Gifford Global Steward Eq K GL/LG 4 - 75.4
PGIM Jennison Global Opport A GL/LG 4 1 74.2
1 YEAR
Inv. Value Line Rank Tot. Ret.Fund Obj./Peer Risk Overall %
5 YEARS
Inv. Value Line Rank Tot. Ret.Fund Obj./Peer Risk Overall %
10 YEARS
Inv. Value Line Rank Tot. Ret.Fund Obj./Peer Risk Overall %
Baillie Gifford Long Tr Glbl Gr I GL 4 - 101.6
Baillie Gifford Intl ConcntrGr Inst FO/LG 4 - 96.9
MSIF Global Advantage I GL/LG 4 1 95.0
Baillie Gifford PositiveChgeEq Inst GL/LG 4 - 88.3
Matthews China Small Companies Inv PB/EM 4 2 82.5
Artisan Developing World Advisor FO/EM 3 - 81.5
Baron Global Advantage Retail GL/LG 4 1 79.0
ProFunds UltraChina Inv PB/NJ 5 3 76.5
Baillie Gifford Global Steward Eq K GL/LG 4 - 75.4
PGIM Jennison Global Opport A GL/LG 4 1 74.2
Baron Global Advantage Retail GL/LG 4 1 29.8
MSIF Global Advantage I GL/LG 4 1 27.9
Morgan Stanley Inst Asia Opp I PB/NJ 3 - 27.2
Artisan Developing World Advisor FO/EM 3 - 26.8
Matthews China Small Companies Inv PB/EM 4 2 25.1
PGIM Jennison Global Opport A GL/LG 4 1 24.6
MSIF Global Opportunity Port I GL/LG 3 1 24.6
Rydex Emerging Market 2X Strat A FO/EM 5 3 24.3
ProFunds UltraEmerg Markets Inv FO/EM 5 3 24.2
Fidelity Emerging Asia Fund PB/NJ 3 1 24.1
YEAR-TO-DATE
WORST PERFORMING INTERNATIONAL EQUITY FUNDS AS OF 12/31/20
Inv. Value Line Rank Tot. Ret.Fund Obj./Peer Risk Overall %
1 YEAR
Inv. Value Line Rank Tot. Ret.Fund Obj./Peer Risk Overall %
5 YEARS
Inv. Value Line Rank Tot. Ret.Fund Obj./Peer Risk Overall %
10 YEARS
Inv. Value Line Rank Tot. Ret.Fund Obj./Peer Risk Overall %
MSIF Global Advantage I GL/LG 4 1 19.1
MSIF Global Opportunity Port I GL/LG 3 1 19.0
Fidelity Trend Fund GL/LG 3 1 17.3
T. Rowe Price Global Stock GL/LG 3 1 15.7
Seven Canyons World Innovators Inv GL/SG 4 2 15.3
Guinness Atkinson Glob Innov Inv GL/LG 3 2 15.1
American Funds New Economy A GL/LG 3 1 15.0
MSIF International Opportunities I GL/LG 3 1 15.0
Sands Capital Global Growth Inv GL/LG 3 1 14.9
Artisan Global Opportunities Inv GL/LG 3 1 14.7
ProFunds UltraShort China Inv PB/BM 5 5 -64.7
ProFunds UltraShort Emkt Inv FO/BM 5 5 -57.9
Rydex Invr Emerging Mrkts 2X Str A FO/EM 5 5 -57.7
ProFunds UltraLatin America Inv FO/LA 5 4 -50.1
ProFunds UltraShort Japan Inv PB/BM 5 5 -47.9
WP International Companies Inc Pl I FO/LV 5 - -39.9
ProFunds UltraShort Latin Amer Inv FO/BM 5 5 -38.8
US Global Emerging Europe EU/MB 4 5 -20.9
Fidelity Latin American FO/LA 5 4 -20.6
AAM/HIMCO Glbl Enhanced Dividend I GL/LV 3 - -20.5
ProFunds UltraShort Latin Amer Inv FO/BM 5 5 -38.7
ProFunds UltraShort Emkt Inv FO/BM 5 5 -36.1
ProFunds UltraShort China Inv PB/BM 5 5 -35.9
Rydex Invr Emerging Mrkts 2X Str A FO/EM 5 5 -35.6
ProFunds UltraShort Japan Inv PB/BM 5 5 -27.8
Hussman Strategic Intl Equity Fund FO/MK 1 3 -0.1
Forester Discovery Fund FO/LG 1 4 0.1
James Alpha Macro A GL/VL 1 3 0.1
Boston Partners Glob Long/Short Inv GL/LS 2 - 0.5
Franklin Intl Small Cap Advisor FO/SV 4 5 0.8
ProFunds UltraShort Japan Inv PB/BM 5 5 -31.1
ProFunds UltraShort China Inv PB/BM 5 5 -30.1
ProFunds UltraShort Emkt Inv FO/BM 5 5 -20.5
Rydex Invr Emerging Mrkts 2X Str A FO/EM 5 5 -20.4
ProFunds UltraLatin America Inv FO/LA 5 4 -19.0
ProFunds UltraShort Latin Amer Inv FO/BM 5 5 -15.4
US Global Emerging Europe EU/MB 4 5 -5.1
Fidelity Latin American FO/LA 5 4 -4.0
BlackRock Latin America A FO/LA 5 4 -4.0
T. Rowe Price Emerging Europe FO/EM 5 4 -2.8
(These fund screens are derived from our entire 20,000+ fund database.)
(These fund screens are derived from our entire 20,000+ fund database.)
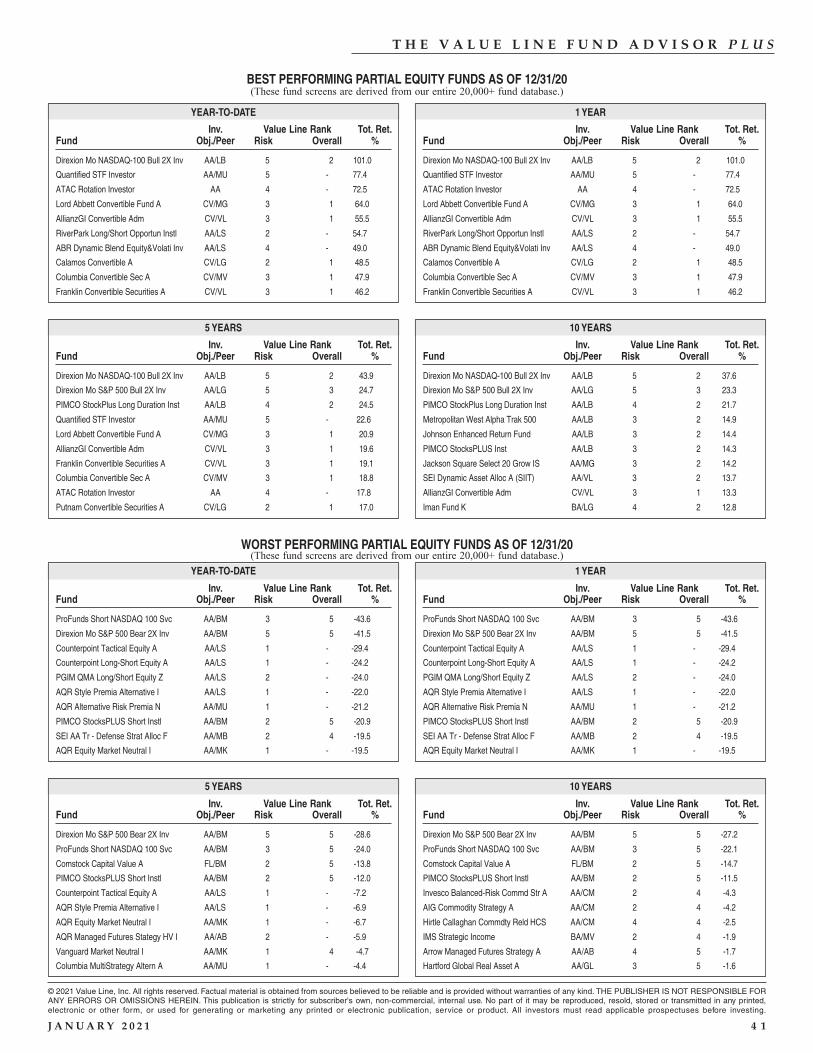
© 2021 Value Line, Inc. All rights reserved. Factual material is obtained from sources believed to be reliable and is provided without warranties of any kind. THE PUBLISHER IS NOT RESPONSIBLE FORANY ERRORS OR OMISSIONS HEREIN. This publication is strictly for subscriber's own, non-commercial, internal use. No part of it may be reproduced, resold, stored or transmitted in any printed,electronic or other form, or used for generating or marketing any printed or electronic publication, service or product. All investors must read applicable prospectuses before investing.
J A N U A R Y 2 0 2 1 4 1
T H E V A L U E L I N E F U N D A D V I S O R P L U S
YEAR-TO-DATE
BEST PERFORMING PARTIAL EQUITY FUNDS AS OF 12/31/20
Inv. Value Line Rank Tot. Ret.Fund Obj./Peer Risk Overall %
Direxion Mo NASDAQ-100 Bull 2X Inv AA/LB 5 2 101.0
Quantified STF Investor AA/MU 5 - 77.4
ATAC Rotation Investor AA 4 - 72.5
Lord Abbett Convertible Fund A CV/MG 3 1 64.0
AllianzGI Convertible Adm CV/VL 3 1 55.5
RiverPark Long/Short Opportun Instl AA/LS 2 - 54.7
ABR Dynamic Blend Equity&Volati Inv AA/LS 4 - 49.0
Calamos Convertible A CV/LG 2 1 48.5
Columbia Convertible Sec A CV/MV 3 1 47.9
Franklin Convertible Securities A CV/VL 3 1 46.2
1 YEAR
Inv. Value Line Rank Tot. Ret.Fund Obj./Peer Risk Overall %
5 YEARS
Inv. Value Line Rank Tot. Ret.Fund Obj./Peer Risk Overall %
10 YEARS
Inv. Value Line Rank Tot. Ret.Fund Obj./Peer Risk Overall %
Direxion Mo NASDAQ-100 Bull 2X Inv AA/LB 5 2 101.0
Quantified STF Investor AA/MU 5 - 77.4
ATAC Rotation Investor AA 4 - 72.5
Lord Abbett Convertible Fund A CV/MG 3 1 64.0
AllianzGI Convertible Adm CV/VL 3 1 55.5
RiverPark Long/Short Opportun Instl AA/LS 2 - 54.7
ABR Dynamic Blend Equity&Volati Inv AA/LS 4 - 49.0
Calamos Convertible A CV/LG 2 1 48.5
Columbia Convertible Sec A CV/MV 3 1 47.9
Franklin Convertible Securities A CV/VL 3 1 46.2
Direxion Mo NASDAQ-100 Bull 2X Inv AA/LB 5 2 43.9
Direxion Mo S&P 500 Bull 2X Inv AA/LG 5 3 24.7
PIMCO StockPlus Long Duration Inst AA/LB 4 2 24.5
Quantified STF Investor AA/MU 5 - 22.6
Lord Abbett Convertible Fund A CV/MG 3 1 20.9
AllianzGI Convertible Adm CV/VL 3 1 19.6
Franklin Convertible Securities A CV/VL 3 1 19.1
Columbia Convertible Sec A CV/MV 3 1 18.8
ATAC Rotation Investor AA 4 - 17.8
Putnam Convertible Securities A CV/LG 2 1 17.0
YEAR-TO-DATE
WORST PERFORMING PARTIAL EQUITY FUNDS AS OF 12/31/20
Inv. Value Line Rank Tot. Ret.Fund Obj./Peer Risk Overall %
1 YEAR
Inv. Value Line Rank Tot. Ret.Fund Obj./Peer Risk Overall %
5 YEARS
Inv. Value Line Rank Tot. Ret.Fund Obj./Peer Risk Overall %
10 YEARS
Inv. Value Line Rank Tot. Ret.Fund Obj./Peer Risk Overall %
Direxion Mo NASDAQ-100 Bull 2X Inv AA/LB 5 2 37.6
Direxion Mo S&P 500 Bull 2X Inv AA/LG 5 3 23.3
PIMCO StockPlus Long Duration Inst AA/LB 4 2 21.7
Metropolitan West Alpha Trak 500 AA/LB 3 2 14.9
Johnson Enhanced Return Fund AA/LB 3 2 14.4
PIMCO StocksPLUS Inst AA/LB 3 2 14.3
Jackson Square Select 20 Grow IS AA/MG 3 2 14.2
SEI Dynamic Asset Alloc A (SIIT) AA/VL 3 2 13.7
AllianzGI Convertible Adm CV/VL 3 1 13.3
Iman Fund K BA/LG 4 2 12.8
ProFunds Short NASDAQ 100 Svc AA/BM 3 5 -43.6
Direxion Mo S&P 500 Bear 2X Inv AA/BM 5 5 -41.5
Counterpoint Tactical Equity A AA/LS 1 - -29.4
Counterpoint Long-Short Equity A AA/LS 1 - -24.2
PGIM QMA Long/Short Equity Z AA/LS 2 - -24.0
AQR Style Premia Alternative I AA/LS 1 - -22.0
AQR Alternative Risk Premia N AA/MU 1 - -21.2
PIMCO StocksPLUS Short Instl AA/BM 2 5 -20.9
SEI AA Tr - Defense Strat Alloc F AA/MB 2 4 -19.5
AQR Equity Market Neutral I AA/MK 1 - -19.5
Direxion Mo S&P 500 Bear 2X Inv AA/BM 5 5 -28.6
ProFunds Short NASDAQ 100 Svc AA/BM 3 5 -24.0
Comstock Capital Value A FL/BM 2 5 -13.8
PIMCO StocksPLUS Short Instl AA/BM 2 5 -12.0
Counterpoint Tactical Equity A AA/LS 1 - -7.2
AQR Style Premia Alternative I AA/LS 1 - -6.9
AQR Equity Market Neutral I AA/MK 1 - -6.7
AQR Managed Futures Stategy HV I AA/AB 2 - -5.9
Vanguard Market Neutral I AA/MK 1 4 -4.7
Columbia MultiStrategy Altern A AA/MU 1 - -4.4
Direxion Mo S&P 500 Bear 2X Inv AA/BM 5 5 -27.2
ProFunds Short NASDAQ 100 Svc AA/BM 3 5 -22.1
Comstock Capital Value A FL/BM 2 5 -14.7
PIMCO StocksPLUS Short Instl AA/BM 2 5 -11.5
Invesco Balanced-Risk Commd Str A AA/CM 2 4 -4.3
AIG Commodity Strategy A AA/CM 2 4 -4.2
Hirtle Callaghan Commdty Reld HCS AA/CM 4 4 -2.5
IMS Strategic Income BA/MV 2 4 -1.9
Arrow Managed Futures Strategy A AA/AB 4 5 -1.7
Hartford Global Real Asset A AA/GL 3 5 -1.6
(These fund screens are derived from our entire 20,000+ fund database.)
(These fund screens are derived from our entire 20,000+ fund database.)
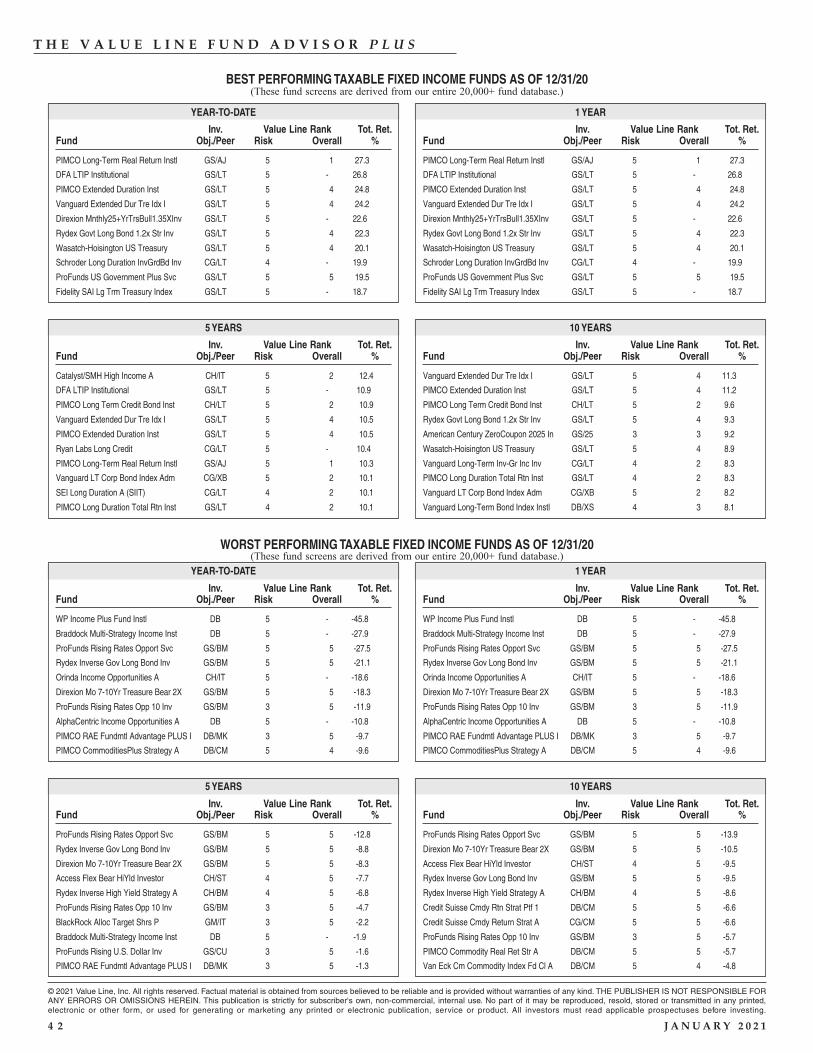
© 2021 Value Line, Inc. All rights reserved. Factual material is obtained from sources believed to be reliable and is provided without warranties of any kind. THE PUBLISHER IS NOT RESPONSIBLE FORANY ERRORS OR OMISSIONS HEREIN. This publication is strictly for subscriber's own, non-commercial, internal use. No part of it may be reproduced, resold, stored or transmitted in any printed,electronic or other form, or used for generating or marketing any printed or electronic publication, service or product. All investors must read applicable prospectuses before investing.
4 2 J A N U A R Y 2 0 2 1
T H E V A L U E L I N E F U N D A D V I S O R P L U S
YEAR-TO-DATE
BEST PERFORMING TAXABLE FIXED INCOME FUNDS AS OF 12/31/20
Inv. Value Line Rank Tot. Ret.Fund Obj./Peer Risk Overall %
PIMCO Long-Term Real Return Instl GS/AJ 5 1 27.3
DFA LTIP Institutional GS/LT 5 - 26.8
PIMCO Extended Duration Inst GS/LT 5 4 24.8
Vanguard Extended Dur Tre Idx I GS/LT 5 4 24.2
Direxion Mnthly25+YrTrsBull1.35XInv GS/LT 5 - 22.6
Rydex Govt Long Bond 1.2x Str Inv GS/LT 5 4 22.3
Wasatch-Hoisington US Treasury GS/LT 5 4 20.1
Schroder Long Duration InvGrdBd Inv CG/LT 4 - 19.9
ProFunds US Government Plus Svc GS/LT 5 5 19.5
Fidelity SAI Lg Trm Treasury Index GS/LT 5 - 18.7
1 YEAR
Inv. Value Line Rank Tot. Ret.Fund Obj./Peer Risk Overall %
5 YEARS
Inv. Value Line Rank Tot. Ret.Fund Obj./Peer Risk Overall %
10 YEARS
Inv. Value Line Rank Tot. Ret.Fund Obj./Peer Risk Overall %
PIMCO Long-Term Real Return Instl GS/AJ 5 1 27.3
DFA LTIP Institutional GS/LT 5 - 26.8
PIMCO Extended Duration Inst GS/LT 5 4 24.8
Vanguard Extended Dur Tre Idx I GS/LT 5 4 24.2
Direxion Mnthly25+YrTrsBull1.35XInv GS/LT 5 - 22.6
Rydex Govt Long Bond 1.2x Str Inv GS/LT 5 4 22.3
Wasatch-Hoisington US Treasury GS/LT 5 4 20.1
Schroder Long Duration InvGrdBd Inv CG/LT 4 - 19.9
ProFunds US Government Plus Svc GS/LT 5 5 19.5
Fidelity SAI Lg Trm Treasury Index GS/LT 5 - 18.7
Catalyst/SMH High Income A CH/IT 5 2 12.4
DFA LTIP Institutional GS/LT 5 - 10.9
PIMCO Long Term Credit Bond Inst CH/LT 5 2 10.9
Vanguard Extended Dur Tre Idx I GS/LT 5 4 10.5
PIMCO Extended Duration Inst GS/LT 5 4 10.5
Ryan Labs Long Credit CG/LT 5 - 10.4
PIMCO Long-Term Real Return Instl GS/AJ 5 1 10.3
Vanguard LT Corp Bond Index Adm CG/XB 5 2 10.1
SEI Long Duration A (SIIT) CG/LT 4 2 10.1
PIMCO Long Duration Total Rtn Inst GS/LT 4 2 10.1
YEAR-TO-DATE
WORST PERFORMING TAXABLE FIXED INCOME FUNDS AS OF 12/31/20
Inv. Value Line Rank Tot. Ret.Fund Obj./Peer Risk Overall %
1 YEAR
Inv. Value Line Rank Tot. Ret.Fund Obj./Peer Risk Overall %
5 YEARS
Inv. Value Line Rank Tot. Ret.Fund Obj./Peer Risk Overall %
10 YEARS
Inv. Value Line Rank Tot. Ret.Fund Obj./Peer Risk Overall %
Vanguard Extended Dur Tre Idx I GS/LT 5 4 11.3
PIMCO Extended Duration Inst GS/LT 5 4 11.2
PIMCO Long Term Credit Bond Inst CH/LT 5 2 9.6
Rydex Govt Long Bond 1.2x Str Inv GS/LT 5 4 9.3
American Century ZeroCoupon 2025 In GS/25 3 3 9.2
Wasatch-Hoisington US Treasury GS/LT 5 4 8.9
Vanguard Long-Term Inv-Gr Inc Inv CG/LT 4 2 8.3
PIMCO Long Duration Total Rtn Inst GS/LT 4 2 8.3
Vanguard LT Corp Bond Index Adm CG/XB 5 2 8.2
Vanguard Long-Term Bond Index Instl DB/XS 4 3 8.1
WP Income Plus Fund Instl DB 5 - -45.8
Braddock Multi-Strategy Income Inst DB 5 - -27.9
ProFunds Rising Rates Opport Svc GS/BM 5 5 -27.5
Rydex Inverse Gov Long Bond Inv GS/BM 5 5 -21.1
Orinda Income Opportunities A CH/IT 5 - -18.6
Direxion Mo 7-10Yr Treasure Bear 2X GS/BM 5 5 -18.3
ProFunds Rising Rates Opp 10 Inv GS/BM 3 5 -11.9
AlphaCentric Income Opportunities A DB 5 - -10.8
PIMCO RAE Fundmtl Advantage PLUS I DB/MK 3 5 -9.7
PIMCO CommoditiesPlus Strategy A DB/CM 5 4 -9.6
ProFunds Rising Rates Opport Svc GS/BM 5 5 -12.8
Rydex Inverse Gov Long Bond Inv GS/BM 5 5 -8.8
Direxion Mo 7-10Yr Treasure Bear 2X GS/BM 5 5 -8.3
Access Flex Bear HiYld Investor CH/ST 4 5 -7.7
Rydex Inverse High Yield Strategy A CH/BM 4 5 -6.8
ProFunds Rising Rates Opp 10 Inv GS/BM 3 5 -4.7
BlackRock Alloc Target Shrs P GM/IT 3 5 -2.2
Braddock Multi-Strategy Income Inst DB 5 - -1.9
ProFunds Rising U.S. Dollar Inv GS/CU 3 5 -1.6
PIMCO RAE Fundmtl Advantage PLUS I DB/MK 3 5 -1.3
ProFunds Rising Rates Opport Svc GS/BM 5 5 -13.9
Direxion Mo 7-10Yr Treasure Bear 2X GS/BM 5 5 -10.5
Access Flex Bear HiYld Investor CH/ST 4 5 -9.5
Rydex Inverse Gov Long Bond Inv GS/BM 5 5 -9.5
Rydex Inverse High Yield Strategy A CH/BM 4 5 -8.6
Credit Suisse Cmdy Rtn Strat Ptf 1 DB/CM 5 5 -6.6
Credit Suisse Cmdy Return Strat A CG/CM 5 5 -6.6
ProFunds Rising Rates Opp 10 Inv GS/BM 3 5 -5.7
PIMCO Commodity Real Ret Str A DB/CM 5 5 -5.7
Van Eck Cm Commodity Index Fd Cl A DB/CM 5 4 -4.8
(These fund screens are derived from our entire 20,000+ fund database.)
(These fund screens are derived from our entire 20,000+ fund database.)
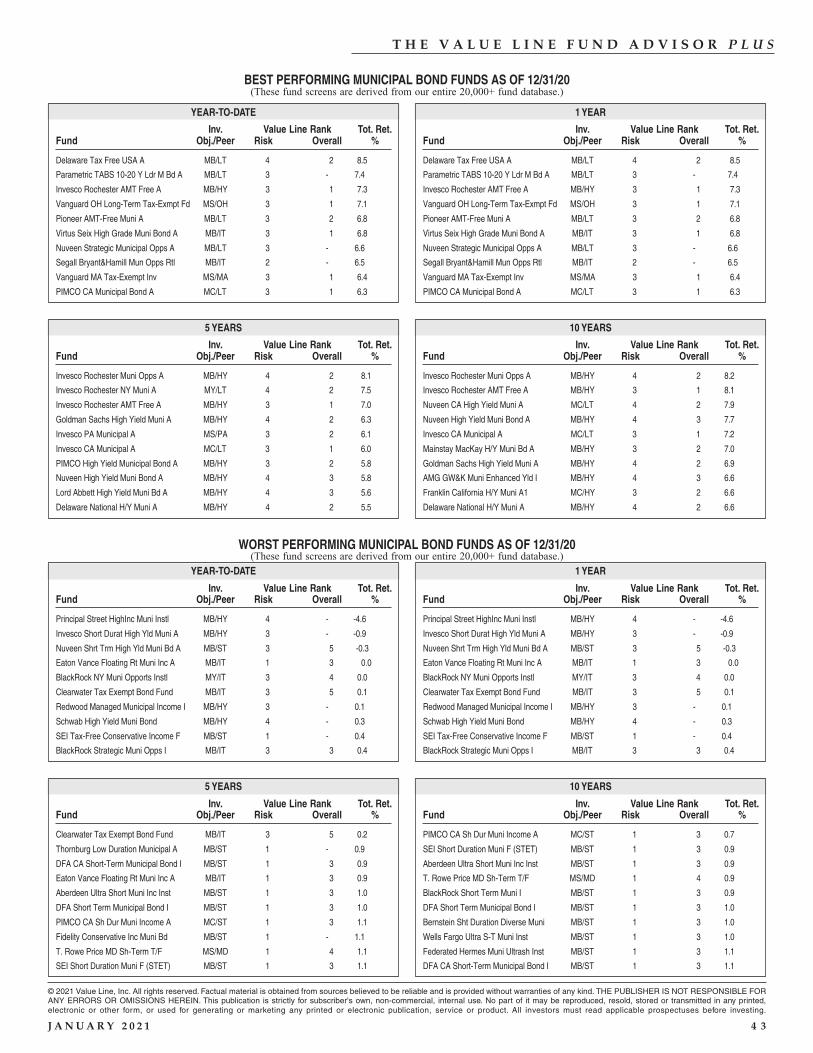
© 2021 Value Line, Inc. All rights reserved. Factual material is obtained from sources believed to be reliable and is provided without warranties of any kind. THE PUBLISHER IS NOT RESPONSIBLE FORANY ERRORS OR OMISSIONS HEREIN. This publication is strictly for subscriber's own, non-commercial, internal use. No part of it may be reproduced, resold, stored or transmitted in any printed,electronic or other form, or used for generating or marketing any printed or electronic publication, service or product. All investors must read applicable prospectuses before investing.
J A N U A R Y 2 0 2 1 4 3
T H E V A L U E L I N E F U N D A D V I S O R P L U S
YEAR-TO-DATE
BEST PERFORMING MUNICIPAL BOND FUNDS AS OF 12/31/20
Inv. Value Line Rank Tot. Ret.Fund Obj./Peer Risk Overall %
Delaware Tax Free USA A MB/LT 4 2 8.5
Parametric TABS 10-20 Y Ldr M Bd A MB/LT 3 - 7.4
Invesco Rochester AMT Free A MB/HY 3 1 7.3
Vanguard OH Long-Term Tax-Exmpt Fd MS/OH 3 1 7.1
Pioneer AMT-Free Muni A MB/LT 3 2 6.8
Virtus Seix High Grade Muni Bond A MB/IT 3 1 6.8
Nuveen Strategic Municipal Opps A MB/LT 3 - 6.6
Segall Bryant&Hamill Mun Opps Rtl MB/IT 2 - 6.5
Vanguard MA Tax-Exempt Inv MS/MA 3 1 6.4
PIMCO CA Municipal Bond A MC/LT 3 1 6.3
1 YEAR
Inv. Value Line Rank Tot. Ret.Fund Obj./Peer Risk Overall %
5 YEARS
Inv. Value Line Rank Tot. Ret.Fund Obj./Peer Risk Overall %
10 YEARS
Inv. Value Line Rank Tot. Ret.Fund Obj./Peer Risk Overall %
Delaware Tax Free USA A MB/LT 4 2 8.5
Parametric TABS 10-20 Y Ldr M Bd A MB/LT 3 - 7.4
Invesco Rochester AMT Free A MB/HY 3 1 7.3
Vanguard OH Long-Term Tax-Exmpt Fd MS/OH 3 1 7.1
Pioneer AMT-Free Muni A MB/LT 3 2 6.8
Virtus Seix High Grade Muni Bond A MB/IT 3 1 6.8
Nuveen Strategic Municipal Opps A MB/LT 3 - 6.6
Segall Bryant&Hamill Mun Opps Rtl MB/IT 2 - 6.5
Vanguard MA Tax-Exempt Inv MS/MA 3 1 6.4
PIMCO CA Municipal Bond A MC/LT 3 1 6.3
Invesco Rochester Muni Opps A MB/HY 4 2 8.1
Invesco Rochester NY Muni A MY/LT 4 2 7.5
Invesco Rochester AMT Free A MB/HY 3 1 7.0
Goldman Sachs High Yield Muni A MB/HY 4 2 6.3
Invesco PA Municipal A MS/PA 3 2 6.1
Invesco CA Municipal A MC/LT 3 1 6.0
PIMCO High Yield Municipal Bond A MB/HY 3 2 5.8
Nuveen High Yield Muni Bond A MB/HY 4 3 5.8
Lord Abbett High Yield Muni Bd A MB/HY 4 3 5.6
Delaware National H/Y Muni A MB/HY 4 2 5.5
YEAR-TO-DATE
WORST PERFORMING MUNICIPAL BOND FUNDS AS OF 12/31/20
Inv. Value Line Rank Tot. Ret.Fund Obj./Peer Risk Overall %
1 YEAR
Inv. Value Line Rank Tot. Ret.Fund Obj./Peer Risk Overall %
5 YEARS
Inv. Value Line Rank Tot. Ret.Fund Obj./Peer Risk Overall %
10 YEARS
Inv. Value Line Rank Tot. Ret.Fund Obj./Peer Risk Overall %
Invesco Rochester Muni Opps A MB/HY 4 2 8.2
Invesco Rochester AMT Free A MB/HY 3 1 8.1
Nuveen CA High Yield Muni A MC/LT 4 2 7.9
Nuveen High Yield Muni Bond A MB/HY 4 3 7.7
Invesco CA Municipal A MC/LT 3 1 7.2
Mainstay MacKay H/Y Muni Bd A MB/HY 3 2 7.0
Goldman Sachs High Yield Muni A MB/HY 4 2 6.9
AMG GW&K Muni Enhanced Yld I MB/HY 4 3 6.6
Franklin California H/Y Muni A1 MC/HY 3 2 6.6
Delaware National H/Y Muni A MB/HY 4 2 6.6
Principal Street HighInc Muni Instl MB/HY 4 - -4.6
Invesco Short Durat High Yld Muni A MB/HY 3 - -0.9
Nuveen Shrt Trm High Yld Muni Bd A MB/ST 3 5 -0.3
Eaton Vance Floating Rt Muni Inc A MB/IT 1 3 0.0
BlackRock NY Muni Opports Instl MY/IT 3 4 0.0
Clearwater Tax Exempt Bond Fund MB/IT 3 5 0.1
Redwood Managed Municipal Income I MB/HY 3 - 0.1
Schwab High Yield Muni Bond MB/HY 4 - 0.3
SEI Tax-Free Conservative Income F MB/ST 1 - 0.4
BlackRock Strategic Muni Opps I MB/IT 3 3 0.4
Clearwater Tax Exempt Bond Fund MB/IT 3 5 0.2
Thornburg Low Duration Municipal A MB/ST 1 - 0.9
DFA CA Short-Term Municipal Bond I MB/ST 1 3 0.9
Eaton Vance Floating Rt Muni Inc A MB/IT 1 3 0.9
Aberdeen Ultra Short Muni Inc Inst MB/ST 1 3 1.0
DFA Short Term Municipal Bond I MB/ST 1 3 1.0
PIMCO CA Sh Dur Muni Income A MC/ST 1 3 1.1
Fidelity Conservative Inc Muni Bd MB/ST 1 - 1.1
T. Rowe Price MD Sh-Term T/F MS/MD 1 4 1.1
SEI Short Duration Muni F (STET) MB/ST 1 3 1.1
PIMCO CA Sh Dur Muni Income A MC/ST 1 3 0.7
SEI Short Duration Muni F (STET) MB/ST 1 3 0.9
Aberdeen Ultra Short Muni Inc Inst MB/ST 1 3 0.9
T. Rowe Price MD Sh-Term T/F MS/MD 1 4 0.9
BlackRock Short Term Muni I MB/ST 1 3 0.9
DFA Short Term Municipal Bond I MB/ST 1 3 1.0
Bernstein Sht Duration Diverse Muni MB/ST 1 3 1.0
Wells Fargo Ultra S-T Muni Inst MB/ST 1 3 1.0
Federated Hermes Muni Ultrash Inst MB/ST 1 3 1.1
DFA CA Short-Term Municipal Bond I MB/ST 1 3 1.1
(These fund screens are derived from our entire 20,000+ fund database.)
(These fund screens are derived from our entire 20,000+ fund database.)
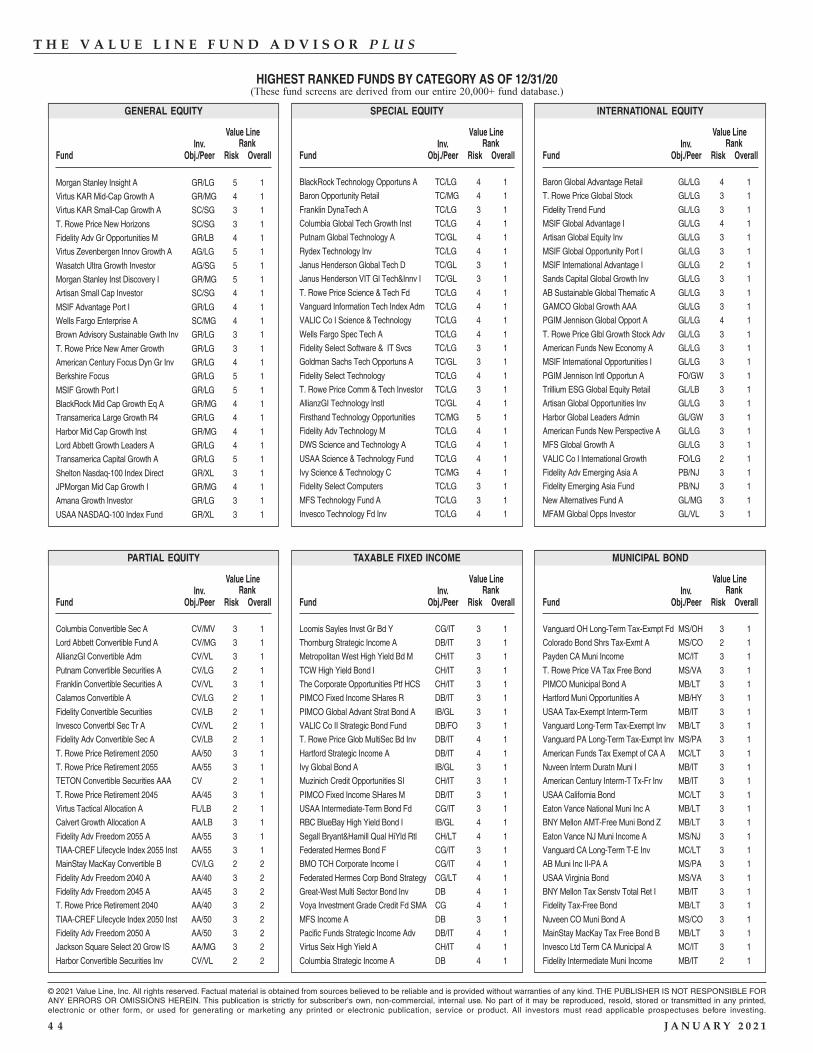
© 2021 Value Line, Inc. All rights reserved. Factual material is obtained from sources believed to be reliable and is provided without warranties of any kind. THE PUBLISHER IS NOT RESPONSIBLE FORANY ERRORS OR OMISSIONS HEREIN. This publication is strictly for subscriber's own, non-commercial, internal use. No part of it may be reproduced, resold, stored or transmitted in any printed,electronic or other form, or used for generating or marketing any printed or electronic publication, service or product. All investors must read applicable prospectuses before investing.
4 4 J A N U A R Y 2 0 2 1
T H E V A L U E L I N E F U N D A D V I S O R P L U S
INTERNATIONAL EQUITYSPECIAL EQUITY
MUNICIPAL BOND
Value LineRankInv.
Fund Obj./Peer Risk Overall
TAXABLE FIXED INCOME
Value LineRankInv.
Fund Obj./Peer Risk Overall
PARTIAL EQUITY
Value LineRankInv.
Fund Obj./Peer Risk Overall
Value LineRankInv.
Fund Obj./Peer Risk Overall
Value LineRankInv.
Fund Obj./Peer Risk Overall
HIGHEST RANKED FUNDS BY CATEGORY AS OF 12/31/20
GENERAL EQUITY
Value LineRankInv.
Fund Obj./Peer Risk Overall
Morgan Stanley Insight A GR/LG 5 1
Virtus KAR Mid-Cap Growth A GR/MG 4 1
Virtus KAR Small-Cap Growth A SC/SG 3 1
T. Rowe Price New Horizons SC/SG 3 1
Fidelity Adv Gr Opportunities M GR/LB 4 1
Virtus Zevenbergen Innov Growth A AG/LG 5 1
Wasatch Ultra Growth Investor AG/SG 5 1
Morgan Stanley Inst Discovery I GR/MG 5 1
Artisan Small Cap Investor SC/SG 4 1
MSIF Advantage Port I GR/LG 4 1
Wells Fargo Enterprise A SC/MG 4 1
Brown Advisory Sustainable Gwth Inv GR/LG 3 1
T. Rowe Price New Amer Growth GR/LG 3 1
American Century Focus Dyn Gr Inv GR/LG 4 1
Berkshire Focus GR/LG 5 1
MSIF Growth Port I GR/LG 5 1
BlackRock Mid Cap Growth Eq A GR/MG 4 1
Transamerica Large Growth R4 GR/LG 4 1
Harbor Mid Cap Growth Inst GR/MG 4 1
Lord Abbett Growth Leaders A GR/LG 4 1
Transamerica Capital Growth A GR/LG 5 1
Shelton Nasdaq-100 Index Direct GR/XL 3 1
JPMorgan Mid Cap Growth I GR/MG 4 1
Amana Growth Investor GR/LG 3 1
USAA NASDAQ-100 Index Fund GR/XL 3 1
BlackRock Technology Opportuns A TC/LG 4 1
Baron Opportunity Retail TC/MG 4 1
Franklin DynaTech A TC/LG 3 1
Columbia Global Tech Growth Inst TC/LG 4 1
Putnam Global Technology A TC/GL 4 1
Rydex Technology Inv TC/LG 4 1
Janus Henderson Global Tech D TC/GL 3 1
Janus Henderson VIT Gl Tech&Innv I TC/GL 3 1
T. Rowe Price Science & Tech Fd TC/LG 4 1
Vanguard Information Tech Index Adm TC/LG 4 1
VALIC Co I Science & Technology TC/LG 4 1
Wells Fargo Spec Tech A TC/LG 4 1
Fidelity Select Software & IT Svcs TC/LG 3 1
Goldman Sachs Tech Opportuns A TC/GL 3 1
Fidelity Select Technology TC/LG 4 1
T. Rowe Price Comm & Tech Investor TC/LG 3 1
AllianzGI Technology Instl TC/GL 4 1
Firsthand Technology Opportunities TC/MG 5 1
Fidelity Adv Technology M TC/LG 4 1
DWS Science and Technology A TC/LG 4 1
USAA Science & Technology Fund TC/LG 4 1
Ivy Science & Technology C TC/MG 4 1
Fidelity Select Computers TC/LG 3 1
MFS Technology Fund A TC/LG 3 1
Invesco Technology Fd Inv TC/LG 4 1
Baron Global Advantage Retail GL/LG 4 1
T. Rowe Price Global Stock GL/LG 3 1
Fidelity Trend Fund GL/LG 3 1
MSIF Global Advantage I GL/LG 4 1
Artisan Global Equity Inv GL/LG 3 1
MSIF Global Opportunity Port I GL/LG 3 1
MSIF International Advantage I GL/LG 2 1
Sands Capital Global Growth Inv GL/LG 3 1
AB Sustainable Global Thematic A GL/LG 3 1
GAMCO Global Growth AAA GL/LG 3 1
PGIM Jennison Global Opport A GL/LG 4 1
T. Rowe Price Glbl Growth Stock Adv GL/LG 3 1
American Funds New Economy A GL/LG 3 1
MSIF International Opportunities I GL/LG 3 1
PGIM Jennison Intl Opportun A FO/GW 3 1
Trillium ESG Global Equity Retail GL/LB 3 1
Artisan Global Opportunities Inv GL/LG 3 1
Harbor Global Leaders Admin GL/GW 3 1
American Funds New Perspective A GL/LG 3 1
MFS Global Growth A GL/LG 3 1
VALIC Co I International Growth FO/LG 2 1
Fidelity Adv Emerging Asia A PB/NJ 3 1
Fidelity Emerging Asia Fund PB/NJ 3 1
New Alternatives Fund A GL/MG 3 1
MFAM Global Opps Investor GL/VL 3 1
Columbia Convertible Sec A CV/MV 3 1
Lord Abbett Convertible Fund A CV/MG 3 1
AllianzGI Convertible Adm CV/VL 3 1
Putnam Convertible Securities A CV/LG 2 1
Franklin Convertible Securities A CV/VL 3 1
Calamos Convertible A CV/LG 2 1
Fidelity Convertible Securities CV/LB 2 1
Invesco Convertbl Sec Tr A CV/VL 2 1
Fidelity Adv Convertible Sec A CV/LB 2 1
T. Rowe Price Retirement 2050 AA/50 3 1
T. Rowe Price Retirement 2055 AA/55 3 1
TETON Convertible Securities AAA CV 2 1
T. Rowe Price Retirement 2045 AA/45 3 1
Virtus Tactical Allocation A FL/LB 2 1
Calvert Growth Allocation A AA/LB 3 1
Fidelity Adv Freedom 2055 A AA/55 3 1
TIAA-CREF Lifecycle Index 2055 Inst AA/55 3 1
MainStay MacKay Convertible B CV/LG 2 2
Fidelity Adv Freedom 2040 A AA/40 3 2
Fidelity Adv Freedom 2045 A AA/45 3 2
T. Rowe Price Retirement 2040 AA/40 3 2
TIAA-CREF Lifecycle Index 2050 Inst AA/50 3 2
Fidelity Adv Freedom 2050 A AA/50 3 2
Jackson Square Select 20 Grow IS AA/MG 3 2
Harbor Convertible Securities Inv CV/VL 2 2
Loomis Sayles Invst Gr Bd Y CG/IT 3 1
Thornburg Strategic Income A DB/IT 3 1
Metropolitan West High Yield Bd M CH/IT 3 1
TCW High Yield Bond I CH/IT 3 1
The Corporate Opportunities Ptf HCS CH/IT 3 1
PIMCO Fixed Income SHares R DB/IT 3 1
PIMCO Global Advant Strat Bond A IB/GL 3 1
VALIC Co II Strategic Bond Fund DB/FO 3 1
T. Rowe Price Glob MultiSec Bd Inv DB/IT 4 1
Hartford Strategic Income A DB/IT 4 1
Ivy Global Bond A IB/GL 3 1
Muzinich Credit Opportunities SI CH/IT 3 1
PIMCO Fixed Income SHares M DB/IT 3 1
USAA Intermediate-Term Bond Fd CG/IT 3 1
RBC BlueBay High Yield Bond I IB/GL 4 1
Segall Bryant&Hamill Qual HiYld Rtl CH/LT 4 1
Federated Hermes Bond F CG/IT 3 1
BMO TCH Corporate Income I CG/IT 4 1
Federated Hermes Corp Bond Strategy CG/LT 4 1
Great-West Multi Sector Bond Inv DB 4 1
Voya Investment Grade Credit Fd SMA CG 4 1
MFS Income A DB 3 1
Pacific Funds Strategic Income Adv DB/IT 4 1
Virtus Seix High Yield A CH/IT 4 1
Columbia Strategic Income A DB 4 1
Vanguard OH Long-Term Tax-Exmpt Fd MS/OH 3 1
Colorado Bond Shrs Tax-Exmt A MS/CO 2 1
Payden CA Muni Income MC/IT 3 1
T. Rowe Price VA Tax Free Bond MS/VA 3 1
PIMCO Municipal Bond A MB/LT 3 1
Hartford Muni Opportunities A MB/HY 3 1
USAA Tax-Exempt Interm-Term MB/IT 3 1
Vanguard Long-Term Tax-Exempt Inv MB/LT 3 1
Vanguard PA Long-Term Tax-Exmpt Inv MS/PA 3 1
American Funds Tax Exempt of CA A MC/LT 3 1
Nuveen Interm Duratn Muni I MB/IT 3 1
American Century Interm-T Tx-Fr Inv MB/IT 3 1
USAA California Bond MC/LT 3 1
Eaton Vance National Muni Inc A MB/LT 3 1
BNY Mellon AMT-Free Muni Bond Z MB/LT 3 1
Eaton Vance NJ Muni Income A MS/NJ 3 1
Vanguard CA Long-Term T-E Inv MC/LT 3 1
AB Muni Inc II-PA A MS/PA 3 1
USAA Virginia Bond MS/VA 3 1
BNY Mellon Tax Senstv Total Ret I MB/IT 3 1
Fidelity Tax-Free Bond MB/LT 3 1
Nuveen CO Muni Bond A MS/CO 3 1
MainStay MacKay Tax Free Bond B MB/LT 3 1
Invesco Ltd Term CA Municipal A MC/IT 3 1
Fidelity Intermediate Muni Income MB/IT 2 1
(These fund screens are derived from our entire 20,000+ fund database.)
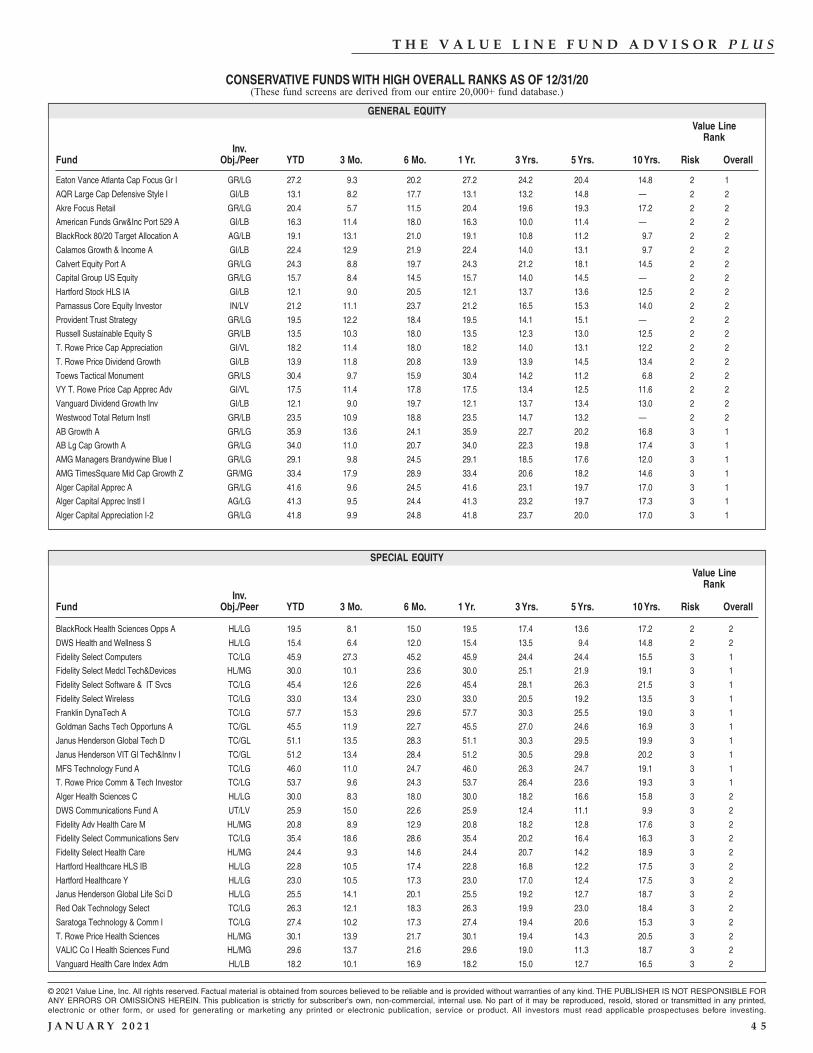
© 2021 Value Line, Inc. All rights reserved. Factual material is obtained from sources believed to be reliable and is provided without warranties of any kind. THE PUBLISHER IS NOT RESPONSIBLE FORANY ERRORS OR OMISSIONS HEREIN. This publication is strictly for subscriber's own, non-commercial, internal use. No part of it may be reproduced, resold, stored or transmitted in any printed,electronic or other form, or used for generating or marketing any printed or electronic publication, service or product. All investors must read applicable prospectuses before investing.
J A N U A R Y 2 0 2 1 4 5
T H E V A L U E L I N E F U N D A D V I S O R P L U S
CONSERVATIVE FUNDS WITH HIGH OVERALL RANKS AS OF 12/31/20
GENERAL EQUITY
SPECIAL EQUITY
Value LineRank
Inv.Fund Obj./Peer YTD 3 Mo. 6 Mo. 1 Yr. 3 Yrs. 5 Yrs. 10 Yrs. Risk Overall
Eaton Vance Atlanta Cap Focus Gr I GR/LG 27.2 9.3 20.2 27.2 24.2 20.4 14.8 2 1
AQR Large Cap Defensive Style I GI/LB 13.1 8.2 17.7 13.1 13.2 14.8 — 2 2
Akre Focus Retail GR/LG 20.4 5.7 11.5 20.4 19.6 19.3 17.2 2 2
American Funds Grw&Inc Port 529 A GI/LB 16.3 11.4 18.0 16.3 10.0 11.4 — 2 2
BlackRock 80/20 Target Allocation A AG/LB 19.1 13.1 21.0 19.1 10.8 11.2 9.7 2 2
Calamos Growth & Income A GI/LB 22.4 12.9 21.9 22.4 14.0 13.1 9.7 2 2
Calvert Equity Port A GR/LG 24.3 8.8 19.7 24.3 21.2 18.1 14.5 2 2
Capital Group US Equity GR/LG 15.7 8.4 14.5 15.7 14.0 14.5 — 2 2
Hartford Stock HLS IA GI/LB 12.1 9.0 20.5 12.1 13.7 13.6 12.5 2 2
Parnassus Core Equity Investor IN/LV 21.2 11.1 23.7 21.2 16.5 15.3 14.0 2 2
Provident Trust Strategy GR/LG 19.5 12.2 18.4 19.5 14.1 15.1 — 2 2
Russell Sustainable Equity S GR/LB 13.5 10.3 18.0 13.5 12.3 13.0 12.5 2 2
T. Rowe Price Cap Appreciation GI/VL 18.2 11.4 18.0 18.2 14.0 13.1 12.2 2 2
T. Rowe Price Dividend Growth GI/LB 13.9 11.8 20.8 13.9 13.9 14.5 13.4 2 2
Toews Tactical Monument GR/LS 30.4 9.7 15.9 30.4 14.2 11.2 6.8 2 2
VY T. Rowe Price Cap Apprec Adv GI/VL 17.5 11.4 17.8 17.5 13.4 12.5 11.6 2 2
Vanguard Dividend Growth Inv GI/LB 12.1 9.0 19.7 12.1 13.7 13.4 13.0 2 2
Westwood Total Return Instl GR/LB 23.5 10.9 18.8 23.5 14.7 13.2 — 2 2
AB Growth A GR/LG 35.9 13.6 24.1 35.9 22.7 20.2 16.8 3 1
AB Lg Cap Growth A GR/LG 34.0 11.0 20.7 34.0 22.3 19.8 17.4 3 1
AMG Managers Brandywine Blue I GR/LG 29.1 9.8 24.5 29.1 18.5 17.6 12.0 3 1
AMG TimesSquare Mid Cap Growth Z GR/MG 33.4 17.9 28.9 33.4 20.6 18.2 14.6 3 1
Alger Capital Apprec A GR/LG 41.6 9.6 24.5 41.6 23.1 19.7 17.0 3 1
Alger Capital Apprec Instl I AG/LG 41.3 9.5 24.4 41.3 23.2 19.7 17.3 3 1
Alger Capital Appreciation I-2 GR/LG 41.8 9.9 24.8 41.8 23.7 20.0 17.0 3 1
Value LineRank
Inv.Fund Obj./Peer YTD 3 Mo. 6 Mo. 1 Yr. 3 Yrs. 5 Yrs. 10 Yrs. Risk Overall
BlackRock Health Sciences Opps A HL/LG 19.5 8.1 15.0 19.5 17.4 13.6 17.2 2 2
DWS Health and Wellness S HL/LG 15.4 6.4 12.0 15.4 13.5 9.4 14.8 2 2
Fidelity Select Computers TC/LG 45.9 27.3 45.2 45.9 24.4 24.4 15.5 3 1
Fidelity Select Medcl Tech&Devices HL/MG 30.0 10.1 23.6 30.0 25.1 21.9 19.1 3 1
Fidelity Select Software & IT Svcs TC/LG 45.4 12.6 22.6 45.4 28.1 26.3 21.5 3 1
Fidelity Select Wireless TC/LG 33.0 13.4 23.0 33.0 20.5 19.2 13.5 3 1
Franklin DynaTech A TC/LG 57.7 15.3 29.6 57.7 30.3 25.5 19.0 3 1
Goldman Sachs Tech Opportuns A TC/GL 45.5 11.9 22.7 45.5 27.0 24.6 16.9 3 1
Janus Henderson Global Tech D TC/GL 51.1 13.5 28.3 51.1 30.3 29.5 19.9 3 1
Janus Henderson VIT Gl Tech&Innv I TC/GL 51.2 13.4 28.4 51.2 30.5 29.8 20.2 3 1
MFS Technology Fund A TC/LG 46.0 11.0 24.7 46.0 26.3 24.7 19.1 3 1
T. Rowe Price Comm & Tech Investor TC/LG 53.7 9.6 24.3 53.7 26.4 23.6 19.3 3 1
Alger Health Sciences C HL/LG 30.0 8.3 18.0 30.0 18.2 16.6 15.8 3 2
DWS Communications Fund A UT/LV 25.9 15.0 22.6 25.9 12.4 11.1 9.9 3 2
Fidelity Adv Health Care M HL/MG 20.8 8.9 12.9 20.8 18.2 12.8 17.6 3 2
Fidelity Select Communications Serv TC/LG 35.4 18.6 28.6 35.4 20.2 16.4 16.3 3 2
Fidelity Select Health Care HL/MG 24.4 9.3 14.6 24.4 20.7 14.2 18.9 3 2
Hartford Healthcare HLS IB HL/LG 22.8 10.5 17.4 22.8 16.8 12.2 17.5 3 2
Hartford Healthcare Y HL/LG 23.0 10.5 17.3 23.0 17.0 12.4 17.5 3 2
Janus Henderson Global Life Sci D HL/LG 25.5 14.1 20.1 25.5 19.2 12.7 18.7 3 2
Red Oak Technology Select TC/LG 26.3 12.1 18.3 26.3 19.9 23.0 18.4 3 2
Saratoga Technology & Comm I TC/LG 27.4 10.2 17.3 27.4 19.4 20.6 15.3 3 2
T. Rowe Price Health Sciences HL/MG 30.1 13.9 21.7 30.1 19.4 14.3 20.5 3 2
VALIC Co I Health Sciences Fund HL/MG 29.6 13.7 21.6 29.6 19.0 11.3 18.7 3 2
Vanguard Health Care Index Adm HL/LB 18.2 10.1 16.9 18.2 15.0 12.7 16.5 3 2
(These fund screens are derived from our entire 20,000+ fund database.)
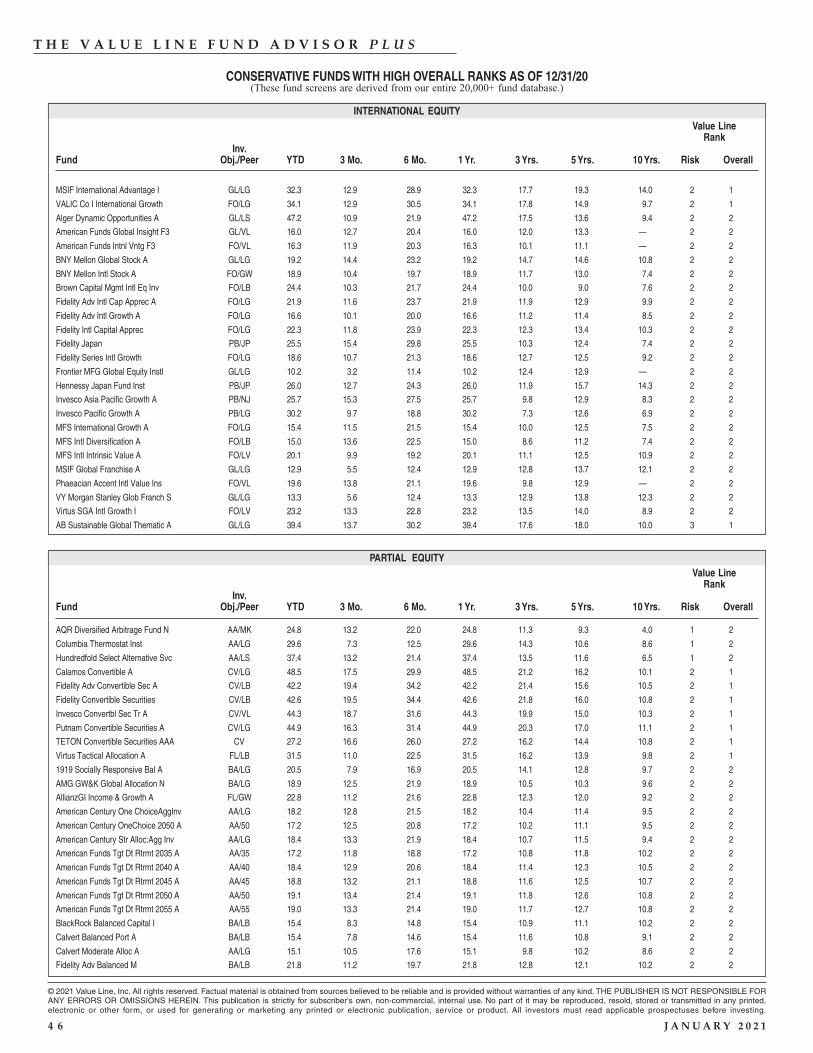
© 2021 Value Line, Inc. All rights reserved. Factual material is obtained from sources believed to be reliable and is provided without warranties of any kind. THE PUBLISHER IS NOT RESPONSIBLE FORANY ERRORS OR OMISSIONS HEREIN. This publication is strictly for subscriber's own, non-commercial, internal use. No part of it may be reproduced, resold, stored or transmitted in any printed,electronic or other form, or used for generating or marketing any printed or electronic publication, service or product. All investors must read applicable prospectuses before investing.
4 6 J A N U A R Y 2 0 2 1
T H E V A L U E L I N E F U N D A D V I S O R P L U S
CONSERVATIVE FUNDS WITH HIGH OVERALL RANKS AS OF 12/31/20
INTERNATIONAL EQUITY
PARTIAL EQUITY
Value LineRank
Inv.Fund Obj./Peer YTD 3 Mo. 6 Mo. 1 Yr. 3 Yrs. 5 Yrs. 10 Yrs. Risk Overall
Value LineRank
Inv.Fund Obj./Peer YTD 3 Mo. 6 Mo. 1 Yr. 3 Yrs. 5 Yrs. 10 Yrs. Risk Overall
AQR Diversified Arbitrage Fund N AA/MK 24.8 13.2 22.0 24.8 11.3 9.3 4.0 1 2
Columbia Thermostat Inst AA/LG 29.6 7.3 12.5 29.6 14.3 10.6 8.6 1 2
Hundredfold Select Alternative Svc AA/LS 37.4 13.2 21.4 37.4 13.5 11.6 6.5 1 2
Calamos Convertible A CV/LG 48.5 17.5 29.9 48.5 21.2 16.2 10.1 2 1
Fidelity Adv Convertible Sec A CV/LB 42.2 19.4 34.2 42.2 21.4 15.6 10.5 2 1
Fidelity Convertible Securities CV/LB 42.6 19.5 34.4 42.6 21.8 16.0 10.8 2 1
Invesco Convertbl Sec Tr A CV/VL 44.3 18.7 31.6 44.3 19.9 15.0 10.3 2 1
Putnam Convertible Securities A CV/LG 44.9 16.3 31.4 44.9 20.3 17.0 11.1 2 1
TETON Convertible Securities AAA CV 27.2 16.6 26.0 27.2 16.2 14.4 10.8 2 1
Virtus Tactical Allocation A FL/LB 31.5 11.0 22.5 31.5 16.2 13.9 9.8 2 1
1919 Socially Responsive Bal A BA/LG 20.5 7.9 16.9 20.5 14.1 12.8 9.7 2 2
AMG GW&K Global Allocation N BA/LG 18.9 12.5 21.9 18.9 10.5 10.3 9.6 2 2
AllianzGI Income & Growth A FL/GW 22.8 11.2 21.6 22.8 12.3 12.0 9.2 2 2
American Century One ChoiceAggInv AA/LG 18.2 12.8 21.5 18.2 10.4 11.4 9.5 2 2
American Century OneChoice 2050 A AA/50 17.2 12.5 20.8 17.2 10.2 11.1 9.5 2 2
American Century Str Alloc:Agg Inv AA/LG 18.4 13.3 21.9 18.4 10.7 11.5 9.4 2 2
American Funds Tgt Dt Rtrmt 2035 A AA/35 17.2 11.8 18.8 17.2 10.8 11.8 10.2 2 2
American Funds Tgt Dt Rtrmt 2040 A AA/40 18.4 12.9 20.6 18.4 11.4 12.3 10.5 2 2
American Funds Tgt Dt Rtrmt 2045 A AA/45 18.8 13.2 21.1 18.8 11.6 12.5 10.7 2 2
American Funds Tgt Dt Rtrmt 2050 A AA/50 19.1 13.4 21.4 19.1 11.8 12.6 10.8 2 2
American Funds Tgt Dt Rtrmt 2055 A AA/55 19.0 13.3 21.4 19.0 11.7 12.7 10.8 2 2
BlackRock Balanced Capital I BA/LB 15.4 8.3 14.8 15.4 10.9 11.1 10.2 2 2
Calvert Balanced Port A BA/LB 15.4 7.8 14.6 15.4 11.6 10.8 9.1 2 2
Calvert Moderate Alloc A AA/LG 15.1 10.5 17.6 15.1 9.8 10.2 8.6 2 2
Fidelity Adv Balanced M BA/LB 21.8 11.2 19.7 21.8 12.8 12.1 10.2 2 2
MSIF International Advantage I GL/LG 32.3 12.9 28.9 32.3 17.7 19.3 14.0 2 1
VALIC Co I International Growth FO/LG 34.1 12.9 30.5 34.1 17.8 14.9 9.7 2 1
Alger Dynamic Opportunities A GL/LS 47.2 10.9 21.9 47.2 17.5 13.6 9.4 2 2
American Funds Global Insight F3 GL/VL 16.0 12.7 20.4 16.0 12.0 13.3 — 2 2
American Funds Intnl Vntg F3 FO/VL 16.3 11.9 20.3 16.3 10.1 11.1 — 2 2
BNY Mellon Global Stock A GL/LG 19.2 14.4 23.2 19.2 14.7 14.6 10.8 2 2
BNY Mellon Intl Stock A FO/GW 18.9 10.4 19.7 18.9 11.7 13.0 7.4 2 2
Brown Capital Mgmt Intl Eq Inv FO/LB 24.4 10.3 21.7 24.4 10.0 9.0 7.6 2 2
Fidelity Adv Intl Cap Apprec A FO/LG 21.9 11.6 23.7 21.9 11.9 12.9 9.9 2 2
Fidelity Adv Intl Growth A FO/LG 16.6 10.1 20.0 16.6 11.2 11.4 8.5 2 2
Fidelity Intl Capital Apprec FO/LG 22.3 11.8 23.9 22.3 12.3 13.4 10.3 2 2
Fidelity Japan PB/JP 25.5 15.4 29.8 25.5 10.3 12.4 7.4 2 2
Fidelity Series Intl Growth FO/LG 18.6 10.7 21.3 18.6 12.7 12.5 9.2 2 2
Frontier MFG Global Equity Instl GL/LG 10.2 3.2 11.4 10.2 12.4 12.9 — 2 2
Hennessy Japan Fund Inst PB/JP 26.0 12.7 24.3 26.0 11.9 15.7 14.3 2 2
Invesco Asia Pacific Growth A PB/NJ 25.7 15.3 27.5 25.7 9.8 12.9 8.3 2 2
Invesco Pacific Growth A PB/LG 30.2 9.7 18.8 30.2 7.3 12.6 6.9 2 2
MFS International Growth A FO/LG 15.4 11.5 21.5 15.4 10.0 12.5 7.5 2 2
MFS Intl Diversification A FO/LB 15.0 13.6 22.5 15.0 8.6 11.2 7.4 2 2
MFS Intl Intrinsic Value A FO/LV 20.1 9.9 19.2 20.1 11.1 12.5 10.9 2 2
MSIF Global Franchise A GL/LG 12.9 5.5 12.4 12.9 12.8 13.7 12.1 2 2
Phaeacian Accent Intl Value Ins FO/VL 19.6 13.8 21.1 19.6 9.8 12.9 — 2 2
VY Morgan Stanley Glob Franch S GL/LG 13.3 5.6 12.4 13.3 12.9 13.8 12.3 2 2
Virtus SGA Intl Growth I FO/LV 23.2 13.3 22.8 23.2 13.5 14.0 8.9 2 2
AB Sustainable Global Thematic A GL/LG 39.4 13.7 30.2 39.4 17.6 18.0 10.0 3 1
(These fund screens are derived from our entire 20,000+ fund database.)
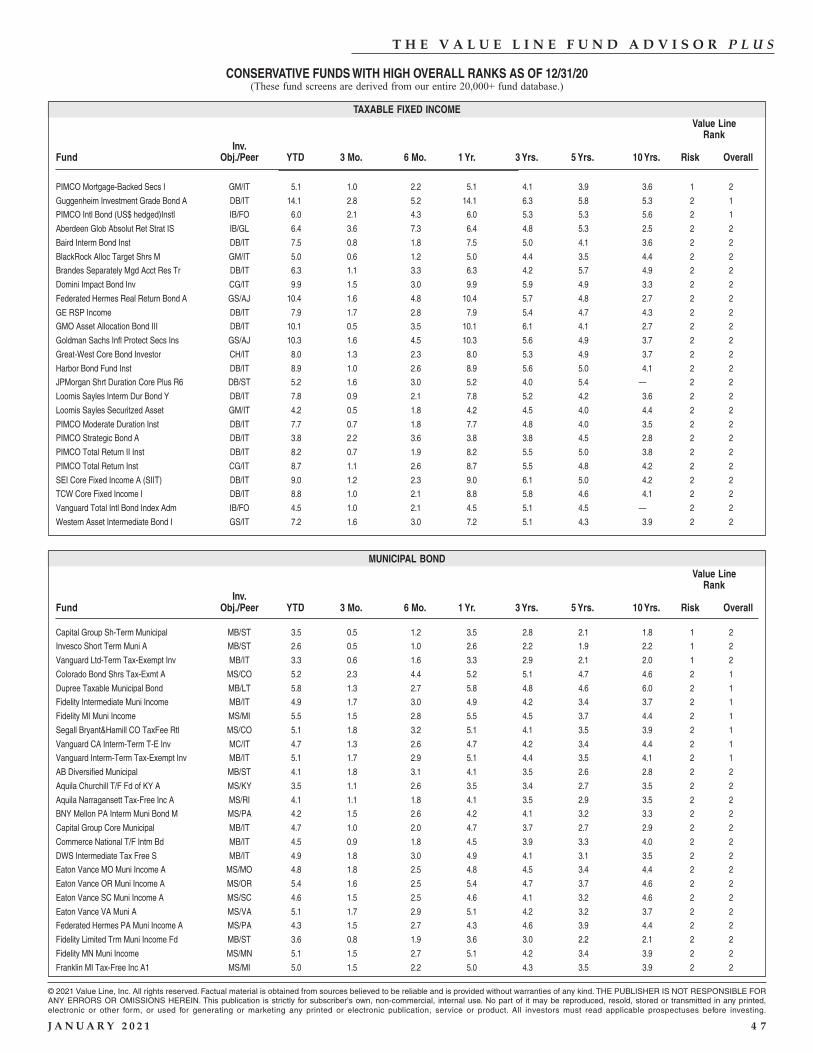
© 2021 Value Line, Inc. All rights reserved. Factual material is obtained from sources believed to be reliable and is provided without warranties of any kind. THE PUBLISHER IS NOT RESPONSIBLE FORANY ERRORS OR OMISSIONS HEREIN. This publication is strictly for subscriber's own, non-commercial, internal use. No part of it may be reproduced, resold, stored or transmitted in any printed,electronic or other form, or used for generating or marketing any printed or electronic publication, service or product. All investors must read applicable prospectuses before investing.
J A N U A R Y 2 0 2 1 4 7
T H E V A L U E L I N E F U N D A D V I S O R P L U S
TAXABLE FIXED INCOME
CONSERVATIVE FUNDS WITH HIGH OVERALL RANKS AS OF 12/31/20
MUNICIPAL BOND
Value LineRank
Inv.Fund Obj./Peer YTD 3 Mo. 6 Mo. 1 Yr. 3 Yrs. 5 Yrs. 10 Yrs. Risk Overall
Value LineRank
Inv.Fund Obj./Peer YTD 3 Mo. 6 Mo. 1 Yr. 3 Yrs. 5 Yrs. 10 Yrs. Risk Overall
PIMCO Mortgage-Backed Secs I GM/IT 5.1 1.0 2.2 5.1 4.1 3.9 3.6 1 2
Guggenheim Investment Grade Bond A DB/IT 14.1 2.8 5.2 14.1 6.3 5.8 5.3 2 1
PIMCO Intl Bond (US$ hedged)Instl IB/FO 6.0 2.1 4.3 6.0 5.3 5.3 5.6 2 1
Aberdeen Glob Absolut Ret Strat IS IB/GL 6.4 3.6 7.3 6.4 4.8 5.3 2.5 2 2
Baird Interm Bond Inst DB/IT 7.5 0.8 1.8 7.5 5.0 4.1 3.6 2 2
BlackRock Alloc Target Shrs M GM/IT 5.0 0.6 1.2 5.0 4.4 3.5 4.4 2 2
Brandes Separately Mgd Acct Res Tr DB/IT 6.3 1.1 3.3 6.3 4.2 5.7 4.9 2 2
Domini Impact Bond Inv CG/IT 9.9 1.5 3.0 9.9 5.9 4.9 3.3 2 2
Federated Hermes Real Return Bond A GS/AJ 10.4 1.6 4.8 10.4 5.7 4.8 2.7 2 2
GE RSP Income DB/IT 7.9 1.7 2.8 7.9 5.4 4.7 4.3 2 2
GMO Asset Allocation Bond III DB/IT 10.1 0.5 3.5 10.1 6.1 4.1 2.7 2 2
Goldman Sachs Infl Protect Secs Ins GS/AJ 10.3 1.6 4.5 10.3 5.6 4.9 3.7 2 2
Great-West Core Bond Investor CH/IT 8.0 1.3 2.3 8.0 5.3 4.9 3.7 2 2
Harbor Bond Fund Inst DB/IT 8.9 1.0 2.6 8.9 5.6 5.0 4.1 2 2
JPMorgan Shrt Duration Core Plus R6 DB/ST 5.2 1.6 3.0 5.2 4.0 5.4 — 2 2
Loomis Sayles Interm Dur Bond Y DB/IT 7.8 0.9 2.1 7.8 5.2 4.2 3.6 2 2
Loomis Sayles Securitzed Asset GM/IT 4.2 0.5 1.8 4.2 4.5 4.0 4.4 2 2
PIMCO Moderate Duration Inst DB/IT 7.7 0.7 1.8 7.7 4.8 4.0 3.5 2 2
PIMCO Strategic Bond A DB/IT 3.8 2.2 3.6 3.8 3.8 4.5 2.8 2 2
PIMCO Total Return II Inst DB/IT 8.2 0.7 1.9 8.2 5.5 5.0 3.8 2 2
PIMCO Total Return Inst CG/IT 8.7 1.1 2.6 8.7 5.5 4.8 4.2 2 2
SEI Core Fixed Income A (SIIT) DB/IT 9.0 1.2 2.3 9.0 6.1 5.0 4.2 2 2
TCW Core Fixed Income I DB/IT 8.8 1.0 2.1 8.8 5.8 4.6 4.1 2 2
Vanguard Total Intl Bond Index Adm IB/FO 4.5 1.0 2.1 4.5 5.1 4.5 — 2 2
Western Asset Intermediate Bond I GS/IT 7.2 1.6 3.0 7.2 5.1 4.3 3.9 2 2
Capital Group Sh-Term Municipal MB/ST 3.5 0.5 1.2 3.5 2.8 2.1 1.8 1 2
Invesco Short Term Muni A MB/ST 2.6 0.5 1.0 2.6 2.2 1.9 2.2 1 2
Vanguard Ltd-Term Tax-Exempt Inv MB/IT 3.3 0.6 1.6 3.3 2.9 2.1 2.0 1 2
Colorado Bond Shrs Tax-Exmt A MS/CO 5.2 2.3 4.4 5.2 5.1 4.7 4.6 2 1
Dupree Taxable Municipal Bond MB/LT 5.8 1.3 2.7 5.8 4.8 4.6 6.0 2 1
Fidelity Intermediate Muni Income MB/IT 4.9 1.7 3.0 4.9 4.2 3.4 3.7 2 1
Fidelity MI Muni Income MS/MI 5.5 1.5 2.8 5.5 4.5 3.7 4.4 2 1
Segall Bryant&Hamill CO TaxFee Rtl MS/CO 5.1 1.8 3.2 5.1 4.1 3.5 3.9 2 1
Vanguard CA Interm-Term T-E Inv MC/IT 4.7 1.3 2.6 4.7 4.2 3.4 4.4 2 1
Vanguard Interm-Term Tax-Exempt Inv MB/IT 5.1 1.7 2.9 5.1 4.4 3.5 4.1 2 1
AB Diversified Municipal MB/ST 4.1 1.8 3.1 4.1 3.5 2.6 2.8 2 2
Aquila Churchill T/F Fd of KY A MS/KY 3.5 1.1 2.6 3.5 3.4 2.7 3.5 2 2
Aquila Narragansett Tax-Free Inc A MS/RI 4.1 1.1 1.8 4.1 3.5 2.9 3.5 2 2
BNY Mellon PA Interm Muni Bond M MS/PA 4.2 1.5 2.6 4.2 4.1 3.2 3.3 2 2
Capital Group Core Municipal MB/IT 4.7 1.0 2.0 4.7 3.7 2.7 2.9 2 2
Commerce National T/F Intm Bd MB/IT 4.5 0.9 1.8 4.5 3.9 3.3 4.0 2 2
DWS Intermediate Tax Free S MB/IT 4.9 1.8 3.0 4.9 4.1 3.1 3.5 2 2
Eaton Vance MO Muni Income A MS/MO 4.8 1.8 2.5 4.8 4.5 3.4 4.4 2 2
Eaton Vance OR Muni Income A MS/OR 5.4 1.6 2.5 5.4 4.7 3.7 4.6 2 2
Eaton Vance SC Muni Income A MS/SC 4.6 1.5 2.5 4.6 4.1 3.2 4.6 2 2
Eaton Vance VA Muni A MS/VA 5.1 1.7 2.9 5.1 4.2 3.2 3.7 2 2
Federated Hermes PA Muni Income A MS/PA 4.3 1.5 2.7 4.3 4.6 3.9 4.4 2 2
Fidelity Limited Trm Muni Income Fd MB/ST 3.6 0.8 1.9 3.6 3.0 2.2 2.1 2 2
Fidelity MN Muni Income MS/MN 5.1 1.5 2.7 5.1 4.2 3.4 3.9 2 2
Franklin MI Tax-Free Inc A1 MS/MI 5.0 1.5 2.2 5.0 4.3 3.5 3.9 2 2
(These fund screens are derived from our entire 20,000+ fund database.)
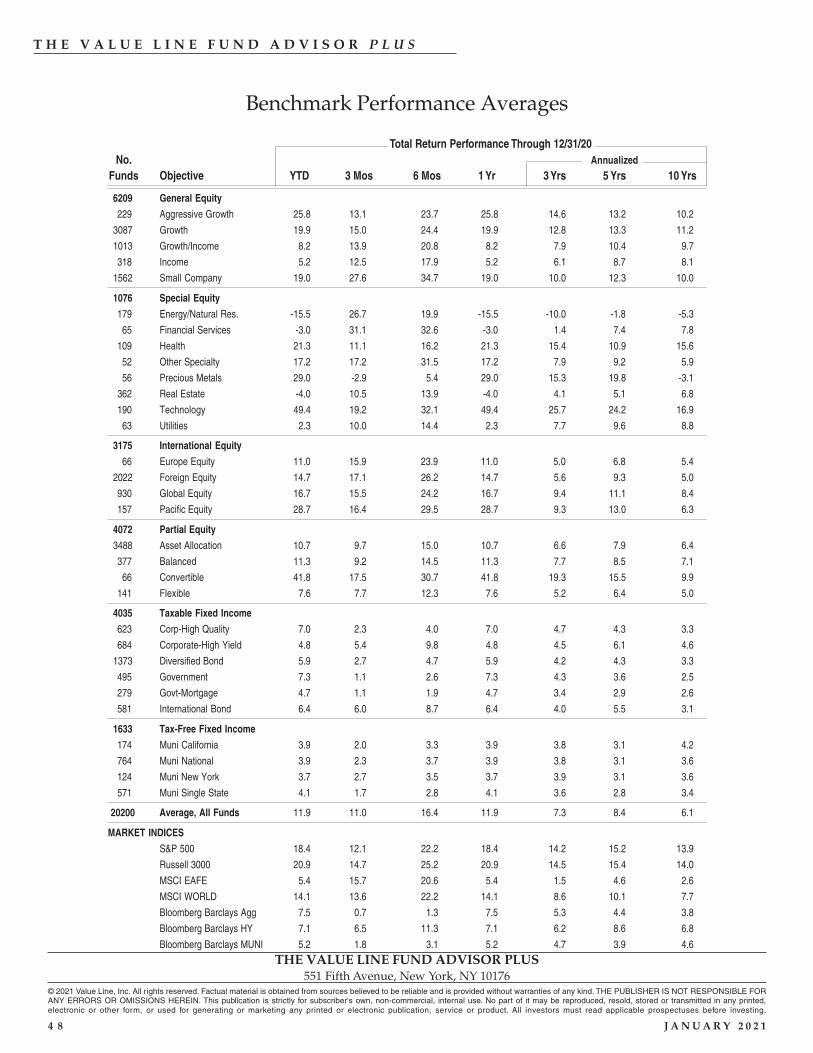
© 2021 Value Line, Inc. All rights reserved. Factual material is obtained from sources believed to be reliable and is provided without warranties of any kind. THE PUBLISHER IS NOT RESPONSIBLE FORANY ERRORS OR OMISSIONS HEREIN. This publication is strictly for subscriber's own, non-commercial, internal use. No part of it may be reproduced, resold, stored or transmitted in any printed,electronic or other form, or used for generating or marketing any printed or electronic publication, service or product. All investors must read applicable prospectuses before investing.
4 8 J A N U A R Y 2 0 2 1
T H E V A L U E L I N E F U N D A D V I S O R P L U S
THE VALUE LINE FUND ADVISOR PLUS551 Fifth Avenue, New York, NY 10176
6209 General Equity
229 Aggressive Growth 25.8 13.1 23.7 25.8 14.6 13.2 10.2
3087 Growth 19.9 15.0 24.4 19.9 12.8 13.3 11.2
1013 Growth/Income 8.2 13.9 20.8 8.2 7.9 10.4 9.7
318 Income 5.2 12.5 17.9 5.2 6.1 8.7 8.1
1562 Small Company 19.0 27.6 34.7 19.0 10.0 12.3 10.0
1076 Special Equity
179 Energy/Natural Res. -15.5 26.7 19.9 -15.5 -10.0 -1.8 -5.3
65 Financial Services -3.0 31.1 32.6 -3.0 1.4 7.4 7.8
109 Health 21.3 11.1 16.2 21.3 15.4 10.9 15.6
52 Other Specialty 17.2 17.2 31.5 17.2 7.9 9.2 5.9
56 Precious Metals 29.0 -2.9 5.4 29.0 15.3 19.8 -3.1
362 Real Estate -4.0 10.5 13.9 -4.0 4.1 5.1 6.8
190 Technology 49.4 19.2 32.1 49.4 25.7 24.2 16.9
63 Utilities 2.3 10.0 14.4 2.3 7.7 9.6 8.8
3175 International Equity
66 Europe Equity 11.0 15.9 23.9 11.0 5.0 6.8 5.4
2022 Foreign Equity 14.7 17.1 26.2 14.7 5.6 9.3 5.0
930 Global Equity 16.7 15.5 24.2 16.7 9.4 11.1 8.4
157 Pacific Equity 28.7 16.4 29.5 28.7 9.3 13.0 6.3
4072 Partial Equity
3488 Asset Allocation 10.7 9.7 15.0 10.7 6.6 7.9 6.4
377 Balanced 11.3 9.2 14.5 11.3 7.7 8.5 7.1
66 Convertible 41.8 17.5 30.7 41.8 19.3 15.5 9.9
141 Flexible 7.6 7.7 12.3 7.6 5.2 6.4 5.0
4035 Taxable Fixed Income
623 Corp-High Quality 7.0 2.3 4.0 7.0 4.7 4.3 3.3
684 Corporate-High Yield 4.8 5.4 9.8 4.8 4.5 6.1 4.6
1373 Diversified Bond 5.9 2.7 4.7 5.9 4.2 4.3 3.3
495 Government 7.3 1.1 2.6 7.3 4.3 3.6 2.5
279 Govt-Mortgage 4.7 1.1 1.9 4.7 3.4 2.9 2.6
581 International Bond 6.4 6.0 8.7 6.4 4.0 5.5 3.1
1633 Tax-Free Fixed Income
174 Muni California 3.9 2.0 3.3 3.9 3.8 3.1 4.2
764 Muni National 3.9 2.3 3.7 3.9 3.8 3.1 3.6
124 Muni New York 3.7 2.7 3.5 3.7 3.9 3.1 3.6
571 Muni Single State 4.1 1.7 2.8 4.1 3.6 2.8 3.4
20200 Average, All Funds 11.9 11.0 16.4 11.9 7.3 8.4 6.1
MARKET INDICES
S&P 500 18.4 12.1 22.2 18.4 14.2 15.2 13.9
Russell 3000 20.9 14.7 25.2 20.9 14.5 15.4 14.0
MSCI EAFE 5.4 15.7 20.6 5.4 1.5 4.6 2.6
MSCI WORLD 14.1 13.6 22.2 14.1 8.6 10.1 7.7
Bloomberg Barclays Agg 7.5 0.7 1.3 7.5 5.3 4.4 3.8
Bloomberg Barclays HY 7.1 6.5 11.3 7.1 6.2 8.6 6.8
Bloomberg Barclays MUNI 5.2 1.8 3.1 5.2 4.7 3.9 4.6
Total Return Performance Through 12/31/20No. Annualized
Funds Objective YTD 3 Mos 6 Mos 1 Yr 3 Yrs 5 Yrs 10 Yrs
Benchmark Performance Averages