Embed Size (px)
Citation preview
PB 202 668
THE VISIBILITY AND AUDIBILITY OF TRAINS APPROACHING RAIL - HIGHWAY GRADE CROSSINGS
Prepared for
FEDERAL RAILROAD ADrtlINISTRATION U. S. DEPARTf·1ENT OF TRANSPORTATION
WASHINGTON, D. C. 20591
fiA.Y 1971 --
F Hl!;L REPORT
PrciJared by
John P. AureJiu5 and NOr'l13n Kor<,;bo.1 Systems
221 West 57th Street New Yc'rk, York ;',,)019
COL...-:) tL L.U:" T r/r/I(IiS C:: i ( i I' i.N F..L .. 4Cj:.. AND '.tIH i if
Ava;lability is unlimited. Docume:"lt mal be t::l
. -
C 'I ear j Ii 9 h 0 use for Fed era J Sci e n t i fie and T e en n jed I ! r (r ''13 t ; c" . Springfield, Virginia 22151, for sale to the ,:;",b ;c
REPRODUCED BY U.S. DEPARTMENT OF COMMERCE
NATIONAL TECHNICAL INFORMATION SERVICE SPRINGFIELD, VA 22161
The contents of this report reflect the views of Systems Consultants Incorporated which is responsible for the facts and the accuracy of the data presented herein. The contents do not necessarily reflect the official views or policy of the Department of Transportation. This does not constitute a standard-,' or regulation.
'"
•
Details of illustration. In tbia document may be better
studied on microfiche - CONTENTS----"- --
CHAPTER 1. INTRODUCTION Objectives I
1 Z Z
Study Guidelines Audible vs. Visible Warnings Multiple-Unit and Other Cars
CHAPTER Z. EXECUTIVE SUMMARY Summary of Studies 4 Performance Criteria for Audible Warnings 6 Summary Table-Conclusions and Recommendations 10 Audibility Conclusions and Recommendations 10 Visual Conclusions and Recommendations 17
CHAPTF;K.3. THE ENCOUNTER: TRAIN VS. AUTOMOBILF At What Range Must Devices Operate Effectively? 22 Analyzing the Encounter 23 The Geometry of the Critical Encounter 24 Tables of Required Warning Distances 27
VISUAL - ALERTING AND CONSPICUITY Alerting 33-
33 34 38
Literature Review Conspicuity in Daylight Cons pic u i t Y a N i g h t
CHAPTER 5. VISUAL - AVAILABLE LIGHTING DEVICES Headlights 41 Swept Headlights 43 Roo f L i g h t s . 45 ·F i e " d E val u a t ion 0 f Vis u aiD i s pia y s 46
CHAPTER 6. ,VISUAL - EMPIRICAL EXPERIMENT
..
Purpose and General Method Used Experimental Hypothesis
_' Ex per i me n t Des c r i Tabulation' Analysis Daylight Analysis - Night
.. II
50 51 53 56 56 59

CHAPTER 7. AUDIBLE - AVAILABLE WARNING DEVICES Whis tIe s Horns Bells Electronic Devices
CHAPTER 8. AUDIBLE - MEASUREMENTS Equipment Yard Measurements T est S tan d Mea sur e m' e· n t s 'Wayside Measurements Additional Me as ure me nts Analysis
65 66 68 68
70 71 75 80 86 89
CHAPTER 9. AUDIBLE - EMPIRICAL TESTING OF WARNING QUALITIES Pur p 0 s e 0 f the T est 94 Con s t r u c t ion 0 f the T est 94 A c c ide n t S tat is tic s as C r i t e ria 97 Sound s 99 Pre par a t ion 0 f Tap e s 101 Conduct of Testing 101 Ve r if i cat ion T est s- 1 05 A n a 1 y sis 1 08 Results 113
CHAPTER 10. AUDIBLE - NUISANCE Nuis ance Value s N u is an c e Ex p e-r i men t Results Discussion
APPE NDIX A. GLOSSARY
APPENDIX B. BIBLIOGRAPHY
APPE NDIX C. GE OME TR Y OF THE CRITICAL ENCOUNTER, CALCULATIONS
APPENDIX D. BAGKGROUND LUMINANCE .-.
116 118 122 122
123
126
128
133
APPENDIX E. REFLECTANCE CURVES OF PIGMENTED TARGETS 134-
APPENDIX F. PURKINJE SHIFT 135
1ft

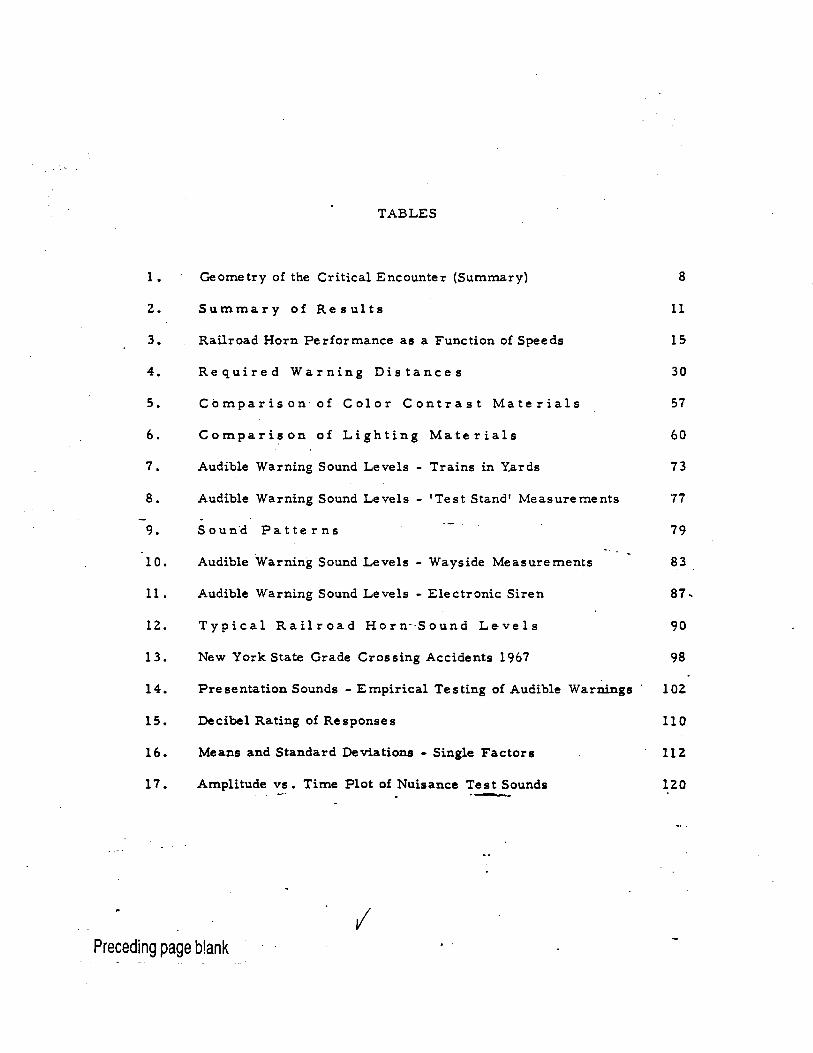
TABLES
1. Geome try of the Critical Encounter (Summary) 8
2. Summary of Results 11
3. Railroad Horn Performance as a Function of Speeds 15
4. Required Warning Distances 30
S. Comparison of Color Contrast Materials 57
6. Comparison of Lighting Materials 60
7. Audible Warning Sound Levels - Trains in Yards 73
8. Audible Warning Sound Levels - 'Test Stand' Measurements 77
9 • Sou nd Pat t ern s 79
10. Audible Warning Sound Levels - Wayside Measure ments 83
11 . Audible Warning Sound Levels - Electronic Siren 87
12. Typical Railroad Horn--Sound Levels 90
13. New York State Grade Crossing Accidents 1967 98
14. Presentation Sounds - Empirical Testing of Audible Warnings - 102
15. Decibel Rating of Responses 110
16. Means and Standard Deviations - Single Factors 11 Z
17. Amplitude vs. Time Plot of Nuisance Test Sounds 120 . -"
I Preceding page blank
1.
2.
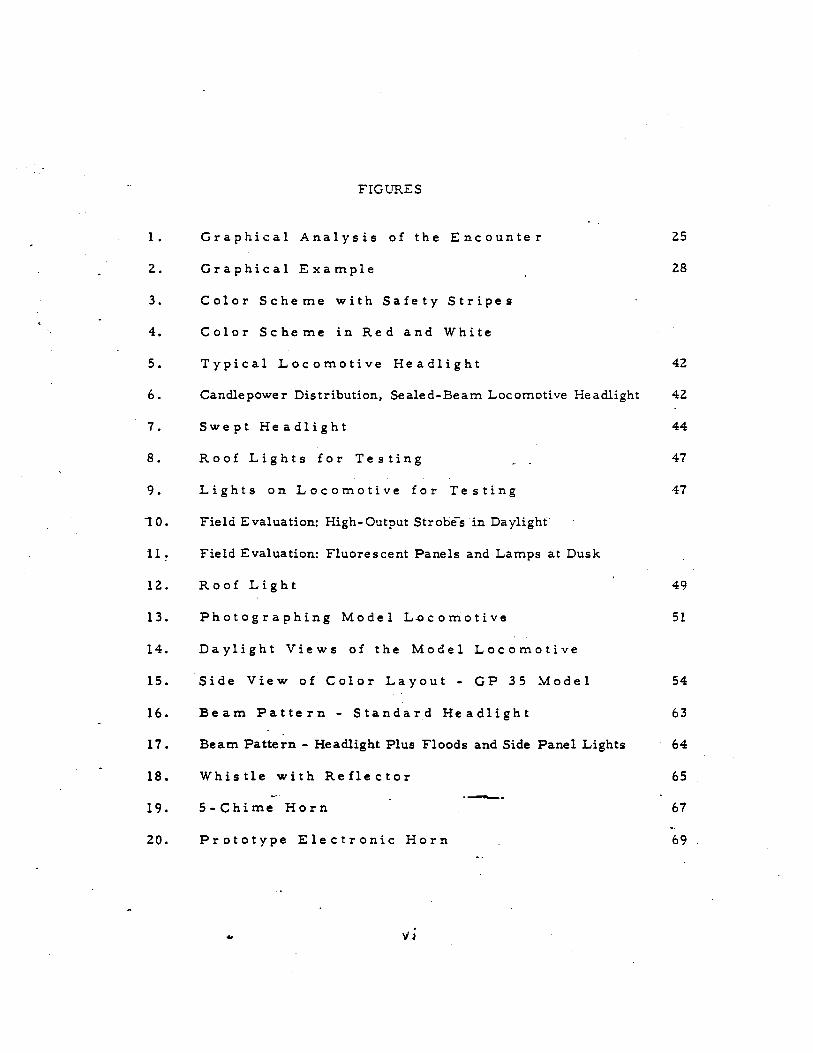
FIGURES
Graphical Analysis of the Encounter
Graphical Example
3. Color Scheme with Safety Stripes
4.
5.
6.
7.
8.
9.
Color Scheme in Red and White
Typical Locomotive Headlight
Candlepower Distribution, Sealed-Beam Locomotive Headlight
Swept Headlight
Roof Lights for Testing
Lights on Locomotive for Testing
"10. Field Evaluation: High-Output Strobe-s in: Daylighf
11. Field Evaluation: Fluorescent Panels and Lamps at Dusk
12.
13.
14.
15.
16.
17.
18.
19.
20.
Roof Light
Photographing Model L.ocomotive
Daylight Views of the Model Locomotive
Side View of Color Layout - GP 35 Model
Beam Pattern - Standard Headlight
Beam Pattern - Headlight Plus Floods and Side Panel Lights
Whistle with Reflector ---5-Chime Horn
Prototype Electronic Horn
25
28
42
42
44
47
47
49
51
54
63
64
65
67
69
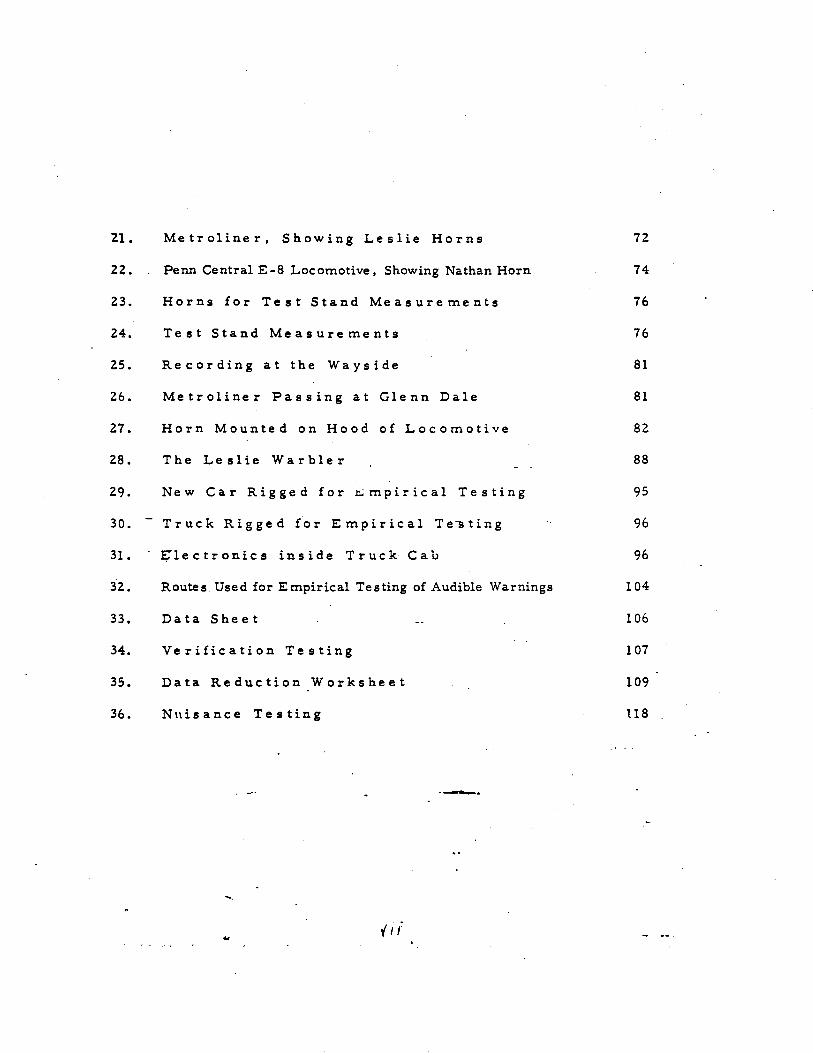
21 • Met r 01 i n e r, S how i n g L e s 1 i e H 0 r n s
22. Penn Central E -8 Locomotive, Showing Nathan Horn
23. Horns for Test Stand Measurements
24. T est S tan d Mea sur e men t s
25. Recording at the Wayside
26. Metro1iner Passing at Glenn Dale
27. Horn Mounted on Hood of Locomotive
28 • The L e s 1i e War b 1 e r
29. New Car Rigged for .t.,;mpirica1 Testing
30. - T r u c k Rig g e d (0 rEm p i ric a 1 T e -s tin g
31. :r;lectronics inside Truck Cab
32. Routes Used for Empirical Testing of Audible Warnings
33. Data Sheet
34. Ve r if i cat ion T est i n g
35. Data Reduction Worksheet
36. Nnis ance Te sting
. . ._-
....
72
74
76
76
81
81
82
88
95
96
96
104
106
107
109
1.18

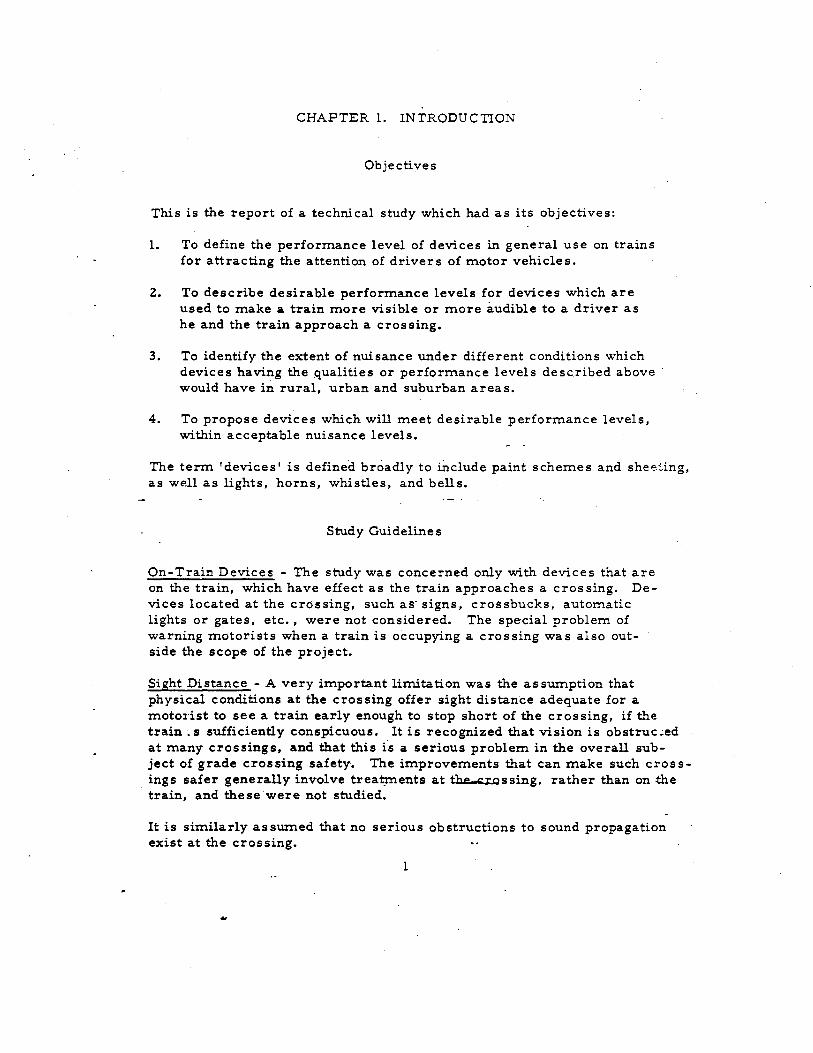
CHAPTER L INTRODUCTION
Objectives
This is the report of a technical study which had as its objectives:
1. To define the performance level of devices in general use on trains for attracting the attention of drivers of motor vehicles.
z. To describe desirable performance levels for devices which are used to make a train more visible or more audible to a driver as he and the train approach a crossing.
3. To identify the extent of nuisance under different conditions which devices having the qualities or performance levels desc.ribed above would have in rural, urban and suburban areas.
4. To propose devices which will meet desirable performance levels, within acceptable nuisance levels.
The term I devices I is defined broadly to include paint schemes and sheeting, as well as lights, horns, whistles, and bells.
Study Guidelines
On-Train Devices - The study was concerned only with devices that are on the train, which have effect as the train approaches a crossing. De-vices located at the crossing, such as- signs, crossbucks, automatic lights or gates, etc., were not considered. The special problem of warning motorists when a train is occupying a crossing was also out-side the scope of the project.
Sight Distance - A very important limitation was the assumption that physical conditions at the crossing offer sight distance adequate for a motolist to see a train early enough to stop short of the crossing, if the train s sufficiently conspicuous. It is recognized that vision is at many crossings, and that this i"s a serious problem in the overall sub-ject of grade crossing safety·. The improvements that can make such cross-ings safer generally involve treat:ments at the -£rQssing, rather than on the train, and these were not studied.
It is similarly assumed that no serious obstructions to sound propagation exist at the crossing.
1
..
Other Parameters - Consideration was given to encounters in which the train speed range is 10 to 120 MPH, and the motor vehicle speed range is 20 to 75 MPH. No special consideration was given to the vehicle which stops before crossing the tracks, and is accelerating over the tracks. To adequately cover this situation, a fairly substantial study into vehicle per-formance characteristics would have been required, and this was not under taken. Motor vehicles were assumed to be operating with all windows closed.
Crossings at angles other than 90 degrees were considered, but both the highway and the railroad are assumed to have no significant curva-ture in the immediate vicinity of the crossing. When considering the driver1s perception of on-train warnings, it is assumed that the cross-ing is marked With advance warning signs and with crossbucks at the crossing site, so that the driver is informed of the existence and loca-tion of the crossing as he approaches it.
Audible vs. Visible Warnings
It was determined early in the study that sound and light stimuli do not compete for attention. Each type of warning ope.rates in its own way without interfering with the other. Ear:h has its advantages and weak-nesses as a warning: light c·annot go around buildings as sound can; sound gives less information as to the train's location than vision; sound can alert a person whose attention-is aimed in the opposite direction; sound is more of a nuisance than visible warnings. The
. independent operation of the two modalities led to the division of this study into two directions, one for visual stimuli and one for audible stimuli.
Multiple-Unit and Other Cars - .
The concern of this study-is with trains approaching grade crossings; it has concentrated on devices and treatments for locomotives, since in the vast majority of trains they are the first unit or units. A sizeable minority of trains are exception$ to this rule, however, particularly in the case of suburban passenger trains.
Multiple-Unit Cars - While a two car suburban train is far less im-pressive th!lll a mile-long freight with four units up front, it offers the same hazard at a crossing. Suburban trains often attain speeds as high as long-di stance-·pas senger .express trains dO:" l'he recommendations -of the study, of course, apply equally to self-propelled cars, push-pull
2
control cars, multiple-unit cars, etc. on any route that has grade crossings.
Switching Movements - Another case of operations across grade crossings in which the lead car is not a locomotive is the backing of a string of cars onto an industrial siding, or similar move. These operations are usually performed at low speeds. This situation was also considered.
--. 3
..

CHAPTER 2. EXECUTIVE SUMMARY
Summary of Studie s
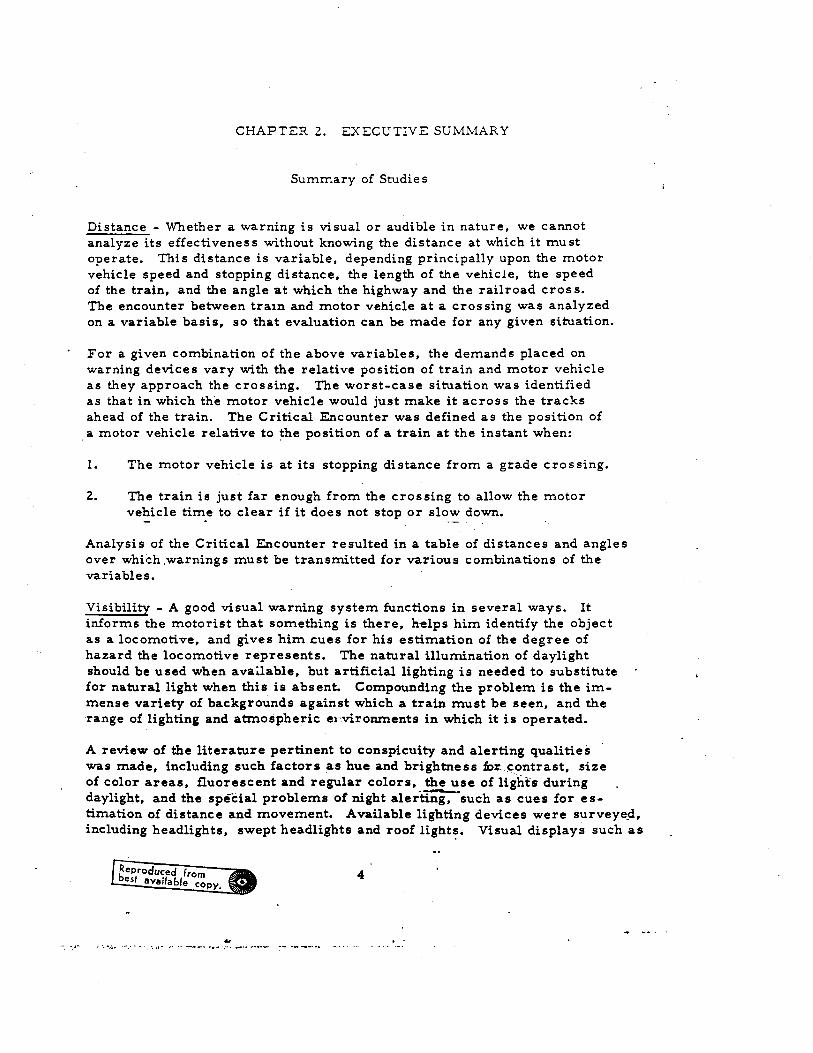
Distance - Whether a warning is visual or audible in nature, we cannot analyze its effectiveness without knowing the distance at which it must operate. This distance is variable, depending principally upon the motor vehicle speed and stopping distance, the length of the vehicle, the speed of the train, and the angle at which the highway and the railroad cros s. The encounter between traIn and motor vehicle at a cros sing was analyzed on a variable basis, so that evaluation can be made for any given situation.
For a given combination of the above variables, the demands placed on warning devices vary with the relative position of train and motor vehicle as they approach the crossing. The worst-case situation was identified as that in which the motor vehic1e would just make it across the tracks ahead of the train. The Critical Encounter was defined as the position of
. a motor vehicle relative to position of a train at the instant when:
1. The motor vehicle is at its stopping distance from a grade crossing.
2. The train is just far enough from the crossing to allow the motor vehicle tim.e to clear if it does not stop or slow down.
Analysis of the Critical Encounter resulted in a table of distances and angles over which .warnings must be transmitted for various combinations of the variables.
Visibility - A good visual warning system functions in several ways. It informs the motorist that something is there, him identify the object as a locomotive, and gives him .cues for his estimation of the degree of hazard the locomotive represents. The natural illumination of daylight should be used when available, but artificial lighting is needed to substitute for natural light when this is absent. Compounding the problem is the im-mense variety of backgrounds against which a train must be seen, and the range of lighting and atmospheric el'.vironments in which it is operated.
A review of the literature pertinent to conspicuity and alerting qualities was made, including such factors as hue and brightness size of color areas, fluorescent and regular colors, the use of light's during daylight, and the speCial problems or night as cues for es-timation of distance and movement. Available lighting devices were including headlights, swept headlights and roof Visual displays such as
from est available copy. • 4
.. '" .... .. "-0"" ··:·· .• 1-· 0" •• -.-...... •• _ ....... _- -- ..... _ ... -. _ ••••• "

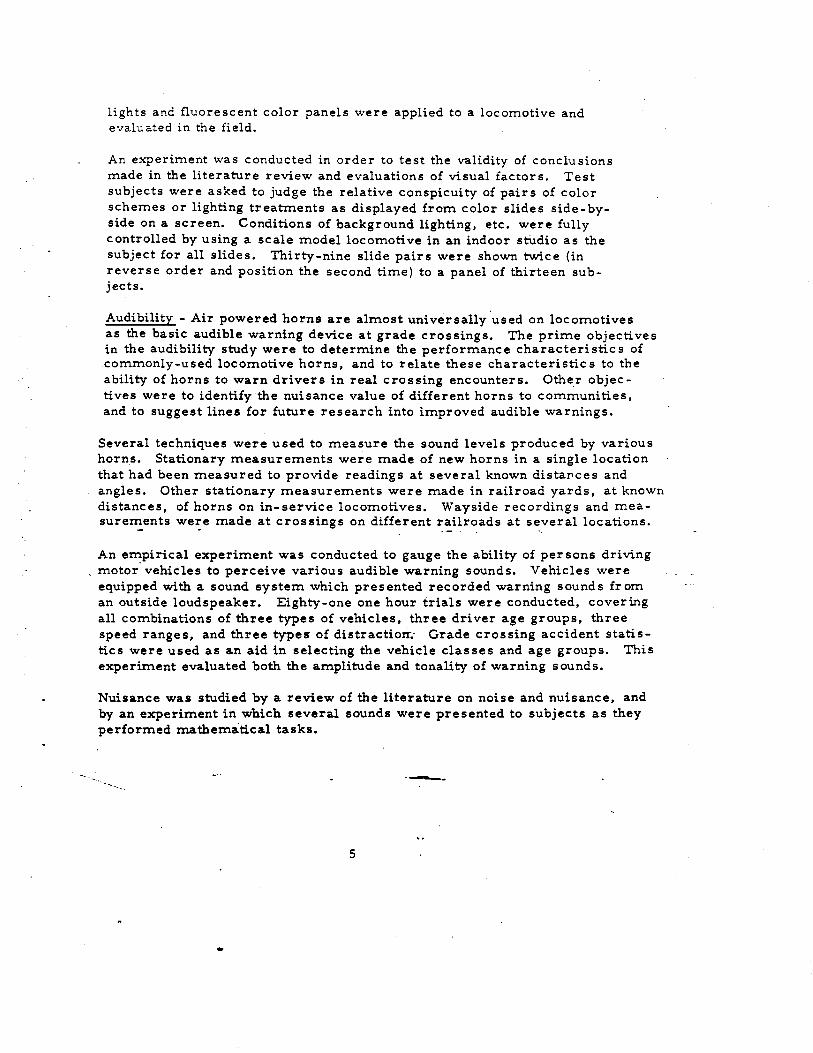
lights and fluorescent color panels were applied to a locomotive and evaluated in the field.
An experiment was conducted in order to test the validity of conclusions made in the literature review and evaluations of visual factors. Test subjects were asked to judge the relative conspicuity of pairs of color schemes or lighting treatments as displayed from color slides side-by-side on a screen. Conditions of background lighting, etc. were fully controlled by using a scale model locomotive in an indoor stUdio as the subject for all slides. Thirty-nine slide pairs were shown twice (in reverse order and position the second time) to a panel of thirteen sub-jects.
Audibility - Air powered horns are almost universally 'used on locomotives as the basic audible warning device at grade crossings. The prime objectives in the audibility study were to determine the performance characteristics of commonly-used locomotive horns, and to relate these characteristics to the ability of horns to warn drivers in real crossing encounters. Othe,r objec-tives were to identify the nuisance value of different horns to communities, and to suggest lines for future research into improved audible warnings.
Several techniques were used to measure the sound levels produced by various horns. Stationary measurements were made of new horns in a single location that had been measured to provide readings at several known distaI'ces and angles. Other stationary measurements were made in railroad yards, at known distances, of horns on in-service locomotives. Wayside recordings and mea-suren::,ents we:e made at crossings on different railroads at several locations.
An experiment was conducted to gauge the ability of per sons driving motor vehicles to perceive various audible warning sounds. Vehicles were equipped with a sound system which presented recorded warning sounds fr om an outside loudspeaker. Eighty-one one hour trials were conducted, covering all combinations of three types of vehicles, three driver age groups, three speed ranges, and three typeS" of distractiorr.- Grade crossing accident statis-tics were used as an aid in selecting the vehicle classes a·nd age groups. This experiment evaluated both the amplitude and tonality of warning sounds.
Nuisance was studied by a review of the literature on noise and nuisance, and by an experiment in which several sounds were presented to subjects as they performed rnatherna:tical tasks.
---5
•
....
Performance Criteria for Audible Warnings
This section is preliminary to the Audibility Conclusions and Recommenda-tions, in that it draws together the several studies relating to audible warn-ings, in order to establish performance criteria that lead to the actual con-clu sions and recommendations •
Establishing Requirements - A three-step approach was used to establish the requirements for adequate audible warnings: ..
1. Determine the sound level required outside a motor vehicle in order to be perceived as a warning by the driver.
2. Determine the distance across which the sound must travel in order to reach the motorist before it is too late for him to take action.
3. Determine the attenuation of the sound as it covers the required distance. This can be referred to some common distance used in sound-level mea-surements of horns.
The information required to fulfill these requirements was developed in differ-ent parts of the study. The work is described in detail in various chapters in this report. In this section, the elements of the study which led to performance criteria for audible warnings will be brought out, and these elements will be placed in logical order as they apply to these criteria.
Step l: Sound Level at the Vehicle - An empirical_method of determining the required outside a motor vehicle was devised, and a testing
program based on this method was conducted (details in Chapter 9). Vehicles were equipped with a sound system which projected recorded railroad horns and warnings at known levels to the driver from outside the vehicle. The vehicles were then driven in traffic on one-hour trials during which the recordings were played. At intervals of about 20 to 70 seconds, sounds were presented; on each trial, ·nine sounds were presented at seven levels (63 presentations). Drivers reported to an observer in the car when they heard a sound, and the observer marked the response on a data sheet.
The result was 729 experimentally-obtained sound level values at which the sounds were perceived under different driVing conditions. The lowest value was 70 dB, the highest was 110 dB, and the overall average (mean) was 87 dB. Table 16 (Chapter 9) shows, for each of the various driving conditions, the mean sound level and the standard deviation. The values in the table are average values; thatl's, one can predict that if is presented under the conditions specified many times at the mean value, it will be heard ap- ._.
6
..
proximately half the time.
In order to be sure that virtually all drivers will hear the sound (or that the sound has a high level of detnand for a driver's attention), the sound level should be increased by three times the standard deviation. Thus the mean for all low-speed presentations is 83 dB, to which 18 dB (three times standard deviation) is added to equal 101 dB; this value is used in this report as the required sound level to alert a driver going less than 35 MPH. The corresponding value for vehicles going 36-50 MPH is 105 dB, and for 51-OS MPH it is 109 dB.
Step 2: Required Distance - A geometrical analysis was prepared (see Chapter' 3) to locate the position of a motor vehicle relative to a train at the time when its driver must be warned of the train's approach. This is used in determining the required distance over which horn must be audible.
It is too late to warn a motorist who is closer to the crossing than his stopping distance; he is going to enter the crossing. If the train is far enough from the crossing, the motorist will be able to drive across the tracks before the train gets there. The Critical Encounter is defined as the situation when a motorist is at his stopping distance from the crossing and the train is just far enough away that the motorist can make it across the tracks with nothing to spare.
A motorist should receive warning before he reaches the Critical Encounter, so that he can make a normal stop before the crossing. The Critical En-counter_is a situ.ation in which the motorist will have a close call whether he uses full braking or keeps going at the same speed; half-hearted braking will not .keep him off the tracks, but will only delay his arrival until the train is there. .
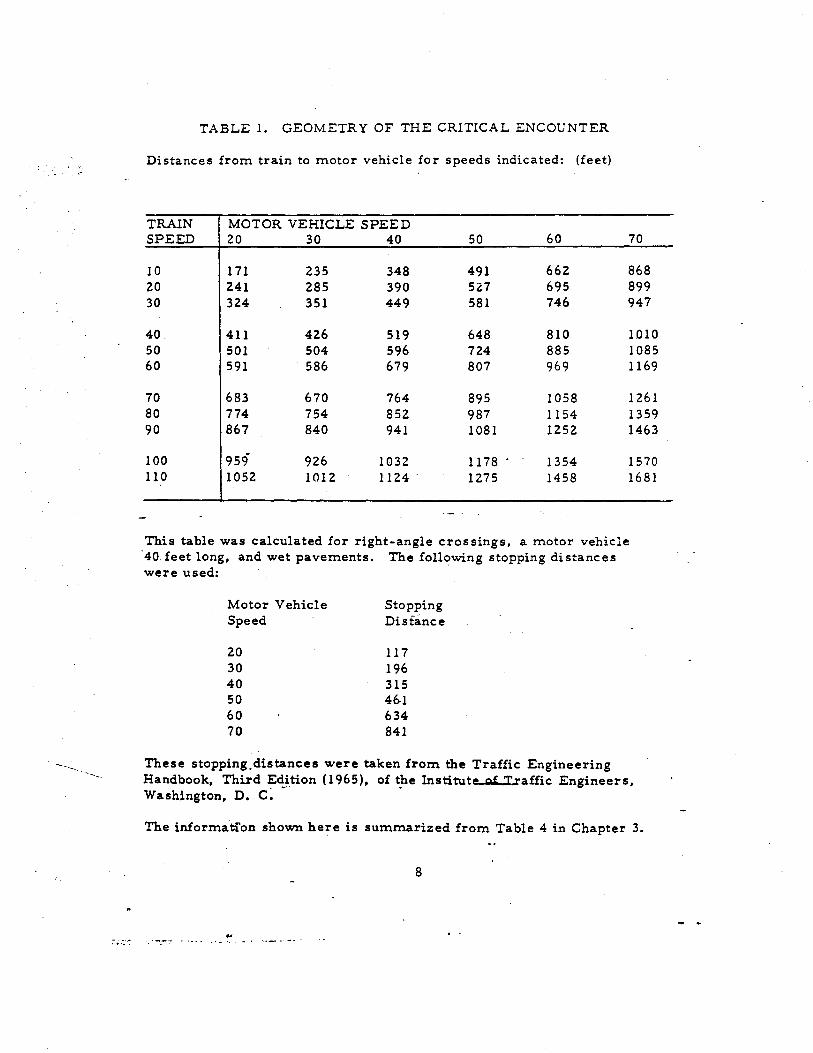
Table 1 gives distances from train to· motor vehicle for right-angle crossings for a 40 foot vehicle on wet pavements. This table is a summary of informa-tion given in the more complete Table 4 in Chapter 3. Similar calculations can be made for other crossing angles, vehicle lengths, or assumed stopping distances.
Wben considering the required distance over which an audible warning must travel, the time that it takes the sound to travel from the train to the motor vehicle is sometimes an important factor. This is genera.lly true if the train is going at 60 MPH or faster. .-.
7
•
-,.
... .; :.-:
TABLE 1. GEOMETRY OF THE CRITICAL ENCOUNTER
Distances from train to motor vehicle for speeds indicated: (feet)
TRAIN MOTOR VEHICLE SPEED SPEED 20 30 40 50 60 70
10 171 235 348 491 662 868 20 241 285 390 5Z7 695 899 30 324 351 449 581 746 947
40 411 426 519 648 810 1010 50 501 504 596 724 885 1085 60 591 586 679 807 969 1169
70 683 670 764 895 1058 1261 80 774 754 852 987 1154 1359 90 867 840 941 1081 1252 1463
100 959 926 1032 1178 1354 1570 110 1052 1012 1124 . 1275 1458 1681
This table was calculated for right-angle crossings, a motor vehicle -40. feet long, and wet pavements. The following stopping distances were used:
Motor Vehicle Speed
20 30 40 50 60 70
Stopping Disfance
117 196 315 46.1 634 841
These stopping.distances were taken from the Traffic Engineering Handbook, Third Edj.tion (1965), of t?e Engineers, Washington, D.
The information shown here is summarized from Table 4 in Chapter 3.
8
Consider a Critical Encounter between a train going 60 MPH and a motor vehicle going 70 MPH. The motorist must receive his warning when the train is approximately 1100 feet away from him. Since the. speed of sound is approximately 1100 feet per second, the sound which the motorist is to hear when he is at the Critical Point originated at the source one second earlier. Since 60 MPH is equivalent to 88 feet per second, the train was 88 feet further back from the crossing than the 781 feet shown in Table 2. The new geometry results in a Radial Distance of 1230 feet rather than the 1169. shown in the table, an in-crease of 61 feet or about five percent. For very high train speeds, such as those attained by the Metroliner, this can increase the re-quired range by as much as fifteen percent.
Step 3: Sound Attenuation - Sound level measurements of horns were made at various distances, and results were compared (for the same horn at different distances) in order to obtain a rule for the attenuation of audible warnings with distance. Details of these measurements are to be found in Chapter 8.
The 'Inverse-Square Law' was found to be adequate -for describing the attenuati.on of horn ·sounds. It states that the power i.. a sound varies as the inverse of the square of the distance. For each factor of two jn distal1ce, the sound level changes by 6 d12,. and for each. factor of 1.4 in distance, the sound level changes by 3 dB. For example, if a .horn produces 110 dB at 100 feet and we wish to find its expected level at ·600 feet, we note that 560 feet is 100 x 2 x 2 x 1. 4 feet, so we subtract the total of 6 + 6 + 3 or 15 dB to obtain 95 dB at 560 feet.
Finding a Required Sound Level - For a given crossing situation, the required performance of a horn can be- found by putting the three elements together. Consider a right-angle crossing where the speed limit for both motor vehicles and trains is 50 MPH.
1. At 50 MPH the mean sound level required for perception plus three standard deviations is 105 dB (see Table 16).
2. The radial distance from train to motor vehicle for a right anglt:: crossing with highway and railroad speed limits is 724 feet, and the angle is 41 degrees (see Table 4). Since the train speed limit is under 60 MPH, sound propagation delay can be ignored. --.
9
3. Using the inverse-square law, the ratio of 724 feet to 100 feet is 7.24; the square of this is 52.4. A power ratio of 52.4 is equal to 17 dB. The required 100-foot rating for the horn is 105 + 17 or 122 dB at 41 degrees off-axis (the approximation of the dis-tance ratio as 8 to 1 would have allowed estimation of the dB difference as follows: 8 = 2 x 2 x 2 so the dB change is 6 + 6 + 6 = 18; the 1 dB error is not serious).
The same series of calculations can be made for other crossing situations.
Summary 'l;'able - Conclusions and Recommendations
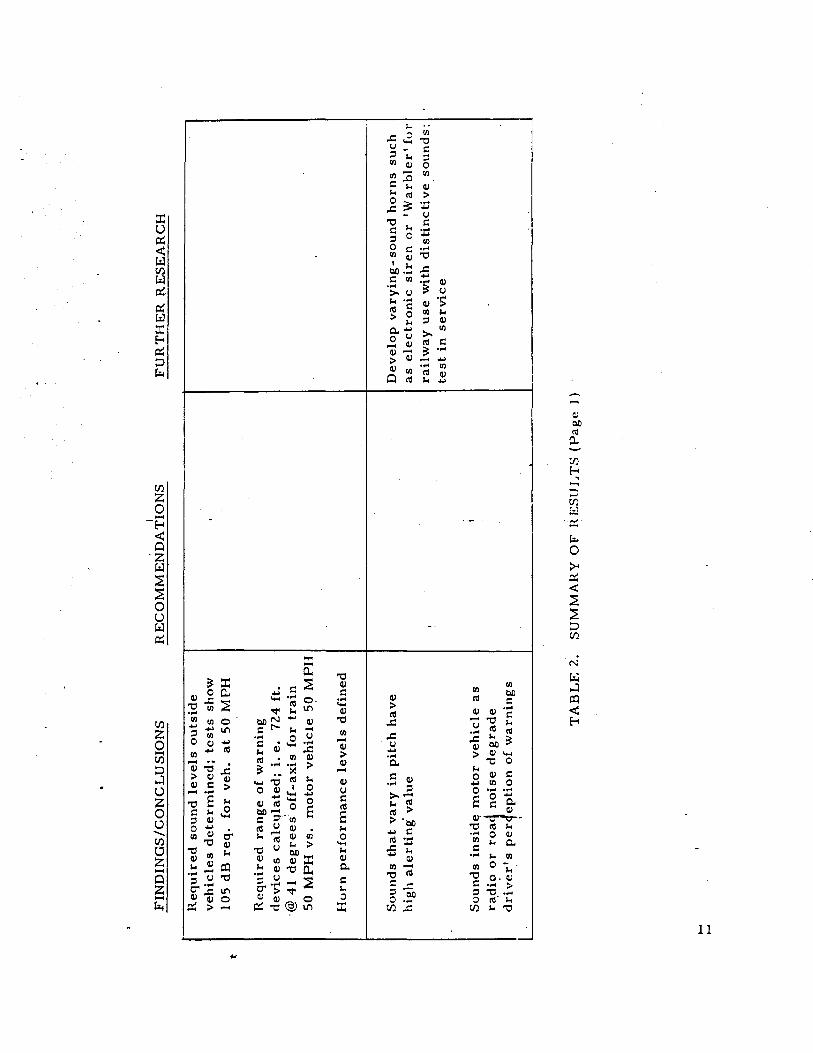
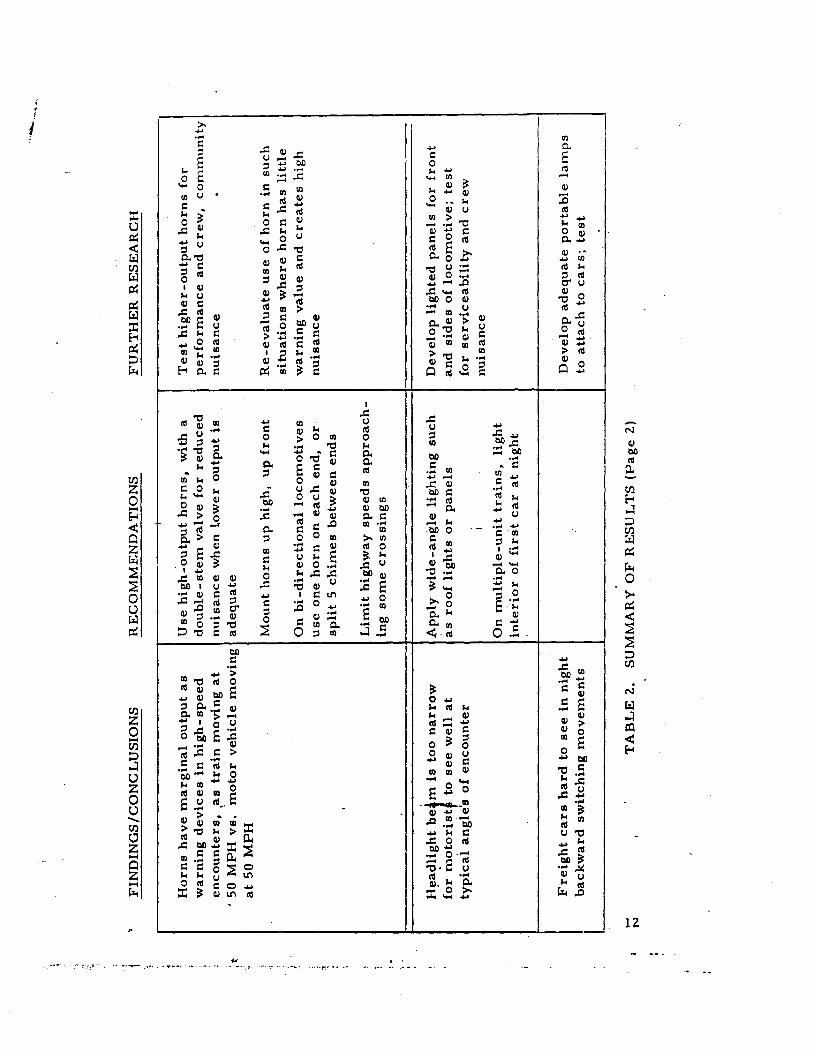
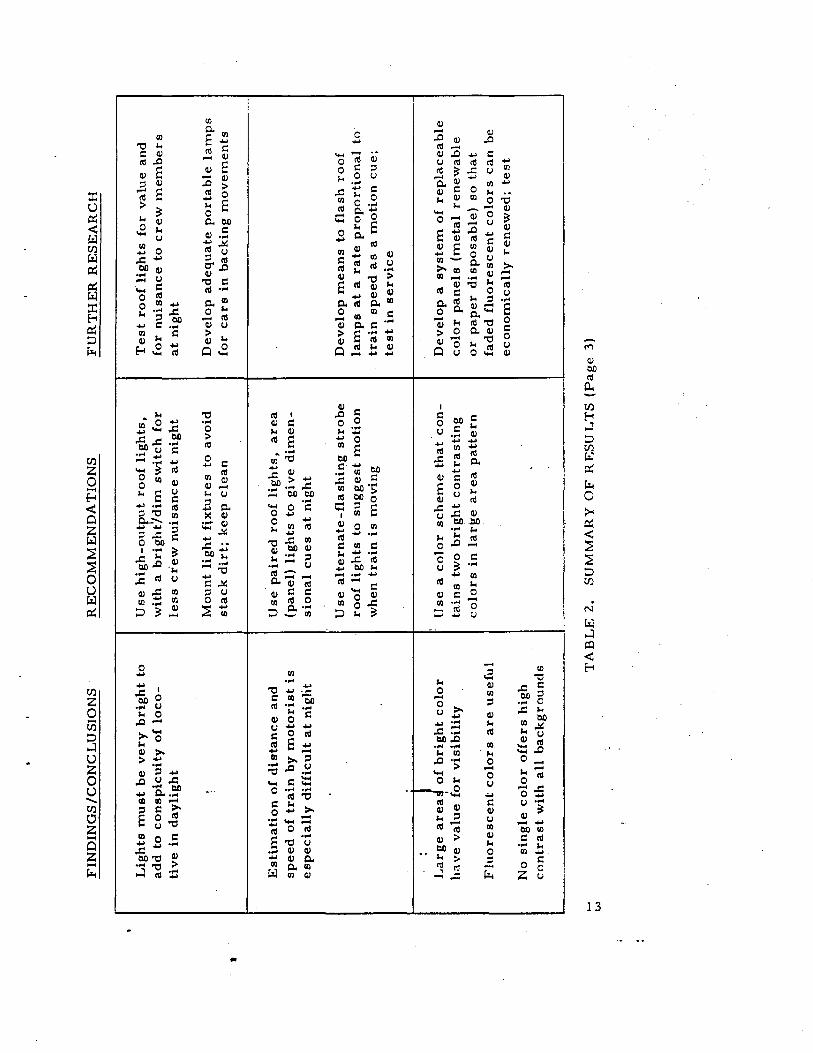
The findings, conclusions, recommendations, and suggestions for further research developed in this study are summarized in Table 2. The first part of the table is for results having to do with audible warnings, and the second part is for results having to do with visi-bility. Eat:h item in the table is discussed more completely in the text of the following sections in this chapter.
Audibility Conclusions and Recommendations
Horn Performance Levels - The criteria for adequate horn performance " developed in the previous section can be compared with the measured performance of actual horns (discussed" in Chapter 8 and summarized in Table 12). The example in the previous section analyzes a crossing where both the highway and the railroad have speed limits of 50 MPH. For this crossing, an adequate warning requires that 105 dB be produced outside a motor vehicle 724 feet away from the train. Manufacturers often rate their horns in terms of sound level produced at 100 feet; a horn that produces 105 dB at 724 feet would have a rating of 122 dB at 100 feet. Table 12 gives 108 dB as the typical railroad horn sound level at 100 feet. This is 14 dB below the level required for an adequate warning in this situation.
In the case of,a right-angle crossing where the railroad and highway speed limits are 70 MPH, 109 dB is required at a range of 1261 feet in order to be effective in warning virtually all drivers under wet pave .. . . " __ • .__.o._.
10
..
t
..... .....
FIN
DIN
GS
/CO
NC
LU
SIO
NS
Req
uir
ed s
ound
lev
els
ou
tsid
e v
ehic
les
det
erm
ined
; te
sts
show
lO
S dB
req
. fo
r ve
h.
at S
O M
PH
Req
uir
ed r
ang
e of
war
nin
g
dev
ices
cal
c\ll
ated
; i.
e.
724
ft.
'@ 4
1 d
egre
es:
off
-ax
is f
or t
rain
SO
MP
H v
s.
mo
tor
veh
icle
SO
MP
H
Hu
rn p
erfo
rman
ce l
evel
s de
fine
d
Suu
nds
that
var
y i
n p
itch
hav
e hi
gh a
lert
ing
' val
ue
Suu
nds
mo
tor
veh
icle
as
ra,d
io o
r ro
a4 n
ois
e d
egra
de
dri
ver'
s p
er1
epti
on
of
war
nin
gs
TA
BL
E 2
.
I R
EC
OM
ME
ND
AT
ION
S
SU
MM
AR
Y O
F R
ES
UL
TS
(P
age
1)
FU
RT
HE
R R
ES
EA
RC
H
Dev
elop
var
yin
g-s
ou
nd
ho
rns
such
as
ele
ctro
nic
sir
en o
r 'W
arb
ler'
fo
r ra
ilw
ay u
se w
ith
dis
tin
ctiv
e so
unds
; te
st i
n se
rvic
e
i
'" .... ;t
.' . '! ,. " .
.... N
FIN
DIN
GS
/CO
NC
LU
SIO
NS
Ho
rns
have
mar
gin
al o
utpu
t as
w
arn
ing
dev
ices
in
hig
h-s
pee
d
RE
CO
MM
EN
DA
TIO
NS
Use
hig
h..'o
utpu
t h
orn
s,
wit
h a
do
ub
le-s
tern
val
ve f
or
red
uce
d
enco
un
ters
, •. a
s tr
ain
mov
ing
at
I nuisa
nce
whe
n lo
wer
out
put
is
. 50
MP
H v
s.m
oto
r ve
hicl
e m
ovin
g ad
equ
ate
at 5
0 M
PH
be,m
is
too
nar
row
fo
r m
oto
rist
# t
o se
e w
ell
at
typ
ical
ang
ie's
of
enco
un
ter
Mou
nt h
orn
s up
hig
h,
up
fro
nt
On
bi-
dir
ecti
on
al l
oco
mo
tiv
es
use
one
ho
rn o
n ea
ch e
nd,
or
spli
t 5
chim
es b
etw
een
ends
Lim
it h
ighw
ay s
pee
ds
app
roac
h-
ing
som
e cr
oss
ing
s
wid
e-an
gle
lig
htin
g su
ch
as r
oo
f li
gh
ts o
r p
anel
s
On
mu
ltip
le-u
nit
tra
ins,
li
gh
t in
teri
or
of f
irst
car
at
nigh
t
'.' .......
.. ,
FU
RT
HE
R R
ES
EA
RC
H
Tes
t h
igh
er-o
utp
ut
ho
rns
for
per
form
ance
and
cre
w,
com
mun
ity
nu
isan
ce
Re-
eval
uat
e u
se o
f h
orn
in
such
si
tuat
ion
s w
her
e h
orn
has
lit
tle
war
ning
val
ue a
nd c
reat
es h
igh
nu
isan
ce
Dev
elop
lig
hted
pan
els
for
fro
nt
and
sid
es o
f lo
com
oti
ve;
tes
t fo
r se
rvic
eab
ilit
y a
nd c
rew
n
uis
ance
Fre
igh
t cars
har
d t
o se
e in
nig
ht
Dev
elop
ade
quat
e p
ort
able
lam
ps
bac
kw
ard
sw
itch
ing
mo
vem
ents
to
att
ach
to
cars
; te
st
TA
BL
E 2
. S
UM
MA
RY
OF
RE
SU
LT
S (
Pag
e 2)
t
...... w
FIN
DIN
GS
ICO
NC
LU
SIO
NS
Lig
hts
mu
st b
e v
ery
bri
gh
t to
ad
d to
co
nsp
icu
ity
of
loco
-ti
ve i
n d
ayli
gh
t
Est
imat
ion
of
dig
tan
ce a
nd
spee
d o
f tr
ain
by
mo
tori
st i
s es
pec
iall
y d
iffi
cult
at
nigh
t
La;
ge
are
a)
of
bri
gh
t co
lor
, ha
ve
valu
e fo
r v
isib
ilit
y
Flu
ore
scen
t co
lors
are
use
ful
No
sin
gle
co
lor
off
ers
high
co
ntr
ast
wit
h al
l b
ack
gro
un
ds
RE
CO
MM
EN
DA
TIO
NS
Use
hig
h-ou
tr.u
t ro
of
lig
hts
, w
ith
a sw
itch
fo
r le
ss c
r'ew
nu
isan
ce a
t ni
ght
Mou
nt l
igh
t fi
xtu
res
to a
void
st
ack
dir
t; k
eep
clea
n
Use
pai
red
ro
of
lig
hts
, ar
ea
(pan
el)
lig
hts
to
give
dim
en-
sio
nal
cu
es a
t ni
ght
Use
alt
ern
ate-
flas
hin
g s
tro
be
roo
f li
gh
ts t
o su
gg
est
mo
tio
n
whe
n tr
ain
is
mov
ing
Use
a c
olo
r sc
hem
e th
at c
on
-ta
ins
two
con
tras
tin
g
colo
rs i
n la
rge
are
a p
atte
rn
FU
R T
HE
R R
ES
EA
RC
H
Tes
t ro
of
lig
hts
fo
r va
lue
and
for
nu
isan
ce t
o cr
ew m
emb
ers
at n
ight
Dev
elop
ad
equ
ate
po
rtab
le l
amp
s fo
r cars
in
back
ing
mo
vem
ents
Dev
elop
mea
ns
to f
lash
ro
of
lam
ps
at a
rat
e p
rop
ort
ion
al t
o tr
ain
sp
eed
as
a m
otio
n cu
e;
test
in
serv
ice
Dev
elop
a
syst
em o
f re
pla
ceab
le
colo
r p
anel
s (m
etal
ren
ewab
le
or
pap
er d
isp
osa
ble
) so
th
at
fade
d fl
uo
resc
ent
colo
rs c
an b
e ec
on
om
ical
ly r
enew
ed;
test
TA
BL
E 2
. S
UM
MA
RY
OF
RE
SU
LT
S (
Pag
e 3)
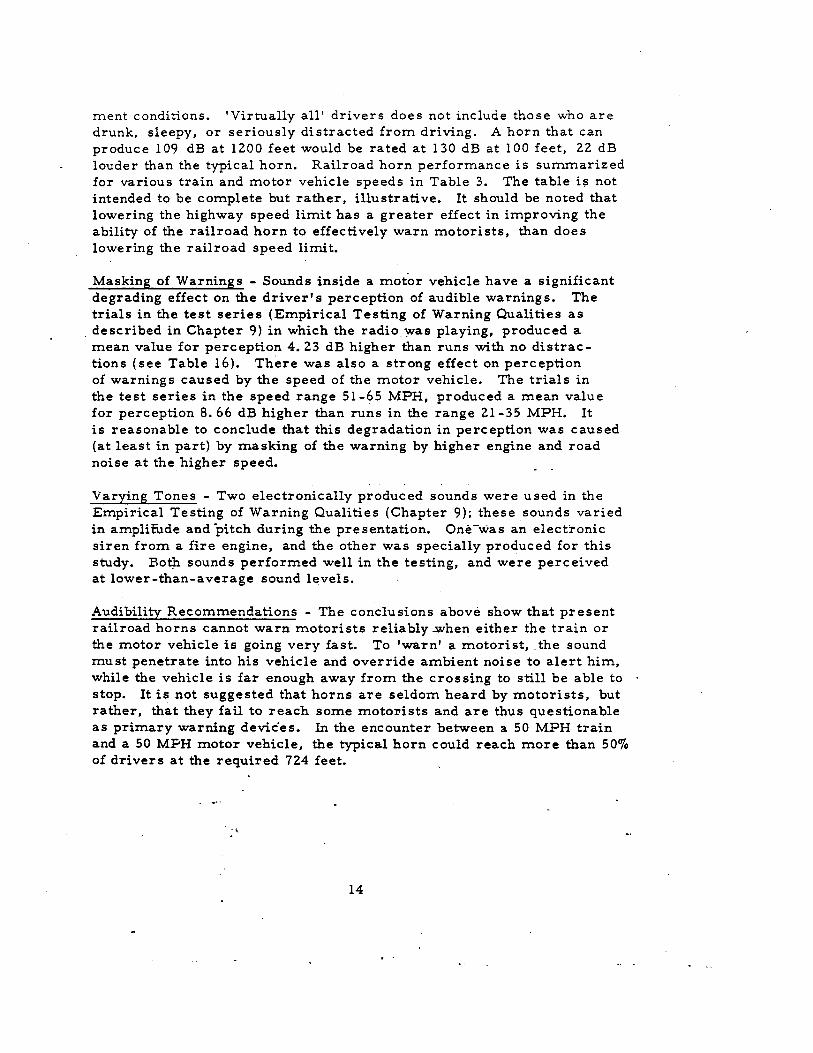
ment conditions. 'Virtually all' drivers does not include those who are drunk, sleepy, or seriously distracted from driving. A horn that can produce 109 dB at 1200 feet would be rated at 130 dB at 100 feet, 22 dB louder than the typical horn. Railroad horn performance is summarized for various train and motor vehicle speeds in Table 3. The table is not intended to be complete but rather, illustrative. It should be noted that lowering the highway speed limit has a greater effect in improving the ability of the railroad horn to effectively warn motorists, than does lowering the railroad speed limit.
Masking of Warnings - Sounds inside a motor vehicle have a significant degrading effect on the driver's perception of audible warnings. The trials in the test series (Empirical Testing of Warning Qualities as
. described in Chapter 9) in which the radio. was playing, produced a mean value for perception 4.23 dB higher than runs with no distrac-tions (see Table 16). There was also a strong effect on perception of warnings caused by the speed of the mot.or vehicle. The trials in the test series in the speed range 51-65 MPH, produced a mean value for perception 8.66 dB higher than runs in the range 21-35 MPH. It is reasonable to conclude that this degradation in perception was caused (at least in part) by masking of the warning by higher engine and road noise at the higher speed.
Varying Tones - Two electronically produced sounds were used in the Empirical Testing of Warning Qualities (Chapter 9); these sounds varied in amplitude and pitch during the presentation. One-was an electronic siren from a fire engine, and the other was specially produced for this study. Bo¢ sounds performed well in the testing, and were perceived at lower-than-average sound levels.
Audibility Recommendations - The conclusions above show that present railroad horns cannot warn motorists reliably -when either the train or the motor vehicle is going very fast. To 'warn' a motori st, . the sound must penetrate into his vehicle and override ambient noise to alert him, while the vehicle is far enough away from the crossing to still be able to stop. It is not suggested that horns are seldom heard by motorists, but rather, that they fail to reach some motol'ists and are thus questionable as primary warning devic'es. In the encounter between a 50 MPH train and a 50 MPH motor vehicle, the typical horn could reach more than 500/0 of drivers at the required 724 feet.
14
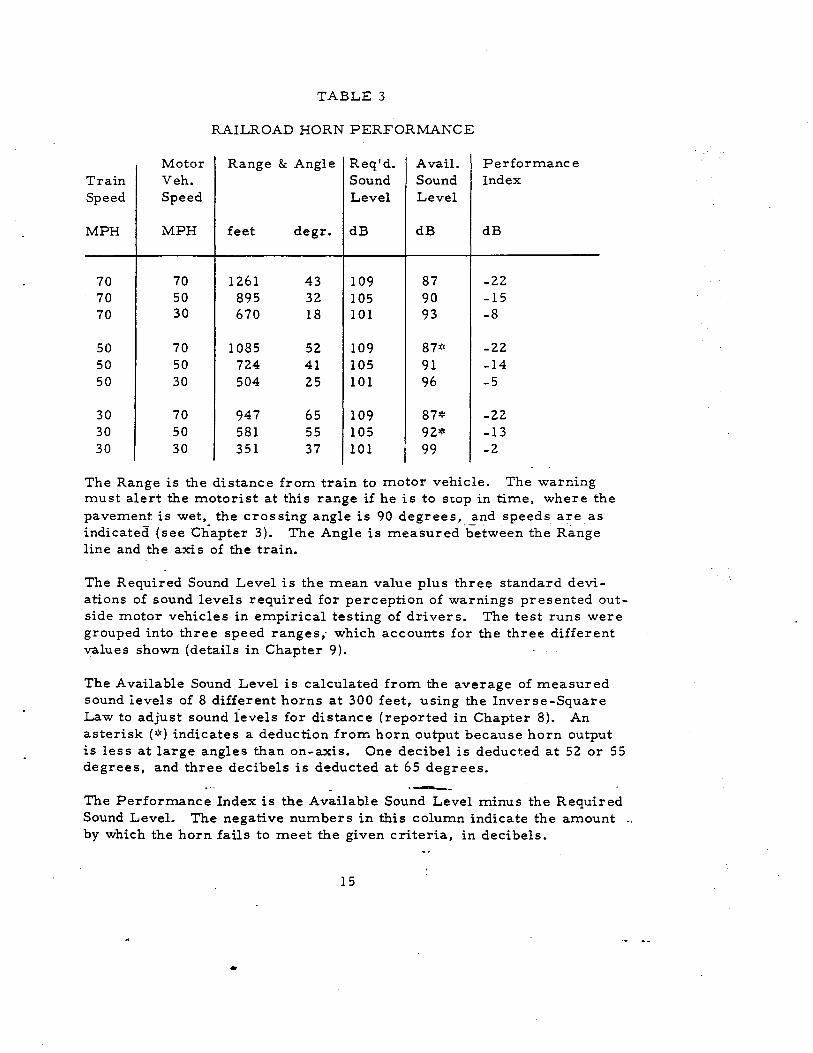
TABLE 3
RAILROAD HORN PERFORMANCE
Motor Range & Angle Req'd. Avail. Performanc e Train Veh. Sound Sound Index Speed Speed Level Level
MPH MPH feet degr. dB dB dB
70 70 1261 43 109 87 -22 70 50 895 32 105 90 -15 70 30 670 18 101 93 -8
50 70 1085 52 109 87;'< -22 50 50 724 41 105 91 -14 50 30 504 25 101 96 -5
30 70 947 65 109 87* -22 30 50 581 55 105 92* -13 30 30 351 37 101 99 -2
The Range is the distance from train to motor vehicle. The warning must alert the motorist at this range if he is to s"tOp in time, where the pavement is wet, the crossing angle is 90 degrees, and speeds are as - - .- . .. indicated (see Chapter 3). The Angle is measured between the Range line and the axis of the train.
The Required Sound Level is the mean value plus three standard devi-ations of sound levels required for perception of warnings presented out-side motor vehicles in empirical testing of drivers. The test runs were grouped into three speed ranges,· which accounts for the three different values shown (details in Chapter 9).
The Available Sound Level is calculated from the average of measured sound levels of 8 horns at 300 feet, using the Inverse-Square Law to adjust sound levels for distance (reported in Chapter 8). An asterisk (*) indicates a deduction from horn output because horn output is less at large angles than on-axis. One decibel is deduct.ed at 52 or 55 degrees, and three decibels is deducted at 65 degrees .
. -. The Performance Index is the Available Sound Level minus the Required Sound Level. The negative numbers in this column indicate the amount _ by which the horn fails to meet the given criteria, in decibels.
15
..
The following recommendations are offered in the context of the finding that horns are not a suitable primary warning in high-speed encounters. They are improvements, but cannot cure the basic problem that a warn-ing sound must be quite loud to penetrate inside a motor vehicle and warn its driver.
1. Use a high-output horn. The five-chime type is favored its tone ranked well in tests of alerting qualities, its tone has many fre-
, quencies to override masking sounds, it has high sound output, and it will still function well if one chime fails. Nuisance studies show that this horn has a less disturbing tone than other types. It should be used with a double-stern air valve which makes it possible to sound the horn at reduced output when desired.
z. Horns should be mounted for optimum projection of sound: up front and up high. Streams of cooling air or stack gas should not be in the path of the sound. On locomotives operated with the long hood in front, the horn should be placed on the end of the hood. This will reduce the nuisance of the horn to the crew as well as improving performance.
3. Bi-directional locomotives should have a horn at eacn end. One economical way to accomplish this would be to split a five-chime horn with three chimes on one end and the remaining two on the
_other end of the locomotive. All five chimes would be a-ctuated together (solenoid valve s at the horns actuated by an electric
_ button at the engineer's control station would ensure that all five chimes start and finish a blast together).
4. At crossings where audible warnings must have a primary role be-cause of poor visibility and/or no automatic protection, highway speed limits for approach to the crossing should r-equire a low
speed.
5. Further research should be directed toward the use of louder horns on trains. Availability of louder horns, use of present horns with higher air pressures, performance, crew nuisance, and community nuisance should be further studied.
---16
.' . -......... _- .. .' ",'C"_. ••. .: •• •• .." '
6. Further developITlent of varying- sound horns is needed. This type of sound has above-average alerting value, but no such horns are presently offered as railroad hardware with sufficient output for use on road locoITlotives. Electronic horns are ideal for this pur-pose, since they can produce a very wide variety of sounds; however, the Leslie 'Warbler' deITlonstrates that air horns can also produce effective varying sounds. Any varying-sound horn should also be able to produce conventional horn sounds for signaling purposes. Such horns are innovative, and an in-service testing prograITl is necessary before they would becoITle routine hardware on loco-ITlotives.
7. Another subject worthy of study would be a re-evaluation of rules for the use of locoITlotive horns. There are crossing situations where the horn has little warning value but high nuisance value, and the present practice of routinely sounding the locoITlotive horn for all grade crossings ITlay be questionable. SOITle cOITlITlunities already have passed legislation restricting the use of horns, parti-cularly at night.
Visual Conclusions and RecoITlITlendations
Although audible warnings can have value for alerting ITlotorists at a grade crossing, they have serious liITlitations. A person driving--a ITlotor vehicle guides it and avoids other traffic basically by visual ITleans, and the rail-highway grade crossing is in ITlany ways siITlilar to any other intersecting traffic artery. Conspicuity, or the property of attracting attention by visual ITleans, is a necessary characteristic of any vehicle which ITlust alert ITlotorists to its presence. Equally. ITleaningful is identification of the perceived object and asseSSITlent of the danger which the object represents.
Evaluation of the conspicuity of a locoITlotive should consider the wide range of environITlental conditions in which it is operated: the aITlount of available light, sky and terrain against which it is viewed, the aITlount of light radiated or reflected by the train, and angle of view froITl which the train is seen. Attenuation of the signal by atITlospheric conditions such as fog and rain can also be of great iITlportance •
. ---
17
..
Daylight Conspicuity - Two different approaches can be used to enhance the conspicuity of a locomotive in daylight:
1. Utilizing the vailable light falling on conspicuous color schemes. Two contrasting colors should be used, one light and one dark, in a very bold pattern (large masses of color). The light color preferably would be a fluorescent type for maximum brightness.
2. Using high-intensity light sources. Roof lights using high-output omnidirectional xenon strobe lamps, or those which sweep the light of sealed-beam incandescent lamps in a full circle are valu-able. The very high ambient light of sunlight demands that a very strong beam be directed right at the motorist, or the lamp will have no value at all in daylight.
The light sources in daylight are intended simply to catch the eye of the motorist and direct his attention toward the train. The color scheme has the additional function of aiding identification of the perceived object as an approaching train. Since in high-speed encounters the train should be identifiable at 1000 feet or more, the color scheme should contain large areas of bright color. Fluorescent colors are u.p to four times brighter than normal ones, and are therefore valuable for conspicuity despite their short service life outdoors. Fluorescent colors are also visually different from colors occurring in nature. The diversity of backgrounds against which a locomotive may. be seen-in grade cro'ssing situations makes it very difficult to choose a single color which will contrast With
. all backgrounds, so two different colors should be designed into the color scheme.
Night Conspicuity - At night, light sources must be used to substitute for the daylight that is not present .. - The only large light used on most locomotives is a headlight or headlights projecting a bright, very nar-row beam along the axis of the locomotive. There is also commonly a number board which is lighted, but this is too weak a light to constitute a good warning. The headlight beam is too narrow to send substantial light toward an approaching motorist in a grade crossing encounter.
It is far more difficult for a motorist to estimate a train's distance from him and its rate of travel at night than it is in daylight. The cues he can rely on in daylight involve seeing the size of the locomotive and its movement to a textured both of which require. a certain amount of ambient liglit. A lighting scheme is required on the locomotive which will at least partly substitute for these missing cues._ ..
18
Maintenance - Visual displays, particularly those for use in daylight, must have high visual impact to be effective. Colors must be bright, and lights must have high actual output. Any bright color scheme, fluorescent or not, requires an above-average maintenance effort to retain its visual impact. In just a few months, even with frequent washing, a brown grime (apparently composed largely of iron oxide from brake shoes and wheels) begins to cover a locomotive's paint and dim its colors. Fluorescent colors, additionally, suffer from fading due to the ultraviolet energy of the sun and do not last more than about two years. Planning of visual devices such as paint schemes and lighting should include consideration of maintenance (i. e. mounting of lamps where stack gases won't dirty them too quickly), and scheduling of the necessary cleaning and renewal.
Visibility Recommendations - Many locomotives today are hard to see by day or by night. Color and lighting designs should have as their prime objective, good conspicuity at 1000 feet at all angles throughout the great environmental and background diver sity in which trains are operated. The following recommendations, directed toward this ob-jective, fall into three categories:
1. Color Schemes - Use a color scheme that contains two bright, contrasting colors in a large area pattern. An example would be a medium blue background color with several rectangular patches (or "panels) of fluorescent yellow 3t fee1: high by 5 feet wide, located on the nose and at the front and rear of each side.
2. Roof Lights - The recommended treatment is to use two omni-directional xenon strobe lamps, mounted on the cab roof near each side of the locomotive. They should be provided with a switch to give high intensity in daylight and lower intensity at night. They shc:>uld flash alternately when the train is moving and simultaneously at a lower rate when it is standing still.
This configuration is by no means the only valuable way to use roof lights, but it provides all the functions listed below:
a. Wide-angle conspicuity at night. A single roof light of al-most any design, . flashing or rotating, satisfies this basic need.
b. A_ brigh!. flash of light is excellent for getting attention in daylight. A single light" can performt'fifs function adequately, .
19
if it has a high enough intensity. A lamp that is bright enough to be valuable in daylight will probably cause complaints from the locomotive crew at night; a switch should be provided to re-duce intensity to a more tolerable level at night when extreme output is not required.
c. Motorists should have a reference dimension at night for esti-mation of distance. Paired lights, one on each side of the cab roof with a standard separation, would help to provide this reference.
d. Paired lights. flashing have value in suggesting motion at night when natural motion cues are lacking. The lamps should have a different flash pattern (simultaneously flashing) when the train is not moving.
Xenon strobe lamps were judged superior to incandescent lamps because they can provide a very quick. high-intensity, omnidirectional flash with-out moving parts. The color spectrum of the xenon la!llP is reputed to be superior to incandescent lamps in penetrating haze and fog. Tb'! second choice is an incandescent lamp of the type which sweeps the light from steady-burning sealed beam units in a full circle. The flash perceived by-an observer several hundred feet fr can sudr a lamp is much quicker and is more conspicuous than the flash that can be obtained by switching the lamp on and off.
3. Panel Lights - Lighted panels are a promising lighting device for improving locomotive conspicuity at night. They are distinctive (not commonly used on other vehic1e.s). visible from a wide angu-lar range. and provide a dimensional cue to aid mptorists in estima-ting distanc.e. The suggested size is about one foot high and six feet long. fluorescent lighted; they should be located above or below the cab windows on each side and on the nose.
Multiple-unit pas senger coaches are naturally equipped with what amounts to panel lights - the lighted interior as viewed through the windows. Interior lights should be on in the front car at night. even if the car is closed off or the train is on a deadhead run.
Further Research - Some of the visual above are for devices or arrangements that have not seen any substantial testing in service. Although roof lamps have been considerable service on several
20
..
railroads, there are unresolved questions concerning their use, in-volving optimum brightness and crew nuisance. The following are some desirable areas for further research:
1. The difficulty in keeping color schemes clean and bright leads to the recommendation that bright colors (particularly fluorescent) applied to locomotives for safety purposes be on easily-replace-able panels in order that they can be frequently renewed at low cost. Either a metal panel using sheeting, intended for re-coat-ing and re-use, or a paper panel to be thrown away when faded could be used. A development program would be required to devise appropriate hardware for locomotive use (it might be adapted from the posters used for advertising on the outside of buses), and to test it in service.
2. Complaints have been made by crews of locomotives that have roof lights, about the annoyance caused by the flashes of light reflected from objects near the right-of-way. These lights should be tested to determine the optimum intensity for effective-ness and low nuisance.
3. The rE"commended use of paired roof lights that 'flash alternately when the train is moving should be tested in b..:rvice. Addition-ally,_ it would be worthwhile to develop a means of flashing these lights at a rate proportional to the speed of the train. No really good cue to motorists exists by which they may estimate a train's speed at night; the recommended alternate-flashing lights suggest motion without indicating how fast the train is going.
4. Lighted panels do not presently exist in a form adapted to the needs of railroad service. Further research is needed to deter-mine the best size, placement, intensity, and materials needed to make this an effective piece of hardware that will not annoy the crew, will not require excessive maintenance, and will not be un-duly expensive.
5. When a cut of freight cars is being backed across a crossing at night, the lead car is usually unlit or carries only a dim lantern. Further research is needed to develop an adequate portable lamp to attach to the leading car,,- Such lamps must be easy to carry and attach, and should as to be visible over wide angles of approach. _,00 ---
21

CHAPTER 3. THE ENCOUNTER: TRAIN VS. AUTOMOBILE
At What Range Must Devices Operate Effectively?
The above is a very basic question in the evaluation of the performance of a warning device. Its answer depends on the geometry of the en-counter, when a train and a motor vehicle approach a crossing on what may be a collision course. The purpose of this chapter is to analyze this geometry and provide rational criteria for calculating the required range of effectiveness for warning devices.
Warning devices emit or reflect sound or light energy, and the observer receives less and less energy as he moves farther from the device. For any device, there is a distance beyond which the energy received by the observer is too small to produce an adequate warning stimulus. In other parts of this report, we will consider what constitutes an adequate stimulus, and how much stimulus is aVailable from existing devices at various d,istances. This determines the maximum available range of devices.
The analysis which follows has as its purpose the determination of max-imum required range of devices. It will show how the radial distance and angle over- which the warning must be transnirtted may be calculated for various conditions. This information can be combined with required levels at the motor vehicle and with transmis sion characteristic s of the device, to specify the necessary intensity (at the device) and directi-vity of the warning under the specified conditions.
The radial distance and angle vary with:--
1. Speed of the train
2. Speed of the motor vehicle
3. Angle of the eros sing
4. Length of the motor vehicle
5. Stopping characteristic s of the motor vehicle .-.
22

Analyzing the Encounter
Critical Point - Consider a motorist approaching a grade cros sing (or any fixed hazard). By nature of his s speed and braking charac-teristics, he is committed to continuing his motion for some distance, the 'stopping distance'. If he is going 40 MPH and his stopping distance is 237 feet, it is too late to warn the motorist if he is less than 237 feet from the hazard; he cannot stop before reaching it (the term' stopping distance', as used in this report, means the sum of perception-reaction distance and braking distance).
When the motorist is at his stopping distance from a grade crossing, he is at the Critical Point, where he decide to stop or proceed. Whether the motorist reaches the Critical Point is not dependent on the existence of a train or the speed of a train. He reaches it whenever he would have to use maximum braking to stop short of the crossing.
The driver who receives a warning with time to spare never reaches the Critical Point; he makes an early decision to come to a full stop and is able to do so without emergency braking. If he is merely slow-ing as a precaution due to partial warning (such as seeing the cross-bucks at the crossing), his stopping distance is decreasing as his velo-city decreases. At any nonzero speed, however, there is some point beyond which the motorist cannot stop bdgre the eros sing. By slowing, he moves the Critical Point closer to the crossing and reduces the dis-
pver which the train's warning must be transmitted.
Time to Clear - Once the motorist has pas sed the Critical Point, his only chance to avoid a collision with a train is to be clear of the cross-ing before the train arrives. It is, therefore, useful to know how long it v.ill take for the vehicle to pass over the crossing after it passes the Critical Point, if the driver decides not to stop. ·The motorist will be assumed unable to change his path or to speed up significantly (these evasive actions are possible in some encounters); he can only continue at the same velocity or stop for the train.
The Time to Clear is the time it takes for the motor vehicle to travel the sum of its stopping distance plus its length plus the width of the crossing. This is the time during which the motorist is committed to being in the possible path of an approaching train.
The Critical Encounter - So fa:!: we have c-GlWiidered the motor vehicle as it approaches a crossing, passes the Critical Point, and crosses the
23
.' , tracks; the relative position of the train has not yet been defined. The f situation that places the greatest demand on train-mounted warning
devices is that when the motor vehicle can just 'make it' across the tracks ahead of the train, if it does not slow down.
The important moment in this situation is when the motorist reaches the Critical Point, since this is the last instant when a warning is of any use in keeping him off the tracks. Thus we define the Critical Encounter as the position of a motor vehicle relative to the position of a train at the instant when:
1. The motor vehicle is at its stopping distance from a grade cross-ing (the Critical Point) and,
"2 •. C The front of the train is just far enough from the crossing to allow the motor vehicle Time to Clear if it does not stop or slow down.
These two elements define the Critical Encounter because a motorist reaching the Critical Encounter will have a narrow escape whether he stops or goes across. He will either stop just short of the crossing or will get across just ahead of the train. Any slowing short of full braking will result in a co'lision.
The Geometry of the Criticc:Ll Encounter
At the beginning of this chapter, the question was posed, "At what range must devices operate effectively?" Analysis of the geometry of the Criti-cal Encounter can give the radial distance and angle over which the warn-ing must be transmitted. This geometry can be analyzed either graphi-cally or mathematically. ' After conSidering the geometrical relation-ships of the Critical Encounter, we will relate them to performance criteria.
Graphical Analvsis - A plan view, drawn to scale, of an actual or hypo-thetical grade crossing can be used to lay-out the relationships in the Critical Encounter. This method can be used as a diagnostic tool for evaluating crossing hazards or planning the installation of advance warn-ing signs, as well as for designing on-train warning devices.
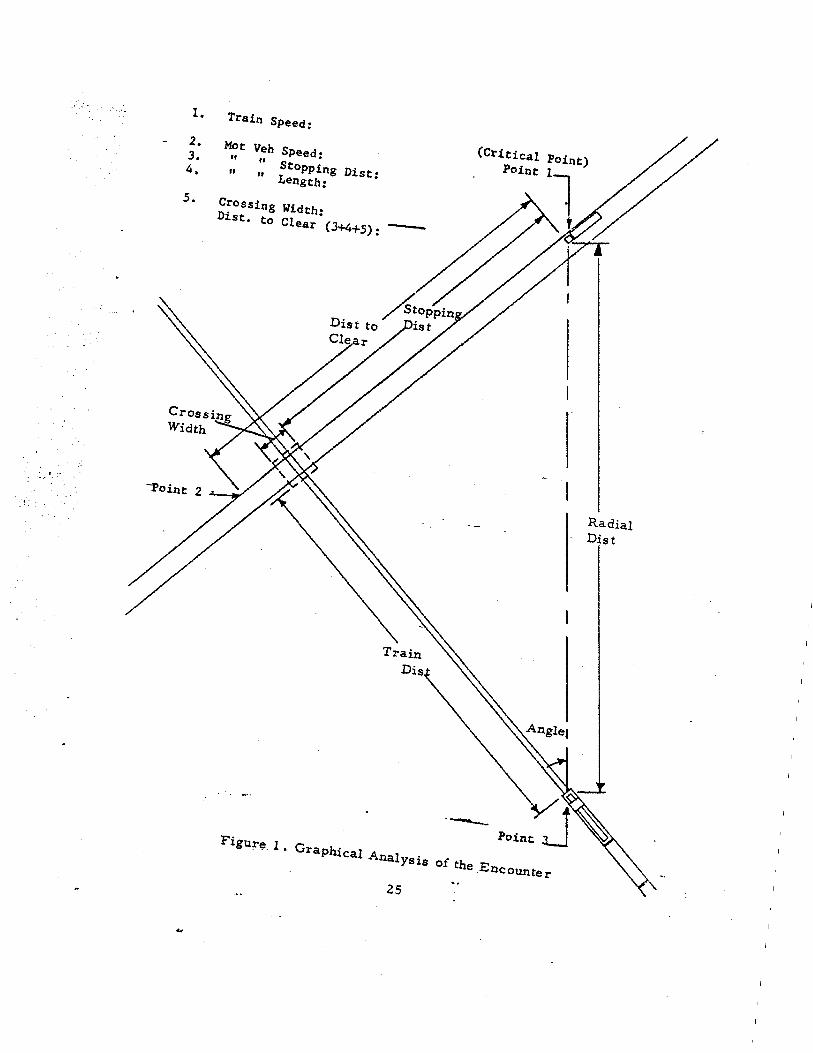
Figure I illustrates a plan view for a right-angle cros sing. The speeds of the fastest rail and highway traffic for the crtf!>siug are noted. The
24
1.
2. 3. 4.
5.
-Point
Train Speed:
Mot Veh Speed: " /I StoPPing Dist: " " Length:
Crossing Width: --Dist. to Clear (3+4+5) :
Figure 1. Graphical AnalYsis of tho Encounter
25
I Radial Dist
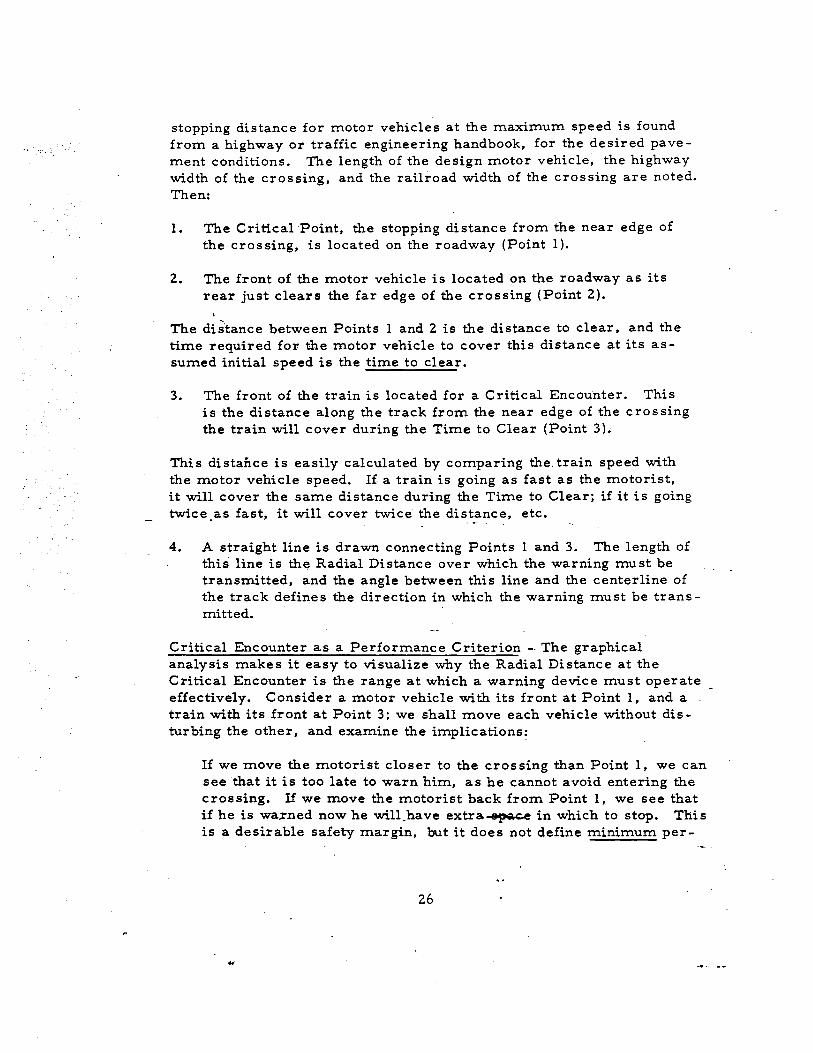
stopping distance for motor vehicles at the maximum speed is found from a highway or traffic engineering handbook, for the desired pave-ment conditions. The length of the design motor vehicle, the highway width of the crossing, and the railroad width of the crossing are noted. Then:
1. The Critical Point, the stopping distance from the near edge of the cros sing, is located on the roadway (Point 1).
2. The front of the motor vehicle is located on the roadway as its rear just clears the far edge of the crossing (Point 2).
The dis'tance between Points 1 and 2 is the distance to clear, and the time required for the motor vehicle to cover this distance at its as-sumed initial speed is the time to clear.
3. The front of the train is located for a Critical Encounter. This is the distance along the track from the near edge of the crossing the train will cover during the Time to Clear (Point 3).
This distance is easily calculated by comparing the train speed with the motor vehicle speed. If a train is going as fast as the motorist, it will cover the same distance during the Time to Clear; if it is going twice_as fast, it will cover twice the distance, etc.
4. A straight line is drawn connecting Points 1 and 3. The length of this line is the Radial Distance over which the warning must be transmitted, and the angle between this line and the centerline of the track defines the direction in which the warning must be trans-mitted.
Critical Encounter as a Performance Criterion -. The graphical analysis makes it easy to visualize why the Radial Distance at the Critical Encounter is the range at which a warning device must operate effectively. Consider a motor vehicle with its front at Point 1, and a train with its front at Point 3; we shall move each vehicle without dis-turbing the other, and examine the implications:
If we move the motorist closer to the crossing than Point 1, we can see that it is too late to warn him, as he cannot avoid entering the crossing. 1£ we move the motorist back from Point 1, we see that if he is wa.rned now he will_have in which to stop. This is a desirable safety margin, but it does not define minimum per-
26
;'-". --. formance of the warning device.
If we move the train back from Point 3, we see that it is not neces-sary to warn the motorist at all, as he will be able to cover the dis-tance from Point 1 to Point 2 before the train reaches the crossing. A warning at this time would provide a desirable safety margin, but it does not define minimum performance of the warning device .
. If we move the train closer to the crossing than Point 3, we see that we have reduced the Radial Distance (if the track and road are rough-ly straight and cross at about 90 degrees) to a value less than the minimum defined at Point 3.
Thus the line connecting Points 1 and 3 is indeed the minimum Radial Distance across which the warning device must operate effectively.
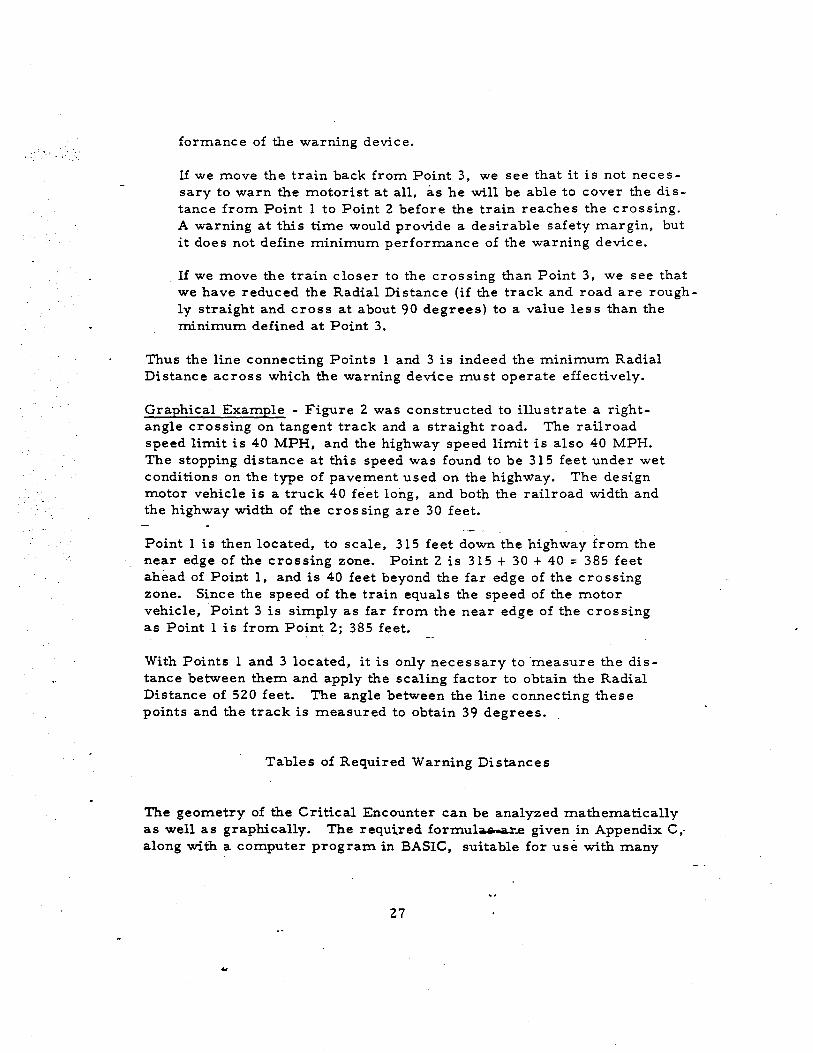
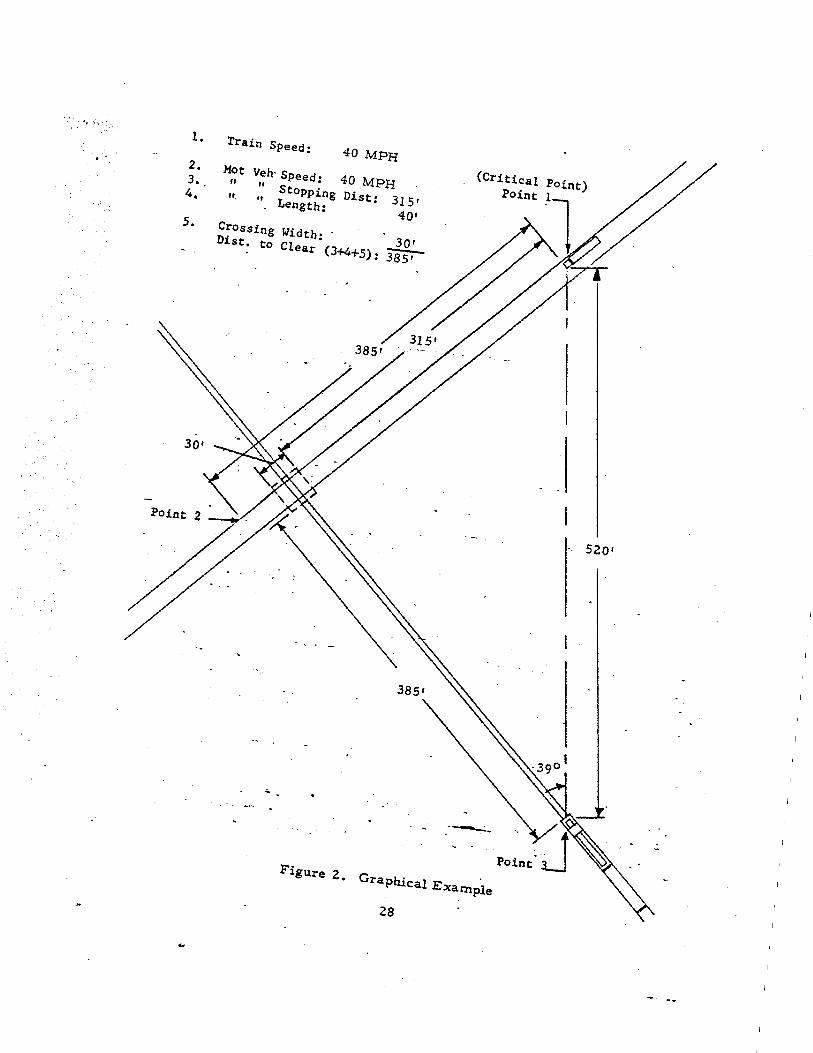
Graphical Example - Figure 2 was constructed to illustrate a right-angle crossing on tangent track and a straight road. The railroad speed limit is 40 MPH, and the highway speed limit is also 40 MPH. The stopping distance at this speed was found to be 315 feet under wet conditions on the type of pavement used on the highway. The design motor vehicle is a truck 40 feet long, and both the railroad width and the highway width of the eros sing are 30 feet.
Point 1 is then located, to scale, 315 feet down the highway from the near edge of the crossing zone. Point 2 is 315 + 30 + 40 = 385 feet ahead of Point 1, and is 40 feet beyond the far edge of the crossing zone. Since the speed of the train equals the speed of the motor vehicle, Point 3 is simply as far from the near edge of the crossing as Point 1 is from Point 2; 385 feet.
With Points 1 and 3 located, it is only necessary to -measure the dis-tance between them and apply the scaling factor to obtain the Radial Distance of 520 feet. The angle between the line connecting these points and the track is measured to obtain 39 degrees.
Tables of Required Warning Distances
The geometry of the Critical Encounter can be analyzed mathematically as well as graphic-ally. The required given in Appendix C,. along with a computer program in BASIC, suitable for use with many
27
., ':::
1. Train Speed: 40 MPH
{Critical 2. Mot Veh'Speed: 40 MPH
POint 3. " " StoPPing Dist: 315' 4. II. " Length:
40' 5. CrOssing Width: 3D' Dist. to Clear (3+4+5) : 385'
POint
520'
-..... -
'--';'.
Figure 2. Graphical Example
28
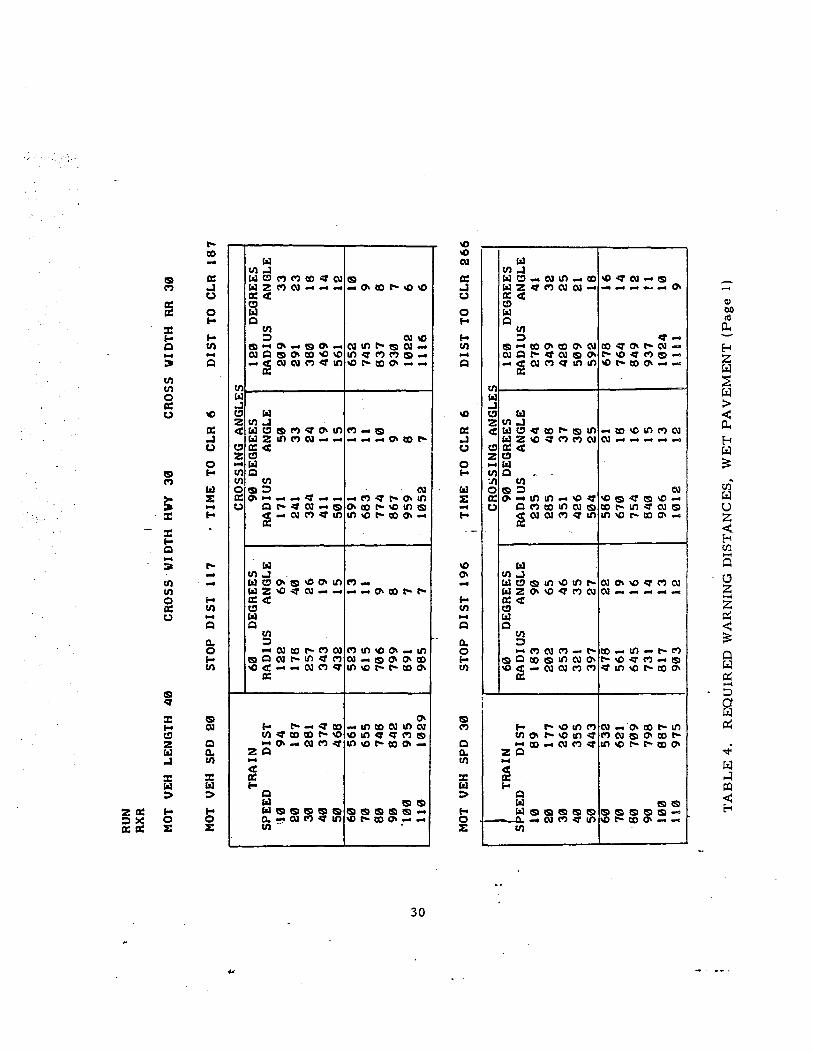
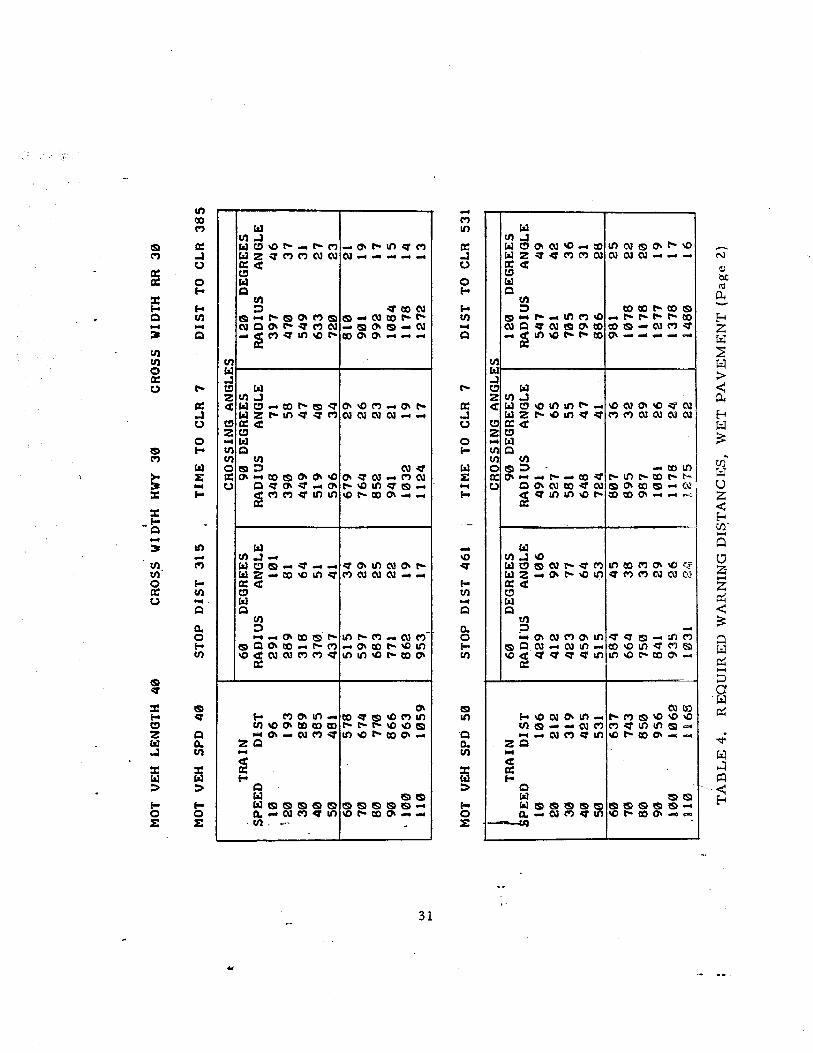
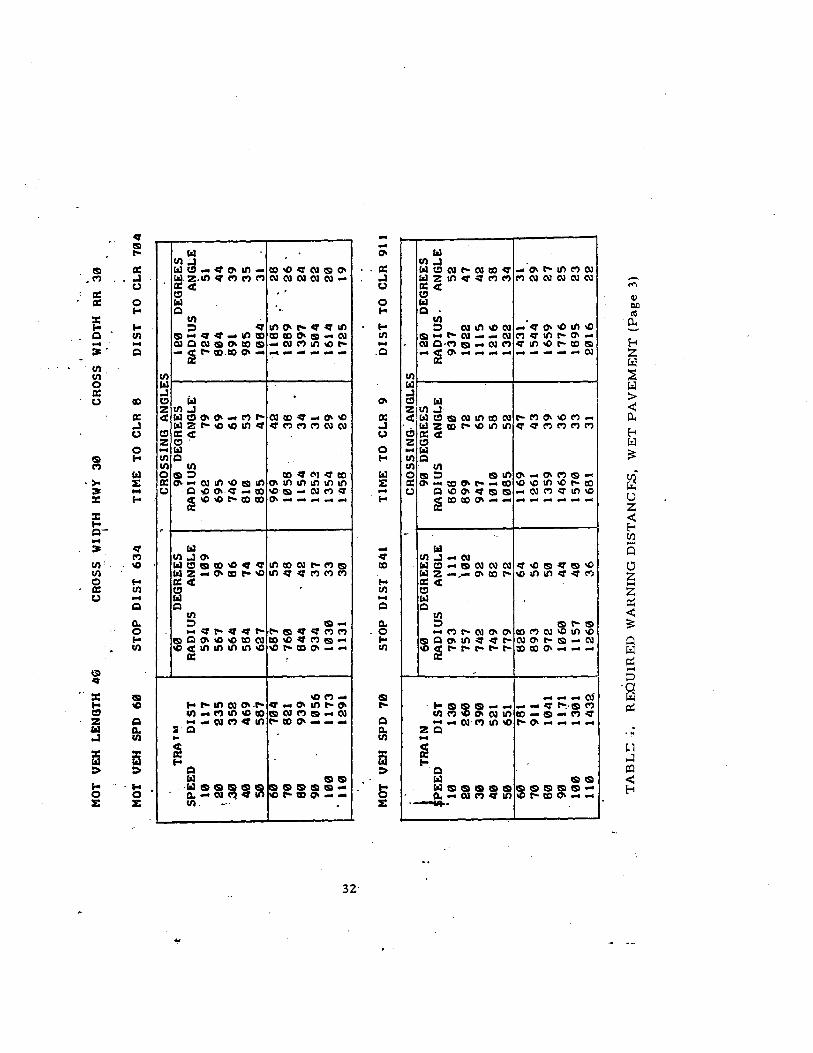
time-sharing computer services. The program utilizes the computer's ability to calculate the radial distance and angle many times, for differ-ent combinations of train and motor vehicle speeds, in a very short time The computer program was used to. generate .l'able 4,. It.is recognized that .there are no unj.versally-accep.ted criteria establish values for stopping ·distances, design motor v.ehicle length,. and crossing geometry. By changing·'the values of the data used in the prog;ram, . fables can be produced that are based on any desired criter'la and local c ondi tion s. ' .
. " ,.' "," ".,.
Using the Tables - Table 4 gives radial' dlstances: and ang"Ies acr..oss which warnings must be transmitted for a design vehicle 40 feet long at crossing angles of 60, 90;- and 120 degree s (the 60 d'egree and 120 degree crossings are the s·ame crossing as approached from opposite sides by either the or the motor vehicle): The values for stopping dist'ances used in the calculations are ba'sed on 'Wet Pavement values given in the Traffic Engineering Handbook, Third E9-ition, -of the Institute of Traffic Engineers (1965).
For eacl?- motor vehicle speed, the table shows'1;he stopping dlsta:nce and the time and distance for the design vehicle-to clear the 'crossing once it .has reached the Critical Point. For each train speed,. the train's dis-tance from the near edge of the crossing is given, for a Critical Encounter. The radius and angle from the train to the motol;' vepicle·.is shown for each of the three selected crossing angles.
.-.
29
t
\.t.I o
RUN
RXR
MOT
VE
H LE
NGTH
MOT
VE
H SP
D
20
TRA
IN
SPEE
D
DIS
T '1
0 20
187
30
281
40
374
50
468
60
561
70
655
80
748
90
842
'100
93
5 11
0 10
29
MOT
VE
H SP
D
30
.,
l TRA
IN
SE
ED
D
IST
10
89
20
177
30
266
40
355
50
443
60
532
70
621
'80
709
90
798
100
687
110
975
CRO
SS 'W
IDTH
HW
Y 30
CR
OSS
W
IDTH
RR
30
STO
P D
IST
117
. TI
ME
TO
CLR
6 D
IST
TO
CLR
187
CRO
SSIN
G A
NGLE
S 60
D
EGRE
ES
90
DEG
REES
12
0 D
EGRE
ES
i RA
DIU
S AN
GLE
RAD
IUS
ANGL
E RA
DIU
S AN
GLE
I
122
69
171
50
209
33
I
178
40
33
291
23
257
26
324
24
380
18
19
411
19
469
432
15
501
15
561
12
523
13
591
13
652
10
615
11
683
11
9 70
6 9
10
837
8 79
9 8
867
9 93
0 7
891
7 95
9 8
1022
6
985
7 10
52
7 11
16
6
STO
P D
IST
196
TIM
E TO
CL
R 6
DIS
T TO
CL
R 26
6
CRO
SSIN
G A
NGLE
S 60
D
EGRE
ES
90
DEG
REES
12
0 D
EGRE
ES
RAD
IUS
ANGL
E RA
DIU
S AN
GLE
RAD
IUS
ANGL
E 18
3 90
23
5 ,
64
278
41
202
65
285
48
349
32
253
46
351
37
428
25
321
35
426
30
509
21
397
27
504
25
592
18
478
22
586
21
678
16
561
19
670
18
764
14
645
16
754
16
849
12
731
14
840
15
937
t 1
817
13
926
13
1024
10
90
3 12
10
12
12
1111
9
---L
--
----
----
.. _
---
TA
BL
E 4
. R
EQ
UIR
ED
WA
RN
ING
DIS
TA
NC
ES
, W
ET
PA
VE
ME
NT
(P
age
1)
t
VJ ......
,
I M
OT
VEH
LENG
TH
40
CRO
SS
WID
TH
HWY
30
CRO
SS
WID
TH
RR
30
MOT
VE
H SP
D
40·
STO
P D
IST
315
TIM
E TO
CL
R 7
DIS
T T
O CL
R 38
5
CRO
SSIN
G
ANGL
ES
TRA
IN
60
DEG
REES
90
D
EGRE
ES
120
DEG
REES
SP
EED
D
IST
RAD
IUS
ANGL
E RA
DIU
S AN
GLE
RAD
IUS
ANGL
E , 1
0 96
29
1 10
1 34
8 71
39
7 46
',2
0 19
3 28
9 81
39
0 58
47
0 37
30
28
9 31
8 64
44
9 47
54
9 31
40
38
5 37
0.
51
519
40
633
27
50
481
437
41
596
34
720
23
60
578
515
34
679
29
810
21
70
674
597
29
764
26
901
19
80
770
683
25
852
23
992
1 7
90
866
771
22
941
21
1084
15
.
100
963
862
19
1032
19
11
78
14
110
1059
95
3 I 17
11
24
17
1272
13
MOT
VE
H SP
J)
50
STO
P D
IST
461
TI
ME
TO
CLR
7 D
IST
TO
CLR
531
CRO
SSIN
G A
NGLE
S !
TRAI
N 60
D
EGRE
ES
90
DEG
REES
12
0 D
EGRE
ES
PEED
D
IST
RA
DIU
S AN
GLE
RADH
,JS
ANGL
E RA
DIU
S A
NG
LE
10
106
429
106
491
76
547
49
20
212
412
92
527
65
621
42
30
319
423
77
581
55
705
36
40
425
459
64
648
47
793
31
50
531
515
53
724
41
886
28
60
637
584
45
807
36
981
25
70
743
664
38
895
32
1078
22
80
85
0 75
0 33
98
7 29
11
78
20
90
956
841
29
1081
26
12
77
19
100
1062
93
5 26
11
78
24
1378
17
.1
10
1166
10
131
2,q,
R2
75
22
14
80
16
TA
BL
E 4
. R
EQ
UIR
ED
WA
RN
ING
W
ET
PA
VE
ME
NT
(P
age
2)
t
IJ.)
N
MOT
VE
H Lt
NG
TH 4
G
MOT
VE
H SP
D
60
TRA
''''
SPEE
D
DIS
T
10
117
,20
23
5 '.3
0 35
2 40
46
9 50
58
7 60
.
704
70
621
80
939
1056
10
0 11
73
. 11
0 12
91
MOT
VE
H SP
D
70
j T
RA
IN"
PEED
D
IST
• 1
0 13
0 20
26
0 30
39
0 ,
40
521
50
651
60
781
70
911
80
1041
90
11
:,11
100
1301
11
0 14
3&
CRO
SS
WID
TH
HWY
30
I CR
OSS
W
IDTH
RR
30
STO
P D
IST
63
4 TI
ME
TO
CLR
8 D
IST
TO
CL
R 70
4 ,
CR
OSS
ING
AN
GLE
S I
60
DEG
REES
';)0
D
EGRE
ES
120
DEG
REES
R
AD
IUS
AN
GLE
RA
"DIU
S AN
GLE"
RA
DIU
S A
NG
LE
594
109
662
79
724
51
567
98
695
69
804
44
564
86
746
61
891
39
584
74
810
53
985
35
627
64
885
47
1084
" 31
66
7 55
96
9 42
11
85
" ,
28
. 76
0 48
10
56
" 36
12
89
. 26
.
844
. 42
11
54
34
1397
24
.
934
37
1252
31
15
04
22
1030
33
13
54
29
1614
20
11
31
30
1458
26
17
25
19
-
STO
P D
IST
64
1 TI
ME
TO
CLR
9 il
l ST
TO
CLR
911
I CR
OSS
I NG
·· AN
GLE
S 60
D
EGRE
ES
90
DEG
REES
12
0 D
EGRE
ES
RAD
IUS
AN
GLE
RA
DIU
S A
NG
LE
RA
DIU
S.
AN
GLE
79
3 11
1 66
6 80
9
j7
52
757
'102
89
9 72
10
22
47
I 74
2 92
94
7 65
11
15
42
I
749
82
1010
58
12
16
38
779
72
1085
52
13
22
34
828
64
1169
47
14
31
31
893
56
1261
43
15
44
29
972
50
1359
39
16
59
27
1060
" 4
4 14
63
36
1776
25
11
57
40
1570
33
18
95
23
1260
36
16
81
31
2016
22
-
----
---
---
L-.
TA
BL
!:;.
R
EQ
UIR
ED
WA
RN
ING
DIS
TA
NC
ES
, W
ET
PA
VE
ME
NT
(P
age
3)
CHAPTER 4. VISUAL - ALERTING AND CONSPICUITY
Alerting
Alerting and conspicuity are related, but it is possible for a train to be conspicuous (easily seen) without alerting a IYlotorist to the presence of danger. The IYlotorist needs to· be given .as IYluch information as possible so that he may correctly decide whether exists. ·This study ts concerned with conspicuity as it relates to alerting, and there-fore devices intended to make a locomotive should, as much
. as possible, work to:
1. Tell the motorist that something is there.
2. Tell the motorist that what he sees is a locomotive.
3. Tell the motorist if the train is on a track that will cross the road on which he is driving.. This can only he done imperfectly by on-train devices, and it is generally.a function of the train's horn.
4. Aid the motorist in estimating the distance he is from the. train.
5. Aid the motorist in estimating the speed and direction of the train's motion.
Having correctly noted and estimated- these factors, if there is danger, the motorist is alerted to the danger and takes appropriate action. Partial alerting can take place where the motorist has not enough information to make all needed estimates. A partially-alerted driver can be expected to slow down and actively search for more details.
Literature Review
A review of the literature pertinent to alerting qualities was utilized in determining the to be in this and in pointing to experimental approach to be utilized. The characteristics of visual stimuli for alerting are much more complex than those of sound. Although visual stimulus may be used as a primary signal, it is used more frequently for verification and localization of an auditory stimulus. The
33
visual signal serves two purposes: to alert an operator to the presence of the locomotive, and to allow him to approximate the closing rate of the train and its distance from the observer.
The literature review was directed at finding answers to the following questions:
1. Considering the range of levels of background light, what type of visual signal(s) is most apparent in daylight?
2. Which type(s) of signal will have utility over the greatest range of conditions (night, fog, dusk, bright daylight, etc.)?
3. What levels and forms of energy are needed for: ( a)dU e.!;.ted (b) incidental viewing of the locomotive?
Conspicuity in Daylight
The performance level of on-train alerting devices must be considered the pe_rspective of the senses utilized. The auditory and visual
stimuli must be considered independently. The visual stimuli in turn require subdivision into reflective and propagative light sources. The reflective sources for daylight are color combinations and designs. An analysis of the conspicuity of the color combinations during daylight requires consideration of the following variables:
1. Hue of Pigment - Which color-s are most conspicuous when viewed against surrounding terrain, sky, etc.
2. Brightnes s of Pigment - Achromatic component of color on a white-black continuum. This is most important in contrasting the color intensity with the surrounding terrain, sky, etc.
3. Range of Sky-Bl'ight- - The reflected light must be con-ness spicuous a wide
range of sky brightness. This range of brightness is from O. 1 foot lamberts at twilight to 10,000 foot lamberts under sunlit clouds '(see Ap?endix B).
34
..
4. Range of Ambient Light
5. De signs and Paint Combination
6. Distance for Viewing Train Conspicuity
7. Detection Potential
The amount of light available for reflection for the pigment.
The pattern and color pairs which together are most conspicuous under the greatest range of environmental conditions.
The distance at which locomotives should be alerting will determine the size of the reflective surfaces.
Alerting qualities of the light source affected by environmental conditions of fog, rain, dusk, etc.
The stimulus value of any alerting visual signal is a function of its trast with the surrounding background. Against a dark background, an effective stimulus must appear bright, while against- a bright backgrourld a darK contrasting area p.L ovides the best stimulus. Hence, a stimulus which may be effective under some environmental conditions may approach zero-effectiveness under other conditions._ A colored pigment that reflects a maximum of light falling on it is most effective under· dark background conditions and bright ambient lighting. A colored which reflects a minimum of light falling on it is best for bright skies.
Frequently research on conspicuity is performed at the detection thresh-old for that color, brightness, etc., level. This practice is not appli-cable to the solution of the alerting problem. It is recommended that factors from 100 to 1,000 times the threshold be applied to attract observers who are not actively searching for the stimulus (Breckenridge2 ). (See Bibliography. )
Conspicuity is not a constant but is dependent upon the contrast between the viewed object and its background. The greater the contrast the better the conspicuity. The light intensity falling on the locomotive varies from o to 5000 foot lamberts. To satisfy all requirements for maximum con-spi cuity, a high contrast must be maintained through all conditions of ambient light and all conditions of background brightness (Cobb4 ).
. . Conspicuity in itself is one component of the alerting-ldentifying process required for detecting and reacting to an approaching locomotive. .. However, knowing that something is there is di£f.erent from
35
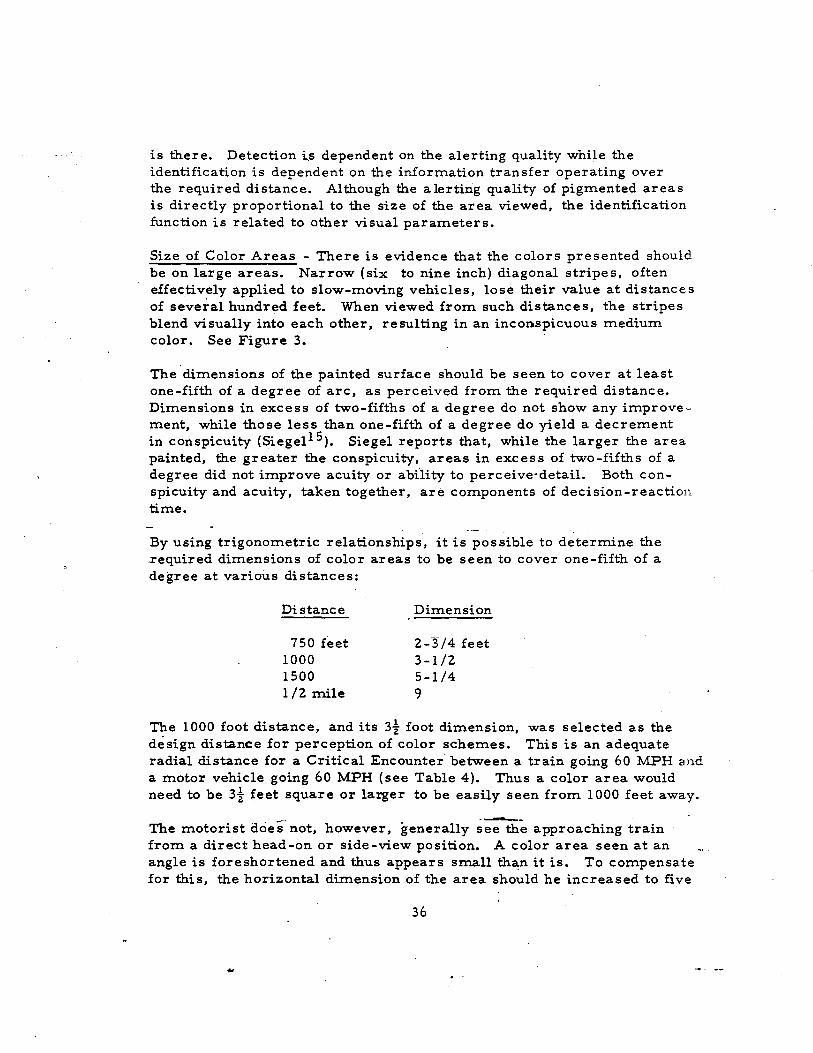
is there. Detection is dependent on the alerting quality while the identification is dependent on the info.rmation transfer operating over the required distance. Although the alerting quality of pigmented areas is directly proportional to the size of the area viewed, the identification function is related to other visual parameters.
Size of Color Areas - There is evidence that the colors presented should be on large areas. Narrow (six to nine inch) diagonal stripes, often effectively applied to slow-moving vehicles, lose their value at distances of several hundred feet. When viewed from such distances, the stripes blend visually into each other, resulting in an inconspicuous medium color. See Figure 3. .
The dimensions of the painted surface should be seen to cover at least one-fifth of a degree of arc, as perceived from the required distance. Dimensions in excess of two-fifths of a degree do not show any improve-ment, while those less than one-fifth of a degree do yield a decrement in conspicuity (Siegel15 ). Siegel reports that, while the larger the area painted, the greater the conspicuity, areas in excess of two-fifths of a degree did not improve acuity or abitity to perceive-detail. Both con-spicuity and acuity, taken together, are components of decision-reaction time.
By using trigonometric relationships, it is possible to determine the .required dimensions of color areas to be seen to cover one-fifth of a degree at various distances:
Distance
750 feet 1000 1500 1/2 mile
Dimension
2-1/4 feet 3-1/2 5-1/4 9
The 1000 foot distance, and its 3t foot dimension, was selected as the design distance for perception of color schemes. This is an adequate radial distance for a Critical Encounter between a train going 60 MPH and a motor vehicle going 60 MPH (see Table 4). Thus a color area would need to be 3t feet square or larger to be easily seen from 1000 feet away.
The motorist does' not, however, generally approaching train from a direct head-on or side-view position. A color area seen at an angle is foreshortened and thus appears small it is. To compensa.te for this, the horizontal dimension of the area should he increased to five
36
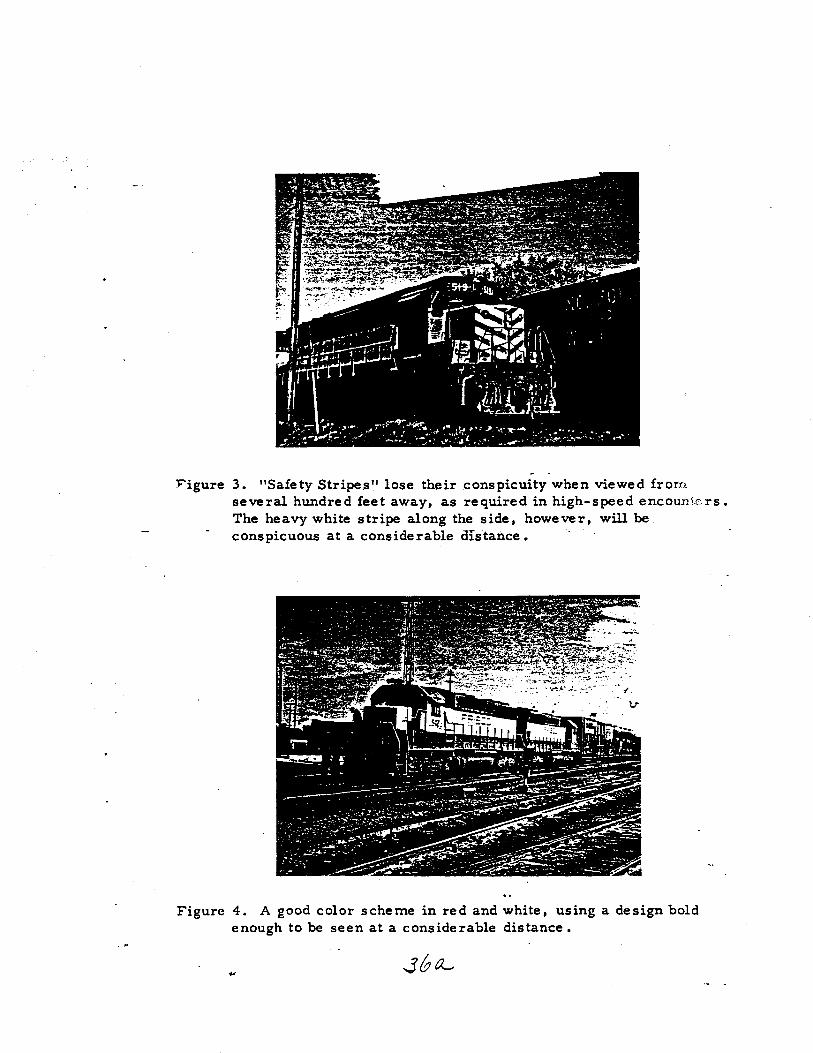
J:'igure 3. "Safety Stripes" lose their conspicuity when viewed from several hundred feet away. as required in high-speed encounters. The heavy white stripe along the side. however. will be conspicuous at a considerable distance.
Figure 4. A good color scheme in red and white. using a design bold enough to be seen at a considerable distance.

feet. Thus the reco:m:mended :mini:mu:m color area for application to loco:motives is 3t feet high by 5 feet wide. See Figure 4.
Specific Colors - If the contrast between target and background bright-ness is high, the addition of color contributes little to the visual acuity. When the brightness contrast is low, color can i:mprove the visual acuity appreciably. However, acuity or visual resolution is increased :much :more by i:mproved brightness contrast than by increasing color contrast. It is true that detection is increased for both high brightness contrast and high color contrast. However, no single color :meets all of the require:ments necessary for :maxi:mu:m visibility under all terrain condi-tions and sky brightness. Yellow has the greatest reflectance, hence is the :most sti:mulating relative to brightness. (The brightness contrasts and conspicuity of pig:ments are reported by Siegel 15 , CookS, and Bynurn3 ).
Fluorescent and ordinary pig:ments have different spectral energy radiation patterns. Fluorescent pig:ments absorb energy £ro:m the green, blue and near ultraviolet region of the spectru:m, and re-e:mit this energy in a narrow spectral band. Conventional pig:ments si:mply absorb the light energy of other colors than pig:ment color, and reflect light of pig:ment color. Thus, under blue light, conventional orange pig:ments appear very dark while fluorescent orange pig:ments appear bright orange.
As in regular pig:ments, the fluorescent yellow/yellow-orange yields the :maxi.:mu:m brightness a:mong fluorescent pig:ments (Hanson8 ). The use of a fluorescent pig:ment increases the brightness of the painted surface and increases its conspicuity under conditions of contrast.
Blackwelll , £ro:m a study of chro:matic and achro:matic sti:muli, reco:m:mende that for overall effectiveness fluorescent yellow":orange be used, concluding that this color at a wavelength of approxi.:mately 555:mu has three ti:mes the reflectivity of orange, and approxi:mately four ti:mes the reflectivity of its corresponding ordinary pig:ment (See Morganll reco:m:mends:
1.
z.
3.
4.
Choose a color that contrasts :most with the colors in the background.
Choose a brightness that differs as :much as possible fro:m the background. Pick white or bright colors for targets on black backgrounds and vice versa. ---Use a fluorescent color for targets against dark backgrounds.
Use as large an area of solid color as
37
5. If the target has to be seen against various kinds of backgrounds, have the target in two contrasting colors, dividing the target so as to make the two areas of solid color as big as possible. One or the other of the two colors will contrast with most backgrounds.
Colors for Contrast - In line with the last recommendation, the literature indicates that reducing the brightness of the less bright contrasting color will yield increased conspicuity and that blue or a low-reflectance red might be recommended as the color against which the bright color is to be applied and viewed. Siegel I 5 reports that white or navy blue in com-bination with fluorescent red-orange improves conspicuity. Actually a generalization would indicate that coupled with a high-brightness color should be a low brightnes s color of maximum color contrast. However, two complementary colors attenuate each other's saturation, resulting in the experience of the gray attribute of brightness.
Conventional red is considered to offer good contrast with a wide variety of colors found in nature. However, it has the lowest reflectivity, poorest detection and recognition time under almost all daylight conditions. At twilight the shift in apparent brightness (Purkinje effect) is away from the red (Appendix F). In effect, red it the first color to approach black in conspicuity with a loss in the level of ambient lighting.
Stainless Steel - While not a common finish on locomotives, it is quite -popular on late-model multiple-unit cars. This finish is a kind of no-color which, particularly when dirty, can blend into the background very easily. The best contrast to no-color is a highly saturated one, such as fluorescent red. Contrasting color areas, in the form of paint or of panels, should be applied to the front and sides to offset the camouflage effect of the stain-less steel background.
_ Light Sources in Daylight - They can have considerable value in enhancing conspicuity, but extremely high intensity is required to afford sufficient contrast to the already very bright background. The time contrast afforded' by a light sources that flashes (or by a sweeping motion, appears to flash) further improves the conspicuity of the light source. The required inten-sities can be obtained by direct viewing of the beam of an incandescent sealed-beam lamp (on-axis) or a high-intensity xenon strobe lamp.
Conspicuity at Night -
When lights are visible, a driver's ability to diffez:entiate these lights from the surrounding terrain and random illuminations, determines their
38
conspicuity. As the output of these lights approaches that of the surrounding countryside and the conspicuity approaches zero, there is a corresponding increase in decision-reaction time. The chief correlate of this is the extra time required for recognizing the light source as a train. The conspicuity of a light signal can be considered to be a function of the Signal-to-Noise Ratio, SIN. Surrounding lights, extraneous stimuli, and light energy not directly related to the signal light represent the noise against which the train signal must be evalu-ated.
In order to attract the attention of the motorist, a light stimulus must alert him even when he is not looking directly at it. Direct view is generally only utilized when an active search is being made for a stimulus. Conditions may arise when the auditory stimulus which cues the direct visual search has not been received. In these cases non-direct vision (peripheral) may become the prime mode of attention getting. Active visual search should not have to be a requirement for visual perception of an approaching train.
Xenon strobe lights, because of their pulse frequency of approximately one flash per second, are approximately five times greater in signaling effectiveness than are fixed sources of light of equal intensity (Douglas(').
quality of such lights is the penetrability of Xenon light through fog, rain and snow. Since such lights ar"; used for" gerieral illumina-tion of stationary objects, their conspicuity is enhanced by maintenance 0f a high signal/noise ratio.
Estimation of Distance - A locomotive headlight or similar lamp, when viewed from a distance of several hundred feet, is perceived as a point; that is, it has no dimension of size. -- Such a light is called a 'point source'. Point source lights are judged as being at a greater distance than they really are. This type of light does not aid an observer to judge depth. To overcome this problem and in turn to allow for a better approximation of distance, two different kinds of light are proposed: paired lights and an area light.
At distances such as those used in decisions in control of high-speed vehicles, binocular cues contribute little or nothing to the experience of depth perception. Depth perception at these distances, rather, depends upon the observer estimating from a known dimension on the perceived A motorist is actual size of an auto. (or a truck or a locomotive), and can estimate its distance from its perceived size. At night, the spacing of the headlights of an oncoming car permit the same sort of estimation (many drivers are very nervous on meeting a car with one inoperative headligRt because this cue is missing).
39
A single flashing roof light, while important as an alerting stimulus, contributes little to depth perception. The utilization of two flashing lights at a fixed distance from each other would contribute much to the perception of distance.
A panel light of standardized size, provides a distinctive, known dimension from which distance may be estimated by an approach-ing motor vehicle operator.
Movement - There are many conditions under which the motorist has difficulty perceiving the locomotive as a moving vehicle. Normally, to be seen as a moving object, one or more of the psychological or physiological cues to changing depth perc;:eption should be present. Frequently, these cues are lacking. Viewed head-on, to be seen as moving, the train must be seen to grow in size. This growth rate is a function of speed and the relative size of the object on the retina of the eye, that is, the proximity of the object. If the- time interposed between two 'or more viewings Of the object is greater, then the object appears more readily moving. A single sighting, however, does not permit the discrimination between a moving and a fixed object.
In a similar way, relative motion of an object is dependent on the objeci.: . seen against a background. The object, to be seen as moving, must be changing its position relative to other objects, conditions, etc. A light seen in the distance, at night, must be seen as its changes relative to other lights, occluding objects and terrain if it is to be per-ceived as a moving li-ght. Two or more lights presented sequentially within specific range of periodicity appear as a moving light (Wood-worthl , Gibspn 7). This effect is responsible for the experience of motion in moving pictures, theatre marquee light movement, airport runway flashers, etc.
,,' Two xenon strobe lights are suggested to improve the conspicuity of
approaching tain, under almost all environmental conditions. They will also satisfy the requirement that identification of the train as a moving vehicle is necessary if the motorist is to see it as a threat. Xenon strobe lights can illuminate the surrounding terrain and cut through low levels of atmospheric transmissivity. In pairs, they serv:e to alert viewers"by apparent movement, extre'ine effectiveness of light output, and wide angle of view (Projector 13, 14, Kinchla 10).
40
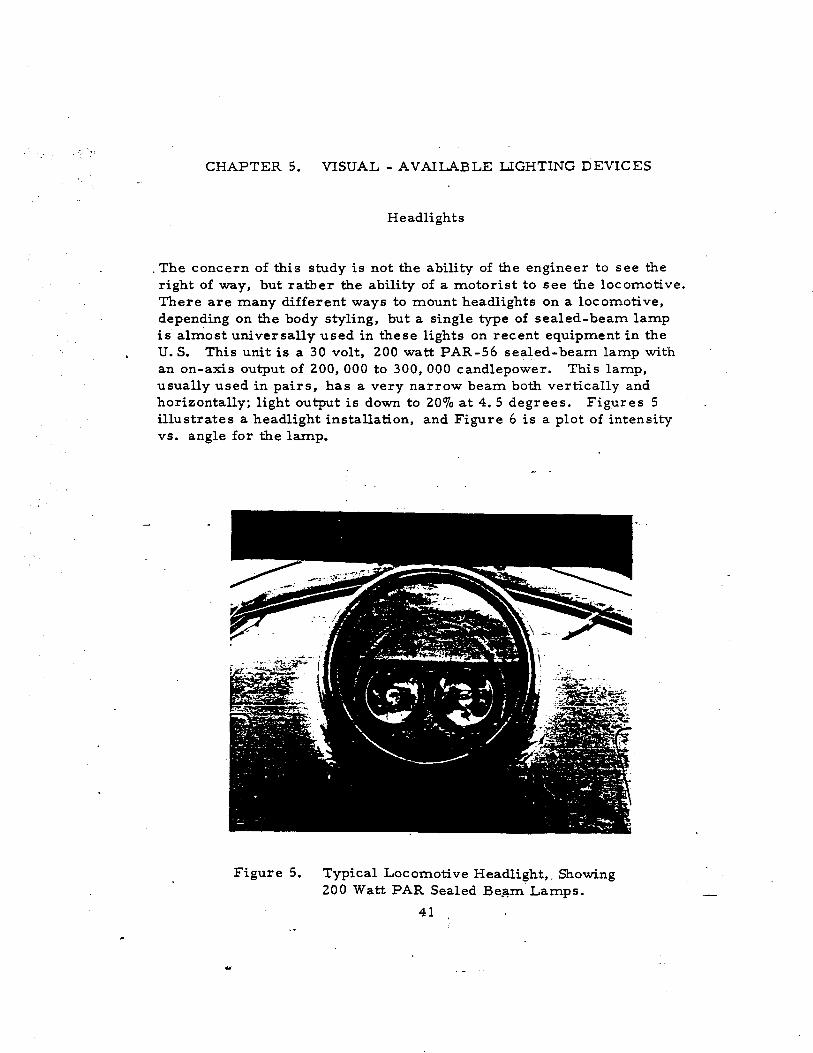
CHAPTER 5. VISUAL - AVAILABLE LIGHTING DEVICES
Headlights
. The concern of this study is not the ability of the engineer to see the right of way, but rather the ability of a motorist to see the locomotive. There are many different ways to mount headlights on a locomotive, depending on the body styling, but a single type of sealed-beam lamp is almost universally used in these lights on recent equipment in the U. S. This unit is a 30 volt, 200 watt PAR-56 sealed-beam lamp with an on-axis output of 200,000 to 300,000 candlepower. This lamp, usually used in pairs, has a very narrow beam both vertically and horizontally; light output is down to 20% at 4.5 degrees. Figures 5 illustrates a headlight installation, and Figure 6 is a plot of intensity vs. angle for the lamp.
Figure 5. Typical Locomotive Headlight,. Showing 200 Watt PAR Sealed Lamps.
41
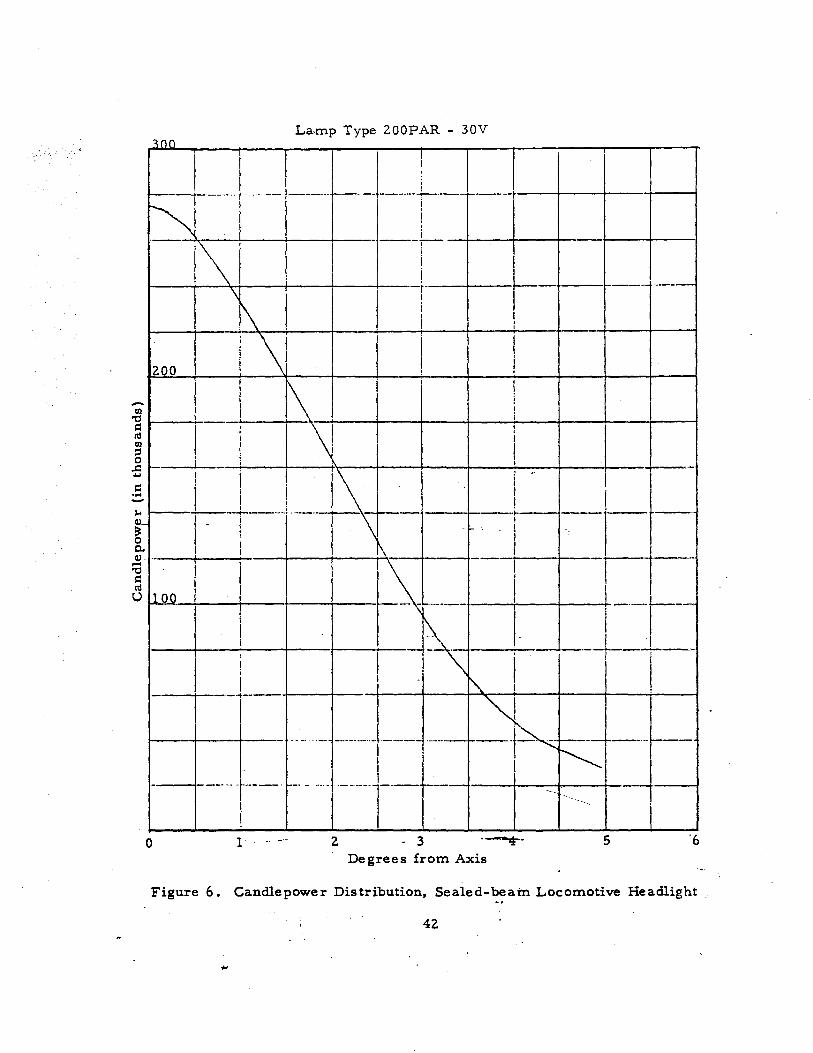
Lamp Type 200PAR - 30V
I ! t-----t------.. .. - .--.. ------r·--- r-----t--+---t---+----i
! 1\' r----t- ! ---
\ 1 I 1\ !!
200 i \1
I
I f\ l 1\ 1 I i
I ! I 1\ i It-._ -·H-L-r t ----+----t---i--j--l----t Loo I ! I I i--i--
I I I l=\' ______ ___ !_ II! I! '\ I' ! I I I - I
I
1---+-----1---- --.. ------ -,--- ------ ---- '--r-I --!
o 1 ... -" 2. - 3 5 6 Degrees from Axis
Figure 6. Candlepower Distribution, Sealed-beam Locomotive Headlight.
42.
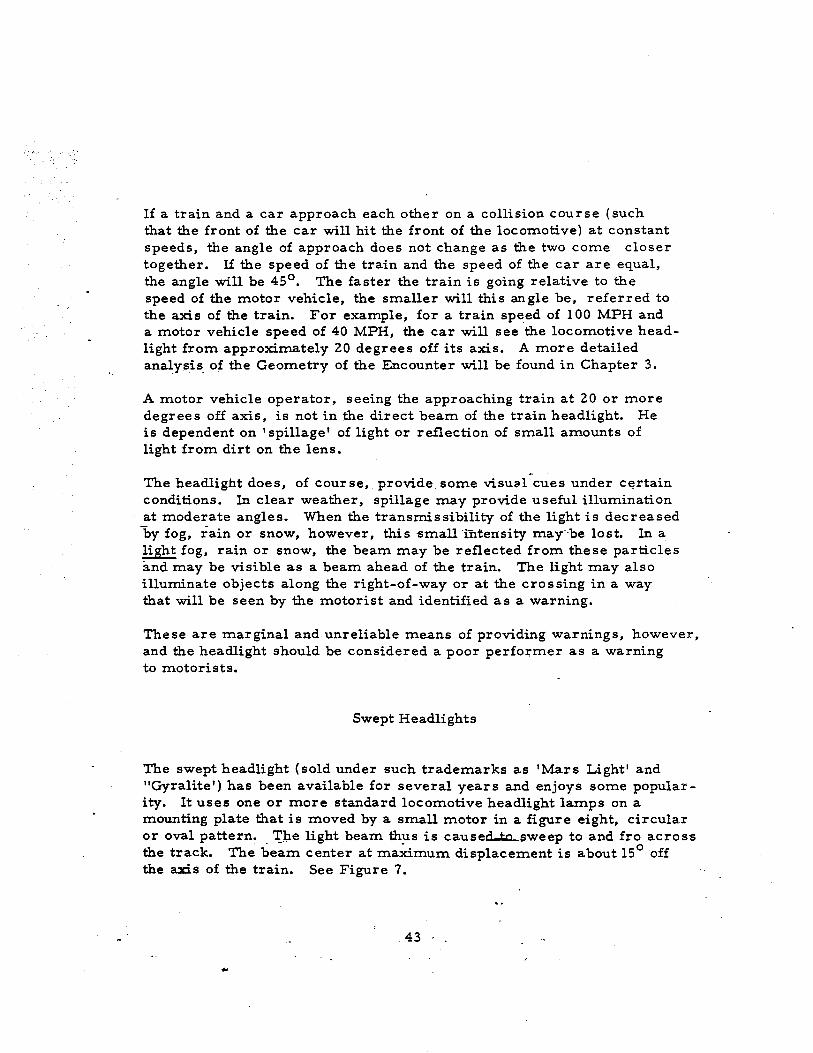
If a train and a car approach each other on a collision course (such that the front of the car will hit the front of the locomotive) at constant speeds, the angle of approach does not change as the two come closer together. If the speed of the train and the speed of the car are equal, the angle will be 45 0 • The faster the train is going relative to the speed of the motor vehicle, the smaller will this angle be, referred to the axis of the train. For example, for a train speed of 100 MPH and a motor vehicle speed of 40 MPH, the car will see the locomotive head-light from approximately 20 degrees off its axis. A more detailed
of the Geometry of the Encounter will be found in Chapter 3.
A motor vehicle operator, seeing the approaching train at 20 or more degrees off axis, is not in the direct beam of the train headlight. He is dependent on 'spillage' of light or reflection of small amounts of light from dirt on the lens.
The headlight does, of course, provide_ some visual cues under conditions. In clear weather, spillage may provide useful illumination
.. at moderate angles •. When the transmissibility of the light is decreased by fog, rain or snow, however, this small -intensity mayo-be lost. In a light fog, rain or snow, the beam may be reflected from these particles and may be visible as a beam ahead of the train. The light may also illuminate objects along the right-of-way or at the crossing in a way that will be seen by the motorist and identified as a warning.
These are marginal and-unreliable means of providing warnings, however, and the headlight should be considered a poor performer as a warning to motorists.
Swept Headlights
The swept headlight (sold under such trademarks as 'Mars Light' and "Gyralite') has been available for several years and enjoys some popular-ity. It uses one or more standard locomotive headlight laIIlps on a mounting plate that is moved by a small motor in a figure eight, circular or oval pattern. _ 'J;::he light beam is caused...ta...sweep to and fro across the track. The beam center at maximum displacement is about 15 0 off the axis of the train. See Figure 7.
43
Figure 7. Swept Headlight
Swept headlights share with ordinary headlights the problem tbat motorists normally encounter the train at an angle too far. off axis to be caught by the direct beam of the light.
The principal value of the swept headlight in the grade-crossing en-counter is its ability to illuminate objects along the right-of-way and at the crossing. The sweeping action makes this light far more effec-.tive for this purpose than fixed lamps because the 150 sweep angle enables the light to pick out objects a short distance from the track and because the motion of the light causes the illuminated objects to 'flash'. It should be noted that the swept headlight can provide warning when the view of the train itself -is obstructed-:--
The motorist, seeing flashes of light off objects (such as crossbuck signs), can easily conclude that some danger may exist, but he is not
44
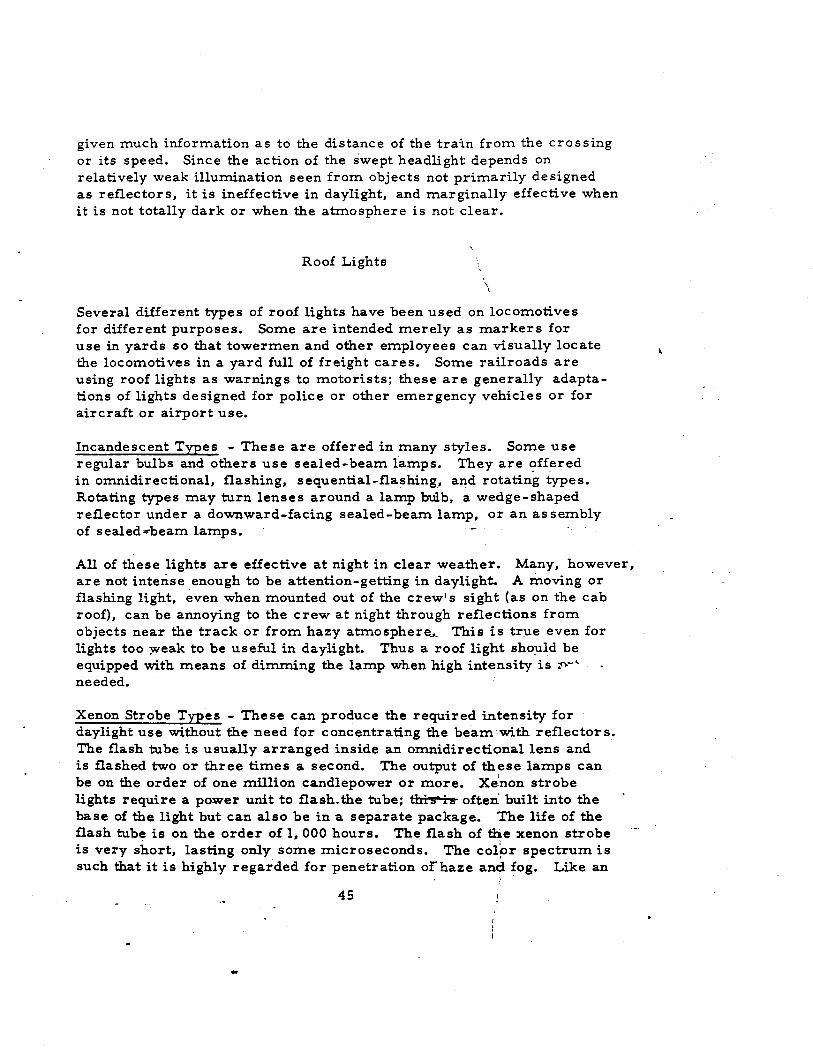
given much information as to the distance of the train from the crossing or its speed. Since the action of the swept headlight depends on relatively weak illumination seen from objects not primarily designed as reflectors, it is ineffective in daylight, and marginally effective when it is not totally dark or when the atmosphere is not clear.
Roof Lights
\
Several different types of roof lights have been used on locom.otives for different purposes. Some are intended merely as markers for use in yards so that towerm.en and other employees can visually locate the locomotives in a yard full of freight cares. Some railroads are using roof lights as warnings to motorists; these are generally adapta-tions of lights designed for police or other emergency vehicles or for aircraft or airport use.
Incandescent Types - These are offered in many styles. Some use regular bulbs and others use sealed-beam lamps. They are c;>ffered in omnidirectional, flashing, sequential-flashing, and rotating types. Rotating types may turn lenses around a lamp bulb, a wedge-shaped reflector under a downward-facing sealed-beam lamp, or an as sembly of sealed--beam lamps.
All of these lights are effective at night in clear weather. Many, however, are not intense enough to be attention-getting in daylight. A moving or flashing light, even when mounted out of the crew's sight (as on the cab roof), can be annoying to the crew at night through reflections from objects near the track or from hazy atmosphere ... _ This is tr:ue even for lights too yveak to be useful in daylight. Thus a roof light should be equipped with means of dimming the lamp when high intensity is needed.
Xenon Strobe Types - These can produce the required intensity for daylight use without the need for concentrating the beam 'with reflector s. The flash tube is usually arranged inside an omnidirectional lens and is flashed two or three times a second. The output of these lamps can be on the order of one million candlepower or more. strobe lights require a power unit to flash. the tube; thi"S" is often built into the base of the light but can also be in a separate package. The life of the flash tube is on the order of 1,000 hours. The flash of the xenon strobe is very short, lasting only some m.icroseconds. The colpr spectrum is such that it is highly regarded for penetration orhaze anc;i fog. Like an
45
..
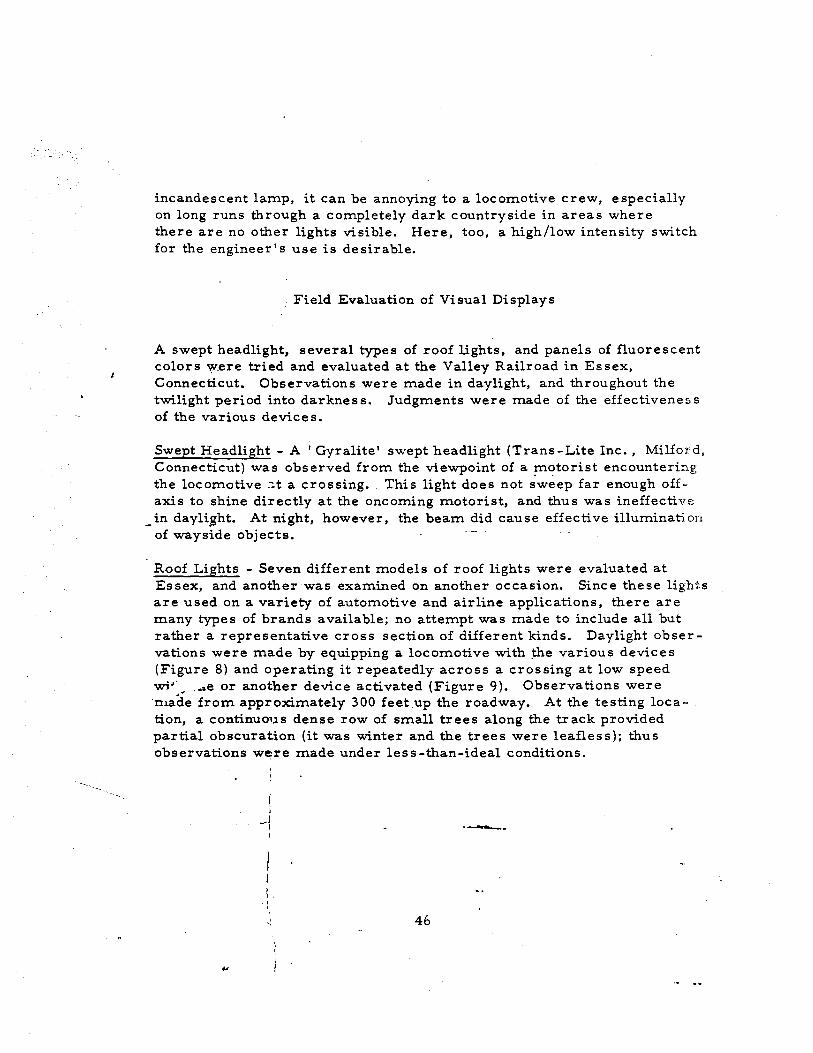
incandescent lamp, it can be annoying to a locomotive crew, especially on long runs through a completely dark countryside in areas where there are no other lights visible. Here, too, a high/low intensity switch for the engineer's use is desirable.
Field Evaluation of Visual Displays
A swept headlight, several types of roof lights, and panels of fluorescent colors were tried and evaluated at the Valley Railroad in Essex, Connecticut. Observations were made in daylight, and throughout the twilight period into darkness. Judgments were made of the effectiveness of the various devices.
Swept Headlight - A 'Gyralite' swept headlight (Trans-Lite Inc., Milford, Connecticut) was observed from the viewpoint of a !flotorist encountering the locomotive .::.t a crossing. This light does not sweep far enough axis to shine directly at the oncoming motorist, and thus was ineffective
_in daylight. At night, however, the beam did cause effective illumination of wayside objects.
Roof Lights - Seven different models of roof lights were evaluated at Essex, and another was examined on another occasion. Since these lights are used on a variety of automotive and airline applications, there are many types of brands available; no attempt was made to include all but rather a representative cross section-of different kinds. Daylight obser-vations were made by equipping a locomotive with the various devices (Figure 8) and operating it repeatedly across a crossing at low speed wi' or another device activated (Figure 9). Observations were nlade from approximately 300 feet up the roadway. At the testing loca-tion, a dense row of small trees along the track provided partial obscuration (it was winter and the trees were leafless); thus observations were made under less-than-ideal conditions.
i I
--j ---. I
I \ . l
46
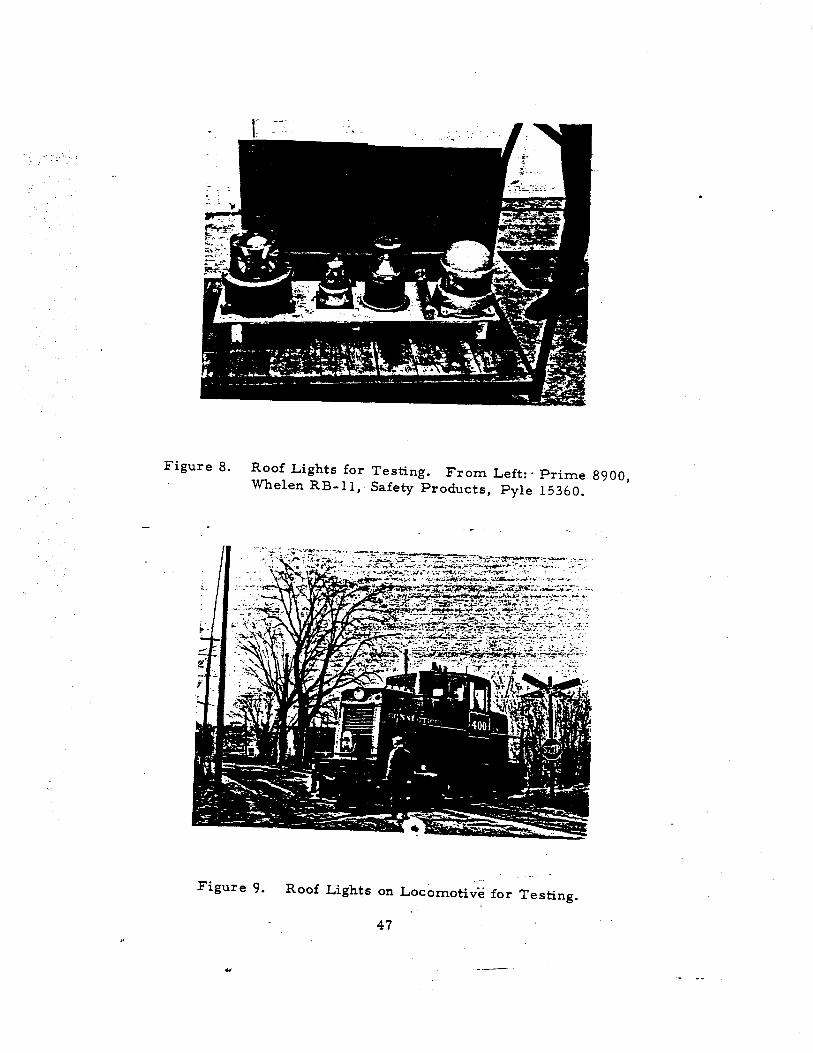
--- : . . .
Figure 8. Roof Lights for Testing. From Left:· Prime 8900, Whelen RB-ll, Safety Products, Pyle 15360.
Figure 9. Roof Lights on Locomotive for Testing.
47
...
The following summarizes the models tested and the results:
1. Prime Manufacturing Corp., Oak Creek, Wisconsin: Model 8900. This light uses three 75 watt sealed-beam lamps which are flashed sequentially to simulate rotation without moving parts. This device was judged poor in daylight because the fixed-position lamps did not provide full brightness at all angles. An observer not posi-tioned in just the right spot did not receive visual impact.
2. Pyle 15360 'Roof Gyralite ' ; Trans-Lite Inc., Milford, Connecticut. This light has a sealed-beam lamp in its upper dome, which is aimed down on a wedge-shaped reflector which is rotated. It provided good visual impact in daylight.
3. Safety Products Co., Chicago, Illinois. No model number. A strobe lamp, using a thin ring-shaped flash tube concentric with a reflector that resembles two cones stuck together at the apexes. The light output of this unit was too small to be effective in daylight.
4. Western-Cullen Division, Federal Sign and Signal Corp., Chicago, Illinois: Model D-312. Two 75 watt sealed:-beam incandescent lamps mounted back-to-back and rotated by a motor. This lamp was not tested at Essex, but it was examined and judged likely to be effective in daylight.
5. Whelen Engineering Co., Inc., Deep River, Connecticut: Model RB=ll. This device uses a light bulb with three magnifying lenses arranged around it and rotated. The light output of this-unit was too small to be effective in daylight.
6. Whelen: Model 2700 Dual Strobe. Two high-output strobe lamps, which for the evaluation were mounted one on each side of the cab roof. The manufacturer claims 1, 000, 000 candlepower, and these were the best performers of all lamps tested in daylight.
7. Whelen: Model 2500 Dual Strobe. Similar to the 2700 but smaller. Very good visual impact in daylight.
8. Whelen: Model 2800 Dual Seal Beam Strobe. The strobe tubes of this unit are mounted in separate sealed:'''be"a"m reflectors looking something like automobile foglights. These make no claim to cover all angles and were not compared with the other units. Their on-axis output is very high. .
48
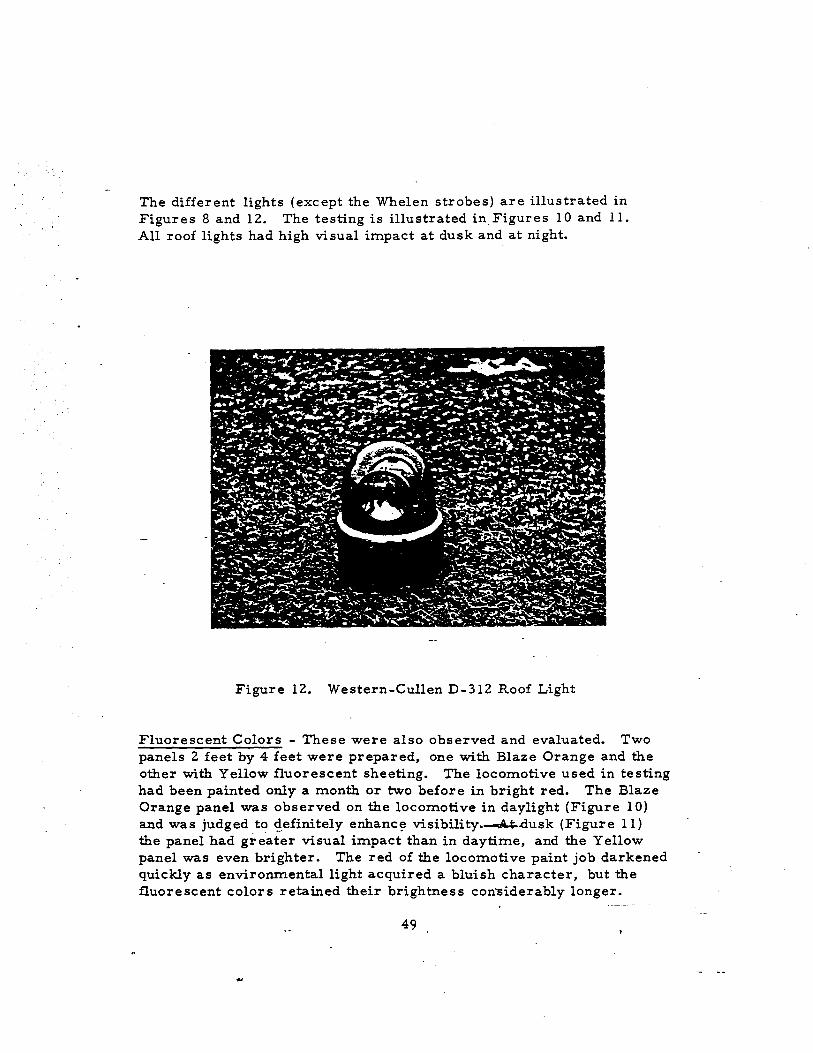
The different lights (except the Whelen strobes) are illustrated in Figures 8 and 12. The testing is illustrated in Figures 10 and 11. All roof lights had high visual impact at dusk and at night.
Figure 12. Western-Cullen D-3l2 Roof Light
Fluorescent Colors - These were also observed and evaluated. Two panels 2 feet by 4 feet were prepared, one with Blaze Orange and the other with Yellow fluorescent sheeting. The locomotive used in testing had been painted only a month or two before in bright red. The Blaze Orange panel was observed on the locomotive in daylight (Figure 10) and was judged to visibility.-A.;...dusk (Figure 11) the panel had greater visual impact than in daytime, and the Yellow panel was even brighter. The red of the locomotive paint job darkened quickly as environmental light acquired a bluish character, but the fluorescent colors retained their brightness con-siderably longer.
49

CHAPTER 6. VISUAL - EMPIRICAL EXPERIMENT
Purpose and General Method Used
An empirical evaluation was made of the devices which might meet the requirements for high conspicuity of locomotives. The objective was to find out how people would react to different visual treatments for locomotives under many different background and ambient light condi-tions.
Relative Conspicuity - The attention-getting quality of a visual stimulus depends on the observer. The signal detection is facilitated if the sub= ject is actively seeking the signal source. In experiments if a subject is asked to report when a specific stimulus is observed, he anticipates the reception and actively looks for the signal. Since a visual signal, to be alerting, should be 100 to 1000 times its threshold, an experi-mental approach based on Idirectedl attention is not useful. When the experimental subjects used are asked to report when they see the
their actions are directed and the alerting quality of the signal is enhanced by the subjectsl expectancy.
An approach to conspicuity which eliminates this problem is to have the subjects judge the relative conspicuity of a stimulus. Errors of judgment are decreased if pairs of stimuli are presented for judgment of the superiority of one over the other. Each of the experimental stimuli are paired with all other stimuli (method_of Paired Comparisons). The votes are tallied and the adequacy of the discrimination subjected to a statis-tical test. The sign test was selected as the most appropriate non-parametric method for this problem (Siegel16).
Experimental Method - A panel of test subjects, all licensed drivers, viewed the various visual displays as photographed on Kodachrome 35 millimeter slides. The slides were presented in pairs, projected simultaneously side-by-side. Panelists were asked to choose from each pair of slides the locomotive of greatest conspicuity. Conspicuity was defined as Imost readily seenl, or Imost attention-getting l • The selected choices were entered on individual sheets for later tabulation •
. -. The locomotive used for the photographs was a s'cale model of the GP-35 hood-type unit. The use of a scale model facilitated the fixing of experimental light sources and the application of various color schemes.· It also made. it possible to obtain different ambient lighting and background
. 50 : i
-.

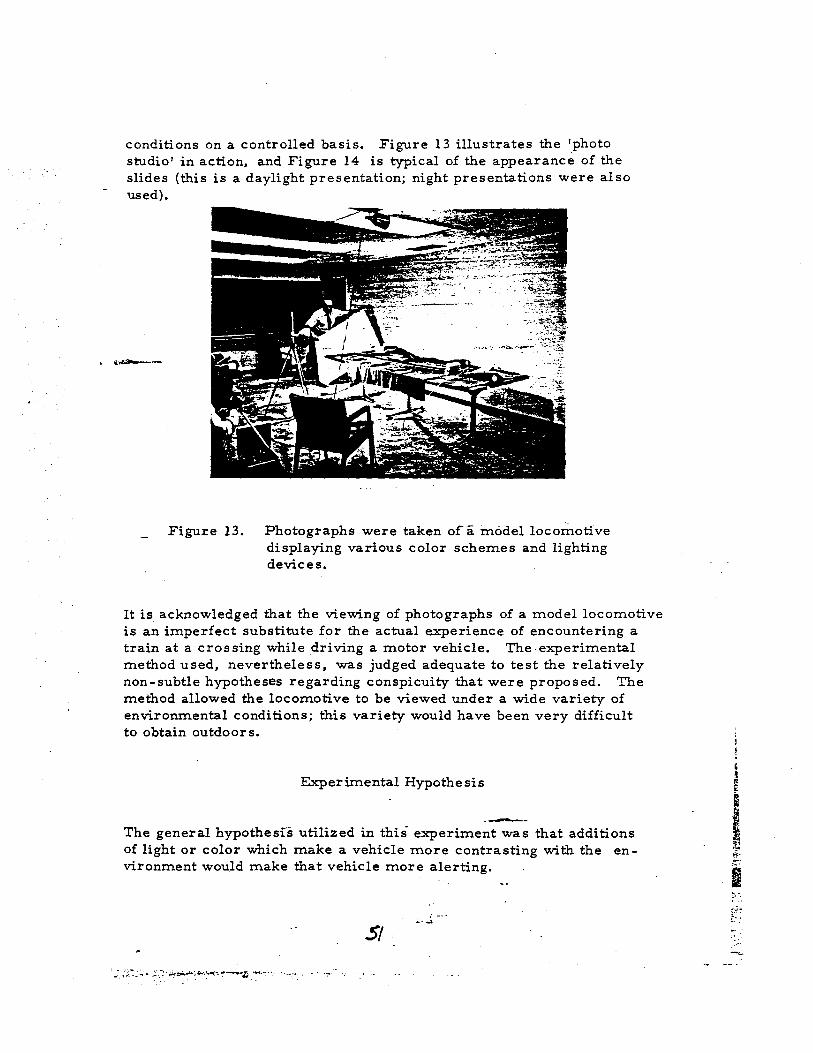
conditions on a controlled basis. Figure 13 illustrates the 'photo studio' in action, and Figure 14 is typical of the appearance of the slides (this is a daylight presentation; night presentations were also used).
Figul:e 13. Photographs were taken ora model locomotive displaying various color schemes and lighting devices.
It is acknowledged that the viewing of photographs of a model locomotive is an imperfect substitute for the actual experience of encountering a train at a crossing while driving a motor vehicle. The-experimental method used, nevertheless, was judged adequate to test the relatively non-subtle hypotheses regarding conspicuity that were proposed. The method allowed the locomotive to be viewed under a wide variety of environmental conditions; this variety would have been very difficult to obtain outdoors.
Experimental Hypothesis
.--The general hypothesfs utilized in this' experiment was that additions of light or color which make a vehicle more contrasting with the en-vironment would make that vehicle more alerting.
51 l---
Daylight - As discussed previously (Chapter 4), an examination of the literature on conspicuity was conducted to provide validation for the assumptions and decisions underlying our experiments. To achieve maximum conspicuity, it was determined that two color s should be utilized. The first color employed should contrast with broad sets of environmental conditions, while a second contrasting color should, likewise, be in contrast with a complementary set of environmental conditions. A dark background color - medium blue - was selected with a contrasting bright foreground - yellow.
A set of hypotheses were developed for conspicuity during daylight. These were:
1. That a pigmented area of low-medium brightness achieves greater conspicuity when employed with a color of contrasting brightness.
2. A bounded stimulus area is more effective in establishing a greater contrast than the non:-bounded a:rea.
3. The brighter pigments are more effective in increasing con-spicuity than the less bright paints.
-The candidate colors were selected as follows:
1. Blue vs. blue background with black band. The medium blue will provide a modal contrast with a high background brightness. It will be improved by the utilizatio!! of a black band which would increase the contrast of the plue when seen against a bright back-ground. That is, it is hypothesized that the addition of a black band improves conspicuity.
2. Blue vs. blue arid yellow (hypotheSis no. 1).
3. Blue and yellow vs. blue and yellow plus a black band around the yellow (hypothesis no. 2). It is hypothesized that a dilution of the yellow brightness is effected by the blue when there is not a delineation of the two colors by the black band.
4. Blue and ye1l9w plus black vs. blue--aad...fluorescent yellow plus black band (hypotheSis no. 3).
The colors used for this experiment were 'floquil' Model Colors: Great Northern Sky Blue and Reefer Yellow. Fluorescent color was
52
- ----_._-..,....,.,.-
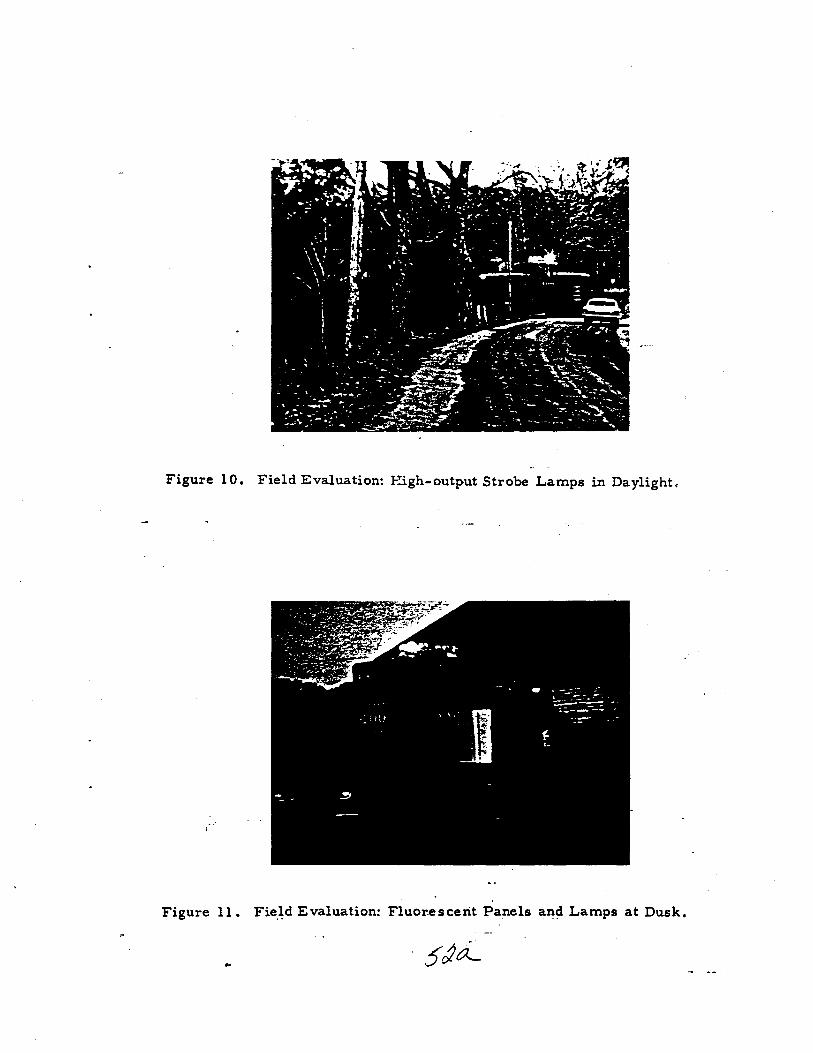
Figure 10. Field Evaluation: Righ-output Strobe Lamps in Daylightc
Figure 11. Evaluation: Fluor.escent Panels Lamps at Dusk.
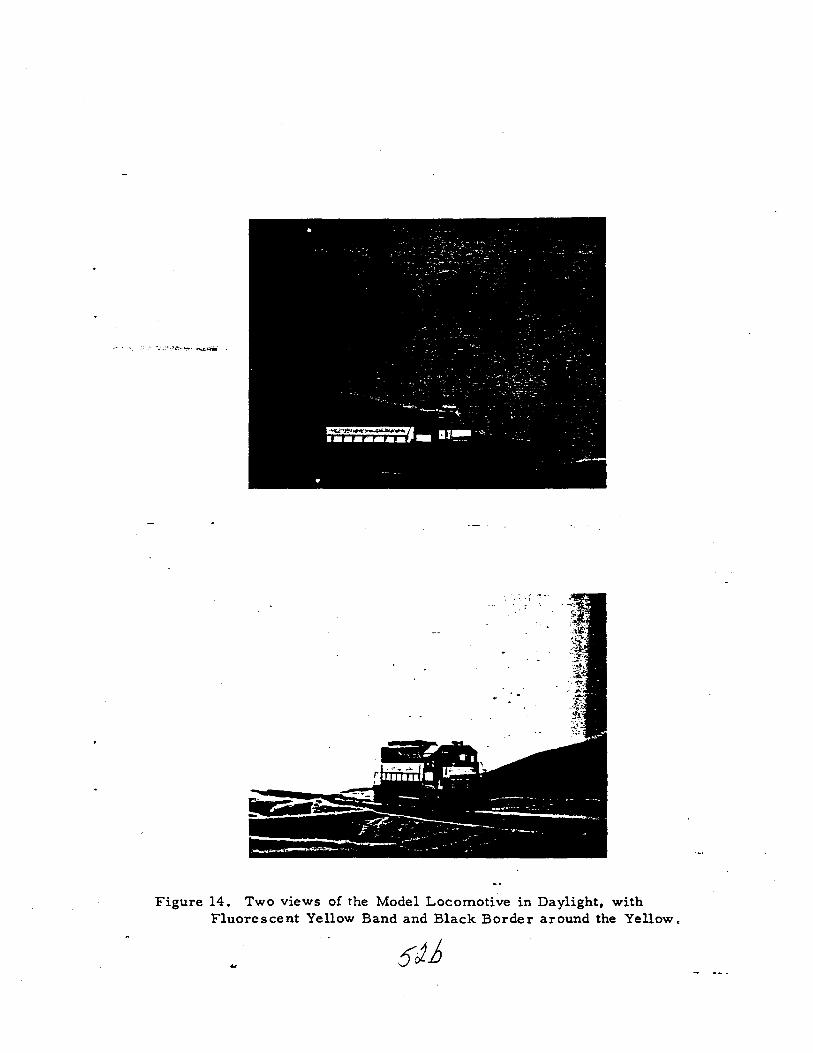
Figure 14. Two views of the Model Locomotive in Daylight, with Fluorescent Yellow Band and Black Border around the Yellow.
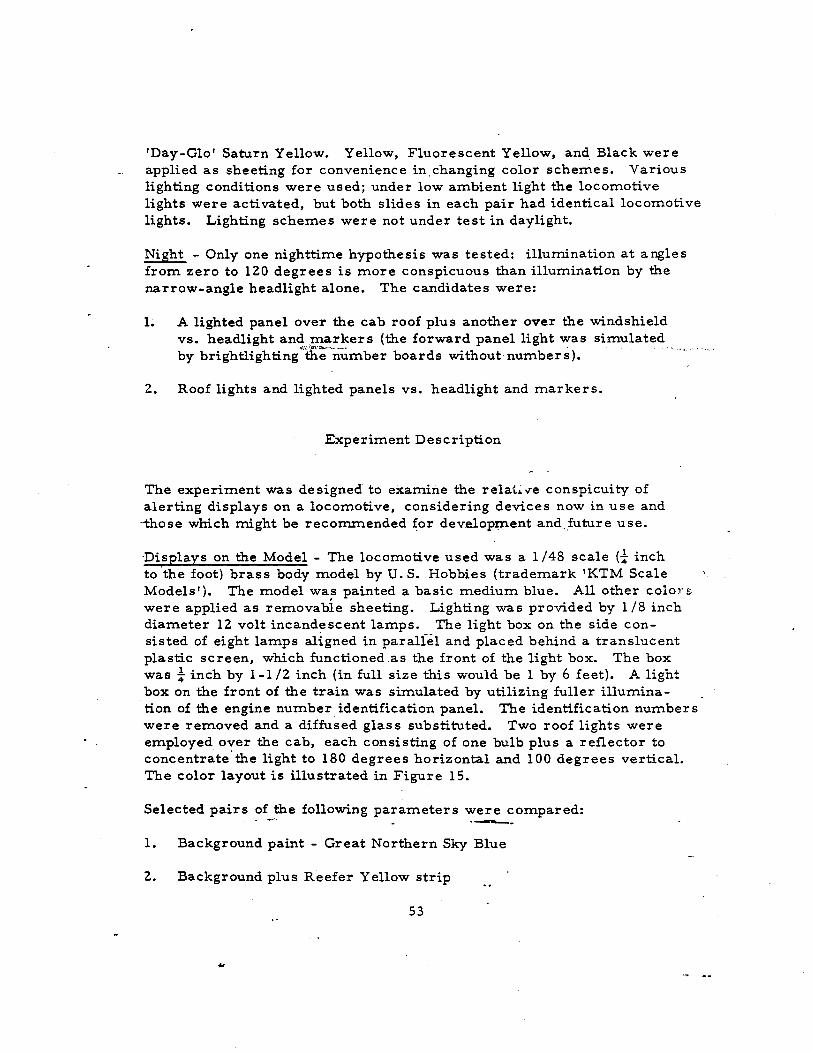
'Day-Glo' Saturn Yellow. Yellow, Fluorescent Yellow, and Black were applied as sheeting for convenience in, changing color schemes. Various lighting conditions were used; under low ambient light the locomotive lights were activated, but both slides in each pair had identical locomotive lights. Lighting schemes were not under test in daylight.
Night - Only one nighttime hypothesis was tested: illumination at angles from zero to 120 degrees is more conspicuous than illumination by the narrow-angle headlight alone. The candidates were:
1. A lighted panel over the cab roof plus another over the windshield vs. headlight and markers (the forward panel light was simulated
.
by brightlighting the number boards without numbers).
2. Roof lights and lighted panels vs. headlight and markers.
Experiment Description
The experiment was designed to examine the conspicuity of alerting displays on a locomotive, considering devices now in use and
-those which might be recommended for developYXlent andJuture use.
'Displays on the Model - The locomotive used was a 1/48 scale (i inch to 'the foot) brass body model by U. S. Hobbies (trademark 'KTM Scale Models'). The model was painted a basic medium blue. All other colo:[ s were applied as removabie sheeting. Lighting was provided by 1/8 inch diameter 12 volt incandescent lamps. The light box on the side con-sisted of eight lamps aligned in parallel and placed behind a translucent plastic screen, which functioned .as the front of the light box. The box was i inch by 1-1/2 inch (in full size this would be 1 by 6 feet). A light box on the front of the train was simulated by utilizing fuller illumina-tion of the engine number identification panel. The identification numbers were removed and a diffused glas s substituted. Two roof lights were employed over the cab, each consisting of one bulb plus a reflector to concentrate' the light to 180 degrees horizontal and 100 degrees vertical. The color layout is illustrated in Figure 15.
Selected pairs following parameters were compared: "-. 1. Background paint - Great Northern Sky Blue
2. Background plus Reefer Yellow strip
53
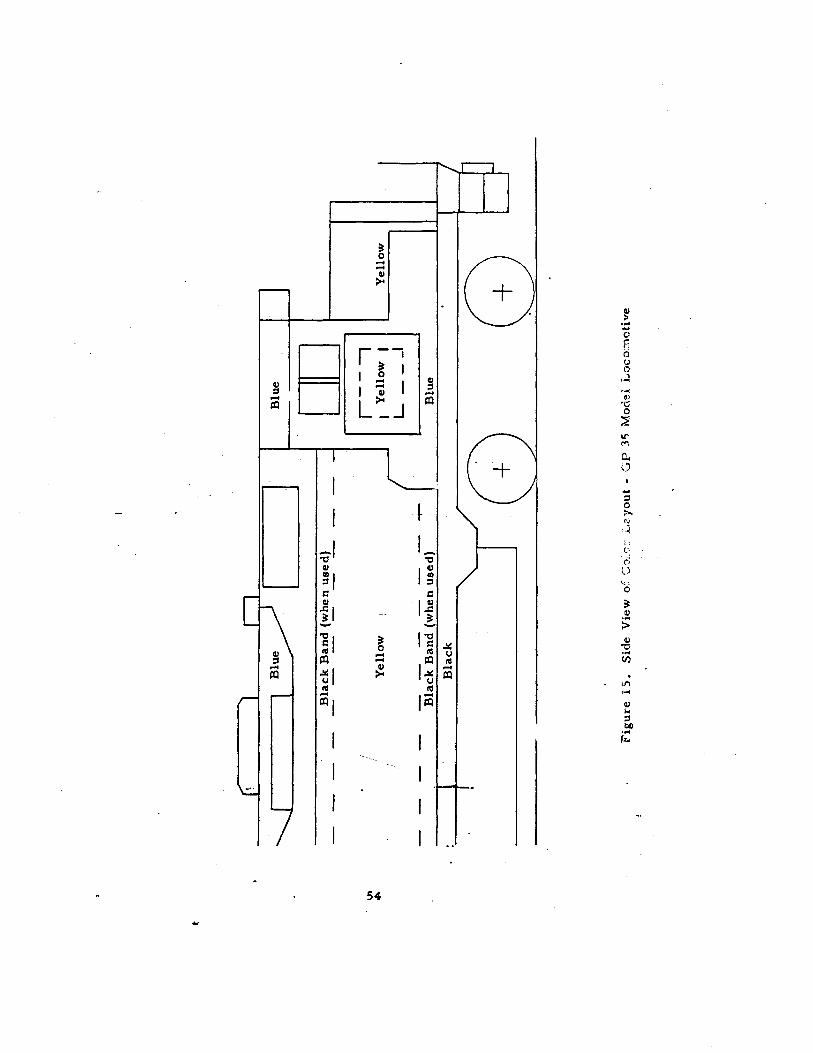
t
U'I .".
- - :
n J -
-
-- l
1
I ,.
Blu
e I
I
DO
Bla
ck B
and
(whe
n us
ed)
-------
--
-r--
--,
Yel
low
!
I Y
ello
w
1 Y
ello
w
L _
__
I -
--
--
--
Bla
ck B
and
(whe
n us
ed)
Blu
e B
lack
0 "
/(+)
__
-----'I
. +
--------
------
-------_
...
---
8 F
igu
re i
5.
Side
Vie
w o
f C'
:};,c;
:-i...
.<.>.y
out
-G
P 3
5 M
odel
Loc
omot
ive
3. Background plus Fluorescent Yellow strip
4. Black band as applied to the above three schemes
5. Ambient light levels and sky brightnesses
6. Angle of view: on-axis to 90 degrees off-axis
7. Regular headlight
8. Roof lights
Panel lights (side)
10. Panel lights (front)
11. Panel lights plus roof lights
12. Various lighting intensities.
Three hundred (300) Kodachrome slides were prepared for all representa-tive variables. From these, thirty-nine pairs of slides were selected for matching conditions, parameter comparisons and selected variables. The selected slides were subdivided into pail'S, matched except for one or more independent variables (see Tables 5 and 6). The pairs of slides in each set were then randomized as to sequence, set and position of pre-sentation (left or right).
The slides were presented on two Eastman Kodak 'Carousel 850' slide projectors. Each projector had a-variable ligl:lt intensity adjustment for fine match_ing of the pairs of slides for overall brightness. The subjects were seated 14-20 feet from the projection screen and each im.age size was approximately four by six feet. The pairs of slides were shown twice to the subjects; the second tim.e inverted both in order and position. This procedure was used to cancel-out position bias, guessing, and indiscriminate choices.
The sets of slides were shown to thirteen subjects, each having driven autom.obiles for from 3 to 35 years. They were asked to choose from each pair of slides the locomotive of greatest conspicuity. Conspicuity was defined Ct'S 'most readily seen' or 'most attention-getting'. The, selected choices were entered on individual sheets for later tabulation. The collected data were then tabulated and the sign test applied. All __ contradictory data were rejected, since these data represented position biases, ambiguous stimuli and indiscriminate choices (Siegel16 ). -
55
Tabulation
The tabulat ed comparisons for daylight conditions are shown in Table 5. The first column in the table is the slide pair identification. The second and third describe the color contrast and boundary, if used, for slide A. The fourth and fifth columns similarly describe Slide B. Column six is the ambient light on the locomotive, and column seven is the sky brightness. The last two columns record the preference indicated by the subjects and the statistical signifi-cance.
Table 6 $hows the comparisons for nighttime. The first column is the slide pair; the second and third indicate the type of lights used for Slide A and Slide B respectively. The fourth column shows the angle of view, and the last two columns record the preference of the subjects and the statistical significance.
Analysis - Daylight
- From the data obtained in the experiment,-improved conspicuity results from the- use. 'of bright colors. The data indicate that the use of a monochromatic paint alone is inferior when compared with its u'se with a contrasting color. For all angles of view and a full-ranged sky brightness and ambient light, a pair of contrasting colors was found to contribute to maximal conspicuity. Yellow is good as a stimu-lus, and a fluorescent color which a greater amount of light is of even greater value than a regular bright yellow pigment.
Utilization of a black band (as suggested by von Fieandtl7 ) on the blue locomotive was not confirmed as being superior. In spite of a medium blue being employed, the general-brightness of the blue was consider-ably darker than the background lighting against which it was viewed •
. The addition of black on the blue did not effectively increase the con-trast of the monochromatic color when seen against both the light and dark background. The added black contributed so little to the contrast ratio as tested that conspicuity did not improve.
Recommendations" - To improve tOe conspictiitYO'i locomotives during daylight conditions, two colors should be used in the color scheme. Each color should contrast with the other, both hue and brightness. Since the brightest color is probably yellow, this color should be
56
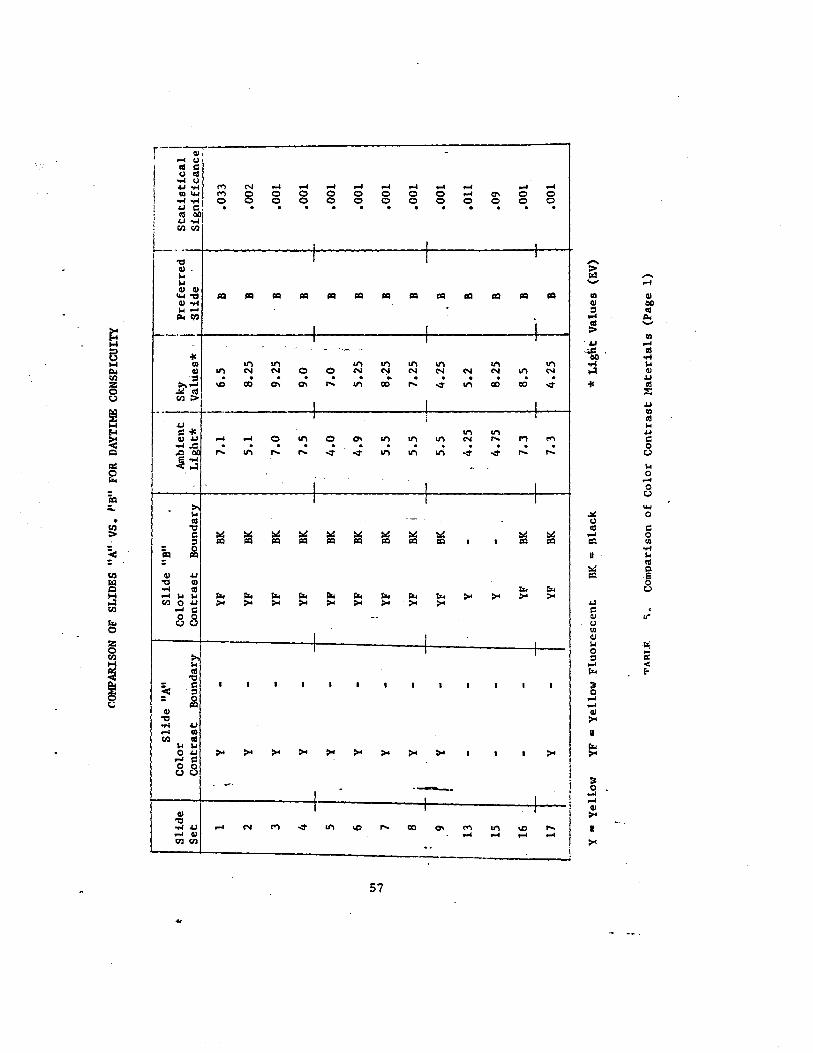
t
Vt
--.l
COM
PARI
SON
OF
SLID
ES "
A'"
VS.
"B
" FO
R DA
YTIM
E C
ON
SPlC
UIT
Y
• "
.•. -
.. -----
--1
S
lide
"A
" Sl
ide
"B"
. ,
I i
Sli
de
Col
or
Col
or
I I
, I
,Am
bien
t Sk
y i P
refe
rred
. S
tati
stic
al
Set
Con
tras
t B
ound
ary
Con
tras
t B
ound
ary
" L
ight
* I
Val
ues*
'S
lid
e'
1 Y
-
YF
BK
7.1
I 6.
5 B
.0
33
\ 2
Y
-YF
BK
5.
1 8.
25
B
.002
3 Y
-
YF
BK
7.0
9.25
B
.0
01
4 Y
-
YF
BK
7.5
9.0
B
.001
-r
--r
--I
--f
--I-
-f-
5 Y
yp
BK
4.
0 7.
0 ,
B
.001
-
. j
6 Y
-
YF
BK
4.9
5.25
B
.0
01
i 7
Y
-YF
BK
5.
5 8,
25
B
.001
8 Y
-
YF
BK
I 5.
5 7.
25
B
.001
:
-J
-I-
-I-
... 1
--I
--l
-
I 9
Y
-YF
BK
5.
5 4.
25
B
.001
I
•
I 13
--
Y
-,
4.25
5.
2 B
.0
11
, 15
-
-Y
-
4.75
8.
25
B
.09
16
--
YF
BK
7.3
8.5
B
.001
.1
--f
--l
-I-
1-'
-
17
Y
-YF
BK
7.
3 4.
25
B
.001
Y -
Yel
low
YF
= Y
ello
w F
luor
esce
nt
BK =
Bla
ck
* L
ight
Val
ues
(EV)
'1'A
IU.F
. ')
. C
ompa
rison
of
Col
or C
ontr
ast
Mat
eria
ls (
Page
1)
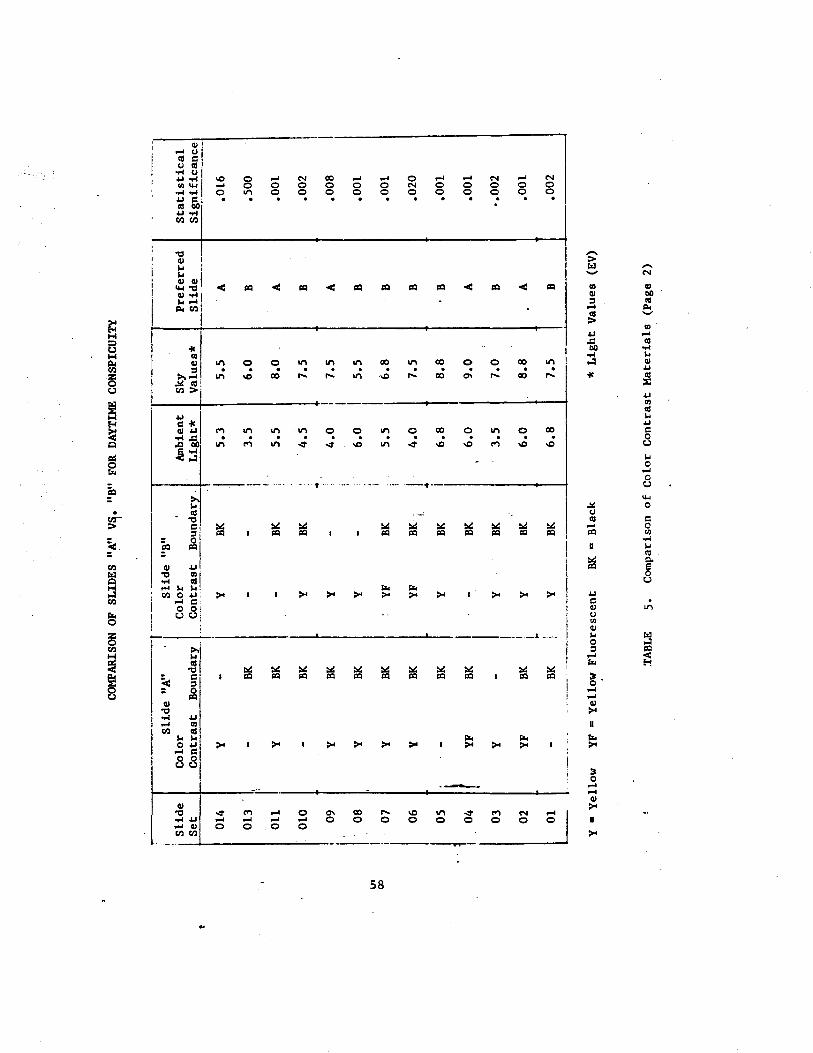
COM
PARI
SON
OF S
LIDE
S "A
" "B
" FO
R DA
YTIM
E CO
NSPI
CUIT
Y
-t ----
------
--._-
----. _
. ---'
".-
.. --
----
-
Sli
de "
A"
. S
lide
"B"
S
lide
C
olor
C
olor
.
I ...
bien
t fkY
Se
t C
ontr
ast
Lig
ht*
Sig!
'ific
ance
t
____
-_ -
014
Y
Y
BK
I 5.
3 5.
5 A
.0
16
013
BK
3.5
6.0
B
.500
r I
011
Y
BK
BK
5.5
I 8.0
A
.001
010
BK
Y
BK
. 4.5
7.
5 B
.0
02
• 4-
09
Y
BK
Y
4.0
I 7.
5 A
.0
08
I !
I' I
08
Y
BK
Y
6.0
I 5.
5 B
.0
01
U1
I I
00
i 07
Y
BK
YF
BK
5.
5 6.
8 B
.0
01
I
I I
I 06
Y
BK
YF
BK
: 4.
0 7.
5 B
.0
20
I. ..
J 05
t BK
I
y BK
!
6.8
8.8
B
.001
04
YF
BK
I BK
6.
0 9.
0 A
.0
01
I _
. I'
03
Y
Y
BK
3.5
7.0
B
·.00
2 I
02
YF
BK
I Y
BK
j
6.0
j 8.8
t A
t .0
01
i .. 01
BK
Y
BK
6.
8 7.
5 B
.0
02
... --
-.-
Y ..
Yel
low
YF
..
Yel
low
Flu
ores
cent
BK
..
Bla
ck
* L
ight
Val
ues
(EV)
TABL
E 5.
C
ompa
rison
of
Col
or C
ontr
ast
Mat
eria
ls (
Page
2)
utilized at its full brightness, whereas the contrasting color, such as blue, red or black, would have a minimum of brightness. The applica-tion of fluorescent colors, such as yellow or yellow-orange, would im-prove the conspicuity more due to the high light output of fluorescent media.
If the background contrasting color is sufficiently dark, there is little need for a band of black to differentiate the two contrasting colors. However, if the background color selected is light to medium light in brightness, a black band around the bright color will improve the spicuity by:-,
...•. ; .. ' . .,.,.-1. Reducing the simultaneous contrast of the two colors and
brightnesses
2. Providing sufficient amounts of dark stimulus for viewing against a bright sky.
It is suggested that the locomotive painted in one basic color have applied to this an area of contrasting color with minimum- dimensions of 3t by 5 feet. This is in keeping with the recommendations that 1/5 degree of visual arc is desirable as the minimum for viewing. Three and one-half feet is' perceived as 1/5 degree of _arc at a distance oLlOOO feet; 5 feet is perceived as 1/5 degree of arc at 1000 feet if viewed from 45 0 off perpendicular.
As Darkness Approaches - The range of conditions under which the locomotive is to be seen ranges from high to very low levels of illumina-tion. It may be seen against a sky ranging in brightness from extremely bright, as into the sun, to extremely low, such as in storm clouds and at dusk. While paints are conspicuous during the'daylight conditions, their effectiveness begins to wane towards dusk. Not only is there the shift in which the apparent brightness of chromatic hues changes, but as the amount of ambient light continues to decrease, the chromatic stimulus approaches zero while the brightness (achromatic) component continues its effectiveness until that, too, goes to zero. Use of a bright, or better, fluorescent color is a definite aid to maintaining conspicuity at low ambient light levels.
Analysis - Nigh-r--
The results tabulated in Table 6 indicate for all angles of view the front panel lights are superior to the reg:ular headlight. The
59
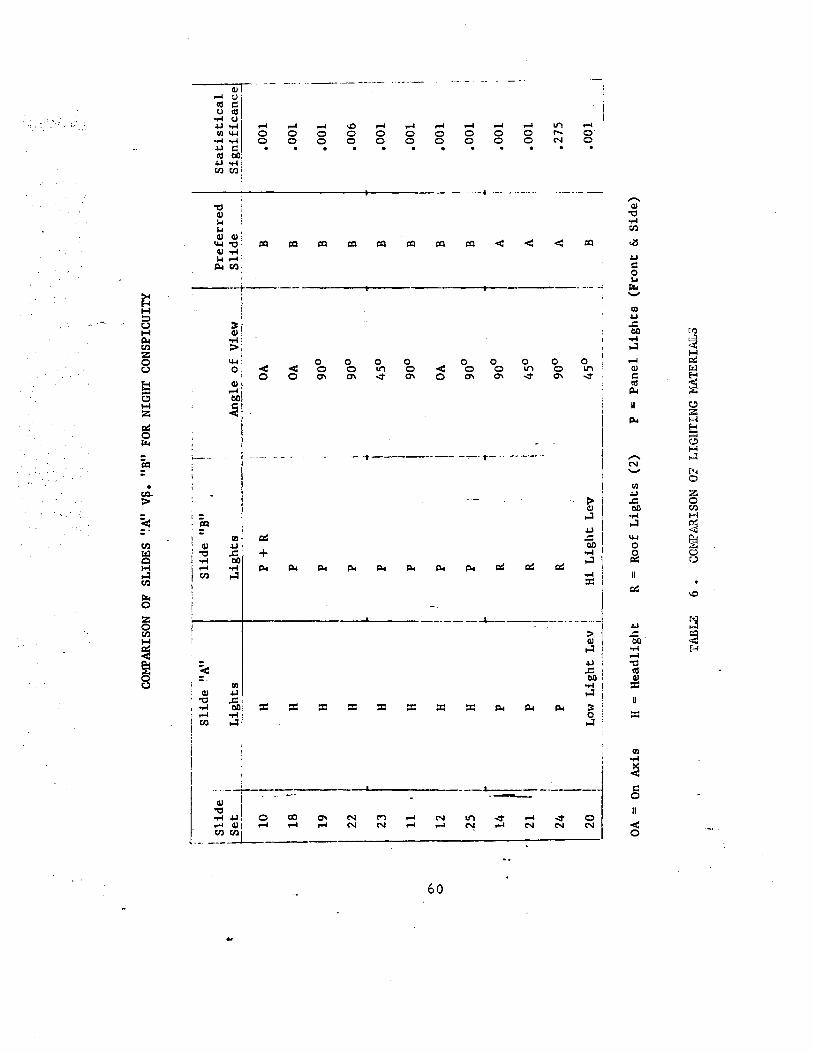
t
0'
o
COM
PARI
SON
OF S
LIDE
S '!A
" "B
" FO
R NI
GHT
CONS
PICU
ITY
--,-
----
-'--
'-"'
---.
-. -.
-. -.. r .-
.. I S
lid
e r::-j·· .
18
'.:1
19
22
23
11
·
12
, .2
5 I t II
14
21
24
20
OA =
On
Axi
s
Sli
de
!'A"
Sli
de
"B"
Pre
ferr
ed
__
__
__
_
.. ... _
_ .
H
H
H
H
H
H
H
H
P P P
I r I '1 .1 1 I ,
P +
R
OA
I B
P O
A!
B
P P P P P P R R R
.. I I I .. I
90°
B
90°
B
45°
B
90°
B
OA
B
90°
B
90°
A
45°
A
90°
A
Low
Lig
ht L
ev I
H
i L
ight
Lev
..•
.•. _
.. _
_ -
--_
. __
._._
1 __
__
. __
__
__
._. _
__
__
_ 45
° B
H =
Hea
dlig
ht
R =
R
oof
Lig
hts
(2)
P =
Pan
el L
ight
s (F
ront
& S
ide)
'fABL
E 6
. CO
J.l1:P
t.\lUS
ON
OF
LIG
HTI
NG
MA
TERI
ALS
't.t
hti
c.'
I ..
.001
.001
.001
.006
.001
.001
.001
.001
.001
.001
.275
.001
rooftop light was not so effective as the side panel light at the 900
viewing angle. Front panel lights and rooftop together were found to be more effective than the headlight, even for head-on viewing. Finally, with all lights on, the train was judged as most conspicuous when the total light output was higher.
All differences were found to be statistically significant at the. 00 I level. This indicates that the probability is less than one part in a thousand that the result was due to chance alone. The results point up that the better illuminated the train, the higher is its level of con-spicuity.
Roof lamps, which on an actual locomotive would be flashing types (or rotating types which appear'to"flash), necessarily displayed a steady light when viewed on slides. The preferred xenon strobe lamp does not photograph well even in moving pictures, since the extremely short flash is often missed by the camera. Flashing at the rate of I to 2 flashes per second, the xenon strobe lamp is at least five times more effective than a steady incandescent lamp of the same rating (Dougl,as 6 , Projector l3 , IES9).
Proposed Devices - The conspicuity of locomotives at presently is dependent on the angle of view and directionality of present lighting. _Lights be provided which permit a vi_ewer to see the train from all angles. The lights should be able to penetrate rain, snow and fog . . These requirements can be met by using:
1. A pair of xenon strobe lamps, one on each side of the cab roof, arranged to flash alternately. They are useful not only for con-spicuity, but also aid in identification and in estimation of the train's speed and distance from tlfe observer.' Subjects evaluating rooftop lights, headlights, and running lights unanimously select the rooftop lights as being most alerting.
2. Side panel lights. The panel light is a flat light box attached to the side of the locomotive; it presents a distinctive source of light to the motor vehicle operator. The data indicate that the panel light plus the roof lights make a good combination.
3. Front panel light. The front panel light supplements the side panel light and is most effective when seen from angles of les s than 45 0 off the locomotive's axis. lights should be large enough to be perceived as a line or area of light (rather than a point) from considerable distances; at approach angles of roughly 300 to 60 0 both front and side panels 'are visible, and their relationship will serve as an additional cue for distance.
61
4. The front panel light used in the experiment was simulated by using the lighted number boards - deleting the number sand increasing the lighting. The effect was midway between a true panel and two floodlights angled out from the center. Such flood-lights may prove to be an effective alternate to the recommended front panel light.
Figures 16 and 17 illustrate the comparison between the normal loco-motive headlight and a locomotive equipped with front floodlights. plus side panel lights.
--.
62

Co? 1=1 ...:I
<;
..c ..... H tt.l
C,!) 1-1 rz..
Po<
W =::l
63
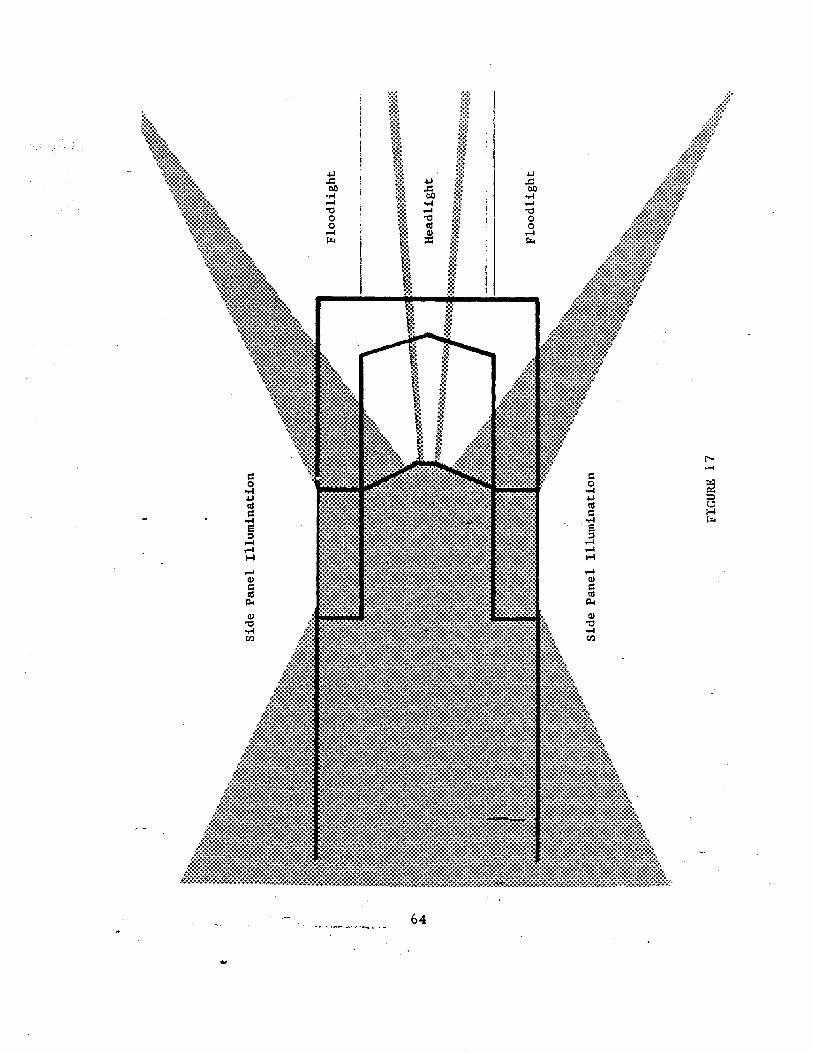
:::
- ;: .IJ .IJ ..c .IJ ..c be ..c be ;: .... be ....
..-I .... ..-I "0 ..-I "0 0 "0 0 0 III 0
..-I III ..-I =
. ..-.
r--.... c:: c:: 0 0 .... .... .IJ .IJ :::I III III '-' c:: c:: H .... .... r... e e ::I ::I
..-I ..-I
..-I ..-I 1-1 1-1 ..-I ..-I III III c:: c:: III III
Po< Po< III III
"0 "0 .... .... til til
64
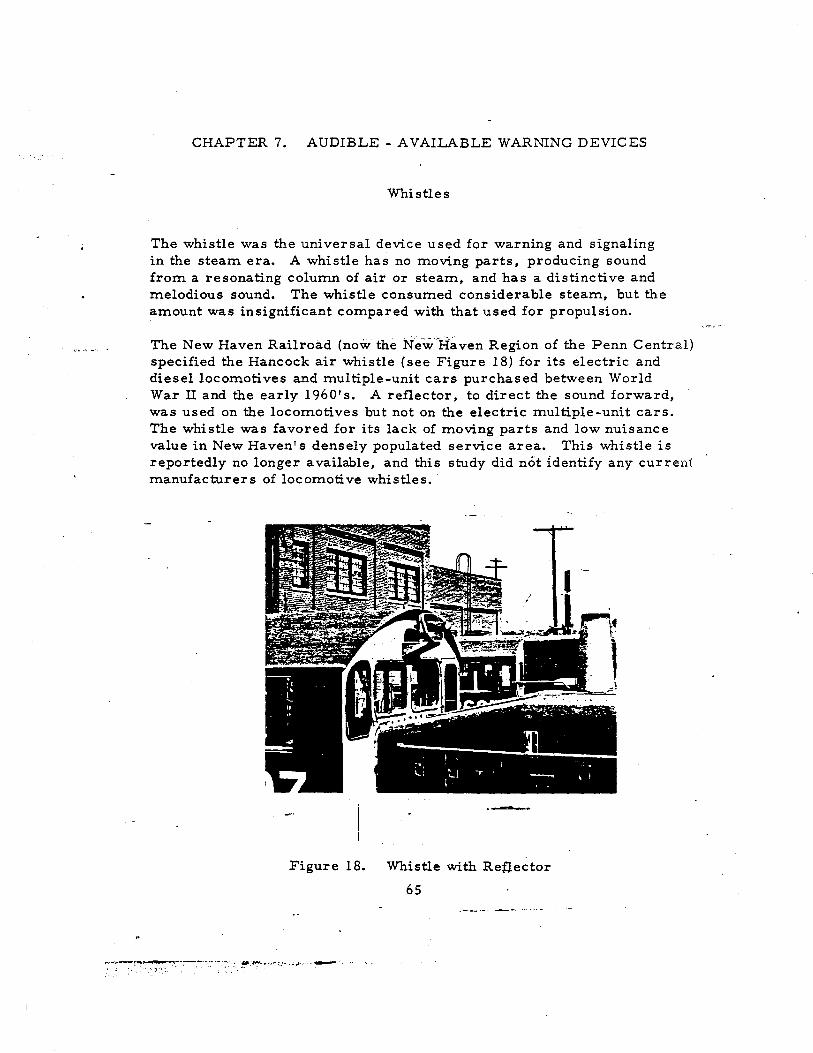
CHAPTER 7. AUDIBLE - AVAILABLE WARNING DEVICES
Whistles
The whistle was the universal device used for warning and signaling in the steam era. A whistle has no moving parts, producing sound from a resonating column of air or steam, and has a distinctive and melodious sound. The whistle consumed considerable steam, but the amount was insignificant compared with that used for propulsion.
The New Haven Railroad (now the N'e-w··Haven Region of the Penn Central) specified the Hancock air whistle (see Figure 18) for its electric and diesel locomotives and multiple-unit cars purchased between World War II and the early 1960's. A reflector, to direct the sound forward, was used on the locomotives but not on the electric multiple-unit cars. The whistle was favored for its lack of moving parts and low nuisance value in New Haven' s densely populated service area. This whistle is reportedly no longer available, and this study did not ldentify any current manufacturers of locomotive whistles ..
Figure 18.
. --Whistle with Reflector
65
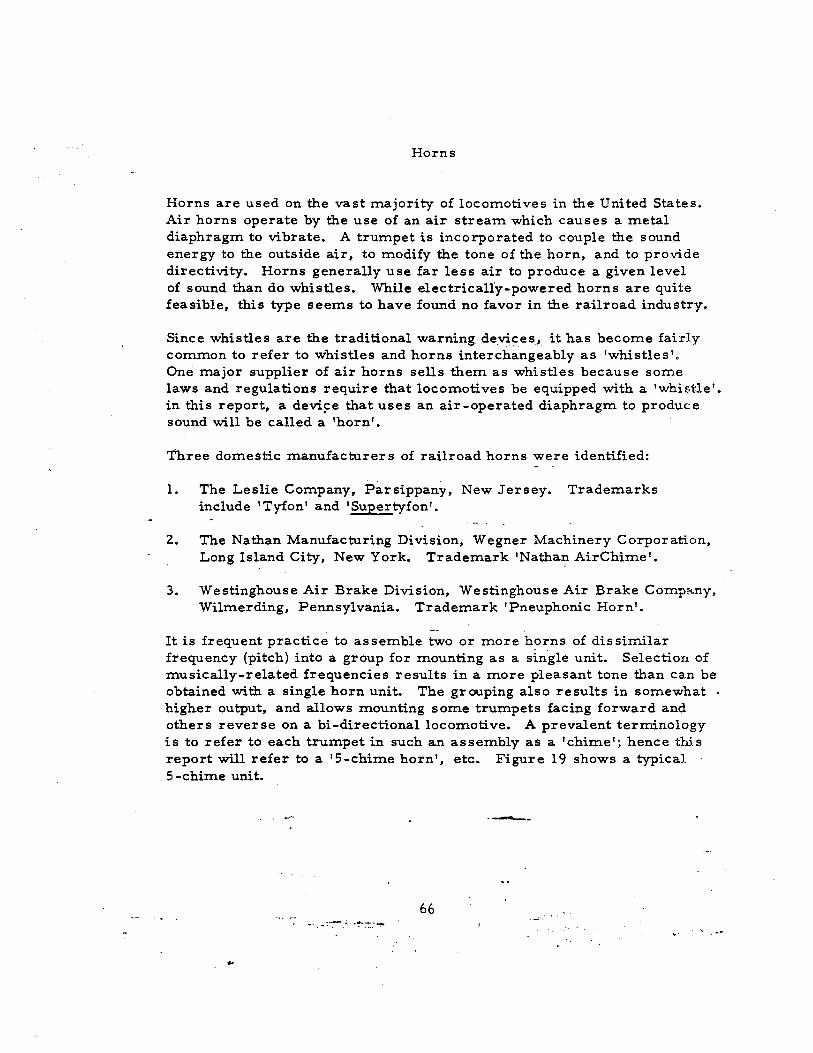
Horns
Horns are used on the vast majority of locomotives in the United States. Air horns operate by the use of an air stream which causes a metal diaphragm to vibrate. A trumpet is incorporated to couple the sound energy to the outside air, to modify the tone of the horn, and to provide directivity. Horns generally use far less air to produce a given level of sound than do whistles. While electrically-powered horns are quite feasible, this type seems to have found no favor in the railroad industry.
Since whistles are the traditional warning devices, it has become fairly common to refer to whistles and horns interchangeably as 'whistles '. One major supplier of air horns sells them as whistles because some laws and regulations require that locomotives be equipped with a 'whistle'. in this report, a that uses an air-operated diaphragm to produce sound will be called a 'horn'.
Three domestic manufacturer s of railroad horns were identified:
1. The Leslie Company, Parsippany, New Jersey. Trademarks include 'Tyfon' and 'Supertyfon'.
2. The Nathan Manufacturing Division, Wegner Machinery Corporation, Long Island City, New York. Trademark 'Nathan AirChime'.
3. Westinghouse Air Brake Division, Westinghouse Air Brake Company, Wilmerding, Pennsylvania. Trademark 'Pneuphonic Horn'.
It is frequent practice to as semble two or more horns of dis similar frequency (pitch) into a group for mounting as a single unit. Selection of musically-related frequencies results in a more pleasant tone than can be obtained with a single horn unit. The grouping also results in somewhat higher output, and allows mounting some trumpets facing forward and others reverse on a bi-directionallocomotive. A prevalent terminology is to refer to each trumpet in such an assembly as a 'chime'; hence this report will refer to a IS-chime horn', etc. Figure 19 shows a typical S-chime unit.
.--
66 ." . -:-:-. " ... , .-
Figure 19. S-Chime Horn
Traditional horn designs utilized the diaphragm as the essential means for controlling the character of the sound produced. Each chime of a horn assembly had a different size and each diaphragm had to be tensioned exactly to produce the correct note. Examples of this -type of design include the Nathan Model 'M', the Leslie 'Tyfon', and the WABCo 'Pneuphonic' horns.
In the last decade or so, Leslie and Nathan came out with redesigned horns utilizing the airstream to both 'push' the diaphragm to its deflected position and to 'pull' it back. This results in longer diaphragm life, elimination of tension adjustments, and interchangeability of diaphragms. Both also claim greater sound output with lower air con-sum.ption. Examples of the new design are the Leslie 'Supertyfon' and Nathan Model 'Pl. .--. The long life of railroad air horns is indicated by the fact that many of the wayside and yard measurements made for this study were of the older-type horns. The Penn Central qG-l locomotives have
67
a l56-Hz Leslie 'Tyfon' horn; Diesel locomotives of the Penn-Central, Long Island, and Richmond, Fredericksburg and Potomac railroads were equipped with Nathan Model 'M' AirChimes.
Bells
Bells are normally intended to warn pedestrians, rather than motorists, and find their greatest use during switching operations in railroad yards and on approach to passenger station platforms. Air-operated bells are most conunon, although electric bells are in use on the Missouri Pacific Railroad and the -Chicago &: Northwestern Railway.
Electronic Devices
Two suppliers are presently developing horns and bells that operate electronically:
1. Federal Sign &: Signal Corporation, Blue Island, Illinois.
2. Prime Manufacturing Corporation, Oak Creek, Wisconsin.
·These units are constructed essentially the same as a public-address system, with a tone generator substituting for the microphone. Federal has for several years supplied electronic sirens for police and fire vehicles. These units typically have a selector for three different tones plus a public-address mode that allows the crew to hear calls on the vehicle radio when they are working outside the ';ehicle. Prime has supplied approximately 200 electronic bells for locomotive use (Milwaukee Road) and claims that its unit has proven more reliable than mechanical bells. Neither manufacturer has a locomotive horn ready for market (as of mid-l970), but Federal has prototypes under evaluation (see Figure 20) in 70 watt and lOO watt models.
---
68 ... ... ; ..
! ..
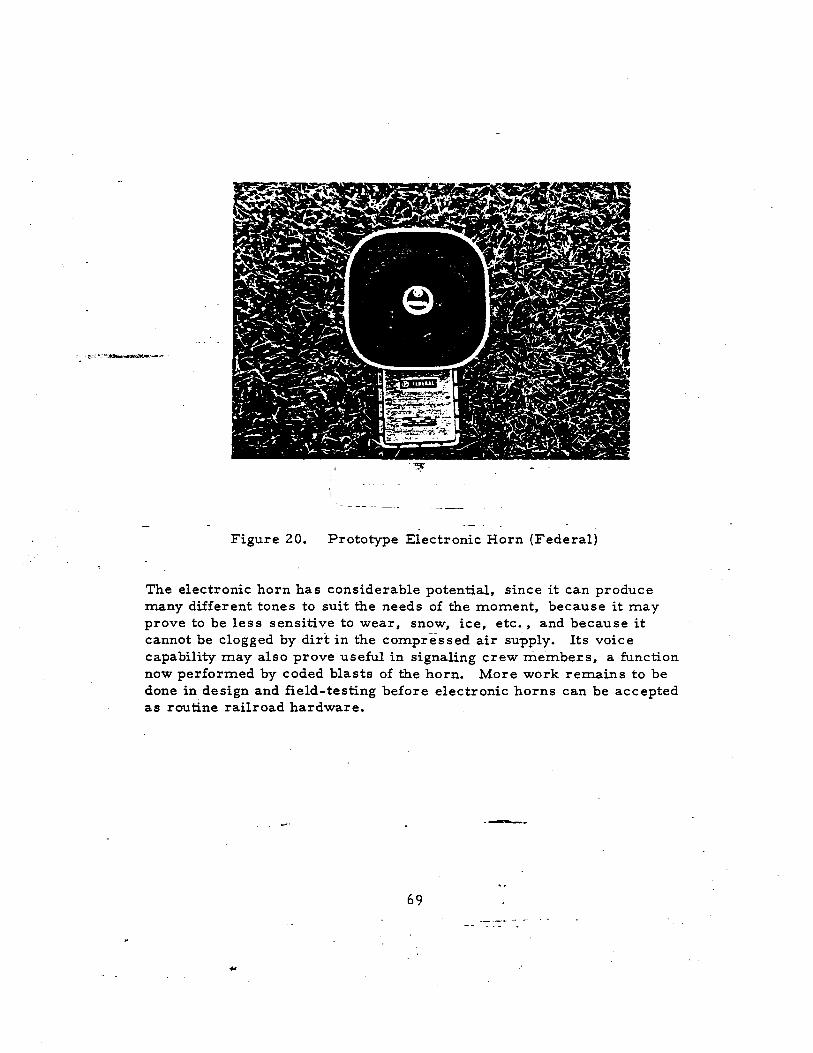
Figure 20. Prototype Electronic Horn (Federal)
The electronic horn has considerable potential, since it can produce many different tones to suit the needs of the moment, because it may prove to be less sensitive to wear, snow, ice, etc., and because it cannot be clogged by dirt in the compressed air supply. Its voice capability may also prove useful in signaling crew members, a function now performed by coded blasts of the horn. More work remains to be done in. design and field-testing before electronic horns can be accepted as routine railroad hardware.
.-.
69

CHAPT ER 8. AUDIBLE - MEASUREMENTS
Equipment
Field measurements of sounds were made using a sound-level meter, calibrator, and tape recorder. A sound analyzer and a graphic-level recorder were used to analyze tape recordings. The calibrator is simply a sound source of known loudness, designed to couple snugly over the microphone of a sound-level meter. It produces a reading on the sound-level meter of 114 dB (referred to 20 \-LN 1m2 ). The sound-level meter consists of a microphone, step attenuator, amplifier and meter. It also includes frequency filters ('tone control') to weight its frequency response in accordance with standards established by the USA Standards Institute. The sound analyzer is a tunable filter and amplifier system which is used to measure the strength of the various frequency components of a sound.
The following instruments were used:
1. Sound-level meter: General Radio type l565-A
2. Sound-level calibrator: General Radio type l562-A
3. Tape recorder: Uher model 4400
4. Sound and vibration analyzer: general Radio type l564-A
5. Graphic level recorder: General Radio type -1521-B
The sound-level meter can be used as a microphone with preamplifier; this makes it possible to adjust the sensitivity in- fixed, known steps. It was used this way in order to make recordings from which sound levels could later be determined in laboratory analysis. The sound-level meter was connected to an input of the recorder, the calibrator was placed over the microphone of the meter unit, and a recording of the calibrator tone was made, just before data was to be recorded. The attenuator of the sound-level meter was then set for a sensitivity appropriate for the sound being measured, sensitivity was noted on a data sheet. On playback, the level of the sound being measured was compared with the level of the calibration tqne. This procedure did not interfere with obtaining meter readings while a recording was
70

being made. The recorder is a two-channel (s-tereo) type, and the second channel was used with a conventional microphone for voice identification of the recording situation and for remarks.
Weightings - The standard designations for the frequency filters in the sound-level meter are 'A', 'B' or 'C' weighting. The' C' filter provides a 'flat' or unweighted characteristic, and the 'A' or 'B' filter makes the meter less sensitive to low frequencies. A selector switch on the instrument allows the desired filter to be connected. The 'A' and 'B' filters are used as a crude approximation of the human response to noise, since a low-pitched noise is generally less annoying than a mid-frequency noise of the same. energy content. As an example, background:::a9J.!E!:.. in a suburban neighborhood 2.50 feet from the street was measured at 65 dB on the 'C' scale and only 55 dB on the'A'scale. This is a quiet neighborhood, and the backgr ound noise is in fact rather unobtrusive.
Railroad horns are high enough in frequency that it makes little difference which weighting is used in measuring their sound level. Frequency analysis shows that the energy in a multi-chime horn sound peaks at about 1,000 Hz, and the (lowest) pitch is seldom less than 220 Hz. The 'C' weighting was normally used in making measurements and recordings. A recording made with the 'C' weighting can be played-back through the sound'-level meter and the 'A' or 'B' weighted level can be read at that time.
A frequency analysis of a railroad horn, recorded at the wayside, is shown in Appendix G.
Yard Measurements
Horn and whistle sounds were measured in yards of the Penn Central at Sunnyside, New York, and New Haven, Connecticut. The purpose was to obtain recordings and measurements of sounds from a known distance ahead of stationary locomotives and Metroliner cards. The results could then be compared with wayside recordings and measurements from moving trains. Four different types of warning devices were measured:
1. a high-pitched sound produced by Leslie 370 Hz and .j
550 Hz ·'Supertyfon' horns (Figure 21);-----
2. GG-LElectric Locomotive - a deep-tone sound produced by a Leslie 156 Hz. 'Tyfon' horn.
71
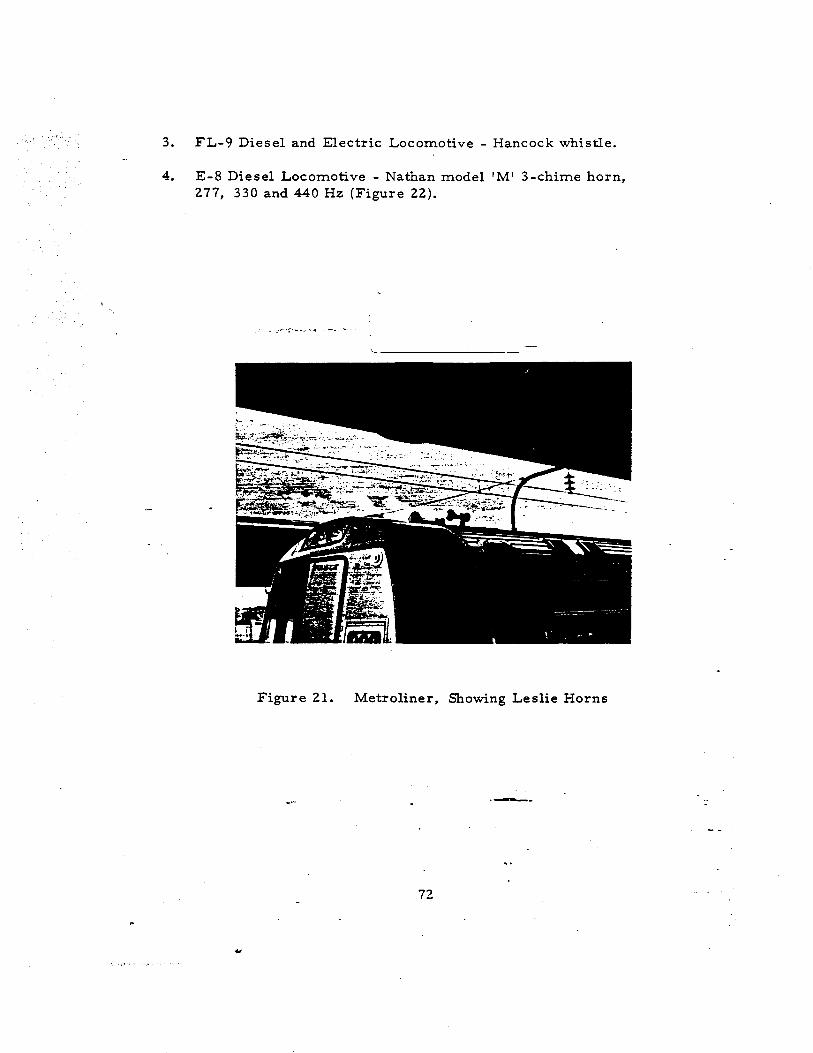
3. FL-9 Diesel and Electric Locomotive - Hancock whistle.
4. E-8 Diesel Locomotive - Nathan model 'M' 3-chime horn, 277, 330 and 440 Hz (Figure 22).
_ ••• _ •• ... ""1; .- .......
Figure 21. Metroliner, Showing Leslie Horns
.-.
72
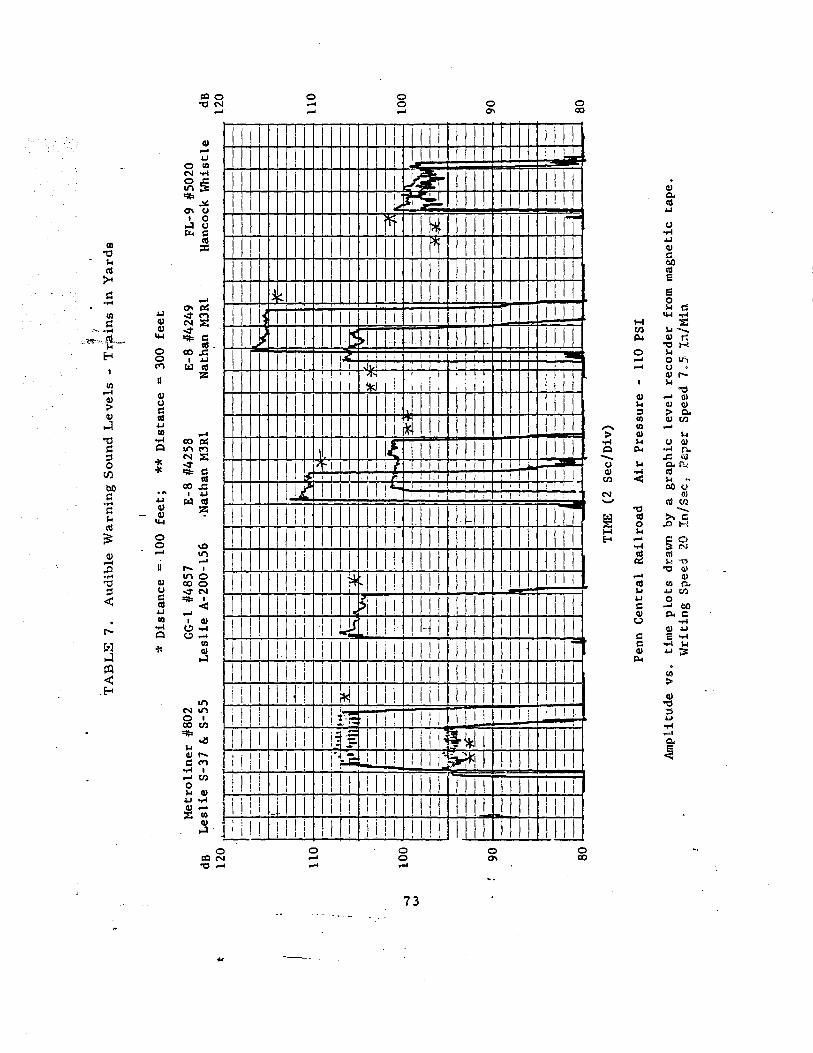
, ,
t
-.J v.>
;: T
AB
LE
7.
Aud
ible
War
ning
Sou
nd L
evel
s -
Tr'
;ain
s in
Yar
ds
(
* D
ista
nce
=·10
0 fe
et;
** D
ista
nce
= 30
0 fe
et
Met
roli
ner
4/80
2 dB
L
esli
e S-
37 &
S-5
5 G
G-1
4/
4857
L
esli
e A
-200
-156
E
-8 4
/425
8 ,N
atha
n M
3Rl
120
. '1-=-r:E
f-E
-8 #
4249
H
110
90
LJ-t=
t=t=t=
-= :
=f-j=
t'1=!
=-I
I--+
-I-
lit 'I
till.i
l A
..._
--
,.,-f---_
.,. ,
,1-
--
--'-
--
--
__
__
__
__
_
. 1-
-.
_ -
-Ii-
f---
--c--
-..
. .
__
. __
_ 1
_-
--
,V'
__
--
-__
_ -
__
-f-
----
[Zl..
-'--=
---
1-
==_=
=_== _
_ ==_
= _-" ___
iC __
_
-.. --
I'"
-'H
f\
--I-
-J--
_ =1-
===
=-= =
= _L
+_
= = =
f----IJ=
= ---
-1=
1-
I--f
---
n-f.-l
__
_ •
__
_ '-
-1
__
'
_ -
-;-r
--:..-
-.--
--
-1
--+
--1
---.
-4
--
--
--I'
J -,-
no
100
100
B
___ I I
-1
--1
1-1
1
1--
+--
11
-+-1
90 1
"
1 III
II I
II I
1 I
I I
II I
II II
I R
I I
§ U§
80
I I
[-TI
ME
(2 S
ec/D
b)
Penn
Cen
tral
Rai
lroa
d A
ir P
ress
ure
-11
0 PS
I
Am
plit
ude
vs.
tim
e p
lots
dra
wn
by a
gra
phic
le
vel
reco
rder
fro
m m
agne
tic
tape
. W
riti
ng S
peed
20
Xn/
Sec,
Pa
per
Spee
d 7.
5 In
/Min
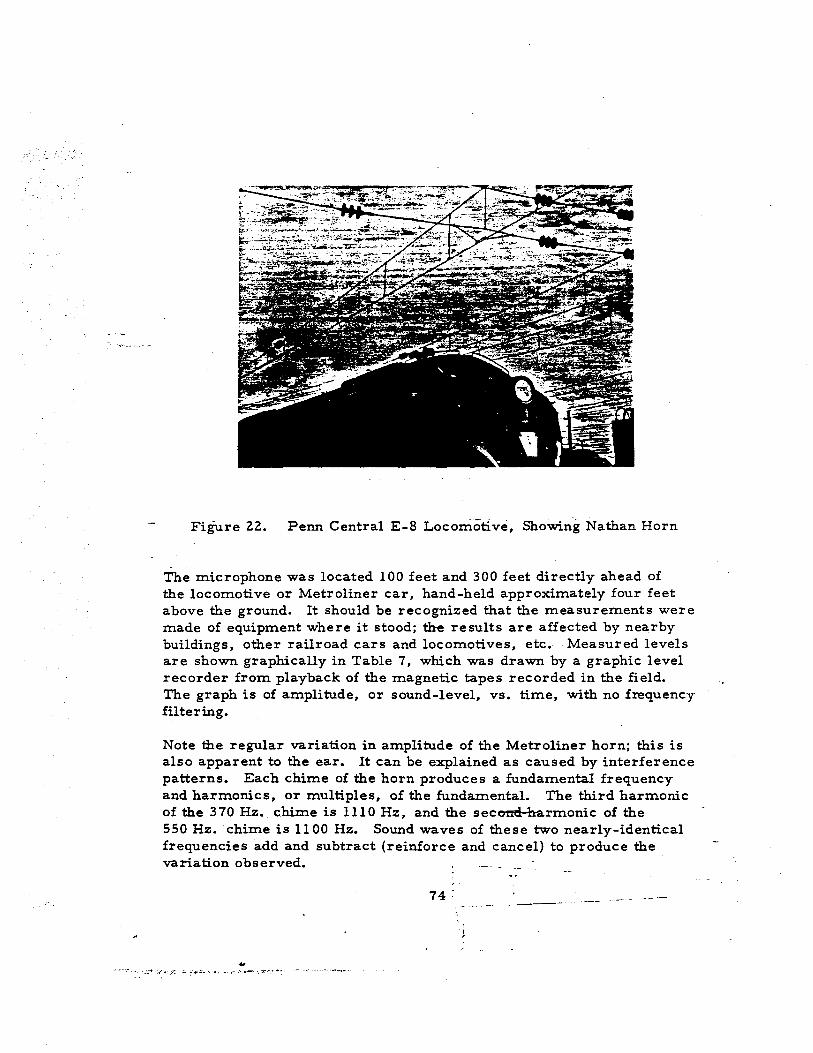
Figure 22. Penn Central E-8 Locomotlve, Showing Nathan Horn
The microphone was located 100 feet and 300 feet directly ahead of the locomotive or Metroliner car, hand-held approximately four feet above the ground. It should be recognized that the measurements were made of equipment where it stood; the results are affected by nearby buildings, other railroad cars and locomotives, etc. Measured levels are shown graphically in Table 7, which was drawn by a graphic level recorder from playback of the magnetic tapes recorded in the field. The graph is of amplitude, or sound-level, vs. time, with no frequency filtering.
Note the regular variation in amplitude of the Metroliner horn; this is also apparent to the ear. It can be explained as caused by interference patterns. Each chime of the horn produces a fundamental frequency and harmonics, or multiples, of the fundamental. The third harmonic of the 370 Hz •. chim.e is 111 0 Hz, and the secomi harmonic of the 550 Hz. chime is 11 00 Hz. Sound waves of these two nearly-identical frequencies add and subtract (reinforce and cancel) to produce the variation observed.
74 :
.. " •.. ): _ •. .. :;.. ........... ,.: ... _ - ..... - .............. .
With the exception of the Hancock whistle, a consistent difference of approximately 10 dB was observed between measurements at 300 feet and at 100 feet. Almost equal levels were measured from the whistle at the two distances; this most likely was caused by the high placement of the whistle and its directivity due to the reflector with which it is fitted. The whistle is approximately fourteen feet above the ground and the microphone was held about four feet above the ground. Thus there was less off-axis angular displacement of the microphone at the greater distance. Another possible cause may be the location of the passenger station 400 feet back from the locomotive; it may have altered the data by causing reflections which reinforced or partially canceled the sound.
The observed sound levels at 100 feet varied from 115 dB (one of the Nathan M-3Rl horns) to 100 dB (whistle). At 300 feet, the range was 105 dB (one of the Nathan M-3R2 horns) to 95 dB (Metroliner).
Test Star.d Measurements
-A chartered locomotive on the Narragansett Pier RaiIibad in Kingston, Rhode Island, was used as a test stand for measurements at various angles and distances. The locomotive was spotted next to a farmer's flat potato field and measurements could be made at various angles as well as along the track. Before the horns were tested, the area was measured and marked to obtain measurement sites at 300 feet and angles of 0, 30, 60, and 90 degr-ees, as well as 100 feet and 600 feet at 0 degrees.
Brand-new horns, submitted for testing by the manufacturers, were rigged onto a dump pipe (portable conductor's valve) and operated from the stationary locomotive (see Figures 23 and 24). The horns were approximately ten feet above the ground and oriented with the logitudinal axis of the locomotive. The microphone was hand-held approximately four feet above the ground. Recordings were made at 300 feet on-axis; at the other measurement sites, the sound-level meter reading was entered on a data sheet. ---
75
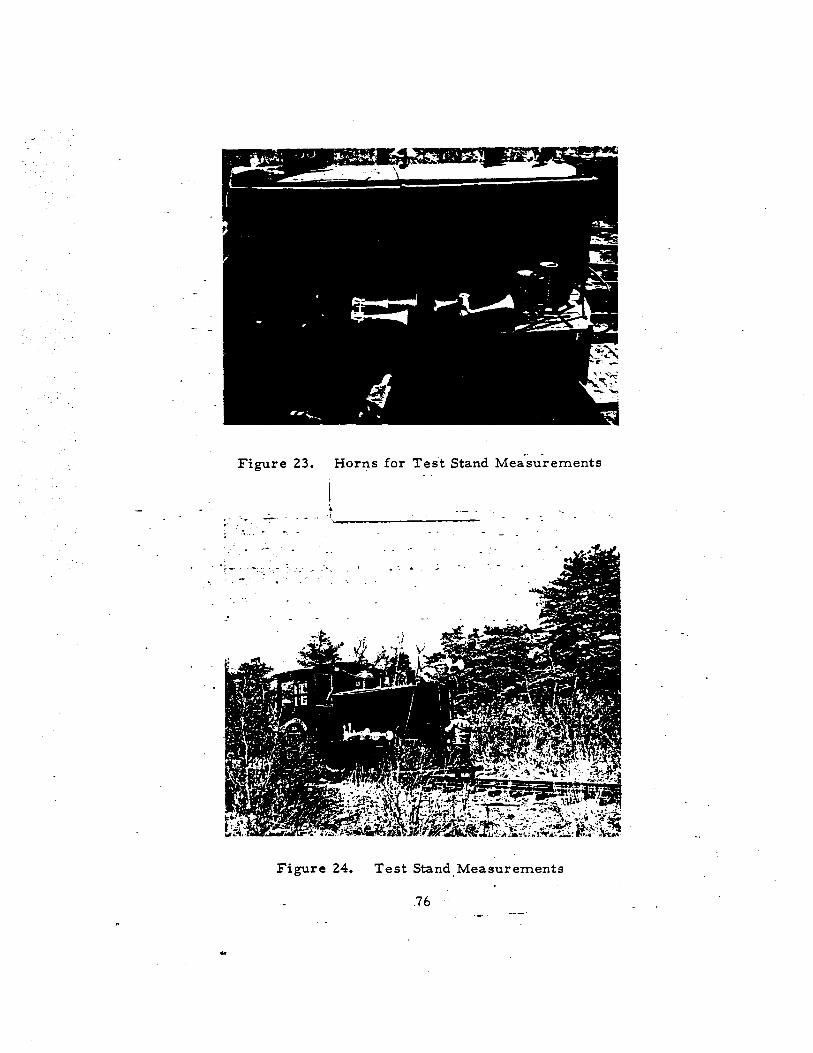
Figure 23. Horns for Test Stand Measurements
I .. ... -. , . ,-----------
Figure 24. Test Stand Measurements
.76
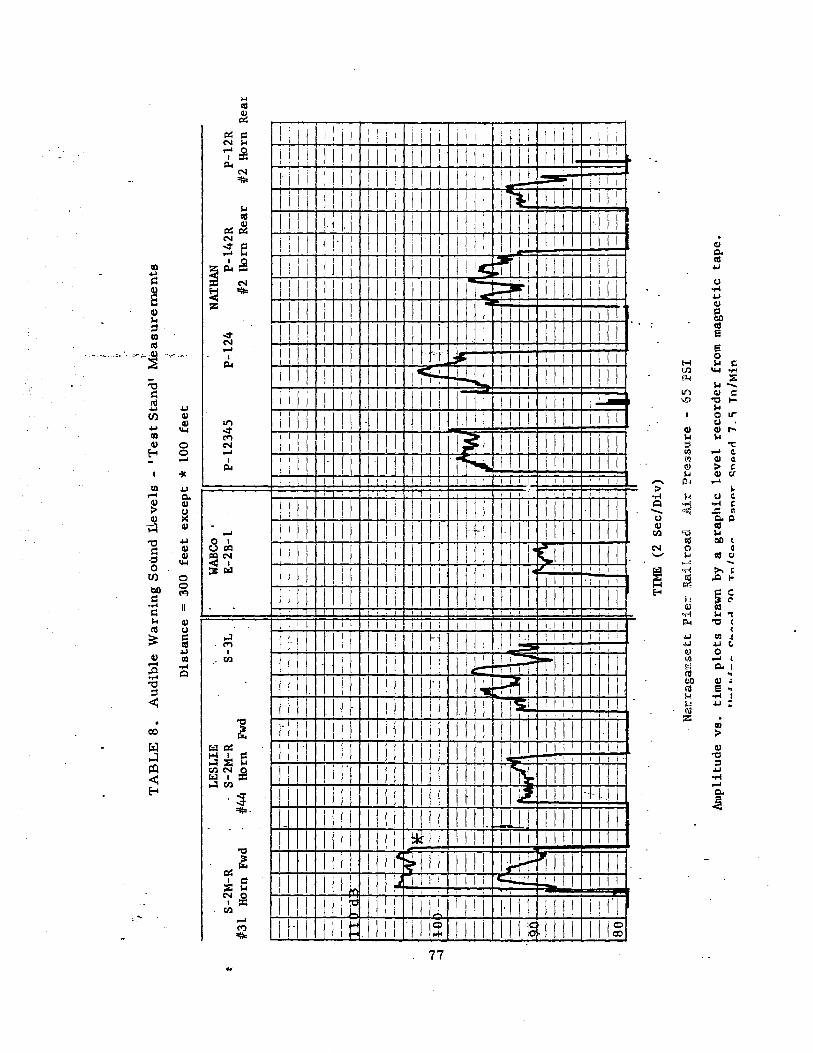
t S-
2M-R
41
31
Hor
n Fw
d
" " T
AB
LE
8.
Aud
ible
War
ning
Sou
nd B
evel
s -
'Tes
t S
tand
' M
easu
rem
ents
LESL
IE
S-2M
-R
4144
Ho
rn
Fwd
Dis
tanc
e
S-3L
300
feet
exc
ept
* 10
0 fe
et
WABC
o E
-2B
-l
P-l2
345
P-l
24
NATH
AN P-
l42R
412
Hor
n R
ear
P-l2
R
412 H
orn
Rea
r
l-t-
1 1
1 1
1 1
1 1
1 1
1 1
1 1
1 1
, -
----
-'--
----
----
_.-
---
---= ----
=---=
--.
--
-----
---
'--
-------'-
--
---
-.-.
. --j
,
1--1
--1
-1
-1
--1
-/-
-'-
I-I-
t---I-
-I-
I-II
--I-
-I-I-I--I-t-t---I--I--
-'-
'--'-
-'-
'-'-
1--1
--.-
--t-t-·-·-.
--
-:I-I-
-I-W
-_
__
__
:j I
lOP- .
.. -t--
-1-11
=1==
11=
-1-11
=1=1-1
l=J 1
=1
=1
1--
+-1
1-+
-1 1
:---
-f---
II=I=
II=r::
:----
TIM
E (2
Sec
/Div
)
Nar
raga
nset
t P
ier
Air
Pre
ssur
e -
65 P
SI
Am
plitu
de v
s.
tim
e pl
ots
draw
n by
a g
raph
ic l
evel
rec
orde
r fr
om m
agne
tic
tape
. _
_
__
T
n/M
in

Eight horn configurations were tested:
1. Leslie Supertyfon S-2M-R, #31 horn forward. This is a 310 and a 440 Hz horn, the former facing forward and the latter facing rear.
2. Leslie Supertyfon S-2M-R, #44 horn forward. The same as configuration 1, oriented with the 440 Hz chime facing forward.
3. Leslie Supertyfon S-3L. This is a three-chime horn, 250, 310 and 440 Hz horns, all facing forward.
4. WABCo E-2B-l Pneuphonic horn. WABCo does not publish frequencies in its catalog; frequency analysis of the tape indicates that the three chime frequencies are 160, 220 and 270 Hz. All face forward.
5. Nathan AirChime P-12345. Five chimes, frequencies 277, 329, 392, 440 and 554 Hz, all facing forward.
6. Nathan AirChime P-124. Three chimes, frequencies 277, 329 and 440 Hz, all facing forward.
_ 7. Nathan AirChime P-142R. Same as #6 but 329 Hz chime facing rear.
8. Nathan AirChime P-12R. Two chimes, frequency 277 Hz facing forward and 329 Hz facing rear.
Table 8 compares the various horris as drawn by the graphic level recorder in the amplitude vs. time mode. The sound levels at 300 feet varied from approximately 100 dB (Nathan P-124}-to 90 dB (WABCo E-2B-l). Note that the air pressure on the Narragansett Pier RR is lower than that on the Penn Central; tables 7 and 8 cannot be fairly compared directly. A Leslie data sheet indicates that Supertyfon horns have approximately 5 dB greater output at 100 PSI than at 60 PSI. The WABCo E-2B-l horn is rated by its manufacturer as capable of produc-ing 107 dB at 100 feet and 120 PSI; this is 6 dB greater than the 101 dB measured for this study at 100 feet and 65 PSI.
Table 9 summarizes the sound-level meter readings at various dis-tances and angles. A major objective of this experiment was to determine the directivity of various devices:-Tlie measurements indicate that, on the average, output was 5 dB lower at 90 degrees compared to the output on-axis. The WABCo E-2B-l and Nathan P-124 were the most directional, with 10 between
78
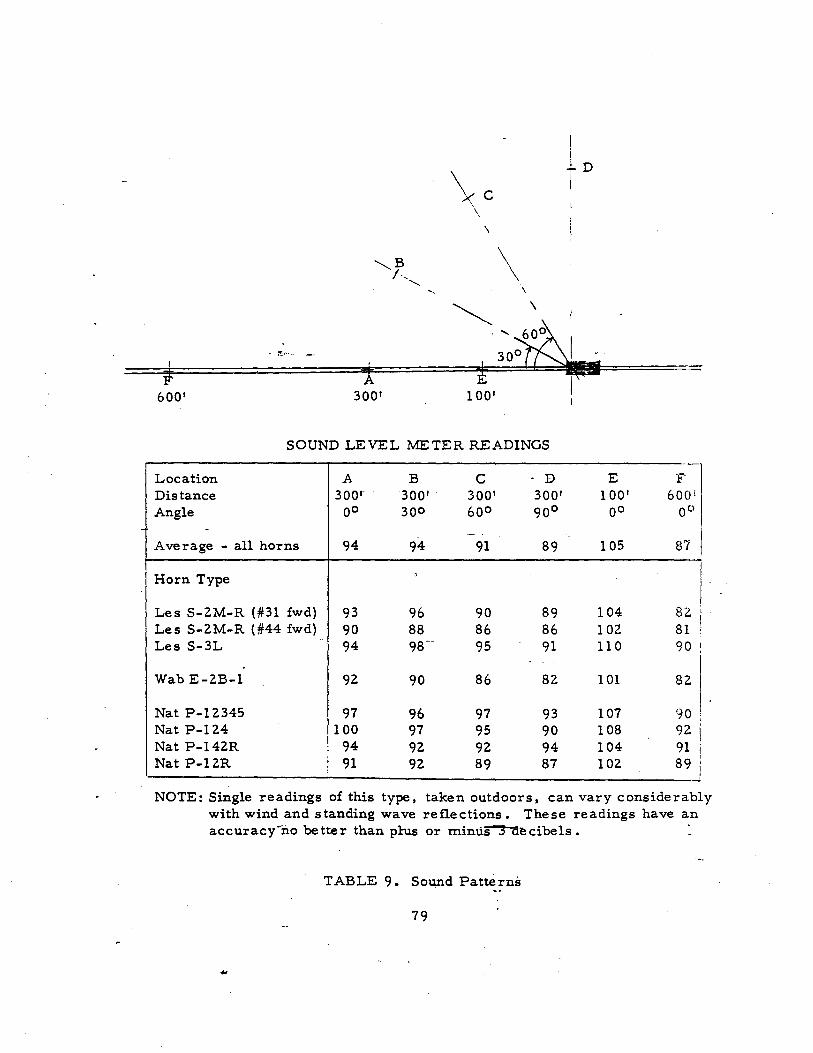
I
\c .)..D
\ \
\ \
:'!-..•.
1 600' 300' 100' I
SOUND LEVEL METER READINGS
Location A B C - D E F Distance 300' 300' . 300' 300' 100' 600£ Angle 00 300 600 90 0 00 0°
Average - all horns 94 94 91 89 105 87 I Horn Type
Les S-2M-R (#31 fwd) 93 96 90 89 104 82 Les S-2M-R (#44 fwd) 90 88 86 86 102 81 Les S-3L 94 98-- 95 91 110 90 i
i Wab E-2B-1 92 90 86 82 101 82 I Nat P-12345 97 96 97
I . 93 107 90 I
Nat P-124 100 97 95 90 108 92 Nat P-142R I 94 92 92 94 104 91 ! Nat P-12R i 91 92 89 87 102 89 i
i J !
NOTE: Single readings of this type, taken outdoors, can vary considerably with wind and standing wave reflections. These readings have an accuracy-no better than plus or
TABLE 9. Sound Patte rns .. 79
on-axis and 90 degrees. Not all measurements with the less-directional horns gave a neat, stair-step result of greatest level on-axis, less at 30 still less at 60 degrees, and least at 90 degrees. The ratio of greatest-to-Ieast level for the other horns was: Leslie S-3L, 7 dB; Leslie S-2M-R, 6 dB; Nathan P-12-R, 5 dB; Nathan P-12345, 4 dB; and Nathan P-242R, 2 dB. The average amount of directivity was judged to be appropriate for the geometry of the train/motor vehicle encounter.
An additional finding is tha.t comparison of levels on-axis at 100, 300 and 600 feet indicates that the 'inverse square law' is an adequate rule for approximating the attenuation of railroad horn sounds vs. distance; This 'law states that the ratio of sound power is inversely proportional to the square of the ratio of distance, when comparing two measurements at different locations.
Wayside Measurements
Wayside measurements were made at fourteen different locations- on - the Perin "Central, Richmond Fredricksburg and Potomac, Southern,
and Long Railroads. The locations were selected to give as - many different types of equipment and operating conditions as possible.
Road locomotives, yard locomotives, suburban multiple-unit cars, Metroliner multiple-unit cars, and the TurboTrain were included, operating at speeds between 10 and 110 MPH.
The purpose was to obtain recordings and measurements under the actual conditions experienced by a motor vehicle at a crossing, with all the variations caused by train speed, engineer s' horn-blowing habits, terrain, surrounding noises, etc., that this implies. Some
the wayside measurements were of horns or whistles identical to those represented in the yard measu!ements. Thus a comparison is possible between the two types of measurements; one made under serni-controlled conditions and the other made under uncontrolled field conditions. Figures 25 and 26 illustrate measurement techniques
---and a Metroliner train during measurements. The recordings were also used in the Empirical Testing of Warning Qualities as described in Chapter 9'. ._-
80
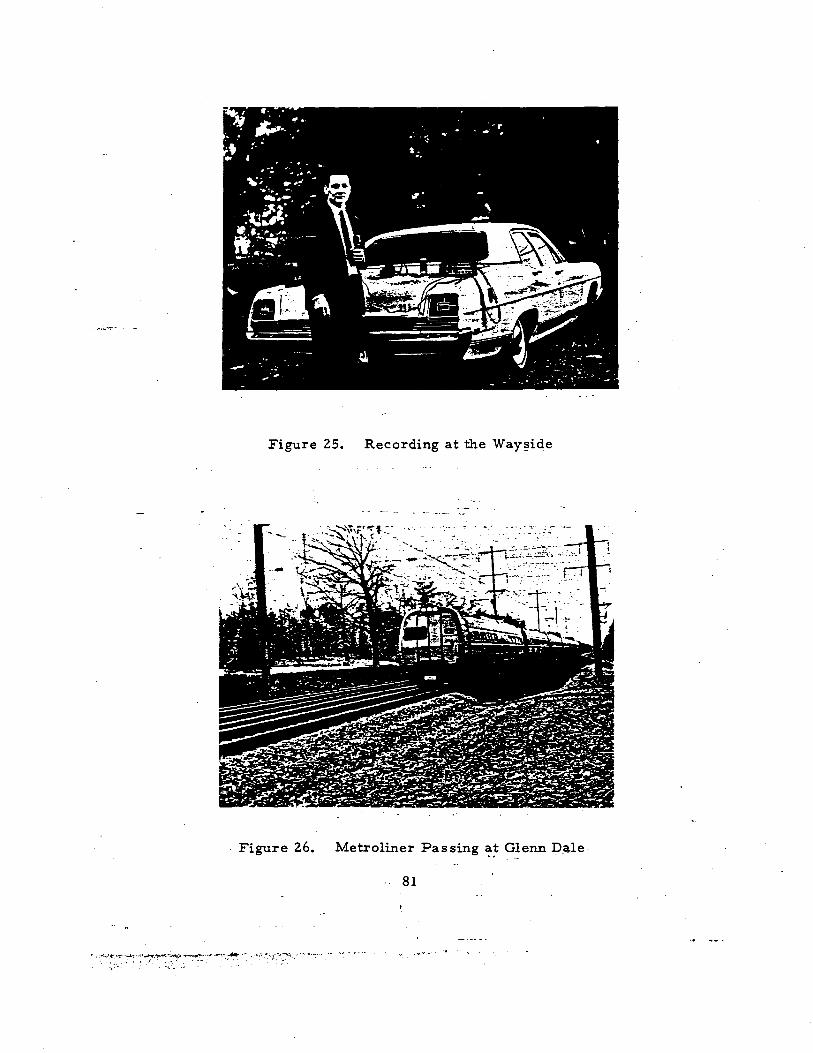
Figure 25. Recording at the
Figure 26. Metroliner Pas sing Ci!enn
.. 81
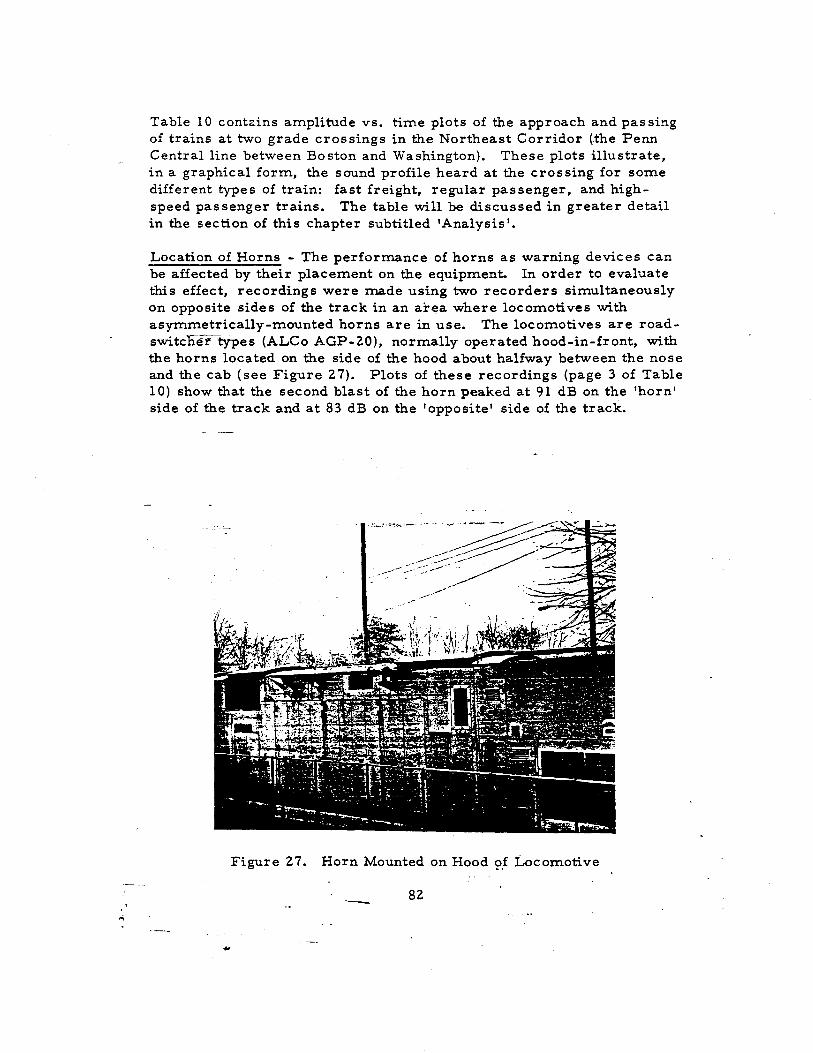
Table 10 contains amplitude vs. time plots of the approach and passing of trains at two grade crossings in the Northeast Corridor (the Penn Central line between Boston and Washington). These plots illustrate, in a graphical form, the sound profile heard at the crossing for some different types of train: fast freight, regular passenger, and high-speed pas senger trains. The table will be discussed in greater detail in the section of this chapter subtitled 'Analysis '.
Location of Horns - The performance of horns as warning devices can be affected by their placement on the equipment. In order to evaluate this effect, recordings were made using two recorders simultaneously on opposite sides of the track in an where locomotives with asymmetrically-mounted horns are in use. The locomotives are road-switchertypes (ALCo AGP-20), normally operated hood-in-front, with the horns located on the side of the hood about halfway between the nose and the cab (see Figure 27). Plots of these recordings (page 3 of Table 10) show that the second blast of the horn peaked at 91 dB on the 'horn' side of the track and at 83 dB on the 'opposite' side of the track.
Figure 27. Horn Mounted on Hood of Locomotive
82
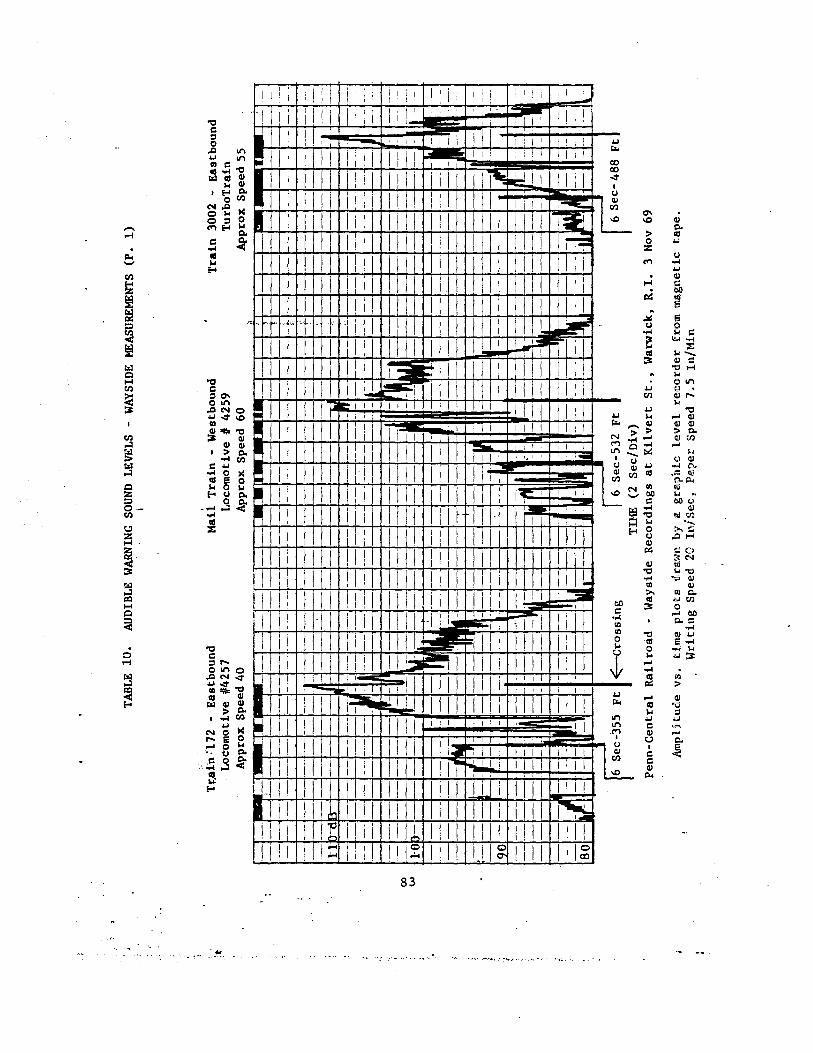
., 't
.;
00
IJ.)
TABL
E 10
. AU
DIBL
E W
ARNI
NG S
OUND
LEV
ELS
-W
AYSI
DE M
EASU
REM
ENTS
(P
. 1)
I
Tr,a
tn ·'1
72 -
Eas t
boun
d Lo
com
otiv
e #4
257
App
rox
Spee
d 40
Mai
l T
rain
-W
estb
ound
Lo
com
otiv
e #
4259
A
ppro
x Sp
eed
60
••• I.
....i
L ,
Tra
in 3
002
-E
astb
ound
T
urbo
Tra
in
App
rox
Spee
d 55
---
I i
I
1--
l-I-
I-I-
I-I-
I-I-
rJ=
t=1
. S
=l S
=t-=t=
t=J t
=t=t=t
=+-H
I l-
S-t=
t=l=
t.-J
-L; 1"
1 h-n
ir--l-
I-/-
/-\-
-1
-1
--1
-/-
1-/-
-1
-1
-1
-1
-1
h
J-/--1
-1
-.. /-
-I-I
-t--
-1-I
-+--
-I-
--1
--'-
-"
1--
/---
1--
--' -
---I
--I-I-
=l-_-
-I=-
. -1
-,-1
---+
1--/-
--1
--
--
---
--
.-
-I-
--+
--I
r-I=I=I
J=t .::::
= I
I I-I-/--
90 --
-=t-
=J
---t-
-t-
-II
-t-
I-I-
---t-
-I-
-I-
i-
1
--I ..I
Sec-
355
Ft
r 6 Se
c-53
2 F
t 6
Sec-
488
Ft
TIM
E (2
Sec
/Div
) Pe
nn-C
entr
al R
ailr
oad
-W
aysi
de R
ecor
ding
s at
Kil
vert
St.
, W
arw
ick,
R
.I.
3 No
v 69
Am
plitu
de v
s.
tim
e pl
ots
draw
n by
a g
raph
ic l
evel
rec
orde
r fr
om m
agne
tic
tape
. W
riti
ng S
peed
20
In/S
ec,
Pape
r Sp
eed
7.5
In/M
in
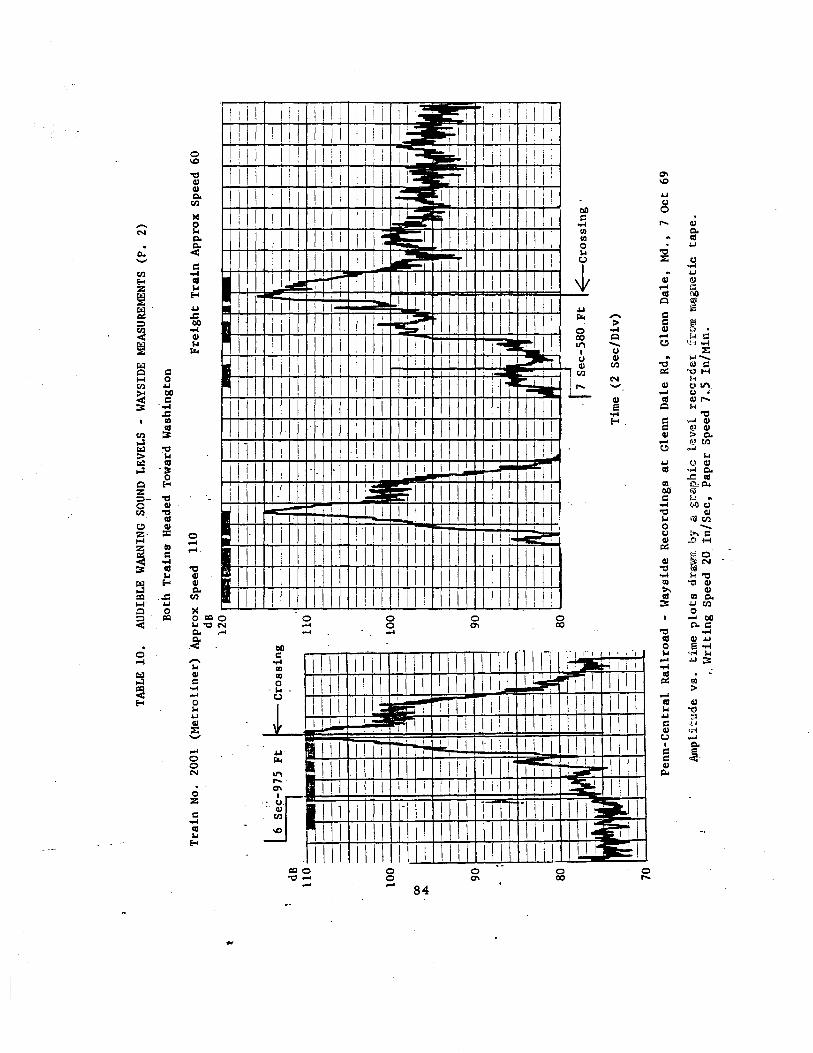
t
dB
110
100
00
,jlo.
90
80
70
TABL
E 10
. AU
DIBL
E W
ARNI
NGSO
¥ND
LEVE
LS
-W
AYSI
DE M
EASU
REM
ENTS
(P.
2)
Bot
h T
rain
s H
eade
d To
war
d W
ashi
ngto
n
Tra
in N
o.
2001
(M
etro
line
r) A
ppro
x Sp
eed
110
Fre
ight
Tra
in A
ppro
x Sp
eed
60
dB
" 12
0 1
-1=-
=1=l
-I=-=
1-1
1 Ll 3
Ij-
II 1=
1=1-
1-1-
-1=1
---1
-+=R=
l=l=r-l=
1 ·
Cro
ssin
----
------
---
----
.----
.-----
----
--
--
----
g
no I
I I
I I
Et -
1--
-/-
----
------
-----
. --
--
---
-----
, ----
1.--
100 --
--
--
----
__
I
. ----
-.-
--
•. -
I --
I
------
7 Se
c-S8
0 F
t
Tim
e (2
Sec
/Div
) ----
----
Penn
-Cen
tral
Rai
lroa
d -
Way
side
Rec
ordi
ngs
at G
lenn
Dal
e Rd
, G
lenn
Dal
e, M
d.,
7 O
ct 6
9
Am
plitu
de v
a.
tim
e pi
ots
a re
cord
er
mag
neti
c ta
pe.
"Wri
ting
Spe
ed 2
0 In
/Sec
, Pa
per
Spee
d 7 •
. 5 I
n/M
in.
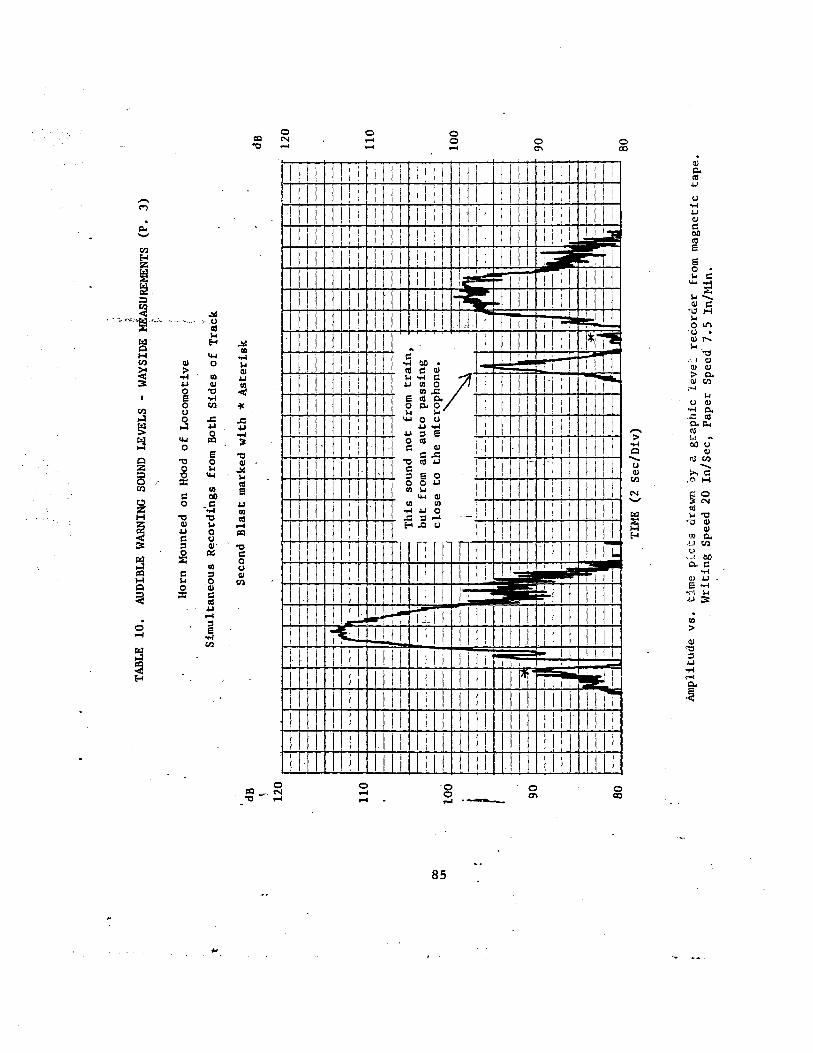
,
t
00
U1
0' " f" TA
BLE
10.
AUDI
BLE
WAR
NIN,
G SO
UND
LEV
ELS
-W
AYSI
DE M
f::AS
UREM
ENTS
(P
. 3)
Hor
n M
ount
ed o
n H
ood
of L
ocom
otiv
e
Sim
ulta
neou
s fr
om B
oth
Sid
es o
f T
rack
dB
Seco
nd B
last
mar
ked
wit
h *
Ast
eris
k dB
120
t __ 12
0
90
1--
' I-
=:I
!' 1
--
f---
-_
__
,_
--
' -l.,
-t-
HO
,-,
_-_
__
I=I _
__
_
_
__
__
_ I-
---t
----
-_=
I--
QM§=
, = =
1-----T
his
soun
d no
t fr
om t
rain
" _
, ==
__..-,-, j
-=
---
+=, =
=:=
1
but
from
an
auto
pas
sing
1 _
_ -
_ = =
---=
---1
--
clos
e to
the
mic
roph
one.
c---'
------,----,
='=;
I--
I_-\-
t -If
I---
--r-
-I=
i-=
-
-I--
1-1
-
---f-
r--r--I--r-=
r-
--1
-.
t----
--1
--
t H
=I
1.1 II
/--
--
--f-
--;-
=1--
__ ..:..
_ -I-
-t=
_
1---
--1-
-= _
__ 1 _
_
,_-_
-_
-_I-
_-I
----
f--=
_\r
-_-.
I-
-j--
-
no
100
100
} • 90 1
-1
-1
-1
-1
-
.--1
-1
-1
-
80 =
= .
TIM
E (2
Sec
/Diy
)
'11=-1
=1=1
= 80
Am
plit
ude
vs.
tim
e dr
awn
by
a gr
aphi
c le
vei
reco
rder
fro
m m
agne
tic
tape
. W
riti
ng S
peed
20
In/S
ec,
Pape
r Sp
eed
7.5
In/M
in.
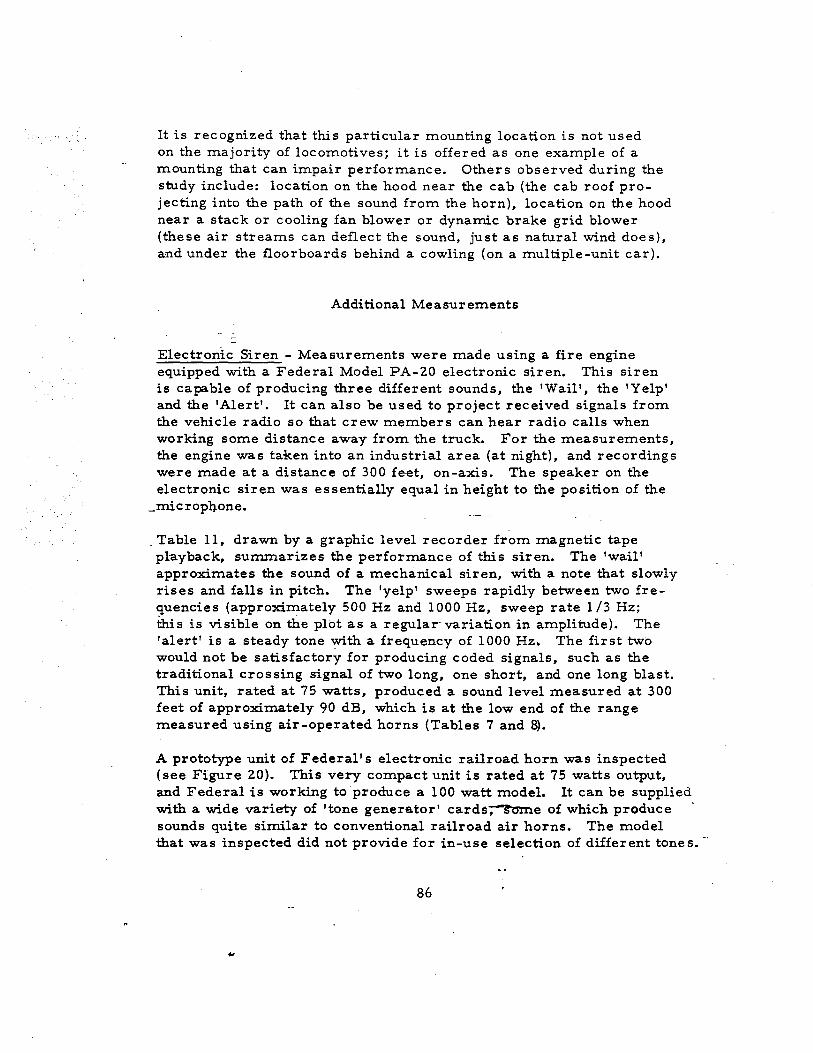
It is recognized that this particular mounting location is not used on the majority of locomotives; it is .offered as one example of a mounting that can impair performance. Others observed during the study include: location on the hood near the cab (the cab roof pro-jecting into the path of the sound from the horn), location on the hood near a stack or cooling fan blower or dynamic brake grid blower (these air streams can deflect the sound, just as natural wind does), and under the floorboards behind a cowling (on a multiple-unit car).
Additional Measurements
Electronic Siren - Measurements were made using a fire engine equipped with a Federal Model PA-20 electronic siren. This siren is capable of producing three different sounds, the 'Wail', the 'Yelp' and the 'Alert'. It can also be used to project received signals from the vehicle radio so that crew members can hear radio calls when working some distance away from the truck. For the measurements, the engine was taken into an industrial area (at night), and recordings were made at a distance of 300 feet, on-axis. The speaker on the electronic siren was essentially equal in height to the position of the
_microphone •
. Table 11, drawn by a graphic level recorder from magnetic tape playback, summarizes the performance of this siren. The 'wail' approximates the sound of a mechanical siren, with a note that slowly rises and falls in pitch. The 'yelp' sweeps rapidly between two fre-quencies (approximately 500 Hz and 1000 Hz, sweep rate 1/3 Hz; this is visible on the plot as a regular- variation in amplitude). The 'alert' is a steady tone a frequency of 1000 Hz. The first two would not be satisfactory for producing coded signals, such as the traditional crossing signal of two long, one short, and one long blast. This unit, rated at 75 watts, produced a sound level measured at 300 feet of approximately 90 dB, which is at the low end of the range measured using air-operated horns (Tables 7 and 8).
A prototype unit of Federal's electronic railroad horn was inspected (see Figure 20). This very compact unit is rated at 75 watts output, and Federal is working to produce a 100 watt model. It can be supplied with a wide variety of 'tone generator' cards00nle of which produce sounds quite similar to conventional railroad air horns. The model that was inspected did not provide for in-use selection of different tones. -
86
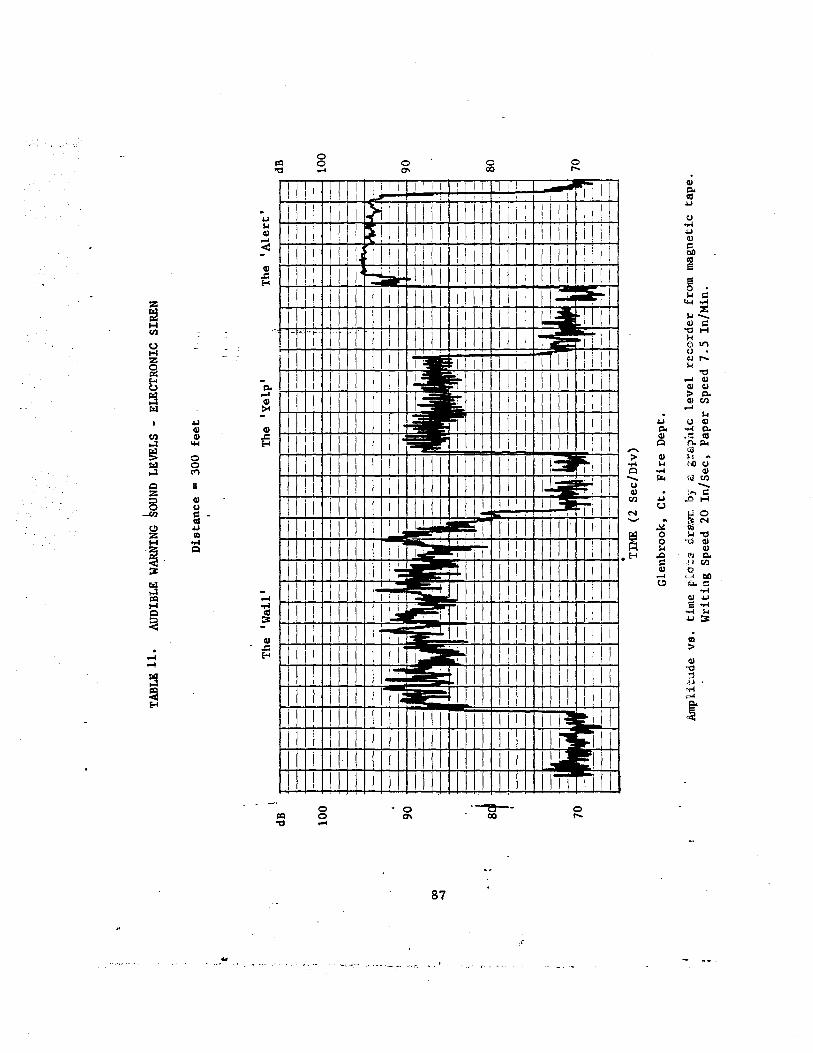
t
dB
100 90
00
-..J
81 I
" .. , .
70
TABL
E.!!.
AU
DIBL
E W
ARNI
NG h
OUND
LEV
ELS
-EL
ECTR
ONIC
SIR
EN
Dis
tanc
e =
300
feet
I,
" ,
The
'Wai
l' Th
e 'Y
elp'
Th
e 'A
lert
'
I--t--II-
--I--i-
--tl-
-I_
-i-
+----I-
---f-
--
1--
-1-
---
----
---
---,
. 1
----
---
---1
--
1_
--
--1
_-----
1--
t--1
\---
1--
--
--
I_
-I_
'-
---
-+
--f-
---l
I-----
--__ f _
__
•
--
_---
I-'-
-I--
-I--
r-
. -
-1
--1
---1
1-
--
---
-1
--
-._
, _
_ I'
!I-
_ __
1 1_' _
_ _
I-t-
-t--
;-t-
-I--
+--
,I--
++
-t
--/-
--f-
--+
--.-
--
--
--
----,------
-,_
.. _
---
-+
--1
--1
-----1
-------
--
-i--
----
------
-,--
---------
,-
1---
-1
--1
_-
--1
_-1
-;----
--
--
-f--
1--
1--
-/--
1--
1--1
--4
------
--
--
--
---,---
-j-------I-
-1
-I---
-1"-
11'
--
--
---_==
-1
--
===--
-= :=
---. .
.-
TIM
E (2
Sec
/Div
)
Gle
nbro
ok,
Ct.
F
ire
Dep
t.
Am
plit
ude
vs.
tim
e p
iots
dra
wn
by 8
gr
aphi
c le
vel
reco
rder
fro
m m
agne
tic
tape
. W
riti
ng S
peed
20
In/S
ec,
Pape
r Sp
eed
7.5
In/M
in.
dB
100
90
80
70
Leslie'Warbler' - The Warbler is an assembly consisting of two 'Supertyfon' horns of different frequencies (310 and 440 Hz) mounted back-to-back on a valve which directs the airstream to the horns alternately. The valve causes each horn to operate for about t second. The overall effect is a high-low sound similar to the 'Yelp' of the Federal electronic siren, except that the rate is slower. The Warbler is intended for stationary applications as a fire or civil defense signal. It is illustrated in Figure 28. .
Figure 28. 'I}le Leslie Warbler
Measurements were made of the Warbler at about 250 feet to the side, and a reading of 94 dB was obtained. This is consistent with the average 88 dB obtained with the Leslie S-2M-R (which Uses the same two horns) at 300 feet to the side at lower air pressure in the. Test Stand Measure-. ments. . -. While the Warbler is not railroad hardware in its present form, it illustrates the potential of mechanical horns t? produce the varying tones found valuable in the Empirical Testing of Warning Qualities.
88
Analysis
Sound Levels Produced - The sound level of the loudest horn tested in the Yard Measurements was 115 dB at 100 feet, and 106 dB at 300 feet. The average of the 300-foot sound level measurements (on-axis) for the eight horn configurations tested in the Test Stand Measure-ments is 94 dB. To adjust for the fact that low air pressure was used in the Test Stand Measurements, we shall add 5 dB to obtain 99 dB at 300 feet. The value of 99 dB at 300 feet will be used in this report as typical horn performance.
Reference to Tables 7 and 8 will show that these figures at 300 feet, 99 dB for high-pressure air and 94 dB for low-pressure air, reflect quite well the performance of the horns measured if a tolerance of ± 5 dB is used. In each table, only one horn is outside the tolerance.
The 'Inverse-Square Law' can be used to expand the 99 dB at 300 feet typical figure into a table of sound levels at distances. This law states that the power ill a sound varies as t}-e inverse of the squa)<c of the distance. For each factor of two in distance, the sound level changes by 6 dB, and for each factor of 1. 4 in distance, the sound level 'changes by 3 dB. Table 12 shows -toe results of"this calcula-tion for distances between 100 and 200 feet. The calculated values at 100 and 600 feet agree within ± 2 dB with measured values.
Tolerances - The tolerance of ± 5 dB shown above may seem impre-- cise, especially to those who recall that + 5 dB represents increasing
sound power by about_ three times, and the 10 dB range covered by the tole-rance represents a sound-power ratio of 10:1._It should be con-sidered, that the listener perceives a of 5 dB in sound level as a relatively small change in loudness. Experimenters in acoustics have asked observers to make judgments of the loudness ratio of sounds, that is, to state when one sound is twice, four times, one-half, etc., as loud as another. It may be inferred from the litera-ture (Peterson12 ) that a railroad horn 10 dB higher in sound-level than another would be perceived to be about twice as loud as the lower one.
A second consideration is that environmental conditions, such as sound reflectionsand--wind conditions,- cause redrretton or augmentation of the sound-level actually available. A considerable variation in sound-level
••
_ 89
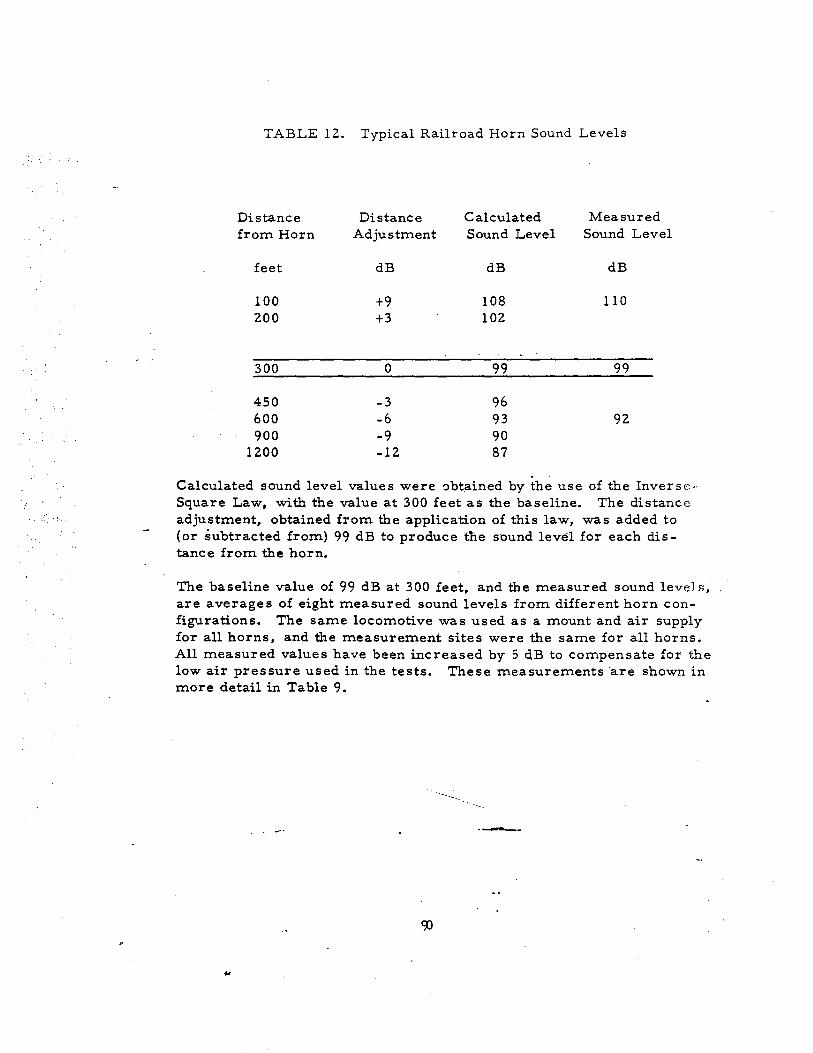
TABLE 12. Typical Railroad Horn Sound Levels
Distance Distance Calculated Measured from Horn Adjustment Sound Level Sound Level
feet dB dB dB
100 +9 108 110 200 +3 102
300 0 99 99
450 -3 96 600 -6 93 92 900 -9 90
1200 -12 87 ..
Calculated sound level values were -:>btained by the use of the Inverse· Square Law, with the value at 300 feet as the baseline. The distance adjustment, obtained from the application of this law, was added to (or subtracted from) 99 dB to produce toe sound level for each dis-tance from the horn.
The baseline value of 99 dB at 300 feet, and the measured sound. levels, are averages of eight measured sound levels from different horn con-figurations. The same locomotive was used as a mount and air supply for all horns, and the measurement sites were the same for all horns. All measured values have been increased by 5 dB to compensate for the low air pressure used in the tests. These measurements -are shown in more detail in Table 9.
--.
is experienced in measurements made of repeated passes of a parti-cular locomotive over a particular crossing. A small sample of this nature was taken at a crossing along a suburban branch of the Penn Central on which a passenger shuttle train is operated; five westbound passes of the same multiple-unit car were measured (all on the same day). Six seconds before the train passed over the crossing, the whistle was measured at 78, 79, 83, 85, and 80 dB.
Sound Levels at the Wayside - The sound perceived by a listener at the crossing as a train approaches and passes changes rapidly as a function of the distance from the train to the crossing. The measure-ment technique used for this analysis involved making a calibrated sound recording at the crossing on magnetic tape, and using a graphic level recorder to produce a plot of sound level vs. time.
On the first two pages of Table 10, the approach and passing of five different trains at two crossings is plotted. Each is analyzed below as a case history, in order to estimate what sound level would exist outside a motor vehicle having a Critical Encounter (S"ee- Chapter 3) with each train. Both crossiflos have a speed limit for motor vehi-cles of approximately 30 MPH. The Time to Clear for such cross-ings is 6 seconds (Table 4); the sound levels pJ"oduced by tl1e horn of each train 6 seconds before entering th-e crossing will be examined. It is recognized that the Critical Point is about 200 feet back from the c-rossing in these examples, and that the measurements ideally should have been taken from that point; this will be considered separately in each case history:
1. Train 172 (Page 1 of 'table 10), a standard passenger train going approximately 40 MPH eastbound. four blasts of the horn that comprise the grade crossing signal are easily dis-tinguished on the chart, and are also indicated by heavy black bars at the top of the plot. The train went over the crossing 50 seconds after the electric crossing protection was activated and 13 seconds after it began sounding its horn as a warning. When the train was 6 seconds and 355 feet from the crossing, the horn produced a sound level of about 96 dB at the crossing. Based on this measurement, a computation shows that at the Critical Point, the Radial Distance is about 425 feet and is 30 degrees; measurement at the Critical should have given a reading of about 94 dB at this time.
91
..
2. Mail Train (Page 1 of Table 10), going approximately 60 MPH westbound. The engineer sounded the grade crossing signal twice. The train went over the cros sing 30 seconds after the electric crossing protection was activated and 11 seconds after it began sounding its horn as a warning. When the train was 6 seconds and 528 feet from the cros sing, the horn produced about 91 dB at the crossing. At the Critical Point, the Radial Distance is 586 feet and the angle is 21 degrees; estimated sound level at the Critical Point is 90 dB.
3. Train 3002 (Page 1 of Table 10), the TurboTrain, going approx-imately 55 MPH eastbound. The train went over the crossing 35 seconds after the electric protection was activated and 9 seconds. after it ·began sounding its horn. When the train was 6 seconds and 488 feet from the crossing, the horn produced about 84 dB at the crossing. At the Critical Point, the Radial Distance is 545 feet and the angle is 23 degrees; estimated sound level at the Critical Point is 83 dB.
4. Train 2001 (Page 2 of Table 10), a Metroliner, going approxi-mately 110 MPH The train went'over the crossing 30 seconds after the electric protection was activated and 9 seconds aiter it began sounding its horn. When the train was 6- seconds and 975 feet from the cros-sing, the horn produced about 78 dB at the crossing. Estimated sound level at the Critical p,oint is also 78 dB. The first blast of the horn can-not be distinguished on the chart, although the ear can pick it out on playback. The second blast is only about 3 dB above the local noise level. Four different recordings were taken of Metroliner s at Glenn Dale on different days; the other trains have results that are similar to these. To show the entire range of sound levels, the train is plotted twice in the table, with different scale factors.
5. Freight Train (Page 2 of Table 10), going approximately 60 MPH westbound. The train went over the crossing 9 seconds after it began sounding its horn. When the train was 7 seconds and 580 feet from the crossing, the horn produced about 86 dB at the crossing.
In all the cases cited above, wayside sound measurements produced . values lower than those listed in Table li;---C;:S-e 1-3 dB, Case 2-2 dB, Case 3-12 dB, Case 4-11 dB, and Case 5-7 dB. The average is -7 dB!.
92
While it should be recognized that the distances and speeds shown in the case analyses are rough estimates, this result is significant enough to suggest that the values given in Table 12 are optimistic rather than conservative, as they apply to the sound levels actually available for warning motorists in the real world.
"--
93


CHAPTER 9. AUDIBLE - EMPIRICAL TESTING OF WARNING QUALITIES
Purpose of the Test
Tonality - The sound of a warning device may be said to have two basic qualities: amplitude and tonality. Amplitude is easily defined as the power of a sound, and this quality can best be measured by instruments. Tonality of a sound is defined here to mean all the elements that make one sound different from another: frequency, harmonic content, dissonance, periodicity, etc. Quite a few in-struments are available to describe these elements, such as fre-quency meters and sound analyzers. The total effect of a sound on a person, however, is elusive.
Therefore, it was decided to construct a test in which human sub-jects would be exposed to various kinds of warning sounds in a manner which would test the comparative merits of different tonali-ties. The basic criterion for evaluating merit was whether a sound could be perceived as a warning at a lower amplitude than another sound.
An important premise in the construction or the· test was that the .subjects had to be engaged in the actual activity of driving a motor vehicle as the sounds were presented. Various schemes involving the use of actual trains, or railroad horns concealed by the wayside, etc., were considered and rejected on grounds of safety or impracti-cality.
Amplitude - A very useful output of this testing was the compilation of actual sound levels required, directly outside the motor vehicle, to be perceived as warnings by the driver. This information, ob-tained under normal driving conditions with windows closed, is available in various categories of speed, vehicle type, etc. It makes evaluation of the performance of railroad horns possible, by relating the sound at the horn to the sound required at the motor vehicle. This is analyzed in detail in chapter 2.
Construction of a
The selected testing method used a sound system attached to the vehicle _.
94

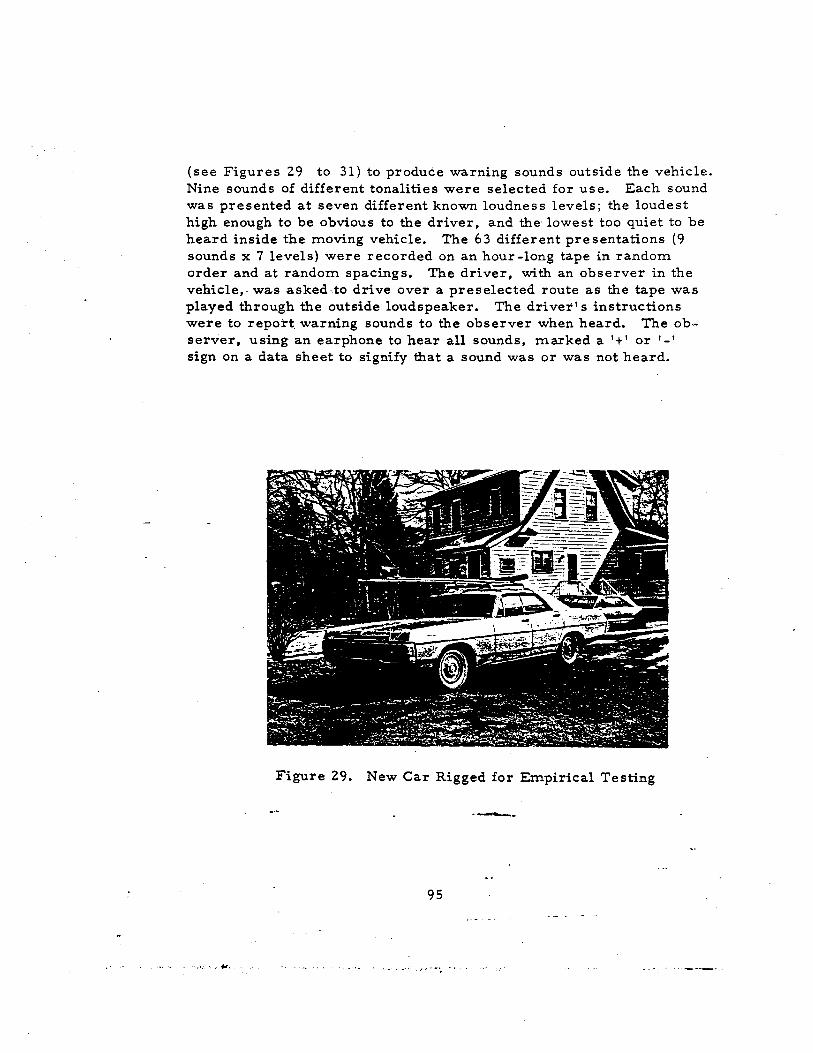
(see Figures 29 to 31) to produce warning sounds outside the vehicle. Nine sounds of different tonalities were selected for use. Each sound was presented at seven different known loudness levels; the loudest high enough to be obvious to the driver, and the lowest too quiet to be heard inside the moving vehicle. The 63 different presentations (9 sounds x 7 levels) were recorded on an hour-long tape in random order and at random spacings. The driver, with an observer in the vehicle,- was asked·to drive over a preselected route as the tape was played through the outside loudspeaker. The driver's instructions were to report. warning sounds to the observer when heard. The ob-server, using an earphone to hear all sounds, marked a '+' or '_I sign on a data sheet to signify that a sound was or was not heard.
Figure 29. New Car Rigged for Empirical Testing
---95
-.
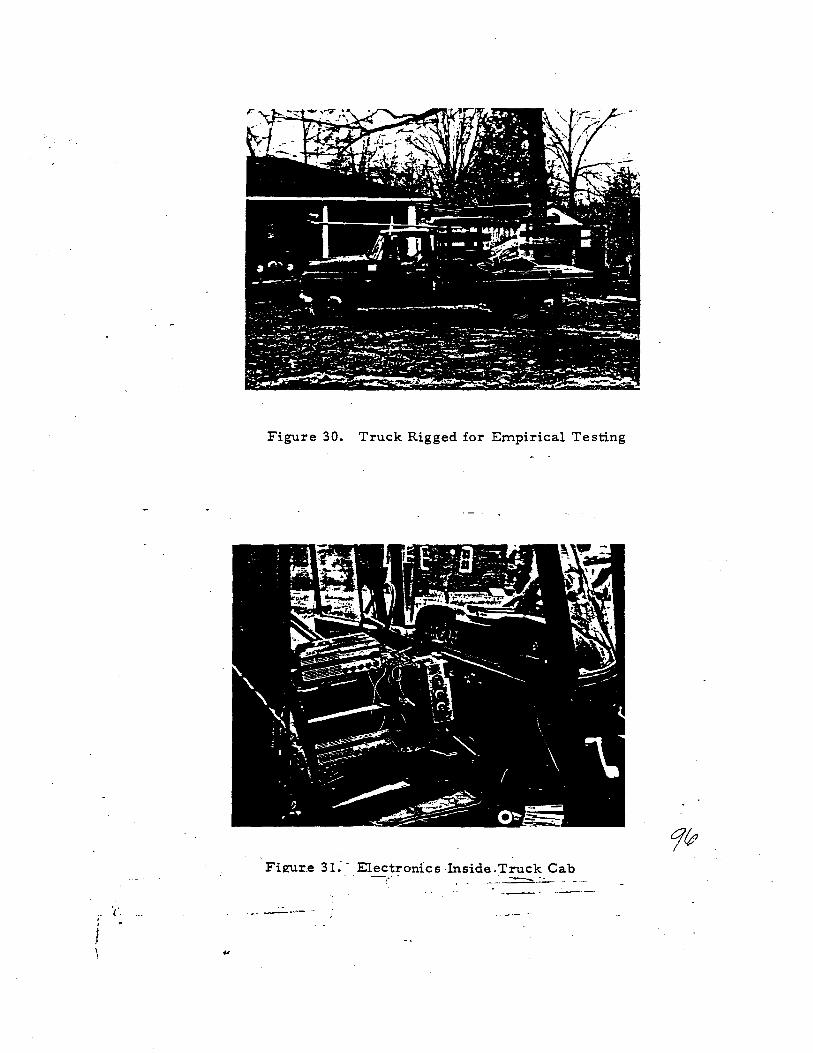
Figure 30. Truck Rigged for Empirical Testing
FiE\lr"e 31: - Electronics Inside.Truck Cab .-... ----""-- .. - .. -
... - .-. J
• ,ro" ' ..
Accident Statistics as Criteria
An analysis was made of grade crossing accident statistics in order to identify whether some particular condition or conditions were es-pecially conducive to this kind of accident, and to identify the popu-lation of people and vehicles involved in such accidents. New York State has a computerized system for handling accident reports, and a printout was obtained for all reported accidents in 1967 in which 'Collision .... -ith Train' was indicated. One hundred seventy-eight cases were printed out, with information on thirteen factors each. This information is summarized in Table 13.
The table shows that December was the worst month of that particular year, with 27 crossing accidents compared with 20 accidents in March. the second worst. July had the fewest accidents with 7. Fifty-five percent occurred in daylight and the same percentage under clear, dry conditions (not necessarily the same accidents). Thirty-seven percent of the accidents involved property damage only; presumably in many of these the car stalled on the tracks and the operator left the car. Ten accidents were reported as having no operator, but this statistic cannot be considered reliable because some operators who left the car may have been confused about the proper entry on
- this part of the accident report.
Design Drivers and Design Vehicles - These accident statistics were u"sed as an aid to determining the range of design drivers and the range of design vehicles. It was desired to have the sample of drivers used in testing match as well as possible the population of drivers who have cross-ing accidents. The sample did, of course, exclude people visibly unfit to drive; sleepy, drunk, not holding va11-d licenses, "etc. Three age clas ses were used for testing, and the age limits of the clas ses were set so as to include approximately equal numbers of operators involved in accidents as shown in Table 13. The 'best fit' using three levels was:
1. 16-25 Years 2. 26-40 Years 3. 41 Years and Over.
An equal number of .runs was scheduled using drivers from each group. Women were 1/5 of the accidents; while sex was not a
it was desired to minority representa--women in the testing .
97
.. - .... ' ,.. •• , • ""' .. J ............... _ .... ;... .... ,. •• :...... _
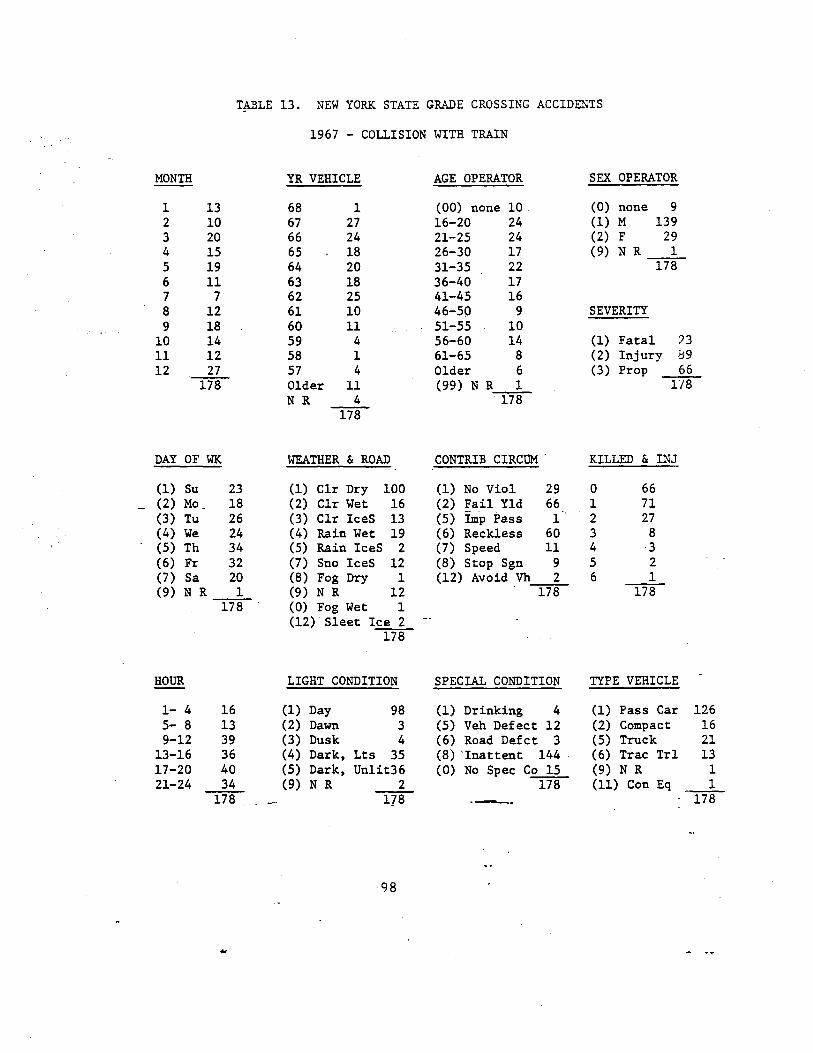
13. NEW YORK STATE GRADE CROSSING ACCIDENTS
1967 - COLLISION WITH TRAIN
MONTH YR VEHICLE AGE OPERATOR SEX OPERATOR
1 l3 68 1 (00) none 10 (0) none 9 2 10 67 27 16-20 24 (1) M l39 3 20 66 24 21-25 24 (2) F 29 4 15 65 18 26-30 17 (9) N R 1 5 19 64 20 31-35 22 178 6 11 63 18 36-40 17 7 7 62 25 41-45 16 8 12 61 10 46-50 9 SEVERITY 9 18 60 11 51-55 10
10 14 59 4 56-60 14 (1) Fatal 23 11 12 58 1 61-65 8 (2) Injury 89 12 27 57 4 Older 6 (3) Prop 66
""T78 Older 11 (99) N R 1 178 N R 4 l7s
178
DAY OF WK WEATHER & ROAD CONTRIB CIRCUM - KILLED & INJ
(1) Su 23 (1) Clr Dry 100 (1) No Viol 29 0 66 (2) Mo 18 (2) Clr Wet 16 (2) Fail Yld 66 1 71 (3) Tu 26 (3) Clr IceS 13 (5) Imp Pass 1 2 27 (4) We 24 (4) Rain Wet 19 (6) Reckless 60 3 8 (5) Th 34 (5) Rain IceS 2 (7) Speed 11 4 3 (6) Fr 32 (7) Sno IceS 12 (8) Stop Sgn 9 5 2 (7) Sa 20 (8) Fog Dry 1 (12) Avoid Vb 2 6 1 (9) N R 1 (9) N R 12 178 178
l7s (0) Fog Wet 1 (12)· Sleet Ice 2
178
HOUR LIGHT CONDITION SPECIAL CONDITION TYPE VEHICLE
1- 4 16 (1) Day 98 (1) Drinking 4 (1) Pass Car 126 5- 8 13 (2) Dawn 3 (5) Veh Defect 12 (2) Compact 16 9-12 39 (3) Dusk 4 (6) Road Defct 3 (5) Truck 21
13-16 36 (4) Dark, Lts 35 (8) 'Inattent 144 (6) Trac Trl l3 17-20 40 (5) Dark, Unlit36 (0) No Spec (9) N R 1 21-24 34 (9) N R 2 178 (11) Con Eq 1
178 178 --- 178
98
The vehicle class was also controlled in three levels. Two levels were chosen to represent automobiles of different age classes, in order to evaluate whether recent changes in car manufacture (ac-companied by much advertising claiming interior silence) and cus-tomer preference for accessories such as air conditioning had made a significant difference in perception of audible warnings. Table 13 indicates that the five most recent model year s (including the present year) account for about half of the automobiles involved in grade-crossing accidents. Trucks and tractor-trailers were involved in about 1/5 of the accidents; they are an important minority because their 'acoustical environment is . quite· different frorn.that of cars, and because grade crossing accidents involving trucks are often very damaging to railroad personnel and property. The chosen levels of this factor are:
1. Automobile, 1966 model or newer 2. Automobile, 1965 model or older 3. Truck.
Other Factors - Two additional factors, other than sounds, were considered controllable and significant. These were selected out reference to Table 13. One was Distractions, in increasing order of mental effort on the part of the driver:
1. No Distractions 2. Radio 3. Driver Conversing with Observer.
The other factor is Speed Range:
1. 21-35 MPH 2. 36-50 MPH 3. 51-65 MPH.
Sounds
Railroad Sounds - Five horns, one whistle, and one locomotive bell were among the sounds used in the testing. The horn and whistle sounds were all recorded at the wayside from trains going at various speeds. It was felt that th_e realism thus gained would offset the .loss of controlled conditions that would have been possible with yard or test stand recordings. Two high-pitched horns were selected, recorded from a Metroliner traveling at 110 MPH, and the other re-
99
corded from the TurboTrain traveling at 55 MPH (all speeds are approximate). Two medium-pitch horns were selected, one a five-chime horn recorded from a train going 70 MPH on the Richmond, Fredricksburg and Potomac RR, the other a three-chime horn recorded from a Long Island Rail Road train going at 55 MPH. A low-pitched horn, from a Penn Central GG-l electric locomotive going at 80 MPH, was also used. The whistle was recorded on a branch of the Penn Central, with the train going about 45 MPH. The bell was recorded in a yard of the Penn Central.
Non-Railroad Sounds - Also used in the testing were an electronic siren and a new sound especially synthesized for the purpose. The electronic siren sound is the 'Yelp' recorded from a fire truck; this sound is described in detail in the section of Chapter 8 subtitled 'Additional Measurerrents'.
The last sound was synthesized for the test by an 'electronic sound' laboratory whose principal market is for radio television adver-tising. The propriet"lr (Raymond Scott, a noted studio musician for many years before going into this field) was asked to create his pre-liminary idea of what a train should sound like approaching a crossing.
- considering the conflicting requirements 01 high warning value plus low nuisance value. The resulting tape had on it a rising and falling musical sound which somewhat resembled notes played on a xylophone, It was judged quite distincthe and recognizable, but somewhat lacking in the urgency that one associates with a good warning, and not sug-gestive of '"train' to the listener. It was included in the testing to determine whether it was sufficiently-audible to justify more effort in this general direction. Mr. Scott had named the tape 'Locomotive 1972,1,
Summarizing the Sounds presented:
1. LIRR (3-Chime) Horn 2. Metroliner Horn 3. RF&P (5-Chime) Horn 4. TurboTrain Horn 5. Whistle 6. Bell 7. Elect.ronic Siren 'Yelp' . __ 8. GG-l Horn 9. Synthesized Sound 'Locomotive 1972'.
100
Preparation of Tapes
Each sound was presented as a single blast of the horn (or equivalent) with a duration of about 2-1/2 seconds. The duration and envelope (shape of the amplitude vs. time curve) could not be closely controlled since wayside recordings were used as a basic source. This had some effect on the results (see the section on 'Analysis'). A master recording tape was made of the nine sounds at equal levels; see Table 14 for an amplitude vs. time plot of the master.
It was desired that the driver should not be able to anticipate the time, sound, or amplitude of the next presentation. Three diffe rent pre sen-tation tapes were prepared, using tables of random numbers for two purposes-:- -
1. Randomization of the sequence of sounds and amplitudes. The first sound, lowest amplitude, was assigned the number 'I'; the first sound, next higher amplitude was assigned '2', etc.
--to. '63' (there are nine sounds x seven amplitudes). For each presentation tape a list was prepared, each number 1 to 63 appearing exactly once, the sequence determined from a table of two-digit random numbers.
- 2. Randomization of the interval between presentations. Numbers between 14 and 76 were selected from a random number table and a sequence list was prepared for each tape, with the num-bers representing seconds between presentations. There was no requirementthat a number appear exactly once.
Using the -sequence lists as a guide, the presentation tapes were pre-pared from the master tape. A steady calibration tone began each tape, and the levels used were -IS, -10, -5, 0, +5, +10, +15 dB referred to the calibration tone.
Conduct of Testing
!our factors of .three levels a 3 x 3 x 3 x 3 or 81 . trials. Each trial used one presentation tape presenting all sounds at
101
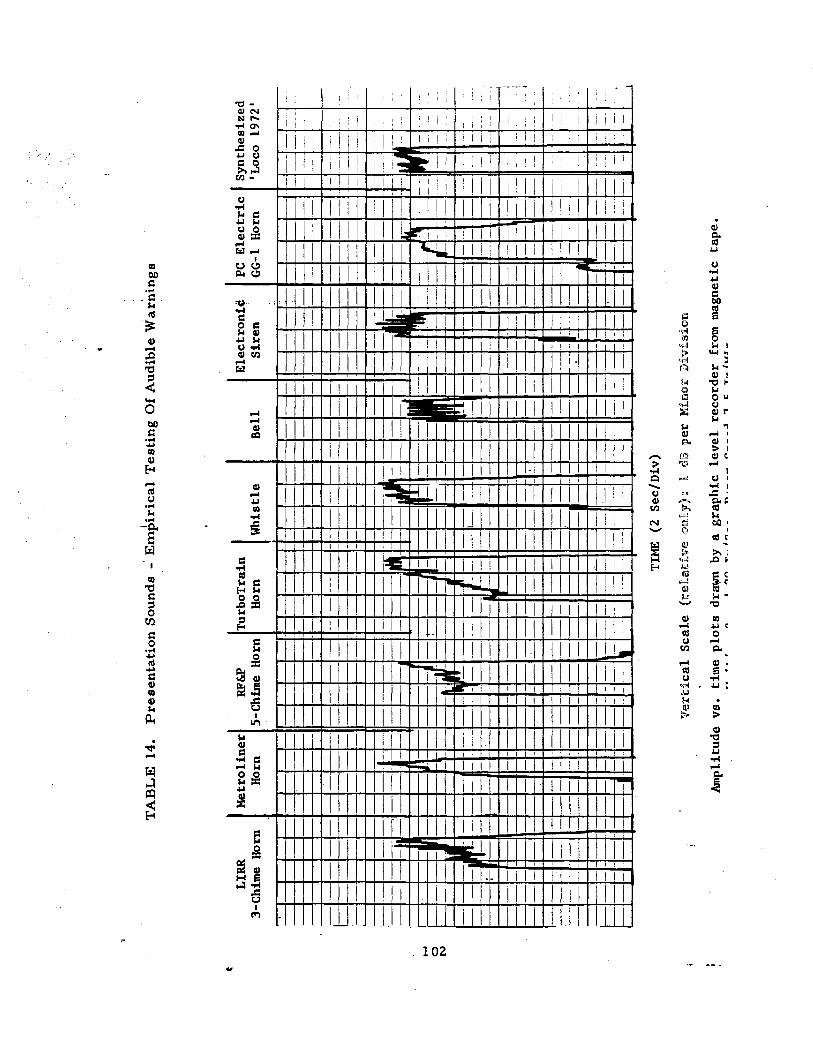
t
..... o N
TA
BL
E 1
4.
Pre
sen
tati
on
Sou
nds
-' E
mp
iric
al T
esti
ng
Of
Aud
ible
War
nin
gs
LIRR
3-
Chi
me
Hor
n M
etro
line
rl
RF&P
IT
urbo
Tra
in
Hor
n H
orn
Hor
n W
hist
le
Bel
l S
iren
PC
Ele
ctri
c G
G-l
Hor
n Sy
nthe
size
d 'L
oco
1972
'
=1
1 1=
1=1=
1 1
1--
1
1 1
-1-1
-1-1
-1-1
1
---+
--1
--1
--1
---1
1
1-1
---1
-1-1
-1--
+--
1-1
I 1
---f
_
. -.
. -
'=I=-I=I
-.i1=I=l=
I-I=t=1
1 -
iii •• .-
I-I-
l--II
-.
--F
.r-l
= . -=
1=-
=1=1=11:
= ==I=
t= -1=
--J
-=1
-----
.. ---
I---I-I-I
J.-II-I--
-t-II-I-I-
I-I-I
0J !H_
1=E1I=
1 II
Ela
'----4
-l-
ll--Il
-J.-
/-II
-H
-I-
l-J-I-
l-I-
-+
-II
--I-
H-l-
P=1§1
-.l
TIM
E (2
Sec
/Div
)
Ver
tica
l Sc
ale
(rel
ati.
ve o
nT,y
) 1.
per
Min
ot'
Div
isio
n
Am
plitu
de v
s.
tim
e pl
ots
draw
n by
a g
raph
ic l
evel
rec
orde
r fr
om m
agne
tic
tape
. ,I'
ll" .
..... 1
,, _
_
"n _
__
_
,, _
_
.... .
.3
...
C
T_
' ..
. .J
_
seven different amplitudes and requiring just under an hour to run. Changes in vehicle type entailed approximately two hours to move equipment from one vehicle to another (see Figures 29 to 3l), so the testing was broken into three series of 27 runs with one vehicle type. Vehicles selected were: 1970 sedan or hardtop with air conditioning, 1960 hardtop, 1966 9-foot rack body truck with manual transmission. All runs were made with windows closed.
At the beginning of each run, the vehicle was pulled to the side of the road, and the calibration tone was played from the beginning of the presentation tape. A sound-level meter was placed on the roof of the vehicle and the volume control of the amplifier was adjusted to ob-tain the desired sound level. This level was entered on the data sheet. Low speed runs were generally set for 80 dB, medium speed runs for 85 dB, and high-speed runs were set for 90 dB. The different levels of calibration only served to shift the loudest and softest tones; the calibration level was taken into account in the Data Analysis.
Drivers were obtained mainly from a 'temporary industrial help' firm, and were all male with one exception. The casual nature of this type of labor made it difficult to enforce a fixed number of runs per individual; this number varied between 1 and 9. Each individual was fitte-d only into trials calling for his age- group, and no individual drove more than one vehicle. Seventeen different individuals were ased in the series.
The most difficult factor to control during the tests was Distractions. It was the observer's duty to minimize conversation on runs not requiring it, and to engage the driver jn conversation when it was re-quired. He also monitored radio volume (when called for) to a 'mod-erate' level. Hardest of all was, on runs requiring- conversation, maintaining a smooth flow of talk as the earphone called out presen-tations; any halting or change at that moment could represent a cue to the driver. Despite this, and the natural human tendency to talk when one should not and to be quiet when one should talk, a good level of control was maintained.
The speed range facto! was controlled basically by setting the route. Three routes were picked- (see Figure 32) appropriate for the speed ranges cal1edfor-:- Route #1 was the over winding country/suburban roads from Stamford to ·Wilton and Weston, Connec-
103
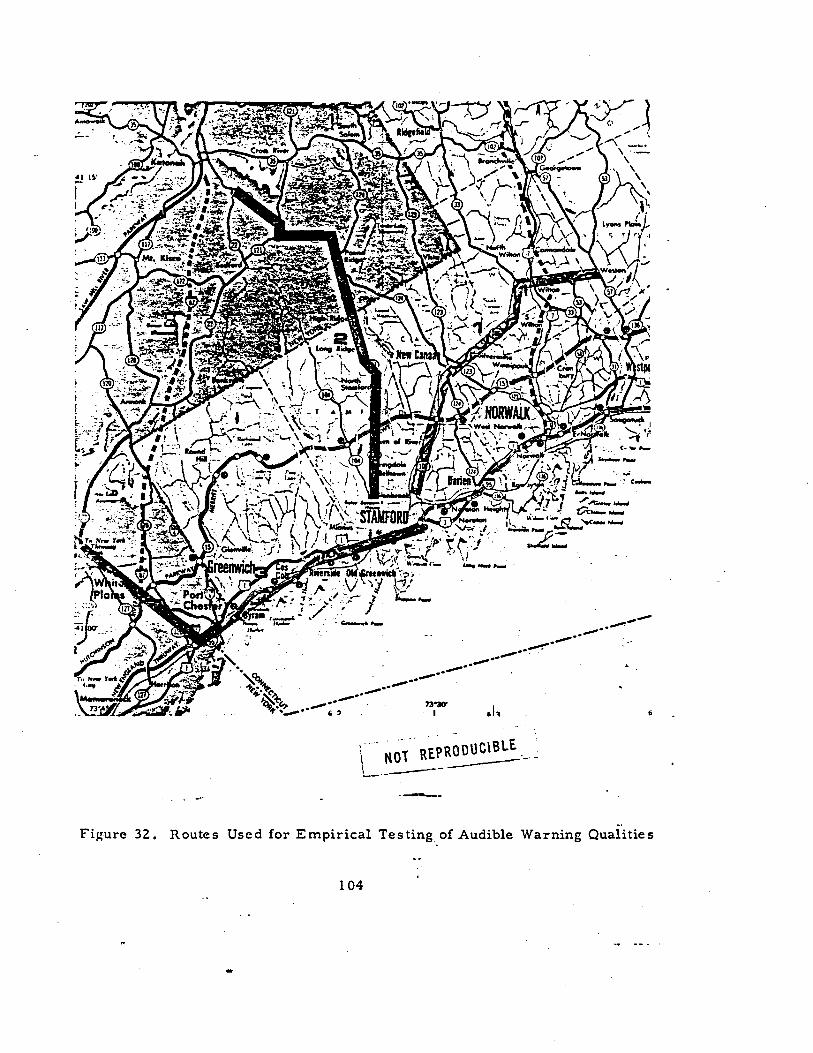
REPROOUC\BLE -_-----------.-. --Figure 32. Routes Used for Empirical Testing of Audible Warning Qualities
104
..
ticut. Route #2 was on a straighter road from Stamford to Bedford, New York, allowing operation in'the middle range. Route #3 was on expressways from Stamford to Tarrytown, New York, and was used for the high-speed runs. Routes were not rigidly controlled; consid-erable variation was allowed in routings within the speed range constraints.
A second tape recorder was in the vehicle and used to re-cord sounds ins ide the car, as a c he ck on sounds, re s ponse s, dis-traction control, etc. This proved valuable at the beginning of testing when observer techniques were being perfected; playback was used to locate missing responses on data sheets. These recordings were deemed superfluous about halfway through the testing program, and were discontinued at that time.
Data from each of the 81 runs was recorded on a data sheet (Figure 33) coded for maximum convenience of the field observer, and delib-erately intended to discourage the observer from giving clues to the driver. The observer, upon hearing a presentation number through his earphone, entered a '+' or I_I sign depending on the response.
Verification Tests
In order to demonstrate the extent to which the recorded sounds simu-lated the actual sound of a locomotive horn, verification tests were con-ducted in the vicinity of YaphanlC, New York, on the eastern portion of the Long Island Rail Road Main Line. A chartered locomotive was used to present sounds to the driver of an automobile equipped with the sound system for presenting recorded warnings, as used in the testing des-cribed earlier in this chapter. There would have been two serious drawbacks to arranging the verification test to present an encounter between the locomotive and the car at a crossing:
1. Safety. It was not desired to have a locomotive and a motor vehicle deliberately set on conflicting paths, despite all precautions that could be devised. . --.
105
' ..
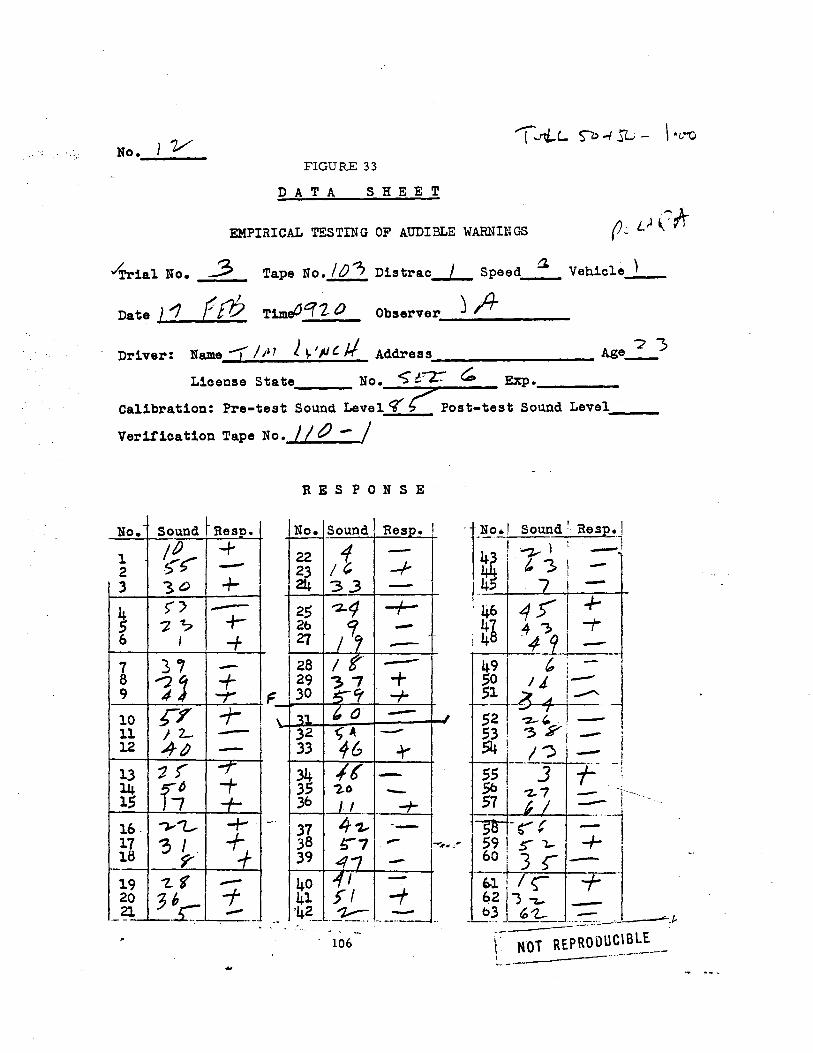
, v No .'---:" __ FIGURE 33
DATA SHEET
EMPIRICAL TESTING OF AUDIBLE WARNIlWS
/Trial No. 3 Tape NO./!)? Dbtrac I Speed a. Vehicle_' __
Date .. 1 .... '1_I-{-.0 .... 9_' T1meIJ q"l 0 Observer __ J _;4_' ___ _
Driver: Name -r lin L 1,.'1JC tI Address, ________ Age.2-3
License State No. <; tT Exp •. ___ _
Calibration: Pre-test Sound Level <6 ? Post-test Sound Level __ _
Verification Tape No. II tJ - /
No. Sound fR •• 1 II) -+ 2 -3 30 -f-
)') ---7-'7 +-6 I -+ 7 3' -8 1j + 9 '-t' 10 ;-r + I 11 )2- - i 12 -13 1}' -r 14 lS 16· ""'Y"1- +-17 '3 I . -1-+ 18 9" 19 "'Z..f -20 __ 2l - -
RESPONSE
I No. Sound Resp. !
It -;, 24 33 -25 -+-
::--28/8" -29 1-1 + F ,30 -f -;-
\ 'n (, 0 - 1
.32 -t; A -
.3.3 46 +-34 It -.35 '2-0 _
-+-" .37 4- '2.- -- I
38 !r7 - ... .39 4; -40 l' :::: 41 5" -,
_ ... ___ -==-- ... . - -.
106
soun. d I Resp •. J I . I : --::z..- 1 . - I -1
1.45 -'46 45' I .;-,47 4 , -r 148
49 -,'-i - '1 S§ I II- i-- J S2 I '2-" ,- ! 53, 3 -.54! /?'_ ! 551--'-3 -1-- --:
i '1,7 :::.- l---j
59 i s-' 1.-1 "+ ! 60i 3 S-'-6.1 tI +_.
J),t- . -- -------_.-
NOT REPRODUC\ BlE -----_. __ ._._----
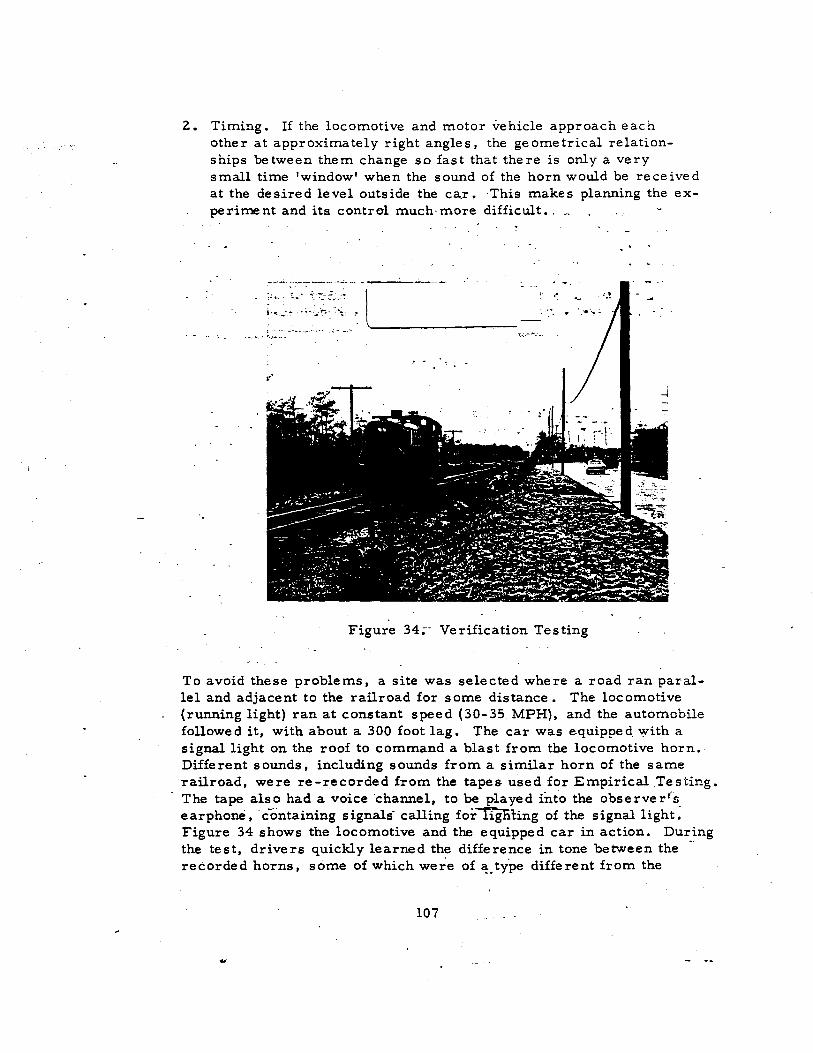
2. Timing. If the locomotive and motor vehicle approach each other at approximately right angles, the geometrical relation-ships between them change so fast that there is only a very small time 'window' when the sound of the horn would be received at the desired level outside the ca.r • This makes planning the ex-periment and its control much·more difficult •.
. -. : . .... -'-:" :.
Figure 34;- Verification Testing
To avoid these problems. a site was selected where a road ran paral-lel and adjacent to the railroad for some distance. The locomotive (running light) ran at constant speed (30-35 MPH), and the automobile followe d it. with about a 300 foot lag. The car was equippe d \1V'ith a signal light on the roof to command a blast from the locomotive horn. Different sounds. including sounds from a similar horn of the same railroad. were re-recorded from the tapes used fOr Empirical Testing. The tape also had a voice channel. to be p-Iayed into the observe r"s earphone,' c-ontaining signals- calling foi---rrgnting of the signal light Figure 34 shows the locomotive and the equipped car in action. During the test, drivers quickly learned the difference in tone between the -recorded horns, some of which of <!-. type different from the
107
--
locomotive horn under test, and the horn on the locomotive. A new recording was made on the spot using the test locomotive, and this was more successful in 'fooling' the drivers. Even here, however, after some experience they were able to recognize the loudness of the tape and the variability in loudness of the real locomotive • Our con-clusion, based on evaluations by several observers, is that the pre-sentation system was realistic in actual operation. The ability of dri-vers to distinguish real from recorded sounds was judged to be based on their learning of characteristics not dependent on sound realism, and not related to the perception thresholds of different sounds.
Analysis
Data Reduction - The '+' and '-' responses from the 81 Data Sheets were transcribed onto 'Data Reduction Worksheets' (Figure 35), which decoded the order in which the sounds were presented into a consistent tabular form, with names of sounds on the left and"decibel values along the top.
- The next step was to select, for each trial, one perception decibel value for each sound. One would expect that, on a given trial, a given sound would be perceived at its loudest level and at some suc-cessively lower levels, then not perceiv'ed at all lower levels. For example (as shown in Figure 35), the TurboTrain elicited a positive response during Trial #3 at 100, 95, 90 and 85 dB, and a negative response at 80, 75 and 70dB. it was found that in a noticeable minority of cases, driver responses did not fit this pat-tern. To obtain decibel ratings in a consistent for-m-which would not bias the final result, a set of rules was devised. The rules are given in Table 15.
Application of these rules resulted in expression of the data from one trial as nine decibel values, or 72.9 values in all (see Appendix I). These values are the raw data used as input to the statistical analysis 0
Statistical Analysis - Means and standard deviations were calculated for each of the .!ive single factors; Sounds, Driver Age, Type of Vehi-cle, Distractions, and Speed Range. ---
108
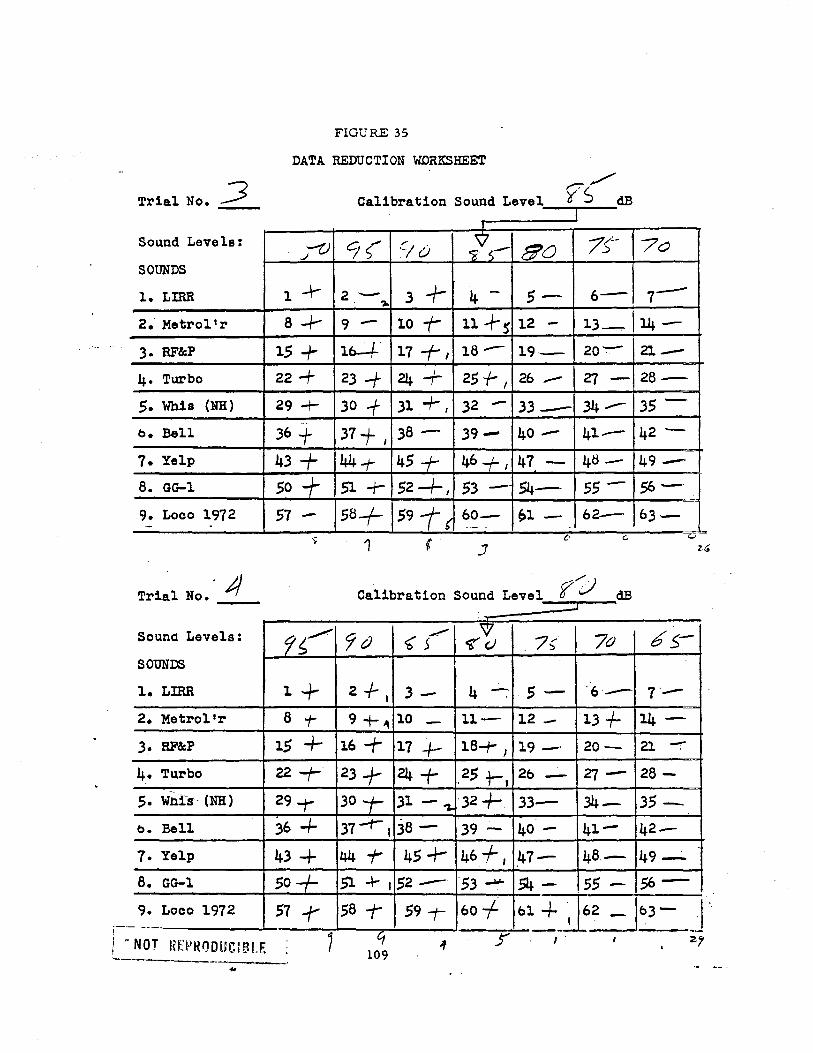
Trial No • ..3 Sound Leve 18 :
SOUNDS
1. LIRR
2. Metrol1r
3. RF&:P
4. Turbo
5. Whis (NH)
b. Bell
7. Yelp
8. GG-l
9. Loco 1972 - -
Trial No . Sound Levels:
SOUNDS
1. LIRR
2. Metrol l r
RF&:P
4. Turbo
5. Whis-- (NH)
b. Bell
7. Yelp
8. GG-l
9. Loco 1972 ----I
I "NOT IHJIRODlICIBLE
FIGURE 35
DATA REDUCTION WORKSHEET
'-tJ J
l-t-
8-1-
15 + 22 -+ 29 + 36 + 43 + 50 -r 57 -
-
1+ 8 1-
15 + 22-t-29 -r-36 -t-43 + 50 + 57 -r .
i
Calibration Sound Level / 7s dB
I
9(' r , '-I () SO 75/- 70
2-, '). 3 -+- 4 - 5- 6- 7--
9 - 10 -r- 11 12 - 13---,. 114 -17 -t I 18- 19- 20- 21-
23 -+ 24+ 25+ I 26 .- 27 - 28-
30 -f 31 +, 32 - 33- 34 -- 35 -
37+ I 38 - 39- 40 - 41- 42 -
44-1- 45 -f- 46 -f- I 47 - 4tl- 49-
51-+- 52+, 53 - 54- 55 - 56-
58+ 59 -t i 60- 61 - 62- 63-
1 o
Calibration Sound Level .-I
YcJ .-"" : 70 b5-
2+ 1 3- 4 - 5- -6- 7'-
9 10 - 11- 12 _ 13 + 14-16 -1- 17 +- 18-+- ) 19 - 20- 21 -23 -J- 24-t- ,25 +-, 2b - 27- 28 -
30 j- 31 - -z. '32 -I- 33- 34- 35-37-t-, 38- 39 - 40 - 41- 42-
441' 45+ 46 +, 47- 48- 49-51 4- I 52- '53 --- 54- 55 - 56-58 -r 59 T 60 -f +_}2 - Jb3 =-J
C, 5' ' I' 109
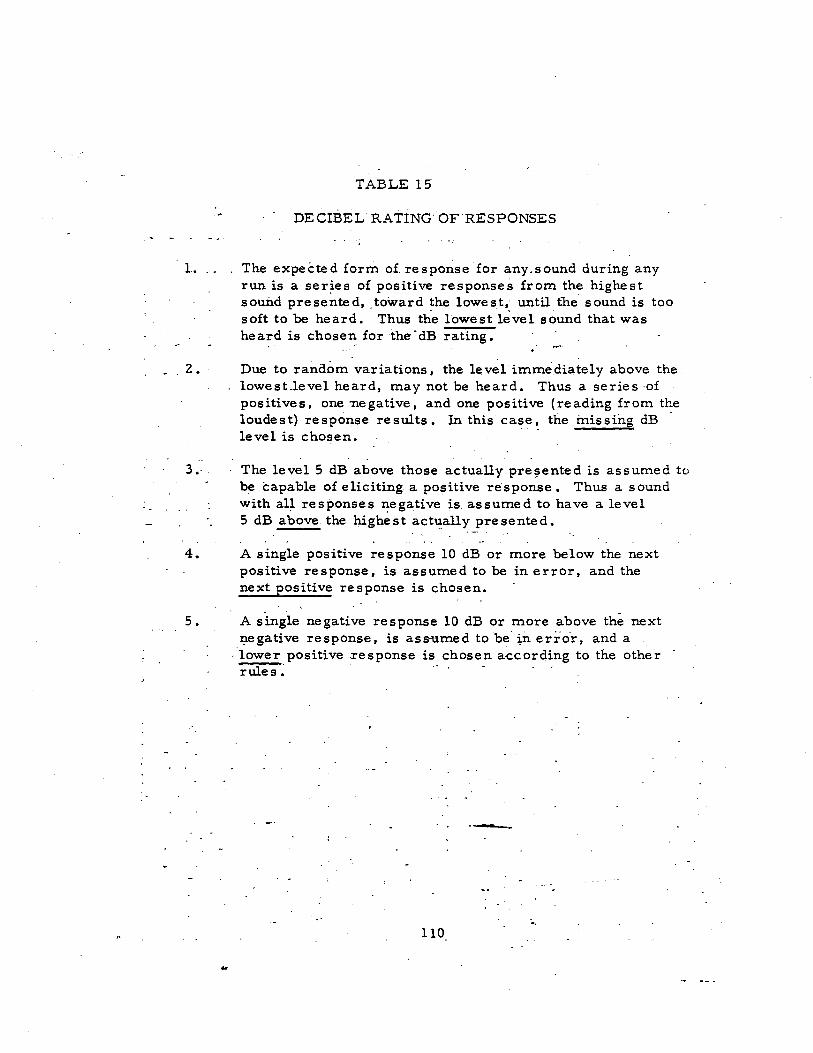
TABLE 15
DE CrBEL RA TING"OF RESPONSES
L The expected form of response for any.sound during any run is a of positive responses from the highest sound presented, ,toward lowest,: untU the sound is too soft to be heard. Thus the lowest level sound that was heard is chosen for the -dB rating.
2. Due to random variations, the level immediately above the lowest-level heard, may not be heard. Thus a series ,of positives, one negative, and one positive (reading from the loudest) response results. In this case, the missing dB ' level is chosen.
3., The levelS dB above those actually is assumed to be capable of eliciting a positive response. Thus a sound with responses is. assumed to have a level 5 dB above the highest presented.
4. A single positive response 10 dB or more below the next positive response, is assumed to be in error, and the next pos itive re s ponse is chosen.
5. A single negative response 10 dB or more above the next response, is as;Umed to be in error, and a
,lower positive response is chosen according to the other rules
--.
110
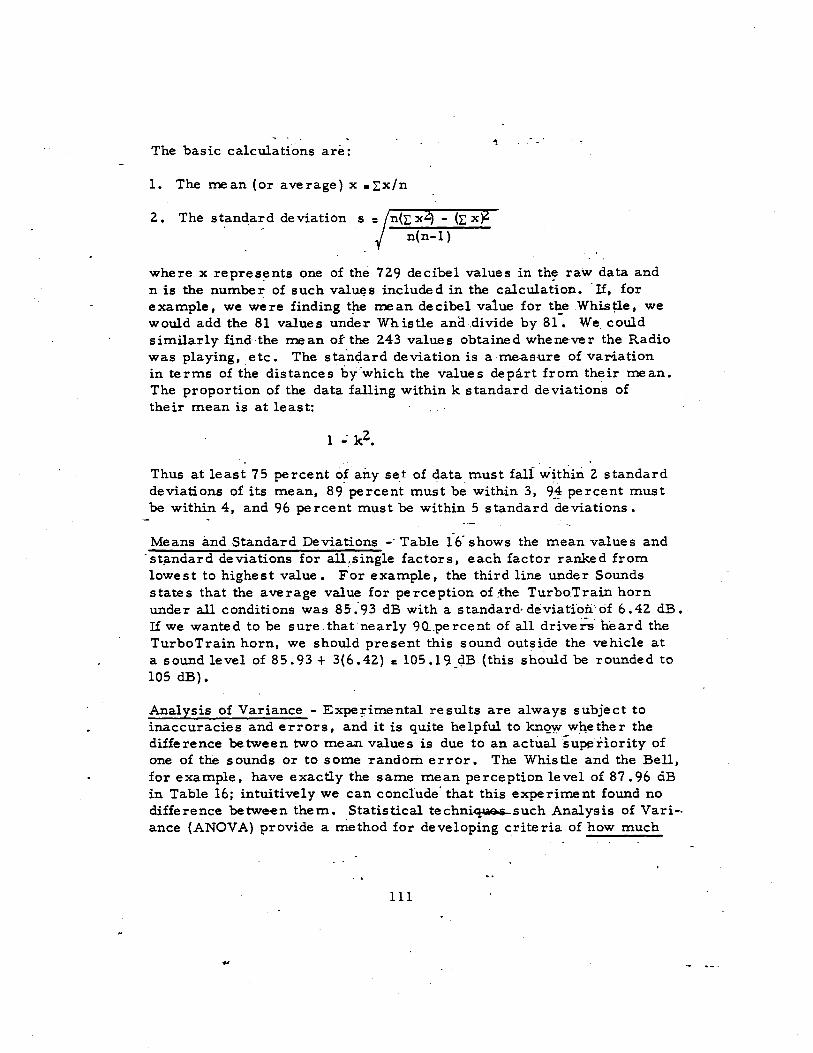
The basic calculations are:
1. The mean (or average) x .r.x/n
2. The standard deviation
where x one of the 729 decibel values in the raw data and n is the number of such included in the calculation. -If, for example, we were finding the mean decibel value for the we would add the 81 values under Wh istle ana.divide by 8(. We could similarly find the mean of- the 243 values obtained whenever the Radio was playing, etc. The standard deviation is a measure of variation in terms of the distances by-which the values depart from their mean. The proportion of the data falling within k standard deviations of their mean is at least:
Thus at least 75 percent any set of data must fali within 2 standard deviations of its mean, 89 percent must be within 3, percent must be within 4, and 96 percent must be within 5 standard deviations.
Means and Standard Deviations -' Table f6- shows the mean values and deviations for all;single factors, each factor ranked from
lowest to highest value. For example, the third line under Sounds states that the average value for perception of :the TurboTrain horn under all conditions was 85:93 dB with a standard,deviationof 6.42 dB.· If we wanted to be sure- that nearly 9Q.percent of all drivers-heard the TurboTrain horn, we should present this sound outside the vehicle at a sound level of 85.93 + 3(6.42) • (this should be rounded to 105 dB).
Analysis of Variance - Experimental results are always subject to inaccuracies and errors, and it is quite helpful to knQ'Y,'I wh,ether the difference between two mean values is due to an of one of the sounds or to some random error. The Whistle and the Bell, for example, have exactly the same mean perception level of 87.96 dB in Table 16; intuitively we can conclude' that this experiment found no difference between them. Statistical .. such Analysis of Vari-ance (.ANOVA) provide a method for developing criteria of how much
111
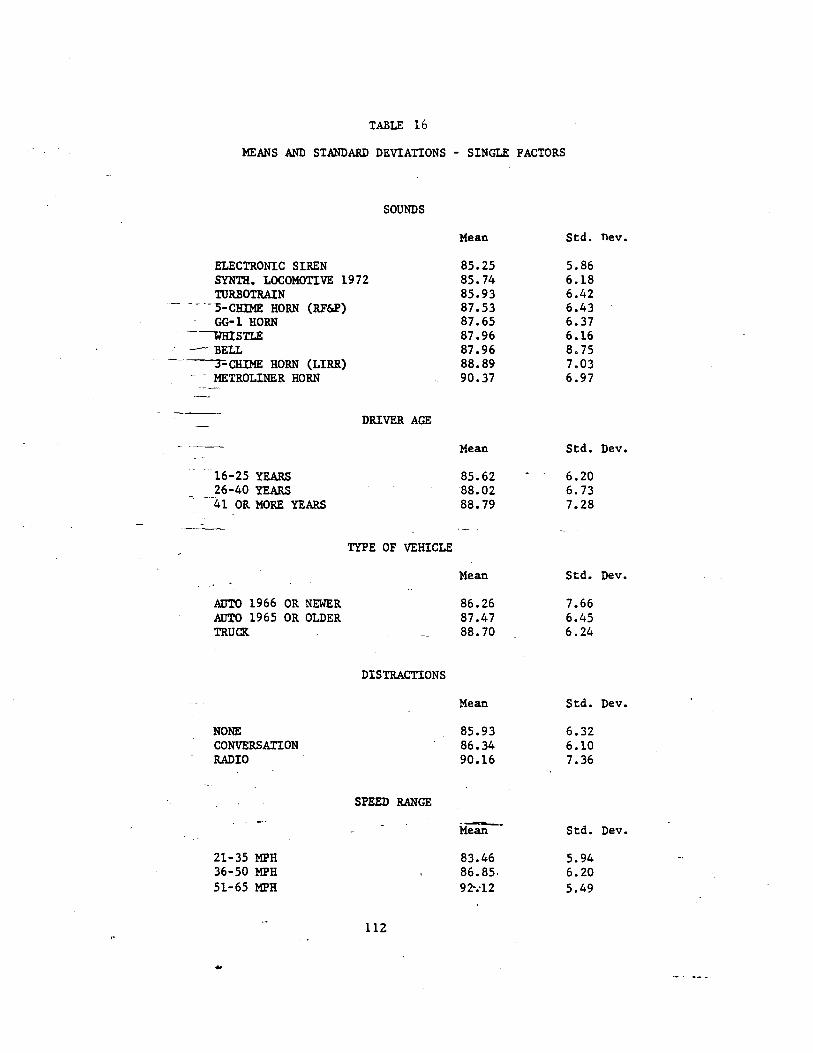
TABLE 16
MEANS AND STANDARD DEVIATIONS - SINGLE FACTORS
SOUNDS
Mean Std. neve
ELECTRONIC SIREN 85.25 5.86 SYNTH. LOCOMOTIVE 1972 85.74 6.18 TIJRBOIRAIN 85.93 6.42
- - --5-CHIME HORN (RF&P) 87.53 6.43 GG-1 HORN 87.65 6.37
87.96 6.16 -" BELL 87.96 8.75 ----r-CHIME HORN (LIRR) 88.89 7.03 - - MElROLlNER HORN 90.37 6.97
DRIVER AGE
---- Mean Std. Dev.
16-25 YEARS 85.62 6.20 26-40 YEARS 88.02 6.73 41 OR MORE YEARS 88.79 7.28
-.-.-TYPE OF VEHICLE
Mean Std. Dev.
AUTO 1966 OR NEWER 86.26 7.66 AUTO 1965 OR OLDER 87.47 6.45 TRUCK 88.70 6.24
DISTRACTIONS
Mean Std. Dev.
NONE 85.93 6.32 CONVERSATION 86.34 6.10 RADIO 90.16 7.36
SPEED RANGE --. Std. Dev. Mean
21-35 MPH 83.46 5.94 36-50 MPH 86.85. 6.20 51-65 MPH 92-.. 12 5.49
112
..
difference in the mean values is enough to be considered significant. The ANOVA is described and summarized in Appendix H.
Another technique, the Tukey Method, also described in Appendix H, was used to identify significant differences in the means of factor levels. For single factors as shown in Table 16, we can not c onc1ude that a real difference between two:
l. Sounds exists unless the mean value differs by at least 2.44 dBo
2. Driver ages, types of vehicle; distractions, or speed ranges exists unless the mean value differs by at least 2.61 dB.
Results
Tonalities - A major purpose of the Empirical Testing of Warning Qualities was to determine differences among tonalities of sounds. Ii one particular type of sound can be perceived at a lower amplitude (sound level) than other types of sounds, it has potential as an improved warnlng. The difference betwee.n the best warning sound and the worst warning sound was 5 dB (comparing mean values in Table 16); this is great enough to be significant but not so great as to grossly affect warning de vice pe rfor mance •
The sounds fell into three groups within which no significant differences existed, reading from best to performer:
l. Electronic Siren/Synthetic Locomotive 1972/Turbotrain
2. 5-Chime RF&P/GG-l/Whistle/Bell
3. 3-Chime LIRR/Metroliner Horn
There is evidence that sounds which vary in pitch and amplitude, such as the electronic siren and 'Locomotive 1972', offer an advantage over standard horn-type sounds which do not vary. Low- and medium-pitched horns, with the exception of the-3-Chime LIRR horn, fell in the middle gr oup •
113
.. • • • , J ..... ' .:. :-".,!.,._ ,"_._ •. _ •.. __ ._._._ •....
The two high-pitched horns, Metroliner and TurboTrain, produced widely different results. This can be explained by the nature of the 'recordings-. The sound of the Metroliner horn, as presented on the tape, suffers from the fact that the' train 'was going at an extre mely high speed when recorded. ,The sound as presented, selected as best from several tapes recorded a'tthe wayside, starts low and rises rapidly in volume during o'ne short blast'. During this single blast, the traln traveled"about 350 feet toward recor'der. The Turbo-Train presentation is a longer blast, allowing the driver more time for perception. conc;:lusioll is that the Metrqliner horn, as ,
at the crossing, is relatively hard to hear; this does mean that another horn mounted, on the same train would have produced a, better re,sult.·
Amplitude - The second function of the Empirical Testing of Warning Qualities was to find out how loud a warning sound must be, outside a motor vehicle, to be perceived by lts driver as a warning sound. The overall mean (average) of the 729 sound-level decibel values obtained in the testing was 87.48 dB with a standard .deviation of 6.87 dB.
four 'con:trolled 'factors' which the sounds were pre-sented to (See Table 16):
1. Age .,' The, youngest group (16-25) of drivers signifi-cantl y In,ore ac ute in he aring the warning sounds than the olde s t group (41+). 'The middle age group (26-40) had a mean less than 1/2 dB below the older group. The spread 'between highest and ,lowe st ,me an value ,was 3.17 dB.
2. Type of Vehicle. There was ,not enough difference between the vehicles to meet the test of significance. The fact that the New Car had' the value for perception tends to indicate that the important factor is masking by, engine noise, rathe r than any superior soundproofing. Thus the New Car, with its quiete'r engine, was the vehicle in which warnings easily heard. Total spread in Ire ans was 2.44 dB.'
3 .. Distractions. Conversation degraded the perception of warning's by only 1/2 dB, but the Radio required an average of 4.23 dB more a mpli for a warning to be pe ixs. d • This s'uppor ts the observation made above that masking of warnings by other sounds is a problem. ' ,
114

4. Speed Range. The speed range levels are all significantly different, with a spread between highest and lowest mean values of 8.66 dB.
--. 115

CHAPTER 10. AUDIBLE - NUISANCE
Nuisance Values
The nuisance value of a signal is relative to a combination of variables. For any given sound level of noise, the variables re-lated to nuisance value are:
1. Type of Noise. A pure tone (contaming a single fre-quency) must be raised 5 dB to be experienced as equal in amplitude to a wide band noise that gives the same sound-level reading.
2. Repetitive Quality. In steps from 1 time per day, 2-4 times per day, 4-20 times per day, 1-10 times per hour, 10-60 times per hour, and continuous: each is separated by 5 dB equivalences. A continuous signal of 60 dB is as
.annoying as an 80 dB signal once per day.
3. Time of Day. Night and day is separated by 5 dB; a sound heard at nlght is as annoying as the same sound presented 5 dB louder in daytime.
4. Type of Neighborhood. Noises in the country, suburban, residential, commercial, and industrial areas are exper-ienced as 5 dB lower for each type of community going from country to industriaL In an industrial area a given noise is acceptable at approximately 20- dB louder than the same type of noise heard in the country.
5. Previous Exposure. The effect of previous exposure varies as to whether the subject has accepted the noise as a normal part of living in the area, or whether he resents the noise. Previous exposure will reinforce either the acceptance or the resentfulness.
Assume that a comm.unity is sUbjected to a particular noise source (such as a factory or railroad traffic}"aii'Ct"'"'the noise is accepted whh few complaints. If the level of the noise is raised 10 dB, some
116

complaints may be anticipated. 1£ raised another 5 - 15 dB, many complaints may be expected.
Human response to noise ranges from simple alerting, nuisance, distraction and task interference, to a psychological stress reac-tion and neural damage. The assessment of a stimulus as a nuisance is dependent on the conditions under which it is experi-enced, the task at hand, on going activities, the predisposition to the stimulus and subjective experience of the respondant •
. In order to assess the nuisance value of railroad train signals, the following assumpti.ons were made:
1. That signals consist of train signals plus track noise.
2. That these stimuli, presented as though the train were 200 feet from the respondent, are representative of the experience of those living near the right of way.
3. That as tasks require mental concentration, interfer-ence with these tasks produces the experience of annoyance.
It was assumed that a fair assessment of nuisance values could be made at distances corresponding to 200 feet from the tracks ide. Schools, hospitals and related service institutions are probably built further from noise sources. The worst case was assumed to be in a home 200 feet from the tracks, with the windows open. A modal house was selected as representative of that type of dwelling found near railroads: --
Frame House 200 feet from Trackside, 50 feet from Street, Windows closed. Sound level meter' C' weighting:
Condition
No Traffic Street Traffic Passing Truck Passing Train
117
dB
56-59 59-62 67-72
"7'2-
With windows open, approximately 15 dB was added to all recorded figures.
Sound absorption for a brick or brick faced house would be greater than that of a frame dwelling, with windows closed. With windows open in both types of houses, the similarities would be
Nuisance Experiment
Problem: To determine which emergency acoustical signals have the greatest nuisance value. Nuisance is defined as irritating, annoying, or feeling that it is unnecessary.
Method: Eight auditory signals identical with those selected as representative of devices for the empirical testing (excluding the TurboTrain) were recorded for playback with equal amplitude and equal duration of presentation. These-signals were then presented to adult subjects with the foHowing instructions:
"You will be required to perform an exercise in simple addition - and division. During that time yO'Q. Will whistles, horns, or
bells, etc. as usually heard, on emergency equipment or an - approaching train. These signals will be presented in pairs. At the completion of each pair the presentation will be- stopped and
. you Will indicate which of the pair constituted the greatest nuisance, the first or the second. After indicated your vote continue with the arithmetic probiems. After io seconds a second -pair of signals will be presented on which you are to vote. Continuing this procedure you will experience all of the experimental signals presented in pairs. The signals will be as though they were heard from the inside of a building 200 feet from a railroad".
The eight selected signals were put into a matrix, paired with each other in random order. Thus 28 pairs of sounds were prepared for presentation. This was designated Series A. A second set of 28 different pairs was made for presentation B. One-half of the subjects was SUbjected to A while doing and B while per-forming the division task. The other half 6tt:'l'rn-subjects were ex-
_ posed to B during the addition tasks, etc.
U8
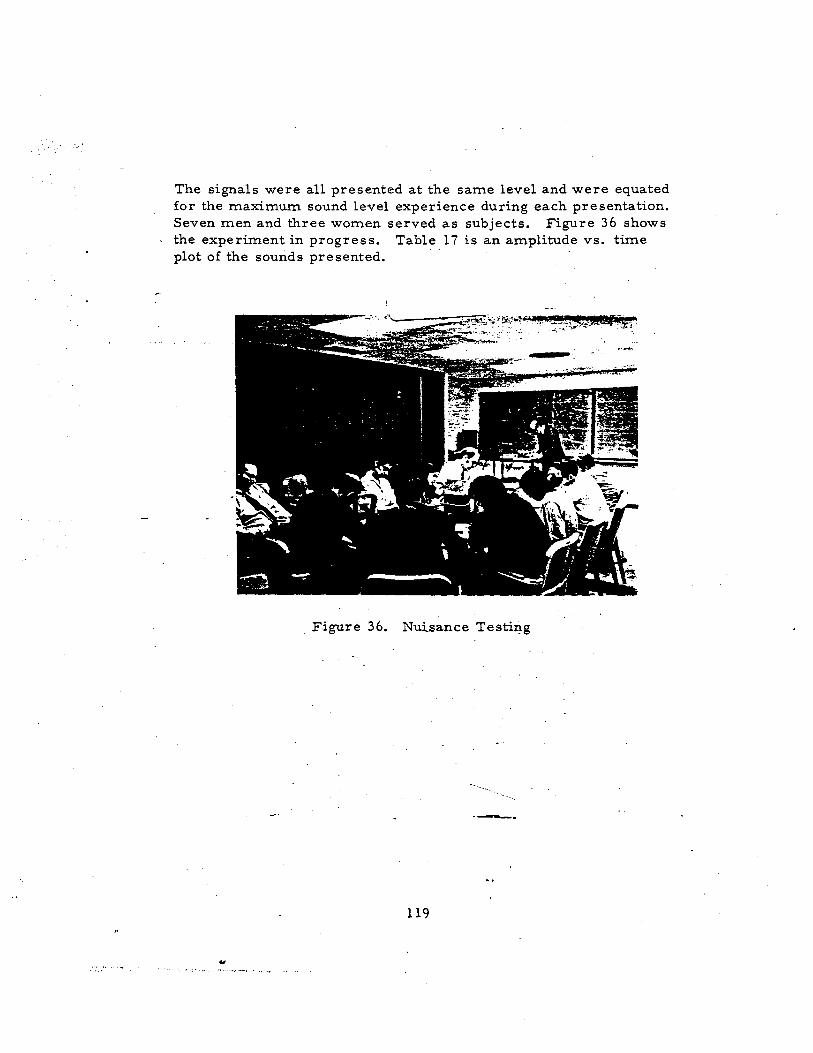
The signals were all presented at the same level and were equated for the maximum sound level experience during each presentation. Seven men and three women served as subjects. Figure 36 shows the experiment in progress. Table 17 is an amplitude vs. time plot of the sounds presented.
Figure 36. Nuisance
---
119
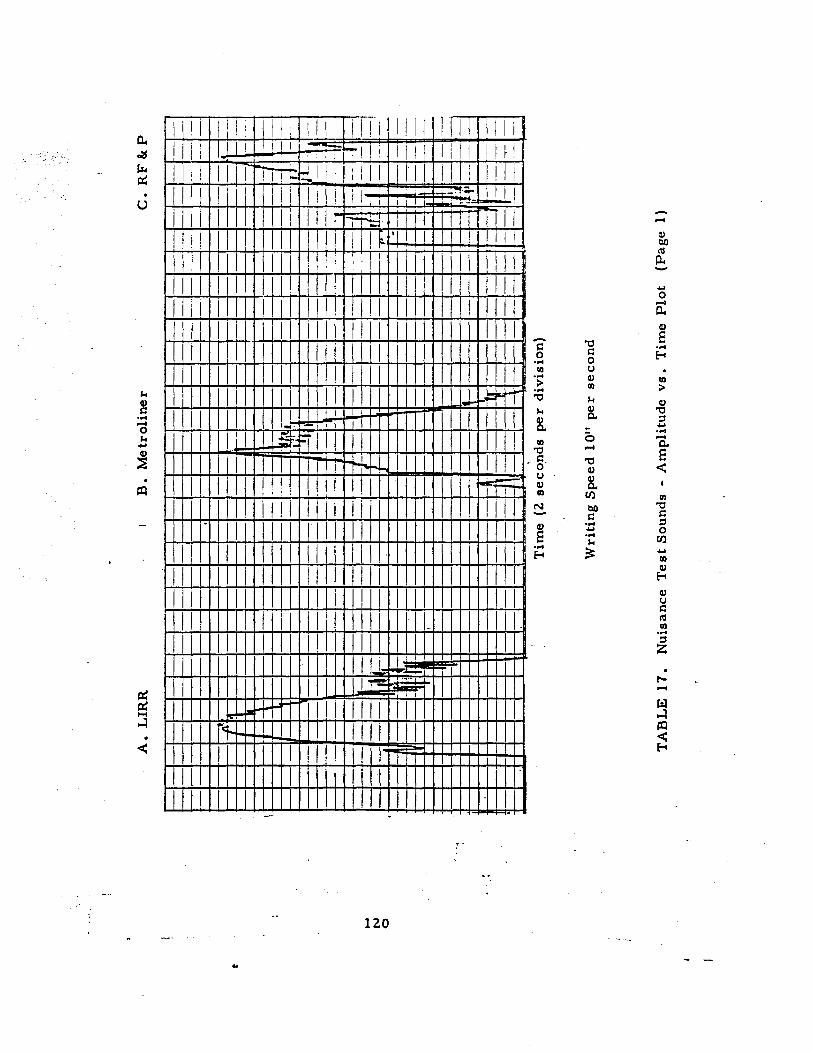
t
.- N o
, "
",
A.
LIR
R
B.
Met
roli
ner
c.
RF
& P
-f--
---t---
,-
---
_I-
-_
_ .,
-f-
_ --\=
1-1
---
1--1
-::=:
= -.
f-
---.
II
I--'
---
-f-. ..._
'_
..
I --
,_
f-
I l-i
_ --I
--
rl
. g..
: -I-
-f--.-
. -
-.-
--
--rf=
; ..
-1
-1
--·1
--
.. j
J -
-.
J .L
. -
------
.--1
---
.-.
-----
I--j
1..-
--
. -
---
.--j
-.
I I AH
=t=tm
1fjt=E
§§ I
I I
,
l I I
II I I
P-U-
I 1=1
-1 I I
I ffi
lE§
I \§33
§=J=
t=8\13
3 rltl
§l §r
J: E
' -T
ime
(2 s
eco,
nds
per
div
isio
n)
Wri
ting
Sp
eed
10"
per
sec
ond
TA
BL
E 1
7.
Nu
isan
ce T
est
Soun
ds -
Am
plit
ude
vs.
Tim
e P
lot
(Pag
e 1)
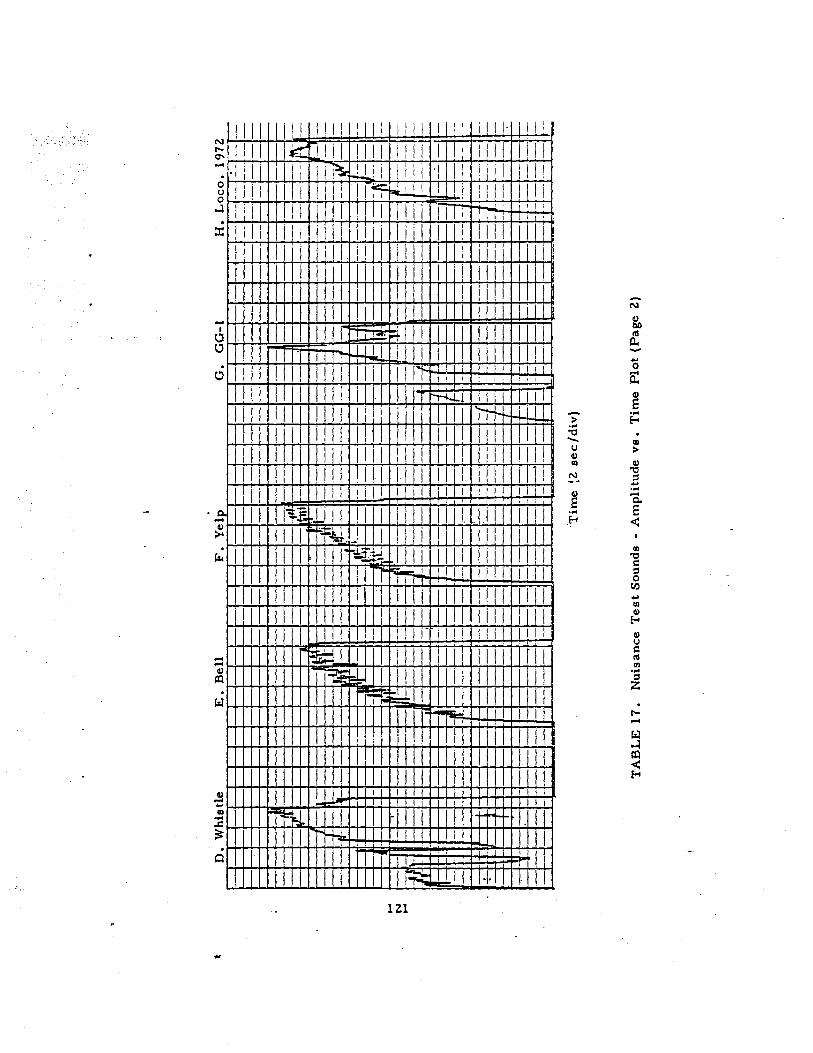
t'·,
t D
. W
hist
le
E.
Bel
l F
. Y
elp
G.
GO
-l
H.
Loc
o. 1
972
I I
I 1
-t--l-
1-l-
1--I-
-1
I
I I
'-S=I
=EF-
Ft=§
I 1
-1 I I
f-
-
--H
--itt
_
_
--1-
-_ -
----
,...
i=
=-1
----
-1
----'-----= -=
---.----
." 1
------
-I-t
-'-
I----
-:-=--=
--.-=/-
---
.... -I--
-J --
--.,
--J.r
-I-----
--, .
--.--
b -1
--
-I--'
--
-A.'
---
----
--
---It----
. 1-
-1(-
'-1
----H
-'--
--:-
1--,-
-.
--
----JJ-:
-----r--
--l f ---.--.
I---.
-I--
-,-------I--·t----
---"---
--
I---
I--H
H--
-il-
+=
-1
--
= = _
= = = _
=1
= I--
. 1--
-; -
-. -t-
.. 1--=
= __
J ,
... N ...
-- I I
-'t=t=I
=l=t=I
=t-=±
= I-
-J
'--I
-I-J
-l-
t -
--
--.---
-.
---
. -
--=-
.:::=
----
.-..
.--._-
=tJ=I=
I=r=.-
-.--
.-.t
--
'Tim
e se
c/d
iv)
TA
BL
E 1
7.
Nui
sanc
e T
est
Soun
ds -
Am
plit
ude
vs.
Tim
e P
lot
(Pag
e 2)
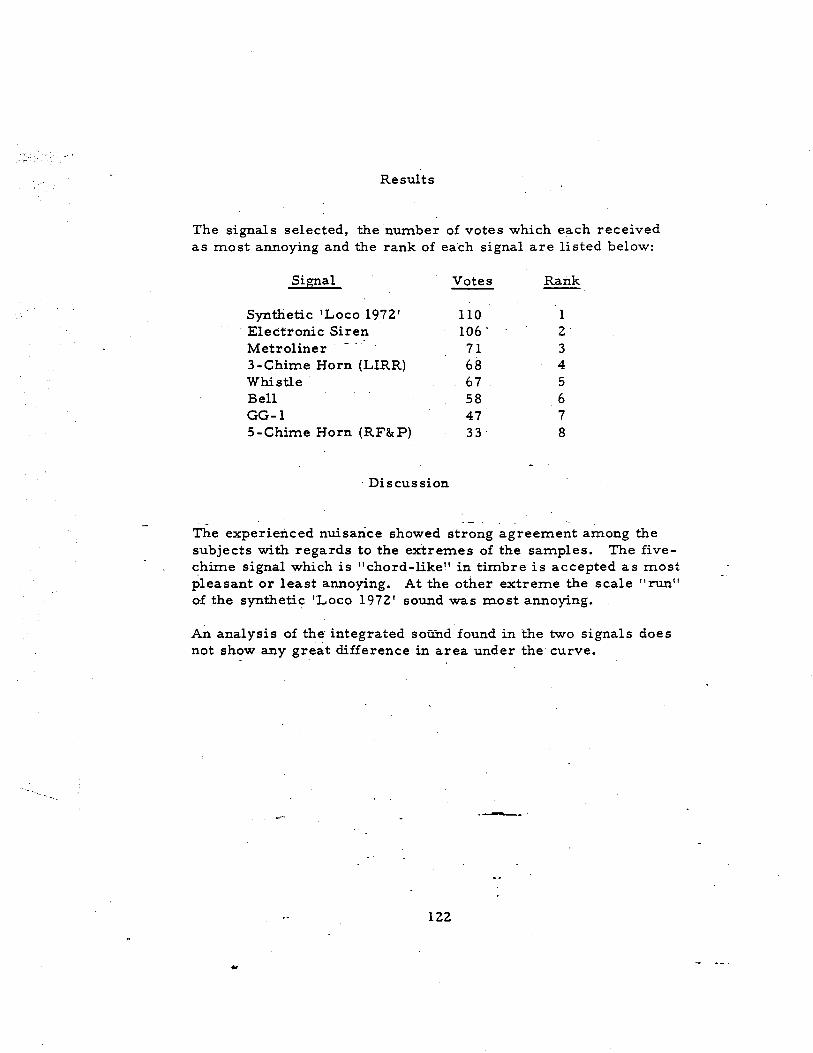
Results
The signals selected, the number of votes which each received as Inost annoying and the rank of each signal are listed below:
Signal Votes Rank
Synthetic 'Loco 1972' 110 1 Elect:r'onic Siren 106 . 2 Metroliner 71 3 3-ChiIne Horn (LIRR) 68 4 Whistle 67 5 Bell 58 6 GG-l 47 7 5-Chinle Horn (RF&P) 33' 8
. Discussion
The experienced nuisance showed strong agreeInent aInong the subjects with regards to the extreInes of the saInples. The iive-chinle signal which is "chord-like" in tinlbre is accepted as Inost pleasant or least annoying. At the other extreIne the scale" run ll
of the synthetic 'Loco 1972' sound was most annoying.
An analysis of the integrated sound found in the two signals does not show any great difference in area under the curve .
. _-122
Achromatic
Acuity
APPENDIX A. GLOSSARY
-Lack of color, non-co,lor (see also Color Brightness).
-Visual resolution, included angle between two observed discrete objects.
Binocular Cues -Those cues to depth perception which are dependent on the use of both eyes. These cues are retinal disparity and convergence. In the former, the greater the difference of images between retinae, the closer the object appears. In the latter, the muscular feedback from eye convergence represents the cues. Binocular cues are rather ineffective for far objects (i.e. beyond 20 feet).
Color Bright-ness -The achromatic number value of a color ranging in steps from
black to white, on a scale from 0 to 10. Syn. with value, luminous reflectance.
Color Contrast -Dissimilarity of hue as seen on a color wheel, i.e. yellow vs. blue.
Conspicuity
Cones
Decibel (dB)
-Property of attracting attention.
-Light sensitive cells of the retina, especially adapted for color stimuli.
-A unit, used in acoustics to express-sound levels. The formal definition of the decibel is as a unit for expressing the ratio of two power levels:
Sound levels are expressed in dB compared with a reference level of 20 micronewtons per square meter. The reference level is, roughly, the smallest sound that can be heard .and is expressed as 0 dB. Since the decibel is a logarithmic unit, each addition of 3 dB represents multiplication of sound power by 2. In Table 12, the sound level of the typical railroad horn at 300 feet is reported to be 99 dB; 100 dB would represent ten billion times the power of the reference level.
Decision Time -Time consumed b.etween the reception of a stimulus and making a response based on.a stimulus-related decision.
Empirical -Originating in or based on observation or experience.
Exposure Value _ or Light Value (E.V.) -Level of illumination.
Appendix A 123
.-.
Figure
Footlambert
Fovea
Ground
Hue
Inverse-Square Law
Mean
mJ.l
Munsell
Nuisance
Periphera.l Vision
Glossary (contd.)
-In perception, the object seen against or contrasted with the ground or background.
-A unit of luminance (luminance is roughly equivalent to brightness). 3.14 footlamberts - 1 candle/sq. ft. White paper in sunlight has a luminance of about 725 footlamberts.
-That part of the retina directly behind the lens of the eye, utilized in direct viewing. The fovea contains the cones and has excellent resolution.
-(or background) In perception, the surround area, as in figure-ground
-The classification of a color as the eye receives it: i.e .• blue, green, red.
-The principle that received light or sound power varies inversely as the square of the distance from the source.
-The mean of a set of n numbers is defined as their sum divided by n. The mean is often called the average.
-(millimicron) A unit of length equal to of a meter. Used in optics to describe the wavelength of light, which in turn specifies color. The visible spectrum covers a range of about 700 400 (violet), and the eye is most sensitive to light of 555 mu (yellow) at moderate levels of illumination (see Purkinje Shift).
-A system of specifying colors on scales of hue (color name), value (brightness) and chroma (saturation).
-Annoying, unpleasant or obnoxious.
-Viewing using the area surrounding the fovea of the retina. This area contains the rods.
Preoccupation-Complete absorption of the mind or interests or operations.
Point Source -As used here, a point source is a light which is not of large enough dimensions to be seen at normal observation distance to have any area; it looks like a point.
Purkinje Shift -A change in the light wavelength to which the eye is most sensitive, as a function of light intensity. Under moderate lIght levels, the eye is most to light at a wavelength of 555 mp; at very low levels it is most sensitive to 505 mp.
Reflectance -Ratio of reflected light to incident light.
Appendix A 124
..
Retina
Rods
Saturation Intensity
Standard Deviation
Statistical Significance
Stimulus
Threshold
Glossary (contd.)
-Part of the eye, containing nerve endings in the form of cells specialized for light reception.
-Light. sensation cells of the retina, specially adapted for achromatic stimuli under low levels of illumination.
-A measure of degree of difference of a color from the grey having the same lightness.
-A statistical measure of how widely individual values are dispersed from their mean. A more detailed explanation will be found in Chapter. 9, in the section on 'Analysis'.
-Level of confidence that tested relationship did not occur by chance alone.
.-Any that elicits a response.
-Minimum amount of energy which a response or becomes a stimulus.
-Transmissivity -The inverse amount of· light attenuation by atmospheric conditions.
Vigilance -State of alertful watching, especially to avoid danger •
. .-.
Appendix A 125

Appendix B. Bibliography
1 •• Blackwell, H. R.: Visibility Assessment of Gray and Chromatic Paints by a New Technique, Washington, D.C., U.S. Coast Guard, 1960
2.
3.
4.
5.
6.
7.
8.
9.
10.
11.
12.
13.
14.
15.
Breckenridge, F. C. and Douglas, C. A.; "Development of Approach and Contact Light Systems", Illumination Engineering, Vol. XL, p. 785, 1945.
Bynum, Joseph A., et a1.; Development of a Paint Scheme for Increasing Helicopter Conspicuity, U.S. Army Aeronautical Research Unit, Ft. Rucker, Alabama, September, 1967.
Cobb, P. W. and Moss, F. K.; ''The Four Variables of Visual Threshold", Journal of the Franklin Institute, pp. 205-831.
Cook, K. G., Beagley, R. M. and Robinson, J. E. Jr.; "Aircraft Conspicuity and Flight Altitude Information Provided by Exterior Paint Pattern", Journal of Applied Psychology, Vol. 46, No.3, 1963
Douglas, C. A.; "Computation of the Effective Intensity of Flashing Lights", Illumination Engineering, Vol. LII, December, 1957.
Gibson, J. J.; The Senses Considered as Perceptual'Systems, Houghton-Mifflin Co., p. 280.
Hanson, D. R. and Dickson, A. D.; Significant Visual Properties of Some Fluorescent Pigments, 43rd Annual Meeting of Highway Research Board, Washington, D.C., 1964.
IES; Lighting Handbook, 4th Edition, Illuminating Engineering Society, New York, 1966.
Kinchla, R. A. and Allan, L. G.; "A Theory of Visual Movement Perception", Psychology Review, Vol. 76, No. 6,
Morgan, C. T. et al.; Human Engineering Guide to-Eauipment Design. New York: Mc Graw-Hill, 1963.
Peterson, A. P. G. and Gross, E. E. Jr.; Handbook of Noise Measurement, 6th Edition. West Concord, Mass: General Radio Company, 1967.
Projector, T. H.; "Efficiency of Flashing Lights", IllUmination Engin-eering, Volume LIII, November, 1958.
Projector, T. H.; The Role of Exterior Lights in Mid-Air Collision PreventionA Arlington, Va, Applied Psychology Corporation, July 1962 •
. . _... .----. Siegel, A. 1. and Federman, P.; "Development of a Paint Scheme for IncreaSing Aircraft Detectability and Visibility", Journal of Applied Psychology, Vol. 49, No.2, 1965.
126

Bibliography (contd. )
16. Siegel, S.; NonparaInetric Statistics. New York: Mc Graw-Hill, 1956.
17. von Fieandt, Kai; The World of Perception. Chicago: Dorsey Press, 1966.
18. Woodworth, R. S.; ExperiInental Psychology. New York: H. Holt !It Co., 1938.
---
Appendix B 127

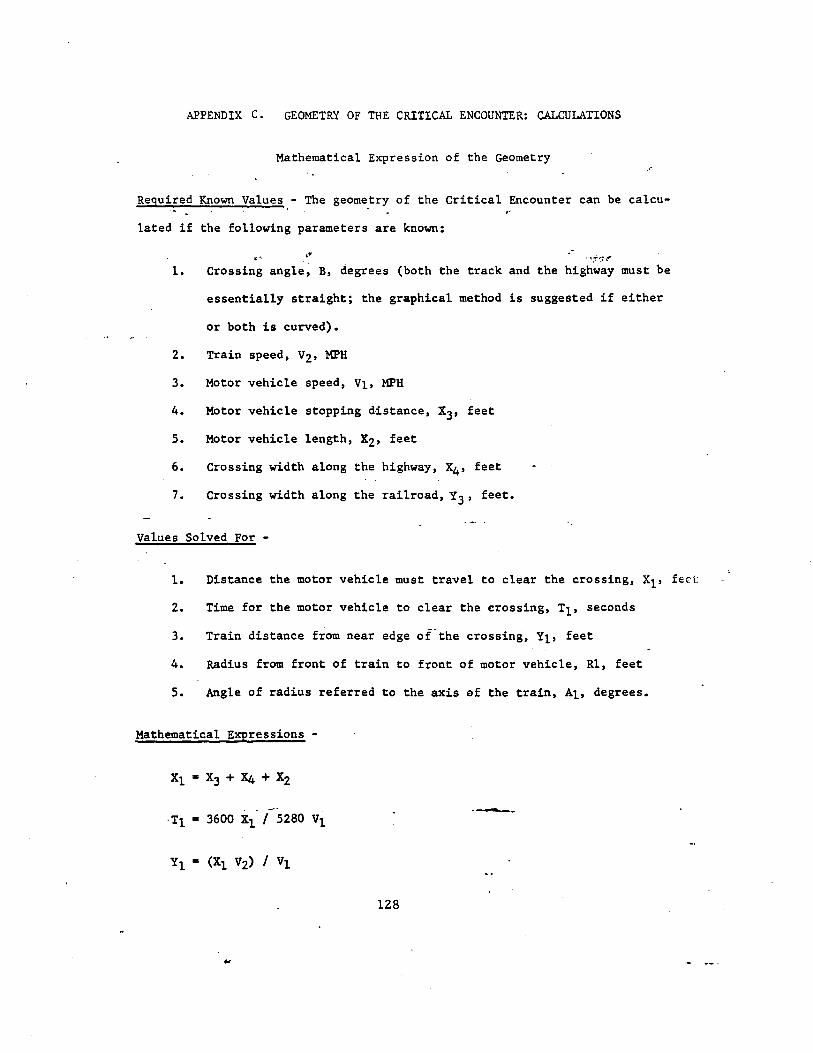
APPENDIX C. GEOMETRY OF THE CRITICAL ENCOUNTER: CALCULATIONS
Mathematical Expression of the Geometry
Required Known Values - The geometry of the Critical Encounter can be calcu-
lated if the following parameters are known:
1. " . 'i'.:L"
Crossing angle, B, degrees (both the track and the highway must be
essentially straight; the graphical method is suggested if either
or both is curved).
2. Train speed, V2' MPH
3. Motor vehicle speed, Vl, MPH
4. Motor vehicle stopping distance, X3 , feet
5. Motor vehicle length, X2' feet
6. Crossing width along the highway, X4' feet
7. Crossing width along the railroad, Y3 ' feet.
Values Solved For -
1. Distance the motor vehicle must travel to clear the crossing, Xl' feel',
2. Time for the motor vehicle to clear the crossing, Tl' seconds
3. Train distance from near edge of " the crossing, Yl' feet
4. Radius from front of train to front of motor vehicle, Rl, feet
5. Angle of radius referred to the axis sf the train, Al, degrees.
Mathematical Expressions -
'Tl - 3600 Xl I 5280 Vi --.
128

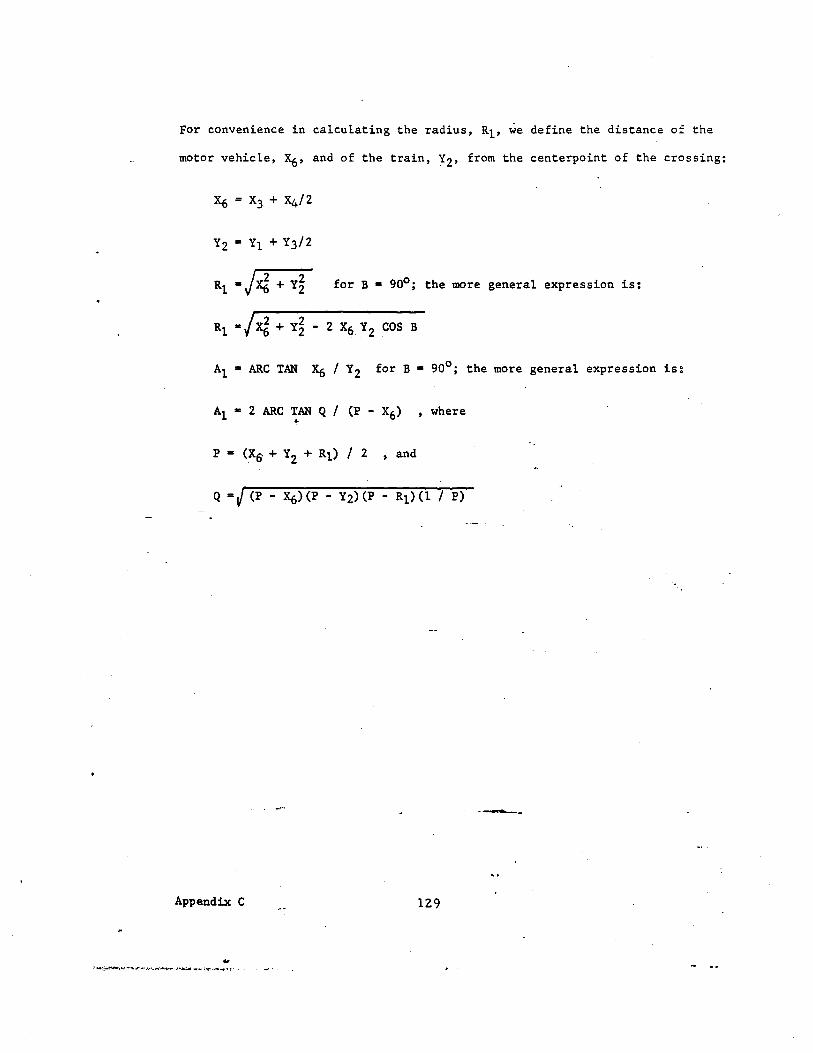
For convenience in calculating the radius, Rl' we define the distance of the
motor vehicle, and of the train, Y2' from the centerpoint of the crossing:
Rl + for B - 90°; the more general expression is:
Rl -/ if, + - 2 X6 Y 2 COS B
Al m ARC TAN I Y2 for B - 900 ; the more general expression
Al - 2 ARC TAN Q I (P - X6) ,where .. P - (XS + Y2 + Rl) I 2 • and
Q = J (P - - Y2)(P - Rl)(l I P)
---
Appendix C 129
.. :- ... !: ____ • ...:..":' ... ......... • ........... 4' ... J ..... ...... :"5'._ .... ; ..
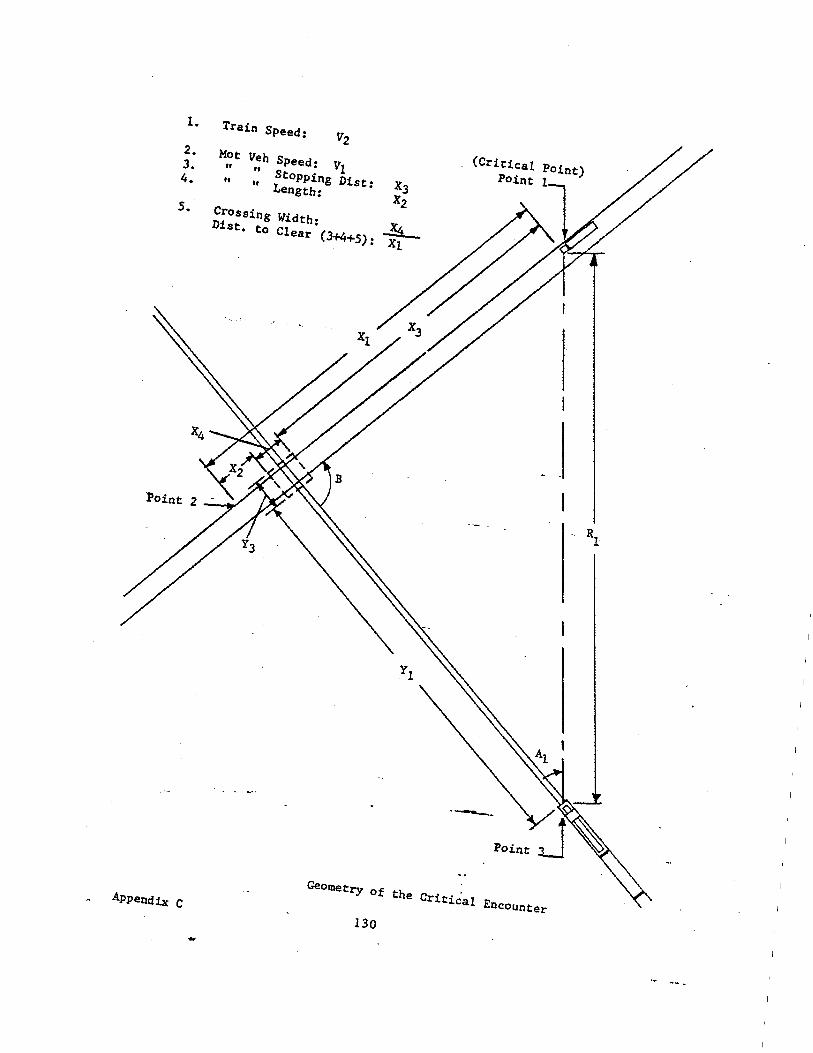
1.
2. 3. 4.
5.
POint
AppendiJc C
Train Speed: V2
Mot Veh ft •• •• tt
CrOSsing Dist. to
Speed: VI StoPPing Dist: Length:
Width: Clear (3+4+5):
X3 X2
...!L Xl
(Critical POint
.-. Point
Geometry of the Critical Encounter
130
Computer Program
On the following page is a computer program in BASIC, which can be run on many diverse time-sharing computers with minimum modification. It is provided to aid in producing tables similar to Table 4, using various crossing angles, vehicle lengths, vehicle stopping dis-tances, and crossing widths.
U sing the Program - The information required for the program is in the statement lines at the bottom of the page, which begin (after the line number) with the word DATA. The values shown in these lines are those used to produce Table 4; substituting new values will cause a modified version of the table to be printed.
Line 440 contains (in order) Motor Vehicle Length, Cros sing Width along the highway, Crossing Width along the railroad, and Crossing Angle.
It should be noted that the program actually calculates answers for Unee angles: the given angle, a right angle, and the complement of the given angle. (180 degrees minus the given angle).
Line 450 and following lines each contain a motor vehicle speed and a corresponding stopping distance.
Any motor vehicle speeds can be used, and there is no limitation to the number of them. The computer will keep calculating and printing the table, two motor- vehicle speed-s to a page, until it runs out of data and stops.
"--
Appendix C 131
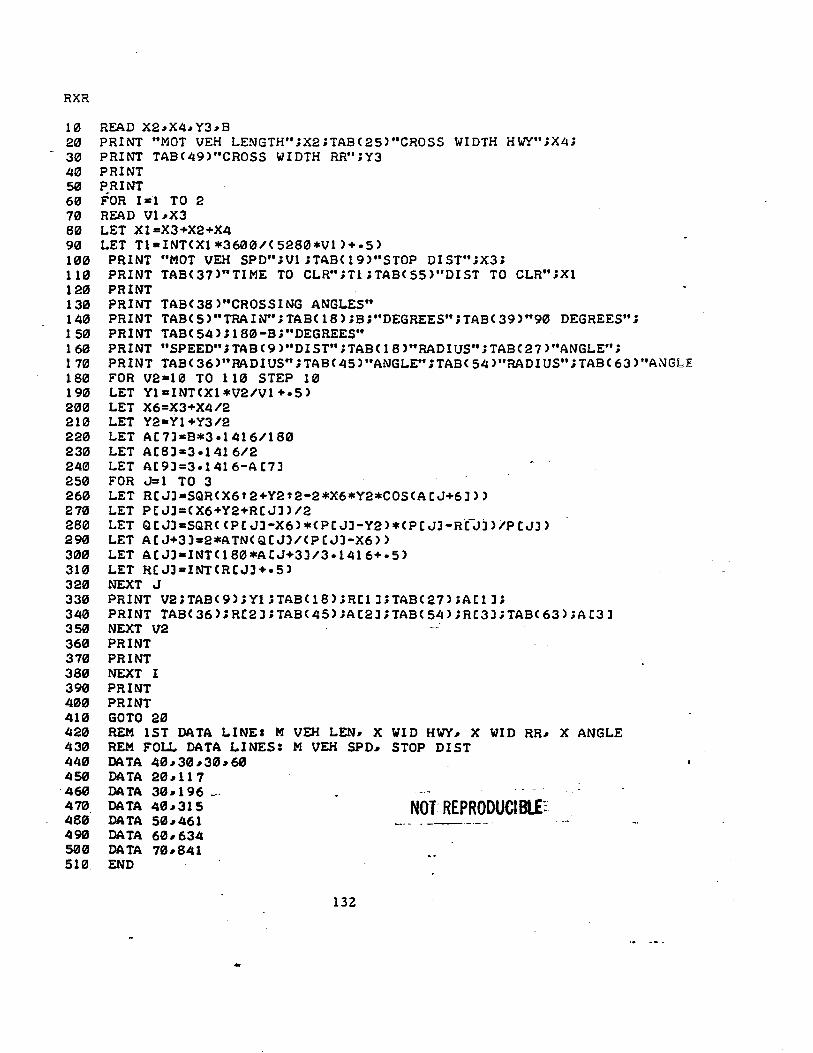
RXR
10 20 30 40 50 60 70 80 90 Hl0 110 120 130 140 150 160 170 180 190 200 210 220 230 24e1 250 260 270 280 290 300 310 320 330 340 350 360 370 380 390 400 410 420 430 LlLI0 450
. Ll60 470 Ll80 490 500 510
READ X2"X4"Y3"B PRINT "MOT VEH LENGTH"iX2iTABC25'''CROSS WIDTH HW'f"iX4i PRINT TABC49'''CROSS WIDTH RR";Y3 PRINT PRINT FOR 1=1 TO 2 READ V1 "X3 LET XI-X3+X2+X4 LET Tl-INT<X1*3600/C5280*Vl)+.5)
PRINT "MOT VEH SPD" iVI ;TABCl9 )"STOP DI ST" ;X3i PRINT TAB(37)"TIME TO CLR"HliTAB(55)"DIST TO CLR";Xl PRINT PRINT TAB( 38 )"CROSSING ANGLES" PRINT TAB( 5 )"TRAIW' i TAB( 18) ;Bi"DEGREES" iTABC 39 "'90 DEGREES" i PRINT TAB(54)i180-Bi"DEGREES" PRINT "SPEED" i TABC9 )"DIST" iTAB< 18 "'RADIUS"; TABC 27 ) "ANGLE" i PRINT TAB ( 36)"RADIUS" iTAB( 45 ) "ANGLE" iTABC 54 )"RADIUS" iTABC 63 )"ANGLE FOR V2-10 TO 110 STEP 10 LET Yl=INTCX1*V2/Vl+.5) LET X6=X3+X4/2 LET Y2=Yl+Y3/2 LET AC7l=B*3.1416/180 LET AC8l=3.1416/2 LET A[9l=3.1416-AC7J FOR J=l TO 3 LET RCJJ-SQRCX6f2+Y2f2-2*X6*Y2*COSCACJ+6J» LET PCJJ=CX6+Y2+RCJJ)/2 LET QCJJ=SQRCCPCJJ-X6>*<PCJJ-Y2)*CPCJJ-R(Jl)/PtJJ) LET ACJ+3J=2*ATN(QtJl/CPtJJ-X6» LET ACJJ-INT(180*A[J+3l/3.1416+.5) LET RCJJ=INT(RCJJ+.5) NEXT J PRINT V2iTAB(9)iYliTABC18)iRClliTABC27)iAtlli PRINT TAB(36)iRC2JiTABC45);AC2JiTABC54)iRC3liTABC63)iAC3J NEXT V2 PRINT PRINT NEXT I PRINT PRINT GOTO 20 REM 1ST DATA LINEa M VEH LEN" X WID HWYI X WID RRI X ANGLE REM FOLL DATA LINES: M VEH SPDI STOP DIST DATA 40130130160 DATA 201117 DATA 301196 _--DATA 401315 DATA 501461 DATA 601634 DATA 7018L11 END
..
.. NOT: REPRODUCIBlE::
132
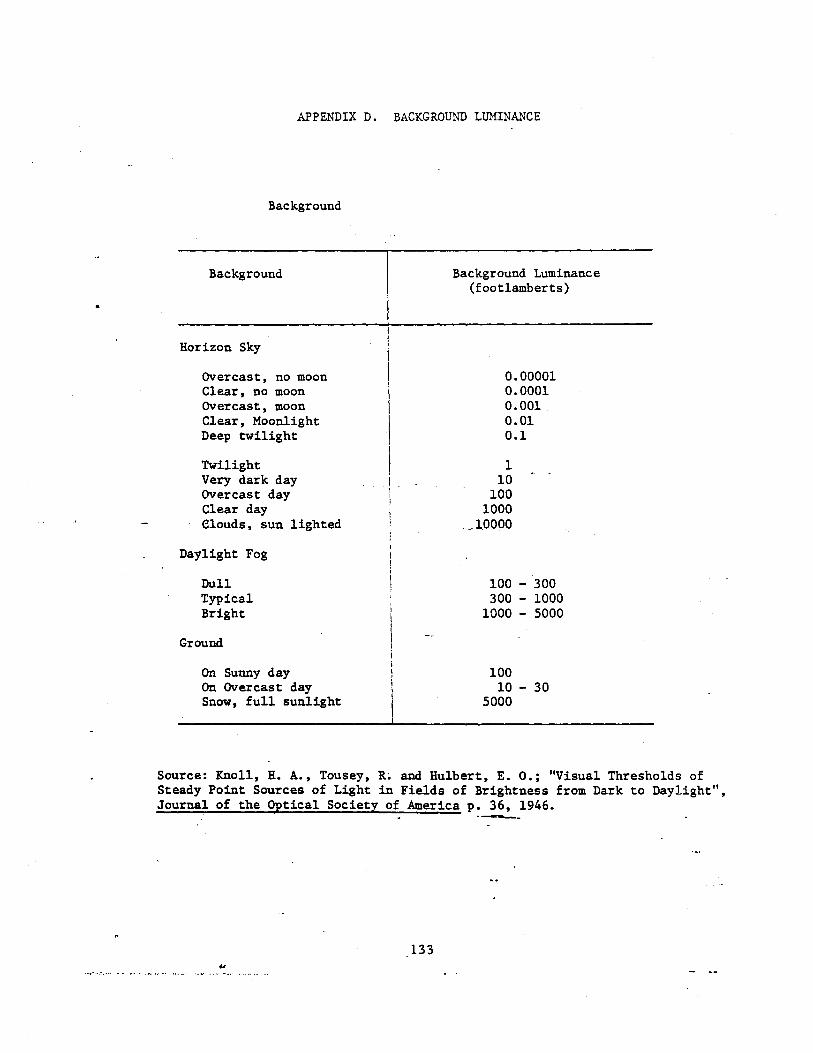
APPENDIX D. BACKGROUND LUMINANCE
Background
Background
Horizon Sky
Overcast, no moon Clear, no moon Overcast, moon Clear, Moonlight Deep twilight
Twilight Very dark day Overcast day Clear day e10uds, sun lighted
Daylight Fog
Dull Typical Bright
Ground
On Sunny day On Overcast day Snow, full sunlight
Background Luminance (foot1amberts)
0.00001 0.0001 0.001 0.01 0.1
1 10
100 1000
__ 10000
100 - 300 300 - 1000
1000 - 5000
100 10 - 30
5000
Source: Knoll, H. A., Tousey, and Hulbert, E. 0.; "Visual Thresholds of Steady Point Sources of Light in Fields of Brightness from Dark to Daylight", Journal of the qptical Society of America p. 36, 1946. ---
133
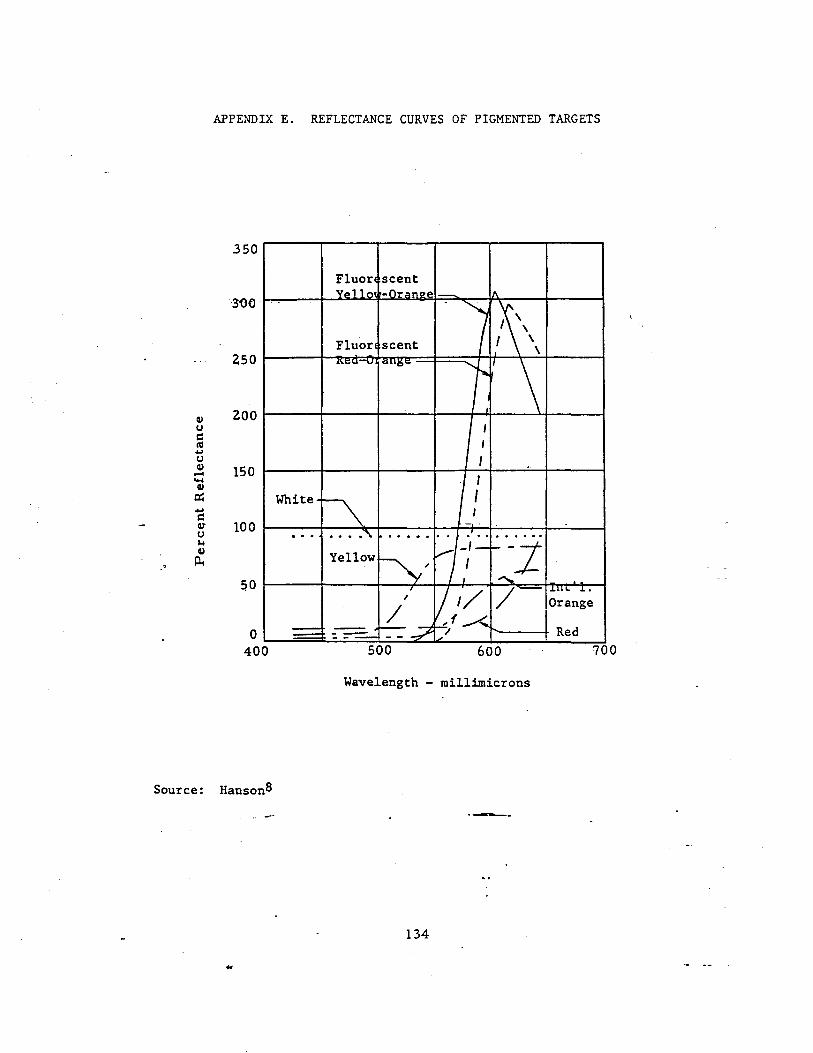
APPENDIX E. REFLECTANCE CURVES OF PIGMENTED TARGETS
II) u C III .... U II) -.... II)
c:: .... c CIT u lot II)
Il4
350
ZSO
200
150
100
:/0
o 400
Source: Hanson8
White
...
Fluor scent Yel101 -- 1\ -
'\' Fluor scent I \ \
ncu-v I ClLlOC ',,' \ I I I .. I
1\. I I
- . . . . . , . . . . . . . . .. . . . . .. Yellow 1,;--/-1-
),' '" V 1/ / I·"'''' .... ,
Orange / ::. ----::-:: // Red
500 600 700
Wavelength - millimicrons
--.
134
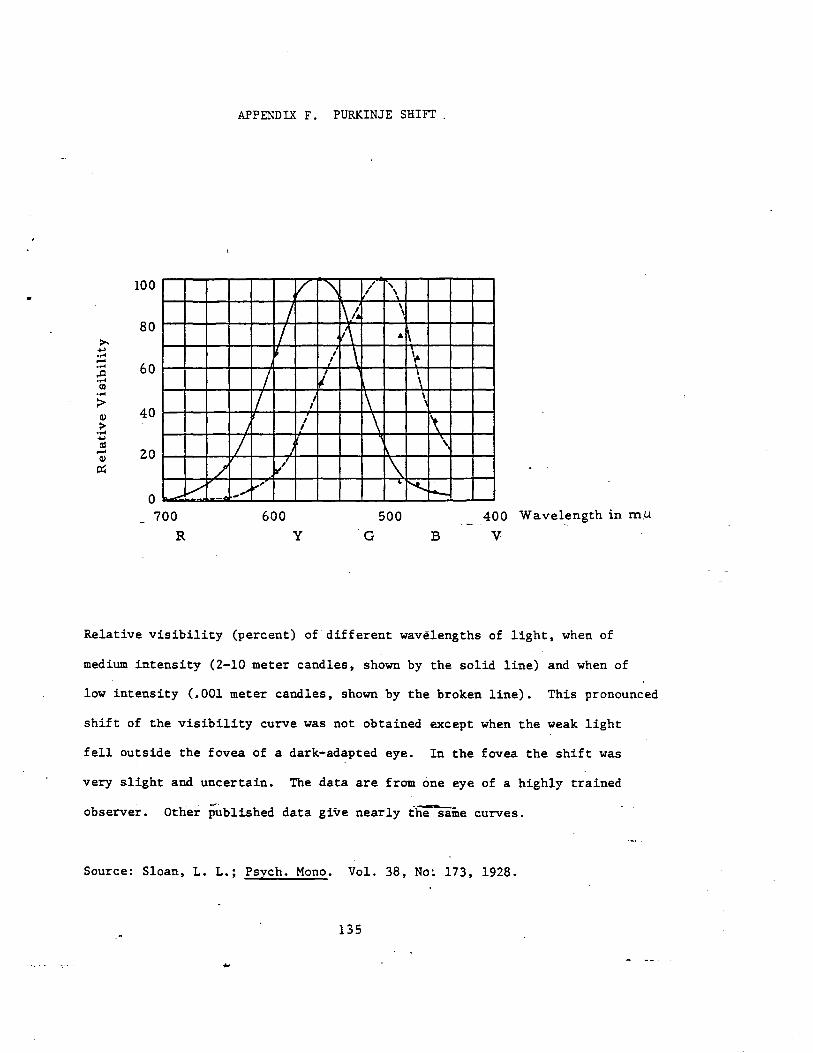
>-.... .... -.... ,.0 .... CD .... :>
CI)
> .... .... nl -CI)
P:<
100
80
60
40
20
0 V 700
R
/' --
APPENDIX F. PURKINJE SHIFT .
V '\ ,- , I \
/ \ \
II V\ . \ I \ \-I
I 1/ , \
II , 1\ \ I
I \ 1'\ I I
/ \ j
1-/ \ ...... v" f"t...
600 500 y G B
400 Wavelength in m.U
V
Relative visibility (percent) of different wavelengths of light, when of
medium intensity (2-10 meter candles, shown by the solid line) and when of
low intensity (.001 meter candles, shown by the broken line). This pronounced
shift of the visibility curve was not obtained except when the weak light
fell outside the fovea of a dark-adapted eye. In the fovea the shift was
very slight and uncertain. The data are from one eye of a highly trained
observer. Other data give nearly ihe-5ime curves.
Source: Sloan, L. L.; Psych. Mono. Vol. 38, 173, 1928.
135
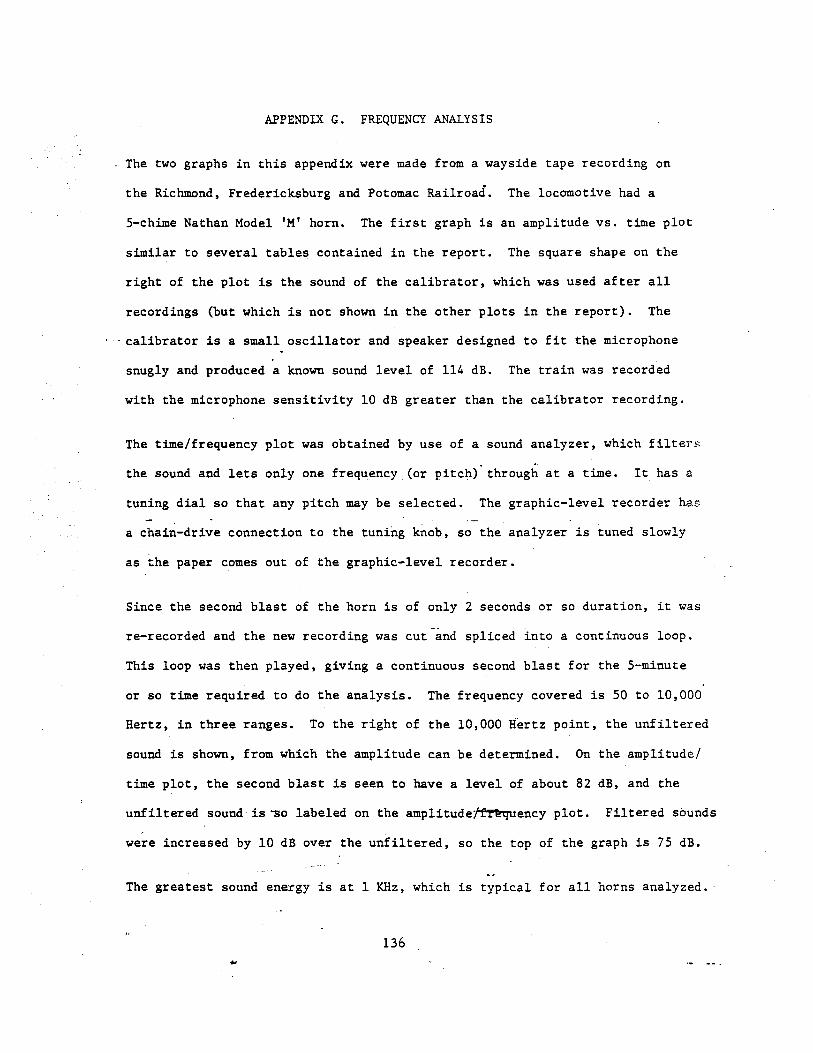
APPENDIX G. FREQUENCY ANALYSIS
The two graphs in this appendix were made from a wayside tape recording on
the Richmond, Fredericksburg and Potomac Railroad. The locomotive had a
5-chime Nathan Model 'M' horn. The first graph is an amplitude vs. time plot
similar to several tables contained in the report. The square shape on the
right of the plot is the sound of the calibrator, which was used after all
recordings (but which is not shown in the other plots in the report). The
- calibrator is a small oscillator and speaker designed to fit the microphone
snugly and produced a known sound level of 114 dB. The train was recorded
with the microphone sensitivity 10 dB greater than the calibrator recording.
The time/frequency plot was obtained by use of a sound analyzer, which filters
the sound and lets only one frequency (or pitch)" through at a time. It has a
tuning dial so that any pitch may be selected. The graphic-level recorder has
a chain-drive connection to the tuning knob, so the analyzer is tuned slowly
as the paper comes out of the graphic-level recorder.
Since the second blast of the horn is of only 2 seconds or so duration, it was
re-recorded and the new recording was cut and spliced into a continuous loop.
This loop was then played, giving a continuous second blast for the 5-minute
or so time required to do the analysis. The frequency covered is 50 to 10,000
Hertz, in three ranges. To the right of the 10,000 Hertz point, the unfiltered
sound is shown, from which the amplitude can be determined. On the amplitude/
time plot, the second blast is seen to have a level of about 82 dB, and the
unfiltered labeled on the plot. Filtered sounds
were increased by 10 dB over the unfiltered, so the top of the graph is 75 dB.
The greatest sound energy is at 1 KHz, which is typical for all horns analyzed •.
136
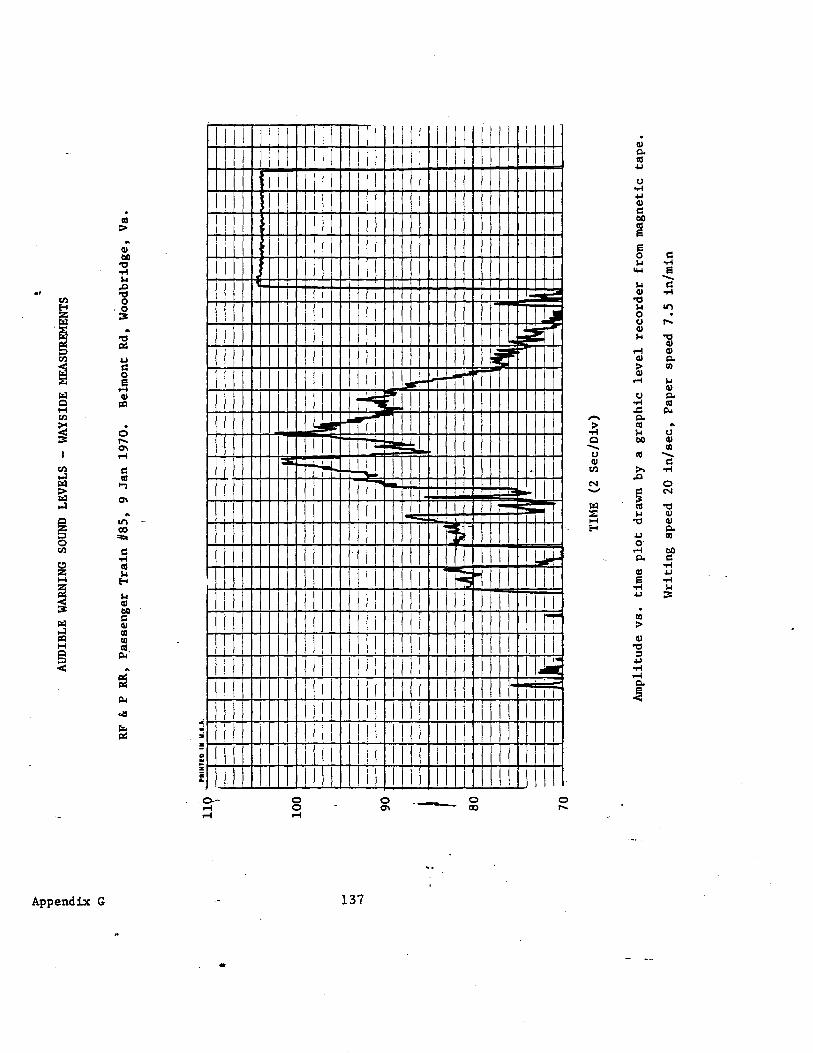
t
'd
ID &. en .....
Ul
-J
t
AUDI
BLE
WAR
NING
SOU
ND L
EVEL
S -
WAY
SIDE
MEA
SURE
MEN
TS
RF &
P R
R,
P.as
seng
er T
rain
118
5,
9 Ja
n 19
70.
Bel
mon
t R
d, W
oodb
ridg
e, V
a.
'.'OTI
D ,
. u .
•.•.
I.
I 1
1 W
-I
I=!=
I=J=
I=I-
I-I=
I I
I I
I I
I U
t=
1=1=
j I
I IT
of •
th I
I 1
--;-
--1
--1
--1
---1
-1-1
-1
_ .1
-1--
-1--
1--
1--
--1
-1--
--1
--1
-1
I-+
--4
1
--1
-/-/
---1
----
1-1
/-
-I-_
+_
---I
100
LI=J
=t-I=
I=1
I I
I I
I I
1=U
1-I=
t=I
I I
I l:!J
I
I I=
l I
I I
I I
1=bt=
i==I=E
=E 1
=1 1
I I
I l=
tl I
F'I
' -I
-_
I ,_
_
_
t--t
-: -
FI
--= -
I :
_ l=
C
r-
r-:--
---
I -
,-,
-_
'_I -
-_
_ c:
,_
_
_ -1
--,
J -I
I· ,E
-'.-
,. ,
_, _ 1_ 1
-I
1-
'--I
I -I-
-r-I
1-
-.-
_1
_
1--
-.-
--
--'_1
_--,
.-,
--_
, >
_,--_
1 _
9 0 '
,----
, ,,--
T I --.-,
tI .L
-'
-t--
t-+--
' .-
,-,
-;;-
-D
-t
" --.J
,_
,-
,. ,-
.-,
. !-
, _.
1-11
-1=l
--l-ll
::J
-,--
. .-
,-,-
, -,
--,-
-r-
I I
---itll
I
-1&
1 1
. -
'-,
'-',--
· : =-
i·
, [-
!Ai
-,.
,
I 1=
I....
: =-:l
± >
t--
E
-I --
I-li In:'
-t-l
--fL
i'tI1J
t:L
80
' 't \
---r
-l:-:
:tlllti
i +
-+
1=1=
1=1:
1 .4
-t
-B It.
:1=
I -,
, I I
I _V
II I
-s=E
l '=
70
TIM
E (2
Sec
/Div
)
Am
plitu
de v
s.
tim
e pl
ot d
raw
n by
a g
raph
ic l
evel
rec
orde
r fr
om m
agne
tic
tape
.
Wri
ting
spe
ed 2
0 in
/sec
, Pa
per
spee
d 7.
5 in
/min
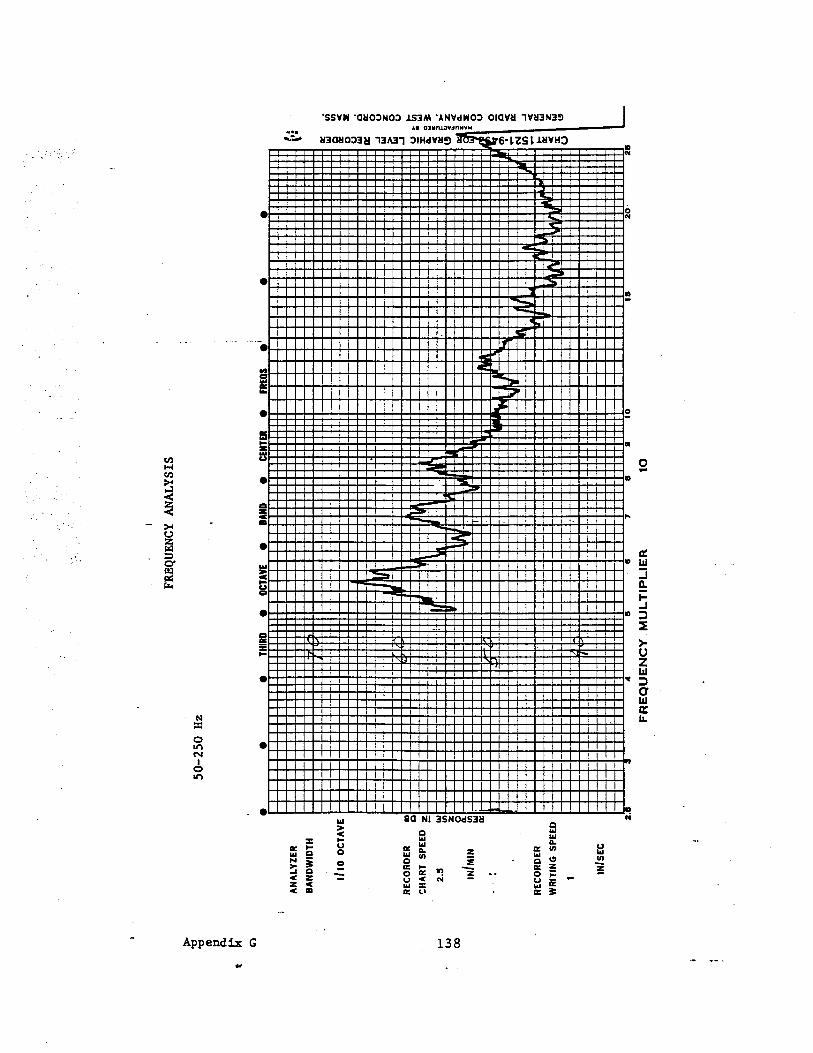
t
"d [ t<" c;
') w
ex>
• A
NA
LYZE
R
BA
ND
WID
TH
1/10
OC
TAV
E
REC
OR
DER
CD
D
t;H
AR
T SP
EED
2.5
IN/M
IN
III
III Z III
III
II:
REC
OR
DER
WR
ITIN
G S
PEED
IN/S
EC
2. .11
FRBQ
UENC
Y AN
ALYS
IS
50-2
50 H
z
• •
THIR
D •
OCTA
VE
• lA
ND
• CE
NTER
•
FREO
S •
i •
• {.
D:
III D
D: 0 U
III a:
-1/
...J III i:i .....I U
.. -. fa
, «
• II
I D
: "
III
I " ji
... 111
/IIi
v - N II
I - .... \
II:
-« x U
-
a 4
II
II
7 II
II
1
0
II
2.0
FR
EQ
UE
NC
Y M
UL
TIP
LIE
R
to
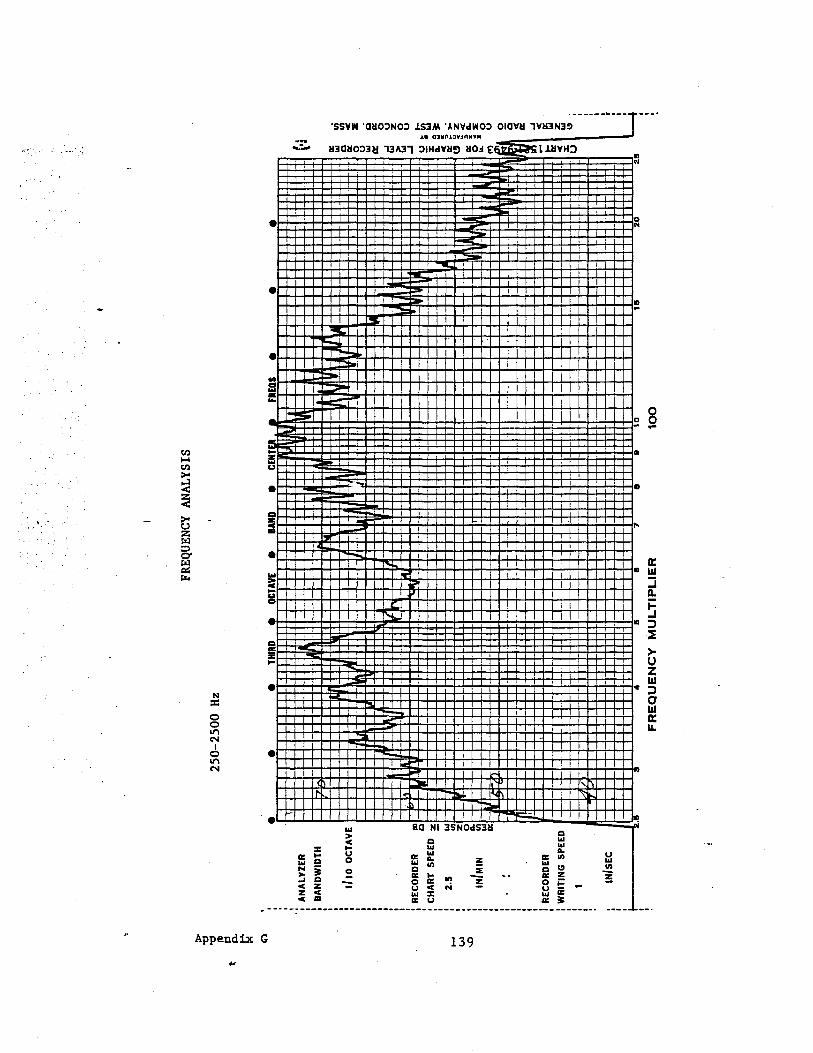
t
'd g t<. I;)
......
VJ
-.0
. , . I I : I I I I
• AN
ALYZ
ER
BAND
WID
TH
h>
1/10
OCT
AVE
RECO
RDER
m
c
CHAR
T SP
EED
1!!:
2.5
\II
1/1 z
1-0-
INIM
IN
1/1
\II
0:
: II.
RECO
RDER
W
RITI
NG S
PEED
I IN/S
EC
.11
FREQ
UENC
Y AN
ALYS
IS
250-
2500
Hz
• •
THIR
D •
OCTA
VE •
lAND
•
CENT
Ul
FRED
S •
• •
.f
IU'
I"
-N -
-I r
-
I-I -
f\ --
---
11 -
I
-
-
I' rL --
It: 00( x U
--
--
4 II
1\
7
a II
10
'IS
2
0
21S
FR
EQ
UE
NC
Y M
UL
TIP
LIE
R
10
0
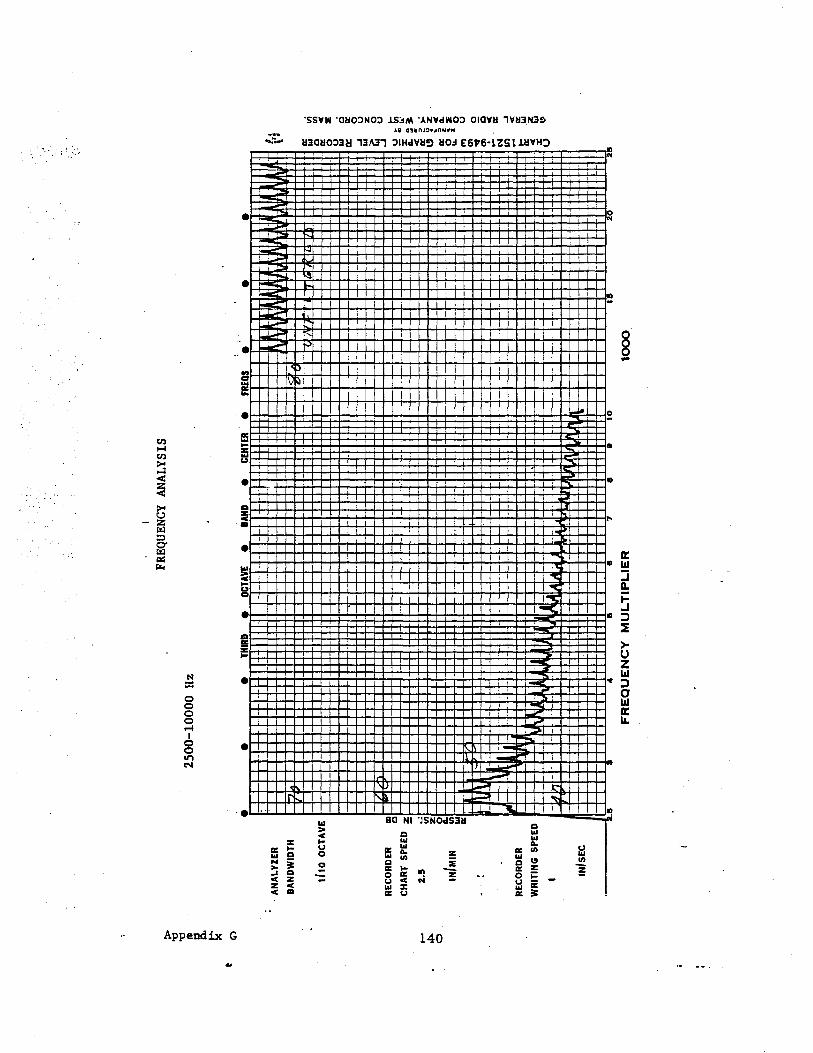
t
'd R
t<. C'l .... o
• AN
ALYZ
ER
BAN
DW
IDTH
M
1110
OC
TAVE
1/
RECO
RDER
II
I I ..
..
c CH
ART
SPEE
D !:
2.5
iii z 0 IN
IMIN
A- U
) '" :
IJ. \
r-
RECO
RDER
...
tYR
ITIN
G S
PEED
1 IN/S
EC
.8
I
FREQ
UENC
Y AN
ALYS
IS
2500
-100
00 H
z
• •
THIR
D •
OCTA
VE
• lA
ND
• C
EN
TER
'.
. 1:IIJ .
J i
_.
.
.. 8
II
7 II
"
10
FR
EQ
UE
NC
Y M
UL
TIP
LIE
R
I ;'
FRED
S •
• '\
lJ- 1
10;:- ....
... I
.
18
10
00
,
•
...
...
. ..
0 2
!.:
\- rr:
. !A
I U
) C
U
) II
: '"
o
a: M
ci
a: rr:
iii
8 i!i ..J
u
i •
&I.'
rr:
" •
ozA
-I&
. ;
1"1
U
QI
0 -Q
I C
.,!
.. N
II If
) oJ
'" Ii:
15 '"
z x
'" U
"
'. ,: .. :.". APPENDIX H. STATISTICAL ANALYSIS
This Appendix is intended to give technical details of the statistical analysis
techniques used to draw conclusions about the data collected in the Empirical:
Testing of Warning Qualities. The raw data consists of 729 values for the
lowest sound level (in dB) heard for each sound in each trial, and is shown
in Appendix I. Analysis of Variance (ANOVA) was imple mented to show .
which factors had variations that can be called significant. Single effect
factors were further analyzed by employing the Tukey method of testing
the differences of the means of factor levels.
ANOVA - The Analysis of Variance is of a 3 x 3 x"3 -x 3 x 9 mixed-plot
design. The following factors were used:
T(J) represents Driver Age
Tl - 16 to 25 Years T2 - 26 to 40 Years T3 - 41 Years or more
V(I) represents Type of Vehicle
VI - Automobile, 1966 to 1970 Model V2 - Automobile, 1965 Model or Older V3 - Truck
B(L) represents Speed Range
Appendix H
Bl - 21 to 35 MPH B2 - 36 to 50 MPH B3 - 51 to 65 MPH
141
.--
A( K) re pre s e nts Dis tr ac tion type
Al - None A2 - Radio A3 - Conversation
C(M) represents Sounds
Ci '- LTRR 3-Chime Horn C2 - Metroliner Horn C3 - RF & P 5-Chime Horn C4 - TurboTrain Horn C5 - Whistle C6 - Bell C7 - Electronic Siren C8 - GG-l Horn C9 - Synthesized 'Locomotive 1972'
Since in operation of the experiment all nine levels of Factor 'C' were
p.1'esented. during a single 'run', not as nine ,ciifferent runs., all interactions
cpntaining this factor were tested in the ANOVA separately from interactiDns
not containing Factor 'C'.
The ANOVA is summarized on the next-page. The Error Mean Square used
for each test is either the Mean Square of the highest order interaction in the
category (VTAB or VTABC, when testing next highest interactions), or a
. computed error term which is obtained by combining all lower interactions
(t SS/td£). Significances are indicated by double asterisks (**) for. 01,
.05 and. 1 confiq,ence levels. ,-.
Appendix H 142
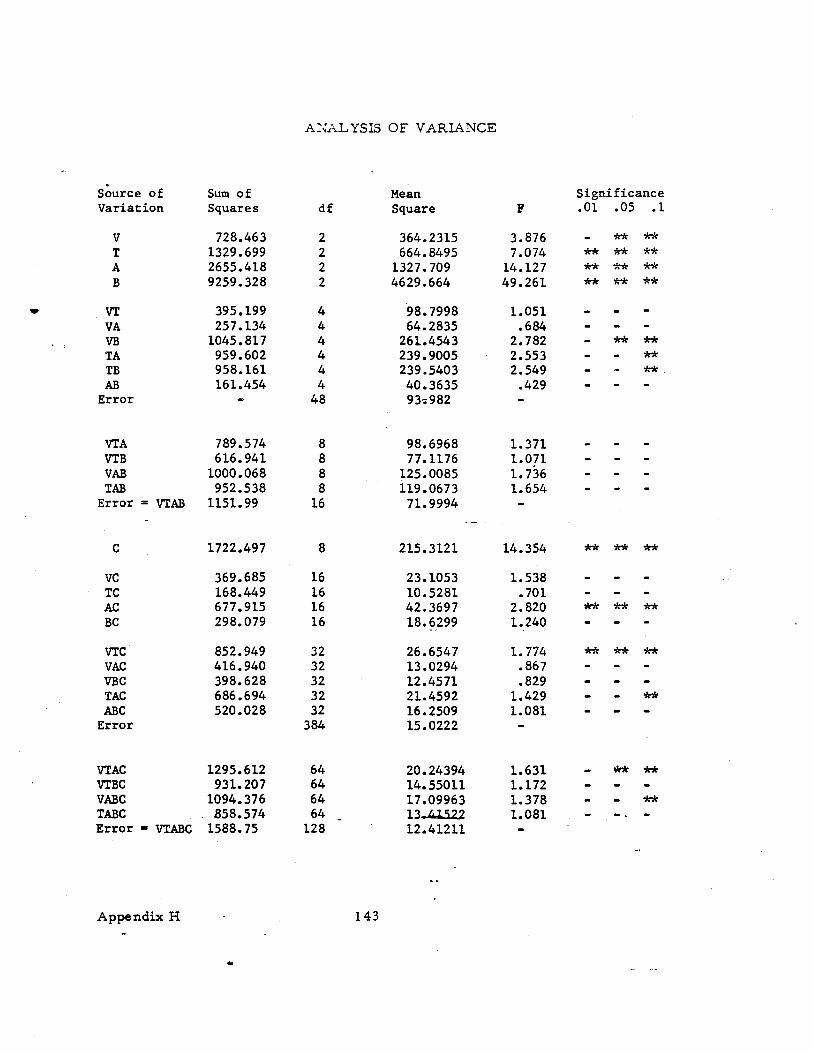
A?';.A.L YSIS OF VARIANCE
Source of Sum of Mean Significance Variation Squares df Square F .01 .05 .1
V 728.463 2 364.2315 3.876 ** ** T 1329.699 2 664.8495 7.074 ** ** ** A 2655.418 2 1327.709 14.127 ** ** ** B 9259.328 2 4629.664 49.261 ** ** ** VT 395.199 4 98.7998 1.051 VA 257.134 4 64.2835 .684 VB 1045.817 4 261.4543 2.782 ** ** TA 959.602 4 239.9005 2.553 ** TB 958.161 4 239.5403 2.549 ** AB 161.454 4 40.3635 .429
Error 48 93;982
VTA 789.574 8 98.6968 1.371 VTB 616.941 8 77.1176 1.071 VAB 1000.068 8 125.0085 1.736 TAB 952.538 8 119.0673 1.654
Error = VTAB 1151.99 16 71.9994
C 1722.497 8 215.3121 14.354 ** ** ** VC 369.685 16 23.1053 1.538 TC 168.449 16 10.5281 .701 AC 677.915 16 42.3697 2.820 ** ** ** BC 298.079 16 18.6299 1.240
VTC 852.949 32 26.6547 1.774 ** ** ** VAC 416.940 32 13.0294 .867 VBC 398.628 32 12.4571 .829 TAC 686.694 32 21.4592 1.429 ** ABC 520.028 32 16.2509 1.081
Error 384 15.0222
VTAC 1295.612 64 20.24394 1.631 W* ** VTBC 931.207 64 14.55011 1.172 VABC lO94.376 64 17.09963 1.378 ** TABC .. B58.574 64 13.4)522 1.081 Error - VTABC 1588.75 128 12.41211
Appendix H 143
•

Tukey Method
The further analysis of single effect factors will proceed by employing the
Tukey method of testing the differences of the means of factor levels. These
means are given in Table 16. This test states (for this experiment) that
there is no difference between factor levels at the .01 level unless the
absolute difference of the sample means exceeds
D - (s)(q.Ol;k,128)/
where:
s2 - the 'error' mean square. This value is 93.98 for Factors A, B, V,
and T; 15.02 for Factor C.
q = the Studentized range.
k s 3 for Factors A, B, V, and T; 9 for Factor C.
n = 243 for Factors A, B, V, and T; 81 for Factor C (n is the number of
terms in the sum making up the mean at each level).
Hence D = 2.61 for A, B, V, and T; and D = 2.44 for C. To say that Cl differs
from C2, for example, it is necessary that means must differ by at least
2.44 dB (the difference in this example is 1.58 dB and this test indicates the
difference to be not significant).
It is seen that among Driver Ages, the youngest group differs from the oldest
group, and. that the youngest group just fails to differ from the middle group.
No significant differences exist between Types although the new-
car just misses being significantly different from the truck. Among
tions, the radio is significantly worse than the other two. The speed levels
are all different.
Appendix H 144

Among the different sounds, C2 (Metro liner Horn) required the highest sound
level of all for perception, and sound C7 (Electronic Siren) the lowest;
the difference between these two is slightly more than twice the 2.44 dB
required to establish significance. From highest to lowest, the means can
be ranked into four groups:
Group 1
C2, C1
Group 2
CS, C6
Group 3
C8, C3
Group 4
C4, C9, C7
C2 is significantly different from Groups 3 & 4; C1 is different from Group 4,
C7 is significantly different from Groups 1 & 2; C4 and C9 are different from
Group 1. Groups 2 & 3 together cover only a range in means of less than dB;
C2 and C7 just barely miss being different from Groups 2 & 3. There is no
significant difference among CS, eG, C8, C3, C4, and C9 •
. -.
Appendix H 145

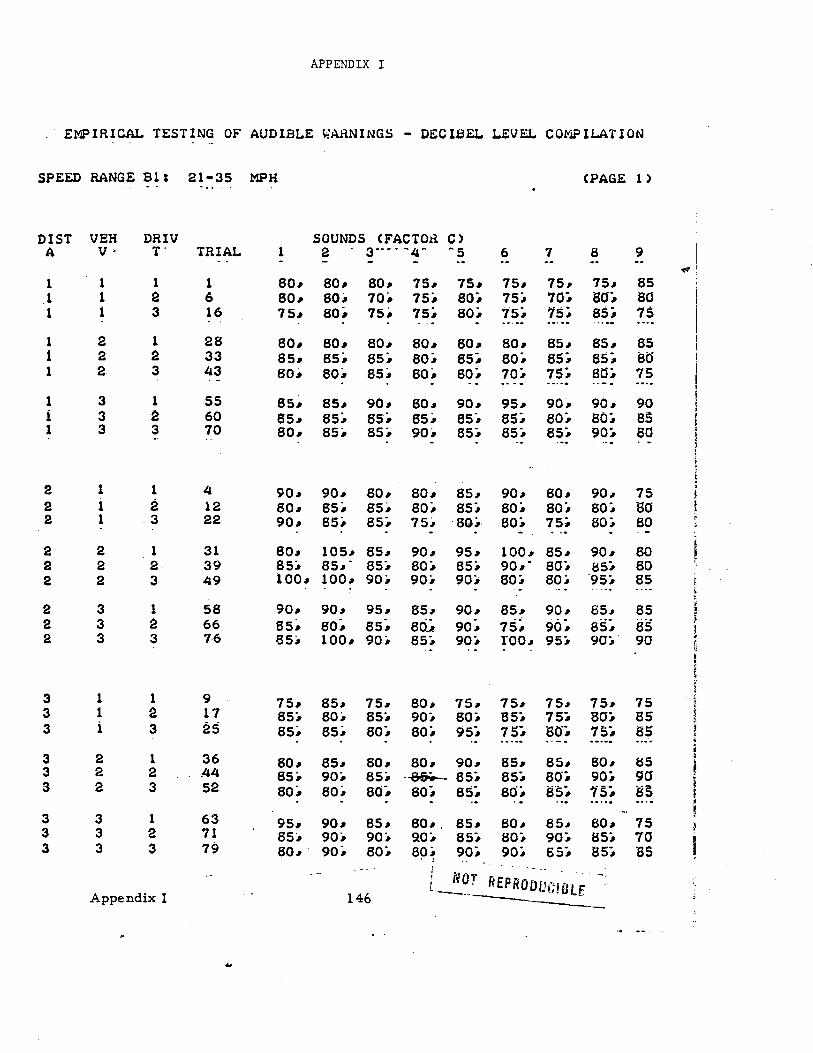
APPENDIX I
.- EMPIRICAL TESTING OF AUDIBLE WARNINGS - DECIBEL LEVEL
SPEED RANGE Bl: 21-35 MPH (PAGE 1)
DIST A
1 1 1
1 1 1
1 i 1
2 2 2
2 2 2
2 2 2
3 3 3
3 3 3
3 3 3
VEH V,
1 1 1
2 2 2
3 3 3
1 1 1
2 2 2
3 3 3
1 1 i
2 2 2
DRIV T-
1 2 3
1 2 3
1 2 3
1 2
- 3
1 2 3
1 2 3
1 2 3
1 2 3
3 1 3 2 3 3
Appendix I
TRIAL
1 6 16
28 33 43
55 60 70
4 12 22
31 39 49
58 66 7·6
9 17 25
36 .44 52
63 71 79
SOUNDS (FACTOR C) 1 2 3···· -4- -5 6 7 8 9
80 .. 80 .. 80 .. 80 .. 80" 70;' 75 .. 80:;' . 80 .. 80 .. 80 .. 85 .. 85. 85:;' 80 .. 80:;' 85,
85, 85 .. 90 .. 65 .. 85, 85:;' 80 .. 85:' 85;
90, 90 .. 80, 80 .. 85. 85;' 90 .. 85;' 85:;'
80 .. 105 .. 65 .. 85; 85, . 65, 100 .. 100 .. 90;'
90 .. 90 .. 95 ..
85;' 100, 90;'
75.. 85, 75 .. 85; 80;' 85; 65:' 85, 80:;'
75 .. 75 .. 75 .. 75, 75, 85 75, 75, 70;' 50i 80 75. 80i 75i 85. 75
80 .. 80 .. 80, 85, 85 .. 85 80, 85; 80. 85:;' 8S:;' ell 80, 80:;' 70:;' 75. 60:;' 75
80 .. 90, 95 .. 90:' 90, 90 85, 65, 85i 80i eOi 85 90:. 85; 85, 85:;' 90:;' 60 .. ...
80 .. 85 .. 90 .. 80 .. 90", 75 80, 85:;' 80:;' 80i 80:;' 50 75;' ·8Gi· 80i 75# 80i 80 -90 .. 95 .. 100 .. 85 .. 90 .. 80 60:;' 65; 90, - 60i B5i 60 90:' 90;' 80:;' 80;' ·95; 85
85", 90 .. 65 .. 90, 85", 85 85
85; 90; IOO", 95; 90i 90
80.. 75.. 75.. 75.. 75, 75 90; 80i 85; 75. 80. 85 80i 95. 75. 15; 85
80.. 85 .. 85;' 90; 80, 80:;'
80.. 80.. 90 .. 85;' 85; 80i 80i 85;
65 .. 85; 8di
85.. 80", 80'; 90; 85. 15.
tsS 90 85
95.. 90.. 85, 85:' 90;' 90;' 80.. 90, 80i
146
80 ... 85 .. 80 .. 85 .. 80 .. 75 20, 85; 80, 90; 85; 70 80i 90:;' 90:;' 65; a5. as
• I
.-.
I --t

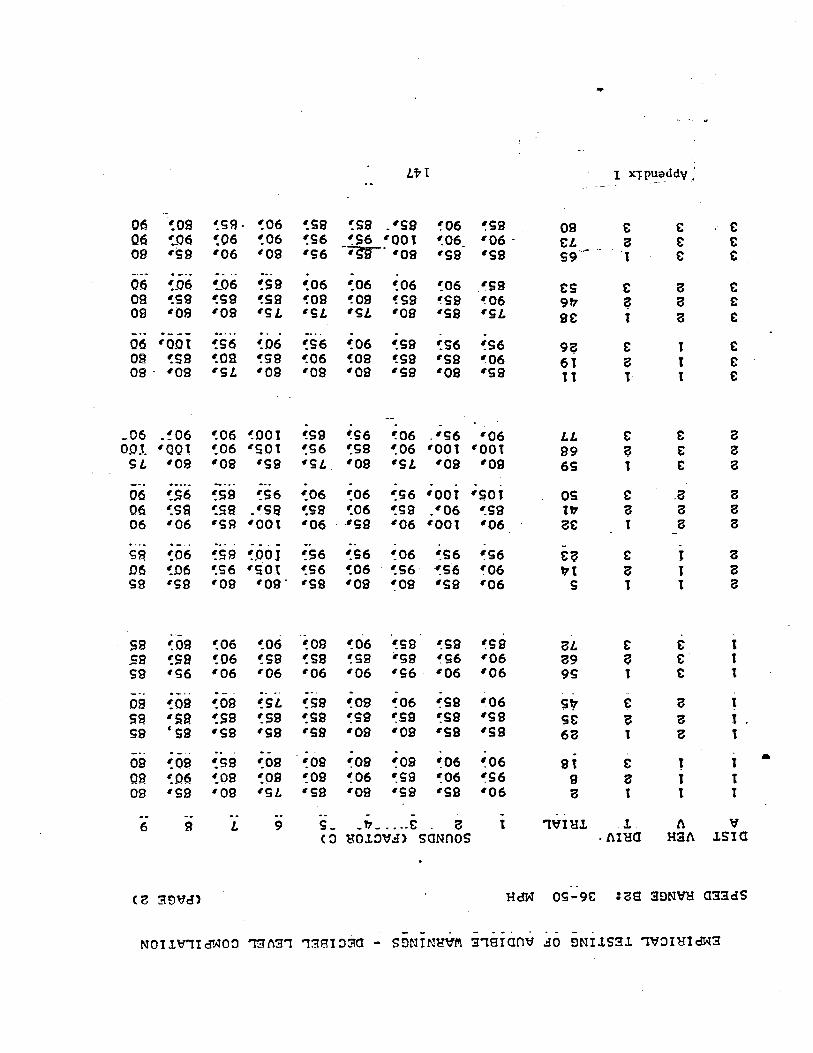
...
LtI I
06 ':S9· ':06 ':59 ':59 _--59 09 & & & 06 ':06 ':56 'OOt ':06_ --06 - &L 8 & & 09 'S9 --06 --09 --S6 '09 '59 'S9 S9 t & &
. 06 ':06 C:06 .--59 £5 & a & 09 -:S9 -:S9 --S9 917 8 & 09 --09 --09 'S L 'SL --SL --09 --SS --5L 9& t a &
06 --OjJt ':06 ':56 ':06 ':S9 ':56 & 1 & 09 l!:5S -:09 -:5S -':06 --59 --06 61 a t & OS' --os 'St --os '09 --os --5S --os 'S9 It 1 1 &
_06 ':06 ':001 '::S6 '::06 .'S6 '06 Lt & & 8 001 'QOt ':06 'SOl ':5S ':06 '001 '001 S9 ? & a
SL '09 'OS 'SS '5t 'OS --St --os '09 6S 1 & 8 . . -
06 '.:56 '.:06 ':56 '001 'SOl OS & .8 8 06 --.S9 C:S9 .'sa '.S9 -:06 -:SS _'06 117 8 8 8 06 '06 '001 '06 . "SS "06 "001 "06 8& 1 a 8
-- -- 0
sg ':06 C:S9 ':.OOJ ':S6 ':56 '.:06 ':56 "56 &? & J 8 D6 ':D6 ':56 'S.O.t ':56 ':06 -:56 ':S6 --06 I7t ? J 8 SS 'S9 'OS '09- --S9 --OS "SS "06 5 I t 8
S8 ':08 ':06 ':06 ':09 ':06 '.:SS ':5S --SS 8t & & I .sa ':SS '.:5S ':5S irS9 'S6 "06 89 ? & t SS 'S6 --06 "06 --06 "06 "S6 "06 "06 95 1 & 1
-09 ':OS '.:09 '.:5t '.:59 '.:09 '.:06 '.:S9 "06 stz & 8 1 sa --sa ':SS '.:5S -:S9 ':59 "S9 S& ? 8 1 59 'S9 "S9 "S9 "59 "09 "09 --59 "S9 68 t 8 1
- - • OS ':09 '.:09 ':09 '.:09 '.:06 '.:06 91 & l 1 09 '.:09 ':09 '.:06 ':S9 ':06 ':56 9 8 1 t OS "S9 "09 'SL --59 "09 "59 "S9 --06 8 1 t 1
-- _. .- 0 -6 9 t 9 S_ .17_ .. __ & 8 1 PJ'1Il:IJ. J. /\ '1
saNnos . /\I'Ha H:;[/\ J.SIO
(8 HOW 05-9& :8S
-
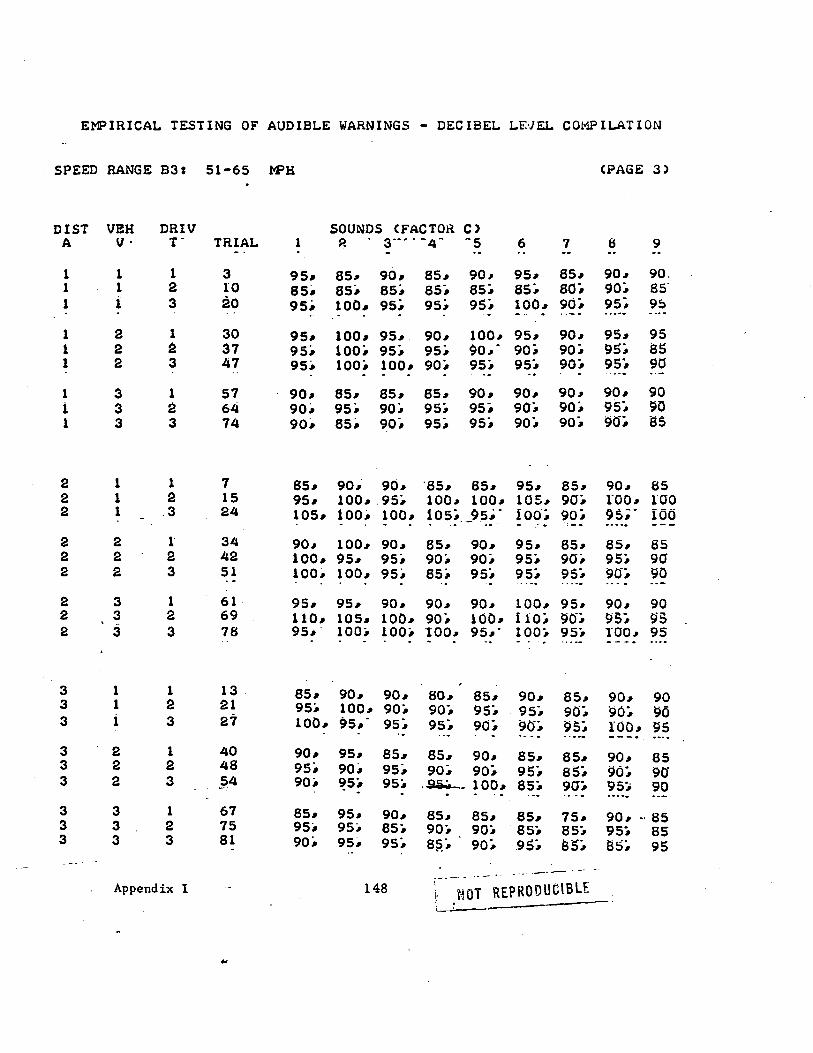
EMPIRICAL TESTING OF AUDIBLE WARNINGS" DECIBEL LF.;JEL COL1?ILATION
SPEED RANGE B3s 51-65 MPH (PAGE 3)
DIST VEH DRIV SOUNDS (FACTOR C) A V· T' TRIAL 1 Po 3"" -4- -5 6 7 8 9 , .,
1 1 1 3 95. 85. 90. 85" 90, 95" 85" 90" 90, 1 1 2 10 85; 85# 85; 85; 85; 80i 85' 1 i 3 20 100" 956 956 95# 100 .. 90; 95; 9:'
,
1 2 1 30 95. 100 .. 95" 90" 100" 95. 90" 95. 95 1 2 37 100; 95# 95; 90"
. 90; 95; 85 1 2 3 47 100; 100 .. 90;' 95;' 95; 90 . - , , .. .,
1 3 1 57 90. 85" 85 .. 85. 90. 90" 90 .. 90" 90 1 3 2 64 90;' 95; 90# 95; 95;' 90;' 90; 90 1 3 3 74 90. 85;' 90# 95; 95;' 90;' 90;' 9(5; as
2 1 1 7 85. 90" 90" '85" 85. 95" 85" 90" 85 2 1 2 15 95" 100" . 95;' 100" 100. 105" 90;' lOO .. 100 2 1 3 24 105. 100" 100 .. 105; __ 95';' 90; 9S;' ioo . - .. - . . 2 2 1- 34 90" 100. 90" 85" 90" 95. 85 .. 85" 85 2 2 2 42 100" 95. 95;' 90;' 90;' 95;' 90;' 95;' 90 2 2 3 51 100" 100. 95;' 85;' 95;' 95;' 95; 90";' 90 . ,
2 3 1 61 95 .. 95. 90. 90" 90" 100" 95 .. 90" 90 2 3 2 69 110. 105. 100. 90;' 100. 110; 9(); 95; 95 2 :3 3 78 95. 100i 100i ,00" 95.' 100;, 95;' 100" 95 , , , . . "
3 1 1 13 85. 90. 90" 80" 85 .. 90" 85". 90". 90 3 1 2 21 95;' 100" 90;' 95; 95; 90; 90 3 1 3 27 100". 95" ,
95;' 95; 90; 90;' 95; lOO" 95
3 2 1 40 90. 95". 85. 85" 90". 85" 85" 90 .. 85 3 2 2 48 95:' 90;' 95;' 90# 90; 95; 85; 90; 90" 3 2 3 §.4 90, 95;' 100" 957; 90 . . . 3 3 1 67 85. 95". 90" 85" 85. 85. 75" 90" ·,85 3 3 2 75 95, 95, 85:. 90;, 90;' 85; 85; 95. 65 3 3 3 81 90;' 95. 95;' 90; .95; 85; as;, 95
. - ---Appendix I 148
i' NOT REPRODUCIBLE
..
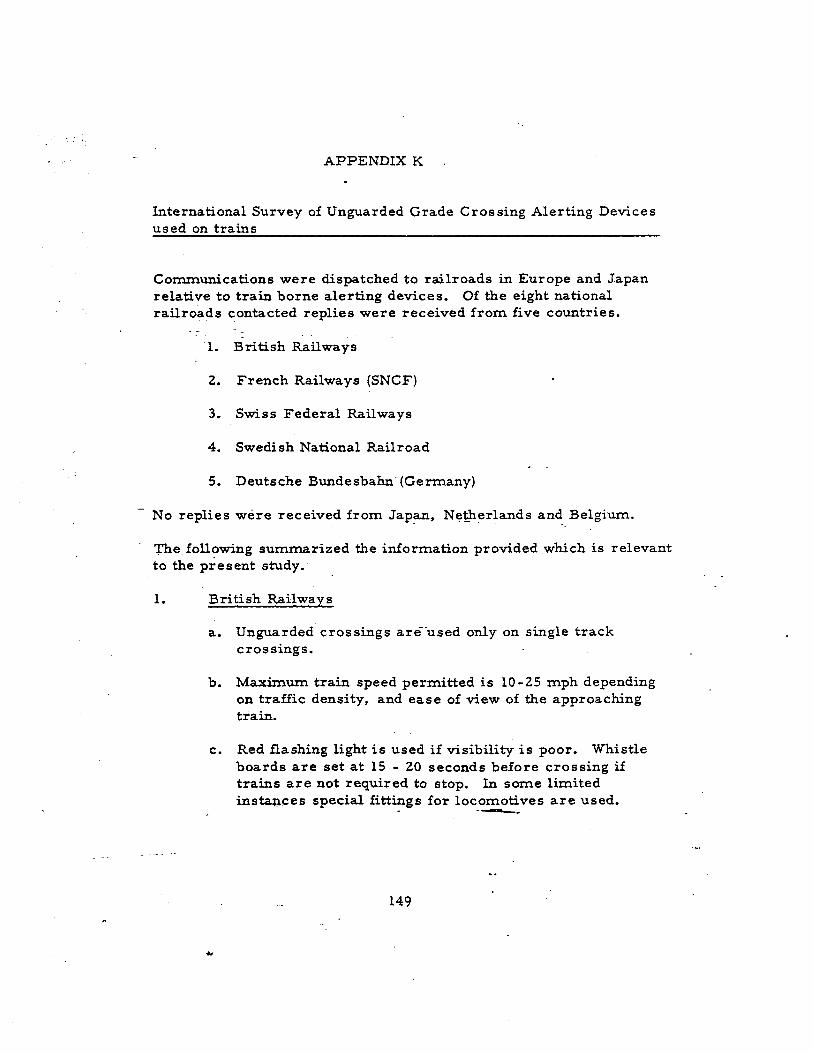
APPENDIX K
International Survey of Unguarded Grade Crossing Alerting Devices used on trains
Communications were dispatched to railroads in Europe and Japan relative to train borne alerting devices. Of the eight national railroads contacted replies were received from five countries •
. 1. British Railways
2. French Railways (SNCF)
3. Swiss Federal Railways
4. Swedish National Railroad
5. Deutsche Bundesbahn (Germany)
No replies were received from Japan, and Belgium.
':):'he following summarized the information provided which is relevant to the present study.
1. British Railways
a. Unguarded crossings are-used only on single track crossings.
b. Maximum train speed permitted is 10-25 mph depending on traffic density, and ease of view of the approaching train.
c. Red flashing light is used if visibility is poor. Whistle boards are set at 15 - 20 seconds before crossing if trains are not required to stop. In some limited instances special fittings for locomotives are used. --.
149
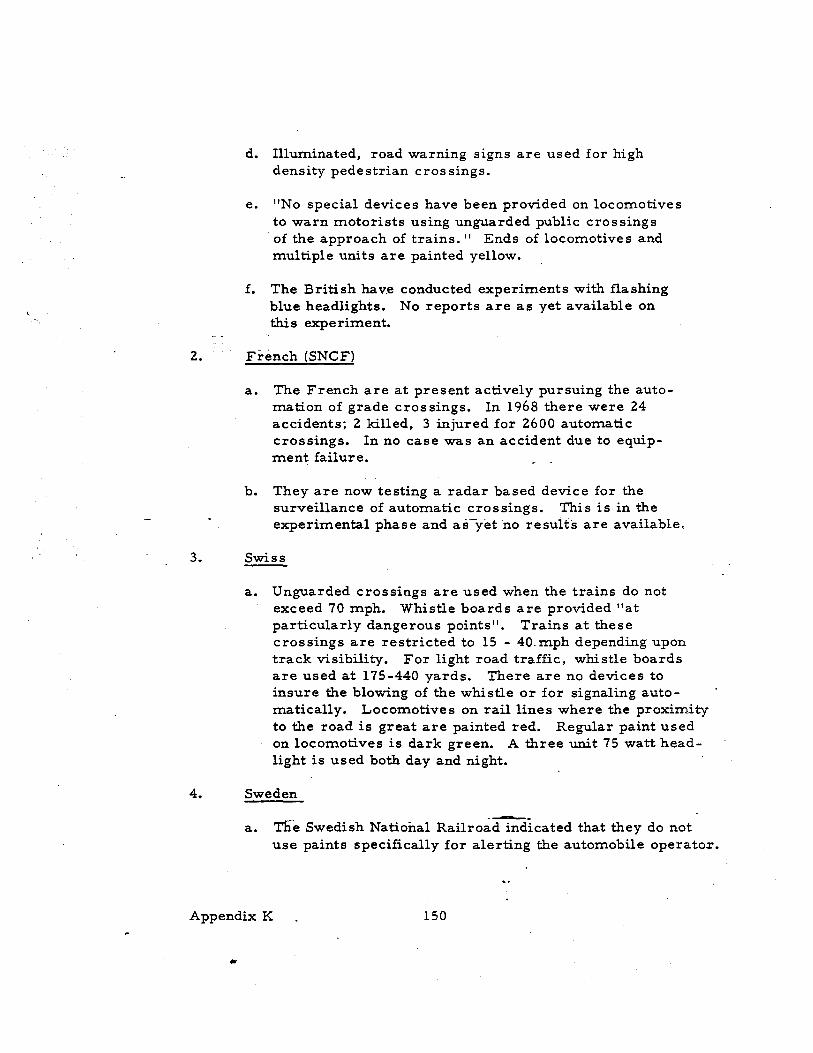
d. Illuminated, road warning signs are used for high density pedestrian crossings.
e. IINo special devices have been provided on locomotives to warn motorists using unguarded public crossings of the approach of trains. II Ends of locomotives and multiple units are painted yellow.
f. The British hav.e conducted experiments with flashing blue headlights. No reports are as yet available on this experiment.
2. French (SNCF)
a. The French are at present actively pursuing the auto-mation of grade cros sings. In 1968 there were 24 accidents; 2 killed, 3 injured for 2600 automatic crossings. In no case was an accident due to equip-ment failure.
b. They are now testing a radar based device for the surveillance of automatic crossings. This is in the experimental phase and as-yet no results are available.
3. Swiss
a. Unguarded crossings are used when the trains do not exceed 70 mph. Whistle boards are provided lIat particularly dangerous points". Trains at these crossings are restricted to 15 - 40. mph depending upon track visibility. For light road traffic, whistle boards are used at 175-440 yards. There are no devices to insure the blowing of the whistle or for signaling auto-matically. Locomotives on rail lines where the proximity to the road is great are painted red. Regular paint used on locomotives is dark green. A three unit 75 watt head-light is used both day and night.
4. Sweden
a. The Swedish National that they do not use paints specifically for alerting the automobile operator.
Appendix K 150
4. Sweden (contd. )
They use a horn which is hand actuated at 1800 feet and 900 feet to the crossing. Under conditions of reduced visibility, the signaling is repeated until the train has reached the crossing. The horn they use is a KOCKUMS supertyfon TA This device has a fundamental . frequency of 460 Hertz, an output of 137 DB at 3 feet in front of the horn and can be heard 6500 feet in clear weather. This horn is similar to those in the U. S. A.
5. Germany
a. There are no special alerting devices used on trains for signaling to automobile operators.
6. Japan
a. Although no response.was r.Etceived from Japan our research indicates that they utilize a spedal direction indicator at the guarded crossings which by an illuminated arrow show the direction of the oncoming train or trains. This device would tend to decrease those accidents in which the motor vehicle operator assumed that the train which just passed was the only train approaching the crossing.
7. Finland
a. The locomotives in Finland are painted white and a red. The l.ower half of the train iI' white with the upper half a medium red. This combinatJ.on approaches the recommen-dation of this report. This information was obtained from the Scandinavian Information Center, N. Y. C.
'--Appendix K 151
.. * 11. So COVEltIlMI!:NT PRINnIlC OFFICE: It'l 0, i


