Embed Size (px)
Citation preview

www.elsevier.com/locate/scitotenv
Science of the Total Environm
The Wheal Jane wetlands model for bioremediation
of acid mine drainage
P.G. Whitehead*, B.J. Cosby, H. Prior
Aquatic Environments Research Centre, Department of Geography, University of Reading, Box 227, Whiteknights, Reading, RG6 6AB, UK
Abstract
Acid mine drainage (AMD) is a widespread environmental problem associated with both working and abandoned mining
operations. As part of an overall strategy to determine a long-term treatment option for AMD, a pilot passive treatment plant
was constructed in 1994 at Wheal Jane Mine in Cornwall, UK. The plant consists of three separate systems, each containing
aerobic reed beds, anaerobic cell and rock filters, and represents the largest European experimental facility of its kind. The
systems only differ by the type of pretreatment utilised to increase the pH of the influent minewater (pH b4): lime dosed (LD),
anoxic limestone drain (ALD) and lime free (LF), which receives no form of pretreatment. Historical data (1994–1997) indicate
median Fe reduction between 55% and 92%, sulphate removal in the range of 3–38% and removal of target metals (cadmium,
copper and zinc) below detection limits, depending on pretreatment and flow rates through the system. A new model to simulate
the processes and dynamics of the wetlands systems is described, as well as the application of the model to experimental data
collected at the pilot plant. The model is process based, and utilises reaction kinetic approaches based on experimental microbial
techniques rather than an equilibrium approach to metal precipitation. The model is dynamic and utilises numerical integration
routines to solve a set of differential equations that describe the behaviour of 20 variables over the 17 pilot plant cells on a daily
basis. The model outputs at each cell boundary are evaluated and compared with the measured data, and the model is
demonstrated to provide a good representation of the complex behaviour of the wetland system for a wide range of variables.
D 2004 Elsevier B.V. All rights reserved.
Keywords: Acid mine drainage; Bioremediation; Metals; Water quality; Wetlands; Modelling; Wheal Jane Mine
1. Introduction models through dynamic lumped process models, to
There are many approaches to modelling environ-
mental systems, ranging from empirical dblack boxT
0048-9697/$ - see front matter D 2004 Elsevier B.V. All rights reserved.
doi:10.1016/j.scitotenv.2004.09.012
* Corresponding author. Tel.: +44 118 987 5123; fax: +44 118
931 4404.
E-mail address: [email protected]
(P.G. Whitehead).
distributed full chemical speciation models. The
impacts of acid mine drainage (AMD) on rivers has
been modelled by Whitehead and Jeffrey (1995) and
detailed process-based models of acidification have
been developed for upland soil systems (Cosby et al.,
1985a, b). Few models have simulated the impact of
constructed wetland treatment of acid mine drainage.
Conceptual models have predicted iron retention and
ent 338 (2005) 125–135

P.G. Whitehead et al. / Science of the Total Environment 338 (2005) 125–135126
cycling in wetland ecosystems receiving coal mine
drainage (Mitsch et al., 1981, 1983; Fennessy and
Mitsch, 1989a,b). In addition, Flanangan et al. (1994)
developed a more comprehensive model predicting
iron, manganese, aluminium and sulphate retention in
a proposed wetland remediation site in Ohio, USA.
This model was then evaluated once the wetland had
been built (Mitsch and Wise, 1998). However, there
have been few comprehensive studies of passive
treatment systems, which have resulted in useful
model developments for highly acidic systems.
A key objective of the Wheal Jane project has been
to develop generic passive treatment system models
that could be used to represent the dominant processes
controlling the behaviour of the wetland system
(Whitehead and Prior, 2004). Once developed, this
model could be used to evaluate other systems and
could also be used to identify the most suitable
operating conditions for the design and operation of
future bioremediation schemes for the treatment of
AMD.
2. Wheal Jane Pilot Plant
The passive treatment plant consists of three
schemes (Whitehead and Prior, 2004). These differ
only in the pretreatment utilised to modify the pH of
the influent minewater, namely, lime dosing to pH 5
(lime dosed, LD), an anoxic limestone drain (ALD)
and no modification (lime free, LF). All three systems
include the following: (i) constructed aerobic reed
beds designed to remove iron and arsenic, (ii) an
Fig. 1. Iron concentrations down the Wheal Jane Pilot
anaerobic cell to encourage the reduction of sulphate
and facilitate the removal of zinc, copper, cadmium
and the remaining iron as metal sulphides, and (iii)
aerobic rock filters designed to promote the growth of
algae and facilitate the precipitation of manganese.
An extensive record of biological, chemical and
physical data exists following the completion of the
first phase of research at the site during 1994–1997
(Hamilton et al., 1999). The second research phase
started in 1998 and included weekly water quality
monitoring of key points across the site (A1–3, A8–9,
A13, B1, B11, B15–16, B21–24, C1, C6–7 and C11;
see Whitehead and Prior, 2004).
Samples were analysed for a broad range of
determinants, including pH, dissolved oxygen
(DO), redox potential, alkalinity, dissolved metals
and anions. All analyses were completed within 1
week of collection at the site, in accordance with
UKAS and BS5750 quality assurance controls.
Comparisons between Adit water and Carnon River
water are provided, for comparison, by Neal et al.
(2004).
3. Biochemical behaviour of the Wheal Jane
wetland system
To develop a model for AMD bioremediation at the
site, historical and current water chemistry data were
analysed to provide an insight into chemical processes
occurring and set limits for the model.
Interim results of the water chemistry appear to
support the original research carried out at the site
Passive Treatment Plant (June–November 1996).

P.G. Whitehead et al. / Science of the Total Environment 338 (2005) 125–135 127
from 1994 to 1998 (Fig. 1). All systems appear to
remove soluble Fe from the AMD, with removal
primarily taking place in the first two aerobic cells.
The ALD configuration has the highest removal rate,
with a median of 99.5%, with the LD and LF
systems removing a median of 96.5% and 94.8%,
respectively.
When comparing the removal rates of other metals
from the three systems, it is noticeable that there is a
broad difference in the capacity of each system to
remove metals in addition to a wide variance between
elements.
The relationship between potential and pH at
sites across the passive treatment plant has been
mapped to allow the interpretation of element
speciation within the three treatment systems using
adapted Pourbaix diagrams (Pourbaix, 1974, White-
head et al., 2004).
These theoretical diagrams depict the thermody-
namically most stable form of an element, as a
function of potential and pH, and show the relative
stability of an element and its predominant form
under a range of environmental conditions. This
simple analysis has allowed the theoretical determi-
nation of which chemical equilibrium equations
could be included in the model for each element
considered. However, recent work by Johnson and
Hallberg (2004), Hall and Puhlmann (2004) and
Hall et al. (2004) indicate that most of the transition
Fig. 2. Spatial variations in dissolved oxygen at Wheal Jane Pilot Passiv
aerobic cells and the rock filters, but low DO in the anaerobic zones (rea
between metal speciation forms is controlled by
microbial behaviour. Thus, using the equilibrium
approach is not the best strategy for determining
metal concentrations. Hall and Puhlmann (2004)
conducted a series of laboratory and field experi-
ments to determine the reaction rate controls and
has found that the processes are generally first-order
microbiologically controlled reactions with measur-
able reaction rates. Thus, it is possible to utilise this
knowledge when modelling the processes at Wheal
Jane and other bioremediation systems.
Spatial variations in pH, dissolved oxygen, con-
ductivity, redox and BOD at the pilot passive treat-
ment plant were determined. The system variations of
these parameters were important, and they allowed the
environmental conditions within each section or reach
of the three systems to be analysed. The maximum,
minimum and interquartile ranges for each reach were
calculated for all parameters for the period June to
November 1996, to allow limits to be established and
the determination of important processes to aid model
development. Dissolved oxygen plots for this period
(Fig. 2) show that, although heavily depleted in the
anaerobic cell, the final stages of the treatment process
in the rock filter are sufficient to return the DO
concentration to levels recorded at the end of the final
aerobic cell. This indicates that DO reaeration is an
important process in this section of the treatment
plant.
e Treatment Plant showing low initial DO, rising DO through the
ches 5, 4 and 3 in the three systems).

P.G. Whitehead et al. / Science of the Total Environment 338 (2005) 125–135128
4. The Wheal Jane model
The model for the Wheal Jane passive treatment
system is based on a set of ordinary differential
equations that are solved using a fourth-order Runge
Kutta Integration routine with a Merson variable step
length procedure. The advantage of this system is that
it is fast and the model results are generated rapidly
(Whitehead et al., 1979, 1998a,b). This allows the
user to simulate the system quickly and repeat runs to
evaluate changing behaviour patterns. The model
consists of 22 equations for each of 17 cells. The 17
cells consist of the limestone treatment tank, the ALD,
the five aerobic cells, the anaerobic cell and the nine
rock filters, as shown in Fig. 3. The 22 equations
consist of the flow, metals, anions, cations and a
tracer.
The basic model structure comprises of the
following: (i) input minewater chemistry, (ii) lime
dosing section (which may be bypassed for LF
system), (iii) ALD section (which may be bypassed
for LD and LF system), (iv) aerobic cells, (v)
anaerobic cells, (vi) rock filter and (vii) output
chemistry. A total of 22 variables is being modelled
(flow, D.O., B.O.D., Al, As, Ca, Cd, Cl, Cu, Fe, Hg,
K, Mg, Mn, N, NH4, Na, Ni, P, Pb, S, Zn and tracer).
Processes modelled include the following:
! Temperature, evapotranspiration and rainfall
effects;
! Water balance, mass balance, first-order temper-
ature dependent reaction kinetics for metals and
nutrients;
! Cation–anion balance, pH calculation;
Fig. 3. The Wheal Jane Model configuration showing lime dosing,
anoxic limestone drain (ALD), aerobic cells, anaerobic cells and the
rock filters.
! Microbial mediation of sulphide reactions, macro-
phyte effects on aerobic cells, algal biomass effects
and uptake of Mn; and
! BOD decay, DO reaeration.
To model water quality, it is necessary to first
simulate water flow in all cells in the system. The
first stage of the flow model development is to
compute a mass balance over the cells. The model
for flow variation in each reach is based on a
nonlinear reservoir model, and thus, the model may
be viewed in hydrological flow routing terms as one
in which the relationship between inflow (I) from
the upstream cell, outflow (Q) from the cell, the
volume (V) of water in the cell and hydrologically
effective rainfall (HER) in each reach is represented
by the continuity equation:
dQ tð Þdt
¼ Q tð ÞV tð Þ I tð Þ þ HER tð Þ � Q tð Þ½ � ð1Þ
The hydrologically effective rainfall is determined
from the actual daily rainfall less the estimated
evapotranspiration calculated using the UK Met
Office MORECS system (MetOffice, 1981). The form
of Eq. (1) has been used and evaluated by Whitehead
et al. (1998a,b) to model a wide range of stream and
catchment systems. The Q/V term represents an
estimate of the reciprocal of the mean residence time
in the cell so that as volume in the cell increases or the
flow rate decreases, the residence time will increase.
The dynamic water quality model is based on a
similar mass balance approach but includes factors to
allow for the nonconservative nature of the water
quality variables. For example, dissolved oxygen in
the system is a balance between the various sources
(e.g., reaeration) and sinks of oxygen (e.g., oxygen
loss by biochemical decay processes). The mass
balance equations required to simulate the behaviour
of any variable can be written in differential equation
form for a reach as follows:
dX tð Þdt
¼ U tð ÞT tð Þ � X tð Þ
T tð Þ FZ tð Þ ð4Þ
where X refers to the downstream (cell output)
concentration, mg l�1; U refers to the upstream (cell
input) concentration, mg l�1; T is the cell residence
time, which will vary as a function of flow and

Fig. 4. Daily rainfall (mms) and temperature (8C) at Wheal Jane (June–December 1996).
P.G. Whitehead et al. / Science of the Total Environment 338 (2005) 125–135 129
volume of the cell as described above; and Z refers to
additional sources or sinks affecting the cell.
The differential equations used in the model are as
follows.
Tracers
dX1 tð Þdt
¼ U1 tð ÞT tð Þ � X1 tð Þ
T tð Þ FZ1 tð Þ ð5Þ
Metals
dX2 tð Þdt
¼ U2 tð ÞT tð Þ � X2 tð Þ
T tð Þ
� k11:047h�20ð ÞX2 tð ÞFZ2 tð Þ ð6Þ
Fig. 5. Wheal Jane Mine chemistry time series results—Reach 7 observed
Zone (June–December 1996).
Nitrogen
dX3 tð Þdt
¼ U3 tð ÞT tð Þ �X3 tð Þ
T tð Þ �k21:047h�20:ð ÞX3 tð ÞFZ3 tð Þ
ð7Þ
Dissolved oxygen
dX4 tð ÞT tð Þ ¼ U4 tð Þ
T tð Þ � X4 tð ÞT tð Þ
þ k31:047h�20:ð Þ Cs � X4 tð Þð Þ
� 4:2 k21:047h�20:ð ÞX3 tð Þ
� k41:047h�20:ð ÞX5 tð ÞFZ2 tð Þ ð8Þ
(dots) and simulated anions and cations at outflow of the Aerobic

Fig. 6. DO and BOD simulated concentrations down the Wheal Jane System.
P.G. Whitehead et al. / Science of the Total Environment 338 (2005) 125–135130
Biochemical oxygen demand
dX5 tð Þdt
¼ U5 tð ÞT tð Þ � X5 tð Þ
T tð Þ � k41:047h�20:ð ÞX5 tð Þ
� k5X5 tð ÞFZ5 tð Þ ð9ÞHere, k1, k2, k3, k4 and k5 are first-order
temperature-dependant rate coefficients relating to
Fig. 7. Flow and chemical simulation p
metal loss, denitrification, reaeration, biochemical
decay and sedimentation (or biofloculation), respec-
tively, in units of days�1. All the rate coefficients,
with the exception of the sedimentation rate, are
temperature dependant via the term 1.047(u�20.),
where h is the cell water temperature (8C). Cs is the
saturation concentration of dissolved oxygen and is
lotted as frequency distributions.

Fig. 8. Metal concentrations simulated halfway down the aerobic cell system.
P.G. Whitehead et al. / Science of the Total Environment 338 (2005) 125–135 131
calculated from the equation below (Whitehead et
al., 1979)
Cs ¼ 14:51233� 0:3928026h þ 0:00732326h2
� 0:00006629h3 ð10Þ
The model has been structured so that any of the
three systems at the Wheal Jane Pilot Plant can be
simulated. In addition, the model is quite generic that
any number of aerobic cells, anaerobic cells or rock
filters can be simulated. This allows for altered
wetland designs to be evaluated.
Table 1
Median removal rates of major elements at Wheal Jane Passive
Treatment Plant, 1999–2001
System Al
(%)
Cd
(%)
Cu
(%)
K
(%)
Mg
(%)
Mn
(%)
Na
(%)
S
(%)
Zn
(%)
LD 65 78 73 24 37 54 30 47 66
ALD 90 98 95 41 41 60 33 39 73
LF 35 53 42 a 2 26 45 20 37 47
LD—lime-dosed system; ALD—anoxic limestone drain system;
and LF—lime-free system.
5. Model results and discussion
The model simulates the dynamic response of the
wetland system on a daily time step. In addition to the
mine drainage driving the behaviour of the system,
environmental factors such as rainfall, temperature
and evapotranspiration affect the performance of the
wetland system.
Fig. 4 shows the rainfall and temperature patterns
for the 6-month period from June 1996 with low
rainfall and high temperature in the summer and
increasing rainfall in the winter with corresponding
cooler temperatures. Clearly, these environmental
variables will affect a whole range of processes in
the wetland system, including plant growth, evapo-
ration and, hence, flow levels and chemical and
microbial reaction rates. All these effects have to be
included in the model, and simulation results are
presented in Fig. 5 for flow, anions and cations. The
low summer rainfall and high temperatures keep the
simulated flows low, as shown in Fig. 5, and flows
increase as autumn proceeds. The chemistry of the
wetlands also responds to this changing flow pattern
and simulated, and the observed behaviour of Ca, Mg,
Na, K, Cl and SO4 all reduce in the autumn as the
flows increase. However, the simulated response
matches the observed behaviour well especially, given

P.G. Whitehead et al. / Science of the Total Environment 338 (2005) 125–135132
that no calibration has been undertaken at this stage in
the modelling programme.
Another key aspect of the model is the ability to
simulate the DO and BOD behaviour down the
system. Fig. 6 shows the simulated patterns of DO
and BOD and indicate that the model represents the
low influent DO levels rising through the aerobic
zone, then dropping to zero in the anaerobic zone,
before recovering again in the rock filters. BOD
shows a major increase at the anaerobic filter, derived
Fig. 9. Metal simulated concentration
from the organic material present, and then a decline
in the rock filters. These changing simulated DO and
BOD conditions compare well with the observed
trends shown in Fig. 2 and create the ideal conditions
for aerobic and anaerobic bacteria to thrive and cause
metal precipitation or loss.
An alternative method of presenting the simulation
results is to compute the frequency distribution and
cumulative frequency distribution of the model out-
puts. Fig. 7 shows these results in a graphical form.
s down the Wheal Jane system.
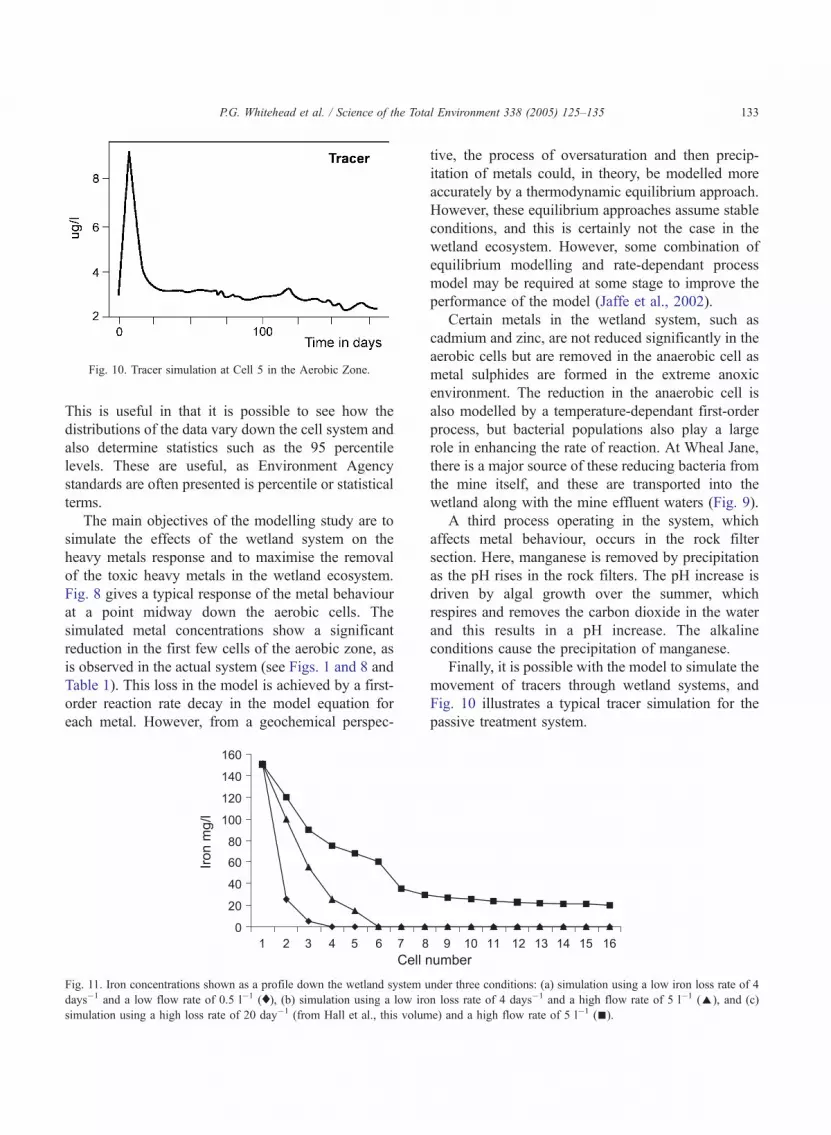
Fig. 10. Tracer simulation at Cell 5 in the Aerobic Zone.
P.G. Whitehead et al. / Science of the Total Environment 338 (2005) 125–135 133
This is useful in that it is possible to see how the
distributions of the data vary down the cell system and
also determine statistics such as the 95 percentile
levels. These are useful, as Environment Agency
standards are often presented is percentile or statistical
terms.
The main objectives of the modelling study are to
simulate the effects of the wetland system on the
heavy metals response and to maximise the removal
of the toxic heavy metals in the wetland ecosystem.
Fig. 8 gives a typical response of the metal behaviour
at a point midway down the aerobic cells. The
simulated metal concentrations show a significant
reduction in the first few cells of the aerobic zone, as
is observed in the actual system (see Figs. 1 and 8 and
Table 1). This loss in the model is achieved by a first-
order reaction rate decay in the model equation for
each metal. However, from a geochemical perspec-
Fig. 11. Iron concentrations shown as a profile down the wetland system u
days�1 and a low flow rate of 0.5 l�1 (x), (b) simulation using a low iro
simulation using a high loss rate of 20 day�1 (from Hall et al., this volum
tive, the process of oversaturation and then precip-
itation of metals could, in theory, be modelled more
accurately by a thermodynamic equilibrium approach.
However, these equilibrium approaches assume stable
conditions, and this is certainly not the case in the
wetland ecosystem. However, some combination of
equilibrium modelling and rate-dependant process
model may be required at some stage to improve the
performance of the model (Jaffe et al., 2002).
Certain metals in the wetland system, such as
cadmium and zinc, are not reduced significantly in the
aerobic cells but are removed in the anaerobic cell as
metal sulphides are formed in the extreme anoxic
environment. The reduction in the anaerobic cell is
also modelled by a temperature-dependant first-order
process, but bacterial populations also play a large
role in enhancing the rate of reaction. At Wheal Jane,
there is a major source of these reducing bacteria from
the mine itself, and these are transported into the
wetland along with the mine effluent waters (Fig. 9).
A third process operating in the system, which
affects metal behaviour, occurs in the rock filter
section. Here, manganese is removed by precipitation
as the pH rises in the rock filters. The pH increase is
driven by algal growth over the summer, which
respires and removes the carbon dioxide in the water
and this results in a pH increase. The alkaline
conditions cause the precipitation of manganese.
Finally, it is possible with the model to simulate the
movement of tracers through wetland systems, and
Fig. 10 illustrates a typical tracer simulation for the
passive treatment system.
nder three conditions: (a) simulation using a low iron loss rate of 4
n loss rate of 4 days�1 and a high flow rate of 5 l�1 (E), and (c)
e) and a high flow rate of 5 l�1 (n).

P.G. Whitehead et al. / Science of the Total Environment 338 (2005) 125–135134
6. Modelling changed operating conditions
The advantage of a model such as the Wheal Jane
model is that the system can be simulated under a
range of differing operating conditions. For example,
Hall et al. (2004) suggest from their iron precip-
itation studies in the aerobic cells that the capacity of
the system is significantly underused. They predict
that the flows could be increased by a factor of 10 in
the aerobic zone; in other words, the wetland system
could treat 10 times the effluent currently treated. We
can test this out using the model, and the results are
presented in Fig. 11. Here, three simulations to
predict the effects of changing flow under differing
iron loss rates, using the model, are shown. The
baseline iron profile (the lower line on Fig. 11)
shows the iron concentrations under low flows and
low iron loss rate, indicating a rapid decline in
concentration, as might be expected given the very
low flow rates. The second simulation (shown as the
upper line) shows the effects of increasing the flows
by a factor of 10. As can be seen, the iron
concentrations fall, but not so quickly, and the low
iron loss rate is not low enough to remove all of the
iron. However, in the intermediate line of iron loss,
the flows are again 10 times higher, but the iron loss
rates are now high and equivalent to those estimated
by Hall et al. (this volume). Here, the iron reduces
quickly, and the total mass of iron removal is 10
times the current loss from the wetland system.
Thus, it does suggest that the passive treatment
system could be made 10 times more efficient by
increasing the flow rates by a factor of 10. It also
emphasises the importance of the microbiological
behaviour in the controlling iron precipitation and
removal down the aerobic zone.
7. Conclusion
The model development in the Wheal Jane project
has produced a prototype model for the simulation of
a wide range of variables observed in wetland
ecosystems used for bioremediation. The combination
of the field data, experimental data and modelling
provides a powerful method of evaluating the com-
plex processes operating in such systems. In such
systems, the physical, chemical, macrobiological and
microbiological processes interact to create a highly
complex set of behaviours. Creating a new model for
such a system represents a major challenge, and the
use of first-order reaction kinetics is shown to be a
good method of modelling the complex microbial
processes controlling metal precipitation and removal
along the passive treatment plant. Moreover, the
model can be used to evaluate the operational
conditions in the wetlands system and, for example,
be used to assess alternative methods of improving
the efficiency of the plant. The dynamic model is
written as a generic model and, as such, can be set up
for a range of different wetland systems. The model is
available from Prof. Paul Whitehead at the University
of Reading.
Acknowledgements
This work is produced as part of the DTI LINK
Project BTL/20/71 RC140.
References
Cosby BJ, Wright RF, Hornberger GM, Galloway JN. Modelling
the effects of acid deposition: assessment of lumped parameter
model of soil and water and stream chemistry. Water Resour Res
1985a;2(1);54–63.
Cosby JB, Wright RF, Hornberger GM, Galloway JN. Modelling
the effects of acid deposition: estimation of long term water
quality responses in a small forested catchment. Water Resour
Res 1985b;21(11);1591–601.
Fennessy MS, Mitsch WJ. Design and use of wetlands for
renovation of drainage from coal mines. In: Mitsch WJ,
Jørgensen SE, editors. Ecological engineering: an introduction
to ecotechnology. New York7 John Wiley and Sons; 1989a.
Fennessy MS, Mitsch WJ. Treating coal mine drainage with and
artificial wetland. Res J Water Pollut Control Fed 1989b;61:
1691–701.
Flanangan NE, Mitsch WJ, Beach K. Predicting metal retention in a
constructed mine drainage wetland. Ecol Eng 1994:135–59.
Hall GH, Puhlmann T. Spatial distribution of iron oxidation in the
aerobic cells of the Wheal Jane pilot passive treatment plant. Sci
Total Environ 2004;338:73–80 [this volume].
Hall G, Swash P, Kitilainen S. The importance of biological
oxidation of iron in the aerobic cells of the Wheal Jane pilot
passive treatment system. Sci Total Environ 2004;338:67–72
[this volume].
Hamilton QUI, Lamb HM, Hallett C, Proctor JA. Passive treatment
systems for the remediation of acid mine drainage at Wheal Jane,
Cornwall. J Chart Inst Water Environ Manag 1999;13:93–103.

P.G. Whitehead et al. / Science of the Total Environment 338 (2005) 125–135 135
Jaffe PR, Sookyun W, Kallin PL, Smith SL. The dynamics of
arsenic in saturated porous media: fate and transport modelling
for deep aquatic sediments, wetland sediments and groundwater
environments. Spec Publ-Geochem Soc 2002;7:379–97.
Johnson DB, Hallberg J. Biogeochemistry of the compost bioreactor
components of a composite acid mine drainage passive
remediation system. Sci Total Environ 2004;338:81–93 [this
volume].
Meteorological Office J. The MORECS system. Hydrological
Memorandum 1981;45:91.
Mitsch WJ, Wise KM. Water quality, fate of metals and predictive
model validation of a constructed wetland treating acid mine
drainage. Water Res 1998;32(6);1888–900.
Mitsch WJ, Bosserman RW, Hill Jr PL, Smith F. Models of
wetlands amid surface coal mining regions of Western
Kentucky. In: Mitsch WJ, Bosserman RW, Klopatek J,
editors. Energy and ecological modelling. Amst.7 Elsevier;
1981. p. 103–13.
Mitsch WJ, Taylor JR, Benson KB. Classification, modelling and
management of wetlands—a case study in Western Kentucky.
In: Skogerboe GV, Flug M, Lauebroth WK, editors. Analysis of
ecological systems, state of the art in ecological modelling.
Amst.7 Elsevier; 1983.
Neal C, Whitehead PG, Jeffrey H, Neal M. The water quality of the
River Carnon, West Cornwall, November 1992 to March 1994:
the impacts of Wheal Jane discharges. Sci Total Environ
2004;338:23–39 [this volume].
Pourbaix M. Atlas of electrochemical equilibira in aqueous
solutions. NACE, Cebelcor. UK7 Pergamon Press; 1974.
Whitehead PG, Jeffrey H. Heavy metals from acid mine drain-
age–impacts and modelling strategies. IAHS Publ 1995;230:
55–68.
Whitehead PG, Hall G, Neal C, Prior H. Chemical behaviour of the
Wheal Jane bioremediation system. Sci Total Environ
2004;338:41–51 [this volume].
Whitehead PG, Prior H. Bioremediation of acid mine drainage: an
introductory overview of the Wheal Jane wetlands project. Sci
Total Environ 2004;338:15–21 [this volume].
Whitehead PG, Young PC, Hornberger GE. A systems model of
flow and water quality in the Bedford Ouse River system: Part I
Streamflow modelling. Water Res 1979;13:15.
Whitehead PG, Wilson EJ, Butterfield D. A semi-distributed
integrated nitrogen model for multiple source assessment in
catchments (INCA): Part I Model structure and process
equations. Sci Total Environ 1998a;210/211:547–58.
Whitehead PG, Wilson EJ, Butterfield D, Seed K. A semi-
distributed integrated nitrogen model for multiple source
assessment in catchments (INCA): Part II Application to large
river basins in South Wales and Eastern England. Sci Total
Environ 1998b;210/211:559–83.