Embed Size (px)
Citation preview
at SciVerse ScienceDirect
Building and Environment 64 (2013) 213e224
Contents lists available
Building and Environment
journal homepage: www.elsevier .com/locate/bui ldenv
Thermal comfort in buildings with split air-conditioners in hot-humid areaof China
Yufeng Zhang a,*, Huimei Chen b, Qinglin Meng a
a State Key Laboratory of Subtropical Building Science, Department of Architecture, South China University of Technology, Wushan, Guangzhou 510640, PR Chinab Foshan Yi Kang Property Development Co., Ltd., Chancheng, Foshan 528000, PR China
a r t i c l e i n f o
Article history:Received 17 July 2012Received in revised form14 September 2012Accepted 14 September 2012
Keywords:Thermal comfortBuildings with split air-conditionersHot-humid areaThermal adaptation
* Corresponding author. Tel.: þ86 18664866529; faE-mail addresses: [email protected], zha
(Y. Zhang).
0360-1323/$ e see front matterhttp://dx.doi.org/10.1016/j.buildenv.2012.09.009
a b s t r a c t
Occupants’ thermal sensations, perceptions and behaviors in buildings with split air-conditioners in hot-humid area of China were systematically investigated for a whole year with longitudinal design. Thirtycollege students, naturally acclimatized to local climate and well experienced with the indoor envi-ronments of buildings, participated in the present study. They reported their thermal sensations,perceptions and behaviors in questionnaires while their ambient environmental variables weremeasured. A close match of indoor and outdoor climate was found. Thermal sensation was found to bea linear function of ET* or SET and thermal neutrality was 25.6 �C in ET* or 24.9 �C in SET. The central fivecategories of the ASHRAE 9-point thermal sensation scale were found to be acceptable and the 90% (80%)acceptable range of thermal environment was found to be 20.6e30.5 �C (16.9e34.2 �C) in ET*. Theadaptive behaviors of clothing adjustment, opening windows and using fans were found to be closelycorrelated with indoor ET*. The split air-conditioners were used fromMay to October and turned on mostoften at midnight with indoor air temperature of 30.1 �C and setting temperature of 26.1 �C. Comparedwith those from naturally ventilated buildings, the occupants from buildings with split air-conditionerskept indoor climates much cooler, used adaptive opportunities much earlier and perceived their ambientenvironments more sensitively and rigidly.
1. Introduction
Literature reviews on thermal comfort studies in built envi-ronment reveal that not only indoor environments, but alsooutdoor climates and building controls may have significantimpacts on human thermal comfort through behavioral orpsychological approaches [1,2]. Along with this finding, a lot of fieldstudies on thermal comfort have been conducted in a great manyreal buildings throughout the world, which are rich in adaptiveopportunities and human interactions with environment andprovide strong evidences for human thermal adaptation.
Located in South China, the hot-humid area of China has a largepopulation, a fast-developed economy and a huge number ofbuildings. The summer is hot and humid and nearly half a year andthermal comfort study is very important in this area especially forbuilding designers and engineers. As only few studies have beencarried out before, a thermal comfort field study had been
x: þ86 20 [email protected]
conducted in this area by the authors and their colleagues (refer to[3]). As its continuing part, the present study is focused as well onhuman thermal comfort in real buildings in hot-humid area ofChina.
The greatest difference between the two mentioned studies ison buildings. Naturally ventilated buildings were investigated inthe previous one and buildings installed with split air-conditionerswere studied in the present one. Compared with naturally venti-lated (NV) or centrally air-conditioned (AC) buildings, buildingswith split air-conditioners (referred to as SAC buildings for conve-nience) are much more common and widely distributed in SouthChina. SAC buildings are very often encountered in residential,office and commercial buildings due to their reasonable prices,great conveniences and good balances between investment andenvironmental quality. Taking a fast-developed province in hot-humid area of China as an example, the ownership of air-conditioners has reached to 2 units per household for the urbanresidents of Guangdong Province at the end of 2010, and most ofthe household air-conditioners are split type. To conduct thermalcomfort study in SAC buildings can provide valuable informationand guidance for design of buildings and air-conditioners in hot-humid area of China.
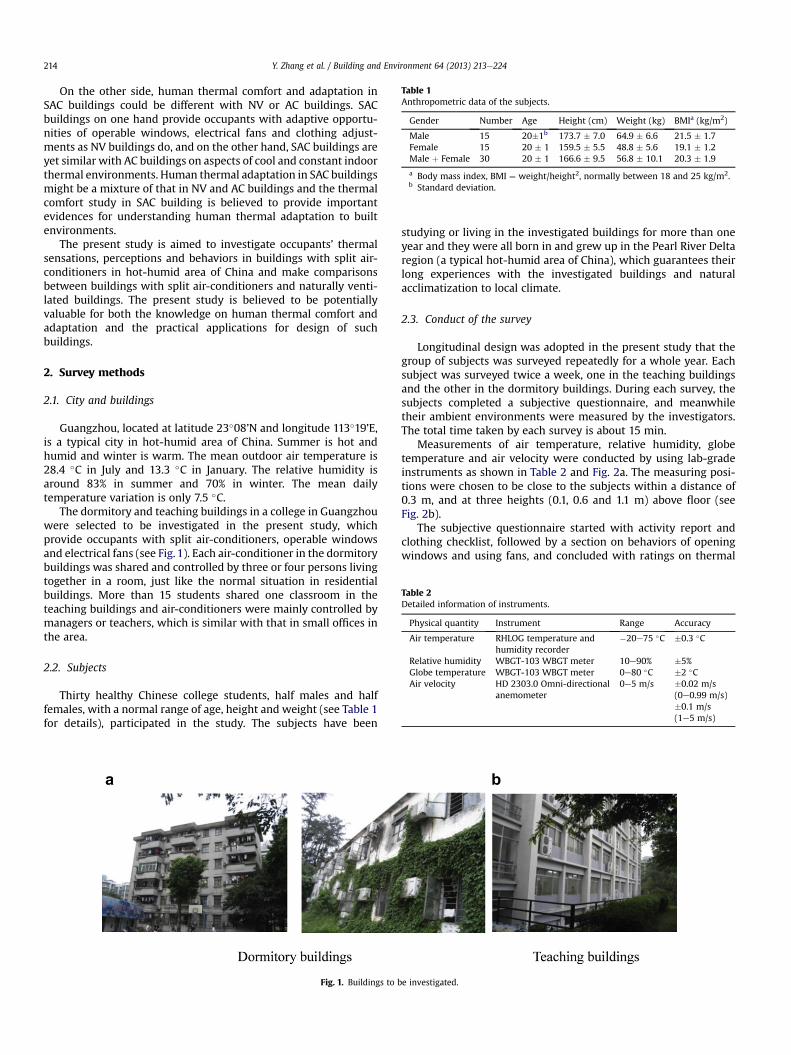
Table 1Anthropometric data of the subjects.
Gender Number Age Height (cm) Weight (kg) BMIa (kg/m2)
Male 15 20�1b 173.7 � 7.0 64.9 � 6.6 21.5 � 1.7Female 15 20 � 1 159.5 � 5.5 48.8 � 5.6 19.1 � 1.2Male þ Female 30 20 � 1 166.6 � 9.5 56.8 � 10.1 20.3 � 1.9
a Body mass index, BMI ¼ weight/height2, normally between 18 and 25 kg/m2.b Standard deviation.
Table 2Detailed information of instruments.
Physical quantity Instrument Range Accuracy
Air temperature RHLOG temperature andhumidity recorder
�20e75 �C �0.3 �C
Relative humidity WBGT-103 WBGT meter 10e90% �5%Globe temperature WBGT-103 WBGT meter 0e80 �C �2 �CAir velocity HD 2303.0 Omni-directional
anemometer0e5 m/s �0.02 m/s
(0e0.99 m/s)�0.1 m/s(1e5 m/s)
Y. Zhang et al. / Building and Environment 64 (2013) 213e224214
On the other side, human thermal comfort and adaptation inSAC buildings could be different with NV or AC buildings. SACbuildings on one hand provide occupants with adaptive opportu-nities of operable windows, electrical fans and clothing adjust-ments as NV buildings do, and on the other hand, SAC buildings areyet similar with AC buildings on aspects of cool and constant indoorthermal environments. Human thermal adaptation in SAC buildingsmight be a mixture of that in NV and AC buildings and the thermalcomfort study in SAC building is believed to provide importantevidences for understanding human thermal adaptation to builtenvironments.
The present study is aimed to investigate occupants’ thermalsensations, perceptions and behaviors in buildings with split air-conditioners in hot-humid area of China and make comparisonsbetween buildings with split air-conditioners and naturally venti-lated buildings. The present study is believed to be potentiallyvaluable for both the knowledge on human thermal comfort andadaptation and the practical applications for design of suchbuildings.
2. Survey methods
2.1. City and buildings
Guangzhou, located at latitude 23�08’N and longitude 113�19’E,is a typical city in hot-humid area of China. Summer is hot andhumid and winter is warm. The mean outdoor air temperature is28.4 �C in July and 13.3 �C in January. The relative humidity isaround 83% in summer and 70% in winter. The mean dailytemperature variation is only 7.5 �C.
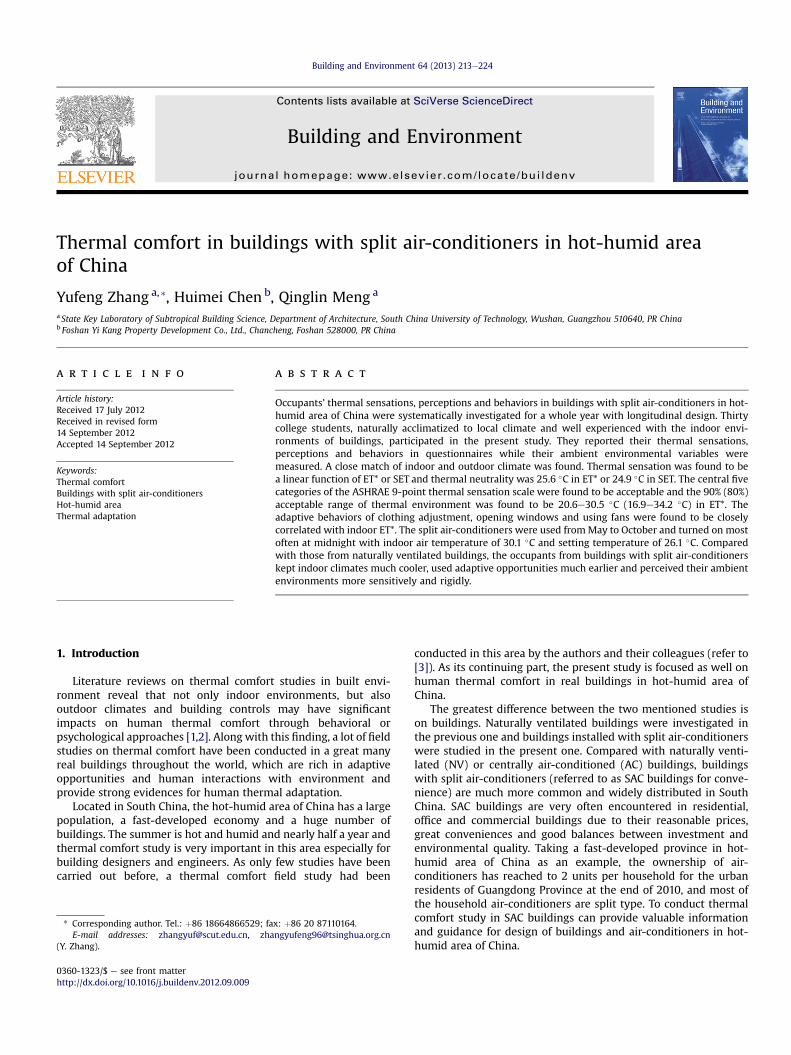
The dormitory and teaching buildings in a college in Guangzhouwere selected to be investigated in the present study, whichprovide occupants with split air-conditioners, operable windowsand electrical fans (see Fig. 1). Each air-conditioner in the dormitorybuildings was shared and controlled by three or four persons livingtogether in a room, just like the normal situation in residentialbuildings. More than 15 students shared one classroom in theteaching buildings and air-conditioners were mainly controlled bymanagers or teachers, which is similar with that in small offices inthe area.
2.2. Subjects
Thirty healthy Chinese college students, half males and halffemales, with a normal range of age, height and weight (see Table 1for details), participated in the study. The subjects have been
Fig. 1. Buildings to b
studying or living in the investigated buildings for more than oneyear and they were all born in and grew up in the Pearl River Deltaregion (a typical hot-humid area of China), which guarantees theirlong experiences with the investigated buildings and naturalacclimatization to local climate.
2.3. Conduct of the survey
Longitudinal design was adopted in the present study that thegroup of subjects was surveyed repeatedly for a whole year. Eachsubject was surveyed twice a week, one in the teaching buildingsand the other in the dormitory buildings. During each survey, thesubjects completed a subjective questionnaire, and meanwhiletheir ambient environments were measured by the investigators.The total time taken by each survey is about 15 min.
Measurements of air temperature, relative humidity, globetemperature and air velocity were conducted by using lab-gradeinstruments as shown in Table 2 and Fig. 2a. The measuring posi-tions were chosen to be close to the subjects within a distance of0.3 m, and at three heights (0.1, 0.6 and 1.1 m) above floor (seeFig. 2b).
The subjective questionnaire started with activity report andclothing checklist, followed by a section on behaviors of openingwindows and using fans, and concluded with ratings on thermal
e investigated.
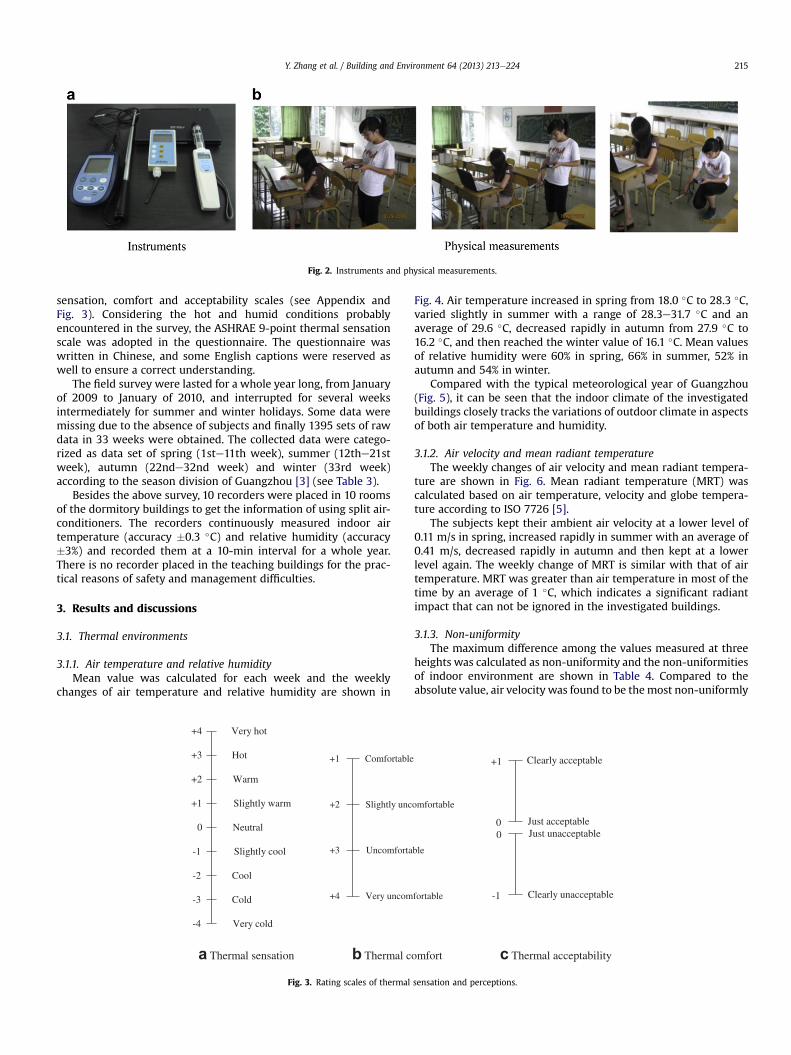
Fig. 2. Instruments and physical measurements.
Y. Zhang et al. / Building and Environment 64 (2013) 213e224 215
sensation, comfort and acceptability scales (see Appendix andFig. 3). Considering the hot and humid conditions probablyencountered in the survey, the ASHRAE 9-point thermal sensationscale was adopted in the questionnaire. The questionnaire waswritten in Chinese, and some English captions were reserved aswell to ensure a correct understanding.
The field survey were lasted for a whole year long, from Januaryof 2009 to January of 2010, and interrupted for several weeksintermediately for summer and winter holidays. Some data weremissing due to the absence of subjects and finally 1395 sets of rawdata in 33 weeks were obtained. The collected data were catego-rized as data set of spring (1ste11th week), summer (12the21stweek), autumn (22nde32nd week) and winter (33rd week)according to the season division of Guangzhou [3] (see Table 3).
Besides the above survey, 10 recorders were placed in 10 roomsof the dormitory buildings to get the information of using split air-conditioners. The recorders continuously measured indoor airtemperature (accuracy �0.3 �C) and relative humidity (accuracy�3%) and recorded them at a 10-min interval for a whole year.There is no recorder placed in the teaching buildings for the prac-tical reasons of safety and management difficulties.
3. Results and discussions
3.1. Thermal environments
3.1.1. Air temperature and relative humidityMean value was calculated for each week and the weekly
changes of air temperature and relative humidity are shown in
Hot
Warm
Slightly warm
Neutral
Slightly cool
Cool
Cold
+3
+2
+1
0
-1
-2
-3
Very cold-4
Very hot+4
Comfortable
Slightly unc
Uncomforta
Very uncom
+1
+2
+3
+4
a Thermal sensation b Thermal c
Fig. 3. Rating scales of thermal
Fig. 4. Air temperature increased in spring from 18.0 �C to 28.3 �C,varied slightly in summer with a range of 28.3e31.7 �C and anaverage of 29.6 �C, decreased rapidly in autumn from 27.9 �C to16.2 �C, and then reached the winter value of 16.1 �C. Mean valuesof relative humidity were 60% in spring, 66% in summer, 52% inautumn and 54% in winter.
Compared with the typical meteorological year of Guangzhou(Fig. 5), it can be seen that the indoor climate of the investigatedbuildings closely tracks the variations of outdoor climate in aspectsof both air temperature and humidity.
3.1.2. Air velocity and mean radiant temperatureThe weekly changes of air velocity and mean radiant tempera-
ture are shown in Fig. 6. Mean radiant temperature (MRT) wascalculated based on air temperature, velocity and globe tempera-ture according to ISO 7726 [5].
The subjects kept their ambient air velocity at a lower level of0.11 m/s in spring, increased rapidly in summer with an average of0.41 m/s, decreased rapidly in autumn and then kept at a lowerlevel again. The weekly change of MRT is similar with that of airtemperature. MRT was greater than air temperature in most of thetime by an average of 1 �C, which indicates a significant radiantimpact that can not be ignored in the investigated buildings.
3.1.3. Non-uniformityThe maximum difference among the values measured at three
heights was calculated as non-uniformity and the non-uniformitiesof indoor environment are shown in Table 4. Compared to theabsolute value, air velocity was found to be themost non-uniformly
omfortable
ble
fortable
Clearly acceptable
Just acceptableJust unacceptable
Clearly unacceptable
+1
-1
00
omfort c Thermal acceptability
sensation and perceptions.
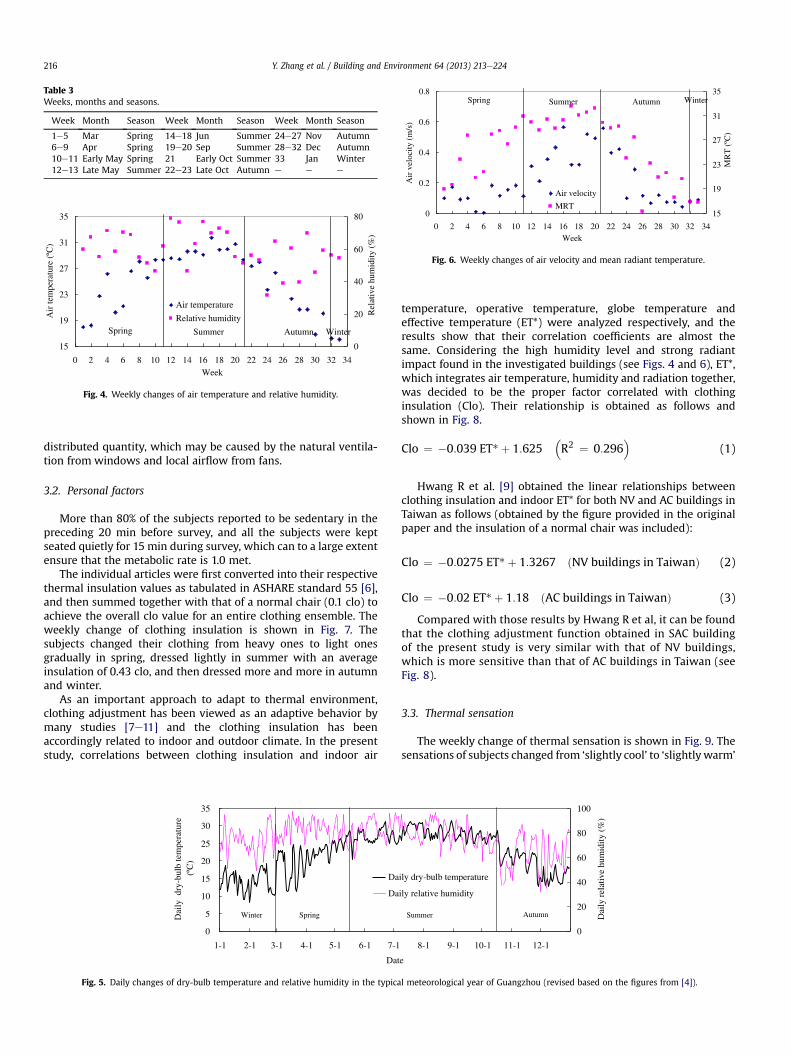
Table 3Weeks, months and seasons.
Week Month Season Week Month Season Week Month Season
1e5 Mar Spring 14e18 Jun Summer 24e27 Nov Autumn6e9 Apr Spring 19e20 Sep Summer 28e32 Dec Autumn10e11 Early May Spring 21 Early Oct Summer 33 Jan Winter12e13 Late May Summer 22e23 Late Oct Autumn e e e
15
19
23
27
31
35
0 2 4 6 8 10 12 14 16 18 20 22 24 26 28 30 32 34Week
Air
tem
pera
ture
(ºC
)
0
20
40
60
80
Rel
ativ
e hu
mid
ity (
%)
Air temperature
Relative humiditySpring AutumnSummer Winter
Fig. 4. Weekly changes of air temperature and relative humidity.
0
0.2
0.4
0.6
0.8
0 2 4 6 8 10 12 14 16 18 20 22 24 26 28 30 32 34Week
Air
vel
ocity
(m
/s)
15
19
23
27
31
35
MR
T (
ºC)
Air velocity
MRT
Spring AutumnSummer Winter
Fig. 6. Weekly changes of air velocity and mean radiant temperature.
Y. Zhang et al. / Building and Environment 64 (2013) 213e224216
distributed quantity, which may be caused by the natural ventila-tion from windows and local airflow from fans.
3.2. Personal factors
More than 80% of the subjects reported to be sedentary in thepreceding 20 min before survey, and all the subjects were keptseated quietly for 15 min during survey, which can to a large extentensure that the metabolic rate is 1.0 met.
The individual articles were first converted into their respectivethermal insulation values as tabulated in ASHARE standard 55 [6],and then summed together with that of a normal chair (0.1 clo) toachieve the overall clo value for an entire clothing ensemble. Theweekly change of clothing insulation is shown in Fig. 7. Thesubjects changed their clothing from heavy ones to light onesgradually in spring, dressed lightly in summer with an averageinsulation of 0.43 clo, and then dressed more and more in autumnand winter.
As an important approach to adapt to thermal environment,clothing adjustment has been viewed as an adaptive behavior bymany studies [7e11] and the clothing insulation has beenaccordingly related to indoor and outdoor climate. In the presentstudy, correlations between clothing insulation and indoor air
0
5
10
15
20
25
30
35
1-1 2-1 3-1 4-1 5-1 6-1 7-1
Dat
Dai
ly d
ry-b
ulb
tem
pera
ture
(ºC
)
Da
Da
SpringWinter
Fig. 5. Daily changes of dry-bulb temperature and relative humidity in the typica
temperature, operative temperature, globe temperature andeffective temperature (ET*) were analyzed respectively, and theresults show that their correlation coefficients are almost thesame. Considering the high humidity level and strong radiantimpact found in the investigated buildings (see Figs. 4 and 6), ET*,which integrates air temperature, humidity and radiation together,was decided to be the proper factor correlated with clothinginsulation (Clo). Their relationship is obtained as follows andshown in Fig. 8.
Clo ¼ �0:039 ET*þ 1:625�R2 ¼ 0:296
�(1)
Hwang R et al. [9] obtained the linear relationships betweenclothing insulation and indoor ET* for both NV and AC buildings inTaiwan as follows (obtained by the figure provided in the originalpaper and the insulation of a normal chair was included):
Clo ¼ �0:0275 ET*þ 1:3267 ðNV buildings in TaiwanÞ (2)
Clo ¼ �0:02 ET*þ 1:18 ðAC buildings in TaiwanÞ (3)
Compared with those results by Hwang R et al, it can be foundthat the clothing adjustment function obtained in SAC buildingof the present study is very similar with that of NV buildings,which is more sensitive than that of AC buildings in Taiwan (seeFig. 8).
3.3. Thermal sensation
The weekly change of thermal sensation is shown in Fig. 9. Thesensations of subjects changed from ‘slightly cool’ to ‘slightlywarm’
8-1 9-1 10-1 11-1 12-1
e
0
20
40
60
80
100
Dai
ly r
elat
ive
hum
idity
(%
)
ily dry-bulb temperature
ily relative humidity
Summer Autumn
l meteorological year of Guangzhou (revised based on the figures from [4]).
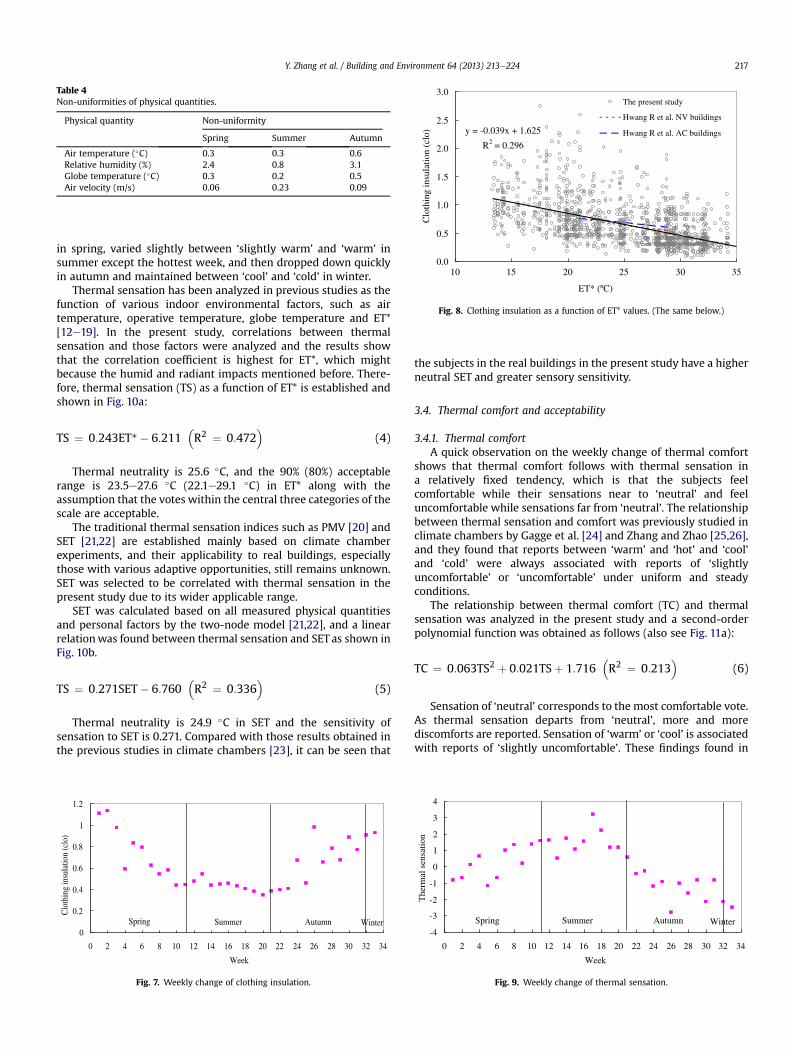
Table 4Non-uniformities of physical quantities.
Physical quantity Non-uniformity
Spring Summer Autumn
Air temperature (�C) 0.3 0.3 0.6Relative humidity (%) 2.4 0.8 3.1Globe temperature (�C) 0.3 0.2 0.5Air velocity (m/s) 0.06 0.23 0.09
y = -0.039x + 1.625
R2 = 0.296
0.0
0.5
1.0
1.5
2.0
2.5
3.0
10 15 20 25 30 35
ET* (ºC)
Clo
thin
g in
sula
tion
(clo
)
The present study
Hwang R et al. NV buildings
Hwang R et al. AC buildings
Fig. 8. Clothing insulation as a function of ET* values. (The same below.)
Y. Zhang et al. / Building and Environment 64 (2013) 213e224 217
in spring, varied slightly between ‘slightly warm’ and ‘warm’ insummer except the hottest week, and then dropped down quicklyin autumn and maintained between ‘cool’ and ‘cold’ in winter.
Thermal sensation has been analyzed in previous studies as thefunction of various indoor environmental factors, such as airtemperature, operative temperature, globe temperature and ET*[12e19]. In the present study, correlations between thermalsensation and those factors were analyzed and the results showthat the correlation coefficient is highest for ET*, which mightbecause the humid and radiant impacts mentioned before. There-fore, thermal sensation (TS) as a function of ET* is established andshown in Fig. 10a:
TS ¼ 0:243ET*� 6:211�R2 ¼ 0:472
�(4)
Thermal neutrality is 25.6 �C, and the 90% (80%) acceptablerange is 23.5e27.6 �C (22.1e29.1 �C) in ET* along with theassumption that the votes within the central three categories of thescale are acceptable.
The traditional thermal sensation indices such as PMV [20] andSET [21,22] are established mainly based on climate chamberexperiments, and their applicability to real buildings, especiallythose with various adaptive opportunities, still remains unknown.SET was selected to be correlated with thermal sensation in thepresent study due to its wider applicable range.
SET was calculated based on all measured physical quantitiesand personal factors by the two-node model [21,22], and a linearrelationwas found between thermal sensation and SET as shown inFig. 10b.
TS ¼ 0:271SET� 6:760�R2 ¼ 0:336
�(5)
Thermal neutrality is 24.9 �C in SET and the sensitivity ofsensation to SET is 0.271. Compared with those results obtained inthe previous studies in climate chambers [23], it can be seen that
0
0.2
0.4
0.6
0.8
1
1.2
0 2 4 6 8 10 12 14 16 18 20 22 24 26 28 30 32 34
Week
Clo
thin
g in
sula
tion
(clo
)
Spring AutumnSummer Winter
Fig. 7. Weekly change of clothing insulation.
the subjects in the real buildings in the present study have a higherneutral SET and greater sensory sensitivity.
3.4. Thermal comfort and acceptability
3.4.1. Thermal comfortA quick observation on the weekly change of thermal comfort
shows that thermal comfort follows with thermal sensation ina relatively fixed tendency, which is that the subjects feelcomfortable while their sensations near to ‘neutral’ and feeluncomfortable while sensations far from ‘neutral’. The relationshipbetween thermal sensation and comfort was previously studied inclimate chambers by Gagge et al. [24] and Zhang and Zhao [25,26],and they found that reports between ‘warm’ and ‘hot’ and ‘cool’and ‘cold’ were always associated with reports of ‘slightlyuncomfortable’ or ‘uncomfortable’ under uniform and steadyconditions.
The relationship between thermal comfort (TC) and thermalsensation was analyzed in the present study and a second-orderpolynomial function was obtained as follows (also see Fig. 11a):
TC ¼ 0:063TS2 þ 0:021TSþ 1:716�R2 ¼ 0:213
�(6)
Sensation of ‘neutral’ corresponds to the most comfortable vote.As thermal sensation departs from ‘neutral’, more and morediscomforts are reported. Sensation of ‘warm’ or ‘cool’ is associatedwith reports of ‘slightly uncomfortable’. These findings found in
-4
-3
-2
-1
0
1
2
3
4
0 2 4 6 8 10 12 14 16 18 20 22 24 26 28 30 32 34
Week
The
rmal
sen
satio
n
Spring AutumnSummer Winter
Fig. 9. Weekly change of thermal sensation.
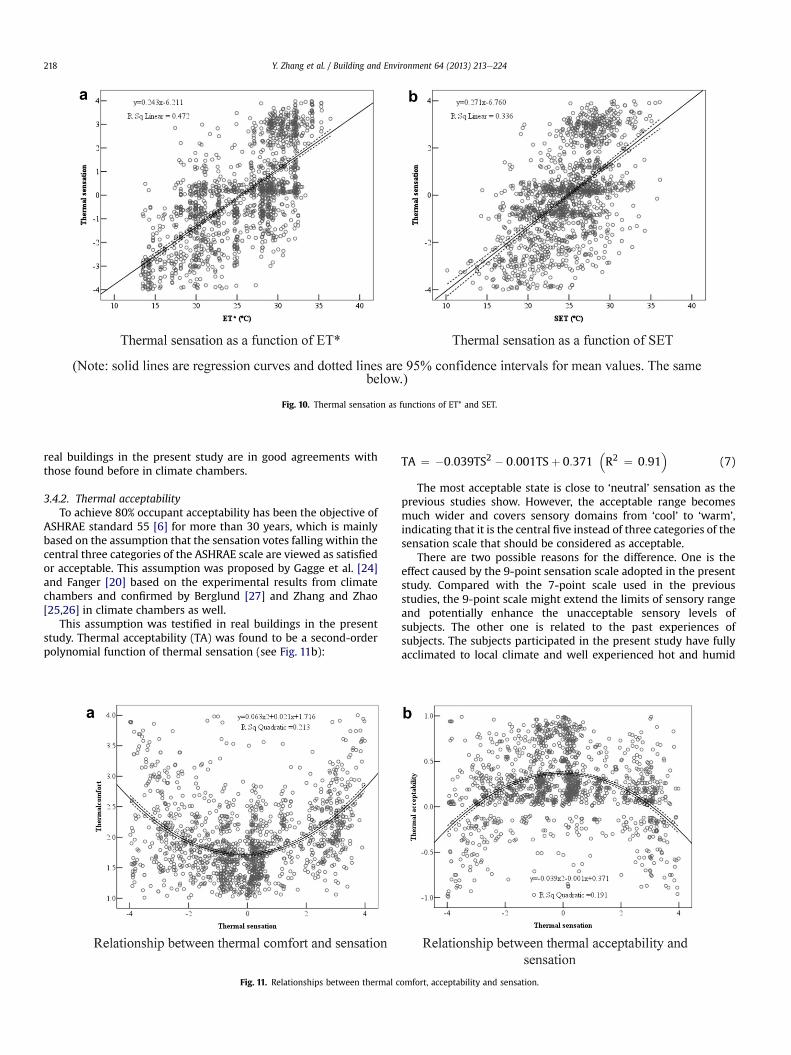
Fig. 10. Thermal sensation as functions of ET* and SET.
Y. Zhang et al. / Building and Environment 64 (2013) 213e224218
real buildings in the present study are in good agreements withthose found before in climate chambers.
3.4.2. Thermal acceptabilityTo achieve 80% occupant acceptability has been the objective of
ASHRAE standard 55 [6] for more than 30 years, which is mainlybased on the assumption that the sensation votes falling within thecentral three categories of the ASHRAE scale are viewed as satisfiedor acceptable. This assumption was proposed by Gagge et al. [24]and Fanger [20] based on the experimental results from climatechambers and confirmed by Berglund [27] and Zhang and Zhao[25,26] in climate chambers as well.
This assumption was testified in real buildings in the presentstudy. Thermal acceptability (TA) was found to be a second-orderpolynomial function of thermal sensation (see Fig. 11b):
Fig. 11. Relationships between thermal c
TA ¼ �0:039TS2 � 0:001TSþ 0:371�R2 ¼ 0:91
�(7)
The most acceptable state is close to ‘neutral’ sensation as theprevious studies show. However, the acceptable range becomesmuch wider and covers sensory domains from ‘cool’ to ‘warm’,indicating that it is the central five instead of three categories of thesensation scale that should be considered as acceptable.
There are two possible reasons for the difference. One is theeffect caused by the 9-point sensation scale adopted in the presentstudy. Compared with the 7-point scale used in the previousstudies, the 9-point scale might extend the limits of sensory rangeand potentially enhance the unacceptable sensory levels ofsubjects. The other one is related to the past experiences ofsubjects. The subjects participated in the present study have fullyacclimated to local climate and well experienced hot and humid
omfort, acceptability and sensation.
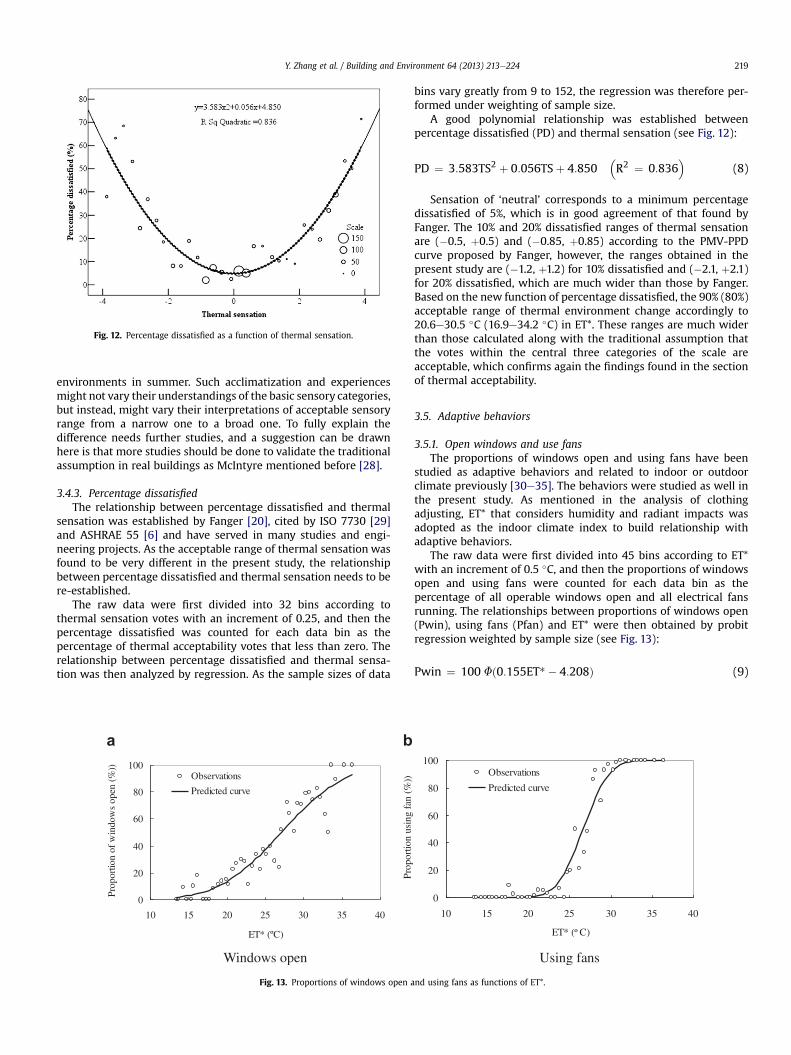
Fig. 12. Percentage dissatisfied as a function of thermal sensation.
Y. Zhang et al. / Building and Environment 64 (2013) 213e224 219
environments in summer. Such acclimatization and experiencesmight not vary their understandings of the basic sensory categories,but instead, might vary their interpretations of acceptable sensoryrange from a narrow one to a broad one. To fully explain thedifference needs further studies, and a suggestion can be drawnhere is that more studies should be done to validate the traditionalassumption in real buildings as McIntyre mentioned before [28].
3.4.3. Percentage dissatisfiedThe relationship between percentage dissatisfied and thermal
sensation was established by Fanger [20], cited by ISO 7730 [29]and ASHRAE 55 [6] and have served in many studies and engi-neering projects. As the acceptable range of thermal sensation wasfound to be very different in the present study, the relationshipbetween percentage dissatisfied and thermal sensation needs to bere-established.
The raw data were first divided into 32 bins according tothermal sensation votes with an increment of 0.25, and then thepercentage dissatisfied was counted for each data bin as thepercentage of thermal acceptability votes that less than zero. Therelationship between percentage dissatisfied and thermal sensa-tion was then analyzed by regression. As the sample sizes of data
0
20
40
60
80
100
10 15 20 25 30 35 40
ET* (ºC)
Prop
ortio
n of
win
dow
s op
en (
%))
Observations
Predicted curve
Pro
port
ion
usin
g fa
n (%
))
Windows open
a b
Fig. 13. Proportions of windows open a
bins vary greatly from 9 to 152, the regression was therefore per-formed under weighting of sample size.
A good polynomial relationship was established betweenpercentage dissatisfied (PD) and thermal sensation (see Fig. 12):
PD ¼ 3:583TS2 þ 0:056TSþ 4:850�R2 ¼ 0:836
�(8)
Sensation of ‘neutral’ corresponds to a minimum percentagedissatisfied of 5%, which is in good agreement of that found byFanger. The 10% and 20% dissatisfied ranges of thermal sensationare (�0.5, þ0.5) and (�0.85, þ0.85) according to the PMV-PPDcurve proposed by Fanger, however, the ranges obtained in thepresent study are (�1.2, þ1.2) for 10% dissatisfied and (�2.1, þ2.1)for 20% dissatisfied, which are much wider than those by Fanger.Based on the new function of percentage dissatisfied, the 90% (80%)acceptable range of thermal environment change accordingly to20.6e30.5 �C (16.9e34.2 �C) in ET*. These ranges are much widerthan those calculated along with the traditional assumption thatthe votes within the central three categories of the scale areacceptable, which confirms again the findings found in the sectionof thermal acceptability.
3.5. Adaptive behaviors
3.5.1. Open windows and use fansThe proportions of windows open and using fans have been
studied as adaptive behaviors and related to indoor or outdoorclimate previously [30e35]. The behaviors were studied as well inthe present study. As mentioned in the analysis of clothingadjusting, ET* that considers humidity and radiant impacts wasadopted as the indoor climate index to build relationship withadaptive behaviors.
The raw data were first divided into 45 bins according to ET*with an increment of 0.5 �C, and then the proportions of windowsopen and using fans were counted for each data bin as thepercentage of all operable windows open and all electrical fansrunning. The relationships between proportions of windows open(Pwin), using fans (Pfan) and ET* were then obtained by probitregression weighted by sample size (see Fig. 13):
Pwin ¼ 100 Fð0:155ET*� 4:208Þ (9)
0
20
40
60
80
100
10 15 20 25 30 35 40
ET* (º C)
Observations
Predicted curve
Using fans
nd using fans as functions of ET*.
24
26
28
30
32
34
7-2418:00
7-250:00
7-256:00
7-2512:00
7-2518:00
7-260:00
7-266:00
7-2612:00
7-2618:00
7-270:00
7-276:00
7-2712:00
7-2718:00
7-280:00
7-286:00
Time
Air
tem
pera
ture
(ºC
)
Starting points
Setting points
Fig. 14. Starting and setting points for air-conditioners.
Y. Zhang et al. / Building and Environment 64 (2013) 213e224220
Pfan ¼ 100 Fð0:403ET*� 10:739Þ (10)
where F(x) is standard normal distribution function.The proportion of windows open started to change while ET*
was 14 �C, increased rapidly and linearly as ET* rose from 18 �C to32 �C, and reached its maximum of 90% while ET* was 36 �C. Theproportion of using fans started to increase at a higher ET* of21 �C, went up much faster as ET* changed from 21 �C to 30 �C,
Fig. 15. Frequency distributions o
and reached its maximum of 100% while ET* was 32 �C. Thesensitivity of behavior to thermal environment is much greaterfor using fans.
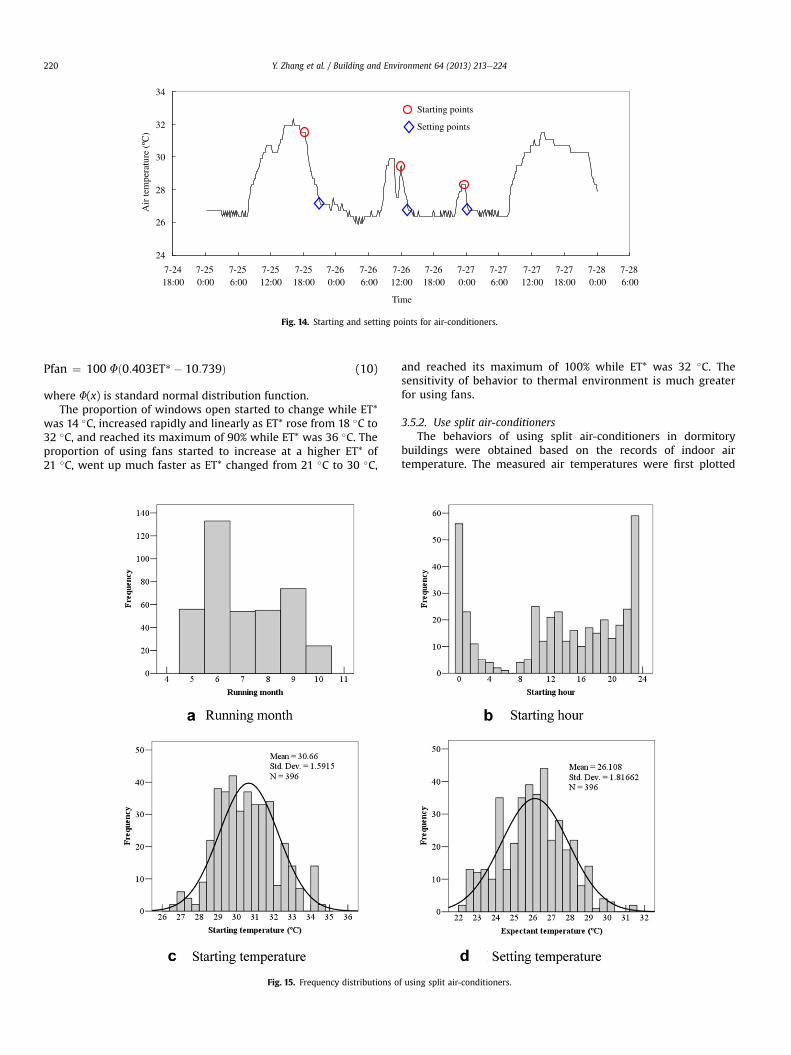
3.5.2. Use split air-conditionersThe behaviors of using split air-conditioners in dormitory
buildings were obtained based on the records of indoor airtemperature. The measured air temperatures were first plotted
f using split air-conditioners.
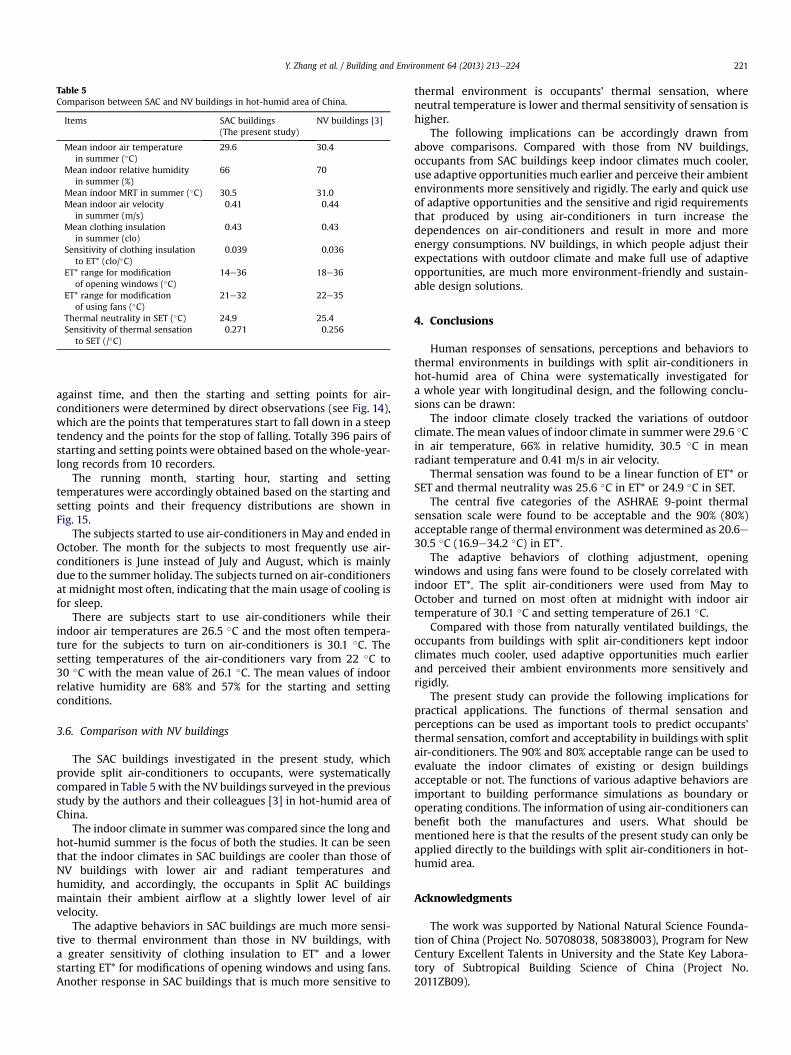
Table 5Comparison between SAC and NV buildings in hot-humid area of China.
Items SAC buildings(The present study)
NV buildings [3]
Mean indoor air temperaturein summer (�C)
29.6 30.4
Mean indoor relative humidityin summer (%)
66 70
Mean indoor MRT in summer (�C) 30.5 31.0Mean indoor air velocity
in summer (m/s)0.41 0.44
Mean clothing insulationin summer (clo)
0.43 0.43
Sensitivity of clothing insulationto ET* (clo/�C)
0.039 0.036
ET* range for modificationof opening windows (�C)
14e36 18e36
ET* range for modificationof using fans (�C)
21e32 22e35
Thermal neutrality in SET (�C) 24.9 25.4Sensitivity of thermal sensation
to SET (/�C)0.271 0.256
Y. Zhang et al. / Building and Environment 64 (2013) 213e224 221
against time, and then the starting and setting points for air-conditioners were determined by direct observations (see Fig. 14),which are the points that temperatures start to fall down in a steeptendency and the points for the stop of falling. Totally 396 pairs ofstarting and setting points were obtained based on the whole-year-long records from 10 recorders.
The running month, starting hour, starting and settingtemperatures were accordingly obtained based on the starting andsetting points and their frequency distributions are shown inFig. 15.
The subjects started to use air-conditioners in May and ended inOctober. The month for the subjects to most frequently use air-conditioners is June instead of July and August, which is mainlydue to the summer holiday. The subjects turned on air-conditionersat midnight most often, indicating that the main usage of cooling isfor sleep.
There are subjects start to use air-conditioners while theirindoor air temperatures are 26.5 �C and the most often tempera-ture for the subjects to turn on air-conditioners is 30.1 �C. Thesetting temperatures of the air-conditioners vary from 22 �C to30 �C with the mean value of 26.1 �C. The mean values of indoorrelative humidity are 68% and 57% for the starting and settingconditions.
3.6. Comparison with NV buildings
The SAC buildings investigated in the present study, whichprovide split air-conditioners to occupants, were systematicallycompared in Table 5 with the NV buildings surveyed in the previousstudy by the authors and their colleagues [3] in hot-humid area ofChina.
The indoor climate in summer was compared since the long andhot-humid summer is the focus of both the studies. It can be seenthat the indoor climates in SAC buildings are cooler than those ofNV buildings with lower air and radiant temperatures andhumidity, and accordingly, the occupants in Split AC buildingsmaintain their ambient airflow at a slightly lower level of airvelocity.
The adaptive behaviors in SAC buildings are much more sensi-tive to thermal environment than those in NV buildings, witha greater sensitivity of clothing insulation to ET* and a lowerstarting ET* for modifications of opening windows and using fans.Another response in SAC buildings that is much more sensitive to
thermal environment is occupants’ thermal sensation, whereneutral temperature is lower and thermal sensitivity of sensation ishigher.
The following implications can be accordingly drawn fromabove comparisons. Compared with those from NV buildings,occupants from SAC buildings keep indoor climates much cooler,use adaptive opportunities much earlier and perceive their ambientenvironments more sensitively and rigidly. The early and quick useof adaptive opportunities and the sensitive and rigid requirementsthat produced by using air-conditioners in turn increase thedependences on air-conditioners and result in more and moreenergy consumptions. NV buildings, in which people adjust theirexpectations with outdoor climate and make full use of adaptiveopportunities, are much more environment-friendly and sustain-able design solutions.
4. Conclusions
Human responses of sensations, perceptions and behaviors tothermal environments in buildings with split air-conditioners inhot-humid area of China were systematically investigated fora whole year with longitudinal design, and the following conclu-sions can be drawn:
The indoor climate closely tracked the variations of outdoorclimate. The mean values of indoor climate in summer were 29.6 �Cin air temperature, 66% in relative humidity, 30.5 �C in meanradiant temperature and 0.41 m/s in air velocity.
Thermal sensation was found to be a linear function of ET* orSET and thermal neutrality was 25.6 �C in ET* or 24.9 �C in SET.
The central five categories of the ASHRAE 9-point thermalsensation scale were found to be acceptable and the 90% (80%)acceptable range of thermal environment was determined as 20.6e30.5 �C (16.9e34.2 �C) in ET*.
The adaptive behaviors of clothing adjustment, openingwindows and using fans were found to be closely correlated withindoor ET*. The split air-conditioners were used from May toOctober and turned on most often at midnight with indoor airtemperature of 30.1 �C and setting temperature of 26.1 �C.
Compared with those from naturally ventilated buildings, theoccupants from buildings with split air-conditioners kept indoorclimates much cooler, used adaptive opportunities much earlierand perceived their ambient environments more sensitively andrigidly.
The present study can provide the following implications forpractical applications. The functions of thermal sensation andperceptions can be used as important tools to predict occupants’thermal sensation, comfort and acceptability in buildings with splitair-conditioners. The 90% and 80% acceptable range can be used toevaluate the indoor climates of existing or design buildingsacceptable or not. The functions of various adaptive behaviors areimportant to building performance simulations as boundary oroperating conditions. The information of using air-conditioners canbenefit both the manufactures and users. What should bementioned here is that the results of the present study can only beapplied directly to the buildings with split air-conditioners in hot-humid area.
Acknowledgments
The work was supported by National Natural Science Founda-tion of China (Project No. 50708038, 50838003), Program for NewCentury Excellent Talents in University and the State Key Labora-tory of Subtropical Building Science of China (Project No.2011ZB09).
Y. Zhang et al. / Building and Environment 64 (2013) 213e224222
Appendix
Questionnaire
1. Your activity in the preceding 20 mins of the survey is:
A Seating B Sleeping C Walking D Doing sports
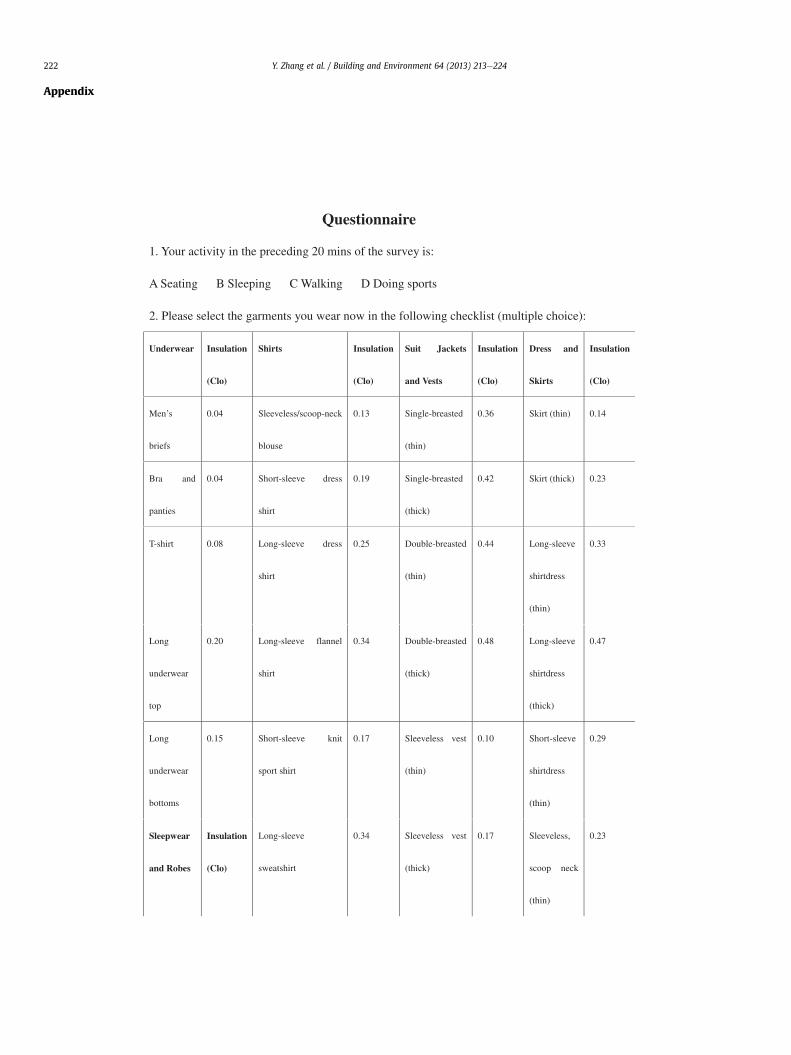
2. Please select the garments you wear now in the following checklist (multiple choice):
Underwear Insulation
(Clo)
Shirts Insulation
(Clo)
Suit Jackets
and Vests
Insulation
(Clo)
Dress and
Skirts
Insulation
(Clo)
Men’s
briefs
0.04 Sleeveless/scoop-neck
blouse
0.13 Single-breasted
(thin)
0.36 Skirt (thin) 0.14
Bra and
panties
0.04 Short-sleeve dress
shirt
0.19 Single-breasted
(thick)
0.42 Skirt (thick) 0.23
T-shirt 0.08 Long-sleeve dress
shirt
0.25 Double-breasted
(thin)
0.44 Long-sleeve
shirtdress
(thin)
0.33
Long
underwear
top
0.20 Long-sleeve flannel
shirt
0.34 Double-breasted
(thick)
0.48 Long-sleeve
shirtdress
(thick)
0.47
Long
underwear
bottoms
0.15 Short-sleeve knit
sport shirt
0.17 Sleeveless vest
(thin)
0.10 Short-sleeve
shirtdress
(thin)
0.29
Sleepwear
and Robes
Insulation
(Clo)
Long-sleeve
sweatshirt
0.34 Sleeveless vest
(thick)
0.17 Sleeveless,
scoop neck
(thin)
0.23
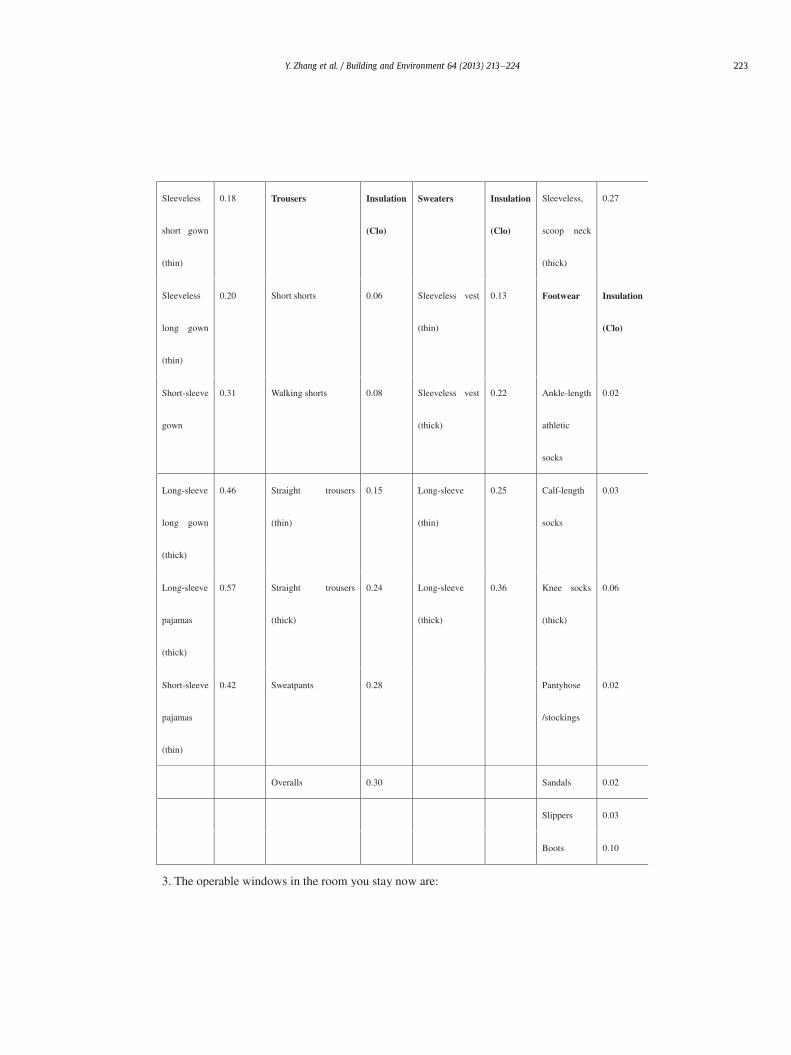
Sleeveless
short gown
(thin)
0.18 Trousers Insulation
(Clo)
Sweaters Insulation
(Clo)
Sleeveless,
scoop neck
(thick)
0.27
Sleeveless
long gown
(thin)
0.20 Short shorts 0.06 Sleeveless vest
(thin)
0.13 Footwear Insulation
(Clo)
Short-sleeve
gown
0.31 Walking shorts 0.08 Sleeveless vest
(thick)
0.22 Ankle-length
athletic
socks
0.02
Long-sleeve
long gown
(thick)
0.46 Straight trousers
(thin)
0.15 Long-sleeve
(thin)
0.25 Calf-length
socks
0.03
Long-sleeve
pajamas
(thick)
0.57 Straight trousers
(thick)
0.24 Long-sleeve
(thick)
0.36 Knee socks
(thick)
0.06
Short-sleeve
pajamas
(thin)
0.42 Sweatpants 0.28 Pantyhose
/stockings
0.02
Overalls 0.30 Sandals 0.02
Slippers 0.03
Boots 0.10
3. The operable windows in the room you stay now are:
Y. Zhang et al. / Building and Environment 64 (2013) 213e224 223
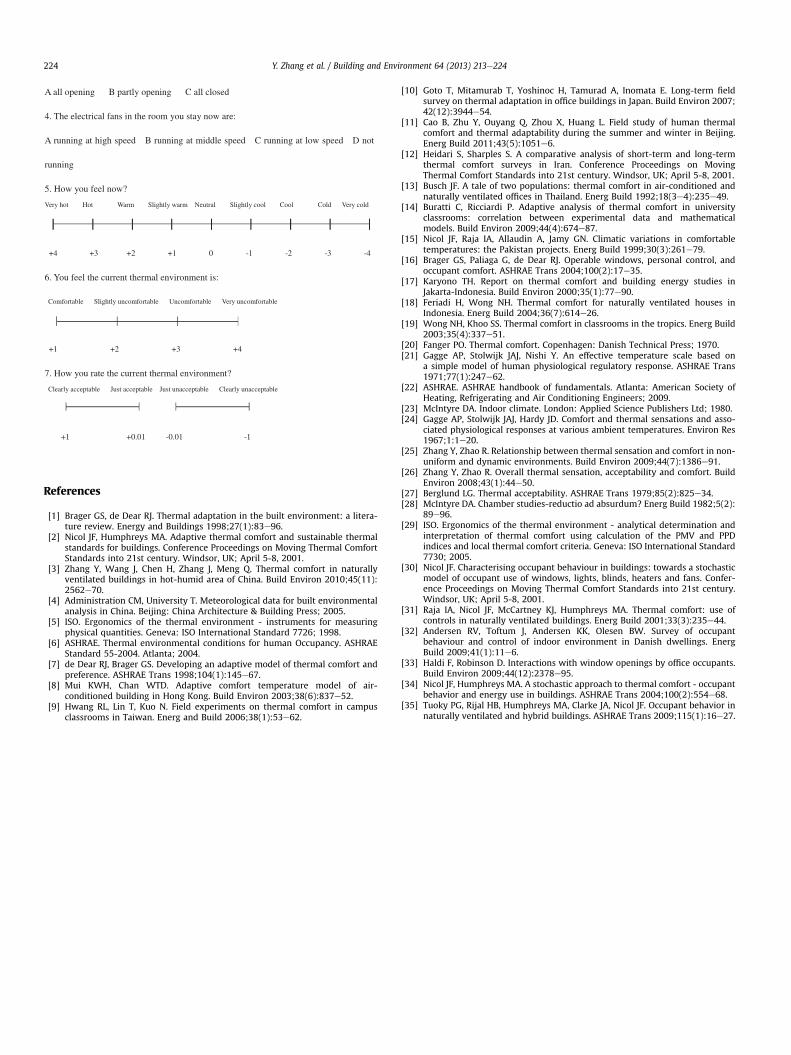
A all opening B partly opening C all closed
4. The electrical fans in the room you stay now are:
A running at high speed B running at middle speed C running at low speed D not
running
5. How you feel now?
Very hot Hot Warm Slightly warm Neutral Slightly cool Cool Cold Very cold
+4 +3 +2 +1 0 -1 -2 -3 -4
6. You feel the current thermal environment is:
Comfortable Slightly uncomfortable Uncomfortable Very uncomfortable
+1 +2 +3 +4
7. How you rate the current thermal environment?
Clearly acceptable Just acceptable Just unacceptable Clearly unacceptable
+1 +0.01 -0.01 -1
Y. Zhang et al. / Building and Environment 64 (2013) 213e224224
References
[1] Brager GS, de Dear RJ. Thermal adaptation in the built environment: a litera-ture review. Energy and Buildings 1998;27(1):83e96.
[2] Nicol JF, Humphreys MA. Adaptive thermal comfort and sustainable thermalstandards for buildings. Conference Proceedings on Moving Thermal ComfortStandards into 21st century. Windsor, UK; April 5-8, 2001.
[3] Zhang Y, Wang J, Chen H, Zhang J, Meng Q. Thermal comfort in naturallyventilated buildings in hot-humid area of China. Build Environ 2010;45(11):2562e70.
[4] Administration CM, University T. Meteorological data for built environmentalanalysis in China. Beijing: China Architecture & Building Press; 2005.
[5] ISO. Ergonomics of the thermal environment - instruments for measuringphysical quantities. Geneva: ISO International Standard 7726; 1998.
[6] ASHRAE. Thermal environmental conditions for human Occupancy. ASHRAEStandard 55-2004. Atlanta; 2004.
[7] de Dear RJ, Brager GS. Developing an adaptive model of thermal comfort andpreference. ASHRAE Trans 1998;104(1):145e67.
[8] Mui KWH, Chan WTD. Adaptive comfort temperature model of air-conditioned building in Hong Kong. Build Environ 2003;38(6):837e52.
[9] Hwang RL, Lin T, Kuo N. Field experiments on thermal comfort in campusclassrooms in Taiwan. Energ and Build 2006;38(1):53e62.
[10] Goto T, Mitamurab T, Yoshinoc H, Tamurad A, Inomata E. Long-term fieldsurvey on thermal adaptation in office buildings in Japan. Build Environ 2007;42(12):3944e54.
[11] Cao B, Zhu Y, Ouyang Q, Zhou X, Huang L. Field study of human thermalcomfort and thermal adaptability during the summer and winter in Beijing.Energ Build 2011;43(5):1051e6.
[12] Heidari S, Sharples S. A comparative analysis of short-term and long-termthermal comfort surveys in Iran. Conference Proceedings on MovingThermal Comfort Standards into 21st century. Windsor, UK; April 5-8, 2001.
[13] Busch JF. A tale of two populations: thermal comfort in air-conditioned andnaturally ventilated offices in Thailand. Energ Build 1992;18(3e4):235e49.
[14] Buratti C, Ricciardi P. Adaptive analysis of thermal comfort in universityclassrooms: correlation between experimental data and mathematicalmodels. Build Environ 2009;44(4):674e87.
[15] Nicol JF, Raja IA, Allaudin A, Jamy GN. Climatic variations in comfortabletemperatures: the Pakistan projects. Energ Build 1999;30(3):261e79.
[16] Brager GS, Paliaga G, de Dear RJ. Operable windows, personal control, andoccupant comfort. ASHRAE Trans 2004;100(2):17e35.
[17] Karyono TH. Report on thermal comfort and building energy studies inJakarta-Indonesia. Build Environ 2000;35(1):77e90.
[18] Feriadi H, Wong NH. Thermal comfort for naturally ventilated houses inIndonesia. Energ Build 2004;36(7):614e26.
[19] Wong NH, Khoo SS. Thermal comfort in classrooms in the tropics. Energ Build2003;35(4):337e51.
[20] Fanger PO. Thermal comfort. Copenhagen: Danish Technical Press; 1970.[21] Gagge AP, Stolwijk JAJ, Nishi Y. An effective temperature scale based on
a simple model of human physiological regulatory response. ASHRAE Trans1971;77(1):247e62.
[22] ASHRAE. ASHRAE handbook of fundamentals. Atlanta: American Society ofHeating, Refrigerating and Air Conditioning Engineers; 2009.
[23] McIntyre DA. Indoor climate. London: Applied Science Publishers Ltd; 1980.[24] Gagge AP, Stolwijk JAJ, Hardy JD. Comfort and thermal sensations and asso-
ciated physiological responses at various ambient temperatures. Environ Res1967;1:1e20.
[25] Zhang Y, Zhao R. Relationship between thermal sensation and comfort in non-uniform and dynamic environments. Build Environ 2009;44(7):1386e91.
[26] Zhang Y, Zhao R. Overall thermal sensation, acceptability and comfort. BuildEnviron 2008;43(1):44e50.
[27] Berglund LG. Thermal acceptability. ASHRAE Trans 1979;85(2):825e34.[28] McIntyre DA. Chamber studies-reductio ad absurdum? Energ Build 1982;5(2):
89e96.[29] ISO. Ergonomics of the thermal environment - analytical determination and
interpretation of thermal comfort using calculation of the PMV and PPDindices and local thermal comfort criteria. Geneva: ISO International Standard7730; 2005.
[30] Nicol JF. Characterising occupant behaviour in buildings: towards a stochasticmodel of occupant use of windows, lights, blinds, heaters and fans. Confer-ence Proceedings on Moving Thermal Comfort Standards into 21st century.Windsor, UK; April 5-8, 2001.
[31] Raja IA, Nicol JF, McCartney KJ, Humphreys MA. Thermal comfort: use ofcontrols in naturally ventilated buildings. Energ Build 2001;33(3):235e44.
[32] Andersen RV, Toftum J, Andersen KK, Olesen BW. Survey of occupantbehaviour and control of indoor environment in Danish dwellings. EnergBuild 2009;41(1):11e6.
[33] Haldi F, Robinson D. Interactions with window openings by office occupants.Build Environ 2009;44(12):2378e95.
[34] Nicol JF, Humphreys MA. A stochastic approach to thermal comfort - occupantbehavior and energy use in buildings. ASHRAE Trans 2004;100(2):554e68.
[35] Tuoky PG, Rijal HB, Humphreys MA, Clarke JA, Nicol JF. Occupant behavior innaturally ventilated and hybrid buildings. ASHRAE Trans 2009;115(1):16e27.


