Embed Size (px)
Citation preview
Western Michigan University Western Michigan University
ScholarWorks at WMU ScholarWorks at WMU
Paper Engineering Senior Theses Chemical and Paper Engineering
4-1978
Thermal Conductivity Measurements of Wet Paper Thermal Conductivity Measurements of Wet Paper
Keith S. Kearcher Western Michigan University
Follow this and additional works at: https://scholarworks.wmich.edu/engineer-senior-theses
Part of the Wood Science and Pulp, Paper Technology Commons
Recommended Citation Recommended Citation Kearcher, Keith S., "Thermal Conductivity Measurements of Wet Paper" (1978). Paper Engineering Senior Theses. 227. https://scholarworks.wmich.edu/engineer-senior-theses/227
This Dissertation/Thesis is brought to you for free and open access by the Chemical and Paper Engineering at ScholarWorks at WMU. It has been accepted for inclusion in Paper Engineering Senior Theses by an authorized administrator of ScholarWorks at WMU. For more information, please contact [email protected].
L±HERMAL CONDUCTIVITY MEASUREMENTS
OF WET PAPER
by.
Keith s. Kearcher
A Thesis submitted
in. partial fulfillment of
the course requirements for
The Bachelor of Science Degree
Western Michigan University
Kalamazoo, Michigan
April, 1978
ABSTRACT
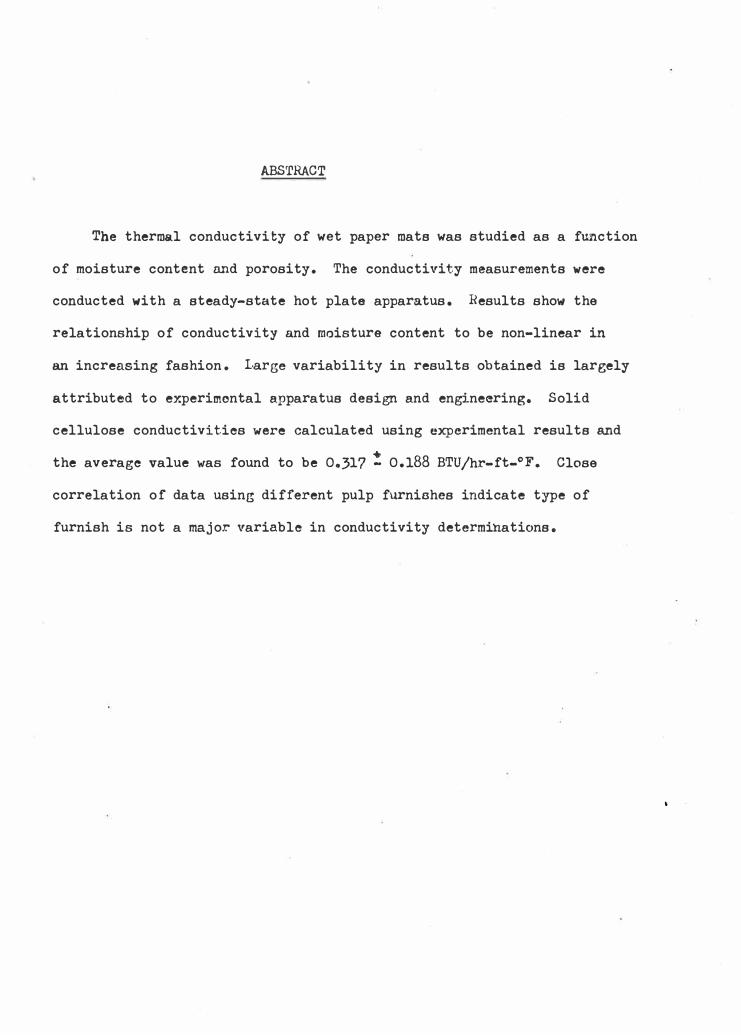
The thermal conductivi·ty of wet paper mats was studied as a fw,ction
of moisture content and porosity. The conductivity measurements were
conducted with a steady-state hot plate apparatus. Results show the
relationship of conductivity and moisture content to be non-linear in
an increasing fashion. 1,arge variability in results obtained is largely
attributed to experimental apparatus design and engineering. Solid
cellulose conductivities were calculated using experimental results and
♦
the average value was found to be 0.317 - 0.188 BTU/hr-ft-°F. Close
correlation of data using different pulp furnishes indicate type of
furnish is not a major variable in conductivity determinations.
.
TABLE OF CONTENTS
INTRODUCTION • • • • • • • • • • • • • • • • • • • •
THEORETICAL AND BACKGROUND DISCUSSION
HEAT TRANSF'LR • • • • • • • • • • • • • • •
THE DRYING PROCESS • • • • • • • • • • • •
FLUID TRANSFER AND VAPOR MOVEMENT • • • • •
THERMAL CONDUCTIVITY • • • • • • • • • • •
CONDUCTIVITY WITHOUT CONVECTION . • • • • •
CONDUCTIVITY WITH CONVECTION
EXPERIMENTAL OBJECTIVES • • • • • • •
• • • • • • •
• • • • • • •
PAGE
l
2
3
5
6
7
8
13
EXPERIMENTAL PROCEDURE • • • • • • • • • • • • • ·• 14
EXPERIMENTAL RESULTS • • • • • • • • • • • • • • • 17
DISCUSSION OF RESULTS • • • • • • • • • • • • • • •
CONCLUSIONS • • •
RECOMMENDA'rIONS •
LITERATURE CITED
• • • •
• • • •
• • • • • • • • • • • • •
• • • • • • • • • • • • •
• • • • • • • • • • • • • • • • •
28
29
30
31
INTRODUCTION
The theory of contact drying has been developed by several in
vestigators whose analyses are in general agreement. However, this
work has found little application in the design of dryer systems or
in dryer performance evaluationo This lack·or application of appro
priate analytical work appears to result from the wide variation of
physical properties of the web and the equally wide variation of
machine variables which make it difficult to develop generally
applicable design and performance evaluating methods. As a result,
dryer system design is based to a large extent on experience, and
performance improvements come slowly. Nevertheless, the industry is
very much concerned with improvements in drying system performance,
in terms of better drying uniformity and of higher drying rates.
Here we will review the available analytical and experimental infor
mation dealing with thermal conductivity, and the closely related
heat and mass transfer characteristics of paper during contact drying.
It is hoped that the following study will provide some of the needed
information.concerning the fundamental properties of paper to achieve
a more thorough quantitative look at the mechanism of hot surface
. drying of paper.
1
\.
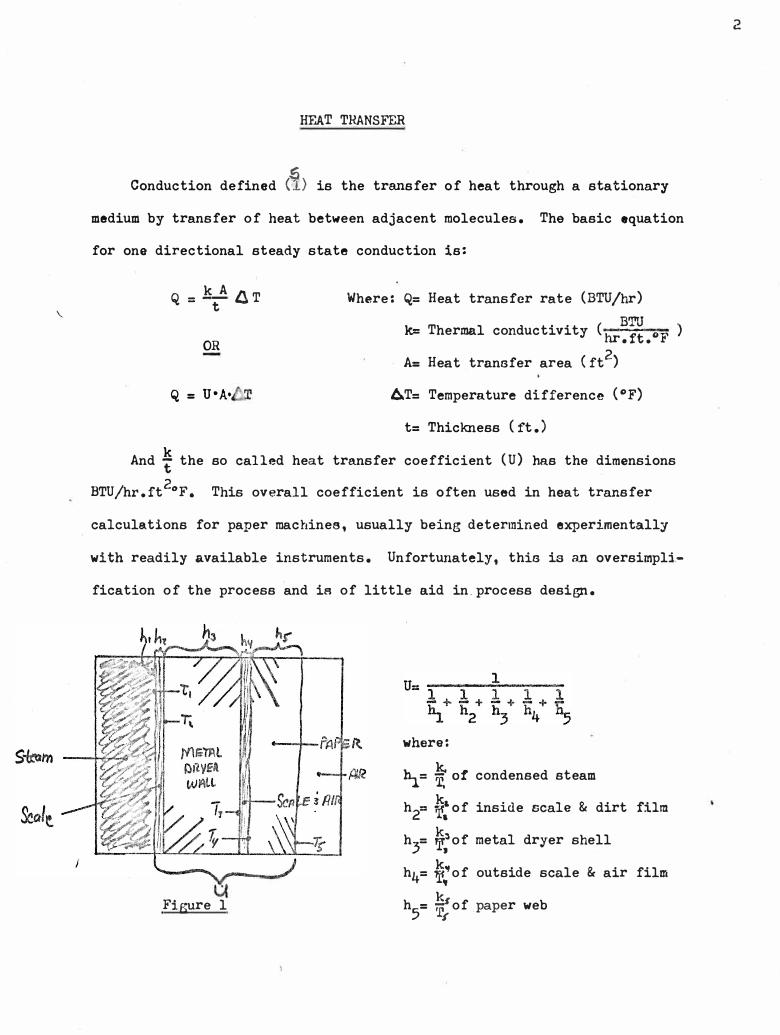
HEAT TRANSFER
Conduction defined (1) is the transfer of heat through a stationary
medium by transfer of heat between adjacent molecules. The basic equation
for one directional steady state conduction is:
Q = k/ �T
OR
Q = U•A•
Where: Q= Heat transfer rate (BTU/hr)
k= Thermal conductivity (hr
�ri.or)
A= Heat transfer area (rt2)
AT= Temperature difference ( °F)
t= Thickness (ft.)
k And t the so called heat transfer coefficient (U) has the dimensions
BTU/hr.rt2°F. This overall coefficient is often used in heat transfer
calculations for paper machines, usually being determined experimentally
with readily available instruments. Unfortunately, this is an oversimpli
fication of the process and is of little aid in.process design.
Figure l
where:
1\= tor condensed steam
hi" �: of inside scale & dirt film
kh3
= 1:of metal dryer shell
h4= f;of outside scale & air film
k h5
= T;of_paper web
2
Seale_
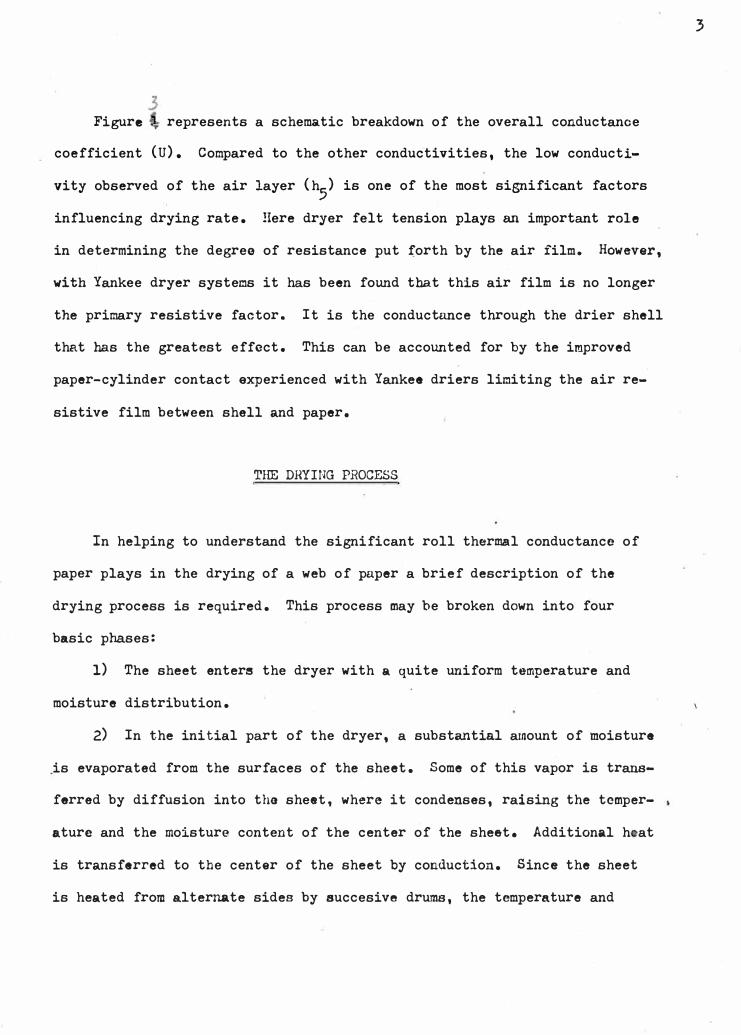
Figure • represents a schema.tic breakdown of the overall conductance
coefficient (U). Compared to the other conductivities, the low conducti
vity observed of the air layer (h5) is one of the most significant factors
influencing drying rate. Here dryer felt tension plays an important role
in determining the degree of resistance put forth by the air film. However,
with Yankee dryer systems it has been found that this air film is no longer
the primary resistive factor. It is the conductance through the drier shell
that has the greatest effect. This can be accounted for by the improved
paper-cylinder contact experienced with Yankee driers limiting the air re
sistive film between shell and paper.
THE DRYING PROCESS
In helping to understand the significant roll thermal conductance of
paper plays in the drying of a web of paper a brief description of the
drying process is required. This process may be broken down into four
basic phases:
1) The sheet enters the dryer with a quite ur1iform temperature and
moisture distribution.
2) In the initial part of the dryer, a substantial amount of moisture
is evaporated from the surfaces of the sheet. Some of this vapor is trans
ferred by diffusion into the sheet, where it condenses, raising the temper-
ature and the moisture content of the center of the sheet. Additional h at
is transferred to the center of the sheet by conduction. Since the sheet
is heated from alternate sides by succesive drums, the temperature and
3
J
e
•
......
•
0
co -
......
0 -
' •
bO a G) .µ ci! bO
.�
moisture distributions are approximately symmetrical about the center of
the sheet.
3) After the initial phase in which temperature and moisture gradients
are established, a period of ne_ar constant drying rate occurs. In this
period, heat is transferred within the sheet by conduction and by diffusion
of vapor. Mass transfer occurs from the center toward the surface by diff
usion of vapor and by capillary movement of water as a result of the moist
ure gradient. Throughout the process, the temperature is lower and the
moisture ratio higher at the center of the sheet than at the surfaces. How
ever, as drying proceeds, the moisture ratio at the center, and therefore
the total moisture content, decreases.
4) As the sheet becomes dryer, the thermal conductivity of the sheet
decreases and below a moisture ratio of approximately 0.2 the vapor pressure
of the water-fiber mixture decreases. The drying rate therefore decreases
·and continues to decrease until the sheet leaves the dryer.
Figure 2
20
15
10
5
0 10 20. 30 40 50
Drying Time (min.)
1 ;..20
0
0 C)
CIJ
�15 C\J
().
':lo b.O 8
Q)
.µ 5�
Figure•3
100
% Moisture Content
4
Dry
2 m
e
Dry
ing
( m
This varying conductivity of the sheet and methods of measurement are
of prime concern when detailed analysis for dryer systems design and pro
cess efficiencies are undertaken.
FLUID TRANSFER AND VAPOR MOVEMENT
As is well known, heat may be transferred by conduction, convection,
and radiation. Radiation in a fibre mat is generally negligible, but con
vection in the pores may constitute a significant part of heat transfer.
From all :a.vailable evidence, water migrates in a fibre mat as soon as drying
is initiated. In a relatively wet state, both water and air are distributed
continuously in the interconnected pores. At any point across the water-air
curved interface, a pressure difference exists which is called capillary
pressure.
p = p - pcap. air water
Water moves in response to pressure gradients, which are in turn de
pendent on saturation and temperature. By virtue of the increase in press
ure due to temperature, the vapor due to evaporation,. migrates from the con
tacting surface to the exposed surface. As the vapor passes through the
web, it also passes through the temperature gradient of the sheet e.nd a
certain amount of condensation occurs which, in turn, releases latent heat
into the web. The latent heat released helps to raise the temperature in
the layers away from the contacting surface and there to increase the dis
tance from the contacting surface at which evaporation occurs. In this way,
it is shown that this convected heat transfer can also contribute substan
tially to the effective conductivity of the web.
5
Aa evaporation at the contacting surface of the web and migration of
vapor from thia surface into the web proceeds, a gradual capillary movement
of water within the web occurs, leading to a migration of liquid water to
wards the hot cylinder surface. When the web separates from the cylinder,
vapor entrapped between the cylinder and the web is immediately released
and rapid evaporation from the hot surface of the web occurs, accompanied by
rapid cooling of the web. Less rapid evaporation also occurs from the cooler
previously exposed surface. Finally, the sheet contacts the next cylinder,
the surface which before was exposed becomes the contacting surface, is
rapidly heated, and the cycle begins ag-ain. It is estimated (1) that cap
illary flow accounts for no more than 3� of fluid movement, vapor diffusion
providing the balance. Of the internal heat flow, conduction accounts for
only 30 to 40 percent, while vapor diffusion and condensation (convection)
provide the major proportion. Even after the overall moisture is reduced to
60 percent dryness, the level of moisture in the core is still only slightly
below that of the sheet as it leaves ti1e press section. This mechanism
suggests that drying could be speeded by preheating the whole web to high
temperatures at the beginning of drying to minimize internal condensation.
THERHAL CONDUCTIVITY
Heat transfer through a sheet of paper is obviously measured by thermal,
conductivity. In view of the complex drying mechanism mentioned before with
respect to the moisture and vapor movement, and the possible existance of
condensation-vaporization cycles, it is extreemly difficult to make a de
tailed heat transfer analysis which would satisfy all the local conditions
6
in the present course of drying.
During the entire drying process, the thermal conductivity is deter
mined by moisture content, the temperature, the porosity of the web, and
the conductivity of the solids.
CONDUCTIVITY WITHOUT CONVECTION (NON-VOLATILE COMPONENT)
True thermal conductivity excludes convection and radiation. The con
tribution of radiation to heat transfer in fibre mats is negligible provided
the porosity is less than 0.99 and the temperature below the normal boiling
point of water (4). The convection of fluids in the pores, however, may not
often be ignored and will be considered later.
A wet paper web may be characterized as being three phased in nature,
i.e. fiber-water-air. Consequently, the mechanisms of heat transfer in the
compressible system ia taken to be:
1. Conduction in the voids
2. Conduction in the fibers
3. Conduction in the contact region between fibers
The contact region includes the fluid filament acljacent to the contact
as well as the solid-solid contact area.
By assuming the heat flow in the voids is parallel with the heat flow
in the solid structure and their cross-section areas are proportional to the ,
void and solid fractions, and that the fibre lengths are the same as the mat
thickness, a prediction equation has been developed.
ka = (1-f) ks + ESk.,(
+ €(1-S)kg
7
ka = Apparent conductivity of water
kl= Thermal conductivity of liquid phase
kg= Thermal conductivity of gas or fluid phase
E = Void fraction or porosity, void volume/total bed volume
S = Average bed saturation, liquid volume/void volume
ks= Thermal conductivity of solid phase
This model represents the limiting case of maximum conductivity of a
porous structure. As the conductivities of the fluid and solid phases come
close to each other, the model becomes a reasonable one.
For a solid-fluid conductivity ratio as high as 10, the parallel model
holds quite well and also agrees with experimental data at a porosity as
cc/ low as 0.7� cc. When a mat of deformable fibres is compressed, its por-
osity decreases, the fibres are brought into more contacts more intimately
either by an increase in macroscopic area or in microscopic proximity, pro
bably both, causing more heat flow through the contact areas. The reduction
of contact resistance results in a higher conductivity at a lower porosity.
Thus the range of porosity in which the parallel model is applicable will
vary with the deformability and surface nature of the fibres.
CONDUCTIVITY WITH CONVECTION (VOLATILE COMPONENT, i.e. PAPER)
NOMENCLATURE
Cf= specific heat of fiber (0.32), cal./(g.)(°C)
Cw = specific heat of water, cal./(g)(°C)
k = apparent thermal conductivity, cal./(sec.)(sq.cm.)(°C/cm)
L = thickness of the whole sheet, cm.
8
m = basis weight (from open surface to the plane under consideration) g./sq.cm.
m = location as defined by the ration m/M, dimensionless
M = basis weight of the whole sheet, g/eq.cm.
Q = heat transferred across a unit area of the hot surface, cal./sq.cm.
Qf = heat absorbed by fiber per unit area, cal./sq.cm.
Qv = heat for evaporation of moisture per unit area, cal./sq.cm.
Qw = heat absorbed by water per unit area, cal./sq.cm.
t = temperature, °C.
w = cumulative moisture content (from open surface to the plane under consideration), g./sq.cm.
w = cumulative moisture content as defined by the ratio w/M, dimen-sionless
W = cumulative moisture content of the whole sheet, g./sq.cm.
x = distance from open surface, cm.
� = latent heat of vaporization of water, cal./g.
�f = apparent density of fiber in sheet as defined by the derivative dm/dx, g./cc.
ew = apparent density of water in sheet as defined by the partial derivative w/ x, g./cc.
Q = drying time, sec.
Considering a deformable fibrous system one would expect a good predic
tion of the conduction contribution to heat flow to be acquired from the
parallel phase distribution equation. The solid-fluid conductivity ratios
in the wood fiber-water-air system are low, but more importantly, the fiber
fiber contact areas are significant and would greatly enhance the heat now
in the fiber network. The internal geometry of both the fiber and the fiber
network are complex but the use of the phase distribution equation may pro-
9
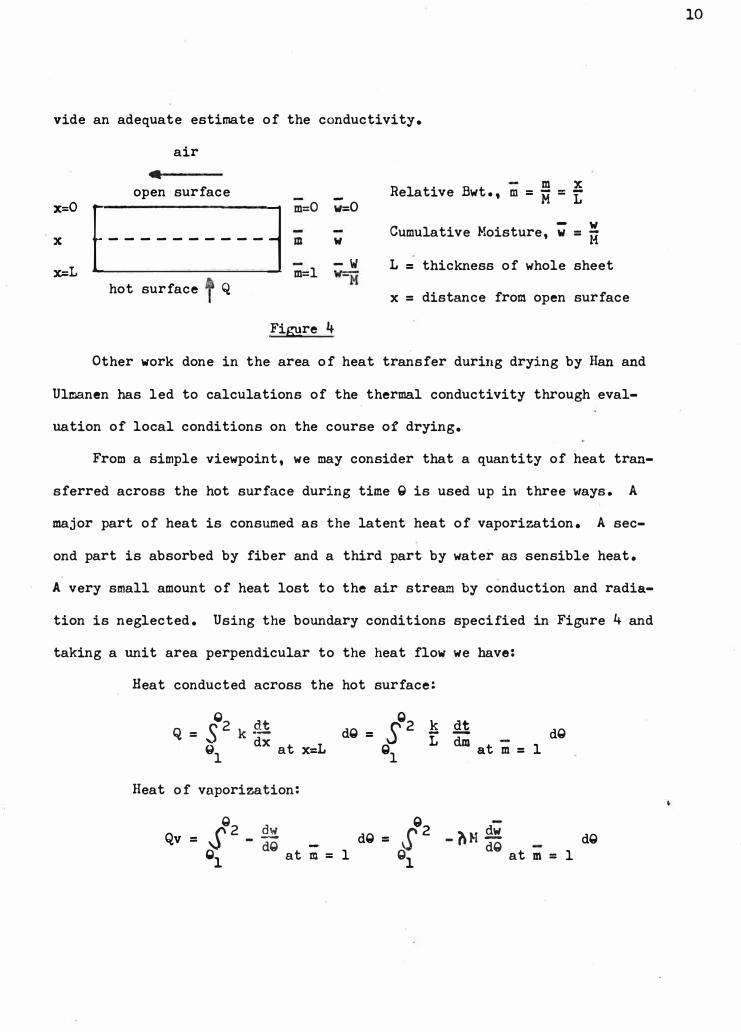
vide an adequate estimate of the conductivity.
air ..
open surface x=O r----------j m=O ;=o
X m w
x=L m=l -w
hot surface Q
Figure 4
m XRelative Bwt., m = M = L
Cumulative Moisture, w = �
L = thickness of whole sheet
x = distance from open surface
Other work done in the area of heat transfer during drying by Han and
Ulmanen has led to calculations of the thermal conductivity through eval
uation of local conditions on the course of drying.
From a simple viewpoint, we may consider that a quantity of heat tran
sferred across the hot surface during time Q is used up in three ways. A
major part of heat is consumed as the latent heat of vaporization. A sec
ond part is absorbed by fiber and a third part by water as sensible heat.
A very small amount of heat lost to the air stream by conduction and radia
tion is neglected. Using the boundary conditions specified in Figure 4 and
taking a unit area perpendicular to the heat flow we have:
Heat conducted across the hot surface:
Q
so2 ls .41 Q=S2k .41 dQ = dQ
Ql dx at x=L gl
L dm at m = 1
Heat of vaporization:
Q2 � 02 - ?,1'I �Qv = s - dQ = gs dQ dQ - dQ
Ql at m = l l at m = l
10
Heat absorbed by fiber:
Heat absorbed by water:
Where e f and ew are apparent densities defined by:
since Q = Qv + Qf + Qw we abstain a heat balance expressed in
terms of the heat transfer variables.
eq. 2)
SQ2Q k � ;2 � d';
Q L dm - dQ = - nM dQ -1 m = 1 1 at·m = 1 dQ + ( Cfm
The left-hand integral cannot be evaluated because we do not have a ·
knowledge of apparent thermal conductivity k as a function of drying time
Q. By taking partial derivatives of equation (2) with respect to Q2
, we
transform it into a rate equation:
eq. 3)
k dt t - l = -LM dma m=
W/M
�d;Q 51�t}m din + Cw S'dQ - l
= Cf O ag m 0 at m =
It will be noted that the upper.limit of W/H of the last integral of
11
' 0
equation (2) is a function of Q, and its partial derivative results in the
last term of equation (3).
In the final equation, all quantities except k can be evaluated from
experimental data. At each chosen time ,Q2), we can determine a value fork
which corresponds to a definate moisture content at the hot surface of the
sheet. In this way a relationship between apparent thermal conductivity and
moisture content is established for the particular sheet.
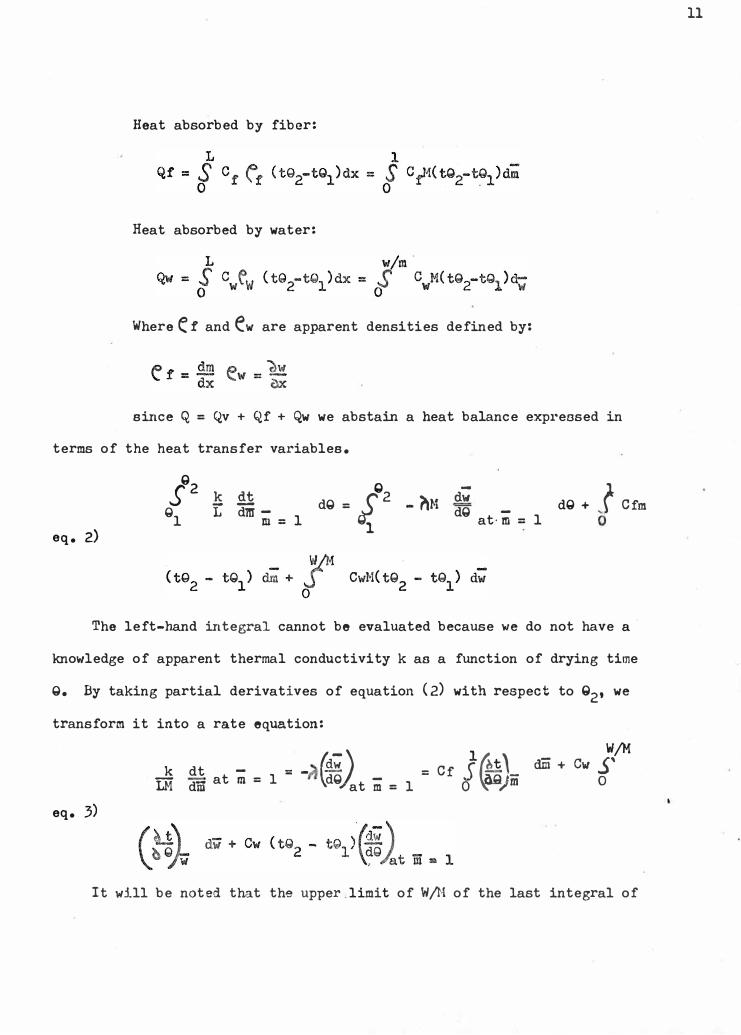
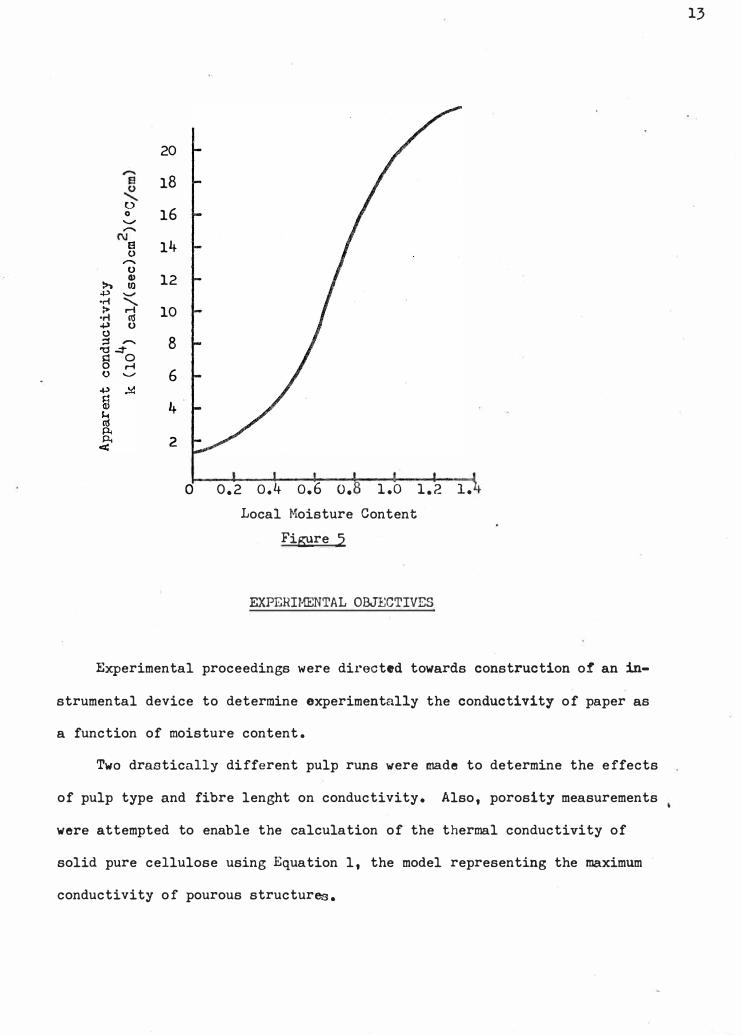
tained by Han and Ulmanen are shown in Figure 5.
The results ob-
The curve is of an "S" shape. In the high moisture region the apparent
conductivity is of the order of magnitude as that of water which has a k
value of 0.0016 cal/(sec)(cm2) or 0.39 BTU/(hr)(ft)(°F) at a temperature of
80°C or 176°F. In the intermediate range of moisture, k drops sharply.
This may be attributed to the entrance of air into the sheet. When moisture
removal exceeds sheet shrinkage, an increase in air voids in the sheet is ex
pected along with a decrease in conductivity. Finally, in the very low mois
ture range, the conductivity approaches a fixed value of approximately 0.039
BTU/(hr)(ft)(°F). According to literature (2), the conductivity of paper is
about ).075 and a lap of wood pulp about 0.028. Since this experimental data
used lightly beaten sulphite pulp the results seem to correlate well.
12
'
0 0
.._,, -
E! 0 -
0 G>
>, lO .µ .....,
-� �·r-1 ro .j.) 0 (.) ;::$ -
"O .::tA O 0 r-1 0 ....,,
20
18
16
14
12
10
8
6
4
2
0 0.2 o.4 o.6 o. 1.0 1.2 1.
Local Moisture Content
Figure 5
EXPERIMENTAL OBJECTIVES
Experimental proceedings were directed towards construction of an in
strumental device to determine experimentally the conductivity of paper as
a function of moisture content.
Two drastically different pulp runs were made to determine the effects
of pulp type and fibre lenght on conductivity. Also, porosity measurements
were attempted to enable the calculation of the thermal conductivity of
solid pure cellulose using Equation l, the model representing the maximum
conductivity of pourous structures.
13
App
aren
t k 2
/cm)
MATERIALS -
EXPERIMENTAL PROCEDURE
- Softwood Kraft pulp lap produced by the Rayonier Co. (Virginia)
- Hardwood Kraft pulp lap produced by the Weyerhaeuser Company.
(West coast)
- Styrofoam and glass wool insulation.
- Chromel-Alumel thermocouple wire.
EQUIPMENT -
- Leeds & Northrup mili-volt potentiomenter.
- Two (0-100° t 0.05° ) centrigrade mercury thermoters.
- Water bath tray and bottle.
- Hydraulic laminating press equipped with "Meebanite" plates capable
of being electrically heated or circulatorily liquid cooled, (pro
duced by the Fred s. Carver Co.).
- Voltage regulator for constant (non-cyclic) voltage input to heat
ing plate.
- Noble & Wood hand sheet mould and press.
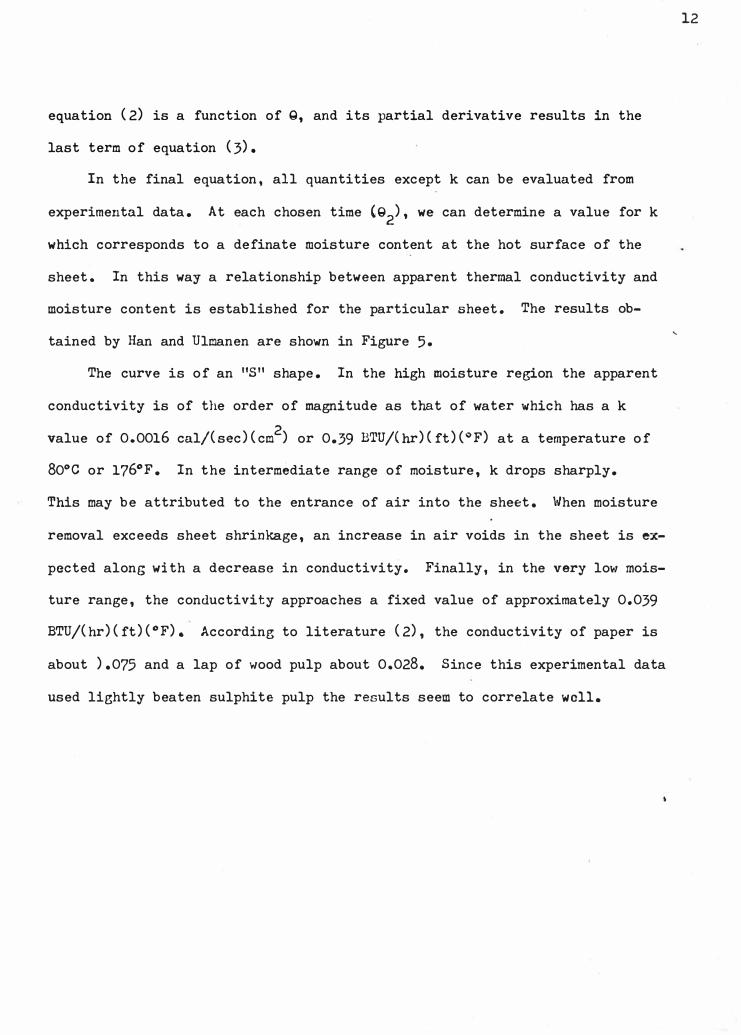
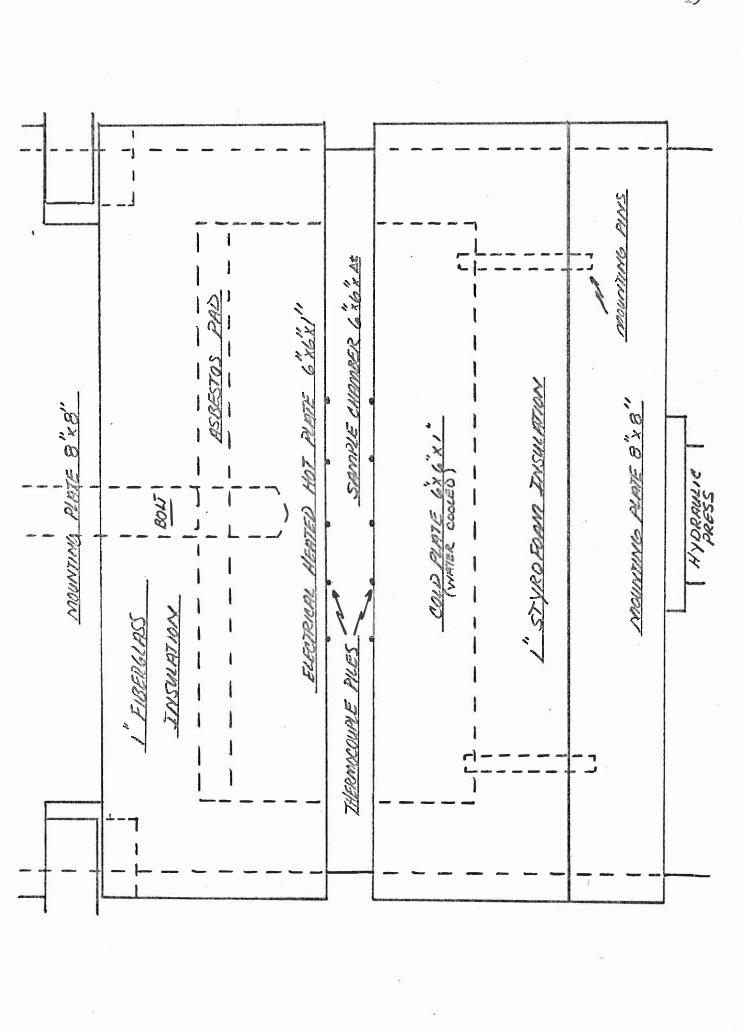
APPARATUS DESCHIPTION -
The apparatus is composed of two parallel plates, the upper plate being,
heated electrically and the lower being cooled by constant water flow. Tem
perature measurements were made using chromel-alumel thermocouple piles with
five sensing elements each. Heat loss due to radiation and convection will
be reduced by using insulation around the plates and by directing the heat
14
,.
-J - - - - - - -
I
____ J
I ----1---,•�, I � .
} ___ _J_L _ _,
I
I
�I
I I
�
---- - -- -
J..-,
I
\/
- -- ------ -----i---
-----.-.-,
.a
'
_L __ --- ..., --1- - - - - -�
I
I
I
I
I
r-l---- -,.__ __ -- - -'
-----
�
'
��
����
t
- � - ....._ - - - � _...___ - ....... - - - - --- - - - -i--.-
... .,,
-- - - -'-1
..... ~- ...... ---- --I
ii
I I
I I
) I I I
I ~ I I I "' I I
I ....
I l :-)( I
I \;
now in a downward direction. Thermocouple readout was made with the use of
a potentiometer. A constant pressure of approximately 1 psi is applied to
the sample by the hot plate.
PROCEDURE
SAMPLE PREPARATION - heat samples were formed on a Noble & Wood sheet
mold. Dry lapped pulp was dispersed in water with a mixer. Maximum thick
ness sheets, which still provide adequate drainage, were formed and pressed.
The sample was then cut down to 6n x 611 •
The potentiometer was referenced to the cold plate after 10 minutes of
constant water flow. The sample was placed between the hot and cold plates.
The cold plate is raised until the hot plate is raised off its stops. The
volgage regulator is used to apply power to the heating elements of the hot
plate. The temperature was raised to approximately l00°F, measured by the
potentiometer, and then is leveled off by adjustment of the regulat·or to ob
tain a constant temperature and thus a constant heat flow. Average time to
reach equilbrium was approximately 30 minutes. At equilibrium, hot and cold
plate temperature measurements were recorded along with cooling water temp
eratures into and out of th& cooling plate. The cooling water temperatures
were used to calculate the heat flow through the sample using the equation:
Q = mC AT. The sample was then weighed and dried. A second weighing was p
performed for moisture calculations and the caliper of the sheet measured.
A special sample preparation technique was used when making porosity
measurements. As before, the sample was formed and pressed and then re
wetted to a fully saturated condition. It was then weighed, pressed again,
reweighed and cut to size.
16
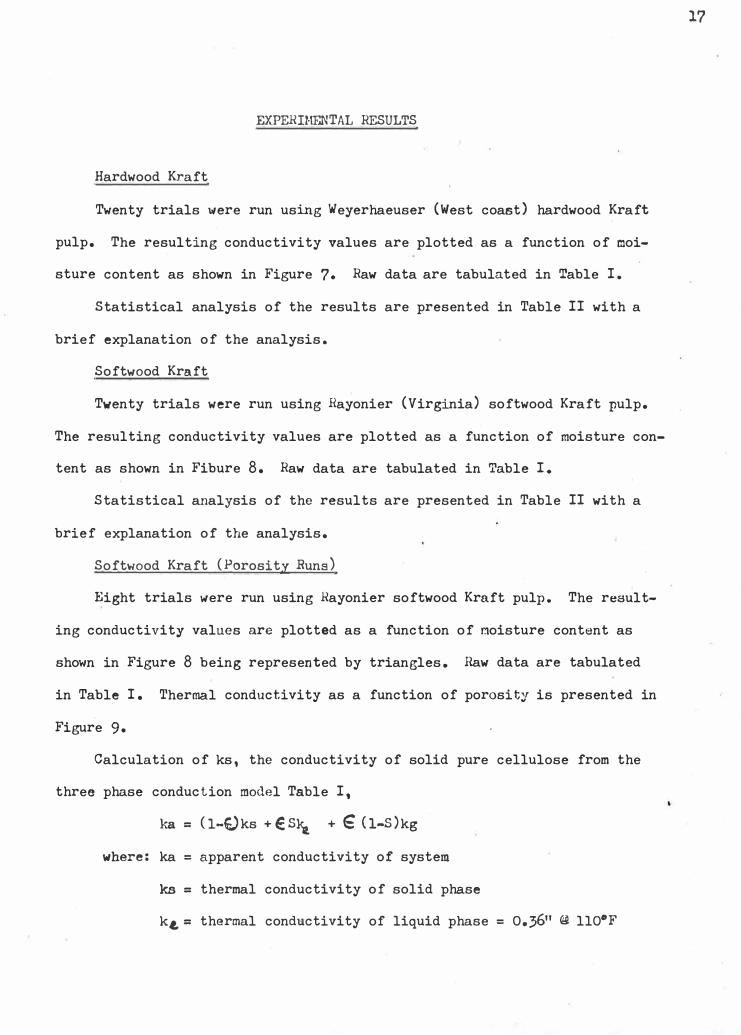
EX.PERIMF..NTAL RESULTS
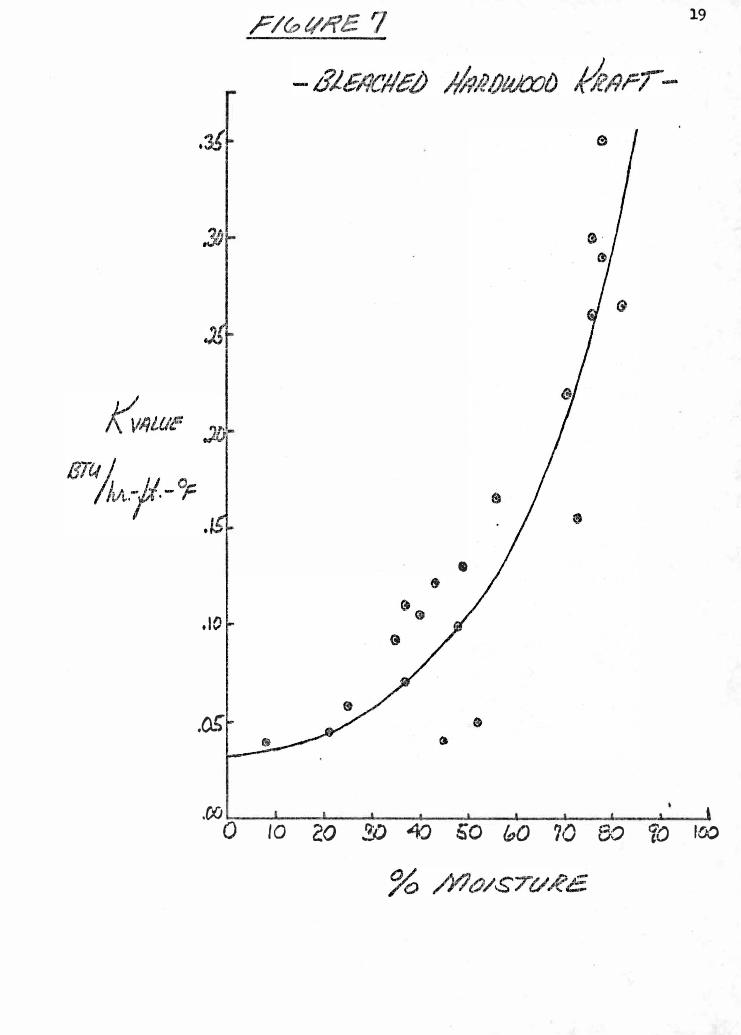
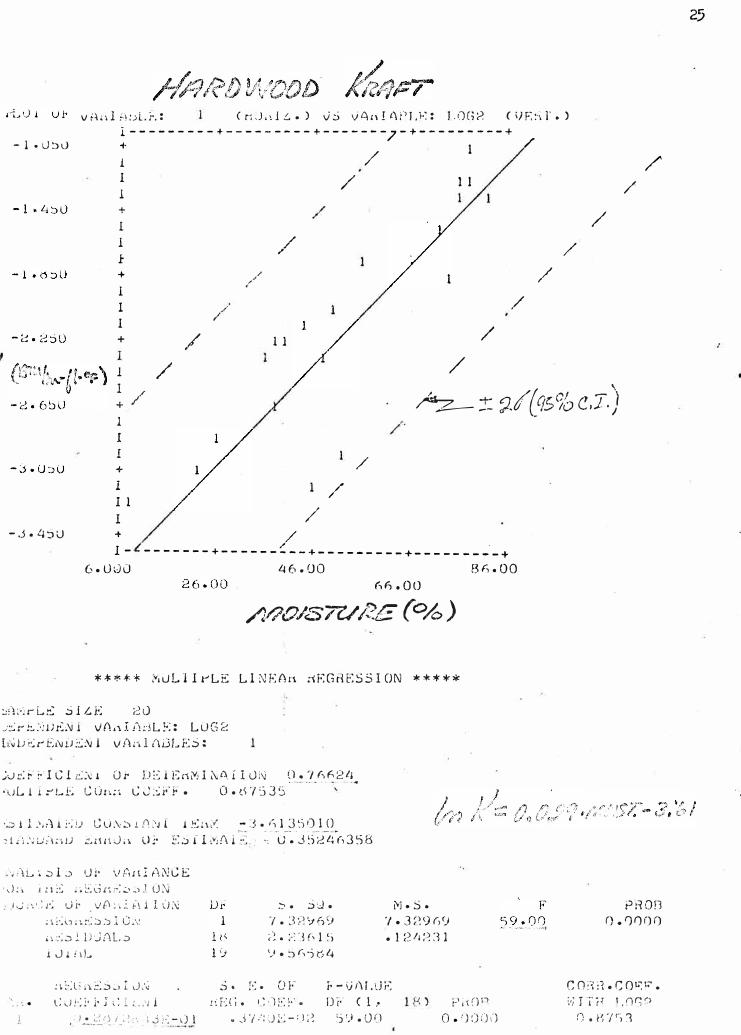
Hardwood Kraft
Twenty trials were run using Weyerhaeuser (West coast) hardwood Kraft
pulp. The resulting conductivity values are plotted as a function of moi
sture content as shown in Figure 7. Raw data are tabulated in Table I.
Statistical analysis of the results are presented in Table II with a
brief explanation of the analysis.
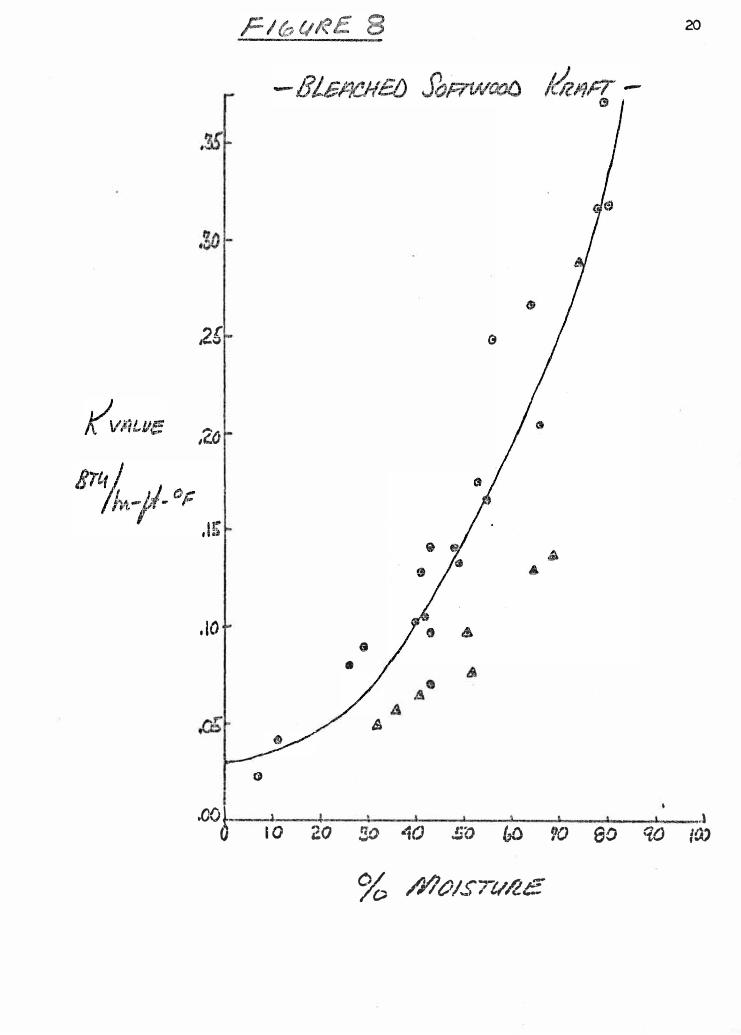
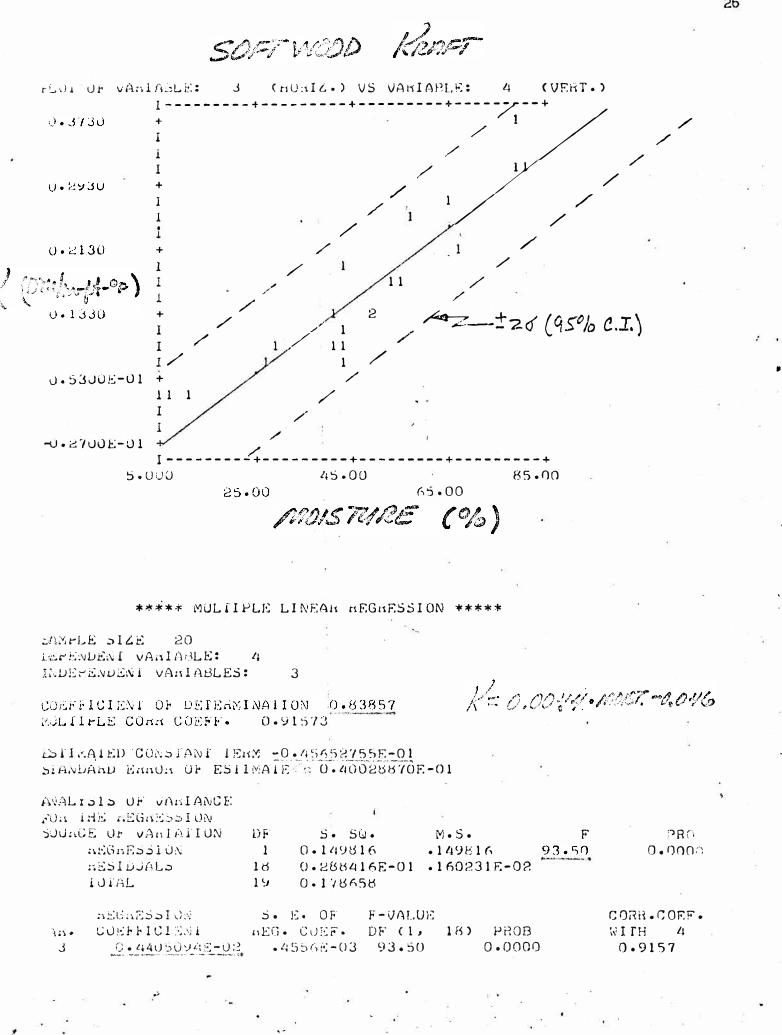
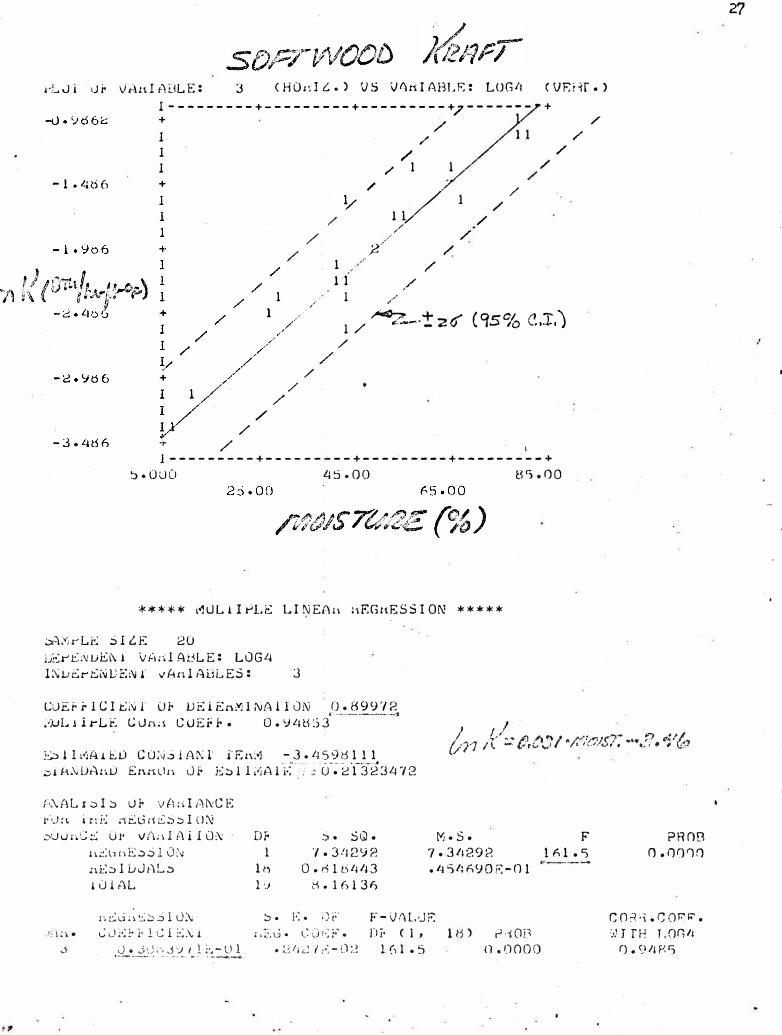
Softwood Kraft
Twenty trials were run using Rayonier (Virginia) softwood Kraft pulp.
The resulting conductivity values are plotted as a function of moisture con
tent as shown in Fibure 8. Raw data are tabulated in Table I.
Statistical analysis of the results are presented in Table II with a
brief explanation of the analysis.
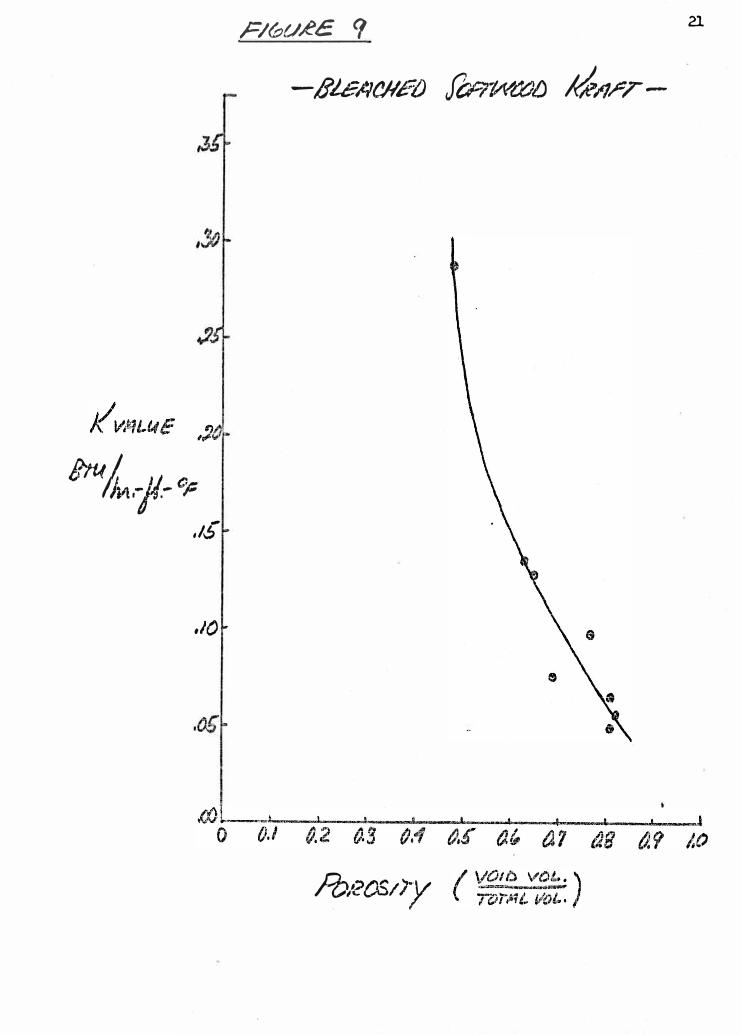
Softwood Kraft (Porosity Runs)
Eight trials were run using Rayonier softwood Kraft pulp. The result
ing conductivity values are plotted as a function of noisture content as
shown in Figure 8 being represented by triangles. Raw data are tabulated
in Table I. Thermal conductivity as a function of porosity is presented in
Figure 9.
Calculation of ks, the conductivity of solid pure cellulose from the
three phase conduction model Table I,
ka = (1-E.)ks +Eska + € <1-s)kg
where: ka = apparent conductivity of system
ks= thermal conductivity of solid phase
kt,= thermal conductivity of liquid phase = 0.3611 @ ll0°F
17
kg= thermal conductivity of gas phase = 0.157 BTU/hr@ 110°F
E = void fraction or porosity
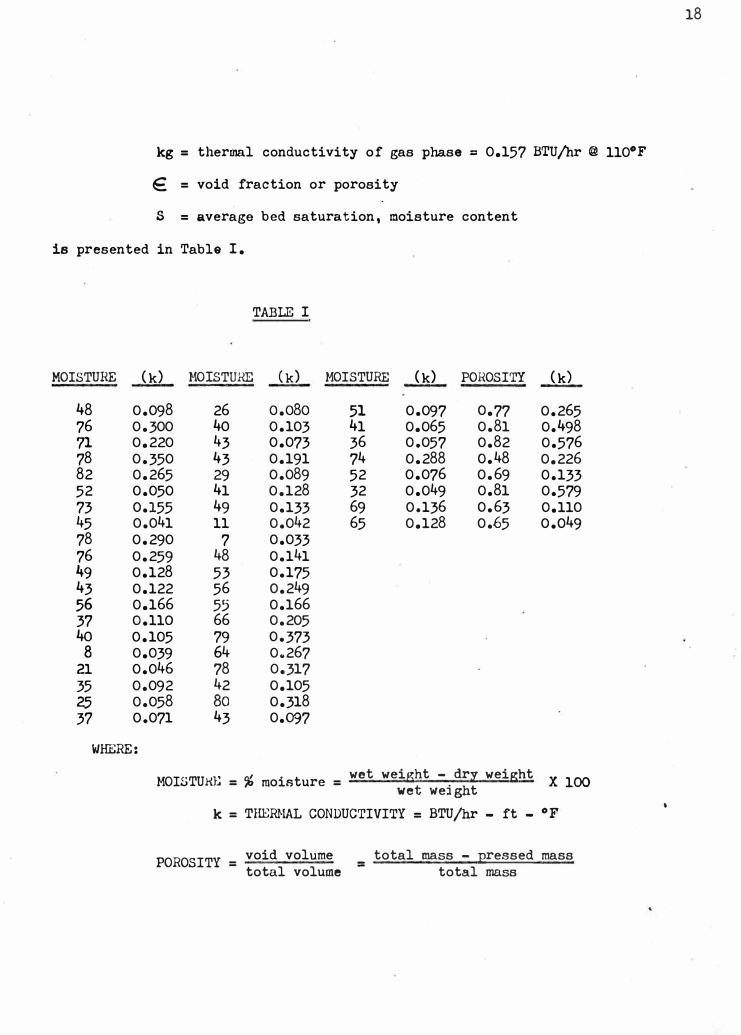
S = average bed saturation, moisture content
is presented in Table I.
TABLE I
MOISTURE (k) MOISTURE (k) MOISTURE (k) POROSITY (k)
48 0.098 26 o.o8o 51 0.097 0.77 0.265 76 0.300 4o 0.103 41 o.o65 0.81 o.49871 0.220 43 0.073 36 0.057 0.82 0.57678 0.350 43 0.191 74 0.288 o.48 0.22682 0.265 29 0.089 52 0.076 0.69 0.13352 0.050 41 0.128 32 0.049 0.81 0.57973 0.155 49 0.133 69 0.136 0.63 0.11045 0.041 11 0.042 65 0.128 0.65 0.04978 0.290 7 0.033 76 0.259 48 0.141 49 0.128 53 0.175 43 0.122 56 0.249 56 0.166 55 0.166 37 0.110 66 0.205 4o 0.105 79 0.373 8 0.039 64 0.267
21 0.046 78 0.317 35 0.092 42 0.105 25 0.058 Bo 0.318 37 0.071 43 0.097
WHERE:
MOISTUHB =%moisture = wet weight - d.rl weightX 100
wet wejght
k = THERMAL CONDUCTIVITY = BTU/hr - ft - °F
POROSITY= void volumetotal volume
=
total mass - pressed mass total mass
18
19
•
• 10
.OS
,00 I l
0 IO 20 20 40 50 ftJO 70 80 �cJ 100
r/(pt/,Ji'E 7
- 8LB7C#~/) 1-/41!/Jl.()COt) 1:fclirT-
20
,26 a
,2C
,10 G
•
IS
a
.oob I I mJ
10 ''O .so 40 5() l,o ¥0 00 qo iaJ '
% //I C,/,,,,\°71112.t!:..
$tu JM ,-jl.� er ,IS
,10
Fltot.1£e. 9
-/JiG/!-l(!/1£1) fenWt!()(J �,?rT-
Pb/?OS1)y . ,
21
( VOlb vot. .) ---T~,, ;L l/..l'i/ • .
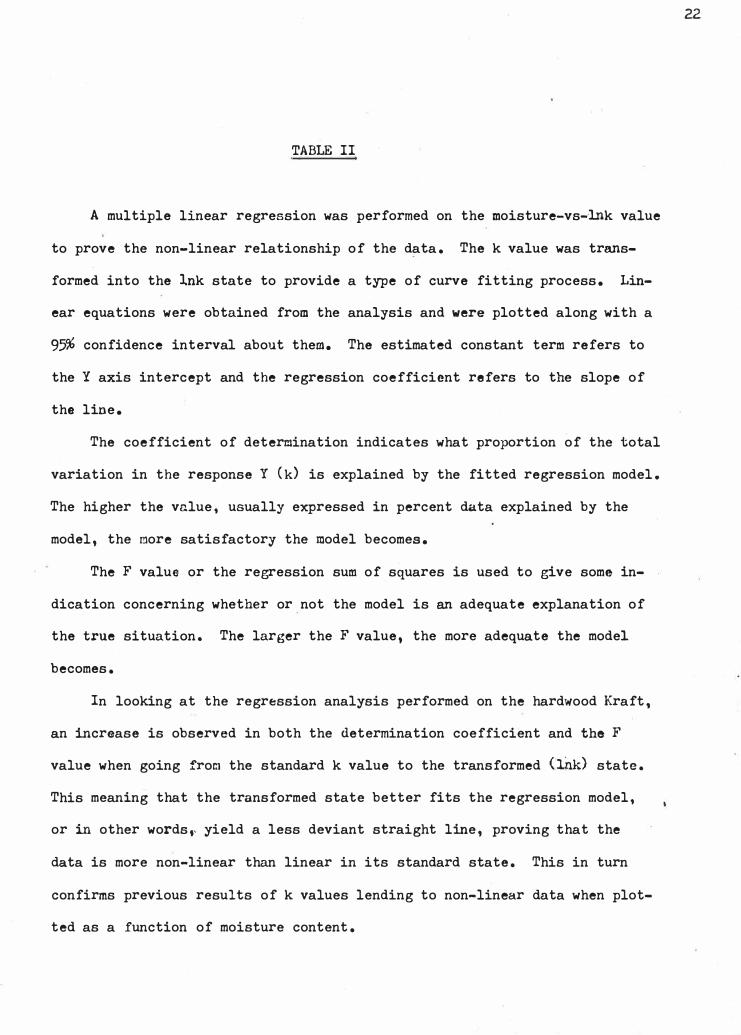
TABLE II
A multiple linear regression was performed on the moisture-vs-·lnk value
to prove the non-linear relationship of the data. The k value was trans
formed into the lnk state to provide a type of curve fitting process. Lin
ear equations were obtained from the analysis and were plotted along with a
95% confidence interval about them. The estimated constant term refers to
the Y axis intercept and the regression coefficient refers to the slope of
the line.
The coefficient of determination indicates what proportion of the total
variation in the response Y (k) is explained by the fitted regression model.
The higher the vnlue, usually expressed in percent data explained by the
model, the more satisfactory the model becomes.
The F value or the regression sum of squares is used to give some in
dication concerning whether or not the model is an adequate explanation of
the true situation. The larger the F value, the more adequate the model
becomes.
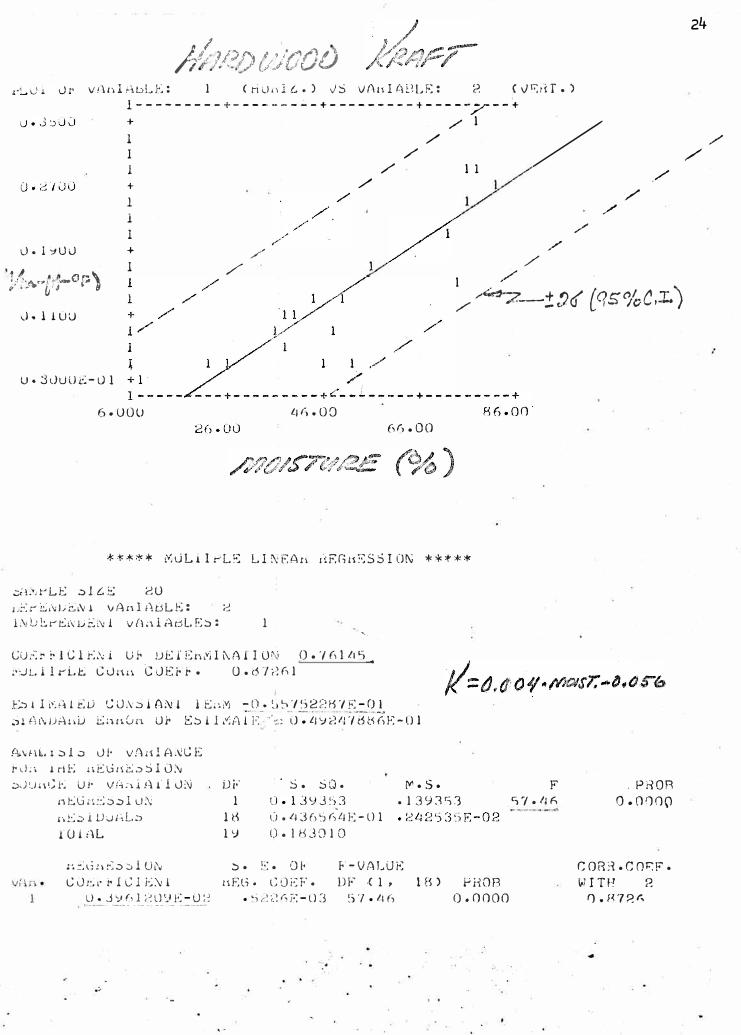
In looking at the regr�ssion analysis performed on the hardwood Kraft,
an increase is observed in both the determination coefficient and the F
value when going from the standard k value to the transformed (l.nk) state.
This meaning that the transformed state better fits the regression model,
or in other words� yield a less deviant straight line, proving that the
data is more non-linear than linear in its standard state. This in turn
confirms previous results of k values lending to non-linear data when plot
ted as a function of moisture content.
22
The same results are also obtained with the softwood regression, only
the increase is much greater,meaning the model is better satisfied.
23
I ),_,, '"1 /'"i I"% , • ,';"1 ,..;o
,
;J ,' / ,fi:"' ' � ! ; ' i f / / i ' "' ·• .,.I' v'•,,- · V
vl\nli-\bLE: 1 (rilJn}t...) J'::> V{\nll'.\ELF:: ?. CVr.:1H 0)
l - - - - ----- +- - - - - - - , - + --- - - - - - - + - - - - . ;;,,· - - '+ + / 1 1 I l
+ /
/ /
1 1 /
\J • 1 ':tUU
l i 1 + l
/
/
/
/
/ /
/ /
,/
'·1 I. • A,�, .. '!' "'{ · ,._._, rr v' ."<» Ii .i
d. l 1 uu
I ,/
/_,,<:St, Z-'!,t){ (qsoJoC,:r..)
U 0 3d0UC.:-ul
6•U00 46.00 (,(). 00
***** ��Lil�L� Ll�EAtt 2�GHSSS!ON *****
.:;,-1'.',i---LE .::>li.E 20 1£�i�U��1 �AnlABLE: 2 l:\d_;t:i--'�i\'Ur:l\l l v{\al i'lciLE::;: 1
'·
CUi��lClE�l u� LJEfEn�I�AflON Q.76145_ hJ L 11 i-- u.:: C 0 ,rn C iJ E F ,t,. 0 • t: 57 ,� 6 1
.\::.,tll-:e1lt:D CU.\•:::,lAN{ lEni-'J :_0_.:.1�:>'/'.)2;:-;W/F:-01 .:,l 1-\t\Ui-'wlJ l::naOn UJ-, E::i l l ,"iPd F>·',.:.: U • L1Si?.Ll 7 i:H� AE-0 1
��HLr�l.::> u� vAMlA�CE h.L, ! ril:: 11EG1tC.:.:,::, l 0�.:>,JUnt;1•; U!· v{"'.·d A fl U[\J
nEGH!.:::::>.::> l Ll:\ ni::.:, i U_;t\L.::> l(J!AL
Di.-1
lt1 19
··s • .SQ •
(J • l'jJ (> �j (, LJ );: - 0 1 l) .1tUO10
�.5. F
.1393S3 57.Qn
n::\i!·1t•:;:>.::,!Ui\1 .::,. !•:. 01• F-VALUr: C O 1:.: 1· l- I C l E \, 1 HE G • C O E: F • D F ·< 1 ,
U • j '-;I 6 1 ?. ll '..ll;_: -U :� • �j ;: ? r, F: -Cl 3 �7, 7 • Lt 6H••---·• --- •• •- •· -- ·- •-~--•
·,
lB) PHOB 0.0000
. PiWR O.OOO(l
COR:1.coi:::F. WIT!-! 2
().P. 1,?.r,
24
/
/
.,
(J . 2, / J(J 1/
U • l 39 3'.',3
v: l' \. .
.. . .
-l•U'.:H)
vi\ .. U\:.,L.r.: (r1.J,d�.) ,J::, vAnit\fl J.'f.�: LOG?. (i)F'.:"tr.,I---------+---------+-------7-+---------+
➔• 1
/
l / I / 1 1 l +l
/
/
/ l ,,/ / f+ / / /lI /
I/
+ ,/
/
1 l /
l / / I +/ fa..z-::: c;;.l{qs9b c,T.) II ! +I I lI /
/
/
-.3 • 4SU; - - - - - - - - + - - - - - - ( _ + - - - - - - - - - + - - - - - - - _. - + 6•000 46 ■ 00 86.QO
66-00�l?O/S7c/!JE (0/4)
***** �ULll�LE LlNEArt �EGRESSION *****
:iH1w Li: .::i IL. E ,� () _;:::1� S.\jJ.J.i:'�:\i l VA,� I i�::3L E: LOG 2i1..il.J�rb\JD:.::::\j l \/;'.\rd {\DLE:S:;ur:�dCl1:.:-;1 Or DElE1,;v!ll'llt).fiUf'J Q"�'}_(-:;F,__2ti_•uL! 1:--LJ:.: CUnn C0:..:i•F• 0.tnS35•:.'.) i l _;; ,"\ i :-: u CU,\:.:, i P. :,J 1 1 !..: n ;� - 3 • r. 1 3 '.'i O 1 0 ��. •· ·--. ____ .. .::ln.\u:'.\nu l:.HHJa U.r E:::ifl,>Ai:�:,: ·: o.J�)�L:(i358.'iALL:il:.) ui' v?',HlAi'!CE· ,J:i .in:..: :,:;:(jr�:-:: ,:, :) .\ UN ,JJ,,•_:1-; ui· _vA:,iJ\i J. (/[',,; M 0 S•
: 1 ;-; (J n :-: � .::i l (l:\:.. �·:.::, l D-Jt1L .:>
:::, • .:,J.'/ • J�H,.1()<j;.� • ? '.l h 1 'j
') • :) r) ") t, ,�7 • 329(, fJ• 1 :?.11:?J 1
-�: � .
l u i 1\1�,d::l; n.::::.S :,--, I ;,y� 1._;u!-�l· i· l t: l L-.\J I
, ._ t __ ._ __ �t�- _/__� � .:·, � j !·� - �) l.:J• l:�• OF
!i F:\i. , _:,:)Fr· • • 3 '/ /; U 1:: - :J ;�
F- \ii'\LUEDF ( 1 �
'.J'J • OUFl i-<()ll
Q.OOOi)
i:,ROD 0.00()()
C O :-, i1 • C O !-� F •i•/TTi-< !,nr.;::>
n.B7"i1
25
-1.,-1'.:) L)
. -. ,.,, • , , e---/ ~ .. , ) .. ,.1t., · / .. . ...
iJ - 2 ° 6:)U
l
l
/
1
l <-q
/ / I , ...... ~• 'i.. "'~-..,,
F '.'> ,~ _ _._:) :?,
r�·.i.i Ur v'l4.;,l/bLi�:: J <HU:'11..•) VS VAtiIAm.i-�: LI <VF.RT.> 1---------+---------+---------+-----7.--+
;/ 1
/ / /
i / /
t /// 1//
//
/
/ +
l
l
1 ,,,,,
/
/ 1 1 /
/
/ /
/+
I /
/
2 .,,/ 1
,,-/ / �--:!"20 (qs% C.I.)
I
1/ , 1 1
1 /
u.SJJUE-01 + / 1 l l / I
/
-0•i:::!7UuE-01 l /
/ !---------+---------+---------+---------+
s.uuu 45.00 85-00
(,'.'S • 00
*"'*** MUL f I PLE: LI t\1F:A1t nF.G11.F:.SSI ON *****
.::Jl,v,r-LE � I l :t-: ;20
i•;.:;rl::c\JuE,'d \iAalP1dLE: ti
I�UE�ENUS�I VAnlABLES: 3
0. Y l :'> '/ J
i::i!I,•.A!ED 'CUi\.::il'Ai.\Jf 1EHYJ -Q.ti�ir,')2'/5SF:-Ol ' ---- . 4•• • .. ·---- · - -----•·· . ---·-•--.-.
�ii-L\fo-'\nu Ennl.b 01' E.::iI I;y:A!E-···- o.,1GO�E.H)'/OE-Ol
A�ALI.::il� u� 0AnlANCE
r\J a i :-i 1:; .:.I::(1ri ;;_;:::,:.:, I Llt\i
SJu:.CE u:r v.CHi l j,\ 1 I UN
a!-.:G nE.::i .:i i 0,\i
;,t:.::i l LiJi'.'.\L.::,
IUi'AL
DF
l
1 d
1 �,
s. SLl• M.S.
□-1�9�16 .1LJ9816
o.���Lll6E-Ol .160231E-O�
0 • 1 '/365ci
n:.::tin1-.:.::i�l ,.l>: .::i. E:, OF F-iJAI..UJ�
\,"'\. Cu!::r r 1 C 1:;:_,j! liEC. C l)f·:F- DF < l, Hn PnOB
J c.,.l.,HJS(l)L:f:-u:� -�5S()i-03 93.50 0.0000 -• •------ ••-~- w• - • -- _, _ _._,. ,,I:
.,
F' PRr,
0. ()()(),;
co;:rn.r,or;:F".
\,.1 I fH LI
0.9151
'
• l
CJi f~ lCI E~ 1 0 ~ DE fEri MINAllO N ~ jL{l~LE co~~ ca ~fV •
,0.~3857
2b
J J . . J- ., · - · "i /'1 / '). 1 / " / i \ .";•.l',_r( l--,r _ ,., A (I/ / \ •~ C/ ,L-'v' c <; ·_ •, •.-.-•,,,., • l.:\,&,' ~; ;,.,!:)
vLUi Ur VAa!AdLE: 3 < H O n I i. • ) 'J S V A Ii I AB L F. : LUG'' < VF: i if • >
- l • 1-.b 6
I---------+---------+---------+7------- ++
/ I / I / I / 1 + /
1/ l✓;
//
/
,
,.2,, 1 l t'
1 /'
/ /
/.
/ /
/ /
/ /
1 / �--! 20 ('15% C' .• I.)/
/ /
..,. /
/ /
/
/
I
!---------+------ --+---�-----+---------+
�-ooo LJs.oo B�.oo
***** i-1\.JL i I i-:-Li-..: LI NEt'\11 :,EGaES:3 I ON *****
�Cli";rLl� .::i I lE 20 Jjr..:t"'t::\JUEl\ i Vh.-;I AiJLE: LOGLJ lNUir��LlENf vAnlABLE:3: J
CUErrlCli�I U!- UEiEnXINAliON 0.89912 fi·. ---�-- ---···----,,,
/
i·:ULi ir-Lr� Cun.I'. CiJEr!- • Q.9Llt1::i3 I
J /,, tJ, A-, • 7- = •#t }:;:,l lL•AlE:D cu:\i.31Al\l fE1,/I -3-LJ59tSl 11
.::,f{,\.\iUA:·,D EtH1.Un ,Jf, E�l'li'i1-'\l-l::-�-, ,;~o-.-·2T�323L172
f�ALr�l� uf, vA�IANC� 1··•Ja i r:r� 1'1SLirH:::::i::, ! (J�
.::-0unG� 01· Vf\;d ?-'\i I Oi\:
,f _,, ... , ... ·i ,-, ·�• ,.f. -.(, tr,,•
{/i1 / I,. -· /ot..·yl �;: ,(?JS , •••.:; • ; /,1
M•S• ai:'.:li 11E.:,.::i l iY� .nEi I 0Jt'\L::>
Dr' 1
lb l 'J
:;; • SQ• 7 • 311292
0. � l btiLJ 3(5.16136
7. 311:?.9?..Lj')l:690F,-() 1
F lf>l.')
?ROB 0.0()()()
! CJ l AL
i.i.�i..l !It.:::::-..:, i 0:-... ::, • 1;:. i) i;'�i.Ji�ri·l(.;i;:.;\d 1,i.;'.l�• C(),;�F.
J. 3,.J,·,Jf/ l i•;-u 1 • :_-:ti� I 1�-l);� ··•.--�----. ---- ... - . ·---•-...
F-Vi\L•Ji�DI· < l ,
l(1l 05 PdOD
0.0000
C(FH .8cwi..'.,J J fH T ,OG/1
() • <) 11 R 5
27
/
65 • 00
/ PlJlS7tfl2/Z ( ~~)
.t:. L \ •
,,
/ /
., __ _
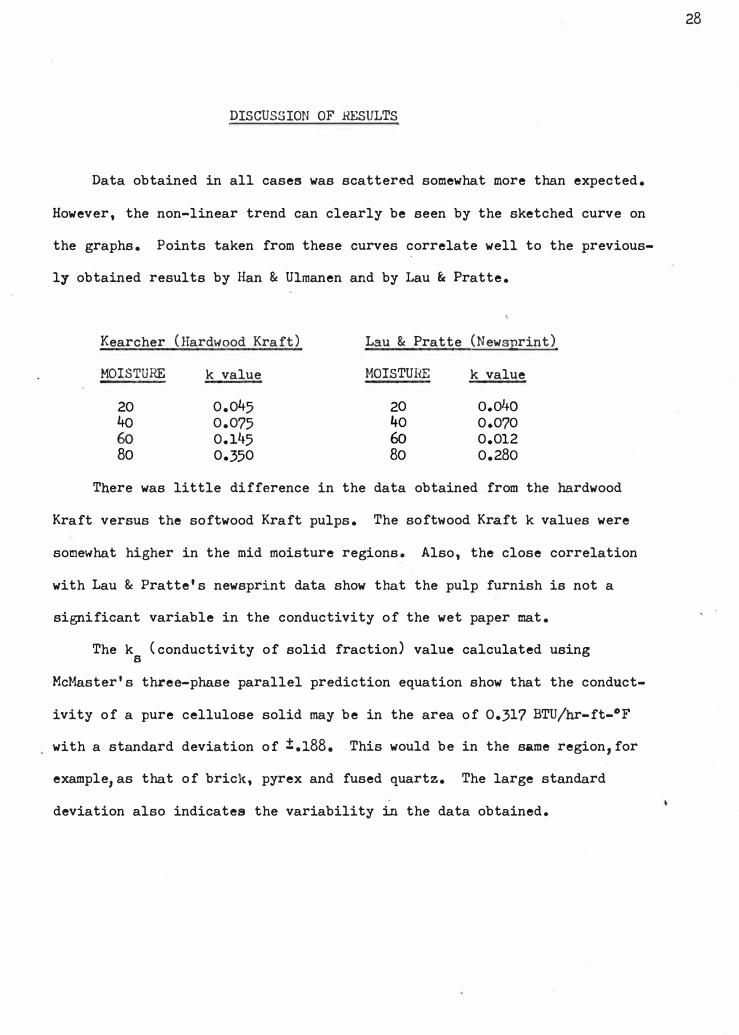
DISCUSSION OF HESULTS
Data obtained in all cases was scattered somewhat more than expected.
However, the non-linear trend can clearly be seen by the sketched curve on
the graphs. Points taken from these curves correlate well to the previous
ly obtained results by Han & Ulmanen and by Lau & Pratte.
Kearcher (Hardwood Kraft) Lau & Pratte (Newsprint)
MOISTURE k value MOISTURE k value
20 0.045 20 o.o4o
40 0.075 40 0.070 0.145 6o 0.012
Bo 0.350 Bo 0.280
There was little difference in the data obtained from the hardwood
Kraft versus the softwood Kraft pulps. The softwood Kraft k values were
somewhat higher in the mid moisture regions. Also, the close correlation
with Lau & Pratte's newsprint data show that the pulp furnish is not a
significant variable in the conductivity of the wet paper mat.
The k (conductivity of solid fraction) value calculated using s
McMaster's three-phase parallel prediction equation show that the conduct-
ivity of a pure cellulose solid may be in the area of 0.317 BTU/hr-ft-°F
with a standard deviation of ±.188. This would be in the same region,for
example,as that of brick, pyrex and fused quartz. The large standard
deviation also indicates the variability in the data obtained.
28
6o
CONCLUSIONS
As metioned earlier, data obtained waa scattered more than expected.
This is believed to be the result of inadequate engineering in the design
of the experimental apparatus. Also despite all precautions and sophis
tication in the design of an apparatus, it is never possible to completely
suppress some sources of error that require corrections to measured quan
tities. Two such sources of error, namely radiation and convection, are
inseparably associated with all measurements on fluid and fluid containing
substances, irrespective of the type of apparatus employed. Both phenomena
effect the energy transfer through the fluid film.
Analysis of tabulated results show that the type of furnish used in
the paper mat is not a prime variable in its conductivity behavior. Prime
variables would include, moisture content, applied pressure and sheet
porosity.
29
RECOMMENDATIONS
Areas of further study should include:
1) Design aspects of the experimental apparatus and how to minimize
experimental error.
2) Further study into the drying machanism and how vapor diffusivity
and water migration effect experimental results.
3) Further study into the effects of film length and species on
conductive properties.
4) Further investigation into dryer length prediction models based
on conductivity parameters •
•
LITERATURE CITED
1) Gunnar, G .N. "Drying of Paper and Paperboard", New. York,
Lockwood, pp. 24-27 & 50.
_/ Han, S.T., and Ulmanen, T., TAPPI 41: 185 (April, 1958)
f;) McMaater, D.G., TAPPI 47: 796 (Dec., 1964)
14) Han, S.T., Pulp and Paper Mag. of Canada 65, No.11: p.537 (Dec.,
1964)
5) Montgomery, A.E., Technical Assoc. Papers 29� series: P• 525 (1946)
6) Lau, Y .L., and Pratte, B.D., "Measurements of Thermal Conductivity
of Wet Pa12?£", National Research Council of Canada, Div. Mech.
Eng. Hydraulics Sect. Rep. LTR HY8: (Dec., 1969)
7) McCabe, W.L., and Smith, J.C., "Unit Operations of Chemical,
Engineering" 3rd ed., McGraw Hill, 1976
8) Tye, H.P., "Thermal Conductivities", Academic Press Inc., New
York 1969
9) Ho, C .Y., "Thermal Conductivity", Plenum Press, New York, 1969
31
I


