Embed Size (px)
Citation preview

Citation: Paroutoglou, E.; Fojan, P.;
Gurevich, L.; Afshari, A. Thermal
Properties of Novel Phase-Change
Materials Based on Tamanu and
Coconut Oil Encapsulated in
Electrospun Fiber Matrices.
Sustainability 2022, 14, 7432.
https://doi.org/10.3390/
su14127432
Academic Editor: Constantin
Chalioris
Received: 9 May 2022
Accepted: 16 June 2022
Published: 17 June 2022
Publisher’s Note: MDPI stays neutral
with regard to jurisdictional claims in
published maps and institutional affil-
iations.
Copyright: © 2022 by the authors.
Licensee MDPI, Basel, Switzerland.
This article is an open access article
distributed under the terms and
conditions of the Creative Commons
Attribution (CC BY) license (https://
creativecommons.org/licenses/by/
4.0/).
sustainability
Article
Thermal Properties of Novel Phase-Change Materials Basedon Tamanu and Coconut Oil Encapsulated in ElectrospunFiber MatricesEvdoxia Paroutoglou 1,*, Peter Fojan 2 , Leonid Gurevich 2 and Alireza Afshari 1
1 Department of Energy Performance, Indoor Environment and Sustainability of Buildings, Aalborg University,BUILD, 2450 København SV, Denmark; [email protected]
2 Department of Materials and Production, Aalborg University, 9220 Aalborg Øst, Denmark;[email protected] (P.F.); [email protected] (L.G.)
* Correspondence: [email protected]
Abstract: The accumulation of thermal energy in construction elements during daytime, and itsrelease during a colder night period is an efficient and green way to maintain a comfortable tempera-ture range in buildings and vehicles. One approach to achieving this goal is to store thermal energyas latent heat of the phase transition using the so-called phase-change materials (PCMs). Vegetableoils came recently into focus as cheap, widely available, and environmentally friendly PCMs. Inthis study, we report the thermal properties of PCMs based on tamanu and coconut oils in threeconfigurations: pure, emulsion, and encapsulated forms. We demonstrate the encapsulation of purecoconut- and tamanu-oil emulsions, and their mixtures and mixtures with commercial PCM paraffinsin fiber matrices produced by a coaxial electrospinning technique. Polycaprolactone (PCL) was usedas a shell, the PCM emulsion was formed by the studied oils, and sodium dodecyl sulfate (SDS) andpolyvinyl alcohol (PVA) were used as emulsifiers. The addition of commercially available paraffinRT18 into a 70/30 mixture of coconut and tamanu oil, successfully encapsulated in the core of a PCLshell, demonstrated latent heats of melting and solidification of 63.8 and 57.6 kJ/kg, respectively.
Keywords: PCM; coconut oil; tamanu oil; electrospun fiber matrix; encapsulation; DSC
1. Introduction
According to the International Energy Agency [1], energy consumption in the buildingsector reached 36% of the total global energy use in 2018. In recent years, energy-savingtechnologies such as thermal energy storage (TES) systems have come into focus. TESsystems are classified as sensible heat storage (SHS), latent heat storage (LHS), and ther-mochemical heat storage (THS) [2]. Latent heat thermal energy storage (LHTES) withphase-change materials (PCM) is currently a preferred energy storage solution due to theincreasing cost of energy resources [3]. In LHTES systems, energy is absorbed as latent heatof the phase transition, and then stored and dissipated into the environment. Novel heat ex-changers employing encapsulated PCMs can minimize energy use compared to traditionalTES solutions [4]. The main challenge in TES technology is selecting a suitable PCM onthe basis of its parameters, e.g., density, thermal conductivity, supercooling degree, phasechange temperature, and heat of fusion [5]. PCM might rely on solid–solid, solid–liquid,and liquid–gas transitions. The classification of solid–liquid PCMs is presented in Figure 1.
Sustainability 2022, 14, 7432. https://doi.org/10.3390/su14127432 https://www.mdpi.com/journal/sustainability

Sustainability 2022, 14, 7432 2 of 20Sustainability 2022, 14, x FOR PEER REVIEW 2 of 21
Figure 1. Classification of solid–liquid PCMs [6].
Organic fatty acids are abundant, sustainable, nontoxic, chemically and physically stable PCMs with relatively low cost that exhibit lower melting points than those of or-ganic paraffins [7]. However, ingenious strategies, e.g., additives and flame retardant ele-ments, are applied to eliminate the moderate–high flammability of organic paraffins and fatty acids [8]. Vegetable oils have recently been investigated as a replacement for tradi-tional PCMs, such as organic paraffins and inorganic salt hydrates. Eutectic binary mix-tures of fatty acids are suitable for thermal comfort applications due to possibility to adjust the melting temperature to the desired range. Arsana et al. [9] studied corn oil as a PCM applied to the walls of cooling equipment for food storage, and they achieved an energy reduction of 4% and a coefficient of performance (COP) increase of 6%. Rasta et al. [10] investigated a water-based PCM solution with the addition of soya oil ester for low-tem-perature TES applications. With the addition of 12.5% soya oil ester in tap water, the freez-ing point was decreased to −6 °C, and the supercooling degree was reduced by 1 K [10]. Djuanda et al. [11] examined virgin coconut oil (VCO) with the addition of 20% soybean oil for TES applications, and a latent heat of fusion of 94.31 kJ/kg was obtained. The addi-tion of 5% to 10% of vegetable oil esters in water with soya oil/corn oil mixtures for cold thermal energy storage (CTES) applications resulted in melting latent heat in the range of 171.72–230.68 J/g [12]. Kahwaji et al. [13] investigated the thermal properties of edible oils margarine and shortening, refined coconut oil, and virgin coconut oil as PCMs for a TES application. Coconut oil exhibited thermally stable performance with a latent heat of 105 ± 11 J/g and a phase-change temperature of 24.5 ± 1.5 °C [13].
Coconut oil is a renewable alternative to traditional PCMs due to its abundance, low cost, and chemical stability. According to the literature, coconut oil exhibits a liquid–solid transition at 24–27 °C [13], rendering it suitable for application in LHTES systems in a moderate climate. The thermophysical parameters of coconut oil PCMs are within the range of human thermal comfort conditions; their application reduces energy consump-tion and improved the temperature comfort. Faraj et al. [14] demonstrated a 53.7% in-crease in the span of charging and discharging processes of an underfloor electric heating system with PCM plates of coconut oil. Coconut oil is utilized in passenger vehicles [15] to reduce the cabin’s average temperature by 15 °C and improve the passengers’ thermal comfort. Irsyad et al. [16] studied a room cooling application with coconut oil as PCM in a container. The experimental solidification phase occurred at 24 °C, and the melting phase was reported at 22–24 °C [16]. Silalahi et al. [17,18] studied coconut oil for potential use in sensible and latent TES for room-temperature conditioning applications in Indone-sia, and the latent heat of coconut oil was decreased by adding graphite nanoparticles, CuO, and ZnO. Putri et al. [19] analyzed coconut oil’s thermal performance, and found that the air temperature was decreased by 2 °C for 2 kg of coconut oil in the solid–liquid phase change. In the study by Rahayu et al. [20], coconut oil with 50% lauric acid demon-strated a melting temperature of 26 °C and latent heat of 103 kJ/kg. Sutjahja et al. [21] proved that adding 1 wt. % of graphite, CuO, or ZnO to coconut oil resulted in thermal conductivity enhancement. Wonorahardjo et al. [22,23] proposed the addition of coconut
Solid liquid PCM
OrganicNon paraffins
Fatty acids
Esters
AlcoholsParaffins
InorganicSalt hydrates
MetallicEutectic
Figure 1. Classification of solid–liquid PCMs [6].
Organic fatty acids are abundant, sustainable, nontoxic, chemically and physicallystable PCMs with relatively low cost that exhibit lower melting points than those of organicparaffins [7]. However, ingenious strategies, e.g., additives and flame retardant elements,are applied to eliminate the moderate–high flammability of organic paraffins and fattyacids [8]. Vegetable oils have recently been investigated as a replacement for traditionalPCMs, such as organic paraffins and inorganic salt hydrates. Eutectic binary mixtures offatty acids are suitable for thermal comfort applications due to possibility to adjust themelting temperature to the desired range. Arsana et al. [9] studied corn oil as a PCMapplied to the walls of cooling equipment for food storage, and they achieved an energyreduction of 4% and a coefficient of performance (COP) increase of 6%. Rasta et al. [10]investigated a water-based PCM solution with the addition of soya oil ester for low-temperature TES applications. With the addition of 12.5% soya oil ester in tap water, thefreezing point was decreased to −6 ◦C, and the supercooling degree was reduced by 1 K [10].Djuanda et al. [11] examined virgin coconut oil (VCO) with the addition of 20% soybean oilfor TES applications, and a latent heat of fusion of 94.31 kJ/kg was obtained. The additionof 5% to 10% of vegetable oil esters in water with soya oil/corn oil mixtures for coldthermal energy storage (CTES) applications resulted in melting latent heat in the range of171.72–230.68 J/g [12]. Kahwaji et al. [13] investigated the thermal properties of edibleoils margarine and shortening, refined coconut oil, and virgin coconut oil as PCMs fora TES application. Coconut oil exhibited thermally stable performance with a latent heat of105 ± 11 J/g and a phase-change temperature of 24.5 ± 1.5 ◦C [13].
Coconut oil is a renewable alternative to traditional PCMs due to its abundance, lowcost, and chemical stability. According to the literature, coconut oil exhibits a liquid–solidtransition at 24–27 ◦C [13], rendering it suitable for application in LHTES systems ina moderate climate. The thermophysical parameters of coconut oil PCMs are within therange of human thermal comfort conditions; their application reduces energy consumptionand improved the temperature comfort. Faraj et al. [14] demonstrated a 53.7% increasein the span of charging and discharging processes of an underfloor electric heating sys-tem with PCM plates of coconut oil. Coconut oil is utilized in passenger vehicles [15] toreduce the cabin’s average temperature by 15 ◦C and improve the passengers’ thermalcomfort. Irsyad et al. [16] studied a room cooling application with coconut oil as PCM ina container. The experimental solidification phase occurred at 24 ◦C, and the melting phasewas reported at 22–24 ◦C [16]. Silalahi et al. [17,18] studied coconut oil for potential use insensible and latent TES for room-temperature conditioning applications in Indonesia, andthe latent heat of coconut oil was decreased by adding graphite nanoparticles, CuO, andZnO. Putri et al. [19] analyzed coconut oil’s thermal performance, and found that the airtemperature was decreased by 2 ◦C for 2 kg of coconut oil in the solid–liquid phase change.In the study by Rahayu et al. [20], coconut oil with 50% lauric acid demonstrated a meltingtemperature of 26 ◦C and latent heat of 103 kJ/kg. Sutjahja et al. [21] proved that adding1 wt.% of graphite, CuO, or ZnO to coconut oil resulted in thermal conductivity enhance-ment. Wonorahardjo et al. [22,23] proposed the addition of coconut oil in the buildingenvelope to improve the thermal mass effect and air circulation. In [23], Wonorahardjo et al.

Sustainability 2022, 14, 7432 3 of 20
showed that 135–170 kg of coconut oil in a 3–4 m2 room could decrease the air temperatureby 2.0–2.5 K in the afternoon. Alqahtani et al. [24] examined the addition of a 4 cm coconutoil layer in the wall thickness as an optimal solution for improving heat storage capacity.The encapsulation of PCM in solid matrices can drastically simplify their application inconstruction elements. Several studies reported PCM applications of encapsulated coconutoil [25–30]. The encapsulation of coconut oil in a biochar matrix [25] for thermal insulationresulted in a maximal latent heat of 74.6 kJ/kg. A coaxial electrospinning technique wasreported by Ranodhi Udangawa et al., and coconut oil was encapsulated in the core ofa cellulose shell [26]. Coconut oil encapsulated by electrospinning can be successfullyused for thermoregulation in the temperature range from 7 to 22 ◦C. Oktay et al. [27]encapsulated coconut oil with two different methods: microencapsulation and UV curing.The melting enthalpy of such microencapsulated oil was 12% higher compared to thatof pure coconut oil. Spherical microcapsules with 81.1% encapsulated coconut oil wasprepared by Németh et al. [28], and a stable core-shell structure was prepared. Few otherstudies focused on the development of microcapsules for thermoregulatory textiles [29,30].Sarac et al. [29] developed organic fabrics with microencapsulated coconut oil in polymershells and acquired latent heats from 6.7 to 14.9 kJ/kg.
Tamanu oil is a vegetable-based oil extracted from the seeds of Calophyllum inophyllumseed oil found in abundance in East Africa, southern coastal India, Malaysia, and Aus-tralia, and exhibits liquid–solid transition in the range of 13–14 ◦C [31]. Tamanu oil’s highcontent in oleic and linoleic fatty acids renders it suitable for biofuel production. Severalstudies [32–36] addressed tamanu oil (Calophyllum inophyllum seed oil) potential for biodieselproduction, and its composition [37], but the thermophysical properties of tamanu oil havenot been characterized.
In the present paper, we report the thermal properties of coconut and tamanu oilsin their pure and emulsion form, and develop a method for their encapsulation intoelectrospun fiber matrices. The novel fiber matrices of oils mixtures with commercial PCMparaffins produced by a coaxial electrospinning technique were characterized. The currentwork aims to identify the thermal properties of electrospun nanofibers as an alternative toPCMs in liquid–solid form. In future work, a layer of nanofibers containing PCM couldreplace traditional PCMs in LHTES applications.
2. Materials and Methods2.1. Thermophysical Studies
The current study examined coconut oil from coconut palm tree Cocos nucifera andtamanu oil from Calophyllum inophyllum seeds as novel PCMs, and their thermal propertieswere analyzed. Tamanu oil and coconut oil are purchased as cosmetic and edible products.The materials’ thermal properties were measured using a differential scanning calorimeter(DSC) Q200 (TA Instruments) with T-zero thermocouples. The blank reference sample wasa conventional empty aluminum crucible [38]. Nitrogen and air were used as inert purgegases with a 50 mL/min controlled flow rate. The thermal cycles for tamanu oil in its firstthermal cycle and coconut oil were set in the range from −30 to 80 ◦C with a scanning rateof 1.5 ◦C/min in a dynamic mode. The mass of each sample was 6 mg. The long-termperformance of tamanu oil was evaluated under 50, 100, 150 and 200 thermal cycles [38] inthe range from −80 to 200 ◦C with a scanning rate of 10 ◦C/min in a dynamic mode. Themass of the four samples was in the range from 5.5 to 7.5 mg.
2.2. PCM Emulsions and Mixtures
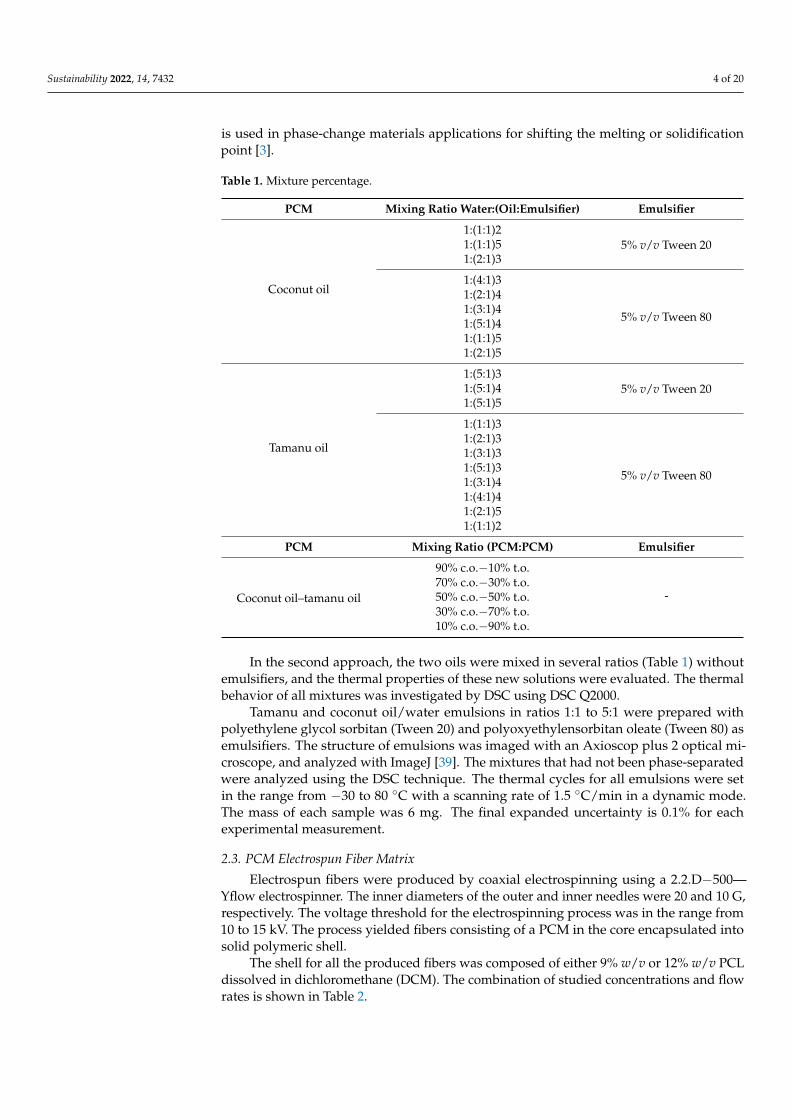
Two approaches were used to prepare emulsions. In the first approach, coconut oiland tamanu oil were mixed with water in a ratio of 1:1 to 5:1 in the presence of a surfactant.Table 1 shows the oil-in-water emulsions prepared using polyethylene glycol sorbitan(Tween 20) and polyoxyethylensorbitan oleate (Tween 80) as emulsifiers. The high heatcapacity of water (335 kJ/kg) further contributes to the latent heat of PCM mixtures. Water
Sustainability 2022, 14, 7432 4 of 20
is used in phase-change materials applications for shifting the melting or solidificationpoint [3].
Table 1. Mixture percentage.
PCM Mixing Ratio Water:(Oil:Emulsifier) Emulsifier
Coconut oil
1:(1:1)25% v/v Tween 201:(1:1)5
1:(2:1)3
1:(4:1)3
5% v/v Tween 80
1:(2:1)41:(3:1)41:(5:1)41:(1:1)51:(2:1)5
Tamanu oil
1:(5:1)35% v/v Tween 201:(5:1)4
1:(5:1)5
1:(1:1)3
5% v/v Tween 80
1:(2:1)31:(3:1)31:(5:1)31:(3:1)41:(4:1)41:(2:1)51:(1:1)2
PCM Mixing Ratio (PCM:PCM) Emulsifier
Coconut oil–tamanu oil
90% c.o.−10% t.o.
-70% c.o.−30% t.o.50% c.o.−50% t.o.30% c.o.−70% t.o.10% c.o.−90% t.o.
In the second approach, the two oils were mixed in several ratios (Table 1) withoutemulsifiers, and the thermal properties of these new solutions were evaluated. The thermalbehavior of all mixtures was investigated by DSC using DSC Q2000.
Tamanu and coconut oil/water emulsions in ratios 1:1 to 5:1 were prepared withpolyethylene glycol sorbitan (Tween 20) and polyoxyethylensorbitan oleate (Tween 80) asemulsifiers. The structure of emulsions was imaged with an Axioscop plus 2 optical mi-croscope, and analyzed with ImageJ [39]. The mixtures that had not been phase-separatedwere analyzed using the DSC technique. The thermal cycles for all emulsions were setin the range from −30 to 80 ◦C with a scanning rate of 1.5 ◦C/min in a dynamic mode.The mass of each sample was 6 mg. The final expanded uncertainty is 0.1% for eachexperimental measurement.
2.3. PCM Electrospun Fiber Matrix
Electrospun fibers were produced by coaxial electrospinning using a 2.2.D−500—Yflow electrospinner. The inner diameters of the outer and inner needles were 20 and 10 G,respectively. The voltage threshold for the electrospinning process was in the range from10 to 15 kV. The process yielded fibers consisting of a PCM in the core encapsulated intosolid polymeric shell.
The shell for all the produced fibers was composed of either 9% w/v or 12% w/v PCLdissolved in dichloromethane (DCM). The combination of studied concentrations and flowrates is shown in Table 2.

Sustainability 2022, 14, 7432 5 of 20
Table 2. Cases examined for the construction of PCM electrospun fiber matrices.
Case Sheath SolutionConcentration (%w/v)
Flow Rate (mL/h)Core Solution
Flow Rate (mL/h)Sheath Solution
1st 9% 0.3 0.62nd 9% 0.5 0.53rd 12% 0.5 0.5
Three different types of core materials were studied: the water emulsions of puretamanu and coconut oil, a mixture of tamanu and coconut oils, and different mixtures oftamanu and coconut oils with commercial PCM materials, as shown in Table 3.
Table 3. PCM compositions encapsulated in the fiber core.
PCM TamanuOil (t.o.)
CoconutOil (c.o.)
Tamanu Oil (t.o.)and Coconut Oil (c.o.)
Tamanu Oil (t.o.) and Coconut Oil (c.o.) andCommercial PCM
% 100% (t.o.) 100% (c.o.) 30% (t.o.) 70% (c.o.)
15% (t.o.) 35% (c.o.) 50%RT15
15% (t.o.) 35% (c.o.) 50%RT18
15% (t.o.) 35% (c.o.) 50%PT15
15% (t.o.) 35% (c.o.) 50%PT18
Oil/water emulsion samples were prepared by mixing a 10% w/v PVA solution withan 80% v/v PCM/water emulsion (with 8.4 mmol/L sodium dodecyl sulfate added asa surfactant) in 1:1 ratio. The resulting PCM–PVA emulsion was homogenized using a T25digital ULTRA-TURRAX disperser with 0.07% of a nonionic surfactant Triton X added toimprove emulsion’s spinnability.
For the third type of samples, four commercial PCMs (RT15, RT18, PT15, and PT18)were mixed with tamanu and coconut oils in the ratios shown in Table 3, and were encap-sulated in a PCL shell by electrospinning. The commercially available PCMs (RT15 andRT18 from Rubitherm Technologies GmbH and PT15 and PT18 from Pure Temp LLC) wereanalyzed earlier in [38,40].
The obtained electrospun fiber matrices were characterized with DSC and scanningelectron microscopy (SEM) using a Zeiss XB1540 field-emission electron microscope. Thethermal cycles for all fiber matrices were set in the range from −30 to 80 ◦C with a scanningrate of 1.5 ◦C/min in a dynamic mode. The mass of each sample was 3 mg.
3. Results and Discussion3.1. Thermophysical Characterization of Pure PCMs
The DSC thermograms of tamanu oil for 200 thermal cycles and coconut oil for the firstthermal cycle are shown in Figure 2. The obtained melting or solidification temperaturesand enthalpies are displayed on the graphs; for each experimental measurement, theexpanded uncertainty was ±0.1%.
The thermal properties and stability of tamanu oil were characterized with DSC bythermal cycling. As can be seen in Figure 2a, thermograms for the 1st, 50th, 100th, 150th,and 200th thermal cycles perfectly coincided, and no supercooling was observed, indicatingno degradation or other changes in material properties. Tamanu oil exhibited averagemelting and solidification peaks at 0.86 ◦C, and the average latent heat of melting andsolidification were 3.56 and 4.64 kJ/kg.
Several studies [15,18,41,42] identified coconut oil as a suitable PCM candidate. Inthis work, the thermophysical properties of coconut oil were studied, and Figure 2bdepicts the DSC thermograph of coconut oil in its first thermal cycle. According to the

Sustainability 2022, 14, 7432 6 of 20
literature [15,18,41,42], the average melting temperature and latent heat of fusion forcoconut oil were in the range from 22 to 28 ◦C and 70 to 255 kJ/kg, respectively. Theaverage melting and solidification peaks were at 23.05 and 7.47 ◦C, respectively. A thermalhysteresis was observed in coconut oil with a supercooling of 15.58 ◦C. The average latentheats of melting and solidification of coconut oil are 50.22 kJ/kg and 56.71 kJ/kg.
Sustainability 2022, 14, x FOR PEER REVIEW 6 of 21
(a) (b)
Figure 2. DSC thermogram of (a) tamanu oil in thermal cycles 1, 50, 100, 150, 200; (b) coconut oil in the first thermal cycle.
The thermal properties and stability of tamanu oil were characterized with DSC by thermal cycling. As can be seen in Figure 2a, thermograms for the 1st, 50th, 100th, 150th, and 200th thermal cycles perfectly coincided, and no supercooling was observed, indicat-ing no degradation or other changes in material properties. Tamanu oil exhibited average melting and solidification peaks at 0.86 °C, and the average latent heat of melting and solidification were 3.56 and 4.64 kJ/kg.
Several studies [15,18,41,42] identified coconut oil as a suitable PCM candidate. In this work, the thermophysical properties of coconut oil were studied, and Figure 2b de-picts the DSC thermograph of coconut oil in its first thermal cycle. According to the liter-ature [15,18,41,42], the average melting temperature and latent heat of fusion for coconut oil were in the range from 22 to 28 °C and 70 to 255 kJ/kg, respectively. The average melt-ing and solidification peaks were at 23.05 and 7.47 °C, respectively. A thermal hysteresis was observed in coconut oil with a supercooling of 15.58 °C. The average latent heats of melting and solidification of coconut oil were 56.71 and 50.22 kJ/kg.
3.2. Thermophysical Characterization of PCM Emulsions The DSC thermographs of the two oil emulsions are shown in Figure 3. Figure 3a,b
show the thermograph for coconut oil/water emulsions mixed in ratios from 1:1 to 5:1 and with Tween 20 and Tween 80 as surfactants, respectively. Thermographs for similar emul-sions produced with tamanu oil are shown in Figure 3c,d. Optical microscopy images of these oil/water emulsions are presented in Figures 4–7. Table 4 summarizes the DSC re-sults and the average emulsion size obtained from optical images.
(a) (b)
Figure 2. DSC thermogram of (a) tamanu oil in thermal cycles 1, 50, 100, 150, 200; (b) coconut oil inthe first thermal cycle.
3.2. Thermophysical Characterization of PCM Emulsions
The DSC thermographs of the two oil emulsions are shown in Figure 3. Figure 3a,bshow the thermograph for coconut oil/water emulsions mixed in ratios from 1:1 to 5:1and with Tween 20 and Tween 80 as surfactants, respectively. Thermographs for similaremulsions produced with tamanu oil are shown in Figure 3c,d. Optical microscopy imagesof these oil/water emulsions are presented in Figures 4–7. Table 4 summarizes the DSCresults and the average emulsion size obtained from optical images.
Sustainability 2022, 14, x FOR PEER REVIEW 6 of 21
(a) (b)
Figure 2. DSC thermogram of (a) tamanu oil in thermal cycles 1, 50, 100, 150, 200; (b) coconut oil in the first thermal cycle.
The thermal properties and stability of tamanu oil were characterized with DSC by thermal cycling. As can be seen in Figure 2a, thermograms for the 1st, 50th, 100th, 150th, and 200th thermal cycles perfectly coincided, and no supercooling was observed, indicat-ing no degradation or other changes in material properties. Tamanu oil exhibited average melting and solidification peaks at 0.86 °C, and the average latent heat of melting and solidification were 3.56 and 4.64 kJ/kg.
Several studies [15,18,41,42] identified coconut oil as a suitable PCM candidate. In this work, the thermophysical properties of coconut oil were studied, and Figure 2b de-picts the DSC thermograph of coconut oil in its first thermal cycle. According to the liter-ature [15,18,41,42], the average melting temperature and latent heat of fusion for coconut oil were in the range from 22 to 28 °C and 70 to 255 kJ/kg, respectively. The average melt-ing and solidification peaks were at 23.05 and 7.47 °C, respectively. A thermal hysteresis was observed in coconut oil with a supercooling of 15.58 °C. The average latent heats of melting and solidification of coconut oil were 56.71 and 50.22 kJ/kg.
3.2. Thermophysical Characterization of PCM Emulsions The DSC thermographs of the two oil emulsions are shown in Figure 3. Figure 3a,b
show the thermograph for coconut oil/water emulsions mixed in ratios from 1:1 to 5:1 and with Tween 20 and Tween 80 as surfactants, respectively. Thermographs for similar emul-sions produced with tamanu oil are shown in Figure 3c,d. Optical microscopy images of these oil/water emulsions are presented in Figures 4–7. Table 4 summarizes the DSC re-sults and the average emulsion size obtained from optical images.
(a) (b)
Sustainability 2022, 14, x FOR PEER REVIEW 7 of 21
(c) (d)
Figure 3. DSC thermograms of (a) coconut oil/water emulsions with Tween 20, (b) coconut oil/water emulsions with Tween 80, (c) tamanu oil/water emulsions with Tween 20, (d) tamanu oil/water emulsions Tween 80 in their first thermal cycle.
(a) (b) (c)
Figure 4. Optical microscopy images of coconut oil/(water emulsion stabilized with Tween 20), wa-ter:(oil:emulsifier): (a) 1:(1:1)2, (b) 1:(1:1)5, (c) 1:(2:1)3.
(a) (b) (c)
(d) (e) (f)
Figure 5. Optical microscopy images of coconut oil/(water emulsion stabilized with Tween 80), wa-ter:(oil:emulsifier); (a) 1:(4:1)3, (b) 1:(2:1)4, (c) 1:(3:1)4, (d) 1:(5:1)4,(e) 1:(1:1)5, (f) 1:(2:1)5.
Figure 3. DSC thermograms of (a) coconut oil/water emulsions with Tween 20, (b) coconut oil/wateremulsions with Tween 80, (c) tamanu oil/water emulsions with Tween 20, (d) tamanu oil/wateremulsions Tween 80 in their first thermal cycle.

Sustainability 2022, 14, 7432 7 of 20
Sustainability 2022, 14, x FOR PEER REVIEW 7 of 21
(c) (d)
Figure 3. DSC thermograms of (a) coconut oil/water emulsions with Tween 20, (b) coconut oil/water emulsions with Tween 80, (c) tamanu oil/water emulsions with Tween 20, (d) tamanu oil/water emulsions Tween 80 in their first thermal cycle.
(a) (b) (c)
Figure 4. Optical microscopy images of coconut oil/(water emulsion stabilized with Tween 20), wa-ter:(oil:emulsifier): (a) 1:(1:1)2, (b) 1:(1:1)5, (c) 1:(2:1)3.
(a) (b) (c)
(d) (e) (f)
Figure 5. Optical microscopy images of coconut oil/(water emulsion stabilized with Tween 80), wa-ter:(oil:emulsifier); (a) 1:(4:1)3, (b) 1:(2:1)4, (c) 1:(3:1)4, (d) 1:(5:1)4,(e) 1:(1:1)5, (f) 1:(2:1)5.
Figure 4. Optical microscopy images of coconut oil/(water emulsion stabilized with Tween 20),water:(oil:emulsifier): (a) 1:(1:1)2, (b) 1:(1:1)5, (c) 1:(2:1)3.
Sustainability 2022, 14, x FOR PEER REVIEW 7 of 21
(c) (d)
Figure 3. DSC thermograms of (a) coconut oil/water emulsions with Tween 20, (b) coconut oil/water emulsions with Tween 80, (c) tamanu oil/water emulsions with Tween 20, (d) tamanu oil/water emulsions Tween 80 in their first thermal cycle.
(a) (b) (c)
Figure 4. Optical microscopy images of coconut oil/(water emulsion stabilized with Tween 20), wa-ter:(oil:emulsifier): (a) 1:(1:1)2, (b) 1:(1:1)5, (c) 1:(2:1)3.
(a) (b) (c)
(d) (e) (f)
Figure 5. Optical microscopy images of coconut oil/(water emulsion stabilized with Tween 80), wa-ter:(oil:emulsifier); (a) 1:(4:1)3, (b) 1:(2:1)4, (c) 1:(3:1)4, (d) 1:(5:1)4,(e) 1:(1:1)5, (f) 1:(2:1)5.
Figure 5. Optical microscopy images of coconut oil/(water emulsion stabilized with Tween 80),water:(oil:emulsifier); (a) 1:(4:1)3, (b) 1:(2:1)4, (c) 1:(3:1)4, (d) 1:(5:1)4,(e) 1:(1:1)5, (f) 1:(2:1)5.
Sustainability 2022, 14, x FOR PEER REVIEW 8 of 21
(a) (b) (c)
Figure 6. Optical microscopy images of tamanu oil/(water emulsion stabilized with Tween 20), wa-ter:(oil:emulsifier); (a) 1:(5:1)3, (b) 1:(5:1)4, (c) 1:(5:1)5.
(a) (b) (c)
(d) (e) (f)
(g) (h)
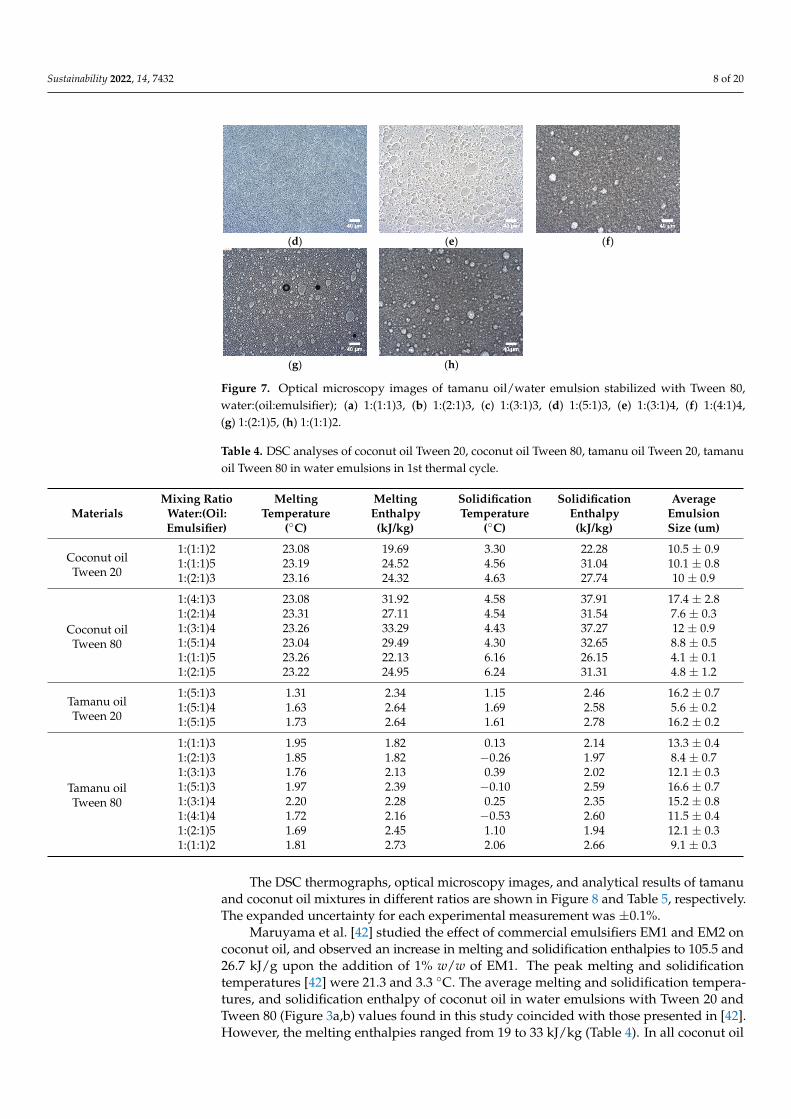
Figure 7. Optical microscopy images of tamanu oil/water emulsion stabilized with Tween 80, wa-ter:(oil:emulsifier); (a) 1:(1:1)3, (b) 1:(2:1)3, (c) 1:(3:1)3, (d) 1:(5:1)3, (e) 1:(3:1)4, (f) 1:(4:1)4, (g) 1:(2:1)5, (h) 1:(1:1)2.
Table 4. DSC analyses of coconut oil Tween 20, coconut oil Tween 80, tamanu oil Tween 20, tamanu oil Tween 80 in water emulsions in 1st thermal cycle.
Materials Mixing Ratio Water:(Oil: Emulsifier)
Melting Tem-perature (°C)
Melting Enthalpy
(kJ/kg)
Solidification Temperature
(°C)
Solidification Enthalpy (kJ/kg)
Average Emul-sion Size (um)
Coconut oil Tween 20
1:(1:1)2 23.08 19.69 3.30 22.28 10.5 ± 0.9 1:(1:1)5 23.19 24.52 4.56 31.04 10.1 ± 0.8 1:(2:1)3 23.16 24.32 4.63 27.74 10 ± 0.9
Coconut oil Tween 80
1:(4:1)3 23.08 31.92 4.58 37.91 17.4 ± 2.8 1:(2:1)4 23.31 27.11 4.54 31.54 7.6 ± 0.3 1:(3:1)4 23.26 33.29 4.43 37.27 12 ± 0.9
Figure 6. Optical microscopy images of tamanu oil/(water emulsion stabilized with Tween 20),water:(oil:emulsifier); (a) 1:(5:1)3, (b) 1:(5:1)4, (c) 1:(5:1)5.
Sustainability 2022, 14, x FOR PEER REVIEW 8 of 21
(a) (b) (c)
Figure 6. Optical microscopy images of tamanu oil/(water emulsion stabilized with Tween 20), wa-ter:(oil:emulsifier); (a) 1:(5:1)3, (b) 1:(5:1)4, (c) 1:(5:1)5.
(a) (b) (c)
(d) (e) (f)
(g) (h)
Figure 7. Optical microscopy images of tamanu oil/water emulsion stabilized with Tween 80, wa-ter:(oil:emulsifier); (a) 1:(1:1)3, (b) 1:(2:1)3, (c) 1:(3:1)3, (d) 1:(5:1)3, (e) 1:(3:1)4, (f) 1:(4:1)4, (g) 1:(2:1)5, (h) 1:(1:1)2.
Table 4. DSC analyses of coconut oil Tween 20, coconut oil Tween 80, tamanu oil Tween 20, tamanu oil Tween 80 in water emulsions in 1st thermal cycle.
Materials Mixing Ratio Water:(Oil: Emulsifier)
Melting Tem-perature (°C)
Melting Enthalpy
(kJ/kg)
Solidification Temperature
(°C)
Solidification Enthalpy (kJ/kg)
Average Emul-sion Size (um)
Coconut oil Tween 20
1:(1:1)2 23.08 19.69 3.30 22.28 10.5 ± 0.9 1:(1:1)5 23.19 24.52 4.56 31.04 10.1 ± 0.8 1:(2:1)3 23.16 24.32 4.63 27.74 10 ± 0.9
Coconut oil Tween 80
1:(4:1)3 23.08 31.92 4.58 37.91 17.4 ± 2.8 1:(2:1)4 23.31 27.11 4.54 31.54 7.6 ± 0.3 1:(3:1)4 23.26 33.29 4.43 37.27 12 ± 0.9
Figure 7. Cont.
Sustainability 2022, 14, 7432 8 of 20
Sustainability 2022, 14, x FOR PEER REVIEW 8 of 21
(a) (b) (c)
Figure 6. Optical microscopy images of tamanu oil/(water emulsion stabilized with Tween 20), wa-ter:(oil:emulsifier); (a) 1:(5:1)3, (b) 1:(5:1)4, (c) 1:(5:1)5.
(a) (b) (c)
(d) (e) (f)
(g) (h)
Figure 7. Optical microscopy images of tamanu oil/water emulsion stabilized with Tween 80, wa-ter:(oil:emulsifier); (a) 1:(1:1)3, (b) 1:(2:1)3, (c) 1:(3:1)3, (d) 1:(5:1)3, (e) 1:(3:1)4, (f) 1:(4:1)4, (g) 1:(2:1)5, (h) 1:(1:1)2.
Table 4. DSC analyses of coconut oil Tween 20, coconut oil Tween 80, tamanu oil Tween 20, tamanu oil Tween 80 in water emulsions in 1st thermal cycle.
Materials Mixing Ratio Water:(Oil: Emulsifier)
Melting Tem-perature (°C)
Melting Enthalpy
(kJ/kg)
Solidification Temperature
(°C)
Solidification Enthalpy (kJ/kg)
Average Emul-sion Size (um)
Coconut oil Tween 20
1:(1:1)2 23.08 19.69 3.30 22.28 10.5 ± 0.9 1:(1:1)5 23.19 24.52 4.56 31.04 10.1 ± 0.8 1:(2:1)3 23.16 24.32 4.63 27.74 10 ± 0.9
Coconut oil Tween 80
1:(4:1)3 23.08 31.92 4.58 37.91 17.4 ± 2.8 1:(2:1)4 23.31 27.11 4.54 31.54 7.6 ± 0.3 1:(3:1)4 23.26 33.29 4.43 37.27 12 ± 0.9
Figure 7. Optical microscopy images of tamanu oil/water emulsion stabilized with Tween 80,water:(oil:emulsifier); (a) 1:(1:1)3, (b) 1:(2:1)3, (c) 1:(3:1)3, (d) 1:(5:1)3, (e) 1:(3:1)4, (f) 1:(4:1)4,(g) 1:(2:1)5, (h) 1:(1:1)2.
Table 4. DSC analyses of coconut oil Tween 20, coconut oil Tween 80, tamanu oil Tween 20, tamanuoil Tween 80 in water emulsions in 1st thermal cycle.
MaterialsMixing Ratio
Water:(Oil:Emulsifier)
MeltingTemperature
(◦C)
MeltingEnthalpy(kJ/kg)
SolidificationTemperature
(◦C)
SolidificationEnthalpy(kJ/kg)
AverageEmulsionSize (um)
Coconut oilTween 20
1:(1:1)2 23.08 19.69 3.30 22.28 10.5 ± 0.91:(1:1)5 23.19 24.52 4.56 31.04 10.1 ± 0.81:(2:1)3 23.16 24.32 4.63 27.74 10 ± 0.9
Coconut oilTween 80
1:(4:1)3 23.08 31.92 4.58 37.91 17.4 ± 2.81:(2:1)4 23.31 27.11 4.54 31.54 7.6 ± 0.31:(3:1)4 23.26 33.29 4.43 37.27 12 ± 0.91:(5:1)4 23.04 29.49 4.30 32.65 8.8 ± 0.51:(1:1)5 23.26 22.13 6.16 26.15 4.1 ± 0.11:(2:1)5 23.22 24.95 6.24 31.31 4.8 ± 1.2
Tamanu oilTween 20
1:(5:1)3 1.31 2.34 1.15 2.46 16.2 ± 0.71:(5:1)4 1.63 2.64 1.69 2.58 5.6 ± 0.21:(5:1)5 1.73 2.64 1.61 2.78 16.2 ± 0.2
Tamanu oilTween 80
1:(1:1)3 1.95 1.82 0.13 2.14 13.3 ± 0.41:(2:1)3 1.85 1.82 −0.26 1.97 8.4 ± 0.71:(3:1)3 1.76 2.13 0.39 2.02 12.1 ± 0.31:(5:1)3 1.97 2.39 −0.10 2.59 16.6 ± 0.71:(3:1)4 2.20 2.28 0.25 2.35 15.2 ± 0.81:(4:1)4 1.72 2.16 −0.53 2.60 11.5 ± 0.41:(2:1)5 1.69 2.45 1.10 1.94 12.1 ± 0.31:(1:1)2 1.81 2.73 2.06 2.66 9.1 ± 0.3
The DSC thermographs, optical microscopy images, and analytical results of tamanuand coconut oil mixtures in different ratios are shown in Figure 8 and Table 5, respectively.The expanded uncertainty for each experimental measurement was ±0.1%.
Maruyama et al. [42] studied the effect of commercial emulsifiers EM1 and EM2 oncoconut oil, and observed an increase in melting and solidification enthalpies to 105.5 and26.7 kJ/g upon the addition of 1% w/w of EM1. The peak melting and solidificationtemperatures [42] were 21.3 and 3.3 ◦C. The average melting and solidification tempera-tures, and solidification enthalpy of coconut oil in water emulsions with Tween 20 andTween 80 (Figure 3a,b) values found in this study coincided with those presented in [42].However, the melting enthalpies ranged from 19 to 33 kJ/kg (Table 4). In all coconut oil

Sustainability 2022, 14, 7432 9 of 20
emulsions thermograms (Figure 3a,b), a thermal shift of 17–20 ◦C between the meltingand solidification curves was observed. Wiyani et al. [43] successfully formulated vir-gin coconut oil emulsions in a ratio of 80:20 with Tween 80 and Span 80 as emulsifiers.Gulao et al. [44] studied the physicochemical properties of coconut oil in water emulsionswith two biopolymers, which resulted in average droplet diameters in the range from310 to 1200 nm. The average emulsion size, analyzed in Table 4, showed that the coconutoil–Tween 20 (Figure 4) and Tween 80 (Figure 5) emulsion size varied between 9 and10 µm, and 4 and 17 µm, respectively.
Sustainability 2022, 14, x FOR PEER REVIEW 9 of 21
1:(5:1)4 23.04 29.49 4.30 32.65 8.8 ± 0.5 1:(1:1)5 23.26 22.13 6.16 26.15 4.1 ± 0.1 1:(2:1)5 23.22 24.95 6.24 31.31 4.8 ± 1.2
Tamanu oil Tween 20
1:(5:1)3 1.31 2.34 1.15 2.46 16.2 ± 0.7 1:(5:1)4 1.63 2.64 1.69 2.58 5.6 ± 0.2 1:(5:1)5 1.73 2.64 1.61 2.78 16.2 ± 0.2
Tamanu oil Tween 80
1:(1:1)3 1.95 1.82 0.13 2.14 13.3 ± 0.4 1:(2:1)3 1.85 1.82 −0.26 1.97 8.4 ± 0.7 1:(3:1)3 1.76 2.13 0.39 2.02 12.1 ± 0.3 1:(5:1)3 1.97 2.39 −0.10 2.59 16.6 ± 0.7 1:(3:1)4 2.20 2.28 0.25 2.35 15.2 ± 0.8 1:(4:1)4 1.72 2.16 −0.53 2.60 11.5 ± 0.4 1:(2:1)5 1.69 2.45 1.10 1.94 12.1 ± 0.3 1:(1:1)2 1.81 2.73 2.06 2.66 9.1 ± 0.3
The DSC thermographs, optical microscopy images, and analytical results of tamanu and coconut oil mixtures in different ratios are shown in Figures 8 and 9, and Table 5, respectively. The expanded uncertainty for each experimental measurement was ±0.1%.
Figure 8. DSC thermograph of different tamanu–coconut oil mixtures in their first thermal cycle.
Table 5. DSC analyses of coconut–tamanu oil mixtures in their first thermal cycle.
Materials Mixing Ratio Melting Temperature (°C) Melting
Enthalpy (kJ/kg)
Freezing Tempera-ture (°C) Solidification
Enthalpy (kJ/kg) Max Min Max Min
Coconut oil–tamanu
oil mixture
90% c.o.−10% t.o. 20.28 9.80 45.34 0.23 5.25 44.89 70% c.o.−30% t.o. 19.87 9.22 43.60 1.26 4.75 47.86 50% c.o.−50% t.o. 16.60 5.27 38.81 −6.66 2.45 38.39 30% c.o.−70% t.o. 13.43 3.82 28.90 −7.68 0.71 28.91 10% c.o.−90% t.o. 0.75 12.06 24.03 −10.24 −1.33 5.85
Maruyama et al. [42] studied the effect of commercial emulsifiers EM1 and EM2 on coconut oil, and observed an increase in melting and solidification enthalpies to 105.5 and 26.7 kJ/g upon the addition of 1% w/w of EM1. The peak melting and solidification tem-peratures [42] were 21.3 and 3.3 °C. The average melting and solidification temperatures, and solidification enthalpy of coconut oil in water emulsions with Tween 20 and Tween 80 (Figure 3a,b) values found in this study coincided with those presented in [42]. How-ever, the melting enthalpies ranged from 19 to 33 kJ/kg (Table 4). In all coconut oil emul-sions thermograms (Figure 3a,b), a thermal shift of 17–20 °C between the melting and so-lidification curves was observed. Wiyani et al. [43] successfully formulated virgin coconut
Figure 8. DSC thermograph of different tamanu–coconut oil mixtures in their first thermal cycle.
Table 5. DSC analyses of coconut–tamanu oil mixtures in their first thermal cycle.
Materials Mixing RatioMelting
Temperature (◦C) MeltingEnthalpy (kJ/kg)
FreezingTemperature (◦C) Solidification
Enthalpy (kJ/kg)Max Min Max Min
Coconutoil–tamanu
oilmixture
90% c.o.−10% t.o. 20.28 9.80 45.34 0.23 5.25 44.89
70% c.o.−30% t.o. 19.87 9.22 43.60 1.26 4.75 47.86
50% c.o.−50% t.o. 16.60 5.27 38.81 −6.66 2.45 38.39
30% c.o.−70% t.o. 13.43 3.82 28.90 −7.68 0.71 28.91
10% c.o.−90% t.o. 0.75 12.06 24.03 −10.24 −1.33 5.85
In [14], Isryad et al. tested Calophyllum inophyllum seed oil (CISO) with water, resultingin peak solidification and melting temperatures of −11.66 and 15.23 ◦C and latent heat ofsolidification and melting of 188.31 and 219.74 kJ/kg. In the current study, the melting andsolidification temperatures and enthalpies of tamanu oil emulsions with Tween 20 and 80were in the range from −0.5 to 2.3 ◦C, and from 2 to 3 kJ/kg. For tamanu oil emulsions(Figure 3c,d), a slight thermal shift in the range of 0.06–2.2 ◦C between the melting andsolidification curves occurred. Urbánková et al. [45] studied tamanu and black cumin oilemulsions with the addition of sodium caseinate, and observed an average emulsion sizein the range from 0.3 to 1.5 µm. In the current study, the average emulsion size of tamanuoil with Tween 20 (Figure 6) and Tween 80 (Figure 7) was 5–16 and 8–17 µm, respectively.The examined macroemulsion systems were composed of coconut oil and tamanu oil inwater, and formed droplets in the micrometer range. This indicates a microemulsion that isgenerally thermodynamically unstable. One emulsifier was used to achieve the stability ofoil in water emulsion in all different ratios, and the mixing was achieved with the sameenergy input.
Moreover, tamanu oil was mixed with coconut oil as pure substances without emulsi-fiers. In the literature, Jatropha curcas seed oil (JCSO) mixed with crude palm oil (CPO) [14]resulted in melting and solidification peak temperatures of −1.79 and −14.98 ◦C, andmelting–solidification enthalpies of 8.44 and 21.17 kJ/kg. The DSC thermographs of

Sustainability 2022, 14, 7432 10 of 20
tamanu oil and coconut oil mixtures (Figure 8) indicate that, for all examined mixing ratios(Table 5), two peaks for tamanu oil and coconut oil could be identified in the melting and so-lidification thermal cycles. A hysteresis loop of the latent heat/temperature thermographsis illustrated in tamanu oil mixtures with coconut oil. The higher the percentage of coconutoil in the solution was, the higher the latent heat of fusion in the mixture. More precisely, inthe mixture containing 90% coconut oil and 10% tamanu oil, there was an increase of 89%in the latent heat of melting and 667% in the latent heat of solidification compared to themixture with 10% coconut oil and 90% tamanu oil.
3.3. Thermophysical Characterization of PCM Electrospun Fiber Matrix
Tamanu oil, coconut oil, and their mixtures with commercially available organicPCM (Table 3) were encapsulated in the core of electrospun fiber matrices. The obtainedfiber mats were cut to prepare samples of 3 mg each. Figure 9 and Table 6 display thethermographs acquired by DSC and the summary of results, respectively. Figures 10–12show the optical images of the PCM fiber matrices and the respective histograms of fiberdiameters. The encapsulation ratio, efficiency, and mean diameter of the electrospun PCMfiber matrices are summarized in Table 7. Equations (1) and (2) were used for the calculationof the encapsulation ratio and efficiency presented in Table 7.
n =Lm,encap.PCM
Lm,PCM(1)
ε =Lm,encap.PCM + Ls,encap.PCM
Lm,PCM + Ls,PCM(2)
Table 6. DSC analyses of electrospun PCM fiber samples in 1st thermal cycle.
Fibers PCL Flow RateMelting
Temperature (◦C) Enthalpy (J/g) Freezing Temperature (◦C) Enthalpy (J/g)
PCM PCL PCM PCL PCM PCL PCM PCL
Coconut oil9%
0.3–0.6 mL/h 56.55 - 34.42 - 34.47 - 39.08 -
0.5–0.5 mL/h 22.94 54.71 46.91 7.36 8.03 36.49 40.16 8.59
12% 0.5–0.5 mL/h 22.99 54.80 49.20 6.87 7.41 36.48 46.50 8.10
Tamanu oil9%
0.3–0.6 mL/h −0.16 53.60 2.59 14.39 0.11 33.76 3.41 14.62
0.5–0.5 mL/h −0.12 50.96 2.35 5.98 −0.05 30.21 3.01 6.64
12% 0.5–0.5 mL/h 0.26 50.51 2.83 11.03 0.12 31.26 3.32 10.74
Coconut oil70%–tamanu
oil 30%
9%0.3–0.6 mL/h 20.73 55.43 20.03 19.34 7.75 - 36.52 7.97 22.30
0.5–0.5 mL/h 20.13 54.26 43.93 5.74 3.01 −1.26 34.34 35.32 7.07
12% 0.5–0.5 mL/h 20.32 53.27 31.83 8.94 4.43 - 33.33 27.04 10.19
Coconut oil35%–tamanu
oil 15%–RT18 50%
9%0.3–0.6 mL/h 13.65 53.75 56.69 5.90 8.98 4.48 34.91 37.00 6.86
0.5–0.5 mL/h 13.65 53.78 63.80 7.44 9.02 4.55, 1.48 34.85 57.58 8.07
12% 0.5–0.5 mL/h 13.61 54.20 54.78 8.75 1.68 4.60, 9.27 35.10 46.11 10.22
Coconut oil35%–tamanu
oil 15%–RT15 50%
9%0.3–0.6 mL/h 12.96 54.12 50.79 9.81 9.12 1.67, 13.15 35.03 30.99 11.46
0.5–0.5 mL/h 12.99 53.75 53.01 7.11 9.46 1.63, 12.84 34.92 31.89 7.61
12% 0.5–0.5 mL/h 13.48 53.78 48.55 9.75 12.74 1.52 34.92 31.85 10.27
Coconut oil35%–tamanu
oil 15%–PT18 50%
9%0.3–0.6 mL/h 6.26 50.55 22.45 7.41 −6.37 33.04 30.51 8.66
0.5–0.5 mL/h 5.89 50.71 23.65 7.75 −6.44 33.71 33.44 8.42
12% 0.5–0.5 mL/h 5.83 2.69 17.60 8.65 −6.70 33.59 28.59 9.52
Coconut oil35%–tamanu
oil 15%–PT 15 50%
9%0.3–0.6 mL/h 8.71 53.99 30.03 5.58 −0.83 35.55 46.81 6.99
0.5–0.5 mL/h 9.06 54.05 33.80 4.89 −0.81 34.70 44.64 5.97
12% 0.5–0.5 mL/h 10.71 55.59 43 10.43 3.05 0.16 35.96 57.96 13.46

Sustainability 2022, 14, 7432 11 of 20
Sustainability 2022, 14, x FOR PEER REVIEW 11 of 21
ε—Encapsulation efficiency (%)
(a) (b)
(c) (d)
(e) (f)
(g)
Figure 9. DSC thermograms of PCM encapsulated in the core of electrospun fiber in 1st thermal cycle. Core compositions: (a) tamanu oil emulsion,; (b) coconut oil emulsion,; (c) mixture of 70% co-conut oil and 30% tamanu oil; (d) mixture of 50% RT15, 15% tamanu oil, and 30% coconut oil,;
Figure 9. DSC thermograms of PCM encapsulated in the core of electrospun fiber in 1st thermal cycle.Core compositions: (a) tamanu oil emulsion; (b) coconut oil emulsion; (c) mixture of 70% co-conutoil and 30% tamanu oil; (d) mixture of 50% RT15, 15% tamanu oil, and 30% coconut oil; (e) mixtureof 50% RT18, 15% tamanu oil, and 35% coconut oil; (f) mixture of 50% PT15, 15% tamanu oil and35% coconut oil; (g) mixture of 50% PT18, 15% tamanu oil, and 35% coconut oil.

Sustainability 2022, 14, 7432 12 of 20
Sustainability 2022, 14, x FOR PEER REVIEW 12 of 21
(e) mixture of 50% RT18, 15% tamanu oil, and 35% coconut oil,; (f) mixture of 50% PT15, 15% ta-manu oil and 35% coconut oil,; (g) mixture of 50% PT18, 15% tamanu oil, and 35% coconut oil.
(a)
(b)
(c)
(d)
(e)
Figure 10. Cont.

Sustainability 2022, 14, 7432 13 of 20Sustainability 2022, 14, x FOR PEER REVIEW 13 of 21
(f)
(g)
Figure 10. (left) SEM images of core/shell fibers and (right) the respective fiber diameter distribu-tions for electrospun fiber mats produced with 9% PCL shell at flow rates of 0.3 mL/h for the core and 0.6 mL/h for the shell. Core compositions: (a) tamanu oil emulsion; (b) coconut oil emulsion; (c) mixture of 70% coconut oil and 30% tamanu oil; (d) mixture of 50% RT15, 15% tamanu oil, and 30% coconut oil; (e) mixture of 50% RT18, 15% tamanu oil, and 35% coconut oil; (f) mixture of 50% PT15, 15% tamanu oil and 35% coconut oil; (g) mixture of 50% PT18, 15% tamanu oil, and 35% coconut oil.
(a)
(b)
Figure 10. (left) SEM images of core/shell fibers and (right) the respective fiber diameter distributionsfor electrospun fiber mats produced with 9% PCL shell at flow rates of 0.3 mL/h for the core and0.6 mL/h for the shell. Core compositions: (a) tamanu oil emulsion; (b) coconut oil emulsion;(c) mixture of 70% coconut oil and 30% tamanu oil; (d) mixture of 50% RT15, 15% tamanu oil, and30% coconut oil; (e) mixture of 50% RT18, 15% tamanu oil, and 35% coconut oil; (f) mixture of50% PT15, 15% tamanu oil and 35% coconut oil; (g) mixture of 50% PT18, 15% tamanu oil, and35% coconut oil.
Sustainability 2022, 14, x FOR PEER REVIEW 13 of 21
(f)
(g)
Figure 10. (left) SEM images of core/shell fibers and (right) the respective fiber diameter distribu-tions for electrospun fiber mats produced with 9% PCL shell at flow rates of 0.3 mL/h for the core and 0.6 mL/h for the shell. Core compositions: (a) tamanu oil emulsion; (b) coconut oil emulsion; (c) mixture of 70% coconut oil and 30% tamanu oil; (d) mixture of 50% RT15, 15% tamanu oil, and 30% coconut oil; (e) mixture of 50% RT18, 15% tamanu oil, and 35% coconut oil; (f) mixture of 50% PT15, 15% tamanu oil and 35% coconut oil; (g) mixture of 50% PT18, 15% tamanu oil, and 35% coconut oil.
(a)
(b)
Figure 11. Cont.

Sustainability 2022, 14, 7432 14 of 20Sustainability 2022, 14, x FOR PEER REVIEW 14 of 21
(c)
(d)
(e)
(f)
(g)
Figure 11. (left) SEM images of core/shell fibers and the (right) respective fiber diameter distribu-tions for electrospun fiber mats produced with 9% PCL shell at flow rates of 0.5 mL/h for the core
Figure 11. (left) SEM images of core/shell fibers and the (right) respective fiber diame-ter distributions for electrospun fiber mats produced with 9% PCL shell at flow rates of0.5 mL/h for the core and 0.5 mL/h for the shell. Core compositions: (a) tamanu oil emulsion;(b) coconut oil emulsion; (c) mixture of 70% coconut oil and 30% tamanu oil; (d) mixture of 50% RT15,15% tamanu oil, and 30% coconut oil; (e) mixture of 50% RT18, 15% tamanu oil, and 35% coconut oil;(f) mixture of 50% PT15, 15% tamanu oil, and 35% coconut oil; (g) mixture of 50% PT18, 15% tamanuoil, and 35% coconut oil.

Sustainability 2022, 14, 7432 15 of 20
Sustainability 2022, 14, x FOR PEER REVIEW 15 of 21
and 0.5 mL/h for the shell. Core compositions: (a) tamanu oil emulsion; (b) coconut oil emulsion; (c) mixture of 70% coconut oil and 30% tamanu oil; (d) mixture of 50% RT15, 15% tamanu oil, and 30% coconut oil; (e) mixture of 50% RT18, 15% tamanu oil, and 35% coconut oil; (f) mixture of 50% PT15, 15% tamanu oil, and 35% coconut oil; (g) mixture of 50% PT18, 15% tamanu oil, and 35% coconut oil.
(a)
(b)
(c)
(d)
Sustainability 2022, 14, x FOR PEER REVIEW 16 of 21
(e)
(f)
(g)
Figure 12. (left) SEM images of core/shell fibers and (right) the respective fiber diameter distribu-tions for electrospun fiber mats produced with 12% PCL shell at flow rates of 0.5 mL/h for the core and 0.5 mL/h for the shell. Core compositions: (a) tamanu oil emulsion; (b) coconut oil emulsion; (c) mixture of 70% coconut oil and 30% tamanu oil; (d) mixture of 50% RT15, 15% tamanu oil, and 30% coconut oil; (e) mixture of 50% RT18, 15% tamanu oil, and 35% coconut oil; (f) mixture of 50% PT15, 15% tamanu oil, and 35% coconut oil; (g) mixture of 50% PT18, 15% tamanu oil, and 35% coconut oil.
Table 6. DSC analyses of electrospun PCM fiber samples in 1st thermal cycle.
Fibers PCL Flow Rate Melting Tempera-
ture (°C) Enthalpy (J/g) Freezing Tempera-
ture (°C) Enthalpy (J/g)
PCM PCL PCM PCL PCM PCL PCM PCL
Coconut oil 9%
0.3–0.6 mL/h 56.55 - 34.42 - 34.47 - 39.08 - 0.5–0.5 mL/h 22.94 54.71 46.91 7.36 8.03 36.49 40.16 8.59
12% 0.5–0.5 mL/h 22.99 54.80 49.20 6.87 7.41 36.48 46.50 8.10
Tamanu oil 9%
0.3–0.6 mL/h −0.16 53.60 2.59 14.39 0.11 33.76 3.41 14.62 0.5–0.5 mL/h −0.12 50.96 2.35 5.98 −0.05 30.21 3.01 6.64
12% 0.5–0.5 mL/h 0.26 50.51 2.83 11.03 0.12 31.26 3.32 10.74
Coconut oil 70%–ta-manu oil 30%
9% 0.3–0.6 mL/h 20.73 55.43 20.03 19.34 7.75 - 36.52 7.97 22.30 0.5–0.5 mL/h 20.13 54.26 43.93 5.74 3.01 −1.26 34.34 35.32 7.07
12% 0.5–0.5 mL/h 20.32 53.27 31.83 8.94 4.43 - 33.33 27.04 10.19 9% 0.3–0.6 mL/h 13.65 53.75 56.69 5.90 8.98 4.48 34.91 37.00 6.86
Figure 12. Cont.

Sustainability 2022, 14, 7432 16 of 20
Sustainability 2022, 14, x FOR PEER REVIEW 16 of 21
(e)
(f)
(g)
Figure 12. (left) SEM images of core/shell fibers and (right) the respective fiber diameter distribu-tions for electrospun fiber mats produced with 12% PCL shell at flow rates of 0.5 mL/h for the core and 0.5 mL/h for the shell. Core compositions: (a) tamanu oil emulsion; (b) coconut oil emulsion; (c) mixture of 70% coconut oil and 30% tamanu oil; (d) mixture of 50% RT15, 15% tamanu oil, and 30% coconut oil; (e) mixture of 50% RT18, 15% tamanu oil, and 35% coconut oil; (f) mixture of 50% PT15, 15% tamanu oil, and 35% coconut oil; (g) mixture of 50% PT18, 15% tamanu oil, and 35% coconut oil.
Table 6. DSC analyses of electrospun PCM fiber samples in 1st thermal cycle.
Fibers PCL Flow Rate Melting Tempera-
ture (°C) Enthalpy (J/g) Freezing Tempera-
ture (°C) Enthalpy (J/g)
PCM PCL PCM PCL PCM PCL PCM PCL
Coconut oil 9%
0.3–0.6 mL/h 56.55 - 34.42 - 34.47 - 39.08 - 0.5–0.5 mL/h 22.94 54.71 46.91 7.36 8.03 36.49 40.16 8.59
12% 0.5–0.5 mL/h 22.99 54.80 49.20 6.87 7.41 36.48 46.50 8.10
Tamanu oil 9%
0.3–0.6 mL/h −0.16 53.60 2.59 14.39 0.11 33.76 3.41 14.62 0.5–0.5 mL/h −0.12 50.96 2.35 5.98 −0.05 30.21 3.01 6.64
12% 0.5–0.5 mL/h 0.26 50.51 2.83 11.03 0.12 31.26 3.32 10.74
Coconut oil 70%–ta-manu oil 30%
9% 0.3–0.6 mL/h 20.73 55.43 20.03 19.34 7.75 - 36.52 7.97 22.30 0.5–0.5 mL/h 20.13 54.26 43.93 5.74 3.01 −1.26 34.34 35.32 7.07
12% 0.5–0.5 mL/h 20.32 53.27 31.83 8.94 4.43 - 33.33 27.04 10.19 9% 0.3–0.6 mL/h 13.65 53.75 56.69 5.90 8.98 4.48 34.91 37.00 6.86
Figure 12. (left) SEM images of core/shell fibers and (right) the respective fiber diameter distributionsfor electrospun fiber mats produced with 12% PCL shell at flow rates of 0.5 mL/h for the core and0.5 mL/h for the shell. Core compositions: (a) tamanu oil emulsion; (b) coconut oil emulsion;(c) mixture of 70% coconut oil and 30% tamanu oil; (d) mixture of 50% RT15, 15% tamanu oil, and30% coconut oil; (e) mixture of 50% RT18, 15% tamanu oil, and 35% coconut oil; (f) mixture of50% PT15, 15% tamanu oil, and 35% coconut oil; (g) mixture of 50% PT18, 15% tamanu oil, and35% coconut oil.
Table 7. Encapsulation ratio, efficiency and mean diameter of encapsulated electrospun PCM.
PCMCore Material PCL Flow
Rate (mL/h)Encapsulation
Ratio n (%)Encapsulation
Efficiency ε (%)Histogram Mean
Diameter (um)
Coconut oil9%
0.3–0.6 68.5 68.7 0.3 ± 0.001
0.5–0.5 93.4 81.4 5.6 ± 0.05
12% 0.5–0.5 98 89.5 0.9 ± 0.002
Tamanu oil9%
0.3–0.6 72.8 73.2 1.3 ± 0.06
0.5–0.5 66.1 65.4 0.8 ± 0.004
12% 0.5–0.5 79.6 75.1 2.7 ± 0.02
Coconut oil70%–tamanu oil
30%
9%0.3–0.6 45.9 30.6 0.4 ± 0.002
0.5–0.5 100 86.6 12.8 ± 0.09
12% 0.5–0.5 73 64.4 0.2 ± 0.0004
Coconut oil35%–tamanu oil15%–PT15 50%
9%0.3–0.6 39.3 51.2 4.4 ± 0.03
0.5–0.5 44.2 52.2 2 ± 0.008
12% 0.5–0.5 56.3 67.2 1.5 ± 0.01
Coconut oil35%–tamanu oil15%–PT18 50%
9%0.3–0.6 28.1 34.4 0.5 ± 0.001
0.5–0.5 29.6 37.1 0.5 ± 0.001
12% 0.5–0.5 22 30 0.1 ± 0.0004
Coconut oil35%–tamanu oil15%–RT15 50%
9%0.3–0.6 100 96 6.5 ± 0.06
0.5–0.5 100 99.6 0.8 ± 0.005
12% 0.5–0.5 100 94.3 7.5 ± 0.04
Coconut oil35%–tamanu oil15%–RT18 50%
9%0.3–0.6 100 91.9 6.9 ± 0.03
0.5–0.5 100 100 6.6 ± 0.02
12% 0.5–0.5 100 99 4.7 ± 0.02
(L)m,encap.PCM—Latent heat of melting for encapsulated PCM (J/g)(L)s,encap.PCM—Latent heat of solidification for encapsulated PCM (J/g)(L)m,PCM—Latent heat of melting for PCM (J/g)(L)s,PCM—Latent heat of solidification for PCM (J/g)n—Encapsulation ratio (%)ε—Encapsulation efficiency (%)

Sustainability 2022, 14, 7432 17 of 20
Several researchers [26,46,47] attempted the encapsulation of coconut oil in microfibers.In the existing literature [26], biomass microfibers with coconut oil encapsulated in the coreresulted in melting and solidification temperatures, and enthalpies for the core material ofTm = 22 ◦C, Tc1 = 14 ◦C, Tc2 = 8 ◦C, and ∆Hm = 134.9 J/g, ∆Hc = 64.7 J/g. The average fiberdiameters were 3 ± 1 µm for the cylindrical region of the fiber, and 8 ± 4 µm for the biconi-cal region of the fiber [26]. In another study, coconut oil was successfully encapsulated inPCL gel nanofibers with an efficiency of 60% [46] and 300 to 370 nm mean diameter. More-over, the melting and crystallization points of the coconut-oil-loaded sample were 25 and3 ◦C [46]. Saravana Kumar Jaganathan et al. [47] examined electrospun polyurethane/virgincoconut oil composites, and the fiber’s diameter was in the range of 886 ± 207 nm.
A coaxial electrospinning setup was adjusted in the laboratory, core-shell fibers wereformed for the oils mixture, and the four commercial PCMs were mixed with the two oilsin a PCL shell. The DSC thermographs of tamanu oil (Figure 9a), coconut oil (Figure 9b),and tamanu oil mixed with coconut oil (Figure 9c) in the core of the fiber display two peaksfor the PCM and the shell material. The melting or solidification enthalpy (Figure 9a) fortamanu oil was stable (Table 6) for the different flow rates and polymer concentrations.In the case of coconut oil, the electrospun fiber matrix examined in this study (Figure 9b)showed a narrower phase change temperature range (23 to 8 ◦C) and an increased enthalpyof melting and solidification at 49 to 47 kJ/kg for the case of 12% PCL shell. In the case oftamanu–coconut oil mixture, the electrospun fiber matrix with 9% PCL shell and 0.5/0.5ml/h core/shell flow rate, enthalpy of 44–35 kJ/kg was observed. In the four cases ofcommercial PCM materials (RT15 (Figure 9d), RT18 (Figure 9e), Pure Temp 15 (Figure 9f),and Pure Temp 18 (Figure 9g) mixed with the two oils, the melting and solidification curvesfollowed the same trend as that of the curves presented in [40] for electrospun fibers withcommercial PCMs alone. Fiber mats with the mixture of RT15 and the two oils in the core(Figure 9d) displayed a phase-change temperature range of 13–9 ◦C, while the mixture ofRT18 with the two oils displayed a 13–2 ◦C PCM temperature range. In the two mixturesof the organic paraffins with the renewable oils, a higher enthalpy was observed in thepolymer concentration of 9% w/v with a 0.5/0.5 mL/h core/shell flow rate. The mixtureof organic nonparaffinic PCM PT15 with the two oils (Figure 9f) resulted in the meltingor solidification temperature range of 8–0 ◦C, and the highest enthalpies, in this case, 43kJ/kg for melting and 58 kJ/kg for solidification observed for the polymer concentration of12% w/v and a 0.5/0.5 mL/h core/shell flow rate. Lastly, organic nonparaffinic PCM PT18demonstrated a melting solidification temperature range from 6 to −6 ◦C, and exhibitedthe highest enthalpies of 24 and 34 kJ/kg for a polymer concentration of 9% w/v and a0.5/0.5 mL/h core/shell flow rate. The highest encapsulation ratio n and encapsulationefficiency ε were observed in the cases of polymer concentration of 9% w/v and 0.5/0.5mL/h core/shell flow rate. The equation used to calculate the encapsulation ratio and theefficiency given in [40] indicates that the latent heat of melting for the solution encapsulatedin the fiber core for organic paraffins RT15 and RT18 mixed with the two oils is equal to thelatent heat of melting the fiber. That being the case, after calculating the encapsulation ratioin organic paraffins RT15 and RT18 with the oil mixture, the outcome was around 100%.This high percentage indicates that the core and fiber materials were melted together in theDSC testing procedure. The average mean diameter of all examined fibers was from 0.1 to12.8 µm. SEM images show that the 12% w/v and 0.5–0.5 mL/h flow rate PT15, tamanu oil,and coconut oil fibers were homogeneous and remained stable, with a mean diameter of1.5 µm and an encapsulation efficiency of 67.2%.
In future work, a uniform layer of electrospun fibers should be fabricated, applied, and testedin the LHTES system to evaluate if the stored energy is sufficient for construction applications.
4. Conclusions
Tamanu oil and coconut oil were studied for potential use as PCM materials in bulk,emulsion, and encapsulated fiber forms. As an outcome of the DSC analysis, bulk coconutoil was classified as a possible new PCM candidate for thermal energy storage applications

Sustainability 2022, 14, 7432 18 of 20
with latent heats of 50 and 56 kJ/kg. Tamanu oil and coconut oil emulsions with water andTween 20 and 80 exhibited lower latent heats than the bulk materials did. The mixture oftamanu oil with coconut oil ata ratio of 70/30 (CO/TO) demonstrated higher latent heats compared to the mixtureswith other ratios. The addition of 50% of RT18, a commercially available PCM, to 70/30mixture of coconut and tamanu oil yielded electrospun fibers with the best latent heat ofmelting and solidification of 63.8 and 57.6 kJ/kg, respectively. Overall, the developed pro-cedure of coaxial electrospinning with a PCL shell was demonstrated to be suitable for theefficient encapsulation of the PCM in the fibers. In the cases of RT15–tamanu oil–coconutoil and RT18–tamanu oil–coconut oil, the latent heat of the PCM fiber was equal to thelatent heat of the encapsulated PCM emulsion. The successful production of electrospunPCM fiber mats with encapsulated oils of biological origin is an important step towardsenergy-saving and environmentally friendly construction materials.
Author Contributions: Conceptualization, E.P. and P.F.; methodology, E.P. and A.A.; software, E.P.;validation, E.P., L.G. and P.F.; formal analysis, E.P.; investigation, E.P., P.F. and A.A.; resources, P.F.;data curation, P.F. and E.P.; writing—original draft preparation, E.P.; writing—review and editing, E.P.,L.G., P.F. and A.A.; supervision, E.P., P.F. and A.A.; project administration, E.P.; funding acqui-sition,A.A. All authors have read and agreed to the published version of the manuscript.
Funding: The authors acknowledge the support provided by ELFORSK, a research and developmentprogram administrated by Danish Energy.
Institutional Review Board Statement: Not applicable.
Informed Consent Statement: Not applicable.
Data Availability Statement: Data are available upon request.
Conflicts of Interest: The authors declare no conflict of interest.
Nomenclature
Parameter Description UnitPCM Phase change material -TES Thermal energy storage -PCL Polycaprolactone -SDS Sodium dodecyl sulfate -DSC Differential scanning calorimetry -(L)m,encap.PCM Latent heat of melting for encapsulated PCM (J/g)(L)s,encap.PCM Latent heat of solidification for encapsulated PCM (J/g)(L)m,PCM Latent heat of melting for PCM (J/g)(L)s,PCM Latent heat of solidification for PCM (J/g)Tm Melting temperature (◦C)Ts Solidification temperature (◦C)n Encapsulation ratio (%)ε Encapsulation efficiency (%)w/v Weight/volume (% g/mL)v/v Volume/volume (% mL/mL)
References1. IEA. 2019 Global Status Report for Buildings and Construction; International Energy Agency: Paris, France, 2019; Volume 224,
ISBN 9789280737684.2. Cabeza, L.F.; Martorell, I.; Miró, L.; Fernández, A.I.; Barreneche, C. Introduction to thermal energy storage (TES) sys-
tems. In Advances in Thermal Energy Storage Systems: Methods and Applications; Woodhead Publishing: Sawston, UK, 2015;ISBN 9781782420965.
3. Kosny, J. PCM-Enhanced Building Components; Springer International Publishing: Cham, Switzerland, 2015; ISBN 978-3-319-14285-2.4. Paroutoglou, E.; Afshari, A.; Bergsøe, N.C.; Fojan, P.; Hultmark, G. A PCM based cooling system for office buildings: A state of
the art review. E3S Web Conf. 2019, 111, 01026. [CrossRef]
Sustainability 2022, 14, 7432 19 of 20
5. Sarbu, I.; Sebarchievici, C. A comprehensive review of thermal energy storage. Sustainability 2018, 10, 191. [CrossRef]6. Bruno, F.; Belusko, M.; Liu, M.; Tay, N.H.S. Using solid-liquid phase change materials (PCMs) in thermal energy storage systems.
In Advances in Thermal Energy Storage Systems; Woodhead Publishing: Sawston, UK, 2015; pp. 201–246. [CrossRef]7. Casini, M.; Temperature, M.; Heat, L.; Phase, I.; Material, C.; Hydrate, S.; Thermal, L.; Storage, T.E.; Material, P.C.; Conductivity, T.
Phase-Change Materials Organic Phase Change Material. Available online: https://www.sciencedirect.com/science/article/pii/B9780081006351000058 (accessed on 8 May 2022).
8. Png, Z.M.; Soo, X.Y.D.; Chua, M.H.; Ong, P.J.; Suwardi, A.; Tan, C.K.I.; Xu, J.; Zhu, Q. Strategies to reduce the flammability oforganic phase change Materials: A review. Sol. Energy 2022, 231, 115–128. [CrossRef]
9. Arsana, M.E.; Temaja, I.W.; Widiantara, I.B.G.; Sukadana, I.B.P. Corn oil phase change material (PCM) in frozen food coolingmachine to improve energy efficiency. J. Phys. Conf. Ser. 2020, 1450, 012107. [CrossRef]
10. Rasta, I.M.; Wardana, I.N.G.; Hamidi, N.; Sasongko, M.N. The Role of Soya Oil Ester in Water-Based PCM for Low TemperatureCool Energy Storage. J. Thermodyn. 2016, 2016, 5384640. [CrossRef]
11. Irfan, A.M. Thermophysical Characteristics of VCO-Soybean Oil Mixture as Phase Change Material (PCM) using T-HistoryMethod. J. Phys. Conf. Ser. 2019, 1244, 012033. [CrossRef]
12. Rasta, I.M.; Suamir, I.N. The role of vegetable oil in water based phase change materials for medium temperature refrigeration.J. Energy Storage 2018, 15, 368–378. [CrossRef]
13. Kahwaji, S.; White, M.A. Edible oils as practical phase change materials for thermal energy storage. Appl. Sci. 2019, 9, 1627.[CrossRef]
14. Faraj, K.; Faraj, J.; Hachem, F.; Bazzi, H.; Khaled, M.; Castelain, C. Analysis of underfloor electrical heating system integratedwith coconut oil-PCM plates. Appl. Therm. Eng. 2019, 158, 113778. [CrossRef]
15. Saleel, C.A.; Mujeebu, M.A.; Algarni, S. Coconut oil as phase change material to maintain thermal comfort in passenger vehicles:An experimental analysis. J. Therm. Anal. Calorim. 2019, 136, 629–636. [CrossRef]
16. Irsyad, M.; Harmen. Heat transfer characteristics of coconut oil as phase change material to room cooling application. InProceedings of the IOP Conference Series: Earth and Environmental Science, Tangerang, Indonesia, 3–5 October 2016.
17. Silalahi, A.O.; Sukmawati, N.; Sutjahja, I.M.; Kurnia, D.; Wonorahardjo, S. Thermophysical Parameters of Organic PCM CoconutOil from T-History Method and Its Potential as Thermal Energy Storage in Indonesia. IOP Conf. Ser. Mater. Sci. Eng. 2017,214, 12034. [CrossRef]
18. Silalahi, A.O.; Sutjahja, I.M.; Kurnia, D.; Wonorahardjo, S. Thermophysical parameters of organic PCM coconut oil from theT-history method and its variation with the chemical dopant. J. Phys. Conf. Ser. 2019, 1204, 012055. [CrossRef]
19. Putri, W.A.; Fahmi, Z.; Sutjahja, I.M.; Kurnia, D.; Wonorahardjo, S. Thermophysical parameters of coconut oil and its potentialapplication as the thermal energy storage system in Indonesia. J. Phys. Conf. Ser. 2016, 739, 12065. [CrossRef]
20. Sri Rahayu, A.U.; Putri, W.A.; Sutjahja, I.M.; Kurnia, D.; Wonorahardjo, S. The effectiveness of organic PCM based on lauric acidfrom coconut oil and inorganic PCM based on salt hydrate CaCl2·6H2O as latent heat energy storage system in Indonesia. J. Phys.Conf. Ser. 2016, 739, 012119. [CrossRef]
21. Sutjahja, I.M.; Silalahi, A.O.; Kurnia, D.; Wonorahardjo, S. The role of particle dopant to the thermal conductivities of PCMcoconut oil by means of the T-history method. J. Phys. Conf. Ser. 2019, 1204, 012156. [CrossRef]
22. Wonorahardjo, S.; Sutjahja, I.M.; Kurnia, D. Potential of Coconut Oil for Temperature Regulation in Tropical Houses. J. Eng. Phys.Thermophys. 2019, 92, 80–88. [CrossRef]
23. Wonorahardjo, S.; Sutjahja, I.M.; Kurnia, D.; Fahmi, Z.; Putri, W.A. Potential of thermal energy storage using coconut oil for airtemperature control. Buildings 2018, 8, 95. [CrossRef]
24. Alqahtani, T.; Mellouli, S.; Bamasag, A.; Askri, F.; Phelan, P.E. Experimental and numerical assessment of using coconut oil asa phase-change material for unconditioned buildings. Int. J. Energy Res. 2020, 44, 5177–5196. [CrossRef]
25. Jeon, J.; Park, J.H.; Wi, S.; Yang, S.; Ok, Y.S.; Kim, S. Characterization of biocomposite using coconut oil impregnated biochar aslatent heat storage insulation. Chemosphere 2019, 236, 124269. [CrossRef]
26. Udangawa, W.M.R.N.; Willard, C.F.; Mancinelli, C.; Chapman, C.; Linhardt, R.J.; Simmons, T.J. Coconut oil-cellulose beadedmicrofibers by coaxial electrospinning: An eco-model system to study thermoregulation of confined phase change materials.Cellulose 2019, 26, 1855–1868. [CrossRef]
27. Oktay, B.; Bastürk, E.; Kahraman, M.V.; Apohan, N.K. Designing Coconut Oil Encapsulated Poly(stearyl methacrylate-co-hydroxylethyl metacrylate) Based Microcapsule for Phase Change Materials. ChemistrySelect 2019, 4, 5110–5115. [CrossRef]
28. Németh, B.; Németh, Á.S.; Ujhidy, A.; Tóth, J.; Trif, L.; Gyenis, J.; Feczkó, T. Fully bio-originated latent heat storing calciumalginate microcapsules with high coconut oil loading. Sol. Energy 2018, 170, 314–322. [CrossRef]
29. Saraç, E.G.; Öner, E.; Kahraman, M.V. Microencapsulated organic coconut oil as a natural phase change material for thermo-regulating cellulosic fabrics. Cellulose 2019, 26, 8939–8950. [CrossRef]
30. Uysal, D.; Dilara, Ç.; Eva, B.; Ángeles, B.M.; Jaime, G.; Pablo, D. Annals of the University of Oradea Fascicle of Textiles;Leatherwork Microencapsulation of Bio-Degradable pcm Using Coconut Oil and Ethyl Celulose. pp. 29–32. Available online: http://textile.webhost.uoradea.ro/Annals/Vol%20XX%20nr.%202-2019/Textile/Art.%20no.%20373%20pag.%2029-32.pdf (accessedon 8 May 2022).
31. Irsyad, M.; Indartono, Y.S.; Suwono, A.; Pasek, A.D. Thermal characteristics of non-edible oils as phase change materials candidateto application of air conditioning chilled water system. IOP Conf. Ser. Mater. Sci. Eng. 2015, 88, 012051. [CrossRef]

Sustainability 2022, 14, 7432 20 of 20
32. Dinesh, K.; Tamilvanan, A.; Vaishnavi, S.; Gopinath, M.; Mohan, K.S.R. Biodiesel production using Calophyllum inophyllum(Tamanu) seed oil and its compatibility test in a CI engine. Biofuels 2019, 10, 347–353. [CrossRef]
33. Raj, M.T.; Kandasamy, M.K.K. Tamanu oil-an alternative fuel for variable compression ratio engine. Int. J. Energy Environ. Eng.2012, 3, 18. [CrossRef]
34. Yarrapragada, K.S.S.R.; Krishna, B.B. Impact of tamanu oil-diesel blend on combustion, performance and emissions of dieselengine and its prediction methodology. J. Brazil. Soc. Mech. Sci. Eng. 2017, 39, 1797–1811. [CrossRef]
35. Rao, Y.K.; Krishna, B.B. Modeling diesel engine fueled with tamanu oil-Diesel blend by hybridizing neural network with fireflyalgorithm. Renew. Energy 2019, 134, 1200–1212. [CrossRef]
36. Mohanraj, T.; Mohan Kumar, K.M. Operating characteristics of a variable compression ratio engine using esterified tamanu oil.Int. J. Green Energy 2013, 10, 285–301. [CrossRef]
37. Ginigini, J.; Lecellier, G.J.; Nicolas, M.; Nour, M.; Hnawia, E.; Lebouvier, N.; Herbette, G.; Lockhart, P.; Raharivelomanana, P.Chemodiversity of Calophyllum inophyllum L. oil bioactive components related to their specific geographical distribution in theSouth Pacific region. PeerJ 2019, 2019, e6896. [CrossRef]
38. Paroutoglou, E.; Afshari, A.; Fojan, P.; Hultmark, G. Investigation of Thermal Behavior of Paraffins, Fatty Acids, Salt Hydratesand Renewable Based Oils as PCM. Available online: https://www.atlantis-press.com/proceedings/ires-20/125952227 (accessedon 8 May 2022).
39. Rasband, W.S. ImageJ. Available online: http://imagej.nih.gov/ij/ (accessed on 10 February 2021).40. Paroutoglou, E.; Fojan, P.; Gurevich, L.; Hultmark, G.; Afshari, A. Thermal Analysis of Organic and Nanoencapsulated Electrospun
Phase Change Materials. Energies 2021, 14, 995. [CrossRef]41. Tipvarakarnkoon, T.; Blochwitz, R.; Senge, B. Rheological Properties and Phase Change Behaviors of Coconut fats and Oils. 2008.
Available online: https://nordicrheologysociety.org/Content/Transactions/2008/Posters/Tipvarakarnkoon%20et%20al.pdf(accessed on 8 May 2022).
42. Maruyama, J.M.; Soares, F.A.S.D.M.; D’Agostinho, N.R.; Gonçalves, M.I.A.; Gioielli, L.A.; Da Silva, R.C. Effects of emulsifieraddition on the crystallization and melting behavior of palm olein and coconut oil. J. Agric. Food Chem. 2014, 62, 2253–2263.[CrossRef] [PubMed]
43. Wiyani, L.; Aladin, A.; Yani, S. Rahmawati Stability of virgin coconut oil emulsion with mixed emulsifiers Tween 80 and Span 80.ARPN J. Eng. Appl. Sci. 2016, 11, 5198–5202.
44. da Silva Gulão, E.; de Souza, C.J.F.; da Costa, A.R.; da Rocha-Leão, M.H.M.; Garcia-Rojas, E.E. Stability and rheological behaviorof coconut oil-in-water emulsions formed by biopolymers. Polimeros 2018, 28, 413–421. [CrossRef]
45. Urbánková, L.; Kašpárková, V.; Egner, P.; Rudolf, O.; Korábková, E. Caseinate-stabilized emulsions of black cumin and tamanuoils: Preparation, characterization and antibacterial activity. Polymers 2019, 11, 1951. [CrossRef] [PubMed]
46. Mohamadi, P.S.; Hivechi, A.; Bahrami, H.; Hemmatinegad, N.; Milan, P.B. Antibacterial and biological properties of coconut oilloaded poly(ε-caprolactone)/gelatin electrospun membranes. J. Ind. Text. 2021, 1528083721991595. [CrossRef]
47. Jaganathan, S.K.; Mohan Prasath, M.; Fauzi Ismail, A.; Manikandan, A.; Gomathi, N. Production and hemocompatibilityassessment of novel electrospun polyurethane nanofibers loaded with dietary virgin coconut oil for vascular graft applications.J. Bioact. Compat. Polym. 2018, 33, 210–223. [CrossRef]


