Embed Size (px)
Citation preview
sustainability
Article
Thermodynamic Analysis of ORC and Its Applicationfor Waste Heat Recovery
Alireza Javanshir *, Nenad Sarunac and Zahra RazzaghpanahFaculty of Mechanical Engineering and Engineering Science, UNC Charlotte, Charlotte, NC 28223, USA;[email protected] (N.S.); [email protected] (Z.R.)* Correspondence: [email protected]; Tel.: +1-704-954-4395
Received: 6 October 2017; Accepted: 25 October 2017; Published: 29 October 2017
Abstract: The analysis and optimization of an organic Rankine cycle (ORC) used as a bottoming cyclein the Brayton/ORC and steam Rankine/ORC combined cycle configurations is the main focus ofthis study. The results show that CO2 and air are the best working fluids for the topping (Brayton)cycle. Depending on the exhaust temperature of the topping cycle, Iso-butane, R11 and ethanol arethe preferred working fluids for the bottoming (ORC) cycle, resulting in the highest efficiency of thecombined cycle. Results of the techno-economic study show that combined Brayton/ORC cycle hassignificantly lower total capital investment and levelized cost of electricity (LCOE) compared to theregenerative Brayton cycle. An analysis of a combined steam Rankine/ORC cycle was performedto determine the increase in power output that would be achieved by adding a bottoming ORCto the utility-scale steam Rankine cycle, and determine the effect of ambient conditions (heat sinktemperature) on power increase. For the selected power plant location, the large difference betweenthe winter and summer temperatures has a considerable effect on the ORC power output, whichvaries by more than 60% from winter to summer.
Keywords: organic Rankine cycle; working fluid properties; thermal efficiency; subcritical ORC;transcritical ORC; combined Brayton ORC cycle; techno-economic analysis
1. Introduction
The increasing global energy demand, energy cost, and sustainability issues bring the need forwaste heat recovery and use. According to the U.S. Department of Energy (U.S. DOE), manufacturingindustries and power plants produce approximately 60% of the low-temperature waste heat [1].Releasing the exhaust with temperatures higher than 350 ◦C directly to the environment representsa large waste of the primary energy. The recovery of exhaust heat and its use through the organicRankine cycle (ORC) is an efficient and flexible method with simpler structure, higher safety, and lowermaintenance requirements compared to the conventional heat recovery methods, such as steamRankine cycle. Employing the low-grade energy (waste heat) by integrating the ORC into an energysystem, such as a power plant, industrial facility, or large diesel engine (or other prime mover) increasesthe power output and system energy efficiency [2].
An organic working fluid is used in a Clausius–Rankine cycle (ORC), instead of water-steam in aconventional steam Rankine cycle. Due to the low temperature of phase change, organic working fluidsrepresent a good choice for utilization of heat recovered from the low temperature heat sources [3].In an ORC cycle, the superheated turbine exhaust due to generally lower boiling temperature andevaporation pressure, helps to avoid erosion of the turbine blades caused by the wet steam in a steamRankine cycle [4]. Performance improvement of a regenerative ORC (ORC with a recuperator) inconjunction with a simple ORC (ORC without a recuperator) is the focus of the recent research work [5].
Due to the remarkable properties of the ORC for waste heat recovery from flue gases, a number ofexperimental studies were carried out and published in the literature. Zhou et al. [6] used a liquefied
Sustainability 2017, 9, 1974; doi:10.3390/su9111974 www.mdpi.com/journal/sustainability
Sustainability 2017, 9, 1974 2 of 26
petroleum gas stove as the heat source maintaining the temperature in the range of 90 ◦C to 220 ◦C.R123 was chosen as a working fluid and a scroll expander was used to achieve a maximum poweroutput of 0.645 kW and a cycle efficiency of 8.5%. Lemort et al. [7] and Quoilin et al. [8] also used thesame working fluid and expander type, reporting the maximum cycle efficiency of 7.4%.
Vatani et al. [9] employed an ORC to recover waste heat from the integrated direct internalreforming-molten carbonate fuel cells (DIR-MCFC) with a pre-reformer. A number of working fluidswere used to simulate the cycle at optimum operating conditions resulting in highest thermal efficiency.The results indicate that both the energy and exergy efficiencies were increased by cathode splitting.In addition, a decrease in exergy loss was observed while using cathode splitting for all substances.
Algieri et al. [10] studied the effect of internal heat recovery for sub-, trans- and supercritical ORCwith dry working fluids. Mago et al. [11] compared the regenerative ORC based on the combined firstand second law of thermodynamics analysis to a simple ORC. The study shows that ORC with dryworking fluid not only requires less amount of waste heat to generate specified power output but alsolowers irreversibility by increasing cycle efficiency. Acar [12] performed an energy and exergy analysisfor the reheat-regenerative Rankine cycle. The results show that, despite the same energy and exergyefficiencies of the closed cycle, exergy analysis yields to a better understanding of the losses in thesystem. Evaluation of five different ORC was done by Wang et al. [13]. Since a portion of the heat fromthe turbine exhaust stream is recovered in the recuperator and beneficially used, a regenerative ORChas the lower rate of exergy destruction, compared to the simple cycles.
Hung et al. [14] compared the effect of different types of working fluids on thermal efficiencyimprovement of the ORCs. The results show that, while the wet and isentropic working fluids donot have a significant effect on thermal efficiency (up to 2% improvements), dry fluids can improvethermal efficiency by more than 9%.
A simple ORC using waste heat sources and different working fluids has been the focus of manypapers and studies [15–19]. Saleh et al. [20] compared 31 different working fluids and their effect on thethermal efficiency for an ORC with different work cycle configurations. The effect of different workingfluids on thermal efficiency was also studied by Lakew and Bolland [21] for a simple subcritical ORCoperating in the 80 ◦C to 160 ◦C temperature range.
Numerous criteria are as well as international safety and environmental protocols and agreementsare considered during the fluid selection procedure. The ozone depletion potential (ODP), flammability,toxicity and global warming potential (GWP) are the criteria that need to be considered during theworking fluid selection process. Papadopoulos et al. [22] used 15 criteria for the fluid selection; withenvironmental, safety, physical, chemical and economical properties being the five main groups.The best working fluid is selected based on the cycle thermal efficiency. Details are provided in [23].
Since there is no working fluid that satisfies all selection criteria [24], the fluid selection methodshould balance all the main mentioned criteria. The selection processes is divided into two steps:elimination and ranking [25]. Elimination is used to remove the unsuitable working fluids from thelist before the ranking process is applied, having in mind that not all the properties have the sameweight of evaluation. Roedder et al. [26] used a combination of the elimination and ranking methodsto choose the best working fluid based on the 22 criteria. Iso-butane was identified as the best workingfluid for a two-stage ORC.
A combined cycle consists of several thermodynamic cycles, grouped into the topping orhigh-temperature and the bottoming or low-temperature cycles. Rejected heat from the toppingcycle is utilized by the bottoming cycle to produce more power. For a low exhaust temperature of thetopping cycle, organic Rankine cycle (ORC) is a suitable choice for the bottoming cycle, which performsbetter than the steam Rankine cycle [27–29]. The ORC power plants are commercially available on asmall scale due to low maximum operating temperature, and are used in renewable energy, geothermaland low-temperature heat recovery applications [27].
Sustainability 2017, 9, 1974 3 of 26
Despite the extensive studies on ORC, the combination of a regenerative Brayton cycle as thetopping cycle and an ORC as the bottoming cycle, i.e., the combined Brayton/ORC, has not beenevaluated to the sufficient level of detail, and warrants more investigation.
This paper is concerned with the exhaust heat recovery from the Brayton and steam Rankinecycles and its use in a simple ORC. The maximum temperature operating range used in this studyis between 50 ◦C and 350 ◦C, which is well within the ORC operating range. In this temperaturerange, other cycles such as steam Rankine, Brayton, or Kalina cycles have a very low thermal efficiency.Thus, there is on benefit of using any of these cycles as a bottoming cycle for recovery and utilizationof the low-grade waste heat.
The effect of twelve working fluids on cycle performance was studied over the range of cycleoperating conditions with the aim to identify the best working fluid for the specified set of operatingconditions. The cycle calculations and simulations were performed by employing the EbsilonProfessional V11 (EPV-11) power systems modeling software [30]. EPV-11 is professional softwareused for a detailed design, analysis, and optimization of the power generation systems.
Selection of working fluids resulting in best performance (thermodynamic efficiency or net specificwork output) of the ORC for the specified operating conditions (maximum temperature and pressure,heat rejection temperature, and others) is a time-consuming and arduous task, especially when a largenumber of working fluids is being considered. The commonly used approach involves performing anumber of parametric calculations over a range of operating parameters for a number of the candidateworking fluids. The results are usually presented in a graphical form, for example: for each of theanalyzed working fluids efficiency is plotted as a function of the maximum temperature and pressure.The best working fluid is selected by manually inspecting efficiency diagrams for all analyzed fluids.In addition, since the selection process is manual, there is a certain level of subjectivity and the potentialfor error involved.
The best (most suitable) working fluid, for use in ORC in waste heat recovery applications,was selected based on the selection procedure developed by the authors and published in theprevious studies [31–33]. The working fluid selection procedure allows for a non-subjective andexact determination of the best working fluid for the selected cycle operating conditions, as wellas construction of performance maps which provide visual and easy-to-interpret information onthe cycle thermal performance and the best working fluids. This selection procedure was appliedto determine the best working fluids for the combined regenerative Brayton/ORC and steamRankine/ORC applications.
A techno-economic analysis of the ORC and combined Brayton/ORC cycles was performed todetermine the total capital investment and levelized cost of electricity (LCOE), and allow economiccomparison of the investigated cycles.
2. Thermodynamic Modeling and Working Fluid Properties
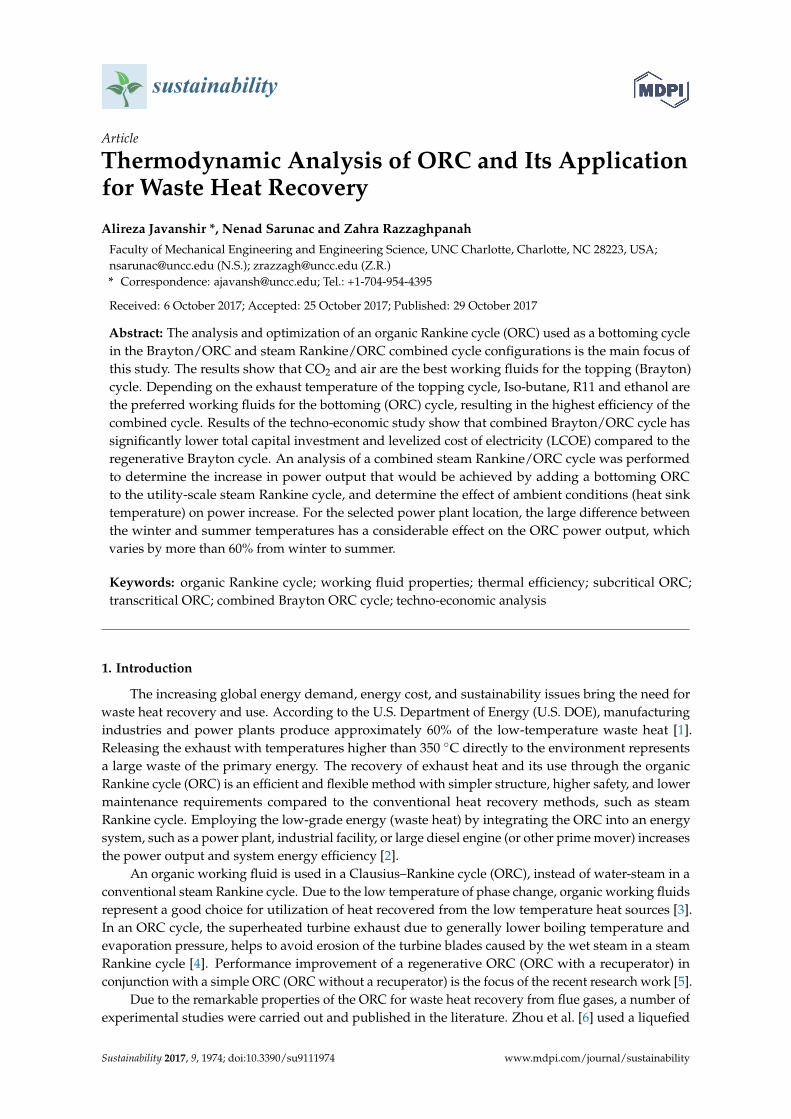
The operating principle of the ORC and steam Rankine cycles are the same: compression ofthe liquid, phase change (evaporation) in the evaporator, expansion in the turbine (expander), andphase change (condensation) in the condenser [34]. The main components involved in a simpleORC (feed pump, evaporator, turbine, and condenser) are presented in Figure 1. The working fluid isdelivered to the evaporator by the feed pump where it is evaporated at approximately constant pressureusing the externally supplied heat. In some ORC designs, a superheater is used to superheat theworking fluid [4]. The saturated or superheated working fluid is expanded in the turbine (expander),which is driving an electric generator. The low-pressure, low-temperature working fluid leaving theturbine is condensed in the condenser. The pressure of the working fluid leaving the condenser as asaturated (or slightly subcooled liquid) is increased by the feed pump, completing the power cycle.
Sustainability 2017, 9, 1974 4 of 26Sustainability 2017, 9, 1974 4 of 26
Figure 1. Schematic of a simple ORC.
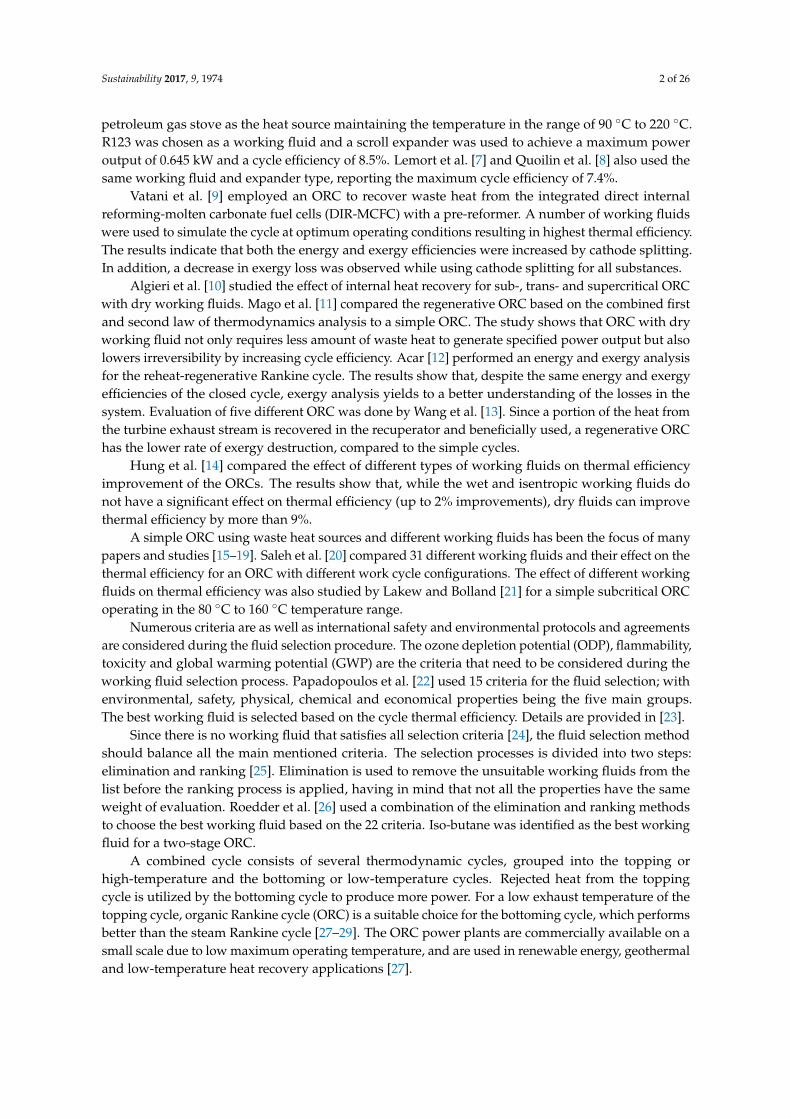
The temperature-specific entropy (T-s) diagrams of simple subcritical and transcritical ORCs are presented in Figure 2. There is no phase change in the supercritical cycle where the working fluid remains as a homogeneous supercritical fluid throughout the entire power cycle.
(A) (B) (C)
Figure 2. T-s diagram for a simple ORC: (A) subcritical; (B) subcritical with superheat; and (C) transcritical.
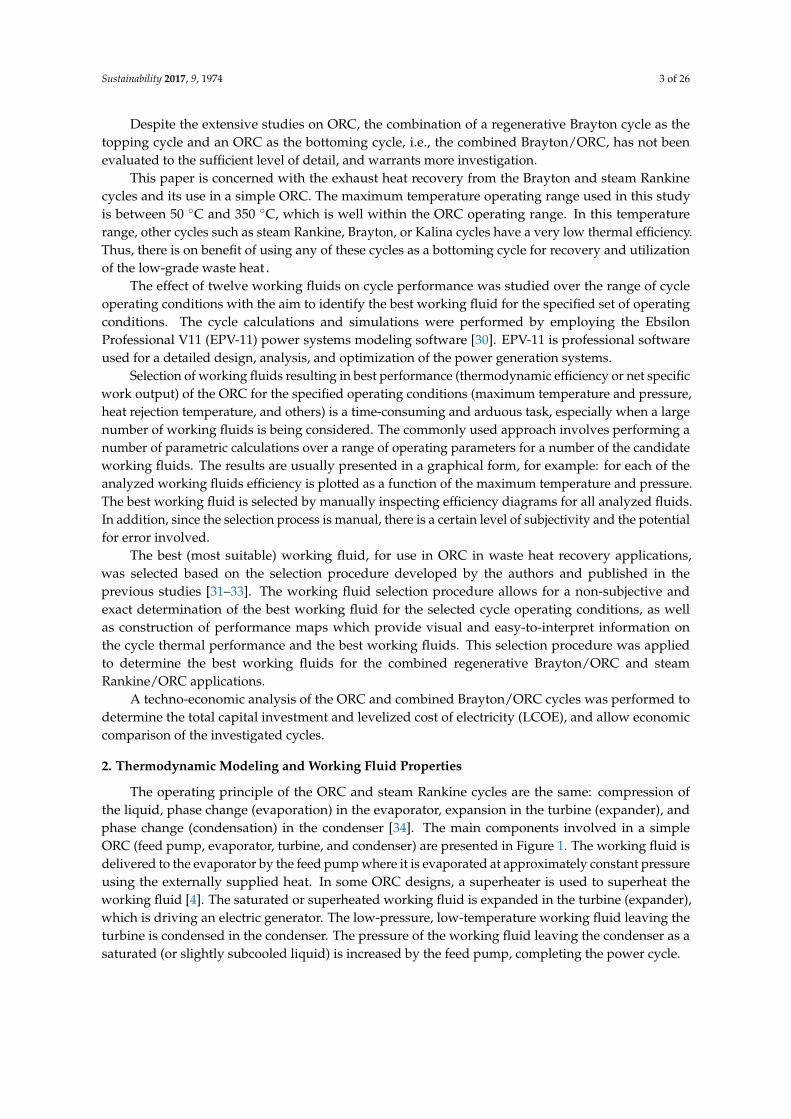
The main components of a regenerative Brayton/simple ORC are shown in Figure 3.
Figure 3. Schematic representation of a combined regenerative Brayton/ORC cycle.
Figure 1. Schematic of a simple ORC.
The temperature-specific entropy (T-s) diagrams of simple subcritical and transcritical ORCs arepresented in Figure 2. There is no phase change in the supercritical cycle where the working fluidremains as a homogeneous supercritical fluid throughout the entire power cycle.
Sustainability 2017, 9, 1974 4 of 26
Figure 1. Schematic of a simple ORC.
The temperature-specific entropy (T-s) diagrams of simple subcritical and transcritical ORCs are presented in Figure 2. There is no phase change in the supercritical cycle where the working fluid remains as a homogeneous supercritical fluid throughout the entire power cycle.
(A) (B) (C)
Figure 2. T-s diagram for a simple ORC: (A) subcritical; (B) subcritical with superheat; and (C) transcritical.
The main components of a regenerative Brayton/simple ORC are shown in Figure 3.
Figure 3. Schematic representation of a combined regenerative Brayton/ORC cycle.
Figure 2. T-s diagram for a simple ORC: (A) subcritical; (B) subcritical with superheat; and(C) transcritical.
The main components of a regenerative Brayton/simple ORC are shown in Figure 3.
Sustainability 2017, 9, 1974 4 of 26
Figure 1. Schematic of a simple ORC.
The temperature-specific entropy (T-s) diagrams of simple subcritical and transcritical ORCs are presented in Figure 2. There is no phase change in the supercritical cycle where the working fluid remains as a homogeneous supercritical fluid throughout the entire power cycle.
(A) (B) (C)
Figure 2. T-s diagram for a simple ORC: (A) subcritical; (B) subcritical with superheat; and (C) transcritical.
The main components of a regenerative Brayton/simple ORC are shown in Figure 3.
Figure 3. Schematic representation of a combined regenerative Brayton/ORC cycle. Figure 3. Schematic representation of a combined regenerative Brayton/ORC cycle.
In a combined power cycle, two or more thermodynamic cycles are combined to achieve higherefficiency and power output. Based on the operating temperature range, the cycles are divided intothe topping and bottoming cycles. The Brayton cycle was selected as a topping cycle because the
Sustainability 2017, 9, 1974 5 of 26
high turbine inlet temperature (TIT) is needed to achieve high thermal efficiency [34]. The exhausttemperature of a simple Brayton cycle (above 400 ◦C) is higher than the maximum allowed ORCoperating temperature; thus, a regenerative Brayton cycle, having lower exhaust temperature, was usedas a topping cycle in a combined Brayton/ORC cycle in this study.
2.1. Thermodynamic and Environmental Properties of the Working Fluids
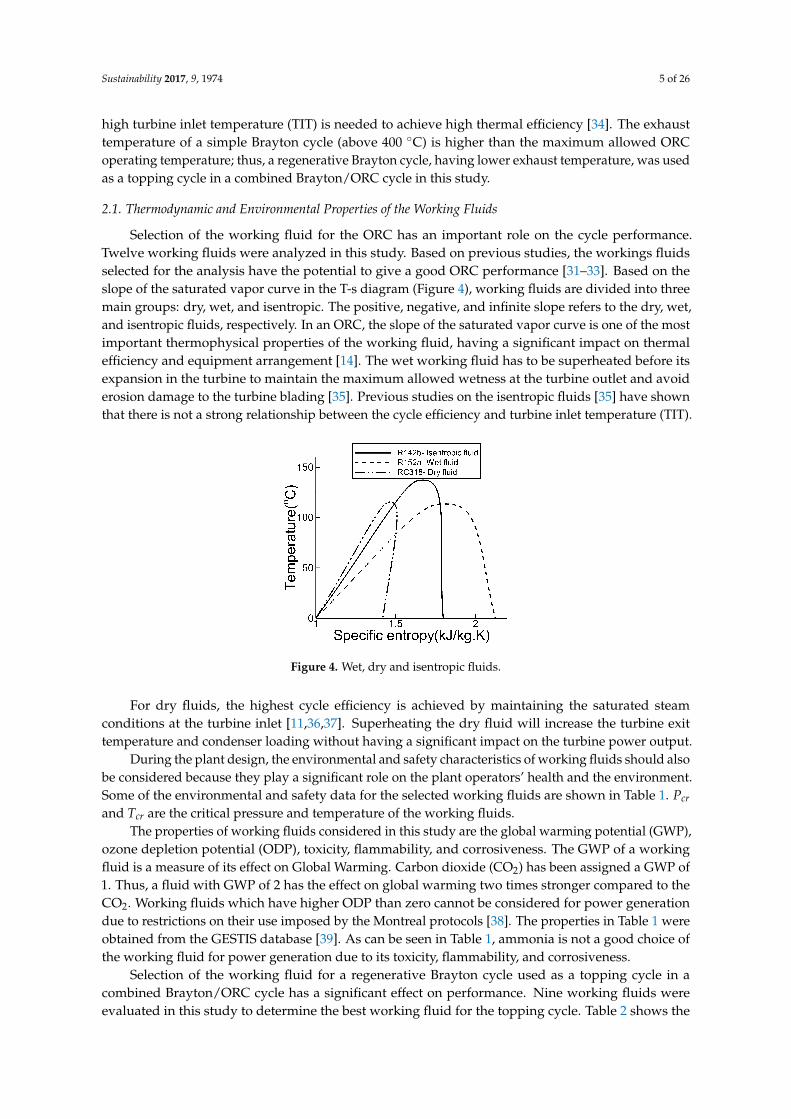
Selection of the working fluid for the ORC has an important role on the cycle performance.Twelve working fluids were analyzed in this study. Based on previous studies, the workings fluidsselected for the analysis have the potential to give a good ORC performance [31–33]. Based on theslope of the saturated vapor curve in the T-s diagram (Figure 4), working fluids are divided into threemain groups: dry, wet, and isentropic. The positive, negative, and infinite slope refers to the dry, wet,and isentropic fluids, respectively. In an ORC, the slope of the saturated vapor curve is one of the mostimportant thermophysical properties of the working fluid, having a significant impact on thermalefficiency and equipment arrangement [14]. The wet working fluid has to be superheated before itsexpansion in the turbine to maintain the maximum allowed wetness at the turbine outlet and avoiderosion damage to the turbine blading [35]. Previous studies on the isentropic fluids [35] have shownthat there is not a strong relationship between the cycle efficiency and turbine inlet temperature (TIT).
Sustainability 2017, 9, 1974 5 of 26
In a combined power cycle, two or more thermodynamic cycles are combined to achieve higher efficiency and power output. Based on the operating temperature range, the cycles are divided into the topping and bottoming cycles. The Brayton cycle was selected as a topping cycle because the high turbine inlet temperature (TIT) is needed to achieve high thermal efficiency [34]. The exhaust temperature of a simple Brayton cycle (above 400 °C) is higher than the maximum allowed ORC operating temperature; thus, a regenerative Brayton cycle, having lower exhaust temperature, was used as a topping cycle in a combined Brayton/ORC cycle in this study.
2.1. Thermodynamic and Environmental Properties of the Working Fluids
Selection of the working fluid for the ORC has an important role on the cycle performance. Twelve working fluids were analyzed in this study. Based on previous studies, the workings fluids selected for the analysis have the potential to give a good ORC performance [31–33]. Based on the slope of the saturated vapor curve in the T-s diagram (Figure 4), working fluids are divided into three main groups: dry, wet, and isentropic. The positive, negative, and infinite slope refers to the dry, wet, and isentropic fluids, respectively. In an ORC, the slope of the saturated vapor curve is one of the most important thermophysical properties of the working fluid, having a significant impact on thermal efficiency and equipment arrangement [14]. The wet working fluid has to be superheated before its expansion in the turbine to maintain the maximum allowed wetness at the turbine outlet and avoid erosion damage to the turbine blading [35]. Previous studies on the isentropic fluids [35] have shown that there is not a strong relationship between the cycle efficiency and turbine inlet temperature (TIT).
Figure 4. Wet, dry and isentropic fluids.
For dry fluids, the highest cycle efficiency is achieved by maintaining the saturated steam conditions at the turbine inlet [11,36,37]. Superheating the dry fluid will increase the turbine exit temperature and condenser loading without having a significant impact on the turbine power output.
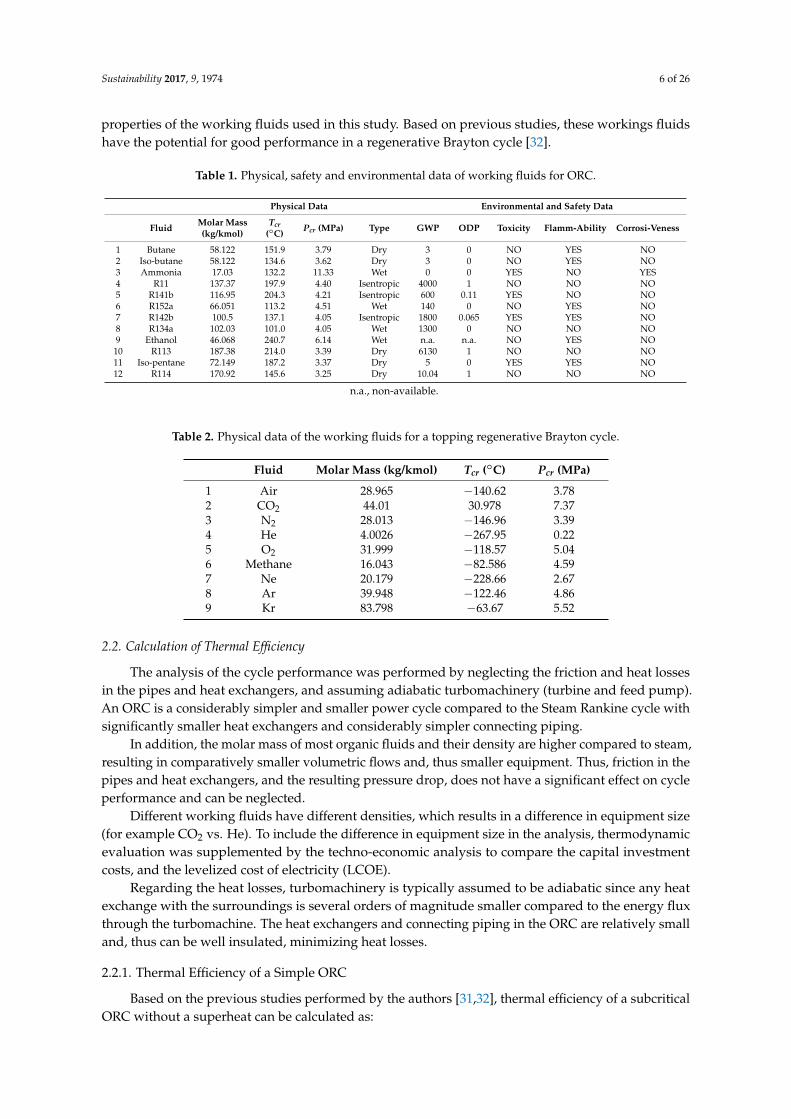
During the plant design, the environmental and safety characteristics of working fluids should also be considered because they play a significant role on the plant operators’ health and the environment. Some of the environmental and safety data for the selected working fluids are shown in Table 1. Pcr and Tcr are the critical pressure and temperature of the working fluids.
The properties of working fluids considered in this study are the global warming potential (GWP), ozone depletion potential (ODP), toxicity, flammability, and corrosiveness. The GWP of a working fluid is a measure of its effect on Global Warming. Carbon dioxide (CO2) has been assigned a GWP of 1. Thus, a fluid with GWP of 2 has the effect on global warming two times stronger compared to the CO2. Working fluids which have higher ODP than zero cannot be considered for
Figure 4. Wet, dry and isentropic fluids.
For dry fluids, the highest cycle efficiency is achieved by maintaining the saturated steamconditions at the turbine inlet [11,36,37]. Superheating the dry fluid will increase the turbine exittemperature and condenser loading without having a significant impact on the turbine power output.
During the plant design, the environmental and safety characteristics of working fluids should alsobe considered because they play a significant role on the plant operators’ health and the environment.Some of the environmental and safety data for the selected working fluids are shown in Table 1. Pcr
and Tcr are the critical pressure and temperature of the working fluids.The properties of working fluids considered in this study are the global warming potential (GWP),
ozone depletion potential (ODP), toxicity, flammability, and corrosiveness. The GWP of a workingfluid is a measure of its effect on Global Warming. Carbon dioxide (CO2) has been assigned a GWP of1. Thus, a fluid with GWP of 2 has the effect on global warming two times stronger compared to theCO2. Working fluids which have higher ODP than zero cannot be considered for power generationdue to restrictions on their use imposed by the Montreal protocols [38]. The properties in Table 1 wereobtained from the GESTIS database [39]. As can be seen in Table 1, ammonia is not a good choice ofthe working fluid for power generation due to its toxicity, flammability, and corrosiveness.
Selection of the working fluid for a regenerative Brayton cycle used as a topping cycle in acombined Brayton/ORC cycle has a significant effect on performance. Nine working fluids wereevaluated in this study to determine the best working fluid for the topping cycle. Table 2 shows the
Sustainability 2017, 9, 1974 6 of 26
properties of the working fluids used in this study. Based on previous studies, these workings fluidshave the potential for good performance in a regenerative Brayton cycle [32].
Table 1. Physical, safety and environmental data of working fluids for ORC.
Physical Data Environmental and Safety Data
Fluid Molar Mass(kg/kmol)
Tcr(◦C) Pcr (MPa) Type GWP ODP Toxicity Flamm-Ability Corrosi-Veness
1 Butane 58.122 151.9 3.79 Dry 3 0 NO YES NO2 Iso-butane 58.122 134.6 3.62 Dry 3 0 NO YES NO3 Ammonia 17.03 132.2 11.33 Wet 0 0 YES NO YES4 R11 137.37 197.9 4.40 Isentropic 4000 1 NO NO NO5 R141b 116.95 204.3 4.21 Isentropic 600 0.11 YES NO NO6 R152a 66.051 113.2 4.51 Wet 140 0 NO YES NO7 R142b 100.5 137.1 4.05 Isentropic 1800 0.065 YES YES NO8 R134a 102.03 101.0 4.05 Wet 1300 0 NO NO NO9 Ethanol 46.068 240.7 6.14 Wet n.a. n.a. NO YES NO10 R113 187.38 214.0 3.39 Dry 6130 1 NO NO NO11 Iso-pentane 72.149 187.2 3.37 Dry 5 0 YES YES NO12 R114 170.92 145.6 3.25 Dry 10.04 1 NO NO NO
n.a., non-available.
Table 2. Physical data of the working fluids for a topping regenerative Brayton cycle.
Fluid Molar Mass (kg/kmol) Tcr (◦C) Pcr (MPa)
1 Air 28.965 −140.62 3.782 CO2 44.01 30.978 7.373 N2 28.013 −146.96 3.394 He 4.0026 −267.95 0.225 O2 31.999 −118.57 5.046 Methane 16.043 −82.586 4.597 Ne 20.179 −228.66 2.678 Ar 39.948 −122.46 4.869 Kr 83.798 −63.67 5.52
2.2. Calculation of Thermal Efficiency
The analysis of the cycle performance was performed by neglecting the friction and heat lossesin the pipes and heat exchangers, and assuming adiabatic turbomachinery (turbine and feed pump).An ORC is a considerably simpler and smaller power cycle compared to the Steam Rankine cycle withsignificantly smaller heat exchangers and considerably simpler connecting piping.
In addition, the molar mass of most organic fluids and their density are higher compared to steam,resulting in comparatively smaller volumetric flows and, thus smaller equipment. Thus, friction in thepipes and heat exchangers, and the resulting pressure drop, does not have a significant effect on cycleperformance and can be neglected.
Different working fluids have different densities, which results in a difference in equipment size(for example CO2 vs. He). To include the difference in equipment size in the analysis, thermodynamicevaluation was supplemented by the techno-economic analysis to compare the capital investmentcosts, and the levelized cost of electricity (LCOE).
Regarding the heat losses, turbomachinery is typically assumed to be adiabatic since any heatexchange with the surroundings is several orders of magnitude smaller compared to the energy fluxthrough the turbomachine. The heat exchangers and connecting piping in the ORC are relatively smalland, thus can be well insulated, minimizing heat losses.
2.2.1. Thermal Efficiency of a Simple ORC
Based on the previous studies performed by the authors [31,32], thermal efficiency of a subcriticalORC without a superheat can be calculated as:
Sustainability 2017, 9, 1974 7 of 26
ηth = ηt(c1 × FOM + c2) (1)
C1 = 1.207TEC2 − 3.973TEC + 2.831 (2)
C2 = −1.862TEC2 + 5.824TEC − 4.009 (3)
where ηt and FOM are turbine isentropic efficiency and figure of merit, respectively. FOM isexpressed by:
FOM = Ja0.1(1
TEC)
0.8(4)
Ja =CP,13(T4 − T1)
h f g(5)
TEC =Evaporation temperature
Condensation temperature=
T4
T1(6)
where CP,13 represents the average specific heat capacity calculated from the State Point (SP) 1 toSP 3, T1 is the temperature at the feed pump inlet, T4 is the maximum temperature (turbine inlettemperature, TIT), and hfg is the latent heat (enthalpy) of evaporation (vaporization). The quantity Ja isthe Jacob number defined as the ratio of the sensible and latent heats.
As can be seen in Equation (1), there is a linear relationship between FOM and ηth. Accordingto Equations (1) and (4), ηth decreases as the Jacob number increases. Details are provided in [31,32].Based on the results, the following expression for the specific heat input for a subcritical ORC withouta superheat was developed:
.qin
.m
= h f g(Ja + 1) (7)
where.
m is mass flow rate of the power cycle.Compared to a subcritical cycle without a superheat, thermal efficiency of a superheated subcritical
cycle is affected by an additional variable; the superheat temperature. The following expression forthermal efficiency of a superheated ORC was proposed by the authors [31,32]
ηth = ηt(c1 Jat + c2) (8)
Jat = (Ja + k × Jas)1.45 (9)
c1 =(c11 × T4
T1+ c12 +
(TevT1
)11)
82.875(
T4Tev
)1.46Tev−41.9199 , c2 =(c21 × T4
T1+ c22 +
(TevT1
)0.1)
82.875(
T4Tev
)−0.44 (10)
c11 = −0.5195T1 + 121.44, c12 = 0.5953T1 − 146.88 (11)
c21 = −0.5157T1 + 225.92, c22 = 0.5179T1 − 243.95 (12)
where k = 1 for the wet and isentropic fluids, while for the dry fluids k = 1.5 [31]. Ja is the Jacob numberand Jas is the superheat Jacob number.
Ja =CP,1ev(Tev − T1)
h f g, Jas =
CP,34(T4 − Tev)
h f g(13)
The results show that thermal efficiency decreases as the Jacob number Ja and superheat Jacobnumber Jas increase. Based on the results, the following expression for the specific heat input for asubcritical ORC with a superheat was developed:
.qin
.m
= h f g(Ja + Jas + 1) (14)
Sustainability 2017, 9, 1974 8 of 26
For the supercritical ORC shown in Figure 2C, a similar procedure was used to determineexpression for thermal efficiency:
ηth = ηt(c1Tmd + c2) (15)
Tmd = ln(TEC)− 0.8 × k(Tr − 1) (16)
c1 = 5.421Tr3 − 18.332Tr
2 + 20.901Tr − 7.483 (17)
c2 = 3.272Tr3 − 11.065Tr
2 + 12.454Tr − 4.63 (18)
Tr =T4
Tcr(19)
where Tcr and Tmd are the critical and modified temperatures of the working fluid, respectively.The constant k has the same value as for a subcritical ORC with the superheat. For a transcritical ORC,as shown by Equation (15), at the critical point of the analyzed working fluids, thermal efficiency is alinear function of the dimensionless temperature Tr.
Based on the results, the following expression for the specific heat input for a transcritical ORCwith the superheat was developed:
.qin
.m
= cp14(T4 − T1) (20)
Finally, the net work output of all types of a simple ORC can be calculated as:
.Wnet = ηth
.qin (21)
2.2.2. Thermal Efficiency of a Combined Regenerative Brayton/ORC
Thermal efficiency of a combined cycle may be calculated as:
ηcombined =
.Wnet, Brayton +
.Wnet, ORC
.qin,Brayton
= ηth,Brayton + A (22)
Equation (22) provides insight into why combined cycles are more efficient compared to thesimple cycles: efficiency of the combined cycle is a sum of the Brayton (topping) cycle efficiency anda positive quantity A. As will be shown later, the value of quantity A depends on selection of theworking fluid for the bottoming (ORC) cycle.
Based on the developed correlations and previous results [31,32], twelve working fluids listedin Table 1 have been selected for this study. The use of these working fluids in a simple ORC has apotential to increase thermal efficiency and net power output compared to the other working fluids.
3. Power Block Cost Estimation
The capital cost of a power block consists of the purchased cost of equipment, the labor andmaterials needed for the installation, such as the piping, the foundations and structural supports,the electrical equipment, the instrumentation and controls, and the indirect expenses. The indirectexpenses cover the transportation costs for shipping equipment to the plant site, and salaries for theproject personnel.
Table 3 shows components of the total capital investment cost considered in this study.More details can be found in [40].
The bare module cost, CBM, is the sum of direct and indirect costs for each unit as described inTurton et al. [41], and can be calculated by Equation (23).
CBM = C0PFBM (23)
Sustainability 2017, 9, 1974 9 of 26
C0P is purchase cost of equipment in base conditions. Base condition represents the case where the
equipment is made of the most common material, usually carbon steel operating at ambient pressure.FBM is the bare module factor.
The data for the purchase cost of the equipment described in Turton et al. [41] were obtainedbased on the average CEPCI (Chemical Engineering Plant Cost Index) value of 397. The updated valueof CEPCI of 556.8 for the year of 2015 was utilized for the present economic estimate.
The purchased equipment cost for base conditions, C0P may be determined by employing
Equation (24).log10C0
P = K1 + K2 × log10 AA + K3(log10 AA)2 (24)
where AA is the size parameter for the equipment, and K1, K2, and K3 are constants given in Table 4.
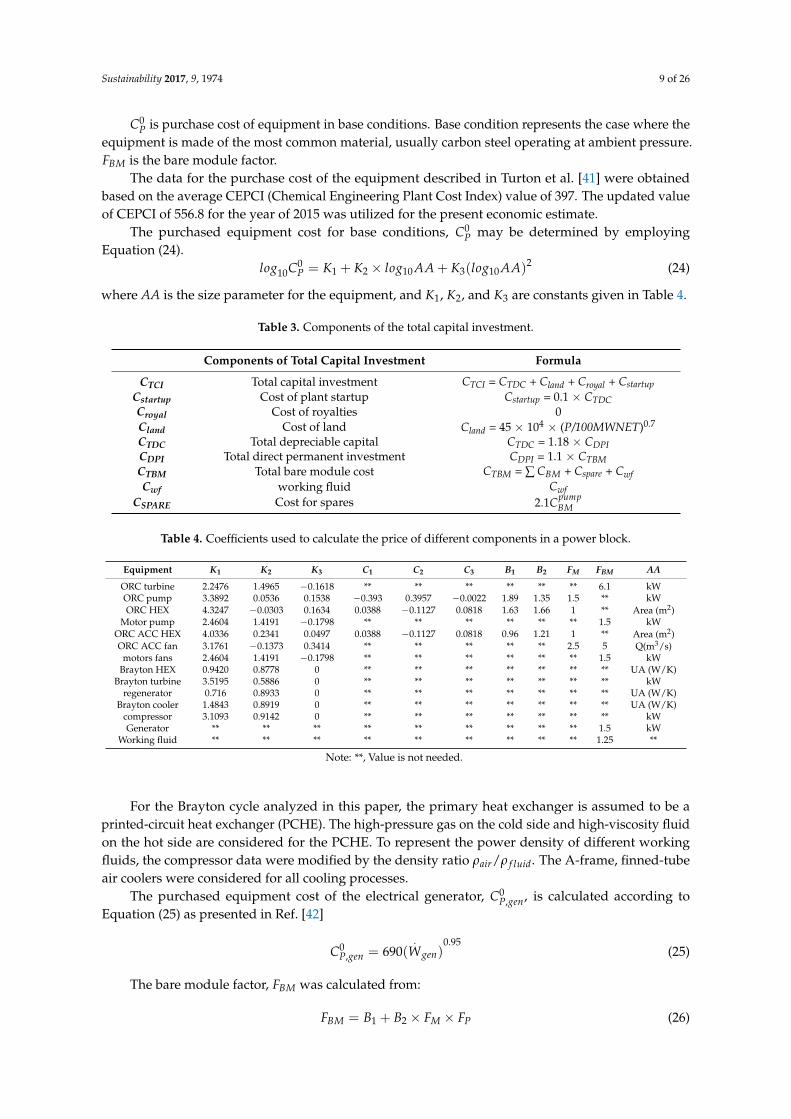
Table 3. Components of the total capital investment.
Components of Total Capital Investment Formula
CTCI Total capital investment CTCI = CTDC + Cland + Croyal + CstartupCstartup Cost of plant startup Cstartup = 0.1 × CTDCCroyal Cost of royalties 0Cland Cost of land Cland = 45 × 104 × (P/100MWNET)0.7
CTDC Total depreciable capital CTDC = 1.18 × CDPICDPI Total direct permanent investment CDPI = 1.1 × CTBMCTBM Total bare module cost CTBM = ∑ CBM + Cspare + CwfCwf working fluid Cwf
CSPARE Cost for spares 2.1CpumpBM
Table 4. Coefficients used to calculate the price of different components in a power block.
Equipment K1 K2 K3 C1 C2 C3 B1 B2 FM FBM AA
ORC turbine 2.2476 1.4965 −0.1618 ** ** ** ** ** ** 6.1 kWORC pump 3.3892 0.0536 0.1538 −0.393 0.3957 −0.0022 1.89 1.35 1.5 ** kWORC HEX 4.3247 −0.0303 0.1634 0.0388 −0.1127 0.0818 1.63 1.66 1 ** Area (m2)
Motor pump 2.4604 1.4191 −0.1798 ** ** ** ** ** ** 1.5 kWORC ACC HEX 4.0336 0.2341 0.0497 0.0388 −0.1127 0.0818 0.96 1.21 1 ** Area (m2)ORC ACC fan 3.1761 −0.1373 0.3414 ** ** ** ** ** 2.5 5 Q(m3/s)
motors fans 2.4604 1.4191 −0.1798 ** ** ** ** ** ** 1.5 kWBrayton HEX 0.9420 0.8778 0 ** ** ** ** ** ** ** UA (W/K)
Brayton turbine 3.5195 0.5886 0 ** ** ** ** ** ** ** kWregenerator 0.716 0.8933 0 ** ** ** ** ** ** ** UA (W/K)
Brayton cooler 1.4843 0.8919 0 ** ** ** ** ** ** ** UA (W/K)compressor 3.1093 0.9142 0 ** ** ** ** ** ** ** kWGenerator ** ** ** ** ** ** ** ** ** 1.5 kW
Working fluid ** ** ** ** ** ** ** ** ** 1.25 **
Note: **, Value is not needed.
For the Brayton cycle analyzed in this paper, the primary heat exchanger is assumed to be aprinted-circuit heat exchanger (PCHE). The high-pressure gas on the cold side and high-viscosity fluidon the hot side are considered for the PCHE. To represent the power density of different workingfluids, the compressor data were modified by the density ratio ρair/ρ f luid. The A-frame, finned-tubeair coolers were considered for all cooling processes.
The purchased equipment cost of the electrical generator, C0P,gen, is calculated according to
Equation (25) as presented in Ref. [42]
C0P,gen = 690(
.Wgen)
0.95(25)
The bare module factor, FBM was calculated from:
FBM = B1 + B2 × FM × FP (26)
Sustainability 2017, 9, 1974 10 of 26
log10FP = C1 + C2 × log10P + C3(log10P)2 (27)
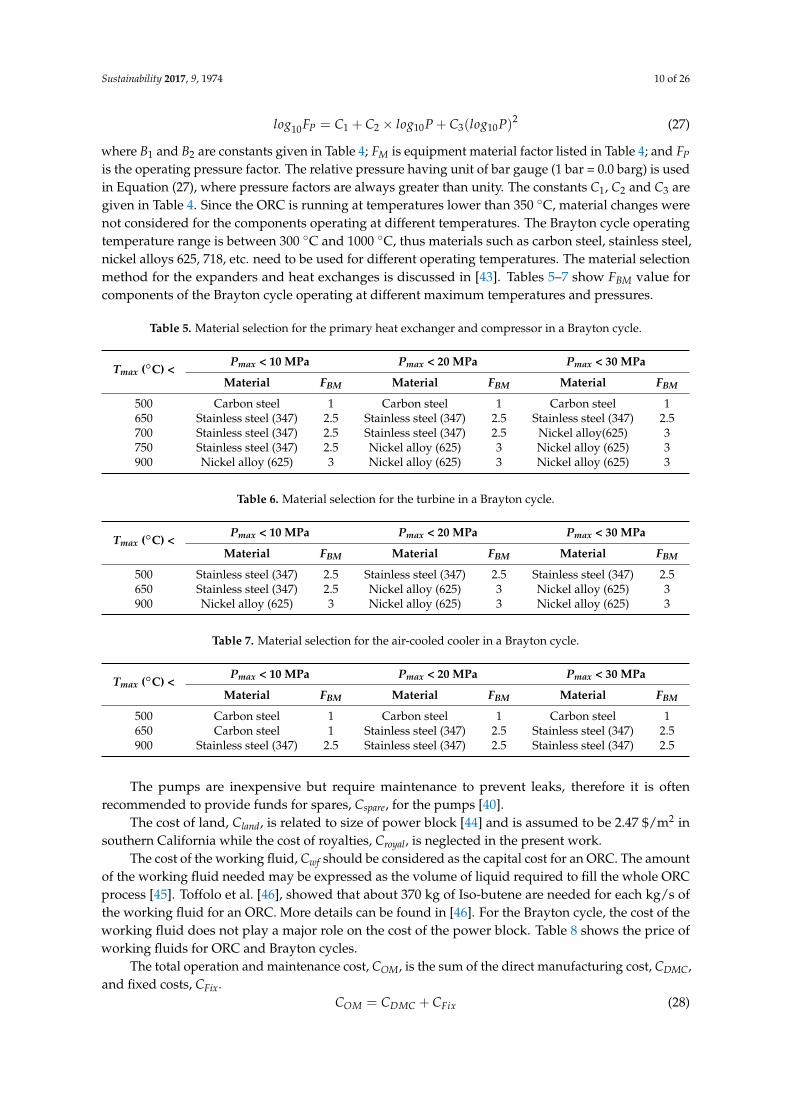
where B1 and B2 are constants given in Table 4; FM is equipment material factor listed in Table 4; and FPis the operating pressure factor. The relative pressure having unit of bar gauge (1 bar = 0.0 barg) is usedin Equation (27), where pressure factors are always greater than unity. The constants C1, C2 and C3 aregiven in Table 4. Since the ORC is running at temperatures lower than 350 ◦C, material changes werenot considered for the components operating at different temperatures. The Brayton cycle operatingtemperature range is between 300 ◦C and 1000 ◦C, thus materials such as carbon steel, stainless steel,nickel alloys 625, 718, etc. need to be used for different operating temperatures. The material selectionmethod for the expanders and heat exchanges is discussed in [43]. Tables 5–7 show FBM value forcomponents of the Brayton cycle operating at different maximum temperatures and pressures.
Table 5. Material selection for the primary heat exchanger and compressor in a Brayton cycle.
Tmax (◦C) <Pmax < 10 MPa Pmax < 20 MPa Pmax < 30 MPa
Material FBM Material FBM Material FBM
500 Carbon steel 1 Carbon steel 1 Carbon steel 1650 Stainless steel (347) 2.5 Stainless steel (347) 2.5 Stainless steel (347) 2.5700 Stainless steel (347) 2.5 Stainless steel (347) 2.5 Nickel alloy(625) 3750 Stainless steel (347) 2.5 Nickel alloy (625) 3 Nickel alloy (625) 3900 Nickel alloy (625) 3 Nickel alloy (625) 3 Nickel alloy (625) 3
Table 6. Material selection for the turbine in a Brayton cycle.
Tmax (◦C) <Pmax < 10 MPa Pmax < 20 MPa Pmax < 30 MPa
Material FBM Material FBM Material FBM
500 Stainless steel (347) 2.5 Stainless steel (347) 2.5 Stainless steel (347) 2.5650 Stainless steel (347) 2.5 Nickel alloy (625) 3 Nickel alloy (625) 3900 Nickel alloy (625) 3 Nickel alloy (625) 3 Nickel alloy (625) 3
Table 7. Material selection for the air-cooled cooler in a Brayton cycle.
Tmax (◦C) <Pmax < 10 MPa Pmax < 20 MPa Pmax < 30 MPa
Material FBM Material FBM Material FBM
500 Carbon steel 1 Carbon steel 1 Carbon steel 1650 Carbon steel 1 Stainless steel (347) 2.5 Stainless steel (347) 2.5900 Stainless steel (347) 2.5 Stainless steel (347) 2.5 Stainless steel (347) 2.5
The pumps are inexpensive but require maintenance to prevent leaks, therefore it is oftenrecommended to provide funds for spares, Cspare, for the pumps [40].
The cost of land, Cland, is related to size of power block [44] and is assumed to be 2.47 $/m2 insouthern California while the cost of royalties, Croyal, is neglected in the present work.
The cost of the working fluid, Cwf should be considered as the capital cost for an ORC. The amountof the working fluid needed may be expressed as the volume of liquid required to fill the whole ORCprocess [45]. Toffolo et al. [46], showed that about 370 kg of Iso-butene are needed for each kg/s ofthe working fluid for an ORC. More details can be found in [46]. For the Brayton cycle, the cost of theworking fluid does not play a major role on the cost of the power block. Table 8 shows the price ofworking fluids for ORC and Brayton cycles.
The total operation and maintenance cost, COM, is the sum of the direct manufacturing cost, CDMC,and fixed costs, CFix.
COM = CDMC + CFix (28)
Sustainability 2017, 9, 1974 11 of 26
CDMC = CMain + CUT (29)
The sum of the maintenance cost and utilities cost, which includes wages and benefits, salaries andbenefits, materials and services, and manufacturing overhead is called the direct manufacturing cost.
As defined in Ref. [40], maintenance cost CMain can be calculated as:
CMain = 0.0805CTCI (30)
Utilities cost is related to the dry cooling tower [44] and it is calculated as:
CUT = 2.1795 × (.
Wnet(MW))0.7
(31)
Fixed cost includes cost of property taxes and liability insurance is equal to:
CFix = 0.02CTDC (32)
Annual operation hours and electricity generation are:
OHAnnual = CF × 24 × 365 (33)
Enet =.
Wnet × OHAnnual (34)
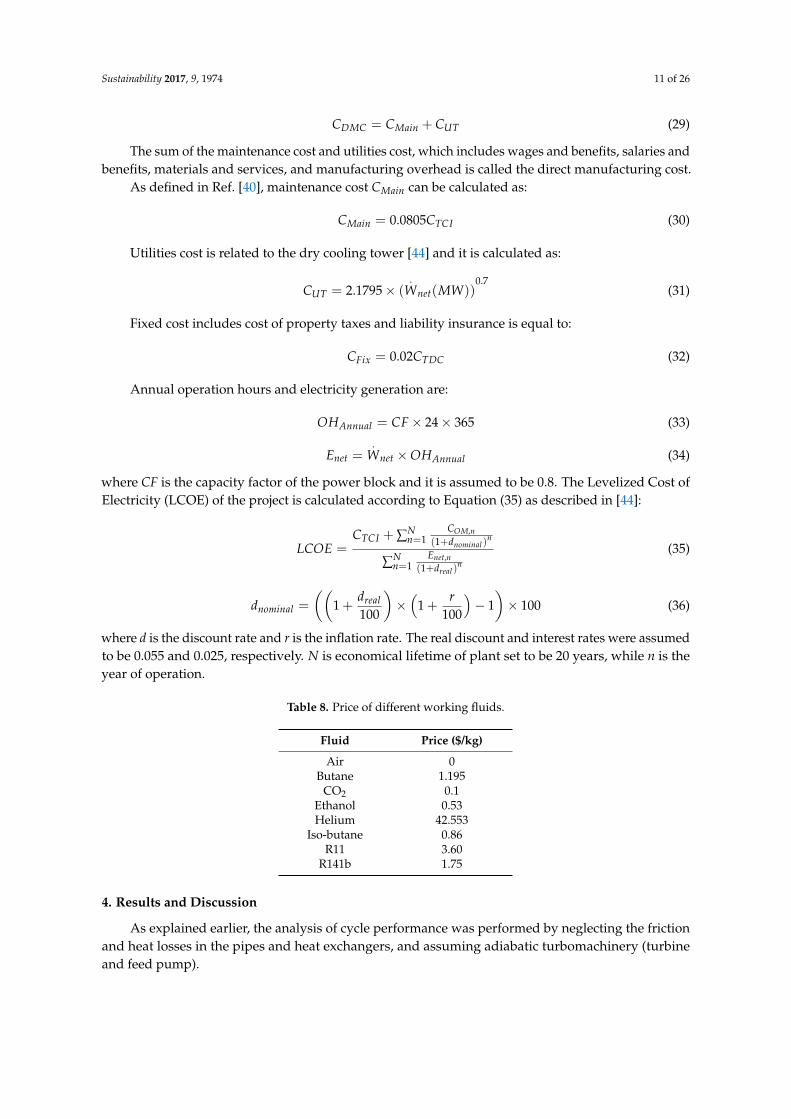
where CF is the capacity factor of the power block and it is assumed to be 0.8. The Levelized Cost ofElectricity (LCOE) of the project is calculated according to Equation (35) as described in [44]:
LCOE =CTCI + ∑N
n=1COM,n
(1+dnominal)n
∑Nn=1
Enet,n(1+dreal)
n
(35)
dnominal =
((1 +
dreal100
)×
(1 +
r100
)− 1
)× 100 (36)
where d is the discount rate and r is the inflation rate. The real discount and interest rates were assumedto be 0.055 and 0.025, respectively. N is economical lifetime of plant set to be 20 years, while n is theyear of operation.
Table 8. Price of different working fluids.
Fluid Price ($/kg)
Air 0Butane 1.195
CO2 0.1Ethanol 0.53Helium 42.553
Iso-butane 0.86R11 3.60
R141b 1.75
4. Results and Discussion
As explained earlier, the analysis of cycle performance was performed by neglecting the frictionand heat losses in the pipes and heat exchangers, and assuming adiabatic turbomachinery (turbineand feed pump).
Sustainability 2017, 9, 1974 12 of 26
4.1. Effect of Working Fluid Properties on Thermal Efficiency and Specific Net Work Output
Correlations for thermal efficiency developed by the authors [31,32] were used to investigate theeffects of the working fluid properties on performance of a simple ORC. Equations (1), (5) and (8) showthat, in a subcritical region, thermal efficiency is a function of the specific heat capacity and the latentheat of evaporation.
It can be shown that the first derivative of Equations (1) and (8) with respect to CP in the subcriticalregion is negative (Equation (37)), meaning that at constant maximum and minimum temperatures,working fluids with higher specific heat capacity give lower thermal efficiency.
∂ηth∂CP
< 0 (37)
However, the first derivative of Equations (1) and (8) with respect to h f g in the subcritical regionis positive (Equation (38)), meaning that at constant maximum and minimum temperatures, workingfluids with higher latent heat of evaporation give higher thermal efficiency.
∂ηth∂h f g
> 0 (38)
Since the first derivatives of expression for.
Wnet (Equation (21)) with respect to specific heatcapacity CP and latent heat of evaporation h f g in the subcritical region are positive, Equation (39),working fluids with higher CP or h f g produce higher net power output.
∂.
Wnet
∂Cp> 0,
∂.
Wnet
∂h f g> 0 (39)
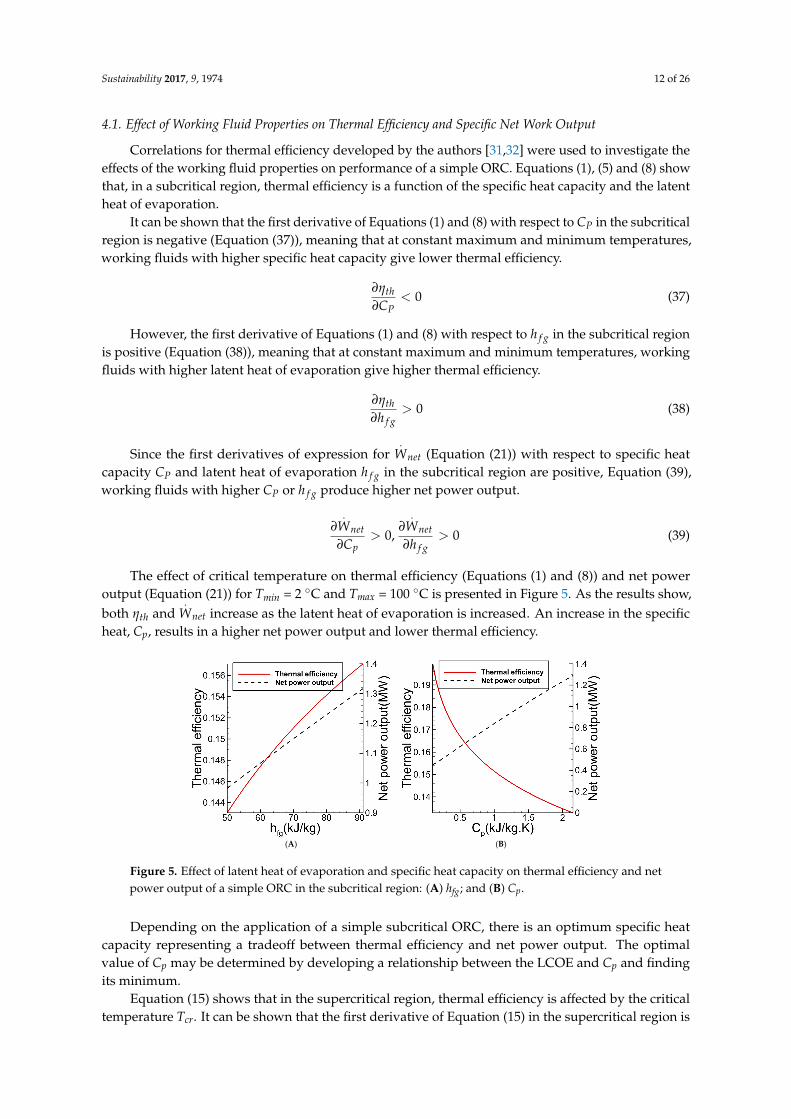
The effect of critical temperature on thermal efficiency (Equations (1) and (8)) and net poweroutput (Equation (21)) for Tmin = 2 ◦C and Tmax = 100 ◦C is presented in Figure 5. As the results show,both ηth and
.Wnet increase as the latent heat of evaporation is increased. An increase in the specific
heat, Cp, results in a higher net power output and lower thermal efficiency.
Sustainability 2017, 9, 1974 12 of 26
Correlations for thermal efficiency developed by the authors [31,32] were used to investigate the effects of the working fluid properties on performance of a simple ORC. Equations (1), (5) and (8) show that, in a subcritical region, thermal efficiency is a function of the specific heat capacity and the latent heat of evaporation.
It can be shown that the first derivative of Equations (1) and (8) with respect to in the subcritical region is negative (Equation (37)), meaning that at constant maximum and minimum temperatures, working fluids with higher specific heat capacity give lower thermal efficiency. < 0 (37)
However, the first derivative of Equations (1) and (8) with respect to ℎ in the subcritical region is positive (Equation (38)), meaning that at constant maximum and minimum temperatures, working fluids with higher latent heat of evaporation give higher thermal efficiency. > 0 (38)
Since the first derivatives of expression for (Equation (21)) with respect to specific heat capacity and latent heat of evaporation ℎ in the subcritical region are positive, Equation (39), working fluids with higher or ℎ produce higher net power output. > 0, ℎ > 0 (39)
The effect of critical temperature on thermal efficiency (Equations (1) and (8)) and net power output (Equation (21)) for Tmin = 2 °C and Tmax = 100 °C is presented in Figure 5. As the results show, both and increase as the latent heat of evaporation is increased. An increase in the specific heat, Cp, results in a higher net power output and lower thermal efficiency.
(A) (B) Figure 5. Effect of latent heat of evaporation and specific heat capacity on thermal efficiency and net power output of a simple ORC in the subcritical region: (A) hfg; and (B) Cp.
Depending on the application of a simple subcritical ORC, there is an optimum specific heat capacity representing a tradeoff between thermal efficiency and net power output. The optimal value of Cp may be determined by developing a relationship between the LCOE and Cp and finding its minimum.
Equation (15) shows that in the supercritical region, thermal efficiency is affected by the critical temperature Tcr. It can be shown that the first derivative of Equation (15) in the supercritical region is positive (Equation (40)), meaning that at constant maximum and minimum temperatures, working fluids with higher critical temperature give higher thermal efficiency.
Figure 5. Effect of latent heat of evaporation and specific heat capacity on thermal efficiency and netpower output of a simple ORC in the subcritical region: (A) hfg; and (B) Cp.
Depending on the application of a simple subcritical ORC, there is an optimum specific heatcapacity representing a tradeoff between thermal efficiency and net power output. The optimalvalue of Cp may be determined by developing a relationship between the LCOE and Cp and findingits minimum.
Equation (15) shows that in the supercritical region, thermal efficiency is affected by the criticaltemperature Tcr. It can be shown that the first derivative of Equation (15) in the supercritical region is
Sustainability 2017, 9, 1974 13 of 26
positive (Equation (40)), meaning that at constant maximum and minimum temperatures, workingfluids with higher critical temperature give higher thermal efficiency.
∂ηth∂Tcr
> 0 (40)
Since the first derivatives of the expression for the net power output (Equation (21)) with respectto the specific heat Cp and critical temperature Tcr (expressed in dimensionless form as Tr) are positive,Equation (41), working fluids with higher Cp or Tcr produce higher net power output.
∂.
Wnet
∂Cp> 0,
∂.
Wnet
∂Tcr> 0 (41)
In addition, the first derivative of Equations (8), (15) and (21) with respect to k in the superheatedsubcritical and supercritical region is negative (Equation (42)), meaning that, at constant maximumand minimum temperatures, wet and isentropic working fluids give higher thermal efficiency and netpower output, compared to the dry fluids.
∂ηth∂k
< 0,∂
.Wnet
∂k< 0 (42)
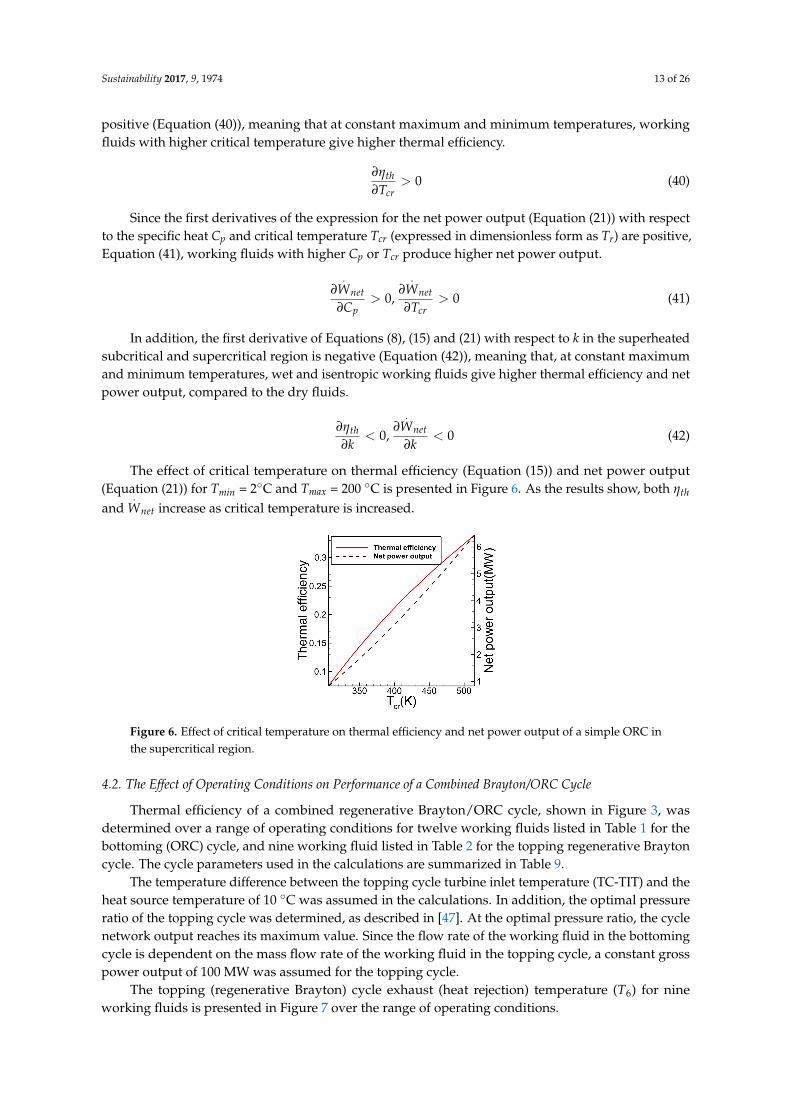
The effect of critical temperature on thermal efficiency (Equation (15)) and net power output(Equation (21)) for Tmin = 2◦C and Tmax = 200 ◦C is presented in Figure 6. As the results show, both ηth
and.
Wnet increase as critical temperature is increased.
Sustainability 2017, 9, 1974 13 of 26
> 0 (40)
Since the first derivatives of the expression for the net power output (Equation (21)) with respect to the specific heat Cp and critical temperature Tcr (expressed in dimensionless form as Tr) are positive, Equation (41), working fluids with higher Cp or Tcr produce higher net power output. > 0, > 0 (41)
In addition, the first derivative of Equations (8), (15) and (21) with respect to in the superheated subcritical and supercritical region is negative (Equation (42)), meaning that, at constant maximum and minimum temperatures, wet and isentropic working fluids give higher thermal efficiency and net power output, compared to the dry fluids. < 0, < 0 (42)
The effect of critical temperature on thermal efficiency (Equation (15)) and net power output (Equation (21)) for Tmin = 2°C and Tmax = 200 °C is presented in Figure 6. As the results show, both and increase as critical temperature is increased.
Figure 6. Effect of critical temperature on thermal efficiency and net power output of a simple ORC in the supercritical region.
4.2. The Effect of Operating Conditions on Performance of a Combined Brayton/ORC Cycle
Thermal efficiency of a combined regenerative Brayton/ORC cycle, shown in Figure 3, was determined over a range of operating conditions for twelve working fluids listed in Table 1 for the bottoming (ORC) cycle, and nine working fluid listed in Table 2 for the topping regenerative Brayton cycle. The cycle parameters used in the calculations are summarized in Table 9.
Table 9. Cycle parameters for a combined regenerative Brayton/ORC cycle.
Parameter Value Reference Brayton cycle turbine isentropic efficiency 0.90 [34]
ORC turbine isentropic efficiency 0.87 [34] Compressor and pump isentropic efficiency 0.80 [34]
P2 (MPa) 5–30 Assumed T1 (°C), T8 (°C) 32–62 Assumed
T3 (°C) 300–1000 Assumed Effectiveness 0.85 [34]
Figure 6. Effect of critical temperature on thermal efficiency and net power output of a simple ORC inthe supercritical region.
4.2. The Effect of Operating Conditions on Performance of a Combined Brayton/ORC Cycle
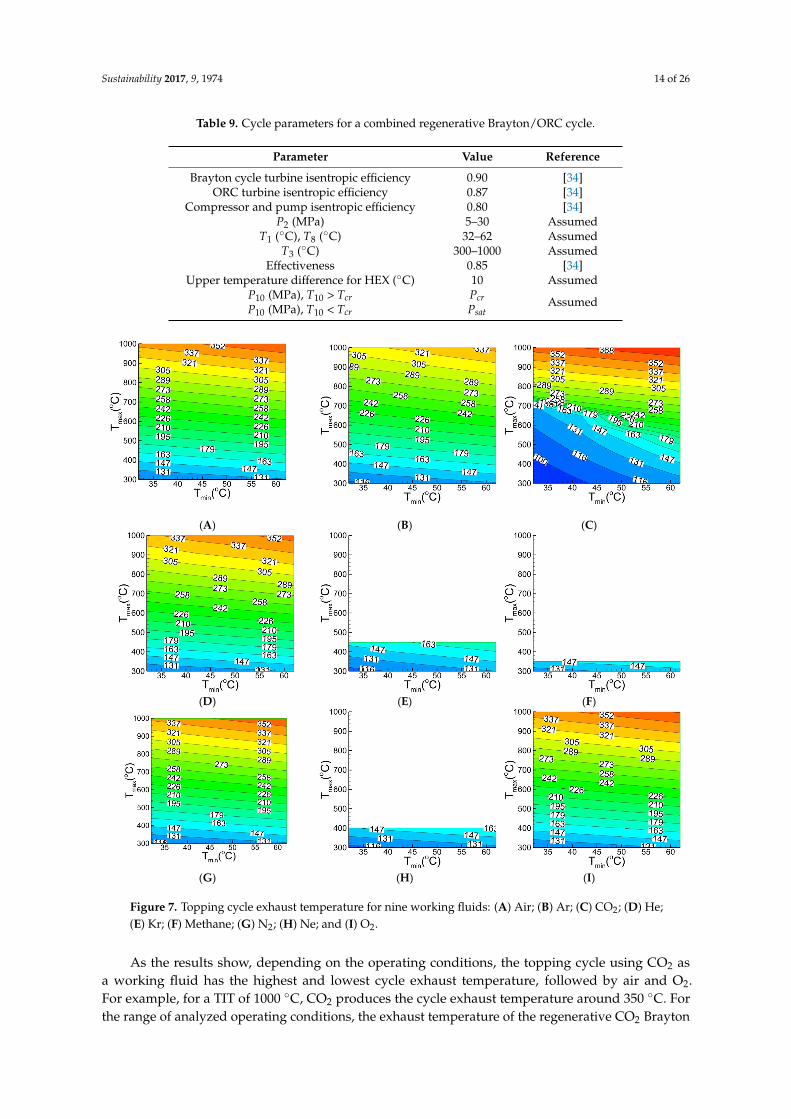
Thermal efficiency of a combined regenerative Brayton/ORC cycle, shown in Figure 3, wasdetermined over a range of operating conditions for twelve working fluids listed in Table 1 for thebottoming (ORC) cycle, and nine working fluid listed in Table 2 for the topping regenerative Braytoncycle. The cycle parameters used in the calculations are summarized in Table 9.
The temperature difference between the topping cycle turbine inlet temperature (TC-TIT) and theheat source temperature of 10 ◦C was assumed in the calculations. In addition, the optimal pressureratio of the topping cycle was determined, as described in [47]. At the optimal pressure ratio, the cyclenetwork output reaches its maximum value. Since the flow rate of the working fluid in the bottomingcycle is dependent on the mass flow rate of the working fluid in the topping cycle, a constant grosspower output of 100 MW was assumed for the topping cycle.
The topping (regenerative Brayton) cycle exhaust (heat rejection) temperature (T6) for nineworking fluids is presented in Figure 7 over the range of operating conditions.
Sustainability 2017, 9, 1974 14 of 26
Table 9. Cycle parameters for a combined regenerative Brayton/ORC cycle.
Parameter Value Reference
Brayton cycle turbine isentropic efficiency 0.90 [34]ORC turbine isentropic efficiency 0.87 [34]
Compressor and pump isentropic efficiency 0.80 [34]P2 (MPa) 5–30 Assumed
T1 (◦C), T8 (◦C) 32–62 AssumedT3 (◦C) 300–1000 Assumed
Effectiveness 0.85 [34]Upper temperature difference for HEX (◦C) 10 Assumed
P10 (MPa), T10 > TcrP10 (MPa), T10 < Tcr
PcrPsat
Assumed
Sustainability 2017, 9, 1974 14 of 26
Upper temperature difference for HEX (°C) 10 Assumed P10 (MPa), T10 > Tcr P10 (MPa), T10 < Tcr
Pcr Psat Assumed
The temperature difference between the topping cycle turbine inlet temperature (TC-TIT) and the heat source temperature of 10 °C was assumed in the calculations. In addition, the optimal pressure ratio of the topping cycle was determined, as described in [47]. At the optimal pressure ratio, the cycle network output reaches its maximum value. Since the flow rate of the working fluid in the bottoming cycle is dependent on the mass flow rate of the working fluid in the topping cycle, a constant gross power output of 100 MW was assumed for the topping cycle.
The topping (regenerative Brayton) cycle exhaust (heat rejection) temperature (T6) for nine working fluids is presented in Figure 7 over the range of operating conditions.
(A) (B) (C)
(D) (E) (F)
(G) (H) (I)
Figure 7. Topping cycle exhaust temperature for nine working fluids: (A) Air; (B) Ar; (C) CO2; (D) He; (E) Kr; (F) Methane; (G) N2; (H) Ne; and (I) O2.
As the results show, depending on the operating conditions, the topping cycle using CO2 as a working fluid has the highest and lowest cycle exhaust temperature, followed by air and O2. For example, for a TIT of 1000 °C, CO2 produces the cycle exhaust temperature around 350 °C. For the range of analyzed operating conditions, the exhaust temperature of the regenerative CO2 Brayton
Figure 7. Topping cycle exhaust temperature for nine working fluids: (A) Air; (B) Ar; (C) CO2; (D) He;(E) Kr; (F) Methane; (G) N2; (H) Ne; and (I) O2.
As the results show, depending on the operating conditions, the topping cycle using CO2 asa working fluid has the highest and lowest cycle exhaust temperature, followed by air and O2.For example, for a TIT of 1000 ◦C, CO2 produces the cycle exhaust temperature around 350 ◦C. Forthe range of analyzed operating conditions, the exhaust temperature of the regenerative CO2 Brayton
Sustainability 2017, 9, 1974 15 of 26
cycle is between 100 ◦C and 350 ◦C, which is within the ORC operating range. Thus, the ORC can beselected as the bottoming cycle in the combined regenerative Brayton/ORC cycle configuration.
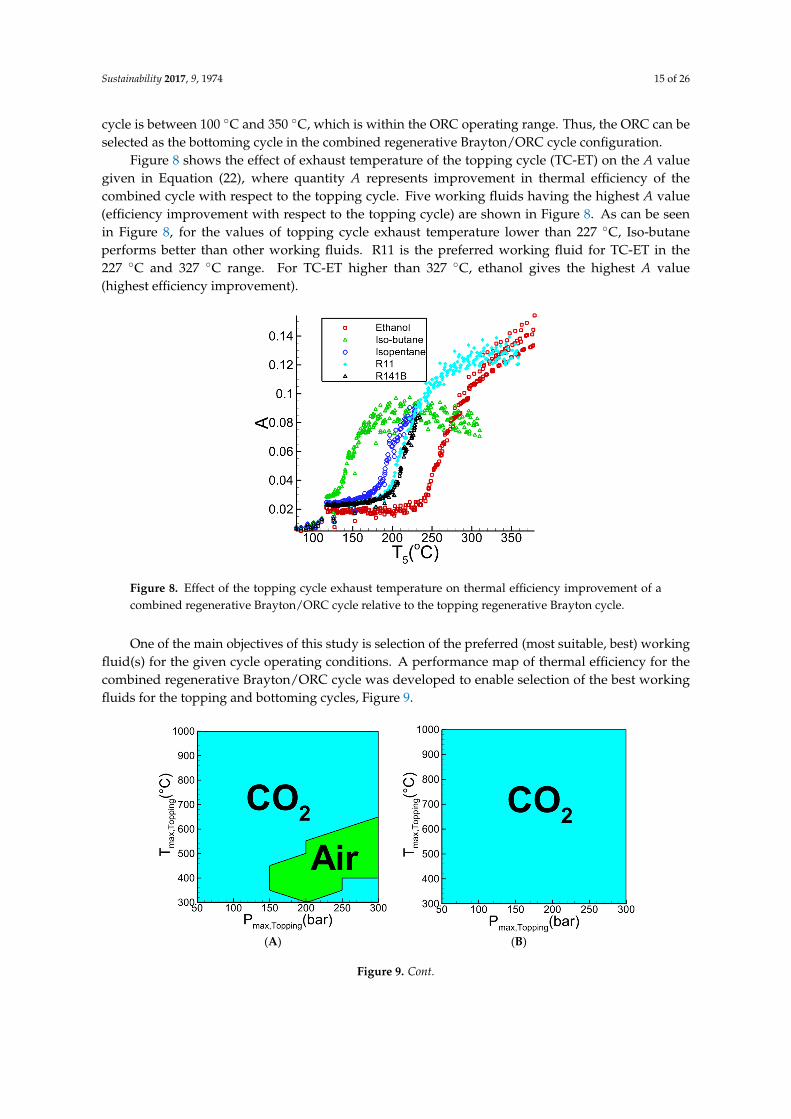
Figure 8 shows the effect of exhaust temperature of the topping cycle (TC-ET) on the A valuegiven in Equation (22), where quantity A represents improvement in thermal efficiency of thecombined cycle with respect to the topping cycle. Five working fluids having the highest A value(efficiency improvement with respect to the topping cycle) are shown in Figure 8. As can be seenin Figure 8, for the values of topping cycle exhaust temperature lower than 227 ◦C, Iso-butaneperforms better than other working fluids. R11 is the preferred working fluid for TC-ET in the227 ◦C and 327 ◦C range. For TC-ET higher than 327 ◦C, ethanol gives the highest A value(highest efficiency improvement).
Sustainability 2017, 9, 1974 15 of 26
cycle is between 100 °C and 350 °C, which is within the ORC operating range. Thus, the ORC can be selected as the bottoming cycle in the combined regenerative Brayton/ORC cycle configuration.
Figure 8 shows the effect of exhaust temperature of the topping cycle (TC-ET) on the A value given in Equation (22), where quantity A represents improvement in thermal efficiency of the combined cycle with respect to the topping cycle. Five working fluids having the highest A value (efficiency improvement with respect to the topping cycle) are shown in Figure 8. As can be seen in Figure 8, for the values of topping cycle exhaust temperature lower than 227 °C, Iso-butane performs better than other working fluids. R11 is the preferred working fluid for TC-ET in the 227 °C and 327 °C range. For TC-ET higher than 327 °C, ethanol gives the highest A value (highest efficiency improvement).
Figure 8. Effect of the topping cycle exhaust temperature on thermal efficiency improvement of a combined regenerative Brayton/ORC cycle relative to the topping regenerative Brayton cycle.
One of the main objectives of this study is selection of the preferred (most suitable, best) working fluid(s) for the given cycle operating conditions. A performance map of thermal efficiency for the combined regenerative Brayton/ORC cycle was developed to enable selection of the best working fluids for the topping and bottoming cycles, Figure 9.
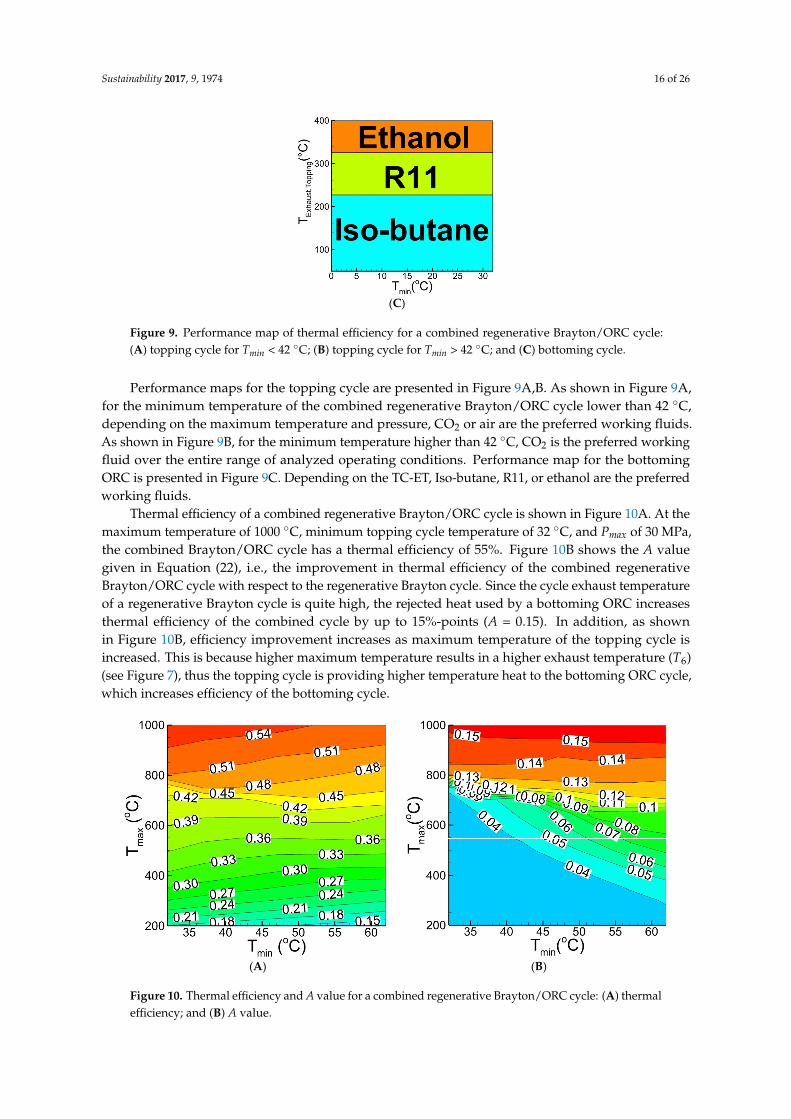
Performance maps for the topping cycle are presented in Figure 9A,B. As shown in Figure 9A, for the minimum temperature of the combined regenerative Brayton/ORC cycle lower than 42 °C, depending on the maximum temperature and pressure, CO2 or air are the preferred working fluids. As shown in Figure 9B, for the minimum temperature higher than 42 °C, CO2 is the preferred working fluid over the entire range of analyzed operating conditions. Performance map for the bottoming ORC is presented in Figure 9C. Depending on the TC-ET, Iso-butane, R11, or ethanol are the preferred working fluids.
(A) (B)
Figure 8. Effect of the topping cycle exhaust temperature on thermal efficiency improvement of acombined regenerative Brayton/ORC cycle relative to the topping regenerative Brayton cycle.
One of the main objectives of this study is selection of the preferred (most suitable, best) workingfluid(s) for the given cycle operating conditions. A performance map of thermal efficiency for thecombined regenerative Brayton/ORC cycle was developed to enable selection of the best workingfluids for the topping and bottoming cycles, Figure 9.
Sustainability 2017, 9, 1974 15 of 26
cycle is between 100 °C and 350 °C, which is within the ORC operating range. Thus, the ORC can be selected as the bottoming cycle in the combined regenerative Brayton/ORC cycle configuration.
Figure 8 shows the effect of exhaust temperature of the topping cycle (TC-ET) on the A value given in Equation (22), where quantity A represents improvement in thermal efficiency of the combined cycle with respect to the topping cycle. Five working fluids having the highest A value (efficiency improvement with respect to the topping cycle) are shown in Figure 8. As can be seen in Figure 8, for the values of topping cycle exhaust temperature lower than 227 °C, Iso-butane performs better than other working fluids. R11 is the preferred working fluid for TC-ET in the 227 °C and 327 °C range. For TC-ET higher than 327 °C, ethanol gives the highest A value (highest efficiency improvement).
Figure 8. Effect of the topping cycle exhaust temperature on thermal efficiency improvement of a combined regenerative Brayton/ORC cycle relative to the topping regenerative Brayton cycle.
One of the main objectives of this study is selection of the preferred (most suitable, best) working fluid(s) for the given cycle operating conditions. A performance map of thermal efficiency for the combined regenerative Brayton/ORC cycle was developed to enable selection of the best working fluids for the topping and bottoming cycles, Figure 9.
Performance maps for the topping cycle are presented in Figure 9A,B. As shown in Figure 9A, for the minimum temperature of the combined regenerative Brayton/ORC cycle lower than 42 °C, depending on the maximum temperature and pressure, CO2 or air are the preferred working fluids. As shown in Figure 9B, for the minimum temperature higher than 42 °C, CO2 is the preferred working fluid over the entire range of analyzed operating conditions. Performance map for the bottoming ORC is presented in Figure 9C. Depending on the TC-ET, Iso-butane, R11, or ethanol are the preferred working fluids.
(A) (B)
Figure 9. Cont.
Sustainability 2017, 9, 1974 16 of 26Sustainability 2017, 9, 1974 16 of 26
(C)
Figure 9. Performance map of thermal efficiency for a combined regenerative Brayton/ORC cycle: (A) topping cycle for Tmin < 42 °C; (B) topping cycle for Tmin > 42 °C; and (C) bottoming cycle.
Thermal efficiency of a combined regenerative Brayton/ORC cycle is shown in Figure 10A. At the maximum temperature of 1000 °C, minimum topping cycle temperature of 32 °C, and Pmax of 30 MPa, the combined Brayton/ORC cycle has a thermal efficiency of 55%. Figure 10B shows the A value given in Equation (22), i.e., the improvement in thermal efficiency of the combined regenerative Brayton/ORC cycle with respect to the regenerative Brayton cycle. Since the cycle exhaust temperature of a regenerative Brayton cycle is quite high, the rejected heat used by a bottoming ORC increases thermal efficiency of the combined cycle by up to 15%-points (A = 0.15). In addition, as shown in Figure 10B, efficiency improvement increases as maximum temperature of the topping cycle is increased. This is because higher maximum temperature results in a higher exhaust temperature (T6) (see Figure 7), thus the topping cycle is providing higher temperature heat to the bottoming ORC cycle, which increases efficiency of the bottoming cycle.
(A) (B)
Figure 10. Thermal efficiency and A value for a combined regenerative Brayton/ORC cycle: (A) thermal efficiency; and (B) A value.
Figures 11A,B shows the net power output in MW generated by the combined regenerative Brayton/ORC cycle and the bottoming ORC, respectively. By the using waste heat from the topping cycle at Tmax of 1000 °C, the power output of the bottoming ORC exceeds 13 MW (25% of the total power output). This is in contradiction with lines 428–429, which state that the constant power output of 100 MW was assumed for the topping cycle.
In addition, as shown in Figure 11B, for the maximum topping cycle temperatures lower than 700 °C, the minimum temperature of the topping cycle has a significant effect on the power generated by the bottoming ORC. However, for maximum temperatures higher than 700 °C, the minimum topping cycle temperature does not have a significant effect on power output of the
Figure 9. Performance map of thermal efficiency for a combined regenerative Brayton/ORC cycle:(A) topping cycle for Tmin < 42 ◦C; (B) topping cycle for Tmin > 42 ◦C; and (C) bottoming cycle.
Performance maps for the topping cycle are presented in Figure 9A,B. As shown in Figure 9A,for the minimum temperature of the combined regenerative Brayton/ORC cycle lower than 42 ◦C,depending on the maximum temperature and pressure, CO2 or air are the preferred working fluids.As shown in Figure 9B, for the minimum temperature higher than 42 ◦C, CO2 is the preferred workingfluid over the entire range of analyzed operating conditions. Performance map for the bottomingORC is presented in Figure 9C. Depending on the TC-ET, Iso-butane, R11, or ethanol are the preferredworking fluids.
Thermal efficiency of a combined regenerative Brayton/ORC cycle is shown in Figure 10A. At themaximum temperature of 1000 ◦C, minimum topping cycle temperature of 32 ◦C, and Pmax of 30 MPa,the combined Brayton/ORC cycle has a thermal efficiency of 55%. Figure 10B shows the A valuegiven in Equation (22), i.e., the improvement in thermal efficiency of the combined regenerativeBrayton/ORC cycle with respect to the regenerative Brayton cycle. Since the cycle exhaust temperatureof a regenerative Brayton cycle is quite high, the rejected heat used by a bottoming ORC increasesthermal efficiency of the combined cycle by up to 15%-points (A = 0.15). In addition, as shownin Figure 10B, efficiency improvement increases as maximum temperature of the topping cycle isincreased. This is because higher maximum temperature results in a higher exhaust temperature (T6)(see Figure 7), thus the topping cycle is providing higher temperature heat to the bottoming ORC cycle,which increases efficiency of the bottoming cycle.
Sustainability 2017, 9, 1974 16 of 26
(C)
Figure 9. Performance map of thermal efficiency for a combined regenerative Brayton/ORC cycle: (A) topping cycle for Tmin < 42 °C; (B) topping cycle for Tmin > 42 °C; and (C) bottoming cycle.
Thermal efficiency of a combined regenerative Brayton/ORC cycle is shown in Figure 10A. At the maximum temperature of 1000 °C, minimum topping cycle temperature of 32 °C, and Pmax of 30 MPa, the combined Brayton/ORC cycle has a thermal efficiency of 55%. Figure 10B shows the A value given in Equation (22), i.e., the improvement in thermal efficiency of the combined regenerative Brayton/ORC cycle with respect to the regenerative Brayton cycle. Since the cycle exhaust temperature of a regenerative Brayton cycle is quite high, the rejected heat used by a bottoming ORC increases thermal efficiency of the combined cycle by up to 15%-points (A = 0.15). In addition, as shown in Figure 10B, efficiency improvement increases as maximum temperature of the topping cycle is increased. This is because higher maximum temperature results in a higher exhaust temperature (T6) (see Figure 7), thus the topping cycle is providing higher temperature heat to the bottoming ORC cycle, which increases efficiency of the bottoming cycle.
(A) (B)
Figure 10. Thermal efficiency and A value for a combined regenerative Brayton/ORC cycle: (A) thermal efficiency; and (B) A value.
Figures 11A,B shows the net power output in MW generated by the combined regenerative Brayton/ORC cycle and the bottoming ORC, respectively. By the using waste heat from the topping cycle at Tmax of 1000 °C, the power output of the bottoming ORC exceeds 13 MW (25% of the total power output). This is in contradiction with lines 428–429, which state that the constant power output of 100 MW was assumed for the topping cycle.
In addition, as shown in Figure 11B, for the maximum topping cycle temperatures lower than 700 °C, the minimum temperature of the topping cycle has a significant effect on the power generated by the bottoming ORC. However, for maximum temperatures higher than 700 °C, the minimum topping cycle temperature does not have a significant effect on power output of the
Figure 10. Thermal efficiency and A value for a combined regenerative Brayton/ORC cycle: (A) thermalefficiency; and (B) A value.
Sustainability 2017, 9, 1974 17 of 26
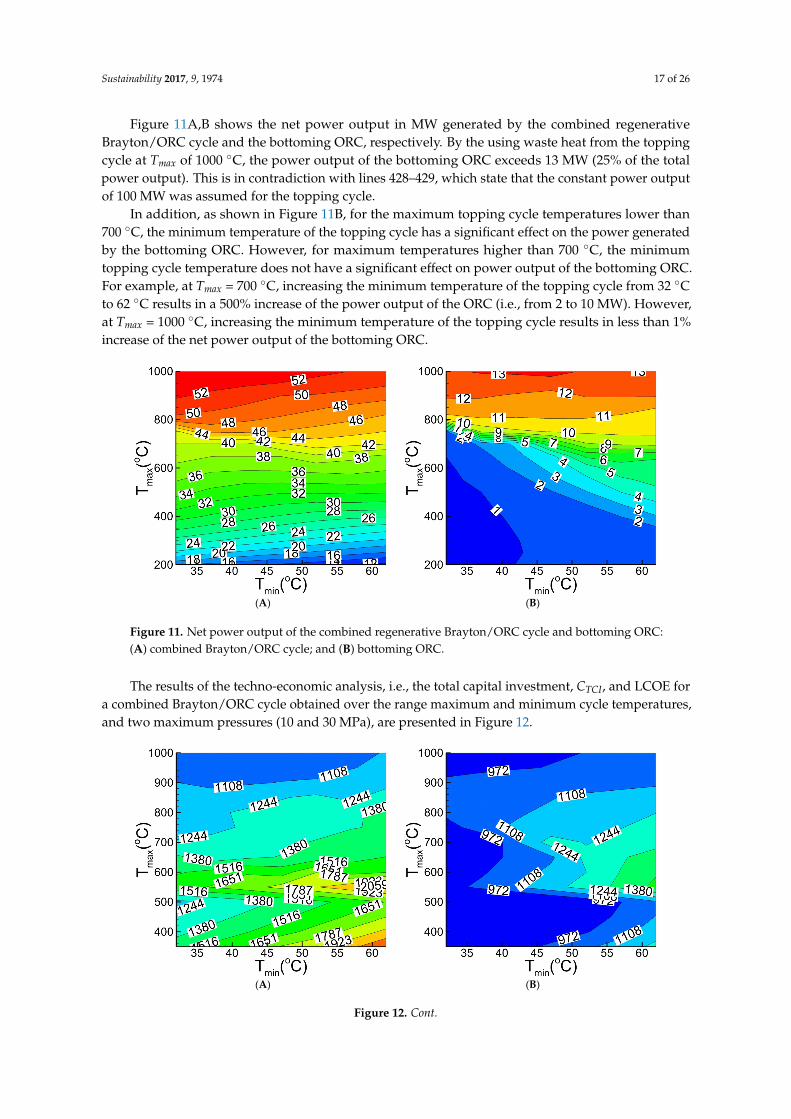
Figure 11A,B shows the net power output in MW generated by the combined regenerativeBrayton/ORC cycle and the bottoming ORC, respectively. By the using waste heat from the toppingcycle at Tmax of 1000 ◦C, the power output of the bottoming ORC exceeds 13 MW (25% of the totalpower output). This is in contradiction with lines 428–429, which state that the constant power outputof 100 MW was assumed for the topping cycle.
In addition, as shown in Figure 11B, for the maximum topping cycle temperatures lower than700 ◦C, the minimum temperature of the topping cycle has a significant effect on the power generatedby the bottoming ORC. However, for maximum temperatures higher than 700 ◦C, the minimumtopping cycle temperature does not have a significant effect on power output of the bottoming ORC.For example, at Tmax = 700 ◦C, increasing the minimum temperature of the topping cycle from 32 ◦Cto 62 ◦C results in a 500% increase of the power output of the ORC (i.e., from 2 to 10 MW). However,at Tmax = 1000 ◦C, increasing the minimum temperature of the topping cycle results in less than 1%increase of the net power output of the bottoming ORC.
Sustainability 2017, 9, 1974 17 of 26
(A) (B)
Figure 11. Net power output of the combined regenerative Brayton/ORC cycle and bottoming ORC: (A) combined Brayton/ORC cycle; and (B) bottoming ORC.
The results of the techno-economic analysis, i.e., the total capital investment, CTCI, and LCOE for a combined Brayton/ORC cycle obtained over the range maximum and minimum cycle temperatures, and two maximum pressures (10 and 30 MPa), are presented in Figure 12.
(A) (B)
Figure 11. Net power output of the combined regenerative Brayton/ORC cycle and bottoming ORC:(A) combined Brayton/ORC cycle; and (B) bottoming ORC.
The results of the techno-economic analysis, i.e., the total capital investment, CTCI, and LCOE fora combined Brayton/ORC cycle obtained over the range maximum and minimum cycle temperatures,and two maximum pressures (10 and 30 MPa), are presented in Figure 12.
Sustainability 2017, 9, 1974 17 of 26
(A) (B)
Figure 11. Net power output of the combined regenerative Brayton/ORC cycle and bottoming ORC: (A) combined Brayton/ORC cycle; and (B) bottoming ORC.
The results of the techno-economic analysis, i.e., the total capital investment, CTCI, and LCOE for a combined Brayton/ORC cycle obtained over the range maximum and minimum cycle temperatures, and two maximum pressures (10 and 30 MPa), are presented in Figure 12.
(A) (B)
Figure 12. Cont.
Sustainability 2017, 9, 1974 18 of 26
Sustainability 2017, 9, 1974 18 of 26
(C) (D)
Figure 12. Total capital investment ($/kWnet) and LCOE ($/MWh) of combined Brayton/ORC cycle: (A) CTCI at Pmax = 10 MPa; (B) CTCI at Pmax = 30 MPa; (C) LCOE at Pmax = 10 MPa; and (D) LCOE at Pmax = 30 MPa.
As Figure 12 shows, the total capital investment and LCOE decrease as the maximum cycle pressure is increased. For example, at Tmin = 32 °C, Pmax = 10 MPa and Tmax = 1000 °C, the total capital investment and LCOE of a combined Brayton/ORC cycle are 1000 $/kWnet and 25 $/MWh, respectively. For the same maximum and minimum temperatures and maximum pressure of 30 MPa, the values of CTCI and LCOE are 940 $/kWnet and 24 $/MWh, i.e., 6 and 4 percent lower.
The effect of the maximum cycle temperature is more complex, since more expensive materials need to be used as temperature is increased, resulting in step change in cost. For example, a significant increase in total capital investment can be observed at Tmax = 500 °C, since for Tmax > 500 °C a more expensive stainless steel has to be used instead of carbon steel for all components of the regenerative Brayton cycle (RBC).
The total capital investment and LCOE of the CO2 regenerative Brayton cycle (RBC) and combined Brayton/ORC cycle are compared in Figure 13 over the range of Tmax from 300 °C to 900 °C, Pmax of 10 and 30 MPa, and Tmin = 32 °C. As the results show, the combined Brayton/ORC cycle has a significantly lower total capital investment and LCOE, compared to the regenerative Brayton cycle. For example, at Tmax = 550 °C and Pmax = 30 MPa, LCOE of the combined Brayton/ORC cycle is 17 $/MWh (43%) lower compared to the RBC. As mentioned before, because of the material change, a significant increase in total capital investment and LCOE occurs at Tmax = 500 °C.
(A) (B)
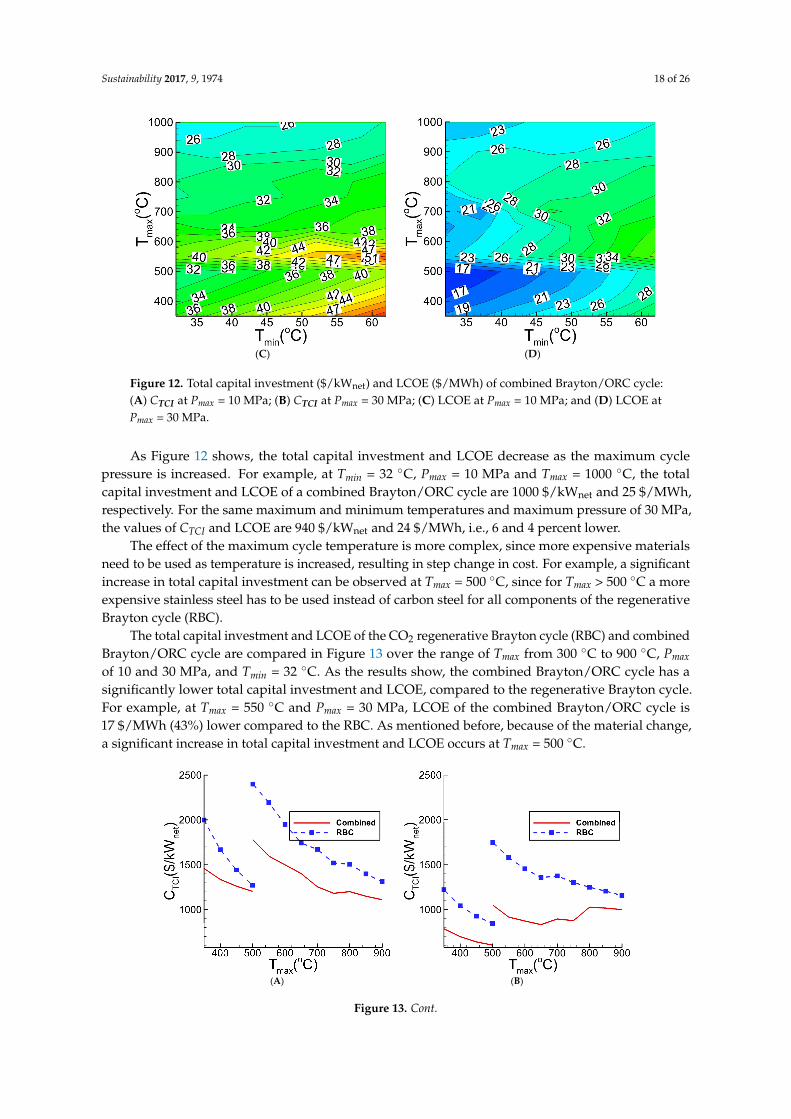
Figure 12. Total capital investment ($/kWnet) and LCOE ($/MWh) of combined Brayton/ORC cycle:(A) CTCI at Pmax = 10 MPa; (B) CTCI at Pmax = 30 MPa; (C) LCOE at Pmax = 10 MPa; and (D) LCOE atPmax = 30 MPa.
As Figure 12 shows, the total capital investment and LCOE decrease as the maximum cyclepressure is increased. For example, at Tmin = 32 ◦C, Pmax = 10 MPa and Tmax = 1000 ◦C, the totalcapital investment and LCOE of a combined Brayton/ORC cycle are 1000 $/kWnet and 25 $/MWh,respectively. For the same maximum and minimum temperatures and maximum pressure of 30 MPa,the values of CTCI and LCOE are 940 $/kWnet and 24 $/MWh, i.e., 6 and 4 percent lower.
The effect of the maximum cycle temperature is more complex, since more expensive materialsneed to be used as temperature is increased, resulting in step change in cost. For example, a significantincrease in total capital investment can be observed at Tmax = 500 ◦C, since for Tmax > 500 ◦C a moreexpensive stainless steel has to be used instead of carbon steel for all components of the regenerativeBrayton cycle (RBC).
The total capital investment and LCOE of the CO2 regenerative Brayton cycle (RBC) and combinedBrayton/ORC cycle are compared in Figure 13 over the range of Tmax from 300 ◦C to 900 ◦C, Pmax
of 10 and 30 MPa, and Tmin = 32 ◦C. As the results show, the combined Brayton/ORC cycle has asignificantly lower total capital investment and LCOE, compared to the regenerative Brayton cycle.For example, at Tmax = 550 ◦C and Pmax = 30 MPa, LCOE of the combined Brayton/ORC cycle is17 $/MWh (43%) lower compared to the RBC. As mentioned before, because of the material change,a significant increase in total capital investment and LCOE occurs at Tmax = 500 ◦C.
Sustainability 2017, 9, 1974 18 of 26
(C) (D)
Figure 12. Total capital investment ($/kWnet) and LCOE ($/MWh) of combined Brayton/ORC cycle: (A) CTCI at Pmax = 10 MPa; (B) CTCI at Pmax = 30 MPa; (C) LCOE at Pmax = 10 MPa; and (D) LCOE at Pmax = 30 MPa.
As Figure 12 shows, the total capital investment and LCOE decrease as the maximum cycle pressure is increased. For example, at Tmin = 32 °C, Pmax = 10 MPa and Tmax = 1000 °C, the total capital investment and LCOE of a combined Brayton/ORC cycle are 1000 $/kWnet and 25 $/MWh, respectively. For the same maximum and minimum temperatures and maximum pressure of 30 MPa, the values of CTCI and LCOE are 940 $/kWnet and 24 $/MWh, i.e., 6 and 4 percent lower.
The effect of the maximum cycle temperature is more complex, since more expensive materials need to be used as temperature is increased, resulting in step change in cost. For example, a significant increase in total capital investment can be observed at Tmax = 500 °C, since for Tmax > 500 °C a more expensive stainless steel has to be used instead of carbon steel for all components of the regenerative Brayton cycle (RBC).
The total capital investment and LCOE of the CO2 regenerative Brayton cycle (RBC) and combined Brayton/ORC cycle are compared in Figure 13 over the range of Tmax from 300 °C to 900 °C, Pmax of 10 and 30 MPa, and Tmin = 32 °C. As the results show, the combined Brayton/ORC cycle has a significantly lower total capital investment and LCOE, compared to the regenerative Brayton cycle. For example, at Tmax = 550 °C and Pmax = 30 MPa, LCOE of the combined Brayton/ORC cycle is 17 $/MWh (43%) lower compared to the RBC. As mentioned before, because of the material change, a significant increase in total capital investment and LCOE occurs at Tmax = 500 °C.
(A) (B)
Figure 13. Cont.
Sustainability 2017, 9, 1974 19 of 26
Sustainability 2017, 9, 1974 19 of 26
(C) (D)
Figure 13. Total capital investment ($/kWnet) and LCOE ($/MWh) of the RBC and combined Brayton/ORC cycle: (A) CTCI at Pmax = 10 MPa; (B) CTCI at Pmax = 30 MPa; (C) LCOE at Pmax = 10 MPa; and (D) LCOE at Pmax = 30 MPa.
4.3. Validation of Results for the Combined Brayton/ORC Cycle
The results obtained in this study by using the EPV-11 modeling software were validated against the results published in the literature. The combined regenerative Brayton/ORC cycle utilizing CO2 in the topping cycle and Iso-pentane in the bottoming ORC was modeled by Dunham et al. [34] using the Engineering Equation Solver (EES). Table 10 presents the cycle parameters used in the calculations. The heat input to the topping cycle is assumed to be 100 MW.
Figure 14. Thermal efficiency for different turbine inlet temperature for combined Brayton/ORC cycle.
Table 10. Cycle parameters for Combined Brayton/ORC cycle.
Parameter ValueCompressor isentropic efficiency 0.80
Pump isentropic efficiency 0.80 Topping cycle turbine isentropic efficiency 0.9
Recuperator effectiveness 0.85 Bottoming cycle turbine isentropic efficiency 0.87
Heater pressure drop (%) 5 Minimum temperature (°C) 32
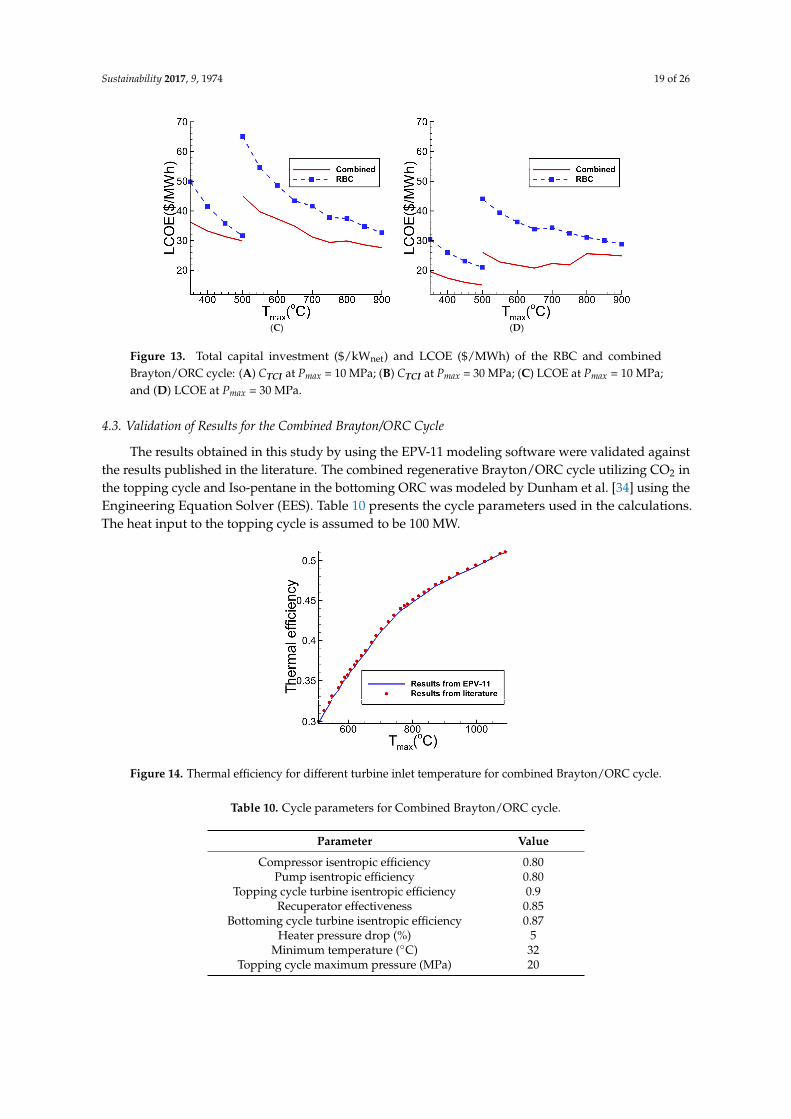
Figure 13. Total capital investment ($/kWnet) and LCOE ($/MWh) of the RBC and combinedBrayton/ORC cycle: (A) CTCI at Pmax = 10 MPa; (B) CTCI at Pmax = 30 MPa; (C) LCOE at Pmax = 10 MPa;and (D) LCOE at Pmax = 30 MPa.
4.3. Validation of Results for the Combined Brayton/ORC Cycle
The results obtained in this study by using the EPV-11 modeling software were validated againstthe results published in the literature. The combined regenerative Brayton/ORC cycle utilizing CO2 inthe topping cycle and Iso-pentane in the bottoming ORC was modeled by Dunham et al. [34] using theEngineering Equation Solver (EES). Table 10 presents the cycle parameters used in the calculations.The heat input to the topping cycle is assumed to be 100 MW.
Sustainability 2017, 9, 1974 19 of 26
(C) (D)
Figure 13. Total capital investment ($/kWnet) and LCOE ($/MWh) of the RBC and combined Brayton/ORC cycle: (A) CTCI at Pmax = 10 MPa; (B) CTCI at Pmax = 30 MPa; (C) LCOE at Pmax = 10 MPa; and (D) LCOE at Pmax = 30 MPa.
4.3. Validation of Results for the Combined Brayton/ORC Cycle
The results obtained in this study by using the EPV-11 modeling software were validated against the results published in the literature. The combined regenerative Brayton/ORC cycle utilizing CO2 in the topping cycle and Iso-pentane in the bottoming ORC was modeled by Dunham et al. [34] using the Engineering Equation Solver (EES). Table 10 presents the cycle parameters used in the calculations. The heat input to the topping cycle is assumed to be 100 MW.
Figure 14. Thermal efficiency for different turbine inlet temperature for combined Brayton/ORC cycle.
Table 10. Cycle parameters for Combined Brayton/ORC cycle.
Parameter ValueCompressor isentropic efficiency 0.80
Pump isentropic efficiency 0.80 Topping cycle turbine isentropic efficiency 0.9
Recuperator effectiveness 0.85 Bottoming cycle turbine isentropic efficiency 0.87
Heater pressure drop (%) 5 Minimum temperature (°C) 32
Figure 14. Thermal efficiency for different turbine inlet temperature for combined Brayton/ORC cycle.
Table 10. Cycle parameters for Combined Brayton/ORC cycle.
Parameter Value
Compressor isentropic efficiency 0.80Pump isentropic efficiency 0.80
Topping cycle turbine isentropic efficiency 0.9Recuperator effectiveness 0.85
Bottoming cycle turbine isentropic efficiency 0.87Heater pressure drop (%) 5
Minimum temperature (◦C) 32Topping cycle maximum pressure (MPa) 20
Sustainability 2017, 9, 1974 20 of 26
4.4. Combined steam Rankine/ORC Cycle
Steam Rankine cycle is the most widely used thermodynamic cycle for power generation. As aheat engine, it rejects large amounts of low-temperature grade heat. Its efficiency ranges from about 32%(efficiencies are given on the higher heating value (HHV) basis) for the subcritical live steam conditions,to 45% for the advanced ultra-supercritical live steam conditions [34]. Most (about 95%) of the exitingpower generation fleet is subcritical, about 5% is supercritical, and only a small number of the unitsoperate at ultra-supercritical live steam conditions and efficiency of about 40% [34]. Commercialoperation of the advanced ultra-supercritical units is expected within the next 10 years [48].
The efficiency of the steam Rankine cycle could be improved by addition of a bottoming cycle.Due to the low temperature of the rejected heat, the ORC is a good choice.
An analysis of a combined steam Rankine/ORC cycle was performed to determine the increase inpower output that could be achieved by adding a bottoming ORC to the utility-scale (600 MW) steamRankine cycle. The analysis included the effect of ambient conditions (heat sink temperature) on thepower output of the bottoming ORC.
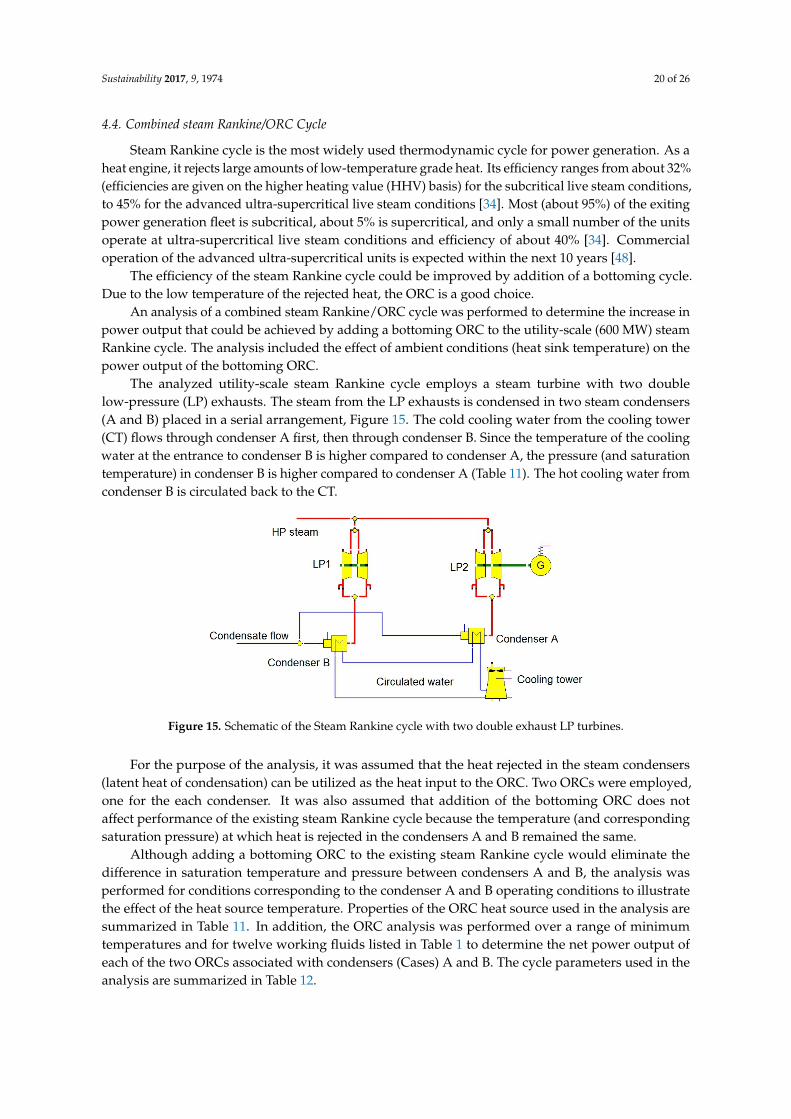
The analyzed utility-scale steam Rankine cycle employs a steam turbine with two doublelow-pressure (LP) exhausts. The steam from the LP exhausts is condensed in two steam condensers(A and B) placed in a serial arrangement, Figure 15. The cold cooling water from the cooling tower(CT) flows through condenser A first, then through condenser B. Since the temperature of the coolingwater at the entrance to condenser B is higher compared to condenser A, the pressure (and saturationtemperature) in condenser B is higher compared to condenser A (Table 11). The hot cooling water fromcondenser B is circulated back to the CT.
Sustainability 2017, 9, 1974 20 of 26
Topping cycle maximum pressure (MPa) 20
4.4. Combined steam Rankine/ORC Cycle
Steam Rankine cycle is the most widely used thermodynamic cycle for power generation. As a heat engine, it rejects large amounts of low-temperature grade heat. Its efficiency ranges from about 32% (efficiencies are given on the higher heating value (HHV) basis) for the subcritical live steam conditions, to 45% for the advanced ultra-supercritical live steam conditions [34]. Most (about 95%) of the exiting power generation fleet is subcritical, about 5% is supercritical, and only a small number of the units operate at ultra-supercritical live steam conditions and efficiency of about 40% [34]. Commercial operation of the advanced ultra-supercritical units is expected within the next 10 years [48].
The efficiency of the steam Rankine cycle could be improved by addition of a bottoming cycle. Due to the low temperature of the rejected heat, the ORC is a good choice.
An analysis of a combined steam Rankine/ORC cycle was performed to determine the increase in power output that could be achieved by adding a bottoming ORC to the utility-scale (600 MW) steam Rankine cycle. The analysis included the effect of ambient conditions (heat sink temperature) on the power output of the bottoming ORC.
The analyzed utility-scale steam Rankine cycle employs a steam turbine with two double low-pressure (LP) exhausts. The steam from the LP exhausts is condensed in two steam condensers (A and B) placed in a serial arrangement, Figure 15. The cold cooling water from the cooling tower (CT) flows through condenser A first, then through condenser B. Since the temperature of the cooling water at the entrance to condenser B is higher compared to condenser A, the pressure (and saturation temperature) in condenser B is higher compared to condenser A (Table 11). The hot cooling water from condenser B is circulated back to the CT.
Figure 15. Schematic of the Steam Rankine cycle with two double exhaust LP turbines.
For the purpose of the analysis, it was assumed that the heat rejected in the steam condensers (latent heat of condensation) can be utilized as the heat input to the ORC. Two ORCs were employed, one for the each condenser. It was also assumed that addition of the bottoming ORC does not affect performance of the existing steam Rankine cycle because the temperature (and corresponding saturation pressure) at which heat is rejected in the condensers A and B remained the same.
Although adding a bottoming ORC to the existing steam Rankine cycle would eliminate the difference in saturation temperature and pressure between condensers A and B, the analysis was performed for conditions corresponding to the condenser A and B operating conditions to illustrate the effect of the heat source temperature. Properties of the ORC heat source used in the analysis are summarized in Table 11. In addition, the ORC analysis was performed over a range of minimum temperatures and for twelve working fluids listed in Table 1 to determine the net power output of each of the two ORCs associated with condensers (Cases) A and B. The cycle parameters used in the analysis are summarized in Table 12.
Figure 15. Schematic of the Steam Rankine cycle with two double exhaust LP turbines.
For the purpose of the analysis, it was assumed that the heat rejected in the steam condensers(latent heat of condensation) can be utilized as the heat input to the ORC. Two ORCs were employed,one for the each condenser. It was also assumed that addition of the bottoming ORC does notaffect performance of the existing steam Rankine cycle because the temperature (and correspondingsaturation pressure) at which heat is rejected in the condensers A and B remained the same.
Although adding a bottoming ORC to the existing steam Rankine cycle would eliminate thedifference in saturation temperature and pressure between condensers A and B, the analysis wasperformed for conditions corresponding to the condenser A and B operating conditions to illustratethe effect of the heat source temperature. Properties of the ORC heat source used in the analysis aresummarized in Table 11. In addition, the ORC analysis was performed over a range of minimumtemperatures and for twelve working fluids listed in Table 1 to determine the net power output ofeach of the two ORCs associated with condensers (Cases) A and B. The cycle parameters used in theanalysis are summarized in Table 12.
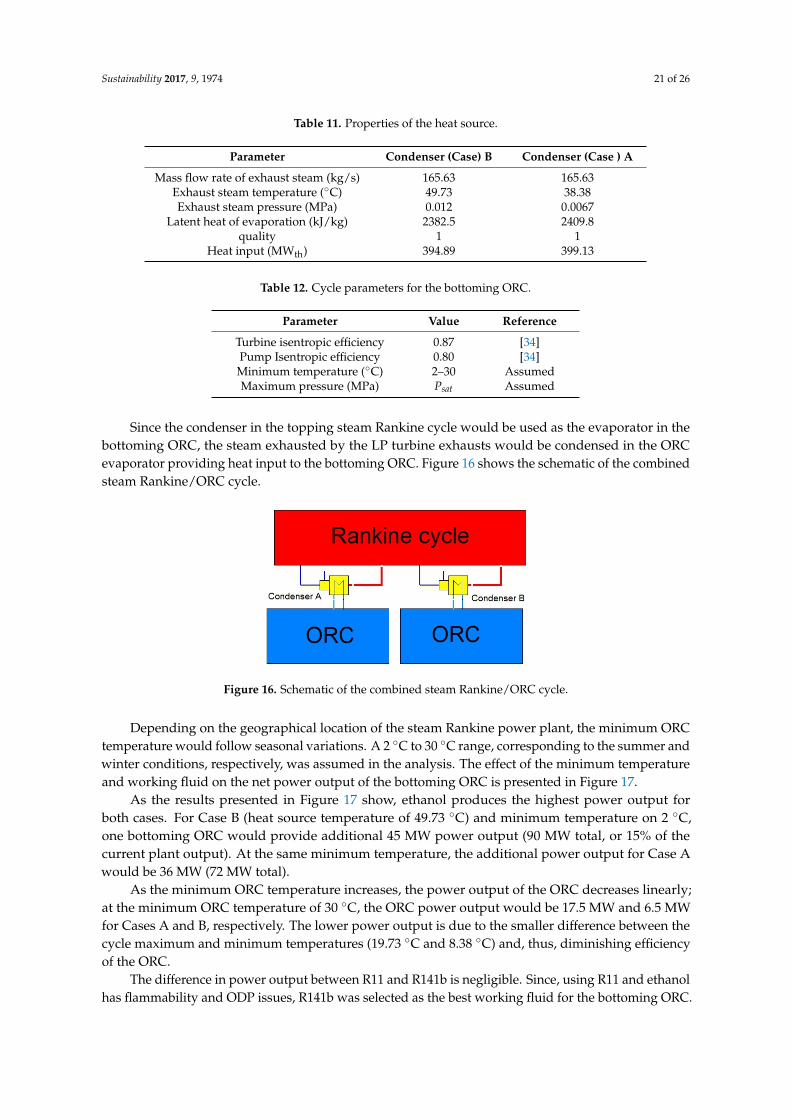
Sustainability 2017, 9, 1974 21 of 26
Table 11. Properties of the heat source.
Parameter Condenser (Case) B Condenser (Case ) A
Mass flow rate of exhaust steam (kg/s) 165.63 165.63Exhaust steam temperature (◦C) 49.73 38.38Exhaust steam pressure (MPa) 0.012 0.0067
Latent heat of evaporation (kJ/kg) 2382.5 2409.8quality 1 1
Heat input (MWth) 394.89 399.13
Table 12. Cycle parameters for the bottoming ORC.
Parameter Value Reference
Turbine isentropic efficiency 0.87 [34]Pump Isentropic efficiency 0.80 [34]Minimum temperature (◦C) 2–30 AssumedMaximum pressure (MPa) Psat Assumed
Since the condenser in the topping steam Rankine cycle would be used as the evaporator in thebottoming ORC, the steam exhausted by the LP turbine exhausts would be condensed in the ORCevaporator providing heat input to the bottoming ORC. Figure 16 shows the schematic of the combinedsteam Rankine/ORC cycle.
Sustainability 2017, 9, 1974 21 of 26
Table 11. Properties of the heat source.
Parameter Condenser (Case) B Condenser (Case ) A Mass flow rate of exhaust steam (kg/s) 165.63 165.63
Exhaust steam temperature (°C) 49.73 38.38 Exhaust steam pressure (MPa) 0.012 0.0067
Latent heat of evaporation (kJ/kg) 2382.5 2409.8 quality 1 1
Heat input (MWth) 394.89 399.13
Table 12. Cycle parameters for the bottoming ORC.
Parameter Value ReferenceTurbine isentropic efficiency 0.87 [34] Pump Isentropic efficiency 0.80 [34] Minimum temperature (°C) 2–30 Assumed Maximum pressure (MPa) Psat Assumed
Since the condenser in the topping steam Rankine cycle would be used as the evaporator in the bottoming ORC, the steam exhausted by the LP turbine exhausts would be condensed in the ORC evaporator providing heat input to the bottoming ORC. Figure 16 shows the schematic of the combined steam Rankine/ORC cycle.
Figure 16. Schematic of the combined steam Rankine/ORC cycle.
Depending on the geographical location of the steam Rankine power plant, the minimum ORC temperature would follow seasonal variations. A 2 °C to 30 °C range, corresponding to the summer and winter conditions, respectively, was assumed in the analysis. The effect of the minimum temperature and working fluid on the net power output of the bottoming ORC is presented in Figure 17.
Figure 16. Schematic of the combined steam Rankine/ORC cycle.
Depending on the geographical location of the steam Rankine power plant, the minimum ORCtemperature would follow seasonal variations. A 2 ◦C to 30 ◦C range, corresponding to the summer andwinter conditions, respectively, was assumed in the analysis. The effect of the minimum temperatureand working fluid on the net power output of the bottoming ORC is presented in Figure 17.
As the results presented in Figure 17 show, ethanol produces the highest power output forboth cases. For Case B (heat source temperature of 49.73 ◦C) and minimum temperature on 2 ◦C,one bottoming ORC would provide additional 45 MW power output (90 MW total, or 15% of thecurrent plant output). At the same minimum temperature, the additional power output for Case Awould be 36 MW (72 MW total).
As the minimum ORC temperature increases, the power output of the ORC decreases linearly;at the minimum ORC temperature of 30 ◦C, the ORC power output would be 17.5 MW and 6.5 MWfor Cases A and B, respectively. The lower power output is due to the smaller difference between thecycle maximum and minimum temperatures (19.73 ◦C and 8.38 ◦C) and, thus, diminishing efficiencyof the ORC.
The difference in power output between R11 and R141b is negligible. Since, using R11 and ethanolhas flammability and ODP issues, R141b was selected as the best working fluid for the bottoming ORC.
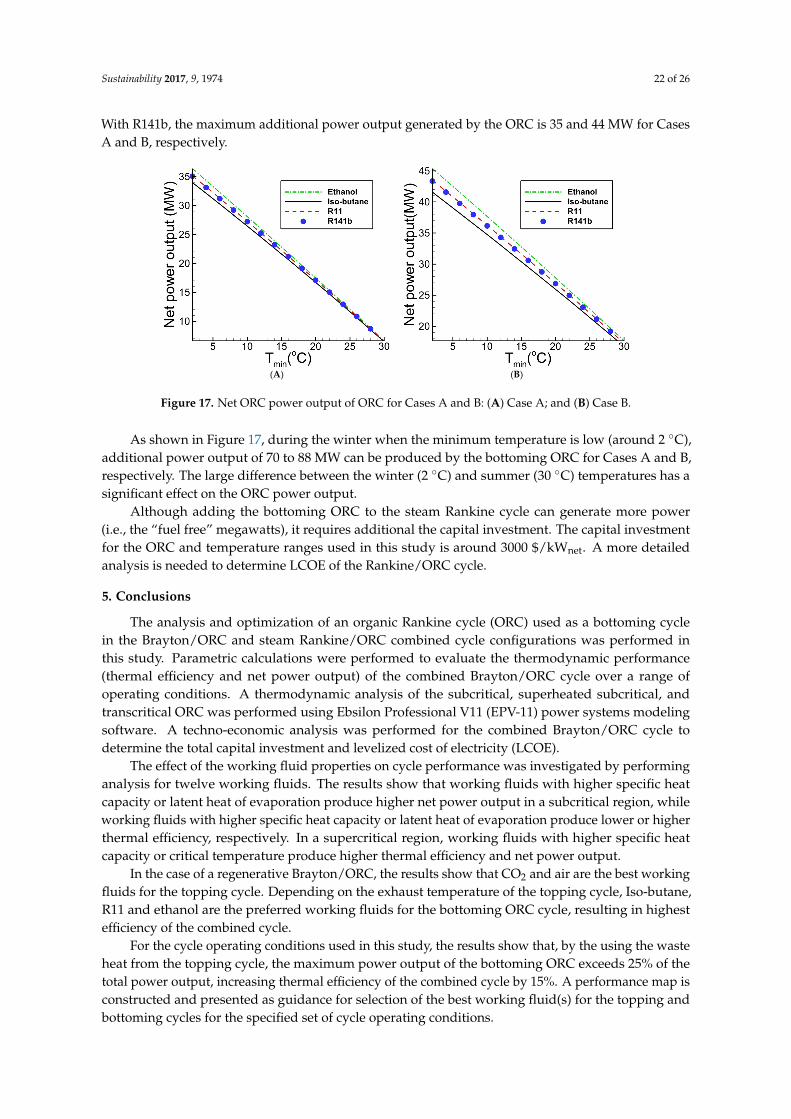
Sustainability 2017, 9, 1974 22 of 26
With R141b, the maximum additional power output generated by the ORC is 35 and 44 MW for CasesA and B, respectively.Sustainability 2017, 9, 1974 22 of 26
(A) (B)
Figure 17. Net ORC power output of ORC for Cases A and B: (A) Case A; and (B) Case B.
As the results presented in Figure 17 show, ethanol produces the highest power output for both cases. For Case B (heat source temperature of 49.73 °C) and minimum temperature on 2 °C, one bottoming ORC would provide additional 45 MW power output (90 MW total, or 15% of the current plant output). At the same minimum temperature, the additional power output for Case A would be 36 MW (72 MW total).
As the minimum ORC temperature increases, the power output of the ORC decreases linearly; at the minimum ORC temperature of 30 °C, the ORC power output would be 17.5 MW and 6.5 MW for Cases A and B, respectively. The lower power output is due to the smaller difference between the cycle maximum and minimum temperatures (19.73 °C and 8.38 °C) and, thus, diminishing efficiency of the ORC.
The difference in power output between R11 and R141b is negligible. Since, using R11 and ethanol has flammability and ODP issues, R141b was selected as the best working fluid for the bottoming ORC. With R141b, the maximum additional power output generated by the ORC is 35 and 44 MW for Cases A and B, respectively.
As shown in Figure 17, during the winter when the minimum temperature is low (around 2 °C), additional power output of 70 to 88 MW can be produced by the bottoming ORC for Cases A and B, respectively. The large difference between the winter (2 °C) and summer (30 °C) temperatures has a significant effect on the ORC power output.
Although adding the bottoming ORC to the steam Rankine cycle can generate more power (i.e., the “fuel free” megawatts), it requires additional the capital investment. The capital investment for the ORC and temperature ranges used in this study is around 3000 $/kWnet. A more detailed analysis is needed to determine LCOE of the Rankine/ORC cycle.
5. Conclusions
The analysis and optimization of an organic Rankine cycle (ORC) used as a bottoming cycle in the Brayton/ORC and steam Rankine/ORC combined cycle configurations was performed in this study. Parametric calculations were performed to evaluate the thermodynamic performance (thermal efficiency and net power output) of the combined Brayton/ORC cycle over a range of operating conditions. A thermodynamic analysis of the subcritical, superheated subcritical, and transcritical ORC was performed using Ebsilon Professional V11 (EPV-11) power systems modeling software. A techno-economic analysis was performed for the combined Brayton/ORC cycle to determine the total capital investment and levelized cost of electricity (LCOE).
The effect of the working fluid properties on cycle performance was investigated by performing analysis for twelve working fluids. The results show that working fluids with higher specific heat capacity or latent heat of evaporation produce higher net power output in a subcritical region, while
Figure 17. Net ORC power output of ORC for Cases A and B: (A) Case A; and (B) Case B.
As shown in Figure 17, during the winter when the minimum temperature is low (around 2 ◦C),additional power output of 70 to 88 MW can be produced by the bottoming ORC for Cases A and B,respectively. The large difference between the winter (2 ◦C) and summer (30 ◦C) temperatures has asignificant effect on the ORC power output.
Although adding the bottoming ORC to the steam Rankine cycle can generate more power(i.e., the “fuel free” megawatts), it requires additional the capital investment. The capital investmentfor the ORC and temperature ranges used in this study is around 3000 $/kWnet. A more detailedanalysis is needed to determine LCOE of the Rankine/ORC cycle.
5. Conclusions
The analysis and optimization of an organic Rankine cycle (ORC) used as a bottoming cyclein the Brayton/ORC and steam Rankine/ORC combined cycle configurations was performed inthis study. Parametric calculations were performed to evaluate the thermodynamic performance(thermal efficiency and net power output) of the combined Brayton/ORC cycle over a range ofoperating conditions. A thermodynamic analysis of the subcritical, superheated subcritical, andtranscritical ORC was performed using Ebsilon Professional V11 (EPV-11) power systems modelingsoftware. A techno-economic analysis was performed for the combined Brayton/ORC cycle todetermine the total capital investment and levelized cost of electricity (LCOE).
The effect of the working fluid properties on cycle performance was investigated by performinganalysis for twelve working fluids. The results show that working fluids with higher specific heatcapacity or latent heat of evaporation produce higher net power output in a subcritical region, whileworking fluids with higher specific heat capacity or latent heat of evaporation produce lower or higherthermal efficiency, respectively. In a supercritical region, working fluids with higher specific heatcapacity or critical temperature produce higher thermal efficiency and net power output.
In the case of a regenerative Brayton/ORC, the results show that CO2 and air are the best workingfluids for the topping cycle. Depending on the exhaust temperature of the topping cycle, Iso-butane,R11 and ethanol are the preferred working fluids for the bottoming ORC cycle, resulting in highestefficiency of the combined cycle.
For the cycle operating conditions used in this study, the results show that, by the using the wasteheat from the topping cycle, the maximum power output of the bottoming ORC exceeds 25% of thetotal power output, increasing thermal efficiency of the combined cycle by 15%. A performance map isconstructed and presented as guidance for selection of the best working fluid(s) for the topping andbottoming cycles for the specified set of cycle operating conditions.
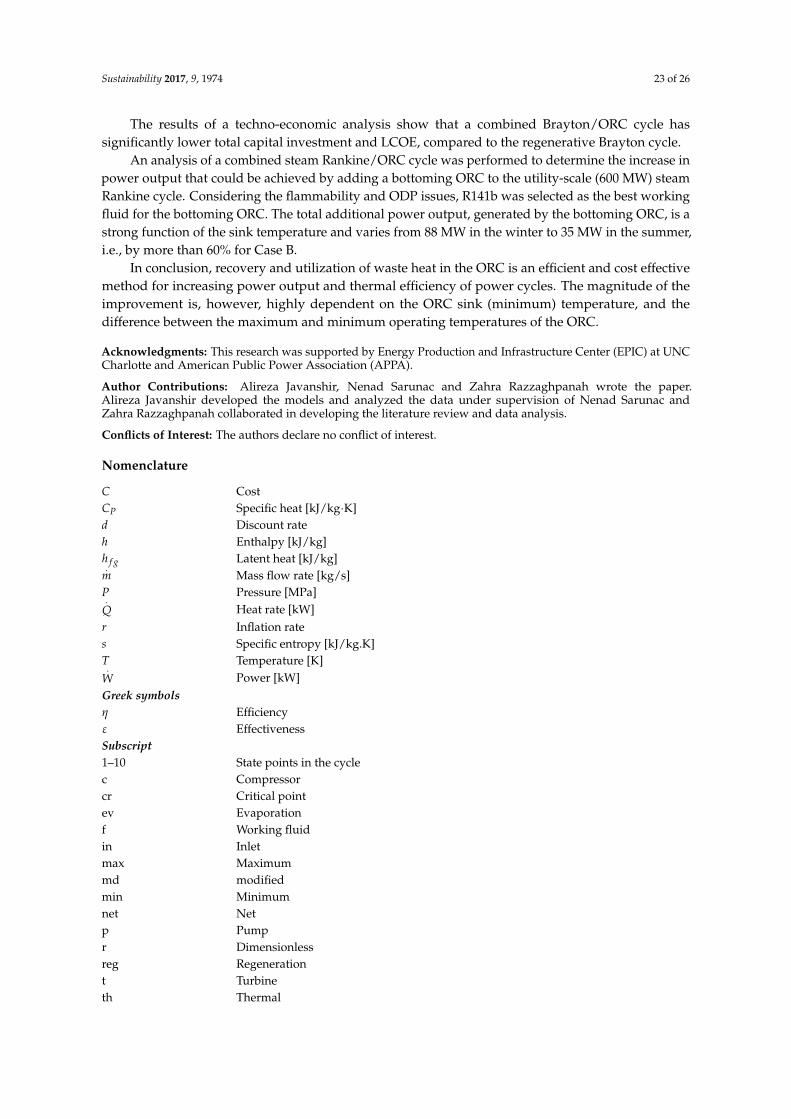
Sustainability 2017, 9, 1974 23 of 26
The results of a techno-economic analysis show that a combined Brayton/ORC cycle hassignificantly lower total capital investment and LCOE, compared to the regenerative Brayton cycle.
An analysis of a combined steam Rankine/ORC cycle was performed to determine the increase inpower output that could be achieved by adding a bottoming ORC to the utility-scale (600 MW) steamRankine cycle. Considering the flammability and ODP issues, R141b was selected as the best workingfluid for the bottoming ORC. The total additional power output, generated by the bottoming ORC, is astrong function of the sink temperature and varies from 88 MW in the winter to 35 MW in the summer,i.e., by more than 60% for Case B.
In conclusion, recovery and utilization of waste heat in the ORC is an efficient and cost effectivemethod for increasing power output and thermal efficiency of power cycles. The magnitude of theimprovement is, however, highly dependent on the ORC sink (minimum) temperature, and thedifference between the maximum and minimum operating temperatures of the ORC.
Acknowledgments: This research was supported by Energy Production and Infrastructure Center (EPIC) at UNCCharlotte and American Public Power Association (APPA).
Author Contributions: Alireza Javanshir, Nenad Sarunac and Zahra Razzaghpanah wrote the paper.Alireza Javanshir developed the models and analyzed the data under supervision of Nenad Sarunac andZahra Razzaghpanah collaborated in developing the literature review and data analysis.
Conflicts of Interest: The authors declare no conflict of interest.
Nomenclature
C CostCP Specific heat [kJ/kg·K]d Discount rateh Enthalpy [kJ/kg]h f g Latent heat [kJ/kg].
m Mass flow rate [kg/s]P Pressure [MPa].
Q Heat rate [kW]r Inflation rates Specific entropy [kJ/kg.K]T Temperature [K]
.W Power [kW]Greek symbolsη Efficiencyε EffectivenessSubscript1–10 State points in the cyclec Compressorcr Critical pointev Evaporationf Working fluidin Inletmax Maximummd modifiedmin Minimumnet Netp Pumpr Dimensionlessreg Regenerationt Turbineth Thermal
Sustainability 2017, 9, 1974 24 of 26
AcronymsEPV-11 Ebsilon Professional V11FOM Figure of meritGWP Global warming potentialJa Jacob numberODP Ozone depletion potentialORC Organic Rankine cycleTCI Total capital investmentTIT Turbine inlet temperatureLCOE Levelized cost of electricity
References
1. First Quadrennial Technology Review (QTR 2011). Available online: https://energy.gov/under-secretary-science-and-energy/downloads/first-quadrennial-technology-review-qtr-2011 (accessed on 23October 2017).
2. Sternlicht, B. Waste energy recovery: an excellent investment opportunity. Energy Convers. Manag. 1982, 22,361–373. [CrossRef]
3. Roy, J.; Misra, A. Parametric optimization and performance analysis of a regenerative Organic Rankine Cycleusing R-123 for waste heat recovery. Energy 2012, 39, 227–235. [CrossRef]
4. Sun, J.; Li, W. Operation optimization of an organic Rankine cycle (ORC) heat recovery power plant.Appl. Therm. Eng. 2011, 31, 2032–2041. [CrossRef]
5. Zhang, J.; Zhang, H.; Yang, K.; Yang, F.; Wang, Z.; Zhao, G.; Yao, B. Performance analysis of regenerativeorganic Rankine cycle (RORC) using the pure working fluid and the zeotropic mixture over the wholeoperating range of a diesel engine. Energy Convers. Manag. 2014, 84, 282–294. [CrossRef]
6. Zhou, N.; Wang, X.; Chen, Z.; Wang, Z. Experimental study on Organic Rankine Cycle for waste heatrecovery from low-temperature flue gas. Energy 2013, 55, 216–225. [CrossRef]
7. Lemort, V.; Quoilin, S.; Cuevas, C.; Lebrun, J. Testing and modeling a scroll expander integrated into anOrganic Rankine Cycle. Appl. Therm. Eng. 2009, 29, 3094–3102. [CrossRef]
8. Quoilin, S.; Lemort, V.; Lebrun, J. Experimental study and modeling of an Organic Rankine Cycle usingscroll expander. Appl. Energy 2010, 87, 1260–1268. [CrossRef]
9. Vatani, A.; Khazaeli, A.; Roshandel, R.; Panjeshahi, M.H. Thermodynamic analysis of application of organicRankine cycle for heat recovery from an integrated DIR-MCFC with pre-reformer. Energy Convers. Manag.2013, 67, 197–207. [CrossRef]
10. Algieri, A.; Morrone, P. Comparative energetic analysis of high-temperature subcritical and transcriticalOrganic Rankine Cycle (ORC). A biomass application in the Sibari district. Appl. Therm. Eng. 2012, 36,236–244. [CrossRef]
11. Mago, P.J.; Chamra, L.M.; Srinivasan, K.; Somayaji, C. An examination of regenerative organic Rankinecycles using dry fluids. Appl. Therm. Eng. 2008, 28, 998–1007. [CrossRef]
12. Acar, H.I. Second law analysis of the reheat-regenerative Rankine cycle. Energy Convers. Manag. 1997, 38,647–657. [CrossRef]
13. Wang, E.; Zhang, H.; Fan, B.; Wu, Y. Optimized performances comparison of organic Rankine cycles for lowgrade waste heat recovery. J. Mech. Sci. Technol. 2012, 26, 2301–2312. [CrossRef]
14. Hung, T.-C. Waste heat recovery of organic Rankine cycle using dry fluids. Energy Convers. Manag. 2001, 42,539–553. [CrossRef]
15. Eller, T.; Heberle, F.; Brüggemann, D. Second law analysis of novel working fluid pairs for waste heatrecovery by the Kalina cycle. Energy 2017, 119, 188–198. [CrossRef]
16. Lecompte, S.; Oyewunmi, O.A.; Markides, C.N.; Lazova, M.; Kaya, A.; Ameel, B.; Broek, M.; De Paepe, M.Potential of Organic Rankine Cycles (ORC) for Waste Heat Recovery on an Electric Arc Furnace (EAF).In Proceedings of the 13th International Conference on Heat Transfer, Fluid Mechanics and Thermodynamics,Portorož, Slovenia, 17–19 July 2017.
Sustainability 2017, 9, 1974 25 of 26
17. Lion, S.; Michos, C.N.; Vlaskos, I.; Rouaud, C.; Taccani, R. A review of waste heat recovery and OrganicRankine Cycles (ORC) in on-off highway vehicle Heavy Duty Diesel Engine applications. Renew. Sustain.Energy Rev. 2017, 79, 691–708. [CrossRef]
18. Mahmoudzadeh Andwari, A.; Pesiridis, A.; Esfahanian, V.; Salavati-Zadeh, A.; Karvountzis-Kontakiotis, A.;Muralidharan, V. A Comparative Study of the Effect of Turbocompounding and ORC Waste Heat RecoverySystems on the Performance of a Turbocharged Heavy-Duty Diesel Engine. Energies 2017, 10, 1087. [CrossRef]
19. Palumbo, C.F.; Barnabei, V.F.; Preziuso, E.; Coronetta, U. Design and CFD analysis of a Ljungstrom turbinefor an ORC cycle in a waste heat recovery application. In Proceedings of the 29th International ConferenceonEfficiency, Cost, Optimization, Simulation and Environmental Impact of Energy Systems, Portorož, Slovenia,19–23 June 2016; pp. 19–23.
20. Saleh, B.; Koglbauer, G.; Wendland, M.; Fischer, J. Working fluids for low-temperature organic Rankinecycles. Energy 2007, 32, 1210–1221. [CrossRef]
21. Lakew, A.A.; Bolland, O. Working fluids for low-temperature heat source. Appl. Therm. Eng. 2010, 30,1262–1268. [CrossRef]
22. Papadopoulos, A.I.; Stijepovic, M.; Linke, P. On the systematic design and selection of optimal workingfluids for Organic Rankine Cycles. Appl. Therm. Eng. 2010, 30, 760–769. [CrossRef]
23. Stijepovic, M.Z.; Linke, P.; Papadopoulos, A.I.; Grujic, A.S. On the role of working fluid properties in OrganicRankine Cycle performance. Appl. Therm. Eng. 2012, 36, 406–413. [CrossRef]
24. Mazur, V.A.; Nikitin, D. Sustainable working media selection for renewable energy technologies.In Proceedings of the World Renewable Energy Congress-Sweden, Linköping, Sweden, 8–13 May 2011;Linköping University Electronic Press: Linköping, Sweden, 2011.
25. Kalra, C.; Becquin, G.; Jackson, J.; Laursen, A.L.; Chen, H.; Myers, K.; Hardy, A.; Klockow, H.; Zia, J.High-Potential Working Fluids and Cycle Concepts for Next-Generation Binary Organic Rankine Cycle forEnhanced Geothermal Systems. In Proceedings of the 37th Workshop on Geothermal Reservoir Engineering,Stanford, CA, USA, 30 January–1 February 2012.
26. Roedder, M.; Neef, M.; Laux, C.; Priebe, K.P. Systematic fluid selection for organic rankine cycles andperformance analysis for a combined high and low temperature cycle. J. Eng. Gas Turbines Power 2016,138, 031701. [CrossRef]
27. Bruno, J.C.; Lopez-Villada, J.; Letelier, E.; Romera, S.; Coronas, A. Modelling and optimisation of solarorganic rankine cycle engines for reverse osmosis desalination. Appl. Therm. Eng. 2008, 28, 2212–2226.[CrossRef]
28. Yamamoto, T.; Furuhata, T.; Arai, N.; Mori, K. Design and testing of the organic Rankine cycle. Energy 2001,26, 239–251. [CrossRef]
29. Invernizzi, C.; Iora, P.; Silva, P. Bottoming micro-Rankine cycles for micro-gas turbines. Appl. Therm. Eng.2007, 27, 100–110. [CrossRef]
30. Ebsilon Professional Program Documentation. 2014. Available online: https://www.steag-systemtechnologies.com/ebsilon_professional+M52087573ab0.html (accessed on 23 October 2017).
31. Javanshir, A.; Sarunac, N. Thermodynamic analysis of a simple Organic Rankine Cycle. Energy 2017, 118,85–96. [CrossRef]
32. Javanshir, A.; Sarunac, N. Effect of the Working Fluid on Performance of the ORC and CombinedBrayton/ORC Cycle. In Proceedings of the ASME 2017 11th International Conference on EnergySustainability Collocated with the ASME 2017 Power Conference Joint With ICOPE-17, the ASME 2017 15thInternational Conference on Fuel Cell Science, Engineering and Technology, and the ASME 2017 NuclearForum, American Society of Mechanical Engineers, Charlotte, NC, USA, 26–30 June 2017.
33. Javanshir, A.; Sarunac, N.; Razzaghpanah, Z. Thermodynamic analysis of a regenerative organic Rankinecycle using dry fluids. Appl. Therm. Eng. 2017, 123, 852–864. [CrossRef]
34. Dunham, M.T.; Iverson, B.D. High-efficiency thermodynamic power cycles for concentrated solar powersystems. Renew. Sustain. Energy Rev. 2014, 30, 758–770. [CrossRef]
35. Desai, N.B.; Bandyopadhyay, S. Process integration of organic Rankine cycle. Energy 2009, 34, 1674–1686.[CrossRef]
36. Srinivasan, K.K.; Mago, P.J.; Krishnan, S.R. Analysis of exhaust waste heat recovery from a dual fuel lowtemperature combustion engine using an Organic Rankine Cycle. Energy 2010, 35, 2387–2399. [CrossRef]
Sustainability 2017, 9, 1974 26 of 26
37. Chen, Q.; Xu, J.; Chen, H. A new design method for Organic Rankine Cycles with constraint of inlet and outletheat carrier fluid temperatures coupling with the heat source. Appl. Energy 2012, 98, 562–573. [CrossRef]
38. U.N.E.P. Handbook for the Montreal Protocol on Substances That Deplete the Ozone Layer; UNEP/Earthprint:Hertfordshire, UK, 2006.
39. GESTIS Information System on Hazardous Substances; IFA: Sankt Augustin, Germany, 2017.40. Seider, W.D.; Seader, J.D.; Lewin, D.R. Product & Process Design Principles: Synthesis, Analysis and Evaluation,
(with cd); John Wiley & Sons: Chichester, UK, 2009.41. Turton, R.; Bailie, R.C.; Whiting, W.B.; Shaeiwitz, J.A. Analysis, Synthesis and Design of Chemical Processes;
Pearson Education: London, UK, 2008.42. Pierobon, L.; Nguyen, T.V.; Larsen, U.; Haglind, F.; Elmegaard, B. Multi-objective optimization of organic
Rankine cycles for waste heat recovery: Application in an offshore platform. Energy 2013, 58, 538–549.[CrossRef]
43. Ho, C.K.; Carlson, M.; Garg, P.; Kumar, P. Technoeconomic Analysis of Alternative Solarized s-CO2 BraytonCycle Configurations. J. Sol. Energy Eng. 2016, 138, 051008. [CrossRef]
44. Turchi, C.S.; Heath, G.A. Molten Salt Power Tower Cost Model for the System Advisor Model (SAM);National Renewable Energy Laboratory (NREL): Golden, CO, USA, 2013.
45. Herrmann Rodrigues, L.; Nie, E.; Raza, A.; Wright, B. Low Grade Heat Recovery. 2010. Availableonline: https://pdfs.semanticscholar.org/7177/b720e5d4612dac94562f0cbb18b4d3d8d19b.pdf (accessed on29 October 2017).
46. Toffolo, A.; Lazzaretto, A.; Manente, G.; Paci, M. A multi-criteria approach for the optimal selection ofworking fluid and design parameters in Organic Rankine Cycle systems. Appl. Energy 2014, 121, 219–232.[CrossRef]
47. El-Wakil, M.M. Powerplant Technology; Tata McGraw-Hill Education: Gujarat, India, 1984.48. Tchanche, B.F.; Lambrinos, G.; Frangoudakis, A.; Papadakis, G. Low-grade heat conversion into power using
organic Rankine cycles—A review of various applications. Renew. Sustain. Energy Rev. 2011, 15, 3963–3979.[CrossRef]
© 2017 by the authors. Licensee MDPI, Basel, Switzerland. This article is an open accessarticle distributed under the terms and conditions of the Creative Commons Attribution(CC BY) license (http://creativecommons.org/licenses/by/4.0/).


![Orc as a Fiery Paradign of Poetic Torsion [Blake poetics]](https://img.pdfslide.net/doc/110x75/634ff72648cb0bd7320fb3e6/orc-as-a-fiery-paradign-of-poetic-torsion-blake-poetics.jpg)


