Embed Size (px)
Citation preview
www.elsevier.com/locate/jnucmat
Journal of Nuclear Materials 327 (2004) 220–225
Thermophysical measurements on dysprosiumand gadolinium titanates
G. Panneerselvam a, R. Venkata Krishnan a, M.P. Antony a,K. Nagarajan a, T. Vasudevan b, P.R. Vasudeva Rao a,*
a Fuel Chemistry Division, Chemical Group, Indira Gandhi Centre for Atomic Research, Kalpakkam 603 102, Indiab Department of Industrial Chemistry, Alagappa University, Karaikkudi 630 003, India
Received 28 October 2003; accepted 18 February 2004
Abstract
Dysprosium and gadolinium titanates were prepared by the solid state route and by the wet chemical route. The
compounds were characterized using inductively coupled plasma mass spectrometry (ICPMS) and X-ray diffraction
(XRD) techniques. Their thermal expansion coefficients were measured using high temperature X-ray diffraction
technique. The quasi-isotropic mean linear thermal expansion coefficient �am of Dy2TiO5 and Gd2TiO5 at room tem-
perature are 6.55· 10�6 and 6.56 · 10�6 K�1, respectively, and in the temperature range 298–1573 K are 1.006 · 10�5 and1.023· 10�5 K�1, respectively. Heat capacity measurements were carried out in the temperature range 320–820 K using
differential scanning calorimetry. From the polynomial fit the Cp;298 of Dy2TiO5 and Gd2TiO5 have been computed to be
178.26 and 168.61 JK�1 mol�1, respectively.
� 2004 Elsevier B.V. All rights reserved.
1. Introduction
Elements with large absorption cross-sections for
thermal neutrons such as cadmium (2450 b), boron
(755 b), hafnium (105 b), iridium (440 b) and their
compounds are generally used as control rod materials
in nuclear reactors [1]. Boron in the form of boron
carbide, B4C, is the absorber material generally used in
fast breeder reactors. The major advantages of boron
carbide are the relatively high neutron absorption cross-
section of boron in the fast spectrum, high thermal
stability and commercial availability. However, during
neutron irradiation, the B(n; a)Li reaction induces he-
lium formation. The helium bubbles nucleate cracks and
thereby reduce the lifetime of control rods.
Lanthanides or their oxides as alloying constituents
or as dispersions in stainless steel, aluminium and tita-
* Corresponding author. Tel.: +91-4114 280229; fax: +91-
4114 280065.
E-mail address: [email protected] (P.R. Vasudeva Rao).
0022-3115/$ - see front matter � 2004 Elsevier B.V. All rights reserv
doi:10.1016/j.jnucmat.2004.02.009
nium can also be used as control rod materials. Among
the rare earth elements, dysprosium and gadolinium
have relatively large thermal neutron absorption cross-
sections, 930 and 4900 b, respectively, and hence com-
pounds of dysprosium and gadolinium are considered
potential candidates for use in nuclear reactors as con-
trol rod materials. Dysprosium titanate (Dy2TiO5) is an
attractive control rod material for thermal neutron
reactors [2]. Its main advantages are the high neutron
absorption cross-section, relatively low swelling, no out-
gassing under neutron irradiation, high melting point
(2143 K), non-interactive nature with the cladding at
high temperatures, ease of fabrication and final product
being non-radioactive. Moreover, titanates of Dy and
Gd have good mechanical properties and thermal sta-
bility. Therefore, an accurate knowledge of the ther-
mophysical properties of these materials and their
behaviour during irradiation is necessary for the design
of control rods and for modeling their performance.
There is not much information available in the open
literature on the heat capacity and thermal expansion of
gadolinium titanate. For dysprosium titanate, one set of
ed.
G. Panneerselvam et al. / Journal of Nuclear Materials 327 (2004) 220–225 221
data from the work of Risovany et al. [2] is currently
available. These researchers have used a calorimeter
built in-house for heat capacity measurements. How-
ever, the accuracy of these measurements was not re-
ported and their data also display a huge amount of
scatter [3]. Hence there is a general need for generating
reliable thermal expansion and heat capacity data for
dysprosium and gadolinium titanates. The present study
attempts to fill this gap.
2. Experimental details
The oxides of dysprosium, gadolinium and titanium
(99.9%) used in this study were obtained from M/s. In-
dian Rare Earths, India. Dysprosium titanate (Dy2TiO5)
and gadolinium titanate (Gd2TiO5) were prepared by
standard solid-state synthesis (ceramic method) route as
well as by wet chemical methods.
2.1. Solid-state synthesis
Stoichiometric amounts of dysprosium and titanium
oxide powders were mixed for about 1 h in an agate
mortar. The homogeneous powder mix was compacted
at a pressure of 500 MPa, using a uniaxial hydraulic
press to get 10 mm · 2 mm pellets. The green pellets were
initially sintered at 1673 K for 24 h. The pellets were
subsequently ground to get fine powders that were
compacted again and heated at 1673 K for another 24 h
to get the final sintered pellets. A similar procedure was
adopted for the preparation of gadolinium titanate.
2.2. Wet chemical synthesis
Stoichiometric amounts of dysprosium oxide and
titanium sponge were dissolved in concentrated HNO3.
The solution was then evaporated to obtain dry powder.
The powder was calcined at 1673 K for 24 h. The sample
was then ground, compacted and sintered at 1673 K for
24 h. This procedure was repeated for gadolinium tita-
nate as well.
For compositional characterisation, a small portion
of the sample was dissolved in concentrated HNO3 and
an elemental analysis for dysprosium, gadolinium and
titanium was done using inductively coupled mass
spectrometry (ICPMS).
2.3. X-ray diffraction studies
For characterization by X-ray powder diffraction, the
sintered pellet was powdered to obtain �100 lm sized
particles. The XRD experiment was performed using Ni
filtered CuKa radiation (k ¼ 154:098 pm), in a Philips
X’pert MPD system that is equipped with a graphite
monochromator and a scintillation detector. The X-ray
diffraction pattern was recorded in the two-theta range,
10� < 2h < 70�. Peak positions and the relative intensi-
ties were estimated using a peak-fit program of the
Philips X’pert Plus software. The calibration of the
diffractometer was carried out using silicon and a-alu-mina standards obtained from the National Institute of
Standards and Technology (NIST), USA.
2.4. Thermal expansion studies
The thermal expansion behaviour of polycrystalline
dysprosium titanate and gadolinium titanate was stud-
ied from room temperature to 1573 K at a pressure of
10�5 Pa. High-temperature XRD measurements were
carried out using a high-temperature attachment sup-
plied by M/s. Johanna Otto, Germany. The detailed
description of the instrument has been given elsewhere
[4]. The temperature of the sample was controlled within
±1 K. Before each run, the vacuum chamber was first
evacuated to a pressure of about 10�3 Pa and then filled
with high pure argon gas. The evacuation and argon
filling cycle was repeated 4–5 times, before the X-ray
patterns were recorded.
Lattice parameters at different temperatures were
calculated using the values of d-spacings derived from
high angle reflections. The approximate lattice parame-
ters calculated from the Miller indices and d-spacingswere refined by the method of least squares using the
computer program AIDS 83 [5]. The estimated error in
the lattice parameter is of the order of ±0.5 pm.
For an orthorhombic lattice, the lattice parameters a,b and c are related to the d-spacing by the following
relation
h2=a2 þ k2=b2 þ l2=c2 ¼ 1=d2hkl: ð1Þ
Hence, dðhklÞ-values corresponding to all major reflectionsbetween 20� and 60�were calculated at each temperature.Three linear equations were set up by substituting the
dðhklÞ-values and corresponding h, k, l values in the above-mentioned equation. The lattice parameters a, b and cwere computed by solving the three linear equations
simultaneously. The estimated lattice parameters of
Dy2TiO5 and Gd2TiO5 as a function of temperature are
given in Tables 1 and 2, respectively.
2.5. Calorimetric measurements
2.5.1. Equipment
A heat flux type differential scanning calorimeter,
model DSC 821e/700 of M/s. Mettler Toledo GmbH,
Switzerland, was used in this study.
2.5.2. Measurements
The pellet samples for the DSC measurements were
prepared so as to fit into the 40 ll Al-pans and were
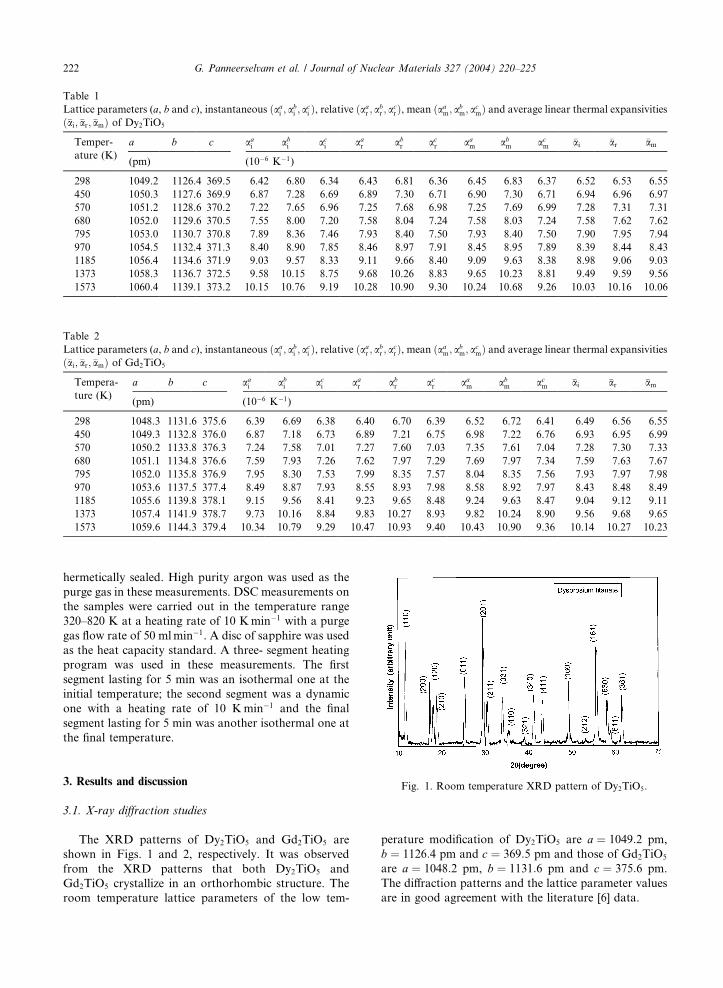
Table 1
Lattice parameters (a, b and c), instantaneous ðaai ; a
bi ; a
ci Þ, relative ðaa
r ; abr ; a
crÞ, mean ðaa
m; abm; a
cmÞ and average linear thermal expansivities
ð�ai; �ar; �amÞ of Dy2TiO5
Temper-
ature (K)
a b c aai ab
i aci aa
r abr ac
r aam ab
m acm �ai �ar �am
(pm) (10�6 K�1)
298 1049.2 1126.4 369.5 6.42 6.80 6.34 6.43 6.81 6.36 6.45 6.83 6.37 6.52 6.53 6.55
450 1050.3 1127.6 369.9 6.87 7.28 6.69 6.89 7.30 6.71 6.90 7.30 6.71 6.94 6.96 6.97
570 1051.2 1128.6 370.2 7.22 7.65 6.96 7.25 7.68 6.98 7.25 7.69 6.99 7.28 7.31 7.31
680 1052.0 1129.6 370.5 7.55 8.00 7.20 7.58 8.04 7.24 7.58 8.03 7.24 7.58 7.62 7.62
795 1053.0 1130.7 370.8 7.89 8.36 7.46 7.93 8.40 7.50 7.93 8.40 7.50 7.90 7.95 7.94
970 1054.5 1132.4 371.3 8.40 8.90 7.85 8.46 8.97 7.91 8.45 8.95 7.89 8.39 8.44 8.43
1185 1056.4 1134.6 371.9 9.03 9.57 8.33 9.11 9.66 8.40 9.09 9.63 8.38 8.98 9.06 9.03
1373 1058.3 1136.7 372.5 9.58 10.15 8.75 9.68 10.26 8.83 9.65 10.23 8.81 9.49 9.59 9.56
1573 1060.4 1139.1 373.2 10.15 10.76 9.19 10.28 10.90 9.30 10.24 10.68 9.26 10.03 10.16 10.06
Table 2
Lattice parameters (a, b and c), instantaneous ðaai ; a
bi ; a
ci Þ, relative ðaa
r ; abr ; a
crÞ, mean ðaa
m; abm; a
cmÞ and average linear thermal expansivities
ð�ai; �ar; �amÞ of Gd2TiO5
Tempera-
ture (K)
a b c aai ab
i aci aa
r abr ac
r aam ab
m acm �ai �ar �am
(pm) (10�6 K�1)
298 1048.3 1131.6 375.6 6.39 6.69 6.38 6.40 6.70 6.39 6.52 6.72 6.41 6.49 6.56 6.55
450 1049.3 1132.8 376.0 6.87 7.18 6.73 6.89 7.21 6.75 6.98 7.22 6.76 6.93 6.95 6.99
570 1050.2 1133.8 376.3 7.24 7.58 7.01 7.27 7.60 7.03 7.35 7.61 7.04 7.28 7.30 7.33
680 1051.1 1134.8 376.6 7.59 7.93 7.26 7.62 7.97 7.29 7.69 7.97 7.34 7.59 7.63 7.67
795 1052.0 1135.8 376.9 7.95 8.30 7.53 7.99 8.35 7.57 8.04 8.35 7.56 7.93 7.97 7.98
970 1053.6 1137.5 377.4 8.49 8.87 7.93 8.55 8.93 7.98 8.58 8.92 7.97 8.43 8.48 8.49
1185 1055.6 1139.8 378.1 9.15 9.56 8.41 9.23 9.65 8.48 9.24 9.63 8.47 9.04 9.12 9.11
1373 1057.4 1141.9 378.7 9.73 10.16 8.84 9.83 10.27 8.93 9.82 10.24 8.90 9.56 9.68 9.65
1573 1059.6 1144.3 379.4 10.34 10.79 9.29 10.47 10.93 9.40 10.43 10.90 9.36 10.14 10.27 10.23
222 G. Panneerselvam et al. / Journal of Nuclear Materials 327 (2004) 220–225
hermetically sealed. High purity argon was used as the
purge gas in these measurements. DSC measurements on
the samples were carried out in the temperature range
320–820 K at a heating rate of 10 Kmin�1 with a purge
gas flow rate of 50 mlmin�1. A disc of sapphire was used
as the heat capacity standard. A three- segment heating
program was used in these measurements. The first
segment lasting for 5 min was an isothermal one at the
initial temperature; the second segment was a dynamic
one with a heating rate of 10 Kmin�1 and the final
segment lasting for 5 min was another isothermal one at
the final temperature.
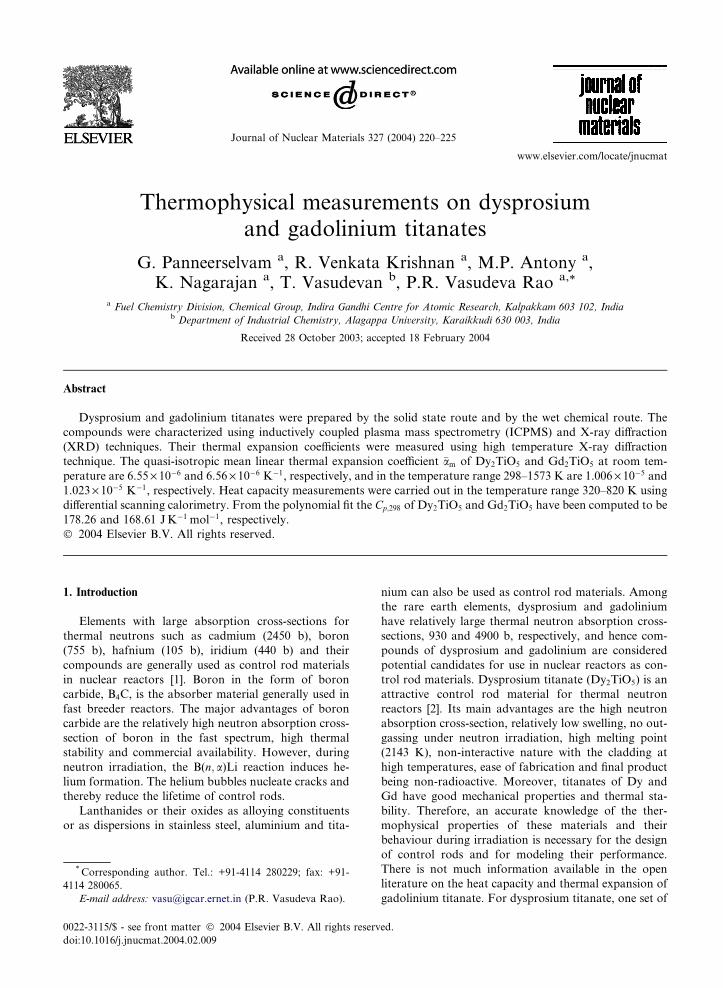
Fig. 1. Room temperature XRD pattern of Dy2TiO5.
3. Results and discussion3.1. X-ray diffraction studies
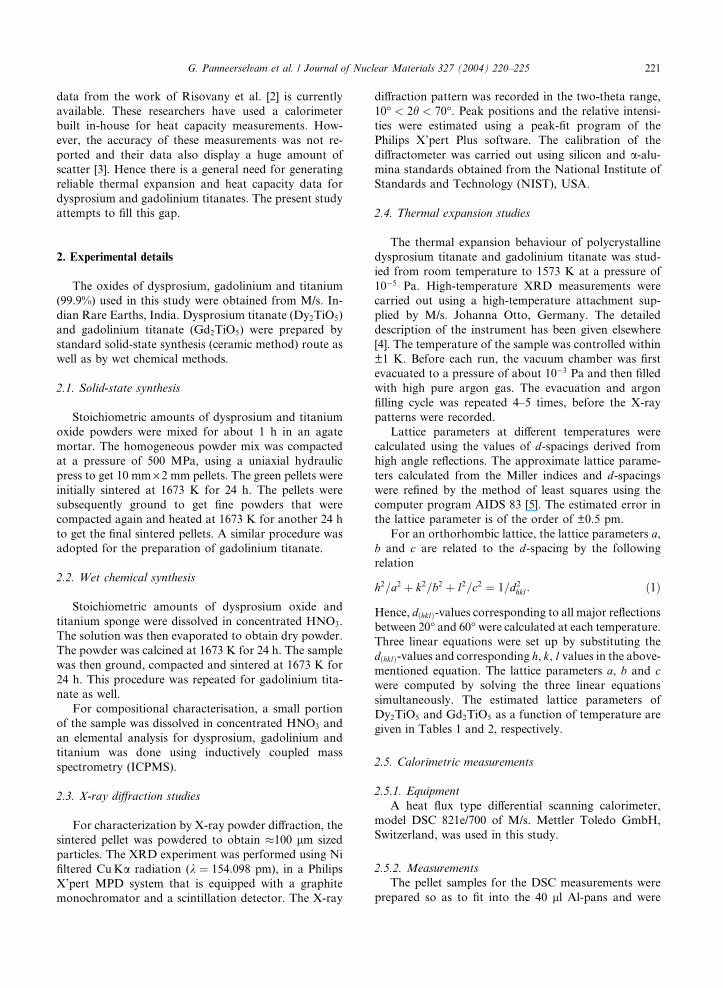
The XRD patterns of Dy2TiO5 and Gd2TiO5 are
shown in Figs. 1 and 2, respectively. It was observed
from the XRD patterns that both Dy2TiO5 and
Gd2TiO5 crystallize in an orthorhombic structure. The
room temperature lattice parameters of the low tem-
perature modification of Dy2TiO5 are a ¼ 1049:2 pm,
b ¼ 1126:4 pm and c ¼ 369:5 pm and those of Gd2TiO5
are a ¼ 1048:2 pm, b ¼ 1131:6 pm and c ¼ 375:6 pm.
The diffraction patterns and the lattice parameter values
are in good agreement with the literature [6] data.
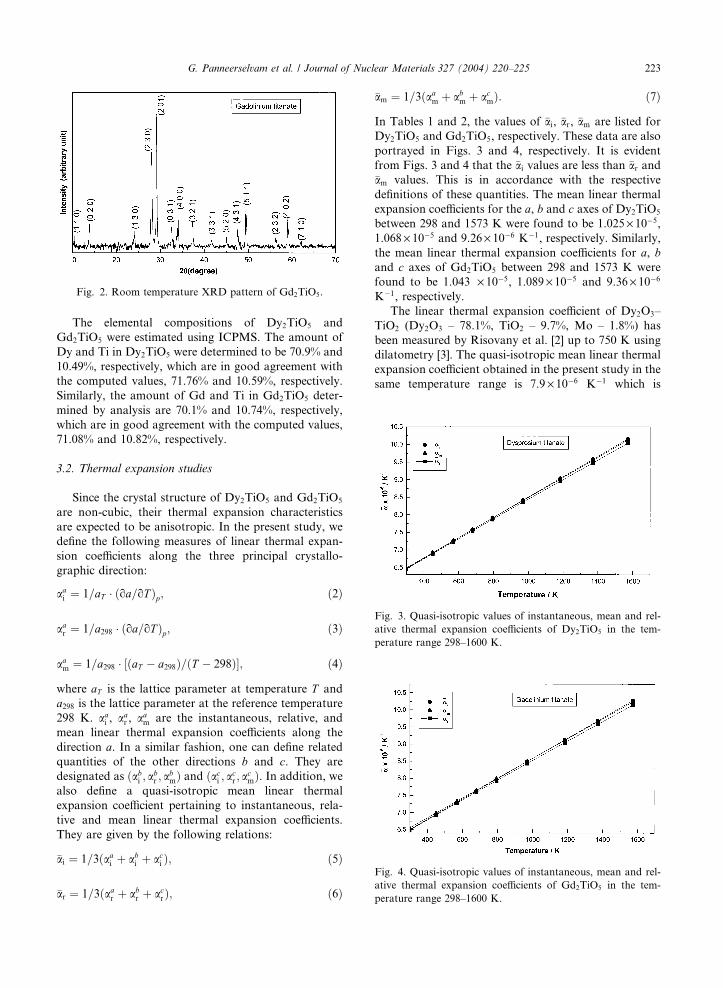
Fig. 2. Room temperature XRD pattern of Gd2TiO5.
G. Panneerselvam et al. / Journal of Nuclear Materials 327 (2004) 220–225 223
The elemental compositions of Dy2TiO5 and
Gd2TiO5 were estimated using ICPMS. The amount of
Dy and Ti in Dy2TiO5 were determined to be 70.9% and
10.49%, respectively, which are in good agreement with
the computed values, 71.76% and 10.59%, respectively.
Similarly, the amount of Gd and Ti in Gd2TiO5 deter-
mined by analysis are 70.1% and 10.74%, respectively,
which are in good agreement with the computed values,
71.08% and 10.82%, respectively.
3.2. Thermal expansion studies
Since the crystal structure of Dy2TiO5 and Gd2TiO5
are non-cubic, their thermal expansion characteristics
are expected to be anisotropic. In the present study, we
define the following measures of linear thermal expan-
sion coefficients along the three principal crystallo-
graphic direction:
aai ¼ 1=aT � ðoa=oT Þp; ð2Þ
Fig. 3. Quasi-isotropic values of instantaneous, mean and rel-
ative thermal expansion coefficients of Dy2TiO5 in the tem-
aar ¼ 1=a298 � ðoa=oT Þp; ð3Þperature range 298–1600 K.
aam ¼ 1=a298 � ½ðaT � a298Þ=ðT � 298Þ; ð4Þ
where aT is the lattice parameter at temperature T and
a298 is the lattice parameter at the reference temperature298 K. aa
i , aar , aa
m are the instantaneous, relative, and
mean linear thermal expansion coefficients along the
direction a. In a similar fashion, one can define related
quantities of the other directions b and c. They are
designated as ðabi ; a
br ; a
bmÞ and ðac
i ; acr ; a
cmÞ. In addition, we
also define a quasi-isotropic mean linear thermal
expansion coefficient pertaining to instantaneous, rela-
tive and mean linear thermal expansion coefficients.
They are given by the following relations:
�ai ¼ 1=3ðaai þ ab
i þ aci Þ; ð5Þ
Fig. 4. Quasi-isotropic values of instantaneous, mean and rel-
ative thermal expansion coefficients of Gd2TiO5 in the tem-
perature range 298–1600 K.
�ar ¼ 1=3ðaar þ abr þ acrÞ; ð6Þ
�am ¼ 1=3ðaam þ ab
m þ acmÞ: ð7Þ
In Tables 1 and 2, the values of �ai, �ar, �am are listed for
Dy2TiO5 and Gd2TiO5, respectively. These data are also
portrayed in Figs. 3 and 4, respectively. It is evident
from Figs. 3 and 4 that the �ai values are less than �ar and�am values. This is in accordance with the respective
definitions of these quantities. The mean linear thermal
expansion coefficients for the a, b and c axes of Dy2TiO5
between 298 and 1573 K were found to be 1.025· 10�5,1.068· 10�5 and 9.26· 10�6 K�1, respectively. Similarly,
the mean linear thermal expansion coefficients for a, band c axes of Gd2TiO5 between 298 and 1573 K were
found to be 1.043 · 10�5, 1.089 · 10�5 and 9.36· 10�6K�1, respectively.
The linear thermal expansion coefficient of Dy2O3–
TiO2 (Dy2O3 – 78.1%, TiO2 – 9.7%, Mo – 1.8%) has
been measured by Risovany et al. [2] up to 750 K using
dilatometry [3]. The quasi-isotropic mean linear thermal
expansion coefficient obtained in the present study in the
same temperature range is 7.9 · 10�6 K�1 which is
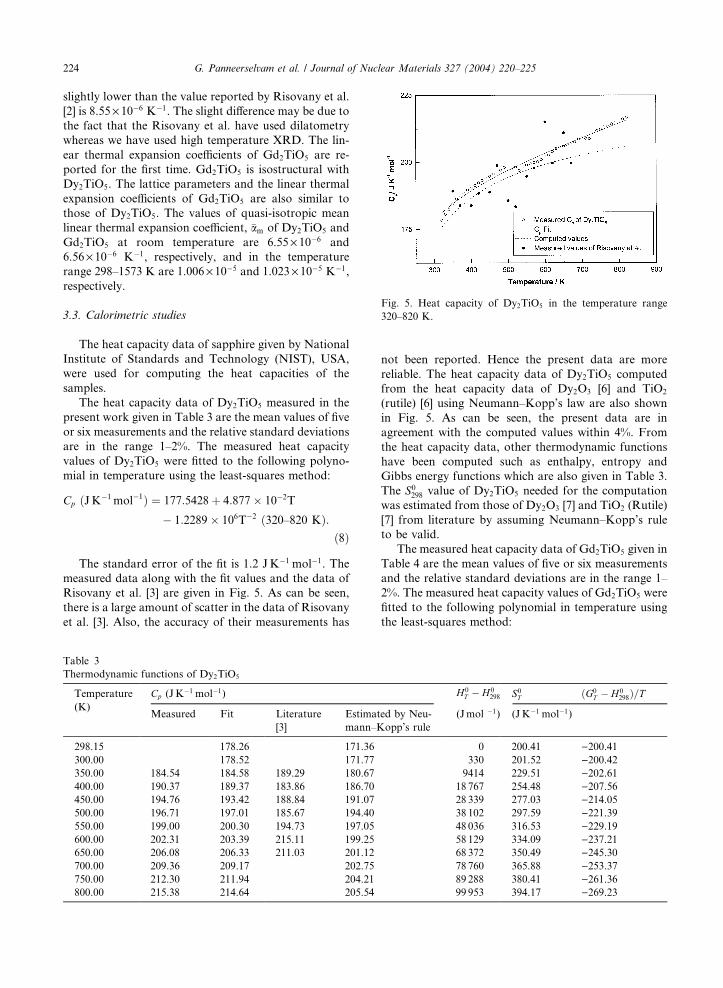
Fig. 5. Heat capacity of Dy2TiO5 in the temperature range
320–820 K.
224 G. Panneerselvam et al. / Journal of Nuclear Materials 327 (2004) 220–225
slightly lower than the value reported by Risovany et al.
[2] is 8.55· 10�6 K�1. The slight difference may be due to
the fact that the Risovany et al. have used dilatometry
whereas we have used high temperature XRD. The lin-
ear thermal expansion coefficients of Gd2TiO5 are re-
ported for the first time. Gd2TiO5 is isostructural with
Dy2TiO5. The lattice parameters and the linear thermal
expansion coefficients of Gd2TiO5 are also similar to
those of Dy2TiO5. The values of quasi-isotropic mean
linear thermal expansion coefficient, �am of Dy2TiO5 and
Gd2TiO5 at room temperature are 6.55· 10�6 and
6.56· 10�6 K�1, respectively, and in the temperature
range 298–1573 K are 1.006 · 10�5 and 1.023 · 10�5 K�1,
respectively.
3.3. Calorimetric studies
The heat capacity data of sapphire given by National
Institute of Standards and Technology (NIST), USA,
were used for computing the heat capacities of the
samples.
The heat capacity data of Dy2TiO5 measured in the
present work given in Table 3 are the mean values of five
or six measurements and the relative standard deviations
are in the range 1–2%. The measured heat capacity
values of Dy2TiO5 were fitted to the following polyno-
mial in temperature using the least-squares method:
Cp ðJK�1 mol�1Þ ¼ 177:5428þ 4:877 10�2T
� 1:2289 106T�2 ð320–820 KÞ:ð8Þ
The standard error of the fit is 1.2 JK�1 mol�1. The
measured data along with the fit values and the data of
Risovany et al. [3] are given in Fig. 5. As can be seen,
there is a large amount of scatter in the data of Risovany
et al. [3]. Also, the accuracy of their measurements has
Table 3
Thermodynamic functions of Dy2TiO5
Temperature
(K)
Cp (JK�1 mol�1)
Measured Fit Literature
[3]
Estimat
mann–K
298.15 178.26 171.36
300.00 178.52 171.77
350.00 184.54 184.58 189.29 180.67
400.00 190.37 189.37 183.86 186.70
450.00 194.76 193.42 188.84 191.07
500.00 196.71 197.01 185.67 194.40
550.00 199.00 200.30 194.73 197.05
600.00 202.31 203.39 215.11 199.25
650.00 206.08 206.33 211.03 201.12
700.00 209.36 209.17 202.75
750.00 212.30 211.94 204.21
800.00 215.38 214.64 205.54
not been reported. Hence the present data are more
reliable. The heat capacity data of Dy2TiO5 computed
from the heat capacity data of Dy2O3 [6] and TiO2
(rutile) [6] using Neumann–Kopp’s law are also shown
in Fig. 5. As can be seen, the present data are in
agreement with the computed values within 4%. From
the heat capacity data, other thermodynamic functions
have been computed such as enthalpy, entropy and
Gibbs energy functions which are also given in Table 3.
The S0298 value of Dy2TiO5 needed for the computation
was estimated from those of Dy2O3 [7] and TiO2 (Rutile)
[7] from literature by assuming Neumann–Kopp’s rule
to be valid.
The measured heat capacity data of Gd2TiO5 given in
Table 4 are the mean values of five or six measurements
and the relative standard deviations are in the range 1–
2%. The measured heat capacity values of Gd2TiO5 were
fitted to the following polynomial in temperature using
the least-squares method:
H 0T � H 0
298 S0T ðG0T � H 0
298Þ=T
ed by Neu-
opp’s rule
(Jmol �1) (JK�1 mol�1)
0 200.41 )200.41330 201.52 )200.429414 229.51 )202.61
18 767 254.48 )207.5628 339 277.03 )214.0538 102 297.59 )221.3948 036 316.53 )229.1958 129 334.09 )237.2168 372 350.49 )245.3078 760 365.88 )253.3789 288 380.41 )261.3699 953 394.17 )269.23
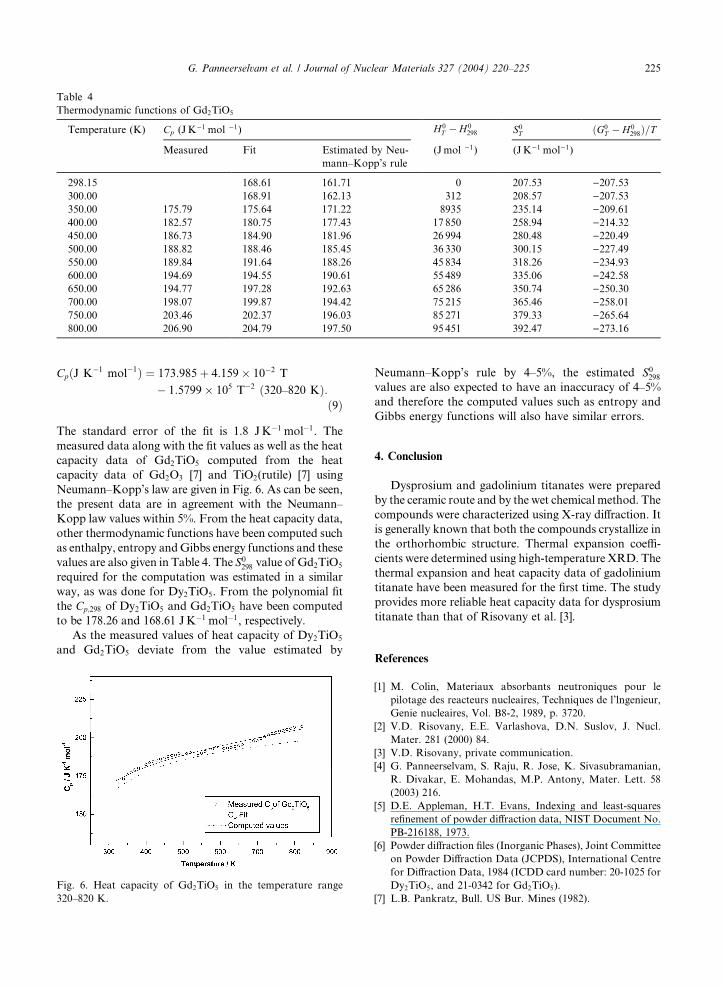
Table 4
Thermodynamic functions of Gd2TiO5
Temperature (K) Cp (JK�1 mol �1) H 0
T � H 0298 S0T ðG0
T � H 0298Þ=T
Measured Fit Estimated by Neu-
mann–Kopp’s rule
(Jmol �1) (JK�1 mol�1)
298.15 168.61 161.71 0 207.53 )207.53300.00 168.91 162.13 312 208.57 )207.53350.00 175.79 175.64 171.22 8935 235.14 )209.61400.00 182.57 180.75 177.43 17 850 258.94 )214.32450.00 186.73 184.90 181.96 26 994 280.48 )220.49500.00 188.82 188.46 185.45 36 330 300.15 )227.49550.00 189.84 191.64 188.26 45 834 318.26 )234.93600.00 194.69 194.55 190.61 55 489 335.06 )242.58650.00 194.77 197.28 192.63 65 286 350.74 )250.30700.00 198.07 199.87 194.42 75 215 365.46 )258.01750.00 203.46 202.37 196.03 85 271 379.33 )265.64800.00 206.90 204.79 197.50 95 451 392.47 )273.16
G. Panneerselvam et al. / Journal of Nuclear Materials 327 (2004) 220–225 225
CpðJ K�1 mol�1Þ ¼ 173:985þ 4:159 10�2 T
� 1:5799 105 T�2 ð320–820 KÞ:ð9Þ
The standard error of the fit is 1.8 JK�1 mol�1. The
measured data along with the fit values as well as the heat
capacity data of Gd2TiO5 computed from the heat
capacity data of Gd2O3 [7] and TiO2(rutile) [7] using
Neumann–Kopp’s law are given in Fig. 6. As can be seen,
the present data are in agreement with the Neumann–
Kopp law values within 5%. From the heat capacity data,
other thermodynamic functions have been computed such
as enthalpy, entropy andGibbs energy functions and these
values are also given in Table 4. The S0298 value of Gd2TiO5
required for the computation was estimated in a similar
way, as was done for Dy2TiO5. From the polynomial fit
the Cp;298 of Dy2TiO5 and Gd2TiO5 have been computed
to be 178.26 and 168.61 JK�1 mol�1, respectively.
As the measured values of heat capacity of Dy2TiO5
and Gd2TiO5 deviate from the value estimated by
Fig. 6. Heat capacity of Gd2TiO5 in the temperature range
320–820 K.
Neumann–Kopp’s rule by 4–5%, the estimated S0298values are also expected to have an inaccuracy of 4–5%
and therefore the computed values such as entropy and
Gibbs energy functions will also have similar errors.
4. Conclusion
Dysprosium and gadolinium titanates were prepared
by the ceramic route and by the wet chemical method. The
compounds were characterized using X-ray diffraction. It
is generally known that both the compounds crystallize in
the orthorhombic structure. Thermal expansion coeffi-
cients were determined using high-temperature XRD. The
thermal expansion and heat capacity data of gadolinium
titanate have been measured for the first time. The study
provides more reliable heat capacity data for dysprosium
titanate than that of Risovany et al. [3].
References
[1] M. Colin, Materiaux absorbants neutroniques pour le
pilotage des reacteurs nucleaires, Techniques de l’lngenieur,
Genie nucleaires, Vol. B8-2, 1989, p. 3720.
[2] V.D. Risovany, E.E. Varlashova, D.N. Suslov, J. Nucl.
Mater. 281 (2000) 84.
[3] V.D. Risovany, private communication.
[4] G. Panneerselvam, S. Raju, R. Jose, K. Sivasubramanian,
R. Divakar, E. Mohandas, M.P. Antony, Mater. Lett. 58
(2003) 216.
[5] D.E. Appleman, H.T. Evans, Indexing and least-squares
refinement of powder diffraction data, NIST Document No.
PB-216188, 1973.
[6] Powder diffraction files (Inorganic Phases), Joint Committee
on Powder Diffraction Data (JCPDS), International Centre
for Diffraction Data, 1984 (ICDD card number: 20-1025 for
Dy2TiO5, and 21-0342 for Gd2TiO5).
[7] L.B. Pankratz, Bull. US Bur. Mines (1982).


